OCTOBER 28, 2025 THIRD QUARTER 2025 FINANCIAL RESULTS .3
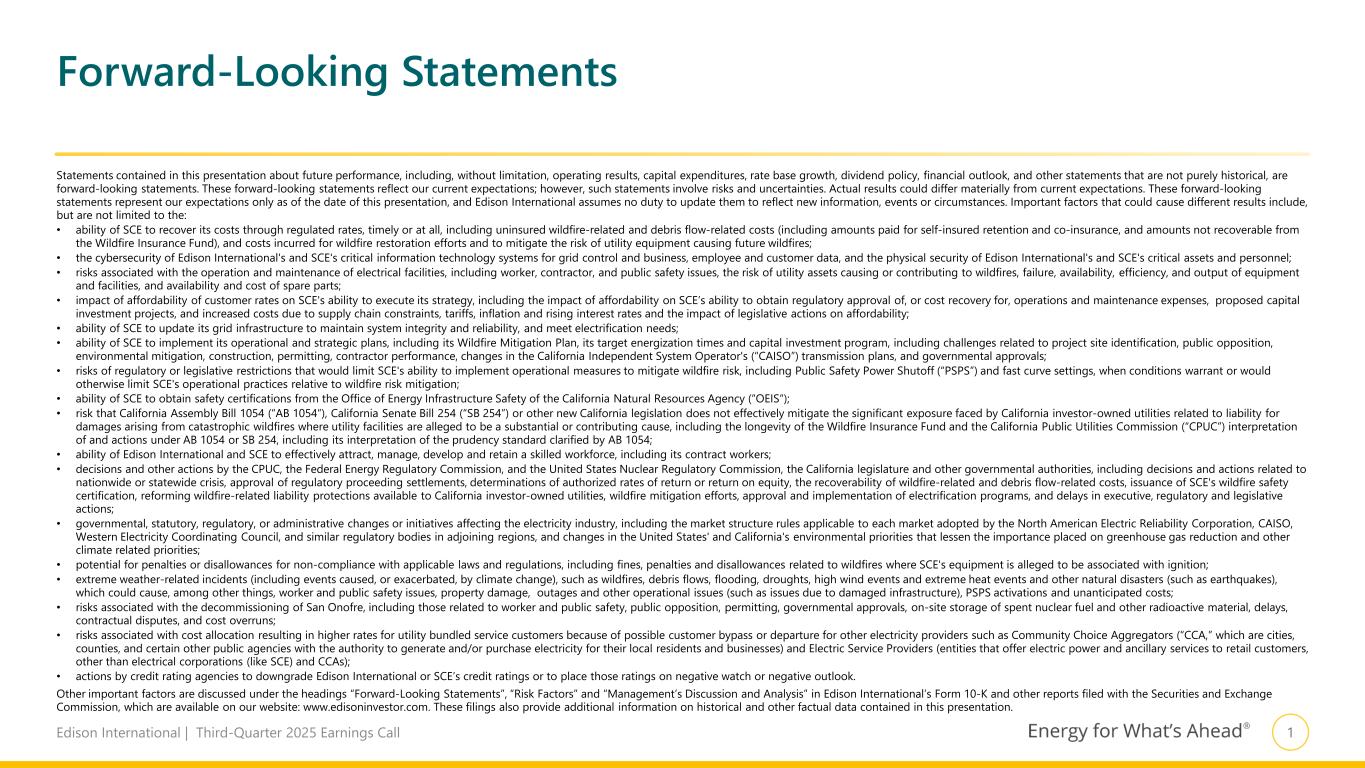
1Edison International | Third-Quarter 2025 Earnings Call Statements contained in this presentation about future performance, including, without limitation, operating results, capital expenditures, rate base growth, dividend policy, financial outlook, and other statements that are not purely historical, are forward-looking statements. These forward-looking statements reflect our current expectations; however, such statements involve risks and uncertainties. Actual results could differ materially from current expectations. These forward-looking statements represent our expectations only as of the date of this presentation, and Edison International assumes no duty to update them to reflect new information, events or circumstances. Important factors that could cause different results include, but are not limited to the: • ability of SCE to recover its costs through regulated rates, timely or at all, including uninsured wildfire-related and debris flow-related costs (including amounts paid for self-insured retention and co-insurance, and amounts not recoverable from the Wildfire Insurance Fund), and costs incurred for wildfire restoration efforts and to mitigate the risk of utility equipment causing future wildfires; • the cybersecurity of Edison International's and SCE's critical information technology systems for grid control and business, employee and customer data, and the physical security of Edison International's and SCE's critical assets and personnel; • risks associated with the operation and maintenance of electrical facilities, including worker, contractor, and public safety issues, the risk of utility assets causing or contributing to wildfires, failure, availability, efficiency, and output of equipment and facilities, and availability and cost of spare parts; • impact of affordability of customer rates on SCE's ability to execute its strategy, including the impact of affordability on SCE’s ability to obtain regulatory approval of, or cost recovery for, operations and maintenance expenses, proposed capital investment projects, and increased costs due to supply chain constraints, tariffs, inflation and rising interest rates and the impact of legislative actions on affordability; • ability of SCE to update its grid infrastructure to maintain system integrity and reliability, and meet electrification needs; • ability of SCE to implement its operational and strategic plans, including its Wildfire Mitigation Plan, its target energization times and capital investment program, including challenges related to project site identification, public opposition, environmental mitigation, construction, permitting, contractor performance, changes in the California Independent System Operator's (“CAISO”) transmission plans, and governmental approvals; • risks of regulatory or legislative restrictions that would limit SCE's ability to implement operational measures to mitigate wildfire risk, including Public Safety Power Shutoff (“PSPS”) and fast curve settings, when conditions warrant or would otherwise limit SCE's operational practices relative to wildfire risk mitigation; • ability of SCE to obtain safety certifications from the Office of Energy Infrastructure Safety of the California Natural Resources Agency (“OEIS“); • risk that California Assembly Bill 1054 (“AB 1054“), California Senate Bill 254 (“SB 254”) or other new California legislation does not effectively mitigate the significant exposure faced by California investor-owned utilities related to liability for damages arising from catastrophic wildfires where utility facilities are alleged to be a substantial or contributing cause, including the longevity of the Wildfire Insurance Fund and the California Public Utilities Commission (“CPUC”) interpretation of and actions under AB 1054 or SB 254, including its interpretation of the prudency standard clarified by AB 1054; • ability of Edison International and SCE to effectively attract, manage, develop and retain a skilled workforce, including its contract workers; • decisions and other actions by the CPUC, the Federal Energy Regulatory Commission, and the United States Nuclear Regulatory Commission, the California legislature and other governmental authorities, including decisions and actions related to nationwide or statewide crisis, approval of regulatory proceeding settlements, determinations of authorized rates of return or return on equity, the recoverability of wildfire-related and debris flow-related costs, issuance of SCE's wildfire safety certification, reforming wildfire-related liability protections available to California investor-owned utilities, wildfire mitigation efforts, approval and implementation of electrification programs, and delays in executive, regulatory and legislative actions; • governmental, statutory, regulatory, or administrative changes or initiatives affecting the electricity industry, including the market structure rules applicable to each market adopted by the North American Electric Reliability Corporation, CAISO, Western Electricity Coordinating Council, and similar regulatory bodies in adjoining regions, and changes in the United States' and California's environmental priorities that lessen the importance placed on greenhouse gas reduction and other climate related priorities; • potential for penalties or disallowances for non-compliance with applicable laws and regulations, including fines, penalties and disallowances related to wildfires where SCE's equipment is alleged to be associated with ignition; • extreme weather-related incidents (including events caused, or exacerbated, by climate change), such as wildfires, debris flows, flooding, droughts, high wind events and extreme heat events and other natural disasters (such as earthquakes), which could cause, among other things, worker and public safety issues, property damage, outages and other operational issues (such as issues due to damaged infrastructure), PSPS activations and unanticipated costs; • risks associated with the decommissioning of San Onofre, including those related to worker and public safety, public opposition, permitting, governmental approvals, on-site storage of spent nuclear fuel and other radioactive material, delays, contractual disputes, and cost overruns; • risks associated with cost allocation resulting in higher rates for utility bundled service customers because of possible customer bypass or departure for other electricity providers such as Community Choice Aggregators (“CCA,” which are cities, counties, and certain other public agencies with the authority to generate and/or purchase electricity for their local residents and businesses) and Electric Service Providers (entities that offer electric power and ancillary services to retail customers, other than electrical corporations (like SCE) and CCAs); • actions by credit rating agencies to downgrade Edison International or SCE’s credit ratings or to place those ratings on negative watch or negative outlook. Other important factors are discussed under the headings “Forward-Looking Statements”, “Risk Factors” and “Management’s Discussion and Analysis” in Edison International’s Form 10-K and other reports filed with the Securities and Exchange Commission, which are available on our website: www.edisoninvestor.com. These filings also provide additional information on historical and other factual data contained in this presentation. Forward-Looking Statements
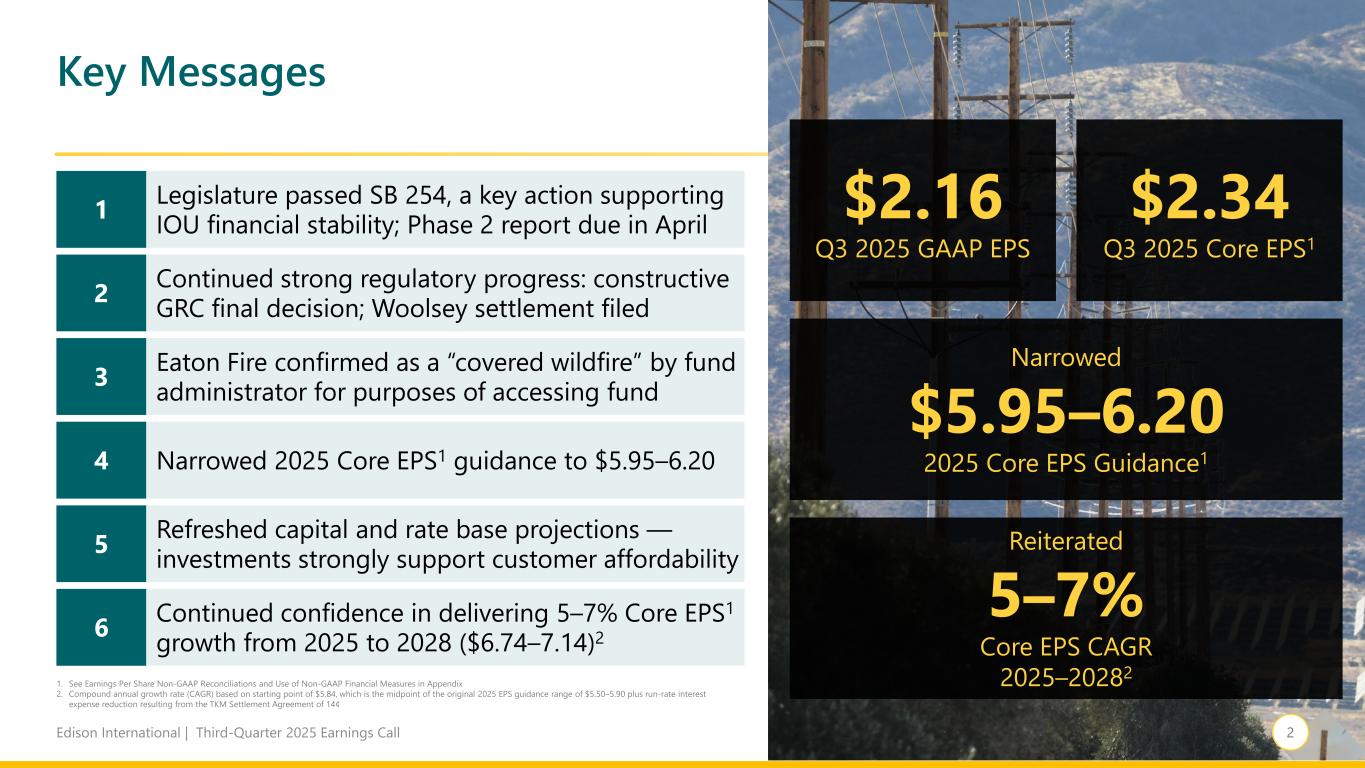
2Edison International | Third-Quarter 2025 Earnings Call Key Messages $2.16 Q3 2025 GAAP EPS $2.34 Q3 2025 Core EPS1 Reiterated 5–7% Core EPS CAGR 2025–20282 Narrowed $5.95–6.20 2025 Core EPS Guidance1 Legislature passed SB 254, a key action supporting IOU financial stability; Phase 2 report due in April Eaton Fire confirmed as a “covered wildfire” by fund administrator for purposes of accessing fund Narrowed 2025 Core EPS1 guidance to $5.95–6.20 1. See Earnings Per Share Non-GAAP Reconciliations and Use of Non-GAAP Financial Measures in Appendix 2. Compound annual growth rate (CAGR) based on starting point of $5.84, which is the midpoint of the original 2025 EPS guidance range of $5.50–5.90 plus run-rate interest expense reduction resulting from the TKM Settlement Agreement of 14¢ Continued confidence in delivering 5–7% Core EPS1 growth from 2025 to 2028 ($6.74–7.14)2 1 3 4 6 Continued strong regulatory progress: constructive GRC final decision; Woolsey settlement filed2 Refreshed capital and rate base projections — investments strongly support customer affordability5
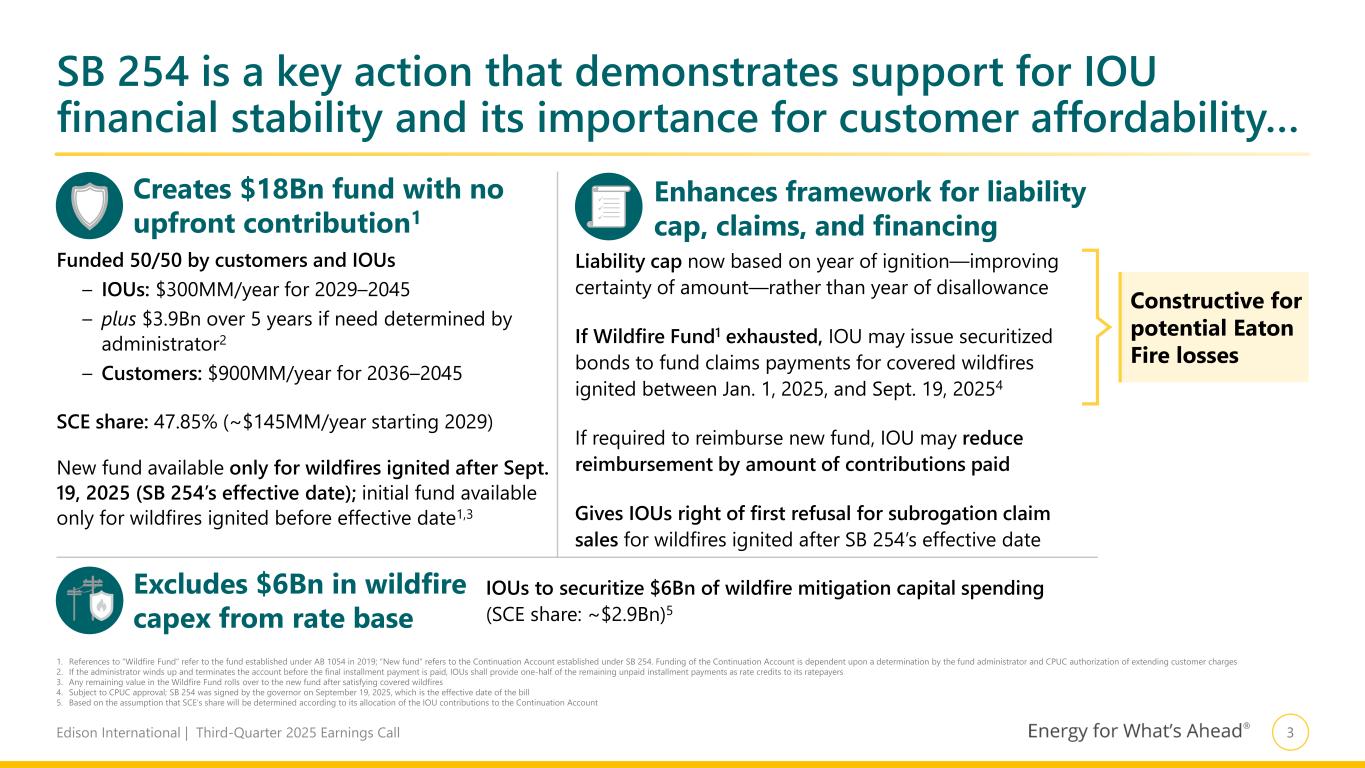
3Edison International | Third-Quarter 2025 Earnings Call SB 254 is a key action that demonstrates support for IOU financial stability and its importance for customer affordability… 1. References to “Wildfire Fund” refer to the fund established under AB 1054 in 2019; “New fund” refers to the Continuation Account established under SB 254. Funding of the Continuation Account is dependent upon a determination by the fund administrator and CPUC authorization of extending customer charges 2. If the administrator winds up and terminates the account before the final installment payment is paid, IOUs shall provide one-half of the remaining unpaid installment payments as rate credits to its ratepayers 3. Any remaining value in the Wildfire Fund rolls over to the new fund after satisfying covered wildfires 4. Subject to CPUC approval; SB 254 was signed by the governor on September 19, 2025, which is the effective date of the bill 5. Based on the assumption that SCE’s share will be determined according to its allocation of the IOU contributions to the Continuation Account Excludes $6Bn in wildfire capex from rate base Creates $18Bn fund with no upfront contribution1 Funded 50/50 by customers and IOUs – IOUs: $300MM/year for 2029–2045 – plus $3.9Bn over 5 years if need determined by administrator2 – Customers: $900MM/year for 2036–2045 SCE share: 47.85% (~$145MM/year starting 2029) New fund available only for wildfires ignited after Sept. 19, 2025 (SB 254’s effective date); initial fund available only for wildfires ignited before effective date1,3 Enhances framework for liability cap, claims, and financing Liability cap now based on year of ignition—improving certainty of amount—rather than year of disallowance If Wildfire Fund1 exhausted, IOU may issue securitized bonds to fund claims payments for covered wildfires ignited between Jan. 1, 2025, and Sept. 19, 20254 If required to reimburse new fund, IOU may reduce reimbursement by amount of contributions paid Gives IOUs right of first refusal for subrogation claim sales for wildfires ignited after SB 254’s effective date IOUs to securitize $6Bn of wildfire mitigation capital spending (SCE share: ~$2.9Bn)5 Constructive for potential Eaton Fire losses
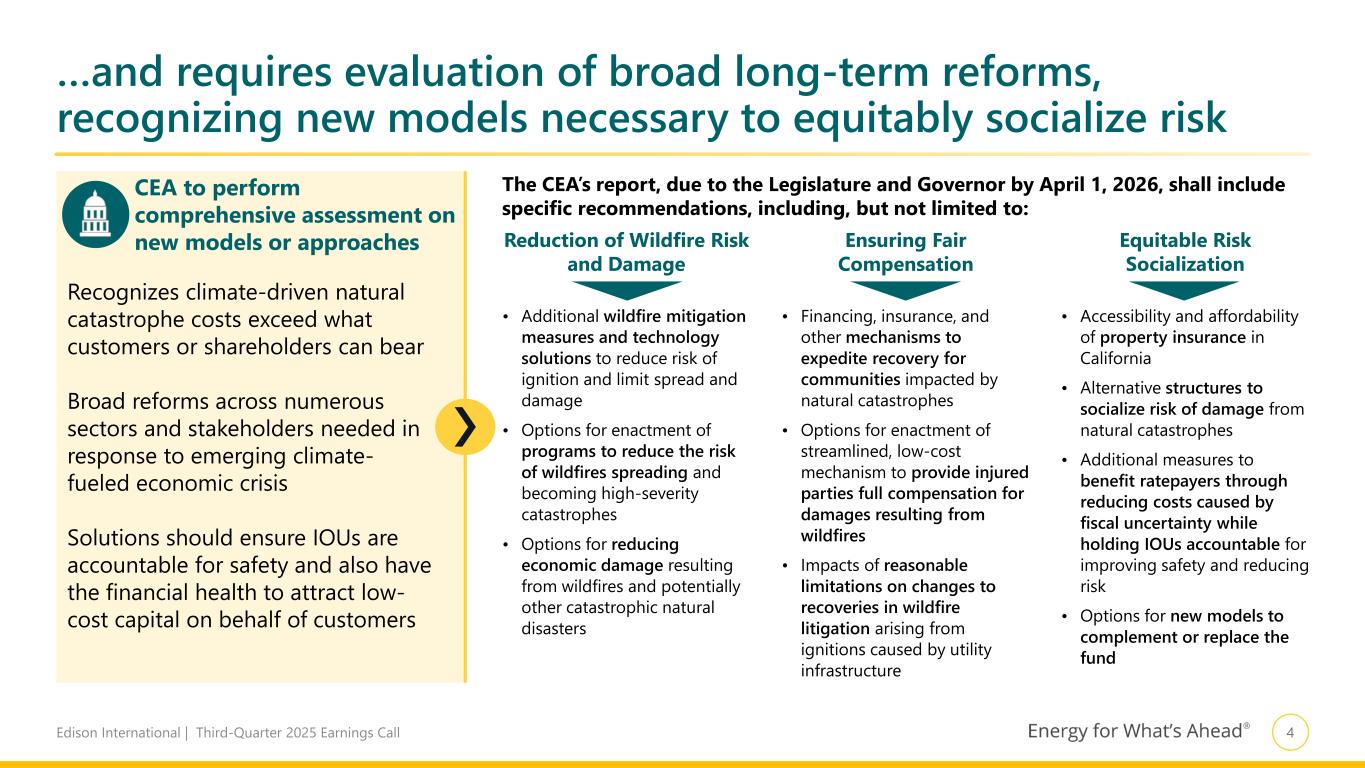
4Edison International | Third-Quarter 2025 Earnings Call …and requires evaluation of broad long-term reforms, recognizing new models necessary to equitably socialize risk Recognizes climate-driven natural catastrophe costs exceed what customers or shareholders can bear Broad reforms across numerous sectors and stakeholders needed in response to emerging climate- fueled economic crisis Solutions should ensure IOUs are accountable for safety and also have the financial health to attract low- cost capital on behalf of customers CEA to perform comprehensive assessment on new models or approaches The CEA’s report, due to the Legislature and Governor by April 1, 2026, shall include specific recommendations, including, but not limited to: Reduction of Wildfire Risk and Damage Ensuring Fair Compensation Equitable Risk Socialization • Additional wildfire mitigation measures and technology solutions to reduce risk of ignition and limit spread and damage • Options for enactment of programs to reduce the risk of wildfires spreading and becoming high-severity catastrophes • Options for reducing economic damage resulting from wildfires and potentially other catastrophic natural disasters • Financing, insurance, and other mechanisms to expedite recovery for communities impacted by natural catastrophes • Options for enactment of streamlined, low-cost mechanism to provide injured parties full compensation for damages resulting from wildfires • Impacts of reasonable limitations on changes to recoveries in wildfire litigation arising from ignitions caused by utility infrastructure • Accessibility and affordability of property insurance in California • Alternative structures to socialize risk of damage from natural catastrophes • Additional measures to benefit ratepayers through reducing costs caused by fiscal uncertainty while holding IOUs accountable for improving safety and reducing risk • Options for new models to complement or replace the fund
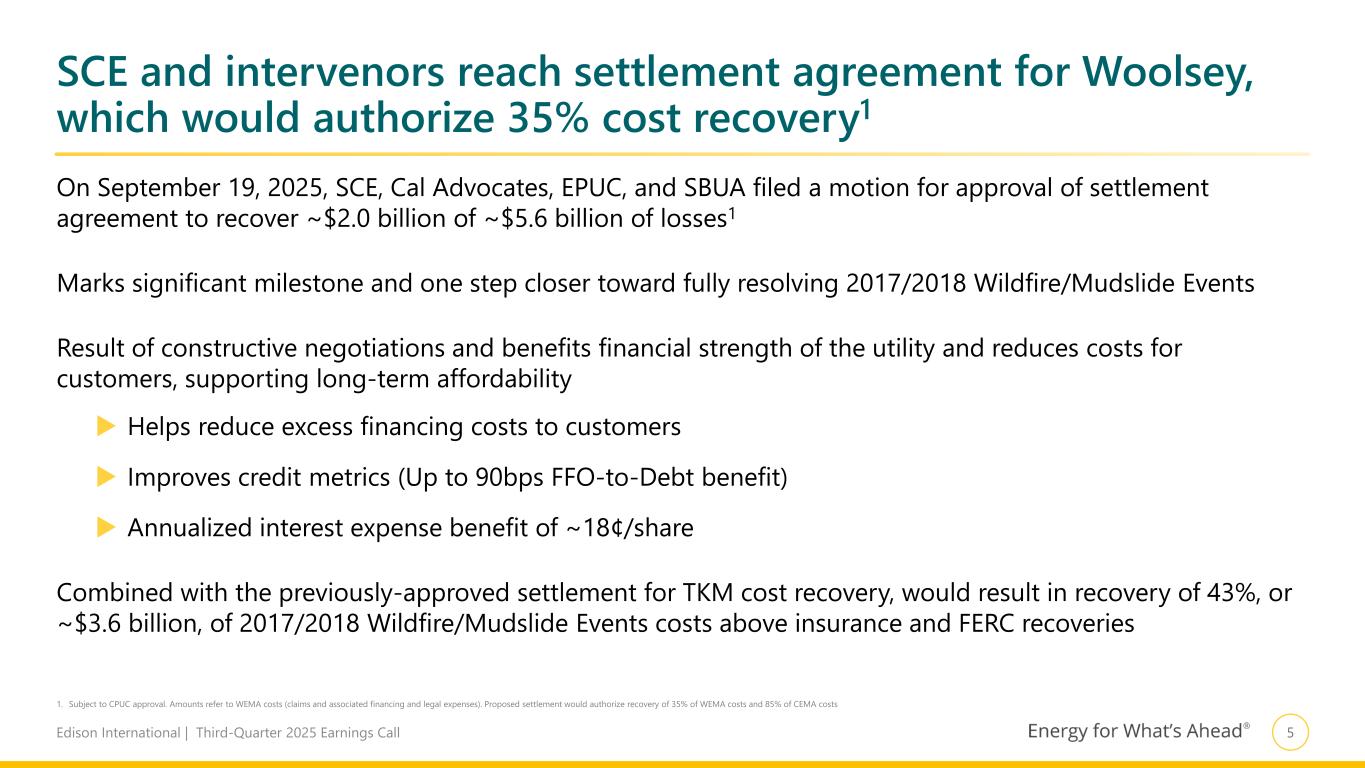
5Edison International | Third-Quarter 2025 Earnings Call SCE and intervenors reach settlement agreement for Woolsey, which would authorize 35% cost recovery1 On September 19, 2025, SCE, Cal Advocates, EPUC, and SBUA filed a motion for approval of settlement agreement to recover ~$2.0 billion of ~$5.6 billion of losses1 Marks significant milestone and one step closer toward fully resolving 2017/2018 Wildfire/Mudslide Events Result of constructive negotiations and benefits financial strength of the utility and reduces costs for customers, supporting long-term affordability Helps reduce excess financing costs to customers Improves credit metrics (Up to 90bps FFO-to-Debt benefit) Annualized interest expense benefit of ~18¢/share Combined with the previously-approved settlement for TKM cost recovery, would result in recovery of 43%, or ~$3.6 billion, of 2017/2018 Wildfire/Mudslide Events costs above insurance and FERC recoveries 1. Subject to CPUC approval. Amounts refer to WEMA costs (claims and associated financing and legal expenses). Proposed settlement would authorize recovery of 35% of WEMA costs and 85% of CEMA costs
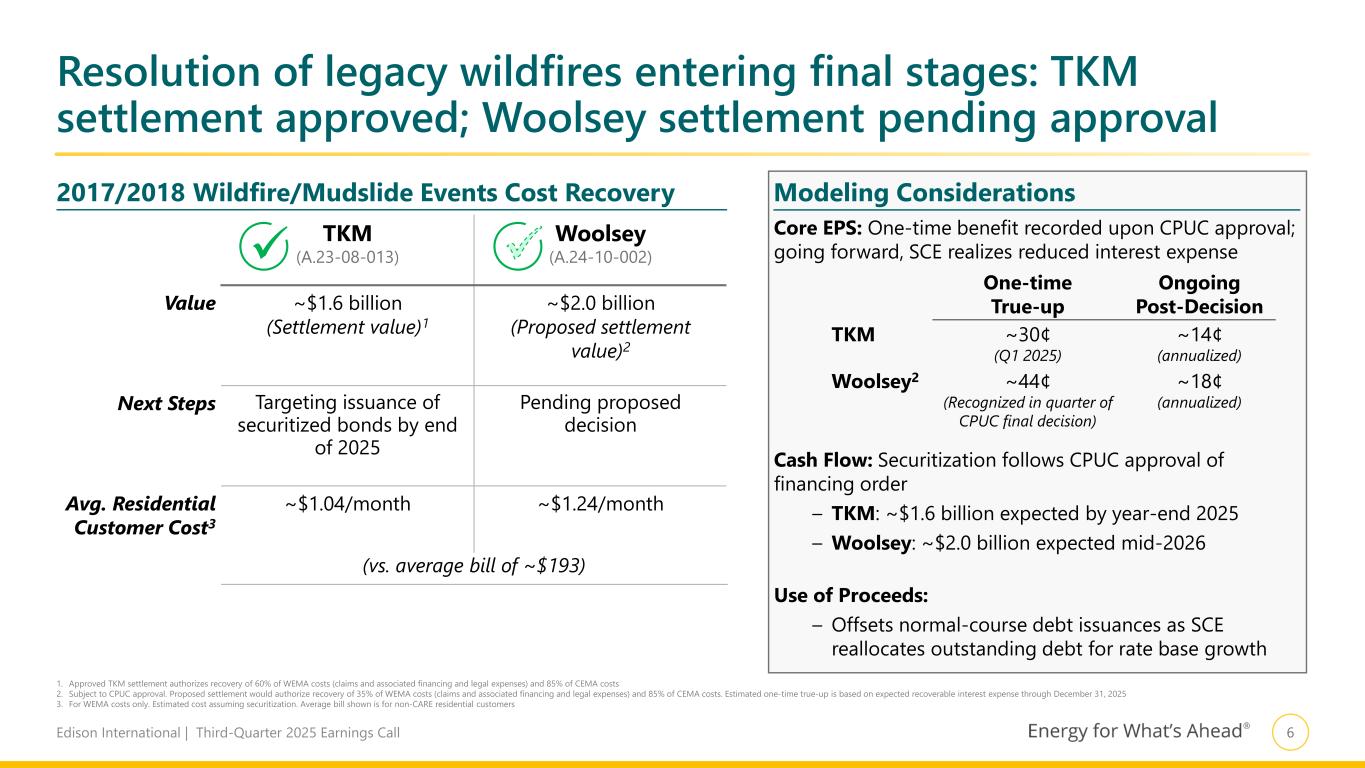
6Edison International | Third-Quarter 2025 Earnings Call Resolution of legacy wildfires entering final stages: TKM settlement approved; Woolsey settlement pending approval TKM (A.23-08-013) Woolsey (A.24-10-002) Value ~$1.6 billion (Settlement value)1 ~$2.0 billion (Proposed settlement value)2 Next Steps Targeting issuance of securitized bonds by end of 2025 Pending proposed decision Avg. Residential Customer Cost3 ~$1.04/month ~$1.24/month (vs. average bill of ~$193) Modeling Considerations2017/2018 Wildfire/Mudslide Events Cost Recovery 1. Approved TKM settlement authorizes recovery of 60% of WEMA costs (claims and associated financing and legal expenses) and 85% of CEMA costs 2. Subject to CPUC approval. Proposed settlement would authorize recovery of 35% of WEMA costs (claims and associated financing and legal expenses) and 85% of CEMA costs. Estimated one-time true-up is based on expected recoverable interest expense through December 31, 2025 3. For WEMA costs only. Estimated cost assuming securitization. Average bill shown is for non-CARE residential customers Core EPS: One-time benefit recorded upon CPUC approval; going forward, SCE realizes reduced interest expense Cash Flow: Securitization follows CPUC approval of financing order – TKM: ~$1.6 billion expected by year-end 2025 – Woolsey: ~$2.0 billion expected mid-2026 Use of Proceeds: – Offsets normal-course debt issuances as SCE reallocates outstanding debt for rate base growth One-time True-up Ongoing Post-Decision TKM ~30¢ (Q1 2025) ~14¢ (annualized) Woolsey2 ~44¢ (Recognized in quarter of CPUC final decision) ~18¢ (annualized)
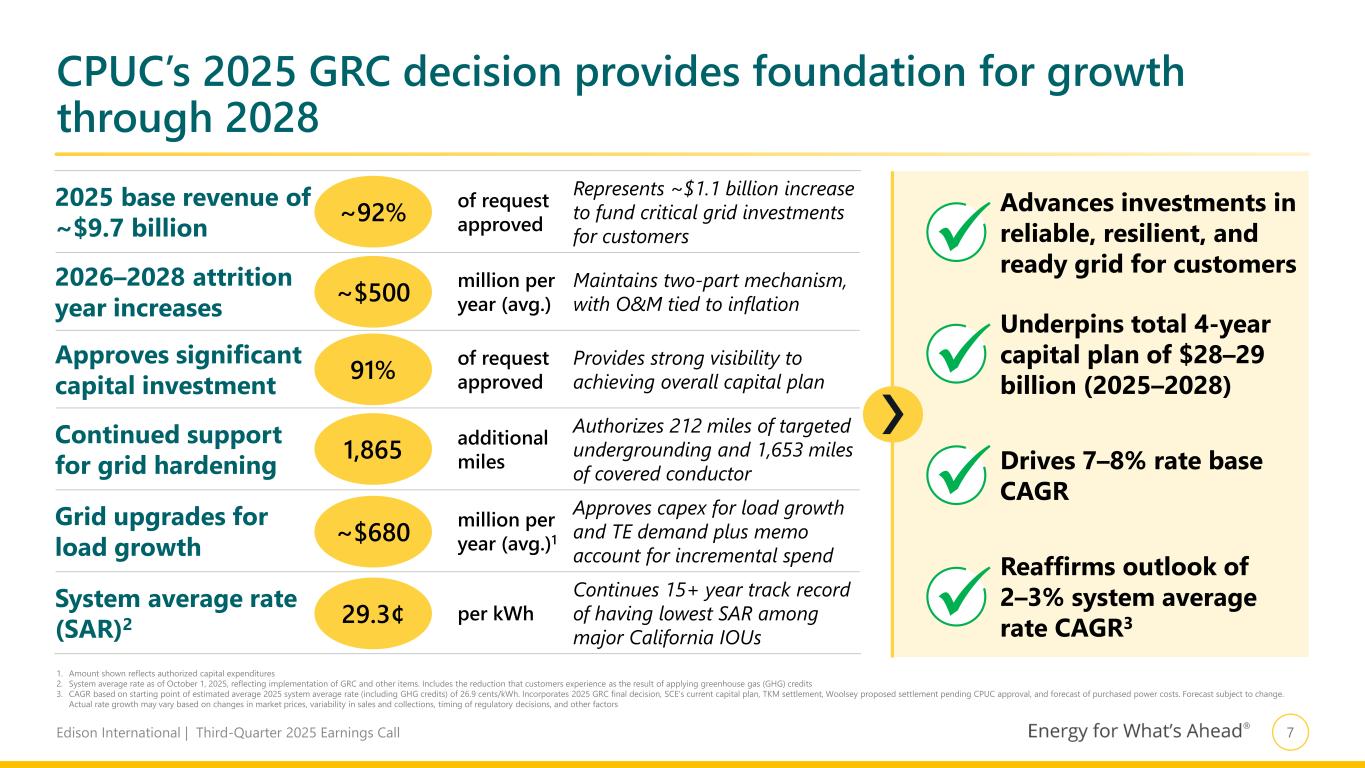
7Edison International | Third-Quarter 2025 Earnings Call CPUC’s 2025 GRC decision provides foundation for growth through 2028 2025 base revenue of ~$9.7 billion of request approved Represents ~$1.1 billion increase to fund critical grid investments for customers 2026–2028 attrition year increases million per year (avg.) Maintains two-part mechanism, with O&M tied to inflation Approves significant capital investment of request approved Provides strong visibility to achieving overall capital plan Continued support for grid hardening additional miles Authorizes 212 miles of targeted undergrounding and 1,653 miles of covered conductor Grid upgrades for load growth million per year (avg.)1 Approves capex for load growth and TE demand plus memo account for incremental spend System average rate (SAR)2 per kWh Continues 15+ year track record of having lowest SAR among major California IOUs 1. Amount shown reflects authorized capital expenditures 2. System average rate as of October 1, 2025, reflecting implementation of GRC and other items. Includes the reduction that customers experience as the result of applying greenhouse gas (GHG) credits 3. CAGR based on starting point of estimated average 2025 system average rate (including GHG credits) of 26.9 cents/kWh. Incorporates 2025 GRC final decision, SCE’s current capital plan, TKM settlement, Woolsey proposed settlement pending CPUC approval, and forecast of purchased power costs. Forecast subject to change. Actual rate growth may vary based on changes in market prices, variability in sales and collections, timing of regulatory decisions, and other factors ~92% ~$500 91% 1,865 ~$680 29.3¢ Advances investments in reliable, resilient, and ready grid for customers Underpins total 4-year capital plan of $28–29 billion (2025–2028) Drives 7–8% rate base CAGR Reaffirms outlook of 2–3% system average rate CAGR3
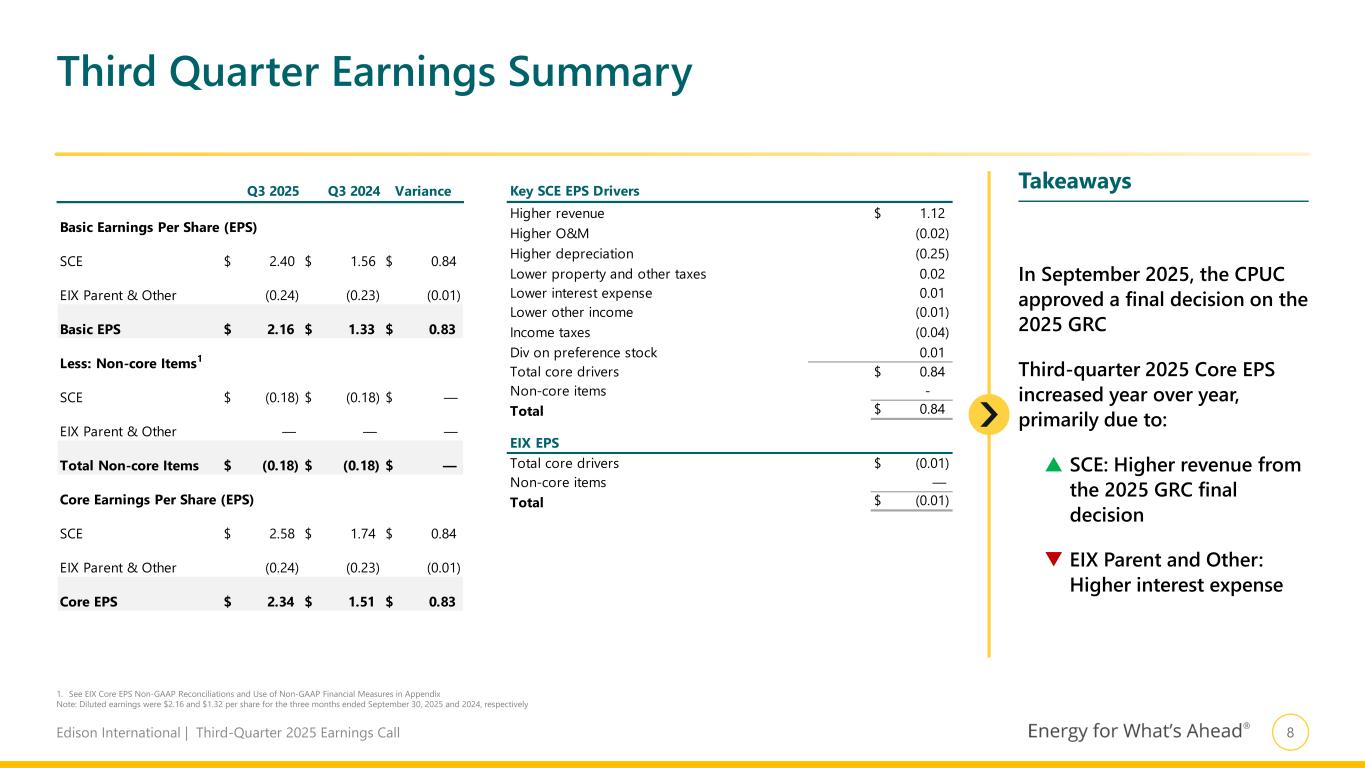
8Edison International | Third-Quarter 2025 Earnings Call Key SCE EPS Drivers Higher revenue 1.12$ Higher O&M (0.02) Higher depreciation (0.25) Lower property and other taxes 0.02 Lower interest expense 0.01 Lower other income (0.01) Income taxes (0.04) Div on preference stock 0.01 Total core drivers 0.84$ Non-core items - Total 0.84$ Total core drivers (0.01)$ Non-core items — Total (0.01)$ EIX EPS Q3 2025 Q3 2024 Variance Basic Earnings Per Share (EPS) SCE 2.40$ 1.56$ 0.84$ EIX Parent & Other (0.24) (0.23) (0.01) Basic EPS 2.16$ 1.33$ 0.83$ Less: Non-core Items1 SCE (0.18)$ (0.18)$ —$ EIX Parent & Other — — — Total Non-core Items (0.18)$ (0.18)$ —$ Core Earnings Per Share (EPS) SCE 2.58$ 1.74$ 0.84$ EIX Parent & Other (0.24) (0.23) (0.01) Core EPS 2.34$ 1.51$ 0.83$ Third Quarter Earnings Summary 1. See EIX Core EPS Non-GAAP Reconciliations and Use of Non-GAAP Financial Measures in Appendix Note: Diluted earnings were $2.16 and $1.32 per share for the three months ended September 30, 2025 and 2024, respectively In September 2025, the CPUC approved a final decision on the 2025 GRC Third-quarter 2025 Core EPS increased year over year, primarily due to: SCE: Higher revenue from the 2025 GRC final decision EIX Parent and Other: Higher interest expense Takeaways
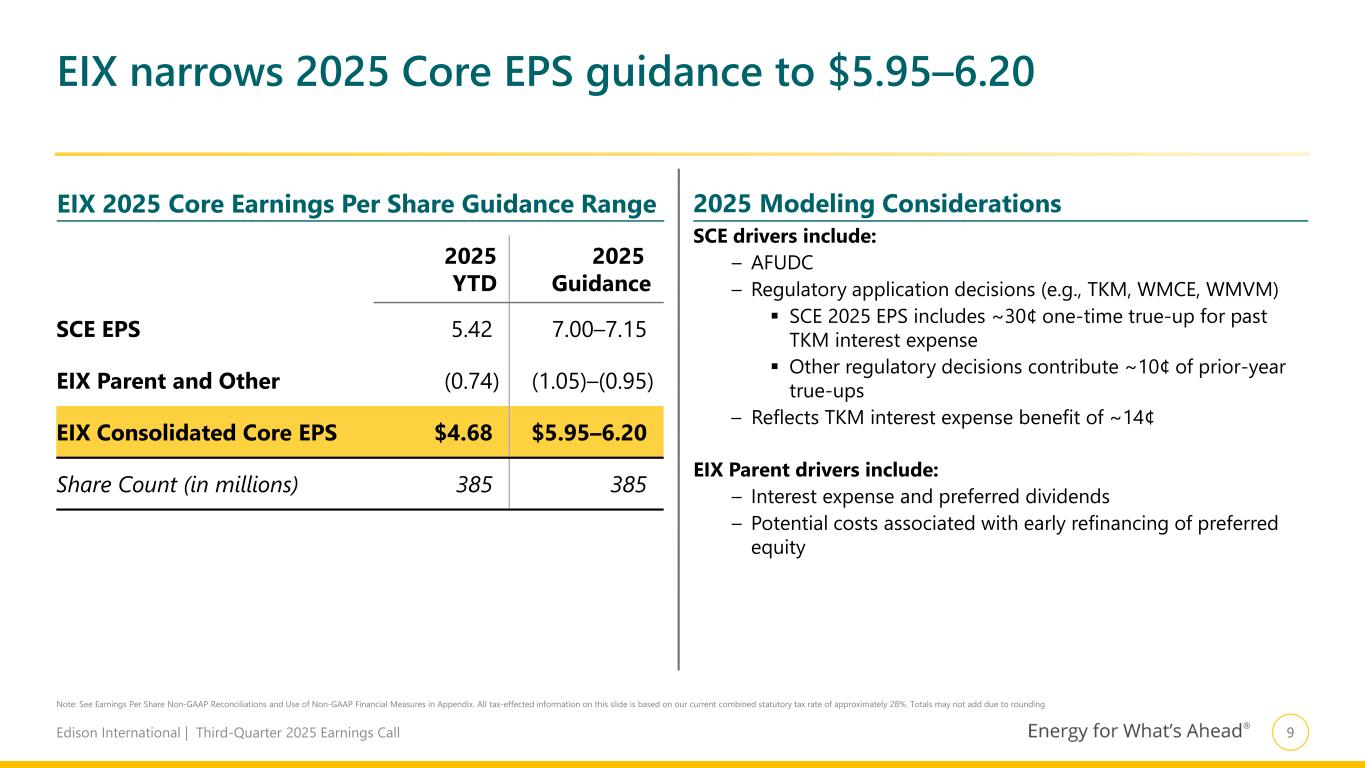
9Edison International | Third-Quarter 2025 Earnings Call Note: See Earnings Per Share Non-GAAP Reconciliations and Use of Non-GAAP Financial Measures in Appendix. All tax-effected information on this slide is based on our current combined statutory tax rate of approximately 28%. Totals may not add due to rounding EIX 2025 Core Earnings Per Share Guidance Range 2025 Modeling Considerations 2025 YTD 2025 Guidance SCE EPS 5.42 7.00–7.15 EIX Parent and Other (0.74) (1.05)–(0.95) EIX Consolidated Core EPS $4.68 $5.95–6.20 Share Count (in millions) 385 385 SCE drivers include: – AFUDC – Regulatory application decisions (e.g., TKM, WMCE, WMVM) SCE 2025 EPS includes ~30¢ one-time true-up for past TKM interest expense Other regulatory decisions contribute ~10¢ of prior-year true-ups – Reflects TKM interest expense benefit of ~14¢ EIX Parent drivers include: – Interest expense and preferred dividends – Potential costs associated with early refinancing of preferred equity EIX narrows 2025 Core EPS guidance to $5.95–6.20
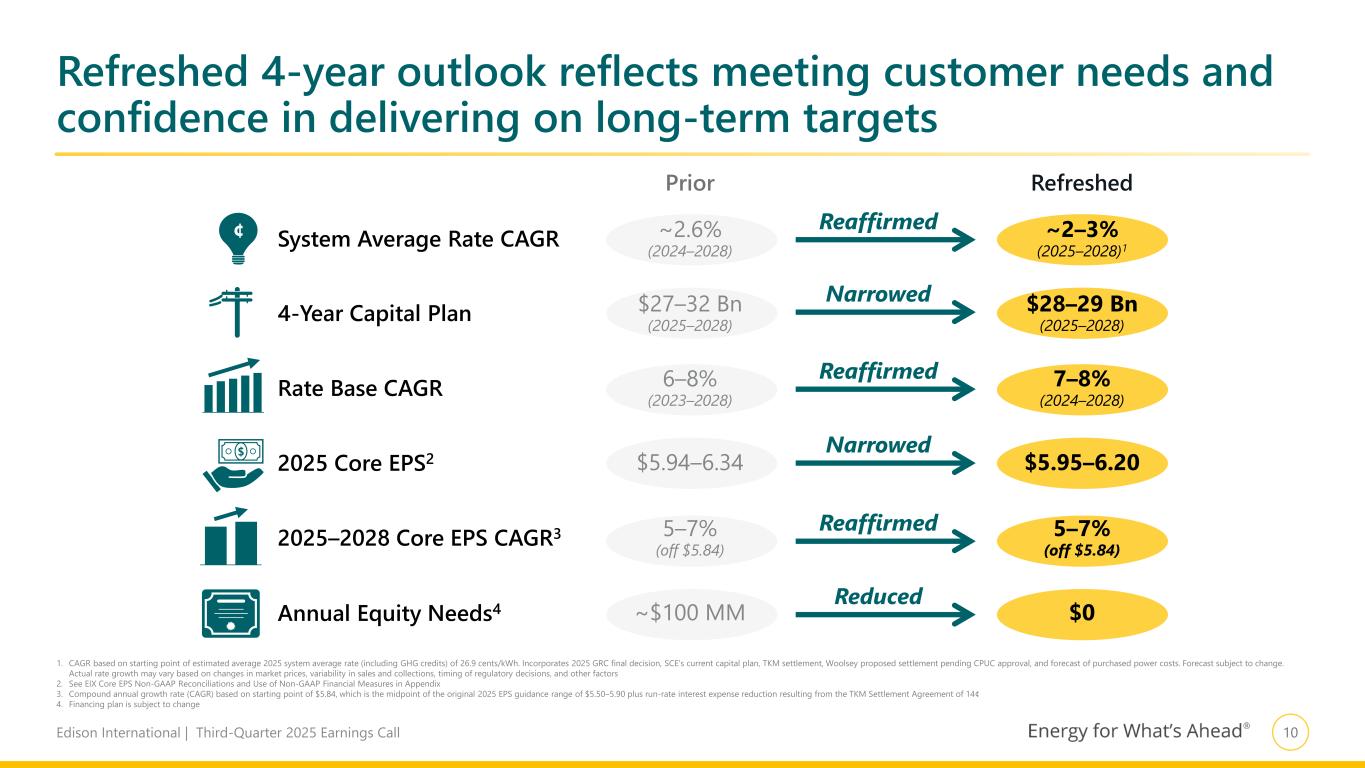
10Edison International | Third-Quarter 2025 Earnings Call Refreshed 4-year outlook reflects meeting customer needs and confidence in delivering on long-term targets 1. CAGR based on starting point of estimated average 2025 system average rate (including GHG credits) of 26.9 cents/kWh. Incorporates 2025 GRC final decision, SCE’s current capital plan, TKM settlement, Woolsey proposed settlement pending CPUC approval, and forecast of purchased power costs. Forecast subject to change. Actual rate growth may vary based on changes in market prices, variability in sales and collections, timing of regulatory decisions, and other factors 2. See EIX Core EPS Non-GAAP Reconciliations and Use of Non-GAAP Financial Measures in Appendix 3. Compound annual growth rate (CAGR) based on starting point of $5.84, which is the midpoint of the original 2025 EPS guidance range of $5.50–5.90 plus run-rate interest expense reduction resulting from the TKM Settlement Agreement of 14¢ 4. Financing plan is subject to change Prior Refreshed System Average Rate CAGR ~2.6% (2024–2028) ~2–3% (2025–2028)1 4-Year Capital Plan $27–32 Bn (2025–2028) $28–29 Bn (2025–2028) Rate Base CAGR 6–8% (2023–2028) 7–8% (2024–2028) 2025 Core EPS2 $5.94–6.34 $5.95–6.20 2025–2028 Core EPS CAGR3 5–7% (off $5.84) 5–7% (off $5.84) Annual Equity Needs4 ~$100 MM $0 Reaffirmed Narrowed Reaffirmed Narrowed Reaffirmed Reduced ¢ $
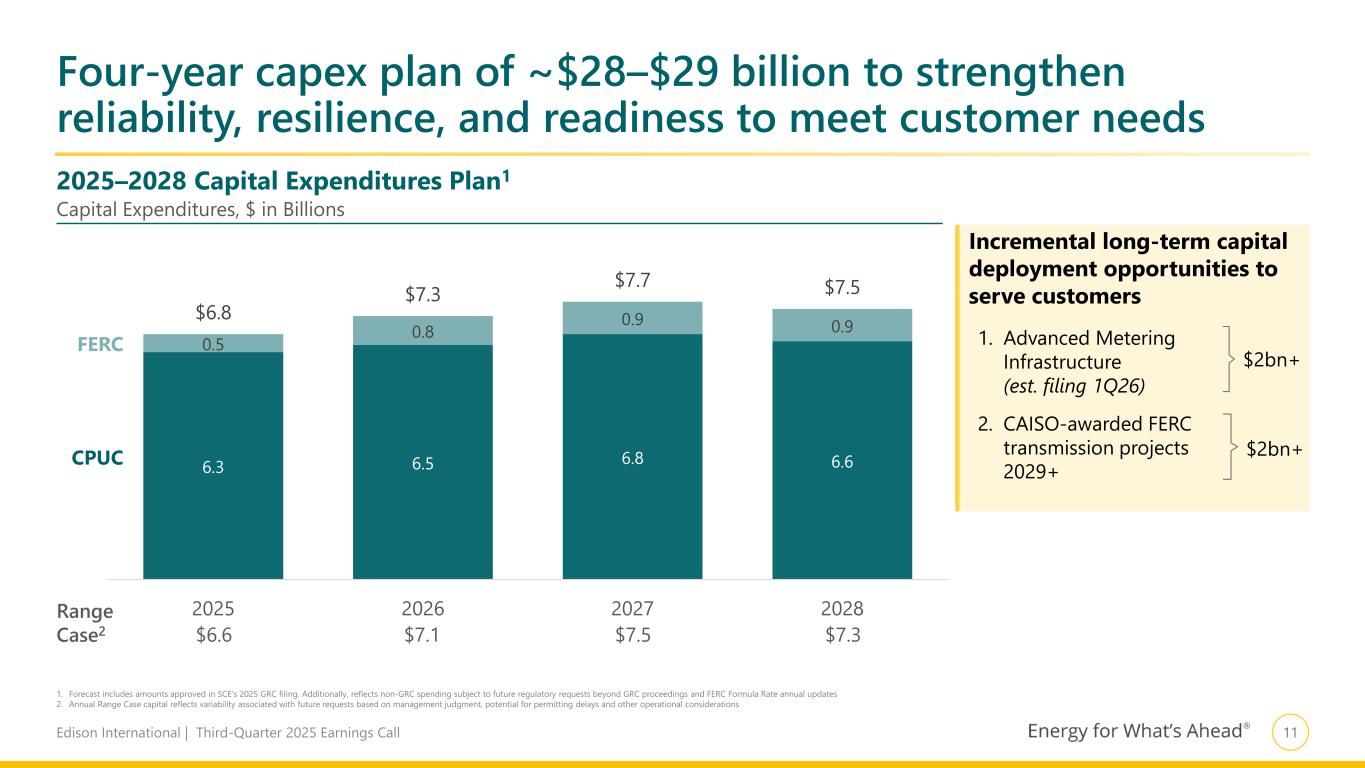
11Edison International | Third-Quarter 2025 Earnings Call 2025–2028 Capital Expenditures Plan1 Four-year capex plan of ~$28–$29 billion to strengthen reliability, resilience, and readiness to meet customer needs Capital Expenditures, $ in Billions 1. Forecast includes amounts approved in SCE’s 2025 GRC filing. Additionally, reflects non-GRC spending subject to future regulatory requests beyond GRC proceedings and FERC Formula Rate annual updates 2. Annual Range Case capital reflects variability associated with future requests based on management judgment, potential for permitting delays and other operational considerations Incremental long-term capital deployment opportunities to serve customers 1. Advanced Metering Infrastructure (est. filing 1Q26) 2. CAISO-awarded FERC transmission projects 2029+ $2bn+ $2bn+ 6.3 6.5 6.8 6.6 0.5 0.8 0.9 0.9 $6.8 $7.3 $7.7 $7.5 2025 2026 2027 2028Range Case2 $6.6 $7.1 $7.5 $7.3 CPUC FERC
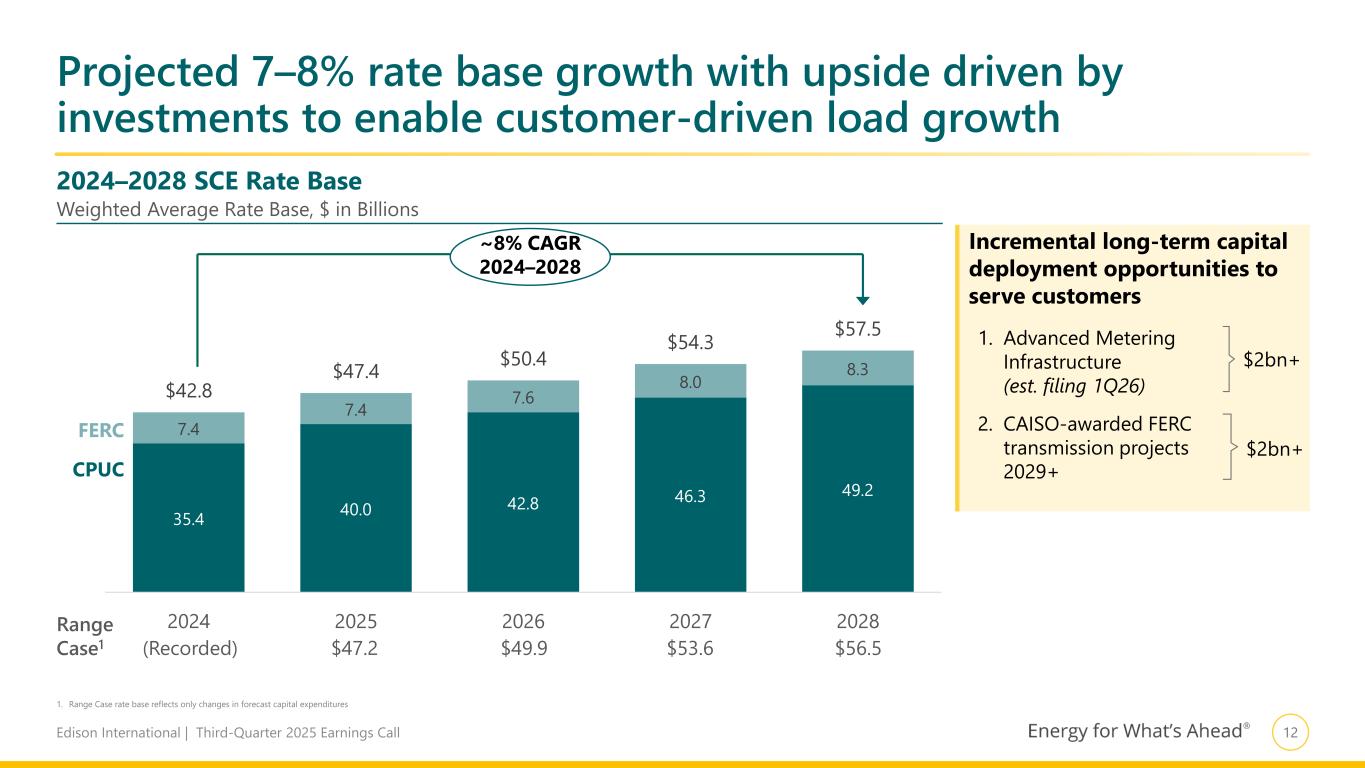
12Edison International | Third-Quarter 2025 Earnings Call 35.4 40.0 42.8 46.3 49.2 7.4 7.4 7.6 8.0 8.3 $42.8 $47.4 $50.4 $54.3 $57.5 2024 2025 2026 2027 2028 Projected 7–8% rate base growth with upside driven by investments to enable customer-driven load growth CPUC FERC ~8% CAGR 2024–2028 Range Case1 (Recorded) $47.2 $49.9 $53.6 $56.5 1. Range Case rate base reflects only changes in forecast capital expenditures 2024–2028 SCE Rate Base Weighted Average Rate Base, $ in Billions Incremental long-term capital deployment opportunities to serve customers 1. Advanced Metering Infrastructure (est. filing 1Q26) 2. CAISO-awarded FERC transmission projects 2029+ $2bn+ $2bn+
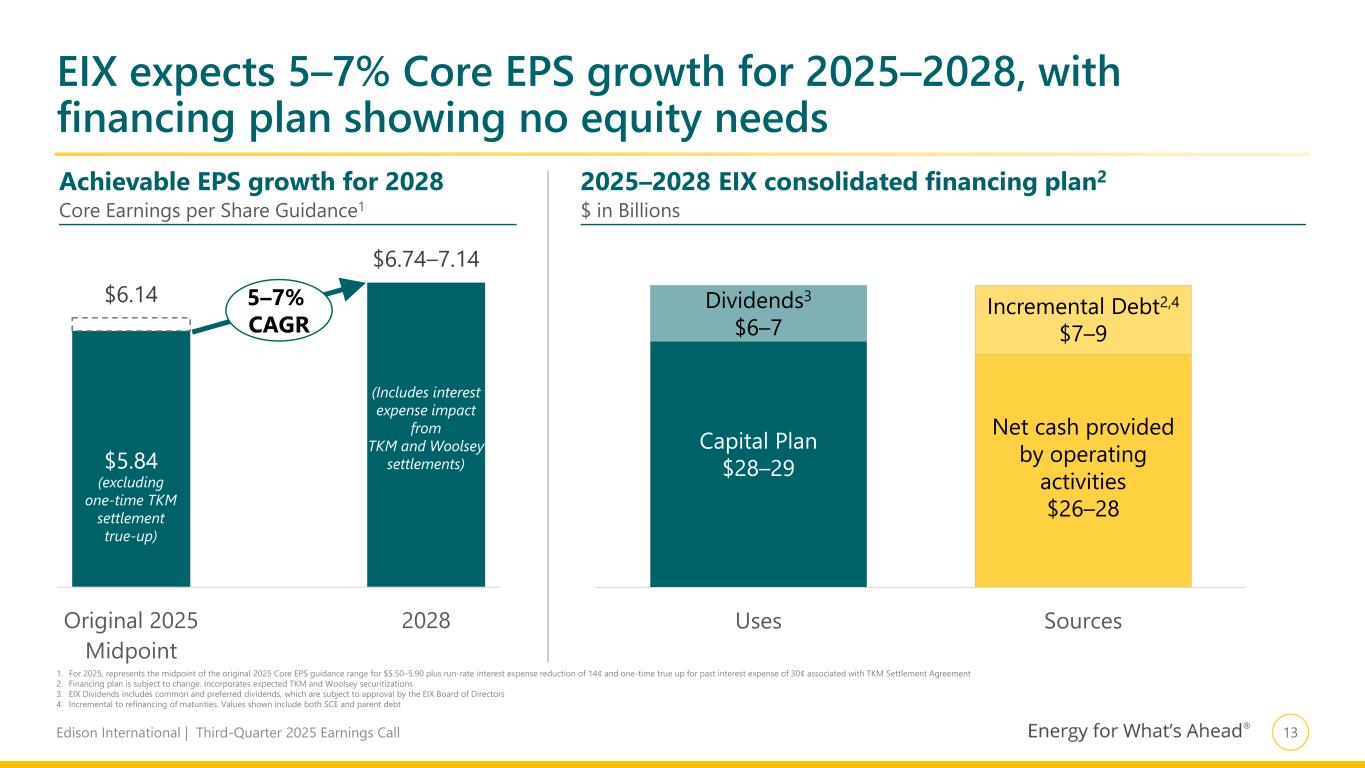
13Edison International | Third-Quarter 2025 Earnings Call EIX expects 5–7% Core EPS growth for 2025–2028, with financing plan showing no equity needs 1. For 2025, represents the midpoint of the original 2025 Core EPS guidance range for $5.50–5.90 plus run-rate interest expense reduction of 14¢ and one-time true up for past interest expense of 30¢ associated with TKM Settlement Agreement 2. Financing plan is subject to change. Incorporates expected TKM and Woolsey securitizations 3. EIX Dividends includes common and preferred dividends, which are subject to approval by the EIX Board of Directors 4. Incremental to refinancing of maturities. Values shown include both SCE and parent debt $5.84 $6.14 $6.74–7.14 Original 2025 Midpoint 2028 Achievable EPS growth for 2028 Core Earnings per Share Guidance1 5–7% CAGR 2025–2028 EIX consolidated financing plan2 $ in Billions (excluding one-time TKM settlement true-up) (Includes interest expense impact from TKM and Woolsey settlements) Uses Sources Capital Plan $28–29 Dividends3 $6–7 Net cash provided by operating activities $26–28 Incremental Debt2,4 $7–9
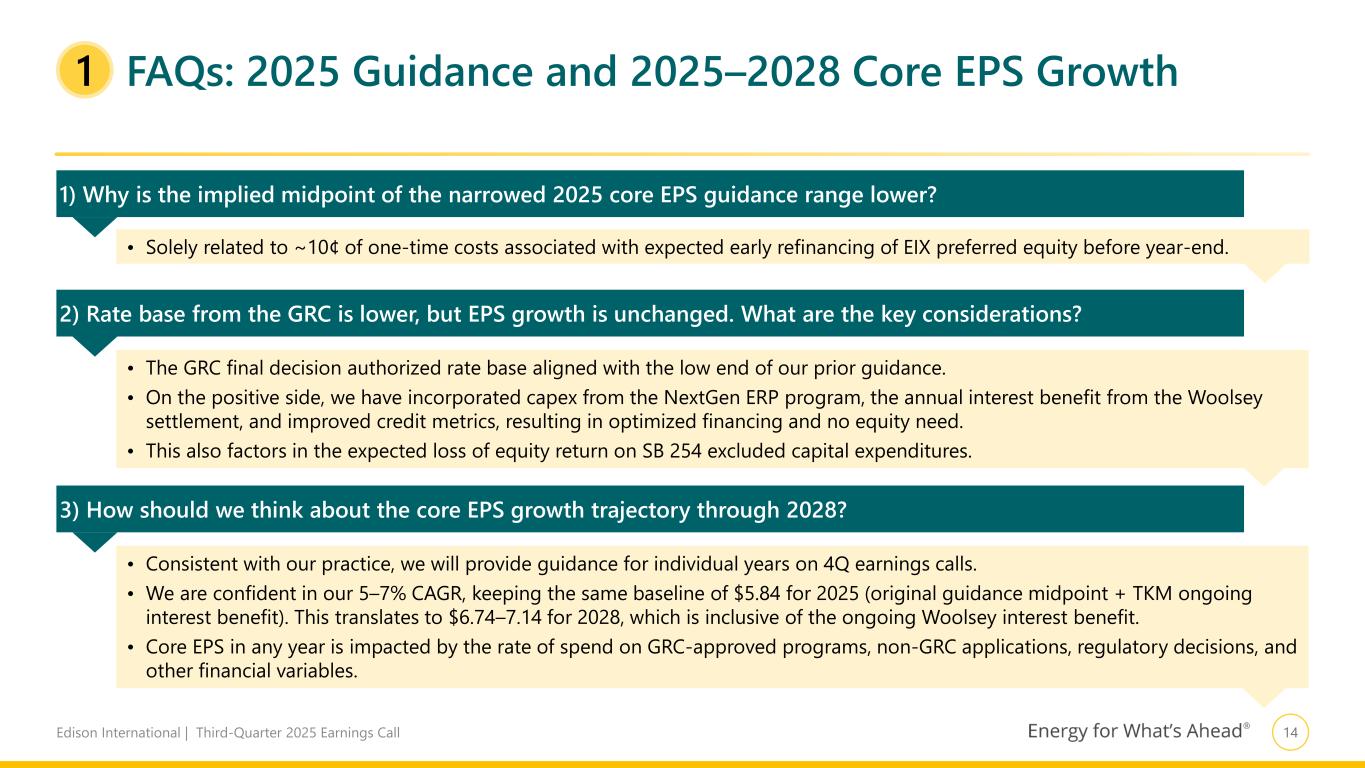
14Edison International | Third-Quarter 2025 Earnings Call FAQs: 2025 Guidance and 2025–2028 Core EPS Growth1 2) Rate base from the GRC is lower, but EPS growth is unchanged. What are the key considerations? • The GRC final decision authorized rate base aligned with the low end of our prior guidance. • On the positive side, we have incorporated capex from the NextGen ERP program, the annual interest benefit from the Woolsey settlement, and improved credit metrics, resulting in optimized financing and no equity need. • This also factors in the expected loss of equity return on SB 254 excluded capital expenditures. 1) Why is the implied midpoint of the narrowed 2025 core EPS guidance range lower? • Solely related to ~10¢ of one-time costs associated with expected early refinancing of EIX preferred equity before year-end. 3) How should we think about the core EPS growth trajectory through 2028? • Consistent with our practice, we will provide guidance for individual years on 4Q earnings calls. • We are confident in our 5–7% CAGR, keeping the same baseline of $5.84 for 2025 (original guidance midpoint + TKM ongoing interest benefit). This translates to $6.74–7.14 for 2028, which is inclusive of the ongoing Woolsey interest benefit. • Core EPS in any year is impacted by the rate of spend on GRC-approved programs, non-GRC applications, regulatory decisions, and other financial variables.
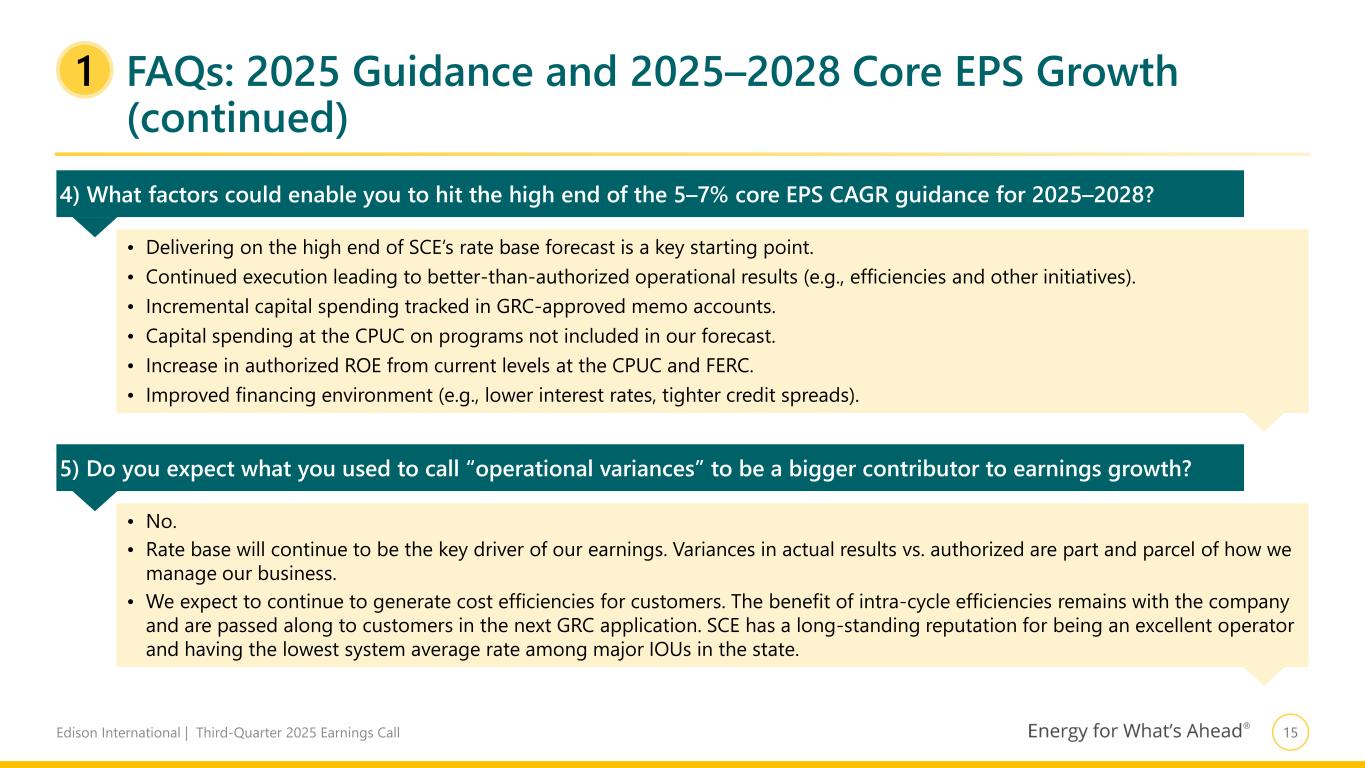
15Edison International | Third-Quarter 2025 Earnings Call FAQs: 2025 Guidance and 2025–2028 Core EPS Growth (continued) 1 4) What factors could enable you to hit the high end of the 5–7% core EPS CAGR guidance for 2025–2028? • Delivering on the high end of SCE’s rate base forecast is a key starting point. • Continued execution leading to better-than-authorized operational results (e.g., efficiencies and other initiatives). • Incremental capital spending tracked in GRC-approved memo accounts. • Capital spending at the CPUC on programs not included in our forecast. • Increase in authorized ROE from current levels at the CPUC and FERC. • Improved financing environment (e.g., lower interest rates, tighter credit spreads). 5) Do you expect what you used to call “operational variances” to be a bigger contributor to earnings growth? • No. • Rate base will continue to be the key driver of our earnings. Variances in actual results vs. authorized are part and parcel of how we manage our business. • We expect to continue to generate cost efficiencies for customers. The benefit of intra-cycle efficiencies remains with the company and are passed along to customers in the next GRC application. SCE has a long-standing reputation for being an excellent operator and having the lowest system average rate among major IOUs in the state.
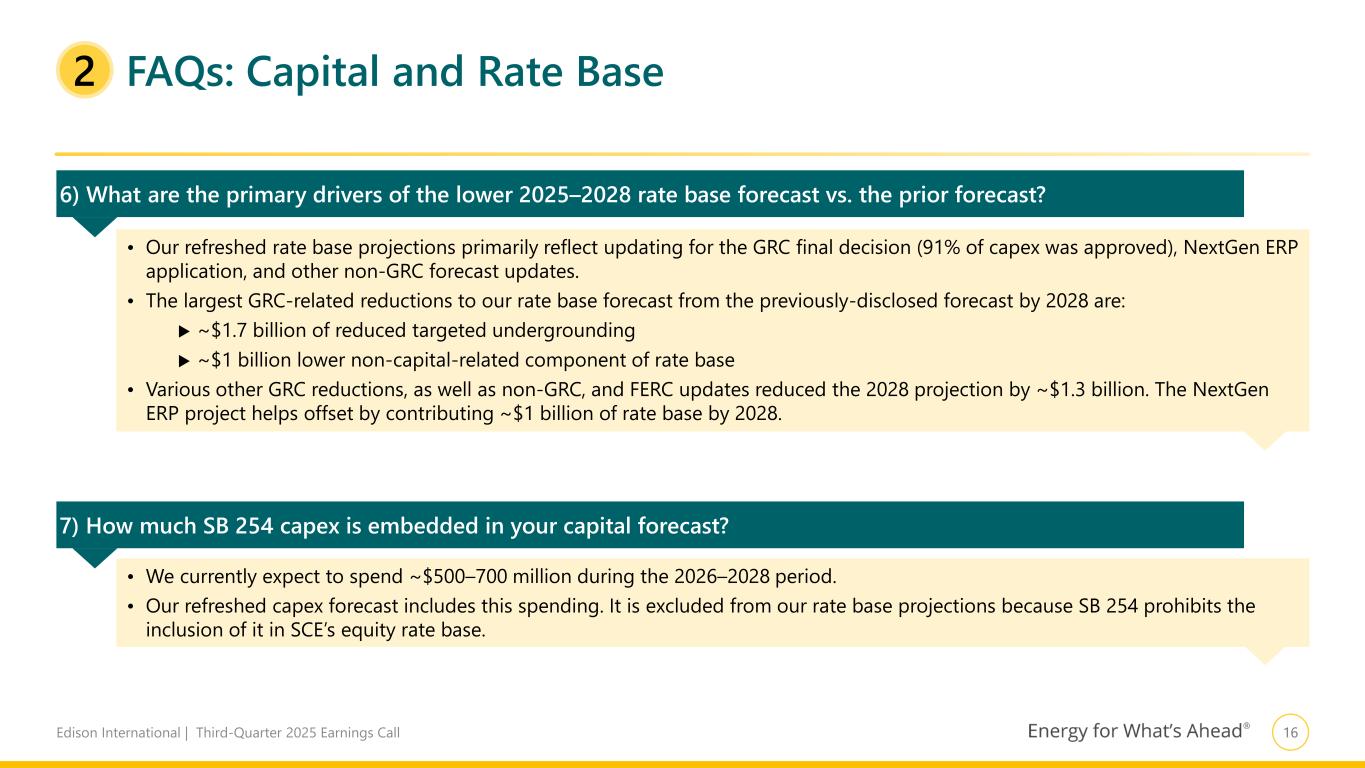
16Edison International | Third-Quarter 2025 Earnings Call FAQs: Capital and Rate Base2 6) What are the primary drivers of the lower 2025–2028 rate base forecast vs. the prior forecast? • Our refreshed rate base projections primarily reflect updating for the GRC final decision (91% of capex was approved), NextGen ERP application, and other non-GRC forecast updates. • The largest GRC-related reductions to our rate base forecast from the previously-disclosed forecast by 2028 are: ~$1.7 billion of reduced targeted undergrounding ~$1 billion lower non-capital-related component of rate base • Various other GRC reductions, as well as non-GRC, and FERC updates reduced the 2028 projection by ~$1.3 billion. The NextGen ERP project helps offset by contributing ~$1 billion of rate base by 2028. 7) How much SB 254 capex is embedded in your capital forecast? • We currently expect to spend ~$500–700 million during the 2026–2028 period. • Our refreshed capex forecast includes this spending. It is excluded from our rate base projections because SB 254 prohibits the inclusion of it in SCE’s equity rate base.
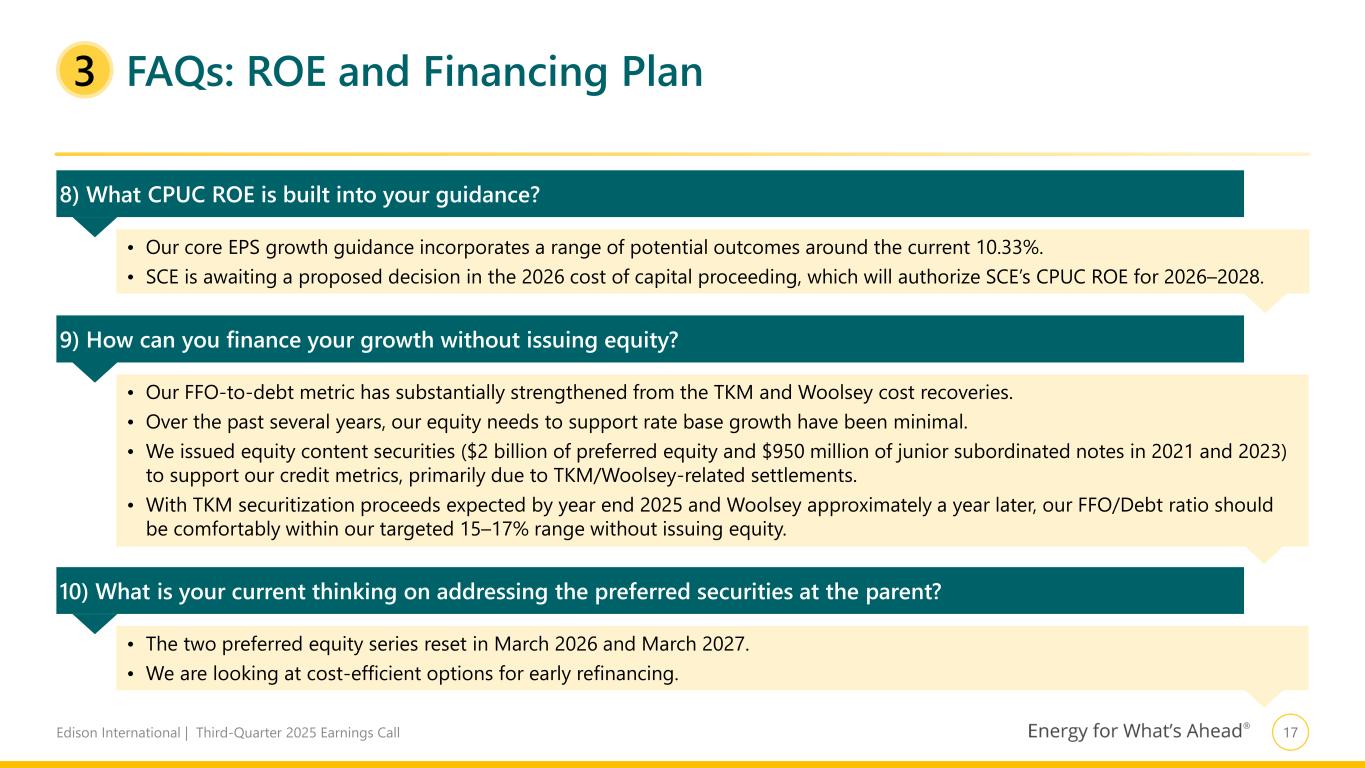
17Edison International | Third-Quarter 2025 Earnings Call FAQs: ROE and Financing Plan3 9) How can you finance your growth without issuing equity? 10) What is your current thinking on addressing the preferred securities at the parent? • Our FFO-to-debt metric has substantially strengthened from the TKM and Woolsey cost recoveries. • Over the past several years, our equity needs to support rate base growth have been minimal. • We issued equity content securities ($2 billion of preferred equity and $950 million of junior subordinated notes in 2021 and 2023) to support our credit metrics, primarily due to TKM/Woolsey-related settlements. • With TKM securitization proceeds expected by year end 2025 and Woolsey approximately a year later, our FFO/Debt ratio should be comfortably within our targeted 15–17% range without issuing equity. • The two preferred equity series reset in March 2026 and March 2027. • We are looking at cost-efficient options for early refinancing. 8) What CPUC ROE is built into your guidance? • Our core EPS growth guidance incorporates a range of potential outcomes around the current 10.33%. • SCE is awaiting a proposed decision in the 2026 cost of capital proceeding, which will authorize SCE’s CPUC ROE for 2026–2028.
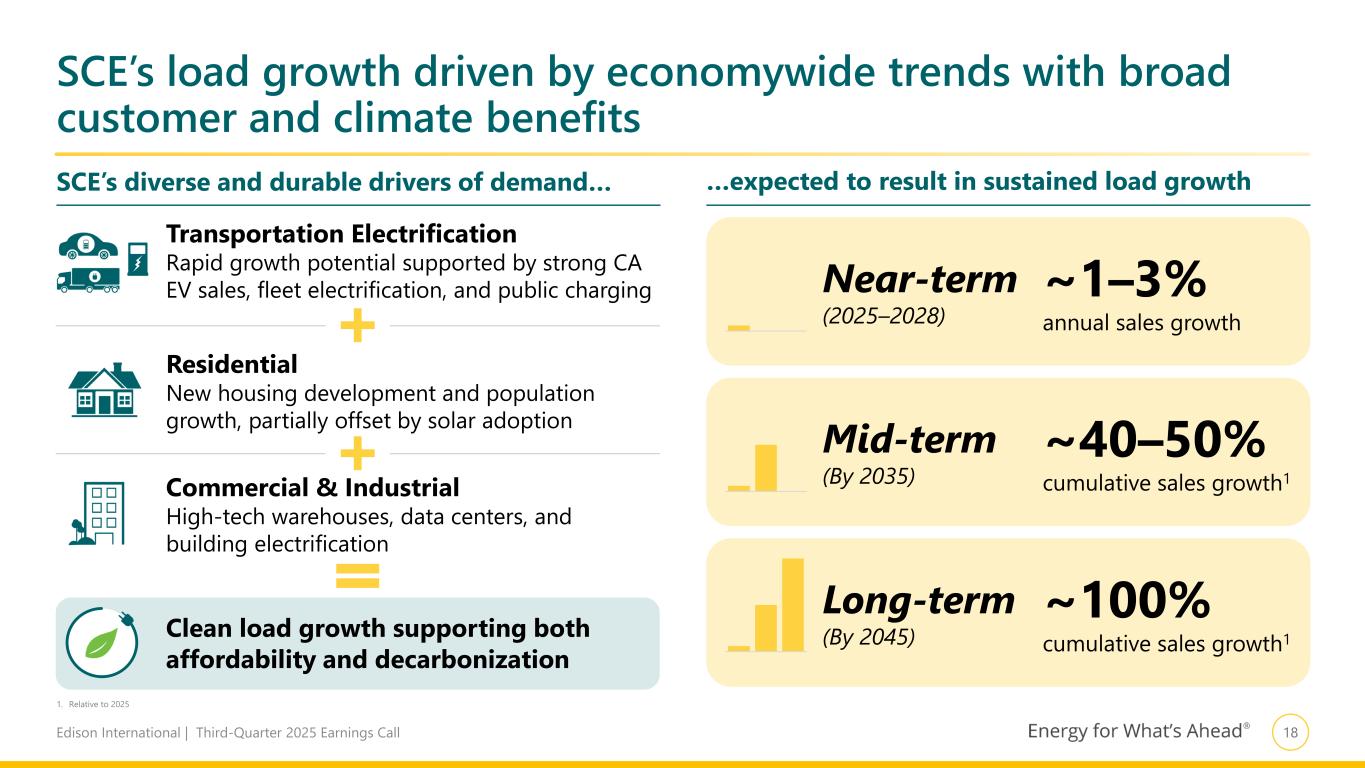
18Edison International | Third-Quarter 2025 Earnings Call SCE’s load growth driven by economywide trends with broad customer and climate benefits SCE’s diverse and durable drivers of demand… …expected to result in sustained load growth Transportation Electrification Rapid growth potential supported by strong CA EV sales, fleet electrification, and public charging Residential New housing development and population growth, partially offset by solar adoption Commercial & Industrial High-tech warehouses, data centers, and building electrification Near-term (2025–2028) Clean load growth supporting both affordability and decarbonization ~1–3% annual sales growth ~40–50% cumulative sales growth1 ~100% cumulative sales growth1 Mid-term (By 2035) Long-term (By 2045) 1. Relative to 2025
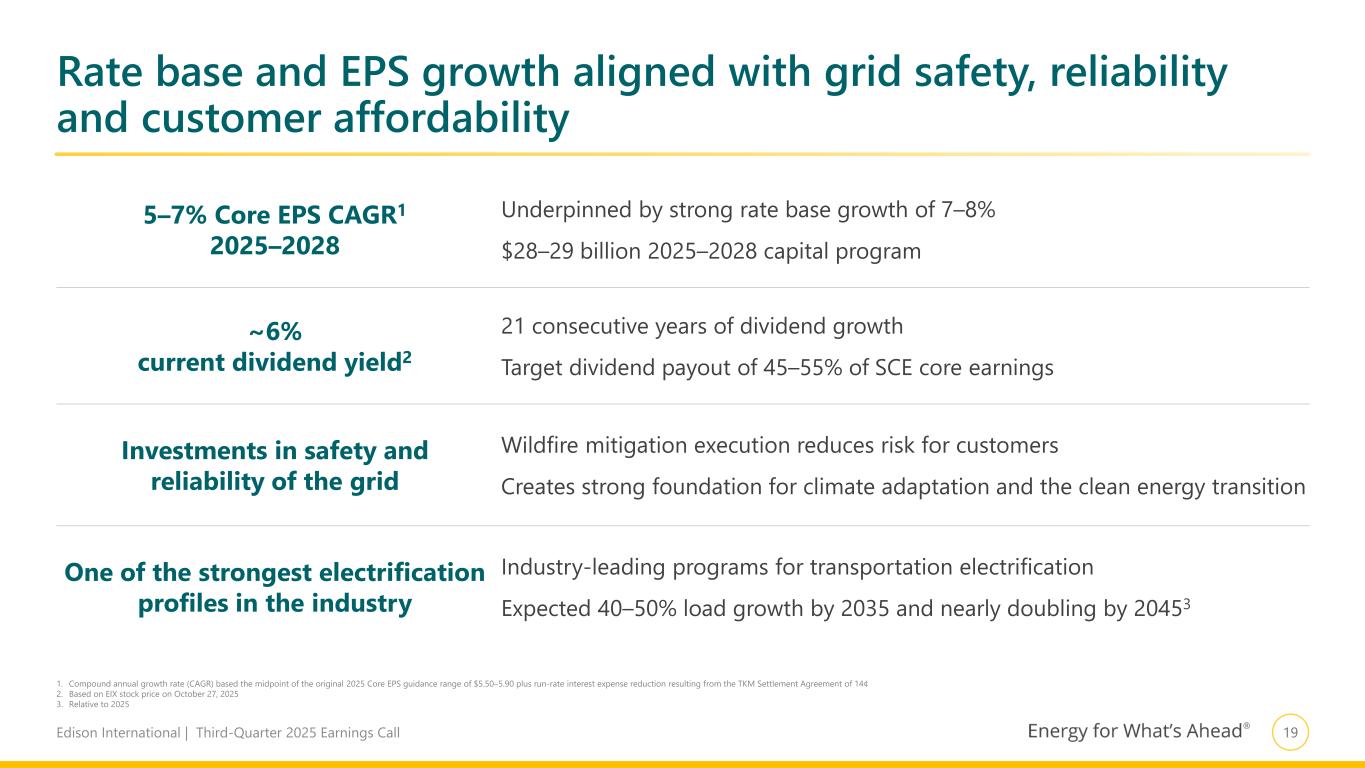
19Edison International | Third-Quarter 2025 Earnings Call Rate base and EPS growth aligned with grid safety, reliability and customer affordability 1. Compound annual growth rate (CAGR) based the midpoint of the original 2025 Core EPS guidance range of $5.50–5.90 plus run-rate interest expense reduction resulting from the TKM Settlement Agreement of 14¢ 2. Based on EIX stock price on October 27, 2025 3. Relative to 2025 5–7% Core EPS CAGR1 2025–2028 Underpinned by strong rate base growth of 7–8% $28–29 billion 2025–2028 capital program ~6% current dividend yield2 21 consecutive years of dividend growth Target dividend payout of 45–55% of SCE core earnings Investments in safety and reliability of the grid Wildfire mitigation execution reduces risk for customers Creates strong foundation for climate adaptation and the clean energy transition One of the strongest electrification profiles in the industry Industry-leading programs for transportation electrification Expected 40–50% load growth by 2035 and nearly doubling by 20453
ADDITIONAL INFORMATION
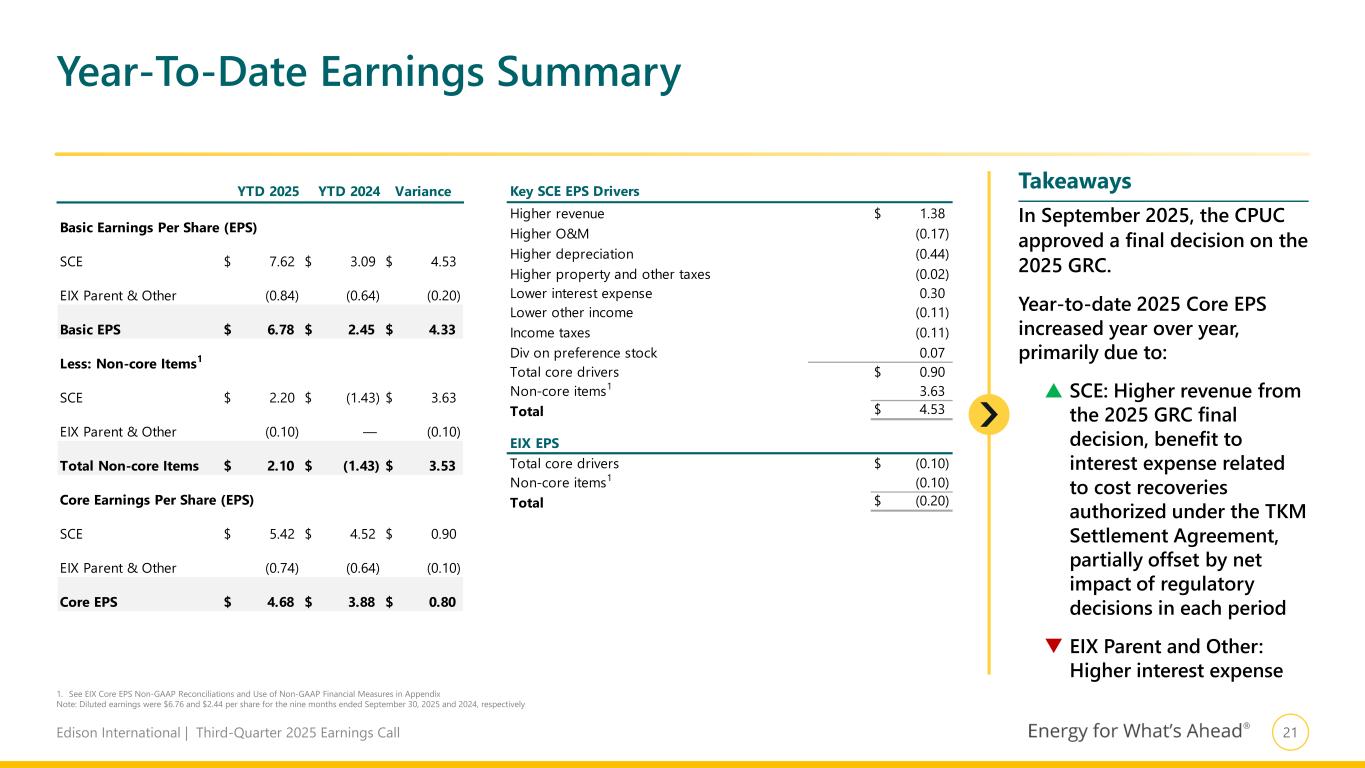
21Edison International | Third-Quarter 2025 Earnings Call Key SCE EPS Drivers Higher revenue 1.38$ Higher O&M (0.17) Higher depreciation (0.44) Higher property and other taxes (0.02) Lower interest expense 0.30 Lower other income (0.11) Income taxes (0.11) Div on preference stock 0.07 Total core drivers 0.90$ Non-core items1 3.63 Total 4.53$ Total core drivers (0.10)$ Non-core items1 (0.10) Total (0.20)$ EIX EPS YTD 2025 YTD 2024 Variance Basic Earnings Per Share (EPS) SCE 7.62$ 3.09$ 4.53$ EIX Parent & Other (0.84) (0.64) (0.20) Basic EPS 6.78$ 2.45$ 4.33$ Less: Non-core Items1 SCE 2.20$ (1.43)$ 3.63$ EIX Parent & Other (0.10) — (0.10) Total Non-core Items 2.10$ (1.43)$ 3.53$ Core Earnings Per Share (EPS) SCE 5.42$ 4.52$ 0.90$ EIX Parent & Other (0.74) (0.64) (0.10) Core EPS 4.68$ 3.88$ 0.80$ Year-To-Date Earnings Summary 1. See EIX Core EPS Non-GAAP Reconciliations and Use of Non-GAAP Financial Measures in Appendix Note: Diluted earnings were $6.76 and $2.44 per share for the nine months ended September 30, 2025 and 2024, respectively In September 2025, the CPUC approved a final decision on the 2025 GRC. Year-to-date 2025 Core EPS increased year over year, primarily due to: SCE: Higher revenue from the 2025 GRC final decision, benefit to interest expense related to cost recoveries authorized under the TKM Settlement Agreement, partially offset by net impact of regulatory decisions in each period EIX Parent and Other: Higher interest expense Takeaways
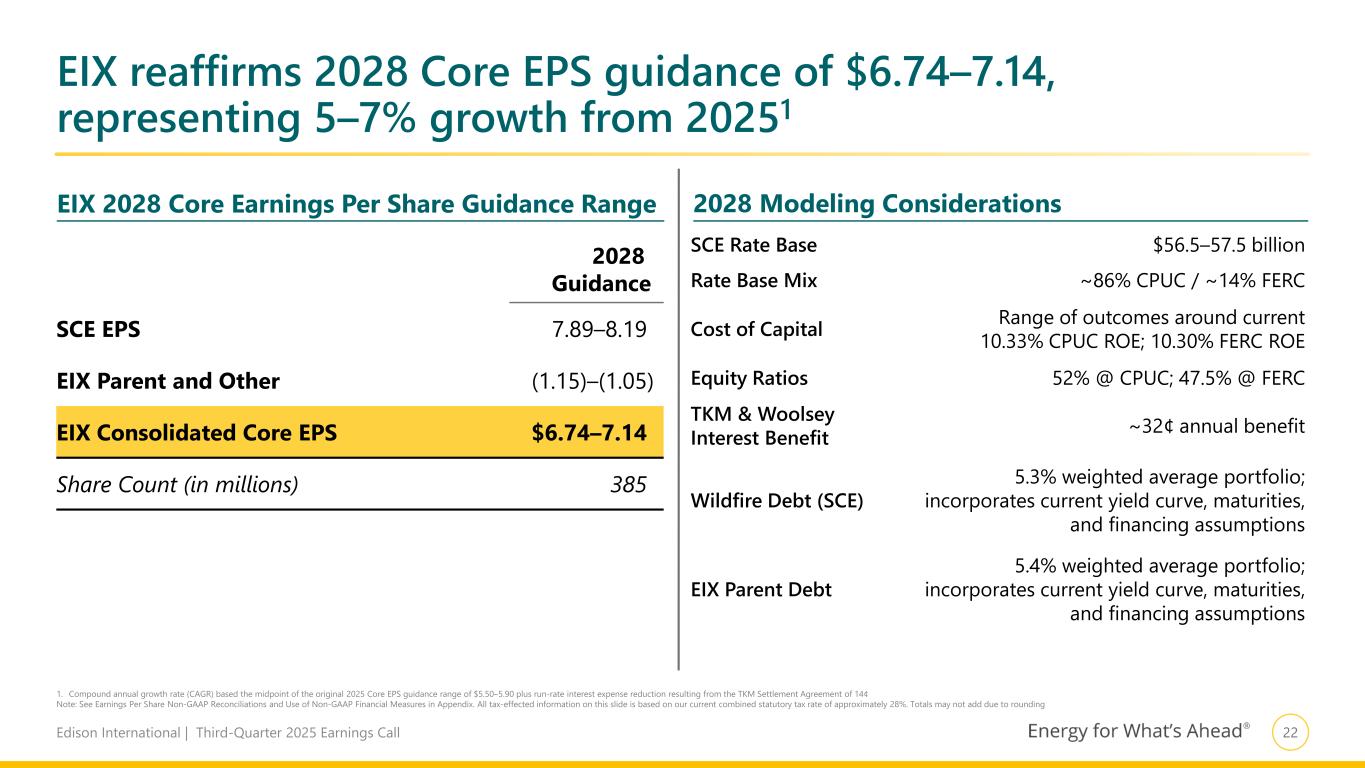
22Edison International | Third-Quarter 2025 Earnings Call 1. Compound annual growth rate (CAGR) based the midpoint of the original 2025 Core EPS guidance range of $5.50–5.90 plus run-rate interest expense reduction resulting from the TKM Settlement Agreement of 14¢ Note: See Earnings Per Share Non-GAAP Reconciliations and Use of Non-GAAP Financial Measures in Appendix. All tax-effected information on this slide is based on our current combined statutory tax rate of approximately 28%. Totals may not add due to rounding EIX 2028 Core Earnings Per Share Guidance Range 2028 Modeling Considerations 2028 Guidance SCE EPS 7.89–8.19 EIX Parent and Other (1.15)–(1.05) EIX Consolidated Core EPS $6.74–7.14 Share Count (in millions) 385 EIX reaffirms 2028 Core EPS guidance of $6.74–7.14, representing 5–7% growth from 20251 SCE Rate Base $56.5–57.5 billion Rate Base Mix ~86% CPUC / ~14% FERC Cost of Capital Range of outcomes around current 10.33% CPUC ROE; 10.30% FERC ROE Equity Ratios 52% @ CPUC; 47.5% @ FERC TKM & Woolsey Interest Benefit ~32¢ annual benefit Wildfire Debt (SCE) 5.3% weighted average portfolio; incorporates current yield curve, maturities, and financing assumptions EIX Parent Debt 5.4% weighted average portfolio; incorporates current yield curve, maturities, and financing assumptions
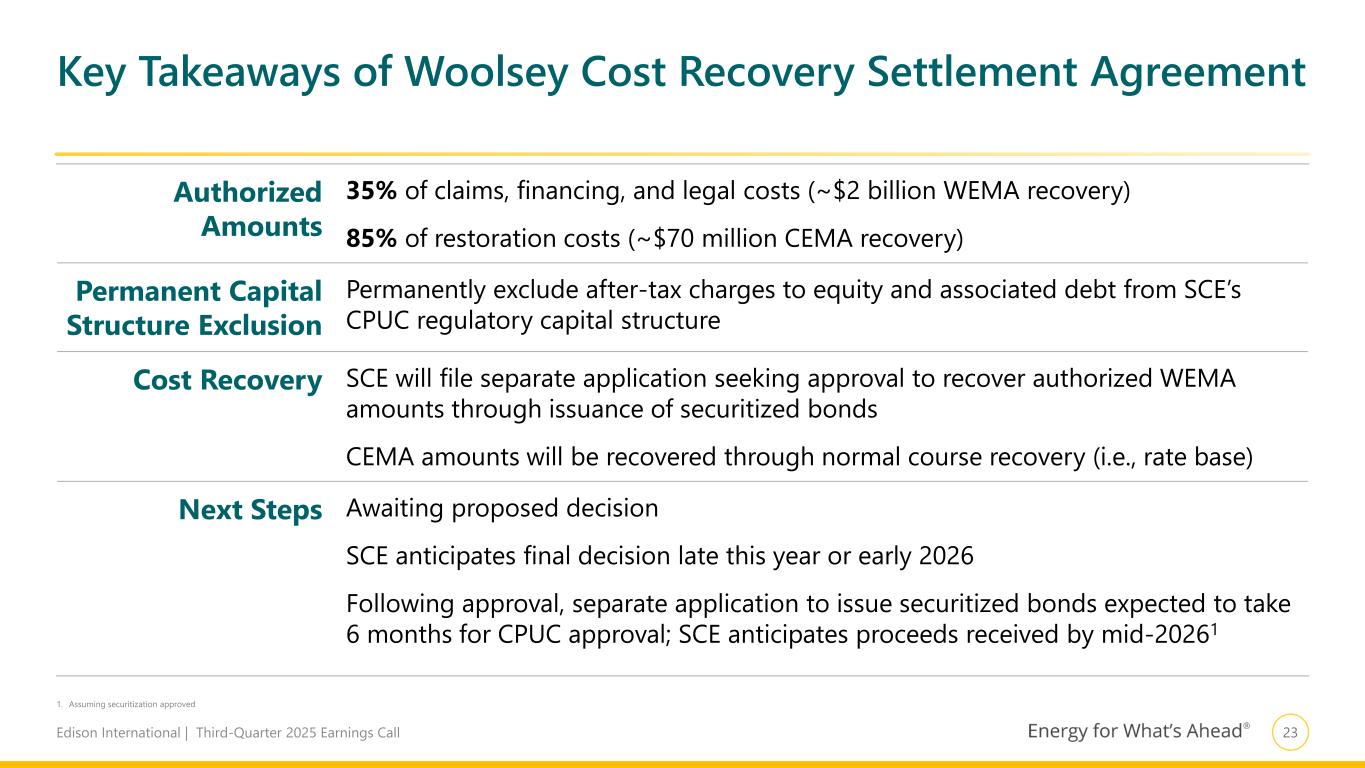
23Edison International | Third-Quarter 2025 Earnings Call Key Takeaways of Woolsey Cost Recovery Settlement Agreement Authorized Amounts 35% of claims, financing, and legal costs (~$2 billion WEMA recovery) 85% of restoration costs (~$70 million CEMA recovery) Permanent Capital Structure Exclusion Permanently exclude after-tax charges to equity and associated debt from SCE’s CPUC regulatory capital structure Cost Recovery SCE will file separate application seeking approval to recover authorized WEMA amounts through issuance of securitized bonds CEMA amounts will be recovered through normal course recovery (i.e., rate base) Next Steps Awaiting proposed decision SCE anticipates final decision late this year or early 2026 Following approval, separate application to issue securitized bonds expected to take 6 months for CPUC approval; SCE anticipates proceeds received by mid-20261 1. Assuming securitization approved
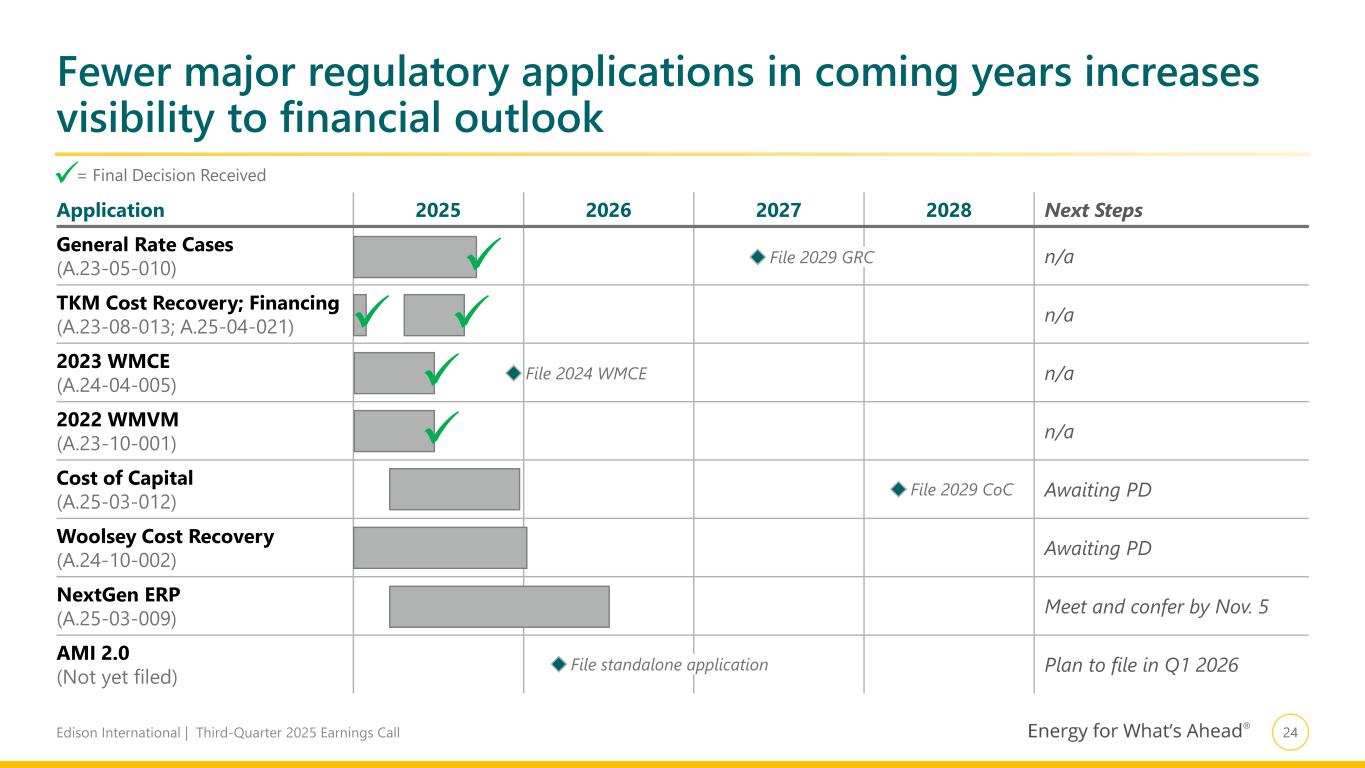
24Edison International | Third-Quarter 2025 Earnings Call Fewer major regulatory applications in coming years increases visibility to financial outlook Application 2025 2026 2027 2028 Next Steps General Rate Cases (A.23-05-010) n/a TKM Cost Recovery; Financing (A.23-08-013; A.25-04-021) n/a 2023 WMCE (A.24-04-005) n/a 2022 WMVM (A.23-10-001) n/a Cost of Capital (A.25-03-012) Awaiting PD Woolsey Cost Recovery (A.24-10-002) Awaiting PD NextGen ERP (A.25-03-009) Meet and confer by Nov. 5 AMI 2.0 (Not yet filed) Plan to file in Q1 2026 = Final Decision Received File 2029 GRC File 2029 CoC File standalone application File 2024 WMCE
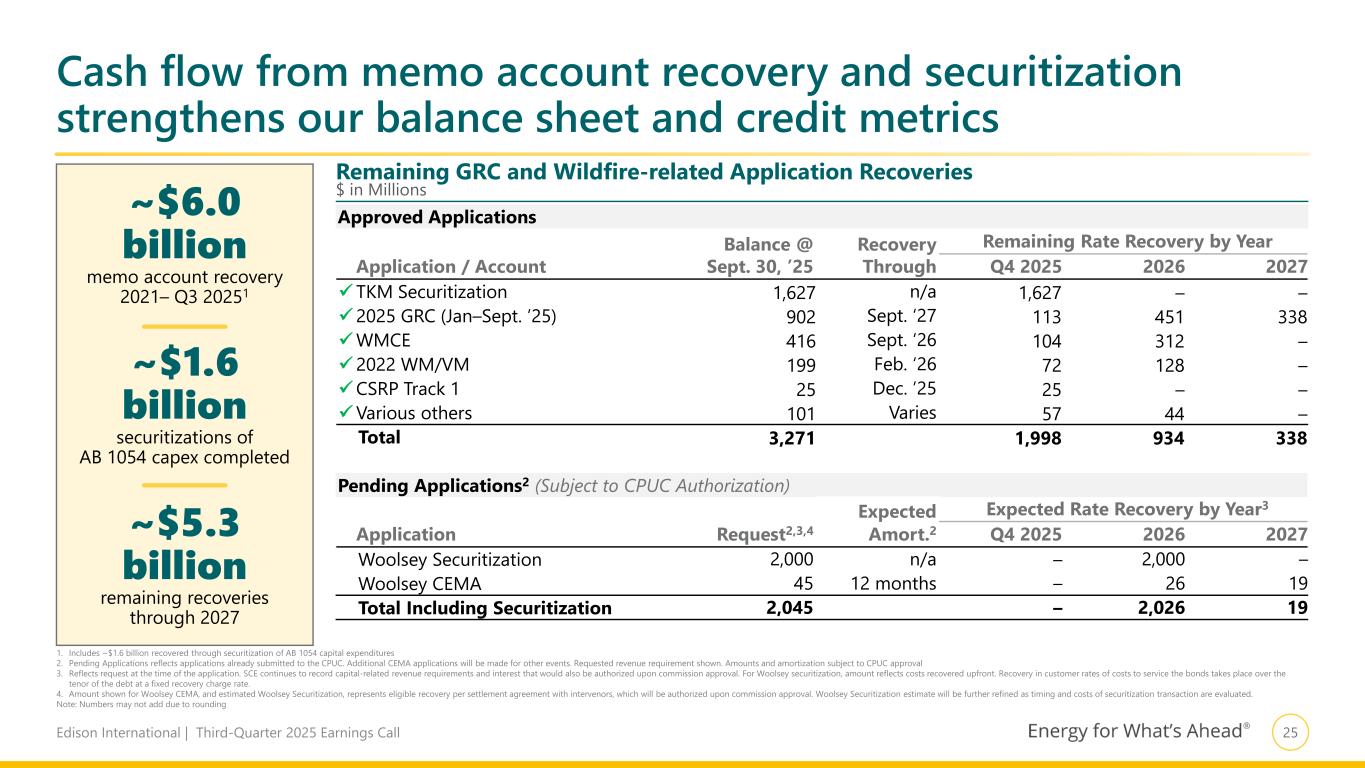
25Edison International | Third-Quarter 2025 Earnings Call ~$6.0 billion memo account recovery 2021– Q3 20251 ~$1.6 billion securitizations of AB 1054 capex completed ~$5.3 billion remaining recoveries through 2027 Cash flow from memo account recovery and securitization strengthens our balance sheet and credit metrics Approved Applications Application / Account Balance @ Sept. 30, ’25 Recovery Through Remaining Rate Recovery by Year Q4 2025 2026 2027 TKM Securitization 1,627 n/a 1,627 – – 2025 GRC (Jan–Sept. ’25) 902 Sept. ‘27 113 451 338 WMCE 416 Sept. ‘26 104 312 – 2022 WM/VM 199 Feb. ‘26 72 128 – CSRP Track 1 25 Dec. ’25 25 – – Various others 101 Varies 57 44 – Total 3,271 1,998 934 338 Pending Applications2 (Subject to CPUC Authorization) Application Request2,3,4 Expected Amort.2 Expected Rate Recovery by Year3 Q4 2025 2026 2027 Woolsey Securitization 2,000 n/a – 2,000 – Woolsey CEMA 45 12 months – 26 19 Total Including Securitization 2,045 – 2,026 19 1. Includes ~$1.6 billion recovered through securitization of AB 1054 capital expenditures 2. Pending Applications reflects applications already submitted to the CPUC. Additional CEMA applications will be made for other events. Requested revenue requirement shown. Amounts and amortization subject to CPUC approval 3. Reflects request at the time of the application. SCE continues to record capital-related revenue requirements and interest that would also be authorized upon commission approval. For Woolsey securitization, amount reflects costs recovered upfront. Recovery in customer rates of costs to service the bonds takes place over the tenor of the debt at a fixed recovery charge rate. 4. Amount shown for Woolsey CEMA, and estimated Woolsey Securitization, represents eligible recovery per settlement agreement with intervenors, which will be authorized upon commission approval. Woolsey Securitization estimate will be further refined as timing and costs of securitization transaction are evaluated. Note: Numbers may not add due to rounding Remaining GRC and Wildfire-related Application Recoveries $ in Millions
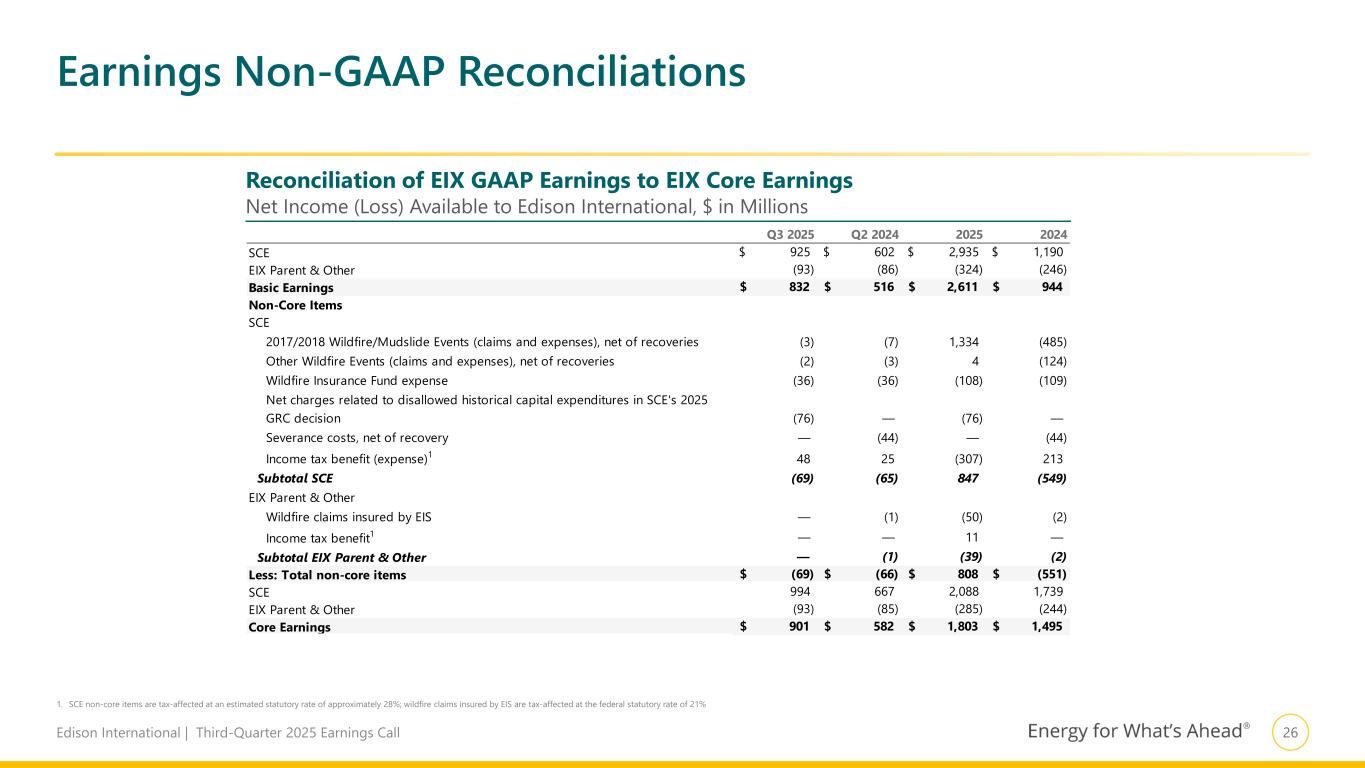
26Edison International | Third-Quarter 2025 Earnings Call Q3 2025 Q2 2024 2025 2024 SCE 925$ 602$ 2,935$ 1,190$ EIX Parent & Other (93) (86) (324) (246) Basic Earnings 832$ 516$ 2,611$ 944$ Non-Core Items SCE 2017/2018 Wildfire/Mudslide Events (claims and expenses), net of recoveries (3) (7) 1,334 (485) Other Wildfire Events (claims and expenses), net of recoveries (2) (3) 4 (124) Wildfire Insurance Fund expense (36) (36) (108) (109) Net charges related to disallowed historical capital expenditures in SCE's 2025 GRC decision (76) — (76) — Severance costs, net of recovery — (44) — (44) Income tax benefit (expense)1 48 25 (307) 213 Subtotal SCE (69) (65) 847 (549) EIX Parent & Other Wildfire claims insured by EIS — (1) (50) (2) Income tax benefit1 — — 11 — Subtotal EIX Parent & Other — (1) (39) (2) Less: Total non-core items (69)$ (66)$ 808$ (551)$ SCE 994 667 2,088 1,739 EIX Parent & Other (93) (85) (285) (244) Core Earnings 901$ 582$ 1,803$ 1,495$ Earnings Non-GAAP Reconciliations 1. SCE non-core items are tax-affected at an estimated statutory rate of approximately 28%; wildfire claims insured by EIS are tax-affected at the federal statutory rate of 21% Reconciliation of EIX GAAP Earnings to EIX Core Earnings Net Income (Loss) Available to Edison International, $ in Millions
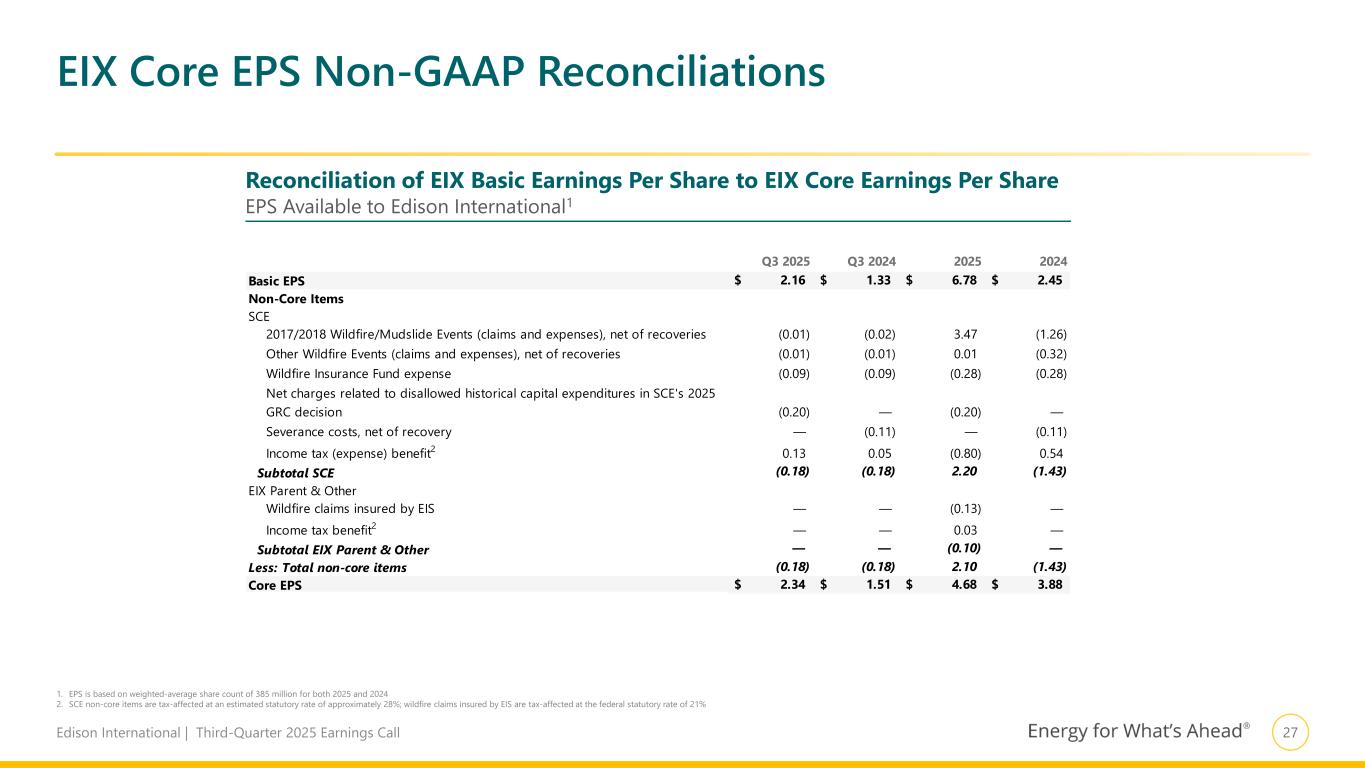
27Edison International | Third-Quarter 2025 Earnings Call Q3 2025 Q3 2024 2025 2024 Basic EPS 2.16$ 1.33$ 6.78$ 2.45$ Non-Core Items SCE 2017/2018 Wildfire/Mudslide Events (claims and expenses), net of recoveries (0.01) (0.02) 3.47 (1.26) Other Wildfire Events (claims and expenses), net of recoveries (0.01) (0.01) 0.01 (0.32) Wildfire Insurance Fund expense (0.09) (0.09) (0.28) (0.28) Net charges related to disallowed historical capital expenditures in SCE's 2025 GRC decision (0.20) — (0.20) — Severance costs, net of recovery — (0.11) — (0.11) Income tax (expense) benefit2 0.13 0.05 (0.80) 0.54 Subtotal SCE (0.18) (0.18) 2.20 (1.43) EIX Parent & Other Wildfire claims insured by EIS — — (0.13) — Income tax benefit2 — — 0.03 — Subtotal EIX Parent & Other — — (0.10) — Less: Total non-core items (0.18) (0.18) 2.10 (1.43) Core EPS 2.34$ 1.51$ 4.68$ 3.88$ EIX Core EPS Non-GAAP Reconciliations 1. EPS is based on weighted-average share count of 385 million for both 2025 and 2024 2. SCE non-core items are tax-affected at an estimated statutory rate of approximately 28%; wildfire claims insured by EIS are tax-affected at the federal statutory rate of 21% Reconciliation of EIX Basic Earnings Per Share to EIX Core Earnings Per Share EPS Available to Edison International1
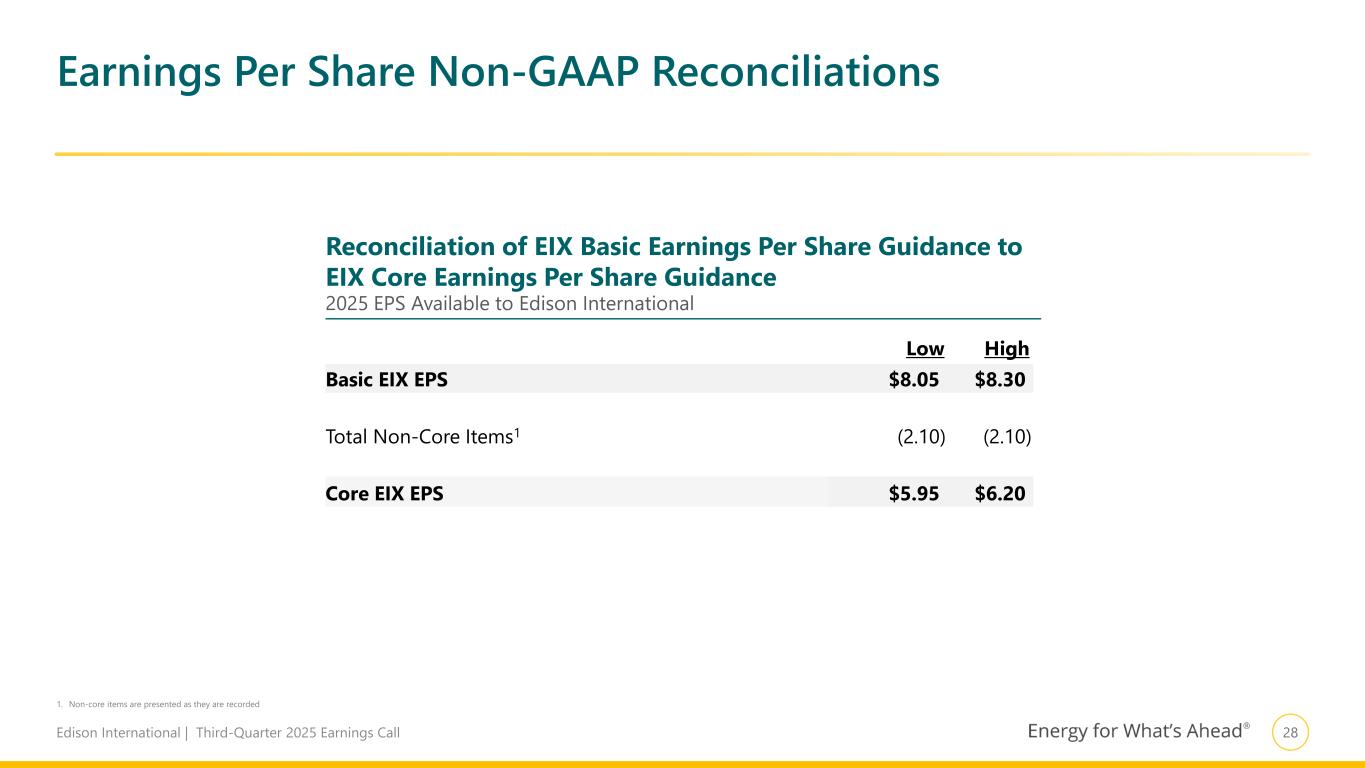
28Edison International | Third-Quarter 2025 Earnings Call Low High Basic EIX EPS $8.05 $8.30 Total Non-Core Items1 (2.10) (2.10) Core EIX EPS $5.95 $6.20 1. Non-core items are presented as they are recorded Earnings Per Share Non-GAAP Reconciliations Reconciliation of EIX Basic Earnings Per Share Guidance to EIX Core Earnings Per Share Guidance 2025 EPS Available to Edison International
29Edison International | Third-Quarter 2025 Earnings Call Use of Non-GAAP Financial Measures EIX Investor Relations Contact Sam Ramraj, Vice President Derek Matsushima, Principal Manager (626) 302-2540 (626) 302-3625 Sam.Ramraj@edisonintl.com Derek.Matsushima@edisonintl.com Edison International's earnings and basic earnings per share (EPS) are prepared in accordance with generally accepted accounting principles used in the United States. Management uses core earnings (loss) internally for financial planning and for analysis of performance. Core earnings (loss) are also used when communicating with investors and analysts regarding Edison International's earnings results to facilitate comparisons of the company's performance from period to period. Core earnings (loss) are a non-GAAP financial measure and may not be comparable to those of other companies. Core earnings (loss) are defined as earnings attributable to Edison International shareholders less non-core items. Non-core items include income or loss from discontinued operations and income or loss from significant discrete items that management does not consider representative of ongoing earnings, such as write downs, asset impairments, wildfire-related claims, and other income and expense related to changes in law, outcomes in tax, regulatory or legal proceedings, and exit activities, including sale of certain assets and other activities that are no longer continuing. A reconciliation of Non-GAAP information to GAAP information is included either on the slide where the information appears or on another slide referenced in this presentation.