QUARTERLY REPORT PURSUANT TO SECTION 13 OR 15(d) OF THE SECURITIES EXCHANGE ACT OF 1934
For the quarterly period ended June 30, 2025
OR
☐
TRANSITION REPORT PURSUANT TO SECTION 13 OR 15(d) OF THE SECURITIES EXCHANGE ACT OF 1934
For the transition period from to
Commission file number 1-9924
Citigroup Inc.
(Exact name of registrant as specified in its charter)
Delaware
52-1568099
(State or other jurisdiction of incorporation or organization)
(I.R.S. Employer Identification No.)
388 Greenwich Street,
New York
NY
10013
(Address of principal executive offices)
(Zip code)
(212) 559-1000
(Registrant’s telephone number, including area code)
Securities registered pursuant to Section 12(b) of the Securities Exchange Act of 1934 formatted in Inline XBRL: See Exhibit 99.01
Indicate by check mark whether the registrant (1) has filed all reports required to be filed by Section 13 or 15(d) of the Securities Exchange Act of 1934 during the preceding 12 months (or for such shorter period that the registrant was required to file such reports), and (2) has been subject to such filing requirements for the past 90 days. Yes☒ No ☐
Indicate by check mark whether the registrant has submitted electronically every Interactive Data File required to be submitted pursuant to Rule 405 of Regulation S-T (§232.405 of this chapter) during the preceding 12 months (or for such shorter period that the registrant was required to submit such files). Yes☒ No ☐
Indicate by check mark whether the registrant is a large accelerated filer, an accelerated filer, a non-accelerated filer, a smaller reporting company, or an emerging growth company. See the definitions of “large accelerated filer,” “accelerated filer,” “smaller reporting company,” and “emerging growth company” in Rule 12b-2 of the Exchange Act.
Large accelerated filer
☒
Accelerated filer
☐
Non-accelerated filer
☐
Smaller reporting company
☐
Emerging growth company
☐
If an emerging growth company, indicate by check mark if the registrant has elected not to use the extended transition period for complying with any new or revised financial accounting standards provided pursuant to Section 13(a) of the Exchange Act. ☐
Indicate by check mark whether the registrant is a shell company (as defined in Rule 12b-2 of the Exchange Act). Yes ☐ No ☒
Number of shares of Citigroup Inc. common stock outstanding on June 30, 2025: 1,840,897,898
This Quarterly Report on Form 10-Q should be read in conjunction with Citigroup’s Annual Report on Form 10-K for the year ended December 31, 2024 (referred to herein as Citi’s 2024 Form 10-K) and Citigroup’s Quarterly Report on Form 10-Q for the quarter ended March 31, 2025 (First Quarter of 2025 Form 10-Q).
Throughout this report, “Citigroup,” “Citi” and “the Company” refer to Citigroup Inc. and its consolidated subsidiaries. All “Note” references correspond to the Notes to the Consolidated Financial Statements herein, unless otherwise indicated.
For a list of certain terms and acronyms used in this Quarterly Report on Form 10-Q and other Citigroup presentations, see “Glossary of Terms and Acronyms” at the end of this report.
Additional Information
Additional information about Citigroup is available on Citi’s website at www.citigroup.com. Citigroup’s annual reports on Form 10-K, quarterly reports on Form 10-Q, current reports on Form 8-K and proxy statements, as well as other filings with the U.S. Securities and Exchange Commission (SEC) are available free of charge through Citi’s website by clicking on “SEC Filings” under the “Investors” tab. The SEC’s website also contains these filings and other information regarding Citi at www.sec.gov.
Certain reclassifications have been made to the prior periods’ financial statements and disclosures to conform to the current period’s presentation, including, effective January 1, 2025, certain transaction processing fees paid by Citi, primarily to credit card networks, reported within U.S. Personal Banking (USPB), Services, Wealth and All Other—Legacy Franchises (Banamex and Asia Consumer), which were previously presented within Other operating expenses and are now presented as contra-revenue within Commissions and fees reported in Non-interest revenue. Prior periods were conformed to reflect this change in presentation. Also effective January 1, 2025, USPB changed its reporting for certain installment lending products that were transferred from Retail Banking to Branded Cards to reflect where these products are managed. Prior periods were conformed to reflect this change.
Please see “Risk Factors” in Citi’s 2024 Form 10-K for a discussion of material risks and uncertainties that could impact Citigroup’s businesses, results of operations and financial condition.
Non-GAAP Financial Measures
Citi prepares its financial statements in accordance with U.S. generally accepted accounting principles (GAAP) and also presents certain non-GAAP financial measures (non-GAAP measures) that exclude certain items or otherwise include components that differ from the most directly comparable measures calculated in accordance with U.S. GAAP. These non-GAAP measures are not intended to be a substitute for GAAP financial measures and may not be defined or calculated the same way as non-GAAP measures with similar names used by other companies.
Citi’s non-GAAP measures in this Form 10-Q include:
•Revenues and expenses excluding divestiture-related impacts
•All Other (managed basis), which excludes divestiture-related impacts
•Banking and Corporate Lending revenues excluding gain (loss) on loan hedges
•Tangible common equity (TCE), return on tangible common equity (RoTCE) and tangible book value per share (TBVPS)
•Non-Markets net interest income
Citi’s revenues and expenses excluding divestiture-related impacts represent as reported, or GAAP, financial results adjusted for items that are incurred and recognized, which are wholly and necessarily a consequence of actions taken to sell (including through a public offering), dispose of or wind down business activities associated with Citi’s previously announced exit markets within All Other—Legacy Franchises.
Additionally, Citi’s Chief Executive Officer, its chief operating decision maker, regularly reviews financial information for All Other on a managed basis that excludes these divestiture-related impacts. For more information on Citi’s results excluding divestiture-related impacts, see “Executive Summary” and “All Other—Divestiture-Related Impacts (Reconciling Items)” below.
Citi believes its revenues and expenses excluding divestiture-related impacts are useful to investors, industry analysts and others in evaluating Citi’s results of operations and comparing its operational performance between periods, by providing a meaningful depiction of the underlying fundamentals of period-to-period operating results; improved visibility into management decisions and their impacts on operational performance; and additional comparability to peer companies.
For more information on Banking and Corporate Lending revenues excluding gain (loss) on loan hedges, see “Executive Summary” and “Banking” below. Citi believes that Banking and Corporate Lending revenues excluding gain (loss) on loan hedges are useful to investors, industry analysts and others because the gain (loss) on loan hedges are independent of Banking and Corporate Lending’s core operations and not indicative of the performance of the business operations.
4
For more information on TCE, RoTCE and TBVPS, see “Capital Resources—Tangible Common Equity, Book Value Per Share, Tangible Book Value Per Share and Return on Equity” below. TCE, RoTCE and TBVPS are used by management, as well as investors, industry analysts and others, in assessing Citi’s use of equity. Citi believes TCE and RoTCE are useful to investors, industry analysts and others by providing alternative measures of capital strength and performance. Citi believes TBVPS provides additional useful information about the level of tangible assets in relation to Citi’s outstanding shares of common stock.
For more information on non-Markets net interest income, see “Market Risk—Non-Markets Net Interest Income” below.Management uses non-Markets net interest income to assess the performance of Citi’s non-Markets lending, investing (including asset-liability management) and deposit-raising activities, apart from any volatility associated with such Markets’ activities. Citi believes the use of this non-GAAP measure provides investors, industry analysts and others with an alternative measure to analyze the net interest income trends of Citi’s lending, investing and deposit-raising activities, by providing a meaningful depiction of the underlying fundamentals of period-to-period operating results of those activities; improved visibility into management decisions and their impacts on operational performance; and additional comparability to peer companies.
5
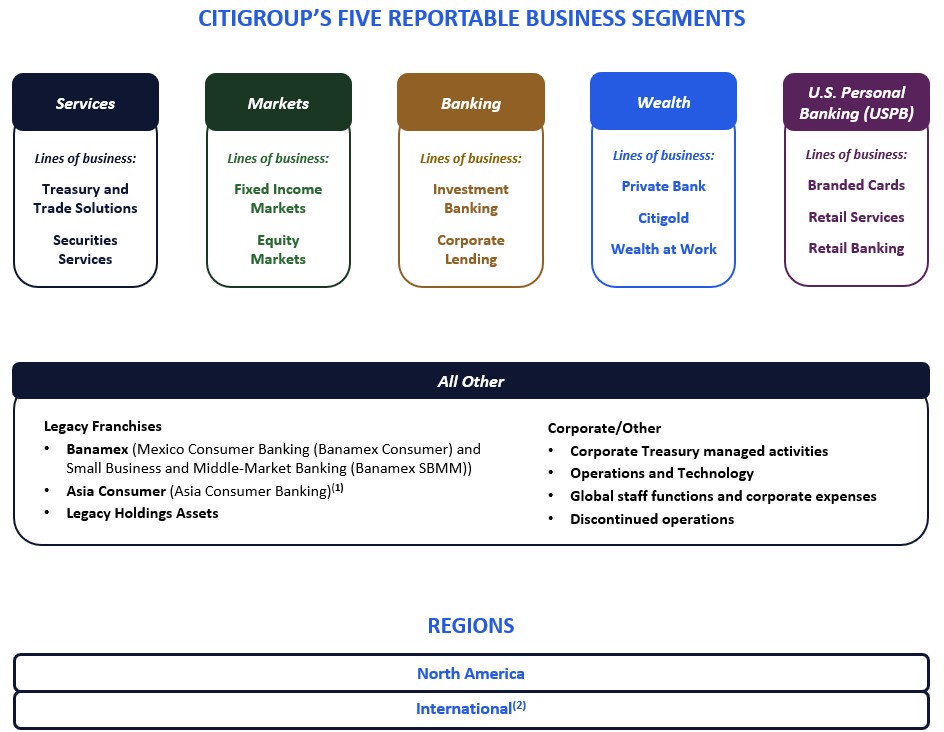
Citigroup is managed pursuant to five reportable business segments (segments), also referred to as Citi’s “five businesses”: Services, Markets, Banking, Wealth and U.S. Personal Banking. Activities not assigned to the segments are included in All Other. For additional information, see the results of operations for each of the segments and All Other within “Management’s Discussion and Analysis of Financial Condition and Results of Operations” below.
Note: Mexico is included in Latin America (LATAM) within International.
(1)Includes the remaining three exit countries (Korea, Poland and Russia).
(2)Within International, Citi is organized into six clusters: United Kingdom; Japan, Asia North and Australia (JANA); LATAM; Asia South; Europe; and Middle East and Africa (MEA). Although the chief operating decision maker (CODM) does not manage Citi’s segments and All Other by cluster, Citi provides additional selected financial information (revenue and certain corporate credit metrics) below for the six clusters within International.
6
MANAGEMENT’S DISCUSSION AND ANALYSIS OF FINANCIAL CONDITION
AND RESULTS OF OPERATIONS
EXECUTIVE SUMMARY
Second Quarter of 2025—Continued Improved Business Performance and Progress on Citigroup’s Strategic Priorities
As described further throughout this Executive Summary, during the second quarter of 2025:
•Citi and its five businesses each achieved positive operating leverage. This is the fifth consecutive quarter of positive operating leverage for Citi and the fourth consecutive quarter of positive operating leverage across the five businesses. Citi’s positive operating leverage was driven by revenue growth of 8% and disciplined expense management (up 2%).
•Citi continued to advance its transformation through the second quarter of 2025, including, among other things, making key investments to consolidate and modernize its infrastructure, retiring legacy applications and improving risk and controls, such as enhancing compliance risk management and updating its financial forecasting engine for stress metrics. (See “Citi’s Multiyear Transformation” below.)
•Citi returned approximately $3.1 billion to common shareholders in the form of share repurchases ($2.0 billion) under its multiyear $20 billion common stock repurchase program, and dividends ($1.1 billion).
•Citi’s Common Equity Tier 1 (CET1) Capital ratio under the Basel III Standardized Approach was 13.5% as of June 30, 2025, approximately 140 basis points above its current regulatory requirement.
•As part of its strategic refresh, Citi continued to make progress on its remaining divestitures, including entering into an agreement to sell its consumer banking business in Poland, progressing the planned initial public offering (IPO) of Banamex and winding down Citi’s consumer banking operations in Korea and overall operations in Russia.
Second Quarter of 2025 Results Summary
Citigroup
Citi reported net income of $4.0 billion, or $1.96 per share, compared to net income of $3.2 billion, or $1.52 per share in the prior-year period.
Net income increased 25% versus the prior-year period, primarily driven by higher revenues, partially offset by higher cost of credit and higher expenses. Citi’s effective tax rate was approximately 23% compared to approximately 24% in the prior-year period, largely due to a resolution of a tax audit. Average diluted shares outstanding decreased 3%, driven by common share repurchases.
Citi’s revenues of $21.7 billion in the second quarter of 2025 increased 8% versus the prior-year period, on a reported basis. The increase included $(177) million in divestiture-related revenue impacts in the current period and $33 million in the prior-year period. Excluding the divestiture-related
impacts in both periods, revenues increased 9%, driven by growth across each of Citi’s five businesses, partially offset by a decline in All Other (managed basis). For additional information on the divestiture-related impacts, see “All Other—Divestiture-Related Impacts (Reconciling Items)” below.
Citi’s average loans were $712 billion, up 5% versus the prior-year period, driven by growth in Markets, Services and USPB, both in Retail Banking and Branded Cards, partially offset by lower loans in Banking, All Other and Wealth. For additional information about Citi’s loans by segment and All Other, including drivers and loan trends, see each respective segment’s and All Other’s results of operations and “Credit Risk—Loans” below.
Citi’s average deposits were approximately $1.3 trillion, up 3% versus the prior-year period, driven by an increase in Services, partially offset by lower deposits in Wealth, Markets, USPB and All Other. For additional information about Citi’s deposits by segment and All Other, including drivers and deposit trends, see each respective segment’s and All Other’s results of operations and “Liquidity Risk—Deposits” below.
Expenses
Citi’s operating expenses of $13.6 billion increased 2% on a reported basis. The increase was driven by higher compensation and benefits expenses, largely offset by lower tax-related and deposit insurance costs as well as the absence of civil money penalties in the prior-year period. The higher compensation and benefits expenses were driven by higher severance costs of approximately $400 million, primarily related to the realignment of Citi’s technology workforce, higher volume and other revenue-related expenses and higher investments in Citi’s transformation and technology, with productivity savings and stranded cost reductions partially offsetting continued investments in the businesses.
The increase in expenses included divestiture-related impacts of $37 million in the current quarter and $85 million in the prior-year period. Excluding divestiture-related impacts in both periods, expenses increased 3%.
Cost of Credit
Citi’s total provisions for credit losses and for benefits and claims in the current period was $2.9 billion, reflecting net credit losses of $2.2 billion, and a net allowance for credit losses (ACL) build of $638 million.
Net credit losses were down 2% from the prior-year period, driven by lower idiosyncratic losses in Markets.
The net ACL build in the current period was primarily driven by transfer risk associated with client activity in Russia, primarily in Services, and changes in portfolio composition in Banking and Markets.
Citi’s total provisions for credit losses and for benefits and claims in the prior-year period was $2.5 billion, reflecting net credit losses of $2.3 billion, and a net ACL build of $193 million, driven by higher loan balances, primarily within USPB, largely offset by an improved macroeconomic outlook.
7
For additional information on Citi’s ACL, see “Significant Accounting Policies and Significant Estimates—Citi’s Allowance for Credit Losses (ACL)” below.
For additional information on Citi’s consumer and corporate credit costs, see each respective segment’s and All Other’s results of operations and “Credit Risk” below.
Capital
Citigroup’s CET1 Capital ratio was 13.5% as of June 30, 2025, compared to 13.6% as of June 30, 2024, based on the Basel III Standardized Approach for determining risk-weighted assets (RWA). The decrease was primarily driven by common share repurchases, the payment of common and preferred dividends and an increase in RWA, partially offset by net income.
In the second quarter of 2025, Citi repurchased $2.0 billion of common shares and paid $1.1 billion of common dividends (see “Unregistered Sales of Equity Securities, Repurchases of Equity Securities and Dividends” below). For the third quarter of 2025, Citi is targeting common share repurchases of at least $4 billion, subject to market conditions and other factors. For additional information on capital-related risks, trends and uncertainties, see “Capital Resources—Regulatory Capital Standards and Developments” below and “Risk Factors—Strategic Risks,” “—Operational Risks” and “—Compliance Risks” in Citi’s 2024 Form 10-K.
Citigroup’s Supplementary Leverage ratio as of June 30, 2025 was 5.5%, compared to 5.9% as of June 30, 2024, driven by an increase in Total Leverage Exposure, partially offset by an increase in Tier 1 Capital. For additional information on Citi’s capital ratios and related components, see “Capital Resources” below.
Services
Services net income of $1.4 billion decreased 3% from the prior-year period, driven by higher cost of credit, offset by higher revenues and lower expenses. Services revenues of $5.1 billion increased 8%, driven by growth in both Treasury and Trade Solutions (TTS), which continued to gain market share, and Securities Services. Net interest income increased 13%, driven by an increase in average deposit and loan balances, as well as higher deposit spreads, partially offset by lower loan spreads. Non-interest revenue decreased 1%, driven by higher lending revenue share with Banking, primarily offset by the benefit of continued strength in underlying fee drivers across the lines of business, particularly cross-border transaction value, assets under custody and administration and U.S. dollar clearing volume.
TTS revenues of $3.7 billion increased 7%, driven by a 12% increase in net interest income, partially offset by a 9% decrease in non-interest revenue. The increase in net interest income was driven by higher deposit spreads, as well as increases in both deposit and loan balances, partially offset by lower loan spreads. The decrease in non-interest revenue was driven by the impact of higher lending revenue share, partially offset by fee growth driven by an increase in cross-border transaction value of 9% and an increase in U.S. dollar clearing volume of 6%.
Securities Services revenues of $1.4 billion increased 11%, driven by both higher net interest income and non-interest revenue. Net interest income increased 14%, driven by higher deposit volumes. Non-interest revenue increased 8%, driven by fee growth stemming from increases in assets under custody and administration, as well as higher levels of activity in Issuer Services.
Services expenses of $2.7 billion decreased 2%, driven by the absence of tax- and legal-related expenses in the prior-year period, largely offset by higher compensation and benefits expenses, including severance costs, as well as technology investments.
Cost of credit was $353 million in the current period, reflecting a net ACL build of $333 million, and net credit losses of $20 million. The net ACL build was primarily driven by transfer risk associated with client activity in Russia. Cost of credit was a benefit of $27 million in the prior-year period, reflecting a net ACL release of $27 million, driven by an improved macroeconomic outlook.
For additional information on the results of operations of Services in the second quarter of 2025, see “Services” below.
Markets
Markets net income of $1.7 billion increased 20% from the prior-year period, driven by higher revenues, partially offset by higher expenses and higher cost of credit.
Markets revenues of $5.9 billion increased 16%, driven by a 20% increase in Fixed Income Markets and a 6% increase in Equity Markets. The increase in Fixed Income Markets was driven by growth across rates and currencies, as well as spread products and other fixed income. Rates and currencies increased 27%, driven by increased client activity and monetization of market activity with both corporate and financial institution clients. Spread products and other fixed income increased 3%, driven by higher financing activity and loan growth, partially offset by lower credit trading. The increase in Equity Markets was driven by momentum in prime services, with prime balances up approximately 27%, as well as higher client activity and volumes in cash equities and monetization of market activity in derivatives, partially offset by prior-year gains related to the Visa B share exchange.
Markets expenses of $3.5 billion increased 6%, largely driven by higher volume and other revenue-related expenses and severance costs, partially offset by an episodic legal reserve in the prior-year period.
Cost of credit was $108 million in the current period, reflecting a net ACL build of $100 million, and net credit losses of $8 million. The net ACL build was driven by changes in portfolio composition. Cost of credit was a benefit of $11 million in the prior-year period, reflecting a net ACL release of $77 million, driven by changes in portfolio composition and an improved macroeconomic outlook, and net credit losses of $66 million.
For additional information on the results of operations of Markets in the second quarter of 2025, see “Markets” below.
8
Banking
Banking net income was $463 million, an increase of 14%, driven by higher revenues, largely offset by higher cost of credit.
Banking revenues of $1.9 billion increased 18%, driven by growth in Corporate Lending, excluding mark-to-market gain (loss) on loan hedges, and Investment Banking, partially offset by the impact of a mark-to-market loss on loan hedges. Excluding the gain (loss) on loan hedges, Banking revenues of $2.0 billion increased 23%. Investment Banking revenues increased 15%, driven by increases in investment banking fees and net interest income, partially offset by higher revenue share with Banking—Corporate Lending. Investment Banking fees increased 13%, reflecting growth in Advisory and Equity Capital Markets (ECM), partially offset by a decline in Debt Capital Markets (DCM). Advisory fees increased 52%, as the business gained wallet share across several sectors and with financial sponsors. ECM fees were up 25%, driven by strength in convertibles and IPOs. DCM fees were down 12%, as Citi’s investment-grade volumes decreased compared to very strong performance in the prior-year period, partially offset by continued wallet share gains in leveraged finance. Corporate Lending revenues increased 21%, including the gain (loss) on loan hedges. Excluding the gain (loss) on loan hedges, Corporate Lending revenues increased 31%, primarily driven by an increase in lending revenue share.
Banking expenses of $1.1 billion increased 1%, driven by higher volume and other revenue-related expenses and continued business investments, primarily offset by the benefits of prior repositioning actions.
Cost of credit was $173 million in the current period, reflecting a net ACL build of $157 million, and net credit losses of $16 million. The net ACL build was primarily driven by changes in portfolio composition. Cost of credit was a benefit of $32 million in the prior-year period, reflecting a net ACL release of $72 million, driven by an improved macroeconomic outlook, and net credit losses of $40 million.
For additional information on the results of operations of Banking in the second quarter of 2025, see “Banking” below.
Wealth
Wealth net income was $494 million, compared to $210 million in the prior-year period, driven by higher revenues, partially offset by higher expenses.
Wealth revenues of $2.2 billion increased 20%, driven by growth across Citigold, the Private Bank and Wealth at Work. Net interest income of $1.3 billion increased 22%, driven by growth in deposit spreads, partially offset by lower mortgage spreads and lower deposit balances. Non-interest revenue of $888 million increased 17%, driven by a gain on sale of an alternative investments fund platform and higher investment fee revenues, with client investment assets up 17%.
Wealth expenses of $1.6 billion increased 1% from the prior-year period, driven by higher volume and revenue-related expenses, episodic items and higher severance costs, primarily offset by benefits from prior repositioning actions and lower deposit insurance costs.
Cost of credit was a benefit of $26 million in the current period, reflecting a net ACL release of $66 million, and net credit losses of $40 million. The net ACL release was driven by an improved macroeconomic outlook and changes in portfolio composition, partially offset by an increase in reserves due to consumer mortgages enrolled in forbearance programs related to the California wildfires. Cost of credit was a benefit of $9 million in the prior-year period, reflecting a net ACL release of $44 million, primarily driven by an improved macroeconomic outlook, and net credit losses of $35 million.
For additional information on the results of operations of Wealth in the second quarter of 2025, see “Wealth” below.
U.S. Personal Banking
USPB net income of $649 million increased 436% from the prior-year period, driven by lower cost of credit and higher revenues.
USPB revenues of $5.1 billion increased 6%, driven by growth in Branded Cards and Retail Banking, partially offset by a decline in Retail Services. Net interest income increased 7%, driven by net interest margin expansion and interest-earning balance growth in Branded Cards, as well as higher deposit spreads in Retail Banking. Non-interest revenue decreased 30%, largely driven by higher partner payment accruals in Retail Services.
Branded Cards revenues of $2.8 billion increased 11%, driven by net interest margin expansion and interest-earning balance growth, up 7%. Retail Services revenues of $1.6 billion decreased 5%, driven by higher partner payment accruals, due to lower net credit losses and lower interest-earning balances. Retail Banking revenues of $648 million increased 16%, driven by higher deposit spreads.
USPB expenses of $2.4 billion increased 1% versus the prior-year period.
Cost of credit was $1.9 billion in the current period, reflecting net credit losses of $1.9 billion, and a net ACL release of $4 million. Net credit losses were down 2%, driven by Retail Services, which were down 10%, reflecting improvements in portfolio performance, partially offset by higher net credit losses in Branded Cards, which were up 3%, reflecting loan growth. The net ACL release was driven by improvements in portfolio quality, including seasonal mix changes, offset by a deterioration in the outlook for the U.S. unemployment rate, as well as loan growth. Cost of credit was $2.3 billion in the prior-year period, reflecting net credit losses of $1.9 billion, and a net ACL build of $384 million, driven by loan growth.
For additional information on the results of operations of USPB in the second quarter of 2025, see “U.S. Personal Banking” below.
9
All Other(Managed Basis)
All Other (managed basis) net loss was $567 million, compared to a net loss of $402 million in the prior-year period, driven by lower revenues, higher expenses and higher cost of credit, partially offset by higher income tax benefits, largely due to the resolution of a tax audit.
All Other (managed basis) revenues of $1.7 billion decreased 14%, driven by lower revenues in both Corporate/Other and Legacy Franchises (managed basis). Legacy Franchises (managed basis) revenues of $1.7 billion decreased 2%, due to lower revenues in Banamex and Asia Consumer (managed basis), primarily offset by higher revenues in Legacy Holdings Assets. Banamex revenues decreased 6%, driven by the impact of Mexican peso depreciation and an episodic item, largely offset by revenues from higher lending volumes in the retail banking and cards businesses, higher deposit volumes and higher fee revenues. Asia Consumer (managed basis) revenues decreased 29%, driven by the closed exits and wind-downs. Legacy Holdings Assets revenues increased due to higher funding costs in the prior-year period. Corporate/Other revenues decreased to $7 million, compared to $253 million in the prior-year period, driven by lower net interest income resulting from actions taken over the last 12 months to reduce Citi’s asset sensitivity in a declining interest rate environment.
All Other (managed basis) expenses of $2.3 billion increased 8%, driven by higher severance costs related to the realignment of the technology workforce and higher investments in Citi’s transformation and technology, primarily offset by a reduction from closed exits and wind-downs, the absence of civil money penalties in the prior-year period, the impact of Mexican peso depreciation and lower deposit insurance costs.
Cost of credit was $374 million in the current period, reflecting net credit losses of $256 million, and a net ACL build of $118 million. Net credit losses were up 20%, driven by higher lending volumes and portfolio seasoning in Banamex. The net ACL build was primarily driven by increased loan volume and changes in portfolio composition in consumer loans in Banamex and transfer risk associated with client activity in Russia. Cost of credit was $243 million in the prior-year period, reflecting net credit losses of $214 million, driven by Banamex, and a net ACL build of $29 million, driven by changes in portfolio composition in consumer loans in Banamex and transfer risk associated with client activity in Russia.
For additional information on the results of operations of All Other (managed basis) in the second quarter of 2025, see “All Other—Divestiture-Related Impacts (Reconciling Items)” and “All Other (Managed Basis)” below.
Macroeconomic and Other Risks and Uncertainties
Various macroeconomic, geopolitical and regulatory factors have contributed to economic uncertainties in the U.S. and globally, including, but not limited to, those related to tariff and other policies of the U.S. administration and its trading partners. These factors could adversely affect inflation, economic growth and unemployment in the U.S. and other countries and result in volatility and disruptions in financial markets. Such risks and uncertainties could also adversely impact Citi’s clients, customers, businesses, funding costs, cost of credit and overall results of operations and financial condition during the remainder of 2025. For a discussion of other trends, uncertainties and risks that will or could impact Citi’s segments and All Other, results of operations, capital and other financial condition during the remainder of 2025, see “Second Quarter of 2025 Results Summary” above, each respective segment’s and All Other’s results of operations, “Managing Global Risk,” including “Managing Global Risk—Other Risks—Country Risk—Russia” and “—Argentina,” and “Forward-Looking Statements” below and “Risk Factors” in Citi’s 2024 Form 10-K.
10
CITI’S MULTIYEAR TRANSFORMATION
Overview
As previously disclosed, Citi’s transformation, including the remediation of its 2020 Consent Orders with the Board of Governors of the Federal Reserve System (FRB) and Office of the Comptroller of the Currency (OCC), is a multiyear endeavor that is not linear. Citi is modernizing and simplifying the Company in order to lead in a dynamic, competitive and digital world. Citi’s transformation will continue to be one of its main priorities for the remainder of 2025 and beyond.
Over the last several years, Citi has made key investments to, among other things, consolidate and modernize its infrastructure, simplify and automate manual processes, and enhance technology, data and analytics. In particular, Citi’s transformation-related expenses include costs related to risk and controls, data and finance programs and other 2020 Consent Order programs, as well as spending on certain other regulatory initiatives unrelated to the 2020 Consent Orders, and spending on enterprise-wide technology infrastructure. Citi expects its transformation investments to increase meaningfully in 2025, compared to 2024.
Progress
Citi made significant progress in its transformation through the second quarter of 2025 and is now at or mostly at Citi’s target state for many programs, including:
•End-to-end risk management lifecycle—from risk identification to stress testing
•Compliance risk management framework
•New financial forecasting engine for financial stress metrics
In addition, Citi continued to make progress in advancing its technology priorities, including:
•Continued to optimize, modernize and simplify Citi by retiring or replacing 211 applications in the first half of 2025
•Enhanced payment controls in 85 countries to detect large, anomalous payments—assessing a daily average of approximately 3 million payments
•Implemented a strategic loan platform across North America, JANA, Asia South, Europe and MEA, where new institutional corporate loans are being booked
For additional information on Citi’s transformation, including focus areas and status, consent order compliance and governance, see “Citi’s Multiyear Transformation” in Citi’s 2024 Form 10-K and Citi’s 2025 Proxy Statement for its Annual Meeting of Stockholders.
11
RESULTS OF OPERATIONS
SUMMARY OF SELECTED FINANCIAL DATA
Citigroup Inc. and Consolidated Subsidiaries
Second Quarter
Six Months
In millions of dollars, except per share amounts
2025
2024
% Change
2025
2024
% Change
Net interest income
$
15,175
$
13,493
12
%
$
29,187
$
27,000
8
%
Non-interest revenue
6,493
6,539
(1)
14,077
14,048
—
Revenues, net of interest expense(1)
$
21,668
$
20,032
8
%
$
43,264
$
41,048
5
%
Operating expenses(1)
13,577
13,246
2
27,002
27,353
(1)
Provisions for credit losses and for benefits and claims
2,872
2,476
16
5,595
4,841
16
Income from continuing operations before income taxes
$
5,219
$
4,310
21
%
$
10,667
$
8,854
20
%
Income taxes
1,186
1,047
13
2,526
2,183
16
Income from continuing operations
$
4,033
$
3,263
24
%
$
8,141
$
6,671
22
%
Income (loss) from discontinued operations, net of taxes
—
—
—
(1)
(1)
—
Net income before attribution of noncontrolling interests
$
4,033
$
3,263
24
%
$
8,140
$
6,670
22
%
Net income attributable to noncontrolling interests
14
46
(70)
57
82
(30)
Citigroup’s net income
$
4,019
$
3,217
25
%
$
8,083
$
6,588
23
%
Earnings per share
Basic
Income from continuing operations
$
1.98
$
1.54
29
%
$
3.98
$
3.14
27
%
Net income
1.98
1.54
29
3.98
3.14
27
Diluted
Income from continuing operations
$
1.96
$
1.52
29
%
$
3.92
$
3.10
26
%
Net income
1.96
1.52
29
3.92
3.10
26
Dividends declared per common share
0.56
0.53
6
1.12
1.06
6
Common dividends
$
1,063
$
1,024
4
%
$
2,135
$
2,054
4
%
Preferred dividends
287
242
19
556
521
7
Common share repurchases
2,000
—
—
3,750
500
NM
Table continues on the next page, including footnotes.
12
SUMMARY OF SELECTED FINANCIAL DATA
(Continued)
Citigroup Inc. and Consolidated Subsidiaries
In millions of dollars, except per share amounts, ratios and direct staff
Second Quarter
Six Months
2025
2024
% Change
2025
2024
% Change
At June 30:
Total assets
$
2,622,772
$
2,405,686
9
%
Total deposits
1,357,733
1,278,137
6
Long-term debt
317,761
280,321
13
Citigroup common stockholders’ equity
196,872
190,210
4
Total Citigroup stockholders’ equity
213,222
208,310
2
Average assets
2,647,805
2,456,489
8
$
2,582,473
$
2,453,413
5
%
Direct staff (in thousands)
230
229
—
%
Performance metrics
Return on average assets
0.61
%
0.53
%
0.63
%
0.54
%
Return on average common stockholders’ equity(2)
7.7
6.3
7.8
6.5
Return on average total stockholders’ equity(2)
7.6
6.3
7.7
6.4
Return on tangible common equity (RoTCE)(3)
8.7
7.2
8.9
7.4
Operating leverage(4)
567 bps
524 bps
668 bps
(170) bps
Efficiency ratio (total operating expenses/total revenues, net)
62.7
66.1
62.4
66.6
Basel III ratios
CET1 Capital(5)
13.48
%
13.59
%
Tier 1 Capital(5)
14.98
15.30
Total Capital(5)
15.28
15.41
Supplementary Leverage ratio
5.53
5.89
Citigroup common stockholders’ equity to assets
7.51
%
7.91
%
Total Citigroup stockholders’ equity to assets
8.13
8.66
Dividend payout ratio(6)
29
34
29
%
34
%
Total payout ratio(7)
82
34
78
42
Book value per common share
$
106.94
$
99.70
7
%
Tangible book value per share (TBVPS)(3)
94.16
87.53
8
(1) Effective January 1, 2025, certain transaction processing fees paid by Citi, primarily to credit card networks, reported within USPB, Services, Wealth and All Other—Legacy Franchises (Banamex and Asia Consumer), which were previously presented within Other operating expenses, are presented as contra-revenue within Commissions and fees reported in Non-interest revenue. Prior periods were conformed to reflect this change in presentation.
(2) The return on average common stockholders’ equity is calculated using net income less preferred stock dividends divided by average common stockholders’ equity. The return on average total Citigroup stockholders’ equity is calculated using net income divided by average Citigroup stockholders’ equity.
(3) RoTCE and TBVPS are non-GAAP financial measures. For information on RoTCE and TBVPS, see “Capital Resources—Tangible Common Equity, Book Value Per Share, Tangible Book Value Per Share and Return on Equity” below.
(4) Represents the year-over-year growth rate in basis points (bps) of Total revenues, net of interest expense less the year-over-year growth rate of Total operating expenses. Positive operating leverage indicates that the revenue growth rate was greater than the expense growth rate.
(5) Citi’s binding CET1 Capital and Tier 1 Capital ratios were derived under the Basel III Standardized Approach, whereas Citi’s binding Total Capital ratio was derived under the Basel III Advanced Approaches framework for both periods presented. As of June 30, 2025, the Tier 1 Capital ratio under the Basel III Standardized Approach became the most binding ratio. In the prior quarter, the Common Equity Tier 1 Capital ratio under the Basel III Standardized Approach was the most binding ratio.
(6) Dividends declared per common share as a percentage of net income per diluted share.
(7) Total common dividends declared plus common share repurchases as a percentage of net income available to common shareholders (Net income less preferred dividends). See “Consolidated Statement of Changes in Stockholders’ Equity,” Note 10 and “Equity Security Repurchases” below for the component details.
NM Not meaningful
13
SEGMENT REVENUES AND INCOME (LOSS)
REVENUES(1)
Second Quarter
Six Months
In millions of dollars
2025
2024
% Change
2025
2024
% Change
Services
$
5,062
$
4,675
8
%
$
9,951
$
9,438
5
%
Markets
5,879
5,086
16
11,865
10,443
14
Banking
1,921
1,627
18
3,873
3,363
15
Wealth
2,166
1,807
20
4,262
3,494
22
USPB
5,119
4,832
6
10,347
9,941
4
All Other—managed basis(2)
1,698
1,972
(14)
3,143
4,348
(28)
All Other—divestiture-related impacts (Reconciling Items)(2)
(177)
33
NM
(177)
21
NM
Total Citigroup net revenues
$
21,668
$
20,032
8
%
$
43,264
$
41,048
5
%
INCOME
Second Quarter
Six Months
In millions of dollars
2025
2024
% Change
2025
2024
% Change
Income (loss) from continuing operations
Services
$
1,448
$
1,498
(3)
%
$
3,058
$
3,013
1
%
Markets
1,749
1,469
19
3,544
2,890
23
Banking
461
409
13
1,003
936
7
Wealth
494
210
135
778
385
102
USPB
649
121
436
1,394
468
198
All Other—managed basis(2)
(588)
(412)
(43)
(1,441)
(895)
(61)
All Other—divestiture-related impacts (Reconciling Items)(2)
(180)
(32)
(463)
(195)
(126)
(55)
Income from continuing operations
$
4,033
$
3,263
24
%
$
8,141
$
6,671
22
%
Discontinued operations
$
—
$
—
—
%
$
(1)
$
(1)
—
%
Less: Net income attributable to noncontrolling interests
14
46
(70)
57
82
(30)
Citigroup’s net income
$
4,019
$
3,217
25
%
$
8,083
$
6,588
23
%
(1) See footnote 1 in “Results of Operations—Summary of Selected Financial Data” above for the description of a change in presentation.
(2) All Other (managed basis) excludes divestiture-related impacts (Reconciling Items) related to (i) Citi’s divestitures of its Asia Consumer businesses and (ii) the planned IPO of Banamex, within Legacy Franchises. The Reconciling Items are reflected in the relevant line items in Citi’s Consolidated Statement of Income. See “All Other—Divestiture-Related Impacts (Reconciling Items)” below.
NM Not meaningful
14
SERVICES
Services includes TTS and Securities Services. TTS provides an integrated suite of tailored cash management, payments and trade and working capital solutions to multinational corporations, financial institutions and public sector organizations. Securities Services provides a comprehensive product offering, connecting clients to global markets across the entire investment cycle, including on-the-ground local market expertise, post-trade technologies, customized data solutions and a wide range of securities services solutions that can be tailored to meet clients’ needs.
Services revenue is generated primarily from spreads and fees associated with these activities. Services earns spread revenue through generating deposits, as well as interest on loans. Revenue generated from these activities is primarily recorded in Net interest income in the table below.
Fee income is earned for assisting clients with transactional services and clearing. Revenue generated from these activities is recorded in Commissions and fees. Revenue is also generated from assets under custody and administration and is recognized when the associated services are provided by Citi. Revenue generated from these activities is primarily recorded in Administration and other fiduciary fees. For additional information on these various types of revenues, see Note 5. Services revenues also include revenues earned by Citi that are subject to a revenue sharing arrangement with Banking—Corporate Lending for Investment Banking, Markets and Services products sold to Banking—Corporate Lending clients, with revenue share to Banking recorded in All other as part of Non-interest revenue. Revenue generated from all of these activities is primarily recorded in Non-interest revenue in the table below.
Second Quarter
Six Months
In millions of dollars, except as otherwise noted
2025
2024
% Change
2025
2024
% Change
Net interest income (including dividends)
$
3,630
$
3,225
13
%
$
7,128
$
6,542
9
%
Fee revenue
Commissions and fees(1)
904
862
5
1,719
1,656
4
Administration and other fiduciary fees, and other
752
695
8
1,410
1,380
2
Total fee revenue
$
1,656
$
1,557
6
%
$
3,129
$
3,036
3
%
Principal transactions
210
182
15
460
430
7
All other(2)
(434)
(289)
(50)
(766)
(570)
(34)
Total non-interest revenue
$
1,432
$
1,450
(1)
%
$
2,823
$
2,896
(3)
%
Total revenues, net of interest expense(1)
$
5,062
$
4,675
8
%
$
9,951
$
9,438
5
%
Total operating expenses(1)
$
2,679
$
2,729
(2)
%
$
5,263
$
5,392
(2)
%
Net credit losses on loans
20
—
NM
26
6
333
Credit reserve build (release) for loans
53
(100)
NM
77
(66)
NM
Provision for credit losses on unfunded lending commitments
(6)
2
NM
(12)
14
NM
Provisions for credit losses on other assets and HTM debt securities
286
71
303
313
83
277
Provision (release) for credit losses
$
353
$
(27)
NM
$
404
$
37
NM
Income from continuing operations before taxes
$
2,030
$
1,973
3
%
$
4,284
$
4,009
7
%
Income taxes
582
475
23
1,226
996
23
Income from continuing operations
$
1,448
$
1,498
(3)
%
$
3,058
$
3,013
1
%
Noncontrolling interests
16
27
(41)
31
52
(40)
Net income
$
1,432
$
1,471
(3)
%
$
3,027
$
2,961
2
%
Efficiency ratio
53
%
58
%
53
%
57
%
Balance Sheet data(in billions of dollars)
EOP assets
$
618
$
569
9
%
Average assets
593
575
3
$
586
$
578
1
%
Revenue by line of business
Net interest income
$
2,949
$
2,629
12
%
$
5,814
$
5,352
9
%
Non-interest revenue
725
797
(9)
1,500
1,587
(5)
TTS
$
3,674
$
3,426
7
%
$
7,314
$
6,939
5
%
Net interest income
$
681
$
596
14
%
$
1,314
$
1,190
10
%
Non-interest revenue
707
653
8
1,323
1,309
1
15
Securities Services
$
1,388
$
1,249
11
%
$
2,637
$
2,499
6
%
Total Services
$
5,062
$
4,675
8
%
$
9,951
$
9,438
5
%
Revenue by geography
North America
$
1,539
$
1,295
19
%
$
2,984
$
2,538
18
%
International
3,523
3,380
4
6,967
6,900
1
Total
$
5,062
$
4,675
8
%
$
9,951
$
9,438
5
%
International revenue by cluster
United Kingdom
$
521
$
468
11
%
$
967
$
948
2
%
Japan, Asia North and Australia (JANA)
679
630
8
1,345
1,243
8
LATAM
565
636
(11)
1,180
1,437
(18)
Asia South
612
569
8
1,215
1,132
7
Europe
628
570
10
1,183
1,112
6
Middle East and Africa (MEA)
518
507
2
1,077
1,028
5
Total
$
3,523
$
3,380
4
%
$
6,967
$
6,900
1
%
Key drivers(3)
Average loans by line of business (in billions of dollars)
TTS
$
93
$
81
15
%
$
90
$
81
11
%
Securities Services
1
1
—
1
1
—
Total
$
94
$
82
15
%
$
91
$
82
11
%
ACLL as a percentage of EOP loans(4)
0.36
%
0.37
%
Average deposits by line of business (in billions of dollars)
TTS
$
713
$
677
5
%
$
702
$
680
3
%
Securities Services
144
127
13
140
126
11
Total
$
857
$
804
7
%
$
842
$
806
4
%
Assets under custody and administration (AUC/AUA) (in trillions of dollars)(5)
$
28.2
$
24.2
17
%
Cross-border transaction value (in billions of dollars)
101.3
92.7
9
$
196.40
$
183.40
7
%
U.S. dollar clearing volume (in millions)(6)
44.3
41.6
6
87
81.2
7
Commercial card spend volume (in billions of dollars)
$
17.9
$
18
(1)
$
35.1
$
34.8
1
(1) See footnote 1 in “Results of Operations—Summary of Selected Financial Data” above for the description of a change in presentation.
(2) Includes revenues earned by Citi that are subject to a revenue sharing arrangement with Banking—Corporate Lending for Investment Banking, Markets and Services products sold to Banking—Corporate Lending clients.
(3) Management uses this information in reviewing the segment’s results and believes it is useful to investors concerning underlying segment performance and trends.
(4) Excludes loans that are carried at fair value for all periods.
(5) AUC/AUA includes assets for which Citi provides custody or safekeeping services for assets held directly or by a third party on behalf of clients, or assets for which Citi provides administrative services for clients. Securities Services managed AUC/AUA, of which Citi provided both custody and administrative services to certain clients related to $2.2 trillion and $2.0 trillion of such assets at June 30, 2025 and 2024, respectively.
(6) Represents the number of U.S. dollar clearing payment instructions processed on behalf of U.S. and foreign-domiciled entities (primarily financial institutions).
NM Not meaningful
2Q25 vs. 2Q24
Net income of $1.4 billion decreased 3%, driven by higher cost of credit, offset by higher revenues and lower expenses.
Revenues increased 8%, driven by higher net interest income in TTS and Securities Services and higher non-interest revenue in Securities Services, partially offset by lower non-interest revenue in TTS.
Net interest income increased 13%, driven by an increase in average deposit and loan balances, as well as higher deposit spreads, partially offset by lower loan spreads. Average deposits increased 7%, driven by growth in TTS and Securities Services, with growth across both International and North America, largely driven by an increase in operating deposits. Average loans increased 15%, primarily driven by strong trade loan demand in TTS.
Non-interest revenue declined 1%, driven by higher revenue share with Banking—Corporate Lending, primarily offset by the benefit of continued strength in underlying fee drivers across the lines of business, particularly cross-border transaction value, assets under custody and administration and U.S. dollar clearing volume.
TTS revenues increased 7%, driven by a 12% increase in net interest income, partially offset by a 9% decrease in non-interest revenue. The increase in net interest income was driven by higher deposit spreads, as well as increases in average deposit and loan balances, partially offset by lower loan spreads. Average deposits increased 5% and average loans increased 15%. The decrease in non-interest revenue was driven by higher revenue share with Banking—Corporate Lending, primarily offset by fee growth, driven by an increase
16
in cross-border transaction value of 9% and an increase in U.S. dollar clearing volume of 6%.
Securities Services revenues increased 11%, driven by a 14% increase in net interest income and an 8% increase in non-interest revenue. The increase in net interest income was driven by higher average deposits, which increased 13%. The increase in non-interest revenue was driven by fee growth stemming from increases in assets under custody and administration, as well as higher levels of activity in Issuer Services.
Expenses decreased 2%, driven by the absence of tax- and legal-related expenses in the prior-year period, largely offset by higher compensation and benefits expenses, including severance costs, as well as technology investments.
Provisions were $353 million, reflecting a net ACL build of $333 million, and net credit losses of $20 million. The net ACL build was primarily driven by transfer risk associated with client activity in Russia. Provisions were a benefit of $27 million in the prior-year period, reflecting a net ACL release of $27 million, driven by an improved macroeconomic outlook. For additional information on Citi’s ACL, see “Significant Accounting Policies and Significant Estimates” below. For additional information on Services’ corporate credit portfolio, see “Managing Global Risk—Credit Risk—Corporate Credit” below.
For additional information on trends in Services’ deposits and loans, see “Managing Global Risk—Credit Risk—Loans” and “Managing Global Risk—Liquidity Risk—Deposits” below.
For additional information about trends, uncertainties and risks related to Services’ future results, see “Executive Summary” above, “Managing Global Risk—Other Risks—Country Risk—Argentina” and “—Russia” and “Forward-Looking Statements” below and “Risk Factors” in Citi’s 2024 Form 10-K.
2025 YTD vs. 2024 YTD
Net income of $3.0 billion increased 2%, driven by higher revenues and lower expenses, largely offset by higher cost of credit.
Revenues increased 5%, driven by higher net interest income in TTS and Securities Services and higher non-interest revenue in Securities Services, partially offset by lower non-interest revenue in TTS.
Net interest income increased 9%, driven by an increase in average deposit and loan balances, as well as higher deposit spreads, partially offset by lower loan spreads. Average deposits increased 4%, driven by growth in TTS and Securities Services. Average loans increased 11%, driven by strong trade loan demand in TTS. Non-interest revenue declined 3%, driven by higher revenue share with Banking—Corporate Lending, largely offset by the benefit of continued strength in underlying fee drivers in TTS and Securities Services.
TTS revenues increased 5%, driven by a 9% increase in net interest income, partially offset by a 5% decrease in non-interest revenue. The increase in net interest income was driven by higher deposit spreads, as well as increases in average deposit and loan balances, partially offset by lower loan spreads. Average deposits increased 3% and average loans increased 11%. The decrease in non-interest revenue was driven by higher revenue share with Banking—Corporate Lending, largely offset by fee growth, driven by an increase in cross-border transaction value of 7% and an increase in U.S. dollar clearing volume of 7%.
Securities Services revenues increased 6%, driven by a 10% increase in net interest income and a 1% increase in non-interest revenue. The increase in net interest income was driven by higher average deposits, which increased 11%, partially offset by lower deposit spreads. The increase in non-interest revenue was driven by higher assets under custody and administration, largely offset by higher revenue share with Banking—Corporate Lending.
Expenses decreased 2%, driven by the absence of tax- and legal-related expenses in the prior-year period and lower deposits insurance costs, partially offset by higher technology investments.
Provisions were $404 million, reflecting a net ACL build of $378 million, and net credit losses of $26 million. The net ACL build was primarily driven by transfer risk associated with client activity in Russia. Provisions were $37 million in the prior-year period, reflecting a net ACL build of $31 million, driven by transfer risk associated with client activity in Russia, partially offset by an improved macroeconomic outlook, and net credit losses of $6 million.
17
MARKETS
Markets includes Fixed Income Markets and Equity Markets and provides corporate, institutional and public sector clients around the world with a full range of sales and trading services across equities, foreign exchange, rates, spread products and commodities. The range of services includes market-making across asset classes, risk management solutions, financing and prime brokerage.
As a market maker, Markets facilitates transactions, including holding product inventory to meet client demand, and earns the differential between the price at which it buys and sells the products. These price differentials and the unrealized gains and losses on the inventory are recorded in Principal transactions. Fee revenue is earned through providing clients with a range of services including but not limited to trading, financing, brokerage, securitization and underwriting. Other primarily includes realized gains and losses on available-for-sale (AFS) debt securities, gains and losses on equity securities not held in trading accounts and
other non-recurring gains and losses. Markets revenues include revenues earned by Citi that are subject to a revenue sharing arrangement with Banking—Corporate Lending for Investment Banking, Markets and Services products sold to Banking—Corporate Lending clients, with revenue share to Banking recorded in Other and All other as part of Non-interest revenue. Revenue generated from all of these activities is primarily recorded in Non-interest revenue in the table below.
Net interest income in the table below includes interest income earned on assets held and equity dividends, less interest paid on long- and short-term debt, secured funding transactions and customer deposits.
For information on various potential impacts to Markets revenues, see “Markets” in Citi’s 2024 Form 10-K.
Markets’ international presence is supported by trading floors in nearly 80 countries and a proprietary network in 94 countries and jurisdictions.
Second Quarter
Six Months
In millions of dollars, except as otherwise noted
2025
2024
% Change
2025
2024
% Change
Net interest income (including dividends)
$
2,902
$
2,038
42
%
$
4,915
$
3,744
31
%
Fee revenue
Brokerage and fees
399
346
15
799
682
17
Investment banking fees(1)
106
104
2
241
204
18
Other(2)
51
62
(18)
103
124
(17)
Total fee revenue
$
556
$
512
9
%
$
1,143
$
1,010
13
%
Principal transactions
2,353
2,696
(13)
5,703
5,874
(3)
All other(2)
68
(160)
NM
104
(185)
NM
Total non-interest revenue
$
2,977
$
3,048
(2)
%
$
6,950
$
6,699
4
%
Total revenues, net of interest expense(3)
$
5,879
$
5,086
16
%
$
11,865
$
10,443
14
%
Total operating expenses
$
3,509
$
3,305
6
%
$
6,977
$
6,689
4
%
Net credit losses (recoveries) on loans
8
66
(88)
150
144
4
Credit reserve build (release) for loans
53
(111)
NM
101
9
NM
Provision (release) for credit losses on unfunded lending commitments
(8)
2
NM
1
1
—
Provisions for credit losses for other assets and HTM debt securities
55
32
72
57
34
68
Provision (release) for credit losses
$
108
$
(11)
NM
$
309
$
188
64
%
Income from continuing operations before taxes
$
2,262
$
1,792
26
%
$
4,579
$
3,566
28
%
Income taxes
513
323
59
1,035
676
53
Income from continuing operations
$
1,749
$
1,469
19
%
$
3,544
$
2,890
23
%
Noncontrolling interests
21
26
(19)
34
41
(17)
Net income
$
1,728
$
1,443
20
%
$
3,510
$
2,849
23
%
Efficiency ratio
60
%
65
%
59
%
64
%
Balance Sheet data(in billions of dollars)
EOP assets
$
1,166
$
1,023
14
%
Average assets
1,222
1,064
15
$
1,172
$
1,056
11
%
18
Revenue by line of business
Fixed Income Markets
$
4,268
$
3,564
20
%
$
8,745
$
7,694
14
%
Equity Markets
1,611
1,522
6
3,120
2,749
13
Total
$
5,879
$
5,086
16
%
$
11,865
$
10,443
14
%
Rates and currencies
$
3,134
$
2,466
27
%
$
6,182
$
5,266
17
%
Spread products/other fixed income
1,134
1,098
3
2,563
2,428
6
Total Fixed Income Markets revenues
$
4,268
$
3,564
20
%
$
8,745
$
7,694
14
%
Revenue by geography
North America
$
2,130
$
2,031
5
%
$
4,306
$
4,098
5
%
International
3,749
3,055
23
7,559
6,345
19
Total
$
5,879
$
5,086
16
%
$
11,865
$
10,443
14
%
International revenue by cluster
United Kingdom
$
1,443
$
959
50
%
$
2,914
$
2,079
40
%
Japan, Asia North and Australia (JANA)
795
678
17
1,470
1,346
9
LATAM
440
441
—
1,025
1,060
(3)
Asia South
488
398
23
976
779
25
Europe
287
275
4
583
511
14
Middle East and Africa (MEA)
296
304
(3)
591
570
4
Total
$
3,749
$
3,055
23
%
$
7,559
$
6,345
19
%
Key drivers(4)(in billions of dollars)
Average loans
$
136
$
119
14
%
$
132
$
120
10
%
Net credit losses (NCLs) as a percentage of average loans
0.02
%
0.22
%
0.23
%
0.24
%
ACLL as a percentage of EOP loans(5)
0.85
%
0.74
%
Average trading account assets
$
549
$
426
29
$
513
$
417
23
(1) Investment banking fees are primarily composed of underwriting, advisory, loan syndication structuring and other related financing activity.
(2) Includes revenues earned by Citi that are subject to a revenue sharing arrangement with Banking—Corporate Lending for Investment Banking, Markets and Services products sold to Banking—Corporate Lending clients.
(3) Citi assesses its Markets business performance on a total revenue basis, as offsets may occur across revenue line items. For example, securities that generate Net interest income may be risk managed by derivatives that are recorded in Principal transactions revenue within Non-interest revenue. For a description of the composition of these revenue line items, see Notes 4, 5 and 6.
(4) Management uses this information in reviewing the segment’s results and believes it is useful to investors concerning underlying segment performance and trends.
(5) Excludes loans that are carried at fair value for all periods.
NM Not meaningful
2Q25 vs. 2Q24
Net income of $1.7 billion increased 20%, driven by higher revenues, partially offset by higher expenses and higher cost of credit.
Revenues increased 16%, driven by higher revenues in both Fixed Income Markets and Equity Markets.
Fixed Income Markets revenues increased 20%, reflecting an increase in rates and currencies revenues and higher revenues in spread products and other fixed income. Rates and currencies revenues increased 27%, reflecting increased client activity and monetization of market activity with both corporate and financial institution clients. Spread products and other fixed income revenues increased 3%, driven by higher financing activity and loan growth, partially offset by a decline in credit trading.
Equity Markets revenues increased 6%, driven by prime services, with prime balances up approximately 27%, as well as higher client activity and volumes in cash equities and monetization of market activity in equity derivatives, partially offset by prior-year gains related to the Visa B share exchange.
Expenses increased 6%, largely driven by higher volume and other revenue-related expenses and severance costs, partially offset by an episodic legal reserve in the prior-year period.
Provisions were $108 million in the current period, reflecting a net ACL build of $100 million, and net credit losses of $8 million. The net ACL build was driven by changes in portfolio composition. Provisions were a benefit of $11 million in the prior-year period, reflecting a net ACL release of $77 million, driven by changes in portfolio composition and an improved macroeconomic outlook, and net credit losses of $66 million. For additional information on Citi’s ACL, see “Significant Accounting Policies and Significant Estimates” below. For additional information on Markets’corporate credit portfolio, see “Managing Global Risk—Credit Risk—Corporate Credit” below.
For additional information on trends in Markets’ deposits and loans, see “Managing Global Risk—Credit Risk—Loans” and “Managing Global Risk—Liquidity Risk—Deposits” below.
19
For additional information about trends, uncertainties and risks related to Markets’ future results, see “Executive Summary” above, “Managing Global Risk—Other Risks—Country Risk—Argentina” and “—Russia” and “Forward-Looking Statements” below and “Risk Factors” in Citi’s 2024 Form 10-K.
2025 YTD vs. 2024 YTD
Net income of $3.5 billion increased 23%, driven by higher revenues, partially offset by higher expenses and higher cost of credit.
Revenues increased 14%, driven by higher revenues in both Fixed Income Markets and Equity Markets.
Fixed Income Markets revenues increased 14%, reflecting an increase in rates and currencies revenues and higher revenues in spread products and other fixed income. Rates and currencies revenues increased 17%, reflecting increased client activity and monetization of market activity with both corporate and financial institution clients. Spread products and other fixed income revenues increased 6%, driven by higher financing activity and loan growth, largely offset by declines in commodities and credit trading revenues.
Equity Markets revenues increased 13%, driven by prime services, as well as monetization of market activity in equity derivatives and higher client activity and volumes in cash equities, partially offset by prior-year gains related to the Visa B share exchange.
Expenses increased 4%, primarily driven by higher volume and other revenue-related expenses.
Provisions were $309 million, reflecting a net ACL build of $159 million, and net credit losses of $150 million. The net ACL build was primarily driven by changes in portfolio composition, and uncertainty and a deterioration in the macroeconomic outlook. Provisions were $188 million in the prior-year period, reflecting a net ACL build of $44 million, primarily due to transfer risk associated with client activity in Russia, and net credit losses of $144 million.
20
BANKING
Banking includes Investment Banking and Corporate Lending. Investment Banking supports clients’ capital-raising needs to help strengthen and grow their businesses, including equity and debt capital markets financing solutions and loan syndication structuring, as well as advisory services related to mergers and acquisitions, divestitures, restructurings and corporate defense activities. Corporate Lending consists of corporate and commercial banking, serving as the conduit for Citi’s full product suite to clients.
Banking revenues include revenues earned by Citi that are subject to a revenue sharing arrangement with Banking—Corporate Lending for Investment Banking, Markets and Services products sold to Corporate Lending clients, with revenue share to Banking recorded in All other as part of Non-interest revenue in the table below.
Second Quarter
Six Months
In millions of dollars, except as otherwise noted
2025
2024
% Change
2025
2024
% Change
Net interest income (including dividends)
$
530
$
527
1
%
$
1,021
$
1,109
(8)
%
Fee revenue
Investment banking fees(1)
1,058
935
13
2,162
1,907
13
Other
59
50
18
108
92
17
Total fee revenue
$
1,117
$
985
13
%
$
2,270
$
1,999
14
%
Principal transactions
(176)
(126)
(40)
(266)
(353)
25
All other(2)
450
241
87
848
608
39
Total non-interest revenue
$
1,391
$
1,100
26
%
$
2,852
$
2,254
27
%
Total revenues, net of interest expense
$
1,921
$
1,627
18
%
$
3,873
$
3,363
15
%
Total operating expenses
$
1,137
$
1,131
1
%
$
2,171
$
2,310
(6)
%
Net credit losses on loans
16
40
(60)
50
106
(53)
Credit reserve build (release) for loans
137
(51)
NM
215
(140)
NM
Provision (release) for credit losses on unfunded lending commitments
2
(9)
NM
109
(105)
NM
Provisions (releases) for credit losses on other assets and HTM debt securities
18
(12)
NM
13
(22)
NM
Provisions (releases) for credit losses
$
173
$
(32)
NM
$
387
$
(161)
NM
Income from continuing operations before taxes
$
611
$
528
16
%
$
1,315
$
1,214
8
%
Income taxes
150
119
26
312
278
12
Income from continuing operations
$
461
$
409
13
%
$
1,003
$
936
7
%
Noncontrolling interests
(2)
3
NM
(3)
6
NM
Net income
$
463
$
406
14
%
$
1,006
$
930
8
%
Efficiency ratio
59
%
70
%
56
%
69
%
Balance Sheet data(in billions of dollars)
EOP assets
$
148
$
147
1
%
Average assets
150
152
(1)
$
147
$
153
(4)
%
Revenue by line of business
Total Investment Banking(2)
$
981
$
853
15
%
$
2,016
$
1,778
13
%
Corporate Lending (excluding gain (loss) on loan hedges)(2)(3)
1,002
765
31
1,905
1,680
13
Total Banking revenues (excluding gain (loss) on loan hedges)(2)(3)
$
1,983
$
1,618
23
%
$
3,921
$
3,458
13
%
Gain (loss) on loan hedges(2)(3)
(62)
9
NM
(48)
(95)
49
Total Banking revenues (including gain (loss) on loan hedges)(2)(3)
$
1,921
$
1,627
18
%
$
3,873
$
3,363
15
%
Investment banking fees
Advisory
$
408
$
268
52
%
$
832
$
498
67
%
Equity underwriting (Equity Capital Markets (ECM))
218
174
25
345
345
—
Debt underwriting (Debt Capital Markets (DCM))
432
493
(12)
985
1,064
(7)
Total
$
1,058
$
935
13
%
$
2,162
$
1,907
13
%
21
Revenue by geography
North America
$
781
$
749
4
%
$
1,770
$
1,522
16
%
International
1,140
878
30
2,103
1,841
14
Total
$
1,921
$
1,627
18
%
$
3,873
$
3,363
15
%
International revenue by cluster
United Kingdom
$
260
$
156
67
%
$
523
$
389
34
%
Japan, Asia North and Australia (JANA)
216
159
36
407
320
27
LATAM
192
183
5
351
407
(14)
Asia South
150
114
32
277
235
18
Europe
247
194
27
390
342
14
Middle East and Africa (MEA)
75
72
4
155
148
5
Total
$
1,140
$
878
30
%
$
2,103
$
1,841
14
%
Key drivers(4)(in billions of dollars)
Average loans
$
84
$
89
(6)
%
$
83
$
89
(7)
%
NCLs as a percentage of average loans
0.08
%
0.18
%
0.12
%
0.24
%
ACLL as a percentage of EOP loans(5)
1.72
%
1.42
%
(1) Investment banking fees are primarily composed of underwriting, advisory, loan syndication structuring and other related financing activity.
(2) Includes revenues earned by Citi that are subject to a revenue sharing arrangement with Banking—Corporate Lending for Investment Banking, Markets and Services products sold to Corporate Lending clients.
(3) Credit derivatives are used to economically hedge a portion of the corporate loan portfolio that includes both accrual loans and loans at fair value. Gain (loss) on loan hedges includes the mark-to-market on the credit derivatives, partially offset by the mark-to-market on the loans in the portfolio that are at fair value. Hedges on accrual loans reflect the mark-to-market on credit derivatives used to economically hedge the corporate loan accrual portfolio. The fixed premium costs of these hedges are netted against the corporate lending revenues to reflect the cost of credit protection. Citigroup’s results of operations excluding the impact of gain (loss) on loan hedges are non-GAAP financial measures.
(4) Management uses this information in reviewing the segment’s results and believes it is useful to investors concerning underlying segment performance and trends.
(5) Excludes loans that are carried at fair value for all periods.
NM Not meaningful
The discussion of the results of operations for Banking below excludes (where noted) the impact of any gain (loss) on hedges of accrual loans, which are non-GAAP financial measures. For a reconciliation of these metrics to the reported results, see the table above.
2Q25 vs. 2Q24
Net income of $463 million increased 14%, driven by higher revenues, largely offset by an increase in cost of credit.
Revenues increased 18% (including gain (loss) on loan hedges), driven by growth in Corporate Lending (excluding the impact of gain (loss) on loan hedges), and Investment Banking, partially offset by the impact of gain (loss) on loan hedges. Excluding the impact of gain (loss) on loan hedges, Banking revenues increased 23%.
Investment Banking revenues increased 15%, driven by increases in investment banking fees and net interest income, partially offset by higher revenue share with Banking—Corporate Lending. Investment banking fees increased 13%, reflecting growth in Advisory and ECM, partially offset by a decline in DCM. Advisory fees increased 52%, driven by share gains across several sectors and with financial sponsors. ECM fees were up 25%, driven by strength in convertibles and IPOs. DCM fees were down 12%, driven by decreased investment-grade volumes compared to very strong performance in the prior-year period, partially offset by continued share gains in leveraged finance.
Corporate Lending revenues increased 21%, including the impact of gain (loss) on loan hedges. Excluding the impact of gain (loss) on loan hedges, Corporate Lending revenues increased 31%, primarily driven by higher lending revenue share from Services, Markets and Investment Banking.
Expenses increased 1%, driven by higher volume and other revenue-related expenses and continued business investments, primarily offset by the benefits of prior repositioning actions.
Provisions were $173 million, reflecting a net ACL build of $157 million, and net credit losses of $16 million. The net ACL build was primarily driven by changes in portfolio composition. Provisions were a benefit of $32 million in the prior-year period, reflecting a net ACL release of $72 million, driven by an improved macroeconomic outlook, and net credit losses of $40 million. For additional information on Citi’s ACL, see “Significant Accounting Policies and Significant Estimates” below. For additional information on Banking’scorporate credit portfolio, see “Managing Global Risk—Credit Risk—Corporate Credit” below.
For additional information on trends in Banking’s deposits and loans, see “Managing Global Risk—Credit Risk—Loans” and “Managing Global Risk—Liquidity Risk—Deposits” below.
For additional information about trends, uncertainties and risks related to Banking’s future results, see “Executive Summary” above, “Managing Global Risk—Other Risks—Country Risk—Argentina” and “—Russia” and “Forward-Looking Statements” below and “Risk Factors” in Citi’s 2024 Form 10-K.
22
2025 YTD vs. 2024 YTD
Net income of $1.0 billion increased 8%, driven by higher revenues and lower expenses, primarily offset by increased cost of credit.
Revenues increased 15% (including losses on loan hedges), reflecting higher Investment Banking revenues, as well as higher revenues in Corporate Lending and lower losses on loan hedges (a $48 million loss versus a $95 million loss in the prior-year period). Excluding the impact of losses on loan hedges, Banking revenues increased 13%.
Investment Banking revenues increased 13%, reflecting a 13% increase in investment banking fees, driven by growth in Advisory, partially offset by a decline in DCM. Advisory fees increased 67%, due to strong previously announced deals that closed, with share gains across several sectors and financial sponsors. ECM fees were largely unchanged, including the impact of accelerated volumes toward the end of the second quarter of 2025, following a slow start to the year. DCM fees were down 7%, as Citi’s investment-grade volumes decreased compared to very strong performance in the prior-year period.
Corporate Lending revenues increased 17%, including the impact of losses on loan hedges. Excluding the impact of losses on loan hedges, Corporate Lending revenues increased 13%, driven by higher lending revenue share, partially offset by the impact of lower average loan balances, which were down 7%.
Expenses decreased 6%, largely driven by the benefits of prior repositioning actions and other related actions.
Provisions were $387 million, reflecting a net ACL build of $337 million, and net credit losses of $50 million. The net ACL build was driven by changes in portfolio composition and uncertainty and a deterioration in the macroeconomic outlook. Provisions were a benefit of $161 million in the prior-year period, reflecting a net ACL release of $267 million, primarily driven by changes in portfolio composition and an improved macroeconomic outlook, and net credit losses of $106 million.
23
WEALTH
Wealth includes the Private Bank, Citigold and Wealth at Work and provides financial services to a range of client segments consisting of ultra-high net worth, high net worth and affluent clients. These services include banking, investment, lending, custody and trust product offerings in approximately 20 countries, including the U.S., Mexico and four wealth management centers: Singapore, Hong Kong, the UAE and London.
The Private Bank provides financial services to ultra-high net worth clients through customized product offerings. Citigold provides financial services to affluent and high net worth clients through elevated product offerings and financial
relationships. Wealth at Work provides financial services to professional industries (including law firms, consulting groups and accounting and asset management firms) through tailored solutions.
At June 30, 2025, Wealth had $635 billion in client investment assets, $310 billion in deposits and $151 billion in loans, including $89 billion in mortgage loans, $31 billion in margin loans, $26 billion in personal, small business and other loans and $5 billion in outstanding credit card balances. For additional information on Wealth’s end-of-period consumer loan portfolios and metrics, see “Managing Global Risk—Credit Risk—Consumer Credit” below.
Second Quarter
Six Months
In millions of dollars, except as otherwise noted
2025
2024
% Change
2025
2024
% Change
Net interest income
$
1,278
$
1,047
22
%
$
2,552
$
2,028
26
%
Fee revenue
Commissions and fees(1)
370
342
8
769
680
13
Other(2)
245
232
6
492
463
6
Total fee revenue
$
615
$
574
7
%
$
1,261
$
1,143
10
%
All other(3)
273
186
47
449
323
39
Total non-interest revenue
$
888
$
760
17
%
$
1,710
$
1,466
17
%
Total revenues, net of interest expense(1)
2,166
1,807
20
4,262
3,494
22
Total operating expenses(1)
$
1,558
$
1,535
1
%
$
3,197
$
3,171
1
%
Net credit losses on loans
40
35
14
78
64
22
Credit reserve build (release) for loans
(64)
(43)
(49)
(3)
(233)
99
Provision (release) for credit losses on unfunded lending commitments
(2)
—
NM
(3)
(8)
63
Provisions for benefits and claims (PBC), and other assets
—
(1)
100
—
(2)
100
Provisions (releases) for credit losses and PBC
$
(26)
$
(9)
(189)
%
$
72
$
(179)
NM
Income from continuing operations before taxes
$
634
$
281
126
%
$
993
$
502
98
%
Income taxes
140
71
97
215
117
84
Income from continuing operations
$
494
$
210
135
%
$
778
$
385
102
%
Noncontrolling interests
—
—
—
—
—
—
Net income
$
494
$
210
135
%
$
778
$
385
102
%
Efficiency ratio
72
%
85
%
75
%
91
%
Balance Sheet data(in billions of dollars)
EOP assets
$
228
$
228
—
%
Average assets
226
230
(2)
$
225
$
233
(3)
%
Revenue by line of business
Private Bank
$
731
$
611
20
%
$
1,395
$
1,182
18
%
Citigold
1,214
1,001
21
2,378
1,936
23
Wealth at Work
221
195
13
489
376
30
Total
$
2,166
$
1,807
20
%
$
4,262
$
3,494
22
%
Revenue by geography
North America
$
1,081
$
847
28
%
$
2,154
$
1,620
33
%
International
1,085
960
13
2,108
1,874
12
Total
$
2,166
$
1,807
20
%
$
4,262
$
3,494
22
%
24
International revenue by cluster
United Kingdom
$
109
$
85
28
%
$
214
$
158
35
%
Japan, Asia North and Australia (JANA)
383
336
14
740
648
14
LATAM
40
33
21
77
63
22
Asia South
381
332
15
753
665
13
Europe
85
81
5
149
155
(4)
Middle East and Africa (MEA)
87
93
(6)
175
185
(5)
Total
$
1,085
$
960
13
%
$
2,108
$
1,874
12
%
Key drivers(4)(in billions of dollars)
EOP client balances
Client investment assets(5)
$
635
$
541
17
%
Deposits
310
318
(3)
Loans
151
150
—
Total
$
1,096
$
1,009
9
%
Net new investment assets (NNIA)(6)
$
2.0
$
10.3
(81)
%
$
18.5
$
13.1
41
%
Average deposits
308
316
(3)
309
316
(2)
Average loans
149
150
(1)
148
150
(1)
ACLL as a percentage of EOP loans
0.36
%
0.35
%
(1) See footnote 1 in “Results of Operations—Summary of Selected Financial Data” above for the description of a change in presentation.
(2) Primarily related to fiduciary and administrative fees.
(3) Primarily related to principal transactions revenue including FX translation.
(4) Management uses this information in reviewing the segment’s results and believes it is useful to investors concerning underlying segment performance and trends.
(5) Includes assets under management, and trust and custody assets.
(6) Represents investment asset inflows, including dividends, interest and distributions, less investment asset outflows. See “Glossary” below for additional information.
NM Not meaningful
2Q25 vs. 2Q24
Net income was $494 million, compared to $210 million in the prior-year period, driven by higher revenues, partially offset by higher expenses.
Revenues increased 20%, driven by growth across Citigold, Private Bank and Wealth at Work. Net interest income increased 22%, driven by growth in deposit spreads, partially offset by lower mortgage spreads and lower deposit balances. Non-interest revenue increased 17%, driven by an $80 million gain on the sale of an alternative investments fund platform, as well as higher investment fee revenues, with client investment assets up 17%.
Client balances increased 9%, driven by higher client investment assets, partially offset by lower deposits. NNIA inflows were $2.0 billion in the current period. Net inflows slowed versus the first quarter of 2025, impacted by several large outflows. NNIA increased to nearly $48 billion over the last 12 months, representing 9% organic growth.
Average deposits decreased 3%, driven by client tax payments and other operating outflows, as well as a shift in deposits to higher-yielding investments on Citi’s platform, partially offset by transfers of certain relationships and the associated deposits to Wealth from USPB (including $4 billion of transfers during the second quarter of 2025). Average loans decreased 1%, driven by the transfers of certain relationships and associated mortgage loans to USPB from Wealth and reductions across other lending portfolios, primarily offset by growth in securities-based lending volumes.
Private Bank revenues increased 20%, driven by the sale of the alternative investments fund platform, higher deposit spreads and higher investment fee revenues, partially offset by lower mortgage spreads.
Citigold revenues increased 21%, driven by higher deposit spreads, higher investment fee revenues and higher lending revenues, partially offset by lower deposit balances.
Wealth at Work revenues increased 13%, driven by higher deposit spreads and higher investment fee revenues, largely offset by lower mortgage spreads.
Expenses increased 1%, driven by higher volume and other revenue-related expenses, episodic items and higher severance costs, primarily offset by benefits from prior repositioning actions and lower deposit insurance costs.
Provisions were a benefit of $26 million, reflecting a net ACL release of $66 million, and net credit losses of $40 million. The net ACL release was driven by an improved macroeconomic outlook and changes in portfolio composition, partially offset by an increase in reserves due to consumer mortgages enrolled in forbearance programs related to the California wildfires. Provisions were a benefit of $9 million in the prior-year period, reflecting a net ACL release of $44 million, primarily driven by an improved macroeconomic outlook, and net credit losses of $35 million. For additional information on Citi’s ACL, see “Significant Accounting Policies and Significant Estimates” below. For additional information on Wealth’sloan portfolios, see “Managing Global Risk—Credit Risk—Consumer Credit” below.
25
For additional information about trends, uncertainties and risks related to Wealth’s future results, see “Executive Summary” above, “Forward-Looking Statements” below and “Risk Factors—Strategic Risks” in Citi’s 2024 Form 10-K.
2025 YTD vs. 2024 YTD
Net income was $778 million, compared to $385 million in the prior-year period, driven by higher revenues, partially offset by higher cost of credit and higher expenses.
Revenues increased 22%, driven by growth across all lines of business. Net interest income was up 26%, driven by higher deposit spreads, partially offset by lower average deposit balances (down 2%). Non-interest revenue increased 17%, driven by higher investment fee revenues and the sale of the alternative investments fund platform.
Private Bank revenues increased 18%, driven by higher deposit spreads, the sale of the alternative investments fund platform and higher investment fee revenues, partially offset by lower mortgage spreads.
Citigold revenues increased 23%, driven by higher deposit spreads, higher investment fee revenues and higher lending revenues, partially offset by lower average deposit balances.
Wealth at Work revenues increased 30%, driven by higher deposit spreads and higher investment fee revenues, partially offset by lower mortgage spreads.
Expenses increased 1%, driven by higher volume and other revenue-related expenses and severance costs, primarily offset by the benefits from prior repositioning actions.
Provisions were $72 million, reflecting net credit losses of $78 million, and a net ACL release of $6 million. The net ACL release was driven by changes in portfolio composition, largely offset by a deterioration in the macroeconomic outlook.
Provisions were a benefit of $179 million in the prior-year period, reflecting a net ACL release of $243 million, driven by changes in the margin lending portfolio and an improved macroeconomic outlook, and net credit losses of $64 million.
26
U.S. PERSONAL BANKING
U.S. Personal Banking (USPB) includes Branded Cards, Retail Services and Retail Banking. Branded Cards includes proprietary credit card portfolios (Value, Rewards and Cash), co-branded card portfolios (including Costco and American Airlines) and personal installment loans. Retail Services includes co-brand and private label relationships (including, among others, The Home Depot, Best Buy, Macy’s and Sears). Retail Banking includes traditional banking services, including deposits, mortgages and other lending products, to retail and small business customers. Retail Banking branches are concentrated in six key metropolitan areas: New York, Los Angeles, San Francisco, Chicago, Miami and Washington, D.C.
At June 30, 2025, USPB had $167 billion in outstanding credit card balances, $91 billion in deposits, $48 billion in mortgages, $4 billion in personal installment loans and $1 billion in small business and personal loans. For additional information on USPB’s end-of-period consumer loan portfolios and metrics, see “Managing Global Risk—Credit Risk—Consumer Credit” below.
Second Quarter
Six Months
In millions of dollars, except as otherwise noted
2025
2024
% Change
2025
2024
% Change
Net interest income
$
5,471
$
5,103
7
%
$
11,012
$
10,329
7
%
Fee revenue
Interchange fees(1)(2)
2,499
2,437
3
4,823
4,720
2
Card rewards and partner payments
(3,008)
(2,847)
(6)
(5,829)
(5,427)
(7)
Other(2)
147
114
29
290
219
32
Total fee revenue
$
(362)
$
(296)
(22)
%
$
(716)
$
(488)
(47)
%
All other(3)
10
25
(60)
51
100
(49)
Total non-interest revenue
$
(352)
$
(271)
(30)
%
$
(665)
$
(388)
(71)
%
Total revenues, net of interest expense(1)
5,119
4,832
6
10,347
9,941
4
Total operating expenses(1)
$
2,381
$
2,355
1
%
$
4,823
$
4,805
—
%
Net credit losses on loans
1,889
1,931
(2)
3,872
3,795
2
Credit reserve build (release) for loans
(6)
382
NM
(177)
719
NM
Provision for credit losses on unfunded lending commitments
1
—
NM
1
—
NM
Provisions for benefits and claims (PBC), and other assets
1
2
(50)
—
5
(100)
Provisions for credit losses and PBC
$
1,885
$
2,315
(19)
%
$
3,696
$
4,519
(18)
%
Income from continuing operations before taxes
$
853
$
162
427
%
$
1,828
$
617
196
%
Income taxes
204
41
398
434
149
191
Income from continuing operations
$
649
$
121
436
%
$
1,394
$
468
198
%
Noncontrolling interests
—
—
—
—
—
—
Net income
$
649
$
121
436
%
$
1,394
$
468
198
%
Efficiency ratio
47
%
49
%
47
%
48
%
Balance Sheet data(in billions of dollars)
EOP assets
$
251
$
242
4
%
Average assets
247
239
3
$
247
$
236
5
%
EOP loans
220
210
5
EOP deposits
91
86
5
Revenue by line of business(1)(4)
Branded Cards
$
2,822
$
2,536
11
%
$
5,714
$
5,188
10
%
Retail Services
1,649
1,735
(5)
3,324
3,625
(8)
Retail Banking
648
561
16
1,309
1,128
16
Total
$
5,119
$
4,832
6
%
$
10,347
$
9,941
4
%
27
Key drivers(5) (in billions of dollars, except as otherwise noted)
Average loans
$
217
$
206
5
%
$
217
$
205
6
%
ACLL as a percentage of EOP loans(6)
6.34
%
6.60
%
NCLs as a percentage of average loans
3.49
%
3.76
%
3.61
%
3.72
%
Average deposits
90
93
(3)
90
97
(7)
Branded Cards
Credit card spend volume
$
136
$
131
4
%
$
261
$
252
4
%
Average loans
118
113
5
117
112
5
NCLs as a percentage of average loans
3.80
%
3.88
%
3.88
%
3.80
%
New credit cards account acquisitions(7)(in thousands of accounts)
1,194
1,144
4
2,494
2,314
8
Retail Services
Credit card spend volume
$
23
$
24
(3)
%
$
42
$
44
(4)
%
Average loans
50
51
(2)
51
51
(1)
NCLs as a percentage of average loans
5.89
%
6.45
%
6.15
%
6.38
%
New credit cards account acquisitions(7)(in thousands of accounts)
2,061
2,034
1
3,601
3,692
(2)
Retail Banking
Branches (actual)
650
641
1
%
Average mortgage loans
$
47
$
41
15
$
47
$
41
15
%
NCLs as a percentage of average loans
0.27
%
0.24
%
0.26
%
0.25
%
(1) See footnote 1 in “Results of Operations—Summary of Selected Financial Data” above for the description of a change in presentation.
(2) Primarily related to credit cards and retail banking related fees.
(3) Primarily related to revenue incentives from card networks and partners.
(4) Effective January 1, 2025, USPB changed its reporting for certain installment lending products that were transferred from Retail Banking to Branded Cards to reflect where these products are managed. Prior periods were conformed to reflect this change.
(5) Management uses this information in reviewing the segment’s results and believes it is useful to investors concerning underlying segment performance and trends.
(6) Excludes loans that are carried at fair value for all periods.
(7) Represents the number of new credit card accounts opened.
NM Not meaningful
2Q25 vs. 2Q24
Net income was $649 million, compared to $121 million in the prior-year period, driven by lower cost of credit and higher revenues.
Revenues increased 6%, driven by growth in Branded Cards and Retail Banking, partially offset by a decline in Retail Services. Net interest income increased 7%, driven by net interest margin expansion and interest-earning balance growth in Branded Cards, as well as higher deposit spreads in Retail Banking. Non-interest revenue decreased 30%, largely driven by higher partner payment accruals in Retail Services.
Branded Cards revenues increased 11%, driven by net interest margin expansion and interest-earning balance growth, which was up 7%. Branded Cards average loans increased 5%, driven by higher card spend volume, which was up 4%, and higher revolving balances.
Retail Services revenues decreased 5%, driven by higher partner payment accruals, due to lower net credit losses and lower interest-earning balances. Retail Services average loans decreased 2%, due to lower card spend volume. Card spend volume decreased 3%, across all spend categories.
Retail Banking revenues increased 16%, driven by the impact of higher deposit spreads. Average deposits decreased 3%, as net new deposits were more than offset by transfers of certain relationships and the associated deposits to Wealth (including $4 billion of transfers during the second quarter of 2025).
Expenses increased 1%, as higher fraud-related expenses were offset by benefits from continued productivity savings.
Provisions were $1.9 billion, reflecting net credit losses of $1.9 billion, and a net ACL release of $4 million. Net credit losses declined 2%, driven by Retail Services, which declined 10%, reflecting improvements in portfolio performance, partially offset by higher net credit losses in Branded Cards, which increased 3%, reflecting loan growth. The net ACL release was driven by improvements in portfolio quality, including seasonal mix changes, offset by a deterioration in the outlook for the U.S. unemployment rate, as well as loan growth. Provisions were $2.3 billion in the prior-year period, reflecting net credit losses of $1.9 billion, and a net ACL build of $384 million, driven by loan growth. For additional information on Citi’s ACL, see “Significant Accounting Policies and Significant Estimates” below.
For additional information on USPB’s Branded Cards, Retail Services and Retail Banking loan portfolios, see “Managing Global Risk—Credit Risk—Consumer Credit” below.
For additional information about trends, uncertainties and risks related to USPB’s future results, see “Executive Summary” above, “Forward-Looking Statements” below and “Risk Factors—Strategic Risks” in Citi’s 2024 Form 10-K.
28
2025 YTD vs. 2024 YTD
Net income was $1.4 billion, compared to $468 million in the prior-year period, driven by lower cost of credit and higher revenues.
Revenues increased 4%, driven by growth in Branded Cards and Retail Banking, partially offset by a decline in Retail Services. Net interest income increased 7%, driven by net interest margin expansion and interest-earning balance growth in Branded Cards, as well as higher deposit spreads in Retail Banking. Non-interest revenue decreased 71%, primarily driven by higher partner payment accruals in Retail Services.
Branded Cards revenues increased 10%, driven by net interest margin expansion and interest-earning balance growth, which was up 7%. Branded Cards average loans increased 5%, driven by higher card spend volume, which was up 4%, and higher revolving balances.
Retail Services revenues decreased 8%, primarily driven by higher partner payment accruals and incentives to card holders. Retail Services average loans decreased 1%, due to lower card spend volume. Card spend volume decreased 4%, across all spend categories.
Retail Banking revenues increased 16%, driven by the impact of higher deposit spreads. Average deposits decreased 7%, as net new deposits were more than offset by transfers of certain relationships and the associated deposits to Wealth.
Expenses were unchanged, as continued productivity savings were offset by higher advertising and marketing, legal and fraud-related expenses.
Provisions were $3.7 billion, reflecting net credit losses of $3.9 billion, and a net ACL release of $176 million. Net credit losses increased 2%, driven by higher net credit losses in Branded Cards, which increased 7%, reflecting loan growth, largely offset by a decrease in Retail Services, which decreased 5%, reflecting improvements in portfolio performance. The net ACL release was driven by a reduction in loan volume and changes in portfolio composition, largely offset by a deterioration in the macroeconomic outlook. Provisions were $4.5 billion in the prior-year period, reflecting net credit losses of $3.8 billion, and a net ACL build of $724 million, driven by changes in portfolio composition.
29
ALL OTHER—Divestiture-Related Impacts (Reconciling Items)
The table below presents a reconciliation from All Other (U.S. GAAP) to All Other (managed basis). All Other (U.S. GAAP), less Reconciling Items, equals All Other (managed basis). The Reconciling Items are reflected on each relevant line item in Citi’s Consolidated Statement of Income.
All Other (managed basis) results exclude divestiture-related impacts (see the “Reconciling Items” column in the table below) related to (i) Citi’s divestitures of its Asia
Consumer businesses and (ii) the planned IPO of Banamex, within Legacy Franchises. Legacy Franchises (managed basis) results also exclude these divestiture-related impacts. Certain of the results of operations of All Other (managed basis) and Legacy Franchises (managed basis) are non-GAAP financial measures (see “Overview—Non-GAAP Financial Measures” above).
Second Quarter
2025
2024
In millions of dollars, except as otherwise noted
All Other (U.S. GAAP)
Reconciling Items(2)
All Other (managed basis)
All Other (U.S. GAAP)
Reconciling Items(3)
All Other (managed basis)
Net interest income
$
1,364
$
—
$
1,364
$
1,553
$
—
$
1,553
Non-interest revenue
157
(177)
334
452
33
419
Total revenues, net of interest expense(1)
$
1,521
$
(177)
$
1,698
$
2,005
$
33
$
1,972
Total operating expenses(1)
$
2,313
$
37
$
2,276
$
2,191
$
85
$
2,106
Net credit losses on loans
261
5
256
211
(3)
214
Credit reserve build (release) for loans
70
—
70
(1)
—
(1)
Provision for credit losses on unfunded lending commitments
(6)
—
(6)
(3)
—
(3)
Provisions for benefits and claims (PBC), other assets and HTM debt securities
54
—
54
33
—
33
Provisions (benefits) for credit losses and PBC
$
379
$
5
$
374
$
240
$
(3)
$
243
Income (loss) from continuing operations before taxes
$
(1,171)
$
(219)
$
(952)
$
(426)
$
(49)
$
(377)
Income taxes (benefits)
(403)
(39)
(364)
18
(17)
35
Income (loss) from continuing operations
$
(768)
$
(180)
$
(588)
$
(444)
$
(32)
$
(412)
Income (loss) from discontinued operations, net of taxes
—
—
—
—
—
—
Noncontrolling interests
(21)
—
(21)
(10)
—
(10)
Net income (loss)
$
(747)
$
(180)
$
(567)
$
(434)
$
(32)
$
(402)
Asia Consumer revenues
$
(22)
$
(177)
$
155
$
252
$
33
$
219
Six Months
2025
2024
In millions of dollars, except as otherwise noted
All Other (U.S. GAAP)
Reconciling Items(4)
All Other (managed basis)
All Other (U.S. GAAP)
Reconciling Items(5)
All Other (managed basis)
Net interest income
$
2,559
$
—
$
2,559
$
3,248
$
—
$
3,248
Non-interest revenue
407
(177)
584
1,121
21
1,100
Total revenues, net of interest expense(1)
$
2,966
$
(177)
$
3,143
$
4,369
$
21
$
4,348
Total operating expenses(1)
$
4,571
$
71
$
4,500
$
4,986
$
195
$
4,791
Net credit losses on loans
517
5
512
471
8
463
Credit reserve build (release) for loans
132
(11)
143
(94)
—
(94)
Provision for credit losses on unfunded lending commitments
(7)
—
(7)
(8)
—
(8)
Provisions for benefits and claims (PBC), other assets and HTM debt securities
85
—
85
68
—
68
Provisions (benefits) for credit losses and PBC
$
727
$
(6)
$
733
$
437
$
8
$
429
Income (loss) from continuing operations before taxes
$
(2,332)
$
(242)
$
(2,090)
$
(1,054)
$
(182)
$
(872)
Income taxes (benefits)
(696)
(47)
(649)
(33)
(56)
23
Income (loss) from continuing operations
$
(1,636)
$
(195)
$
(1,441)
$
(1,021)
$
(126)
$
(895)
Income (loss) from discontinued operations, net of taxes
(1)
—
(1)
(1)
—
(1)
Noncontrolling interests
(5)
—
(5)
(17)
—
(17)
Net income (loss)
$
(1,632)
$
(195)
$
(1,437)
$
(1,005)
$
(126)
$
(879)
Asia Consumer revenues
$
113
$
(177)
$
290
$
492
$
21
$
471
30
(1) See footnote 1 in “Results of Operations—Summary of Selected Financial Data” above for the description of a change in presentation.
(2) The three months ended June 30, 2025 includes (i) an approximate $186 million loss recorded in revenue (approximately $157 million after tax) related to the announced sale of the Poland consumer banking business and (ii) approximately $37 million in operating expenses (approximately $26 million after-tax), primarily related to separation costs in Mexico.
(3) The three months ended June 30, 2024 includes approximately $85 million in operating expenses (approximately $58 million after-tax), primarily related to separation costs in Mexico and severance costs in the Asia exit markets. For additional information, see Citi’s Quarterly Report on Form 10-Q for the period ended June 30, 2024.
(4) The six months ended June 30, 2025 includes (i) an approximate $186 million loss recorded in revenue (approximately $157 million after tax) related to the announced sale of the Poland consumer banking business and (ii) approximately $71 million in operating expenses (approximately $49 million after-tax), largely related to separation costs in Mexico and severance costs in the Asia exit markets.
(5) The six months ended June 30, 2024 includes approximately $195 million in operating expenses (approximately $135 million after-tax) related to separation costs in Mexico and severance costs in the Asia exit markets. For additional information, see Citi’s Quarterly Report on Form 10-Q for the period ended June 30, 2024.
31
ALL OTHER—Managed Basis
At June 30, 2025, All Other (managed basis) had $212 billion in assets, primarily related to (i) Banamex and Asia Consumer reported within Legacy Franchises (managed basis) and (ii) Corporate Treasury investment securities and Citi’s deferred tax assets (DTAs) reported within Corporate/Other.
Legacy Franchises (Managed Basis)
Legacy Franchises (managed basis) includes:
•Banamex (Banamex Consumer and Banamex SBMM);
•Asia Consumer, primarily representing the consumer banking operations of the remaining three exit countries (Korea, Poland and Russia); and
•Legacy Holdings Assets, consisting of $1.9 billion of legacy consumer mortgage loans in North America, as well as other legacy assets.
Banamex operates primarily through Grupo Financiero Banamex S.A. de C.V. and its consolidated subsidiaries, including Banco Nacional de Mexico, S.A., which provides traditional retail banking and branded card products to consumers and small business customers and traditional middle-market banking products and services to commercial customers, and other affiliated subsidiaries that offer retirement fund administration and insurance products. As previously disclosed, Citi completed the separation of Banamex from its Services, Markets, Banking and Wealth businesses in Mexico in the fourth quarter of 2024, and intends to pursue an IPO of Banamex, the timing of which will be driven by regulatory approvals and market conditions. For additional information, see “Forward-Looking Statements” below. Citi will retain its Services, Markets, Banking and Wealth businesses in Mexico.
Since announcing its intention to exit consumer banking across 14 markets in Asia, Europe, the Middle East and Mexico as part of its strategic refresh, Citi has now closed sales in nine of those markets; has announced the sale of the Poland consumer banking business, which is expected to close by mid-2026, subject to regulatory approvals and other customary closing conditions; and has continued to make progress on its wind-downs in Korea and Russia (Citi completed the wind-down of its consumer loan portfolio in Russia during the second quarter of 2025). The previously announced wind-down of Citi’s consumer business in China is substantially complete. See Note 2 for additional information on Legacy Franchises’ consumer banking business sales and wind-downs. For additional information about Citi’s continued efforts to reduce its operations and exposures in Russia, see “Managing Global Risk—Other Risks—Country Risk—Russia” below and “Risk Factors—Other Risks” and “Managing Global Risk—Other Risks—Country Risk—Russia” in Citi’s 2024 Form 10-K.
At June 30, 2025, on a combined basis, Legacy Franchises (managed basis) had 1,291 retail branches, $40 billion in deposits, $16 billion in retail banking loans and $9 billion in outstanding credit card balances. In addition, Banamex SBMM had $7 billion in outstanding corporate loans. For additional information on the loans and deposits of Banamex and Asia Consumer, see “Banamex—” and “Asia Consumer—key indicators” in the table below.
Corporate/Other
Corporate/Otherincludes certain unallocated costs of global staff functions (including finance, risk, human resources, legal and compliance-related costs), other corporate expenses and unallocated global operations and technology expenses and income taxes, as well as results of Corporate Treasury investment activities and discontinued operations.
32
Second Quarter
Six Months
% Change
In millions of dollars, except as otherwise noted
2025
2024
% Change
2025
2024
Net interest income
$
1,364
$
1,553
(12)
%
$
2,559
$
3,248
(21)
%
Non-interest revenue
334
419
(20)
584
1,100
(47)
Total revenues, net of interest expense(1)
$
1,698
$
1,972
(14)
%
$
3,143
$
4,348
(28)
%
Total operating expenses(1)
$
2,276
$
2,106
8
%
$
4,500
$
4,791
(6)
%
Net credit losses on loans
256
214
20
512
463
11
Credit reserve build (release) for loans
70
(1)
NM
143
(94)
NM
Provision (release) for credit losses on unfunded lending commitments
(6)
(3)
(100)
(7)
(8)
13
Provisions (release) for benefits and claims (PBC), other assets and HTM debt securities
54
33
64
85
68
25
Provisions for credit losses and PBC
$
374
$
243
54
%
$
733
$
429
71
%
Income (loss) from continuing operations before taxes
$
(952)
$
(377)
(153)
%
$
(2,090)
$
(872)
(140)
%
Income taxes (benefits)
(364)
35
NM
(649)
23
NM
Income (loss) from continuing operations
$
(588)
$
(412)
(43)
%
$
(1,441)
$
(895)
(61)
%
Income (loss) from discontinued operations, net of taxes
—
—
—
(1)
(1)
—
Noncontrolling interests
(21)
(10)
(110)
(5)
(17)
71
Net income (loss)
$
(567)
$
(402)
(41)
%
$
(1,437)
$
(879)
(63)
%
Balance Sheet data(in billions of dollars)
EOP assets
$
212
$
197
8
%
Average assets
210
197
7
$
206
$
197
5
%
Revenue by line of business(1)
Banamex
$
1,536
$
1,633
(6)
%
$
3,003
$
3,196
(6)
%
Asia Consumer
155
219
(29)
290
471
(38)
Legacy Holdings Assets
—
(133)
100
19
(129)
NM
Corporate/Other
7
253
(97)
(169)
810
NM
Total
$
1,698
$
1,972
(14)
%
$
3,143
$
4,348
(28)
%
Banamex—key indicators(in billions of dollars)
EOP loans
$
26.8
$
24.5
9
%
EOP deposits
38.4
37.6
2
Average loans
25.5
25.3
1
$
24.6
$
25.2
(2)
%
NCLs as a percentage of average loans (Banamex Consumer only)
5.28
%
4.30
%
5.39
%
4.47
%
Loans 90+ days past due as a percentage of EOP loans (Banamex Consumer only)
1.58
1.32
Loans 30–89 days past due as a percentage of EOP loans (Banamex Consumer only)
1.52
1.33
Asia Consumer—key indicators(2)(in billions of dollars)
EOP loans
$
3.0
$
5.6
(46)
%
EOP deposits
1.5
8.3
(82)
Average loans
4.0
6.1
(34)
$
4.4
$
6.5
(32)
%
Legacy Holdings Assets—key indicators(in billions of dollars)
EOP loans
$
2.1
$
2.4
(13)
%
(1) See footnote 1 in “Results of Operations—Summary of Selected Financial Data” above for the description of a change in presentation.
(2) The key indicators for Asia Consumer also reflect the reclassification of loans and deposits to Other assets and Other liabilities under held-for-sale (HFS) accounting on Citi’s Consolidated Balance Sheet.
NM Not meaningful
33
2Q25 vs. 2Q24
Net loss was $567 million, compared to a net loss of $402 million in the prior-year period, driven by lower revenues, higher expenses and higher cost of credit, partially offset by higher income tax benefits, largely due to the resolution of a tax audit.
All Other (managed basis) revenues decreased 14%, driven by lower revenues in both Corporate/Other and Legacy Franchises (managed basis).
Legacy Franchises (managed basis) revenues decreased 2%, due to lower revenues in Banamex and Asia Consumer (managed basis), primarilyoffset by higher revenues in Legacy Holdings Assets.
Banamex revenues decreased 6%, driven by depreciation of the Mexican peso and an episodic item, largely offset by revenues from higher lending volumes in the retail banking and cards businesses, higher deposit volumes and higher fee revenues.
Asia Consumer (managed basis) revenues decreased 29%, driven by the closed exits and wind-downs.
Legacy Holdings Assets revenues increased to $0 million from $(133) million, reflecting higher funding costs in the prior-year period.
Corporate/Other revenues decreased to $7 million, compared to $253 million in the prior-year period, driven by lower net interest income resulting from actions taken over the last 12 months to reduce Citi’s asset sensitivity in a declining interest rate environment.
Expenses increased 8%, driven by higher severance costs related to the realignment of the technology workforce and higher investments in Citi’s transformation and technology, primarily offset by a reduction from the closed exits and wind-downs, the absence of civil money penalties in the prior-year period, the impact of Mexican peso depreciation and lower deposit insurance costs.
Provisions were $374 million, reflecting net credit losses of $256 million, and a net ACL build of $118 million. Net credit losses increased 20%, driven by higher lending volumes and portfolio seasoning in Banamex. The net ACL build was primarily driven by increased loan volumes and changes in portfolio composition in consumer loans in Banamex and transfer risk associated with client activity in Russia. Provisions were $243 million in the prior-year period, reflecting net credit losses of $214 million, driven by Banamex, and a net ACL build of $29 million, driven by changes in portfolio composition in consumer loans in Banamex and transfer risk associated with client activity in Russia.
For additional information on Citi’s ACL, see “Significant Accounting Policies and Significant Estimates” below. For additional information on the consumer portion of All Other—Legacy Franchises, including the Banamex Consumer loan portfolios, see “Managing Global Risk—Credit Risk—Consumer Credit” below.
For additional information about trends, uncertainties and risks related to All Other’s (managed basis) future results, see “Executive Summary” above, “Managing Global Risk—Other Risks—Country Risk—Russia” and “Forward-Looking Statements” below and “Risk Factors” in Citi’s 2024 Form 10-K.
2025 YTD vs. 2024 YTD
Net loss was $1.4 billion, compared to a net loss of $879 million in the prior-year period, driven by lower revenues and higher cost of credit, largely offset by higher income tax benefits and lower expenses.
All Other (managed basis) revenues decreased 28%, driven by lower revenues in Corporate/Other and Legacy Franchises (managed basis).
Legacy Franchises (managed basis) revenues decreased 6%, due to lower revenues in Banamex and Asia Consumer (managed basis), partially offset by higher revenues in Legacy Holdings Assets.
Banamex revenues decreased 6%, driven by depreciation of the Mexican peso and an episodic item, largely offset by revenues from higher lending volumes in the retail banking and cards businesses, higher deposit volumes and higher fee revenues.
Asia Consumer (managed basis) revenues decreased 38%, driven by the closed exits and wind-downs.
Legacy Holdings Assets revenues increased to $19 million, compared to $(129) million in the prior-year period, reflecting higher funding costs in the prior-year period.
Corporate/Other revenues were $(169) million, compared to $810 million in the prior-year period, largely driven by lower net interest income resulting from actions taken over the last 12 months to reduce Citi’s asset sensitivity in a declining interest rate environment.
Expenses decreased 6%, driven by lower deposit insurance costs (see Note 17), a reduction from the closed exits and wind-downs, the impact of Mexican peso depreciation, the absence of a restructuring charge versus the prior-year period (see Note 9) and the absence of civil money penalties in the prior-year period. This decline was partially offset by higher severance costs related to the realignment of the technology workforce and higher investments in Citi’s transformation and technology.
Provisions were $733million, reflecting net credit losses of $512 million, and a net ACL build of $221 million. Net credit losses increased 11%, driven by higher lending volumes and portfolio seasoning in Banamex. The net ACL build was primarily driven by increased loan volume and changes in portfolio composition in consumer loans in Banamex and a deterioration in the macroeconomic outlook. Provisions were $429 million in the prior-year period, reflecting net credit losses of $463 million, and a net ACL release of $34 million, driven by changes in portfolio composition in consumer loans in Banamex.
34
CAPITAL RESOURCES
For additional information about capital resources, including Citi’s capital management, regulatory capital buffers, the stress testing component of capital planning and current regulatory capital standards and developments, see “Capital Resources” and “Risk Factors” in Citi’s 2024 Form 10-K.
During the second quarter of 2025, Citi returned a total of $3.1 billion of capital to common shareholders in the form of $2.0 billion in share repurchases (approximately 27 million common shares) under Citi’s multiyear $20 billion common stock repurchase program and $1.1 billion in dividends. For the third quarter of 2025, Citi is targeting common share repurchases of at least $4 billion, subject to market conditions and other factors. For additional information, see “Unregistered Sales of Equity Securities, Repurchases of Equity Securities and Dividends” below.
Citi paid common dividends of $0.56 per share for the second quarter of 2025, and on July 14, 2025, declared common dividends of $0.60 per share for the third quarter of 2025. Citi plans to maintain a quarterly common dividend of $0.60 per share, subject to financial and macroeconomic conditions as well as its Board of Directors’ approval.
Common Equity Tier 1 Capital Ratio
Citi’s Common Equity Tier 1 (CET1) Capital ratio under the Basel III Standardized Approach was 13.5% as of June 30, 2025, compared to 13.4% as of March 31, 2025 and 13.6% as of December 31, 2024, relative to a required regulatory CET1 Capital ratio of 12.1% as of such dates under the Standardized Approach. Citi’s CET1 Capital ratio under the Basel III Advanced Approaches was 11.9% as of June 30, 2025 and March 31, 2025, compared to 12.1% as of December 31, 2024, relative to a required regulatory CET1 Capital ratio of 10.5% as of such dates under the Advanced Approaches framework.
Citi’s CET1 Capital ratio increased under the Standardized Approach from March 31, 2025, driven primarily by net income and net beneficial movements in AOCI, partially offset by common share repurchases, the payment of common and preferred dividends and an increase in Standardized Approach RWA. The CET1 Capital ratio under the Advanced Approaches framework remained largely unchanged from March 31, 2025, as net income and net beneficial movements in AOCI were largely offset by common share repurchases, the payment of common and preferred dividends and an increase in Advanced Approaches RWA.
Citi’s CET1 Capital ratio decreased under both the Standardized Approach and Advanced Approaches from year-end 2024, primarily driven by common share repurchases, the payment of common and preferred dividends and increases in Standardized Approach RWA and Advanced Approaches RWA, partially offset by year-to-date net income of $8.1 billion and net beneficial movements in AOCI.
Stress Capital Buffer
In June 2025, the FRB communicated that Citi’s indicative Stress Capital Buffer (SCB) requirement is 3.6%, down from the current 4.1%. Accordingly, based on the current SCB standard, Citi’s required regulatory CET1 Capital ratio effective October 1, 2025 is expected to decrease to 11.6% from 12.1% under the Standardized Approach, incorporating the indicative 3.6% SCB and Citi’s current GSIB surcharge of 3.5%. Citi’s required regulatory CET1 Capital ratio under the Advanced Approaches (using the fixed 2.5% Capital Conservation Buffer) will remain unchanged at 10.5%. The SCB applies to Citigroup only; the regulatory capital framework applicable to Citibank, including the Capital Conservation Buffer, is unaffected by Citigroup’s SCB.
A proposed rulemaking from the FRB, which would modify the calculation and the effective date of the SCB requirement, remains outstanding. For information on the proposed changes to the SCB, see “Capital Resources—Regulatory Capital Standards and Developments” below.
35
Citigroup’s Capital Resources
The following table presents Citi’s required risk-based capital ratios as of June 30, 2025, March 31, 2025 and December 31, 2024:
Advanced Approaches(1)
Standardized Approach(2)
June 30, 2025
March 31, 2025
December 31, 2024
June 30, 2025
March 31, 2025
December 31, 2024
CET1 Capital ratio
10.5
%
10.5
%
10.5
%
12.1
%
12.1
%
12.1
%
Tier 1 Capital ratio
12.0
12.0
12.0
13.6
13.6
13.6
Total Capital ratio
14.0
14.0
14.0
15.6
15.6
15.6
(1)For all periods presented, Citi’s required risk-based capital ratios under the Advanced Approaches included the 2.5% Capital Conservation Buffer and 3.5% GSIB (Global Systemically Important Bank) surcharge (all of which must be composed of CET1 Capital).
(2)Citi’s required risk-based capital ratios under the Standardized Approach included the 4.1% SCB and 3.5% GSIB surcharge (all of which must be composed of CET1 Capital). See “Stress Capital Buffer” above for more information. For additional information on regulatory capital buffers, see “Capital Resources—Regulatory Capital Buffers” in Citi’s 2024 Form 10-K.
The following tables present Citi’s capital components and ratios as of June 30, 2025, March 31, 2025 and December 31, 2024:
Advanced Approaches
Standardized Approach
In millions of dollars, except ratios
June 30, 2025
March 31, 2025
December 31, 2024
June 30, 2025
March 31, 2025
December 31, 2024
CET1 Capital(1)
$
158,943
$
155,839
$
155,363
$
158,943
$
155,839
$
155,363
Tier 1 Capital(1)
176,619
175,514
174,527
176,619
175,514
174,527
Total Capital (Tier 1 Capital + Tier 2 Capital)(1)
204,181
201,355
197,371
212,915
209,930
205,827
Total Risk-Weighted Assets
1,335,913
1,306,822
1,280,190
1,178,756
1,162,306
1,139,988
Credit Risk(1)
$
958,329
$
924,860
$
901,345
$
1,116,409
$
1,090,672
$
1,073,354
Market Risk
61,492
70,873
66,221
62,347
71,634
66,634
Operational Risk
316,092
311,089
312,624
—
—
—
CET1 Capital ratio(2)
11.90
%
11.93
%
12.14
%
13.48
%
13.41
%
13.63
%
Tier 1 Capital ratio(2)
13.22
13.43
13.63
14.98
15.10
15.31
Total Capital ratio(2)
15.28
15.41
15.42
18.06
18.06
18.06
In millions of dollars, except ratios
Required Capital Ratios
June 30, 2025
March 31, 2025
December 31, 2024
Quarterly Adjusted Average Total Assets(1)(3)
$
2,608,993
$
2,478,351
$
2,433,364
Total Leverage Exposure(1)(4)
3,195,323
3,033,450
2,985,418
Leverage ratio
4.0
%
6.77
%
7.08
%
7.17
%
Supplementary Leverage ratio
5.0
5.53
5.79
5.85
(1)Commencing January 1, 2025, the capital effects resulting from adoption of the current expected credit losses (CECL) methodology have been fully reflected in Citi’s regulatory capital. For additional information, see “Capital Resources—Regulatory Capital Treatment—Modified Transition of the Current Expected Credit Losses Methodology” in Citi’s 2024 Form 10-K.
(2)Citi’s binding CET1 Capital and Tier 1 Capital ratios were derived under the Basel III Standardized Approach, whereas Citi’s binding Total Capital ratio was derived under the Basel III Advanced Approaches framework for all periods presented.
(3)Leverage ratio denominator. Represents quarterly average total assets less amounts deducted from Tier 1 Capital.
(4)Supplementary Leverage ratio denominator. Represents quarterly average on-balance sheet assets and certain off-balance sheet exposures less amounts deducted from Tier 1 Capital.
As indicated in the table above, Citigroup’s capital ratios at June 30, 2025 were in excess of the regulatory capital requirements under the U.S. Basel III rules. In addition, Citi was “well capitalized” under current federal bank regulatory agencies definitions as of June 30, 2025.
36
Components of Citigroup Capital
In millions of dollars
June 30, 2025
December 31, 2024
CET1 Capital
Citigroup common stockholders’ equity(1)
$
196,931
$
190,815
Add: Qualifying noncontrolling interests
200
186
Regulatory capital adjustments and deductions:
Add: CECL transition provision(2)
—
757
Less: Accumulated net unrealized gains (losses) on cash flow hedges, net of tax
(141)
(220)
Less: Cumulative unrealized net gain (loss) related to changes in fair value of financial liabilities attributable to own creditworthiness, net of tax
(408)
(910)
Less: Intangible assets:
Goodwill, net of related DTLs(3)
18,524
17,994
Identifiable intangible assets other than MSRs, net of related DTLs
3,236
3,357
Less: Defined benefit pension plan net assets and other
1,610
1,504
Less: DTAs arising from net operating loss, foreign tax credit and general business credit
carry-forwards(4)
11,163
11,628
Less: Excess over 10%/15% limitations for other DTAs, certain common stock investments
and MSRs(4)(5)
4,204
3,042
Total CET1 Capital (Standardized Approach and Advanced Approaches)
$
158,943
$
155,363
Additional Tier 1 Capital
Qualifying noncumulative perpetual preferred stock(1)
$
16,291
$
17,783
Qualifying trust preferred securities(6)
1,428
1,422
Qualifying noncontrolling interests
32
30
Regulatory capital deductions:
Less: Other
75
71
Total Additional Tier 1 Capital (Standardized Approach and Advanced Approaches)
$
17,676
$
19,164
Total Tier 1 Capital (CET1 Capital + Additional Tier 1 Capital)
(Standardized Approach and Advanced Approaches)
$
176,619
$
174,527
Tier 2 Capital
Qualifying subordinated debt
$
22,631
$
18,185
Qualifying noncontrolling interests
40
38
Eligible allowance for credit losses(2)(7)
14,138
13,560
Regulatory capital deduction:
Less: Other
513
483
Total Tier 2 Capital (Standardized Approach)
$
36,296
$
31,300
Total Capital (Tier 1 Capital + Tier 2 Capital) (Standardized Approach)
$
212,915
$
205,827
Adjustment for excess of eligible credit reserves over expected credit losses(2)(7)
$
(8,734)
$
(8,456)
Total Tier 2 Capital (Advanced Approaches)
$
27,562
$
22,844
Total Capital (Tier 1 Capital + Tier 2 Capital) (Advanced Approaches)
$
204,181
$
197,371
(1)Issuance costs of $59 million and $67 million related to outstanding noncumulative perpetual preferred stock at June 30, 2025 and December 31, 2024, respectively, were excluded from common stockholders’ equity and netted against such preferred stock in accordance with FRB regulatory reporting requirements, which differ from those under U.S. GAAP.
(2)Commencing January 1, 2025, the capital effects resulting from adoption of the current expected credit losses (CECL) methodology have been fully reflected in Citi’s regulatory capital. For additional information, see “Capital Resources—Regulatory Capital Treatment—Modified Transition of the Current Expected Credit Losses Methodology” in Citi’s 2024 Form 10-K.
(3)Includes goodwill “embedded” in the valuation of significant common stock investments in unconsolidated financial institutions.
(4)Of Citi’s $29.5 billion of net DTAs at June 30, 2025, $11.2 billion of net DTAs arising from net operating loss, foreign tax credit and general business credit tax carry-forwards, as well as $4.2 billion of DTAs arising from temporary differences that exceeded the 10% limitation, were excluded from Citi’s CET1 Capital as of June 30, 2025. DTAs arising from net operating loss, foreign tax credit and general business credit tax carry-forwards are required to be entirely deducted from CET1 Capital under the U.S. Basel III rules. DTAs arising from temporary differences are required to be deducted from capital only if they exceed 10%/15% limitations under the U.S. Basel III rules.
(5)Assets subject to 10%/15% limitations include MSRs, DTAs arising from temporary differences and significant common stock investments in unconsolidated financial institutions. At June 30, 2025 and December 31, 2024, this deduction related only to DTAs arising from temporary differences that exceeded the 10% limitation.
(6)Represents Citigroup Capital XIII trust preferred securities, which are permanently grandfathered as Tier 1 Capital under the U.S. Basel III rules.
37
(7)Under the Standardized Approach, the allowance for credit losses is eligible for inclusion in Tier 2 Capital up to 1.25% of credit risk-weighted assets, with any excess allowance for credit losses being deducted in arriving at credit risk-weighted assets, which differs from the Advanced Approaches framework, in which eligible credit reserves that exceed expected credit losses are eligible for inclusion in Tier 2 Capital to the extent that the excess reserves do not exceed 0.6% of credit risk-weighted assets. The total amount of eligible credit reserves in excess of expected credit losses that were eligible for inclusion in Tier 2 Capital, subject to limitation, under the Advanced Approaches framework were $5.4 billion and $5.1 billion at June 30, 2025 and December 31, 2024, respectively.
38
Citigroup Capital Rollforward
In millions of dollars
Three Months Ended June 30, 2025
Six Months Ended June 30, 2025
CET1 Capital, beginning of period
$
155,839
$
155,363
Net income (loss)
4,019
8,083
Common and preferred dividends declared
(1,350)
(2,691)
Treasury stock
(2,006)
(3,044)
Common stock and additional paid-in capital
215
(286)
CTA net of hedges, net of tax
1,966
2,816
Unrealized gains (losses) on debt securities AFS, net of tax
278
793
Defined benefit plans liability adjustment, net of tax
(37)
(63)
Adjustment related to change in fair value of financial liabilities attributable to
own creditworthiness, net of tax(1)
34
(65)
Other Accumulated other comprehensive income (loss) (AOCI)
—
5
Goodwill, net of related DTLs
(402)
(530)
Identifiable intangible assets other than MSRs, net of related DTLs
55
121
Defined benefit pension plan net assets
(25)
(51)
DTAs arising from net operating loss, foreign tax credit and general business
credit carry-forwards
354
465
Excess over 10%/15% limitations for other DTAs, certain common stock
investments and MSRs
57
(1,162)
CECL transition provision
—
(757)
Other
(54)
(54)
Net change in CET1 Capital
$
3,104
$
3,580
CET1 Capital, end of period (Standardized Approach and Advanced Approaches)
$
158,943
$
158,943
Additional Tier 1 Capital, beginning of period
$
19,675
$
19,164
Qualifying perpetual preferred stock
(1,992)
(1,492)
Qualifying trust preferred securities
3
6
Other
(10)
(2)
Net change in Additional Tier 1 Capital
$
(1,999)
$
(1,488)
Tier 1 Capital, end of period (Standardized Approach and Advanced Approaches)
$
176,619
$
176,619
Tier 2 Capital, beginning of period (Standardized Approach)
$
34,416
$
31,300
Qualifying subordinated debt
1,401
4,446
Eligible allowance for credit losses
327
578
Other
152
(28)
Net change in Tier 2 Capital (Standardized Approach)
$
1,880
$
4,996
Tier 2 Capital, end of period (Standardized Approach)
$
36,296
$
36,296
Total Capital, end of period (Standardized Approach)
$
212,915
$
212,915
Tier 2 Capital, beginning of period (Advanced Approaches)
$
25,841
$
22,844
Qualifying subordinated debt
1,401
4,446
Excess of eligible credit reserves over expected credit losses
168
300
Other
152
(28)
Net change in Tier 2 Capital (Advanced Approaches)
$
1,721
$
4,718
Tier 2 Capital, end of period (Advanced Approaches)
$
27,562
$
27,562
Total Capital, end of period (Advanced Approaches)
$
204,181
$
204,181
(1) Includes the changes in Citigroup (own credit) credit valuation adjustments (CVA) attributable to own creditworthiness, net of tax.
39
Citigroup Risk-Weighted Assets Rollforward (Basel III Standardized Approach)
In millions of dollars
Three Months Ended June 30, 2025
Six Months Ended June 30, 2025
Total Risk-Weighted Assets, beginning of period
$
1,162,306
$
1,139,988
General credit risk exposures(1)
8,960
4,627
Derivatives(2)
4,871
5,999
Securities financing transactions(3)
7,763
16,695
Securitization exposures
308
1,876
Equity exposures
(69)
1,776
Other exposures(4)
3,904
12,082
Net change in Credit Risk-Weighted Assets
$
25,737
$
43,055
Net change in Market Risk-Weighted Assets(5)
$
(9,287)
$
(4,287)
Total Risk-Weighted Assets, end of period
$
1,178,756
$
1,178,756
(1)General credit risk exposures include cash and balances due from depository institutions, securities, and loans and leases. General credit risk exposures increased during the three and six months ended June 30, 2025, primarily due to increased lending exposures, partially offset by the recategorization of certain exposures to other assets in March 2025.
(2)Derivatives increased during the three and six months ended June 30, 2025, mainly due to increased exposures.
(3)Securities financing transactions include repurchase and reverse repurchase agreements, securities loaned and borrowed and eligible margin loans. Securities financing transactions increased during the three and six months ended June 30, 2025, primarily driven by increased exposures.
(4)Other exposures increased during the three and six months ended June 30, 2025, mainly due to broad-based exposure increases, accompanied by the recategorization of certain exposures previously classified as general credit risk exposures to other assets in March 2025.
(5)Market risk decreased during the three and six months ended June 30, 2025, primarily due to Value at Risk (VaR) and Stressed VaR driven by reduced exposures and model updates, partially offset by an increase in specific risk.
40
Citigroup Risk-Weighted Assets Rollforward (Basel III Advanced Approaches)
In millions of dollars
Three Months Ended June 30, 2025
Six Months Ended June 30, 2025
Total Risk-Weighted Assets, beginning of period
$
1,306,822
$
1,280,190
General credit risk exposures(1)
22,893
23,222
Derivatives(2)
7,556
11,646
Securities financing transactions(3)
1,051
5,014
Securitization exposures(4)
(2,748)
1,217
Equity exposures
22
1,598
Other exposures(5)
4,695
14,288
Net change in Credit Risk-Weighted Assets
$
33,469
$
56,985
Net change in Market Risk-Weighted Assets(6)
$
(9,381)
$
(4,729)
Net change in Operational Risk-Weighted Assets(7)
$
5,003
$
3,467
Total Risk-Weighted Assets, end of period
$
1,335,913
$
1,335,913
(1)General credit risk exposures include cash and balances due from depository institutions, securities, and loans and leases. General credit risk exposures increased during the three and six months ended June 30, 2025, primarily due to increased exposures in lending and investment securities, credit rating downgrades and risk parameter updates, partially offset by the recategorization of certain exposures to other assets in March 2025.
(2)Derivatives increased during the three and six months ended June 30, 2025, mainly due to increased exposures and credit spread widening.
(3)Securities financing transactions include repurchase and reverse repurchase agreements, securities loaned and borrowed and eligible margin loans. Securities financing transactions increased during the six months ended June 30, 2025, primarily driven by increased exposures.
(4)Securitization exposures decreased during the three months ended June 30, 2025, primarily driven by exposure and parameter changes.
(5)Other exposures increased during the three and six months ended June 30, 2025, mainly due to broad-based exposure increases, accompanied by the recategorization of certain exposures previously classified as general credit risk exposures to other assets in March 2025.
(6)Market risk decreased during the three and six months ended June 30, 2025, primarily due to VaR and Stressed VaR driven by reduced exposures and model updates, partially offset by an increase in specific risk.
(7)Operational risk increased during the three and six months ended June 30, 2025, mainly due to model severity parameter updates.
41
Supplementary Leverage Ratio
The following table presents Citi’s Supplementary Leverage ratio and related components as of June 30, 2025, March 31, 2025 and December 31, 2024:
In millions of dollars, except ratios
June 30, 2025
March 31, 2025
December 31, 2024
Tier 1 Capital(1)
$
176,619
$
175,514
$
174,527
Total Leverage Exposure
On-balance sheet assets(1)(2)
$
2,672,411
$
2,540,965
$
2,494,016
Certain off-balance sheet exposures(3)
Potential future exposure on derivative contracts
150,382
146,060
136,931
Effective notional of sold credit derivatives, net(4)
43,094
41,637
36,507
Counterparty credit risk for repo-style transactions(5)
26,302
25,622
23,391
Other off-balance sheet exposures
341,946
317,953
332,169
Total of certain off-balance sheet exposures
$
561,724
$
531,272
$
528,998
Less: Tier 1 Capital deductions
38,812
38,787
37,596
Total Leverage Exposure
$
3,195,323
$
3,033,450
$
2,985,418
Supplementary Leverage ratio
5.53
%
5.79
%
5.85
%
(1)Commencing January 1, 2025, the capital effects resulting from adoption of the current expected credit losses (CECL) methodology have been fully reflected in Citi’s regulatory capital. For additional information, see “Capital Resources—Regulatory Capital Treatment—Modified Transition of the Current Expected Credit Losses Methodology” in Citi’s 2024 Form 10-K.
(2)Represents the daily average of on-balance sheet assets for the quarter.
(3)Represents the average of certain off-balance sheet exposures calculated as of the last day of each month in the quarter.
(4)Under the U.S. Basel III rules, banking organizations are required to include in Total Leverage Exposure the effective notional amount of sold credit derivatives, with netting of exposures permitted if certain conditions are met.
(5)Repo-style transactions include repurchase and reverse repurchase transactions as well as securities borrowing and securities lending transactions.
As presented in the table above, Citigroup’s Supplementary Leverage ratio was 5.5% at June 30, 2025, compared to 5.8% at March 31, 2025 and December 31, 2024. The decreases were primarily driven by an increase in Total Leverage Exposure, common share repurchases and redemption of qualifying perpetual preferred stock and the payment of common and preferred dividends, partially offset by net income and net beneficial movements in AOCI.
42
Capital Resources of Citigroup’s Subsidiary U.S. Depository Institutions
Citigroup’s subsidiary U.S. depository institutions are also subject to regulatory capital standards issued by their respective primary bank regulatory agencies, which are similar to the standards of the FRB.
The following tables present the capital components and ratios for Citibank, Citi’s primary subsidiary U.S. depository institution, as of June 30, 2025, March 31, 2025 and December 31, 2024:
Advanced Approaches
Standardized Approach
In millions of dollars, except ratios
Required Capital Ratios(1)
June 30, 2025
March 31, 2025
December 31, 2024
June 30, 2025
March 31, 2025
December 31, 2024
CET1 Capital(2)
$
157,575
$
155,956
$
153,483
$
157,575
$
155,956
$
153,483
Tier 1 Capital(2)
159,707
158,087
155,613
159,707
158,087
155,613
Total Capital (Tier 1 Capital + Tier 2 Capital)(2)(3)
169,842
168,066
165,581
177,374
175,530
173,060
Total Risk-Weighted Assets
1,145,351
1,116,746
1,109,387
1,021,796
1,004,682
998,817
Credit Risk(2)
$
841,708
$
811,860
$
811,464
$
968,635
$
951,205
$
953,377
Market Risk
53,100
53,455
45,383
53,161
53,477
45,440
Operational Risk
250,543
251,431
252,540
—
—
—
CET1 Capital ratio(4)(5)
7.0
%
13.76
%
13.97
%
13.83
%
15.42
%
15.52
%
15.37
%
Tier 1 Capital ratio(4)(5)
8.5
13.94
14.16
14.03
15.63
15.74
15.58
Total Capital ratio(4)(5)
10.5
14.83
15.05
14.93
17.36
17.47
17.33
In millions of dollars, except ratios
Required Capital Ratios
June 30, 2025
March 31, 2025
December 31, 2024
Quarterly Adjusted Average Total Assets(2)(6)
$
1,784,392
$
1,721,548
$
1,726,312
Total Leverage Exposure(2)(7)
2,280,745
2,179,496
2,195,386
Leverage ratio(5)
5.0
%
8.95
%
9.18
%
9.01
%
Supplementary Leverage ratio(5)
6.0
7.00
7.25
7.09
(1)Citibank’s required risk-based capital ratios are inclusive of the 2.5% Capital Conservation Buffer (all of which must be composed of CET1 Capital).
(2)Commencing January 1, 2025, the capital effects resulting from adoption of the current expected credit losses (CECL) methodology have been fully reflected in Citibank’s regulatory capital. For additional information, see “Capital Resources—Regulatory Capital Treatment—Modified Transition of the Current Expected Credit Losses Methodology” in Citi’s 2024 Form 10-K.
(3)Under the Standardized Approach, the allowance for credit losses is eligible for inclusion in Tier 2 Capital up to 1.25% of credit risk-weighted assets, with any excess allowance for credit losses being deducted in arriving at credit risk-weighted assets, which differs from the Advanced Approaches framework, in which eligible credit reserves that exceed expected credit losses are eligible for inclusion in Tier 2 Capital to the extent that the excess reserves do not exceed 0.6% of credit risk-weighted assets.
(4)Citibank’s binding CET1 Capital, Tier 1 Capital and Total Capital ratios were derived under the Basel III Advanced Approaches framework for all periods presented.
(5)Citibank must maintain required CET1 Capital, Tier 1 Capital, Total Capital and Leverage ratios of 6.5%, 8.0%, 10.0% and 5.0%, respectively, to be considered “well capitalized” under the revised Prompt Corrective Action (PCA) regulations applicable to insured depository institutions as established by the U.S. Basel III rules. Citibank must also maintain a required Supplementary Leverage ratio of 6.0% to be considered “well capitalized.”
(6)Leverage ratio denominator. Represents quarterly average total assets less amounts deducted from Tier 1 Capital.
(7)Supplementary Leverage ratio denominator.
As presented in the table above, Citibank’s capital ratios at June 30, 2025 were in excess of the regulatory capital requirements under the U.S. Basel III rules. In addition, Citibank was “well capitalized” as of June 30, 2025.
Citibank’s Supplementary Leverage ratio was 7.0% at June 30, 2025, compared to 7.3% at March 31, 2025 and 7.1% at December 31, 2024. The decreases were primarily driven by increases in Total Leverage Exposure and the payment of common and preferred dividends, partially offset by net income and net beneficial movements in AOCI.
43
Impact of Changes on Citigroup and Citibank Capital Ratios
The following tables present the hypothetical sensitivity of Citigroup’s and Citibank’s capital ratios to changes of $100 million in CET1 Capital, Tier 1 Capital and Total Capital (numerator), and changes of $1 billion in Advanced Approaches and Standardized Approach RWA and quarterly adjusted average total assets, as well as Total Leverage Exposure (denominator), as of June 30, 2025. This
information is provided for the purpose of analyzing the impact that a change in Citigroup’s or Citibank’s financial position or results of operations could have on these ratios. These sensitivities only consider a single change to either a component of capital, RWA, quarterly adjusted average total assets or Total Leverage Exposure. Accordingly, an event that affects more than one factor may have a larger basis point impact than is reflected in these tables.
CET1 Capital ratio
Tier 1 Capital ratio
Total Capital ratio
In basis points
Impact of
$100 million
change in
CET1 Capital
Impact of
$1 billion
change in RWA
Impact of
$100 million
change in
Tier 1 Capital
Impact of
$1 billion
change in RWA
Impact of
$100 million
change in
Total Capital
Impact of
$1 billion
change in RWA
Citigroup
Advanced Approaches
0.7
0.9
0.7
1.0
0.7
1.1
Standardized Approach
0.8
1.1
0.8
1.3
0.8
1.5
Citibank
Advanced Approaches
0.9
1.2
0.9
1.2
0.9
1.3
Standardized Approach
1.0
1.5
1.0
1.5
1.0
1.7
Leverage ratio
Supplementary Leverage ratio
In basis points
Impact of
$100 million
change in
Tier 1 Capital
Impact of
$1 billion change in quarterly adjusted average total assets
Impact of
$100 million
change in
Tier 1 Capital
Impact of
$1 billion change in Total Leverage Exposure
Citigroup
0.4
0.3
0.3
0.2
Citibank
0.6
0.5
0.4
0.3
Citigroup Broker-Dealer Subsidiaries
At June 30, 2025, Citigroup Global Markets Inc., a U.S. broker-dealer registered with the SEC that is an indirect wholly owned subsidiary of Citigroup, had net capital, computed in accordance with the SEC’s net capital rule, of $20 billion, which exceeded the minimum requirement by $14 billion.
Moreover, Citigroup Global Markets Limited, a broker-dealer registered with the United Kingdom’s Prudential Regulation Authority (PRA) that is also an indirect wholly owned subsidiary of Citigroup, had total regulatory capital of $27 billion at June 30, 2025, which exceeded the PRA’s minimum regulatory capital requirements.
In addition, certain of Citi’s other broker-dealer subsidiaries are subject to regulation in the countries in which they do business, including requirements to maintain specified levels of net capital or its equivalent. Citigroup’s other principal broker-dealer subsidiaries were in compliance with their regulatory capital requirements at June 30, 2025.
44
Total Loss-Absorbing Capacity (TLAC)
The table below details Citi’s eligible external TLAC and long-term debt (LTD) amounts and ratios, and each TLAC and LTD regulatory requirement, as well as the surplus amount in dollars in excess of each requirement:
June 30, 2025
In billions of dollars, except ratios
External TLAC
LTD
Total eligible amount
$
342
$
157
% of Advanced Approaches risk- weighted assets
25.6
%
11.7
%
Regulatory requirement(1)(2)
22.5
9.5
Surplus amount
$
41
$
30
% of Total Leverage Exposure
10.7
%
4.9
%
Regulatory requirement
9.5
4.5
Surplus amount
$
38
$
13
(1) External TLAC includes method 1 GSIB surcharge of 2.0%.
(2) LTD includes method 2 GSIB surcharge of 3.5%.
As of June 30, 2025, Citi exceeded each of the TLAC and LTD regulatory requirements, resulting in a $13 billion surplus above its binding TLAC requirement of LTD as a percentage of Total Leverage Exposure.
For additional information on Citi’s TLAC-related requirements, see “Capital Resources—Total Loss-Absorbing Capacity (TLAC)” in Citi’s 2024 Form 10-K.
Regulatory Capital Standards and Developments
Stress Capital Buffer (SCB) Requirements
On April 17, 2025, the FRB issued a notice of proposed rulemaking intended to reduce the volatility of the SCB requirement by averaging the results of the annual supervisory stress test over two years. The proposal would also change the annual effective date of the SCB requirement from October 1 to January 1 in each year. If adopted as proposed, the changes to the calculation of the SCB requirement would be effective beginning with the 2025 supervisory stress test, such that the maximum CET1 Capital declines projected in the 2024 and 2025 supervisory stress tests for Citi would be averaged in producing Citi’s new SCB requirement, which would be effective January 1, 2026.
Leverage Capital Requirements
On June 27, 2025, the U.S. banking agencies issued a notice of proposed rulemaking designed to ensure that the enhanced Supplementary Leverage ratio (eSLR) standards serve as a backstop to risk-based capital requirements rather than a binding constraint.
The proposal would recalibrate the eSLR buffer applicable to GSIBs, currently set at 2%, to equal 50% of the GSIB’s method 1 surcharge. It would also replace the requirement that a depository institution subsidiary of a GSIB maintain a Supplementary Leverage ratio (SLR) of at least 6% to be considered “well capitalized,” with a buffer requirement also equal to 50% of the GSIB’s method 1 surcharge, which would apply on top of the 3% SLR such depository institution subsidiaries must maintain to be considered “adequately capitalized.” The proposal would also make corresponding changes to the external TLAC and LTD leverage-based requirements to align with the proposed modifications to the eSLR standard.
If adopted as proposed, both Citigroup and Citibank, N.A. would be required to maintain an eSLR buffer of 1%, based on Citi’s current GSIB method 1 surcharge of 2%, for a total SLR requirement of 4%. This is compared to the current SLR requirement of 5% for Citigroup and 6% for Citibank, N.A. In addition, the proposal would lower Citi’s TLAC and LTD leverage-based requirements from the current 9.5% TLAC leverage-based requirement and 4.5% LTD leverage-based requirement to 8.5% and 3.5%, respectively.
For information on proposed changes to U.S. regulatory capital requirements, known as the Basel III Endgame, as well as to the GSIB surcharge and the TLAC rule, see “Capital Resources—Regulatory Capital Standards and Developments” in Citi’s 2024 Form 10-K.
45
Tangible Common Equity, Book Value Per Share, Tangible Book Value Per Share and Return on Equity
As defined by Citi, tangible common equity (TCE) represents common stockholders’ equity less goodwill and identifiable intangible assets (other than mortgage servicing rights (MSRs)). Return on tangible common equity (RoTCE) represents annualized net income available to common shareholders as a percentage of average TCE. Tangible book value per share (TBVPS) represents average TCE divided by average common shares outstanding. Other companies may calculate these measures differently.
In millions of dollars or shares, except per share amounts
June 30, 2025
December 31, 2024
Total Citigroup stockholders’ equity
$
213,222
$
208,598
Less: Preferred stock
16,350
17,850
Common stockholders’ equity
$
196,872
$
190,748
Less:
Goodwill
19,878
19,300
Identifiable intangible assets (other than MSRs)
3,639
3,734
Goodwill and identifiable intangible assets (other than MSRs) related to
businesses held-for-sale (HFS)
16
16
Tangible common equity (TCE)
$
173,339
$
167,698
Common shares outstanding (CSO)
1,840.9
1,877.1
Book value per share (common stockholders’ equity/CSO)
$
106.94
$
101.62
Tangible book value per share (TCE/CSO)
94.16
89.34
Three Months Ended June 30,
Six Months Ended June 30,
In millions of dollars
2025
2024
2025
2024
Net income available to common shareholders
$
3,732
$
2,975
$
7,527
$
6,067
Average common stockholders’ equity
$
195,622
$
189,211
$
193,708
$
188,606
Less:
Average goodwill
19,807
19,486
19,349
19,538
Average intangible assets (other than MSRs)
3,659
3,577
3,684
3,628
Average goodwill and identifiable intangible assets (other than MSRs) related to businesses HFS
(1) For additional information regarding certain credit risk, market risk and other quantitative and qualitative information, refer to
Citi’s Pillar 3 Basel III Advanced Approaches Disclosures, as required by the rules of the FRB, on Citi’s Investor Relations website.
These Pillar 3 disclosures are not incorporated by reference into, and do not form any part of, this Form 10-Q.
47
MANAGING GLOBAL RISK
For Citi, effective risk management is of primary importance to its overall operations. Accordingly, Citi’s risk management process has been designed to monitor, evaluate and manage the principal risks it assumes in conducting its activities. Specifically, the activities that Citi engages in, and the risks those activities generate, must be consistent with Citi’s Mission and Value Proposition and the key Leadership Principles that support it, as well as Citi’s risk appetite. For more information on managing global risk at Citi, see “Managing Global Risk” in Citi’s 2024 Form 10-K.
CREDIT RISK
For more information on credit risk, including Citi’s credit risk management, measurement and stress testing, and Citi’s consumer and corporate credit portfolios, see “Credit Risk” and “Risk Factors” in Citi’s 2024 Form 10-K. In addition, see Notes 14 and 15.
Loans
The table below details the average loans, by segment and All Other, and the total Citigroup end-of-period loans for each of the periods indicated:
In billions of dollars
2Q25
1Q25
2Q24
Services
$
94
$
87
$
82
Markets
136
128
119
Banking
84
82
89
Wealth
149
147
150
USPB
Branded Cards
$
118
$
117
$
113
Retail Services
50
51
51
Retail Banking
49
48
42
Total USPB
$
217
$
216
$
206
All Other
$
32
$
31
$
34
Total Citigroup loans (AVG)
$
712
$
691
$
680
Total Citigroup loans (EOP)
$
725
$
702
$
688
Average loans increased 5% year-over-year and 3% sequentially. The year-over-year increase was driven by growth in Markets, Services and USPB, partially offset by declines in Banking, All Other and Wealth.
As of the second quarter of 2025, average loans for:
•Services increased 15% year-over-year, primarily driven by strong demand in TTS for export and agency finance, as well as working capital loans.
•Markets increased 14% year-over-year, primarily driven by asset-backed financing and commercial warehouse lending in spread products.
•Banking decreased 6% year-over-year, driven by actions taken to optimize the balance sheet to support client activity across Banking, Markets and Services.
•Wealth decreased 1%, driven by the transfers of certain relationships and associated mortgage loans to USPB from Wealth, and reductions across other lending portfolios, primarily offset by growth in securities-based lending volumes.
•USPB increased 5% year-over-year, driven by growth in Retail Banking, largely due to transfers of certain relationships and associated mortgage loans to USPB from Wealth, as well as growth in Branded Cards, driven by higher card spend volume and higher revolving balances.
•All Other decreased 6% year-over-year, driven by the impact of the Mexican peso depreciation and continued wind-downs in Legacy Franchises (including the impact of moving HFS loans to Other assets), largely offset by growth in Banamex lending volumes.
End-of-period loans increased 5% year-over-year and 3% sequentially. The year-over-year increase was driven by growth in Markets and Services,as well as growth in Retail Banking and Branded Cards in USPB, partially offset by a decline in Banking.
48
CORPORATE CREDIT
The following table details Citi’s corporate credit portfolio across Services, Markets, Banking and the Banamex SBMM portion of All Other—Legacy Franchises(excluding loans carried at fair value and loans held-for-sale), and before consideration of collateral or hedges, by remaining tenor or expiration for the periods indicated:
June 30, 2025
March 31, 2025
December 31, 2024
In billions of dollars
Due within 1 year
Greater than 1 year but within 5 years
Greater than 5 years
Total exposure
Due within 1 year
Greater than 1 year but within 5 years
Greater than 5 years
Total exposure
Due within 1 year
Greater than 1 year but within 5 years
Greater than 5 years
Total exposure
Direct outstandings (on-balance sheet)(1)
$
140
$
134
$
46
$
320
$
140
$
126
$
42
$
308
$
133
$
122
$
39
$
294
Unfunded lending commitments
(off-balance sheet)(2)
133
275
24
432
128
269
28
425
131
274
24
429
Total exposure
$
273
$
409
$
70
$
752
$
268
$
395
$
70
$
733
$
264
$
396
$
63
$
723
(1) Includes drawn loans, overdrafts, bankers’ acceptances and leases.
(2) Includes unused commitments to lend, letters of credit and financial guarantees.
Portfolio Mix—Geography and Counterparty
Citi’s corporate credit portfolio is diverse across geographies and types of counterparties. The following table presents the percentages of this portfolio across North America and the clusters within International based on the country of risk of the obligor (for additional information on Citi’s international exposures, see “Other Risks—Country Risk—Top 25 Country Exposures” below):
June 30, 2025
March 31, 2025
December 31, 2024
North America
56
%
57
%
56
%
International
44
43
44
Total
100
%
100
%
100
%
International by cluster
(percentages are based on total Citi)
Europe
17
%
16
%
16
%
LATAM
7
7
7
United Kingdom
6
6
6
Japan, Asia North and Australia (JANA)
6
6
6
Asia South
4
4
5
Middle East and Africa (MEA)
4
4
4
The maintenance of accurate and consistent risk ratings across the corporate credit portfolio facilitates the comparison of credit exposure across all lines of business, geographies and products. Counterparty risk ratings reflect an estimated probability of default for a counterparty, and internal risk ratings are derived by leveraging validated statistical models and scorecards in combination with consideration of factors specific to the obligor or market, such as management experience, competitive position, regulatory environment and commodity prices. Facility risk ratings are assigned that reflect the probability of default of the obligor and factors that affect the loss given default of the facility, such as support or
collateral. Internal ratings that generally correspond to BBB and above are considered investment grade, while those below are considered non-investment grade.
The following table presents the corporate credit portfolio by facility risk rating as a percentage of the total corporate credit portfolio:
Total exposure
June 30, 2025
March 31, 2025
December 31, 2024
AAA/AA/A
49
%
48
%
49
%
BBB
30
30
30
BB/B
19
20
19
CCC or below
2
2
2
Total
100
%
100
%
100
%
Note: Total exposure includes direct outstandings and unfunded lending commitments.
In addition to the obligor and facility risk ratings assigned to all exposures, Citi may classify exposures in the corporate credit portfolio. These classifications are consistent with Citi’s interpretation of the U.S. banking regulators’ definition of criticized exposures, which may categorize exposures as special mention, substandard, doubtful or loss.
Risk ratings and classifications are reviewed regularly and adjusted as appropriate. The credit review process incorporates quantitative and qualitative factors, including financial and non-financial disclosures or metrics, idiosyncratic events or changes to the competitive, regulatory or macroeconomic environment.
Citi believes the corporate credit portfolio to be appropriately rated and classified as of June 30, 2025. Citi has applied management judgment to adjust internal ratings and classifications of exposures as both the macroeconomic environment and obligor-specific factors have changed, particularly where additional stress has been observed.
49
As obligor risk ratings are downgraded, the probability of default increases. Downgrades of obligor risk ratings tend to result in a higher provision for credit losses. In addition, appetite per obligor is reduced consistent with the ratings, and downgrades may result in the purchase of additional credit derivatives or other risk/structural mitigants to hedge the incremental credit risk, or may result in Citi seeking to reduce exposure to an obligor or an industry sector. Citi will continue to review exposures to ensure that the appropriate probability of default is incorporated into all risk assessments.
See Note 14 for additional information on Citi’s corporate credit portfolio.
Portfolio Mix—Industry
Citi’s corporate credit portfolio is diversified by industry. The following table details the allocation of Citi’s total corporate credit portfolio by industry:
Total exposure
June 30, 2025
March 31, 2025
December 31, 2024
Transportation and industrials
20
%
20
%
20
%
Banks and finance companies(1)
13
13
12
Technology, media and telecom
12
13
12
Consumer retail
11
11
11
Real estate
11
10
11
Commercial
8
8
8
Residential
3
2
3
Power, chemicals, metals and mining
8
8
9
Energy and commodities
6
6
6
Health
5
5
5
Insurance
4
4
4
Public sector
4
3
4
Asset managers and funds
3
3
3
Financial markets infrastructure
2
3
2
Other industries
1
1
1
Total
100
%
100
%
100
%
(1) As of the periods in the table, Citi had less than 1% exposure to securities firms. See corporate credit portfolio by industry, below.
50
The following table details Citi’s corporate credit portfolio by industry as of June 30, 2025:
Non-investment grade
Selected metrics
In millions of dollars
Total credit exposure(1)
Funded(2)
Unfunded(3)
Investment grade
Non-criticized
Criticized performing
Criticized non-performing(4)
30 days or more past due and accruing
Net credit losses (recoveries)
Credit derivative hedges(5)
Transportation and industrials
$
151,837
$
59,194
$
92,643
$
113,070
$
32,405
$
5,942
$
420
$
86
$
5
$
(8,121)
Industrials
72,493
24,415
48,078
50,236
18,460
3,533
264
45
5
(4,312)
Autos(6)
51,953
23,171
28,782
41,733
8,560
1,650
10
9
—
(2,621)
Transportation
27,391
11,608
15,783
21,101
5,385
759
146
32
—
(1,188)
Banks and finance companies
98,638
68,225
30,413
87,496
10,211
696
235
3
147
(645)
Technology, media and telecom
93,413
31,851
61,562
71,511
17,263
4,501
138
38
—
(7,231)
Real estate
81,926
58,286
23,640
68,353
9,594
3,257
722
32
9
(874)
Commercial
62,298
40,313
21,985
48,980
9,428
3,168
722
32
9
(874)
Residential
19,628
17,973
1,655
19,373
166
89
—
—
—
Consumer retail
81,686
34,939
46,747
55,589
22,013
3,845
239
70
53
(5,611)
Power, chemicals, metals and mining
61,903
18,948
42,955
44,162
13,135
4,407
199
72
(2)
(5,720)
Power
27,896
5,894
22,002
23,187
4,225
408
76
1
—
(2,731)
Chemicals
20,662
7,462
13,200
12,281
5,390
2,924
67
70
2
(2,122)
Metals and mining
13,345
5,592
7,753
8,694
3,520
1,075
56
1
(4)
(867)
Energy and commodities(7)
42,981
11,477
31,504
33,930
8,345
528
178
—
19
(3,230)
Health
36,335
8,604
27,731
28,866
5,890
1,528
51
20
1
(3,489)
Insurance
27,052
3,148
23,904
25,017
1,975
54
6
1
—
(4,423)
Public sector
28,316
14,232
14,084
25,094
2,635
575
12
13
1
(601)
Asset managers and funds
23,285
7,406
15,879
19,729
3,377
179
—
8
—
(91)
Financial markets infrastructure
18,269
247
18,022
18,135
134
—
—
—
—
(24)
Securities firms
1,858
627
1,231
1,540
317
1
—
—
—
(27)
Other industries(8)
4,733
3,172
1,561
3,301
1,281
101
50
25
(2)
(1)
Total
$
752,232
$
320,356
$
431,876
$
595,793
$
128,575
$
25,614
$
2,250
$
368
$
231
$
(40,088)
(1) Represents gross credit exposures excluding any purchased credit protection.
(2) Funded excludes loans carried at fair value of $9.2 billion and HFS of $8.1 billion as of June 30, 2025.
(3) Unfunded includes lending-related commitments carried at fair value and HFS as of June 30, 2025.
(4) Includes non-accrual loan exposures and related criticized unfunded exposures.
(5) Represents the amount of purchased credit protection in the form of derivatives to economically hedge funded and unfunded exposures. Of the $40.1 billion of purchased credit protection, $37.1 billion represents the total notional amount of purchased credit derivatives on individual reference entities. The remaining $3.0 billion represents the first loss tranche of portfolios of purchased credit derivatives with a total notional amount of $23.3 billion, where the protection seller absorbs the first loss on the referenced loan portfolios.
(6) Autos total credit exposure includes securitization financing facilities secured by auto loans and leases, extended mainly to the finance company subsidiaries of global auto manufacturers, bank subsidiaries and independent auto finance companies, of approximately $18.3 billion ($10.6 billion of which was funded exposure with 100% rated investment grade) as of June 30, 2025.
(7) In addition to this exposure, Citi has energy-related exposure within the public sector (e.g., energy-related state-owned entities) and the transportation and industrials sector (e.g., offshore drilling entities) included in the table above. As of June 30, 2025, Citi’s total exposure to these energy-related entities was approximately $4.4 billion, of which approximately $2.1 billion consisted of direct outstanding funded loans.
(8) Includes $0.8 billion and $0.1 billion of funded and unfunded exposure at June 30, 2025, respectively, primarily related to commercial credit card delinquency-managed loans.
Exposure to Commercial Real Estate
As of June 30, 2025 and December 31, 2024, Citi’s total credit exposure to commercial real estate (CRE) was $71 billion and $65 billion, respectively, including $6 billion of exposure related to office buildings in both periods. This total CRE exposure consisted of approximately $62 billion and $56 billion, respectively, related to corporate clients, included in the real estate category in the tables above and below. Total CRE exposure also includes approximately $9 billion and $9 billion, respectively, related to Wealth clients, not included in the tables above and below as they are not considered corporate exposures.
In addition, as of June 30, 2025, approximately 79% of Citi’s total CRE exposure was rated investment grade and more than 76% was to borrowers in the U.S. (compared to approximately 78% rated investment grade and more than 75% to borrowers in the U.S. as of December 31, 2024).
As of June 30, 2025, the ACLL attributed to the total funded CRE exposure (including Wealth) was approximately 1.64%, and there were $659 million of non-accrual CRE loans. As of December 31, 2024, the ACLL attributed to the total funded CRE exposure (including Wealth) was approximately 1.60%, and there were $574 million of non-accrual CRE loans.
51
The following table details Citi’s corporate credit portfolio by industry as of December 31, 2024:
Non-investment grade
Selected metrics
In millions of dollars
Total credit exposure(1)
Funded(2)
Unfunded(3)
Investment grade
Non-criticized
Criticized performing
Criticized non-performing(4)
30 days or more past due and accruing
Net credit losses (recoveries)
Credit derivative hedges(5)
Transportation and industrials
$
144,381
$
57,166
$
87,215
$
106,336
$
32,849
$
4,944
$
252
$
73
$
19
$
(7,643)
Autos(6)
50,266
23,427
26,839
40,758
8,591
909
8
3
4
(2,420)
Transportation
26,138
11,416
14,722
19,460
5,792
795
91
3
(7)
(1,165)
Industrials
67,977
22,323
45,654
46,118
18,466
3,240
153
67
22
(4,058)
Technology, media and telecom
88,797
29,534
59,263
68,615
16,776
3,217
189
68
55
(6,720)
Banks and finance companies
86,500
56,716
29,784
76,754
8,625
882
239
7
5
(560)
Consumer retail
80,871
32,212
48,659
57,425
19,579
3,676
191
30
43
(5,423)
Real estate
74,481
53,186
21,295
61,430
8,976
3,545
530
6
173
(813)
Commercial
55,810
36,200
19,610
42,960
8,782
3,545
523
6
156
(813)
Residential
18,671
16,986
1,685
18,470
194
—
7
—
17
—
Power, chemicals, metals and mining
66,669
18,504
48,165
49,383
12,653
4,416
217
35
75
(5,267)
Power
32,185
5,092
27,093
27,204
4,414
417
150
1
48
(2,406)
Chemicals
20,618
7,529
13,089
12,747
5,034
2,779
58
33
28
(2,064)
Metals and mining
13,866
5,883
7,983
9,432
3,205
1,220
9
1
(1)
(797)
Energy and commodities(7)
41,919
11,686
30,233
33,899
7,266
555
199
3
(5)
(3,153)
Health
39,028
8,537
30,491
29,579
8,018
1,411
20
19
13
(3,267)
Insurance
28,317
2,115
26,202
26,734
1,560
17
6
2
—
(4,089)
Public sector
26,022
13,209
12,813
23,344
2,308
360
10
28
7
(678)
Asset managers and funds
19,648
5,258
14,390
17,679
1,788
181
—
—
(4)
(97)
Financial markets infrastructure
17,368
181
17,187
17,238
130
—
—
—
—
(29)
Securities firms
1,876
590
1,286
1,407
468
1
—
—
—
(20)
Other industries(8)
7,213
4,733
2,480
4,979
2,099
114
21
42
16
(51)
Total
$
723,090
$
293,627
$
429,463
$
574,802
$
123,095
$
23,319
$
1,874
$
313
$
397
$
(37,810)
(1) Represents gross credit exposures excluding any purchased credit protection.
(2) Funded excludes loans carried at fair value of $7.8 billion and HFS of $3.6 billion as of December 31, 2024.
(3) Unfunded includes lending-related commitments carried at fair value and HFS as of December 31, 2024.
(4) Includes non-accrual loan exposures and related criticized unfunded exposures.
(5) Represents the amount of purchased credit protection in the form of derivatives to economically hedge funded and unfunded exposures. Of the $37.8 billion of purchased credit protection, $34.8 billion represents the total notional amount of purchased credit derivatives on individual reference entities. The remaining $3 billion represents the first loss tranche of portfolios of purchased credit derivatives with a total notional amount of $22.9 billion, where the protection seller absorbs the first loss on the referenced loan portfolios.
(6) Autos total credit exposure includes securitization financing facilities secured by auto loans and leases, extended mainly to the finance company subsidiaries of global auto manufacturers, bank subsidiaries and independent auto finance companies, of approximately $17.5 billion ($10.5 billion of which was funded exposure with 100% rated investment grade) as of December 31, 2024.
(7) In addition to this exposure, Citi has energy-related exposure within the public sector (e.g., energy-related state-owned entities) and the transportation and industrials sector (e.g., offshore drilling entities) included in the table above. As of December 31, 2024, Citi’s total exposure to these energy-related entities was approximately $4.4 billion, of which approximately $2.1 billion consisted of direct outstanding funded loans.
(8) Includes $0.6 billion and $0.1 billion of funded and unfunded exposure at December 31, 2024, respectively, primarily related to commercial credit card delinquency-managed loans.
52
Credit Risk Mitigation
As part of its overall risk management activities, Citigroup uses credit derivatives, both partial and full term, and other risk mitigants to economically hedge portions of the credit risk in its corporate credit portfolio, in addition to outright asset sales. In advance of the expiration of partial-term economic hedges, Citi will determine, among other factors, the economic feasibility of hedging the remaining life of the instrument. The results of the mark-to-market and any realized gains or losses on credit derivatives are reflected primarily in Principal transactions in the Consolidated Statement of Income.
At June 30, 2025, March 31, 2025 and December 31, 2024, Banking had economic hedges on the corporate credit portfolio of $40.1 billion, $38.8 billion and $37.8 billion, respectively. Citi’s expected credit loss model used in the calculation of its ACL does not include the favorable impact of credit derivatives and other mitigants that are marked-to-market.
The following is the risk rating distribution of the underlying corporate credit portfolio exposures in Banking for which credit protection was purchased:
Rating of Hedged Exposure
June 30, 2025
March 31, 2025
December 31, 2024
AAA/AA/A
47
%
45
%
44
%
BBB
42
45
45
BB/B
10
9
10
CCC or below
1
1
1
Total
100
%
100
%
100
%
53
CONSUMER CREDIT
The following section provides information about Citi’s consumer credit portfolio across Wealth, USPB and the consumer portion of All Other—Legacy Franchises.
Consumer Credit Portfolio
The following table presents Citi’s quarterly end-of-period consumer loans(1):
In billions of dollars
2Q24
3Q24
4Q24
1Q25
2Q25
Wealth(2)(3)
Mortgages(4)
$
92.0
$
91.5
$
89.0
$
87.9
$
88.6
Margin lending
27.6
28.1
29.4
31.5
31.3
Personal, small business and other
25.9
26.4
24.1
23.1
25.9
Cards
4.9
5.0
5.0
4.8
4.9
Total
$
150.4
$
151.0
$
147.5
$
147.3
$
150.7
USPB
Branded Cards(5)
$
115.3
$
115.9
$
121.1
$
116.3
$
120.2
Credit cards
111.8
112.1
117.3
112.6
116.6
Personal installment loans(5)
3.5
3.8
3.8
3.7
3.6
Retail Services
51.7
51.6
53.8
50.2
50.7
Retail Banking(5)
42.7
45.6
46.8
48.2
49.3
Mortgages(4)
41.4
44.4
45.5
47.0
48.1
Personal, small business and other
1.3
1.2
1.3
1.2
1.2
Total
$
209.7
$
213.1
$
221.7
$
214.7
$
220.2
All Other—Legacy Franchises
Banamex Consumer
$
18.2
$
17.4
$
17.2
$
17.9
$
20.0
Asia Consumer(6)
5.6
5.5
4.7
4.5
3.0
Legacy Holdings Assets(7)
2.2
2.2
2.0
1.9
1.9
Total
$
26.0
$
25.1
$
23.9
$
24.3
$
24.9
Total consumer loans
$
386.1
$
389.2
$
393.1
$
386.3
$
395.8
(1)End-of-period loans include interest and fees on credit cards.
(2)Consists of $98.0 billion, $96.7 billion, $98.0 billion, $99.8 billion and $100.9 billion of loans in North America as of June 30, 2025, March 31, 2025, December 31, 2024, September 30, 2024 and June 30, 2024, respectively. For additional information on the credit quality of the Wealth portfolio, see Note 14.
(3)Consists of $52.7 billion, $50.6 billion, $49.5 billion, $51.2 billion and $49.5 billion of loans outside North America as of June 30, 2025, March 31, 2025, December 31, 2024, September 30, 2024 and June 30, 2024, respectively.
(4)See Note 14 for details on loan-to-value ratios for the portfolios and FICO scores for the U.S. portfolio.
(5)Effective January 1, 2025, USPB changed its reporting for certain installment lending products that were transferred from Retail Banking to Branded Cards to reflect where these products are managed. Prior periods were conformed to reflect this change.
(6)Asia Consumer loan balances, reported within All Other—Legacy Franchises, include the three remaining Asia Consumer loan portfolios—Korea, Poland (through the first quarter of 2025) and Russia until the completion of its consumer loan portfolio wind-down in the second quarter of 2025. Asia Consumer loan balances for the second quarter of 2025 exclude approximately $2 billion of loans ($1 billion of retail banking loans and $1 billion of credit card loan balances) reclassified to held-for-sale (HFS) (Other assets on the Consolidated Balance Sheet) as a result of Citi’s agreement to sell its Poland consumer banking business (expected to close in the second half of 2026). See Note 2.
(7) Consists of certain North America consumer mortgages.
For information on changes to Citi’s consumer loans, see “Credit Risk—Loans” above.
54
Consumer Credit Trends
U.S. Personal Banking
U.S. Personal Banking (USPB) includes Branded Cards, Retail Services and Retail Banking. Branded Cards includes proprietary credit card portfolios (Value, Rewards and Cash), co-branded card portfolios (including Costco and American Airlines) and personal installment loans. Retail Services includes co-brand and private label relationships (including, among others, The Home Depot, Best Buy, Macy’s and Sears). Retail Banking includes traditional banking services, including deposits, mortgages and other lending products, to retail and small business customers concentrated in six key U.S. metropolitan areas. Retail Banking also provides mortgages through correspondent channels.
As of June 30, 2025, approximately 76% of USPB EOP loans consisted of Branded Cards and Retail Services credit card loans, which generally drives the overall credit performance of USPB, as Branded Cards and Retail Services card net credit losses represented approximately 95% of USPB’s total net credit losses for the second quarter of 2025. As of June 30, 2025, Branded Cards and Retail Services represented 70% and 30%, respectively, of EOP cards loans in USPB.
As presented in the chart above, the second quarter of 2025 net credit loss rate for USPB decreased quarter-over-quarter, primarily driven by seasonality, and decreased year-over-year, reflecting improvements in portfolio performance (see “Branded Cards—Credit Cards” and “Retail Services” below).
The 90+ days past due delinquency rate decreased quarter-over-quarter, primarily driven by seasonality, and decreased year-over-year, reflecting improvements in portfolio performance.
Branded Cards—Credit Cards
USPB’s Branded Cards portfolio consists of both proprietary Citi branded cards portfolios (Value, Rewards and Cash) and co-branded cards portfolios (including Costco and American Airlines) and personal installment loans. Citi’s Branded Cards portfolio benefits from a diverse combination of products.
As presented in the chart above, the second quarter of 2025 net credit loss rate for Branded Cards’ credit cards decreased quarter-over-quarter, primarily driven by seasonality, and decreased year-over-year, reflecting improvements in portfolio performance.
The 90+ days past due delinquency rate was broadly stable year-over-year and decreased quarter-over-quarter, primarily driven by seasonality.
Retail Services
USPB’s Retail Services partners directly with more than 20 retailers and dealers to offer private label and co-branded cards. Retail Services’ target market focuses on select industry segments such as home improvement, specialty retail, consumer electronics and fuel.
As presented in the chart above, the second quarter of 2025 net credit loss rate for Retail Services decreased quarter-over-quarter, primarily driven by seasonality, and decreased year-over-year, reflecting improvements in portfolio performance.
55
The 90+ days past due delinquency rate decreased quarter-over-quarter, primarily driven by seasonality, and decreased year-over-year, reflecting improvements in portfolio performance.
For additional details on cost of credit, loan delinquency and other information for Citi’s cards portfolios, see USPB’s results of operations above and Note 14.
Retail Banking
USPB’s Retail Banking portfolio consists primarily of consumer mortgages (including home equity) and unsecured lending products, such as small business loans and revolving products. The portfolio is generally delinquency managed, where Citi evaluates credit risk based on FICO scores, delinquencies and the value of underlying collateral. The consumer mortgages in this portfolio have historically been extended to high credit quality customers, generally with loan-to-value ratios that are less than or equal to 80% on first and second mortgages. For additional information, see “Loan-to-Value (LTV) Ratios” in Note 14.
As presented in the chart above, the second quarter of 2025 net credit loss rate for Retail Banking was broadly stable quarter-over-quarter and year-over-year.
The 90+ days past due delinquency rate increased quarter-over-quarter and year-over-year, driven by consumer mortgages enrolled in forbearance programs related to the California wildfires.
Wealth
Wealth provides consumer mortgages, margin lending, credit cards and other lending products to customer segments that range from affluent to ultra-high net worth through the Private Bank, Citigold and Wealth at Work businesses. These customer segments represent a target market that is characterized by historically low default rates and delinquencies and includes loans that are delinquency managed or classifiably managed. The delinquency-managed portfolio consists primarily of mortgages, margin lending and credit cards.
As of June 30, 2025, approximately $47 billion, or 31%, of the portfolios were classifiably managed and primarily consisted of margin loans, commercial real estate loans, personal and small business loans and other lending programs. These classifiably managed loans are primarily evaluated for credit risk based on their internal risk rating, of which 70% were rated investment grade. While the 90+ days past due delinquency rates shown in the chart above were calculated only for the delinquency-managed portfolio, the net credit loss rates presented were calculated using net credit losses for both the delinquency and classifiably managed portfolios.
As presented in the chart above, the second quarter of 2025 net credit loss rate in Wealth was broadly stable quarter-over-quarter and year-over-year. The 90+ days past due delinquency rate increased quarter-over-quarter and year-over-year, primarily driven by consumer mortgages enrolled in forbearance programs related to the California wildfires. The low net credit loss and the 90+ days past due delinquency rates continued to reflect the strong credit profiles of the portfolios.
56
Banamex Consumer
Banamex Consumer provides credit cards, consumer mortgages and small business and personal loans. Banamex Consumer serves a mass-market segment in Mexico and focuses on developing multiproduct relationships with customers.
As of June 30, 2025, approximately 40% of Banamex Consumer’s EOP loans consisted of credit card loans, which largely drives the overall credit performance of the Banamex Consumer portfolios, as the cards net credit losses represented approximately 61% of total Banamex Consumer net credit losses for the second quarter of 2025.
As presented in the chart above, the second quarter of 2025 net credit loss rate in Banamex Consumer decreased quarter-over-quarter, driven by the non-recurrence of a $13 million charge-off for uncollectible value added tax on accrued interest in the prior quarter. The net credit loss rate increased year-over-year, primarily driven by the ongoing normalization of loss and delinquency rates from post-pandemic lows.
The 90+ days past due delinquency rate increased quarter-over-quarter, primarily driven by seasonality, and increased year-over-year, driven by the ongoing normalization of loss and delinquency rates from post-pandemic lows.
For additional details on cost of credit, loan delinquency and other information for Citi’s consumer loan portfolios, see the results of operations for USPB, Wealth and All Other above and Note 14.
U.S. Cards FICO Distribution
The following tables present the current FICO score distributions for Citi’s Branded Cards and Retail Services portfolios based on end-of-period receivables. FICO scores are updated as they become available.
Branded Cards
FICO distribution(1)
June 30, 2025
March 31, 2025
June 30, 2024
≥ 740
56
%
54
%
57
%
660–739
33
34
33
< 660
11
12
10
Total
100
%
100
%
100
%
Retail Services
FICO distribution(1)
June 30, 2025
March 31, 2025
June 30, 2024
≥ 740
36
%
35
%
35
%
660–739
41
42
42
< 660
23
23
23
Total
100
%
100
%
100
%
(1) Excludes immaterial balances for Canada and for customers for which no FICO scores are available.
The FICO distribution of the Branded Cards portfolio improved slightly quarter-over-quarter, and declined slightly year-over-year. The FICO distribution of the Retail Services portfolio improved slightly quarter-over-quarter, as well as year-over-year. The FICO distribution continued to reflect the strong underlying credit quality of the portfolios. See Note 14 for additional information on FICO scores.
57
Additional Consumer Credit Details
Consumer Loan Delinquencies Amounts and Ratios
EOP
loans(1)
90+ days past due(2)
30–89 days past due(2)
In millions of dollars, except EOP loan amounts in billions
June 30, 2025
June 30, 2025
March 31, 2025
June 30, 2024
June 30, 2025
March 31, 2025
June 30, 2024
Wealth delinquency-managed loans(3)
$
104.2
$
452
$
239
$
228
$
263
$
548
$
262
Ratio
0.43
%
0.23
%
0.21
%
0.25
%
0.53
%
0.25
%
Wealth classifiably managed loans(4)
46.5
N/A
N/A
N/A
N/A
N/A
N/A
USPB(5)(6)
Total
$
220.2
$
2,596
$
2,725
$
2,609
$
2,380
$
2,536
$
2,372
Ratio
1.18
%
1.27
%
1.25
%
1.08
%
1.18
%
1.13
%
Credit cards and personal installment loans total (d+b)
170.9
2,401
2,568
2,461
2,162
2,268
2,162
Ratio
1.40
%
1.54
%
1.47
%
1.27
%
1.36
%
1.29
%
Credit cards total (a+c) = (d)(6)
$
167.3
$
2,380
$
2,550
$
2,445
$
2,112
$
2,217
$
2,119
Ratio
1.42
%
1.57
%
1.50
%
1.26
%
1.36
%
1.30
%
Branded Cards (a+b)
$
120.2
$
1,311
$
1,372
$
1,239
$
1,167
$
1,203
$
1,098
Ratio
1.09
%
1.18
%
1.07
%
0.97
%
1.03
%
0.95
%
Credit cards (a)
116.6
1,290
1,354
1,223
1,117
1,152
1,055
Ratio
1.11
%
1.20
%
1.09
%
0.96
%
1.02
%
0.94
%
Personal installment loans (b)
3.6
21
18
16
50
51
43
Ratio
0.58
%
0.49
%
0.46
%
1.39
%
1.38
%
1.23
%
Retail Services (c)
$
50.7
$
1,090
$
1,196
$
1,222
$
995
$
1,065
$
1,064
Ratio
2.15
%
2.38
%
2.36
%
1.96
%
2.12
%
2.06
%
Retail Banking(5)
$
49.3
$
195
$
157
$
148
$
218
$
268
$
210
Ratio
0.40
%
0.33
%
0.35
%
0.45
%
0.56
%
0.50
%
All Other
Total
$
24.9
$
391
$
338
$
361
$
372
$
345
$
337
Ratio
1.58
%
1.40
%
1.40
%
1.51
%
1.43
%
1.31
%
Banamex Consumer
20.0
315
252
241
304
261
242
Ratio
1.58
%
1.41
%
1.32
%
1.52
%
1.46
%
1.33
%
Asia Consumer(7)
3.0
16
22
26
17
29
33
Ratio
0.53
%
0.49
%
0.46
%
0.57
%
0.64
%
0.59
%
Legacy Holdings Assets (consumer)(8)
1.9
60
64
94
51
55
62
Ratio
3.53
%
3.76
%
4.70
%
3.00
%
3.24
%
3.10
%
Total Citigroup consumer
$
395.8
$
3,439
$
3,302
$
3,198
$
3,015
$
3,429
$
2,971
Ratio
0.99
%
0.97
%
0.94
%
0.86
%
1.01
%
0.87
%
(1)End-of-period (EOP) loans include interest and fees on credit cards.
(2)The ratios of 90+ days past due and 30–89 days past due are calculated based on EOP loans, net of unearned income.
(3)Excludes EOP classifiably managed Private Bank loans. These loans are not included in the delinquency numerator, denominator and ratios.
(4)These loans are evaluated for non-accrual status and write-off primarily based on their internal risk classification and not solely on their delinquency status, and, therefore, delinquency metrics are excluded from this table. As of June 30, 2025, March 31, 2025 and June 30, 2024, 70%, 69% and 75% of Wealth classifiably managed loans were rated investment grade. For additional information on the credit quality of the Wealth portfolio, including classifiably managed portfolios, see “Consumer Credit Trends” above.
(5)The 90+ days past due and 30–89 days past due and related ratios forRetail Banking exclude loans guaranteed by U.S. government-sponsored agencies since the potential risk of loss predominantly resides with the U.S. government-sponsored agencies. The amounts excluded for loans 90+ days past due and (EOP loans) were $57 million ($0.5 billion), $64 million ($0.5 billion) and $63 million ($0.5 billion) at June 30, 2025, March 31, 2025 and June 30, 2024, respectively. The amounts excluded for loans 30–89 days past due (the 30–89 days past due EOP loans have the same adjustments as the 90+ days past due EOP loans) were $61 million, $59 million and $75 million at June 30, 2025, March 31, 2025 and June 30, 2024, respectively. The EOP loans in the table include the guaranteed loans.
(6)The 90+ days past due balances for Branded Cards and Retail Services are generally still accruing interest. Citi’s policy is generally to accrue interest on credit card loans until 180 days past due, unless notification of bankruptcy filing has been received earlier.
58
(7)Asia Consumer loan balances and the related delinquencies, reported within All Other—Legacy Franchises, include the three remaining Asia Consumer loan portfolios: Korea, Poland (through the first quarter of 2025) and Russia until the completion of its consumer loan portfolio wind-down in the second quarter of 2025. During the second quarter of 2025, Citi’s Poland consumer banking business was classified as HFS as a result of Citi’s agreement to sell the business. Accordingly, the Poland consumer loans are recorded in Other assets on the Consolidated Balance Sheet. As a result, the Poland consumer loans and related delinquencies are not included in this table for the second quarter of 2025. See Note 2.
(8)The 90+ days past due and 30–89 days past due and related ratios exclude U.S. mortgage loans that are primarily related to U.S. mortgages guaranteed by U.S. government-sponsored agencies since the potential risk of loss predominantly resides with the U.S. agencies. The amounts excluded for 90+ days past due and (EOP loans) were $62 million ($0.2 billion), $62 million ($0.2 billion) and $65 million ($0.2 billion) at June 30, 2025, March 31, 2025 and June 30, 2024, respectively. The amounts excluded for loans 30–89 days past due (the 30–89 days past due EOP loans have the same adjustments as the 90+ days past due EOP loans) were $32 million, $32 million and $42 million at June 30, 2025, March 31, 2025 and June 30, 2024, respectively. The EOP loans in the table include the guaranteed loans.
N/A Not applicable
Consumer Loan Net Credit Losses (NCLs) and Ratios
Average loans(1)
Net credit losses(2)
In millions of dollars, except average loan amounts in billions
2Q25
2Q25
1Q25
2Q24
Wealth
$
148.5
$
40
$
38
$
35
Ratio
0.11
%
0.11
%
0.09
%
USPB
Total
$
216.9
$
1,889
$
1,983
$
1,931
Ratio
3.49
%
3.72
%
3.76
%
Credit cards and personal installment loans total (d+b)
168.2
1,856
1,954
1,906
Ratio
4.43
%
4.72
%
4.68
%
Credit cards total (a+c) = (d)
$
164.5
$
1,799
$
1,896
$
1,855
Ratio
4.39
%
4.68
%
4.65
%
Branded Cards (a+b)
$
118.0
$
1,119
$
1,141
$
1,088
Ratio
3.80
%
3.97
%
3.88
%
Credit cards (a)
114.3
1,062
1,083
1,037
Ratio
3.73
%
3.89
%
3.82
%
Personal installment loans (b)
3.7
57
58
51
Ratio
6.18
%
6.19
%
5.86
%
Retail Services (c)
$
50.2
$
737
$
813
$
818
Ratio
5.89
%
6.43
%
6.45
%
Retail Banking
$
48.7
$
33
$
29
$
25
Ratio
0.27
%
0.25
%
0.24
%
All Other—Legacy Franchises (managed basis)(3)
Total
$
24.9
$
251
$
256
$
212
Ratio
4.04
%
4.27
%
3.11
%
Banamex Consumer
19.0
250
239
203
Ratio
5.28
%
5.51
%
4.30
%
Asia Consumer (managed basis)(3)(4)
4.0
5
18
15
Ratio
0.50
%
1.55
%
0.99
%
Legacy Holdings Assets (consumer)
1.9
(4)
(1)
(6)
Ratio
(0.84)
%
(0.20)
%
(1.05)
%
Reconciling Items(3)
5
—
(3)
Total Citigroup
$
390.3
$
2,185
$
2,277
$
2,175
Ratio
2.25
%
2.39
%
2.28
%
(1)Average loans include interest and fees on credit cards.
(2)The ratios of net credit losses are calculated based on average loans, net of unearned income.
(3)All Other (managed basis) excludes divestiture-related impacts (Reconciling Items) related to (i) Citi’s divestitures of its Asia Consumer businesses and (ii) the planned IPO of Banamex, within Legacy Franchises. The Reconciling Items are reflected in Citi’s Consolidated Statement of Income. See “All Other—Divestiture-Related Impacts (Reconciling Items)” above.
(4)Asia Consumer NCLs and average loan balances, reported within All Other—Legacy Franchises, include the three remaining Asia Consumer loan portfolios: Korea, Poland (through the first quarter of 2025) and Russia until the completion of its consumer loan portfolio wind-down in the second quarter of 2025. During the second quarter of 2025, Citi’s Poland consumer banking business was classified as HFS as a result of Citi’s agreement to sell the business. In accordance with HFS accounting treatment, the Poland consumer average loans (approximately $1 billion in the second quarter of 2025) are recorded in Other assets on the Consolidated Balance Sheet, and the related NCLs of approximately $(5) million in 2Q25 were reclassified to Other revenue for the second quarter of 2025.Accordingly, these NCLs are not included in this table. See Note 2.
ACLL as a percentage of total loans— net of unearned income(6)
2.67
%
2.70
%
2.71
%
2.70
%
2.68
%
ACLL for consumer loan losses as a percentage of total consumer loans—net of unearned income(6)
4.07
%
4.14
%
4.08
%
4.05
%
4.08
%
ACLL for corporate loan losses as a percentage of total corporate loans—net of unearned income(6)
0.94
%
0.89
%
0.87
%
0.89
%
0.85
%
(1)North America includes the U.S., Canada and Puerto Rico. Mexico is included in offices outside North America. The classification of corporate loans between offices in North America and outside North America is based on the domicile of the booking unit. The difference between the domicile of the booking unit and the risk-based country view is not material for the purposes of classification of corporate loans between offices in North America and outside North America.
(2)Loans secured primarily by real estate.
60
(3)Consumer loans are net of unearned income of $913 million, $893 million, $889 million, $883 million and $852 million at June 30, 2025, March 31, 2025, December 31, 2024, September 30, 2024 and June 30, 2024, respectively. Unearned income on consumer loans primarily represents loan origination fees, net of certain direct origination costs, that are deferred and recognized as Interest income over the lives of the related loans.
(4)Installment and other includes loans to SPEs and TTS commercial cards.
(5)Corporate loans include Banamex SBMM loans and are net of unearned income of $(991) million, $(1,021) million, $(969) million, $(912) million and $(917) million at June 30, 2025, March 31, 2025, December 31, 2024, September 30, 2024 and June 30, 2024, respectively. Unearned income on corporate loans primarily represents loan origination fees, net of certain direct origination costs, that are deferred and recognized as Interest income over the lives of the related loans.
(6)Because loans carried at fair value do not have an ACLL, they are excluded from the ACLL ratio calculation.
Details of Credit Loss Experience
2nd Qtr.
1st Qtr.
4th Qtr.
3rd Qtr.
2nd Qtr.
In millions of dollars
2025
2025
2024
2024
2024
Allowance for credit losses on loans (ACLL) at beginning of period
$
18,726
$
18,574
$
18,356
$
18,216
$
18,296
Provision for credit losses on loans (PCLL)
Consumer
$
2,169
$
2,225
$
2,528
$
2,205
$
2,525
Corporate
308
336
35
177
(166)
Total
$
2,477
$
2,561
$
2,563
$
2,382
$
2,359
Gross credit losses on loans
Consumer
In U.S. offices
$
2,314
$
2,402
$
2,307
$
2,210
$
2,282
In offices outside the U.S.
346
325
300
286
304
Corporate
In U.S. offices
34
53
14
81
115
In offices outside the U.S.
29
146
59
32
14
Total
$
2,723
$
2,926
$
2,680
$
2,609
$
2,715
Gross recoveries on loans
Consumer
In U.S. offices
$
426
$
413
$
371
$
353
$
354
In offices outside the U.S.
49
37
45
45
57
Corporate
In U.S. offices
7
11
15
22
10
In offices outside the U.S.
7
6
7
17
11
Total
$
489
$
467
$
438
$
437
$
432
Net credit losses on loans (NCLs)
In U.S. offices
$
1,915
$
2,031
$
1,935
$
1,916
$
2,033
In offices outside the U.S.
319
428
307
256
250
Total
$
2,234
$
2,459
$
2,242
$
2,172
$
2,283
Other—net(1)(2)(3)(4)(5)(6)
$
154
$
50
$
(103)
$
(70)
$
(156)
Allowance for credit losses on loans (ACLL) at end of period
$
19,123
$
18,726
$
18,574
$
18,356
$
18,216
ACLL as a percentage of EOP loans(7)
2.67
%
2.70
%
2.71
%
2.70
%
2.68
%
Allowance for credit losses on unfunded lending commitments (ACLUC)(8)
$
1,721
$
1,720
$
1,601
$
1,725
$
1,619
Total ACLL and ACLUC
$
20,844
$
20,446
$
20,175
$
20,081
$
19,835
Net consumer credit losses on loans
$
2,185
$
2,277
$
2,191
$
2,098
$
2,175
As a percentage of average consumer loans
2.25
%
2.39
%
2.24
%
2.16
%
2.28
%
Net corporate credit losses on loans
$
49
$
182
$
51
$
74
$
108
As a percentage of average corporate loans
0.06
%
0.24
%
0.07
%
0.10
%
0.15
%
ACLL by type at end of period(9)
Consumer
$
16,100
$
16,001
$
16,018
$
15,765
$
15,732
Corporate
3,023
2,725
2,556
2,591
2,484
Total
$
19,123
$
18,726
$
18,574
$
18,356
$
18,216
(1)Includes all adjustments to the allowance for credit losses, such as changes in the allowance from acquisitions, dispositions, securitizations, FX translation, purchase accounting adjustments, etc.
(2)The second quarter of 2025 includes an approximate $29 million reclass related to Citi’s agreement to sell its Poland consumer banking business. That ACLL was transferred to Other assets during the second quarter of 2025. The second quarter of 2025 also includes FX translation.
(3)The first quarter of 2025 includes an increase of approximately $50 million related to FX translation.
61
(4)The fourth quarter of 2024 includes a decrease of approximately $103 million related to FX translation.
(5)The third quarter of 2024 includes approximately $23 million related to an acquired portfolio and a decrease of approximately $93 million related to FX translation.
(6)The second quarter of 2024 includes a decrease of approximately $156 million related to FX translation.
(7)June 30, 2025, March 31, 2025, December 31, 2024, September 30, 2024 and June 30, 2024 exclude $9.3 billion, $8.2 billion, $8.0 billion, $8.1 billion and $8.5 billion, respectively, of loans that are carried at fair value.
(8)Represents additional credit reserves recorded as Other liabilities on the Consolidated Balance Sheet.
(9)See “Significant Accounting Policies and Significant Estimates” below. Attribution of the allowance is made for analytical purposes only and is available to absorb probable credit losses inherent in the overall portfolio.
Allowance for Credit Losses on Loans (ACLL)
The following tables detail information on Citi’s ACLL, loans and coverage ratios:
June 30, 2025
In billions of dollars
ACLL
EOP loans, net of unearned income
ACLL as a
% of EOP loans(1)
Consumer
North America cards(2)
$
13.4
$
167.3
8.0
%
North America personal installment loans
0.4
3.6
11.1
North America mortgages(3)
0.1
119.8
0.1
North America other(3)
0.3
29.3
1.0
International cards
1.0
13.4
7.5
International other(3)
0.9
62.2
1.4
Total(1)
$
16.1
$
395.6
4.1
%
Corporate(4)
Commercial and industrial
$
1.7
$
154.6
1.1
%
Financial institutions
0.3
82.8
0.4
Mortgage and real estate(4)
0.8
27.3
2.9
Installment and other
0.2
55.7
0.4
Total(1)
$
3.0
$
320.4
0.9
%
Loans at fair value(1)
N/A
$
9.3
N/A
Total Citigroup
$
19.1
$
725.3
2.7
%
December 31, 2024
In billions of dollars
ACLL
EOP loans, net of unearned income
ACLL as a
% of EOP loans(1)
Consumer
North America cards(2)
$
13.6
$
171.1
7.9
%
North America personal installment loans
0.4
3.8
10.5
North America mortgages(3)
0.1
117.2
0.1
North America other(3)
0.3
29.4
1.0
International cards
0.9
12.9
7.0
International other(3)
0.7
58.4
1.2
Total(1)
$
16.0
$
392.8
4.1
%
Corporate(4)
Commercial and industrial
$
1.3
$
148.7
0.9
%
Financial institutions
0.4
68.4
0.6
Mortgage and real estate(4)
0.7
26.4
2.7
Installment and other
0.2
50.1
0.4
Total(1)
$
2.6
$
293.6
0.9
%
Loans at fair value(1)
N/A
$
8.0
N/A
Total Citigroup
$
18.6
$
694.5
2.7
%
(1)Excludes loans carried at fair value, since they do not have an ACLL and are excluded from the ACLL ratio calculation.
(2)Includes both Branded Cards and Retail Services. As of June 30, 2025, the $13.4 billion of ACLL represented approximately 22 months of coincident net credit loss coverage (based on second quarter of 2025 NCLs). As of June 30, 2025, Branded Cards ACLL as a percentage of EOP loans was 6.5% and Retail Services ACLL as a percentage of EOP loans was 11.5%. As of December 31, 2024, the $13.6 billion of ACLL represented approximately 22 months of coincident net credit loss coverage (based on fourth quarter of 2024 NCLs). As of December 31, 2024, Branded Cards ACLL as a percentage of EOP loans was 6.4% and Retail Services ACLL as a percentage of EOP loans was 11.3%.
(3)Includes residential mortgages, retail loans and personal, small business and other loans, including those extended through the Private Bank network.
62
(4)The above corporate loan classifications are broadly based on the loan’s collateral, purpose and type of borrower, which may be different from the following industry table. For example, commercial and industrial, financial institutions, and installment and other loan classifications include various forms of loans to borrowers across multiple industries, whereas mortgage and real estate includes loans secured primarily by real estate.
N/A Not applicable
The following table details Citi’s corporate credit ACLL by industry exposure:
June 30, 2025
In millions of dollars, except percentages
Funded exposure(1)
ACLL
ACLL as a % of funded exposure
Banks and finance companies
$
68,225
$
247
0.4
%
Transportation and industrials
59,194
606
1.0
Real estate(2)
58,286
814
1.4
Commercial
40,313
743
1.8
Residential
17,973
71
0.4
Consumer retail
34,939
270
0.8
Technology, media and telecom
31,851
323
1.0
Power, chemicals, metals and mining
18,948
330
1.7
Public sector
14,232
53
0.4
Energy and commodities
11,477
168
1.5
Health
8,604
110
1.3
Asset managers and funds
7,406
35
0.5
Insurance
3,148
12
0.4
Securities firms
627
—
—
Financial markets infrastructure
247
1
0.4
Other industries(3)
3,172
54
1.7
Total(4)
$
320,356
$
3,023
0.9
%
(1) Funded exposure excludes loans carried at fair value of $9.2 billion that are not subject to the ACLL.
(2) As of June 30, 2025, the portion of the ACLL attributed to the total funded CRE exposure (including the Private Bank) was approximately 1.64%.
(3) Includes $0.8 billion of funded exposure at June 30, 2025, primarily related to commercial credit card delinquency-managed loans.
(4) As of June 30, 2025, the ACLL above reflects coverage of 0.4% of funded investment-grade exposure and 2.5% of funded non-investment-grade exposure.
The following table details Citi’s corporate credit ACLL by industry exposure:
December 31, 2024
In millions of dollars, except percentages
Funded exposure(1)
ACLL
ACLL as a % of funded exposure
Transportation and industrials
$
57,166
$
460
0.8
%
Banks and finance companies
56,716
307
0.5
Real estate(2)
53,186
717
1.3
Commercial
36,200
645
1.8
Residential
16,986
72
0.4
Consumer retail
32,212
258
0.8
Technology, media and telecom
29,534
238
0.8
Power, chemicals, metals and mining
18,504
257
1.4
Public sector
13,209
47
0.4
Energy and commodities
11,686
136
1.2
Health
8,537
77
0.9
Asset managers and funds
5,258
28
0.5
Insurance
2,115
8
0.4
Securities firms
590
9
1.5
Financial markets infrastructure
181
1
0.6
Other industries(3)
4,733
13
0.3
Total(4)
$
293,627
$
2,556
0.9
%
(1) Funded exposure excludes loans carried at fair value of $7.8 billion that are not subject to the ACLL.
(2) As of December 31, 2024, the portion of the ACLL attributed to the total funded CRE exposure (including the Private Bank) was approximately 1.60%.
(3) Includes $0.6 billion of funded exposure at December 31, 2024, primarily related to commercial credit card delinquency-managed loans.
(4) As of December 31, 2024, the ACLL above reflects coverage of 0.4% of funded investment-grade exposure and 2% of funded non-investment-grade exposure.
63
Non-Accrual Loans and Assets
For additional information on Citi’s non-accrual loans and assets, see “Non-Accrual Loans and Assets” in Citi’s 2024 Form 10-K.
Non-Accrual Loans
The table below summarizes Citigroup’s non-accrual loans (NAL) as of the periods indicated. Non-accrual loans may still be current on interest payments. In situations where Citi reasonably expects that only a portion of the principal owed will ultimately be collected, all payments received are reflected as a reduction of principal and not as interest income. For all other non-accrual loans, cash interest receipts are generally recorded as revenue.
The increase in corporate non-accrual loans at June 30, 2025 was primarily related to the credit downgrade of a small number of customers. The increase in consumer non-accrual loans at June 30, 2025 was driven by consumer mortgages enrolled in forbearance programs related to the California wildfires, whose loans are contractually past due at June 30, 2025.
Jun. 30,
Mar. 31,
Dec. 31,
Sept. 30,
Jun. 30,
In millions of dollars
2025
2025
2024
2024
2024
Corporate non-accrual loans by region(1)(2)(3)
North America
$
953
$
822
$
757
$
459
$
456
International
769
554
620
485
542
Total
$
1,722
$
1,376
$
1,377
$
944
$
998
International NAL by cluster
United Kingdom
$
249
$
52
$
190
$
62
$
109
Japan, Asia North and Australia (JANA)
19
18
22
24
52
LATAM
391
382
301
260
276
Asia South
19
26
17
49
30
Europe
63
51
58
64
45
Middle East and Africa (MEA)
28
25
32
26
30
Corporate non-accrual loans(1)(2)(3)
Banking
$
502
$
510
$
498
$
348
$
462
Services
134
110
65
96
30
Markets
932
631
715
390
362
Banamex SBMM
154
125
99
110
144
Total
$
1,722
$
1,376
$
1,377
$
944
$
998
Consumer non-accrual loans(1)
Wealth
$
637
$
415
$
404
$
284
$
303
USPB
329
305
290
292
285
Banamex Consumer
485
416
411
415
425
Asia Consumer(4)
16
20
19
21
22
Legacy Holdings Assets (consumer)
165
172
186
210
217
Total
$
1,632
$
1,328
$
1,310
$
1,222
$
1,252
Total non-accrual loans
$
3,354
$
2,704
$
2,687
$
2,166
$
2,250
(1)Corporate loans are placed on non-accrual status based on a review by Citigroup’s risk officers. Corporate non-accrual loans may still be current on interest payments. With limited exceptions, the following practices are applied for consumer loans: consumer loans, excluding credit cards and mortgages, are placed on non-accrual status at 90 days past due and are charged off at 120 days past due; residential mortgage loans are placed on non-accrual status at 90 days past due and written down to net realizable value at 180 days past due. Consistent with industry conventions, Citigroup generally accrues interest on credit card loans until such loans are charged off, which typically occurs at 180 days contractual delinquency. As such, the non-accrual loan disclosures do not include credit card loans, with the exception of certain international portfolios. The balances above represent non-accrual loans within Corporate loans and Consumer loans on the Consolidated Balance Sheet.
(2)Approximately 61%, 65%, 61%, 64% and 68% of Citi’s corporate non-accrual loans remain current on interest and principal payments at June 30, 2025, March 31, 2025, December 31, 2024, September 30, 2024 and June 30, 2024, respectively.
(3)The June 30, 2025 total corporate non-accrual loans represented 0.52% of total corporate loans.
(4)Asia Consumer includes the three remaining consumer loan portfolios: Korea, Poland (through the first quarter of 2025) and Russia until the completion of its consumer loan portfolio wind-down in the second quarter of 2025.
64
The changes in Citigroup’s non-accrual loans were as follows:
Three Months Ended
Three Months Ended
June 30, 2025
June 30, 2024
In millions of dollars
Corporate
Consumer
Total
Corporate
Consumer
Total
Non-accrual loans at beginning of quarter
$
1,376
$
1,328
$
2,704
$
1,489
$
1,281
$
2,770
Additions
629
846
1,475
212
477
689
Sales and transfers to HFS
(6)
(3)
(9)
(105)
(2)
(107)
Returned to performing
—
(83)
(83)
(244)
(50)
(294)
Paydowns/settlements
(228)
(148)
(376)
(248)
(153)
(401)
Charge-offs
(49)
(346)
(395)
(106)
(208)
(314)
Other
—
38
38
—
(93)
(93)
Ending balance
$
1,722
$
1,632
$
3,354
$
998
$
1,252
$
2,250
Six Months Ended
Six Months Ended
June 30, 2025
June 30, 2024
In millions of dollars
Corporate
Consumer
Total
Corporate
Consumer
Total
Non-accrual loans at beginning of year
$
1,377
$
1,310
$
2,687
$
1,882
$
1,315
$
3,197
Additions
1,136
1,378
2,514
450
895
1,345
Sales and transfers to HFS
(81)
(6)
(87)
(318)
(6)
(324)
Returned to performing
—
(155)
(155)
(246)
(107)
(353)
Paydowns/settlements
(483)
(253)
(736)
(561)
(256)
(817)
Charge-offs
(227)
(691)
(918)
(206)
(464)
(670)
Other
—
49
49
(3)
(125)
(128)
Ending balance
$
1,722
$
1,632
$
3,354
$
998
$
1,252
$
2,250
The table below summarizes Citigroup’s other real estate owned (OREO) assets. OREO is recorded on the Consolidated Balance Sheet within Other assets. This represents the carrying value of all real estate property acquired by foreclosure or other legal proceedings when Citi has taken possession of the collateral:
Jun. 30,
Mar. 31,
Dec. 31,
Sept. 30,
Jun. 30,
In millions of dollars
2025
2025
2024
2024
2024
OREO
North America
$
15
$
10
$
9
$
13
$
17
International(1)
11
11
9
12
10
Total OREO
$
26
$
21
$
18
$
25
$
27
Non-accrual assets
Corporate non-accrual loans
$
1,722
$
1,376
$
1,377
$
944
$
998
Consumer non-accrual loans
1,632
1,328
1,310
1,222
1,252
Non-accrual loans (NAL)
$
3,354
$
2,704
$
2,687
$
2,166
$
2,250
OREO
26
21
18
25
27
Non-accrual assets (NAA)
$
3,380
$
2,725
$
2,705
$
2,191
$
2,277
NAL as a percentage of total loans
0.46
%
0.39
%
0.39
%
0.31
%
0.33
%
NAA as a percentage of total assets
0.13
0.11
0.11
0.09
0.09
ACLL as a percentage of NAL(2)
570
693
691
847
810
(1)The International OREO details by cluster are not provided due to the immateriality of such amounts.
(2)The ACLL includes the allowance for Citi’s credit card portfolios and purchased credit-deteriorated loans, while the non-accrual loans exclude credit card balances (with the exception of certain international portfolios).
65
This page intentionally left blank.
66
LIQUIDITY RISK
For additional information on funding and liquidity at Citi, including objectives and stress testing, see “Liquidity Risk” and “Risk Factors—Liquidity Risks” in Citi’s 2024 Form 10-K.
Overview
Adequate and diverse sources of funding and liquidity are essential to Citi’s businesses. Funding and liquidity risks arise from several factors, many of which are mostly or entirely outside of Citi’s control, such as disruptions in the financial markets, changes in key funding sources, credit spreads, changes in Citi’s credit ratings and macroeconomic, geopolitical and other conditions.
Citi’s funding and liquidity management objectives are aimed at (i) funding its existing asset base, (ii) growing its core businesses, (iii) maintaining sufficient liquidity, structured appropriately, so that Citi can operate under a variety of adverse circumstances, including potential Company-specific and/or market liquidity events in varying durations and severity, and (iv) satisfying regulatory requirements, including, but not limited to, those related to resolution planning. Citigroup’s primary liquidity objectives are established by entity, and in aggregate, across two major categories:
•Citibank (including Citibank Europe plc, Citibank Singapore Ltd. and Citibank (Hong Kong) Ltd.); and
•Citi’s non-bank and other entities, including the parent holding company (Citigroup Inc.), Citi’s primary intermediate holding company (Citicorp LLC), Citi’s broker-dealer subsidiaries (including Citigroup Global Markets Inc., Citigroup Global Markets Limited and Citigroup Global Markets Japan Inc.) and other bank and non-bank subsidiaries that are consolidated into Citigroup (including Banamex).
At an aggregate Citigroup level, Citi’s goal is to maintain sufficient funding in amount and tenor to fully fund customer assets and to provide an appropriate amount of cash and high-quality liquid assets (as discussed below), even in times of stress, in order to meet its payment obligations as they come due. The liquidity risk management framework provides that, in addition to the aggregate requirements, certain entities be self-sufficient or net providers of liquidity, including in conditions established under their designated stress tests.
Citi’s primary funding sources include (i) corporate and consumer deposits via Citi’s bank subsidiaries, including Citibank, N.A. (Citibank), (ii) long-term debt (primarily senior and subordinated debt) mainly issued by Citigroup Inc., as the parent, and Citibank, and (iii) stockholders’ equity. These sources may be supplemented by short-term borrowings, primarily in the form of secured funding transactions.
Citi’s funding and liquidity framework, working in concert with overall asset/liability management, helps ensure that there is sufficient liquidity and tenor in the overall liability structure (including funding products) of the Company relative to the liquidity requirements of Citi’s assets. This reduces the risk that liabilities will become due before assets mature or are monetized. The Company holds excess liquidity, primarily in the form of high-quality liquid assets (HQLA), as presented in the table below.
67
High-Quality Liquid Assets (HQLA)
Citibank
Citi non-bank and other entities
Total
In billions of dollars
Jun. 30, 2025
Mar. 31, 2025
Jun. 30, 2024
Jun. 30, 2025
Mar. 31, 2025
Jun. 30, 2024
Jun. 30, 2025
Mar. 31, 2025
Jun. 30, 2024
Available cash
$
239.5
$
224.3
$
207.6
$
8.8
$
7.2
$
7.6
$
248.3
$
231.5
$
215.2
U.S. sovereign
150.1
162.6
216.8
47.8
48.5
47.2
197.9
211.1
264.0
U.S. agency/agency MBS
32.0
29.6
28.3
1.8
2.0
0.2
33.8
31.6
28.5
Foreign government debt(1)
73.0
63.0
18.4
15.3
16.0
15.5
88.3
79.0
33.9
Other investment grade
—
—
—
—
—
—
—
—
—
Total HQLA (AVG)
$
494.6
$
479.5
$
471.1
$
73.7
$
73.7
$
70.5
$
568.3
$
553.2
$
541.6
Note: The amounts in the table above are presented on an average basis. For securities, the amounts represent the liquidity value that potentially could be realized and, therefore, exclude any securities that are encumbered and incorporate any haircuts applicable under the U.S. LCR rule. The table above incorporates various restrictions that could limit the transferability of liquidity between legal entities, including Section 23A of the Federal Reserve Act. Changes in HQLA line categories from the prior-year period were primarily driven by the reallocation of nontransferable HQLA, which did not change total average HQLA, and thus did not impact Citi’s LCR ratio.
(1) Foreign government debt includes securities issued or guaranteed by foreign sovereigns, agencies and multilateral development banks. Foreign government debt securities are held largely to support local liquidity requirements and Citi’s local franchises and principally include government bonds from Japan, Korea, the United Kingdom, China and India.
The table above includes average amounts of HQLA held at Citigroup’s operating entities that are eligible for inclusion in the calculation of Citigroup’s consolidated LCR, pursuant to the U.S. LCR rules. These amounts include the HQLA needed to meet the minimum requirements at these entities as well as any amounts in excess of these minimums that are available to be transferred to other entities within Citigroup. Citigroup’s average HQLA increased quarter-over-quarter as of the second quarter of 2025, primarily driven by an increase in average wholesale deposits.
As of June 30, 2025, Citigroup had approximately $1.0 trillion of available liquidity resources to support client and business needs, including end-of-period HQLA ($589 billion); additional unencumbered HQLA, including excess liquidity held at bank entities that is non-transferable to other entities within Citigroup ($272 billion); and unused borrowing capacity from available assets not already accounted for within Citi’s HQLA to support additional advances from the Federal Home Loan Bank (FHLB) and the Federal Reserve Bank discount window ($154 billion).
Short-Term Liquidity Measurement: Liquidity Coverage Ratio (LCR)
In addition to internal 30-day liquidity stress testing performed for Citi’s major entities, operating subsidiaries and countries, Citi also monitors its liquidity by reference to the LCR. The table below details the components of Citi’s LCR calculation and HQLA in excess of net outflows for the periods indicated:
In billions of dollars
Jun. 30, 2025
Mar. 31, 2025
Jun. 30, 2024
HQLA
$
568.3
$
553.2
$
541.6
Net outflows
494.4
473.8
464.0
LCR
115
%
117
%
117
%
HQLA in excess of net outflows
$
73.9
$
79.4
$
77.6
Note: The amounts are presented on an average basis.
As of June 30, 2025, Citigroup’s average LCR decreased from the quarter ended March 31, 2025, driven by an increase in net secured wholesale funding outflows from Markets business activities.
In addition, considering Citi’s total available liquidity resources at quarter end of $1.0 trillion, Citi maintained approximately $521 billion of excess liquidity resources above the stressed net outflows of approximately $494 billion, presented in the LCR table above.
68
Long-Term Liquidity Measurement: Net Stable Funding Ratio (NSFR)
The NSFR measures the availability of an institution’s stable funding against the required stable funding in accordance with a calculation required by the rule. The ratio of available stable funding to required stable funding must be greater than 100%.
In general, an institution’s available stable funding includes portions of equity, deposits and long-term debt, while its required stable funding is based on the liquidity characteristics of its assets, derivatives and commitments. Standardized weightings are required to be applied to the various asset and liability classes.
For the quarter ended June 30, 2025, Citigroup’s consolidated NSFR was compliant with the 100% minimum requirement of the rule. (For additional information, see the Consolidated Citigroup NSFR Disclosure for the quarterly periods ended June 30, 2025 and March 31, 2025, on Citi’s Investor Relations website. The Consolidated Citigroup NSFR Disclosure on Citi’s Investor Relations website is not incorporated by reference into, and does not form any part of, this Form 10-Q).
Select Balance Sheet Items
This section provides details of select liquidity-related assets and liabilities reported on Citigroup’s Consolidated Balance Sheet.
Cash and Investments
The table below details average and end-of-period Cash and due from banks, Deposits with banks (collectively cash) and Investment securities. Citi’s investment securities portfolio consists largely of highly liquid U.S. Treasury, U.S. agency and other sovereign bonds, with an aggregate duration of less than three years. EOP cash, deposits and investments increased 3% quarter-over-quarter, primarily driven by an increase in deposits late in the current quarter.
In billions of dollars
2Q25
1Q25
2Q24
Cash and due from banks
$
27
$
28
$
25
Deposits with banks
298
281
251
Investment securities
450
459
511
Total Citigroup cash and investment securities (AVG)
$
775
$
768
$
787
Total Citigroup cash and investment securities (EOP)
$
787
$
761
$
754
At June 30, 2025, Citi’s EOP cash and Investment securities comprised approximately 30% of total assets.
Deposits
The table below details the average deposits, by segment and/or business, and the total Citigroup end-of-period deposits for each of the periods indicated:
In billions of dollars
2Q25
1Q25
2Q24
Services
$
857
$
826
$
804
TTS
713
690
677
Securities Services
144
136
127
Markets(1)
18
15
25
Banking
—
—
1
Wealth
308
310
316
USPB
90
89
93
All Other—Legacy Franchises
41
43
50
All Other—Corporate/Other
29
22
21
Total Citigroup deposits (AVG)
$
1,343
$
1,305
$
1,310
Total Citigroup deposits (EOP)
$
1,358
$
1,316
$
1,278
(1)During the third quarter of 2024, approximately $9 billion of institutional deposits were moved from Markets to All Other—Corporate/Other. Prior periods were not reclassified. For additional information about the reallocated deposits, see Note 3 to the Consolidated Financial Statements in Citi’s 2024 Form 10-K.
End-of-period deposits increased 6% year-over-year, driven by increases in Services and USPB, partially offset by declines in Wealth and continued wind-downs in Legacy Franchises within All Other (including the impact of moving HFS deposits to Other liabilities). End-of-period deposits increased 3% sequentially, driven by Services and an increase in corporate certificates of deposit in Corporate/Other within All Other, partially offset by declines in Legacy Franchises within All Other and USPB.
On an average basis, deposits increased 3% both year-over-year and sequentially. In the second quarter of 2025, average deposits for:
•Services increased 7% year-over-year, as TTS increased 5%, due to deepened client relationships and growth in operational deposits, and Securities Services increased 13%, driven by growth in Custody and Issuer Services.
•Wealth decreased 3% year-over-year, driven by client tax payments and other operating outflows, as well as a shift from deposits to higher-yielding investments on Citi’s platform, partially offset by the transfer of certain relationships and associated deposits from USPB.
•USPB decreased 3% year-over-year, as the transfer of certain relationships and the associated deposits to Wealth more than offset net new deposits.
•All Other decreased 1% year-over-year, reflecting continued wind-downs in Legacy Franchises (including the impact of moving HFS deposits to Other liabilities), offset by growth in corporate certificates of deposit in Corporate/Other.
69
The majority of Citi’s $1.3 trillion of end-of-period deposits are institutional (approximately $892 billion) and span approximately 90 countries. A large majority of these institutional deposits are within TTS, and of these, approximately 80% are from clients that use all three TTS integrated services: payments and collections, liquidity management and working capital solutions. In addition, approximately 80% of TTS deposits are from clients that have a longer than 15-year relationship with Citi.
Citi also has a strong consumer and wealth deposit base, with approximately $400 billion of Wealth and USPB deposits as of the end of the current quarter, which are diversified across the Private Bank, Citigold and Wealth at Work within Wealth, as well as USPB, and across regions and products. As of the end of the current quarter, approximately 67% of U.S. Citigold clients have been with Citi for more than 10 years and approximately 41% of Private Bank ultra-high net worth clients have been with Citi for more than 10 years. In addition, USPB’sdeposits are spread across six key metropolitan areas in the U.S.
Long-Term Debt
Long-Term Debt Outstanding
The following table presents Citi’s end-of-period total long-term debt outstanding for each of the dates indicated:
In billions of dollars
Jun. 30, 2025
Mar. 31, 2025
Jun. 30, 2024
Non-bank(1)
Benchmark debt:
Senior debt
$
116.1
$
110.5
$
107.7
Subordinated debt
29.0
30.6
27.2
Trust preferred
1.6
1.6
1.6
Customer-related debt(2)
115.5
107.5
102.3
Local country and other(3)
12.1
11.0
8.5
Total non-bank
$
274.3
$
261.2
$
247.3
Bank
FHLB borrowings
$
6.5
$
7.5
$
11.5
Securitizations(4)
7.1
5.1
5.6
Citibank benchmark senior debt
26.0
19.4
12.8
Customer-related debt(2)
2.5
1.0
1.3
Local country and other(3)
1.4
1.5
1.8
Total bank
$
43.5
$
34.5
$
33.0
Total long-term debt
$
317.8
$
295.7
$
280.3
Note: Amounts represent the current value of long-term debt on Citi’s Consolidated Balance Sheet that, for certain debt instruments, includes consideration of fair value, hedging impacts and unamortized discounts and premiums.
(1)Non-bank includes long-term debt issued to third parties by the parent holding company (Citigroup) and Citi’s non-bank subsidiaries (including broker-dealer subsidiaries) that are consolidated into Citigroup. As of June 30, 2025, non-bank included $100.7 billion of long-term debt issued by Citi’s broker-dealer and other subsidiaries that are consolidated into Citigroup. Certain Citigroup consolidated hedging activities are also included in this line.
(2)Primarily structured notes, which contain an embedded derivative component that adjusts each security’s risk-return profile. See Note 24 for the fair value component of these issuances.
(3)Local country and other includes debt issued by Citi’s affiliates in support of their local operations. Within non-bank, certain secured financing is also included.
(4)Predominantly credit card securitizations, primarily backed by Branded Cards receivables.
Citi’s total long-term debt outstanding increased 13% year-over-year and increased 7% sequentially, largely driven by net issuances in benchmark debt and customer-related debt at both bank and non-bank entities.
As part of its liability management, Citi has considered, and may continue to consider, opportunities to redeem or repurchase its long-term debt pursuant to open market purchases, tender offers or other means. Such redemptions and repurchases help reduce Citi’s overall funding costs. During the second quarter of 2025, Citi redeemed or repurchased an aggregate of $11.7 billion of its outstanding long-term debt.
70
Long-Term Debt Issuances and Maturities
The table below details Citi’s long-term debt issuances and maturities (including repurchases and redemptions) during the periods presented:
2Q25
1Q25
2Q24
In billions of dollars
Maturities
Issuances
Maturities
Issuances
Maturities
Issuances
Non-bank
Benchmark debt:
Senior debt
$
5.3
$
8.2
$
6.2
$
7.3
$
9.0
$
5.7
Subordinated debt
2.9
1.1
1.5
3.0
—
—
Trust preferred
—
—
—
—
—
—
Customer-related debt
13.1
16.9
12.7
17.2
16.5
13.4
Local country and other
0.6
1.5
0.5
1.0
1.1
2.3
Total non-bank
$
21.9
$
27.7
$
20.9
$
28.5
$
26.6
$
21.4
Bank
FHLB borrowings
$
1.0
$
—
$
2.0
$
1.0
$
1.0
$
1.0
Securitizations
—
2.0
—
—
1.1
—
Citibank benchmark senior debt
—
6.5
—
—
—
5.0
Customer-related debt
0.2
1.7
0.2
—
—
—
Local country and other
0.1
—
—
0.1
0.4
0.3
Total bank
$
1.3
$
10.2
$
2.2
$
1.1
$
2.5
$
6.3
Total
$
23.2
$
37.9
$
23.1
$
29.6
$
29.1
$
27.7
The table below details Citi’s aggregate long-term debt maturities (including repurchases and redemptions) during the six months of 2025, as well as its aggregate expected remaining long-term debt maturities by year as of June 30, 2025:
Maturities
In billions of dollars
2Q25 YTD
Remaining 2025
2026
2027
2028
2029
2030
Thereafter
Total
Non-bank
Benchmark debt:
Senior debt
$
11.5
$
0.8
$
17.3
$
7.5
$
20.4
$
7.9
$
10.8
$
51.4
$
116.1
Subordinated debt
4.4
1.4
2.5
3.7
2.0
—
—
19.4
29.0
Trust preferred
—
—
—
—
—
—
—
1.6
1.6
Customer-related debt
25.8
10.6
18.3
13.5
11.3
9.8
7.2
44.8
115.5
Local country and other
1.1
1.6
1.9
1.3
1.2
1.3
1.2
3.6
12.1
Total non-bank
$
42.8
$
14.4
$
40.0
$
26.0
$
34.9
$
19.0
$
19.2
$
120.8
$
274.3
Bank
FHLB borrowings
$
3.0
$
3.5
$
3.0
$
—
$
—
$
—
$
—
$
—
$
6.5
Securitizations
—
—
0.7
1.9
—
0.8
2.3
1.4
7.1
Citibank benchmark senior debt
—
2.5
8.0
6.5
2.5
1.5
3.0
2.0
26.0
Customer-related debt
0.4
—
—
—
0.1
0.7
0.6
1.1
2.5
Local country and other
0.1
0.1
0.8
0.5
—
—
—
—
1.4
Total bank
$
3.5
$
6.1
$
12.5
$
8.9
$
2.6
$
3.0
$
5.9
$
4.5
$
43.5
Total long-term debt
$
46.3
$
20.5
$
52.5
$
34.9
$
37.5
$
22.0
$
25.1
$
125.3
$
317.8
71
Secured Funding Transactions and Short-Term Borrowings
Citi supplements its primary sources of funding with short-term financings that generally include (i) secured funding transactions consisting of securities loaned or sold under agreements to repurchase, i.e., repos, and (ii) to a lesser extent, short-term borrowings consisting of commercial paper issuances and borrowings from the FHLB and other market participants.
Secured Funding Transactions
Secured funding is primarily accessed through Citi’s broker-dealer subsidiaries, with a smaller portion executed through Citi’s bank entities to efficiently fund both (i) secured lending activity and (ii) a portion of the securities inventory held in the context of market making and customer activities. Secured funding transactions are predominantly collateralized by government debt securities. Generally, changes in the level of Citi’s secured funding are primarily due to fluctuations in secured lending activity in the matched book (as described below), and changes in securities inventory and eligible counterparty balance sheet netting. In order to maintain reliable funding under a wide range of market conditions, Citi manages risks related to its secured funding by establishing secured funding limits and conducting daily stress tests that account for risks related to capacity, tenor, haircut, collateral type, counterparty and client actions.
Secured funding of $348 billion as of June 30, 2025 increased 14% year-over-year, driven by additional financing to support Markets activities, largely offset by additional balance sheet netting, and decreased 14% from the prior quarter. The quarter-over-quarter decrease was driven by balance sheet netting, largely offset by additional secured financing activities to support Markets activities. As of the quarter ended June 30, 2025, on an average basis, secured funding was $421 billion. The portion of secured funding in the broker-dealer subsidiaries that funds secured lending is commonly referred to as “matched book” activity and is primarily secured by high-quality liquid securities such as U.S. Treasury securities, U.S. agency securities and foreign government debt securities. Other “matched book” activity is secured by less liquid securities, including equity securities, corporate bonds and asset-backed securities, the tenor of which is generally equal to or longer than the tenor of the corresponding assets. As indicated above, the remaining portion of secured funding is used to fund securities inventory held in the context of market making and customer activities.
Short-Term Borrowings
Citi’s short-term borrowings of $56 billion as of June 30, 2025 increased 44% year-over-year and 13% sequentially, compared to March 31, 2025. The year-over-year and sequential increase was mainly attributable to additional funding raised by non-bank entities to support client activities. See Note 18 for further information on Citigroup’s and its affiliates’ outstanding short-term borrowings.
72
Credit Ratings
The table below presents the current ratings for Citigroup and Citibank as of June 30, 2025. While not included in the table below, the current long-term and short-term ratings of Citigroup Global Markets Holdings Inc. (CGMHI) were A+/F1 at Fitch Ratings, A2/P-1 at Moody’s Ratings and A/A-1 at S&P Global Ratings as of June 30, 2025.
Ratings as of June 30, 2025
Citigroup Inc.
Citibank, N.A.
Long-term
Short-term
Outlook
Long- term
Short- term
Outlook
Fitch Ratings (Fitch)
A
F1
Stable
A+
F1
Stable
Moody’s Ratings (Moody’s)
A3
P-2
Stable
Aa3
P-1
Stable
S&P Global Ratings (S&P)
BBB+
A-2
Stable
A+
A-1
Stable
Potential Impacts of Ratings Downgrades
Ratings downgrades by Fitch, Moody’s or S&P could negatively impact Citigroup’s and/or Citibank’s funding and liquidity due to reduced funding capacity, including derivative triggers, which could take the form of cash obligations and collateral requirements.
For additional information on the impact of credit rating changes on Citi and its applicable subsidiaries, see “Risk Factors—Liquidity Risks” and “Credit Ratings” in Citi’s 2024 Form 10-K.
Citigroup Inc. and Citibank—Potential Derivative Triggers
As of June 30, 2025, Citi estimates that a hypothetical one-notch downgrade of the senior debt/long-term rating across all three major rating agencies could impact funding and liquidity due to derivative triggers by approximately $0.1 billion, unchanged from March 31, 2025, for Citigroup Inc., and $0.1 billion, unchanged from March 31, 2025, for Citibank. Other funding sources, such as secured financing transactions and other margin requirements, for which there are no explicit triggers, could also be adversely affected.
In total, as of June 30, 2025, Citi estimates that a one-notch downgrade of Citigroup Inc. and Citibank across all three major rating agencies could result in increased aggregate cash obligations and collateral requirements of approximately $0.2 billion, unchanged from March 31, 2025. As detailed under “High-Quality Liquid Assets (HQLA)” above, Citigroup has various liquidity resources available to its bank and non-bank entities in part as a contingency for the potential events described above.
Citibank—Additional Potential Impacts
In addition to the above derivative triggers, Citi believes that a potential downgrade of Citibank’s senior debt/long-term rating across any of the three major rating agencies could also have an adverse impact on the commercial paper/short-term rating of Citibank. Citibank has provided liquidity commitments to consolidated asset-backed commercial paper conduits (ABCP), primarily in the form of asset purchase agreements. As of June 30, 2025, Citibank had liquidity commitments of approximately $12.9 billion to consolidated asset-backed commercial paper conduits (compared to $13.6 billion at March 31, 2025) (see Note 21).
In addition to the above-referenced liquidity resources of certain Citibank entities, Citibank could reduce the funding and liquidity risk, if any, of the potential downgrades described above through mitigating actions, including repricing or reducing certain commitments to commercial paper conduits. In the event of the potential downgrades described above, Citi believes that certain corporate customers could re-evaluate borrowing behavior through the conduits. A reduction in client borrowing would result in a reduced amount of ABCP issuance.
73
MARKET RISK
Market risk arises from both Citi’s trading and non-trading portfolios. For additional information on market risk and market risk management at Citi, see “Market Risk—Overview” and “Risk Factors” in Citi’s 2024 Form 10-K.
MARKET RISK OF NON-TRADING PORTFOLIOS
Market risk from non-trading portfolios stems predominantly from the potential impact of changes in interest rates and foreign exchange rates on Citi’s net interest income and on Citi’s Accumulatedother comprehensive income (loss) (AOCI) from its investment securities portfolios. Market risk from non-trading portfolios also includes the potential impact of changes in foreign exchange rates on Citi’s capital invested in foreign currencies.
For interest rate risk purposes, Citi’s non-trading portfolios are referred to as the Banking Book, and Citi uses multiple metrics to measure its Banking Book interest rate risk, including Interest Rate Exposure (IRE). For additional information, see “Market Risk—Market Risk of Non-Trading Portfolios—Banking Book Interest Rate Risk” in Citi’s 2024 Form 10-K.
74
Interest Rate Risk of Investment Portfolios—Impact on AOCI
Citi measures the potential impacts of changes in interest rates on the value of its AOCI, which can in turn impact Citi’s common equity and tangible common equity. This will impact Citi’s CET1 and other regulatory capital ratios. Citi seeks to manage its exposure to changes in the market level of interest rates, while limiting the potential impact on its AOCI and regulatory capital position.
AOCI at risk is managed as part of the Company-wide interest rate risk position. AOCI at risk considers potential changes in AOCI (and the corresponding impact on the CET1 Capital ratio) relative to Citi’s capital generation capacity.
Citi uses 100 basis point (bps) shocks in each scenario to reflect its net interest income sensitivity to unanticipated changes in market interest rates, as potential monetary policy decisions and changes in economic conditions may be reflected in current market-implied forward rates.
The following table presents the 12-month estimated impact to Citi’s net interest income, AOCI and the CET1 Capital ratio, each assuming an unanticipated parallel instantaneous 100 bps increase in interest rates:
In millions of dollars, except as otherwise noted
Jun. 30, 2025
Mar. 31, 2025
Jun. 30, 2024
Parallel interest rate shock +100 bps
Interest rate exposure(1)(2)
U.S. dollar
$
(313)
$
(225)
$
(406)
All other currencies
1,578
1,470
1,382
Total net interest income
$
1,265
$
1,245
$
976
As a percentage of average interest-earning assets
0.05
%
0.05
%
0.04
%
Estimated initial negative impact to AOCI (after-tax)(2)
$
(1,881)
$
(1,207)
$
(1,084)
Estimated initial impact on CET1 Capital ratio (bps) from AOCI scenario(3)
(18)
(14)
(14)
(1)Excludes trading book and fair value option banking book portfolios and replaces them with the associated transfer pricing.
(2)Includes the effect of changes in interest rates on AOCI related to investment securities, cash flow hedges and pension liability adjustments.
(3)Excludes the effect of changes in interest rates on AOCI related to cash flow hedges, as those changes are excluded from CET1 Capital.
As presented in the table above, Citi’s balance sheet is asset sensitive (assets reprice faster than liabilities), resulting in higher net interest income in increasing interest rate scenarios. The estimated impact to Citi’s net interest income in a 100 bps upward rate shock scenario as of June 30, 2025 increased year-over-year, primarily driven by higher customer deposits. At progressively higher interest rate levels, the marginal net interest income benefit is lower, as Citi assumes it will pass on a larger share of rate changes to depositors (i.e., higher betas), further reducing Citi’s IRE sensitivity. Currency-specific interest rate changes and balance sheet factors may drive quarter-to-quarter volatility in Citi’s estimated IRE for a 100 bps upward rate shock.
In a 100 bps upward rate shock scenario, Citi expects that the approximate $1.9 billion initial negative impact to AOCI could potentially be offset in shareholders’ equity through the forecasted interest income and paydowns from Citi’s investment portfolio over a period of approximately 10 months.
75
Scenario Analysis
The following table presents the estimated impact to Citi’s net interest income and AOCI under eight different interest rate scenarios for the U.S. dollar and all other currencies as of June 30, 2025. The 100 bps and 200 bps downward rate scenarios potentially may be impacted by the low level of interest rates in several countries and the assumption that market interest rates, as well as rates paid to depositors and charged to borrowers, do not fall below zero (i.e., the “flooring assumption”). The interest rate scenarios are also impacted by convexity related to mortgage products and deposit pricing.
In millions of dollars, except as otherwise noted
Scenario 1
Scenario 2
Scenario 3
Scenario 4
Scenario 5
Scenario 6
Scenario 7
Scenario 8
Overnight rate change (bps)
100
100
—
—
(100)
(100)
200
(200)
10-year rate change (bps)
100
—
100
(100)
—
(100)
200
(200)
Interest rate exposure
U.S. dollar
$
(313)
$
(286)
$
65
$
(137)
$
(324)
$
(385)
$
(645)
$
(766)
All other currencies(1)
1,578
1,349
230
(222)
(1,193)
(1,386)
3,135
(2,602)
Total
$
1,265
$
1,063
$
295
$
(359)
$
(1,517)
$
(1,771)
$
2,490
$
(3,368)
Estimated initial impact to AOCI (after-tax)(2)
$
(1,881)
$
(1,641)
$
(288)
$
(96)
$
1,657
$
1,574
$
(3,940)
$
2,616
Note: Each scenario assumes that the rate change will occur instantaneously. Changes in interest rates for maturities between the overnight rate and the 10-year rate are interpolated. The interest rate exposure in the table above assumes no change in deposit size or mix from the baseline forecast included in the different interest rate scenarios presented. As a result, in higher interest rate scenarios, customer activity resulting in a shift from non-interest-bearing and low interest rate deposit products to higher-yielding deposits would reduce the expected benefit to net interest income. Conversely, in lower interest rate scenarios, customer activity resulting in a shift from higher-yielding deposits to non-interest-bearing and low interest rate deposit products would reduce the expected decrease to net interest income.
(1)The Scenario 1 impact of $1,578 million consists of the following top five non-U.S. dollar currencies as of June 30, 2025 by absolute size: approximately $(0.3) billion from the euro, $0.3 billion from the British pound sterling and Japanese yen, and approximately $0.1 billion each from the Indian rupee and Swiss franc. The remaining balance is spread across more than 30 additional currencies.
(2)Includes the effect of changes in interest rates on AOCI related to investment securities, cash flow hedges and pension liability adjustments.
As presented in the table above, the estimated impact to Citi’s net interest income is larger in the short end compared to the long end as Citi’s Banking Book has relatively higher interest rate exposure to the short end of the yield curve. For the U.S. dollar, exposure to downward rate shocks is larger in magnitude than to upward rate shocks. This is because of the lower benefit to net interest income from Citi’s deposit base at higher rate levels, as well as the prepayment effects on mortgage loans and mortgage-backed securities.
The magnitude of the impact to AOCI is greater in the short end compared to the long end. This is because Citi’s investment portfolio is more sensitive to shorter-term rates and pension liabilities are more sensitive at intermediate-term maturities.
76
Changes in Foreign Exchange Rates—Impacts on AOCI and Capital
As of June 30, 2025, Citi estimates that a parallel instantaneous 5% appreciation of the U.S. dollar against all of the other currencies in which Citi has invested capital could reduce Citi’s tangible common equity (TCE) by approximately $1.8 billion, or 1.0%, as a result of changes to Citi’s CTA in AOCI, net of hedges. This reduction in the TCE would be primarily driven by depreciation in the value of the euro, Mexican peso and Indian rupee.
This reduction in the TCE does not reflect any mitigating actions Citi may take, including ongoing management of its foreign currency translation exposure. TCE is used as a simplified metric to manage CET1 capital ratio volatility. Specifically, as currency movements change the value of Citi’s net investments in foreign currency-denominated
capital, these movements also change the value of Citi’s RWA denominated in those same currencies. This, coupled with Citi’s foreign currency hedging strategies, such as foreign currency borrowings, foreign currency forwards and other currency hedging instruments, lessens the impact of foreign currency movements on Citi’s CET1 Capital ratio. Changes in these hedging strategies, as well as hedging costs, divestitures and tax impacts, can further affect the actual impact of changes in foreign exchange rates on Citi’s capital compared to an unanticipated parallel shock, as described above.
The effect of Citi’s ongoing management strategies with respect to quarterly changes in foreign exchange rates (versus the U.S. dollar), and the quarterly impact of these changes on Citi’s TCE and CET1 Capital ratio, are presented in the table below. See Note 19 for additional information on the changes in AOCI.
For the quarter ended
In millions of dollars
Jun. 30, 2025
Mar. 31, 2025
Jun. 30, 2024
Change in FX spot rate(1)
5.2
%
2.7
%
(2.7)
%
Change in TCE due to FX translation, net of hedges
$
1,490
$
721
$
(1,274)
As a percentage of TCE
0.9
%
0.4
%
(0.8)
%
(1) FX spot rate change is a weighted average based on Citi’s quarterly average GAAP capital exposure to foreign countries. A negative change in FX spot rate represents foreign currency depreciation versus the U.S. dollar.
77
Interest Income/Expense and Net Interest Margin (NIM)
2nd Qtr.
1st Qtr.
2nd Qtr.
Change
In millions of dollars, except as otherwise noted
2025
2025
2024
2Q25 vs. 2Q24
Interest income(1)
$
35,887
$
33,692
$
36,009
—
%
Interest expense(2)
20,684
19,654
22,494
(8)
Net interest income, taxable equivalent basis(1)
$
15,203
$
14,038
$
13,515
12
%
Interest income—average rate(3)
5.93
%
5.92
%
6.42
%
(49)
bps
Interest expense—average rate
4.17
4.26
4.96
(79)
bps
Net interest margin(3)(4)
2.51
2.47
2.41
10
bps
Interest rate benchmarks
Two-year U.S. Treasury note—average rate
3.86
%
4.15
%
4.83
%
(97)
bps
10-year U.S. Treasury note—average rate
4.36
4.45
4.45
(9)
bps
10-year vs. two-year spread
50
bps
30
bps
(38)
bps
(1)Interest income and Net interest income include the taxable equivalent gross-up adjustments (TEGU) primarily related to the tax-exempt bond portfolio and certain tax-advantaged loan programs of $28 million, $26 million and $22 million for the three months ended June 30, 2025, March 31, 2025 and June 30, 2024, respectively.
(2)Interest expense associated with certain hybrid financial instruments, which are classified as Long-term debt and accounted for at fair value, is reported together with any changes in fair value as part of Principal transactions in the Consolidated Statement of Income and is therefore not reflected in Interest expense in the table above.
(3)The average rate on interest income and NIM reflects TEGU. See footnote 1 above.
(4)Citi’s NIM is calculated by dividing net interest income (including TEGU) by average interest-earning assets.
78
Non-Markets Net Interest Income
2nd Qtr.
1st Qtr.
2nd Qtr.
Change
In millions of dollars
2025
2025
2024
2Q25 vs. 2Q24
Net interest income—taxable equivalent basis(1) per above
$
15,203
$
14,038
$
13,515
12
%
Markets net interest income—taxable equivalent basis(1)
2,930
2,039
2,060
42
Non-Markets net interest income—taxable equivalent basis(1)
$
12,273
$
11,999
$
11,455
7
%
(1)Interest income and Net interest income include TEGU discussed in the table above.
Citi’s net interest income in the second quarter of 2025 was $15.2 billion, on both a reported and taxable equivalent basis, an increase of 12%, or $1.7 billion, from the prior-year period. The increases were primarily driven by a 42%, or $0.9 billion, increase in Markets net interest income and a 7%, or $0.8 billion, increase in non-Markets net interest income.
The increase in Markets net interest income was driven by lower funding costs, higher interest revenue from trading in Fixed Income Marketsand higher dividends in Equity Markets.
The increase in non-Markets net interest income was largely due to net interest margin expansion and interest-earning balance growth in Branded Cards, higher deposit spreads in Retail Banking in USPB and higher deposit spreads in Services and Wealth. Services net interest income also benefited from higher deposit and loan balances. The impact of these drivers was largely offset by lower net interest income in All Other, driven by lower net interest income in Corporate/Other due to actions taken over the last 12 months to reduce Citi’s asset sensitivity in a declining rate environment.
Citi’s net interest margin was 2.51% on a taxable equivalent basis in the second quarter of 2025, an increase from 2.47% in the prior quarter, largely driven by higher Markets net interest income and a benefit from rates, largely offset by asset mix and pricing.
79
Additional Interest Rate Details
Average Balances and Interest Rates—Assets(1)(2)(3)
Taxable Equivalent Basis
Quarterly—Assets
Average balance
Interest income
% Average rate
2nd Qtr.
1st Qtr.
2nd Qtr.
2nd Qtr.
1st Qtr.
2nd Qtr.
2nd Qtr.
1st Qtr.
2nd Qtr.
In millions of dollars, except rates
2025
2025
2024
2025
2025
2024
2025
2025
2024
Deposits with banks(4)
$
298,158
$
280,566
$
250,665
$
3,043
$
3,001
$
2,710
4.09
%
4.34
%
4.35
%
Securities borrowed and purchased under agreements to resell(5)
In U.S. offices
$
195,488
$
204,033
$
144,904
$
3,751
$
3,592
$
2,949
7.70
%
7.14
%
8.19
%
In offices outside the U.S.(4)
179,717
158,107
212,065
2,870
2,699
4,262
6.41
6.92
8.08
Total
$
375,205
$
362,140
$
356,969
$
6,621
$
6,291
$
7,211
7.08
%
7.05
%
8.12
%
Trading account assets(6)(7)
In U.S. offices
$
287,610
$
255,073
$
225,993
$
3,105
$
2,719
$
2,769
4.33
%
4.32
%
4.93
%
In offices outside the U.S.(4)
219,267
182,305
162,648
2,716
1,651
1,734
4.97
3.67
4.29
Total
$
506,877
$
437,378
$
388,641
$
5,821
$
4,370
$
4,503
4.61
%
4.05
%
4.66
%
Investments
In U.S. offices
Taxable
$
242,238
$
259,648
$
312,425
$
1,581
$
1,646
$
2,078
2.62
%
2.57
%
2.68
%
Exempt from U.S. income tax
10,682
10,766
11,143
107
104
108
4.02
3.92
3.90
In offices outside the U.S.(4)
196,932
188,940
186,974
2,527
2,425
2,641
5.15
5.21
5.68
Total
$
449,852
$
459,354
$
510,542
$
4,215
$
4,175
$
4,827
3.76
%
3.69
%
3.80
%
Consumer loans(8)
In U.S. offices
$
314,545
$
313,407
$
307,629
$
8,185
$
8,198
$
8,010
10.44
%
10.61
%
10.47
%
In offices outside the U.S.(4)
75,804
73,283
75,582
1,586
1,560
1,770
8.39
8.63
9.42
Total
$
390,349
$
386,690
$
383,211
$
9,771
$
9,758
$
9,780
10.04
%
10.23
%
10.26
%
Corporate loans(8)
In U.S. offices
$
150,979
$
141,960
$
136,197
$
2,207
$
2,068
$
2,216
5.86
%
5.91
%
6.54
%
In offices outside the U.S.(4)
170,848
162,087
160,213
3,005
2,917
3,502
7.05
7.30
8.79
Total
$
321,827
$
304,047
$
296,410
$
5,212
$
4,985
$
5,718
6.50
%
6.65
%
7.76
%
Total loans(8)
In U.S. offices
$
465,524
$
455,367
$
443,826
$
10,392
$
10,266
$
10,226
8.95
%
9.14
%
9.27
%
In offices outside the U.S.(4)
246,652
235,370
235,795
4,591
4,477
5,272
7.47
7.71
8.99
Total
$
712,176
$
690,737
$
679,621
$
14,983
$
14,743
$
15,498
8.44
%
8.66
%
9.17
%
Other interest-earning assets(9)
$
83,064
$
75,982
$
70,486
$
1,204
$
1,112
$
1,260
5.81
%
5.94
%
7.19
%
Total interest-earning assets
$
2,425,332
$
2,306,157
$
2,256,924
$
35,887
$
33,692
$
36,009
5.93
%
5.92
%
6.42
%
Non-interest-earning assets(6)
$
222,473
$
210,984
$
199,565
Total assets
$
2,647,805
$
2,517,141
$
2,456,489
80
Six Months—Assets
Average balance
Interest income
% Average rate
Six Months
Six Months
Six Months
Six Months
Six Months
Six Months
In millions of dollars, except rates
2025
2024
2025
2024
2025
2024
Deposits with banks(4)
$
289,362
$
251,297
$
6,044
$
5,357
4.21
%
4.29
%
Securities borrowed and purchased under agreements to resell(5)
In U.S. offices
$
199,761
$
145,904
$
7,343
$
6,373
7.41
%
8.78
%
In offices outside the U.S.(4)
168,912
211,930
5,569
8,660
6.65
8.22
Total
$
368,673
$
357,834
$
12,912
$
15,033
7.06
%
8.45
%
Trading account assets(6)(7)
In U.S. offices
$
271,342
$
223,859
$
5,824
$
5,429
4.33
%
4.88
%
In offices outside the U.S.(4)
200,786
155,302
4,367
3,202
4.39
4.15
Total
$
472,128
$
379,161
$
10,191
$
8,631
4.35
%
4.58
%
Investments
In U.S. offices
Taxable
$
250,943
$
316,737
$
3,227
$
4,222
2.59
%
2.68
%
Exempt from U.S. income tax
10,724
11,240
211
215
3.97
3.85
In offices outside the U.S.(4)
192,936
185,355
4,952
5,247
5.18
5.69
Total
$
454,603
$
513,332
$
8,390
$
9,684
3.72
%
3.79
%
Consumer loans(8)
In U.S. offices
$
313,976
$
306,549
$
16,383
$
16,048
10.52
%
10.53
%
In offices outside the U.S.(4)
74,544
75,957
3,146
3,530
8.51
9.35
Total
$
388,520
$
382,506
$
19,529
$
19,578
10.14
%
10.29
%
Corporate loans(8)
In U.S. offices
$
146,513
$
136,563
$
4,275
$
4,416
5.88
%
6.50
%
In offices outside the U.S.(4)
166,468
160,120
5,922
7,061
7.17
8.87
Total
$
312,981
$
296,683
$
10,197
$
11,477
6.57
%
7.78
%
Total loans(8)
In U.S. offices
$
460,489
$
443,112
$
20,658
$
20,464
9.05
%
9.29
%
In offices outside the U.S.(4)
241,012
236,077
9,068
10,591
7.59
9.02
Total
$
701,501
$
679,189
$
29,726
$
31,055
8.55
%
9.19
%
Other interest-earning assets(9)
$
79,523
$
72,744
$
2,316
$
2,495
5.87
%
6.90
%
Total interest-earning assets
$
2,365,790
$
2,253,557
$
69,579
$
72,255
5.93
%
6.45
%
Non-interest-earning assets(6)
$
216,683
$
199,856
Total assets
$
2,582,473
$
2,453,413
(1)Interest income and Net interest income include TEGU of $28 million, $26 million and $22 million for the three months ended June 30, 2025, March 31, 2025 and June 30, 2024, respectively, and $54 million and $45 million for the six months ended June 30, 2025 and 2024, respectively.
(2)Interest rates and amounts include the effects of risk management activities associated with the respective asset categories.
(3)Monthly or quarterly averages have been used by certain subsidiaries where daily averages are unavailable.
(4)Average rates reflect prevailing local interest rates, including inflationary effects and monetary corrections in certain countries.
(5)Average volumes of securities borrowed or purchased under agreements to resell are reported net pursuant to ASC 210-20-45. However, Interest income excludes the impact of ASC 210-20-45.
(6)The fair value carrying amounts of derivative contracts are reported net, pursuant to ASC 815-10-45, in Non-interest-earning assets and Other non-interest-bearing liabilities.
(7)Interest expense on Trading account liabilities of Services, Markets and Banking is reported as a reduction of Interest income. Interest income and Interest expense on cash collateral positions are reported in interest on Trading account assets and Trading account liabilities, respectively.
(8)Net of unearned income. Includes cash-basis loans.
(9)Includes Brokerage receivables.
81
Average Balances and Interest Rates—Liabilities and Equity, and Net Interest Income(1)(2)(3)
Taxable Equivalent Basis
Quarterly—Liabilities
Average balance
Interest expense
% Average rate
2nd Qtr.
1st Qtr.
2nd Qtr.
2nd Qtr.
1st Qtr.
2nd Qtr.
2nd Qtr.
1st Qtr.
2nd Qtr.
In millions of dollars, except rates
2025
2025
2024
2025
2025
2024
2025
2025
2024
Deposits
In U.S. offices(4)
$
567,842
$
560,608
$
563,915
$
4,861
$
4,692
$
5,747
3.43
%
3.39
%
4.10
%
In offices outside the U.S.(5)
571,154
543,160
544,818
3,824
3,746
4,488
2.69
2.80
3.31
Total
$
1,138,996
$
1,103,768
$
1,108,733
$
8,685
$
8,438
$
10,235
3.06
%
3.10
%
3.71
%
Securities loaned and sold under agreements to repurchase(6)
In U.S. offices
$
308,568
$
283,177
$
243,792
$
4,975
$
4,418
$
4,349
6.47
%
6.33
%
7.17
%
In offices outside the U.S.(5)
112,630
89,016
92,575
1,963
1,838
2,613
6.99
8.37
11.35
Total
$
421,198
$
372,193
$
336,367
$
6,938
$
6,256
$
6,962
6.61
%
6.82
%
8.32
%
Trading account liabilities(7)(8)
In U.S. offices
$
37,488
$
34,368
$
39,110
$
437
$
391
$
432
4.68
%
4.61
%
4.44
%
In offices outside the U.S.(5)
66,660
56,801
64,438
311
366
362
1.87
2.61
2.26
Total
$
104,148
$
91,169
$
103,548
$
748
$
757
$
794
2.88
%
3.37
%
3.08
%
Short-term borrowings and other interest-bearing liabilities(9)
In U.S. offices
$
95,789
$
92,187
$
74,353
$
1,508
$
1,471
$
1,626
6.31
%
6.47
%
8.80
%
In offices outside the U.S.(5)
44,782
38,467
32,924
292
255
282
2.62
2.69
3.44
Total
$
140,571
$
130,654
$
107,277
$
1,800
$
1,726
$
1,908
5.14
%
5.36
%
7.15
%
Long-term debt(10)
In U.S. offices
$
181,070
$
173,343
$
167,043
$
2,483
$
2,440
$
2,547
5.50
%
5.71
%
6.13
%
In offices outside the U.S.(5)
1,733
1,678
2,486
30
37
48
6.94
8.94
7.77
Total
$
182,803
$
175,021
$
169,529
$
2,513
$
2,477
$
2,595
5.51
%
5.74
%
6.16
%
Total interest-bearing liabilities
$
1,987,716
$
1,872,805
$
1,825,454
$
20,684
$
19,654
$
22,494
4.17
%
4.26
%
4.96
%
Non-interest-bearing deposits(11)
$
203,780
$
201,192
$
201,167
Other non-interest-bearing liabilities(7)
242,966
232,801
222,322
Total liabilities
$
2,434,462
$
2,306,798
$
2,248,943
Citigroup stockholders’ equity
$
212,472
$
209,519
$
206,749
Noncontrolling interests
871
824
797
Total equity
$
213,343
$
210,343
$
207,546
Total liabilities and stockholders’ equity
$
2,647,805
$
2,517,141
$
2,456,489
Net interest income as a percentage of average interest-earning assets(12)
In U.S. offices
$
1,395,504
$
1,370,460
$
1,278,753
$
7,248
$
7,285
$
5,720
2.08
%
2.16
%
1.80
%
In offices outside the U.S.(6)
1,029,828
935,697
978,171
7,955
6,753
7,795
3.10
2.93
3.21
Total
$
2,425,332
$
2,306,157
$
2,256,924
$
15,203
$
14,038
$
13,515
2.51
%
2.47
%
2.41
%
82
Six Months—Liabilities
Average balance
Interest expense
% Average rate
Six Months
Six Months
Six Months
Six Months
Six Months
Six Months
In millions of dollars, except rates
2025
2024
2025
2024
2025
2024
Deposits
In U.S. offices(4)
$
564,225
$
577,013
$
9,553
$
11,648
3.41
%
4.06
%
In offices outside the U.S.(5)
557,157
543,452
7,570
8,998
2.74
3.33
Total
$
1,121,382
$
1,120,465
$
17,123
$
20,646
3.08
%
3.71
%
Securities loaned and sold under agreements to repurchase(6)
In U.S. offices
$
295,873
$
229,348
$
9,393
$
8,659
6.40
%
7.59
%
In offices outside the U.S.(5)
100,823
94,106
3,801
5,269
7.60
11.26
Total
$
396,696
$
323,454
$
13,194
$
13,928
6.71
%
8.66
%
Trading account liabilities(7)(8)
In U.S. offices
$
35,928
$
41,077
$
828
$
872
4.65
%
4.27
%
In offices outside the U.S.(5)
61,731
62,534
677
753
2.21
2.42
Total
$
97,659
$
103,611
$
1,505
$
1,625
3.11
%
3.15
%
Short-term borrowings and other interest bearing liabilities(9)
In U.S. offices
$
93,988
$
76,381
$
2,979
$
3,328
6.39
%
8.76
%
In offices outside the U.S.(5)
41,625
31,558
547
536
2.65
3.42
Total
$
135,613
$
107,939
$
3,526
$
3,864
5.24
%
7.20
%
Long-term debt(10)
In U.S. offices
$
177,206
$
166,586
$
4,923
$
5,047
5.60
%
6.09
%
In offices outside the U.S.(5)
1,706
2,493
67
100
7.92
8.07
Total
$
178,912
$
169,079
$
4,990
$
5,147
5.62
%
6.12
%
Total interest-bearing liabilities
$
1,930,262
$
1,824,548
$
40,338
$
45,210
4.21
%
4.98
%
Non-interest-bearing deposits(11)
$
202,486
$
197,703
Other non-interest-bearing liabilities(7)
237,881
224,267
Total liabilities
$
2,370,629
$
2,246,518
Citigroup stockholders’ equity
$
210,996
$
206,106
Noncontrolling interests
848
789
Total equity
$
211,844
$
206,895
Total liabilities and stockholders’ equity
$
2,582,473
$
2,453,413
Net interest income as a percentage of average interest-earning assets(11)
In U.S. offices
$
1,383,027
$
1,286,424
$
14,533
$
11,752
2.12
%
1.84
%
In offices outside the U.S.(6)
982,763
967,131
14,708
15,293
3.02
3.18
Total
$
2,365,790
$
2,253,555
$
29,241
$
27,045
2.49
%
2.41
%
(1)Interest income and Net interest income include TEGU discussed in the table above.
(2)Interest rates and amounts include the effects of risk management activities associated with the respective liability categories.
(3)Monthly or quarterly averages have been used by certain subsidiaries where daily averages are unavailable.
(4)Consists of other time deposits and savings deposits. Savings deposits are composed of insured money market accounts and other savings deposits.
(5)Average rates reflect prevailing local interest rates, including inflationary effects and monetary corrections in certain countries.
(6)Average volumes of securities sold under agreements to repurchase are reported net pursuant to ASC 210-20-45. However, Interest expense excludes the impact of ASC 210-20-45.
(7)The fair value carrying amounts of derivative contracts are reported net, pursuant to ASC 815-10-45, in Non-interest-earning assets and Other non-interest-bearing liabilities.
(8)Interest expense on Trading account liabilities of Services, Markets and Banking is reported as a reduction of Interest income. Interest income and Interest expense on cash collateral positions are reported in interest on Trading account assets and Trading account liabilities, respectively.
(9)Includes Brokerage payables.
(10)Excludes hybrid financial instruments and beneficial interests in consolidated VIEs that are classified as Long-term debt, as the changes in fair value for these obligations are recorded in Principal transactions.
(11)Includes non-interest-bearing deposits in both the U.S. and outside of the U.S.
(12)Includes allocations for capital and funding costs based on the location of the asset.
83
MARKET RISK OF TRADING PORTFOLIOS
Value at Risk (VaR)
Citi believes its VaR model is conservatively calibrated to incorporate fat-tail scaling and the greater of short-term (approximately the most recent month) and long-term (18 months for commodities and three years for others) market volatility. As of June 30, 2025, Citi estimates that the conservative features of the VaR calibration contribute an approximate 21% add-on to what would be a VaR estimated under the assumption of normally distributed markets. As of March 31, 2025, the add-on was 17%.
As presented in the table below, Citi’s average trading VaR for the second quarter of 2025 remained unchanged from the first quarter of 2025 despite VaR changes within asset classes from inventory changes and volatility updates.
Quarter-end and Average Trading VaR and Trading and Credit Portfolio VaR
Second Quarter
First Quarter
Second Quarter
In millions of dollars
June 30, 2025
2025 Average
March 31, 2025
2025 Average
June 30, 2024
2024 Average
Interest rate
$
102
$
93
$
86
$
92
$
79
$
97
Credit spread
87
77
72
67
64
66
Covariance adjustment(1)
(66)
(61)
(58)
(55)
(48)
(56)
Fully diversified interest rate and credit spread(2)
$
123
$
109
$
100
$
104
$
95
$
107
Foreign exchange
50
67
73
69
49
45
Equity
27
30
28
24
36
23
Commodity
39
32
40
28
29
25
Covariance adjustment(1)
(116)
(115)
(115)
(104)
(113)
(85)
Total trading VaR—all market risk factors, including general and specific risk (excluding credit portfolios)(2)
$
123
$
123
$
126
$
121
$
96
$
115
Specific risk-only component(3)
$
5
$
1
$
(3)
$
(2)
$
(3)
$
(5)
Total trading VaR—general market risk factors only (excluding credit portfolios)
$
118
$
122
$
129
$
123
$
99
$
120
Incremental impact of the credit portfolio(4)
$
5
$
7
$
8
$
8
$
10
$
9
Total trading and credit portfolio VaR
$
128
$
130
$
134
$
129
$
106
$
124
(1) Covariance adjustment (also known as diversification benefit) equals the difference between the total VaR and the sum of the VaRs tied to each risk type. The benefit reflects the fact that the risks within individual and across risk types are not perfectly correlated and, consequently, the total VaR on a given day will be lower than the sum of the VaRs relating to each risk type. The determination of the primary drivers of changes to the covariance adjustment is made by an examination of the impact of both model parameter and position changes.
(2) The total trading VaR includes mark-to-market and certain fair value option trading positions with the exception of hedges of the loan portfolio, fair value option loans and all CVA exposures. Available-for-sale and accrual exposures are not included.
(3) The specific risk-only component represents the level of equity and fixed income issuer-specific risk embedded in VaR.
(4) The credit portfolio is composed of mark-to-market positions associated with non-trading business units, with the CVA relating to derivative counterparties, all associated CVA hedges and market sensitivity FVA hedges. FVA and DVA are not included. The credit portfolio also includes hedges of the loan portfolio, fair value option loans and hedges of the leveraged finance pipeline within capital markets origination.
The table below provides the range of market factor VaRs associated with Citi’s total trading VaR, inclusive of specific risk:
Second Quarter
First Quarter
Second Quarter
2025
2025
2024
In millions of dollars
Low
High
Low
High
Low
High
Interest rate
$
81
$
118
$
76
$
104
$
76
$
120
Credit spread
61
87
57
77
58
74
Fully diversified interest rate and credit spread
$
94
$
131
$
87
$
129
$
88
$
129
Foreign exchange
36
94
54
81
32
60
Equity
19
51
18
32
13
36
Commodity
24
44
19
40
20
32
Total trading
$
109
$
141
$
107
$
133
$
92
$
147
Total trading and credit portfolio
114
152
117
143
97
156
Note: No covariance adjustment can be inferred from the above table as the high and low for each market factor will be from different close-of-business dates.
84
The following table provides the VaR for Markets, excluding the CVA relating to derivative counterparties, hedges of CVA, fair value option loans and hedges of the loan portfolio:
In millions of dollars
June 30, 2025
Total—all market risk factors, including general and specific risk
Average—during quarter
$
117
High—during quarter
141
Low—during quarter
102
Regulatory VaR Back-Testing
In accordance with Basel III, Citi is required to perform back-testing to evaluate the effectiveness of its Regulatory VaR model. Regulatory VaR back-testing is the process in which the daily one-day VaR, at a 99% confidence interval, is compared to the buy-and-hold profit and loss (i.e., the profit and loss impact if the portfolio is held constant at the end of the day and re-priced the following day). Buy-and-hold profit and loss represents the daily mark-to-market profit and loss attributable to price movements in covered positions from the close of the previous business day. Buy-and-hold profit and loss excludes realized trading revenue, net interest, fees and commissions, intra-day trading profit and loss and changes in reserves.
Based on a 99% confidence level, Citi would expect two to three days in any one year where buy-and-hold losses exceed the Regulatory VaR. Given the conservative calibration of Citi’s VaR model (as a result of taking the greater of short- and long-term volatilities and fat-tail scaling of volatilities), Citi would expect fewer exceptions under normal and stable market conditions. Periods of unstable market conditions could increase the number of back-testing exceptions.
As of June 30, 2025, there were no back-testing exceptions observed for Citi’s Regulatory VaR in the last 12 months.
OTHER RISKS
For additional information regarding other risks, including Citi’s management of other risks, see “Managing Global Risk—Other Risks” in Citi’s 2024 Form 10-K.
Country Risk
Country risk is defined as the exposure to potential loss caused by economic, financial or sociopolitical conditions or weaknesses in legal systems in a country or jurisdiction that Citi may be exposed to through its business activities. Country risk may impair the value of Citi’s franchise within a country or jurisdiction or adversely affect the ability of Citi to enforce the obligations of its obligors. Citi is exposed to country risk through its business activities such as lending, payments, investing and market-making activities, whether cross-border or locally funded, and including activity with corporations, governments and institutions in a country or jurisdiction.
Citi manages country risk through a comprehensive risk framework supported by governance committees and councils that oversee country risk exposures, including but not limited to relevant limits, concentrations, metrics and frameworks, stress testing, significant country developments and risk mitigation actions. This is supported by tools and processes designed to facilitate the objective, consistent and ongoing assessments of individual countries and jurisdictions and the risks that may arise from Citi’s business activities within them.
85
Top 25 Country Exposures
The following table presents Citi’s top 25 exposures by country (excluding the U.S.) as of June 30, 2025. (Citi’s combined top 25 exposures by country and the U.S. represent 97% of Citi’s exposure to all countries as of June 30, 2025.)
Citi’s top 25 exposures by country may fluctuate from period to period due to a variety of factors, including client activity, market flows, FX fluctuations and liquidity management activities undertaken by Citi’s businesses.
For purposes of the table, amounts are reflected based on the country of risk of the obligor.
The country of risk will generally be the same as the country of incorporation of the obligor, except in certain situations, such as where the source of repayment is concentrated in a different country or jurisdiction or where the obligor is guaranteed by a parent entity incorporated in a different country or jurisdiction (e.g., a Swiss-incorporated subsidiary that is guaranteed by a Chinese-incorporated parent would be reflected as China risk).
Investment securities and trading account assets are generally categorized based on the domicile of the issuer of the security of the underlying reference entity.
In billions of dollars
Services, Markets, Banking and Wealth loans
Legacy Franchises loans
Other funded(1)
Unfunded(2)
Net MTM on derivatives/repos(3)
Total hedges (on loans and CVA)
Investment securities(4)
Trading account assets(5)
Total
as of
2Q25
Total as of 4Q24
Total
as a %
of Citi
as of
2Q25
United Kingdom
$
24.2
$
—
$
1.1
$
27.9
$
15.7
$
(4.8)
$
8.6
$
4.2
$
76.9
$
75.6
4.4
%
Mexico
11.5
27.7
1.4
10.5
7.6
(4.1)
19.4
2.0
76.0
69.4
4.3
Singapore
21.1
—
0.3
5.3
1.5
(0.7)
7.2
1.0
35.7
34.4
2.0
Hong Kong
21.6
—
0.1
1.9
0.7
(0.5)
8.7
0.8
33.3
36.2
1.9
India
11.7
—
0.3
3.7
1.3
(0.3)
9.0
2.8
28.5
27.7
1.6
Brazil
13.0
—
0.3
2.5
6.1
(0.7)
5.6
0.7
27.5
25.9
1.6
Germany
4.1
—
—
14.7
5.9
(4.3)
7.2
(3.4)
24.2
19.9
1.4
South Korea
8.9
3.0
—
1.7
1.0
(0.4)
6.2
3.7
24.1
22.7
1.4
Luxembourg
9.6
—
0.7
6.5
1.0
(0.5)
4.6
0.5
22.4
16.0
1.3
China
6.4
—
0.4
2.0
1.1
(0.8)
11.0
1.6
21.7
19.0
1.2
Canada
4.8
—
0.4
7.8
2.5
(1.4)
3.5
3.9
21.5
21.1
1.2
Japan
2.1
—
0.2
3.1
3.1
(1.0)
6.1
7.7
21.3
12.2
1.2
Poland
4.3
1.7
—
3.2
0.4
(0.1)
7.9
2.5
19.9
16.4
1.1
Australia
8.5
—
0.2
6.1
1.4
(1.2)
0.9
2.5
18.4
16.7
1.1
Netherlands
5.6
0.1
—
10.1
1.7
(1.8)
2.0
(0.4)
17.3
15.0
1.0
France
2.8
—
1.2
12.6
5.0
(5.1)
1.8
(1.8)
16.5
26.1
0.9
Ireland
6.0
—
—
7.1
1.0
(0.7)
—
0.9
14.3
9.9
0.8
United Arab Emirates
6.5
—
0.1
1.8
0.3
(0.3)
4.4
—
12.8
14.1
0.7
Cayman Islands
3.6
—
0.1
3.7
1.6
(0.1)
—
0.3
9.2
7.3
0.5
Switzerland
3.6
—
0.2
6.8
2.1
(1.8)
—
(2.0)
8.9
9.5
0.5
Spain
2.9
—
—
3.4
0.4
(1.4)
—
2.7
8.0
6.2
0.5
Virgin Islands (British)
6.2
—
—
0.2
0.8
—
—
—
7.2
3.6
0.4
Taiwan
4.4
—
—
0.4
0.7
(0.1)
1.6
(0.3)
6.7
5.6
0.4
Belgium
0.4
0.1
—
1.7
0.1
(0.4)
4.9
(0.3)
6.5
5.5
0.4
Czech Republic
0.9
—
—
0.6
3.1
—
1.7
0.1
6.4
4.6
0.4
Total as a % of Citi’s total exposure
32.2
%
Total as a % of Citi’s non-U.S. total exposure
91.7
%
(1) Other funded includes other direct exposures such as loans HFS, other loans in Corporate/Other and investments accounted for under the equity method.
(2) Unfunded commitments include unfunded corporate lending commitments, letters of credit and other contingencies, including clearing house guarantee funds.
(3) Net counterparty exposure includes mark-to-market (MTM) exposures on OTC derivatives, carrying amounts of securities lending/borrowing transactions (repos) and margin loan balances. This exposure is also net of collateral and inclusive of CVA.
(4) Investment securities include debt securities AFS, recorded at fair market value, and debt securities HTM, recorded at amortized cost.
(5) Trading account assets are represented on a net basis and include issuer risk on both long and short debt and equity securities and derivative exposure.
86
Russia
Overview
Citi previously ended nearly all of the institutional banking services it offered in Russia and ceased soliciting any new business or new clients in the country, with the remaining services only those necessary to fulfill its remaining legal and regulatory obligations, as well as support its employees.
In addition, during the second quarter of 2025, Citi completed the wind-down of its All Other—Legacy Franchises consumer loan portfolio in Russia (reported as part of Asia Consumer). For additional information, see “Citi’s Wind-Down of Its Russia Operations” below.
Citi’s remaining operations are conducted through Services, Markets, Banking and All Other—Legacy Franchises. Citi continues to monitor the war in Ukraine, related sanctions and economic conditions and continues to mitigate its Russia exposures and risks as appropriate.
For additional information about Citi’s risks related to its Russia exposures, see “Risk Factors—Market-Related Risks,” “—Operational Risks” and “—Other Risks” in Citi’s 2024 Form 10-K.
Impact of the Russia–Ukraine War on Citi’s Businesses
Russia-related Balance Sheet Exposures
Citi’s remaining domestic operations in Russia are conducted through a subsidiary of Citibank, AO Citibank, which uses the Russian ruble as its functional currency.
The following table summarizes Citi’s and its clients’ Russia-related exposures, excluding associated reserves:
In billions of U.S. dollars
June 30, 2025
March 31, 2025
June 30, 2024
Change 2Q25 vs. 1Q25
Loans
$
—
$
—
$
—
$
—
Investment securities(1)
0.1
0.1
0.3
—
Net MTM on derivatives/repos
—
—
0.9
—
Cash on deposit and placements(2)
1.7
1.8
0.6
(0.1)
Additional exposures to Russian counterparties that are not held by the Russian subsidiary
0.1
0.1
0.1
—
Total Citi exposure
$
1.9
$
2.0
$
1.9
$
(0.1)
Deposit Insurance Agency (DIA)(3)
$
10.5
$
9.0
$
5.3
$
1.5
Cash on deposit and placements(2)
—
—
1.0
—
Total clients’ exposure(4)
$
10.5
$
9.0
$
6.3
$
1.5
Total Citi and clients’ Russia-related exposure(5)
$
12.4
$
11.0
$
8.2
$
1.4
(1) Investment securities include debt securities AFS, recorded at fair market value, primarily local government debt securities.
(2) Cash on deposit and placements are primarily with the Central Bank of Russia. Due to sanctions restrictions, as well as Citi being unable to enter into reverse repos beginning in the third quarter of 2024, any excess liquidity is placed with the Central Bank of Russia.
(3) Represents dividends relating to Russian securities held by Citi in its role as custodian for clients in Russia, which Citi is required by local regulation to hold at the DIA. Citi is unable to remit these funds, which are held at clients’ risk, to these clients due to restrictions imposed by the Russian government.
(4) Clients’ exposure of $10.5 billion as of June 30, 2025 consists of corporate dividends that Citi cannot remit to its clients due to restrictions imposed by the Russian government and are held with the DIA.
(5) Citigroup’s CTA loss of $1.6 billion as of June 30, 2025 included in its AOCI related to its indirect subsidiary, AO Citibank, and $1.3 billion of intercompany liabilities owed by AO Citibank to other Citi entities outside Russia are excluded from the above table. Citi has separately described these amounts in “Deconsolidation Risk” below.
During the second quarter of 2025, Citi’s Russia-related exposures slightly decreased $0.1 billion to $1.9 billion. Total clients’ exposures increased $1.5 billion to $10.5 billion, driven by corporate dividends received during the quarter, as well as appreciation of the Russian ruble.
Citi’s net investment in Russia declined by $0.2 billion in the second quarter of 2025, resulting in a negative net investment of approximately $(0.2) billion as of June 30, 2025 (down from less than $0.1 billion at March 31, 2025). Citi is now fully reserved for its net investment in Russia. The net investment became negative during the second quarter of 2025, due to an ACL build related to transfer risk associated with client activity in Russia.
Citi hedges its Russian ruble/U.S. dollar spot FX exposure in AOCI through the purchase of FX derivatives. The ongoing mark-to-market of the hedging derivatives is also reported in AOCI. When the Russian ruble depreciates against the U.S. dollar, the U.S. dollar equivalent value of Citigroup’s investment in AO Citibank also declines. This change in value is offset by the change in value of the hedging instrument (FX derivative). Going forward, Citi may record devaluations on its net ruble-denominated assets in earnings, without the benefit from a change in the fair value of derivative positions used to economically hedge the exposures.
87
Earnings and Other Impacts
Services, Markets, Banking and All Other—Legacy Franchises results have been impacted by various macroeconomic factors and volatilities, including the war in Ukraine and its direct and indirect impacts on the European and global economies. For a broader discussion of the impacts of these factors and volatilities on Citi’s businesses and All Other, see “Executive Summary” and each segment’s and All Other’s results of operations above.
As of June 30, 2025, Citigroup’s ACL included less than $0.1 billion of remaining credit reserves for Citi’s direct Russian counterparties (largely unchanged from March 31, 2025). This ACL balance for Citi’s direct Russian counterparties does not include reserves for transfer risk associated with exposures in Russia, which are included in the ACL on Other assets. For additional information on these reserves, see “Significant Accounting Policies and Significant Estimates” below.
Citi’s Wind-Down of Its Russia Operations
In connection with Citi’s wind-down of its Russia operations, Citi has incurred approximately $86 million to date in charges, largely from restructuring, vendor termination fees and other related charges. Citi expects to incur an additional approximate $16 million in estimated charges (in All Other,excluding the impact from any portfolio sales). For additional information about Citi’s continued efforts to reduce its operations and exposure in Russia, see “Risk Factors” and “Managing Global Risk—Other Risks—Country Risk—Russia” in Citi’s 2024 Form 10-K.
Deconsolidation Risk
Citi’s remaining operations in Russia subject it to various risks, including, among others, foreign currency volatility, including appreciation or devaluation; restrictions arising from retaliatory Russian laws and regulations on the conduct of its business; sanctions or asset freezes; or other deconsolidation events (see “Risk Factors—Other Risks” in Citi’s 2024 Form 10-K).
As of June 30, 2025, Citi continued to consolidate AO Citibank because none of the deconsolidation factors were triggered. Examples of factors that may result in deconsolidation of AO Citibank include voluntary or forced sale of ownership or loss of control due to actions of relevant governmental authorities, including expropriation (i.e., the entity becomes subject to the complete control of a government, court, administrator, trustee or regulator); revocation of banking license; and loss of ability to elect a board of directors or appoint members of senior management.
In the event Citi deems there is a loss of control, for example, through expropriation of AO Citibank, Citi anticipates that it would be required to (i) recognize a CTA loss of approximately $1.6 billion (unchanged from March 31, 2025) through earnings, (ii) recognize a loss of $1.3 billion (an increase of $0.2 billion from March 31, 2025) on intercompany liabilities owed by AO Citibank to other Citi entities outside Russia, and (iii) write-off its fully reserved net investment, resulting in a recovery of $0.2 billion. While the circumstances surrounding any loss-of-control scenario are inherently uncertain, losses recognized by Citi in relation to item (ii) as referenced above may be substantially offset by Citi exercising its rights to consider certain related client liabilities as extinguished by such an event. In the sole event of a substantial liquidation, as opposed to a loss of control, Citi would be required to recognize the CTA loss of approximately $1.6 billion through earnings and would evaluate its remaining net investment as circumstances evolve. The $1.6 billion CTA write-off through earnings under either event is expected to be largely equity neutral, since the reversal of the CTA loss out of AOCI would improve Citi’s total AOCI.
For additional information, see “Managing Global Risk—Other Risks—Country Risk—Russia—Citi as Paying Agent for Russia-related Clients,” “—Reputational Risks” and “—Board of Directors’ Role in Overseeing Related Risks” in Citi’s 2024 Form 10-K.
Ukraine
Citi has continued to operate in Ukraine throughout the war through its Services, Markets and Banking businesses, serving the local subsidiaries of multinationals, along with local financial institutions and the public sector. Citi employs approximately 220 people in Ukraine and their safety is Citi’s top priority. All of Citi’s domestic operations in Ukraine are conducted through a subsidiary of Citibank, which uses the Ukrainian hryvnia as its functional currency. As of June 30, 2025, Citi had $1.6 billion of direct exposures related to Ukraine (unchanged from March 31, 2025).
88
Argentina
Citi operates in Argentina through its Services, Markets and Banking businesses. As of June 30, 2025, Citi’s net investment in its Argentine operations, inclusive of associated reserves, was approximately $1.5 billion (compared to $1.6 billion at March 31, 2025). Citi uses Argentina’s official market exchange rate to remeasure its net Argentine peso (ARS)–denominated assets into U.S. dollars (USD), with the impact of exchange rate fluctuations recorded directly in earnings. As of June 30, 2025, the official ARS exchange rate was 1,205, which devalued by 12.2% against the USD during the second quarter of 2025.
The Central Bank of Argentina (BCRA) has generally maintained certain capital and currency controls that have broadly restricted Citi’s ability to access USD in Argentina and remit earnings from its Argentine operations.
During the second quarter of 2025, the government of Argentina executed an extended funding facility with the International Monetary Fund, pursuant to which the government announced that it would be softening some of its historical capital and currency controls. Additionally, the BCRA also issued a new series of certain USD-denominated bonds (BOPREALs) during the quarter, similar to the prior year, which provides a mechanism for companies to remit dividends up to a certain amount through the purchase and subsequent sale of the bonds and remittance of the bond proceeds. In June 2025, Citi subscribed to BOPREALs at a par value of approximately $340 million. Citi intends to sell these BOPREALs and remit the proceeds during 2025, thereby reducing its net investment in the country. The actual remittance amount will depend on the ultimate sale price of the BOPREALs.
Of the $1.5 billion net investment in Argentina as of June 30, 2025, Citi’s net ARS exposure (net of the associated reserves) was approximately $1.0 billion (compared to $1.1 billion at March 31, 2025). As of June 30, 2025, Citi hedged approximately $0.4 billion of its ARS exposure through offshore hedges, and Citi was unable to hedge its remaining exposure, given illiquidity in the offshore derivatives market. Given the historical capital and currency controls, certain indirect foreign exchange mechanisms continue to exist that some Argentine entities may use to obtain USD, often at rates higher than the official exchange rate. To the extent that Citi is unable to hedge its ARS exposure in the future, Citi may incur additional translation losses on its net investment in Argentina.
For additional information on Citi’s emerging markets risks, including those related to its Argentina exposures, see “Managing Global Risk—Other Risks—Country Risk—Argentina” and “Risk Factors—Other Risks” in Citi’s 2024 Form 10-K.
89
SIGNIFICANT ACCOUNTING POLICIES AND SIGNIFICANT ESTIMATES
This section contains a summary of Citi’s most significant accounting policies. Note 1 to the Consolidated Financial Statements in Citi’s 2024 Form 10-K contains a summary of all of Citigroup’s significant accounting policies. These policies, as well as estimates made by management, are integral to the presentation of Citi’s results of operations and financial condition. While all of these policies require a certain level of management judgment and estimates, this section highlights and discusses the significant accounting policies that require management to make highly difficult, complex or subjective judgments and estimates at times regarding matters that are inherently uncertain and susceptible to change (see also “Risk Factors—Operational Risks” in Citi’s 2024 Form 10-K). Management has discussed each of these significant accounting policies, the related estimates and its judgments with the Audit Committee of the Citigroup Board of Directors.
Valuations of Financial Instruments
Citigroup holds debt and equity securities, derivatives, retained interests in securitizations, investments in private equity and other financial instruments. A portion of these assets and liabilities is reflected at fair value on Citi’s Consolidated Balance Sheet as Trading account assets, Available-for-sale securities and Trading account liabilities.
Citi purchases securities under agreements to resell (reverse repos or resale agreements) and sells securities under agreements to repurchase (repos), a substantial portion of which is carried at fair value. In addition, certain loans, short-term borrowings, long-term debt and deposits, as well as certain securities borrowed and loaned positions that are collateralized with cash, are carried at fair value. Citigroup holds its investments, trading assets and liabilities, and resale and repurchase agreements on Citi’s Consolidated Balance Sheet to meet customer needs and to manage liquidity needs, interest rate risks and private equity investing.
When available, Citi generally uses quoted market prices to determine fair value and classifies such items within Level 1 of the fair value hierarchy established under ASC 820-10, Fair Value Measurement. If quoted market prices are not available, fair value is based on internally developed valuation models that use, where possible, current market-based or independently sourced market parameters, such as interest rates, currency rates and option volatilities. Such models are often based on a discounted cash flow analysis. In addition, items valued using such internally generated valuation techniques are classified according to the lowest level input or value driver that is significant to the valuation. Thus, an item may be classified under the fair value hierarchy as Level 2 if the significant inputs are observable or Level 3 if there are some significant inputs that are not readily observable.
Citi is required to exercise subjective judgments relating to the applicability and functionality of internal valuation models, the significance of inputs or drivers to the valuation of an instrument and the degree of illiquidity and subsequent lack of observability in certain markets. The fair value of these instruments is reported on Citi’s Consolidated Balance Sheet with the changes in fair value recognized in either the Consolidated Statement of Income or in AOCI.
Losses on available-for-sale securities whose fair values are less than the amortized cost, where Citi intends to sell the security or could more-likely-than-not be required to sell the security prior to recovery, are recognized in earnings. Where Citi does not intend to sell the security nor could more-likely-than-not be required to sell the security, any portion of the loss that is attributable to credit is recognized as an allowance for credit losses with a corresponding provision for credit losses, and the remainder of the loss is recognized in AOCI. Such losses are capped at the difference between the fair value and amortized cost of the security.
For equity securities carried at cost or under the measurement alternative, decreases in fair value below the carrying value are recognized as impairment in the Consolidated Statement of Income. Moreover, for certain equity method investments, decreases in fair value are only recognized in earnings in the Consolidated Statement of Income if such decreases are judged to be an other-than-temporary impairment (OTTI). Assessing if the fair value impairment is temporary is also inherently judgmental.
The fair value of financial instruments incorporates the effects of Citi’s own credit risk and the market view of counterparty credit risk, the quantification of which is also complex and judgmental. For additional information on Citi’s fair value analysis, see Notes 6, 23 and 24 in this Form 10-Q and Note 1 to the Consolidated Financial Statements in Citi’s 2024 Form 10-K.
90
Citi’s Allowance for Credit Losses (ACL)
The table below presents Citi’s allowance for credit losses on loans (ACLL) and total ACL as of June 30, 2025 and December 31, 2024, as well as builds and releases during 2025. For information on the drivers of Citi’s ACL net build in the second quarter of 2025, see below. For additional information on Citi’s accounting policy on accounting for credit losses under ASC Topic 326, Financial Instruments—Credit Losses; Current Expected Credit Losses (CECL), see Note 1 to the Consolidated Financial Statements in Citi’s 2024 Form 10-K.
ACL
In millions of dollars
Balance Dec. 31, 2024
1Q25 build (release)
1Q25 FX/ Other
Balance Mar. 31, 2025
2Q25 build (release)
2Q25 FX/ Other
Balance Jun. 30, 2025
ACLL/EOP loans Jun. 30, 2025
Services
$
264
$
24
$
2
$
290
$
53
$
4
$
347
Markets
1,030
48
5
1,083
53
7
1,143
Banking
1,167
78
7
1,252
137
21
1,410
Legacy Franchisescorporate (Banamex SBMM and AFG)(1)
95
4
1
100
16
7
123
Total corporate ACLL
$
2,556
$
154
$
15
$
2,725
$
259
$
39
$
3,023
0.94
%
U.S. cards(2)(3)
$
13,560
$
(169)
$
1
$
13,392
$
(12)
$
2
$
13,382
8.00
%
Installment loans(3)
425
(5)
(1)
419
7
(1)
425
Retail Banking
144
3
—
147
(1)
1
147
Total USPB
$
14,129
$
(171)
$
—
$
13,958
$
(6)
$
2
$
13,954
Wealth
529
61
2
592
(64)
7
535
All Other consumer—managed basis(4)
1,360
69
22
1,451
54
106
1,611
Reconciling Items(4)
—
(11)
11
—
—
—
—
Total consumer ACLL
$
16,018
$
(52)
$
35
$
16,001
$
(16)
$
115
$
16,100
4.07
%
Total ACLL
$
18,574
$
102
$
50
$
18,726
$
243
$
154
$
19,123
2.67
%
Allowance for credit losses on unfunded lending commitments (ACLUC)
$
1,601
$
108
$
11
$
1,720
$
(19)
$
20
$
1,721
Total ACLL and ACLUC
$
20,175
$
210
$
61
$
20,446
$
224
$
174
$
20,844
Other(5)
2,002
34
300
2,336
388
111
2,835
Total ACL
$
22,177
$
244
$
361
$
22,782
$
612
$
285
$
23,679
(1) Includes Legacy Franchises corporate loans activity related to Banamex SBMM and the Assets Finance Group (AFG) (AFG was previously reported in Markets; all periods have been reclassified to reflect this move into Legacy Franchises), as well as other Legacy Holdings Assets corporate loans.
(2) As of June 30, 2025, in USPB, Branded Cards ACLL/EOP loans was 6.5% and Retail Services ACLL/EOP loans was 11.5%.
(3) See footnote 4 in “U.S. Personal Banking” above for the description of a change in reporting.
(4) All Other (managed basis) excludes divestiture-related impacts (Reconciling Items) related to (i) Citi’s divestitures of its Asia Consumer businesses and (ii) the planned IPO of Banamex, within Legacy Franchises. The Reconciling Items are reflected in Citi’s Consolidated Statement of Income. See “All Other—Divestiture-Related Impacts (Reconciling Items)” above.
(5) Includes ACL on Other assets, primarily related to transfer risk associated with exposures outside the U.S. and Held-to-maturity debt securities.
Citi’s reserves for expected credit losses on funded loans and for unfunded lending commitments, standby letters of credit and financial guarantees are reflected on the Consolidated Balance Sheet in the Allowance for credit losses on loans (ACLL) and Other liabilities (for Allowance for credit losses on unfunded lending commitments (ACLUC)), respectively. In addition, Citi’s reserves for expected credit losses on other financial assets carried at amortized cost, including held-to-maturity securities, reverse repurchase agreements, securities borrowed, deposits with banks and other financial receivables, are reflected in Other assets,including transfer risk associated with exposures outside the U.S. These reserves, together with the ACLL and ACLUC, are referred to as the ACL. Changes in the ACL are reflected in
Provision for credit losses in the Consolidated Statement of Income for each reporting period. Citi’s ability to estimate expected credit losses is based on the ability to forecast economic activity over a reasonable and supportable (R&S) timeframe. The R&S forecast period is eight quarters.
The ACL is composed of quantitative and qualitative management adjustment components. The quantitative component uses three forward-looking macroeconomic forecast scenarios—base, upside and downside. The qualitative management adjustment component includes risks not fully captured in the quantitative component. Both the quantitative and qualitative components are further discussed below.
91
Quantitative Component
Citi estimates expected credit losses for its quantitative component using (i) its comprehensive internal data on loss and default history, (ii) internal credit risk ratings, (iii) external credit bureau and rating agencies information and (iv) reasonable and supportable (R&S) forecasts of macroeconomic conditions.
For its consumer and corporate portfolios, Citi’s expected credit losses are determined primarily by utilizing models that consider the borrowers’ probability of default (PD), loss given default (LGD) and exposure at default (EAD). The loss likelihood and severity models used for estimating expected credit losses are sensitive to changes in macroeconomic variables, including unemployment rate, real GDP and housing prices, and cover a wide range of geographic, industry, product and business segments.
In addition, Citi’s models determine expected credit losses based on portfolio characteristics, including loan delinquencies, changes in portfolio size, default frequency, risk ratings and loss recovery rates, as well as other credit trends.
Qualitative Component
The qualitative management adjustment component includes risks that are not fully captured in the quantitative component. These may include but are not limited to portfolio characteristics, idiosyncratic events, factors not within historical loss data or the economic forecast, uncertainty in the credit environment and other factors as required by banking supervisory guidance for the ACL. The primary examples of these are the following:
•Transfer risk associated with exposures outside the U.S.
•Potential impacts on vulnerable industries and regions due to emerging macroeconomic risks and uncertainties, including those related to a potential global recession, inflation, interest rates and commodity prices.
As of the second quarter of 2025, Citi’s qualitative component of the ACL increased quarter-over-quarter. The increase was primarily driven by transfer risk associated with client activity in Russia, partially offset by a reduction in qualitative reserves associated with consumer payment behavior related to the elevated inflationary and interest rate environment.
Macroeconomic Variables
As further discussed below, Citi considers various global macroeconomic variables for the base, upside and downside probability-weighted macroeconomic scenario forecasts it uses to estimate the quantitative component of the ACL. Citi’s forecasts of the U.S. unemployment rate and U.S. real GDP growth rate represent the key macroeconomic variables that most significantly affect its estimate of the ACL.
The tables below present Citi’s forecasted quarterly average U.S. unemployment rate and year-over-year U.S. real GDP growth rate used in determining the base macroeconomic forecast for Citi’s ACL at each quarterly reporting period from the second quarter of 2024 to the second quarter of 2025:
Quarterly average
U.S. unemployment
3Q25
1Q26
3Q26
8-quarter average(1)
Citi forecast at 2Q24
4.1
%
3.9
%
4.0
%
4.1
%
Citi forecast at 3Q24
4.4
3.9
3.9
4.2
Citi forecast at 4Q24
4.3
4.1
4.1
4.2
Citi forecast at 1Q25
4.3
4.3
4.3
4.3
Citi forecast at 2Q25
4.4
4.7
4.7
4.6
(1) Represents the average unemployment rate for the rolling, forward-looking eight quarters in the forecast horizon.
Year-over-year growth rate(1)
Full year
U.S. real GDP
2025
2026
2027
Citi forecast at 2Q24
1.8
%
2.0
%
2.0
%
Citi forecast at 3Q24
1.8
2.0
2.0
Citi forecast at 4Q24
2.2
2.1
2.2
Citi forecast at 1Q25
2.0
1.9
2.0
Citi forecast at 2Q25
1.4
1.4
2.0
(1) The year-over-year growth rate is the percentage change in the real (inflation adjusted) GDP level.
Under the base macroeconomic forecast as of the second quarter of 2025, U.S. real GDP growth in 2025 is expected to slow from 2024 levels, while the unemployment rate is expected to increase.
Scenario Weighting
Citi’s ACL is estimated using three probability-weighted macroeconomic scenarios—base, upside and downside. The macroeconomic scenario weights are estimated using a statistical model, which, among other factors, takes into consideration (i) key macroeconomic drivers of the ACL, (ii) the severity of the scenario and (iii) other sources of macroeconomic uncertainties and risks. Citi evaluates scenario weights on a quarterly basis.
Citi’s downside scenario incorporates more adverse macroeconomic assumptions than the weighted scenario assumptions or the base scenario. For example, compared to the base scenario, Citi’s downside scenario reflects a recession, including an elevated average U.S. unemployment rate of 6.9% over the eight-quarter R&S period, with a peak difference of 3.3% in the fourth quarter of 2026. The weighted-average U.S. unemployment rate that considers all three probability-weighted scenarios is 5.2%. The downside scenario also reflects a year-over-year U.S. real GDP contraction in 2026 of 1.9%, with a peak quarter-over-quarter difference to the base scenario of 1.2%.
92
Citi’s ACL is sensitive to the various macroeconomic scenarios that drive the quantitative component of expected credit losses, due to changes in the length and severity of forecasted economic variables or events in the respective scenarios. Citi’s downside scenario incorporates more adverse macroeconomic assumptions than the weighted scenario assumptions. To demonstrate this sensitivity, if Citi applied 100% weight to the downside scenario as of June 30, 2025 to reflect the most severe economic deterioration forecast in the macroeconomic scenarios, there would have been a hypothetical incremental increase in the ACL of approximately $5.3 billion related to lending exposures, except for loans individually evaluated for credit losses and other financial assets carried at amortized cost.
This analysis does not incorporate any impacts or changes to the qualitative component of the ACL, which could change the outcome of the sensitivity analysis based on historical experience and current conditions at the time of the assessment. Given the uncertainty inherent in macroeconomic forecasting, Citi continues to believe that its ACL estimate based on a three probability-weighted macroeconomic scenario approach combined with the qualitative component remains appropriate as of June 30, 2025.
2Q25 Changes in the ACL
As further discussed below, Citi’s ending ACL balance for the second quarter of 2025 was $23.7 billion, an increase of $0.9 billion from March 31, 2025, driven by a net ACL build of $0.6 billion and a $0.3 billion increase related to FX translation on the ACL. The net build of $0.6 billion in the quarter was largely driven by transfer risk associated with client activity in Russia, primarily in Services,and changes in portfolio composition in Banking and Markets. Citi believes its analysis of the ACL reflects the forward view of the economic environment as of June 30, 2025. See Note 15 for additional information.
Consumer Allowance for Credit Losses on Loans
Citi’s consumer ACLL is primarily driven by U.S. cards (Branded Cards and Retail Services) in USPB. Citi’s total consumer ACLL net release was less than $0.1 billion in the second quarter of 2025, driven by changes in portfolio composition in USPB,offset by a deterioration in the outlook for the U.S. unemployment rate, as well as higher loan growth in USPB. This resulted in a June 30, 2025 ACLL balance of $16.1 billion, or 4.07% of total funded consumer loans.
For U.S. cards, the level of reserves relative to total funded loans decreased to 8.00% at June 30, 2025, compared to 8.23% at March 31, 2025, driven by changes in portfolio composition. For the remaining consumer exposures, the level of reserves relative to total funded loans was 1.19% at June 30, 2025, compared to 1.17% at March 31, 2025.
Corporate Allowance for Credit Losses on Loans
Citi had a corporate ACLL build of $0.3 billion in the second quarter of 2025, driven by changes in portfolio composition within Banking and Markets.This resulted in a June 30, 2025 ACLL balance of $3.0 billion, or 0.94% of total funded corporate loans.
ACLUC
Citi’s ACLUC reserve balance in the second quarter of 2025, included in Other liabilities,was $1.7 billion at June 30, 2025, unchanged from March 31, 2025.
ACL on Other Financial Assets
Citi had an ACL build of $0.4 billion on other financial assets carried at amortized cost for the second quarter of 2025, driven by transfer risk associated with client activity in Russia. Including FX/Other, the ACL reserve balance increased by $0.5 billion to $2.8 billion at June 30, 2025 from March 31, 2025. See Note 15 for additional information.
See Notes 1 and 16 to the Consolidated Financial Statements in Citi’s 2024 Form 10-K for further descriptions of the ACL and related accounts.
Goodwill
Citi tests for goodwill impairment annually as of October 1 (the annual test) and conducts interim assessments between annual tests if an event occurs or circumstances change that would more-likely-than-not reduce the fair value of a reporting unit below its carrying amount. These events or circumstances include, among other things, a significant adverse change in the business climate, a decision to sell or dispose of all or a significant portion of a reporting unit or a sustained decrease in Citi’s stock price.
Citi performed its annual goodwill impairment test, which resulted in no impairment of any of Citi’s consolidated reporting units’ goodwill. No additional triggering events were identified and no goodwill was impaired during 2024. For each of the Company’s reporting units, fair value exceeded carrying value by at least 10%.
Reporting units used for goodwill assessment at the Citigroup consolidated level may differ from the reporting units of its subsidiaries.
Unanticipated declines in business performance, increases in credit losses, increases in capital requirements and adverse regulatory or legislative changes, and deterioration in economic or market conditions, as well as circumstances related to Citi’s strategic refresh, are factors that could result in a material impairment loss to earnings in a future period related to some portion of the associated goodwill. See Note 16 for additional information on goodwill, including the changes in the goodwill balance in the quarter and the segments’ and All Other’s goodwill balances as of June 30, 2025.
Litigation Accruals
See the discussion in Note 27 for Citi’s policies on establishing accruals for litigation and regulatory contingencies.
93
INCOME TAXES
Effective Tax Rate
Three Months Ended June 30,
Six Months Ended June 30,
In millions of dollars, except effective tax rate
2025
2024
2025
2024
Income from continuing operations before income tax expense
$
5,219
$
4,310
$
10,667
$
8,854
Provision for income taxes
1,186
1,047
2,526
2,183
Effective tax rate
23
%
24
%
24
%
25
%
Citi’s effective tax rate was 23% in the second quarter of 2025 and 24% in the second quarter of 2024, with the rates for all periods including the impact of divestitures, driven by a benefit related to a resolution of a tax audit.
Deferred Tax Assets
For additional information on Citi’s deferred tax assets (DTAs), see “Capital Resources,” “Risk Factors—Strategic Risks,” “Significant Accounting Policies and Significant Estimates—Income Taxes” and Notes 1 and 10 to the Consolidated Financial Statements in Citi’s 2024 Form 10-K.
The table below summarizes Citi’s net DTAs balance:
Jurisdiction/Component
DTAs balance
In billions of dollars
June 30, 2025
December 31, 2024
Total U.S.
$
26.6
$
26.6
Total foreign
2.9
3.2
Total
$
29.5
$
29.8
At June 30, 2025, Citigroup had recorded net DTAs of approximately $29.5 billion, a decrease of $0.1 billion from March 31, 2025. The quarter-over-quarter decrease was primarily from a carry-forward reduction. Of Citi’s $29.5 billion of net DTAs, $13.3 billion (compared to $13.8 billion at March 31, 2025) was deducted in calculating Citi’s regulatory capital, and the remaining $16.2 billion was appropriately risk weighted under the Basel III rules.
The $13.3 billion of DTAs deducted from regulatory capital was composed of $11.2 billion related to tax carry-forwards, with $4.2 billion of temporary differences in excess of the 10%/15% regulatory limitations, reduced by $2.1 billion of deferred tax liabilities, primarily associated with goodwill and certain other intangible assets that were separately deducted from capital.
DTA Realizability
Citi believes that the net DTAs of $29.5 billion at June 30, 2025 are more-likely-than-not to be realized, based on management’s expectations of future taxable income generation in the jurisdictions in which the DTAs arise, as well as consideration of available tax planning strategies (as defined in ASC Topic 740, Income Taxes).
Legislative Developments
On July 4, 2025, H.R. 1, the U.S. fiscal-year 2025 budget reconciliation legislation, was signed into law, implementing changes in tax and other provisions. Citi does not currently believe the impacts of H.R. 1 will be material to Citi’s financial results or financial condition.
94
DISCLOSURE CONTROLS AND PROCEDURES
Citi’s disclosure controls and procedures are designed to ensure that information required to be disclosed under the Securities Exchange Act of 1934, as amended, is recorded, processed, summarized and reported within the time periods specified in the SEC’s rules and forms, including without limitation that information required to be disclosed by Citi in its SEC filings is accumulated and communicated to management, including the Chief Executive Officer (CEO) and Chief Financial Officer (CFO), as appropriate, to allow for timely decisions regarding required disclosure.
Citi’s Disclosure Committee assists the CEO and CFO in their responsibilities to design, establish, maintain and evaluate the effectiveness of Citi’s disclosure controls and procedures. The Disclosure Committee is responsible for, among other things, the oversight, maintenance and implementation of the disclosure controls and procedures, subject to the supervision and oversight of the CEO and CFO.
Citi’s management, with the participation of its CEO and CFO, has evaluated the effectiveness of Citigroup’s disclosure controls and procedures (as defined in Rule 13a-15(e) under the Securities Exchange Act of 1934) as of June 30, 2025. Based on that evaluation, the CEO and CFO have concluded that at that date Citigroup’s disclosure controls and procedures were effective.
DISCLOSURE PURSUANT TO SECTION 219 OF THE IRAN THREAT REDUCTION AND SYRIA HUMAN RIGHTS ACT
Pursuant to Section 219 of the Iran Threat Reduction and Syria Human Rights Act of 2012 (Section 219), which added Section 13(r) to the Securities Exchange Act of 1934, as amended, Citi is required to disclose in its annual or quarterly reports, as applicable, whether it or any of its affiliates knowingly engaged in certain activities, transactions or dealings relating to Iran or with certain individuals or entities that are the subject of sanctions under U.S. law. Disclosure may be required even where the activities, transactions or dealings were conducted in compliance with applicable law. To the extent that transactions or dealings for its clients are permitted by U.S. law, Citi may continue to engage in such activities.
During the first quarter of 2025, Citigroup identified one transaction that was reportable pursuant to Section 219. Citi did not identify any reportable activities, transactions or dealings pursuant to Section 219 for the second quarter of 2025.
95
FORWARD-LOOKING STATEMENTS
Certain statements in this Form 10-Q, including but not limited to statements included within Management’s Discussion and Analysis of Financial Condition and Results of Operations, are “forward-looking statements” within the meaning of the Private Securities Litigation Reform Act of 1995. In addition, Citigroup may make forward-looking statements in its other documents filed or furnished with the SEC, and its management may make forward-looking statements orally to analysts, investors, representatives of the media and others.
Generally, forward-looking statements are not based on historical facts but instead represent Citigroup’s and its management’s beliefs regarding future events. Such statements may be identified by words such as believe, expect, anticipate, intend, estimate, may increase, may fluctuate, target, outlook, guidance and illustrative, and similar expressions or future or conditional verbs such as will, should, would and could.
Such statements are based on management’s current expectations and are subject to risks, uncertainties and changes in circumstances. Actual results of operations and financial conditions, including capital and liquidity, may differ materially from those included in these statements due to a variety of factors, including without limitation (i) the precautionary statements included within the “Executive Summary,” “Citi’s Multiyear Transformation” and each business’s discussion and analysis of its results of operations above, as well as those included within Citi’s First Quarter of 2025 Form 10-Q, Citi’s 2024 Form 10-K and Citi’s other SEC filings; (ii) the factors described under “Risk Factors” in Citi’s 2024 Form 10-K; and (iii) the risks and uncertainties summarized below:
•the potential impact to Citi and its clients and customers in the U.S. and globally related to U.S. trade and tariff policies and resulting retaliatory actions, including heightened market volatility and increased economic uncertainty, such as negative impacts to inflation and global economic activity, disruptions in global supply chains and trade flows, deterioration in corporate and consumer confidence and other adverse macroeconomic impacts;
•the potential impact to Citi from other macroeconomic and geopolitical tensions, conflicts and other challenges, uncertainties and volatility, including, among others, government fiscal and monetary actions or expected actions, including changes in interest rate policy or other monetary policies; conflicts in the Middle East, between Russia and Ukraine and in other regions; economic and geopolitical challenges related to China, including weak economic growth and related policy actions, challenges in its real estate sector, banking and credit markets and tensions or conflicts between China and Taiwan and/or involving China and the U.S.; natural disasters; and pandemics;
•the potential impact on Citi’s ability to return capital to common shareholders, whether through its common stock dividend or through its stock repurchase program, consistent with its capital planning efforts and targets, due to, among other things, regulatory capital requirements, including annual recalibration of the Stress Capital Buffer, recalibration of the GSIB surcharge and supervisory expectations and assessments, including any negative findings regarding absolute capital levels or other aspects of Citi’s operations; changes in regulatory capital rules, requirements or interpretations, including significant revisions to the U.S. Basel III rules; Citi’s results of operations and financial condition, including the capital impact related to Citi’s remaining divestitures; Citi’s effectiveness in planning, managing and calculating its level of regulatory capital and risk-weighted assets under both the Advanced Approaches and the Standardized Approach and Supplementary Leverage ratio; Citi’s implementation and maintenance of an effective capital planning process and management framework; forecasts of macroeconomic conditions; and Citi’s DTA utilization;
•the ongoing regulatory and legislative uncertainties and changes faced by financial institutions, including Citi, in the U.S. and globally, such as potential changes to various aspects of the U.S. regulatory capital framework and requirements applicable to Citi; potential fiscal, monetary, tax, sanctions, human capital and other changes from the U.S. federal government and other governments; and the potential impact these uncertainties and changes could have on Citi’s competitive position, businesses, revenues, results of operations and financial condition and compliance risks and costs;
•Citi’s ability to achieve its objectives, including those related to revenue, net interest income, expense and capital expectations, from its priorities regarding its simplification, transformation and enhanced business performance, including the planned IPO of Banamex, which involve significant complexities, execution challenges and uncertainties, may not be as productive or effective as Citi expects or at all, may result in higher-than-expected expenses or lower expense savings or revenue growth than expected, litigation and regulatory scrutiny, CTA and other losses or other negative financial or strategic impacts, which could be material, and depend, in part, on factors that Citi cannot control or be able to mitigate, including, among others, macroeconomic challenges and uncertainties, customer, client and competitor actions, regulatory requirements or changes and heightened regulatory and supervisory expectations and scrutiny;
•the potential impact to Citi from climate change due to both physical risks, including acute risks as well as the consequences of chronic changes in climate, and transition risks, including those arising from regulatory, market, technological, stakeholder and legal changes from a transition to a low-carbon economy, such as increased regulatory, compliance, credit, reputational and other risks and costs;
96
•Citi’s ability to utilize its DTAs and thus reduce the negative impact of the DTAs on Citi’s regulatory capital, including as a result of its ability to generate U.S. taxable income in the relevant reversal periods or changes to the U.S. federal corporate tax rate;
•the potential impact to Citi if its interpretation or application of the complex income-based and non- income-based (such as withholding, stamp, service and other non-income taxes) tax laws to which it is subject in the U.S. and in non-U.S. jurisdictions differs from those of the relevant governmental taxing authorities, including as a result of litigation or examinations regarding non- income-based tax matters, and the resulting payment of additional taxes, penalties or interest, the reduction of certain tax benefits or the requirement to make adjustments to amounts recorded;
•the potential impact from a deterioration in or failure to maintain Citi’s co-branding or private label credit card relationships, due to, among other things, increasing competition among card issuers; the general economic environment, including the impacts stemming from potential increases in unemployment, inflation or interest rates or lower economic growth rates, as well as a risk of recession; changes in consumer sentiment, spending patterns and credit card usage behaviors; a decline in sales and revenues, partner store closures or other operational difficulties of the retailer or merchant; changes in partner business strategies, including changes in products and services offered; termination or non-renewal of partner agreements, including early termination of a particular relationship; or other factors, including partner bankruptcies, liquidations, restructurings, consolidations or other similar events, whether due to the impact of a challenging macroeconomic environment or otherwise;
•Citi’s ability to address shortcomings or deficiencies or guidance provided by the FRB or FDIC on its resolution plan submissions;
•the potential impact on Citi’s performance and the performance of its individual businesses, including its competitive position and ability to effectively manage its businesses, and its ability to effectively execute its transformation, simplification and other priorities, if Citi is unable to hire and retain qualified employees, particularly given the highly competitive environment for talent and other factors, such as potential attrition driven by, among other things, changes in worker expectations and regulation of employee compensation in the banking industry;
•Citi’s ability to compete effectively in the U.S. and globally with both financial and non-financial services firms, including as a result of certain competitors being subject to less stringent legal, regulatory and supervisory requirements; the introduction of mobile platforms and new or emerging technologies, such as artificial intelligence (AI)–driven solutions; mergers and acquisitions involving traditional financial services companies such as regional banks or credit card issuers; changes in the payments space; developments in digital finance, including growth and use of digital assets resulting from regulatory and other changes driven by the
U.S. administration and Congress; reliance on third parties for certain product and service offerings and any impact if a third party is unable to provide adequate support for such product and service offerings; and the increased operational, compliance and other risks resulting from the need to develop new or change or adapt existing products and services to attract and retain customers or clients or adapt to their changing policies or priorities to compete more effectively;
•the potential impact to Citi from a prior or future failure or disruption of its operational processes or systems, including as a result of, among other things, operational or execution failures or deficiencies by third parties, including third parties that provide products or services to Citi or other market participants or those that otherwise have an ongoing partnership or business relationship with Citi; deficiencies in processes or controls; inadequate management of data governance practices, data controls and monitoring mechanisms that may adversely impact internal or external reporting and decision-making; cyber or information security incidents; human error, such as manual transaction processing errors, which can be exacerbated by staffing challenges and processing backlogs; ineffective, inadequate or faulty Generative AI development or deployment practices by Citi or third parties; fraud or malice on the part of employees or third parties; insufficient (or limited) straight-through processing between legacy or bespoke systems and any failure to design and effectively operate controls that mitigate operational risks associated with those legacy or bespoke systems, leading to potential risk of errors and operating losses; accidental system or technological failure; electrical or telecommunication outages; failure of or cyber incidents involving computer servers or infrastructure, including software updates and cloud services; and other similar losses or damage to Citi’s property or assets;
•the increasing risk to Citi’s and third parties’ computer systems, software and networks from ongoing, continually evolving, sophisticated cybersecurity incidents that could result in, among other things, the theft, loss, non-availability, misuse or disclosure of personal, confidential or proprietary Citi, client, customer or employee information or assets and a disruption of computer, software or network systems; and the potential impact from such risks, including reputational damage, loss of revenues, deposit outflows, additional costs (including repair, replacement, remediation and other costs), exposure to litigation and regulatory action and other financial losses;
•the potential impact of changes or errors in accounting assumptions, judgments or estimates, or the application of certain accounting principles, related to the preparation of Citi’s financial statements, including the estimate of Citi’s ACL, which is subject to judgments and depends on its CECL models and assumptions, forecasted macroeconomic conditions, which can be more challenging to forecast during times of significant market volatility and uncertainty, and characteristics of Citi’s loan portfolios and other applicable financial assets;
97
reserves related to litigation, regulatory and tax matters; valuation of DTAs; the fair values of certain assets and liabilities and the assessment of goodwill and other assets for impairment; and the financial impact from reclassification of any CTA component of AOCI into Citi’s earnings due to a sale, substantial liquidation, expropriation or other deconsolidation event, such as those related to Citi’s remaining consumer banking divestitures or other legacy businesses;
•the impact of changes to financial accounting and reporting standards or interpretations of how Citi records and reports its financial condition and results of operations;
•the potential impact to Citi’s results of operations and/or regulatory capital and capital ratios if Citi’s risk management and other processes, strategies or models are deficient or ineffective, including, among others, those related to its comprehensive stress testing initiatives or management and aggregation of data; Citi’s Basel III regulatory capital models require refinement, modification or enhancement; or any negative regulatory evaluation or examination finding is issued or enforcement action is taken by Citi’s U.S. banking regulators;
•the potential impact of credit risk and concentrations of risk on Citi’s results of operations, including due to higher-than-expected defaults by or a significant downgrade in credit ratings of consumer, corporate or public sector borrowers or other counterparties in the U.S. or in various countries and jurisdictions globally, such as from indemnification obligations in connection with various transactions, including hedging or reinsurance arrangements related to those obligations, or Citi’s inability to liquidate or realize the fair value of its collateral, which risks can be heightened for vulnerable sectors, industries or countries impacted by macroeconomic, geopolitical, market and other challenges, uncertainties and volatilities;
•the potential impact on Citi’s liquidity, sources of funding and costs of funding if it does not effectively manage its liquidity whether due to factors it cannot control or otherwise, including, among others, general disruptions in the financial markets; changes in fiscal and monetary policies; regulatory requirements, including changes in regulations; negative investor or counterparty perceptions of Citi’s creditworthiness; deposit outflows or unfavorable changes in deposit mix; unexpected increases in cash or collateral requirements; competition for funding, including for deposits and any decrease in demand for corporate debt securities; the consequent inability to monetize available liquidity resources; changes in Citi’s credit spreads; changes in interest rates; and changes in currency exchange rates;
•the impact of a credit ratings downgrade of Citi or certain of its subsidiaries or issuing entities, or from negative actions on U.S. sovereign ratings or on Citi’s funding and liquidity as well as on the results of operations of certain of its businesses;
•the potential impact to Citi of significantly heightened regulatory and supervisory expectations and scrutiny in the U.S. and globally and ongoing interpretation and implementation of regulatory and legislative requirements and changes, with respect to, among other things, governance, infrastructure, data, risk management practices and controls, customer and client protection, market practices, anti-money laundering, increasingly complex sanctions and disclosure regimes and various regulatory reporting requirements, including the impact on Citi’s compliance, regulatory and other risks and costs, such as increased regulatory oversight, material restrictions, including, among others, imposition of additional capital buffers and limitations on capital distributions, enforcement proceedings, penalties and fines;
•the potential outcomes of the extensive legal and regulatory proceedings, examinations, investigations, consent orders and related compliance efforts and other inquiries to which Citi is or may be subject at any given time, such as the 2020 consent orders with the FRB and OCC and the amendment to the 2020 OCC consent order, particularly given the increased focus by regulators on risk and controls, such as enterprise-wide risk management, compliance, data quality management and governance and internal controls, and policies and procedures; Citi’s ability to implement extensive targeted action plans and submit quarterly progress reports on a timely and sufficient basis detailing the results and status of improvements to comply with the consent orders, which will continue to require significant investments to meet regulatory expectations; and the heightened scrutiny and expectations generally from regulators, and the severity of the remedies that may be sought by regulators; and
•the various risks faced by Citi as a result of its presence in the emerging markets, including, among others, those resulting from the impact of policies and actions from the U.S. administration; limitations or unavailability of hedges on foreign investments; foreign currency volatility and devaluations; central bank interest rate and other monetary policies; unemployment, recessions or weak or slowing economic growth; elevated inflation and hyperinflation; foreign exchange controls; macroeconomic, geopolitical and domestic political challenges, uncertainties and volatility; cyberattacks; restrictions arising from retaliatory laws and regulations; sanctions or asset freezes; sovereign debt volatility; fluctuations in commodity prices; regulatory changes, including potential conflicts among regulations with other jurisdictions where Citi does business; limitations on foreign investment; sociopolitical instability; nationalization or loss of licenses; closure of branches or subsidiaries; any substantial liquidation, expropriation or other deconsolidation event related to Citi’s remaining consumer banking divestitures or other legacy businesses; and the need to record CTA and other losses, as well as additional reserves for expected losses for credit exposures based on the transfer risk associated with exposures outside the U.S.
98
Any forward-looking statements made by or on behalf of Citigroup speak only as to the date they are made, and Citi does not undertake to update forward-looking statements to reflect the impact of circumstances or events that arise after the date that the forward-looking statements were made.
99
This page intentionally left blank.
100
FINANCIAL STATEMENTS AND NOTES—TABLE OF CONTENTS
CONSOLIDATED FINANCIAL STATEMENTS
Consolidated Statement of Income (Unaudited)— For the Three and Six Months Ended June 30, 2025 and 2024
Net impairment losses on investments recognized in earnings
(35)
(21)
(93)
(51)
Other revenue
(884)
62
(1,036)
539
Total non-interest revenues
$
6,493
$
6,539
$
14,077
$
14,048
Total revenues, net of interest expense(1)
$
21,668
$
20,032
$
43,264
$
41,048
Provisions for credit losses and for benefits and claims
Provision for credit losses on loans
$
2,477
$
2,359
$
5,038
$
4,781
Provision (release) for credit losses on HTM debt securities
7
(5)
2
5
Provision for credit losses on other assets
381
112
420
116
Policyholder benefits and claims
26
18
46
45
Provision (release) for credit losses on unfunded lending commitments
(19)
(8)
89
(106)
Total provisions for credit losses and for benefits and claims
$
2,872
$
2,476
$
5,595
$
4,841
Operating expenses(1)
Compensation and benefits
$
7,633
$
6,888
$
15,097
$
14,561
Technology/communication
2,290
2,238
4,669
4,484
Transactional and tax charges
985
1,035
1,921
1,939
Premises and equipment
615
597
1,189
1,182
Professional services
510
449
986
875
Advertising and marketing
269
280
519
508
Restructuring
(2)
36
(5)
261
Other operating
1,277
1,723
2,626
3,543
Total operating expenses
$
13,577
$
13,246
$
27,002
$
27,353
Income from continuing operations before income taxes
$
5,219
$
4,310
$
10,667
$
8,854
Provision for income taxes
1,186
1,047
2,526
2,183
Income from continuing operations
$
4,033
$
3,263
$
8,141
$
6,671
Discontinued operations
Income (loss) from discontinued operations
$
—
$
—
$
(1)
$
(1)
Benefit for income taxes
—
—
—
—
Income (loss) from discontinued operations, net of taxes
$
—
$
—
$
(1)
$
(1)
Net income before attribution to noncontrolling interests
$
4,033
$
3,263
$
8,140
$
6,670
Noncontrolling interests
14
46
57
82
Citigroup’s net income
$
4,019
$
3,217
$
8,083
$
6,588
Statement continues on the next page.
102
Basic earnings per share(2)
Income from continuing operations
$
1.98
$
1.54
$
3.98
$
3.14
Income from discontinued operations, net of taxes
—
—
—
—
Net income
$
1.98
$
1.54
$
3.98
$
3.14
Weighted-average common shares outstanding (in millions)
1,855.9
1,907.7
1,867.5
1,909.1
Diluted earnings per share(2)
Income from continuing operations
$
1.96
$
1.52
$
3.92
$
3.10
Income (loss) from discontinued operations, net of taxes
—
—
—
—
Net income
$
1.96
$
1.52
$
3.92
$
3.10
Adjusted weighted-average diluted common shares outstanding
(in millions)
1,893.1
1,945.7
1,906.4
1,944.4
(1) Effective January 1, 2025, certain transaction processing fees paid by Citi, primarily to credit card networks, which were previously presented within Other operating expenses, are presented as contra-revenue within Commissions and fees reported in Non-interest revenue. Prior periods were conformed to reflect this change in presentation.
(2) Due to rounding, earnings per share on continuing operations and discontinued operations may not sum to earnings per share on net income.
The Notes to the Consolidated Financial Statements are an integral part of these Unaudited Consolidated Financial Statements.
CONSOLIDATED STATEMENT OF COMPREHENSIVE INCOME
Citigroup Inc. and Subsidiaries
(UNAUDITED)
Three Months Ended June 30,
Six Months Ended June 30,
In millions of dollars
2025
2024
2025
2024
Citigroup’s net income
$
4,019
$
3,217
$
8,083
$
6,588
Net changes, net of taxes in Citigroup’s other comprehensive income (loss)
Unrealized gains and losses on AFS debt securities
$
278
$
(38)
$
793
$
62
Debt valuation adjustment (DVA)
(342)
256
437
(307)
Cash flow hedges
72
285
79
777
Benefit plans liability adjustment
(37)
179
(63)
256
Currency translation adjustments (CTA), net of hedges
1,966
(1,634)
2,815
(2,688)
Excluded component of fair value hedges
—
3
7
1
Long-duration insurance contracts
(1)
1
(2)
22
Citigroup’s total other comprehensive income (loss)
$
1,936
$
(948)
$
4,066
$
(1,877)
Citigroup’s total comprehensive income
$
5,955
$
2,269
$
12,149
$
4,711
Add: Other comprehensive income (loss) attributable to noncontrolling interests
$
58
$
(20)
$
107
$
(33)
Add: Net income (loss) attributable to noncontrolling interests
14
46
57
82
Total comprehensive income
$
6,027
$
2,295
$
12,313
$
4,760
The Notes to the Consolidated Financial Statements are an integral part of these Unaudited Consolidated Financial Statements.
103
CONSOLIDATED BALANCE SHEET
Citigroup Inc. and Subsidiaries
June 30,
2025
December 31,
In millions of dollars
(Unaudited)
2024
Assets
Cash and due from banks (including segregated cash and other deposits)
$
24,991
$
22,782
Deposits with banks, net of allowance
312,482
253,750
Securities borrowed and purchased under agreements to resell (including $175,024 and $140,855 as of June 30, 2025 and December 31, 2024, respectively, at fair value), net of allowance
323,892
274,062
Brokerage receivables, net of allowance
64,029
50,841
Trading account assets (including $216,338 and $193,291 pledged to creditors as of June 30, 2025 and December 31, 2024, respectively)
568,558
442,747
Investments:
Available-for-sale debt securities (including $10,072 and $5,389 pledged to creditors as of June 30, 2025 and December 31, 2024, respectively)
235,802
226,876
Held-to-maturity debt securities, net of allowance (fair value of which is $192,136 and $224,410 as of June 30, 2025 and December 31, 2024, respectively) (includes $63 and $0 pledged to creditors as of June 30, 2025 and December 31, 2024, respectively)
206,094
242,382
Equity securities (including $583 and $578 as of June 30, 2025 and December 31, 2024, respectively, at fair value)
7,504
7,399
Total investments
$
449,400
$
476,657
Loans:
Consumer (including $27 and $281 as of June 30, 2025 and December 31, 2024, respectively, at fair value)
395,759
393,102
Corporate (including $9,230 and $7,759 as of June 30, 2025 and December 31, 2024, respectively, at fair value)
329,586
301,386
Loans, net of unearned income
$
725,345
$
694,488
Allowance for credit losses on loans (ACLL)
(19,123)
(18,574)
Total loans, net
$
706,222
$
675,914
Goodwill
19,878
19,300
Intangible assets (including MSRs of $770 and $760 as of June 30, 2025 and December 31, 2024, respectively)
4,409
4,494
Premises and equipment, net of depreciation and amortization
32,312
30,192
Other assets (including $14,588 and $13,703 as of June 30, 2025 and December 31, 2024, respectively, at fair value), net of allowance
116,599
102,206
Total assets
$
2,622,772
$
2,352,945
Statement continues on the next page.
104
CONSOLIDATED BALANCE SHEETCitigroup Inc. and Subsidiaries
(Continued)
June 30,
2025
December 31,
In millions of dollars, except shares and par value per share amounts
(Unaudited)
2024
Liabilities
Deposits (including $4,112 and $3,608 as of June 30, 2025 and December 31, 2024, respectively,
at fair value)
$
1,357,733
$
1,284,458
Securities loaned and sold under agreements to repurchase (including $192,398 and $49,154 as of June 30, 2025 and December 31, 2024, respectively, at fair value)
347,913
254,755
Brokerage payables (including $3,915 and $5,207 as of June 30, 2025 and December 31, 2024,
respectively, at fair value)
90,949
66,601
Trading account liabilities
163,952
133,846
Short-term borrowings (including $20,594 and $12,484 as of June 30, 2025 and December 31, 2024, respectively, at fair value)
55,560
48,505
Long-term debt (including $127,373 and $112,719 as of June 30, 2025 and December 31, 2024, respectively, at fair value)
317,761
287,300
Other liabilities, plus allowances
74,774
68,114
Total liabilities
$
2,408,642
$
2,143,579
Stockholders’ equity
Preferred stock ($1.00 par value; authorized shares: 30 million), issued shares: as of June 30, 2025—654,000 and as of December 31, 2024—714,000, at aggregate liquidation value
$
16,350
$
17,850
Common stock ($0.01 par value; authorized shares: 6 billion), issued shares: as of June 30, 2025—3,099,750,015 and as of December 31, 2024—3,099,719,006
31
31
Additional paid-in capital
108,839
109,117
Retained earnings
211,674
206,294
Treasury stock, at cost: June 30, 2025—1,258,852,117 shares and December 31, 2024—
1,222,647,540 shares
(79,886)
(76,842)
Accumulated other comprehensive income (loss) (AOCI)
(43,786)
(47,852)
Total Citigroup stockholders’ equity
$
213,222
$
208,598
Noncontrolling interests
908
768
Total equity
$
214,130
$
209,366
Total liabilities and equity
$
2,622,772
$
2,352,945
The Notes to the Consolidated Financial Statements are an integral part of these Consolidated Financial Statements.
105
CONSOLIDATED STATEMENT OF CHANGES IN STOCKHOLDERS’ EQUITY
Citigroup Inc. and Subsidiaries
(UNAUDITED)
Three Months Ended June 30,
Six Months Ended June 30,
In millions of dollars
2025
2024
2025
2024
Preferred stock at aggregate liquidation value
Balance, beginning of period
$
18,350
$
17,600
$
17,850
$
17,600
Issuance of new preferred stock
—
1,750
2,000
2,300
Redemption of preferred stock
(2,000)
(1,250)
(3,500)
(1,800)
Balance, end of period
$
16,350
$
18,100
$
16,350
$
18,100
Common stock and additional paid-in capital (APIC)
Balance, beginning of period
$
108,647
$
108,623
$
109,148
$
108,986
Employee benefit plans
217
235
(285)
(137)
Other
6
(42)
7
(33)
Balance, end of period
$
108,870
$
108,816
$
108,870
$
108,816
Retained earnings
Balance, beginning of period
$
209,013
$
200,956
$
206,294
$
198,905
Citigroup’s net income
4,019
3,217
8,083
6,588
Common dividends(1)
(1,063)
(1,024)
(2,135)
(2,054)
Preferred dividends
(287)
(242)
(556)
(521)
Other (primarily reclassifications from APIC for preferred issuance costs on redemptions)
(8)
6
(12)
(5)
Balance, end of period
$
211,674
$
202,913
$
211,674
$
202,913
Treasury stock, at cost
Balance, beginning of period
$
(77,880)
$
(74,865)
$
(76,842)
$
(75,238)
Employee benefit plans(2)
14
23
732
896
Excise tax on share repurchases(3)
(20)
—
(26)
—
Treasury stock acquired
(2,000)
—
(3,750)
(500)
Balance, end of period
$
(79,886)
$
(74,842)
$
(79,886)
$
(74,842)
Citigroup’s accumulated other comprehensive income (loss)
Balance, beginning of period
$
(45,722)
$
(45,729)
$
(47,852)
$
(44,800)
Citigroup’s total other comprehensive income (loss)
1,936
(948)
4,066
(1,877)
Balance, end of period
$
(43,786)
$
(46,677)
$
(43,786)
$
(46,677)
Total Citigroup common stockholders’ equity
$
196,872
$
190,210
$
196,872
$
190,210
Total Citigroup stockholders’ equity
$
213,222
$
208,310
$
213,222
$
208,310
Noncontrolling interests
Balance, beginning of period
$
850
$
813
$
768
$
798
Transactions between Citigroup and the noncontrolling-interest shareholders
—
—
(10)
(9)
Net income attributable to noncontrolling-interest shareholders
14
46
57
82
Distributions paid to noncontrolling-interest shareholders
(14)
(4)
(14)
(4)
Other comprehensive income (loss)attributable to noncontrolling-interest shareholders
58
(20)
107
(33)
Other
—
(1)
—
—
Net change in noncontrolling interests
$
58
$
21
$
140
$
36
Balance, end of period
$
908
$
834
$
908
$
834
Total equity
$
214,130
$
209,144
$
214,130
$
209,144
(1) Common dividends declared were $0.56 per share for both 1Q25 and 2Q25, and $0.53 per share for both 1Q24 and 2Q24.
(2) Includes treasury stock related to certain activity under Citi’s employee restricted or deferred stock programs where shares are withheld to satisfy employees’ tax requirements.
(3) The 1% excise tax on the fair market value of common stock repurchased in the taxable year, reduced by the fair market value of any common stock issued during the same year.
The Notes to the Consolidated Financial Statements are an integral part of these Unaudited Consolidated Financial Statements.
106
This page intentionally left blank.
107
CONSOLIDATED STATEMENT OF CASH FLOWS
Citigroup Inc. and Subsidiaries
(UNAUDITED)
Six Months Ended June 30,
In millions of dollars
2025
2024
Cash flows from operating activities of continuing operations
Net income before attribution of noncontrolling interests
$
8,140
$
6,670
Net income attributable to noncontrolling interests
57
82
Citigroup’s net income
$
8,083
$
6,588
Income (loss) from discontinued operations, net of taxes
(1)
(1)
Income from continuing operations—excluding noncontrolling interests
$
8,084
$
6,589
Adjustments to reconcile net income to net cash provided by (used in) operating activities of continuing operations
Net loss (gain) on sale of significant disposals(1)
186
—
Depreciation and amortization
2,147
2,211
Deferred income taxes
220
(953)
Provisions for credit losses and for benefits and claims
5,595
4,841
Realized gains from sales of investments
(259)
(138)
Impairment losses on investments and other assets
97
47
Change in trading account assets
(125,897)
(34,677)
Change in trading account liabilities
30,106
(4,086)
Change in brokerage receivables net of brokerage payables
11,160
(566)
Change in loans held-for-sale (HFS)
(4,810)
(1,281)
Change in other assets
(8,588)
(1,528)
Change in other liabilities(2)
437
(6,470)
Other, net
(13,765)
8,220
Total adjustments
$
(103,371)
$
(34,380)
Net cash provided by (used in) operating activities of continuing operations
$
(95,287)
$
(27,791)
Cash flows from investing activities of continuing operations
Change in securities borrowed and purchased under agreements to resell
$
(49,830)
$
27,730
Change in loans
(40,293)
(5,440)
Proceeds from sales and securitizations of loans
2,063
1,667
Available-for-sale (AFS) debt securities
Purchases of investments
(140,047)
(129,401)
Proceeds from sales of investments
54,554
23,392
Proceeds from maturities of investments
91,153
108,561
Held-to-maturity (HTM) debt securities
Purchases of investments
(5,006)
(7,393)
Proceeds from maturities of investments
41,335
10,247
Capital expenditures on premises and equipment and capitalized software
(3,272)
(3,251)
Proceeds from sales of premises and equipment and repossessed assets
16
174
Other, net
378
827
Net cash provided by (used in) investing activities of continuing operations
$
(48,949)
$
27,113
Statement continues on the next page.
108
CONSOLIDATED STATEMENT OF CASH FLOWS
(UNAUDITED) (Continued)
Six Months Ended June 30,
In millions of dollars
2025
2024
Cash flows from financing activities of continuing operations
Dividends paid
$
(2,651)
$
(2,543)
Issuance of preferred stock
1,995
2,291
Redemption of preferred stock
(3,500)
(1,800)
Treasury stock acquired(3)
(3,750)
(524)
Stock tendered for payment of withholding taxes
(770)
(443)
Change in securities loaned and sold under agreements to repurchase
93,158
27,099
Issuance of long-term debt
67,498
48,083
Payments and redemptions of long-term debt
(46,333)
(49,245)
Change in deposits
79,363
(30,544)
Change in short-term borrowings
7,055
1,237
Net cash provided by (used in) financing activities of continuing operations
$
192,065
$
(6,389)
Effect of exchange rate changes on cash, due from banks and deposits with banks
$
13,112
$
(7,731)
Change in cash, due from banks and deposits with banks
60,941
(14,798)
Cash, due from banks and deposits with banks at beginning of period
276,532
260,932
Cash, due from banks and deposits with banks at end of period
$
337,473
$
246,134
Cash and due from banks (including segregated cash and other deposits)
$
24,991
$
26,917
Deposits with banks, net of allowance
312,482
219,217
Cash, due from banks and deposits with banks at end of period
$
337,473
$
246,134
Supplemental disclosure of cash flow information for continuing operations
Cash paid during the period for income taxes(4)
$
3,167
$
3,181
Cash paid during the period for interest
39,284
44,179
Non-cash investing activities(1)(5)
Decrease in net loans associated with divestitures reclassified to HFS
$
1,680
$
—
Transfers to loans HFS (Other assets) from loans HFI
1,942
2,359
Non-cash financing activities(1)
Decrease in deposits associated with divestitures reclassified to HFS
$
6,088
$
—
(1) See Note 2.
(2) Includes balances related to the FDIC special assessment and restructuring charges (see Notes 17 and 9, respectively).
(3) Balances based on transaction date.
(4) Includes net cash paid (received) for purchases and sales of nonrefundable, transferable tax credits.
(5) Operating and finance lease right-of-use assets and lease liabilities represent non-cash investing and financing activities, respectively, and are not included in the non-cash investing activities presented here. See Note 26 for more information and balances as of June 30, 2025.
The Notes to the Consolidated Financial Statements are an integral part of these Unaudited Consolidated Financial Statements.
109
NOTES TO CONSOLIDATED FINANCIAL STATEMENTS (UNAUDITED)
1. BASIS OF PRESENTATION, UPDATED ACCOUNTING POLICIES AND ACCOUNTING CHANGES
Basis of Presentation
The accompanying unaudited Consolidated Financial Statements as of June 30, 2025 and for the three and six months ended June 30, 2025 and 2024 include the accounts of Citigroup Inc. and its consolidated subsidiaries.
In the opinion of management, all adjustments, consisting of normal recurring adjustments, necessary for a fair presentation have been reflected. The accompanying unaudited Consolidated Financial Statements should be read in conjunction with the Consolidated Financial Statements and related notes included within Citigroup’s Annual Report on Form 10-K for the year ended December 31, 2024 (2024 Form 10-K) and Citigroup’s Quarterly Report on Form 10-Q for the quarter ended March 31, 2025 (First Quarter of 2025 Form 10-Q).
Certain financial information that is usually included in annual financial statements prepared in accordance with U.S. generally accepted accounting principles (GAAP), but is not required for interim reporting purposes, has been condensed or omitted.
Management must make estimates and assumptions that affect the Consolidated Financial Statements and the related footnote disclosures. While management uses its best judgment, actual results could differ from those estimates.
As noted above, the Notes to these Consolidated Financial Statements are unaudited.
Throughout these Notes, “Citigroup,” “Citi” and “the Company” refer to Citigroup Inc. and its consolidated subsidiaries.
Certain reclassifications and updates have been made to the prior periods’ financial statements and notes to conform to the current period’s presentation.
Cash equivalents are defined as those amounts included in Cash and due from banks and predominately all of Deposits with banks. Cash flows from risk management activities are classified in the same category as the related assets and liabilities. Amounts included in Cash and due from banks and Deposits with banks approximate fair value.
ACCOUNTING CHANGES
Income Taxes (Topic 740): Improvements to Income Tax Disclosures
In December 2023, the FASB issued ASU No. 2023-09, Income Taxes (Topic 740): Improvements to Income Tax Disclosures, intended to enhance the transparency and decision usefulness of income tax disclosures. This guidance requires that public business entities disclose on an annual basis a tabular rate reconciliation in eight specific categories disaggregated by nature and for foreign tax effects by each jurisdiction that meets a 5% of pretax income multiplied by the applicable statutory tax rate or greater threshold annually. The eight categories include state and local income taxes, net of federal income tax effect; foreign tax effects; enactment of new tax laws; enactment of new tax credits; effect of cross-border tax laws; valuation allowances; nontaxable items and nondeductible items; and changes in unrecognized tax benefits. Additional disclosures include qualitative description of the state and local jurisdictions that contribute to the majority (greater than 50%) of the effect of the state and local income tax category and explanation of the nature and effect of changes in individual reconciling items. The guidance also requires entities annually to disclose income taxes paid (net of refunds received) disaggregated by federal, state and foreign taxes and by jurisdiction identified based on the same 5% quantitative threshold.
The standard is effective for fiscal years beginning after December 15, 2024. The transition method is prospective with the retrospective method permitted. Citi plans to adopt the ASU for the year ending December 31, 2025.
See Note 1 to the Consolidated Financial Statements in Citi’s 2024 Form 10-K for a discussion of 2024 accounting changes.
110
FUTURE ACCOUNTING CHANGES
Identifying the Acquirer in a Business Combination
In May 2025, the FASB issued ASU No. 2025-03, Business Combinations (Topic 805) and Consolidation (Topic 810): Determining the Accounting Acquirer in the Acquisition of a Variable Interest Entity, intended to clarify the guidance for identifying the accounting acquirer when the legal acquiree is a variable interest entity that meets the definition of a business. The revised guidance requires entities to consider the factors in Topic 805 when a business combination involving a VIE is effected primarily by exchanging equity interests in which a VIE is acquired.
The ASU will be effective for fiscal years beginning after December 15, 2026, and interim periods within those fiscal years. Citi is currently evaluating the impact of the ASU. Adoption of the ASU is not expected to have a material impact on Citi’s operating results or financial position.
Disaggregation of Income Statement Expenses
In November 2024, the FASB issued ASU No. 2024-03, Income Statement—Reporting Comprehensive Income—Expense Disaggregation Disclosures (Subtopic 220-40),to improve the disclosures of expenses by requiring public business entities to provide further disaggregation of relevant expense captions (i.e., employee compensation, depreciation, intangible asset amortization) in a separate note to the financial statements, a qualitative description of the amounts remaining in relevant expense captions that are not separately disaggregated quantitatively, and the total amount of selling expenses and, in an annual reporting period, an entity’s definition of selling expenses.
The transition method is prospective with the retrospective method permitted, and the ASU will be effective for Citi for its annual period ending December 31, 2027 and interim periods for the interim period beginning January 1, 2028. Citi is currently evaluating the impact on its disclosures.
111
2. DISCONTINUED OPERATIONS, SIGNIFICANT DISPOSALS AND OTHER BUSINESS EXITS
Summary of Discontinued Operations
Citi’s results from Discontinued operations consisted of residual activities related to the sales of the Egg Banking plc credit card business in 2011 and the German retail banking business in 2008. All Discontinued operations results are recorded within All Other.
Citi’s Income (loss) from discontinued operations, net of taxes,as well as cash flows from Discontinued operations, were not material for the periods presented.
Significant Disposals
As of June 30, 2025, Citi had closed the sales of nine consumer banking businesses within All Other—Legacy Franchises: Australia closed in the second quarter of 2022, the Philippines closed in the third quarter of 2022, Bahrain, Malaysia and Thailand closed in the fourth quarter of 2022, India and Vietnam closed in the first quarter of 2023, Taiwan closed in the third quarter of 2023 and Indonesia closed in the fourth quarter of 2023.
In the second quarter of 2025, the following transactions were identified as significant disposals that are recorded within All Other—Legacy Franchises, including the assets and liabilities that were reclassified to held-for-sale (HFS) within Other assets and Other liabilities on the Consolidated Balance Sheet and the Income (loss) before taxes (benefits) related to each business.
Agreement to Sell Poland Consumer Banking Business
On May 27, 2025, Citi entered into an agreement to sell its Poland consumer banking business, which is part of All Other—Legacy Franchises. The sale, which is subject to regulatory approvals and other customary closing conditions, is expected to close in the second half of 2026. As of June 30, 2025, Citi reported the business as HFS, resulting in a pretax loss on sale of approximately $186 million recorded in Other revenue ($157 million after-tax), subject to closing adjustments.
Income before taxes, excluding the pretax loss on sale, for the Poland consumer banking business is as follows:
Three Months Ended June 30,
Six Months Ended June 30,
In millions of dollars
2025
2024
2025
2024
Income before taxes
$
38
$
35
$
70
$
70
The following assets and liabilities related to the Poland consumer banking business were reclassified to HFS within Other assets and Other liabilities,respectively, on the Consolidated Balance Sheet at June 30, 2025:
In millions of dollars
June 30, 2025
Assets
Cash and deposits with banks(1)
$
4,660
Loans (net of allowance of $26 at June 30, 2025)
1,680
Other assets
70
Total assets
$
6,410
Liabilities
Deposits
$
6,088
Other liabilities
78
Total liabilities
$
6,166
(1) Includes liquidity resources currently composed of approximately $4.6 billion of Deposits with banks. This may transfer as cash and securities at time of closing and is primarily recorded in Markets.
Citi did not have any other significant disposals as of June 30, 2025.
As of August 6, 2025, Citi had not entered into sale agreements for the remaining All Other—Legacy Franchises businesses to be sold, specifically the Banamex businesses.
For a description of the Company’s significant disposal transactions in prior periods and financial impact, see Note 2 to the Consolidated Financial Statements in Citi’s 2024 Form 10-K.
112
3. REPORTABLE BUSINESS SEGMENTS AND ALL OTHER
The reportable business segments (segments) and All Other reflect how the CEO, who is the chief operating decision maker (CODM), manages the Company, including allocating resources and measuring performance.
Citi is organized into five reportable business segments: Services, Markets, Banking, Wealth and U.S. Personal Banking (USPB), with the remaining operations recorded in All Other, which includes activities not assigned to a specific segment, as well as discontinued operations. See segment details in Note 3 to the Consolidated Financial Statements in Citi’s 2024 Form 10-K.
Revenues and expenses directly associated with each segment or line of business are included in determining respective operating results. Other revenues and expenses that are attributable to a particular segment or All Other are generally allocated from Corporate/Other within All Other based on respective net revenues, non-interest expenses or other relevant measures.
Revenues and expenses from transactions with other segments and All Other are treated as transactions with external parties for purposes of segment disclosures, while funding charges paid by segments and funding credits received by Corporate Treasury within All Other are included in net interest income. The Company includes intersegment eliminations from Corporate/Other within All Other to reconcile the segment results to Citi’s consolidated results.
The accounting policies of these segments and All Other are the same as those disclosed in Note 1 to the Consolidated Financial Statements in Citi’s 2024 Form 10-K.
113
The following tables present certain information regarding the Company’s continuing operations by reportable business segment and All Other on a managed basis that excludes divestiture-related impacts. The CODM uses Income (loss) from continuing operations as the performance measure, to evaluate the results of each reportable business segment and
All Other by comparing to and monitoring against budget and prior-year results. This information is used to allocate resources to each of the segments and All Other and to make operational decisions when managing the Company, such as whether to reinvest profits or to return capital to shareholders through dividends and share repurchases.
Three Months Ended June 30,
In millions of dollars, except identifiable assets, average loans and average deposits in billions
Services
Markets
Banking
2025
2024
2025
2024
2025
2024
Net interest income
$
3,630
$
3,225
$
2,902
$
2,038
$
530
$
527
Non-interest revenue
1,432
1,450
2,977
3,048
1,391
1,100
Total revenues, net of interest expense(1)
$
5,062
$
4,675
$
5,879
$
5,086
$
1,921
$
1,627
Compensation expense(2)
$
641
$
572
$
992
$
896
$
695
$
695
Non-compensation expense(1)(3)
2,038
2,157
2,517
2,409
442
436
Total operating expense(1)
$
2,679
$
2,729
$
3,509
$
3,305
$
1,137
$
1,131
Provisions for credit losses and for benefits and claims
$
353
$
(27)
$
108
$
(11)
$
173
$
(32)
Provision (benefits) for income taxes
582
475
513
323
150
119
Income (loss) from continuing operations
1,448
1,498
1,749
1,469
461
409
Identifiable assets (June 30, 2025 and December 31, 2024)
$
618
$
584
$
1,166
$
949
$
148
$
143
Average loans
94
82
136
119
84
89
Average deposits
857
804
18
25
—
1
In millions of dollars, except identifiable assets, average loans and average deposits in billions
Wealth
USPB
2025
2024
2025
2024
Net interest income
$
1,278
$
1,047
$
5,471
$
5,103
Non-interest revenue
888
760
(352)
(271)
Total revenues, net of interest expense(1)
$
2,166
$
1,807
$
5,119
$
4,832
Compensation expense(2)
$
619
$
627
$
537
$
553
Non-compensation expense(1)(3)
939
908
1,844
1,802
Total operating expense(1)
$
1,558
$
1,535
$
2,381
$
2,355
Provisions for credit losses and for benefits and claims
$
(26)
$
(9)
$
1,885
$
2,315
Provision (benefits) for income taxes
140
71
204
41
Income (loss) from continuing operations
494
210
649
121
Identifiable assets (June 30, 2025 and December 31, 2024)
$
228
$
224
$
251
$
252
Average loans
149
150
217
206
Average deposits
308
316
90
93
In millions of dollars, except identifiable assets, average loans and average deposits in billions
All Other(4)
Reconciling Items(4)
Total Citi
2025
2024
2025
2024
2025
2024
Net interest income
$
1,364
$
1,553
$
—
$
—
$
15,175
$
13,493
Non-interest revenue
334
419
(177)
33
6,493
6,539
Total revenues, net of interest expense(1)
$
1,698
$
1,972
$
(177)
$
33
$
21,668
$
20,032
Total operating expense(1)
$
2,276
$
2,106
$
37
$
85
$
13,577
$
13,246
Provisions for credit losses and for benefits and claims
$
374
$
243
$
5
$
(3)
$
2,872
$
2,476
Provision (benefits) for income taxes
(364)
35
(39)
(17)
1,186
1,047
Income (loss) from continuing operations
(588)
(412)
(180)
(32)
4,033
3,263
Identifiable assets (June 30, 2025 and December 31, 2024)
$
212
$
201
$
2,623
$
2,353
Average loans
32
34
712
680
Average deposits
70
71
1,343
1,310
114
Six Months Ended June 30,
In millions of dollars, except average loans and average deposits in billions
Services
Markets
Banking
2025
2024
2025
2024
2025
2024
Net interest income
$
7,128
$
6,542
$
4,915
$
3,744
$
1,021
$
1,109
Non-interest revenue
2,823
2,896
6,950
6,699
2,852
2,254
Total revenues, net of interest expense(1)
$
9,951
$
9,438
$
11,865
$
10,443
$
3,873
$
3,363
Compensation expense(2)
$
1,273
$
1,196
$
2,010
$
1,874
$
1,327
$
1,419
Non-compensation expense(1)(3)
3,990
4,196
4,967
4,815
844
891
Total operating expense(1)
$
5,263
$
5,392
$
6,977
$
6,689
$
2,171
$
2,310
Provisions for credit losses and for benefits and claims
$
404
$
37
$
309
$
188
$
387
$
(161)
Provision (benefits) for income taxes
1,226
996
1,035
676
312
278
Income (loss) from continuing operations
3,058
3,013
3,544
2,890
1,003
936
Average loans
$
91
$
82
$
132
$
120
$
83
$
89
Average deposits
842
806
17
25
—
1
In millions of dollars, except average loans and average deposits in billions
Wealth
USPB
2025
2024
2025
2024
Net interest income
$
2,552
$
2,028
$
11,012
$
10,329
Non-interest revenue
1,710
1,466
(665)
(388)
Total revenues, net of interest expense(1)
$
4,262
$
3,494
$
10,347
$
9,941
Compensation expense(2)
$
1,288
$
1,273
$
1,091
$
1,117
Non-compensation expense(1)(3)
1,909
1,898
3,732
3,688
Total operating expense(1)
$
3,197
$
3,171
$
4,823
$
4,805
Provisions for credit losses and for benefits and claims
$
72
$
(179)
$
3,696
$
4,519
Provision (benefits) for income taxes
215
117
434
149
Income (loss) from continuing operations
778
385
1,394
468
Average loans
$
148
$
150
$
217
$
205
Average deposits
309
316
90
97
In millions of dollars, except average loans and average deposits in billions
All Other(4)
Reconciling Items(4)
Total Citi
2025
2024
2025
2024
2025
2024
Net interest income
$
2,559
$
3,248
$
—
$
—
$
29,187
$
27,000
Non-interest revenue
584
1,100
(177)
21
14,077
14,048
Total revenues, net of interest expense(1)
$
3,143
$
4,348
$
(177)
$
21
$
43,264
$
41,048
Total operating expense(1)
$
4,500
$
4,791
$
71
$
195
$
27,002
$
27,353
Provisions for credit losses and for benefits and claims
$
733
$
429
$
(6)
$
8
$
5,595
$
4,841
Provision (benefits) for income taxes
(649)
23
(47)
(56)
2,526
2,183
Income (loss) from continuing operations
(1,441)
(895)
(195)
(126)
8,141
6,671
Average loans
$
31
$
33
$
702
$
679
Average deposits
66
73
1,324
1,318
(1) Effective January 1, 2025, certain transaction processing fees paid by Citi, primarily to credit card networks, reported within USPB, Services, Wealth and All Other—Legacy Franchises (Banamex and Asia Consumer), which were previously presented within Other operating expenses, are presented as contra-revenue within Commissions and fees reported in Non-interest revenue. Prior periods were conformed to reflect this change in presentation.
(2) Excludes allocations of Compensation and benefits expense related to services provided by Corporate/Other within All Other, which are allocated from All Other to each segment, as applicable, through the non-compensation expense line.
(3) Non-compensation expense for each segment includes allocated compensation and benefits-related costs from Corporate/Other within All Other to the respective segments, and expenses related to Technology/communication, Transactional and tax charges, Premises and equipment, Professional services, Advertising and marketing and Other operating (all of which include certain overhead expenses).
(4) Segment results are presented on a managed basis that excludes divestiture-related impacts related to (i) Citi’s divestitures of its Asia Consumer businesses and (ii) the planned IPO of Banamex, within All Other—Legacy Franchises. Adjustments are included in Legacy Franchises within All Other and are reflected in the reconciliations above to arrive at Citi’s reported results in the Consolidated Statement of Income.
115
The following table presents a reconciliation of total Citigroup income from continuing operations as reported:
Three Months Ended June 30,
Six Months Ended June 30,
In millions of dollars
2025(1)
2024(2)
2025(3)
2024(4)
Total reportable business segments and All Other—income from continuing operations(5)
$
4,213
$
3,295
$
8,336
$
6,797
Divestiture-related impact on:
Total revenues, net of interest expense
(177)
33
(177)
21
Total operating expenses
37
85
71
195
Provision (release) for credit losses
5
(3)
(6)
8
Provision (benefits) for income taxes
(39)
(17)
(47)
(56)
Income from continuing operations
$
4,033
$
3,263
$
8,141
$
6,671
(1) The three months ended June 30, 2025 includes (i) an approximate $186 million loss recorded in revenue (approximately $157 million after tax) related to the announced sale of the Poland consumer banking business; and (ii) approximately $37 million in operating expenses (approximately $26 million after-tax), primarily related to separation costs in Mexico.
(2) The three months ended June 30, 2024 includes approximately $85 million in operating expenses (approximately $58 million after-tax), primarily related to separation costs in Mexico and severance costs in the Asia exit markets. For additional information, see Citi’s Quarterly Report on Form 10-Q for the period ended June 30, 2024.
(3) The six months ended June 30, 2025 includes (i) an approximate $186 million loss recorded in revenue (approximately $157 million after tax) related to the announced sale of the Poland consumer banking business; and (ii) approximately $71 million in operating expenses (approximately $49 million after-tax), largely related to separation costs in Mexico and severance costs in the Asia exit markets.
(4) The six months ended June 30, 2024 includes approximately $195 million in operating expenses (approximately $135 million after-tax), related to separation costs in Mexico and severance costs in the Asia exit markets. For additional information, see Citi’s Quarterly Report on Form 10-Q for the period ended June 30, 2024.
(5) Reportable business segment results are presented on a managed basis that excludes divestiture-related impacts related to (i) Citi’s divestitures of its Asia Consumer businesses and (ii) the planned IPO of Banamex, within All Other—Legacy Franchises. Adjustments are included in Legacy Franchises within All Other and are reflected in the reconciliations above to arrive at Citi’s reported results in the Consolidated Statement of Income.
116
4. INTEREST INCOME AND EXPENSE
Interest income and Interest expense consisted of the following:
Three Months Ended June 30,
Six Months Ended June 30,
In millions of dollars
2025
2024
2025
2024
Interest income
Consumer loans
$
9,771
$
9,780
$
19,529
$
19,578
Corporate loans
5,193
5,702
10,161
11,446
Loan interest, including fees
$
14,964
$
15,482
$
29,690
$
31,024
Deposits with banks
3,043
2,710
6,044
5,357
Securities borrowed and purchased under agreements to resell
6,621
7,211
12,912
15,033
Investments, including dividends
4,206
4,821
8,372
9,670
Trading account assets(1)
5,821
4,503
10,191
8,631
Other interest-bearing assets(2)
1,204
1,260
2,316
2,495
Total interest income
$
35,859
$
35,987
$
69,525
$
72,210
Interest expense
Deposits
$
8,685
$
10,235
$
17,123
$
20,646
Securities loaned and sold under agreements to repurchase
6,938
6,962
13,194
13,928
Trading account liabilities(1)
748
794
1,505
1,625
Short-term borrowings and other interest-bearing liabilities(3)
1,800
1,908
3,526
3,864
Long-term debt
2,513
2,595
4,990
5,147
Total interest expense
$
20,684
$
22,494
$
40,338
$
45,210
Net interest income
$
15,175
$
13,493
$
29,187
$
27,000
Provision for credit losses on loans
2,477
2,359
5,038
4,781
Net interest income after provision for credit losses on loans
$
12,698
$
11,134
$
24,149
$
22,219
(1)Interest expense on Trading account liabilities of Services, Markets and Banking is reported as a reduction of Interest income. Interest income and Interest expense on cash collateral positions are reported in interest on Trading account assets and Trading account liabilities, respectively.
(2)Includes assets from businesses held-for-sale (see Note 2) and Brokerage receivables.
(3)Includes liabilities from businesses held-for-sale (see Note 2) and Brokerage payables.
117
5. COMMISSIONS AND FEES; ADMINISTRATION AND OTHER FIDUCIARY FEES
Commissions and Fees
The primary components of Commissions and fees revenue are investment banking fees, brokerage commissions, credit card and bank card income, deposit-related fees and transactional service fees. See Note 3 for segment results and Note 5 to the Consolidated Financial Statements in Citi’s 2024 Form 10-K for additional information on Citi’s commissions and fees.
The following table presents Commissions and fees revenue:
Three Months Ended June 30,
Six Months Ended June 30,
In millions of dollars
2025
2024
2025
2024
Investment banking(1)
$
1,006
$
875
$
2,043
$
1,748
Brokerage commissions(2)
701
622
1,405
1,241
Credit and bank card income(3)
Interchange fees(4)
3,038
3,003
5,876
5,826
Card-related loan fees
179
147
342
277
Card rewards and partner payments
(3,325)
(3,189)
(6,460)
(6,106)
Deposit-related fees(5)
338
341
666
681
Transactional service fees(6)
381
359
734
699
Corporate finance(7)
171
150
343
349
Insurance distribution revenue(8)
79
78
160
162
Insurance premiums(9)
30
24
53
49
Loan servicing
23
22
47
35
Other
124
123
243
230
Total(10)
$
2,745
$
2,555
$
5,452
$
5,191
(1) Investment banking fees are earned primarily by Banking and Markets. For the periods presented, the contract liability amount was negligible.
(2) Brokerage commissions are earned primarily by Markets and Wealth. The Company recognized $45 million and $91 million of revenue related to variable consideration for the three and six months ended June 30, 2025, and $44 million and $86 million for the three and six months ended June 30, 2024, respectively. These amounts primarily relate to performance obligations satisfied in prior periods.
(3) Credit card and bank card income is earned primarily by USPB and Services.
(4) See footnote 1 to the Consolidated Statement of Income above for the description of a change in presentation. Interchange fees are presented net of certain transaction processing fees paid by Citi, primarily to credit card networks, for the periods presented.
(5) Deposit-related fees are earned primarily by Services.
(6) Transactional service fees are earned primarily by Services.
(7) Consists primarily of fees earned from structuring and underwriting loan syndications or related financing activity earned primarily by Banking. This activity is accounted for under ASC 310.
(8) Insurance distribution revenue is earned primarily by Wealth and Legacy Franchises within All Other.
(9)Insurance premiums are earned primarily by Legacy Franchises within All Other.
(10) Commissions and fees include $(2,918) million and $(5,668) million not accounted for under ASC 606, Revenue from Contracts with Customers, for the three and six months ended June 30, 2025, and $(2,833) million and $(5,365) million for the three and six months ended June 30, 2024, respectively. Amounts reported in Commissions and fees accounted for under other guidance primarily include card-related loan fees, card reward programs and certain partner payments, corporate finance fees, insurance premiums and loan servicing fees.
Administration and Other Fiduciary Fees
Administration and other fiduciary fees revenue is primarily composed of custody fees and fiduciary fees. See Note 3 for segment results and Note 5 to the Consolidated Financial Statements in Citi’s 2024 Form 10-K for additional information on Citi’s administration and other fiduciary fees.
The following table presents Administration and other fiduciary fees revenue:
Three Months Ended June 30,
Six Months Ended June 30,
In millions of dollars
2025
2024
2025
2024
Custody fees(1)
$
567
$
529
$
1,046
$
1,042
Fiduciary fees(2)
422
388
855
780
Guarantee fees
134
129
267
261
Total administration and other fiduciary fees(3)
$
1,123
$
1,046
$
2,168
$
2,083
(1) Custody fees are earned primarily by Services.
(2) Fiduciary fees are earned primarily by Wealth and Legacy Franchises within All Other.
(3) Administration and other fiduciary fees include $134 million and $129 million for the three months ended June 30, 2025 and 2024, and $267 million and $261 million for the six months ended June 30, 2025 and 2024, respectively, that are not accounted for under ASC 606, Revenue from Contracts with Customers. These generally include guarantee fees.
118
6. PRINCIPAL TRANSACTIONS
Principal transactions revenue consists of realized and unrealized gains and losses from trading activities. Trading activities include revenues from fixed income, equities, credit and commodities products and foreign exchange transactions that are managed on a portfolio basis and characterized below based on the primary risk managed by each trading desk (as such, the trading desks can be periodically reorganized and thus the risk categories). Not included in the table below is the impact of net interest income related to trading activities, which is an integral part of the profitability of trading
activities (see Note 4 for information about net interest income related to trading activities). Principal transactions include CVA (credit valuation adjustments) and FVA (funding valuation adjustments) on over-the-counter derivatives, and gains (losses) on certain economic hedges on loans in Services, Markets and Banking. These adjustments are discussed further in Note 23.
In certain transactions, Citi incurs fees and presents these fees paid to third parties in operating expenses.
The following table presents Principal transactions revenue:
Three Months Ended June 30,
Six Months Ended June 30,
In millions of dollars
2025
2024
2025
2024
Interest rate risks(1)
$
663
$
369
$
1,307
$
1,085
Foreign exchange risks(2)
2,323
1,335
4,019
2,808
Equity risks(3)(4)
303
686
1,341
1,300
Commodity and other risks(5)
272
321
631
624
Credit products and risks(6)
(155)
163
29
331
Total
$
3,406
$
2,874
$
7,327
$
6,148
(1) Includes revenues from government securities, municipal securities, mortgage securities and other debt instruments. Also includes spot and forward trading of currencies and exchange-traded and over-the-counter (OTC) currency options, options on fixed income securities, interest rate swaps, currency swaps, swap options, caps and floors, financial futures, OTC options and forward contracts on fixed income securities.
(2) Includes revenues from foreign exchange spot, forward, option and swap contracts, as well as foreign currency translation (FX translation) gains and losses.
(3) Includes revenues from common, preferred and convertible preferred stock, convertible corporate debt, equity-linked notes and exchange-traded and OTC equity options and warrants.
(4) The three and six months ended June 30, 2024 include an approximate $400 million episodic gain related to the Visa B exchange.
(5) Primarily includes revenues from crude oil, refined oil products, natural gas, metals and other commodities trades.
(6) Includes revenues from corporate debt, secondary trading loans, mortgage securities, single name and index credit default swaps, and structured credit products.
119
7. INCENTIVE PLANS
For information on Citi’s incentive plans, see Note 7 to the Consolidated Financial Statements in Citi’s 2024 Form 10-K.
8. RETIREMENT BENEFITS
For additional information on Citi’s retirement benefits, see Note 8 to the Consolidated Financial Statements in Citi’s 2024 Form 10-K.
Citigroup remeasures its significant pension and postretirement benefits plans’ obligations and assets by updating plan actuarial assumptions quarterly, when certain conditions are met to trigger interim remeasurement. No interim remeasurement occurred for the first and second quarters of 2025.
Net Expense (Benefit)
The following table summarizes the components of net expense (benefit) recognized in the Consolidated Statement of Income for the Company’s pension and postretirement benefit plans for Significant Plans and All Other Plans. Service cost is reported in Compensation and benefits expenses and all other components of the net periodic benefit cost are reported in Other operating expenses in the Consolidated Statement of Income.
Three Months Ended June 30,
Pension plans
Postretirement benefit plans
U.S. plans
Non-U.S. plans
U.S. plans
Non-U.S. plans
In millions of dollars
2025
2024
2025
2024
2025
2024
2025
2024
Service cost
$
—
$
—
$
28
$
30
$
—
$
—
$
—
$
1
Interest cost on benefit obligation
119
119
106
109
3
4
29
28
Expected return on assets
(151)
(152)
(94)
(82)
(2)
(2)
(18)
(20)
Amortization of unrecognized:
Prior service cost (benefit)
1
1
(1)
(1)
(3)
(3)
(1)
(2)
Net actuarial loss (gain)
50
45
16
20
(3)
(3)
2
2
Settlement loss(1)
—
—
—
2
—
—
—
—
Total net expense (benefit)
$
19
$
13
$
55
$
78
$
(5)
$
(4)
$
12
$
9
Six Months Ended June 30,
Pension plans
Postretirement benefit plans
U.S. plans
Non-U.S. plans
U.S. plans
Non-U.S. plans
In millions of dollars
2025
2024
2025
2024
2025
2024
2025
2024
Service cost
$
—
$
—
$
54
$
59
$
—
$
—
$
—
$
1
Interest cost on benefit obligation
237
236
206
218
7
8
57
57
Expected return on assets
(301)
(303)
(182)
(169)
(5)
(5)
(35)
(42)
Amortization of unrecognized:
Prior service cost (benefit)
1
1
(2)
(2)
(5)
(5)
(3)
(4)
Net actuarial loss (gain)
98
91
32
43
(6)
(5)
5
5
Settlement loss(1)
—
—
—
2
—
—
—
—
Total net expense (benefit)
$
35
$
25
$
108
$
151
$
(9)
$
(7)
$
24
$
17
(1)Settlement loss relates to divestiture activities.
Contributions
The following table summarizes the Company’s expected contributions for 2025 and the actual contributions made in 2024:
Pension plans
Postretirement benefit plans
U.S. plans(1)
Non-U.S. plans(2)
U.S. plans
Non-U.S. plans
In millions of dollars
2025
2024
2025
2024
2025
2024
2025
2024
Company contributions(3) expected to be made during the year, and made during the prior year
$
63
$
59
$
93
$
763
$
5
$
8
$
11
$
9
(1)The U.S. plans include benefits paid directly by the Company for the nonqualified pension plans.
(2)The Company made a discretionary contribution of approximately $600 million to a pension plan in Banamex during the fourth quarter of 2024.
(3)Company contributions are composed of cash contributions made to the plans and benefits paid directly by the Company.
120
9. RESTRUCTURING
As previously disclosed, Citi is pursuing various initiatives to simplify the Company and further align its organizational structure with its business strategy. As part of its overall simplification initiatives, in the fourth quarter of 2023, Citi eliminated the previous Institutional Clients Group and Personal Banking and Wealth Management layers, exited certain institutional business lines, and consolidated its regional structure, creating one international group, while centralizing client capabilities and streamlining its global staff functions.
Citi has recorded net restructuring charges of approximately $1.035 billion program to date.
Restructuring charges are recorded as a separate line item within Operating expenses in the Company’s Consolidated Statement of Income. These charges were included within All Other—Corporate/Other.
The following costs associated with these initiatives are included in restructuring charges:
•Personnel costs: severance costs associated with actual headcount reductions (as well as those that were probable and could be reasonably estimated)
•Other: costs associated with contract terminations and other direct costs associated with the restructuring, including asset write-downs (non-cash write-downs of capitalized software, which are included in Premises and equipment related to exited businesses)
The following table is a rollforward of the liability related to the restructuring charges:
In millions of dollars
Personnel costs
Other
Total
Beginning balance at January 1, 2023
$
—
$
—
$
—
Restructuring charges
$
687
$
94
$
781
Change in estimate(1)
—
—
—
Net restructuring charges
$
687
$
94
$
781
Payments and utilization
—
(69)
(69)
Foreign exchange
—
—
—
Balance at December 31, 2023
$
687
$
25
$
712
Restructuring charges
$
354
$
54
$
408
Change in estimate(1)(2)
(146)
(3)
(149)
Net restructuring charges
$
208
$
51
$
259
Payments and utilization
$
(860)
$
(76)
$
(936)
Foreign exchange
7
—
7
Balance at December 31, 2024
$
42
$
—
$
42
Restructuring charges
$
1
$
—
$
1
Change in estimate(1)
(4)
—
(4)
Net restructuring charges
$
(3)
$
—
$
(3)
Payments and utilization
$
(13)
$
—
$
(13)
Foreign exchange
(6)
—
(6)
Balance at March 31, 2025
$
20
$
—
$
20
Restructuring charges
$
—
$
—
$
—
Change in estimate(1)
(2)
—
(2)
Net restructuring charges
$
(2)
$
—
$
(2)
Payments and utilization
$
(8)
$
—
$
(8)
Foreign exchange
1
—
1
Balance at June 30, 2025
$
11
$
—
$
11
(1) Revisions primarily relate to higher-than-anticipated redeployments of displaced employees to other positions within the Company, job function releveling and employee attrition.
(2) Revisions primarily relate to lower-than-anticipated costs associated with contract terminations.
121
10. EARNINGS PER SHARE
The following table reconciles the income and share data used in the basic and diluted earnings per share (EPS) computations:
Three Months Ended June 30,
Six Months Ended June 30,
In millions of dollars, except per share amounts
2025
2024
2025
2024
Earnings per common share
Income from continuing operations before attribution of noncontrolling interests
$
4,033
$
3,263
$
8,141
$
6,671
Less: Noncontrolling interests from continuing operations
14
46
57
82
Net income from continuing operations (for EPS purposes)
$
4,019
$
3,217
$
8,084
$
6,589
Loss from discontinued operations, net of taxes
—
—
(1)
(1)
Citigroup’s net income
$
4,019
$
3,217
$
8,083
$
6,588
Less: Preferred dividends
287
242
556
521
Net income available to common shareholders
$
3,732
$
2,975
$
7,527
$
6,067
Less: Dividends and undistributed earnings allocated to employee restricted and deferred shares with rights to dividends, and other relevant items(1), applicable to basic EPS
49
32
93
77
Net income allocated to common shareholders for basic EPS
$
3,683
$
2,943
$
7,434
$
5,990
Weighted-average common shares outstanding applicable to basic EPS (in millions)
1,855.9
1,907.7
1,867.5
1,909.1
Basic earnings per share
Income from continuing operations
$
1.98
$
1.54
$
3.98
$
3.14
Discontinued operations
—
—
—
—
Net income per share—basic(2)
$
1.98
$
1.54
$
3.98
$
3.14
Diluted earnings per share
Net income allocated to common shareholders for basic EPS
$
3,683
$
2,943
$
7,434
$
5,990
Add back: Dividends allocated to employee restricted and deferred shares with rights to dividends that are forfeitable
19
19
36
34
Net income allocated to common shareholders for diluted EPS
$
3,702
$
2,962
$
7,470
$
6,024
Weighted-average common shares outstanding applicable to basic EPS (in millions)
1,855.9
1,907.7
1,867.5
1,909.1
Effect of dilutive securities(3)
Other employee plans
37.2
38.0
38.9
35.3
Adjusted weighted-average common shares outstanding applicable to diluted EPS
(in millions)
1,893.1
1,945.7
1,906.4
1,944.4
Diluted earnings per share
Income from continuing operations
$
1.96
$
1.52
$
3.92
$
3.10
Discontinued operations
—
—
—
—
Net income per share—diluted(2)
$
1.96
$
1.52
$
3.92
$
3.10
(1)Other relevant items in the second quarter of 2025 include issuance costs of $8 million related to the redemption of preferred stock Series P. The issuance costs were reclassified from Additional paid-in capital to Retained earnings upon redemption of the preferred stock. See Note 20. The total for this line also includes dividends and undistributed earnings ($41 million combined for 2Q25) allocated to employee restricted and deferred shares with rights to dividends.
(2)Due to rounding, earnings per share on continuing operations and discontinued operations may not sum to earnings per share on net income.
(3) During the six months ended June 30, 2025 and 2024, there were no weighted-average options outstanding.
122
11. SECURITIES BORROWED, LOANED AND SUBJECT TO REPURCHASE AGREEMENTS
For additional information on the Company’s resale and repurchase agreements and securities borrowing and lending agreements, see Note 12 to the Consolidated Financial Statements in Citi’s 2024 Form 10-K.
Securities borrowed and purchased under agreements to resell, at their respective carrying values, consisted of the following:
In millions of dollars
June 30, 2025
December 31, 2024
Securities purchased under agreements to resell
$
244,999
$
192,950
Securities borrowed
78,903
81,115
Total, net(1)
$
323,902
$
274,065
Allowance for credit losses on securities purchased and borrowed(2)
(10)
(3)
Total, net of allowance
$
323,892
$
274,062
Securities loaned and sold under agreements to repurchase, at their respective carrying values, consisted of the following:
In millions of dollars
June 30, 2025
December 31, 2024
Securities sold under agreements to repurchase
$
330,203
$
239,767
Securities loaned
17,710
14,988
Total, net(1)
$
347,913
$
254,755
(1) The above tables do not include securities-for-securities lending transactions of $3.9 billion and $5.2 billion at June 30, 2025 and December 31, 2024, respectively, where the Company acts as lender and receives securities that can be sold or pledged as collateral. In these transactions, the Company recognizes the securities received at fair value within Other assets and the obligation to return those securities as a liability within Brokerage payables.
(2) See Note 15.
123
The following tables present the gross and net resale and repurchase agreements and securities borrowing and lending agreements and the related offsetting amounts permitted under ASC 210-20-45. The tables also include amounts related to financial instruments that are not permitted to be offset under ASC 210-20-45, but would be eligible for offsetting to the extent that an event of default has occurred and a legal opinion supporting enforceability of the offsetting rights has been obtained. Remaining exposures continue to be secured by financial collateral, but the Company may not have sought or been able to obtain a legal opinion evidencing enforceability of the offsetting right.
As of June 30, 2025
In millions of dollars
Gross amounts of recognized assets
Gross amounts offset on the Consolidated Balance Sheet(1)(2)
Net amounts of assets included on the Consolidated Balance Sheet
Amounts not offset on the Consolidated Balance Sheet but eligible for offsetting upon counterparty default(2)(3)
Net amounts(4)
Securities purchased under agreements to resell
$
571,388
$
326,389
$
244,999
$
237,911
$
7,088
Securities borrowed
101,780
22,877
78,903
29,718
49,185
Total
$
673,168
$
349,266
$
323,902
$
267,629
$
56,273
In millions of dollars
Gross amounts of recognized liabilities
Gross amounts offset on the Consolidated Balance Sheet(1)(2)
Net amounts of liabilities included on the Consolidated Balance Sheet
Amounts not offset on the Consolidated Balance Sheet but eligible for offsetting upon counterparty default(2)(3)
Net amounts(4)
Securities sold under agreements to repurchase
$
656,592
$
326,389
$
330,203
$
275,604
$
54,599
Securities loaned
40,587
22,877
17,710
13,819
3,891
Total
$
697,179
$
349,266
$
347,913
$
289,423
$
58,490
As of December 31, 2024
In millions of dollars
Gross amounts of recognized assets
Gross amounts offset on the Consolidated Balance Sheet(1)
Net amounts of assets included on the Consolidated Balance Sheet
Amounts not offset on the Consolidated Balance Sheet but eligible for offsetting upon counterparty default(3)
Net amounts(4)
Securities purchased under agreements to resell
$
516,722
$
323,772
$
192,950
$
186,121
$
6,829
Securities borrowed
100,442
19,327
81,115
22,228
58,887
Total
$
617,164
$
343,099
$
274,065
$
208,349
$
65,716
In millions of dollars
Gross amounts of recognized liabilities
Gross amounts offset on the Consolidated Balance Sheet(1)
Net amounts of liabilities included on the Consolidated Balance Sheet
Amounts not offset on the Consolidated Balance Sheet but eligible for offsetting upon counterparty default(3)
Net amounts(4)
Securities sold under agreements to repurchase
$
563,539
$
323,772
$
239,767
$
193,714
$
46,053
Securities loaned
34,315
19,327
14,988
12,317
2,671
Total
$
597,854
$
343,099
$
254,755
$
206,031
$
48,724
(1)Includes financial instruments subject to enforceable master netting agreements that are permitted to be offset under ASC 210-20-45.
(2)Beginning January 1, 2025, excludes amounts relating to accrued interest. Accrued interest receivable on Securities purchased under agreements to resell (reverse repos) is presented in Other assets and accrued interest payable on Securities sold under agreements to repurchase (repos) is presented in Other liabilities.
(3)Includes financial instruments subject to enforceable master netting agreements that are not permitted to be offset under ASC 210-20-45, but would be eligible for offsetting to the extent that an event of default has occurred and a legal opinion supporting enforceability of the offsetting right has been obtained.
(4)Remaining exposures continue to be secured by financial collateral, but the Company may not have sought or been able to obtain a legal opinion evidencing enforceability of the offsetting right.
124
The following tables present the gross amounts of liabilities associated with repurchase agreements and securities lending agreements by remaining contractual maturity:
As of June 30, 2025
In millions of dollars
Open and overnight
Up to 30 days
31–90 days
Greater than 90 days
Total
Securities sold under agreements to repurchase
$
360,155
$
159,940
$
60,979
$
75,518
$
656,592
Securities loaned
31,404
215
1,316
7,652
40,587
Total
$
391,559
$
160,155
$
62,295
$
83,170
$
697,179
As of December 31, 2024
In millions of dollars
Open and overnight
Up to 30 days
31–90 days
Greater than 90 days
Total
Securities sold under agreements to repurchase
$
299,527
$
154,036
$
46,635
$
63,341
$
563,539
Securities loaned
25,898
213
1,007
7,197
34,315
Total
$
325,425
$
154,249
$
47,642
$
70,538
$
597,854
The following tables present the gross amounts of liabilities associated with repurchase agreements and securities lending agreements by class of underlying collateral:
As of June 30, 2025
In millions of dollars
Repurchase agreements
Securities lending agreements
Total
U.S. Treasury and federal agency securities
$
318,840
$
—
$
318,840
State and municipal securities
93
12
105
Foreign government securities
183,417
1,154
184,571
Corporate bonds
20,455
937
21,392
Equity securities
30,118
38,070
68,188
Mortgage-backed securities
96,070
24
96,094
Asset-backed securities
5,026
23
5,049
Other
2,573
367
2,940
Total
$
656,592
$
40,587
$
697,179
As of December 31, 2024
In millions of dollars
Repurchase agreements
Securities lending agreements
Total
U.S. Treasury and federal agency securities
$
324,233
$
40
$
324,273
State and municipal securities
183
—
183
Foreign government securities
132,123
1,069
133,192
Corporate bonds
17,467
330
17,797
Equity securities
18,498
32,837
51,335
Mortgage-backed securities
65,279
—
65,279
Asset-backed securities
2,609
23
2,632
Other
3,147
16
3,163
Total
$
563,539
$
34,315
$
597,854
125
12. BROKERAGE RECEIVABLES AND BROKERAGE PAYABLES
The Company has receivables and payables for financial instruments sold to and purchased from brokers, dealers and customers, which arise in the ordinary course of business.
For additional information on these receivables and payables, see Note 13 to the Consolidated Financial Statements in Citi’s 2024 Form 10-K.
Brokerage receivables and Brokerage payables consisted of the following:
In millions of dollars
June 30, 2025
December 31, 2024
Receivables from customers
$
18,468
$
18,512
Receivables from brokers, dealers and clearing organizations
45,561
32,329
Total brokerage receivables(1)
$
64,029
$
50,841
Payables to customers
$
65,109
$
51,993
Payables to brokers, dealers and clearing organizations
25,840
14,608
Total brokerage payables(1)
$
90,949
$
66,601
(1) Includes brokerage receivables and payables recorded by Citi’s broker-dealer entities that are accounted for in accordance with the AICPA Accounting Guide for Brokers and Dealers in Securities as codified in ASC 940-320.
126
13. INVESTMENTS
For additional information regarding Citi’s investment portfolios, including evaluating investments for impairment, see Note 14 to the Consolidated Financial Statements
in Citi’s 2024 Form 10-K.
The following table presents Citi’s investments by category:
In millions of dollars
June 30, 2025
December 31, 2024
Debt securities available-for-sale (AFS)
$
235,802
$
226,876
Debt securities held-to-maturity (HTM)(1)
206,094
242,382
Marketable equity securities carried at fair value(2)
112
151
Non-marketable equity securities carried at fair value(2)(3)
471
427
Non-marketable equity securities measured using the measurement alternative(4)
1,581
1,574
Non-marketable equity securities carried at cost(5)
5,340
5,247
Total investments(6)
$
449,400
$
476,657
(1)Carried at adjusted amortized cost basis, net of any ACL.
(2)Unrealized gains and losses are recognized in earnings.
(3)Includes $32 million and $23 million of investments in funds for which the fair values are estimated using the net asset value of the Company’s ownership interest in the funds at June 30, 2025 and December 31, 2024, respectively.
(4)Impairment losses and adjustments to the carrying value as a result of observable price changes are recognized in earnings. See “Non-Marketable Equity Securities Not Carried at Fair Value” below.
(5) Represents shares issued by the Federal Reserve Bank, Federal Home Loan Banks and certain exchanges of which Citigroup is a member.
(6) Not included in the balances above is approximately $2 billion of accrued interest receivable at June 30, 2025 and December 31, 2024, which is included in Other assets on the Consolidated Balance Sheet. The Company does not recognize an allowance for credit losses on accrued interest receivable for AFS and HTM debt securities, consistent with its non-accrual policy, which results in timely write-off of accrued interest. The Company did not reverse through interest income any accrued interest receivables for the quarters ended June 30, 2025 and 2024.
The following table presents interest and dividend income on investments:
Three Months Ended June 30,
Six Months Ended June 30,
In millions of dollars
2025
2024
2025
2024
Taxable interest
$
4,022
$
4,637
$
8,043
$
9,328
Interest exempt from U.S. federal income tax
78
81
155
161
Dividend income
106
103
174
181
Total interest and dividend income on investments
$
4,206
$
4,821
$
8,372
$
9,670
The following table presents realized gains and losses on the sales of investments, which exclude impairment losses:
Three Months Ended June 30,
Six Months Ended June 30,
In millions of dollars
2025
2024
2025
2024
Gross realized investment gains
$
152
$
144
$
286
$
286
Gross realized investment losses
(14)
(121)
(27)
(148)
Net realized gains on sales of investments
$
138
$
23
$
259
$
138
127
Debt Securities Available-for-Sale
The amortized cost and fair value of AFS debt securities were as follows:
June 30, 2025
December 31, 2024
In millions of dollars
Amortized cost
Gross unrealized gains
Gross unrealized losses
Allowance for credit losses
Fair value
Amortized cost
Gross unrealized gains
Gross unrealized losses
Allowance for credit losses
Fair value
Debt securities AFS
Mortgage-backed securities(1)
U.S. government-sponsored agency guaranteed(2)
$
37,163
$
26
$
1,015
$
—
$
36,174
$
30,208
$
40
$
942
$
—
$
29,306
Residential
831
—
3
—
828
626
—
2
—
624
Commercial
1
—
—
—
1
1
—
—
—
1
Total mortgage-backed securities
$
37,995
$
26
$
1,018
$
—
$
37,003
$
30,835
$
40
$
944
$
—
$
29,931
U.S. Treasury and federal agency securities
U.S. Treasury
$
35,603
$
53
$
166
$
—
$
35,490
$
52,630
$
13
$
264
$
—
$
52,379
Total U.S. Treasury and federal agency securities
$
35,603
$
53
$
166
$
—
$
35,490
$
52,630
$
13
$
264
$
—
$
52,379
State and municipal
$
1,774
$
3
$
105
$
—
$
1,672
$
1,749
$
12
$
103
$
—
$
1,658
Foreign government
150,681
956
647
—
150,990
134,002
444
1,087
—
133,359
Corporate
5,316
32
88
2
5,258
4,923
19
122
6
4,814
Asset-backed securities(1)
988
4
5
—
987
856
3
11
—
848
Other debt securities
4,401
1
—
—
4,402
3,887
1
1
—
3,887
Total debt securities AFS
$
236,758
$
1,075
$
2,029
$
2
$
235,802
$
228,882
$
532
$
2,532
$
6
$
226,876
(1)The Company invests in mortgage- and asset-backed securities, which are typically issued by VIEs through securitization transactions. The Company’s maximum exposure to loss from these VIEs is equal to the carrying amount of the securities, which is reflected in the table above. See Note 21 for mortgage- and asset-backed securitizations in which the Company has other involvement.
(2)Amortized cost includes unallocated portfolio-layer cumulative basis adjustments of $0.3 billion and $(0.2) billion as of June 30, 2025 and December 31, 2024, respectively. Gross unrealized gains and gross unrealized (losses) on mortgage-backed securities excluding the effect of unallocated portfolio-layer hedges cumulative basis adjustments were $80 million and $(739) million, respectively, as of June 30, 2025. Gross unrealized gains and gross unrealized (losses) on mortgage-backed securities excluding the effect of unallocated portfolio-layer hedges cumulative basis adjustments were $35 million and $(1,129) million, respectively, as of December 31, 2024.
128
The following table presents the fair value of AFS debt securities that have been in an unrealized loss position:
Less than 12 months
12 months or longer
Total
In millions of dollars
Fair value
Gross unrealized losses
Fair value
Gross unrealized losses
Fair value
Gross unrealized losses
June 30, 2025
Debt securities AFS
Mortgage-backed securities
U.S. government-sponsored agency guaranteed
$
24,634
$
393
$
8,303
$
622
$
32,937
$
1,015
Residential
602
2
203
1
805
3
Commercial
1
—
—
—
1
—
Total mortgage-backed securities
$
25,237
$
395
$
8,506
$
623
$
33,743
$
1,018
U.S. Treasury and federal agency securities
U.S. Treasury
$
15,868
$
94
$
4,591
$
72
$
20,459
$
166
Total U.S. Treasury and federal agency securities
$
15,868
$
94
$
4,591
$
72
$
20,459
$
166
State and municipal
$
962
$
69
$
454
$
36
$
1,416
$
105
Foreign government
34,128
222
14,064
425
48,192
647
Corporate
561
36
1,726
52
2,287
88
Asset-backed securities
436
5
—
—
436
5
Other debt securities
17
—
279
—
296
—
Total debt securities AFS
$
77,209
$
821
$
29,620
$
1,208
$
106,829
$
2,029
December 31, 2024
Debt securities AFS
Mortgage-backed securities
U.S. government-sponsored agency guaranteed
$
16,690
$
255
$
8,484
$
687
$
25,174
$
942
Residential
375
1
216
1
591
2
Commercial
—
—
1
—
1
—
Total mortgage-backed securities
$
17,065
$
256
$
8,701
$
688
$
25,766
$
944
U.S. Treasury and federal agency securities
U.S. Treasury
$
13,660
$
166
$
1,710
$
98
$
15,370
$
264
Total U.S. Treasury and federal agency securities
$
13,660
$
166
$
1,710
$
98
$
15,370
$
264
State and municipal
$
855
$
72
$
335
$
31
$
1,190
$
103
Foreign government
49,384
487
19,719
600
69,103
1,087
Corporate
455
45
2,444
77
2,899
122
Asset-backed securities
388
11
—
—
388
11
Other debt securities
1,098
—
939
1
2,037
1
Total debt securities AFS
$
82,905
$
1,037
$
33,848
$
1,495
$
116,753
$
2,532
129
The following table presents the amortized cost and fair value of AFS debt securities by contractual maturity dates:
June 30, 2025
In millions of dollars
Amortized cost
Fair value
Mortgage-backed securities(1)
Due within 1 year
$
4
$
4
After 1 but within 5 years
1,096
1,089
After 5 but within 10 years
638
621
After 10 years
35,928
35,289
Total(2)
$
37,666
$
37,003
U.S. Treasury and federal agency securities
Due within 1 year
$
14,001
$
13,949
After 1 but within 5 years
21,399
21,359
After 5 but within 10 years
203
182
After 10 years
—
—
Total
$
35,603
$
35,490
State and municipal
Due within 1 year
$
14
$
14
After 1 but within 5 years
159
155
After 5 but within 10 years
356
346
After 10 years
1,245
1,157
Total
$
1,774
$
1,672
Foreign government
Due within 1 year
$
62,146
$
62,172
After 1 but within 5 years
82,735
83,153
After 5 but within 10 years
5,158
5,101
After 10 years
642
564
Total
$
150,681
$
150,990
All other(3)
Due within 1 year
$
4,993
$
4,989
After 1 but within 5 years
5,020
4,990
After 5 but within 10 years
638
643
After 10 years
54
25
Total
$
10,705
$
10,647
Total debt securities AFS(2)
$
236,429
$
235,802
(1)Includes mortgage-backed securities of U.S. government-sponsored agencies. The Company invests in mortgage- and asset-backed securities, which are typically issued by VIEs through securitization transactions. See Note 21 for additional information about mortgage- and asset-backed securitizations in which the Company has other involvement.
(2)Amortized cost excludes unallocated portfolio-layer cumulative basis adjustments of $0.3 billion as of June 30, 2025.
(3)Includes corporate, asset-backed and other debt securities.
130
Debt Securities Held-to-Maturity
The carrying value and fair value of debt securities HTM were as follows:
In millions of dollars
Amortized
cost, net(1)
Gross unrealized gains
Gross unrealized losses
Fair value
June 30, 2025
Debt securities HTM
Mortgage-backed securities(2)
U.S. government-sponsored agency guaranteed
$
69,227
$
1
$
8,617
$
60,611
Non-U.S. residential
—
—
—
—
Commercial
1,221
20
126
1,115
Total mortgage-backed securities
$
70,448
$
21
$
8,743
$
61,726
U.S. Treasury securities
$
94,987
$
—
$
4,509
$
90,478
State and municipal
8,780
16
793
8,003
Foreign government
747
19
—
766
Asset-backed securities(2)
31,132
88
57
31,163
Total debt securities HTM, net
$
206,094
$
144
$
14,102
$
192,136
December 31, 2024
Debt securities HTM
Mortgage-backed securities(2)
U.S. government-sponsored agency guaranteed
$
72,542
$
—
$
10,291
$
62,251
Non-U.S. residential
—
—
—
—
Commercial
1,247
12
151
1,108
Total mortgage-backed securities
$
73,789
$
12
$
10,442
$
63,359
U.S. Treasury securities
$
126,142
$
—
$
6,934
$
119,208
State and municipal
8,903
27
668
8,262
Foreign government
988
3
—
991
Asset-backed securities(2)
32,560
91
61
32,590
Total debt securities HTM, net
$
242,382
$
133
$
18,105
$
224,410
(1)Amortized cost is reported net of ACL of $136 million and $137 million at June 30, 2025 and December 31, 2024, respectively.
(2)The Company invests in mortgage- and asset-backed securities. These securitizations are generally considered VIEs. The Company’s maximum exposure to loss from these VIEs is equal to the carrying amount of the securities, which is reflected in the table above. See Note 21 for mortgage- and asset-backed securitizations in which the Company has other involvement.
131
The following table presents the carrying value and fair value of HTM debt securities by contractual maturity dates:
June 30, 2025
In millions of dollars
Amortized cost(1)
Fair value
Mortgage-backed securities
Due within 1 year
$
232
$
230
After 1 but within 5 years
955
928
After 5 but within 10 years
1,254
1,181
After 10 years
68,007
59,387
Total
$
70,448
$
61,726
U.S. Treasury securities
Due within 1 year
$
19,145
$
18,716
After 1 but within 5 years
75,842
71,762
After 5 but within 10 years
—
—
After 10 years
—
—
Total
$
94,987
$
90,478
State and municipal
Due within 1 year
$
23
$
21
After 1 but within 5 years
186
185
After 5 but within 10 years
2,002
1,997
After 10 years
6,569
5,800
Total
$
8,780
$
8,003
Foreign government
Due within 1 year
$
168
$
170
After 1 but within 5 years
579
596
After 5 but within 10 years
—
—
After 10 years
—
—
Total
$
747
$
766
All other(2)
Due within 1 year
$
—
$
—
After 1 but within 5 years
—
—
After 5 but within 10 years
9,975
9,993
After 10 years
21,157
21,170
Total
$
31,132
$
31,163
Total debt securities HTM
$
206,094
$
192,136
(1)Amortized cost is reported net of ACL of $136 million at June 30, 2025.
(2)Includes corporate and asset-backed securities.
HTM Debt Securities Delinquency and Non-Accrual Details
Citi did not have any HTM debt securities that were delinquent or on non-accrual status at June 30, 2025 and December 31, 2024.
There were no purchased credit-deteriorated HTM debt securities held by the Company as of June 30, 2025 and December 31, 2024.
132
Evaluating Investments for Impairment—AFS Debt Securities
The Company conducts periodic reviews of all AFS debt securities with unrealized losses to evaluate whether the impairment resulted from expected credit losses or from other factors and to evaluate the Company’s intent to sell such securities.
For more information on evaluating investments for impairment, see Note 14 to the Consolidated Financial Statements in Citi’s 2024 Form 10-K.
Recognition and Measurement of Impairment
The following table presents total impairment on AFS investments recognized in earnings:
Three Months Ended June 30,
Six Months Ended June 30,
In millions of dollars
2025
2024
2025
2024
Impairment losses recognized in earnings for debt securities that the Company intends to sell, would more-likely-than-not be required to sell or will be subject to an issuer call deemed probable of exercise
$
2
$
9
$
5
$
23
Total impairment losses recognized in earnings
$
2
$
9
$
5
$
23
Allowance for Credit Losses on AFS Debt Securities
The allowance for credit losses on AFS debt securities held that the Company does not intend to sell nor will likely be required to sell was immaterial as of June 30, 2025 and December 31, 2024.
Non-Marketable Equity Securities Not Carried at
Fair Value
Non-marketable equity securities are required to be measured at fair value with changes in fair value recognized in earnings unless (i) the measurement alternative is elected or (ii) the investment represents Federal Reserve Bank and Federal Home Loan Bank stock or certain exchange seats that continue to be carried at cost.
The election to measure a non-marketable equity security using the measurement alternative is made on an instrument-by-instrument basis. Under the measurement alternative, an equity security is carried at cost plus or minus changes resulting from observable prices in orderly transactions for the identical or a similar investment of the same issuer. The carrying value of the equity security is adjusted to fair value on the date of an observed transaction. Fair value may differ from the observed transaction price due to a number of factors, including marketability adjustments and differences in rights and obligations when the observed transaction is not for the identical investment held by Citi.
Equity securities under the measurement alternative, which are composed of private equity investments, are also assessed for impairment. On a quarterly basis, management qualitatively assesses whether each equity security under the measurement alternative is impaired. For details on impairment indicators that are considered, see Note 14 to the Consolidated Financial Statements in Citi’s 2024 Form 10-K.
When the qualitative assessment indicates that the equity security is impaired, its fair value is determined. If the fair value of the investment is less than its carrying value, the investment is written down to fair value through earnings.
Below is the carrying value of non-marketable equity securities measured using the measurement alternative at June 30, 2025 and December 31, 2024:
In millions of dollars
June 30, 2025
December 31, 2024
Measurement alternative:
Carrying value
$
1,581
$
1,574
Below are amounts recognized in earnings and life-to-date amounts for non-marketable equity securities measured using the measurement alternative:
Three Months Ended June 30,
Six Months Ended June 30,
In millions of dollars
2025
2024
2025
2024
Measurement alternative(1):
Impairment losses
$
37
$
8
$
89
$
24
Downward changes for observable prices
—
1
—
1
Upward changes for observable prices
38
3
47
52
(1) See Note 23 for additional information on these nonrecurring fair value measurements.
Life-to-date amounts on securities still held
In millions of dollars
June 30, 2025
Measurement alternative:
Impairment losses
$
501
Downward changes for observable prices
39
Upward changes for observable prices
1,076
A similar impairment analysis is performed for non-marketable equity securities carried at cost. For the three months ended June 30, 2025 and 2024, there was no impairment loss recognized in earnings for non-marketable equity securities carried at cost.
133
14. LOANS
Citigroup loans are reported in two categories: corporate and consumer. These categories are classified primarily according to the segment that manages the loans (or, if applicable, All Other—Legacy Franchises), in addition to the nature of the obligor, with corporate loans generally made for corporate, institutional and public sector clients and consumer loans to retail and small business customers. For additional information regarding Citi’s corporate and consumer loans, including related accounting policies, see Notes 1 and 15 to the Consolidated Financial Statements in Citi’s 2024 Form 10-K.
CORPORATE LOANS
Corporate loans represent loans and leases managed by Services, Markets, Banking and the Banamex SBMM portion of All Other—Legacy Franchises. The following table presents information by corporate loan type:
In millions of dollars
June 30, 2025
December 31, 2024
In North America offices(1)
Commercial and industrial
$
59,382
$
57,730
Financial institutions
56,727
41,815
Mortgage and real estate(2)
17,887
18,411
Installment and other(3)
25,480
25,529
Lease financing
185
235
Total
$
159,661
$
143,720
In offices outside North America(1)
Commercial and industrial
$
97,338
$
92,856
Financial institutions
27,131
27,276
Mortgage and real estate(2)
9,434
8,136
Installment and other(3)
31,776
25,800
Lease financing
45
40
Governments and official institutions
4,151
3,630
Total
$
169,875
$
157,738
Corporate loans, net of unearned income, excluding portfolio-layer hedges cumulative basis adjustments(4)(5)(6)
(1)North America includes the U.S., Canada and Puerto Rico. Mexico is included in offices outside North America. The classification between offices in North America and outside North America is based on the domicile of the booking unit. The difference between the domicile of the booking unit and the risk-based country view is not material for the purposes of classification of corporate loans between offices in North America and outside North America.
(2)Loans secured primarily by real estate.
(3)Installment and other includes loans to SPEs and TTS commercial cards.
(4)Corporate loans are net of unearned income of $(991) million and $(969) million at June 30, 2025 and December 31, 2024, respectively. Unearned income on corporate loans primarily represents loan origination fees, net
of certain direct origination costs, that are deferred and recognized as Interest income over the lives of the related loans.
(5)Not included in the balances above is approximately $2 billion of accrued interest receivable at June 30, 2025 and December 31, 2024, which is included in Other assets on the Consolidated Balance Sheet.
(6)Accrued interest receivable considered to be uncollectible is reversed through interest income. Amounts reversed were not material for the three and six months ended June 30, 2025 and 2024.
(7)Represents fair value hedge basis adjustments related to portfolio-layer method hedges of mortgage and real estate loans, which are not allocated to individual loans in the portfolio. See Note 22.
The Company sold and/or reclassified to held-for-sale $0.9 billion and $1.9 billion of corporate loans during the three and six months ended June 30, 2025, and $1.5 billion and $2.3 billion of corporate loans during the three and six months ended June 30, 2024, respectively. The Company did not have significant purchases of corporate loans classified as held-for-investment for the three and six months ended June 30, 2025 or 2024.
134
Corporate Loan Delinquencies and Non-Accrual Details at June 30, 2025
In millions of dollars
30–89 days
past due
and accruing(1)
≥ 90 days
past due and
accruing(1)
Total past due and accruing
Total
non-accrual(2)
Total
current(3)
Total
loans(4)
Commercial and industrial
$
215
$
63
$
278
$
570
$
153,772
$
154,620
Financial institutions
34
—
34
214
82,561
82,809
Mortgage and real estate
2
2
4
746
26,570
27,320
Lease financing
—
1
1
14
216
231
Other
32
19
51
178
55,097
55,326
Loans at fair value
N/A
N/A
N/A
N/A
N/A
9,230
Total(5)
$
283
$
85
$
368
$
1,722
$
318,216
$
329,536
Corporate Loan Delinquencies and Non-Accrual Details at December 31, 2024
In millions of dollars
30–89 days
past due
and accruing(1)
≥ 90 days
past due and
accruing(1)
Total past due and accruing
Total
non-accrual(2)
Total
current(3)
Total
loans(4)
Commercial and industrial
$
183
$
35
$
218
$
542
$
147,914
$
148,674
Financial institutions
8
—
8
73
68,297
68,378
Mortgage and real estate
6
2
8
567
25,971
26,546
Lease financing
—
1
1
—
275
276
Other
62
16
78
195
49,552
49,825
Loans at fair value
N/A
N/A
N/A
N/A
N/A
7,759
Total(5)
$
259
$
54
$
313
$
1,377
$
292,009
$
301,458
(1)Corporate loans that are 90 days or more past due are generally classified as non-accrual. Corporate loans are considered past due when principal or interest is contractually due but unpaid.
(2)Non-accrual loans generally include those loans that are 90 days or more past due or those loans for which Citi believes, based on actual experience and a forward-looking assessment of the collectibility of the loan in full, that the payment of interest and/or principal is doubtful.
(3)Loans less than 30 days past due are presented as current.
(4)The Total loans column includes loans at fair value, which are not included in the various delinquency columns and, therefore, the tables’ total rows will not cross-foot.
(5)Excludes $50 million and $(72) million of unallocated portfolio-layer hedges cumulative basis adjustments at June 30, 2025 and December 31, 2024, respectively.
N/A Not applicable
135
Corporate Loan Credit Quality Indicators
Recorded investment in loans(1)
Term loans by year of origination
Revolving line
of credit arrangements(2)
June 30, 2025
In millions of dollars
2025
2024
2023
2022
2021
Prior
Investment grade(3)
Commercial and industrial(4)
$
31,851
$
11,158
$
7,669
$
4,976
$
2,102
$
4,809
$
31,841
$
94,406
Financial institutions(4)
15,314
6,177
2,350
1,235
417
2,057
45,040
72,590
Mortgage and real estate
2,525
5,070
3,779
2,758
2,020
2,291
472
18,915
Other(5)
6,143
4,316
2,395
3,649
693
5,540
26,651
49,387
Total investment grade
$
55,833
$
26,721
$
16,193
$
12,618
$
5,232
$
14,697
$
104,004
$
235,298
Non-investment grade(3)
Accrual
Commercial and industrial(4)
$
20,193
$
7,041
$
4,275
$
2,939
$
1,108
$
2,710
$
21,378
$
59,644
Financial institutions(4)
2,796
1,339
405
217
444
213
4,591
10,005
Mortgage and real estate
394
735
1,432
1,812
1,022
1,781
483
7,659
Other(5)
1,569
1,018
706
260
118
409
1,898
5,978
Non-accrual
Commercial and industrial(4)
98
40
76
81
24
53
198
570
Financial institutions
5
—
—
—
182
—
27
214
Mortgage and real estate
34
1
6
39
237
391
38
746
Other(5)
—
—
20
—
129
30
13
192
Total non-investment grade
$
25,089
$
10,174
$
6,920
$
5,348
$
3,264
$
5,587
$
28,626
$
85,008
Loans at fair value(6)
$
9,230
Corporate loans, net of unearned income(7)
$
80,922
$
36,895
$
23,113
$
17,966
$
8,496
$
20,284
$
132,630
$
329,536
136
Recorded investment in loans(1)
Term loans by year of origination
Revolving line
of credit arrangements(2)
December 31, 2024
In millions of dollars
2024
2023
2022
2021
2020
Prior
Investment grade(3)
Commercial and industrial(4)
$
36,039
$
8,101
$
5,035
$
2,492
$
1,225
$
4,853
$
32,862
$
90,607
Financial institutions(4)
13,074
2,136
1,162
326
265
1,500
41,415
59,878
Mortgage and real estate
5,325
3,927
3,269
2,537
1,460
1,533
248
18,299
Other(5)
5,773
2,643
4,036
822
1,156
5,578
24,623
44,631
Total investment grade
$
60,211
$
16,807
$
13,502
$
6,177
$
4,106
$
13,464
$
99,148
$
213,415
Non-investment grade(3)
Accrual
Commercial and industrial(4)
$
24,937
$
5,082
$
3,576
$
1,583
$
318
$
2,560
$
19,468
$
57,524
Financial institutions(4)
4,103
529
255
655
41
355
2,489
8,427
Mortgage and real estate
801
1,112
1,936
1,400
770
1,190
472
7,681
Other(5)
1,227
592
427
261
190
274
2,304
5,275
Non-accrual
Commercial and industrial
43
78
48
17
7
44
305
542
Financial institutions(4)
—
—
—
55
—
—
18
73
Mortgage and real estate
16
2
104
107
28
279
31
567
Other(5)
1
—
1
18
—
19
156
195
Total non-investment grade
$
31,128
$
7,395
$
6,347
$
4,096
$
1,354
$
4,721
$
25,243
$
80,284
Loans at fair value(6)
$
7,759
Corporate loans, net of unearned income(7)
$
91,339
$
24,201
$
19,849
$
10,274
$
5,460
$
18,185
$
124,391
$
301,458
(1)Recorded investment in a loan includes net deferred loan fees and costs, unamortized premium or discount, less any direct write-downs.
(2)There were no significant revolving line of credit arrangements that converted to term loans during the period.
(3)Held-for-investment loans are accounted for on an amortized cost basis.
(4)Includes certain short-term loans with less than one year in tenor.
(5)Other includes installment and other, lease financing and loans to government and official institutions.
(6)Loans at fair value include loans to commercial and industrial, financial institutions, mortgage and real estate and other.
(7)Excludes $50 million and $(72) million of unallocated portfolio-layer hedges cumulative basis adjustments at June 30, 2025 and December 31, 2024, respectively.
137
Corporate Gross Credit Losses
The table below details gross credit losses recognized during the six months ended June 30, 2025, by year of loan origination:
For the Six Months Ended June 30, 2025
In millions of dollars
2025
2024
2023
2022
2021
Prior
Revolving line of credit arrangement
Total
Commercial and industrial
$
—
$
4
$
—
$
—
$
—
$
6
$
75
$
85
Financial institutions
—
—
—
—
—
—
7
7
Mortgage and real estate
—
—
—
—
—
7
2
9
Other(1)
2
—
141
—
—
2
16
161
Total
$
2
$
4
$
141
$
—
$
—
$
15
$
100
$
262
The table below details gross credit losses recognized during the six months ended June 30, 2024, by year of loan origination:
For the Six Months Ended June 30, 2024
In millions of dollars
2024
2023
2022
2021
2020
Prior
Revolving line of credit arrangement
Total
Commercial and industrial
$
2
$
—
$
3
$
9
$
—
$
3
$
111
$
128
Financial institutions
—
—
—
—
—
1
9
10
Mortgage and real estate
1
37
9
—
—
63
20
130
Other(1)
—
—
—
—
—
15
24
39
Total
$
3
$
37
$
12
$
9
$
—
$
82
$
164
$
307
(1) Other includes installment and other, lease financing and loans to government and official institutions.
Non-Accrual Corporate Loans
June 30, 2025
December 31, 2024
In millions of dollars
Recorded
investment(1)(2)
Related specific allowance
Recorded
investment(1)(2)
Related specific allowance
Non-accrual corporate loans with specific allowances
Commercial and industrial
$
307
$
118
$
199
$
86
Financial institutions
134
7
—
—
Mortgage and real estate
292
20
276
42
Other
35
28
185
174
Total non-accrual corporate loans with specific allowances
$
768
$
173
$
660
$
302
Non-accrual corporate loans without specific allowances
Commercial and industrial
$
263
$
343
Financial institutions
80
73
Mortgage and real estate
454
291
Lease financing
14
—
Other
143
10
Total non-accrual corporate loans without specific allowances
$
954
N/A
$
717
N/A
(1)Recorded investment in a loan includes net deferred loan fees and costs, unamortized premium or discount, less any direct write-downs.
(2)Interest income recognized for the three and six months ended June 30, 2025 was $6 million and $14 million, respectively, and for the three and six months ended June 30, 2024 was $12 million and $30 million, respectively.
N/A Not applicable
138
Corporate Loan Modifications to Borrowers Experiencing Financial Difficulty
Citi seeks to modify certain corporate loans to borrowers experiencing financial difficulty to reduce Citi’s exposure to loss, often providing the borrower with an opportunity to work through financial difficulties. Each modification is unique to the borrower’s individual circumstances. The following tables
detail corporate loan modifications granted during the three and six months ended June 30, 2025 and 2024 to borrowers experiencing financial difficulty by type of modification granted and the financial effect of those modifications. Citi defines a corporate loan modification to a borrower experiencing financial difficulty as a modification of a loan classified as substandard or worse at the time of modification.
For the Three and Six Months Ended June 30, 2025
In millions of dollars, except for weighted-average term extension
Total modifications balance at June 30, 2025(1)(2)(3)
Term extension
Combination:
Term extension and payment delay(4)
Weighted-average term extension (months)
Three Months Ended June 30, 2025
Commercial and industrial
$
133
$
133
$
—
12
Financial institutions
—
—
—
—
Mortgage and real estate
—
—
—
—
Other(5)
—
—
—
—
Total
$
133
$
133
$
—
Six Months Ended June 30, 2025
Commercial and industrial
$
151
$
151
$
—
13
Financial institutions
—
—
—
—
Mortgage and real estate
—
—
—
—
Other(5)
—
—
—
—
Total
$
151
$
151
$
—
For the Three and Six Months Ended June 30, 2024
In millions of dollars, except for weighted-average term extension
Total modifications balance at June 30, 2024(1)(2)(3)
Term extension
Combination:
Term extension and payment delay(4)
Weighted-average term extension (months)
Three Months Ended June 30, 2024
Commercial and industrial
$
50
$
50
$
—
9
Financial institutions
—
—
—
—
Mortgage and real estate
91
91
—
8
Other(5)
—
—
—
—
Total
$
141
$
141
$
—
Six Months Ended June 30, 2024
Commercial and industrial
$
131
$
131
$
—
13
Financial institutions
—
—
—
—
Mortgage and real estate
177
177
—
16
Other(5)
—
—
—
—
Total
$
308
$
308
$
—
(1)The above table reflects activity for loans outstanding as of the end of the reporting period. The balances are not significant as a percentage of the total carrying values of loans by class of receivable as of June 30, 2025 and 2024.
(2)Commitments to lend to borrowers experiencing financial difficulty that were granted modifications totaled $355 million and $890 million as of June 30, 2025 and 2024, respectively.
(3)The allowance for corporate loans, including modified loans, is based on the borrower’s overall financial performance. Charge-offs for amounts deemed uncollectible may be recorded at the time of the modification or may have already been recorded in prior periods such that no charge-off is required at the time of modification.
(4)Payment delays either for principal or interest payments had an immaterial financial impact.
(5)Other includes installment and other, lease financing and loans to government and official institutions.
139
Performance of Modified Corporate Loans
The following tables present the delinquencies of modified corporate loans to borrowers experiencing financial difficulty. It includes loans that were modified during the 12 months ended June 30, 2025 and December 31, 2024:
As of June 30, 2025(1)
In millions of dollars
Total
Current
30–89 days
past due
90+ days past due
Commercial and industrial
$
267
$
267
$
—
$
—
Financial institutions
—
—
—
—
Mortgage and real estate
63
63
—
—
Other(2)
—
—
—
—
Total
$
330
$
330
$
—
$
—
As of December 31, 2024(1)
In millions of dollars
Total
Current
30–89 days past due
90+ days past due
Commercial and industrial
$
251
$
251
$
—
$
—
Financial institutions
—
—
—
—
Mortgage and real estate
105
105
—
—
Other(2)
—
—
—
—
Total
$
356
$
356
$
—
$
—
(1)Corporate loans are generally not modified as a result of their delinquency status; rather, they are modified because of events that have impacted the overall financial performance of the borrower. Corporate loans, if past due, are re-aged to current status upon modification.
(2)Other includes installment and other, lease financing and loans to government and official institutions.
Defaults of Modified Corporate Loans
No modified corporate loans to borrowers experiencing financial difficulty defaulted during the three months ended June 30, 2025 and 2024. Default is defined as 60 days past due, except for classifiably managed commercial banking loans, where default is defined as 90 days past due. For a modified corporate loan that is not collateral dependent, expected default rates are considered in the loan’s individually assessed ACL.
CONSUMER LOANS
Consumer loans represent loans and leases managed primarily by USPB, Wealth and All Other—Legacy Franchises (except Banamex SBMM).
Citigroup has established a risk management process to monitor, evaluate and manage the principal risks associated with its consumer loan portfolio. Credit quality indicators that are actively monitored include delinquency status, consumer credit scores under Fair Isaac Corporation (FICO) and loan-to-value (LTV) ratios, each as discussed in more detail below.
For Citi’s policies related to consumer loans, including non-accrual and charge-off policies, see Note 1 to the Consolidated Financial Statements in Citi’s 2024 Form 10-K.
140
The following tables provide Citi’s consumer loans by type:
Consumer Loans, Delinquencies and Non-Accrual Status at June 30, 2025
In millions of dollars
Total
current(1)(2)
30–89
days past
due(3)
≥ 90 days
past
due(3)
Past due
government
guaranteed(4)
Total loans
Non-accrual loans for which there is no ACLL
Non-accrual loans for which there is an ACLL
Total non-accrual
90 days past due and accruing
In North America offices(5)
Residential first mortgages(6)
$
115,112
$
384
$
607
$
212
$
116,315
$
142
$
649
$
791
$
113
Home equity loans(7)(8)
2,889
30
46
—
2,965
22
97
119
—
Credit cards
162,799
2,112
2,380
—
167,291
—
—
—
2,380
Personal, small business and other(9)
32,798
102
30
—
32,930
6
155
161
—
Total
$
313,598
$
2,628
$
3,063
$
212
$
319,501
$
170
$
901
$
1,071
$
2,493
In offices outside North America(5)
Residential mortgages(6)
$
23,970
$
45
$
68
$
—
$
24,083
$
—
$
166
$
166
$
—
Credit cards
12,911
224
267
—
13,402
—
258
258
88
Personal, small business and other(9)
38,098
118
41
—
38,257
—
137
137
—
Total
$
74,979
$
387
$
376
$
—
$
75,742
$
—
$
561
$
561
$
88
Total excluding portfolio-layer hedges cumulative basis adjustments
$
388,577
$
3,015
$
3,439
$
212
$
395,243
$
170
$
1,462
$
1,632
$
2,581
Unallocated portfolio-layer hedges
cumulative basis adjustments(10)
$
516
Total Citigroup(11)(12)
$
395,759
Consumer Loans, Delinquencies and Non-Accrual Status at December 31, 2024
In millions of dollars
Total
current(1)(2)
30–89
days past
due(3)
≥ 90 days
past
due(3)
Past due
government
guaranteed(4)
Total loans
Non-accrual loans for which there is no ACLL
Non-accrual loans for which there is an ACLL
Total non-accrual
90 days past due and accruing
In North America offices(5)
Residential first mortgages(6)
$
113,613
$
397
$
349
$
234
$
114,593
$
114
$
409
$
523
$
128
Home equity loans(7)(8)
3,060
23
58
—
3,141
25
114
139
—
Credit cards
166,021
2,333
2,705
—
171,059
—
—
—
2,705
Personal, small business and other(9)
33,010
94
50
1
33,155
7
154
161
2
Total
$
315,704
$
2,847
$
3,162
$
235
$
321,948
$
146
$
677
$
823
$
2,835
In offices outside North America(5)
Residential mortgages(6)
$
24,358
$
38
$
60
$
—
$
24,456
$
—
$
155
$
155
$
—
Credit cards
12,523
190
214
—
12,927
—
211
211
72
Personal, small business and other(9)
33,859
100
36
—
33,995
—
121
121
—
Total
$
70,740
$
328
$
310
$
—
$
71,378
$
—
$
487
$
487
$
72
Total excluding portfolio-layer hedges cumulative basis adjustments
$
386,444
$
3,175
$
3,472
$
235
$
393,326
$
146
$
1,164
$
1,310
$
2,907
Unallocated portfolio-layer hedges
cumulative basis adjustments(10)
$
(224)
Total Citigroup(11)(12)
$
393,102
(1)Loans less than 30 days past due are presented as current.
(2)Includes $27 million and $281 million at June 30, 2025 and December 31, 2024, respectively, of residential first mortgages recorded at fair value.
(3)Excludes loans guaranteed by U.S. government-sponsored agencies. Excludes delinquencies on $25.8 billion and $20.6 billion of classifiably managed Private Bank loans in North America and outside North America, respectively, at June 30, 2025. Excludes delinquencies on $25.9 billion and $17.6 billion of classifiably managed Private Bank loans in North America and outside North America, respectively, at December 31, 2024.
(4)Consists of loans that are guaranteed by U.S. government-sponsored agencies that are 30–89 days past due of $0.1 billion and $0.1 billion and 90 days or more past due of $0.1 billion and $0.1 billion at June 30, 2025 and December 31, 2024, respectively.
(5)North America includes the U.S., Canada and Puerto Rico. Mexico is included in offices outside North America.
141
(6)Includes approximately $0.1 billion and less than $0.1 billion of residential first mortgage loans in process of foreclosure in North America and outside North America, respectively, and $18.8 billion of residential mortgages outside North America related to Wealth at June 30, 2025. Includes approximately $0.2 billion and less than $0.1 billion of residential first mortgage loans in process of foreclosure in North America and outside North America, respectively, and $19.1 billion of residential mortgages outside North America related to Wealth at December 31, 2024.
(7)Includes less than $0.1 billion and less than $0.1 billion at June 30, 2025 and December 31, 2024, respectively, of home equity loans in process of foreclosure.
(8)Fixed-rate home equity loans and loans extended under home equity lines of credit, which are typically in junior lien positions.
(9)As of June 30, 2025, Wealth in North America includes $28.1 billion of loans, of which $25.8 billion are classifiably managed with 84% rated investment grade, and Wealth outside North America includes $29.0 billion of loans, of which $20.6 billion are classifiably managed with 53% rated investment grade. As of December 31, 2024, Wealth in North America includes $28.1 billion of loans, of which $25.9 billion are classifiably managed with 83% rated investment grade, and Wealth outside North America includes $25.4 billion of loans, of which $17.6 billion are classifiably managed with 56% rated investment grade. Such loans are presented as “current” above.
(10)Represents fair value hedge basis adjustments related to portfolio-layer method hedges of mortgage and real estate loans, which are not allocated to individual loans in the portfolio. See Note 22.
(11)Consumer loans were net of unearned income of $913 million and $889 million at June 30, 2025 and December 31, 2024, respectively. Unearned income on consumer loans primarily represents loan origination fees, net of certain direct origination costs, that are deferred and recognized as Interest income over the lives of the related loans.
(12)Not included in the balances above is approximately $1 billion and $1 billion of accrued interest receivable at June 30, 2025 and December 31, 2024, respectively, which is included in Other assets on the Consolidated Balance Sheet, except for credit card loans (which include accrued interest and fees).
During the three and six months ended June 30, 2025, the Company reversed accrued interest (primarily related to credit cards) of approximately $0.5 billion and $0.9 billion, respectively. During the three and six months ended June 30, 2024, the Company reversed accrued interest (primarily related to credit cards) of approximately $0.4 billion and $0.8 billion, respectively. These reversals of accrued interest are reflected as a reduction to Interest income in the Consolidated Statement of Income.
Interest Income Recognized for Non-Accrual Consumer Loans
In millions of dollars
Three Months Ended June 30, 2025
Three Months Ended June 30, 2024
Six Months Ended June 30, 2025
Six Months Ended June 30, 2024
In North America offices(1)
Residential first mortgages
$
2
$
2
$
4
$
5
Home equity loans
1
2
2
3
Personal, small business and other
1
—
1
—
Total
$
4
$
4
$
7
$
8
In offices outside North America(1)
Residential mortgages
$
2
$
3
$
4
$
5
Personal, small business and other
—
1
1
1
Total
$
2
$
4
$
5
$
6
Total Citigroup
$
6
$
8
$
12
$
14
(1)North America includes the U.S., Canada and Puerto Rico. Mexico is included in offices outside North America.
Sales and Purchases of Consumer Loans
During the three and six months ended June 30, 2025, the Company sold and/or reclassified to held-for-sale (HFS) $10 million and $42 million of consumer loans, respectively. During the three and six months ended June 30, 2024, the Company sold and/or reclassified to held-for-sale less than $1 million and $59 million of consumer loans, respectively. Accordingly, there were immaterial releases of the associated allowance for credit losses for the three and six months ended June 30, 2025 and 2024. The transfers exclude certain consumer mortgage loans for which Citi has elected the fair value option (see Note 24), which do not have an associated allowance for credit losses. The transfers also exclude consumer loans held by businesses held-for-sale (see Note 2).
The Company did not have significant purchases of consumer loans classified as held-for-investment for the three and six months ended June 30, 2025 or 2024.
142
Consumer Credit Scores (FICO)
The following tables provide details on the Fair Isaac Corporation (FICO) scores for Citi’s U.S. consumer loan portfolio based on end-of-period receivables by year of origination. FICO scores are updated monthly for substantially all of the portfolio or, otherwise, on a quarterly basis for the remaining portfolio. Loans that did not have FICO scores as of the prior period have been updated with FICO scores as they become available.
With respect to Citi’s consumer loan portfolio outside of the U.S. as of June 30, 2025 and December 31, 2024 ($77.7 billion and $72.5 billion, respectively), various country-specific or regional credit risk metrics and acquisition and behavior scoring models are leveraged as one of the factors to evaluate the credit quality of customers (see “Consumer Loans and Ratios Outside of North America” below). As a result, details of relevant credit quality indicators for those loans are not comparable to the below FICO score distribution for the U.S. portfolio.
FICO score distribution—U.S. portfolio
June 30, 2025
In millions of dollars
Less than 660
660 to 739
Greater than or equal to 740
Classifiably managed(1)
FICO not available(2)
Total loans
Residential first mortgages
2025
$
30
$
973
$
5,781
2024
167
1,961
9,368
2023
182
2,253
12,276
2022
369
3,042
15,624
2021
329
2,559
14,332
Prior
1,708
6,682
31,396
Total residential first mortgages
$
2,785
$
17,470
$
88,777
$
—
$
7,283
$
116,315
Home equity line of credit (pre-reset)
$
242
$
728
$
1,524
Home equity line of credit (post-reset)
61
73
71
Home equity term loans
42
77
104
2025
—
—
—
2024
—
—
—
2023
—
—
—
2022
—
—
—
2021
—
—
1
Prior
42
77
103
Total home equity loans
$
345
$
878
$
1,699
$
—
$
43
$
2,965
Credit cards
$
22,621
$
57,886
$
81,645
Revolving loans converted to term loans(3)
1,604
754
145
Total credit cards(4)
$
24,225
$
58,640
$
81,790
$
—
$
2,057
$
166,712
Personal, small business and other
2025
$
21
$
116
$
444
2024
145
397
982
2023
113
206
382
2022
94
120
173
2021
18
23
31
Prior
92
139
138
Total personal, small business and other(5)(6)
$
483
$
1,001
$
2,150
$
25,842
$
2,614
$
32,090
Total(7)
$
27,838
$
77,989
$
174,416
$
25,842
$
11,997
$
318,082
143
FICO score distribution—U.S. portfolio
December 31, 2024
In millions of dollars
Less than 660
660 to 739
Greater than or equal to 740
Classifiably managed(1)
FICO not available(2)
Total loans
Residential first mortgages
2024
$
123
$
2,213
$
10,308
2023
223
2,451
12,936
2022
354
3,272
16,034
2021
312
2,745
14,651
2020
298
1,990
12,245
Prior
1,473
5,034
20,573
Total residential first mortgages
$
2,783
$
17,705
$
86,747
$
—
$
7,358
$
114,593
Home equity line of credit (pre-reset)
$
266
$
764
$
1,597
Home equity line of credit (post-reset)
58
80
75
Home equity term loans
45
87
114
2024
—
—
—
2023
—
—
—
2022
—
—
—
2021
—
—
1
2020
—
1
2
Prior
45
86
111
Total home equity loans
$
369
$
931
$
1,786
$
—
$
55
$
3,141
Credit cards
$
22,855
$
59,574
$
83,935
Revolving loans converted to term loans(3)
1,462
668
129
Total credit cards(4)
$
24,317
$
60,242
$
84,064
$
—
$
1,874
$
170,497
Personal, small business and other
2024
$
96
$
398
$
1,219
2023
132
282
577
2022
131
180
271
2021
28
38
54
2020
2
2
4
Prior
94
152
150
Total personal, small business and other(5)(6)
$
483
$
1,052
$
2,275
$
25,860
$
2,730
$
32,400
Total(7)
$
27,952
$
79,930
$
174,872
$
25,860
$
12,017
$
320,631
(1) These personal, small business and other loans without a FICO score available include $25.8 billion and $25.9 billion of Private Bank loans as of June 30, 2025 and December 31, 2024, respectively, which are classifiably managed within Wealth and are primarily evaluated for credit risk based on their internal risk ratings. As of June 30, 2025 and December 31, 2024, approximately 84% and 83% of these loans, respectively, were rated investment grade.
(2) FICO scores not available are primarily driven by loans associated with clients whose underlying properties are held in trusts or LLCs, for non-U.S. citizens, and loans guaranteed by government-sponsored entities, for which FICO scores are generally not considered by Citi.
(3) Not included in the tables above are $38 million and $33 million of revolving credit card loans outside of the U.S. that were converted to term loans as of June 30, 2025 and December 31, 2024, respectively.
(4) Excludes $579 million and $562 million of balances related to Canada for June 30, 2025 and December 31, 2024, respectively.
(5) Excludes $840 million and $755 million of balances related to Canada for June 30, 2025 and December 31, 2024, respectively.
(6) Includes approximately $18 million and $22 million of personal revolving loans that were converted to term loans for June 30, 2025 and December 31, 2024, respectively.
(7) Excludes $516 million and $(224) million of unallocated portfolio-layer hedges cumulative basis adjustments at June 30, 2025 and December 31, 2024, respectively.
144
Consumer Gross Credit Losses
The following tables provide details on gross credit losses recognized during the six months ended June 30, 2025 and 2024, by year of loan origination:
LTV ratios (loan balance divided by appraised value) are calculated at origination and updated by applying market price data.
The following tables provide details on the LTV ratios for Citi’s U.S. consumer mortgage portfolios by year of origination. LTV ratios are updated monthly using the most recent Core Logic Home Price Index data available for substantially all of the portfolio, applied at the Metropolitan Statistical Area level, if available, or the state level if not. The remainder of the portfolio is updated in a similar manner using the Federal Housing Finance Agency indices.
LTV distribution—U.S. portfolio(1)
June 30, 2025
In millions of dollars
Less than or equal to 80%
> 80% but less than or equal to 100%
Greater than 100%
LTV not available(1)
Total
Residential first mortgages
2025
$
5,464
$
1,355
$
1
2024
9,560
2,258
—
2023
13,830
1,358
2
2022
18,763
1,389
20
2021
17,999
306
6
Prior
42,368
488
38
Total residential first mortgages
$
107,984
$
7,154
$
67
$
1,110
$
116,315
Home equity loans (pre-reset)
$
2,415
$
45
$
37
Home equity loans (post-reset)
396
12
20
Total home equity loans
$
2,811
$
57
$
57
$
40
$
2,965
Total(2)
$
110,795
$
7,211
$
124
$
1,150
$
119,280
LTV distribution—U.S. portfolio(1)
December 31, 2024
In millions of dollars
Less than or equal to 80%
> 80% but less than or equal to 100%
Greater than 100%
LTV not available(1)
Total
Residential first mortgages
2024
$
9,196
$
3,550
$
1
2023
13,973
2,036
2
2022
18,546
2,078
42
2021
18,247
472
33
2020
15,434
226
1
Prior
28,797
351
25
Total residential first mortgages
$
104,193
$
8,713
$
104
$
1,583
$
114,593
Home equity loans (pre-reset)
$
2,514
$
26
$
45
Home equity loans (post-reset)
435
3
9
Total home equity loans
$
2,949
$
29
$
54
$
109
$
3,141
Total(2)
$
107,142
$
8,742
$
158
$
1,692
$
117,734
(1)Residential first mortgages with no LTV information available include government-guaranteed loans that do not require LTV information for credit risk assessment and fair value loans.
(2)Excludes $516 million and $(224) million of unallocated portfolio-layer cumulative basis adjustments at June 30, 2025 and December 31, 2024, respectively.
146
Loan-to-Value (LTV) Ratios—Outside of U.S. Consumer Mortgages
The following tables provide details on the LTV ratios for Citi’s consumer mortgage portfolio outside of the U.S. by year of origination:
LTV distribution—outside of U.S. portfolio(1)
June 30, 2025
In millions of dollars
Less than or equal to 80%
> 80% but less than or equal to 100%
Greater than 100%
LTV not available
Total
Residential mortgages
2025
$
1,122
$
100
$
—
2024
2,795
390
—
2023
2,210
595
388
2022
2,409
459
651
2021
2,312
429
613
Prior
8,571
422
167
Total
$
19,419
$
2,395
$
1,819
$
450
$
24,083
LTV distribution—outside of U.S. portfolio(1)
December 31, 2024
In millions of dollars
Less than or equal to 80%
> 80% but less than or equal to 100%
Greater than 100%
LTV not available
Total
Residential mortgages
2024
$
2,808
$
421
$
—
2023
2,406
654
412
2022
2,579
462
698
2021
2,505
426
657
2020
1,739
326
176
Prior
7,642
148
8
Total
$
19,679
$
2,437
$
1,951
$
389
$
24,456
(1)Mortgage portfolios outside of the U.S. are primarily in Wealth. As of June 30, 2025 and December 31, 2024, mortgage portfolios outside of the U.S. had an average LTV of approximately 58% and 58%, respectively.
147
Consumer Loans and Ratios Outside of North America
Delinquency-managed loans and ratios
In millions of dollars at June 30, 2025
Total
loans outside of North America(1)
Classifiably managed loans(2)
Delinquency-managed loans
30–89 days past due ratio
≥ 90 days
past
due ratio
2Q25 NCL ratio
2Q24 NCL ratio
Residential mortgages(3)
$
24,083
$
—
$
24,083
0.19
%
0.28
%
0.22
%
0.04
%
Credit cards
13,402
—
13,402
1.67
1.99
5.83
4.70
Personal, small business and other(4)
38,257
20,620
17,637
0.67
0.23
1.00
0.96
Total
$
75,742
$
20,620
$
55,122
0.70
%
0.68
%
1.59
%
1.33
%
Delinquency-managed loans and ratios
In millions of dollars at December 31, 2024
Total
loans outside
of North America(1)
Classifiably managed loans(2)
Delinquency-managed loans
30–89 days past due ratio
≥ 90 days
past
due ratio
Residential mortgages(3)
$
24,456
$
—
$
24,456
0.16
%
0.25
%
Credit cards
12,927
—
12,927
1.47
1.66
Personal, small business and other(4)
33,995
17,553
16,442
0.61
0.22
Total
$
71,378
$
17,553
$
53,825
0.61
%
0.58
%
(1) Mexico is included in offices outside of North America.
(2) Classifiably managed loans are primarily evaluated for credit risk based on their internal risk classification. As of June 30, 2025 and December 31, 2024, approximately 53% and 56% of these loans, respectively, were rated investment grade.
(3) Includes $18.8 billion and $19.1 billion as of June 30, 2025 and December 31, 2024, respectively, of residential mortgages related to Wealth.
(4) Includes $29.0 billion and $25.4 billion as of June 30, 2025 and December 31, 2024, respectively, of loans related to Wealth.
Consumer Loan Modifications to Borrowers Experiencing Financial Difficulty
Citi’s significant consumer modification programs are described below.
Credit Cards
Citi seeks to assist credit card borrowers who are experiencing financial difficulty by offering long-term loan modification programs. These modifications generally involve reducing the interest rate on the credit card, placing the customer on a fixed payment plan not to exceed 60 months and canceling the customer’s available line of credit. Citi also grants modifications to credit card borrowers working with third-party renegotiation agencies that seek to restructure customers’ entire unsecured debt. In certain situations, Citi may forgive a portion of an outstanding balance if the borrower pays a required amount.
Residential Mortgages
Citi utilizes a third-party subservicer for the servicing of its residential mortgage loans. Through this third-party subservicer, Citi seeks to assist residential mortgage borrowers who are experiencing financial difficulty primarily by offering interest rate reductions, principal and/or interest forbearance, term extensions or combinations thereof. Borrowers enrolled in forbearance programs typically have payments suspended until the end of the forbearance period. In the U.S., before permanently modifying the contractual payment terms of a mortgage loan, Citi enters into a trial modification with the borrower, generally a three-month period during which the borrower makes monthly payments under the anticipated modified payment terms. Upon successful completion of the trial period, and the borrower’s formal acceptance of the modified terms, Citi and the borrower enter into a permanent modification. Citi expects the majority of loans entering trial modifications to ultimately be enrolled in a permanent modification. During the three and six months ended June 30, 2025, $20 million and $28 million, respectively, of mortgage loans were enrolled in trial programs. During the three and six months ended June 30, 2024, $11 million and $17 million, respectively, of mortgage loans were enrolled in trial programs. Mortgage loans of $2 million and $5 million had gone through Chapter 7 bankruptcy during the three and six months ended June 30, 2025, and $1 million and $3 million during the three and six months ended June 30, 2024, respectively.
148
Types of Consumer Loan Modifications and Their Financial Effect
The following tables provide details on permanent consumer loan modifications granted during the three and six months ended June 30, 2025 and 2024 to borrowers experiencing financial difficulty by type of modification granted and the financial effect of those modifications:
For the Three Months Ended June 30, 2025
In millions of dollars, except weighted averages
Modifications as % of loans
Total modifications balance at June 30, 2025(1)(2)(3)
Interest rate reduction
Term extension
Payment delay
Combination: interest rate reduction and term extension
Combination: term extension and payment delay
Combination: interest rate reduction, term extension and payment delay
Weighted-average interest rate reduction %
Weighted-average term extension (months)
Weighted-average delay in payments (months)
In North America offices(4)
Residential first mortgages(5)
0.25
%
$
294
$
—
$
18
$
270
$
6
$
—
$
—
—
%
155
6
Home equity loans
0.07
2
—
—
2
—
—
—
—
—
6
Credit cards
0.26
435
435
—
—
—
—
—
25
—
—
Personal, small business and other
0.03
10
—
—
—
10
—
—
8
18
—
Total
0.23
%
$
741
$
435
$
18
$
272
$
16
$
—
$
—
In offices outside North America(4)
Residential mortgages
0.05
%
$
11
$
—
$
—
$
11
$
—
$
—
$
—
—
%
—
12
Credit cards
0.06
8
8
—
—
—
—
—
23
—
—
Personal, small business and other
0.02
9
1
—
—
8
—
—
6
27
—
Total
0.04
%
$
28
$
9
$
—
$
11
$
8
$
—
$
—
For the Three Months Ended June 30, 2024
In millions of dollars, except weighted averages
Modifications as % of loans
Total modifications balance at June 30, 2024(1)(2)(3)
Interest rate reduction
Term extension
Payment delay
Combination: interest rate reduction and term extension
Combination: term extension and payment delay
Combination: interest rate reduction, term extension and payment delay
Weighted-average interest rate reduction %
Weighted-average term extension (months)
Weighted-average delay in payments (months)
In North America offices(4)
Residential first mortgages(5)
0.02
%
$
26
$
—
$
17
$
7
$
2
$
—
$
—
—
%
190
9
Home equity loans
0.03
1
—
—
—
1
—
—
1
172
—
Credit cards
0.25
411
411
—
—
—
—
—
24
—
—
Personal, small business and other
0.02
6
—
—
—
6
—
—
8
17
—
Total
0.14
%
$
444
$
411
$
17
$
7
$
9
$
—
$
—
In offices outside North America(4)
Residential mortgages
0.05
%
$
12
$
—
$
—
$
11
$
1
$
—
$
—
2
%
168
12
Credit cards
0.03
4
4
—
—
—
—
—
24
—
—
Personal, small business and other
0.02
8
1
1
—
6
—
—
6
24
—
Total
0.03
%
$
24
$
5
$
1
$
11
$
7
$
—
$
—
(1) The above tables reflect activity for loans outstanding as of the end of the reporting period. During the three months ended June 30, 2025 and 2024, Citi granted forgiveness of $1 million and $2 million in residential first mortgage loans, $34 million and $28 million in credit card loans and $2 million and $2 million in personal, small business and other loans, respectively. As a result, there were no outstanding balances as of June 30, 2025 and 2024.
(2) Commitments to lend to borrowers experiencing financial difficulty that were granted modifications included in the tables above were immaterial at June 30, 2025 and 2024.
(3) For major consumer portfolios, the ACLL is based on macroeconomic-sensitive models that rely on historical performance and macroeconomic scenarios to forecast expected credit losses. Modifications of consumer loans impact expected credit losses by affecting the likelihood of default.
(4) North America includes the U.S., Canada and Puerto Rico. Mexico is included in offices outside North America.
(5) Excludes residential first mortgages discharged in Chapter 7 bankruptcy in the three months ended June 30, 2025 and 2024.
149
For the Six Months Ended June 30, 2025
In millions of dollars, except weighted averages
Modifications as % of loans
Total modifications balance at June 30, 2025(1)(2)(3)
Interest rate reduction
Term extension
Payment delay
Combination: interest rate reduction and term extension
Combination: term extension and payment delay
Combination: interest rate reduction, term extension and payment delay
Weighted-average interest rate reduction %
Weighted-average term extension (months)
Weighted-average delay in payments (months)
In North America offices(4)
Residential first mortgages(5)
0.31
%
$
364
$
1
$
29
$
321
$
13
$
—
$
—
1
%
144
6
Home equity loans
0.13
4
—
—
4
—
—
—
—
—
8
Credit cards
0.51
857
856
—
1
—
—
—
25
—
4
Personal, small business and other
0.06
19
1
—
—
18
—
—
8
18
—
Total
0.39
%
$
1,244
$
858
$
29
$
326
$
31
$
—
$
—
In offices outside North America(4)
Residential mortgages
0.10
%
$
24
$
—
$
—
$
22
$
2
$
—
$
—
2
%
191
12
Credit cards
0.10
13
13
—
—
—
—
—
24
—
—
Personal, small business and other
0.04
15
3
—
—
12
—
—
6
28
—
Total
0.07
%
$
52
$
16
$
—
$
22
$
14
$
—
$
—
For the Six Months Ended June 30, 2024
In millions of dollars, except weighted averages
Modifications as % of loans
Total modifications balance at June 30, 2024(1)(2)(3)
Interest rate reduction
Term extension
Payment delay
Combination: interest rate reduction and term extension
Combination: term extension and payment delay
Combination: interest rate reduction, term extension and payment delay
Weighted-average interest rate reduction %
Weighted-average term extension (months)
Weighted-average delay in payments (months)
In North America offices(4)
Residential first mortgages(5)
0.05
%
$
55
$
—
$
38
$
14
$
3
$
—
$
—
—
%
187
9
Home equity loans
0.03
1
—
—
—
1
—
—
2
146
—
Credit cards
0.48
777
777
—
—
—
—
—
24
—
—
Personal, small business and other
0.04
13
1
—
1
11
—
—
8
18
5
Total
0.27
%
$
846
$
778
$
38
$
15
$
15
$
—
$
—
In offices outside North America(4)
Residential mortgages
0.09
%
$
24
$
—
$
—
$
23
$
1
$
—
$
—
2
%
183
12
Credit cards
0.06
8
8
—
—
—
—
—
24
—
—
Personal, small business and other
0.04
15
3
3
—
9
—
—
7
24
—
Total
0.06
%
$
47
$
11
$
3
$
23
$
10
$
—
$
—
(1) The above tables reflect activity for loans outstanding as of the end of the reporting period. During the six months ended June 30, 2025 and 2024, Citi granted forgiveness of $1 million and $2 million in residential first mortgage loans, $62 million and $39 million in credit card loans and $2 million and $2 million in personal, small business and other loans, respectively. As a result, there were no outstanding balances as of June 30, 2025 and 2024.
(2) Commitments to lend to borrowers experiencing financial difficulty that were granted modifications included in the tables above were immaterial at June 30, 2025 and 2024.
(3) For major consumer portfolios, the ACLL is based on macroeconomic-sensitive models that rely on historical performance and macroeconomic scenarios to forecast expected credit losses. Modifications of consumer loans impact expected credit losses by affecting the likelihood of default.
(4) North America includes the U.S., Canada and Puerto Rico. Mexico is included in offices outside North America.
(5) Excludes residential first mortgages discharged in Chapter 7 bankruptcy in the six months ended June 30, 2025 and 2024.
150
Performance of Modified Consumer Loans
The following tables present the delinquencies and gross credit losses of permanently modified consumer loans to borrowers experiencing financial difficulty, including loans that were modified during the 12 months ended June 30, 2025 and the year ended December 31, 2024:
As of June 30, 2025
In millions of dollars
Total
Current
30–89 days
past due
90+ days past due
Gross credit losses
In North America offices(1)
Residential first mortgages
$
407
$
56
$
17
$
334
$
—
Home equity loans
5
—
2
3
—
Credit cards
1,491
1,202
182
107
292
Personal, small business and other
30
27
2
1
2
Total(2)
$
1,933
$
1,285
$
203
$
445
$
294
In offices outside North America(1)
Residential mortgages
$
41
$
38
$
2
$
1
$
—
Credit cards
24
21
3
—
1
Personal, small business and other
20
16
3
1
—
Total(2)
$
85
$
75
$
8
$
2
$
1
As of December 31, 2024
In millions of dollars
Total
Current
30–89 days
past due
90+ days past due
Gross credit losses
In North America offices(1)
Residential first mortgages
$
99
$
40
$
19
$
40
$
—
Home equity loans
3
1
—
2
—
Credit cards
1,432
1,081
211
140
291
Personal, small business and other
25
22
2
1
2
Total(2)
$
1,559
$
1,144
$
232
$
183
$
293
In offices outside North America(1)
Residential mortgages
$
37
$
34
$
2
$
1
$
—
Credit cards
17
16
1
—
—
Personal, small business and other
30
24
4
2
1
Total(2)
$
84
$
74
$
7
$
3
$
1
(1) North America includes the U.S., Canada and Puerto Rico. Mexico is included in offices outside North America.
(2) Typically, upon modification a loan re-ages to current. However, FFIEC guidelines for re-aging certain loans require that at least three consecutive minimum monthly payments, or the equivalent amount, be received. In these cases, the loan will remain delinquent until the payment criteria for re-aging have been satisfied.
151
Defaults of Modified Consumer Loans
The following tables present default activity for permanently modified consumer loans to borrowers experiencing financial difficulty by type of modification granted, including loans that were modified and subsequently defaulted during the three and six months ended June 30, 2025 and 2024. Default is defined as 60 days past due:
For the Three Months Ended June 30, 2025
In millions of dollars
Total(1)(2)
Interest rate reduction
Term extension
Payment delay
Combination: interest rate reduction and term extension
Combination: term extension and payment delay
Combination: interest rate reduction, term extension and payment delay
In North America offices(3)
Residential first mortgages
$
11
$
—
$
7
$
—
$
4
$
—
$
—
Home equity loans
—
—
—
—
—
—
—
Credit cards(4)
83
83
—
—
—
—
—
Personal, small business and other
1
—
—
—
1
—
—
Total
$
95
$
83
$
7
$
—
$
5
$
—
$
—
In offices outside North America(3)
Residential mortgages
$
1
$
—
$
—
$
1
$
—
$
—
$
—
Credit cards(4)
1
1
—
—
—
—
—
Personal, small business and other
2
—
—
—
2
—
—
Total
$
4
$
1
$
—
$
1
$
2
$
—
$
—
For the Three Months Ended June 30, 2024
In millions of dollars
Total(1)(2)
Interest rate reduction
Term extension
Payment delay
Combination: interest rate reduction and term extension
Combination: term extension and payment delay
Combination: interest rate reduction, term extension and payment delay
In North America offices(3)
Residential first mortgages
$
9
$
—
$
9
$
—
$
—
$
—
$
—
Home equity loans
—
—
—
—
—
—
—
Credit cards(4)
95
95
—
—
—
—
—
Personal, small business and other
1
—
—
—
1
—
—
Total
$
105
$
95
$
9
$
—
$
1
$
—
$
—
In offices outside North America(3)
Residential mortgages
$
1
$
—
$
—
$
1
$
—
$
—
$
—
Credit cards(4)
—
—
—
—
—
—
—
Personal, small business and other
1
—
—
—
1
—
—
Total
$
2
$
—
$
—
$
1
$
1
$
—
$
—
(1) The above tables reflect activity for loans outstanding as of the end of the reporting period.
(2) Modified residential first mortgages that default are typically liquidated through foreclosure or a similar type of liquidation.
(3) North America includes the U.S., Canada and Puerto Rico. Mexico is included in offices outside North America.
(4) Modified credit card loans that default continue to be charged off in accordance with Citi’s consumer charge-off policy.
152
For the Six Months Ended June 30, 2025
In millions of dollars
Total(1)(2)
Interest rate reduction
Term extension
Payment delay
Combination: interest rate reduction and term extension
Combination: term extension and payment delay
Combination: interest rate reduction, term extension and payment delay
In North America offices(3)
Residential first mortgages
$
17
$
—
$
11
$
—
$
6
$
—
$
—
Home equity loans
—
—
—
—
—
—
—
Credit cards(4)
127
127
—
—
—
—
—
Personal, small business and other
1
—
—
—
1
—
—
Total
$
145
$
127
$
11
$
—
$
7
$
—
$
—
In offices outside North America(3)
Residential mortgages
$
2
$
—
$
—
$
2
$
—
$
—
$
—
Credit cards(4)
1
1
—
—
—
—
—
Personal, small business and other
3
—
—
—
3
—
—
Total
$
6
$
1
$
—
$
2
$
3
$
—
$
—
For the Six Months Ended June 30, 2024
In millions of dollars
Total(1)(2)
Interest rate reduction
Term extension
Payment delay
Combination: interest rate reduction and term extension
Combination: term extension and payment delay
Combination: interest rate reduction, term extension and payment delay
In North America offices(3)
Residential first mortgages
$
19
$
—
$
17
$
—
$
2
$
—
$
—
Home equity loans
—
—
—
—
—
—
—
Credit cards(4)
136
136
—
—
—
—
—
Personal, small business and other
1
—
—
—
1
—
—
Total
$
156
$
136
$
17
$
—
$
3
$
—
$
—
In offices outside North America(3)
Residential mortgages
$
2
$
—
$
—
$
2
$
—
$
—
$
—
Credit cards(4)
—
—
—
—
—
—
—
Personal, small business and other
2
—
—
—
2
—
—
Total
$
4
$
—
$
—
$
2
$
2
$
—
$
—
(1) The above tables reflect activity for loans outstanding as of the end of the reporting period.
(2) Modified residential first mortgages that default are typically liquidated through foreclosure or a similar type of liquidation.
(3) North America includes the U.S., Canada and Puerto Rico. Mexico is included in offices outside North America.
(4) Modified credit card loans that default continue to be charged off in accordance with Citi’s consumer charge-off policy.
153
15. ALLOWANCE FOR CREDIT LOSSES
Three Months Ended June 30,
Six Months Ended June 30,
In millions of dollars
2025
2024
2025
2024
Allowance for credit losses on loans (ACLL) at beginning of period
$
18,726
$
18,296
$
18,574
$
18,145
Gross credit losses on loans
(2,723)
(2,715)
(5,649)
(5,405)
Gross recoveries on loans
489
432
956
819
Net credit losses (NCLs) on loans
$
(2,234)
$
(2,283)
$
(4,693)
$
(4,586)
Replenishment of NCLs
$
2,234
$
2,283
$
4,693
$
4,586
Net reserve builds (releases) for loans
249
136
476
382
Net specific reserve builds (releases) for loans
(6)
(60)
(131)
(187)
Total provision for credit losses on loans (PCLL)
$
2,477
$
2,359
$
5,038
$
4,781
Other, net (see table below)
154
(156)
204
(124)
ACLL at end of period
$
19,123
$
18,216
$
19,123
$
18,216
Allowance for credit losses on unfunded lending commitments (ACLUC) at beginning of period(1)
$
1,720
$
1,629
$
1,601
$
1,728
Provision (release) for credit losses on unfunded lending commitments
(19)
(8)
89
(106)
Other, net
20
(2)
31
(3)
ACLUC at end of period(1)
$
1,721
$
1,619
$
1,721
$
1,619
Total ACLL and ACLUC
$
20,844
$
19,835
$
20,844
$
19,835
Allowance for credit losses on other assets at beginning of period(2)
$
2,206
$
1,722
$
1,865
$
1,788
NCLs on other assets
(5)
(2)
(18)
(15)
Provision (release) for credit losses on other assets
381
112
420
116
Other, net(3)
117
79
432
22
Allowance for credit losses on other assets at end of period(2)
$
2,699
$
1,911
$
2,699
$
1,911
Allowance for credit losses on HTM debt securities at beginning of period
$
130
$
106
$
137
$
95
Provision (release) for credit losses on HTM debt securities
7
(5)
2
5
Other, net
(1)
(2)
(3)
(1)
Allowance for credit losses on HTM debt securities at end of period
$
136
$
99
$
136
$
99
Total ACL
$
23,679
$
21,845
$
23,679
$
21,845
Other, net details (ACLL)
Three Months Ended June 30,
Six Months Ended June 30,
In millions of dollars
2025
2024
2025
2024
Reclasses of consumer ACLL to HFS(4)
$
(29)
$
—
$
(29)
$
—
FX translation and other
183
(156)
233
(124)
Other, net (ACLL)
$
154
$
(156)
$
204
$
(124)
(1)Represents additional credit loss reserves for unfunded lending commitments and letters of credit recorded in Other liabilities on the Consolidated Balance Sheet.
(2)See additional details on the Allowance for credit losses on other assets below.
(3)Primarily reflects the impact of FX translation on the ACL on Other assets for transfer risk associated with exposures outside the U.S.
(4)See Note 2.
154
Allowance for Credit Losses on Loans (ACLL) and End-of-Period Loans
Three Months Ended
June 30, 2025
June 30, 2024
In millions of dollars
Corporate
Consumer
Total
Corporate
Consumer
Total
ACLL at beginning of period
$
2,725
$
16,001
$
18,726
$
2,772
$
15,524
$
18,296
Charge-offs
(63)
(2,660)
(2,723)
(129)
(2,586)
(2,715)
Recoveries
14
475
489
21
411
432
Replenishment of NCLs
49
2,185
2,234
108
2,175
2,283
Net reserve builds (releases)
265
(16)
249
(216)
352
136
Net specific reserve builds (releases)
(6)
—
(6)
(58)
(2)
(60)
Other
39
115
154
(14)
(142)
(156)
Ending balance
$
3,023
$
16,100
$
19,123
$
2,484
$
15,732
$
18,216
Six Months Ended
June 30, 2025
June 30, 2024
In millions of dollars
Corporate
Consumer
Total
Corporate
Consumer
Total
ACLL at beginning of period
$
2,556
$
16,018
$
18,574
$
2,714
$
15,431
$
18,145
Charge-offs
(262)
(5,387)
(5,649)
(307)
(5,098)
(5,405)
Recoveries
31
925
956
35
784
819
Replenishment of NCLs
231
4,462
4,693
272
4,314
4,586
Net reserve builds (releases)
544
(68)
476
(28)
410
382
Net specific reserve builds (releases)
(131)
—
(131)
(189)
2
(187)
Other
54
150
204
(13)
(111)
(124)
Ending balance
$
3,023
$
16,100
$
19,123
$
2,484
$
15,732
$
18,216
June 30, 2025
December 31, 2024
In millions of dollars
Corporate
Consumer
Total
Corporate
Consumer
Total
ACLL
Collectively evaluated
$
2,850
$
16,061
$
18,911
$
2,254
$
15,967
$
18,221
Individually evaluated
173
39
212
302
38
340
Purchased credit deteriorated
—
—
—
—
13
13
Total ACLL
$
3,023
$
16,100
$
19,123
$
2,556
$
16,018
$
18,574
Loans, net of unearned income
Collectively evaluated
$
318,634
$
395,513
$
714,147
$
292,250
$
392,562
$
684,812
Individually evaluated
1,722
107
1,829
1,377
134
1,511
Purchased credit deteriorated
—
112
112
—
125
125
Held at fair value
9,230
27
9,257
7,759
281
8,040
Total loans, net of unearned income
$
329,586
$
395,759
$
725,345
$
301,386
$
393,102
$
694,488
155
2Q25 Changes in the ACL
The total allowance for credit losses on loans, leases, unfunded lending commitments, other assets and HTM debt securities (in aggregate, total ACL) as of June 30, 2025 was $23,679 million, an increase of $1.5 billion from $22,177 million at December 31, 2024, primarily driven by a deterioration in the macroeconomic outlook and FX translation on the ACL on Other assets related to reserves on transfer risk associated with Russia.
Consumer ACLL
Citi’s total consumer allowance for credit losses on loans (ACLL) as of June 30, 2025 was $16,100 million, an increase of $82 million from $16,018 million at December 31, 2024. The increase was driven by FX translation on ACLL within All Other consumer, partially offset by a net release in ACLL.
Corporate ACLL
Citi’s total corporate ACLL as of June 30, 2025 was $3,023 million, an increase of $467 million from $2,556 million at December 31, 2024. The increase was largely driven by changes in portfolio composition, primarily within Banking and Markets.
ACLUC
As of June 30, 2025, Citi’s total allowance for unfunded lending commitments (ACLUC), included in Other liabilities, was $1,721 million, an increase of $120 million from $1,601 million at December 31, 2024. The increase was largely driven by uncertainty and a deterioration in the macroeconomic outlook.
156
Allowance for Credit Losses on Other Assets
Three Months Ended June 30, 2025
In millions of dollars
Deposits with banks
Securities borrowed and purchased under agreements to resell
All other assets(1)
Total
Allowance for credit losses on other assets at beginning of quarter
$
19
$
4
$
2,183
$
2,206
Gross credit losses
—
—
(14)
(14)
Gross recoveries
—
—
9
9
Net credit losses (NCLs)
$
—
$
—
$
(5)
$
(5)
Replenishment of NCLs
$
—
$
—
$
5
$
5
Net reserve builds (releases)
21
6
349
376
Total provision for credit losses
$
21
$
6
$
354
$
381
Other, net
$
—
$
—
$
117
$
117
Allowance for credit losses on other assets at end of quarter
$
40
$
10
$
2,649
$
2,699
Six Months Ended June 30, 2025
In millions of dollars
Deposits with banks
Securities borrowed and purchased under agreements to resell
All other assets(1)
Total
Allowance for credit losses on other assets at beginning of year
$
25
$
3
$
1,837
$
1,865
Gross credit losses
—
—
(31)
(31)
Gross recoveries
—
—
13
13
Net credit losses (NCLs)
$
—
$
—
$
(18)
$
(18)
Replenishment of NCLs
$
—
$
—
$
18
$
18
Net reserve builds (releases)
15
7
380
402
Total provision for credit losses
$
15
$
7
$
398
$
420
Other, net
$
—
$
—
$
432
$
432
Allowance for credit losses on other assets at end of quarter
$
40
$
10
$
2,649
$
2,699
(1)Primarily ACL related to transfer risk associated with exposures outside the U.S.
157
Three Months Ended June 30, 2024
In millions of dollars
Deposits with banks
Securities borrowed and purchased under agreements to resell
All other assets(1)
Total
Allowance for credit losses on other assets at beginning of quarter
$
28
$
18
$
1,676
$
1,722
Adjustment to opening balance for CECL adoption
—
—
—
—
Gross credit losses
—
—
(10)
(10)
Gross recoveries
—
—
8
8
Net credit losses (NCLs)
$
—
$
—
$
(2)
$
(2)
Replenishment of NCLs
$
—
$
—
$
2
$
2
Net reserve builds (releases)
(8)
14
104
110
Total provision for credit losses
$
(8)
$
14
$
106
$
112
Other, net
$
1
$
1
$
77
$
79
Allowance for credit losses on other assets at end of quarter
$
21
$
33
$
1,857
$
1,911
Six Months Ended June 30, 2024
In millions of dollars
Deposits with banks
Securities borrowed and purchased under agreements to resell
All other assets(1)
Total
Allowance for credit losses on other assets at beginning of year
$
31
$
27
$
1,730
$
1,788
Adjustment to opening balance for CECL adoption
—
—
—
—
Gross credit losses
—
—
(28)
(28)
Gross recoveries
—
—
13
13
Net credit losses (NCLs)
$
—
$
—
$
(15)
$
(15)
Replenishment of NCLs
$
—
$
—
$
15
$
15
Net reserve builds (releases)
(11)
5
107
101
Total provision for credit losses
$
(11)
$
5
$
122
$
116
Other, net
$
1
$
1
$
20
$
22
Allowance for credit losses on other assets at end of quarter
$
21
$
33
$
1,857
$
1,911
(1) Primarily ACL related to transfer risk associated with exposures outside the U.S.
For the ACL on AFS debt securities, see Note 13.
158
16. GOODWILL AND INTANGIBLE ASSETS
Goodwill
The changes in Goodwill were as follows:
In millions of dollars
Services
Markets
Banking
USPB
Wealth
All Other
Total
Balance at December 31, 2024
$
2,052
$
5,674
$
1,002
$
5,219
$
4,451
$
902
$
19,300
Foreign currency translation
11
75
3
16
—
17
122
Balance at March 31, 2025
$
2,063
$
5,749
$
1,005
$
5,235
$
4,451
$
919
$
19,422
Foreign currency translation
109
171
20
71
2
83
456
Balance at June 30, 2025
$
2,172
$
5,920
$
1,025
$
5,306
$
4,453
$
1,002
$
19,878
Citi tests for goodwill impairment annually as of October 1 (the annual test) and conducts interim assessments between the annual test if an event occurs or circumstances change that would more-likely-than-not reduce the fair value of a reporting unit below its carrying amount. No such events or circumstances were identified as part of the qualitative assessment performed as of June 30, 2025. For additional information regarding Citi’s goodwill impairment testing process, see Notes 1 and 17 to the Consolidated Financial Statements in Citi’s 2024 Form 10-K.
Unanticipated declines in business performance, increases
in credit losses, increases in capital requirements and adverse regulatory or legislative changes, and deterioration in economic or market conditions, as well as circumstances related to Citi’s strategic refresh, are factors that could result in a material impairment loss to earnings in a future period related to some portion of the associated goodwill.
Reporting units used for goodwill assessment at the Citigroup consolidated level may differ from the reporting units of its subsidiaries.
Intangible Assets
The components of intangible assets were as follows:
June 30, 2025
December 31, 2024
In millions of dollars
Gross carrying amount
Accumulated amortization
Net carrying amount
Gross carrying amount
Accumulated amortization
Net carrying amount
Purchased credit card relationships(1)
$
5,315
$
4,573
$
742
$
5,315
$
4,507
$
808
Credit card contract-related intangibles(2)
4,578
1,940
2,638
4,586
1,905
2,681
Other customer relationships
342
302
40
325
278
47
Present value of future profits
35
34
1
31
30
1
Indefinite-lived intangible assets
218
—
218
197
—
197
Intangible assets (excluding MSRs)
$
10,488
$
6,849
$
3,639
$
10,454
$
6,720
$
3,734
Mortgage servicing rights (MSRs)(3)
770
—
770
760
—
760
Total intangible assets
$
11,258
$
6,849
$
4,409
$
11,214
$
6,720
$
4,494
The changes in intangible assets were as follows:
In millions of dollars
Net carrying amount at December 31, 2024
Acquisitions/renewals/ divestitures
Amortization
Impairments
FX translation and other
Net carrying amount at June 30, 2025
Purchased credit card relationships(1)
$
808
$
—
$
(66)
$
—
$
—
$
742
Credit card contract-related intangibles(2)
2,681
—
(45)
—
2
2,638
Other customer relationships
47
—
(10)
—
3
40
Present value of future profits
1
—
—
—
—
1
Indefinite-lived intangible assets
197
—
—
—
21
218
Intangible assets (excluding MSRs)
$
3,734
$
—
$
(121)
$
—
$
26
$
3,639
Mortgage servicing rights (MSRs)(3)
760
770
Total intangible assets
$
4,494
$
4,409
(1)Reflects intangibles for the value of purchased cardholder relationships, which are discrete from contract-related intangibles.
(2)Reflects contract-related intangibles associated with Citi’s credit card program agreements with partners.
(3)See Note 21.
159
17. DEPOSITS
Deposits consisted of the following:
June 30,
December 31,
In millions of dollars
2025(1)
2024
Non-interest-bearing deposits in U.S. offices
$
119,898
$
123,338
Interest-bearing deposits in U.S. offices (including $1,701 and $1,262 as of June 30, 2025 and December 31, 2024, respectively, at fair value)
575,709
551,547
Total deposits in U.S. offices(1)
$
695,607
$
674,885
Non-interest-bearing deposits in offices outside the U.S. (including $486 million and $383 million as of June 30, 2025 and December 31, 2024, respectively, at fair value)
$
86,458
$
84,349
Interest-bearing deposits in offices outside the U.S. (including $1,925 and $1,963 as of June 30, 2025 and December 31, 2024, respectively, at fair value)
575,668
525,224
Total deposits in offices outside the U.S.(1)
$
662,126
$
609,573
Total deposits
$
1,357,733
$
1,284,458
(1) For information on time deposits that met or exceeded the insured limit at December 31, 2024, see Note 18 to the Consolidated Financial Statements in Citi’s 2024 Form 10-K.
For additional information on Citi’s deposits, see Citi’s 2024 Form 10-K.
FDIC Special Assessment
Citi recorded a $20 million benefit and a $34 million charge in Other operating expenses for the three months ended June 30, 2025 and 2024, respectively, related to the FDIC’s final rule implementing a special assessment to recover the uninsured deposit losses from the failures of Silicon Valley Bank and Signature Bank. The special assessment expenses are reflected in Corporate/Other in All Other.
160
18. DEBT
For additional information regarding Citi’s short-term borrowings and long-term debt, see Note 19 to the Consolidated Financial Statements in Citi’s 2024 Form 10-K.
Short-Term Borrowings
In millions of dollars
June 30, 2025
December 31, 2024
Commercial paper
Bank(1)
$
13,035
$
15,127
Broker-dealer and other(2)
9,297
13,789
Total commercial paper
$
22,332
$
28,916
Other borrowings(3)
33,228
19,589
Total
$
55,560
$
48,505
(1)Represents Citibank entities as well as other bank entities.
(2)Represents broker-dealer and other non-bank subsidiaries that are consolidated into Citigroup Inc., the parent holding company.
(3)Includes borrowings from Federal Home Loan Banks and other market participants. At June 30, 2025 and December 31, 2024, collateralized short-term advances from Federal Home Loan Banks were $9.0 billion and $5.0 billion, respectively.
Long-Term Debt
In millions of dollars
June 30, 2025
December 31, 2024
Citigroup Inc.(1)
$
173,516
$
164,024
Bank(2)
43,513
35,470
Broker-dealer and other(3)
100,732
87,806
Total
$
317,761
$
287,300
(1)Represents the parent holding company.
(2)Represents Citibank entities as well as other bank entities. At June 30, 2025 and December 31, 2024, collateralized long-term advances from the Federal Home Loan Banks were $6.5 billion and $8.5 billion, respectively.
(3)Represents broker-dealer and other non-bank subsidiaries that are consolidated into Citigroup Inc., the parent holding company. Certain Citigroup consolidated hedging activities are also included in this line.
Long-term debt outstanding includes trust preferred securities with a balance sheet carrying value of $1.6 billion at June 30, 2025 and December 31, 2024.
The following table summarizes Citi’s outstanding trust preferred securities at June 30, 2025:
Junior subordinated debentures owned by trust
Trust
Issuance date
Securities issued
Liquidation
value(1)
Coupon
rate(2)
Common shares issued to parent
Notional amount
Maturity
Redeemable by issuer beginning
In millions of dollars, except securities and share amounts
Citigroup Capital III
Dec. 1996
194,053
$
194
7.625
%
6,003
$
200
Dec. 1, 2036
Not redeemable
Citigroup Capital XIII
Oct. 2010
89,840,000
2,246
3 mo. SOFR +663.161 bps(3)
1,000
2,246
Oct. 30, 2040
Oct. 30, 2015
Total obligated
$
2,440
$
2,446
Note: Distributions on the trust preferred securities and interest on the subordinated debentures are payable semiannually for Citigroup Capital III and quarterly for Citigroup Capital XIII.
(1)Represents the notional value received by outside investors from the trusts at the time of issuance. This differs from Citi’s balance sheet carrying value due primarily to unamortized discount and issuance costs.
(2)In each case, the coupon rate on the subordinated debentures is the same as that on the trust preferred securities.
(3)The spread incorporates the original contractual spread and a 26.161 bps tenor spread adjustment.
161
19. CHANGES IN ACCUMULATED OTHER COMPREHENSIVE INCOME (LOSS) (AOCI)
Changes in each component of Citigroup’s Accumulated other comprehensive income (loss) were as follows:
In millions of dollars
Net unrealized gains (losses) on debt securities
Debt valuation adjustment (DVA)(1)
Cash flow hedges(2)
Benefit plans(3)
CTA, net of hedges(4)
Excluded component of fair value hedges
Long-duration insurance contracts(5)
Accumulated other comprehensive income (loss)
Three Months Ended June 30, 2025
Balance, March 31, 2025
$
(2,322)
$
(342)
$
(213)
$
(5,653)
$
(37,198)
$
(45)
$
51
$
(45,722)
Other comprehensive income before reclassifications
378
(344)
(56)
(80)
1,966
(2)
(1)
1,861
Increase (decrease) due to amounts reclassified from AOCI into earnings
(100)
2
128
43
—
2
—
75
Change, net of taxes
$
278
$
(342)
$
72
$
(37)
$
1,966
$
—
$
(1)
$
1,936
Balance at June 30, 2025
$
(2,044)
$
(684)
$
(141)
$
(5,690)
$
(35,232)
$
(45)
$
50
$
(43,786)
Six Months Ended June 30, 2025
Balance, December 31, 2024
$
(2,837)
$
(1,121)
$
(220)
$
(5,627)
$
(38,047)
$
(52)
$
52
$
(47,852)
Other comprehensive income before reclassifications
979
431
(192)
(151)
2,803
4
(2)
3,872
Increase (decrease) due to amounts reclassified from AOCI
(186)
6
271
88
12
3
—
194
Change, net of taxes
$
793
$
437
$
79
$
(63)
$
2,815
$
7
$
(2)
$
4,066
Balance at June 30, 2025
$
(2,044)
$
(684)
$
(141)
$
(5,690)
$
(35,232)
$
(45)
$
50
$
(43,786)
In millions of dollars
Net unrealized gains (losses) on debt securities
Debt valuation adjustment (DVA)(1)
Cash flow hedges(2)
Benefit plans(3)
CTA, net
of hedges(4)
Excluded component of fair value hedges
Long-duration insurance contracts(5)
Accumulated other comprehensive income (loss)
Three Months Ended June 30, 2024
Balance at March 31, 2024
$
(3,644)
$
(1,272)
$
(914)
$
(5,973)
$
(33,939)
$
(42)
$
55
$
(45,729)
Other comprehensive income before reclassifications
(24)
254
87
135
(1,634)
4
2
(1,176)
Increase (decrease) due to amounts reclassified from AOCI
(14)
2
198
44
—
(1)
(1)
228
Change, net of taxes
$
(38)
$
256
$
285
$
179
$
(1,634)
$
3
$
1
$
(948)
Balance at June 30, 2024
$
(3,682)
$
(1,016)
$
(629)
$
(5,794)
$
(35,573)
$
(39)
$
56
$
(46,677)
Six Months Ended June 30, 2024
Balance, December 31, 2023
$
(3,744)
$
(709)
$
(1,406)
$
(6,050)
$
(32,885)
$
(40)
$
34
$
(44,800)
Other comprehensive income before reclassifications
152
(319)
319
163
(2,688)
12
23
(2,338)
Increase (decrease) due to amounts reclassified from AOCI
(90)
12
458
93
—
(11)
(1)
461
Change, net of taxes
$
62
$
(307)
$
777
$
256
$
(2,688)
$
1
$
22
$
(1,877)
Balance at June 30, 2024
$
(3,682)
$
(1,016)
$
(629)
$
(5,794)
$
(35,573)
$
(39)
$
56
$
(46,677)
(1)Reflects the after-tax valuation of Citi’s fair value option liabilities. See “Market Valuation Adjustments” in Note 23.
(2)Primarily driven by Citi’s pay floating/receive fixed interest rate swap programs that hedge certain floating rates on assets.
(3)Primarily reflects adjustments based on actuarial valuations of the Company’s significant pension and postretirement plans, actuarial valuations of all other plans and amortization of amounts previously recognized in other comprehensive income. Citigroup remeasures its significant pension and postretirement benefits plans’ obligations and assets by updating plan actuarial assumptions quarterly, when certain conditions are met to trigger interim remeasurement. No interim remeasurement occurred for the second quarter of 2025.
(4)Primarily reflects the movements in (by order of impact) the euro, Mexican peso, Polish zloty, South Korean won, Singapore dollar, Brazilian real, British pound sterling and Japanese yen against the U.S. dollar and changes in related tax effects and hedges for the three months ended June 30, 2025. Primarily reflects the
162
movements in (by order of impact) the euro, Mexican peso, Polish zloty, South Korean won, Brazilian real, Japanese yen, Singapore dollar, British pound sterling and Chilean peso against the U.S. dollar and changes in related tax effects and hedges for the six months ended June 30, 2025. Primarily reflects the movement in (by order of impact) the Mexican peso, Brazilian real, Japanese yen and euro against the U.S. dollar and changes in related tax effects and hedges for the three months ended June 30, 2024. Primarily reflects the movement in (by order of impact) the Mexican peso, Egyptian pound, Brazilian real, euro, Japanese yen, Chilean peso and South Korean won against the U.S. dollar and changes in related tax effects and hedges for the six months ended June 30, 2024. Amounts recorded in the CTA component of AOCI remain in AOCI until the sale or substantial liquidation of the foreign entity, at which point such amounts related to the foreign entity are reclassified into earnings.
(5)Reflects the change in the liability for future policyholder benefits for certain long-duration life-contingent annuity contracts that are issued by a regulated Citi insurance subsidiary within Banamex and reported within Legacy Franchises. The amount reflects the change in the liability after discounting using an upper-medium-grade fixed income instrument yield that reflects the duration characteristics of the liability. The balance of the liability for future policyholder benefits, which is recorded within Other liabilities, for this insurance subsidiary was approximately $464 million and $474 million at June 30, 2025 and 2024, respectively.
163
The pretax and after-tax changes in each component of Accumulated other comprehensive income (loss) were as follows:
In millions of dollars
Pretax
Tax effect(1)
After-tax
Three Months Ended June 30, 2025
Balance, March 31, 2025
$
(51,933)
$
6,211
$
(45,722)
Change in net unrealized gains (losses) on debt securities
363
(85)
278
Debt valuation adjustment (DVA)
(391)
49
(342)
Cash flow hedges
88
(16)
72
Benefit plans
(57)
20
(37)
Foreign currency translation adjustment (CTA)
2,003
(37)
1,966
Excluded component of fair value hedges
(2)
2
—
Long-duration insurance contracts
2
(3)
(1)
Change
$
2,006
$
(70)
$
1,936
Balance at June 30, 2025
$
(49,927)
$
6,141
$
(43,786)
Six Months Ended June 30, 2025
Balance, December 31, 2024
$
(54,439)
$
6,587
$
(47,852)
Change in net unrealized gains (losses) on debt securities
1,107
(314)
793
DVA
609
(172)
437
Cash flow hedges
96
(17)
79
Benefit plans
(75)
12
(63)
CTA
2,767
48
2,815
Excluded component of fair value hedges
8
(1)
7
Long-duration insurance contracts
—
(2)
(2)
Change
$
4,512
$
(446)
$
4,066
Balance at June 30, 2025
$
(49,927)
$
6,141
$
(43,786)
In millions of dollars
Pretax
Tax effect(1)
After-tax
Three Months Ended June 30, 2024
Balance at March 31, 2024
$
(53,391)
$
7,662
$
(45,729)
Change in net unrealized gains (losses) on debt securities
(52)
14
(38)
DVA
343
(87)
256
Cash flow hedges
364
(79)
285
Benefit plans
250
(71)
179
CTA
(1,622)
(12)
(1,634)
Excluded component of fair value hedges
2
1
3
Long-duration insurance contracts
4
(3)
1
Change
$
(711)
$
(237)
$
(948)
Balance, June 30, 2024
$
(54,102)
$
7,425
$
(46,677)
Six Months Ended June 30, 2024
Balance, December 31, 2023
$
(52,422)
$
7,622
$
(44,800)
Change in net unrealized gains (losses) on debt securities
72
(10)
62
DVA
(407)
100
(307)
Cash flow hedges
1,014
(237)
777
Benefit plans
318
(62)
256
CTA
(2,711)
23
(2,688)
Excluded component of fair value hedges
(2)
3
1
Long-duration insurance contracts
36
(14)
22
Change
$
(1,680)
$
(197)
$
(1,877)
Balance, June 30, 2024
$
(54,102)
$
7,425
$
(46,677)
(1) Income tax effects of these items are released from AOCI contemporaneously with the related gross pretax amount.
164
The Company recognized pretax (gains) losses related to amounts in AOCI reclassified to the Consolidated Statement of Income as follows:
Increase (decrease) in AOCI due to amounts reclassified to Consolidated Statement of Income
Three Months Ended June 30,
Six Months Ended June 30,
In millions of dollars
2025
2024
2025
2024
Realized (gains) losses on sales of investments
$
(138)
$
(23)
$
(259)
$
(138)
Gross impairment losses
2
9
5
23
Subtotal, pretax
$
(136)
$
(14)
$
(254)
$
(115)
Tax effect
36
—
68
25
Net realized (gains) losses on investments, after-tax(1)
$
(100)
$
(14)
$
(186)
$
(90)
Realized DVA (gains) losses on fair value option liabilities, pretax
$
2
$
3
$
7
$
16
Tax effect
—
(1)
(1)
(4)
Net realized DVA, after-tax
$
2
$
2
$
6
$
12
Interest rate contracts
$
168
$
260
$
357
$
602
Foreign exchange contracts
—
1
—
2
Subtotal, pretax
$
168
$
261
$
357
$
604
Tax effect
(40)
(63)
(86)
(146)
Amortization of cash flow hedges, after-tax(2)
$
128
$
198
$
271
$
458
Amortization of unrecognized:
Prior service cost (benefit)
$
(5)
$
(5)
$
(9)
$
(10)
Net actuarial loss
66
64
130
134
Curtailment/settlement impact(3)
—
2
—
2
Subtotal, pretax
$
61
$
61
$
121
$
126
Tax effect
(18)
(17)
(33)
(33)
Amortization of benefit plans, after-tax(3)
$
43
$
44
$
88
$
93
Excluded component of fair value hedges, pretax
$
2
$
(1)
$
3
$
(14)
Tax effect
—
—
—
3
Excluded component of fair value hedges, after-tax
$
2
$
(1)
$
3
$
(11)
Long-duration contracts, pretax
$
—
$
(1)
$
—
$
(1)
Tax effect
—
—
—
—
Long-duration contracts, after-tax
$
—
$
(1)
$
—
$
(1)
CTA, pretax
$
—
$
—
$
12
$
—
Tax effect
—
—
—
—
CTA, after-tax(4)
$
—
$
—
$
12
$
—
Total amounts reclassified out of AOCI, pretax
$
97
$
309
$
246
$
616
Total tax effect
(22)
(81)
(52)
(155)
Total amounts reclassified out of AOCI, after-tax
$
75
$
228
$
194
$
461
(1)The pretax amount is reclassified to Realized gains (losses) on sales of investments, net and Gross impairment losses in the Consolidated Statement of Income. See Note 13.
(2)See Note 22.
(3)See Note 8.
(4)The pretax amount is reclassified to Other revenue in the Consolidated Statement of Income.
165
20. PREFERRED STOCK
The following table summarizes the Company’s preferred stock outstanding:
Dividend rate as of June 30, 2025
Redemption price per depositary share/preference share
Carrying value
(in millions of dollars)
Issuance date
Redeemable by issuer beginning
Number of depositary shares
June 30, 2025
December 31, 2024
Series P(1)
April 24, 2015
May 15, 2025
N/A
$
1,000
2,000,000
$
—
$
2,000
Series T(2)
April 25, 2016
August 15, 2026
6.250
%
1,000
1,500,000
1,500
1,500
Series V(3)
January 23, 2020
January 30, 2025
N/A
1,000
1,500,000
—
1,500
Series W(4)
December 10, 2020
December 10, 2025
4.000
1,000
1,500,000
1,500
1,500
Series X(5)
February 18, 2021
February 18, 2026
3.875
1,000
2,300,000
2,300
2,300
Series Y(6)
October 27, 2021
November 15, 2026
4.150
1,000
1,000,000
1,000
1,000
Series Z(7)
March 7, 2023
May 15, 2028
7.375
1,000
1,250,000
1,250
1,250
Series AA(8)
September 21, 2023
November 15, 2028
7.625
1,000
1,500,000
1,500
1,500
Series BB(9)
March 6, 2024
May 15, 2029
7.200
1,000
550,000
550
550
Series CC(10)
May 29, 2024
August 15, 2029
7.125
1,000
1,750,000
1,750
1,750
Series DD(11)
July 30, 2024
August 15, 2034
7.000
1,000
1,500,000
1,500
1,500
Series EE(12)
December 3, 2024
February 15, 2030
6.750
1,000
1,500,000
1,500
1,500
Series FF(13)
February 12, 2025
February 15, 2030
6.950
1,000
2,000,000
2,000
—
$
16,350
$
17,850
(1)Citi redeemed Series P in its entirety on May 15, 2025.
(2)Issued as depositary shares, each representing a 1/25th interest in a share of the corresponding series of non-cumulative perpetual preferred stock. Dividends are payable semiannually on February 15 and August 15 at a fixed rate until, but excluding, August 15, 2026, thereafter payable quarterly on February 15, May 15, August 15 and November 15 at a floating rate, in each case when, as and if declared by the Citi Board of Directors.
(3)Citi redeemed Series V in its entirety on January 30, 2025.
(4)Issued as depositary shares, each representing a 1/25th interest in a share of the corresponding series of non-cumulative perpetual preferred stock. Dividends are payable quarterly on March 10, June 10, September 10 and December 10 at a fixed rate until, but excluding, December 10, 2025, thereafter payable quarterly on the same dates at a fixed rate that resets on the Series W reset date and every five years thereafter equal to the five-year treasury rate plus 3.597%, in each case when, as and if declared by the Citi Board of Directors.
(5)Issued as depositary shares, each representing a 1/25th interest in a share of the corresponding series of non-cumulative perpetual preferred stock. Dividends are payable quarterly on February 18, May 18, August 18 and November 18 at a fixed rate until, but excluding, February 18, 2026, thereafter payable quarterly on the same dates at a fixed rate that resets on the Series X reset date and every five years thereafter equal to the five-year treasury rate plus 3.417%, in each case when, as and if declared by the Citi Board of Directors.
(6)Issued as depositary shares, each representing a 1/25th interest in a share of the corresponding series of non-cumulative perpetual preferred stock. Dividends are payable quarterly on February 15, May 15, August 15 and November 15 at a fixed rate until, but excluding, November 15, 2026, thereafter payable quarterly on the same dates at a fixed rate that resets on the Series Y reset date and every five years thereafter equal to the five-year treasury rate plus 3.000%, in each case when, as and if declared by the Citi Board of Directors.
(7)Issued as depositary shares, each representing a 1/25th interest in a share of the corresponding series of non-cumulative perpetual preferred stock. Dividends are payable quarterly on February 15, May 15, August 15 and November 15 at a fixed rate until, but excluding, May 15, 2028, thereafter payable quarterly on the same dates at a fixed rate that resets on the Series Z reset date and every five years thereafter equal to the five-year treasury rate plus 3.209%, in each case when, as and if declared by the Citi Board of Directors.
(8)Issued as depositary shares, each representing a 1/25th interest in a share of the corresponding series of non-cumulative perpetual preferred stock. Dividends are payable quarterly on February 15, May 15, August 15 and November 15 at a fixed rate until, but excluding, November 15, 2028, thereafter payable quarterly on the same dates at a fixed rate that resets on the Series AA reset date and every five years thereafter equal to the five-year treasury rate plus 3.211%, in each case when, as and if declared by the Citi Board of Directors.
(9)Issued as depositary shares, each representing a 1/25th interest in a share of the corresponding series of non-cumulative perpetual preferred stock. Dividends are payable quarterly on February 15, May 15, August 15 and November 15 at a fixed rate until, but excluding, May 15, 2029, thereafter payable quarterly on the same dates at a fixed rate that resets on the Series BB reset date and every five years thereafter equal to the five-year treasury rate plus 2.905%, in each case when, as and if declared by the Citi Board of Directors.
(10)Issued as depositary shares, each representing a 1/25th interest in a share of the corresponding series of non-cumulative perpetual preferred stock. Dividends are payable quarterly on February 15, May 15, August 15 and November 15 at a fixed rate until, but excluding, August 15, 2029, thereafter payable quarterly on the same dates at a fixed rate that resets on the Series CC reset date and every five years thereafter equal to the five-year treasury rate plus 2.693%, in each case when, as and if declared by the Citi Board of Directors.
(11)Issued as depositary shares, each representing a 1/25th interest in a share of the corresponding series of non-cumulative perpetual preferred stock. Dividends are payable quarterly on February 15, May 15, August 15 and November 15 at a fixed rate until, but excluding, August 15, 2034, thereafter payable quarterly on the same dates at a fixed rate that resets on the Series DD reset date and every 10 years thereafter equal to the 10-year treasury rate plus 2.757%, in each case when, as and if declared by the Citi Board of Directors.
(12)Issued as depositary shares, each representing a 1/25th interest in a share of the corresponding series of non-cumulative perpetual preferred stock. Dividends are payable quarterly on February 15, May 15, August 15 and November 15 at a fixed rate until, but excluding, February 15, 2030, thereafter payable quarterly on the same dates at a fixed rate that resets on the Series EE reset date and every five years thereafter equal to the five-year treasury rate plus 2.572%, in each case when, as and if declared by the Citi Board of Directors.
166
(13)Issued as depositary shares, each representing a 1/25th interest in a share of the corresponding series of non-cumulative perpetual preferred stock. Dividends are payable quarterly on February 15, May 15, August 15 and November 15 at a fixed rate until, but excluding, February 15, 2030, thereafter payable quarterly on the same dates at a fixed rate that resets on the Series FF reset date and every five years thereafter equal to the five-year treasury rate plus 2.726%, in each case when, as and if declared by the Citi Board of Directors.
N/A Not applicable, as the series has been redeemed.
On July 23, 2025, Citi issued $2.7 billion of Series GG preferred stock.
167
21. SECURITIZATIONS AND VARIABLE INTEREST ENTITIES
For additional information regarding Citi’s use of special purpose entities (SPEs) and variable interest entities (VIEs), see Note 23 to the Consolidated Financial Statements in Citi’s 2024 Form 10-K.
Citigroup’s involvement with consolidated and unconsolidated VIEs with which the Company holds significant variable interests or has continuing involvement through servicing a majority of the assets in a VIE is presented below:
As of June 30, 2025
Maximum exposure to loss in significant unconsolidated VIEs(1)
Funded exposures(2)
Unfunded exposures
In millions of dollars
Total involvement with SPE assets
Consolidated VIE/SPE assets
Significant
unconsolidated
VIE assets(3)
Debt investments
Equity investments
Funding commitments
Guarantees and derivatives
Total
Credit card securitizations
$
28,094
$
28,094
$
—
$
—
$
—
$
—
$
—
$
—
Mortgage securitizations(4)
U.S. agency-sponsored
118,516
—
118,516
3,287
—
—
119
3,406
Non-agency-sponsored
64,406
—
64,406
4,099
—
336
—
4,435
Citi-administered asset-backed commercial paper conduits
20,217
20,217
—
—
—
—
—
—
Collateralized loan obligations (CLOs)
2,528
—
2,528
1,031
—
—
—
1,031
Asset-based financing(5)
323,102
8,648
314,454
57,299
675
15,775
—
73,749
Municipal securities tender option bond trusts (TOBs)
1,901
1,901
—
—
—
—
—
—
Municipal investments
21,433
—
21,433
2,493
2,911
3,293
—
8,697
Client intermediation
380
80
300
11
—
—
53
64
Investment funds
1,179
7
1,172
4
46
94
—
144
Total
$
581,756
$
58,947
$
522,809
$
68,224
$
3,632
$
19,498
$
172
$
91,526
As of December 31, 2024
Maximum exposure to loss in significant unconsolidated VIEs(1)
Funded exposures(2)
Unfunded exposures
In millions of dollars
Total involvement with SPE assets
Consolidated VIE/SPE assets
Significant
unconsolidated
VIE assets(3)
Debt investments
Equity investments
Funding commitments
Guarantees and derivatives
Total
Credit card securitizations
$
29,746
$
29,746
$
—
$
—
$
—
$
—
$
—
$
—
Mortgage securitizations(4)
U.S. agency-sponsored
120,568
—
120,568
2,387
—
—
123
2,510
Non-agency-sponsored
62,378
—
62,378
3,479
—
566
—
4,045
Citi-administered asset-backed commercial paper conduits
21,306
21,306
—
—
—
—
—
—
Collateralized loan obligations (CLOs)
3,920
—
3,920
2,019
—
—
—
2,019
Asset-based financing(5)
268,498
7,947
260,551
54,349
735
13,185
—
68,269
Municipal securities tender option bond trusts (TOBs)
935
935
—
—
—
—
—
—
Municipal investments
20,280
3
20,277
2,360
2,730
2,502
—
7,592
Client intermediation
387
81
306
20
—
—
49
69
Investment funds
641
21
620
4
18
98
—
120
Total
$
528,659
$
60,039
$
468,620
$
64,618
$
3,483
$
16,351
$
172
$
84,624
(1) The definition of maximum exposure to loss is included in the text that follows this table.
(2) Included on Citigroup’s June 30, 2025 and December 31, 2024 Consolidated Balance Sheet.
(3) A significant unconsolidated VIE is an entity in which the Company has any variable interest or continuing involvement considered to be significant, regardless of the likelihood of loss.
(4) Citigroup mortgage securitizations also include agency and non-agency (private label) re-securitization activities. These SPEs are not consolidated. See “Re-securitizations” below for further discussion.
(5) Included within this line are loans to third-party-sponsored private equity funds, which represent $91.7 billion and $45.5 billion in unconsolidated VIE assets and $867 million and $824 million in maximum exposure to loss as of June 30, 2025 and December 31, 2024, respectively.
168
The previous tables do not include:
•certain investment funds for which the Company provides investment management services and personal estate trusts for which the Company provides administrative, trustee and/or investment management services;
•certain third-party-sponsored private equity funds to which the Company provides credit facilities. The Company has no decision-making power and does not consolidate these funds, some of which may meet the definition of a VIE. The Company’s maximum exposure to loss is generally limited to a loan or lending-related commitment. As of June 30, 2025 and December 31, 2024, the Company’s maximum exposure to loss related to these transactions was $8.7 billion and $8.1 billion, respectively (see Note 14 and Note 23 to the Consolidated Financial Statements in Citi’s 2024 Form 10-K);
•certain VIEs structured by third parties in which the Company holds securities in inventory, as these investments are made on arm’s-length terms;
•certain positions in mortgage- and asset-backed securities held by the Company, which are classified as Trading account assets, Investments or Loans, in which the Company has no other involvement with the related securitization entity deemed to be significant (see Notes 13, 14 and 23);
•certain representations and warranties exposures in Citigroup residential mortgage securitizations, in which the original mortgage loan balances are no longer outstanding; and
•VIEs such as preferred securities trusts used in connection with the Company’s funding activities. The Company does not have a variable interest in these trusts.
Consolidated VIEs
The Company engages in on-balance sheet securitizations, which are securitizations that do not qualify for sales treatment; thus, the assets remain on Citi’s Consolidated Balance Sheet, and any proceeds received are recognized as secured liabilities. In general, the third-party investors in the obligations of consolidated VIEs have legal recourse only to the assets of the respective VIEs and do not have such recourse to the Company, except where Citi has provided a guarantee to the investors or is the counterparty to certain derivative transactions involving the VIE. Thus, Citigroup’s maximum legal exposure to loss related to consolidated VIEs is significantly less than the carrying value of the consolidated VIE assets due to outstanding third-party financing.
Intercompany assets and liabilities are excluded from Citi’s Consolidated Balance Sheet. All VIE assets are restricted from being sold or pledged as collateral. The cash flows from these assets are the only source used to pay down the associated liabilities, which are non-recourse to Citi’s general assets.
The asset balances for consolidated VIEs represent the carrying amounts of the assets consolidated by the Company. The carrying amount may represent the amortized cost or the current fair value of the assets depending on the classification of the asset (e.g., loan or security) and the associated accounting model ascribed to that classification.
The asset balances for unconsolidated VIEs in which the Company has significant involvement represent the most current information available to the Company. In most cases, the asset balances represent an amortized cost basis without regard to impairments, unless fair value information is readily available to the Company.
The maximum funded exposure represents the balance sheet carrying amount of the Company’s investment in the VIE. It reflects the initial amount of cash invested in the VIE, adjusted for any accrued interest and cash principal payments received. The carrying amount may also be adjusted for increases or declines in fair value or any impairment in value recognized in earnings. The maximum exposure of unfunded positions represents the remaining undrawn committed amount, including liquidity and credit facilities provided by the Company or the notional amount of a derivative instrument considered to be a variable interest. In certain transactions, the Company has entered into derivative instruments or other arrangements that are not considered variable interests in the VIE (e.g., interest rate swaps, cross-currency swaps or where the Company is the purchaser of credit protection under a credit default swap or total return swap where the Company pays the total return on certain assets to the SPE). Receivables under such arrangements are not included in the maximum exposure amounts.
169
The following tables present certain assets and liabilities of consolidated VIEs, which are included on Citi’s Consolidated Balance Sheet. The assets include those assets that can only be used to settle obligations of consolidated VIEs and are in excess of those obligations. In addition, the assets include third-party assets of consolidated VIEs only and exclude intercompany balances that eliminate in consolidation. The liabilities include third-party liabilities of consolidated VIEs only and exclude intercompany balances that eliminate in consolidation. The liabilities also exclude amounts where creditors or beneficial interest holders have recourse to the general credit of Citigroup.
June 30,
2025
December 31,
In millions of dollars
(Unaudited)
2024
Assets of consolidated VIEs to be used to settle obligations of consolidated VIEs
Cash and due from banks
$
60
$
65
Trading account assets
7,706
6,971
Investments
1,463
739
Loans, net of unearned income
Consumer
31,235
32,958
Corporate
20,643
21,492
Loans, net of unearned income
$
51,878
$
54,450
Allowance for credit losses on loans (ACLL)
(2,293)
(2,376)
Total loans, net
$
49,585
$
52,074
Other assets
133
190
Total assets of consolidated VIEs to be used to settle obligations of consolidated VIEs
$
58,947
$
60,039
June 30,
2025
December 31,
In millions of dollars
(Unaudited)
2024
Liabilities of consolidated VIEs for which creditors or beneficial interest holders do not have recourse to the general credit of Citigroup
Short-term borrowings
$
11,772
$
13,628
Long-term debt
7,274
5,271
Other liabilities
416
920
Total liabilities of consolidated VIEs for which creditors or beneficial interest holders do not have recourse to the general credit of Citigroup
$
19,462
$
19,819
170
Funding Commitments for Significant Unconsolidated VIEs—Liquidity Facilities and Loan Commitments
The following table presents the notional amount of liquidity facilities and loan commitments that are classified as funding commitments in the VIE tables above:
June 30, 2025
December 31, 2024
In millions of dollars
Liquidity facilities
Loan/equity commitments
Liquidity facilities
Loan/equity commitments
Non-agency-sponsored mortgage securitizations
$
—
$
336
$
—
$
566
Citi-administered asset-backed commercial paper conduits
—
—
—
—
Asset-based financing
—
15,775
—
13,185
Municipal securities tender option bond trusts (TOBs)
—
—
—
—
Municipal investments
—
3,293
—
2,502
Investment funds
—
94
—
98
Total funding commitments
$
—
$
19,498
$
—
$
16,351
Significant Interests in Unconsolidated VIEs—Balance Sheet Classification
The following table presents the carrying amounts and classification of significant variable interests in unconsolidated VIEs:
In billions of dollars
June 30, 2025
December 31, 2024
Cash
$
—
$
—
Trading account assets
4.0
3.4
Investments
5.4
5.6
Total loans, net of allowance
61.9
58.4
Other
0.6
0.6
Total assets
$
71.9
$
68.0
Credit Card Securitizations
The Company’s primary credit card securitization activity is through two trusts—Citibank Credit Card Master Trust and Citibank Omni Trust. These trusts are consolidated entities given Citi’s continuing involvement. The following table reflects amounts related to the Company’s securitized credit card receivables:
In billions of dollars
June 30, 2025
December 31, 2024
Ownership interests in principal amount of trust credit card receivables
Sold to investors via trust-issued securities
$
7.2
$
5.2
Retained by Citigroup as trust-issued securities
3.3
3.7
Retained by Citigroup via non-certificated interests
29.1
22.1
Total
$
39.6
$
31.0
The following table summarizes selected cash flow information related to Citigroup’s credit card securitizations:
Three Months Ended June 30,
Six Months Ended June 30,
In billions of dollars
2025
2024
2025
2024
Proceeds from new securitizations
$
2.0
$
—
$
2.0
$
—
Paydown of maturing notes
—
1.1
—
1.2
Master Trust Liabilities (at Par Value)
The weighted average maturity of the third-party term notes issued by the Master Trust was 3.3 years as of June 30, 2025 and 3.6 years as of December 31, 2024.
In billions of dollars
Jun. 30, 2025
Dec. 31, 2024
Term notes issued to third parties
$
6.3
$
4.3
Term notes retained by Citigroup affiliates
1.8
1.7
Total Master Trust liabilities
$
8.1
$
6.0
Omni Trust Liabilities (at Par Value)
The weighted average maturity of the third-party term notes issued by the Omni Trust was 0.9 years as of June 30, 2025 and 1.4 years as of December 31, 2024.
In billions of dollars
Jun. 30, 2025
Dec. 31, 2024
Term notes issued to third parties
$
0.9
$
0.9
Term notes retained by Citigroup affiliates
1.5
2.0
Total Omni Trust liabilities
$
2.4
$
2.9
171
Mortgage Securitizations
The following tables summarize selected cash flow information and retained interests related to Citigroup mortgage securitizations:
Three Months Ended June 30,
2025
2024
In billions of dollars
U.S. agency- sponsored mortgages
Non-agency- sponsored mortgages
U.S. agency- sponsored mortgages
Non-agency- sponsored mortgages
Principal securitized
$
1.8
$
1.4
$
1.5
$
3.0
Proceeds from new securitizations
1.8
1.0
1.5
2.7
Contractual servicing fees received
—
—
—
—
Cash flows received on retained interests and other net cash flows
—
—
—
—
Purchases of previously transferred financial assets
—
—
—
—
Six Months Ended June 30,
2025
2024
In billions of dollars
U.S. agency- sponsored mortgages
Non-agency- sponsored mortgages
U.S. agency- sponsored mortgages
Non-agency- sponsored mortgages
Principal securitized
$
3.4
$
2.8
$
3.0
$
4.1
Proceeds from new securitizations
3.5
2.3
3.0
3.7
Contractual servicing fees received
0.1
—
0.1
—
Cash flows received on retained interests and other net cash flows
—
0.1
—
0.1
Purchases of previously transferred financial assets
—
—
—
—
Note: Excludes re-securitization transactions.
Gains recognized on the securitization of U.S. agency-sponsored mortgages were less than $1 million for the three and six months ended June 30, 2025. Gains recognized on the securitization of non-agency-sponsored mortgages were $34.7 million and $95.5 million for the three and six months ended June 30, 2025, respectively.
Gains recognized on the securitization of U.S. agency-sponsored mortgages were less than $1 million for the three and six months ended June 30, 2024. Gains recognized on the securitization of non-agency-sponsored mortgages were $45.5 million and $82.0 million for the three and six months ended June 30, 2024, respectively.
June 30, 2025
December 31, 2024
Non-agency-sponsored mortgages(1)
Non-agency-sponsored mortgages(1)
In millions of dollars
U.S. agency- sponsored mortgages
Senior interests
Subordinated interests
U.S. agency- sponsored mortgages
Senior interests
Subordinated interests
Carrying value of retained interests(2)
$
806
$
908
$
1,047
$
783
$
902
$
1,058
(1) Disclosure of non-agency-sponsored mortgages as senior and subordinated interests is indicative of the interests’ position in the capital structure of the securitization.
(2) Retained interests consist of Level 2 and Level 3 assets depending on the observability of significant inputs. See Note 23 for more information about fair value measurements.
The following table includes information about loan delinquencies and liquidation losses for assets held in non-consolidated, non-agency-sponsored securitization entities:
Liquidation (gains) losses
Securitized assets
90 days past due
Three Months Ended June 30,
Six Months Ended June 30,
In billions of dollars, except liquidation losses in millions
Jun. 30, 2025
Dec. 31, 2024
Jun. 30, 2025
Dec. 31, 2024
2025
2024
2025
2024
Securitized assets
Residential mortgages(1)
$
31.4
$
31.0
$
0.4
$
0.3
$
1.3
$
0.5
$
1.3
$
1.2
Commercial and other
30.1
31.1
—
—
—
—
—
—
Total
$
61.5
$
62.1
$
0.4
$
0.3
$
1.3
$
0.5
$
1.3
$
1.2
(1) Securitized assets include $0.1 billion of personal loan securitizations as of June 30, 2025.
172
Consumer Loan Securitizations
Beginning in the third quarter of 2023, Citi relaunched a program securitizing other consumer loans into asset-backed securities. The principal securitized for the three and six months ended March 31, 2025 was $0.3 billion and $0.6 billion, respectively. The proceeds from new securitizations for the three and six months ended June 30, 2025 were $0.3 billion and $0.6 billion, respectively. The gains recognized on the securitization of consumer loans were $0.5 billion and $0.7 billion for the three and six months ended June 30, 2025, respectively.
Mortgage Servicing Rights (MSRs)
In connection with the securitization of mortgage loans, Citi’s U.S. consumer mortgage business generally retains the servicing rights, which entitle the Company to a future stream of cash flows based on the outstanding principal balances of the loans and the contractual servicing fee. Failure to service the loans in accordance with contractual requirements may lead to a termination of the servicing rights and the loss of future servicing fees. These transactions create intangible assets referred to as MSRs, which are recorded at fair value on Citi’s Consolidated Balance Sheet (see Note 23 for the valuation of MSRs). The MSRs correspond to principal loan balances of $57 billion and $53 billion as of June 30, 2025 and 2024, respectively.
The Company receives fees during the course of servicing previously securitized mortgages. The amounts of these fees were as follows:
Three Months Ended June 30,
Six Months Ended June 30,
In millions of dollars
2025
2024
2025
2024
Servicing fees
$
38
$
33
$
75
$
65
Late fees
—
1
1
1
Total MSR fees
$
38
$
34
$
76
$
66
In the Consolidated Statement of Income these fees are primarily classified as Commissions and fees, and changes in MSR fair values are classified as Other revenue.
Re-securitizations
The Company engages in re-securitization transactions backed by either residential or commercial mortgages in which debt securities are transferred to a VIE in exchange for new beneficial interests. Citi did not transfer non-agency (private label) securities to re-securitization entities, nor did Citi hold retained interests in such securitizations, during the three months ended June 30, 2025 and 2024.
As of June 30, 2025 and December 31, 2024, Citi held no retained interests in private label re-securitization transactions structured by Citi.
The Company also re-securitizes U.S. government-agency-guaranteed mortgage-backed (agency) securities. During the three and six months ended June 30, 2025, Citi transferred agency securities with a fair value of approximately $6.7 billion and $13.6 billion to re-securitization entities, compared to approximately $6.3 billion
and $10.7 billion for the three and six months ended June 30, 2024, respectively.
As of June 30, 2025, the fair value of Citi-retained interests in agency re-securitization transactions structured by Citi totaled approximately $2.5 billion (including $1.6 billion related to re-securitization transactions executed in 2025), compared to $1.6 billion as of December 31, 2024 (including $977 million related to re-securitization transactions executed in 2024), which is recorded in Trading account assets. The original fair values of agency re-securitization transactions in which Citi holds a retained interest as of June 30, 2025 and December 31, 2024 were approximately $73.4 billion and $76.8 billion, respectively.
As of June 30, 2025 and December 31, 2024, the Company did not consolidate any private label or agency re-securitization entities.
Citi-Administered Asset-Backed Commercial Paper Conduits
At June 30, 2025 and December 31, 2024, the commercial paper conduits administered by Citi had approximately $20.2 billion and $21.3 billion of purchased assets outstanding, and unfunded commitments with clients of approximately $15.2 billion and $16.7 billion, respectively.
At June 30, 2025 and December 31, 2024, the weighted-average remaining maturities of the commercial paper issued by the conduits were approximately 65 and 82 days, respectively.
The conduits have obtained letters of credit from the Company that equal at least 8% to 10% of the conduit’s assets with a minimum of $200 million to $350 million. The letters of credit provided by the Company to the conduits total approximately $2.0 billion and $2.1 billion as of June 30, 2025 and December 31, 2024, respectively. In the event that defaulted assets exceed the transaction-specific credit enhancement described above, any losses in each conduit are allocated first to the Company and then to the commercial paper investors.
At June 30, 2025 and December 31, 2024, the Company owned $7.3 billion and $6.4 billion, respectively, of the commercial paper issued by its administered conduits. The Company’s investments were not driven by market illiquidity and the Company is not obligated under any agreement to purchase the commercial paper issued by the conduits.
Municipal Securities Tender Option Bond (TOB) Trusts
The Company provides credit enhancement for certain non-customer trusts. At June 30, 2025 and December 31, 2024, $0.8 billion and $0.4 billion, respectively, of the municipal bonds owned by non-customer TOB trusts were subject to a credit guarantee provided by the Company.
The Company provides other liquidity agreements or letters of credit to customer-sponsored municipal investment funds, which are not variable interest entities, and municipality-related issuers that totaled $0.1 billion and $0.5 billion as of June 30, 2025 and December 31, 2024, respectively. These liquidity agreements and letters of credit are offset by reimbursement agreements with various term-out provisions.
173
Asset-Based Financing
The primary types of Citi’s asset-based financings, total assets of the unconsolidated VIEs with significant involvement and Citi’s maximum exposure to loss are presented below. For Citi to realize the maximum loss, the VIE (borrower) would have to default with no recovery from the assets held by the VIE.
June 30, 2025
December 31, 2024
In millions of dollars
Total unconsolidated VIE assets
Maximum exposure to unconsolidated VIEs
Total unconsolidated VIE assets
Maximum exposure to unconsolidated VIEs
Type
Commercial and other real estate
$
60,452
$
11,947
$
61,322
$
9,693
Corporate loans
55,166
26,514
45,542
21,009
Other (including investment funds, airlines and shipping)
198,836
35,288
153,687
37,567
Total
$
314,454
$
73,749
$
260,551
$
68,269
174
22. DERIVATIVES
In the ordinary course of business, Citigroup enters into various types of derivative transactions. All derivatives are recorded in Trading account assets/Trading account liabilities on the Consolidated Balance Sheet. For additional information regarding Citi’s use of and accounting for derivatives, see Note 24 to the Consolidated Financial Statements in Citi’s 2024 Form 10-K.
Information pertaining to Citigroup’s derivatives activities, based on notional amounts, is presented in the table below. Derivative notional amounts are reference amounts from which contractual payments are derived and do not represent a complete measure of Citi’s exposure to derivative transactions. Citi’s derivative exposure arises primarily from
market fluctuations (i.e., market risk), counterparty failure (i.e., credit risk) and/or periods of high volatility or financial stress (i.e., liquidity risk), as well as any market valuation adjustments that may be required on the transactions. Moreover, notional amounts presented below do not reflect the netting of offsetting trades. For example, if Citi enters into a receive-fixed interest rate swap with $100 million notional, and offsets this risk with an identical but opposite pay-fixed position with a different counterparty, $200 million in derivative notionals is reported, although these offsetting positions may result in de minimis overall market risk.
In addition, aggregate derivative notional amounts can fluctuate from period to period in the normal course of business based on Citi’s market share, levels of client activity and other factors.
Derivative Notionals
Hedging instruments under ASC 815
Trading derivative instruments
In millions of dollars
June 30, 2025
December 31, 2024
June 30, 2025
December 31, 2024
Interest rate contracts
Swaps
$
344,522
$
276,939
$
20,123,482
$
15,245,212
Futures and forwards
—
—
3,744,099
3,006,869
Written options
—
—
3,182,139
2,799,577
Purchased options
—
—
2,948,408
2,526,165
Total interest rate contracts
$
344,522
$
276,939
$
29,998,128
$
23,577,823
Foreign exchange contracts
Swaps
$
42,500
$
36,421
$
9,180,755
$
7,422,309
Futures, forwards and spot
61,633
55,671
5,797,263
4,028,135
Written options
—
—
1,271,157
1,022,109
Purchased options
—
—
1,247,119
1,013,884
Total foreign exchange contracts
$
104,133
$
92,092
$
17,496,294
$
13,486,437
Equity contracts
Swaps
$
—
$
—
$
380,769
$
323,751
Futures and forwards
—
—
79,995
73,437
Written options
—
—
836,521
581,659
Purchased options
—
—
686,292
436,702
Total equity contracts
$
—
$
—
$
1,983,577
$
1,415,549
Commodity and other contracts
Swaps
$
—
$
—
$
77,260
$
80,582
Futures and forwards
9,153
4,403
175,589
183,494
Written options
—
—
68,451
54,673
Purchased options
—
—
72,091
55,819
Total commodity and other contracts
$
9,153
$
4,403
$
393,391
$
374,568
Credit derivatives(1)
Protection sold
$
—
$
—
$
502,959
$
439,146
Protection purchased
—
—
601,645
531,429
Total credit derivatives
$
—
$
—
$
1,104,604
$
970,575
Total derivative notionals
$
457,808
$
373,434
$
50,975,994
$
39,824,952
(1)Credit derivatives are arrangements designed to allow one party (protection purchaser) to transfer the credit risk of a “reference asset” to another party (protection seller). These arrangements allow a protection seller to assume the credit risk associated with the reference asset without directly purchasing that asset. The Company enters into credit derivative positions for purposes such as risk management, yield enhancement, reduction of credit concentrations and diversification of overall risk, and as a market-maker to facilitate client transactions.
175
The following tables present the gross and net fair values of the Company’s derivative transactions and the related offsetting amounts as of June 30, 2025 and December 31, 2024. Gross positive fair values are offset against gross negative fair values by counterparty, pursuant to enforceable master netting agreements. Under ASC 815-10-45, payables and receivables in respect of cash collateral received from or paid to a given counterparty pursuant to a credit support annex are included in the offsetting amount if a legal opinion supporting the enforceability of netting and collateral rights has been obtained. GAAP does not permit similar offsetting for security collateral.
In addition, the following tables reflect rule changes adopted by clearing organizations that require or allow entities to treat certain derivative assets, liabilities and the related variation margin as settlement of the related derivative fair values for legal and accounting purposes, as opposed to presenting gross derivative assets and liabilities that are subject to collateral, whereby the counterparties would also record a related collateral payable or receivable. The tables also present amounts that are not permitted to be offset in the Company’s balance sheet presentation, such as security collateral or cash collateral posted at third-party custodians, but which would be eligible for offsetting to the extent that an event of default has occurred and a legal opinion supporting enforceability of the netting and collateral rights has been obtained.
Derivatives classified in Trading account assets/liabilities(1)(2)
In millions of dollars at June 30, 2025
Assets
Liabilities
Derivatives instruments designated as ASC 815 hedges
Over-the-counter
$
298
$
488
Cleared
79
116
Interest rate contracts
$
377
$
604
Over-the-counter
$
1,100
$
2,174
Cleared
—
—
Foreign exchange contracts
$
1,100
$
2,174
Total derivatives instruments designated as ASC 815 hedges
$
1,477
$
2,778
Derivatives instruments not designated as ASC 815 hedges
Over-the-counter
$
98,949
$
89,056
Cleared
98,131
99,694
Exchange traded
33
45
Interest rate contracts
$
197,113
$
188,795
Over-the-counter
$
174,311
$
162,788
Cleared
1,249
1,218
Exchange traded
4
5
Foreign exchange contracts
$
175,564
$
164,011
Over-the-counter
$
26,036
$
37,673
Cleared
—
—
Exchange traded
47,206
44,851
Equity contracts
$
73,242
$
82,524
Over-the-counter
$
13,590
$
14,957
Exchange traded
746
1,049
Commodity and other contracts
$
14,336
$
16,006
Over-the-counter
$
7,256
$
6,826
Cleared
2,731
2,683
Credit derivatives
$
9,987
$
9,509
Total derivatives instruments not designated as ASC 815 hedges
$
470,242
$
460,845
Total derivatives
$
471,719
$
463,623
Less: Netting agreements(3)
$
(385,343)
$
(385,343)
Less: Netting cash collateral received/paid(4)
(27,790)
(23,829)
Net receivables/payables included on the Consolidated Balance Sheet(5)
$
58,586
$
54,451
Additional amounts subject to an enforceable master netting agreement, but not offset on the Consolidated Balance Sheet
Less: Cash collateral received/paid
$
(1,560)
$
(56)
Less: Non-cash collateral received/paid
(5,616)
(3,152)
Total net receivables/payables(5)
$
51,410
$
51,243
(1)The derivatives fair values are also presented in Note 23.
(2)Over-the-counter (OTC) derivatives are derivatives executed and settled bilaterally with counterparties without the use of an organized exchange or central clearing house. Cleared derivatives include derivatives executed bilaterally with a counterparty in the OTC market, but then novated to a central clearing house, whereby the central clearing house becomes the counterparty to both of the original counterparties. Exchange-traded derivatives include derivatives executed directly on an organized exchange that provides pre-trade price transparency.
(3)Represents the netting of balances with the same counterparty under enforceable netting agreements. Approximately $241 billion, $100 billion and $44 billion of the netting against trading account asset/liability balances is attributable to each of the OTC, cleared and exchange-traded derivatives, respectively.
(4)Represents the netting of cash collateral paid and received by counterparties under enforceable credit support agreements with appropriate legal opinion supporting enforceability of netting. Substantially all netting of cash collateral received and paid is against OTC derivative assets and liabilities, respectively.
(5)The net receivables/payables include approximately $10 billion of derivative asset and $14 billion of derivative liability fair values not subject to enforceable master netting agreements, respectively.
177
Derivatives classified in Trading account assets/liabilities(1)(2)
In millions of dollars at December 31, 2024
Assets
Liabilities
Derivatives instruments designated as ASC 815 hedges
Over-the-counter
$
695
$
1
Cleared
154
19
Interest rate contracts
$
849
$
20
Over-the-counter
$
2,951
$
1,117
Cleared
—
—
Foreign exchange contracts
$
2,951
$
1,117
Total derivatives instruments designated as ASC 815 hedges
$
3,800
$
1,137
Derivatives instruments not designated as ASC 815 hedges
Over-the-counter
$
95,907
$
88,776
Cleared
33,447
33,269
Exchange traded
75
67
Interest rate contracts
$
129,429
$
122,112
Over-the-counter
$
210,755
$
202,582
Cleared
2,329
2,298
Exchange traded
10
20
Foreign exchange contracts
$
213,094
$
204,900
Over-the-counter
$
19,262
$
25,950
Cleared
—
—
Exchange traded
35,882
35,786
Equity contracts
$
55,144
$
61,736
Over-the-counter
$
11,945
$
13,804
Exchange traded
675
826
Commodity and other contracts
$
12,620
$
14,630
Over-the-counter
$
6,907
$
5,569
Cleared
1,808
1,684
Credit derivatives
$
8,715
$
7,253
Total derivatives instruments not designated as ASC 815 hedges
$
419,002
$
410,631
Total derivatives
$
422,802
$
411,768
Less: Netting agreements(3)
$
(334,900)
$
(334,900)
Less: Netting cash collateral received/paid(4)
(27,303)
(28,570)
Net receivables/payables included on the Consolidated Balance Sheet(5)
$
60,599
$
48,298
Additional amounts subject to an enforceable master netting agreement, but not offset on the Consolidated Balance Sheet
Less: Cash collateral received/paid
$
(808)
$
(52)
Less: Non-cash collateral received/paid
(6,017)
(3,376)
Total net receivables/payables(5)
$
53,774
$
44,870
(1)The derivative fair values are also presented in Note 23.
(2)OTC derivatives are derivatives executed and settled bilaterally with counterparties without the use of an organized exchange or central clearing house. Cleared derivatives include derivatives executed bilaterally with a counterparty in the OTC market, but then novated to a central clearing house, whereby the central clearing house becomes the counterparty to both of the original counterparties. Exchange-traded derivatives include derivatives executed directly on an organized exchange that provides pre-trade price transparency.
(3)Represents the netting of balances with the same counterparty under enforceable netting agreements. Approximately $264 billion, $36 billion and $35 billion of the netting against trading account asset/liability balances is attributable to each of the OTC, cleared and exchange-traded derivatives, respectively.
(4)Represents the netting of cash collateral paid and received by counterparties under enforceable credit support agreements with appropriate legal opinion supporting enforceability of netting. Substantially all netting of cash collateral received and paid is against OTC derivative assets and liabilities, respectively.
(5)The net receivables/payables include approximately $13 billion of derivative asset and $15 billion of derivative liability fair values not subject to enforceable master netting agreements, respectively.
178
For the three and six months ended June 30, 2025 and 2024, amounts recognized in Principal transactions in the Consolidated Statement of Income include certain derivatives not designated in a qualifying hedging relationship. Citigroup presents this disclosure by business classification, showing derivative gains and losses related to its trading activities together with gains and losses related to non-derivative instruments within the same trading portfolios, as this represents how these portfolios are risk managed. See Note 6 for further information.
The amounts recognized in Other revenue in the Consolidated Statement of Income related to derivatives not designated in a qualifying hedging relationship are presented below. The table below does not include any offsetting gains (losses) on the economically hedged items:
Gains (losses) included in Other revenue
Three Months Ended June 30,
Six Months Ended June 30,
In millions of dollars
2025
2024
2025
2024
Interest rate contracts
$
(36)
$
(8)
$
(32)
$
(44)
Foreign exchange
(323)
(136)
(412)
(122)
Total
$
(359)
$
(144)
$
(444)
$
(166)
179
Fair Value Hedges
For additional information on Citi’s fair value hedges, see Notes 1 and 24 to the Consolidated Financial Statements in Citi’s 2024 Form 10-K.
The following table summarizes the gains (losses) on the Company’s fair value hedges:
Gains (losses) on fair value hedges(1)
Three Months Ended June 30,
Six Months Ended June 30,
2025
2024
2025
2024
In millions of dollars
Other revenue
Net interest income
Other revenue
Net interest income
Other revenue
Net interest income
Other revenue
Net interest income
Gain (loss) on the hedging derivatives included in assessment of the effectiveness of fair value hedges
Interest rate hedges
$
—
$
(9)
$
—
$
(436)
$
—
$
(423)
$
—
$
(1,040)
Foreign exchange hedges
308
—
145
—
317
—
74
—
Commodity hedges(2)
(496)
—
(289)
—
(770)
—
1,231
—
Total gain (loss) on the hedging derivatives included in assessment of the effectiveness of fair value hedges
$
(188)
$
(9)
$
(144)
$
(436)
$
(453)
$
(423)
$
1,305
$
(1,040)
Gain (loss) on the hedged item in designated and qualifying fair value hedges
Interest rate hedges
$
—
$
9
$
—
$
448
$
—
$
428
$
—
$
1,068
Foreign exchange hedges
(308)
—
(145)
—
(317)
—
(74)
—
Commodity hedges(2)
496
—
289
—
770
—
(1,231)
—
Total gain (loss) on the hedged item in designated and qualifying fair value hedges
$
188
$
9
$
144
$
448
$
453
$
428
$
(1,305)
$
1,068
Net gain (loss) on the hedging derivatives excluded from assessment of the effectiveness of fair value hedges
Interest rate hedges
$
—
$
—
$
—
$
—
$
—
$
—
$
—
$
—
Foreign exchange hedges(3)
94
—
32
—
121
—
3
—
Commodity hedges(2)(4)
154
—
70
—
356
—
167
—
Total net gain (loss) on the hedging derivatives excluded from assessment of the effectiveness of fair value hedges
$
248
$
—
$
102
$
—
$
477
$
—
$
170
$
—
(1)Gain (loss) amounts for interest rate risk hedges are included in Interest income/Interest expense. The accrued interest income on fair value hedges is recorded in Net interest income and is excluded from this table. Amounts included both hedges of AFS securities and long-term debt on a net basis, which largely offset in the current period.
(2)The gain (loss) amounts for commodity hedges are included in Principal transactions.
(3)Amounts related to the forward points (i.e., the spot-forward difference) that are excluded from the assessment of hedge effectiveness and are generally reflected directly in earnings under the mark-to-market approach. Amounts related to cross-currency basis, which are recognized in AOCI, are not reflected in the table above. The amount of cross-currency basis included in AOCI was $(2) million and $2 million for the three months ended June 30, 2025 and 2024, respectively.
(4)Amounts related to the forward points (i.e., the spot-forward difference) that are excluded from the assessment of hedge effectiveness and are generally reflected directly in earnings under the mark-to-market approach or recorded in AOCI under the amortization approach. The quarter ended June 30, 2025 includes a gain (loss) of approximately $139 million and $15 million under the mark-to-market approach and amortization approach, respectively. The quarter ended June 30, 2024 includes a gain (loss) of approximately $51 million and $19 million under the mark-to-market approach and amortization approach, respectively.
180
Cumulative Basis Adjustment
For additional information on Citi’s cumulative basis adjustment, see Notes 1 and 24 to the Consolidated Financial Statements in Citi’s 2024 Form 10-K.
The table below presents the carrying amount of Citi’s hedged assets and liabilities under qualifying fair value hedges at June 30, 2025 and December 31, 2024, along with the cumulative basis adjustments included in the carrying value of those hedged assets and liabilities that would reverse through earnings in future periods:
Balance sheet line item in which
hedged item is recorded (in millions of dollars)
Carrying amount of hedged asset/ liability(1)
Cumulative basis adjustment increasing (decreasing) the carrying amount
Active
De-designated
As of June 30, 2025
Debt securities AFS—specifically hedged(2)
$
43,449
$
103
$
115
Debt securities AFS—portfolio-layer method(2)(3)
35,468
329
14
Consumer loans—portfolio-layer method(4)
52,655
516
—
Corporate loans—portfolio-layer method(5)
3,630
50
(39)
Long-term debt
163,245
739
(3,784)
As of December 31, 2024
Debt securities AFS—specifically hedged(2)
$
55,786
$
(348)
$
(100)
Debt securities AFS—portfolio-layer method(2)(3)
28,554
(193)
(67)
Consumer loans—portfolio-layer method(4)
53,700
(224)
—
Corporate loans—portfolio-layer method(5)
4,269
(72)
(12)
Long-term debt
147,910
(1,051)
(4,499)
(1)Excludes physical commodities inventories with a carrying value of approximately $9.2 billion and $11.4 billion as of June 30, 2025 and December 31, 2024, respectively, which includes cumulative basis adjustments of approximately $0.5 billion and $0.8 billion, respectively, for active hedges.
(2)Carrying amount represents the amortized cost basis of the hedged securities or portfolio layers.
(3)The Company designated approximately $27.4 billion and $12.9 billion as the hedged amount in the portfolio-layer hedging relationship as of June 30, 2025 and December 31, 2024, respectively.
(4) The Company designated approximately $26.0 billion and $17.0 billion as the hedged amount in the portfolio-layer hedging relationship as of June 30, 2025 and December 31, 2024, respectively.
(5) The Company designated approximately $2.6 billion and $3.0 billion as the hedged amount in the portfolio-layer hedging relationship as of June 30, 2025 and December 31, 2024, respectively.
181
Cash Flow Hedges
For additional information on Citi’s cash flow hedges, see Notes 1 and 24 to the Consolidated Financial Statements in Citi’s 2024 Form 10-K.
The pretax change in AOCI from cash flow hedges is presented below:
Three Months Ended June 30,
Six Months Ended June 30,
In millions of dollars
2025
2024
2025
2024
Amount of gain (loss) recognized in AOCI on derivatives
Interest rate contracts
$
(80)
$
34
$
(261)
$
340
Foreign exchange contracts
—
(2)
—
(1)
Total gain (loss) recognized in AOCI
$
(80)
$
32
$
(261)
$
339
Other revenue
Net interest income
Other revenue
Net interest income
Other revenue
Net interest income
Other revenue
Net interest income
Amount of gain (loss) reclassified from AOCI to earnings(1)
Interest rate contracts
$
—
$
(168)
$
—
$
(260)
$
—
$
(357)
$
—
$
(602)
Foreign exchange contracts
—
—
(1)
—
—
—
(2)
—
Total gain (loss) reclassified from AOCI into earnings
$
—
$
(168)
$
(1)
$
(260)
$
—
$
(357)
$
(2)
$
(602)
Net pretax change in cash flow hedges included within AOCI
$
88
$
293
$
96
$
943
(1)All amounts reclassified into earnings for interest rate contracts are included in Interest income/Interest expense (Net interest income). For all other hedges, the amounts reclassified to earnings are included primarily in Other revenue and Net interest income in the Consolidated Statement of Income.
The net gain (loss) associated with cash flow hedges expected to be reclassified from AOCI within 12 months of June 30, 2025 is approximately $(0.2) billion. The maximum length of time over which forecasted cash flows are hedged is 13 years.
The after-tax impact of cash flow hedges on AOCI is presented in Note 19.
Net Investment Hedges
For additional information on Citi’s net investment hedges, see Notes 1 and 24 to the Consolidated Financial Statements in Citi’s 2024 Form 10-K.
The pretax gain (loss) recorded in CTA within AOCI, related to net investment hedges, was $(1,881) million and $(2,462) million for the three and six months ended June 30, 2025 and $1,057 million and $1,250 million for the three and six months ended June 30, 2024, respectively.
182
Credit Derivatives
The following tables summarize the key characteristics of Citi’s credit derivatives portfolio by reference entity and derivative form:
Fair values
Notionals
In millions of dollars at June 30, 2025
Receivable(1)
Payable(2)
Protection purchased
Protection sold
By instrument
Credit default swaps and options
$
7,920
$
7,936
$
541,514
$
489,116
Total return swaps and other
2,067
1,573
60,131
13,843
Total by instrument
$
9,987
$
9,509
$
601,645
$
502,959
By rating of reference entity
Investment grade
$
5,214
$
4,549
$
457,412
$
406,280
Non-investment grade
4,773
4,960
144,233
96,679
Total by rating of reference entity
$
9,987
$
9,509
$
601,645
$
502,959
By maturity
Within 1 year
$
1,188
$
1,546
$
155,348
$
137,149
From 1 to 5 years
7,002
6,558
387,961
336,282
After 5 years
1,797
1,405
58,336
29,528
Total by maturity
$
9,987
$
9,509
$
601,645
$
502,959
(1)The fair value amount receivable is composed of $3,890 million under protection purchased and $6,097 million under protection sold.
(2)The fair value amount payable is composed of $7,684 million under protection purchased and $1,825 million under protection sold.
Fair values
Notionals
In millions of dollars at December 31, 2024
Receivable(1)
Payable(2)
Protection purchased
Protection sold
By instrument
Credit default swaps and options
$
6,765
$
6,545
$
486,901
$
431,005
Total return swaps and other
1,950
708
44,528
8,141
Total by instrument
$
8,715
$
7,253
$
531,429
$
439,146
By rating of reference entity
Investment grade
$
4,578
$
3,450
$
405,271
$
350,124
Non-investment grade
4,137
3,803
126,158
89,022
Total by rating of reference entity
$
8,715
$
7,253
$
531,429
$
439,146
By maturity
Within 1 year
$
1,606
$
1,166
$
140,541
$
118,885
From 1 to 5 years
5,625
4,906
342,608
295,503
After 5 years
1,484
1,181
48,280
24,758
Total by maturity
$
8,715
$
7,253
$
531,429
$
439,146
(1) The fair value amount receivable is composed of $3,864 million under protection purchased and $4,851 million under protection sold.
(2) The fair value amount payable is composed of $5,403 million under protection purchased and $1,850 million under protection sold.
183
Credit Risk-Related Contingent Features in Derivatives
Certain derivative instruments contain provisions that require the Company to either post additional collateral or immediately settle any outstanding liability balances upon the occurrence of a specified event related to the credit risk of the Company. These events, which are defined by the existing derivative contracts, are primarily downgrades in the credit ratings of the Company and its affiliates.
The fair value (excluding CVA) of all derivative instruments with credit risk-related contingent features that were in a net liability position at June 30, 2025 and December 31, 2024 was $13 billion and $15 billion, respectively. The Company posted $10 billion and $13 billion as collateral for this exposure in the normal course of business as of June 30, 2025 and December 31, 2024, respectively.
A downgrade could trigger additional collateral or cash settlement requirements for the Company and certain affiliates. In the event that Citigroup and Citibank were downgraded a single notch by all three major rating agencies as of June 30, 2025, the Company could be required to post an additional $0.2 billion as either collateral or settlement of the derivative transactions. In addition, the Company could be required to segregate with third-party custodians collateral previously received from existing derivative counterparties in an amount of approximately $1 million upon the single notch downgrade, resulting in aggregate cash obligations and collateral requirements of approximately $0.2 billion.
Derivatives Accompanied by Financial Asset Transfers
For transfers of financial assets accounted for as a sale by the Company, and for which the Company has retained substantially all of the economic exposure to the transferred asset through a total return swap executed with the same counterparty in contemplation of the initial sale (and still outstanding), the asset amounts derecognized and the gross cash proceeds received as of the date of derecognition were $4.9 billion and $6.2 billion as of June 30, 2025 and December 31, 2024, respectively.
At June 30, 2025, the fair value of these previously derecognized assets was $4.6 billion. The fair value of the total return swaps as of June 30, 2025 was $119 million recorded as gross derivative assets and $26 million recorded as gross derivative liabilities. At December 31, 2024, the fair value of these previously derecognized assets was $5.8 billion, and the fair value of the total return swaps was $179 million recorded as gross derivative assets and $29 million recorded as gross derivative liabilities.
The balances for the total return swaps are on a gross basis, before the application of counterparty and cash collateral netting, and are included primarily as equity derivatives in the tabular disclosures in this Note.
184
23. FAIR VALUE MEASUREMENT
For additional information regarding fair value measurement at Citi, see Note 26 to the Consolidated Financial Statements in Citi’s 2024 Form 10-K.
Fair Value Hierarchy Principles
ASC 820-10 specifies a hierarchy of inputs based on whether the inputs are observable or unobservable. Observable inputs are developed using market data and reflect market participant assumptions, while unobservable inputs reflect the Company’s market assumptions. These two types of inputs have created the following fair value hierarchy:
•Level 1: Quoted prices for identical instruments in active markets.
•Level 2: Quoted prices for similar instruments in active markets, quoted prices for identical or similar instruments in markets that are not active and model-derived valuations in which all significant inputs and value drivers are observable in the market.
•Level 3: Valuations derived from valuation techniques in which one or more significant inputs or significant value drivers are unobservable.
As required under the fair value hierarchy, the Company considers relevant and observable market inputs in its valuations where possible.
The fair value hierarchy classification approach typically utilizes rules-based and data-driven criteria to determine whether an instrument is classified as Level 1, Level 2 or Level 3:
•The determination of whether an instrument is quoted in an active market and therefore considered a Level 1 instrument is based on the frequency of observed transactions and the quality of independent market data available on the measurement date.
•A Level 2 classification is assigned where there is observability of prices/market inputs to models, or where any unobservable inputs are not significant to the valuation. The determination of whether an input is considered observable is based on the availability of independent market data and its corroboration, for example through observed transactions in the market.
•Otherwise, an instrument is classified as Level 3.
Market Valuation Adjustments
The table below summarizes the credit valuation adjustments (CVA) and funding valuation adjustments (FVA) applied to the fair value of derivative instruments (recorded in Trading account assets and Trading account liabilities on the Consolidated Balance Sheet) at June 30, 2025 and December 31, 2024:
Credit and funding valuation adjustments contra-liability (contra-asset)
In millions of dollars
June 30, 2025
December 31, 2024
Counterparty CVA
$
(654)
$
(561)
Asset FVA
(608)
(539)
Citigroup (own credit) CVA
347
346
Liability FVA
218
209
Total CVA and FVA—derivative instruments
$
(697)
$
(545)
The table below summarizes pretax gains (losses) related to changes in CVA and FVA on derivative instruments, net of hedges (recorded in Principal transactions revenue in the Consolidated Statement of Income), and changes in debt valuation adjustments (DVA) on Citi’s own fair value option (FVO) liabilities (recorded in Other comprehensive income in the Consolidated Statement of Comprehensive Income) for the periods indicated:
Credit/funding/debt valuation adjustments gain (loss)
Three Months Ended June 30,
Six Months Ended June 30,
In millions of dollars
2025
2024
2025
2024
Counterparty CVA
$
(37)
$
(25)
$
(61)
$
(17)
Asset FVA
(40)
2
(3)
86
Own credit CVA
(27)
6
19
(46)
Liability FVA
12
27
17
(30)
Total CVA and FVA—derivative instruments
$
(92)
$
10
$
(28)
$
(7)
DVA related to own FVO liabilities(1)
$
(391)
$
343
$
609
$
(407)
Total CVA, DVA and FVA
$
(483)
$
353
$
581
$
(414)
(1) See Note 21 to the Consolidated Financial Statements in Citi’s 2024 Form 10-K.
185
Items Measured at Fair Value on a Recurring Basis
The following tables present for each of the fair value hierarchy levels the Company’s assets and liabilities that are measured at fair value on a recurring basis at June 30, 2025 and December 31, 2024. The Company may hedge positions
that have been classified in the Level 3 category with other financial instruments (hedging instruments) that may be classified as Level 3, but also with financial instruments classified as Level 1 or Level 2. These hedges are presented gross in the following tables:
Fair Value Levels
In millions of dollars at June 30, 2025
Level 1
Level 2
Level 3
Gross inventory
Netting(1)
Net balance
Assets
Securities borrowed and purchased under agreements to resell
$
—
$
494,333
$
86
$
494,419
$
(319,395)
$
175,024
Trading non-derivative assets
Trading mortgage-backed securities
U.S. government-sponsored agency guaranteed
—
88,527
545
89,072
—
89,072
Residential
—
577
85
662
—
662
Commercial
—
741
62
803
—
803
Total trading mortgage-backed securities
$
—
$
89,845
$
692
$
90,537
$
—
$
90,537
U.S. Treasury and federal agency securities
$
153,324
$
3,676
$
—
$
157,000
$
—
$
157,000
State and municipal
—
166
1
167
—
167
Foreign government
70,486
57,875
4
128,365
—
128,365
Corporate
1,873
21,941
282
24,096
—
24,096
Equity securities
70,649
8,271
251
79,171
—
79,171
Asset-backed securities
—
2,034
211
2,245
—
2,245
Other trading assets
1
27,824
566
28,391
—
28,391
Total trading non-derivative assets
$
296,333
$
211,632
$
2,007
$
509,972
$
—
$
509,972
Trading derivatives
Interest rate contracts
$
49
$
195,757
$
1,684
$
197,490
Foreign exchange contracts
—
176,044
620
176,664
Equity contracts
159
72,007
1,076
73,242
Commodity contracts
—
13,316
1,020
14,336
Credit derivatives
—
9,285
702
9,987
Total trading derivatives—before netting and collateral
$
208
$
466,409
$
5,102
$
471,719
Netting agreements
$
(385,343)
Netting of cash collateral received
(27,790)
Total trading derivatives—after netting and collateral
$
208
$
466,409
$
5,102
$
471,719
$
(413,133)
$
58,586
Investments
Mortgage-backed securities
U.S. government-sponsored agency guaranteed
$
—
$
36,155
$
19
$
36,174
$
—
$
36,174
Residential
—
817
11
828
—
828
Commercial
—
1
—
1
—
1
Total investment mortgage-backed securities
$
—
$
36,973
$
30
$
37,003
$
—
$
37,003
U.S. Treasury and federal agency securities
$
35,490
$
—
$
—
$
35,490
$
—
$
35,490
State and municipal
—
1,169
503
1,672
—
1,672
Foreign government
77,400
73,563
27
150,990
—
150,990
Corporate
3,708
1,342
208
5,258
—
5,258
Marketable equity securities
104
5
3
112
—
112
Asset-backed securities
—
987
—
987
—
987
Other debt securities
45
4,357
—
4,402
—
4,402
Non-marketable equity securities(2)
—
—
439
439
—
439
Total investments
$
116,747
$
118,396
$
1,210
$
236,353
$
—
$
236,353
Table continues on the next page.
186
In millions of dollars at June 30, 2025
Level 1
Level 2
Level 3
Gross inventory
Netting(1)
Net balance
Loans
$
—
$
9,077
$
180
$
9,257
$
—
$
9,257
Mortgage servicing rights
—
—
770
770
—
770
Other financial assets
$
5,065
$
10,702
$
83
$
15,850
$
—
$
15,850
Total assets
$
418,353
$
1,310,549
$
9,438
$
1,738,340
$
(732,528)
$
1,005,812
Total as a percentage of gross assets(3)
24.1%
75.4%
0.5%
Liabilities
Deposits
$
—
$
4,069
$
43
$
4,112
$
—
$
4,112
Securities loaned and sold under agreements to repurchase
—
361,567
955
362,522
(170,124)
192,398
Trading account liabilities
Securities sold, not yet purchased
89,670
19,781
37
109,488
—
109,488
Other trading liabilities
—
13
—
13
—
13
Total trading account liabilities
$
89,670
$
19,794
$
37
$
109,501
$
—
$
109,501
Trading derivatives
Interest rate contracts
$
19
$
187,240
$
2,140
$
189,399
Foreign exchange contracts
—
165,633
552
166,185
Equity contracts
148
79,133
3,243
82,524
Commodity contracts
—
15,113
893
16,006
Credit derivatives
—
8,619
890
9,509
Total trading derivatives—before netting and collateral
$
167
$
455,738
$
7,718
$
463,623
Netting agreements
$
(385,343)
Netting of cash collateral paid
(23,829)
Total trading derivatives—after netting and collateral
$
167
$
455,738
$
7,718
$
463,623
$
(409,172)
$
54,451
Short-term borrowings
$
—
$
20,251
$
343
$
20,594
$
—
$
20,594
Long-term debt
—
106,207
21,166
127,373
—
127,373
Other financial liabilities
$
3,431
$
419
$
65
$
3,915
$
—
$
3,915
Total liabilities
$
93,268
$
968,045
$
30,327
$
1,091,640
$
(579,296)
$
512,344
Total as a percentage of gross liabilities(3)
8.5
%
88.7
%
2.8
%
(1)Represents netting of (i) the amounts due under securities purchased under agreements to resell and the amounts owed under securities sold under agreements to repurchase and (ii) derivative exposures covered by a qualifying master netting agreement and cash collateral offsetting.
(2)Amounts exclude $32 million of investments measured at net asset value (NAV) in accordance with ASU 2015-07, Fair Value Measurement (Topic 820): Disclosures for Investments in Certain Entities That Calculate Net Asset Value per Share (or Its Equivalent).
(3)Because the amount of the cash collateral paid/received has not been allocated to the Level 1, 2 and 3 subtotals, these percentages are calculated based on total assets and liabilities measured at fair value on a recurring basis, excluding the cash collateral paid/received on derivatives.
187
Fair Value Levels
In millions of dollars at December 31, 2024
Level 1
Level 2
Level 3
Gross inventory
Netting(1)
Net balance
Assets
Securities borrowed and purchased under agreements to resell
$
—
$
462,542
$
128
$
462,670
$
(321,815)
$
140,855
Trading non-derivative assets
Trading mortgage-backed securities
U.S. government-sponsored agency guaranteed
—
63,365
301
63,666
—
63,666
Residential
—
528
67
595
—
595
Commercial
—
631
36
667
—
667
Total trading mortgage-backed securities
$
—
$
64,524
$
404
$
64,928
$
—
$
64,928
U.S. Treasury and federal agency securities
$
142,837
$
6,517
$
1
$
149,355
$
—
$
149,355
State and municipal
—
168
11
179
—
179
Foreign government
35,805
39,035
15
74,855
—
74,855
Corporate
1,197
13,474
269
14,940
—
14,940
Equity securities
41,163
7,479
166
48,808
—
48,808
Asset-backed securities
—
2,131
178
2,309
—
2,309
Other trading assets
—
26,441
333
26,774
—
26,774
Total trading non-derivative assets
$
221,002
$
159,769
$
1,377
$
382,148
$
—
$
382,148
Trading derivatives
Interest rate contracts
$
17
$
128,562
$
1,699
$
130,278
Foreign exchange contracts
—
215,330
715
216,045
Equity contracts
44
53,734
1,366
55,144
Commodity contracts
—
11,546
1,074
12,620
Credit derivatives
—
7,993
722
8,715
Total trading derivatives—before netting and collateral
$
61
$
417,165
$
5,576
$
422,802
Netting agreements
$
(334,900)
Netting of cash collateral received
(27,303)
Total trading derivatives—after netting and collateral
$
61
$
417,165
$
5,576
$
422,802
$
(362,203)
$
60,599
Investments
Mortgage-backed securities
U.S. government-sponsored agency guaranteed
$
—
$
29,270
$
36
$
29,306
$
—
$
29,306
Residential
—
596
28
624
—
624
Commercial
—
1
—
1
—
1
Total investment mortgage-backed securities
$
—
$
29,867
$
64
$
29,931
$
—
$
29,931
U.S. Treasury and federal agency securities
$
51,501
$
878
$
—
$
52,379
$
—
$
52,379
State and municipal
—
1,230
428
1,658
—
1,658
Foreign government
62,106
71,241
12
133,359
—
133,359
Corporate
3,163
1,505
146
4,814
—
4,814
Marketable equity securities
130
7
14
151
—
151
Asset-backed securities
—
846
2
848
—
848
Other debt securities
—
3,881
6
3,887
—
3,887
Non-marketable equity securities(2)
—
—
404
404
—
404
Total investments
$
116,900
$
109,455
$
1,076
$
227,431
$
—
$
227,431
Table continues on the next page.
188
In millions of dollars at December 31, 2024
Level 1
Level 2
Level 3
Gross inventory
Netting(1)
Net balance
Loans
$
—
$
7,778
$
262
$
8,040
$
—
$
8,040
Mortgage servicing rights
—
—
760
760
—
760
Other financial assets
$
5,373
$
9,424
$
15
$
14,812
$
—
$
14,812
Total assets
$
343,336
$
1,166,133
$
9,194
$
1,518,663
$
(684,018)
$
834,645
Total as a percentage of gross assets(3)
22.6%
76.8%
0.6%
Liabilities
Deposits
$
—
$
3,569
$
39
$
3,608
$
—
$
3,608
Securities loaned and sold under agreements to repurchase
—
260,286
390
260,676
(211,522)
49,154
Trading account liabilities
Securities sold, not yet purchased
72,324
13,184
28
85,536
—
85,536
Other trading liabilities
—
12
—
12
—
12
Total trading account liabilities
$
72,324
$
13,196
$
28
$
85,548
$
—
$
85,548
Trading derivatives
Interest rate contracts
$
6
$
120,097
$
2,029
$
122,132
Foreign exchange contracts
—
205,487
530
206,017
Equity contracts
40
58,642
3,054
61,736
Commodity contracts
—
13,960
670
14,630
Credit derivatives
—
6,635
618
7,253
Total trading derivatives—before netting and collateral
$
46
$
404,821
$
6,901
$
411,768
Netting agreements
$
(334,900)
Netting of cash collateral paid
(28,570)
Total trading derivatives—after netting and collateral
$
46
$
404,821
$
6,901
$
411,768
$
(363,470)
$
48,298
Short-term borrowings
$
—
$
12,187
$
297
$
12,484
$
—
$
12,484
Long-term debt
—
91,619
21,100
112,719
—
112,719
Other financial liabilities
$
4,478
$
744
$
—
$
5,222
$
—
$
5,222
Total liabilities
$
76,848
$
786,422
$
28,755
$
892,025
$
(574,992)
$
317,033
Total as a percentage of gross liabilities(3)
8.6
%
88.2
%
3.2
%
(1)Represents netting of (i) the amounts due under securities purchased under agreements to resell and the amounts owed under securities sold under agreements to repurchase and (ii) derivative exposures covered by a qualifying master netting agreement and cash collateral offsetting.
(2)Amounts exclude $23 million of investments measured at NAV in accordance with ASU 2015-07, Fair Value Measurement (Topic 820): Disclosures for Investments in Certain Entities That Calculate Net Asset Value per Share (or Its Equivalent).
(3)Because the amount of the cash collateral paid/received has not been allocated to the Level 1, 2 and 3 subtotals, these percentages are calculated based on total assets and liabilities measured at fair value on a recurring basis, excluding the cash collateral paid/received on derivatives.
189
Changes in Level 3 Fair Value Category
The following tables present the changes in the Level 3 fair value category for the three and six months ended June 30, 2025 and 2024. The gains and losses presented below include changes in the fair value related to both observable and unobservable inputs.
The Company often hedges positions with offsetting positions that are classified in a different level. For example,
the gains and losses for assets and liabilities in the Level 3 category presented in the tables below do not reflect the effect of offsetting losses and gains on hedging instruments that may be classified in the Level 1 or Level 2 categories. In addition, the Company hedges items classified in the Level 3 category with instruments also classified in Level 3 of the fair value hierarchy. The hedged items and related hedges are presented gross in the following tables:
Level 3 Fair Value Rollforward
Net realized/unrealized
gains (losses) incl. in(1)
Transfers
Unrealized gains (losses) still held(3)
In millions of dollars
Mar. 31, 2025
Principal transactions
Other(1)(2)
into Level 3
out of Level 3
Purchases
Issuances
Sales
Settlements
Jun. 30, 2025
Assets
Securities borrowed and purchased under agreements to resell
$
153
$
21
$
—
$
—
$
—
$
18
$
—
$
—
$
(106)
$
86
$
22
Trading non-derivative assets
Trading mortgage-backed securities
U.S. government-sponsored agency guaranteed
614
17
—
86
(174)
134
—
(132)
—
545
8
Residential
118
1
—
26
(49)
46
—
(57)
—
85
—
Commercial
87
—
—
9
(30)
13
—
(17)
—
62
(1)
Total trading mortgage-backed securities
$
819
$
18
$
—
$
121
$
(253)
$
193
$
—
$
(206)
$
—
$
692
$
7
U.S. Treasury and federal agency securities
$
—
$
—
$
—
$
—
$
—
$
—
$
—
$
—
$
—
$
—
$
—
State and municipal
1
—
—
—
—
—
—
—
—
1
—
Foreign government
3
(4)
—
—
(4)
9
—
—
—
4
—
Corporate
250
68
—
53
(50)
21
—
(60)
—
282
164
Marketable equity securities
227
13
—
21
(4)
52
—
(58)
—
251
10
Asset-backed securities
220
(10)
—
29
(35)
76
—
(69)
—
211
(3)
Other trading assets
468
21
—
9
(24)
221
12
(133)
(8)
566
30
Total trading non-derivative assets
$
1,988
$
106
$
—
$
233
$
(370)
$
572
$
12
$
(526)
$
(8)
$
2,007
$
208
Trading derivatives, net(4)
Interest rate contracts
$
(637)
$
180
$
—
$
(58)
$
35
$
(54)
$
7
$
—
$
71
$
(456)
$
145
Foreign exchange contracts
181
68
—
18
(125)
8
—
(90)
8
68
(67)
Equity contracts
(2,205)
251
—
(128)
334
(399)
—
(7)
(13)
(2,167)
80
Commodity contracts
325
(57)
—
(184)
19
47
—
—
(23)
127
(38)
Credit derivatives
28
(93)
—
(84)
(4)
(21)
—
—
(14)
(188)
(144)
Total trading derivatives, net(4)
$
(2,308)
$
349
$
—
$
(436)
$
259
$
(419)
$
7
$
(97)
$
29
$
(2,616)
$
(24)
Table continues on the next page.
190
Net realized/unrealized
gains (losses) incl. in(1)
Transfers
Unrealized gains (losses) still held(3)
In millions of dollars
Mar. 31, 2025
Principal transactions
Other(1)(2)
into Level 3
out of Level 3
Purchases
Issuances
Sales
Settlements
Jun. 30, 2025
Investments
Mortgage-backed securities
U.S. government-sponsored agency guaranteed
$
32
$
—
$
(1)
$
—
$
(12)
$
—
$
—
$
—
$
—
$
19
$
(1)
Residential
10
—
1
—
—
—
—
—
—
11
1
Commercial
—
—
—
—
—
—
—
—
—
—
—
Total investment mortgage-backed securities
$
42
$
—
$
—
$
—
$
(12)
$
—
$
—
$
—
$
—
$
30
$
—
U.S. Treasury and federal agency securities
$
—
$
—
$
—
$
—
$
—
$
—
$
—
$
—
$
—
$
—
$
—
State and municipal
435
—
—
67
(1)
7
—
(5)
—
503
—
Foreign government
9
—
(2)
20
—
—
—
—
—
27
—
Corporate
194
—
3
85
(33)
38
—
(79)
—
208
2
Marketable equity securities
6
—
(3)
—
—
—
—
—
—
3
—
Asset-backed securities
—
—
—
—
—
—
—
—
—
—
Other debt securities
1
—
—
—
—
—
—
(1)
—
—
—
Non-marketable equity securities
414
—
13
—
—
21
—
(9)
—
439
—
Total investments
$
1,101
$
—
$
11
$
172
$
(46)
$
66
$
—
$
(94)
$
—
$
1,210
$
2
Loans
$
318
$
—
$
19
$
2
$
(97)
$
—
$
3
$
—
$
(65)
$
180
$
9
Mortgage servicing rights
751
—
12
—
—
—
27
—
(20)
770
12
Other financial assets
13
—
—
2
—
61
19
—
(12)
83
—
Liabilities
Deposits
$
47
$
—
$
(4)
$
1
$
—
$
—
$
7
$
—
$
(16)
$
43
$
—
Securities loaned and sold under agreements to repurchase
798
(5)
—
—
—
339
—
—
(187)
955
1
Trading account liabilities
Securities sold, not yet purchased
29
(11)
—
5
(16)
19
—
—
(11)
37
(12)
Other trading liabilities
—
—
—
—
—
—
—
—
—
—
—
Short-term borrowings
721
37
—
45
(24)
—
43
—
(405)
343
(5)
Long-term debt
21,441
(470)
—
628
(1,224)
—
765
—
(914)
21,166
(586)
Other financial liabilities measured on a recurring basis
1
—
—
14
—
50
—
—
—
65
—
(1)Net realized/unrealized gains (losses) are presented as increase (decrease) to Level 3 assets, and as (increase) decrease to Level 3 liabilities. Changes in fair value of available-for-sale debt securities are recorded in AOCI, unless related to credit impairment, while gains and losses from sales are recorded in Realized gains (losses) from sales of investments in the Consolidated Statement of Income.
(2)Unrealized gains (losses) on MSRs are recorded in Other revenue in the Consolidated Statement of Income.
(3)Represents the amount of total gains or losses for the period, included in earnings (and AOCI for changes in fair value of available-for-sale debt securities and DVA on fair value option liabilities), attributable to the change in fair value relating to assets and liabilities classified as Level 3 that are still held at June 30, 2025.
(4)Total Level 3 trading derivative assets and liabilities have been netted in these tables for presentation purposes only.
191
Net realized/unrealized
gains (losses) incl. in(1)
Transfers
Unrealized gains (losses) still held(3)
In millions of dollars
Dec. 31, 2024
Principal transactions
Other(1)(2)
into Level 3
out of Level 3
Purchases
Issuances
Sales
Settlements
Jun. 30, 2025
Assets
Securities borrowed and purchased under agreements to resell
$
128
$
27
$
—
$
—
$
(84)
$
168
$
—
$
—
$
(153)
$
86
$
24
Trading non-derivative assets
Trading mortgage-backed securities
U.S. government-sponsored agency guaranteed
301
40
—
242
(210)
454
—
(282)
—
545
29
Residential
67
2
—
37
(61)
106
—
(66)
—
85
(1)
Commercial
36
(4)
—
30
(39)
56
—
(17)
—
62
(3)
Total trading mortgage-backed securities
$
404
$
38
$
—
$
309
$
(310)
$
616
$
—
$
(365)
$
—
$
692
$
25
U.S. Treasury and federal agency securities
$
1
$
—
$
—
$
—
$
(1)
$
—
$
—
$
—
$
—
$
—
$
—
State and municipal
11
1
—
—
(11)
—
—
—
—
1
—
Foreign government
15
(3)
—
—
(10)
9
—
(7)
—
4
1
Corporate
269
52
—
70
(110)
114
—
(113)
—
282
171
Marketable equity securities
166
18
—
43
(6)
123
—
(93)
—
251
11
Asset-backed securities
178
(19)
—
39
(40)
173
—
(120)
—
211
(6)
Other trading assets
333
100
—
53
(32)
275
24
(171)
(16)
566
83
Total trading non-derivative assets
$
1,377
$
187
$
—
$
514
$
(520)
$
1,310
$
24
$
(869)
$
(16)
$
2,007
$
285
Trading derivatives, net(4)
Interest rate contracts
$
(330)
$
(52)
$
—
$
(72)
$
(63)
$
(63)
$
10
$
(9)
$
123
$
(456)
$
(113)
Foreign exchange contracts
185
(6)
—
80
(75)
49
—
(149)
(16)
68
(207)
Equity contracts
(1,688)
386
—
(276)
467
(1,313)
—
(28)
285
(2,167)
(557)
Commodity contracts
404
40
—
(207)
135
(79)
—
(4)
(162)
127
73
Credit derivatives
104
(171)
—
(74)
78
(117)
—
—
(8)
(188)
(137)
Total trading derivatives, net(4)
$
(1,325)
$
197
$
—
$
(549)
$
542
$
(1,523)
$
10
$
(190)
$
222
$
(2,616)
$
(941)
Table continues on the next page.
192
Net realized/unrealized
gains (losses) incl. in(1)
Transfers
Unrealized gains (losses) still held(3)
In millions of dollars
Dec. 31, 2024
Principal transactions
Other(1)(2)
into Level 3
out of Level 3
Purchases
Issuances
Sales
Settlements
Jun. 30, 2025
Investments
Mortgage-backed securities
U.S. government-sponsored agency guaranteed
$
36
$
—
$
(2)
$
—
$
(15)
$
—
$
—
$
—
$
—
$
19
$
(2)
Residential
28
—
1
—
(5)
—
—
(13)
—
11
1
Total investment mortgage-backed securities
$
64
$
—
$
(1)
$
—
$
(20)
$
—
$
—
$
(13)
$
—
$
30
$
(1)
U.S. Treasury and federal agency securities
$
—
$
—
$
—
$
—
$
—
$
—
$
—
$
—
$
—
$
—
$
—
State and municipal
428
—
4
89
(14)
255
—
(259)
—
503
(2)
Foreign government
12
—
(3)
20
(2)
—
—
—
—
27
—
Corporate
146
—
12
85
(65)
135
—
(105)
—
208
4
Marketable equity securities
14
—
(11)
—
—
—
—
—
—
3
—
Asset-backed securities
2
—
—
—
(2)
—
—
—
—
—
—
Other debt securities
6
—
—
—
—
1
—
(7)
—
—
—
Non-marketable equity securities
404
—
18
—
—
33
—
(16)
—
439
—
Total investments
$
1,076
$
—
$
19
$
194
$
(103)
$
424
$
—
$
(400)
$
—
$
1,210
$
1
Loans
$
262
$
—
$
96
$
2
$
(99)
$
—
$
7
$
—
$
(88)
$
180
$
10
Mortgage servicing rights
760
—
(3)
—
—
—
52
—
(39)
770
(4)
Other financial assets
15
—
—
2
—
62
30
—
(26)
83
4
Liabilities
Deposits
$
39
$
—
$
(4)
$
1
$
—
$
—
$
26
$
—
$
(27)
$
43
$
—
Securities loaned and sold under agreements to repurchase
390
(2)
—
—
—
1,071
—
—
(508)
955
1
Trading account liabilities
Securities sold, not yet purchased
28
18
—
7
(21)
76
—
—
(35)
37
(26)
Other trading liabilities
—
1
—
—
(2)
25
—
—
(22)
—
—
Short-term borrowings
297
46
—
59
(59)
—
616
—
(524)
343
(103)
Long-term debt
21,100
(419)
—
1,240
(2,065)
—
2,049
—
(1,577)
21,166
(520)
Other financial liabilities
—
—
—
14
—
50
1
—
—
65
—
(1)Net realized/unrealized gains (losses) are presented as increase (decrease) to Level 3 assets, and as (increase) decrease to Level 3 liabilities. Changes in fair value of available-for-sale debt securities are recorded in AOCI, unless related to credit impairment, while gains and losses from sales are recorded in Realized gains (losses) from sales of investments in the Consolidated Statement of Income.
(2)Unrealized gains (losses) on MSRs are recorded in Other revenue in the Consolidated Statement of Income.
(3)Represents the amount of total gains or losses for the period, included in earnings (and AOCI for changes in fair value of available-for-sale debt securities and DVA on fair value option liabilities), attributable to the change in fair value relating to assets and liabilities classified as Level 3 that are still held at June 30, 2025.
(4)Total Level 3 trading derivative assets and liabilities have been netted in these tables for presentation purposes only.
193
Net realized/unrealized
gains (losses) incl. in(1)
Transfers
Unrealized gains (losses) still held(3)
In millions of dollars
Mar. 31, 2024
Principal transactions
Other(1)(2)
into Level 3
out of Level 3
Purchases
Issuances
Sales
Settlements
Jun. 30, 2024
Assets
Securities borrowed and purchased under agreements to resell
$
132
$
(3)
$
—
$
—
$
—
$
21
$
—
$
—
$
(24)
$
126
$
(3)
Trading non-derivative assets
Trading mortgage-backed securities
U.S. government-sponsored agency guaranteed
531
—
—
205
(131)
233
—
(147)
—
691
5
Residential
170
(2)
—
17
(23)
23
—
(94)
—
91
—
Commercial
159
3
—
26
(22)
34
—
(34)
—
166
2
Total trading mortgage-backed securities
$
860
$
1
$
—
$
248
$
(176)
$
290
$
—
$
(275)
$
—
$
948
$
7
U.S. Treasury and federal agency securities
$
—
$
—
$
—
$
—
$
—
$
—
$
—
$
—
$
—
$
—
$
—
State and municipal
1
—
—
—
—
—
—
—
—
1
—
Foreign government
113
—
—
—
(9)
38
—
(97)
—
45
1
Corporate
464
66
—
62
(180)
105
—
(202)
—
315
65
Marketable equity securities
232
(27)
—
101
(26)
29
—
(65)
—
244
(22)
Asset-backed securities
370
(21)
—
15
(60)
40
—
(100)
—
244
(4)
Other trading assets
752
98
—
95
(98)
120
2
(184)
(2)
783
44
Total trading non-derivative assets
$
2,792
$
117
$
—
$
521
$
(549)
$
622
$
2
$
(923)
$
(2)
$
2,580
$
91
Trading derivatives, net(4)
Interest rate contracts
$
(1,362)
$
(198)
$
—
$
99
$
12
$
107
$
8
$
(20)
$
326
$
(1,028)
$
(293)
Foreign exchange contracts
335
553
—
36
(20)
22
—
(144)
(231)
551
507
Equity contracts
(2,222)
123
—
73
324
(298)
—
(54)
4
(2,050)
141
Commodity contracts
342
79
—
1
(6)
1
—
(6)
(7)
404
84
Credit derivatives
(37)
41
—
5
11
50
—
—
4
74
15
Total trading derivatives, net(4)
$
(2,944)
$
598
$
—
$
214
$
321
$
(118)
$
8
$
(224)
$
96
$
(2,049)
$
454
Table continues on the next page.
194
Net realized/unrealized
gains (losses) incl. in(1)
Transfers
Unrealized gains (losses) still held(3)
In millions of dollars
Mar. 31, 2024
Principal transactions
Other(1)(2)
into Level 3
out of Level 3
Purchases
Issuances
Sales
Settlements
Jun. 30, 2024
Investments
Mortgage-backed securities
U.S. government-sponsored agency guaranteed
$
27
$
—
$
2
$
—
$
—
$
—
$
—
$
(1)
$
—
$
28
$
2
Residential
25
—
(1)
1
—
—
—
—
—
25
(1)
Commercial
—
—
—
—
—
—
—
—
—
—
—
Total investment mortgage-backed securities
$
52
$
—
$
1
$
1
$
—
$
—
$
—
$
(1)
$
—
$
53
$
1
U.S. Treasury and federal agency securities
$
—
$
—
$
—
$
—
$
—
$
—
$
—
$
—
$
—
$
—
$
—
State and municipal
479
—
(5)
—
(5)
—
—
(30)
—
439
(4)
Foreign government
24
—
(4)
—
(6)
—
—
—
—
14
(3)
Corporate
388
—
(7)
12
(251)
10
—
(40)
—
112
10
Marketable equity securities
8
—
2
—
—
—
—
—
—
10
(1)
Asset-backed securities
—
—
—
—
—
—
—
—
—
—
—
Other debt securities
—
—
—
—
—
—
—
—
—
—
—
Non-marketable equity securities
488
—
(3)
—
—
21
—
(1)
—
505
1
Total investments
$
1,439
$
—
$
(16)
$
13
$
(262)
$
31
$
—
$
(72)
$
—
$
1,133
$
4
Loans
$
1,057
$
—
$
(23)
$
—
$
(851)
$
1
$
128
$
—
$
(11)
$
301
$
(1)
Mortgage servicing rights
702
—
5
—
—
—
19
—
(17)
709
5
Other financial assets
31
—
(1)
—
—
2
—
(2)
(9)
21
—
Liabilities
Deposits
$
72
$
—
$
1
$
5
$
(32)
$
—
$
10
$
—
$
(13)
$
41
$
(8)
Securities loaned and sold under agreements to repurchase
326
—
—
—
—
184
—
—
(224)
286
—
Trading account liabilities
Securities sold, not yet purchased
105
(2)
—
13
(8)
9
—
—
(89)
32
—
Other trading liabilities
—
—
—
—
—
—
—
—
—
—
—
Short-term borrowings
583
12
—
9
(479)
—
177
—
(77)
201
—
Long-term debt
40,364
832
—
1,680
(20,890)
—
1,192
—
(1,139)
20,375
394
Other financial liabilities measured on a recurring basis
3
—
—
—
—
—
2
—
(2)
3
—
(1)Net realized/unrealized gains (losses) are presented as increase (decrease) to Level 3 assets, and as (increase) decrease to Level 3 liabilities. Changes in fair value of available-for-sale debt securities are recorded in AOCI, unless related to credit impairment, while gains and losses from sales are recorded in Realized gains (losses) from sales of investments in the Consolidated Statement of Income.
(2)Unrealized gains (losses) on MSRs are recorded in Other revenue in the Consolidated Statement of Income.
(3)Represents the amount of total gains or losses for the period, included in earnings (and AOCI for changes in fair value of available-for-sale debt securities and DVA on fair value option liabilities), attributable to the change in fair value relating to assets and liabilities classified as Level 3 that are still held at June 30, 2024.
(4)Total Level 3 trading derivative assets and liabilities have been netted in these tables for presentation purposes only.
195
Net realized/unrealized
gains (losses) incl. in(1)
Transfers
Unrealized gains (losses) still held(3)
In millions of dollars
Dec. 31, 2023
Principal transactions
Other(1)(2)
into Level 3
out of Level 3
Purchases
Issuances
Sales
Settlements
Jun. 30, 2024
Assets
Securities borrowed and purchased under agreements to resell
$
139
$
(8)
$
—
$
—
$
—
$
66
$
—
$
—
$
(71)
$
126
$
(6)
Trading non-derivative assets
Trading mortgage-backed securities
U.S. government-sponsored agency guaranteed
581
(39)
—
284
(285)
433
—
(283)
—
691
(13)
Residential
116
(3)
—
53
(58)
111
—
(128)
—
91
3
Commercial
202
17
—
39
(89)
131
—
(134)
—
166
2
Total trading mortgage-backed securities
$
899
$
(25)
$
—
$
376
$
(432)
$
675
$
—
$
(545)
$
—
$
948
$
(8)
U.S. Treasury and federal agency securities
$
7
$
4
$
—
$
—
$
(1)
$
—
$
—
$
—
$
(10)
$
—
$
—
State and municipal
3
—
—
—
—
—
—
(2)
—
1
—
Foreign government
54
—
—
12
(49)
163
—
(135)
—
45
2
Corporate
500
139
—
75
(388)
365
—
(368)
(8)
315
71
Marketable equity securities
292
(9)
—
130
(49)
60
—
(180)
—
244
(20)
Asset-backed securities
531
(18)
—
30
(178)
176
—
(297)
—
244
(12)
Other trading assets
833
165
—
152
(166)
195
6
(399)
(3)
783
55
Total trading non-derivative assets
$
3,119
$
256
$
—
$
775
$
(1,263)
$
1,634
$
6
$
(1,926)
$
(21)
$
2,580
$
88
Trading derivatives, net(4)
Interest rate contracts
$
(1,085)
$
(683)
$
—
$
130
$
(17)
$
80
$
14
$
(17)
$
550
$
(1,028)
$
(810)
Foreign exchange contracts
295
507
—
38
73
(73)
—
(166)
(123)
551
414
Equity contracts
(1,634)
(226)
—
(71)
537
(568)
—
(55)
(33)
(2,050)
35
Commodity contracts
279
161
—
32
(12)
11
—
(17)
(50)
404
288
Credit derivatives
(73)
100
—
2
(20)
58
—
—
7
74
(51)
Total trading derivatives, net(4)
$
(2,218)
$
(141)
$
—
$
131
$
561
$
(492)
$
14
$
(255)
$
351
$
(2,049)
$
(124)
Table continues on the next page.
196
Net realized/unrealized
gains (losses) incl. in(1)
Transfers
Unrealized gains (losses) still held(3)
In millions of dollars
Dec. 31, 2023
Principal transactions
Other(1)(2)
into Level 3
out of Level 3
Purchases
Issuances
Sales
Settlements
Jun. 30, 2024
Investments
Mortgage-backed securities
U.S. government-sponsored agency guaranteed
$
75
$
—
$
(1)
$
—
$
—
$
3
$
—
$
(49)
$
—
$
28
$
(1)
Residential
116
—
(2)
1
(90)
—
—
—
—
25
(2)
Total investment mortgage-backed securities
$
191
$
—
$
(3)
$
1
$
(90)
$
3
$
—
$
(49)
$
—
$
53
$
(3)
U.S. Treasury and federal agency securities
$
—
$
—
$
—
$
—
$
—
$
—
$
—
$
—
$
—
$
—
$
—
State and municipal
542
—
(31)
—
(6)
—
—
(66)
—
439
(13)
Foreign government
194
—
(12)
6
(174)
36
—
(36)
—
14
(3)
Corporate
362
—
(7)
42
(279)
51
—
(57)
—
112
10
Marketable equity securities
27
—
(17)
—
—
—
—
—
—
10
(1)
Asset-backed securities
—
—
—
—
—
—
—
—
—
—
—
Other debt securities
—
—
—
—
—
—
—
—
—
—
—
Non-marketable equity securities
483
—
(8)
—
—
60
—
(30)
—
505
1
Total investments
$
1,799
$
—
$
(78)
$
49
$
(549)
$
150
$
—
$
(238)
$
—
$
1,133
$
(9)
Loans
$
427
$
—
$
(52)
$
663
$
(891)
$
1
$
232
$
—
$
(79)
$
301
$
10
Mortgage servicing rights
691
—
17
—
—
—
36
—
(35)
709
(4)
Other financial assets
30
—
(2)
—
—
5
13
(2)
(23)
21
4
Liabilities
Deposits
$
29
$
—
$
4
$
51
$
(33)
$
—
$
15
$
—
$
(17)
$
41
$
(8)
Securities loaned and sold under agreements to repurchase
390
—
—
—
—
438
—
—
(542)
286
—
Trading account liabilities
Securities sold, not yet purchased
35
(8)
—
14
(10)
96
—
—
(111)
32
—
Other trading liabilities
—
—
—
—
—
—
—
—
—
—
—
Short-term borrowings
481
(82)
—
20
(517)
1
211
—
(77)
201
(3)
Long-term debt
38,380
1,427
—
3,038
(21,730)
—
4,782
—
(2,668)
20,375
819
Other financial liabilities
6
—
—
—
—
—
5
—
(8)
3
—
(1)Net realized/unrealized gains (losses) are presented as increase (decrease) to Level 3 assets, and as (increase) decrease to Level 3 liabilities. Changes in fair value of available-for-sale debt securities are recorded in AOCI, unless related to credit impairment, while gains and losses from sales are recorded in Realized gains (losses) from sales of investments in the Consolidated Statement of Income.
(2)Unrealized gains (losses) on MSRs are recorded in Other revenue in the Consolidated Statement of Income.
(3)Represents the amount of total gains or losses for the period, included in earnings (and AOCI for changes in fair value of available-for-sale debt securities and DVA on fair value option liabilities), attributable to the change in fair value relating to assets and liabilities classified as Level 3 that are still held at June 30, 2024.
(4)Total Level 3 trading derivative assets and liabilities have been netted in these tables for presentation purposes only.
197
Level 3 Fair Value Transfers
The following were the significant Level 3 transfers for the period from December 31, 2024 to June 30, 2025:
•During the three and six months ended June 30, 2025, transfers of Long-term debt were $1.2 billion and $2.1 billion from Level 3 to Level 2, and $0.6 billion and $1.2 billion from Level 2 to Level 3, respectively. The transfers were primarily related to certain unobservable inputs becoming less significant to the overall valuation of the instruments in the case of Level 3 to 2 transfers, and more significant in the case of Level 2 to 3.
The following were the significant Level 3 transfers for the period from December 31, 2023 to June 30, 2024:
•During the three and six months ended June 30, 2024, transfers of Long-term debt were $20.9 billion and $21.7 billion from Level 3 to Level 2, and $1.7 billion and $3.0 billion from Level 2 to Level 3, respectively. The Level 3 to Level 2 transfers were primarily the result of enhanced significance testing of unobservable inputs for certain structured debt instruments. The Level 2 to Level 3 transfers were primarily the result of certain unobservable inputs becoming more significant to the overall valuation of these instruments.
198
Valuation Techniques and Inputs for Level 3 Fair Value Measurements
The following tables present the valuation techniques covering the majority of Level 3 inventory and the most significant unobservable inputs used in Level 3 fair value measurements.
Differences between these tables and amounts presented in the Level 3 Fair Value Rollforward tables represent individually immaterial items that have been measured using a variety of valuation techniques other than those listed.
As of June 30, 2025
Fair value(1)
(in millions)
Methodology
Input
Low(2)(3)
High(2)(3)
Weighted
average(4)
Assets
Mortgage-backed securities
$
443
Price-based
Price
$
1.06
$
148.90
$
45.95
278
Yield analysis
Yield
5.04
%
22.56
%
7.66
%
State and municipal, foreign government, corporate and other debt securities
$
845
Price-based
Price
$
—
$
193.44
$
98.65
647
Model-based
Credit spread
167.00 bps
550.00 bps
396.34 bps
Equity volatility
2.66
%
180.16
%
39.12
%
IR normal volatility
0.40
%
1.05
%
0.90
%
Recovery rate
25.00
%
25.00
%
25.00
%
Yield
2.30
%
10.40
%
9.54
%
Non-marketable equities(5)
$
272
Comparables analysis
Illiquidity discount
7.70
%
33.00
%
16.36
%
Revenue multiple
3.60x
33.56x
14.49x
EBITDA multiple
16.80x
16.80x
16.80x
70
Price-based
Price
$
2.90
$
161.37
$
91.32
56
Model-based
Discount rate
12.60
%
17.50
%
15.41
%
Derivatives—gross(6)
Interest rate contracts (gross)
$
3,773
Model-based
IR normal volatility
0.04
%
3.00
%
0.81
%
Equity volatility
1.74
%
118.70
%
16.85
%
Yield
0.73
%
13.32
%
3.51
%
Inflation volatility
0.20
%
6.32
%
2.36
%
Foreign exchange contracts (gross)
$
1,172
Model-based
IR normal volatility
0.40
%
1.05
%
0.82
%
Yield
0.73
%
13.32
%
5.27
%
IR basis
(7.12)
%
44.50
%
5.56
%
FX volatility
3.89
%
16.76
%
9.38
%
Equity contracts (gross)(7)
$
4,273
Model-based
Equity volatility
2.66
%
129.53
%
31.97
%
Equity forward
71.42
%
342.98
%
106.73
%
Equity-FX correlation
(75.00)
%
70.00
%
(5.95)
%
Equity-Equity correlation
(36.22)
%
98.51
%
69.47
%
WAL
1.90 years
1.90 years
1.90 years
Recovery rate
6.76
%
6.76
%
6.76
%
Commodity and other contracts (gross)
$
1,901
Model-based
Forward price
1.76
%
303.57
%
101.93
%
Commodity volatility
8.67
%
278.08
%
50.19
%
Credit derivatives (gross)
$
1,003
Model-based
Credit spread
5.66 bps
688.17 bps
71.11 bps
Credit correlation
20.00
%
95.00
%
49.26
%
586
Price-based
Price
$
54.04
$
114.32
$
95.80
Upfront points
5.04%
106.17%
60.33%
Mortgage servicing rights
$
676
Cash flow
WAL
3.42 years
8.62 years
7.39 years
86
Model-based
Yield
(0.20)
%
12.00
%
6.54
%
Liabilities
Securities loaned and sold under agreements to repurchase
$
955
Model-based
Interest rate
3.68
%
5.67
%
4.06
%
IR Normal volatility
0.93
%
1.09
%
1.06
%
199
As of June 30, 2025
Fair value(1)
(in millions)
Methodology
Input
Low(2)(3)
High(2)(3)
Weighted
average(4)
Short-term borrowings and long-term debt
$
21,466
Model-based
IR normal volatility
0.04
%
3.00
%
0.88
%
Equity volatility
2.66
%
118.70
%
19.62
%
Equity-IR correlation
(35.19)
%
50.00
%
25.92
%
Equity forward
71.42
%
342.98
%
105.87
%
Equity-FX correlation
(75.00)
%
70.00
%
(9.74)
%
As of December 31, 2024
Fair value(1)
(in millions)
Methodology
Input
Low(2)(3)
High(2)(3)
Weighted
average(4)
Assets
Securities borrowed and purchased under agreements to resell
$
128
Model-based
Credit spread
10 bps
10 bps
10 bps
Interest rate
3.81
%
3.81
%
3.81
%
Mortgage-backed securities
$
230
Yield analysis
Yield
5.24
%
18.43
%
9.25
%
214
Price-based
Price
$
0.01
$
99.81
$
35.24
State and municipal, foreign government, corporate and other debt securities
$
560
Price-based
Price
$
—
$
173.20
$
98.52
489
Model-based
Credit spread
35 bps
550 bps
277 bps
Yield
4.20
%
10.60
%
9.88
%
140
Cash flow
WAL
3.59 years
8.82 years
7.57 years
Marketable equities securities(5)
$
131
Price-based
Price
$
—
$
14,382.07
$
442.64
22
Model-based
WAL
2.40 years
2.40 years
2.40 years
Recovery(in millions)
$
8,628
$
8,628
$
8,628
Asset-backed securities
$
132
Price-based
Price
$
3.46
$
132.54
$
74.86
47
Yield analysis
Yield
5.85
%
12.76
%
8.07
%
Non-marketable equities
$
222
Comparables analysis
Illiquidity discount
7.40
%
33.00
%
16.47
%
Revenue multiple
4.50x
16.31x
11.97x
EBITDA multiples
16.20x
16.20x
16.20x
81
Price-based
Price
$
0.54
$
2,960.96
$
432.84
50
Cash flow
Discount rate
9.75
%
17.50
%
13.28
%
50
Model-based
Derivatives—gross(6)
Interest rate contracts (gross)
$
3,574
Model-based
IR normal volatility
0.16
%
20.00
%
2.18
%
Yield
1.69
%
46.32
%
5.64
%
Equity forward
71.78
%
334.29
%
106.48
%
Foreign exchange contracts (gross)
$
1,247
Model-based
IR normal volatility
0.67
%
1.13
%
0.93
%
IR basis
(7.50)
%
64.75
%
5.01
%
FX volatility
3.33
%
27.64
%
12.55
%
Yield
1.69
%
46.32
%
9.26
%
Equity contracts (gross)(7)
$
4,345
Model-based
Equity volatility
—
%
145.41
%
32.89
%
Equity forward
71.78
%
334.29
%
105.90
%
Equity-FX correlation
(93.33)
%
70.00
%
(14.52)
%
Equity-Equity correlation
(36.22)
%
99.00
%
72.43
%
Commodity and other contracts (gross)
$
1,716
Model-based
Forward price
1.84
%
244.41
%
115.84
%
Commodity volatility
7.14
%
285.61
%
35.86
%
200
As of December 31, 2024
Fair value(1)
(in millions)
Methodology
Input
Low(2)(3)
High(2)(3)
Weighted
average(4)
Credit derivatives (gross)
$
869
Model-based
Recovery rate
20.00
%
72.00
%
41.54
%
Credit spread
5.00 bps
747.27 bps
100.50 bps
Credit spread volatility
29.85
%
81.44
%
67.58
%
468
Price-based
Price
$
43.71
$
103.53
$
85.76
Upfront points
(6.25)
%
110.52
%
43.93
%
Other financial assets and liabilities (gross)
$
14
Price-based
Price
$
91.12
$
104.49
$
100.04
Loans and leases
$
177
Model-based
Equity volatility
35.42
%
41.94
%
37.21
%
Forward price
1.84
%
244.41
%
102.92
%
82
Price-based
Price
$
73.88
$
99.25
$
85.09
Mortgage servicing rights
$
671
Cash flow
WAL
3.59 years
8.82 years
7.57 years
84
Model-based
Yield
0.30
%
12.00
%
6.82
%
Liabilities
Interest-bearing deposits
$
39
Model-based
Forward price
100.00
%
100.00
%
100.00
%
Securities loaned and sold under agreements to repurchase
$
390
Model-based
Interest rate
4.25
%
4.85
%
4.28
%
IR normal volatility
0.67
%
1.13
%
0.93
%
Trading account liabilities
Securities sold, not yet purchased and other trading liabilities
$
27
Price-based
Price
$
—
$
14,382.07
$
91.47
Short-term borrowings and long-term debt
$
20,883
Model-based
IR normal volatility
0.04
%
20.00
%
1.54
%
Equity volatility
—
%
145.41
%
19.81
%
Equity-IR correlation
(34.00)
%
60.00
%
27.29
%
(1)The tables above include the fair values for the items listed and may not represent the total population for each category.
(2)Some inputs are shown as zero due to rounding.
(3)When the low and high inputs are the same, there is either a constant input applied to all positions, or the methodology involving the input applies to only one large position.
(4)Weighted averages are calculated based on the fair values of the instruments.
(5)For equity securities, the price inputs are expressed on an absolute basis, not as a percentage of the notional amount.
(6)Both trading and non-trading account derivatives—assets and liabilities—are presented on a gross absolute value basis.
(7)Includes hybrid products.
201
Items Measured at Fair Value on a Nonrecurring Basis
Certain assets and liabilities are measured at fair value on a nonrecurring basis and, therefore, are not included in the tables above. These include assets measured at cost that have been written down to fair value during the periods as a result of an impairment. These also include non-marketable equity securities that have been measured using the measurement alternative and are either (i) written down to fair value during the periods as a result of an impairment or (ii) adjusted upward or downward to fair value as a result of a transaction observed during the periods for an identical or similar investment in the same issuer. In addition, these assets include loans held-for-sale and other real estate owned that are measured at the lower of cost or market value.
The following tables present the carrying amounts of all assets that were still held as of the balance sheet date for which a nonrecurring fair value measurement was recorded during the year. The amounts reflect the fair values of the assets as of their respective remeasurement dates, which are generally prior to the balance sheet date. The following tables exclude certain consumer mortgage loans for which Citi has elected the fair value option (see Note 24), and consumer loans and other assets held by businesses held-for-sale (see Note 2):
In millions of dollars
Fair value
Level 2
Level 3
June 30, 2025
Loans HFS(1)
$
1,898
$
734
$
1,164
Other real estate owned
—
—
—
Loans(2)
504
—
504
Non-marketable equity securities measured using the measurement alternative
246
—
246
Total assets at fair value on a nonrecurring basis
$
2,648
$
734
$
1,914
In millions of dollars
Fair value
Level 2
Level 3
December 31, 2024
Loans HFS(1)
$
684
$
413
$
271
Other real estate owned
1
—
1
Loans(2)
353
—
353
Non-marketable equity securities measured using the measurement alternative
184
—
184
Total assets at fair value on a nonrecurring basis
$
1,222
$
413
$
809
(1)Net of mark-to-market amounts on the unfunded portion of loans HFS recognized as Other liabilities on the Consolidated Balance Sheet.
(2)Represents collateral-dependent loans held for investment for which the fair value of collateral is used to estimate expected credit losses, and whose carrying amount is based on the fair value of the underlying collateral less costs to sell, as applicable (primarily real estate).
202
Valuation Techniques and Inputs for Level 3 Nonrecurring Fair Value Measurements
The following tables present the valuation techniques covering the majority of Level 3 nonrecurring fair value measurements and the most significant unobservable inputs used in those measurements:
As of June 30, 2025
Fair value(1)
(in millions)
Methodology
Input
Low(2)
High
Weighted
average(3)
Loans HFS
$
1,164
Price-based
Price
$
86.01
$
100.00
$
99.62
Loans(5)
$
504
Recovery analysis
Appraised value(4)
$
10,000
$
128,904,278
$
70,025,894
Non-marketable equity securities measured using the measurement alternative
$
123
Price-based
Price
$
9.94
$
203.98
$
98.78
122
Comparables analysis
Revenue multiple
3.28x
53.75x
32.50x
As of December 31, 2024
Fair value(1)
(in millions)
Methodology
Input
Low(2)
High
Weighted
average(3)
Loans HFS
$
271
Price-based
Price
$
—
$
101.00
$
96.61
Loans(5)
$
353
Recovery analysis
Appraised value(4)
$
10,000
$
104,049,422
$
58,636,070
Non-marketable equity securities measured using the measurement alternative
$
136
Price-based
Price
$
1.50
$
2,961.00
$
258.00
29
Comparable analysis
Revenue multiple
3.80x
9.19x
6.67x
19
Recovery analysis
Appraised value(4)
$
503,332
$
7,220,000
$
4,309,976
(1)The tables above include the fair values for the items listed and may not represent the total population for each category.
(2)Some inputs are shown as zero due to rounding.
(3)Weighted averages are calculated based on the fair values of the instruments.
(4)Appraised values are disclosed in whole dollars.
(5)Represents collateral-dependent loans held for investment for which the fair value of collateral is used to estimate expected credit losses, and whose carrying amount is based on the fair value of the underlying collateral less costs to sell, as applicable (primarily real estate).
Nonrecurring Fair Value Changes
The following table presents total nonrecurring fair value measurements for the period, included in earnings, attributable to the change in fair value relating to assets that were still held:
Three Months Ended June 30,
Six Months Ended June 30,
In millions of dollars
2025
2024
2025
2024
Loans HFS
$
(38)
$
(82)
$
(51)
$
(123)
Other real estate owned
—
—
—
—
Loans(1)
21
4
3
10
Non-marketable equity securities measured using the measurement alternative
1
(5)
(43)
28
Total nonrecurring fair value gains (losses)
$
(16)
$
(83)
$
(91)
$
(85)
(1)Represents collateral-dependent loans held for investment for which the fair value of collateral is used to estimate expected credit losses, and whose carrying amount is based on the fair value of the underlying collateral less costs to sell, as applicable (primarily real estate).
203
Estimated Fair Value of Financial Instruments Not Carried at Fair Value
The following tables present the carrying value and fair value of Citigroup’s financial instruments that are not carried at fair value. The tables below therefore exclude items measured at fair value on a recurring basis presented in the tables above.
June 30, 2025
Estimated fair value
Carrying value
Estimated fair value
In billions of dollars
Level 1
Level 2
Level 3
Assets
HTM debt securities, net of allowance(1)
$
211.4
$
197.6
$
91.2
$
104.1
$
2.3
Securities borrowed and purchased under agreements to resell
148.9
148.9
—
148.9
—
Loans(2)(3)
696.7
712.4
—
—
712.4
Other financial assets(3)(4)(5)
439.0
439.0
337.5
101.5
—
Liabilities
Deposits
$
1,353.6
$
1,353.6
$
—
$
1,353.6
$
—
Securities loaned and sold under agreements to repurchase
155.5
155.5
—
155.5
—
Long-term debt(6)
190.3
193.5
—
188.4
5.1
Other financial liabilities(5)(7)
163.5
163.5
—
163.5
—
December 31, 2024
Estimated fair value
Carrying value
Estimated fair value
In billions of dollars
Level 1
Level 2
Level 3
Assets
HTM debt securities, net of allowance(1)
$
247.6
$
229.8
$
120.2
$
107.4
$
2.2
Securities borrowed and purchased under agreements to resell
133.2
133.2
—
133.2
—
Loans(2)(3)
667.6
673.5
—
—
673.5
Other financial assets(3)(4)
362.2
362.2
260.6
15.9
85.7
Liabilities
Deposits
$
1,280.9
$
1,280.9
$
—
$
1,280.9
$
—
Securities loaned and sold under agreements to repurchase
205.6
205.6
—
205.6
—
Long-term debt(6)
174.5
178.0
—
162.1
15.9
Other financial liabilities(7)
137.7
137.7
—
34.7
103.0
(1)Includes $5.3 billion and $5.2 billion of non-marketable equity securities carried at cost at June 30, 2025 and December 31, 2024, respectively.
(2)The carrying value of loans is net of the allowance for credit losses on loans of $19.1 billion for June 30, 2025 and $18.6 billion for December 31, 2024. In addition, the carrying values exclude $0.2 billion and $0.3 billion of lease finance receivables at June 30, 2025 and December 31, 2024, respectively.
(3)Includes items measured at fair value on a nonrecurring basis.
(4)Includes cash and due from banks, deposits with banks, brokerage receivables, reinsurance recoverables and other financial instruments included in Other assets on the Consolidated Balance Sheet, for all of which the carrying value is a reasonable estimate of fair value.
(5)As a result of Citi refining its application of fair value hierarchy methodologies, certain other financial assets and other financial liabilities that were previously classified as Level 2 or 3 are now classified as Level 1 or 2.
(6)The carrying value includes long-term debt balances under qualifying fair value hedges.
(7)Includes brokerage payables, separate and variable accounts, short-term borrowings (carried at cost) and other financial instruments included in Other liabilities on the Consolidated Balance Sheet, for all of which the carrying value is a reasonable estimate of fair value.
The estimated fair values of the Company’s corporate unfunded lending commitments at June 30, 2025 and December 31, 2024 were off-balance sheet liabilities of $9.8 billion and $13.5 billion, respectively, substantially all of which are classified as Level 3. The Company does not estimate the fair values of consumer unfunded lending commitments, which are generally cancelable by providing notice to the borrower.
204
24. FAIR VALUE ELECTIONS
The Company may elect to report most financial instruments and certain other items at fair value on an instrument-by-instrument basis with changes in fair value reported in earnings, other than DVA (see below). The election is made upon the initial recognition of an eligible financial asset, financial liability or firm commitment or when certain specified reconsideration events occur. The fair value election
may not otherwise be revoked once an election is made. The changes in fair value are recorded in current earnings. Movements in DVA are reported as a component of AOCI.
The Company has elected fair value accounting for its mortgage servicing rights (MSRs). See Note 21 for additional details on Citi’s MSRs.
Additional discussion regarding other applicable areas in which fair value elections were made is presented in Note 23.
The following table presents the changes in fair value of those items for which the fair value option has been elected:
Changes in fair value—gains (losses)
Three Months Ended June 30,
Six Months Ended June 30,
In millions of dollars
2025
2024
2025
2024
Assets
Securities borrowed and purchased under agreements to resell
$
114
$
(6)
$
122
$
(59)
Trading account assets
19
(5)
39
2
Loans
Corporate loans
914
160
952
1,378
Consumer loans
(3)
(2)
3
(10)
Total loans
$
911
$
158
$
955
$
1,368
Other assets
MSRs
$
12
$
5
$
(3)
$
17
Mortgage loans HFS(1)
15
4
30
5
Total other assets
$
27
$
9
$
27
$
22
Total assets
$
1,071
$
156
$
1,143
$
1,333
Liabilities
Deposits
$
(50)
$
(21)
$
(95)
$
(63)
Securities loaned and sold under agreements to repurchase
(7)
(10)
12
26
Trading account liabilities
29
(153)
(153)
(224)
Short-term borrowings(2)
235
(79)
(276)
(381)
Long-term debt(2)
(4,885)
(194)
(5,138)
(2,122)
Total liabilities
$
(4,678)
$
(457)
$
(5,650)
$
(2,764)
(1)Includes gains (losses) associated with interest rate lock commitments for originated loans for which the Company has elected the fair value option.
(2)Includes DVA that is included in AOCI. See Notes 19 and 23.
205
Own Debt Valuation Adjustments (DVA)
Own debt valuation adjustments are recognized on Citi’s liabilities for which the fair value option has been elected using Citi’s credit spreads observed in the bond market. Changes in fair value of fair value option liabilities related to changes in Citigroup’s own credit spreads (DVA) are reflected as a component of AOCI. See Note 19 for additional information.
Among other variables, the fair value of liabilities for which the fair value option has been elected (other than non-recourse debt and similar liabilities) is impacted by the narrowing or widening of the Company’s credit spreads.
The estimated changes in the fair value of these non-derivative liabilities due to such changes in the Company’s own credit spread (or instrument-specific credit risk) were a loss of $(391) million and a gain of $343 million for the three months ended June 30, 2025 and 2024, and a gain of $609 million and a loss of $(407) million for the six months ended June 30, 2025 and 2024, respectively. Changes in fair value resulting from changes in instrument-specific credit risk were estimated by incorporating the Company’s current credit spreads observable in the bond market into the relevant valuation technique used to value each liability as described above.
The Fair Value Option for Financial Assets and Financial Liabilities
Selected Portfolios of Securities Purchased Under Agreements to Resell, Securities Borrowed, Securities Sold Under Agreements to Repurchase, Securities Loaned and Certain Uncollateralized Short-Term Borrowings
The Company elected the fair value option for certain portfolios of fixed income securities purchased under agreements to resell and fixed income securities sold under
agreements to repurchase, securities borrowed, securities loaned and certain uncollateralized short-term borrowings held primarily by broker-dealer entities in the U.S., the U.K. and Japan. In each case, the election was made because the related interest rate risk is managed on a portfolio basis, primarily with offsetting derivative instruments that are accounted for at fair value through earnings.
Changes in fair value for transactions in these portfolios are recorded in Principal transactions. The related interest income and interest expense are measured based on the contractual rates specified in the transactions and are reported as Interest income and Interest expense in the Consolidated Statement of Income.
Loans and Other Credit Products
Citigroup has also elected the fair value option for certain other originated and purchased loans, including certain unfunded loan products, such as guarantees and letters of credit, executed by Citigroup’s lending and trading businesses. Significant groups of transactions include loans and unfunded loan products that are expected to be either sold or securitized in the near term, or transactions where the economic risks are hedged with derivative instruments, such as purchased credit default swaps or total return swaps where the Company pays the total return on the underlying loans to a third party. Citigroup has elected the fair value option to mitigate accounting mismatches in cases where hedge accounting is complex and to achieve operational simplifications. Fair value was not elected for most lending transactions across the Company.
The following table provides information about certain credit products carried at fair value:
June 30, 2025
December 31, 2024
In millions of dollars
Trading assets
Loans
Trading assets
Loans
Carrying amount reported on the Consolidated Balance Sheet
$
5,476
$
9,257
$
5,025
$
8,040
Aggregate unpaid principal balance in excess of (less than) fair value
141
(17)
137
(55)
Balance of non-accrual loans or loans more than 90 days past due
—
1
—
2
Aggregate unpaid principal balance in excess of (less than) fair value for non-accrual loans or loans more than 90 days past due
—
—
—
—
In addition to the amounts reported above, $360 million and $280 million of unfunded commitments related to certain credit products selected for fair value accounting were outstanding as of June 30, 2025 and December 31, 2024, respectively.
206
Changes in the fair value of funded and unfunded credit products are classified in Principal transactions in Citi’s Consolidated Statement of Income. Related interest income is measured based on the contractual interest rates and reported as Interest income on Trading account assets or loan interest depending on the balance sheet classifications of the credit products. The changes in fair value for the three months ended June 30, 2025 and 2024 due to instrument-specific credit risk were a loss of $(7) million and $0 million, respectively. Changes in fair value due to instrument-specific credit risk are estimated based on changes in borrower-specific credit spreads and recovery assumptions.
Certain Investments in Unallocated Precious Metals
Citigroup invests in unallocated precious metals accounts (e.g., gold, silver, platinum and palladium) as part of its commodity trading activities. Under ASC 815, the investment is bifurcated into a debt host contract and a commodity derivative instrument. Citigroup elects the fair value option for the debt host contract and reports the contract within Trading account assets on the Company’s Consolidated Balance Sheet.
As part of its commodity trading activities, Citi trades unallocated precious metals investments and executes forward purchase and forward sale derivative contracts with trading counterparties. When Citi sells an unallocated precious metals investment, Citi’s receivable from its depository bank is repaid and Citi derecognizes its investment in the unallocated precious metal. The forward purchase or sale contract with the trading counterparty indexed to unallocated precious metals is accounted for as a derivative, at fair value through earnings.
Certain Mortgage Loans Held-for-Sale (HFS)
Citigroup has elected the fair value option for certain purchased and originated prime fixed-rate and conforming adjustable-rate first mortgage loans HFS. These loans are intended for sale or securitization and are economically hedged with derivative instruments. The Company has elected the fair value option to mitigate accounting mismatches in cases where hedge accounting is complex and to achieve operational simplifications.
The following table provides information about certain mortgage loans HFS carried at fair value:
In millions of dollars
June 30, 2025
December 31, 2024
Carrying amount reported on the Consolidated Balance Sheet
$
1,020
$
692
Aggregate fair value in excess of (less than) unpaid principal balance
(28)
4
Balance of non-accrual loans or loans more than 90 days past due
1
1
Aggregate unpaid principal balance in excess of fair value for non-accrual loans or loans more than 90 days past due
—
—
During the six months ended June 30, 2025 and 2024, certain mortgage loans of approximately $241 million and $0 million, respectively, for which Citi has elected the fair value option (FVO), were reclassified from loans held-for-investment carried at fair value to loans HFS carried at fair value. The changes in the fair values of these mortgage loans are reported in Other revenue in the Company’s Consolidated Statement of Income. There was no net change in fair value during the six months ended June 30, 2025 and 2024 due to instrument-specific credit risk. Changes in fair value due to instrument-specific credit risk are estimated based on changes in the borrower default, prepayment and recovery forecasts in addition to instrument-specific credit spread. Related interest income continues to be measured based on the contractual interest rates and reported as Interest income in the Consolidated Statement of Income.
207
Certain Debt Liabilities
The Company has elected the fair value option for certain debt liabilities, because these exposures are considered to be trading-related positions and, therefore, are managed on a fair value basis. These positions are classified as Long-term debt or Short-term borrowings on the Company’s Consolidated Balance Sheet.
The following table provides information about the carrying value of notes carried at fair value, disaggregated by type of risk:
In billions of dollars
June 30, 2025
December 31, 2024
Interest rate linked
$
65.6
$
58.0
Foreign exchange linked
—
0.1
Equity linked
47.3
41.8
Commodity linked
7.5
6.9
Credit linked
6.9
5.9
Total
$
127.3
$
112.7
The portion of the changes in fair value attributable to changes in Citigroup’s own credit spreads (DVA) is reflected as a component of AOCI while all other changes in fair value are reported in Principal transactions. Changes in the fair value of these liabilities include accrued interest, which is also included in the change in fair value reported in Principal transactions.
The following table provides information about long-term debt and short-term borrowings carried at fair value:
In millions of dollars
June 30, 2025
December 31, 2024
Long-term debt
Carrying amount reported on the Consolidated Balance Sheet
$
127,373
$
112,719
Aggregate unpaid principal balance in excess of (less than) fair value
811
(1,943)
Short-term borrowings
Carrying amount reported on the Consolidated Balance Sheet
$
20,594
$
12,484
Aggregate unpaid principal balance in excess of (less than) fair value
(162)
(87)
208
25. GUARANTEES AND COMMITMENTS
The following tables present information about Citi’s guarantees at June 30, 2025 and December 31, 2024.
For additional information on Citi’s guarantees and indemnifications included in the tables below, as well as its other guarantees and indemnifications excluded from these tables, see Note 28 to the Consolidated Financial Statements in Citi’s 2024 Form 10-K.
Maximum potential amount of future payments
In billions of dollars at June 30, 2025
Expire within 1 year
Expire after 1 year
Total amount outstanding
Carrying value
(in millions of dollars)
Financial standby letters of credit
$
14.9
$
65.4
$
80.3
$
539
Performance guarantees
4.6
5.7
10.3
27
Derivative instruments considered to be guarantees
29.6
32.0
61.6
486
Loans sold with recourse
—
0.9
0.9
—
Securities lending indemnifications(1)
114.9
—
114.9
—
Card merchant processing(2)
36.1
—
36.1
—
Credit card arrangements with partners(3)
1.1
20.5
21.6
1
Guarantees under the Fixed Income Clearing Corporation sponsored member repo program
153.4
—
153.4
—
Other(4)(5)
—
8.4
8.4
87
Total
$
354.6
$
132.9
$
487.5
$
1,140
Maximum potential amount of future payments
In billions of dollars at December 31, 2024
Expire within 1 year
Expire after 1 year
Total amount outstanding
Carrying value
(in millions of dollars)
Financial standby letters of credit
$
15.5
$
63.5
$
79.0
$
546
Performance guarantees
4.2
5.8
10.0
27
Derivative instruments considered to be guarantees
15.8
27.3
43.1
332
Loans sold with recourse
—
1.0
1.0
—
Securities lending indemnifications(1)
96.3
—
96.3
—
Card merchant processing(2)
124.3
—
124.3
—
Credit card arrangements with partners(3)
0.2
21.5
21.7
2
Guarantees under the Fixed Income Clearing Corporation sponsored member repo program
139.5
—
139.5
—
Other(4)(5)
0.1
8.4
8.5
57
Total
$
395.9
$
127.5
$
523.4
$
964
(1)The carrying values of securities lending indemnifications were not material for either period presented, as the probability of potential liabilities arising from these guarantees is minimal.
(2)At June 30, 2025 and December 31, 2024, this maximum potential exposure was estimated to be approximately $36 billion and $124 billion, respectively. However, Citi believes that the maximum exposure is not representative of the actual potential loss exposure based on its historical experience. This contingent liability is unlikely to arise, as most products and services are delivered when purchased and amounts are refunded when items are returned to merchants. As such, any losses incurred and the carrying amounts of Citi’s contingent obligations related to merchant processing activities were immaterial. See “Card Merchant Processing” below.
(3)Includes additional guarantees entered into as part of the extension and amendment of the American Airlines co-branded credit card partnership agreement, executed in December 2024. See “Credit Card Arrangements with Partners” in Note 28 to the Consolidated Financial Statements in Citi’s 2024 Form 10-K. Citi believes that the maximum exposure is not representative of actual potential loss exposure based on historical and expected future performance of the portfolio.
(4)Includes guarantees of subsidiaries.
(5)In the fourth quarter of 2024, the Company entered into an agreement that indemnifies certain subsidiaries of the Company against certain matters related to the business operated by the Company through other subsidiaries, including certain existing, as well as potential future, legal proceedings, including tax matters. Certain of such indemnification obligations have no stated expiration date and are not subject to specific limitations on the maximum potential amount of future payments that the Company could be required to make. The Company is not able to estimate the maximum potential amount of future payments to be made under this agreement because the triggering events are not predictable.
209
Loans Sold with Recourse
In addition to the amounts presented in the tables above, the repurchase reserve was approximately $13 million and $12 million at June 30, 2025 and December 31, 2024, respectively, and these amounts are included in Other liabilities on the Consolidated Balance Sheet.
Futures and Over-the-Counter Derivatives Clearing
Citi provides clearing services on central clearing parties (CCP) for clients that need to clear exchange-traded and over-the-counter (OTC) derivatives contracts with CCPs. As a clearing member, Citi is exposed to the risk of non-performance by clients (e.g., failure of a client to post variation margin to the CCP for negative changes in the value of the client’s derivative contracts). In the event of non-performance by a client, Citi would move to close out the client’s positions. The CCP would typically utilize initial margin posted by the client and held by the CCP, with any remaining shortfalls required to be paid by Citi as clearing member. Citi generally holds incremental cash or securities margin posted by the client, which would typically be expected to be sufficient to mitigate Citi’s credit risk in the event that the client fails to perform.
Carrying Value—Guarantees and Indemnifications
At June 30, 2025 and December 31, 2024, the total carrying amounts of the liabilities related to the guarantees and indemnifications included in the tables above amounted to approximately $1.1 billion and $1.0 billion, respectively. The carrying value of financial and performance guarantees is included in Other liabilities.
Collateral
Cash collateral available to Citi to reimburse losses realized under these guarantees and indemnifications amounted to $53.4 billion and $49.0 billion at June 30, 2025 and December 31, 2024, respectively. Securities and other marketable assets held as collateral amounted to $78.5 billion and $62.5 billion at June 30, 2025 and December 31, 2024, respectively. The majority of collateral is held to reimburse losses realized under securities lending indemnifications. In addition, letters of credit in favor of Citi held as collateral amounted to $3.1 billion and $3.1 billion at June 30, 2025 and December 31, 2024, respectively. Other property may also be available to Citi to cover losses under certain guarantees and indemnifications; however, the value of such property has not been determined.
Performance Risk
Presented in the tables below are the maximum potential amounts of future payments that are classified based on internal and external credit ratings. The determination of the maximum potential future payments is based on the notional amount of the guarantees without consideration of possible recoveries under recourse provisions or from collateral held or pledged. As such, Citi believes such amounts bear no relationship to the anticipated losses, if any, on these guarantees.
Maximum potential amount of future payments
In billions of dollars at June 30, 2025
Investment grade
Non-investment grade
Not rated
Total
Financial standby letters of credit
$
67.4
$
12.9
$
—
$
80.3
Loans sold with recourse
—
—
0.9
0.9
Other
—
8.4
—
8.4
Total
$
67.4
$
21.3
$
0.9
$
89.6
Maximum potential amount of future payments
In billions of dollars at December 31, 2024
Investment grade
Non-investment grade
Not rated
Total
Financial standby letters of credit
$
63.2
$
15.6
$
0.2
$
79.0
Loans sold with recourse
—
—
1.0
1.0
Other
—
8.4
—
8.4
Total
$
63.2
$
24.0
$
1.2
$
88.4
210
Credit Commitments and Lines of Credit
The table below summarizes Citigroup’s credit commitments:
In millions of dollars
U.S.
Outside of
U.S.(1)
June 30, 2025
December 31, 2024
Commercial and similar letters of credit
$
644
$
3,595
$
4,239
$
4,031
One- to four-family residential mortgages
872
652
1,524
967
Revolving open-end loans secured by one- to four-family residential properties
5,142
12
5,154
5,271
Commercial real estate, construction and land development
11,894
2,996
14,890
14,107
Credit card lines
624,682
63,846
688,528
676,749
Commercial and other consumer loan commitments
211,402
115,033
326,435
325,329
Other commitments and contingencies(2)
4,672
225
4,897
4,908
Total
$
859,308
$
186,359
$
1,045,667
$
1,031,362
(1)Consumer commitments related to the business HFS countries under sales agreements are reflected in their original categories until the respective sales are completed.
(2)Other commitments and contingencies include commitments to purchase certain debt and equity securities.
The majority of unused commitments are contingent upon customers maintaining specific credit standards. Commercial commitments generally have floating interest rates and fixed expiration dates and may require payment of fees. Such fees (net of certain direct costs) are deferred and, upon exercise of the commitment, amortized over the life of the loan or, if exercise is deemed remote, amortized over the commitment period.
Other Commitments
As a Federal Reserve member bank, Citi is required to subscribe to half of a certain amount of shares issued by its Federal Reserve District Bank. As of June 30, 2025 and December 31, 2024, Citi holds shares with a carrying value of $4.5 billion, with the remaining half subject to call by the Federal Reserve District Bank Board.
In the normal course of business, Citi enters into reverse repurchase and securities borrowing agreements, as well as repurchase and securities lending agreements, which settle at a future date. At June 30, 2025 and December 31, 2024, Citi had approximately $209.2 billion and $117.7 billion of unsettled reverse repurchase and securities borrowing agreements, and approximately $209.0 billion and $126.8 billion of unsettled repurchase and securities lending agreements, respectively. See Note 11 for a further discussion of securities purchased under agreements to resell and securities borrowed, and securities sold under agreements to repurchase and securities loaned, including the Company’s policy for offsetting repurchase and reverse repurchase agreements.
These amounts are not included in the table above.
Restricted Cash
Citigroup defines restricted cash (as cash subject to withdrawal restrictions) to include cash deposited with central banks that must be maintained to meet minimum regulatory requirements, and cash set aside for the benefit of customers or for other purposes such as compensating balance arrangements or debt retirement. Restricted cash may include minimum reserve requirements at certain central banks and cash segregated to satisfy rules regarding the protection of customer assets as required by Citigroup broker-dealers’ primary regulators, including the SEC, the Commodity Futures Trading Commission and the United Kingdom’s Prudential Regulation Authority.
Restricted cash is included on the Consolidated Balance Sheet within the following balance sheet lines:
In millions of dollars
June 30, 2025
December 31, 2024
Cash and due from banks
$
4,140
$
3,325
Deposits with banks, net of allowance
18,341
16,217
Total
$
22,481
$
19,542
In addition to the restricted cash amounts presented above, at June 30, 2025 and December 31, 2024, approximately $10.5 billion and $7.2 billion, respectively, was held at the Russian Deposit Insurance Agency (DIA) and was subject to restrictions imposed by the Russian government. These restricted amounts are reported within Other assets on the Consolidated Balance Sheet.
211
26. LEASES
The Company’s operating leases, where Citi is a lessee, include real estate, such as office space and branches, and various types of equipment. These leases may contain renewal and extension options and early termination features; however, these options do not impact the lease term unless the Company is reasonably certain that it will exercise options. These leases have a weighted-average remaining lease term of approximately seven years as of June 30, 2025.
For additional information regarding Citi’s leases, see Notes 1 and 29 to the Consolidated Financial Statements in Citi’s 2024 Form 10-K.
The following table presents information on the right-of-use (ROU) asset and lease liabilities included in Premises and equipment and Other liabilities, respectively:
In millions of dollars
June 30, 2025
December 31, 2024
ROU asset
$
3,055
$
2,836
Lease liability
3,218
3,013
The Company recognizes fixed lease costs on a straight-line basis throughout the lease term in the Consolidated Statement of Income. In addition, variable lease costs are recognized in the period in which the obligation for those payments is incurred.
212
27. CONTINGENCIES
The following information supplements and amends, as applicable, the disclosures in Note 27 to the Consolidated Financial Statements of Citigroup’s First Quarter of 2025 Form 10-Q and in Note 30 to the Consolidated Financial Statements in Citi’s 2024 Form 10-K. For purposes of this Note, Citigroup, its affiliates and subsidiaries and current and former officers, directors, and employees, are sometimes collectively referred to as Citigroup and Related Parties.
In accordance with ASC 450, Citigroup establishes accruals for contingencies, including any litigation, regulatory, or tax matters disclosed herein, when Citigroup believes it is probable that a loss has been incurred and the amount of the loss can be reasonably estimated. Once established, accruals are adjusted from time to time, as appropriate, in light of additional information. The amount of loss ultimately incurred in relation to those matters may be substantially higher or lower than the amounts accrued for those matters. With respect to previously incurred loss contingencies for which recovery is expected, Citi applies loss recovery accounting when disputes and uncertainties affecting recognition are resolved.
If Citigroup has not accrued for a matter because the matter does not meet the criteria for accrual (as set forth above), or Citigroup believes an exposure to loss exists in excess of the amount accrued for a particular matter, in each case assuming a material loss is reasonably possible but not probable, Citigroup discloses the matter. In addition, for such matters, Citigroup discloses an estimate of the aggregate reasonably possible loss or range of loss in excess of the amounts accrued for those matters for which an estimate can be made. At June 30, 2025, Citigroup estimates that the reasonably possible unaccrued loss for these matters ranges up to approximately $1.3 billion in the aggregate.
As available information changes, the matters for which Citigroup is able to estimate will change, and the estimates themselves will change. In addition, while many estimates presented in financial statements and other financial disclosures involve significant judgment and may be subject to significant uncertainty, estimates of the range of reasonably possible loss arising from litigation, regulatory, tax, or other matters are subject to particular uncertainties. For example, at the time of making an estimate, Citigroup may only have preliminary or incomplete information about the facts underlying the claim; its assumptions about the future rulings of the court or other tribunal on significant issues, or about the behavior and incentives of adverse parties, regulators, or tax authorities, may prove to be wrong; and the outcomes it is attempting to predict are often not amenable to the use of statistical or other quantitative analytical tools. In addition, from time to time an outcome may occur that Citigroup had not accounted for in its estimates because it had deemed such an outcome to be remote. For all these reasons, the amount of loss in excess of amounts accrued in relation to matters for which an estimate has been made could be substantially higher or lower than the range of loss included in the estimate.
Subject to the foregoing, it is the opinion of Citigroup’s management, based on current knowledge and after taking into account its current accruals, that the eventual outcome of all matters described in this Note would not be likely to have a material adverse effect on the consolidated financial condition of Citigroup. Nonetheless, given the substantial or indeterminate amounts sought in certain of these matters and the inherent unpredictability of such matters, an adverse outcome in certain of these matters could, from time to time, have a material adverse effect on Citigroup’s consolidated results of operations or cash flows in particular quarterly or annual periods.
For further information on ASC 450 and Citigroup’s accounting and disclosure framework for contingencies, including for any litigation, regulatory, and tax matters disclosed herein, see Note 30 to the Consolidated Financial Statements in Citi’s 2024 Form 10-K.
Greek Pension Claims
On July 16, 2025, in GIACHOUNTOUDI & OTHERS v. CITIBANK EUROPE PUBLIC LIMITED COMPANY, the Athens Court of Appeal dismissed some claims and allowed others to proceed with directions on the calculation methodology of the pension benefits. Additional information is available in court filings under the docket number 3845/2025 in the Athens Court of Appeal.
Interest Rate Swap Litigation
On July 16, 2025, the district court held a fairness hearing and granted final approval of the settlement of the class action. Additional information concerning this action is publicly available in court filings under the docket numbers 18-CV-5361 (S.D.N.Y.) (Oetken, J.) and 16-MD-2704 (S.D.N.Y.) (Oetken, J.) and 24-81 (2d Cir.).
Variable Rate Demand Obligation Litigation
On April 23, 2025, in STATE OF NEW YORK EX REL. EDELWEISS FUND, LLC v. JP MORGAN CHASE & CO., ET AL., plaintiff-relator filed a motion for leave to reargue defendants’ motion for summary judgment, seeking the reinstatement of statutory penalties associated with conduit bonds. On May 15, the Commercial Division granted plaintiff-relator’s motion, and on June 6, defendants filed notices of appeal of this reargument decision. Additional information concerning this action is publicly available in court filings under the docket numbers 100559/2014 (N.Y. Sup. Ct.) (Borrok, J.) and 2025-02242 (N.Y. App. Div.).
On May 16, 2025, in STATE OF NEW JERSEY EX REL. EDELWEISS FUND, LLC v. JP MORGAN CHASE & CO., ET AL., the New Jersey Supreme Court granted plaintiff-relator’s petition for certification of the appeal. Additional information concerning this action is publicly available in court filings under the docket numbers L-885-15 (N.J. Super. Ct.) (Hurd, J.), A-001340-23T2 (N.J. Super. Ct. App. Div.), and 090285 (N.J. Sup. Ct.).
On June 13, 2025, in STATE OF CALIFORNIA EX REL. EDELWEISS FUND, LLC v. JP MORGAN CHASE & CO., ET AL., plaintiff-relator and defendants filed cross motions for summary judgment. On July 1, the Superior Court granted defendants’ motion for summary adjudication related
213
to claims for liquidity facility fees. Additional information concerning this action is publicly available in court filings under the docket number CGC-14-540777 (Cal. Super. Ct.) (Schulman, J.).
Settlement Payments
Payments required in any settlement agreements described above have been made or are covered by existing litigation or other accruals.
214
28. SUBSIDIARY GUARANTEES
Citigroup Inc. has fully and unconditionally guaranteed the payments due on debt securities issued by Citigroup Global Markets Holdings Inc. (CGMHI), a wholly owned subsidiary, under the Senior Debt Indenture dated as of March 8, 2016, between CGMHI, Citigroup Inc. and The Bank of New York Mellon, as trustee. In addition, Citigroup Capital III and Citigroup Capital XIII (collectively, the Capital Trusts), each of which is a wholly owned finance subsidiary of Citigroup Inc., have issued trust preferred securities. Citigroup Inc. has guaranteed the payments due on the trust preferred securities
to the extent that the Capital Trusts have insufficient available funds to make payments on the trust preferred securities. The guarantee, together with Citigroup Inc.’s other obligations with respect to the trust preferred securities, effectively provides a full and unconditional guarantee of amounts due on the trust preferred securities (see Note 18). No other subsidiary of Citigroup Inc. guarantees the debt securities issued by CGMHI or the trust preferred securities issued by the Capital Trusts.
Summarized financial information for Citigroup Inc. and CGMHI is presented in the tables below:
SUMMARIZED INCOME STATEMENT
Six Months Ended
June 30, 2025
In millions of dollars
Citigroup parent company
CGMHI
Total revenues, net of interest expense
$
5,761
$
6,740
Total operating expenses
116
7,887
Provision for credit losses
—
35
Equity in undistributed income of subsidiaries
1,576
—
Income (loss) from continuing operations before income taxes
$
7,221
$
(1,182)
Provision (benefit) for income taxes
(862)
(520)
Net income (loss)
$
8,083
$
(662)
SUMMARIZED BALANCE SHEET
June 30, 2025
December 31, 2024
In millions of dollars
Citigroup parent company
CGMHI
Citigroup parent company
CGMHI
Cash and deposits with banks
$
4,026
$
24,100
$
4,014
$
19,464
Securities borrowed and purchased under resale agreements
—
251,159
—
215,995
Trading account assets
255
358,804
203
294,396
Advances to subsidiaries
154,261
—
150,790
—
Investments in subsidiary bank holding company
185,499
—
179,253
—
Investments in non-bank subsidiaries
44,082
—
46,549
—
Other assets(1)
16,358
175,006
14,642
158,080
Total assets
$
404,481
$
809,069
$
395,451
$
687,935
Securities loaned and sold under agreements to repurchase
$
—
$
344,834
$
—
$
268,178
Trading account liabilities
5
104,955
69
89,146
Short-term borrowings
—
31,509
—
29,410
Long-term debt
173,516
194,532
164,024
184,516
Advances from subsidiaries
14,731
—
19,974
—
Other liabilities
3,007
96,921
2,786
80,486
Stockholders’ equity
213,222
36,318
208,598
36,199
Total liabilities and equity
$
404,481
$
809,069
$
395,451
$
687,935
(1) Other assets of CGMHI includes loans to affiliates of $99 billion and $91 billion at June 30, 2025 and December 31, 2024, respectively.
215
UNREGISTERED SALES OF EQUITY SECURITIES, REPURCHASES OF EQUITY SECURITIES AND DIVIDENDS
Unregistered Sales of Equity Securities
None.
Equity Security Repurchases
All large banks, including Citi, are subject to limitations on capital distributions in the event of a breach of any regulatory capital buffers, including the Stress Capital Buffer, with the degree of such restrictions based on the extent to which the buffers are breached. For additional information, see “Capital Resources—Regulatory Capital Buffers” and “Risk Factors—Strategic Risks,” “—Operational Risks” and “—Compliance Risks” in Citi’s 2024 Form 10-K.
The following table summarizes Citi’s common share repurchases for the second quarter of 2025:
In thousands, except per share amounts and remaining program dollar value
Total shares purchased
Average price paid per share
Total shares purchased as part of publicly announced program(1)
Approximate remaining dollar value of shares that may be purchased under the program
(in billions of dollars)
April 2025
Open market repurchases(1)
6,425
$
65.84
29,892
$
17.8
Employee transactions(2)
—
—
—
—
May 2025
Open market repurchases(1)
10,488
73.34
40,380
17.1
Employee transactions(2)
—
—
—
—
June 2025
Open market repurchases(1)
10,180
79.35
50,560
16.3
Employee transactions(2)
—
—
—
—
Total for 2Q25
27,093
$
73.82
50,560
$
16.3
(1) Represents repurchases under the multiyear $20 billion common stock repurchase program that was approved by Citigroup’s Board of Directors (the Board) on January 13, 2025 and announced on January 15, 2025. Repurchases by Citigroup under this common stock repurchase program are subject to quarterly approval by Citigroup’s Board; may be effected from time to time through open market purchases, trading plans established in accordance with SEC rules or other means; and, as determined by Citigroup, may be subject to satisfactory market conditions, Citigroup’s capital position and capital requirements, applicable legal requirements and other factors.
(2) During the second quarter, pursuant to the Board’s authorization, Citi withheld an insignificant number of shares of common stock, added to treasury stock, related to activity on employee stock programs to satisfy the employee tax requirements.
During the second quarter of 2025, Citi repurchased $2.0 billion of common shares under the $20 billion stock repurchase program. For the third quarter of 2025, Citi is targeting at least $4 billion of common share repurchases, subject to market conditions and other factors.
Dividends
Citi paid common dividends of $0.56 per share for the second quarter of 2025, and on July 14, 2025, declared common dividends of $0.60 per share for the third quarter of 2025.
Citi’s ability to pay common stock dividends is subject to limitations on capital distributions in the event of a breach of any regulatory capital buffers, including the Stress Capital
Buffer, with the degree of such restrictions based on the extent to which the buffers are breached. For additional information, see “Capital Resources—Regulatory Capital Buffers” and “Risk Factors—Strategic Risks,” “—Operational Risks” and “—Compliance Risks” in Citi’s 2024 Form 10-K.
Any dividend on Citi’s outstanding common stock would also need to be in compliance with Citi’s obligations on its outstanding preferred stock.
On July 14, 2025, Citi declared preferred dividends of approximately $274 million for the third quarter of 2025.
For information on the ability of Citigroup’s subsidiary depository institutions to pay dividends, see Note 20 to the Consolidated Financial Statements in Citi’s 2024 Form 10-K.
216
OTHER INFORMATION
Insider Trading Arrangements
During the second quarter of 2025, no director or executive officer of Citi adopted or terminated any Rule 10b5-1 or non-Rule 10b5-1 trading arrangement (each, as defined in Item 408 of Regulation S-K).
Amendments to By-laws
On August 1, 2025, Citi’s Board of Directors (the Board) amended Citi’s By-laws (the By-laws), effective as of such date, to include certain technical and conforming revisions to align with Delaware law, and to clarify certain provisions in connection with director candidates’ questionnaires, director resignations, and indemnification and advancement of expenses, including:
•amending Article III, Sections 11 and 12 relating to the form of questionnaire that must be completed by a stockholder nominee for director election
•amending Article III, Section 12 to remove a requirement that a stockholder nominee for director election must tender an irrevocable resignation that would be effective following the nominee or the nominating stockholder’s violation of the access by-law requirements
•amending Article III, Section 12 to permit a stockholder access nominee for director election to decline to agree to a specific guideline or policy provided the nominee discloses his or her objection to Citi
•amending Article III, Section 12 to clarify that the actions taken by the chair of a stockholder meeting are subject to the supervision of the Board
•amending Article IV, Section 1 to delete resignation requirements related to majority voting in director elections and to require that questionnaires be completed by all persons nominated for director election
•replacing Article IV, Section 4 with a new Article XXII, which clarifies that “officers,” as used in such Article, generally refers to Board-appointed officers, adds certain carve-outs from the obligations described therein and clarifies who is entitled, by right, to advancement of expenses
The amendments to the By-laws also incorporate certain other modifications that provide clarification and consistency.
The foregoing description of the amendments to the By-laws does not purport to be complete and is qualified in its entirety by the text of the By-laws, as amended, a copy of which is attached as Exhibit 3.2 to this Quarterly Report on Form 10-Q and is incorporated herein by reference.
Financial statements from the Quarterly Report on Form 10-Q of Citigroup Inc. for the quarterly period ended June 30, 2025, filed on August 6, 2025, formatted in Inline XBRL: (i) the Consolidated Statement of Income, (ii) the Consolidated Balance Sheet, (iii) the Consolidated Statement of Changes in Stockholders’ Equity, (iv) the Consolidated Statement of Cash Flows and (v) the Notes to the Consolidated Financial Statements.
104
See the cover page of this Quarterly Report on Form 10-Q, formatted in Inline XBRL.
The total amount of securities authorized pursuant to any instrument defining rights of holders of long-term debt of Citigroup Inc. does not exceed 10% of the total assets of Citigroup Inc. and its consolidated subsidiaries. Citigroup Inc. will furnish copies of any such instrument to the SEC upon request.
+ Filed herewith.
218
SIGNATURES
Pursuant to the requirements of the Securities Exchange Act of 1934, the Registrant has duly caused this report to be signed on its behalf by the undersigned, thereunto duly authorized, on the 6th day of August, 2025.
CITIGROUP INC.
(Registrant)
By /s/ Mark A. L. Mason
Mark A. L. Mason
Chief Financial Officer
(Principal Financial Officer)
By /s/ Nicole Giles
Nicole Giles
Controller and Chief Accounting Officer
(Principal Accounting Officer)
219
GLOSSARY OF TERMS AND ACRONYMS
The following is a list of terms and acronyms that are used in this report and certain other Citigroup presentations.
* Denotes a Citi metric
2024 Annual Report on Form 10-K (2024 Form 10-K): Annual Report on Form 10-K for the year ended December 31, 2024, filed with the SEC.
90+ days past due delinquency rate*: Represents consumer loans that are past due by 90 or more days, divided by that period’s total EOP loans.
ABS: Asset-backed securities
ACL: Allowance for credit losses, which is composed of the allowance for credit losses on loans (ACLL), allowance for credit losses on unfunded lending commitments (ACLUC), allowance for credit losses on HTM securities and allowance for credit losses on other assets.
ACLL: Allowance for credit losses on loans
ACLUC: Allowance for credit losses on unfunded lending commitments
Advanced Approaches: The Advanced Approaches capital framework, established through Basel III rules by the FRB, requires certain banking organizations to use an internal ratings-based approach and other methodologies to calculate risk-based capital requirements for credit risk and advanced measurement approaches to calculate risk-based capital requirements for operational risk.
AFS: Available-for-sale
ALCO: Asset and Liability Committee
Amortized cost: Amount at which a financing receivable or investment is originated or acquired, adjusted for accretion or amortization of premium, discount, and net deferred fees or costs, collection of cash, charge-offs, foreign exchange and fair value hedge accounting adjustments. For AFS securities, amortized cost is also reduced by any impairment losses recognized in earnings. Amortized cost is not reduced by the allowance for credit losses, except where explicitly presented net.
AOCI: Accumulated other comprehensive income (loss)
ASC: Accounting Standards Codification under GAAP issued by the FASB.
Asia Consumer: Asia Consumer Banking
ASU: Accounting Standards Update under GAAP issued by the FASB.
AUC/A: Assets under custody/administration includes assets for which Citi provides custody or safekeeping services for assets held directly or by a third party on behalf of clients, or assets for which Citi provides administrative services for clients.
Available liquidity resources*: Resources available at the balance sheet date to support Citi’s client and business needs, including HQLA assets; additional unencumbered securities,
including excess liquidity held at bank entities that is non-transferable to other entities within Citigroup; and available assets not already accounted for within Citi’s HQLA to support Federal Home Loan Bank (FHLB) and Federal Reserve Bank discount window borrowing capacity.
Banamex: Consists of Mexico Consumer Banking (Banamex Consumer) and Small Business and Middle-Market Banking (Banamex SBMM), reflected within Legacy Franchises. Banamex operates primarily through Grupo Financiero Banamex S.A. de C.V. and its consolidated subsidiaries, including Banco Nacional de Mexico, S.A., which provides traditional retail banking and branded card products to consumers and small business customers and traditional middle-market banking products and services to commercial customers, and other affiliated subsidiaries that offer retirement fund administration and insurance products.
Basel III: Liquidity and capital rules adopted by the FRB based on an internationally agreed set of measures developed by the Basel Committee on Banking Supervision.
Beneficial interests issued by consolidated VIEs: Represents the interest of third-party holders of debt, equity securities or other obligations, issued by VIEs that Citi consolidates.
Benefit obligation: Refers to the projected benefit obligation for pension plans and the accumulated postretirement benefit obligation for OPEB plans.
BHC: Bank holding company
Board: Citigroup’s Board of Directors
Book value per share*: EOP common equity divided by EOP common shares outstanding.
Bps: Basis points. One basis point equals 1/100th of one percent.
Branded Cards: Citi’s branded cards business with a portfolio of proprietary cards (Value, Rewards and Cash), co-branded cards (including Costco and American Airlines) and personal installment loans.
Build: A net increase in the ACL through the provision for credit losses.
Card spend volume*: Dollar amount of card customers’ gross purchases. Also known as purchase sales.
Cards: Citi’s credit cards’ businesses or activities.
CCAR: Comprehensive Capital Analysis and Review
CCO: Chief Compliance Officer
CDS: Credit default swaps
CECL: Current expected credit losses
CEO: Chief Executive Officer
220
CET1 Capital: Common Equity Tier 1 Capital. See “Capital Resources—Components of Citigroup Capital” above within MD&A for the components of CET1.
CET1 Capital ratio*: Common Equity Tier 1 Capital ratio. A primary regulatory capital ratio representing end-of-period CET1 Capital divided by total risk-weighted assets.
CFO: Chief Financial Officer
CGMHI: Citigroup Global Markets Holdings Inc.
CGMI: Citigroup Global Markets Inc.
CGML: Citigroup Global Markets Limited
Citi: Citigroup Inc.
Citibank or CBNA: Citibank, N.A. (National Association)
Classifiably managed: Loans primarily evaluated for credit risk based on internal risk rating classification.
Client investment assets: Represent assets under management, trust and custody assets.
Cluster revenues: Cluster revenues are primarily based on where the underlying transaction is managed.
CODM: Chief operating decision maker. For Citi, the Chief Executive Officer.
Collateral dependent: A loan is considered collateral dependent when repayment of the loan is expected to be provided substantially through the operation or sale of the collateral when the borrower is experiencing financial difficulty, including when foreclosure is deemed probable based on borrower delinquency.
Commercial card spend volume: Represents the total global spend volumes using Citi-issued commercial cards net of refunds and returns.
Commercial cards: Provides a wide range of payment services to corporate and public sector clients worldwide through commercial card products. Services include procurement, corporate travel and entertainment, expense management services and business-to-business payment solutions.
Consent Orders: In October 2020, Citigroup and Citibank entered into consent orders with the FRB and OCC that require Citigroup and Citibank to make improvements in various aspects of enterprise-wide risk management, compliance, data quality management related to governance, and internal controls. In July 2024, the FRB and OCC entered into civil money penalty consent orders with Citigroup and Citibank to address remediation effort shortcomings.
CRE: Commercial real estate
Credit cycle: A period of time over which credit quality improves, deteriorates and then improves again (or vice versa). The duration of a credit cycle can vary from a couple of years to several years.
Credit derivatives: Financial instruments whose value is derived from the credit risk associated with the debt of a third-party issuer (the reference entity), which allow one party (the
protection purchaser) to transfer that risk to another party (the protection seller).
Criticized: Loans, lending-related commitments or derivative receivables that are classified as special mention, substandard or doubtful for regulatory purposes.
Cross-border transaction value: Represents the total value of cross-border FX payments processed through Citi’s proprietary Worldlink and Cross-Border Funds Transfer platforms, including payments from consumer, corporate, financial institution and public sector clients.
CTA: Cumulative translation adjustment (also known as currency translation adjustment). A separate component of equity within AOCI reported net of tax. For Citi, represents the impact of translating non-USD balance sheet items into USD each period. The CTA amount in EOP AOCI is a cumulative balance, net of tax.
CVA: Credit valuation adjustment
DCM: Debt Capital Markets
Delinquency managed: Loans primarily evaluated for credit risk based on delinquencies, FICO scores and the value of underlying collateral.
Digital asset: Anything created and stored digitally that is identifiable and discoverable, establishes ownership and has or provides value (e.g., cryptocurrency).
Divestiture-related impacts: Citi’s results excluding divestiture-related impacts represent as reported, or GAAP, financial results adjusted for items that are incurred and recognized, which are wholly and necessarily a consequence of actions taken to sell (including through a public offering), dispose of or wind down business activities associated with Citi’s announced 14 exit markets.
Dividend payout ratio*: Represents dividends declared per common share as a percentage of net income per diluted share.
DPD: Days past due
DTA: Deferred tax asset
DVA: Debt valuation adjustment
ECM: Equity Capital Markets
Efficiency ratio*: A ratio signifying how much of a dollar in expenses (as a percentage) it takes to generate one dollar in revenue. Represents total operating expenses divided by total revenues, net.
EOP: End-of-period
EPS*: Earnings per share
EU: European Union
Fannie Mae: Federal National Mortgage Association
FASB: Financial Accounting Standards Board
FCA: Financial Conduct Authority
FDIC: Federal Deposit Insurance Corporation
Federal Reserve Board (FRB): The Board of the Governors of the Federal Reserve System
221
FFIEC: Federal Financial Institutions Examination Council
FHA: Federal Housing Administration
FHLB: Federal Home Loan Bank
FICO: Fair Isaac Corporation
FICO score: A measure of consumer credit risk provided by credit bureaus, typically produced from statistical models by Fair Isaac Corporation utilizing data collected by the credit bureaus.
FINRA: Financial Industry Regulatory Authority
FRB: Federal Reserve Board
Freddie Mac: Federal Home Loan Mortgage Corporation
FVA: Funding valuation adjustment
FX: Foreign exchange
FX translation: The impact of converting non-U.S. dollar currencies into U.S. dollars.
GAAP or U.S. GAAP: Generally accepted accounting principles in the United States of America.
Ginnie Mae: Government National Mortgage Association
GSIB: Global Systemically Important Bank
HFI loans: Loans that are held-for-investment (i.e., excludes loans held-for-sale).
HFS: Held-for-sale
HQLA: High-quality liquid assets. Consist of cash and certain high-quality liquid securities as defined in the LCR rule.
HTM: Held-to-maturity
Hyperinflation: Extreme economic inflation with prices rising at a very high rate in a very short time. Under U.S. GAAP, entities operating in a hyperinflationary economy need to change their functional currency to the U.S. dollar. Once the change is made, the CTA balance is frozen.
IMF: International Monetary Fund
Interchange fees: Fees earned from merchants based on Citi’s credit and debit card customer sales transactions. Interchange fees are presented net of certain transaction processing fees paid, primarily to the networks, on behalf of the merchant.
International region: Comprises six clusters: United Kingdom; Japan, Asia North and Australia (JANA); LATAM; Asia South; Europe; and Middle East and Africa (MEA).
IPO: Initial public offering
JANA: Japan, Asia North and Australia
KPMG: KPMG LLP, Citi’s Independent Registered Public Accounting Firm
LATAM: Latin America
LCR: Liquidity Coverage ratio. Represents HQLA divided by net outflows in the period.
LGD: Loss given default
LIBOR: London Interbank Offered Rate
LLC: Limited Liability Company
LTD: Long-term debt
LTV: Loan-to-value. For residential real estate loans, the relationship, expressed as a percentage, between the principal amount of a loan and the estimated value of the collateral (i.e., residential real estate) securing the loan.
Managed basis: Results reflected on a managed basis exclude divestiture-related impacts.
Master netting agreement: A single agreement with a counterparty that permits multiple transactions governed by that agreement to be terminated or accelerated and settled through a single payment in a single currency in the event of a default (e.g., bankruptcy, failure to make a required payment or securities transfer or deliver collateral or margin when due).
MBS: Mortgage-backed securities
MD&A: Management’s Discussion and Analysis, a section within an SEC Form 10-Q or 10-K.
MEA: Middle East and Africa
Measurement alternative: Measures equity securities without readily determinable fair values at cost less impairment (if any), plus or minus observable price changes from an identical or similar investment of the same issuer.
Moody’s: Moody’s Ratings
MSRs: Mortgage servicing rights
N/A: Data is not applicable or available for the period presented.
NAA: Non-accrual assets. Consists of non-accrual loans and OREO.
NAL: Non-accrual loans. Loans for which interest income is not recognized on an accrual basis. Loans (other than credit card loans and certain consumer loans insured by U.S. government-sponsored agencies) are placed on non-accrual status when full payment of principal and interest is not expected, regardless of delinquency status, or when principal and interest have been in default for a period of 90 days or more unless the loan is both well secured and in the process of collection. Collateral-dependent loans are typically maintained on non-accrual status.
NAV: Net asset value
NCL(s): Net credit losses. Represents gross credit losses, less gross credit recoveries.
NCL ratio*: Represents net credit losses (recoveries) (annualized), divided by average loans for the reporting period.
Net capital rule: Rule 15c3-1 under the Securities Exchange Act of 1934.
Net new investment asset flows (NNIA) (Wealth): Represents investment asset inflows, including dividends, interest and distributions, less investment asset outflows. Excluded from the calculation are the impacts of fees and commissions, market movement, internal transfers within Citi specific to systematic upgrades/downgrades with USPB and any impact from strategic decisions by Citi to exit certain markets or services. Also excluded from the calculation are net
222
new investment assets associated with markets for which data was not available for current-period reporting.
NIM*: Net interest margin expressed as a yield percentage, calculated as annualized net interest income divided by average interest-earning assets for the period.
NM: Not meaningful
Noncontrolling interests: The portion of an investment that has been consolidated by Citi that is not 100% owned by Citi.
Non-GAAP financial measure: A non-GAAP financial measure is a numerical measure of the Company’s historical or future financial performance, financial position or cash flows that (i) excludes amounts, or is subject to adjustments that have the effect of excluding amounts, that are included in the most directly comparable measure calculated and presented in accordance with GAAP in the statement of income, balance sheet or statement of cash flows (or equivalent statements) of the Company; or (ii) includes amounts, or is subject to adjustments that have the effect of including amounts, that are excluded from the most directly comparable measure so calculated and presented.
Note: All “Note” references correspond to the Notes to the Consolidated Financial Statements herein, unless otherwise indicated.
NSFR: Net stable funding ratio
O/S: Outstanding
OCC: Office of the Comptroller of the Currency
OCI: Other comprehensive income (loss)
Operating leverage*: Represents the year-over-year growth rate in basis points (bps) of Total revenues, net of interest expense less the year-over-year growth rate of Total operating expenses. A positive operating leverage percentage indicates that the revenue growth rate was greater than the expense growth rate.
OREO: Other real estate owned
Organic growth (Wealth): Organic growth is defined as the sum of net new investment assets (NNIA) for each quarter from the third quarter of 2024 through the second quarter of 2025 divided by second quarter of 2024 client investment assets.
OTTI: Other-than-temporary impairment
Over-the-counter cleared (OTC-cleared) derivatives: Derivative contracts that are negotiated and executed bilaterally, but subsequently settled via a central clearing house, such that each derivative counterparty is only exposed to the default of that clearing house.
Over-the-counter (OTC) derivatives: Derivative contracts that are negotiated, executed and settled bilaterally between two derivative counterparties, where one or both counterparties are derivatives dealers.
Parent company: Citigroup Inc.
Partner payments: Payments made to credit card partners primarily based on program sales and profitability.
PD: Probability of default
PIL: Personal installment loans
Prime balances: Prime balances are defined as clients’ billable balances where Citi provides cash or synthetic prime brokerage services. Management uses this information in reviewing the business’s size and growth and believes it is useful to investors concerning underlying business size and growth trends.
Principal transactions revenue: Primarily trading-related revenues predominantly generated by the Services, Markets and Banking segments. See Note 6.
Provision for credit losses: Composed of the provision for credit losses on loans, provision for credit losses on HTM investments, provision for credit losses on other assets and provision for credit losses on unfunded lending commitments.
Provisions: Provisions for credit losses and for benefits and claims.
Purchased credit-deteriorated: Purchased credit-deteriorated assets are financial assets that as of the date of acquisition have experienced a more-than-insignificant deterioration in credit quality since origination, as determined by the Company.
R&S forecast period: Reasonable and supportable period over which Citi forecasts future macroeconomic conditions for CECL purposes.
Real GDP: Real gross domestic product is the inflation-adjusted value of the goods and services produced by labor and property located in a country.
Reconciling Items: Divestiture-related impacts excluded from the results of All Other, as well as All Other—Legacy Franchises on a managed basis. The Reconciling Items are fully reflected in Citi’s Consolidated Statement of Income for each respective line item.
Regulatory VaR: Daily aggregated VaR calculated in accordance with regulatory rules.
Release: A net decrease in the ACL through the provision for credit losses.
Reported basis: Financial statements prepared under U.S. GAAP.
Results of operations that exclude certain impacts from gains or losses on sale, or one-time charges*: Represents GAAP items, excluding the impact of gains or losses on sales, or one-time charges (e.g., the loss on sale related to the sale of Citi’s consumer banking business in Australia).
Results of operations that exclude the impact of FX translation*: Represents GAAP items, excluding the impact of FX translation, whereby the prior periods’ foreign currency balances are translated into U.S. dollars at the current period’s conversion rates (also known as constant dollar). GAAP measures excluding the impact of FX translation are non-GAAP financial measures.
223
Retail Services: Citi’s U.S. retail services cards business with a portfolio of co-brand and private label relationships (including, among others, The Home Depot, Best Buy, Macy’s and Sears).
RoTCE*: Return on tangible common equity. Represents net income less preferred dividends (both annualized), divided by average tangible common equity for the period.
RWA: Risk-weighted assets. Basel III establishes two comprehensive approaches for calculating RWA (the Standardized Approach and the Advanced Approaches), which include capital requirements for credit risk, market risk and operational risk for Advanced Approaches. Key differences in the calculation of credit risk RWA between the Standardized and Advanced Approaches are that for Advanced, credit risk RWA is based on risk-sensitive approaches that largely rely on the use of internal credit models and parameters, whereas for Standardized, credit risk RWA is generally based on supervisory risk-weightings, which vary primarily by counterparty type and asset class. Market risk RWA is calculated on a generally consistent basis between Basel III Standardized Approach and Basel III Advanced Approaches.
S&P: Standard and Poor’s Global Ratings
SCB: Stress Capital Buffer
SEC: The U.S. Securities and Exchange Commission
SLR: Supplementary Leverage ratio. Represents Tier 1 Capital divided by Total Leverage Exposure.
SOFR: Secured Overnight Financing Rate
SPEs: Special purpose entities
Standardized Approach: Established through Basel III, the Standardized Approach aligns regulatory capital requirements more closely with the key elements of banking risk by introducing a wider differentiation of risk weights and a wider recognition of credit risk mitigation techniques, while avoiding excessive complexity. Accordingly, the Standardized Approach produces capital ratios more in line with the actual economic risks that banks face.
Tangible book value per share (TBVPS)*: Represents tangible common equity divided by EOP common shares outstanding.
Tangible common equity (TCE): Represents common stockholders’ equity less goodwill and identifiable intangible assets, other than MSRs.
Taxable-equivalent basis: Represents the total revenue, net of interest expense for the business, adjusted for revenue from investments that receive tax credits and the impact of tax-exempt securities. This metric presents results on a level comparable to taxable investments and securities. GAAP measures on a taxable equivalent basis, including the metrics derived from these measures, are non-GAAP financial measures.
TDR: Troubled debt restructuring. Prior to January 1, 2023, a TDR was deemed to occur when the Company modified the original terms of a loan agreement by granting a concession to a borrower that was experiencing financial difficulty. Loans with short-term and other insignificant modifications that are not considered concessions were not TDRs. The accounting guidance for TDRs was eliminated with the adoption of ASU 2022-02. See “Accounting Changes” in Note 1.
TEGU: taxable equivalent gross-up adjustments
TLAC: Total loss-absorbing capacity
Total ACL: Allowance for credit losses, which comprises the allowance for credit losses on loans (ACLL), allowance for credit losses on unfunded lending commitments (ACLUC), allowance for credit losses on HTM securities and allowance for credit losses on other assets.
Total payout ratio*: Represents total common dividends declared plus common share repurchases as a percentage of net income available to common shareholders.
Transactional and tax charges: Largely comprises costs that are driven by revenues and transaction volumes, and is primarily composed of brokerage exchange and clearance costs, exchange fees, regulatory memberships and certain indirect, non-income tax payments that are not recorded in Provision for income taxes in the Consolidated Statement of Income.
Transformation: Citi has embarked on a multiyear transformation, with the target outcome to change Citi’s business and operating models such that they simultaneously strengthen risk and controls and improve Citi’s value to customers, clients and shareholders.
Unaudited: Financial statements and information that have not been subjected to auditing procedures sufficient to permit an independent certified public accountant to express an opinion.
U.S. dollar clearing volume: Represents the number of U.S. dollar clearing payment instructions processed by Citi on behalf of U.S. and foreign-domiciled entities (primarily financial institutions).
U.S. Treasury: U.S. Department of the Treasury
VaR: Value at risk. A measure of the dollar amount of potential loss from adverse market moves in an ordinary market environment.
VIEs: Variable interest entities
Wallet: Proportion of fee revenue based on estimates of investment banking fees generated across the industry (i.e., the revenue wallet) from investment banking transactions in M&A, equity and debt underwriting, and loan syndications.