Please wait

.2


Announcement


Tuesday, 25 August 2026


LOGO


Woodside Energy Group Ltd.

ACN 004 898 962

Mia Yellagonga

11 Mount Street

Perth WA 6000

Australia

T +61 8 9348 4000

www.woodside.com


ASX: WDS

NYSE: WDS

HALF-YEAR 2026 RESULTS TELECONFERENCE AND PRESENTATION

A teleconference providing an overview of the half-year 2026 results and a question-and-answer session will be hosted by Woodside CEO and Managing Director, Liz Westcott, and Chief Financial Officer, Graham Tiver, today at 08:00 AWST / 10:00 AEST (19:00 CST on Monday, 24 August 2026).

We recommend participants pre-register 5 to 10 minutes prior to the event with one of the following links:


https://webcast.openbriefing.com/wds-hyr-2026/ to view the presentation and listen to a live stream of the Q&A session


https://s1.c-conf.com/diamondpass/10055832-aiwh8k.html to participate in the Q&A session. Following pre-registration, participants will receive the teleconference details and a unique access passcode.

The half-year results briefing pack follows this announcement and will be referred to during the teleconference. The briefing pack, Half-Year Report 2026 and teleconference archive will also be available on the Woodside website (www.woodside.com).


INVESTORS


Vanessa Martin
M: +61 477 397 961


E: investor@woodside.com


MEDIA


Christine Abbott
M: +61 484 112 469


E: christine.abbott@woodside.com

This announcement was approved and authorised for release by Woodside’s Disclosure Committee.


LOGO

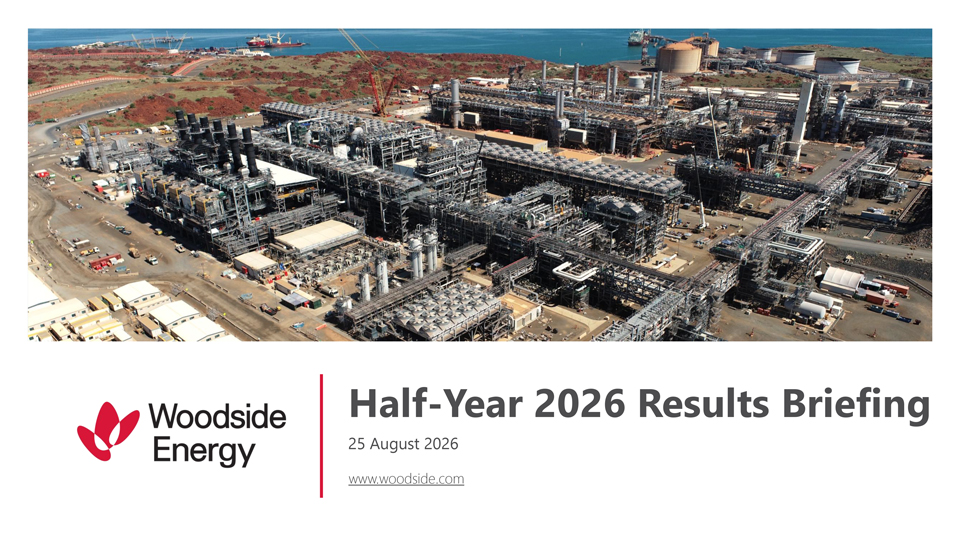
Half-Year 2026 Results Briefing 25 August 2026 www.woodside.com


LOGO

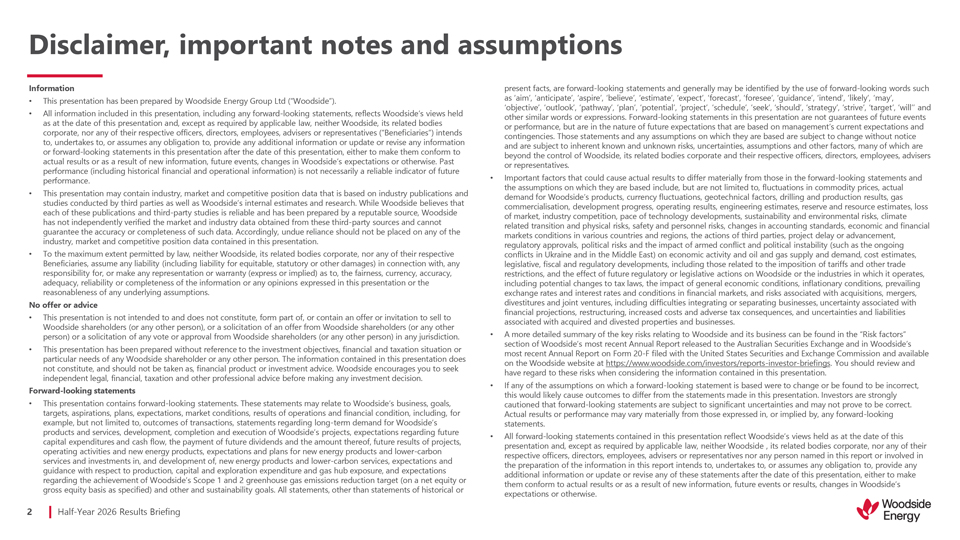
Half-Year 2026 Results Briefing 2 Disclaimer, important notes and assumptions Information This presentation has been prepared by Woodside Energy Group Ltd (“Woodside”). All information included in this presentation, including any forward-looking statements, reflects Woodside’s views held as at the date of this presentation and, except as required by applicable law, neither Woodside, its related bodies corporate, nor any of their respective officers, directors, employees, advisers or representatives (“Beneficiaries”) intends to, undertakes to, or assumes any obligation to, provide any additional information or update or revise any information or forward-looking statements in this presentation after the date of this presentation, either to make them conform to actual results or as a result of new information, future events, changes in Woodside’s expectations or otherwise. Past performance (including historical financial and operational information) is not necessarily a reliable indicator of future performance. This presentation may contain industry, market and competitive position data that is based on industry publications and studies conducted by third parties as well as Woodside’s internal estimates and research. While Woodside believes that each of these publications and third-party studies is reliable and has been prepared by a reputable source, Woodside has not independently verified the market and industry data obtained from these third-party sources and cannot guarantee the accuracy or completeness of such data. Accordingly, undue reliance should not be placed on any of the industry, market and competitive position data contained in this presentation. To the maximum extent permitted by law, neither Woodside, its related bodies corporate, nor any of their respective Beneficiaries, assume any liability (including liability for equitable, statutory or other damages) in connection with, any responsibility for, or make any representation or warranty (express or implied) as to, the fairness, currency, accuracy, adequacy, reliability or completeness of the information or any opinions expressed in this presentation or the reasonableness of any underlying assumptions. No offer or advice This presentation is not intended to and does not constitute, form part of, or contain an offer or invitation to sell to Woodside shareholders (or any other person), or a solicitation of an offer from Woodside shareholders (or any other person) or a solicitation of any vote or approval from Woodside shareholders (or any other person) in any jurisdiction. This presentation has been prepared without reference to the investment objectives, financial and taxation situation or particular needs of any Woodside shareholder or any other person. The information contained in this presentation does not constitute, and should not be taken as, financial product or investment advice. Woodside encourages you to seek independent legal, financial, taxation and other professional advice before making any investment decision. Forward-looking statements This presentation contains forward-looking statements. These statements may relate to Woodside’s business, goals, targets, aspirations, plans, expectations, market conditions, results of operations and financial condition, including, for example, but not limited to, outcomes of transactions, statements regarding long-term demand for Woodside’s products and services, development, completion and execution of Woodside’s projects, expectations regarding future capital expenditures and cash flow, the payment of future dividends and the amount thereof, future results of projects, operating activities and new energy products, expectations and plans for new energy products and lower-carbon services and investments in, and development of, new energy products and lower-carbon services, expectations and guidance with respect to production, capital and exploration expenditure and gas hub exposure, and expectations regarding the achievement of Woodside’s Scope 1 and 2 greenhouse gas emissions reduction target (on a net equity or gross equity basis as specified) and other and sustainability goals. All statements, other than statements of historical or present facts, are forward-looking statements and generally may be identified by the use of forward-looking words such as ‘aim’, ‘anticipate’, ‘aspire’, ‘believe’, ‘estimate’, ‘expect’, ‘forecast’, ‘foresee’, ‘guidance’, ‘intend’, ‘likely’, ‘may’, ‘objective’, ‘outlook’, ‘pathway’, ‘plan’, ‘potential’, ‘project’, ‘schedule’, ‘seek’, ‘should’, ‘strategy’, ‘strive’, ‘target’, ‘will’’ and other similar words or expressions. Forward-looking statements in this presentation are not guarantees of future events or performance, but are in the nature of future expectations that are based on management’s current expectations and contingencies. Those statements and any assumptions on which they are based are subject to change without notice and are subject to inherent known and unknown risks, uncertainties, assumptions and other factors, many of which are beyond the control of Woodside, its related bodies corporate and their respective officers, directors, employees, advisers or representatives. Important factors that could cause actual results to differ materially from those in the forward-looking statements and the assumptions on which they are based include, but are not limited to, fluctuations in commodity prices, actual demand for Woodside’s products, currency fluctuations, geotechnical factors, drilling and production results, gas commercialisation, development progress, operating results, engineering estimates, reserve and resource estimates, loss of market, industry competition, pace of technology developments, sustainability and environmental risks, climate related transition and physical risks, safety and personnel risks, changes in accounting standards, economic and financial markets conditions in various countries and regions, the actions of third parties, project delay or advancement, regulatory approvals, political risks and the impact of armed conflict and political instability (such as the ongoing conflicts in Ukraine and in the Middle East) on economic activity and oil and gas supply and demand, cost estimates, legislative, fiscal and regulatory developments, including those related to the imposition of tariffs and other trade restrictions, and the effect of future regulatory or legislative actions on Woodside or the industries in which it operates, including potential changes to tax laws, the impact of general economic conditions, inflationary conditions, prevailing exchange rates and interest rates and conditions in financial markets, and risks associated with acquisitions, mergers, divestitures and joint ventures, including difficulties integrating or separating businesses, uncertainty associated with financial projections, restructuring, increased costs and adverse tax consequences, and uncertainties and liabilities associated with acquired and divested properties and businesses. A more detailed summary of the key risks relating to Woodside and its business can be found in the “Risk factors” section of Woodside’s most recent Annual Report released to the Australian Securities Exchange and in Woodside’s most recent Annual Report on Form 20-F filed with the United States Securities and Exchange Commission and available on the Woodside website at https://www.woodside.com/investors/reports-investor-briefings. You should review and have regard to these risks when considering the information contained in this presentation. If any of the assumptions on which a forward-looking statement is based were to change or be found to be incorrect, this would likely cause outcomes to differ from the statements made in this presentation. Investors are strongly cautioned that forward-looking statements are subject to significant uncertainties and may not prove to be correct. Actual results or performance may vary materially from those expressed in, or implied by, any forward-looking statements. All forward-looking statements contained in this presentation reflect Woodside’s views held as at the date of this presentation and, except as required by applicable law, neither Woodside , its related bodies corporate, nor any of their respective officers, directors, employees, advisers or representatives nor any person named in this report or involved in the preparation of the information in this report intends to, undertakes to, or assumes any obligation to, provide any additional information or update or revise any of these statements after the date of this presentation, either to make them conform to actual results or as a result of new information, future events or results, changes in Woodside’s expectations or otherwise.


LOGO

Half-Year 2026 Results Briefing 3 Disclaimer, important notes and assumptions (continued) Disclosure of reserve information and cautionary note to US investors Woodside is an Australian company with securities listed on the Australian Securities Exchange and the New York Stock Exchange. Woodside reports its Proved (1P) Reserves in accordance with SEC regulations, which are also compliant with SPE-PRMS guidelines, and prepares and reports its Proved plus Probable (2P) Reserves and Best Estimate (2C) Contingent Resources in accordance with SPE-PRMS guidelines. Woodside reports all of its petroleum resource estimates using definitions consistent with SPE-PRMS. The SEC prohibits oil and gas companies, in their filings with the SEC, from disclosing estimates of oil or gas resources other than ‘reserves’ (as that term is defined by the SEC). In this presentation, Woodside includes estimates of quantities of oil and gas using certain terms, such as ‘proved plus probable (2P) reserves’, ‘best estimate (2C) contingent resources’, ‘reserves and contingent resources’, ‘proved plus probable’, ‘developed and undeveloped’, ‘probable developed’, ‘probable undeveloped’, ‘contingent resources’ or other descriptions of volumes of reserves, which include quantities of oil and gas that may not meet the SEC’s definitions of proved, probable and possible reserves, and which the SEC’s guidelines strictly prohibit Woodside from including in filings with the SEC. These estimates are by their nature more speculative than estimates of proved reserves and would require substantial capital spending over a significant number of years to implement recovery, and accordingly are subject to substantially greater risk of not being recovered by Woodside. In addition, actual locations drilled and quantities that may be ultimately recovered from Woodside’s properties may differ substantially. Woodside has made no commitment to drill, and likely will not drill, all drilling locations that have been attributable to these quantities. US investors are urged to consider closely the disclosures in Woodside’s filings with the SEC which are available at www.sec.gov. Assumptions Unless otherwise indicated, the targets set out in this presentation have been estimated on the basis of a variety of economic assumptions including: (1) US$70/bbl Brent long-term oil price, US$10/MMBtu long term JKM price, US$9/MMBtu long-term TTF price, US$3.50 long-term Henry Hub price (2024 real terms) and a long-term inflation rate of 2.0%; (2) currently sanctioned projects being delivered in accordance with their current project schedules; and (3) applicable growth opportunities being sanctioned and delivered in accordance with the target schedules provided in this presentation. These growth opportunities are subject to relevant project participant approvals, commercial arrangements with third parties and regulatory approvals being obtained in the timeframe contemplated or at all. Woodside expresses no view as to whether project participants will agree with and support Woodside’s current position in relation to these opportunities, or such commercial arrangements and regulatory approvals will be obtained. Additional assumptions relevant to particular targets or other statements in this presentation may be set out in the relevant slides. Any such additional assumptions are in addition to the assumptions and qualifications applicable to the presentation as a whole. Climate strategy and emissions data All greenhouse gas emissions data in this presentation are estimates, due to the inherent uncertainty and limitations in measuring or quantifying greenhouse gas emissions. Methodologies for measuring or quantifying greenhouse gas emissions may evolve as best practices continue to develop and data quality and quantity continue to improve. Woodside “greenhouse gas” or “emissions” information reported are Scope 1 greenhouse gas emissions, Scope 2 greenhouse gas emissions, and/or Scope 3 greenhouse gas emissions, each on a net equity basis, unless otherwise stated. For more information on Woodside’s climate strategy, including references to ‘lower-carbon’ and ‘lower-carbon services’ as part of that strategy, and emissions data, refer to Woodside’s 2025 Climate and Sustainability Summary, available on the Woodside website at https://www.woodside.com/sustainability and section 3.6 of Woodside’s 2025 Annual Report, unless otherwise updated in this presentation. Non-IFRS Financial Measures Throughout this presentation, a range of financial and non-financial measures are used to assess Woodside’s performance, including a number of financial measures that are not defined in, and have not been prepared in accordance with, International Financial Reporting Standards (IFRS) and are not recognised measures of financial performance or liquidity under IFRS (Non-IFRS Financial Measures). These measures include EBIT, EBITDA, EBITDA margin, Gearing, Underlying NPAT, Average realised price, Unit production cost, Net debt, Liquidity, Free cash flow, Capital expenditure, Exploration expenditure, Return on Equity, Return on average capital employed, Cash margin and Other cash cost margin. These Non-IFRS Financial Measures are defined in the glossary section of this presentation. A quantitative reconciliation of these measures to the most directly comparable financial measure calculated and presented in accordance with IFRS can be found in the Alternative Performance Measures section of Woodside’s Half-Year Report for the period ended 30 June 2026. Woodside’s management uses these measures to monitor Woodside’s financial performance alongside IFRS measures to improve the comparability of information between reporting periods and business units and Woodside believes that the Non-IFRS Financial Measures it presents provide a useful means through which to examine the underlying performance of its business. Undue reliance should not be placed on the Non-IFRS Financial Measures contained in this presentation and these Non-IFRS Financial Measures should be considered in addition to, and not as a substitute for, or as superior to, measures of financial performance, financial position or cash flows reported in accordance with IFRS. Non-IFRS Financial Measures are not uniformly defined by all companies, including those in Woodside’s industry. Accordingly, they may not be comparable with similarly titled measures and disclosures by other companies. Other important information All references to dollars, cents or $ in this presentation are to US currency, unless otherwise stated. References to “Woodside” may be references to Woodside Energy Group Ltd and/or its applicable subsidiaries (as the context requires). References and links to Woodside’s or third-party websites are provided for convenience only and are not incorporated by reference into this presentation. This presentation does not include any express or implied prices at which Woodside will buy or sell financial products. A securities rating is not a recommendation to buy, sell or hold securities and may be subject to revision or withdrawal at any time.

LOGO

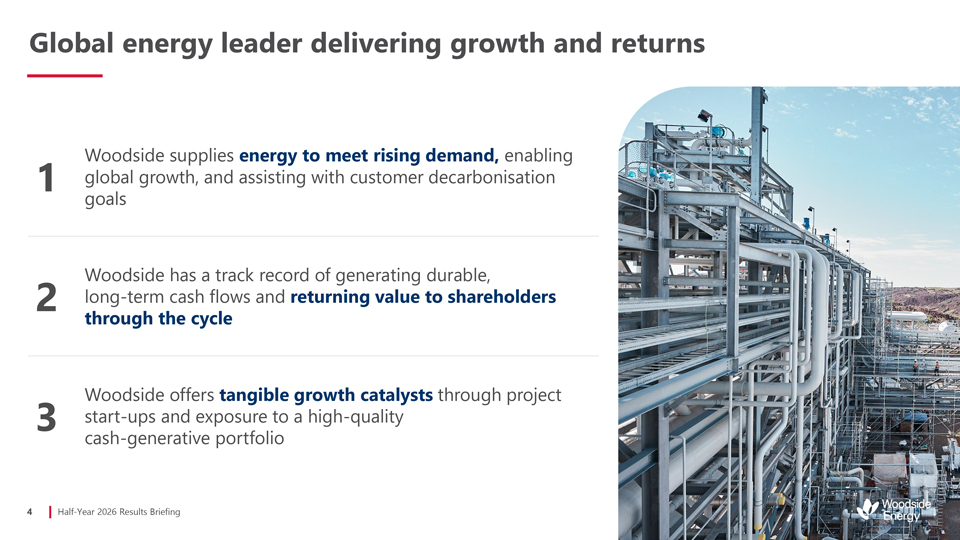
Half-Year 2026 Results Briefing 4 Global energy leader delivering growth and returns 1 Woodside supplies energy to meet rising demand, enabling global growth, and assisting with customer decarbonisation goals 2 Woodside has a track record of generating durable, long-term cash flows and returning value to shareholders through the cycle 3 Woodside offers tangible growth catalysts through project start-ups and exposure to a high-quality cash-generative portfolio


LOGO

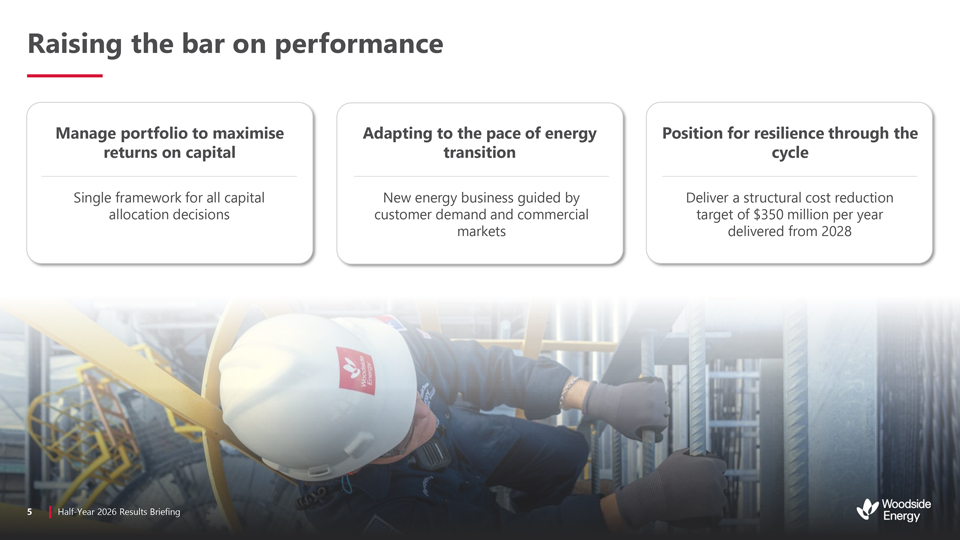
2025 Capital Markets Day 5 Raising the bar on performance Manage portfolio to maximise returns on capital Adapting to the pace of energy transition Position for resilience through the cycle Single framework for all capital allocation decisions New energy business guided by customer demand and commercial markets Deliver a structural cost reduction target of $350 million per year delivered from 2028 Half-Year 2026 Results Briefing


LOGO

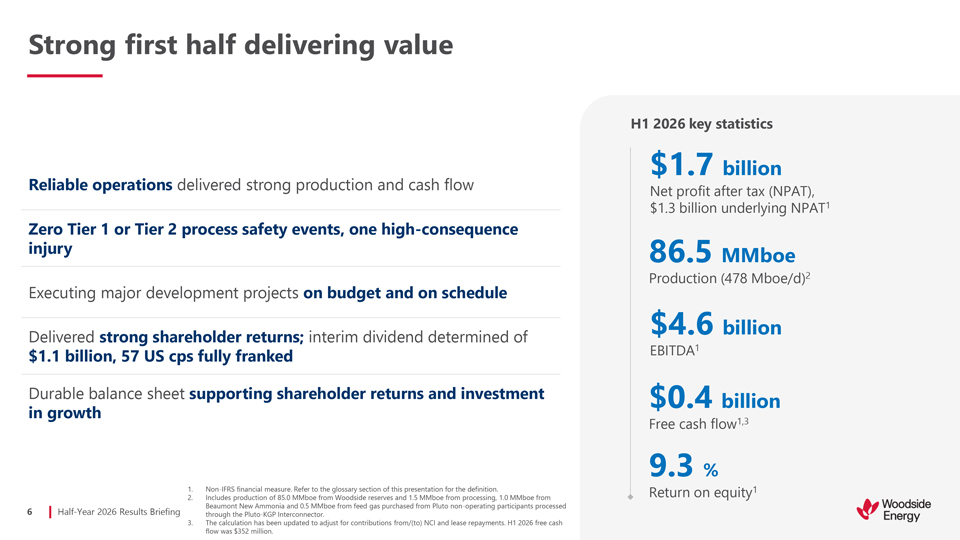
Strong first half delivering value Reliable operations delivered strong production and cash flow Zero Tier 1 or Tier 2 process safety events, one high-consequence injury Executing major development projects on budget and on schedule Delivered strong shareholder returns; interim dividend determined of $1.1 billion, 57 US cps fully franked Durable balance sheet supporting shareholder returns and investment in growth H1 2026 key statistics $1.7 billion Net profit after tax (NPAT), $1.3 billion underlying NPAT1 86.5 MMboe Production (478 Mboe/d)2 $4.6 billion EBITDA1 $0.4 billion Free cash flow1,3 9.3 % Return on equity1 Non-IFRS financial measure. Refer to the glossary section of this presentation for the definition. Includes production of 85.0 MMboe from Woodside reserves and 1.5 MMboe from processing, 1.0 MMboe from Beaumont New Ammonia and 0.5 MMboe from feed gas purchased from Pluto non-operating participants processed through the Pluto-KGP Interconnector. The calculation has been updated to adjust for contributions from/(to) NCI and lease repayments. H1 2026 free cash flow was $352 million. Half-Year 2026 Results Briefing 6


LOGO

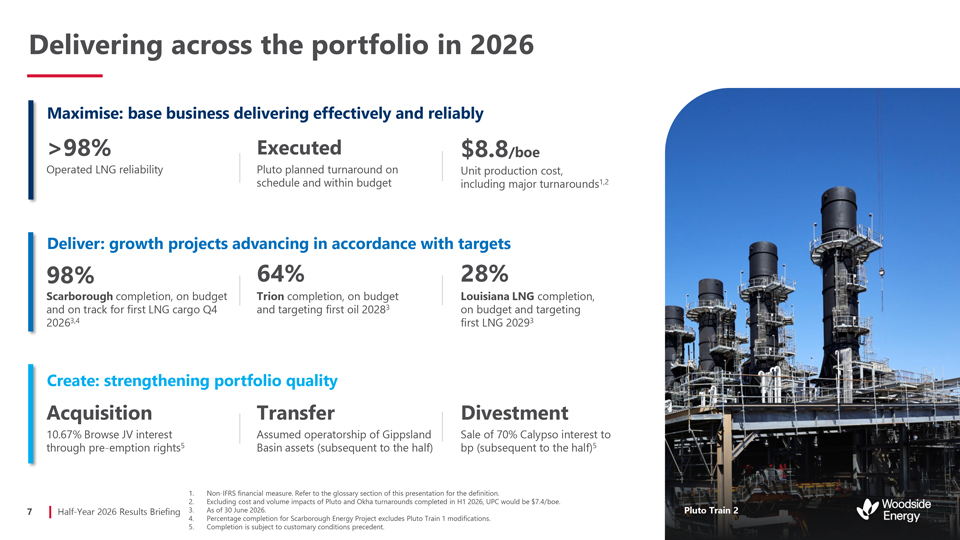
Delivering across the portfolio in 2026 Maximise: base business delivering effectively and reliably Maximise: base business delivering effectively and reliably >98% Executed $8.8/boe Operated LNG reliability Pluto planned turnaround on Unit production cost, schedule and within budget including major turnarounds1,2 Deliver: growth projects advancing in accordance with targets 98% 64%28% Scarborough completion, on budget Trion completion, on budget Louisiana LNG completion, and on track for first LNG cargo Q4 and targeting first oil 20283on budget and targeting 20263,4 first LNG 20293 Create: strengthening portfolio quality AcquisitionTransfer Divestment 10.67% Browse JV interest Assumed operatorship of Gippsland Sale of 70% Calypso interest to through pre-emption rights5Basin assets (subsequent to the half) bp (subsequent to the half)5 1. Non-IFRS financial measure. Refer to the glossary section of this presentation for the definition. 2. Excluding cost and volume impacts of Pluto and Okha turnarounds completed in H1 2026, UPC would be $7.4/boe. 3. As of 30 June 2026. 4. Percentage completion for Scarborough Energy Project excludes Pluto Train 1 modifications. 5. Completion is subject to customary conditions precedent. 7 Half-Year 2026 Results Briefing Pluto Train 2


LOGO

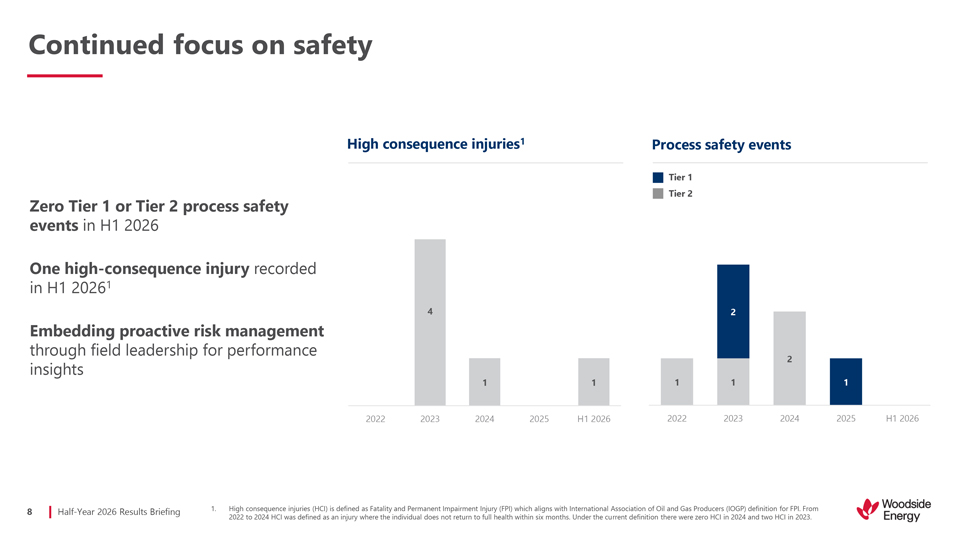
Half-Year 2026 Results Briefing 8 4 1 1 2022 2023 2024 2025 H1 2026 Continued focus on safety High consequence injuries (HCI) is defined as Fatality and Permanent Impairment Injury (FPI) which aligns with International Association of Oil and Gas Producers (IOGP) definition for FPI. From 2022 to 2024 HCI was defined as an injury where the individual does not return to full health within six months. Under the current definition there were zero HCI in 2024 and two HCI in 2023. High consequence injuries1 Process safety events Zero Tier 1 or Tier 2 process safety events in H1 2026 One high-consequence injury recorded in H1 20261 Embedding proactive risk management through field leadership for performance insights Tier 1 Tier 2 1 1 2 2 1 2022 2023 2024 2025 H1 2026


LOGO

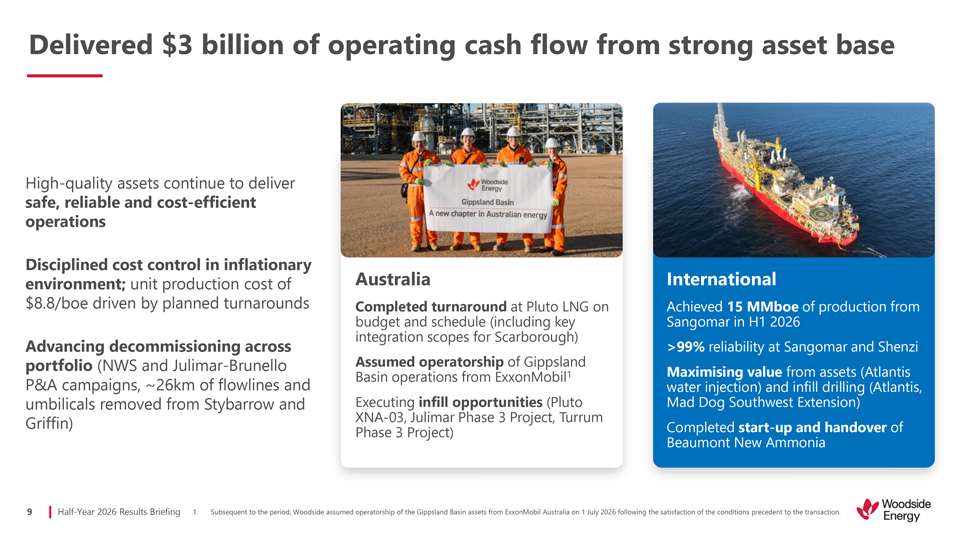
Half-Year 2026 Results Briefing 9 Delivered $3 billion of operating cash flow from strong asset base High-quality assets continue to deliver safe, reliable and cost-efficient operations Disciplined cost control in inflationary environment; unit production cost of $8.8/boe driven by planned turnarounds Advancing decommissioning across portfolio (NWS and Julimar-Brunello P&A campaigns, ~26km of flowlines and umbilicals removed from Stybarrow and Griffin) Subsequent to the period, Woodside assumed operatorship of the Gippsland Basin assets from ExxonMobil Australia on 1 July 2026 following the satisfaction of the conditions precedent to the transaction. Australia Completed turnaround at Pluto LNG on budget and schedule (including key integration scopes for Scarborough) Assumed operatorship of Gippsland Basin operations from ExxonMobil1 Executing infill opportunities (Pluto XNA-03, Julimar Phase 3 Project, Turrum Phase 3 Project) International Achieved 15 MMboe of production from Sangomar in H1 2026 >99% reliability at Sangomar and Shenzi Maximising value from assets (Atlantis water injection) and infill drilling (Atlantis, Mad Dog Southwest Extension) Completed start-up and handover of Beaumont New Ammonia


LOGO

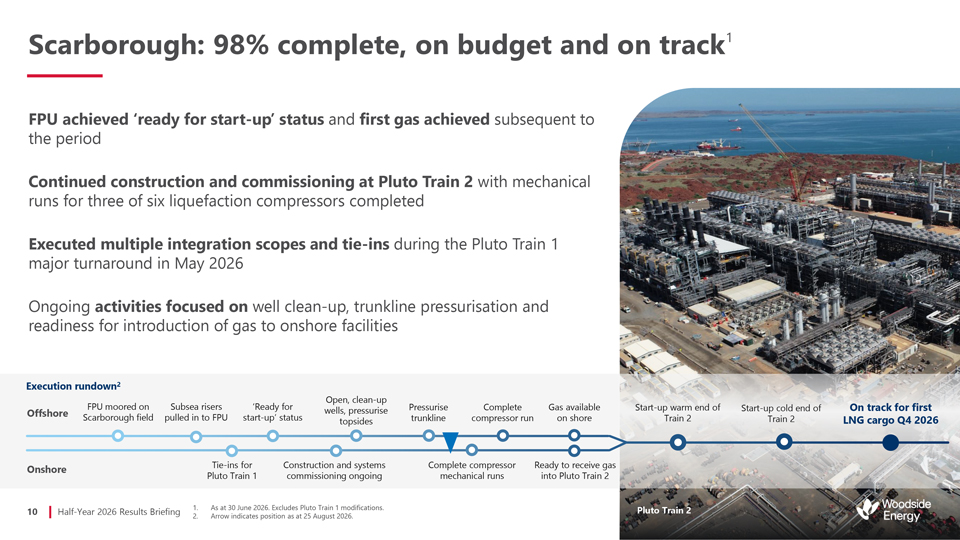
Half-Year 2026 Results Briefing 10 Scarborough: 98% complete, on budget and on track1 As at 30 June 2026. Excludes Pluto Train 1 modifications. Arrow indicates position as at 25 August 2026. FPU achieved ‘ready for start-up’ status and first gas achieved subsequent to the period Continued construction and commissioning at Pluto Train 2 with mechanical runs for three of six liquefaction compressors completed Executed multiple integration scopes and tie-ins during the Pluto Train 1 major turnaround in May 2026 Ongoing activities focused on well clean-up, trunkline pressurisation and readiness for introduction of gas to onshore facilities Tie-ins for Pluto Train 1 Ready to receive gas into Pluto Train 2 Construction and systems commissioning ongoing Complete compressor mechanical runs Execution rundown2 FPU moored on Scarborough field Subsea risers pulled in to FPU ‘Ready for start-up’ status Open, clean-up wells, pressurise topsides Pressurise trunkline Complete compressor run Gas available on shore Onshore Offshore Pluto Train 2 On track for first LNG cargo Q4 2026 Start-up cold end of Train 2 Start-up warm end of Train 2


LOGO

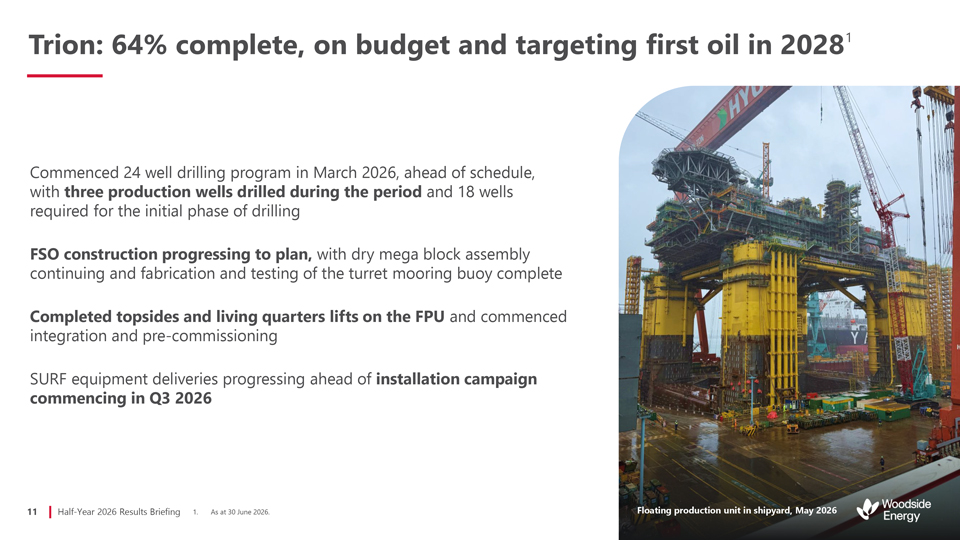
Half-Year 2026 Results Briefing 11 Trion: 64% complete, on budget and targeting first oil in 20281 As at 30 June 2026. Commenced 24 well drilling program in March 2026, ahead of schedule, with three production wells drilled during the period and 18 wells required for the initial phase of drilling FSO construction progressing to plan, with dry mega block assembly continuing and fabrication and testing of the turret mooring buoy complete Completed topsides and living quarters lifts on the FPU and commenced integration and pre-commissioning SURF equipment deliveries progressing ahead of installation campaign commencing in Q3 2026 Floating production unit in shipyard, May 2026


LOGO

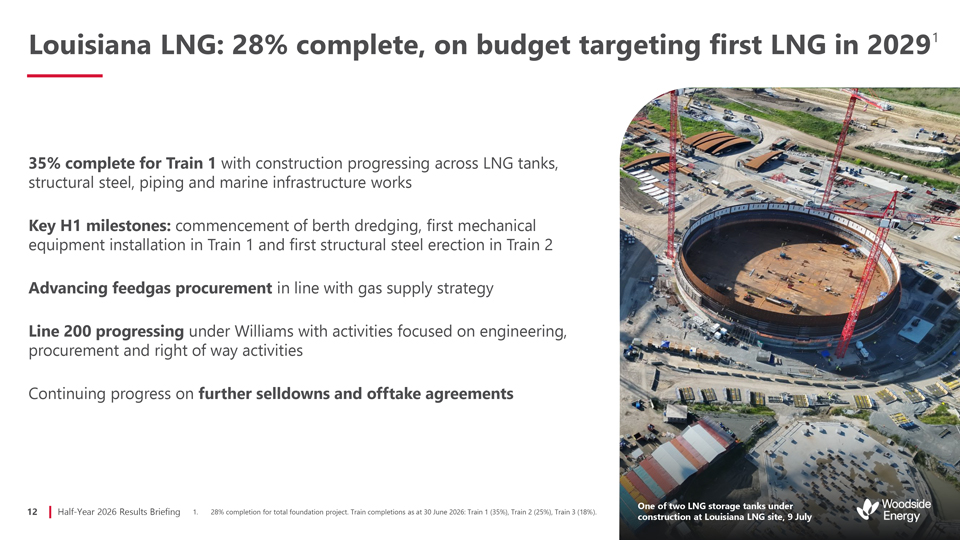
Half-Year 2026 Results Briefing 12 One of two LNG storage tanks under construction at Louisiana LNG site, 9 July Louisiana LNG: 28% complete, on budget targeting first LNG in 20291 28% completion for total foundation project. Train completions as at 30 June 2026: Train 1 (35%), Train 2 (25%), Train 3 (18%). 35% complete for Train 1 with construction progressing across LNG tanks, structural steel, piping and marine infrastructure works Key H1 milestones: commencement of berth dredging, first mechanical equipment installation in Train 1 and first structural steel erection in Train 2 Advancing feedgas procurement in line with gas supply strategy Line 200 progressing under Williams with activities focused on engineering, procurement and right of way activities Continuing progress on further selldowns and offtake agreements


LOGO

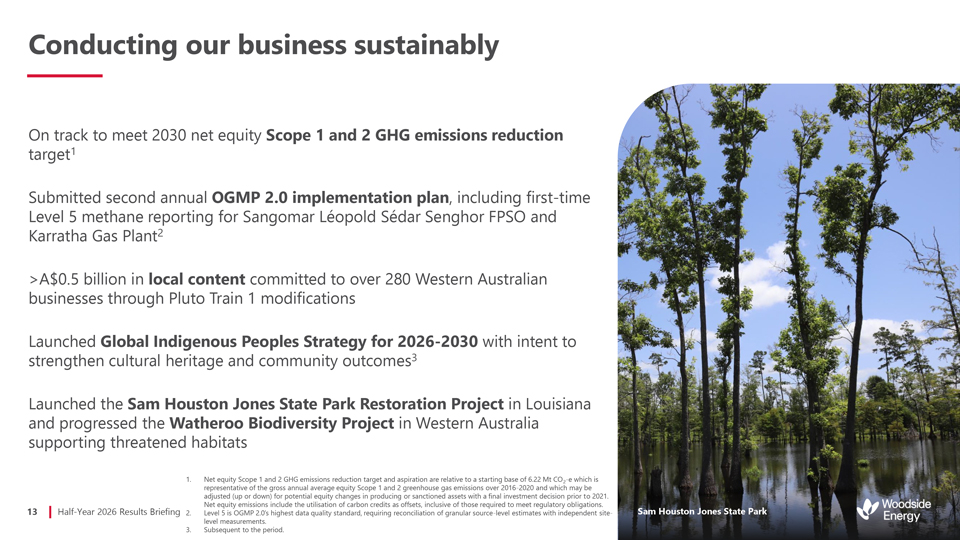
Half-Year 2026 Results Briefing 13 Conducting our business sustainably Net equity Scope 1 and 2 GHG emissions reduction target and aspiration are relative to a starting base of 6.22 Mt CO2-e which is representative of the gross annual average equity Scope 1 and 2 greenhouse gas emissions over 2016-2020 and which may be adjusted (up or down) for potential equity changes in producing or sanctioned assets with a final investment decision prior to 2021. Net equity emissions include the utilisation of carbon credits as offsets, inclusive of those required to meet regulatory obligations. Level 5 is OGMP 2.0’s highest data quality standard, requiring reconciliation of granular source-level estimates with independent site-level measurements. Subsequent to the period. Sam Houston Jones State Park On track to meet 2030 net equity Scope 1 and 2 GHG emissions reduction target1 Submitted second annual OGMP 2.0 implementation plan, including first-time Level 5 methane reporting for Sangomar Léopold Sédar Senghor FPSO and Karratha Gas Plant2 >A$0.5 billion in local content committed to over 280 Western Australian businesses through Pluto Train 1 modifications Launched Global Indigenous Peoples Strategy for 2026-2030 with intent to strengthen cultural heritage and community outcomes3 Launched the Sam Houston Jones State Park Restoration Project in Louisiana and progressed the Watheroo Biodiversity Project in Western Australia supporting threatened habitats


LOGO

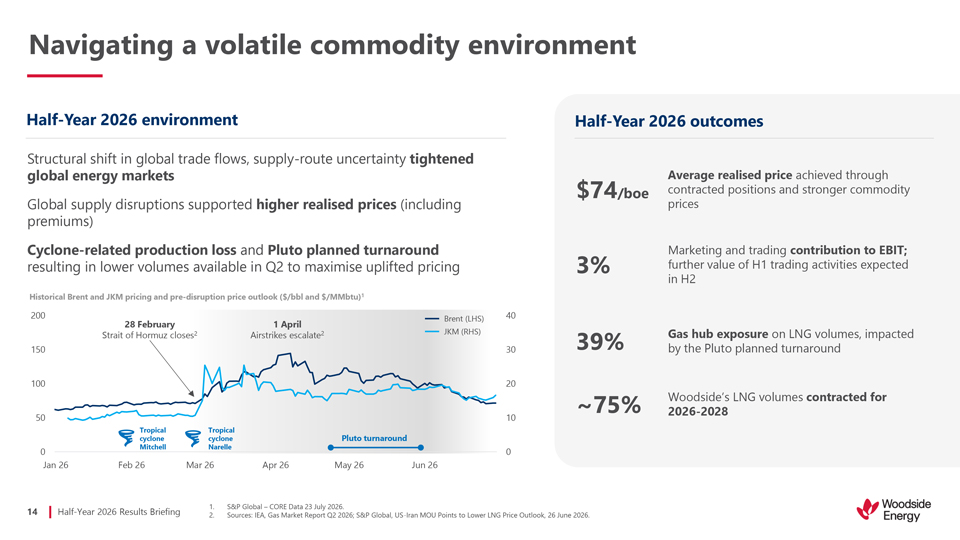
Half-Year 2026 Results Briefing 14 010 20 30 40 0 50 100 150 200Jan 26 Feb 26 Mar 26 Apr 26 May 26 Jun 26 Structural shift in global trade flows, supply-route uncertainty tightened global energy markets Global supply disruptions supported higher realised prices (including premiums) Cyclone-related production loss and Pluto planned turnaround resulting in lower volumes available in Q2 to maximise uplifted pricing Navigating a volatile commodity environment 3%  Marketing and trading contribution to EBIT; further value of H1 trading activities expected in H2 Half-Year 2026 outcomes Historical Brent and JKM pricing and pre-disruption price outlook ($/bbl and $/MMbtu)1 $74/boe Average realised price achieved through contracted positions and stronger commodity prices 3% Marketing and trading contribution to EBIT; further value of H1 trading activities expected in H2 39% Gas hub exposure on LNG volumes, impacted by the Pluto planned turnaround 75% Woodside’s LNG volumes contracted for 2026-2028 S&P Global – CORE Data 23 July 2026. Sources: IEA, Gas Market Report Q2 2026; S&P Global, US-Iran MOU Points to Lower LNG Price Outlook, 26 June 2026.


LOGO

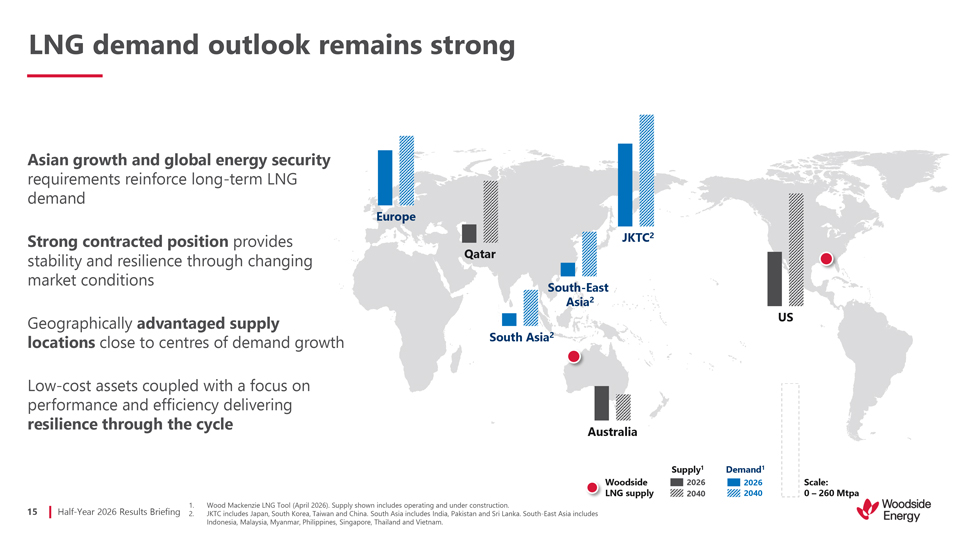
Half-Year 2026 Results Briefing 15 LNG demand outlook remains strong 2026 2040 Demand1 2026 2040 Supply1 Wood Mackenzie LNG Tool (April 2026). Supply shown includes operating and under construction. JKTC includes Japan, South Korea, Taiwan and China. South Asia includes India, Pakistan and Sri Lanka. South-East Asia includes Indonesia, Malaysia, Myanmar, Philippines, Singapore, Thailand and Vietnam. South-East Asia2 South Asia2 Europe JKTC2 Australia Qatar US Asian growth and global energy security requirements reinforce long-term LNG demand Strong contracted position provides stability and resilience through changing market conditions Geographically advantaged supply locations close to centres of demand growth Low-cost assets coupled with a focus on performance and efficiency delivering resilience through the cycle Woodside LNG supply Scale: 0 – 260 Mtpa


LOGO

Graham Tiver EVP and Chief Financial Officer Capital management Delivering value through financial strength and capital discipline


LOGO

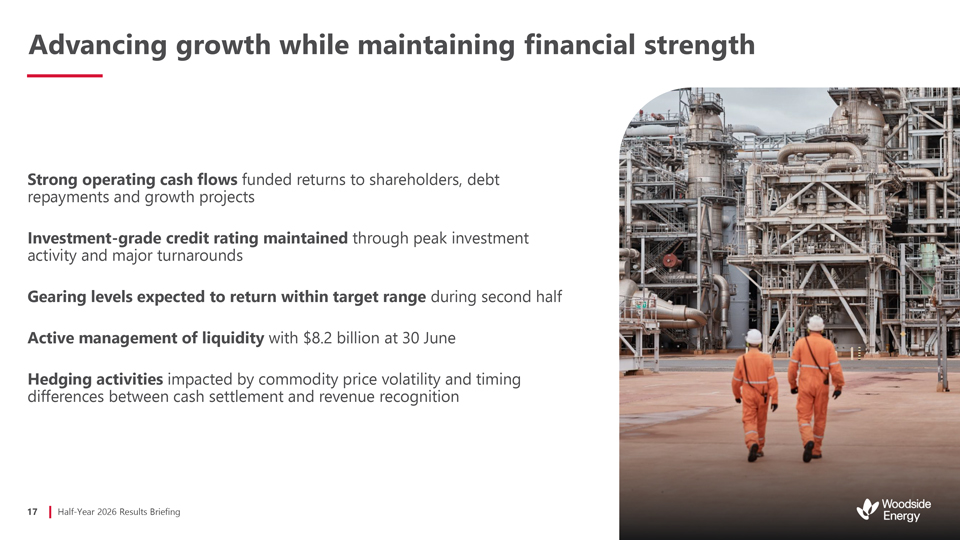
Half-Year 2026 Results Briefing 17 Advancing growth while maintaining financial strength Strong operating cash flows funded returns to shareholders, debt repayments and growth projects Investment-grade credit rating maintained through peak investment activity and major turnarounds Gearing levels expected to return within target range during second half Active management of liquidity with $8.2 billion at 30 June Hedging activities impacted by commodity price volatility and timing differences between cash settlement and revenue recognition


LOGO

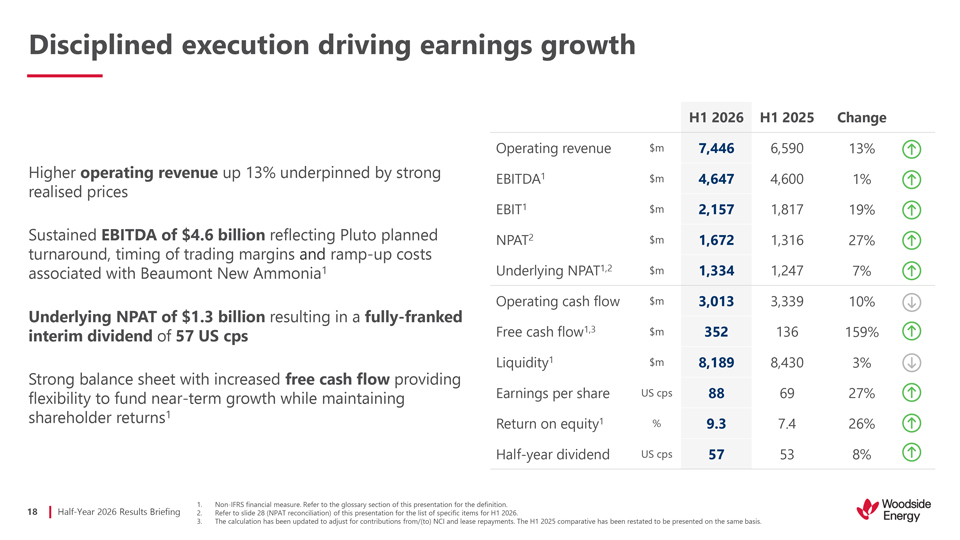
Half-Year 2026 Results Briefing 18 Non-IFRS financial measure. Refer to the glossary section of this presentation for the definition. Refer to slide 28 (NPAT reconciliation) of this presentation for the list of specific items for H1 2026. The calculation has been updated to adjust for contributions from/(to) NCI and lease repayments. The H1 2025 comparative has been restated to be presented on the same basis. Disciplined execution driving earnings growth H1 2026  H1 2025 Change Operating revenue $m 7,446 6,590 13% EBITDA1 $m 4,647 4,600 1% EBIT1 $m 2,157 1,817 19% NPAT2 $m 1,672 1,316 27% Underlying NPAT1,2 $m 1,334 1,247 7% Operating cash flow $m 3,013 3,339 10% Free cash flow1,3 $m 352 136 159% Liquidity1 $m 8,189 8,430 3% Earnings per share US cps 88 69 27% Return on equity1 % 9.3 7.4 26% Half-year dividend US cps 57 53 8%


LOGO

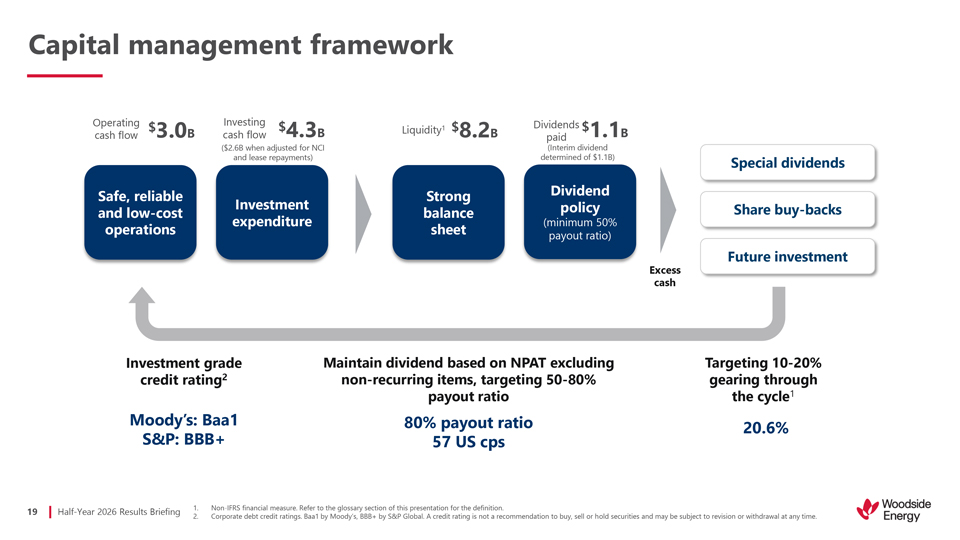
Half-Year 2026 Results Briefing 19  Operating cash flow Investing cash flow Dividends paid Liquidity1 $3.0B $4.3B $8.2B $1.1B Non-IFRS financial measure. Refer to the glossary section of this presentation for the definition. Corporate debt credit ratings. Baa1 by Moody’s, BBB+ by S&P Global. A credit rating is not a recommendation to buy, sell or hold securities and may be subject to revision or withdrawal at any time. ($2.6B when adjusted for NCI and lease repayments) (Interim dividend determined of $1.1B)


LOGO

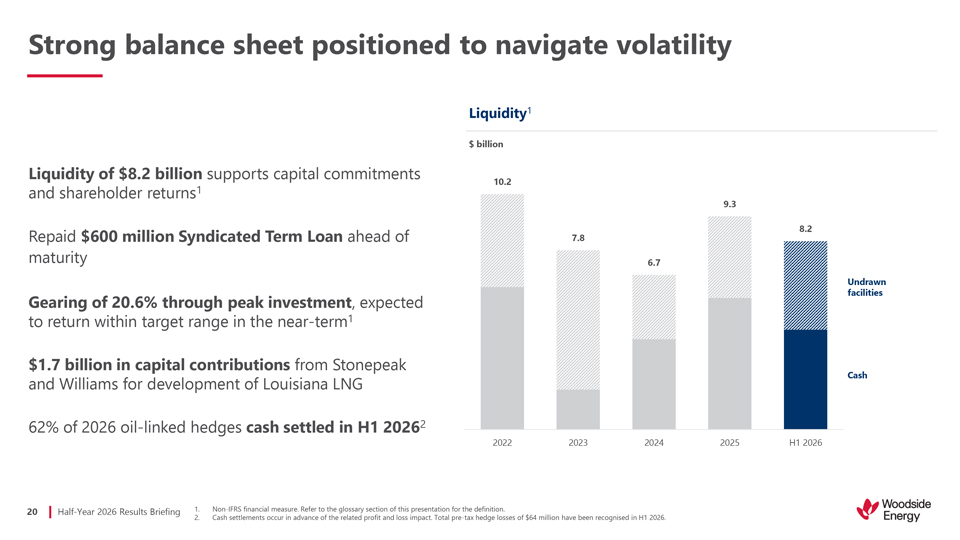
Half-Year 2026 Results Briefing 20 Strong balance sheet positioned to navigate volatility Liquidity of $8.2 billion supports capital commitments and shareholder returns1 Repaid $600 million Syndicated Term Loan ahead of maturity Gearing of 20.6% through peak investment, expected to return within target range in the near-term1 $1.7 billion in capital contributions from Stonepeak and Williams for development of Louisiana LNG 62% of 2026 oil-linked hedges cash settled in H1 20262 Non-IFRS financial measure. Refer to the glossary section of this presentation for the definition. Cash settlements occur in advance of the related profit and loss impact. Total pre-tax hedge losses of $64 million have been recognised in H1 2026. Undrawn facilities Cash Liquidity1 $ billion 10.2 7.8 6.7 9.3 8.2 2022 2023 2024 2025 H1 2026 Safe, reliable and low-cost operations Investment expenditure Strong balance sheet Dividend policy(minimum 50% payout ratio) Special dividends Share buy-backs Investment grade credit rating2 Maintain dividend based on NPAT excluding non-recurring items, targeting 50-80% payout ratio Targeting 10-20% gearing through the cycle1 Future investment Non-IFRS financial measure. Refer to the glossary section of this presentation for the definition. Corporate debt credit ratings. Baa1 by Moody’s, BBB+ by S&P Global. A credit rating is not a recommendation to buy, sell or hold securities and may be subject to revision or withdrawal at any time.  Moody’s: Baa1 S&P: BBB+ 80% payout ratio 57 US cps 20.6%


LOGO

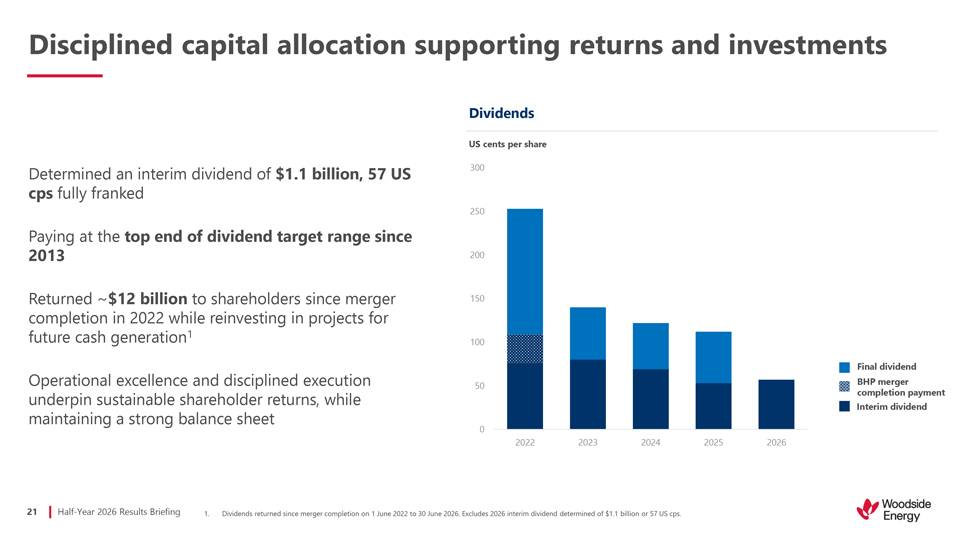
Half-Year 2026 Results Briefing 21 Disciplined capital allocation supporting returns and investments Determined an interim dividend of $1.1 billion, 57 US cps fully franked Paying at the top end of dividend target range since 2013 Returned ~$12 billion to shareholders since merger completion in 2022 while reinvesting in projects for future cash generation1 Operational excellence and disciplined execution underpin sustainable shareholder returns, while maintaining a strong balance sheet Dividends returned since merger completion on 1 June 2022 to 30 June 2026. Excludes 2026 interim dividend determined of $1.1 billion or 57 US cps. Dividends US cents per share Interim dividend Final dividend BHP merger completion payment 0 50 100 150 200 250 300 2022 2023 2024 2025 2026


LOGO

Liz Westcott Chief Executive Officer Building on our strengths


LOGO

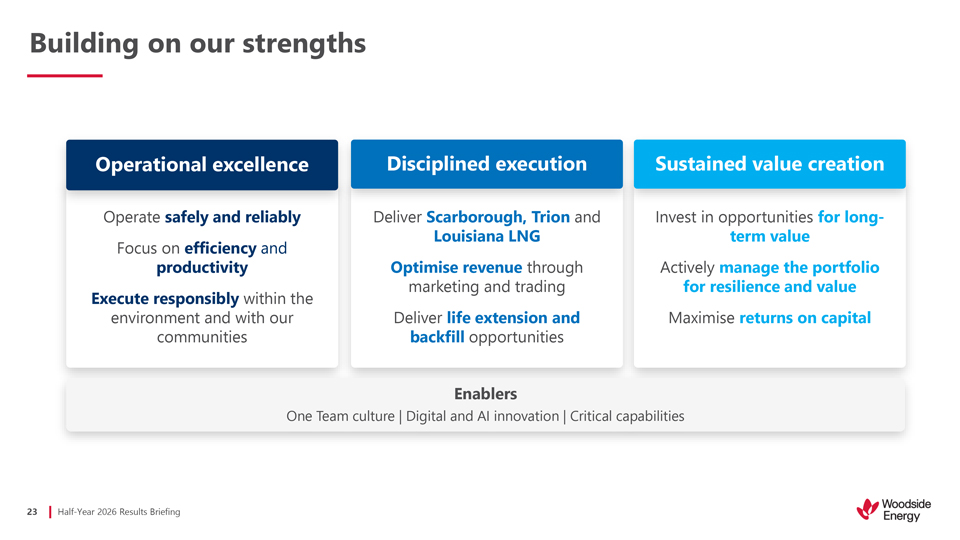
Half-Year 2026 Results Briefing 23  Building on our strengths Operate safely and reliably Focus on efficiency and productivity Execute responsibly within the environment and with our communities Deliver Scarborough, Trion and Louisiana LNG Optimise revenue through marketing and trading Deliver life extension and backfill opportunities Invest in opportunities for long-term value Actively manage the portfolio for resilience and value Maximise returns on capital Operational excellence Disciplined execution Sustained value creation Enablers One Team culture | Digital and AI innovation | Critical capabilities


LOGO

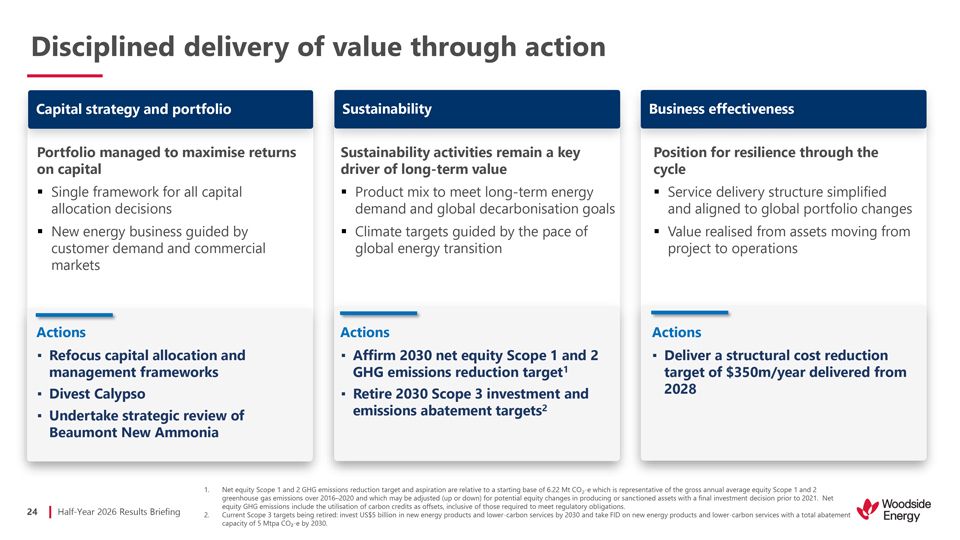
Half-Year 2026 Results Briefing 24 Disciplined delivery of value through action Net equity Scope 1 and 2 GHG emissions reduction target and aspiration are relative to a starting base of 6.22 Mt CO2-e which is representative of the gross annual average equity Scope 1 and 2 greenhouse gas emissions over 2016–2020 and which may be adjusted (up or down) for potential equity changes in producing or sanctioned assets with a final investment decision prior to 2021. Net equity GHG emissions include the utilisation of carbon credits as offsets, inclusive of those required to meet regulatory obligations. Current Scope 3 targets being retired: invest US$5 billion in new energy products and lower-carbon services by 2030 and take FID on new energy products and lower-carbon services with a total abatement capacity of 5 Mtpa CO2-e by 2030. Capital strategy and portfolio Sustainability Business effectiveness Portfolio managed to maximise returns on capital Single framework for all capital allocation decisions New energy business guided by customer demand and commercial markets Sustainability activities remain a key driver of long-term value Product mix to meet long-term energy demand and global decarbonisation goals Climate targets guided by the pace of global energy transition Position for resilience through the cycle Service delivery structure simplified and aligned to global portfolio changes Value realised from assets moving from project to operations Actions Refocus capital allocation and management frameworks Divest Calypso Undertake strategic review of Beaumont New Ammonia Affirm 2030 net equity Scope 1 and 2 GHG emissions reduction target1 Retire 2030 Scope 3 investment and emissions abatement targets2 Deliver a structural cost reduction target of $350m/year delivered from 2028 Actions Actions


LOGO

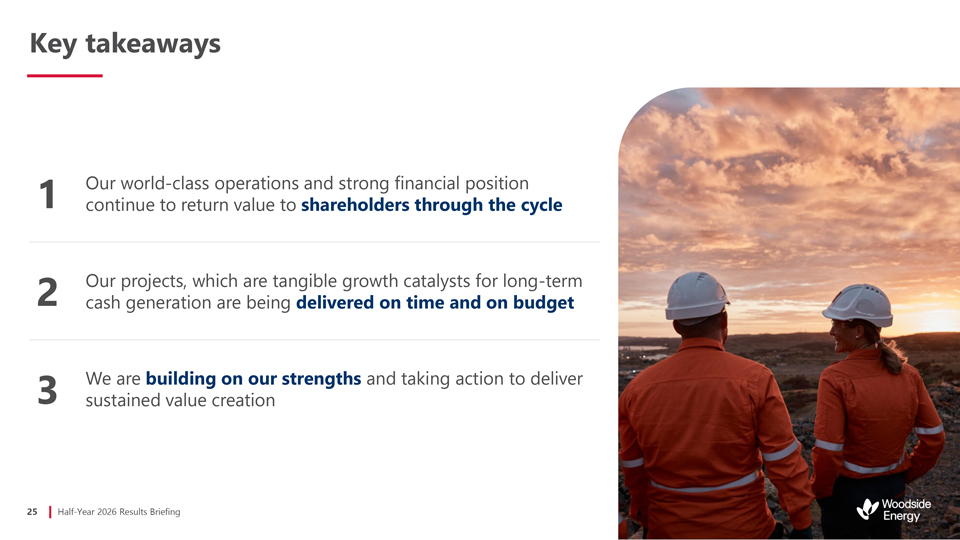
Half-Year 2026 Results Briefing 25 Key takeaways1 Our world-class operations and strong financial position continue to return value to shareholders through the cycle 2 Our projects, which are tangible growth catalysts for long-term cash generation are being delivered on time and on budget 3We are building on our strengths and taking action to deliver sustained value creation


LOGO

Q&A


LOGO

Annexure


LOGO

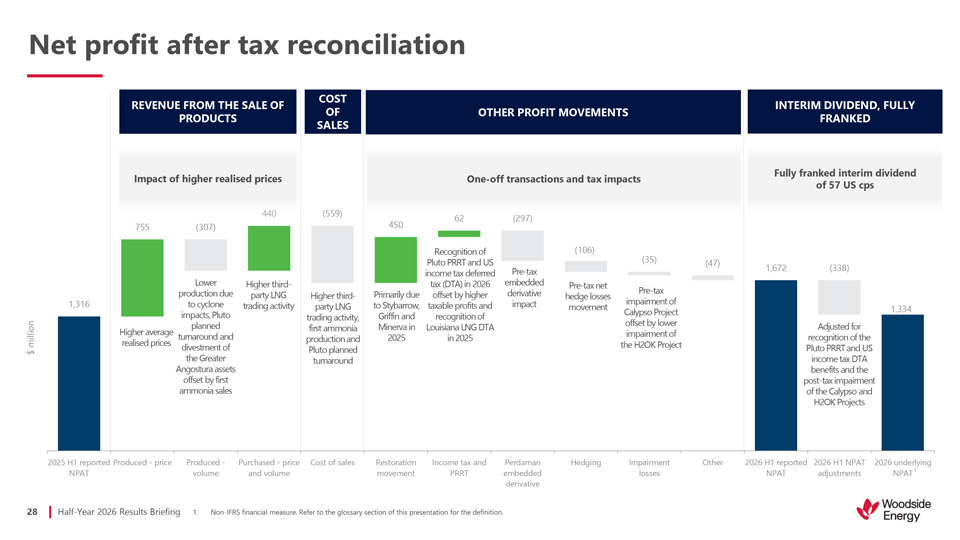
Half-Year 2026 Results Briefing 28 1,316 755 (307) 440 (559) 450 62 (297) (106) (35) (47) 1,672 (338) 1,334 2025 H1 reported NPAT Produced—price Produced—volume Purchased—price and volume Cost of sales Restoration movement Income tax and PRRT Perdaman embedded derivative Hedging Impairment losses Other 2026 H1 reported NPAT 2026 H1 NPAT adjustments 2026 underlying NPAT $ million Net profit after tax reconciliation Non-IFRS financial measure. Refer to the glossary section of this presentation for the definition. Impact of higher realised prices Pre-tax net hedge losses movement Pre-tax embedded derivative impact Pre-tax impairment of Calypso Project offset by lower impairment of the H2OK Project Adjusted for recognition of the Pluto PRRT and US income tax DTA benefits and the post-tax impairment of the Calypso and H2OK Projects REVENUE FROM THE SALE OF PRODUCTS COST OF SALES OTHER PROFIT MOVEMENTS INTERIM DIVIDEND, FULLY FRANKED Fully franked interim dividend of 57 US cps One-off transactions and tax impacts Higher third-party LNG trading activity, first ammonia production and Pluto planned turnaround Primarily due to Stybarrow, Griffin and Minerva in 2025 Recognition of Pluto PRRT and US income tax deferred tax (DTA) in 2026 offset by higher taxable profits and recognition of Louisiana LNG DTA in 2025 Lower production due to cyclone impacts, Pluto planned turnaround and divestment of the Greater Angostura assets offset by first ammonia sales Higher average realised prices Higher third-party LNG trading activity 1


LOGO

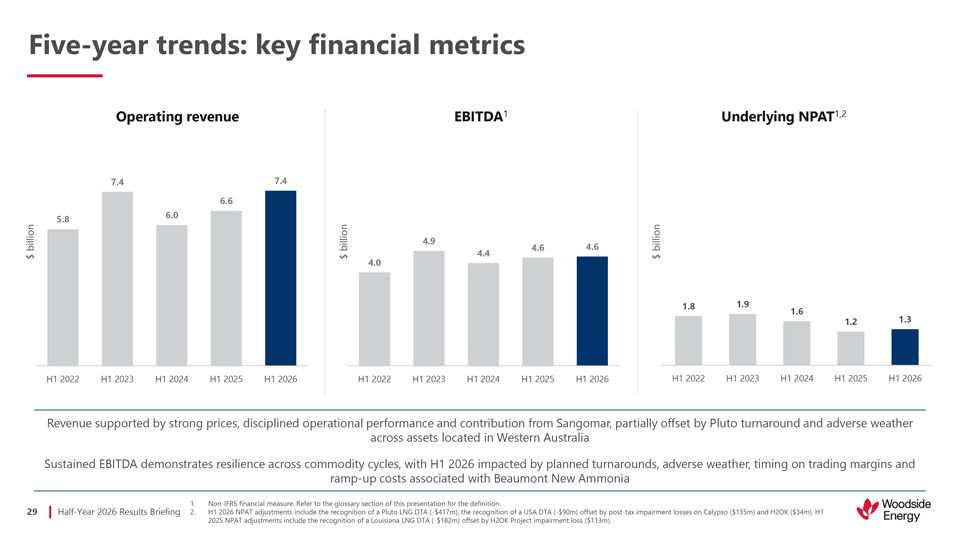
Half-Year 2026 Results Briefing 29  $ billion $ billion Five-year trends: key financial metrics Non-IFRS financial measure. Refer to the glossary section of this presentation for the definition. H1 2026 NPAT adjustments include the recognition of a Pluto LNG DTA (-$417m), the recognition of a USA DTA (-$90m) offset by post-tax impairment losses on Calypso ($135m) and H2OK ($34m). H1 2025 NPAT adjustments include the recognition of a Louisiana LNG DTA (-$182m) offset by H2OK Project impairment loss ($113m). Revenue supported by strong prices, disciplined operational performance and contribution from Sangomar, partially offset by Pluto turnaround and adverse weather across assets located in Western Australia Sustained EBITDA demonstrates resilience across commodity cycles, with H1 2026 impacted by planned turnarounds, adverse weather, timing on trading margins and ramp-up costs associated with Beaumont New Ammonia


LOGO

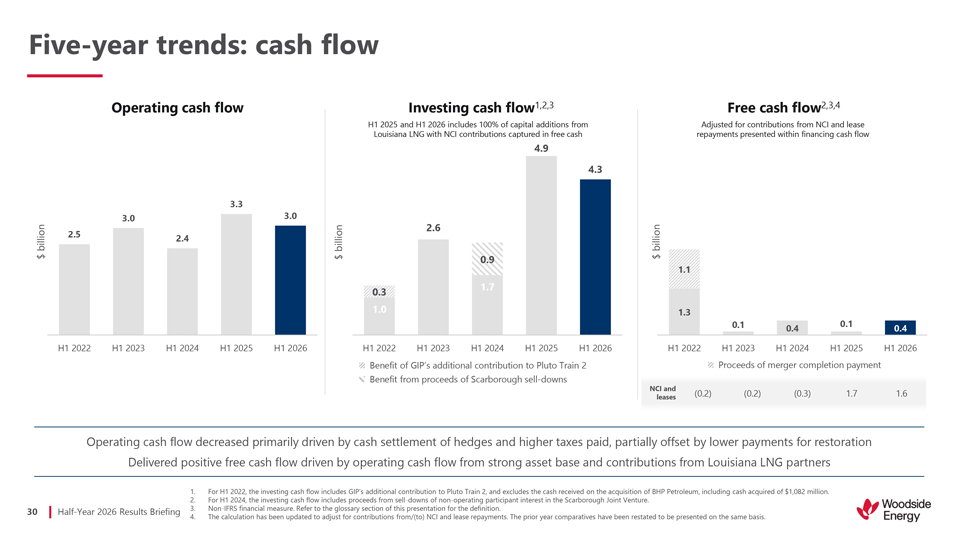
Half-Year 2026 Results Briefing 30 1.3 0.1 0.4 0.1 0.4 1.1 H1 2022 H1 2023 H1 2024 H1 2025 H1 2026 Thousands  $ billion $ billion Five-year trends: cash flow For H1 2022, the investing cash flow includes GIP’s additional contribution to Pluto Train 2, and excludes the cash received on the acquisition of BHP Petroleum, including cash acquired of $1,082 million. For H1 2024, the investing cash flow includes proceeds from sell-downs of non-operating participant interest in the Scarborough Joint Venture. Non-IFRS financial measure. Refer to the glossary section of this presentation for the definition. The calculation has been updated to adjust for contributions from/(to) NCI and lease repayments. The prior year comparatives have been restated to be presented on the same basis. Investing cash flow1,2,3


LOGO

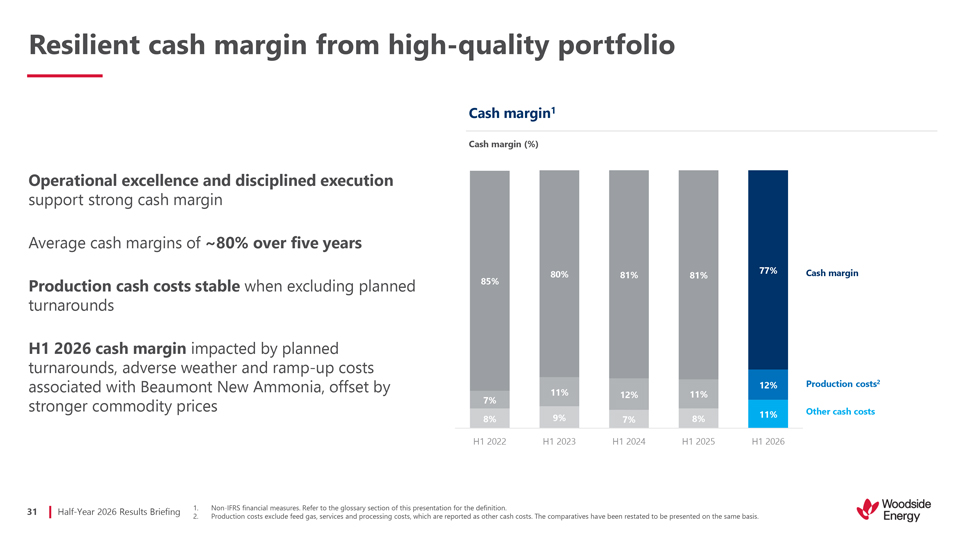
Half-Year 2026 Results Briefing 31 Resilient cash margin from high-quality portfolio Operational excellence and disciplined execution support strong cash margin Average cash margins of ~80% over five years Production cash costs stable when excluding planned turnarounds H1 2026 cash margin impacted by planned turnarounds, adverse weather and ramp-up costs associated with Beaumont New Ammonia, offset by stronger commodity prices Non-IFRS financial measures. Refer to the glossary section of this presentation for the definition. Production costs exclude feed gas, services and processing costs, which are reported as other cash costs. The comparatives have been restated to be presented on the same basis. Cash margin1 Cash margin (%) Cash margin Production costs2 Other cash costs 8% 9% 7% 8% 11% 7% 11% 12% 11% 12% 85% 80% 81% 81% 77% H1 2022 H1 2023 H1 2024 H1 2025 H1 2026


LOGO

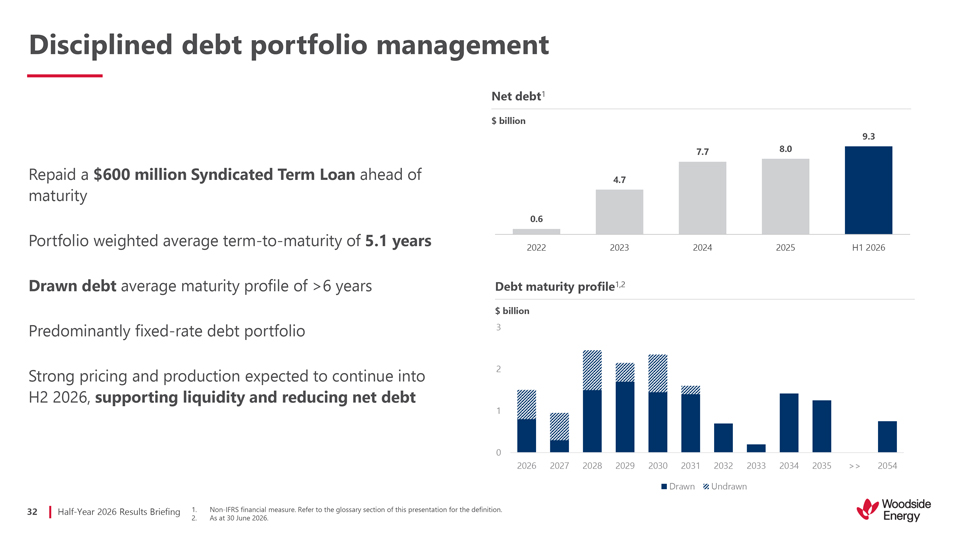
Half-Year 2026 Results Briefing 32 Disciplined debt portfolio management Non-IFRS financial measure. Refer to the glossary section of this presentation for the definition. As at 30 June 2026. Repaid a $600 million Syndicated Term Loan ahead of maturity Portfolio weighted average term-to-maturity of 5.1 years Drawn debt average maturity profile of >6 years Predominantly fixed-rate debt portfolio Strong pricing and production expected to continue into H2 2026, supporting liquidity and reducing net debt Net debt1 Debt maturity profile1,2 $ billion $ billion 0.6 4.7 7.7 8.0 9.3 2022 2023 2024 2025 H1 2026 0123 2026 2027 2028 2029 2030 2031 2032 2033 2034 2035 >> 2054 Drawn Undrawn


LOGO

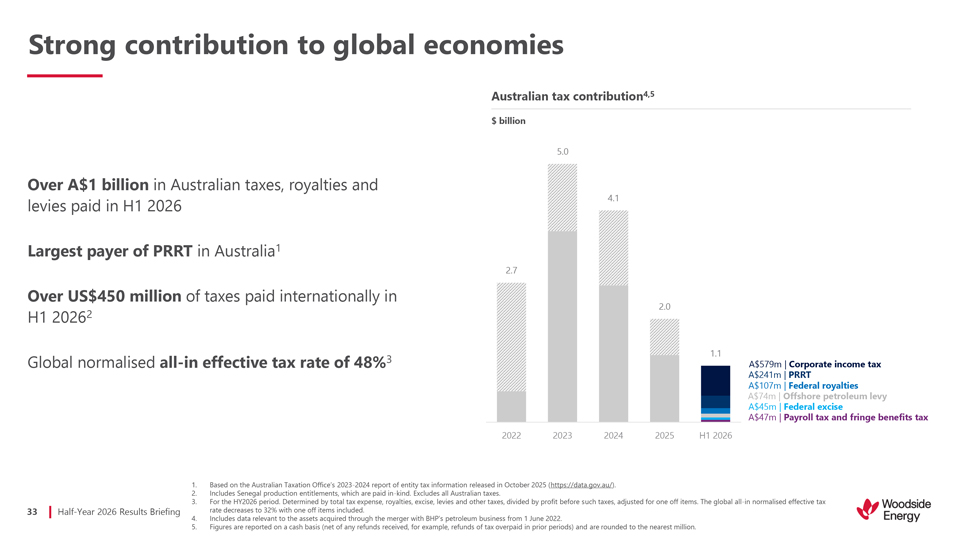
Half-Year 2026 Results Briefing 33 Strong contribution to global economies Based on the Australian Taxation Office’s 2023-2024 report of entity tax information released in October 2025 (https://data.gov.au/). Includes Senegal production entitlements, which are paid in-kind. Excludes all Australian taxes. For the HY2026 period. Determined by total tax expense, royalties, excise, levies and other taxes, divided by profit before such taxes, adjusted for one off items. The global all-in normalised effective tax rate decreases to 32% with one off items included. Includes data relevant to the assets acquired through the merger with BHP’s petroleum business from 1 June 2022. Figures are reported on a cash basis (net of any refunds received, for example, refunds of tax overpaid in prior periods) and are rounded to the nearest million. Over A$1 billion in Australian taxes, royalties and levies paid in H1 2026 Largest payer of PRRT in Australia1 Over US$450 million of taxes paid internationally in H1 20262 Global normalised all-in effective tax rate of 48%3 Australian tax contribution4,5 A$579m | Corporate income tax A$241m | PRRT A$107m | Federal royalties A$45m | Federal excise A$74m | Offshore petroleum levy A$47m | Payroll tax and fringe benefits tax $ billion 2.7 5.0 4.1 2.0 1.1 2022 2023 2024 2025 H1 2026


LOGO

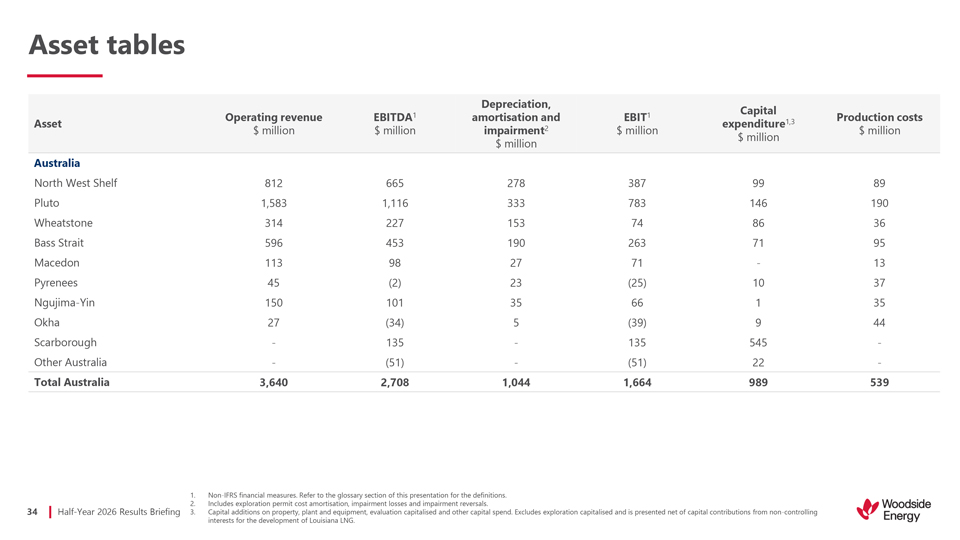
Half-Year 2026 Results Briefing 34 Asset tablesAsset Operating revenue $ million EBITDA1 $ millionDepreciation, amortisation and impairment2 $ millionEBIT1 $ millionCapital expenditure1,3 $ millionProduction costs $ million Australia North West Shelf8126652783879989 Pluto1,583 1,116333783146190 Wheatstone314227153748636 Bass Strait5964531902637195 Macedon113982771-13 Pyrenees45(2)23(25)1037 Ngujima-Yin1501013566135 Okha27(34)5(39)944 Scarborough-135-135545- Other Australia-(51)-(51)22- Total Australia3,6402,7081,0441,664989539


LOGO

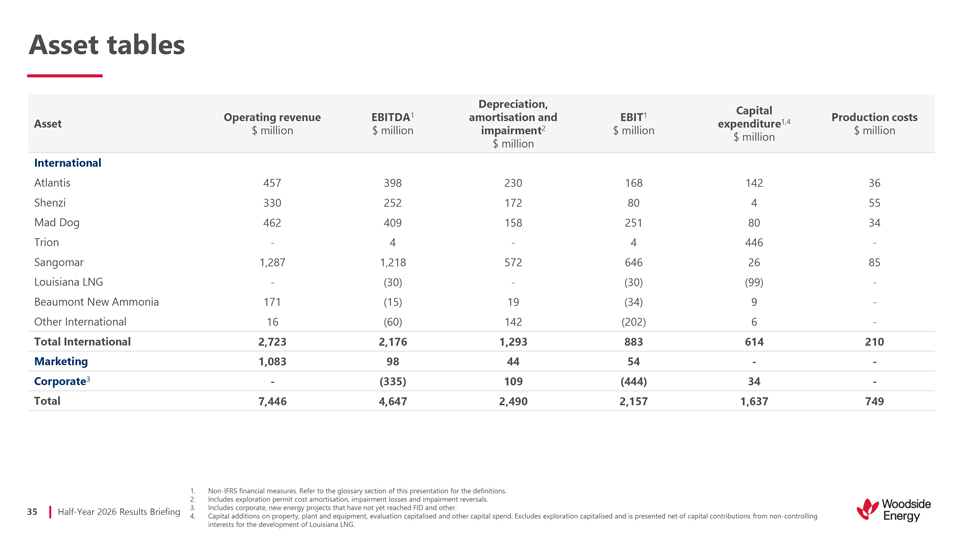
Half-Year 2026 Results Briefing 35 Asset tables Non-IFRS financial measures. Refer to the glossary section of this presentation for the definitions. Includes exploration permit cost amortisation, impairment losses and impairment reversals. Includes corporate, new energy projects that have not yet reached FID and other. Capital additions on property, plant and equipment, evaluation capitalised and other capital spend. Excludes exploration capitalised and is presented net of capital contributions from non-controlling interests for the development of Louisiana LNG. Asset Operating revenue $ million EBITDA1 $ million Depreciation, amortisation and impairment2 $ million EBIT1 $ million Capital expenditure1,4 $ million Production costs $ million International Atlantis 457 398 230 168 142 36 Shenzi 330 252 172 80 4 55 Mad Dog 462 409 158 251 80 34 Trion—4—4 446—Sangomar 1,287 1,218 572 646 26 85 Louisiana LNG—(30)—(30) (99)—Beaumont New Ammonia 171 (15) 19 (34) 9—Other International 16 (60) 142 (202) 6—Total International 2,723 2,176 1,293 883 614 210 Marketing 1,083 98 44 54 — Corporate3—(335) 109 (444) 34—Total 7,446 4,647 2,490 2,157 1,637 749


LOGO

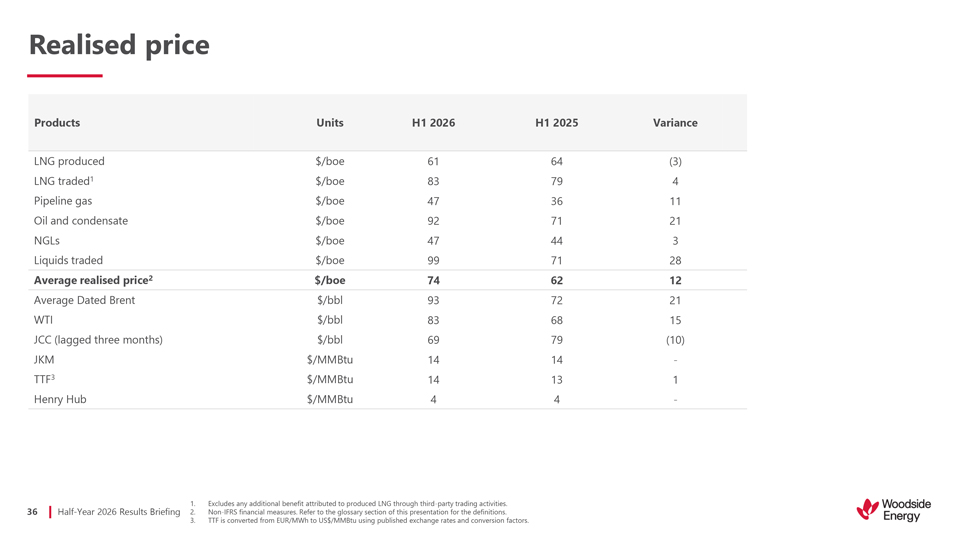
Half-Year 2026 Results Briefing 36 Realised price Excludes any additional benefit attributed to produced LNG through third-party trading activities. Non-IFRS financial measures. Refer to the glossary section of this presentation for the definitions. TTF is converted from EUR/MWh to US$/MMBtu using published exchange rates and conversion factors. Products Units H1 2026H1 2025Variance LNG produced$/boe6164(3) LNG traded1$/boe83794 Pipeline gas$/boe473611 Oil and condensate$/boe927121 NGLs$/boe47443 Liquids traded$/boe997128 Average realised price2$/boe746212 Average Dated Brent$/bbl937221 WTI$/bbl836815 JCC (lagged three months)$/bbl6979(10) JKM$/MMBtu1414- TTF3$/MMBtu14131 Henry Hub$/MMBtu44-


LOGO

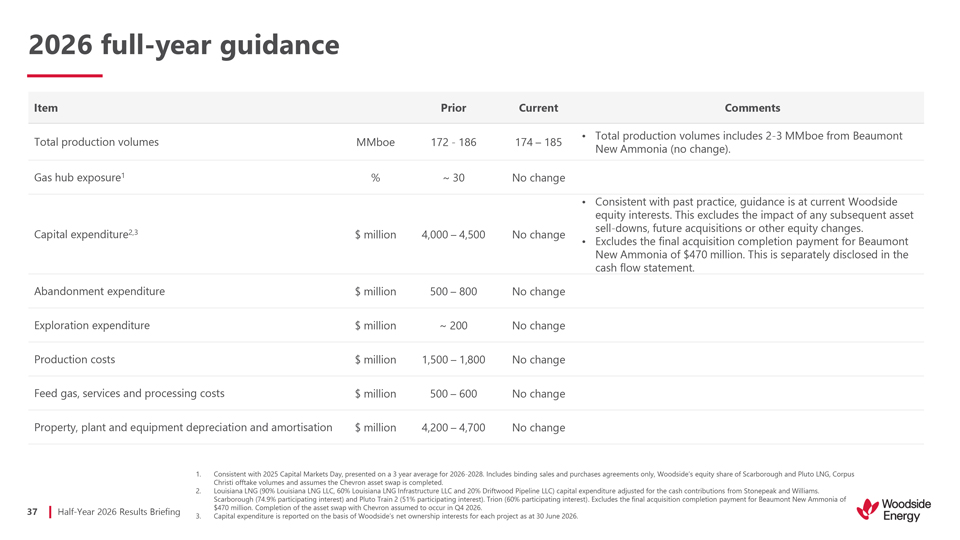
Half-Year 2026 Results Briefing 37 2026 full-year guidanceItem Prior CurrentComments Total production volumesMMboe172—186174 – 185 Total production volumes includes 2-3 MMboe from Beaumont New Ammonia (no change). Gas hub exposure1%~ 30No change Capital expenditure2,3$ million4,000 – 4,500No change Consistent with past practice, guidance is at current Woodside equity interests. This excludes the impact of any subsequent asset sell-downs, future acquisitions or other equity changes. Excludes the final acquisition completion payment for Beaumont New Ammonia of $470 million. This is separately disclosed in the cash flow statement. Abandonment expenditure$ million500 – 800No change Exploration expenditure$ million~ 200No change Production costs$ million1,500 – 1,800No change Feed gas, services and processing costs $ million500 – 600No change Property, plant and equipment depreciation and amortisation$ million4,200 – 4,700No change


LOGO

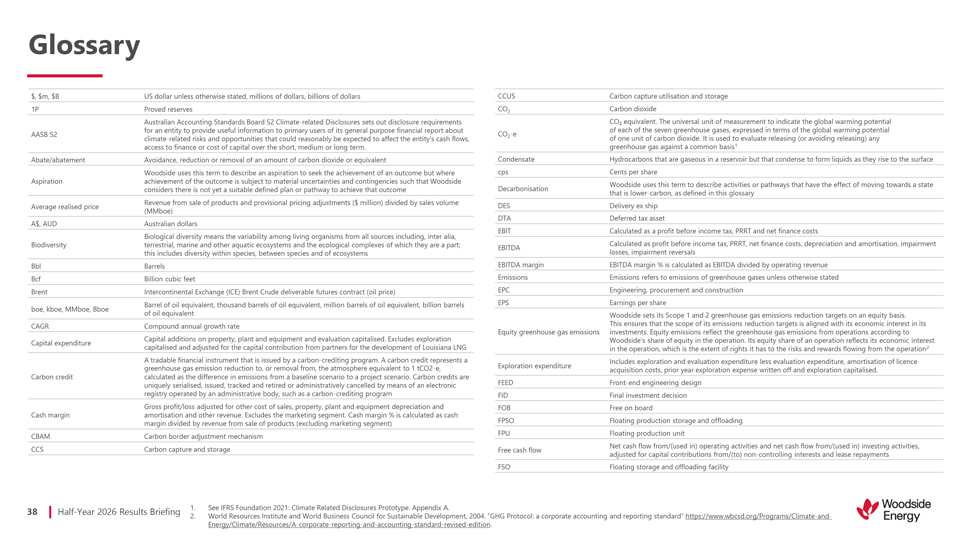
Half-Year 2026 Results Briefing 38 Glossary$, $m, $B US dollar unless otherwise stated, millions of dollars, billions of dollars 1P Proved reserves AASB S2Australian Accounting Standards Board S2 Climate-related Disclosures sets out disclosure requirements for an entity to provide useful information to primary users of its general purpose financial report about climate-related risks and opportunities that could reasonably be expected to affect the entity’s cash flows, access to finance or cost of capital over the short, medium or long term. Abate/abatementAvoidance, reduction or removal of an amount ofcarbon dioxide or equivalent AspirationWoodside uses this term to describe an aspiration to seek the achievement of an outcome but where achievement of the outcome is subject to material uncertainties and contingencies such that Woodside considers there is not yet a suitable defined plan or pathway to achieve that outcome Average realised priceRevenue from sale of products and provisional pricing adjustments ($ million) divided by sales volume (MMboe) A$, AUDAustralian dollars BiodiversityBiological diversity means the variability among living organisms from all sources including, inter alia, terrestrial, marine and other aquatic ecosystems and the ecological complexes of which they are a part; this includes diversity within species, between species and of ecosystems BblBarrels BcfBillion cubic feet BrentIntercontinental Exchange (ICE) Brent Crude deliverable futures contract (oil price) boe, kboe, MMboe, BboeBarrel of oil equivalent, thousand barrels of oil equivalent, million barrels of oil equivalent, billion barrels of oil equivalent CAGRCompound annual growth rate Capital expenditureCapital additions on property, plant and equipment and evaluation capitalised. Excludes exploration capitalised and adjusted for the capital contribution from partners for the development of Louisiana LNG Carbon creditA tradable financial instrument that is issued by a carbon-crediting program. A carbon credit represents a greenhouse gas emission reduction to, or removal from, the atmosphere equivalent to 1 tCO2-e, calculated as the difference in emissions from a baseline scenario to a project scenario. Carbon credits are uniquely serialised, issued, tracked and retired or administratively cancelled by means of an electronic registry operated by an administrative body, such as a carbon-crediting program Cash marginGross profit/loss adjusted for other cost of sales, property, plant and equipment depreciation and amortisation and other revenue. Excludes the marketing segment. Cash margin % is calculated as cash margin divided by revenue from sale of products (excluding marketing segment) CBAMCarbon border adjustment mechanism CCSCarbon capture and storage


LOGO

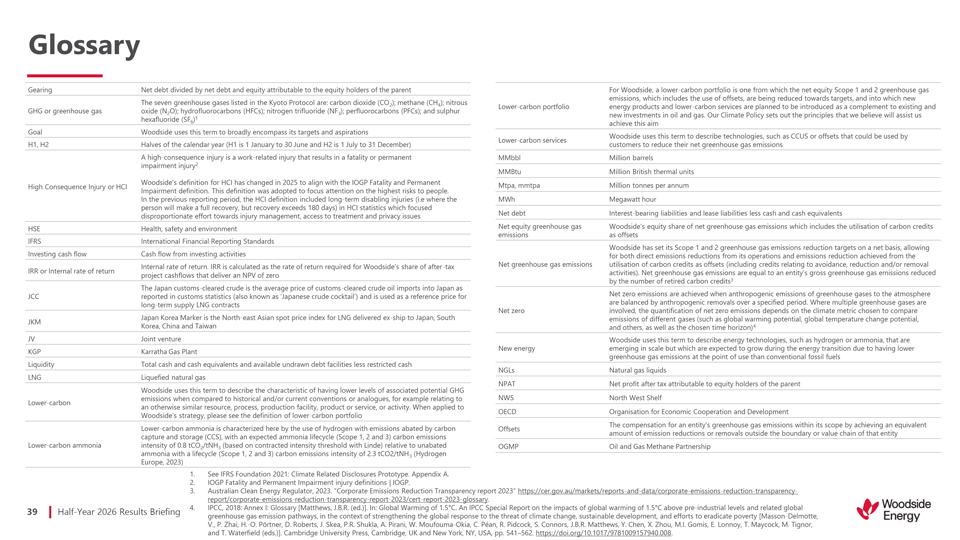
Half-Year 2026 Results Briefing 39 Glossary See IFRS Foundation 2021: Climate Related Disclosures Prototype. Appendix A. IOGP Fatality and Permanent Impairment injury definitions | IOGP. Australian Clean Energy Regulator, 2023. “Corporate Emissions Reduction Transparency report 2023” https://cer.gov.au/markets/reports-and-data/corporate-emissions-reduction-transparency-report/corporate-emissions-reduction-transparency-report-2023/cert-report-2023-glossary. IPCC, 2018: Annex I: Glossary [Matthews, J.B.R. (ed.)]. In: Global Warming of 1.5°C. An IPCC Special Report on the impacts of global warming of 1.5°C above pre-industrial levels and related global greenhouse gas emission pathways, in the context of strengthening the global response to the threat of climate change, sustainable development, and efforts to eradicate poverty [Masson-Delmotte, V.,P.Zhai, H.-O. Pörtner, D. Roberts, J. Skea, P.R. Shukla, A. Pirani, W. Moufouma-Okia, C. Péan, R. Pidcock, S. Connors, J.B.R. Matthews, Y. Chen, X. Zhou, M.I. Gomis, E. Lonnoy, T. Maycock, M. Tignor, andT.Waterfield (eds.)]. Cambridge University Press, Cambridge, UK and New York, NY, USA, pp. 541–562. https://doi.org/10.1017/9781009157940.008. Gearing Net debt divided by net debt and equity attributable to the equity holders of the parent GHG or greenhouse gas The seven greenhouse gases listed in the Kyoto Protocol are: carbon dioxide (CO2); methane (CH4); nitrous oxide (N2O); hydrofluorocarbons (HFCs); nitrogen trifluoride (NF3); perfluorocarbons (PFCs); and sulphur hexafluoride (SF6)1 GoalWoodside uses this term to broadly encompass its targets and aspirations H1, H2Halves of the calendar year (H1 is 1 January to 30 June and H2 is 1 July to 31 December) High Consequence Injury or HCIA high-consequence injury is a work-related injury that results in a fatality or permanent impairmentinjury2 Woodside’s definition for HCI has changed in 2025 toalign with the IOGP Fatality and Permanent Impairment definition. This definition was adopted tofocus attention on the highest risks to people. Inthe previous reporting period, the HCI definition included long-term disabling injuries (i.e where the person will make a full recovery, but recovery exceeds 180 days) in HCI statistics which focused disproportionate effort towards injury management, access to treatment and privacy issues HSEHealth, safety and environment IFRSInternational Financial Reporting Standards Investing cash flowCash flow from investing activities IRR or Internal rate of returnInternal rate of return. IRR is calculated as the rate of return required for Woodside’s share of after-tax project cashflows that deliver an NPV of zero JCCThe Japan customs-cleared crude is the average price of customs-cleared crude oil imports into Japan as reported in customs statistics (also known as ‘Japanese crude cocktail’) and is used as a reference price for long-term supply LNG contracts JKMJapan Korea Marker is the North-east Asian spot price index for LNG delivered ex-ship to Japan, South Korea, China and Taiwan JVJoint venture KGPKarratha Gas Plant LiquidityTotal cash and cash equivalents and available undrawn debt facilities less restricted cash LNGLiquefied natural gas Lower-carbonWoodside uses this term to describe the characteristic of having lower levels of associated potential GHG emissions when compared to historical and/or current conventions or analogues, for example relating to an otherwise similar resource, process, production facility, product or service, or activity. When applied to Woodside’s strategy, please see the definition of lower-carbon portfolio Lower-carbon ammoniaLower-carbon ammonia is characterized here by the use of hydrogen with emissions abated by carbon capture and storage (CCS), with an expected ammonia lifecycle (Scope 1, 2 and 3) carbon emissions intensity of 0.8 tCO2/tNH3 (based on contracted intensity threshold with Linde) relative to unabated ammonia with a lifecycle (Scope 1, 2 and 3) carbon emissions intensity of 2.3 tCO2/tNH3 (Hydrogen Europe, 2023)


LOGO

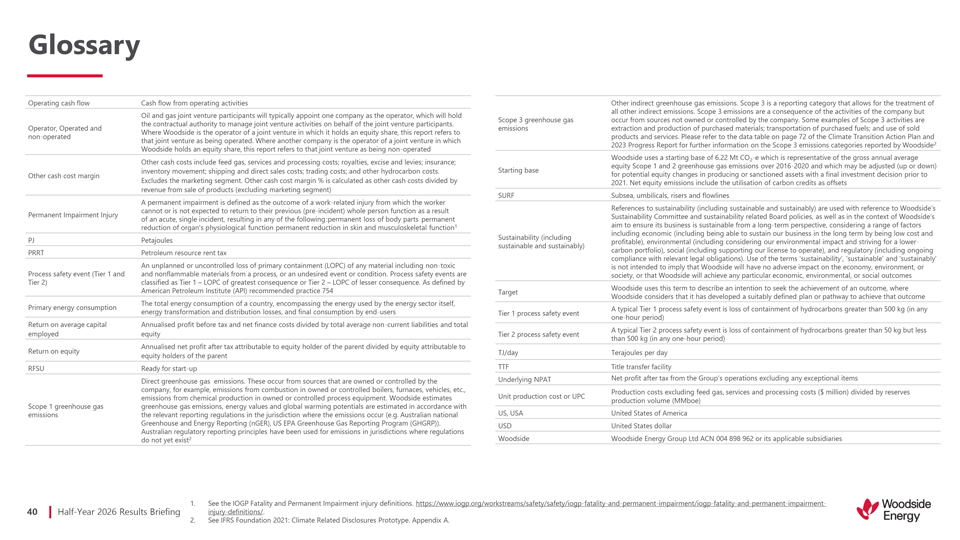
Half-Year 2026 Results Briefing 40 Glossary See the IOGP Fatality and Permanent Impairment injury definitions. https://www.iogp.org/workstreams/safety/safety/iogp-fatality-and-permanent-impairment/iogp-fatality-and-permanent-impairment-injury-definitions/. See IFRS Foundation 2021: Climate Related Disclosures Prototype. Appendix A. Operating cash flow Cash flow from operating activities Operator, Operated and non-operated Oil and gas joint venture participants will typically appoint one company as the operator, which will hold the contractual authority to manage joint venture activities on behalf of the joint venture participants. Where Woodside is the operator of a joint venture in which it holds an equity share, this report refers to that joint venture as being operated. Where another company is the operator of a joint venture in which Woodside holds an equity share, this report refers to that joint venture as being non-operated Other cash cost marginOther cash costs include feed gas, services and processing costs; royalties, excise and levies; insurance; inventory movement; shipping and direct sales costs; trading costs; and other hydrocarbon costs. Excludes the marketing segment. Other cash cost margin % is calculated as other cash costs divided by revenue from sale of products (excluding marketing segment) Permanent Impairment InjuryA permanent impairment is defined as the outcome of a work-related injury from which the worker cannot or is not expected to return to their previous (pre-incident) whole person function as a result ofanacute, single incident, resulting in any of thefollowing:permanent loss of body parts permanent reduction of organ’s physiologicalfunction permanent reduction in skin and musculoskeletalfunction1 PJPetajoules PRRTPetroleum resource rent tax Process safety event (Tier 1 and Tier 2)An unplanned or uncontrolled loss of primary containment (LOPC) of any material including non-toxic and nonflammable materials from a process, or an undesired event or condition. Process safety events are classified as Tier 1 – LOPC of greatest consequence or Tier 2 – LOPC of lesser consequence. As defined by American Petroleum Institute (API) recommended practice 754 Primary energy consumptionThe total energy consumption of a country, encompassing the energy used by the energy sector itself, energy transformation and distribution losses, and final consumption by end-users Return on average capital employedAnnualised profit before tax and net finance costs divided by total average non-current liabilities and total equity Return on equityAnnualised net profit after tax attributable to equity holder of the parent divided by equity attributable to equity holders of the parent RFSUReady for start-up Scope 1 greenhouse gas emissionsDirect greenhouse gas emissions. These occur from sources that are owned or controlled by the company, for example, emissions from combustion in owned or controlled boilers, furnaces, vehicles, etc., emissions from chemical production in owned or controlled process equipment. Woodside estimates greenhouse gas emissions, energy values and global warming potentials are estimated in accordance with the relevant reporting regulations in the jurisdiction where the emissions occur (e.g. Australian national Greenhouse and Energy Reporting (nGER), US EPA Greenhouse Gas Reporting Program (GHGRP)). Australian regulatory reporting principles have been used for emissions in jurisdictions where regulations do not yet exist2


LOGO

Head Office: Woodside Energy Mia Yellagonga 11 Mount Street Perth WA 6000 Australia Postal Address: GPO Box D188 Perth WA 6840 Australia T: +61 8 9348 4000 F: +61 8 9214 2777 E: companyinfo@woodside.com Woodside Energy Group Ltd ABN 55 004 898 962 woodside.com  Half-Year 2026 Results Briefing 41