| NASDAQ: ZYXI Discussion Materials November 13, 2025 |

| NASDAQ: ZYXI Disclaimer The purpose of this presentation (the “Presentation”) is to introduce the reader to Zynex, Inc. (“Zynex” or the “Company”) and Province, LLC (“Province”). This Presentation is being made available only to parties who have signed and returned a Confidentiality Agreement. Recipients agree to use and maintain the information in this Presentation in accordance with its compliance policies, contractual obligations (including their Confidentiality Agreements) and applicable laws and regulations, including federal and state securities laws. The Company does not intend for this Presentation to form the sole basis of any transaction decision. The recipients should conduct their own investigations and analyses of the Company in connection with any transaction. This Presentation does not purport to be all-inclusive or contain all the information that a party may desire while reviewing the Company or any transaction. This Presentation may not be photocopied, reproduced or distributed at any time unless in accordance with the Confidentiality Agreement. The recipient will promptly return or destroy all material received from Province or the Company (including this Presentation) in accordance with such Confidentiality Agreement. None of the Company, Province, their respective affiliates or their respective employees, directors, officers, contractors, advisors, consultants, members, successors, representatives, agents or controlling persons or any representatives of the foregoing, has made or makes any representation or warranty (express or implied) in respect of the accuracy, completeness or fair presentation of any information or any conclusion contained in this Presentation or in any other information provided or made available to the recipient in the course of its evaluation of the Company, and none shall have any liability resulting from the use or content of this Presentation or any other such information provided or made available to the recipient including, for any representations or warranties (expressed or implied) contained in, or for any omissions from, this Presentation or any other written or oral communications. The only information that will have any legal effect and upon which an interested party may rely will be in such representations and warranties as may be contained in a definitive agreement providing for a Transaction, when, as and if executed, and in accordance with such terms and subject to such conditions as may be specified therein. The information in this Presentation was provided by the Company or is from public or other sources. Province has not assumed any responsibility for independently verifying such information and expressly disclaims any liability to any recipient in connection with such information or any transaction with the Company. This Presentation is not an offer, nor a solicitation of an offer, of the sale or purchase of securities, nor shall any securities of the Company or any of its subsidiaries be offered or sold, in any jurisdiction in which such an offer, solicitation or sale would be unlawful. In furnishing this Presentation, the Company and Province reserve the right to amend or replace this Presentation at any time, but undertake no obligation to update, correct or supplement any information contained herein or to provide the recipient with access to any additional information. This Presentation does not purport to be all-inclusive or to contain all of the information that the recipient may require in order to make an informed investment decision. No investment or other financial decisions or actions should be based solely on the information in this Presentation. Non-GAAP Measures: In addition to the financial measures prepared in accordance with U.S. generally accepted accounting principles (“GAAP”), this Presentation contains certain non-GAAP financial measures (and projections of such measures), including EBITDA and EBITDA Margin. The Company believes these non-GAAP financial measures are commonly used by analysts and investors to evaluate the performance of companies in its industry, and such non-GAAP financial measures help investors evaluate its operating and financial performance and trends in its business, consistent with how management evaluates such performance and trends. The Company also believes that these non-GAAP financial measures may be useful in comparing its performance to the performance of other companies, although the Company’s non-GAAP financial measures are specific to it and the non-GAAP financial measures of other companies may not be calculated in the same manner. These non-GAAP financial measures should be considered only as supplemental to, and not as a substitute for or superior to, financial measures prepared in accordance with GAAP. The Company cannot provide a reconciliation between its non-GAAP projections and the most directly comparable GAAP measures without unreasonable efforts because it is unable to predict with reasonable certainty the ultimate outcome of certain significant items required for the reconciliation. These items are uncertain, depend on various factors and could have a material impact on GAAP reported results. |
| NASDAQ: ZYXI Disclaimer Continued Financial Projections: This Presentation includes certain statements, claims, estimates, predictions and other information prepared and provided by the Company with respect to the anticipated future performance of the Company and its subsidiaries. Any assumptions, views or opinions (including statements, projections, forecasts or other forward-looking statements) contained in this Presentation represent the assumptions, views or opinions of the Company as of the date indicated and are subject to change without notice. These statements are subject to known and unknown risks, uncertainties, changes in circumstances, assumptions and other important factors, many of which are outside our control, that could cause actual results to differ materially and potentially adversely from the results discussed in the forward-looking statements. Forecasts and estimates regarding the Company’s industry and markets are based on sources the Company believes to be reliable; however, there can be no assurance these forecasts and estimates will prove accurate in whole or in part. All information not separately sourced is from internal data of the Company and estimates. There is no guarantee that any of the forecasts, estimates or projections (including projections of revenue, expenses and earnings) set forth herein will be achieved. Actual results may vary from the projections and such variations may be material. Nothing contained herein is, or shall be relied upon as, a promise or representation as to the past or the future performance of the Company or any of its subsidiaries or any of its or their businesses. Forward-Looking Statements: This Presentation includes “forward-looking statements,” within the meaning of Section 27A of the Securities Act of 1933, as amended, and Section 21E of the Securities Exchange Act of 1934, as amended, including, in particular, any statements about the Company’s plans, strategies, objectives, initiatives, roadmap and prospects. The Company generally uses the words “may,” “will,” “could,” “expect,” “anticipate,” “believe,” “estimate,” “plan,” “intend,” “aim” and similar expressions to identify forward-looking statements. The Company bases these forward-looking statements on its current views with respect to future events and financial performance. In addition, any statements that refer to expectations or other characterizations of future events or circumstances, such as statements about the Company’s positioning in a competitive environment and go forward strategy are forward-looking statements. Statements that describe or relate to the Company’s plans, goals, intentions, strategies, initiatives, roadmap, prospects or financial projections or outlook, and statements that do not relate to historical or current fact, are examples of forward-looking statements. These statements are not guarantees of future performance and are subject to certain risks, uncertainties and other important factors, some of which are beyond the Company’s control and are difficult to predict. Various risks that could cause future results to differ from those expressed by the forward-looking statements. Other unknown or unpredictable factors also could have material adverse effects on the Company’s future results, performances or achievements. In light of these risks, uncertainties, assumptions and factors, the forward-looking events discussed in this Presentation and other materials provided by the Company may not occur. In particular, the projections are subject to inherent uncertainties and necessarily represent certain assumptions, and actual performance may differ. In addition, there is a risk the Company is unable to deliver any anticipated cost savings or re-alignment of strategy (or recognize the expected benefits therefrom) either from an inability to identify appropriate opportunities, anticipate implementation cost, delays in implementation or other factors. Do not place undue reliance on these forward-looking statements, which speak only as of the date stated, or if no date is stated, as of the date hereof. Forward-looking statements are not guarantees of future performance. Risks that could cause future results to differ from those expressed by any forward-looking statement are described in the Company’s periodic reports filed with the United States Securities and Exchange Commission (the “SEC”), including the disclosure contained in Item 1A. Risk Factors in the Company’s 2024 Annual Report on Form 10-K and Item 1A. Risk Factors in the Company’s Quarterly Reports on Form 10-Q filed with the SEC, as updated by the Company’s other filings with the SEC. Except as required by law, the Company does not undertake any obligation to update or revise these forward-looking statements to reflect new information or events or circumstances that occur after the date of this Presentation or to reflect the occurrence of unanticipated events or otherwise. You are advised to review the Company’s filings with the SEC (which are available on the SEC’s EDGAR database at www.sec.gov). |
| NASDAQ: ZYXI Disclaimer Continued Market Data: Certain market data information in this Presentation is based on management’s estimates. The Company believes its estimates to be reasonably accurate as of the date of this Presentation or as of the date indicated with respect to such estimates, as applicable. However, this information may prove to be inaccurate because of the method by which the Company obtained some of the data or estimates or because this information cannot always be verified due to the limits of the availability and reliability of raw data, the voluntary nature of the data gathering process and other limitations and uncertainties. Unless otherwise indicated, the information contained herein speaks only as of the date hereof and is subject to change, completion or amendment without notice. This Presentation contains trademarks, service marks, copyrights and trade names of other companies, which are the property of their respective owners. We do not intend to use or display other companies’ trademarks, service marks, copyrights and trade names to imply a relationship with, or endorsement or sponsorship of us by, any other companies. |
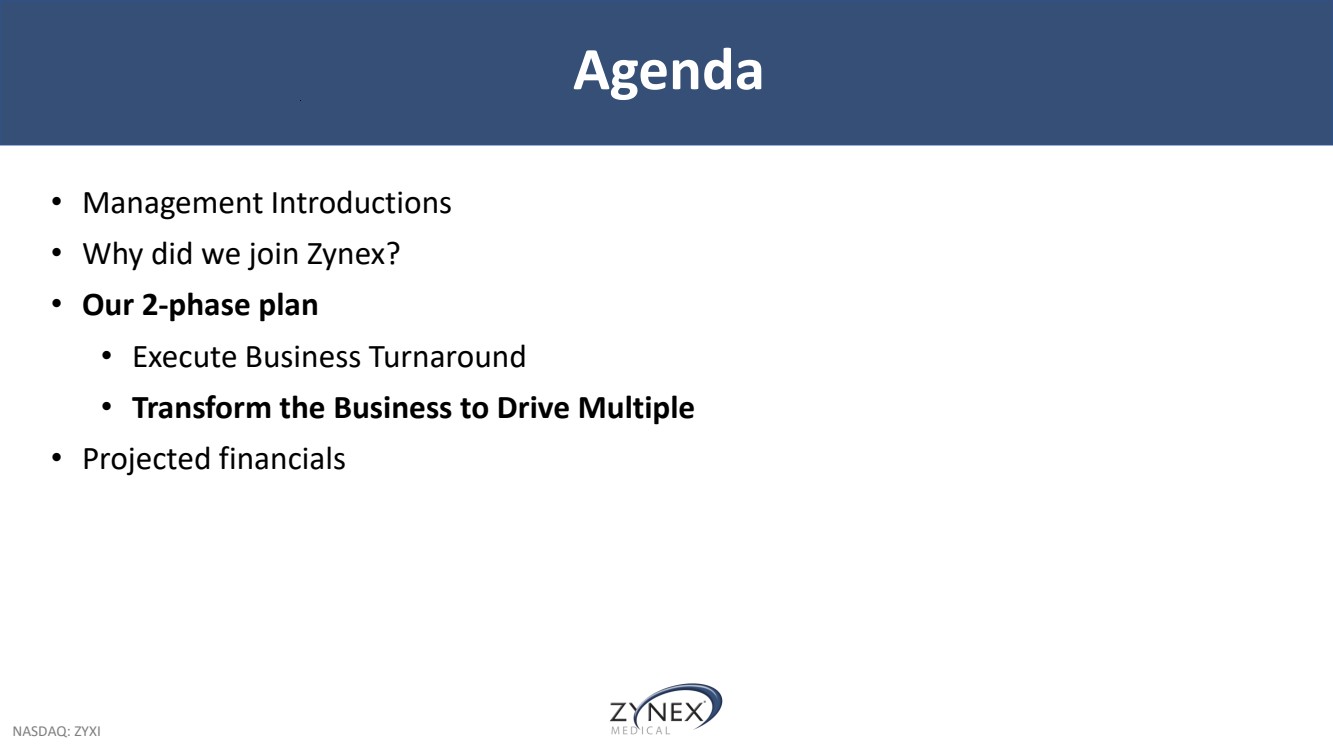
| NASDAQ: ZYXI Agenda • Management Introductions • Why did we join Zynex? • Our 2-phase plan • Execute Business Turnaround • Transform the Business to Drive Multiple • Projected financials |

| NASDAQ: ZYXI Management Introductions • 25+ years of experience in the medical technology sector, primarily through leadership at Apax. • Experienced in growing healthcare and medtech companies worldwide. • Board and transaction experience includes Candela (US), KCI (US), Rodenstock (Germany), Healthium Medtech (India), and Unilabs (Switzerland). • 20+ years of leadership experience in finance, M&A, and strategy in the med-tech sector. • Previously served as CFO of Vyaire Medical and Kepro, and as Head of Corp Dev at KCI • Earlier career includes investment banking at J.P. Morgan advising healthcare companies, and public accounting with Arthur Andersen; he is also a Chartered Accountant. • 20+ years of leadership in legal, compliance, and HR across the med-tech sector, including roles at Kinetic Concepts, LifeCell, and Vyaire Medical. • Experienced in guiding companies through M&A, capital markets, complex litigation, government disputes, compliance remediation, and intellectual property matters. • Oversses Zynex’s Legal, HR, Compliance, and Communications functions. |
| NASDAQ: ZYXI Agenda • Management Introductions • Why did we join Zynex? • Our 2-phase plan • Execute Business Turnaround • Transform the Business to Drive Multiple • Projected financials |
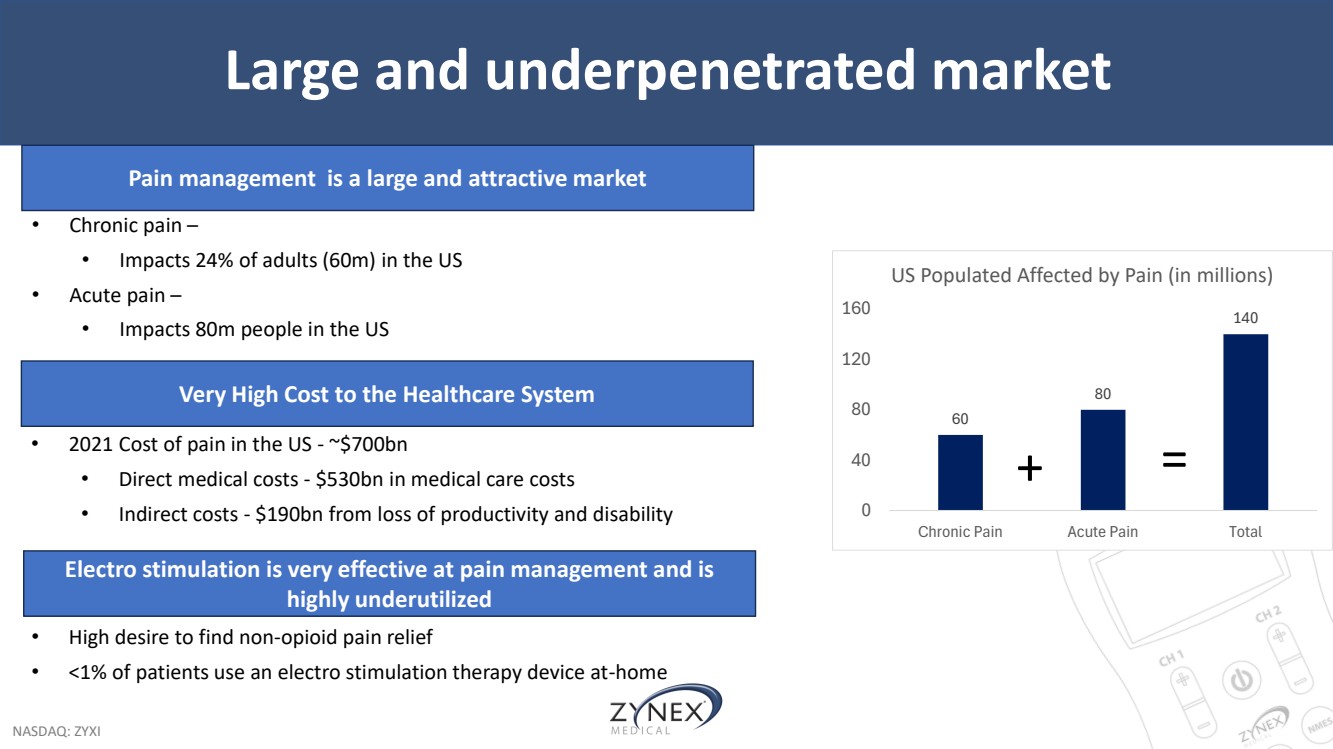
| NASDAQ: ZYXI Large and underpenetrated market 60 80 140 0 40 80 120 160 Chronic Pain Acute Pain Total US Populated Affected by Pain (in millions) + = • Chronic pain – • Impacts 24% of adults (60m) in the US • Acute pain – • Impacts 80m people in the US Pain management is a large and attractive market Electro stimulation is very effective at pain management and is highly underutilized • High desire to find non-opioid pain relief • <1% of patients use an electro stimulation therapy device at-home Very High Cost to the Healthcare System • 2021 Cost of pain in the US - ~$700bn • Direct medical costs - $530bn in medical care costs • Indirect costs - $190bn from loss of productivity and disability |
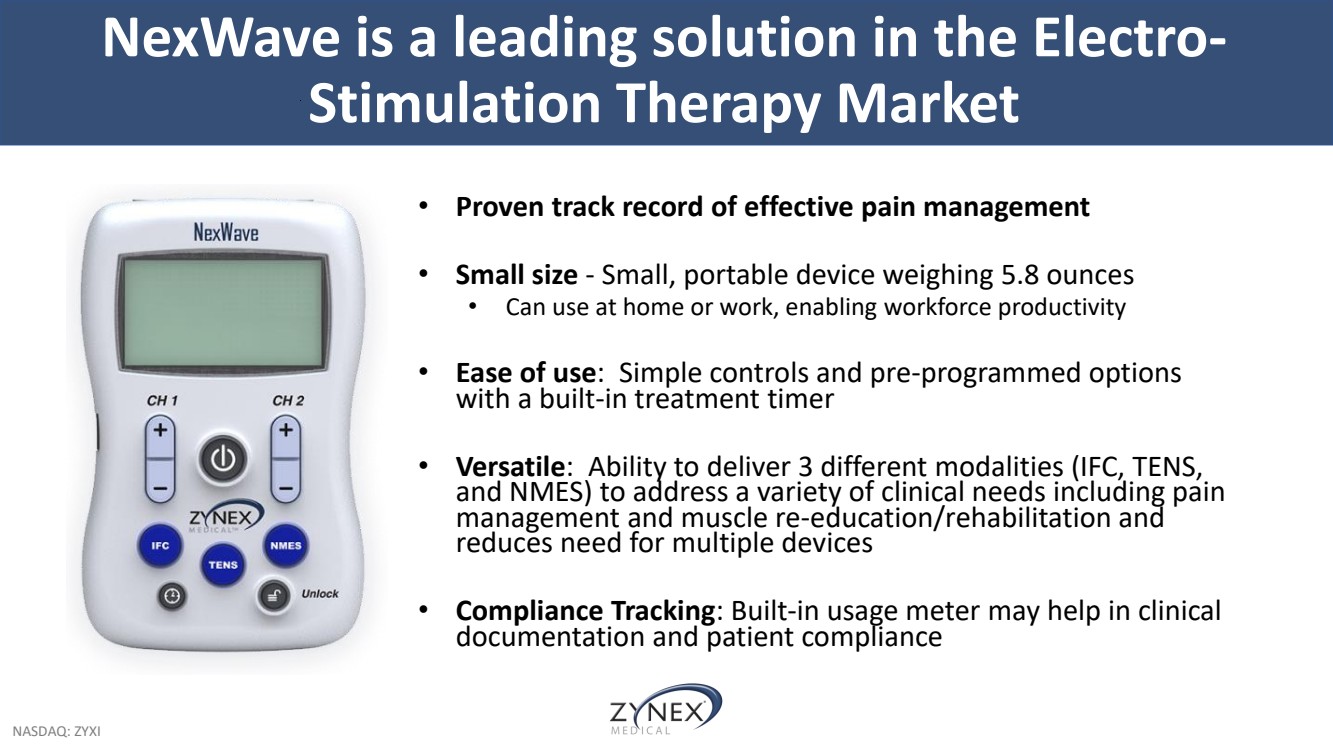
| NASDAQ: ZYXI • Proven track record of effective pain management • Small size - Small, portable device weighing 5.8 ounces • Can use at home or work, enabling workforce productivity • Ease of use: Simple controls and pre-programmed options with a built-in treatment timer • Versatile: Ability to deliver 3 different modalities (IFC, TENS, and NMES) to address a variety of clinical needs including pain management and muscle re-education/rehabilitation and reduces need for multiple devices • Compliance Tracking: Built-in usage meter may help in clinical documentation and patient compliance NexWave is a leading solution in the Electro-Stimulation Therapy Market |
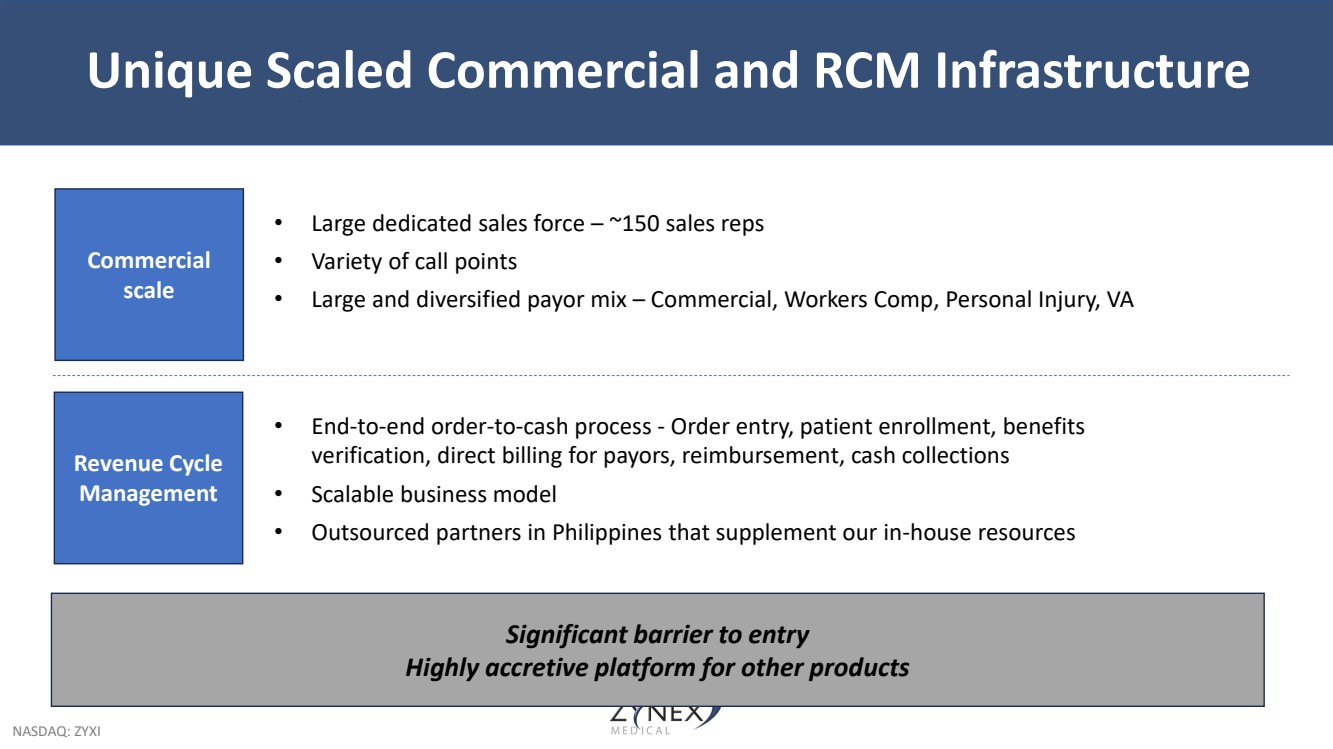
| NASDAQ: ZYXI Unique Scaled Commercial and RCM Infrastructure Commercial scale • Large dedicated sales force – ~150 sales reps • Variety of call points • Large and diversified payor mix – Commercial, Workers Comp, Personal Injury, VA • End-to-end order-to-cash process - Order entry, patient enrollment, benefits verification, direct billing for payors, reimbursement, cash collections • Scalable business model • Outsourced partners in Philippines that supplement our in-house resources Revenue Cycle Management Significant barrier to entry Highly accretive platform for other products |
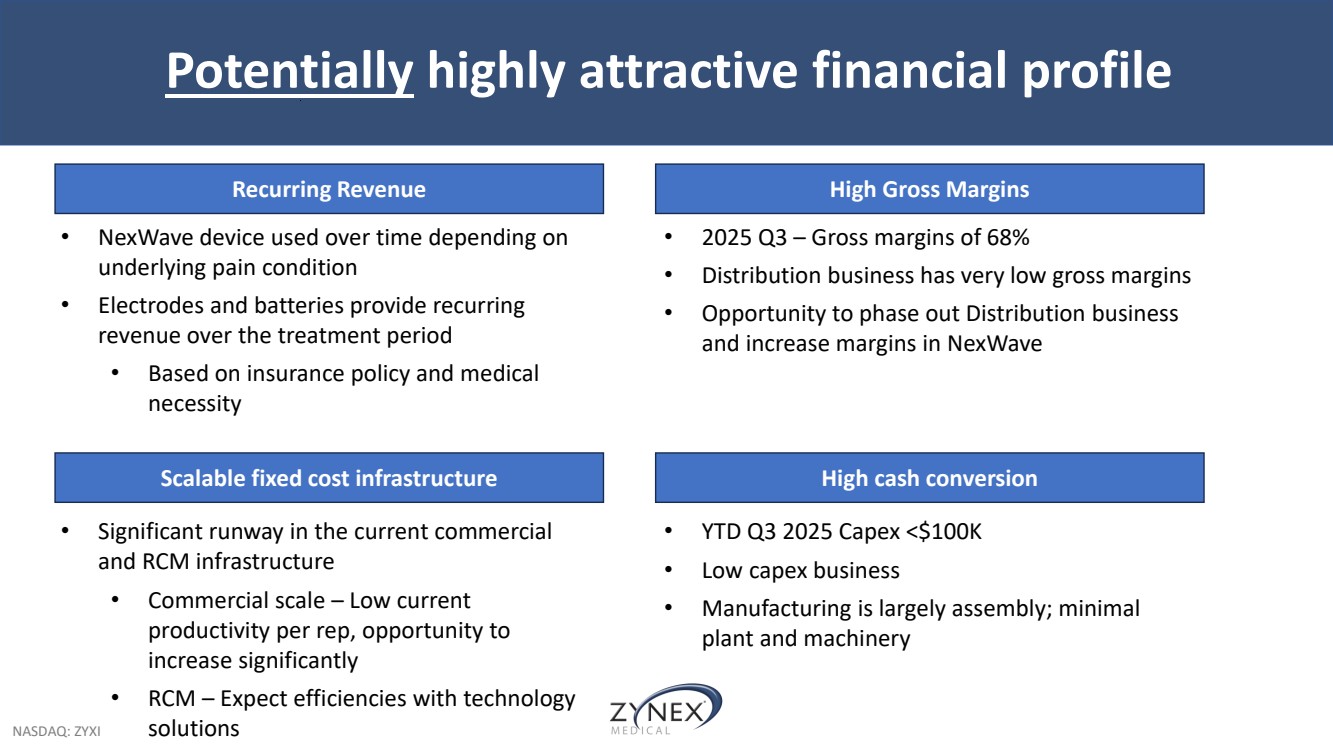
| NASDAQ: ZYXI Potentially highly attractive financial profile Recurring Revenue Scalable fixed cost infrastructure High Gross Margins High cash conversion • NexWave device used over time depending on underlying pain condition • Electrodes and batteries provide recurring revenue over the treatment period • Based on insurance policy and medical necessity • Significant runway in the current commercial and RCM infrastructure • Commercial scale – Low current productivity per rep, opportunity to increase significantly • RCM – Expect efficiencies with technology solutions • 2025 Q3 – Gross margins of 68% • Distribution business has very low gross margins • Opportunity to phase out Distribution business and increase margins in NexWave • YTD Q3 2025 Capex <$100K • Low capex business • Manufacturing is largely assembly; minimal plant and machinery |
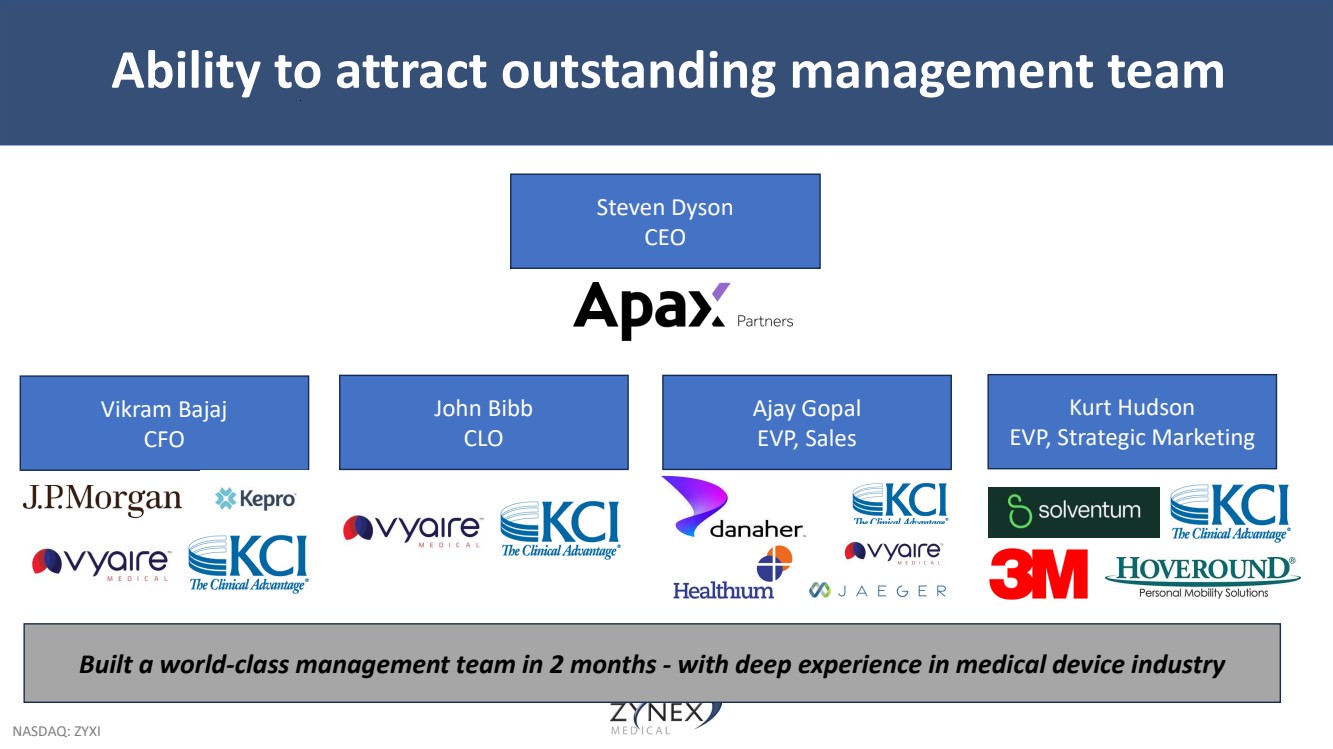
| NASDAQ: ZYXI Ability to attract outstanding management team Steven Dyson CEO Vikram Bajaj CFO John Bibb CLO Ajay Gopal EVP, Sales Kurt Hudson EVP, Strategic Marketing Built a world-class management team in 2 months - with deep experience in medical device industry |
| NASDAQ: ZYXI Agenda • Management Introductions • Why did we join Zynex? • Our 2-phase plan • Execute Business Turnaround • Transform the Business to Drive Multiple • Projected financials |
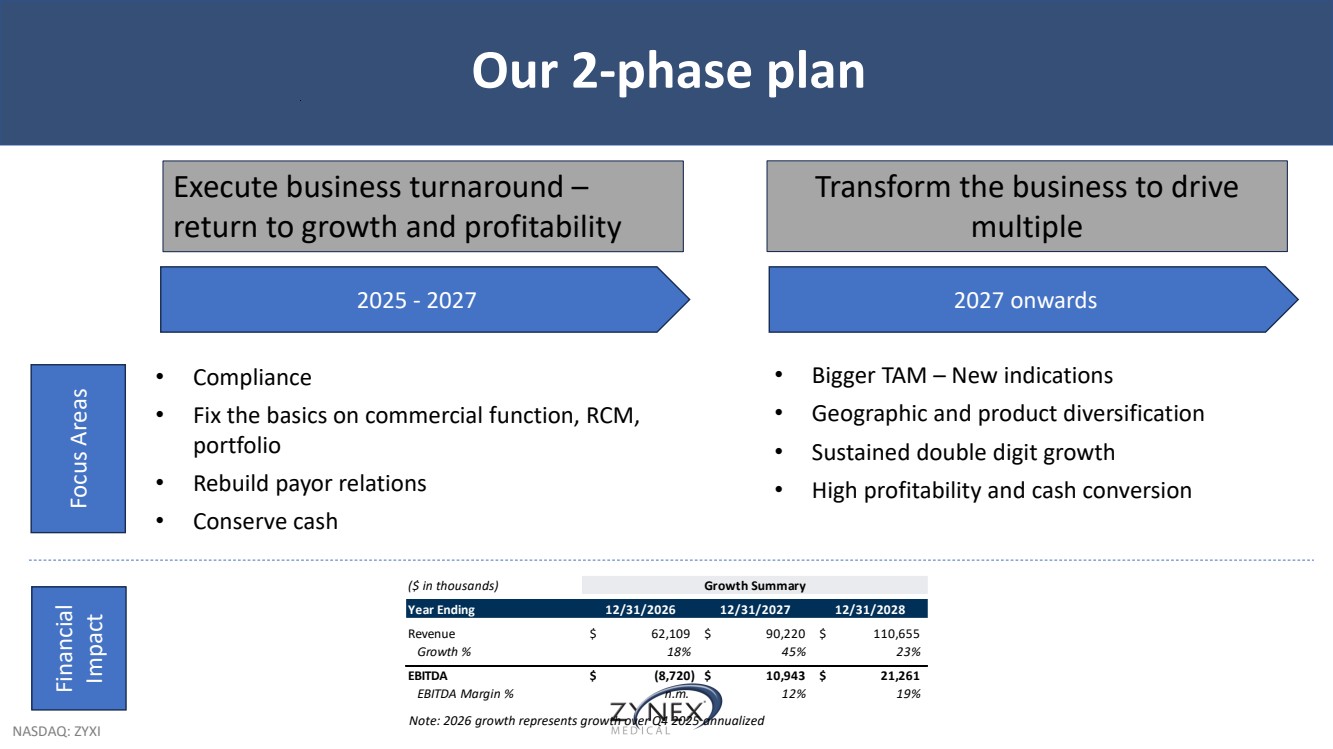
| NASDAQ: ZYXI Our 2-phase plan Execute business turnaround – return to growth and profitability Transform the business to drive multiple 2025 - 2027 2027 onwards • Compliance • Fix the basics on commercial function, RCM, portfolio • Rebuild payor relations • Conserve cash Focus Areas Financial Impact • Bigger TAM – New indications • Geographic and product diversification • Sustained double digit growth • High profitability and cash conversion ($ in thousands) Growth Summary Year Ending 12/31/2026 12/31/2027 12/31/2028 Revenue $ 62,109 $ 90,220 $ 110,655 Growth % 18% 45% 23% EBITDA $ (8,720) $ 10,943 $ 21,261 EBITDA Margin % n.m. 12% 19% Note: 2026 growth represents growth over Q4 2025 annualized |
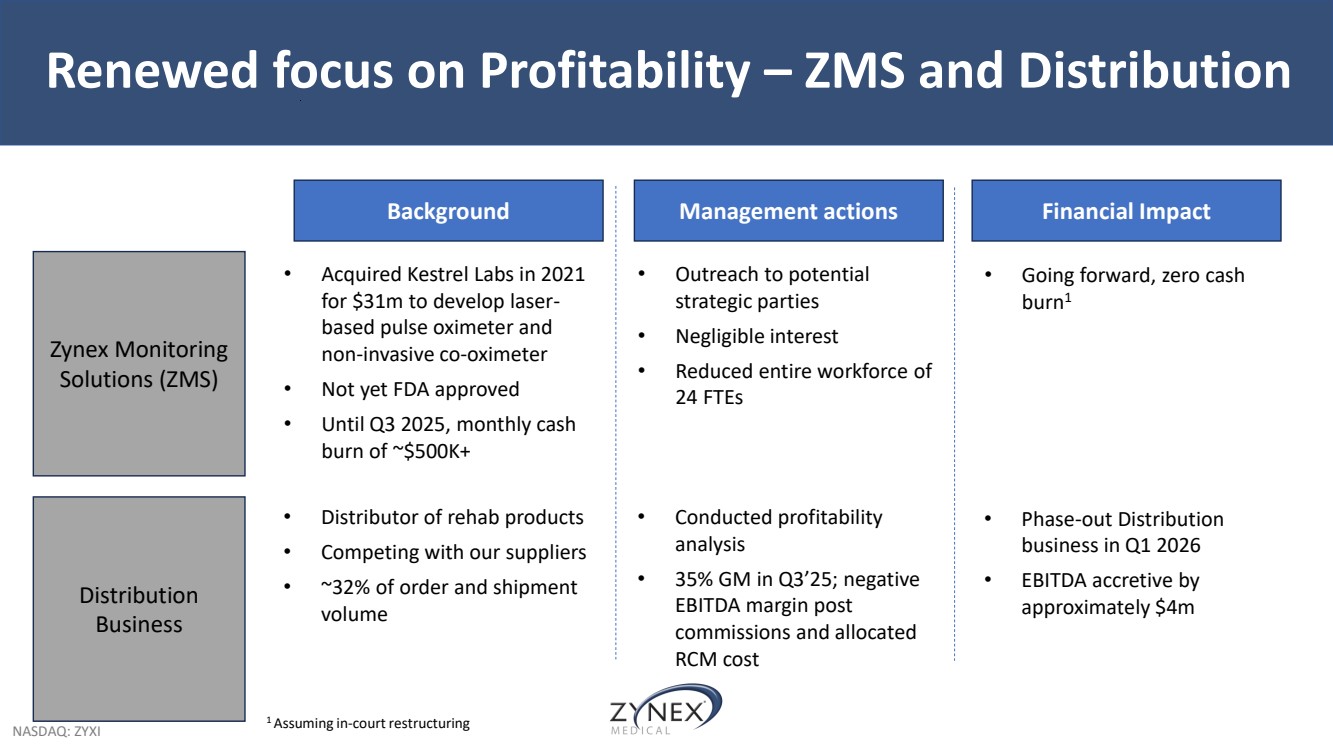
| NASDAQ: ZYXI Renewed focus on Profitability – ZMS and Distribution Background Management actions Zynex Monitoring Solutions (ZMS) Distribution Business Financial Impact • Acquired Kestrel Labs in 2021 for $31m to develop laser-based pulse oximeter and non-invasive co-oximeter • Not yet FDA approved • Until Q3 2025, monthly cash burn of ~$500K+ • Outreach to potential strategic parties • Negligible interest • Reduced entire workforce of 24 FTEs • Going forward, zero cash burn1 • Distributor of rehab products • Competing with our suppliers • ~32% of order and shipment volume • Conducted profitability analysis • 35% GM in Q3’25; negative EBITDA margin post commissions and allocated RCM cost • Phase-out Distribution business in Q1 2026 • EBITDA accretive by approximately $4m 1 Assuming in-court restructuring |
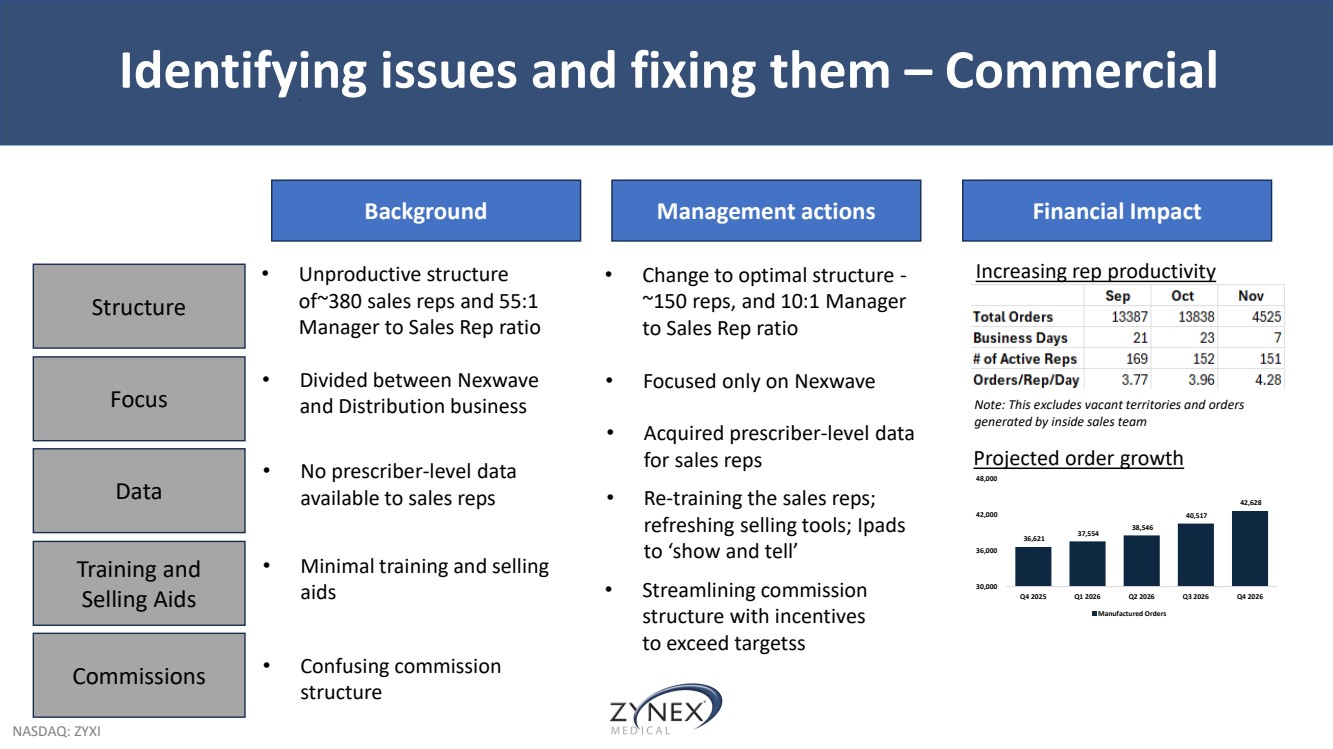
| NASDAQ: ZYXI Identifying issues and fixing them – Commercial Background Management actions Financial Impact • Unproductive structure of~380 sales reps and 55:1 Manager to Sales Rep ratio Structure Training and Selling Aids Focus Data • Change to optimal structure - ~150 reps, and 10:1 Manager to Sales Rep ratio Commissions • Divided between Nexwave and Distribution business • Focused only on Nexwave • No prescriber-level data available to sales reps • Acquired prescriber-level data for sales reps • Minimal training and selling aids • Re-training the sales reps; refreshing selling tools; Ipads to ‘show and tell’ • Confusing commission structure Increasing rep productivity Note: This excludes vacant territories and orders generated by inside sales team 36,621 37,554 38,546 40,517 42,628 30,000 36,000 42,000 48,000 Q4 2025 Q1 2026 Q2 2026 Q3 2026 Q4 2026 Manufactured Orders Projected order growth • Streamlining commission structure with incentives to exceed targetss |
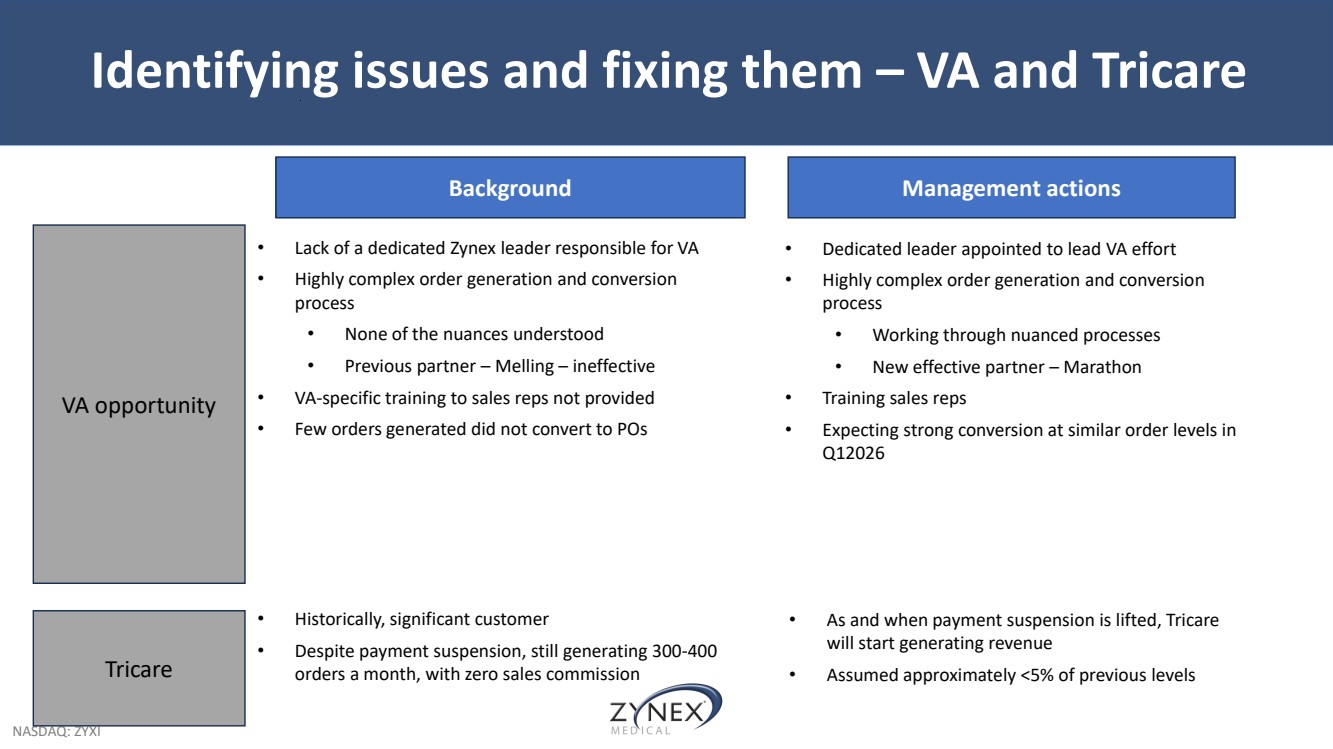
| NASDAQ: ZYXI Identifying issues and fixing them – VA and Tricare VA opportunity Tricare Background • Lack of a dedicated Zynex leader responsible for VA • Highly complex order generation and conversion process • None of the nuances understood • Previous partner – Melling – ineffective • VA-specific training to sales reps not provided • Few orders generated did not convert to POs • Historically, significant customer • Despite payment suspension, still generating 300-400 orders a month, with zero sales commission Management actions • Dedicated leader appointed to lead VA effort • Highly complex order generation and conversion process • Working through nuanced processes • New effective partner – Marathon • Training sales reps • Expecting strong conversion at similar order levels in Q12026 • As and when payment suspension is lifted, Tricare will start generating revenue • Assumed approximately <5% of previous levels |
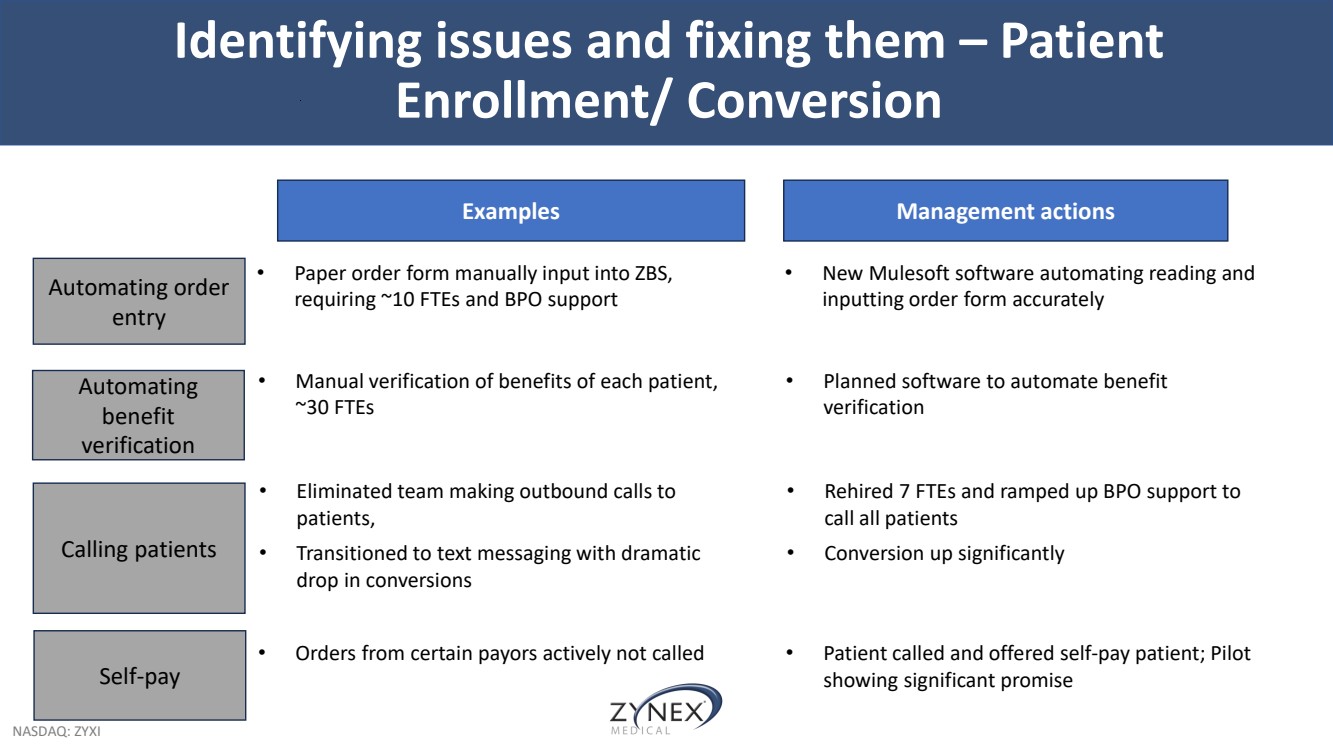
| NASDAQ: ZYXI Identifying issues and fixing them – Patient Enrollment/ Conversion Automating order entry Calling patients Automating benefit verification Self-pay Examples • Paper order form manually input into ZBS, requiring ~10 FTEs and BPO support • Eliminated team making outbound calls to patients, • Transitioned to text messaging with dramatic drop in conversions • Manual verification of benefits of each patient, ~30 FTEs • Orders from certain payors actively not called Management actions • New Mulesoft software automating reading and inputting order form accurately • Rehired 7 FTEs and ramped up BPO support to call all patients • Conversion up significantly • Planned software to automate benefit verification • Patient called and offered self-pay patient; Pilot showing significant promise |
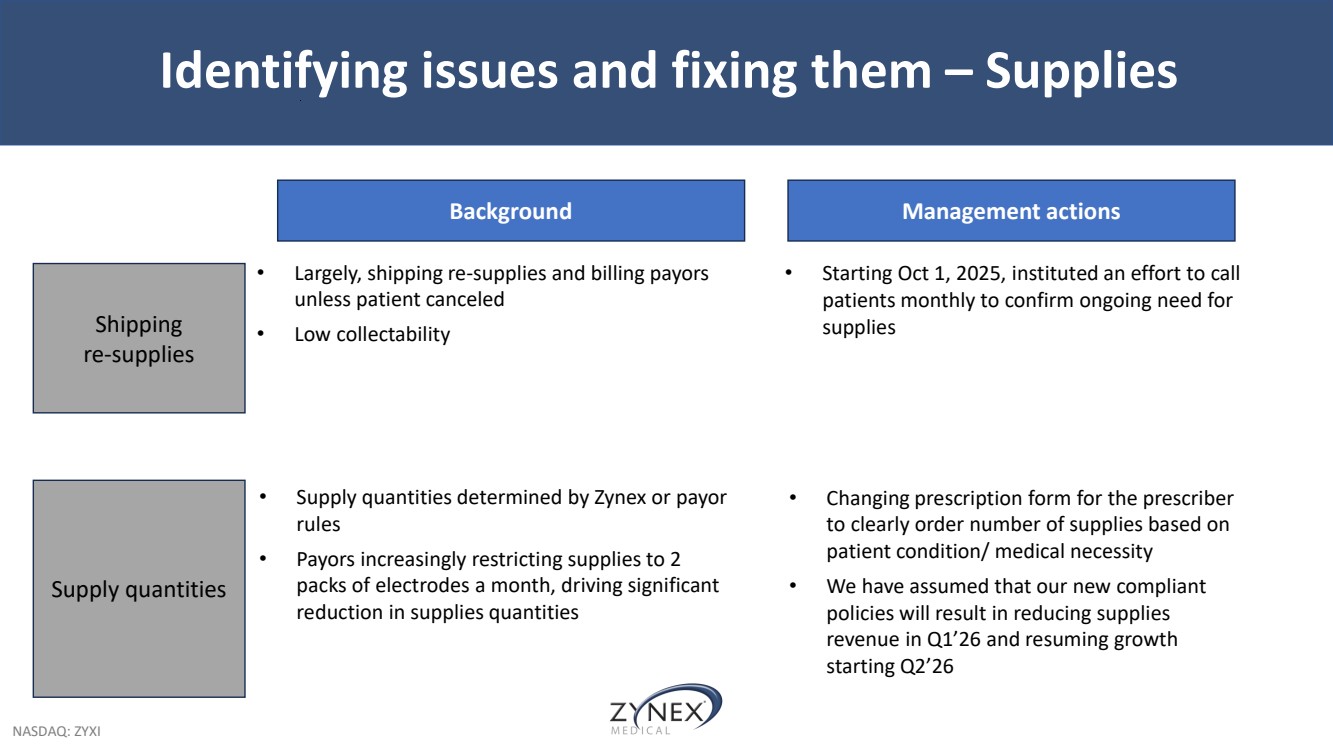
| NASDAQ: ZYXI Identifying issues and fixing them – Supplies Shipping re-supplies Supply quantities Background • Largely, shipping re-supplies and billing payors unless patient canceled • Low collectability • Supply quantities determined by Zynex or payor rules • Payors increasingly restricting supplies to 2 packs of electrodes a month, driving significant reduction in supplies quantities Management actions • Starting Oct 1, 2025, instituted an effort to call patients monthly to confirm ongoing need for supplies • Changing prescription form for the prescriber to clearly order number of supplies based on patient condition/ medical necessity • We have assumed that our new compliant policies will result in reducing supplies revenue in Q1’26 and resuming growth starting Q2’26 |
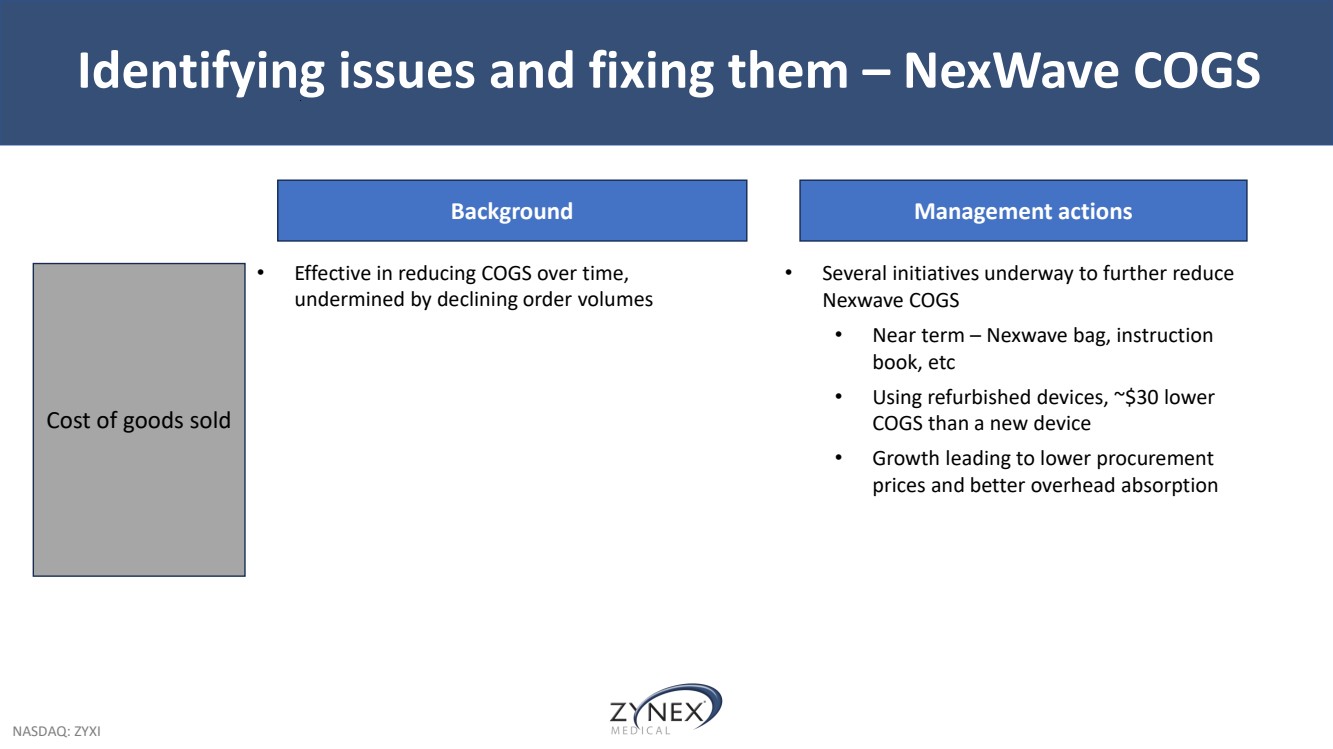
| NASDAQ: ZYXI Identifying issues and fixing them – NexWave COGS Background • Effective in reducing COGS over time, undermined by declining order volumes Cost of goods sold Management actions • Several initiatives underway to further reduce Nexwave COGS • Near term – Nexwave bag, instruction book, etc • Using refurbished devices, ~$30 lower COGS than a new device • Growth leading to lower procurement prices and better overhead absorption |
| NASDAQ: ZYXI Agenda • Management Introductions • Why did we join Zynex? • Our 2-phase plan • Execute Business Turnaround • Transform the Business to Drive Multiple • Projected financials |
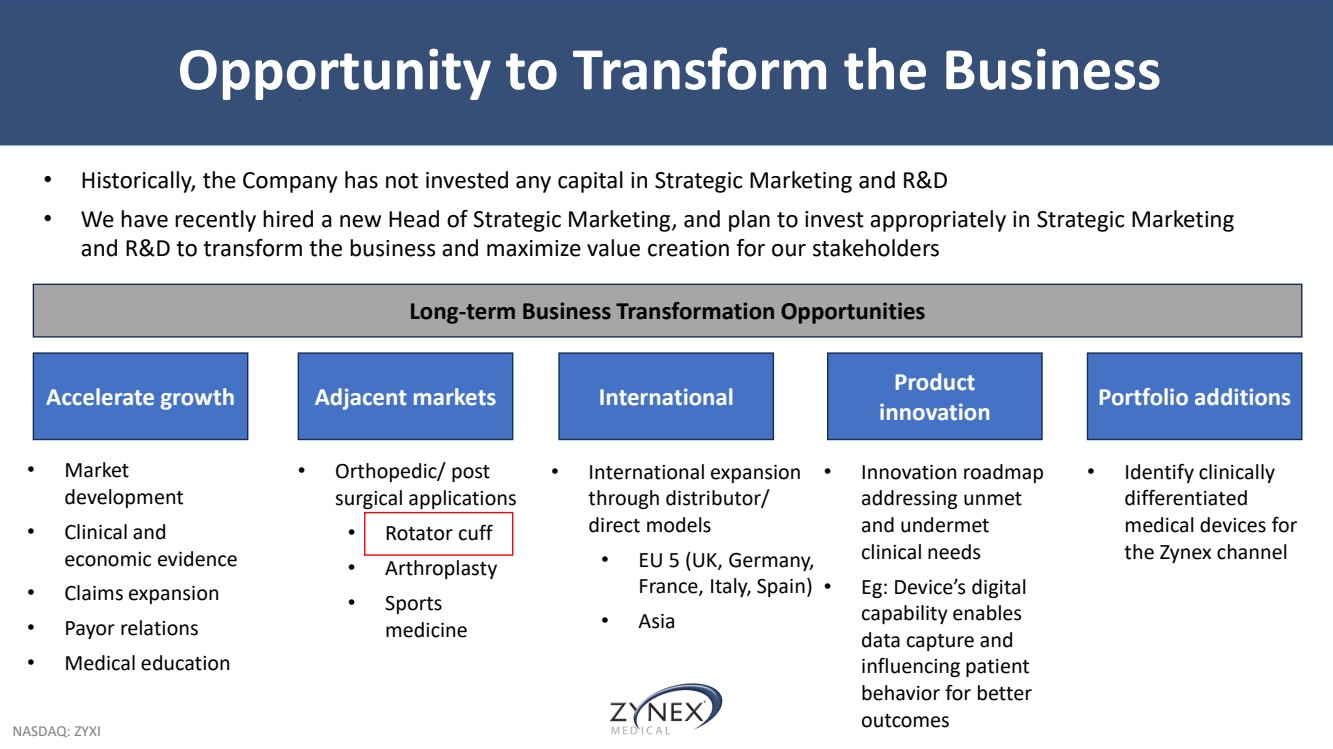
| NASDAQ: ZYXI Opportunity to Transform the Business International Product innovation Accelerate growth Adjacent markets Portfolio additions • Historically, the Company has not invested any capital in Strategic Marketing and R&D • We have recently hired a new Head of Strategic Marketing, and plan to invest appropriately in Strategic Marketing and R&D to transform the business and maximize value creation for our stakeholders Long-term Business Transformation Opportunities • Market development • Clinical and economic evidence • Claims expansion • Payor relations • Medical education • Orthopedic/ post surgical applications • Rotator cuff • Arthroplasty • Sports medicine • International expansion through distributor/ direct models • EU 5 (UK, Germany, France, Italy, Spain) • Asia • Innovation roadmap addressing unmet and undermet clinical needs • Eg: Device’s digital capability enables data capture and influencing patient behavior for better outcomes • Identify clinically differentiated medical devices for the Zynex channel |
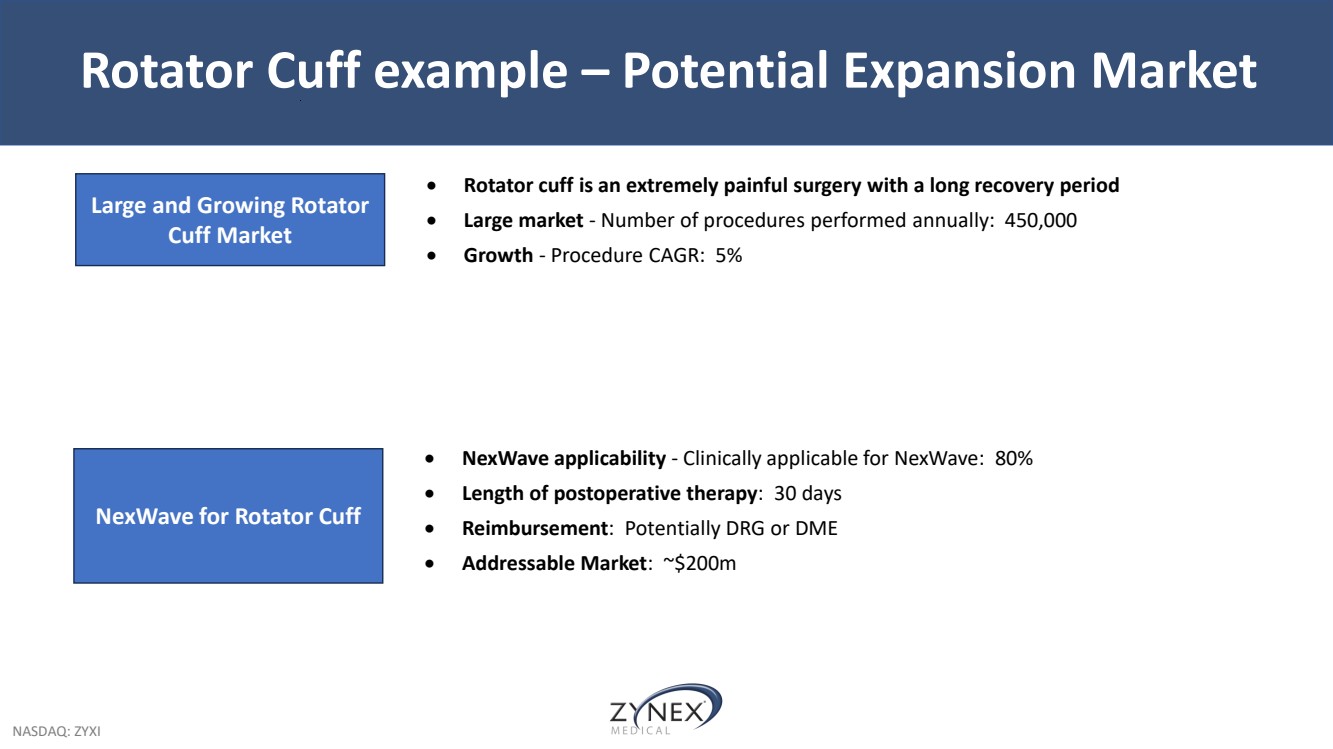
| NASDAQ: ZYXI Rotator Cuff example – Potential Expansion Market • Rotator cuff is an extremely painful surgery with a long recovery period • Large market - Number of procedures performed annually: 450,000 • Growth - Procedure CAGR: 5% Large and Growing Rotator Cuff Market • NexWave applicability - Clinically applicable for NexWave: 80% • Length of postoperative therapy: 30 days • Reimbursement: Potentially DRG or DME • Addressable Market: ~$200m NexWave for Rotator Cuff |
| NASDAQ: ZYXI Agenda • Management Introductions • Why did we join Zynex? • Our 2-phase plan • Execute Business Turnaround • Transform the Business to Drive Multiple • Projected financials |
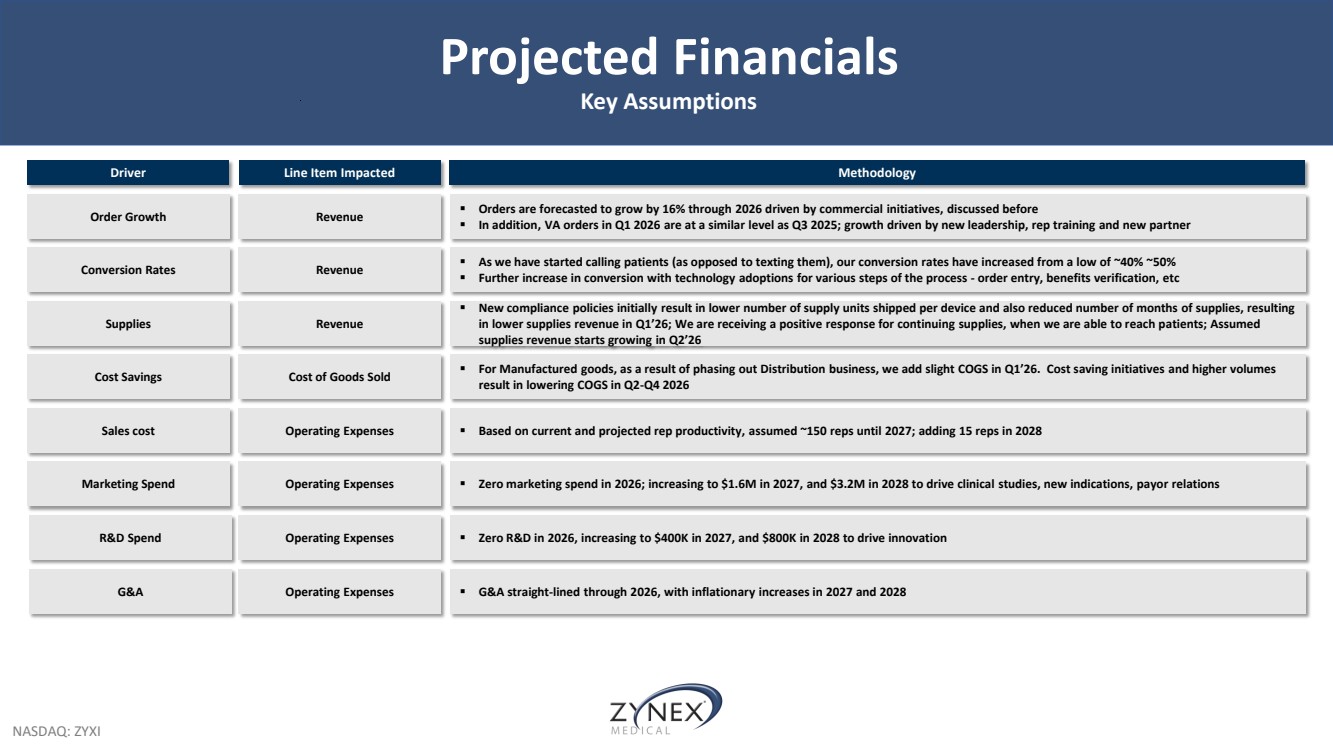
| NASDAQ: ZYXI Projected Financials Key Assumptions R&D Spend Driver Line Item Impacted Methodology Order Growth Revenue ▪ Orders are forecasted to grow by 16% through 2026 driven by commercial initiatives, discussed before ▪ In addition, VA orders in Q1 2026 are at a similar level as Q3 2025; growth driven by new leadership, rep training and new partner Conversion Rates Revenue ▪ As we have started calling patients (as opposed to texting them), our conversion rates have increased from a low of ~40% ~50% ▪ Further increase in conversion with technology adoptions for various steps of the process - order entry, benefits verification, etc Cost Savings Cost of Goods Sold ▪ For Manufactured goods, as a result of phasing out Distribution business, we add slight COGS in Q1’26. Cost saving initiatives and higher volumes result in lowering COGS in Q2-Q4 2026 Sales cost Operating Expenses ▪ Based on current and projected rep productivity, assumed ~150 reps until 2027; adding 15 reps in 2028 Marketing Spend Operating Expenses ▪ Zero marketing spend in 2026; increasing to $1.6M in 2027, and $3.2M in 2028 to drive clinical studies, new indications, payor relations Operating Expenses ▪ Zero R&D in 2026, increasing to $400K in 2027, and $800K in 2028 to drive innovation Supplies Revenue ▪ New compliance policies initially result in lower number of supply units shipped per device and also reduced number of months of supplies, resulting in lower supplies revenue in Q1’26; We are receiving a positive response for continuing supplies, when we are able to reach patients; Assumed supplies revenue starts growing in Q2’26 G&A Operating Expenses ▪ G&A straight-lined through 2026, with inflationary increases in 2027 and 2028 |
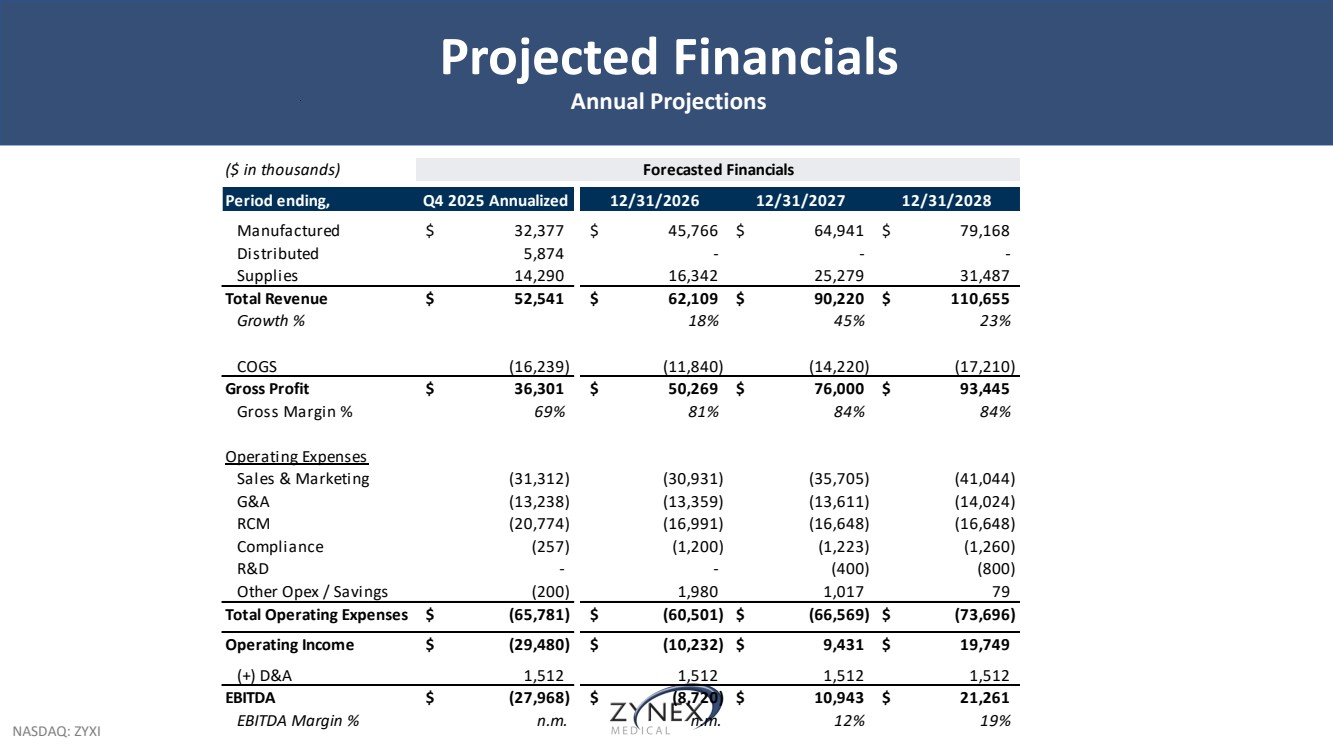
| NASDAQ: ZYXI Projected Financials Annual Projections ($ in thousands) Forecasted Financials Period ending, Q4 2025 Annualized 12/31/2026 12/31/2027 12/31/2028 Manufactured $ 32,377 $ 45,766 $ 64,941 $ 79,168 Distributed 5,874 - - - Supplies 14,290 16,342 25,279 31,487 Total Revenue $ 52,541 $ 62,109 $ 90,220 $ 110,655 Growth % 18% 45% 23% COGS (16,239) (11,840) (14,220) (17,210) Gross Profit $ 36,301 $ 50,269 $ 76,000 $ 93,445 Gross Margin % 69% 81% 84% 84% Operating Expenses Sales & Marketing (31,312) (30,931) (35,705) (41,044) G&A (13,238) (13,359) (13,611) (14,024) RCM (20,774) (16,991) (16,648) (16,648) Compliance (257) (1,200) (1,223) (1,260) R&D - - (400) (800) Other Opex / Savings (200) 1,980 1,017 7 9 Total Operating Expenses $ (65,781) $ (60,501) $ (66,569) $ (73,696) Operating Income $ (29,480) $ (10,232) $ 9,431 $ 19,749 (+) D&A 1,512 1,512 1,512 1,512 EBITDA $ (27,968) $ (8,720) $ 10,943 $ 21,261 EBITDA Margin % n.m. n.m. 12% 19% |
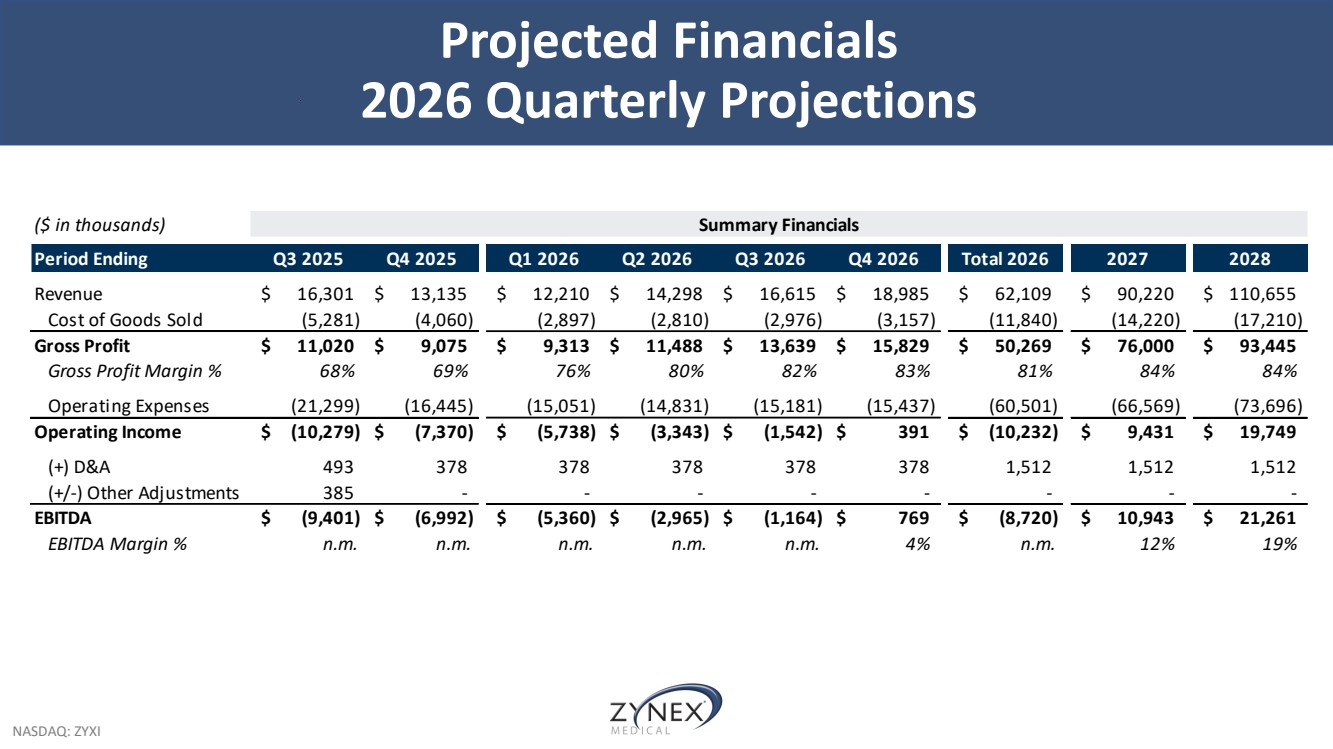
| NASDAQ: ZYXI Projected Financials 2026 Quarterly Projections ($ in thousands) Summary Financials Period Ending Q3 2025 Q4 2025 Q1 2026 Q2 2026 Q3 2026 Q4 2026 Total 2026 2027 2028 Revenue $ 16,301 $ 13,135 $ 12,210 $ 14,298 $ 16,615 $ 18,985 $ 62,109 $ 90,220 $ 110,655 Cost of Goods Sold (5,281) (4,060) (2,897) (2,810) (2,976) (3,157) (11,840) (14,220) (17,210) Gross Profit $ 11,020 $ 9,075 $ 9,313 $ 11,488 $ 13,639 $ 15,829 $ 50,269 $ 76,000 $ 93,445 Gross Profit Margin % 68% 69% 76% 80% 82% 83% 81% 84% 84% Operating Expenses (21,299) (16,445) (15,051) (14,831) (15,181) (15,437) (60,501) (66,569) (73,696) Operating Income $ (10,279) $ (7,370) $ (5,738) $ (3,343) $ (1,542) $ 391 $ (10,232) $ 9,431 $ 19,749 (+) D&A 493 378 378 378 378 378 1,512 1,512 1,512 (+/-) Other Adjustments 385 - - - - - - - - EBITDA $ (9,401) $ (6,992) $ (5,360) $ (2,965) $ (1,164) $ 769 $ (8,720) $ 10,943 $ 21,261 EBITDA Margin % n.m. n.m. n.m. n.m. n.m. 4 % n.m. 12% 19% |
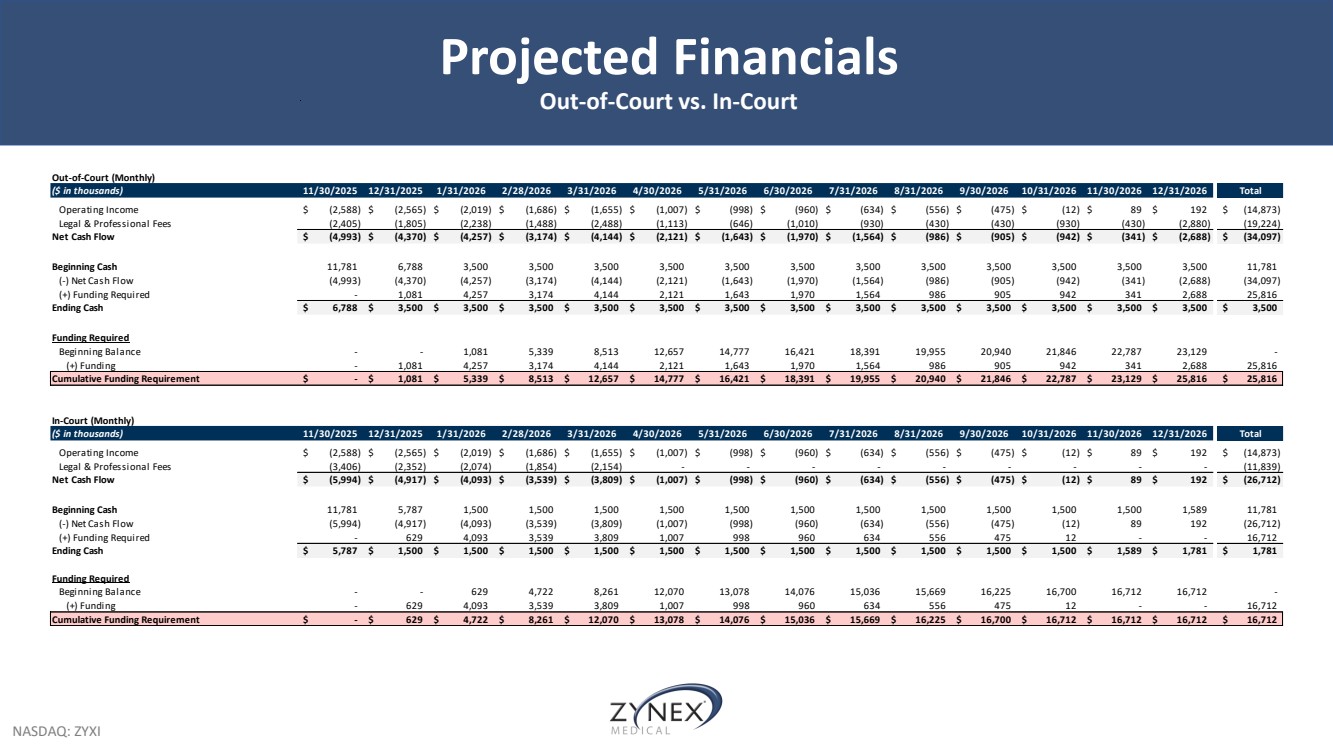
| NASDAQ: ZYXI Projected Financials Out-of-Court vs. In-Court Out-of-Court (Monthly) ($ in thousands) 11/30/2025 12/31/2025 1/31/2026 2/28/2026 3/31/2026 4/30/2026 5/31/2026 6/30/2026 7/31/2026 8/31/2026 9/30/2026 10/31/2026 11/30/2026 12/31/2026 Total Operating Income $ (2,588) $ (2,565) $ (2,019) $ (1,686) $ (1,655) $ (1,007) $ (998) $ (960) $ (634) $ (556) $ (475) $ (12) $ 8 9 $ 192 $ (14,873) Legal & Professional Fees (2,405) (1,805) (2,238) (1,488) (2,488) (1,113) (646) (1,010) (930) (430) (430) (930) (430) (2,880) (19,224) Net Cash Flow $ (4,993) $ (4,370) $ (4,257) $ (3,174) $ (4,144) $ (2,121) $ (1,643) $ (1,970) $ (1,564) $ (986) $ (905) $ (942) $ (341) $ (2,688) $ (34,097) Beginning Cash 11,781 6,788 3,500 3,500 3,500 3,500 3,500 3,500 3,500 3,500 3,500 3,500 3,500 3,500 11,781 (-) Net Cash Flow (4,993) (4,370) (4,257) (3,174) (4,144) (2,121) (1,643) (1,970) (1,564) (986) (905) (942) (341) (2,688) (34,097) (+) Funding Required - 1,081 4,257 3,174 4,144 2,121 1,643 1,970 1,564 986 905 942 341 2,688 25,816 Ending Cash $ 6,788 $ 3,500 $ 3,500 $ 3,500 $ 3,500 $ 3,500 $ 3,500 $ 3,500 $ 3,500 $ 3,500 $ 3,500 $ 3,500 $ 3,500 $ 3,500 $ 3,500 Funding Required Beginning Balance - - 1,081 5,339 8,513 12,657 14,777 16,421 18,391 19,955 20,940 21,846 22,787 23,129 - (+) Funding - 1,081 4,257 3,174 4,144 2,121 1,643 1,970 1,564 986 905 942 341 2,688 25,816 Cumulative Funding Requirement $ - $ 1,081 $ 5,339 $ 8,513 $ 12,657 $ 14,777 $ 16,421 $ 18,391 $ 19,955 $ 20,940 $ 21,846 $ 22,787 $ 23,129 $ 25,816 $ 25,816 In-Court (Monthly) ($ in thousands) 11/30/2025 12/31/2025 1/31/2026 2/28/2026 3/31/2026 4/30/2026 5/31/2026 6/30/2026 7/31/2026 8/31/2026 9/30/2026 10/31/2026 11/30/2026 12/31/2026 Total Operating Income $ (2,588) $ (2,565) $ (2,019) $ (1,686) $ (1,655) $ (1,007) $ (998) $ (960) $ (634) $ (556) $ (475) $ (12) $ 8 9 $ 192 $ (14,873) Legal & Professional Fees (3,406) (2,352) (2,074) (1,854) (2,154) - - - - - - - - - (11,839) Net Cash Flow $ (5,994) $ (4,917) $ (4,093) $ (3,539) $ (3,809) $ (1,007) $ (998) $ (960) $ (634) $ (556) $ (475) $ (12) $ 8 9 $ 192 $ (26,712) Beginning Cash 11,781 5,787 1,500 1,500 1,500 1,500 1,500 1,500 1,500 1,500 1,500 1,500 1,500 1,589 11,781 (-) Net Cash Flow (5,994) (4,917) (4,093) (3,539) (3,809) (1,007) (998) (960) (634) (556) (475) (12) 8 9 192 (26,712) (+) Funding Required - 629 4,093 3,539 3,809 1,007 998 960 634 556 475 1 2 - - 16,712 Ending Cash $ 5,787 $ 1,500 $ 1,500 $ 1,500 $ 1,500 $ 1,500 $ 1,500 $ 1,500 $ 1,500 $ 1,500 $ 1,500 $ 1,500 $ 1,589 $ 1,781 $ 1,781 Funding Required Beginning Balance - - 629 4,722 8,261 12,070 13,078 14,076 15,036 15,669 16,225 16,700 16,712 16,712 - (+) Funding - 629 4,093 3,539 3,809 1,007 998 960 634 556 475 1 2 - - 16,712 Cumulative Funding Requirement $ - $ 629 $ 4,722 $ 8,261 $ 12,070 $ 13,078 $ 14,076 $ 15,036 $ 15,669 $ 16,225 $ 16,700 $ 16,712 $ 16,712 $ 16,712 $ 16,712 |