.2
Earnings Presentation October 2026 Great Southern Bancorp. Inc (NASDAQ: GSBC) Third Quarter Ended September 30, 2026
Forward - Looking Statements When used in this presentation and in other documents filed or furnished by the Company with or to the Securities and Exchange Commission (the “SEC”), in the Company's other press releases or other public or stockholder communications, and in oral statements made with the approval of an authorized executive officer, the words or phrases “may,” “might,” “could,” “should,” "will likely result," "are expected to," "will continue," "is anticipated," “believe,” "estimate," "project," "intends" or similar expressions are intended to identify "forward - looking statements" within the meaning of the Private Securities Litigation Reform Act of 1995. Forward - looking statements also include, but are not limited to, statements regarding plans, objectives, expectations or consequences of announced transactions, known trends and statements about future performance, operations, products and services of the Company. The Company’s ability to predict results or the actual effects of future plans or strategies is inherently uncertain, and the Company’s actual results could differ materially from those contained in the forward - looking statements. Factors that could cause or contribute to such differences include, but are not limited to: (i) expected revenues, cost savings, earnings accretion, synergies and other benefits from the Company's merger and acquisition activities might not be realized within the anticipated time frames or at all, and costs or difficulties relating to integration matters, including but not limited to customer and employee retention, might be greater than expected; (ii) changes in economic conditions, either nationally or in the Company's market areas; (iii) the effects of any new or continuing public health issues on general economic and financial market conditions; (iv) fluctuations in interest rates, the effects of inflation or a potential recession, whether caused by Federal Reserve actions or otherwise; (v) the impact of bank failures or adverse developments at other banks and related negative press about the banking industry in general on investor and depositor sentiment; (vi) slower or negative economic growth caused by tariffs, changes in energy prices, supply chain disruptions or other factors; (vii) the risks of lending and investing activities, including changes in the level and direction of loan delinquencies and write - offs and changes in estimates of the adequacy of the allowance for credit losses; (viii) the possibility of realized or unrealized losses on securities held in the Company's investment portfolio; (ix) the Company's ability to access cost - effective funding and maintain sufficient liquidity; (x) fluctuations in real estate values and both residential and commercial real estate market conditions; (xi) the ability to adapt successfully to technological changes to meet customers' needs and developments in the marketplace; (xii) the possibility that security measures implemented might not be sufficient to mitigate the risk of a cyber - attack or cyber theft, and that such security measures might not protect against systems failures or interruptions; (xiii) legislative or regulatory changes that adversely affect the Company's business; (xiv) changes in accounting policies and practices or accounting standards; (xv) results of examinations of the Company and Great Southern Bank by their regulators, including the possibility that the regulators may, among other things, require the Company to limit its business activities, change its business mix, increase its allowance for credit losses, write - down assets or increase its capital levels, or affect its ability to borrow funds or maintain or increase deposits, which could adversely affect its liquidity and earnings; (xvi) costs and effects of litigation, including settlements and judgments; (xvii) competition; and (xviii) natural disasters, war, terrorist activities or civil unrest and their effects on economic and business environments in which the Company operates. The Company wishes to advise readers that the factors listed above and other risks described in the Company’s most recent Annual Report on Form 10 - K, including, without limitation, those described under “Item 1A. Risk Factors,” subsequent Quarterly Reports on Form 10 - Q and other documents filed or furnished from time to time by the Company with the SEC (which are available on our website at www.greatsouthernbank.com and the SEC’s website at www.sec.gov), could affect the Company's financial performance and cause the Company's actual results for future periods to differ materially from any opinions or statements expressed with respect to future periods in any current statements. The Company does not undertake - and specifically declines any obligation - to publicly release the result of any revisions which may be made to any forward - looking statements to reflect events or circumstances after the date of such statements or to reflect the occurrence of anticipated or unanticipated events. Great Southern Bancorp. Inc | 2
Executive Management Team Joseph W. Turner joined Great Southern in 1991 and became an officer of Bancorp in 1995. He was appointed to the Board of Directors of Bancorp and Great Southern in 1997 and has served as President and Chief Executive Officer since 2000. In this role, he has led the company’s strategic vision, financial growth, and operational execution, positioning Great Southern as a strong and competitive institution. Before joining Great Southern, Mr. Turner practiced law with Stinson LLP in Kansas City, Missouri, where he specialized in financial and corporate matters. His deep understanding of regulatory compliance, risk management, and corporate governance has been instrumental in guiding the bank’s financial strategy. Mr. Turner is the son of William V. Turner, Chairman of the Board, and the brother of Julie Turner Brown, a fellow director. He also serves on the board of CoxHealth, contributing expertise in financial oversight. His decades of leadership have driven Great Southern’s success, ensuring stability, disciplined management, and long - term value for shareholders. Joseph W. Turner President & Chief Executive Officer Rex A. Copeland Senior Vice President & Chief Financial Officer Rex A. Copeland has served as Senior Vice President, Chief Financial Officer, and Treasurer of Great Southern Bancorp, Inc. and Great Southern Bank since 2000. He oversees all financial functions of the company, including financial reporting, strategic planning, risk management, and capital allocation. With decades of experience in corporate finance, he has played a pivotal role in shaping financial policies, ensuring regulatory compliance, and optimizing efficiency. Before joining Great Southern, Mr. Copeland held financial leadership positions at Bank One Corporation, where he contributed to internal audit, financial strategy and corporate accounting. He began his career as an auditor with Forvis Mazars, LLP (formerly BKD, LLP), developing a strong foundation in financial reporting, internal controls, and audit procedures. Previously practicing as a Certified Public Accountant, he has expertise in financial management, corporate governance, and regulatory affairs. Mr. Copeland’s leadership has been instrumental in Great Southern’s stability and long - term growth. His financial expertise supports disciplined fiscal management and shareholder value. He remains active in industry organizations, offering insights on financial best practices and corporate strategy. Great Southern Bancorp. Inc | 3
Financial Performance Great Southern Bancorp. Inc (NASDAQ: GSBC) Quarter Ended September 30, 2026
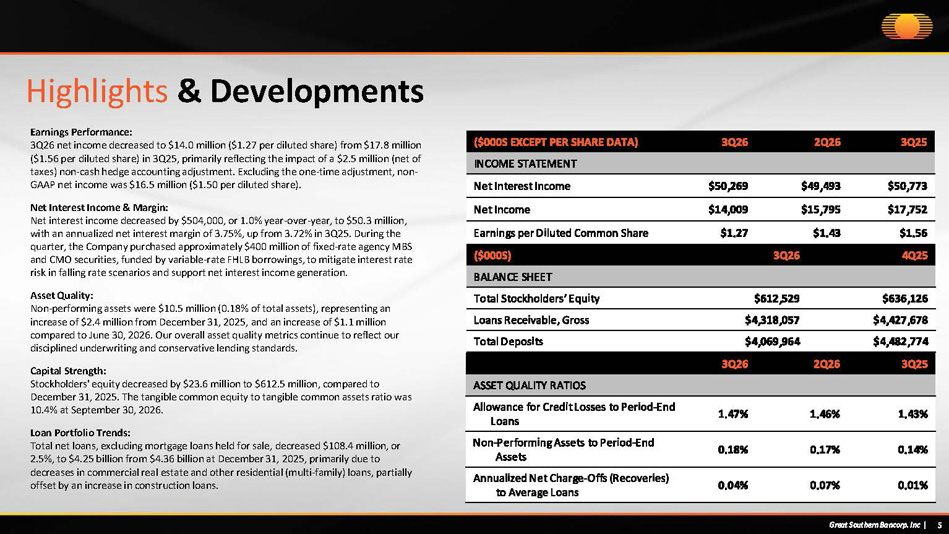
Highlights & Developments Great Southern Bancorp. Inc | 5 Earnings Performance: 3Q26 net income decreased to $14.0 million ($1.27 per diluted share) from $17.8 million ($1.56 per diluted share) in 3Q25, primarily reflecting the impact of a $2.5 million (net of taxes) non - cash hedge accounting adjustment. Excluding the one - time adjustment, non - GAAP net income was $16.5 million ($1.50 per diluted share). Net Interest Income & Margin: Net interest income decreased by $504,000, or 1.0% year - over - year, to $50.3 million, with an annualized net interest margin of 3.75%, up from 3.72% in 3Q25. During the quarter, the Company purchased approximately $400 million of fixed - rate agency MBS and CMO securities, funded by variable - rate FHLB borrowings, to mitigate interest rate risk in falling rate scenarios and support net interest income generation. Asset Quality: Non - performing assets were $10.5 million (0.18% of total assets), representing an increase of $2.4 million from December 31, 2025, and an increase of $1.1 million compared to June 30, 2026. Our overall asset quality metrics continue to reflect our disciplined underwriting and conservative lending standards. Capital Strength: Stockholders' equity decreased by $23.6 million to $612.5 million, compared to December 31, 2025. The tangible common equity to tangible common assets ratio was 10.4% at September 30, 2026. Loan Portfolio Trends: Total net loans, excluding mortgage loans held for sale, decreased $108.4 million, or 2.5%, to $4.25 billion from $4.36 billion at December 31, 2025, primarily due to decreases in commercial real estate and other residential (multi - family) loans, partially offset by an increase in construction loans. 3Q25 2Q26 3Q26 ($000S EXCEPT PER SHARE DATA) INCOME STATEMENT $50,773 $49,493 $50,269 Net Interest Income $17,752 $15,795 $14,009 Net Income $1.56 $1.43 $1.27 Earnings per Diluted Common Share 4Q25 3Q26 ($000S) BALANCE SHEET $636,126 $612,529 Total Stockholders’ Equity $4,427,678 $4,318,057 Loans Receivable, Gross $4,482,774 $4,069,964 Total Deposits 3Q25 2Q26 3Q26 ASSET QUALITY RATIOS 1.43% 1.46% 1.47% Allowance for Credit Losses to Period - End Loans 0.14% 0.17% 0.18% Non - Performing Assets to Period - End Assets 0.01% 0.07% 0.04% Annualized Net Charge - Offs (Recoveries) to Average Loans
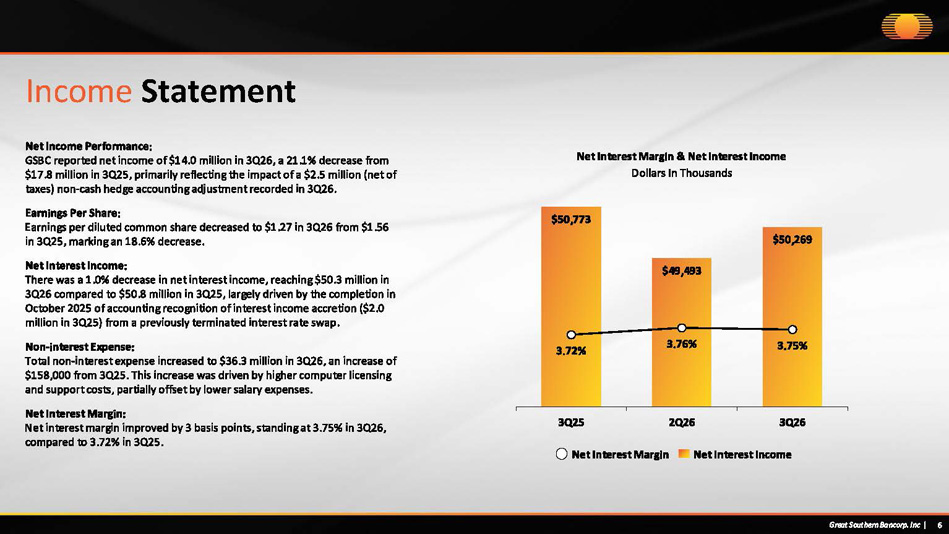
$50,773 $49,493 $50,269 3.72% 3.76% 3.75% 3Q25 2Q26 3Q26 Income Statement Net Income Performance: GSBC reported net income of $14.0 million in 3Q26, a 21.1% decrease from $17.8 million in 3Q25, primarily reflecting the impact of a $2.5 million (net of taxes) non - cash hedge accounting adjustment recorded in 3Q26. Earnings Per Share: Earnings per diluted common share decreased to $1.27 in 3Q26 from $1.56 in 3Q25, marking an 18.6% decrease. Net Interest Income: There was a 1.0% decrease in net interest income, reaching $50.3 million in 3Q26 compared to $50.8 million in 3Q25, largely driven by the completion in October 2025 of accounting recognition of interest income accretion ($2.0 million in 3Q25) from a previously terminated interest rate swap. Non - interest Expense: Total non - interest expense increased to $36.3 million in 3Q26, an increase of $158,000 from 3Q25. This increase was driven by higher computer licensing and support costs, partially offset by lower salary expenses. Net Interest Margin: Net interest margin improved by 3 basis points, standing at 3.75% in 3Q26, compared to 3.72% in 3Q25. Net Interest Margin & Net Interest Income Dollars In Thousands Net Interest Margin Net Interest Income Great Southern Bancorp. Inc | 6
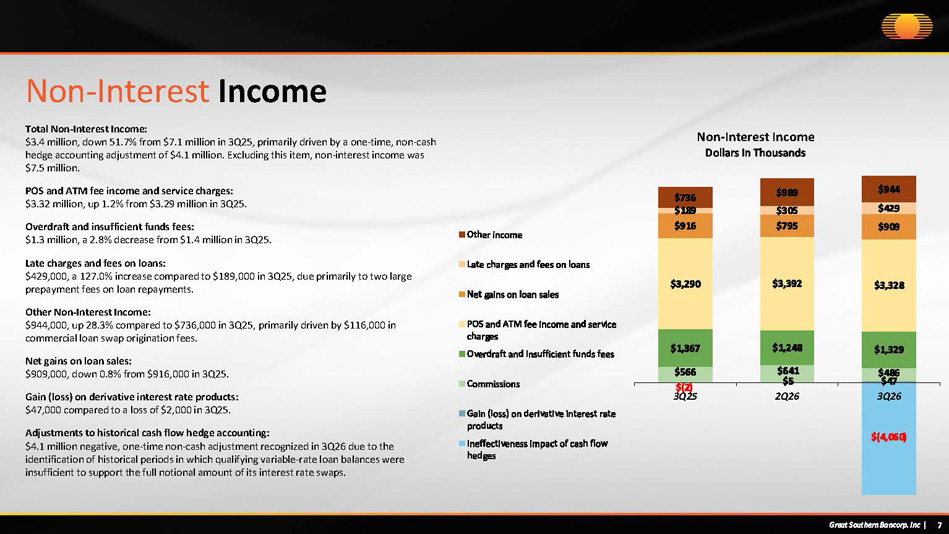
$(4,060) $566 $641 $5 $486 $47 $1,367 $1,248 $1,329 $3,290 $3,392 $3,328 $916 $795 $909 $189 $305 $429 $736 $989 $944 $(2) 3Q25 2Q26 3Q26 Non - Interest Income Dollars In Thousands Other income Late charges and fees on loans Net gains on loan sales POS and ATM fee income and service charges Overdraft and Insufficient funds fees Commissions Gain (loss) on derivative interest rate products Ineffectiveness impact of cash flow hedges Great Southern Bancorp. Inc | 7 Non - Interest Income Total Non - Interest Income: $3.4 million, down 51.7% from $7.1 million in 3Q25, primarily driven by a one - time, non - cash hedge accounting adjustment of $4.1 million. Excluding this item, non - interest income was $7.5 million. POS and ATM fee income and service charges: $3.32 million, up 1.2% from $3.29 million in 3Q25. Overdraft and insufficient funds fees: $1.3 million, a 2.8% decrease from $1.4 million in 3Q25. Late charges and fees on loans: $429,000, a 127.0% increase compared to $189,000 in 3Q25, due primarily to two large prepayment fees on loan repayments. Other Non - Interest Income: $944,000, up 28.3% compared to $736,000 in 3Q25, primarily driven by $116,000 in commercial loan swap origination fees. Net gains on loan sales: $909,000, down 0.8% from $916,000 in 3Q25. Gain (loss) on derivative interest rate products: $47,000 compared to a loss of $2,000 in 3Q25. Adjustments to historical cash flow hedge accounting: $4.1 million negative, one - time non - cash adjustment recognized in 3Q26 due to the identification of historical periods in which qualifying variable - rate loan balances were insufficient to support the full notional amount of its interest rate swaps.
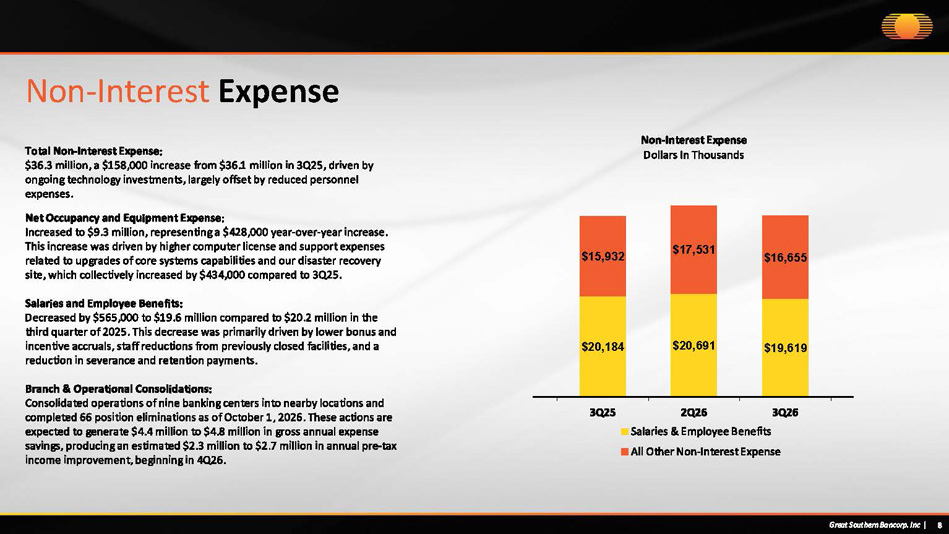
All Other Non - Interest Expense Non - Interest Expense Total Non - Interest Expense: $36.3 million, a $158,000 increase from $36.1 million in 3Q25, driven by ongoing technology investments, largely offset by reduced personnel expenses. Net Occupancy and Equipment Expense: Increased to $9.3 million, representing a $428,000 year - over - year increase. This increase was driven by higher computer license and support expenses related to upgrades of core systems capabilities and our disaster recovery site, which collectively increased by $434,000 compared to 3Q25. Salaries and Employee Benefits: Decreased by $565,000 to $19.6 million compared to $20.2 million in the third quarter of 2025. This decrease was primarily driven by lower bonus and incentive accruals, staff reductions from previously closed facilities, and a reduction in severance and retention payments. Branch & Operational Consolidations: Consolidated operations of nine banking centers into nearby locations and completed 66 position eliminations as of October 1, 2026. These actions are expected to generate $4.4 million to $4.8 million in gross annual expense savings, producing an estimated $2.3 million to $2.7 million in annual pre - tax income improvement, beginning in 4Q26. $20,184 $20,691 $19,619 $15,932 $17,531 $16,655 3Q25 2Q26 Salaries & Employee Benefits 3Q26 Non - Interest Expense Dollars In Thousands Great Southern Bancorp. Inc | 8
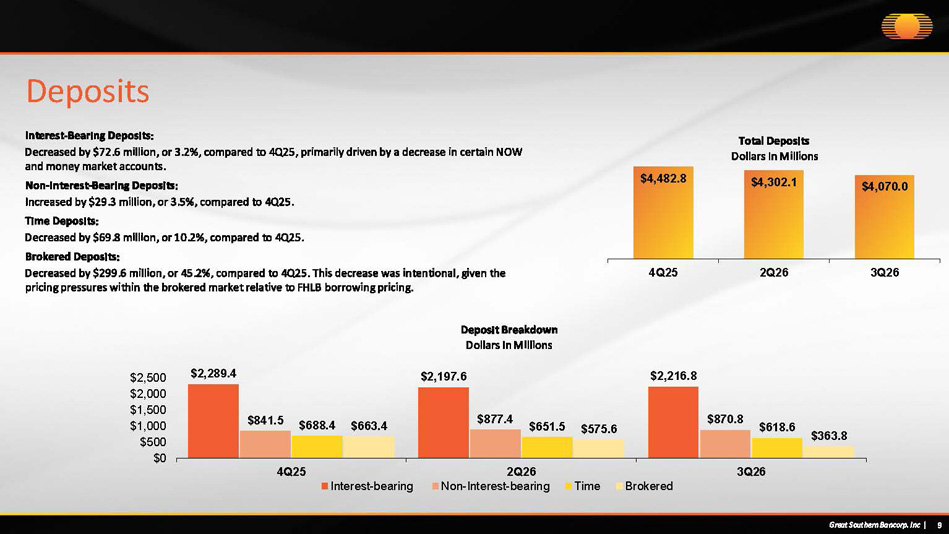
$4,482.8 $4,302.1 $4,070.0 4Q25 2Q26 3Q26 $2,289.4 $2,197.6 $2,216.8 $841.5 $877.4 $870.8 $688.4 $651.5 $618.6 $663.4 $575.6 $363.8 $2,500 $2,000 $1,500 $1,000 $500 $0 4Q25 3Q26 Interest - bearing 2Q26 Non - Interest - bearing Time Brokered Great Southern Bancorp. Inc | 9 Deposits Interest - Bearing Deposits: Decreased by $72.6 million, or 3.2%, compared to 4Q25, primarily driven by a decrease in certain NOW and money market accounts. Non - Interest - Bearing Deposits: Increased by $29.3 million, or 3.5%, compared to 4Q25. Time Deposits: Decreased by $69.8 million, or 10.2%, compared to 4Q25. Brokered Deposits: Decreased by $299.6 million, or 45.2%, compared to 4Q25. This decrease was intentional, given the pricing pressures within the brokered market relative to FHLB borrowing pricing. Deposit Breakdown Dollars In Millions Total Deposits Dollars In Millions
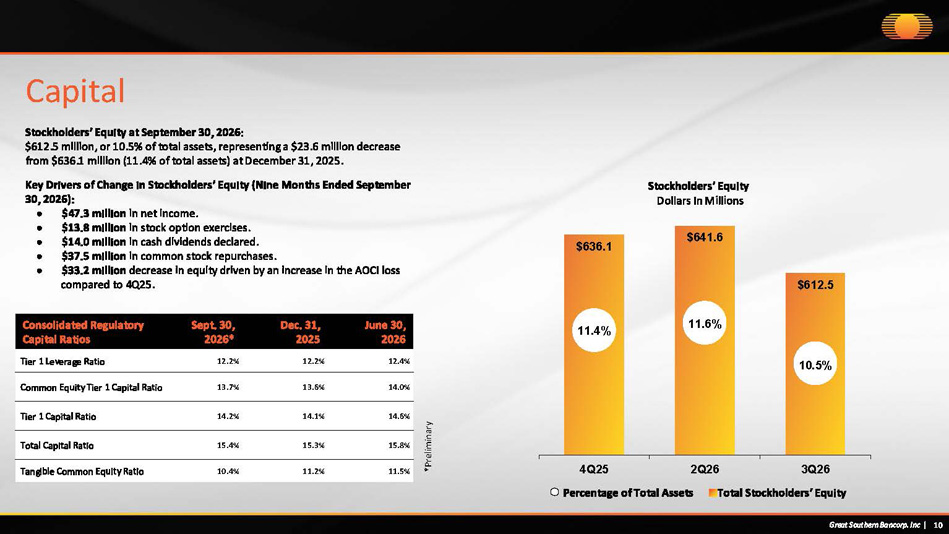
Capital Stockholders’ Equity at September 30, 2026: $612.5 million, or 10.5% of total assets, representing a $23.6 million decrease from $636.1 million (11.4% of total assets) at December 31, 2025. Key Drivers of Change in Stockholders’ Equity (Nine Months Ended September 30, 2026): ● $47.3 million in net income. ● $13.8 million in stock option exercises. ● $14.0 million in cash dividends declared. ● $37.5 million in common stock repurchases. ● $33.2 million decrease in equity driven by an increase in the AOCI loss compared to 4Q25. *Preliminary June 30, 2026 Dec. 31, 2025 Sept. 30, 2026* Consolidated Regulatory Capital Ratios 12.4% 12.2% 12.2% Tier 1 Leverage Ratio 14.0% 13.6% 13.7% Common Equity Tier 1 Capital Ratio 14.6% 14.1% 14.2% Tier 1 Capital Ratio 15.8% 15.3% 15.4% Total Capital Ratio 11.5% 11.2% 10.4% Tangible Common Equity Ratio $636.1 11.4% $641.6 11.6% $612.5 10.5% 4Q25 2Q26 3Q26 Stockholders’ Equity Dollars In Millions Percentage of Total Assets Total Stockholders’ Equity Great Southern Bancorp. Inc | 10
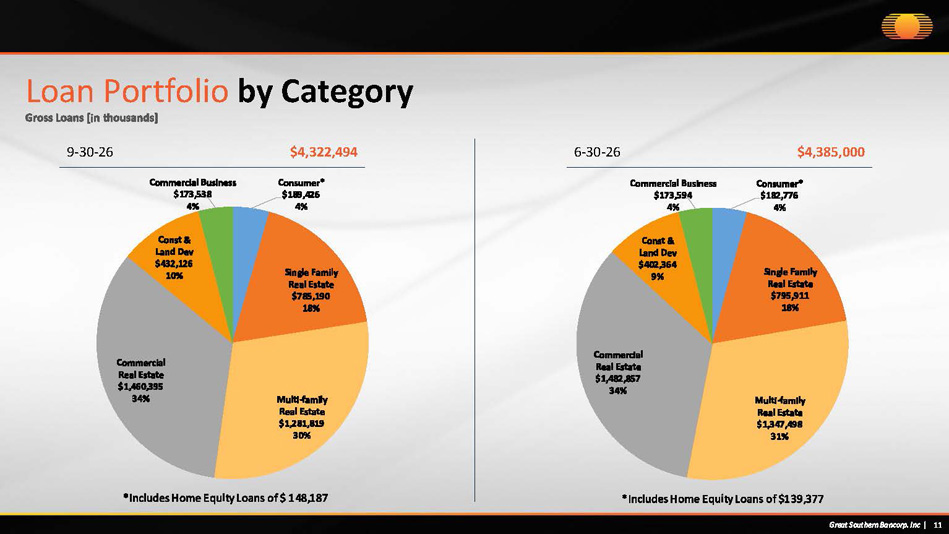
Consumer* $189,426 4% Single Family Real Estate $785,190 18% Multi - family Real Estate $1,281,819 30% Commercial Real Estate $1,460,395 34% Const & Land Dev $432,126 10% Commercial Business $173,538 4% Loan Portfolio by Category Gross Loans [in thousands] *Includes Home Equity Loans of $ 148,187 9 - 30 - 26 $4,322,494 *Includes Home Equity Loans of $139,377 6 - 30 - 26 $4,385,000 Consumer* $182,776 4% Great Southern Bancorp. Inc | 11 Single Family Real Estate $795,911 18% Multi - family Real Estate $1,347,498 31% Commercial Real Estate $1,482,857 34% Const & Land Dev $402,364 9% Commercial Business $173,594 4%
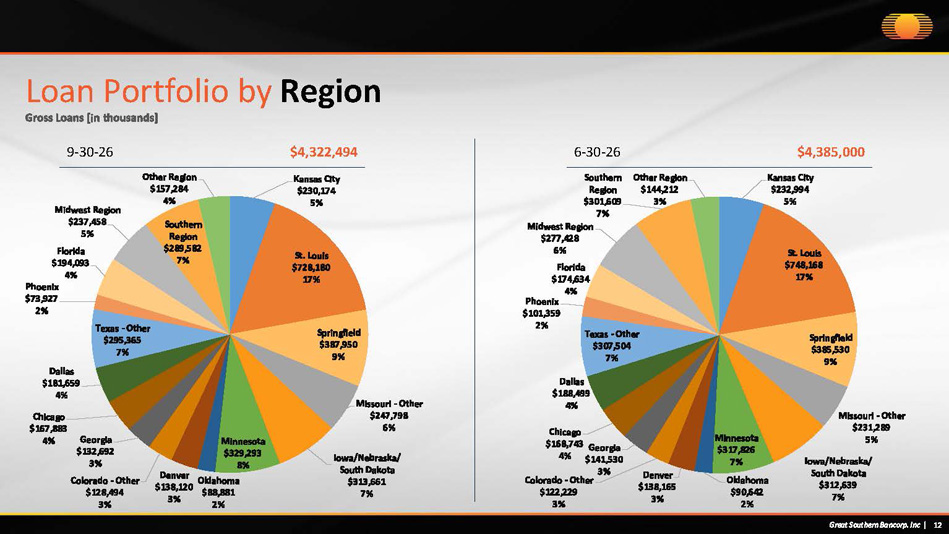
Loan Portfolio by Region Gross Loans [in thousands] 9 - 30 - 26 $4,322,494 6 - 30 - 26 $4,385,000 Kansas City $232,994 5% Great Southern Bancorp. Inc | 12 St. Louis $748,168 17% Springfield $385,530 9% Missouri - Other $231,289 5% Iowa/Nebraska/ South Dakota $312,639 7% Minnesota $317,826 7% Oklahoma $90,642 2% Denver $138,165 3% $141,530 3% Colorado - Other $122,229 3% Chicago $168,743 Georgia 4% Dallas $188,499 4% Texas - Other $307,504 7% 2% Southern Region $301,609 7% Midwest Region $277,428 6% Florida $174,634 4% Phoenix $101,359 Other Region $144,212 3% Kansas City $230,174 5% St. Louis $728,180 17% Springfield $387,950 9% Missouri - Other $247,798 6% Iowa/Nebraska/ South Dakota $313,661 7% Minnesota $329,293 8% Oklahoma $88,881 2% Denver $138,120 3% Georgia $132,692 3% Colorado - Other $128,494 3% Chicago $167,883 4% Dallas $181,659 4% Texas - Other $295,365 7% Midwest Region $237,458 5% Florida $194,093 4% Phoenix $73,927 2% Southern Region $289,582 7% Other Region $157,284 4%
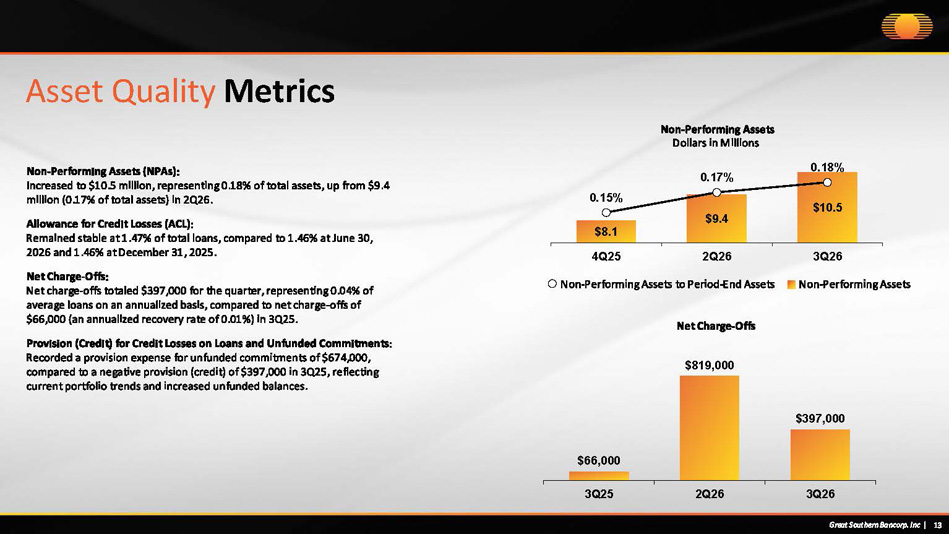
Asset Quality Metrics Non - Performing Assets (NPAs): Increased to $10.5 million, representing 0.18% of total assets, up from $9.4 million (0.17% of total assets) in 2Q26. Allowance for Credit Losses (ACL): Remained stable at 1.47% of total loans, compared to 1.46% at June 30, 2026 and 1.46% at December 31, 2025. Net Charge - Offs: Net charge - offs totaled $397,000 for the quarter, representing 0.04% of average loans on an annualized basis, compared to net charge - offs of $66,000 (an annualized recovery rate of 0.01%) in 3Q25. Provision (Credit) for Credit Losses on Loans and Unfunded Commitments: Recorded a provision expense for unfunded commitments of $674,000, compared to a negative provision (credit) of $397,000 in 3Q25, reflecting current portfolio trends and increased unfunded balances. Net Charge - Offs $66,000 $819,000 $397,000 3Q25 2Q26 3Q26 $8.1 $9.4 $10.5 0.15% 0.17% 0.18% 3Q26 Non - Performing Assets Dollars in Millions 4Q25 2Q26 Non - Performing Assets to Period - End Assets Non - Performing Assets Great Southern Bancorp. Inc | 13
Non - GAAP Reconciliation Great Southern Bancorp. Inc | 14 This document contains certain financial information determined by methods other than in accordance with accounting principles generally accepted in the United States (“GAAP”), including the ratio of tangible common equity to tangible assets and information excluding one - time adjustments to historical cash flow hedge accounting, specifically, net income, earnings per diluted common share, annualized return on average common equity, annualized return on average assets and efficiency ratio. In calculating the ratio of tangible common equity to tangible assets, we subtract period - end intangible assets from common equity and from total assets. Management believes that the presentation of this measure excluding the impact of intangible assets provides useful supplemental information that is helpful in understanding our financial condition and results of operations, as it provides a method to assess management’s success in utilizing our tangible capital as well as our capital strength. Management also believes that providing a measure that excludes balances of intangible assets, which are subjective components of valuation, facilitates the comparison of our performance with the performance of our peers. In addition, management believes that this is a standard financial measure used in the banking industry to evaluate performance. Management believes that the presentation of certain measures excluding one - time adjustments to historical cash flow hedge accounting provides useful supplemental information that is helpful in understanding our core operating performance when comparing periods. These non - GAAP financial measurements are supplemental and not a substitute for any analysis based on GAAP financial measures. Because not all companies use the same calculation of non - GAAP measures, this presentation may not be comparable to other similarly titled measures as calculated by other companies.
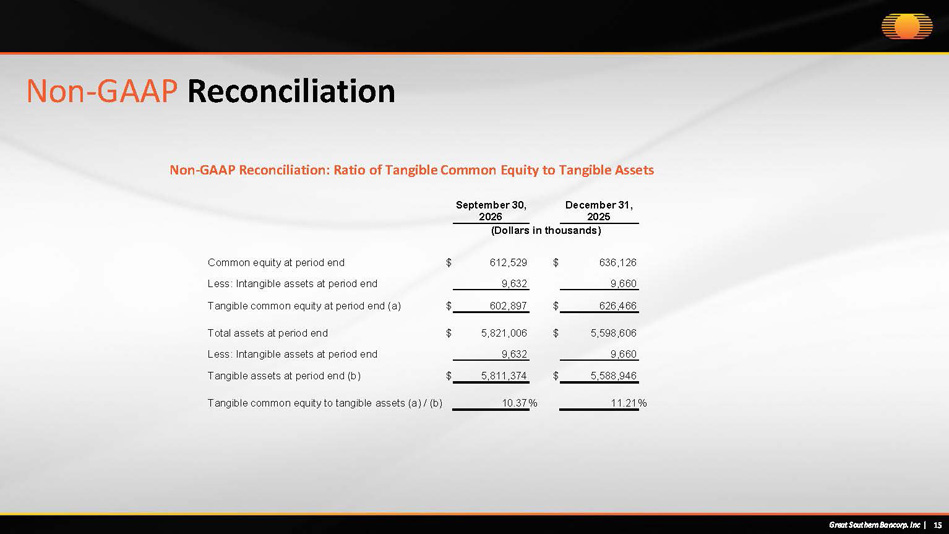
Non - GAAP Reconciliation Great Southern Bancorp. Inc | 15 Non - GAAP Reconciliation: Ratio of Tangible Common Equity to Tangible Assets September 30, 2026 December 31, 2025 (Dollars in thousands) $ 636,126 $ 612,529 Common equity at period end 9,660 9,632 Less: Intangible assets at period end $ 626,466 $ 602,897 Tangible common equity at period end (a) $ 5,598,606 $ 5,821,006 Total assets at period end 9,660 9,632 Less: Intangible assets at period end $ 5,588,946 $ 5,811,374 Tangible assets at period end (b) 11.21 % 10.37 % Tangible common equity to tangible assets (a) / (b)
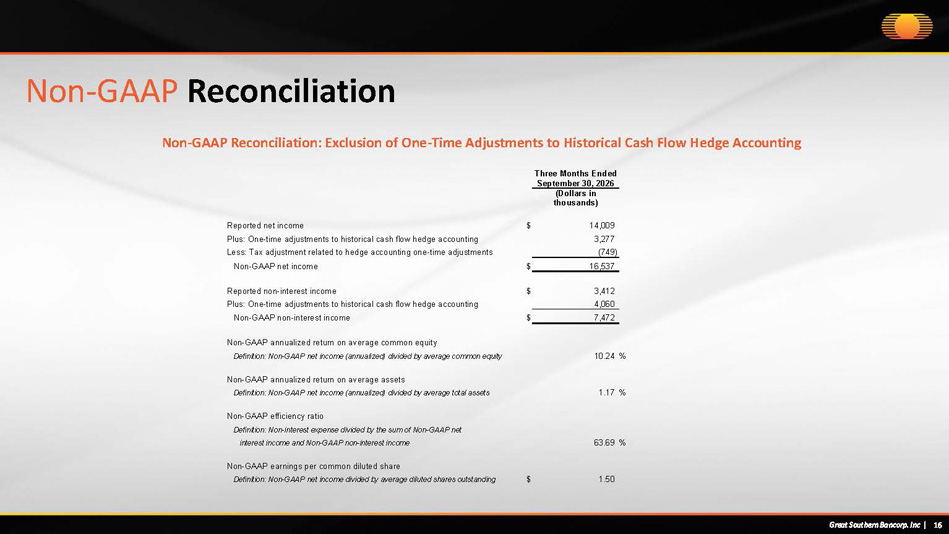
Non - GAAP Reconciliation Great Southern Bancorp. Inc | 16 Non - GAAP Reconciliation: Exclusion of One - Time Adjustments to Historical Cash Flow Hedge Accounting Three Months Ended September 30, 2026 (Dollars in thousands) $ 14,009 Reported net income 3,277 Plus: One - time adjustments to historical cash flow hedge accounting (749) Less: Tax adjustment related to hedge accounting one - time adjustments $ 16,537 Non - GAAP net income 3,412 $ Reported non - interest income 4,060 Plus: One - time adjustments to historical cash flow hedge accounting 7,472 $ Non - GAAP non - interest income Non - GAAP annualized return on average common equity Definition: Non - GAAP net income (annualized) divided by average common equity 10.24 % Non - GAAP annualized return on average assets Definition: Non - GAAP net income (annualized) divided by average total assets 1.17 % Non - GAAP efficiency ratio Definition: Non - interest expense divided by the sum of Non - GAAP net interest income and Non - GAAP non - interest income 63.69 % Non - GAAP earnings per common diluted share Definition: Non - GAAP net income divided by average diluted shares outstanding $ 1.50
Contact Us Great Southern Bancorp. Inc (NASDAQ: GSBC) Kincade Ayers (616) 233 - 0500 - GSBC@lambert.com Investor Relations