Oyu Tolgoi, Mongolia 2026 Half Year Results 29 July 2026 EXHIBIT 99.11
Cautionary and supporting statements 2©2026, Rio Tinto, All Rights Reserved | 2026 Half Year Results This presentation has been prepared by Rio Tinto plc and Rio Tinto Limited (together with their subsidiaries, “Rio Tinto”). By accessing/attending this presentation you acknowledge that you have read and understood the following statements. Forward-looking statements This presentation includes “forward-looking statements” within the meaning of the Private Securities Litigation Reform Act of 1995. All statements other than statements of historical facts included in this presentation, including, without limitation, those regarding Rio Tinto’s financial position, business strategy, plans and objectives of management for future operations (including development plans and objectives relating to Rio Tinto’s products, production forecasts and reserve and resource positions), are forward-looking statements. The words “intend”, “aim”, “project”, “anticipate”, “estimate”, “plan”, “believes”, “expects”, “may”, “should”, “will”, “target”, “set to” or similar expressions, commonly identify such forward-looking statements. Such forward-looking statements involve known and unknown risks, uncertainties and other factors which may cause the actual results, performance or achievements of Rio Tinto, or industry results, to be materially different from any future results, performance or achievements expressed or implied by such forward-looking statements. Such forward-looking statements are based on numerous assumptions regarding Rio Tinto’s present and future business strategies and the environment in which Rio Tinto will operate in the future. Among the important factors that could cause Rio Tinto’s actual results, performance or achievements to differ materially from those in the forward- looking statements include, but are not limited to: an inability to live up to Rio Tinto’s values and any resultant damage to its reputation; the impacts of geopolitics on trade and investment; the impacts of climate change and the transition to a low-carbon future; an inability to successfully execute and/or realise value from acquisitions and divestments; the level of new ore resources, including the results of exploration programmes and/or acquisitions; disruption to strategic partnerships that play a material role in delivering growth, production, cash or market positioning; damage to Rio Tinto’s relationships with communities and governments; an inability to attract and retain requisite skilled people; declines in commodity prices and adverse exchange rate movements; an inability to raise sufficient funds for capital investment; inadequate estimates of ore resources and reserves; delays or overruns of large and complex projects; changes in tax regulation; safety incidents or major hazard events; cyber breaches; physical impacts from climate change; the impacts of water scarcity; natural disasters; an inability to successfully manage the closure, reclamation and rehabilitation of sites; the impacts of civil unrest; breaches of Rio Tinto’s policies, standard and procedures, laws or regulations; trade tensions between the world’s major economies; increasing societal and investor expectations, in particular with regard to environmental, social and governance considerations; the impacts of technological advancements; and such other risks and uncertainties identified in Rio Tinto’s most recent Annual Report and accounts in Australia and the United Kingdom and the most recent Annual Report on Form 20-F filed with the United States Securities and Exchange Commission (the “SEC”) or Form 6-Ks furnished to, or filed with, the SEC. Forward-looking statements should, therefore, be construed in light of such risk factors and undue reliance should not be placed on forward-looking statements. These forward-looking statements speak only as of the date of this presentation. Rio Tinto expressly disclaims any obligation or undertaking (except as required by applicable law, the UK Listing Rules, the Disclosure Guidance and Transparency Rules of the Financial Conduct Authority and the Listing Rules of the Australian Securities Exchange) to release publicly any updates or revisions to any forward-looking statement contained herein to reflect any change in Rio Tinto’s expectations with regard thereto or any change in events, conditions or circumstances on which any such statement is based. Nothing in this presentation should be interpreted to mean that future earnings per share of Rio Tinto plc or Rio Tinto Limited will necessarily match or exceed its historical published earnings per share. Past performance cannot be relied on as a guide to future performance. Disclaimer Neither this presentation, nor the question and answer session, nor any part thereof, may be recorded, transcribed, distributed, published or reproduced in any form, except as permitted by Rio Tinto. By accessing / attending this presentation, you agree with the foregoing and, upon request, you will promptly return any records or transcripts at the presentation without retaining any copies. This presentation contains a number of non-IFRS financial measures. Rio Tinto management considers these to be key financial performance indicators of the business and they are defined and/or reconciled in Rio Tinto’s annual results press release, Annual Report and accounts in Australia and the United Kingdom and/or the most recent Annual Report on Form 20-F filed with the SEC or Form 6-Ks furnished to, or filed with, the SEC. Reference to consensus figures are not based on Rio Tinto’s own opinions, estimates or forecasts and are compiled and published without comment from, or endorsement or verification by, Rio Tinto. The consensus figures do not necessarily reflect guidance provided from time to time by Rio Tinto where given in relation to equivalent metrics, which to the extent available can be found on the Rio Tinto website. By referencing consensus figures, Rio Tinto does not imply that it endorses, confirms or expresses a view on the consensus figures. The consensus figures are provided for informational purposes only and are not intended to, nor do they, constitute investment advice or any solicitation to buy, hold or sell securities or other financial instruments. No warranty or representation, either express or implied, is made by Rio Tinto or its affiliates, or their respective directors, officers and employees, in relation to the accuracy, completeness or achievability of the consensus figures and, to the fullest extent permitted by law, no responsibility or liability is accepted by any of those persons in respect of those matters. Rio Tinto assumes no obligation to update, revise or supplement the consensus figures to reflect circumstances existing after the date hereof. Rio Tinto Copper - Oyu Tolgoi production target The 500ktpa copper production target (stated as recoverable metal) for the Oyu Tolgoi underground and open pit mines for the years 2028 to 2036 referenced in slide 11 was previously reported in a release to the Australian Securities Exchange dated 11 July 2023 “Investor site visit to Oyu Tolgoi copper mine, Mongolia”. All material assumptions underpinning that production target and those production profiles continue to apply and have not materially changed. Copper equivalent (CuEq) volumes The formula applied for calculating Copper equivalent volume throughout this presentation is: CuEq = Rio Tinto’s share of production volumes / Volume conversion factor x Product price ($/t) / Copper price ($/t). Prices are based on long-term consensus prices. The operating unit cost measure uses the denominator of Rio Tinto’s sales volumes in copper equivalent terms (using the same calculation), albeit based on Rio Tinto consolidated basis Rio Tinto plc No. 719885 6 St James’s Square, London SW1Y 4AD, United Kingdom Rio Tinto Limited ACN 004 458 404 Level 43, 120 Collins Street, Melbourne 3000 Australia This presentation is authorised for release to the market by Matthew Whyte, Rio Tinto’s Group Company Secretary.
Dampier, Australia Simon Trott CEO
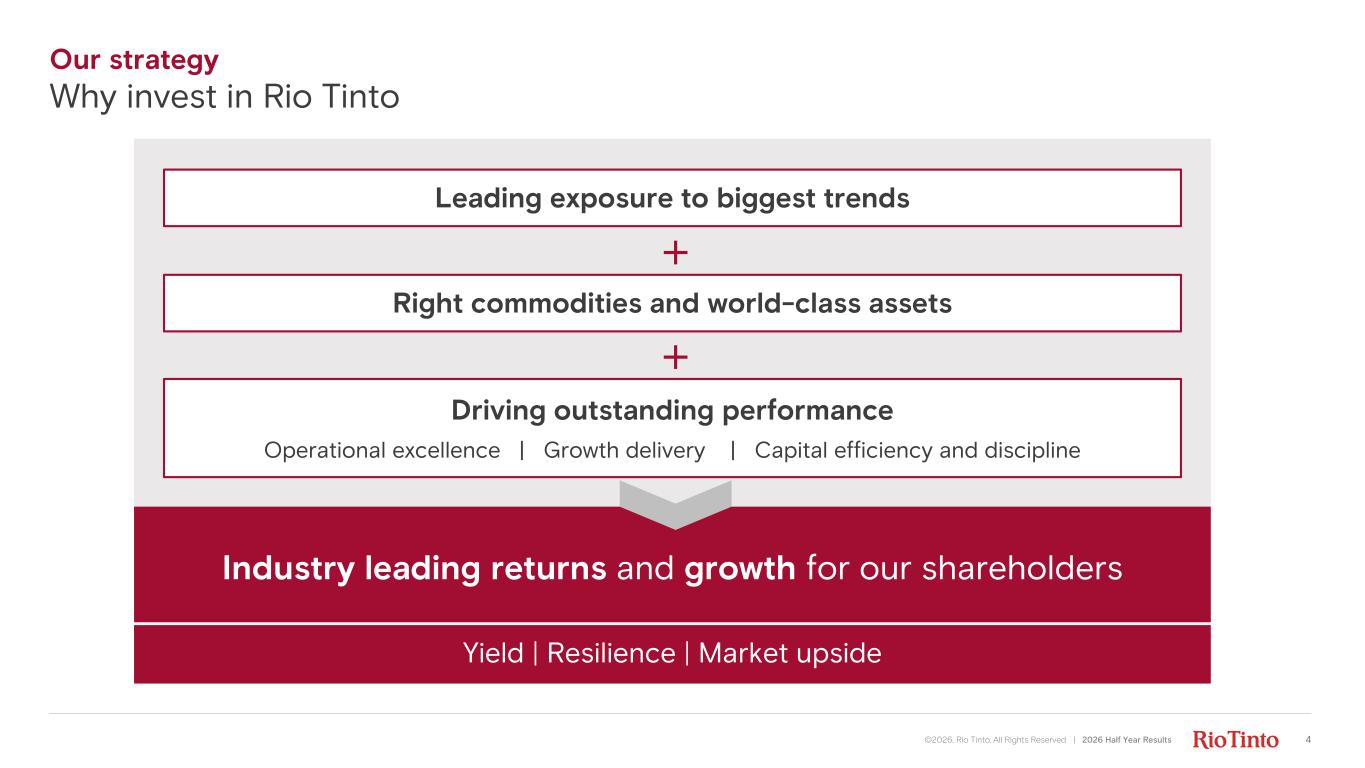
Our strategy Why invest in Rio Tinto Industry leading returns and growth for our shareholders Leading exposure to biggest trends Right commodities and world-class assets Driving outstanding performance Operational excellence | Growth delivery | Capital efficiency and discipline Yield | Resilience | Market upside 4©2026, Rio Tinto, All Rights Reserved | 2026 Half Year Results
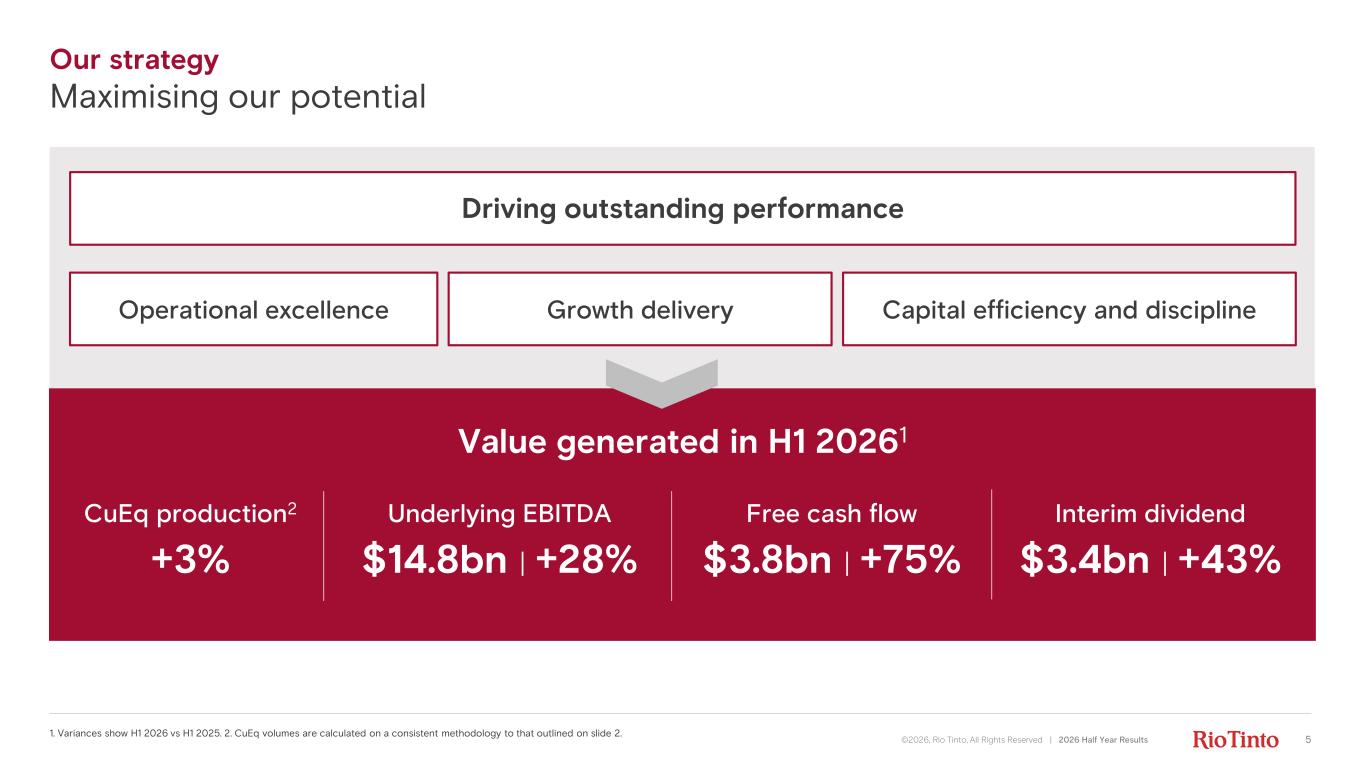
Growth delivery Capital efficiency and disciplineOperational excellence 5©2026, Rio Tinto, All Rights Reserved | 2026 Half Year Results CuEq production2 +3% Underlying EBITDA $14.8bn | +28% Interim dividend $3.4bn | +43% Value generated in H1 20261 1. Variances show H1 2026 vs H1 2025. 2. CuEq volumes are calculated on a consistent methodology to that outlined on slide 2. Free cash flow $3.8bn | +75% Driving outstanding performance Our strategy Maximising our potential
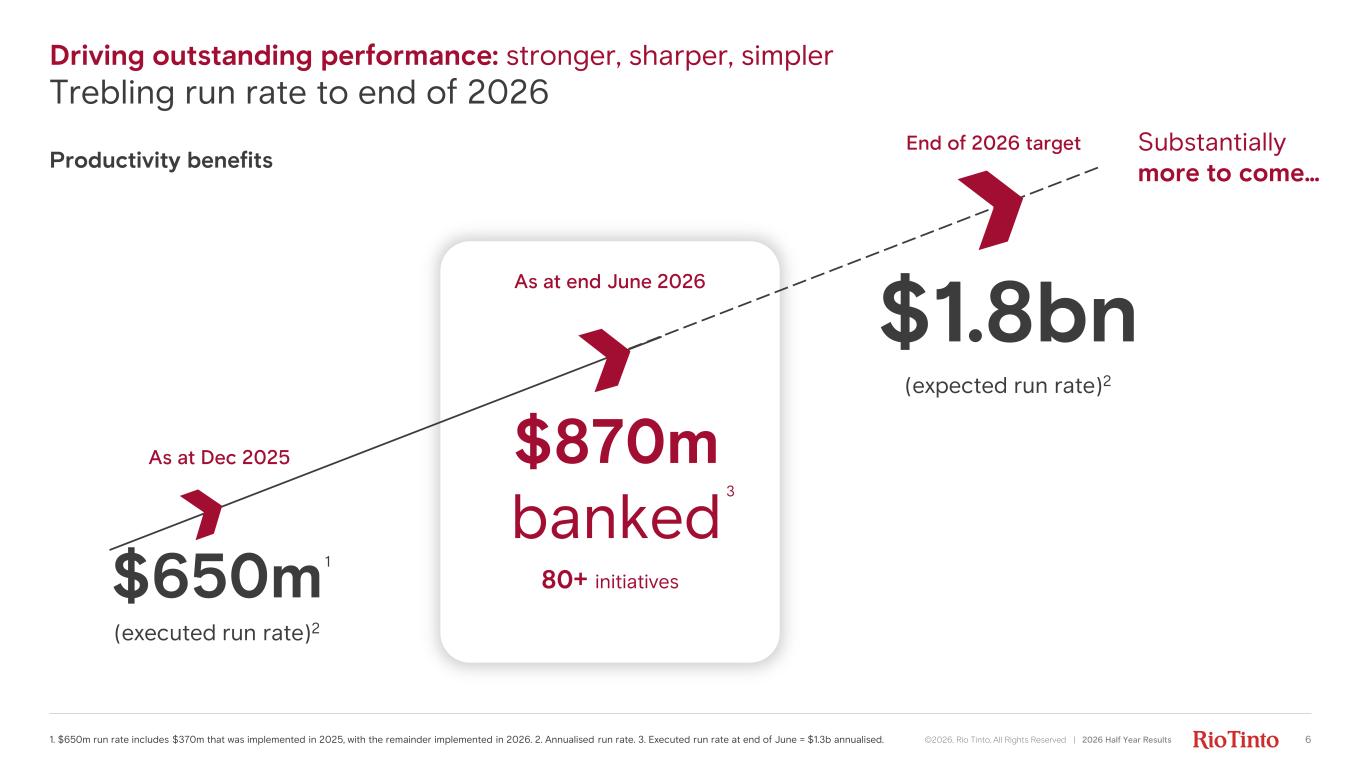
1. $650m run rate includes $370m that was implemented in 2025, with the remainder implemented in 2026. 2. Annualised run rate. 3. Executed run rate at end of June = $1.3b annualised. Driving outstanding performance: stronger, sharper, simpler Trebling run rate to end of 2026 $650m (executed run rate)2 $1.8bn (expected run rate)2 As at Dec 2025 Substantially more to come… End of 2026 target As at end June 2026 1 $870m banked 80+ initiatives 6©2026, Rio Tinto, All Rights Reserved | 2026 Half Year Results Productivity benefits 3
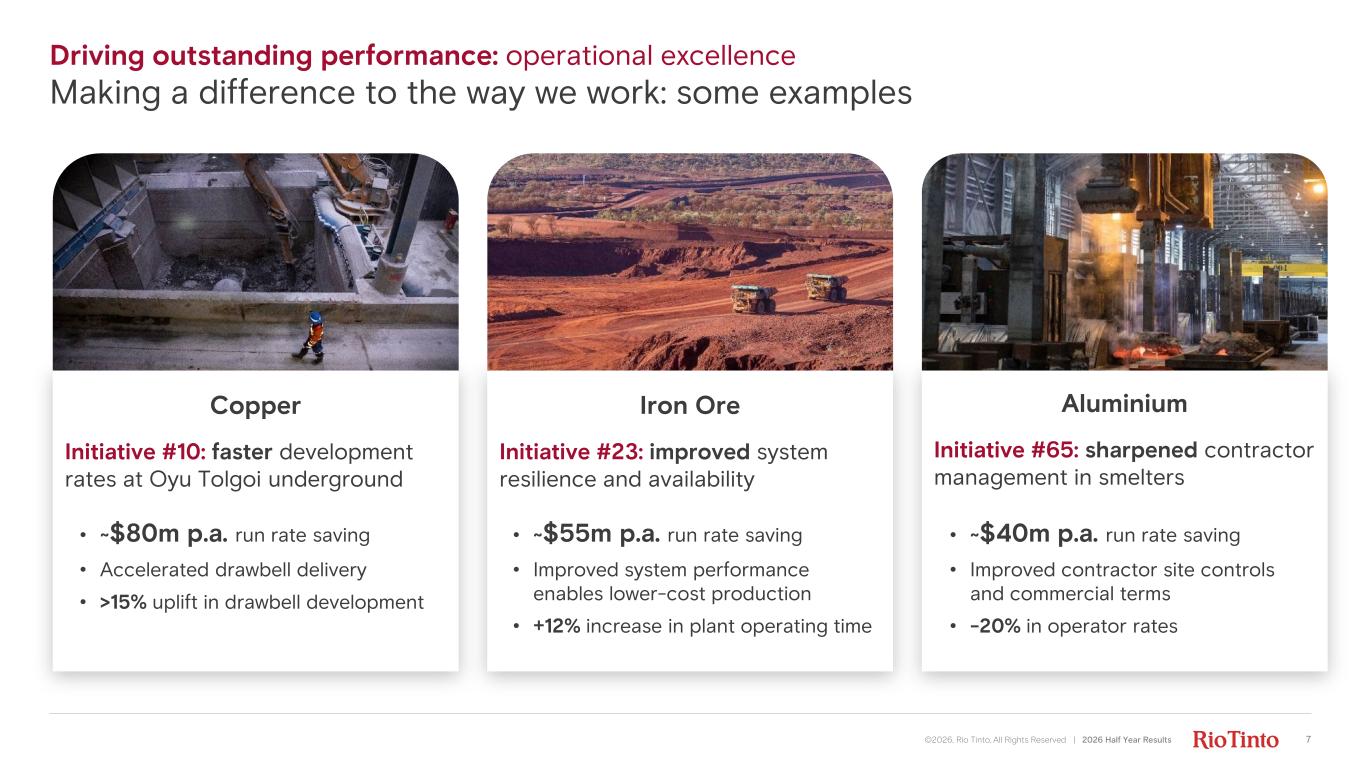
Driving outstanding performance: operational excellence Making a difference to the way we work: some examples Iron Ore Initiative #23: improved system resilience and availability • ~$55m p.a. run rate saving • Improved system performance enables lower-cost production • +12% increase in plant operating time Aluminium Initiative #65: sharpened contractor management in smelters • ~$40m p.a. run rate saving • Improved contractor site controls and commercial terms • -20% in operator rates 7©2026, Rio Tinto, All Rights Reserved | 2026 Half Year Results Copper Initiative #10: faster development rates at Oyu Tolgoi underground • ~$80m p.a. run rate saving • Accelerated drawbell delivery • >15% uplift in drawbell development
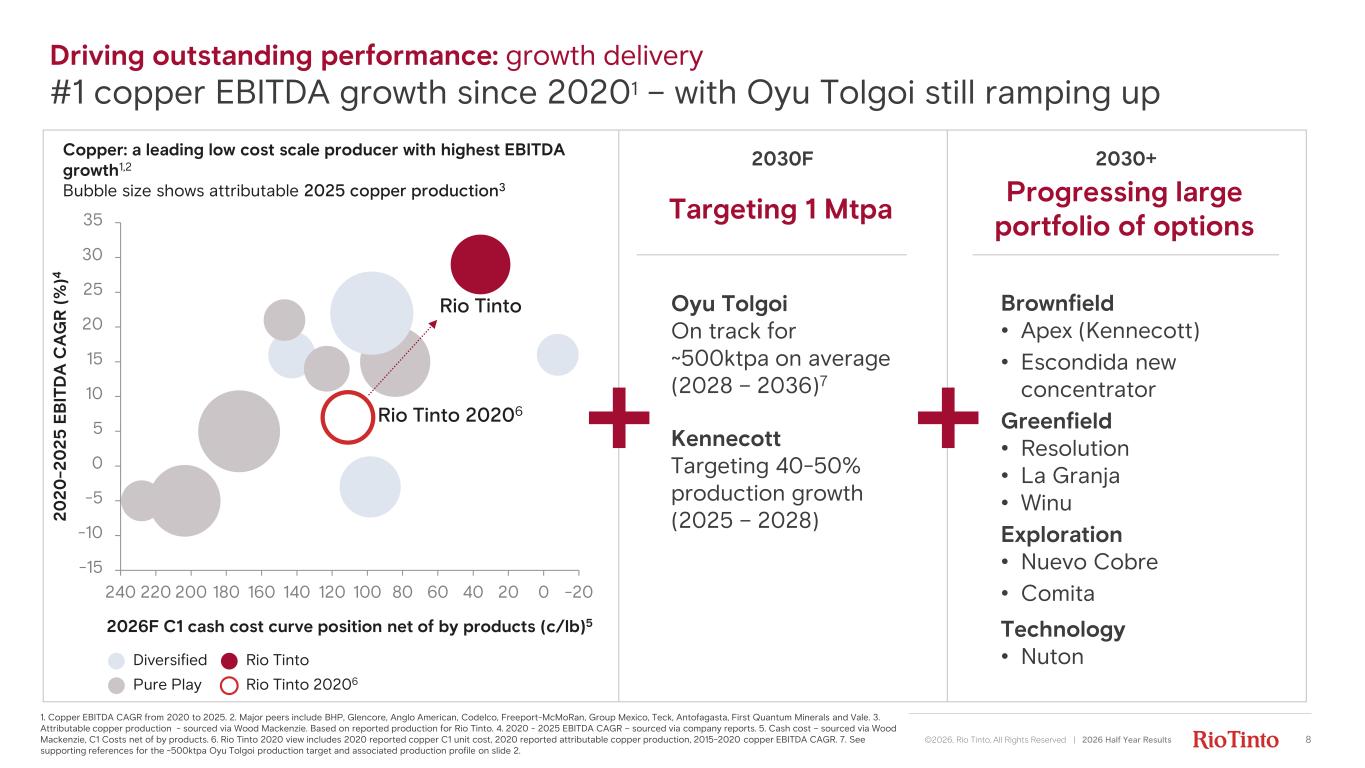
Driving outstanding performance: growth delivery #1 copper EBITDA growth since 20201 – with Oyu Tolgoi still ramping up -15 -10 -5 0 5 10 15 20 25 30 35 -20020406080100120140160180200220240 2026F C1 cash cost curve position net of by products (c/lb)5 Rio Tinto Rio Tinto 20206 Diversified Pure Play Rio Tinto Rio Tinto 20206 20 20 -2 0 25 E B IT D A C A G R ( % )4 Targeting 1 Mtpa Brownfield • Apex (Kennecott) • Escondida new concentrator Greenfield • Resolution • La Granja • Winu Exploration • Nuevo Cobre • Comita Technology • Nuton 2030F 2030+ Oyu Tolgoi On track for ~500ktpa on average (2028 – 2036)7 Kennecott Targeting 40-50% production growth (2025 – 2028) Progressing large portfolio of options Copper: a leading low cost scale producer with highest EBITDA growth1,2 Bubble size shows attributable 2025 copper production3 8©2026, Rio Tinto, All Rights Reserved | 2026 Half Year Results 1. Copper EBITDA CAGR from 2020 to 2025. 2. Major peers include BHP, Glencore, Anglo American, Codelco, Freeport-McMoRan, Group Mexico, Teck, Antofagasta, First Quantum Minerals and Vale. 3. Attributable copper production - sourced via Wood Mackenzie. Based on reported production for Rio Tinto. 4. 2020 - 2025 EBITDA CAGR – sourced via company reports. 5. Cash cost – sourced via Wood Mackenzie, C1 Costs net of by products. 6. Rio Tinto 2020 view includes 2020 reported copper C1 unit cost, 2020 reported attributable copper production, 2015-2020 copper EBITDA CAGR. 7. See supporting references for the ~500ktpa Oyu Tolgoi production target and associated production profile on slide 2.
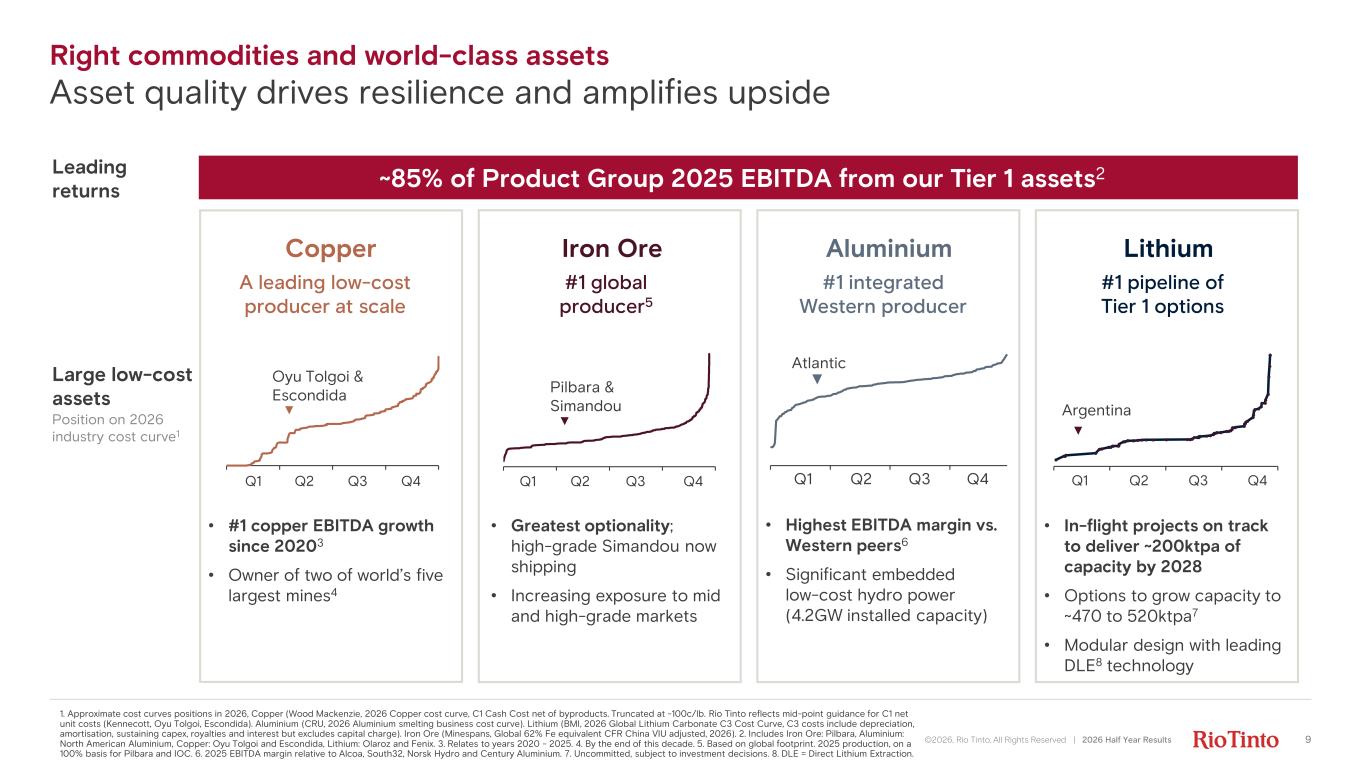
©2026, Rio Tinto, All Rights Reserved | 2026 Half Year Results 9 - 450 900 1,350 1,800 21 3. 59 66 28 .0 6 13 81 6. 6 2 20 41 9. 0 6 25 34 3. 38 33 46 8. 37 41 89 6. 32 48 25 6 .7 2 56 22 4. 29 63 16 1.8 5 68 6 28 .6 5 72 37 4. 11 75 82 0 .0 1Q1 Q2 Q3 Q4 Atlantic 0% 25% 50% 75% 100% 0.00 675,000.001,350,000.002, 25,000.002,700,000.00 1. Approximate cost curves positions in 2026, Copper (Wood Mackenzie, 2026 Copper cost curve, C1 Cash Cost net of byproducts. Truncated at -100c/lb. Rio Tinto reflects mid-point guidance for C1 net unit costs (Kennecott, Oyu Tolgoi, Escondida). Aluminium (CRU, 2026 Aluminium smelting business cost curve). Lithium (BMI, 2026 Global Lithium Carbonate C3 Cost Curve, C3 costs include depreciation, amortisation, sustaining capex, royalties and interest but excludes capital charge). Iron Ore (Minespans, Global 62% Fe equivalent CFR China VIU adjusted, 2026). 2. Includes Iron Ore: Pilbara, Aluminium: North American Aluminium, Copper: Oyu Tolgoi and Escondida, Lithium: Olaroz and Fenix. 3. Relates to years 2020 - 2025. 4. By the end of this decade. 5. Based on global footprint. 2025 production, on a 100% basis for Pilbara and IOC. 6. 2025 EBITDA margin relative to Alcoa, South32, Norsk Hydro and Century Aluminium. 7. Uncommitted, subject to investment decisions. 8. DLE = Direct Lithium Extraction. Iron Ore LithiumAluminium Large low-cost assets Position on 2026 industry cost curve1 Pilbara & Simandou Q1 Q2 Q3 Q4 #1 pipeline of Tier 1 options #1 global producer5 #1 integrated Western producer Leading returns • Greatest optionality; high-grade Simandou now shipping • Increasing exposure to mid and high-grade markets • Highest EBITDA margin vs. Western peers6 • Significant embedded low-cost hydro power (4.2GW installed capacity) • In-flight projects on track to deliver ~200ktpa of capacity by 2028 • Options to grow capacity to ~470 to 520ktpa7 • Modular design with leading DLE8 technology Q1 Q2 Q3 Q4 Oyu Tolgoi & Escondida Copper A leading low-cost producer at scale • #1 copper EBITDA growth since 20203 • Owner of two of world’s five largest mines4 ~85% of Product Group 2025 EBITDA from our Tier 1 assets2 Q1 Q2 Q3 Q4 Argentina Right commodities and world-class assets Asset quality drives resilience and amplifies upside
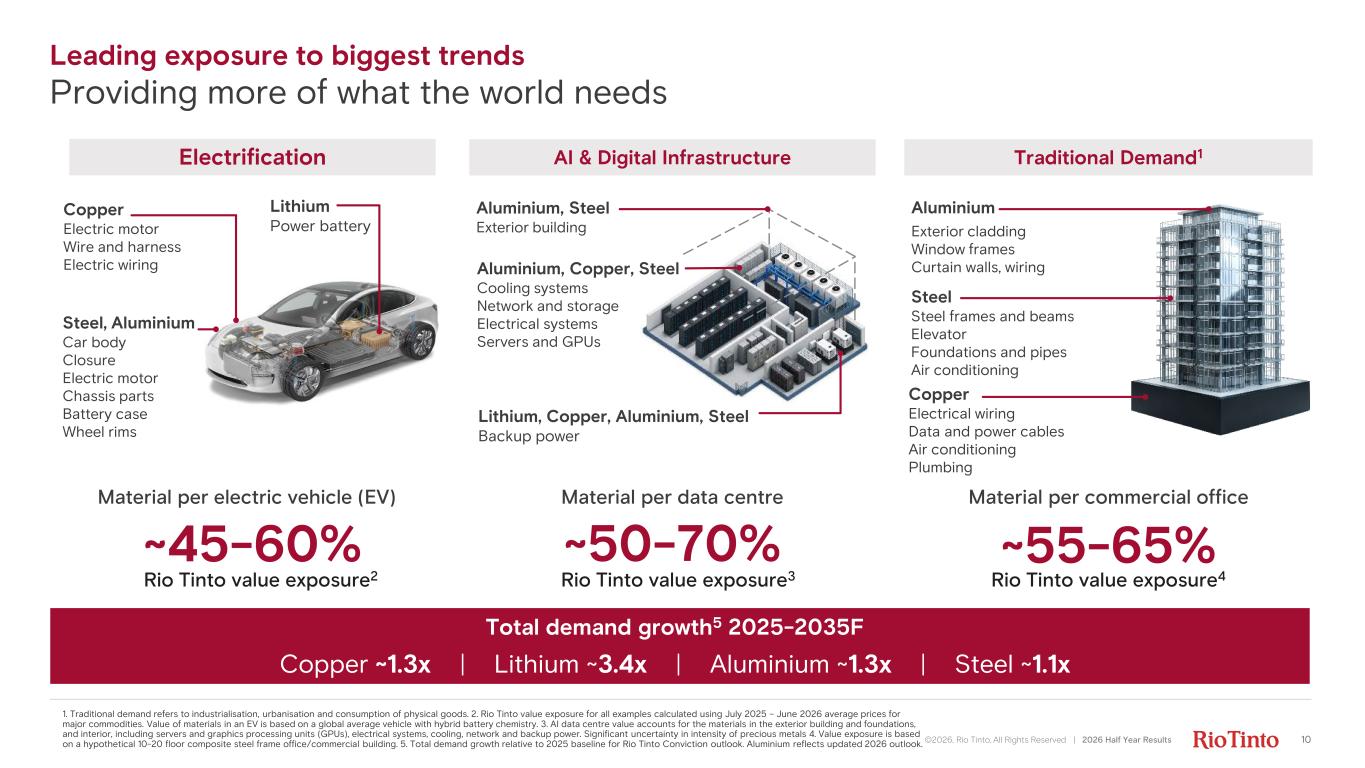
©2026, Rio Tinto, All Rights Reserved | 2026 Half Year Results 10 1. Traditional demand refers to industrialisation, urbanisation and consumption of physical goods. 2. Rio Tinto value exposure for all examples calculated using July 2025 – June 2026 average prices for major commodities. Value of materials in an EV is based on a global average vehicle with hybrid battery chemistry. 3. AI data centre value accounts for the materials in the exterior building and foundations, and interior, including servers and graphics processing units (GPUs), electrical systems, cooling, network and backup power. Significant uncertainty in intensity of precious metals 4. Value exposure is based on a hypothetical 10-20 floor composite steel frame office/commercial building. 5. Total demand growth relative to 2025 baseline for Rio Tinto Conviction outlook. Aluminium reflects updated 2026 outlook. Electrification AI & Digital Infrastructure Traditional Demand1 Lithium Power battery Steel, Aluminium Car body Closure Electric motor Chassis parts Battery case Wheel rims Copper Electric motor Wire and harness Electric wiring Aluminium Exterior cladding Window frames Curtain walls, wiring Copper Electrical wiring Data and power cables Air conditioning Plumbing Steel Steel frames and beams Elevator Foundations and pipes Air conditioning Aluminium, Copper, Steel Cooling systems Network and storage Electrical systems Servers and GPUs Lithium, Copper, Aluminium, Steel Backup power Aluminium, Steel Exterior building Material per data centre Material per commercial officeMaterial per electric vehicle (EV) ~45-60% ~50-70% ~55-65% Total demand growth5 2025-2035F Leading exposure to biggest trends Providing more of what the world needs Copper ~1.3x | Lithium ~3.4x | Aluminium ~1.3x | Steel ~1.1x Rio Tinto value exposure2 Rio Tinto value exposure3 Rio Tinto value exposure4
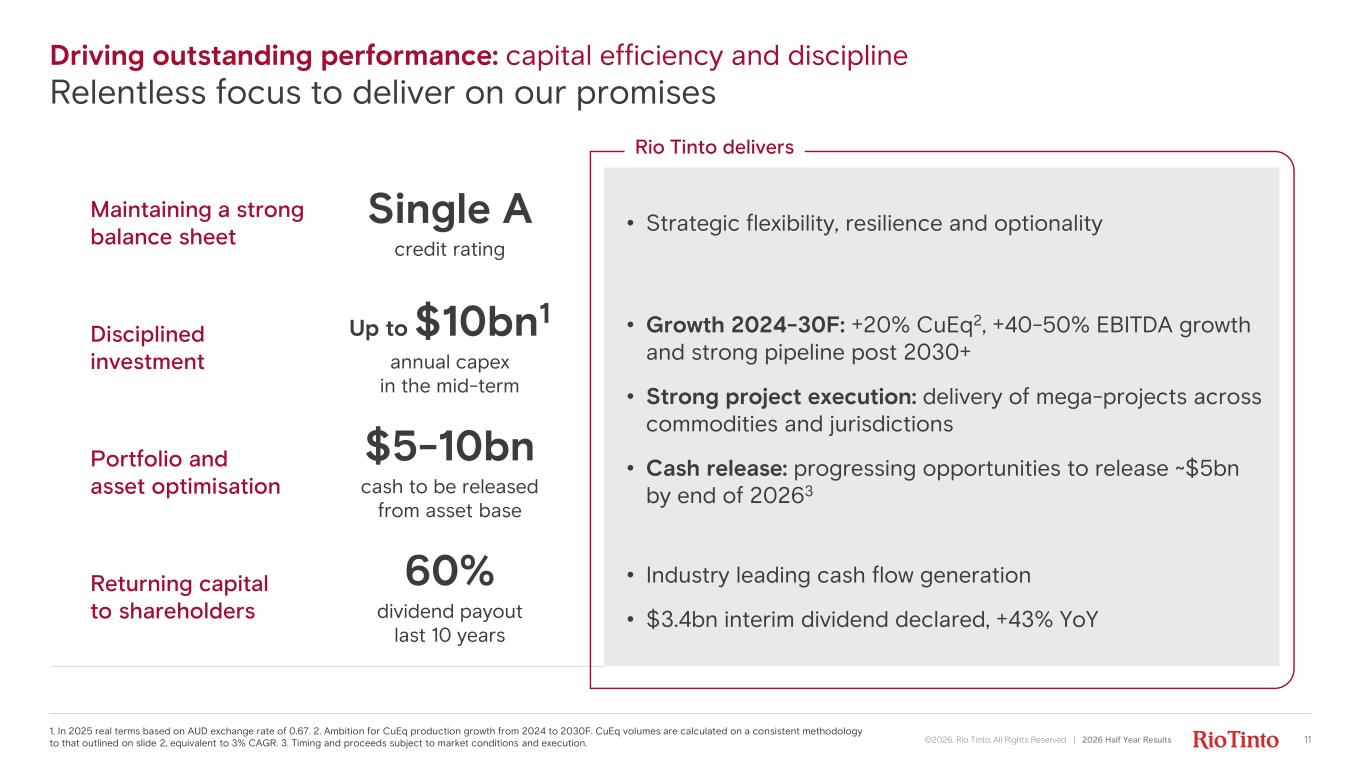
Maintaining a strong balance sheet Single A credit rating • Strategic flexibility, resilience and optionality Disciplined investment Up to $10bn1 annual capex in the mid-term • Growth 2024-30F: +20% CuEq2, +40-50% EBITDA growth and strong pipeline post 2030+ • Strong project execution: delivery of mega-projects across commodities and jurisdictions • Cash release: progressing opportunities to release ~$5bn by end of 20263 Portfolio and asset optimisation $5-10bn cash to be released from asset base Returning capital to shareholders 60% dividend payout last 10 years • Industry leading cash flow generation • $3.4bn interim dividend declared, +43% YoY Driving outstanding performance: capital efficiency and discipline Relentless focus to deliver on our promises 11 Rio Tinto delivers 1. In 2025 real terms based on AUD exchange rate of 0.67. 2. Ambition for CuEq production growth from 2024 to 2030F. CuEq volumes are calculated on a consistent methodology to that outlined on slide 2, equivalent to 3% CAGR. 3. Timing and proceeds subject to market conditions and execution. ©2026, Rio Tinto, All Rights Reserved | 2026 Half Year Results
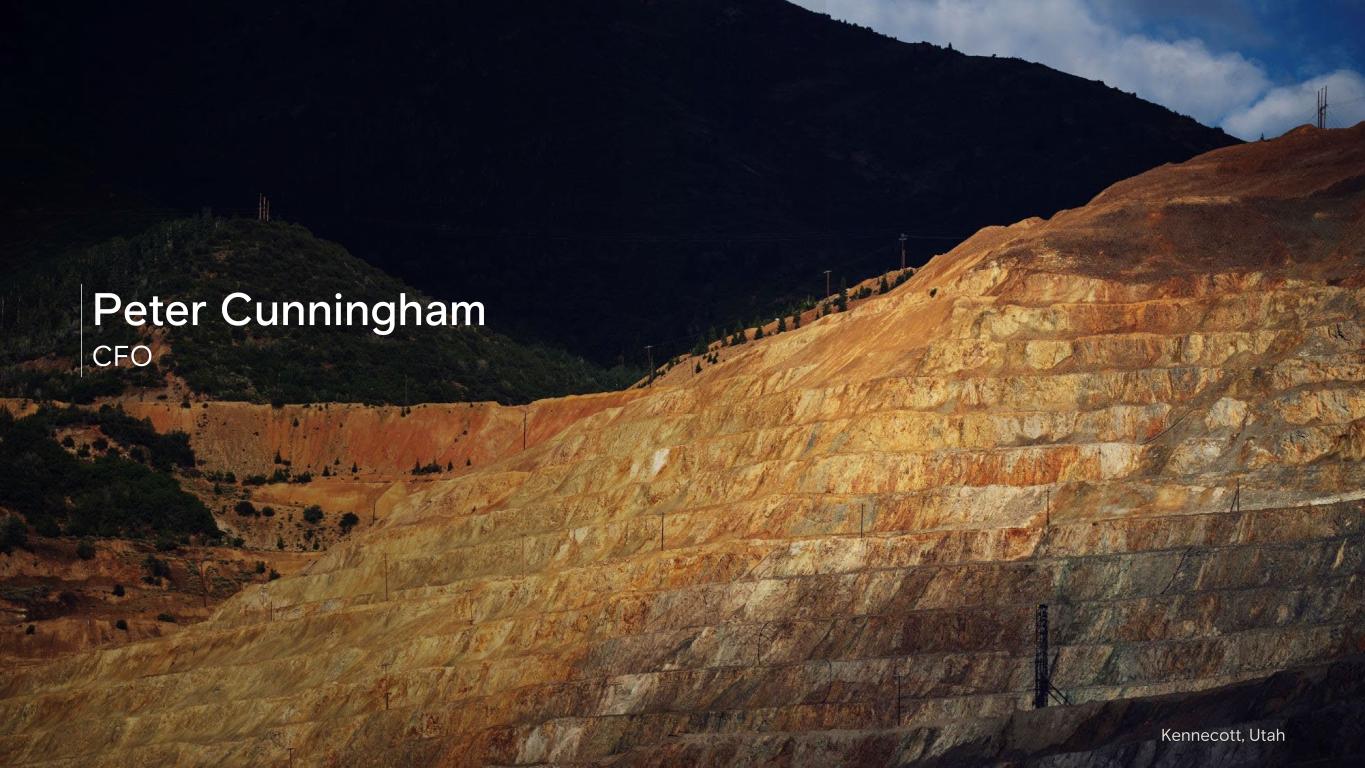
Kennecott, Utah Peter Cunningham CFO
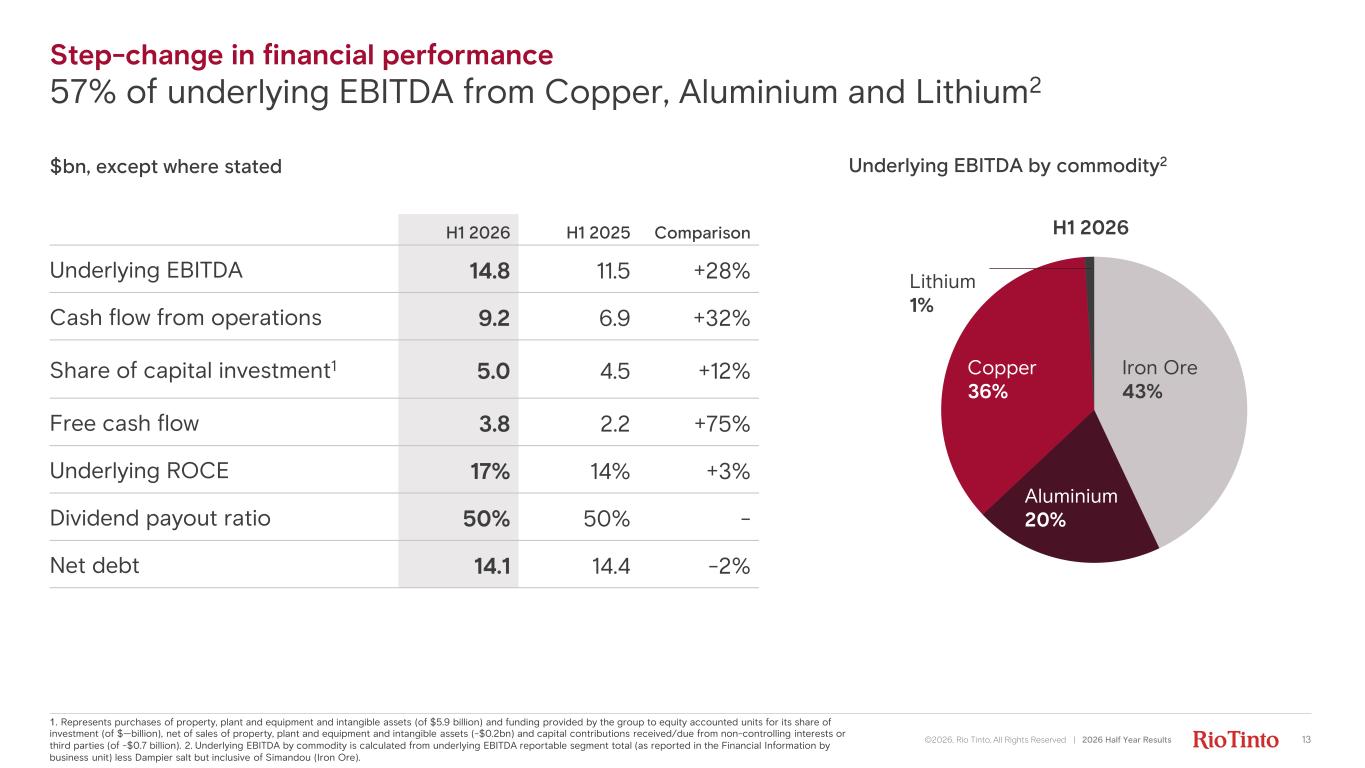
Step-change in financial performance 57% of underlying EBITDA from Copper, Aluminium and Lithium2 13 1. Represents purchases of property, plant and equipment and intangible assets (of $5.9 billion) and funding provided by the group to equity accounted units for its share of investment (of $—billion), net of sales of property, plant and equipment and intangible assets (-$0.2bn) and capital contributions received/due from non-controlling interests or third parties (of -$0.7 billion). 2. Underlying EBITDA by commodity is calculated from underlying EBITDA reportable segment total (as reported in the Financial Information by business unit) less Dampier salt but inclusive of Simandou (Iron Ore). ©2026, Rio Tinto, All Rights Reserved | 2026 Half Year Results H1 2026 H1 2025 Comparison Underlying EBITDA 14.8 11.5 +28% Cash flow from operations 9.2 6.9 +32% Share of capital investment1 5.0 4.5 +12% Free cash flow 3.8 2.2 +75% Underlying ROCE 17% 14% +3% Dividend payout ratio 50% 50% - Net debt 14.1 14.4 -2% $bn, except where stated H1 2026 Iron Ore 43% Aluminium 20% Copper 36% Lithium 1% Underlying EBITDA by commodity2
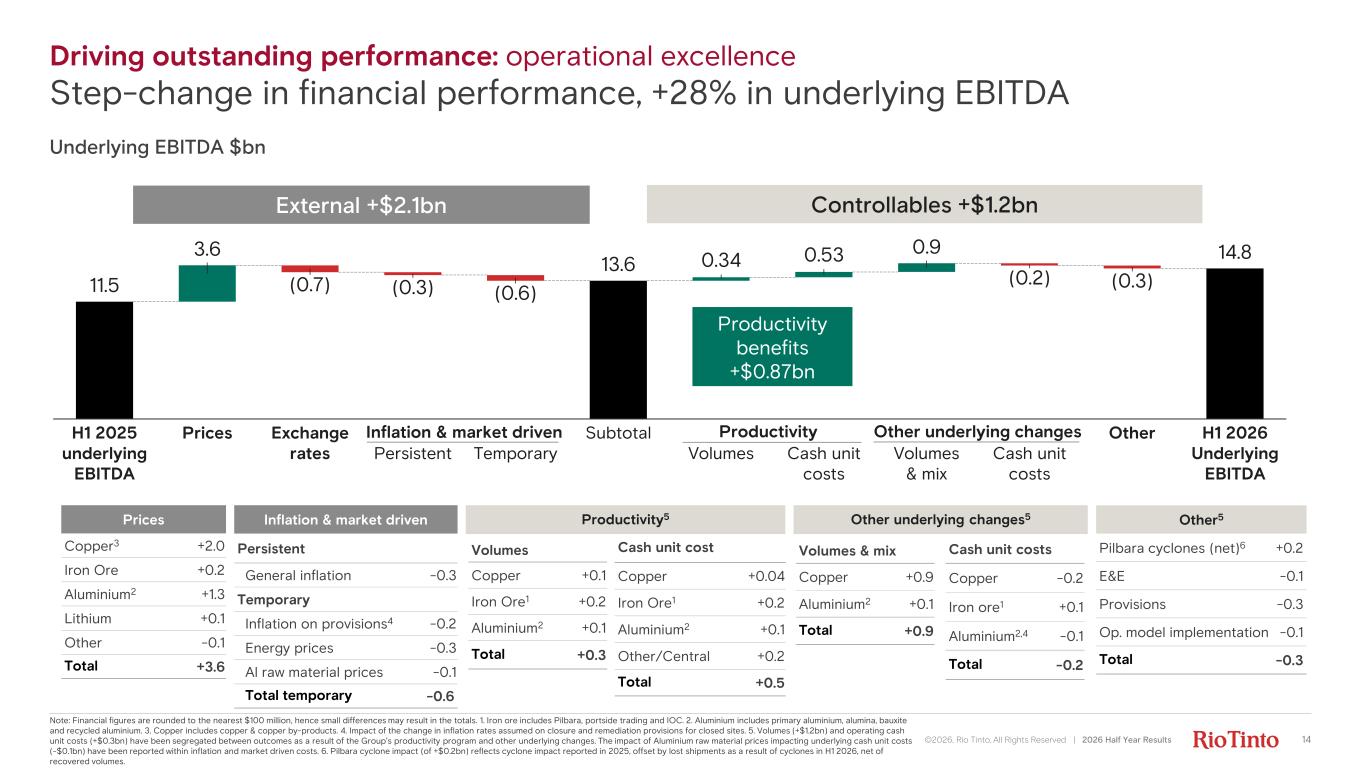
Underlying EBITDA $bn ©2026, Rio Tinto, All Rights Reserved | 2026 Half Year Results 14 Prices Copper3 +2.0 Iron Ore +0.2 Aluminium2 +1.3 Lithium +0.1 Other -0.1 Total +3.6 Inflation & market driven Persistent General inflation -0.3 Temporary Inflation on provisions4 -0.2 Energy prices -0.3 Al raw material prices -0.1 Total temporary -0.6 Volumes Copper +0.1 Iron Ore1 +0.2 Aluminium2 +0.1 Total +0.3 Cash unit cost Copper +0.04 Iron Ore1 +0.2 Aluminium2 +0.1 Other/Central +0.2 Total +0.5 Volumes & mix Copper +0.9 Aluminium2 +0.1 Total +0.9 Other5 Pilbara cyclones (net)6 +0.2 E&E -0.1 Provisions -0.3 Op. model implementation -0.1 Total -0.3 External +$2.1bn Controllables +$1.2bn Note: Financial figures are rounded to the nearest $100 million, hence small differences may result in the totals. 1. Iron ore includes Pilbara, portside trading and IOC. 2. Aluminium includes primary aluminium, alumina, bauxite and recycled aluminium. 3. Copper includes copper & copper by-products. 4. Impact of the change in inflation rates assumed on closure and remediation provisions for closed sites. 5. Volumes (+$1.2bn) and operating cash unit costs (+$0.3bn) have been segregated between outcomes as a result of the Group’s productivity program and other underlying changes. The impact of Aluminium raw material prices impacting underlying cash unit costs (-$0.1bn) have been reported within inflation and market driven costs. 6. Pilbara cyclone impact (of +$0.2bn) reflects cyclone impact reported in 2025, offset by lost shipments as a result of cyclones in H1 2026, net of recovered volumes. Cash unit costs Copper -0.2 Iron ore1 +0.1 Aluminium2,4 -0.1 Total -0.2 11.5 13.6 14.83.6 0.9 (0.2) Prices Cash unit costs (0.3)(0.7) Other H1 2026 Underlying EBITDA Exchange rates (0.3) Persistent (0.6) Temporary Subtotal 0.34 Volumes 0.53 Cash unit costs H1 2025 underlying EBITDA Volumes & mix Inflation & market driven Productivity Other underlying changes Other underlying changes5Productivity5 Productivity benefits +$0.87bn Driving outstanding performance: operational excellence Step-change in financial performance, +28% in underlying EBITDA
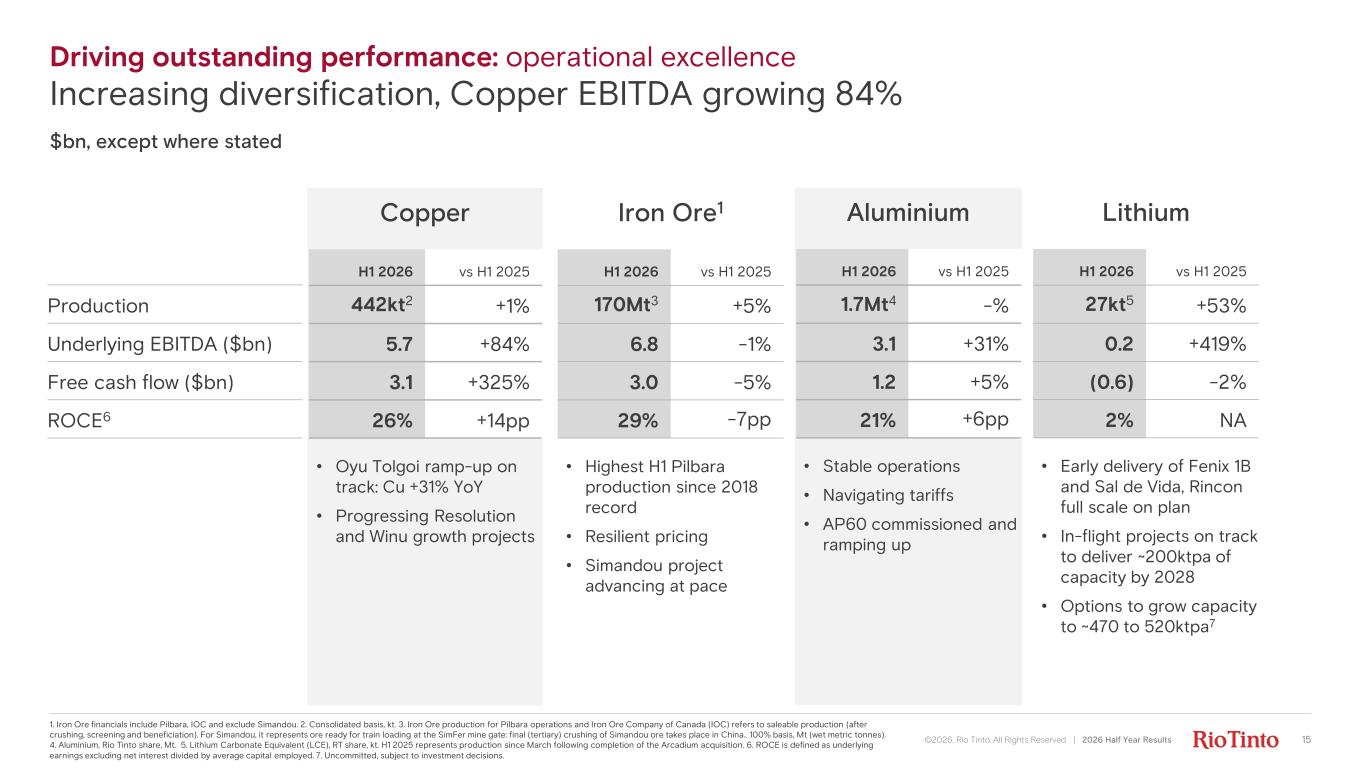
Driving outstanding performance: operational excellence Increasing diversification, Copper EBITDA growing 84% 15 1. Iron Ore financials include Pilbara, IOC and exclude Simandou. 2. Consolidated basis, kt. 3. Iron Ore production for Pilbara operations and Iron Ore Company of Canada (IOC) refers to saleable production (after crushing, screening and beneficiation). For Simandou, it represents ore ready for train loading at the SimFer mine gate: final (tertiary) crushing of Simandou ore takes place in China.. 100% basis, Mt (wet metric tonnes). 4. Aluminium, Rio Tinto share, Mt. 5. Lithium Carbonate Equivalent (LCE), RT share, kt. H1 2025 represents production since March following completion of the Arcadium acquisition. 6. ROCE is defined as underlying earnings excluding net interest divided by average capital employed. 7. Uncommitted, subject to investment decisions. ©2026, Rio Tinto, All Rights Reserved | 2026 Half Year Results Production Underlying EBITDA ($bn) Free cash flow ($bn) ROCE6 $bn, except where stated Iron Ore1 H1 2026 vs H1 2025 170Mt3 +5% 6.8 -1% 3.0 -5% 29% -7pp • Highest H1 Pilbara production since 2018 record • Resilient pricing • Simandou project advancing at pace Aluminium H1 2026 vs H1 2025 1.7Mt4 -% 3.1 +31% 1.2 +5% 21% +6pp • Stable operations • Navigating tariffs • AP60 commissioned and ramping up Copper H1 2026 vs H1 2025 442kt2 +1% 5.7 +84% 3.1 +325% 26% +14pp • Oyu Tolgoi ramp-up on track: Cu +31% YoY • Progressing Resolution and Winu growth projects Lithium H1 2026 vs H1 2025 27kt5 +53% 0.2 +419% (0.6) -2% 2% NA • Early delivery of Fenix 1B and Sal de Vida, Rincon full scale on plan • In-flight projects on track to deliver ~200ktpa of capacity by 2028 • Options to grow capacity to ~470 to 520ktpa7
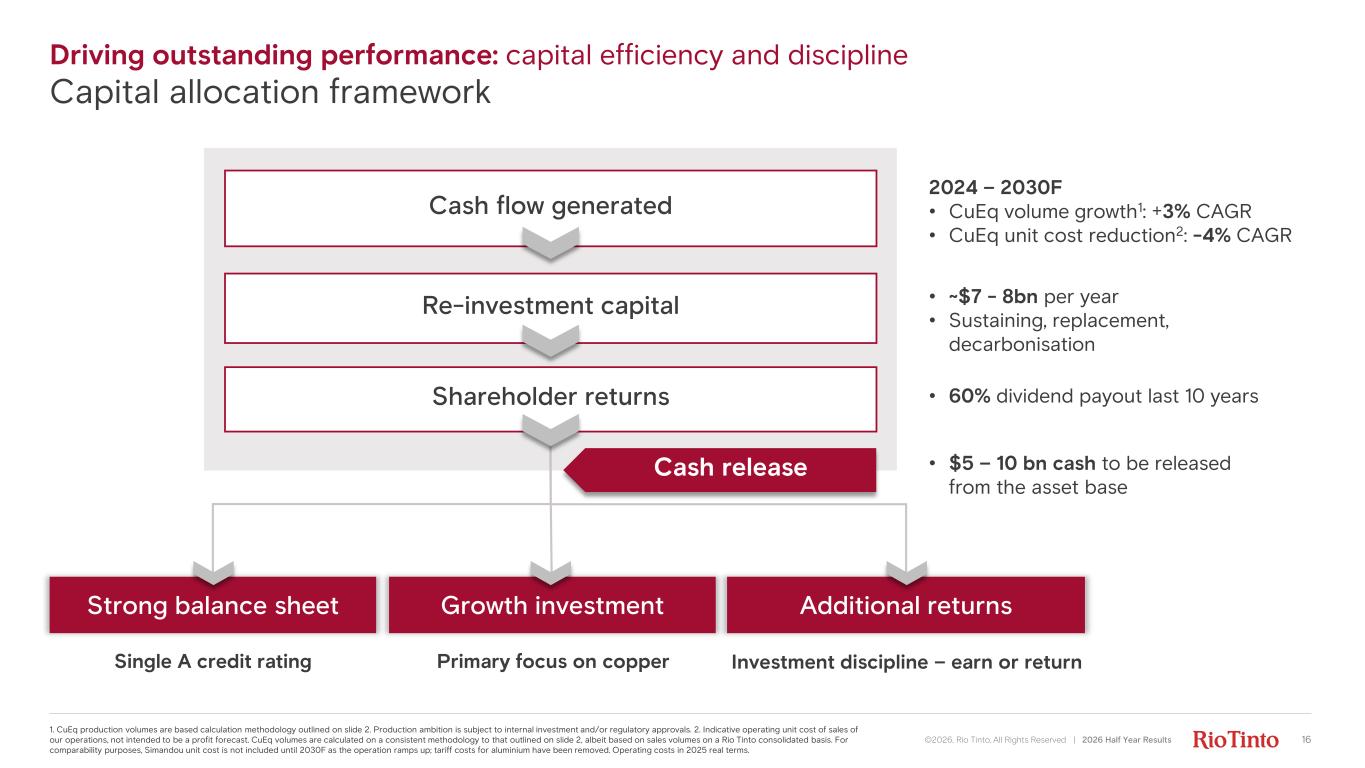
Driving outstanding performance: capital efficiency and discipline Capital allocation framework ©2026, Rio Tinto, All Rights Reserved | 2026 Half Year Results 16 1. CuEq production volumes are based calculation methodology outlined on slide 2. Production ambition is subject to internal investment and/or regulatory approvals. 2. Indicative operating unit cost of sales of our operations, not intended to be a profit forecast. CuEq volumes are calculated on a consistent methodology to that outlined on slide 2, albeit based on sales volumes on a Rio Tinto consolidated basis. For comparability purposes, Simandou unit cost is not included until 2030F as the operation ramps up; tariff costs for aluminium have been removed. Operating costs in 2025 real terms. Cash flow generated Re-investment capital Shareholder returns 2024 – 2030F • CuEq volume growth1: +3% CAGR • CuEq unit cost reduction2: -4% CAGR Strong balance sheet Growth investment Additional returns Single A credit rating Primary focus on copper Investment discipline – earn or return • $5 – 10 bn cash to be released from the asset base • ~$7 - 8bn per year • Sustaining, replacement, decarbonisation • 60% dividend payout last 10 years Cash release
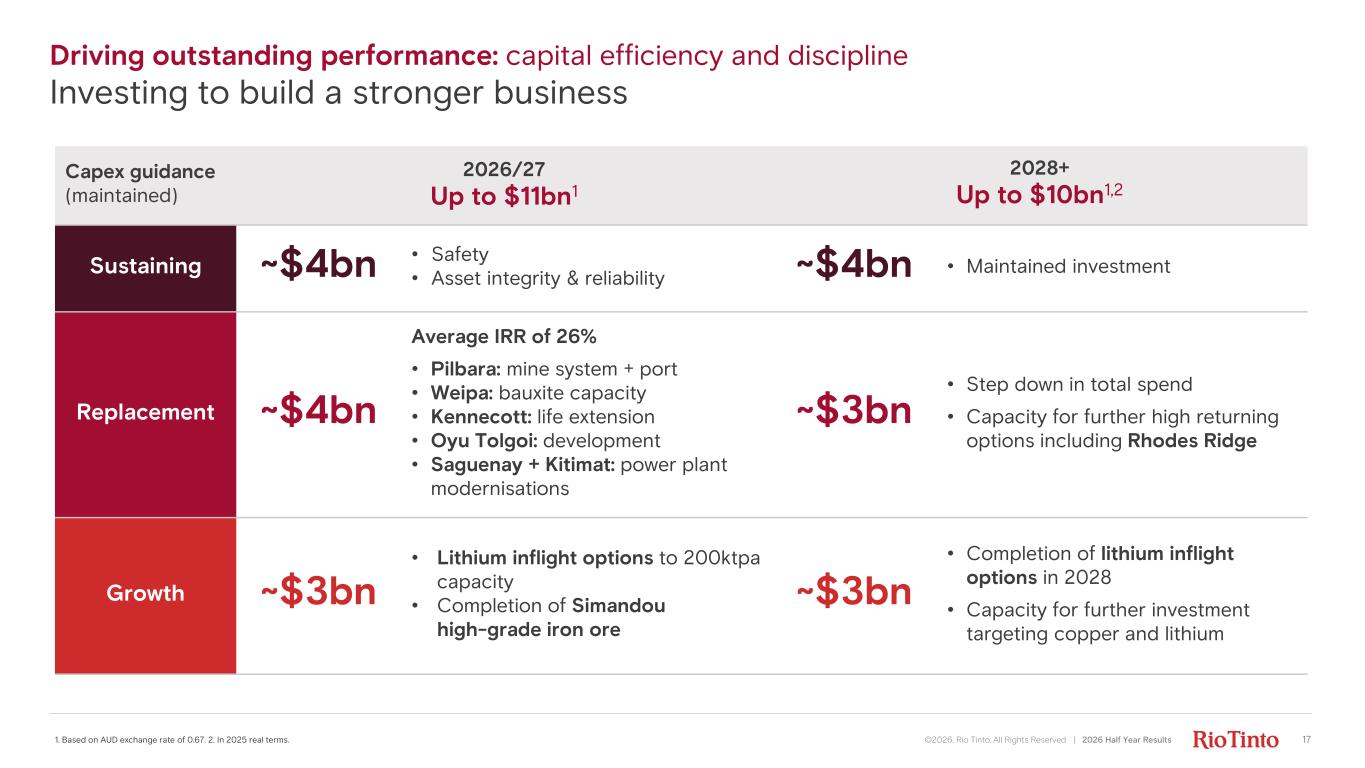
Capex guidance (maintained) 2026/27 Up to $11bn1 2028+ Up to $10bn1,2 Sustaining ~$4bn • Safety • Asset integrity & reliability ~$4bn • Maintained investment Replacement ~$4bn Average IRR of 26% • Pilbara: mine system + port • Weipa: bauxite capacity • Kennecott: life extension • Oyu Tolgoi: development • Saguenay + Kitimat: power plant modernisations ~$3bn • Step down in total spend • Capacity for further high returning options including Rhodes Ridge Growth ~$3bn • Lithium inflight options to 200ktpa capacity • Completion of Simandou high-grade iron ore ~$3bn • Completion of lithium inflight options in 2028 • Capacity for further investment targeting copper and lithium Driving outstanding performance: capital efficiency and discipline Investing to build a stronger business ©2026, Rio Tinto, All Rights Reserved | 2026 Half Year Results 171. Based on AUD exchange rate of 0.67. 2. In 2025 real terms.
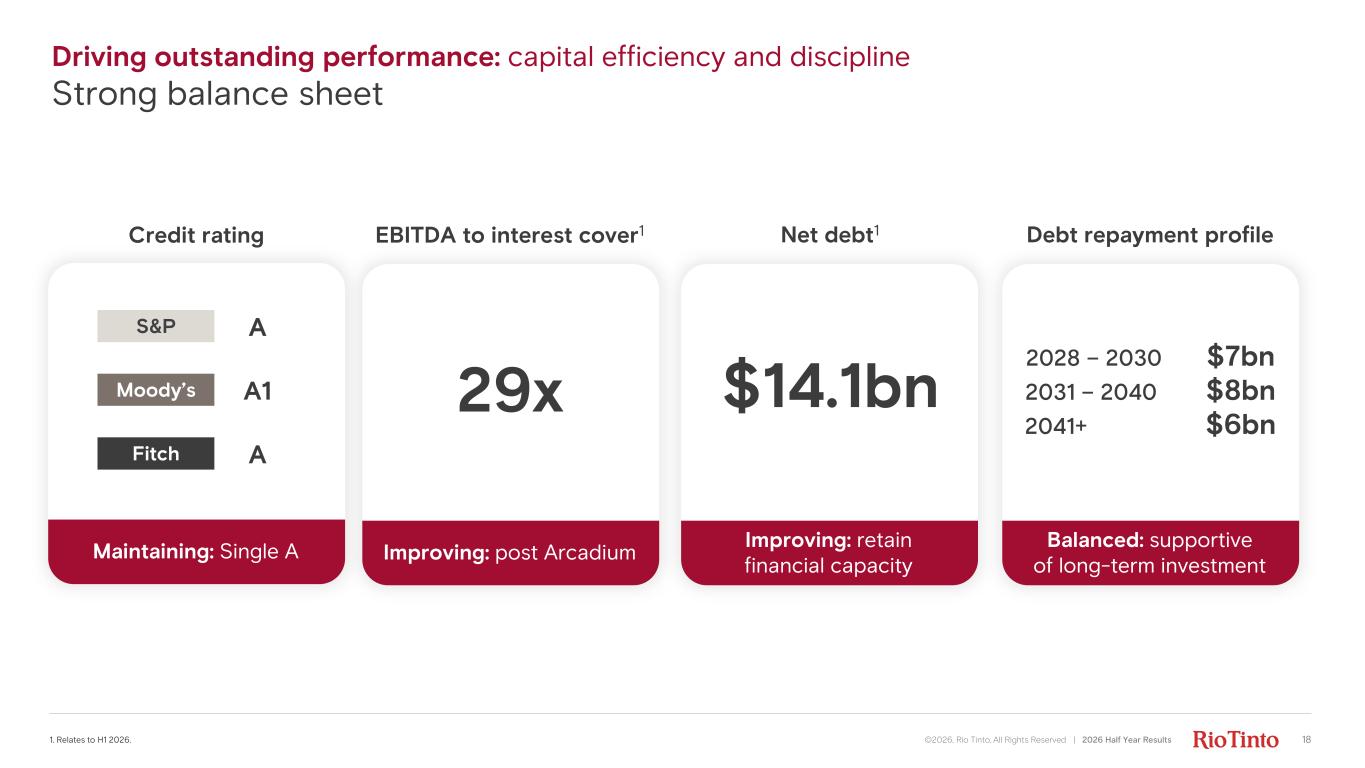
Balanced: supportive of long-term investment Improving: retain financial capacity Improving: post ArcadiumMaintaining: Single A Driving outstanding performance: capital efficiency and discipline Strong balance sheet ©2026, Rio Tinto, All Rights Reserved | 2026 Half Year Results 181. Relates to H1 2026. Credit rating Net debt1EBITDA to interest cover1 Debt repayment profile S&P Moody’s Fitch A A1 A 29x $14.1bn 2028 – 2030 $7bn 2031 – 2040 $8bn 2041+ $6bn
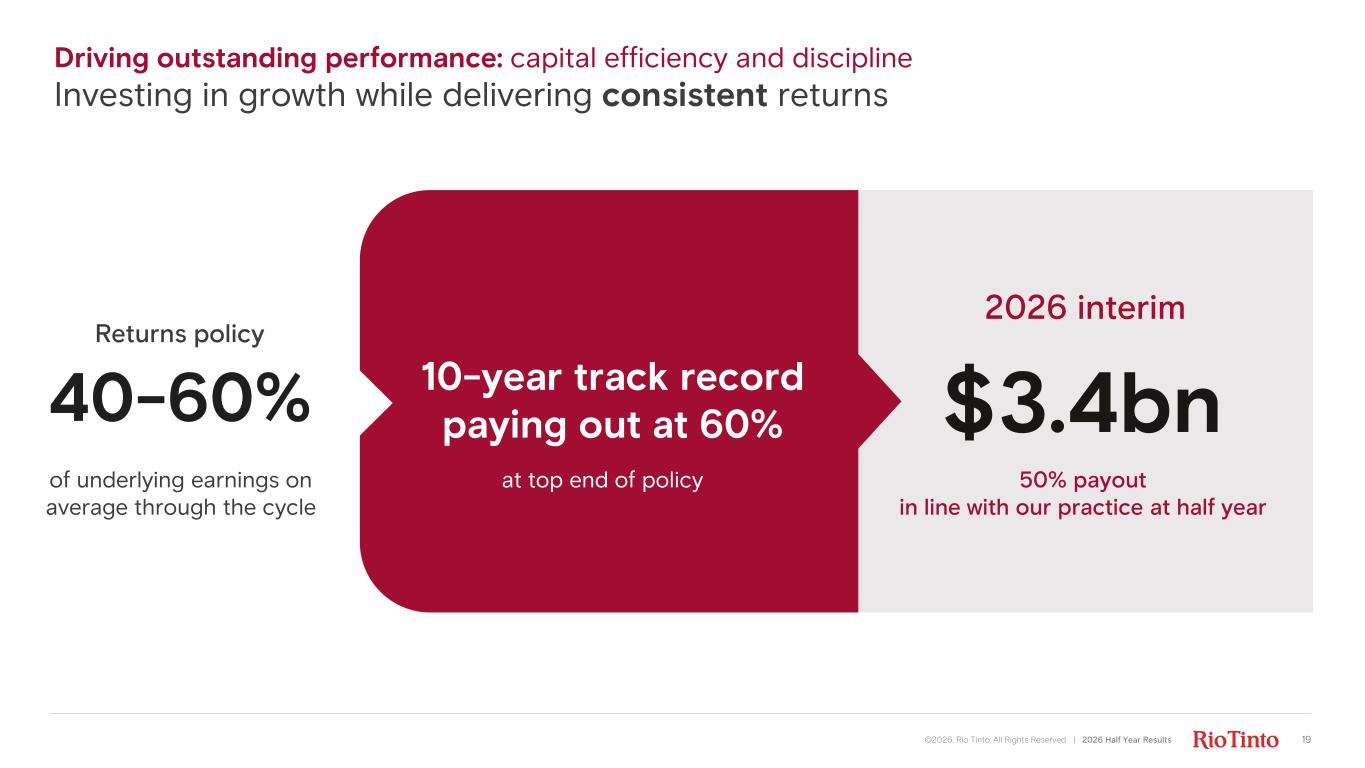
Driving outstanding performance: capital efficiency and discipline Investing in growth while delivering consistent returns 19©2026, Rio Tinto, All Rights Reserved | 2026 Half Year Results 40-60% of underlying earnings on average through the cycle Returns policy $3.4bn 50% payout in line with our practice at half year 2026 interim 10-year track record paying out at 60% at top end of policy
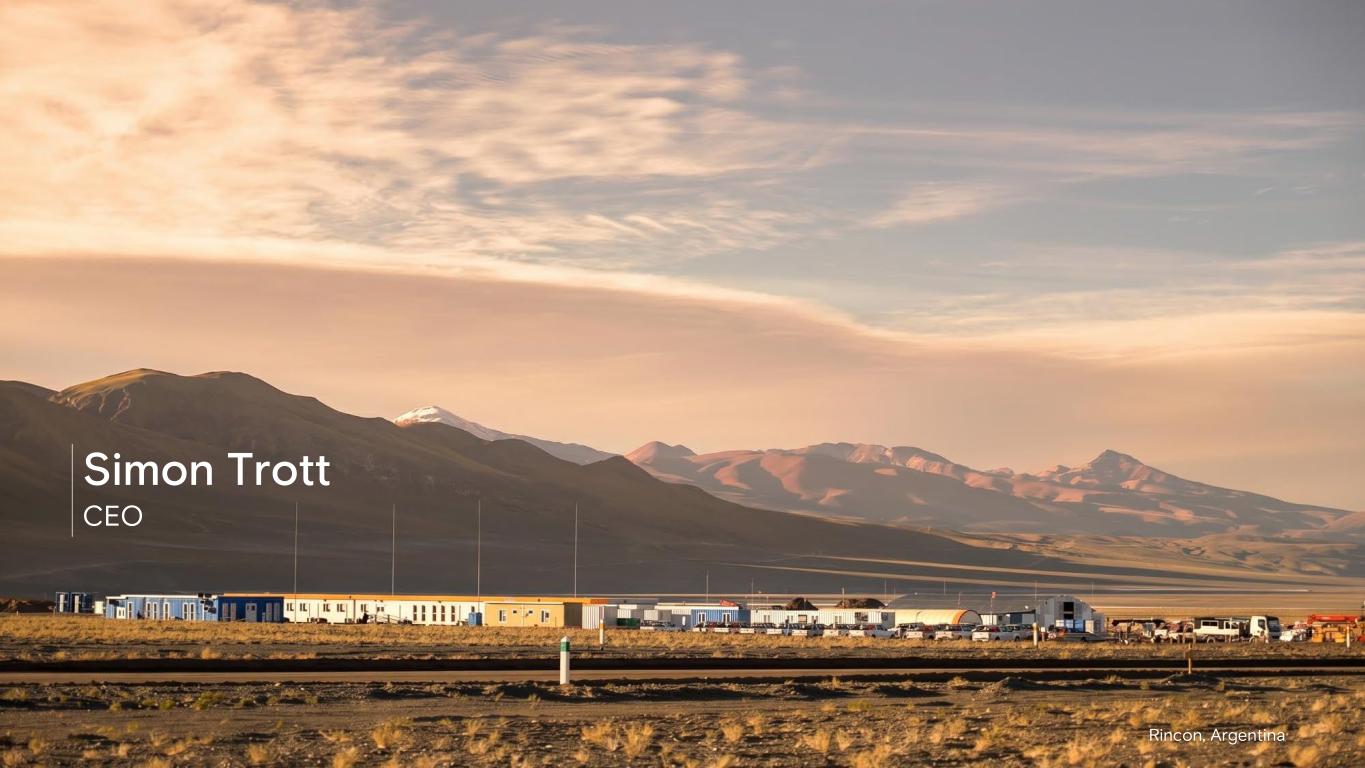
Rincon, Argentina Simon Trott CEO
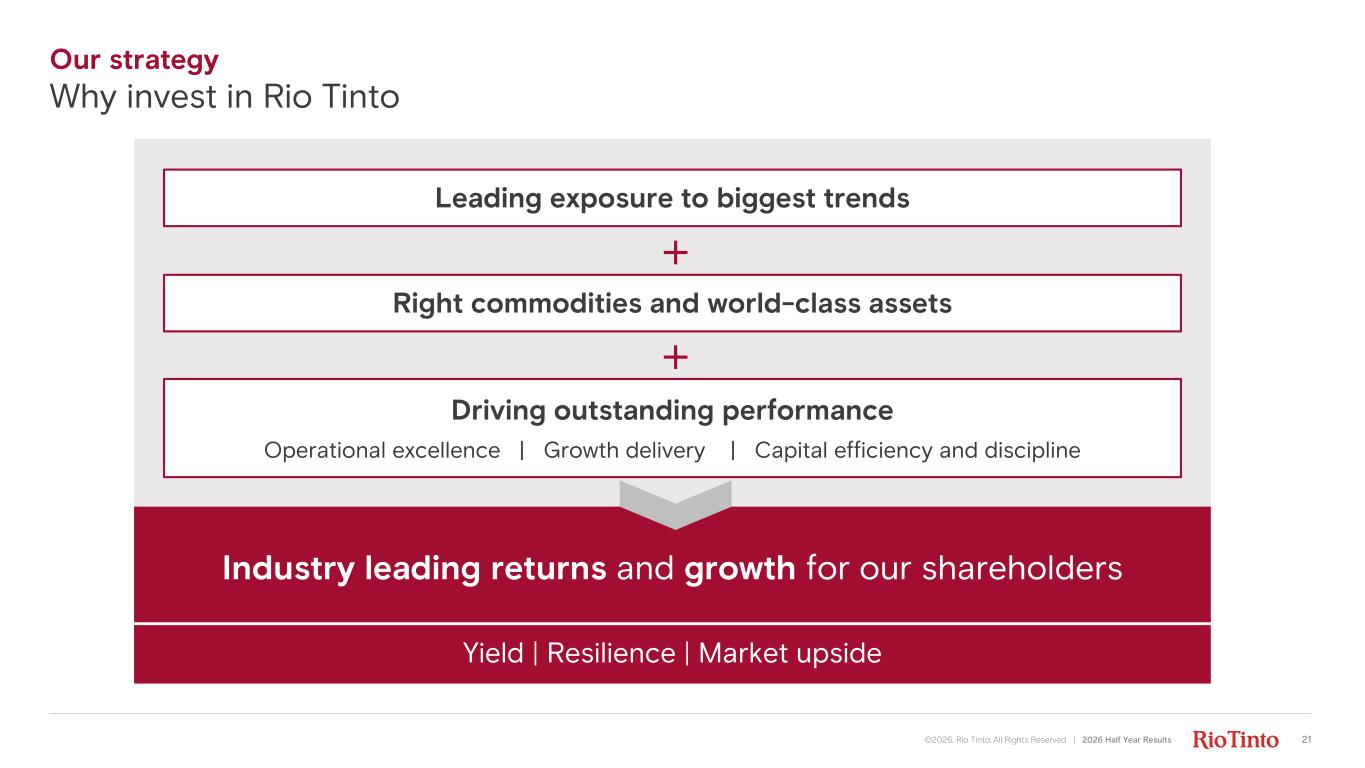
Our strategy Why invest in Rio Tinto Industry leading returns and growth for our shareholders Leading exposure to biggest trends Right commodities and world-class assets Driving outstanding performance Operational excellence | Growth delivery | Capital efficiency and discipline Yield | Resilience | Market upside 21©2026, Rio Tinto, All Rights Reserved | 2026 Half Year Results
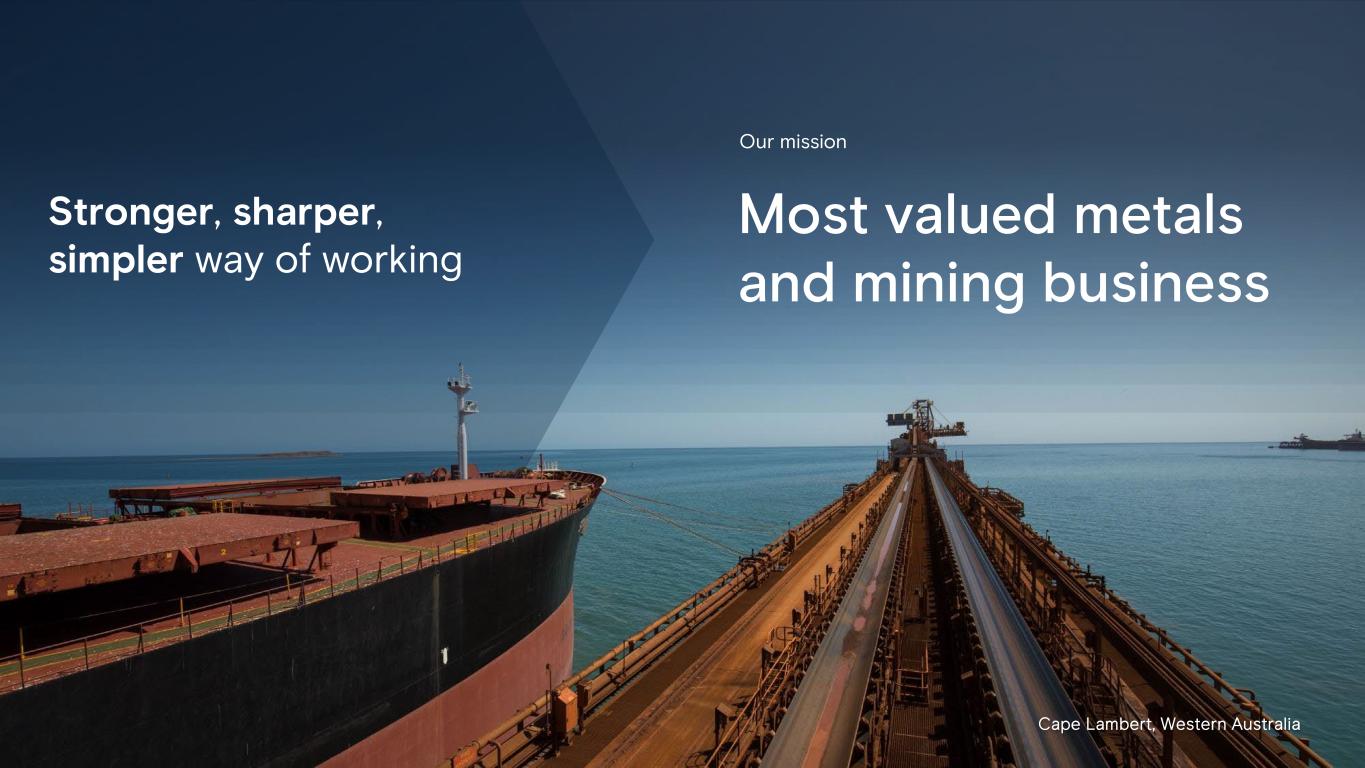
Cape Lambert, Western Australia Most valued metals and mining business Our mission Stronger, sharper, simpler way of working
Gudai-Darri, Australia Q&A
Yarwun, Gladstone Appendix
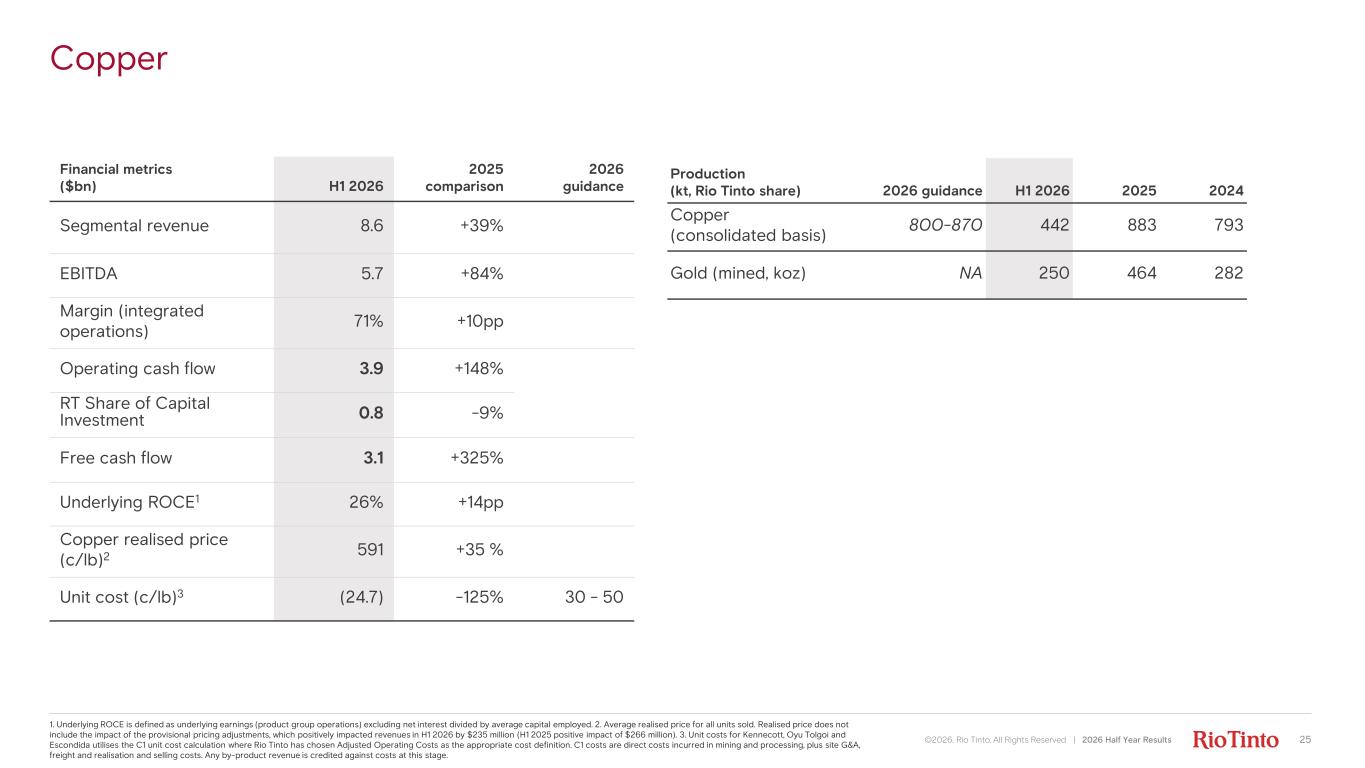
Production (kt, Rio Tinto share) 2026 guidance H1 2026 2025 2024 Copper (consolidated basis) 800-870 442 883 793 Gold (mined, koz) NA 250 464 282 Financial metrics ($bn) H1 2026 2025 comparison 2026 guidance Segmental revenue 8.6 +39% EBITDA 5.7 +84% Margin (integrated operations) 71% +10pp Operating cash flow 3.9 +148% RT Share of Capital Investment 0.8 -9% Free cash flow 3.1 +325% Underlying ROCE1 26% +14pp Copper realised price (c/lb)2 591 +35 % Unit cost (c/lb)3 (24.7) -125% 30 - 50 Copper 1. Underlying ROCE is defined as underlying earnings (product group operations) excluding net interest divided by average capital employed. 2. Average realised price for all units sold. Realised price does not include the impact of the provisional pricing adjustments, which positively impacted revenues in H1 2026 by $235 million (H1 2025 positive impact of $266 million). 3. Unit costs for Kennecott, Oyu Tolgoi and Escondida utilises the C1 unit cost calculation where Rio Tinto has chosen Adjusted Operating Costs as the appropriate cost definition. C1 costs are direct costs incurred in mining and processing, plus site G&A, freight and realisation and selling costs. Any by-product revenue is credited against costs at this stage. 25©2026, Rio Tinto, All Rights Reserved | 2026 Half Year Results
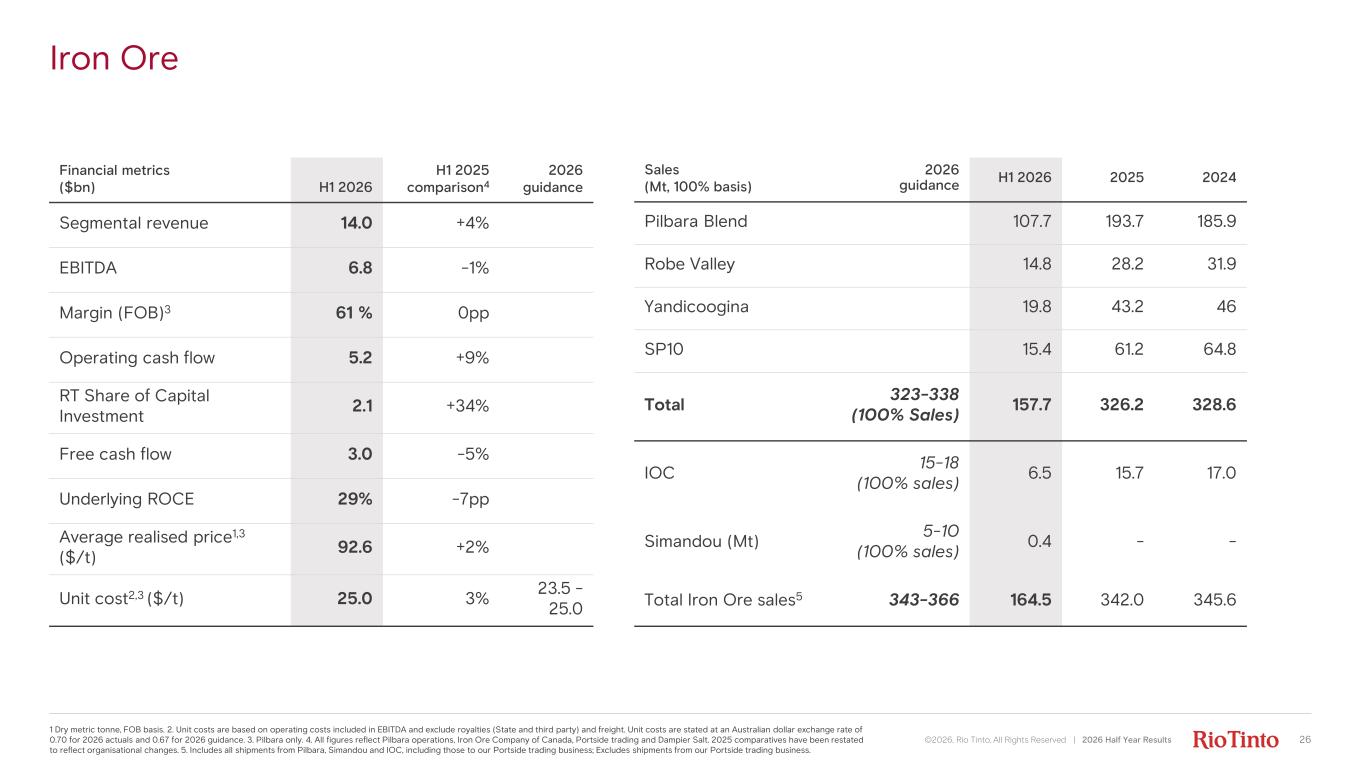
Sales (Mt, 100% basis) 2026 guidance H1 2026 2025 2024 Pilbara Blend 107.7 193.7 185.9 Robe Valley 14.8 28.2 31.9 Yandicoogina 19.8 43.2 46 SP10 15.4 61.2 64.8 Total 323-338 (100% Sales) 157.7 326.2 328.6 IOC 15-18 (100% sales) 6.5 15.7 17.0 Simandou (Mt) 5-10 (100% sales) 0.4 - - Total Iron Ore sales5 343-366 164.5 342.0 345.6 Financial metrics ($bn) H1 2026 H1 2025 comparison4 2026 guidance Segmental revenue 14.0 +4% EBITDA 6.8 -1% Margin (FOB)3 61 % 0pp Operating cash flow 5.2 +9% RT Share of Capital Investment 2.1 +34% Free cash flow 3.0 -5% Underlying ROCE 29% -7pp Average realised price1,3 ($/t) 92.6 +2% Unit cost2,3 ($/t) 25.0 3% 23.5 - 25.0 Iron Ore 1 Dry metric tonne, FOB basis. 2. Unit costs are based on operating costs included in EBITDA and exclude royalties (State and third party) and freight. Unit costs are stated at an Australian dollar exchange rate of 0.70 for 2026 actuals and 0.67 for 2026 guidance. 3. Pilbara only. 4. All figures reflect Pilbara operations, Iron Ore Company of Canada, Portside trading and Dampier Salt. 2025 comparatives have been restated to reflect organisational changes. 5. Includes all shipments from Pilbara, Simandou and IOC, including those to our Portside trading business; Excludes shipments from our Portside trading business. 26©2026, Rio Tinto, All Rights Reserved | 2026 Half Year Results
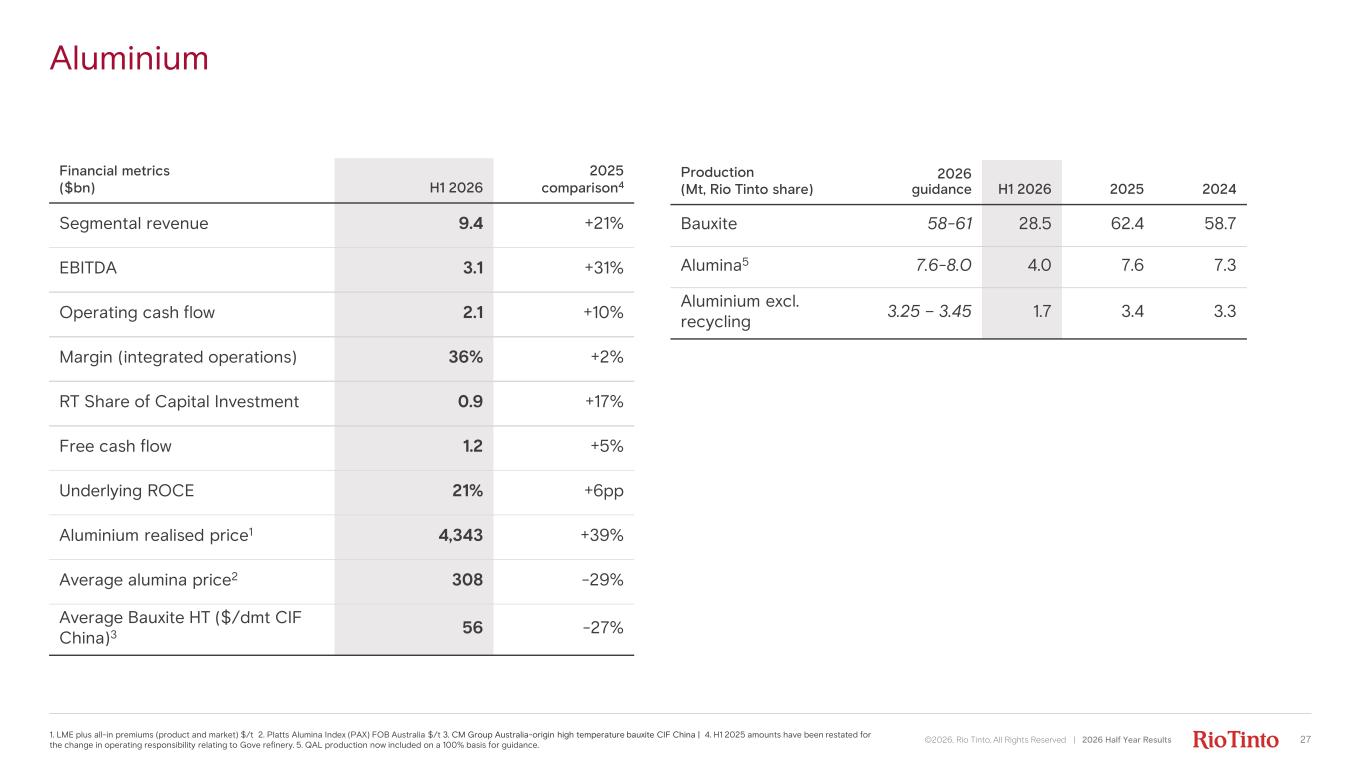
Production (Mt, Rio Tinto share) 2026 guidance H1 2026 2025 2024 Bauxite 58-61 28.5 62.4 58.7 Alumina5 7.6-8.0 4.0 7.6 7.3 Aluminium excl. recycling 3.25 – 3.45 1.7 3.4 3.3 Financial metrics ($bn) H1 2026 2025 comparison4 Segmental revenue 9.4 +21% EBITDA 3.1 +31% Operating cash flow 2.1 +10% Margin (integrated operations) 36% +2% RT Share of Capital Investment 0.9 +17% Free cash flow 1.2 +5% Underlying ROCE 21% +6pp Aluminium realised price1 4,343 +39% Average alumina price2 308 -29% Average Bauxite HT ($/dmt CIF China)3 56 -27% Aluminium 1. LME plus all-in premiums (product and market) $/t 2. Platts Alumina Index (PAX) FOB Australia $/t 3. CM Group Australia-origin high temperature bauxite CIF China | 4. H1 2025 amounts have been restated for the change in operating responsibility relating to Gove refinery. 5. QAL production now included on a 100% basis for guidance. 27©2026, Rio Tinto, All Rights Reserved | 2026 Half Year Results
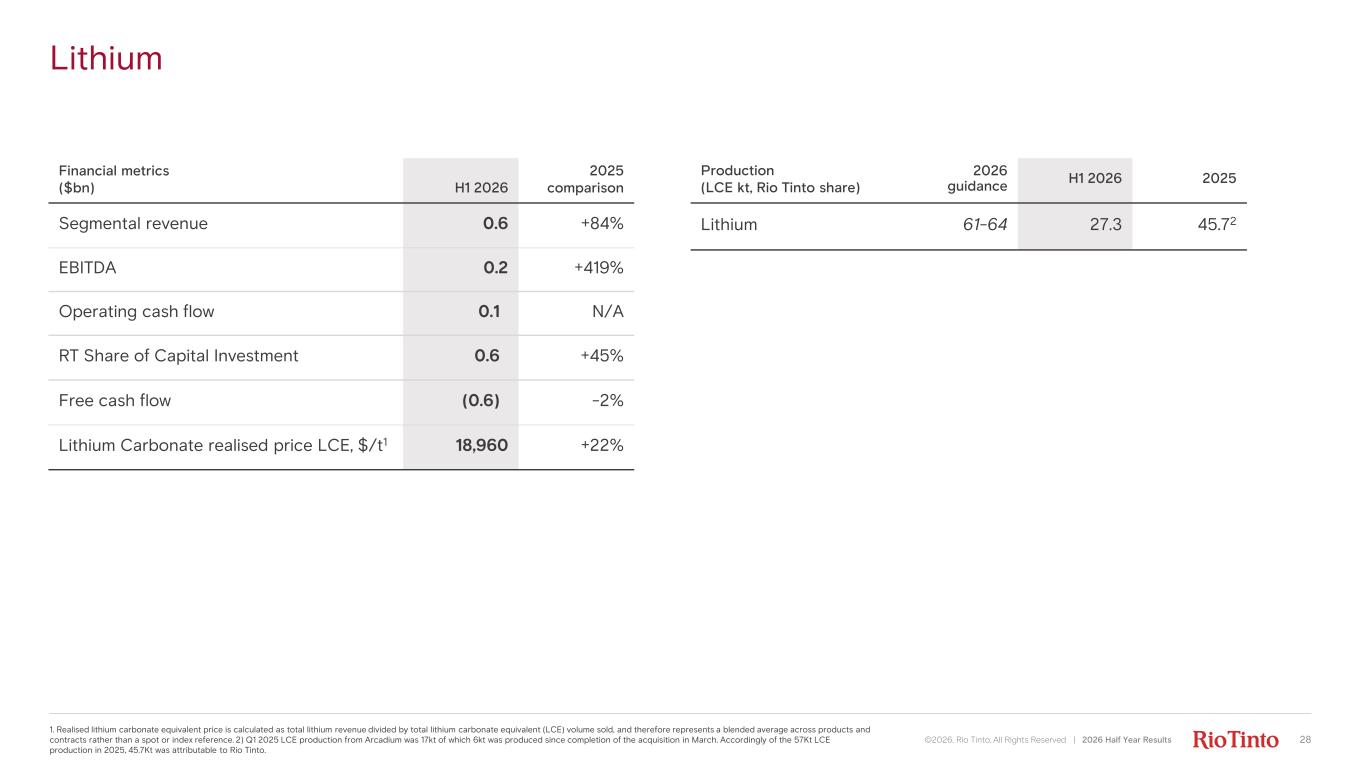
Production (LCE kt, Rio Tinto share) 2026 guidance H1 2026 2025 Lithium 61-64 27.3 45.72 Financial metrics ($bn) H1 2026 2025 comparison Segmental revenue 0.6 +84% EBITDA 0.2 +419% Operating cash flow 0.1 N/A RT Share of Capital Investment 0.6 +45% Free cash flow (0.6) -2% Lithium Carbonate realised price LCE, $/t1 18,960 +22% Lithium 1. Realised lithium carbonate equivalent price is calculated as total lithium revenue divided by total lithium carbonate equivalent (LCE) volume sold, and therefore represents a blended average across products and contracts rather than a spot or index reference. 2) Q1 2025 LCE production from Arcadium was 17kt of which 6kt was produced since completion of the acquisition in March. Accordingly of the 57Kt LCE production in 2025, 45.7Kt was attributable to Rio Tinto. 28©2026, Rio Tinto, All Rights Reserved | 2026 Half Year Results
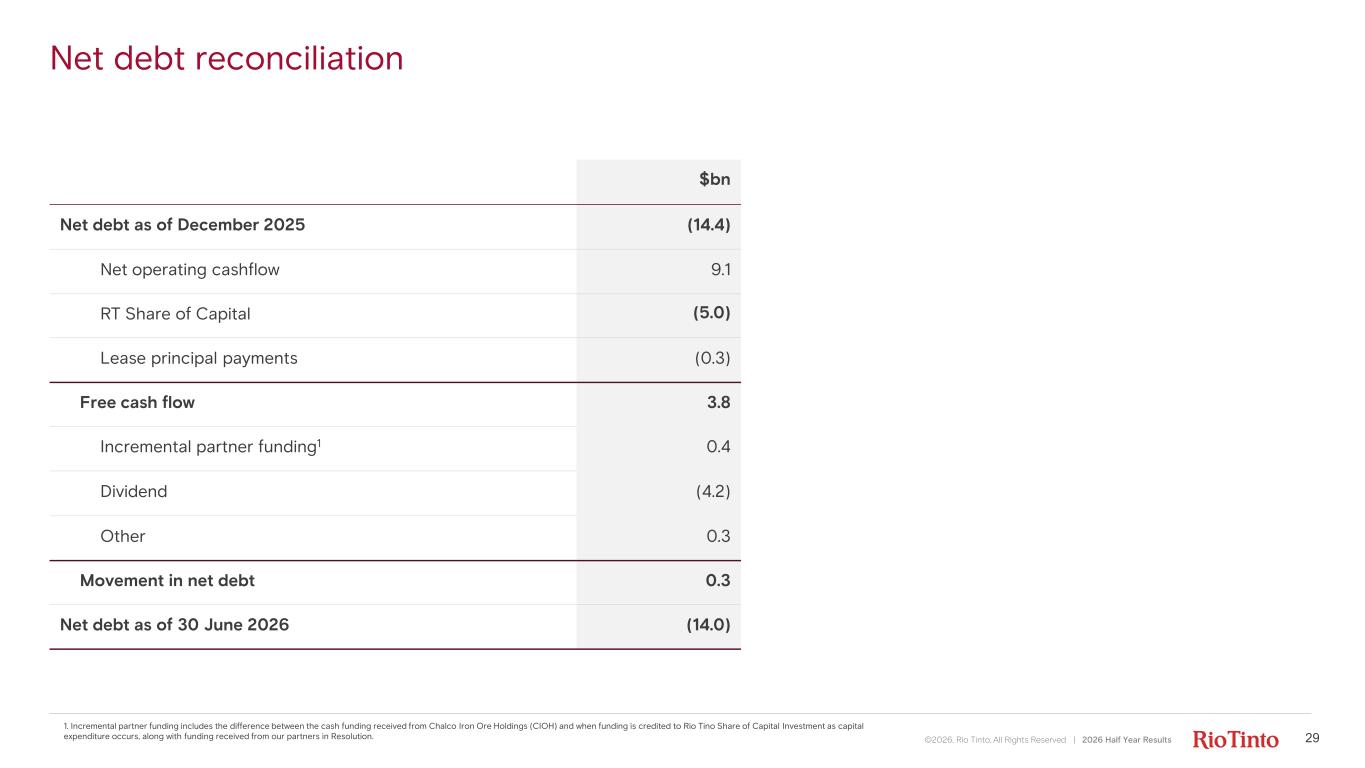
29 $bn Net debt as of December 2025 (14.4) Net operating cashflow 9.1 RT Share of Capital (5.0) Lease principal payments (0.3) Free cash flow 3.8 Incremental partner funding1 0.4 Dividend (4.2) Other 0.3 Movement in net debt 0.3 Net debt as of 30 June 2026 (14.0) Net debt reconciliation ©2026, Rio Tinto, All Rights Reserved | 2026 Half Year Results 1. Incremental partner funding includes the difference between the cash funding received from Chalco Iron Ore Holdings (CIOH) and when funding is credited to Rio Tino Share of Capital Investment as capital expenditure occurs, along with funding received from our partners in Resolution.
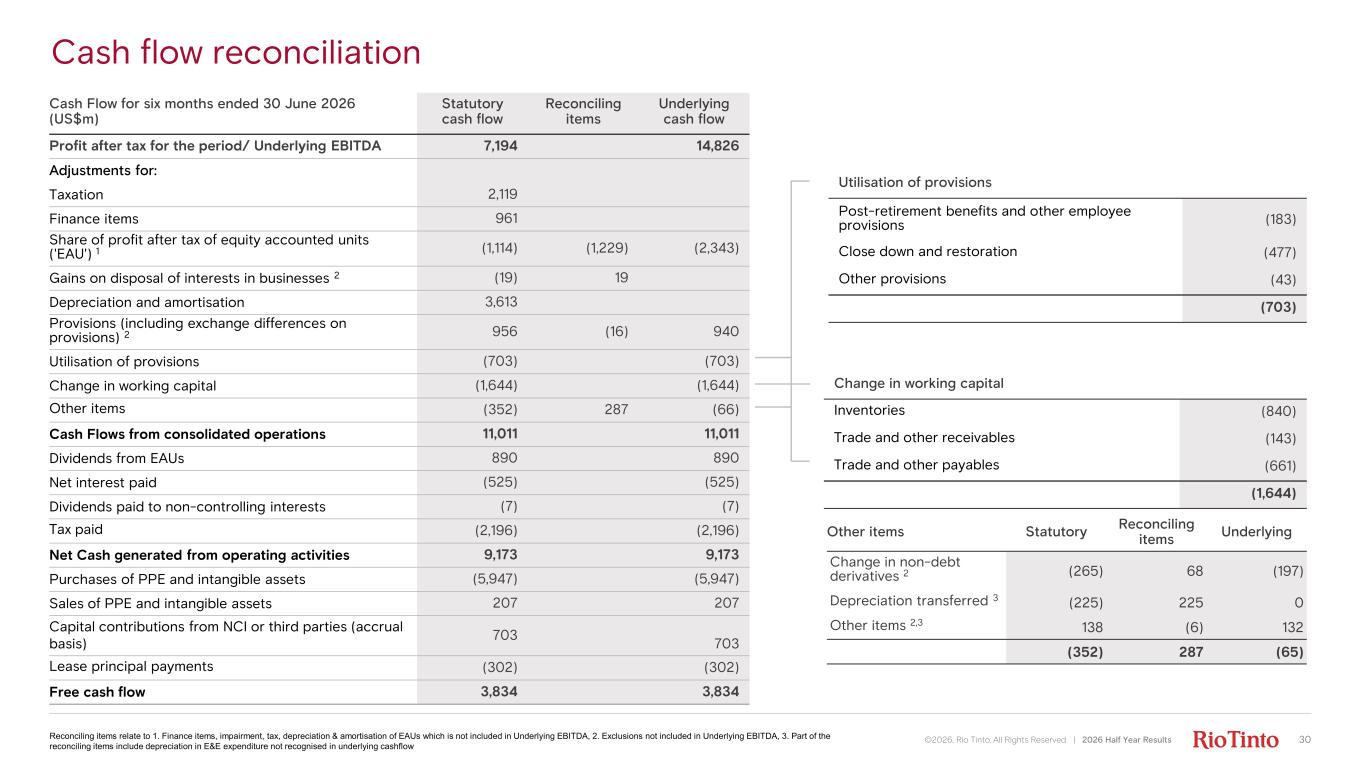
Cash flow reconciliation Cash Flow for six months ended 30 June 2026 (US$m) Statutory cash flow Reconciling items Underlying cash flow Profit after tax for the period/ Underlying EBITDA 7,194 14,826 Adjustments for: Taxation 2,119 Finance items 961 Share of profit after tax of equity accounted units ('EAU') 1 (1,114) (1,229) (2,343) Gains on disposal of interests in businesses 2 (19) 19 Depreciation and amortisation 3,613 Provisions (including exchange differences on provisions) 2 956 (16) 940 Utilisation of provisions (703) (703) Change in working capital (1,644) (1,644) Other items (352) 287 (66) Cash Flows from consolidated operations 11,011 11,011 Dividends from EAUs 890 890 Net interest paid (525) (525) Dividends paid to non-controlling interests (7) (7) Tax paid (2,196) (2,196) Net Cash generated from operating activities 9,173 9,173 Purchases of PPE and intangible assets (5,947) (5,947) Sales of PPE and intangible assets 207 207 Capital contributions from NCI or third parties (accrual basis) 703 703 Lease principal payments (302) (302) Free cash flow 3,834 3,834 Utilisation of provisions Post-retirement benefits and other employee provisions (183) Close down and restoration (477) Other provisions (43) (703) Change in working capital Inventories (840) Trade and other receivables (143) Trade and other payables (661) (1,644) Other items Statutory Reconciling items Underlying Change in non-debt derivatives 2 (265) 68 (197) Depreciation transferred 3 (225) 225 0 Other items 2,3 138 (6) 132 (352) 287 (65) Reconciling items relate to 1. Finance items, impairment, tax, depreciation & amortisation of EAUs which is not included in Underlying EBITDA, 2. Exclusions not included in Underlying EBITDA, 3. Part of the reconciling items include depreciation in E&E expenditure not recognised in underlying cashflow 30©2026, Rio Tinto, All Rights Reserved | 2026 Half Year Results
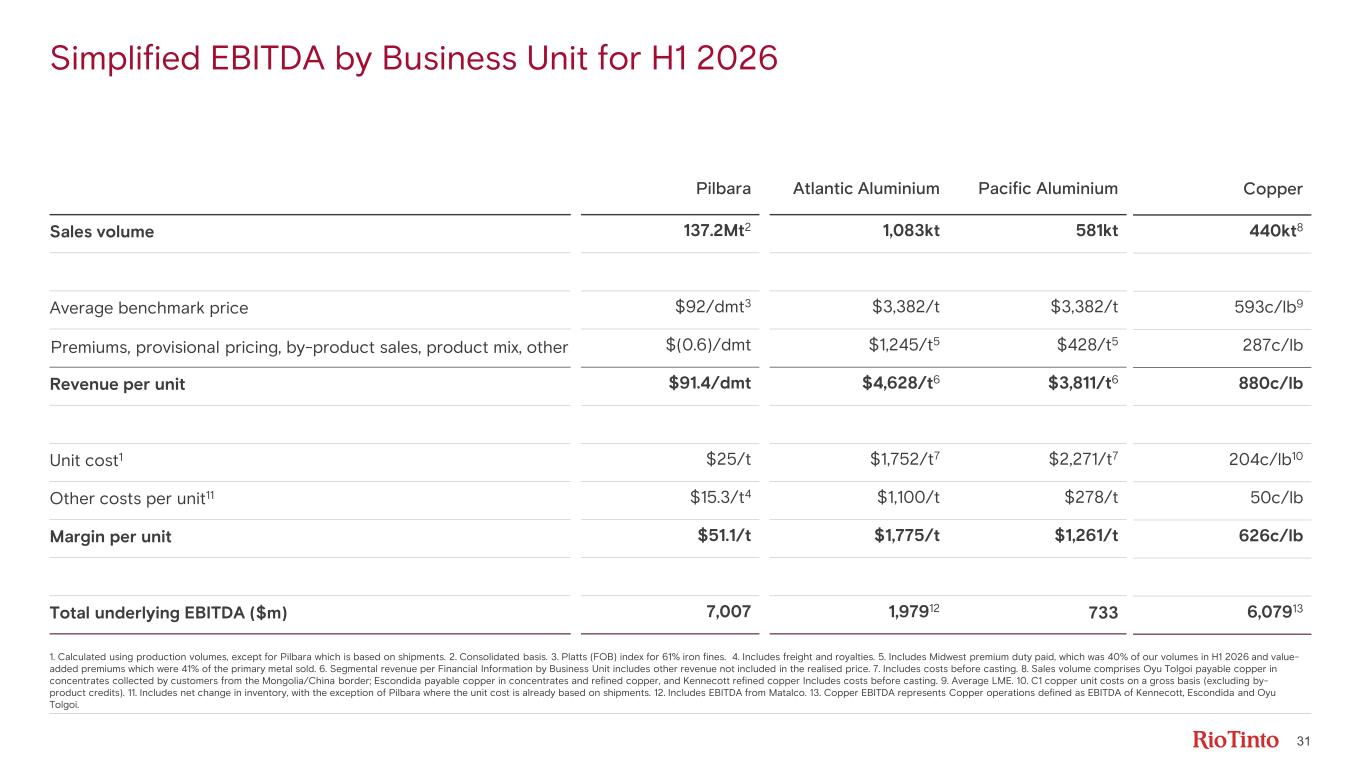
Simplified EBITDA by Business Unit for H1 2026 31 1. Calculated using production volumes, except for Pilbara which is based on shipments. 2. Consolidated basis. 3. Platts (FOB) index for 61% iron fines. 4. Includes freight and royalties. 5. Includes Midwest premium duty paid, which was 40% of our volumes in H1 2026 and value- added premiums which were 41% of the primary metal sold. 6. Segmental revenue per Financial Information by Business Unit includes other revenue not included in the realised price. 7. Includes costs before casting. 8. Sales volume comprises Oyu Tolgoi payable copper in concentrates collected by customers from the Mongolia/China border; Escondida payable copper in concentrates and refined copper, and Kennecott refined copper Includes costs before casting. 9. Average LME. 10. C1 copper unit costs on a gross basis (excluding by- product credits). 11. Includes net change in inventory, with the exception of Pilbara where the unit cost is already based on shipments. 12. Includes EBITDA from Matalco. 13. Copper EBITDA represents Copper operations defined as EBITDA of Kennecott, Escondida and Oyu Tolgoi. Sales volume Average benchmark price Premiums, provisional pricing, by-product sales, product mix, other Revenue per unit Unit cost1 Other costs per unit11 Margin per unit Total underlying EBITDA ($m) Pilbara 137.2Mt2 $92/dmt3 $(0.6)/dmt $91.4/dmt $25/t $15.3/t4 $51.1/t 7,007 Atlantic Aluminium Pacific Aluminium 1,083kt 581kt $3,382/t $3,382/t $1,245/t5 $428/t5 $4,628/t6 $3,811/t6 $1,752/t7 $2,271/t7 $1,100/t $278/t $1,775/t $1,261/t 1,97912 733 Copper 440kt8 593c/lb9 287c/lb 880c/lb 204c/lb10 50c/lb 626c/lb 6,07913
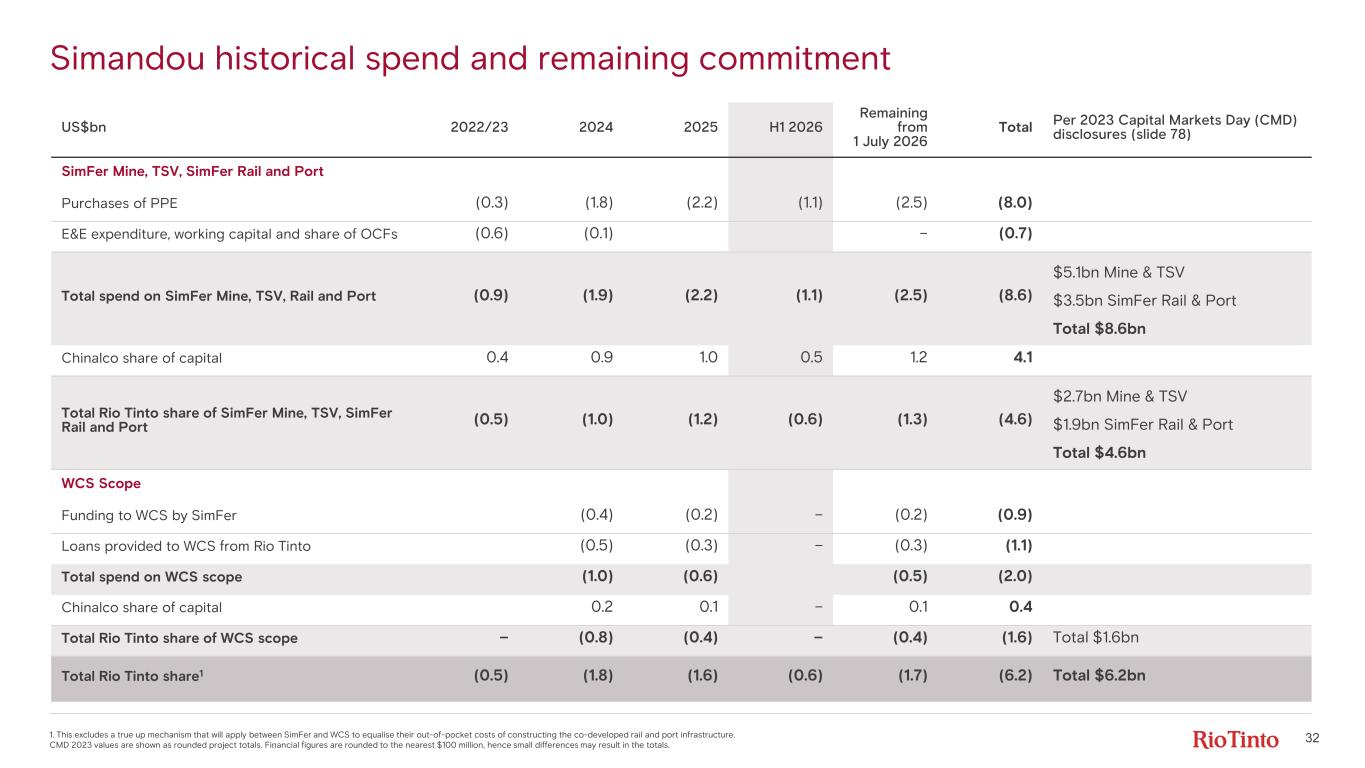
32 US$bn 2022/23 2024 2025 H1 2026 Remaining from 1 July 2026 Total Per 2023 Capital Markets Day (CMD) disclosures (slide 78) SimFer Mine, TSV, SimFer Rail and Port Purchases of PPE (0.3) (1.8) (2.2) (1.1) (2.5) (8.0) E&E expenditure, working capital and share of OCFs (0.6) (0.1) – (0.7) Total spend on SimFer Mine, TSV, Rail and Port (0.9) (1.9) (2.2) (1.1) (2.5) (8.6) $5.1bn Mine & TSV $3.5bn SimFer Rail & Port Total $8.6bn Chinalco share of capital 0.4 0.9 1.0 0.5 1.2 4.1 Total Rio Tinto share of SimFer Mine, TSV, SimFer Rail and Port (0.5) (1.0) (1.2) (0.6) (1.3) (4.6) $2.7bn Mine & TSV $1.9bn SimFer Rail & Port Total $4.6bn WCS Scope Funding to WCS by SimFer (0.4) (0.2) – (0.2) (0.9) Loans provided to WCS from Rio Tinto (0.5) (0.3) – (0.3) (1.1) Total spend on WCS scope (1.0) (0.6) (0.5) (2.0) Chinalco share of capital 0.2 0.1 – 0.1 0.4 Total Rio Tinto share of WCS scope – (0.8) (0.4) – (0.4) (1.6) Total $1.6bn Total Rio Tinto share1 (0.5) (1.8) (1.6) (0.6) (1.7) (6.2) Total $6.2bn Simandou historical spend and remaining commitment 1. This excludes a true up mechanism that will apply between SimFer and WCS to equalise their out-of-pocket costs of constructing the co-developed rail and port infrastructure. CMD 2023 values are shown as rounded project totals. Financial figures are rounded to the nearest $100 million, hence small differences may result in the totals.
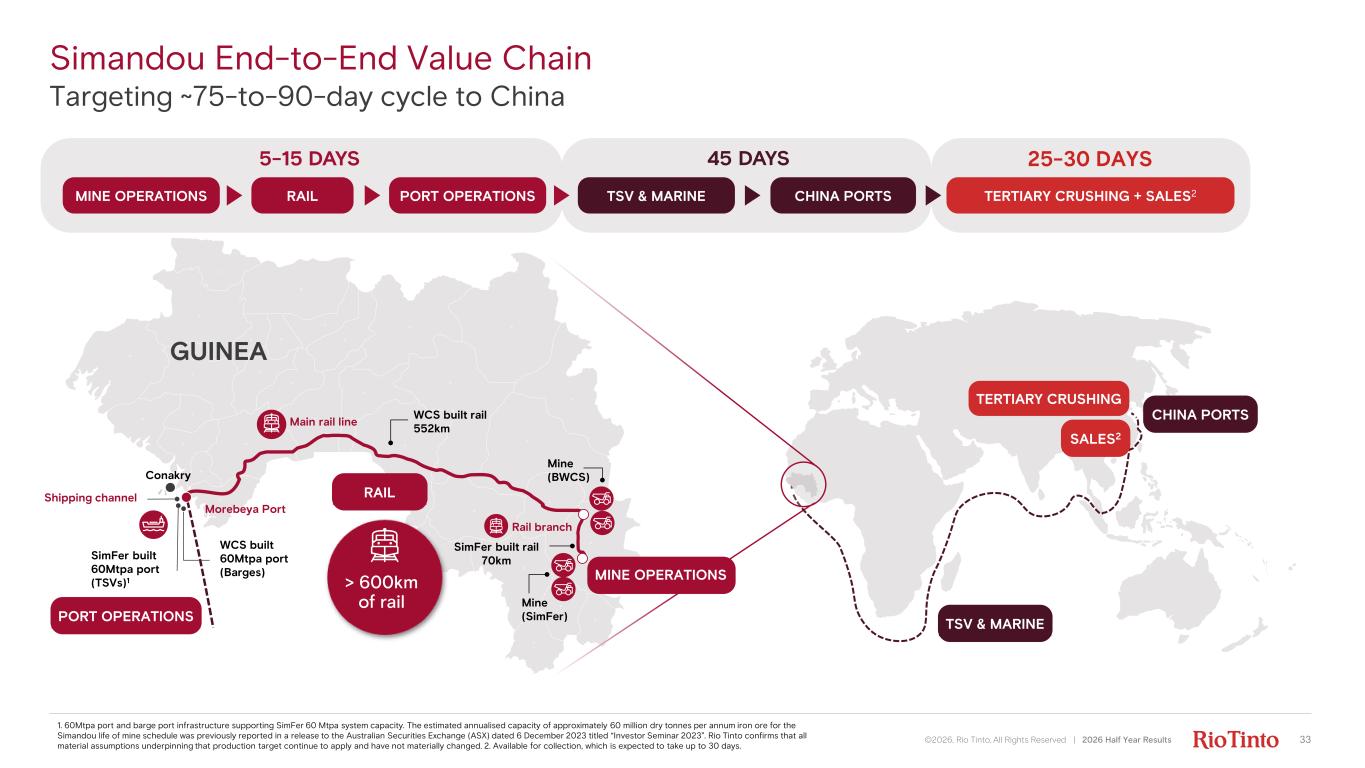
MINE OPERATIONS Simandou End-to-End Value Chain Targeting ~75-to-90-day cycle to China ©2026, Rio Tinto, All Rights Reserved | 2026 Half Year Results 33 45 DAYS TSV & MARINE CHINA PORTS TERTIARY CRUSHING SALES2 PORT OPERATIONSRAIL TSV & MARINE CHINA PORTS TERTIARY CRUSHING + SALES2 1. 60Mtpa port and barge port infrastructure supporting SimFer 60 Mtpa system capacity. The estimated annualised capacity of approximately 60 million dry tonnes per annum iron ore for the Simandou life of mine schedule was previously reported in a release to the Australian Securities Exchange (ASX) dated 6 December 2023 titled “Investor Seminar 2023”. Rio Tinto confirms that all material assumptions underpinning that production target continue to apply and have not materially changed. 2. Available for collection, which is expected to take up to 30 days. Shipping channel Morebeya Port Main rail line Rail branch Mine (BWCS) Mine (SimFer) Conakry WCS built 60Mtpa port (Barges) GUINEA RAIL MINE OPERATIONS PORT OPERATIONS SimFer built 60Mtpa port (TSVs)1 SimFer built rail 70km WCS built rail 552km 5-15 DAYS 25-30 DAYS
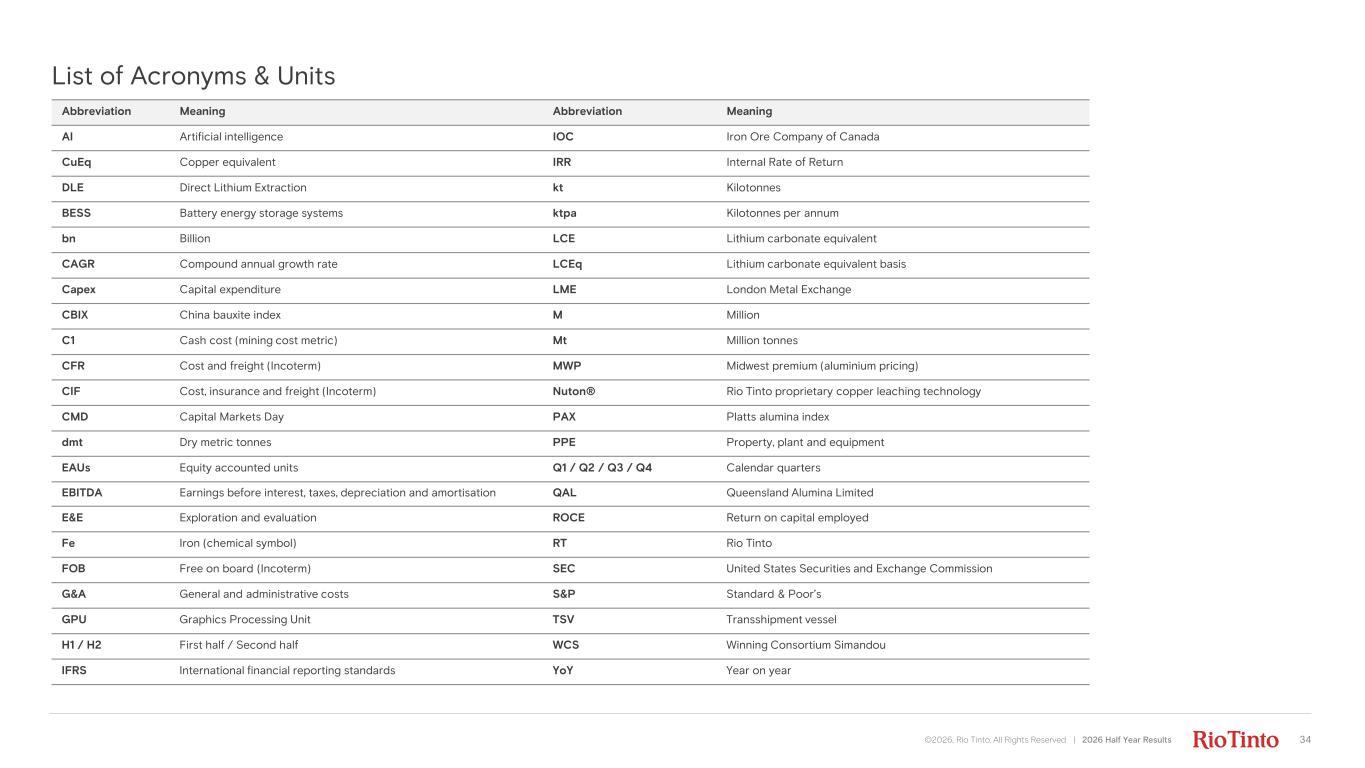
List of Acronyms & Units 34 Abbreviation Meaning Abbreviation Meaning AI Artificial intelligence IOC Iron Ore Company of Canada CuEq Copper equivalent IRR Internal Rate of Return DLE Direct Lithium Extraction kt Kilotonnes BESS Battery energy storage systems ktpa Kilotonnes per annum bn Billion LCE Lithium carbonate equivalent CAGR Compound annual growth rate LCEq Lithium carbonate equivalent basis Capex Capital expenditure LME London Metal Exchange CBIX China bauxite index M Million C1 Cash cost (mining cost metric) Mt Million tonnes CFR Cost and freight (Incoterm) MWP Midwest premium (aluminium pricing) CIF Cost, insurance and freight (Incoterm) Nuton® Rio Tinto proprietary copper leaching technology CMD Capital Markets Day PAX Platts alumina index dmt Dry metric tonnes PPE Property, plant and equipment EAUs Equity accounted units Q1 / Q2 / Q3 / Q4 Calendar quarters EBITDA Earnings before interest, taxes, depreciation and amortisation QAL Queensland Alumina Limited E&E Exploration and evaluation ROCE Return on capital employed Fe Iron (chemical symbol) RT Rio Tinto FOB Free on board (Incoterm) SEC United States Securities and Exchange Commission G&A General and administrative costs S&P Standard & Poor’s GPU Graphics Processing Unit TSV Transshipment vessel H1 / H2 First half / Second half WCS Winning Consortium Simandou IFRS International financial reporting standards YoY Year on year ©2026, Rio Tinto, All Rights Reserved | 2026 Half Year Results