Pilbara Operations Technical Report Summary – 31 December 2025 Page 1 of 176 Pilbara Operations Technical Report Summary In accordance with Subpart 1300 of Regulation S-K under the U.S. Securities Act of 1933 and Item 601(b)(96) thereunder 31 December 2025 Pilbara Operations Technical Report Summary – 31 December 2025 Page 2 of 176 Date and signature page Qualified Persons Signature Date Phil Savory /s/ Phil Savory 12 February 2026 Christian Valentine /s/ Christian Valentine 11 February 2026 Malcolm Judge /s/ Malcolm Judge 11 February 2026 Renjini Nair /s/ Renjini Nair 12 February 2026 Leonardo Vilela Couto /s/ Leonardo Vilela Couto 11 February 2026 Leon Fouché /s/ Leon Fouché 11 February 2026 Paul Barnes /s/ Paul Barnes 12 February 2026 Budi Satria Yudha /s/ Budi Satria Yudha 11 February 2026 Olga Abdrashitova /s/ Olga Abdrashitova 12 February 2026 Amrita Ghosh /s/ Amrita Ghosh 11 February 2026
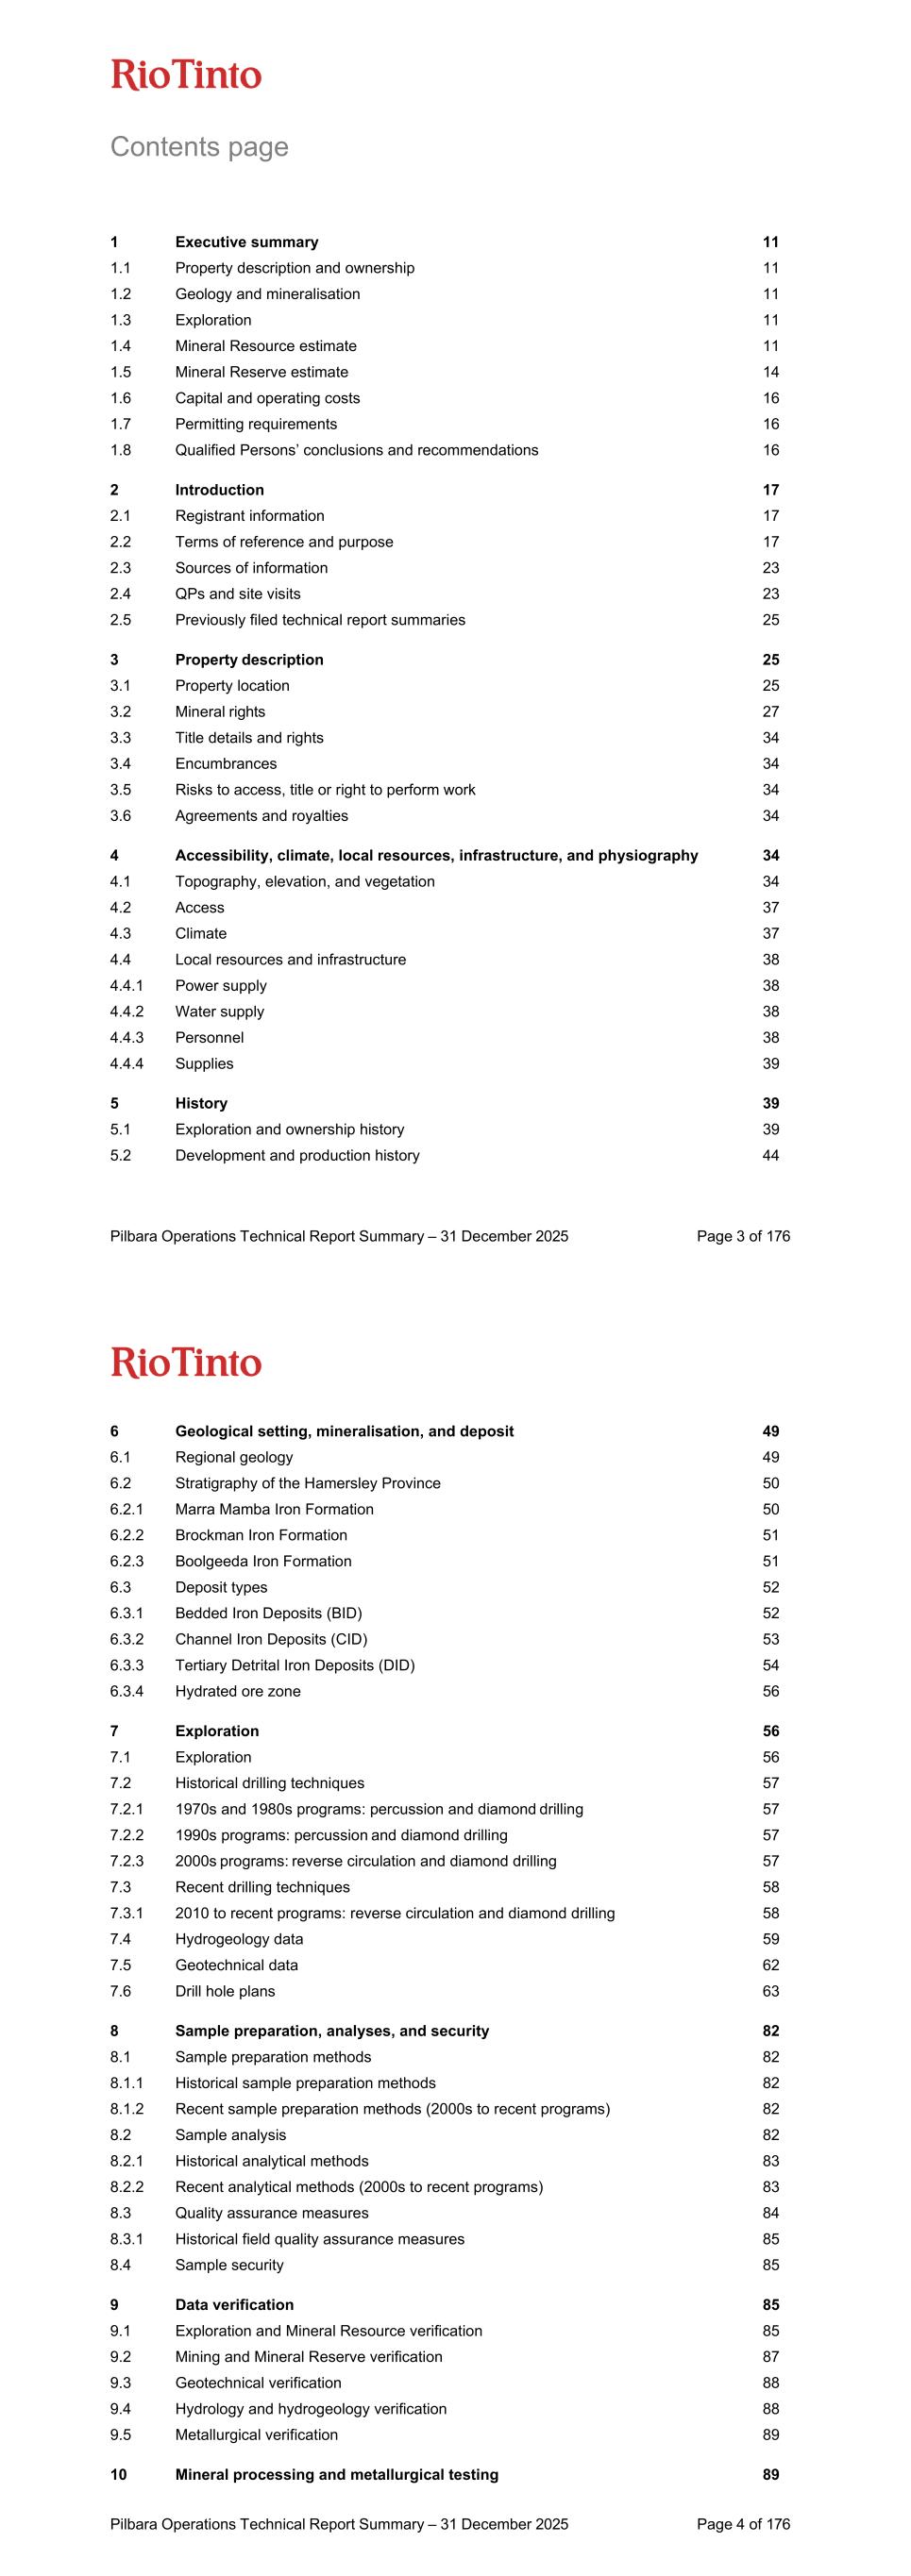
Pilbara Operations Technical Report Summary – 31 December 2025 Page 3 of 176 Contents page 1 Executive summary 11 1.1 Property description and ownership 11 1.2 Geology and mineralisation 11 1.3 Exploration 11 1.4 Mineral Resource estimate 11 1.5 Mineral Reserve estimate 14 1.6 Capital and operating costs 16 1.7 Permitting requirements 16 1.8 Qualified Persons’ conclusions and recommendations 16 2 Introduction 17 2.1 Registrant information 17 2.2 Terms of reference and purpose 17 2.3 Sources of information 23 2.4 QPs and site visits 23 2.5 Previously filed technical report summaries 25 3 Property description 25 3.1 Property location 25 3.2 Mineral rights 27 3.3 Title details and rights 34 3.4 Encumbrances 34 3.5 Risks to access, title or right to perform work 34 3.6 Agreements and royalties 34 4 Accessibility, climate, local resources, infrastructure, and physiography 34 4.1 Topography, elevation, and vegetation 34 4.2 Access 37 4.3 Climate 37 4.4 Local resources and infrastructure 38 4.4.1 Power supply 38 4.4.2 Water supply 38 4.4.3 Personnel 38 4.4.4 Supplies 39 5 History 39 5.1 Exploration and ownership history 39 5.2 Development and production history 44 Pilbara Operations Technical Report Summary – 31 December 2025 Page 4 of 176 6 Geological setting, mineralisation, and deposit 49 6.1 Regional geology 49 6.2 Stratigraphy of the Hamersley Province 50 6.2.1 Marra Mamba Iron Formation 50 6.2.2 Brockman Iron Formation 51 6.2.3 Boolgeeda Iron Formation 51 6.3 Deposit types 52 6.3.1 Bedded Iron Deposits (BID) 52 6.3.2 Channel Iron Deposits (CID) 53 6.3.3 Tertiary Detrital Iron Deposits (DID) 54 6.3.4 Hydrated ore zone 56 7 Exploration 56 7.1 Exploration 56 7.2 Historical drilling techniques 57 7.2.1 1970s and 1980s programs: percussion and diamond drilling 57 7.2.2 1990s programs: percussion and diamond drilling 57 7.2.3 2000s programs: reverse circulation and diamond drilling 57 7.3 Recent drilling techniques 58 7.3.1 2010 to recent programs: reverse circulation and diamond drilling 58 7.4 Hydrogeology data 59 7.5 Geotechnical data 62 7.6 Drill hole plans 63 8 Sample preparation, analyses, and security 82 8.1 Sample preparation methods 82 8.1.1 Historical sample preparation methods 82 8.1.2 Recent sample preparation methods (2000s to recent programs) 82 8.2 Sample analysis 82 8.2.1 Historical analytical methods 83 8.2.2 Recent analytical methods (2000s to recent programs) 83 8.3 Quality assurance measures 84 8.3.1 Historical field quality assurance measures 85 8.4 Sample security 85 9 Data verification 85 9.1 Exploration and Mineral Resource verification 85 9.2 Mining and Mineral Reserve verification 87 9.3 Geotechnical verification 88 9.4 Hydrology and hydrogeology verification 88 9.5 Metallurgical verification 89 10 Mineral processing and metallurgical testing 89
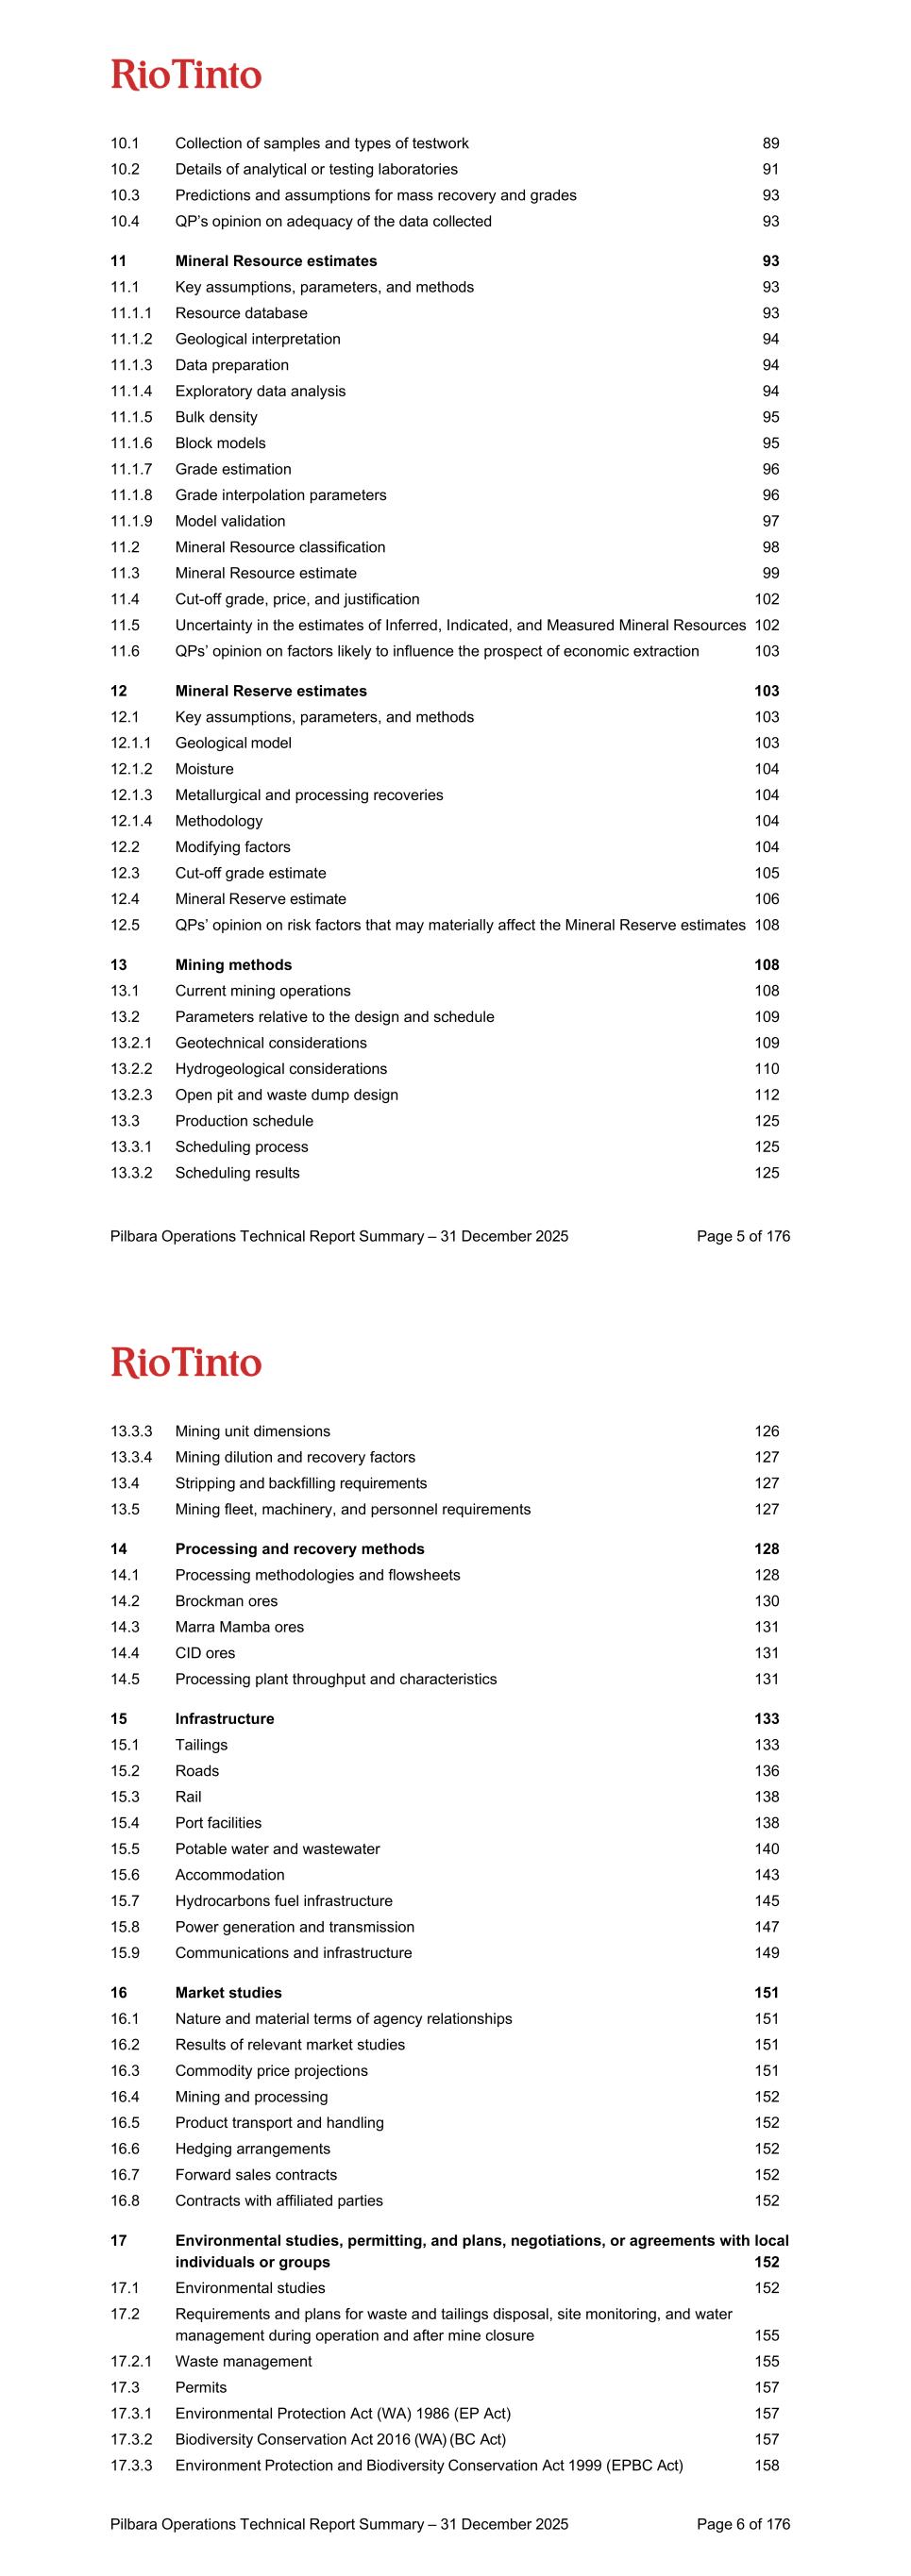
Pilbara Operations Technical Report Summary – 31 December 2025 Page 5 of 176 10.1 Collection of samples and types of testwork 89 10.2 Details of analytical or testing laboratories 91 10.3 Predictions and assumptions for mass recovery and grades 93 10.4 QP’s opinion on adequacy of the data collected 93 11 Mineral Resource estimates 93 11.1 Key assumptions, parameters, and methods 93 11.1.1 Resource database 93 11.1.2 Geological interpretation 94 11.1.3 Data preparation 94 11.1.4 Exploratory data analysis 94 11.1.5 Bulk density 95 11.1.6 Block models 95 11.1.7 Grade estimation 96 11.1.8 Grade interpolation parameters 96 11.1.9 Model validation 97 11.2 Mineral Resource classification 98 11.3 Mineral Resource estimate 99 11.4 Cut-off grade, price, and justification 102 11.5 Uncertainty in the estimates of Inferred, Indicated, and Measured Mineral Resources 102 11.6 QPs’ opinion on factors likely to influence the prospect of economic extraction 103 12 Mineral Reserve estimates 103 12.1 Key assumptions, parameters, and methods 103 12.1.1 Geological model 103 12.1.2 Moisture 104 12.1.3 Metallurgical and processing recoveries 104 12.1.4 Methodology 104 12.2 Modifying factors 104 12.3 Cut-off grade estimate 105 12.4 Mineral Reserve estimate 106 12.5 QPs’ opinion on risk factors that may materially affect the Mineral Reserve estimates 108 13 Mining methods 108 13.1 Current mining operations 108 13.2 Parameters relative to the design and schedule 109 13.2.1 Geotechnical considerations 109 13.2.2 Hydrogeological considerations 110 13.2.3 Open pit and waste dump design 112 13.3 Production schedule 125 13.3.1 Scheduling process 125 13.3.2 Scheduling results 125 Pilbara Operations Technical Report Summary – 31 December 2025 Page 6 of 176 13.3.3 Mining unit dimensions 126 13.3.4 Mining dilution and recovery factors 127 13.4 Stripping and backfilling requirements 127 13.5 Mining fleet, machinery, and personnel requirements 127 14 Processing and recovery methods 128 14.1 Processing methodologies and flowsheets 128 14.2 Brockman ores 130 14.3 Marra Mamba ores 131 14.4 CID ores 131 14.5 Processing plant throughput and characteristics 131 15 Infrastructure 133 15.1 Tailings 133 15.2 Roads 136 15.3 Rail 138 15.4 Port facilities 138 15.5 Potable water and wastewater 140 15.6 Accommodation 143 15.7 Hydrocarbons fuel infrastructure 145 15.8 Power generation and transmission 147 15.9 Communications and infrastructure 149 16 Market studies 151 16.1 Nature and material terms of agency relationships 151 16.2 Results of relevant market studies 151 16.3 Commodity price projections 151 16.4 Mining and processing 152 16.5 Product transport and handling 152 16.6 Hedging arrangements 152 16.7 Forward sales contracts 152 16.8 Contracts with affiliated parties 152 17 Environmental studies, permitting, and plans, negotiations, or agreements with local individuals or groups 152 17.1 Environmental studies 152 17.2 Requirements and plans for waste and tailings disposal, site monitoring, and water management during operation and after mine closure 155 17.2.1 Waste management 155 17.3 Permits 157 17.3.1 Environmental Protection Act (WA) 1986 (EP Act) 157 17.3.2 Biodiversity Conservation Act 2016 (WA) (BC Act) 157 17.3.3 Environment Protection and Biodiversity Conservation Act 1999 (EPBC Act) 158
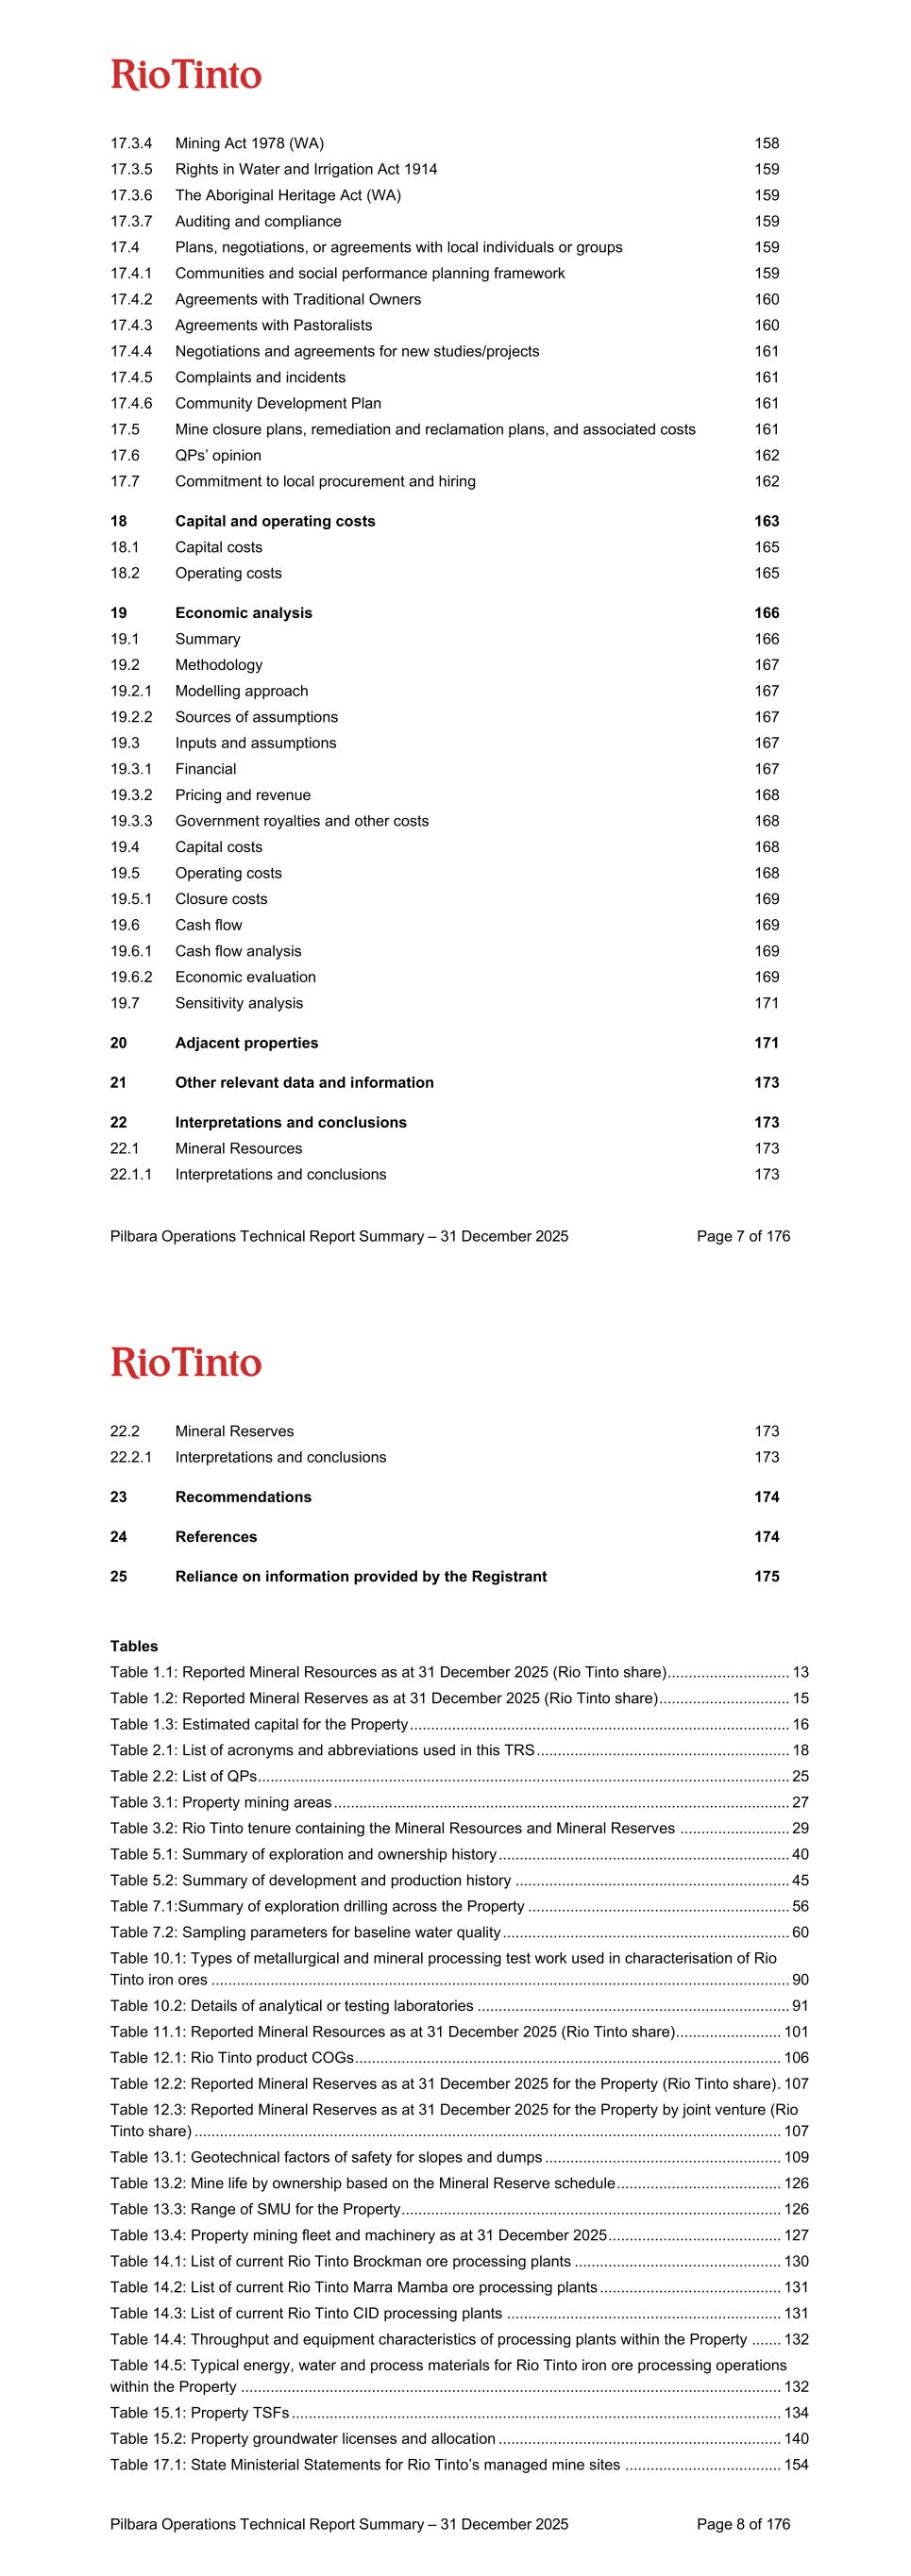
Pilbara Operations Technical Report Summary – 31 December 2025 Page 7 of 176 17.3.4 Mining Act 1978 (WA) 158 17.3.5 Rights in Water and Irrigation Act 1914 159 17.3.6 The Aboriginal Heritage Act (WA) 159 17.3.7 Auditing and compliance 159 17.4 Plans, negotiations, or agreements with local individuals or groups 159 17.4.1 Communities and social performance planning framework 159 17.4.2 Agreements with Traditional Owners 160 17.4.3 Agreements with Pastoralists 160 17.4.4 Negotiations and agreements for new studies/projects 161 17.4.5 Complaints and incidents 161 17.4.6 Community Development Plan 161 17.5 Mine closure plans, remediation and reclamation plans, and associated costs 161 17.6 QPs’ opinion 162 17.7 Commitment to local procurement and hiring 162 18 Capital and operating costs 163 18.1 Capital costs 165 18.2 Operating costs 165 19 Economic analysis 166 19.1 Summary 166 19.2 Methodology 167 19.2.1 Modelling approach 167 19.2.2 Sources of assumptions 167 19.3 Inputs and assumptions 167 19.3.1 Financial 167 19.3.2 Pricing and revenue 168 19.3.3 Government royalties and other costs 168 19.4 Capital costs 168 19.5 Operating costs 168 19.5.1 Closure costs 169 19.6 Cash flow 169 19.6.1 Cash flow analysis 169 19.6.2 Economic evaluation 169 19.7 Sensitivity analysis 171 20 Adjacent properties 171 21 Other relevant data and information 173 22 Interpretations and conclusions 173 22.1 Mineral Resources 173 22.1.1 Interpretations and conclusions 173 Pilbara Operations Technical Report Summary – 31 December 2025 Page 8 of 176 22.2 Mineral Reserves 173 22.2.1 Interpretations and conclusions 173 23 Recommendations 174 24 References 174 25 Reliance on information provided by the Registrant 175 Tables Table 1.1: Reported Mineral Resources as at 31 December 2025 (Rio Tinto share)............................. 13 Table 1.2: Reported Mineral Reserves as at 31 December 2025 (Rio Tinto share)............................... 15 Table 1.3: Estimated capital for the Property .......................................................................................... 16 Table 2.1: List of acronyms and abbreviations used in this TRS ............................................................ 18 Table 2.2: List of QPs .............................................................................................................................. 25 Table 3.1: Property mining areas ............................................................................................................ 27 Table 3.2: Rio Tinto tenure containing the Mineral Resources and Mineral Reserves .......................... 29 Table 5.1: Summary of exploration and ownership history ..................................................................... 40 Table 5.2: Summary of development and production history ................................................................. 45 Table 7.1:Summary of exploration drilling across the Property .............................................................. 56 Table 7.2: Sampling parameters for baseline water quality .................................................................... 60 Table 10.1: Types of metallurgical and mineral processing test work used in characterisation of Rio Tinto iron ores ......................................................................................................................................... 90 Table 10.2: Details of analytical or testing laboratories .......................................................................... 91 Table 11.1: Reported Mineral Resources as at 31 December 2025 (Rio Tinto share)......................... 101 Table 12.1: Rio Tinto product COGs ..................................................................................................... 106 Table 12.2: Reported Mineral Reserves as at 31 December 2025 for the Property (Rio Tinto share). 107 Table 12.3: Reported Mineral Reserves as at 31 December 2025 for the Property by joint venture (Rio Tinto share) ........................................................................................................................................... 107 Table 13.1: Geotechnical factors of safety for slopes and dumps ........................................................ 109 Table 13.2: Mine life by ownership based on the Mineral Reserve schedule ....................................... 126 Table 13.3: Range of SMU for the Property .......................................................................................... 126 Table 13.4: Property mining fleet and machinery as at 31 December 2025 ......................................... 127 Table 14.1: List of current Rio Tinto Brockman ore processing plants ................................................. 130 Table 14.2: List of current Rio Tinto Marra Mamba ore processing plants ........................................... 131 Table 14.3: List of current Rio Tinto CID processing plants ................................................................. 131 Table 14.4: Throughput and equipment characteristics of processing plants within the Property ....... 132 Table 14.5: Typical energy, water and process materials for Rio Tinto iron ore processing operations within the Property ................................................................................................................................ 132 Table 15.1: Property TSFs .................................................................................................................... 134 Table 15.2: Property groundwater licenses and allocation ................................................................... 140 Table 17.1: State Ministerial Statements for Rio Tinto’s managed mine sites ..................................... 154
Pilbara Operations Technical Report Summary – 31 December 2025 Page 9 of 176 Table 17.2: Federal EPBC Decision Notices for Rio Tinto’s managed mine sites. .............................. 158 Table 18.1: Estimated capital expenditure for the Property .................................................................. 165 Table 18.2: Estimated operating costs for the Property ........................................................................ 165 Table 19.1: Capital and operating cost estimation accuracy guidelines. .............................................. 166 Table 19.2: Economic analysis assumptions used as the basis for financial evaluation ...................... 167 Table 19.3: FX and inflation rates used in economic analysis .............................................................. 168 Table 19.4: Iron ore pricing used in economic analysis ........................................................................ 168 Table 19.5: Net present value of cash flows for the Property as at 31 December 2025. ..................... 170 Table 19.6: Non-discounted cashflow for the Property ......................................................................... 170 Table 19.7: Price, FX and cost sensitivity analysis ............................................................................... 171 Table 19.8: Discount rate sensitivity analysis ....................................................................................... 171 Figures Figure 3.1: Property location map ........................................................................................................... 26 Figure 3.2: Tenure location map ............................................................................................................. 33 Figure 4.1: Physiography and infrastructure ........................................................................................... 36 Figure 4.2: Climate statistics for the Pilbara Region, Western Australia ................................................ 38 Figure 6.1: Regional geology of the Hamersley Province ....................................................................... 49 Figure 6.2: Stratigraphy of the Hamersley Province ............................................................................... 50 Figure 6.3: BID geology cross-section, Brockman deposit ..................................................................... 53 Figure 6.4: CID geology cross-section, gorge type deposit .................................................................... 54 Figure 6.5: CID geology cross-section, mesa type deposit .................................................................... 54 Figure 6.6: DID geology cross-section, Marra Mamba derived deposit .................................................. 55 Figure 7.1: Robe Valley drill hole location plan ....................................................................................... 64 Figure 7.2: Greater Brockman drill hole location plan ............................................................................. 65 Figure 7.3: Greater Tom Price drill hole location plan ............................................................................ 66 Figure 7.4: Greater Paraburdoo drill hole location plan .......................................................................... 67 Figure 7.5: West Pilbara - Area 1 drill hole location plan ........................................................................ 68 Figure 7.6: West Pilbara - Area 2 drill hole location plan ........................................................................ 69 Figure 7.7: West Pilbara - Area 3 drill hole location plan ........................................................................ 70 Figure 7.8: Gudai-Darri drill hole plan ..................................................................................................... 71 Figure 7.9: Yandicoogina drill hole location plan .................................................................................... 72 Figure 7.10: Greater West Angelas drill hole location plan ..................................................................... 73 Figure 7.11: Greater Hope Downs drill hole location plan ...................................................................... 74 Figure 7.12: East Pilbara - Area 1 drill hole location plan ....................................................................... 75 Figure 7.13: East Pilbara - Area 2 drill hole location plan ....................................................................... 76 Figure 7.14: East Pilbara - Area 3 drill hole location plan ....................................................................... 77 Figure 7.15: East Pilbara - Area 4 drill hole location plan ....................................................................... 78 Figure 7.16: East Pilbara - Area 5 drill hole location plan ....................................................................... 79 Figure 7.17: East Pilbara - Area 6 drill hole location plan ....................................................................... 80 Pilbara Operations Technical Report Summary – 31 December 2025 Page 10 of 176 Figure 7.18: Rest of East Pilbara drill hole location plan ........................................................................ 81 Figure 13.1: Rio Tinto mining areas across the Property by ownership ............................................... 113 Figure 13.2: Hamersley Iron - Brockman 4 Mining Area ....................................................................... 114 Figure 13.3: Hamersley Iron – Greater Nammuldi Mining Area............................................................ 115 Figure 13.4: Hamersley Iron - Yandicoogina Mining Area .................................................................... 116 Figure 13.5: Hamersley Iron – Greater Tom Price Mining Area ........................................................... 117 Figure 13.6: Hamersley Iron - Paraburdoo Mining Area ....................................................................... 118 Figure 13.7: Hamersley Iron - Marandoo Mining Area .......................................................................... 119 Figure 13.8: Gudai-Darri Mining Area ................................................................................................... 120 Figure 13.9: Hope Downs JV - Hope Downs 1 Mining Area ................................................................. 121 Figure 13.10: Hope Downs JV - Hope Downs 4 Mining Area ............................................................... 122 Figure 13.11: Robe River JV - West Angelas Mining Area ................................................................... 123 Figure 13.12: Robe River JV - Robe Valley Mining Area ...................................................................... 124 Figure 13.13: Mineral Reserve schedule .............................................................................................. 126 Figure 14.1: Typical flowsheet for a dry crushing and screening iron ore plant ................................... 128 Figure 14.2: Typical flowsheet for a wet screening and de-sliming iron ore plant ................................ 129 Figure 14.3: Flowsheet for the existing Rio Tinto iron ore beneficiation plant at Mount Tom Price ..... 129 Figure 15.1: TSFs across the Property ................................................................................................. 135 Figure 15.2: Privately owned and public roads across the Property .................................................... 137 Figure 15.3: Rail network and port facilities across the Property.......................................................... 139 Figure 15.4: Major pipelines network and bore/pumping locations across the Property ...................... 142 Figure 15.5: FIFO/residential accommodation across the Property ..................................................... 144 Figure 15.6: Fuel hub locations across the Property ............................................................................ 146 Figure 15.7: Power transmission lines and facilities across the Property ............................................. 148 Figure 15.8: Communication layout across the Property ...................................................................... 150 Figure 17.1: Environmental mitigation hierarchy.................................................................................. 153 Figure 20.1: Property location map ....................................................................................................... 172
Pilbara Operations Technical Report Summary – 31 December 2025 Page 11 of 176 1 Executive summary 1.1 Property description and ownership In the Pilbara region of Western Australia, Rio Tinto operates and owns an integrated portfolio of iron ore assets comprising a network of 18 iron ore mines, four port terminals, a nearly 2,000 kilometre (km) rail network and related infrastructure (the Property). Mineral Resources and Mineral Reserves are dispersed across the Pilbara region over an area of approximately 70,000 square kilometres (km2). Mined product is transported by two dedicated rail lines to ports at Dampier or Cape Lambert. The Property is accessible by rail, road or by air, utilising Rio Tinto rail lines, major highways and rail access roads, and public and Rio Tinto owned airports. There are no limitations for year-round access and operations due to climate and precipitation at the Property, with the exception of some cyclone events when minor disruptions and access restrictions can occur. 1.2 Geology and mineralisation The Property is situated in the Hamersley Province of Western Australia, located on the southern margin of the Pilbara Craton, within the volcanic and sedimentary rock sequence of the Mount Bruce Supergroup. The Mount Bruce Supergroup contains the 2,500 metre (m) thick Hamersley Group, the main host to iron ore deposits, characterised by around 1,000 m of laterally extensive Banded Iron Formation (BIF). Mineralisation may be grouped into three by genesis. BIF Derived Iron Deposits (BIDs) (Boolgeeda, Brockman, and Marra Mamba), Channel Iron Deposits (CIDs), and Detrital Iron Deposits (DIDs). Five ore type categories are defined for reporting Mineral Resources: Boolgeeda, Brockman, Marra Mamba, CID, and DID. 1.3 Exploration Rio Tinto has an ongoing, active program of exploration over various parts of the Property. During 2025 370,813 m of drilling was completed on programs that are aimed at discovery and development of Rio Tinto’s iron ore deposits in the Pilbara. 1.4 Mineral Resource estimate The Mineral Resource estimate for the Property is presented by ore type in Table 1.1. The only potentially payable element is iron. Mineral Resources are estimated by Rio Tinto for operating mines and development projects. The effective date of the Mineral Resource estimate is 31 December 2025. The Mineral Resource estimate is based on the following assumptions: • Exclusive of Mineral Reserves – Mineral Resources are reported exclusive of Mineral Reserves. • Moisture – All Mineral Resource tonnages are estimated and reported on a dry basis. • Mineral Resources are provided as in situ estimates. • Mining factors or assumptions – It is assumed that standard open pit load and haul mining operations used by Rio Tinto Iron Ore will be applicable for the mining of Mineral Resources. Pilbara Operations Technical Report Summary – 31 December 2025 Page 12 of 176 • Metallurgical factors or assumptions – It is assumed that crushing, screening and beneficiation processes used by Rio Tinto will be applicable for the processing of reported Mineral Resources. Predicted yield and upgrade are deposit specific and are based on metallurgical test work conducted on representative samples collected from those deposits or adjacent analogous deposits. • Environmental factors or assumptions – Extensive environmental surveys and studies will be completed during the project study phases to determine if the project requires formal State and Commonwealth environmental assessment and approval. Mapping of oxidised shales, black carbonaceous shales, lignite, and the location of the water table, is used to predict and manage potential environmental impacts. • Heritage factors or assumptions - Extensive cultural heritage studies, surveys and engagement with Traditional Owners will be completed during the project study phases to determine if the project requires additional assessment, monitoring, or exclusion areas to be maintained during mining, to manage potential impacts to sites and cultural values. The Mineral Resources presented are not Mineral Reserves. The reported Inferred Mineral Resources are considered too geologically uncertain to apply economic assumptions and subsequently convert these to Mineral Reserves. There is no certainty that all or any part of the Inferred Mineral Resources will be converted into Measured or Indicated categories of Mineral Resources (see section 11.5). Mineral Resources that are not Mineral Reserves do not meet the threshold for reserve modifying factors such as estimated economic viability that would allow for conversion to Mineral Reserves. All figures are rounded to reflect the relative accuracy of the estimates and totals may not add correctly. Based on the body of technical studies completed across the Property, it is the Qualified Persons’ (QPs’) opinion that the Mineral Resources have reasonable prospects of economic extraction (see Section 11.6).
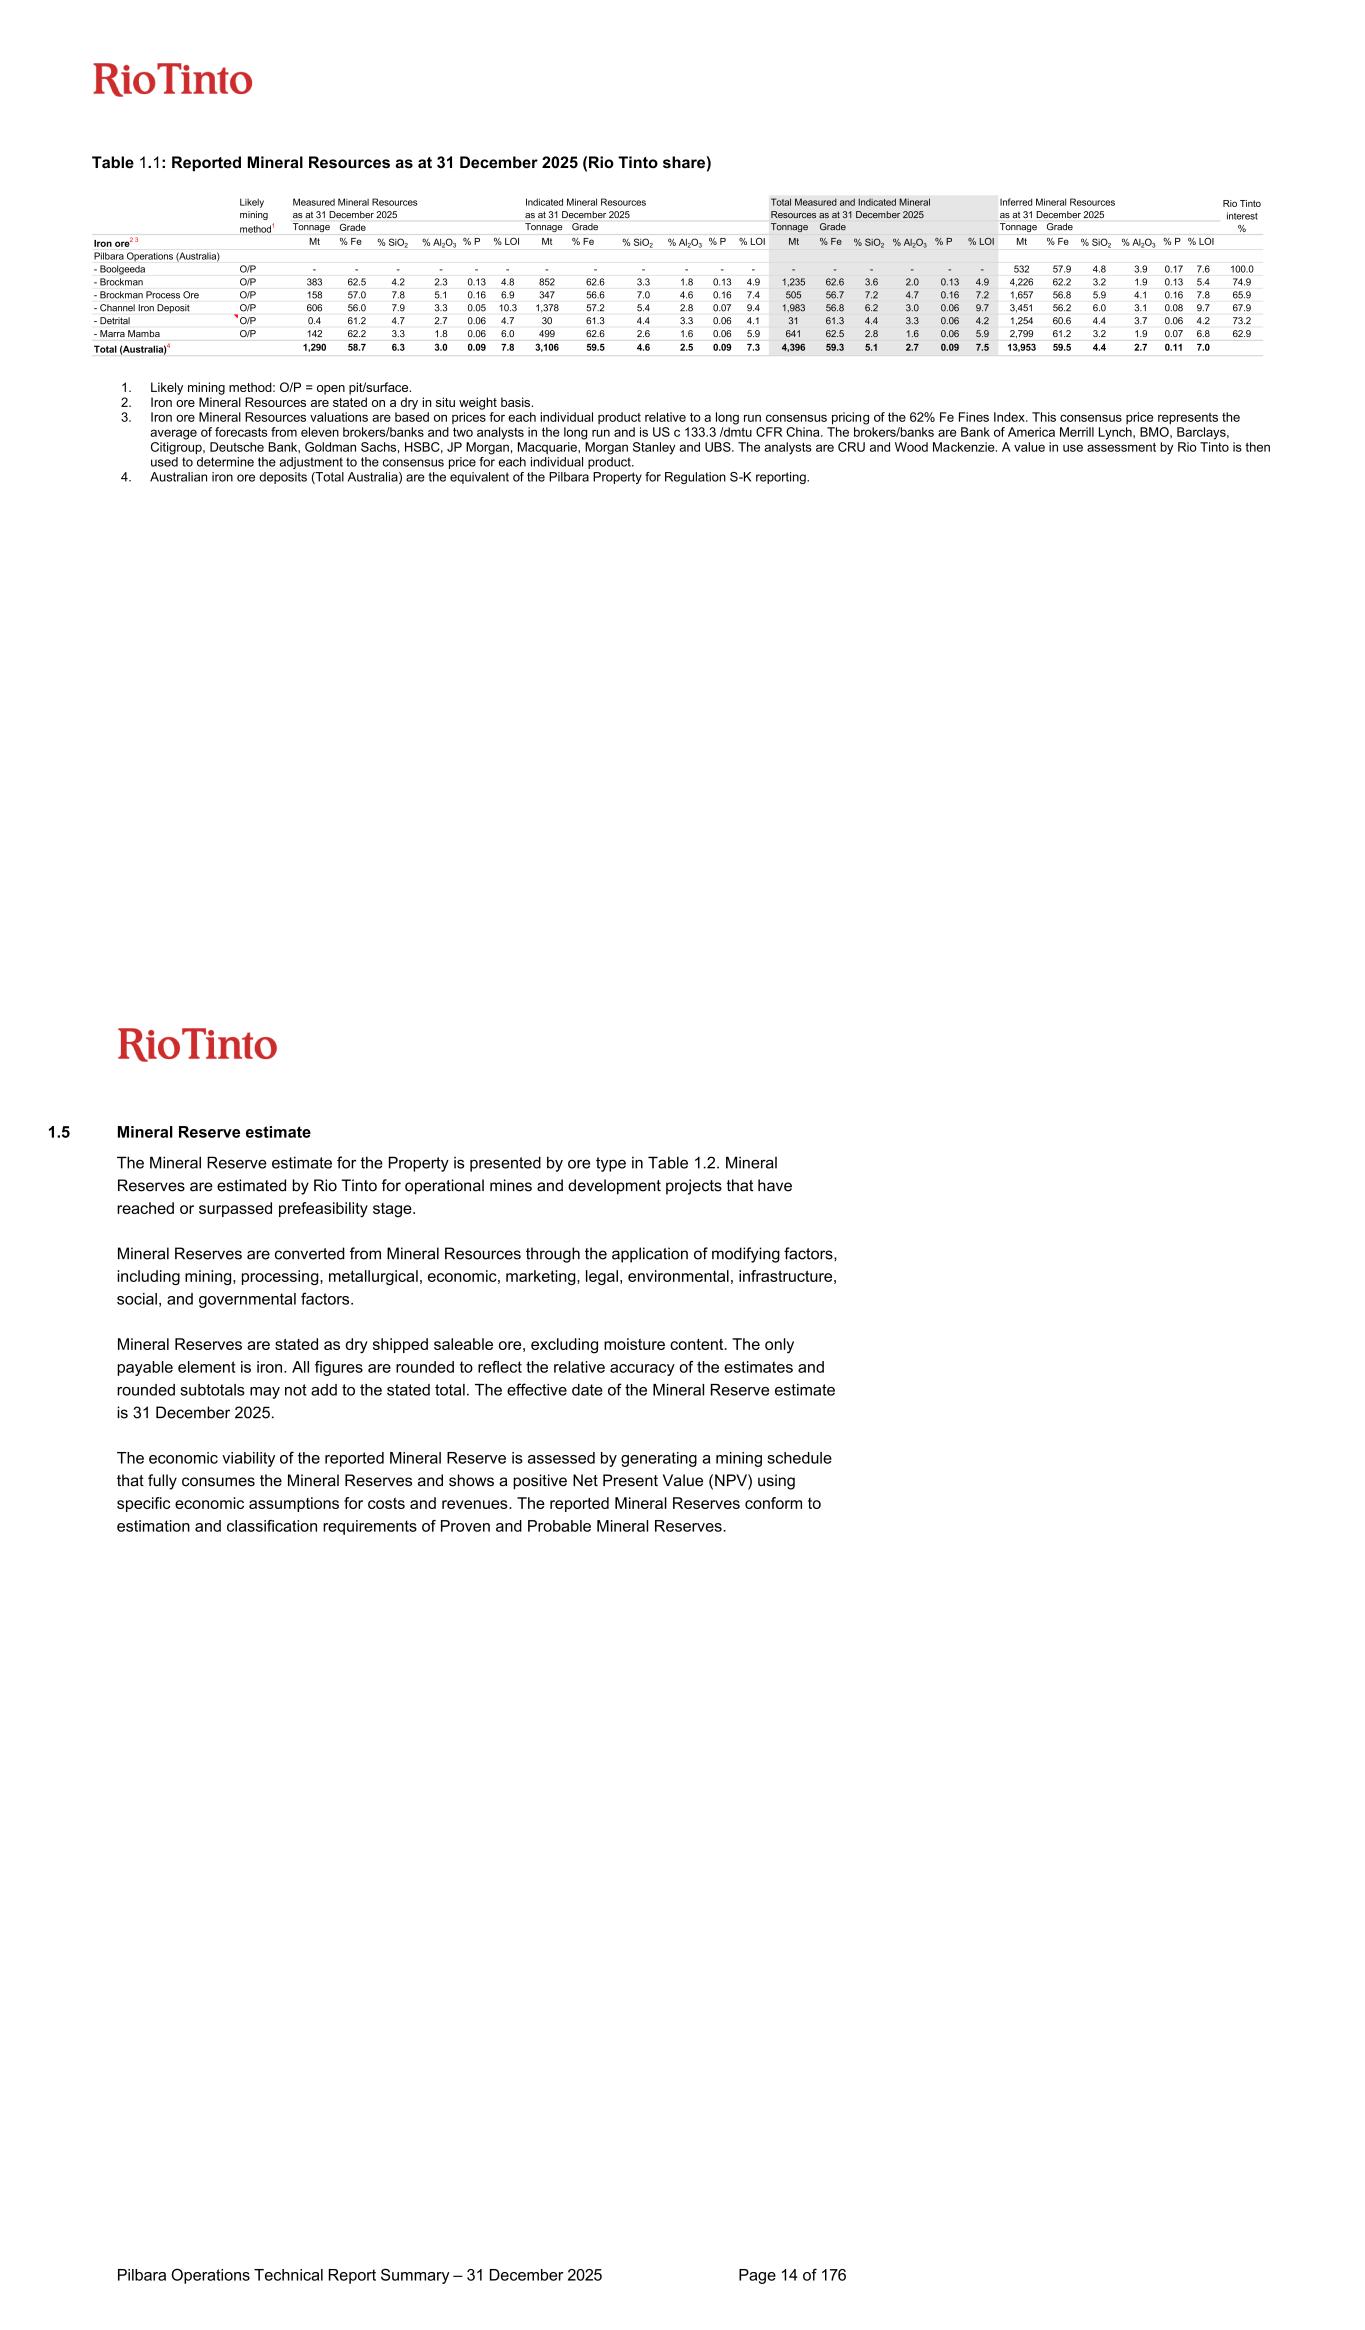
Table 1.1: Reported Mineral Resources as at 31 December 2025 (Rio Tinto share) 1. Likely mining method: O/P = open pit/surface. 2. Iron ore Mineral Resources are stated on a dry in situ weight basis. 3. Iron ore Mineral Resources valuations are based on prices for each individual product relative to a long run consensus pricing of the 62% Fe Fines Index. This consensus price represents the average of forecasts from eleven brokers/banks and two analysts in the long run and is US c 133.3 /dmtu CFR China. The brokers/banks are Bank of America Merrill Lynch, BMO, Barclays, Citigroup, Deutsche Bank, Goldman Sachs, HSBC, JP Morgan, Macquarie, Morgan Stanley and UBS. The analysts are CRU and Wood Mackenzie. A value in use assessment by Rio Tinto is then used to determine the adjustment to the consensus price for each individual product. 4. Australian iron ore deposits (Total Australia) are the equivalent of the Pilbara Property for Regulation S-K reporting. Tonnage Tonnage Grade Tonnage Grade Tonnage Grade Iron ore 2 3 Mt % Fe % SiO2 % Al2O3 % P % LOI Mt % Fe % SiO2 % Al2O3 % P % LOI Mt % Fe % SiO2 % Al2O3 % P % LOI Mt % Fe % SiO2 % Al2O3 % P % LOI Pilbara Operations (Australia) - Boolgeeda O/P - - - - - - - - - - - - - - - - - - 532 57.9 4.8 3.9 0.17 7.6 100.0 - Brockman O/P 383 62.5 4.2 2.3 0.13 4.8 852 62.6 3.3 1.8 0.13 4.9 1,235 62.6 3.6 2.0 0.13 4.9 4,226 62.2 3.2 1.9 0.13 5.4 74.9 - Brockman Process Ore O/P 158 57.0 7.8 5.1 0.16 6.9 347 56.6 7.0 4.6 0.16 7.4 505 56.7 7.2 4.7 0.16 7.2 1,657 56.8 5.9 4.1 0.16 7.8 65.9 - Channel Iron Deposit O/P 606 56.0 7.9 3.3 0.05 10.3 1,378 57.2 5.4 2.8 0.07 9.4 1,983 56.8 6.2 3.0 0.06 9.7 3,451 56.2 6.0 3.1 0.08 9.7 67.9 - Detrital O/P 0.4 61.2 4.7 2.7 0.06 4.7 30 61.3 4.4 3.3 0.06 4.1 31 61.3 4.4 3.3 0.06 4.2 1,254 60.6 4.4 3.7 0.06 4.2 73.2 - Marra Mamba O/P 142 62.2 3.3 1.8 0.06 6.0 499 62.6 2.6 1.6 0.06 5.9 641 62.5 2.8 1.6 0.06 5.9 2,799 61.2 3.2 1.9 0.07 6.8 62.9 Total (Australia) 4 1,290 58.7 6.3 3.0 0.09 7.8 3,106 59.5 4.6 2.5 0.09 7.3 4,396 59.3 5.1 2.7 0.09 7.5 13,953 59.5 4.4 2.7 0.11 7.0 as at 31 December 2025Resources as at 31 December 2025 Likely mining method 1 Inferred Mineral Resources Grade Rio Tinto interest % Measured Mineral Resources Indicated Mineral Resources Total Measured and Indicated Mineral as at 31 December 2025 as at 31 December 2025 Pilbara Operations Technical Report Summary – 31 December 2025 Page 14 of 176 1.5 Mineral Reserve estimate The Mineral Reserve estimate for the Property is presented by ore type in Table 1.2. Mineral Reserves are estimated by Rio Tinto for operational mines and development projects that have reached or surpassed prefeasibility stage. Mineral Reserves are converted from Mineral Resources through the application of modifying factors, including mining, processing, metallurgical, economic, marketing, legal, environmental, infrastructure, social, and governmental factors. Mineral Reserves are stated as dry shipped saleable ore, excluding moisture content. The only payable element is iron. All figures are rounded to reflect the relative accuracy of the estimates and rounded subtotals may not add to the stated total. The effective date of the Mineral Reserve estimate is 31 December 2025. The economic viability of the reported Mineral Reserve is assessed by generating a mining schedule that fully consumes the Mineral Reserves and shows a positive Net Present Value (NPV) using specific economic assumptions for costs and revenues. The reported Mineral Reserves conform to estimation and classification requirements of Proven and Probable Mineral Reserves.
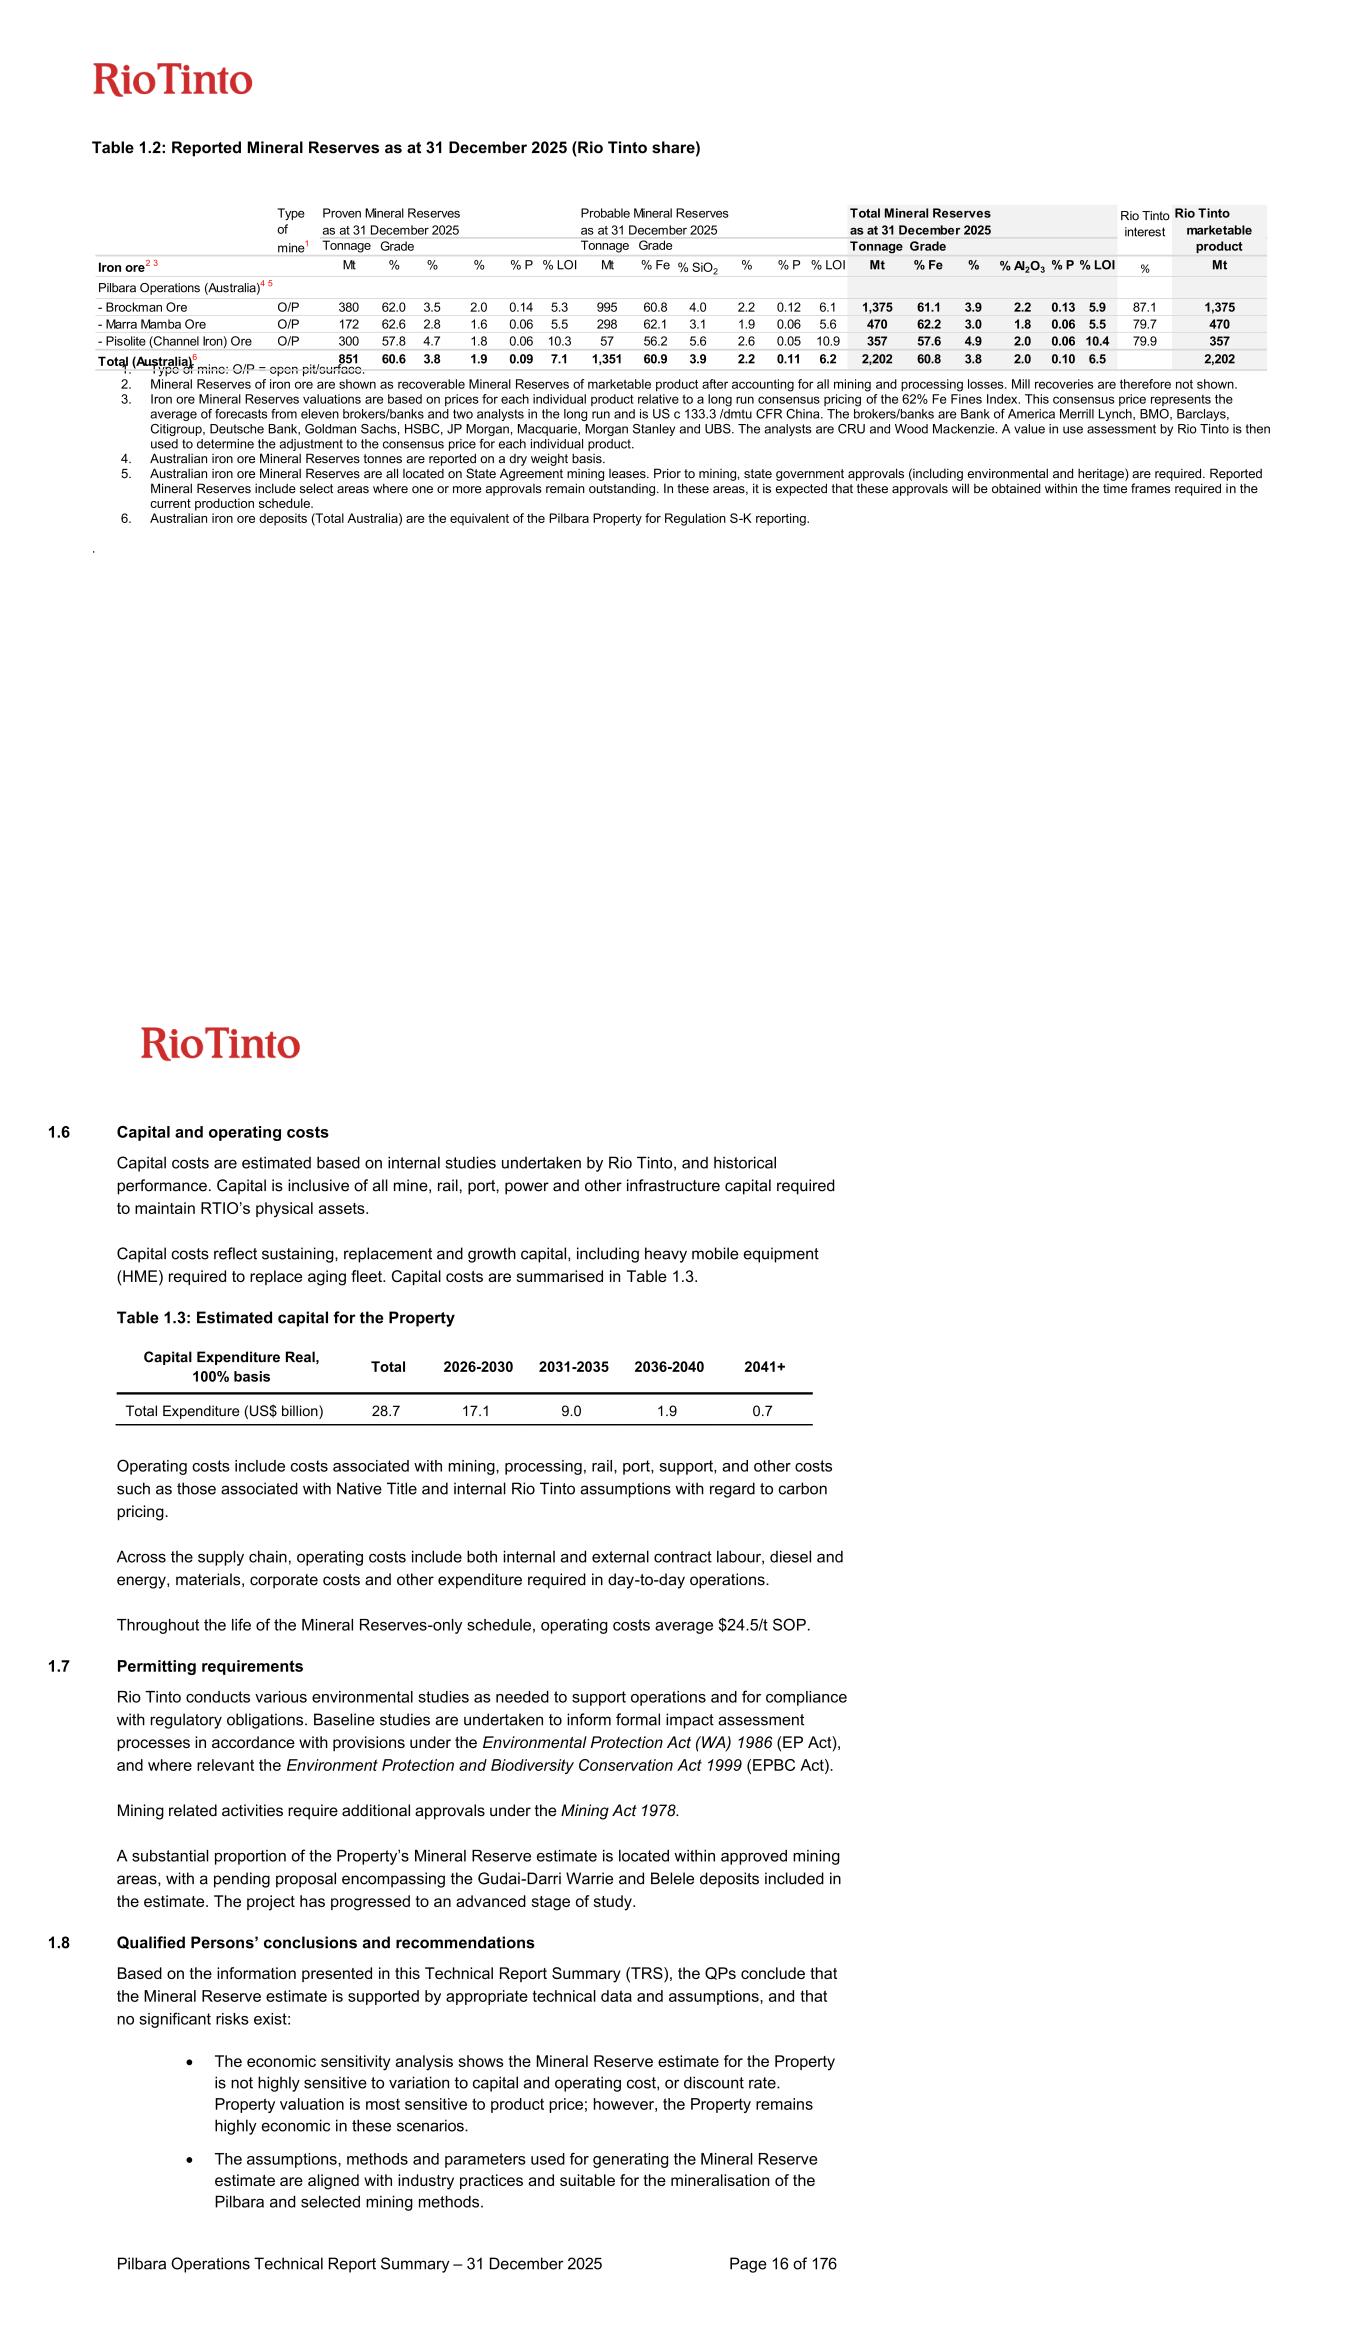
Table 1.2: Reported Mineral Reserves as at 31 December 2025 (Rio Tinto share) 1. Type of mine: O/P = open pit/surface. 2. Mineral Reserves of iron ore are shown as recoverable Mineral Reserves of marketable product after accounting for all mining and processing losses. Mill recoveries are therefore not shown. 3. Iron ore Mineral Reserves valuations are based on prices for each individual product relative to a long run consensus pricing of the 62% Fe Fines Index. This consensus price represents the average of forecasts from eleven brokers/banks and two analysts in the long run and is US c 133.3 /dmtu CFR China. The brokers/banks are Bank of America Merrill Lynch, BMO, Barclays, Citigroup, Deutsche Bank, Goldman Sachs, HSBC, JP Morgan, Macquarie, Morgan Stanley and UBS. The analysts are CRU and Wood Mackenzie. A value in use assessment by Rio Tinto is then used to determine the adjustment to the consensus price for each individual product. 4. Australian iron ore Mineral Reserves tonnes are reported on a dry weight basis. 5. Australian iron ore Mineral Reserves are all located on State Agreement mining leases. Prior to mining, state government approvals (including environmental and heritage) are required. Reported Mineral Reserves include select areas where one or more approvals remain outstanding. In these areas, it is expected that these approvals will be obtained within the time frames required in the current production schedule. 6. Australian iron ore deposits (Total Australia) are the equivalent of the Pilbara Property for Regulation S-K reporting. . Rio Tinto marketable Tonnage Tonnage Grade Tonnage Grade product Iron ore2 3 Mt % Fe % SiO2 % Al2O3 % P % LOI Mt % Fe % SiO2 % Al2O3 % P % LOI Mt % Fe % SiO2 % Al2O3 % P % LOI % Mt Pilbara Operations (Australia)4 5 - Brockman Ore O/P 380 62.0 3.5 2.0 0.14 5.3 995 60.8 4.0 2.2 0.12 6.1 1,375 61.1 3.9 2.2 0.13 5.9 87.1 1,375 - Marra Mamba Ore O/P 172 62.6 2.8 1.6 0.06 5.5 298 62.1 3.1 1.9 0.06 5.6 470 62.2 3.0 1.8 0.06 5.5 79.7 470 - Pisolite (Channel Iron) Ore O/P 300 57.8 4.7 1.8 0.06 10.3 57 56.2 5.6 2.6 0.05 10.9 357 57.6 4.9 2.0 0.06 10.4 79.9 357 Total (Australia)6 851 60.6 3.8 1.9 0.09 7.1 1,351 60.9 3.9 2.2 0.11 6.2 2,202 60.8 3.8 2.0 0.10 6.5 2,202 as at 31 December 2025 as at 31 December 2025 as at 31 December 2025 Type of mine1 Proven Mineral Reserves Total Mineral Reserves Rio Tinto interest Grade Probable Mineral Reserves Pilbara Operations Technical Report Summary – 31 December 2025 Page 16 of 176 1.6 Capital and operating costs Capital costs are estimated based on internal studies undertaken by Rio Tinto, and historical performance. Capital is inclusive of all mine, rail, port, power and other infrastructure capital required to maintain RTIO’s physical assets. Capital costs reflect sustaining, replacement and growth capital, including heavy mobile equipment (HME) required to replace aging fleet. Capital costs are summarised in Table 1.3. Table 1.3: Estimated capital for the Property Operating costs include costs associated with mining, processing, rail, port, support, and other costs such as those associated with Native Title and internal Rio Tinto assumptions with regard to carbon pricing. Across the supply chain, operating costs include both internal and external contract labour, diesel and energy, materials, corporate costs and other expenditure required in day-to-day operations. Throughout the life of the Mineral Reserves-only schedule, operating costs average $24.5/t SOP. 1.7 Permitting requirements Rio Tinto conducts various environmental studies as needed to support operations and for compliance with regulatory obligations. Baseline studies are undertaken to inform formal impact assessment processes in accordance with provisions under the Environmental Protection Act (WA) 1986 (EP Act), and where relevant the Environment Protection and Biodiversity Conservation Act 1999 (EPBC Act). Mining related activities require additional approvals under the Mining Act 1978. A substantial proportion of the Property’s Mineral Reserve estimate is located within approved mining areas, with a pending proposal encompassing the Gudai-Darri Warrie and Belele deposits included in the estimate. The project has progressed to an advanced stage of study. 1.8 Qualified Persons’ conclusions and recommendations Based on the information presented in this Technical Report Summary (TRS), the QPs conclude that the Mineral Reserve estimate is supported by appropriate technical data and assumptions, and that no significant risks exist: • The economic sensitivity analysis shows the Mineral Reserve estimate for the Property is not highly sensitive to variation to capital and operating cost, or discount rate. Property valuation is most sensitive to product price; however, the Property remains highly economic in these scenarios. • The assumptions, methods and parameters used for generating the Mineral Reserve estimate are aligned with industry practices and suitable for the mineralisation of the Pilbara and selected mining methods. Capital Expenditure Real, 100% basis Total 2026-2030 2031-2035 2036-2040 2041+ Total Expenditure (US$ billion) 28.7 17.1 9.0 1.9 0.7
Pilbara Operations Technical Report Summary – 31 December 2025 Page 17 of 176 • A significant proportion of the Mineral Reserve estimate is located within existing, permitted operating mining areas, supported by established labour accommodation and transport facilities, processing, rail and port infrastructure, HME maintenance workshops, ground water abstraction and discharge networks, and surface mine haul roads and waste dumps. • Historical performance and reconciliation underpin the confidence in technical modifying factors such as ore loss and dilution, geotechnical parameters, and metallurgical and hydrogeological assumptions. Based on the results presented in this TRS and consistent with Rio Tinto’s long standing operating practices, ongoing technical work will be performed on the Property as part of studies to improve confidence, decrease risk and enable the conversion of Mineral Resources to Mineral Reserves. The following items are recommended to sustain Mineral Resources and Mineral Reserves: • Continue to engage with Traditional Owner groups through the existing Integrated Heritage Management Process and Communities and Social Performance teams. • Complete in progress technical work and obtain relevant permits for sections of the Property that are currently not approved under the EP Act. These recommendations reflect Rio Tinto’s ongoing operating practices: as such costs are incorporated into the Property’s operating and capital costs, the costs of these recommendations have not been separately disclosed in this TRS. 2 Introduction 2.1 Registrant information This TRS for Rio Tinto’s integrated mining operations (the Property), located in the Pilbara region of Western Australia, is prepared by Rio Tinto. The Rio Tinto Group consists of Rio Tinto plc (registered in England and Wales as company number 719885 under the UK Companies Act 2006 and listed on the London Stock Exchange), and Rio Tinto Limited (registered in Australia as ABN 96 004 458 404 under the Australian Corporations Act 2001 and listed on the Australian Securities Exchange). Rio Tinto plc and Rio Tinto Limited operate together and are referred to in this report as Rio Tinto, the Rio Tinto Group or the Group. As noted on the Date and Signature Page, several QPs were involved in the technical work summarised in this TRS. The Property consists of an integrated portfolio of iron ore assets comprising a network of 18 iron ore mines, four port terminals, a nearly 2,000 km rail network and related infrastructure. Mineral Resources and Mineral Reserves are dispersed across the Pilbara region over an area of approximately 70,000 km2. For SEC reporting purposes the Pilbara Operations are considered a production stage property. 2.2 Terms of reference and purpose The purpose of this TRS is to report Mineral Resources and Mineral Reserves for the Property effective as of 31 December 2025. The report utilises: • Australian English spelling. • Metric units of measure. • Grades are presented in weight percent (wt.%). Pilbara Operations Technical Report Summary – 31 December 2025 Page 18 of 176 • Coordinate system is presented in metric units using Map Grid of Australia 1994 (MGA94) Zone 50. • Real US Dollars. • Summary Mineral Resource (section 11) and Mineral Reserve (section 12) are presented based on Rio Tinto ownership. • All other information in the TRS is presented on a 100% basis for the Property1. Key acronyms and definitions used in this TRS include those items listed in Table 2.1. Table 2.1: List of acronyms and abbreviations used in this TRS Acronym/Abbreviation Definition AAS Atomic Absorption Spectroscopy ACMA Australian Communications and Media Authority AEP Annual Exceedance Probability AHS Autonomous Haulage System ALS Australian Laboratory Services Limited AMD Acid Mine Drainage ANCOLD Australian National Committee on Large Dams ANZECC Australian and New Zealand Environment and Conservation Council APT Analytical Precision Testing BHJV Bao-HI Joint Venture BHP Broken Hill Proprietary Company Limited BHPIO BHP Billiton Iron Ore Pty Ltd BID Bedded Iron Deposit BIF Banded Iron Formation Block One minute latitude by one minute longitude Btpa Billion tonnes per annum CAT Chemical Analysis Testing CDP Community Development Plan CID Channel Iron Deposit Channar Mining Channar Mining Pty Ltd CIDPL Cliffs International Drilling Pty Ltd Cliffs Cliffs International Inc. CMJV Channar Mining Joint Venture 1 In this TRS, 100 percent basis for the Property means the Property (including the volume of Mineral Reserves within the Property and all economic analysis related to the Mineral Reserves) is presented on the basis of 100% ownership of the Property as a whole, without regard for any joint venture or other ownership structures that may exist between Rio Tinto and third parties in respect of the Property. This approach differs from external guidance in other Rio Tinto reporting, which is presented on an equity basis. As such, certain figures presented in this TRS may deviate from figures published by Rio Tinto elsewhere.
Pilbara Operations Technical Report Summary – 31 December 2025 Page 19 of 176 Acronym/Abbreviation Definition COG Cut-Off Grade CRA CRA Pty Ltd CRAE CRA Exploration CRAL CRA Limited CRRIA Cliffs Robe River Iron Associates CSP Communities and Social Performance CSR CSR Ltd. DAC Design Acceptance Criteria DD Diamond Drilling DID Detrital Iron Deposit DMPE Department of Energy, Mines and Exploration (WA) dmtu Dry metric tonne unit DWER Department of Water and Environmental Regulation (WA) EDA Exploratory Data Analysis EMP Environmental Management Plan EoR Engineer of Record EP Environmental Protection EPA Environmental Protection Authority EPBC Environmental Protection and Biodiversity Conservation ERA Economic Regulation Authority FAusIMM Fellow of the Australasian Institute of Mining and Metallurgy FAusIMM(CP) Fellow and Chartered Professional of the Australasian Institute of Mining and Metallurgy FCOG Fixed Cut-Off Grade FIFO Fly-In-Fly-Out FOB Free on Board FPIC Free, Prior and Informed Consent FWZ Foot Wall Zone g Gram/mes Ga Giga-annum (1 billion years) GIS Geographical Information System GSWA Geological Survey of Western Australia GTG Gas Turbine Generator GWL Groundwater Limit Hancock Hancock Prospecting Pty Ltd Pilbara Operations Technical Report Summary – 31 December 2025 Page 20 of 176 Acronym/Abbreviation Definition ha Hectare/s HC Hematite Conglomerate HD Hematite Detrital HDJV Hope Downs Joint Venture HEX Hamersley Exploration Pty Ltd HI Hamersley Iron HIY Yandicoogina Fines HME Heavy Mobile Equipment HRL Hamersley Resources Limited HSEQ Health, Safety, Environmental and Quality ICOLD International Committee on Large Dams ICP-MS Inductively Coupled Plasma – Mass Spectroscopy ICP-OES Inductively Coupled Plasma – Optical Emission Spectroscopy ICSS Integrated Control Signalling System ICMM International Council on Mining and Metals IFC International Finance Corporation IFRS International Financial Reporting Standards ILUA Indigenous Land Use Agreement ITS Intertek Services ISO International Organization for Standardization kg Kilogram/s km Kilometre/s km2 Square kilometre/s KNA Kriging Neighbourhood Analysis kV Kilovolt kWh/t Kilowatt Hours per tonne lb Pound LGIRS Department of Local Government, Industry Regulation and Safety (WA) LIC Local Implementation Committee LiDAR Light Detection and Ranging LIMS Laboratory Information Management System LOI Loss on Ignition LOM Life of Mine LoR Limits of Reporting LPB Low Phosphorus
Pilbara Operations Technical Report Summary – 31 December 2025 Page 21 of 176 Acronym/Abbreviation Definition LPP Local Participation Plan LTE Long-Term Evolution m Metre/s Ma Million Years MAC Mining Association of Canada MAusIMM Member of the Australasian Institute of Mining and Metallurgy MBM Mount Bruce Mining Pty Ltd MBAS Methylene Blue Active Substances MCA Minerals Council of Australia MCP Mine Closure Plan MGA 94 Map Grid of Australia 1994 mm Millimetre/s MNES Matters of National Environmental Significance MPU Mobile Processing Unit Mtpa Million tonnes per annum MV Megavolt µm Micron/micrometre NATA National Association of Testing Authorities NBHC New Broken Hill Consolidated Limited NPP National Participation Program NPV Net Present Value NWIS Northwest Integrated System OBM Orebody Block Model OECD Organisation for Economic Co-operation and Development OK Ordinary Kriging ONRSR Office of National Rail Safety and Regulation Pacminex Pacminex Pty Limited PBL Pilbara Blend Lump PPE Point Potential Evaporation QA/QC Quality Assurance/Quality Control QP Qualified Person RC Reverse Circulation RIC Regional Implementation Committee Rio Tinto Rio Tinto plc and Rio Tinto Limited operating together under a dual-listed company structure, as described in section 2.1 Pilbara Operations Technical Report Summary – 31 December 2025 Page 22 of 176 Acronym/Abbreviation Definition RIWI Rights in Water and Irrigation Rockwater Rockwater Pty Ltd Robe River Robe River Mining Co Pty Ltd. ROD Red Ochre Detritals ROM Run Of Mine RQD Rock Quality Designation RRIA Robe River Iron Associates RRJV Rhodes Ridge Joint Venture RRM Rhodes Ridge Mining Co. Ltd. RRSA Rhodes Ridge State Agreement RTDB Rio Tinto acQuire™ Database RTIO Rio Tinto Iron Ore RTMTCS Rio Tinto Material Type Classification Scheme RTF Resource Task Force RTX Rio Tinto Exploration RVF Robe Valley Fines RVL Robe Valley Lump SD Siliceous Detrital SDN Sample Despatch Note SGS Société Générale de Surveillance SME Subject Matter Expert SMU Selective Mining Unit SOP Saleable Ore Product (wet tonnes) t Tonne/s Texasgulf Texasgulf Inc TMS Tenement Database TO Traditional Owners TRH Thermostable-related Hemolysin TRS Technical Report Summary TSF Tailings Storage Facility UCS Unconfined Compressive Strength USSC US Steel Corporation VCOG Variable Cut-Off Grade VSMOW Vienna Standard Mean Ocean Water WA Western Australia
Pilbara Operations Technical Report Summary – 31 December 2025 Page 23 of 176 Acronym/Abbreviation Definition Wright Wright Prospecting Pty Ltd WRS Waste Rock Storage wt.% Weight Percent XRF X-Ray Fluorescence 2.3 Sources of information Sources of exploration and geological data supporting the modelling and Mineral Resource estimates presented in this TRS include data and observations collected by Rio Tinto during the various exploration campaigns completed across the Property, and the various Mineral Resource estimate reports prepared by Rio Tinto and dated 31 December 2025. General regional and local geological interpretation and information for the Property is sourced from various geological reports prepared by or on behalf of Rio Tinto tenement holders as well as from publicly available peer-reviewed geological papers; these geological reports and papers are referenced throughout this TRS where relied upon. This TRS also utilises relevant external technical reports and data available to Rio Tinto providing input to location, setting, geology, project history, exploration activities, methodology, quality assurance and interpretations. Sources of data and information supporting the Mineral Reserves estimates presented in this TRS are the various Mineral Reserve estimate reports prepared by Rio Tinto and dated 31 December 2025. Observations and interpretations of geostatistics, geology and mineralised trends, grade estimation, and Mineral Resources and Mineral Reserves estimates have been generated by Rio Tinto personnel. The following software was utilised: • acQuire™ for the drill hole database. • Leapfrog Geo™ for geological interpretation. • Vulcan™ for block model development. • Isatis™ and Datamine Supervisor™ for variography and statistical analysis. • GEOVIA Whittle™ for definition of economic pit limits. • Vulcan™ for pit design. • AROA™, Alastri Tactical Scheduler™, DeswikGo™ for mine scheduling. • ArcPro™ for multi-purpose 2D data visualisation, and map generation. A detailed list of references is provided in section 25 of this TRS. 2.4 QPs and site visits Information in this TRS has been prepared under the supervision of the following QPs: • Phil Savory – Information in this TRS has been prepared under the supervision of Phil Savory, Fellow of the Australasian Institute of Mining and Metallurgy (FAusIMM, Member Number 107730), Manager Modelling & Data Systems at Rio Tinto Iron Ore. Phil is responsible for Pilbara Pilbara Operations Technical Report Summary – 31 December 2025 Page 24 of 176 Iron Ore Mineral Resources. Visits to selected sites occur each year. The last site visit was in December 2025. • Christian Valentine – Information in this TRS has been prepared under the supervision of Christian Valentine, Member of the Australasian Institute of Mining and Metallurgy (MAusIMM, Member Number 334958), Principal Geoscientist. Christian is responsible for Pilbara Iron Ore Mineral Resources. Visits to selected sites occur each year. The last site visit was in June 2025. • Malcolm Judge – Information in this TRS has been prepared under the supervision of Malcolm Judge, Member of the Australian Institute of Mining and Metallurgy (MAusIMM, Member Number 110049), Superintendent Geoscience. Malcolm is responsible for Pilbara Iron Ore Mineral Resources. Visits to selected sites occur each year. The last visit was in June 2025. • Renjini Nair – Information in this TRS has been prepared under the supervision of Renjini Nair, Member of the Australian Institute of Mining and Metallurgy (MAusIMM, Member Number 311798), Specialist Geoscientist. Renjini is responsible for Pilbara Iron Ore Mineral Resources. Visits to selected sites occur each year. The last visit was in June 2025. • Leonardo Vilela Couto - Information in this TRS has been prepared under the supervision of Leonardo Vilela Couto, Member of the Australian Institute of Mining and Metallurgy (MAusIMM, Member Number 308304), Manager Planning. Leonardo is responsible for Pilbara Iron Ore Mineral Reserves. Visits to selected sites occur each year. The last visit was in October 2025. • Leon Fouché - Information in this TRS has been prepared under the supervision of Leon Fouché, Fellow of the Australian Institute of Mining and Metallurgy (FAusIMM(CP), Member Number 222693), Manager Mine Development & Studies. Leon is responsible for Pilbara Iron Ore Mineral Reserves. Visits to selected sites occur each year. The last visit was in July 2025. • Paul Barnes - Information in this TRS has been prepared under the supervision of Paul Barnes, Member of the Australian Institute of Mining and Metallurgy (MAusIMM, Member Number 225790), Principal Mine Development & Studies. Paul is responsible for Pilbara Iron Ore Mineral Reserves. Visits to selected sites occur each year. The last visit was in July 2025. • Budi Satria Yudha - Information in this TRS has been prepared under the supervision of Budi Satria Yudha, Member of the Australian Institute of Mining and Metallurgy (MAusIMM, Member Number 3003596), Principal Mine Development & Studies. Budi is responsible for Pilbara Iron Ore Mineral Reserves. Visits to selected sites occur each year. The last visit was in July 2025. • Olga Abdrashitova - Information in this TRS has been prepared under the supervision of Olga Abdrashitova, Member of the Australian Institute of Mining and Metallurgy (MAusIMM, Member Number 319085), Principal Mine Planning. Olga is responsible for Pilbara Iron Ore Mineral Reserves. Visits to selected sites occur each year. The last visit was in October 2025. • Amrita Ghosh - Information in this TRS has been prepared under the supervision of Amrita Ghosh, Member of the Australian Institute of Mining and Metallurgy (MAusIMM, Member Number 322619), Principal Mine Planning. Amrita is responsible for Pilbara Iron Ore Mineral Reserves. Visits to selected sites occur each year. The last visit was in Nov 2025. Table 2.2 presents a tabulation of the QPs and their areas of responsibility.
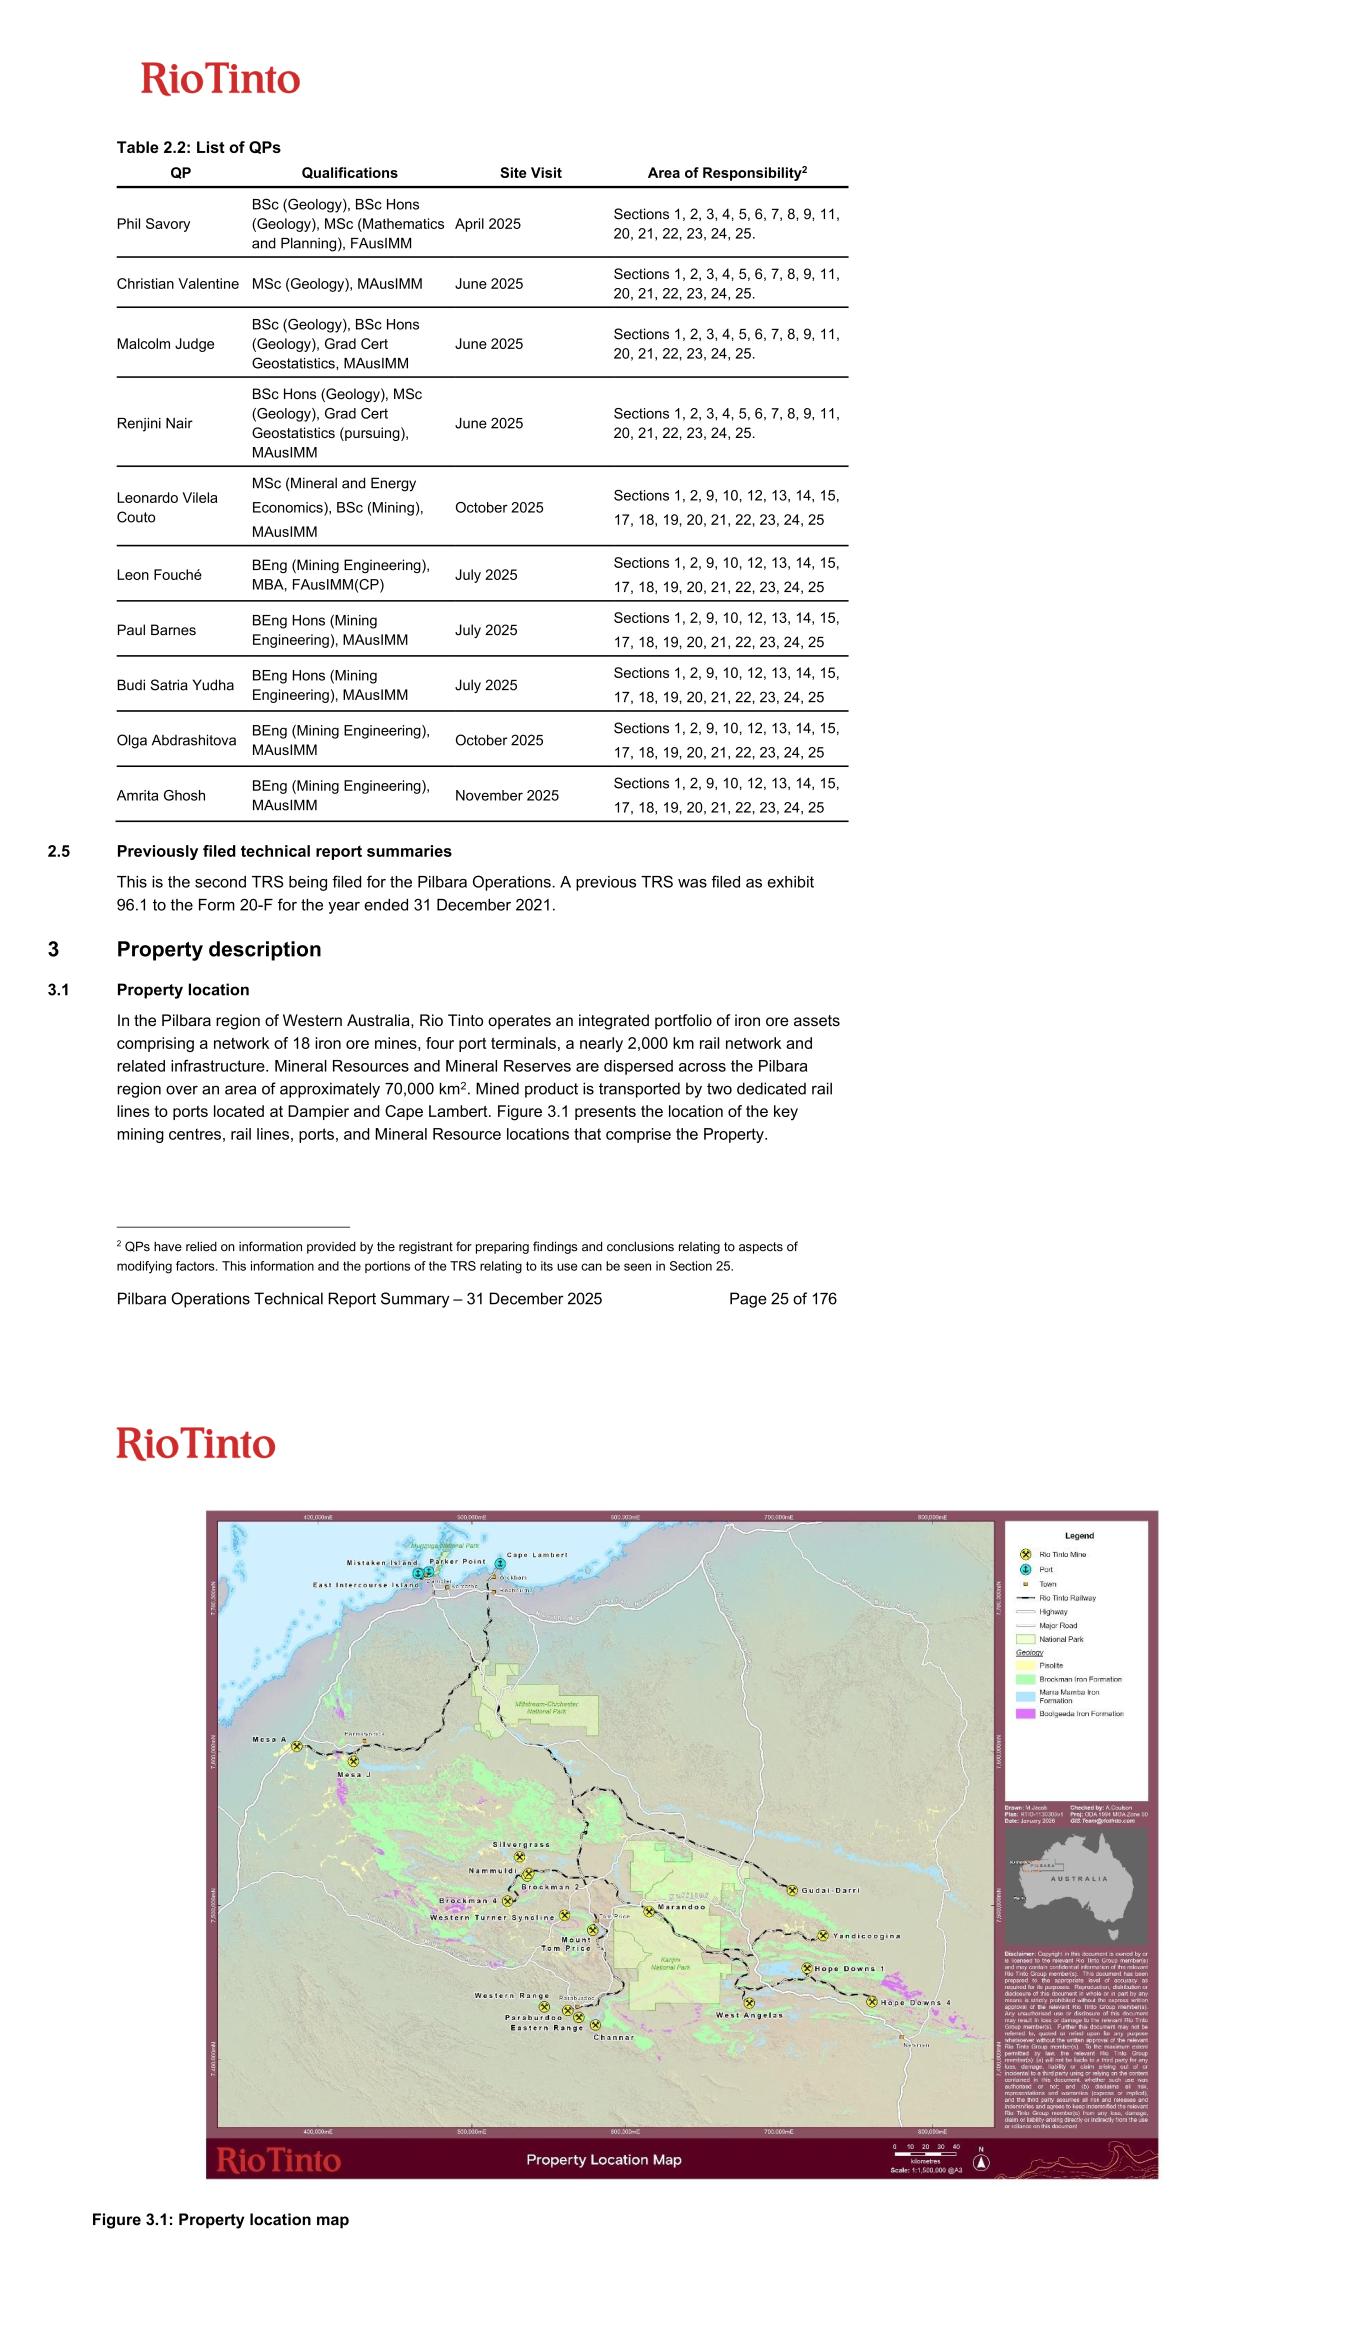
Pilbara Operations Technical Report Summary – 31 December 2025 Page 25 of 176 Table 2.2: List of QPs QP Qualifications Site Visit Area of Responsibility2 Phil Savory BSc (Geology), BSc Hons (Geology), MSc (Mathematics and Planning), FAusIMM April 2025 Sections 1, 2, 3, 4, 5, 6, 7, 8, 9, 11, 20, 21, 22, 23, 24, 25. Christian Valentine MSc (Geology), MAusIMM June 2025 Sections 1, 2, 3, 4, 5, 6, 7, 8, 9, 11, 20, 21, 22, 23, 24, 25. Malcolm Judge BSc (Geology), BSc Hons (Geology), Grad Cert Geostatistics, MAusIMM June 2025 Sections 1, 2, 3, 4, 5, 6, 7, 8, 9, 11, 20, 21, 22, 23, 24, 25. Renjini Nair BSc Hons (Geology), MSc (Geology), Grad Cert Geostatistics (pursuing), MAusIMM June 2025 Sections 1, 2, 3, 4, 5, 6, 7, 8, 9, 11, 20, 21, 22, 23, 24, 25. Leonardo Vilela Couto MSc (Mineral and Energy Economics), BSc (Mining), MAusIMM October 2025 Sections 1, 2, 9, 10, 12, 13, 14, 15, 17, 18, 19, 20, 21, 22, 23, 24, 25 Leon Fouché BEng (Mining Engineering), MBA, FAusIMM(CP) July 2025 Sections 1, 2, 9, 10, 12, 13, 14, 15, 17, 18, 19, 20, 21, 22, 23, 24, 25 Paul Barnes BEng Hons (Mining Engineering), MAusIMM July 2025 Sections 1, 2, 9, 10, 12, 13, 14, 15, 17, 18, 19, 20, 21, 22, 23, 24, 25 Budi Satria Yudha BEng Hons (Mining Engineering), MAusIMM July 2025 Sections 1, 2, 9, 10, 12, 13, 14, 15, 17, 18, 19, 20, 21, 22, 23, 24, 25 Olga Abdrashitova BEng (Mining Engineering), MAusIMM October 2025 Sections 1, 2, 9, 10, 12, 13, 14, 15, 17, 18, 19, 20, 21, 22, 23, 24, 25 Amrita Ghosh BEng (Mining Engineering), MAusIMM November 2025 Sections 1, 2, 9, 10, 12, 13, 14, 15, 17, 18, 19, 20, 21, 22, 23, 24, 25 2.5 Previously filed technical report summaries This is the second TRS being filed for the Pilbara Operations. A previous TRS was filed as exhibit 96.1 to the Form 20-F for the year ended 31 December 2021. 3 Property description 3.1 Property location In the Pilbara region of Western Australia, Rio Tinto operates an integrated portfolio of iron ore assets comprising a network of 18 iron ore mines, four port terminals, a nearly 2,000 km rail network and related infrastructure. Mineral Resources and Mineral Reserves are dispersed across the Pilbara region over an area of approximately 70,000 km2. Mined product is transported by two dedicated rail lines to ports located at Dampier and Cape Lambert. Figure 3.1 presents the location of the key mining centres, rail lines, ports, and Mineral Resource locations that comprise the Property. 2 QPs have relied on information provided by the registrant for preparing findings and conclusions relating to aspects of modifying factors. This information and the portions of the TRS relating to its use can be seen in Section 25. Figure 3.1: Property location map
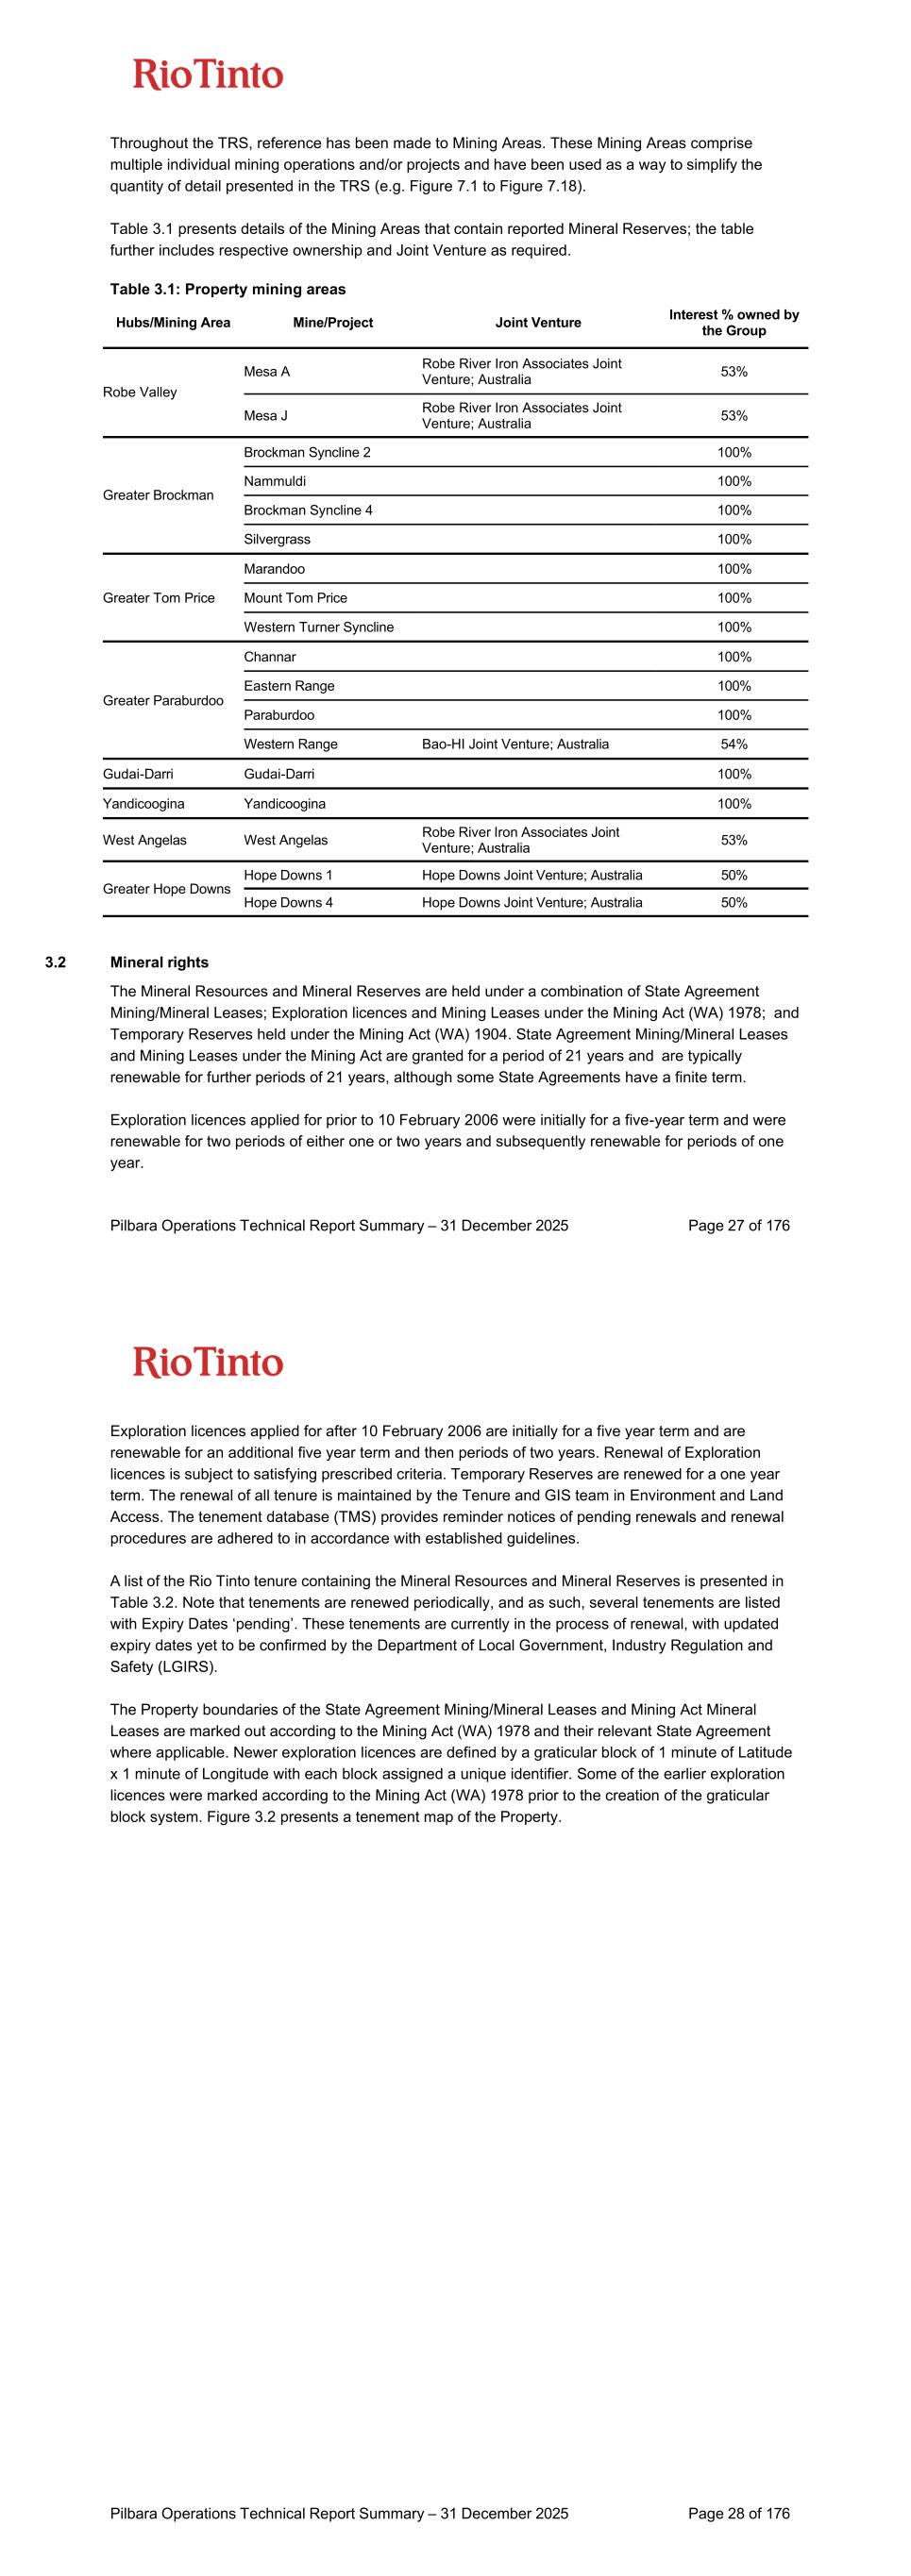
Pilbara Operations Technical Report Summary – 31 December 2025 Page 27 of 176 Throughout the TRS, reference has been made to Mining Areas. These Mining Areas comprise multiple individual mining operations and/or projects and have been used as a way to simplify the quantity of detail presented in the TRS (e.g. Figure 7.1 to Figure 7.18). Table 3.1 presents details of the Mining Areas that contain reported Mineral Reserves; the table further includes respective ownership and Joint Venture as required. Table 3.1: Property mining areas Hubs/Mining Area Mine/Project Joint Venture Interest % owned by the Group Robe Valley Mesa A Robe River Iron Associates Joint Venture; Australia 53% Mesa J Robe River Iron Associates Joint Venture; Australia 53% Greater Brockman Brockman Syncline 2 100% Nammuldi 100% Brockman Syncline 4 100% Silvergrass 100% Greater Tom Price Marandoo 100% Mount Tom Price 100% Western Turner Syncline 100% Greater Paraburdoo Channar 100% Eastern Range 100% Paraburdoo 100% Western Range Bao-HI Joint Venture; Australia 54% Gudai-Darri Gudai-Darri 100% Yandicoogina Yandicoogina 100% West Angelas West Angelas Robe River Iron Associates Joint Venture; Australia 53% Greater Hope Downs Hope Downs 1 Hope Downs Joint Venture; Australia 50% Hope Downs 4 Hope Downs Joint Venture; Australia 50% 3.2 Mineral rights The Mineral Resources and Mineral Reserves are held under a combination of State Agreement Mining/Mineral Leases; Exploration licences and Mining Leases under the Mining Act (WA) 1978; and Temporary Reserves held under the Mining Act (WA) 1904. State Agreement Mining/Mineral Leases and Mining Leases under the Mining Act are granted for a period of 21 years and are typically renewable for further periods of 21 years, although some State Agreements have a finite term. Exploration licences applied for prior to 10 February 2006 were initially for a five-year term and were renewable for two periods of either one or two years and subsequently renewable for periods of one year. Pilbara Operations Technical Report Summary – 31 December 2025 Page 28 of 176 Exploration licences applied for after 10 February 2006 are initially for a five year term and are renewable for an additional five year term and then periods of two years. Renewal of Exploration licences is subject to satisfying prescribed criteria. Temporary Reserves are renewed for a one year term. The renewal of all tenure is maintained by the Tenure and GIS team in Environment and Land Access. The tenement database (TMS) provides reminder notices of pending renewals and renewal procedures are adhered to in accordance with established guidelines. A list of the Rio Tinto tenure containing the Mineral Resources and Mineral Reserves is presented in Table 3.2. Note that tenements are renewed periodically, and as such, several tenements are listed with Expiry Dates ‘pending’. These tenements are currently in the process of renewal, with updated expiry dates yet to be confirmed by the Department of Local Government, Industry Regulation and Safety (LGIRS). The Property boundaries of the State Agreement Mining/Mineral Leases and Mining Act Mineral Leases are marked out according to the Mining Act (WA) 1978 and their relevant State Agreement where applicable. Newer exploration licences are defined by a graticular block of 1 minute of Latitude x 1 minute of Longitude with each block assigned a unique identifier. Some of the earlier exploration licences were marked according to the Mining Act (WA) 1978 prior to the creation of the graticular block system. Figure 3.2 presents a tenement map of the Property.
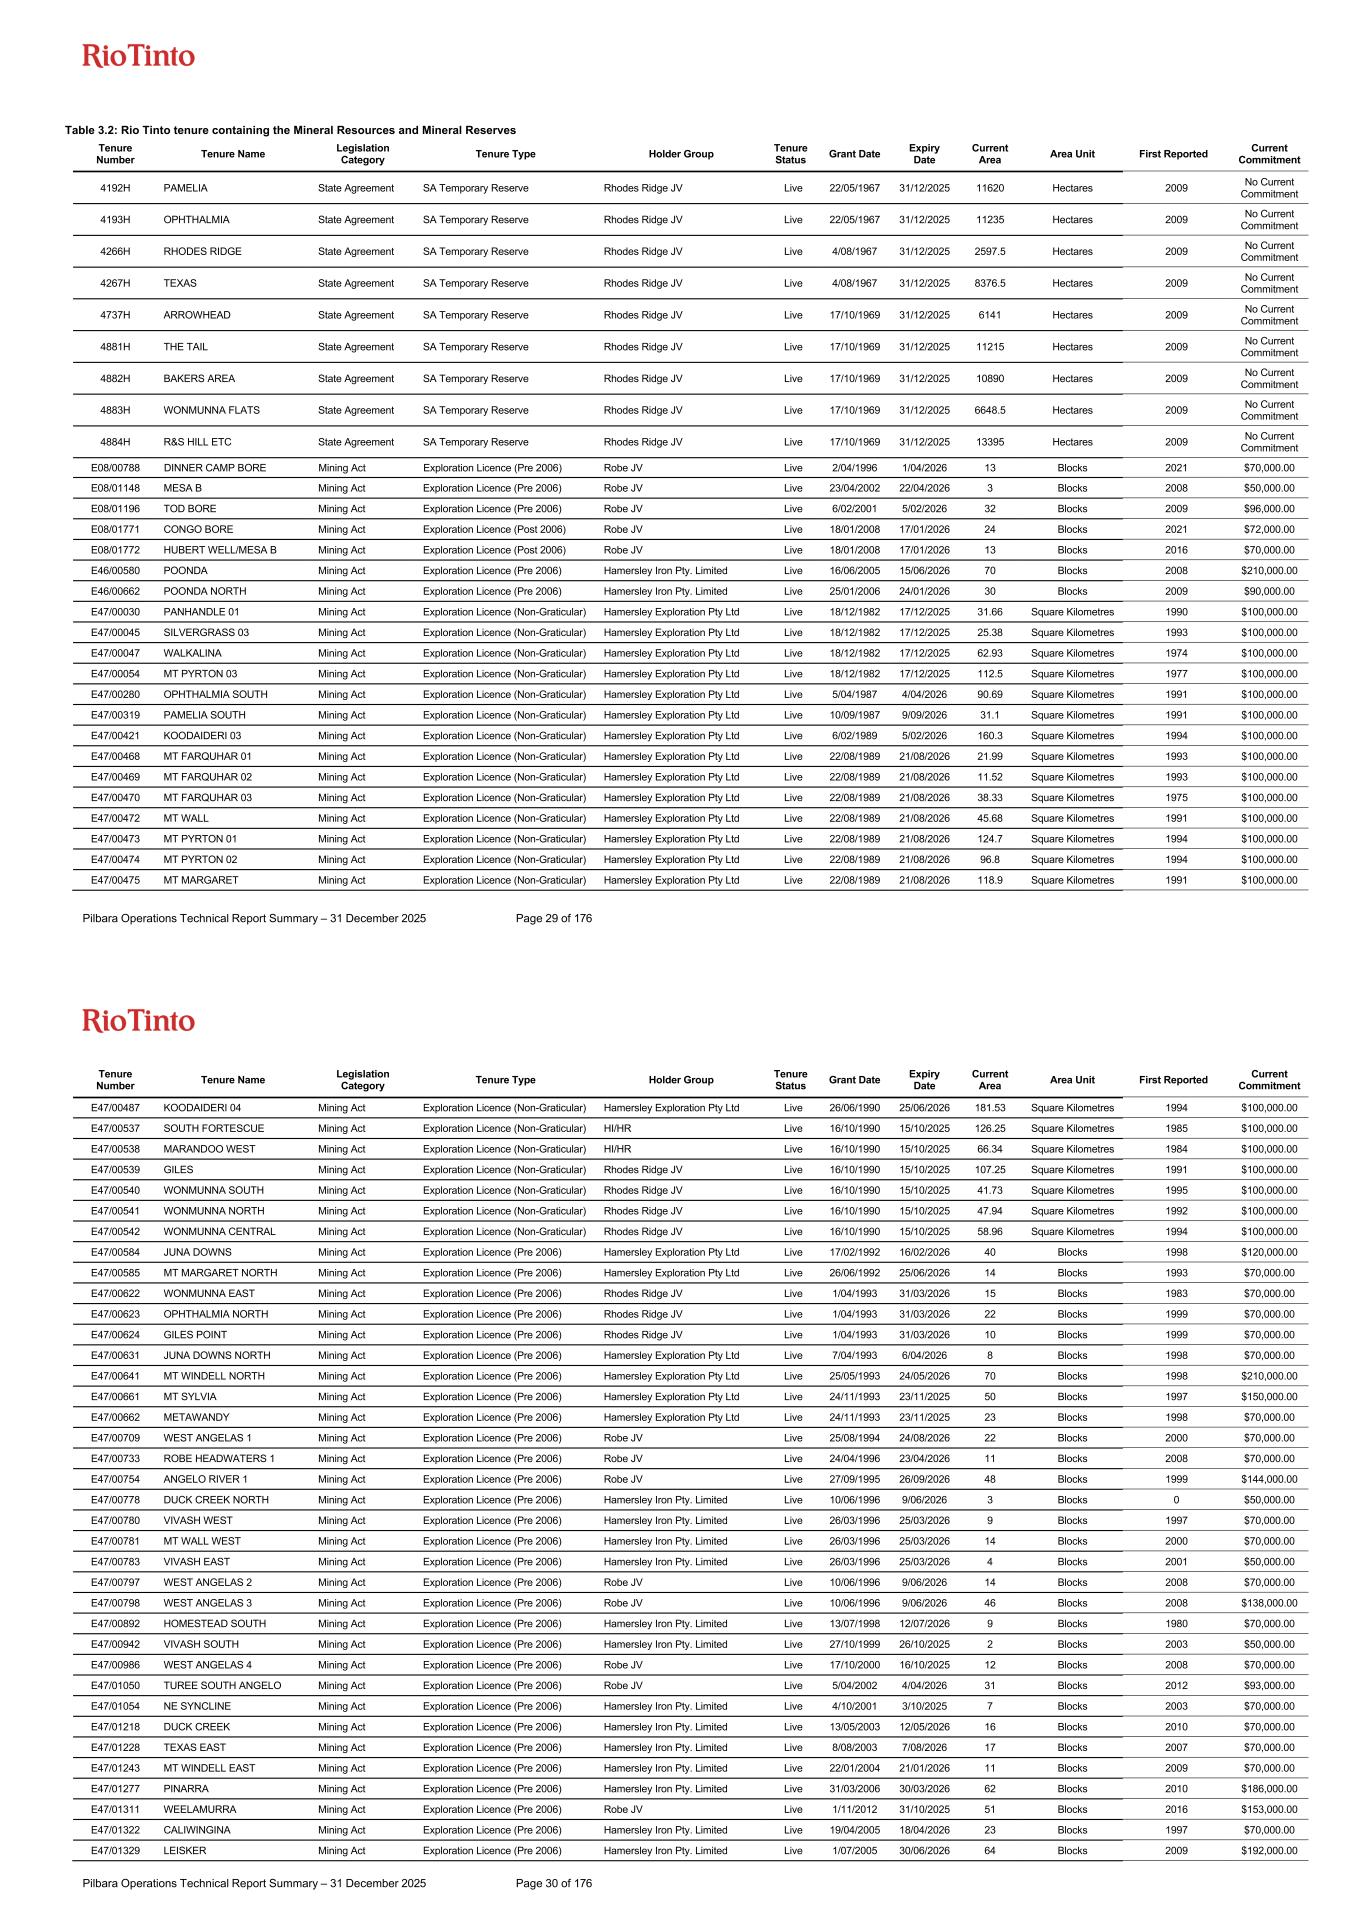
Pilbara Operations Technical Report Summary – 31 December 2025 Page 29 of 176 Table 3.2: Rio Tinto tenure containing the Mineral Resources and Mineral Reserves Tenure Number Tenure Name Legislation Category Tenure Type Holder Group Tenure Status Grant Date Expiry Date Current Area Area Unit First Reported Current Commitment 4192H PAMELIA State Agreement SA Temporary Reserve Rhodes Ridge JV Live 22/05/1967 31/12/2025 11620 Hectares 2009 No Current Commitment 4193H OPHTHALMIA State Agreement SA Temporary Reserve Rhodes Ridge JV Live 22/05/1967 31/12/2025 11235 Hectares 2009 No Current Commitment 4266H RHODES RIDGE State Agreement SA Temporary Reserve Rhodes Ridge JV Live 4/08/1967 31/12/2025 2597.5 Hectares 2009 No Current Commitment 4267H TEXAS State Agreement SA Temporary Reserve Rhodes Ridge JV Live 4/08/1967 31/12/2025 8376.5 Hectares 2009 No Current Commitment 4737H ARROWHEAD State Agreement SA Temporary Reserve Rhodes Ridge JV Live 17/10/1969 31/12/2025 6141 Hectares 2009 No Current Commitment 4881H THE TAIL State Agreement SA Temporary Reserve Rhodes Ridge JV Live 17/10/1969 31/12/2025 11215 Hectares 2009 No Current Commitment 4882H BAKERS AREA State Agreement SA Temporary Reserve Rhodes Ridge JV Live 17/10/1969 31/12/2025 10890 Hectares 2009 No Current Commitment 4883H WONMUNNA FLATS State Agreement SA Temporary Reserve Rhodes Ridge JV Live 17/10/1969 31/12/2025 6648.5 Hectares 2009 No Current Commitment 4884H R&S HILL ETC State Agreement SA Temporary Reserve Rhodes Ridge JV Live 17/10/1969 31/12/2025 13395 Hectares 2009 No Current Commitment E08/00788 DINNER CAMP BORE Mining Act Exploration Licence (Pre 2006) Robe JV Live 2/04/1996 1/04/2026 13 Blocks 2021 $70,000.00 E08/01148 MESA B Mining Act Exploration Licence (Pre 2006) Robe JV Live 23/04/2002 22/04/2026 3 Blocks 2008 $50,000.00 E08/01196 TOD BORE Mining Act Exploration Licence (Pre 2006) Robe JV Live 6/02/2001 5/02/2026 32 Blocks 2009 $96,000.00 E08/01771 CONGO BORE Mining Act Exploration Licence (Post 2006) Robe JV Live 18/01/2008 17/01/2026 24 Blocks 2021 $72,000.00 E08/01772 HUBERT WELL/MESA B Mining Act Exploration Licence (Post 2006) Robe JV Live 18/01/2008 17/01/2026 13 Blocks 2016 $70,000.00 E46/00580 POONDA Mining Act Exploration Licence (Pre 2006) Hamersley Iron Pty. Limited Live 16/06/2005 15/06/2026 70 Blocks 2008 $210,000.00 E46/00662 POONDA NORTH Mining Act Exploration Licence (Pre 2006) Hamersley Iron Pty. Limited Live 25/01/2006 24/01/2026 30 Blocks 2009 $90,000.00 E47/00030 PANHANDLE 01 Mining Act Exploration Licence (Non-Graticular) Hamersley Exploration Pty Ltd Live 18/12/1982 17/12/2025 31.66 Square Kilometres 1990 $100,000.00 E47/00045 SILVERGRASS 03 Mining Act Exploration Licence (Non-Graticular) Hamersley Exploration Pty Ltd Live 18/12/1982 17/12/2025 25.38 Square Kilometres 1993 $100,000.00 E47/00047 WALKALINA Mining Act Exploration Licence (Non-Graticular) Hamersley Exploration Pty Ltd Live 18/12/1982 17/12/2025 62.93 Square Kilometres 1974 $100,000.00 E47/00054 MT PYRTON 03 Mining Act Exploration Licence (Non-Graticular) Hamersley Exploration Pty Ltd Live 18/12/1982 17/12/2025 112.5 Square Kilometres 1977 $100,000.00 E47/00280 OPHTHALMIA SOUTH Mining Act Exploration Licence (Non-Graticular) Hamersley Exploration Pty Ltd Live 5/04/1987 4/04/2026 90.69 Square Kilometres 1991 $100,000.00 E47/00319 PAMELIA SOUTH Mining Act Exploration Licence (Non-Graticular) Hamersley Exploration Pty Ltd Live 10/09/1987 9/09/2026 31.1 Square Kilometres 1991 $100,000.00 E47/00421 KOODAIDERI 03 Mining Act Exploration Licence (Non-Graticular) Hamersley Exploration Pty Ltd Live 6/02/1989 5/02/2026 160.3 Square Kilometres 1994 $100,000.00 E47/00468 MT FARQUHAR 01 Mining Act Exploration Licence (Non-Graticular) Hamersley Exploration Pty Ltd Live 22/08/1989 21/08/2026 21.99 Square Kilometres 1993 $100,000.00 E47/00469 MT FARQUHAR 02 Mining Act Exploration Licence (Non-Graticular) Hamersley Exploration Pty Ltd Live 22/08/1989 21/08/2026 11.52 Square Kilometres 1993 $100,000.00 E47/00470 MT FARQUHAR 03 Mining Act Exploration Licence (Non-Graticular) Hamersley Exploration Pty Ltd Live 22/08/1989 21/08/2026 38.33 Square Kilometres 1975 $100,000.00 E47/00472 MT WALL Mining Act Exploration Licence (Non-Graticular) Hamersley Exploration Pty Ltd Live 22/08/1989 21/08/2026 45.68 Square Kilometres 1991 $100,000.00 E47/00473 MT PYRTON 01 Mining Act Exploration Licence (Non-Graticular) Hamersley Exploration Pty Ltd Live 22/08/1989 21/08/2026 124.7 Square Kilometres 1994 $100,000.00 E47/00474 MT PYRTON 02 Mining Act Exploration Licence (Non-Graticular) Hamersley Exploration Pty Ltd Live 22/08/1989 21/08/2026 96.8 Square Kilometres 1994 $100,000.00 E47/00475 MT MARGARET Mining Act Exploration Licence (Non-Graticular) Hamersley Exploration Pty Ltd Live 22/08/1989 21/08/2026 118.9 Square Kilometres 1991 $100,000.00 Pilbara Operations Technical Report Summary – 31 December 2025 Page 30 of 176 Tenure Number Tenure Name Legislation Category Tenure Type Holder Group Tenure Status Grant Date Expiry Date Current Area Area Unit First Reported Current Commitment E47/00487 KOODAIDERI 04 Mining Act Exploration Licence (Non-Graticular) Hamersley Exploration Pty Ltd Live 26/06/1990 25/06/2026 181.53 Square Kilometres 1994 $100,000.00 E47/00537 SOUTH FORTESCUE Mining Act Exploration Licence (Non-Graticular) HI/HR Live 16/10/1990 15/10/2025 126.25 Square Kilometres 1985 $100,000.00 E47/00538 MARANDOO WEST Mining Act Exploration Licence (Non-Graticular) HI/HR Live 16/10/1990 15/10/2025 66.34 Square Kilometres 1984 $100,000.00 E47/00539 GILES Mining Act Exploration Licence (Non-Graticular) Rhodes Ridge JV Live 16/10/1990 15/10/2025 107.25 Square Kilometres 1991 $100,000.00 E47/00540 WONMUNNA SOUTH Mining Act Exploration Licence (Non-Graticular) Rhodes Ridge JV Live 16/10/1990 15/10/2025 41.73 Square Kilometres 1995 $100,000.00 E47/00541 WONMUNNA NORTH Mining Act Exploration Licence (Non-Graticular) Rhodes Ridge JV Live 16/10/1990 15/10/2025 47.94 Square Kilometres 1992 $100,000.00 E47/00542 WONMUNNA CENTRAL Mining Act Exploration Licence (Non-Graticular) Rhodes Ridge JV Live 16/10/1990 15/10/2025 58.96 Square Kilometres 1994 $100,000.00 E47/00584 JUNA DOWNS Mining Act Exploration Licence (Pre 2006) Hamersley Exploration Pty Ltd Live 17/02/1992 16/02/2026 40 Blocks 1998 $120,000.00 E47/00585 MT MARGARET NORTH Mining Act Exploration Licence (Pre 2006) Hamersley Exploration Pty Ltd Live 26/06/1992 25/06/2026 14 Blocks 1993 $70,000.00 E47/00622 WONMUNNA EAST Mining Act Exploration Licence (Pre 2006) Rhodes Ridge JV Live 1/04/1993 31/03/2026 15 Blocks 1983 $70,000.00 E47/00623 OPHTHALMIA NORTH Mining Act Exploration Licence (Pre 2006) Rhodes Ridge JV Live 1/04/1993 31/03/2026 22 Blocks 1999 $70,000.00 E47/00624 GILES POINT Mining Act Exploration Licence (Pre 2006) Rhodes Ridge JV Live 1/04/1993 31/03/2026 10 Blocks 1999 $70,000.00 E47/00631 JUNA DOWNS NORTH Mining Act Exploration Licence (Pre 2006) Hamersley Exploration Pty Ltd Live 7/04/1993 6/04/2026 8 Blocks 1998 $70,000.00 E47/00641 MT WINDELL NORTH Mining Act Exploration Licence (Pre 2006) Hamersley Exploration Pty Ltd Live 25/05/1993 24/05/2026 70 Blocks 1998 $210,000.00 E47/00661 MT SYLVIA Mining Act Exploration Licence (Pre 2006) Hamersley Exploration Pty Ltd Live 24/11/1993 23/11/2025 50 Blocks 1997 $150,000.00 E47/00662 METAWANDY Mining Act Exploration Licence (Pre 2006) Hamersley Exploration Pty Ltd Live 24/11/1993 23/11/2025 23 Blocks 1998 $70,000.00 E47/00709 WEST ANGELAS 1 Mining Act Exploration Licence (Pre 2006) Robe JV Live 25/08/1994 24/08/2026 22 Blocks 2000 $70,000.00 E47/00733 ROBE HEADWATERS 1 Mining Act Exploration Licence (Pre 2006) Robe JV Live 24/04/1996 23/04/2026 11 Blocks 2008 $70,000.00 E47/00754 ANGELO RIVER 1 Mining Act Exploration Licence (Pre 2006) Robe JV Live 27/09/1995 26/09/2026 48 Blocks 1999 $144,000.00 E47/00778 DUCK CREEK NORTH Mining Act Exploration Licence (Pre 2006) Hamersley Iron Pty. Limited Live 10/06/1996 9/06/2026 3 Blocks 0 $50,000.00 E47/00780 VIVASH WEST Mining Act Exploration Licence (Pre 2006) Hamersley Iron Pty. Limited Live 26/03/1996 25/03/2026 9 Blocks 1997 $70,000.00 E47/00781 MT WALL WEST Mining Act Exploration Licence (Pre 2006) Hamersley Iron Pty. Limited Live 26/03/1996 25/03/2026 14 Blocks 2000 $70,000.00 E47/00783 VIVASH EAST Mining Act Exploration Licence (Pre 2006) Hamersley Iron Pty. Limited Live 26/03/1996 25/03/2026 4 Blocks 2001 $50,000.00 E47/00797 WEST ANGELAS 2 Mining Act Exploration Licence (Pre 2006) Robe JV Live 10/06/1996 9/06/2026 14 Blocks 2008 $70,000.00 E47/00798 WEST ANGELAS 3 Mining Act Exploration Licence (Pre 2006) Robe JV Live 10/06/1996 9/06/2026 46 Blocks 2008 $138,000.00 E47/00892 HOMESTEAD SOUTH Mining Act Exploration Licence (Pre 2006) Hamersley Iron Pty. Limited Live 13/07/1998 12/07/2026 9 Blocks 1980 $70,000.00 E47/00942 VIVASH SOUTH Mining Act Exploration Licence (Pre 2006) Hamersley Iron Pty. Limited Live 27/10/1999 26/10/2025 2 Blocks 2003 $50,000.00 E47/00986 WEST ANGELAS 4 Mining Act Exploration Licence (Pre 2006) Robe JV Live 17/10/2000 16/10/2025 12 Blocks 2008 $70,000.00 E47/01050 TUREE SOUTH ANGELO Mining Act Exploration Licence (Pre 2006) Robe JV Live 5/04/2002 4/04/2026 31 Blocks 2012 $93,000.00 E47/01054 NE SYNCLINE Mining Act Exploration Licence (Pre 2006) Hamersley Iron Pty. Limited Live 4/10/2001 3/10/2025 7 Blocks 2003 $70,000.00 E47/01218 DUCK CREEK Mining Act Exploration Licence (Pre 2006) Hamersley Iron Pty. Limited Live 13/05/2003 12/05/2026 16 Blocks 2010 $70,000.00 E47/01228 TEXAS EAST Mining Act Exploration Licence (Pre 2006) Hamersley Iron Pty. Limited Live 8/08/2003 7/08/2026 17 Blocks 2007 $70,000.00 E47/01243 MT WINDELL EAST Mining Act Exploration Licence (Pre 2006) Hamersley Iron Pty. Limited Live 22/01/2004 21/01/2026 11 Blocks 2009 $70,000.00 E47/01277 PINARRA Mining Act Exploration Licence (Pre 2006) Hamersley Iron Pty. Limited Live 31/03/2006 30/03/2026 62 Blocks 2010 $186,000.00 E47/01311 WEELAMURRA Mining Act Exploration Licence (Pre 2006) Robe JV Live 1/11/2012 31/10/2025 51 Blocks 2016 $153,000.00 E47/01322 CALIWINGINA Mining Act Exploration Licence (Pre 2006) Hamersley Iron Pty. Limited Live 19/04/2005 18/04/2026 23 Blocks 1997 $70,000.00 E47/01329 LEISKER Mining Act Exploration Licence (Pre 2006) Hamersley Iron Pty. Limited Live 1/07/2005 30/06/2026 64 Blocks 2009 $192,000.00
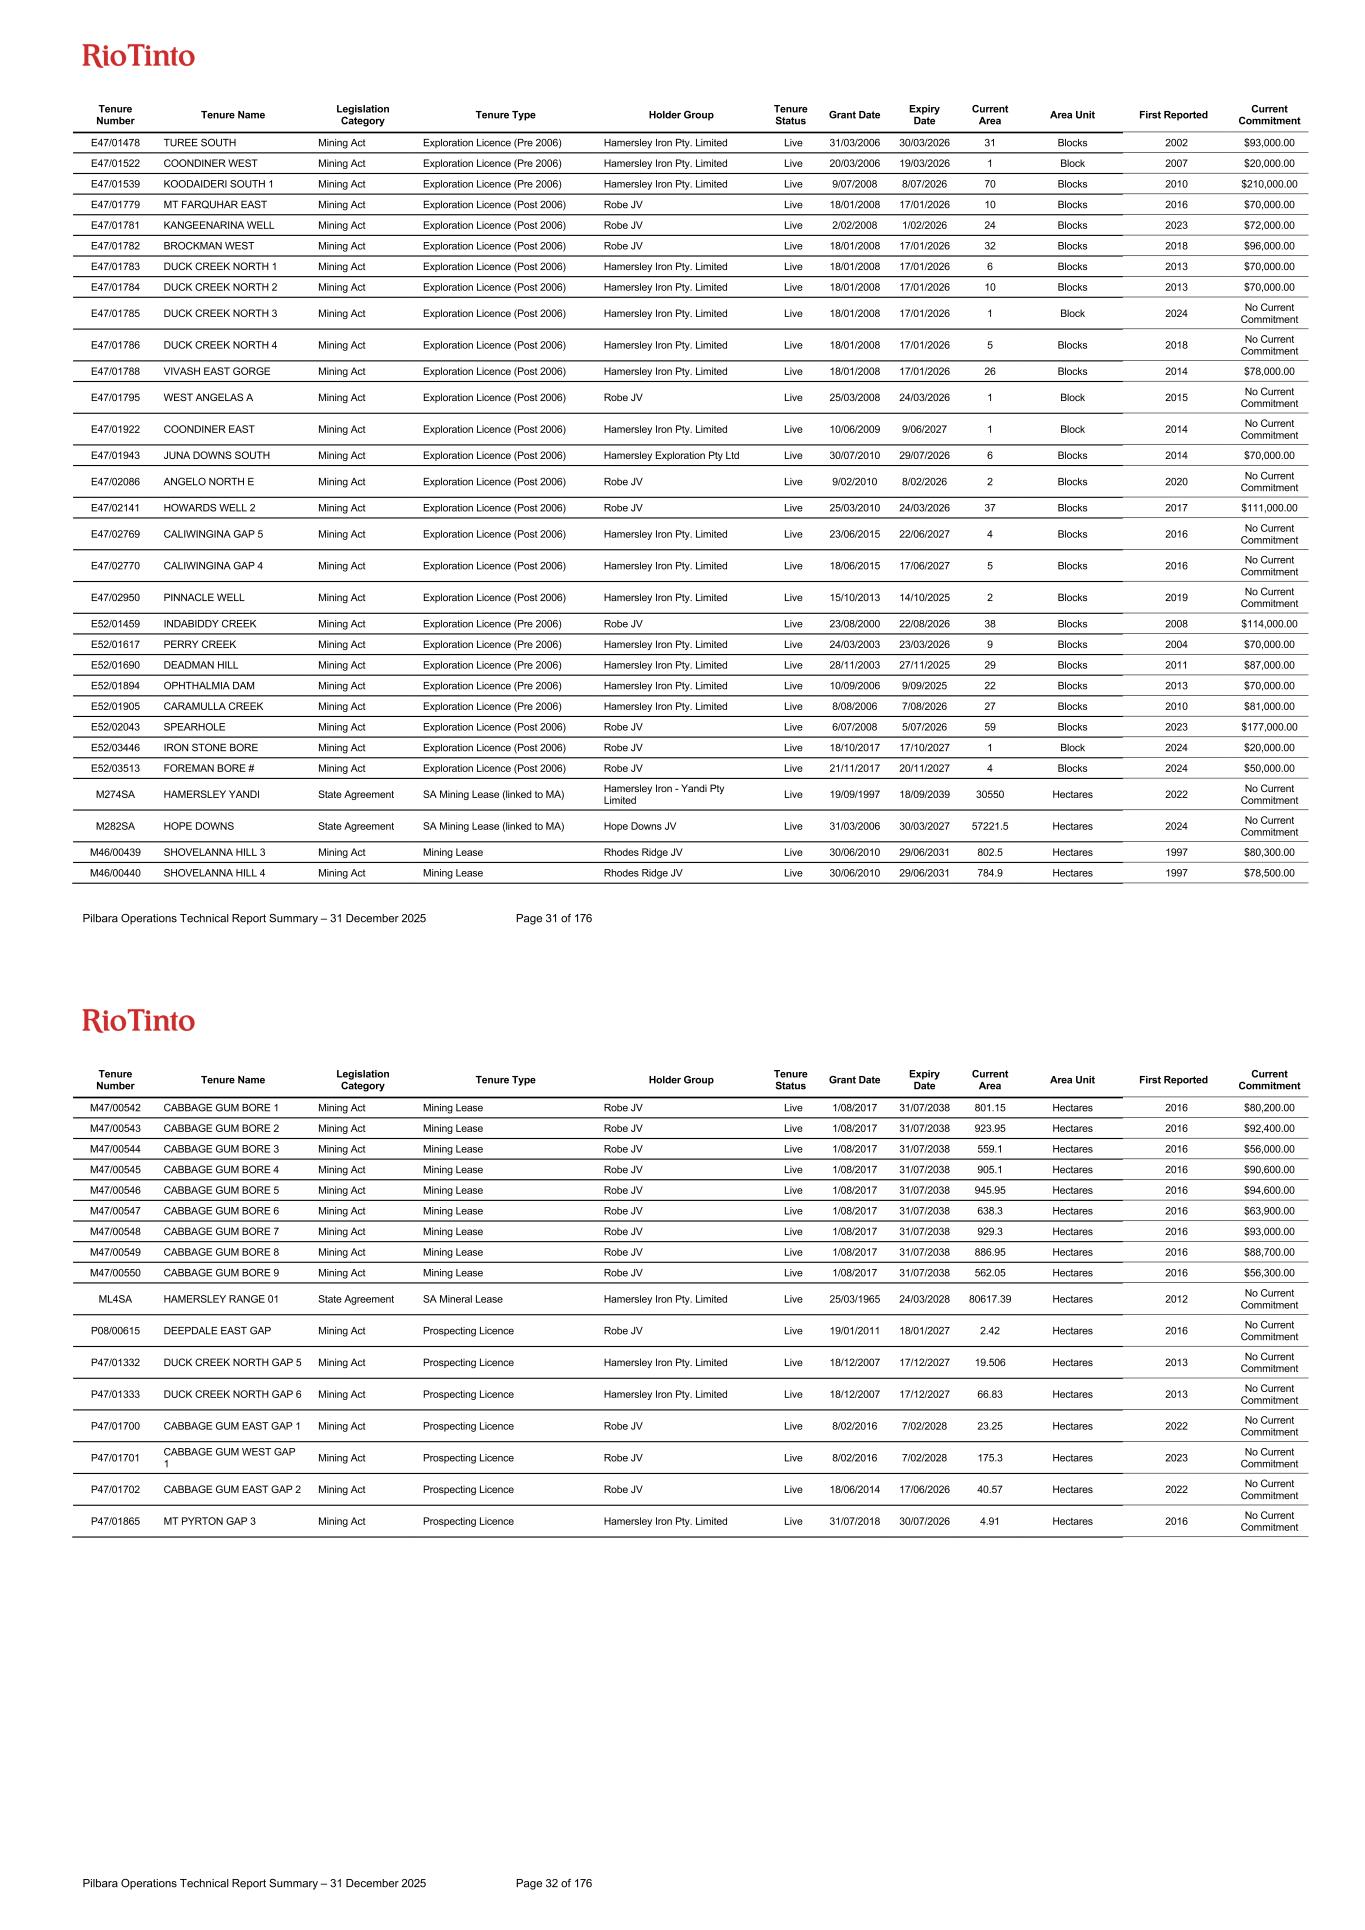
Pilbara Operations Technical Report Summary – 31 December 2025 Page 31 of 176 Tenure Number Tenure Name Legislation Category Tenure Type Holder Group Tenure Status Grant Date Expiry Date Current Area Area Unit First Reported Current Commitment E47/01478 TUREE SOUTH Mining Act Exploration Licence (Pre 2006) Hamersley Iron Pty. Limited Live 31/03/2006 30/03/2026 31 Blocks 2002 $93,000.00 E47/01522 COONDINER WEST Mining Act Exploration Licence (Pre 2006) Hamersley Iron Pty. Limited Live 20/03/2006 19/03/2026 1 Block 2007 $20,000.00 E47/01539 KOODAIDERI SOUTH 1 Mining Act Exploration Licence (Pre 2006) Hamersley Iron Pty. Limited Live 9/07/2008 8/07/2026 70 Blocks 2010 $210,000.00 E47/01779 MT FARQUHAR EAST Mining Act Exploration Licence (Post 2006) Robe JV Live 18/01/2008 17/01/2026 10 Blocks 2016 $70,000.00 E47/01781 KANGEENARINA WELL Mining Act Exploration Licence (Post 2006) Robe JV Live 2/02/2008 1/02/2026 24 Blocks 2023 $72,000.00 E47/01782 BROCKMAN WEST Mining Act Exploration Licence (Post 2006) Robe JV Live 18/01/2008 17/01/2026 32 Blocks 2018 $96,000.00 E47/01783 DUCK CREEK NORTH 1 Mining Act Exploration Licence (Post 2006) Hamersley Iron Pty. Limited Live 18/01/2008 17/01/2026 6 Blocks 2013 $70,000.00 E47/01784 DUCK CREEK NORTH 2 Mining Act Exploration Licence (Post 2006) Hamersley Iron Pty. Limited Live 18/01/2008 17/01/2026 10 Blocks 2013 $70,000.00 E47/01785 DUCK CREEK NORTH 3 Mining Act Exploration Licence (Post 2006) Hamersley Iron Pty. Limited Live 18/01/2008 17/01/2026 1 Block 2024 No Current Commitment E47/01786 DUCK CREEK NORTH 4 Mining Act Exploration Licence (Post 2006) Hamersley Iron Pty. Limited Live 18/01/2008 17/01/2026 5 Blocks 2018 No Current Commitment E47/01788 VIVASH EAST GORGE Mining Act Exploration Licence (Post 2006) Hamersley Iron Pty. Limited Live 18/01/2008 17/01/2026 26 Blocks 2014 $78,000.00 E47/01795 WEST ANGELAS A Mining Act Exploration Licence (Post 2006) Robe JV Live 25/03/2008 24/03/2026 1 Block 2015 No Current Commitment E47/01922 COONDINER EAST Mining Act Exploration Licence (Post 2006) Hamersley Iron Pty. Limited Live 10/06/2009 9/06/2027 1 Block 2014 No Current Commitment E47/01943 JUNA DOWNS SOUTH Mining Act Exploration Licence (Post 2006) Hamersley Exploration Pty Ltd Live 30/07/2010 29/07/2026 6 Blocks 2014 $70,000.00 E47/02086 ANGELO NORTH E Mining Act Exploration Licence (Post 2006) Robe JV Live 9/02/2010 8/02/2026 2 Blocks 2020 No Current Commitment E47/02141 HOWARDS WELL 2 Mining Act Exploration Licence (Post 2006) Robe JV Live 25/03/2010 24/03/2026 37 Blocks 2017 $111,000.00 E47/02769 CALIWINGINA GAP 5 Mining Act Exploration Licence (Post 2006) Hamersley Iron Pty. Limited Live 23/06/2015 22/06/2027 4 Blocks 2016 No Current Commitment E47/02770 CALIWINGINA GAP 4 Mining Act Exploration Licence (Post 2006) Hamersley Iron Pty. Limited Live 18/06/2015 17/06/2027 5 Blocks 2016 No Current Commitment E47/02950 PINNACLE WELL Mining Act Exploration Licence (Post 2006) Hamersley Iron Pty. Limited Live 15/10/2013 14/10/2025 2 Blocks 2019 No Current Commitment E52/01459 INDABIDDY CREEK Mining Act Exploration Licence (Pre 2006) Robe JV Live 23/08/2000 22/08/2026 38 Blocks 2008 $114,000.00 E52/01617 PERRY CREEK Mining Act Exploration Licence (Pre 2006) Hamersley Iron Pty. Limited Live 24/03/2003 23/03/2026 9 Blocks 2004 $70,000.00 E52/01690 DEADMAN HILL Mining Act Exploration Licence (Pre 2006) Hamersley Iron Pty. Limited Live 28/11/2003 27/11/2025 29 Blocks 2011 $87,000.00 E52/01894 OPHTHALMIA DAM Mining Act Exploration Licence (Pre 2006) Hamersley Iron Pty. Limited Live 10/09/2006 9/09/2025 22 Blocks 2013 $70,000.00 E52/01905 CARAMULLA CREEK Mining Act Exploration Licence (Pre 2006) Hamersley Iron Pty. Limited Live 8/08/2006 7/08/2026 27 Blocks 2010 $81,000.00 E52/02043 SPEARHOLE Mining Act Exploration Licence (Post 2006) Robe JV Live 6/07/2008 5/07/2026 59 Blocks 2023 $177,000.00 E52/03446 IRON STONE BORE Mining Act Exploration Licence (Post 2006) Robe JV Live 18/10/2017 17/10/2027 1 Block 2024 $20,000.00 E52/03513 FOREMAN BORE # Mining Act Exploration Licence (Post 2006) Robe JV Live 21/11/2017 20/11/2027 4 Blocks 2024 $50,000.00 M274SA HAMERSLEY YANDI State Agreement SA Mining Lease (linked to MA) Hamersley Iron - Yandi Pty Limited Live 19/09/1997 18/09/2039 30550 Hectares 2022 No Current Commitment M282SA HOPE DOWNS State Agreement SA Mining Lease (linked to MA) Hope Downs JV Live 31/03/2006 30/03/2027 57221.5 Hectares 2024 No Current Commitment M46/00439 SHOVELANNA HILL 3 Mining Act Mining Lease Rhodes Ridge JV Live 30/06/2010 29/06/2031 802.5 Hectares 1997 $80,300.00 M46/00440 SHOVELANNA HILL 4 Mining Act Mining Lease Rhodes Ridge JV Live 30/06/2010 29/06/2031 784.9 Hectares 1997 $78,500.00 Pilbara Operations Technical Report Summary – 31 December 2025 Page 32 of 176 Tenure Number Tenure Name Legislation Category Tenure Type Holder Group Tenure Status Grant Date Expiry Date Current Area Area Unit First Reported Current Commitment M47/00542 CABBAGE GUM BORE 1 Mining Act Mining Lease Robe JV Live 1/08/2017 31/07/2038 801.15 Hectares 2016 $80,200.00 M47/00543 CABBAGE GUM BORE 2 Mining Act Mining Lease Robe JV Live 1/08/2017 31/07/2038 923.95 Hectares 2016 $92,400.00 M47/00544 CABBAGE GUM BORE 3 Mining Act Mining Lease Robe JV Live 1/08/2017 31/07/2038 559.1 Hectares 2016 $56,000.00 M47/00545 CABBAGE GUM BORE 4 Mining Act Mining Lease Robe JV Live 1/08/2017 31/07/2038 905.1 Hectares 2016 $90,600.00 M47/00546 CABBAGE GUM BORE 5 Mining Act Mining Lease Robe JV Live 1/08/2017 31/07/2038 945.95 Hectares 2016 $94,600.00 M47/00547 CABBAGE GUM BORE 6 Mining Act Mining Lease Robe JV Live 1/08/2017 31/07/2038 638.3 Hectares 2016 $63,900.00 M47/00548 CABBAGE GUM BORE 7 Mining Act Mining Lease Robe JV Live 1/08/2017 31/07/2038 929.3 Hectares 2016 $93,000.00 M47/00549 CABBAGE GUM BORE 8 Mining Act Mining Lease Robe JV Live 1/08/2017 31/07/2038 886.95 Hectares 2016 $88,700.00 M47/00550 CABBAGE GUM BORE 9 Mining Act Mining Lease Robe JV Live 1/08/2017 31/07/2038 562.05 Hectares 2016 $56,300.00 ML4SA HAMERSLEY RANGE 01 State Agreement SA Mineral Lease Hamersley Iron Pty. Limited Live 25/03/1965 24/03/2028 80617.39 Hectares 2012 No Current Commitment P08/00615 DEEPDALE EAST GAP Mining Act Prospecting Licence Robe JV Live 19/01/2011 18/01/2027 2.42 Hectares 2016 No Current Commitment P47/01332 DUCK CREEK NORTH GAP 5 Mining Act Prospecting Licence Hamersley Iron Pty. Limited Live 18/12/2007 17/12/2027 19.506 Hectares 2013 No Current Commitment P47/01333 DUCK CREEK NORTH GAP 6 Mining Act Prospecting Licence Hamersley Iron Pty. Limited Live 18/12/2007 17/12/2027 66.83 Hectares 2013 No Current Commitment P47/01700 CABBAGE GUM EAST GAP 1 Mining Act Prospecting Licence Robe JV Live 8/02/2016 7/02/2028 23.25 Hectares 2022 No Current Commitment P47/01701 CABBAGE GUM WEST GAP 1 Mining Act Prospecting Licence Robe JV Live 8/02/2016 7/02/2028 175.3 Hectares 2023 No Current Commitment P47/01702 CABBAGE GUM EAST GAP 2 Mining Act Prospecting Licence Robe JV Live 18/06/2014 17/06/2026 40.57 Hectares 2022 No Current Commitment P47/01865 MT PYRTON GAP 3 Mining Act Prospecting Licence Hamersley Iron Pty. Limited Live 31/07/2018 30/07/2026 4.91 Hectares 2016 No Current Commitment
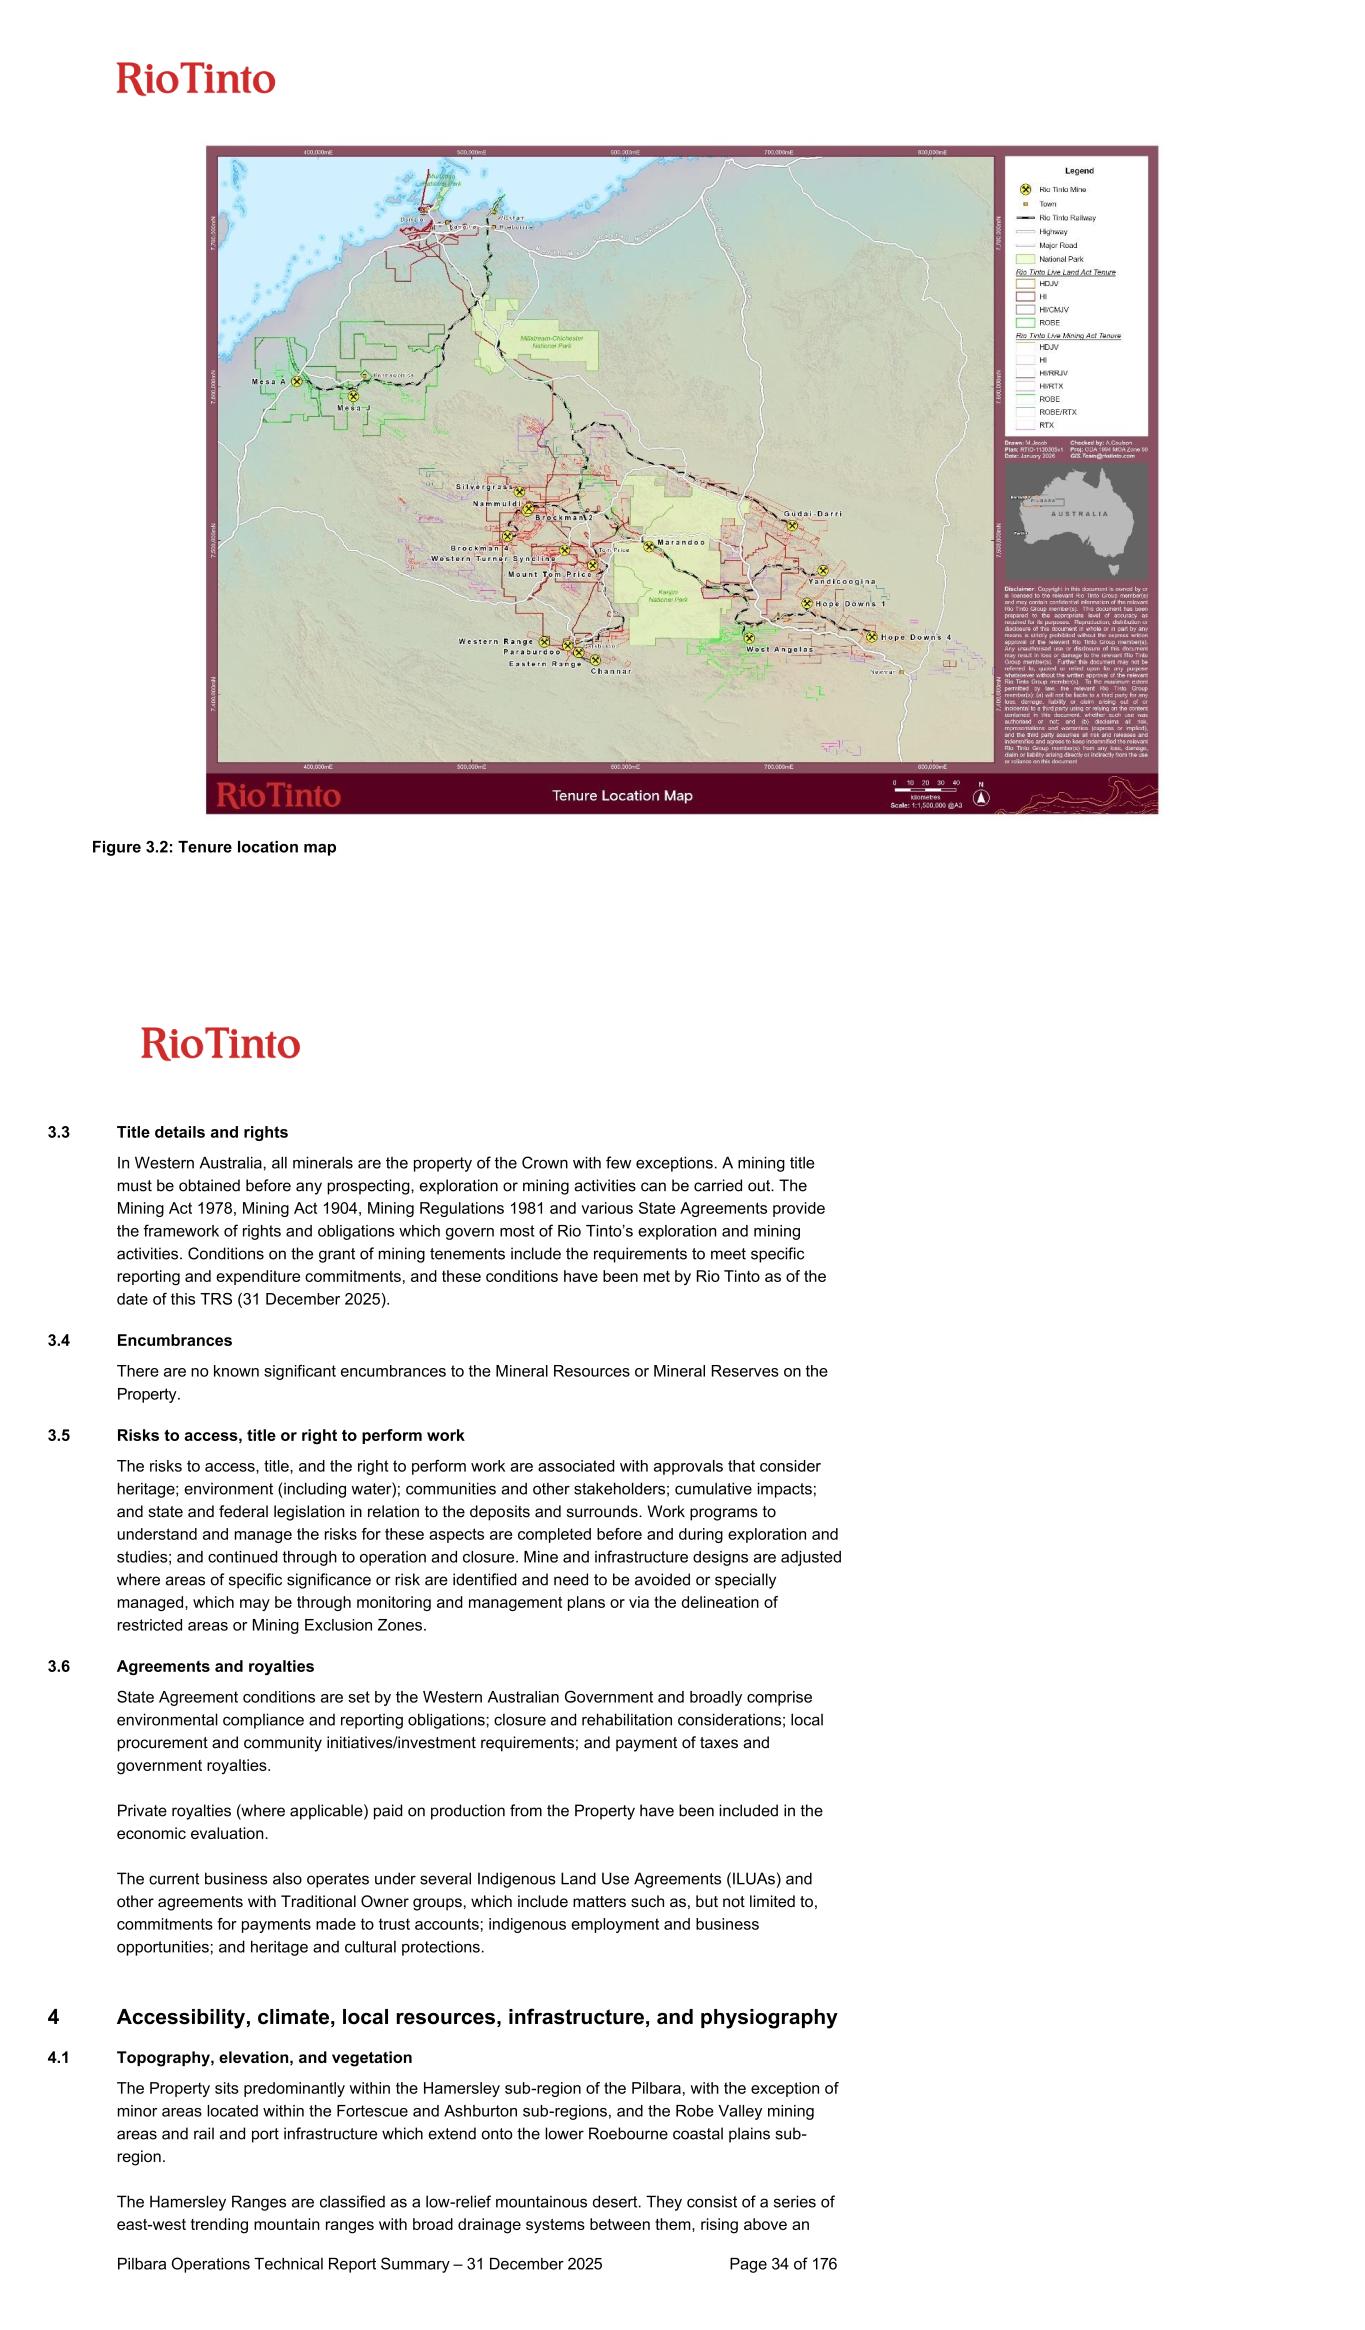
Figure 3.2: Tenure location map Pilbara Operations Technical Report Summary – 31 December 2025 Page 34 of 176 3.3 Title details and rights In Western Australia, all minerals are the property of the Crown with few exceptions. A mining title must be obtained before any prospecting, exploration or mining activities can be carried out. The Mining Act 1978, Mining Act 1904, Mining Regulations 1981 and various State Agreements provide the framework of rights and obligations which govern most of Rio Tinto’s exploration and mining activities. Conditions on the grant of mining tenements include the requirements to meet specific reporting and expenditure commitments, and these conditions have been met by Rio Tinto as of the date of this TRS (31 December 2025). 3.4 Encumbrances There are no known significant encumbrances to the Mineral Resources or Mineral Reserves on the Property. 3.5 Risks to access, title or right to perform work The risks to access, title, and the right to perform work are associated with approvals that consider heritage; environment (including water); communities and other stakeholders; cumulative impacts; and state and federal legislation in relation to the deposits and surrounds. Work programs to understand and manage the risks for these aspects are completed before and during exploration and studies; and continued through to operation and closure. Mine and infrastructure designs are adjusted where areas of specific significance or risk are identified and need to be avoided or specially managed, which may be through monitoring and management plans or via the delineation of restricted areas or Mining Exclusion Zones. 3.6 Agreements and royalties State Agreement conditions are set by the Western Australian Government and broadly comprise environmental compliance and reporting obligations; closure and rehabilitation considerations; local procurement and community initiatives/investment requirements; and payment of taxes and government royalties. Private royalties (where applicable) paid on production from the Property have been included in the economic evaluation. The current business also operates under several Indigenous Land Use Agreements (ILUAs) and other agreements with Traditional Owner groups, which include matters such as, but not limited to, commitments for payments made to trust accounts; indigenous employment and business opportunities; and heritage and cultural protections. 4 Accessibility, climate, local resources, infrastructure, and physiography 4.1 Topography, elevation, and vegetation The Property sits predominantly within the Hamersley sub-region of the Pilbara, with the exception of minor areas located within the Fortescue and Ashburton sub-regions, and the Robe Valley mining areas and rail and port infrastructure which extend onto the lower Roebourne coastal plains sub- region. The Hamersley Ranges are classified as a low-relief mountainous desert. They consist of a series of east-west trending mountain ranges with broad drainage systems between them, rising above an
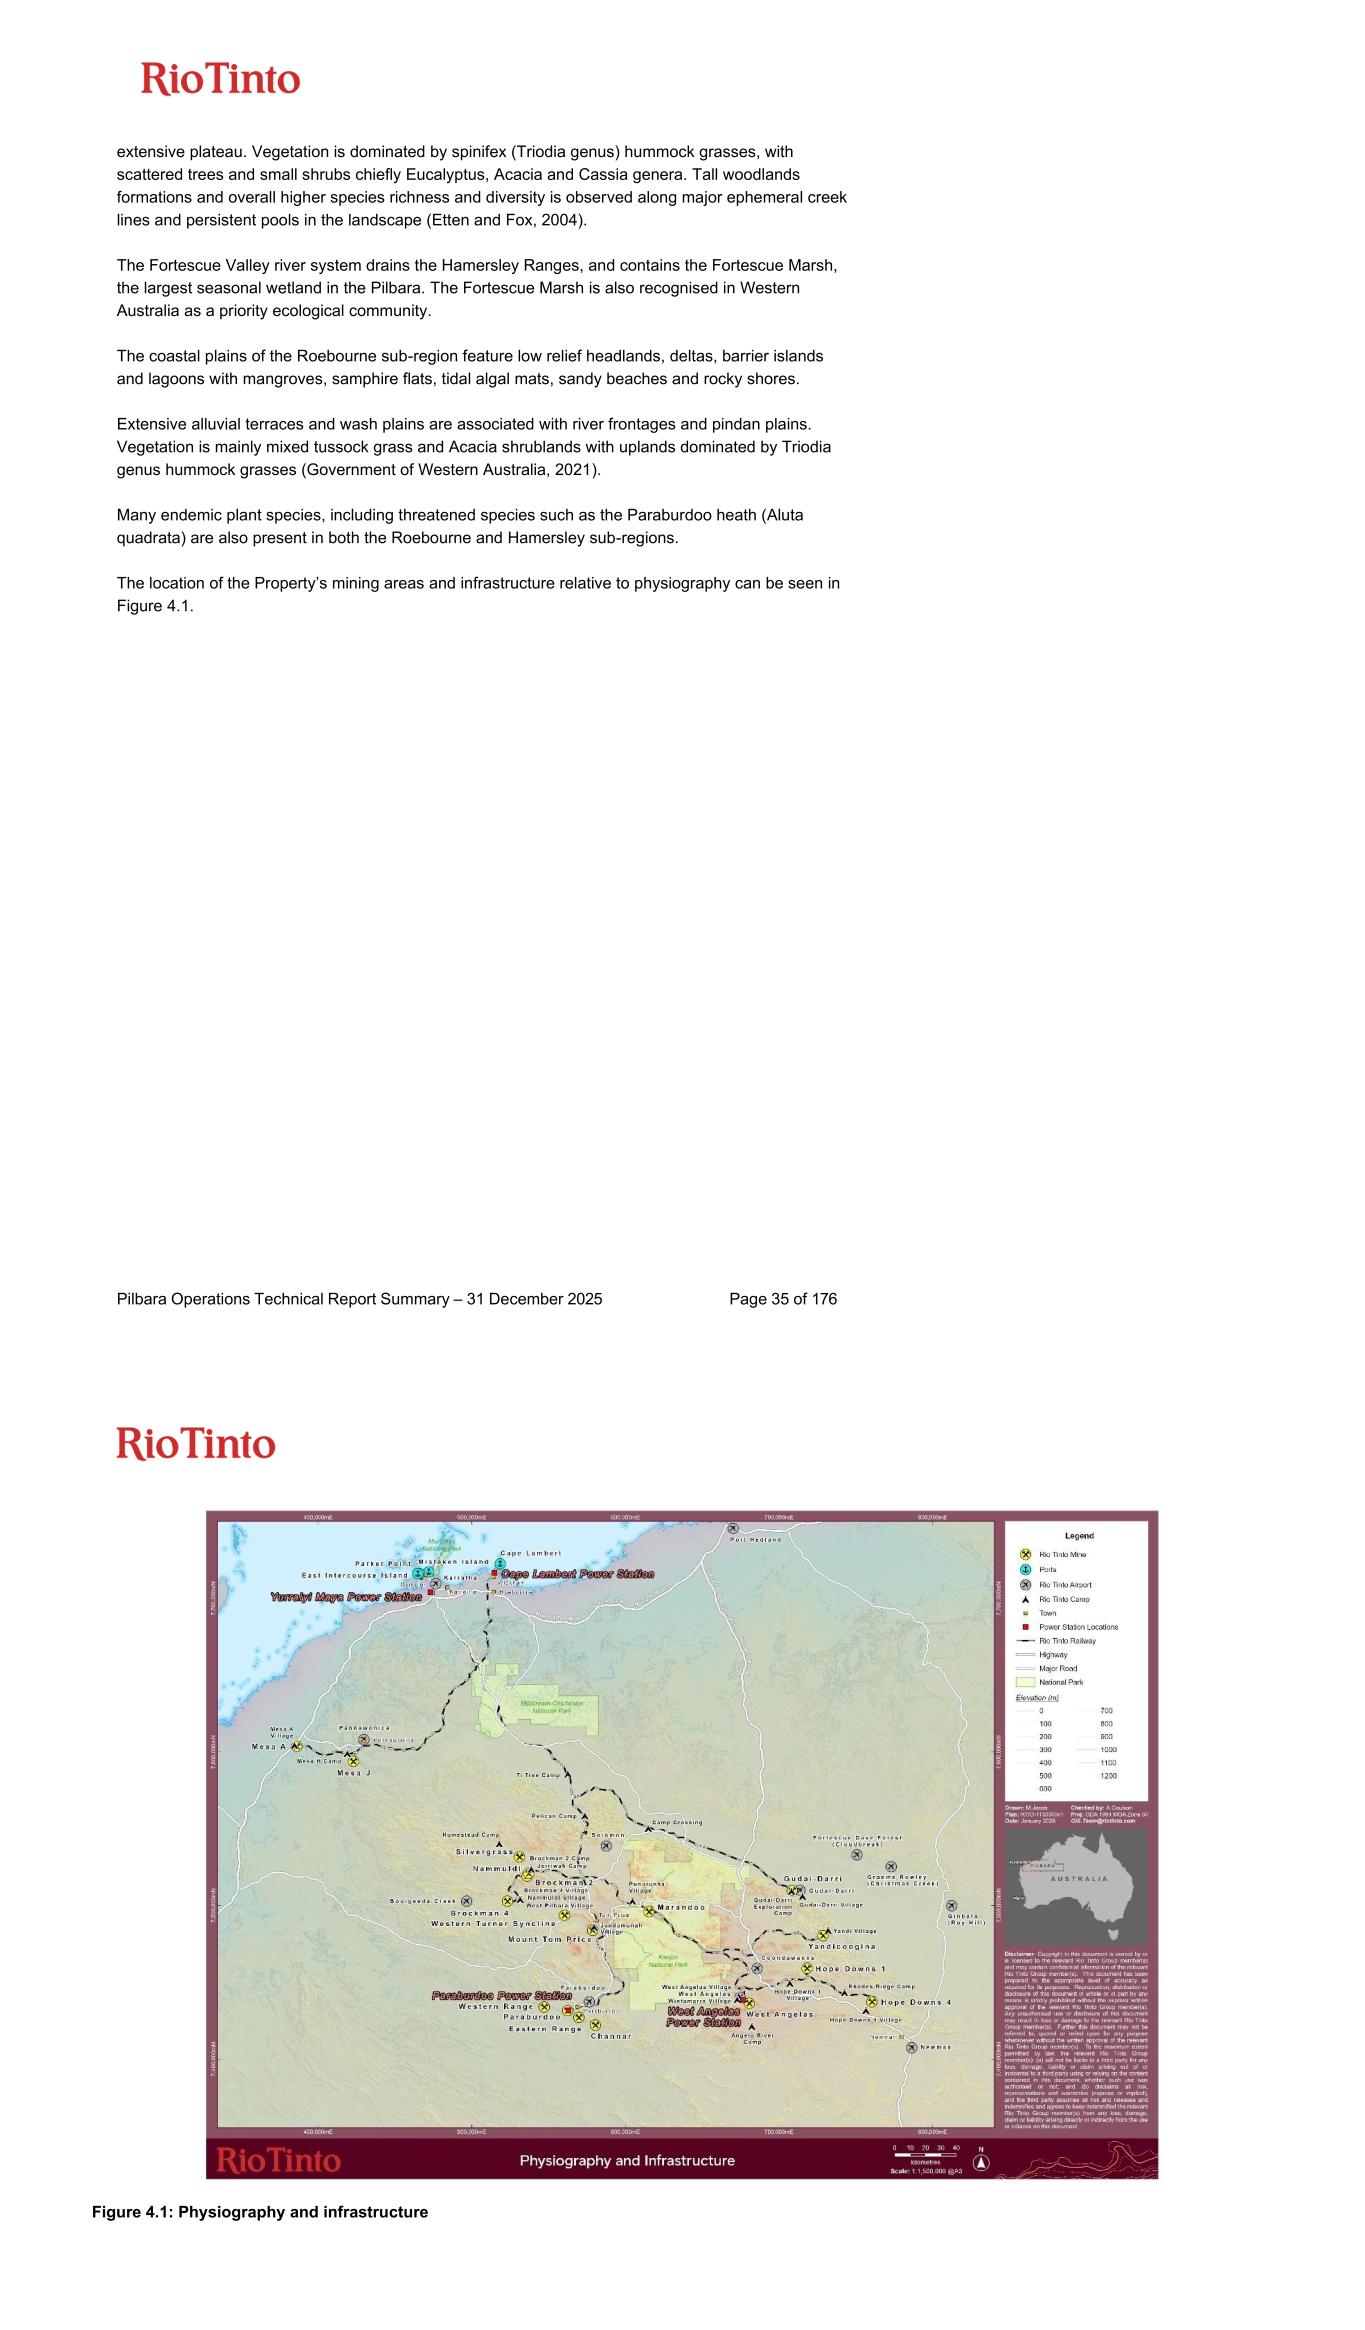
Pilbara Operations Technical Report Summary – 31 December 2025 Page 35 of 176 extensive plateau. Vegetation is dominated by spinifex (Triodia genus) hummock grasses, with scattered trees and small shrubs chiefly Eucalyptus, Acacia and Cassia genera. Tall woodlands formations and overall higher species richness and diversity is observed along major ephemeral creek lines and persistent pools in the landscape (Etten and Fox, 2004). The Fortescue Valley river system drains the Hamersley Ranges, and contains the Fortescue Marsh, the largest seasonal wetland in the Pilbara. The Fortescue Marsh is also recognised in Western Australia as a priority ecological community. The coastal plains of the Roebourne sub-region feature low relief headlands, deltas, barrier islands and lagoons with mangroves, samphire flats, tidal algal mats, sandy beaches and rocky shores. Extensive alluvial terraces and wash plains are associated with river frontages and pindan plains. Vegetation is mainly mixed tussock grass and Acacia shrublands with uplands dominated by Triodia genus hummock grasses (Government of Western Australia, 2021). Many endemic plant species, including threatened species such as the Paraburdoo heath (Aluta quadrata) are also present in both the Roebourne and Hamersley sub-regions. The location of the Property’s mining areas and infrastructure relative to physiography can be seen in Figure 4.1. Figure 4.1: Physiography and infrastructure
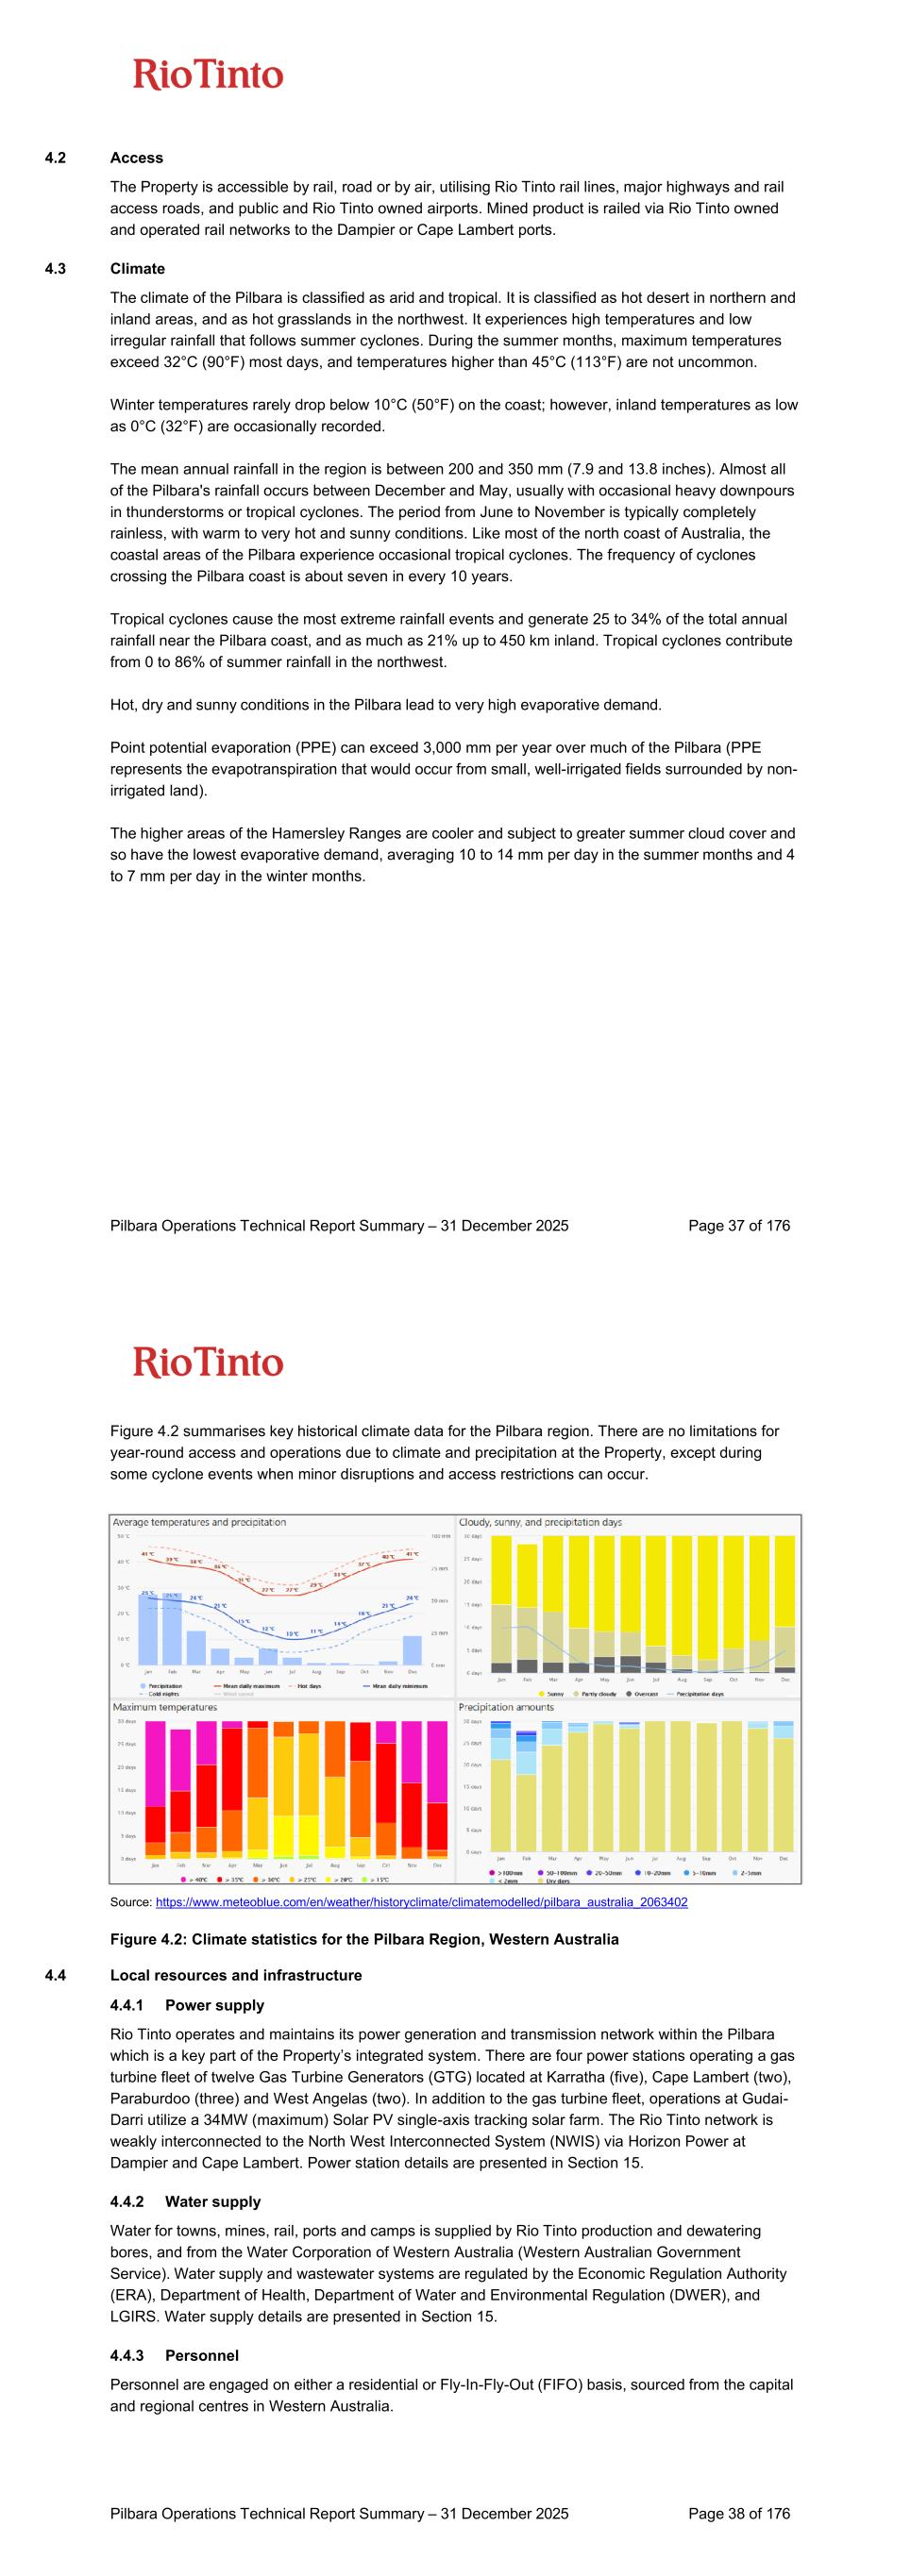
Pilbara Operations Technical Report Summary – 31 December 2025 Page 37 of 176 4.2 Access The Property is accessible by rail, road or by air, utilising Rio Tinto rail lines, major highways and rail access roads, and public and Rio Tinto owned airports. Mined product is railed via Rio Tinto owned and operated rail networks to the Dampier or Cape Lambert ports. 4.3 Climate The climate of the Pilbara is classified as arid and tropical. It is classified as hot desert in northern and inland areas, and as hot grasslands in the northwest. It experiences high temperatures and low irregular rainfall that follows summer cyclones. During the summer months, maximum temperatures exceed 32°C (90°F) most days, and temperatures higher than 45°C (113°F) are not uncommon. Winter temperatures rarely drop below 10°C (50°F) on the coast; however, inland temperatures as low as 0°C (32°F) are occasionally recorded. The mean annual rainfall in the region is between 200 and 350 mm (7.9 and 13.8 inches). Almost all of the Pilbara's rainfall occurs between December and May, usually with occasional heavy downpours in thunderstorms or tropical cyclones. The period from June to November is typically completely rainless, with warm to very hot and sunny conditions. Like most of the north coast of Australia, the coastal areas of the Pilbara experience occasional tropical cyclones. The frequency of cyclones crossing the Pilbara coast is about seven in every 10 years. Tropical cyclones cause the most extreme rainfall events and generate 25 to 34% of the total annual rainfall near the Pilbara coast, and as much as 21% up to 450 km inland. Tropical cyclones contribute from 0 to 86% of summer rainfall in the northwest. Hot, dry and sunny conditions in the Pilbara lead to very high evaporative demand. Point potential evaporation (PPE) can exceed 3,000 mm per year over much of the Pilbara (PPE represents the evapotranspiration that would occur from small, well-irrigated fields surrounded by non- irrigated land). The higher areas of the Hamersley Ranges are cooler and subject to greater summer cloud cover and so have the lowest evaporative demand, averaging 10 to 14 mm per day in the summer months and 4 to 7 mm per day in the winter months. Pilbara Operations Technical Report Summary – 31 December 2025 Page 38 of 176 Figure 4.2 summarises key historical climate data for the Pilbara region. There are no limitations for year-round access and operations due to climate and precipitation at the Property, except during some cyclone events when minor disruptions and access restrictions can occur. Source: https://www.meteoblue.com/en/weather/historyclimate/climatemodelled/pilbara_australia_2063402 Figure 4.2: Climate statistics for the Pilbara Region, Western Australia 4.4 Local resources and infrastructure 4.4.1 Power supply Rio Tinto operates and maintains its power generation and transmission network within the Pilbara which is a key part of the Property’s integrated system. There are four power stations operating a gas turbine fleet of twelve Gas Turbine Generators (GTG) located at Karratha (five), Cape Lambert (two), Paraburdoo (three) and West Angelas (two). In addition to the gas turbine fleet, operations at Gudai- Darri utilize a 34MW (maximum) Solar PV single-axis tracking solar farm. The Rio Tinto network is weakly interconnected to the North West Interconnected System (NWIS) via Horizon Power at Dampier and Cape Lambert. Power station details are presented in Section 15. 4.4.2 Water supply Water for towns, mines, rail, ports and camps is supplied by Rio Tinto production and dewatering bores, and from the Water Corporation of Western Australia (Western Australian Government Service). Water supply and wastewater systems are regulated by the Economic Regulation Authority (ERA), Department of Health, Department of Water and Environmental Regulation (DWER), and LGIRS. Water supply details are presented in Section 15. 4.4.3 Personnel Personnel are engaged on either a residential or Fly-In-Fly-Out (FIFO) basis, sourced from the capital and regional centres in Western Australia.
Pilbara Operations Technical Report Summary – 31 December 2025 Page 39 of 176 4.4.4 Supplies Supplies are transported to sites by rail, road or by air, utilising major highways and rail access roads, public and Rio Tinto-owned airports and the Rio Tinto-owned railway. 5 History 5.1 Exploration and ownership history Rio Tinto commenced exploration in the Hamersley Ranges in 1962 through its subsidiary CRA (then known as Conzinc Riotinto of Australia), following the easing of the Australian Government’s iron ore export embargo in November 1960 and the subsequent issue of exploration permits, which laid the foundation for the development and growth of the iron ore industry in the Pilbara region. The Property has since been subject to comprehensive exploration activity as summarised in Table 5.1. CRA was formed as the result of the 1962 merger between two British companies: the Rio Tinto Company and the Consolidated Zinc Corporation and was a subsidiary of the main entity, originally called the Rio Tinto – Zinc Corporation (RTZ). RTZ went on to develop mining and other activities across the world while CRA concentrated on Australasia. The companies were run independently by separate management teams until 1995, when the two companies merged under a dual listing structure into RTZ-CRA. The merged name proved unwieldy and a proposal to rename both of the dual-listed entities to ‘Rio Tinto’ was approved by shareholders in 1997, leading to the formation of Rio Tinto plc (the former Rio Tinto Zinc Corporation) and Rio Tinto Limited (for the former CRA). (“Rio Tinto: United for Growth”, https://www.riotinto.com/invest/corporate-governance) Hamersley Iron Pty. Limited (Hamersley Iron) was formed in 1962 as the operating subsidiary of Hamersley Holdings Limited (Hamersley Holdings), a joint venture between CRA and the USA-based Kaiser Corporation. CRA originally owned 60% of the partnership, which was diluted after public listing in 1967 (Lee, 2013). During the 1980s, CRA progressively rebought shares in Hamersley Holdings, including Kaiser’s remaining share in 1982, until Hamersley Holdings became a wholly owned subsidiary of CRA. CRA Exploration (CRAE) was a wholly-owned subsidiary of CRA, which primarily engaged in exploration for minerals within Australasia. Following the acquisition of North Limited, Rio Tinto progressively merged its interests within the Property under the wholly-owned Hamersley Holdings. Hamersley Exploration Pty Limited (Hamersley Exploration) is a wholly-owned subsidiary of Hamersley Holdings. Table 5.1: Summary of exploration and ownership history Exploration Area Deposit Current Holders Previous Holders/ Operators Work completed by Previous Holders/ Operators East Pilbara- Area 1 Gorge Bore Mt Lockyer Rio Tinto (100%) None Historical assessment of the Exploration Area has concentrated on delineating both detrital iron and bedrock resources within the Brockman Iron Formation. Previous iron ore exploration by Rio Tinto Exploration Pty Limited (RTX) within the Project Area has identified both detrital and bedded iron deposits. East Pilbara-Area 2 Enterprise Juna Downs Rio Tinto (100%) Pacminex Pty Limited 1970 – 1973 Reconnaissance mapping using aerial photography and geological mapping (1: 14,000) revealed no significant iron ore deposits although several small occurrences of Brockman Iron Formation were mapped. 1974 – 1976 Percussion drilling of the concealed Marra Mamba Iron Formation on the north limb of the anticline showed the prospective Mount Newman Member to be covered by at least 50m of superficial sediment. Further percussion drilling to test the down dip extension of the mineralisation intersected in 1975. The possibility of further iron enrichment within 50m of the surface on the tested gridlines was largely eliminated. East Pilbara-Area 3 Howards Well Robe River Iron Associates Joint Venture – comprising Rio Tinto (53%), Mitsui Iron Ore Development (33%) and Nippon Steel Corporation (14%) (Robe JV) BHP Billiton Iron Ore Pty Ltd Early exploration drilling was conducted by BHP Billiton Iron Ore Pty Ltd during 1994-1996. The results from these programs have not been used for Mineral Resource work. East Pilbara-Area 4 Poonda Caramulla Creek Rio Tinto (100%) None Pre-2006 drilling programs were conducted by CRA Pty Ltd targeting Boolgeeda deposits. East Pilbara-Area 4 Ophthalmia Dam Rio Tinto (100%) Pacminex Pty Limited The initial exploration drilling was conducted by Pacminex Pty Limited in 1973-1978, targeting low phosphorus deposit. In 1988, CRA continued exploration work by drilling 5 Reverse Circulation (RC) drill holes.
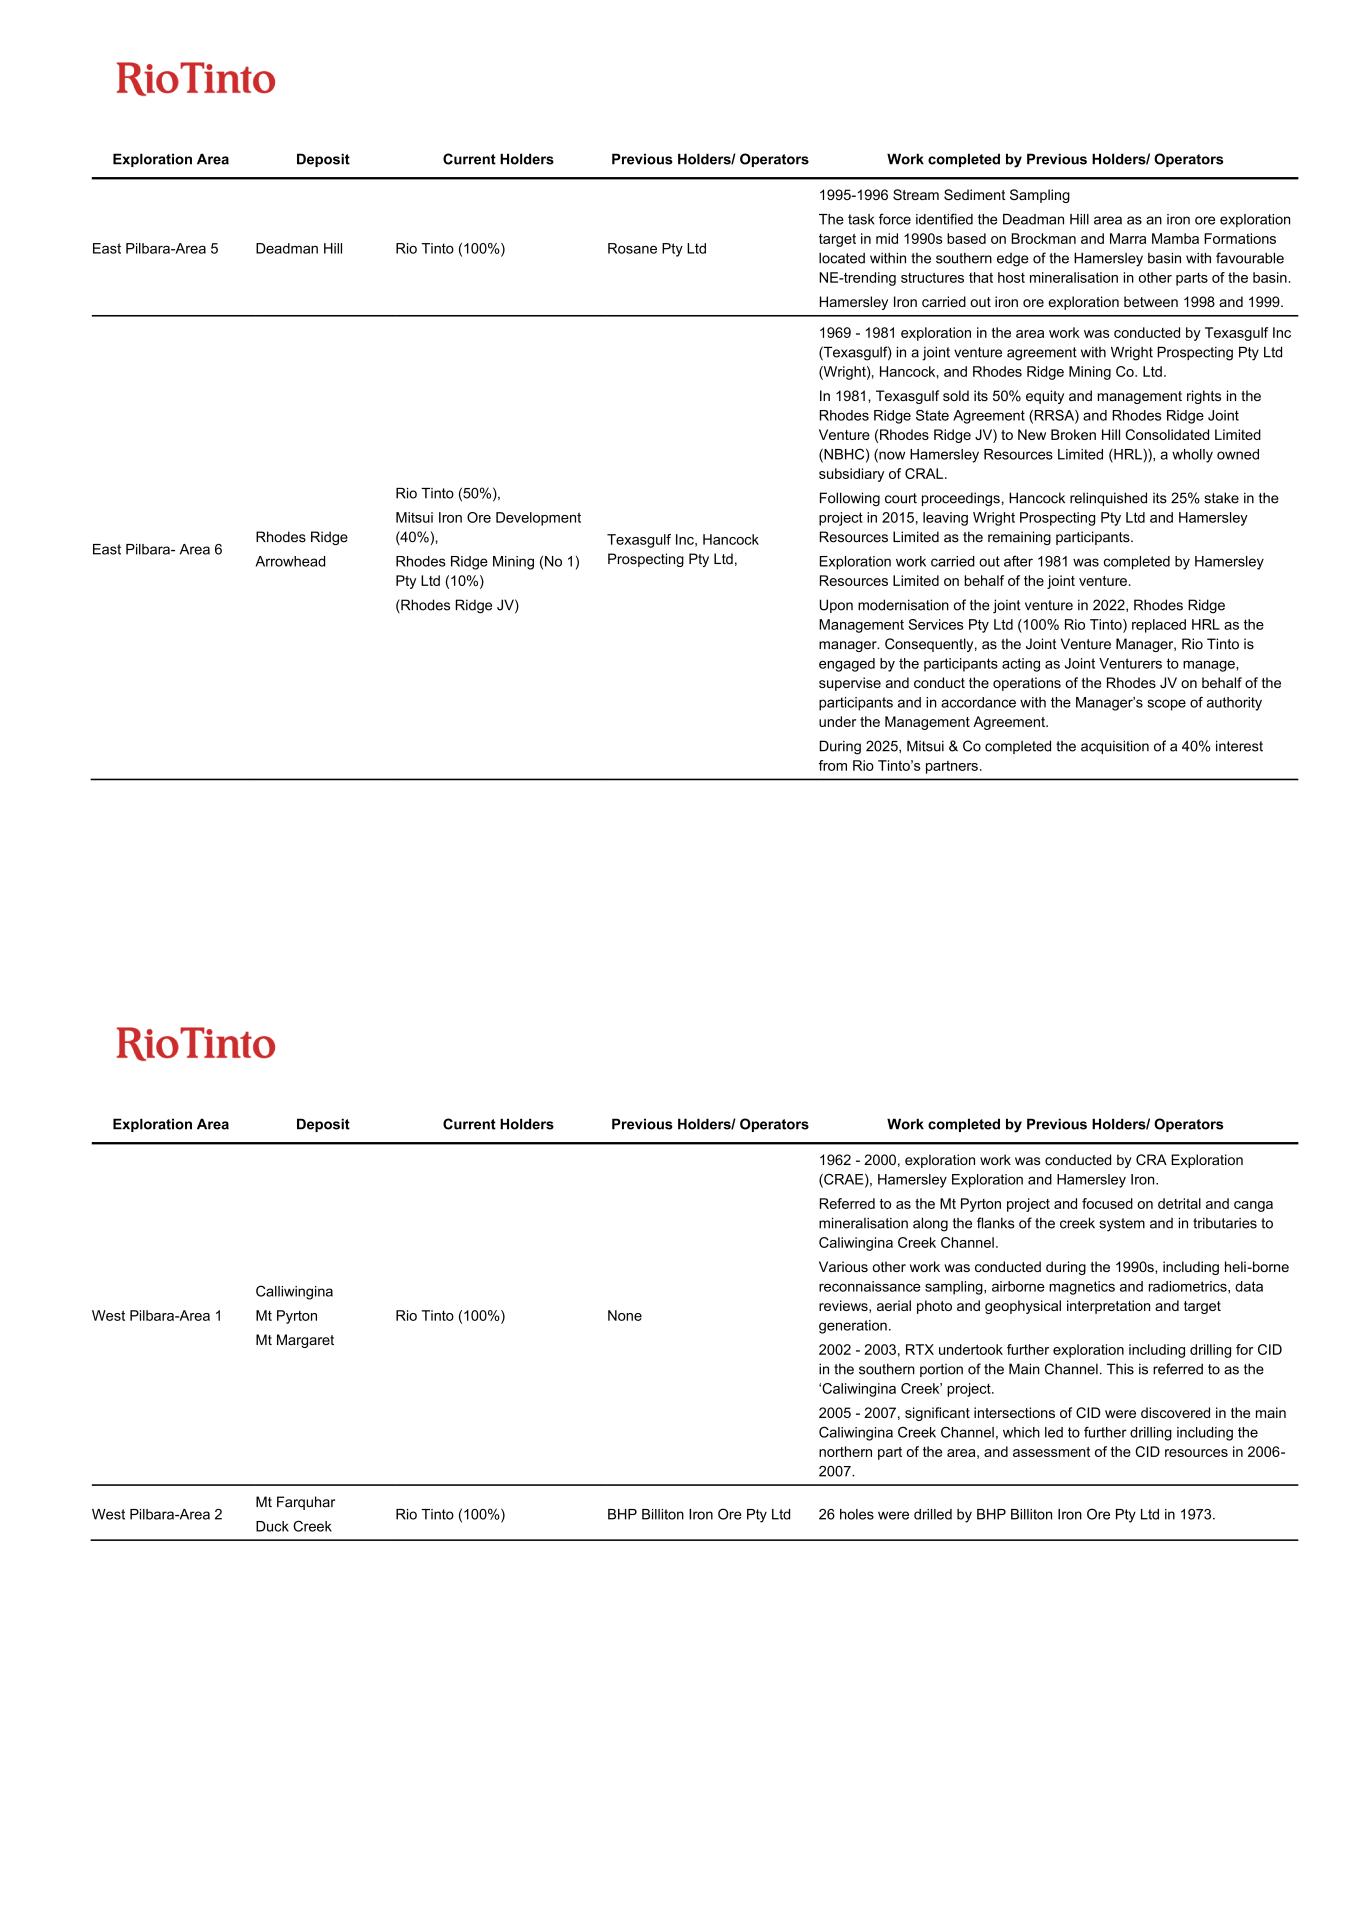
Exploration Area Deposit Current Holders Previous Holders/ Operators Work completed by Previous Holders/ Operators East Pilbara-Area 5 Deadman Hill Rio Tinto (100%) Rosane Pty Ltd 1995-1996 Stream Sediment Sampling The task force identified the Deadman Hill area as an iron ore exploration target in mid 1990s based on Brockman and Marra Mamba Formations located within the southern edge of the Hamersley basin with favourable NE-trending structures that host mineralisation in other parts of the basin. Hamersley Iron carried out iron ore exploration between 1998 and 1999. East Pilbara- Area 6 Rhodes Ridge Arrowhead Rio Tinto (50%), Mitsui Iron Ore Development (40%), Rhodes Ridge Mining (No 1) Pty Ltd (10%) (Rhodes Ridge JV) Texasgulf Inc, Hancock Prospecting Pty Ltd, 1969 - 1981 exploration in the area work was conducted by Texasgulf Inc (Texasgulf) in a joint venture agreement with Wright Prospecting Pty Ltd (Wright), Hancock, and Rhodes Ridge Mining Co. Ltd. In 1981, Texasgulf sold its 50% equity and management rights in the Rhodes Ridge State Agreement (RRSA) and Rhodes Ridge Joint Venture (Rhodes Ridge JV) to New Broken Hill Consolidated Limited (NBHC) (now Hamersley Resources Limited (HRL)), a wholly owned subsidiary of CRAL. Following court proceedings, Hancock relinquished its 25% stake in the project in 2015, leaving Wright Prospecting Pty Ltd and Hamersley Resources Limited as the remaining participants. Exploration work carried out after 1981 was completed by Hamersley Resources Limited on behalf of the joint venture. Upon modernisation of the joint venture in 2022, Rhodes Ridge Management Services Pty Ltd (100% Rio Tinto) replaced HRL as the manager. Consequently, as the Joint Venture Manager, Rio Tinto is engaged by the participants acting as Joint Venturers to manage, supervise and conduct the operations of the Rhodes JV on behalf of the participants and in accordance with the Manager’s scope of authority under the Management Agreement. During 2025, Mitsui & Co completed the acquisition of a 40% interest from Rio Tinto’s partners. Exploration Area Deposit Current Holders Previous Holders/ Operators Work completed by Previous Holders/ Operators West Pilbara-Area 1 Calliwingina Mt Pyrton Mt Margaret Rio Tinto (100%) None 1962 - 2000, exploration work was conducted by CRA Exploration (CRAE), Hamersley Exploration and Hamersley Iron. Referred to as the Mt Pyrton project and focused on detrital and canga mineralisation along the flanks of the creek system and in tributaries to Caliwingina Creek Channel. Various other work was conducted during the 1990s, including heli-borne reconnaissance sampling, airborne magnetics and radiometrics, data reviews, aerial photo and geophysical interpretation and target generation. 2002 - 2003, RTX undertook further exploration including drilling for CID in the southern portion of the Main Channel. This is referred to as the ‘Caliwingina Creek’ project. 2005 - 2007, significant intersections of CID were discovered in the main Caliwingina Creek Channel, which led to further drilling including the northern part of the area, and assessment of the CID resources in 2006- 2007. West Pilbara-Area 2 Mt Farquhar Duck Creek Rio Tinto (100%) BHP Billiton Iron Ore Pty Ltd 26 holes were drilled by BHP Billiton Iron Ore Pty Ltd in 1973.
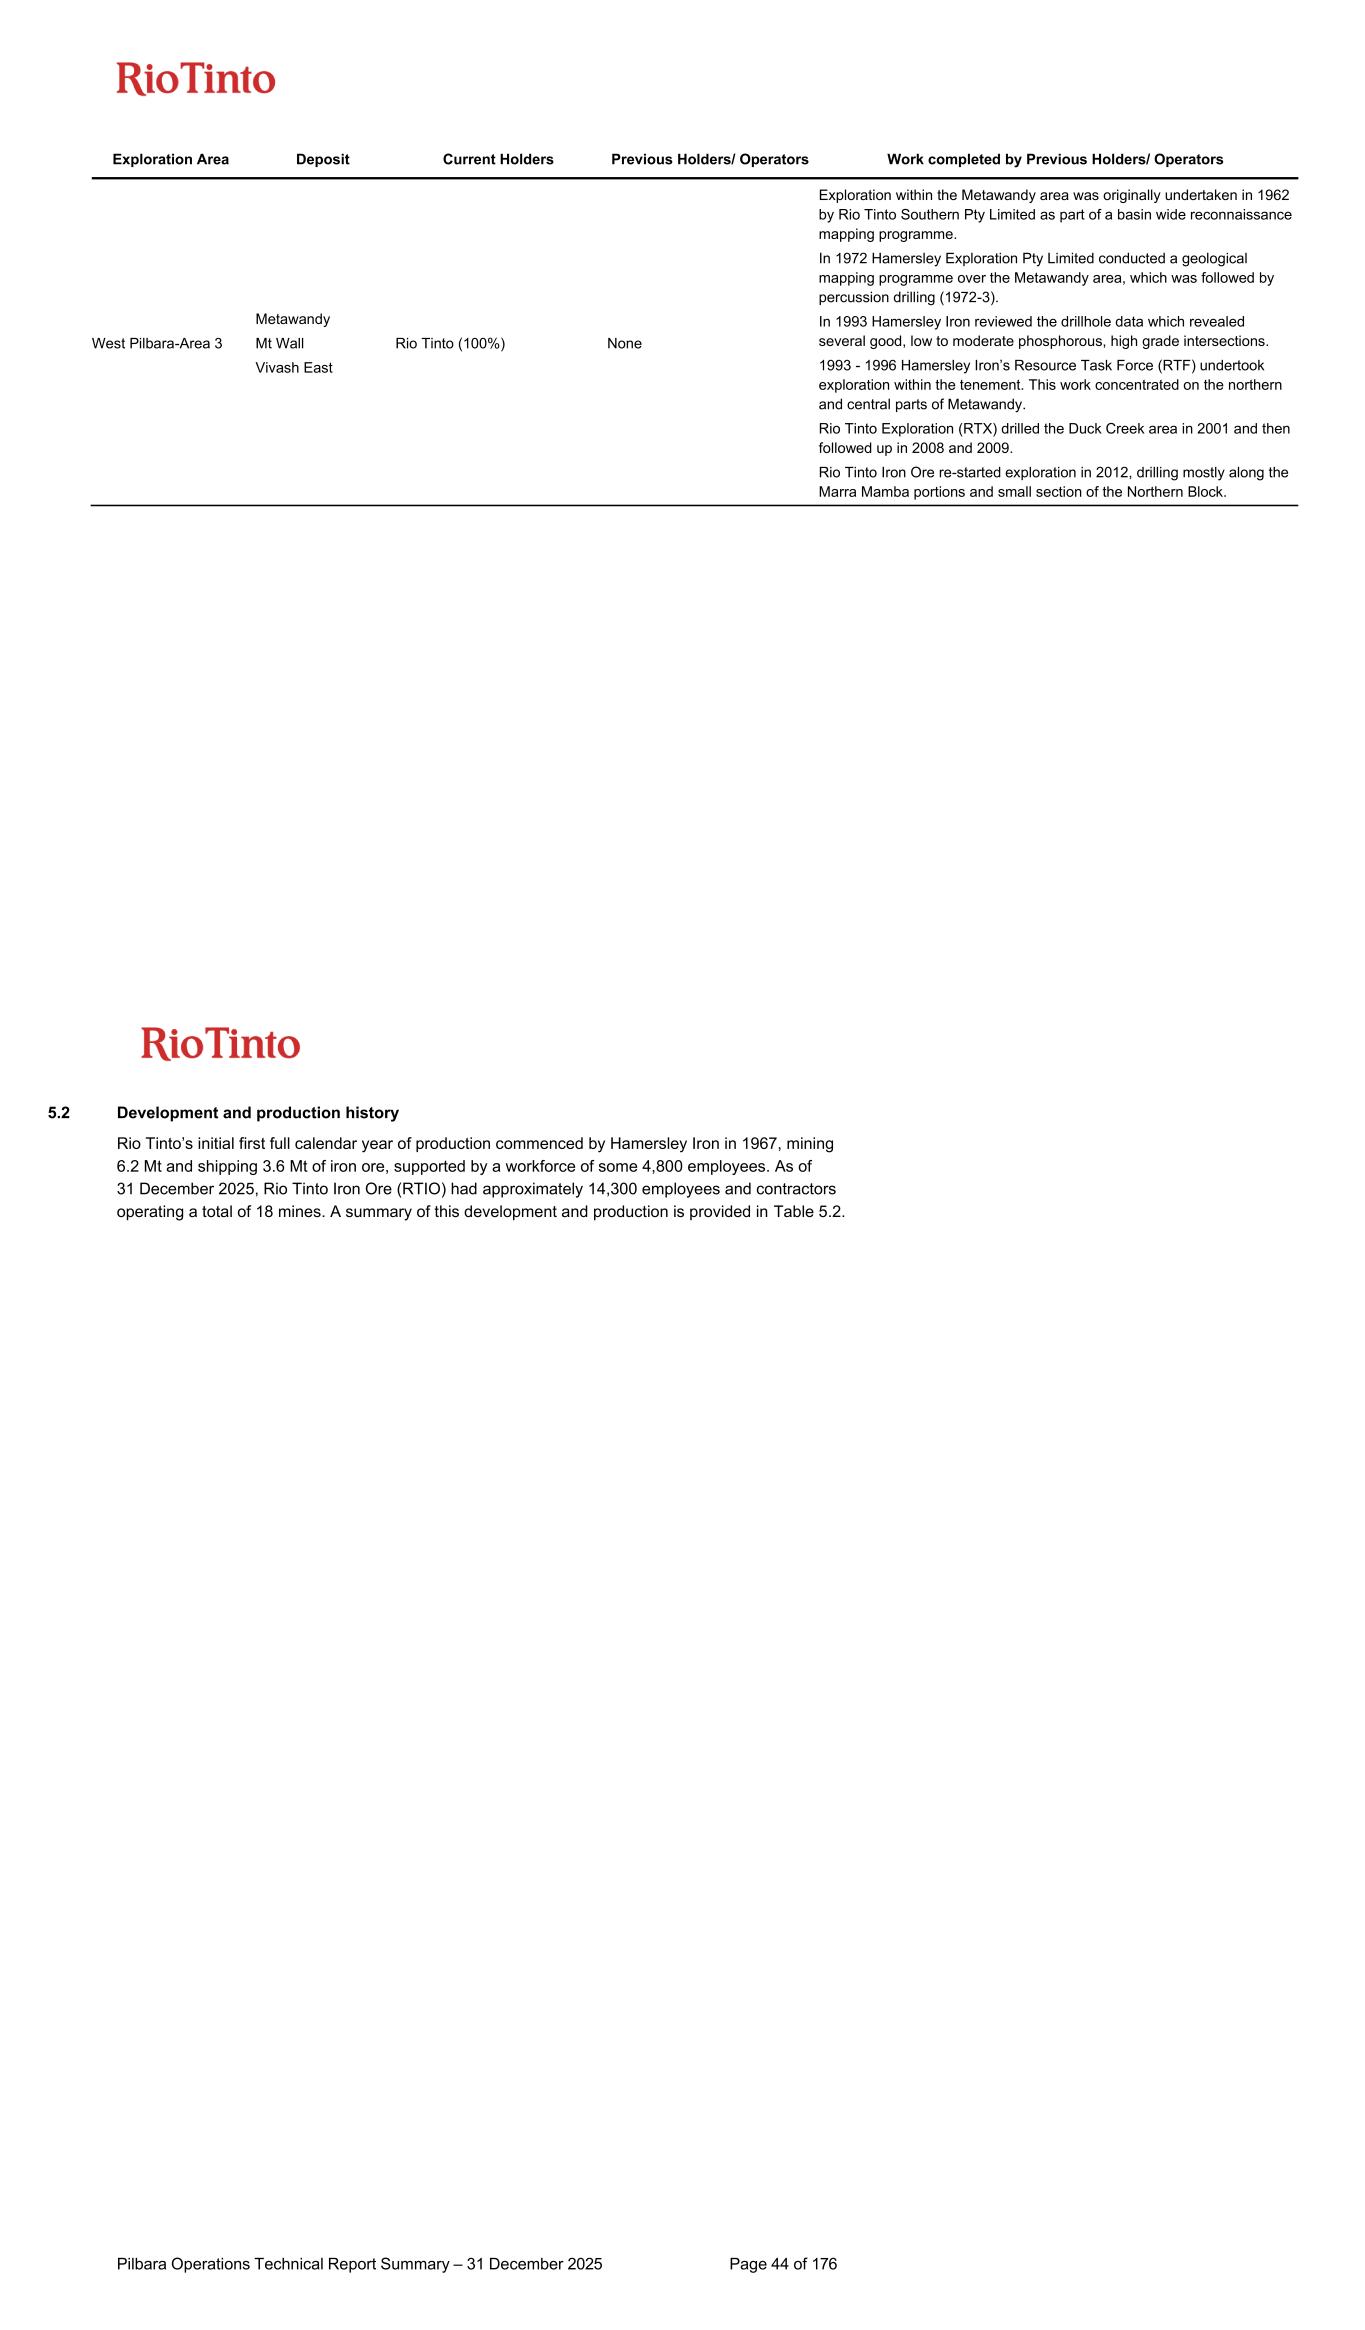
Exploration Area Deposit Current Holders Previous Holders/ Operators Work completed by Previous Holders/ Operators West Pilbara-Area 3 Metawandy Mt Wall Vivash East Rio Tinto (100%) None Exploration within the Metawandy area was originally undertaken in 1962 by Rio Tinto Southern Pty Limited as part of a basin wide reconnaissance mapping programme. In 1972 Hamersley Exploration Pty Limited conducted a geological mapping programme over the Metawandy area, which was followed by percussion drilling (1972-3). In 1993 Hamersley Iron reviewed the drillhole data which revealed several good, low to moderate phosphorous, high grade intersections. 1993 - 1996 Hamersley Iron’s Resource Task Force (RTF) undertook exploration within the tenement. This work concentrated on the northern and central parts of Metawandy. Rio Tinto Exploration (RTX) drilled the Duck Creek area in 2001 and then followed up in 2008 and 2009. Rio Tinto Iron Ore re-started exploration in 2012, drilling mostly along the Marra Mamba portions and small section of the Northern Block. Pilbara Operations Technical Report Summary – 31 December 2025 Page 44 of 176 5.2 Development and production history Rio Tinto’s initial first full calendar year of production commenced by Hamersley Iron in 1967, mining 6.2 Mt and shipping 3.6 Mt of iron ore, supported by a workforce of some 4,800 employees. As of 31 December 2025, Rio Tinto Iron Ore (RTIO) had approximately 14,300 employees and contractors operating a total of 18 mines. A summary of this development and production is provided in Table 5.2.
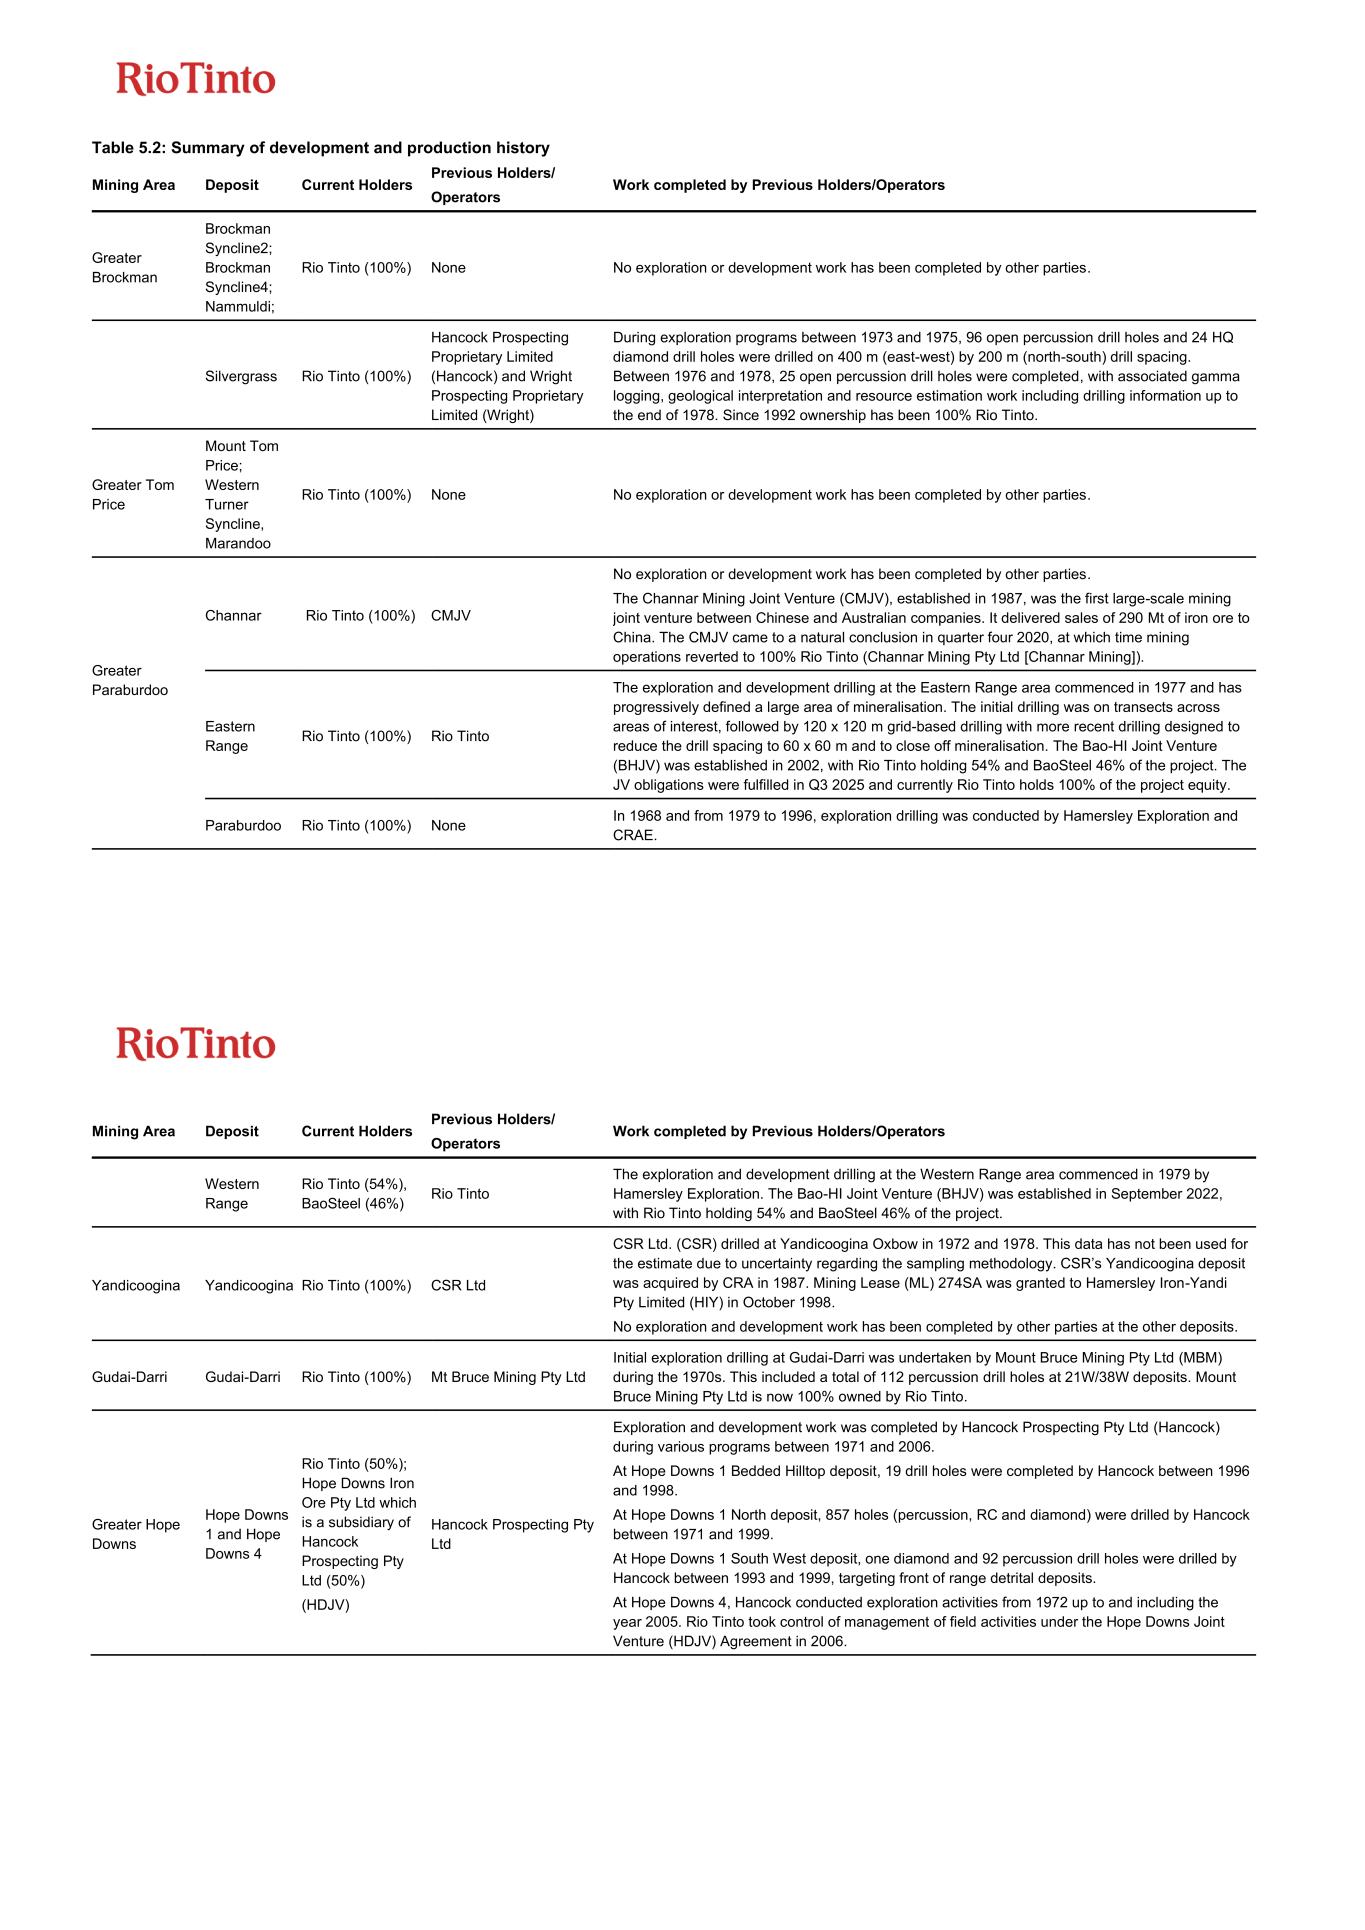
Table 5.2: Summary of development and production history Mining Area Deposit Current Holders Previous Holders/ Operators Work completed by Previous Holders/Operators Greater Brockman Brockman Syncline2; Brockman Syncline4; Nammuldi; Rio Tinto (100%) None No exploration or development work has been completed by other parties. Silvergrass Rio Tinto (100%) Hancock Prospecting Proprietary Limited (Hancock) and Wright Prospecting Proprietary Limited (Wright) During exploration programs between 1973 and 1975, 96 open percussion drill holes and 24 HQ diamond drill holes were drilled on 400 m (east-west) by 200 m (north-south) drill spacing. Between 1976 and 1978, 25 open percussion drill holes were completed, with associated gamma logging, geological interpretation and resource estimation work including drilling information up to the end of 1978. Since 1992 ownership has been 100% Rio Tinto. Greater Tom Price Mount Tom Price; Western Turner Syncline, Marandoo Rio Tinto (100%) None No exploration or development work has been completed by other parties. Greater Paraburdoo Channar Rio Tinto (100%) CMJV No exploration or development work has been completed by other parties. The Channar Mining Joint Venture (CMJV), established in 1987, was the first large-scale mining joint venture between Chinese and Australian companies. It delivered sales of 290 Mt of iron ore to China. The CMJV came to a natural conclusion in quarter four 2020, at which time mining operations reverted to 100% Rio Tinto (Channar Mining Pty Ltd [Channar Mining]). Eastern Range Rio Tinto (100%) Rio Tinto The exploration and development drilling at the Eastern Range area commenced in 1977 and has progressively defined a large area of mineralisation. The initial drilling was on transects across areas of interest, followed by 120 x 120 m grid-based drilling with more recent drilling designed to reduce the drill spacing to 60 x 60 m and to close off mineralisation. The Bao-HI Joint Venture (BHJV) was established in 2002, with Rio Tinto holding 54% and BaoSteel 46% of the project. The JV obligations were fulfilled in Q3 2025 and currently Rio Tinto holds 100% of the project equity. Paraburdoo Rio Tinto (100%) None In 1968 and from 1979 to 1996, exploration drilling was conducted by Hamersley Exploration and CRAE. Mining Area Deposit Current Holders Previous Holders/ Operators Work completed by Previous Holders/Operators Western Range Rio Tinto (54%), BaoSteel (46%) Rio Tinto The exploration and development drilling at the Western Range area commenced in 1979 by Hamersley Exploration. The Bao-HI Joint Venture (BHJV) was established in September 2022, with Rio Tinto holding 54% and BaoSteel 46% of the project. Yandicoogina Yandicoogina Rio Tinto (100%) CSR Ltd CSR Ltd. (CSR) drilled at Yandicoogina Oxbow in 1972 and 1978. This data has not been used for the estimate due to uncertainty regarding the sampling methodology. CSR’s Yandicoogina deposit was acquired by CRA in 1987. Mining Lease (ML) 274SA was granted to Hamersley Iron-Yandi Pty Limited (HIY) in October 1998. No exploration and development work has been completed by other parties at the other deposits. Gudai-Darri Gudai-Darri Rio Tinto (100%) Mt Bruce Mining Pty Ltd Initial exploration drilling at Gudai-Darri was undertaken by Mount Bruce Mining Pty Ltd (MBM) during the 1970s. This included a total of 112 percussion drill holes at 21W/38W deposits. Mount Bruce Mining Pty Ltd is now 100% owned by Rio Tinto. Greater Hope Downs Hope Downs 1 and Hope Downs 4 Rio Tinto (50%); Hope Downs Iron Ore Pty Ltd which is a subsidiary of Hancock Prospecting Pty Ltd (50%) (HDJV) Hancock Prospecting Pty Ltd Exploration and development work was completed by Hancock Prospecting Pty Ltd (Hancock) during various programs between 1971 and 2006. At Hope Downs 1 Bedded Hilltop deposit, 19 drill holes were completed by Hancock between 1996 and 1998. At Hope Downs 1 North deposit, 857 holes (percussion, RC and diamond) were drilled by Hancock between 1971 and 1999. At Hope Downs 1 South West deposit, one diamond and 92 percussion drill holes were drilled by Hancock between 1993 and 1999, targeting front of range detrital deposits. At Hope Downs 4, Hancock conducted exploration activities from 1972 up to and including the year 2005. Rio Tinto took control of management of field activities under the Hope Downs Joint Venture (HDJV) Agreement in 2006.
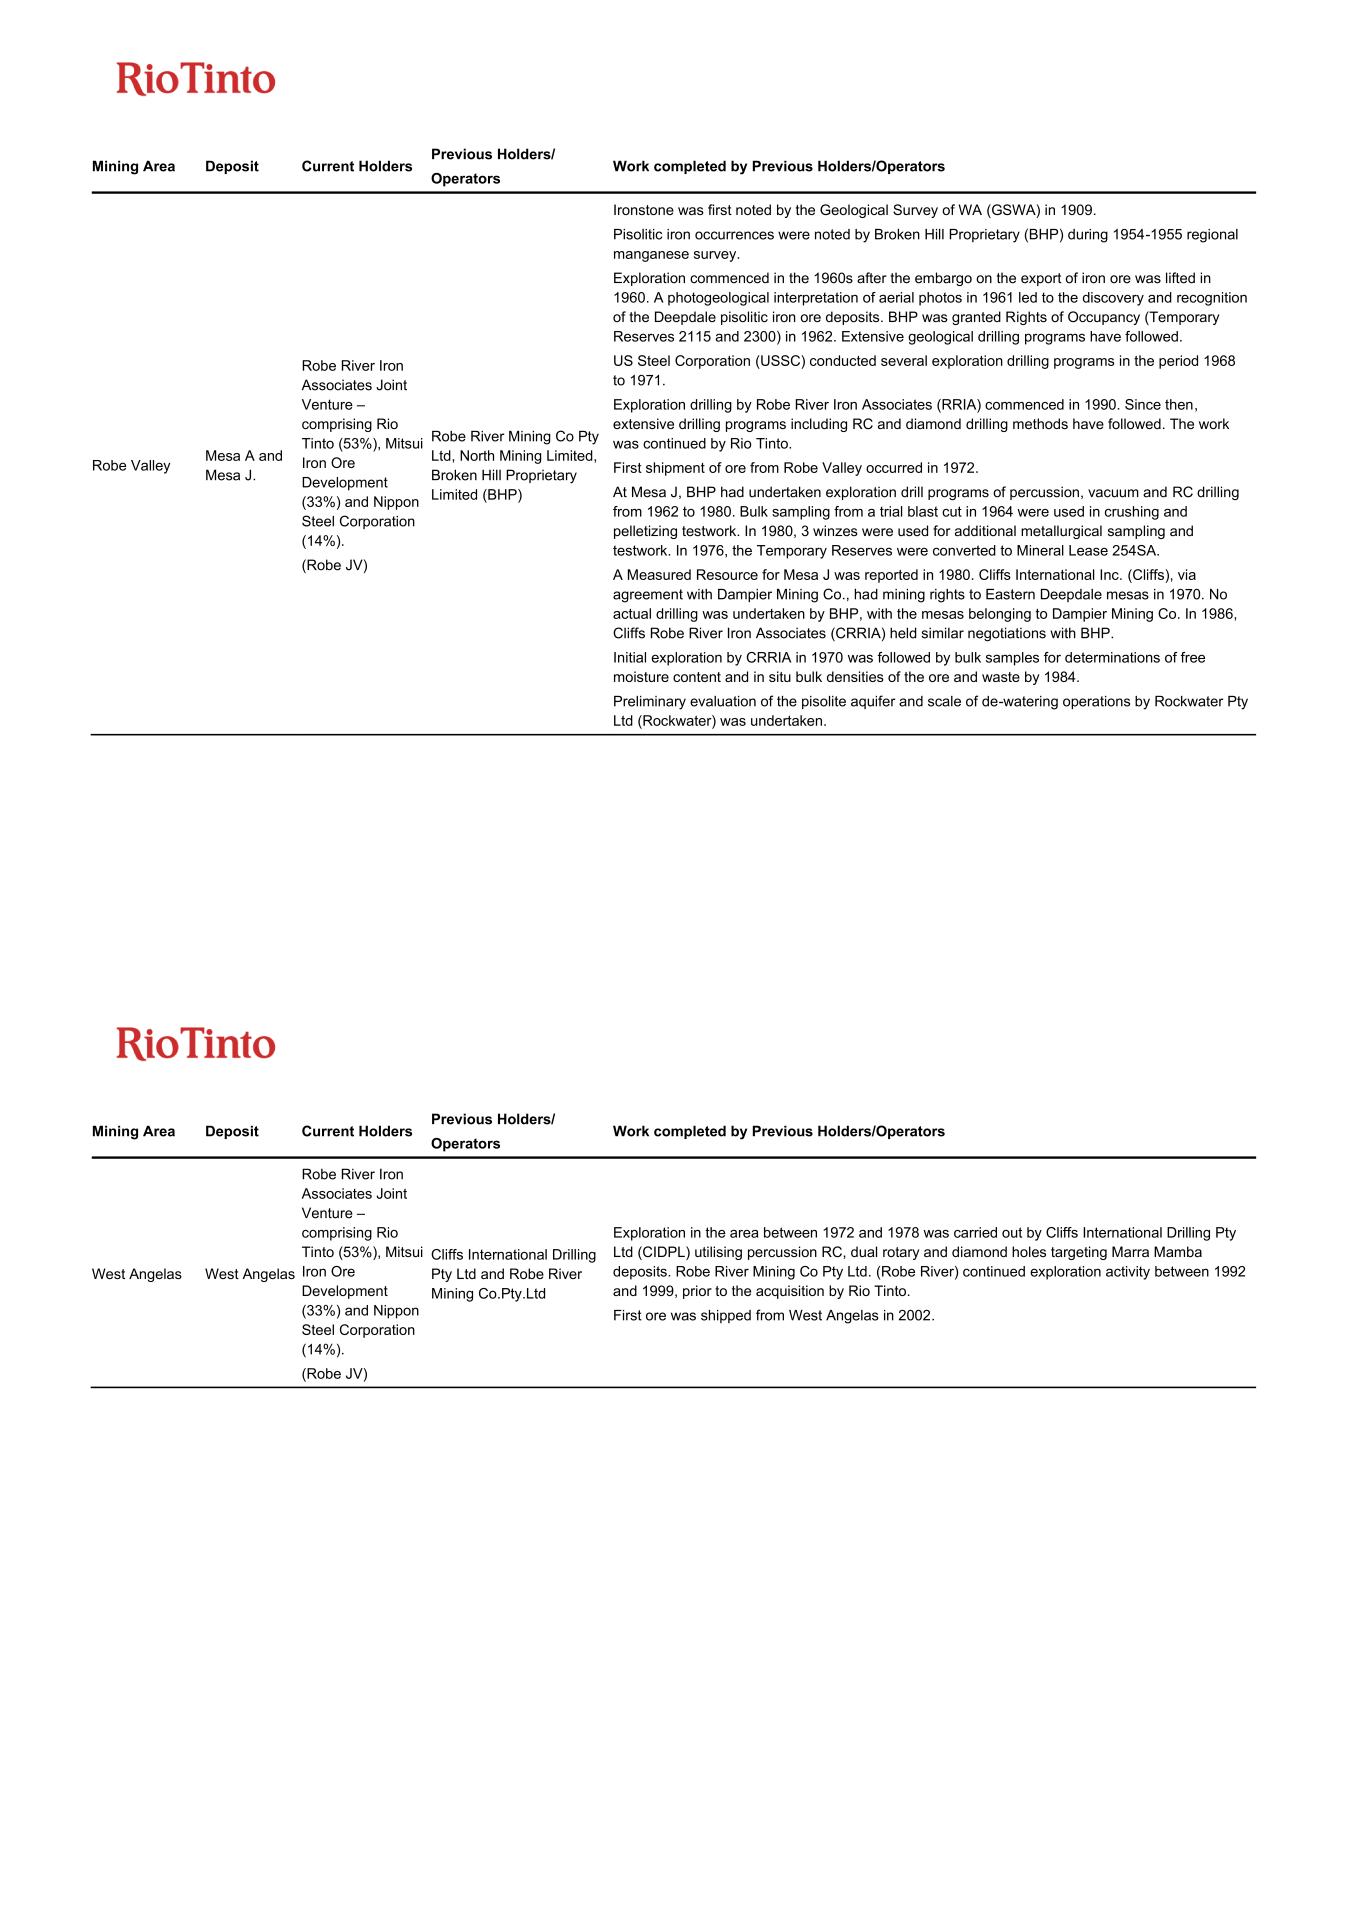
Mining Area Deposit Current Holders Previous Holders/ Operators Work completed by Previous Holders/Operators Robe Valley Mesa A and Mesa J. Robe River Iron Associates Joint Venture – comprising Rio Tinto (53%), Mitsui Iron Ore Development (33%) and Nippon Steel Corporation (14%). (Robe JV) Robe River Mining Co Pty Ltd, North Mining Limited, Broken Hill Proprietary Limited (BHP) Ironstone was first noted by the Geological Survey of WA (GSWA) in 1909. Pisolitic iron occurrences were noted by Broken Hill Proprietary (BHP) during 1954-1955 regional manganese survey. Exploration commenced in the 1960s after the embargo on the export of iron ore was lifted in 1960. A photogeological interpretation of aerial photos in 1961 led to the discovery and recognition of the Deepdale pisolitic iron ore deposits. BHP was granted Rights of Occupancy (Temporary Reserves 2115 and 2300) in 1962. Extensive geological drilling programs have followed. US Steel Corporation (USSC) conducted several exploration drilling programs in the period 1968 to 1971. Exploration drilling by Robe River Iron Associates (RRIA) commenced in 1990. Since then, extensive drilling programs including RC and diamond drilling methods have followed. The work was continued by Rio Tinto. First shipment of ore from Robe Valley occurred in 1972. At Mesa J, BHP had undertaken exploration drill programs of percussion, vacuum and RC drilling from 1962 to 1980. Bulk sampling from a trial blast cut in 1964 were used in crushing and pelletizing testwork. In 1980, 3 winzes were used for additional metallurgical sampling and testwork. In 1976, the Temporary Reserves were converted to Mineral Lease 254SA. A Measured Resource for Mesa J was reported in 1980. Cliffs International Inc. (Cliffs), via agreement with Dampier Mining Co., had mining rights to Eastern Deepdale mesas in 1970. No actual drilling was undertaken by BHP, with the mesas belonging to Dampier Mining Co. In 1986, Cliffs Robe River Iron Associates (CRRIA) held similar negotiations with BHP. Initial exploration by CRRIA in 1970 was followed by bulk samples for determinations of free moisture content and in situ bulk densities of the ore and waste by 1984. Preliminary evaluation of the pisolite aquifer and scale of de-watering operations by Rockwater Pty Ltd (Rockwater) was undertaken. Mining Area Deposit Current Holders Previous Holders/ Operators Work completed by Previous Holders/Operators West Angelas West Angelas Robe River Iron Associates Joint Venture – comprising Rio Tinto (53%), Mitsui Iron Ore Development (33%) and Nippon Steel Corporation (14%). (Robe JV) Cliffs International Drilling Pty Ltd and Robe River Mining Co.Pty.Ltd Exploration in the area between 1972 and 1978 was carried out by Cliffs International Drilling Pty Ltd (CIDPL) utilising percussion RC, dual rotary and diamond holes targeting Marra Mamba deposits. Robe River Mining Co Pty Ltd. (Robe River) continued exploration activity between 1992 and 1999, prior to the acquisition by Rio Tinto. First ore was shipped from West Angelas in 2002.
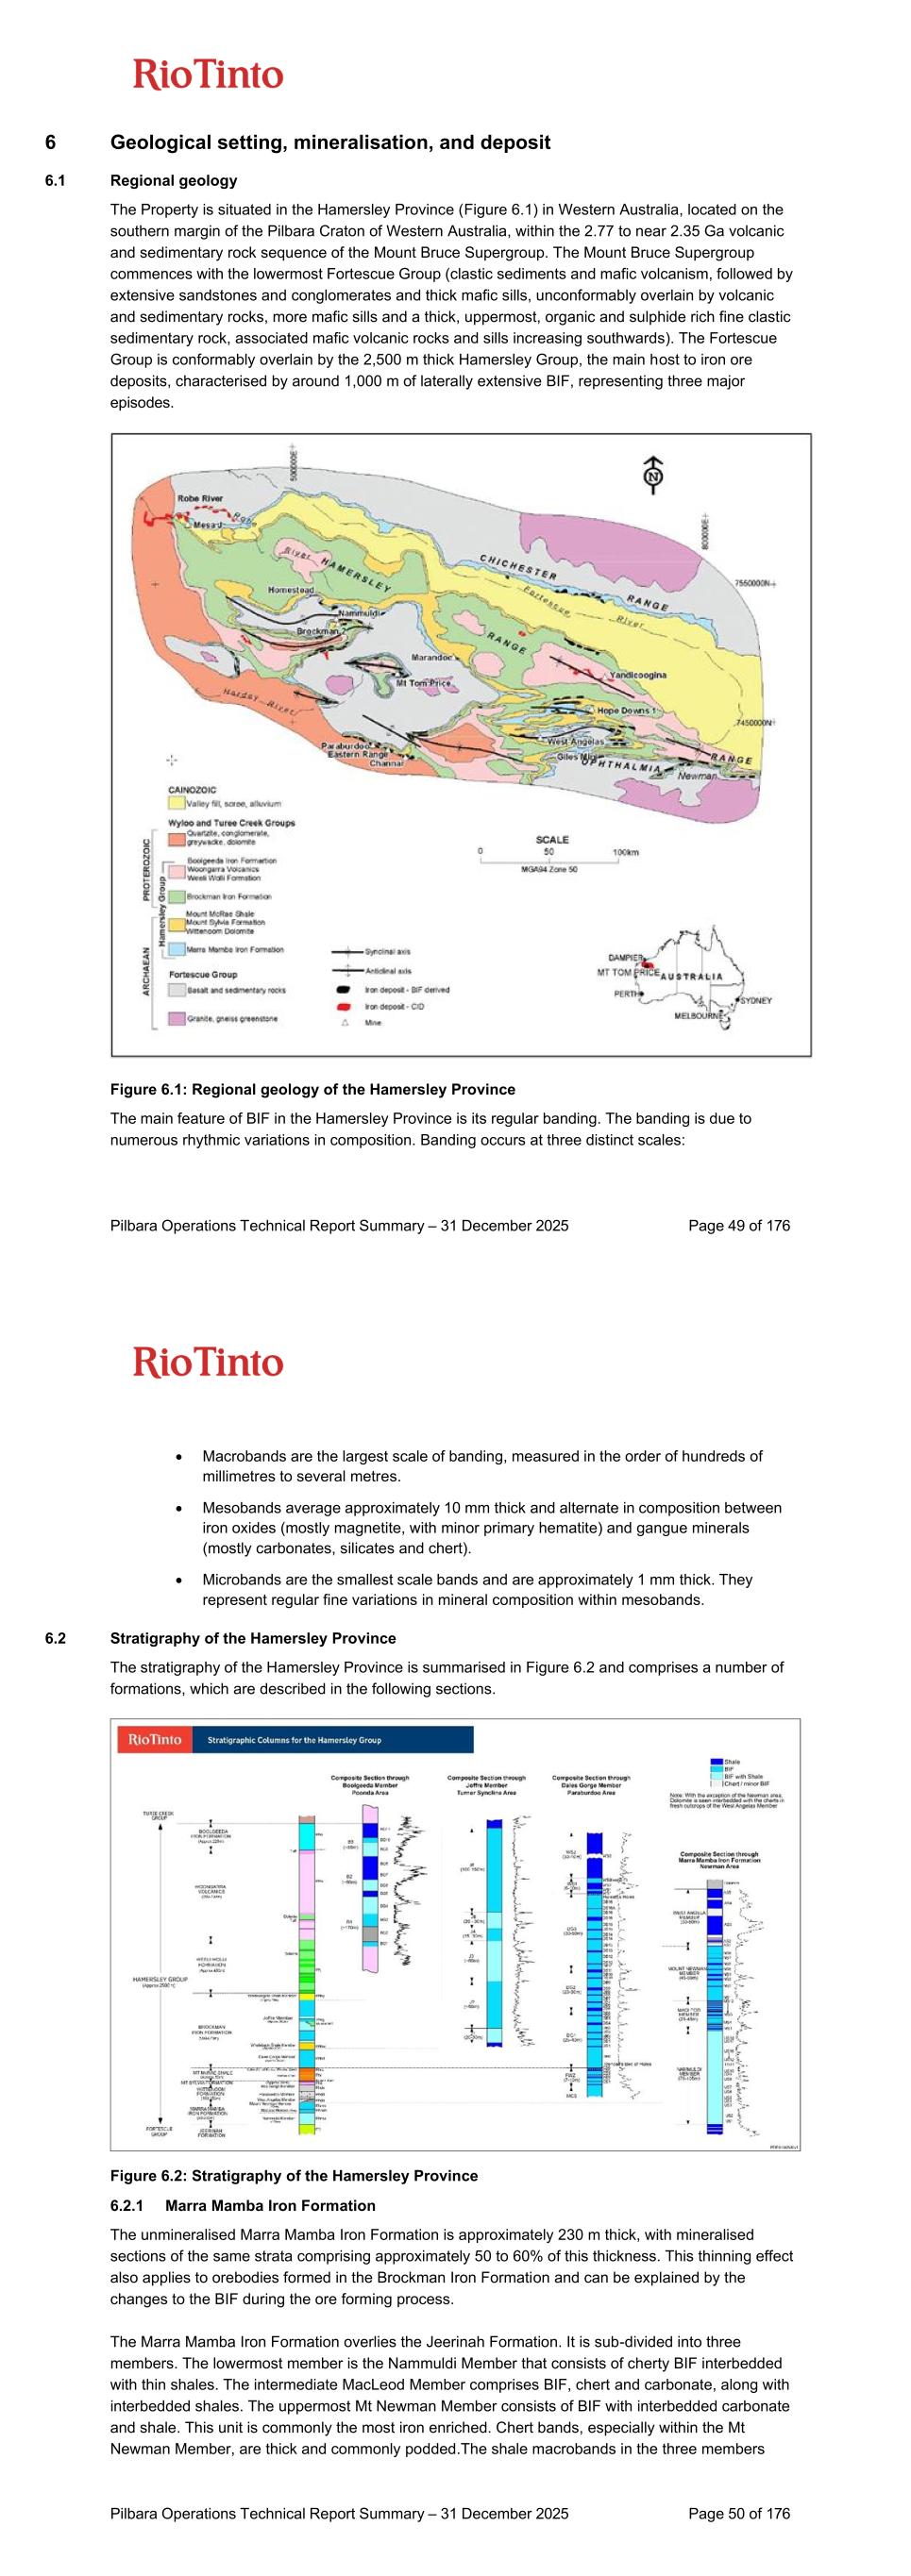
Pilbara Operations Technical Report Summary – 31 December 2025 Page 49 of 176 6 Geological setting, mineralisation, and deposit 6.1 Regional geology The Property is situated in the Hamersley Province (Figure 6.1) in Western Australia, located on the southern margin of the Pilbara Craton of Western Australia, within the 2.77 to near 2.35 Ga volcanic and sedimentary rock sequence of the Mount Bruce Supergroup. The Mount Bruce Supergroup commences with the lowermost Fortescue Group (clastic sediments and mafic volcanism, followed by extensive sandstones and conglomerates and thick mafic sills, unconformably overlain by volcanic and sedimentary rocks, more mafic sills and a thick, uppermost, organic and sulphide rich fine clastic sedimentary rock, associated mafic volcanic rocks and sills increasing southwards). The Fortescue Group is conformably overlain by the 2,500 m thick Hamersley Group, the main host to iron ore deposits, characterised by around 1,000 m of laterally extensive BIF, representing three major episodes. Figure 6.1: Regional geology of the Hamersley Province The main feature of BIF in the Hamersley Province is its regular banding. The banding is due to numerous rhythmic variations in composition. Banding occurs at three distinct scales: Pilbara Operations Technical Report Summary – 31 December 2025 Page 50 of 176 • Macrobands are the largest scale of banding, measured in the order of hundreds of millimetres to several metres. • Mesobands average approximately 10 mm thick and alternate in composition between iron oxides (mostly magnetite, with minor primary hematite) and gangue minerals (mostly carbonates, silicates and chert). • Microbands are the smallest scale bands and are approximately 1 mm thick. They represent regular fine variations in mineral composition within mesobands. 6.2 Stratigraphy of the Hamersley Province The stratigraphy of the Hamersley Province is summarised in Figure 6.2 and comprises a number of formations, which are described in the following sections. Figure 6.2: Stratigraphy of the Hamersley Province 6.2.1 Marra Mamba Iron Formation The unmineralised Marra Mamba Iron Formation is approximately 230 m thick, with mineralised sections of the same strata comprising approximately 50 to 60% of this thickness. This thinning effect also applies to orebodies formed in the Brockman Iron Formation and can be explained by the changes to the BIF during the ore forming process. The Marra Mamba Iron Formation overlies the Jeerinah Formation. It is sub-divided into three members. The lowermost member is the Nammuldi Member that consists of cherty BIF interbedded with thin shales. The intermediate MacLeod Member comprises BIF, chert and carbonate, along with interbedded shales. The uppermost Mt Newman Member consists of BIF with interbedded carbonate and shale. This unit is commonly the most iron enriched. Chert bands, especially within the Mt Newman Member, are thick and commonly podded.The shale macrobands in the three members
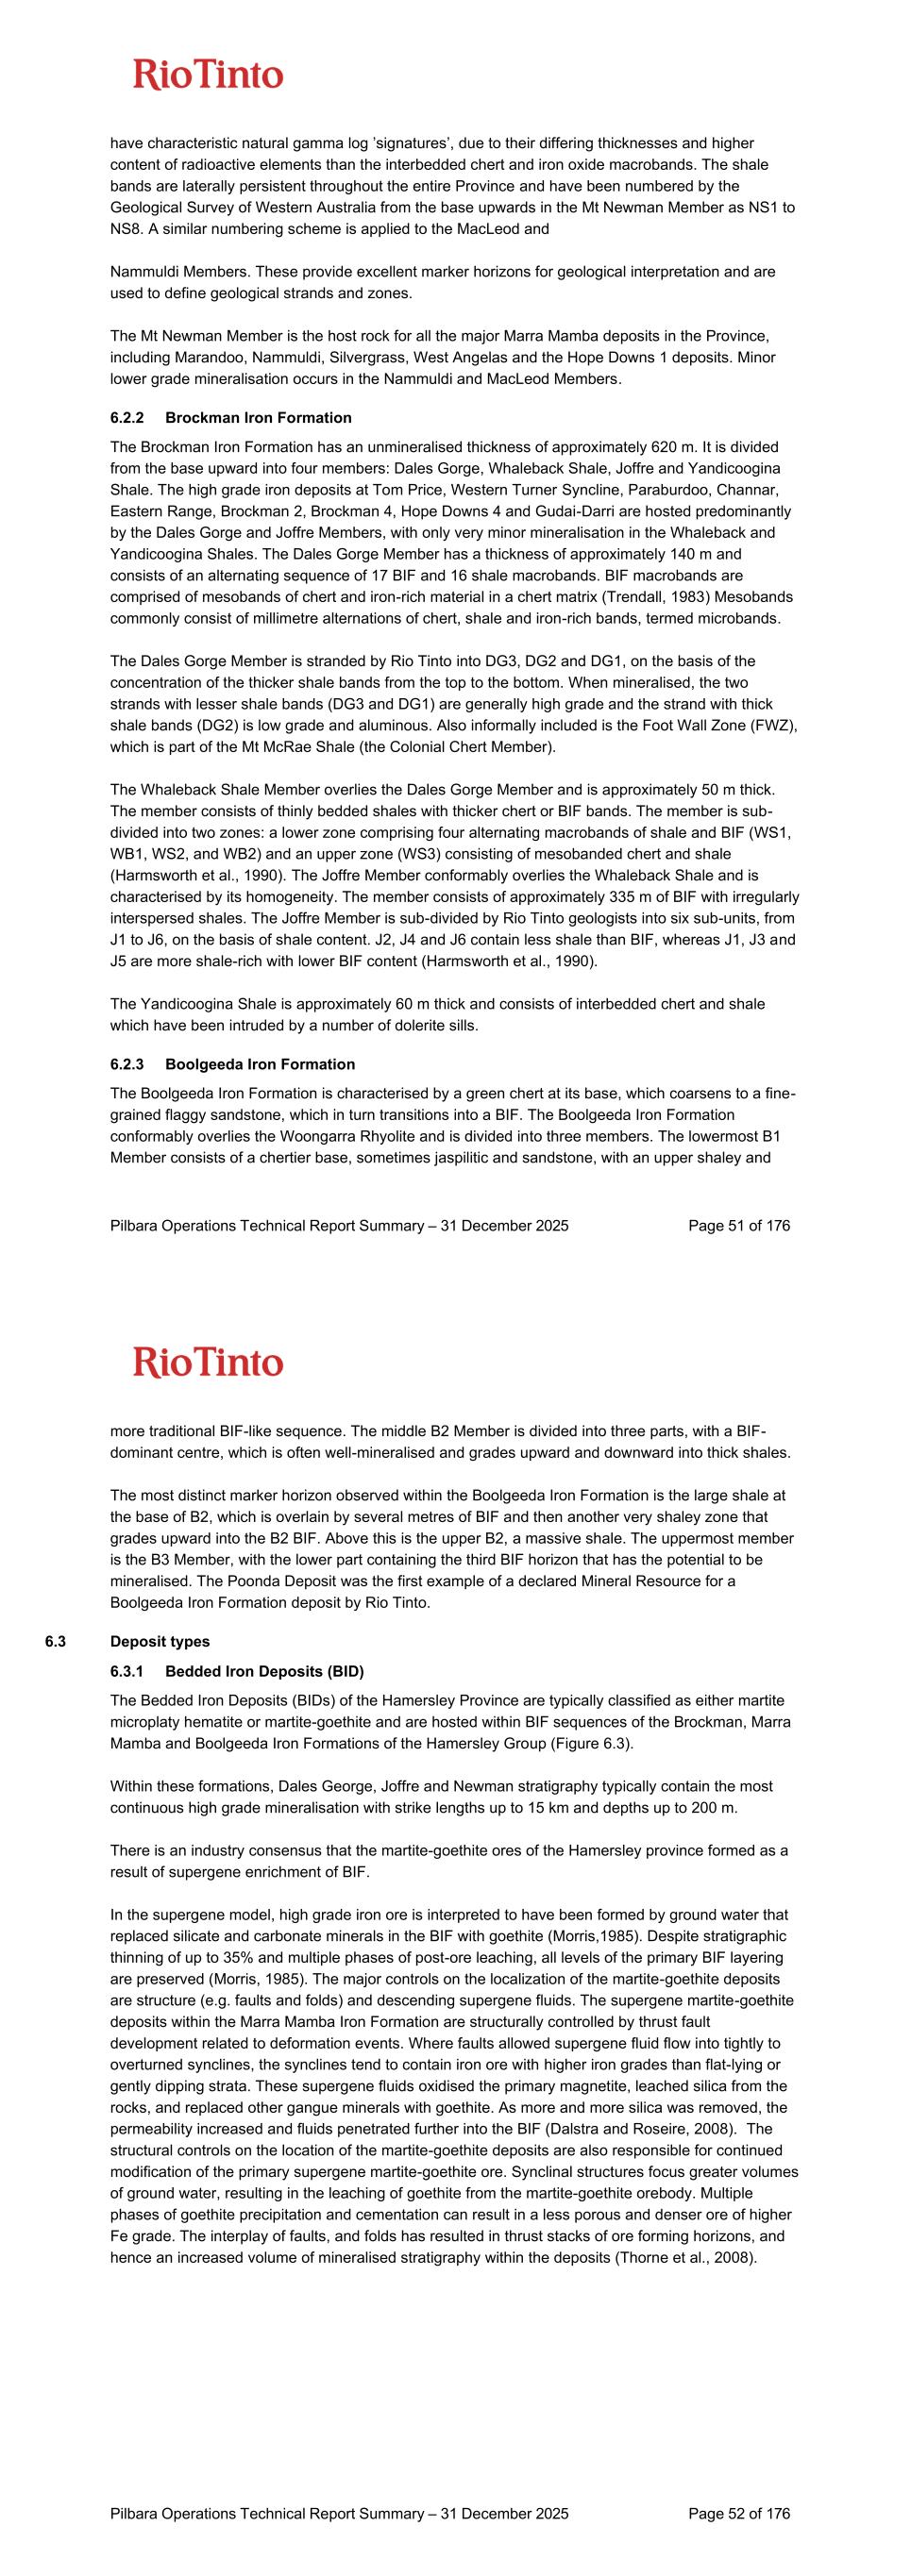
Pilbara Operations Technical Report Summary – 31 December 2025 Page 51 of 176 have characteristic natural gamma log ’signatures’, due to their differing thicknesses and higher content of radioactive elements than the interbedded chert and iron oxide macrobands. The shale bands are laterally persistent throughout the entire Province and have been numbered by the Geological Survey of Western Australia from the base upwards in the Mt Newman Member as NS1 to NS8. A similar numbering scheme is applied to the MacLeod and Nammuldi Members. These provide excellent marker horizons for geological interpretation and are used to define geological strands and zones. The Mt Newman Member is the host rock for all the major Marra Mamba deposits in the Province, including Marandoo, Nammuldi, Silvergrass, West Angelas and the Hope Downs 1 deposits. Minor lower grade mineralisation occurs in the Nammuldi and MacLeod Members. 6.2.2 Brockman Iron Formation The Brockman Iron Formation has an unmineralised thickness of approximately 620 m. It is divided from the base upward into four members: Dales Gorge, Whaleback Shale, Joffre and Yandicoogina Shale. The high grade iron deposits at Tom Price, Western Turner Syncline, Paraburdoo, Channar, Eastern Range, Brockman 2, Brockman 4, Hope Downs 4 and Gudai-Darri are hosted predominantly by the Dales Gorge and Joffre Members, with only very minor mineralisation in the Whaleback and Yandicoogina Shales. The Dales Gorge Member has a thickness of approximately 140 m and consists of an alternating sequence of 17 BIF and 16 shale macrobands. BIF macrobands are comprised of mesobands of chert and iron-rich material in a chert matrix (Trendall, 1983) Mesobands commonly consist of millimetre alternations of chert, shale and iron-rich bands, termed microbands. The Dales Gorge Member is stranded by Rio Tinto into DG3, DG2 and DG1, on the basis of the concentration of the thicker shale bands from the top to the bottom. When mineralised, the two strands with lesser shale bands (DG3 and DG1) are generally high grade and the strand with thick shale bands (DG2) is low grade and aluminous. Also informally included is the Foot Wall Zone (FWZ), which is part of the Mt McRae Shale (the Colonial Chert Member). The Whaleback Shale Member overlies the Dales Gorge Member and is approximately 50 m thick. The member consists of thinly bedded shales with thicker chert or BIF bands. The member is sub- divided into two zones: a lower zone comprising four alternating macrobands of shale and BIF (WS1, WB1, WS2, and WB2) and an upper zone (WS3) consisting of mesobanded chert and shale (Harmsworth et al., 1990). The Joffre Member conformably overlies the Whaleback Shale and is characterised by its homogeneity. The member consists of approximately 335 m of BIF with irregularly interspersed shales. The Joffre Member is sub-divided by Rio Tinto geologists into six sub-units, from J1 to J6, on the basis of shale content. J2, J4 and J6 contain less shale than BIF, whereas J1, J3 and J5 are more shale-rich with lower BIF content (Harmsworth et al., 1990). The Yandicoogina Shale is approximately 60 m thick and consists of interbedded chert and shale which have been intruded by a number of dolerite sills. 6.2.3 Boolgeeda Iron Formation The Boolgeeda Iron Formation is characterised by a green chert at its base, which coarsens to a fine- grained flaggy sandstone, which in turn transitions into a BIF. The Boolgeeda Iron Formation conformably overlies the Woongarra Rhyolite and is divided into three members. The lowermost B1 Member consists of a chertier base, sometimes jaspilitic and sandstone, with an upper shaley and Pilbara Operations Technical Report Summary – 31 December 2025 Page 52 of 176 more traditional BIF-like sequence. The middle B2 Member is divided into three parts, with a BIF- dominant centre, which is often well-mineralised and grades upward and downward into thick shales. The most distinct marker horizon observed within the Boolgeeda Iron Formation is the large shale at the base of B2, which is overlain by several metres of BIF and then another very shaley zone that grades upward into the B2 BIF. Above this is the upper B2, a massive shale. The uppermost member is the B3 Member, with the lower part containing the third BIF horizon that has the potential to be mineralised. The Poonda Deposit was the first example of a declared Mineral Resource for a Boolgeeda Iron Formation deposit by Rio Tinto. 6.3 Deposit types 6.3.1 Bedded Iron Deposits (BID) The Bedded Iron Deposits (BIDs) of the Hamersley Province are typically classified as either martite microplaty hematite or martite-goethite and are hosted within BIF sequences of the Brockman, Marra Mamba and Boolgeeda Iron Formations of the Hamersley Group (Figure 6.3). Within these formations, Dales George, Joffre and Newman stratigraphy typically contain the most continuous high grade mineralisation with strike lengths up to 15 km and depths up to 200 m. There is an industry consensus that the martite-goethite ores of the Hamersley province formed as a result of supergene enrichment of BIF. In the supergene model, high grade iron ore is interpreted to have been formed by ground water that replaced silicate and carbonate minerals in the BIF with goethite (Morris,1985). Despite stratigraphic thinning of up to 35% and multiple phases of post-ore leaching, all levels of the primary BIF layering are preserved (Morris, 1985). The major controls on the localization of the martite-goethite deposits are structure (e.g. faults and folds) and descending supergene fluids. The supergene martite-goethite deposits within the Marra Mamba Iron Formation are structurally controlled by thrust fault development related to deformation events. Where faults allowed supergene fluid flow into tightly to overturned synclines, the synclines tend to contain iron ore with higher iron grades than flat-lying or gently dipping strata. These supergene fluids oxidised the primary magnetite, leached silica from the rocks, and replaced other gangue minerals with goethite. As more and more silica was removed, the permeability increased and fluids penetrated further into the BIF (Dalstra and Roseire, 2008). The structural controls on the location of the martite-goethite deposits are also responsible for continued modification of the primary supergene martite-goethite ore. Synclinal structures focus greater volumes of ground water, resulting in the leaching of goethite from the martite-goethite orebody. Multiple phases of goethite precipitation and cementation can result in a less porous and denser ore of higher Fe grade. The interplay of faults, and folds has resulted in thrust stacks of ore forming horizons, and hence an increased volume of mineralised stratigraphy within the deposits (Thorne et al., 2008).
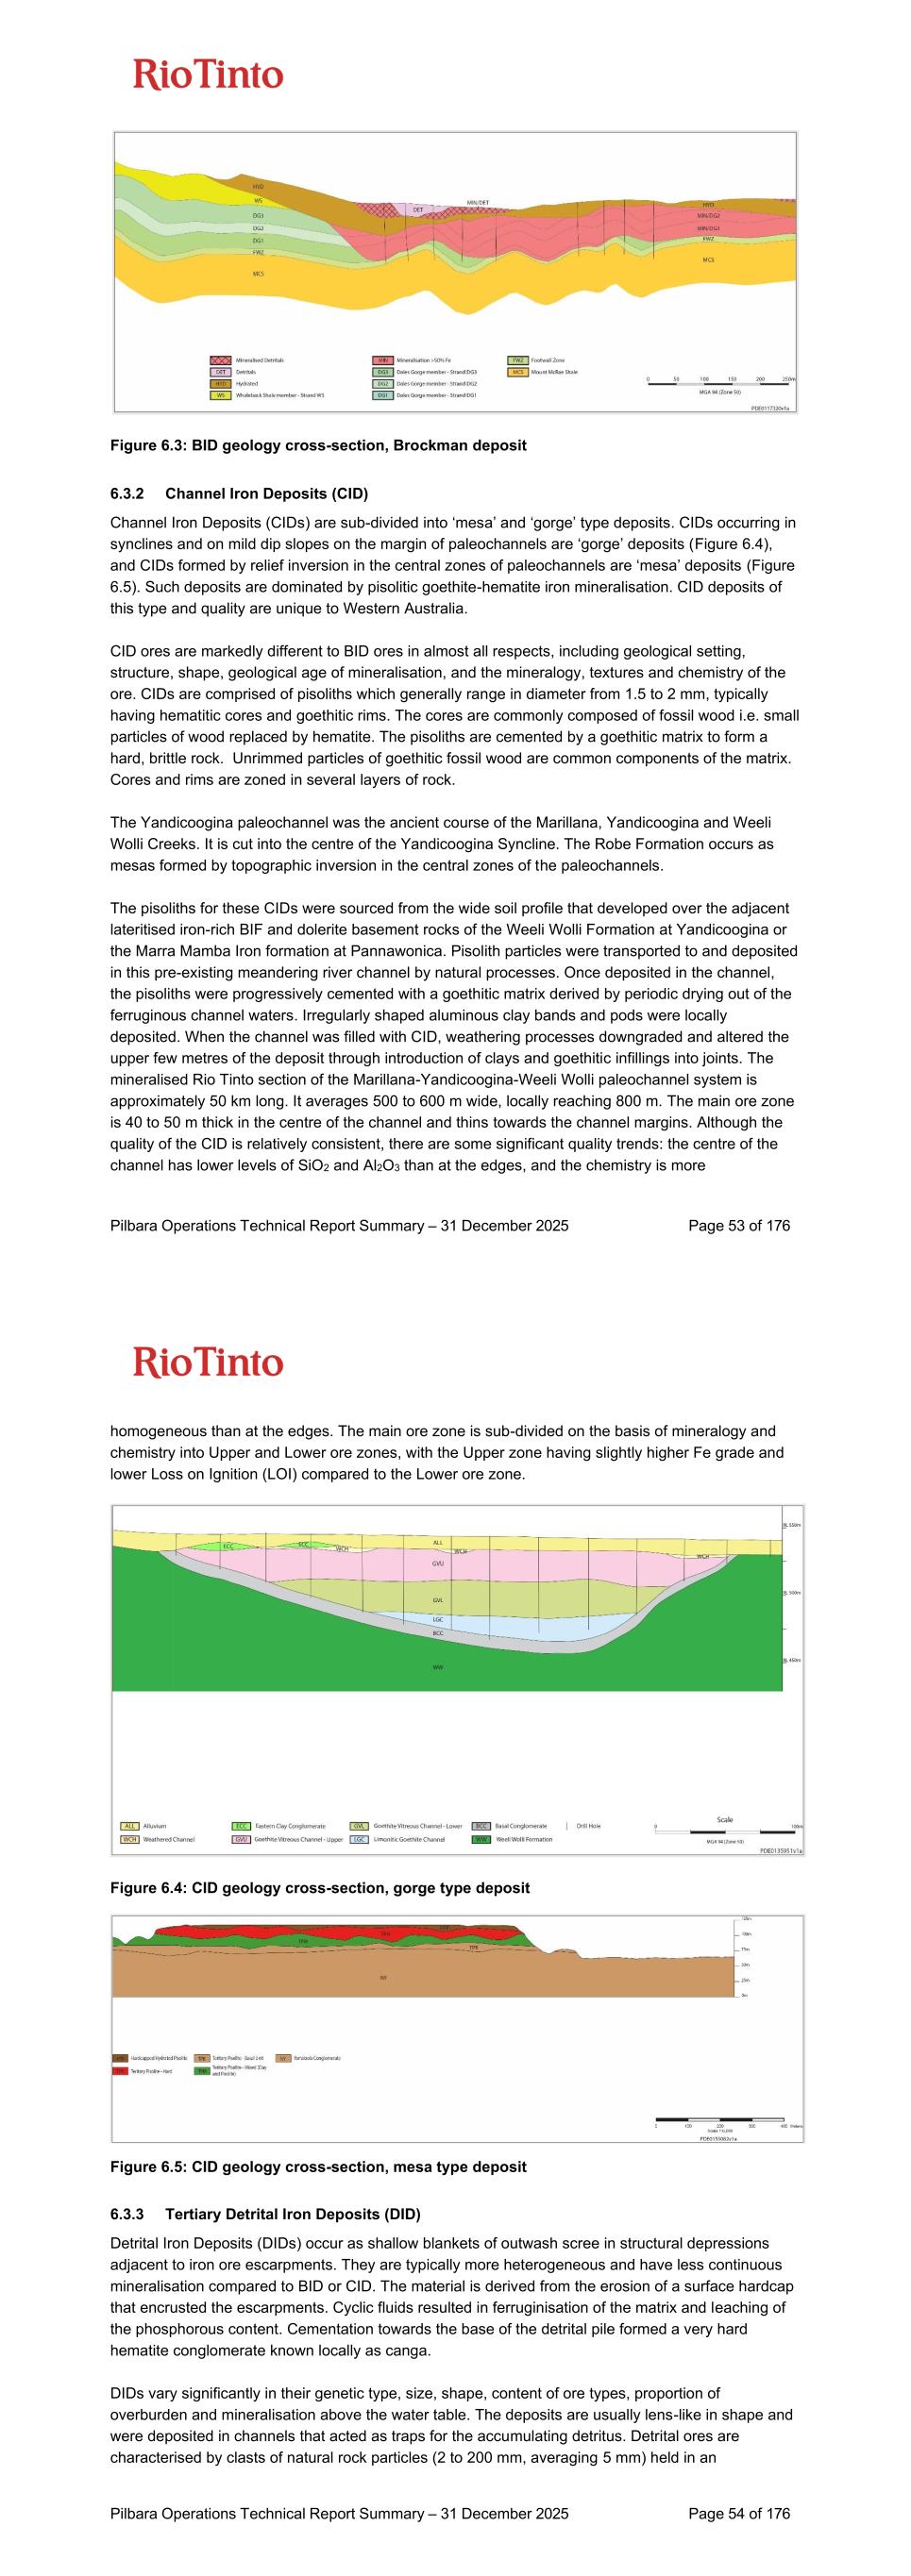
Pilbara Operations Technical Report Summary – 31 December 2025 Page 53 of 176 Figure 6.3: BID geology cross-section, Brockman deposit 6.3.2 Channel Iron Deposits (CID) Channel Iron Deposits (CIDs) are sub-divided into ‘mesa’ and ‘gorge’ type deposits. CIDs occurring in synclines and on mild dip slopes on the margin of paleochannels are ‘gorge’ deposits (Figure 6.4), and CIDs formed by relief inversion in the central zones of paleochannels are ‘mesa’ deposits (Figure 6.5). Such deposits are dominated by pisolitic goethite-hematite iron mineralisation. CID deposits of this type and quality are unique to Western Australia. CID ores are markedly different to BID ores in almost all respects, including geological setting, structure, shape, geological age of mineralisation, and the mineralogy, textures and chemistry of the ore. CIDs are comprised of pisoliths which generally range in diameter from 1.5 to 2 mm, typically having hematitic cores and goethitic rims. The cores are commonly composed of fossil wood i.e. small particles of wood replaced by hematite. The pisoliths are cemented by a goethitic matrix to form a hard, brittle rock. Unrimmed particles of goethitic fossil wood are common components of the matrix. Cores and rims are zoned in several layers of rock. The Yandicoogina paleochannel was the ancient course of the Marillana, Yandicoogina and Weeli Wolli Creeks. It is cut into the centre of the Yandicoogina Syncline. The Robe Formation occurs as mesas formed by topographic inversion in the central zones of the paleochannels. The pisoliths for these CIDs were sourced from the wide soil profile that developed over the adjacent lateritised iron-rich BIF and dolerite basement rocks of the Weeli Wolli Formation at Yandicoogina or the Marra Mamba Iron formation at Pannawonica. Pisolith particles were transported to and deposited in this pre-existing meandering river channel by natural processes. Once deposited in the channel, the pisoliths were progressively cemented with a goethitic matrix derived by periodic drying out of the ferruginous channel waters. Irregularly shaped aluminous clay bands and pods were locally deposited. When the channel was filled with CID, weathering processes downgraded and altered the upper few metres of the deposit through introduction of clays and goethitic infillings into joints. The mineralised Rio Tinto section of the Marillana-Yandicoogina-Weeli Wolli paleochannel system is approximately 50 km long. It averages 500 to 600 m wide, locally reaching 800 m. The main ore zone is 40 to 50 m thick in the centre of the channel and thins towards the channel margins. Although the quality of the CID is relatively consistent, there are some significant quality trends: the centre of the channel has lower levels of SiO2 and Al2O3 than at the edges, and the chemistry is more Pilbara Operations Technical Report Summary – 31 December 2025 Page 54 of 176 homogeneous than at the edges. The main ore zone is sub-divided on the basis of mineralogy and chemistry into Upper and Lower ore zones, with the Upper zone having slightly higher Fe grade and lower Loss on Ignition (LOI) compared to the Lower ore zone. Figure 6.4: CID geology cross-section, gorge type deposit Figure 6.5: CID geology cross-section, mesa type deposit 6.3.3 Tertiary Detrital Iron Deposits (DID) Detrital Iron Deposits (DIDs) occur as shallow blankets of outwash scree in structural depressions adjacent to iron ore escarpments. They are typically more heterogeneous and have less continuous mineralisation compared to BID or CID. The material is derived from the erosion of a surface hardcap that encrusted the escarpments. Cyclic fluids resulted in ferruginisation of the matrix and leaching of the phosphorous content. Cementation towards the base of the detrital pile formed a very hard hematite conglomerate known locally as canga. DIDs vary significantly in their genetic type, size, shape, content of ore types, proportion of overburden and mineralisation above the water table. The deposits are usually lens-like in shape and were deposited in channels that acted as traps for the accumulating detritus. Detrital ores are characterised by clasts of natural rock particles (2 to 200 mm, averaging 5 mm) held in an
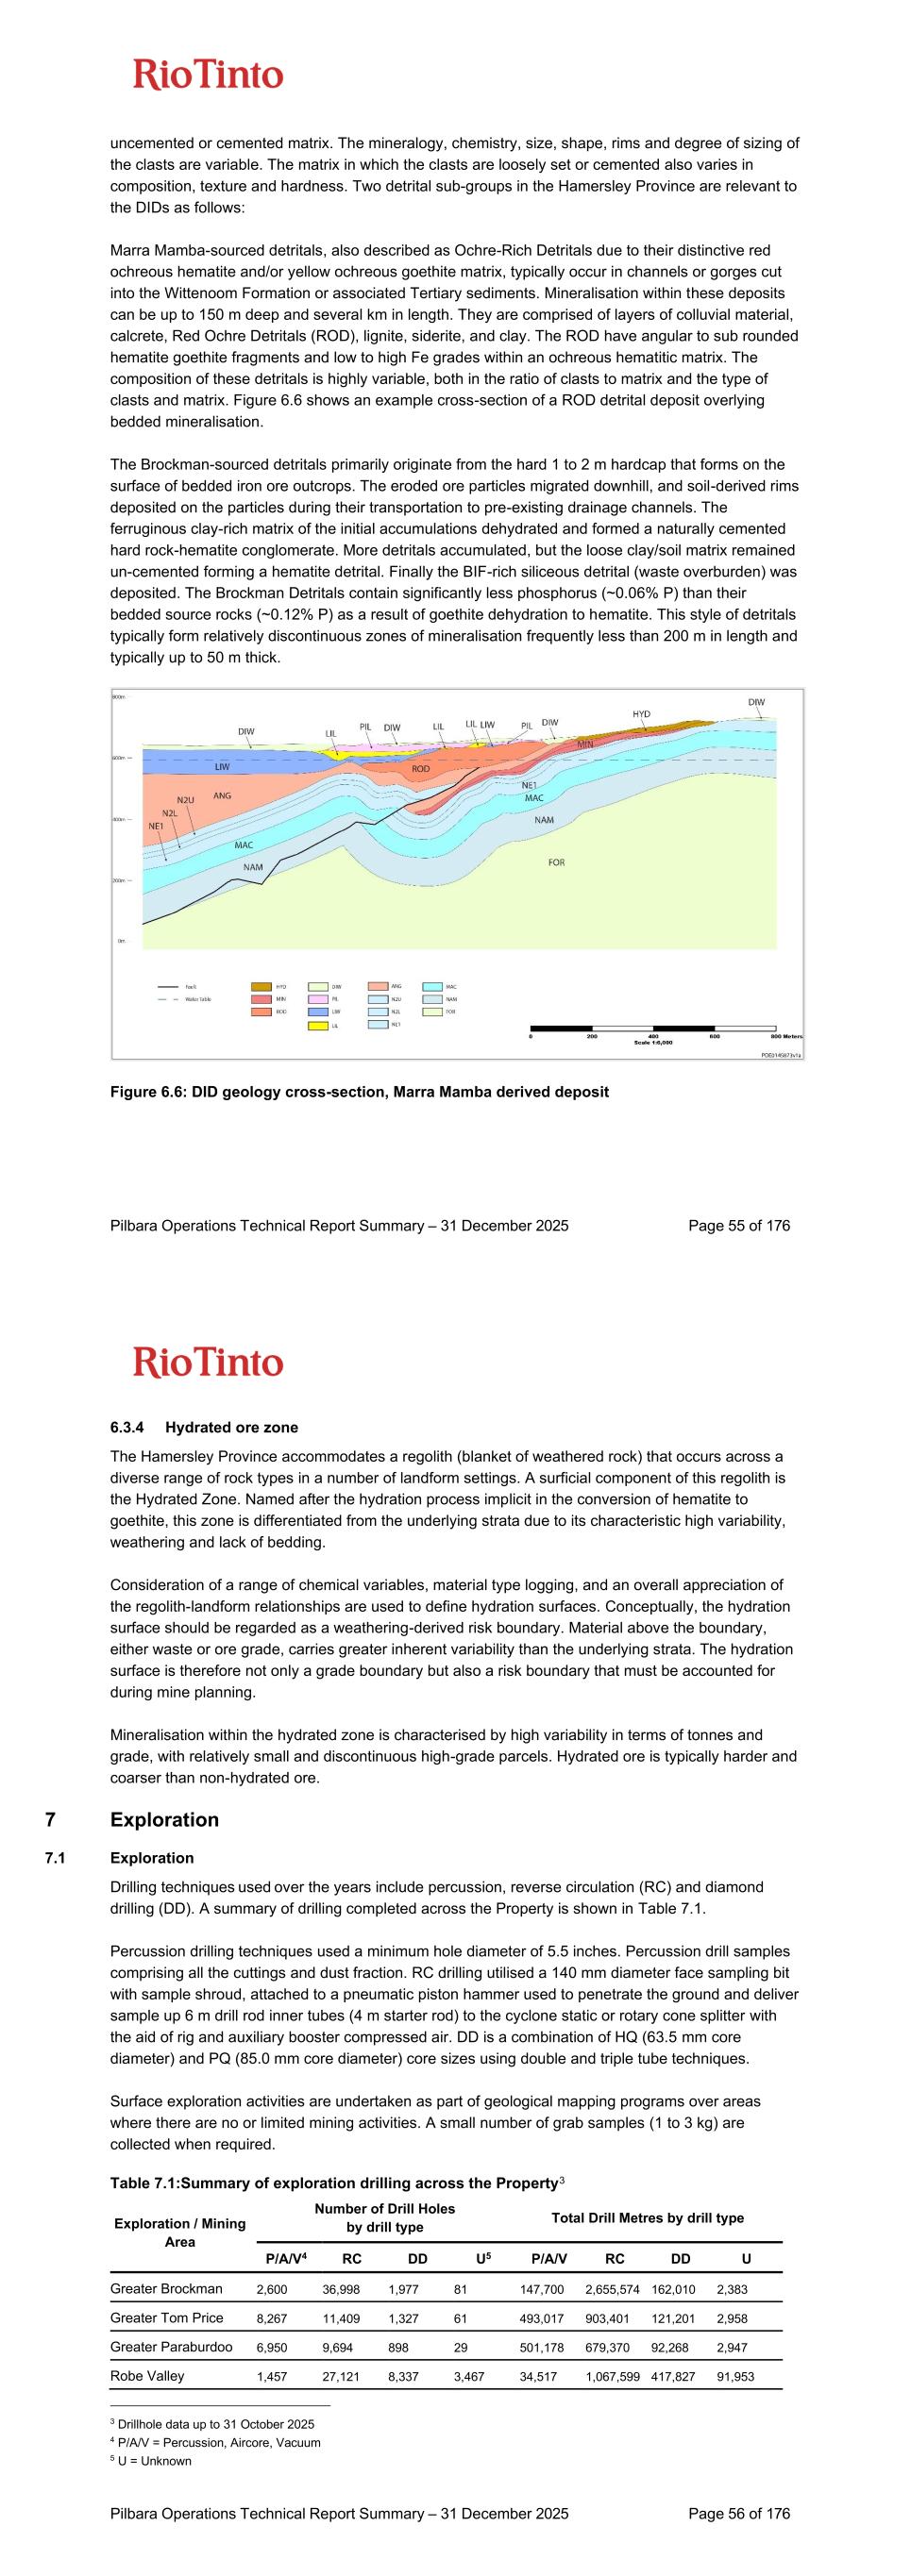
Pilbara Operations Technical Report Summary – 31 December 2025 Page 55 of 176 uncemented or cemented matrix. The mineralogy, chemistry, size, shape, rims and degree of sizing of the clasts are variable. The matrix in which the clasts are loosely set or cemented also varies in composition, texture and hardness. Two detrital sub-groups in the Hamersley Province are relevant to the DIDs as follows: Marra Mamba-sourced detritals, also described as Ochre-Rich Detritals due to their distinctive red ochreous hematite and/or yellow ochreous goethite matrix, typically occur in channels or gorges cut into the Wittenoom Formation or associated Tertiary sediments. Mineralisation within these deposits can be up to 150 m deep and several km in length. They are comprised of layers of colluvial material, calcrete, Red Ochre Detritals (ROD), lignite, siderite, and clay. The ROD have angular to sub rounded hematite goethite fragments and low to high Fe grades within an ochreous hematitic matrix. The composition of these detritals is highly variable, both in the ratio of clasts to matrix and the type of clasts and matrix. Figure 6.6 shows an example cross-section of a ROD detrital deposit overlying bedded mineralisation. The Brockman-sourced detritals primarily originate from the hard 1 to 2 m hardcap that forms on the surface of bedded iron ore outcrops. The eroded ore particles migrated downhill, and soil-derived rims deposited on the particles during their transportation to pre-existing drainage channels. The ferruginous clay-rich matrix of the initial accumulations dehydrated and formed a naturally cemented hard rock-hematite conglomerate. More detritals accumulated, but the loose clay/soil matrix remained un-cemented forming a hematite detrital. Finally the BIF-rich siliceous detrital (waste overburden) was deposited. The Brockman Detritals contain significantly less phosphorus (~0.06% P) than their bedded source rocks (~0.12% P) as a result of goethite dehydration to hematite. This style of detritals typically form relatively discontinuous zones of mineralisation frequently less than 200 m in length and typically up to 50 m thick. Figure 6.6: DID geology cross-section, Marra Mamba derived deposit Pilbara Operations Technical Report Summary – 31 December 2025 Page 56 of 176 6.3.4 Hydrated ore zone The Hamersley Province accommodates a regolith (blanket of weathered rock) that occurs across a diverse range of rock types in a number of landform settings. A surficial component of this regolith is the Hydrated Zone. Named after the hydration process implicit in the conversion of hematite to goethite, this zone is differentiated from the underlying strata due to its characteristic high variability, weathering and lack of bedding. Consideration of a range of chemical variables, material type logging, and an overall appreciation of the regolith-landform relationships are used to define hydration surfaces. Conceptually, the hydration surface should be regarded as a weathering-derived risk boundary. Material above the boundary, either waste or ore grade, carries greater inherent variability than the underlying strata. The hydration surface is therefore not only a grade boundary but also a risk boundary that must be accounted for during mine planning. Mineralisation within the hydrated zone is characterised by high variability in terms of tonnes and grade, with relatively small and discontinuous high-grade parcels. Hydrated ore is typically harder and coarser than non-hydrated ore. 7 Exploration 7.1 Exploration Drilling techniques used over the years include percussion, reverse circulation (RC) and diamond drilling (DD). A summary of drilling completed across the Property is shown in Table 7.1. Percussion drilling techniques used a minimum hole diameter of 5.5 inches. Percussion drill samples comprising all the cuttings and dust fraction. RC drilling utilised a 140 mm diameter face sampling bit with sample shroud, attached to a pneumatic piston hammer used to penetrate the ground and deliver sample up 6 m drill rod inner tubes (4 m starter rod) to the cyclone static or rotary cone splitter with the aid of rig and auxiliary booster compressed air. DD is a combination of HQ (63.5 mm core diameter) and PQ (85.0 mm core diameter) core sizes using double and triple tube techniques. Surface exploration activities are undertaken as part of geological mapping programs over areas where there are no or limited mining activities. A small number of grab samples (1 to 3 kg) are collected when required. Table 7.1:Summary of exploration drilling across the Property3 Exploration / Mining Area Number of Drill Holes by drill type Total Drill Metres by drill type P/A/V4 RC DD U5 P/A/V RC DD U Greater Brockman 2,600 36,998 1,977 81 147,700 2,655,574 162,010 2,383 Greater Tom Price 8,267 11,409 1,327 61 493,017 903,401 121,201 2,958 Greater Paraburdoo 6,950 9,694 898 29 501,178 679,370 92,268 2,947 Robe Valley 1,457 27,121 8,337 3,467 34,517 1,067,599 417,827 91,953 3 Drillhole data up to 31 October 2025 4 P/A/V = Percussion, Aircore, Vacuum 5 U = Unknown
Pilbara Operations Technical Report Summary – 31 December 2025 Page 57 of 176 Exploration / Mining Area Number of Drill Holes by drill type Total Drill Metres by drill type P/A/V4 RC DD U5 P/A/V RC DD U West Pilbara 584 5,624 272 146 26,567 363,116 11,839 5,061 Greater West Angelas 615 26,884 1,867 3,291 20,647 2,076,479 159,751 221,291 Gudai-Darri 774 17,480 609 17 40,734 1,120,789 39,497 252 Greater Hope Downs 173 19,571 1,325 160 5,154 1,529,655 124,798 7,685 Yandicoogina 211 4,652 5,647 25 9,722 320,645 308,305 1,385 East Pilbara 1,816 12,107 573 26 140,576 1,187,528 60,978 2,360 7.2 Historical drilling techniques 7.2.1 1970s and 1980s programs: percussion and diamond drilling During the 1970s, percussion drill sampling was conducted using splash trays around the drill collar or through use of a T-piece coupled to a sample hose and trailer-mounted hydrocyclone. Subsequently, percussion samples were taken at 1.5 m intervals and riffle split into two samples, each weighing approximately 1 kg, with one sample serving as a storage duplicate. Each sample interval was logged from the residue pile for basic lithology by a company geologist. Diamond holes samples varied in length and excluded thick zones of material logged as waste. The core was transported to the lab for splitting. One half of the core was stored, the other crushed and analysed. Sample run lengths were determined by geologists from lithological characteristics. 7.2.2 1990s programs: percussion and diamond drilling Percussion samples were taken at 1.5 m intervals (1990 to 1993) and 2 m intervals (1995 onwards) and riffle split into two samples, one weighing approximately 0.5 to1 kg which was kept onsite as a retention sample in a screw top plastic jar, and one weighing approximately 2.5 to 5 kg, which was placed in a calico bag and sent for analysis. Each sample interval was logged from the residue pile for magnetic susceptibility, hardness, colour, texture, streak and lithology by a company geologist. Diamond core drilling used double and triple-tube techniques and samples were taken at 1 m intervals for density and geotechnical purposes. 7.2.3 2000s programs: reverse circulation and diamond drilling RC holes were sampled at 2 m down hole depth intervals. Each rig used a 4-way Jones riffle splitter attached beneath the cyclone, with the final splits being: 87.5% reject: 6.25% laboratory sample and 6.25% retention sample. The laboratory sample was collected in a calico bag, and the retention sample was collected in a plastic ‘honey-pot’. The reject samples were placed in rows of 10, 15 or 20 samples in a sample farm near the drilling rig, for use as a reference and to provide logging material for the geologists. In 2006, RC holes were sampled at 2 m intervals and passed through a Metalcraft rotating cone splitter attached to the rig which produced approximate splits of 88% reject, 6% laboratory (‘A’ split) and 6% retention samples (‘B’ split). The B splits remained on site, while the A splits were sent to the laboratory. Each sample interval was logged from the residue pile for lithology, percentage occurrence, colour, weathering, texture and magnetism by a company geologist. Pilbara Operations Technical Report Summary – 31 December 2025 Page 58 of 176 Diamond core drilling used double and triple-tube techniques and samples were taken at 1 m intervals for density, geotechnical and metallurgical purposes. Geotechnical samples were collected via diamond core drilling of HQ-3 (triple tube) core for density and metallurgical samples were collected via diamond core drilling of HQ-3 (triple tube) and PQ-3 (triple tube) core respectively. 7.3 Recent drilling techniques 7.3.1 2010 to recent programs: reverse circulation and diamond drilling RC holes are sampled in 2 m composites and collected in alpha-numerically numbered calico bags. Due to potential fibre mineral intersections, water injection is used throughout the programs from 2014. ‘A’ and ‘B’ splits are collected and always taken from the same respective chute of the splitter, keeping any possible biases constant. Regular cleaning of the splitter and cyclone is undertaken to avoid smearing and contamination across intervals. Respective splits are laid out in separate rows on the ground adjacent to bulk reject samples, avoiding mixing of bags and ensuring only ‘A’ sample splits are collected and sent to the laboratory. The particle size of RC chips is around 6 mm and the primary sample collected post-splitting is between 5 and 8 kg, depending on the density of the material. Each diamond hole is sampled in 1 m composites using a ‘crushing sheet’ created by a geologist and collected in alpha-numerically numbered calico bags (the ‘crushing sheet’ allocates bag numbers to each metre drilled and shows where check standards are to be inserted). Field check standards are inserted selectively by the rig/logging geologist at a rate of one in every 30 samples in mineralised zones and one in every 60 samples in waste with a minimum of one per drill hole. All check standards contained a trace of strontium carbonate that is added at the time of preparation. These standards are used to check sample preparation and analytical precision and accuracy at the laboratory. No direct recovery measurements of RC samples are performed. Sample weights are recorded at the laboratory upon receipt and are qualitatively estimated for loss per drilling interval at the rig. Diamond core recovery is maximised via the use of triple-tube sampling and additive drilling muds. Diamond core recovery is recorded using rock quality designation (RQD) measurements with all cavities and core loss recorded. Sample recovery in some friable mineralisation may be reduced however it is unlikely to have a material impact on the reported assays for these intervals. Geological logging is performed on 2 m intervals for all RC drilling, and either 1 m or 2 m intervals for diamond holes, depending on the level of detail required. Magnetic susceptibility readings are recorded for each interval. All diamond drill core is photographed. Since 2001, all drill holes have been logged geophysically for gamma trace, calliper, gamma density, resistivity and magnetic susceptibility. Open-hole acoustic and optical televiewer image data is collected in specific RC and diamond holes throughout the deposit for structural analyses. Data collected from pre-2000 campaigns is recorded on paper logs, and mineral constituents resolved predominantly to 5%, with 1% resolutions also used (rarely) for minor or trace constituents. In the opinion of the QPs, the processes outlined above are adequate for collecting quality samples and information for use in the interpretation and estimation of Mineral Resources.
Pilbara Operations Technical Report Summary – 31 December 2025 Page 59 of 176 7.4 Hydrogeology data Groundwater modelling is undertaken in accordance with Rio Tinto groundwater modelling framework which provides guidance for modellers, reviewers and managers on groundwater modelling in the context of iron ore mining support in the Pilbara. The framework draws on established modelling procedures, modern decision support concepts and Rio Tinto’s extensive experience of groundwater modelling in the Pilbara region. All models are underpinned by a conceptual understanding of the hydrological system. A conceptual model summarises what is known about the system and guides the selection of appropriate assumptions and simplifications. Conceptual models are qualitative and uncertain, due to limitations in representing or having knowledge of the full complexity of even a relatively simple hydrogeological system. In some cases, hydrologically important features, (such as a fault or dyke), may be poorly characterised by field data, or may be completely unknown. The Pilbara groundwater system can be categorised into three broad aquifer types: • Local fractured rock aquifers: Typically associated with orebodies and most commonly found in the central and southeastern Pilbara. • Regional consolidated sedimentary aquifers: Predominantly weathered or chemically altered dolomite, most often encountered beneath the east-west trending valley systems in the central and south-eastern Pilbara. • Alluvial aquifers that can be sub-divided into: o Unconsolidated sedimentary aquifers that commonly overlay the dolomitic aquifers, e.g. the Fortescue Marsh. o Near coastal plain aquifers of chemically deposited sediments such as dolocretes or altered channel iron deposits. The hydro-stratigraphy at each site is characterised in terms of its water quality. The locations of groundwater bores to be monitored for baseline studies are selected on the basis of the geology, and the site conceptual model where available. Isolated aquifer units are represented by at least one monitoring bore for baseline conditions. Additionally, all production and dewatering bores that are or will be covered by a 5C Groundwater Well Licence are sampled. Selection of surface water sampling locations considers any springs or pools in proximity to the site. If discharge of surplus dewatering water is proposed, then potential discharge locations and extents are investigated for any permanent or ephemeral pools. Often similar work will be undertaken by the approvals group and similar sites can be adopted or sites determined in consultation. Table 7.2 provides a list of parameters and frequency of sampling typically considered at a site, including the limits of reporting (LoR) currently provided by most commercial laboratories. The parameters and frequencies are selected based on the known prevalence of trace elements across the Pilbara and should provide a template that suits most situations. For metals and trace elements, only dissolved forms are required unless otherwise specified. Sufficiently low LoR are used to allow for comparison with relevant guideline values. Two general Pilbara Operations Technical Report Summary – 31 December 2025 Page 60 of 176 methods with different LoR are offered by commercial laboratories for these parameters. The low level ICP-MS method is preferred over the routine ICP-OES for AMD bores and bores discharging to the environment because of their lower LoR. If low level ICP-MS LoR does not meet applicable guidelines (e.g. ANZECC guidelines for the protection of aquatic ecosystems) for certain parameters (e.g. silver, chromium, mercury), consultation with other stakeholders (i.e. approvals, environment, mineral waste, management and utilities) is undertaken to determine if specialised analysis are required for these parameters. Additional analyses (such as isotopes, metal speciation (e.g. FeII/FeIII, CrIII/CrIV or AsIII/AsIV), total metals among others) may be required in some situations to assist with site conceptualisation or to address a specific study or concern (e.g. health or environmental compliance, bore biofouling, colloid studies, etc). Once a project commences operation, licence commitments may mean additional parameters are required, e.g. TRH, MBAS, bacteria (e.g. iron precipitating bacteria and sulphate reducing bacteria). Table 7.2: Sampling parameters for baseline water quality Parameter Frequency Borefields in Proximity to Mining Areas Borefields Located Outside Mining Areas Bores Associated with Potential ARDa Bores Associated with Surface Discharge Available LoR (ICP-OES / ICP- MS)b Surface Water Field & Lab pH Quarterly Biannually Quarterly Quarterly Biannuallyc 0.1 Field & Lab EC Quarterly Biannually Quarterly Quarterly Biannuallyc 2 Field temp Quarterly Biannually Quarterly Quarterly Biannuallyc 0.1 TDS Not Required Not Required Quarterly Quarterly Biannuallyc TSS Not Required Not Required Not Required Quarterly Biannuallyc 5 CO3 Not Required Not Required Not Required Not Required Not Required 5 HCO3 Annual Annual Quarterly Quarterly Biannuallyc 5 SO4 Annual Annual Quarterly Quarterly Biannuallyc 1 SiO2 Not Required Not Required Not Required Not Required Not Required 1 Si Annual Annual Quarterly Quarterly Biannuallyc 0.05 Cl Annual Annual Quarterly Quarterly Biannuallyc 1 F Annual Annual Quarterly Quarterly Biannuallyc 0.1 Br Annual Annual Quarterly Quarterly Biannuallyc Varies depending on lab Ca Annual Annual Quarterly Quarterly Biannuallyc 0.2 Na Annual Annual Quarterly Quarterly Biannuallyc 0.5 K Annual Annual Quarterly Quarterly Biannuallyc 0.1 Mg Annual Annual Quarterly Quarterly Biannuallyc 0.1 Al Annual Annual Quarterly Quarterly Biannuallyc 0.02/0.005
Pilbara Operations Technical Report Summary – 31 December 2025 Page 61 of 176 Parameter Frequency Borefields in Proximity to Mining Areas Borefields Located Outside Mining Areas Bores Associated with Potential ARDa Bores Associated with Surface Discharge Available LoR (ICP-OES / ICP- MS)b Surface Water Ag Annual or Trienniald Annual or Trienniald Quarterly Annual or Trienniald Biannuallyc 0.005/0.001 As Annual Annual Quarterly Annual Biannuallyc 0.02/0.002 B Annual Annual or Trienniald Quarterly Annual Biannuallyc 0.05/0.005 Ba Annual Annual or Trienniald Quarterly Annual Biannuallyc 0.005/0.001 Cd Annual Annual or Trienniald Quarterly Annual Biannuallyc 0.0001 Co Annual Annual or Trienniald Quarterly Annual Biannuallyc 0.001 Fe Annual Annual Quarterly Quarterly Biannuallyc 0.02/0.005 Cr Annual Annual or Trienniald Quarterly Annual Biannuallyc 0.005/0.001 Cr (VI)e Not required Not required Not required Not required Not required Cu Annual Annual Quarterly Annual Biannuallyc 0.005/0.001 Hg Annual or Trienniald Annual or Trienniald Quarterly Annual or Trienniald Biannuallyc 0.0001 Mn Annual Annual Quarterly Annual Biannuallyc 0.005/0.001 Mo Annual or Trienniald Annual or Trienniald Quarterly Annual Biannuallyc 0.01/0.001 Ni Annual Annual or Trienniald Quarterly Annual Biannuallyc 0.005/0.001 Pb Annual or Trienniald Annual or Trienniald Quarterly Annual Biannuallyc 0.02/0.001 Sb Annual or Trienniald Annual or Trienniald Quarterly Annual Biannuallyc 0.05/0.001 Se Annual Annual Quarterly Annual Biannuallyc 0.05/0.002 Sn Annual Annual Quarterly Annual Biannuallyc 0.05/0.001 Tl Annual or Trienniald Annual or Trienniald Annual or Trienniald Annual or Trienniald Annual or Trienniald 0.001 U Annual or Trienniald Annual or Trienniald Quarterly Annual or Trienniald Biannuallyc 0.001 V Annual or Trienniald Annual or Trienniald Annual or Trienniald Annual or Trienniald Annual or Trienniald 0.01/0.001 Zn Annual Annual Quarterly Annual Biannuallyc 0.01/0.005 Total P Annual Annual Quarterly Annual Biannuallyc 0.05 Pilbara Operations Technical Report Summary – 31 December 2025 Page 62 of 176 Parameter Frequency Borefields in Proximity to Mining Areas Borefields Located Outside Mining Areas Bores Associated with Potential ARDa Bores Associated with Surface Discharge Available LoR (ICP-OES / ICP- MS)b Surface Water Total N Annual Annual Quarterly Annual Biannuallyc 0.05 NO2 Annual Annual Quarterly Annual Biannuallyc 0.05/0.01 NO3 Annual Annual Quarterly Annual Biannuallyc 0.05 NH4 Annual Annual Quarterly Annual Biannuallyc 0.05/0.01 δ18O VSMOW Not required Not required Not required Not required Biannuallyc 0.1 δ2H VSMOW Not required Not required Not required Not required Biannuallyc 0.01 Notes: a Relevant bores at Tom Price, Paraburdoo, Brockman 2, Hope Downs 1, Hope Downs 4, Nammuldi, Brockman 4 and Western Turner Syncline. b All units in mg/L except for pH (standards unit), EC (µS/cm) and temp (°C). c Must be sampled in both wet season and dry season. d Annual can be switched to triennial if concentrations are consistently low and any permitting allows. e May be required at Marandoo for HSE requirements. The QPs are satisfied that the hydrogeological information collected is sufficient and meets requirements for the intended use. 7.5 Geotechnical data Geotechnical diamond drilling is carried out to provide structural geological and geotechnical data. This enables the effective evaluation of material and rock mass properties for the economic and safe design of pit walls and underground excavations. Three types of data are collected using geotechnical core logging techniques. These include: • Interval data – Properties that describe the type and quality of the rock mass. • Structural data – Characteristics of specific discontinuities that intersect the core. • Sample data – Information on specific samples is gained through physical tests on the specimens under laboratory conditions to determine properties such as strength, mineralogy, slaking susceptibility etc. This data is then used to define the geomechanical characteristics of the materials. Geotechnical diamond drilling preferably uses triple tube drilling techniques to maintain the integrity of the core. Typical geotechnical drilling core sizes include NQ-3 (45 mm diameter), HQ-3 (61 mm) and PQ-3 (83 mm). PQ-3 is the preferred core size for holes that are planned to intersect weak material types such as clays and weak detritals. Geotechnical samples are collected at the rig for a variety of destructive and non-destructive laboratory tests. This is essential when sampling weak rock types such as clays that degrade quickly on exposure to the atmosphere. The logger is present when critical zones for sampling are intersected. Additional samples may also need to be collected for environmental (e.g. acid rock drainage), metallurgical, petrological, and assay testing. The following aspects are considered when selecting geotechnical samples:
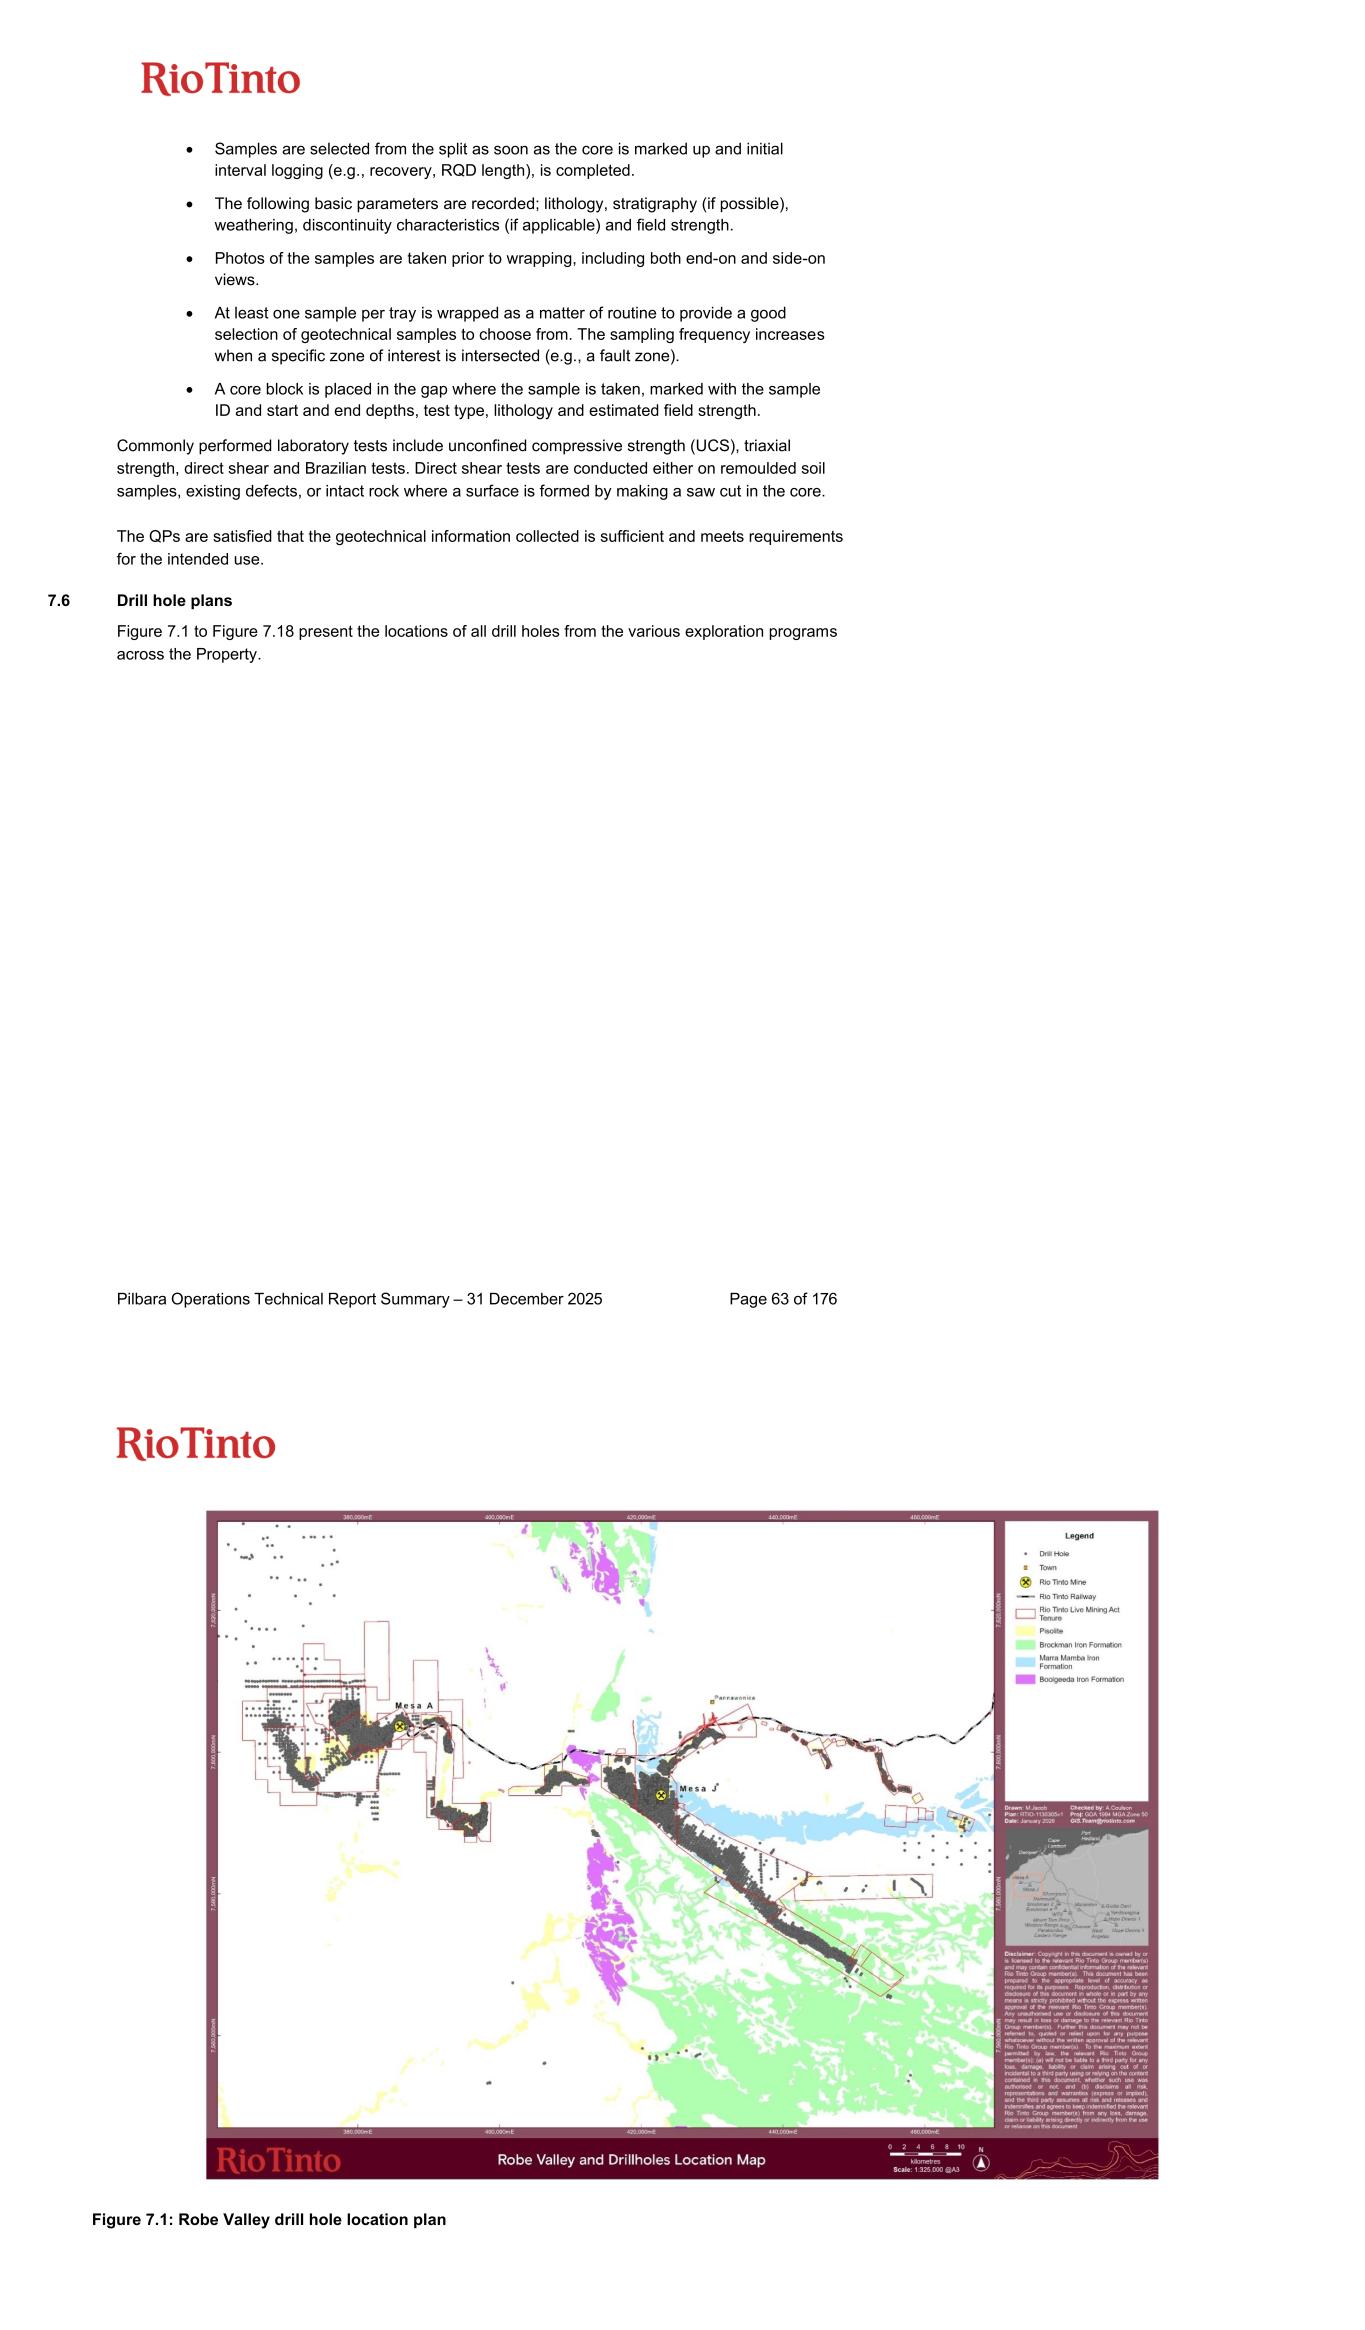
Pilbara Operations Technical Report Summary – 31 December 2025 Page 63 of 176 • Samples are selected from the split as soon as the core is marked up and initial interval logging (e.g., recovery, RQD length), is completed. • The following basic parameters are recorded; lithology, stratigraphy (if possible), weathering, discontinuity characteristics (if applicable) and field strength. • Photos of the samples are taken prior to wrapping, including both end-on and side-on views. • At least one sample per tray is wrapped as a matter of routine to provide a good selection of geotechnical samples to choose from. The sampling frequency increases when a specific zone of interest is intersected (e.g., a fault zone). • A core block is placed in the gap where the sample is taken, marked with the sample ID and start and end depths, test type, lithology and estimated field strength. Commonly performed laboratory tests include unconfined compressive strength (UCS), triaxial strength, direct shear and Brazilian tests. Direct shear tests are conducted either on remoulded soil samples, existing defects, or intact rock where a surface is formed by making a saw cut in the core. The QPs are satisfied that the geotechnical information collected is sufficient and meets requirements for the intended use. 7.6 Drill hole plans Figure 7.1 to Figure 7.18 present the locations of all drill holes from the various exploration programs across the Property. Figure 7.1: Robe Valley drill hole location plan
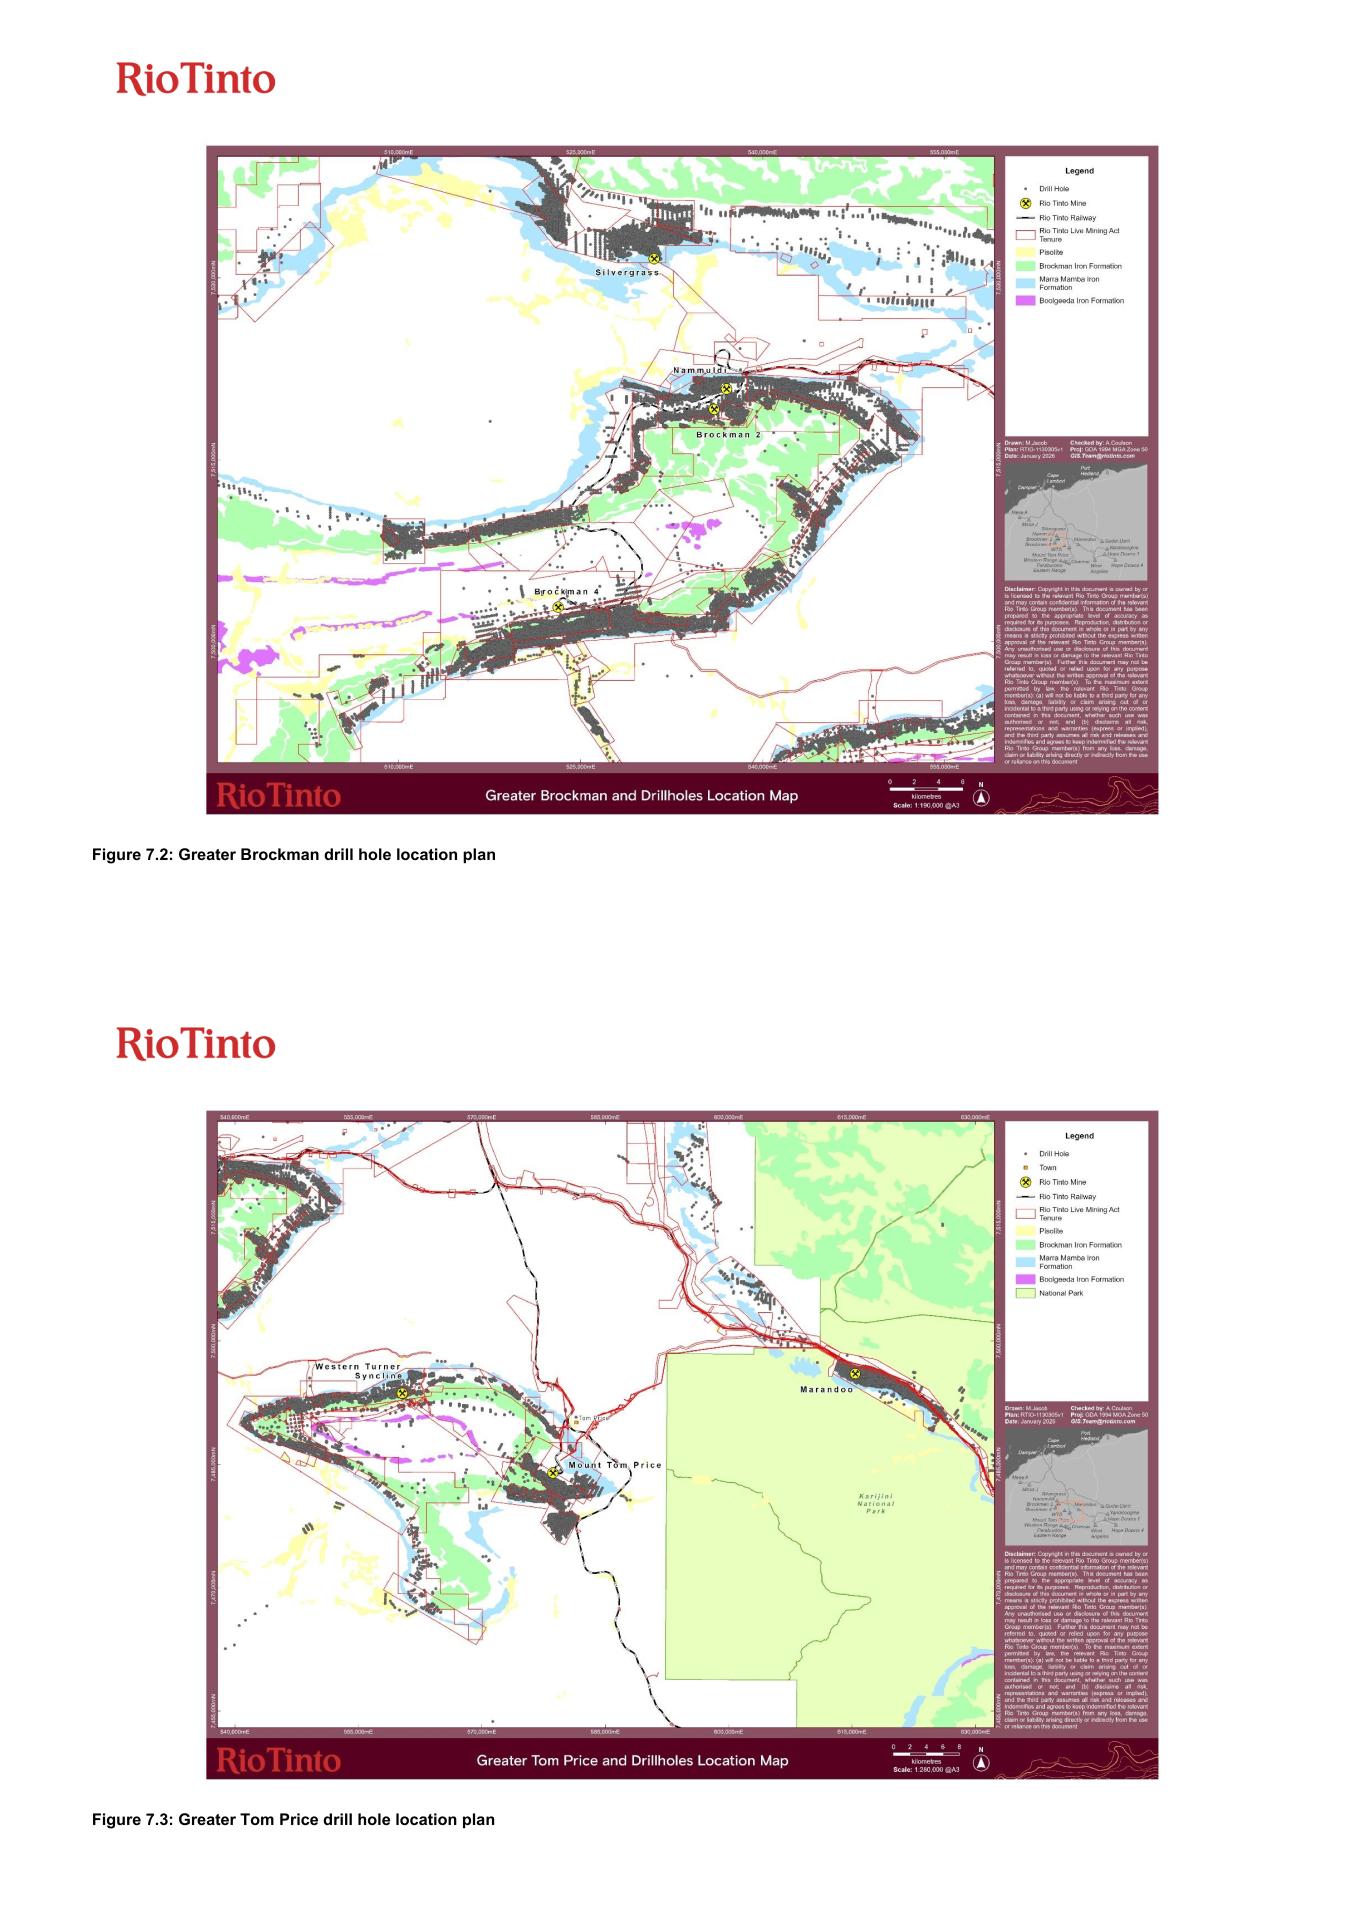
Figure 7.2: Greater Brockman drill hole location plan Figure 7.3: Greater Tom Price drill hole location plan
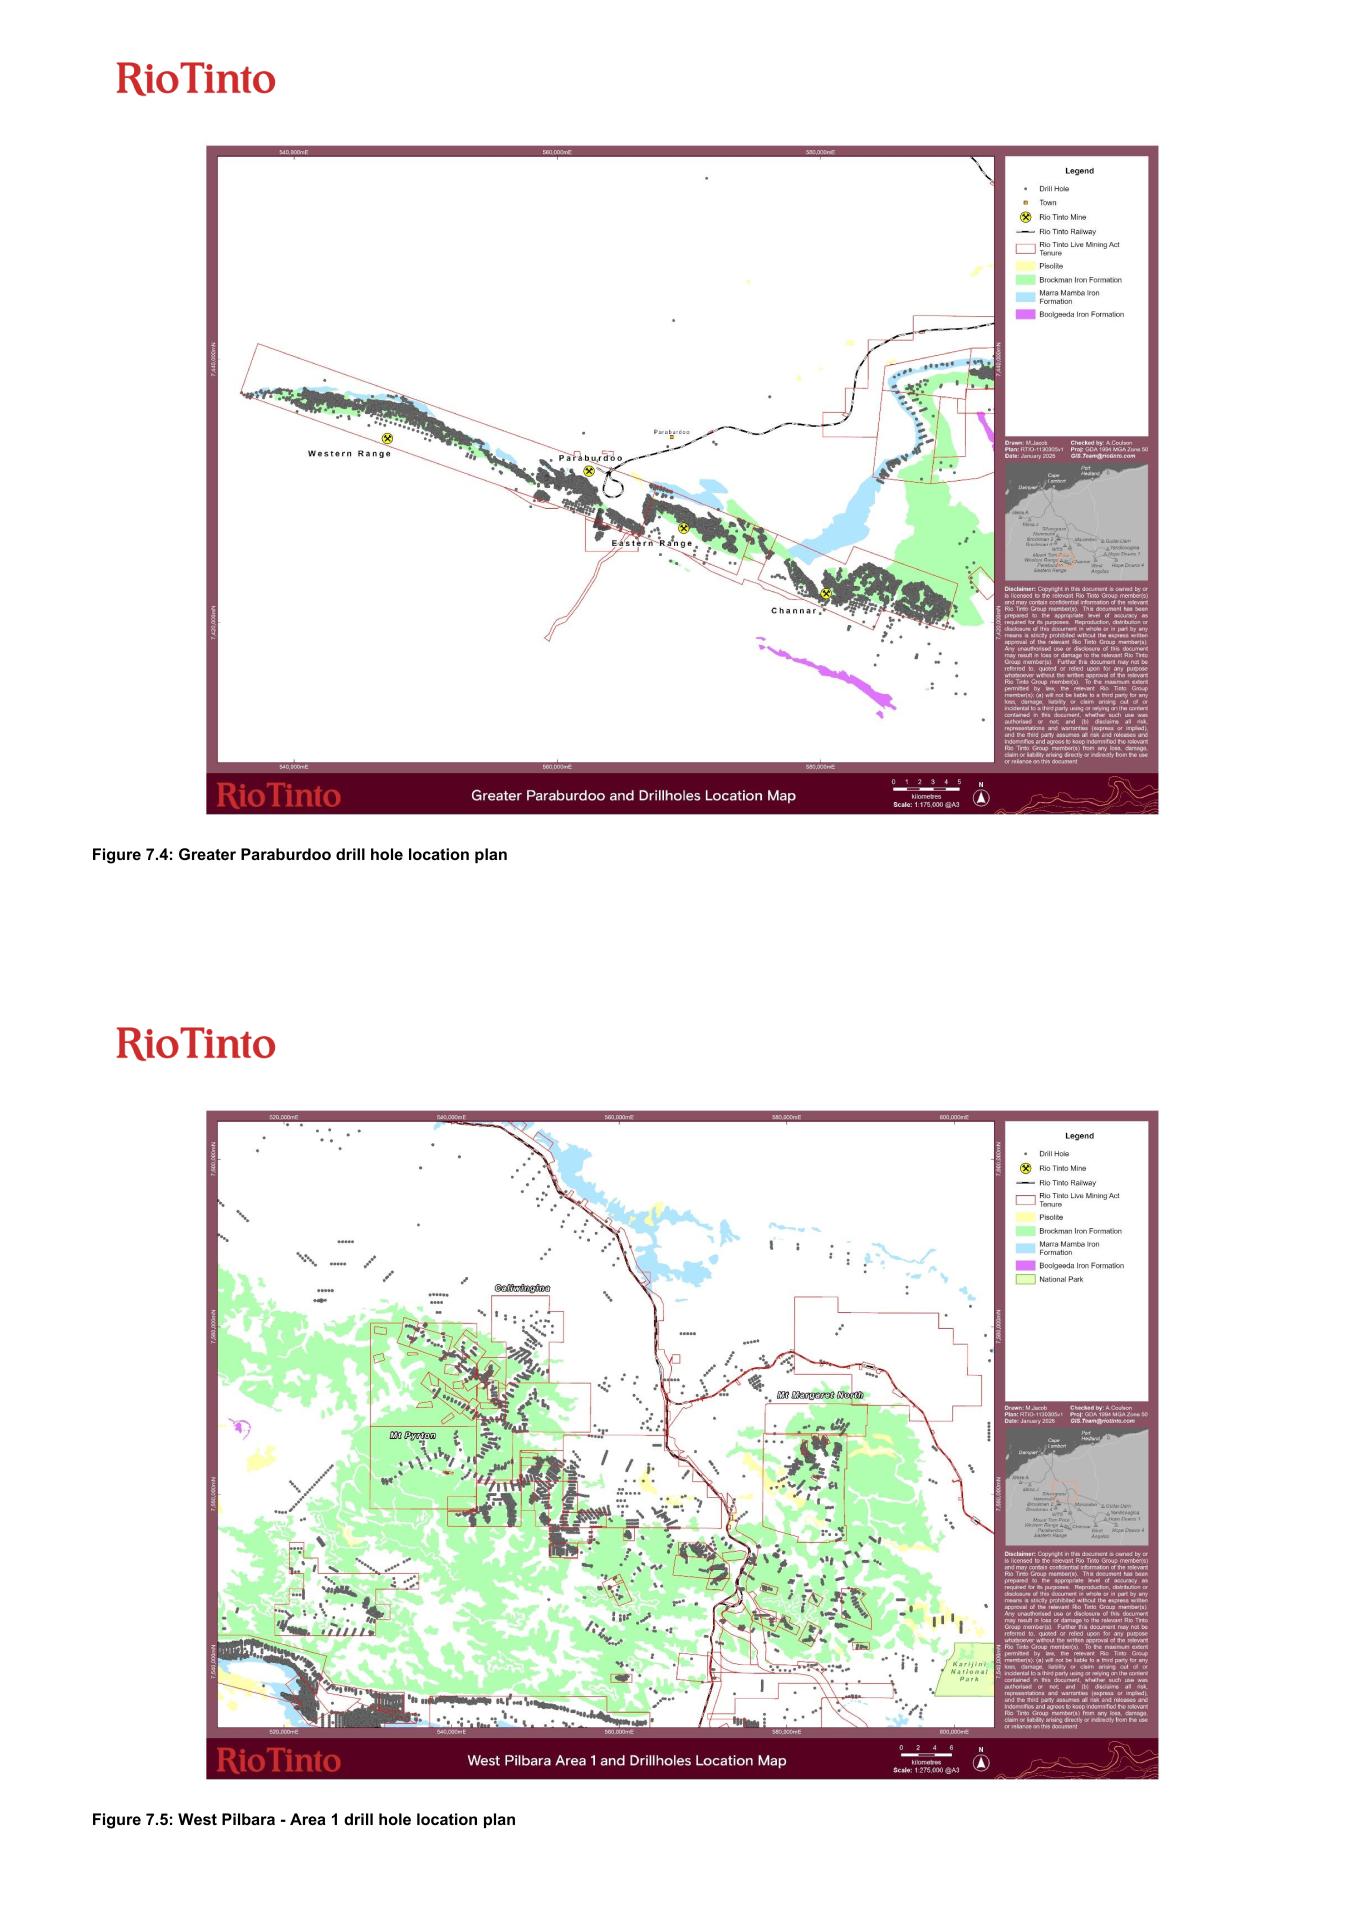
Figure 7.4: Greater Paraburdoo drill hole location plan Figure 7.5: West Pilbara - Area 1 drill hole location plan
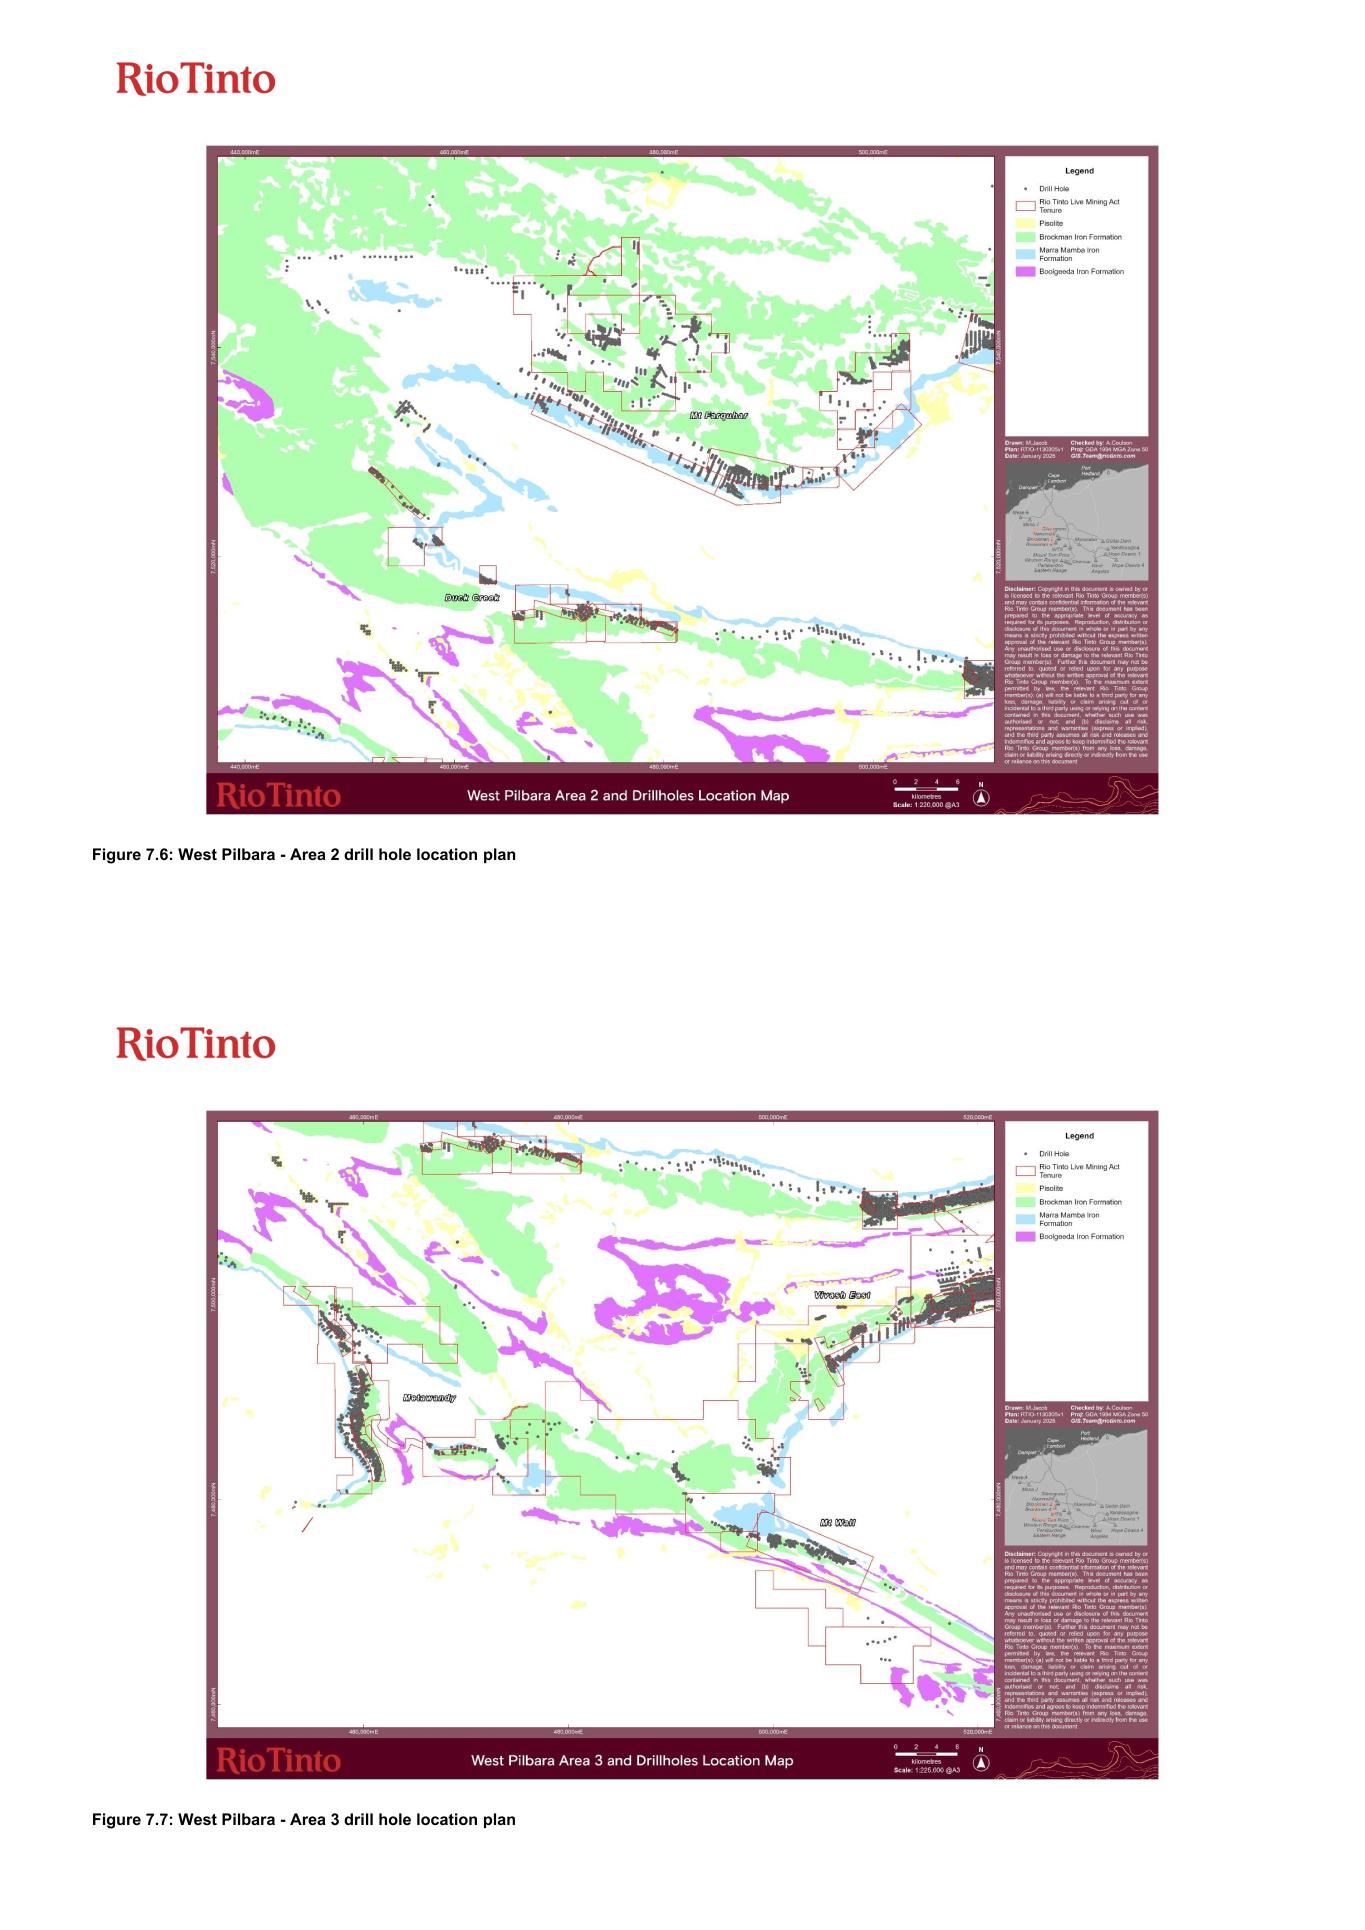
Figure 7.6: West Pilbara - Area 2 drill hole location plan Figure 7.7: West Pilbara - Area 3 drill hole location plan
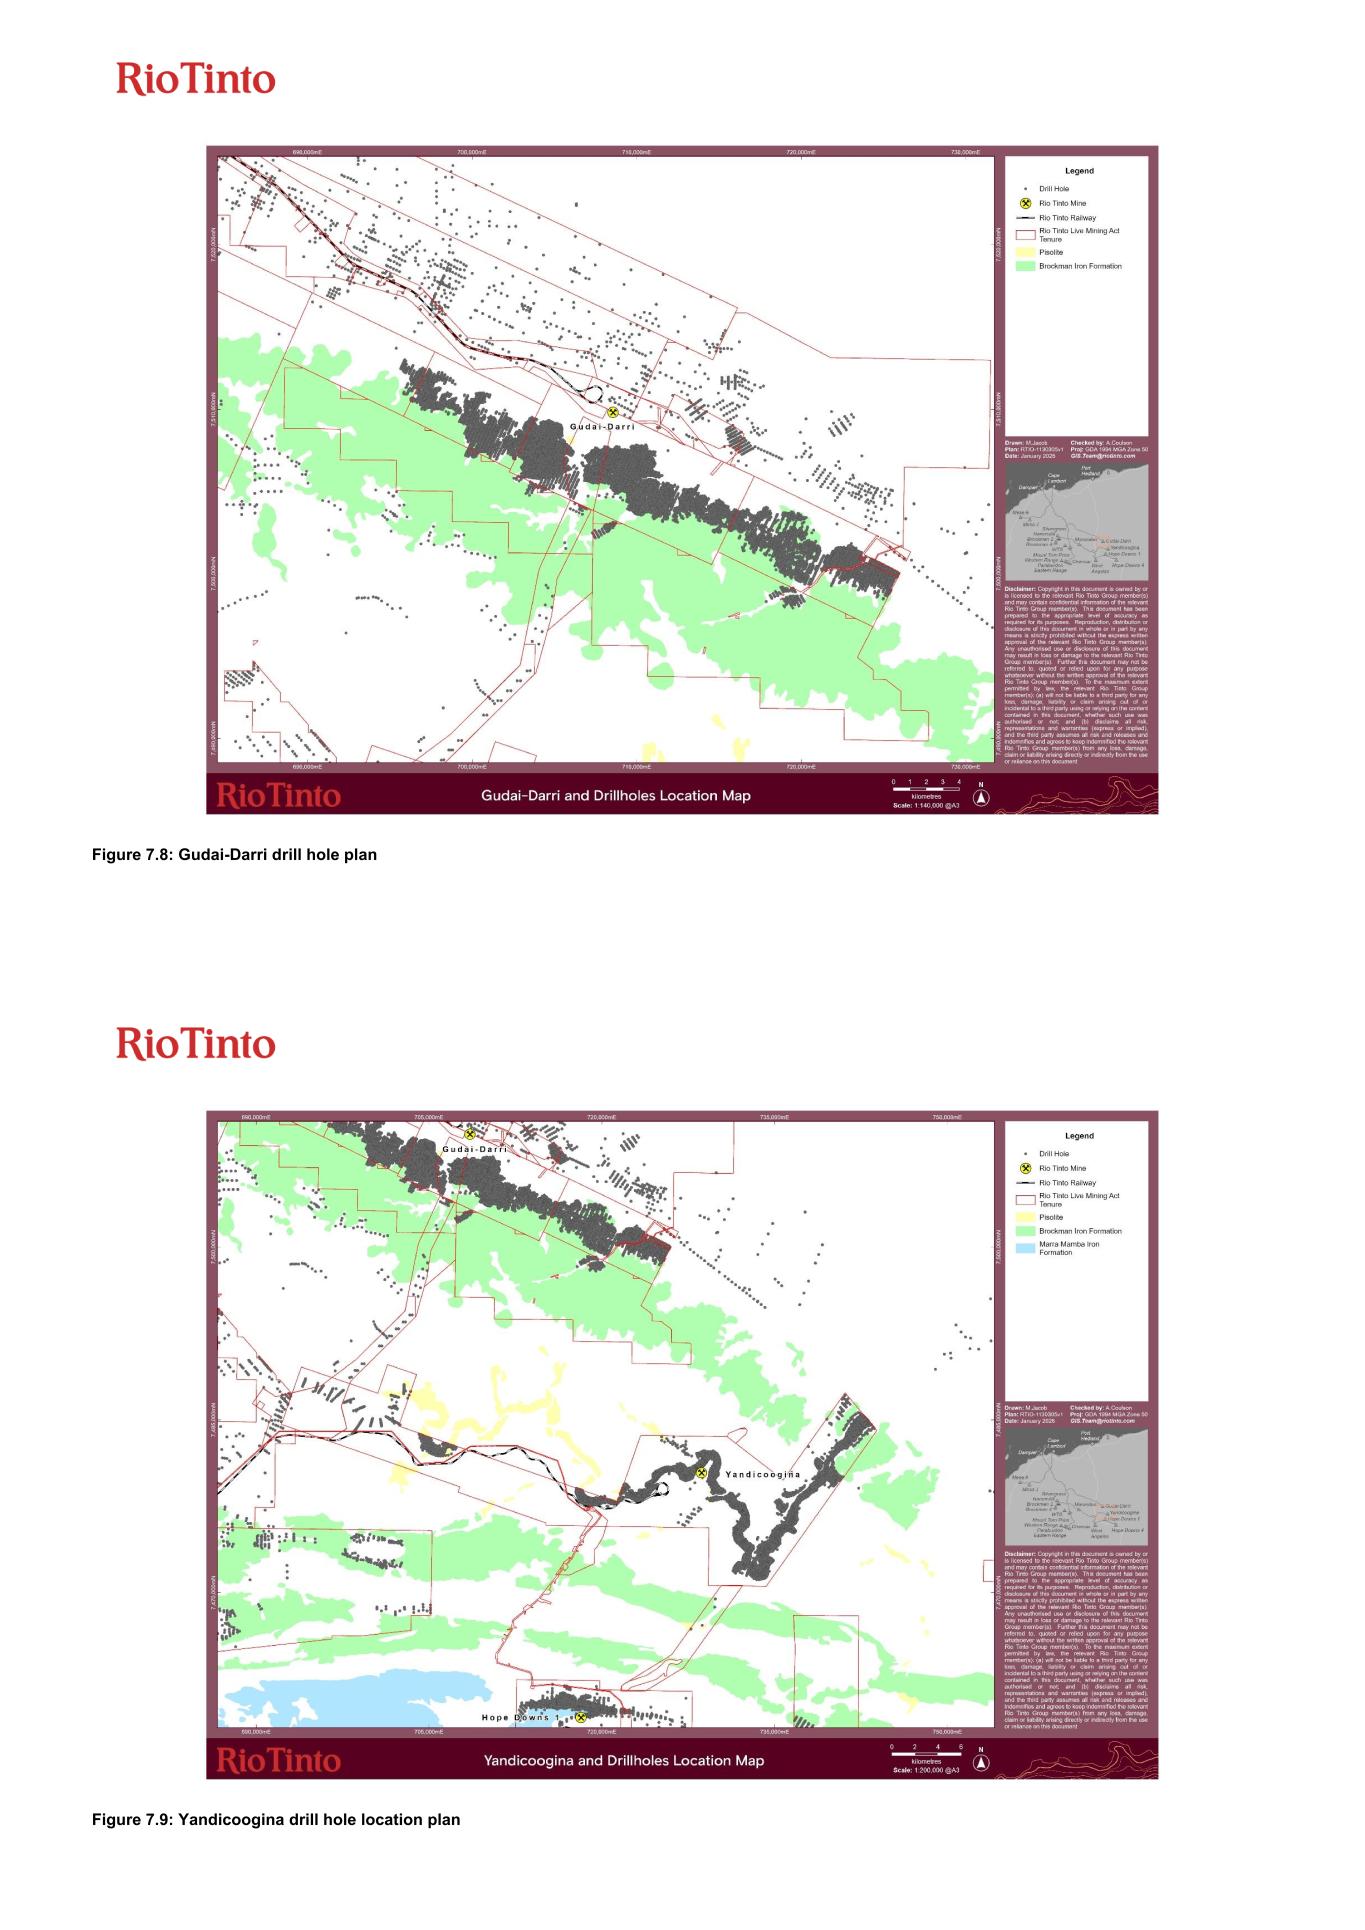
Figure 7.8: Gudai-Darri drill hole plan Figure 7.9: Yandicoogina drill hole location plan
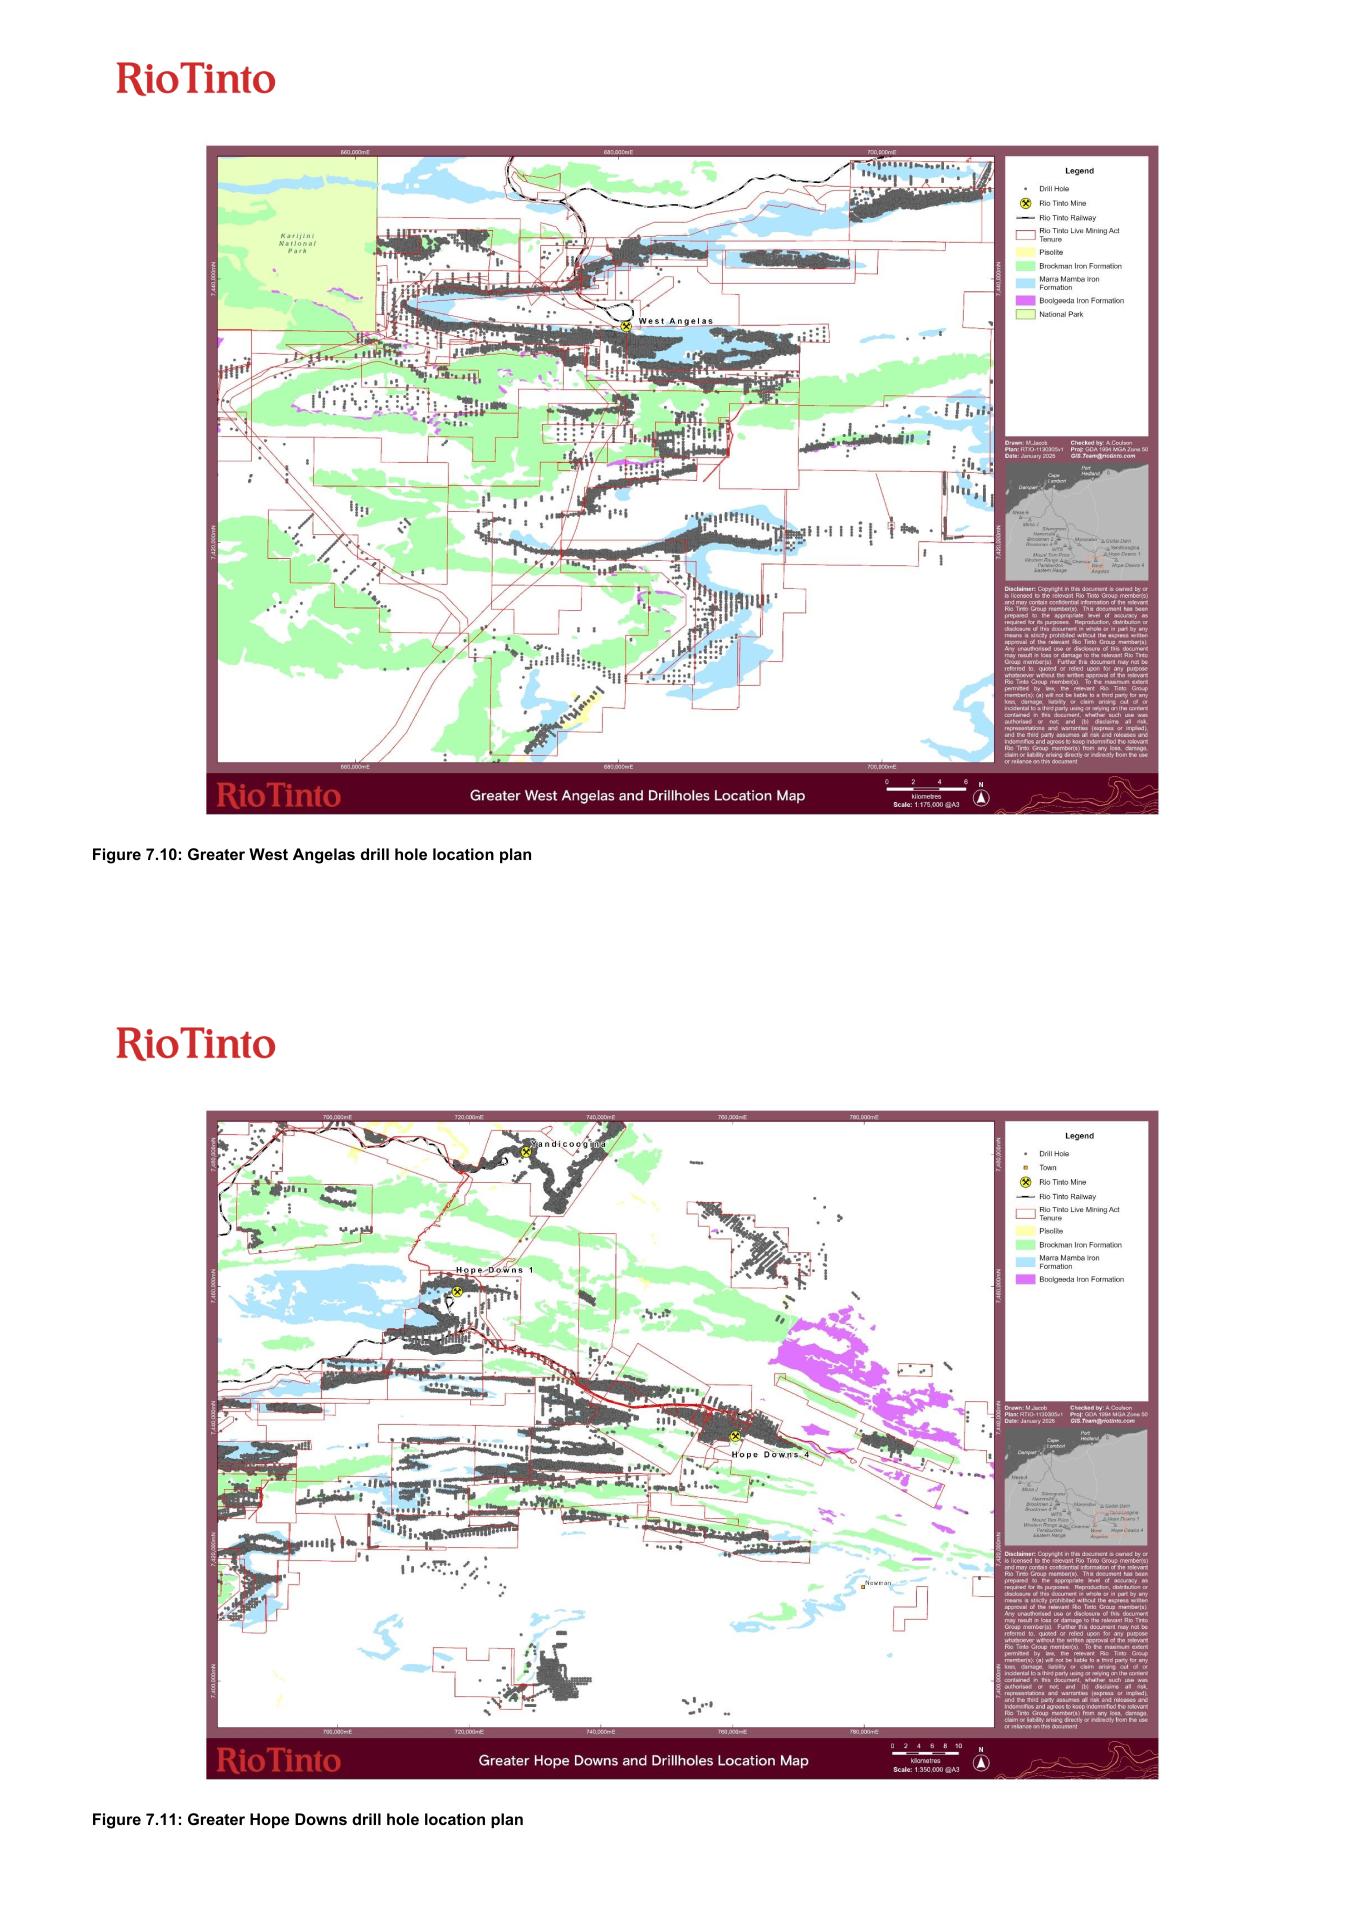
Figure 7.10: Greater West Angelas drill hole location plan Figure 7.11: Greater Hope Downs drill hole location plan
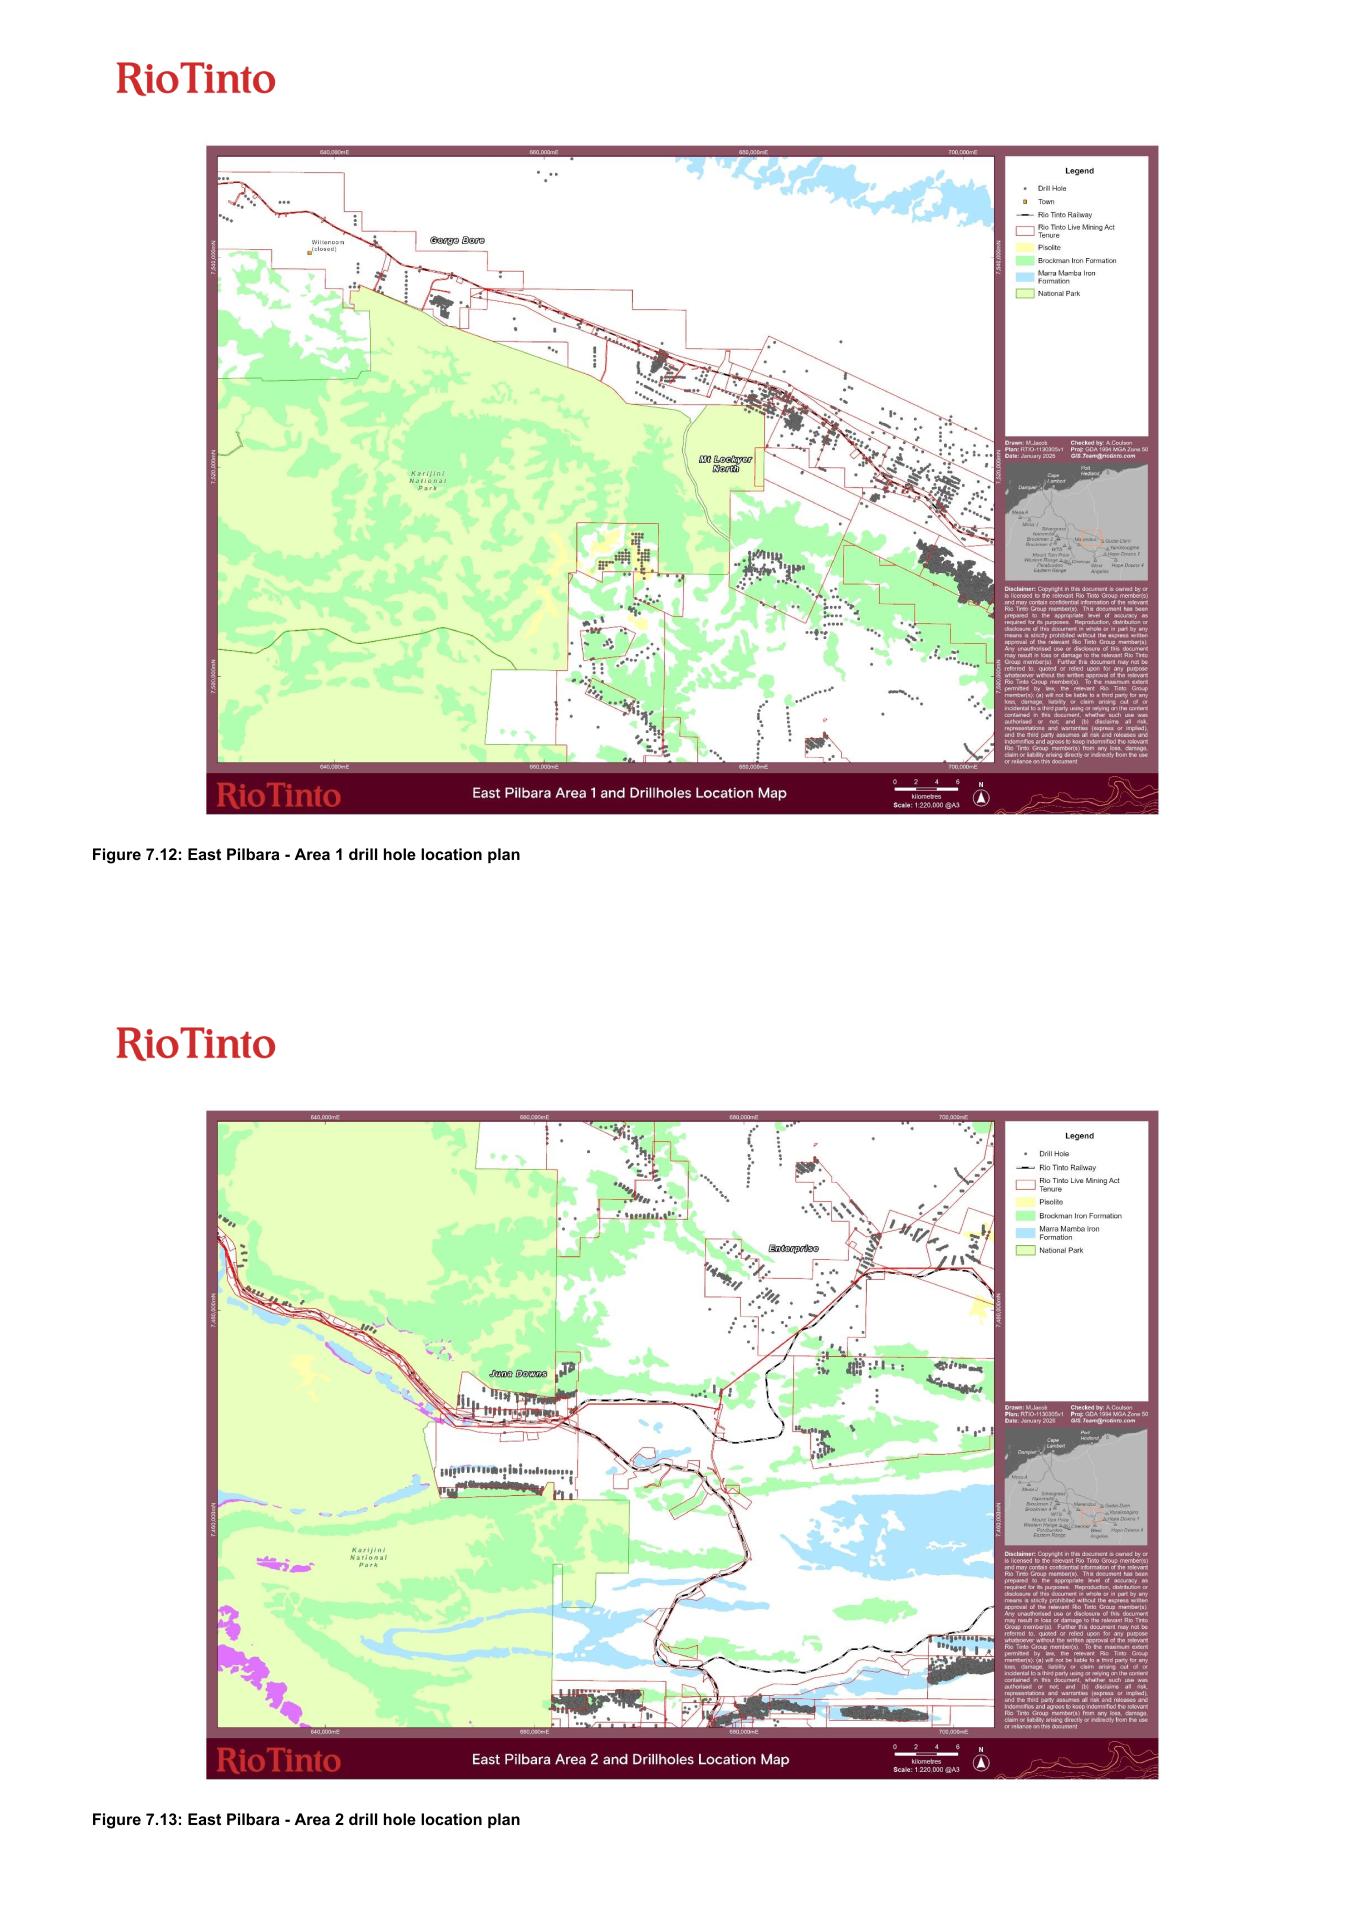
Figure 7.12: East Pilbara - Area 1 drill hole location plan Figure 7.13: East Pilbara - Area 2 drill hole location plan
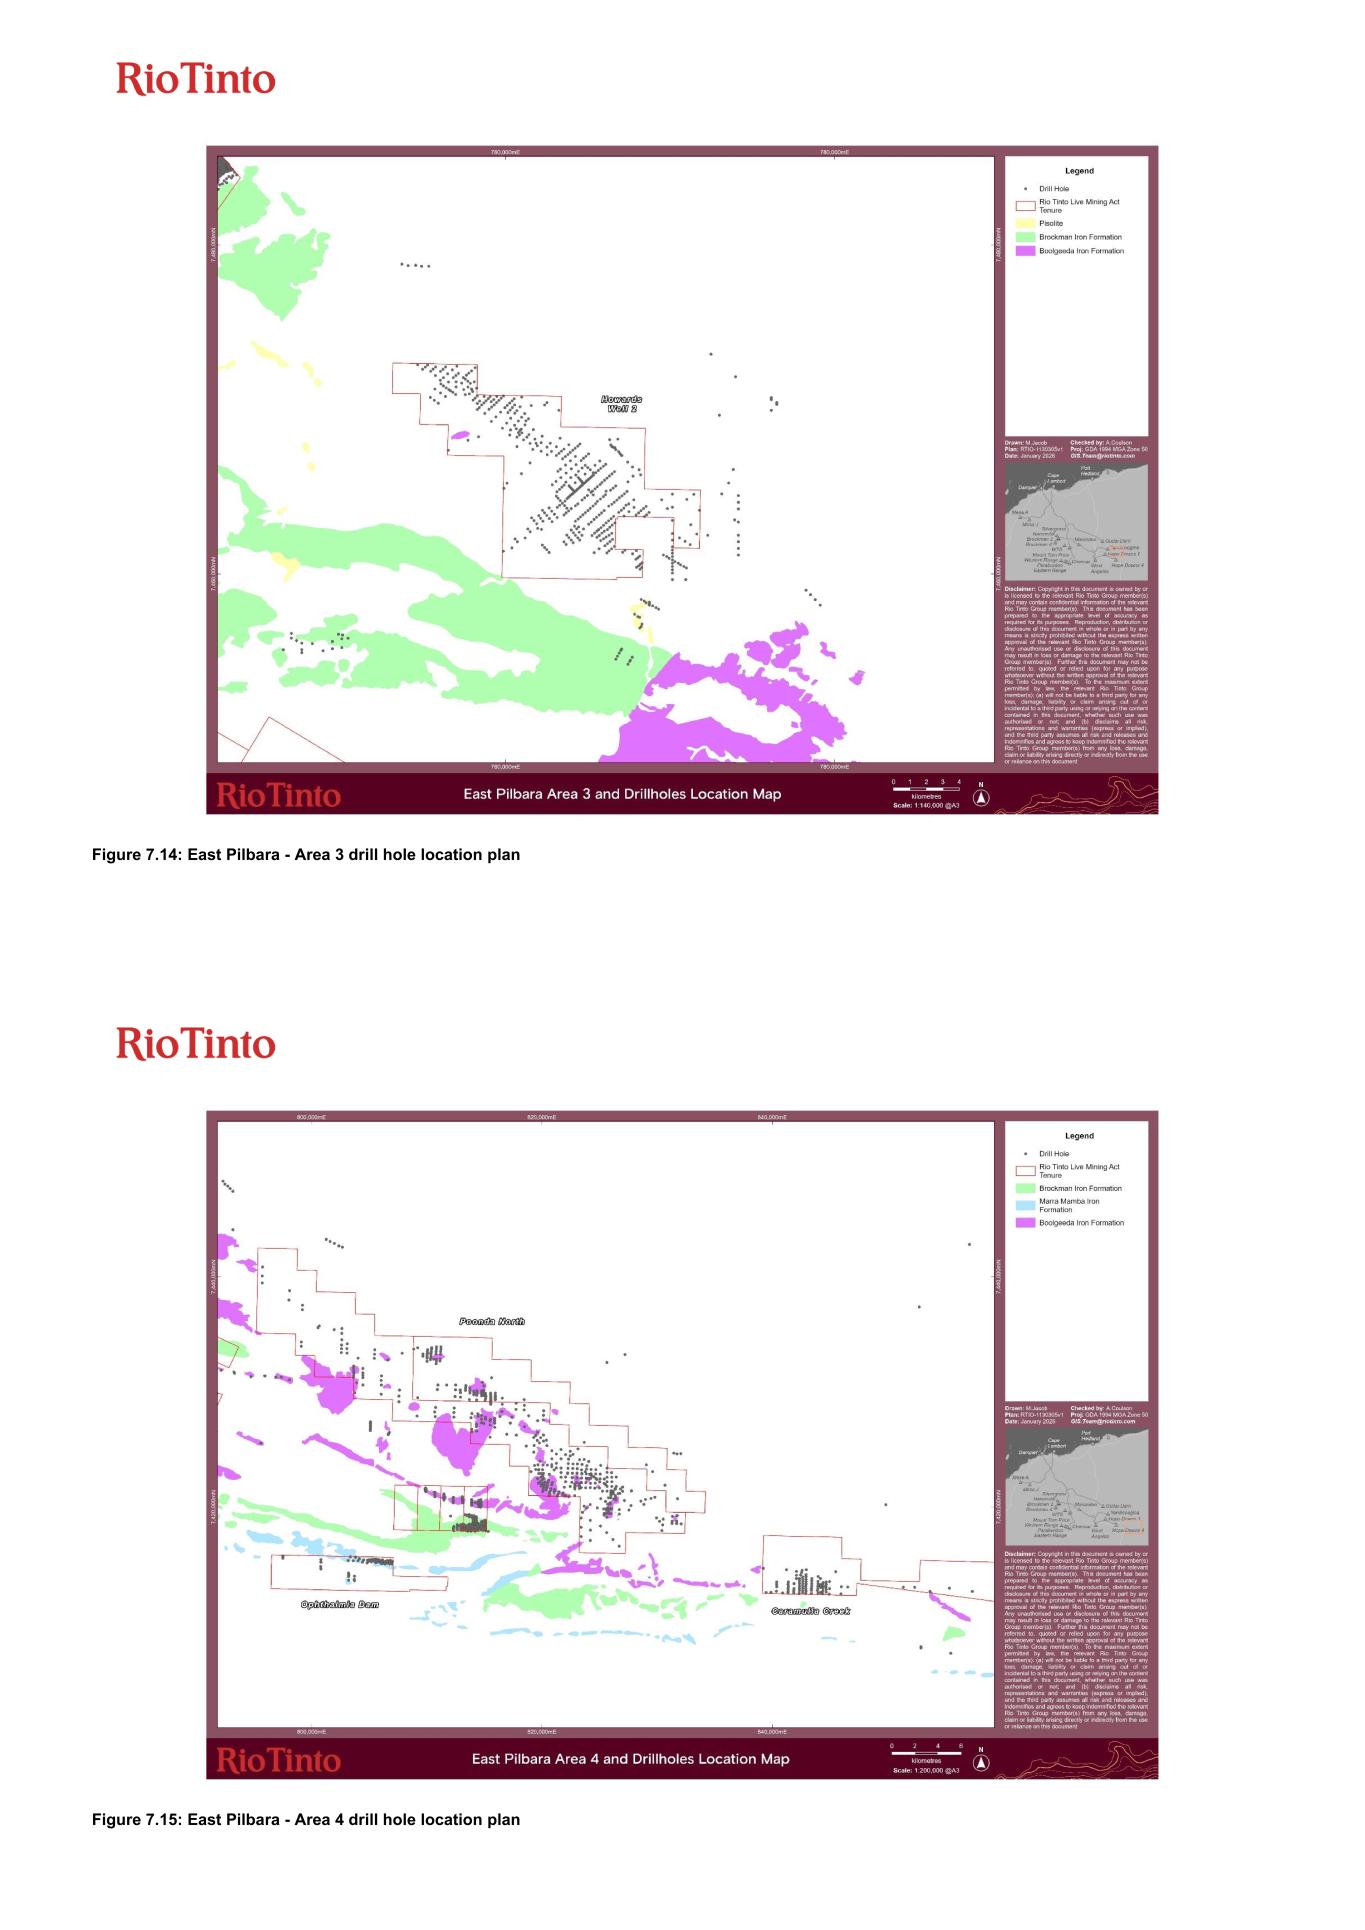
Figure 7.14: East Pilbara - Area 3 drill hole location plan Figure 7.15: East Pilbara - Area 4 drill hole location plan
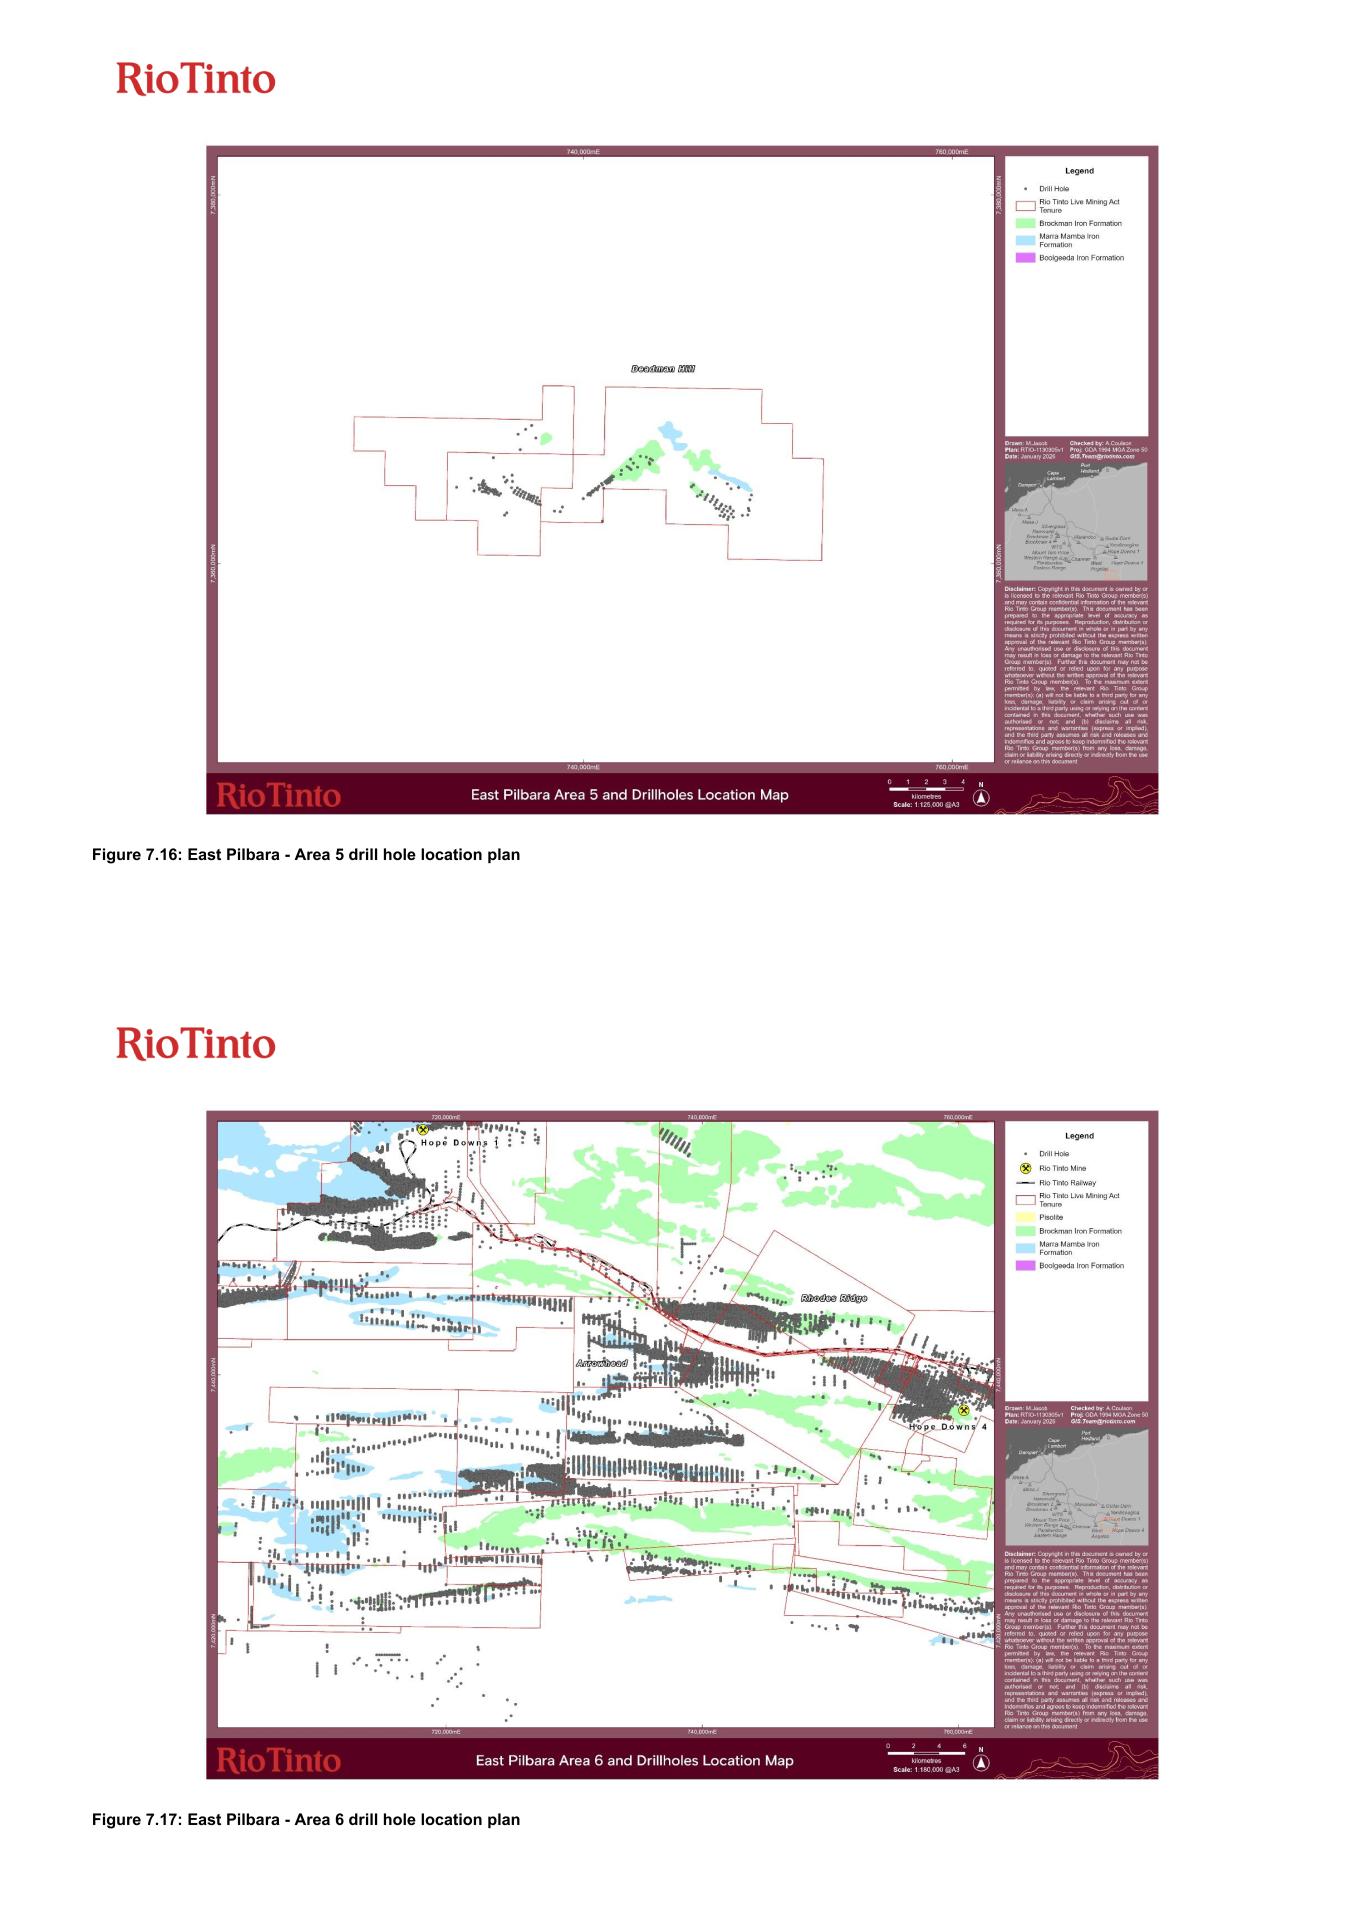
Figure 7.16: East Pilbara - Area 5 drill hole location plan Figure 7.17: East Pilbara - Area 6 drill hole location plan
Figure 7.18: Rest of East Pilbara drill hole location plan Pilbara Operations Technical Report Summary – 31 December 2025 Page 82 of 176 8 Sample preparation, analyses, and security 8.1 Sample preparation methods The laboratory sample preparation procedure requires samples received to be sorted according to the sample submission or sample dispatch note (SDN) and a reconciliation report issued for checking prior to sample preparation. Sample weight as received is recorded, prior to drying at 1,050°C for 24 hours or more, depending on the condition/moisture content of the samples. The dry weight is then recorded. Samples are then crushed utilising jaw and/or Boyd crushers to pass 3 mm in fraction and split by rotary cone or linear divider before pulverising through a manual or robotic LM5 mill to reduce particles below 150 µm. Equipment performance monitoring is conducted via use of sieve tests at the rate of one sample per batch, used to verify that 95% passing 150 µm is consistently achieved. 8.1.1 Historical sample preparation methods 8.1.1.1 1970s and 1980s programs Samples were sent to HEX Wittenoom, Tom Price laboratory, Minex laboratory in Melbourne and Amdel in Adelaide for sample preparation and analysis. After splitting to approximate ¾ lbs, samples were dried for 1.5 hours at 110°C, then halved; one half was stored as the laboratory duplicate. The other half was pulverised to -80 mesh (-177 µm) and dried for a further 1.5 hours at 1,100oC, then stored in a desiccator prior to analysis. 8.1.1.2 1990s programs Samples were sent to Cape Lambert, Dampier, Paraburdoo and Tom Price laboratories for sample preparation and analysis. The 5 kg samples were crushed to <3 mm, split to 200 g using a rotary sample divider, dried at 105°C for eight hours and then ground in a ring mill (95% passing a 100- micron [µm] sieve) to form a sub-sample for X-Ray Fluorescence (XRF) analysis. In the late 1990s, some samples were also sent to external laboratories in Perth (SGS and UltraTrace). The whole sample was dried at 105°C in gas-fired ovens. If required, the sample was crushed using a Jacques jaw crusher to approximately -5 mm. The entire sample was pulverised for samples of 3.5 kg or less. Samples over 3.5 kg were split in half, and one half was pulverised. Samples containing greater than 2.5% combined water were pulverised to 90% passing 150 µm. All other samples were pulverised to 95% passing 106 µm. 8.1.2 Recent sample preparation methods (2000s to recent programs) Samples were sent to Dampier and Tom Price; SGS, ALS, UltraTrace/Bureau Veritas and Intertek Genalysis laboratories. At the laboratory, the RC samples are weighed, dried at 105°C for at least 24 hours, crushed to 3 mm passing in a Boyd crusher, split utilising linier or rotary splitting dividers and then pulverised in a LM5 robotic or manual mill. The diamond core samples are crushed to -6 mm, utilising a jaw crusher before further reduction with a Boyd crusher. 8.2 Sample analysis Sample analysis is undertaken utilising XRF for 24 elements/oxides and Loss on Ignition (LOI) is determined utilising a Thermogravimetric Analyser. A split of 100 g pulps is used for analytical process. 0.66 g pulps are mixed with flux to form a glass bead for the XRF analysis whilst 3 to 5 g pulps are used for LOI determination.
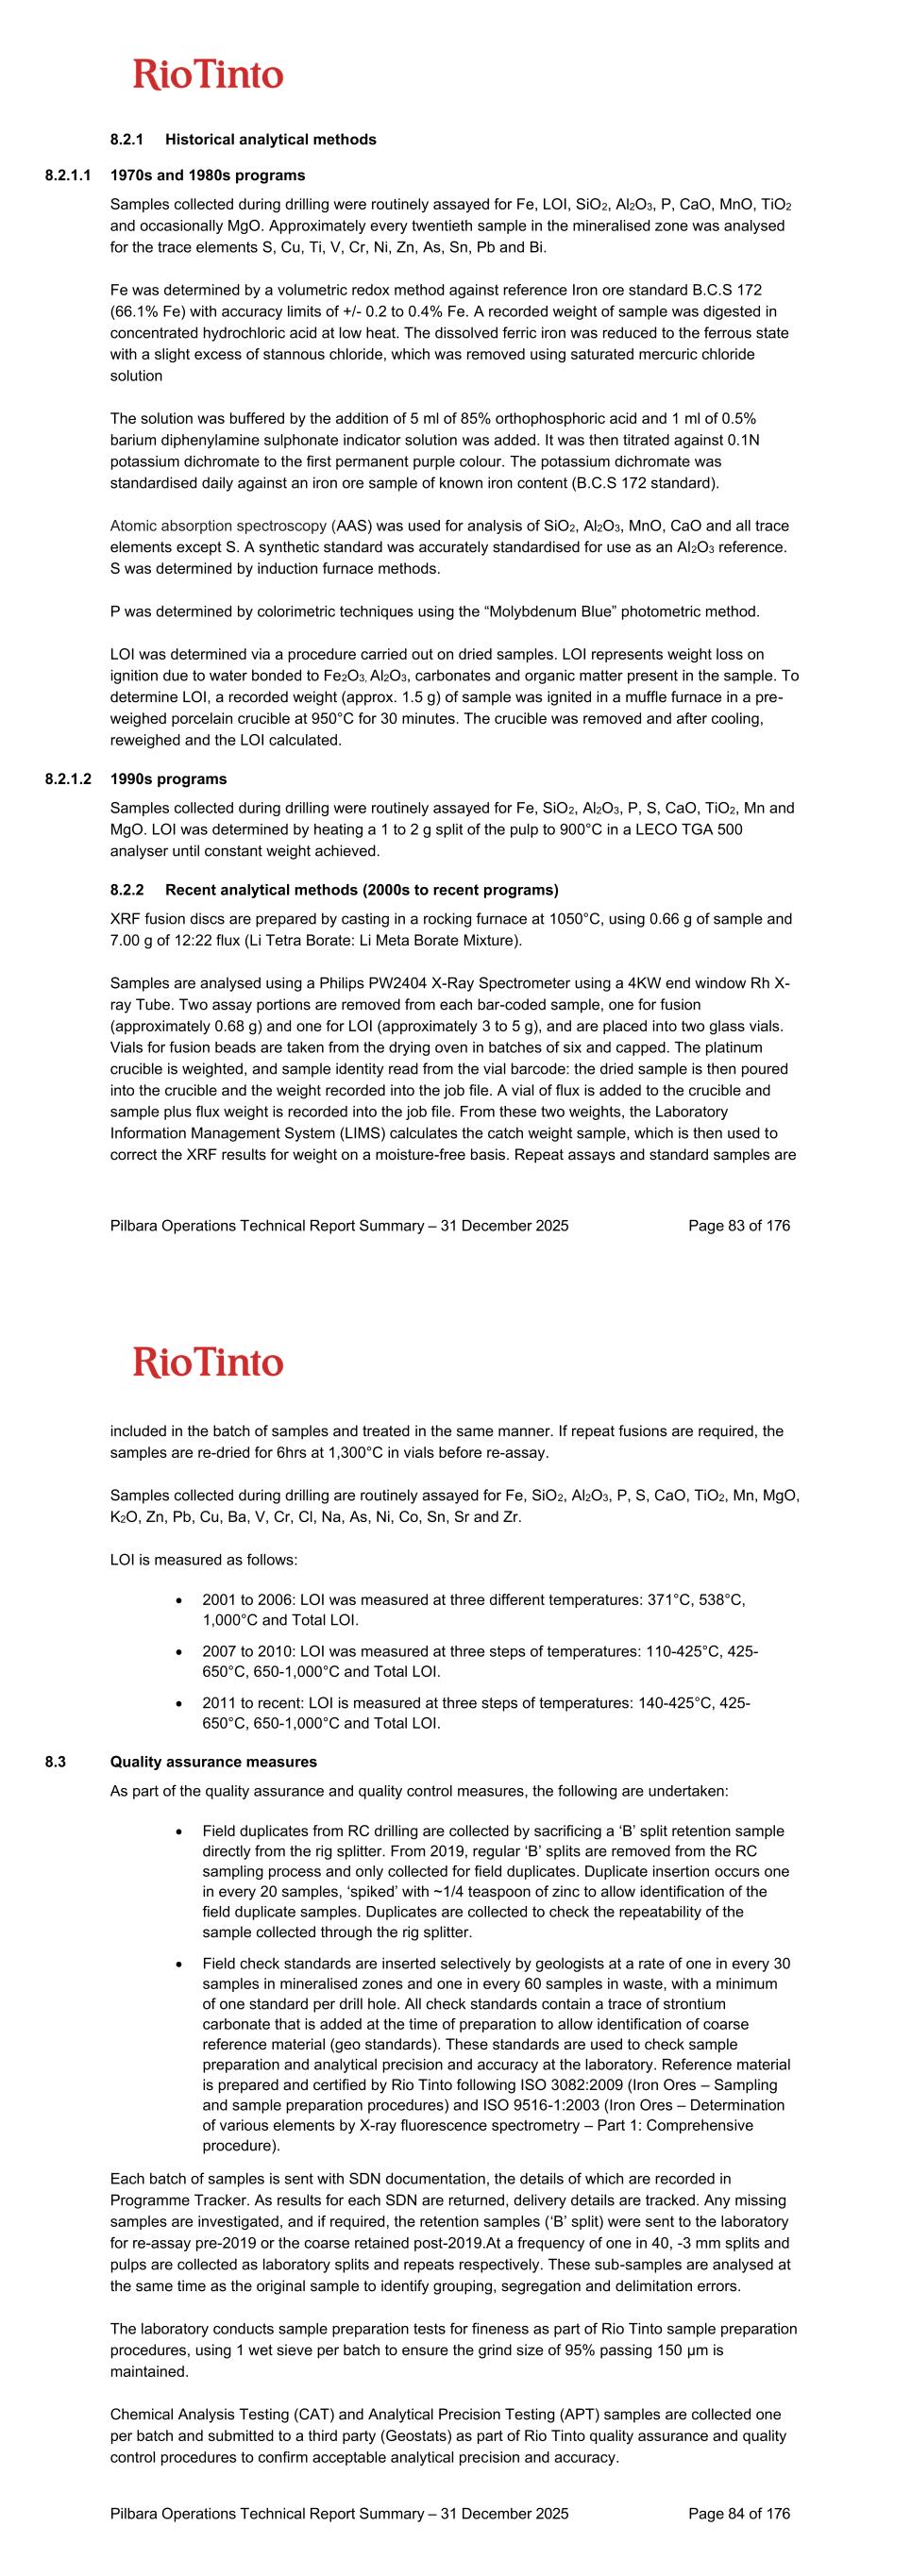
Pilbara Operations Technical Report Summary – 31 December 2025 Page 83 of 176 8.2.1 Historical analytical methods 8.2.1.1 1970s and 1980s programs Samples collected during drilling were routinely assayed for Fe, LOI, SiO2, Al2O3, P, CaO, MnO, TiO2 and occasionally MgO. Approximately every twentieth sample in the mineralised zone was analysed for the trace elements S, Cu, Ti, V, Cr, Ni, Zn, As, Sn, Pb and Bi. Fe was determined by a volumetric redox method against reference Iron ore standard B.C.S 172 (66.1% Fe) with accuracy limits of +/- 0.2 to 0.4% Fe. A recorded weight of sample was digested in concentrated hydrochloric acid at low heat. The dissolved ferric iron was reduced to the ferrous state with a slight excess of stannous chloride, which was removed using saturated mercuric chloride solution The solution was buffered by the addition of 5 ml of 85% orthophosphoric acid and 1 ml of 0.5% barium diphenylamine sulphonate indicator solution was added. It was then titrated against 0.1N potassium dichromate to the first permanent purple colour. The potassium dichromate was standardised daily against an iron ore sample of known iron content (B.C.S 172 standard). Atomic absorption spectroscopy (AAS) was used for analysis of SiO2, Al2O3, MnO, CaO and all trace elements except S. A synthetic standard was accurately standardised for use as an Al2O3 reference. S was determined by induction furnace methods. P was determined by colorimetric techniques using the “Molybdenum Blue” photometric method. LOI was determined via a procedure carried out on dried samples. LOI represents weight loss on ignition due to water bonded to Fe2O3, Al2O3, carbonates and organic matter present in the sample. To determine LOI, a recorded weight (approx. 1.5 g) of sample was ignited in a muffle furnace in a pre- weighed porcelain crucible at 950°C for 30 minutes. The crucible was removed and after cooling, reweighed and the LOI calculated. 8.2.1.2 1990s programs Samples collected during drilling were routinely assayed for Fe, SiO2, Al2O3, P, S, CaO, TiO2, Mn and MgO. LOI was determined by heating a 1 to 2 g split of the pulp to 900°C in a LECO TGA 500 analyser until constant weight achieved. 8.2.2 Recent analytical methods (2000s to recent programs) XRF fusion discs are prepared by casting in a rocking furnace at 1050°C, using 0.66 g of sample and 7.00 g of 12:22 flux (Li Tetra Borate: Li Meta Borate Mixture). Samples are analysed using a Philips PW2404 X-Ray Spectrometer using a 4KW end window Rh X- ray Tube. Two assay portions are removed from each bar-coded sample, one for fusion (approximately 0.68 g) and one for LOI (approximately 3 to 5 g), and are placed into two glass vials. Vials for fusion beads are taken from the drying oven in batches of six and capped. The platinum crucible is weighted, and sample identity read from the vial barcode: the dried sample is then poured into the crucible and the weight recorded into the job file. A vial of flux is added to the crucible and sample plus flux weight is recorded into the job file. From these two weights, the Laboratory Information Management System (LIMS) calculates the catch weight sample, which is then used to correct the XRF results for weight on a moisture-free basis. Repeat assays and standard samples are Pilbara Operations Technical Report Summary – 31 December 2025 Page 84 of 176 included in the batch of samples and treated in the same manner. If repeat fusions are required, the samples are re-dried for 6hrs at 1,300°C in vials before re-assay. Samples collected during drilling are routinely assayed for Fe, SiO2, Al2O3, P, S, CaO, TiO2, Mn, MgO, K2O, Zn, Pb, Cu, Ba, V, Cr, Cl, Na, As, Ni, Co, Sn, Sr and Zr. LOI is measured as follows: • 2001 to 2006: LOI was measured at three different temperatures: 371°C, 538°C, 1,000°C and Total LOI. • 2007 to 2010: LOI was measured at three steps of temperatures: 110-425°C, 425- 650°C, 650-1,000°C and Total LOI. • 2011 to recent: LOI is measured at three steps of temperatures: 140-425°C, 425- 650°C, 650-1,000°C and Total LOI. 8.3 Quality assurance measures As part of the quality assurance and quality control measures, the following are undertaken: • Field duplicates from RC drilling are collected by sacrificing a ‘B’ split retention sample directly from the rig splitter. From 2019, regular ‘B’ splits are removed from the RC sampling process and only collected for field duplicates. Duplicate insertion occurs one in every 20 samples, ‘spiked’ with ~1/4 teaspoon of zinc to allow identification of the field duplicate samples. Duplicates are collected to check the repeatability of the sample collected through the rig splitter. • Field check standards are inserted selectively by geologists at a rate of one in every 30 samples in mineralised zones and one in every 60 samples in waste, with a minimum of one standard per drill hole. All check standards contain a trace of strontium carbonate that is added at the time of preparation to allow identification of coarse reference material (geo standards). These standards are used to check sample preparation and analytical precision and accuracy at the laboratory. Reference material is prepared and certified by Rio Tinto following ISO 3082:2009 (Iron Ores – Sampling and sample preparation procedures) and ISO 9516-1:2003 (Iron Ores – Determination of various elements by X-ray fluorescence spectrometry – Part 1: Comprehensive procedure). Each batch of samples is sent with SDN documentation, the details of which are recorded in Programme Tracker. As results for each SDN are returned, delivery details are tracked. Any missing samples are investigated, and if required, the retention samples (‘B’ split) were sent to the laboratory for re-assay pre-2019 or the coarse retained post-2019.At a frequency of one in 40, -3 mm splits and pulps are collected as laboratory splits and repeats respectively. These sub-samples are analysed at the same time as the original sample to identify grouping, segregation and delimitation errors. The laboratory conducts sample preparation tests for fineness as part of Rio Tinto sample preparation procedures, using 1 wet sieve per batch to ensure the grind size of 95% passing 150 µm is maintained. Chemical Analysis Testing (CAT) and Analytical Precision Testing (APT) samples are collected one per batch and submitted to a third party (Geostats) as part of Rio Tinto quality assurance and quality control procedures to confirm acceptable analytical precision and accuracy.
Pilbara Operations Technical Report Summary – 31 December 2025 Page 85 of 176 Internal laboratory quality assurance and quality control measures involve the use of internal laboratory standards using certified reference material in the form of pulps, blanks and duplicates, and are inserted in each batch. Random re-submission of pulps at an external laboratory is performed following analysis. A total of 5% of inter laboratory check assays are conducted on a quarterly basis. Analysis of the performance of certified standards and field duplicates has indicated an acceptable level of accuracy and precision with no significant bias. 8.3.1 Historical field quality assurance measures To measure sampling precision, a duplicate sample was collected from the mineralised zone at a frequency of approximately one per hole. The duplicate sample replaced one of the retention samples and was allocated a laboratory sample number in sequence within the mineralised zone. At an approximate rate of one per hole, a pre-prepared standard sample of known analysis was introduced into the samples for the purpose of monitoring the accuracy of the laboratory. These check standards were allocated a laboratory sample number in sequence within the mineralised zone. The laboratory samples were then sent to the laboratory, and the retention samples were stored for future reference. 8.4 Sample security All assaying of samples used in Mineral Resource estimates has been conducted by independent, National Association of Testing Authorities (NATA) and International Standard Organisation (ISO) certified laboratories. Assay data is returned electronically from the laboratory and uploaded into the Rio Tinto acQuire™ database (RTDB). The sample chain of custody is managed by Rio Tinto. As of 2008, analytical samples (‘A’ splits) are collected by field assistants, placed onto steel sample racks and delivered to Perth by a recognised freight service and then to the assay laboratory by a Perth-based courier service. Whilst in storage the samples are kept in a locked yard. Retention samples (‘B’ splits) were collected and stored in drums at on-site facilities until 2018. Since 2019, approximately 500 g of coarse retains (+/- 3 mm fractions) have been kept at laboratories for 24 months. 150 g of excess pulps from primary samples is retained indefinitely at laboratories and external storage facilities at CTI Logistics Ltd in Perth, Western Australia. 9 Data verification 9.1 Exploration and Mineral Resource verification Written procedures outline the processes of geological logging and data importing, quality assurance and quality control validation and assay importing. A robust, restricted-access database is in place to ensure that any requests to modify existing data go through appropriate channels and approvals, and that changes are tracked by date, time and user. Pilbara Operations Technical Report Summary – 31 December 2025 Page 86 of 176 Field data is logged directly onto field Toughbook™ laptops using pre-formatted and validated logging templates, with details uploaded to the RTDB on a daily basis. Assay data are only accepted in the RTDB once the quality control process has been undertaken utilising the Batch Analysis tool. Batch Analysis is a module within acQuire™ that enables geologists to assess a batch of assay data received from a laboratory for its accuracy and precision, by way of performance of duplicates and standards inserted within the batch. All holes are surveyed by qualified surveyors. The drillholes are surveyed in Mine Grid of Australia 1994 (MGA94) Zone 50 and 51 coordinates using Differential Global Positioning System (DGPS) survey equipment, which is accurate to 10 cm in both horizontal and vertical directions. Surveyed drillhole coordinates are validated against the planned drillhole coordinates, and then uploaded to the drillhole database. The historical drillholes were re-surveyed using DGPS; however, not all holes could be located and therefore the survey method for these holes is unknown and presumed to be planned coordinates. This is taken into consideration in the resource classification. Drill hole collar reduced level (RL) data is compared to detailed topographic maps and show that the collar survey data is accurate. The topographic surface is based on 5 m grid sampling of the most recent Light Detecting and Ranging (LiDAR) survey, including spot heights from DGPS drilling collars and is considered robust. Downhole surveys are conducted on every hole, with the exception of collapsed or otherwise hazardous holes. Significant, unexpected deviations are investigated and validated. Holes greater than 100 m depth are surveyed with an in-rod gyro tool. All the drill holes are geologically logged utilising standard Rio Tinto Iron Ore Material Type Classification Scheme logging codes. Geological logging is performed on 2 m intervals for all reverse circulation drilling. All drill holes are logged using downhole geophysical tools for gamma trace, calliper, gamma density, resistivity, and magnetic susceptibility. In most recent years, acoustic and optical televiewer data are collected at select drill hole locations for geological structural analyses. Drilling data is securely stored in an acQuire™ geoscientific information management system. The system is backed up nightly on servers located in Perth, Western Australia. The backup system was tested in November 2025, demonstrating that the system is effective. The import/exporting process requires limited keyboard transcription and has multiple built-in safeguards to ensure information is not overwritten or deleted. These include: • Data is imported and exported through automated interfaces, with limited manual input. • Inbuilt validation checks ensure errors are identified prior to import. • Once within the acQuire™ database, editing is limited, and warning messages ensure accidental changes are not made. • An audit trail records updates and deletions should an anomaly be identified.
Pilbara Operations Technical Report Summary – 31 December 2025 Page 87 of 176 • An export interface ensures the correct tables, fields and format are selected. The drill hole database used for Mineral Resource estimation is validated. Methods include checking: • acQuire™ scripts for relational integrity, duplicates, total assay and missing/blank assay values. • Grade ranges in each domain. • Domain names and tags. • Survey data downhole consistency. • Null and negative grade values. • Missing or overlapping intervals. • Duplicate data. • Drill hole data is also validated visually by domain and compared to the geological model. Comparison of RC and twinned DD core assay data distributions show that both drilling methods have similar grade distributions, verifying the suitability of RC samples for use in the Mineral Resource estimate. The geological models and Mineral Resource estimates of deposits are created using established industry methods set out in section 11. Verification of each geological model and Mineral Resource estimate occurs as noted in section 11.1.7. In addition, a peer review is completed at each step of the modelling process, inclusive of a sign-off by a QP at the completion of major steps. A QP also prepares separate documentation to aid and support the Mineral Resource classification, including information about all factors that may affect the confidence in the final model of the deposit, including, but not limited to, geological complexity, data quality, data quantity, aspects of geological interpretation, grade and geological continuity, and Mineral Resource estimation. 9.2 Mining and Mineral Reserve verification Multiple verification steps and processes are in place to verify the Mineral Reserve estimate. Verification applies to the assumptions and inputs into the estimate, as well as the estimation process itself. Rio Tinto undertakes extensive comparison of actual ore produced to the orebody block model (OBM) that underpins the Mineral Reserve estimates on a quarterly and annual basis. This reconciliation continually demonstrates that Rio Tinto produces ore in the amount and of the quality as predicted by the OBMs and is in accordance with the Mineral Reserve estimate. Reconciliations are undertaken for both in-situ (head) ore as well as saleable ore product. This allows verification of the in-situ ore estimate, as well as the metallurgical assumptions (upgrades, recovery etc.) of the Mineral Reserve estimate. Verification of the key modifying factors applied to the Mineral Resource is also undertaken as part of the production process during operations. Actual performance for operational mining areas provides a high level of confidence where similar performance can be expected from future mining areas. In addition to the verification of the modifying factors, the reported Mineral Reserve data itself undergoes several peer review and reconciliation steps prior to publication and release. One key component of the process is a comprehensive comparison between the current and prior-year Mineral Reserve estimates on a deposit-by-deposit basis. Any changes in the Mineral Reserve estimate are Pilbara Operations Technical Report Summary – 31 December 2025 Page 88 of 176 reconciled and verified against reported production (in cases of operating deposits), any changes to the underlying Mineral Resource estimate (e.g. tonnages, quality, confidence levels), changes to metallurgical assumptions, changes to pit designs and changes to the mine plan underpinning the Mineral Reserve estimate. The QP has only used data deemed to have been generated in line with a proved industry standard procedures and that is suitable for use for the purposes of preparing the mine design, schedule and Mineral Reserve estimate. 9.3 Geotechnical verification Geotechnical data verification processes and safeguards are similar to those implemented for Mineral Resource verification, although geotechnical drill holes are focused on geological units that will form the walls of the pits and any structures that may impact slope stability. The drillhole data is securely stored in an acQuire™ geoscientific information management system. The system is backed up nightly on servers located in Perth, Western Australia. The backup system was tested in November 2025 demonstrating that the system is effective. Drill hole logging is undertaken by appropriately qualified geotechnical engineers and a minimum of 10% of the core is relogged as part of a quality assurance/quality control (QA/QC) process. Data goes through two stages of validation before it can be utilised for design purposes. Geotechnical slope designs are signed off by suitably qualified and experienced professionals. The number of individuals authorised to sign off geotechnical aspects of designs is limited to ensure quality verification of design data. The QP ensures that there is adequate data of suitable quality to justify the reliance on the information in the final design. As pits are excavated, reconciliation mapping is undertaken in specifically identified areas to assess the reliability of the geotechnical model in predicting actual ground conditions. Based on the reliability of the models, additional data may need to be collected, or modifications made to the design. In the opinion of the QP, the geotechnical data used to inform slope parameters is of adequate quality for the Property and its material types and for the purposes discussed in this TRS. 9.4 Hydrology and hydrogeology verification The collection of surface water flows, groundwater levels and water quality data is undertaken in line with internal work procedures and adheres to best practice guidelines and industry standards. Hydrologists, hydrogeologists and scientific technicians ensure traceability during all stages of data collection to the point of analysis through use of data handling and verification protocols. Temporal data is uploaded directly by satellite networks or to Toughbooks™ and downloaded via scripts into the appropriate database. Verification of groundwater models involves comparing predictive outputs from the existing model with datasets collected after the development of the original model, with the aim of confirming the model is suitable for use as a predictive tool, and to ensure that the inverse problem and the issue of non- uniqueness are addressed. The model verification process occurs quarterly to annually, depending on operations and activity within individual pits.
Pilbara Operations Technical Report Summary – 31 December 2025 Page 89 of 176 If adjustments to parameters or boundary conditions are required to achieve verification, then the original model is re-run until a set of parameters and boundary conditions is identified that produces a good match of all data sets. In the opinion of the QPs, the data used to inform the groundwater models is of adequate quality, supported by historical performance and regular reconciliation. Surface water models are built based on baseline flows and historical observations. In the opinion of the QPs, this data is adequate for use in the mine design and production schedules and for the purposes used in this TRS 9.5 Metallurgical verification Metallurgical product predictions are verified numerous times through to their application for deposit estimates. Raw metallurgical laboratory results are peer reviewed and double-checked through redundancy analysis techniques. Following creation of product predictions, a second peer review process is conducted to verify the validity of the predictions across the geozones and grade ranges. The QP reviews the OBM product data and ensures predictions are accurately included in relevant fields. The OBM is also reviewed and endorsed by the relevant metallurgical subject matter expert. Once mining and production data is available, reconciliations are carried out on a quarterly basis, comparing actual mass and grade data to the block model predictions. Reconciliation trends are monitored and where biases are observed over multiple quarters, reasons are investigated and product predictions updated as required. Reconciliations are used to verify that greenfield projects have the correct techniques used to develop predictions for existing process flowsheets and any adjustments can be applied. Where new flowsheets are employed, pilot scale test work is conducted on actual bulk samples to confirm the techniques and settings used to generate predictions. In the opinion of the QPs, the metallurgical data used to inform product predictions is adequate for the purposes used for this TRS. 10 Mineral processing and metallurgical testing 10.1 Collection of samples and types of testwork Samples for metallurgical and material characteristic testing are obtained from: • Drill core from holes selected to provide representative metallurgical characterisation across the deposit. Selection of location, number and depth of metallurgical drill holes is informed by comparison of key metallurgical parameters to the deposit geological model. • Quarterly composite samples of mine site products. • Bulk ore samples. • Laboratory or pilot plant product samples, used for material characteristic testing for transportation and ironmaking or sintering. Samples of drill core are subjected to a ‘plant mimic’ that seeks to simulate the comminution and resulting particle size distribution imparted by crushers and handling equipment at full scale. The plant Pilbara Operations Technical Report Summary – 31 December 2025 Page 90 of 176 mimic utilised is calibrated to full scale operations and is also regularly validated against actual results. The products of the plant mimic are typically lump (nominally -31.5 + 6.3 mm) and fines (nominally - 6.3 mm). The lump and fines products are tested for metallurgical properties (Table 10.1) such as particle size distribution and grade per size fraction, bulk density, moisture and selected samples for densio-metric analysis, soil water characterisation, dust extinction moisture and materials handling test work. Separate samples of drill core are selected for crushability test work to assist in selection of crushing and handling equipment. Sample reserves are then composited together to represent the stratigraphic geo-domains and orebody initial mining area average. These samples are subjected to pilot test work and more detailed characterisation as required by the flowsheet selected. Tests at this stage may include thickening, filtration, rheology, tailings consolidation, X-ray particle sorting, lump physicals, and fines sintering test work. Table 10.1: Types of metallurgical and mineral processing test work used in characterisation of Rio Tinto iron ores Ore type Test type Intended use of testwork Laboratories or other providers Brockman, Marra Mamba, CID Crushability testwork - unconfined compressive strength, crushing work index, bond abrasion index, Brazilian tensile strength, gouging index Design and selection of crushing equipment for comminution of ore from run of mine to product sizing ALS Global Bureau Veritas AMTC TAFE Brockman, Marra Mamba, CID Soil water characterisation curve and saturated hydraulic conductivity Prediction of run of mine and product moisture Rio Tinto Iron Ore metallurgical laboratory, Dampier Brockman, Marra Mamba, CID Dust extinction moisture Prediction of propensity to generate dust during handling and transport The University of Newcastle Research Association (TUNRA) Bulk Solids, Jenike and Johanson Brockman, Marra Mamba, CID Handleability testwork - flow indexes, angle of repose, angle of surcharge, angle of drawdown, wall friction angle, chute angle, stable rathole diameter, bulk density Design of bins, transfer chutes, conveyors and stockyards. The University of Newcastle Research Association (TUNRA) Bulk Solids Jenike and Johanson Brockman, Marra Mamba, CID Process mimics (crushing and screening laboratory circuits) Development of grade predictions for products, particle size distributions for feed, product and tailings, bulk density of feed and products Rio Tinto Iron Ore metallurgical laboratory, Dampier, ALS Global Bureau Veritas Brockman, Marra Mamba, CID Lump physicals and sintering testwork Amenability of iron ore products to blast furnace and sintering or other ironmaking processes Commonwealth Scientific and Industrial Research Organisation (CSIRO) ALS Global
Pilbara Operations Technical Report Summary – 31 December 2025 Page 91 of 176 Ore type Test type Intended use of testwork Laboratories or other providers Brockman, Marra Mamba, CID Mineralogical quantification of ore and plant samples (tailings and products) Grade partition curves, liberation analysis, tailings characterisation Rio Tinto Bundoora Research Centre Brockman, Marra Mamba Densiometric analysis lump - heavy media separation/Individual particle pycnometry Propensity for lump concentration and resulting product predictions Rio Tinto Iron Ore metallurgical laboratory, Dampier MPIPP Laboratory Pty Ltd Pesco Brockman, Marra Mamba Densiometric analysis fines - heavy liquid separation Propensity for fines concentration and resulting product predictions Bureau Veritas, Adelaide Mineral Technologies Brockman, Marra Mamba Lump x-ray particle sorting Propensity for lump concentration through x- ray particle sorting Tomra Brockman, Marra Mamba, CID Thickening and filtration Ability to remove water from tailings and products Delkor Jord FLSmidth Outotec Brockman, Marra Mamba, CID Rheology Rheological properties of slurry to design pumping systems Slurry Systems Brockman, Marra Mamba, CID Consolidated bulk density of tailings and other strength/drainage characteristics Design of tailings storage facilities WSP Red Earth Engineering 10.2 Details of analytical or testing laboratories Details of the internal and external laboratories or other testing facilities used by Rio Tinto to characterise iron ore within the Property are listed in Table 10.2. Table 10.2: Details of analytical or testing laboratories Laboratory Location Relationship to Rio Tinto Certification Certifying Organisation Rio Tinto Iron Ore Metallurgical Evaluation Facility Dampier, Western Australia Internal test facility None Not applicable Rio Tinto Bundoora Research Centre Melbourne, Victoria, Australia Internal test facility None Not applicable ALS - Perth Iron Ore Technical Centre Perth, Western Australia, Australia Independent facility ISO:9001 ISO:14001 ISO:45001 International Organization for Standardization (ISO) Bureau Veritas Perth, Western Australia, Australia Independent facility ISO:9001 ISO:14001 ISO:45001 International Organization for Standardization (ISO) The University of Newcastle Research Associates Newcastle, New South Wales, Australia Independent facility ISO:9001 ISO:14001 ISO:45001 International Organization for Standardization (ISO) Pilbara Operations Technical Report Summary – 31 December 2025 Page 92 of 176 Laboratory Location Relationship to Rio Tinto Certification Certifying Organisation (TUNRA) – Bulk Handling Nagrom Perth, Western Australia, Australia Independent facility ISO:9001 International Organization for Standardization (ISO) Jenike and Johanson Perth, Western Australia, Australia Independent facility None Not applicable Bureau Veritas Adelaide, South Australia, Australia Independent facility ISO:9001 ISO:14001 ISO:45001 International Organization for Standardization (ISO) Mineral Technologies Gold Coast, Queensland, Australia Independent facility ISO:9001 ISO:14001 ISO:45001 International Organization for Standardization (ISO) AMTC TAFE Bentley, Western Australia, Australia Independent facility None Not applicable Metso/Outotec Perth, Western Australia, Australia Independent facility ISO:9001 ISO:14001 ISO:45001 ISO:50001 International Organization for Standardization (ISO) FLS Perth, Western Australia, Australia Independent facility ISO:9001 ISO:14001 ISO:45001 International Organization for Standardization (ISO) Delkor Perth, Western Australia, Australia Independent facility ISO:9001 International Organization for Standardization (ISO) Slurry Systems Engineering Perth, Western Australia, Australia Independent facility None Not applicable Pesco Pretoria, Townland, South Africa Independent facility None Not applicable Commonwealth Scientific and Industrial Research Organisation (CSIRO) Brisbane, Queensland, Australia Independent facility None Not applicable MPIPP Laboratory Pty Ltd Perth, Western Australia, Australia Independent facility None Not applicable WSP Perth, Western Australia, Australia Independent facility Accreditation no. 1961 Site No. 1598 NATA Red Earth Engineering Perth, Western Australia, Australia Independent facility None Not applicable
Pilbara Operations Technical Report Summary – 31 December 2025 Page 93 of 176 Laboratory Location Relationship to Rio Tinto Certification Certifying Organisation Jord Perth, Western Australia, Australia Independent facility ISO:9001 ISO:14001 ISO:45001 AS-NZS 4801 International Organization for Standardization (ISO) Tomra Sydney, New South Wales, Australia Independent facility ISO:9001 ISO:14001 ISO:45001 International Organization for Standardization (ISO) 10.3 Predictions and assumptions for mass recovery and grades Results from the testwork are used to generate: • Predictions for grade deportment between products and tailings. • Size distributions for feed, products and tailings. • Mass splits used in plant design. • Predicted mass recoveries in wet processing and beneficiation circuits. Grade predictions are applied to both iron and to the primary gangue minerals/elements. The latter includes SiO2, Al2O3, P and Mn. LOI is also predicted in products and tailings. Predictions for both grade and recovery are monitored through comparison with operational data or by comparison with similar deposits for future orebodies. Where further deposits will be fed to existing plants, current performance and characteristics of the existing plant are integrated with the results from the processing mimics. Mass recovery (yield) predictions are developed from the process plant mimic, incorporating lithological characteristics, predicted size distributions from ROM curves, process modelling of equipment to determine mass and size splits in unit operations and mineralogical quantification of process streams from sampling and modelling. Predictions for current operations are routinely compared with actual results for grades, product splits and mass recovery, with updates made where a statistically significant change has been made. Predictions for operating and future mines will also consider reconciliation performance. 10.4 QP’s opinion on adequacy of the data collected In the opinion of the QP, the data derived from the various sources detailed above is adequate for design of processing facilities and provides suitable product grade/recovery predictions for use in production schedules. Confidence is further increased by historical performance demonstrated through reconciliation. 11 Mineral Resource estimates 11.1 Key assumptions, parameters, and methods 11.1.1 Resource database All drilling data used in estimates of Mineral Resources is securely stored and validated as described in section 9.1. Pilbara Operations Technical Report Summary – 31 December 2025 Page 94 of 176 11.1.2 Geological interpretation Overall, the QP’s confidence in the geological interpretation of the area is good, based on the quantity and quality of data available, and the continuity and nature of the mineralisation. Geological modelling is undertaken by Rio Tinto geologists. The method involves interpretation of downhole stratigraphy using surface geological mapping, lithological logging data, down-hole gamma data, and assay data. Implicit modelling in Leapfrog Geo™ software of each stratigraphic unit is performed, followed by interpretation of mineralisation and hydration boundaries based on mapping and drilling data. Three- dimensional wireframes of the sectional interpretations are created to produce the geological model. The geological model is subdivided into domains defined by stratigraphy and mineralisation and both the composites and model blocks are coded with these domains. Blocks in domains are estimated using composites from the same domain. The mineralisation reported as a Mineral Resource is continuous across at least two adjacent drill holes. The mineralisation continuity is affected by stratigraphy, structure and weathering. The drill hole spacing is sufficient to capture grade and geology changes at a large scale. Mineralisation continuity varies by deposit but typically extends for several kilometres along strike and from surface to a maximum depth of 200 m. 11.1.3 Data preparation The majority of the drill hole data is sampled on 2 m intervals which is used as the nominal composite interval for grade variables using either a “straight compositing” approach or a “run-length compositing” approach where considered more appropriate for all drill holes. Density is composited to the sample interval used for the grade variables, typically yielding a 2 m composite file containing both grade and density variables, used in subsequent data analysis and estimation processes. 11.1.4 Exploratory data analysis Exploratory Data Analysis (EDA) for density and grade variables is completed using Datamine SupervisorTM data software, typically comprising descriptive univariate statistics for both mineralised and un-mineralised strands (geozones). The EDA also includes correlation coefficients between pairs of variables and various plots to convey the overall nature of the grade and density distributions and bivariate relationship between variables (including histograms, scatter plots and box plots), for all geozones. Spatial analysis is undertaken using a conventional directional variography approach. Traditional or “absolute” semi-variograms (or “variograms”) are used, conveying the variance of each variable modelled. Appropriate lag spacings are used, reflecting the nominal drill hole spacing for horizontal directions (typically using a 50 to 60 m lag), and a 2 m lag for the downhole (vertical) direction, reflecting the nominal composite length. Variogram maps in the horizontal plane are used to assess anisotropy in the mineralised geozones. Where applicable, the direction of greatest continuity is modelled as the major axis based on the longest range and lowest variogram sill, with the orthogonal direction model as the semi-major direction. Where present, zonal anisotropy is appropriately reflected by modelling an additional very long-range structure between the major/ semi-major and minor directions.
Pilbara Operations Technical Report Summary – 31 December 2025 Page 95 of 176 The nugget values for all modelled directions are defined by modelling of the downhole variogram for each element and applying the nugget variance to the major and semi-major directions. Where appropriate, a “pseudo-isotropic” approach is applied, using the same variogram model for the major and semi-major directions and a separate shorter range variogram for the downhole orientation. Variogram models for the mineralised domains of the Pilbara deposits generally result in reasonable structures. Many bedded geozones yielded relatively low nugget effects, with relatively short-range first structures (typically <100 m) comprising a significant proportion of the total sill. 11.1.5 Bulk density Dry bulk density is derived from gamma-density data collected at 10 cm intervals from downhole geophysical sondes. Accepted gamma-density data is corrected for moisture using diamond drill core specifically drilled throughout the deposit. Dry core densities are generated via the following process: • The core volume is measured in the split and the mass of the core is measured and recorded. • Wet core densities are calculated by the split and by the tray. • Core recovery is recorded. • The core is dried and dry core masses are measured and recorded. • Dry core densities are then calculated. • Accepted gamma-density values are estimated as per grade estimation procedures described below. 11.1.6 Block models The Property is divided into individual deposits for practical modelling purposes, each with its own block model. Each block model is created in MGA94 or the appropriate local mine grid. A parent block size is selected, based on the local nominal drill hole spacing. Typically the parent block size is half the drill hole spacing, at 25 m (X) x 25 m (Y) x 5 m (Z) with some variation depending on the local drilling grid and selective mining unit (SMU) for subsequent regularised models. The vertical block size varies from 4 m to 10 m across the Property. Sub-blocking is used to achieve acceptable resolution with geological boundaries, based on a block size as small as a fifth of the parent lateral and vertical block. Variable codes are added to the block model reflecting various attributes such as geology, strand, deposit type, mineralisation, geozone, water table and other risk-related attributes (mine danger, sulphide and fibre). The geological block models are validated by visual checks in section and plan view, for both strand and geozone, with numerical checks to identify and address incorrectly assigned variables. Pilbara Operations Technical Report Summary – 31 December 2025 Page 96 of 176 11.1.7 Grade estimation Grade estimation is undertaken using linear estimation methods using Vulcan™ software. Thirteen grade attributes (Fe, SiO2, Al2O3, P, Mn, LOI, LOI425, LOI650, S, TiO2, MgO, CaO, and Cl), gamma- density, and material hardness attributes are estimated into the block model. Mineralised domains are estimated by ordinary kriging (OK) where there is sufficient data available for variogram modelling or by inverse distance to the power of two (ID2) for domains with very low sample numbers. For certain deposits, non-linear estimation methods (indicator kriging and local uniform conditioning) are also used where considered applicable. These methods are deemed appropriate by the QP for estimating the tonnes and grade of the reported Mineral Resources. A small number of blocks that are not populated by estimation runs (typically <5%) are assigned average geozone grades via scripting. For unpopulated density values Machine Learning values are assigned. A Multi-Layer Perceptron Deep Neural Network (MLP DNN) model, a common model type in Machine Learning for physical systems, has been developed to model the non-linear and interdependent relationship between like variables common between Diamond Density (DD) and Reverse-Circulation (RC) holes and dry bulk density from diamond density core. Non-mineralised domains are estimated by inverse distance weighting or assigned average geozone grades in minor domains via scripting where sufficient data is not available. Other aspects of the estimation process are as follows: • Estimates are completed into parent blocks. • Parent blocks are sub-celled to the geological boundaries to preserve volume. Sub- cells received the parent cell estimate. • High yield limits are placed on some minor variables (CaO, MgO, Mn) in some geozones to limit the influence of outlier sample data as deemed appropriate for the dataset. • Grades are typically extrapolated to a maximum distance of approximately 300 m from data points, with variability based on spatial continuity and data spacing. 11.1.8 Grade interpolation parameters Grade interpolation parameters are based on local drilling spacing and a universal set of kriging neighbourhood analysis (KNA) parameters, grounded on 20 years of modelling data across multiple geological settings across the Pilbara. The universal parameters include: • Search distances (radii). • Minimum and maximum samples per estimate. • Maximum samples per drill hole.

Pilbara Operations Technical Report Summary – 31 December 2025 Page 97 of 176 • Search approach (conventional vs unfolding approaches via tetra models). Other key aspects regarding the estimation parameters and implementation are as follows: • The same search parameters within a given geozone are applied to the 13 assay variables to maintain the relationships between variables and to maintain stoichiometric closure (total assay). • Application of high yield limits are initially selected based on a coefficient of variation greater than 2.0, with spatial assessment to check whether the high values are spatially isolated and not clustered with other high values. If also a spatial outlier, the high yield threshold is selected on the basis of inflection points in the cumulative probability plot. • Blocks not filled are assigned the domain average composite grades or, in the case of density, the Machine Learning-derived values. • With the exception of select CID deposits, domains are estimated using hard boundaries, with samples from the respective domain only used for estimation of that domain. • Estimation of density follows the same process as that of grade estimation. 11.1.9 Model validation The model is validated using a combination of visual and statistical methods to check that the estimation has performed as expected and shows acceptable conformance to the input samples. The overall validation process typically includes: • Visual validation, typically involving sectional review of the model with drill holes in cross section, long-section and plan for select variables. • Global comparison between the block model and composite statistics to assess for global average grade conformance by geozone. • Swath plot comparisons by geozone for cross-section, long-section and elevation slices. • Correlation coefficient comparisons for composites vs blocks between Fe and all other estimated assay variables. • Assessment of global smoothing effects, using a multivariate change of support model applied to the drill hole composites to confirm the block model conformed to the tonnages reported by the change of support model, (and hence represented an appropriate smoothing level), and that the scatter relationship between variables is appropriately reproduced. • Check of the total assay calculated from the estimated 13 assay values for conformance with the expected value of 100% and with an acceptable range tolerance (typically between 98 and 102%). • Where production data is available, reconciliation is carried out as part of the model validation process. In the QPs’ opinion, the validation processes applied to the Mineral Resource estimates demonstrate that the models reasonably represent the underlying input data. Pilbara Operations Technical Report Summary – 31 December 2025 Page 98 of 176 11.2 Mineral Resource classification SEC subpart 1300 of Regulation S-K (S-K 1300) requires publicly listed mining companies to provide standard and detailed disclosure on mineral resources. Mineral Resources are sub-divided into the following categories based on increased geological confidence: Inferred, Indicated, and Measured, which are defined under S-K 1300 as follows: “Inferred Mineral Resource is that part of a mineral resource for which quantity and grade or quality are estimated on the basis of limited geological evidence and sampling. The level of geological uncertainty associated with an inferred mineral resource is too high to apply relevant technical and economic factors likely to influence the prospects of economic extraction in a manner useful for evaluation of economic viability. Because an Inferred Mineral Resource has the lowest level of geological confidence of all Mineral Resources, which prevents the application of the modifying factors in a manner useful for evaluation of economic viability, an Inferred Mineral Resource may not be considered when assessing the economic viability of a mining project, and may not be converted to a Mineral Reserve.” “Indicated Mineral Resource is that part of a mineral resource for which quantity and grade or quality are estimated on the basis of adequate geological evidence and sampling. The level of geological certainty associated with an indicated mineral resource is sufficient to allow a QP to apply modifying factors in sufficient detail to support mine planning and evaluation of the economic viability of the deposit. Because an Indicated Mineral Resource has a lower level of confidence than the level of confidence of a Measured Mineral Resource, an Indicated Mineral Resource may only be converted to a Probable Mineral Reserve.” “Measured Mineral Resource is that part of a Mineral Resource for which quantity and grade or quality are estimated on the basis of conclusive geological evidence and sampling. The level of geological certainty associated with a measured mineral resource is sufficient to allow a QP to apply modifying factors, as defined in this section, in sufficient detail to support detailed mine planning and final evaluation of the economic viability of the deposit. Because a Measured Mineral Resource has a higher level of confidence than the level of confidence of either an Indicated Mineral Resource or an Inferred Mineral Resource, a Measured Mineral Resource may be converted to a Proven Mineral Reserve or to a Probable Mineral Reserve.” Mineral Resources are classified by Rio Tinto based on consideration of relevant factors including, but not limited to, geology, continuity of mineralisation, grade continuity, sample spacing, data quality, and reconciliation. For bedded mineralisation, Mineral Resource classification is informed by the following indicative drill spacings: • Measured Resources – 60 m x 60 m. • Indicated Resources – 100 m x 50 m. • Inferred Resources – drill spacing greater than 100 m x 50 m, or less continuous drilling. Hydrated and detrital mineralisation is typically assigned a lower confidence classification than the underlying bedded material, due to poorer grade continuity and higher variability observed in these units.
Pilbara Operations Technical Report Summary – 31 December 2025 Page 99 of 176 At the completion of the resource estimation process, the QP for Mineral Resources conducts a final review of the classification. This review considers the amount and quality of data, assays, structural complexity, continuity of mineralisation and grade, estimation technique and reconciliation performance as well as other aspects of the deposit that may affect how it could be economically mined, such as social, environmental, approvals, government, licences, contaminants, depth of mineralisation etc. The purpose of the review is to identify the risks and opportunities within the deposit and assign the appropriate classification. 11.3 Mineral Resource estimate The basis of the Property’s Mineral Resource estimate and how it is generated are summarised below. The Mineral Resource estimate for the Property is reported here in accordance with the S-K 1300 regulations (Table 11.1). For estimating the Mineral Resource, the following definition as set forth in the S-K 1300 Definition Standards adopted December 26, 2018 is applied. Under S-K 1300, a Mineral Resource is defined as: • “… a concentration or occurrence of material of economic interest in or on the Earth’s crust in such form, grade or quality, and quantity that there are reasonable prospects for economic extraction. A mineral resource is a reasonable estimate of mineralization, taking into account relevant factors such as cut-off grade, likely mining dimensions, location or continuity, that, with the assumed and justifiable technical and economic conditions, is likely to, in whole or in part, become economically extractable. It is not merely an inventory of all mineralization drilled or sampled.” The Mineral Resource estimate for the Property is presented by ore type in Table 11.1. Mineral Resources are estimated by Rio Tinto for operating mines and development projects within the Property. The effective date of the Mineral Resource estimate is 31 December 2025. The Mineral Resource estimate is based on the following assumptions: • Exclusive of Mineral Reserves – Mineral Resources are reported exclusive of Mineral Reserves. • Moisture – All Mineral Resource tonnages are estimated and reported on a dry basis. Mining factors or assumptions – It is assumed that standard open pit load and haul mining operations used by Rio Tinto Iron Ore will be applicable for the mining of Mineral Resource Ore. • Metallurgical factors or assumptions – It is assumed that crushing, screening and beneficiation processes used by Rio Tinto will be applicable for the processing of Mineral Resource ore. Predicted yield and upgrades are deposit specific and are based on metallurgical test work conducted on representative samples collected from those deposits or adjacent analogous deposits. • Environmental factors or assumptions – Extensive environmental studies and surveys will be completed during the project study phases to determine if the project requires formal State and Commonwealth environmental assessment and approval. Mapping of oxidised shales, black carbonaceous shales, lignite, and the location of the water table is used to predict and manage potential environmental impacts. Pilbara Operations Technical Report Summary – 31 December 2025 Page 100 of 176 • Heritage factors or assumptions - Extensive cultural heritage studies, surveys and engagement with traditional owners will be completed during the project study phases to determine if the project requires additional assessment, monitoring, or exclusion areas to be maintained during mining, to manage potential impacts to sites. The Mineral Resources presented are not Mineral Reserves and do not reflect demonstrated economic viability. The level of geological uncertainty associated with the reported Inferred Mineral Resources is considered too high to apply relevant economic and technical factors to have the economic considerations applied that would enable these to be categorised as Mineral Reserves. There is no certainty that all or any part of the Inferred Mineral Resources will be converted into Mineral Reserve. All figures are rounded to reflect the relative accuracy of the estimates and totals may not sum exactly as a consequence. Based on the body of technical studies completed across the Property, it is the QPs’ opinion that the Mineral Resources have reasonable prospects of economic extraction.
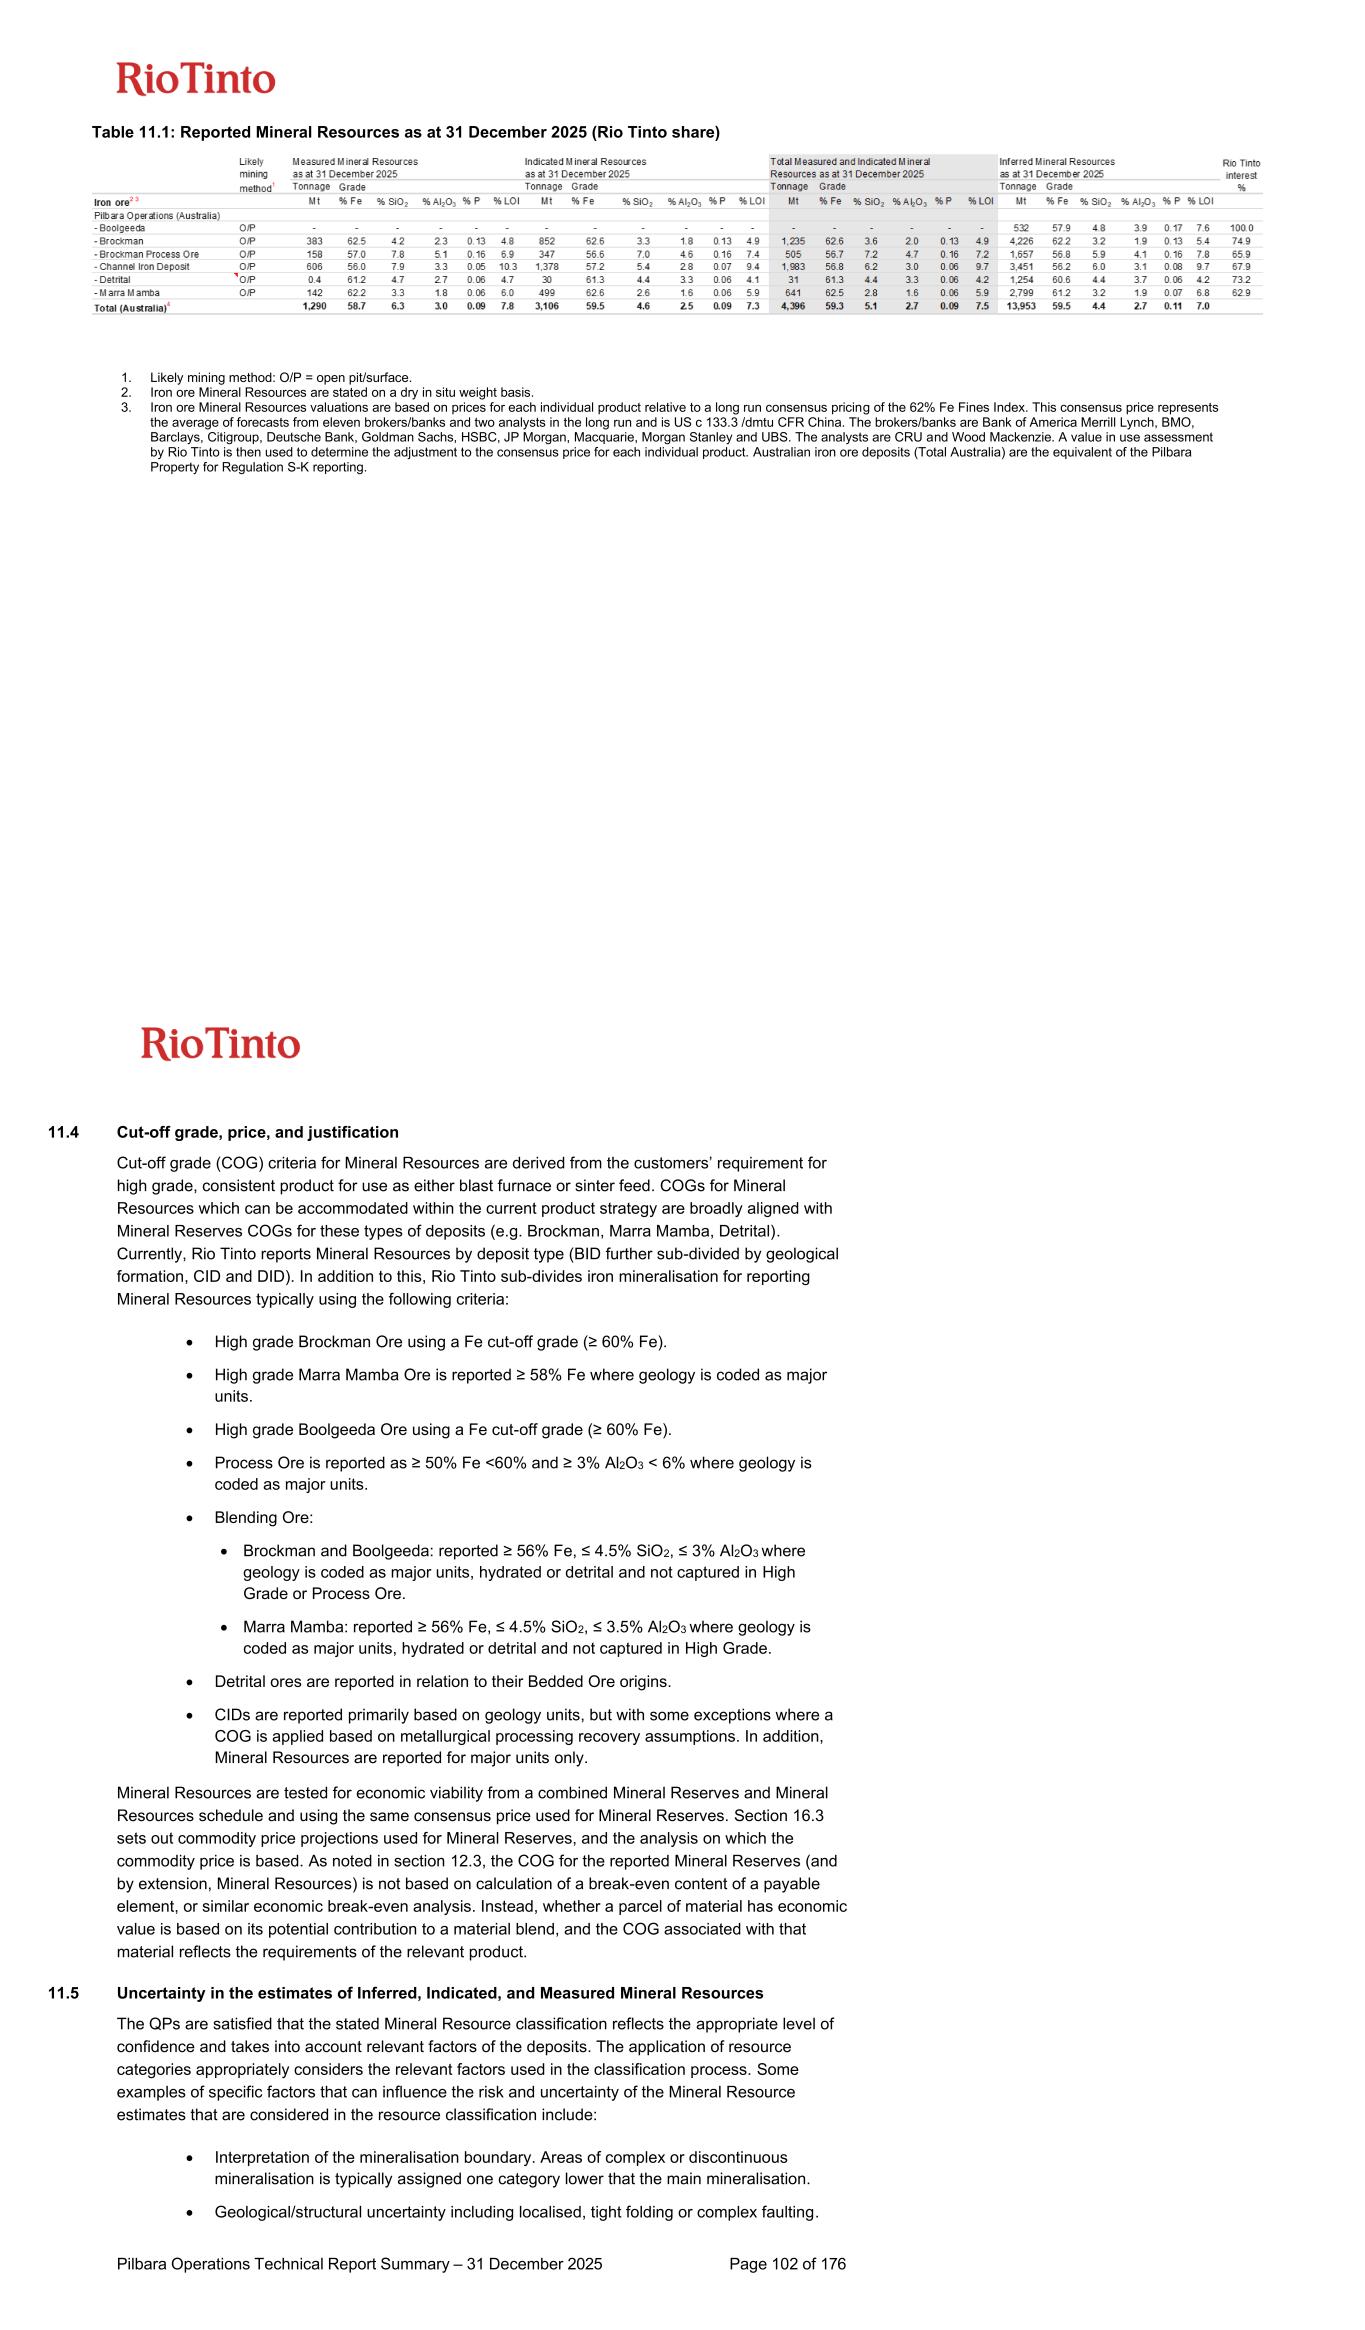
Table 11.1: Reported Mineral Resources as at 31 December 2025 (Rio Tinto share) 1. Likely mining method: O/P = open pit/surface. 2. Iron ore Mineral Resources are stated on a dry in situ weight basis. 3. Iron ore Mineral Resources valuations are based on prices for each individual product relative to a long run consensus pricing of the 62% Fe Fines Index. This consensus price represents the average of forecasts from eleven brokers/banks and two analysts in the long run and is US c 133.3 /dmtu CFR China. The brokers/banks are Bank of America Merrill Lynch, BMO, Barclays, Citigroup, Deutsche Bank, Goldman Sachs, HSBC, JP Morgan, Macquarie, Morgan Stanley and UBS. The analysts are CRU and Wood Mackenzie. A value in use assessment by Rio Tinto is then used to determine the adjustment to the consensus price for each individual product. Australian iron ore deposits (Total Australia) are the equivalent of the Pilbara Property for Regulation S-K reporting. Pilbara Operations Technical Report Summary – 31 December 2025 Page 102 of 176 11.4 Cut-off grade, price, and justification Cut-off grade (COG) criteria for Mineral Resources are derived from the customers’ requirement for high grade, consistent product for use as either blast furnace or sinter feed. COGs for Mineral Resources which can be accommodated within the current product strategy are broadly aligned with Mineral Reserves COGs for these types of deposits (e.g. Brockman, Marra Mamba, Detrital). Currently, Rio Tinto reports Mineral Resources by deposit type (BID further sub-divided by geological formation, CID and DID). In addition to this, Rio Tinto sub-divides iron mineralisation for reporting Mineral Resources typically using the following criteria: • High grade Brockman Ore using a Fe cut-off grade (≥ 60% Fe). • High grade Marra Mamba Ore is reported ≥ 58% Fe where geology is coded as major units. • High grade Boolgeeda Ore using a Fe cut-off grade (≥ 60% Fe). • Process Ore is reported as ≥ 50% Fe <60% and ≥ 3% Al2O3 < 6% where geology is coded as major units. • Blending Ore: • Brockman and Boolgeeda: reported ≥ 56% Fe, ≤ 4.5% SiO2, ≤ 3% Al2O3 where geology is coded as major units, hydrated or detrital and not captured in High Grade or Process Ore. • Marra Mamba: reported ≥ 56% Fe, ≤ 4.5% SiO2, ≤ 3.5% Al2O3 where geology is coded as major units, hydrated or detrital and not captured in High Grade. • Detrital ores are reported in relation to their Bedded Ore origins. • CIDs are reported primarily based on geology units, but with some exceptions where a COG is applied based on metallurgical processing recovery assumptions. In addition, Mineral Resources are reported for major units only. Mineral Resources are tested for economic viability from a combined Mineral Reserves and Mineral Resources schedule and using the same consensus price used for Mineral Reserves. Section 16.3 sets out commodity price projections used for Mineral Reserves, and the analysis on which the commodity price is based. As noted in section 12.3, the COG for the reported Mineral Reserves (and by extension, Mineral Resources) is not based on calculation of a break-even content of a payable element, or similar economic break-even analysis. Instead, whether a parcel of material has economic value is based on its potential contribution to a material blend, and the COG associated with that material reflects the requirements of the relevant product. 11.5 Uncertainty in the estimates of Inferred, Indicated, and Measured Mineral Resources The QPs are satisfied that the stated Mineral Resource classification reflects the appropriate level of confidence and takes into account relevant factors of the deposits. The application of resource categories appropriately considers the relevant factors used in the classification process. Some examples of specific factors that can influence the risk and uncertainty of the Mineral Resource estimates that are considered in the resource classification include: • Interpretation of the mineralisation boundary. Areas of complex or discontinuous mineralisation is typically assigned one category lower that the main mineralisation. • Geological/structural uncertainty including localised, tight folding or complex faulting.
Pilbara Operations Technical Report Summary – 31 December 2025 Page 103 of 176 • Drill hole spacing and adequacy in defining geology, mineralisation, structure, and grade. • Quality of samples, assays and geological information. • Domains or regions within domains where grades are more variable are typically assigned lower levels of resource classification. • Reconciliation performance, in instances where the deposit or similar deposit/domains have been mined. • Density uncertainty, particularly below water table, is mainly driven by less data (example due to hole collapse). The Mineral Resources have addressed reasonable prospects of economic extraction and have considered a range of mining, metallurgical and environmental factors. Mineral Resource confidence is also assessed via independent reviews and internal peer reviews conducted at key stages of the Mineral Resource estimation process with no material issues identified. Rio Tinto operates multiple mines in the Pilbara region of Western Australia. The Mineral Resource data collection and estimation techniques used for all Pilbara deposits are consistent with those applied at other deposits where mining has commenced. Reconciliation of actual production with the Mineral Resource estimates for individual deposits is generally accurate to within 10% for tonnes on an annual basis. This result is indicative of a robust process and provide a high level of confidence in the Mineral Resource estimate used as the basis of Mineral Reserves for the operations. 11.6 QPs’ opinion on factors likely to influence the prospect of economic extraction The main factors likely to influence the prospect of economic extraction include: • Size and location of the deposit and its proximity to infrastructure. • Grade of mineralisation in relation to market requirements/preferences. • Mineralogy in relation to amenability to processing, upgrade, and yield. • Areas which should be excluded for environmental, heritage, water or infrastructure reasons. • Mineralisation which has limited prospects of being recovered due to being remnant areas of existing mines or backfill areas. In the QPs’ opinion, all these factors are adequately considered for the Mineral Resources reported. 12 Mineral Reserve estimates 12.1 Key assumptions, parameters, and methods 12.1.1 Geological model OBMs developed for Mineral Resource reporting within each mining area form the basis of the Mineral Reserves estimates. OBMs are derived from the geology model (outlined in Section 11) and are extended by: • Undergoing regularisation to a selective mining unit, thereby reflecting dilution and recovery losses during mining. Pilbara Operations Technical Report Summary – 31 December 2025 Page 104 of 176 • Addition of approved pit designs and cutbacks. • Integration of actual and planned mined surfaces. • Addition of non-recoverable zones. • Application of grade binning to support scheduling. • Assigning of moistures to in situ material. • Applying product predictions for planned processing streams. 12.1.2 Moisture Geology models contain tonnage estimates on a dry in situ basis. During generation of the OBMs, the estimated water content (moisture) for each block model block is added. The moisture estimate includes consideration of material physical properties and hydrogeology. By including both dry tonnes and water content in the block models, estimates for dry and wet tonnages can be determined from the block models as required for planning, reporting or any other purpose. Metallurgical regressions are applied to dry material. From this, expected water content is predicted for each product, allowing reporting of wet product tonnes by combining the dry tonnes and contained water. 12.1.3 Metallurgical and processing recoveries Metallurgical and processing recovery estimates are applied to crusher feed tonnages based on the processing plant type (refer Section 14.1). Dry crushing and screening plants achieve a recovery of 100%. Wet plants achieve typical mass recoveries of 85 to 92% (dry basis) for Marra Mamba and Brockman ores. Processing of pisolite ores results in mass recoveries ranging from 50 to 90%, due to the relatively higher and more variable clay content. Beneficiation plant mass recovery is approximately 60 to 70%. 12.1.4 Methodology A mining schedule that fully consumes the scheduling inventory for the Property is developed from the prepared OBMs. To demonstrate economic viability of the Property’s Mineral Reserves, economic modelling is completed. Material is only reported as Mineral Reserve if the level of geological certainty is sufficient to allow a QP to apply the modifying factors in sufficient detail to support detailed mine planning and economic viability of the deposit. 12.2 Modifying factors Modifying factors are applied to mineralised material within the Measured and Indicated Resource classifications in the Mineral Resource to establish the economic viability of Mineral Reserves. The QPs consider mining, processing, metallurgical, economic, marketing, legal, environmental, infrastructure, social, and governmental factors that are applicable to each mining area within the Property. Key modifying factors considered when converting Mineral Resources to Mineral Reserves include: • Geotechnical parameters: Geotechnical models are prepared for each deposit based on drilling, mapping, and other data. These models form the basis for slope stability
Pilbara Operations Technical Report Summary – 31 December 2025 Page 105 of 176 analysis and development of pit design parameters to ensure pit walls meet an acceptable factor of safety. • Surface water (hydrology) assessments: Hydrological modelling techniques are used to assess the potential impact of ephemeral water courses and flooding due to surface water runoff post rain events. Pit designs are either modified, or appropriate surface water control measures are included in the pit design. • Groundwater (hydrogeology) assessments: In the case of orebodies extending below the water table, groundwater models are developed, accounting for geological assessments, drill holes, test pumping and monitoring bores. Groundwater models form the basis for assessing the technical feasibility of pit dewatering and are necessary for design of an adequate dewatering strategy, inclusive of location, number and capacity of dewatering bores, discharge requirements and projected drawdown of the groundwater table. Projected drawdowns are used to constrain mine plans as appropriate. • Pit designs are developed based on the geotechnical, hydrological and hydrogeological assessments, incorporating access and any other technical requirements. Only material contained inside a designed pit is converted to a Mineral Reserve. • Metallurgical tests on appropriate samples form the basis for selection of the processing method, prediction of throughput rates, as well as metallurgical recoveries and product qualities. These metallurgical predictions are incorporated into the OBM that underpin mine plans and schedules. Plans and schedules are developed to meet target product specifications; expected saleable product tonnes and grades are the basis for estimation of the Mineral Reserve. • Part of a Mineral Resource is only converted to a Mineral Reserve if it is within the footprint of an existing mining area or processing hub or if a prefeasibility study has been completed, demonstrating the technical and economic feasibility of establishing a mining operation. Studies consider processing and rail infrastructure for transportation to ports, requirements for workshops and offices, workforce accommodation, access to water and power, and other required facilities. • Only parts of deposits where all statutory and regulatory requirements for mining have been satisfied, or where previous experience shows there is a reasonable expectation of obtaining all required permits and authorisations prior to scheduled mining, are converted to Mineral Reserves. 12.3 Cut-off grade estimate The key determinant for the classification of mineralised material into ore and waste is the target product specification of the various iron ore products. Whether a particular parcel of material has economic value is not solely dependent on the characteristics of the parcel itself but also on its potential contribution to a material blend. Target product specifications determine the quantity of saleable ore that can be economically extracted from the orebodies, and thus the reported Mineral Reserve. The COG for the reported Mineral Reserve is not based on calculation of a break-even content of a payable mineral, or similar economic break-even analysis. Pilbara Blend Lump and Fines are the core products from Rio Tinto’s operations within the Property and are produced by combining ore from the Eastern Range, Western Range, Paraburdoo, Tom Price, Western Turner Syncline, West Angelas, Hope Downs 1, Hope Downs 4, Brockman 2, Nammuldi, Silvergrass, Brockman 4, Gudai-Darri and Marandoo mining areas. Ore produced from the Pilbara Operations Technical Report Summary – 31 December 2025 Page 106 of 176 Yandicoogina mine and the Robe Valley mines is sold as standalone products (Yandicoogina Fines, and Robe Valley Lump and Fines respectively). The primary parameter for determining if material is ore or waste is iron content. Deleterious elements such as phosphorous or alumina can also influence the ore-waste determination. For example, material high in iron may be excluded from product due to its phosphorous content. COGs are shown in Table 12.1. Table 12.1: Rio Tinto product COGs Ore Type COG Range (Fe%) Yandicoogina Pisolite 55% Robe Valley Pisolite 50-55% Pilbara Blend Brockman 56-60% Pilbara Blend Marra Mamba 56-58% COGs for sites contributing to the Yandicoogina and the Robe Valley products tend to be constant over time. COGs for joint venture mines contributing to blended products are governed by commercial arrangements between the joint venture participants. COGs for 100% Rio Tinto-owned and joint venture mines (subject to joint venture partner agreement) that contribute to blended products are varied over time. Across the system, ore from the contributing mines is blended to ensure product specifications are met. The economic viability of the reported Mineral Reserve is assessed by generating a production schedule that fully consumes the Mineral Reserves with all other material treated as non-revenue generating. Economic assessments confirm that a positive NPV is achieved using specific economic assumptions for costs and revenues. Further details on price, costs, and time disclosure are provided in Section 19. 12.4 Mineral Reserve estimate The Mineral Reserve for the Property is presented by ore type in Table 12.2 and by Table 12.2joint venture in Table 12.3. Mineral Reserves are estimated by Rio Tinto for operating mines and development projects within the Property that have reached or surpassed prefeasibility stage. The effective date of the Mineral Reserve estimate is 31 December 2025. Mineral Reserves are reported as the economically mineable portion of a Measured and/or Indicated Resource after consideration of modifying factors. Measured Resources are typically reported as Proved Reserves, and Indicated Resources are reported as Probable Reserves in order to reflect the level of confidence in the Resource estimate forming the basis of the Reserve estimate. In certain circumstances, Measured Resources are reported as Probable Reserves to reflect the QPs’ relatively lower confidence in one or more modifying factors. All stockpile Mineral Reserves are classified as Probable Reserves due to the inherent variability of stockpiled material.
Table 12.2: Reported Mineral Reserves as at 31 December 2025 for the Property (Rio Tinto share) 1. Type of mine: O/P = open pit/surface. 2. Mineral Reserves of iron ore are shown as recoverable Mineral Reserves of marketable product after accounting for all mining and processing losses. Mill recoveries are therefore not shown. 3. Iron ore Mineral Reserves valuations are based on prices for each individual product relative to a long run consensus pricing of the 62% Fe Fines Index. This consensus price represents the average of forecasts from eleven brokers/banks and two analysts in the long run and is US c 133.3 /dmtu CFR China. The brokers/banks are Bank of America Merrill Lynch, BMO, Barclays, Citigroup, Deutsche Bank, Goldman Sachs, HSBC, JP Morgan, Macquarie, Morgan Stanley and UBS. The analysts are CRU and Wood Mackenzie. A value in use assessment by Rio Tinto is then used to determine the adjustment to the consensus price for each individual product. 4. Australian iron ore Mineral Reserves tonnes are reported on a dry weight basis. 5. Australian iron ore Mineral Reserves are all located on State Agreement mining leases. Prior to mining, state government approvals (including environmental and heritage) are required. Reported Mineral Reserves include select areas where one or more approvals remain outstanding. In these areas, it is expected that these approvals will be obtained within the time frames required in the current production schedule. 6. Australian iron ore deposits (Total Australia) are the equivalent of the Pilbara Property for Regulation S-K reporting. Table 12.3: Reported Mineral Reserves as at 31 December 2025 for the Property by joint venture (Rio Tinto share) 1. Type of mine: O/P = open pit/surface. Rio Tinto sharemarketable Tonnage Grade Tonnage Grade Tonnage Grade product Iron ore Mt % Fe Mt % Fe Mt % Fe % Mt - Hamersley O/P 662 60.5 1,084 60.9 1,746 60.8 100% 1,746 - Hope Downs JV O/P 45 62.4 68 61.8 113 62.1 50% 113 - Robe River JV O/P 99 59.7 114 58.7 213 59.2 53% 213 - Bao-HI JV O/P 46 62.3 85 62.1 130 62.2 54% 130 Total 851 60.6 1,351 60.9 2,202 60.8 2,202 as at 31 December 2025 as at 31 December 2025 as at 31 December 2025 Type of mine 1 Proven Mineral Reserves Probable Mineral Reserves Total Mineral Reserves Rio Tinto interest Rio Tinto share marketable Tonnage Tonnage Grade Tonnage Grade product Tonnage Iron ore 2 3 Mt % Fe % SiO2 % Al2O3 % P % LOI Mt % Fe % SiO2 % Al2O3 % P % LOI Mt % Fe % SiO2 % Al2O3 % P % LOI % Mt Mt Pilbara Operations (Australia) 4 5 - Brockman Ore O/P 380 62.0 3.5 2.0 0.14 5.3 995 60.8 4.0 2.2 0.12 6.1 1,375 61.1 3.9 2.2 0.13 5.9 87.1 1,375 1,320 - Marra Mamba Ore O/P 172 62.6 2.8 1.6 0.06 5.5 298 62.1 3.1 1.9 0.06 5.6 470 62.2 3.0 1.8 0.06 5.5 79.7 470 500 - Pisolite (Channel Iron) Ore O/P 300 57.8 4.7 1.8 0.06 10.3 57 56.2 5.6 2.6 0.05 10.9 357 57.6 4.9 2.0 0.06 10.4 79.9 357 410 Total (Australia) 6 851 60.6 3.8 1.9 0.09 7.1 1,351 60.9 3.9 2.2 0.11 6.2 2,202 60.8 3.8 2.0 0.10 6.5 2,202 2,230 Total Mineral Reserves as at 31 December 2025 as at 31 December 2025 as at 31 December 2025 as at 31 December 2024 Type of mine 1 Proven Mineral Reserves Total Mineral Reserves Rio Tinto interest Grade Probable Mineral Reserves Pilbara Operations Technical Report Summary – 31 December 2025 Page 108 of 176 Mineral Reserves are stated as dry shipped saleable ore, excluding moisture content, and account for all mining and processing losses. The only payable mineral is iron. All figures are rounded to reflect the relative accuracy of the estimates and rounded subtotals may not add to the stated total. Since the publication of the previous TRS report in 2021, Mineral Reserves have decreased by approximately 8%, mainly due to depletion by production. Reductions were partially offset by additions from new deposits at several mines within the Property, and changes to product specifications. 12.5 QPs’ opinion on risk factors that may materially affect the Mineral Reserve estimates Mineral Reserve estimates are reviewed annually or when new information becomes available that may impact the respective modifying factors. The QPs are not aware of any risk factors that may materially affect the Mineral Reserve estimates. 13 Mining methods 13.1 Current mining operations Mining areas within the Property currently operate using conventional open pit mining methods. Haulage is done both manually and autonomously using haul trucks ranging from 180 to 310 t capacity. Hydraulic excavators and front-end loaders are used to mine ore in benches. Bench heights of 8 to 12 m are generally employed, although in some areas reduced height benches of 4 or 5 m are implemented to optimise orebody recovery and minimise dilution and ore loss. Drilling is segregated between production and contour areas. Production areas consist of flat laying ground, with typical blast hole diameters greater than 200 mm. Contour drilling is completed by smaller support drills on contour areas of natural ground or to enable impact controls around culturally or environmentally sensitive areas. Contour drilling is done at a diameter less than 200 mm. Bulk explosive products such as ammonium nitrate and fuel or emulsion are used to load drill holes. The products are mixed on bench through Mobile Processing Units (MPU). Holes encountered on the Property that are in areas with a high amount of water or an elevated water table are loaded with pumped emulsion blends. Where the blend allows, ore is hauled directly to crushers from the open pit: alternatively, ore is stored on stockpiles. Stockpiles comprise run-of-mine (ROM) stockpiles located near crushers and long- term stockpiles spread throughout the mining area. Waste is hauled from the open pit to adjacent waste rock storage (WRS) areas, used as fill material for development projects or used to back-fill pits to meet closure obligations under Part IV of the Environmental Protection Act (EP Act). Most projects within the Property are located at or near existing operations, hence the schedule used to support the estimation of Mineral Reserves assumes that the existing mining method will continue for both existing and new projects under consideration. This is deemed adequate for the Mineral Reserves due to strong historical performances, in-grained efficiencies from long term operation and the presence of large, near-surface orebodies targeted for mining.
Pilbara Operations Technical Report Summary – 31 December 2025 Page 109 of 176 13.2 Parameters relative to the design and schedule 13.2.1 Geotechnical considerations The Property covers a geographically large area with varying ground conditions. The development of a realistic ground model with an understood degree of confidence plays a critical role in the design of optimised and stable pit slopes. Ground models used for designs and schedules incorporate: • Structural geology – Orientation of weak shale bands associated with folding and fault orientation. • Rockmass conditions – RQD, joint spacing, orientation, conditions, and intact rock strength. • Porewater pressure during the life of the operation. Data is collected and analysed to create the ground model. This includes: • Surface mapping. • Orientated diamond drill holes. • Downhole televiewer. • Geology model. • Groundwater model. Validation of the ground model is conducted through the operating life of each mine. Geotechnical monitoring and reconciliation of mapping allows for continuous improvement and adaption of the ground control models. A degree of contingency is mandated in designs through a design acceptance criterion (DAC). DAC is applied based on the risk profile of the design sector or area. If slope instability in a particular sector impacts critical infrastructure, it will be assigned a higher DAC than if that same instability were to impact non-critical infrastructure, which in turn is assigned a higher DAC than if there were only a minor impact on production. An outline of DAC for mine slopes and waste dumps is shown in Table 13.1. Due to the varying nature of pits amongst the Property, several analytical tools are deployed to analyse slope stability: • 2D and 3D limited equilibrium slope stability analysis (Slide 2 and Slide 3). • 2D and 3D finite element modelling (RS2, RS3 and FLAC). • Rockfall and RocTopple for natural slopes and rock toppling mechanisms. Table 13.1: Geotechnical factors of safety for slopes and dumps Criteria Factor of Safety Probability of Failure (%) Risk Category Risk Category Scale Infrastructure High Mod-Low High Mod-Low Slopes Single Batter N/A 1.2 1.1 25 30 Pilbara Operations Technical Report Summary – 31 December 2025 Page 110 of 176 Double Batter N/A 1.2 1.1 10 15 Inter-ramp None 1.2 1.2 10 15 Inter-ramp Long term ramp 1.3 1.3 10 10 Overall Slope None 1.3 1.2 5 5 Overall Slope Long term ramp 1.3 1.3 5 5 Overall/ Inter-ramp slope Fixed Infrastructure > 1.5 1.5 3-1 5-3 Dumps Dump Point/ Single Lift None 1.1 1.1 20 30 Overall dump/deep seated and foundation instability None 1.3 1.2 5 10 Overall Dump /Closure Fixed Infrastructure > 1.5 1.5 3-1 5-3 Slope angles implemented are controlled by the DAC, geometrical limitations (including access and berm configurations) and ground conditions. Typical overall slope angles in different geology are: • 48-54° in detritals. • 35-50° in bedding-controlled slopes. • 50-60° in rockmass controlled slopes. Monitoring of slopes is conducted to improve understanding and increase safety and efficiencies of designs. High risk slopes are monitored through continuous monitoring systems measuring slope movement. Moderate and low risk slopes utilise prism monitoring. Action and response plans are created and updated depending on risk profiles for slopes. Porewater pressure immediately behind the slope is measured by vibrating wire piezometers in areas where the pits are below water table. 13.2.2 Hydrogeological considerations Mathematical (numerical and analytical) modelling, of both surface water and groundwater provides essential information for decision making in support of existing and proposed mining operations in the Property. Models are designed to inform risk during all stages of pit development, spanning from operational mine dewatering to closure obligations. Approximately 35% of the pits Rio Tinto currently mines on the Property are below the water table. Below water table mining from the Property is planned to continue at a rate of approximately 30 to 45% ex-pit over the next 10 years. Groundwater modelling is completed using industry standard software. Uncertainty analysis is assessed through robust, industry standard algorithms. Models are constructed according to internal frameworks and standards and build on the hydrogeological conceptual model. Structural controls and hydro-stratigraphical layers are sourced from the geological block models and surrounding geological outcrops, augmented by hydrogeological investigations including drilling and pumping testing. Models are historically matched to temporal stress events including changes in groundwater level, rainfall, pumping or changes to outflow conditions. Non-uniqueness and associated statistical parameter uncertainty are assessed by adopting an ensemble modelling approach and supporting Monte Carlo techniques under the umbrella and principles of Bayesian decision analysis. The models are then used predictively to assess the likelihood and consequences of impacts of pumping on groundwater levels and to devise and optimise appropriate pit dewatering strategies.
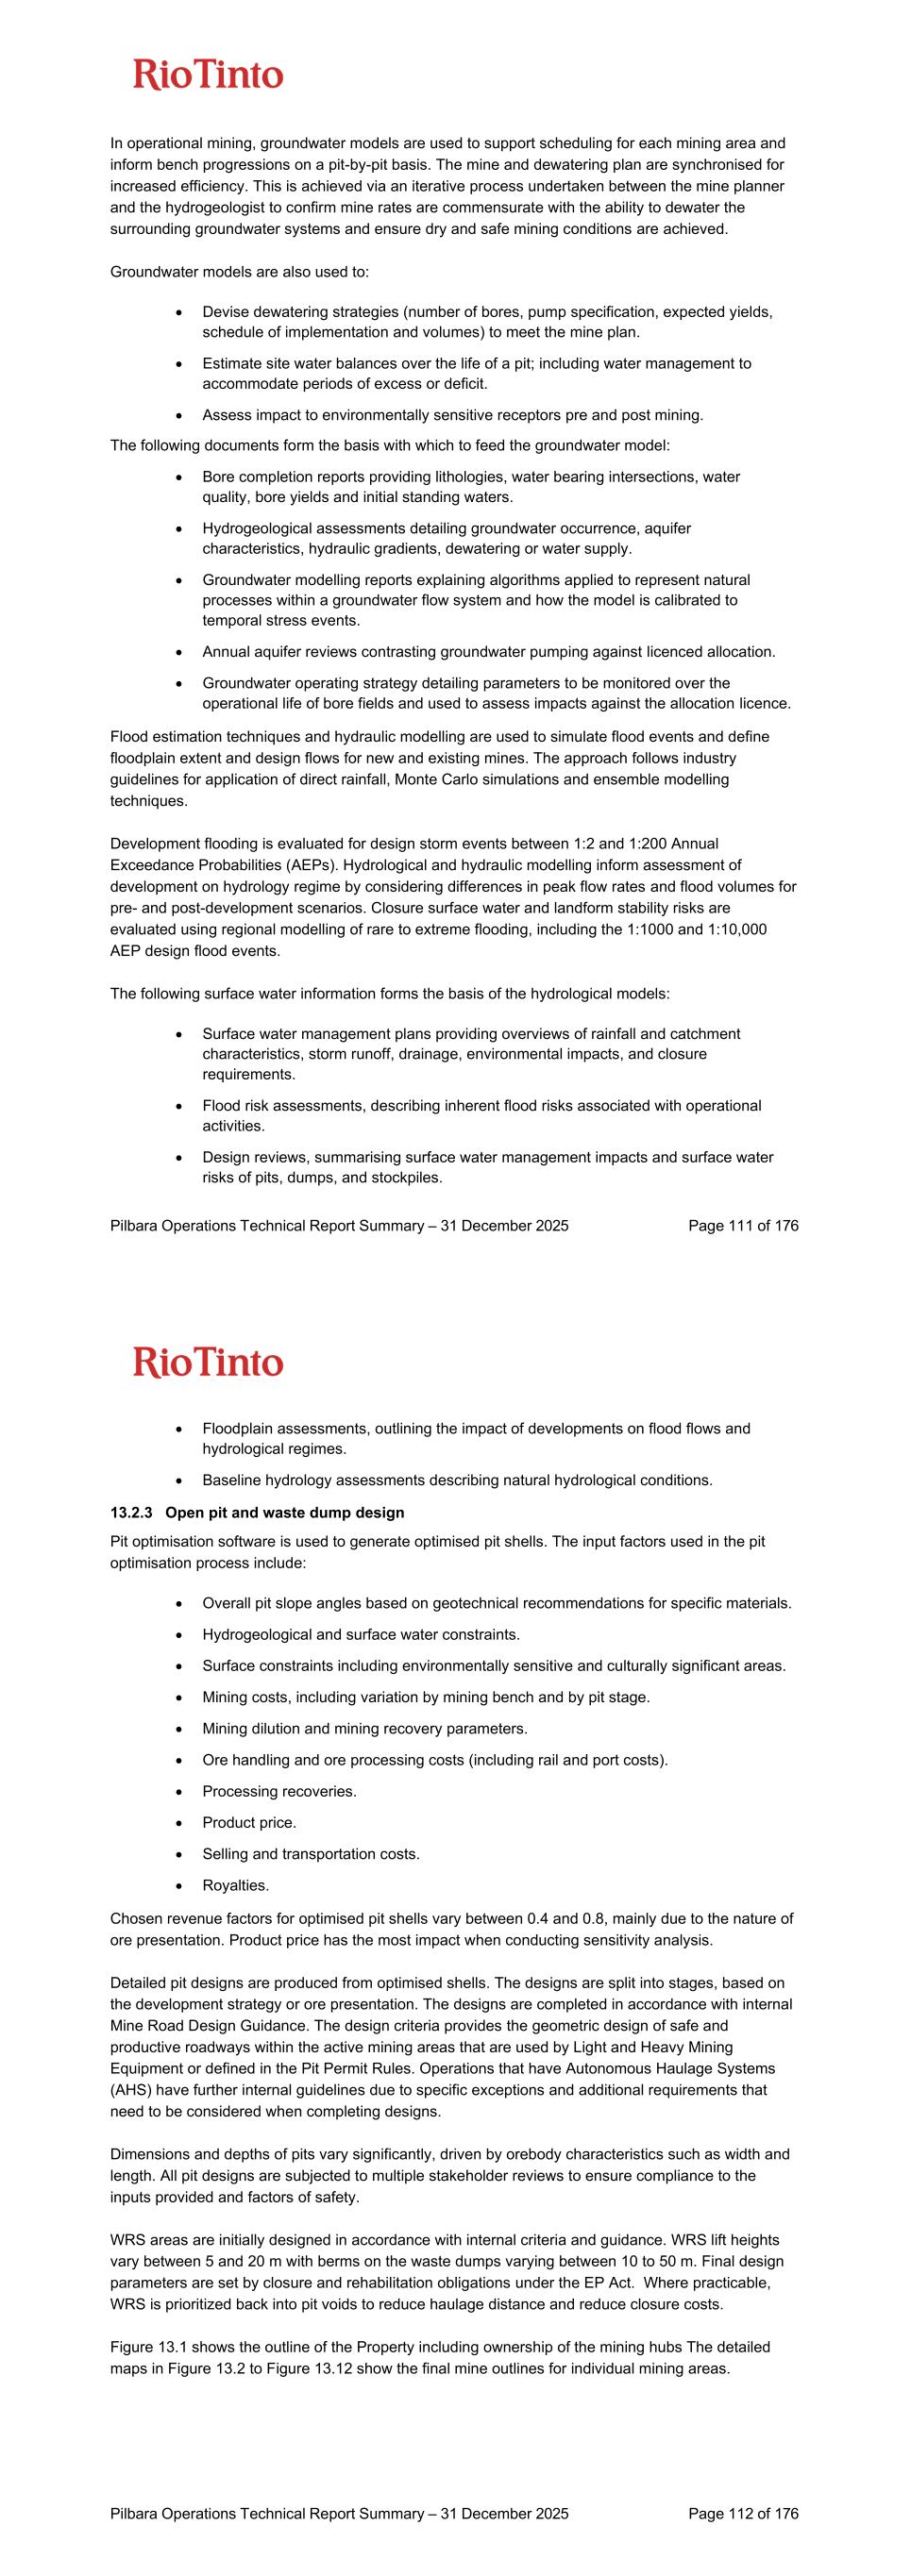
Pilbara Operations Technical Report Summary – 31 December 2025 Page 111 of 176 In operational mining, groundwater models are used to support scheduling for each mining area and inform bench progressions on a pit-by-pit basis. The mine and dewatering plan are synchronised for increased efficiency. This is achieved via an iterative process undertaken between the mine planner and the hydrogeologist to confirm mine rates are commensurate with the ability to dewater the surrounding groundwater systems and ensure dry and safe mining conditions are achieved. Groundwater models are also used to: • Devise dewatering strategies (number of bores, pump specification, expected yields, schedule of implementation and volumes) to meet the mine plan. • Estimate site water balances over the life of a pit; including water management to accommodate periods of excess or deficit. • Assess impact to environmentally sensitive receptors pre and post mining. The following documents form the basis with which to feed the groundwater model: • Bore completion reports providing lithologies, water bearing intersections, water quality, bore yields and initial standing waters. • Hydrogeological assessments detailing groundwater occurrence, aquifer characteristics, hydraulic gradients, dewatering or water supply. • Groundwater modelling reports explaining algorithms applied to represent natural processes within a groundwater flow system and how the model is calibrated to temporal stress events. • Annual aquifer reviews contrasting groundwater pumping against licenced allocation. • Groundwater operating strategy detailing parameters to be monitored over the operational life of bore fields and used to assess impacts against the allocation licence. Flood estimation techniques and hydraulic modelling are used to simulate flood events and define floodplain extent and design flows for new and existing mines. The approach follows industry guidelines for application of direct rainfall, Monte Carlo simulations and ensemble modelling techniques. Development flooding is evaluated for design storm events between 1:2 and 1:200 Annual Exceedance Probabilities (AEPs). Hydrological and hydraulic modelling inform assessment of development on hydrology regime by considering differences in peak flow rates and flood volumes for pre- and post-development scenarios. Closure surface water and landform stability risks are evaluated using regional modelling of rare to extreme flooding, including the 1:1000 and 1:10,000 AEP design flood events. The following surface water information forms the basis of the hydrological models: • Surface water management plans providing overviews of rainfall and catchment characteristics, storm runoff, drainage, environmental impacts, and closure requirements. • Flood risk assessments, describing inherent flood risks associated with operational activities. • Design reviews, summarising surface water management impacts and surface water risks of pits, dumps, and stockpiles. Pilbara Operations Technical Report Summary – 31 December 2025 Page 112 of 176 • Floodplain assessments, outlining the impact of developments on flood flows and hydrological regimes. • Baseline hydrology assessments describing natural hydrological conditions. 13.2.3 Open pit and waste dump design Pit optimisation software is used to generate optimised pit shells. The input factors used in the pit optimisation process include: • Overall pit slope angles based on geotechnical recommendations for specific materials. • Hydrogeological and surface water constraints. • Surface constraints including environmentally sensitive and culturally significant areas. • Mining costs, including variation by mining bench and by pit stage. • Mining dilution and mining recovery parameters. • Ore handling and ore processing costs (including rail and port costs). • Processing recoveries. • Product price. • Selling and transportation costs. • Royalties. Chosen revenue factors for optimised pit shells vary between 0.4 and 0.8, mainly due to the nature of ore presentation. Product price has the most impact when conducting sensitivity analysis. Detailed pit designs are produced from optimised shells. The designs are split into stages, based on the development strategy or ore presentation. The designs are completed in accordance with internal Mine Road Design Guidance. The design criteria provides the geometric design of safe and productive roadways within the active mining areas that are used by Light and Heavy Mining Equipment or defined in the Pit Permit Rules. Operations that have Autonomous Haulage Systems (AHS) have further internal guidelines due to specific exceptions and additional requirements that need to be considered when completing designs. Dimensions and depths of pits vary significantly, driven by orebody characteristics such as width and length. All pit designs are subjected to multiple stakeholder reviews to ensure compliance to the inputs provided and factors of safety. WRS areas are initially designed in accordance with internal criteria and guidance. WRS lift heights vary between 5 and 20 m with berms on the waste dumps varying between 10 to 50 m. Final design parameters are set by closure and rehabilitation obligations under the EP Act. Where practicable, WRS is prioritized back into pit voids to reduce haulage distance and reduce closure costs. Figure 13.1 shows the outline of the Property including ownership of the mining hubs The detailed maps in Figure 13.2 to Figure 13.12 show the final mine outlines for individual mining areas.
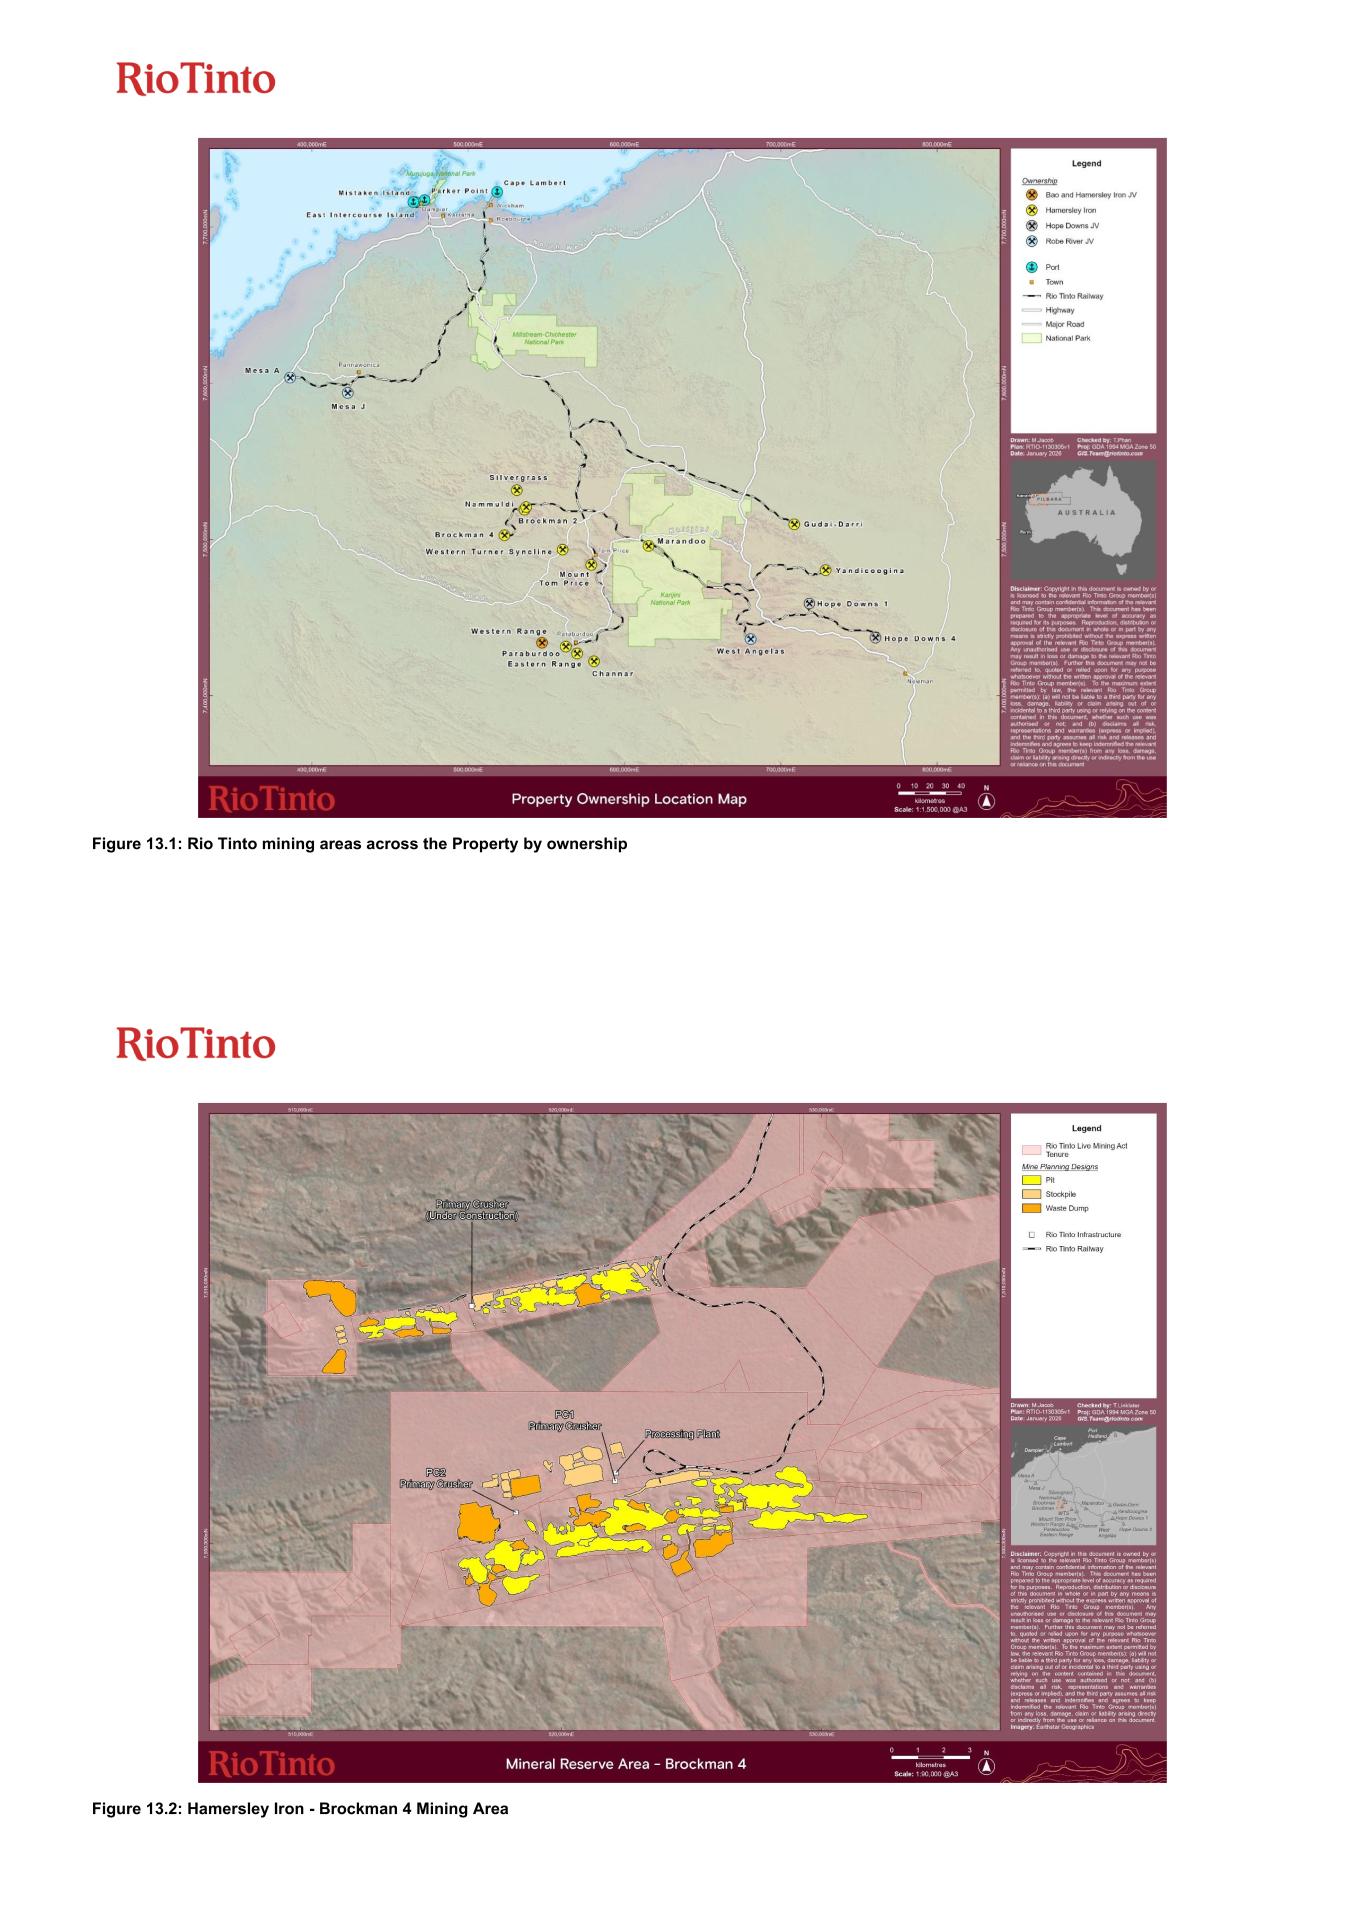
Figure 13.1: Rio Tinto mining areas across the Property by ownership Figure 13.2: Hamersley Iron - Brockman 4 Mining Area
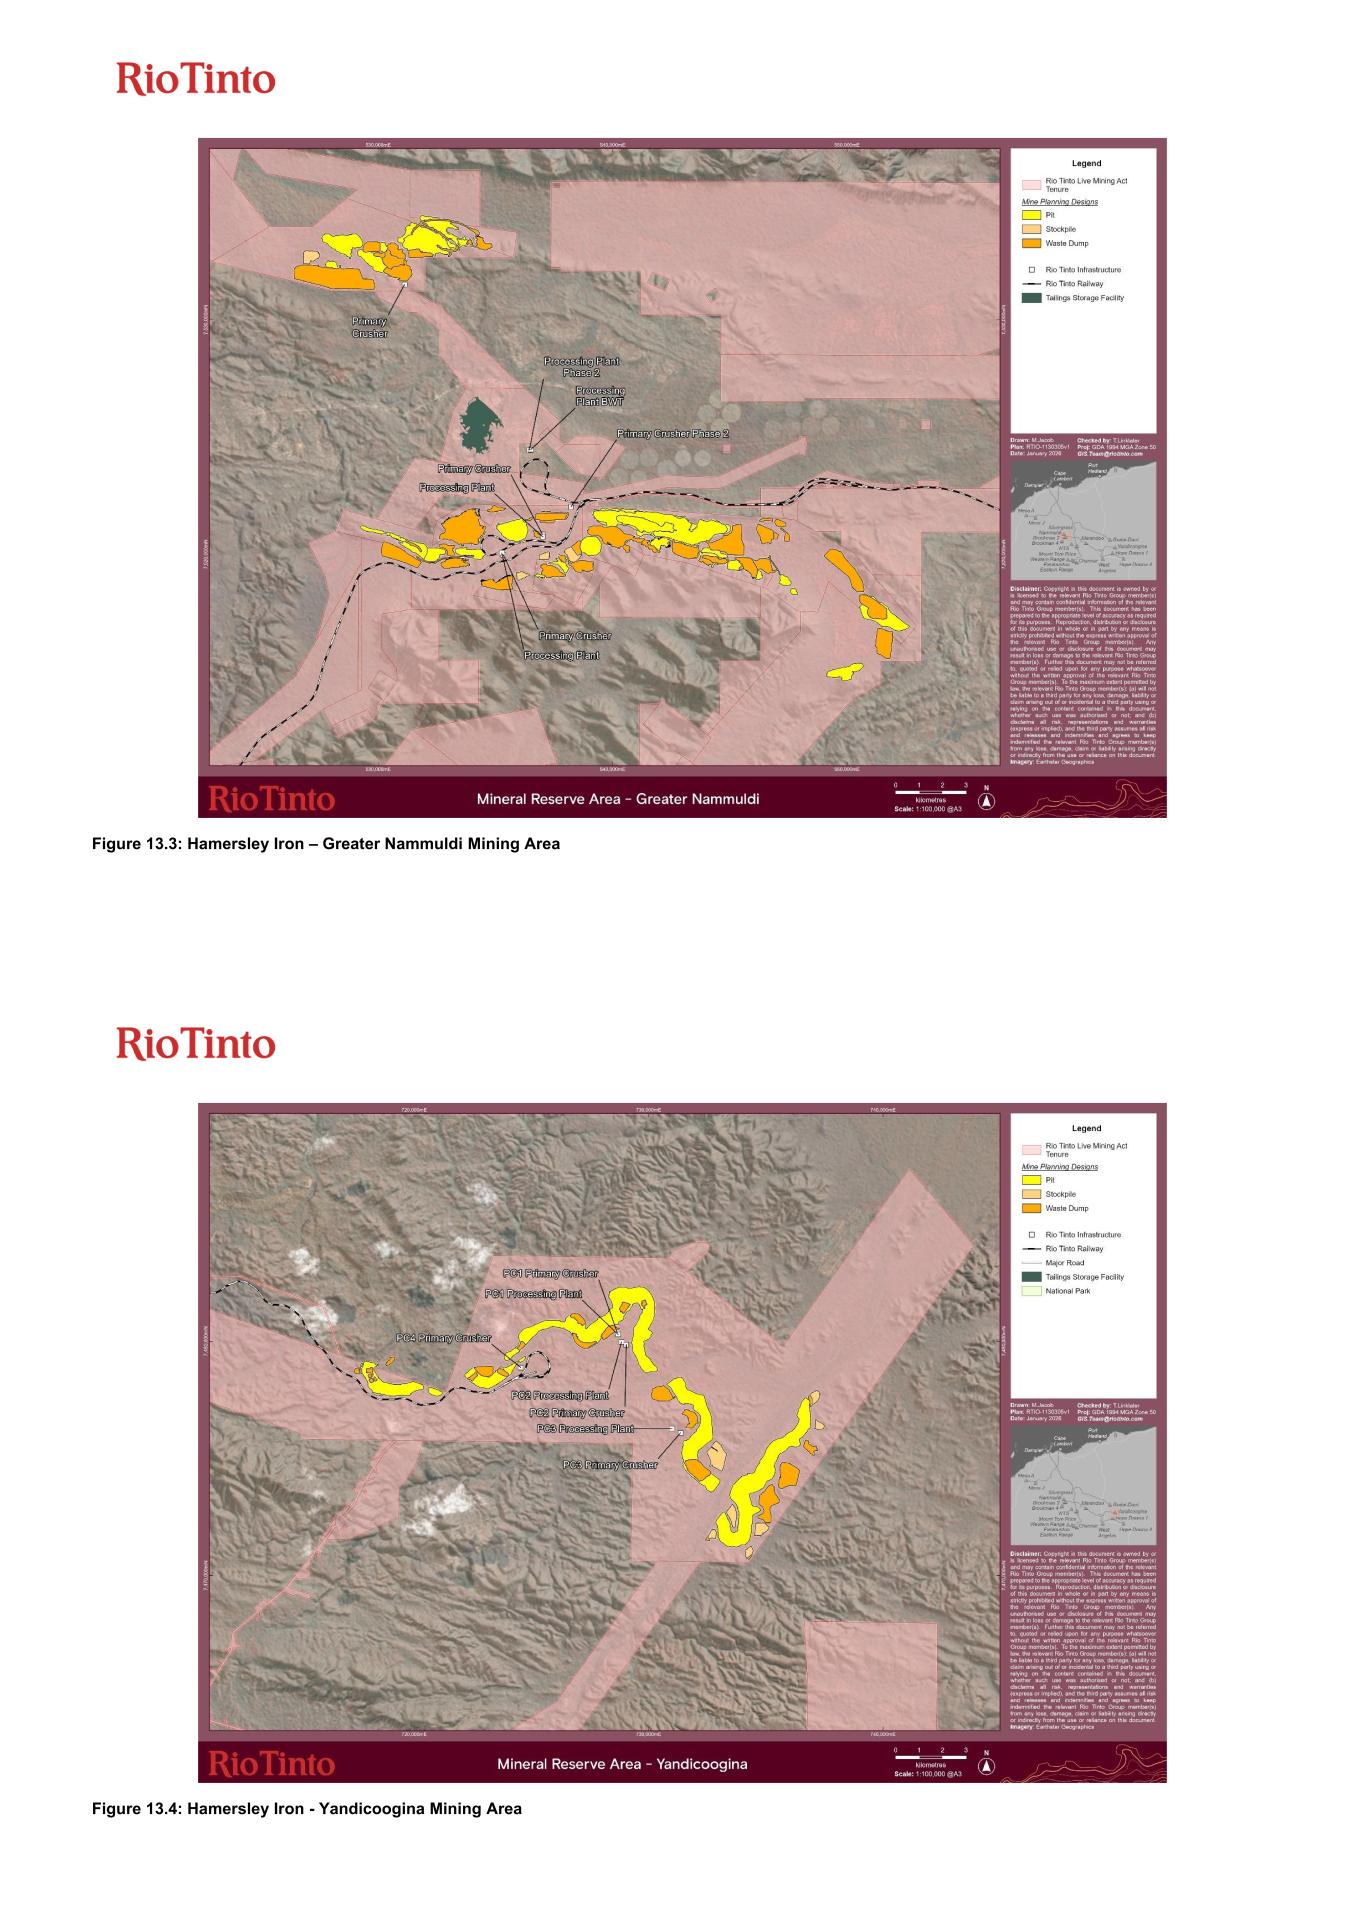
Figure 13.3: Hamersley Iron – Greater Nammuldi Mining Area Figure 13.4: Hamersley Iron - Yandicoogina Mining Area
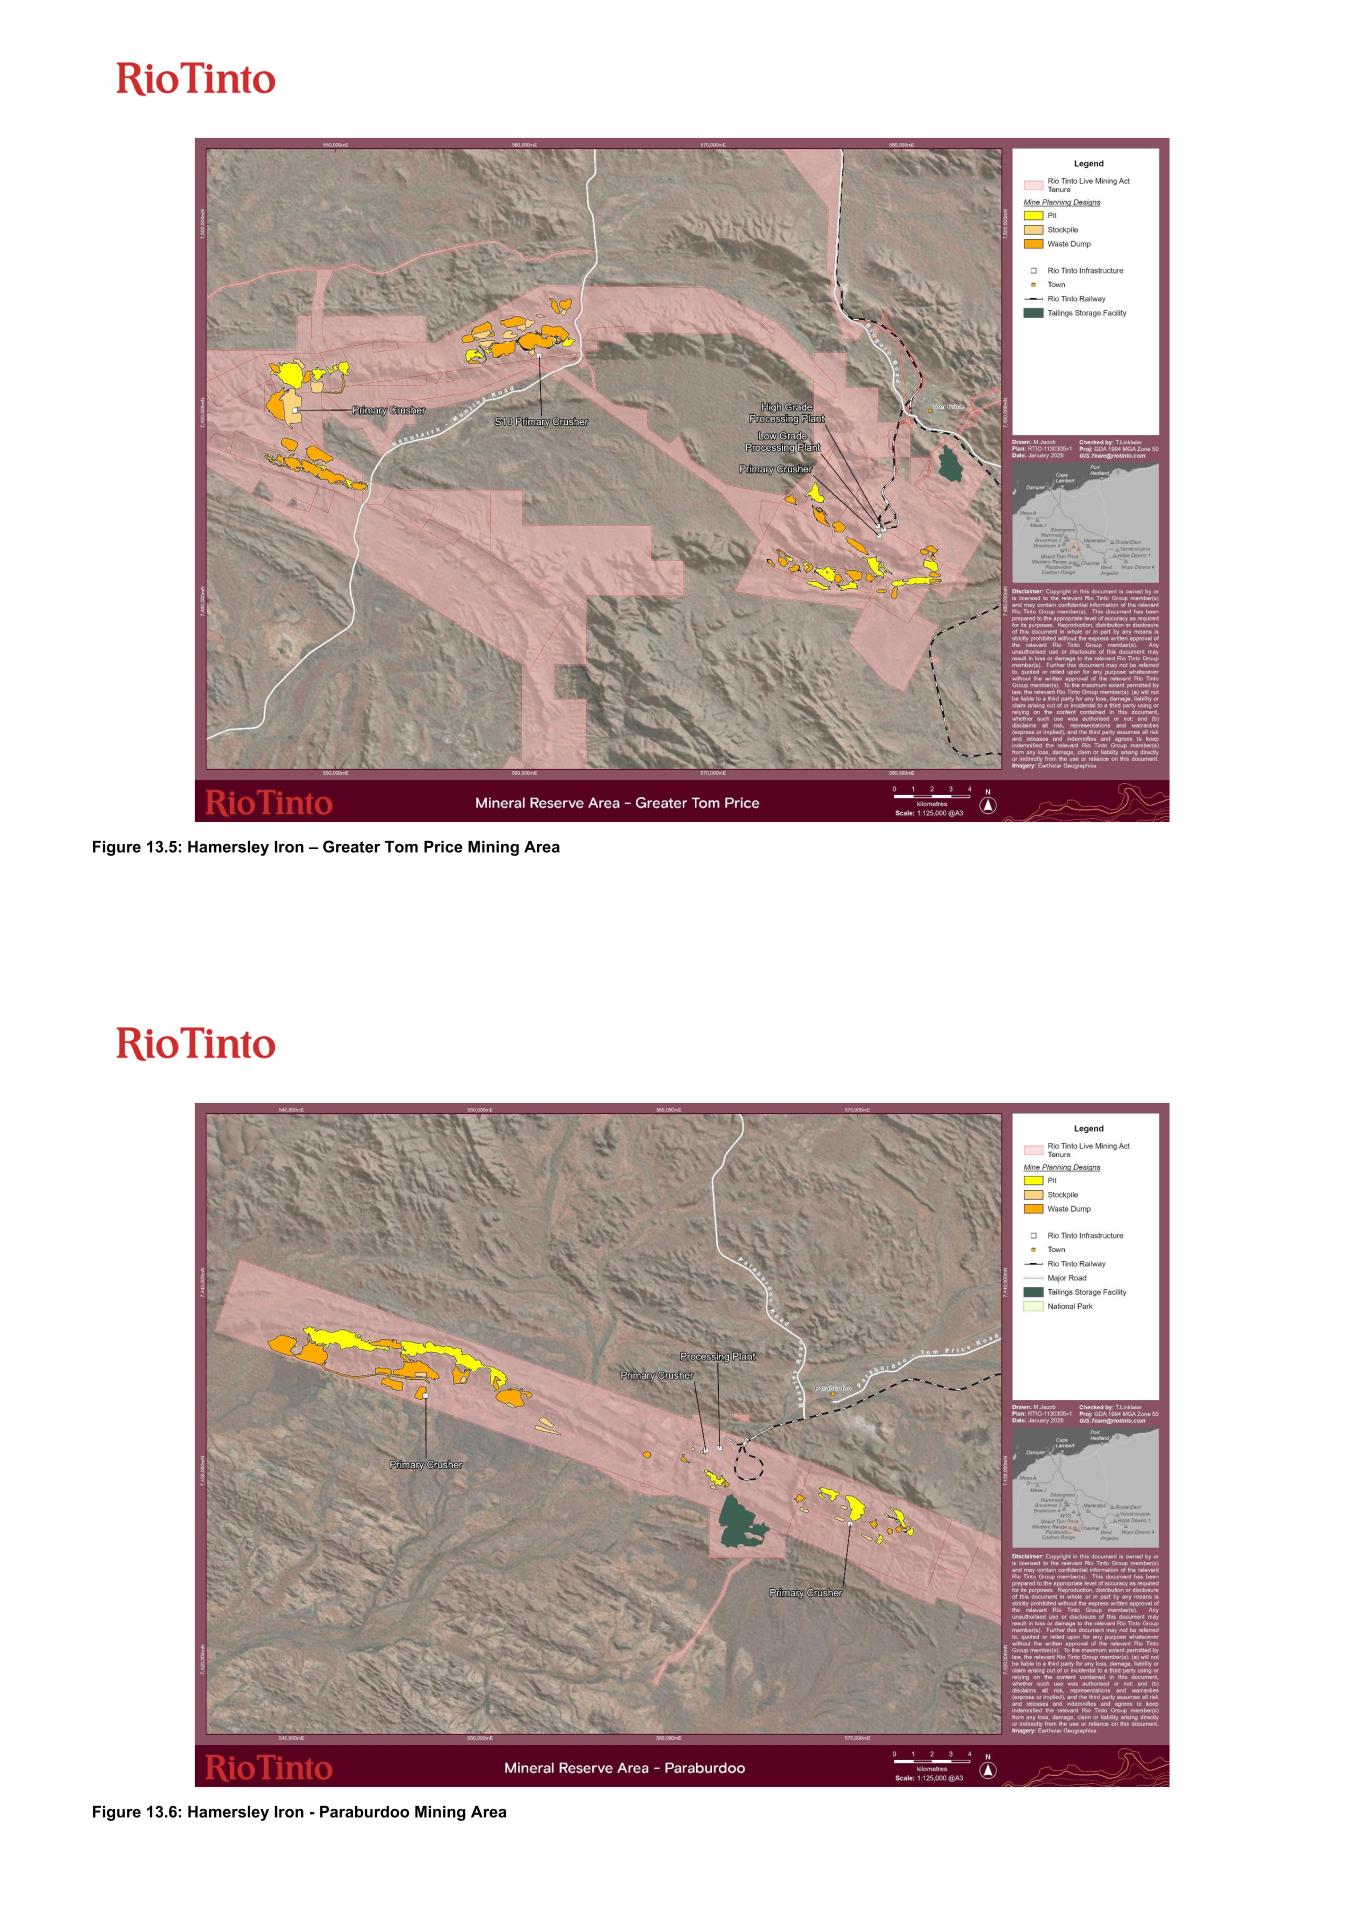
Figure 13.5: Hamersley Iron – Greater Tom Price Mining Area Figure 13.6: Hamersley Iron - Paraburdoo Mining Area
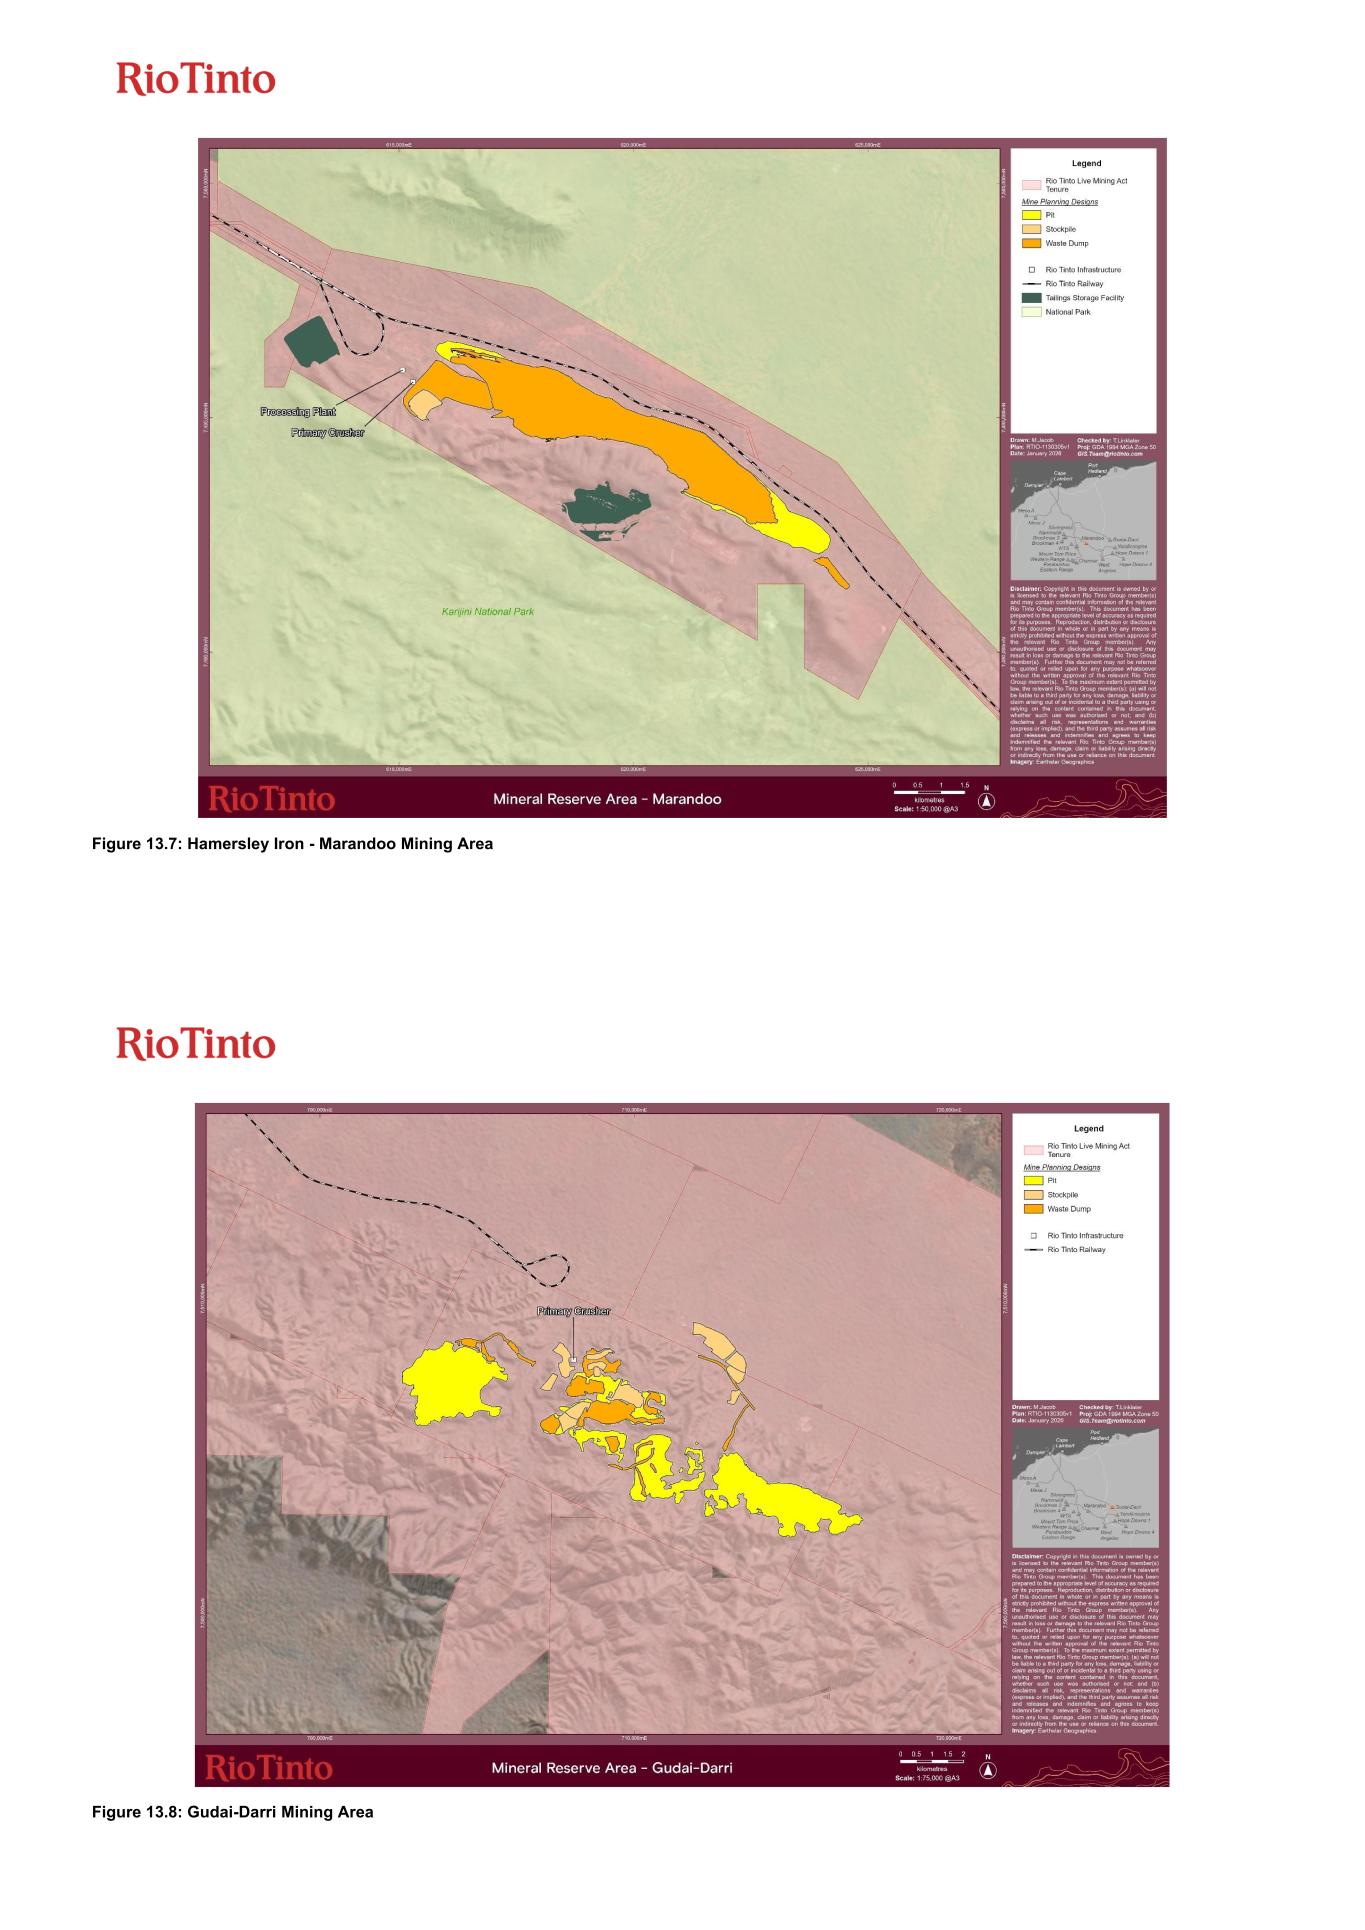
Figure 13.7: Hamersley Iron - Marandoo Mining Area Figure 13.8: Gudai-Darri Mining Area
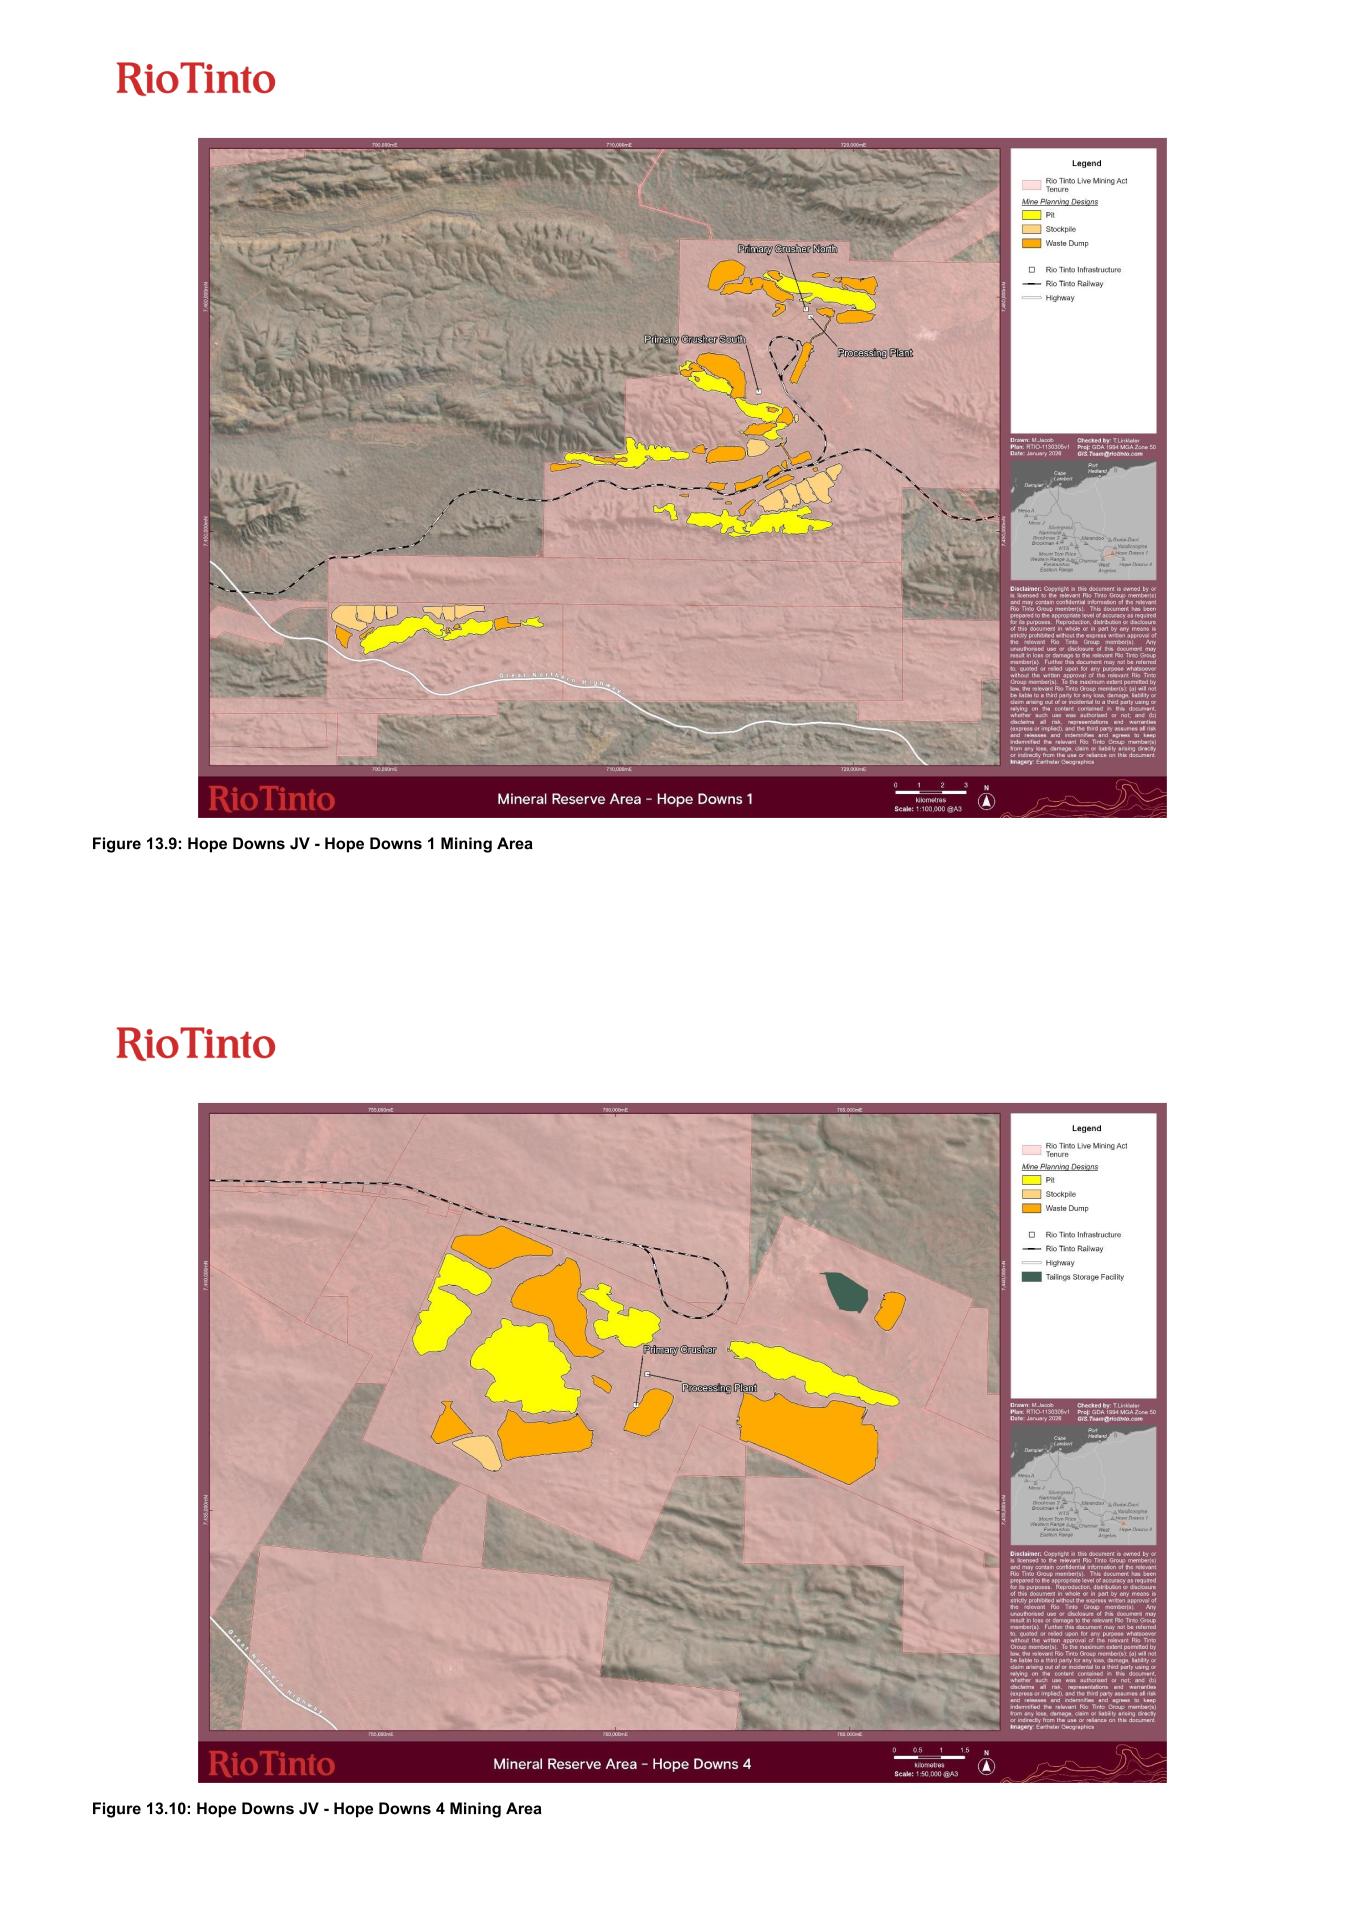
Figure 13.9: Hope Downs JV - Hope Downs 1 Mining Area Figure 13.10: Hope Downs JV - Hope Downs 4 Mining Area
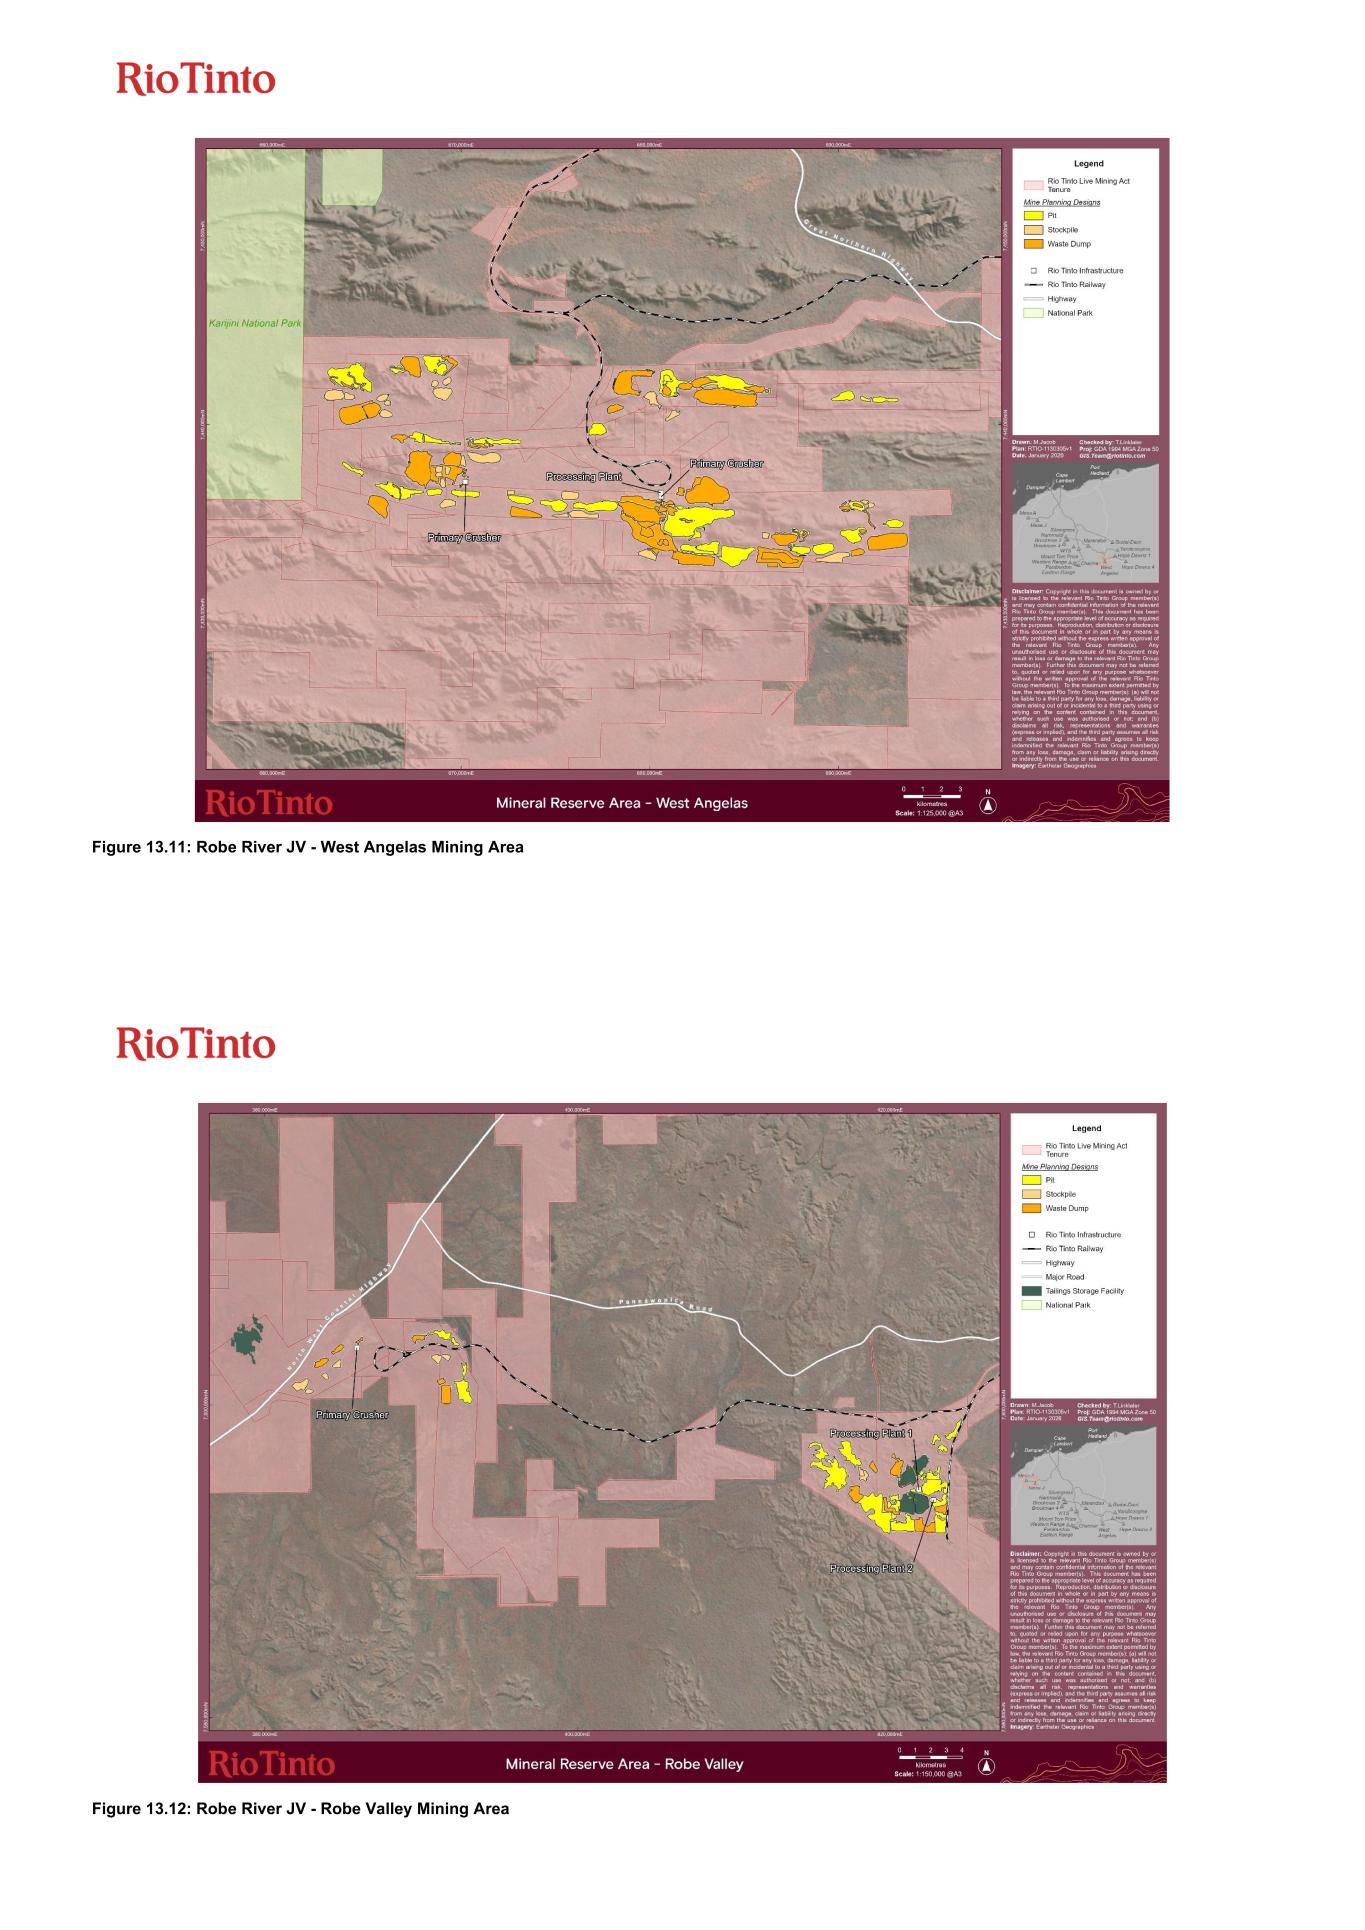
Figure 13.11: Robe River JV - West Angelas Mining Area Figure 13.12: Robe River JV - Robe Valley Mining Area
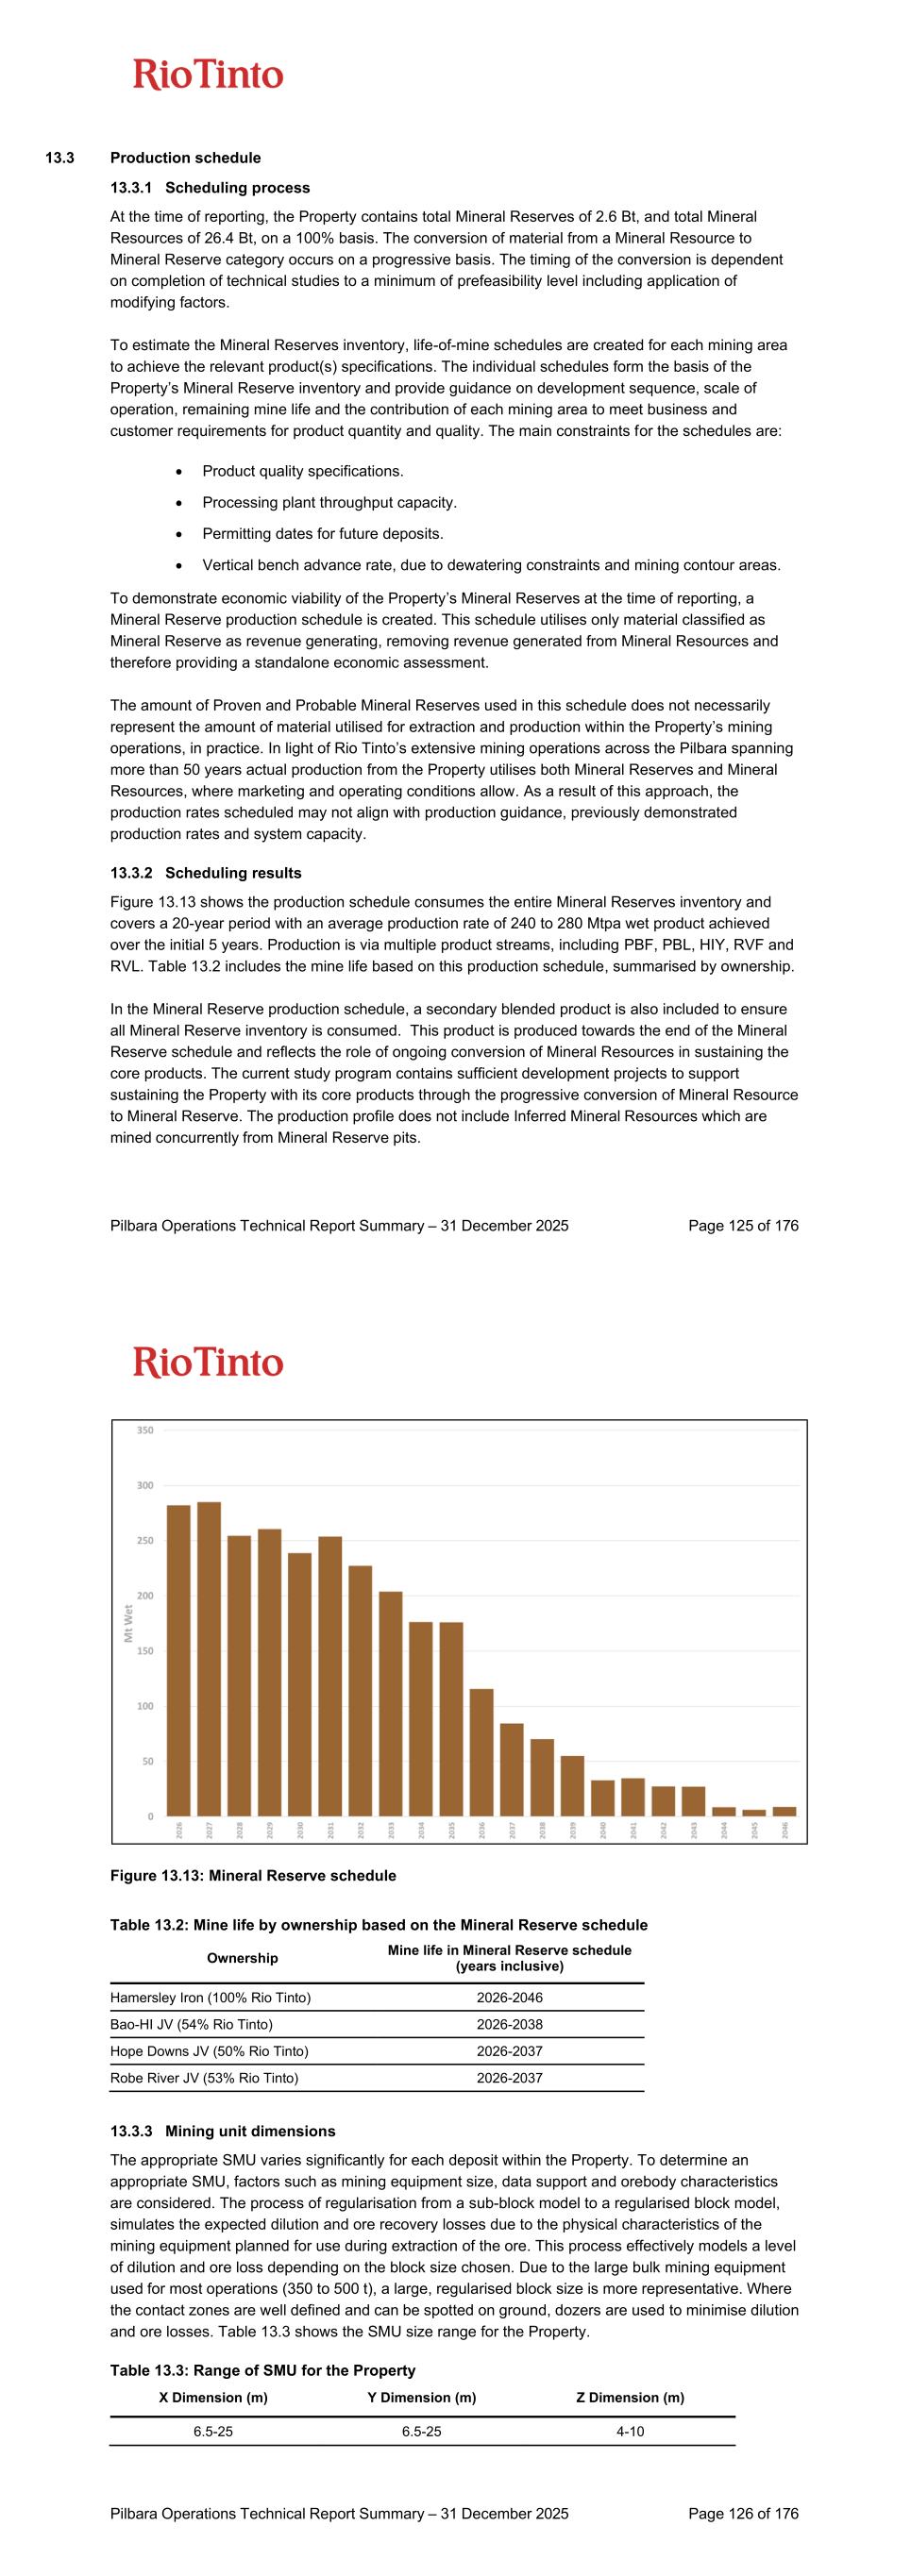
Pilbara Operations Technical Report Summary – 31 December 2025 Page 125 of 176 13.3 Production schedule 13.3.1 Scheduling process At the time of reporting, the Property contains total Mineral Reserves of 2.6 Bt, and total Mineral Resources of 26.4 Bt, on a 100% basis. The conversion of material from a Mineral Resource to Mineral Reserve category occurs on a progressive basis. The timing of the conversion is dependent on completion of technical studies to a minimum of prefeasibility level including application of modifying factors. To estimate the Mineral Reserves inventory, life-of-mine schedules are created for each mining area to achieve the relevant product(s) specifications. The individual schedules form the basis of the Property’s Mineral Reserve inventory and provide guidance on development sequence, scale of operation, remaining mine life and the contribution of each mining area to meet business and customer requirements for product quantity and quality. The main constraints for the schedules are: • Product quality specifications. • Processing plant throughput capacity. • Permitting dates for future deposits. • Vertical bench advance rate, due to dewatering constraints and mining contour areas. To demonstrate economic viability of the Property’s Mineral Reserves at the time of reporting, a Mineral Reserve production schedule is created. This schedule utilises only material classified as Mineral Reserve as revenue generating, removing revenue generated from Mineral Resources and therefore providing a standalone economic assessment. The amount of Proven and Probable Mineral Reserves used in this schedule does not necessarily represent the amount of material utilised for extraction and production within the Property’s mining operations, in practice. In light of Rio Tinto’s extensive mining operations across the Pilbara spanning more than 50 years actual production from the Property utilises both Mineral Reserves and Mineral Resources, where marketing and operating conditions allow. As a result of this approach, the production rates scheduled may not align with production guidance, previously demonstrated production rates and system capacity. 13.3.2 Scheduling results Figure 13.13 shows the production schedule consumes the entire Mineral Reserves inventory and covers a 20-year period with an average production rate of 240 to 280 Mtpa wet product achieved over the initial 5 years. Production is via multiple product streams, including PBF, PBL, HIY, RVF and RVL. Table 13.2 includes the mine life based on this production schedule, summarised by ownership. In the Mineral Reserve production schedule, a secondary blended product is also included to ensure all Mineral Reserve inventory is consumed. This product is produced towards the end of the Mineral Reserve schedule and reflects the role of ongoing conversion of Mineral Resources in sustaining the core products. The current study program contains sufficient development projects to support sustaining the Property with its core products through the progressive conversion of Mineral Resource to Mineral Reserve. The production profile does not include Inferred Mineral Resources which are mined concurrently from Mineral Reserve pits. Pilbara Operations Technical Report Summary – 31 December 2025 Page 126 of 176 Figure 13.13: Mineral Reserve schedule Table 13.2: Mine life by ownership based on the Mineral Reserve schedule Ownership Mine life in Mineral Reserve schedule (years inclusive) Hamersley Iron (100% Rio Tinto) 2026-2046 Bao-HI JV (54% Rio Tinto) 2026-2038 Hope Downs JV (50% Rio Tinto) 2026-2037 Robe River JV (53% Rio Tinto) 2026-2037 13.3.3 Mining unit dimensions The appropriate SMU varies significantly for each deposit within the Property. To determine an appropriate SMU, factors such as mining equipment size, data support and orebody characteristics are considered. The process of regularisation from a sub-block model to a regularised block model, simulates the expected dilution and ore recovery losses due to the physical characteristics of the mining equipment planned for use during extraction of the ore. This process effectively models a level of dilution and ore loss depending on the block size chosen. Due to the large bulk mining equipment used for most operations (350 to 500 t), a large, regularised block size is more representative. Where the contact zones are well defined and can be spotted on ground, dozers are used to minimise dilution and ore losses. Table 13.3 shows the SMU size range for the Property. Table 13.3: Range of SMU for the Property X Dimension (m) Y Dimension (m) Z Dimension (m) 6.5-25 6.5-25 4-10
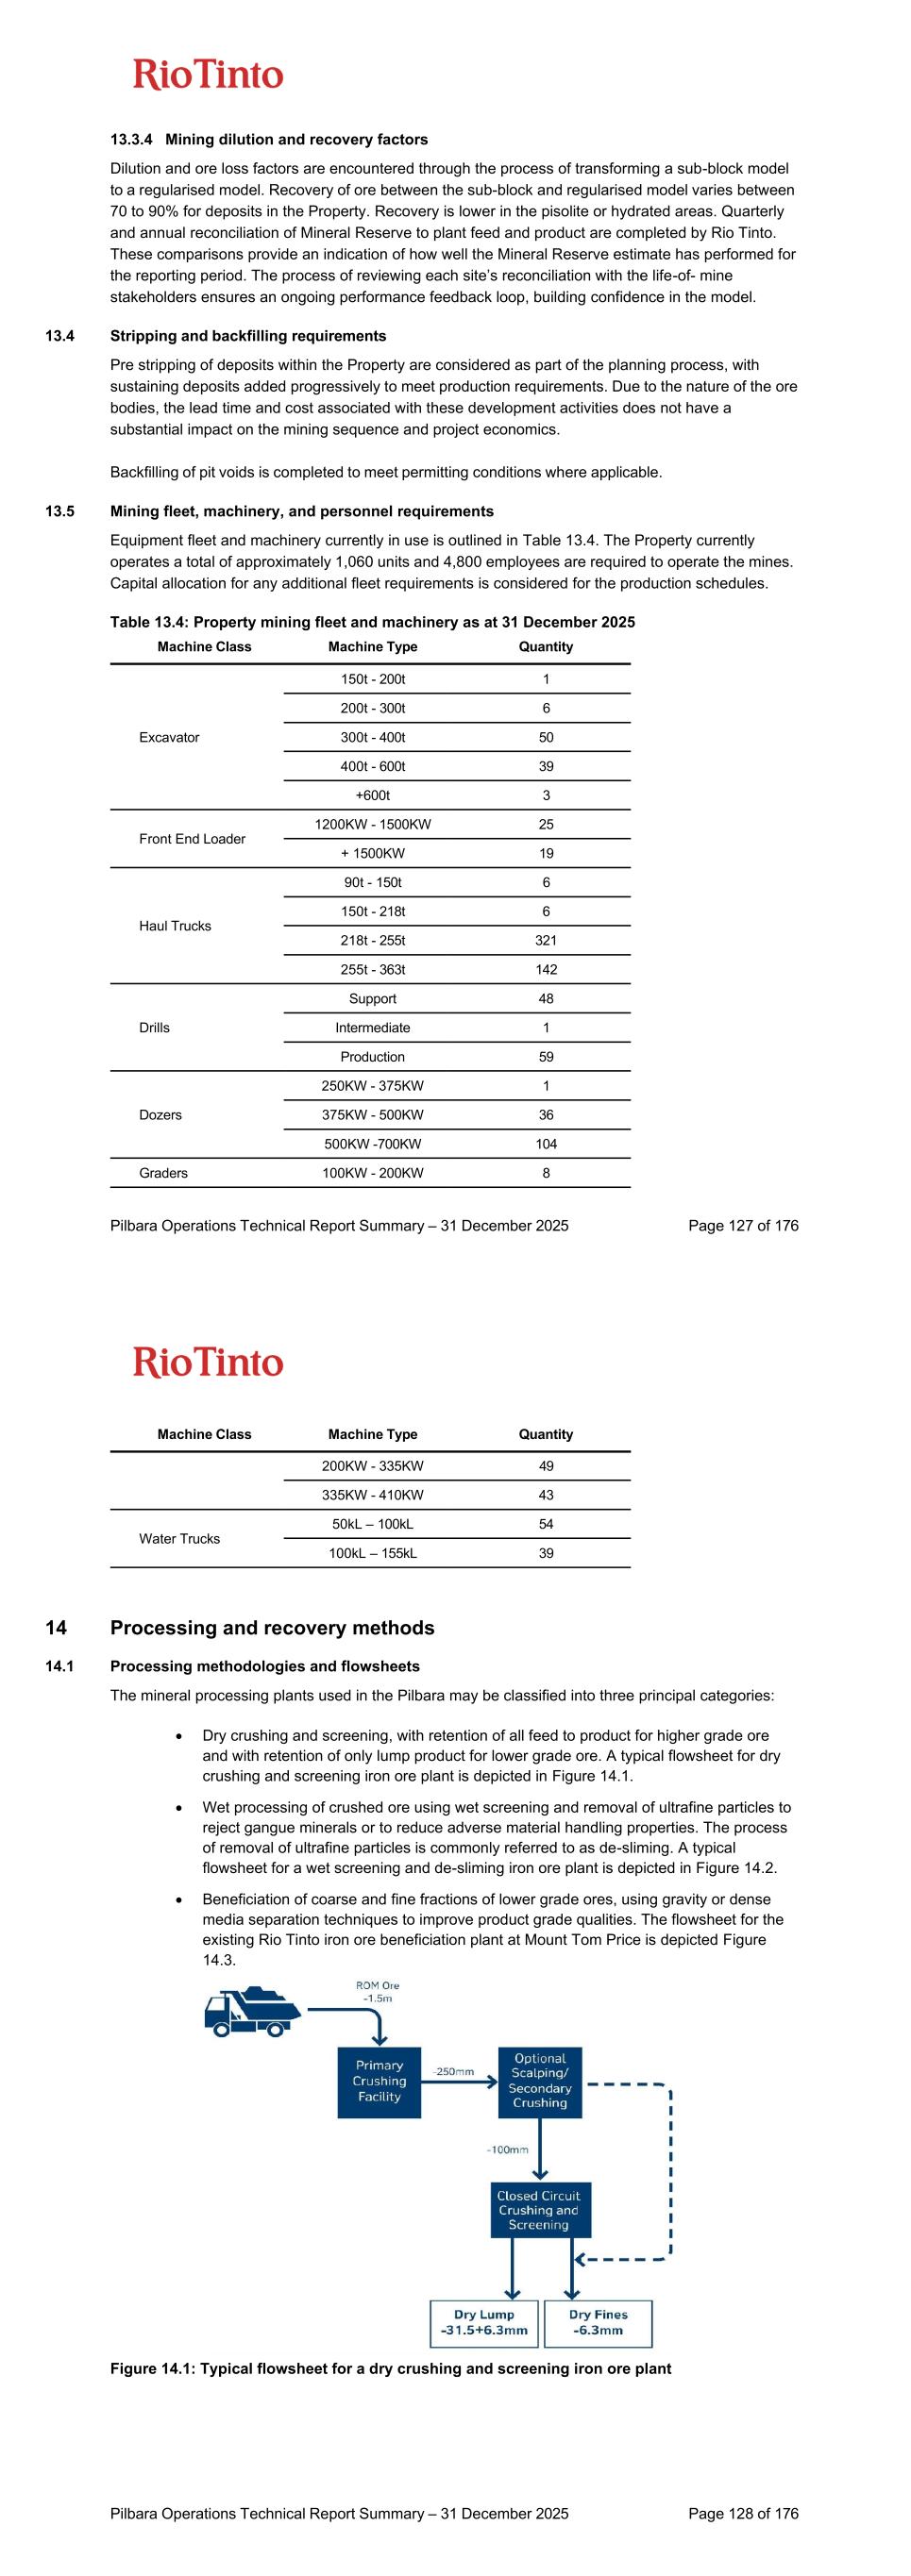
Pilbara Operations Technical Report Summary – 31 December 2025 Page 127 of 176 13.3.4 Mining dilution and recovery factors Dilution and ore loss factors are encountered through the process of transforming a sub-block model to a regularised model. Recovery of ore between the sub-block and regularised model varies between 70 to 90% for deposits in the Property. Recovery is lower in the pisolite or hydrated areas. Quarterly and annual reconciliation of Mineral Reserve to plant feed and product are completed by Rio Tinto. These comparisons provide an indication of how well the Mineral Reserve estimate has performed for the reporting period. The process of reviewing each site’s reconciliation with the life-of- mine stakeholders ensures an ongoing performance feedback loop, building confidence in the model. 13.4 Stripping and backfilling requirements Pre stripping of deposits within the Property are considered as part of the planning process, with sustaining deposits added progressively to meet production requirements. Due to the nature of the ore bodies, the lead time and cost associated with these development activities does not have a substantial impact on the mining sequence and project economics. Backfilling of pit voids is completed to meet permitting conditions where applicable. 13.5 Mining fleet, machinery, and personnel requirements Equipment fleet and machinery currently in use is outlined in Table 13.4. The Property currently operates a total of approximately 1,060 units and 4,800 employees are required to operate the mines. Capital allocation for any additional fleet requirements is considered for the production schedules. Table 13.4: Property mining fleet and machinery as at 31 December 2025 Machine Class Machine Type Quantity Excavator 150t - 200t 1 200t - 300t 6 300t - 400t 50 400t - 600t 39 +600t 3 Front End Loader 1200KW - 1500KW 25 + 1500KW 19 Haul Trucks 90t - 150t 6 150t - 218t 6 218t - 255t 321 255t - 363t 142 Drills Support 48 Intermediate 1 Production 59 Dozers 250KW - 375KW 1 375KW - 500KW 36 500KW -700KW 104 Graders 100KW - 200KW 8 Pilbara Operations Technical Report Summary – 31 December 2025 Page 128 of 176 14 Processing and recovery methods 14.1 Processing methodologies and flowsheets The mineral processing plants used in the Pilbara may be classified into three principal categories: • Dry crushing and screening, with retention of all feed to product for higher grade ore and with retention of only lump product for lower grade ore. A typical flowsheet for dry crushing and screening iron ore plant is depicted in Figure 14.1. • Wet processing of crushed ore using wet screening and removal of ultrafine particles to reject gangue minerals or to reduce adverse material handling properties. The process of removal of ultrafine particles is commonly referred to as de-sliming. A typical flowsheet for a wet screening and de-sliming iron ore plant is depicted in Figure 14.2. • Beneficiation of coarse and fine fractions of lower grade ores, using gravity or dense media separation techniques to improve product grade qualities. The flowsheet for the existing Rio Tinto iron ore beneficiation plant at Mount Tom Price is depicted Figure 14.3. Figure 14.1: Typical flowsheet for a dry crushing and screening iron ore plant Machine Class Machine Type Quantity 200KW - 335KW 49 335KW - 410KW 43 Water Trucks 50kL – 100kL 54 100kL – 155kL 39
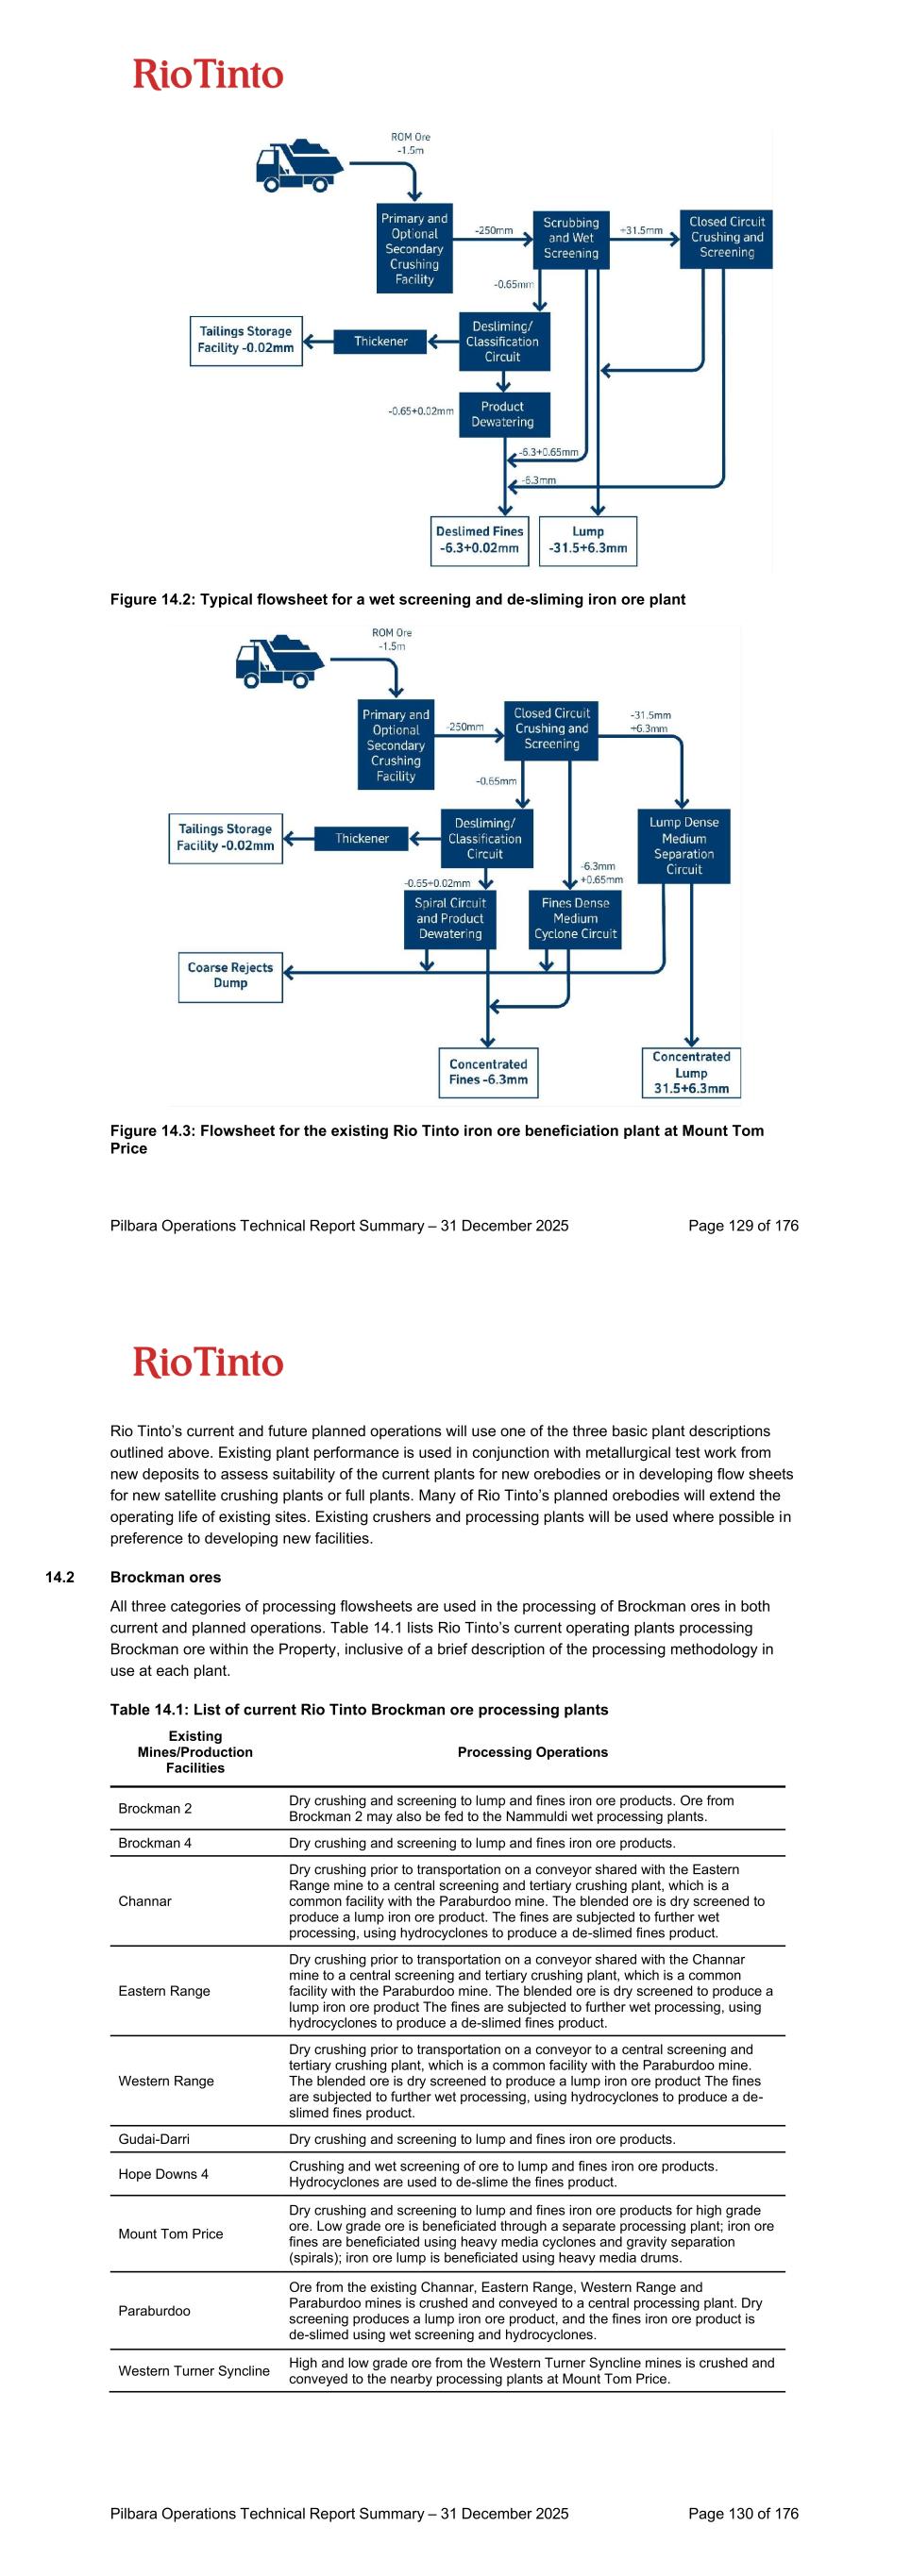
Pilbara Operations Technical Report Summary – 31 December 2025 Page 129 of 176 Figure 14.2: Typical flowsheet for a wet screening and de-sliming iron ore plant Figure 14.3: Flowsheet for the existing Rio Tinto iron ore beneficiation plant at Mount Tom Price Pilbara Operations Technical Report Summary – 31 December 2025 Page 130 of 176 Rio Tinto’s current and future planned operations will use one of the three basic plant descriptions outlined above. Existing plant performance is used in conjunction with metallurgical test work from new deposits to assess suitability of the current plants for new orebodies or in developing flow sheets for new satellite crushing plants or full plants. Many of Rio Tinto’s planned orebodies will extend the operating life of existing sites. Existing crushers and processing plants will be used where possible in preference to developing new facilities. 14.2 Brockman ores All three categories of processing flowsheets are used in the processing of Brockman ores in both current and planned operations. Table 14.1 lists Rio Tinto’s current operating plants processing Brockman ore within the Property, inclusive of a brief description of the processing methodology in use at each plant. Table 14.1: List of current Rio Tinto Brockman ore processing plants Existing Mines/Production Facilities Processing Operations Brockman 2 Dry crushing and screening to lump and fines iron ore products. Ore from Brockman 2 may also be fed to the Nammuldi wet processing plants. Brockman 4 Dry crushing and screening to lump and fines iron ore products. Channar Dry crushing prior to transportation on a conveyor shared with the Eastern Range mine to a central screening and tertiary crushing plant, which is a common facility with the Paraburdoo mine. The blended ore is dry screened to produce a lump iron ore product. The fines are subjected to further wet processing, using hydrocyclones to produce a de-slimed fines product. Eastern Range Dry crushing prior to transportation on a conveyor shared with the Channar mine to a central screening and tertiary crushing plant, which is a common facility with the Paraburdoo mine. The blended ore is dry screened to produce a lump iron ore product The fines are subjected to further wet processing, using hydrocyclones to produce a de-slimed fines product. Western Range Dry crushing prior to transportation on a conveyor to a central screening and tertiary crushing plant, which is a common facility with the Paraburdoo mine. The blended ore is dry screened to produce a lump iron ore product The fines are subjected to further wet processing, using hydrocyclones to produce a de- slimed fines product. Gudai-Darri Dry crushing and screening to lump and fines iron ore products. Hope Downs 4 Crushing and wet screening of ore to lump and fines iron ore products. Hydrocyclones are used to de-slime the fines product. Mount Tom Price Dry crushing and screening to lump and fines iron ore products for high grade ore. Low grade ore is beneficiated through a separate processing plant; iron ore fines are beneficiated using heavy media cyclones and gravity separation (spirals); iron ore lump is beneficiated using heavy media drums. Paraburdoo Ore from the existing Channar, Eastern Range, Western Range and Paraburdoo mines is crushed and conveyed to a central processing plant. Dry screening produces a lump iron ore product, and the fines iron ore product is de-slimed using wet screening and hydrocyclones. Western Turner Syncline High and low grade ore from the Western Turner Syncline mines is crushed and conveyed to the nearby processing plants at Mount Tom Price.
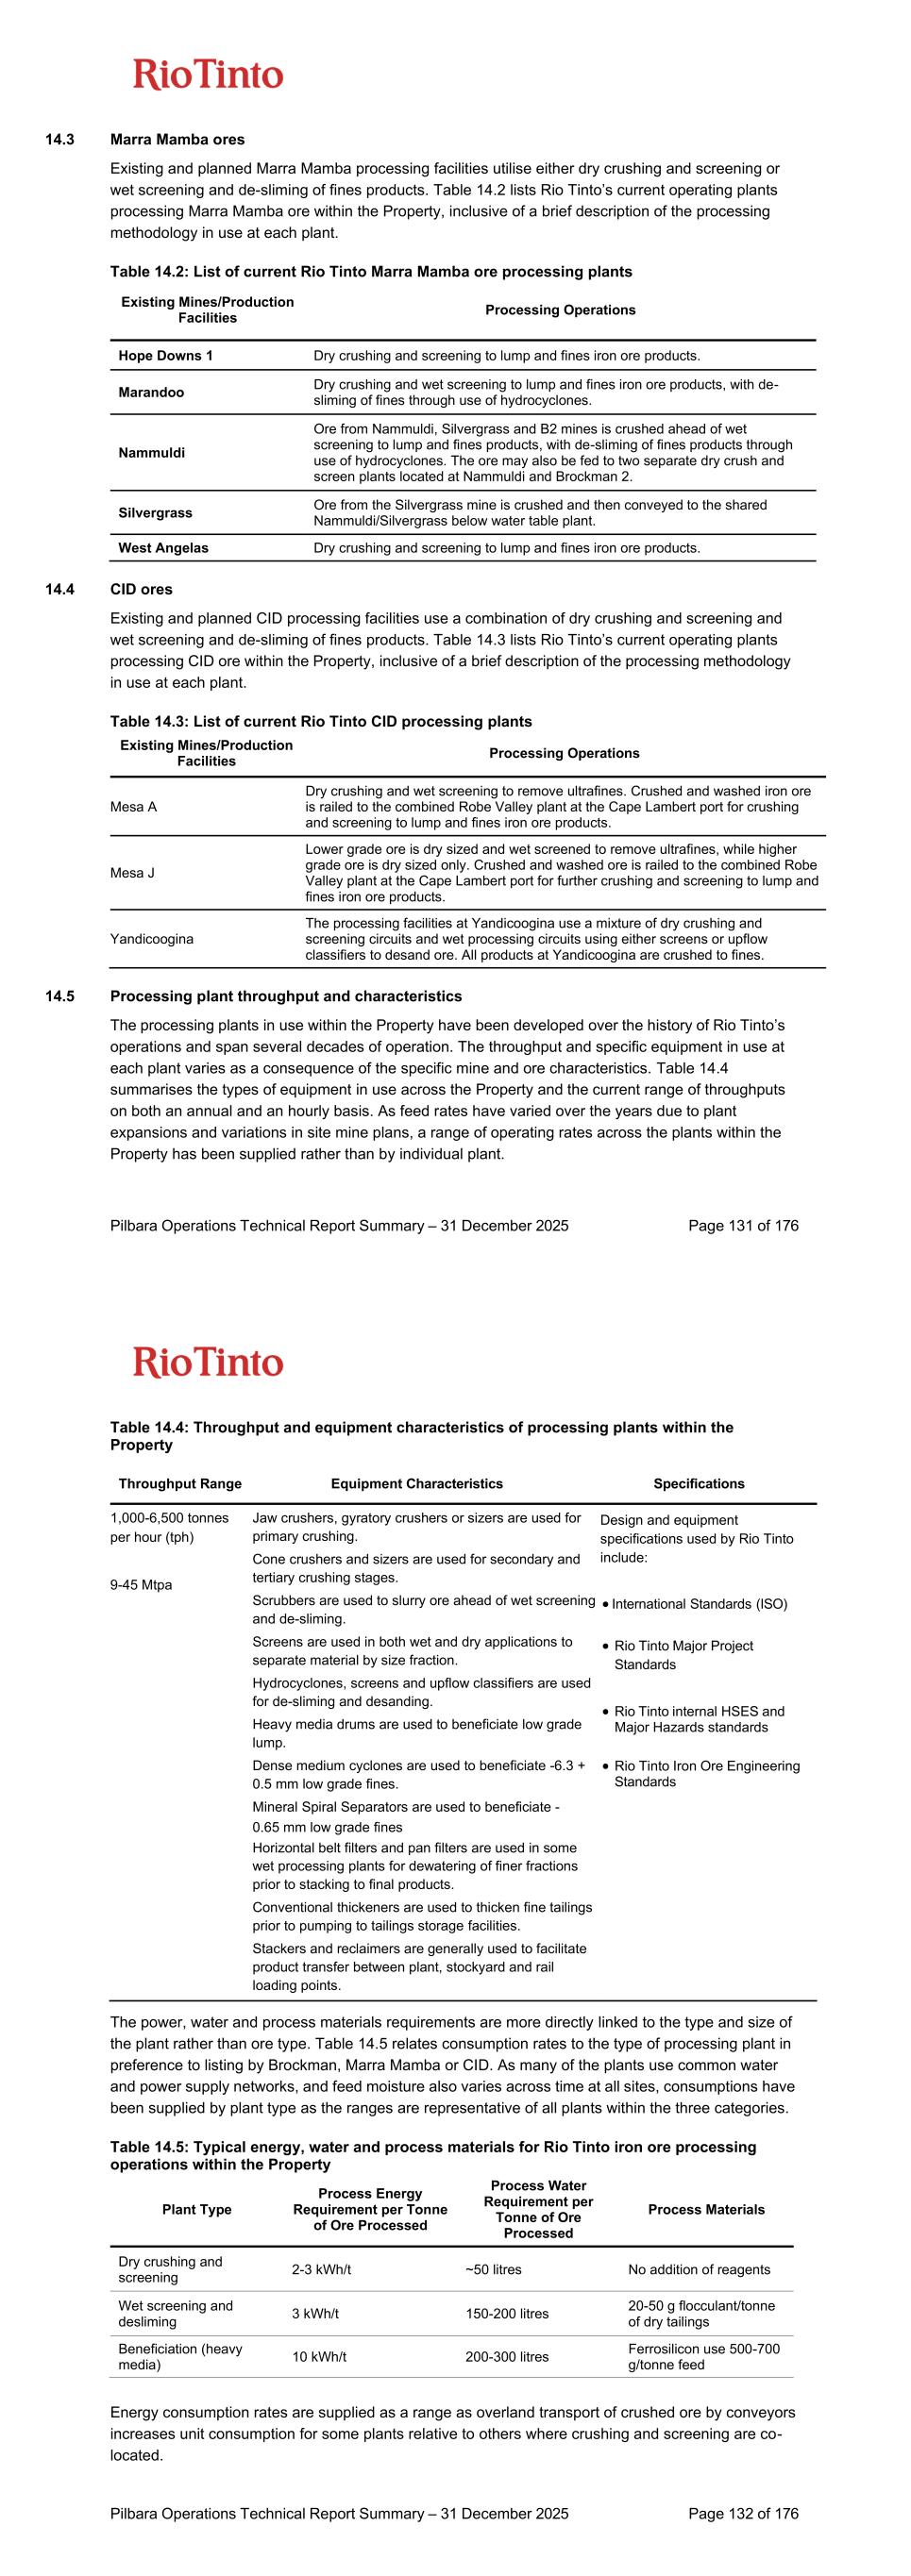
Pilbara Operations Technical Report Summary – 31 December 2025 Page 131 of 176 14.3 Marra Mamba ores Existing and planned Marra Mamba processing facilities utilise either dry crushing and screening or wet screening and de-sliming of fines products. Table 14.2 lists Rio Tinto’s current operating plants processing Marra Mamba ore within the Property, inclusive of a brief description of the processing methodology in use at each plant. Table 14.2: List of current Rio Tinto Marra Mamba ore processing plants Existing Mines/Production Facilities Processing Operations Hope Downs 1 Dry crushing and screening to lump and fines iron ore products. Marandoo Dry crushing and wet screening to lump and fines iron ore products, with de- sliming of fines through use of hydrocyclones. Nammuldi Ore from Nammuldi, Silvergrass and B2 mines is crushed ahead of wet screening to lump and fines products, with de-sliming of fines products through use of hydrocyclones. The ore may also be fed to two separate dry crush and screen plants located at Nammuldi and Brockman 2. Silvergrass Ore from the Silvergrass mine is crushed and then conveyed to the shared Nammuldi/Silvergrass below water table plant. West Angelas Dry crushing and screening to lump and fines iron ore products. 14.4 CID ores Existing and planned CID processing facilities use a combination of dry crushing and screening and wet screening and de-sliming of fines products. Table 14.3 lists Rio Tinto’s current operating plants processing CID ore within the Property, inclusive of a brief description of the processing methodology in use at each plant. Table 14.3: List of current Rio Tinto CID processing plants Existing Mines/Production Facilities Processing Operations Mesa A Dry crushing and wet screening to remove ultrafines. Crushed and washed iron ore is railed to the combined Robe Valley plant at the Cape Lambert port for crushing and screening to lump and fines iron ore products. Mesa J Lower grade ore is dry sized and wet screened to remove ultrafines, while higher grade ore is dry sized only. Crushed and washed ore is railed to the combined Robe Valley plant at the Cape Lambert port for further crushing and screening to lump and fines iron ore products. Yandicoogina The processing facilities at Yandicoogina use a mixture of dry crushing and screening circuits and wet processing circuits using either screens or upflow classifiers to desand ore. All products at Yandicoogina are crushed to fines. 14.5 Processing plant throughput and characteristics The processing plants in use within the Property have been developed over the history of Rio Tinto’s operations and span several decades of operation. The throughput and specific equipment in use at each plant varies as a consequence of the specific mine and ore characteristics. Table 14.4 summarises the types of equipment in use across the Property and the current range of throughputs on both an annual and an hourly basis. As feed rates have varied over the years due to plant expansions and variations in site mine plans, a range of operating rates across the plants within the Property has been supplied rather than by individual plant. Pilbara Operations Technical Report Summary – 31 December 2025 Page 132 of 176 Table 14.4: Throughput and equipment characteristics of processing plants within the Property Throughput Range Equipment Characteristics Specifications 1,000-6,500 tonnes per hour (tph) 9-45 Mtpa Jaw crushers, gyratory crushers or sizers are used for primary crushing. Cone crushers and sizers are used for secondary and tertiary crushing stages. Scrubbers are used to slurry ore ahead of wet screening and de-sliming. Screens are used in both wet and dry applications to separate material by size fraction. Hydrocyclones, screens and upflow classifiers are used for de-sliming and desanding. Heavy media drums are used to beneficiate low grade lump. Dense medium cyclones are used to beneficiate -6.3 + 0.5 mm low grade fines. Mineral Spiral Separators are used to beneficiate - 0.65 mm low grade fines Horizontal belt filters and pan filters are used in some wet processing plants for dewatering of finer fractions prior to stacking to final products. Conventional thickeners are used to thicken fine tailings prior to pumping to tailings storage facilities. Stackers and reclaimers are generally used to facilitate product transfer between plant, stockyard and rail loading points. Design and equipment specifications used by Rio Tinto include: • International Standards (ISO) • Rio Tinto Major Project Standards • Rio Tinto internal HSES and Major Hazards standards • Rio Tinto Iron Ore Engineering Standards The power, water and process materials requirements are more directly linked to the type and size of the plant rather than ore type. Table 14.5 relates consumption rates to the type of processing plant in preference to listing by Brockman, Marra Mamba or CID. As many of the plants use common water and power supply networks, and feed moisture also varies across time at all sites, consumptions have been supplied by plant type as the ranges are representative of all plants within the three categories. Table 14.5: Typical energy, water and process materials for Rio Tinto iron ore processing operations within the Property Plant Type Process Energy Requirement per Tonne of Ore Processed Process Water Requirement per Tonne of Ore Processed Process Materials Dry crushing and screening 2-3 kWh/t ~50 litres No addition of reagents Wet screening and desliming 3 kWh/t 150-200 litres 20-50 g flocculant/tonne of dry tailings Beneficiation (heavy media) 10 kWh/t 200-300 litres Ferrosilicon use 500-700 g/tonne feed Energy consumption rates are supplied as a range as overland transport of crushed ore by conveyors increases unit consumption for some plants relative to others where crushing and screening are co- located.
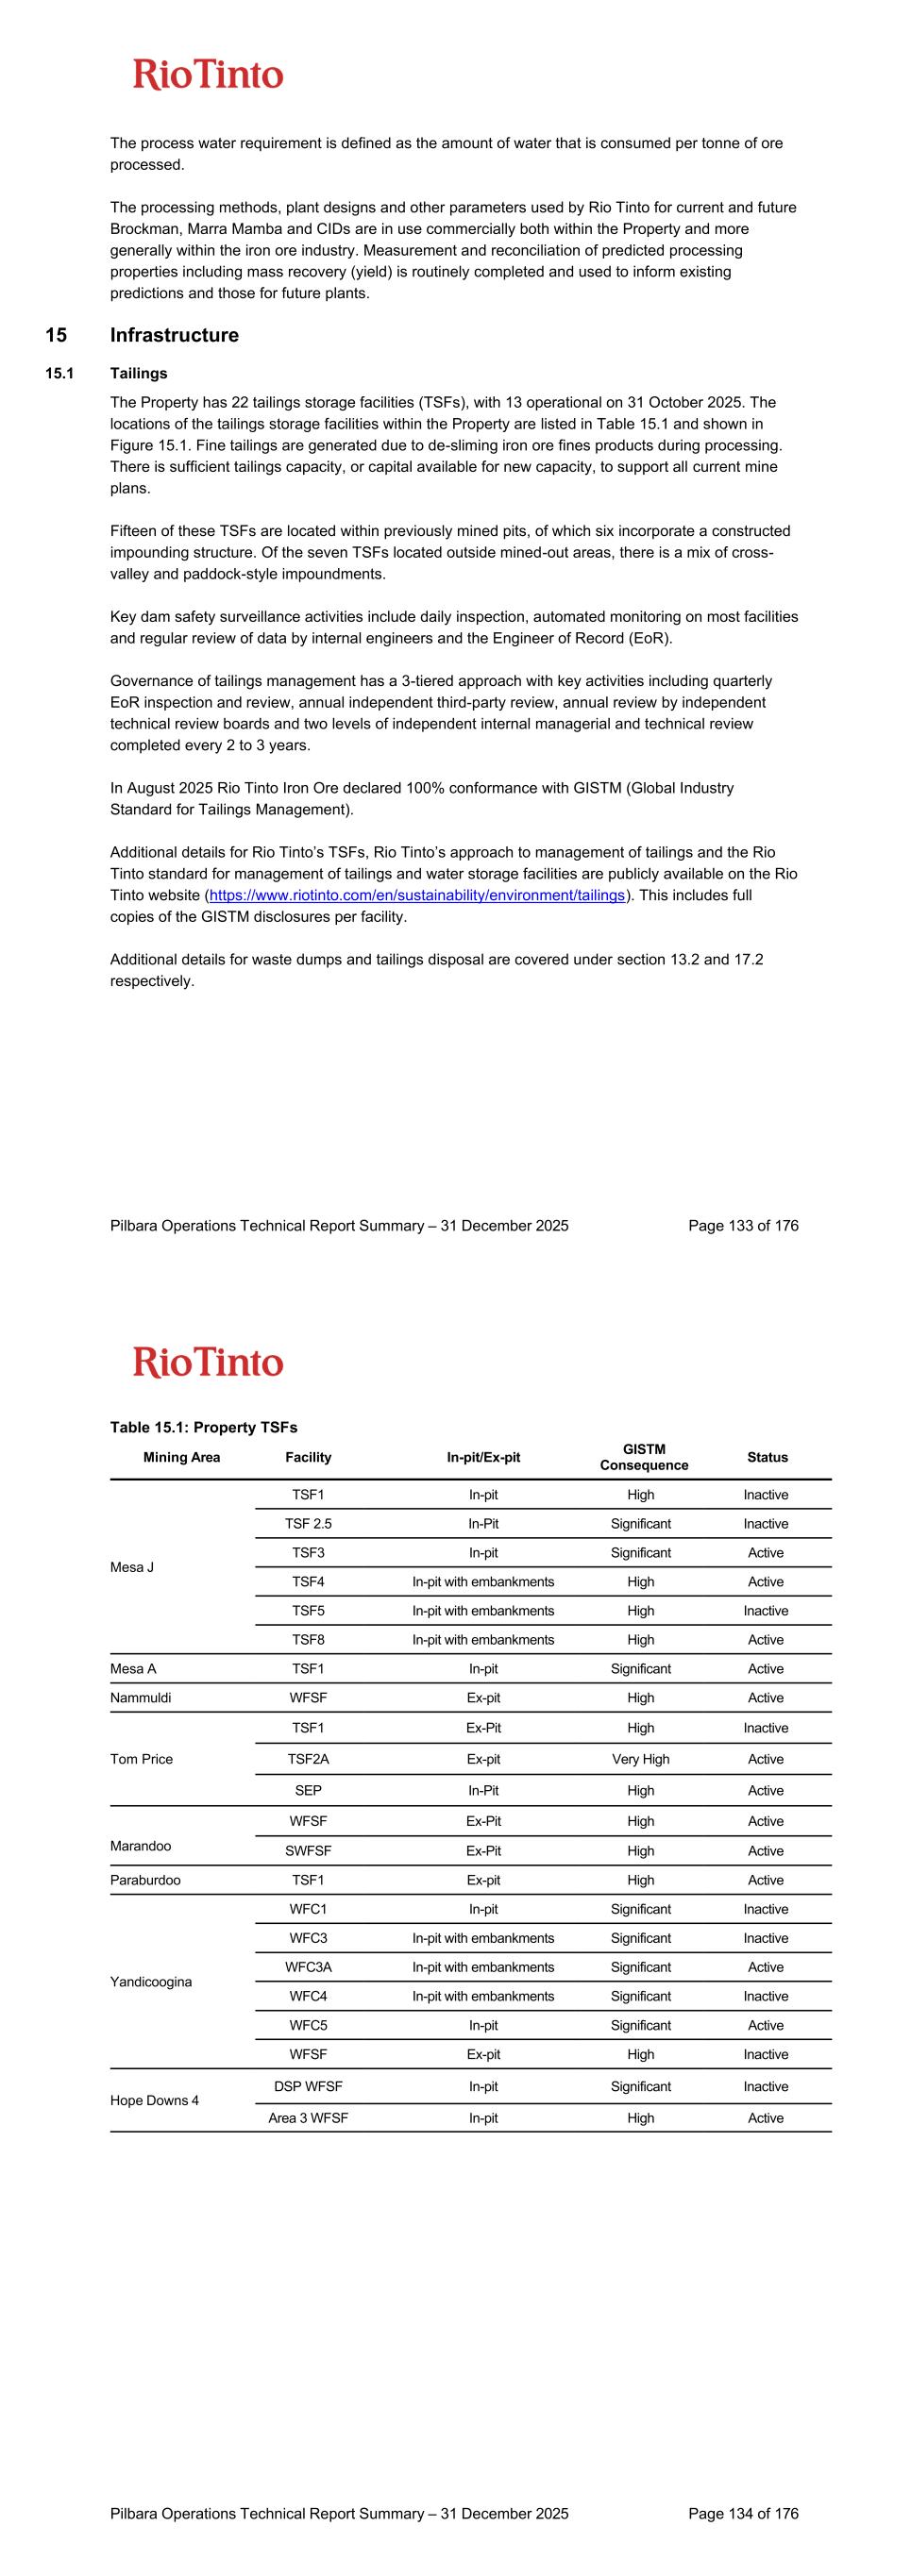
Pilbara Operations Technical Report Summary – 31 December 2025 Page 133 of 176 The process water requirement is defined as the amount of water that is consumed per tonne of ore processed. The processing methods, plant designs and other parameters used by Rio Tinto for current and future Brockman, Marra Mamba and CIDs are in use commercially both within the Property and more generally within the iron ore industry. Measurement and reconciliation of predicted processing properties including mass recovery (yield) is routinely completed and used to inform existing predictions and those for future plants. 15 Infrastructure 15.1 Tailings The Property has 22 tailings storage facilities (TSFs), with 13 operational on 31 October 2025. The locations of the tailings storage facilities within the Property are listed in Table 15.1 and shown in Figure 15.1. Fine tailings are generated due to de-sliming iron ore fines products during processing. There is sufficient tailings capacity, or capital available for new capacity, to support all current mine plans. Fifteen of these TSFs are located within previously mined pits, of which six incorporate a constructed impounding structure. Of the seven TSFs located outside mined-out areas, there is a mix of cross- valley and paddock-style impoundments. Key dam safety surveillance activities include daily inspection, automated monitoring on most facilities and regular review of data by internal engineers and the Engineer of Record (EoR). Governance of tailings management has a 3-tiered approach with key activities including quarterly EoR inspection and review, annual independent third-party review, annual review by independent technical review boards and two levels of independent internal managerial and technical review completed every 2 to 3 years. In August 2025 Rio Tinto Iron Ore declared 100% conformance with GISTM (Global Industry Standard for Tailings Management). Additional details for Rio Tinto’s TSFs, Rio Tinto’s approach to management of tailings and the Rio Tinto standard for management of tailings and water storage facilities are publicly available on the Rio Tinto website (https://www.riotinto.com/en/sustainability/environment/tailings). This includes full copies of the GISTM disclosures per facility. Additional details for waste dumps and tailings disposal are covered under section 13.2 and 17.2 respectively. Pilbara Operations Technical Report Summary – 31 December 2025 Page 134 of 176 Table 15.1: Property TSFs Mining Area Facility In-pit/Ex-pit GISTM Consequence Status Mesa J TSF1 In-pit High Inactive TSF 2.5 In-Pit Significant Inactive TSF3 In-pit Significant Active TSF4 In-pit with embankments High Active TSF5 In-pit with embankments High Inactive TSF8 In-pit with embankments High Active Mesa A TSF1 In-pit Significant Active Nammuldi WFSF Ex-pit High Active Tom Price TSF1 Ex-Pit High Inactive TSF2A Ex-pit Very High Active SEP In-Pit High Active Marandoo WFSF Ex-Pit High Active SWFSF Ex-Pit High Active Paraburdoo TSF1 Ex-pit High Active Yandicoogina WFC1 In-pit Significant Inactive WFC3 In-pit with embankments Significant Inactive WFC3A In-pit with embankments Significant Active WFC4 In-pit with embankments Significant Inactive WFC5 In-pit Significant Active WFSF Ex-pit High Inactive Hope Downs 4 DSP WFSF In-pit Significant Inactive Area 3 WFSF In-pit High Active
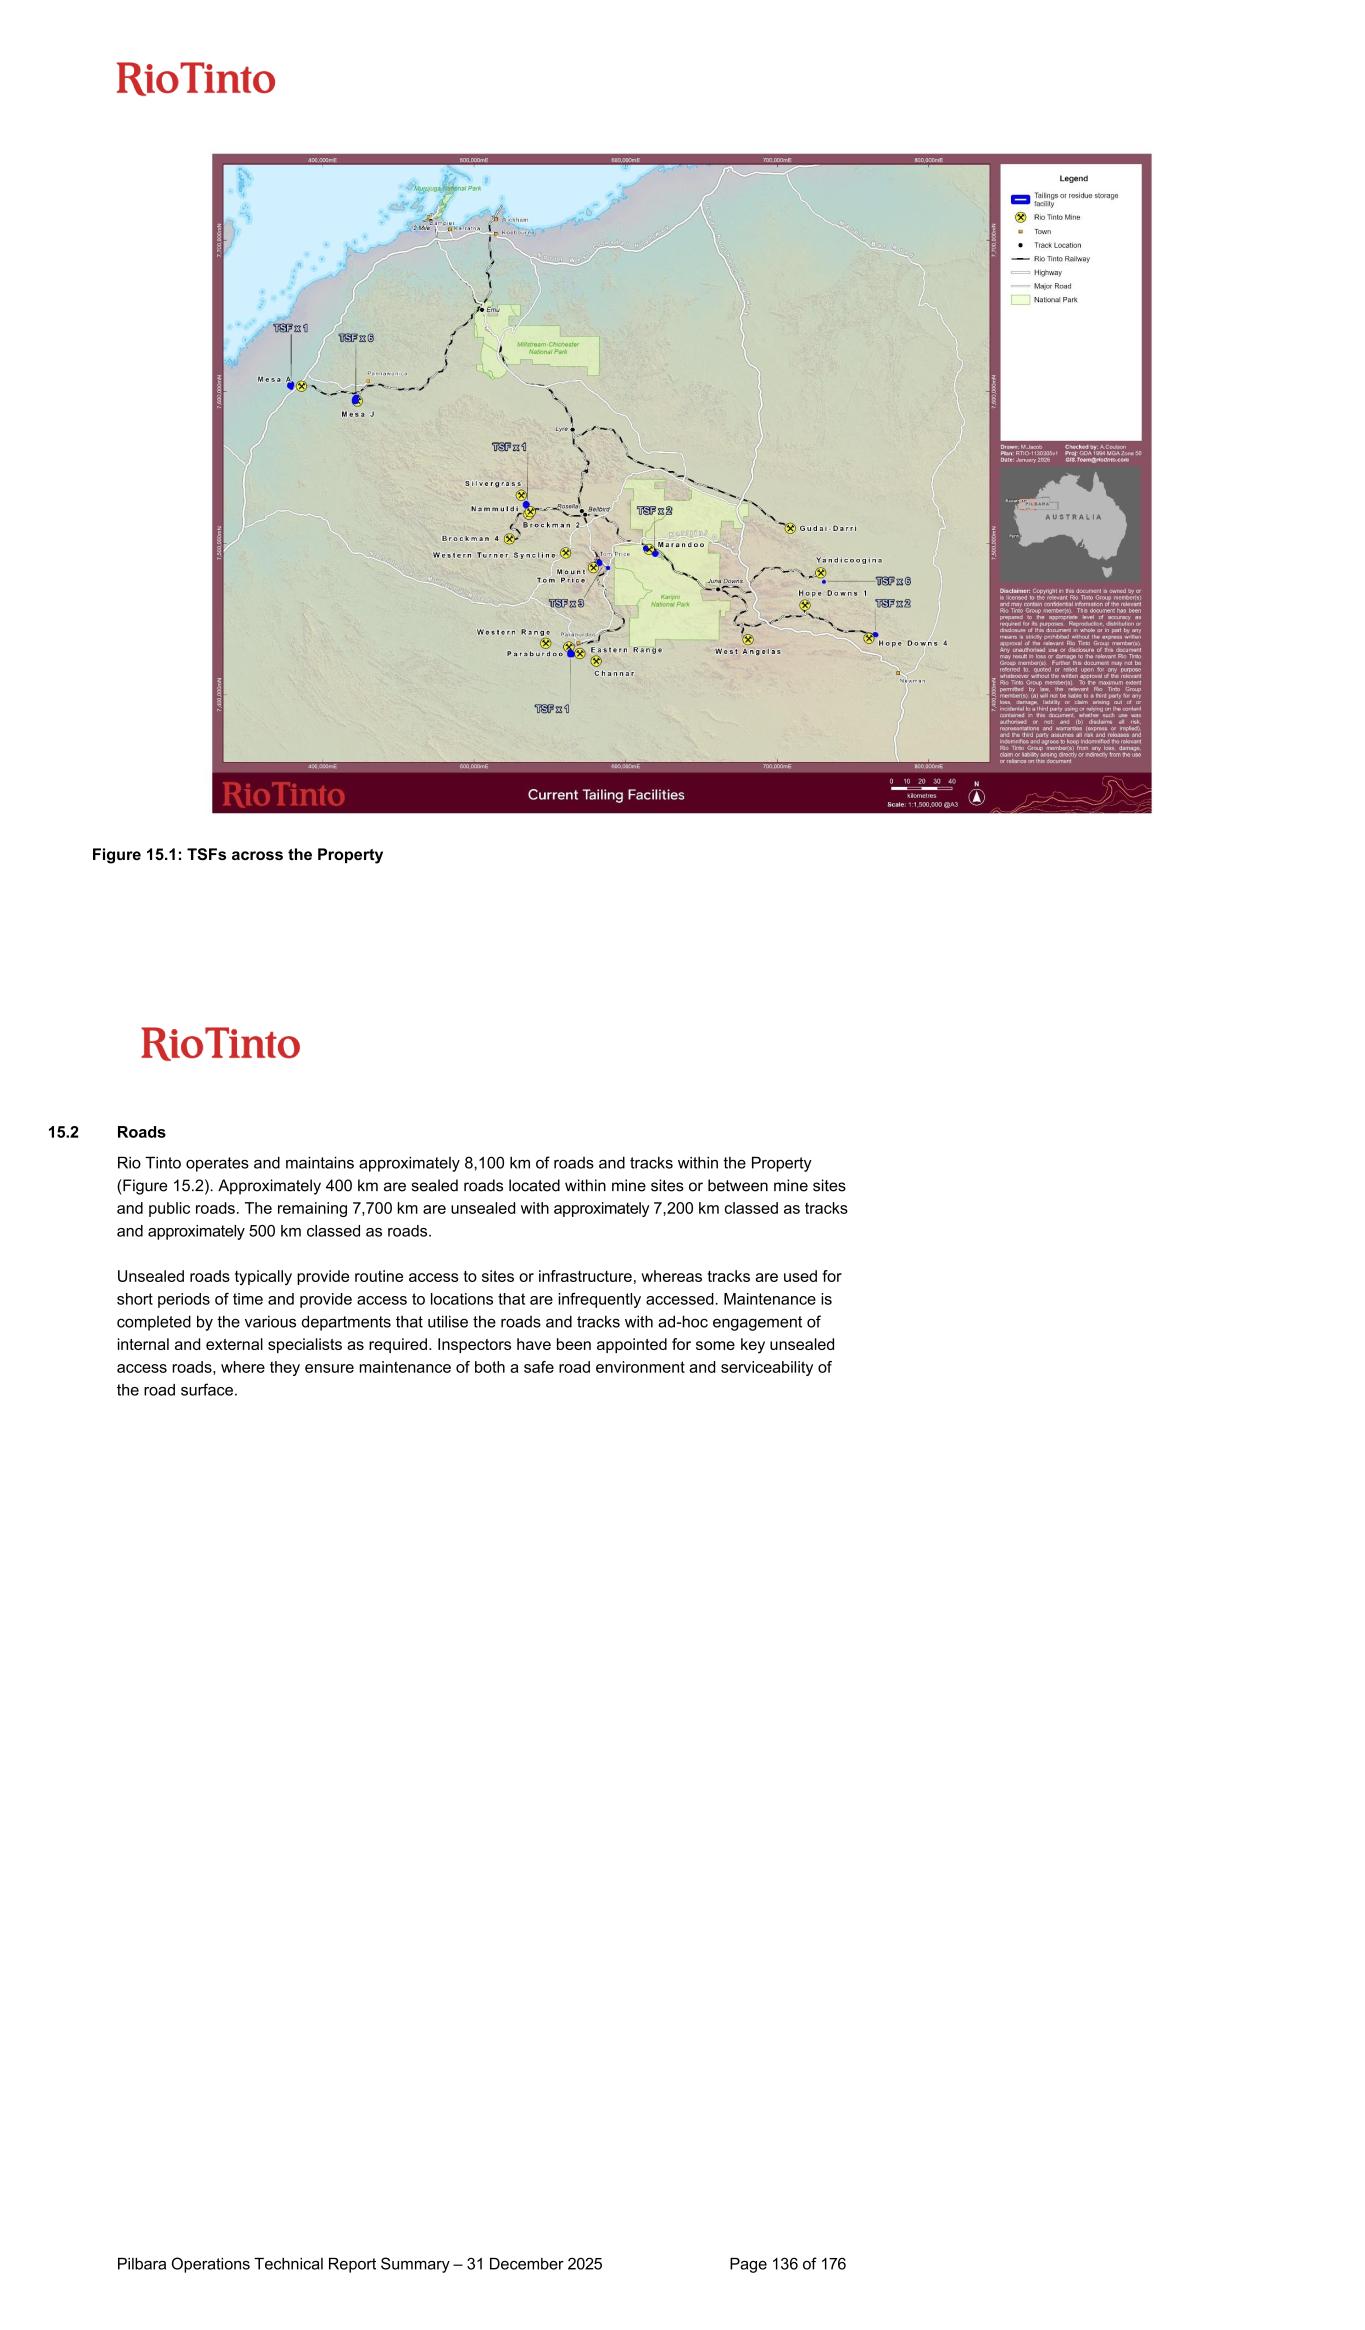
Figure 15.1: TSFs across the Property Pilbara Operations Technical Report Summary – 31 December 2025 Page 136 of 176 15.2 Roads Rio Tinto operates and maintains approximately 8,100 km of roads and tracks within the Property (Figure 15.2). Approximately 400 km are sealed roads located within mine sites or between mine sites and public roads. The remaining 7,700 km are unsealed with approximately 7,200 km classed as tracks and approximately 500 km classed as roads. Unsealed roads typically provide routine access to sites or infrastructure, whereas tracks are used for short periods of time and provide access to locations that are infrequently accessed. Maintenance is completed by the various departments that utilise the roads and tracks with ad-hoc engagement of internal and external specialists as required. Inspectors have been appointed for some key unsealed access roads, where they ensure maintenance of both a safe road environment and serviceability of the road surface.
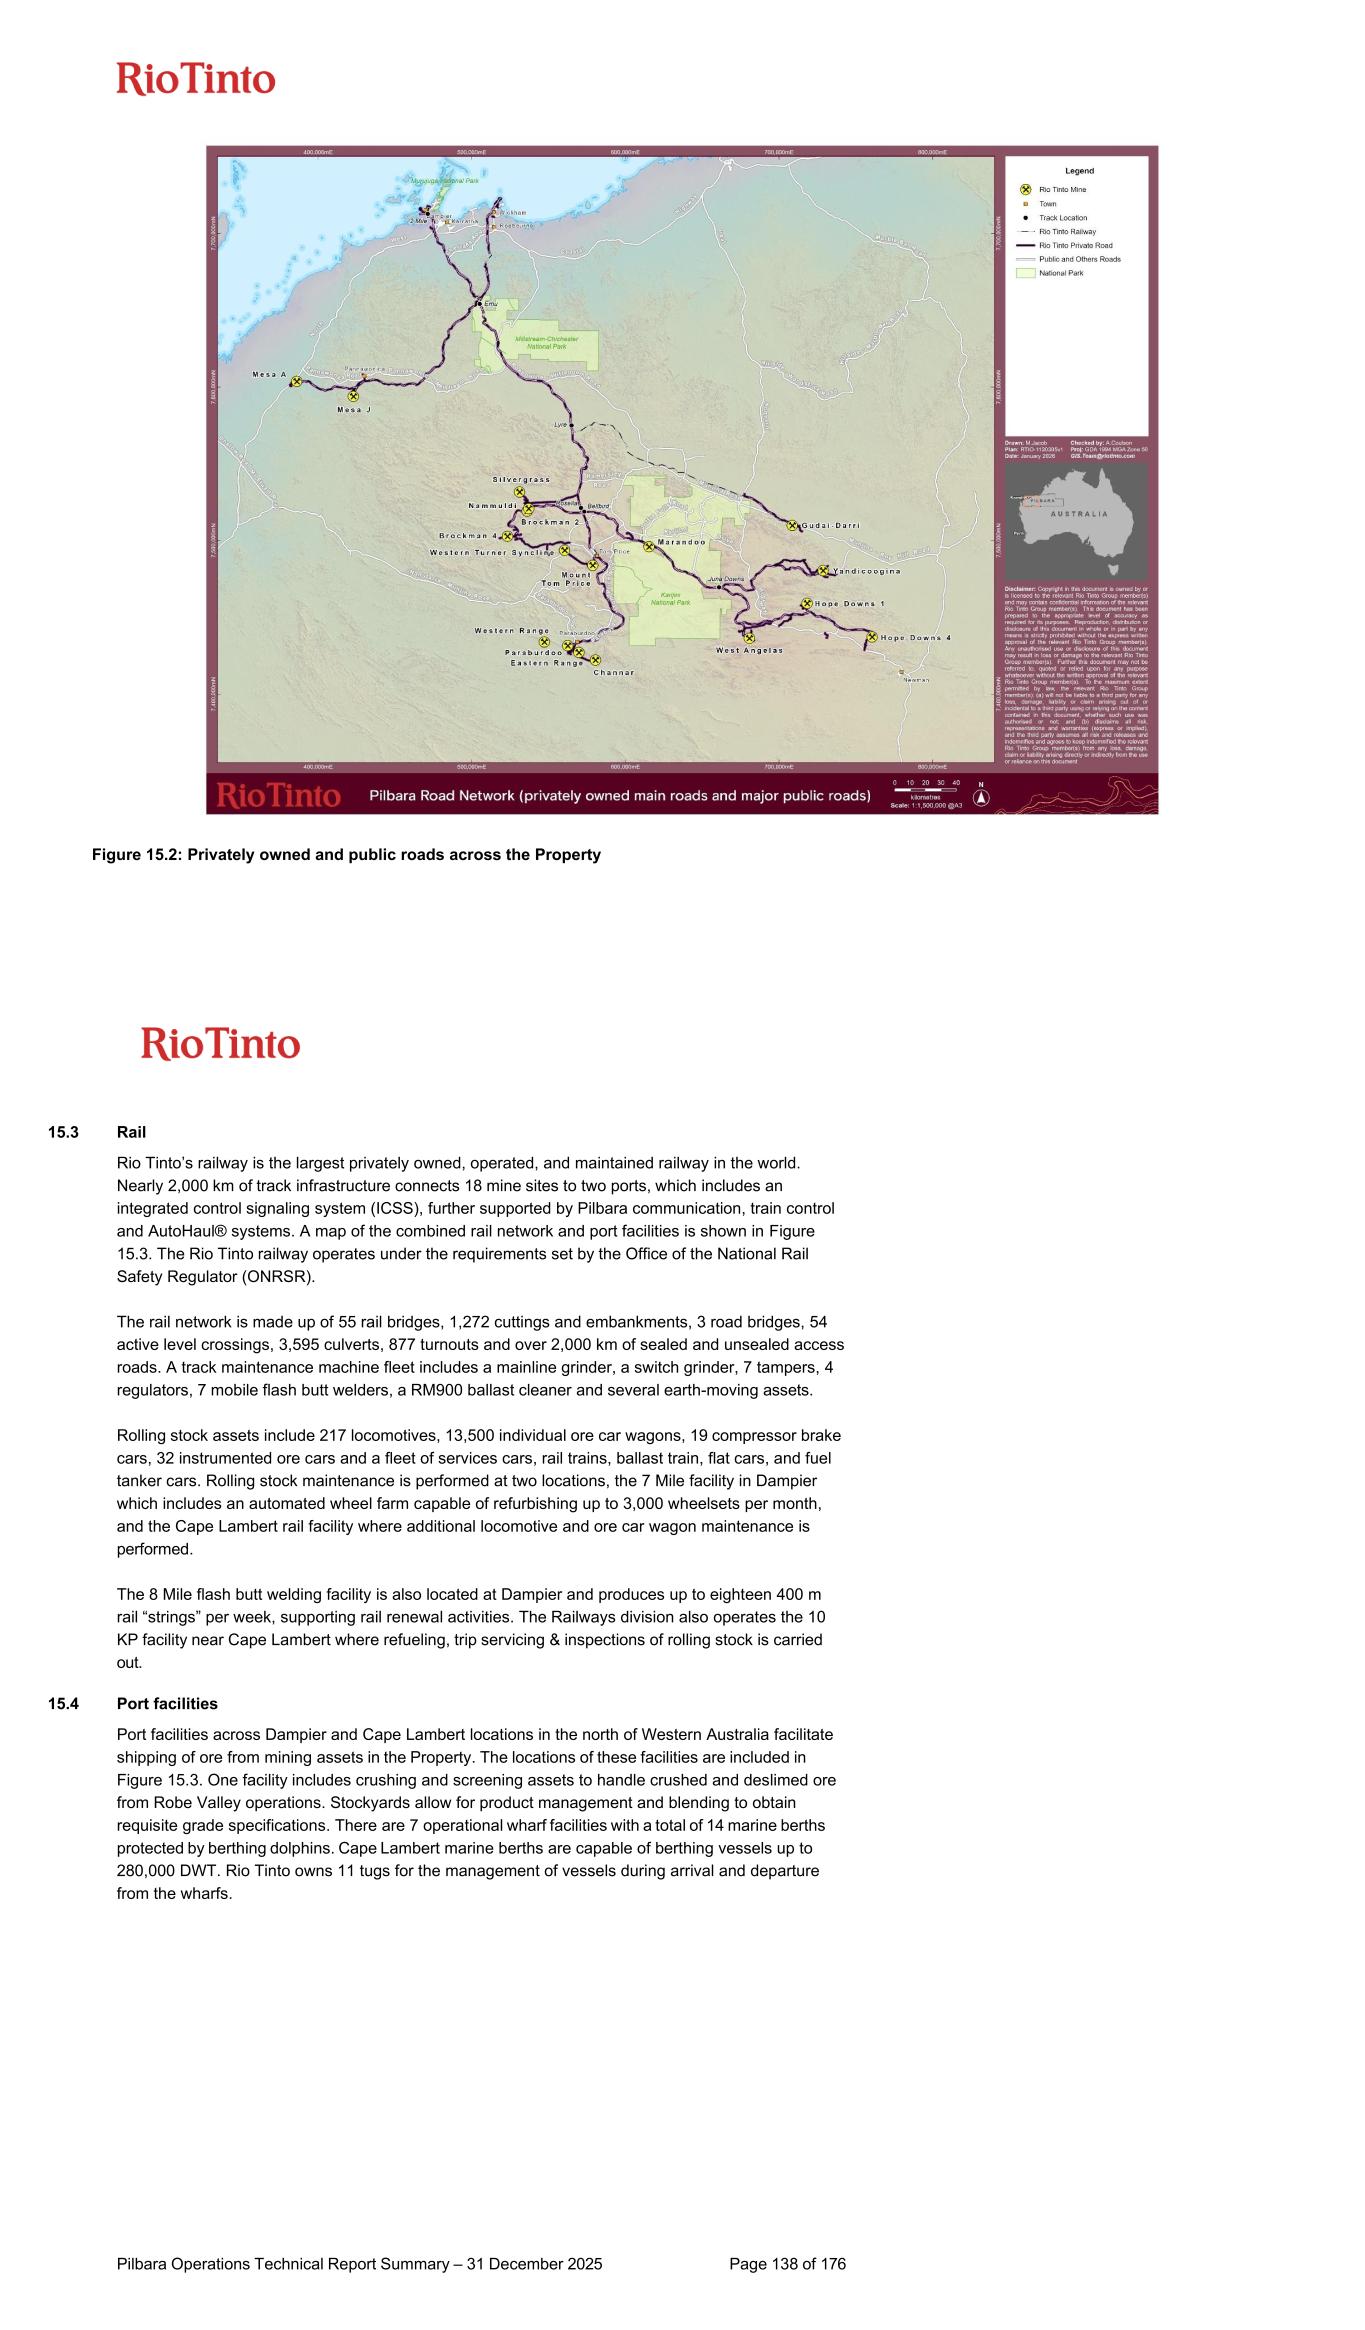
Figure 15.2: Privately owned and public roads across the Property Pilbara Operations Technical Report Summary – 31 December 2025 Page 138 of 176 15.3 Rail Rio Tinto’s railway is the largest privately owned, operated, and maintained railway in the world. Nearly 2,000 km of track infrastructure connects 18 mine sites to two ports, which includes an integrated control signaling system (ICSS), further supported by Pilbara communication, train control and AutoHaul® systems. A map of the combined rail network and port facilities is shown in Figure 15.3. The Rio Tinto railway operates under the requirements set by the Office of the National Rail Safety Regulator (ONRSR). The rail network is made up of 55 rail bridges, 1,272 cuttings and embankments, 3 road bridges, 54 active level crossings, 3,595 culverts, 877 turnouts and over 2,000 km of sealed and unsealed access roads. A track maintenance machine fleet includes a mainline grinder, a switch grinder, 7 tampers, 4 regulators, 7 mobile flash butt welders, a RM900 ballast cleaner and several earth-moving assets. Rolling stock assets include 217 locomotives, 13,500 individual ore car wagons, 19 compressor brake cars, 32 instrumented ore cars and a fleet of services cars, rail trains, ballast train, flat cars, and fuel tanker cars. Rolling stock maintenance is performed at two locations, the 7 Mile facility in Dampier which includes an automated wheel farm capable of refurbishing up to 3,000 wheelsets per month, and the Cape Lambert rail facility where additional locomotive and ore car wagon maintenance is performed. The 8 Mile flash butt welding facility is also located at Dampier and produces up to eighteen 400 m rail “strings” per week, supporting rail renewal activities. The Railways division also operates the 10 KP facility near Cape Lambert where refueling, trip servicing & inspections of rolling stock is carried out. 15.4 Port facilities Port facilities across Dampier and Cape Lambert locations in the north of Western Australia facilitate shipping of ore from mining assets in the Property. The locations of these facilities are included in Figure 15.3. One facility includes crushing and screening assets to handle crushed and deslimed ore from Robe Valley operations. Stockyards allow for product management and blending to obtain requisite grade specifications. There are 7 operational wharf facilities with a total of 14 marine berths protected by berthing dolphins. Cape Lambert marine berths are capable of berthing vessels up to 280,000 DWT. Rio Tinto owns 11 tugs for the management of vessels during arrival and departure from the wharfs.
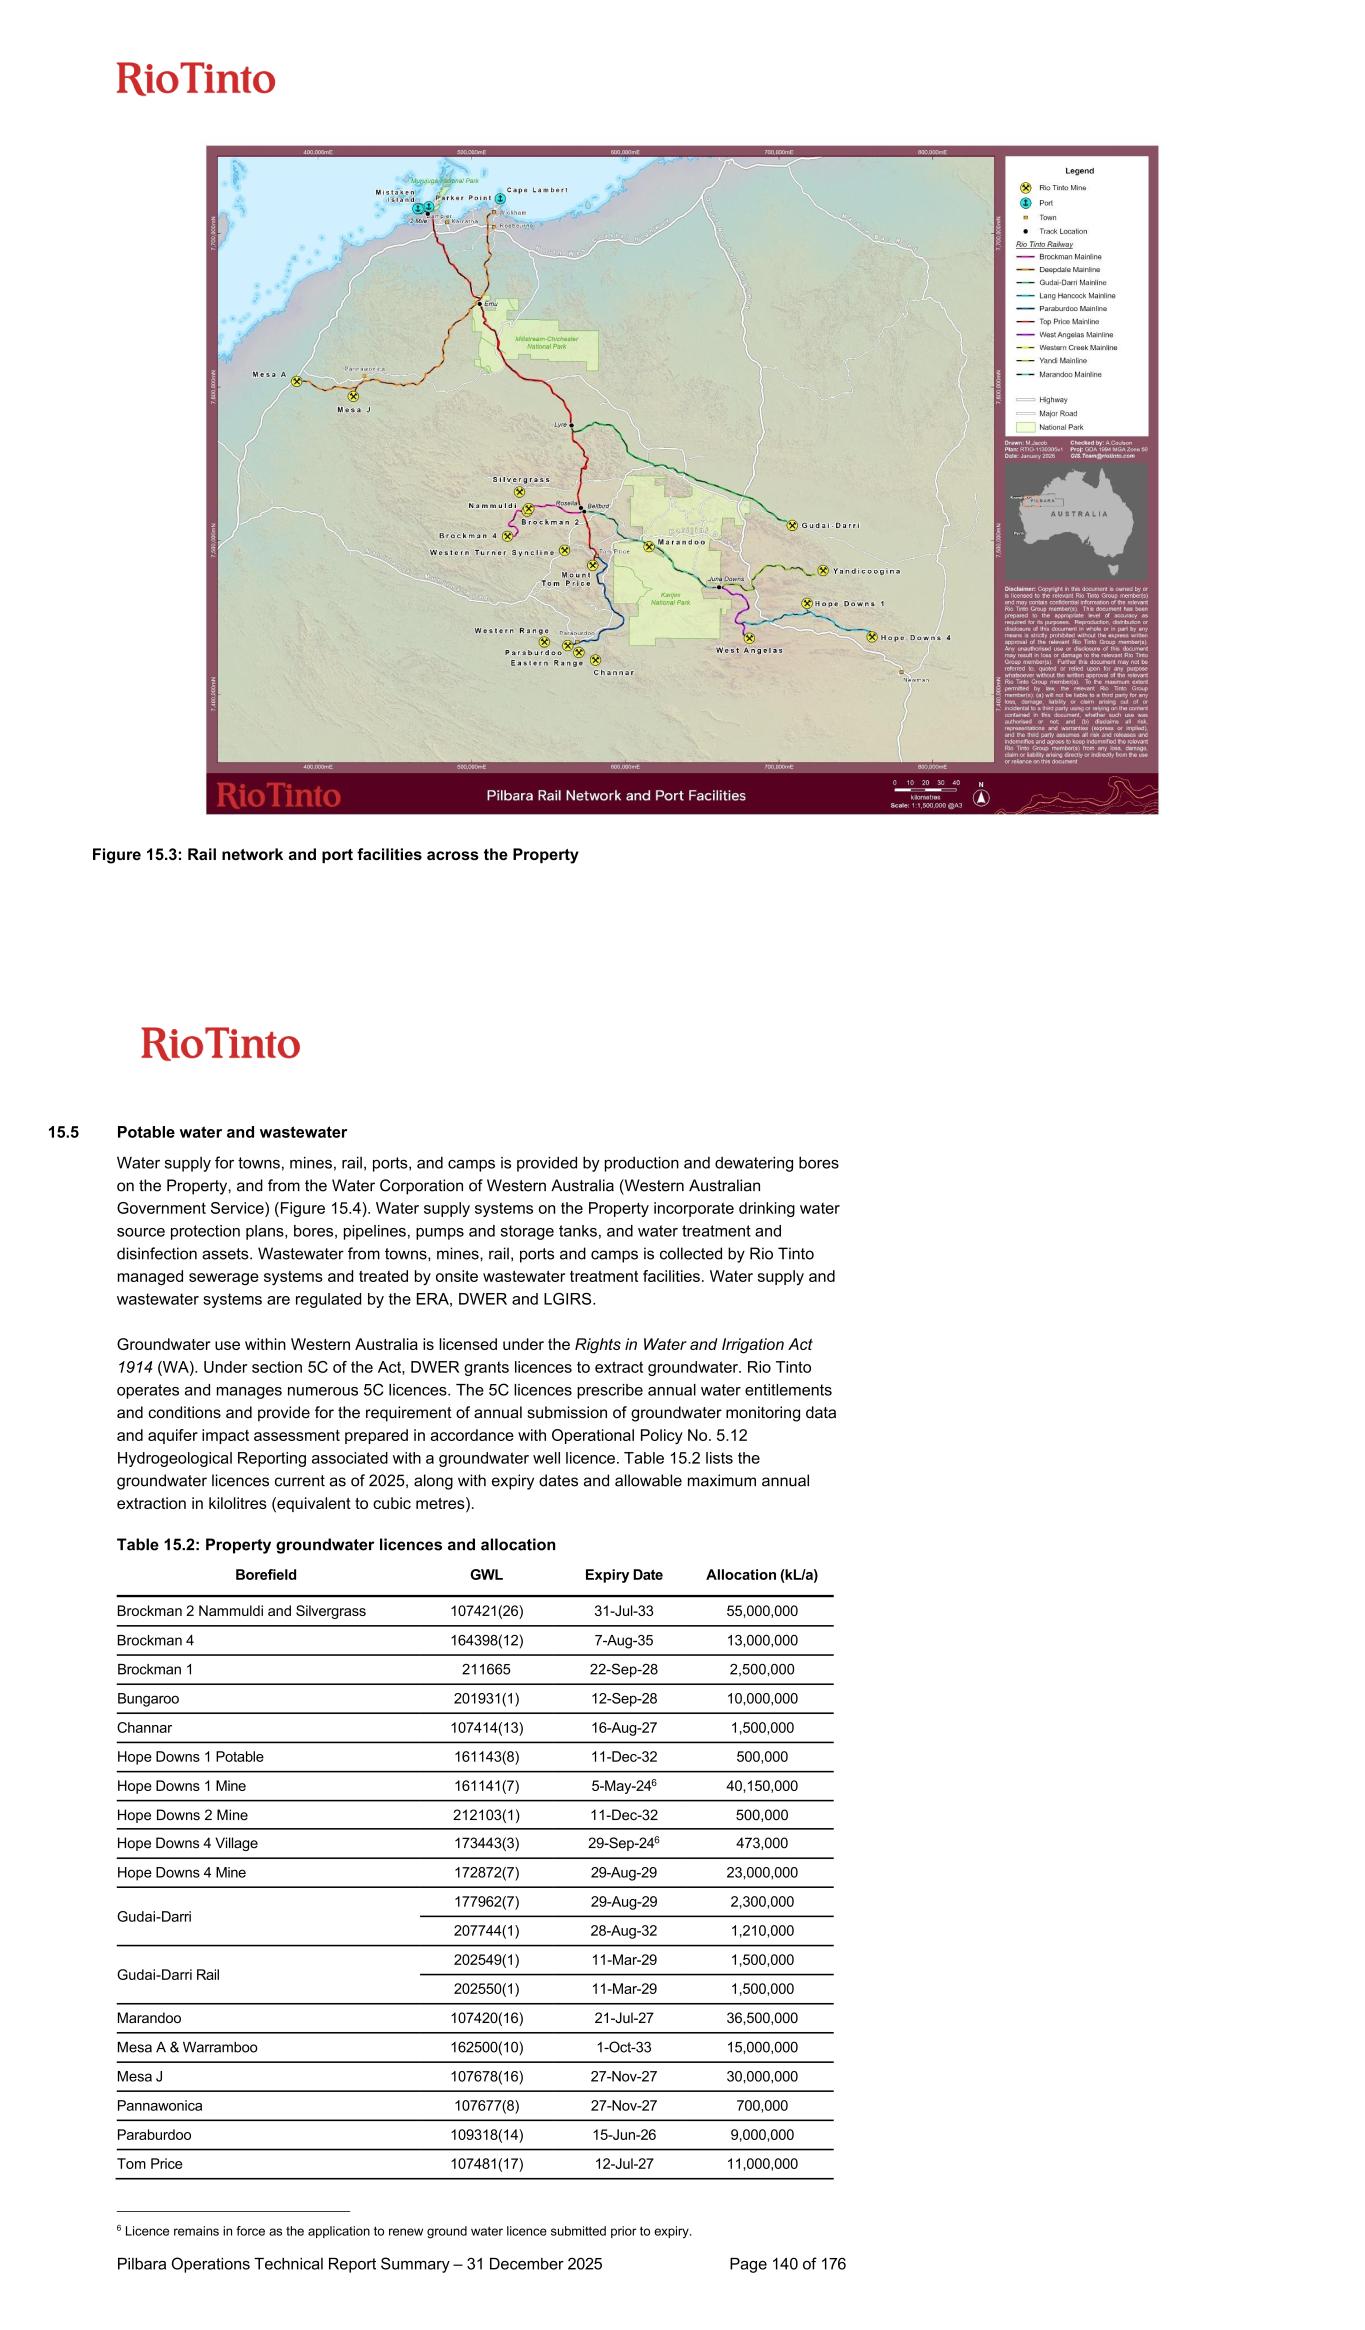
Figure 15.3: Rail network and port facilities across the Property Pilbara Operations Technical Report Summary – 31 December 2025 Page 140 of 176 15.5 Potable water and wastewater Water supply for towns, mines, rail, ports, and camps is provided by production and dewatering bores on the Property, and from the Water Corporation of Western Australia (Western Australian Government Service) (Figure 15.4). Water supply systems on the Property incorporate drinking water source protection plans, bores, pipelines, pumps and storage tanks, and water treatment and disinfection assets. Wastewater from towns, mines, rail, ports and camps is collected by Rio Tinto managed sewerage systems and treated by onsite wastewater treatment facilities. Water supply and wastewater systems are regulated by the ERA, DWER and LGIRS. Groundwater use within Western Australia is licensed under the Rights in Water and Irrigation Act 1914 (WA). Under section 5C of the Act, DWER grants licences to extract groundwater. Rio Tinto operates and manages numerous 5C licences. The 5C licences prescribe annual water entitlements and conditions and provide for the requirement of annual submission of groundwater monitoring data and aquifer impact assessment prepared in accordance with Operational Policy No. 5.12 Hydrogeological Reporting associated with a groundwater well licence. Table 15.2 lists the groundwater licences current as of 2025, along with expiry dates and allowable maximum annual extraction in kilolitres (equivalent to cubic metres). Table 15.2: Property groundwater licences and allocation Borefield GWL Expiry Date Allocation (kL/a) Brockman 2 Nammuldi and Silvergrass 107421(26) 31-Jul-33 55,000,000 Brockman 4 164398(12) 7-Aug-35 13,000,000 Brockman 1 211665 22-Sep-28 2,500,000 Bungaroo 201931(1) 12-Sep-28 10,000,000 Channar 107414(13) 16-Aug-27 1,500,000 Hope Downs 1 Potable 161143(8) 11-Dec-32 500,000 Hope Downs 1 Mine 161141(7) 5-May-246 40,150,000 Hope Downs 2 Mine 212103(1) 11-Dec-32 500,000 Hope Downs 4 Village 173443(3) 29-Sep-246 473,000 Hope Downs 4 Mine 172872(7) 29-Aug-29 23,000,000 Gudai-Darri 177962(7) 29-Aug-29 2,300,000 207744(1) 28-Aug-32 1,210,000 Gudai-Darri Rail 202549(1) 11-Mar-29 1,500,000 202550(1) 11-Mar-29 1,500,000 Marandoo 107420(16) 21-Jul-27 36,500,000 Mesa A & Warramboo 162500(10) 1-Oct-33 15,000,000 Mesa J 107678(16) 27-Nov-27 30,000,000 Pannawonica 107677(8) 27-Nov-27 700,000 Paraburdoo 109318(14) 15-Jun-26 9,000,000 Tom Price 107481(17) 12-Jul-27 11,000,000 6 Licence remains in force as the application to renew ground water licence submitted prior to expiry.
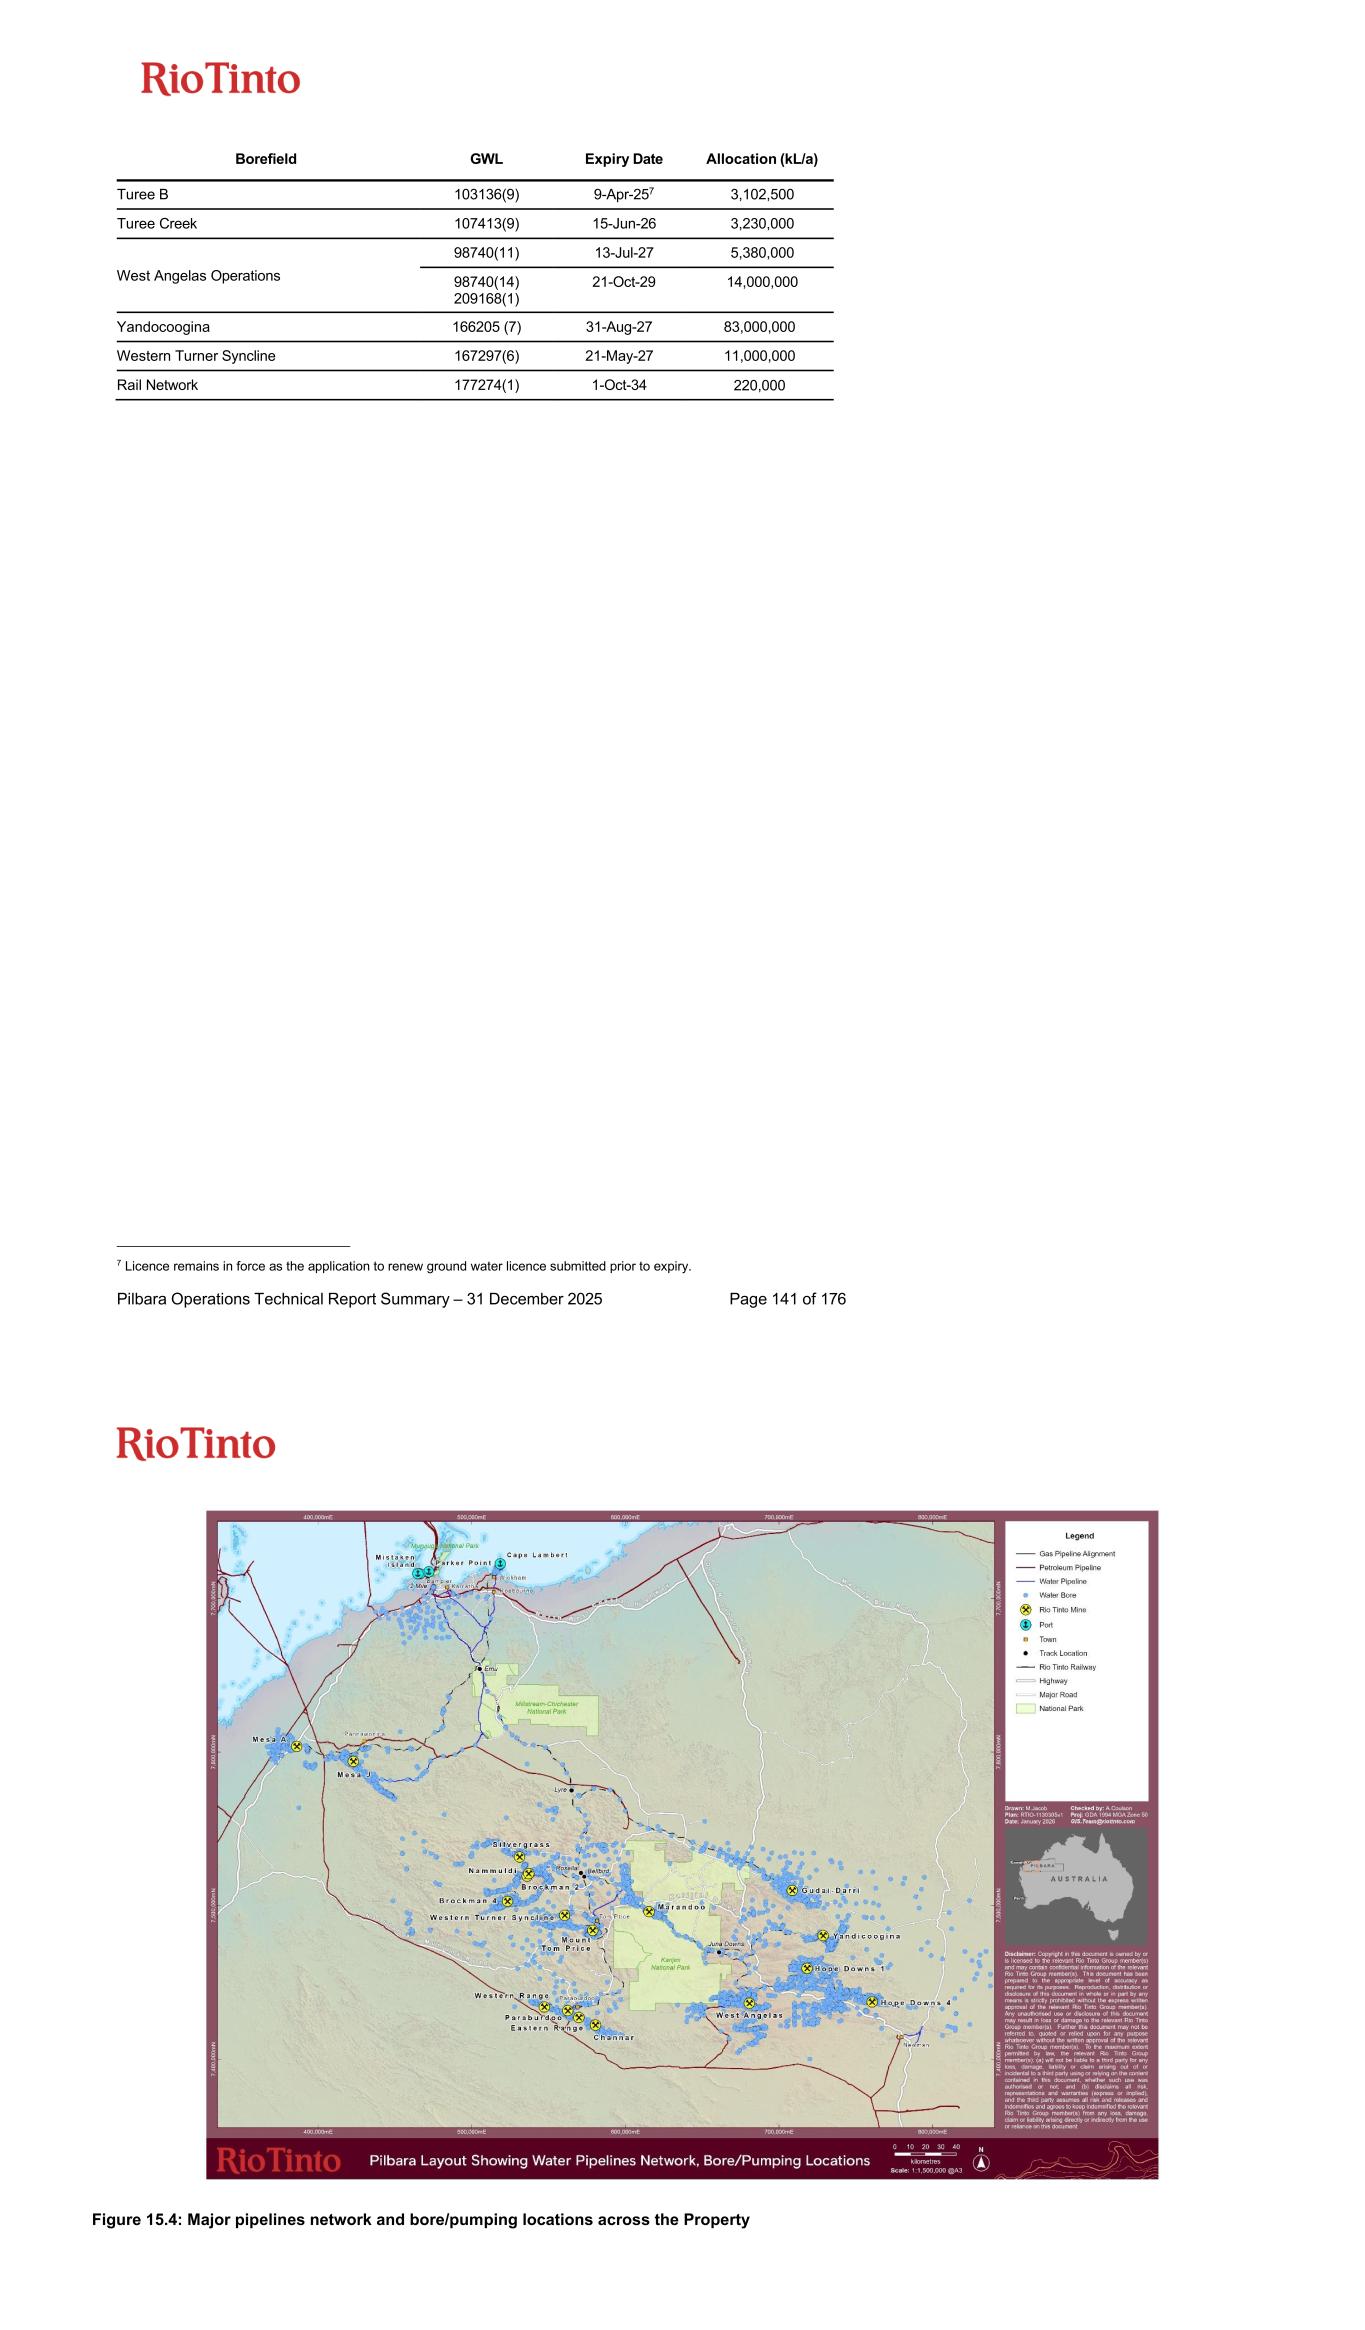
Pilbara Operations Technical Report Summary – 31 December 2025 Page 141 of 176 Borefield GWL Expiry Date Allocation (kL/a) Turee B 103136(9) 9-Apr-257 3,102,500 Turee Creek 107413(9) 15-Jun-26 3,230,000 West Angelas Operations 98740(11) 13-Jul-27 5,380,000 98740(14) 209168(1) 21-Oct-29 14,000,000 Yandocoogina 166205 (7) 31-Aug-27 83,000,000 Western Turner Syncline 167297(6) 21-May-27 11,000,000 Rail Network 177274(1) 1-Oct-34 220,000 7 Licence remains in force as the application to renew ground water licence submitted prior to expiry. Figure 15.4: Major pipelines network and bore/pumping locations across the Property
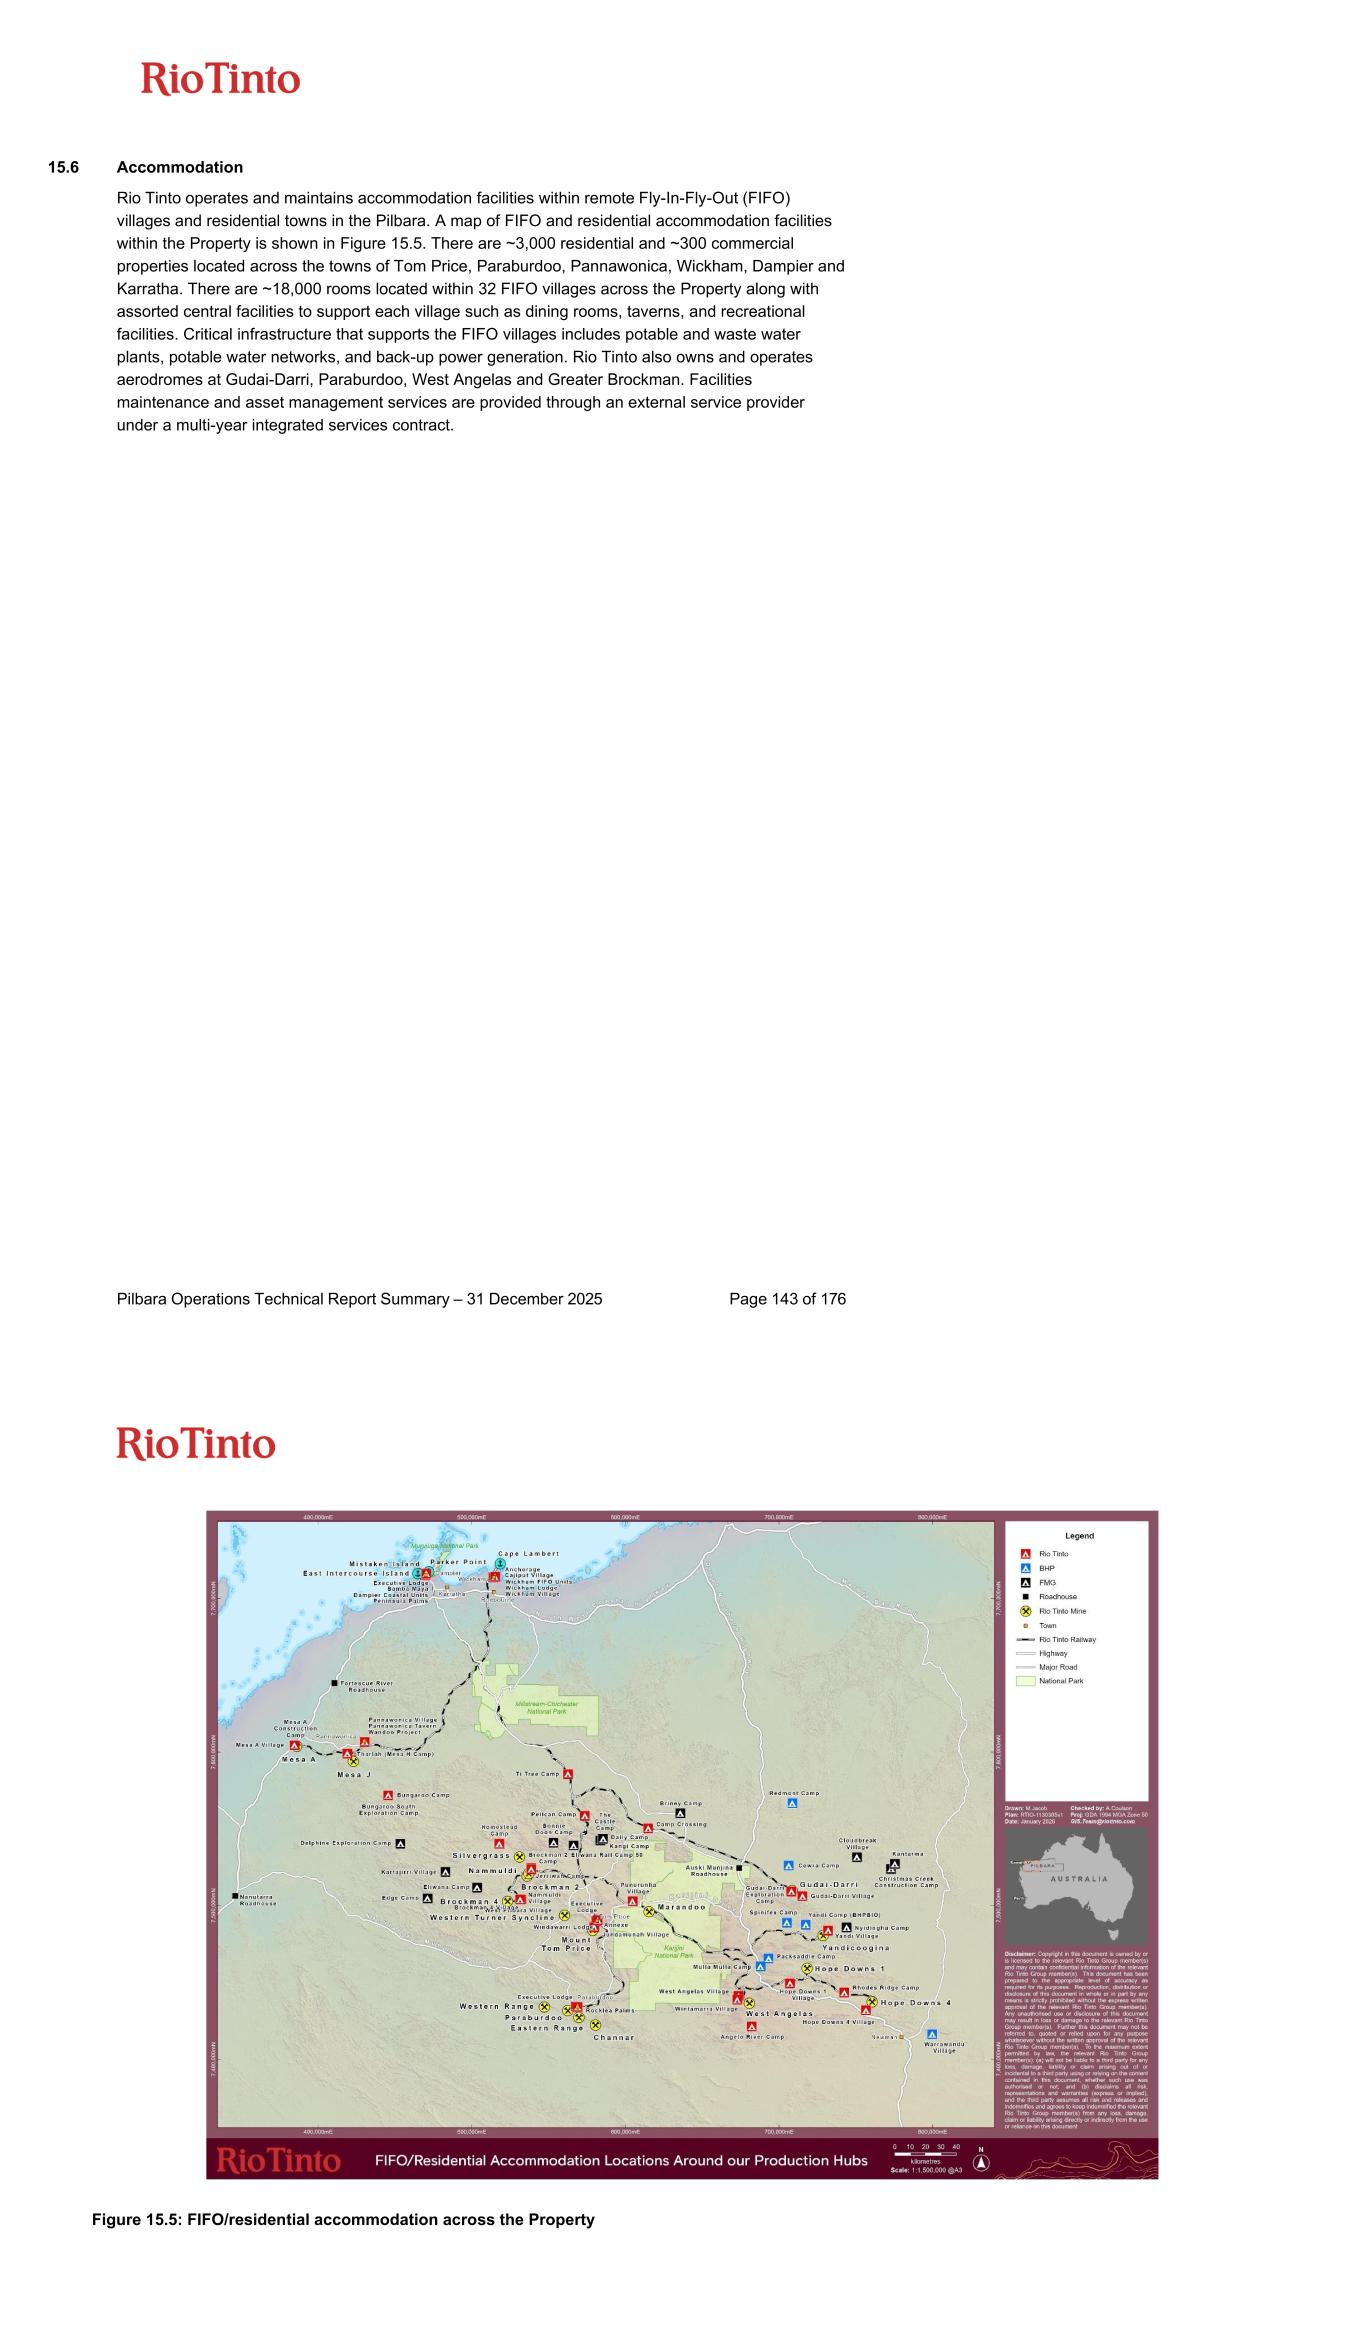
Pilbara Operations Technical Report Summary – 31 December 2025 Page 143 of 176 15.6 Accommodation Rio Tinto operates and maintains accommodation facilities within remote Fly-In-Fly-Out (FIFO) villages and residential towns in the Pilbara. A map of FIFO and residential accommodation facilities within the Property is shown in Figure 15.5. There are ~3,000 residential and ~300 commercial properties located across the towns of Tom Price, Paraburdoo, Pannawonica, Wickham, Dampier and Karratha. There are ~18,000 rooms located within 32 FIFO villages across the Property along with assorted central facilities to support each village such as dining rooms, taverns, and recreational facilities. Critical infrastructure that supports the FIFO villages includes potable and waste water plants, potable water networks, and back-up power generation. Rio Tinto also owns and operates aerodromes at Gudai-Darri, Paraburdoo, West Angelas and Greater Brockman. Facilities maintenance and asset management services are provided through an external service provider under a multi-year integrated services contract. Figure 15.5: FIFO/residential accommodation across the Property
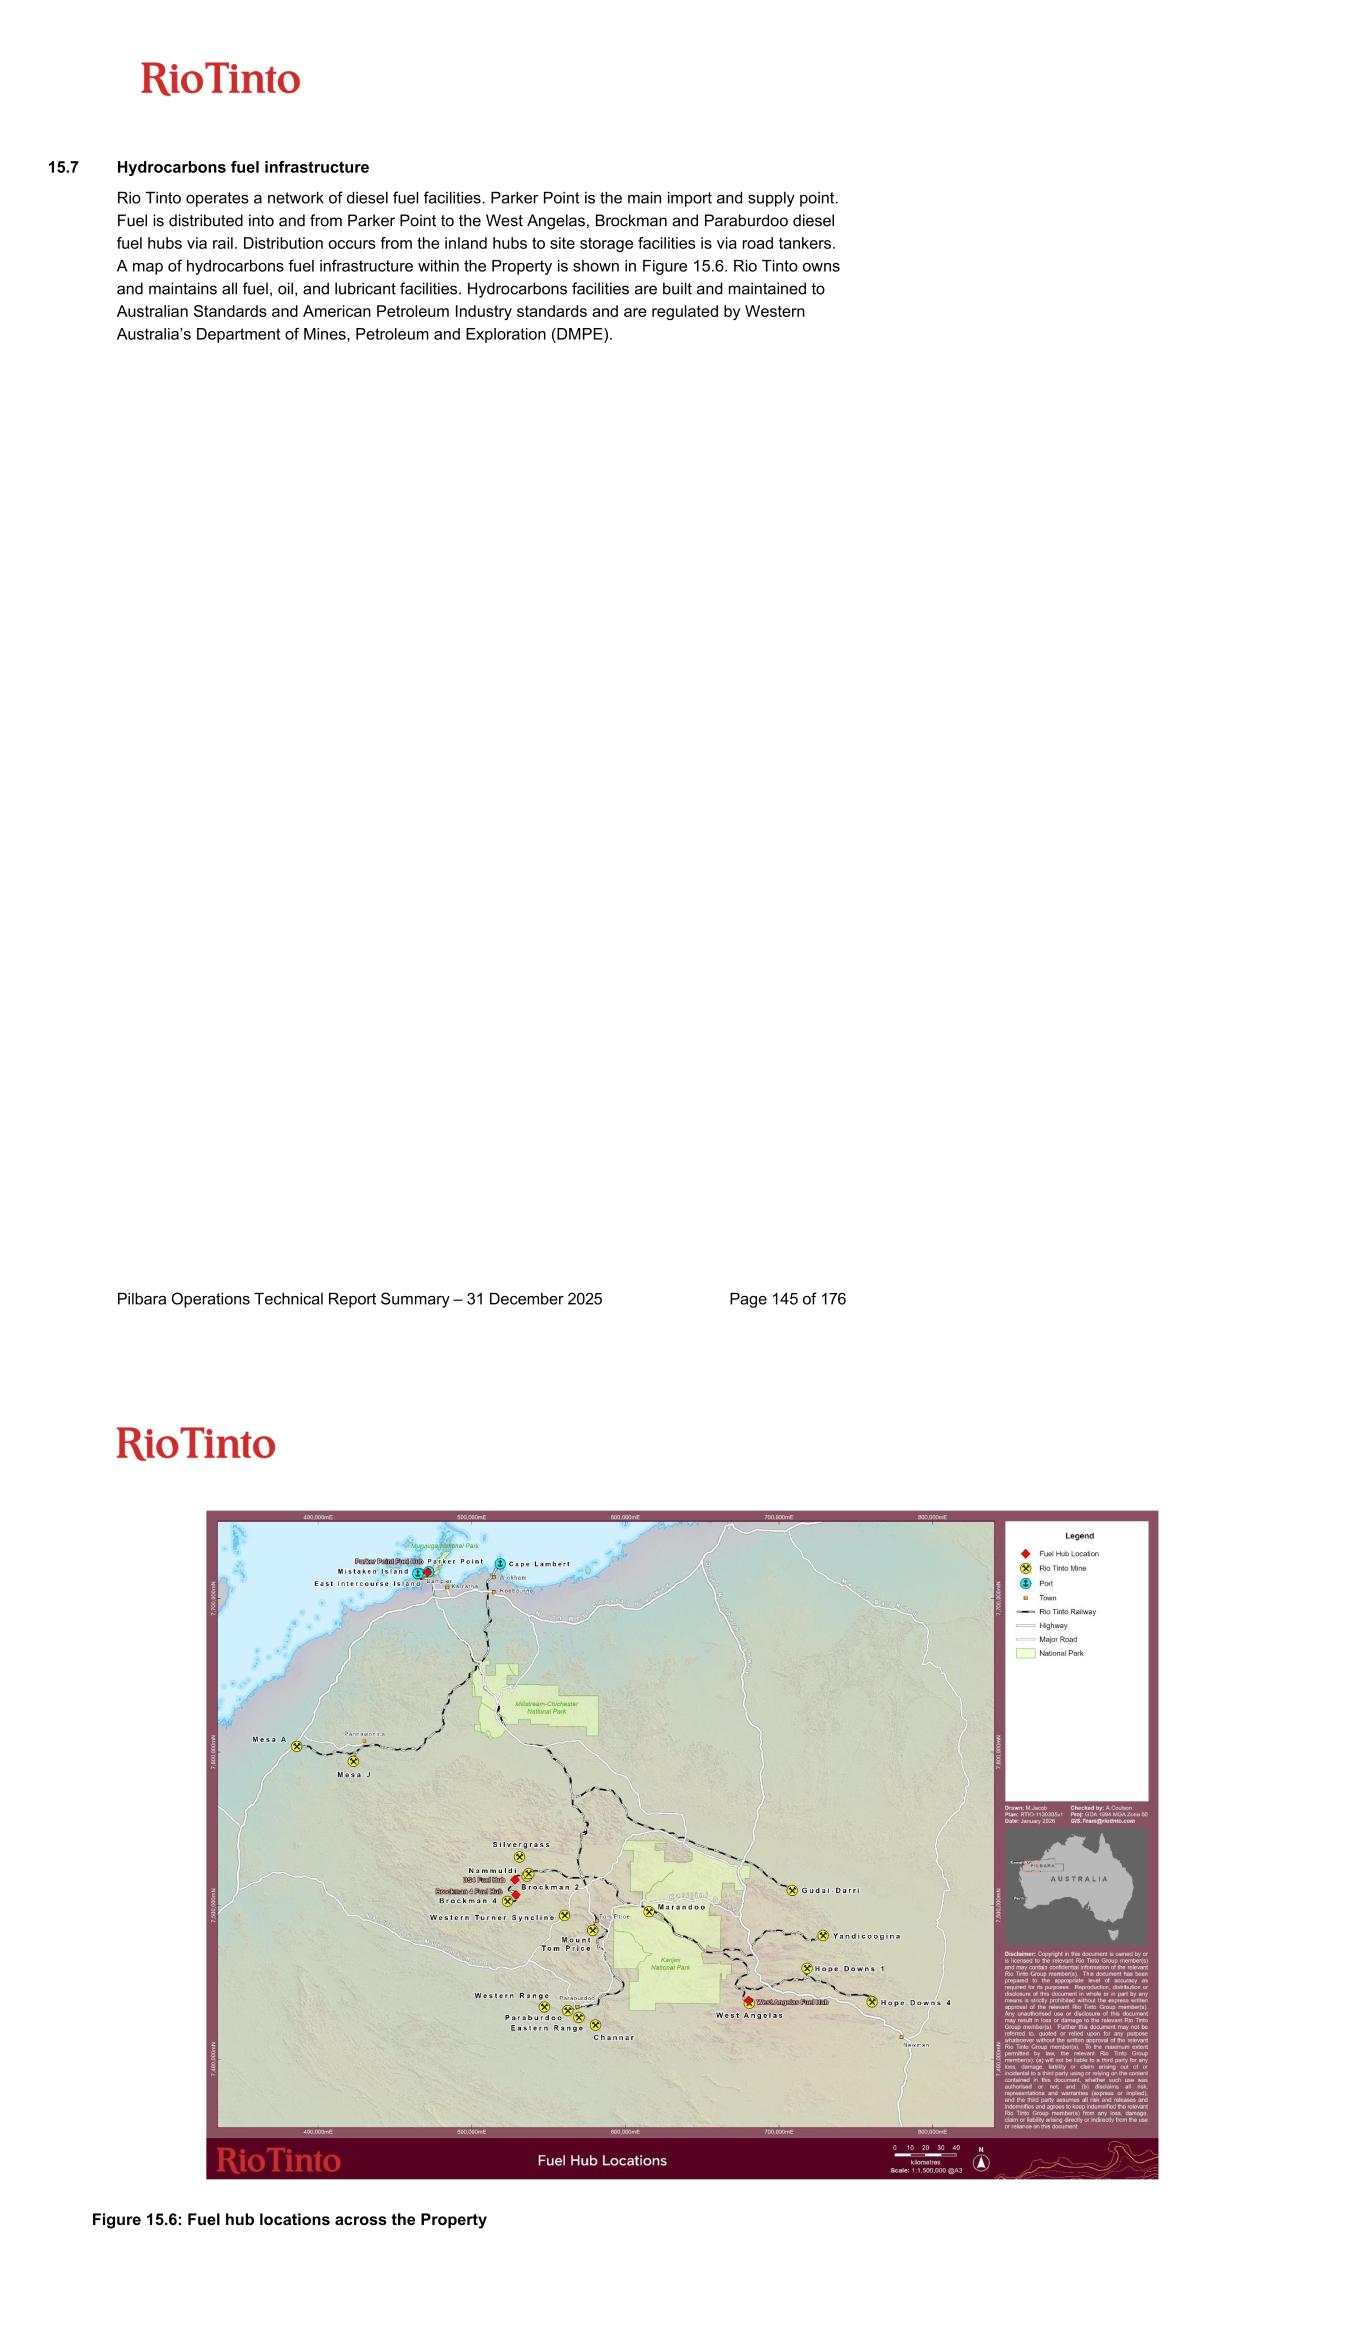
Pilbara Operations Technical Report Summary – 31 December 2025 Page 145 of 176 15.7 Hydrocarbons fuel infrastructure Rio Tinto operates a network of diesel fuel facilities. Parker Point is the main import and supply point. Fuel is distributed into and from Parker Point to the West Angelas, Brockman and Paraburdoo diesel fuel hubs via rail. Distribution occurs from the inland hubs to site storage facilities is via road tankers. A map of hydrocarbons fuel infrastructure within the Property is shown in Figure 15.6. Rio Tinto owns and maintains all fuel, oil, and lubricant facilities. Hydrocarbons facilities are built and maintained to Australian Standards and American Petroleum Industry standards and are regulated by Western Australia’s Department of Mines, Petroleum and Exploration (DMPE). Figure 15.6: Fuel hub locations across the Property
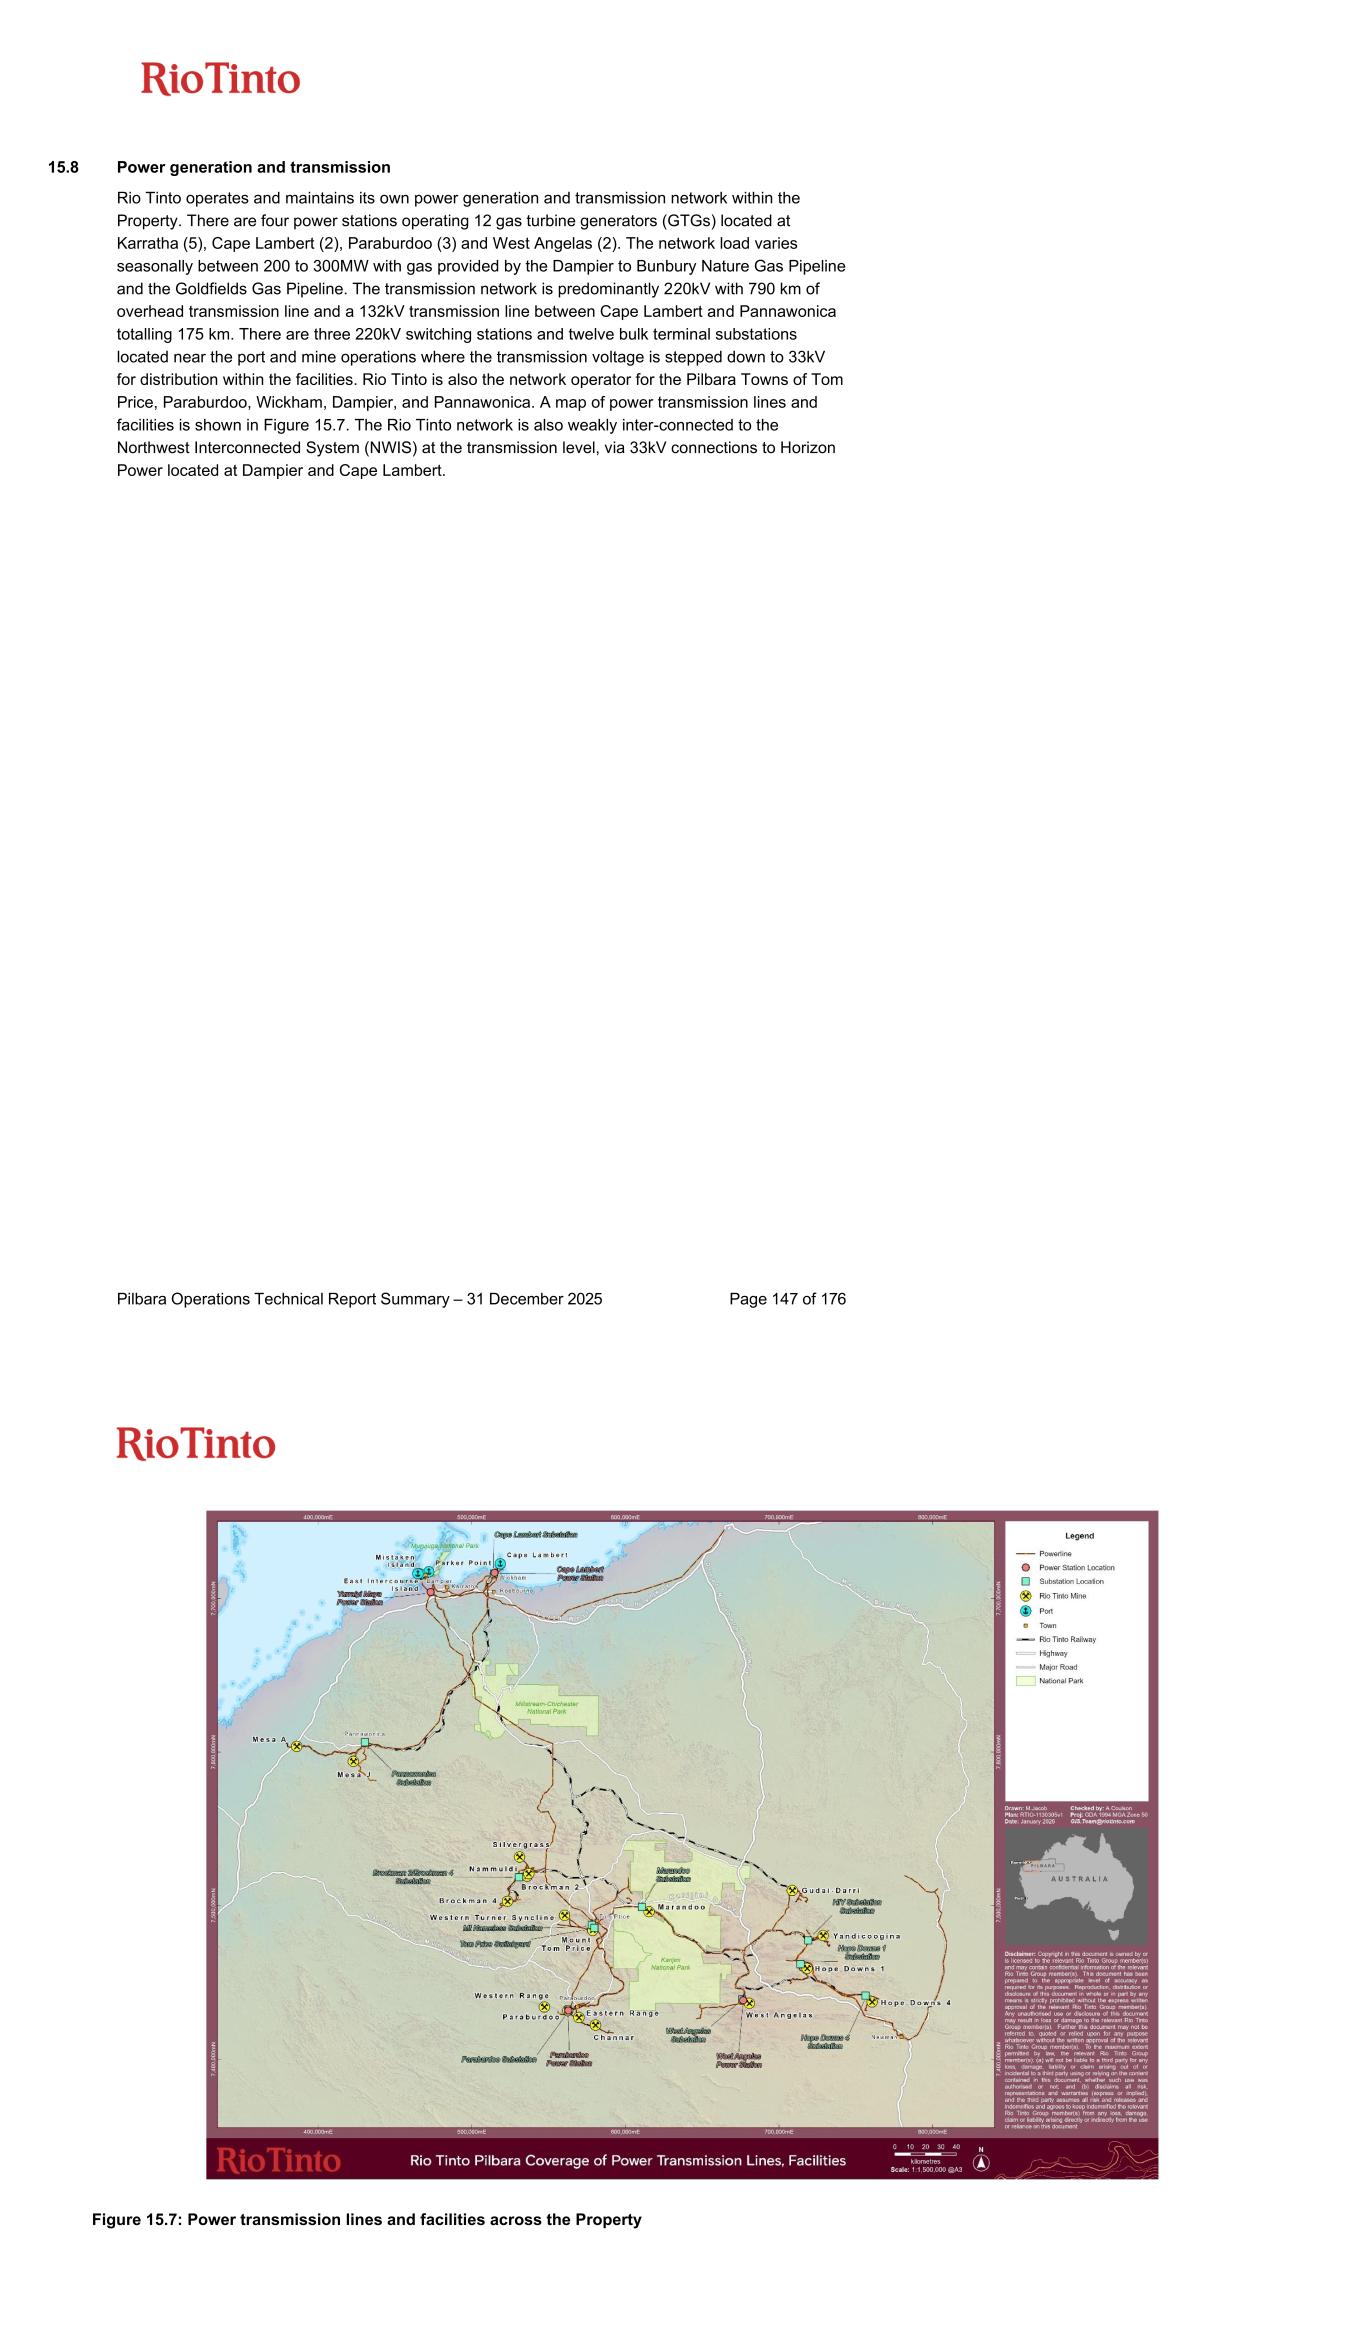
Pilbara Operations Technical Report Summary – 31 December 2025 Page 147 of 176 15.8 Power generation and transmission Rio Tinto operates and maintains its own power generation and transmission network within the Property. There are four power stations operating 12 gas turbine generators (GTGs) located at Karratha (5), Cape Lambert (2), Paraburdoo (3) and West Angelas (2). The network load varies seasonally between 200 to 300MW with gas provided by the Dampier to Bunbury Nature Gas Pipeline and the Goldfields Gas Pipeline. The transmission network is predominantly 220kV with 790 km of overhead transmission line and a 132kV transmission line between Cape Lambert and Pannawonica totalling 175 km. There are three 220kV switching stations and twelve bulk terminal substations located near the port and mine operations where the transmission voltage is stepped down to 33kV for distribution within the facilities. Rio Tinto is also the network operator for the Pilbara Towns of Tom Price, Paraburdoo, Wickham, Dampier, and Pannawonica. A map of power transmission lines and facilities is shown in Figure 15.7. The Rio Tinto network is also weakly inter-connected to the Northwest Interconnected System (NWIS) at the transmission level, via 33kV connections to Horizon Power located at Dampier and Cape Lambert. Figure 15.7: Power transmission lines and facilities across the Property
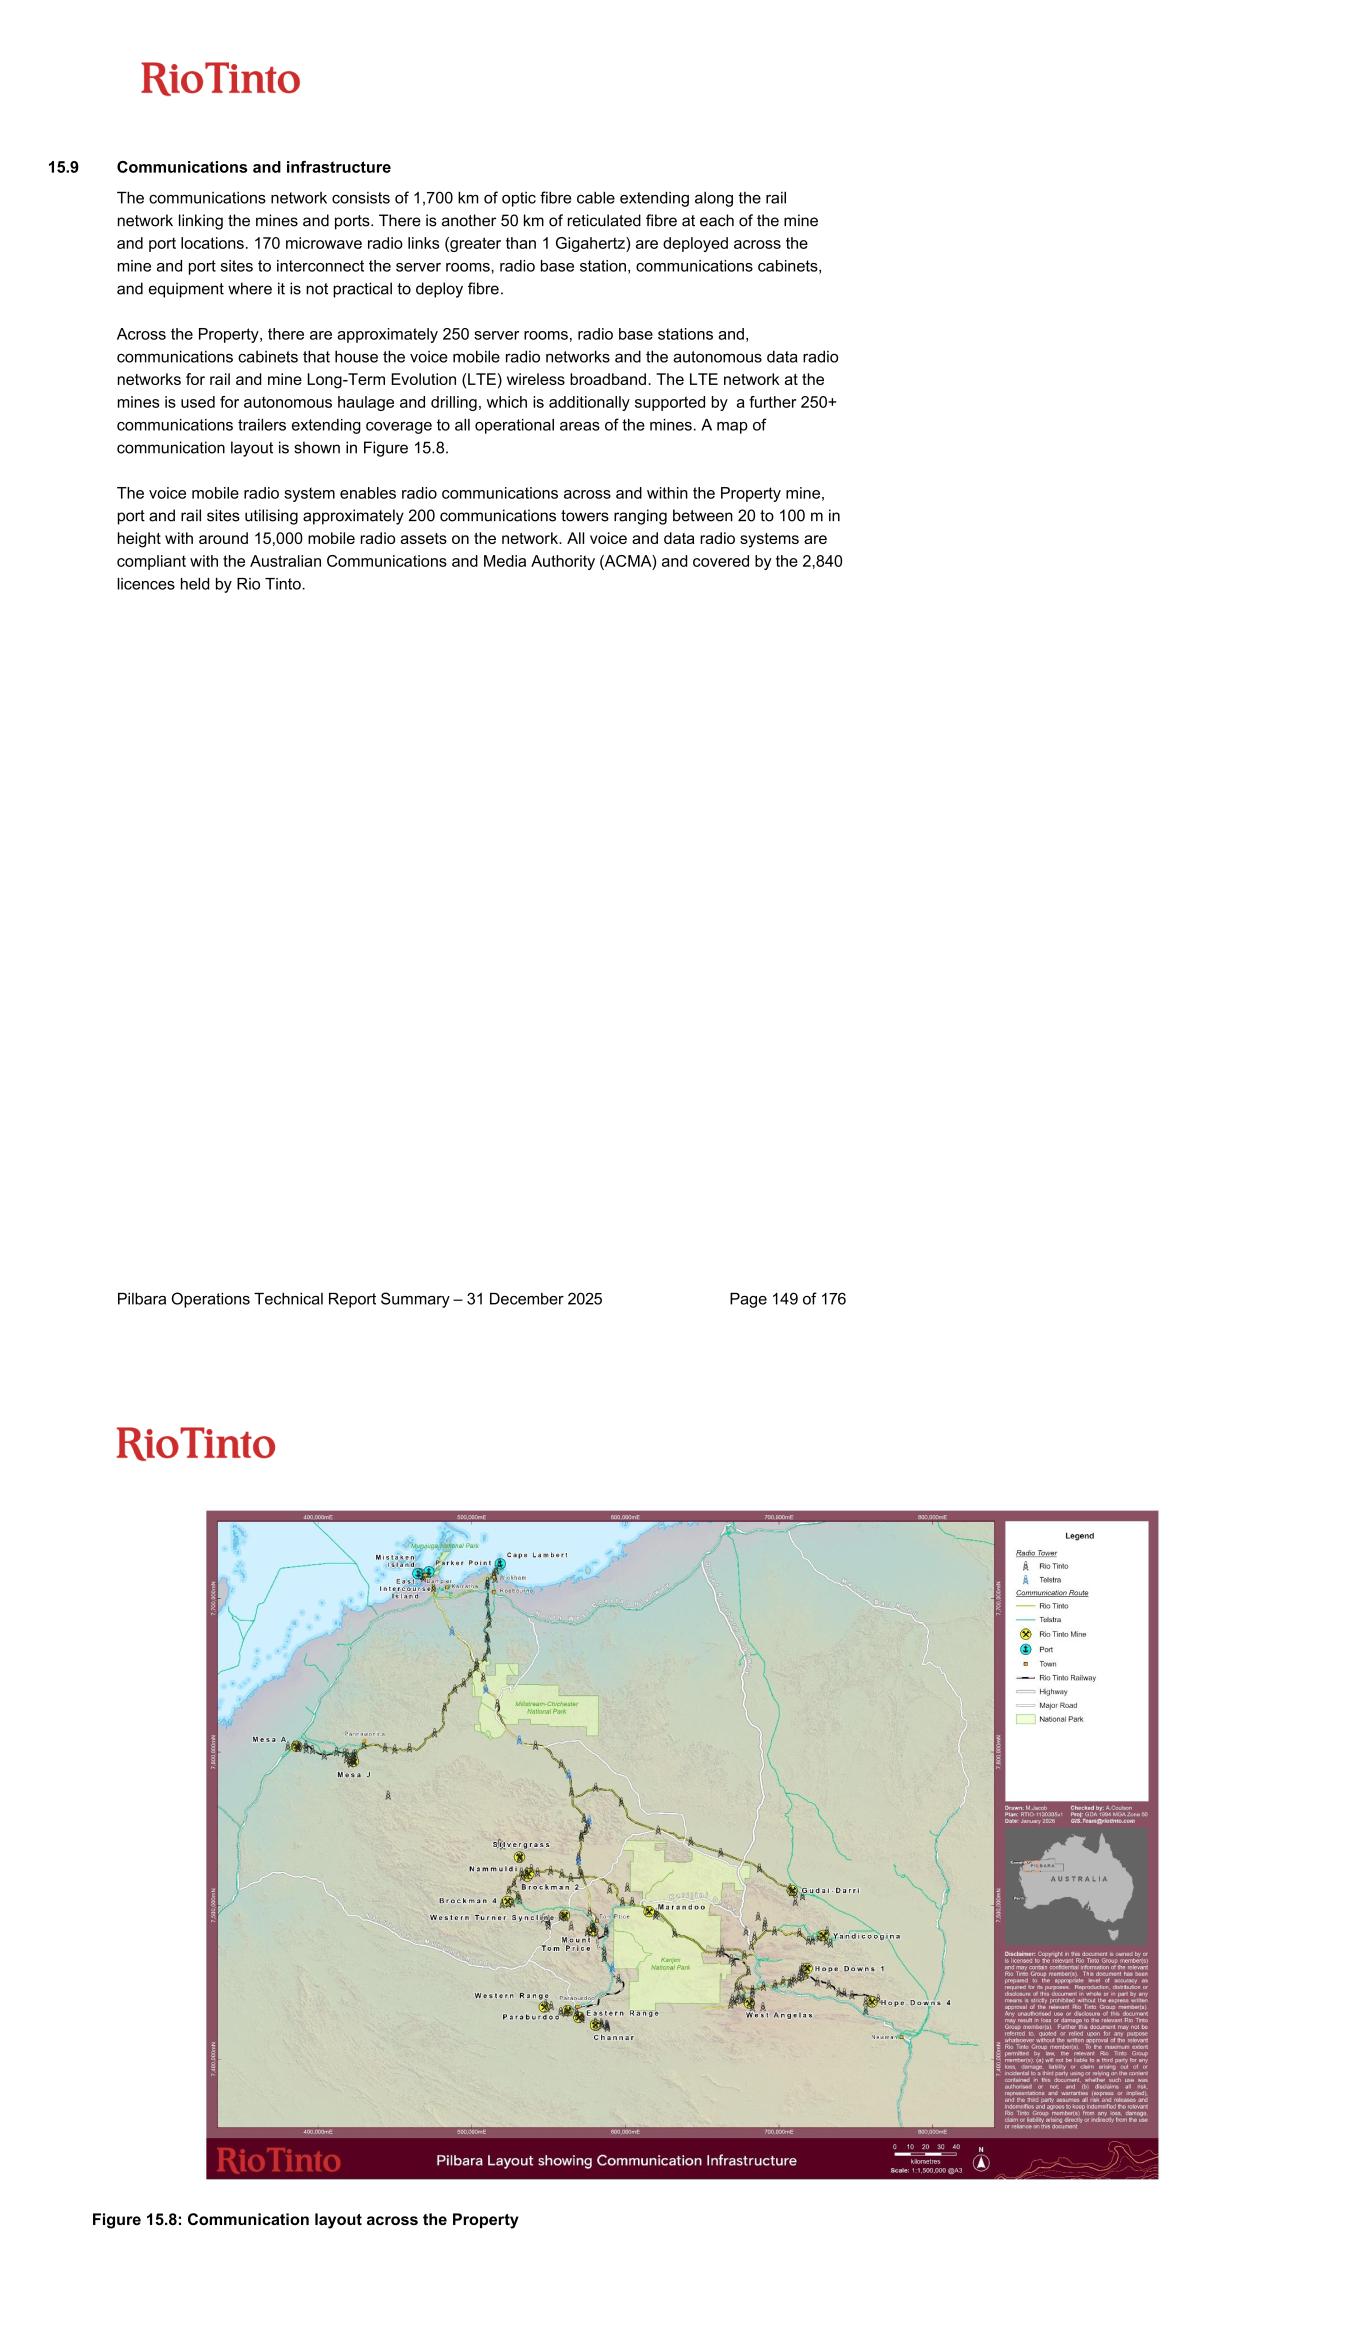
Pilbara Operations Technical Report Summary – 31 December 2025 Page 149 of 176 15.9 Communications and infrastructure The communications network consists of 1,700 km of optic fibre cable extending along the rail network linking the mines and ports. There is another 50 km of reticulated fibre at each of the mine and port locations. 170 microwave radio links (greater than 1 Gigahertz) are deployed across the mine and port sites to interconnect the server rooms, radio base station, communications cabinets, and equipment where it is not practical to deploy fibre. Across the Property, there are approximately 250 server rooms, radio base stations and, communications cabinets that house the voice mobile radio networks and the autonomous data radio networks for rail and mine Long-Term Evolution (LTE) wireless broadband. The LTE network at the mines is used for autonomous haulage and drilling, which is additionally supported by a further 250+ communications trailers extending coverage to all operational areas of the mines. A map of communication layout is shown in Figure 15.8. The voice mobile radio system enables radio communications across and within the Property mine, port and rail sites utilising approximately 200 communications towers ranging between 20 to 100 m in height with around 15,000 mobile radio assets on the network. All voice and data radio systems are compliant with the Australian Communications and Media Authority (ACMA) and covered by the 2,840 licences held by Rio Tinto. Figure 15.8: Communication layout across the Property
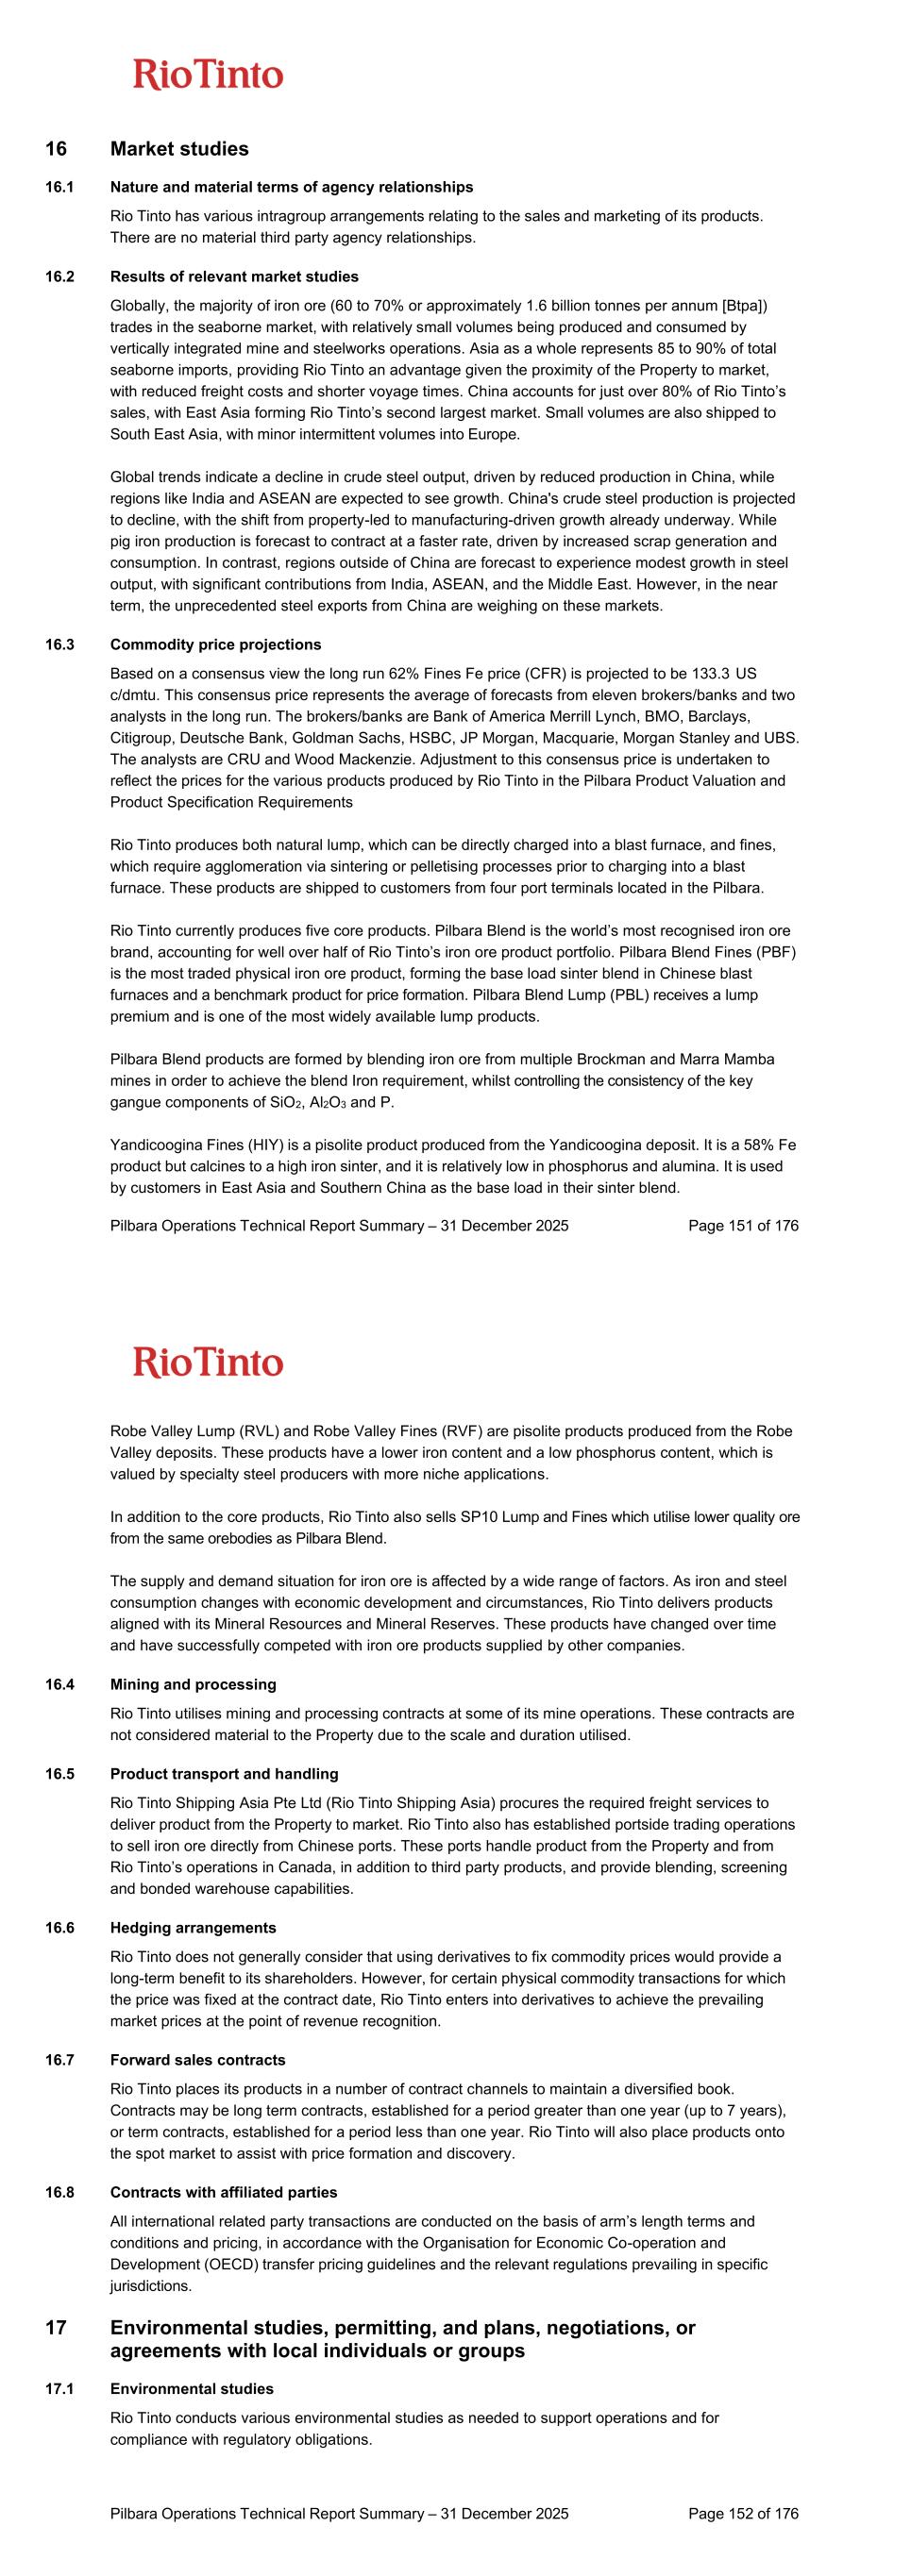
Pilbara Operations Technical Report Summary – 31 December 2025 Page 151 of 176 16 Market studies 16.1 Nature and material terms of agency relationships Rio Tinto has various intragroup arrangements relating to the sales and marketing of its products. There are no material third party agency relationships. 16.2 Results of relevant market studies Globally, the majority of iron ore (60 to 70% or approximately 1.6 billion tonnes per annum [Btpa]) trades in the seaborne market, with relatively small volumes being produced and consumed by vertically integrated mine and steelworks operations. Asia as a whole represents 85 to 90% of total seaborne imports, providing Rio Tinto an advantage given the proximity of the Property to market, with reduced freight costs and shorter voyage times. China accounts for just over 80% of Rio Tinto’s sales, with East Asia forming Rio Tinto’s second largest market. Small volumes are also shipped to South East Asia, with minor intermittent volumes into Europe. Global trends indicate a decline in crude steel output, driven by reduced production in China, while regions like India and ASEAN are expected to see growth. China's crude steel production is projected to decline, with the shift from property-led to manufacturing-driven growth already underway. While pig iron production is forecast to contract at a faster rate, driven by increased scrap generation and consumption. In contrast, regions outside of China are forecast to experience modest growth in steel output, with significant contributions from India, ASEAN, and the Middle East. However, in the near term, the unprecedented steel exports from China are weighing on these markets. 16.3 Commodity price projections Based on a consensus view the long run 62% Fines Fe price (CFR) is projected to be 133.3 US c/dmtu. This consensus price represents the average of forecasts from eleven brokers/banks and two analysts in the long run. The brokers/banks are Bank of America Merrill Lynch, BMO, Barclays, Citigroup, Deutsche Bank, Goldman Sachs, HSBC, JP Morgan, Macquarie, Morgan Stanley and UBS. The analysts are CRU and Wood Mackenzie. Adjustment to this consensus price is undertaken to reflect the prices for the various products produced by Rio Tinto in the Pilbara Product Valuation and Product Specification Requirements Rio Tinto produces both natural lump, which can be directly charged into a blast furnace, and fines, which require agglomeration via sintering or pelletising processes prior to charging into a blast furnace. These products are shipped to customers from four port terminals located in the Pilbara. Rio Tinto currently produces five core products. Pilbara Blend is the world’s most recognised iron ore brand, accounting for well over half of Rio Tinto’s iron ore product portfolio. Pilbara Blend Fines (PBF) is the most traded physical iron ore product, forming the base load sinter blend in Chinese blast furnaces and a benchmark product for price formation. Pilbara Blend Lump (PBL) receives a lump premium and is one of the most widely available lump products. Pilbara Blend products are formed by blending iron ore from multiple Brockman and Marra Mamba mines in order to achieve the blend Iron requirement, whilst controlling the consistency of the key gangue components of SiO2, Al2O3 and P. Yandicoogina Fines (HIY) is a pisolite product produced from the Yandicoogina deposit. It is a 58% Fe product but calcines to a high iron sinter, and it is relatively low in phosphorus and alumina. It is used by customers in East Asia and Southern China as the base load in their sinter blend. Pilbara Operations Technical Report Summary – 31 December 2025 Page 152 of 176 Robe Valley Lump (RVL) and Robe Valley Fines (RVF) are pisolite products produced from the Robe Valley deposits. These products have a lower iron content and a low phosphorus content, which is valued by specialty steel producers with more niche applications. In addition to the core products, Rio Tinto also sells SP10 Lump and Fines which utilise lower quality ore from the same orebodies as Pilbara Blend. The supply and demand situation for iron ore is affected by a wide range of factors. As iron and steel consumption changes with economic development and circumstances, Rio Tinto delivers products aligned with its Mineral Resources and Mineral Reserves. These products have changed over time and have successfully competed with iron ore products supplied by other companies. 16.4 Mining and processing Rio Tinto utilises mining and processing contracts at some of its mine operations. These contracts are not considered material to the Property due to the scale and duration utilised. 16.5 Product transport and handling Rio Tinto Shipping Asia Pte Ltd (Rio Tinto Shipping Asia) procures the required freight services to deliver product from the Property to market. Rio Tinto also has established portside trading operations to sell iron ore directly from Chinese ports. These ports handle product from the Property and from Rio Tinto’s operations in Canada, in addition to third party products, and provide blending, screening and bonded warehouse capabilities. 16.6 Hedging arrangements Rio Tinto does not generally consider that using derivatives to fix commodity prices would provide a long-term benefit to its shareholders. However, for certain physical commodity transactions for which the price was fixed at the contract date, Rio Tinto enters into derivatives to achieve the prevailing market prices at the point of revenue recognition. 16.7 Forward sales contracts Rio Tinto places its products in a number of contract channels to maintain a diversified book. Contracts may be long term contracts, established for a period greater than one year (up to 7 years), or term contracts, established for a period less than one year. Rio Tinto will also place products onto the spot market to assist with price formation and discovery. 16.8 Contracts with affiliated parties All international related party transactions are conducted on the basis of arm’s length terms and conditions and pricing, in accordance with the Organisation for Economic Co-operation and Development (OECD) transfer pricing guidelines and the relevant regulations prevailing in specific jurisdictions. 17 Environmental studies, permitting, and plans, negotiations, or agreements with local individuals or groups 17.1 Environmental studies Rio Tinto conducts various environmental studies as needed to support operations and for compliance with regulatory obligations.
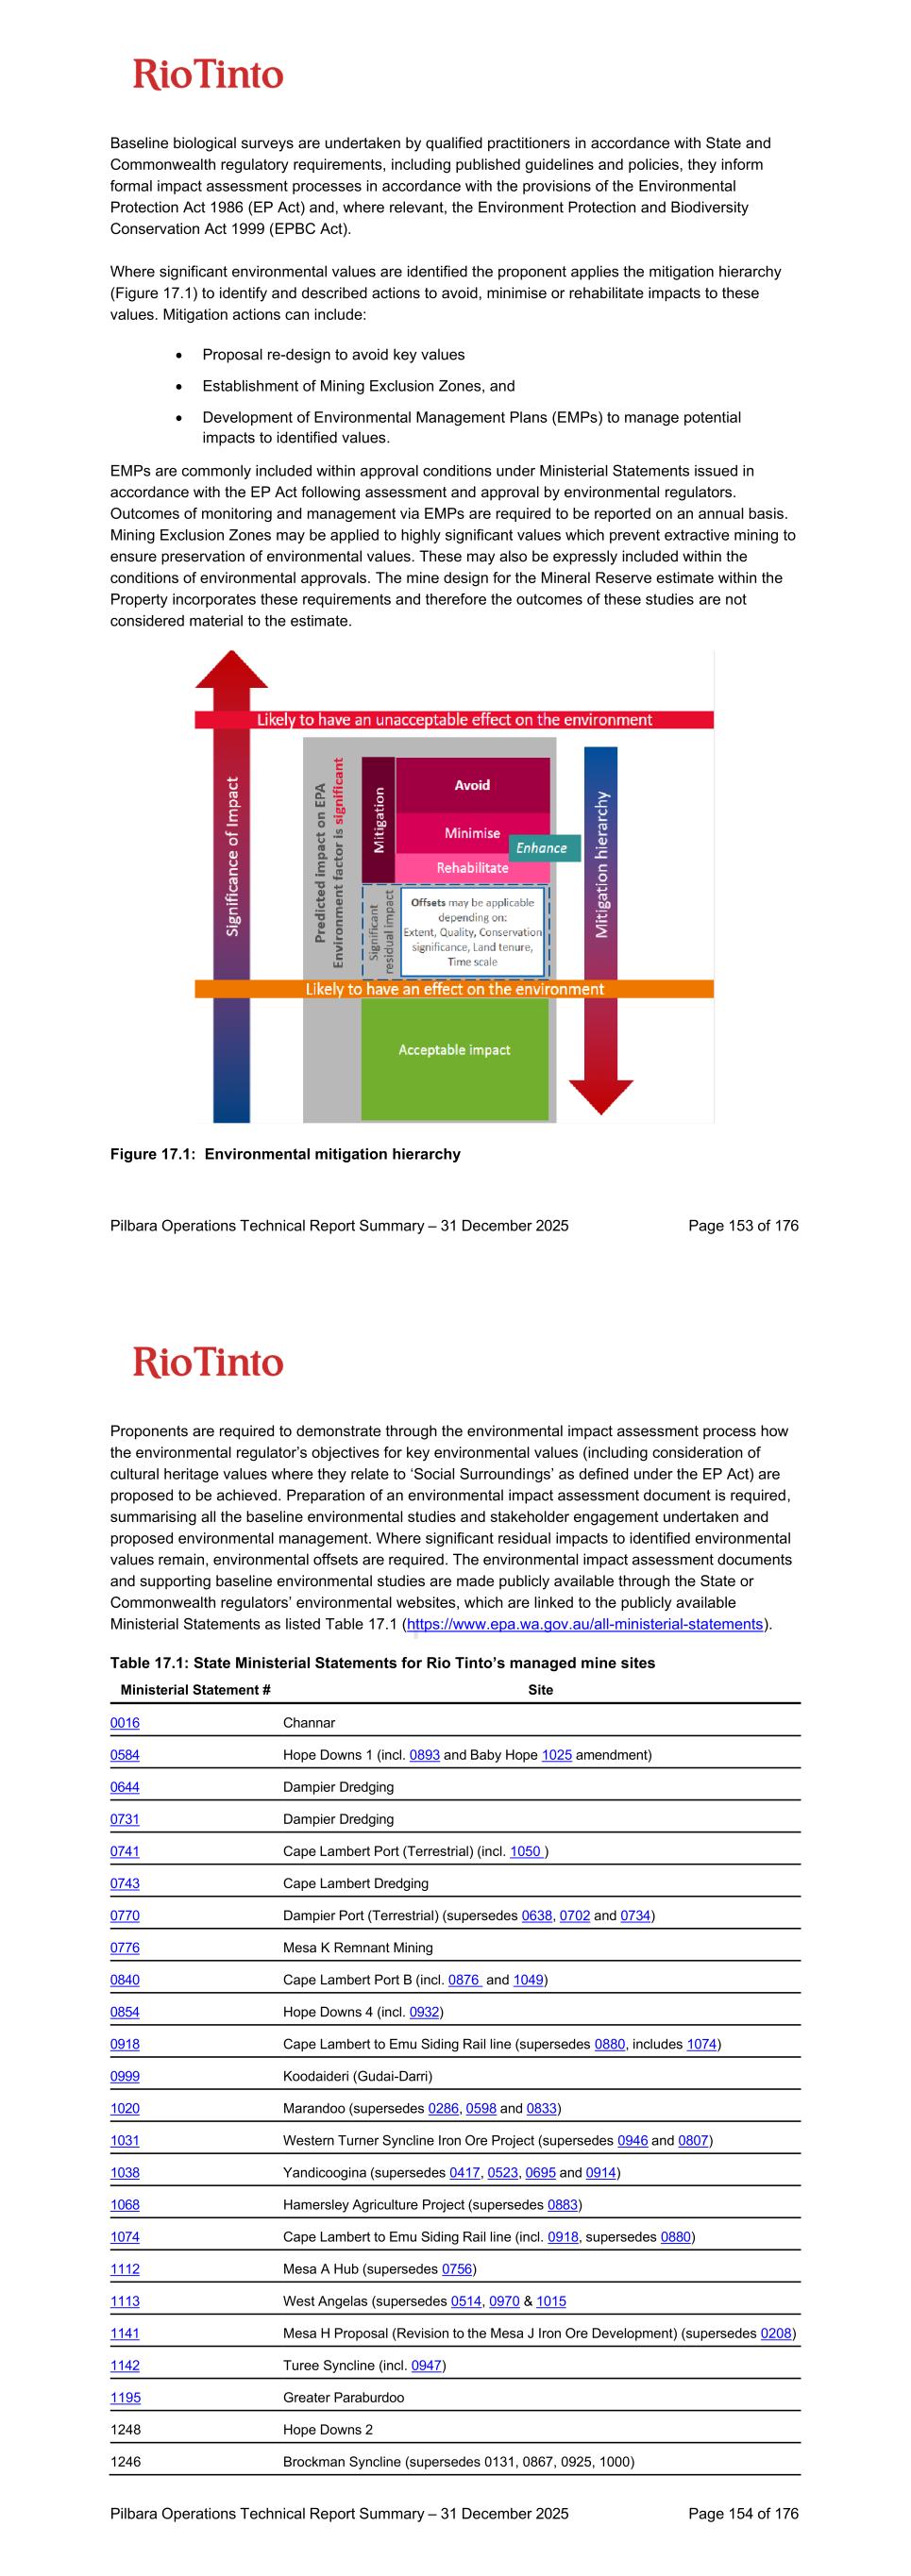
Pilbara Operations Technical Report Summary – 31 December 2025 Page 153 of 176 Baseline biological surveys are undertaken by qualified practitioners in accordance with State and Commonwealth regulatory requirements, including published guidelines and policies, they inform formal impact assessment processes in accordance with the provisions of the Environmental Protection Act 1986 (EP Act) and, where relevant, the Environment Protection and Biodiversity Conservation Act 1999 (EPBC Act). Where significant environmental values are identified the proponent applies the mitigation hierarchy (Figure 17.1) to identify and described actions to avoid, minimise or rehabilitate impacts to these values. Mitigation actions can include: • Proposal re-design to avoid key values • Establishment of Mining Exclusion Zones, and • Development of Environmental Management Plans (EMPs) to manage potential impacts to identified values. EMPs are commonly included within approval conditions under Ministerial Statements issued in accordance with the EP Act following assessment and approval by environmental regulators. Outcomes of monitoring and management via EMPs are required to be reported on an annual basis. Mining Exclusion Zones may be applied to highly significant values which prevent extractive mining to ensure preservation of environmental values. These may also be expressly included within the conditions of environmental approvals. The mine design for the Mineral Reserve estimate within the Property incorporates these requirements and therefore the outcomes of these studies are not considered material to the estimate. Figure 17.1: Environmental mitigation hierarchy Pilbara Operations Technical Report Summary – 31 December 2025 Page 154 of 176 Proponents are required to demonstrate through the environmental impact assessment process how the environmental regulator’s objectives for key environmental values (including consideration of cultural heritage values where they relate to ‘Social Surroundings’ as defined under the EP Act) are proposed to be achieved. Preparation of an environmental impact assessment document is required, summarising all the baseline environmental studies and stakeholder engagement undertaken and proposed environmental management. Where significant residual impacts to identified environmental values remain, environmental offsets are required. The environmental impact assessment documents and supporting baseline environmental studies are made publicly available through the State or Commonwealth regulators’ environmental websites, which are linked to the publicly available Ministerial Statements as listed Table 17.1 (https://www.epa.wa.gov.au/all-ministerial-statements). Table 17.1: State Ministerial Statements for Rio Tinto’s managed mine sites Ministerial Statement # Site 0016 Channar 0584 Hope Downs 1 (incl. 0893 and Baby Hope 1025 amendment) 0644 Dampier Dredging 0731 Dampier Dredging 0741 Cape Lambert Port (Terrestrial) (incl. 1050 ) 0743 Cape Lambert Dredging 0770 Dampier Port (Terrestrial) (supersedes 0638, 0702 and 0734) 0776 Mesa K Remnant Mining 0840 Cape Lambert Port B (incl. 0876 and 1049) 0854 Hope Downs 4 (incl. 0932) 0918 Cape Lambert to Emu Siding Rail line (supersedes 0880, includes 1074) 0999 Koodaideri (Gudai-Darri) 1020 Marandoo (supersedes 0286, 0598 and 0833) 1031 Western Turner Syncline Iron Ore Project (supersedes 0946 and 0807) 1038 Yandicoogina (supersedes 0417, 0523, 0695 and 0914) 1068 Hamersley Agriculture Project (supersedes 0883) 1074 Cape Lambert to Emu Siding Rail line (incl. 0918, supersedes 0880) 1112 Mesa A Hub (supersedes 0756) 1113 West Angelas (supersedes 0514, 0970 & 1015 1141 Mesa H Proposal (Revision to the Mesa J Iron Ore Development) (supersedes 0208) 1142 Turee Syncline (incl. 0947) 1195 Greater Paraburdoo 1248 Hope Downs 2 1246 Brockman Syncline (supersedes 0131, 0867, 0925, 1000)
Pilbara Operations Technical Report Summary – 31 December 2025 Page 155 of 176 Ministerial Statement # Site 1251 West Angelas Sustaining Project (supersedes 1113) Referred for Assessment Rhodes Ridge Iron Ore Project Referred for Assessment Robe Valley Iron Ore Mine 17.2 Requirements and plans for waste and tailings disposal, site monitoring, and water management during operation and after mine closure 17.2.1 Waste management DWER is responsible for regulating industrial emissions and discharges to the environment under Part V, Division 3 of the EP Act. This includes emissions to air, land, and water from activities that may impact public health or the environment. Sites that have the potential to cause such emissions are classified as prescribed premises, with categories defined in Schedule 1 of the Environmental Protection Regulations 1987. Operators of these premises must obtain: • A works approval before constructing or modifying facilities, and • An environmental licence to operate the premises once commissioned. Works approvals may also authorise limited emissions during construction and commissioning. Ongoing operations must be conducted in accordance with licence conditions, including those for facilities such as landfills, which are classified under the Landfill Waste Classification and Waste Definitions 1996 (as amended 2019) Hazardous chemicals and dangerous goods within a site are managed in accordance with the Dangerous Goods Safety Act 2004 which is administered by the Department of Local Government, Industry Regulation and Safety (LGIRS). All sites must comply with applicable legislation, environmental approvals, and licence conditions. Design and operation must also meet Rio Tinto’s internal environmental standards, which may exceed regulatory requirements. In such cases, the more stringent standard applies (refer to Section 17.3.4). Rio Tinto implements these obligations through its Health, Safety, Environment and Quality (HSEQ) Management System, which includes: • A legal and compliance register. • Environmental performance standards and design criteria. • Regular monitoring and reporting aligned with regulatory requirements. • Support for external audits and inspections. 17.2.1.1 Tailings disposal, site monitoring and water management The primary requirements for tailings storage facilities are taken from relevant legislation, works approval and licence conditions and supporting documents published by regulators, primarily DWER (EP Act) and the DMPE (Mining Act 1978). Internal requirements are contained in the Rio Tinto D5 Management of Tailings and Water Storage Facilities standard and supporting documents, along with other relevant standards covering water, mineral waste, closure and risk management. Rio Tinto Iron Ore has achieved compliance with the Global Industry Standard on Tailings Management and Pilbara Operations Technical Report Summary – 31 December 2025 Page 156 of 176 supporting guidelines published by the International Council on Mining and Metals (ICMM). Further guidance is taken from widely applied industry guidance published by organisations such as the Australian National Committee on Large Dams (ANCOLD), the International Committee on Large Dams (ICOLD) and the Mining Association of Canada (MAC). The DMPE, through administering the Mining Act 1978 (WA), Mining Act Regulations 1981 (WA), Mines Safety and Inspection Act 1994 (WA) and Mine Safety and Inspection Regulations 1995 (WA), governs safety and environmental aspects of tailings disposal in Western Australia. All tailings storage facility proposals must be documented and the facility constructed as per the DMPE Code of Practice (2013) and Guidance (2015). The tailings facilities are generally assessed by DMPE or included with the environmental approval applications and undergo formal assessment under Part IV of the EP Act. The facilities also require a works approval (to construct) and a Licence (to operate) under Part V of the EP Act. Appropriate environmental conditions are attached to works approvals and licences which also set out monitoring and regulatory reporting/compliance requirements to which the company must adhere. The tailings storage facilities are also designed to ensure achievement and adherence to overarching environmental conditions of approval and management outcomes as set out in Ministerial approvals or environmental management plans. All sites on the Property have documented plans for the provision of life of mine tailings storage, including definition of the requirements for financial investment and external approvals. Long-term planning is linked with day-to-day operations by detailed deposition and water management plans, detailed within the Operations Maintenance and Surveillance manual. Each site has: • An appointed nominated manager (accountable for all aspects of tailings management). • Responsible dams engineer (responsible for technical and planning aspects of tailings management). • A qualified site representative (responsible for day-to-day operations and surveillance of tailings facilities). Technical leadership is provided by an EoR and support team sourced from third-party suppliers for each facility. Inspections are conducted by trained personnel in accordance with the Operations Maintenance and Surveillance manual and pre-prepared checklists, at least daily for operational facilities and on a risk- basis for dormant facilities. Monitoring instrumentation such as piezometers, ground survey and groundwater monitoring bores are installed on all facilities, with remote telemetry installed for instruments where possible for the respective instrument type. Quarterly Light Detection and Ranging (LiDAR) surveys are also undertaken to track tailings beach development and storage capacity. Each site undergoes annual independent technical and stewardship review, conducted by qualified third parties. All recommendations arising from any review or audit are entered into the company’s action- management system, tracked and reported to senior management periodically. Treatment of water entrained within tailings is managed in accordance with Rio Tinto Standards, environmental licences and environmental approvals. Additives are either not utilised or are selected to avoid potential contamination. In addition, the iron ore tailings materials are benign. In some cases, surface drainage is employed to limit inflows to a facility to promote dam safety, but there are no instances where inflows must be avoided to prevent mixing and contamination. Monitoring and
Pilbara Operations Technical Report Summary – 31 December 2025 Page 157 of 176 management focusses on avoiding or minimising potential associated environmental impacts, particularly to ground water quality and associated groundwater-dependent environmental values. The design of such systems is informed by key environmental values identified during the design phase and controls are introduced to ensure that potential risks can be managed to prevent unacceptable environmental impacts. 17.3 Permits 17.3.1 Environmental Protection Act (WA) 1986 (EP Act) Projects within the Property require compliance with the EP Act. Licences and approvals granted under this Act can be found at: https://www.der.wa.gov.au/our-work/licences-and-works- approvals/current-licences. Clearing within the Property complies with the EP Act and Environmental Protection (Clearing of Native Vegetation) Regulations 2004 which generally requires a Native Vegetation Clearing Permit under Part V the EP Act to undertake material new clearing. Rio Tinto projects that have the potential to significantly impact the environment are formally referred and assessed under Part IV of the EP Act. The EPA undertakes the assessment and issues a report which makes a recommendation to the Minister for the Environment as to whether a project should be approved and if so, conditions of approval. This report is also made publicly available and is open for a public appeal period. The Minister for Environment then considers the EPA’s report and any public appeals before determining, in consultation with other Ministers, whether the proposal or scheme should be allowed to proceed and, if so, under what conditions. Formal environmental approval is granted by the State Minister for the Environment with conditions of approval required to be met set out within a Ministerial Statement. This includes environmental requirements to be met through approved EMPs (as described in Section 17.1) to demonstrate that the company is managing the project to meet the conditions of approval, in addition to the requirement to demonstrate compliance via compliance reporting requirements. A list of Rio Tinto‘s Ministerial Statements which contain the conditions of approval are provided in Table 17.1: the full contents of these are accessible at https://www.epa.wa.gov.au/all-ministerial-statements. Operations which pre-dated the EP Act (Tom Price, Paraburdoo), and do not have a Ministerial Statement were originally managed under relevant legislation at the time and are now currently managed under the provisions of the EP Act (Part V licencing and EP Act Regulations 1987). 17.3.2 Biodiversity Conservation Act 2016 (WA) (BC Act) The BC Act provides for the listing of threatened native plants (flora), threatened native animals (fauna), and threatened ecological communities that need protection as critically endangered, endangered, or vulnerable species or ecological communities because they are under identifiable threat of extinction (species) or collapse (ecological communities). A licence is required to be granted for the taking or disturbance of threatened species and communities listed under this Act (in addition to approvals granted under the EP Act and EPBC Act). The licences contain conditions and reporting requirements which Rio Tinto must meet. Pilbara Operations Technical Report Summary – 31 December 2025 Page 158 of 176 17.3.3 Environment Protection and Biodiversity Conservation Act 1999 (EPBC Act) The EPBC Act is the Australian Government’s central piece of environmental legislation. It provides a legal framework to protect and manage nationally and internationally important flora, fauna, ecological communities and heritage places, referred to as Matters of National Environmental Significance (MNES). Where MNES are present and have the potential to be significantly impacted, the project is required to be formally referred and assessed under the EPBC Act. If assessed under the EPBC Act as a ‘Controlled Action’ the project requires formal approval by the Federal Environment Minister outlining conditions of approval (EPBC Act Decision Notice). This includes environmental requirements to be met (which may include significant species management plans) to demonstrate that the company is managing the project to meet the conditions of approval, in addition to the requirement to demonstrate compliance via compliance reporting. A list of Rio Tinto‘s EPBC Act Decision Notices is provided in Table 17.2 and can be found on the Department of Climate Change, Energy, the Environment and Water’s website (http://epbcnotices.environment.gov.au/referralslist). Table 17.2: Federal EPBC Decision Notices for Rio Tinto’s managed mine sites EPBC Decision # Site 2008/4032 Cape Lambert Port B 2011/5815 Yandicoogina JSW & Oxbow 2012/6391 Turee Syncline 2012/6422 Koodaideri (Gudai-Darri) 2016/7843 Mesa A Hub 2017/8017 Mesa H 2018/8299 West Angelas C, D, G 2018/8341 Greater Paraburdoo 2021/9035 Hope Downs 2 2019/8518 Brockman Syncline 2021/8923 West Angelas Beyond 2020 Referred for Assessment Rhodes Ridge Iron Ore Project Referred for Assessment Robe Valley Iron Ore Mine 17.3.4 Mining Act 1978 (WA) Mining-related activities require additional approvals under the Mining Act 1978 (WA). Mineral exploration-type activities on non-State Agreement tenure require an approved Program of Works from DMPE. A Mining Proposal is required for construction and operation of mining related activities on Mining Act tenure. A Mining Proposal details the activity, environmental management, compliance with other legislation and rehabilitation requirements and includes the provision of a Mine Closure Plan (refer to Section 17.5).
Pilbara Operations Technical Report Summary – 31 December 2025 Page 159 of 176 17.3.5 Rights in Water and Irrigation Act 1914 Approvals are required under the Rights in Water and Irrigation Act 1914 (WA) (RiWI Act) to take ground or surface water, or to interfere with the bed and banks of a watercourse. The three main approval types required to support Rio Tinto's operations are: • 26D Licence - a licence to construct or alter a production bore. • 5C Licence - a licence to take water from a watercourse, wetland or underground source. For large volumes (i.e. above 500,000 kL/a), significant hydrogeological / hydrological information and a groundwater operating strategy is required to support the application. • S17 Bed and Banks Permit - a permit may be required for works impacting on the bed or banks of a significant creek / drainage line. 17.3.6 The Aboriginal Heritage Act (WA) The Aboriginal Heritage Act 1972 (WA) (as amended) provides for the recognition, protection, conservation and preservation of Aboriginal cultural heritage and provides an avenue to obtain legal consent to impact or harm heritage. The AHA requires Traditional Owner engagement on projects and in relation to the impacts to cultural heritage values. Rio Tinto therefore conducts heritage surveys, assessments and consultation with Traditional Owners over all areas of proposed developments to ensure heritage values are identified and to support the integration of heritage considerations into mine planning and development studies. Where impact or harm to cultural heritage has been demonstrated to not practically be able to be avoided, Rio Tinto’s Communities and Social Performance Standard is implemented and Rio Tinto’s Integrated Heritage Management Process is employed to assess whether the necessary heritage approvals required under relevant legislation have been obtained and remain current or are likely to be obtained within the time required by the relevant mine plan. 17.3.7 Auditing and compliance Rio Tinto operates under a robust HSEQ Management System that embeds compliance and governance across its operations. This system incorporates a comprehensive register of legal and legislative obligations, including external reporting requirements, environmental standards, and environmental design criteria. Through the HSEQ Management System, internal audits are systematically undertaken within Rio Tinto to demonstrate compliance with internal guidelines and standards, and to confirm Government regulations and laws are being met. In addition to internal assurance processes, operational areas are subjected to scheduled and ad hoc environmental compliance audits from State and Commonwealth environmental regulators, providing independent assurance that Rio Tinto continues to satisfy regulatory requirements. 17.4 Plans, negotiations, or agreements with local individuals or groups 17.4.1 Communities and social performance planning framework Rio Tinto’s activities are directed by a suite of governance documents including standards, policies, procedures, and guidance notes. In the area of Communities and Social Performance (CSP), application of the CSP Standard is mandatory for all Rio Tinto sites globally. Pilbara Operations Technical Report Summary – 31 December 2025 Page 160 of 176 Broadly, the CSP Standard requires assets maintain mutually beneficial relationships with host communities, and that business planning and decision making be informed by a robust socio- economic knowledge base and impact assessment. The CSP Standard also requires that engagement must be transparent, inclusive, culturally appropriate, and publicly defensible, and there are also measures to afford protection of human rights. Rio Tinto businesses are also required to proactively seek opportunities to reach legally binding community agreements and pay compensation to communities for specified losses. Rio Tinto has multiple guidance notes on CSP subjects such as agreement-making, complaints resolution, engagement, land access, resettlement, social impact assessment, human rights and community investment. The CSP Standard is publicly available on the Rio Tinto website (https://www.riotinto.com/-/media/Content/Documents/Sustainability/Corporate-policies/RT- Communities-social-performance-standard.pdf). These documents are based on international good practice set by agencies such as the International Finance Corporation, ICMM and Minerals Council of Australia. 17.4.2 Agreements with Traditional Owners In the Pilbara region of Western Australia, Rio Tinto have agreements covering the traditional Country of the Banjima, Muntulgura Guruma, Ngarlawangga, Ngarluma, Nyiyaparli, Puutu Kunti Kurrama and Pinikura, Robe River Kuruma, Yindjibarndi and Yinhawangka Traditional Owner groups. Agreements often include protocols for managing cultural heritage, engagement protocols for implementation of agreement approaches, and benefit payments for access to Country. The agreements are implemented through formal processes, such as Local Implementation Committee and Regional Implementation Committee meetings, as well as informal engagement as part of ongoing, long-standing relationships. These agreements with Traditional Owners are jointly being reviewed to ensure they are aligned to the parties’ expectations, Rio Tinto’s internal standards and the changing external landscape, including in relation to the protection of Aboriginal cultural heritage in Western Australia. Where impacts to Aboriginal cultural heritage cannot be avoided, approval is required under the Aboriginal Heritage Act 1972 (WA) (as amended). 17.4.3 Agreements with Pastoralists Rio Tinto holds the head lease for six pastoral leases across the Pilbara region in Western Australia. Each station is operated as a pastoral lease with three stations sub-leased to third party operators and the remaining managed by Rio Tinto personnel. These include: • Hamersley, Rocklea, Juna Downs (Rio Tinto-operated). • Yalleen, Yarraloola and Karratha (third party-operated). Rio Tinto has agreements in place with several pastoralists that commit Rio Tinto to pay compensation where pastoral activities are impacted. Additionally, the access agreements clearly outline the activities permitted on pastoral leases as well as the behaviours expected when Rio Tinto access a pastoral station.
Pilbara Operations Technical Report Summary – 31 December 2025 Page 161 of 176 17.4.4 Negotiations and agreements for new studies/projects For each new project, negotiations may be undertaken with individuals or groups including Traditional Owners, other land holders and relevant shires or communities. In some instances, this is done with the aim of reaching agreement on development aspects such as benefit payments, land access, etc. Where development is undertaken on Traditional Owner Country, Rio Tinto also strives to achieve free, prior and informed consent with the Traditional Owners, through a process of iterative engagement. 17.4.5 Complaints and incidents All Rio Tinto employees and contractors are responsible for following the Rio Tinto CSP Standard and the Community Complaints, Disputes & Grievances Guidance Note. These documents provide guidance to Rio Tinto personnel on how to manage community complaints, disputes and grievances. The CSP Standard includes targets to reduce repeat and significant complaints. The Rio Tinto CSP team capture and track all Sentiments (Complaints, Comments, Compliments and Incidents). These are then linked to the appropriate stakeholders and prioritised accordingly where further action is required. Risk assessments are used to prioritise complaints and incidents, and where appropriate followed by an incident investigation and root cause analysis. 17.4.6 Community Development Plan Under the various State Agreements governing Rio Tinto’s mining activities in the Property, Rio Tinto is required to produce and implement a Community Development Plan (CDP). The CDP outlines Rio Tinto’s approach to delivering community and social benefits in connection with its activities under the State Agreements. For the purposes of the State Agreements, community and social benefits include: • Assistance with skills, development, and training opportunities to promote work readiness and employment of persons living in the Pilbara region. • Regional development activities in the Pilbara region, including partnerships and sponsorships. • Contribution to any community projects, town services or facilities. • Maintaining a regionally based workforce. Rio Tinto reports annually on its implementation of the CDP to the Minister for State Development in satisfaction of its obligations under the Iron Ore State Agreement. 17.5 Mine closure plans, remediation and reclamation plans, and associated costs Planning for closure of a site is a critical business process that demonstrates Rio Tinto’s commitment to sustainable development. Mine Closure Plans (MCPs) are prepared for all mines on the Property. These are submitted to regulatory agencies for assessment against requirements. They are also shared with non-regulatory stakeholders, such as Traditional Owners, to support engagement on closure planning. MCPs follow the form and content requirements prescribed in the DMPE Statutory Guidelines for Preparing Mine Closure Plans (2025) and Mine Closure Plan Guidance (2025). Pilbara Operations Technical Report Summary – 31 December 2025 Page 162 of 176 The MCPs are developed to: • Assist Rio Tinto in the planning for and management of the mine rehabilitation and closure requirements by informing life of mine planning, operational activities and the development of closure provisions. • Meet the internal requirements of the Rio Tinto Closure Standard mandated for all Rio Tinto assets. • Inform key stakeholders on how Rio Tinto plans to meet its mine rehabilitation and closure requirements. • Reflect the current knowledge and requirements for closure of the mine, identify the knowledge gaps and inform the closure task register to continue to reduce risk and progress towards a planned and managed closure of the site. • Meet the requirements in the DMPE Statutory Guidelines for Mine Closure Plans (2025). A closure cost estimate is developed for each asset based on closure plans and updated annually at a minimum. The closure cost estimates include contingency and have an accuracy margin of error between -30% and +50%. The pre-tax NPC5.5 of all closure costs assumed within Rio Tinto’s Mineral Reserves only economic evaluation is $6.8 billion. These costs are factored into the economic analysis and can be seen in section 19.5.1. Closure strategies and designs for waste facilities are refined throughout mine life and detailed in the asset MCP. Significant technical work has been done to characterise the physical and geochemical properties of waste rock and tailings across the Rio Tinto Pilbara Iron ore operations. This information describes closure designs for each waste landform to ensure environmental risks are effectively managed. Post-closure monitoring requirements for vegetation establishment, erosion of waste landforms, surface/groundwater and other environmental parameters are also detailed in MCPs. The closure monitoring plans become progressively more detailed throughout the operating life of the asset. 17.6 QPs’ opinion It is the opinion of the QPs that Rio Tinto’s current actions and plans are appropriate to address issues related to environmental compliance and permitting, relationship with local individuals or groups, and tailings water management. A significant proportion of the Mineral Reserve estimate is located within existing permitted operating mining areas, supported by regular monitoring and compliance reporting undertaken in line with regulatory licence requirements. 17.7 Commitment to local procurement and hiring The various State Agreements governing Rio Tinto’s mining activities within the Property require Rio Tinto to produce and implement a Local Participation Plan (LPP). The LPP recognises the importance of WA labour (including training), services and procurement and is designed to ensure WA suppliers, manufacturers and contractors are given fair and reasonable opportunity to tender or quote when preparing specifications for tenders and letting contracts for work, materials, plant, equipment and supplies.
Pilbara Operations Technical Report Summary – 31 December 2025 Page 163 of 176 Rio Tinto must use reasonable endeavours to ensure that every contract entered with a third party contains appropriate provisions requiring the third party to undertake procurement activities in accordance with the LPP. In addition to the LPP, Rio Tinto also has other obligations under the State Agreements, such as the requirement to use WA labour, services, materials, plant equipment, and supplies where reasonably and economically practicable. When submitting State Agreement proposals for significant works, Rio Tinto is also required to submit to the State the details of any services, works, materials, plant or supplies that it plans to obtain from outside of Australia, and to consult with the Minister for State Development in respect of such details if required. Further to this, as part of the commitment to sourcing labour, services and materials from the local, regional and broader WA community, Rio Tinto submits two types of local content reports. These reports are submitted on an annual and quarterly basis in satisfaction of all Rio Tinto’s State Agreement obligations within the Property. In October 2021, Rio Tinto implemented a revised National Procurement Procedure (NPP) across all its Australian operating sites. The NPP is specifically aimed at increasing the participation of Indigenous and local businesses across Rio Tinto’s Australian supply chain. Additionally, the policy establishes a consistent national approach across Rio Tinto asset groups for identifying and segmenting diverse businesses (focusing on Indigenous and local), encouraging their participation, and prioritizing them in contract awards. This consistent approach creates easier entry points for engagement with Rio Tinto and supports the growth of existing Indigenous businesses. 18 Capital and operating costs Capital and operating costs are reflective of the modelled Mineral Reserves only schedule, presented at a Property level on a 100 percent basis8 and in real 2026 US$ dollars (with no allowance for inflation). As asset values are presented in this TRS at a Property level on a 100 percent basis, capital and operating costs are modelled and presented on the same basis. By contrast, external guidance in other Rio Tinto reporting is presented on an equity basis and in nominal terms. As such, the costs presented in this TRS are likely to deviate from costs reported by Rio Tinto elsewhere. As noted in section 13.3, the volume of material classified as Mineral Reserves for the purpose of this TRS does not represent the total volume of material that may be available for extraction and production within the Property’s mining operations. Where marketing and operating conditions allow, actual production across the Property utilises both Mineral Reserves and Mineral Resources, and as a result the production rates scheduled in this TRS may not fully align with production guidance reported elsewhere, previously demonstrated production rates or system capacity. As such, capital estimates used in this TRS do not necessarily represent the capital forecasts released by Rio Tinto regarding projects within the Property, as these forecasts may have regard to material that is not classified as Mineral Reserves at the time of reporting. At the time of reporting, total Mineral Reserves of 2.6 billion tonnes and total Mineral Resources of 26.4 billion tonnes are declared for the Property. The conversion of material from a Mineral Resource to a Mineral Reserve occurs on a progressive basis. 8 For the purposes of this section, 100 percent basis means without regard for any apportionment of the expenses as between Rio Tinto and other equity holders, such as joint venture participants. Pilbara Operations Technical Report Summary – 31 December 2025 Page 164 of 176 All deposits classified as Mineral Reserves within the Property at the reporting date have been the subject of detailed study to at least a prefeasibility level. Studies are specific to an individual deposit or, in some cases, several deposits that sit within the same geographic ‘hub’. These study processes require prefeasibility level capital and operating expenditure estimates for the deposits which reflect the likely development sequence of those deposits. For this TRS, to reflect the Mineral Reserves-only schedule on an aggregated basis for the Property, capital costs that do not relate to Mineral Reserves have been excluded and the likely development sequence of deposits has been adjusted to solely reflect Mineral Reserves. Capital estimates for some long-dated projects within the Mineral Reserves only schedule are sourced from generic assumptions informed by historical performance, however, these constitute a small proportion of total required capital expenditure. The remainder of the capital estimate is based on studies at prefeasibility study level or higher with an accuracy level of ±25% and a contingency range not exceeding 15%. In this TRS, capital costs average $3.4 billion annually between 2026 and 2030 and total $28.7 billion over the duration of the Property’s Mineral Reserves-only schedule (2026 to 2046). Capital estimates are based on the annual plan capital submission for the first five years, adjusted to reflect this Mineral Reserves-only schedule. During the annual plan process, development capital estimates are based on detailed study assumptions whilst the mine sites and business functions provide sustaining capital estimates using a bottom-up project by project approach. Sustaining capital cost estimates beyond 2026 are based on historical capital performance and are driven by the physicals in the Mineral Reserves-only schedule. The unit rate for sustaining capital is determined based on a review of historical spend and calculated using actual Total Material Movement and Saleable Ore Product. For the purposes of this Mineral Reserves only schedule, operating costs have been modelled at $24.5/t SOP consistent with current operating performance adjusted and applied to the Mineral Reserves only schedule. Operating costs include costs associated with mining, processing, rail, port, support and other costs such as Native Title and internal Rio Tinto assumptions with regard to carbon pricing. Annual cost projections are driven by physicals contained within the Mineral Reserves only schedule. The operating cost estimates are based on actual performance and studies at prefeasibility level or higher, with an accuracy level of ±25% and a contingency range not exceeding 15%. The QPs consider all cost estimates in this TRS relating to this schedule to be reasonable.
Pilbara Operations Technical Report Summary – 31 December 2025 Page 165 of 176 18.1 Capital costs Capital costs are estimated based on internal studies undertaken by Rio Tinto and historical performance. Capital is inclusive of all mine, rail, port, power and other infrastructure capital required to maintain the physical assets. Capital costs reflect sustaining, replacement and growth capital, including heavy mobile equipment (HME) required to replace aging fleet. Capital costs are summarised in Table 18.1. Table 18.1: Estimated capital expenditure for the Property 18.2 Operating costs Operating costs include costs associated with mining, processing, rail, port, support, and other costs such as those associated with Native Title and internal Rio Tinto assumptions regarding carbon pricing. Across the supply chain, operating costs include both internal and external contract labour, diesel and energy, materials, corporate costs and other expenditure required in day-to-day operations. Throughout the life of the Mineral Reserves only schedule, operating costs average $24.5/t SOP. Major components of operating costs are set out in Table 18.2. Table 18.2: Estimated operating costs for the Property Average operating costs, US$/t Saleable Ore Product (wet) Real, 100% basis Mining and Processing11 16.6 Logistics and Other12 3.3 Corporate Overheads and Other13 4.6 Total 24.5 9 Consists of sustaining, replacement and growth capital, including HME required to replace aging fleet. 10 Consists of rail, port, power and other infrastructure capital. 11 Consists of mining (drill, blast, load, haul), processing (crush, screen, stack and reclaim) and diesel and energy costs. 12 Consists of rail, port and supply chain costs. 13 Consists of internal and external contract labour, corporate costs and other expenditures required in day-to-day operations, including costs associated with Native Title and internal Rio Tinto assumptions regarding carbon pricing. Capital Expenditure Real, 100% basis Total 2026-2030 2031-2035 2036-2040 2041+ Mine and Plant9 15.9 9.5 4.9 1.1 0.4 Logistics and Other10 12.8 7.6 4.1 0.8 0.3 Total Expenditure (US$ billion) 28.7 17.1 9.0 1.9 0.7 Pilbara Operations Technical Report Summary – 31 December 2025 Page 166 of 176 19 Economic analysis The accuracy of capital and operating cost estimates must comply with the following guidelines (Table 19.1). Table 19.1: Capital and operating cost estimation accuracy guidelines. Factors14 Initial Assessment Preliminary Feasibility Study Feasibility Study Capital Costs Optional15 If included: Accuracy: ±50% Contingency: ≤25% Accuracy: ±25% Contingency: ≤15% Accuracy: ±15% Contingency: ≤10% Operating Costs Optional13 If included: Accuracy: ±50% Contingency: ≤25% Accuracy: ±25% Contingency: ≤15% Accuracy: ±15% Contingency: ≤10% 19.1 Summary Rio Tinto has produced an economic evaluation of the Property’s Mineral Reserves. Analysis excludes Mineral Resources and other lower confidence inventory. All cashflows are presented at a Property level on a 100% basis, in real 2026 US$ dollars with no allowance for inflation. The economic evaluation presented in this chapter may differ from other external guidance published by Rio Tinto. The amount of Mineral Reserves in the schedule does not necessarily represent the amount of material available and utilised for extraction and production within the Property’s mining operations from time to time (as explained in previous sections of this TRS). In light of Rio Tinto’s extensive mining operations across the Pilbara spanning more than 50 years, where marketing and operating conditions allow, actual production across the Property utilises both Mineral Reserves and Mineral Resources. As a result of this approach, the capital estimates, operating costs and production rates may not align with other published production guidance, previously demonstrated production rates and system capacity. Rio Tinto’s Pilbara assets (the Property) comprise 18 mines and an integrated rail and port infrastructure network. An integrated system schedule was completed based on only existing Mineral Reserves to provide guidance on development sequence, scale of operation, mine life and the contribution of each mining area toward Rio Tinto’s Pilbara product suite, based on current product strategy. Economic analysis confirmed the strong economic viability of the Property’s Mineral Reserves, which deliver a post-tax NPV of $39.7 billion based on a real discount rate of 5.5%. This valuation is robust against sensitivities to changes in major variables. 14 When applied in an initial assessment, these factors pertain to the relevant technical and economic factors likely to influence the prospect of economic extraction. When applied in a preliminary or final feasibility study, these factors reflect a reduced level of uncertainty in assessing the prospect of economic extraction. 15 Initial assessment, as defined in this subpart, does not require a cash flow analysis or operating and capital cost estimates. The Qualified Person(s) may include a cash flow analysis at their discretion.
Pilbara Operations Technical Report Summary – 31 December 2025 Page 167 of 176 19.2 Methodology 19.2.1 Modelling approach An economic evaluation of the Property’s Mineral Reserves was completed. Valuations are conducted in a standalone valuation model that forecast cash flows relating to Rio Tinto’s Pilbara mine, rail and port operations. Mine economics have been evaluated using the discounted cash flow method, mid-year discounting and considering annual iron ore production and sales. Sensitivities to price, operating costs, capital costs, foreign exchange and discount rate are evaluated. 19.2.2 Sources of assumptions A combination of internal and external sources is used as the basis for the financial evaluation. Key assumptions used in this economic analysis are outlined in Table 19.2. Table 19.2: Economic analysis assumptions used as the basis for financial evaluation Category of Assumption Source of Assumption Pricing and Revenue Consensus of Iron Ore Analysts’ estimates Physicals Rio Tinto Technical Services Department Operating Costs Rio Tinto actual costs, flexed for physical drivers Capital Costs Rio Tinto Projects & Sustaining Capital estimates Taxation Australian Taxation Office Rio Tinto Tax Department Royalties and Native Title Western Australian Government Rio Tinto Communities Department 19.3 Inputs and assumptions 19.3.1 Financial Financial inputs and assumptions include: • Valuation date: 1 January, 2026; • Model based in US$ and in real 2026 terms; • Valuation undertaken on a 100% basis, without regard for any apportionment of the expenses as between Rio Tinto and other equity holders, such as joint venture participants; • Discount rate of 5.5%16, real after tax; and • Australian company tax rate of 30%. 16 Discount rate is the average real Rio Tinto Group Weighted Average Cost of Capital (WACC) based on consensus view using the average nominal forecasts from Bank of America Merrill Lynch, Deutsche Bank, Goldman Sachs, Morgan Stanley, UBS, Royal Bank of Canada, Bank of Montreal, ODDO BHF, Berenberg and HSBC. The average nominal WACC is adjusted for 2.5% inflation. Pilbara Operations Technical Report Summary – 31 December 2025 Page 168 of 176 Table 19.3 outlines FX and Inflation rates used in the economic analysis. Table 19.3: FX and inflation rates used in economic analysis FX and Inflation Rates 2026+ Foreign Exchange Rate (US$:A$ Real) 0.68 Inflation (Australia) % 2.5% Inflation (USA) % 2.0% The Australian inflation forecast of 2.5% represents the mid-point of the Reserve Bank of Australia’s inflation rate guidance of 2.0 to 3.0%, on average, over time. The US inflation forecast of 2.0% is consistent with the Federal Reserve’s long term inflation target. 19.3.2 Pricing and revenue The long run 62% Fines Fe price is projected to be 133 USc/dmtu (CFR) based on a consensus17 view of future pricing. Table 19.4 outlines iron ore pricing used in the economic analysis. Table 19.4: Iron ore pricing used in economic analysis Iron Ore Reference Price US Cents per Dry Metric Tonne unit (c/dmtu) - CFR 2026+ Iron Ore Fines 133 The actual price received for each Pilbara product is adjusted against this benchmark price to account for the value in use premium/discount associated with each product, driven by chemistry and physical characteristics. 19.3.3 Government royalties and other costs Government royalties and other costs include: • The Western Australian Government payment of 7.5% of FOB lump and fines revenue for crushed or screened product, and 5.0% of FOB lump and fines revenue for concentrated product. • Private royalties. • Lease rentals. • Native Title. 19.4 Capital costs Capital costs are summarised in section 18.1. Capital expenditure is inclusive of sustaining, replacement and growth capital across the Property’s supply chain. 19.5 Operating costs Operating costs are summarised in section 18.2. Unit operating costs reflect the ‘all in’ cost associated with producing each tonne of iron ore, on average, over time. Operating costs presented in section 18.2 exclude closure and rehabilitation costs. 17 Consensus view represents the average of forecasts from Bank of America Merrill Lynch, BMO, Barclays, Citigroup, Deutsche Bank, Goldman Sachs, HSBC, JP Morgan, Macquarie, Morgan Stanley, UBS, CRU and Wood Mackenzie.
Pilbara Operations Technical Report Summary – 31 December 2025 Page 169 of 176 19.5.1 Closure costs Economic analysis includes allowances for rehabilitation and closure costs for each site based on current and future projected land disturbance. Closure costs include activities such as demolition and disposal of infrastructure, earthworks and civil works, water management, remediation of contaminated sites and revegetation. Closure costs included in this economic evaluation represent the Total Projected Cost of Closure (TPC) based on the property’s current and future disturbance footprint. Closure costs are incurred when each asset within the Property has reached its mine life and production ceases. Closure costs are also included for rail, port and utilities infrastructure, assumed to be incurred at the conclusion of the Mineral Reserves-only schedule. Actual closure timing is likely to differ as a consequence of inclusion of Mineral Resources and other currently excluded lower- confidence material. The pre-tax NPC5.5 of all closure costs assumed within Rio Tinto’s Mineral Reserves-only economic evaluation is $6.8 billion. Rio Tinto is progressing opportunities to materially reduce closure costs by challenging key assumptions and methodologies that underpin closure, including improving estimation processes that will better inform costs, resourcing, and timing estimations. As noted in Section 18, all deposits within this Mineral Reserves-only schedule have been the subject of detailed study to at least a prefeasibility level. Studies are specific to an individual deposit or in some cases several deposits which sit within the same geographic ‘hub’. These study processes consider closure costs which reflect the likely development sequence and disturbance footprint of those deposits. As prefeasibility studies include both Mineral Reserves and Mineral Resources, and due to the difficulty in differentiating closure costs that relate to Mineral Reserves or Mineral Resources, the closure costs used within this TRS have been held consistent with recent studies and therefore may be overstated when contemplating the disturbance footprint and costs associated with this Mineral Reserves only schedule. This is a conservative approach and consequently Rio Tinto considers all closure cost estimates relating to this schedule to be reasonable. Additionally, Rio Tinto completes detailed closure studies for deposits as these approach end of mine life. Given the Property comprises 13 iron ore mining hubs and an integrated rail and port infrastructure network, the timing of detailed closure studies will differ for each asset comprising the Property, resulting in differing levels of accuracy for closure cost estimates across these assets. 19.6 Cash flow 19.6.1 Cash flow analysis Rio Tinto reviewed the Mineral Reserve production schedule and after-tax cash flows to confirm the economics of the mine plan contemplated by this Mineral Reserve schedule. The Property’s Mineral Reserves are value-accretive, delivering $52.6 billion in post-tax free cash flow. 19.6.2 Economic evaluation Economic analysis and discounted cash flow modelling confirmed the economic viability of the Property’s Mineral Reserves which deliver a post-tax NPV5.5 of $39.7 billion. Negative cash flows occur sporadically from 2040 due to closure costs. Table 19.5 and Table 19.6 set out the major components of the cash flows for the Property. Pilbara Operations Technical Report Summary – 31 December 2025 Page 170 of 176 Table 19.5: Net present value of cash flows for the Property as at 31 December 2025. Net present value of cash flows 100% basis, US$ billion Total Total revenue 150.7 Operating costs, royalties, and closure (72.6) Tax and working capital (15.8) Capital expenditure (22.6) Free cashflow – total 39.7 Table 19.6: Non-discounted cashflow for the Property 100% basis US$ billion Ore Production (Mt wet) Revenue Operating costs, royalties and closure Tax and working capital Capital expenditure Free cashflow 2026 282.0 20.1 (8.9) (2.3) (4.5) 4.3 2027 285.0 20.3 (9.0) (2.7) (3.9) 4.7 2028 254.6 18.1 (8.5) (2.2) (3.1) 4.4 2029 260.6 18.5 (8.1) (2.4) (3.0) 5.0 2030 238.7 17.1 (7.5) (2.3) (2.5) 4.9 2031 253.8 18.3 (8.0) (2.5) (2.0) 5.9 2032 227.2 16.5 (7.6) (1.8) (2.1) 5.0 2033 203.7 14.8 (6.6) (1.9) (1.6) 4.6 2034 176.3 12.6 (5.5) (1.6) (1.8) 3.7 2035 176.1 12.6 (5.5) (1.6) (1.5) 4.0 2036 115.6 8.4 (3.6) (1.0) (0.7) 3.1 2037 84.4 6.2 (2.7) (0.6) (0.4) 2.5 2038 70.3 5.2 (4.5) 0.5 (0.4) 0.7 2039 55.1 4.0 (1.7) (0.3) (0.3) 1.7 2040 32.9 2.4 (3.2) 0.7 (0.2) (0.2) 2041 34.8 2.5 (1.6) 0.0 (0.2) 0.8 2042 27.4 2.0 (3.9) 0.9 (0.1) (1.1) 2043 27.2 2.0 (0.9) (0.1) (0.2) 0.9 2044 8.4 0.6 (0.3) 0.0 (0.1) 0.3 2045 6.2 0.5 (0.2) 0.1 (0.0) 0.3 2046 8.8 0.7 (0.3) 0.0 (0.1) 0.3 2047 - - (6.5) 2.2 - (4.3) 2048 - - - 1.2 - 1.2
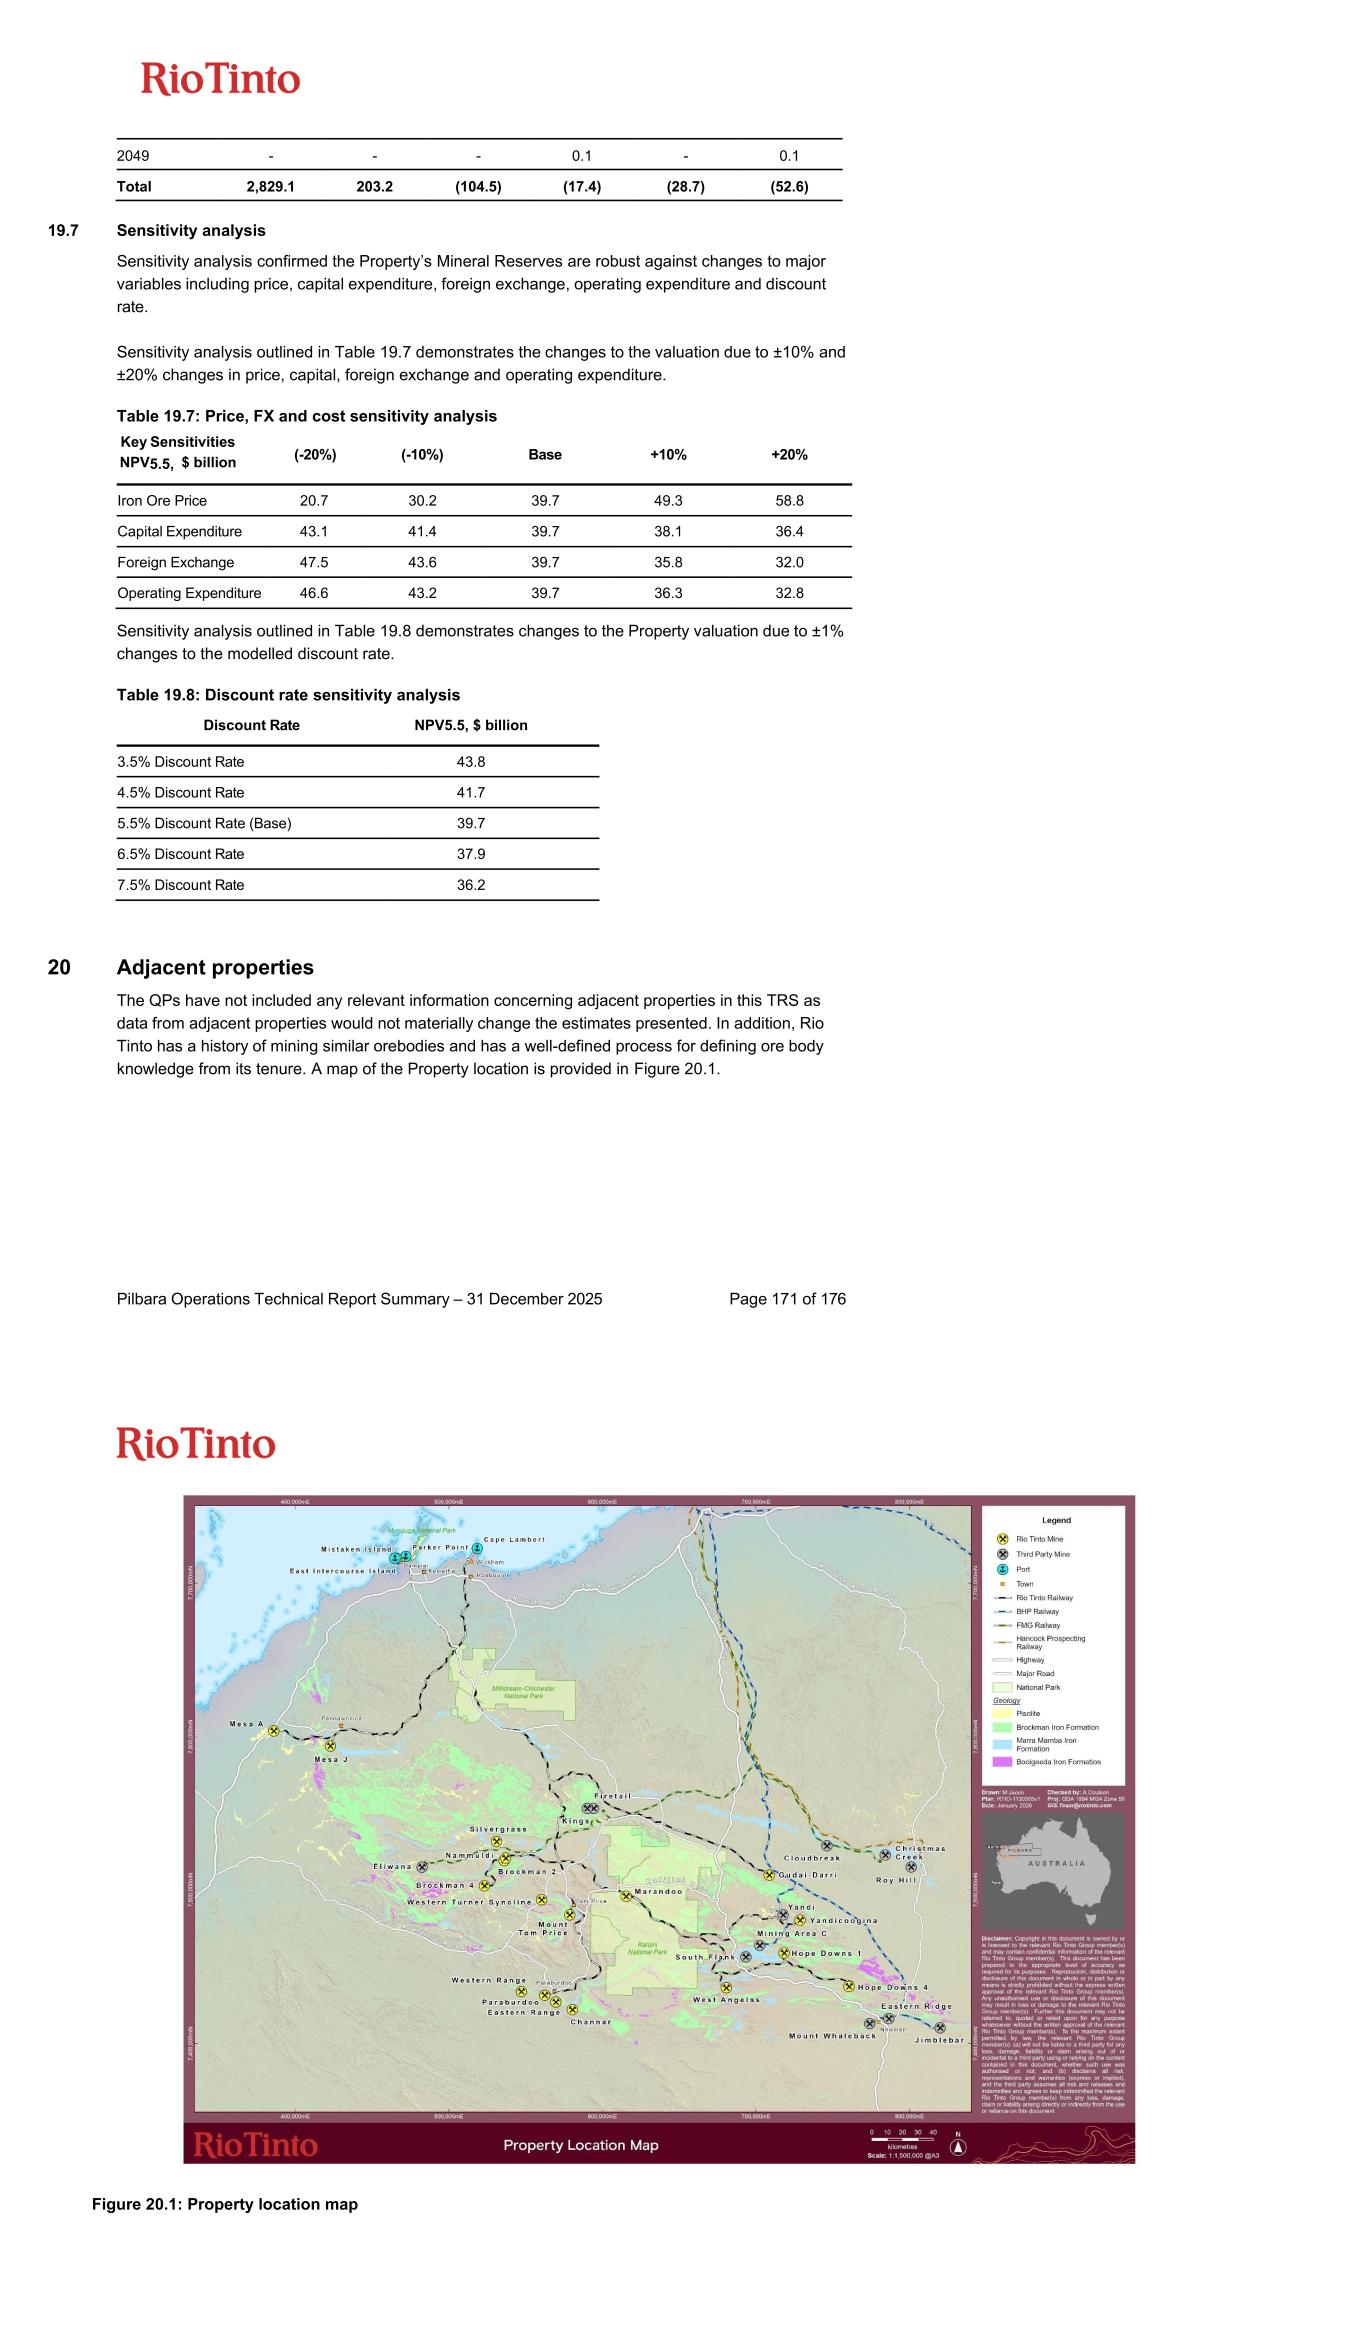
Pilbara Operations Technical Report Summary – 31 December 2025 Page 171 of 176 2049 - - - 0.1 - 0.1 Total 2,829.1 203.2 (104.5) (17.4) (28.7) (52.6) 19.7 Sensitivity analysis Sensitivity analysis confirmed the Property’s Mineral Reserves are robust against changes to major variables including price, capital expenditure, foreign exchange, operating expenditure and discount rate. Sensitivity analysis outlined in Table 19.7 demonstrates the changes to the valuation due to ±10% and ±20% changes in price, capital, foreign exchange and operating expenditure. Table 19.7: Price, FX and cost sensitivity analysis Key Sensitivities NPV5.5, $ billion (-20%) (-10%) Base +10% +20% Iron Ore Price 20.7 30.2 39.7 49.3 58.8 Capital Expenditure 43.1 41.4 39.7 38.1 36.4 Foreign Exchange 47.5 43.6 39.7 35.8 32.0 Operating Expenditure 46.6 43.2 39.7 36.3 32.8 Sensitivity analysis outlined in Table 19.8 demonstrates changes to the Property valuation due to ±1% changes to the modelled discount rate. Table 19.8: Discount rate sensitivity analysis Discount Rate NPV5.5, $ billion 3.5% Discount Rate 43.8 4.5% Discount Rate 41.7 5.5% Discount Rate (Base) 39.7 6.5% Discount Rate 37.9 7.5% Discount Rate 36.2 20 Adjacent properties The QPs have not included any relevant information concerning adjacent properties in this TRS as data from adjacent properties would not materially change the estimates presented. In addition, Rio Tinto has a history of mining similar orebodies and has a well-defined process for defining ore body knowledge from its tenure. A map of the Property location is provided in Figure 20.1. Figure 20.1: Property location map
Pilbara Operations Technical Report Summary – 31 December 2025 Page 173 of 176 21 Other relevant data and information The QPs believe that all material information has been stated in the above sections of the TRS. 22 Interpretations and conclusions 22.1 Mineral Resources 22.1.1 Interpretations and conclusions Based on the information presented in this TRS, the QPs’ key conclusions are as follows: • The data collected during exploration drilling and sampling programs is collected using appropriate industry standard practices relating to drilling, surveying, logging, sampling, analyses, and QA/QC. • Base data is reviewed and validated by Subject Matter Experts (SMEs), working under supervision by the QPs, and has been deemed appropriate for use in developing geological models and estimating Mineral Resources for the Property. • The geological models and resource estimates of deposits are created using established industry methods set out in section 11. Verification of each geological model and Mineral Resource estimate occurs as discussed in section 11.1.7. In addition, a peer review is completed at each step of the modelling process, inclusive of a sign-off by a QP at the completion of major steps. A QP also prepares separate documentation to aid and support the Mineral Resource classification. • Mining, processing and market modifying factors, and assumptions and parameters from studies are used to establish the reasonable prospects of economic extraction necessary for estimating Mineral Resources. • No significant risks exist that could impact the reliability and/or confidence of Mineral Resources estimates. 22.2 Mineral Reserves 22.2.1 Interpretations and conclusions Based on the information presented in this TRS, the QPs conclude that the Mineral Reserve estimate is supported by appropriate technical data and assumptions, and no significant risks exist that could impact the reliability and/or confidence of the Mineral Reserve estimates: • As shown in the economic sensitivity analysis in section 19.7, the Mineral Reserve estimate for the Property is not highly sensitive to variation to capital and operating cost, or discount rate. Property valuation is most sensitive to product price: however, as demonstrated, the Property remains highly economic in these scenarios. • The assumptions, methods and parameters used for generating the Mineral Reserve estimate are aligned with industry practices and suitable for the mineralisation of the Pilbara and selected mining methods. • A significant proportion of the Mineral Reserve estimate is located within existing permitted operating mining areas, supported by established labour accommodation and transport facilities, processing, rail and port infrastructure, HME maintenance workshops, groundwater abstraction and discharge networks, and surface mine haul roads and waste dumps. Pilbara Operations Technical Report Summary – 31 December 2025 Page 174 of 176 • Historical performance and reconciliation underpin the confidence in technical modifying factors such as ore loss and dilution, geotechnical parameters, and metallurgical and hydrogeological assumptions. 23 Recommendations Based on the results presented in this TRS and consistent with Rio Tinto’s long standing operating practices, ongoing technical work will be performed on the Property as part of studies to improve confidence, decrease risk and enable the conversion of Mineral Resources to Mineral Reserves. The following items are in progress to support this action: • Agreement modernization with Traditional Owner groups to support ongoing Mineral Resource and Mineral Reserve access in a culturally respectful manner • Complete technical work in progress and obtain relevant permits for sections of the Property that are currently not approved, including: o Gudai-Darri Warrie and Belele – Pending associated secondary approvals to support conversion of Mineral Resource to Mineral Reserve. These recommendations reflect Rio Tinto’s ongoing operating practices and associated costs are incorporated into the Property’s operating and capital costs, therefore the costs of these recommendations have not been separately disclosed in this TRS. 24 References Corporate Policies. (2021). Retrieved 11 November 2021, from https://www.riotinto.com/- /media/Content/Documents/Sustainability/Corporate-policies/. Corporate structure of Rio Tinto, from https://www.riotinto.com/invest/corporate-governance Dalstra, H and Flis, M. High Grade Iron Ore Exploration in an Increasingly Steel-Hungry World: The Past, Current, and Future Role of Exploration Models and Technological Advances. Reviews in Economic Geology; Society of Economic Geologists, Volume 15. pp. 393-409. Department of Agriculture, Water and the Environment. Environmental Protection and Biodiversity Conservation Act (1999). Australia. Department of Mines, Industry Regulation and Safety. Mining Act (1978). Western Australia. Department of Mines, Industry Regulation and Safety. Mines Safety and Inspection Act (1994). Western Australia. Department of Mines, Industry Regulation and Safety. (2020a). Statutory Guidelines for Mine Closure Plans. Western Australia. Department of Mines, Industry Regulation and Safety. (2020b). Mine Closure Plan Guidance. Western Australia. Department of Mines and Petroleum. (2013). Tailings Storage Facilities in Western Australia. Resources Safety and Environment Divisions.
Pilbara Operations Technical Report Summary – 31 December 2025 Page 175 of 176 Department of Mines and Petroleum. (2015). Guide to Departmental requirements for the management and closure of tailings storage facilities (TSFs) in Western Australia. Resources Safety and Environment Divisions. Department of Water and Environmental Regulation. Environmental Protection Act (1986). Western Australia. Harmsworth R.A, Kneeshaw M, Morris R.C, Robinson C.J, Shrivastava P.K, 1990. BIF Derived Iron Ores of the Hamersley Province: in Hughes FE (Ed.), 1990 Geology of the Mineral Deposits of Australia & Papua New Guinea The Australasian Institute of Mining and Metallurgy: Melbourne, pp 617-642 ISO 3082:2009 (Iron Ores – Sampling and sample preparation procedures) ISO 9516-1: (2003) Iron Ores – Determination of various elements by X-ray fluorescence spectrometry – Part 1: Comprehensive procedure Lee, D, 2013, The Establishment of Iron Ore Giants: Hamersley Iron and the Mount Newman Mining Company, 1961-1969. In Journal of Australasian Mining History, volume 11, October 2013. Morris, R.C, 1985. Genesis of Iron Ore in Banded Iron-Formation by Supergene and Supergene- metamorphic Processes - a Conceptual Model. In Handbook of Strata-Bound and Stratiform Ore Deposits, Vol 13 (Ed. K.H Wolf), pp. 73-235 (Elsevier: Amsterdam). Thorne, W; Hagemann, S; Webb, A; Clout, J, 2008. Banded Iron Formation Related Iron Ore deposits of the Hamersley province, Western Australia. Reviews in Economic Geology, Society of Economic Geologists, Volume 15. pp. 197-221 Trendall, A.F, 1983. Introduction, in Iron-Formation: Facts and Problems. Elsevier, Amsterdam, 1-12. Government of Western Australia, 2021. Pilbara Conservation Strategy. Government of Western Australia, Perth. https://www.dpaw.wa.gov.au/images/documents/conservation- management/pilbara/pilbara_conservation_strategy.pdf van Etten, E.J.B; Fox, J.E D, 2004. Vegetation classification and ordination of the central Hamersley Ranges, Western Australia, Journal of the Royal Society of Western Australia, 87:63–79. 25 Reliance on information provided by the Registrant The QPs have wholly relied upon the Registrant for the following: • Macroeconomic trends, data, and assumptions, and interest rates (Sections 18 and 19); • Marketing information and plans within the control of the registrant (Sections 16, 18 and 19); • Legal matters outside the expertise of the Qualified Person, such as statutory and regulatory interpretations affecting the mine plan (Sections 3, 13, 15 and 17); • Environmental matters outside the expertise of the qualified person (Section 17); • Accommodations the registrant commits or plans to provide to local individuals or Pilbara Operations Technical Report Summary – 31 December 2025 Page 176 of 176 groups in connection with its mine plans (Section 17); and • Governmental factors outside the expertise of the Qualified Person (Section 17). The QPs consider it reasonable to rely upon the Registrant for the above information based on the QPs’ past and ongoing interactions with the subject-matter experts in these areas employed or engaged by the Registrant, as well as the Registrant’s considerable experience in iron ore mining, which includes more than 50 years of iron ore mining operations in the Pilbara region of Western Australia. Further, the QPs have taken all appropriate steps, in their professional opinion, to satisfy themselves that the above information provided by the Registrant is accurate in all material respects for the purposes of this TRS, and have no reason to believe that any material facts relevant to the matters relied on have been withheld or misstated.