

Benchmark Electronics Third Quarter 2025 Financial Results November 4th, 2025
Forward-Looking 2025 Statements This document contains forward-looking statements within the meaning of Section 27A of the Securities Act of 1933, as amended and Section 21E of the Securities Exchange Act of 1934, as amended. These forward-looking statements are identified as any statement that does not relate strictly to historical or current facts and may include words such as “anticipate,” “believe,” “intend,” “plan,” “project,” “forecast,” “strategy,” “position,” “continue,” “estimate,” “expect,” “may,” “will,” “could,” “predict,” and similar expressions of the negative or other variations thereof. In particular, statements, expressed or implied, concerning the Company’s outlook and guidance for fourth quarter and fiscal year 2025 results, future operating results or margins, the ability to generate sales and income or cash flow, expected revenue mix, the Company’s business strategy and strategic initiatives, the Company’s repurchases of shares of its common stock, regarding enterprise AI opportunities, anticipated growth in bookings, the Company’s expectations regarding restructuring charges, stock-based compensation expense, amortization of intangibles, capital expenditures, and the Company’s intentions concerning the payment of dividends, among others, are forward-looking statements. Although the Company believes these statements are based on and derived from reasonable assumptions, they involve risks, uncertainties and assumptions that are beyond the Company’s ability to control or predict, relating to operations, markets and the business environment generally, including those discussed under Part I, Item 1A of the Company's Annual Report on Form 10-K for the year ended December 31, 2024, and in any of the Company’s subsequent reports filed with the Securities and Exchange Commission. Events relating to the possibility of customer demand fluctuations, supply chain constraints, continuing inflationary pressures, the effects of foreign currency fluctuations and high interest rates, the continuing U.S. government shutdown and the economic impacts, volatility and uncertainty resulting therefrom, geopolitical uncertainties including continuing hostilities and tensions, trade restrictions and sanctions, tariffs and retaliatory countermeasures, the ability to utilize the Company’s manufacturing facilities at sufficient levels to cover its fixed operating costs, or write-downs or write-offs of obsolete or unsold inventory, may have resulting impacts on the Company’s business, financial condition, results of operations, and the Company’s ability (or inability) to execute on its plans. Should one or more of these risks or uncertainties materialize, or should underlying assumptions prove incorrect, actual outcomes, including the future results of the Company’s operations, may vary materially from those indicated. Undue reliance should not be placed on any forward-looking statements. Forward-looking statements are not guarantees of performance. All forward-looking statements included in this document are based upon information available to the Company as of the date of this document, and the Company assumes no obligation to update. Non-GAAP Financial Information Management discloses certain non‐GAAP information to provide investors with additional information to analyze the Company’s performance and underlying trends. These non-GAAP financial measures exclude restructuring charges, stock-based compensation expense, amortization of intangible assets acquired in business combinations, certain legal and other settlement losses (gains), customer insolvency losses (recoveries), asset impairments, other significant non-recurring costs and the related tax impacts, including discrete tax items and other non-GAAP tax adjustments, of all of the above. A detailed reconciliation between GAAP results and results excluding certain items (“non-GAAP”) is included in the following tables attached to this document. In situations where a non-GAAP reconciliation has not been provided, the Company was unable to provide such a reconciliation without unreasonable effort due to the uncertainty and inherent difficulty predicting the occurrence, the financial impact and the periods in which the non-GAAP adjustments may be recognized. Management uses non‐GAAP measures that exclude certain items in order to better assess operating performance and help investors compare results with our previous guidance. This document also references “free cash flow”, a non-GAAP measure, which the Company defines as cash flow from operations less additions to property, plant and equipment and purchased software. The Company’s non‐GAAP information is not necessarily comparable to the non‐GAAP information used by other companies. Non‐GAAP information should not be viewed as a substitute for, or superior to, net income or other data prepared in accordance with GAAP as a measure of the Company’s profitability or liquidity. Readers should consider the types of events and transactions for which adjustments have been made.

Today’s Speakers PM: Sent to Teresa to change titles
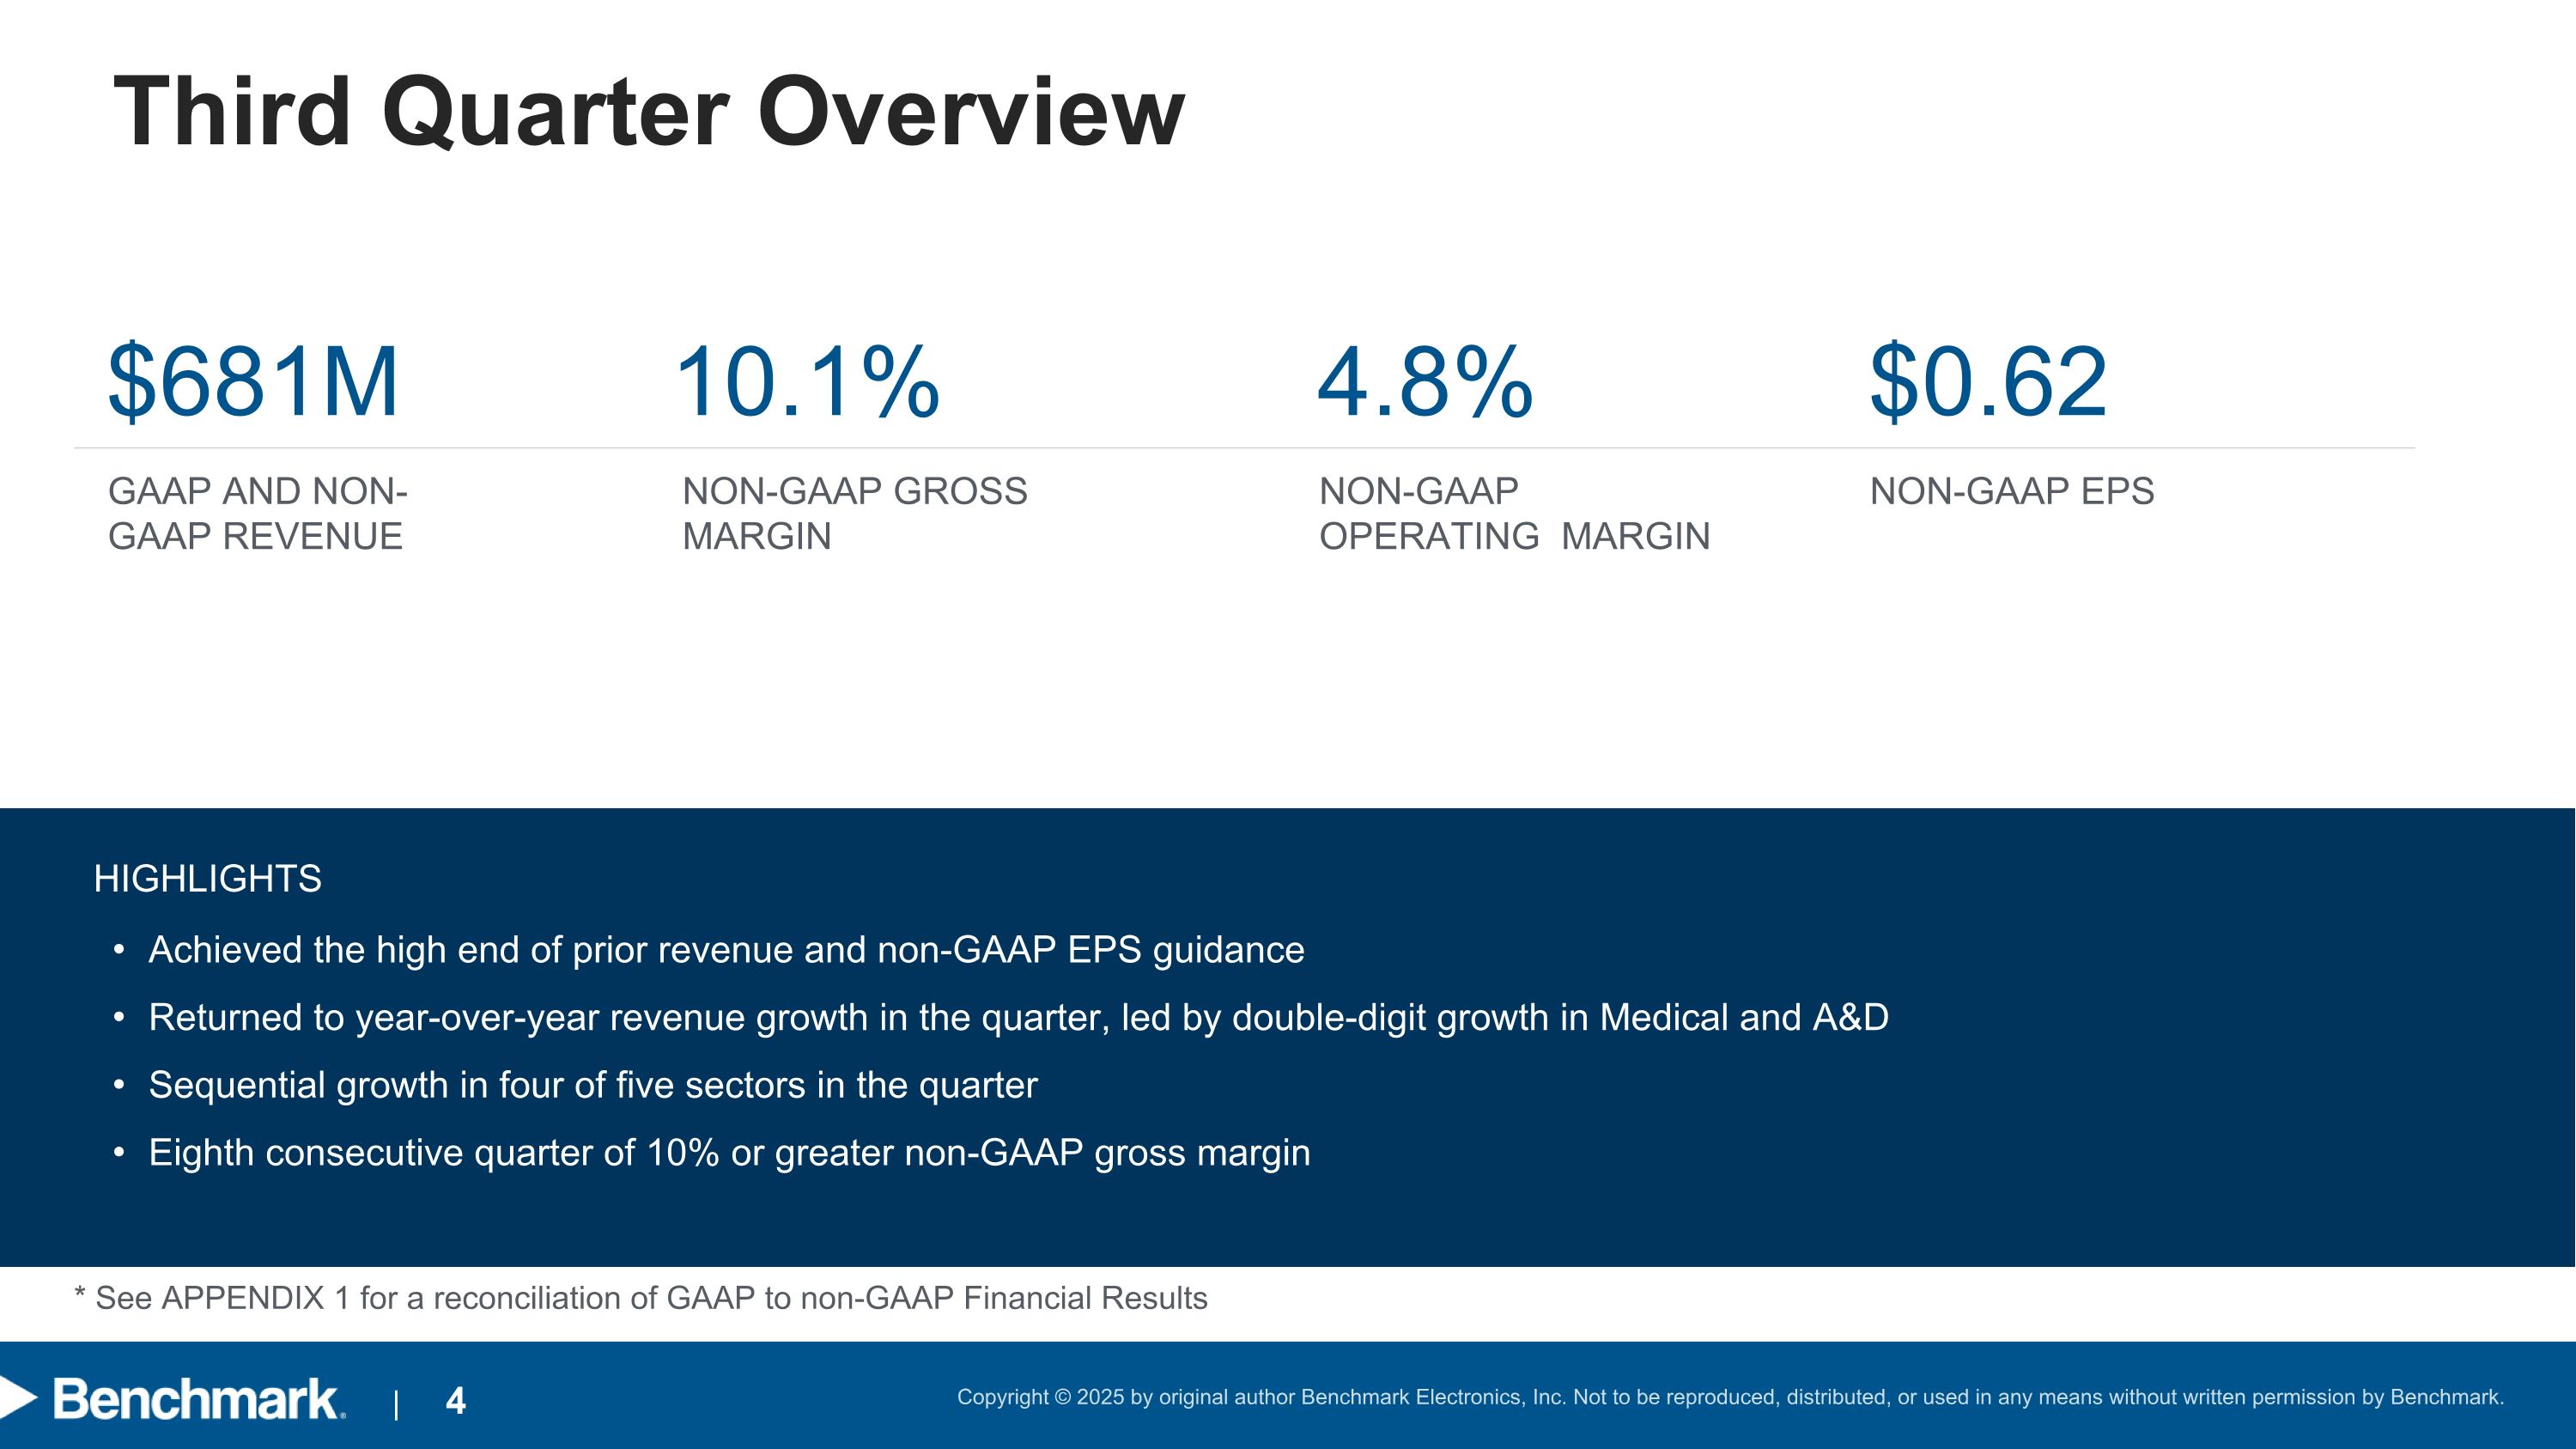
Third Quarter Overview GAAP AND NON-GAAP REVENUE $681M NON-GAAP GROSS MARGIN 10.1% NON-GAAP EPS $0.62 NON-GAAP OPERATING MARGIN 4.8% HIGHLIGHTS Achieved the high end of prior revenue and non-GAAP EPS guidance Returned to year-over-year revenue growth in the quarter, led by double-digit growth in Medical and A&D Sequential growth in four of five sectors in the quarter Eighth consecutive quarter of 10% or greater non-GAAP gross margin * See APPENDIX 1 for a reconciliation of GAAP to non-GAAP Financial Results
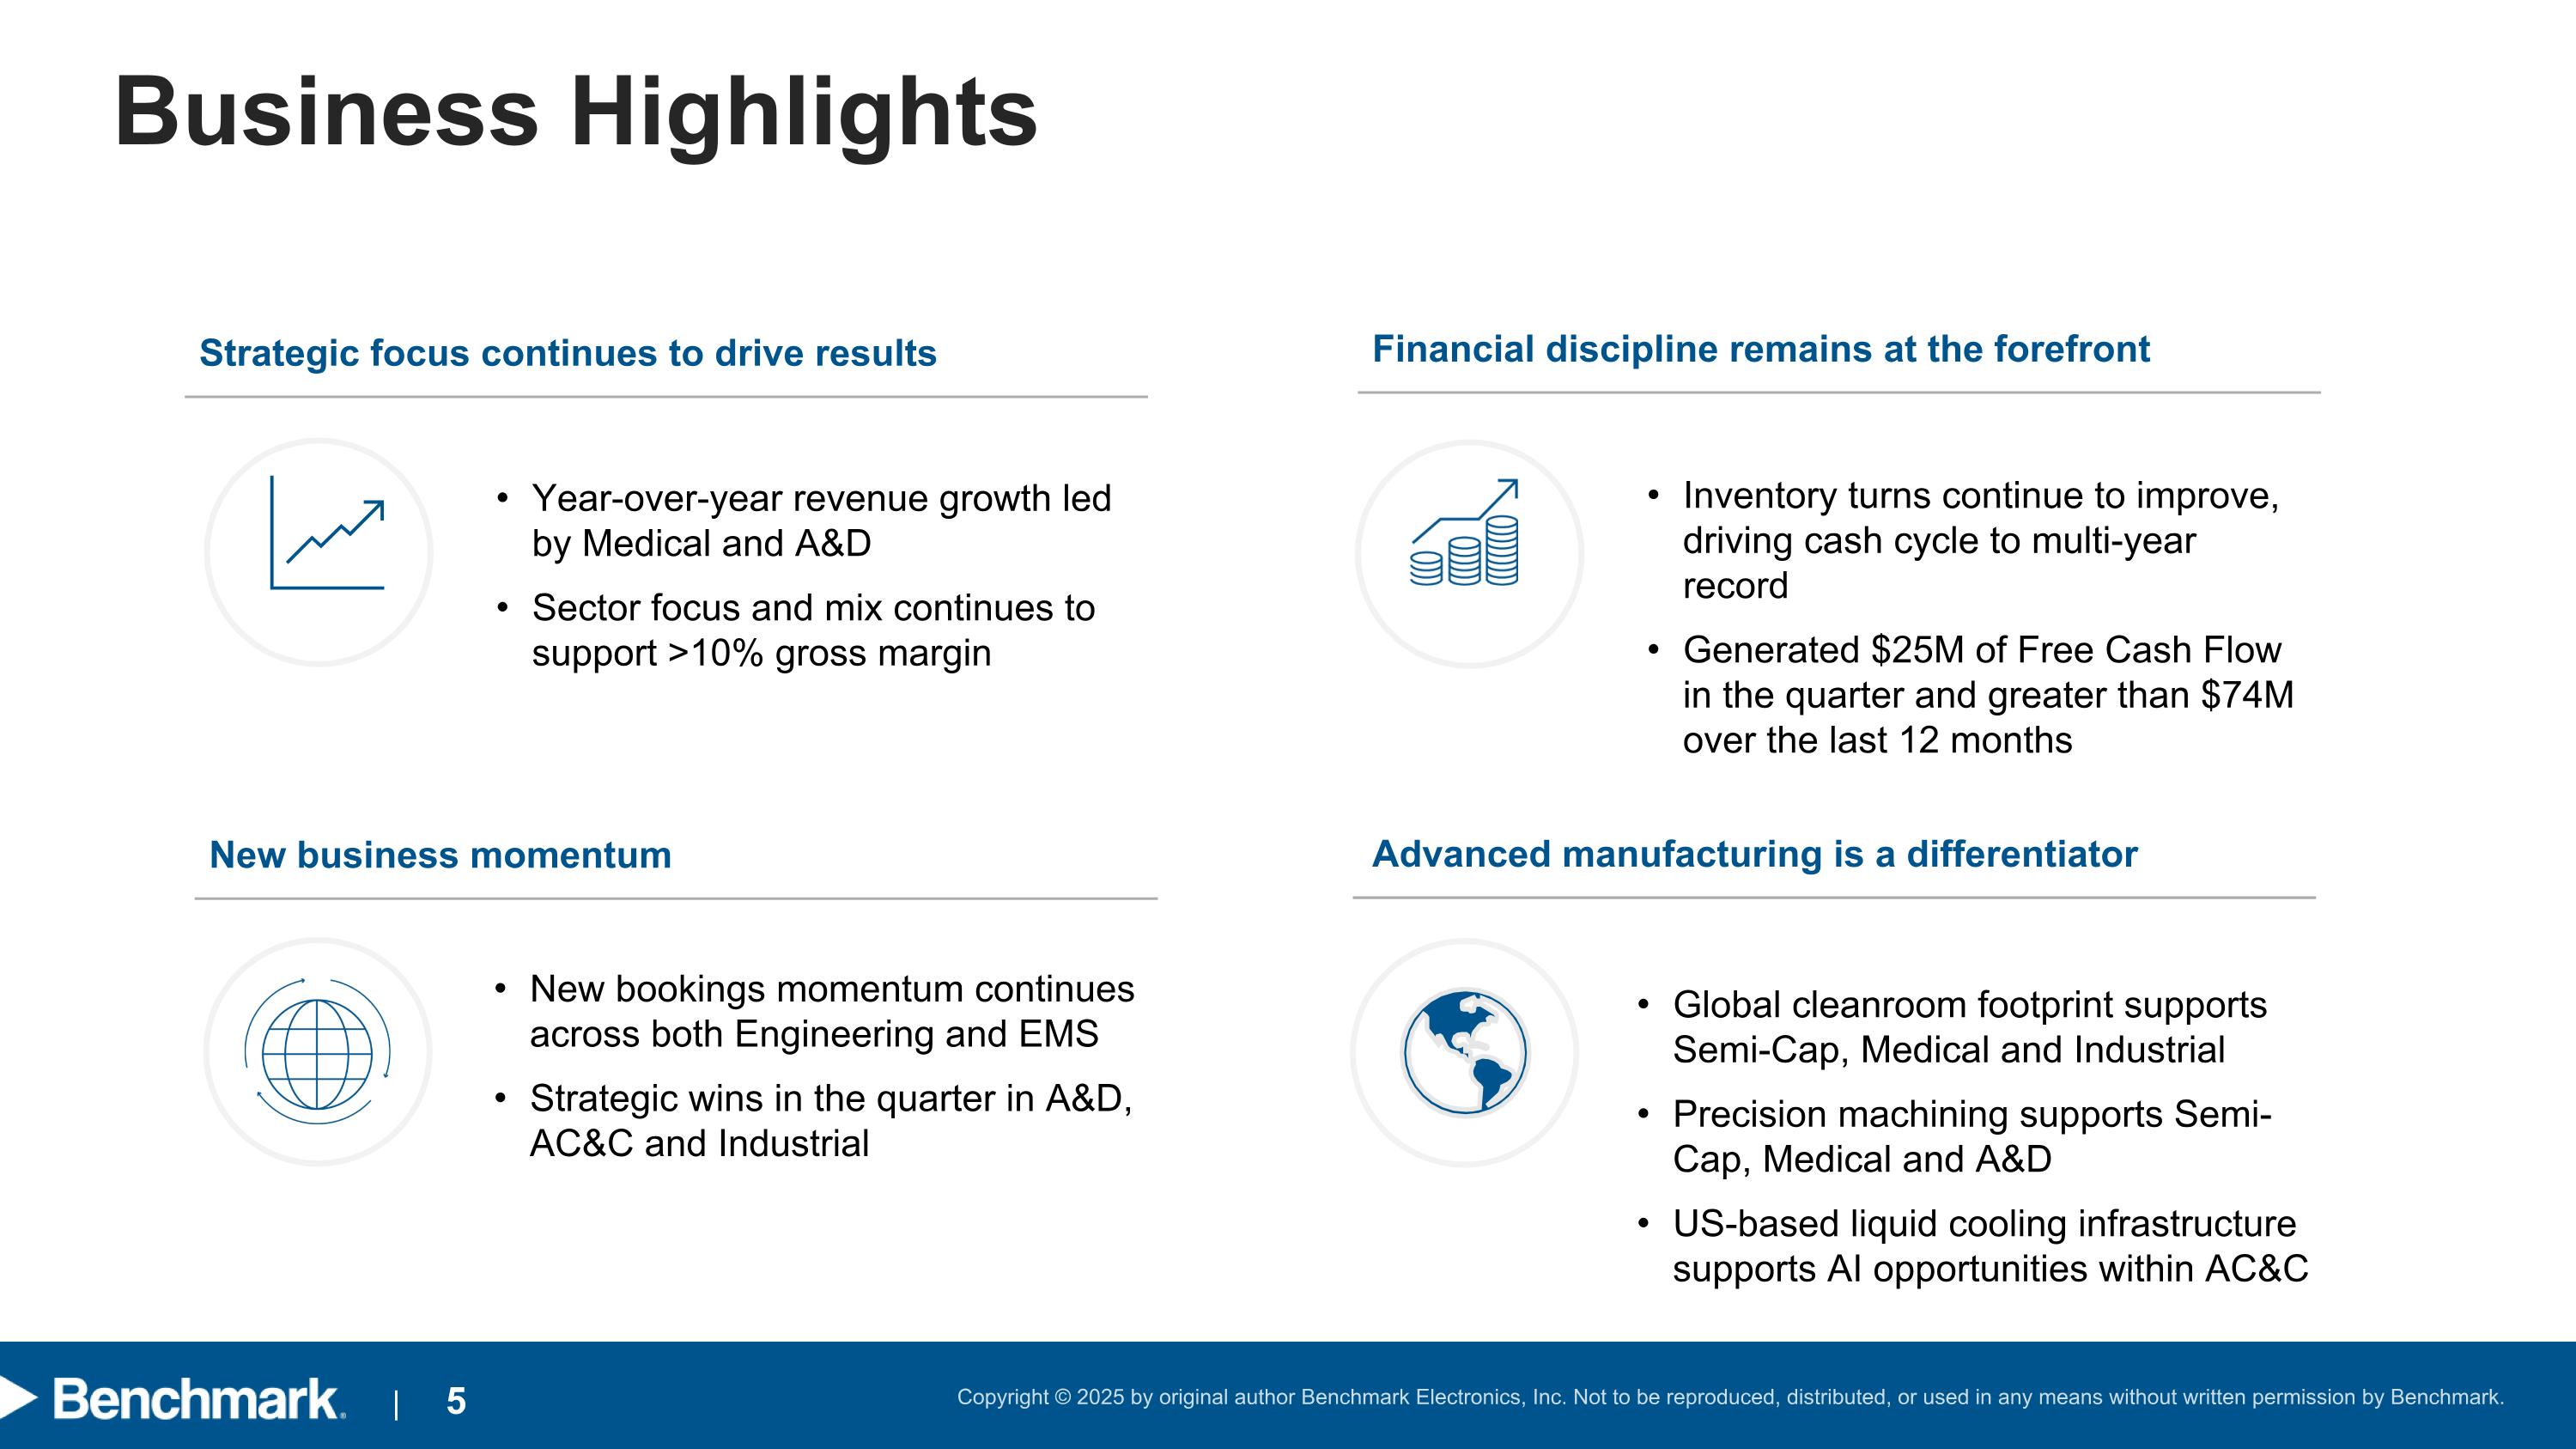
Business Highlights Strategic focus continues to drive results Year-over-year revenue growth led by Medical and A&D Sector focus and mix continues to support >10% gross margin New business momentum New bookings momentum continues across both Engineering and EMS Strategic wins in the quarter in A&D, AC&C and Industrial Financial discipline remains at the forefront Inventory turns continue to improve, driving cash cycle to multi-year record Generated $25M of Free Cash Flow in the quarter and greater than $74M over the last 12 months Advanced manufacturing is a differentiator Global cleanroom footprint supports Semi-Cap, Medical and Industrial Precision machining supports Semi-Cap, Medical and A&D US-based liquid cooling infrastructure supports AI opportunities within AC&C
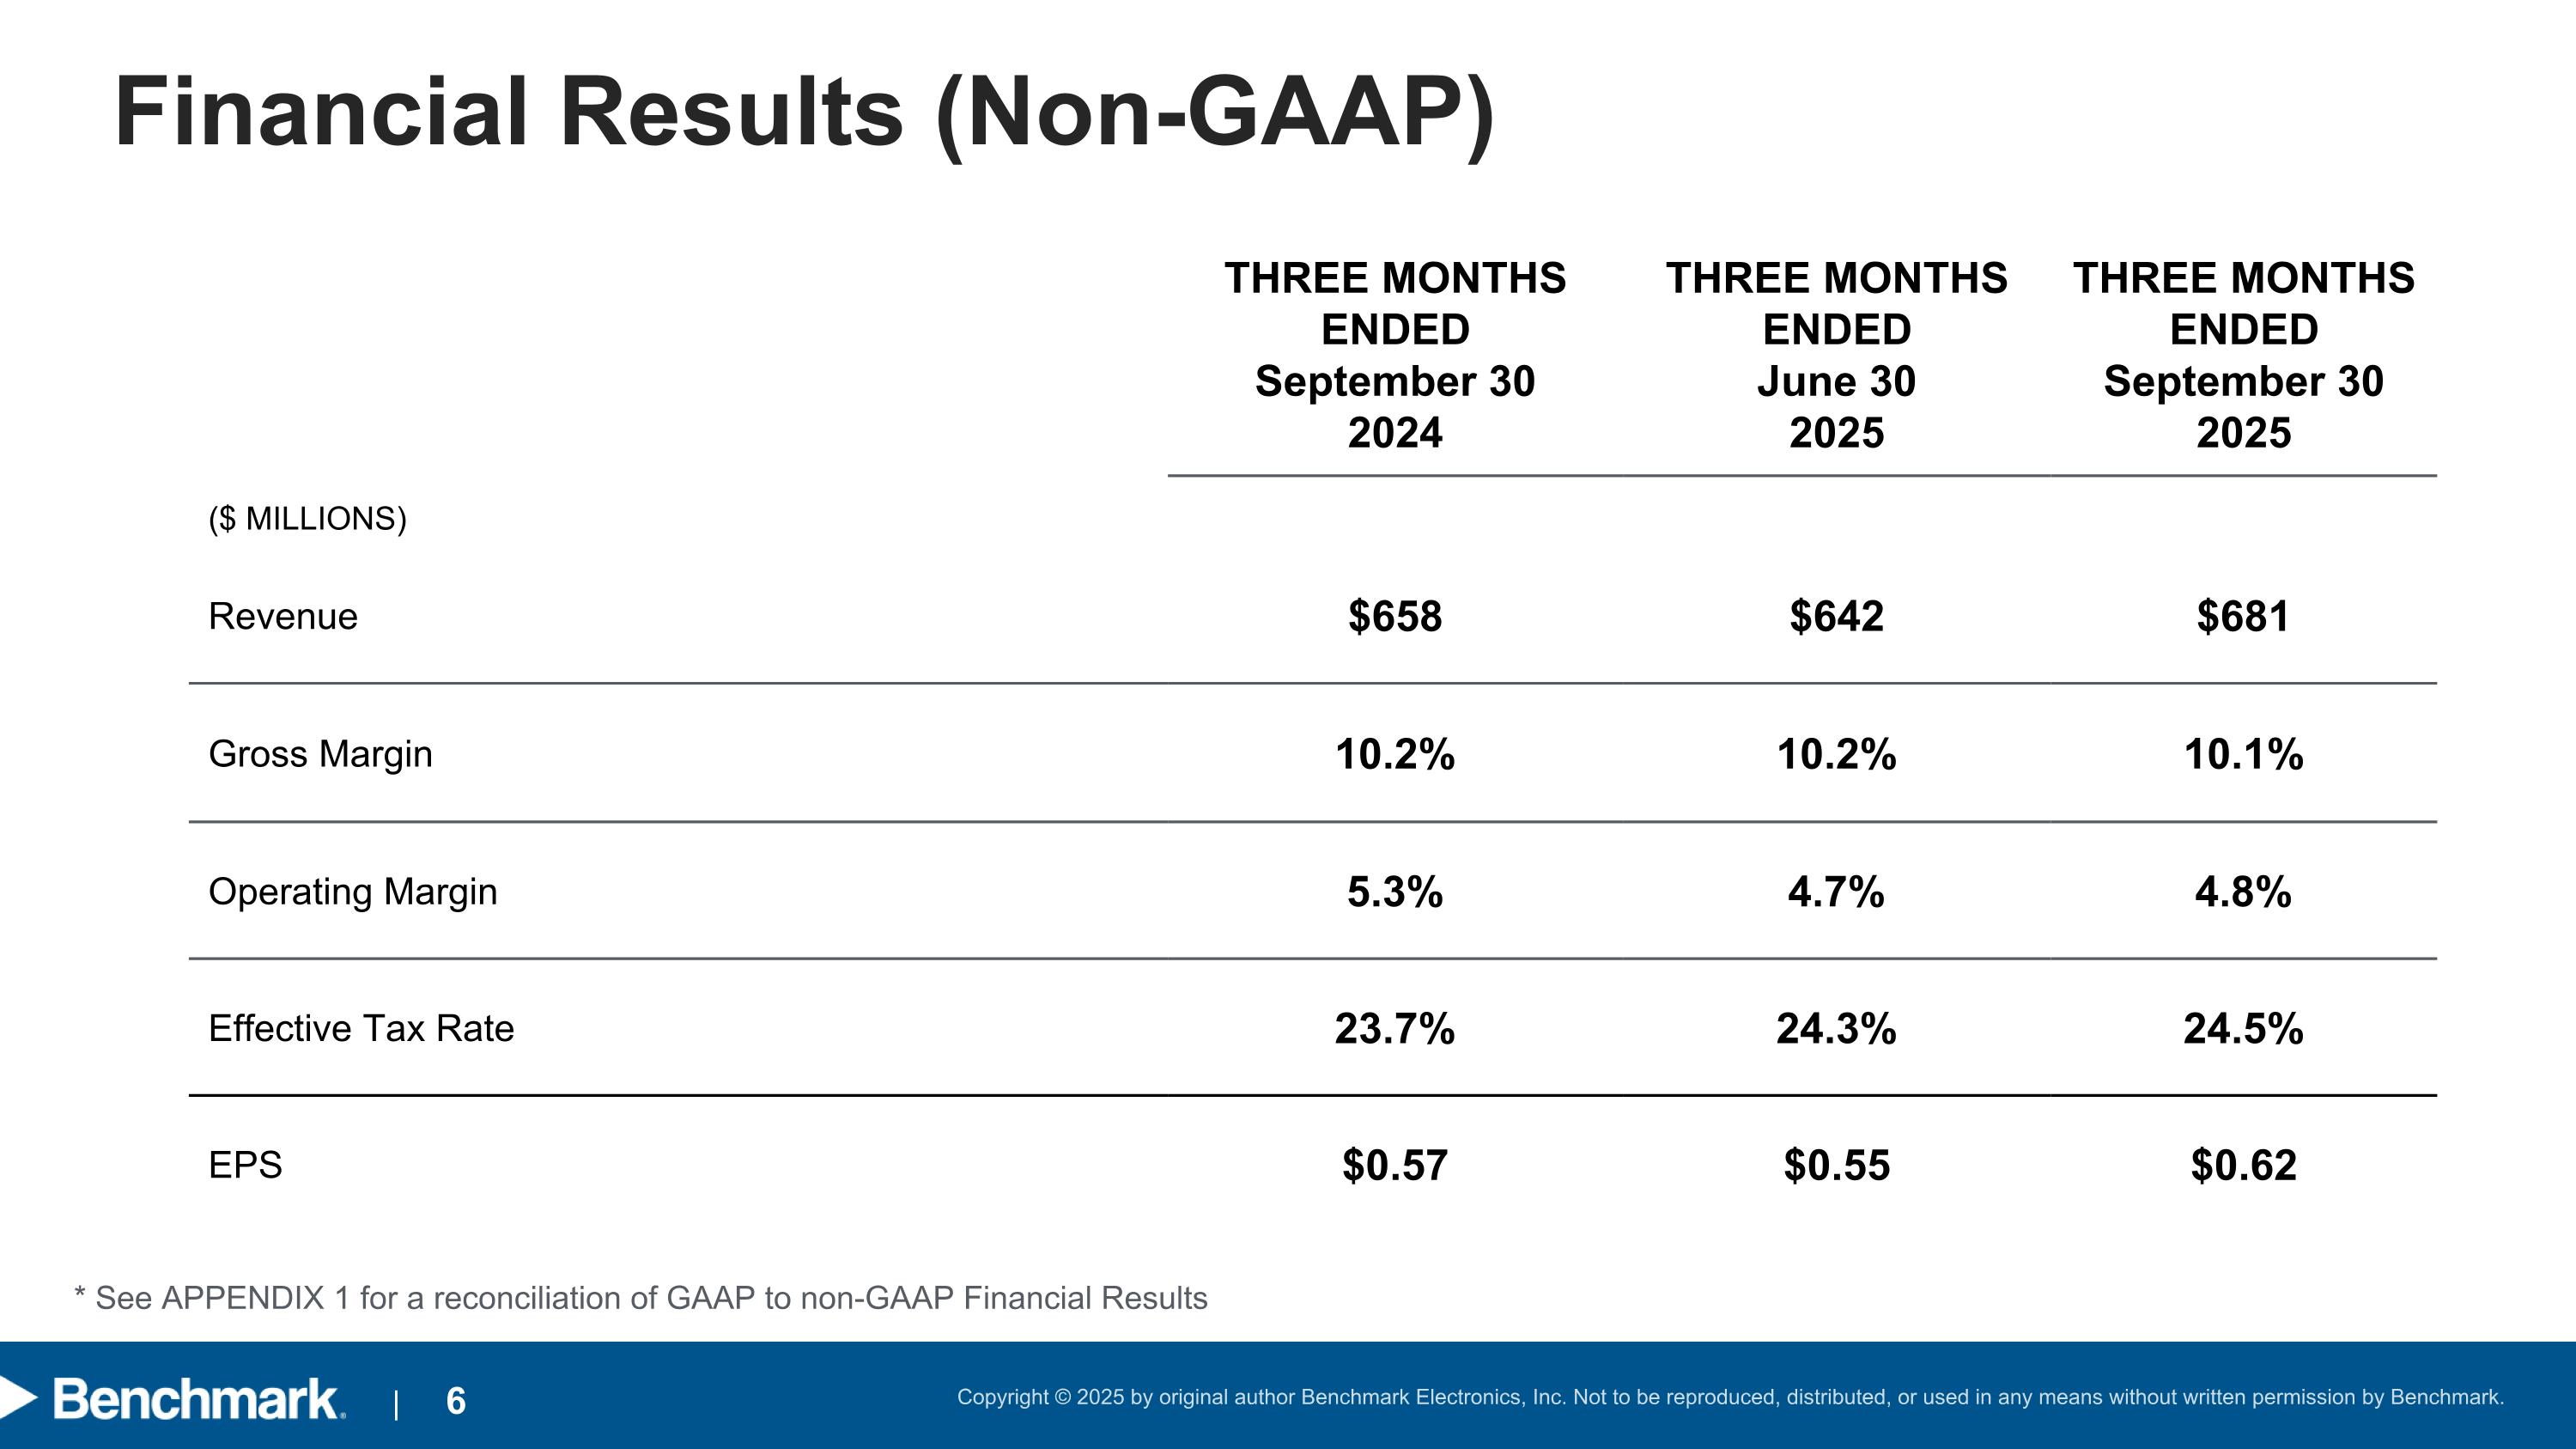
Financial Results (Non-GAAP) THREE MONTHS ENDED September 30 2024 THREE MONTHS ENDED June 30 2025 THREE MONTHS ENDED September 30 2025 ($ MILLIONS) Revenue $658 $642 $681 Gross Margin 10.2% 10.2% 10.1% Operating Margin 5.3% 4.7% 4.8% Effective Tax Rate 23.7% 24.3% 24.5% EPS $0.57 $0.55 $0.62 * See APPENDIX 1 for a reconciliation of GAAP to non-GAAP Financial Results
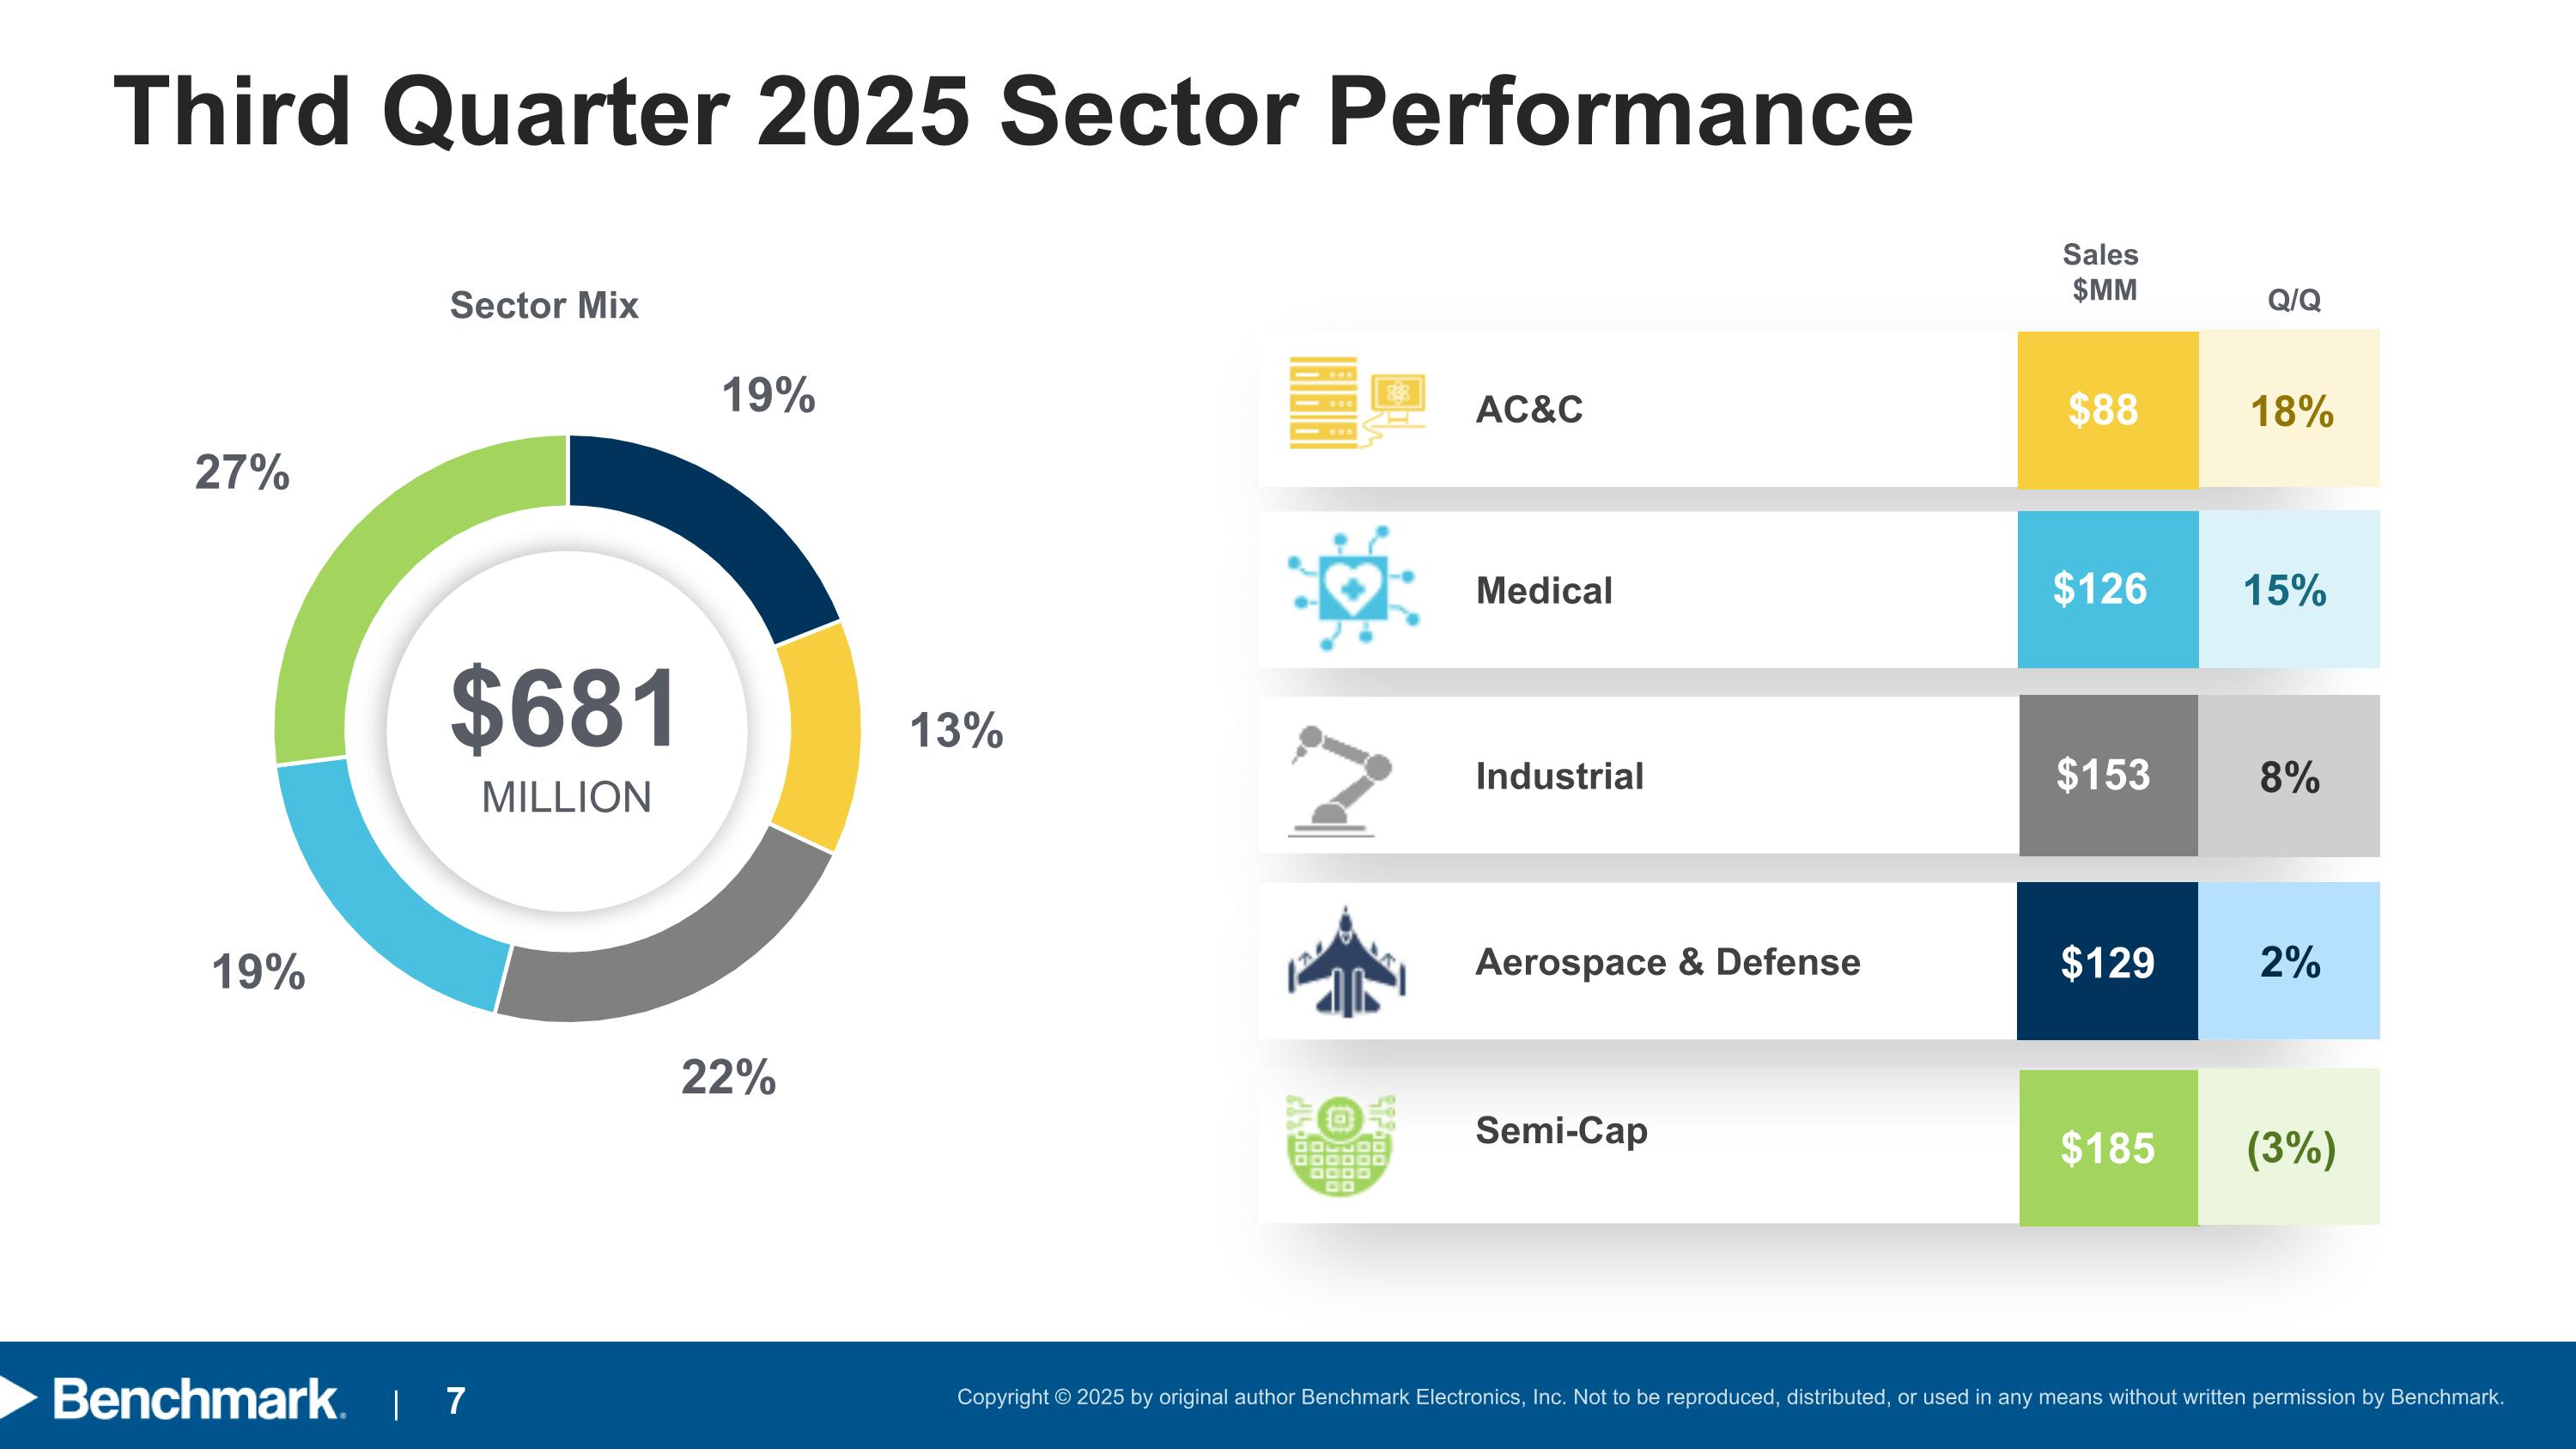
Third Quarter 2025 Sector Performance 19% 27% 19% 13% 22% $681 MILLION Sales $MM Q/Q Sector Mix AC&C $88 18% Medical $126 15% $153 8% Industrial Aerospace & Defense $129 2% Semi-Cap $185 (3%)
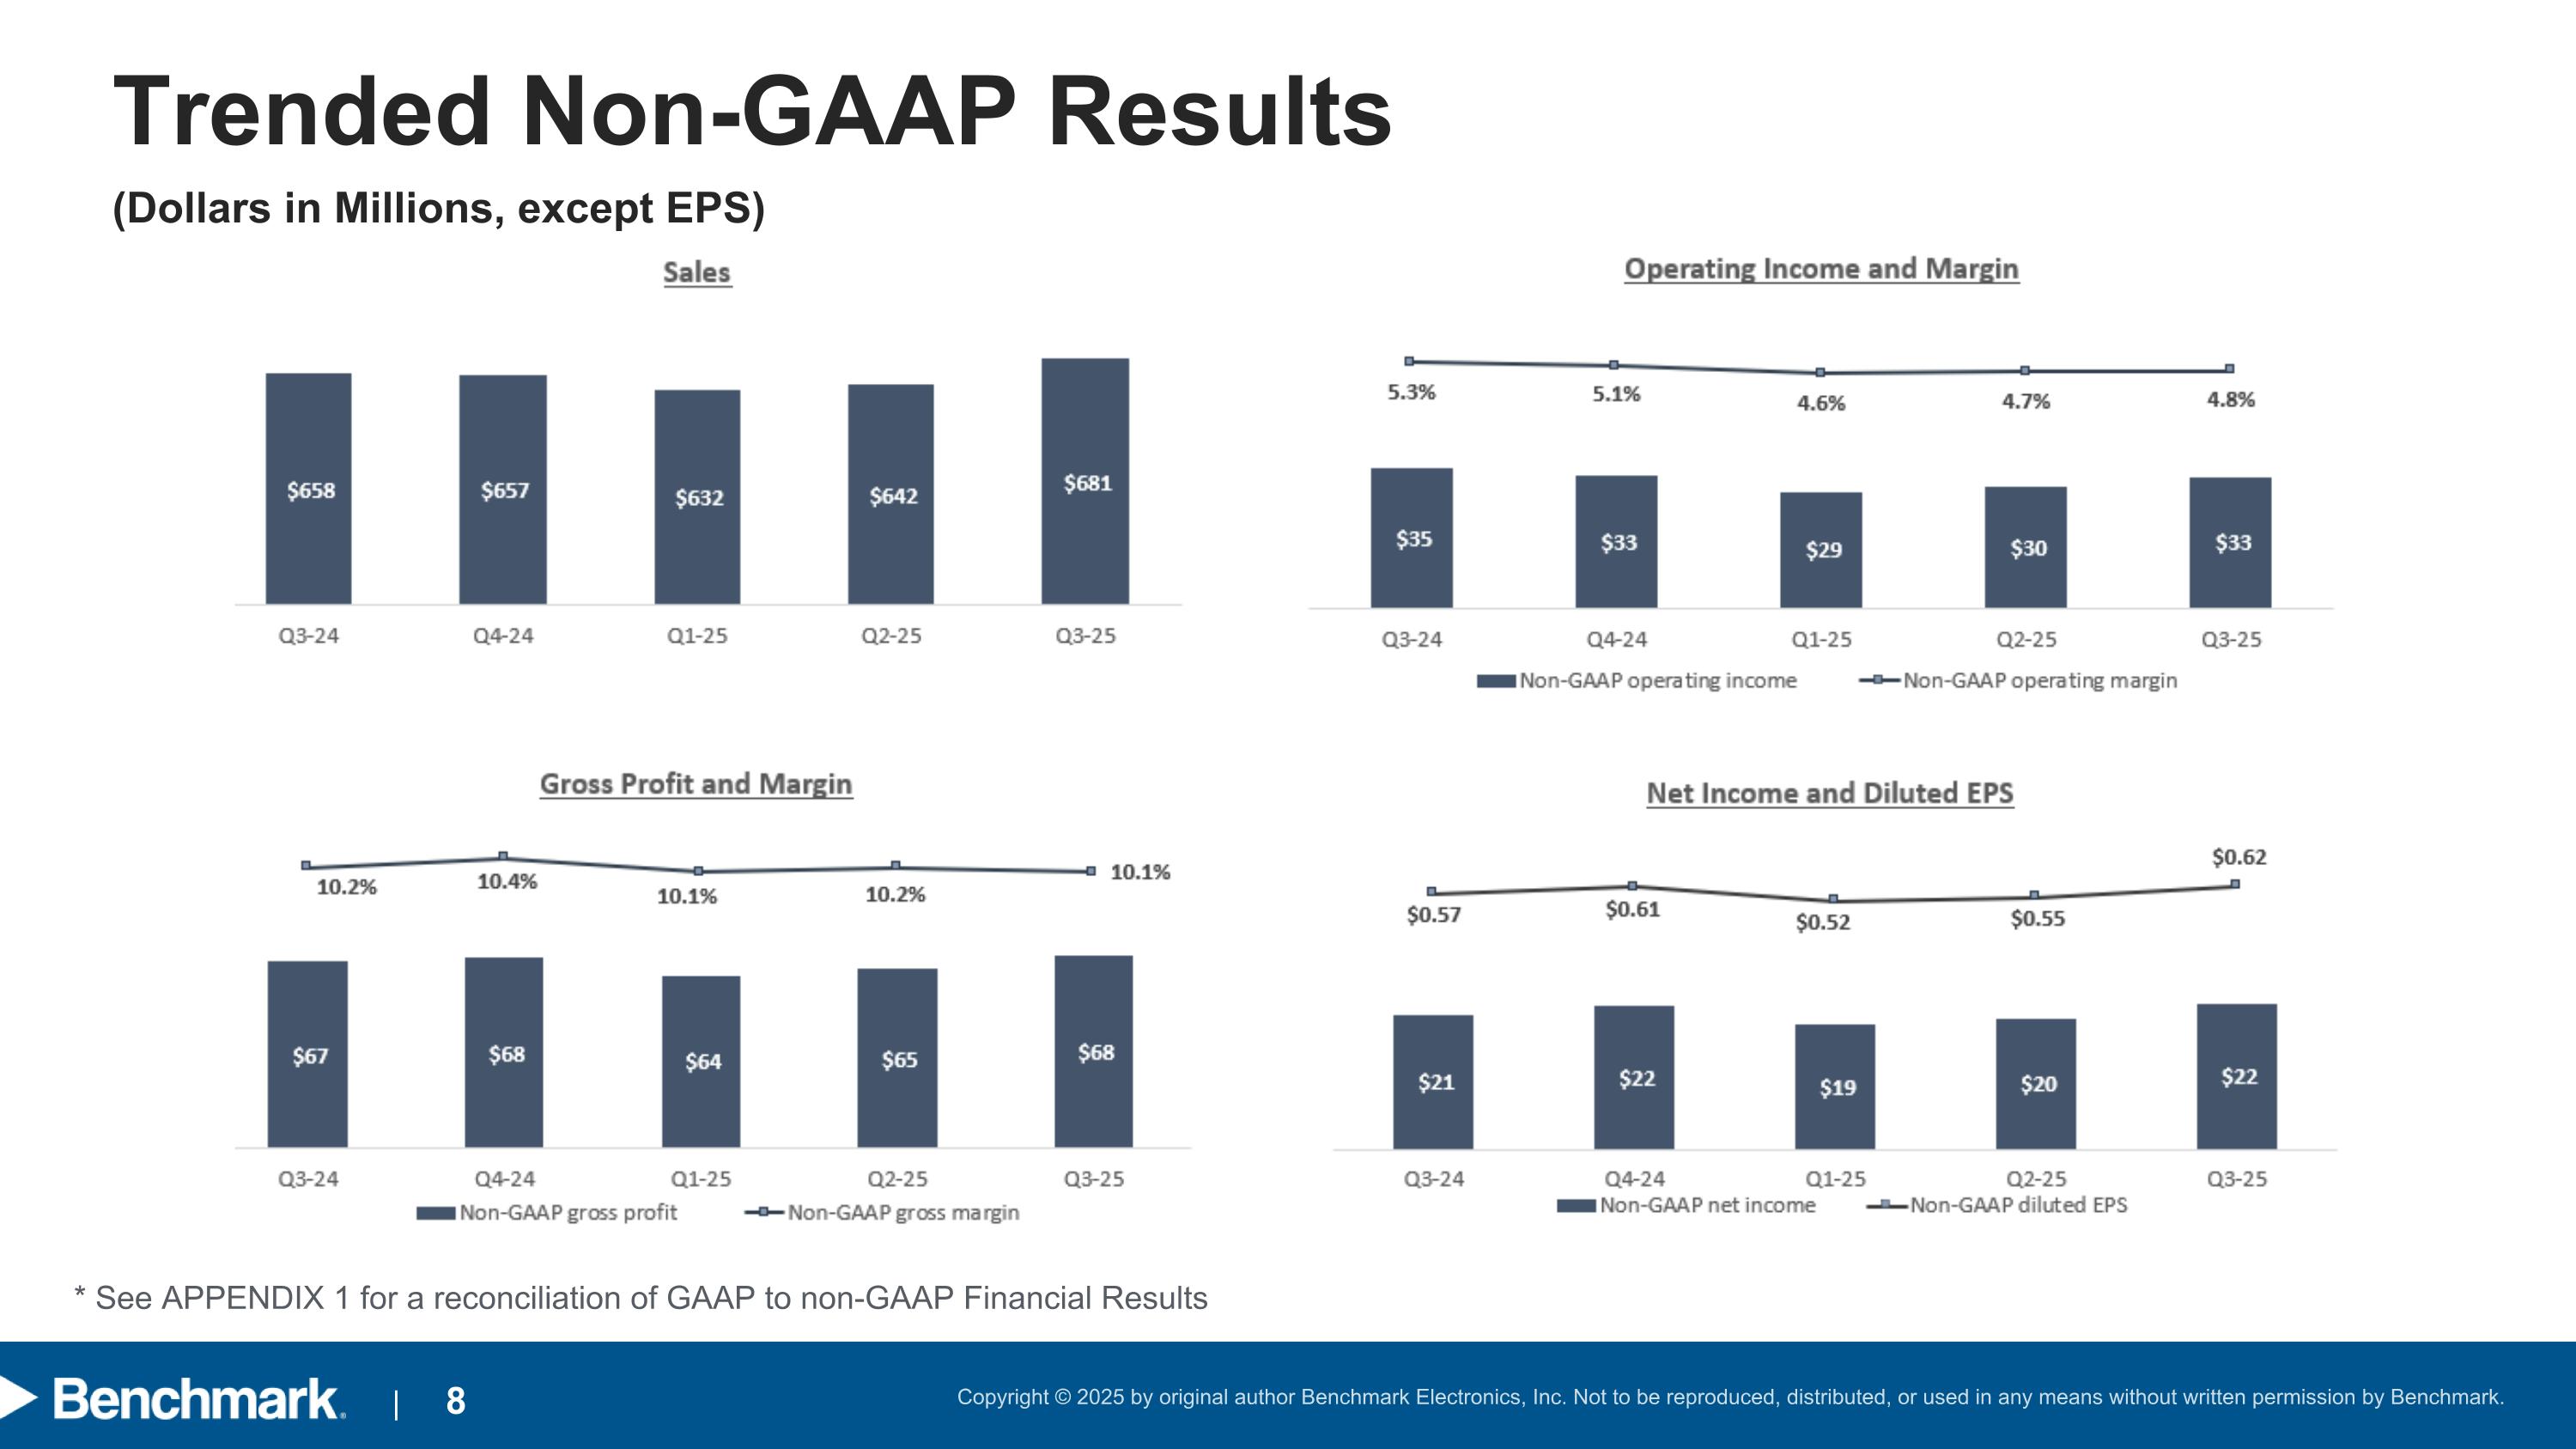
Trended Non-GAAP Results (Dollars in Millions, except EPS) * See APPENDIX 1 for a reconciliation of GAAP to non-GAAP Financial Results
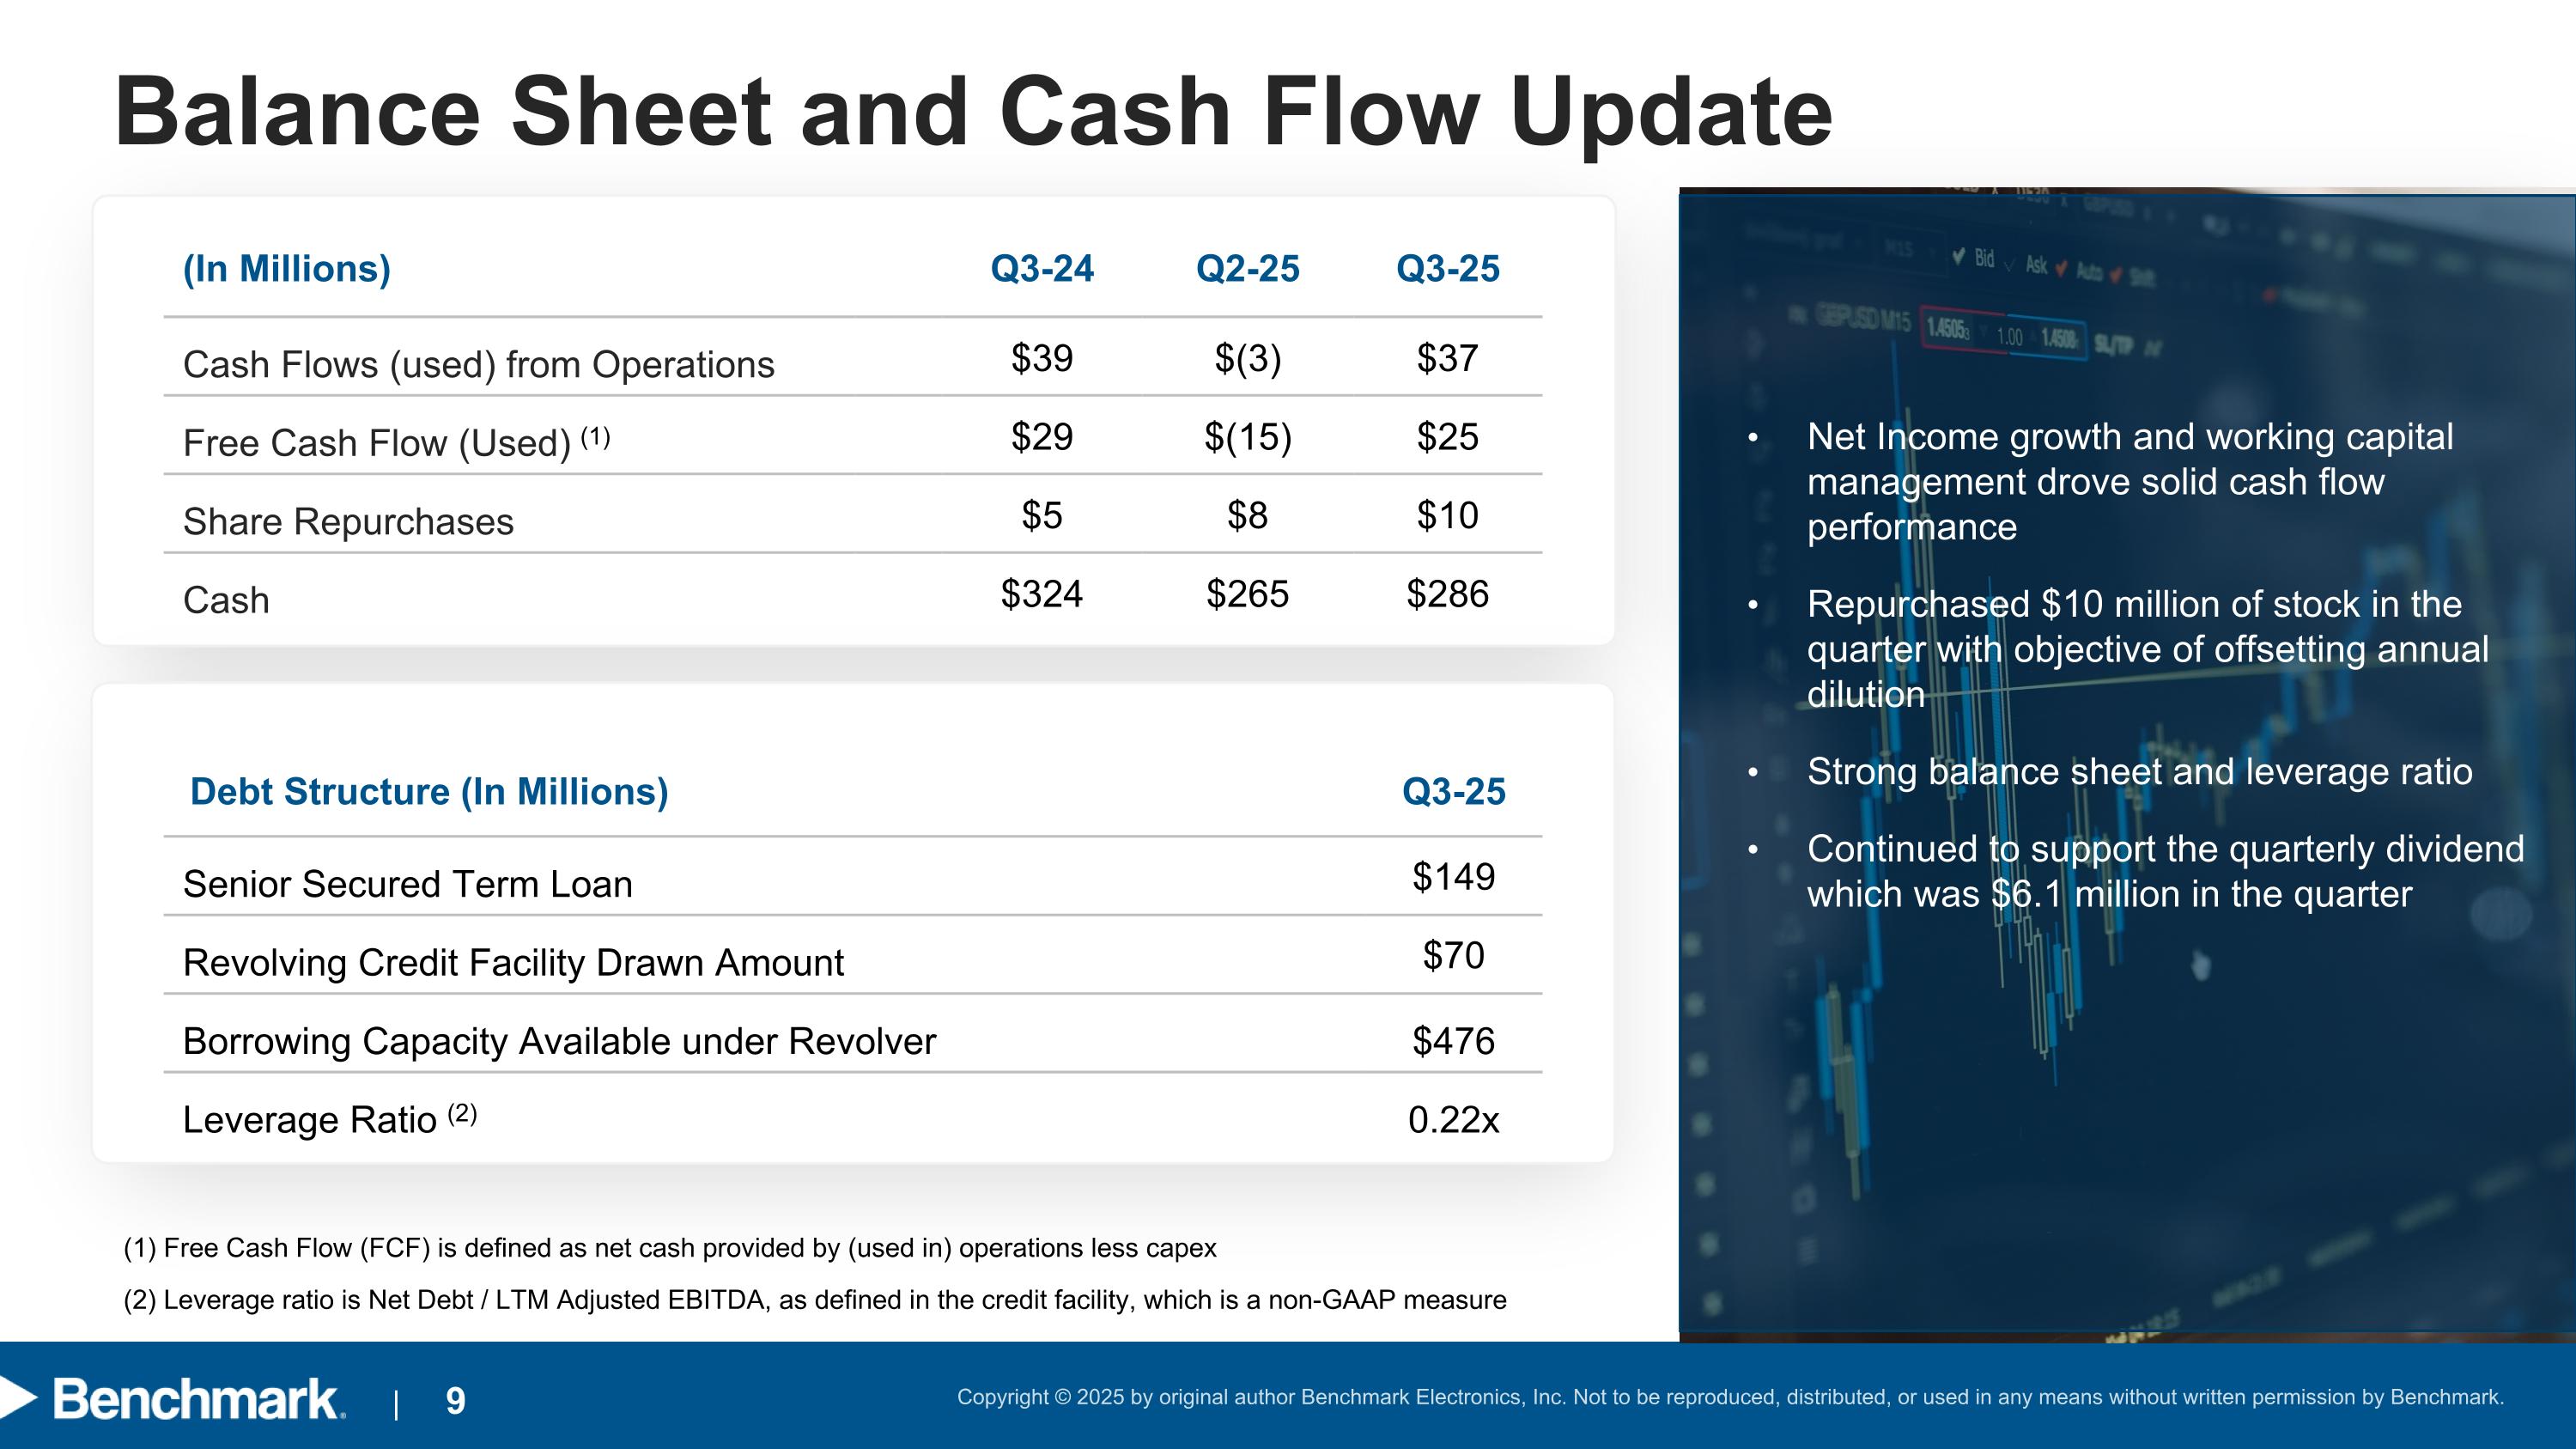
Balance Sheet and Cash Flow Update Debt Structure (In Millions) Q3-25 Senior Secured Term Loan $149 Revolving Credit Facility Drawn Amount $70 Borrowing Capacity Available under Revolver $476 Leverage Ratio (2) 0.22x (In Millions) Q3-24 Q2-25 Q3-25 Cash Flows (used) from Operations $39 $(3) $37 Free Cash Flow (Used) (1) $29 $(15) $25 Share Repurchases $5 $8 $10 Cash $324 $265 $286 (1) Free Cash Flow (FCF) is defined as net cash provided by (used in) operations less capex (2) Leverage ratio is Net Debt / LTM Adjusted EBITDA, as defined in the credit facility, which is a non-GAAP measure Net Income growth and working capital management drove solid cash flow performance Repurchased $10 million of stock in the quarter with objective of offsetting annual dilution Strong balance sheet and leverage ratio Continued to support the quarterly dividend which was $6.1 million in the quarter
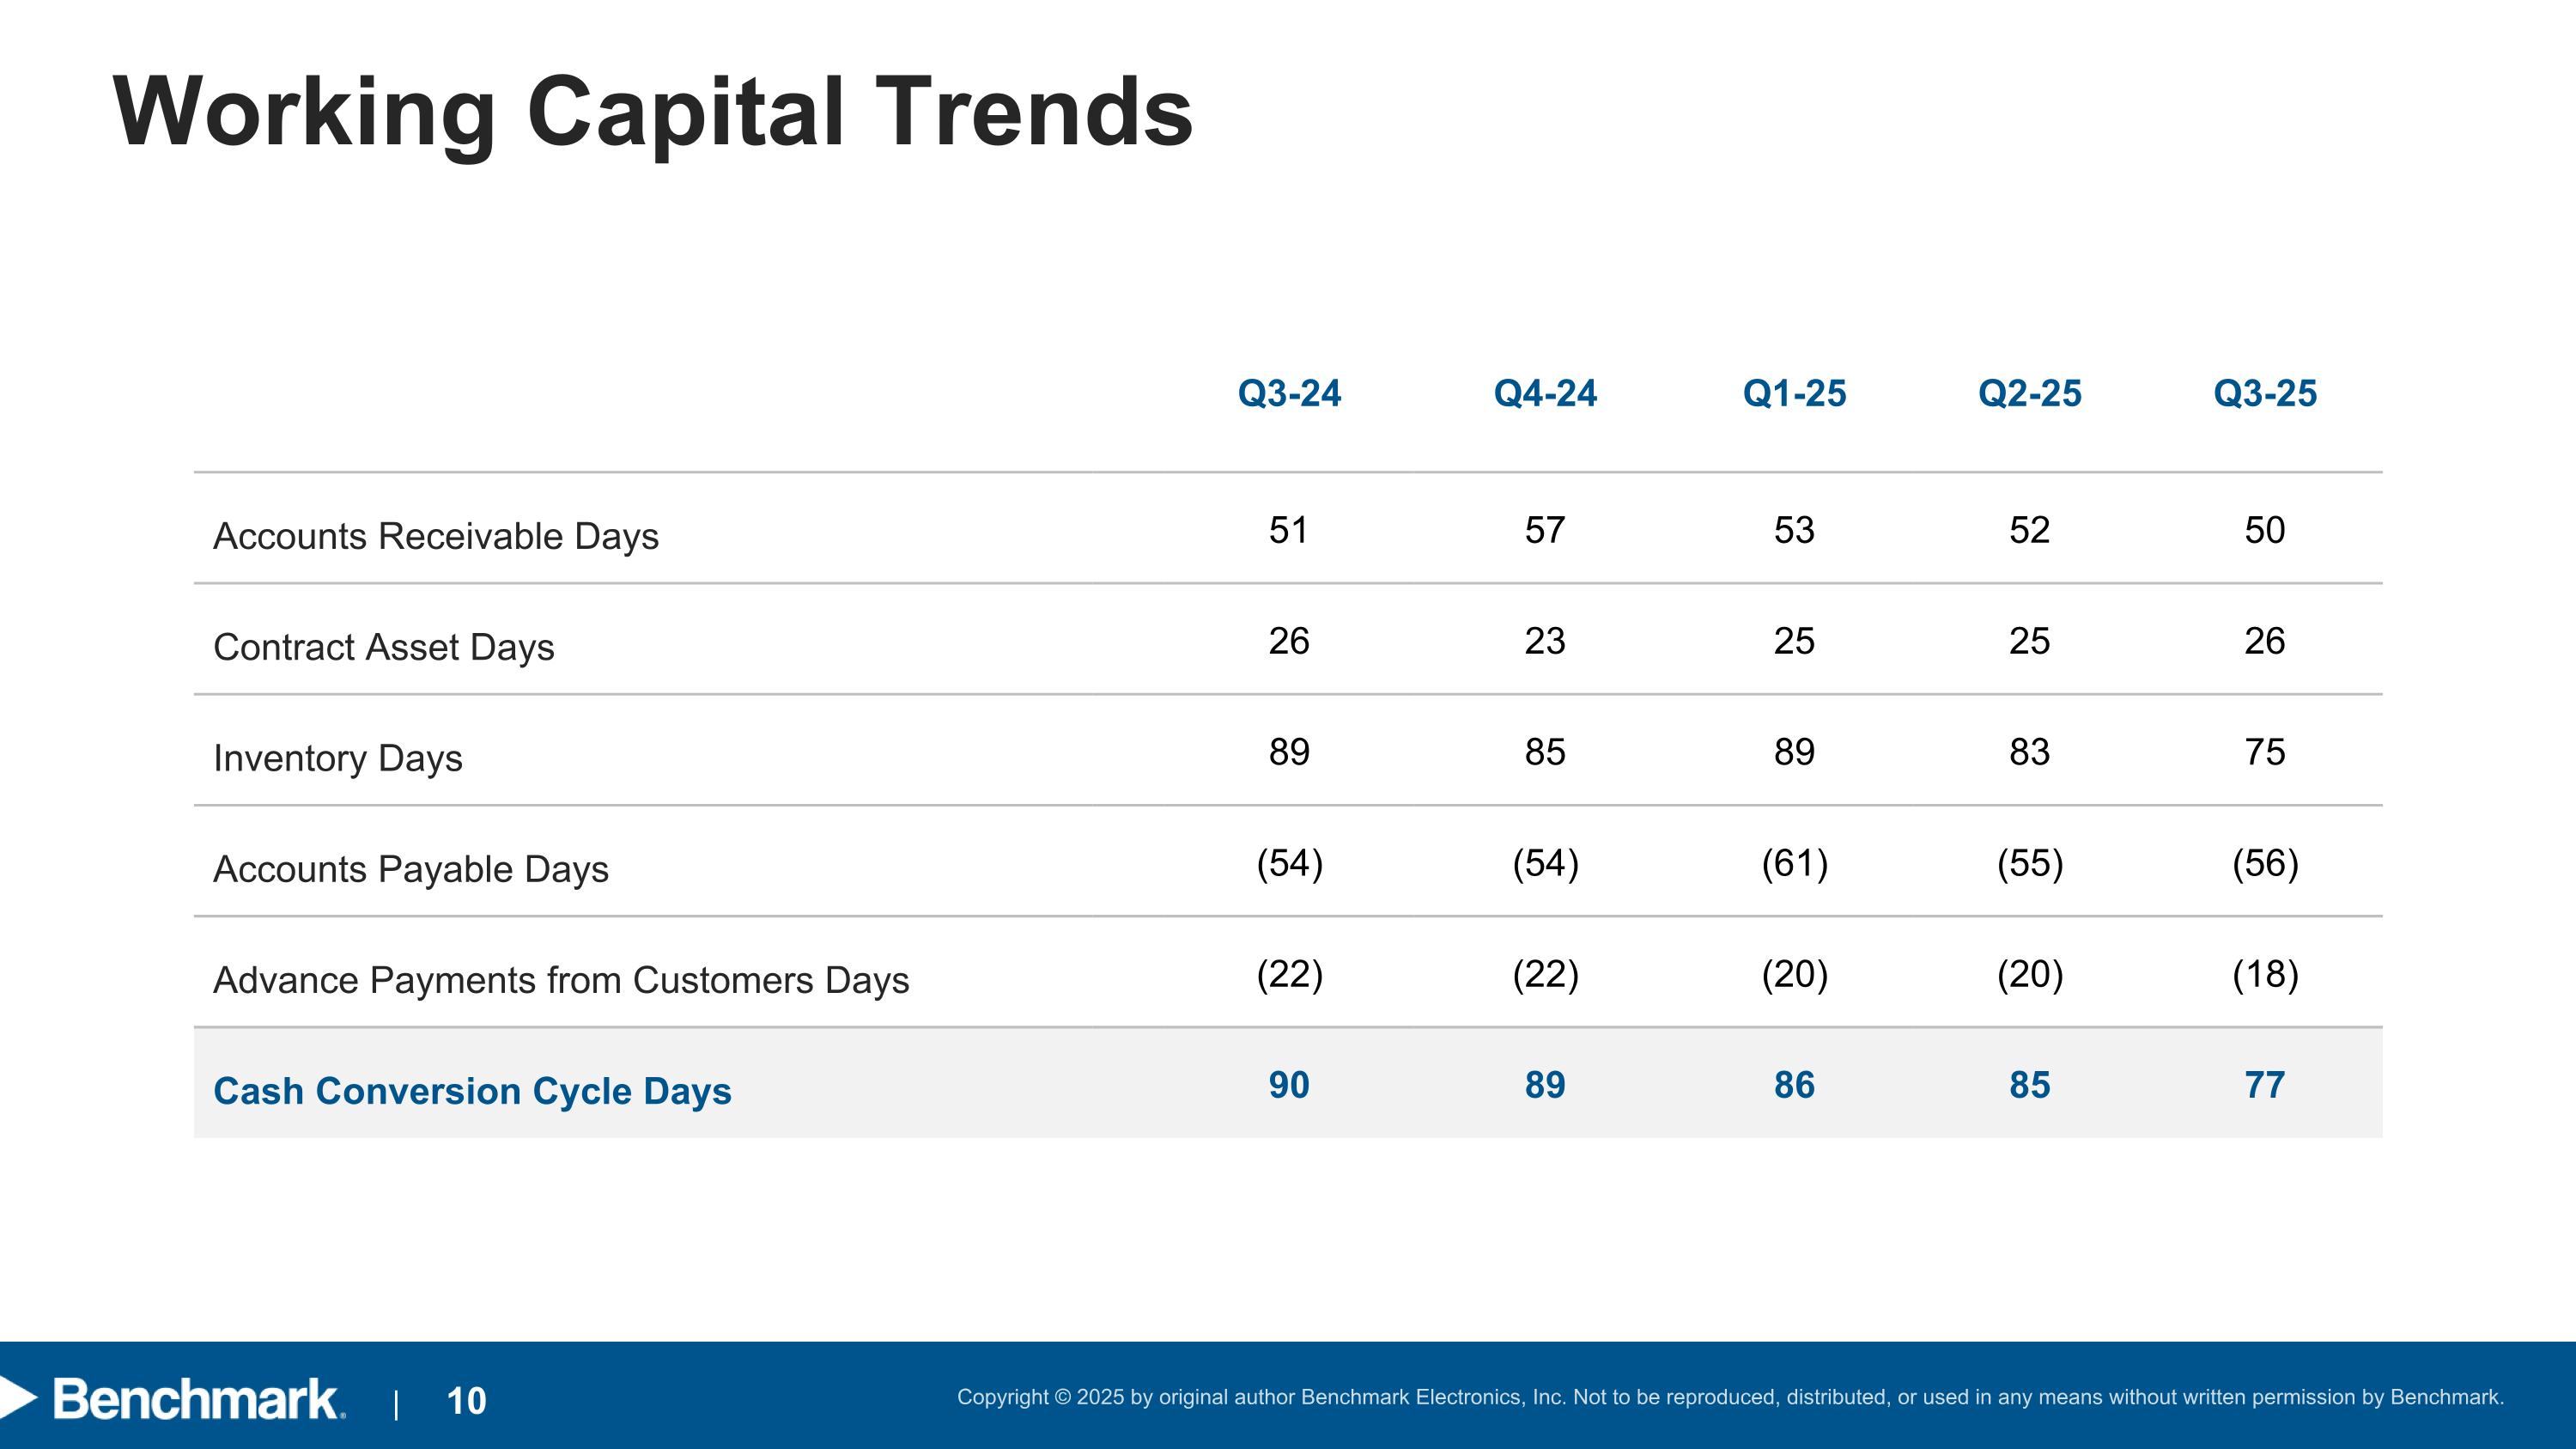
Working Capital Trends Q3-24 Q4-24 Q1-25 Q2-25 Q3-25 Accounts Receivable Days 51 57 53 52 50 Contract Asset Days 26 23 25 25 26 Inventory Days 89 85 89 83 75 Accounts Payable Days (54) (54) (61) (55) (56) Advance Payments from Customers Days (22) (22) (20) (20) (18) Cash Conversion Cycle Days 90 89 86 85 77
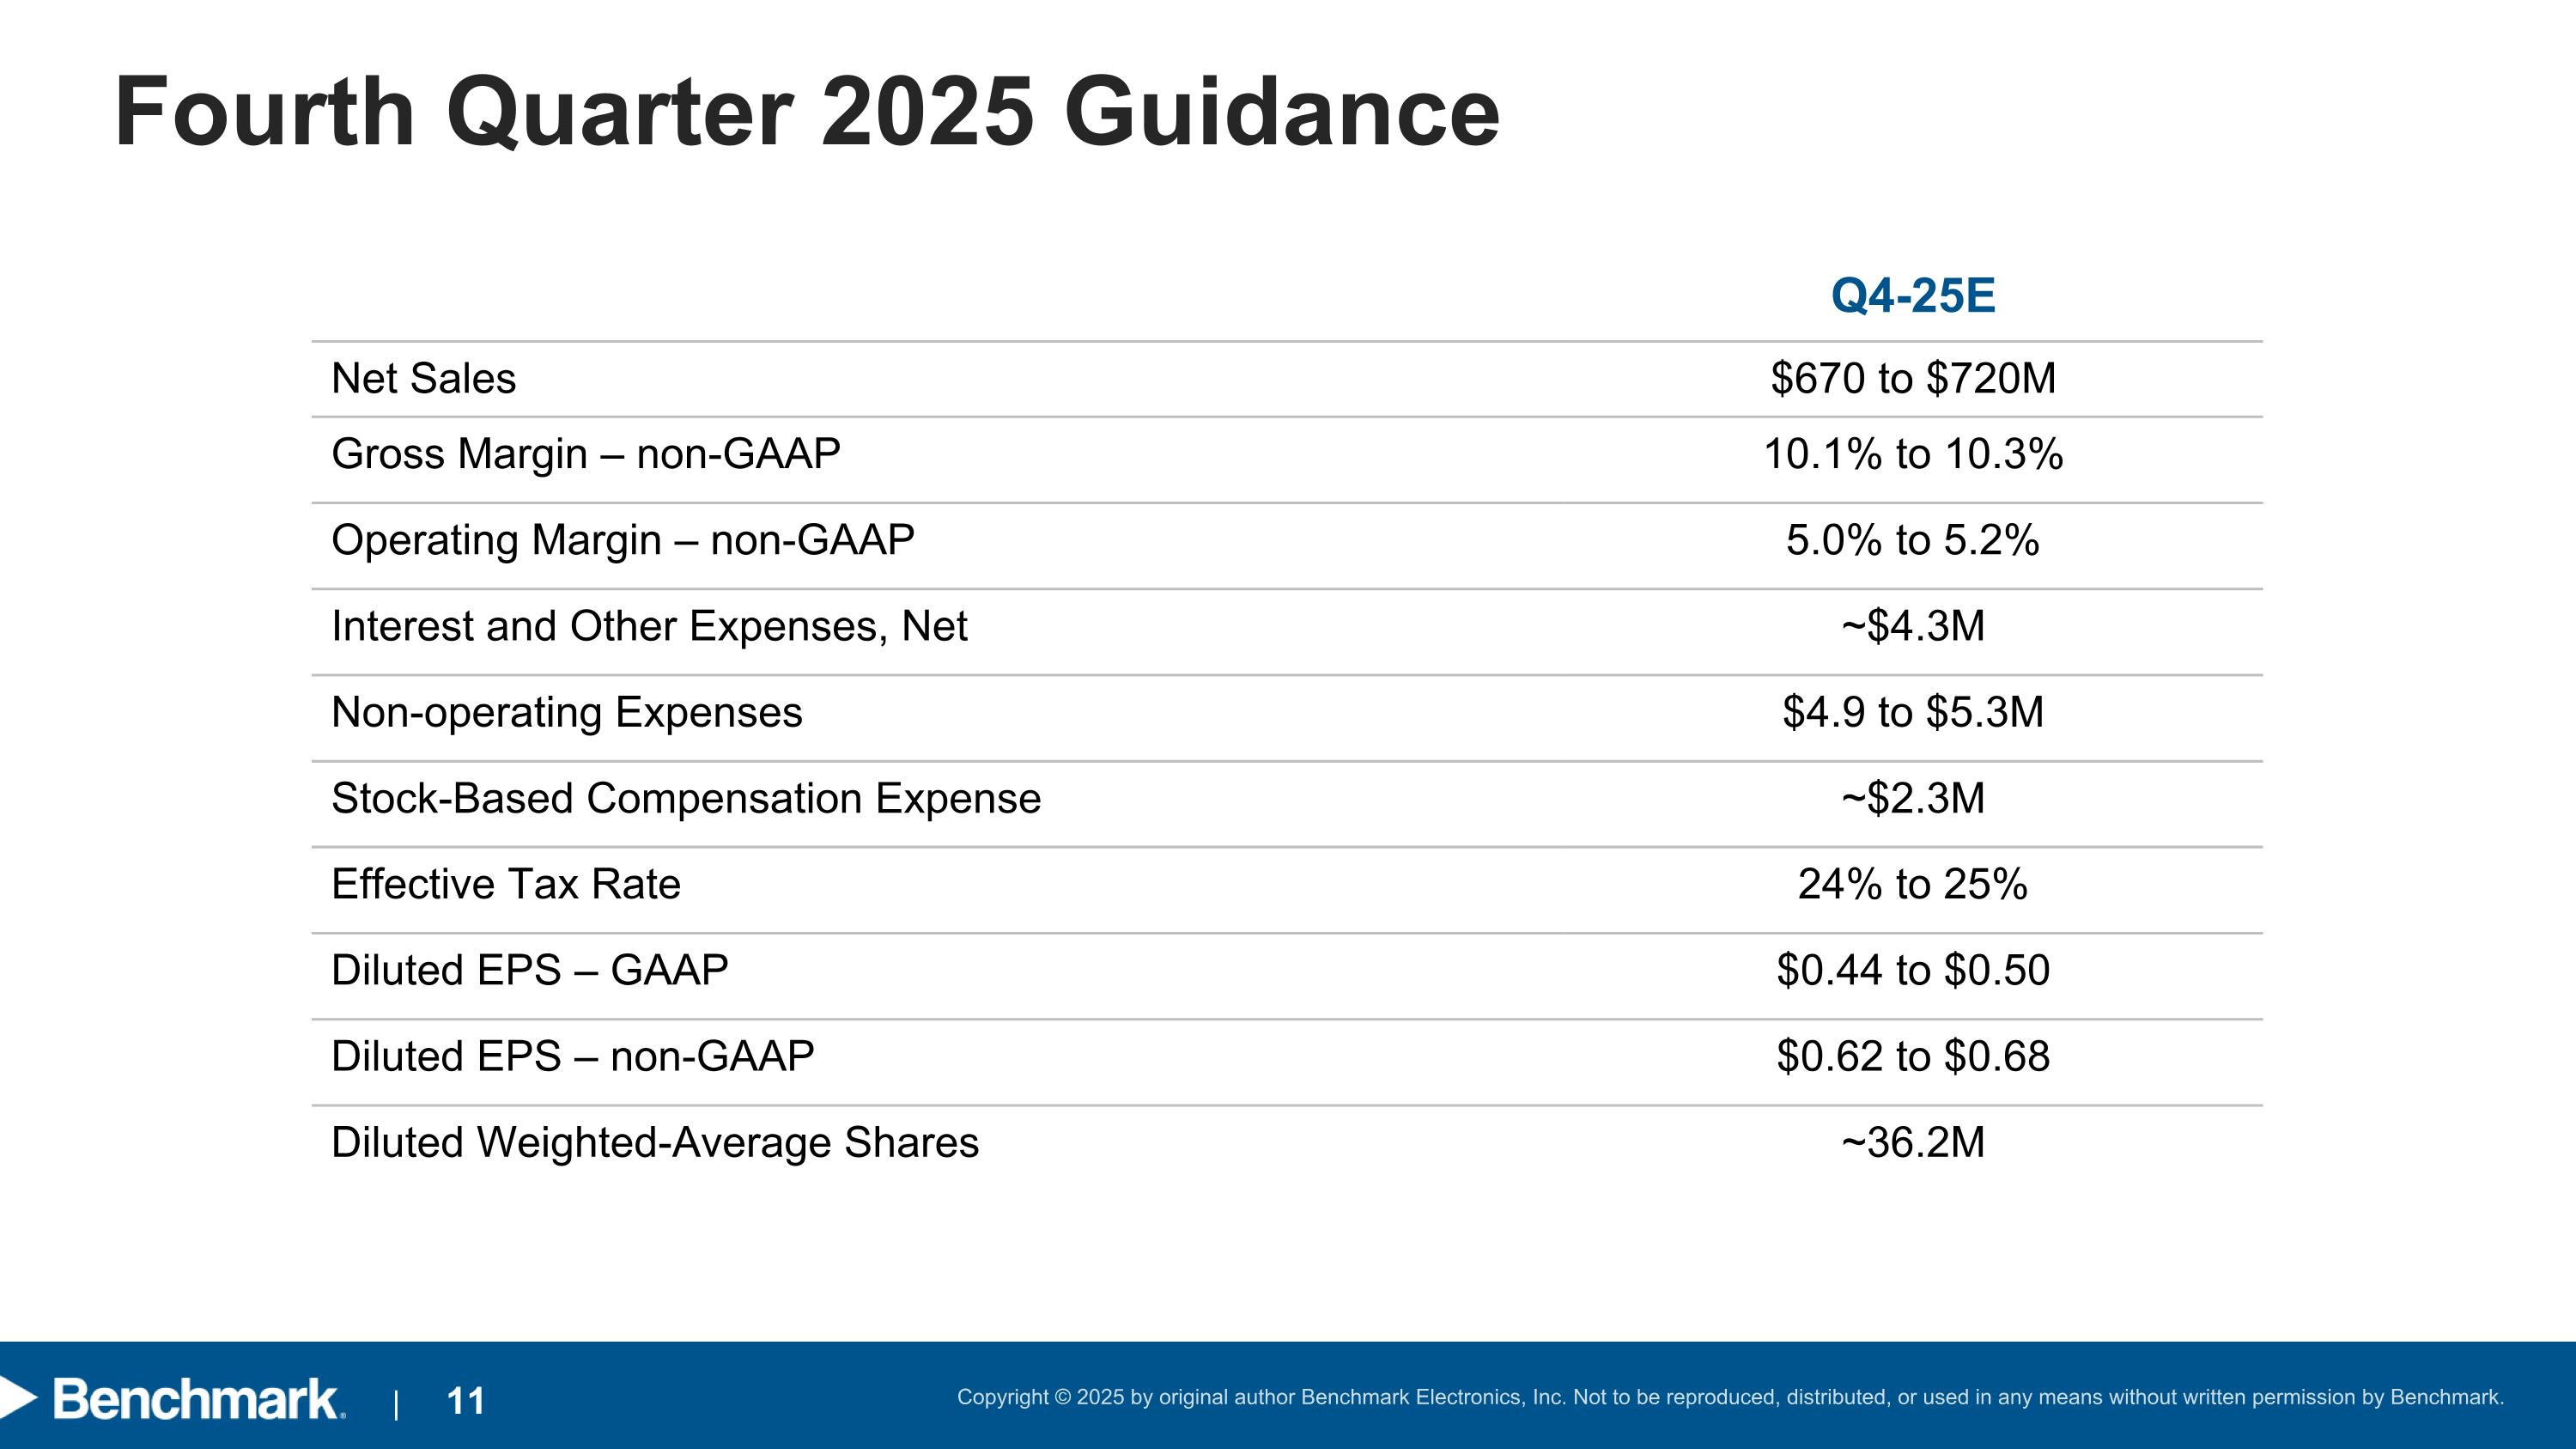
Fourth Quarter 2025 Guidance Q4-25E Net Sales $670 to $720M Gross Margin – non-GAAP 10.1% to 10.3% Operating Margin – non-GAAP 5.0% to 5.2% Interest and Other Expenses, Net ~$4.3M Non-operating Expenses $4.9 to $5.3M Stock-Based Compensation Expense ~$2.3M Effective Tax Rate 24% to 25% Diluted EPS – GAAP $0.44 to $0.50 Diluted EPS – non-GAAP $0.62 to $0.68 Diluted Weighted-Average Shares ~36.2M
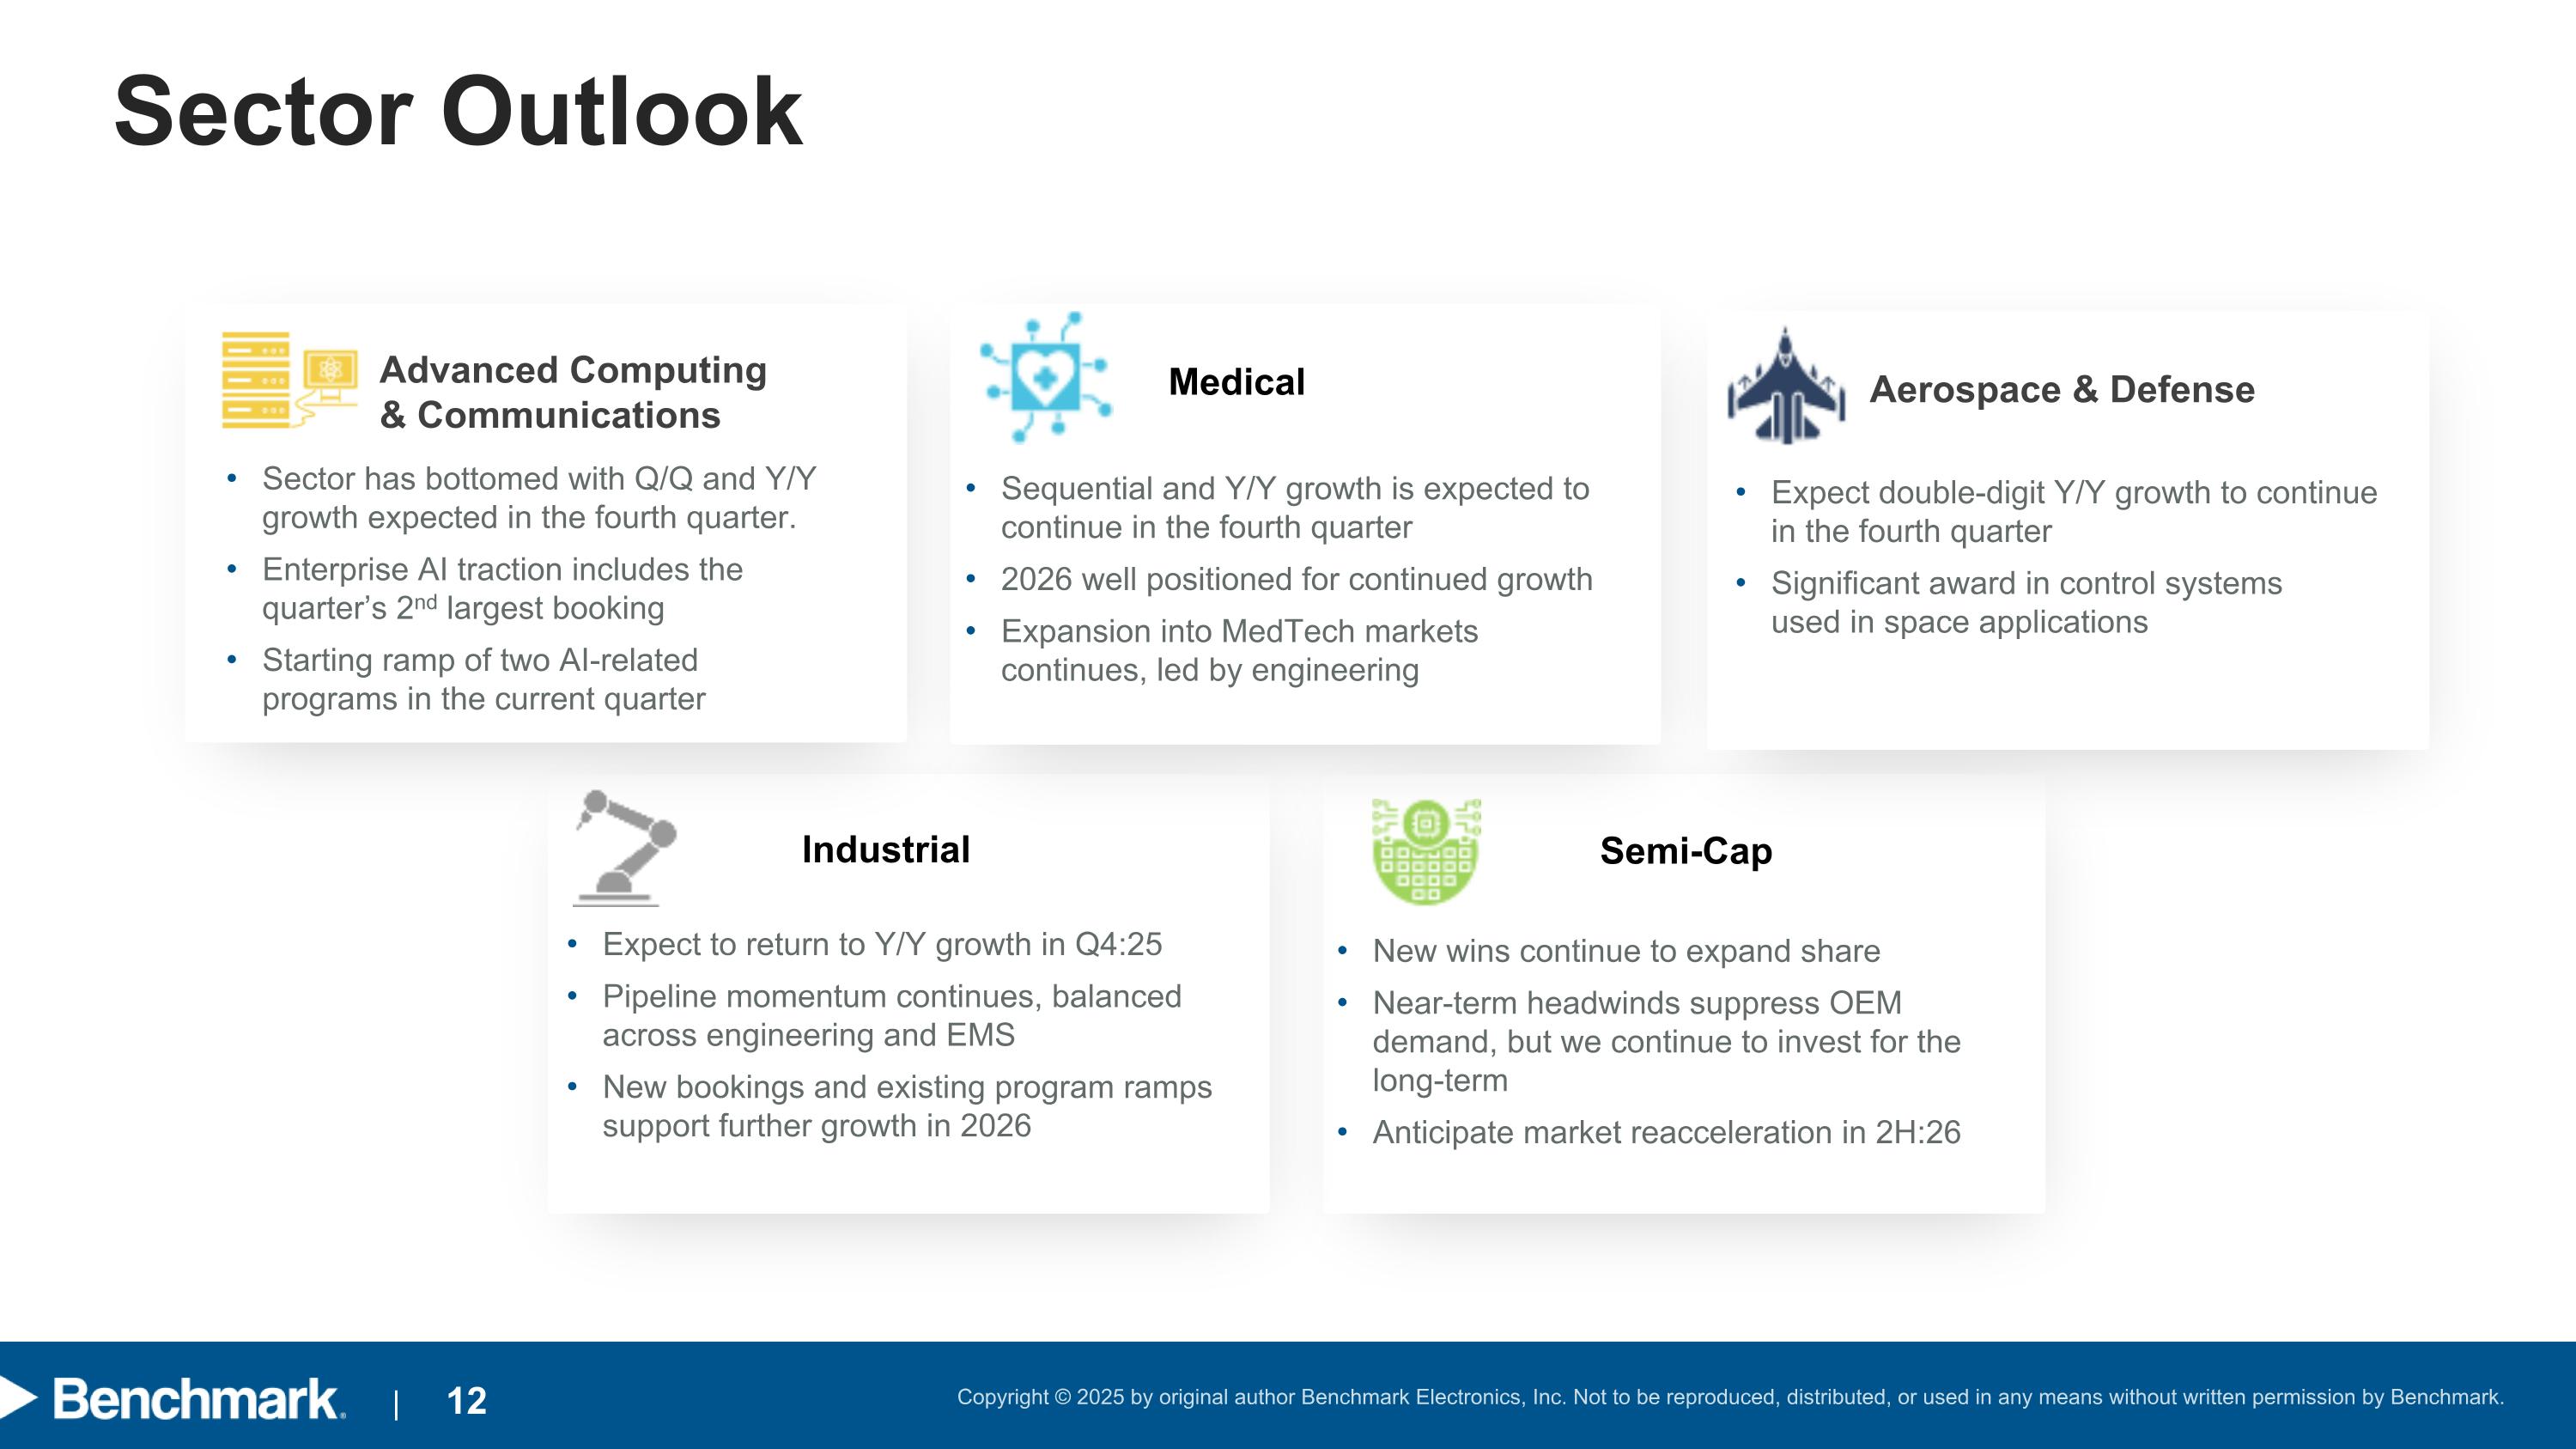
Sector Outlook Semi-Cap New wins continue to expand share Near-term headwinds suppress OEM demand, but we continue to invest for the long-term Anticipate market reacceleration in 2H:26 Industrial Expect to return to Y/Y growth in Q4:25 Pipeline momentum continues, balanced across engineering and EMS New bookings and existing program ramps support further growth in 2026 Sector has bottomed with Q/Q and Y/Y growth expected in the fourth quarter. Enterprise AI traction includes the quarter’s 2nd largest booking Starting ramp of two AI-related programs in the current quarter Advanced Computing & Communications Sequential and Y/Y growth is expected to continue in the fourth quarter 2026 well positioned for continued growth Expansion into MedTech markets continues, led by engineering Medical Expect double-digit Y/Y growth to continue in the fourth quarter Significant award in control systems used in space applications Aerospace & Defense
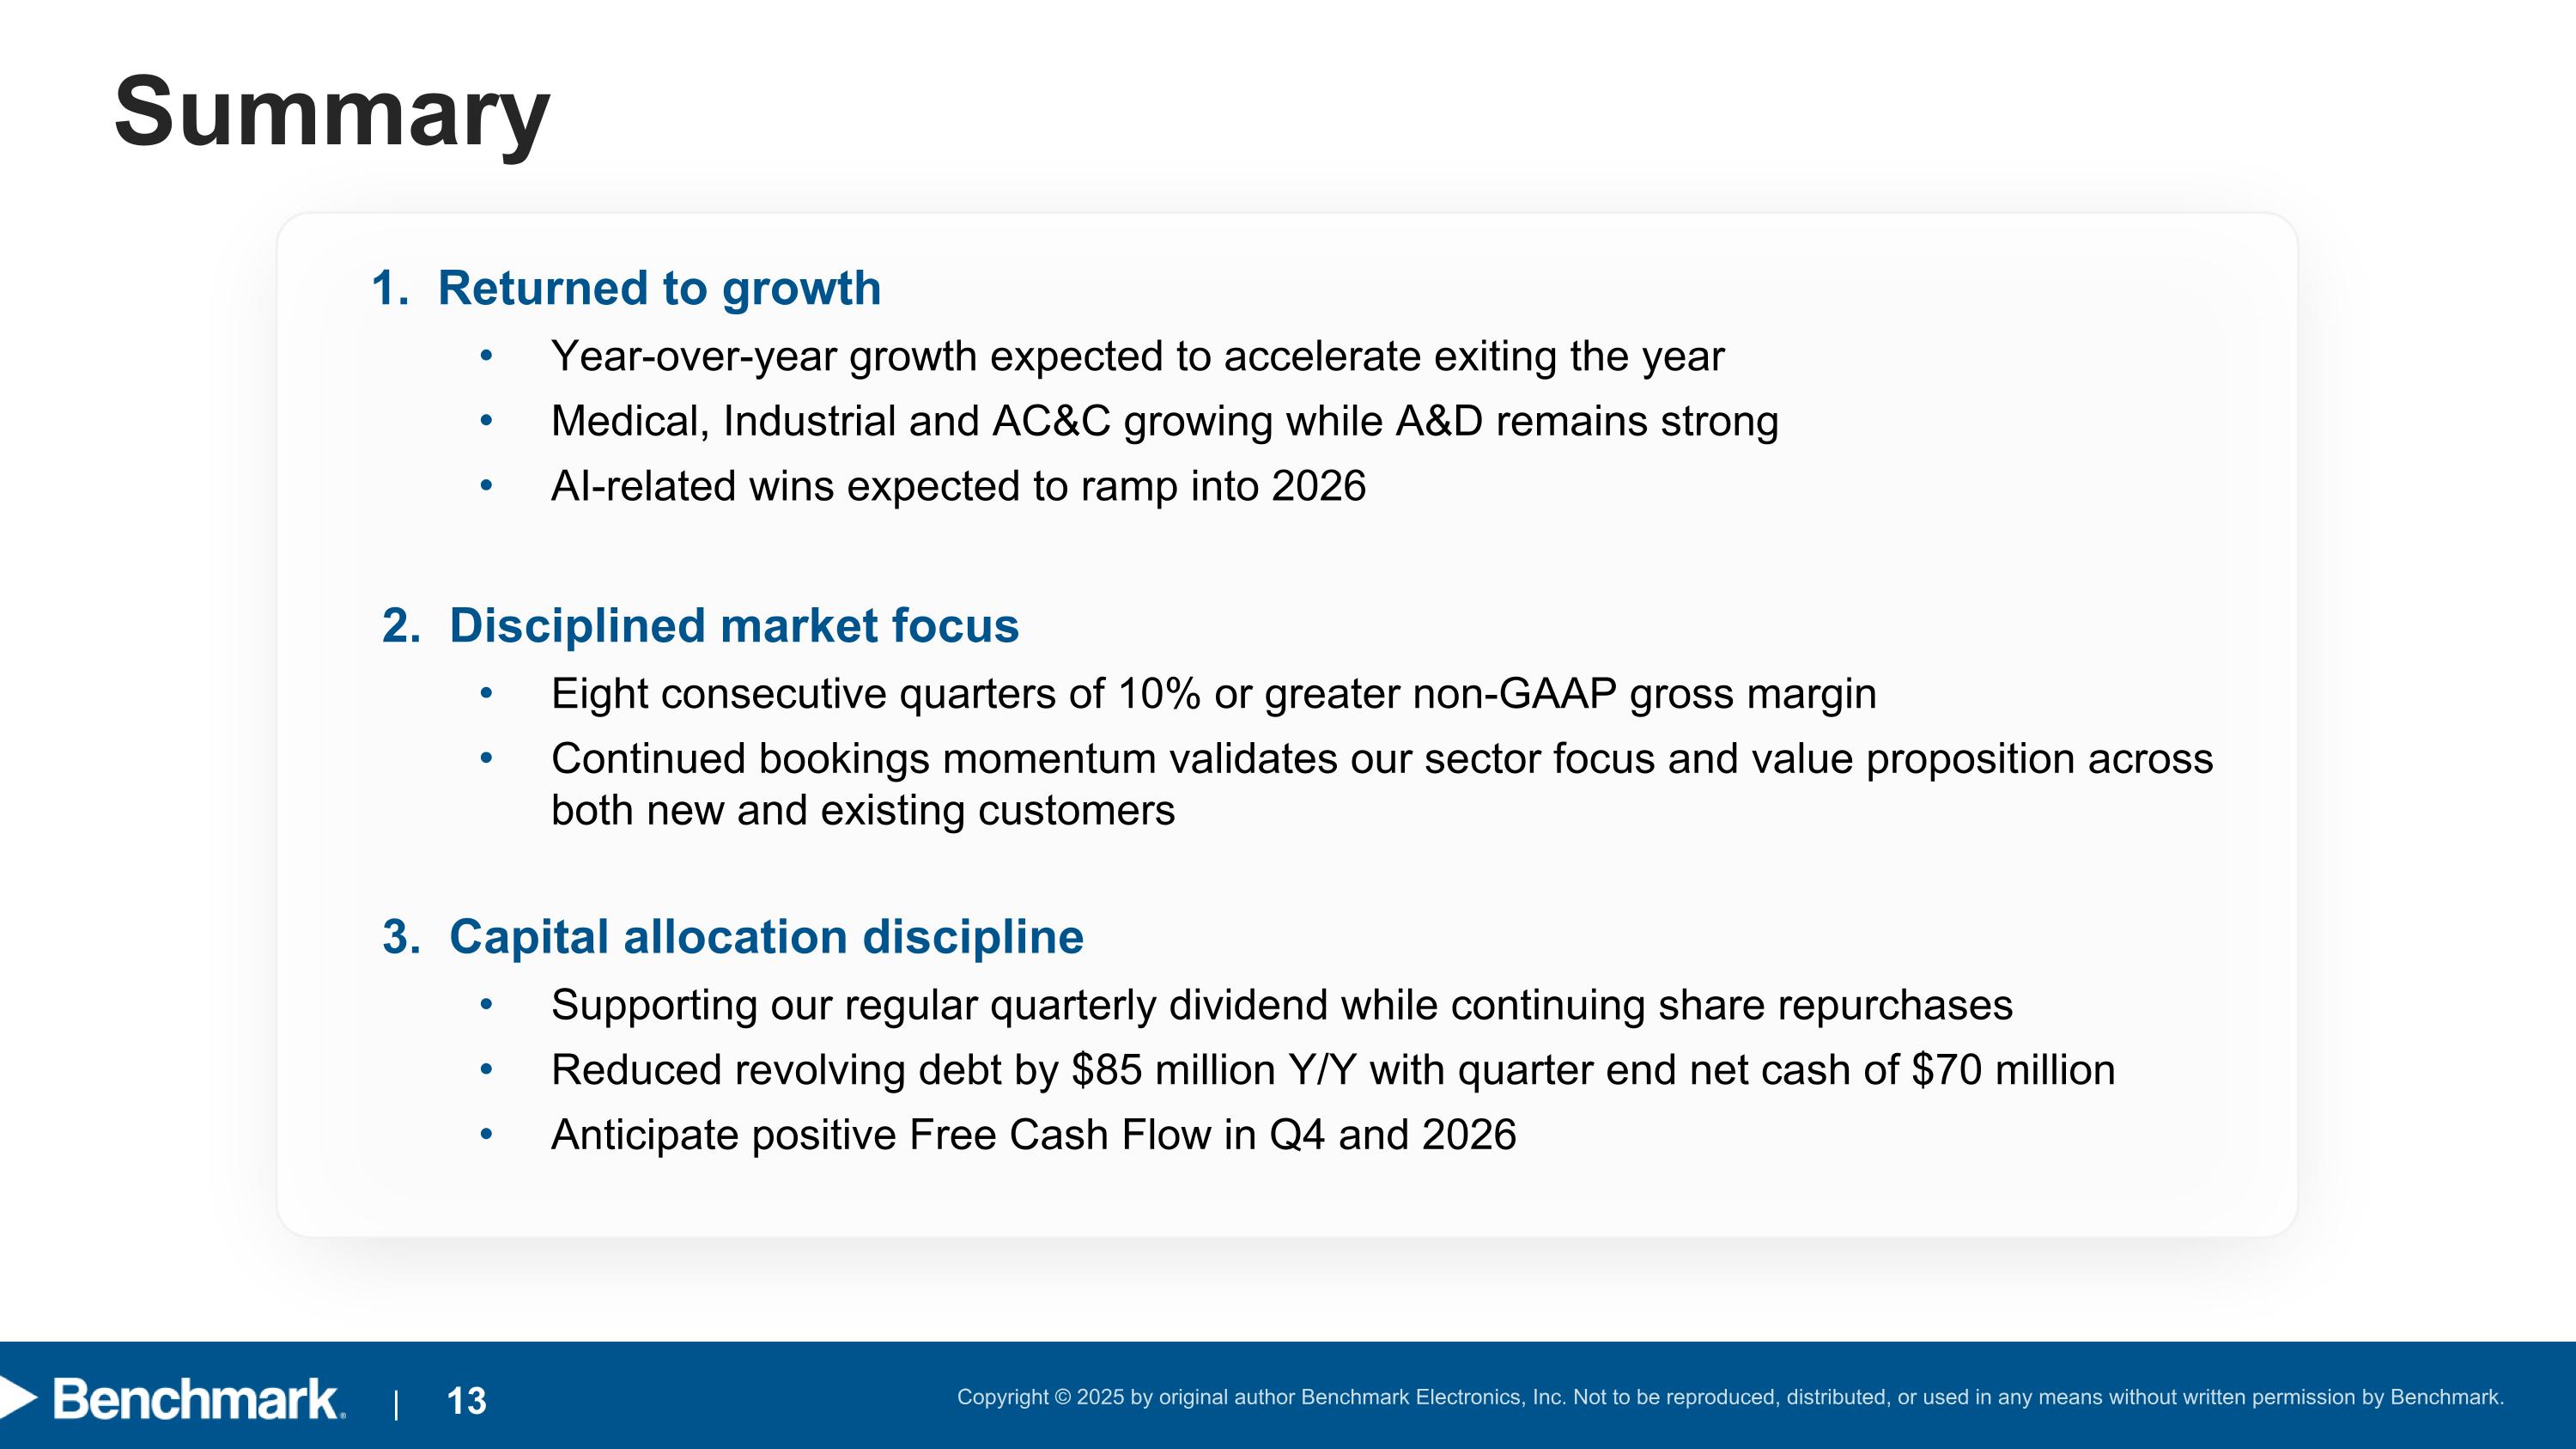
Summary 1. Returned to growth Year-over-year growth expected to accelerate exiting the year Medical, Industrial and AC&C growing while A&D remains strong AI-related wins expected to ramp into 2026 2. Disciplined market focus Eight consecutive quarters of 10% or greater non-GAAP gross margin Continued bookings momentum validates our sector focus and value proposition across both new and existing customers 3. Capital allocation discipline Supporting our regular quarterly dividend while continuing share repurchases Reduced revolving debt by $85 million Y/Y with quarter end net cash of $70 million Anticipate positive Free Cash Flow in Q4 and 2026

Appendix
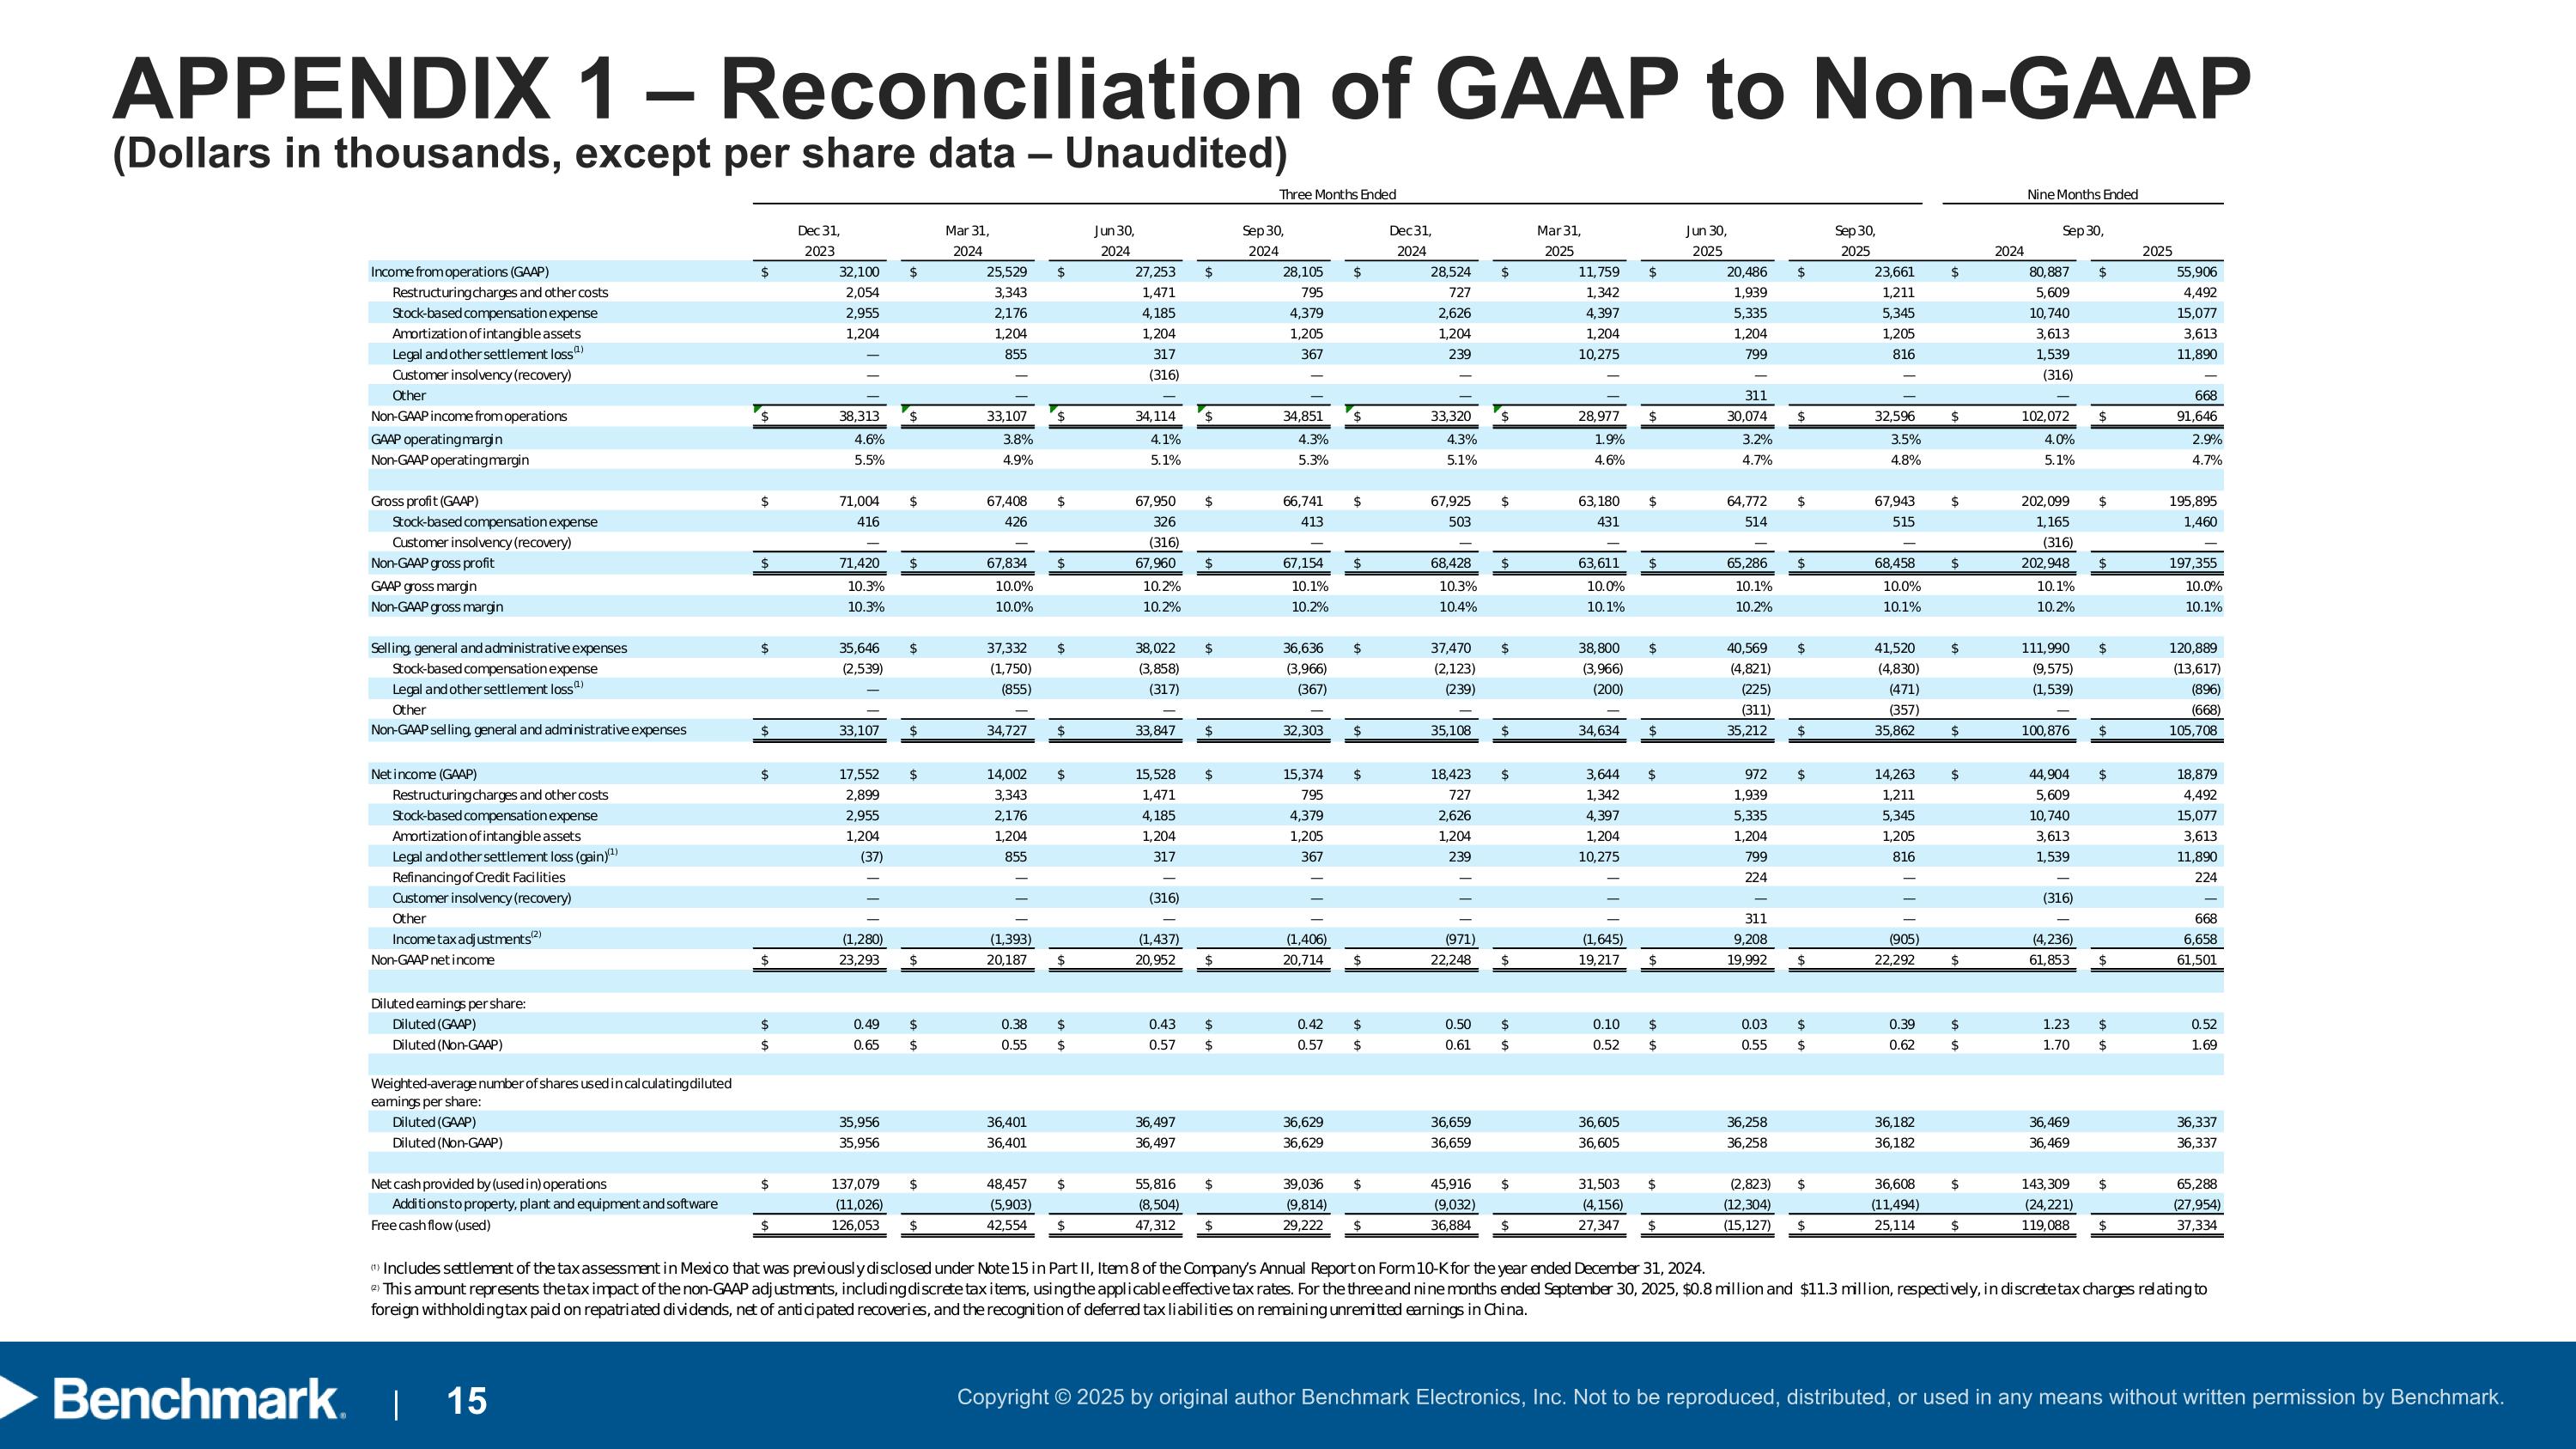
APPENDIX 1 – Reconciliation of GAAP to Non-GAAP (Dollars in thousands, except per share data – Unaudited)