| February 24, 2026 Fourth Quarter 2025 Earnings Conference Call .2 |
| Page 2 © 2026 Helix ESG This presentation contains forward-looking statements that involve risks, uncertainties and assumptions that could cause our results to differ materially from those expressed or implied by such forward-looking statements. All statements, other than statements of historical fact, are "forward-looking statements" within the meaning of the Private Securities Litigation Reform Act of 1995, including, without limitation, any statements regarding: our plans, strategies and objectives for future operations; any projections of financial items including projections as to guidance and other outlook information; future operations expenditures; our ability to enter into, renew and/or perform commercial contracts; the spot market; our current work continuing; visibility and future utilization; our protocols and plans; future economic or political conditions; energy transition or energy security; our spending and cost management efforts and our ability to manage changes; oil price volatility and its effects and results; our ability to identify, effect and integrate mergers, acquisitions, joint ventures or other transactions; developments; any financing transactions or arrangements or our ability to enter into such transactions or arrangements; our sustainability initiatives; our share repurchase program or execution; any statements of expectation or belief; and any statements of assumptions underlying any of the foregoing. Forward-looking statements are subject to a number of known and unknown risks, uncertainties and other factors that could cause results to differ materially from those in the forward-looking statements, including but not limited to market conditions and the demand for our services; volatility of oil and natural gas prices; complexities of global political and economic developments; results from mergers, acquisitions, joint ventures or similar transactions; results from acquired properties; our ability to secure and realize backlog; the performance of contracts by customers, suppliers and other counterparties; actions by governmental and regulatory authorities; operating hazards and delays, which include delays in delivery, chartering or customer acceptance of assets or terms of their acceptance; the effectiveness of our sustainability initiatives and disclosures; human capital management issues; geologic risks; and other risks described from time to time in our filings with the Securities and Exchange Commission ("SEC"), including our most recently filed Annual Report on Form 10-K, which are available free of charge on the SEC's website at www.sec.gov. We assume no obligation and do not intend to update these forward-looking statements, which speak only as of their respective dates, except as required by law. Forward-Looking Statements |
| 3 Page 3 © 2026 Helix ESG • Executive Summary (pg. 4) • Operational Highlights (pg. 8) • Key Financial Metrics and Outlook (pg. 13) • Non-GAAP Reconciliations (pg. 21) • Questions and Answers Agenda |
| Executive Summary |
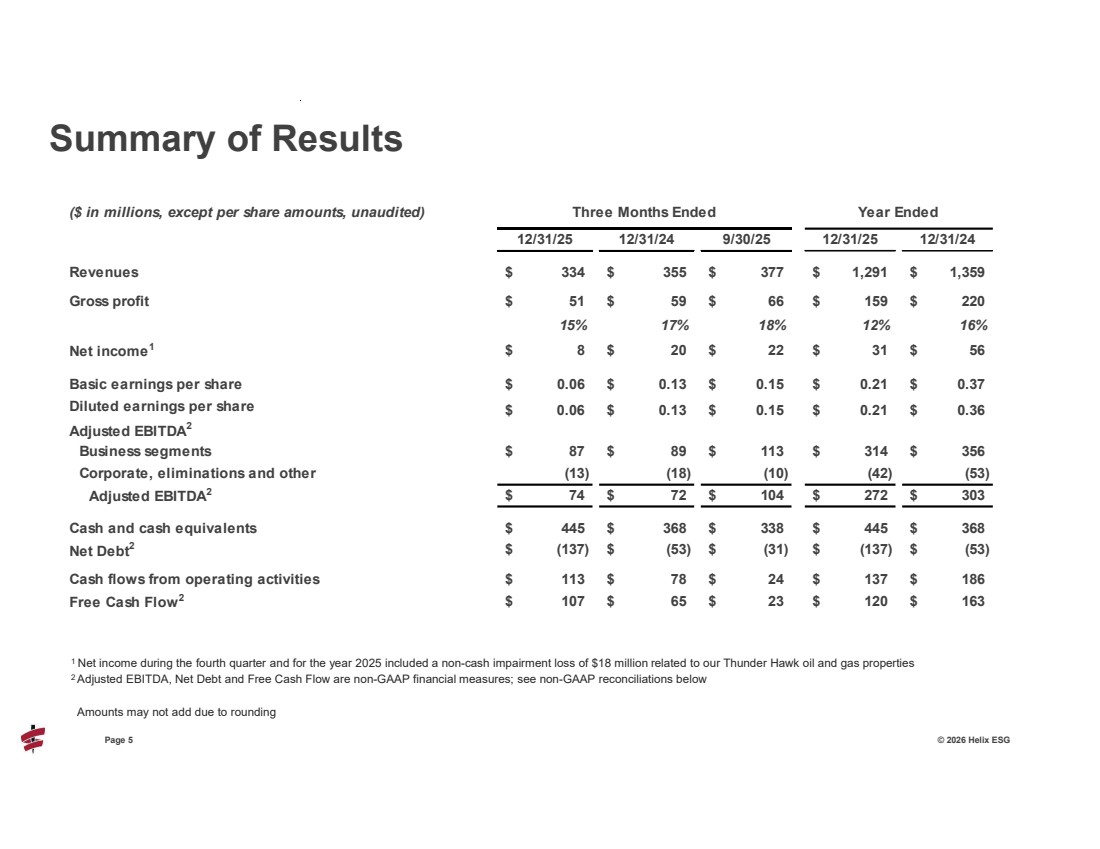
| 5 Page 5 © 2026 Helix ESG Summary of Results ($ in millions, except per share amounts, unaudited) Three Months Ended 12/31/25 12/31/24 9/30/25 12/31/25 12/31/24 Revenues 334 $ 355 $ 377 $ 1,291 $ 1,359 $ Gross profit 51 $ 59 $ 66 $ 159 $ 220 $ 15% 17% 18% 12% 16% Net income1 $ 20 8 $ 22 $ 31 $ 56 $ Basic earnings per share 0.06 $ 0.13 $ 0.15 $ 0.21 $ 0.37 $ Diluted earnings per share $ 0.13 0.06 $ 0.15 $ 0.21 $ 0.36 $ Adjusted EBITDA2 Business segments 87 $ 89 $ 113 $ 314 $ 356 $ Corporate, eliminations and other (13) (18) (10) (42) (53) Adjusted EBITDA2 $ 72 74 $ 104 $ 272 $ 303 $ Cash and cash equivalents 445 $ 368 $ 338 $ 445 $ 368 $ Net Debt2 $ (53) (137) $ (31) $ (137) $ (53) $ Cash flows from operating activities 113 $ 78 $ 24 $ 137 $ 186 $ Free Cash Flow2 $ 65 107 $ 23 $ 120 $ 163 $ Year Ended 1 Net income during the fourth quarter and for the year 2025 included a non-cash impairment loss of $18 million related to our Thunder Hawk oil and gas properties 2 Adjusted EBITDA, Net Debt and Free Cash Flow are non-GAAP financial measures; see non-GAAP reconciliations below Amounts may not add due to rounding |
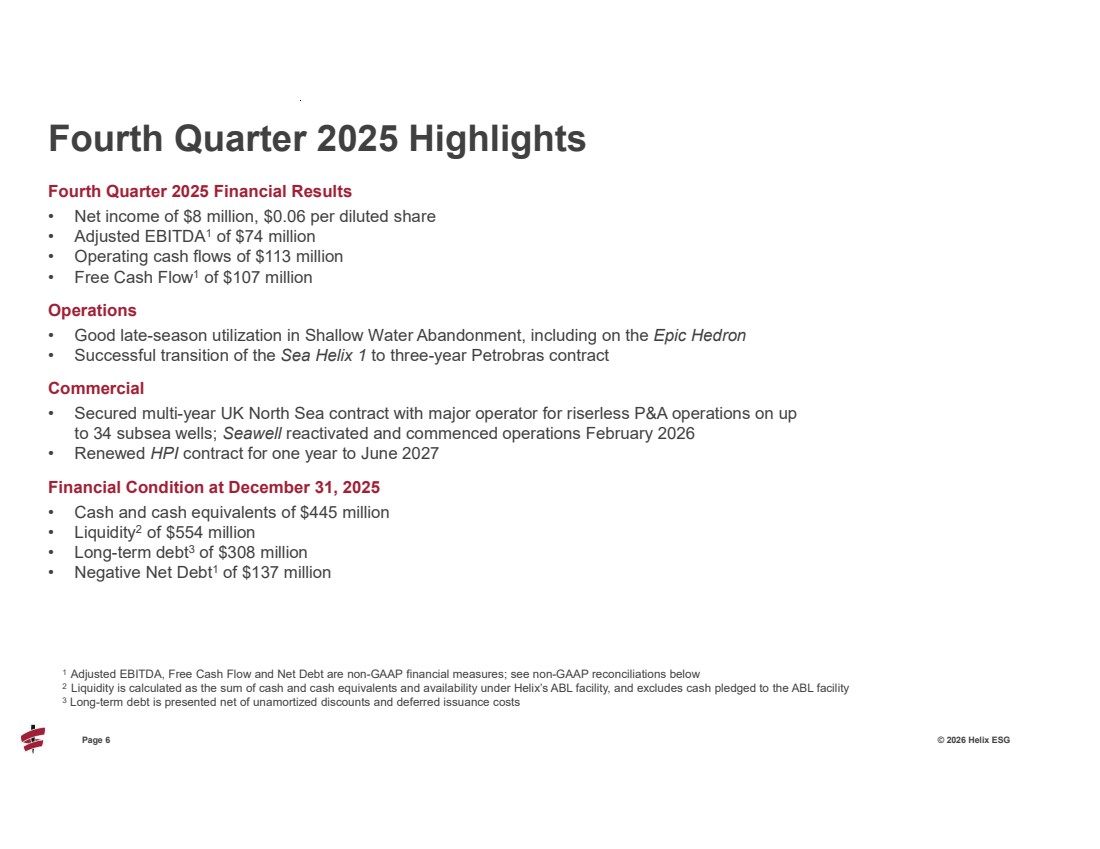
| Page 6 © 2026 Helix ESG Fourth Quarter 2025 Financial Results • Net income of $8 million, $0.06 per diluted share • Adjusted EBITDA1 of $74 million • Operating cash flows of $113 million • Free Cash Flow1 of $107 million Operations • Good late-season utilization in Shallow Water Abandonment, including on the Epic Hedron • Successful transition of the Sea Helix 1 to three-year Petrobras contract Commercial • Secured multi-year UK North Sea contract with major operator for riserless P&A operations on up to 34 subsea wells; Seawell reactivated and commenced operations February 2026 • Renewed HPI contract for one year to June 2027 Financial Condition at December 31, 2025 • Cash and cash equivalents of $445 million • Liquidity2 of $554 million • Long-term debt3 of $308 million • Negative Net Debt1 of $137 million Fourth Quarter 2025 Highlights 1 Adjusted EBITDA, Free Cash Flow and Net Debt are non-GAAP financial measures; see non-GAAP reconciliations below 2 Liquidity is calculated as the sum of cash and cash equivalents and availability under Helix’s ABL facility, and excludes cash pledged to the ABL facility 3 Long-term debt is presented net of unamortized discounts and deferred issuance costs |
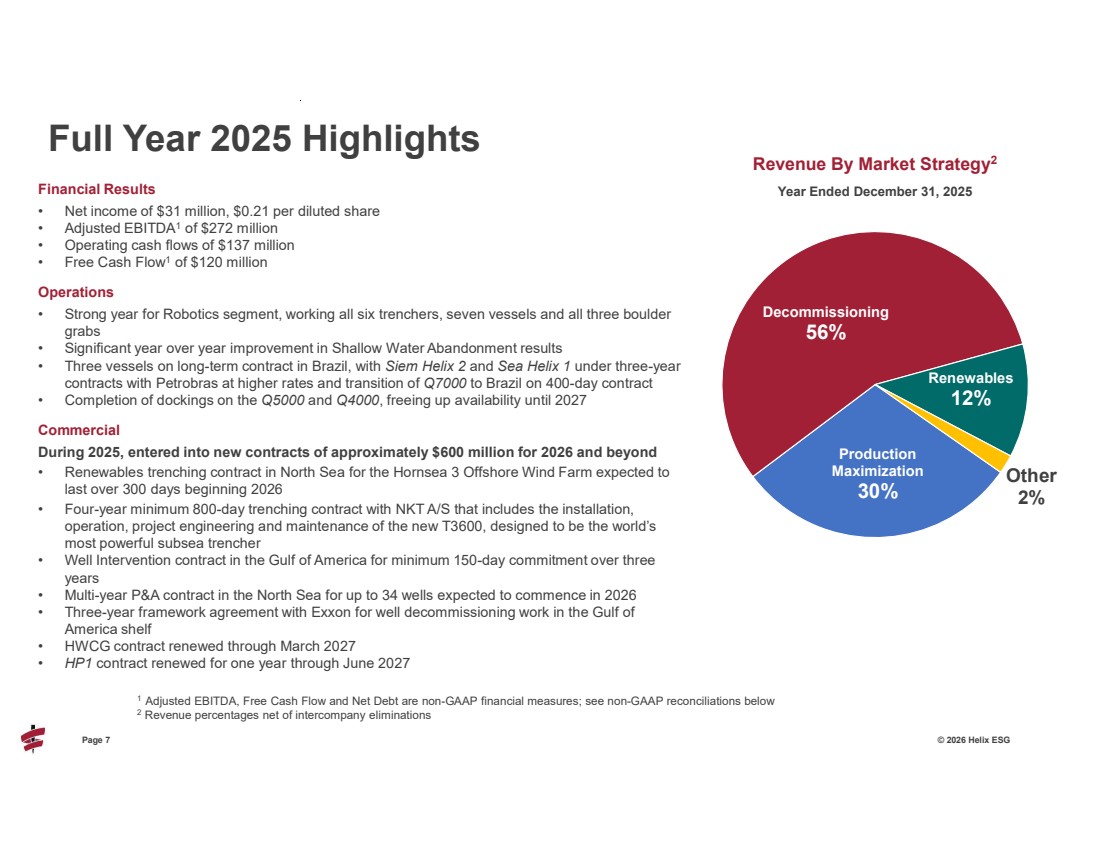
| Page 7 © 2026 Helix ESG Financial Results • Net income of $31 million, $0.21 per diluted share • Adjusted EBITDA1 of $272 million • Operating cash flows of $137 million • Free Cash Flow1 of $120 million Operations • Strong year for Robotics segment, working all six trenchers, seven vessels and all three boulder grabs • Significant year over year improvement in Shallow Water Abandonment results • Three vessels on long-term contract in Brazil, with Siem Helix 2 and Sea Helix 1 under three-year contracts with Petrobras at higher rates and transition of Q7000 to Brazil on 400-day contract • Completion of dockings on the Q5000 and Q4000, freeing up availability until 2027 Commercial During 2025, entered into new contracts of approximately $600 million for 2026 and beyond • Renewables trenching contract in North Sea for the Hornsea 3 Offshore Wind Farm expected to last over 300 days beginning 2026 • Four-year minimum 800-day trenching contract with NKT A/S that includes the installation, operation, project engineering and maintenance of the new T3600, designed to be the world’s most powerful subsea trencher • Well Intervention contract in the Gulf of America for minimum 150-day commitment over three years • Multi-year P&A contract in the North Sea for up to 34 wells expected to commence in 2026 • Three-year framework agreement with Exxon for well decommissioning work in the Gulf of America shelf • HWCG contract renewed through March 2027 • HP1 contract renewed for one year through June 2027 Full Year 2025 Highlights 1 Adjusted EBITDA, Free Cash Flow and Net Debt are non-GAAP financial measures; see non-GAAP reconciliations below 2 Revenue percentages net of intercompany eliminations Production Maximization 30% Decommissioning 56% Renewables 12% Other 2% Revenue By Market Strategy2 Year Ended December 31, 2025 |
| Operational Highlights |
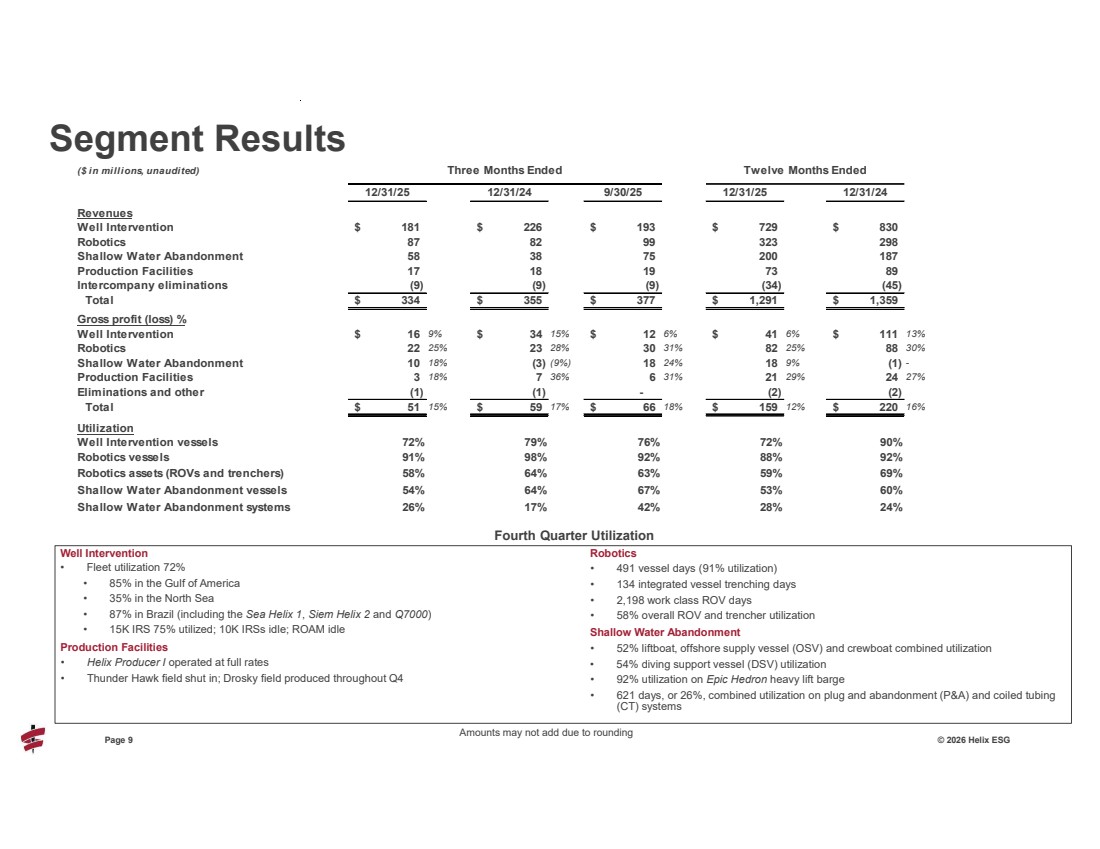
| 9 Page 9 © 2026 Helix ESG Well Intervention • Fleet utilization 72% • 85% in the Gulf of America • 35% in the North Sea • 87% in Brazil (including the Sea Helix 1, Siem Helix 2 and Q7000) • 15K IRS 75% utilized; 10K IRSs idle; ROAM idle Production Facilities • Helix Producer I operated at full rates • Thunder Hawk field shut in; Drosky field produced throughout Q4 Robotics • 491 vessel days (91% utilization) • 134 integrated vessel trenching days • 2,198 work class ROV days • 58% overall ROV and trencher utilization Shallow Water Abandonment • 52% liftboat, offshore supply vessel (OSV) and crewboat combined utilization • 54% diving support vessel (DSV) utilization • 92% utilization on Epic Hedron heavy lift barge • 621 days, or 26%, combined utilization on plug and abandonment (P&A) and coiled tubing (CT) systems Segment Results ($ in millions, unaudited) Three Months Ended Twelve Months Ended 12/31/25 12/31/24 9/30/25 12/31/25 12/31/24 Revenues Well Intervention 181 $ 226 $ 193 $ 729 $ 830 $ Robotics 87 82 99 323 298 Shallow Water Abandonment 58 38 75 200 187 Production Facilities 17 18 19 73 89 Intercompany eliminations (9) (9) (9) (34) (45) Total 334 $ 355 $ 377 $ 1,291 $ 1,359 $ Gross profit (loss) % Well Intervention 16 $ 9% $ 34 15% $ 12 6% $ 41 6% $ 111 13% Robotics 22 25% 23 28% 30 31% 82 25% 88 30% Shallow Water Abandonment 10 18% (3) (9%) 18 24% 18 9% (1) - Production Facilities 3 18% 7 36% 6 31% 21 29% 24 27% Eliminations and other (1) (1) - (2) (2) Total 51 $ 15% $ 59 17% $ 66 18% $ 159 12% $ 220 16% Utilization Well Intervention vessels 72% 79% 76% 72% 90% Robotics vessels 91% 98% 92% 88% 92% Robotics assets (ROVs and trenchers) 58% 64% 63% 59% 69% Shallow Water Abandonment vessels 54% 64% 67% 53% 60% Shallow Water Abandonment systems 26% 17% 42% 28% 24% Amounts may not add due to rounding Fourth Quarter Utilization |
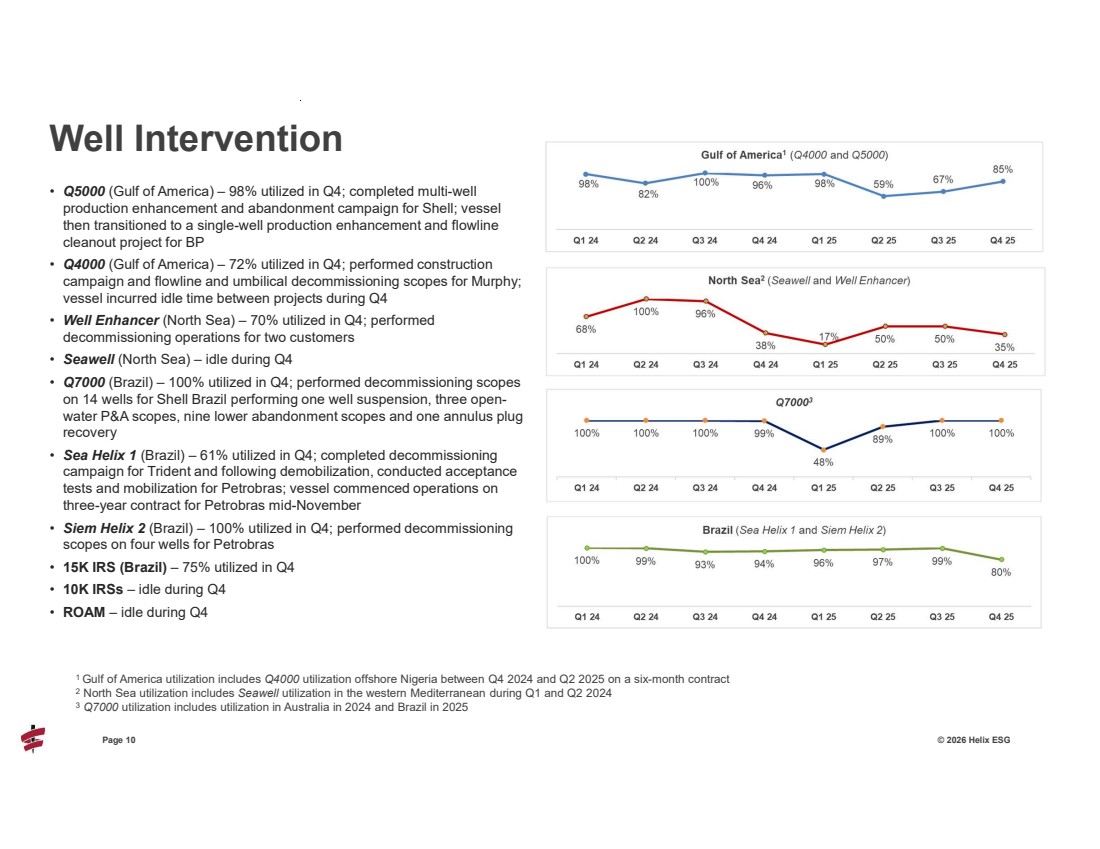
| 10 Page 10 © 2026 Helix ESG • Q5000 (Gulf of America) – 98% utilized in Q4; completed multi-well production enhancement and abandonment campaign for Shell; vessel then transitioned to a single-well production enhancement and flowline cleanout project for BP • Q4000 (Gulf of America) – 72% utilized in Q4; performed construction campaign and flowline and umbilical decommissioning scopes for Murphy; vessel incurred idle time between projects during Q4 • Well Enhancer (North Sea) – 70% utilized in Q4; performed decommissioning operations for two customers • Seawell (North Sea) – idle during Q4 • Q7000 (Brazil) – 100% utilized in Q4; performed decommissioning scopes on 14 wells for Shell Brazil performing one well suspension, three open-water P&A scopes, nine lower abandonment scopes and one annulus plug recovery • Sea Helix 1 (Brazil) – 61% utilized in Q4; completed decommissioning campaign for Trident and following demobilization, conducted acceptance tests and mobilization for Petrobras; vessel commenced operations on three-year contract for Petrobras mid-November • Siem Helix 2 (Brazil) – 100% utilized in Q4; performed decommissioning scopes on four wells for Petrobras • 15K IRS (Brazil) – 75% utilized in Q4 • 10K IRSs – idle during Q4 • ROAM – idle during Q4 Well Intervention 1 Gulf of America utilization includes Q4000 utilization offshore Nigeria between Q4 2024 and Q2 2025 on a six-month contract 2 North Sea utilization includes Seawell utilization in the western Mediterranean during Q1 and Q2 2024 3 Q7000 utilization includes utilization in Australia in 2024 and Brazil in 2025 |
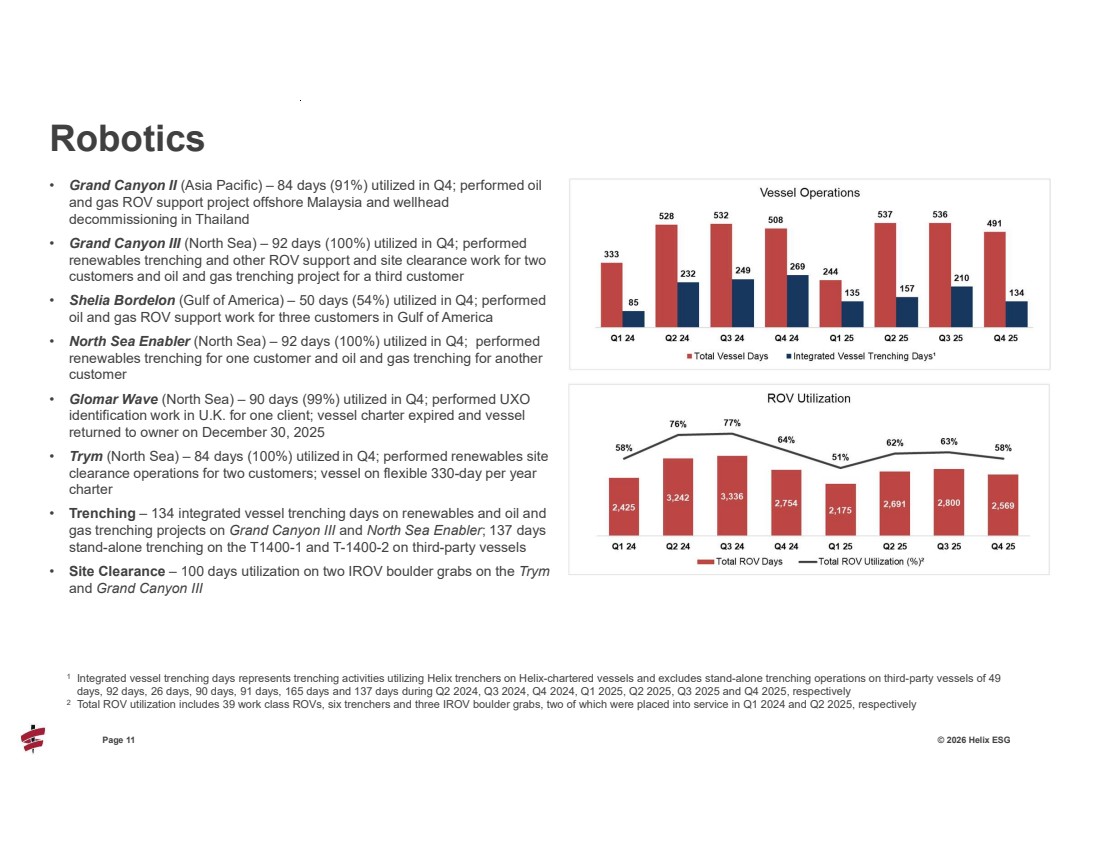
| 11 Page 11 © 2026 Helix ESG • Grand Canyon II (Asia Pacific) – 84 days (91%) utilized in Q4; performed oil and gas ROV support project offshore Malaysia and wellhead decommissioning in Thailand • Grand Canyon III (North Sea) – 92 days (100%) utilized in Q4; performed renewables trenching and other ROV support and site clearance work for two customers and oil and gas trenching project for a third customer • Shelia Bordelon (Gulf of America) – 50 days (54%) utilized in Q4; performed oil and gas ROV support work for three customers in Gulf of America • North Sea Enabler (North Sea) – 92 days (100%) utilized in Q4; performed renewables trenching for one customer and oil and gas trenching for another customer • Glomar Wave (North Sea) – 90 days (99%) utilized in Q4; performed UXO identification work in U.K. for one client; vessel charter expired and vessel returned to owner on December 30, 2025 • Trym (North Sea) – 84 days (100%) utilized in Q4; performed renewables site clearance operations for two customers; vessel on flexible 330-day per year charter • Trenching – 134 integrated vessel trenching days on renewables and oil and gas trenching projects on Grand Canyon III and North Sea Enabler; 137 days stand-alone trenching on the T1400-1 and T-1400-2 on third-party vessels • Site Clearance – 100 days utilization on two IROV boulder grabs on the Trym and Grand Canyon III Robotics 1 Integrated vessel trenching days represents trenching activities utilizing Helix trenchers on Helix-chartered vessels and excludes stand-alone trenching operations on third-party vessels of 49 days, 92 days, 26 days, 90 days, 91 days, 165 days and 137 days during Q2 2024, Q3 2024, Q4 2024, Q1 2025, Q2 2025, Q3 2025 and Q4 2025, respectively 2 Total ROV utilization includes 39 work class ROVs, six trenchers and three IROV boulder grabs, two of which were placed into service in Q1 2024 and Q2 2025, respectively |
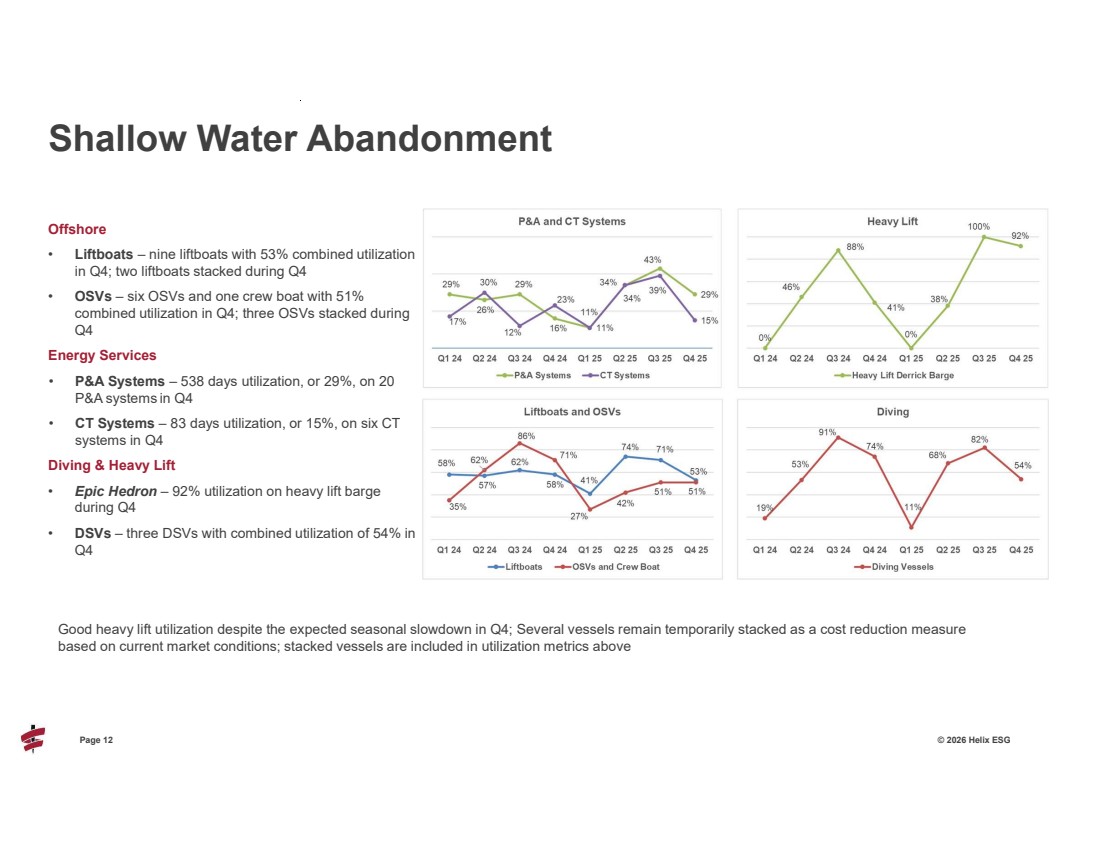
| Page 12 © 2026 Helix ESG Good heavy lift utilization despite the expected seasonal slowdown in Q4; Several vessels remain temporarily stacked as a cost reduction measure based on current market conditions; stacked vessels are included in utilization metrics above Shallow Water Abandonment Offshore • Liftboats – nine liftboats with 53% combined utilization in Q4; two liftboats stacked during Q4 • OSVs – six OSVs and one crew boat with 51% combined utilization in Q4; three OSVs stacked during Q4 Energy Services • P&A Systems – 538 days utilization, or 29%, on 20 P&A systems in Q4 • CT Systems – 83 days utilization, or 15%, on six CT systems in Q4 Diving & Heavy Lift • Epic Hedron – 92% utilization on heavy lift barge during Q4 • DSVs – three DSVs with combined utilization of 54% in Q4 |
| Key Financial Metrics and Outlook |
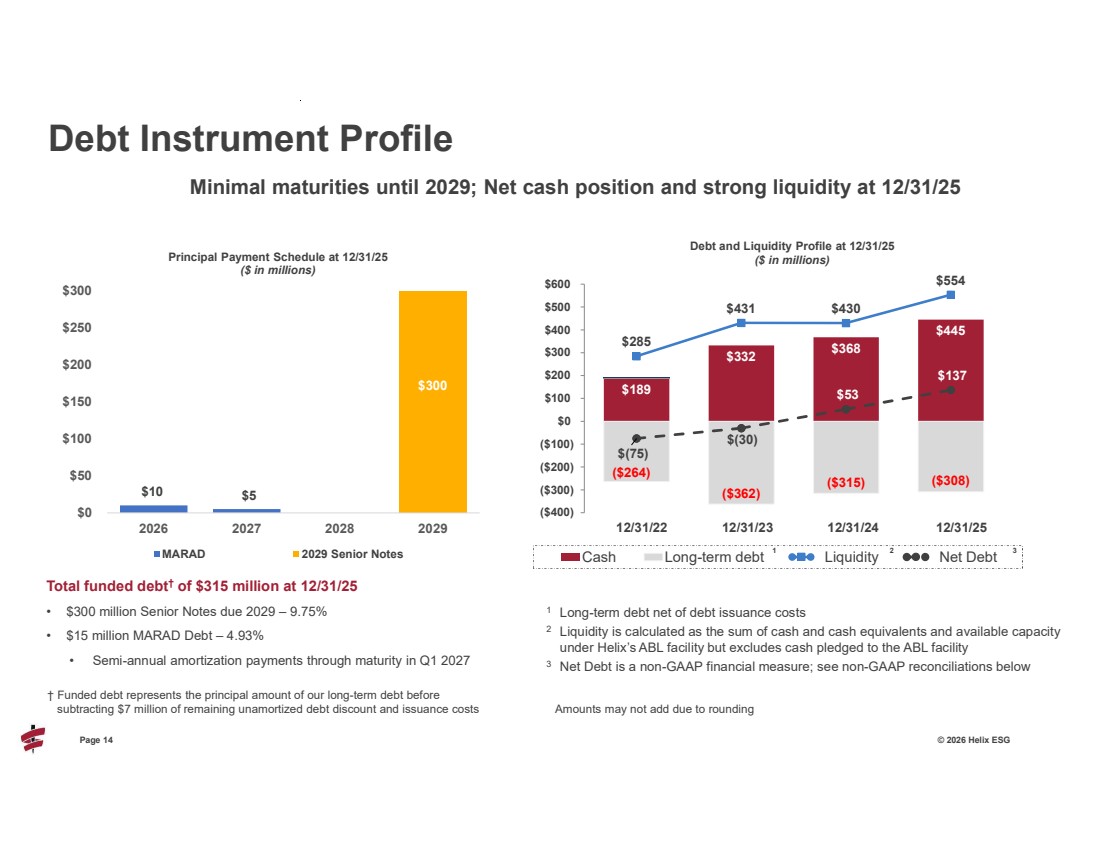
| Page 14 © 2026 Helix ESG Total funded debt† of $315 million at 12/31/25 • $300 million Senior Notes due 2029 – 9.75% • $15 million MARAD Debt – 4.93% • Semi-annual amortization payments through maturity in Q1 2027 Debt Instrument Profile † Funded debt represents the principal amount of our long-term debt before subtracting $7 million of remaining unamortized debt discount and issuance costs $10 $5 $300 $0 $50 $100 $150 $200 $250 $300 2026 2027 2028 2029 Principal Payment Schedule at 12/31/25 ($ in millions) MARAD 2029 Senior Notes $189 $332 $368 $445 ($264) ($362) ($315) ($308) $285 $431 $430 $554 $(75) $(30) $53 $137 ($400) ($300) ($200) ($100) $0 $100 $200 $300 $400 $500 $600 Cash Long-term debt Liquidity Net Debt 12/31/22 12/31/23 12/31/24 12/31/25 Debt and Liquidity Profile at 12/31/25 ($ in millions) 1 Long-term debt net of debt issuance costs 2 Liquidity is calculated as the sum of cash and cash equivalents and available capacity under Helix’s ABL facility but excludes cash pledged to the ABL facility 3 Net Debt is a non-GAAP financial measure; see non-GAAP reconciliations below 1 2 3 Amounts may not add due to rounding Minimal maturities until 2029; Net cash position and strong liquidity at 12/31/25 |
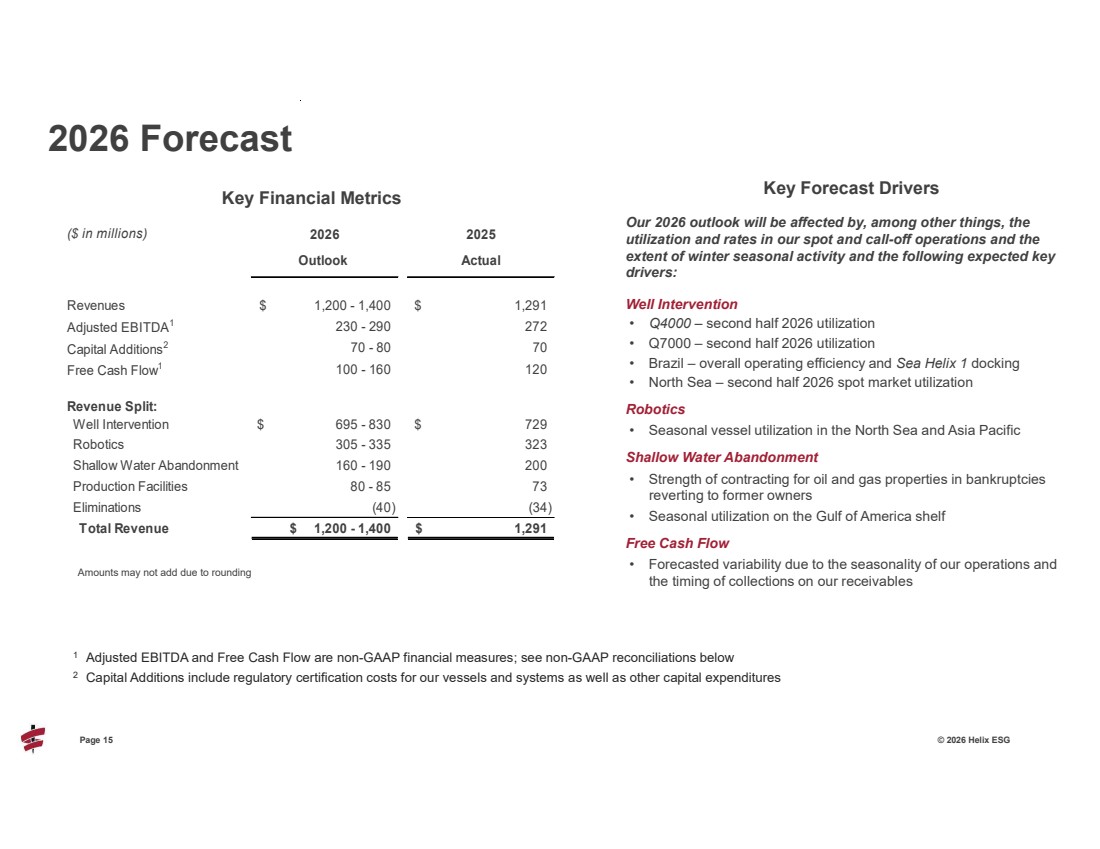
| Page 15 © 2026 Helix ESG Our 2026 outlook will be affected by, among other things, the utilization and rates in our spot and call-off operations and the extent of winter seasonal activity and the following expected key drivers: Well Intervention • Q4000 – second half 2026 utilization • Q7000 – second half 2026 utilization • Brazil – overall operating efficiency and Sea Helix 1 docking • North Sea – second half 2026 spot market utilization Robotics • Seasonal vessel utilization in the North Sea and Asia Pacific Shallow Water Abandonment • Strength of contracting for oil and gas properties in bankruptcies reverting to former owners • Seasonal utilization on the Gulf of America shelf Free Cash Flow • Forecasted variability due to the seasonality of our operations and the timing of collections on our receivables 2026 Forecast ($ in millions) 2026 2025 Outlook Actual Revenues $ 1,200 - 1,400 1,291 $ Adjusted EBITDA1 230 - 290 272 Capital Additions2 70 - 80 70 Free Cash Flow1 100 - 160 120 Revenue Split: Well Intervention $ 695 - 830 729 $ Robotics 305 - 335 323 Shallow Water Abandonment 160 - 190 200 Production Facilities 80 - 85 73 Eliminations (40) (34) Total Revenue $ 1,200 - 1,400 1,291 $ 1 Adjusted EBITDA and Free Cash Flow are non-GAAP financial measures; see non-GAAP reconciliations below 2 Capital Additions include regulatory certification costs for our vessels and systems as well as other capital expenditures Key Financial Metrics Key Forecast Drivers Amounts may not add due to rounding |
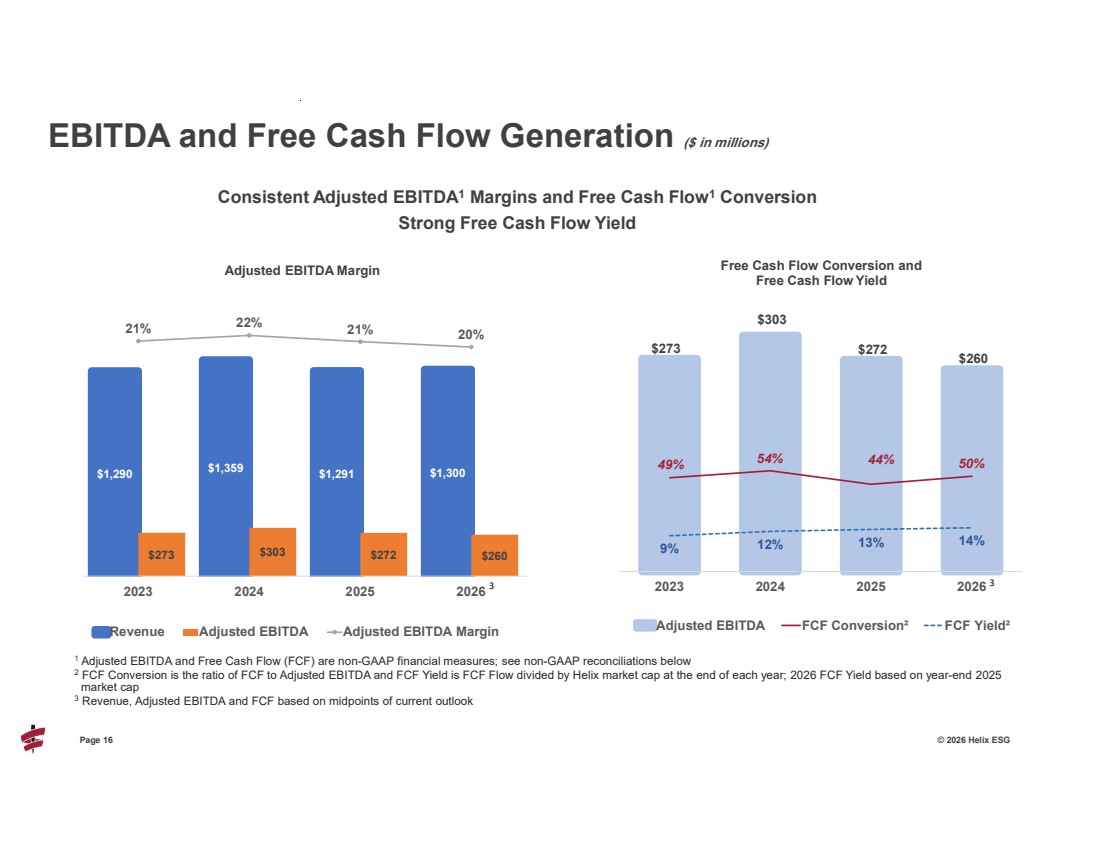
| Page 16 © 2026 Helix ESG EBITDA and Free Cash Flow Generation ($ in millions) $1,290 $1,359 $1,291 $1,300 $273 $303 $272 $260 21% 22% 21% 20% -25% -20% -15% -10% -5% 0% 5% 10% 15% 20% 25% $0 $200 $400 $600 $800 $1,000 $1,200 $1,400 $1,600 2023 2024 2025 2026 Revenue Adjusted EBITDA Adjusted EBITDA Margin Adjusted EBITDA Margin $273 $303 $272 $260 49% 54% 44% 50% 9% 12% 13% 14% -30% -10% 10% 30% 50% 70% 90% 110% 130% 150% $(25) $25 $75 $125 $175 $225 $275 $325 2023 2024 2025 2026 Free Cash Flow Conversion and Free Cash Flow Yield Adjusted EBITDA FCF Conversion² FCF Yield² 3 Consistent Adjusted EBITDA1 Margins and Free Cash Flow1 Conversion Strong Free Cash Flow Yield 1 Adjusted EBITDA and Free Cash Flow (FCF) are non-GAAP financial measures; see non-GAAP reconciliations below 2 FCF Conversion is the ratio of FCF to Adjusted EBITDA and FCF Yield is FCF Flow divided by Helix market cap at the end of each year; 2026 FCF Yield based on year-end 2025 market cap 3 Revenue, Adjusted EBITDA and FCF based on midpoints of current outlook 3 |
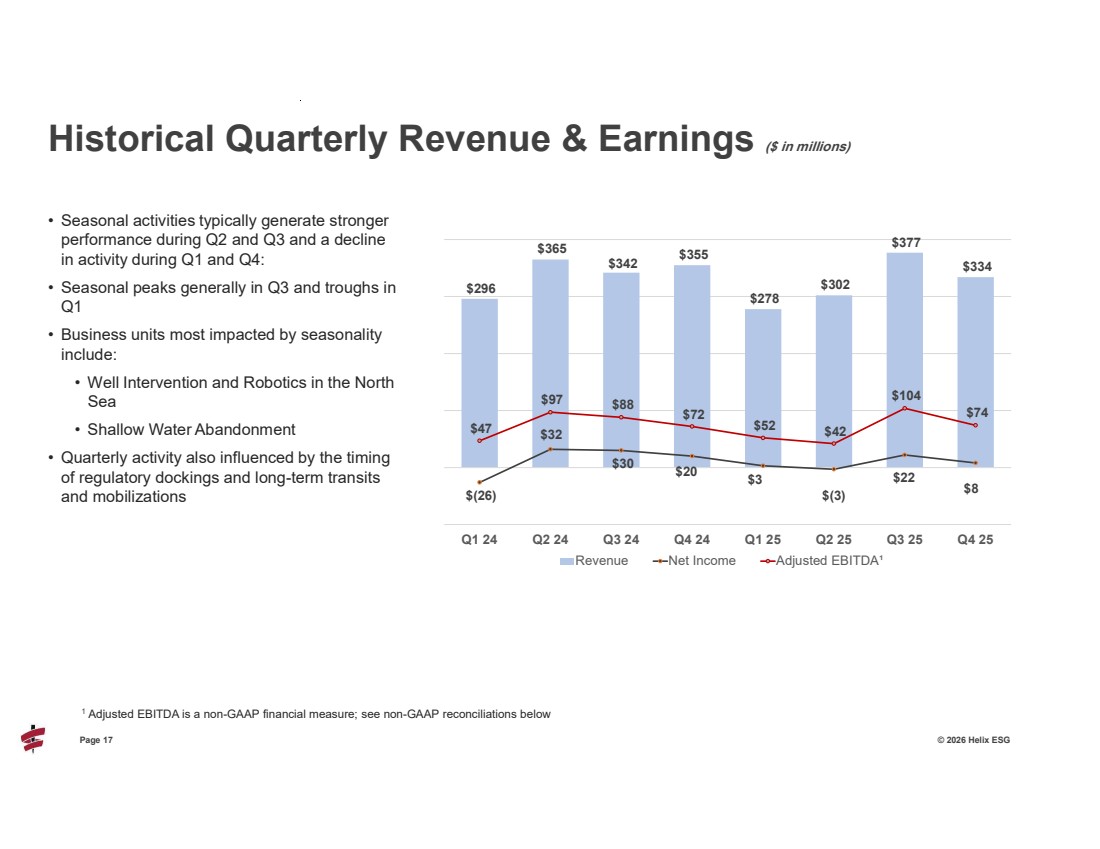
| Page 17 © 2026 Helix ESG • Seasonal activities typically generate stronger performance during Q2 and Q3 and a decline in activity during Q1 and Q4: • Seasonal peaks generally in Q3 and troughs in Q1 • Business units most impacted by seasonality include: • Well Intervention and Robotics in the North Sea • Shallow Water Abandonment • Quarterly activity also influenced by the timing of regulatory dockings and long-term transits and mobilizations Historical Quarterly Revenue & Earnings ($ in millions) 1 Adjusted EBITDA is a non-GAAP financial measure; see non-GAAP reconciliations below $296 $365 $342 $355 $278 $302 $377 $334 $(26) $32 $30 $20 $3 $(3) $22 $8 $47 $97 $88 $72 $52 $42 $104 $74 Q1 24 Q2 24 Q3 24 Q4 24 Q1 25 Q2 25 Q3 25 Q4 25 Revenue Net Income Adjusted EBITDA¹ |
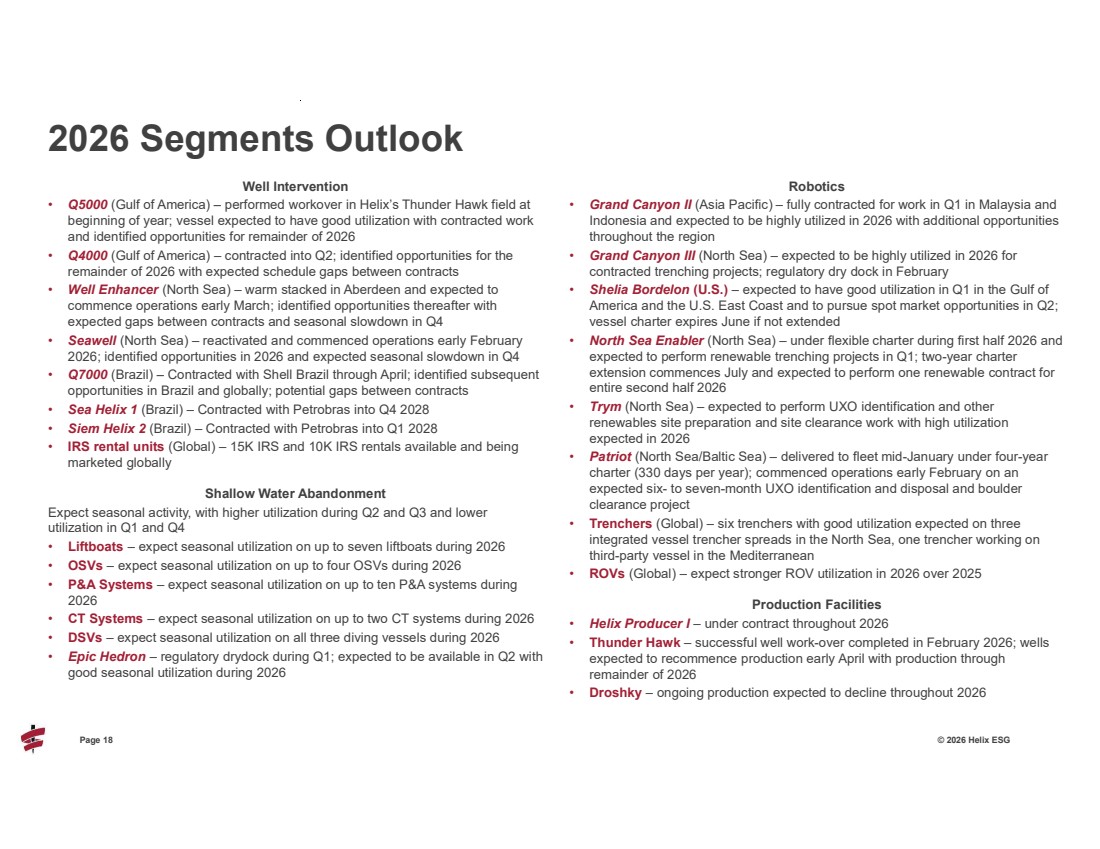
| Page 18 © 2026 Helix ESG Well Intervention • Q5000 (Gulf of America) – performed workover in Helix’s Thunder Hawk field at beginning of year; vessel expected to have good utilization with contracted work and identified opportunities for remainder of 2026 • Q4000 (Gulf of America) – contracted into Q2; identified opportunities for the remainder of 2026 with expected schedule gaps between contracts • Well Enhancer (North Sea) – warm stacked in Aberdeen and expected to commence operations early March; identified opportunities thereafter with expected gaps between contracts and seasonal slowdown in Q4 • Seawell (North Sea) – reactivated and commenced operations early February 2026; identified opportunities in 2026 and expected seasonal slowdown in Q4 • Q7000 (Brazil) – Contracted with Shell Brazil through April; identified subsequent opportunities in Brazil and globally; potential gaps between contracts • Sea Helix 1 (Brazil) – Contracted with Petrobras into Q4 2028 • Siem Helix 2 (Brazil) – Contracted with Petrobras into Q1 2028 • IRS rental units (Global) – 15K IRS and 10K IRS rentals available and being marketed globally Shallow Water Abandonment Expect seasonal activity, with higher utilization during Q2 and Q3 and lower utilization in Q1 and Q4 • Liftboats – expect seasonal utilization on up to seven liftboats during 2026 • OSVs – expect seasonal utilization on up to four OSVs during 2026 • P&A Systems – expect seasonal utilization on up to ten P&A systems during 2026 • CT Systems – expect seasonal utilization on up to two CT systems during 2026 • DSVs – expect seasonal utilization on all three diving vessels during 2026 • Epic Hedron – regulatory drydock during Q1; expected to be available in Q2 with good seasonal utilization during 2026 Robotics • Grand Canyon II (Asia Pacific) – fully contracted for work in Q1 in Malaysia and Indonesia and expected to be highly utilized in 2026 with additional opportunities throughout the region • Grand Canyon III (North Sea) – expected to be highly utilized in 2026 for contracted trenching projects; regulatory dry dock in February • Shelia Bordelon (U.S.) – expected to have good utilization in Q1 in the Gulf of America and the U.S. East Coast and to pursue spot market opportunities in Q2; vessel charter expires June if not extended • North Sea Enabler (North Sea) – under flexible charter during first half 2026 and expected to perform renewable trenching projects in Q1; two-year charter extension commences July and expected to perform one renewable contract for entire second half 2026 • Trym (North Sea) – expected to perform UXO identification and other renewables site preparation and site clearance work with high utilization expected in 2026 • Patriot (North Sea/Baltic Sea) – delivered to fleet mid-January under four-year charter (330 days per year); commenced operations early February on an expected six- to seven-month UXO identification and disposal and boulder clearance project • Trenchers (Global) – six trenchers with good utilization expected on three integrated vessel trencher spreads in the North Sea, one trencher working on third-party vessel in the Mediterranean • ROVs (Global) – expect stronger ROV utilization in 2026 over 2025 Production Facilities • Helix Producer I – under contract throughout 2026 • Thunder Hawk – successful well work-over completed in February 2026; wells expected to recommence production early April with production through remainder of 2026 • Droshky – ongoing production expected to decline throughout 2026 2026 Segments Outlook |
| Page 19 © 2026 Helix ESG 2026 Capital additions1 are forecasted at approximately $70 – $80 million: • Approximately $40 – $45 million for regulatory certification costs for our vessels and systems, reported in operating cash flows • Approximately $30 – $35 million for capital expenditures, reported in investing cash flows Free Cash Flow2 • Free Cash Flow outlook includes approximately $70 – $80 million of capital spending, $30 million of gross cash interest expense, and cash income taxes expected between $20 – $30 million • Working capital expected to be impacted by seasonality and timing of collections from customers Balance Sheet • No significant debt maturities until 2029 • Targeting 25% of Free Cash Flow for share repurchases Capital Additions, Cash Flow and Balance Sheet 1 Capital additions represents accrued capital additions; total cash capital spending may differ depending on the timing of capital spending payments 2 Free Cash Flow is a non-GAAP financial measure; see non-GAAP reconciliations below |
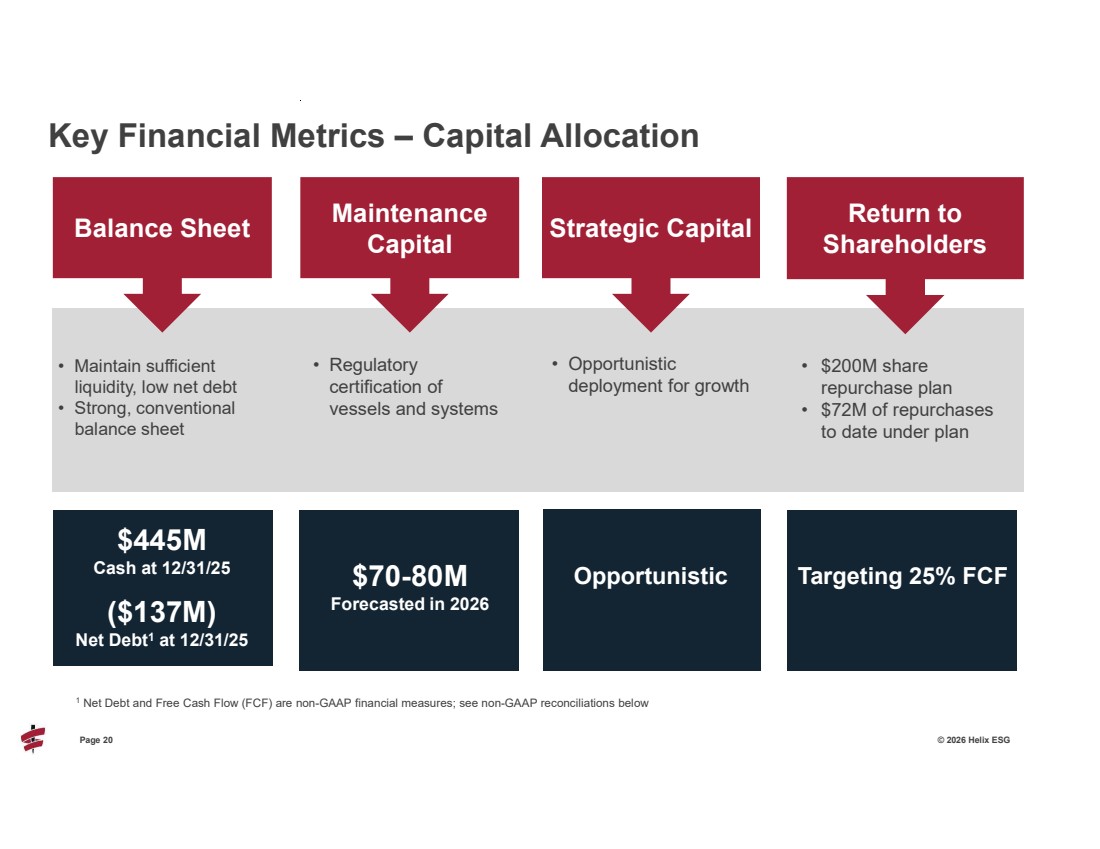
| Page 20 © 2026 Helix ESG Key Financial Metrics – Capital Allocation Strategic Capital • Opportunistic deployment for growth Return to Shareholders • $200M share repurchase plan • $72M of repurchases to date under plan Maintenance Capital • Regulatory certification of vessels and systems Balance Sheet • Maintain sufficient liquidity, low net debt • Strong, conventional balance sheet $445M Cash at 12/31/25 ($137M) Net Debt1 at 12/31/25 $70-80M Targeting 25% FCF Forecasted in 2026 Opportunistic 1 Net Debt and Free Cash Flow (FCF) are non-GAAP financial measures; see non-GAAP reconciliations below |
| Non-GAAP Reconciliations and Other Financial Information |
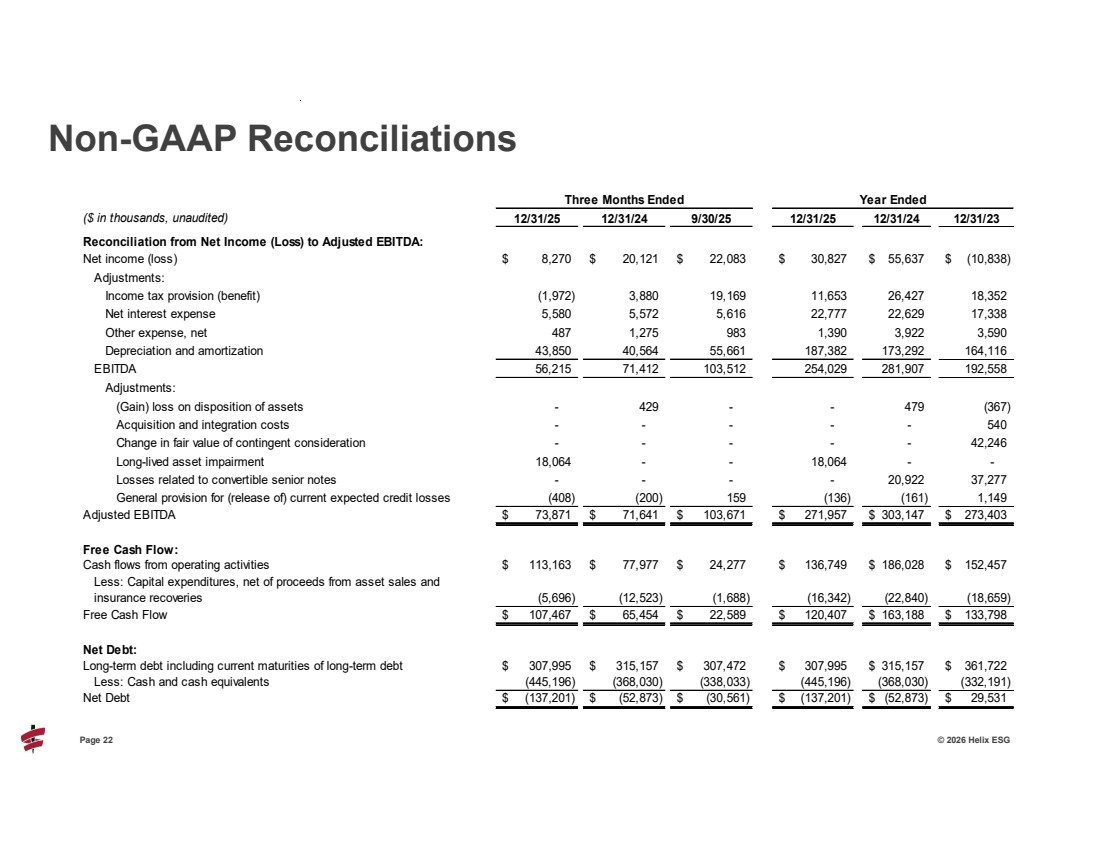
| Page 22 © 2026 Helix ESG Non-GAAP Reconciliations ($ in thousands, unaudited) 12/31/25 12/31/24 9/30/25 12/31/25 12/31/24 12/31/23 Reconciliation from Net Income (Loss) to Adjusted EBITDA: Net income (loss) 8,270 $ 20,121 $ 22,083 $ 30,827 $ 55,637 $ (10,838) $ Adjustments: Income tax provision (benefit) (1,972) 3,880 19,169 11,653 26,427 18,352 Net interest expense 5,580 5,572 5,616 22,777 22,629 17,338 Other expense, net 487 1,275 983 1,390 3,922 3,590 Depreciation and amortization 43,850 40,564 55,661 187,382 173,292 164,116 EBITDA 56,215 71,412 103,512 254,029 281,907 192,558 Adjustments: (Gain) loss on disposition of assets - 429 - - 479 (367) Acquisition and integration costs - - - - - 540 Change in fair value of contingent consideration - - - - - 42,246 Long-lived asset impairment 18,064 - - 18,064 - - Losses related to convertible senior notes - - - - 20,922 37,277 General provision for (release of) current expected credit losses (408) (200) 159 (136) (161) 1,149 Adjusted EBITDA 73,871 $ 71,641 $ 103,671 $ 271,957 $ 303,147 $ 273,403 $ Free Cash Flow: Cash flows from operating activities 113,163 $ 77,977 $ 24,277 $ 136,749 $ 186,028 $ 152,457 $ Less: Capital expenditures, net of proceeds from asset sales and insurance recoveries (5,696) (12,523) (1,688) (16,342) (22,840) (18,659) Free Cash Flow 107,467 $ 65,454 $ 22,589 $ 120,407 $ 163,188 $ 133,798 $ Net Debt: Long-term debt including current maturities of long-term debt 307,995 $ 315,157 $ 307,472 $ 307,995 $ 315,157 $ 361,722 $ Less: Cash and cash equivalents (445,196) (368,030) (338,033) (445,196) (368,030) (332,191) Net Debt (137,201) $ (52,873) $ (30,561) $ (137,201) $ (52,873) $ 29,531 $ Three Months Ended Year Ended |
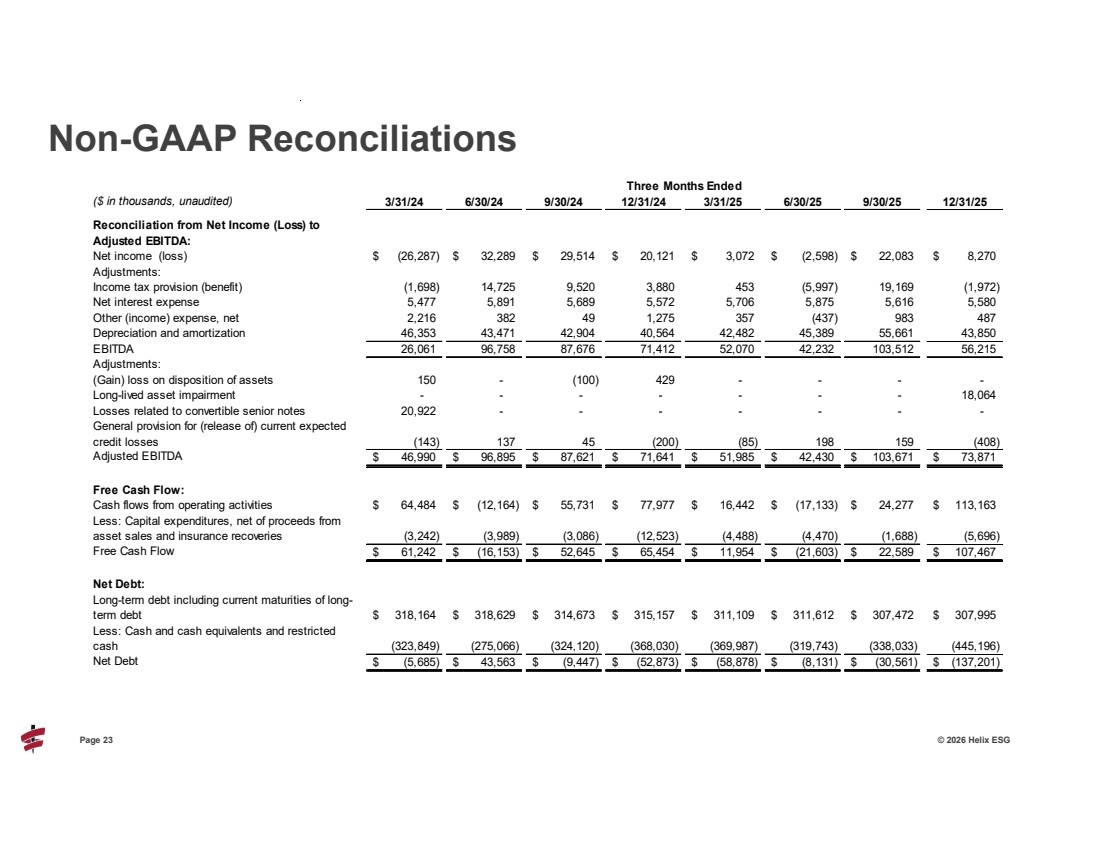
| Page 23 © 2026 Helix ESG Non-GAAP Reconciliations ($ in thousands, unaudited) 3/31/24 6/30/24 9/30/24 12/31/24 3/31/25 6/30/25 9/30/25 12/31/25 Reconciliation from Net Income (Loss) to Adjusted EBITDA: Net income (loss) (26,287) $ 32,289 $ 29,514 $ 20,121 $ 3,072 $ (2,598) $ 22,083 $ 8,270 $ Adjustments: Income tax provision (benefit) (1,698) 14,725 9,520 3,880 453 (5,997) 19,169 (1,972) Net interest expense 5,477 5,891 5,689 5,572 5,706 5,875 5,616 5,580 Other (income) expense, net 2,216 382 49 1,275 357 (437) 983 487 Depreciation and amortization 46,353 43,471 42,904 40,564 42,482 45,389 55,661 43,850 EBITDA 26,061 96,758 87,676 71,412 52,070 42,232 103,512 56,215 Adjustments: (Gain) loss on disposition of assets 150 - (100) 429 - - - - Long-lived asset impairment - - - - - - - 18,064 Losses related to convertible senior notes 20,922 - - - - - - - General provision for (release of) current expected credit losses (143) 137 45 (200) (85) 198 159 (408) Adjusted EBITDA $ 96,895 46,990 $ 87,621 $ 71,641 $ 51,985 $ 42,430 $ 103,671 $ 73,871 $ Free Cash Flow: Cash flows from operating activities 64,484 $ (12,164) $ 55,731 $ 77,977 $ 16,442 $ (17,133) $ 24,277 $ 113,163 $ Less: Capital expenditures, net of proceeds from asset sales and insurance recoveries (3,242) (3,989) (3,086) (12,523) (4,488) (4,470) (1,688) (5,696) Free Cash Flow $ (16,153) 61,242 $ 52,645 $ 65,454 $ 11,954 $ (21,603) $ 22,589 $ 107,467 $ Net Debt: Long-term debt including current maturities of long-term debt 318,164 $ 318,629 $ 314,673 $ 315,157 $ 311,109 $ 311,612 $ 307,472 $ 307,995 $ Less: Cash and cash equivalents and restricted cash (323,849) (275,066) (324,120) (368,030) (369,987) (319,743) (338,033) (445,196) Net Debt $ 43,563 (5,685) $ (9,447) $ (52,873) $ (58,878) $ (8,131) $ (30,561) $ (137,201) $ Three Months Ended |
| Page 24 © 2026 Helix ESG Non-GAAP Financial Measures We define EBITDA as earnings before income taxes, net interest expense, net other income or expense, and depreciation and amortization expense. To arrive at our measure of Adjusted EBITDA, we exclude gains or losses on disposition of assets, long-lived asset impairment losses, acquisition and integration costs, gains or losses related to convertible senior notes, the change in fair value of contingent consideration and the general provision for (release of) current expected credit losses, if any. We define Free Cash Flow as cash flows from operating activities less capital expenditures, net of proceeds from asset sales and insurance recoveries (related to property and equipment), if any. Net debt is calculated as long-term debt including current maturities of long-term debt less cash and cash equivalents and restricted cash. We use EBITDA, Adjusted EBITDA, Free Cash Flow and Net Debt to monitor and facilitate internal evaluation of the performance of our business operations, to facilitate external comparison of our business results to those of others in our industry, to analyze and evaluate financial and strategic planning decisions regarding future investments and acquisitions, to plan and evaluate operating budgets, and in certain cases, to report our results to the holders of our debt as required by our debt covenants. We believe that our measures of EBITDA, Adjusted EBITDA, Free Cash Flow and Net Debt provide useful information to the public regarding our operating performance and ability to service debt and fund capital expenditures and may help our investors understand and compare our results to other companies that have different financing, capital and tax structures. Other companies may calculate their measures of EBITDA, Adjusted EBITDA, Free Cash Flow and Net Debt differently from the way we do, which may limit their usefulness as comparative measures. EBITDA, Adjusted EBITDA, Free Cash Flow and Net Debt should not be considered in isolation or as a substitute for, but instead are supplemental to, income from operations, net income, cash flows from operating activities, or other income or cash flow data prepared in accordance with GAAP. Users of this financial information should consider the types of events and transactions that are excluded from these measures. See reconciliation of the non-GAAP financial information presented in this press release to the most directly comparable financial information presented in accordance with GAAP. We have not provided reconciliations of forward-looking non-GAAP financial measures to comparable GAAP measures due to the challenges and impracticability with estimating some of the items without unreasonable effort, which amounts could be significant. Non-GAAP Reconciliations |
| 25 Page 25 © 2026 Helix ESG |