Hornbeck Offshore Services Third Quarter 2026 Earnings A Premier Integrated Offshore Services Company November 5, 2026 .2
Disclaimer Cautionary Note Regarding Forward-Looking Statements This presentation contains forward-looking statements within the meaning of the Private Securities Litigation Reform Act of 1995. All statements other than statements of present or historical fact included in this presentation are forward-looking statements. Words such as “anticipate,” “believe,” “expect,” “intend,” “may,” “plan,” “project,” “should,” “will” and similar expressions are intended to identify forward-looking statements, though not all forward-looking statements contain these identifying words, and the absence of these words does not mean that a statement is not forward-looking. Such forward-looking statements include, but are not limited to, statements regarding the combined company’s expectations, hopes, beliefs, intentions or strategies regarding the combined company’s growth and stockholder value; the timeline and ability to realize anticipated benefits and expected synergies of the merger; and the combined company’s anticipated financial and operating performance, business strategy and growth opportunities. Forward-looking statements are based on current expectations and assumptions and involve known and unknown risks, uncertainties and other important factors, many of which are beyond the combined company’s control, including, but not limited to, risks related to potential litigation relating to the merger, including the effects of any outcomes related thereto; the ability of the combined company to retain and hire key personnel, to retain customers or maintain relationships with Helix’s and Hornbeck’s respective suppliers and customers; the diversion of management’s time and attention from ordinary course of business operations to the integration of Helix’s and Hornbeck’s businesses and the ability to achieve the anticipated synergies and value creation contemplated by the merger; potential adverse reactions or changes to business relationships resulting from the completion of the merger; legislative, regulatory and economic developments; potential business uncertainty following completion of the merger that could affect the combined company’s financial performance, business and management strategies, expansion and growth; actions by governments, regulatory authorities, customers, suppliers and partners; market conditions; demand for services; the performance of contracts by suppliers, customers and partners; operating hazards and delays, including delays in delivery, chartering or customer acceptance of assets or the terms of their acceptance; complexities of global political and economic developments; the impact of general economic conditions, including inflation, on economic activity and on the combined company’s operations; the general volatility of oil and natural gas prices and cyclicality of the oil and gas industry; and other risks described from time to time in Helix’s and the combined company’s filings with the U.S. Securities and Exchange Commission (the “SEC”). Forward-looking statements speak only as of the date they are made. The forward-looking statements in this presentation are based upon information available to the combined company as of the date of this presentation and, while the combined company believes such information forms a reasonable basis for such statements, these statements are inherently uncertain, and you are cautioned not to unduly rely upon these statements. Actual outcomes may vary materially from those described in these statements. Additional information concerning these and other factors that may impact the operations and projections discussed herein can be found in Helix’s and the combined company’s filings with the SEC, including Helix’s Annual Report on Form 10-K for the fiscal year ended December 31, 2025, Helix’s subsequent Quarterly Reports on Form 10-Q and Helix’s Definitive Proxy Statement/Prospectus filed with the SEC on July 31, 2026. The combined company does not undertake, and specifically disclaims, any obligation to update any forward-looking statements to reflect events or circumstances occurring after the date of such statements, other than as may be required by applicable law or regulation. Non-GAAP Financial Measures This presentation contains certain financial measures not presented in accordance with U.S. generally accepted accounting principles (“GAAP”), including, but not limited to, EBITDA, Adjusted EBITDA, Adjusted Free Cash Flow and net debt. These non-GAAP financial measures are not measures of financial performance in accordance with GAAP and may exclude items that are significant in understanding and assessing the historical financial results of Helix and Hornbeck or the financial results of the combined company. Therefore, these measures should not be considered in isolation or as an alternative to net income, cash flows from operations or other measures of profitability, liquidity or performance under GAAP. You should be aware that the presentation of these measures may not be comparable to similarly titled measures used by other companies. A reconciliation of these non-GAAP financial measures to the most directly comparable GAAP measure is included in the Appendix to this presentation. The combined company’s management believes the non-GAAP financial measures contained in this presentation provide useful information to management and investors regarding certain financial and business trends relating to the combined company’s financial condition and results of operations. However, these non-GAAP financial measures are subject to inherent uncertainty and reflect the exercise of judgments by the combined company’s management about which items of expense and income are excluded or included in determining these non-GAAP financial measures. Please refer to the Appendix to this presentation for additional information about the items of expense and income that are included in determining the non-GAAP financial measures contained in this presentation and for a reconciliation of the non-GAAP financial measures contained in this presentation to the most directly comparable GAAP measure. For purposes of this presentation, the presentation of legacy Helix non-GAAP metrics has been aligned to Hornbeck’s historical calculation and presentation of such non-GAAP metrics and may therefore differ from Helix’s presentation of non-GAAP metrics elsewhere.
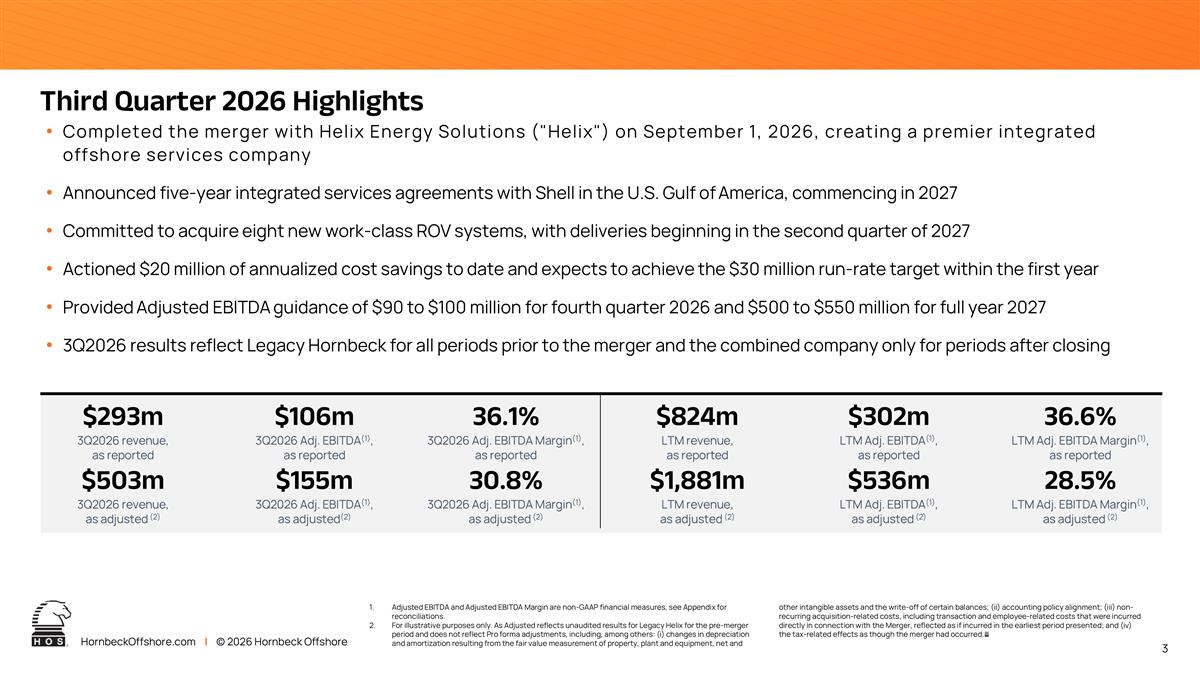
Third Quarter 2026 Highlights Adjusted EBITDA and Adjusted EBITDA Margin are non-GAAP financial measures, see Appendix for reconciliations. For illustrative purposes only. As Adjusted reflects unaudited results for Legacy Helix for the pre-merger period and does not reflect Pro forma adjustments, including, among others: (i) changes in depreciation and amortization resulting from the fair value measurement of property, plant and equipment, net and other intangible assets and the write-off of certain balances; (ii) accounting policy alignment; (iii) non-recurring acquisition-related costs, including transaction and employee-related costs that were incurred directly in connection with the Merger, reflected as if incurred in the earliest period presented; and (iv) the tax-related effects as though the merger had occurred.` Completed the merger with Helix Energy Solutions ("Helix") on September 1, 2026, creating a premier integrated offshore services company Announced five-year integrated services agreements with Shell in the U.S. Gulf of America, commencing in 2027 Committed to acquire eight new work-class ROV systems, with deliveries beginning in the second quarter of 2027 Actioned $20 million of annualized cost savings to date and expects to achieve the $30 million run-rate target within the first year Provided Adjusted EBITDA guidance of $90 to $100 million for fourth quarter 2026 and $500 to $550 million for full year 2027 3Q2026 results reflect Legacy Hornbeck for all periods prior to the merger and the combined company only for periods after closing $293m 3Q2026 revenue, as reported $503m 3Q2026 revenue, as adjusted (2) $106m 3Q2026 Adj. EBITDA(1), as reported $155m 3Q2026 Adj. EBITDA(1), as adjusted(2) 36.1% 3Q2026 Adj. EBITDA Margin(1), as reported 30.8% 3Q2026 Adj. EBITDA Margin(1), as adjusted (2) $302m LTM Adj. EBITDA(1), as reported $536m LTM Adj. EBITDA(1), as adjusted (2) 36.6% LTM Adj. EBITDA Margin(1), as reported 28.5% LTM Adj. EBITDA Margin(1), as adjusted (2) $824m LTM revenue, as reported $1,881m LTM revenue, as adjusted (2)
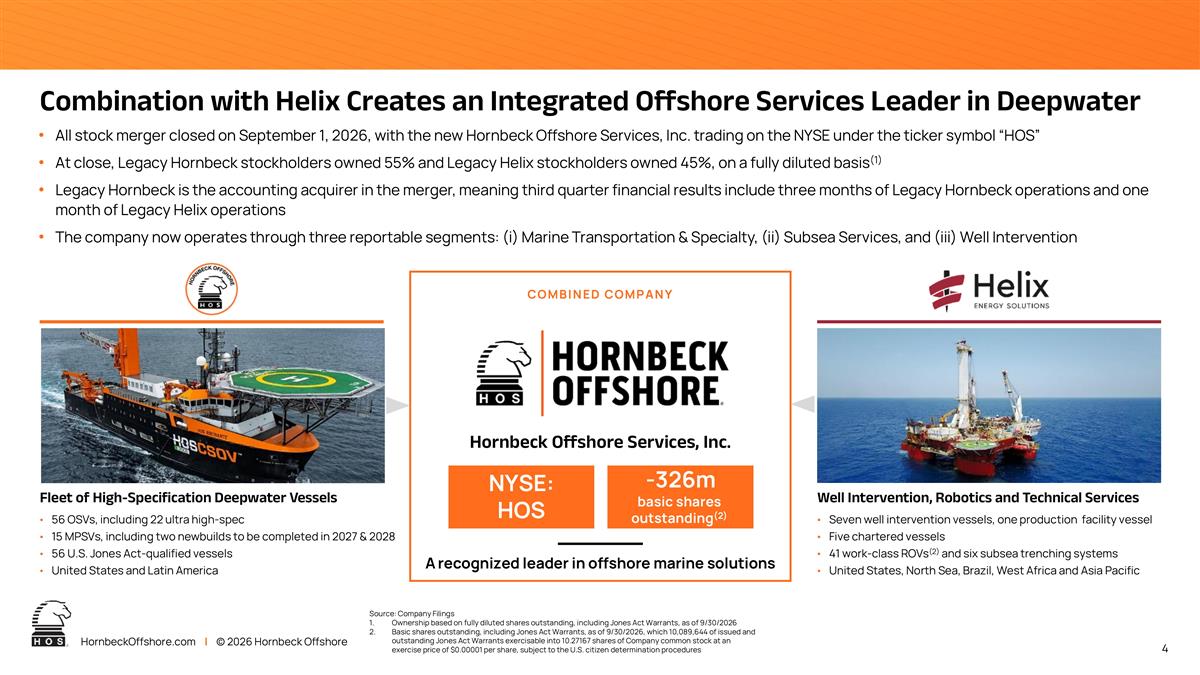
Combination with Helix Creates an Integrated Offshore Services Leader in Deepwater 4 Fleet of High-Specification Deepwater Vessels 56 OSVs, including 22 ultra high-spec 15 MPSVs, including two newbuilds to be completed in 2027 & 2028 56 U.S. Jones Act-qualified vessels United States and Latin America Well Intervention, Robotics and Technical Services Seven well intervention vessels, one production facility vessel Five chartered vessels 41 work-class ROVs(2) and six subsea trenching systems United States, North Sea, Brazil, West Africa and Asia Pacific COMBINED COMPANY Hornbeck Offshore Services, Inc. A recognized leader in offshore marine solutions All stock merger closed on September 1, 2026, with the new Hornbeck Offshore Services, Inc. trading on the NYSE under the ticker symbol “HOS” At close, Legacy Hornbeck stockholders owned 55% and Legacy Helix stockholders owned 45%, on a fully diluted basis(1) Legacy Hornbeck is the accounting acquirer in the merger, meaning third quarter financial results include three months of Legacy Hornbeck operations and one month of Legacy Helix operations The company now operates through three reportable segments: (i) Marine Transportation & Specialty, (ii) Subsea Services, and (iii) Well Intervention Source: Company Filings Ownership based on fully diluted shares outstanding, including Jones Act Warrants, as of 9/30/2026 Basic shares outstanding, including Jones Act Warrants, as of 9/30/2026, which 10,089,644 of issued and outstanding Jones Act Warrants exercisable into 10.27167 shares of Company common stock at an exercise price of $0.00001 per share, subject to the U.S. citizen determination procedures -326m basic shares outstanding(2) NYSE: HOS
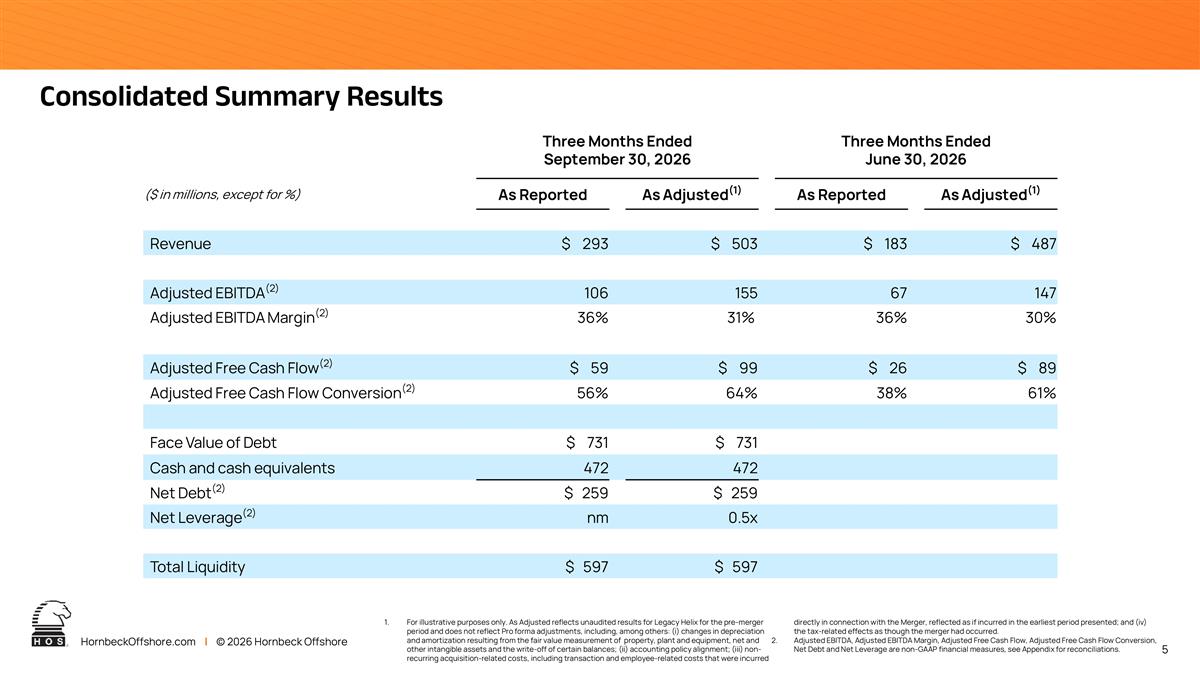
5 Consolidated Summary Results Three Months Ended September 30, 2026 Three Months Ended June 30, 2026 ($ in millions, except for %) As Reported As Adjusted(1) As Reported As Adjusted(1) Revenue $ 293 $ 503 $ 183 $ 487 Adjusted EBITDA(2) 106 155 67 147 Adjusted EBITDA Margin(2) 36% 31% 36% 30% Adjusted Free Cash Flow(2) $ 59 $ 99 $ 26 $ 89 Adjusted Free Cash Flow Conversion(2) 56% 64% 38% 61% Face Value of Debt $ 731 $ 731 Cash and cash equivalents 472 472 Net Debt(2) $ 259 $ 259 Net Leverage(2) nm 0.5x Total Liquidity $ 597 $ 597 For illustrative purposes only. As Adjusted reflects unaudited results for Legacy Helix for the pre-merger period and does not reflect Pro forma adjustments, including, among others: (i) changes in depreciation and amortization resulting from the fair value measurement of property, plant and equipment, net and other intangible assets and the write-off of certain balances; (ii) accounting policy alignment; (iii) non-recurring acquisition-related costs, including transaction and employee-related costs that were incurred directly in connection with the Merger, reflected as if incurred in the earliest period presented; and (iv) the tax-related effects as though the merger had occurred. Adjusted EBITDA, Adjusted EBITDA Margin, Adjusted Free Cash Flow, Adjusted Free Cash Flow Conversion, Net Debt and Net Leverage are non-GAAP financial measures, see Appendix for reconciliations.
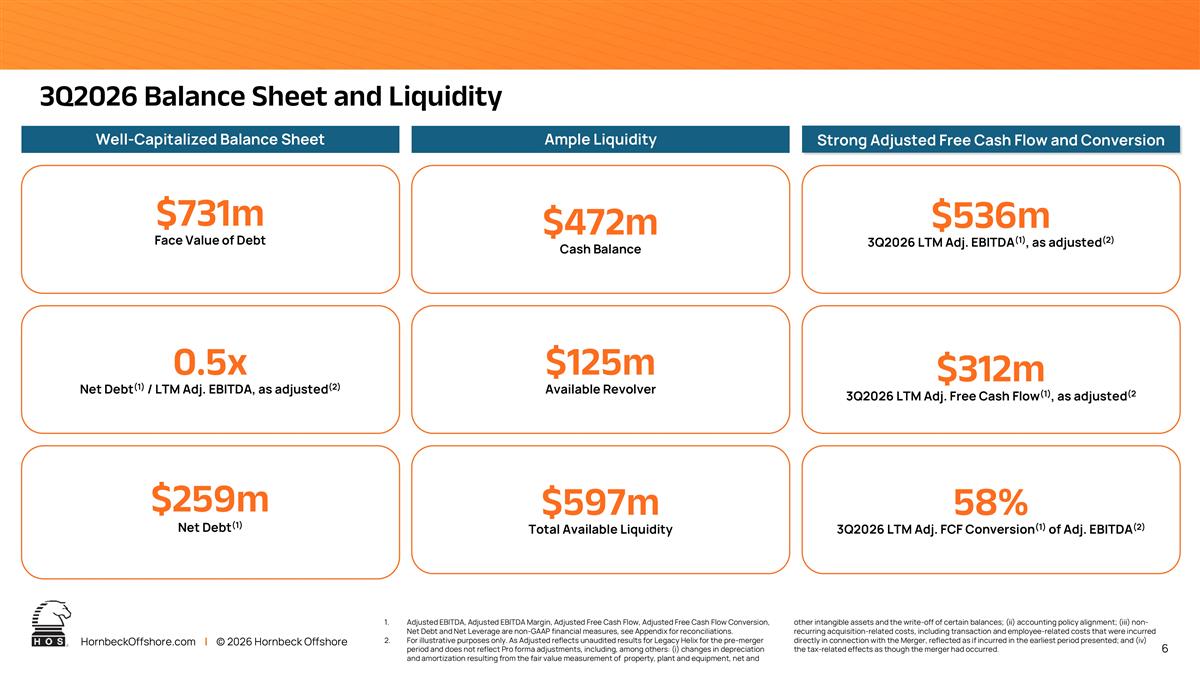
3Q2026 Balance Sheet and Liquidity Well-Capitalized Balance Sheet $731m Face Value of Debt Strong Adjusted Free Cash Flow and Conversion $536m 3Q2026 LTM Adj. EBITDA(1), as adjusted(2) Ample Liquidity $472m Cash Balance Adjusted EBITDA, Adjusted EBITDA Margin, Adjusted Free Cash Flow, Adjusted Free Cash Flow Conversion, Net Debt and Net Leverage are non-GAAP financial measures, see Appendix for reconciliations. For illustrative purposes only. As Adjusted reflects unaudited results for Legacy Helix for the pre-merger period and does not reflect Pro forma adjustments, including, among others: (i) changes in depreciation and amortization resulting from the fair value measurement of property, plant and equipment, net and other intangible assets and the write-off of certain balances; (ii) accounting policy alignment; (iii) non-recurring acquisition-related costs, including transaction and employee-related costs that were incurred directly in connection with the Merger, reflected as if incurred in the earliest period presented; and (iv) the tax-related effects as though the merger had occurred. 0.5x Net Debt(1) / LTM Adj. EBITDA, as adjusted(2) $259m Net Debt(1) $125m Available Revolver $597m Total Available Liquidity $312m 3Q2026 LTM Adj. Free Cash Flow(1), as adjusted(2 58% 3Q2026 LTM Adj. FCF Conversion(1) of Adj. EBITDA(2)
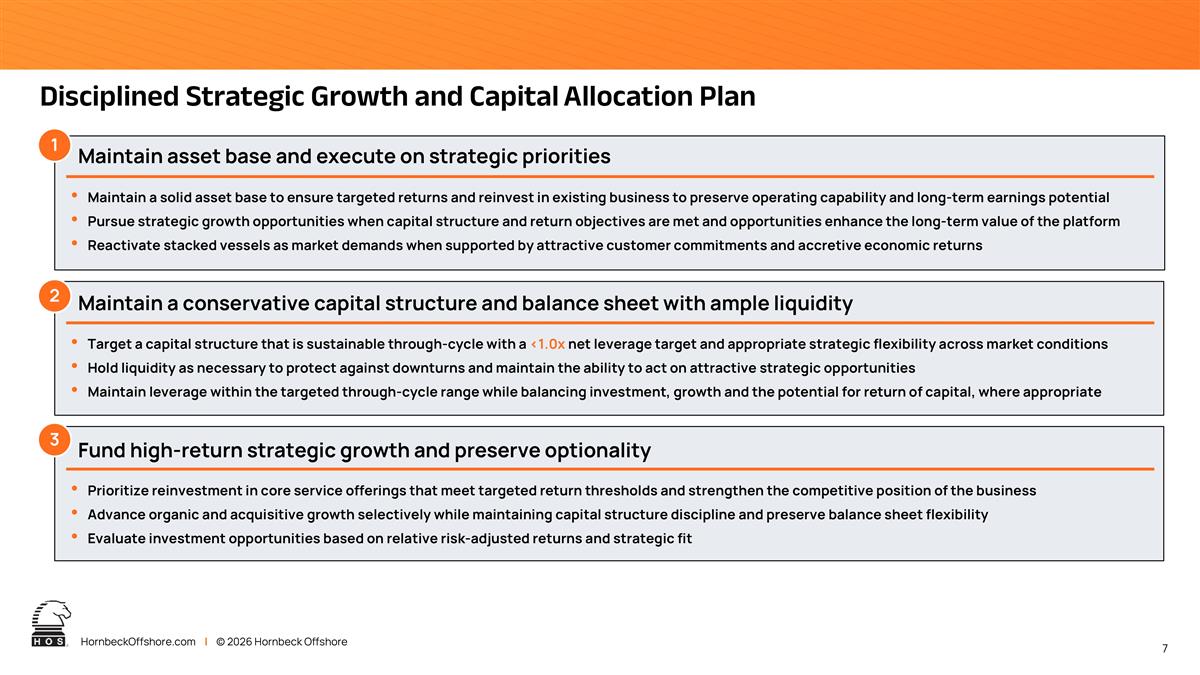
Disciplined Strategic Growth and Capital Allocation Plan Maintain asset base and execute on strategic priorities Maintain a solid asset base to ensure targeted returns and reinvest in existing business to preserve operating capability and long-term earnings potential Pursue strategic growth opportunities when capital structure and return objectives are met and opportunities enhance the long-term value of the platform Reactivate stacked vessels as market demands when supported by attractive customer commitments and accretive economic returns 1 2 Maintain a conservative capital structure and balance sheet with ample liquidity Target a capital structure that is sustainable through-cycle with a <1.0x net leverage target and appropriate strategic flexibility across market conditions Hold liquidity as necessary to protect against downturns and maintain the ability to act on attractive strategic opportunities Maintain leverage within the targeted through-cycle range while balancing investment, growth and the potential for return of capital, where appropriate 3 Fund high-return strategic growth and preserve optionality Prioritize reinvestment in core service offerings that meet targeted return thresholds and strengthen the competitive position of the business Advance organic and acquisitive growth selectively while maintaining capital structure discipline and preserve balance sheet flexibility Evaluate investment opportunities based on relative risk-adjusted returns and strategic fit
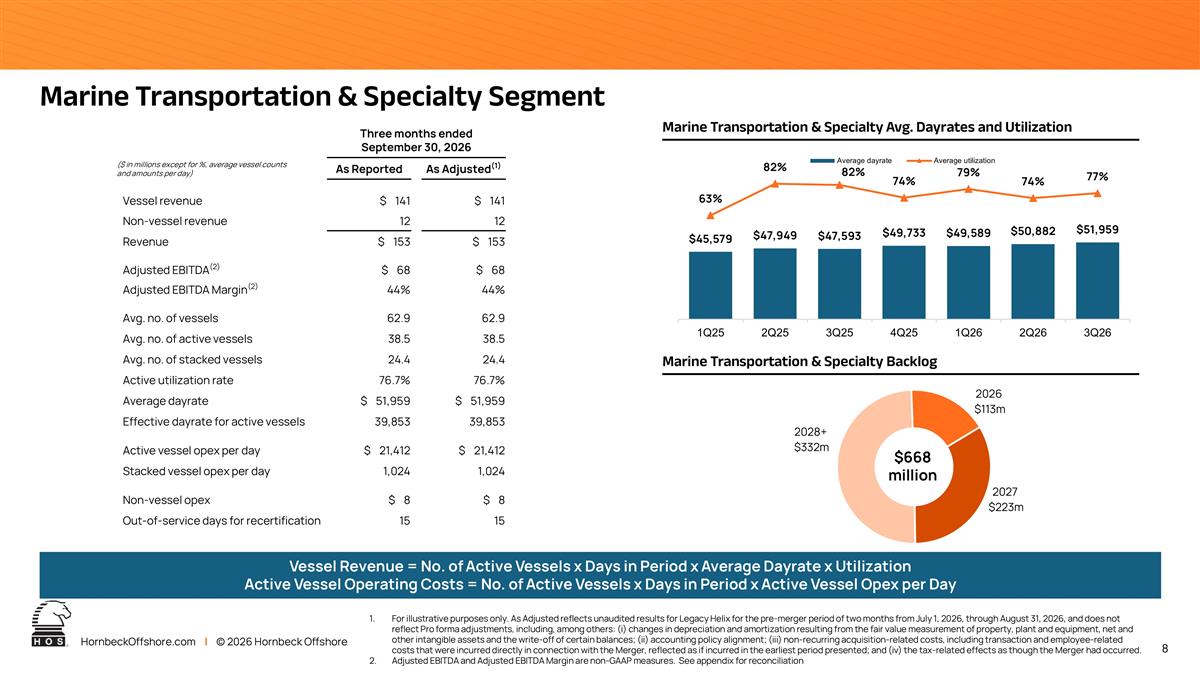
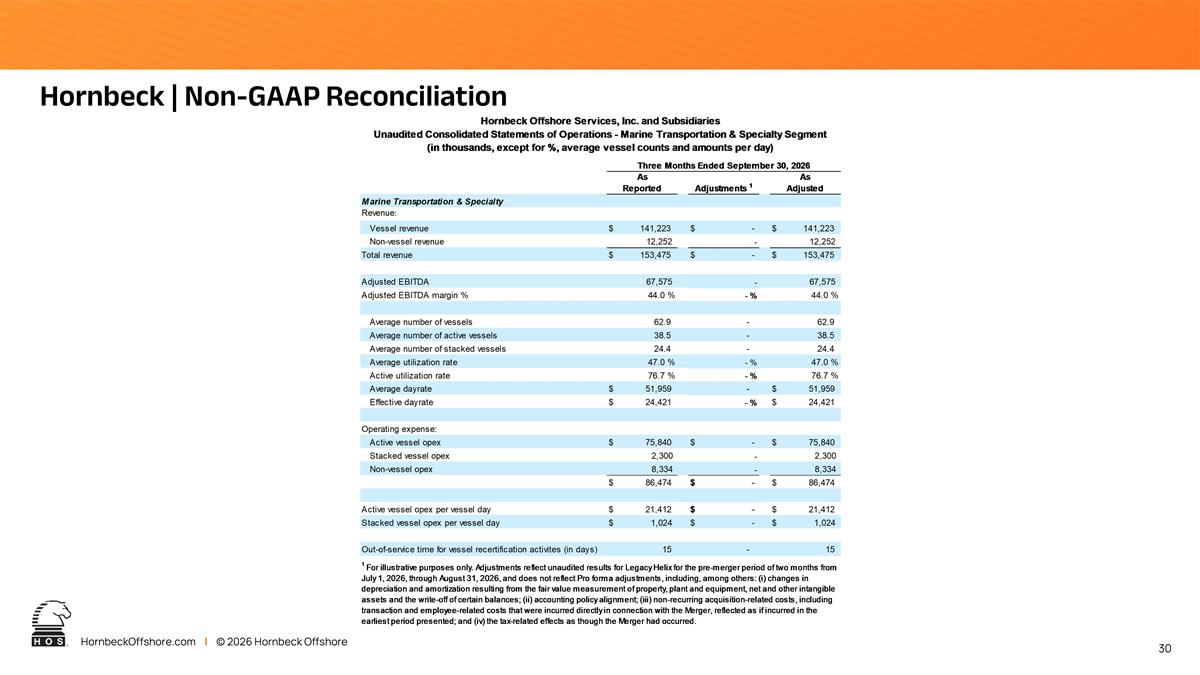
Marine Transportation & Specialty Segment Vessel Revenue = No. of Active Vessels x Days in Period x Average Dayrate x Utilization Active Vessel Operating Costs = No. of Active Vessels x Days in Period x Active Vessel Opex per Day For illustrative purposes only. As Adjusted reflects unaudited results for Legacy Helix for the pre-merger period of two months from July 1, 2026, through August 31, 2026, and does not reflect Pro forma adjustments, including, among others: (i) changes in depreciation and amortization resulting from the fair value measurement of property, plant and equipment, net and other intangible assets and the write-off of certain balances; (ii) accounting policy alignment; (iii) non-recurring acquisition-related costs, including transaction and employee-related costs that were incurred directly in connection with the Merger, reflected as if incurred in the earliest period presented; and (iv) the tax-related effects as though the Merger had occurred. Adjusted EBITDA and Adjusted EBITDA Margin are non-GAAP measures. See appendix for reconciliation Three months ended September 30, 2026 ($ in millions except for %, average vessel counts and amounts per day) As Reported As Adjusted(1) Vessel revenue $ 141 $ 141 Non-vessel revenue 12 12 Revenue $ 153 $ 153 Adjusted EBITDA(2) $ 68 $ 68 Adjusted EBITDA Margin(2) 44% 44% Avg. no. of vessels 62.9 62.9 Avg. no. of active vessels 38.5 38.5 Avg. no. of stacked vessels 24.4 24.4 Active utilization rate 76.7% 76.7% Average dayrate $ 51,959 $ 51,959 Effective dayrate for active vessels 39,853 39,853 Active vessel opex per day $ 21,412 $ 21,412 Stacked vessel opex per day 1,024 1,024 Non-vessel opex $ 8 $ 8 Out-of-service days for recertification 15 15 Marine Transportation & Specialty Avg. Dayrates and Utilization Marine Transportation & Specialty Backlog $668 million
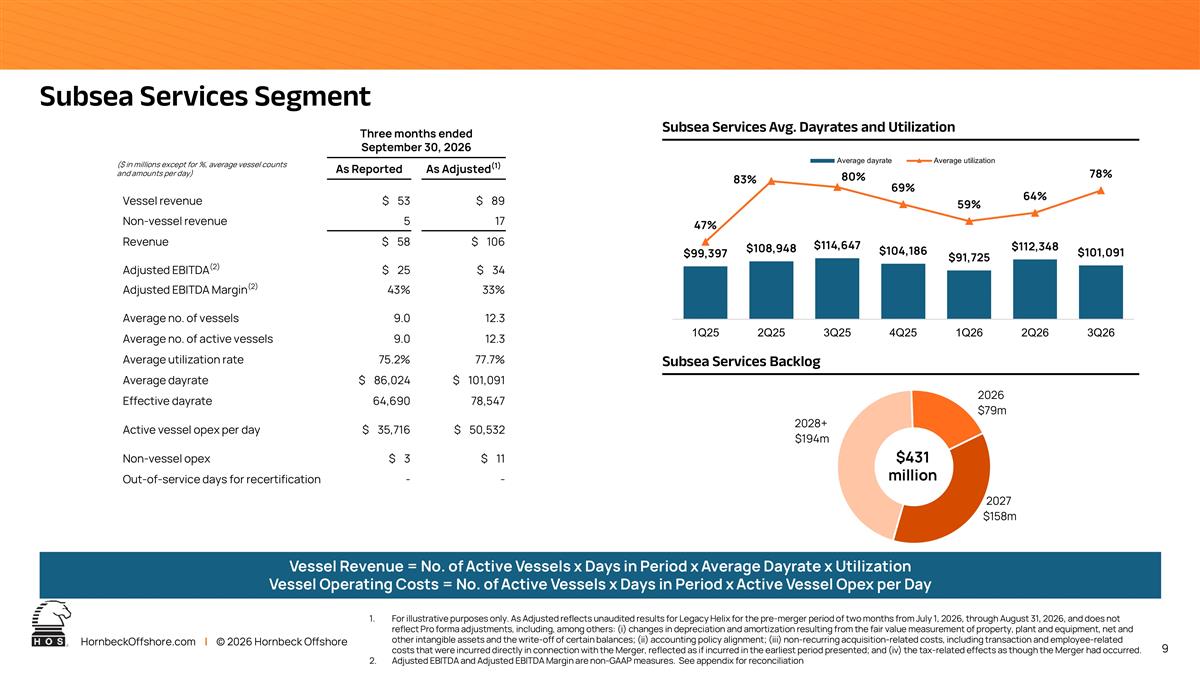
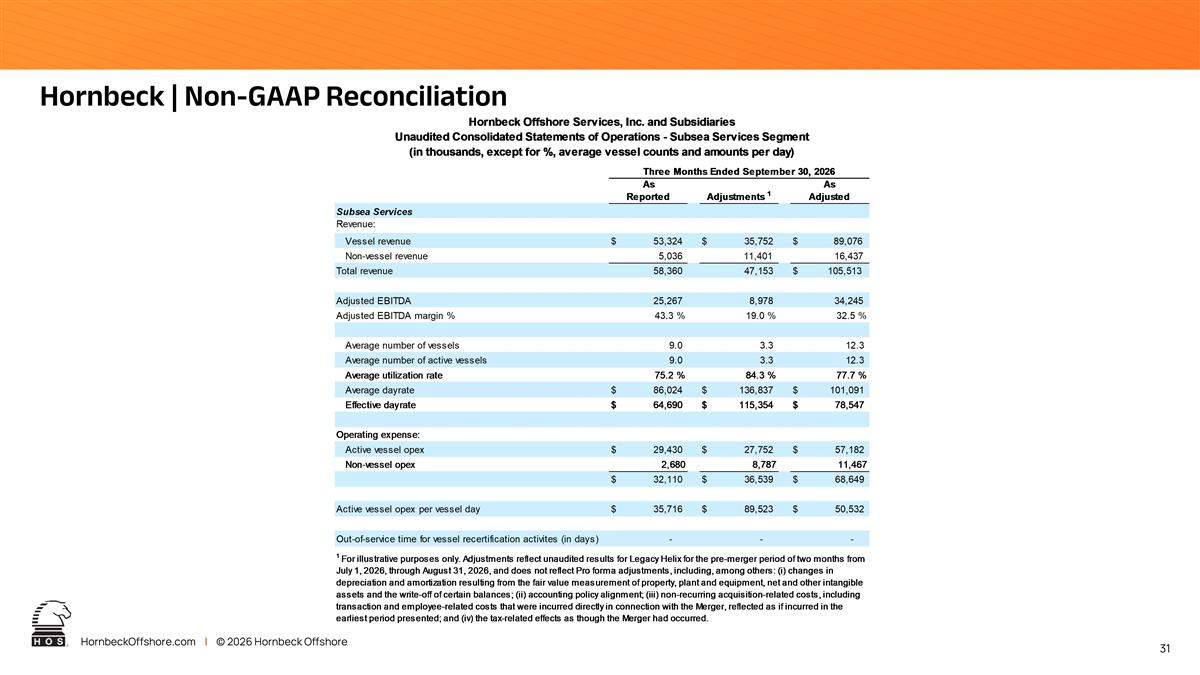
Subsea Services Segment Vessel Revenue = No. of Active Vessels x Days in Period x Average Dayrate x Utilization Vessel Operating Costs = No. of Active Vessels x Days in Period x Active Vessel Opex per Day Three months ended September 30, 2026 ($ in millions except for %, average vessel counts and amounts per day) As Reported As Adjusted(1) Vessel revenue $ 53 $ 89 Non-vessel revenue 5 17 Revenue $ 58 $ 106 Adjusted EBITDA(2) $ 25 $ 34 Adjusted EBITDA Margin(2) 43% 33% Average no. of vessels 9.0 12.3 Average no. of active vessels 9.0 12.3 Average utilization rate 75.2% 77.7% Average dayrate $ 86,024 $ 101,091 Effective dayrate 64,690 78,547 Active vessel opex per day $ 35,716 $ 50,532 Non-vessel opex $ 3 $ 11 Out-of-service days for recertification - - Subsea Services Avg. Dayrates and Utilization Subsea Services Backlog $431 million For illustrative purposes only. As Adjusted reflects unaudited results for Legacy Helix for the pre-merger period of two months from July 1, 2026, through August 31, 2026, and does not reflect Pro forma adjustments, including, among others: (i) changes in depreciation and amortization resulting from the fair value measurement of property, plant and equipment, net and other intangible assets and the write-off of certain balances; (ii) accounting policy alignment; (iii) non-recurring acquisition-related costs, including transaction and employee-related costs that were incurred directly in connection with the Merger, reflected as if incurred in the earliest period presented; and (iv) the tax-related effects as though the Merger had occurred. Adjusted EBITDA and Adjusted EBITDA Margin are non-GAAP measures. See appendix for reconciliation
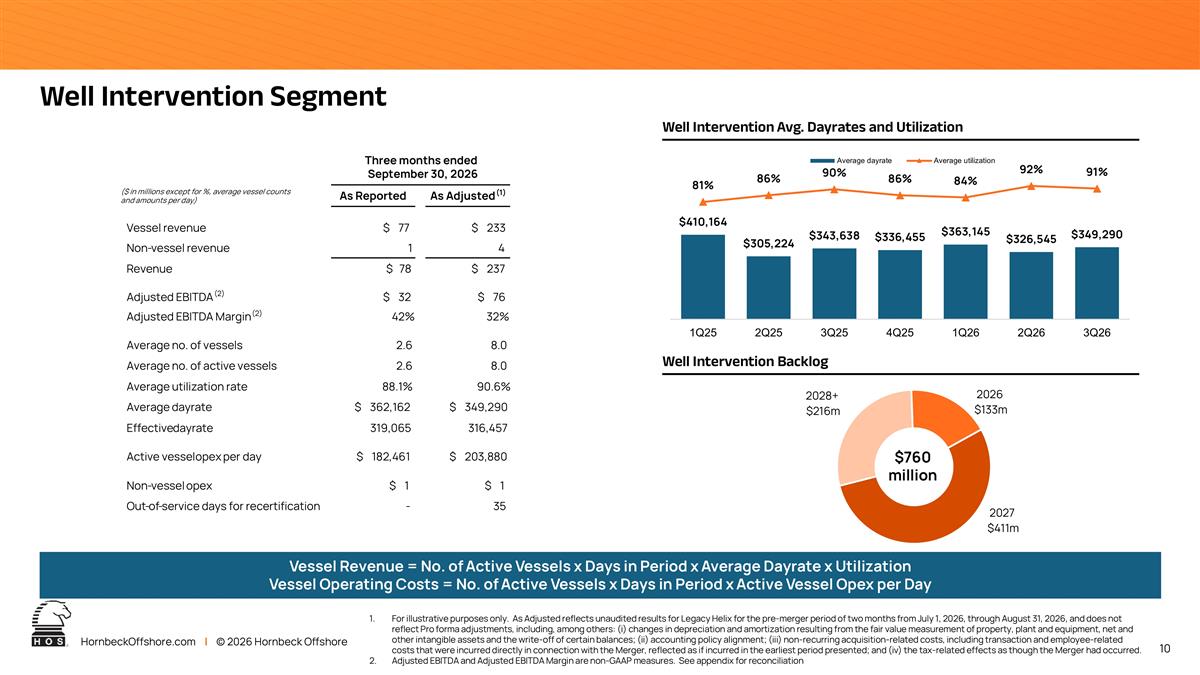
Well Intervention Segment Vessel Revenue = No. of Active Vessels x Days in Period x Average Dayrate x Utilization Vessel Operating Costs = No. of Active Vessels x Days in Period x Active Vessel Opex per Day Well Intervention Avg. Dayrates and Utilization Well Intervention Backlog $760 million For illustrative purposes only. As Adjusted reflects unaudited results for Legacy Helix for the pre-merger period of two months from July 1, 2026, through August 31, 2026, and does not reflect Pro forma adjustments, including, among others: (i) changes in depreciation and amortization resulting from the fair value measurement of property, plant and equipment, net and other intangible assets and the write-off of certain balances; (ii) accounting policy alignment; (iii) non-recurring acquisition-related costs, including transaction and employee-related costs that were incurred directly in connection with the Merger, reflected as if incurred in the earliest period presented; and (iv) the tax-related effects as though the Merger had occurred. Adjusted EBITDA and Adjusted EBITDA Margin are non-GAAP measures. See appendix for reconciliation Three months ended September 30, 2026 As Adjusted (1) As Reported ($ in millions except for %, average vessel counts and amounts per day) $ 233 $ 77 Vessel revenue 4 1 Non - vessel revenue $ 237 $ 78 Revenue $ 76 $ 32 Adjusted EBITDA (2) 32% 42% Adjusted EBITDA Margin (2) 8.0 2.6 Average no. of vessels 8.0 2.6 Average no. of active vessels 90.6% 88.1% Average utilization rate $ 349,290 $ 362,162 Average dayrate 316,457 319,065 Effective dayrate $ 203,880 $ 182,461 Active vessel opex per day $ 1 $ 1 Non - vessel opex 35 - Out - of - service days for recertification
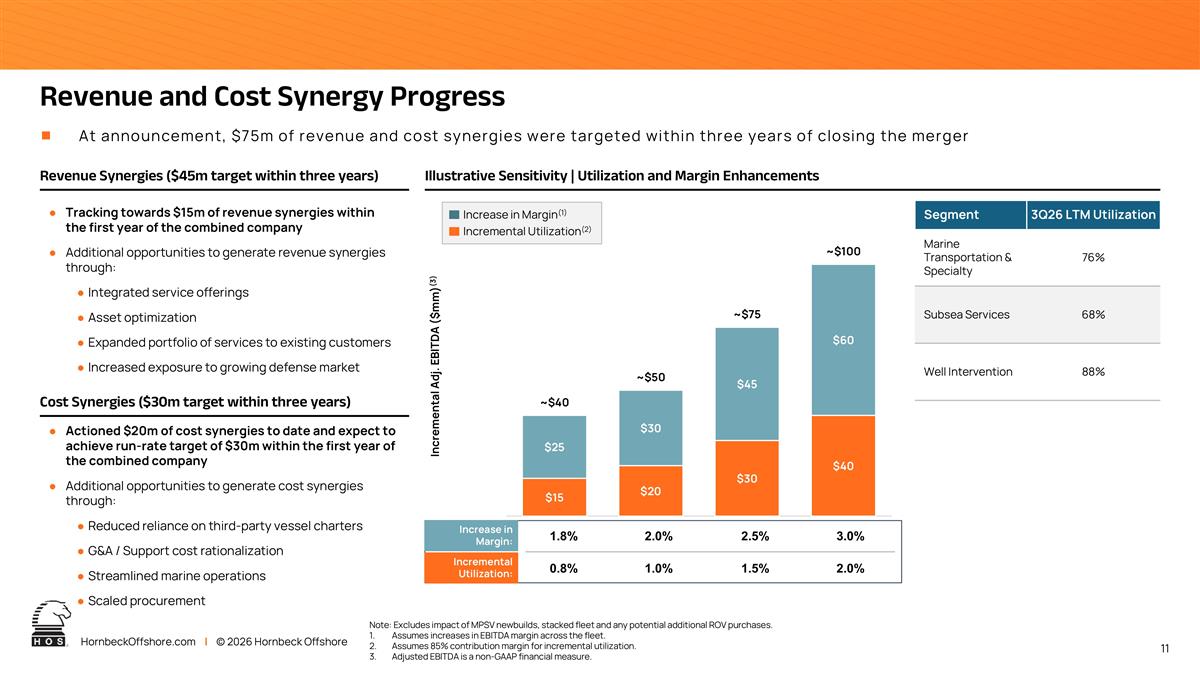
Revenue and Cost Synergy Progress At announcement, $75m of revenue and cost synergies were targeted within three years of closing the merger Tracking towards $15m of revenue synergies within the first year of the combined company Additional opportunities to generate revenue synergies through: Integrated service offerings Asset optimization Expanded portfolio of services to existing customers Increased exposure to growing defense market Revenue Synergies ($45m target within three years) Cost Synergies ($30m target within three years) Increase in Margin: Incremental Utilization: Incremental Adj. EBITDA ($mm)(3) Increase in Margin(1) Incremental Utilization(2) Segment 3Q26 LTM Utilization Marine Transportation & Specialty 76% Subsea Services 68% Well Intervention 88% Illustrative Sensitivity | Utilization and Margin Enhancements Note: Excludes impact of MPSV newbuilds, stacked fleet and any potential additional ROV purchases. Assumes increases in EBITDA margin across the fleet. Assumes 85% contribution margin for incremental utilization. Adjusted EBITDA is a non-GAAP financial measure. 1.8% 2.0% 2.5% 3.0% 0.8% 1.0% 1.5% 2.0% Actioned $20m of cost synergies to date and expect to achieve run-rate target of $30m within the first year of the combined company Additional opportunities to generate cost synergies through: Reduced reliance on third-party vessel charters G&A / Support cost rationalization Streamlined marine operations Scaled procurement
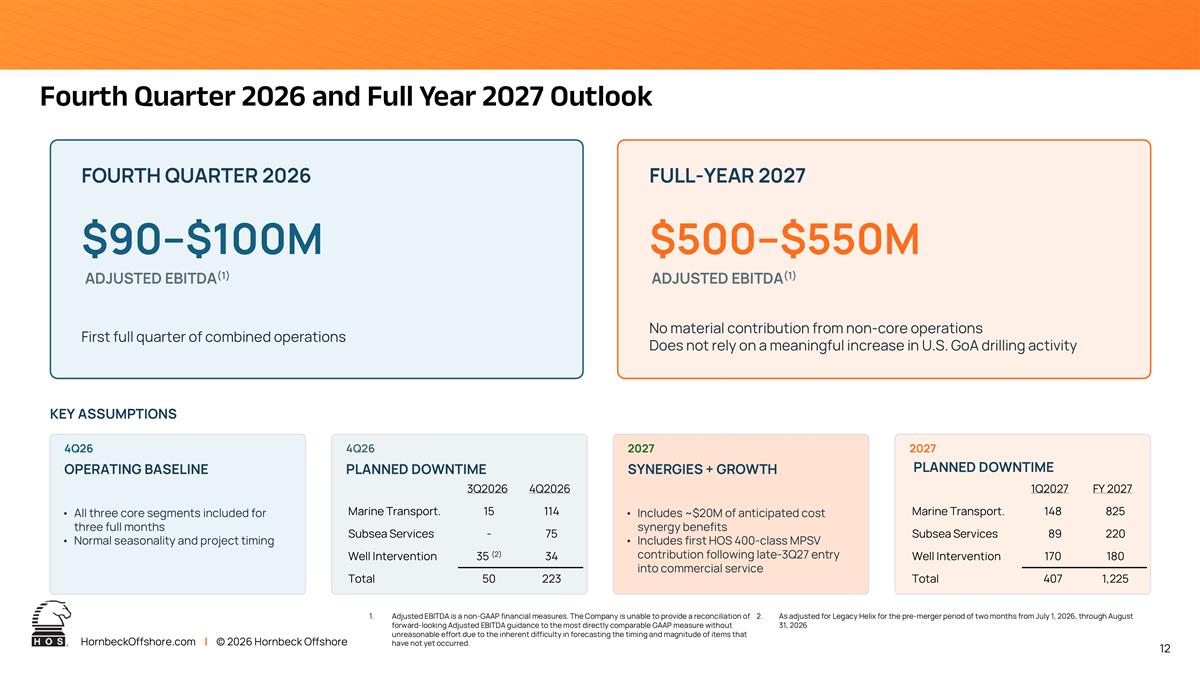
Fourth Quarter 2026 and Full Year 2027 Outlook FOURTH QUARTER 2026 $90–$100M ADJUSTED EBITDA(1) First full quarter of combined operations FULL-YEAR 2027 $500–$550M No material contribution from non-core operations Does not rely on a meaningful increase in U.S. GoA drilling activity ADJUSTED EBITDA(1) KEY ASSUMPTIONS 4Q26 OPERATING BASELINE All three core segments included for three full months Normal seasonality and project timing 4Q26 PLANNED DOWNTIME 2027 SYNERGIES + GROWTH Includes ~$20M of anticipated cost synergy benefits Includes first HOS 400-class MPSV contribution following late-3Q27 entry into commercial service 2027 3Q2026 4Q2026 Marine Transport. 15 114 Subsea Services - 75 Well Intervention 35 (2) 34 Total 50 223 PLANNED DOWNTIME 1Q2027 FY 2027 Marine Transport. 148 825 Subsea Services 89 220 Well Intervention 170 180 Total 407 1,225 Adjusted EBITDA is a non-GAAP financial measures. The Company is unable to provide a reconciliation of forward-looking Adjusted EBITDA guidance to the most directly comparable GAAP measure without unreasonable effort due to the inherent difficulty in forecasting the timing and magnitude of items that have not yet occurred. As adjusted for Legacy Helix for the pre-merger period of two months from July 1, 2026, through August 31, 2026
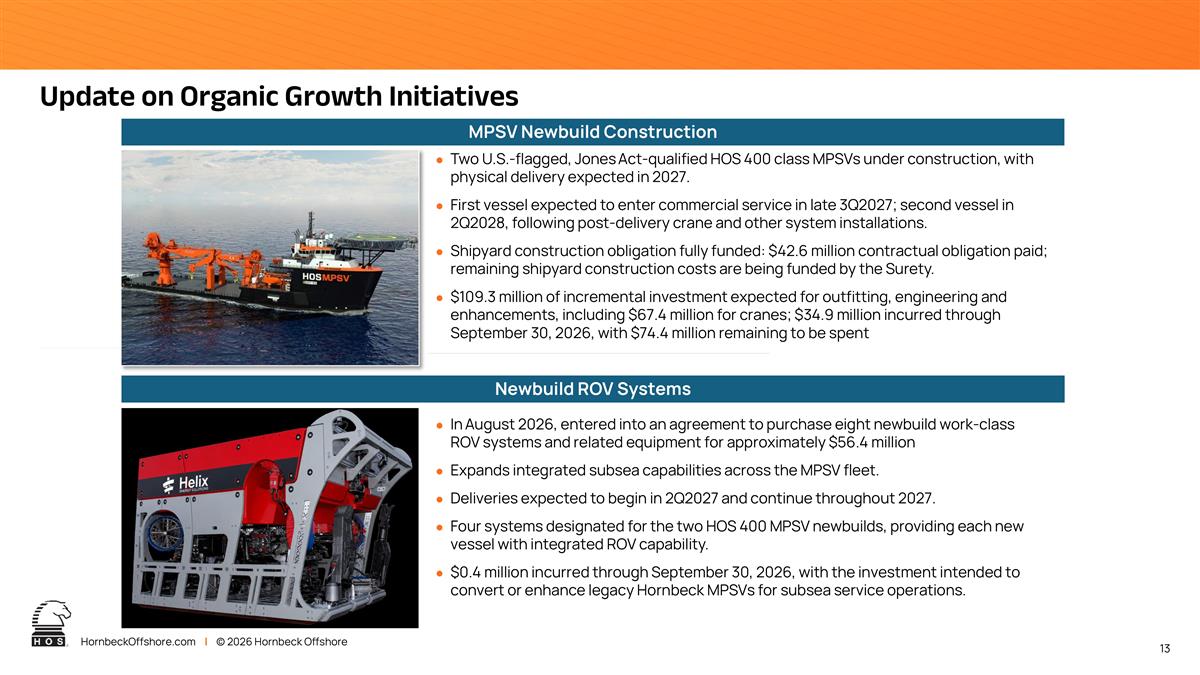
Update on Organic Growth Initiatives Two U.S.-flagged, Jones Act-qualified HOS 400 class MPSVs under construction, with physical delivery expected in 2027. First vessel expected to enter commercial service in late 3Q2027; second vessel in 2Q2028, following post-delivery crane and other system installations. Shipyard construction obligation fully funded: $42.6 million contractual obligation paid; remaining shipyard construction costs are being funded by the Surety. $109.3 million of incremental investment expected for outfitting, engineering and enhancements, including $67.4 million for cranes; $34.9 million incurred through September 30, 2026, with $74.4 million remaining to be spent MPSV Newbuild Construction In August 2026, entered into an agreement to purchase eight newbuild work-class ROV systems and related equipment for approximately $56.4 million Expands integrated subsea capabilities across the MPSV fleet. Deliveries expected to begin in 2Q2027 and continue throughout 2027. Four systems designated for the two HOS 400 MPSV newbuilds, providing each new vessel with integrated ROV capability. $0.4 million incurred through September 30, 2026, with the investment intended to convert or enhance legacy Hornbeck MPSVs for subsea service operations. Newbuild ROV Systems
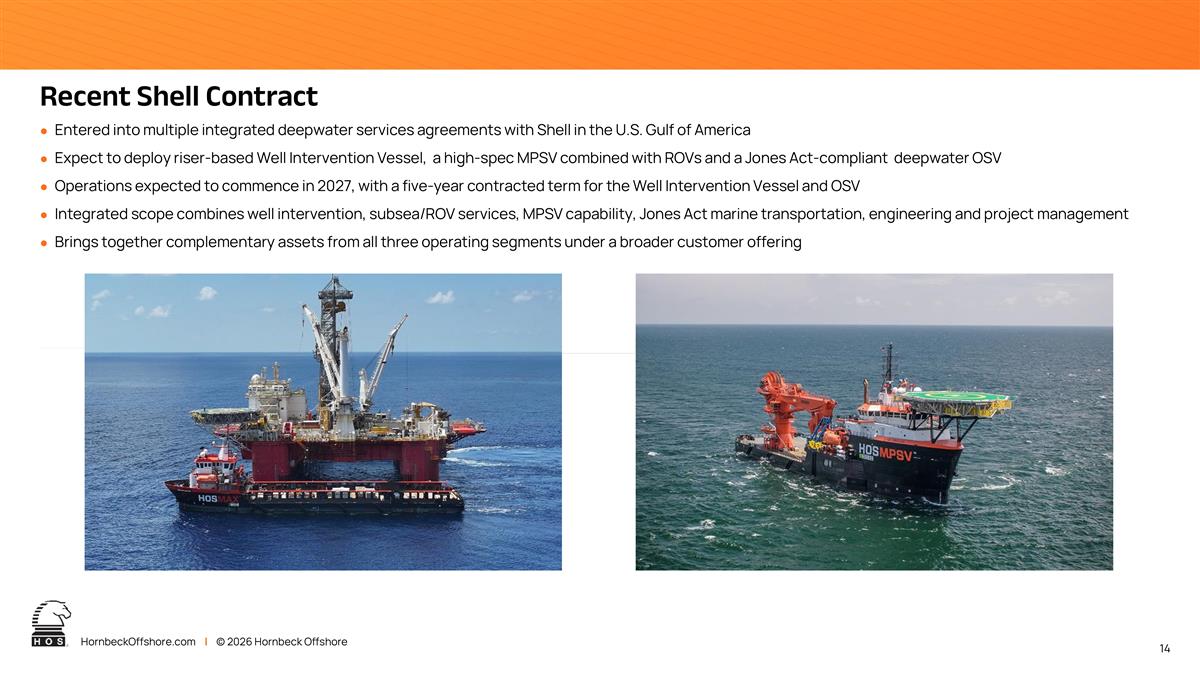
Recent Shell Contract Entered into multiple integrated deepwater services agreements with Shell in the U.S. Gulf of America Expect to deploy riser-based Well Intervention Vessel, a high-spec MPSV combined with ROVs and a Jones Act-compliant deepwater OSV Operations expected to commence in 2027, with a five-year contracted term for the Well Intervention Vessel and OSV Integrated scope combines well intervention, subsea/ROV services, MPSV capability, Jones Act marine transportation, engineering and project management Brings together complementary assets from all three operating segments under a broader customer offering
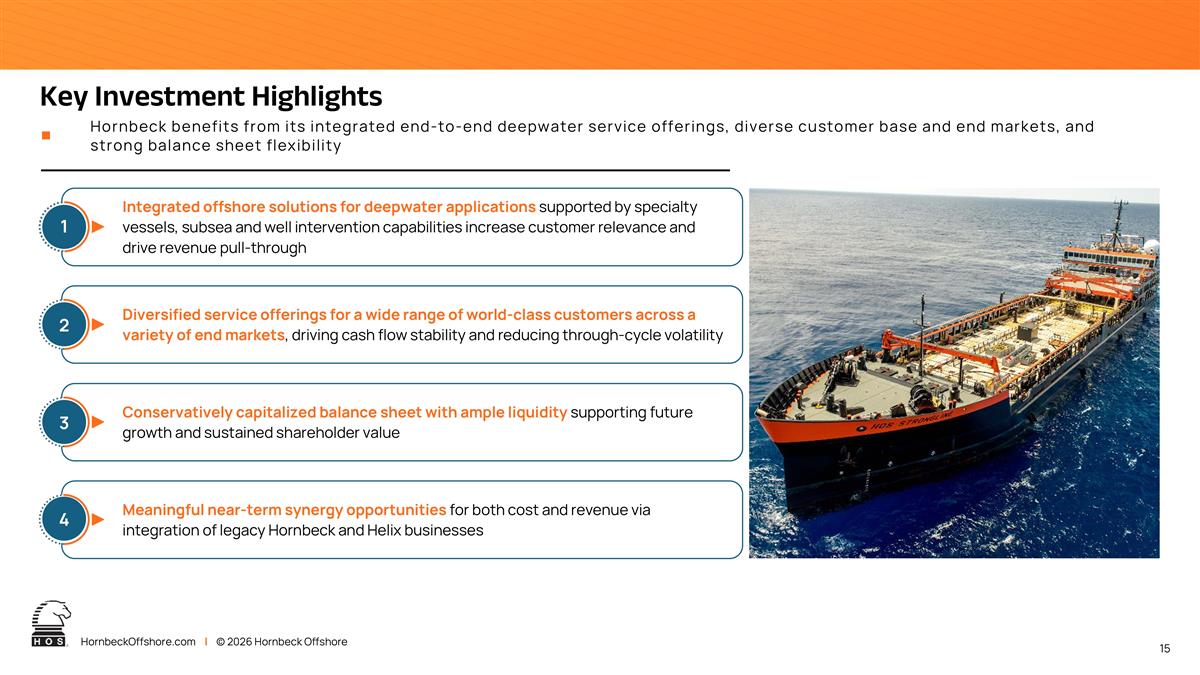
Key Investment Highlights Hornbeck benefits from its integrated end-to-end deepwater service offerings, diverse customer base and end markets, and strong balance sheet flexibility Diversified service offerings for a wide range of world-class customers across a variety of end markets, driving cash flow stability and reducing through-cycle volatility 2 Conservatively capitalized balance sheet with ample liquidity supporting future growth and sustained shareholder value 3 Meaningful near-term synergy opportunities for both cost and revenue via integration of legacy Hornbeck and Helix businesses 4 Integrated offshore solutions for deepwater applications supported by specialty vessels, subsea and well intervention capabilities increase customer relevance and drive revenue pull-through 1
Appendix
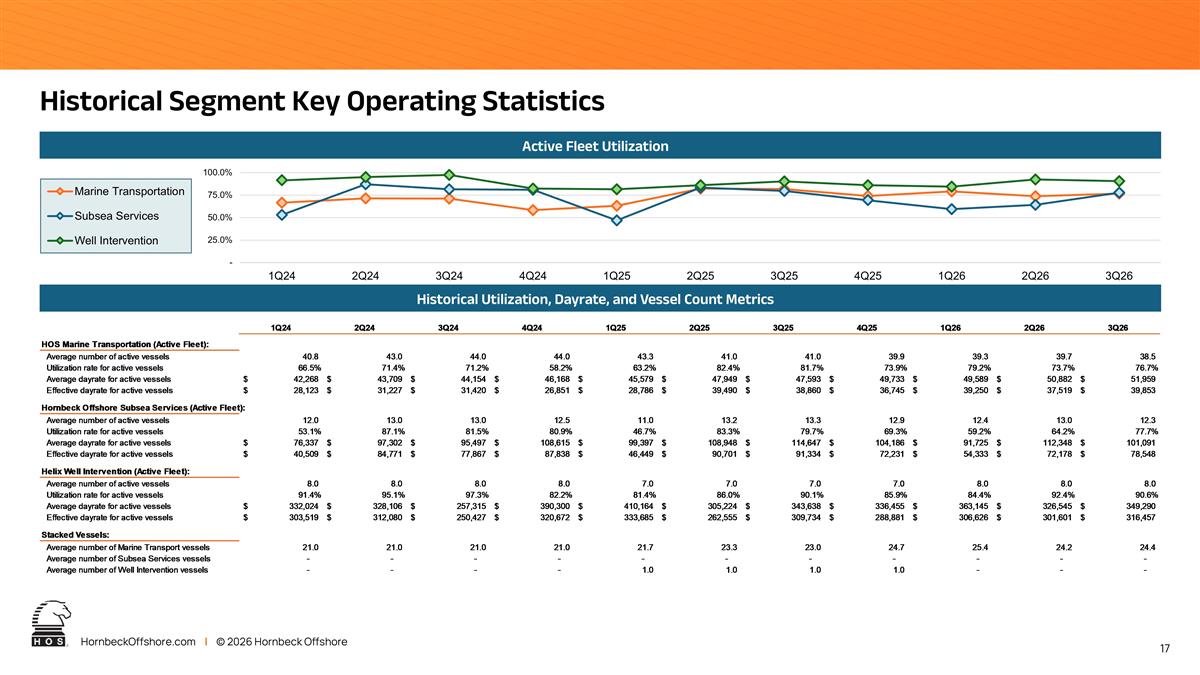
Historical Segment Key Operating Statistics Historical Utilization, Dayrate, and Vessel Count Metrics Active Fleet Utilization
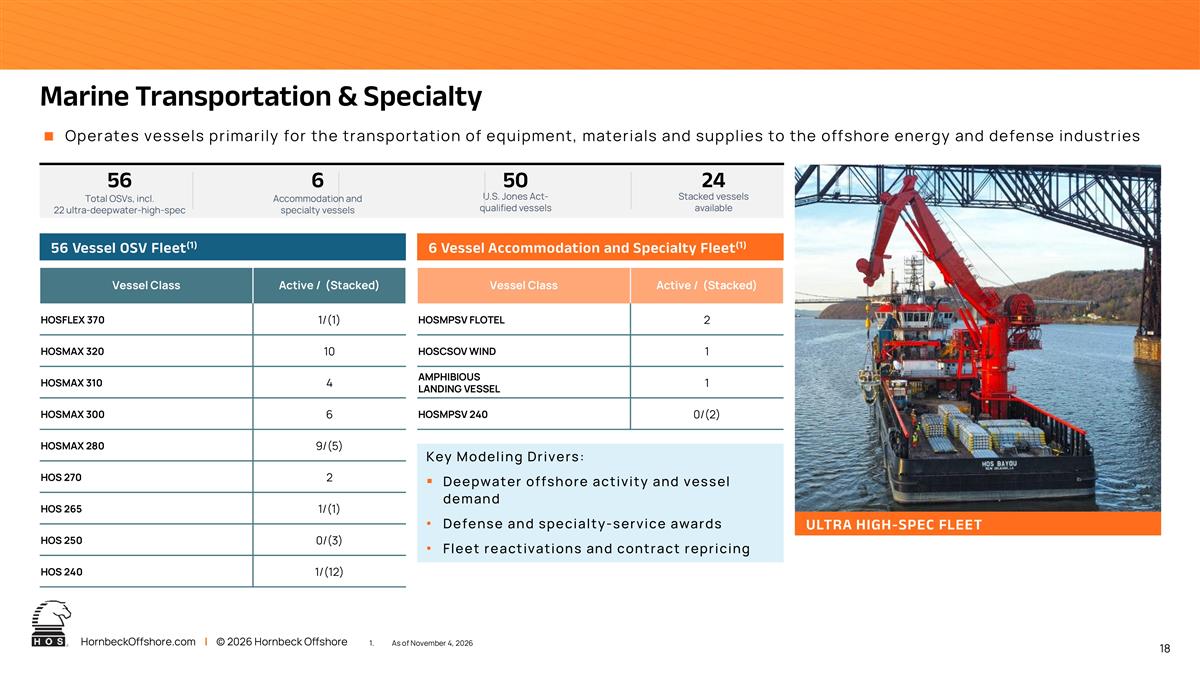
Marine Transportation & Specialty Operates vessels primarily for the transportation of equipment, materials and supplies to the offshore energy and defense industries 56 Total OSVs, incl. 22 ultra-deepwater-high-spec 50 U.S. Jones Act- qualified vessels 24 Stacked vessels available ULTRA HIGH-SPEC FLEET 6 Accommodation and specialty vessels 56 Vessel OSV Fleet(1) 6 Vessel Accommodation and Specialty Fleet(1) Vessel Class Active / (Stacked) HOSFLEX 370 1/(1) HOSMAX 320 10 HOSMAX 310 4 HOSMAX 300 6 HOSMAX 280 9/(5) HOS 270 2 HOS 265 1/(1) HOS 250 0/(3) HOS 240 1/(12) Vessel Class Active / (Stacked) HOSMPSV FLOTEL 2 HOSCSOV WIND 1 AMPHIBIOUS LANDING VESSEL 1 HOSMPSV 240 0/(2) As of November 4, 2026 Key Modeling Drivers: Deepwater offshore activity and vessel demand Defense and specialty-service awards Fleet reactivations and contract repricing
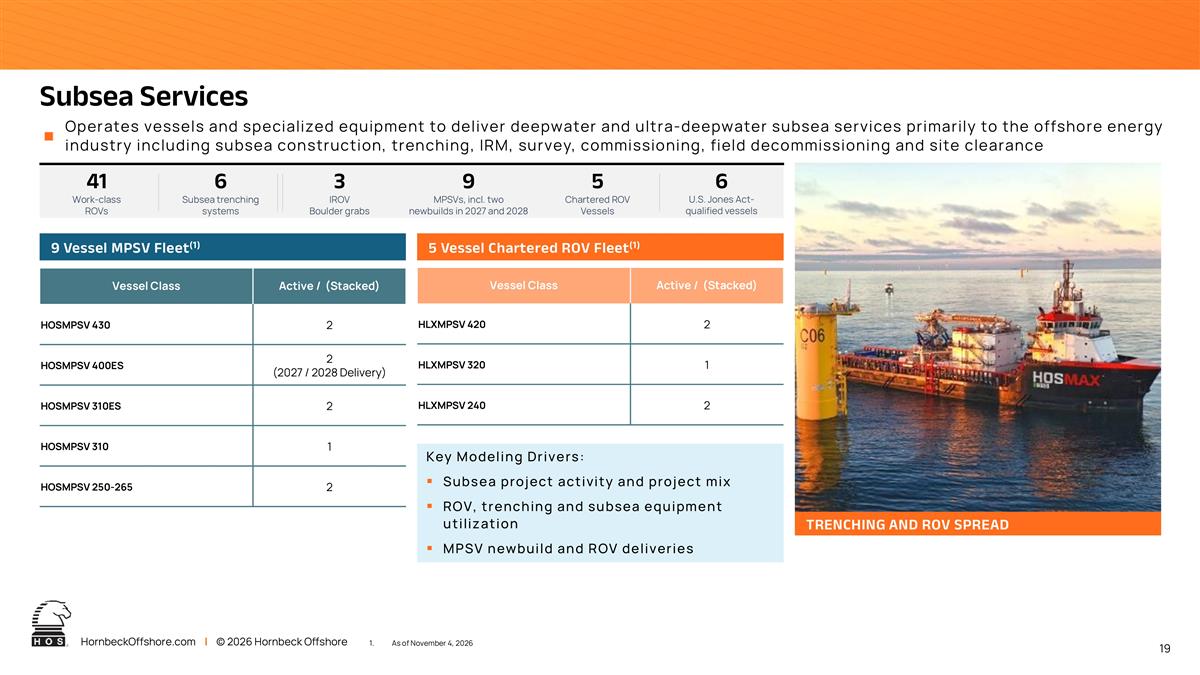
41 Work-class ROVs 6 Subsea trenching systems 9 MPSVs, incl. two newbuilds in 2027 and 2028 6 U.S. Jones Act- qualified vessels 3 IROV Boulder grabs Subsea Services TRENCHING AND ROV SPREAD As of November 4, 2026 9 Vessel MPSV Fleet(1) 5 Vessel Chartered ROV Fleet(1) Vessel Class Active / (Stacked) HLXMPSV 420 2 HLXMPSV 320 1 HLXMPSV 240 2 Vessel Class Active / (Stacked) HOSMPSV 430 2 HOSMPSV 400ES 2 (2027 / 2028 Delivery) HOSMPSV 310ES 2 HOSMPSV 310 1 HOSMPSV 250-265 2 Operates vessels and specialized equipment to deliver deepwater and ultra-deepwater subsea services primarily to the offshore energy industry including subsea construction, trenching, IRM, survey, commissioning, field decommissioning and site clearance Key Modeling Drivers: Subsea project activity and project mix ROV, trenching and subsea equipment utilization MPSV newbuild and ROV deliveries 5 Chartered ROV Vessels
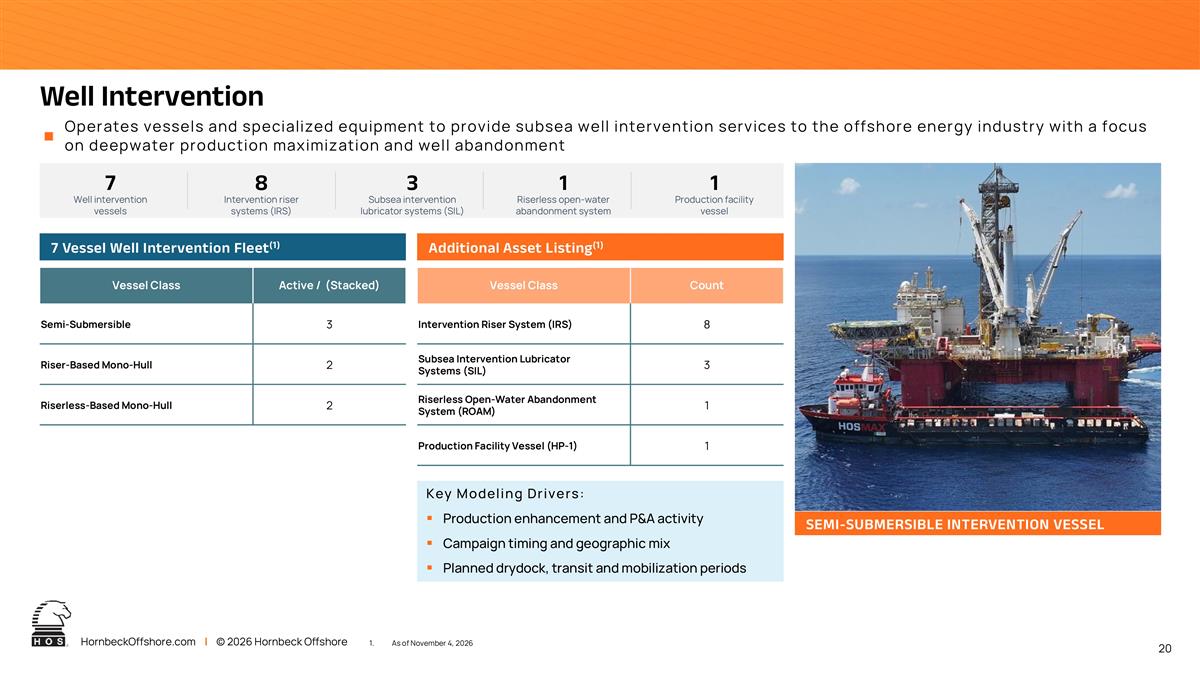
7 Well intervention vessels 8 Intervention riser systems (IRS) 3 Subsea intervention lubricator systems (SIL) 1 Riserless open-water abandonment system 1 Production facility vessel Well Intervention SEMI-SUBMERSIBLE INTERVENTION VESSEL 7 Vessel Well Intervention Fleet(1) Additional Asset Listing(1) Vessel Class Count Intervention Riser System (IRS) 8 Subsea Intervention Lubricator Systems (SIL) 3 Riserless Open-Water Abandonment System (ROAM) 1 Production Facility Vessel (HP-1) 1 Vessel Class Active / (Stacked) Semi-Submersible 3 Riser-Based Mono-Hull 2 Riserless-Based Mono-Hull 2 As of November 4, 2026 Operates vessels and specialized equipment to provide subsea well intervention services to the offshore energy industry with a focus on deepwater production maximization and well abandonment Key Modeling Drivers: Production enhancement and P&A activity Campaign timing and geographic mix Planned drydock, transit and mobilization periods
Non-GAAP Reconciliations
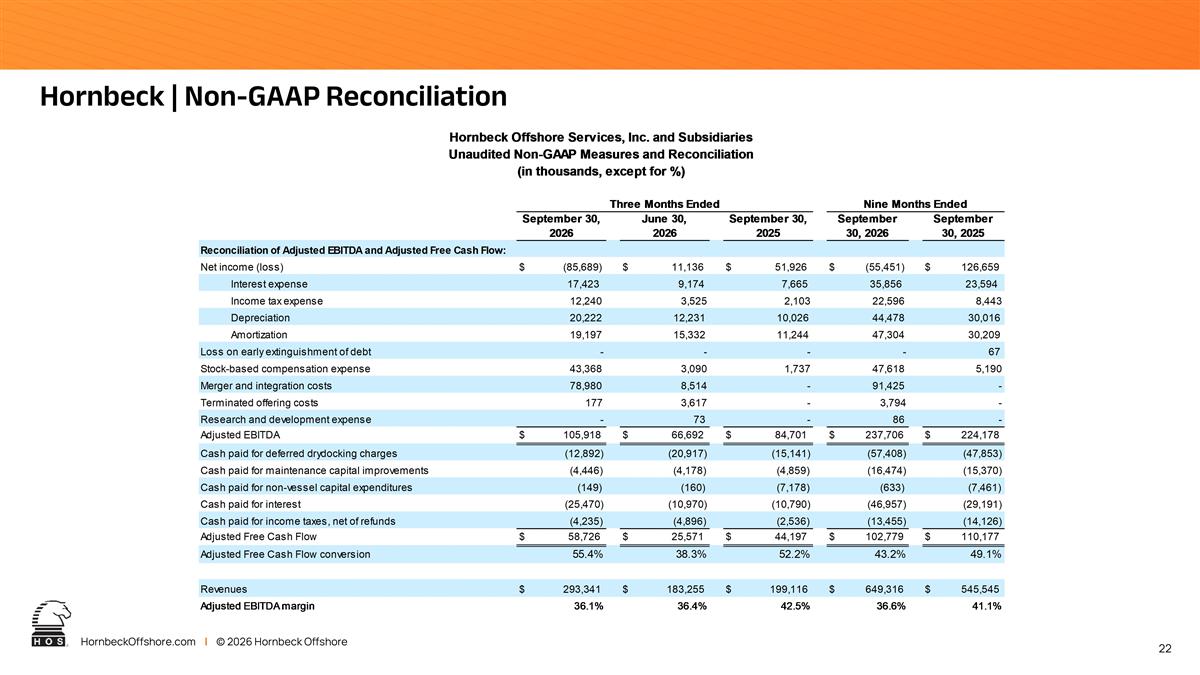
Hornbeck | Non-GAAP Reconciliation
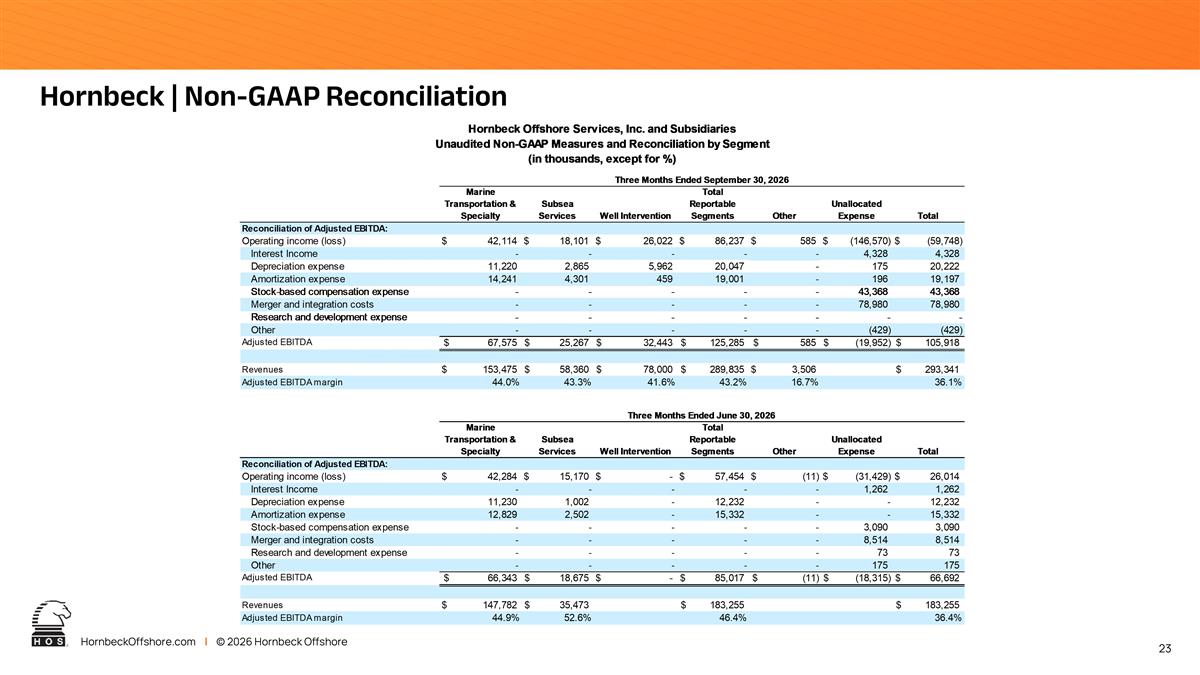
Hornbeck | Non-GAAP Reconciliation
Hornbeck | Non-GAAP Reconciliation
Hornbeck | Non-GAAP Reconciliation
Hornbeck | Non-GAAP Reconciliation
Hornbeck | Non-GAAP Reconciliation
Hornbeck | Non-GAAP Reconciliation
Hornbeck | Non-GAAP Reconciliation
Hornbeck | Non-GAAP Reconciliation
Hornbeck | Non-GAAP Reconciliation
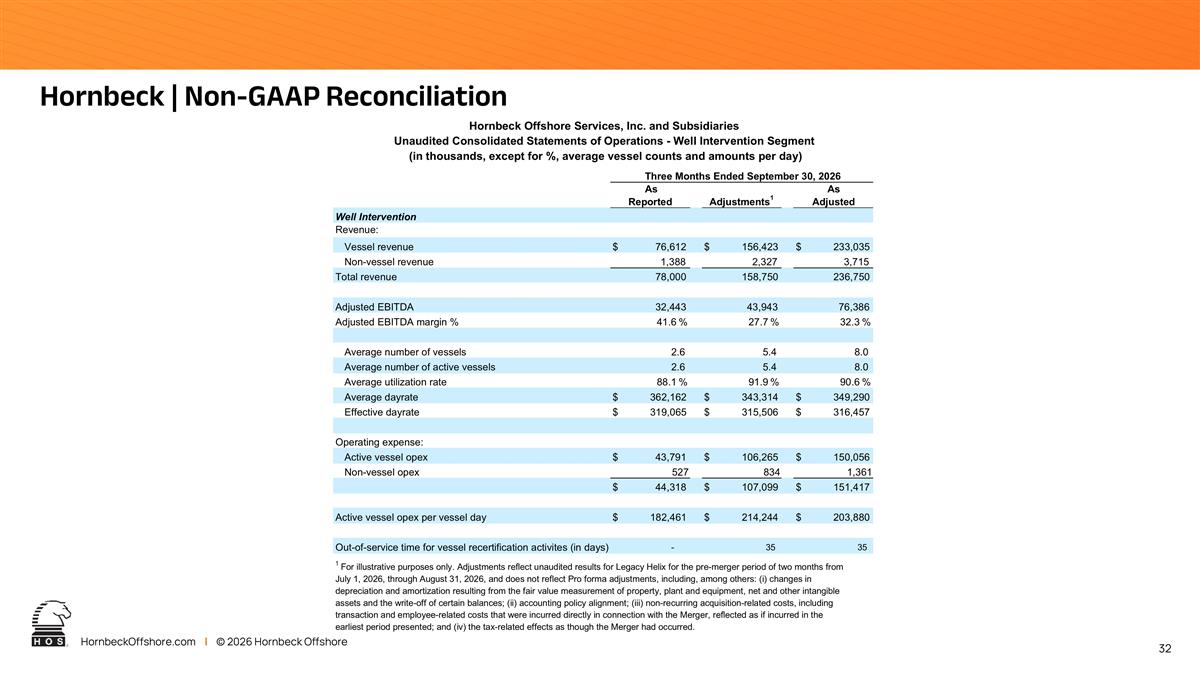
Hornbeck | Non-GAAP Reconciliation As Reported Adjustments 1 As Adjusted Well Intervention Revenue: Vessel revenue 76,612 $ 156,423 $ 233,035 $ Non-vessel revenue 1,388 2,327 3,715 Total revenue 78,000 158,750 236,750 Adjusted EBITDA 32,443 43,943 76,386 Adjusted EBITDA margin % 41.6 % 27.7 % 32.3 % Average number of vessels 2.6 5.4 8.0 Average number of active vessels 2.6 5.4 8.0 Average utilization rate 88.1 % 91.9 % 90.6 % Average dayrate 362,162 $ 343,314 $ 349,290 $ Effective dayrate 319,065 $ 315,506 $ 316,457 $ Operating expense: Active vessel opex 43,791 $ 106,265 $ 150,056 $ Non-vessel opex 527 834 1,361 44,318 $ 107,099 $ 151,417 $ Active vessel opex per vessel day 182,461 $ 214,244 $ 203,880 $ Out-of-service time for vessel recertification activites (in days) - 35 35 Hornbeck Offshore Services, Inc. and Subsidiaries Unaudited Consolidated Statements of Operations - Well Intervention Segment (in thousands, except for %, average vessel counts and amounts per day) Three Months Ended September 30, 2026 1 For illustrative purposes only. Adjustments reflect unaudited results for Legacy Helix for the pre-merger period of two months from July 1, 2026, through August 31, 2026, and does not reflect Pro forma adjustments, including, among others: (i) changes in depreciation and amortization resulting from the fair value measurement of property, plant and equipment, net and other intangible assets and the write-off of certain balances; (ii) accounting policy alignment; (iii) non-recurring acquisition-related costs, including transaction and employee-related costs that were incurred directly in connection with the Merger, reflected as if incurred in the earliest period presented; and (iv) the tax-related effects as though the Merger had occurred.
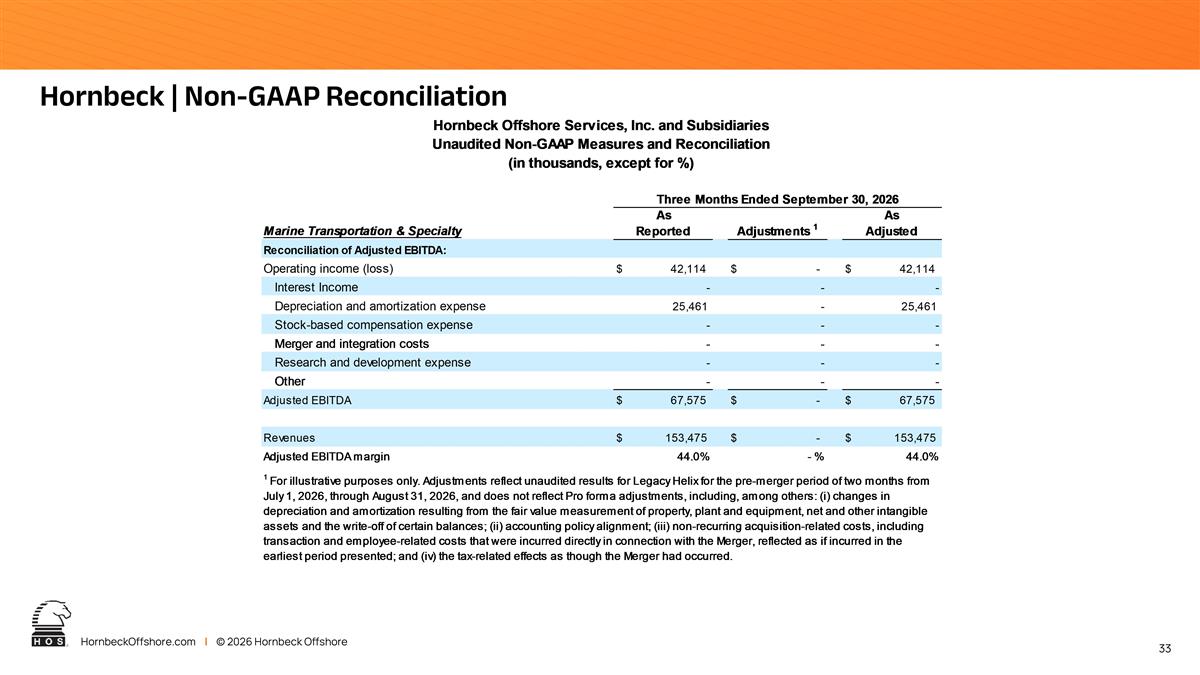
Hornbeck | Non-GAAP Reconciliation
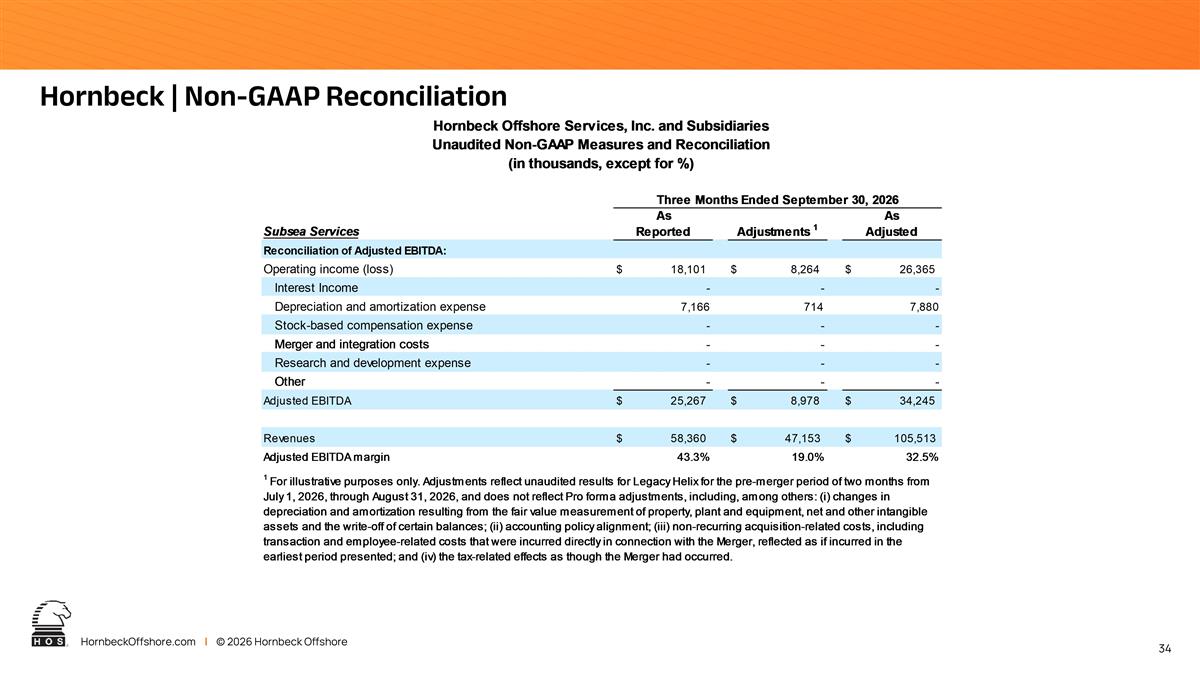
Hornbeck | Non-GAAP Reconciliation
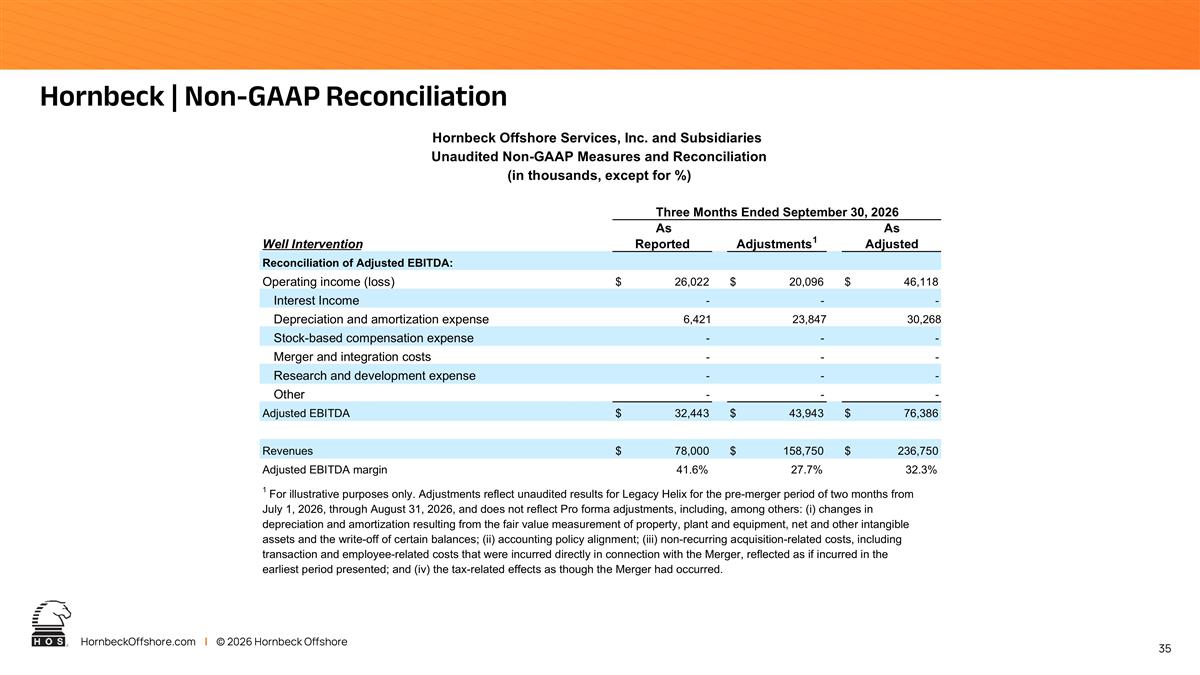
Hornbeck | Non-GAAP Reconciliation Well Intervention As Reported Adjustments 1 As Adjusted Reconciliation of Adjusted EBITDA: Operating income (loss) $ 26,022 $ 20,096 $ 46,118 Interest Income - - - Depreciation and amortization expense 6,421 23,847 30,268 Stock-based compensation expense - - - Merger and integration costs - - - Research and development expense - - - Other - - - Adjusted EBITDA $ 32,443 $ 43,943 $ 76,386 Revenues $ 78,000 $ 158,750 $ 236,750 Adjusted EBITDA margin 41.6% 27.7% 32.3% Hornbeck Offshore Services, Inc. and Subsidiaries Unaudited Non-GAAP Measures and Reconciliation (in thousands, except for %) Three Months Ended September 30, 2026 1 For illustrative purposes only. Adjustments reflect unaudited results for Legacy Helix for the pre-merger period of two months from July 1, 2026, through August 31, 2026, and does not reflect Pro forma adjustments, including, among others: (i) changes in depreciation and amortization resulting from the fair value measurement of property, plant and equipment, net and other intangible assets and the write-off of certain balances; (ii) accounting policy alignment; (iii) non-recurring acquisition-related costs, including transaction and employee-related costs that were incurred directly in connection with the Merger, reflected as if incurred in the earliest period presented; and (iv) the tax-related effects as though the Merger had occurred.
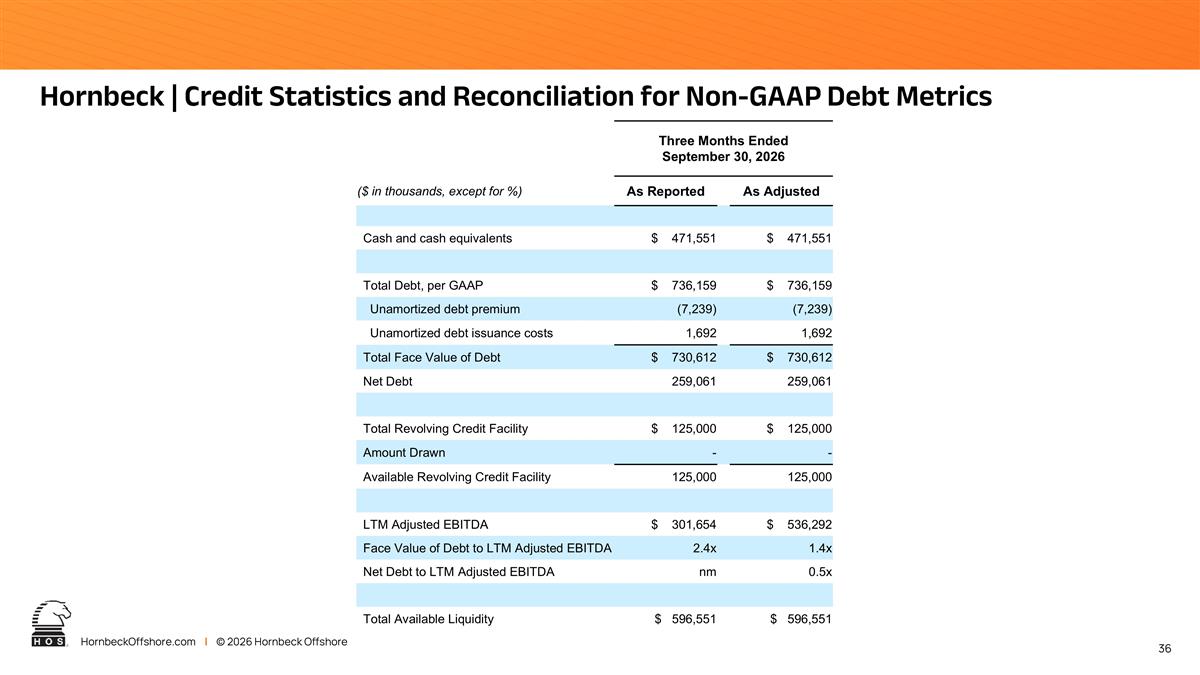
Hornbeck | Credit Statistics and Reconciliation for Non-GAAP Debt Metrics 36 Three Months Ended September 30, 2026 ($ in thousands, except for %) As Reported As Adjusted Cash and cash equivalents $ 471,551 $ 471,551 Total Debt, per GAAP $ 736,159 $ 736,159 Unamortized debt premium (7,239) (7,239) Unamortized debt issuance costs 1,692 1,692 Total Face Value of Debt $ 730,612 $ 730,612 Net Debt 259,061 259,061 Total Revolving Credit Facility $ 125,000 $ 125,000 Amount Drawn - - Available Revolving Credit Facility 125,000 125,000 LTM Adjusted EBITDA $ 301,654 $ 536,292 Face Value of Debt to LTM Adjusted EBITDA 2.4x 1.4x Net Debt to LTM Adjusted EBITDA nm 0.5x Total Available Liquidity $ 596,551 $ 596,551