Please wait

FLAHERTY & CRUMRINE PREFERRED INCOME FUND

To the Shareholders of Flaherty & Crumrine Preferred Income Fund (“PFD”):

Despite general weakness in most fixed-income markets (e.g., investment-grade corporate bonds), attributable mostly to higher benchmark interest rates, preferred securities performed reasonably well on a relative basis. Total return1 on net asset value (“NAV”) for the first fiscal quarter2 was -0.5%, while total return on market price was -8.2%.

The U.S. economy remains on solid footing, with most economists forecasting faster growth in 2018. Inflation has remained in check thus far, and modest wage growth and strong business investment suggest that faster economic growth can be accommodated without the economy overheating. Faster economic growth combined with optimism around tax reform has caused interest rates to move modestly higher. Tax reform should be supportive of growth and investment, but much of it will be deficit-financed and could result in higher Treasury rates as government borrowing increases.

Investors often associate higher long-term interest rates with lower prices for preferred securities, and to some extent this is true. However, sensitivity of the Fund’s preferred portfolio to benchmark interest rates is much lower today than it was ten years ago. That is primarily attributable to larger holdings of fixed-to-floating rate securities relative to traditional fixed-for-life preferreds. Including these securities in a portfolio (~72% as of 2/28/2018) reduces sensitivity to benchmark interest rates. Moderate interest-rate sensitivity, along with a tightening of preferred credit spreads during the quarter, offset much of the weakness experienced by other fixed-income asset classes.

Most of the portfolio experienced credit-spread tightening as noted above, but one area of mixed performance was the energy sector, notably master limited partnerships (MLPs). The MLP industry appears to be in transition. The traditional MLP structure has struggled to meet investor expectations, leading some to collapse partnership structures into simpler organizations. Lower corporate tax rates from recent tax reform may accelerate that trend. While a simpler structure should benefit preferred investors over time, many MLPs issued preferreds in the last few months, causing yields to increase as concessions were offered to entice demand. Importantly, individual MLPs are in various stages of transition, and we remain comfortable with the level of MLP exposure in the Fund’s portfolio (~7.6% as of 2/28/2018). Many of the MLPs held by the Fund are among the strongest credits in the sector and a step ahead of peers in navigating these rough waters.

The Fund’s dividend rate was reduced during the quarter to reflect changes in interest rates and credit spreads that have cumulated over time. Tightening by the Federal Reserve has raised short-term interest rates and, therefore, leverage cost, while lower preferred yields have gradually reduced portfolio income. The investment objective of the Fund is to provide high current income consistent with the preservation of capital, and we believe the Fund will continue to meet that objective – although distributable income may be reduced as we proceed through this economic cycle. Fund shareholders have benefited from years of record-low interest rates and low leverage costs, but rates have moved up as the economy has improved. We believe the Fund’s strategy of investing in preferred securities and using leverage to increase income will continue to produce a competitive distribution rate for shareholders. We encourage shareholders to read the Fund’s 2017 annual report for a more-thorough discussion of this important topic.


1 Following the methodology required by the Securities and Exchange Commission, total return assumes dividend reinvestment.

2 December 1, 2017 — February 28, 2018

2

Market volatility is likely to increase from record-low levels as we move into later stages of this economic cycle, but we believe preferreds will continue to offer competitive performance. Their combination of credit quality and yield (much of which is tax-advantaged) will be difficult to replicate in other fixed-income asset classes.

As always, we encourage you to visit the Fund’s website, www.preferredincome.com, for timely and important information.

Sincerely,

The Flaherty & Crumrine Portfolio Management Team

March 31, 2018

3


Flaherty & Crumrine Preferred Income Fund Incorporated

PORTFOLIO OVERVIEW

February 28, 2018 (Unaudited)


Fund Statistics


Net Asset Value

​

$

14.02


Market Price

​

$

13.98


Discount

​


0.29%

​

Yield on Market Price

​


6.70%

​

Common Stock Shares Outstanding

​


11,182,896


Security Ratings**

% of Net Assets†

A


0.7%

​

BBB


54.5%

​

BB


33.2%

​

Below “BB”

​

0.9%

​

Not Rated***


9.3%

​


Portfolio Rating Guidelines

% of Net Assets†

Security Rated Below Investment Grade By All****


30.5%

​

Issuer or Senior Debt Rated Below Investment Grade by All*****

1.4%

​


**Ratings are from Moody’s Investors Service, Inc. “Not Rated” securities are those with no ratings available from Moody’s.

***Excludes common stock and money market fund investments and net other assets and liabilities of 1.4%.

****Security rating below investment grade by all of Moody’s, Standard & Poor’s, and Fitch Ratings.

*****Security rating and issuer’s senior unsecured debt or issuer rating are below investment grade by all of Moody’s, S&P, and Fitch. The Fund’s investment policy currently limits such securities to 15% of Net Assets.

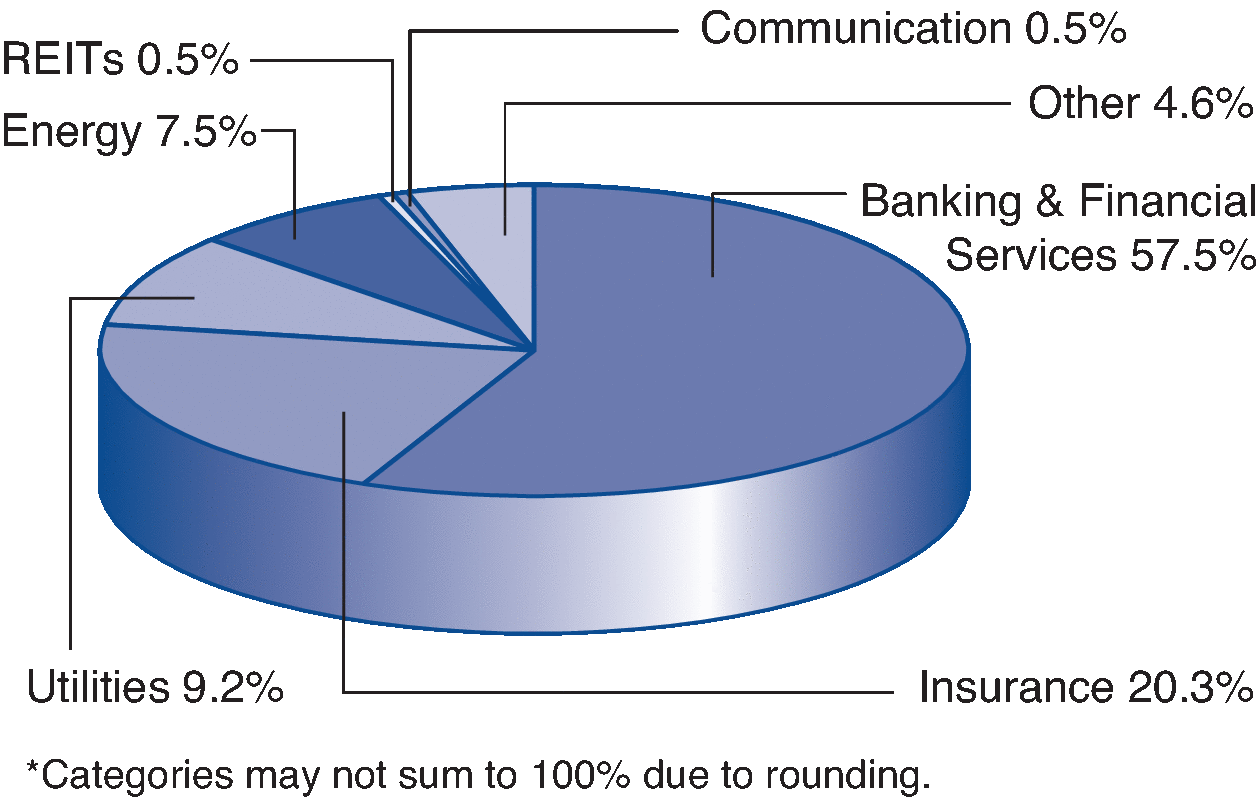
Industry Categories*

% of Net Assets†


Top 10 Holdings by Issuer

% of Net Assets†

JPMorgan Chase & Co


4.6%

​

MetLife Inc


4.2%

​

Wells Fargo & Company


4.1%

​

Citigroup Inc


3.8%

​

Morgan Stanley

​

​

3.7%

​

PNC Financial Services Group Inc


3.7%

​

BNP Paribas


3.2%

​

Fifth Third Bancorp

​

​

3.1%

​

Liberty Mutual Group


3.1%

​

Enbridge Energy Partners

​

​

3.1%

​


% of Net Assets******†

Holdings Generating Qualified Dividend Income (QDI) for Individuals


61%

​

Holdings Generating Income Eligible for the Corporate Dividends Received Deduction (DRD)

46%

​


******This does not reflect year-end results or actual tax categorization of Fund distributions. These percentages can, and do, change, perhaps significantly, depending on market conditions. Investors should consult their tax advisor regarding their personal situation.

†Net Assets includes assets attributable to the use of leverage.

4


Flaherty & Crumrine Preferred Income Fund Incorporated

PORTFOLIO OF INVESTMENTS

February 28, 2018 (Unaudited)


Shares/$ Par

​

​

​

Value

​

​

​

​

Preferred Securities§ — 93.9%

Banking — 54.7%

$

1,655,000

​

Australia & New Zealand Banking Group Ltd., 6.75% to 06/15/26 then
ISDA5 + 5.168%, 144A****

$

1,814,294

**(2)

​

​

​

Banco Bilbao Vizcaya Argentaria SA:

$

2,400,000

​

6.125% to 11/16/27 then SW5 + 3.87%

​

2,448,000

**(2)

$

400,000

​

9.00% to 05/09/18 then SW5 + 8.262%, 144A****

​

404,776

**(2)

$

530,000

​

Banco Mercantil del Norte SA, 7.625% to 01/06/28 then T10Y + 5.353%, 144A****

​

578,469

**(2)

​

​

​

Bank of America Corporation:

$

400,000

​

6.30% to 03/10/26 then 3ML + 4.553%, Series DD

​

440,000

*

$

2,170,000

​

3ML + 3.63%, 5.3969%(5), Series K

​

2,188,987

*(1)

$

1,751,000

​

8.125% to 05/15/18 then 3ML + 3.64%, Series M

​

1,779,454

*(1)

$

2,802,000

​

Barclays Bank PLC, 7.875% to 03/15/22 then SW5 + 6.772%, 144A****

​

3,028,976

**(2)

​

​

​

BNP Paribas:

$

5,315,000

​

7.375% to 08/19/25 then SW5 + 5.15%, 144A****

​

5,919,581

**(1)(2)

$

1,500,000

​

7.625% to 03/30/21 then SW5 + 6.314%, 144A****

​

1,635,000

**(2)

​

​

​

Capital One Financial Corporation:

​

2,100

​

6.00%, Series B

​

53,445

*

​

7,000

​

6.20%, Series F

​

185,990

*

​

12,900

​

6.00%, Series H

​

340,818

*

​

29,600

​

6.70%, Series D

​

790,320

*

​

​

​

Citigroup, Inc.:

​

113,670

​

6.875% to 11/15/23 then 3ML + 4.13%, Series K

​

3,204,357

*(1)

​

119,778

​

7.125% to 09/30/23 then 3ML + 4.04%, Series J

​

3,440,024

*(1)

$

2,299,000

​

8.40% to 04/30/18 then 3ML + 4.0285%, min 7.7575%, Series E

​

2,307,621

*(1)

​

​

​

CoBank ACB:

​

19,300

​

6.125%, Series G, 144A****

​

1,958,950

*

​

10,000

​

6.20% to 01/01/25 then 3ML + 3.744%, Series H, 144A****

​

1,071,750

*

​

10,000

​

6.25% to 10/01/22 then 3ML + 4.557%, Series F, 144A****

​

1,075,000

*(1)

$

447,000

​

6.25% to 10/01/26 then 3ML + 4.66%, Series I, 144A****

​

487,618

*

$

5,210,000

​

Colonial BancGroup, 7.114%, 144A****

​

521

(3)(4)††

$

290,000

​

Credit Agricole SA, 7.875% to 01/23/24 then SW5 + 4.898%,144A****

​

324,438

**(2)

​

258,558

​

Fifth Third Bancorp, 6.625% to 12/31/23 then 3ML + 3.71%, Series I

​

7,433,542

*(1)

​

​

​

First Horizon National Corporation:

​

795

​

First Tennessee Bank, 3ML + 0.85%, min 3.75%, 3.75%(5), 144A****

​

634,012

*(1)

​

1

​

FT Real Estate Securities Company, 9.50% 03/31/31, 144A****

​

1,296,250

​

​

​

​

Goldman Sachs Group:

$

2,100,000

​

5.00% to 11/10/22 then 3ML + 2.874%, Series P

​

2,047,752

*(1)

$

195,000

​

5.70% to 05/10/19 then 3ML + 3.884%, Series L

​

200,392

*

​

50,000

​

6.375% to 05/10/24 then 3ML + 3.55%, Series K

​

1,399,000

*(1)

​

​

​

HSBC Holdings PLC:

$

350,000

​

6.00% to 05/22/27 then ISDA5 + 3.746%

​

358,400

**(2)

$

995,000

​

6.875% to 06/01/21 then ISDA5 + 5.514%

​

1,067,138

**(2)

​

15,407

​

8.00%, Series 2

​

410,365

**(1)(2)

$

800,000

​

HSBC Capital Funding LP, 10.176% to 06/30/30 then 3ML + 4.98%, 144A****

​

1,281,504

(1)(2)


Flaherty & Crumrine Preferred Income Fund Incorporated

PORTFOLIO OF INVESTMENTS (Continued)

February 28, 2018 (Unaudited)


5

Shares/$ Par

​

​

​

​

Value

​


Preferred Securities — (Continued)

​

​

​

​


Banking — (Continued)


​

​

​

Huntington Bancshares, Inc.:

$

1,000,000

​

5.700% to 04/15/23 then 3ML + 2.88%, Series E

$

1,009,375

*

​

106,000

​

6.25%, Series D

​

2,869,420

*(1)

​

40,000

​

ING Groep NV, 6.375%

​

1,034,000

**(2)

​

​

​

JPMorgan Chase & Company:

​

61,700

​

6.70%, Series T

​

1,612,221

*(1)

$

4,715,000

​

6.75% to 02/01/24 then 3ML + 3.78%, Series S

​

5,215,969

*(1)

$

4,000,000

​

7.90% to 04/30/18 then 3ML + 3.47%, Series I

​

4,040,000

*(1)

​

90,400

​

KeyCorp, 6.125% to 12/15/26 then 3ML + 3.892%, Series E

​

2,518,562

*(1)

$

1,660,000

​

Lloyds TSB Bank PLC, 12.00% to 12/16/24 then 3ML + 11.756%, 144A****

​

2,166,501

(2)

$

2,790,000

​

M&T Bank Corporation, 6.45% to 02/15/24 then 3ML + 3.61%, Series E

​

3,100,611

*(1)

$

540,000

​

Macquarie Bank Ltd., 6.125% to 03/08/27 then SW5 + 3.703%, 144A****

​

550,800

**(2)

​

43,230

​

MB Financial, Inc., 6.00%, Series C

​

1,074,265

*

​

​

​

Morgan Stanley:

​

77,800

​

5.85% to 04/15/27 then 3ML + 3.491%, Series K

​

2,086,596

*

​

154,665

​

6.875% to 01/15/24 then 3ML + 3.94%, Series F

​

4,397,126

*(1)

​

80,516

​

7.125% to 10/15/23 then 3ML + 4.32%, Series E

​

2,330,133

*(1)

​

174,600

​

New York Community Bancorp, Inc., 6.375% to 03/17/27 then
3ML + 3.821%, Series A

​

4,914,990

*(1)

​

​

​

PNC Financial Services Group, Inc.:

​

289,050

​

6.125% to 05/01/22 then 3ML + 4.067%, Series P

​

8,074,438

*(1)

$

625,000

​

6.75% to 08/01/21 then 3ML + 3.678%, Series O

​

676,294

*(1)

$

2,160,000

​

RaboBank Nederland, 11.00% to 06/30/19 then 3ML + 10.868%, 144A****

​

2,367,900

(1)(2)

​

50,000

​

Regions Financial Corporation, 6.375% to 09/15/24 then 3ML + 3.536%, Series B

​

1,379,330

*(1)

$

4,000,000

​

Societe Generale SA, 7.375% to 09/13/21 then SW5 + 6.238%, 144A****

​

4,320,000

**(1)(2)

​

1,750

​

Sovereign Bancorp:
Sovereign REIT, 12.00%, Series A, 144A****

​

2,178,750

​

​

​

​

Standard Chartered PLC:

$

1,565,000

​

7.50% to 04/02/22 then SW5 + 6.301%, 144A****

​

1,697,321

**(1)(2)

$

1,250,000

​

7.75% to 04/02/23 then SW5 + 5.723%, 144A****

​

1,360,938

**(2)

​

92,900

​

State Street Corporation, 5.90% to 03/15/24 then 3ML + 3.108%, Series D

​

2,531,525

*(1)

​

8,494

​

Sterling Bancorp, 6.50%, Series A

​

222,543

*

​

8,800

​

SunTrust Banks, Inc., 5.875%, Series E

​

221,936

*

​

10,000

​

Texas Capital Bancshares Inc., 6.50%, Series A

​

254,100

*

​

35,000

​

US Bancorp, 6.50% to 01/15/22 then 3ML + 4.468%, Series F

​

984,763

*(1)

​

30,000

​

Valley National Bancorp, 5.50% to 09/30/22 then 3ML + 3.578%, Series B

​

775,800

*


6


Flaherty & Crumrine Preferred Income Fund Incorporated

PORTFOLIO OF INVESTMENTS (Continued)

February 28, 2018 (Unaudited)


Shares/$ Par

​

​

​

​

Value

​


Preferred Securities — (Continued)

​

​

​

​


Banking — (Continued)


​

​

​

Wells Fargo & Company:

​

15,000

​

5.625%, Series Y

$

377,430

*

​

60,300

​

5.85% to 09/15/23 then 3ML + 3.09%, Series Q

​

1,611,216

*(1)

$

2,075,000

​

5.875% to 06/15/25 then 3ML + 3.99%, Series U

​

2,208,589

*(1)

​

35,900

​

6.625% to 03/15/24 then 3ML + 3.69%, Series R

​

993,353

*(1)

​

241

​

7.50% , Series L

​

307,275

*

$

1,095,000

​

7.98% to 03/15/18 then 3ML + 3.77%, Series K

​

1,114,163

*(1)

​

123,500

​

8.00%, Series J

​

3,214,705

*(1)

$

1,200,000

​

Westpac Banking Corporation, 5.00% to 09/21/27 then ISDA5 + 2.888%

​

1,148,561

**(2)

$

1,000,000

​

Zions Bancorporation, 7.20% to 09/15/23 then 3ML + 4.44%, Series J

​

1,105,000

*

​

​

129,653,243

​

Financial Services — 0.6%

$

460,000

​

AerCap Global Aviation Trust, 6.50% to 06/15/25 then
3ML + 4.30%, 06/15/45, 144A****

​

501,400

(2)

$

476,000

​

E*TRADE Financial Corporation, 5.30% to 03/15/23 then 3ML + 3.16%, Series B

​

471,240

*

$

453,000

​

General Motors Financial Company, 5.75% to 09/30/27
then 3ML + 3.598%, Series A

​

460,429

*

​

​

1,433,069

​

Insurance — 19.1%

​

82,392

​

Allstate Corporation, 6.625%, Series E

​

2,178,502

*(1)

$

300,000

​

Aon Corporation, 8.205% 01/01/27

​

387,750

(1)

​

​

​

Arch Capital Group, Ltd.:

​

12,000

​

5.25%, Series E

​

282,000

**(2)

​

10,500

​

5.45%, Series F

​

253,995

**(2)

$

1,423,000

​

AXA SA, 6.379% to 12/14/36 then 3ML + 2.256%, 144A****

​

1,657,795

**(1)(2)

​

21,450

​

Axis Capital Holdings Ltd., 5.50%, Series E

​

521,664

**(2)

$

975,000

​

Chubb Ltd.:
Ace Capital Trust II, 9.70% 04/01/30

​

1,455,187

(1)(2)

​

124,779

​

Delphi Financial Group, 3ML + 3.19%, 5.0288%(5) 05/15/37

​

2,869,917

(1)

$

1,778,000

​

Everest Reinsurance Holdings, 3ML + 2.385%, 4.2238%(5) 05/15/37

​

1,748,663

(1)

​

10,000

​

Hartford Financial Services Group, Inc., 7.875% to 04/15/22 then
3ML + 5.596%, 04/15/42

​

298,300

​

$

3,736,000

​

Liberty Mutual Group, 7.80% 03/15/37, 144A****

​

4,651,320

(1)

​

​

​

MetLife, Inc.:

$

3,600,000

​

9.25% 04/08/38, 144A****

​

5,049,000

(1)

$

3,096,000

​

10.75% 08/01/39

​

4,961,340

(1)

​

​

​

PartnerRe Ltd.:

​

25,000

​

5.875%, Series I

​

640,750

**(1)(2)

​

5,600

​

6.50%, Series G

​

147,336

**(2)

​

94,510

​

7.25%, Series H

​

2,611,311

**(1)(2)


7


Flaherty & Crumrine Preferred Income Fund Incorporated

PORTFOLIO OF INVESTMENTS (Continued)

February 28, 2018 (Unaudited)


Shares/$ Par

​

​

​

​

Value

​


Preferred Securities — (Continued)

​

​

​

​


Insurance — (Continued)


$

402,000

​

Prudential Financial, Inc., 5.625% to 06/15/23 then 3ML + 3.92%, 06/15/43

$

424,613

​

$

4,043,000

​

QBE Insurance Group Ltd., 7.50% to 11/24/23 then
SW10 + 6.03%, 11/24/43, 144A****

​

4,598,913

(1)(2)

$

2,820,000

​

Unum Group:
Provident Financing Trust I, 7.405% 03/15/38

​

3,214,800

(1)

​

24,000

​

W.R. Berkley Corporation, 5.75% 06/01/56

​

616,056

​

​

​

​

XL Group Limited:

$

1,400,000

​

Catlin Insurance Company Ltd., 3ML + 2.975%, 4.7142%(5), 144A****

​

1,379,000

(1)(2)

$

5,500,000

​

XL Capital Ltd., 3ML + 2.4575%, 4.1790%(5), Series E

​

5,259,375

(1)(2)

​

​

45,207,587

​

Utilities — 9.2%

$

3,127,000

​

Commonwealth Edison:
COMED Financing III, 6.35% 03/15/33

​

3,345,890

(1)

​

145,000

​

Dominion Energy, Inc., 5.25% 07/30/76, Series A

​

3,530,764

(1)

​

​

​

DTE Energy Company:

​

18,000

​

5.375% 06/01/76, Series B

​

443,698

​

​

10,000

​

6.00% 12/15/76, Series F

​

267,201

​

$

2,180,000

​

Emera, Inc., 6.75% to 06/15/26 then 3ML + 5.44%, 06/15/76, Series 2016A

​

2,430,700

(1)(2)

​

22,700

​

Georgia Power Company, 5.00% 10/01/77, Series 2017A

​

554,220

​

​

25,000

​

Indianapolis Power & Light Company, 5.65%

​

2,583,182

*

​

84,500

​

Integrys Energy Group, Inc., 6.00% to 08/01/23 then 3ML + 3.22%, 08/01/73

​

2,260,375

(1)

$

1,500,000

​

NextEra Energy:
FPL Group Capital, Inc., 3ML + 2.125%, 3.7135%
(5) 06/15/67, Series C

​

1,459,740

(1)

$

500,000

​

PECO Energy:
PECO Energy Capital Trust III, 7.38% 04/06/28, Series D

​

572,524

(1)

​

​

​

PPL Corp:

​

44,960

​

PPL Capital Funding, Inc., 5.90% 04/30/73, Series B

​

1,142,883

(1)

$

1,632,000

​

PPL Capital Funding, Inc., 3ML + 2.665%, 4.3584%(5) 03/30/67, Series A

​

1,627,920

(1)

$

1,103,000

​

Puget Sound Energy, Inc., 3ML + 2.53%, 4.0106%(5) 06/01/67, Series A

​

1,094,728

(1)

​

20,000

​

Southern California Edison:
SCE Trust V, 5.45% to 03/15/26 then 3ML + 3.79%, Series K

​

523,128

*

​

​

21,836,953

​

Energy — 5.9%

$

1,140,000

​

DCP Midstream LP, 7.375% to 12/15/22 then 3ML + 5.148%, Series A

​

1,152,113

​

$

1,120,000

​

Enbridge, Inc., 6.00% to 01/15/27 then 3ML + 3.89%, 01/15/77

​

1,136,800

(2)

$

7,302,000

​

Enbridge Energy Partners LP, 3ML + 3.7975%, 5.4917%(5) 10/01/37

​

7,320,255

(1)

​

​

​

Enterprise Products Operating L.P.:

$

450,000

​

3ML + 3.7075%, 5.4809%(5) 08/01/66, Series A

​

448,313

​

$

500,000

​

5.25% to 08/16/27 then 3ML + 3.033%, 08/16/77, Series E

​

483,750

​

​

16,900

​

Kinder Morgan, Inc., 9.75% 10/26/18, Series A

​

566,150

*


8


Flaherty & Crumrine Preferred Income Fund Incorporated

PORTFOLIO OF INVESTMENTS (Continued)

February 28, 2018 (Unaudited)


Shares/$ Par

​

​

​

​

Value

​


Preferred Securities — (Continued)

​

​

​

​


Energy — (Continued)


​

33,700

​

NuStar Logistics LP, 3ML + 6.734%, 8.4555%(5) 01/15/43

$

864,405

​

​

​

​

Transcanada Pipelines, Ltd.:

$

1,000,000

​

5.30% to 03/15/27 then 3ML + 3.208%, 03/15/77, Series 2017-A

​

1,009,375

(2)

$

1,000,000

​

5.875% to 08/15/26 then 3ML + 4.64%, 08/15/76, Series 2016-A

​

1,077,500

(1)(2)

​

​

14,058,661

​

Real Estate Investment Trust (REIT) — 0.5%

​

3,440

​

Annaly Capital Management, Inc., 6.95% to 09/30/22 then 3ML + 4.993%, Series F

​

85,037

​

​

​

​

National Retail Properties, Inc.:

​

5,500

​

5.20%, Series F

​

126,995

​

​

24,270

​

5.70%, Series E

​

595,251

(1)

​

​

​

PS Business Parks, Inc.:

​

7,760

​

5.20%, Series W

​

187,171

​

​

4,000

​

5.70%, Series V

​

99,160

​

​

325

​

5.75%, Series U

​

8,057

​

​

​

1,101,671

​

Miscellaneous Industries — 3.9%


$


400,000

​

BHP Billiton Limited:

BHP Billiton Finance U.S.A., Ltd., 6.75% to 10/19/25 then
SW5 + 5.093%, 10/19/75, 144A****

​

455,000

(2)

$

833,000

​

General Electric Company, 5.00% to 01/21/21 then 3ML + 3.33%, Series D

​

823,629

*(1)

​

​

​

Land O’ Lakes, Inc.:

$

260,000

​

7.25%, Series B, 144A****

​

290,550

*

$

3,900,000

​

8.00%, Series A, 144A****

​

4,416,750

*(1)

​

34,700

​

Ocean Spray Cranberries, Inc., 6.25%, 144A****

​

3,157,700

*

​

​

9,143,629

​

​

​

Total Preferred Securities
 
(Cost $211,395,178)

​

222,434,813

​

​

​

​

Corporate Debt Securities§ — 4.7%

Banking — 2.0%

$

600,000

​

Regions Financial Corporation, 7.375% 12/10/37, Sub Notes

​

794,979

(1)

​

133,500

​

Texas Capital Bancshares Inc., 6.50% 09/21/42, Sub Notes

​

3,453,511

(1)

​

18,000

​

Zions Bancorporation, 6.95% to 09/15/23 then 3ML + 3.89%, 09/15/28, Sub Notes

​

526,498

(1)

​

​

4,774,988

​

Financial Services — 0.0%

​

1,000

​

B. Riley Financial, Inc., 7.50% 05/31/27

​

25,690

​

​

​

25,690

​


9


Flaherty & Crumrine Preferred Income Fund Incorporated

PORTFOLIO OF INVESTMENTS (Continued)

February 28, 2018 (Unaudited)


Shares/$ Par

​

​

​

​

Value

​


Corporate Debt Securities — (Continued)

​

​

​

​


Insurance — 1.2%


$

2,000,000

​

Liberty Mutual Insurance, 7.697% 10/15/97, 144A****

$

2,750,618

(1)

​

​

2,750,618

​

Energy — 0.9%

$

1,680,000

​

Energy Transfer Partners LP, 8.25% 11/15/29

​

2,108,720

(1)

​

​

2,108,720

​

Communication — 0.5%

​

​

​

Qwest Corporation:

​

22,170

​

6.50% 09/01/56

​

478,872

​

​

28,330

​

6.75% 06/15/57

​

640,825

​

​

400

​

7.00% 04/01/52

​

9,477

​

​

​

1,129,174

​

Miscellaneous Industries — 0.1%

​

10,000

​

eBay, Inc., 6.00% 02/01/56

​

264,315

​

​

​

264,315

​

​

​

Total Corporate Debt Securities
 
(Cost $9,691,041)

​

11,053,505

​

​

​

​

Common Stock — 0.8%

Banking — 0.1%

​

3,620

​

CIT Group, Inc.

​

192,041

*

​

​

192,041

​

Energy — 0.7%

​

99,212

​

Kinder Morgan, Inc.

​

1,607,234

*

​

​

1,607,234

​

Insurance — 0.0%

​

19,896

​

WMI Holdings Corporation, 144A****

​

25,666

*†

​

​

25,666

​

​

​

Total Common Stock
 
(Cost $3,041,295)

​

1,824,941

​

​

​

​

Money Market Fund — 0.1%

​

307,820

​

BlackRock Liquidity Funds:
T-Fund, Institutional Class

​

307,820

​

​

​

Total Money Market Fund
 
(Cost $307,820)

​

307,820

​


10


Flaherty & Crumrine Preferred Income Fund Incorporated

PORTFOLIO OF INVESTMENTS (Continued)

February 28, 2018 (Unaudited)


​

​

​

Value

​

Total Investments (Cost $224,435,334***)

99.5

%

$

235,621,079

​

Other Assets And Liabilities (Net)

0.5

%

​

1,239,087

​

Total Managed Assets

100.0

%‡

$

236,860,166

​

Loan Principal Balance

​

​

(80,100,000

)

Total Net Assets Available To Common Stock

​

$

156,760,166

​


§Date shown is maturity date unless referencing the end of the fixed-rate period of a fixed-to-floating rate security.

*Securities eligible for the Dividends Received Deduction and distributing Qualified Dividend Income.

**Securities distributing Qualified Dividend Income only.

***Aggregate cost of securities held.

****Securities exempt from registration under Rule 144A of the Securities Act of 1933. These securities may be resold in transactions exempt from registration to qualified institutional buyers. At February 28, 2018, these securities amounted to $65,087,061 or 27.5% of total managed assets.

(1)All or a portion of this security is pledged as collateral for the Fund’s loan. The total value of such securities was $144,970,804 at February 28, 2018.

(2)Foreign Issuer.

(3)Level 3, illiquid security (designation is unaudited; see Note 2: Additional Accounting Standards).

(4)Valued at fair value as determined in good faith by or under the direction of the Board of Directors as of February 28, 2018.

(5)Represents the rate in effect as of the reporting date.

†Non-income producing.

††The issuer has filed for bankruptcy protection. As a result, the Fund may not be able to recover the principal invested and also does not expect to receive income on this security going forward.

‡The percentage shown for each investment category is the total value of that category as a percentage of total managed assets.

ABBREVIATIONS:

3ML — 3-Month ICE LIBOR USD A/360

ISDA5 — 5-year USD ICE Swap Semiannual 30/360

SW5 — 5-year USD Swap Semiannual 30/360

SW10 — 10-year USD Swap Semiannual 30/360

T10Y — Federal Reserve H.15 10-Yr Constant Maturity Treasury Semiannual yield

11


Flaherty & Crumrine Preferred Income Fund Incorporated

STATEMENT OF CHANGES IN NET ASSETS AVAILABLE TO COMMON STOCK(1)

For the period from December 1, 2017 through February 28, 2018 (Unaudited)


​

​

​

​

​

​

​

​

​

Value

​

OPERATIONS:

​

​

​

​

Net investment income

​

$

2,368,570

​

Net realized gain/(loss) on investments sold during the period

​

(60,136

)

Change in net unrealized appreciation/(depreciation) of investments

​

(3,137,456

)

Net decrease in net assets resulting from operations

(829,022

)

DISTRIBUTIONS:

​

​

​

​

Dividends paid from net investment income to Common Stock Shareholders(2)

​

(2,705,828

)

Total Distributions to Common Stock Shareholders

(2,705,828

)

FUND SHARE TRANSACTIONS:

​

​

​

​

Increase from shares issued under the Dividend Reinvestment and
Cash Purchase Plan

​

146,234

​

Net increase in net assets available to Common Stock resulting from
Fund share transactions

​

146,234

​

​

​

​

​

​

​

​

​

NET DECREASE IN NET ASSETS AVAILABLE TO COMMON STOCK
FOR THE period

​

$

(3,388,616

)

​

​

NET ASSETS AVAILABLE TO COMMON STOCK:

​

​

​

​

Beginning of period

​

$

160,148,782

​

Net decrease in net assets during the period

​

(3,388,616

)

End of period

​

$

156,760,166

​


(1)These tables summarize the three months ended February 28, 2018 and should be read in conjunction with the Fund’s audited financial statements, including notes to the financial statements, in its Annual Report dated November 30, 2017.

(2)May include income earned, but not paid out, in prior fiscal year.


Flaherty & Crumrine Preferred Income Fund Incorporated

Financial Highlights(1)

For the period December 1, 2017 through February 28, 2018 (Unaudited)
For a Common Stock share outstanding throughout the period


12


PER SHARE OPERATING PERFORMANCE:


​

​

Net asset value, beginning of period


$

14.33

​

INVESTMENT OPERATIONS:


​

​

Net investment income


0.21

​

Net realized and unrealized gain/(loss) on investments


(0.28

)

Total from investment operations


(0.07

)

DISTRIBUTIONS TO COMMON STOCK SHAREHOLDERS:


​

​

From net investment income


(0.24

)

Total distributions to Common Stock Shareholders


(0.24

)

Net asset value, end of period


$

14.02

​

Market value, end of period


$

13.98

​

Common Stock shares outstanding, end of period


11,182,896

​

RATIOS TO AVERAGE NET ASSETS AVAILABLE TO COMMON STOCK SHAREHOLDERS:


Net investment income†


6.04

%*

Operating expenses including interest expense


2.41

%*

Operating expenses excluding interest expense


1.25

%*


​

​

SUPPLEMENTAL DATA: ††


​

​

Portfolio turnover rate


1

%**

Total managed assets, end of period (in 000’s)


$

236,860

​

Ratio of operating expenses including interest expense to average total managed assets


1.61

%*

Ratio of operating expenses excluding interest expense to average total managed assets


0.83

%*


(1)These tables summarize the three months ended February 28, 2018 and should be read in conjunction with the Fund’s audited financial statements, including notes to the financial statements, in its Annual Report dated November 30, 2017.

*Annualized.

**Not annualized.

†The net investment income ratio reflects income net of operating expenses, including interest expense.

††Information presented under heading Supplemental Data includes loan principal balance.


13


Flaherty & Crumrine Preferred Income Fund Incorporated

Financial Highlights (Continued)

Per Share of Common Stock (Unaudited)


​

​

Total
Dividends
Paid

​

Net Asset
Value

​

NYSE
Closing Price

​

Dividend
Reinvestment
Price
(1)

December 29, 2017

​

$0.0820

​

$14.33

​

$14.98

​

$14.33

January 31, 2018

​

0.0820

​

14.17

​

13.41

​

13.65

February 28, 2018

​

0.0780

​

14.02

​

13.98

​

13.98


(1)Whenever the net asset value per share of the Fund’s Common Stock is less than or equal to the market price per share on the reinvestment date, new shares issued will be valued at the higher of net asset value or 95% of the then current market price. Otherwise, the reinvestment shares of Common Stock will be purchased in the open market.


14


Flaherty & Crumrine Preferred Income Fund Incorporated

Notes to Financial Statements (Unaudited)


1.Aggregate Information for Federal Income Tax Purposes

At February 28, 2018, the aggregate cost of securities for federal income tax purposes was $234,764,547, the aggregate gross unrealized appreciation for all securities in which there was an excess of value over tax cost was $18,138,875 and the aggregate gross unrealized depreciation for all securities in which there was an excess of tax cost over value was $17,282,343.

2.Additional Accounting Standards

Fair Value Measurements: The Fund has analyzed all existing investments to determine the significance and character of all inputs to their fair value determination. The levels of fair value inputs used to measure the Fund’s investments are characterized into a fair value hierarchy. Where inputs for an asset or liability fall into more than one level in the fair value hierarchy, the investment is classified in its entirety based on the lowest level input that is significant to that investment’s valuation. The three levels of the fair value hierarchy are described below:

●Level 1 – quoted prices in active markets for identical securities

●Level 2 – other significant observable inputs (including quoted prices for similar securities, interest rates, prepayment speeds, credit risk, etc.)

●Level 3 – significant unobservable inputs (including the Fund’s own assumptions in determining the fair value of investments)

The inputs or methodology used for valuing securities are not necessarily an indication of the risk associated with investing in those securities. Transfers in and out of levels are recognized at market value at the end of the period.

15


Flaherty & Crumrine Preferred Income Fund Incorporated

Notes to Financial Statements (Unaudited) (Continued)


A summary of the inputs used to value the Fund’s investments as of February 28, 2018 is as follows:

​

​

Total
Value at
February 28, 2018

​

Level 1
Quoted
Price

​

Level 2
Significant
Observable
Inputs

​

Level 3
Significant
Unobservable
Inputs

Preferred Securities

​

​

​

​

​

​

​

​

Banking

​

$129,653,243​

​

$110,787,756 ​

​

$18,864,966 ​

​

$521 ​

Financial Services

​

1,433,069

​

931,669

​

501,400

​

—

Insurance

​

45,207,587

​

23,244,242

​

21,963,345

​

—

Utilities

​

21,836,953

​

11,980,254

​

9,856,699

​

—

Energy

​

14,058,661

​

6,738,406

​

7,320,255

​

—

Real Estate Investment Trust (REIT)

​

1,101,671

​

1,101,671

​

—

​

—

Miscellaneous Industries

​

9,143,629

​

1,278,629

​

7,865,000

​

—

Corporate Debt Securities

​

​

​

​

​

​

​

​

Banking

​

4,774,988

​

3,980,009

​

794,979

​

—

Financial Services

​

25,690

​

25,690

​

—

​

—

Insurance

​

2,750,618

​

—

​

2,750,618

​

—

Energy

​

2,108,720

​

—

​

2,108,720

​

—

Communication

​

1,129,174

​

1,129,174

​

—

​

—

Miscellaneous Industries

​

264,315

​

264,315

​

—

​

—

Common Stock

​

​

​

​

​

​

​

​

Banking

​

192,041

​

192,041

​

—

​

—

Energy

​

1,607,234

​

1,607,234

​

—

​

—

Insurance

​

25,666

​

25,666

​

—

​

—

Money Market Fund

​

307,820

​

307,820

​

—

​

—

Total Investments

​

$ 235,621,079 ​

​

$163,594,576 ​


$72,025,982 ​


$521 ​


During the reporting period, securities with an aggregate market value of $3,100,611 were transferred into Level 2 from Level 1. The securities were transferred due to a decrease in the quantity and quality of information related to trading activity or broker quotes for these securities. During the period, there were no transfers into Level 1 from Level 2. During the reporting period, there were no transfers into or out of Level 3.

The fair values of the Fund’s investments are generally based on market information and quotes received from brokers or independent pricing services that are approved by the Board of Directors and are unaffiliated with the Adviser. To assess the continuing appropriateness of security valuations, management, in consultation with the Adviser, regularly compares current prices to prior prices, prices across comparable securities, actual sale prices for securities in the Fund’s portfolio, and market information obtained by the Adviser as a function of being an active market participant.

Securities with quotes that are based on actual trades or actionable bids and offers with a sufficient level of activity on or near the measurement date are classified as Level 1. Securities that are priced using quotes derived from implied values, indicative bids and offers, or a limited number of actual trades—or the same information for securities that are similar in many respects to those being valued—are classified as

16


Flaherty & Crumrine Preferred Income Fund Incorporated

Notes to Financial Statements (Unaudited) (Continued)


Level 2. If market information is not available for securities being valued, or materially-comparable securities, then those securities are classified as Level 3. In considering market information, management evaluates changes in liquidity, willingness of a broker to execute at the quoted price, the depth and consistency of prices from pricing services, and the existence of observable trades in the market.

The following is a reconciliation of Level 3 investments for which significant unobservable inputs were used to determine fair value:


Preferred Securities


Total Investments


Banking

Balance as of 11/30/17


$

521


$

521


Accrued discounts/premiums


—


—


Realized gain/(loss)


—


—


Change in unrealized appreciation/(depreciation)


—


—


Purchases


—


—


Sales


—


—


Transfer in


—


—


Transfer out


—


—


Balance as of 02/28/18


$

521


$

521


For the three months ended February 28, 2018, total change in unrealized gain/(loss) on Level 3 securities still held at period-end and included in the change in net assets was $0.

The following table summarizes the valuation techniques used and unobservable inputs developed to determine the fair value of Level 3 investments:

Category


Fair Value
at 02/28/18


Valuation Technique


Unobservable Input


Input Range (Wgt Avg)

Preferred Securities (Banking)


$521


Bankruptcy recovery


Credit/Structure-specific recovery


0.00% - 0.02% (0.01%)


The significant unobservable inputs used in the fair value measurement technique for bankruptcy recovery are based on recovery analysis that is specific to the security being valued, including the level of subordination and structural features of the security, and the current status of any bankruptcy or liquidation proceedings. Observable market trades in bankruptcy claims are utilized by management, when available, to assess the appropriateness of valuations, although the frequency of trading depends on the specific credit and seniority of the claim. Expected recoveries in bankruptcy by security type and industry do not tend to deviate much from historical recovery rates, which are very low (sometimes zero) for preferred securities and more moderate for senior debt. Significant changes in these inputs would result in a significantly higher or lower fair value measurement.

Directors

R. Eric Chadwick, CFA
Chairman of the Board

Morgan Gust

David Gale

Karen H. Hogan

Officers

R. Eric Chadwick, CFA
Chief Executive Officer and
President

Chad C. Conwell
Chief Compliance Officer,
Vice President and Secretary

Bradford S. Stone
Chief Financial Officer,
Vice President and Treasurer

Roger W. Ko
Assistant Treasurer

Laurie C. Lodolo
Assistant Compliance Officer,
Assistant Treasurer and
Assistant Secretary

Linda M. Puchalski
Assistant Treasurer

Investment Adviser

Flaherty & Crumrine Incorporated
e-mail: flaherty@pfdincome.com

Questions concerning your shares of Flaherty & Crumrine Preferred Income Fund?

•If your shares are held in a Brokerage Account, contact your Broker.

•If you have physical possession of your shares in certificate form, contact the Fund’s Transfer Agent & Shareholder Servicing Agent —

BNY Mellon c/o Computershare
P.O. Box 30170
College Station, TX 77842-3170
1-866-351-7446

This report is sent to shareholders of Flaherty & Crumrine Preferred Income Fund Incorporated for their information. It is not a Prospectus, circular or representation intended for use in the purchase or sale of shares of the Fund or of any securities mentioned in this report.


Quarterly
Report

February 28, 2018

www.preferredincome.com