


Getting the right Customers and keeping them is the foundation of our business. It demands a single-minded commitment to Customer satisfaction. Meeting this commitment requires tough standards, good people, and constant attention to the importance of each individual Customer. Introduced during the summer of 1986, the precepts are displayed throughout the company, and each person has a copy. These words have been reviewed every year since they were written, and not one word has ever been changed. (In 2000, a new precept was added.) These precepts are simple and straightforward, and we mean every single one.
CONTENTS
2 |
2003 Financial Highlights | |
3 |
Letter to Stockholders | |
4 |
Who We Are | |
6 |
How We Market | |
8 |
How We Lend | |
9 |
How We Keep Customers | |
10 |
Funding | |
11 |
Financials | |
104 |
MBNA Corporation Board of Directors, | |
| MBNA Principal Officers, | ||
| MBNA Office Locations |

2 |

2003 FINANCIAL HIGHLIGHTS
| Year Ended December 31, | 2003 | 2002 | 2001 | 2000 | 1999 | |||||||||||||||
| (dollars in thousands, except per share amounts) | ||||||||||||||||||||
Per Common Share Data (a) |
||||||||||||||||||||
Earnings |
$ | 1.82 | $ | 1.37 | $ | 1.31 | $ | 1.05 | $ | .84 | ||||||||||
Earnings—assuming dilution |
1.79 | 1.34 | 1.28 | 1.02 | .80 | |||||||||||||||
Dividends (b) |
.36 | .27 | .24 | .21 | .19 | |||||||||||||||
Book value |
8.53 | 6.96 | 5.94 | 5.02 | 3.31 | |||||||||||||||
Ratios |
||||||||||||||||||||
Return on average total assets |
4.16 | % | 3.67 | % | 4.16 | % | 3.94 | % | 3.62 | % | ||||||||||
Return on average stockholders’
equity |
22.98 | 21.29 | 24.07 | 25.79 | 27.18 | |||||||||||||||
Stockholders’ equity to total assets |
18.80 | 17.22 | 17.16 | 17.13 | 13.61 | |||||||||||||||
Sales and cash advance volume |
$ | 184,293,873 | $ | 160,046,164 | $ | 142,261,636 | $ | 125,683,731 | $ | 105,806,935 | ||||||||||
Financial Statement Data |
||||||||||||||||||||
Net interest income (c) |
$ | 2,350,373 | $ | 2,074,575 | $ | 1,657,340 | $ | 1,395,015 | $ | 1,175,759 | ||||||||||
Other operating income (c) |
7,825,480 | 6,752,923 | 6,673,316 | 4,920,403 | 4,193,527 | |||||||||||||||
Net Income (a) |
2,338,104 | 1,765,954 | 1,694,291 | 1,312,532 | 1,024,423 | |||||||||||||||
Deposits |
31,836,081 | 30,616,216 | 27,094,745 | 24,343,595 | 18,714,753 | |||||||||||||||
Stockholders’ equity |
11,113,040 | 9,101,319 | 7,798,718 | 6,627,278 | 4,199,443 | |||||||||||||||
Managed Data |
||||||||||||||||||||
Total managed loans |
$ | 118,493,560 | $ | 107,257,842 | $ | 97,496,051 | $ | 88,790,721 | $ | 72,255,513 | ||||||||||
| (a) | For full year 2002, net income excluding the change in the estimated value of accrued interest and fees in September 2002 would have been $1.93 billion or $1.47 per common share—assuming dilution. |
| (b) | On January 22, 2004, the Board of Directors approved an increase of 20% in the quarterly dividend to $.12 per common share. |
| (c) | For purposes of comparability, certain prior period amounts have been reclassified. These reclassifications did not affect net income. |
This annual report includes managed data. A reconciliation of the managed data to the most directly comparable GAAP data is included in the Management’s Discussion and Analysis of Financial Condition and Results of Operations section of the annual report.

3 |
DEAR STOCKHOLDERS
On behalf of all the people of MBNA, we are pleased to report another year of solid financial performance.
For the 13th consecutive year, we have recorded increases in both our earnings and our quarterly dividends. Net income for 2003 increased to $2.34 billion, or $1.79 per common share, and the quarterly dividend rate rose 20% to $.12 per common share.
Everything that happens at MBNA is the direct result of the commitment and dedication of the people who work here. We are very proud of the people of MBNA and what they have accomplished over a long period of time.

Several notable achievements helped drive our performance in 2003:
| • | Growing managed loans $11.2 billion to $118.5 billion. |
| • | The acquisition of 10.7 million new accounts with characteristics that are consistent with our existing cardholders. |
| • | The signing of 384 new endorsements and the renewal of more than 1,400 group contracts—remaining the leader in affinity marketing. |
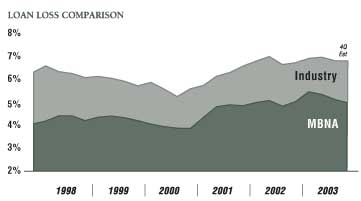
| • | Controlling loan losses at 5.22%—lower than published industry levels. |
MBNA is an international financial services company providing lending, insurance, and deposit account products and services. Our core business is to provide credit card services to affinity groups, financial institutions, and consumers. We provide a service that enables people to have the things they need today while paying for them sensibly out of future income. It is a good business and an enduring one. It is a business that if done right, can produce consistent profitability—something we have been able to do for 22 years through varying economic cycles.
We continue to strengthen the company through investments in new products and services. Our marketing franchise consists of more than 5,000 organizations that endorse our products throughout the United States, the United Kingdom, Ireland, Canada, and Spain—and these organizations will help ensure a continuing supply of new Customers.
On December 30, 2003, Charlie Cawley, MBNA’s CEO, retired after more than 31 years with MBNA and its former parent company. We thank him for his leadership, vision, and determination, and for his contributions to MBNA’s success and growth.
This year’s annual report discusses the factors that shaped 2003 results. It also explores MBNA’s approach to its business—the mix of beliefs, practices, and commitments that define us. We believe it is a solid formula for success.
Sincerely,

4 |

WHO WE ARE

MBNA Corporation is an international financial services company that provides lending, insurance, and deposit account products and services through MBNA America Bank, N.A., in the United States; MBNA Europe Bank Limited in the United Kingdom, Ireland, and Spain; and MBNA Canada Bank in Canada. Our core business is lending through credit cards to consumers.

The credit card business is a good business for a number of reasons. Credit cards free people from the need to carry cash and let them have the things they need today and pay for them out of future income. It is a business that has universal demand. Demand for our product cuts across industry, geography, and Customer type. Literally tens of millions of potential additional Customers already could qualify for our cards in the countries in which we operate, and economic growth and development bring millions more into the market every year. That leaves plenty of opportunities to add new accounts and grow our business.
It is a business with no industry, geographic, or Customer concentrations. Our loans are spread across the five countries where we do business with more than 30 million active borrowers whose average account balance is $3,800—so credit card lending produces relatively low-risk assets.
It is a business that is reliably profitable. Done right, the credit card business is a business that can be managed and priced to achieve consistent profitability—something MBNA has been able to do since 1982.


MBNA has been successful by carefully differentiating the company from its competitors through our excellence in marketing, lending, and providing service to our Customers. We predominately market our products through affinity marketing—selling to people with a common interest.

MBNA’s preeminence in the affinity credit card market can be traced to our ability to do many things. We understand the importance of partnering with organizations that people care about. We provide products that enable consumers to express their pride, passion, and interests and be rewarded for it. In addition, we provide our affinity partners with the ability to strengthen their relationship with their members.
Our approach to affinity marketing is based on a simple yet demanding formula: use our understanding of people who share common interests to craft the best products, marketing programs, and lending strategies, and then provide Customers
5 |

MBNA Europe
with truly superior service and attention. Our expertise has enabled us to develop successful partnerships with more than 5,000 endorsing organizations.
Our approach also has enabled us to successfully expand internationally. Just five years ago, our international operations represented just 8% of our managed loan portfolio. In 2003, the figure grew to 18%.

In 1993, MBNA entered its first international market in the United Kingdom, and since then has become the second largest credit card lender in the United Kingdom with $17.2 billion in loans and a 15% market share. MBNA Europe has earned the endorsement of more than 900 membership organizations and financial institutions, including Thomas Cook, Abbey, Law Society of Ireland, Royal College of Physicians of England, Oxford University, the WWF, Alliance & Leicester, and Manchester United. In 2003, we added new endorsements including the British Heart Foundation, National Geographic, and Banco Cooperativo in Spain, among many others.
MBNA Canada

Our experience in the United Kingdom helped us expand our international business by opening a bank in Canada in 1997. Since then, MBNA Canada has generated $3.6 billion in loans and 2.5 million accounts and gained a market share of 9%. In 2003, we added 79 new endorsements in Canada including Sheridan College, the Toronto Blue Jays, and the Edmonton Oilers.
MBNA’s international operations are an important part of the company’s future. We have been successful in other countries because we follow the same principles that made us an industry leader in the United States.
Our $12 billion Consumer Finance business includes installment and revolving unsecured loan products. Customers use these non-credit card products to consolidate loans or for large expenses such as home improvements or college tuition.
6 |

HOW WE MARKET
MBNA’s business is the business of affinity.

Affinity marketing seeks to understand and identify people sharing a special bond or relationship—people united by some shared experience, common pursuit, belief, or other unifying consideration—and to market products that help satisfy and promote that sense of affinity and belonging.
MBNA is the recognized leader in credit card affinity marketing. Since we first entered the business in 1982, we have marketed our products and services through more than 5,000 endorsing organizations, serving the needs of more than 50 million Customers.
Our business sectors encompass an exceptionally broad range of affinity groups. Today, we enjoy endorsements internationally from organizations representing such groups as:

Professionals including physicians, dentists, attorneys, educators, military, and law enforcement.
Our Professional sector has more than 1,400 professional organization endorsements, including the Association of Trial Lawyers of America, the American Medical Student Association, and the American Institute of Architects. The sector added more than 1 million new accounts in 2003.
Special interest groups. MBNA provides credit cards for members of a variety of clubs, associations, and other organizations devoted to supporting special causes. Endorsing environmental groups, for example, include the Nature Conservancy, Sierra Club, and National Audubon Society.
Enthusiasts for virtually all major sports, including baseball, football, basketball, hockey, golf, tennis, and motorsports. More than 700 sports-related organizations, including the National Football League, Major League Baseball, NASCAR, and the PGA, endorse MBNA products, and more than 7.8 million people now carry MBNA cards featuring their favorite team or race car driver.
College and university alumni and loyalists. MBNA is the official credit card of more than 800 colleges and universities. Familiar names on our cards include Penn State University, the University of California at Los Angeles, the University of North Carolina, and Stanford University.

7 |
More than 350 financial institutions. MBNA products are sold to Customers of such well-known names as Wachovia Bank, SunTrust Bank, and PNC Bank. These financial institution partnerships helped generate 750,000 new accounts in 2003 through a network of more than 15,000 bank branches.
Alliances with nearly 100 prominent businesses. Our alliances with other companies allow us to reach out to Customers of L.L. Bean, Cendant, Barnes & Noble, Carlson Wagonlit Travel, and Amtrak among others.
In 2003, MBNA earned 384 new endorsements from such high-quality organizations as Merrill Lynch, eBay, Gander Mountain, the American Institute of Chemical Engineers, the California Teachers Association, and Arizona State University. Affinity marketing enabled us to acquire 10.7 million new accounts in 2003. The marketing programs we used included a spectrum of techniques and channels:
Direct Mail is one of our most important marketing tools. MBNA’s in-house, full-service advertising agency develops thousands of customized mail campaigns for our affinity groups. Keeping design and production of these campaigns inside lets marketing managers and advertising professionals work together closely on a continuing basis, helping generate the creative and cost-effective programs that have made direct mail the source of the majority of our new accounts.
Telesales complements our customized direct mail campaigns. We operate one of the largest financial services telesales systems in the United States and Europe, which allows us to customize each call to appeal to the personal interest or group affiliation of the individual Customer.

Event Marketing extends our personal approach to marketing to large events. Each year, we attend more than 1,000 events, ranging from football games to professional conventions, to offer our products directly to members or fans of our endorsing organizations.
The Internet allows us to use the Web sites of our endorsing organizations and the e-mail addresses of their members to market our products. Advertising in the publications and newsletters of many of our groups also provides a targeted and effective means of bringing our product offering to more potential Customers.
In addition to these familiar marketing methods, our commitment to innovation has led to the development of our newest acquisition channel—Point-of-Sale Marketing. This technique allows a Customer to apply for a credit card in a bank or retail store and receive an instant loan decision for immediate activation. Point-of-sale programs with firms such as Bass Pro Shops, Gander Mountain, and RadioShack have been particularly successful.
8 |
HOW WE LEND
MBNA’s unique marketing strategy and diverse acquisition methods get the right people to apply for our products. Effective lending ensures that MBNA chooses the right Customers. The right Customer is someone who borrows from us and pays us back responsibly. Our success at approving the right Customer is the result of a personal approach to lending. Experienced credit analysts, using sophisticated technology, highly predictive scoring models, and good common sense, approve most of the loans we make at MBNA.
Credit analysts look at many factors before making a lending decision. They analyze the applicant’s capacity to repay—making sure their income is sufficient to handle their household debt. They also look at the overall stability of the individual, such as homeownership and length of time on the job. And most important, the credit analyst makes sure the applicant has good repayment habits with a history of paying bills on time.
More than a third of all teachers in the U.S. carry an MBNA credit card.

A credit analyst may decide yes, no, or maybe when making a lending decision. When a credit analyst says maybe, he or she calls the applicant to develop additional information needed to change the answer to yes or no. This additional information is fundamental in making the right lending decision and also ensures that the Customer receives the proper credit line.
Marketing to people with strong common interests and judgmental lending result in getting Customers who perform well and are very loyal. MBNA Customers have a 53% higher balance per active account and are 25% less likely to default than industry averages.
9 |
HOW WE KEEP CUSTOMERS
Getting the right Customers is just part of producing consistent results. Keeping these Customers is equally important to our success now and in the future. We do this by treating our Customers as we expect to be treated. Every time a Customer communicates with us presents another opportunity to strengthen our relationship. Each person who works at MBNA is responsible for influencing how our Customers feel about the company. Maintaining high levels of Customer satisfaction enables us to continue to retain our most profitable Customers and endorsing organizations every year.
We make substantial investments in the latest and best technology to enhance the quality and efficiency of our Customer satisfaction. Our Customer Satisfaction and Loss Prevention Super Stations, for example, provide MBNA representatives with the tools and information they need to meet Customer needs. We match that investment with unremitting attention to how we do things.
Customer Satisfaction representatives communicate directly with our Customers every day. We receive nearly 100 million Customer inquiries each year, and every contact is an opportunity for MBNA to exceed our Customers’ expectations and let them know how important they are to us. MBNA representatives are empowered to make decisions
and exercise individual judgment to satisfy our Customers—one at a time. We continually monitor service standards important to our Customers, such as average speed of answer and initial call resolution, to ensure that we maintain the highest levels of Customer satisfaction.
The single most important factor in our success has always been the people of MBNA. Today, MBNA is a company of 28,000 people driven to satisfy the Customer.

10 |

FUNDING
MBNA continues to expand and diversify its funding sources and investor base to support asset growth globally. Our funding sources include asset-backed securitizations, retail deposits, brokered CDs, and senior and subordinated debt.
MBNA continues to securitize loan receivables as a major source of funding. MBNA has been a leader in this market since pioneering the practice of securitizing credit card receivables in 1986. Asset securitization removes loan receivables from the balance sheet through a sale to a trust that is independent of MBNA. The securities issued by these trusts are primarily AAA-rated securities sold to investors on a global basis. Subordinated asset-backed securities are also sold to investors and typically not retained by MBNA. Proceeds are used by MBNA to fund its lending activities.
The global credit card asset securitization market continues to be a vibrant, cost-effective source of funding. The innovative design of these securitizations, MBNA’s reputation, and the consistent performance of the receivables have allowed the company to price these transactions at favorable rates compared to other issuers. MBNA issues in multiple currencies and markets, drawing investors from North America, Europe, and Asia to participate in transactions. MBNA maintained its status as a top-tier issuer by completing 31 securitizations totaling $13.6 billion in 2003. Securitizations now total $84.9 billion. These transactions continue to be well received by investors.
We also have established a $32 billion deposit base, mainly through the issuance of retail certificate of

deposit and money market accounts. More than 2,000 affinity groups endorse our deposit products for their members, including the American Automobile Association, Military Officers Association of America, and National Education Association. MBNA’s retail deposit products are marketed much like our other products: through the mail and over the telephone. MBNA does not maintain a large retail branch network; as a result, we can offer investors very competitive rates on deposit products.
MBNA’s unsecured debt programs are also important components of our funding mix and are attractive investments for pension funds, investment advisors, foreign and domestic banks, insurance companies, and retail investors. They allow MBNA to tap investors in domestic and international markets. Current outstandings under these programs are $11.8 billion.

12 |
FIVE-YEAR STATISTICAL SUMMARY (dollars in thousands, except per share amounts)
| Year Ended December 31, | 2003 | 2002 | 2001 | 2000 | 1999 | |||||||||||||||
Income Statement Data for the Year (a) |
||||||||||||||||||||
Net interest income (b) |
$ | 2,350,373 | $ | 2,074,575 | $ | 1,657,340 | $ | 1,395,015 | $ | 1,175,759 | ||||||||||
Provision for possible credit losses |
1,392,701 | 1,340,157 | 1,140,615 | 547,309 | 636,614 | |||||||||||||||
Other operating income (b) |
7,825,480 | 6,752,923 | 6,673,316 | 4,920,403 | 4,193,527 | |||||||||||||||
Other operating expense |
5,124,147 | 4,701,925 | 4,474,831 | 3,647,702 | 3,077,708 | |||||||||||||||
Net income |
2,338,104 | 1,765,954 | 1,694,291 | 1,312,532 | 1,024,423 | |||||||||||||||
Per Common Share Data for the Year (a) (c) |
||||||||||||||||||||
Earnings |
$ | 1.82 | $ | 1.37 | $ | 1.31 | $ | 1.05 | $ | .84 | ||||||||||
Earnings—assuming dilution |
1.79 | 1.34 | 1.28 | 1.02 | .80 | |||||||||||||||
Dividends |
.36 | .27 | .24 | .21 | .19 | |||||||||||||||
Book value |
8.53 | 6.96 | 5.94 | 5.02 | 3.31 | |||||||||||||||
Ratios (a) |
||||||||||||||||||||
Net interest margin (d) (e) |
5.37 | % | 5.54 | % | 5.51 | % | 5.50 | % | 5.30 | % | ||||||||||
Return on average total assets |
4.16 | 3.67 | 4.16 | 3.94 | 3.62 | |||||||||||||||
Return on average stockholders’ equity |
22.98 | 21.29 | 24.07 | 25.79 | 27.18 | |||||||||||||||
Stockholders’ equity to total assets |
18.80 | 17.22 | 17.16 | 17.13 | 13.61 | |||||||||||||||
Loan receivables (e) (f): |
||||||||||||||||||||
Delinquency (g) |
3.84 | 4.36 | 4.67 | 4.03 | 4.01 | |||||||||||||||
Net credit losses (h) |
4.84 | 4.57 | 4.20 | 3.38 | 3.65 | |||||||||||||||
Sales and cash advance volume |
$ | 184,293,873 | $ | 160,046,164 | $ | 142,261,636 | $ | 125,683,731 | $ | 105,806,935 | ||||||||||
Managed Data (a) (i) |
||||||||||||||||||||
At year end: |
||||||||||||||||||||
Loans held for securitization |
$ | 13,084,105 | $ | 11,029,627 | $ | 9,929,948 | $ | 8,271,933 | $ | 9,692,616 | ||||||||||
Loan portfolio |
20,539,972 | 17,696,881 | 14,703,616 | 11,682,904 | 7,971,093 | |||||||||||||||
Securitized loans |
84,869,483 | 78,531,334 | 72,862,487 | 68,835,884 | 54,591,804 | |||||||||||||||
Total managed loans |
$ | 118,493,560 | $ | 107,257,842 | $ | 97,496,051 | $ | 88,790,721 | $ | 72,255,513 | ||||||||||
Average for the year: |
||||||||||||||||||||
Loans held for securitization |
$ | 9,198,810 | $ | 8,130,207 | $ | 6,909,840 | $ | 8,129,333 | $ | 4,071,394 | ||||||||||
Loan portfolio |
18,985,008 | 17,184,993 | 13,429,548 | 9,588,815 | 10,351,101 | |||||||||||||||
Securitized loans |
81,691,156 | 74,718,731 | 70,560,600 | 59,726,838 | 49,706,760 | |||||||||||||||
Total managed loans |
$ | 109,874,974 | $ | 100,033,931 | $ | 90,899,988 | $ | 77,444,986 | $ | 64,129,255 | ||||||||||
For the year: |
||||||||||||||||||||
Delinquency (e) (g) |
4.39 | % | 4.88 | % | 5.09 | % | 4.49 | % | 4.45 | % | ||||||||||
Net credit losses (e) (h) |
5.22 | 4.99 | 4.74 | 4.39 | 4.33 | |||||||||||||||
Net interest margin (d) (e) |
8.39 | 8.42 | 8.42 | 7.08 | 7.42 | |||||||||||||||
Net interest income |
$ | 10,204,638 | $ | 9,118,677 | $ | 8,204,142 | $ | 5,837,109 | $ | 5,187,801 | ||||||||||
Provision for possible credit losses |
5,768,170 | 5,175,540 | 4,592,629 | 3,348,289 | 2,885,149 | |||||||||||||||
Other operating income |
4,346,684 | 3,544,204 | 3,578,528 | 3,279,289 | 2,430,020 | |||||||||||||||
| (a) | In September 2002, MBNA Corporation implemented the one-time industry wide Federal Financial Institutions Examination Council’s (“FFIEC”) accounting guidance, and changed the estimated value of accrued interest and fees, resulting in a decrease to income before income taxes of $263.7 million ($167.2 million after taxes) for the year ended December 31, 2002. Net income for the year ended December 31, 2002 was $1.8 billion or $1.34 per common share—assuming dilution. Excluding this change in September 2002, earnings per common share—assuming dilution for the year ended December 31, 2002 would have been $1.47, an increase of 15% compared with the year ended December 31, 2001. Earnings per common share—assuming dilution for the year ended December 31, 2003 increased 34%, compared with the year ended December 31, 2002. Excluding this change in September 2002, earnings per common share—assuming dilution for the year ended December 31, 2003 would have increased 22%, compared with the year ended December 31, 2002. | |||
| (b) | For purposes of comparability, certain prior period amounts have been reclassified. These reclassifications did not affect net income. | |||
| (c) | Per common share data and weighted average common shares outstanding and common stock equivalents have been adjusted to reflect the three-for-two stock split of MBNA Corporation’s Common Stock effected in the form of a dividend, issued on July 15, 2002, to stockholders of record as of the close of business on July 1, 2002. Earnings per common share is computed using net income applicable to common stock and weighted average common shares outstanding, whereas earnings per common share—assuming dilution includes the potential dilutive effect of common stock equivalents in accordance with Statement of Financial Accounting Standards No. 128, “Earnings per Share.” | |||
| (d) | Net interest margin ratios are presented on a fully taxable equivalent basis. | |||
| (e) | In December 2000, MBNA Corporation implemented the FFIEC revised policy on the classification of consumer loans. Excluding the one-time FFIEC adjustment, loan delinquency and managed loan delinquency would have been 4.32% and 4.94%, respectively, at December 31, 2000, and loan receivable net credit losses, managed net credit losses, managed net interest margin, and net interest margin would have been 3.03%, 3.94%, 7.14%, and 5.54%, respectively, for the year ended December 31, 2000. | |||
FIVE-YEAR STATISTICAL SUMMARY — Continued (dollars in thousands)
| Year Ended December 31, | 2003 | 2002 | 2001 | 2000 | 1999 | |||||||||||||||
Balance Sheet Data at Year End (a) |
||||||||||||||||||||
Investment securities and money market instruments (b) |
$ | 9,581,715 | $ | 9,423,620 | $ | 6,517,052 | $ | 5,205,395 | $ | 4,546,132 | ||||||||||
Loans held for securitization |
13,084,105 | 11,029,627 | 9,929,948 | 8,271,933 | 9,692,616 | |||||||||||||||
Credit card loans |
11,910,507 | 9,484,115 | 8,261,575 | 7,798,772 | 6,060,564 | |||||||||||||||
Other consumer loans |
8,629,465 | 8,212,766 | 6,442,041 | 3,884,132 | 1,910,529 | |||||||||||||||
Total loan portfolio |
20,539,972 | 17,696,881 | 14,703,616 | 11,682,904 | 7,971,093 | |||||||||||||||
Reserve for possible credit losses |
(1,216,316 | ) | (1,111,299 | ) | (833,423 | ) | (527,573 | ) | (516,261 | ) | ||||||||||
Net loan portfolio |
19,323,656 | 16,585,582 | 13,870,193 | 11,155,331 | 7,454,832 | |||||||||||||||
Total assets |
59,113,355 | 52,856,746 | 45,447,945 | 38,678,096 | 30,859,132 | |||||||||||||||
Total deposits |
31,836,081 | 30,616,216 | 27,094,745 | 24,343,595 | 18,714,753 | |||||||||||||||
Long-term debt and bank notes |
12,145,628 | 9,538,173 | 6,867,033 | 5,735,635 | 5,708,880 | |||||||||||||||
Stockholders’ equity |
11,113,040 | 9,101,319 | 7,798,718 | 6,627,278 | 4,199,443 | |||||||||||||||
Average Balance Sheet Data for the Year (a) |
||||||||||||||||||||
Investment securities and money market instruments (b) |
$ | 11,693,550 | $ | 8,257,838 | $ | 6,500,608 | $ | 5,051,619 | $ | 5,771,007 | ||||||||||
Loans held for securitization |
9,198,810 | 8,130,207 | 6,909,840 | 8,129,333 | 4,071,394 | |||||||||||||||
Credit card loans |
10,657,649 | 9,672,043 | 7,887,115 | 6,784,742 | 8,184,713 | |||||||||||||||
Other consumer loans |
8,327,359 | 7,512,950 | 5,542,433 | 2,804,073 | 2,166,388 | |||||||||||||||
Total loan portfolio |
18,985,008 | 17,184,993 | 13,429,548 | 9,588,815 | 10,351,101 | |||||||||||||||
Reserve for possible credit losses |
(1,158,510 | ) | (941,780 | ) | (656,654 | ) | (549,033 | ) | (416,627 | ) | ||||||||||
Net loan portfolio |
17,826,498 | 16,243,213 | 12,772,894 | 9,039,782 | 9,934,474 | |||||||||||||||
Total assets |
56,232,903 | 48,154,027 | 40,764,316 | 33,299,176 | 28,310,222 | |||||||||||||||
Total deposits |
31,880,540 | 28,481,487 | 25,147,782 | 20,654,087 | 16,901,334 | |||||||||||||||
Long-term debt and bank notes |
10,557,593 | 8,040,419 | 6,309,446 | 5,699,638 | 5,974,276 | |||||||||||||||
Stockholders’ equity |
10,172,778 | 8,293,823 | 7,039,986 | 5,088,882 | 3,769,539 | |||||||||||||||
Weighted average common shares outstanding (000) (c) |
1,278,166 | 1,277,787 | 1,277,745 | 1,230,827 | 1,201,530 | |||||||||||||||
Weighted average common shares outstanding and common
stock equivalents (000) (c) |
1,295,142 | 1,302,712 | 1,314,230 | 1,269,803 | 1,255,625 | |||||||||||||||
| (f) | Loan receivables include loans held for securitization and the loan portfolio. | |||
| (g) | Delinquency represents accruing loans that are 30 days or more past due. | |||
| (h) | MBNA Corporation’s net credit loss ratio is calculated by dividing annualized net credit losses, which exclude uncollectible accrued interest and fees and fraud losses, for the period by average loans, which include estimated collectible billed interest and fees for the corresponding period. | |||
| (i) | MBNA Corporation allocates resources on a managed basis, and financial data provided to management reflects MBNA Corporation’s results on a managed basis. Managed data assumes MBNA Corporation’s securitized loan principal receivables have not been sold and presents the earnings on securitized loan principal receivables in the same fashion as MBNA Corporation’s owned loans. Management, equity and debt analysts, rating agencies and others evaluate MBNA Corporation’s operations on a managed basis because the loans that are securitized are subject to underwriting standards comparable to MBNA Corporation’s owned loans, and MBNA Corporation services the securitized and owned loans, and the related accounts, together and in the same manner without regard to ownership of the loans. In a securitization, the loan principal receivables are sold to the trust, but the account relationships are not sold. MBNA Corporation continues to own and service the accounts that generate the securitized loan principal receivables. The credit performance of the entire managed loan portfolio is important to understand the quality of originations and the related credit risks inherent in the owned portfolio and retained interests in its securitization transactions. | |||
| Table 34 reconciles income statement data for the period to managed net interest income, managed provision for possible credit losses, and managed other operating income, and the loan receivables net credit loss ratio to the managed net credit loss ratio, the loan receivables delinquency ratio to the managed delinquency ratio, and the net interest margin ratio to the managed net interest margin ratio. Managed other operating income includes the impact of the net gain (loss) recognized on securitization activity in accordance with Statement of Financial Accounting Standards No. 140, “Accounting for Transfers and Servicing of Financial Assets and Extinguishments of Liabilities—a Replacement of FASB Statement No. 125” (“Statement No. 140”). | ||||
14 |
MANAGEMENT’S DISCUSSION AND ANALYSIS OF FINANCIAL CONDITION AND RESULTS OF OPERATIONS
This discussion is intended to further the reader’s understanding of the consolidated financial statements, financial condition, and results of operations of MBNA Corporation. It should be read in conjunction with the audited consolidated financial statements, notes, and tables included in this report. For purposes of comparability, certain prior period amounts have been reclassified.
| Page | ||
15 |
Introduction and Overview | |
16 |
Critical Accounting Policies | |
19 |
Change in Accounting Estimate for Interest | |
| and Fees Recognized In 2002 | ||
19 |
Earnings Summary | |
21 |
Net Interest Income | |
25 |
Investment Securities and Money Market Instruments | |
26 |
Other Interest-Earning Assets | |
26 |
Loan Receivables | |
29 |
Premises and Equipment | |
30 |
Accounts Receivable from Securitization | |
30 |
Prepaid Expenses and Deferred Charges | |
30 |
Other Assets | |
30 |
Interest-Bearing Deposits | |
31 |
Borrowed Funds | |
31 |
Noninterest-Bearing Deposits | |
31 |
Accrued Expenses and Other Liabilities | |
32 |
Accumulated Other Comprehensive Income | |
32 |
Total Other Operating Income | |
36 |
Total Other Operating Expense | |
37 |
Income Taxes | |
37 |
Loan Quality | |
45 |
Dividend Limitations | |
46 |
Capital Adequacy | |
46 |
Off-Balance Sheet Arrangements | |
52 |
Liquidity and Rate Sensitivity | |
59 |
Cross-Border Outstandings | |
59 |
Regulatory Matters | |
60 |
Managed Reconciliation of the Five-Year Statistical Summary |
MANAGEMENT’S DISCUSSION AND ANALYSIS OF FINANCIAL CONDITION AND RESULTS OF OPERATIONS
INTRODUCTION AND OVERVIEW
MBNA Corporation (“the Corporation”), a bank holding company located in Wilmington, Delaware, is the parent company of MBNA America Bank, N.A. (“the Bank”), a national bank and the Corporation’s principal subsidiary. The Bank has two wholly owned foreign bank subsidiaries, MBNA Europe Bank Limited (“MBNA Europe”) located in the United Kingdom (U.K.) and MBNA Canada Bank (“MBNA Canada”) located in Canada. The Corporation’s primary business is giving its Customers the ability to have what they need today and pay for it out of future income by lending money through credit card and other consumer loans. Through the Bank, the Corporation is the largest independent credit card lender in the world and is the leading issuer of credit cards through endorsed marketing. In addition to its credit card lending, the Corporation also makes other consumer loans, which include installment and revolving unsecured loan products, and offers insurance and deposit products. The Corporation is also the parent of MBNA America (Delaware), N.A. (“MBNA Delaware”), a national bank, which offers business card products, mortgage loans, aircraft loans, and other specialty lending products. Mortgage loans, aircraft loans, and other specialty lending products are included in other consumer loan receivables, and business card products are included in credit card loan receivables in the Corporation’s audited consolidated statements of financial condition.
The Corporation seeks to manage its business to achieve its net income and other objectives. It does this primarily by attempting to grow loans to generate related interest and other operating income through adding new accounts and stimulating usage of existing accounts while controlling loan losses and expense growth. The Corporation generates income through finance charges assessed on outstanding loan receivables, securitization income, interchange income, credit card and other consumer loan fees, insurance income, interest earned on investment securities and money market instruments and other interest-earning assets. The Corporation’s primary costs are the costs of funding and growing its loan receivables, investment securities, and other assets, which include interest paid on deposits, short-term borrowings and long-term debt and bank notes, credit losses, business development and operating expenses, royalties to endorsing organizations, and income taxes.
The Corporation obtains funds to make loans to its Customers primarily through the process of asset securitization, raising deposits, and the issuance of short-term and long-term debt. Asset securitization removes loan principal receivables from the audited consolidated statements of financial condition through the sale of loan principal receivables to a trust. The trust sells securities backed by those loan principal receivables to investors. The trusts
are independent of the Corporation, and the Corporation has no control over the trusts. The trusts are not subsidiaries of the Corporation and are excluded from the Corporation’s audited consolidated financial statements in accordance with accounting principles generally accepted in the United States (“GAAP”).
The Corporation allocates resources on a managed basis, and financial data provided to management reflects the Corporation’s results on a managed basis. Managed data assumes the Corporation’s securitized loan principal receivables have not been sold and presents the earnings on securitized loan principal receivables in the same fashion as the Corporation’s owned loans. Management, equity and debt analysts, rating agencies and others evaluate the Corporation’s operations on a managed basis because the loans that are securitized are subject to underwriting standards comparable to the Corporation’s owned loans, and the Corporation services the securitized and owned loans, and the related accounts, together and in the same manner without regard to ownership of the loans. In a securitization, the loan principal receivables are sold to the trust, but the account relationships are not sold. The Corporation continues to own and service the accounts that generate the securitized loan principal receivables. The credit performance of the entire managed loan portfolio is important to understand the quality of originations and the related credit risks inherent in the owned portfolio and retained interests in securitization transactions. Asset securitization has a significant effect on the Corporation’s audited consolidated financial statements. The impact is discussed under “Off-Balance Sheet Arrangements—Impact of Off-Balance Sheet Securitization Transactions on the Corporation’s Results.” Securitization income is the most significant revenue item and is discussed under “Total Other Operating Income.” Whenever managed data is included in this report, a reconciliation of the managed data to the most directly comparable financial measure presented in accordance with GAAP is provided.
DURING 2003, THE CORPORATION:
| • | Grew loan receivables by $4.9 billion to $33.6 billion, and grew managed loans by $11.2 billion to $118.5 billion, through marketing and portfolio acquisitions. The Corporation’s international loan growth in the U.K., Canada, Ireland, and Spain benefited in part from the strengthening of foreign currencies against the U.S. dollar, which increased foreign loan receivables by $960.9 million in 2003. |
| • | Added 10.7 million new loan, deposit, and insurance accounts, 384 new endorsements from organizations, and renewed more than 1,400 group contracts. The Corporation is now endorsed by more than 5,000 affinity groups and financial institutions. |
16 |
| • | Maintained a relatively stable net interest margin by balancing the interest rates it charges on its loan accounts against the Corporation’s funding costs. The net interest margin was 5.37% and 5.54% for the years ended December 31, 2003 and 2002, respectively. The managed net interest margin was 8.39% and 8.42% for the years ended December 31, 2003 and 2002, respectively. |
| • | Controlled loan losses at 4.84% and losses on managed loans at 5.22%. Loan quality was affected by general economic conditions, such as levels of unemployment, bankruptcy filings, and the continued seasoning of the Corporation’s loan receivables and managed loans. |
| • | Increased interchange income, credit card fee income, and insurance income. |
| • | Continued to securitize loan principal receivables as a source of funding, increasing securitization income. |
| • | Controlled other operating expenses, which increased at a slower rate than growth in managed loans. |
These items, as well as other factors, contributed to the increase in net income for 2003 to $2.3 billion, or $1.79 per common share—assuming dilution and are discussed in further detail throughout “Management’s Discussion and Analysis of Financial Condition and Results of Operations.”
2004
In 2004, the Corporation will continue to focus on loan and account growth and managing its net interest margin, while attempting to control expenses and credit losses and manage its business to achieve its net income and other objectives.
Should interest rates increase in 2004, the Corporation’s funding costs are likely to increase, impacting the Corporation’s managed net interest margin. The Corporation could then determine to increase the interest rates it charges on its loan accounts or change its promotional or other interest rates on new loans in marketing activation programs to attempt to achieve a certain net interest margin. Any increases in the rates it charges on accounts could have an effect on the Corporation’s efforts to attract new Customers and grow managed loans, particularly with the continuing competition in the credit card and consumer lending industry. The Corporation’s interest rate risk is further discussed under “Liquidity and Rate Sensitivity.”
In 2004, the Corporation’s results will continue to be affected by the amount of credit losses. Credit losses are influenced by a number of factors, including the credit quality of the Corporation’s loans, general economic conditions, the level of consumer bankruptcies and regulatory policies. The pace of the U.S. economic recovery in 2004, and the levels of consumer spending and consumer confidence will be important factors that affect the Corporation’s success controlling credit losses and growing loans.
In 2004, the Corporation will continue to utilize strategies to control other operating expenses. These expenses are important for the Corporation to continue to attract new accounts and grow
loans. However, the Corporation will continue to strive to be more efficient and focus on controlling the growth of these expenses so that they grow more slowly than the growth in managed loans.
For 2004, management will be focused on the above challenges and opportunities and other factors affecting the business similar to the factors driving 2003 results as discussed in “Management’s Discussion and Analysis of Financial Condition and Results of Operations.” The risks to achieving the Corporation’s financial objectives for 2004 are discussed in the “Important Factors Regarding Forward-Looking Statements” section of the Corporation’s Annual Report on Form 10-K for the year ended December 31, 2003.
The Corporation has filed as exhibits to its Form 10-K the certification of the Chief Executive Officer and the certification of the Chief Financial Officer under section 302 of the Sarbanes-Oxley Act of 2002.
CRITICAL ACCOUNTING POLICIES
Management makes certain judgments and uses certain estimates and assumptions when applying accounting principles in the preparation of the Corporation’s audited consolidated financial statements. The nature of the estimates and assumptions are material due to the levels of subjectivity and judgment necessary to account for highly uncertain factors or the susceptibility of such factors to change. Management has identified the policies related to the accounting for asset securitization, the reserve for possible credit losses, intangible assets, and revenue recognition as critical accounting policies, which require management to make significant judgments, estimates and assumptions.
Management believes the current assumptions and other considerations used to estimate amounts reflected in the Corporation’s audited consolidated financial statements are appropriate. However, if actual experience differs from the assumptions and other considerations used in estimating amounts reflected in the Corporation’s audited consolidated financial statements, the resulting changes could have a material adverse effect on the Corporation’s consolidated results of operations, and in certain situations, could have a material adverse effect on the Corporation’s financial condition.
The development and selection of the critical accounting policies, and the related disclosures have been reviewed with the Audit Committee of the Corporation’s Board of Directors.
ASSET SECURITIZATION
The Corporation uses securitization of its loan principal receivables as one source to meet its funding needs. The Corporation accounts for its securitization transactions in accordance with Statement of Financial Accounting Standards No. 140, “Accounting for Transfers and Servicing of Financial Assets and Extinguishments of Liabilities—a Replacement of FASB Statement No. 125” (“Statement No. 140”), issued by the Financial Accounting Standards Board (“FASB”). When the Corporation securitizes loan
principal receivables, the Corporation recognizes a gain on sale and retained beneficial interests, including an interest-only strip receivable. The interest-only strip receivable represents the contractual right to receive interest and other revenue less certain costs from the trust over the estimated life of the securitized loan principal receivables. The Corporation’s securitization trusts are qualified special-purpose entities as defined by Statement No. 140 that are specifically exempted from the requirements of FASB Interpretation No. 46, “Consolidation of Variable Interest Entities” (“Interpretation No. 46”).
The Corporation estimates the fair value of the interest-only strip receivable based on the present value of expected future net revenue flows. Since quoted market prices for the interest-only strip receivable are not available, management uses certain assumptions and estimates in determining the fair value of the interest-only strip receivable. These assumptions and estimates include projections concerning interest income, certain fees, recoveries on charged-off securitized loans, gross credit losses on securitized loans, contractual servicing fees, and the interest rate paid to investors in a securitization transaction (“excess spread”). These projections are used to estimate the excess spread to be earned by the Corporation over the estimated life of the securitized loan principal receivables. The other assumptions and estimates used by the Corporation in estimating the fair value of the interest-only strip receivable include projected loan payment rates, which are used to determine the estimated life of the securitized loan principal receivables, and an appropriate discount rate.
The assumptions and estimates used to estimate the fair value of the interest-only strip receivable at December 31, 2003, reflect management’s judgment as to the expected excess spread to be earned and projected loan payment rates to be experienced on the securitized loans. These estimates are likely to change in the future, as the individual components of the excess spread and projected loan payment rates are sensitive to market and economic conditions. For example, the rates paid to investors in the Corporation’s securitization transactions are primarily variable rates subject to change based on changes in market interest rates. Changes in market interest rates and competitive pressures can also affect the projected interest income on securitized loans, as the Corporation could reprice the managed loan portfolio. Credit loss projections could change in the future based on changes in the credit quality of the securitized loans, the Corporation’s account management and collection practices, and general economic conditions. Projected loan payment rates could fluctuate based on general economic conditions and competition. Actual and expected changes in these assumptions may result in future estimates of the excess spread and projected loan payment rates being materially different from the estimates used in the periods covered by this report.
On a quarterly basis, the Corporation reviews prior assumptions and estimates compared to actual trust performance and other factors based on the prior period that approximates the average life of the securitized loan receivables. The actual trust performance
results and other factors are compared to the estimates and assumptions used in the determination of the fair value of the interest-only strip receivable. Based on this review and the Corporation’s current assumptions and estimates for future periods, the Corporation adjusts as appropriate, the assumptions and estimates used in determining the fair value of the interest-only strip receivable. If the assumptions change, or actual results differ from projected results, the interest-only strip receivable and securitization income would be affected. If management had made different assumptions for the periods covered by this report that raised or lowered the excess spread or projected loan payment rates, the Corporation’s financial condition and results of operations could have differed materially. For example, a 20% change in the excess spread assumption for all securitized loan principal receivables could have resulted in a change of approximately $268 million in the value of the total interest-only strip receivable at December 31, 2003, and a related change in securitization income.
Based on quarterly 2003 reviews of the interest-only strip receivable, the actual performance of the securitized receivables did not materially differ from the assumptions and estimates used to value the interest-only strip receivable.
Note 8: Asset Securitization to the audited consolidated financial statements provides further detail regarding the Corporation’s assumptions and estimates used in determining the fair value of the interest-only strip receivable and their sensitivities to adverse changes.
RESERVE FOR POSSIBLE CREDIT LOSSES
The Corporation maintains the reserve for possible credit losses at an amount sufficient to absorb losses inherent in the Corporation’s loan principal receivables at the reporting date based on a projection of probable net credit losses. To project probable net credit losses, the Corporation regularly performs a migration analysis of delinquent and current accounts. A migration analysis is a technique used to estimate the likelihood that a loan receivable will progress through the various delinquency stages and ultimately charge off. On a quarterly basis, the Corporation reviews and adjusts, as appropriate, these estimates. The Corporation’s projection of probable net credit losses considers the impact of economic conditions on the borrowers’ ability to repay, past collection experience, the risk characteristics and composition of the portfolio, and other factors. The Corporation then reserves for the projected probable net credit losses based on its projection of these amounts. The Corporation establishes appropriate levels of the reserve for possible credit losses for its products, including domestic credit card, domestic other consumer and foreign loans, based on their risk characteristics. A provision is charged against earnings to maintain the reserve for possible credit losses at an appropriate level. The Corporation records acquired reserves for current period loan acquisitions.
The Corporation’s projections of probable net credit losses are inherently uncertain, and as a result the Corporation cannot predict with certainty the amount of such losses. Changes in
18 |
economic conditions, the risk characteristics and composition of the portfolio, bankruptcy laws or regulatory policies, and other factors could impact the Corporation’s actual and projected net credit losses and the related reserve for possible credit losses. If management had made different assumptions about probable net credit losses, the Corporation’s financial condition and results of operations could have differed materially. For example, a 10% change in management’s projection of probable net credit losses could have resulted in a change of approximately $122 million in the reserve for possible credit losses and a related change in the provision for possible credit losses at December 31, 2003.
Based on the 2003 review of the reserve for possible credit losses, the actual net credit losses did not materially differ from the projections of net credit losses used to establish the reserve for possible credit losses.
Note 10: Reserve for Possible Credit Losses to the audited consolidated financial statements provides further detail regarding the Corporation’s reserve for possible credit losses.
INTANGIBLE ASSETS
The Corporation’s intangible assets include purchased credit card relationships (“PCCRs”), which are carried at net book value. The Corporation records these intangible assets as part of the acquisition of credit card loans and the corresponding Customer relationships. The Corporation’s intangible assets are amortized over the period the assets are expected to contribute to the cash flows of the Corporation, which reflect the expected pattern of benefit. PCCRs are amortized using an accelerated method based upon the projected cash flows the Corporation will receive from the Customer relationships during the estimated useful lives of the PCCRs.
The Corporation’s PCCRs are subject to impairment tests in accordance with Statement of Financial Accounting Standards No. 144, “Accounting for the Impairment or Disposal of Long-Lived Assets” (“Statement No. 144”). The Corporation reviews the carrying value of its PCCRs for impairment on a quarterly basis, or sooner, whenever events or changes in circumstances indicate that their carrying amount may not be fully recoverable, by comparing their carrying value to the sum of the undiscounted expected future cash flows from the loans and corresponding credit card relationships. In accordance with Statement No. 144, an impairment exists if the sum of the undiscounted expected future cash flows is less than the carrying amount of the asset. An impairment would result in a write-down of the PCCRs to estimated fair value based on the discounted future cash flows expected from the PCCRs. The Corporation performs the impairment test on a specific portfolio basis, since it represents the lowest level for which identifiable cash flows are independent of the cash flows of other assets and liabilities.
The Corporation makes certain estimates and assumptions that affect the determination of the expected future cash flows from the loans and corresponding credit card relationships. These estimates and assumptions include levels of account usage and activation,
active account attrition, funding costs, credit loss experience, servicing costs, growth in average account balances, interest and fees assessed on loans, and other factors. Significant changes in these estimates and assumptions could result in an impairment of the PCCRs. The estimated undiscounted cash flows of acquired Customer credit card relationships exceeds the $3.1 billion net book value of the Corporation’s PCCRs at December 31, 2003 by approximately $3.8 billion. If the active account attrition rates for all acquired portfolios in the twelve month period following December 31, 2003, were to be 10 percentage points higher than the rates assumed by management when it valued the PCCRs (for example, the assumed attrition rates were 10% but the actual rates were 20%) and all other estimates and assumptions were held constant, the estimated undiscounted cash flows of acquired Customer accounts in the aggregate would still exceed the net book value of acquired Customer accounts by approximately $2.6 billion, and no impairment would result on any individual PCCR.
There were no impairment write-downs of intangible assets during the year ended December 31, 2003.
REVENUE RECOGNITION
Interest income is recognized based upon the amount of loans outstanding and their contractual annual percentage rates. Interest income is included in loan receivables when billed to the Customer. The Corporation accrues unbilled interest income on a monthly basis from the Customer’s statement billing cycle date to the end of the month. The Corporation uses certain estimates and assumptions (for example, estimated yield) in the determination of the accrued unbilled portion of interest income that is included in accrued income receivable in the Corporation’s audited consolidated statements of financial condition. The Corporation also uses certain assumptions and estimates in the valuation of the accrued interest on securitized loans which is included in accounts receivable from securitization in the Corporation’s audited consolidated statements of financial condition. If management had made different assumptions about the determination of the accrued unbilled portion of interest income and the valuation of accrued interest on securitized loans, the Corporation’s financial condition and results of operations could have differed materially. For example, a 10% change in management’s projection of the estimated yield on its loan receivables and the valuation of the accrued interest receivable on securitized loans could have resulted in a change totaling approximately $70 million in interest income and other operating income at December 31, 2003.
For 2003, the Corporation’s estimated yield on its loan receivables and the valuation of the accrued interest receivable on securitized loans did not materially differ from the actual yield.
The Corporation also recognizes fees (except annual fees) on loan receivables in earnings as the fees are assessed according to agreements with the Corporation’s Customers. Credit card and other consumer loan fees include annual, late, overlimit, returned check, cash advance, express payment, and other miscellaneous
fees. These fees are included in the Corporation’s loan receivables when billed. Annual fees on loan receivables and incremental direct loan origination costs are deferred and amortized on a straight-line basis over the one-year period to which they pertain.
The Corporation adjusts the amount of interest and fee income on loan receivables recognized in the current period for its estimate of interest and fee income that it does not expect to collect in subsequent periods through adjustments to the respective income statement captions, loan receivables, and accrued income receivable. The estimate of uncollectible interest and fees is based on a migration analysis of delinquent and current loan receivables that will progress through the various delinquency stages and will ultimately charge off. The Corporation also adjusts the estimated value of accrued interest and fees on securitized loans for the amount of uncollectible interest and fees that are not expected to be collected through an adjustment to accounts receivable from securitization and securitization income. This estimate is also based on a migration analysis of delinquent and current securitized loans that will progress through the various delinquency stages and ultimately charge off. On a quarterly basis, the Corporation reviews and adjusts, as appropriate, these estimates.
If management had made different assumptions about uncollectible interest and fees on its loan receivables and its securitized loans, the Corporation’s financial condition and results of operations could have differed. For example, a 10% change in management’s estimate of uncollectible interest and fees could have resulted in a change totaling approximately $41 million in interest income and other operating income at December 31, 2003.
CHANGE IN ACCOUNTING ESTIMATE FOR INTEREST AND FEES RECOGNIZED IN 2002
In September 2002, the Corporation implemented the Federal Financial Institutions Examination Council (“FFIEC”) guidance for uncollectible accrued interest and fees for its managed loan portfolio. As a result, the Corporation changed its estimate of the value of accrued interest and fees in September 2002. The change in the estimated value of accrued interest and fees resulted in a decrease to income before income taxes of $263.7 million ($167.2 million after taxes) or $.13 per common share—assuming dilution for the year ended December 31, 2002, through a reduction of $66.3 million of interest income and $197.4 million of other operating income. This change in the estimated value of accrued interest and fees in 2002 also reduced ending total loan receivables by $86.5 million, accrued income receivable by $5.2 million, and accounts receivable from securitization by $172.0 million. The Corporation’s earnings per common share, excluding the change in the estimated value of accrued interest and fees in 2002, would have been $1.50 for the year ended December 31, 2002, and earnings per common share—assuming dilution would have been $1.47 for the year ended December 31, 2002. The change in the estimated value of accrued interest and fees has not had a material effect on earnings in subsequent periods.
Throughout this report, various items in the
consolidated financial statements are discussed
excluding the change in the estimated value of 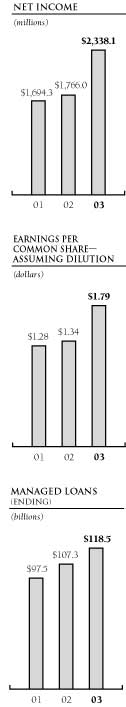 accrued interest and fees in 2002. Management
believes this presentation is useful to
investors because the change in accounting
estimate had a material impact on the results
of operations in 2002, but not in 2003. As a
result, the business factors and trends
affecting the Corporation’s results from 2002
to 2003 and from 2001 to 2002 in certain cases
are better discussed and analyzed without the
impact of the change in estimate.
accrued interest and fees in 2002. Management
believes this presentation is useful to
investors because the change in accounting
estimate had a material impact on the results
of operations in 2002, but not in 2003. As a
result, the business factors and trends
affecting the Corporation’s results from 2002
to 2003 and from 2001 to 2002 in certain cases
are better discussed and analyzed without the
impact of the change in estimate.
EARNINGS SUMMARY
Net income for 2003 increased $572.2 million or 32.4% to $2.3 billion or $1.79 per common share from $1.8 billion or $1.34 per common share in 2002. Excluding the change in the estimated value of accrued interest and fees in 2002, net income would have increased $405.0 million or 20.9% for 2003. Net income for 2002 increased $71.7 million or 4.2% from $1.7 billion or $1.28 per common share in 2001. Excluding the change in the estimated value of accrued interest and fees in 2002, net income would have increased $238.8 million or 14.1% to $1.9 billion or $1.47 per common share for 2002. All earnings per common share amounts are presented assuming dilution.
The overall growth in earnings for 2003 was primarily attributable to the growth in the Corporation’s loan receivables, higher levels of securitized loans, an increase in other operating income, interest income, and a decrease in interest expense, partially offset by higher credit losses and an increase in other operating expense. The overall growth in earnings for 2002 was primarily attributable to the growth in the Corporation’s loan receivables and higher levels of securitized loans, partially offset by the change in the estimated value of accrued interest and fees in 2002 and higher credit losses.
20 |
TABLE 1: SUMMARIZED CONSOLIDATED STATEMENTS OF INCOME (dollars in thousands, except per share amounts)
| Year Ended December 31, | 2003 | 2002 | 2001 | |||||||||
Total interest income |
$ | 3,858,884 | $ | 3,678,070 | $ | 3,471,405 | ||||||
Total interest expense |
1,508,511 | 1,603,495 | 1,814,065 | |||||||||
Net interest income |
2,350,373 | 2,074,575 | 1,657,340 | |||||||||
Provision for possible credit losses |
1,392,701 | 1,340,157 | 1,140,615 | |||||||||
Net interest income after provision for possible credit losses |
957,672 | 734,418 | 516,725 | |||||||||
Total other operating income |
7,825,480 | 6,752,923 | 6,673,316 | |||||||||
Total other operating expense |
5,124,147 | 4,701,925 | 4,474,831 | |||||||||
Income before income taxes |
3,659,005 | 2,785,416 | 2,715,210 | |||||||||
Applicable income taxes |
1,320,901 | 1,019,462 | 1,020,919 | |||||||||
Net income |
$ | 2,338,104 | $ | 1,765,954 | $ | 1,694,291 | ||||||
Earnings per common share |
$ | 1.82 | $ | 1.37 | $ | 1.31 | ||||||
Earnings per
common share—assuming dilution |
1.79 | 1.34 | 1.28 | |||||||||
Dividends per common share |
.36 | .27 | .24 | |||||||||
Table 1 summarizes the Corporation’s consolidated statements of income, which has been derived from the audited consolidated financial statements, for the years ended December 31, 2003, 2002, and 2001.
Ending loan receivables increased $4.9 billion or 17.0% to $33.6 billion for 2003 and increased $4.1 billion or 16.6% to $28.7 billion for 2002 from $24.6 billion for 2001. Total managed loans increased $11.2 billion or 10.5% to $118.5 billion for 2003 and increased $9.8 billion or 10.0% to $107.3 billion for 2002, as compared to $97.5 billion for 2001. Average loan receivables increased $2.9 billion or 11.3% to $28.2 billion for 2003 and increased $5.0 billion or 24.5% to $25.3 billion for 2002 from $20.3 billion for 2001. Total average managed loans increased $9.8 billion or 9.8% to $109.9 billion for 2003 and increased $9.1 billion or 10.0% to $100.0 billion for 2002 from $90.9 billion for 2001.
Table 2 reconciles the Corporation’s loan receivables to its managed loans and average loan receivables to its average managed loans.
Other operating income increased $1.1 billion or 15.9% to $7.8 billion for 2003 and increased $79.6 million or 1.2% to $6.8 billion for 2002 from $6.7 billion for 2001. Excluding the change in the estimated value of accrued interest and fees in 2002, other operating income would have increased $875.2 million or
12.6% for 2003 and $277.0 million or 4.2% for 2002. Interest income increased $180.8 million or 4.9% to $3.9 billion for 2003 and increased $206.7 million or 6.0% to $3.7 billion for 2002 from $3.5 billion for 2001. Excluding the change in the estimated value of accrued interest and fees in 2002, interest income would have increased $114.5 million or 3.1% for 2003 and $272.9 million or 7.9% for 2002. Interest expense decreased $95.0 million or 5.9% to $1.5 billion for 2003 and decreased $210.6 million or 11.6% to $1.6 billion for 2002 from $1.8 billion for 2001. Other operating expense increased $422.2 million or 9.0% to $5.1 billion for 2003, and increased $227.1 million or 5.1% to $4.7 billion for 2002 from $4.5 billion for 2001.
The net credit loss ratio on loan receivables for 2003 was 4.84%, as compared to 4.57% in 2002, and 4.20% in 2001. The net credit loss ratio on managed loans for 2003 was 5.22%, as compared to 4.99% in 2002 and 4.74% in 2001. Delinquency on loan receivables at December 31, 2003 was 3.84%, as compared to 4.36% at December 31, 2002 and 4.67% at December 31, 2001. Delinquency on managed loans was 4.39% at December 31, 2003, as compared to 4.88% at December 31, 2002, and 5.09% at December 31, 2001.
Refer to Table 13 for a reconciliation of the loan receivables delinquency ratio to the managed delinquency ratio. Refer to Table 18 for a reconciliation of the loan receivables net credit loss ratio to the managed net credit loss ratio.
TABLE 2: RECONCILIATION OF LOAN RECEIVABLES TO MANAGED LOANS (dollars in thousands)
| Year Ended December 31, | 2003 | 2002 | 2001 | |||||||||
At Year End: |
||||||||||||
Loans held for securitization |
$ | 13,084,105 | $ | 11,029,627 | $ | 9,929,948 | ||||||
Loan portfolio |
20,539,972 | 17,696,881 | 14,703,616 | |||||||||
Loan receivables |
33,624,077 | 28,726,508 | 24,633,564 | |||||||||
Securitized loans |
84,869,483 | 78,531,334 | 72,862,487 | |||||||||
Total managed loans |
$ | 118,493,560 | $ | 107,257,842 | $ | 97,496,051 | ||||||
Average for the Year: |
||||||||||||
Loans held for securitization |
$ | 9,198,810 | $ | 8,130,207 | $ | 6,909,840 | ||||||
Loan portfolio |
18,985,008 | 17,184,993 | 13,429,548 | |||||||||
Loan receivables |
28,183,818 | 25,315,200 | 20,339,388 | |||||||||
Securitized loans |
81,691,156 | 74,718,731 | 70,560,600 | |||||||||
Total managed loans |
$ | 109,874,974 | $ | 100,033,931 | $ | 90,899,988 | ||||||
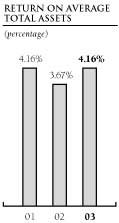
The Corporation’s return on average total assets for 2003 increased to 4.16% from 3.67% for 2002. Excluding the change in the estimated value of accrued interest and fees in 2002, the Corporation’s return on average total assets for 2003 would have increased 15 basis points from 2002 as a result of the Corporation’s net income growing faster than its average total assets. The Corporation’s return on average total assets for 2002 decreased to 3.67% from 4.16% for 2001. Excluding the change in the estimated value of accrued interest and fees in 2002, the Corporation’s return on average total assets for 2002 would have decreased 15 basis points from 2001 as a result of the Corporation’s net income growing slower than its average total assets.
The Corporation’s net income grew at a faster rate than its average total assets during 2003, excluding the change in the estimated value of accrued interest and fees in 2002, primarily as a result of an increase of 11.7% in securitization income for 2003 from 2002. Net income grew at a slower rate than average total assets during 2002, excluding the change in the estimated value of accrued interest and fees in 2002, primarily as a result of an increase of only 2.0% in securitization income for 2002 from 2001. See “Total Other Operating Income” for further discussion of the changes in securitization income for 2003 and 2002.
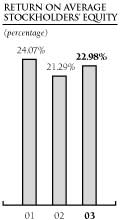
The Corporation’s return on average stockholders’ equity was 22.98% for 2003, as compared to 21.29% for 2002 and 24.07% for 2001. Excluding the change in the estimated value of accrued interest and fees in 2002, the Corporation’s return on average stockholders’ equity would have decreased 21 basis points and 88 basis points for 2003 and 2002, respectively, as a result of the
Corporation’s net income growing at a slower rate than its average stockholders’ equity. The Corporation’s net income typically grows at a slower rate than its average stockholders’ equity as the Corporation reinvests a significant portion of its net income back into the business. Also, the strengthening of foreign currencies against the U.S. dollar increased stockholders’ equity, partially offset by an increase in the Corporation’s dividend rate per common share and other factors.
Table 3 reconciles the Corporation’s return on average total assets and return on average stockholders’ equity for 2002, to the Corporation’s return on average total assets and return on average stockholders’ equity for 2002 excluding the change in the estimated value of accrued interest and fees in 2002.
NET INTEREST INCOME
Net interest income represents interest income on total interest-earning assets, on a fully taxable equivalent basis where appropriate, less interest expense on total interest-bearing liabilities. Fully taxable equivalent basis represents the income on total interest-earning assets that is either tax-exempt or taxed at a reduced rate, adjusted to give effect to the prevailing incremental federal income tax rate, and adjusted for nondeductible carrying costs and state income taxes, where applicable. Yield calculations, where appropriate, include these adjustments.
Tables 4 and 5 provide further detail regarding the Corporation’s average balances, yields and rates, interest income and expense, and the impact that rate and volume changes had on the Corporation’s net interest income for the years ended December 31, 2003, 2002, and 2001.
TABLE 3: RECONCILIATION OF THE AS REPORTED RETURN ON AVERAGE TOTAL ASSETS AND STOCKHOLDERS’ EQUITY TO THE RETURN ON AVERAGE TOTAL ASSETS AND STOCKHOLDERS’ EQUITY EXCLUDING THE CHANGE IN THE ESTIMATED VALUE OF ACCRUED INTEREST AND FEES IN 2002 (dollars in thousands)
| Year Ended December 31, 2002 |
||||||||||||
| Average Balance | Ratio | Net Income | ||||||||||
Return on Average Total Assets |
||||||||||||
As reported |
$ | 48,154,027 | 3.67 | % | $ | 1,765,954 | ||||||
Impact of the change in the estimated value of accrued interest and fees in 2002 |
67,182 | 167,167 | ||||||||||
Excluding the change in the estimated value of accrued interest and fees in 2002 |
$ | 48,221,209 | 4.01 | $ | 1,933,121 | |||||||
Return on Average Stockholders’ Equity |
||||||||||||
As reported |
$ | 8,293,823 | 21.29 | $ | 1,765,954 | |||||||
Impact of the change in the estimated value of accrued interest and fees in 2002 |
42,593 | 167,167 | ||||||||||
Excluding the change in the estimated value of accrued interest and fees in 2002 |
$ | 8,336,416 | 23.19 | $ | 1,933,121 | |||||||
22 |
TABLE 4: STATEMENTS OF AVERAGE BALANCES, YIELDS AND RATES, INCOME OR EXPENSE
(dollars in thousands, yields and rates on a fully taxable equivalent basis)
| Year Ended December 31, | 2003 | | | 2002 | | | 2001 | |||||||||||||||||||||||||||||||
| Average | Yield/ | Income | Average | Yield/ | Income | Average | Yield/ | Income | ||||||||||||||||||||||||||||
| Balance | Rate | or Expense | Balance | Rate | or Expense | Balance | Rate | or Expense | ||||||||||||||||||||||||||||
Assets |
||||||||||||||||||||||||||||||||||||
Interest-earning assets: |
||||||||||||||||||||||||||||||||||||
Money market instruments: |
||||||||||||||||||||||||||||||||||||
Interest-earning time deposits in other banks: |
||||||||||||||||||||||||||||||||||||
Domestic |
$ | 8,181 | 1.91 | % | $ | 156 | $ | 1,244 | .96 | % | $ | 12 | $ | 1,199 | 3.59 | % | $ | 43 | ||||||||||||||||||
Foreign |
4,629,799 | 1.71 | 79,103 | 2,149,065 | 2.47 | 53,121 | 1,690,774 | 4.22 | 71,298 | |||||||||||||||||||||||||||
Total interest-earning time deposits
in other banks |
4,637,980 | 1.71 | 79,259 | 2,150,309 | 2.47 | 53,133 | 1,691,973 | 4.22 | 71,341 | |||||||||||||||||||||||||||
Federal funds sold |
2,957,819 | 1.12 | 33,137 | 2,127,914 | 1.67 | 35,460 | 1,526,879 | 3.71 | 56,651 | |||||||||||||||||||||||||||
Total money market instruments |
7,595,799 | 1.48 | 112,396 | 4,278,223 | 2.07 | 88,593 | 3,218,852 | 3.98 | 127,992 | |||||||||||||||||||||||||||
Investment securities (a): |
||||||||||||||||||||||||||||||||||||
Domestic: |
||||||||||||||||||||||||||||||||||||
Taxable (b) |
3,722,062 | 2.67 | 99,223 | 3,688,047 | 3.42 | 126,062 | 3,001,592 | 5.04 | 151,173 | |||||||||||||||||||||||||||
Tax-exempt (c) |
109,403 | 1.99 | 2,176 | 110,054 | 2.69 | 2,965 | 102,710 | 4.68 | 4,807 | |||||||||||||||||||||||||||
Total domestic investment securities |
3,831,465 | 2.65 | 101,399 | 3,798,101 | 3.40 | 129,027 | 3,104,302 | 5.02 | 155,980 | |||||||||||||||||||||||||||
Foreign |
266,286 | 4.19 | 11,147 | 181,514 | 4.60 | 8,349 | 177,454 | 5.55 | 9,840 | |||||||||||||||||||||||||||
Total investment securities |
4,097,751 | 2.75 | 112,546 | 3,979,615 | 3.45 | 137,376 | 3,281,756 | 5.05 | 165,820 | |||||||||||||||||||||||||||
Other interest-earning assets (a) (b) (d) |
3,904,013 | 7.82 | 305,468 | 3,869,893 | 9.28 | 359,159 | 3,256,773 | 11.89 | 387,250 | |||||||||||||||||||||||||||
Loan receivables: |
||||||||||||||||||||||||||||||||||||
Loans held for securitization: |
||||||||||||||||||||||||||||||||||||
Domestic: |
||||||||||||||||||||||||||||||||||||
Credit card |
7,143,690 | 12.33 | 881,161 | 6,311,804 | 12.89 | 813,536 | 5,178,099 | 14.61 | 756,463 | |||||||||||||||||||||||||||
Other consumer |
52,883 | 5.35 | 2,827 | 438,187 | 15.30 | 67,062 | 605,683 | 15.86 | 96,088 | |||||||||||||||||||||||||||
Total domestic loans held for
securitization |
7,196,573 | 12.28 | 883,988 | 6,749,991 | 13.05 | 880,598 | 5,783,782 | 14.74 | 852,551 | |||||||||||||||||||||||||||
Foreign |
2,002,237 | 11.44 | 228,989 | 1,380,216 | 12.75 | 175,960 | 1,126,058 | 12.99 | 146,330 | |||||||||||||||||||||||||||
Total loans held for securitization |
9,198,810 | 12.10 | 1,112,977 | 8,130,207 | 13.00 | 1,056,558 | 6,909,840 | 14.46 | 998,881 | |||||||||||||||||||||||||||
Loan portfolio (d): |
||||||||||||||||||||||||||||||||||||
Domestic: |
||||||||||||||||||||||||||||||||||||
Credit card |
7,346,064 | 10.71 | 786,682 | 7,269,526 | 10.61 | 771,292 | 6,368,297 | 12.80 | 814,853 | |||||||||||||||||||||||||||
Other consumer |
6,229,575 | 13.78 | 858,553 | 5,895,108 | 13.73 | 809,659 | 4,388,008 | 14.89 | 653,267 | |||||||||||||||||||||||||||
Total domestic loan portfolio |
13,575,639 | 12.12 | 1,645,235 | 13,164,634 | 12.01 | 1,580,951 | 10,756,305 | 13.65 | 1,468,120 | |||||||||||||||||||||||||||
Foreign |
5,409,369 | 10.56 | 571,021 | 4,020,359 | 11.35 | 456,503 | 2,673,243 | 12.16 | 325,025 | |||||||||||||||||||||||||||
Total loan portfolio |
18,985,008 | 11.67 | 2,216,256 | 17,184,993 | 11.86 | 2,037,454 | 13,429,548 | 13.35 | 1,793,145 | |||||||||||||||||||||||||||
Total loan receivables |
28,183,818 | 11.81 | 3,329,233 | 25,315,200 | 12.22 | 3,094,012 | 20,339,388 | 13.73 | 2,792,026 | |||||||||||||||||||||||||||
Total interest-earning assets |
43,781,381 | 8.82 | 3,859,643 | 37,442,931 | 9.83 | 3,679,140 | 30,096,769 | 11.54 | 3,473,088 | |||||||||||||||||||||||||||
Cash and due from banks |
781,507 | 766,003 | 744,798 | |||||||||||||||||||||||||||||||||
Premises and equipment, net (b) |
2,576,437 | 2,434,161 | 2,153,716 | |||||||||||||||||||||||||||||||||
Other assets (b) (d) |
10,252,088 | 8,452,712 | 8,425,687 | |||||||||||||||||||||||||||||||||
Reserve for possible credit losses |
(1,158,510 | ) | (941,780 | ) | (656,654 | ) | ||||||||||||||||||||||||||||||
Total assets |
$ | 56,232,903 | $ | 48,154,027 | $ | 40,764,316 | ||||||||||||||||||||||||||||||
Liabilities and Stockholders’ Equity |
||||||||||||||||||||||||||||||||||||
Interest-bearing liabilities: |
||||||||||||||||||||||||||||||||||||
Interest-bearing deposits: |
||||||||||||||||||||||||||||||||||||
Domestic: |
||||||||||||||||||||||||||||||||||||
Time deposits |
$ | 21,472,666 | 4.39 | 942,296 | $ | 19,485,060 | 5.28 | 1,027,905 | $ | 17,999,374 | 6.43 | 1,157,995 | ||||||||||||||||||||||||
Money market deposit accounts |
7,844,120 | 1.80 | 141,117 | 7,040,563 | 2.70 | 190,072 | 5,534,407 | 4.51 | 249,425 | |||||||||||||||||||||||||||
Interest-bearing transaction accounts |
50,369 | 1.07 | 538 | 47,157 | 1.71 | 808 | 43,675 | 3.46 | 1,513 | |||||||||||||||||||||||||||
Savings accounts |
82,088 | 1.18 | 967 | 74,839 | 1.74 | 1,302 | 16,967 | 2.99 | 508 | |||||||||||||||||||||||||||
Total domestic interest-bearing deposits |
29,449,243 | 3.68 | 1,084,918 | 26,647,619 | 4.58 | 1,220,087 | 23,594,423 | 5.97 | 1,409,441 | |||||||||||||||||||||||||||
Foreign: |
||||||||||||||||||||||||||||||||||||
Time deposits |
712,239 | 3.21 | 22,888 | 924,325 | 3.83 | 35,440 | 701,937 | 5.02 | 35,265 | |||||||||||||||||||||||||||
Total interest-bearing deposits |
30,161,482 | 3.67 | 1,107,806 | 27,571,944 | 4.55 | 1,255,527 | 24,296,360 | 5.95 | 1,444,706 | |||||||||||||||||||||||||||
Borrowed funds: |
||||||||||||||||||||||||||||||||||||
Short-term borrowings: |
||||||||||||||||||||||||||||||||||||
Domestic |
988,533 | 3.46 | 34,185 | 1,037,403 | 3.57 | 37,051 | 383,638 | 4.39 | 16,858 | |||||||||||||||||||||||||||
Foreign |
153,421 | 3.22 | 4,947 | 215,718 | 2.75 | 5,927 | 179,993 | 4.39 | 7,908 | |||||||||||||||||||||||||||
Total short-term borrowings |
1,141,954 | 3.43 | 39,132 | 1,253,121 | 3.43 | 42,978 | 563,631 | 4.39 | 24,766 | |||||||||||||||||||||||||||
Long-term debt and bank notes (e): |
||||||||||||||||||||||||||||||||||||
Domestic |
7,291,420 | 2.50 | 182,240 | 5,696,163 | 3.05 | 173,463 | 4,620,270 | 5.23 | 241,805 | |||||||||||||||||||||||||||
Foreign |
3,266,173 | 5.49 | 179,333 | 2,344,256 | 5.61 | 131,527 | 1,689,176 | 6.09 | 102,788 | |||||||||||||||||||||||||||
Total long-term debt and bank notes |
10,557,593 | 3.42 | 361,573 | 8,040,419 | 3.79 | 304,990 | 6,309,446 | 5.46 | 344,593 | |||||||||||||||||||||||||||
Total borrowed funds |
11,699,547 | 3.42 | 400,705 | 9,293,540 | 3.74 | 347,968 | 6,873,077 | 5.37 | 369,359 | |||||||||||||||||||||||||||
Total interest-bearing liabilities |
41,861,029 | 3.60 | 1,508,511 | 36,865,484 | 4.35 | 1,603,495 | 31,169,437 | 5.82 | 1,814,065 | |||||||||||||||||||||||||||
Noninterest-bearing deposits |
1,719,058 | 909,543 | 851,422 | |||||||||||||||||||||||||||||||||
Other liabilities |
2,480,038 | 2,085,177 | 1,703,471 | |||||||||||||||||||||||||||||||||
Total liabilities |
46,060,125 | 39,860,204 | 33,724,330 | |||||||||||||||||||||||||||||||||
Stockholders’ equity |
10,172,778 | 8,293,823 | 7,039,986 | |||||||||||||||||||||||||||||||||
Total liabilities and
stockholders’ equity |
$ | 56,232,903 | $ | 48,154,027 | $ | 40,764,316 | ||||||||||||||||||||||||||||||
Net interest income (d) |
$ | 2,351,132 | $ | 2,075,645 | $ | 1,659,023 | ||||||||||||||||||||||||||||||
Net interest margin (d) |
5.37 | 5.54 | 5.51 | |||||||||||||||||||||||||||||||||
Interest rate spread (d) |
5.22 | 5.48 | 5.72 | |||||||||||||||||||||||||||||||||
| (a) | Average balances for investment securities available-for-sale and other interest-earning assets are based on market values or estimated market values; if these assets were carried at amortized cost, there would not be a material impact on the net interest margin. | |||
| (b) | For purposes of comparability, certain prior period amounts have been reclassified. | |||
| (c) | The fully taxable equivalent adjustment for the years ended December 31, 2003, 2002, and 2001 was $759, $1,070, and $1,683, respectively. | |||
| (d) | December 31, 2002 includes the impact of the change in the estimated value of accrued interest and fees. | |||
| (e) | Includes the impact of interest rate swap agreements and foreign exchange swap agreements used to change a portion of fixed-rate funding sources to floating-rate funding sources. | |||
TABLE 5: RATE-VOLUME VARIANCE ANALYSIS (a) (dollars in thousands, on a fully taxable equivalent basis)
| Year Ended December 31, | 2003 Compared to 2002 | | | 2002 Compared to 2001 | |||||||||||||||||||||
| Volume | Rate | Total | Volume | Rate | Total | |||||||||||||||||||
Interest-Earning Assets |
||||||||||||||||||||||||
Money market instruments: |
||||||||||||||||||||||||
Interest-earning time deposits in other banks: |
||||||||||||||||||||||||
Domestic |
$ | 123 | $ | 21 | $ | 144 | $ | 2 | $ | (33 | ) | $ | (31 | ) | ||||||||||
Foreign |
46,381 | (20,399 | ) | 25,982 | 16,160 | (34,337 | ) | (18,177 | ) | |||||||||||||||
Total interest-earning time deposits in other banks |
46,504 | (20,378 | ) | 26,126 | 16,162 | (34,370 | ) | (18,208 | ) | |||||||||||||||
Federal funds sold |
11,367 | (13,690 | ) | (2,323 | ) | 17,180 | (38,371 | ) | (21,191 | ) | ||||||||||||||
Total money market instruments |
57,871 | (34,068 | ) | 23,803 | 33,342 | (72,741 | ) | (39,399 | ) | |||||||||||||||
Investment securities: |
||||||||||||||||||||||||
Domestic: |
||||||||||||||||||||||||
Taxable (b) |
1,152 | (27,991 | ) | (26,839 | ) | 29,954 | (55,065 | ) | (25,111 | ) | ||||||||||||||
Tax-exempt |
(17 | ) | (772 | ) | (789 | ) | 323 | (2,165 | ) | (1,842 | ) | |||||||||||||
Total domestic investment securities |
1,135 | (28,763 | ) | (27,628 | ) | 30,277 | (57,230 | ) | (26,953 | ) | ||||||||||||||
Foreign |
3,605 | (807 | ) | 2,798 | 221 | (1,712 | ) | (1,491 | ) | |||||||||||||||
Total investment securities |
4,740 | (29,570 | ) | (24,830 | ) | 30,498 | (58,942 | ) | (28,444 | ) | ||||||||||||||
Other interest-earning assets (b) (c) |
3,140 | (56,831 | ) | (53,691 | ) | 65,516 | (93,607 | ) | (28,091 | ) | ||||||||||||||
Loan receivables: |
||||||||||||||||||||||||
Loans held for securitization: |
||||||||||||||||||||||||
Domestic: |
||||||||||||||||||||||||
Credit card |
103,746 | (36,121 | ) | 67,625 | 152,942 | (95,869 | ) | 57,073 | ||||||||||||||||
Other consumer |
(36,916 | ) | (27,319 | ) | (64,235 | ) | (25,740 | ) | (3,286 | ) | (29,026 | ) | ||||||||||||
Total domestic loans held for securitization |
66,830 | (63,440 | ) | 3,390 | 127,202 | (99,155 | ) | 28,047 | ||||||||||||||||
Foreign |
72,656 | (19,627 | ) | 53,029 | 32,450 | (2,820 | ) | 29,630 | ||||||||||||||||
Total loans held for securitization |
139,486 | (83,067 | ) | 56,419 | 159,652 | (101,975 | ) | 57,677 | ||||||||||||||||
Loan portfolio (c): |
||||||||||||||||||||||||
Domestic: |
||||||||||||||||||||||||
Credit card |
8,161 | 7,229 | 15,390 | 106,392 | (149,953 | ) | (43,561 | ) | ||||||||||||||||
Other consumer |
46,087 | 2,807 | 48,894 | 210,189 | (53,797 | ) | 156,392 | |||||||||||||||||
Total domestic loan portfolio |
54,248 | 10,036 | 64,284 | 316,581 | (203,750 | ) | 112,831 | |||||||||||||||||
Foreign |
148,502 | (33,984 | ) | 114,518 | 154,218 | (22,740 | ) | 131,478 | ||||||||||||||||
Total loan portfolio |
202,750 | (23,948 | ) | 178,802 | 470,799 | (226,490 | ) | 244,309 | ||||||||||||||||
Total loan receivables |
342,236 | (107,015 | ) | 235,221 | 630,451 | (328,465 | ) | 301,986 | ||||||||||||||||
Total interest income (c) |
407,987 | (227,484 | ) | 180,503 | 759,807 | (553,755 | ) | 206,052 | ||||||||||||||||
Interest-Bearing Liabilities |
||||||||||||||||||||||||
Interest-bearing deposits: |
||||||||||||||||||||||||
Domestic: |
||||||||||||||||||||||||
Time deposits |
98,196 | (183,805 | ) | (85,609 | ) | 90,173 | (220,263 | ) | (130,090 | ) | ||||||||||||||
Money market deposit accounts |
19,849 | (68,804 | ) | (48,955 | ) | 56,875 | (116,228 | ) | (59,353 | ) | ||||||||||||||
Interest-bearing transaction accounts |
52 | (322 | ) | (270 | ) | 112 | (817 | ) | (705 | ) | ||||||||||||||
Savings accounts |
117 | (452 | ) | (335 | ) | 1,086 | (292 | ) | 794 | |||||||||||||||
Total domestic interest-bearing deposits |
118,214 | (253,383 | ) | (135,169 | ) | 148,246 | (337,600 | ) | (189,354 | ) | ||||||||||||||
Foreign: |
||||||||||||||||||||||||
Time deposits |
(7,360 | ) | (5,192 | ) | (12,552 | ) | 9,659 | (9,484 | ) | 175 | ||||||||||||||
Total interest-bearing deposits |
110,854 | (258,575 | ) | (147,721 | ) | 157,905 | (347,084 | ) | (189,179 | ) | ||||||||||||||
Borrowed funds: |
||||||||||||||||||||||||
Short-term borrowings: |
||||||||||||||||||||||||
Domestic |
(1,712 | ) | (1,154 | ) | (2,866 | ) | 23,882 | (3,689 | ) | 20,193 | ||||||||||||||
Foreign |
(1,897 | ) | 917 | (980 | ) | 1,366 | (3,347 | ) | (1,981 | ) | ||||||||||||||
Total short-term borrowings |
(3,609 | ) | (237 | ) | (3,846 | ) | 25,248 | (7,036 | ) | 18,212 | ||||||||||||||
Long-term debt and bank notes: |
||||||||||||||||||||||||
Domestic |
43,270 | (34,493 | ) | 8,777 | 47,886 | (116,228 | ) | (68,342 | ) | |||||||||||||||
Foreign |
50,676 | (2,870 | ) | 47,806 | 37,274 | (8,535 | ) | 28,739 | ||||||||||||||||
Total long-term debt and bank notes |
93,946 | (37,363 | ) | 56,583 | 85,160 | (124,763 | ) | (39,603 | ) | |||||||||||||||
Total borrowed funds |
90,337 | (37,600 | ) | 52,737 | 110,408 | (131,799 | ) | (21,391 | ) | |||||||||||||||
Total interest expense |
201,191 | (296,175 | ) | (94,984 | ) | 268,313 | (478,883 | ) | (210,570 | ) | ||||||||||||||
Net interest income (c) |
$ | 206,796 | $ | 68,691 | $ | 275,487 | $ | 491,494 | $ | (74,872 | ) | $ | 416,622 | |||||||||||
| (a) | The rate-volume variance for each category has been allocated on a consistent basis between rate and volume variances based on the percentage of the rate or volume variance to the sum of the two absolute variances. | |||
| (b) | For purposes of comparability, certain prior period amounts have been reclassified. | |||
| (c) | Rate-volume variance amounts include the impact of the change in the estimated value of accrued interest and fees in 2002. | |||
24 |
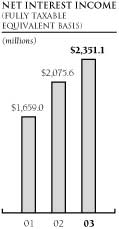
Net interest income, on a fully taxable equivalent basis, increased $275.5 million or 13.3% to $2.4 billion for 2003 from 2002. Excluding the change in the estimated value of accrued interest and fees in 2002, net interest income, on a fully taxable equivalent basis, would have increased $209.2 million or 9.8% in 2003.
Average interest-earning assets increased $6.3 billion or 16.9% to $43.8 billion for 2003 from 2002. The increase in average interest-earning assets for 2003 was primarily the result of an increase in average loan receivables of $2.9 billion and an increase in average money market instruments of $3.3 billion. The yield on average interest-earning assets decreased 101 basis points to 8.82%, as compared to 9.83% for 2002. The decrease in the yield on average interest-earning assets was primarily the result of the decrease in the yield earned on average loan receivables, average total investment securities and money market instruments, and average other interest-earning assets, combined with an increase in lower yielding average total investment securities and money market instruments, and other interest-earning assets as a percentage of total average interest-earning assets. The decrease in the yield on average interest-earning assets for 2003, as compared to 2002, would have been larger excluding the change in the estimated value of accrued interest and fees in 2002, which decreased the yield earned on average loan receivables by 25 basis points for 2002 (see “Loan Receivables” for further discussion).
Table 6 highlights average interest-earning assets and average interest-bearing liabilities.
Average interest-bearing liabilities increased $5.0 billion or 13.6% to $41.9 billion for 2003 from 2002. The increase in average interest-bearing liabilities for 2003 was primarily the result of an increase of $2.6 billion in average interest-bearing deposits and an increase of $2.4 billion in average borrowed funds. The 75 basis point decrease in the rate paid on average interest-bearing liabilities to 3.60% for 2003, from 4.35% for 2002, reflects the continued impact of actions by the Federal Open Market
Committee (“FOMC”) of the Federal Reserve throughout 2001, in the fourth quarter of 2002, and the second quarter of 2003 that impacted overall market interest rates.
The impact on the Corporation’s net interest income from the changes in interest rates in 2003 and 2002 reflects the difference in the timeframe the Corporation’s interest rate sensitive assets and interest rate sensitive liabilities reprice. The Corporation’s loan receivables comprised approximately 64.4% and 67.6% of the average interest-earning assets for 2003 and 2002, respectively. Loan receivables are not repriced directly as market conditions change. Instead, these assets are repriced over time as the underlying Customer account behavior changes, market rate conditions change, competitive pressures change, and other events occur. A portion of the Corporation’s interest rate sensitive liabilities, however, can reprice more rapidly due to changes in the market interest rate environment, since they have either variable interest rates or are swapped to variable interest rates or have short-term maturities. Accordingly, the decline in the overall market interest rates in the fourth quarter of 2002 and the second quarter of 2003, that caused a portion of the Corporation’s interest rate sensitive liabilities to reprice at a faster rate than a portion of the Corporation’s interest rate sensitive assets, led to a $68.7 million increase in 2003 net interest income. The impact of the increase in the interest rates in 2003 would have been smaller excluding the change in the estimated value of accrued interest and fees in 2002. Actions by the FOMC throughout 2001, and the competitive environment reduced the yields on the Corporation’s interest rate sensitive assets in 2002 further than the decline in the rates on the Corporation’s interest rate sensitive liabilities in 2002 which had already begun to reprice in 2001. These changes, combined with the change in the estimated value of accrued interest and fees in 2002, led to a $74.9 million decrease in 2002 net interest income. The impact of the decrease in the interest rates in 2002 would have been smaller excluding the change in the estimated value of accrued interest and fees in 2002.
Net interest income, on a fully taxable equivalent basis, increased $416.6 million or 25.1% to $2.1 billion for 2002 from 2001. Excluding the change in the estimated value of accrued interest and fees in 2002, net interest income, on a fully taxable equivalent basis would have increased $482.9 million or 29.1% from 2001.
TABLE 6: SUMMARIZED AVERAGE INTEREST-EARNING ASSETS AND AVERAGE INTEREST-BEARING LIABILITIES
(dollars in thousands, yields and rates on a fully taxable equivalent basis)
| Year Ended December 31, | 2003 | | | 2002 | | | 2001 | |||||||||||||||||||||||||||||||||||
| Average | Yield/ | Income or | Average | Yield/ | Income or | Average | Yield/ | Income or | ||||||||||||||||||||||||||||||||
| Balance | Rate | Expense | Balance | Rate | Expense | Balance | Rate | Expense | ||||||||||||||||||||||||||||||||
Total interest-earning assets |
$ | 43,781,381 | 8.82 | % | $ | 3,859,643 | $ | 37,442,931 | 9.83 | % | $ | 3,679,140 | $ | 30,096,769 | 11.54 | % | $ | 3,473,088 | ||||||||||||||||||||||
Total interest-bearing liabilities |
41,861,029 | 3.60 | 1,508,511 | 36,865,484 | 4.35 | 1,603,495 | 31,169,437 | 5.82 | 1,814,065 | |||||||||||||||||||||||||||||||
Net interest income |
$ | 2,351,132 | $ | 2,075,645 | $ | 1,659,023 | ||||||||||||||||||||||||||||||||||
Net interest margin |
5.37 | 5.54 | 5.51 | |||||||||||||||||||||||||||||||||||||
Average interest-earning assets increased $7.3 billion or 24.4% to $37.4 billion for 2002 from 2001. The increase in average interest-earning assets for 2002 was primarily a result of an increase in average loan receivables of $5.0 billion and an increase in average investment securities and money market instruments of $1.8 billion. The yield on average interest-earning assets decreased 171 basis points to 9.83%, as compared to 11.54% for 2001. The decrease in the yield on average interest-earning assets was primarily the result of the decrease in the yield earned on average loan receivables, average total investment securities and money market instruments, and average other interest-earning assets. The decrease in the yield would have been smaller excluding the change in the estimated value of accrued interest and fees in 2002, which decreased the yield earned on average loan receivables by 25 basis points for 2002 (see “Loan Receivables” for further discussion).
Average interest-bearing liabilities increased $5.7 billion or 18.3% to $36.9 billion for 2002 from 2001. The increase in average interest-bearing liabilities for 2002, was primarily the result of an increase of $3.3 billion in average interest-bearing deposits and an increase of $2.4 billion in average borrowed funds. The 147 basis point decrease in the rate paid on average interest-bearing liabilities to 4.35% for 2002, from 5.82% for 2001, reflects actions by the FOMC throughout 2001 that impacted overall market interest rates and lowered the Corporation’s cost of funds.
The Corporation’s net interest margin, on a fully taxable equivalent basis, was 5.37% for 2003, as compared to 5.54% for 2002. The net interest margin represents net interest income on a fully taxable equivalent basis expressed as a percentage of average total interest-earning assets. Excluding the change in the estimated value of accrued interest and fees in 2002, the net interest margin, on a fully taxable equivalent basis for 2003, would have decreased 34 basis points as compared to 2002, primarily as a result of average interest-earning assets growing at a faster rate than net interest income combined with the decrease in the yield earned on average interest-earning assets, partially offset by the decrease in the rate paid on average interest-bearing liabilities. Also, the increase in lower yielding average total investment securities and money market instruments, and other interest-earning assets as a percentage of average interest-earning assets further reduced the net interest margin.
The Corporation’s net interest margin, on a fully taxable equivalent basis, was 5.54% for 2002, as compared to 5.51% for 2001. Excluding the change in the estimated value of accrued interest and fees in 2002, the net interest margin, on a fully taxable equivalent basis, would have increased 20 basis points for 2002, primarily as a result of the actions by the FOMC throughout 2001 that impacted overall market interest rates and decreased the Corporation’s funding costs, as the Corporation’s interest-bearing liabilities matured and repriced during the continued low interest rate environment. The Corporation’s net interest margin in 2002 also had the full benefit of the actions by the FOMC throughout 2001.
See “Off-Balance Sheet Arrangements—Impact of Off-Balance Sheet Securitization Transactions on the Corporation’s Results” for a discussion of the managed net interest margin and a reconciliation of the net interest margin ratio to the net interest margin ratio excluding the change in the estimated value of accrued interest and fees in 2002.
INVESTMENT SECURITIES AND MONEY MARKET INSTRUMENTS
The Corporation seeks to maintain its portfolio
of investment securities and money market
instruments at a level appropriate for the
Corporation’s liquidity needs. The
Corporation’s average
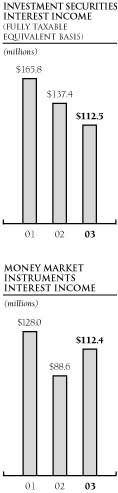 investment securities and money
market instruments are affected by the
timing of receipt of funds from asset
securitization transactions, deposits,
loan payments, and unsecured long-term debt and bank note issuances.
Funds received from these sources are
normally invested in short-term, liquid
money market instruments and investment securities available-for-sale until
the funds are needed for loan growth
and other liquidity needs.
investment securities and money
market instruments are affected by the
timing of receipt of funds from asset
securitization transactions, deposits,
loan payments, and unsecured long-term debt and bank note issuances.
Funds received from these sources are
normally invested in short-term, liquid
money market instruments and investment securities available-for-sale until
the funds are needed for loan growth
and other liquidity needs.
Average investment securities and money market instruments as a percentage of average interest-earning assets were 26.7% for 2003, as compared to 22.1% for 2002 and 21.6% for 2001. Money market instruments increased in 2003 to provide liquidity to support portfolio acquisition activity, to support anticipated loan growth, and in anticipation of possible market disruptions due to uncertainty created by world events. Also, money market instruments increased in 2003 as a result of the change in the timing of the remittance of principal collections on securitized loans to the trusts (see “Noninterest-Bearing Deposits” for further discussion). Money market instruments increased in 2002 to provide liquidity to support portfolio acquisition activity and anticipated loan growth.
Interest income on investment securities for 2003, on a fully taxable equivalent basis, decreased $24.8 million or 18.1% to $112.5 million for 2003 from 2002. The decrease in interest income on investment securities for 2003 was primarily a result of a 70 basis point decrease in the yield earned on average investment securities, partially offset by an increase in average investment securities of $118.1 million from 2002. Interest income on
26 |
investment securities for 2002, on a fully taxable equivalent basis, decreased $28.4 million or 17.2% to $137.4 million for 2002 from 2001. The decrease in interest income on investment securities for 2002 was primarily a result of a 160 basis point decrease in the yield earned on average investment securities, partially offset by an increase in average investment securities of $697.9 million from 2001.
Money market instruments include interest-earning time deposits in other banks and federal funds sold. Interest income on money market instruments was $112.4 million for 2003, an increase of $23.8 million or 26.9% from 2002. The increase in interest income on money market instruments was primarily the result of an increase in average money market instruments of $3.3 billion for 2003, partially offset by a 59 basis point decrease in the yield earned on average money market instruments. Interest income on money market instruments was $88.6 million for 2002, a decrease of $39.4 million or 30.8% from 2001. The decrease in interest income on money market instruments was primarily the result of a 191 basis point decrease in the yield earned on average money market instruments for 2002, partially offset by a $1.1 billion increase in average money market instruments for 2002.
OTHER INTEREST-EARNING ASSETS
Other interest-earning assets include the Corporation’s retained interests in securitization transactions, which are the interest-only strip receivable, cash reserve accounts, accrued interest and fees on securitized loans, and other subordinated retained interests. Also included in other interest-earning assets is Federal Reserve Bank stock. The Corporation accrues interest income related to its retained beneficial interests in its securitization transactions accounted for as sales in the Corporation’s audited consolidated financial statements. The Corporation includes these retained interests in accounts receivable from securitization in the audited consolidated statements of financial condition.
Interest income on other interest-earning assets decreased $53.7 million or 14.9% to $305.5 million for 2003 from 2002, as compared to a decrease of $28.1 million or 7.3% to $359.2 million for 2002 from 2001. The decrease in interest income on other interest-earning assets for 2003 was primarily the result of a decrease in the yield earned on average other interest-earning assets of 146 basis points in 2003. The decrease in the yield earned on average other interest-earning assets in 2003 was primarily the result of the decrease in the discount rate assumptions used in the valuation of the Corporation’s retained beneficial interests in its securitization transactions. The decrease in interest income on other interest-earning assets for 2002 was primarily the result of a decrease of 261 basis points in the yield earned on average other interest-earning assets in 2002, partially offset by an increase of $613.1 million in average other interest-earning assets, as compared to 2001. The decrease in the yield earned on average other interest-earning assets was primarily the result of the decrease in the discount rate assumptions used in the valuation of the Corporation’s retained beneficial interests in its securitization transactions.
Note 8: Asset Securitization to the audited consolidated financial statements provides further detail regarding the Corporation’s asset securitization transactions.
LOAN RECEIVABLES
Loan receivables consist of the Corporation’s loans held for securitization and the loan portfolio.
Interest income generated by the
Corporation’s loan receivables increased $235.2
million or 7.6% to $3.3 billion for 2003 from
2002. Excluding the change in the estimated
value of accrued
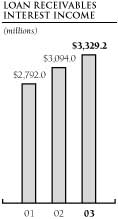 interest and fees in 2002, the
interest income generated by the Corporation’s
loan receivables would have increased by $169.0
million or 5.3% from 2002. The increase in
interest income on loan receivables for 2003
was primarily the result of an increase in
average loan receivables of $2.9 billion from
2002, partially offset by a decrease in the
yield earned on average loan receivables. The
yield earned by the Corporation for 2003 on
average loan receivables was 11.81%, as
compared to 12.22% for 2002. Excluding the
change in the estimated value of accrued
interest and fees in 2002, the yield earned by
the Corporation for 2003 on average loan
receivables would have decreased 66 basis
points from 2002.
interest and fees in 2002, the
interest income generated by the Corporation’s
loan receivables would have increased by $169.0
million or 5.3% from 2002. The increase in
interest income on loan receivables for 2003
was primarily the result of an increase in
average loan receivables of $2.9 billion from
2002, partially offset by a decrease in the
yield earned on average loan receivables. The
yield earned by the Corporation for 2003 on
average loan receivables was 11.81%, as
compared to 12.22% for 2002. Excluding the
change in the estimated value of accrued
interest and fees in 2002, the yield earned by
the Corporation for 2003 on average loan
receivables would have decreased 66 basis
points from 2002.
Interest income generated by the Corporation’s loan receivables increased $302.0 million or 10.8% to $3.1 billion for 2002 from 2001. Excluding the change in the estimated value of accrued interest and fees in 2002, the interest income generated by the Corporation’s loan receivables would have increased by $368.2 million or 13.2% from 2001. The increase in interest

TABLE 7: LOAN RECEIVABLES DISTRIBUTION (dollars in thousands)
| December 31, | 2003 | 2002 | 2001 | 2000 | 1999 | |||||||||||||||||||||||||||||||||||
Loans Held for Securitization (a) |
||||||||||||||||||||||||||||||||||||||||
Domestic: |
||||||||||||||||||||||||||||||||||||||||
Credit card |
$ | 10,274,262 | 30.6 | % | $ | 9,157,751 | 31.9 | % | $ | 7,943,965 | 32.2 | % | $ | 6,396,652 | 32.1 | % | $ | 7,835,429 | 44.3 | % | ||||||||||||||||||||
Other consumer |
11,653 | — | 40,962 | .1 | 1,032,697 | 4.2 | 1,022,756 | 5.1 | 1,001,271 | 5.7 | ||||||||||||||||||||||||||||||
Total domestic loans held for securitization |
10,285,915 | 30.6 | 9,198,713 | 32.0 | 8,976,662 | 36.4 | 7,419,408 | 37.2 | 8,836,700 | 50.0 | ||||||||||||||||||||||||||||||
Foreign (b) |
2,798,190 | 8.3 | 1,830,914 | 6.4 | 953,286 | 3.9 | 852,525 | 4.3 | 855,916 | 4.9 | ||||||||||||||||||||||||||||||
Total loans held for securitization |
13,084,105 | 38.9 | 11,029,627 | 38.4 | 9,929,948 | 40.3 | 8,271,933 | 41.5 | 9,692,616 | 54.9 | ||||||||||||||||||||||||||||||
Loan Portfolio |
||||||||||||||||||||||||||||||||||||||||
Domestic: |
||||||||||||||||||||||||||||||||||||||||
Credit card |
7,905,173 | 23.5 | 6,413,116 | 22.3 | 6,439,471 | 26.1 | 6,612,913 | 33.1 | 5,116,381 | 28.9 | ||||||||||||||||||||||||||||||
Other consumer |
6,211,016 | 18.5 | 6,285,751 | 21.9 | 5,094,198 | 20.7 | 2,799,289 | 14.0 | 1,268,019 | 7.2 | ||||||||||||||||||||||||||||||
Total domestic loan portfolio |
14,116,189 | 42.0 | 12,698,867 | 44.2 | 11,533,669 | 46.8 | 9,412,202 | 47.1 | 6,384,400 | 36.1 | ||||||||||||||||||||||||||||||
Foreign (b) |
6,423,783 | 19.1 | 4,998,014 | 17.4 | 3,169,947 | 12.9 | 2,270,702 | 11.4 | 1,586,693 | 9.0 | ||||||||||||||||||||||||||||||
Total loan portfolio |
20,539,972 | 61.1 | 17,696,881 | 61.6 | 14,703,616 | 59.7 | 11,682,904 | 58.5 | 7,971,093 | 45.1 | ||||||||||||||||||||||||||||||
Total loan receivables |
$ | 33,624,077 | 100.0 | % | $ | 28,726,508 | 100.0 | % | $ | 24,633,564 | 100.0 | % | $ | 19,954,837 | 100.0 | % | $ | 17,663,709 | 100.0 | % | ||||||||||||||||||||
| (a) | Loans held for securitization includes loans originated through certain endorsing organizations or financial institutions who have the contractual right to purchase the loans from the Corporation at fair value and the lesser of loan principal receivables eligible for securitization or sale or loan principal receivables which management intends to securitize or sell within one year. | |||
| (b) | Note 28: Foreign Activities to the audited consolidated financial statements provides the foreign loan distribution between credit card and other consumer loans. | |||
income on loan receivables for 2002 was primarily the result of an increase in average loan receivables of $5.0 billion from 2001, partially offset by a decrease in the yield earned on average loan receivables. The yield earned by the Corporation for 2002 on average loan receivables was 12.22%, as compared to 13.73% for 2001. Excluding the change in the estimated value of accrued interest and fees in 2002, the yield earned by the Corporation for 2002 on average loan receivables would have decreased 126 basis points from 2001.
Table 7 presents the Corporation’s loan receivables distributed by loan type. Loan receivables increased to $33.6 billion at December 31, 2003, as compared to $28.7 billion and $24.6 billion at December 31, 2002 and 2001, respectively.
Domestic credit card loan receivables increased $2.6 billion or 16.8% to $18.2 billion at December 31, 2003, from $15.6 billion at December 31, 2002, and $14.4 billion at December 31, 2001. The increase in domestic credit card loan receivables during 2003 and 2002 was the result of loan originations through marketing programs and loan portfolio acquisitions, partially offset by a net increase in securitized domestic credit card loan principal receivables. Higher Customer payment volume also slowed the growth in domestic credit card loan receivables for 2002, as compared to 2001.
During 2003, the Corporation securitized $10.8 billion of domestic credit card loan principal receivables, partially offset by an increase of $7.0 billion in the Corporation’s domestic credit card loan receivables when certain securitization transactions used principal payments on securitized loans to pay the investors rather than to purchase new loan principal receivables. During 2002, the Corporation securitized $13.3 billion of domestic credit card loan
principal receivables, partially offset by an increase of $9.7 billion in the Corporation’s domestic credit card loan receivables when certain securitization transactions used principal payments on securitized loans to pay the investors rather than to purchase new loan principal receivables. When the trusts use principal payments to pay the investors, the Corporation’s on-balance-sheet loan receivables increase by the amount of any new loans on the Customer accounts because the trusts are no longer purchasing new loan receivables from the Corporation. The Corporation acquired $1.4 billion of domestic credit card loan receivables during 2003 and $2.5 billion of domestic credit card loan receivables in 2002, including a $1.3 billion credit card loan portfolio from Wachovia Corporation.
The yield on average domestic credit card loan receivables was 11.51% for 2003, as compared to 11.67% for 2002 and 13.61% for 2001. Excluding the change in the estimated value of accrued interest and fees in 2002, the yield on average domestic credit card loan receivables would have decreased 42 basis points for 2003 and 168 basis points for 2002. The decrease in the yield on average domestic credit card loan receivables for 2003 and 2002, excluding the change in the estimated value of accrued interest and fees in 2002, reflects lower interest rates offered to attract and retain Customers and to grow loan receivables, and an increase in the percentage of loans in the portfolio with promotional interest rates.
Domestic credit card loans held for securitization increased $1.1 billion or 12.2% to $10.3 billion at December 31, 2003, from $9.2 billion at December 31, 2002 and $7.9 billion at December 31, 2001. The increases reflect higher planned levels of domestic credit card securitizations.
28 |
TABLE 8: RECONCILIATION OF AVERAGE LOAN RECEIVABLES TO AVERAGE MANAGED LOANS (dollars in thousands)
| Year Ended December 31, | 2003 | | | 2002 | | | 2001 | |||||||||||||||||||||||||||||||
| Average | Average | Average | ||||||||||||||||||||||||||||||||||
| Balance | Yield | Income | Balance | Yield | Income | Balance | Yield | Income | ||||||||||||||||||||||||||||
Loan receivables: |
||||||||||||||||||||||||||||||||||||
Domestic credit card |
$ | 14,489,754 | 11.51 | % | $ | 1,667,843 | $ | 13,581,330 | 11.67 | % | $ | 1,584,828 | $ | 11,546,396 | 13.61 | % | $ | 1,571,316 | ||||||||||||||||||
Domestic other consumer |
6,282,458 | 13.71 | 861,380 | 6,333,295 | 13.84 | 876,721 | 4,993,691 | 15.01 | 749,355 | |||||||||||||||||||||||||||
Foreign |
7,411,606 | 10.79 | 800,010 | 5,400,575 | 11.71 | 632,463 | 3,799,301 | 12.41 | 471,355 | |||||||||||||||||||||||||||
Total loan receivables |
28,183,818 | 11.81 | 3,329,233 | 25,315,200 | 12.22 | 3,094,012 | 20,339,388 | 13.73 | 2,792,026 | |||||||||||||||||||||||||||
Securitized loans |
81,691,156 | 11.98 | 9,786,020 | 74,718,731 | 12.36 | 9,232,653 | 70,560,600 | 14.15 | 9,985,734 | |||||||||||||||||||||||||||
Total managed loans |
$ | 109,874,974 | 11.94 | $ | 13,115,253 | $ | 100,033,931 | 12.32 | $ | 12,326,665 | $ | 90,899,988 | 14.06 | $ | 12,777,760 | |||||||||||||||||||||
Domestic other consumer loan receivables decreased $104.0 million or 1.6% to $6.2 billion at December 31, 2003, as compared to $6.3 billion and $6.1 billion at December 31, 2002 and 2001, respectively. The decrease in domestic other consumer loan receivables during 2003 was primarily a result of a decrease in the Corporation’s sales finance loan receivables as the Corporation placed less emphasis on this product in 2003. This decrease was partially offset by a $433.9 million portfolio acquisition comprised of unsecured lines of credit to small businesses during the fourth quarter of 2003. The increase in domestic other consumer loan receivables during 2002 was primarily a result of loan growth from lines of credit accessed through checks and growth in sales finance loans. Sales finance loans are loan products offered by the Corporation through associations with retailers where the Corporation provides financing to Customers to purchase the retailer’s goods and services.
Table 8 reconciles the Corporation’s average loan receivables to average managed loans.
The yield on average domestic other consumer loan receivables was 13.71% for 2003, as compared to 13.84% for 2002 and 15.01% for 2001. Excluding the change in the estimated value of accrued interest and fees in 2002, the yield on average domestic other consumer loan receivables would have decreased 51 basis points for 2003 and 79 basis points for 2002. The Corporation’s domestic other consumer loans generally have higher delinquency and charge-off rates than the Corporation’s domestic credit card loans. As a result, the Corporation generally charges higher interest rates on its domestic other consumer loans than on its domestic credit card loans. For 2003, the decrease in the yield on average domestic other consumer loan receivables, excluding the change in the estimated value of accrued interest and fees in 2002, reflects an increase in the percentage of unsecured loans and a decrease in the percentage of sales finance loans as compared to total domestic other consumer loans. The Corporation generally charges a higher interest rate for its sales finance products than its other unsecured lending products. For 2002, the decrease in the yield on average domestic other consumer loan receivables, excluding the change in the estimated value of accrued interest and fees in 2002, reflects lower promotional and other interest rates offered to attract and retain Customers and to grow loan receivables, and an increase in the percentage of loans in the portfolio with promotional rates.
Domestic other consumer loans held for securitization decreased $29.3 million to $11.7 million at December 31, 2003, from $41.0 million at December 31, 2002, and $1.0 billion at December 31, 2001. The Corporation originates and sells mortgage loans through MBNA Delaware. The mortgage loans that MBNA Delaware originates and intends to sell are the only items included in domestic other consumer loans held for securitization at December 31, 2003 and 2002. The 2002 domestic other consumer loans held for securitization decreased in comparison to 2001 as the Corporation reduced the amount of other consumer loans it intended to securitize or sell within one year at December 31, 2002. The net gains realized by the Corporation from the sale of its mortgage loans were not material to the Corporation’s audited consolidated statements of income for 2003, 2002, and 2001.
Foreign loan receivables increased $2.4 billion or 35.0% to $9.2 billion at December 31, 2003, as compared to $6.8 billion at December 31, 2002, and $4.1 billion at December 31, 2001. The growth in foreign loan receivables for 2003 was a result of loan originations through marketing programs at the Corporation’s two foreign bank subsidiaries, MBNA Europe and MBNA Canada, combined with the strengthening of foreign currencies against the U.S. dollar, partially offset by a net increase in securitization activity. The strengthening of foreign currencies increased foreign loan receivables by $960.9 million in 2003. Also during 2003, the Corporation securitized approximately $2.8 billion of foreign credit card loan principal receivables, partially offset by an increase of $1.5 billion in the Corporation’s foreign loan receivables when certain securitization transactions used principal payments to pay the investors rather than to purchase new loan principal receivables from the Corporation. The growth in foreign loan receivables for 2002 was primarily a result of loan originations through marketing programs at MBNA Europe and MBNA Canada, and foreign portfolio acquisitions. During 2002, MBNA Europe acquired approximately $1.2 billion of credit card loan receivables from Alliance & Leicester plc. During 2002, the Corporation securitized approximately $2.2 billion of foreign credit card loan principal receivables, partially offset by an increase of $512.3 million in the Corporation’s foreign loan receivables when certain securitization
TABLE 9: RECONCILIATION OF THE AS REPORTED LOAN YIELDS TO THE LOAN YIELDS EXCLUDING THE CHANGE IN THE ESTIMATED VALUE OF ACCRUED INTEREST AND FEES IN 2002 (dollars in thousands)
| Year Ended December 31, 2002 | ||||||||||||
| Average | ||||||||||||
| Balance |
Yield |
Income |
||||||||||
As Reported |
||||||||||||
Loan receivables: |
||||||||||||
Domestic credit card |
$ | 13,581,330 | 11.67 | % | $ | 1,584,828 | ||||||
Domestic other consumer |
6,333,295 | 13.84 | 876,721 | |||||||||
Foreign |
5,400,575 | 11.71 | 632,463 | |||||||||
Total loan receivables |
25,315,200 | 12.22 | 3,094,012 | |||||||||
Securitized loans |
74,718,731 | 12.36 | 9,232,653 | |||||||||
Total managed loans |
$ | 100,033,931 | 12.32 | $ | 12,326,665 | |||||||
Impact of the Change in the Estimated Value of Accrued Interest and Fees in 2002 |
||||||||||||
Loan receivables: |
||||||||||||
Domestic credit card |
$ | 12,428 | $ | 36,824 | ||||||||
Domestic other consumer |
8,228 | 25,219 | ||||||||||
Foreign |
1,374 | 4,193 | ||||||||||
Total loan receivables |
22,030 | 66,236 | ||||||||||
Securitized loans |
71,386 | 211,425 | ||||||||||
Total managed loans |
$ | 93,416 | $ | 277,661 | ||||||||
Excluding the Change in the Estimated Value of Accrued Interest and Fees in 2002 |
||||||||||||
Loan receivables: |
||||||||||||
Domestic credit card |
$ | 13,593,758 | 11.93 | $ | 1,621,652 | |||||||
Domestic other consumer |
6,341,523 | 14.22 | 901,940 | |||||||||
Foreign |
5,401,949 | 11.79 | 636,656 | |||||||||
Total loan receivables |
25,337,230 | 12.47 | 3,160,248 | |||||||||
Securitized loans |
74,790,117 | 12.63 | 9,444,078 | |||||||||
Total managed loans |
$ | 100,127,347 | 12.59 | $ | 12,604,326 | |||||||
transactions used principal payments to pay the investors rather than to purchase new loan principal receivables from the Corporation. The strengthening of foreign currencies against the U.S. dollar also increased foreign loan receivables by $509.7 million during 2002.
In January 2004, the Corporation acquired approximately $1.5 billion in insurance premium finance loans as part of its acquisition of Premium Credit Limited, the largest independent insurance premium finance company in the U.K. Through insurance premium financing, the Corporation will make loans to businesses, including professionals and small business owners, to pay premiums on property, general liability, and other types of insurance. The Corporation will also provide loans to retail consumers to pay premiums on insurance. The Corporation will generate these loans through its relationships with a network of brokers and insurance companies.
The yield on average foreign loan receivables was 10.79% for 2003, as compared to 11.71% for 2002 and 12.41% for 2001. Excluding the change in the estimated value of accrued interest and fees in 2002, the yield on average foreign loan receivables would have decreased 100 basis points for 2003 and 62 basis points for 2002. The decline in the yield on average foreign loan receivables for 2003 and 2002, excluding the change in the estimated value of accrued interest and fees in 2002, reflects lower promotional and other interest rates offered to attract and retain Customers and to grow loan receivables.
Table 9 reconciles the Corporation’s loan yields for 2002, to the loan yields excluding the change in the estimated value of accrued interest and fees in 2002.
Note 9: Geographical Diversification of Loans to the audited consolidated financial statements provides further detail regarding the Corporation’s loan receivables.
PREMISES AND EQUIPMENT
Effective January 1, 2003, the Corporation reclassified capitalized software from other assets to premises and equipment in the Corporation’s audited consolidated statements of financial condition. Also, effective January 1, 2003, the Corporation reclassified computer software expense, which includes amortization of capitalized software, from the other expense component of other operating expenses to furniture and equipment expense in the Corporation’s audited consolidated statements of income. Capitalized software was $461.3 million (net of accumulated amortization of $271.9 million) and $330.5 million (net of accumulated amortization of $216.2 million) at December 31, 2003, and December 31, 2002, respectively. Computer software expense, including amortization of capitalized software, was $127.3 million, $101.6 million, and $83.2 million for 2003, 2002, and 2001, respectively. For purposes of comparability, prior period amounts have been reclassified.
30 |
In 2002, the Corporation launched a multi-phase project to extend the use of the Corporation’s U.S. core Customer information systems to MBNA Europe’s business in the U.K. and Ireland. MBNA Canada already uses this system. The capital expenditures associated with capitalized software for this project at December 31, 2003 and 2002, were $214.0 million and $89.4 million, respectively. The Corporation anticipates total capital expenditures of approximately $300 million related to this project and estimates the project will be completed during the second quarter of 2004.
ACCOUNTS RECEIVABLE FROM SECURITIZATION
Accounts receivable from securitization increased $839.6 million or 12.1% to $7.8 billion at December 31, 2003, as compared to $6.9 billion at December 31, 2002. The increase in accounts receivable from securitization is primarily related to an increase in the amount due from the trusts due to an increase in the amounts due on the sale of new loan principal receivables to the trust and the revaluation of the Corporation’s interest-only strip receivable.
Note 8: Asset Securitization to the audited consolidated financial statements provides further detail regarding accounts receivable from securitization.
PREPAID EXPENSES AND DEFERRED CHARGES
Prepaid expenses and deferred charges increased $87.2 million or 21.1% to $499.8 million at December 31, 2003, as compared to $412.6 million at December 31, 2002. The increase was primarily related to increases in prepaid royalties to endorsing organizations of $49.5 million and deferred loan origination costs of $20.1 million.
OTHER ASSETS
Other assets increased $211.1 million or 12.6% to $1.9 billion at December 31, 2003, as compared to $1.7 billion at December 31, 2002. The increase is primarily the result of increases in the Corporation’s Community Development investments in the form of limited partnership interests that qualify under the Community Reinvestment Act, the cash surrender value of corporate owned life insurance policies, and the fair market value of interest rate swap agreements and foreign exchange swap agreements accounted for as fair value hedges under Statement of Financial Accounting Standards No. 133, “Accounting for Derivative Instruments and Hedging Activities” (“Statement No. 133”), as amended. The increase in the fair market value of the Corporation’s interest rate swap agreements and foreign exchange swap agreements that qualified for, and are accounted for, as fair value hedges was partially offset by changes in the carrying value of the corresponding hedged long-term debt and bank notes. In addition to the increases discussed above, on July 1, 2003, the Corporation’s other assets increased by $32.9 million related to the deconsolidation of MBNA Capital A, MBNA Capital B, MBNA Capital C, MBNA Capital D, and MBNA Capital E, each a statutory business trust created under the laws of the State of Delaware.
Note 17: Long-Term Debt and Bank Notes to the audited consolidated financial statements provides further discussion.
Note 3: Significant Accounting Policies—Derivative Financial Instruments and Hedging Activities and Note 30: Fair Value of Financial Instruments to the audited consolidated financial statements provide further detail regarding the Corporation’s derivative financial instruments and hedging activities.
INTEREST-BEARING DEPOSITS
Total interest expense on deposits decreased $147.7 million or 11.8% to $1.1 billion for 2003, compared to $1.3 billion for 2002. The decrease in interest expense on deposits for 2003 was primarily the result of an 88 basis point decrease in the rate paid on average interest-bearing deposits, partially offset by a $2.6 billion increase in average interest-bearing deposits. The decrease in the rate paid on average interest-bearing deposits reflects the continued impact of actions by the FOMC throughout 2001, the fourth quarter of 2002, and the second quarter of 2003, that impacted overall market interest rates and decreased the funding costs of the Corporation.
Total interest expense on deposits decreased $189.2 million or 13.1% to $1.3 billion for 2002, as compared to $1.4 billion for 2001. The decrease in interest expense on deposits for 2002 was primarily the result of a 140 basis point decrease in the rate paid on average interest-bearing deposits, partially offset by a $3.3 billion increase in average interest-bearing deposits. The decrease in the rate paid on average interest-bearing deposits reflects actions by the FOMC throughout 2001 that impacted overall market interest rates and decreased the funding costs of the Corporation’s deposits as a portion of the Corporation’s deposits matured and were reinvested in a lower interest rate environment.
The Corporation’s money market deposit accounts are variable-rate products. In addition, the Corporation’s foreign time deposits, although fixed-rate, generally mature within one year. Therefore, the decrease in market interest rates in the fourth quarter of 2002 and the second quarter of 2003 permitted the Corporation to decrease the rate paid on average money market deposit accounts and average foreign time deposits during the year ended December 31, 2003, as compared to the same period in 2002. The Corporation’s domestic time deposits are primarily fixed-rate deposits with maturities that range from three months to five years. Therefore, the Corporation realized the benefits of the decrease in market rates in 2002 and 2003 on domestic time deposits more slowly than the benefits of lower market rates on money market deposits and foreign time deposits and continued to realize the benefit of the decrease in market rates throughout 2001 on domestic time deposits.
The increases in average interest-bearing deposits for 2003 and 2002 were a result of the Corporation’s continued emphasis on marketing domestic time deposits and money market deposit accounts to members of certain endorsing organizations, as well as obtaining other domestic deposits through the use of third-party intermediaries, to fund loan and other asset growth and to diversify funding sources.
BORROWED FUNDS
Borrowed funds include both short-term borrowings and long-term debt and bank notes.
Interest expense on short-term borrowings decreased $3.8 million or 8.9% to $39.1 million for 2003, compared to an increase of $18.2 million or 73.5% to $43.0 million for 2002. The decrease in interest expense on short-term borrowings for 2003 was primarily a result of a decrease of $111.2 million in average short-term borrowings. The increase in interest expense on short-term borrowings for 2002 was primarily a result of an increase of $689.5 million in average short-term borrowings, partially offset by a 96 basis point decrease in the interest rate paid on average short-term borrowings. The increase in average short-term borrowings in 2002 was primarily a result of on-balance-sheet structured financings totaling $1.0 billion, which were entered into during the second half of 2001. These structured financings were secured by $1.1 billion of domestic other consumer loan receivables. For 2002, the decrease in the rate paid on average short-term borrowings reflects actions by the FOMC throughout 2001 that impacted overall market interest rates.
Note 16: Short-Term Borrowings to the audited consolidated financial statements provides further detail regarding the Corporation’s short-term borrowings.
Interest expense on long-term debt and bank notes increased $56.6 million or 18.6% to $361.6 million for 2003, compared to a decrease of $39.6 million or 11.5% to $305.0 million for 2002. The increase in interest expense on long-term debt and bank notes in 2003 was primarily a result of an increase in average long-term debt and bank notes of $2.5 billion, partially offset by a decrease in the interest rate paid on average long-term debt and bank notes of 37 basis points. The decrease in the interest rate paid on average long-term debt and bank notes for 2003 reflects actions by the FOMC in the fourth quarter of 2002 and the second quarter of 2003 that impacted overall market interest rates. The decrease in interest expense on long-term debt and bank notes in 2002 was primarily the result of a decrease in the interest rate paid on average long-term debt and bank notes of 167 basis points, partially offset by an increase in average long-term debt and bank notes of $1.7 billion. The decrease in the interest rate paid on average long-term debt and bank notes for 2002 reflects actions by the FOMC throughout 2001 that impacted overall market interest rates.
Interest expense on domestic long-term debt and bank notes increased $8.8 million or 5.1% to $182.2 million during 2003, as compared to a decrease of $68.3 million or 28.3% to $173.5 million for 2002. The increase in interest expense on domestic long-term debt and bank notes for 2003 was primarily the result of an increase in average long-term debt and bank notes of $1.6 billion, partially offset by a decrease of 55 basis points in the interest rate paid on average domestic long-term debt and bank notes, as compared to 2002. The Corporation issued additional long-term debt and bank notes during 2003 to fund
loan and other asset growth and to diversify funding sources. The decrease in the rate paid on average domestic long-term debt and bank notes for 2003 reflects actions by the FOMC in the fourth quarter of 2002 and the second quarter of 2003 that impacted overall market interest rates. The decrease in interest expense on domestic long-term debt and bank notes for 2002 was primarily a result of a decrease of 218 basis points in the interest rate paid on average domestic long-term debt and bank notes, as compared to 2001, partially offset by an increase in average domestic long-term debt and bank notes of $1.1 billion. For 2002, the decrease in the rate paid on average domestic long-term debt and bank notes reflects actions by the FOMC throughout 2001 that impacted overall market interest rates.
Interest expense on foreign long-term debt and bank notes increased $47.8 million or 36.3% to $179.3 million for 2003, and increased $28.7 million or 28.0% to $131.5 million for 2002. The increases in interest expense on foreign long-term debt and bank notes were primarily a result of an increase in average foreign long-term debt and bank notes of $921.9 million and $655.1 million for 2003 and 2002, respectively. MBNA Europe and MBNA Canada issued additional long-term debt and bank notes in 2003 and 2002 to fund loan and other asset growth and to diversify funding sources.
The Corporation uses interest rate swap agreements and foreign exchange swap agreements to change a portion of fixed-rate long-term debt and bank notes to floating-rate long-term debt and bank notes to more closely match the interest rate sensitivity of the Corporation’s assets. The Corporation also uses foreign exchange swap agreements to minimize its foreign currency exchange risk on a portion of long-term debt and bank notes issued by MBNA Europe.
Note 17: Long-Term Debt and Bank Notes to the audited consolidated financial statements provides further detail regarding the Corporation’s long-term debt and bank notes.
NONINTEREST-BEARING DEPOSITS
Noninterest-bearing deposits increased $1.5 billion or 164.2% to $2.4 billion at December 31, 2003, as compared to $915.7 million at December 31, 2002. This increase was a result of the change in the timing of the remittance of principal collections on securitized loans to the trusts. Since the second quarter of 2003, the Corporation is no longer obligated to transfer principal collections on the Corporation’s primary domestic credit card securitization trust on a daily basis. These funds are now retained on behalf of the trust with the Corporation until the funds are remitted on a monthly basis. The funds are primarily invested in money market instruments until they are remitted to the trust.
ACCRUED EXPENSES AND OTHER LIABILITIES
Accrued expenses and other liabilities increased $609.1 million or 29.5% to $2.7 billion at December 31, 2003, as compared to $2.1 billion at December 31, 2002. This increase was primarily
32 |
the result of increases in the gross unrealized losses on the Corporation’s interest rate swap agreements, forward exchange contracts, and foreign exchange swap agreements accounted for under Statement No. 133, an increase in income taxes payable, and an increase in amounts accrued for Customer reward programs expected to be redeemed in future periods.
ACCUMULATED OTHER COMPREHENSIVE INCOME
Accumulated other comprehensive income increased $324.6 million to $409.3 million at December 31, 2003, as compared to $84.7 million at December 31, 2002. The increase was primarily attributable to favorable foreign currency translation related to the strengthening of foreign currencies against the U.S. dollar.
Note 19: Comprehensive Income to the audited consolidated financial statements provides further detail on the components of other comprehensive income.
TOTAL OTHER OPERATING INCOME
Total other operating income includes
securitization income, interchange income,
credit card fees, other consumer loan fees,
insurance income, and other income. Total other
operating income
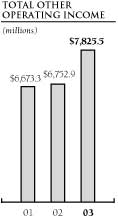 increased $1.1 billion or
15.9% to $7.8 billion for 2003, as compared to
$6.8 billion in 2002. Excluding the change in
the estimated value of accrued interest and
fees in 2002, total other operating income for
2003 would have increased $875.2 million or
12.6% from 2002. Total other operating income
increased $79.6 million or 1.2% for 2002 as
compared to $6.7 billion for 2001. Excluding
the change in the estimated value of accrued
interest and fees in 2002, total other
operating income would have increased $277.0
million or 4.2% for 2002.
increased $1.1 billion or
15.9% to $7.8 billion for 2003, as compared to
$6.8 billion in 2002. Excluding the change in
the estimated value of accrued interest and
fees in 2002, total other operating income for
2003 would have increased $875.2 million or
12.6% from 2002. Total other operating income
increased $79.6 million or 1.2% for 2002 as
compared to $6.7 billion for 2001. Excluding
the change in the estimated value of accrued
interest and fees in 2002, total other
operating income would have increased $277.0
million or 4.2% for 2002.
Table 10 presents the components of total other operating income.
TABLE 10: COMPONENTS OF TOTAL OTHER OPERATING INCOME (dollars in thousands)
| Year Ended December 31, | 2003 | 2002 | 2001 | |||||||||
Securitization income: |
||||||||||||
Excess servicing fees (a) |
$ | 4,875,381 | $ | 4,304,428 | $ | 4,206,551 | ||||||
Loan servicing fees (a) |
1,535,427 | 1,403,132 | 1,311,537 | |||||||||
Gain from the sale of loan
principal receivables for
new securitizations (b) |
124,450 | 154,556 | 96,732 | |||||||||
Net revaluation of the
interest-only strip
receivable (b) |
(11,302 | ) | (195,764 | ) | 107,504 | |||||||
Total securitization income |
6,523,956 | 5,666,352 | 5,722,324 | |||||||||
Interchange |
391,827 | 357,410 | 300,957 | |||||||||
Credit card fees |
513,605 | 385,422 | 295,101 | |||||||||
Other consumer loan fees |
108,226 | 100,862 | 92,447 | |||||||||
Insurance |
231,941 | 181,474 | 145,338 | |||||||||
Other |
55,925 | 61,403 | 117,149 | |||||||||
Total other operating
income |
$ | 7,825,480 | $ | 6,752,923 | $ | 6,673,316 | ||||||
| (a) | Total securitization servicing fees include excess servicing fees and loan servicing fees. | |||
| (b) | The net gain (or loss) from securitization activity includes the gain from the sale of loan principal receivables for new securitizations and the net revaluation of the interest-only strip receivable. | |||
Certain components and increases in total other operating income are discussed as follows:
SECURITIZATION INCOME
Securitization income includes excess servicing and loan servicing fees, the gain from the sale of loan principal receivables recognized for new securitizations, and the net revaluation of the Corporation’s interest-only strip receivable. The Corporation has the rights to all excess revenue generated from the securitized loans arising after the trusts absorb the cost of funds, loan servicing fees and credit losses (“excess servicing fees”). The Corporation continues to service the securitized loans and receives an annual contractual servicing fee of approximately 2% of the investor principal outstanding (“loan servicing fees”). The Corporation
recognizes a gain from the sale of loan principal receivables for new securitizations. Securitization income is also impacted by the net revaluation of the Corporation’s interest-only strip receivable as a result of changes in the estimated excess spread to be earned in the future and changes in projected loan payment rates and securitization transactions that are currently in their scheduled accumulation period. The accumulation period occurs when the trusts begin accumulating principal collections to make payments to the investors, instead of purchasing new loan principal receivables from the Corporation.
Securitization income increased $857.6 million or 15.1% to $6.5 billion for 2003, as compared to a decrease of $56.0 million or 1.0% to $5.7 billion for 2002 from 2001. Excluding the change in the estimated value of accrued interest and fees in 2002, securitization income would have increased $685.6 million or 11.7% for 2003 and $116.0 million or 2.0% for 2002. The increases are discussed below.
Total Securitization Servicing Fees
Total securitization servicing fees include both excess servicing fees and loan servicing fees. These items are discussed below.
Table 11 provides further detail regarding total excess servicing fees.
TABLE 11: COMPONENTS OF TOTAL EXCESS SERVICING FEES (dollars in thousands)
| Year Ended December 31, | 2003 | 2002 | 2001 | |||||||||
Interest income
on securitized loans |
$ | 9,484,680 | $ | 8,877,207 | $ | 9,602,048 | ||||||
Interest expense
on securitized loans |
(1,630,415 | ) | (1,833,105 | ) | (3,055,246 | ) | ||||||
Net interest income
on securitized loans |
7,854,265 | 7,044,102 | 6,546,802 | |||||||||
Other fee income
on securitized loans |
2,932,012 | 2,498,841 | 2,423,300 | |||||||||
Net credit losses
on securitized loans |
(4,375,469 | ) | (3,835,383 | ) | (3,452,014 | ) | ||||||
Total securitization
servicing fees |
6,410,808 | 5,707,560 | 5,518,088 | |||||||||
Loan servicing fees |
(1,535,427 | ) | (1,403,132 | ) | (1,311,537 | ) | ||||||
Total excess servicing fees |
$ | 4,875,381 | $ | 4,304,428 | $ | 4,206,551 | ||||||
Excess Servicing Fees
Excess servicing fees increased $571.0 million or 13.3% to $4.9 billion for 2003, as compared to an increase of $97.9 million or 2.3% to $4.3 billion for 2002 from $4.2 billion for 2001. The increases for 2003 and 2002 were primarily the result of increases in net interest income and other fee income earned on securitized loans, partially offset by an increase in net credit losses on securitized loans.
The net interest income earned on securitized loans increased excess servicing fees by $810.2 million or 11.5% to $7.9 billion for 2003, as compared to an increase of $497.3 million or 7.6% for 2002 from 2001. Excluding the change in the estimated value of accrued interest and fees in 2002, net interest income earned on securitized loans would have increased excess servicing fees by $598.8 million or 8.3% for 2003 and $708.7 million or 10.8% for 2002. Securitized net interest income, excluding the change in the estimated value of accrued interest and fees in 2002, was affected by the growth in average securitized loans, which increased $7.0 billion or 9.3% to $81.7 billion for 2003, as compared to an increase of $4.2 billion or 5.9% to $74.7 billion for 2002. The growth in average securitized loans was consistent with the overall growth in the Corporation’s average managed loans, which increased 9.8% and 10.0% for 2003 and 2002, respectively.
In addition, the net interest margin on securitized interest-earning assets increased to 10.09% for 2003, as compared to 9.93% in 2002, and 9.72% for 2001. Excluding the change in the estimated value of accrued interest and fees in 2002, the securitized net interest margin would have decreased 14 basis points for 2003, and would have increased 51 basis points for 2002. The securitized net interest margin represents securitized net interest income for the period expressed as a percentage of average securitized interest-earning assets. Refer to “Off-Balance Sheet Arrangements—Impact of Off-Balance Sheet Securitization Transactions on the Corporation’s Results” for a reconciliation of the Corporation’s net interest margin on securitized interest-earning assets to the net interest margin and a reconciliation of the securitized net interest margin ratio to the securitized net interest margin ratio excluding the change in the estimated value of accrued interest and fees in 2002. Changes in the yield earned on average securitized loans and the interest rate paid to investors in the Corporation’s securitization transactions impact the securitized net interest margin. The yield earned on average securitized loans was 11.98% for 2003, as compared to 12.36% in 2002, and 14.15% in 2001. Excluding the change in the estimated value of accrued interest and fees in 2002, the yield earned on average securitized loans would have decreased 65 basis points for 2003 and 152 basis points for 2002. Refer to “Loan Receivables” for a reconciliation of the securitized loan yields to the loan receivables loan yields and a reconciliation of securitized loan yields to the securitized loan yields excluding the change in the estimated value of accrued interest and fees in 2002. The decrease in the yield earned on average securitized loans for 2003 and 2002, excluding the change in the estimated value of accrued interest and fees in 2002, reflects lower average interest rates offered to attract and retain Customers and to grow
34 |
managed loans. The average interest rate paid to investors in the Corporation’s securitization transactions was 2.04% for 2003, as compared to 2.51% in 2002, and 4.44% in 2001. Refer to “Off-Balance Sheet Arrangements—Impact of Off-Balance Sheet Securitization Transactions on the Corporation’s Results” for a reconciliation of the average interest rate paid to investors in the Corporation’s securitization transactions to the average interest rate on net-interest bearing liabilities. The decrease in the average interest rate paid to investors in 2003 reflects the continued impact of actions by the FOMC throughout 2001, in the fourth quarter of 2002, and the second quarter of 2003 that impacted overall market interest rates. The decrease in the average interest rate paid to investors in 2002 reflects actions by the FOMC throughout 2001 that impacted overall market interest rates. The interest rate paid to investors generally resets on a monthly basis.
Other fee income generated by securitized loans increased excess servicing fees by $433.2 million or 17.3% for 2003, as compared to $75.5 million or 3.1% for 2002, primarily as a result of higher average securitized loans. The increase in 2003 is also attributable to an increase in the average fees assessed related to the implementation of modified fee structures, which included higher late, overlimit, and cash advance fees. Excluding the change in the estimated value of accrued interest and fees in 2002, the increase in other fee income in 2003 would have been smaller. Therefore, the change in 2002 would have been larger.
The net charge-off rate on securitized loans increased 23 basis points to 5.36% in 2003 as compared to an increase of 24 basis points to 5.13% in 2002 from 4.89% in 2001. The increase was consistent with the overall trend in the Corporation’s managed loan portfolio. The increase in net credit losses on securitized loans decreased excess servicing fees by $540.1 million or 14.1% for 2003 and $383.4 million or 11.1% for 2002.
An additional decrease to excess servicing fees was a result of the increase in loan servicing fees, which is described below.
LOAN SERVICING FEES
Loan servicing fees during 2003 increased $132.3 million or 9.4% to $1.5 billion, as compared to an increase of $91.6 million or 7.0% to $1.4 billion for 2002, from $1.3 billion for 2001. The increase was a result of a $7.0 billion or 9.3% increase in average securitized loans for 2003, as compared to a $4.2 billion or 5.9% increase in average securitized loans for 2002. The growth in average securitized loans reflects the overall growth in the Corporation’s average managed loans, which increased 9.8% and 10.0% for 2003 and 2002, respectively.
NET GAIN (OR LOSS) FROM SECURITIZATION ACTIVITY
The net gain (or loss) from securitization activity consists of gains associated with the sale of new loan principal receivables (net of securitization transaction costs), changes in the projected excess
spread used to value the interest-only strip receivable for securitized credit card and other consumer loan principal receivables, and all other changes in the fair value of the interest-only strip receivable. The net gain from securitization activity was $113.1 million for 2003, as compared to a net loss of $41.2 million in 2002, resulting in an increase in securitization income of $154.4 million for 2003. Excluding the change in the estimated value of accrued interest and fees in 2002, there would have been a net loss of $165.1 million for 2002, which would have resulted in an increase in securitization income of $278.3 million for 2003.
During the third quarter of 2003, the Corporation began including projected express payment and returned check fees in the determination of the fair value of the interest-only strip receivable. Upon inclusion of projected express payment and returned check fees, the interest-only strip receivable and securitization income increased by approximately $28.9 million. For the fourth quarter of 2003, this inclusion increased the interest-only strip receivable and securitization income an additional $3.0 million. The Corporation began including express payment fees in the determination of the fair value of the interest-only strip receivable because Customers are increasingly choosing to utilize express payment services to ensure that their payments are received on time and that they do not incur a late fee. The Corporation does not expect the inclusion of these fees to have a material effect on the Corporation’s earnings in subsequent periods.
The net loss from securitization activity was $41.2 million for 2002, as compared to a net gain of $204.2 million in 2001, resulting in a decrease in securitization income of $245.4 million for 2002. Excluding the change in the estimated value of accrued interest and fees in 2002, there would have been a net loss of $165.1 million for 2002, which would have resulted in a decrease in securitization income of $369.3 million for 2002.
During 2002, the change in the estimated value of accrued interest and fees in 2002 reduced the carrying value of accrued interest and fees on securitized loans by $295.9 million. The Corporation also adjusted the value of the interest-only strip receivable as a result of the change in the estimated value of the uncollectible accrued interest and fees in 2002. The Corporation had always included an estimate of uncollectible accrued interest and fees in determining the value of the interest-only strip receivable. Since the Corporation now recognizes uncollectible interest and fees in the estimated value of accrued interest and fees on securitized loans, the estimated value of the interest-only strip receivable was adjusted at September 30, 2002. The value of uncollectible accrued interest and fees on securitized loans that are currently owed by the underlying Customer are now considered in the value of accrued interest and fees on securitized loans. Accordingly, the estimated value of the interest-only strip receivable now only considers the impact of uncollectible interest and fees that will be
billed to the underlying Customer in the future. This adjustment caused the interest-only strip receivable to increase $123.9 million at September 30, 2002. The net impact of these changes resulted in a $172.0 million reduction to accounts receivable from securitization.
Certain components of the net gain (or loss) from securitization activity are discussed separately as follows:
GAIN
FROM THE SALE OF LOAN PRINCIPAL RECEIVABLES
The gain from the sale of loan principal
receivables for new securitization transactions
that the Corporation recognizes as sales in
accordance with Statement No. 140 is included
in securitization income in the Corporation’s
audited consolidated statements of income. The
gain was $124.5 million (net of securitization
transaction costs of $51.2 million) for 2003
(on the sale of $13.6 billion of credit card
loan principal receivables in 2003), as
compared to a gain of $154.6 million (net of
securitization transaction costs of $41.7
million) in 2002 (on the sale of $15.5 billion
of credit card loan principal receivables in
2002), and a gain of $96.7 million (net of
securitization transaction costs of $62.3
million) in 2001 (on the sale of $12.4 billion
of credit card loan principal receivables in
2001).
NET REVALUATION OF THE INTEREST-ONLY STRIP RECEIVABLE
The projected excess spread used to value the
interest-only strip receivable for securitized
credit card loan principal receivables
increased to 5.19% at December 31, 2003, as
compared to 4.84% at December 31, 2002. The
increase in the projected excess spread for
December 31, 2003, used to value the
interest-only strip receivable, was the result
of a decrease in the projected interest rate
paid to investors, combined with lower
projected charge-off rates on securitized
credit card loan principal receivables, and the
inclusion of projected express payment and
returned check fees in the excess spread used
to value the interest-only strip receivable,
which began in the third quarter of 2003,
partially offset by a decrease in projected
interest yields on securitized credit card loan
principal receivables resulting from the
Corporation’s pricing decisions to attract and
retain Customers and to grow managed loans.
This increase in the projected excess spread
used to value the interest-only strip
receivable for securitized credit card loan
principal receivables was offset by an increase
in the projected loan payment rates and
securitization transactions that are currently
in their scheduled accumulation period. The
projected excess spread used to value the
interest-only strip receivable for securitized
other consumer loan principal receivables
increased to 1.95% at December 31, 2003, as
compared to .91% at December 31, 2002. The
increase in the projected excess spread used to
value the interest-only strip receivable was
the result of lower projected charge-off rates
on securitized other consumer loan principal
receivables combined with a decrease in the
projected interest rate paid to investors, and
the inclusion of projected express payment and
returned check fees in the excess spread used
to value the interest-
only strip receivable, which began in the third quarter of 2003. The net of these items and all other changes in the fair value of the interest-only strip receivable for both securitized credit card loan principal receivables and securitized other consumer loan principal receivables resulted in a $11.3 million loss for 2003.
The projected excess spread used to value the interest-only strip receivable for securitized credit card loan principal receivables decreased to 4.84% at December 31, 2002, as compared to 5.14% at December 31, 2001. The decrease in the projected excess spread for December 31, 2002, used to value the interest-only strip receivable, was the result of a decrease in the projected interest yields on securitized credit card loan principal receivables resulting from the Corporation’s pricing decisions to attract and retain Customers and to grow managed loans, partially offset by the change in the estimated value of accrued interest and fees in 2002. The decrease in the projected excess spread used to value the interest-only strip receivable for securitized credit card loan principal receivables was combined with an increase in the projected loan payment rates and securitization transactions that are currently in their scheduled accumulation period. The projected excess spread used to value the interest-only strip receivable for securitized other consumer loan principal receivables decreased to .91% at December 31, 2002, as compared to 2.60% at December 31, 2001. The decrease in the projected excess spread used to value the interest-only strip receivable was the result of an increase in projected charge-off rates on securitized other consumer loan principal receivables, a decrease in the projected interest yield on securitized other consumer loan principal receivables, offset by the change in the estimated value of accrued interest and fees in 2002. The net of these items and all other changes in the fair value of the interest-only strip receivable for both securitized credit card loan principal receivables and securitized other consumer loan principal receivables resulted in a $195.8 million loss for 2002.
Note 8: Asset Securitization to the audited consolidated financial statements provides further detail regarding the sensitivity to changes in the key assumptions and estimates used in determining the estimated value of the interest-only strip receivable.
INTERCHANGE INCOME
Interchange income is a fee paid by a merchant
bank to the card-issuing bank through the
interchange network as compensation for risk,
grace period, and other operating costs. Such
fees are set annually by MasterCard
International Incorporated (“MasterCard”) and
Visa U.S.A. Incorporated (“Visa”).
Interchange income increased $34.4 million or 9.6% to $391.8 million in 2003, as compared to an increase of $56.5 million or 18.8% to $357.4 million for 2002 from $301.0 million for 2001. The increases in interchange income in 2003 and 2002 were primarily the result of increases in cardholder
36 |
sales volume. Additionally in 2003, MasterCard and Visa increased their interchange rates, which were partially offset by higher costs associated with Customer reward programs. Interchange income on securitized loans is included in securitization income.
CREDIT CARD FEES
Credit card fees include annual, late,
overlimit, returned check, cash advance,
express payment, and other miscellaneous fees
on credit card loans.
Credit card fees increased $128.2 million or 33.3% to $513.6 million for 2003, as compared to an increase of $90.3 million or 30.6% to $385.4 million for 2002 from $295.1 million for 2001. Excluding the change in the estimated value of accrued interest and fees in 2002, credit card fees would have increased $113.2 million or 28.3% for 2003 and $105.3 million or 35.7% for 2002. The increase in credit card fees for 2003 was primarily the result of the growth in the Corporation’s loan receivables, the number of accounts, and an increase in the average fees assessed related to the implementation of modified fee structures, which included higher late, overlimit, and cash advance fees. The increase in credit card fees in 2002 was primarily the result of the growth in the Corporation’s loan receivables, the number of accounts, and the number of fees assessed. Credit card fees on securitized loans are included in securitization income.
INSURANCE INCOME
The Corporation’s insurance income primarily
relates to fees received for marketing credit
related life and disability insurance and
credit protection products to its Customers.
The Corporation recognizes insurance income
over the policy or contract period as earned.
Insurance income increased $50.5 million or 27.8% to $231.9 million in 2003, as compared to an increase of $36.1 million or 24.9% to $181.5 million for 2002 from $145.3 million for 2001. The increases for 2003 and 2002 were primarily the result of increases in the number of accounts using credit related insurance products and in the fees associated with these products. Insurance income on securitized loans is included in securitization income.
TOTAL OTHER OPERATING EXPENSE
Total other operating expense includes salaries
and employee benefits, occupancy expense of
premises, furniture and equipment expense, and
other operating expenses. Total other operating
expense increased $422.2 million or 9.0% to
$5.1 billion for 2003, as compared to an
increase of $227.1 million or 5.1% to $4.7
billion for 2002 from $4.5 billion for 2001.
The growth in total other operating expense for
2003 and 2002 primarily reflects the
Corporation’s continued investment in
attracting, servicing, and retaining credit
card and other consumer loan Customers.
The Corporation added 10.7 million new accounts in 2003, as compared to 12.0 million new accounts in 2002, including 1.2 million accounts from the Wachovia portfolio acquisition and 1.0 million accounts from the Alliance & Leicester plc portfolio acquisition, and 9.5 million new accounts in 2001. The Corporation added 384 new endorsements from organizations during 2003, as compared to 405 new endorsements in 2002 and 439 new endorsements in 2001. Certain components of other operating expenses are discussed below.
SALARIES AND EMPLOYEE BENEFITS
Salaries and employee benefits increased $135.7
million or 7.0% to $2.1 billion for 2003, as
compared to an increase of $126.1 million or
6.9% to $1.9 billion in 2002 from $1.8 billion
in 2001. The increase in salaries and employee
benefits for 2003 is primarily related to
increases in employee salary levels and
additional MBNA Europe employees as a result of
the operations in Spain. The increase for 2003
also includes the release of restrictions on
restricted stock awards of $41.8 million. The
increase in salaries and employee benefits for
2002 was primarily related to increases in
employee salary levels and an additional
compensation expense of $51.3 million
associated with the immediate vesting of
restricted stock awards on the death of a
holder of the awards.
The Corporation had approximately 26,500, 26,100, and 25,400 full-time equivalent employees at December 31, 2003, 2002, and 2001, respectively.
Included in salaries and employee benefits is the net periodic benefit cost for the Corporation’s noncontributory deferred benefit pension plan (“Pension Plan”) and the supplemental executive retirement plan (“SERP”) of $96.1 million in 2003, as compared to $66.6 million in 2002 and $34.3 million in 2001. The Corporation anticipates, based on current conditions, that net periodic benefit cost for the Pension Plan and the SERP plan will increase by $20.9 million in 2004 because of a lower assumed discount rate and normal operations of the plans, partially offset by a lower assumed rate of compensation increase. The Corporation expects to contribute the maximum tax deductible contribution to the Pension Plan in 2004, which is estimated to be approximately $75 million. In 2003, the Corporation contributed $69.0 million to the Pension Plan.
Note 22: Employee Benefits to the audited consolidated financial statements provides further detail regarding the Corporation’s employee benefits.
OTHER
EXPENSE COMPONENT OF OTHER
OPERATING EXPENSE
The other expense component of other operating
expense increased $265.2 million or 11.8% to
$2.5 billion for 2003, as compared to $2.2
billion in 2002 and 2001. Certain components of
the other expense component of other operating
expense are discussed separately.
Table 12 provides further detail regarding the other expense component of the Corporation’s other operating expenses.
TABLE 12: OTHER EXPENSE COMPONENT OF OTHER OPERATING EXPENSE (dollars in thousands)
| Year Ended December 31, | 2003 | 2002 | 2001 | |||||||||
Purchased services |
$ | 582,724 | $ | 544,104 | $ | 498,809 | ||||||
Advertising |
421,965 | 315,393 | 268,897 | |||||||||
Collection |
77,482 | 54,872 | 46,260 | |||||||||
Stationery and supplies |
41,833 | 48,073 | 45,477 | |||||||||
Service bureau |
83,171 | 75,444 | 63,375 | |||||||||
Postage and delivery |
459,592 | 366,129 | 354,226 | |||||||||
Telephone usage |
89,448 | 86,562 | 84,900 | |||||||||
Loan receivable fraud losses |
139,193 | 160,639 | 172,366 | |||||||||
Amortization of intangible assets |
410,973 | 348,727 | 381,792 | |||||||||
Other |
207,031 | 248,317 | 274,329 | |||||||||
Total other expense |
$ | 2,513,412 | $ | 2,248,260 | $ | 2,190,431 | ||||||
ADVERTISING
Advertising expense increased $106.6 million or
33.8% to $422.0 million for 2003, as compared
to an increase of $46.5 million or 17.3% to
$315.4 million in 2002 from $268.9 million in
2001. The increases in advertising expense for
2003 and 2002 reflect the Corporation’s
continued investment in attracting and
retaining Customers. Also during 2003, the
Corporation increased the marketing of its
products through increased levels of mailings
to existing and potential Customers.
POSTAGE AND DELIVERY
Postage and delivery expense increased $93.5
million or 25.5% to $459.6 million for 2003, as
compared to an increase of $11.9 million or
3.4% to $366.1 million in 2002 from $354.2
million in 2001. The increases in postage and
delivery expense for 2003 and 2002 reflect the
Corporation’s continued investment in
attracting, servicing, and retaining Customers.
Also during 2003, the Corporation increased the
marketing of its products through increased
levels of mailings to existing and potential
Customers.
AMORTIZATION OF INTANGIBLE ASSETS
Amortization of intangible assets increased
$62.2 million or 17.8% to $411.0 million for
2003, as compared to a decrease of $33.1
million or 8.7% to $348.7 million in 2002 from
$381.8 million in 2001. The increase in
amortization of intangible assets for 2003 was
the result of higher levels of PCCRs, primarily
from the Wachovia and Alliance & Leicester plc
credit card portfolio acquisitions, which were
acquired in the second and third quarters of
2002, respectively.
Prior to 2003, the Corporation amortized the value of its foreign PCCRs over a period of 10 years. Effective January 1, 2003, the Corporation extended the amortization period for its foreign PCCRs to 15 years to more appropriately match the amortization period with the foreign PCCRs’ estimated useful lives. The change in estimate did not have a material impact on the Corporation’s financial condition or results of operations for the year ended December 31, 2003.
The decrease in amortization of intangible assets in 2002 was primarily attributable to the change in the Corporation’s amortization period of its domestic PCCRs. Prior to 2002, the Corporation amortized the value of its domestic PCCRs over a period of 10 years. In the first quarter of 2002, the Corporation completed a statistical study of the useful lives of its acquired domestic PCCRs. As a result of the study, effective January 1, 2002, the Corporation extended the amortization period of its domestic PCCRs to 15 years to more appropriately match the amortization period with the domestic PCCRs’ estimated useful lives.
As a result of the change in the amortization period for domestic PCCRs, the Corporation’s 2002 income before income taxes increased $100.5 million ($63.7 million after taxes). Excluding the change in the amortization period of the domestic PCCRs, the Corporation’s earnings per common share would have been $1.32 and earnings per common share—assuming dilution would have been $1.30 in 2002.
Note 3: Significant Accounting Policies—Intangible Assets to the audited consolidated financial statements provides further detail regarding the Corporation’s intangible assets.
OTHER
Other expense decreased $41.3 million or 16.6%
to $207.0 million for 2003, as compared to a
decrease of $26.0 million or 9.5% to $248.3
million in 2002 from $274.3 million in 2001.
The decrease in other expense for 2003 was
primarily related to increases in the market
value of company owned life insurance, as
compared to decreases in the market value in
2002.
INCOME TAXES
Income tax expense increased $301.4 million or
29.6% to $1.3 billion for 2003, as compared to
$1.0 billion for 2002 and 2001. These amounts
represent an effective tax rate of 36.1% for
2003, 36.6% for 2002, and 37.6% for 2001. The
reduction in the effective tax rate was
primarily driven by favorable resolutions of
tax examination issues at the federal and state
levels and an increase in favorable tax
adjustments.
Note 21: Income Taxes to the audited consolidated financial statements provides further detail regarding the Corporation’s income taxes.
LOAN QUALITY
The Corporation’s loan quality, at any time,
reflects, among other factors, the credit
quality of the Corporation’s credit card and
other consumer loans, the success of the
Corporation’s collection efforts, the
composition of credit card and other consumer
loans included in the Corporation’s loan
receivables, the seasoning of the Corporation’s
loans, and general economic conditions. As new
loans season, the delinquency and charge-off
rates on these loans normally rise and then
stabilize. The Corporation’s financial results
are sensitive to changes in delinquencies and
net credit losses related to the Corporation’s
loans. During an economic downturn,
delinquencies and net credit losses are more
likely to increase. The
38 |
Corporation considers the levels of delinquent loans, renegotiated loans, re-aged loans, and other factors in determining the appropriate reserve for possible credit losses and the estimate of uncollectible accrued interest and fees. The following loan quality discussion includes credit risk, delinquencies, renegotiated loan programs, which include nonaccrual loans and reduced-rate loans, re-aged loans, net credit losses, the reserve and provision for possible credit losses, and the estimate of uncollectible accrued interest and fees (see “Critical Accounting Policies—Reserve For Possible Credit Losses” and “Revenue Recognition” for further discussion).
CREDIT RISK
Credit risk is one of the Corporation’s most
significant risks. It primarily represents the
risk to earnings and capital arising from the
failure of Customers to repay loans according
to their terms. Credit risk is particularly
important for the Corporation because its
primary products are unsecured consumer credit
cards and other unsecured consumer loans that
generally have higher credit risks than secured
consumer lending products, such as mortgages
and automobile loans, and commercial lending
products. In addition, the Corporation
generates significant revenues from fees, such
as late and overlimit fees, on accounts that
exhibit higher credit risk.
Management attempts to manage credit risk through a variety of techniques, including prudent underwriting of applications for credit and review of credit risk for portfolios of loans that are acquired, setting and managing appropriate credit line amounts, monitoring account usage and, where appropriate, blocking use of accounts, and working with Customers with past-due balances to help them manage their accounts and to collect past-due amounts. These efforts are described under “Business” in the Corporation’s 2003 Annual Report on Form 10-K.
The level of the Corporation’s credit risk is affected by the Corporation’s marketing and credit underwriting strategies. The Corporation markets its products through endorsements from associations, financial institutions, and other organizations. Through this endorsed marketing strategy and the Corporation’s underwriting of loan applications, the Corporation attempts to attract quality loan applicants and offer optimal, initial credit lines on accounts and periodic credit-line increases, resulting in higher usage and average account balances. When Customers experience financial difficulties however, the higher usage and average account balances will result in higher average balances for accounts that charge off. The Corporation attempts to control this risk through blocking use of accounts or reducing credit lines. The Corporation may also set or increase the interest rate charged on accounts to compensate for increased credit risk. For example, as discussed under “Loan Quality—Delinquencies” below, the
Corporation generally charges higher interest rates on domestic other consumer loan receivables because these receivables typically have a higher delinquency and charge-off rate than the Corporation’s domestic credit card loan receivables. The Corporation also assesses certain fees, such as late and overlimit fees, to encourage Customers to pay and manage their accounts responsibly and to compensate the Corporation for the risks associated with certain activity on the Customers’ accounts.
Credit quality and the impact of credit losses on the Corporation’s financial condition and results of operations are discussed below.
DELINQUENCIES
The entire balance of an account is 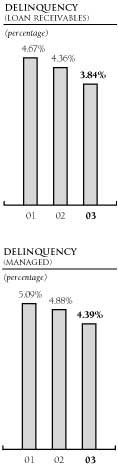 contractually delinquent if the minimum payment
is not received by the specified date on the
Customer’s billing
statement. Interest and
fees continue to accrue on
the Corporation’s
delinquent loans.
Delinquency is reported on
accruing loans that are 30
or more days past due.
Delinquency as a percentage
of the Corporation’s loan
receivables was 3.84% at
December 31, 2003, as
compared to 4.36% and 4.67%
at December 31, 2002, and
2001, respectively. The
Corporation’s delinquency
as a percentage of managed
loans was 4.39% at December
31, 2003, as compared to
4.88% and 5.09% at December
31, 2002, and 2001,
respectively. The reduction
in the Corporation’s
delinquency rates was due
to growth in foreign loan
receivables, including
growth as a result of the
strengthening of foreign
currencies against the U.S.
dollar, and increased
collection efforts by the
Corporation during 2003. It
also reflects a decrease in
other consumer loan
receivables as a percentage
of total loan receivables.
The decrease in domestic
other consumer loan
receivables during 2003 was
due to a decrease in the
Corporation’s sales finance
loan receivables, as the
Corporation placed less
emphasis on this product in
2003.
contractually delinquent if the minimum payment
is not received by the specified date on the
Customer’s billing
statement. Interest and
fees continue to accrue on
the Corporation’s
delinquent loans.
Delinquency is reported on
accruing loans that are 30
or more days past due.
Delinquency as a percentage
of the Corporation’s loan
receivables was 3.84% at
December 31, 2003, as
compared to 4.36% and 4.67%
at December 31, 2002, and
2001, respectively. The
Corporation’s delinquency
as a percentage of managed
loans was 4.39% at December
31, 2003, as compared to
4.88% and 5.09% at December
31, 2002, and 2001,
respectively. The reduction
in the Corporation’s
delinquency rates was due
to growth in foreign loan
receivables, including
growth as a result of the
strengthening of foreign
currencies against the U.S.
dollar, and increased
collection efforts by the
Corporation during 2003. It
also reflects a decrease in
other consumer loan
receivables as a percentage
of total loan receivables.
The decrease in domestic
other consumer loan
receivables during 2003 was
due to a decrease in the
Corporation’s sales finance
loan receivables, as the
Corporation placed less
emphasis on this product in
2003.
TABLE 13: DELINQUENT LOANS (a) (b) (c) (dollars in thousands)
| December 31, | 2003 | 2002 | 2001 | 2000 | 1999 | ||||||||||||||||||||||||||||||||||||
Loan Receivables
|
|||||||||||||||||||||||||||||||||||||||||
Loan receivables outstanding |
$ | 33,624,077 | $ | 28,726,508 | $ | 24,633,564 | $ | 19,954,837 | $ | 17,663,709 | |||||||||||||||||||||||||||||||
Loan receivables delinquent: |
|||||||||||||||||||||||||||||||||||||||||
30 to 59 days |
$ | 429,266 | 1.28 | % | $ | 439,911 | 1.53 | % | $ | 433,212 | 1.76 | % | $ | 304,928 | 1.53 | % | $ | 246,160 | 1.39 | % | |||||||||||||||||||||
60 to 89 days |
277,928 | .83 | 273,103 | .95 | 242,784 | .99 | 169,462 | .85 | 140,909 | .80 | |||||||||||||||||||||||||||||||
90 or more days (d) |
582,605 | 1.73 | 538,589 | 1.88 | 474,905 | 1.92 | 329,290 | 1.65 | 321,682 | 1.82 | |||||||||||||||||||||||||||||||
Total |
$ | 1,289,799 | 3.84 | % | $ | 1,251,603 | 4.36 | % | $ | 1,150,901 | 4.67 | % | $ | 803,680 | 4.03 | % | $ | 708,751 | 4.01 | % | |||||||||||||||||||||
Loan receivables delinquent by
geographic area: |
|||||||||||||||||||||||||||||||||||||||||
Domestic: |
|||||||||||||||||||||||||||||||||||||||||
Credit card |
$ | 775,420 | 4.27 | % | $ | 722,988 | 4.64 | % | $ | 676,876 | 4.71 | % | $ | 562,716 | 4.33 | % | $ | 551,013 | 4.25 | % | |||||||||||||||||||||
Other consumer |
339,199 | 5.45 | 391,568 | 6.19 | 366,695 | 5.99 | 173,204 | 4.53 | 115,274 | 5.08 | |||||||||||||||||||||||||||||||
Total domestic |
1,114,619 | 4.57 | 1,114,556 | 5.09 | 1,043,571 | 5.09 | 735,920 | 4.37 | 666,287 | 4.38 | |||||||||||||||||||||||||||||||
Foreign |
175,180 | 1.90 | 137,047 | 2.01 | 107,330 | 2.60 | 67,760 | 2.17 | 42,464 | 1.74 | |||||||||||||||||||||||||||||||
Total |
$ | 1,289,799 | 3.84 | $ | 1,251,603 | 4.36 | $ | 1,150,901 | 4.67 | $ | 803,680 | 4.03 | $ | 708,751 | 4.01 | ||||||||||||||||||||||||||
Securitized Loans |
|||||||||||||||||||||||||||||||||||||||||
Securitized loans outstanding |
$ | 84,869,483 | $ | 78,531,334 | $ | 72,862,487 | $ | 68,835,884 | $ | 54,591,804 | |||||||||||||||||||||||||||||||
Securitized loans delinquent: |
|||||||||||||||||||||||||||||||||||||||||
30 to 59 days |
$ | 1,235,230 | 1.46 | % | $ | 1,374,779 | 1.75 | % | $ | 1,383,681 | 1.90 | % | $ | 1,187,368 | 1.72 | % | $ | 863,967 | 1.58 | % | |||||||||||||||||||||
60 to 89 days |
818,356 | .96 | 844,811 | 1.08 | 797,077 | 1.09 | 677,300 | .98 | 507,363 | .93 | |||||||||||||||||||||||||||||||
90 or more days (d) |
1,860,265 | 2.19 | 1,758,318 | 2.24 | 1,630,802 | 2.24 | 1,318,190 | 1.92 | 1,136,815 | 2.08 | |||||||||||||||||||||||||||||||
Total |
$ | 3,913,851 | 4.61 | % | $ | 3,977,908 | 5.07 | % | $ | 3,811,560 | 5.23 | % | $ | 3,182,858 | 4.62 | % | $ | 2,508,145 | 4.59 | % | |||||||||||||||||||||
Securitized loans delinquent by
geographic area: |
|||||||||||||||||||||||||||||||||||||||||
Domestic: |
|||||||||||||||||||||||||||||||||||||||||
Credit card |
$ | 3,244,512 | 4.80 | % | $ | 3,248,814 | 5.09 | % | $ | 3,102,237 | 5.13 | % | $ | 2,624,415 | 4.57 | % | $ | 2,106,961 | 4.60 | % | |||||||||||||||||||||
Other consumer |
351,655 | 6.20 | 401,469 | 7.07 | 444,464 | 7.79 | 372,845 | 6.55 | 249,623 | 6.26 | |||||||||||||||||||||||||||||||
Total domestic |
3,596,167 | 4.91 | 3,650,283 | 5.25 | 3,546,701 | 5.36 | 2,997,260 | 4.75 | 2,356,584 | 4.73 | |||||||||||||||||||||||||||||||
Foreign |
317,684 | 2.74 | 327,625 | 3.65 | 264,859 | 3.98 | 185,598 | 3.25 | 151,561 | 3.19 | |||||||||||||||||||||||||||||||
Total |
$ | 3,913,851 | 4.61 | $ | 3,977,908 | 5.07 | $ | 3,811,560 | 5.23 | $ | 3,182,858 | 4.62 | $ | 2,508,145 | 4.59 | ||||||||||||||||||||||||||
Managed Loans |
|||||||||||||||||||||||||||||||||||||||||
Managed loans outstanding |
$ | 118,493,560 | $ | 107,257,842 | $ | 97,496,051 | $ | 88,790,721 | $ | 72,255,513 | |||||||||||||||||||||||||||||||
Managed loans delinquent: |
|||||||||||||||||||||||||||||||||||||||||
30 to 59 days |
$ | 1,664,496 | 1.40 | % | $ | 1,814,690 | 1.69 | % | $ | 1,816,893 | 1.86 | % | $ | 1,492,296 | 1.68 | % | $ | 1,110,127 | 1.54 | % | |||||||||||||||||||||
60 to 89 days |
1,096,284 | .93 | 1,117,914 | 1.04 | 1,039,861 | 1.07 | 846,762 | .95 | 648,272 | .90 | |||||||||||||||||||||||||||||||
90 or more days (d) |
2,442,870 | 2.06 | 2,296,907 | 2.15 | 2,105,707 | 2.16 | 1,647,480 | 1.86 | 1,458,497 | 2.01 | |||||||||||||||||||||||||||||||
Total |
$ | 5,203,650 | 4.39 | % | $ | 5,229,511 | 4.88 | % | $ | 4,962,461 | 5.09 | % | $ | 3,986,538 | 4.49 | % | $ | 3,216,896 | 4.45 | % | |||||||||||||||||||||
Managed loans delinquent by
geographic area: |
|||||||||||||||||||||||||||||||||||||||||
Domestic: |
|||||||||||||||||||||||||||||||||||||||||
Credit card |
$ | 4,019,932 | 4.69 | % | $ | 3,971,802 | 5.00 | % | $ | 3,779,113 | 5.05 | % | $ | 3,187,131 | 4.52 | % | $ | 2,657,974 | 4.52 | % | |||||||||||||||||||||
Other consumer |
690,854 | 5.81 | 793,037 | 6.61 | 811,159 | 6.86 | 546,049 | 5.74 | 364,897 | 5.83 | |||||||||||||||||||||||||||||||
Total domestic |
4,710,786 | 4.82 | 4,764,839 | 5.21 | 4,590,272 | 5.29 | 3,733,180 | 4.67 | 3,022,871 | 4.65 | |||||||||||||||||||||||||||||||
Foreign |
492,864 | 2.37 | 464,672 | 2.94 | 372,189 | 3.45 | 253,358 | 2.87 | 194,025 | 2.70 | |||||||||||||||||||||||||||||||
Total |
$ | 5,203,650 | 4.39 | $ | 5,229,511 | 4.88 | $ | 4,962,461 | 5.09 | $ | 3,986,538 | 4.49 | $ | 3,216,896 | 4.45 | ||||||||||||||||||||||||||
| (a) | Amounts exclude nonaccrual loans, which are presented in Table 15. | |||
| (b) | The Corporation considers these loans and other factors in determining an appropriate reserve for possible credit losses and the estimate of uncollectible accrued interest and fees. | |||
| (c) | In September 2002, the Corporation changed the estimated value of accrued interest and fees. Excluding the change in the estimated value of accrued interest and fees in 2002, delinquency on loan receivables and managed loans would have been 4.66% and 5.19%, respectively, at December 31, 2002. | |||
| (d) | See Table 14 for further detail on accruing loans past due 90 days or more. | |||
Table 13 presents a reconciliation of the Corporation’s loan receivables delinquency ratio to the managed loans delinquency ratio.
Loan delinquency on domestic credit card loan receivables was 4.27% at December 31, 2003, as compared to 4.64% and 4.71% at December 31, 2002, and 2001, respectively. Loan delinquency on domestic other consumer loan receivables was 5.45% at December 31, 2003, as compared to 6.19% and 5.99% at December 31, 2002, and 2001, respectively. Loan delinquency on foreign loan receivables was 1.90% at December 31, 2003, as
compared to 2.01% and 2.60% at December 31, 2002, and 2001, respectively. The delinquency rate on the Corporation’s foreign loan receivables is typically lower than the delinquency rate on the Corporation’s domestic credit card loan receivables. The Corporation’s domestic other consumer loan receivables typically have a higher delinquency and charge-off rate than the Corporation’s domestic credit card loan receivables, and as a result, the Corporation generally charges higher interest rates on domestic other consumer loan receivables.
40 |
TABLE 14: ACCRUING LOANS PAST DUE 90 DAYS OR MORE (a) (b) (c) (dollars in thousands)
| December 31, |
2003 |
2002 |
2001 |
2000 |
1999 |
|||||||||||||||
Loan Receivables
|
||||||||||||||||||||
Domestic: |
||||||||||||||||||||
Credit card |
$ | 365,668 | $ | 310,413 | $ | 289,907 | $ | 236,010 | $ | 250,534 | ||||||||||
Other consumer |
164,315 | 179,378 | 150,189 | 69,932 | 54,636 | |||||||||||||||
Total domestic |
529,983 | 489,791 | 440,096 | 305,942 | 305,170 | |||||||||||||||
Foreign |
52,622 | 48,798 | 34,809 | 23,348 | 16,512 | |||||||||||||||
Total |
$ | 582,605 | $ | 538,589 | $ | 474,905 | $ | 329,290 | $ | 321,682 | ||||||||||
Securitized Loans
|
||||||||||||||||||||
Domestic: |
||||||||||||||||||||
Credit card |
$ | 1,563,719 | $ | 1,429,522 | $ | 1,331,890 | $ | 1,088,991 | $ | 951,970 | ||||||||||
Other consumer |
174,314 | 186,256 | 184,539 | 156,326 | 114,694 | |||||||||||||||
Total domestic |
1,738,033 | 1,615,778 | 1,516,429 | 1,245,317 | 1,066,664 | |||||||||||||||
Foreign |
122,232 | 142,540 | 114,373 | 72,873 | 70,151 | |||||||||||||||
Total |
$ | 1,860,265 | $ | 1,758,318 | $ | 1,630,802 | $ | 1,318,190 | $ | 1,136,815 | ||||||||||
Managed Loans
|
||||||||||||||||||||
Domestic: |
||||||||||||||||||||
Credit card |
$ | 1,929,387 | $ | 1,739,935 | $ | 1,621,797 | $ | 1,325,001 | $ | 1,202,504 | ||||||||||
Other consumer |
338,629 | 365,634 | 334,728 | 226,258 | 169,330 | |||||||||||||||
Total domestic |
2,268,016 | 2,105,569 | 1,956,525 | 1,551,259 | 1,371,834 | |||||||||||||||
Foreign |
174,854 | 191,338 | 149,182 | 96,221 | 86,663 | |||||||||||||||
Total |
$ | 2,442,870 | $ | 2,296,907 | $ | 2,105,707 | $ | 1,647,480 | $ | 1,458,497 | ||||||||||
| (a) | Amounts exclude nonaccrual loans, which are presented in Table 15. | |||
| (b) | This Table provides further detail on 90 days or more delinquent loans presented in Table 13. | |||
| (c) | The Corporation considers these loans and other factors in determining an appropriate reserve for possible credit losses and the estimate of uncollectible accrued interest and fees. | |||
Table 14 presents accruing loans past due 90 days or more.
RENEGOTIATED LOAN PROGRAMS
The Corporation may modify the terms of its
credit card and other consumer loan agreements
with Customers who have experienced
financial difficulties by offering them
renegotiated loan programs, which include
either placing them on nonaccrual status or
reducing their interest rate. The Corporation
considers these loans and other factors in
determining an appropriate reserve for possible
credit losses and estimate of uncollectible
accrued interest and fees.
TABLE 15: NONACCRUAL LOANS (a) (b) (dollars in thousands)
| December 31, |
2003 |
2002 |
2001 |
2000 |
1999 |
|||||||||||||||
Loan Receivables |
||||||||||||||||||||
Domestic: |
||||||||||||||||||||
Credit card |
||||||||||||||||||||
| $ | 13,114 | $ | 48,318 | $ | 27,570 | $ | 21,488 | $ | 13,793 | |||||||||||
Other consumer |
1,053 | 2,481 | 2,043 | 2,628 | 905 | |||||||||||||||
Total domestic |
14,167 | 50,799 | 29,613 | 24,116 | 14,698 | |||||||||||||||
Foreign |
85,284 | 6,733 | 6,159 | 17,046 | 9,214 | |||||||||||||||
Total |
$ | 99,451 | $ | 57,532 | $ | 35,772 | $ | 41,162 | $ | 23,912 | ||||||||||
Nonaccrual loan receivables as a percentage
of ending loan receivables |
.30 | % | .20 | % | .15 | % | .21 | % | .14 | % | ||||||||||
Securitized Loans |
||||||||||||||||||||
Domestic: |
||||||||||||||||||||
Credit card |
||||||||||||||||||||
| $ | 47,772 | $ | 215,605 | $ | 120,494 | $ | 99,938 | $ | 62,126 | |||||||||||
Other consumer |
1,050 | 2,348 | 2,031 | 4,571 | 6,167 | |||||||||||||||
Total domestic |
48,822 | 217,953 | 122,525 | 104,509 | 68,293 | |||||||||||||||
Foreign |
||||||||||||||||||||
| 129,140 | 11,798 | 15,528 | 44,882 | 24,491 | ||||||||||||||||
Total |
||||||||||||||||||||
| $ | 177,962 | $ | 229,751 | $ | 138,053 | $ | 149,391 | $ | 92,784 | |||||||||||
Nonaccrual
securitized loans
as a percentage of
ending securitized
loans |
.21 | % | .29 | % | .19 | % | .22 | % | .17 | % | ||||||||||
Managed Loans |
||||||||||||||||||||
Domestic: |
||||||||||||||||||||
Credit card |
||||||||||||||||||||
| $ | 60,886 | $ | 263,923 | $ | 148,064 | $ | 121,426 | $ | 75,919 | |||||||||||
Other consumer |
2,103 | 4,829 | 4,074 | 7,199 | 7,072 | |||||||||||||||
Total domestic |
62,989 | 268,752 | 152,138 | 128,625 | 82,991 | |||||||||||||||
Foreign |
||||||||||||||||||||
| 214,424 | 18,531 | 21,687 | 61,928 | 33,705 | ||||||||||||||||
Total |
||||||||||||||||||||
| $ | 277,413 | $ | 287,283 | $ | 173,825 | $ | 190,553 | $ | 116,696 | |||||||||||
Nonaccrual managed loans as a percentage of
ending managed loans |
.23 | % | .27 | % | .18 | % | .21 | % | .16 | % | ||||||||||
| (a) | Although nonaccrual loans are charged off consistent with Corporation’s charge-off policy as described in “Loan Quality—Net Credit Losses,” nonaccrual loans are not included in the delinquent loans presented in Table 13 and Table 14 and the reduced-rate loans presented in Table 16. | |||
| (b) | The Corporation considers these loans and other factors in determining an appropriate reserve for possible credit losses and the estimate of uncollectible accrued interest and fees. | |||
TABLE 16: REDUCED-RATE LOANS (a) (b) (dollars in thousands)
| December 31, |
2003 |
2002 |
2001 |
2000 |
1999 |
|||||||||||||||
Loan Receivables |
||||||||||||||||||||
Domestic: |
||||||||||||||||||||
Credit card |
$ | 410,156 | $ | 429,122 | $ | 356,536 | $ | 316,354 | $ | 297,562 | ||||||||||
Other consumer |
131,048 | 163,521 | 145,305 | 79,378 | 25,127 | |||||||||||||||
Total domestic |
541,204 | 592,643 | 501,841 | 395,732 | 322,689 | |||||||||||||||
Foreign |
31,446 | 64,951 | 42,572 | 16,529 | 6,236 | |||||||||||||||
Total |
$ | 572,650 | $ | 657,594 | $ | 544,413 | $ | 412,261 | $ | 328,925 | ||||||||||
Reduced-rate loan receivables as a percentage of ending loan receivables |
1.70 | % | 2.29 | % | 2.21 | % | 2.07 | % | 1.86 | % | ||||||||||
Securitized Loans |
||||||||||||||||||||
Domestic: |
||||||||||||||||||||
Credit card |
$ | 1,626,721 | $ | 1,928,406 | $ | 1,601,882 | $ | 1,381,046 | $ | 1,167,012 | ||||||||||
Other consumer |
139,476 | 158,254 | 144,439 | 122,797 | 186,795 | |||||||||||||||
Total domestic |
1,766,197 | 2,086,660 | 1,746,321 | 1,503,843 | 1,353,807 | |||||||||||||||
Foreign |
66,009 | 80,172 | 69,658 | 32,113 | 13,757 | |||||||||||||||
Total |
$ | 1,832,206 | $ | 2,166,832 | $ | 1,815,979 | $ | 1,535,956 | $ | 1,367,564 | ||||||||||
Reduced-rate securitized loans as a percentage of ending securitized loans |
2.16 | % | 2.76 | % | 2.49 | % | 2.23 | % | 2.51 | % | ||||||||||
Managed Loans |
||||||||||||||||||||
Domestic: |
||||||||||||||||||||
Credit card |
$ | 2,036,877 | $ | 2,357,528 | $ | 1,958,418 | $ | 1,697,400 | $ | 1,464,574 | ||||||||||
Other consumer |
270,524 | 321,775 | 289,744 | 202,175 | 211,922 | |||||||||||||||
Total domestic |
2,307,401 | 2,679,303 | 2,248,162 | 1,899,575 | 1,676,496 | |||||||||||||||
Foreign |
97,455 | 145,123 | 112,230 | 48,642 | 19,993 | |||||||||||||||
Total |
$ | 2,404,856 | $ | 2,824,426 | $ | 2,360,392 | $ | 1,948,217 | $ | 1,696,489 | ||||||||||
Reduced-rate managed loans as a percentage of ending managed loans |
2.03 | % | 2.63 | % | 2.42 | % | 2.19 | % | 2.35 | % | ||||||||||
| (a) | Reduced-rate loans presented in this Table exclude accruing loans past due 90 days or more and nonaccrual loans, which are presented in Table 14 and Table 15, respectively. | |||
| (b) | The Corporation considers these loans and other factors in determining an appropriate reserve for possible credit losses and the estimate of uncollectible accrued interest and fees. | |||
NONACCRUAL LOANS
On a case-by-case basis, management determines
whether an account should be placed on
nonaccrual status. When loans are classified as
nonaccrual, the accrual of interest ceases. In
future periods, when a payment is received, it
is recorded as a reduction of principal.
Nonaccrual loan receivables as a percentage of the Corporation’s ending loan receivables were ..30% at December 31, 2003, as compared to .20% and .15% at December 31, 2002, and 2001, respectively. Nonaccrual managed loans as a percentage of ending managed loans were .23% at December 31, 2003, as compared to .27% and .18% at December 31, 2002, and 2001, respectively (see Table 15 for a geographic breakdown of nonaccrual loans). The decreases in domestic nonaccrual loans are primarily the result of a reduction in the number of renegotiated loan programs offered to domestic Customers. The increases in foreign nonaccrual loans are primarily the result of MBNA Europe, in September 2003, reclassifying certain collection accounts to nonaccrual loans, as well as MBNA Europe conforming its practices with the Corporation’s domestic practices as to when loans are placed on nonaccrual status, combined with the strengthening of foreign currencies against the U.S. dollar. Prior year amounts have not been reclassified.
Table 15 presents the Corporation’s nonaccrual loan receivables and includes a reconciliation to the nonaccrual managed loans.
REDUCED-RATE LOANS
On a case-by-case basis, management determines
whether an account should be placed on
reduced-rate status. Reduced-rate loans are
loans for which the interest rate was reduced
because of the inability of the Customer to
comply with the original terms and conditions
of the agreement. Income is accrued at the
reduced rate as long as the Customer complies
with the revised terms and conditions of the
agreement.
Reduced-rate loan receivables as a percentage of the Corporation’s ending loan receivables were 1.70% at December 31, 2003, as compared to 2.29% and 2.21% at December 31, 2002, and 2001, respectively. Reduced-rate managed loans as a percentage of ending managed loans were 2.03% at December 31, 2003, as compared to 2.63% and 2.42% at December 31, 2002, and 2001, respectively. The decreases were primarily the result of a reduction in the number of renegotiated loan programs offered to Customers.
Table 16 presents the Corporation’s reduced-rate loan receivables and includes a reconciliation to the reduced-rate managed loans.
42 |
TABLE 17: RE-AGED AMOUNTS (a) (dollars in thousands)
| December 31, | ||||||||||||
| 2003 |
2002 |
2001 |
||||||||||
Loan Receivables Re-aged Amounts |
||||||||||||
Domestic: |
||||||||||||
Credit card
|
$ | 374,410 | $ | 732,916 | $ | 735,824 | ||||||
Other consumer
|
235,635 | 350,372 | 321,049 | |||||||||
Total domestic
|
610,045 | 1,083,288 | 1,056,873 | |||||||||
Foreign
|
104,776 | 71,500 | 54,721 | |||||||||
Total loan receivables re-aged amounts |
$ | 714,821 | $ | 1,154,788 | $ | 1,111,594 | ||||||
Securitized Loan Re-aged Amounts |
||||||||||||
Domestic: |
||||||||||||
Credit card
|
$ | 1,757,696 | $ | 3,591,995 | $ | 4,041,381 | ||||||
Other consumer
|
230,997 | 332,735 | 389,450 | |||||||||
Total domestic
|
1,988,693 | 3,924,730 | 4,430,831 | |||||||||
Foreign
|
148,013 | 105,863 | 90,450 | |||||||||
Total securitized loans re-aged amounts |
$ | 2,136,706 | $ | 4,030,593 | $ | 4,521,281 | ||||||
Managed Loan Re-aged Amounts |
||||||||||||
Domestic: |
||||||||||||
Credit card
|
$ | 2,132,106 | $ | 4,324,911 | $ | 4,777,205 | ||||||
Other consumer
|
466,632 | 683,107 | 710,499 | |||||||||
Total domestic
|
2,598,738 | 5,008,018 | 5,487,704 | |||||||||
Foreign
|
252,789 | 177,363 | 145,171 | |||||||||
Total managed loans re-aged amounts.
|
$ | 2,851,527 | $ | 5,185,381 | $ | 5,632,875 | ||||||
| (a) | Re-aged loans that returned to delinquency status are included in the delinquency amounts presented in Table 13 and Table 14. |
RE-AGED
LOANS
A Customer’s account may be re-aged to remove
existing delinquency. Generally, the intent of
a re-age is to assist Customers who have
recently overcome temporary financial
difficulties, and have demonstrated both the
ability and willingness to resume regular
payments, but may be unable to pay the entire
past due amount. To qualify for re-aging, the
account must have been open for at least one
year and cannot have been re-aged during the
preceding 365 days. An account may not be
re-aged more than two times in a five-year
period. To qualify for re-aging, the Customer
must also have made three regular minimum
monthly payments within the last 90 days. In
addition, the Corporation may re-age the
account of a Customer who is experiencing
long-term financial difficulties and apply
modified, concessionary terms and conditions to
the account. Such additional re-ages are
limited to one in a five year period and must
meet the qualifications for re-ages described
above, except that the Customer’s three
consecutive minimum monthly payments may be
based on the modified terms and conditions
applied to the account. All re-age strategies
are approved by the Corporation’s senior
management and the Corporation’s Loan Review
Department.
Re-ages can have the effect of delaying charge-offs. There were $714.8 million of loan receivables re-aged during 2003, as compared to $1.2 billion and $1.1 billion during 2002 and 2001, respectively. Managed loans re-aged during 2003 were $2.9 billion, as compared to $5.2 billion and $5.6 billion during 2002 and
2001, respectively. Of those accounts that were re-aged during the three months ended December 31, 2002, approximately 22.0% returned to delinquency status and approximately 21.8% charged off by December 31, 2003. Of those accounts that were re-aged during the three months ended December 31, 2001, approximately 19.5% returned to delinquency status and approximately 20.4% charged off by December 31, 2002.
Table 17 presents the Corporation’s loan receivables re-aged amounts and includes a reconciliation to the managed re-aged amounts.
The decreases for 2003 in loan receivables, securitized loan, and managed loan re-aged amounts were the result of changes in re-age practices implemented by the Corporation during 2002 and the first quarter of 2003, which reduced the number of accounts that qualified for re-age. Re-aged amounts for 2002 were also impacted by the changes in re-age practices.
NET
CREDIT LOSSES
The Corporation’s net credit losses include the
principal amount of losses charged off less
current period recoveries and exclude
uncollectible accrued interest and fees and
fraud losses. Uncollectible accrued interest
and fees are recognized by the
Corporation through a 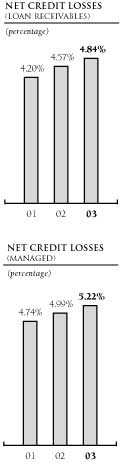 reduction of the amount of
interest income and fee
income recognized in the
current period that the
Corporation does not expect
to collect in subsequent
periods. The respective
income amounts, loan
receivables, and accrued
income receivable are
reduced for uncollectible
interest and fees. The
Corporation records current
period recoveries on loans
previously charged off in
the reserve for possible
credit losses. If the
Corporation sells
charged-off loans, it
records the proceeds
received from these sales
as recoveries. Fraud losses
are recognized through a
charge to other expense.
reduction of the amount of
interest income and fee
income recognized in the
current period that the
Corporation does not expect
to collect in subsequent
periods. The respective
income amounts, loan
receivables, and accrued
income receivable are
reduced for uncollectible
interest and fees. The
Corporation records current
period recoveries on loans
previously charged off in
the reserve for possible
credit losses. If the
Corporation sells
charged-off loans, it
records the proceeds
received from these sales
as recoveries. Fraud losses
are recognized through a
charge to other expense.
The Corporation works with Customers continually at each stage of delinquency. The Corporation’s policy is to charge off open-end delinquent retail loans by the end of the month in which the account becomes 180 days contractually past due and closed-end delinquent retail loans by the end of the month in which they become 120 days contractually past due. Delinquent bankrupt accounts are charged off the end of the second calendar month following receipt of notification of filing from the
TABLE 18: NET CREDIT LOSS RATIO (dollars in thousands)
| 2003 | | | 2002 | | | 2001 | | | |||||||||||||||||||||||||||||||||||||||
| Net Credit | Average | Net Credit | Net Credit | Average | Net Credit | Net Credit | Average | Net Credit | ||||||||||||||||||||||||||||||||||||
| Losses | Balance | Loss Ratio | Losses | Balance | Loss Ratio | Losses | Balance | Loss Ratio | ||||||||||||||||||||||||||||||||||||
Loan Receivables |
||||||||||||||||||||||||||||||||||||||||||||
Domestic: |
||||||||||||||||||||||||||||||||||||||||||||
Credit card |
$ | 682,282 | $ | 14,489,754 | 4.71 | % | $ | 597,876 | $ | 13,581,330 | 4.40 | % | $ | 502,898 | $ | 11,546,396 | 4.36 | % | ||||||||||||||||||||||||||
Other consumer |
476,770 | 6,282,458 | 7.59 | 422,587 | 6,333,295 | 6.67 | 253,891 | 4,993,691 | 5.08 | |||||||||||||||||||||||||||||||||||
Total domestic loan receivables |
1,159,052 | 20,772,212 | 5.58 | 1,020,463 | 19,914,625 | 5.12 | 756,789 | 16,540,087 | 4.58 | |||||||||||||||||||||||||||||||||||
Foreign |
204,644 | 7,411,606 | 2.76 | 135,749 | 5,400,575 | 2.51 | 98,225 | 3,799,301 | 2.59 | |||||||||||||||||||||||||||||||||||
Total loan receivables |
$ | 1,363,696 | $ | 28,183,818 | 4.84 | $ | 1,156,212 | $ | 25,315,200 | 4.57 | $ | 855,014 | $ | 20,339,388 | 4.20 | |||||||||||||||||||||||||||||
Securitized Loans |
||||||||||||||||||||||||||||||||||||||||||||
Domestic: |
||||||||||||||||||||||||||||||||||||||||||||
Credit card |
$ | 3,532,128 | $ | 65,914,563 | 5.36 | $ | 3,113,346 | $ | 61,623,821 | 5.05 | $ | 2,823,610 | $ | 59,185,084 | 4.77 | |||||||||||||||||||||||||||||
Other consumer |
504,555 | 5,682,404 | 8.88 | 474,122 | 5,703,851 | 8.31 | 439,627 | 5,703,402 | 7.71 | |||||||||||||||||||||||||||||||||||
Total domestic securitized
loans |
4,036,683 | 71,596,967 | 5.64 | 3,587,468 | 67,327,672 | 5.33 | 3,263,237 | 64,888,486 | 5.03 | |||||||||||||||||||||||||||||||||||
Foreign |
338,786 | 10,094,189 | 3.36 | 247,915 | 7,391,059 | 3.35 | 188,777 | 5,672,114 | 3.33 | |||||||||||||||||||||||||||||||||||
Total securitized loans |
$ | 4,375,469 | $ | 81,691,156 | 5.36 | $ | 3,835,383 | $ | 74,718,731 | 5.13 | $ | 3,452,014 | $ | 70,560,600 | 4.89 | |||||||||||||||||||||||||||||
Managed Loans |
||||||||||||||||||||||||||||||||||||||||||||
Domestic: |
||||||||||||||||||||||||||||||||||||||||||||
Credit card |
$ | 4,214,410 | $ | 80,404,317 | 5.24 | $ | 3,711,222 | $ | 75,205,151 | 4.93 | $ | 3,326,508 | $ | 70,731,480 | 4.70 | |||||||||||||||||||||||||||||
Other consumer |
981,325 | 11,964,862 | 8.20 | 896,709 | 12,037,146 | 7.45 | 693,518 | 10,697,093 | 6.48 | |||||||||||||||||||||||||||||||||||
Total domestic managed loans |
5,195,735 | 92,369,179 | 5.62 | 4,607,931 | 87,242,297 | 5.28 | 4,020,026 | 81,428,573 | 4.94 | |||||||||||||||||||||||||||||||||||
Foreign |
543,430 | 17,505,795 | 3.10 | 383,664 | 12,791,634 | 3.00 | 287,002 | 9,471,415 | 3.03 | |||||||||||||||||||||||||||||||||||
Total managed loans |
$ | 5,739,165 | $ | 109,874,974 | 5.22 | $ | 4,991,595 | $ | 100,033,931 | 4.99 | $ | 4,307,028 | $ | 90,899,988 | 4.74 | |||||||||||||||||||||||||||||
applicable court, but not later than the applicable 180-day or 120-day timeframes described above. Accounts of deceased Customers are charged off when the loss is determined, but not later than the applicable 180-day or 120-day timeframes described above. Accounts failing to make a payment within charge-off policy timeframes are written off. Managers may on an exception basis defer charge off of an account for another month, pending continued payment activity or other special circumstances. Senior manager approval is required on all such exceptions to the above charge-off policies.
Loan receivables net credit losses increased $207.5 million or 17.9% to $1.4 billion for 2003, as compared to an increase of $301.2 million or 35.2% to $1.2 billion for 2002, from $855.0 million for 2001. Net credit losses as a percentage of average loan receivables were 4.84% for 2003, as compared to 4.57% and 4.20% for 2002, and 2001, respectively. The Corporation’s managed net credit losses as a percentage of average managed loans for 2003, were 5.22%, as compared to 4.99% and 4.74% for 2002, and 2001, respectively. The increase in net credit losses for 2003, reflects a weak economy, the continuing seasoning of the Corporation’s loans, and an increase in average loan receivables.
Domestic credit card net credit losses as a percentage of average domestic credit card loan receivables were 4.71% for 2003, as compared to 4.40% and 4.36% for 2002, and 2001, respectively. Domestic other consumer net credit losses as a percentage of average domestic other consumer loan receivables were 7.59% for 2003, as compared to 6.67% and 5.08% for 2002, and 2001, respectively. In addition to the weak general economic conditions,
domestic other consumer net credit losses reflect the higher credit risk associated with these products. Foreign net credit losses as a percentage of average foreign loan receivables were 2.76% for 2003, as compared to 2.51% and 2.59% for 2002, and 2001, respectively. The lower level of net credit losses on the Corporation’s foreign loan receivables, as compared to domestic loan receivables, primarily reflects the growth in the Corporation’s foreign loan receivables and the seasoning of those accounts. A higher percentage of newer, less seasoned accounts results in a lower charge-off ratio compared to a more seasoned portfolio. Managed domestic credit card net credit losses as a percentage of average managed domestic credit card loans were 5.24% for 2003, as compared to 4.93% and 4.70% for 2002, and 2001, respectively. Managed domestic other consumer net credit losses as a percentage of average managed domestic other consumer loans were 8.20% for 2003, as compared to 7.45% and 6.48% for 2002, and 2001, respectively. Managed foreign net credit losses as a percentage of average managed foreign loans were 3.10% for 2003, as compared to 3.00% and 3.03% for 2002, and 2001, respectively. The net credit loss ratio is calculated by dividing annualized net credit losses, which exclude uncollectible accrued interest and fees and fraud losses, for the period by average loan receivables, which include the estimated collectible billed interest and fees for the corresponding period.
Table 18 presents the Corporation’s loan receivables net credit loss ratio and includes a reconciliation to the managed net credit loss ratio.
44 |
TABLE 19: RESERVE FOR POSSIBLE CREDIT LOSSES (dollars in thousands)
| December 31, | 2003 | 2002 | 2001 | 2000 | 1999 | |||||||||||||||
Reserve for possible credit losses, beginning of year |
$ | 1,111,299 | $ | 833,423 | $ | 527,573 | $ | 516,261 | $ | 296,474 | ||||||||||
Reserves acquired |
61,116 | 84,878 | 20,748 | 64,726 | 109,757 | |||||||||||||||
Provision for possible credit losses: |
||||||||||||||||||||
Domestic |
1,189,344 | 1,153,486 | 1,028,047 | 477,630 | 590,558 | |||||||||||||||
Foreign |
203,357 | 186,671 | 112,568 | 69,679 | 46,056 | |||||||||||||||
Total provision for possible credit losses |
1,392,701 | 1,340,157 | 1,140,615 | 547,309 | 636,614 | |||||||||||||||
Foreign currency translation |
14,896 | 9,053 | (499 | ) | (1,081 | ) | (96 | ) | ||||||||||||
Credit losses: |
||||||||||||||||||||
Domestic: |
||||||||||||||||||||
Credit card |
(731,646 | ) | (635,408 | ) | (541,072 | ) | (435,134 | ) | (422,504 | ) | ||||||||||
Other consumer |
(509,965 | ) | (447,135 | ) | (265,829 | ) | (138,892 | ) | (104,268 | ) | ||||||||||
Total domestic credit losses |
(1,241,611 | ) | (1,082,543 | ) | (806,901 | ) | (574,026 | ) | (526,772 | ) | ||||||||||
Foreign |
(238,175 | ) | (157,025 | ) | (117,572 | ) | (72,831 | ) | (41,157 | ) | ||||||||||
Total credit losses |
(1,479,786 | ) | (1,239,568 | ) | (924,473 | ) | (646,857 | ) | (567,929 | ) | ||||||||||
Recoveries: |
||||||||||||||||||||
Domestic: |
||||||||||||||||||||
Credit card |
49,364 | 37,532 | 38,174 | 29,367 | 27,356 | |||||||||||||||
Other consumer |
33,195 | 24,548 | 11,938 | 8,811 | 7,611 | |||||||||||||||
Total domestic recoveries |
82,559 | 62,080 | 50,112 | 38,178 | 34,967 | |||||||||||||||
Foreign |
33,531 | 21,276 | 19,347 | 9,037 | 6,474 | |||||||||||||||
Total recoveries |
116,090 | 83,356 | 69,459 | 47,215 | 41,441 | |||||||||||||||
Net credit losses |
(1,363,696 | ) | (1,156,212 | ) | (855,014 | ) | (599,642 | ) | (526,488 | ) | ||||||||||
Reserve for possible credit losses, end of year |
$ | 1,216,316 | $ | 1,111,299 | $ | 833,423 | $ | 527,573 | $ | 516,261 | ||||||||||
Net credit losses as a % of average loan receivables |
4.84 | % | 4.57 | % | 4.20 | % | 3.38 | % | 3.65 | % | ||||||||||
Reserve for possible credit losses as a % of ending loan receivables |
3.62 | 3.87 | 3.38 | 2.64 | 2.92 | |||||||||||||||
Ending loan receivables |
$ | 33,624,077 | $ | 28,726,508 | $ | 24,633,564 | $ | 19,954,837 | $ | 17,663,709 | ||||||||||
Average loan receivables |
28,183,818 | 25,315,200 | 20,339,388 | 17,718,148 | 14,422,495 | |||||||||||||||
RESERVE AND PROVISION FOR POSSIBLE CREDIT LOSSES
The Corporation maintains the reserve for
possible credit losses at an amount sufficient
to absorb losses inherent in the Corporation’s
loan principal receivables at the reporting
date based on a projection of probable net
credit losses. To project probable net credit
losses, the Corporation regularly performs a
migration analysis of delinquent and current
accounts. A migration analysis is a technique
used to estimate the likelihood that a loan
receivable will progress through the various
delinquency stages and ultimately charge off.
On a quarterly basis, the Corporation reviews
and adjusts, as appropriate, these estimates.
The Corporation’s projection of probable net
credit losses considers the impact of economic
conditions on the borrowers’ ability to repay,
past collection experience, the risk
characteristics and composition of the
portfolio, and other factors. The Corporation
then reserves for the projected probable net
credit losses based on its projection of these
amounts. The Corporation establishes
appropriate levels of the reserve for possible
credit losses for its products, including
domestic credit card, domestic other consumer
and foreign loans, based on their risk
characteristics. A provision is charged against
earnings to maintain the reserve for possible
credit losses at an appropriate level. The
Corporation records acquired reserves for
current period loan acquisitions.
The reserve for possible credit losses is a general allowance applicable to the Corporation’s loan receivables and does not include an allocation for credit risk related to securitized loans. Net credit losses on securitized loans are absorbed directly by the related trusts under their respective contractual agreements and do not affect the reserve for possible credit losses.
The Corporation’s reserve for possible credit losses increased $105.0 million or 9.4% to $1.2 billion at December 31, 2003, as compared to an increase of $277.9 million or 33.3% to $1.1 billion at December 31, 2002, from $833.4 million at December 31, 2001. The provision for possible credit losses for 2003, increased $52.5 million or 3.9% to $1.4 billion, as compared to an increase of $199.5 million or 17.5% to $1.3 billion in 2002 from $1.1 billion in 2001. The increases in the reserve for possible credit losses and the related provision for possible credit losses in 2003 and 2002 primarily reflects a weak economy, as demonstrated by the increases in the Corporation’s net credit losses, and increases in loan receivables.
While the Corporation’s reserve for possible credit losses is a general reserve applicable to the Corporation’s loan receivables, the reserve for possible credit losses is allocated to the Corporation’s domestic and foreign loan receivables for internal purposes based on the type of loan product and its underlying risk of loss. The percentage of the reserve allocated to the domestic other consumer loan receivables decreased from 41.6% at December 31, 2002, to 37.5% at December 31, 2003, primarily due to a decrease in the Corporation’s sales finance loan receivables, as the Corporation placed less emphasis on this product in 2003.
The percentage of the reserve allocated to the domestic other consumer loans increased from 24.3% at December 31, 2001, to 41.6% at December 31, 2002. The percentage of the reserve allocated to foreign loans increased from 6.2% at December 31, 2001, to 11.7% at December 31, 2002, because foreign loans increased as
TABLE 20: ALLOCATION OF THE RESERVE FOR POSSIBLE CREDIT LOSSES (dollars in thousands)
| December 31, | 2003 | 2002 | 2001 | 2000 | 1999 | |||||||||||||||||||||||||||||||||||
Domestic: |
||||||||||||||||||||||||||||||||||||||||
Credit card |
$ | 614,974 | 50.5 | % | $ | 518,889 | 46.7 | % | $ | 578,995 | 69.5 | % | $ | 396,806 | 75.2 | % | $ | 428,847 | 83.1 | % | ||||||||||||||||||||
Other consumer |
455,699 | 37.5 | 462,756 | 41.6 | 203,040 | 24.3 | 102,350 | 19.4 | 63,801 | 12.3 | ||||||||||||||||||||||||||||||
Domestic reserve for possible
credit losses |
1,070,673 | 88.0 | 981,645 | 88.3 | 782,035 | 93.8 | 499,156 | 94.6 | 492,648 | 95.4 | ||||||||||||||||||||||||||||||
Foreign |
145,643 | 12.0 | 129,654 | 11.7 | 51,388 | 6.2 | 28,417 | 5.4 | 23,613 | 4.6 | ||||||||||||||||||||||||||||||
Reserve for possible credit losses,
end of year |
$ | 1,216,316 | 100.0 | % | $ | 1,111,299 | 100.0 | % | $ | 833,423 | 100.0 | % | $ | 527,573 | 100.0 | % | $ | 516,261 | 100.0 | % | ||||||||||||||||||||
a percentage of total loan receivables and because the Corporation anticipated higher probable net credit losses on its foreign loans due to the continued seasoning of the portfolio.
Table 19 presents activity for the Corporation’s reserve for possible credit losses.
During the fourth quarter of 2002, the Corporation increased its reserve for domestic other consumer loans by $109.5 million because these products exhibited higher credit risk.
The Corporation’s projections of probable net credit losses are inherently uncertain, and as a result, the Corporation cannot predict with certainty the amount of such losses. Changes in economic conditions, the risk characteristics and composition of the Corporation’s loan receivables, bankruptcy laws or regulatory policies, and other factors could impact the Corporation’s actual and projected net credit losses and the related reserve for possible credit losses.
The Corporation recorded acquired reserves for possible credit losses for loan portfolio acquisitions of $61.1 million, $84.9 million, and $20.7 million for 2003, 2002, and 2001, respectively.
Table 20 presents the allocation of the reserve for possible credit losses.
ESTIMATE OF UNCOLLECTIBLE ACCRUED INTEREST AND FEES
The Corporation adjusts the amount of interest and fee income on loan receivables recognized in the current period for its estimate of interest and fee income that it does not expect to collect in subsequent periods through adjustments to the respective income statement amounts, loan receivables, and accrued income receivable. The estimate of uncollectible accrued interest and fees is based on a migration analysis of delinquent and current loan receivables that will progress through the various delinquency stages and will ultimately charge off. The Corporation also adjusts the estimated value of accrued interest and fees on securitized loans for the amount of uncollectible interest and fees that are not expected to be collected through an adjustment to accounts receivable from securitization and securitization income. This estimate is also based on a migration analysis of delinquent and current securitized loans that will progress through the various delinquency stages and ultimately charge off.
The difference between the amounts of interest and fees the Corporation was contractually entitled to and the amounts recognized as revenue was $1.2 billion, $1.4 billion and $858.3 million during the years ended December 31, 2003, 2002, and 2001, respectively. Excluding the change in the estimated value of accrued interest and fees in 2002, the difference between the amounts of interest and fees the Corporation was contractually entitled to and the amounts recognized as revenue was $1.0 billion for 2002. The difference between the amounts of interest and fees the Corporation was contractually entitled to and the amounts recognized as revenue for the year ended December 31, 2003, excluding the change in the estimated value of accrued interest and fees in 2002, increased $141.1 million or 13.5%, primarily as a result of an increase in ending managed loans. The increase of $185.6 million or 21.6% for the year ended December 31, 2002, excluding the change in the estimated value of accrued interest and fees in 2002, was primarily the result of an increase in managed loans.
Table 21 presents the domestic and foreign amounts for the difference between the amounts of interest and fees the Corporation was contractually entitled to and the amounts recognized as revenue.
TABLE 21: DIFFERENCE BETWEEN THE AMOUNTS OF INTEREST AND FEES THE CORPORATION WAS CONTRACTUALLY ENTITLED TO AND THE AMOUNTS RECOGNIZED AS REVENUE (a) (dollars in thousands)
| Year Ended December 31, | 2003 | 2002 | 2001 (b) | |||||||||
Domestic |
$ | 1,099,791 | $ | 1,342,362 | $ | 825,238 | ||||||
Foreign |
85,326 | 68,261 | 33,110 | |||||||||
Total |
$ | 1,185,117 | $ | 1,410,623 | $ | 858,348 | ||||||
| (a) | Includes the valuation of securitized loans. | |||
| (b) | During 2001, the Corporation accrued interest and fees on managed loans until the managed loans were paid or charged off. When the managed loans charged off, the Corporation deducted the accrued interest and fees related to the managed loans against current period income. | |||
DIVIDEND LIMITATIONS
The payment of dividends in the future and the amount of such dividends, if any, will be at the discretion of the Corporation’s Board of Directors. The payment of preferred and common stock dividends by the Corporation may be limited by certain factors, including regulatory capital requirements, broad enforcement
46 |
powers of the federal bank regulatory agencies, and tangible net worth maintenance requirements under the Corporation’s revolving credit facilities. The payment of common stock dividends may also be limited by the terms of the Corporation’s preferred stock.
Note 25: Dividend Limitations to the audited consolidated financial statements provides further detail regarding the Corporation’s dividend limitations and is incorporated by this reference into this section.
CAPITAL ADEQUACY
The Corporation is subject to risk-based capital guidelines adopted by the Federal Reserve Board for bank holding companies. The Bank and MBNA Delaware are also subject to similar capital requirements adopted by the Office of the Comptroller of the Currency. Under these requirements, the federal bank regulatory agencies have established quantitative measures to ensure that minimum thresholds for Tier 1 Capital, Total Capital, and Leverage ratios are maintained. Failure to meet these minimum capital requirements can initiate certain mandatory, and possible additional discretionary, actions by the federal bank regulators that, if undertaken, could have a direct material effect on the Corporation’s, the Bank’s, and MBNA Delaware’s consolidated financial statements. Under the capital adequacy guidelines and the regulatory framework for prompt corrective action, the Corporation, the Bank, and MBNA Delaware must meet specific capital guidelines that involve quantitative measures of their assets, liabilities, and certain off-balance-sheet items as calculated under regulatory accounting practices.
Note 26: Capital Adequacy to the audited consolidated financial statements provides further detail regarding the Corporation’s, the Bank’s, and MBNA Delaware’s capital adequacy and is incorporated by this reference into this section.
OFF-BALANCE SHEET ARRANGEMENTS
In the normal course of business, the Corporation is a party to a number of activities that contain credit, market and operational risk that are not reflected in whole or in part in the Corporation’s audited consolidated financial statements. Such activities include asset securitization, off-balance sheet derivative financial instruments, and other items.
ASSET SECURITIZATION
Asset securitization is the process whereby loan principal receivables are converted into securities normally referred to as asset-backed securities. The securitization of the Corporation’s loan principal receivables is accomplished through the public and private issuance of asset-backed securities and is accounted for in accordance with Statement No. 140. Asset securitization removes loan principal receivables from the consolidated statements of financial condition through the transfer of loan principal receivables to a trust. The trust then sells undivided interests to investors that entitle the investors to specified cash flows generated from the securitized loan principal receivables, while
the Corporation retains the remaining undivided interest and is entitled to specific cash flows allocable to that retained interest. As loan principal receivables are securitized, the Corporation’s on-balance-sheet funding needs are reduced by the amount of loans securitized. Interpretation No. 46 requires consolidation of certain off-balance sheet entities. The Corporation’s securitization trusts are qualified special-purpose entities as defined by Statement No. 140 that are specifically exempted from the requirements of Interpretation No. 46.
A credit card account represents a contractual relationship between the Corporation and the Customer. A loan receivable is a financial asset of the Corporation. Unlike a mortgage or other closed-end loan account, the terms of a credit card account permit a Customer to borrow additional amounts and to repay each month an amount the Customer chooses, subject to a minimum payment requirement. The account remains open after repayment of the balance and the Customer may continue to use it to borrow additional amounts. The Corporation reserves the right to change the account terms, including interest rates and fees, in accordance with the terms of the agreement and applicable law. The credit card account is, therefore, separate and distinct from the loan receivable.
In a credit card securitization, the loan principal receivables are sold to the trust, but the account relationships are not sold to the securitization trust. The Corporation retains ownership of the account relationship, including the right to change the terms of the account and the right to additional principal receivables generated by the account. During a securitization’s revolving period, the Corporation agrees to sell the additional principal receivables to the trusts until the trusts begin using principal collections to make payments to investors. When the revolving period of the securitization ends, the account relationship between the Corporation and the Customer continues.
The undivided interests in the trusts sold to investors are issued through different classes of securities with different risk levels and credit ratings. The Corporation’s securitization transactions are generally structured to include up to three classes of securities sold to investors. With the exception of the most senior class, each class of securities issued by the trusts provides credit enhancement, in the form of subordination, to the more senior, higher-rated classes. The most senior class of asset-backed securities is the largest and generally receives a AAA credit rating at the time of issuance. In order to issue senior classes of securities, it is necessary to obtain the appropriate amount of credit enhancement, generally through the issuance of subordinated classes. The Corporation’s retained beneficial interests, such as its interest-only strip receivable and cash reserve accounts, provides credit enhancement to the other subordinated interests.
The trusts are qualified special-purpose entities as defined under Statement No. 140. To meet the criteria to be considered a qualifying special-purpose entity, a trust must be demonstrably distinct from the Corporation and have activities that are significantly limited
and entirely specified in the legal documents that established the trust. The Corporation cannot change the activities that the trusts can perform. These activities may only be changed by a majority of the beneficial interest holders not including the Corporation. As qualifying special-purpose entities under Statement No. 140, the trusts’ assets and liabilities are not consolidated in the Corporation’s statements of financial condition. The trusts are administered by an independent trustee.
During the revolving period, which normally ranges from 24 months to 120 months, the trust makes no principal payments to the investors in the securitization. Instead, during the revolving period, the trust uses principal payments received from Customers, which pay off the loan principal receivables that were sold to the trust, to purchase for the trust from the Corporation new loan principal receivables generated by these accounts, in accordance with the terms of the transaction, so that the principal dollar amount of the investors’ undivided interest remains unchanged. Once the revolving period ends, the accumulation period begins and the trust accumulates principal payment for distribution to the investors according to the terms of the transaction. When the trust uses principal payments to pay the investors, the Corporation’s on-balance-sheet loan receivables increase by the amount of any new loans on the Customer accounts because the trust is no longer purchasing new loan receivables from the Corporation. The Corporation may fund this increase with its deposit activity or re-securitize these assets.
The Corporation maintains retained interests in its securitization transactions, which are included in accounts receivable from securitization in the Corporation’s audited consolidated statements of financial condition. These retained interests include the cash reserve accounts and other subordinated interests. The investors and providers of credit enhancement had a lien on a portion of these retained interests of $1.2 billion at December 31, 2003 and 2002. Should the trusts experience cash flows which are insufficient to satisfy its obligations to the beneficial interest holders, these retained interests may become impaired. The Corporation would have no further obligation to provide funding support to either the investors or the trusts if the securitized loans are not paid when due.
Note 8: Asset Securitization to the audited consolidated financial statements provides further detail regarding the Corporation’s asset securitization transactions.
IMPACT OF OFF-BALANCE SHEET SECURITIZATION TRANSACTIONS ON THE CORPORATION’S RESULTS
When adjusted for the effects of securitization, certain components of the Corporation’s audited consolidated financial information may be reconciled to its managed data. This securitization adjustment reclassifies interest income, interchange income, credit card and other consumer loan fees, insurance income, recoveries on charged-off securitized loan principal receivables in excess of interest paid to investors, gross credit losses, and other trust expenses into securitization income. Table 22 reconciles income statement data for the period to managed net interest income, managed provision for possible credit losses, and managed other operating income.
TABLE 22: RECONCILIATION OF INCOME STATEMENT DATA FOR THE PERIOD TO MANAGED NET INTEREST INCOME, MANAGED PROVISION FOR POSSIBLE CREDIT LOSSES, AND MANAGED OTHER OPERATING INCOME
(dollars in thousands)
| Year Ended December 31, | 2003 | 2002 | 2001 | |||||||||
Net Interest Income |
||||||||||||
Net interest income |
$ | 2,350,373 | $ | 2,074,575 | $ | 1,657,340 | ||||||
Securitization adjustments |
7,854,265 | 7,044,102 | 6,546,802 | |||||||||
Managed net interest income |
$ | 10,204,638 | $ | 9,118,677 | $ | 8,204,142 | ||||||
Provision for Possible |
||||||||||||
Credit Losses |
||||||||||||
Provision for possible
credit losses |
$ | 1,392,701 | $ | 1,340,157 | $ | 1,140,615 | ||||||
Securitization adjustments |
4,375,469 | 3,835,383 | 3,452,014 | |||||||||
Managed provision for
possible credit losses |
$ | 5,768,170 | $ | 5,175,540 | $ | 4,592,629 | ||||||
Other Operating Income |
||||||||||||
Other operating income |
$ | 7,825,480 | $ | 6,752,923 | $ | 6,673,316 | ||||||
Securitization adjustments |
(3,478,796 | ) | (3,208,719 | ) | (3,094,788 | ) | ||||||
Managed other operating
income |
$ | 4,346,684 | $ | 3,544,204 | $ | 3,578,528 | ||||||
Managed net interest income increased $1.1 billion or 11.9% to $10.2 billion for 2003, as compared to $9.1 billion in 2002. Excluding the change in the estimated value of accrued interest and fees in 2002, managed net interest income would have increased $808.3 million or 8.6%, for 2003.
Average managed interest-earning assets increased $13.3 billion or 12.3% to $121.6 billion for 2003, as compared to $108.4 billion in 2002. The increase in average managed interest-earning assets was primarily the result of the increase in average managed loans and investment securities and money market instruments. The yield earned on average managed interest-earning assets for 2003 was 10.97% as compared to 11.59% in 2002. The decrease in the yield earned on managed average interest-earning assets for 2003 was primarily the result of lower rates offered to attract and retain Customers and to grow managed loans combined with a decrease in the yield earned on average money market instruments and an increase in lower yielding average investment securities and money market instruments as a percentage of average total managed interest-earning assets. The decrease in the yield on average managed interest-earning assets for 2003, as compared to 2002, would have been larger excluding the change in the estimated value of accrued interest and fees in 2002, which decreased the yield earned on average managed loans by 27 basis points for 2002. See Table 9 for a reconciliation of the yield earned on average managed loans to the yield earned on average managed loans excluding the change in the estimated value of accrued interest and fees in 2002.
48 |
TABLE 23: RECONCILIATION OF AVERAGE INTEREST-EARNING ASSETS AND AVERAGE INTEREST-BEARING LIABILITIES TO AVERAGE MANAGED INTEREST-EARNING ASSETS AND AVERAGE MANAGED INTEREST-BEARING LIABILITIES
(dollars in thousands, yields and rates on a fully taxable equivalent basis)
| Year Ended December 31, | 2003 | | | 2002 | | | 2001 | ||||||||||||||||||||||||||||||||
| Average | Yield/ | Income or | Average | Yield/ | Income or | Average | Yield/ | Income or | |||||||||||||||||||||||||||||
| Balance | Rate | Expense | Balance | Rate | Expense | Balance | Rate | Expense | |||||||||||||||||||||||||||||
Assets |
|||||||||||||||||||||||||||||||||||||
Net interest-earning assets |
$ | 43,781,381 | 8.82 | % | $ | 3,859,643 | $ | 37,442,931 | 9.83 | % | $ | 3,679,140 | $ | 30,096,769 | 11.54 | % | $ | 3,473,088 | |||||||||||||||||||
Securitization adjustments |
77,855,940 | 12.18 | 9,484,680 | 70,910,552 | 12.52 | 8,877,207 | 67,363,219 | 14.25 | 9,602,048 | ||||||||||||||||||||||||||||
Managed interest-bearing
liabilities |
|||||||||||||||||||||||||||||||||||||
Managed interest-earning
assets |
$ | 121,637,321 | 10.97 | $ | 13,344,323 | $ | 108,353,483 | 11.59 | $ | 12,556,347 | $ | 97,459,988 | 13.42 | $ | 13,075,136 | ||||||||||||||||||||||
Liabilities |
|||||||||||||||||||||||||||||||||||||
Net interest-bearing liabilities |
$ | 41,861,029 | 3.60 | $ | 1,508,511 | $ | 36,865,484 | 4.35 | $ | 1,603,495 | $ | 31,169,437 | 5.82 | $ | 1,814,065 | ||||||||||||||||||||||
Securitization adjustments |
80,033,724 | 2.04 | 1,630,415 | 72,908,284 | 2.51 | 1,833,105 | 68,763,345 | 4.44 | 3,055,246 | ||||||||||||||||||||||||||||
Managed interest-bearing
liabilities |
$ | 121,894,753 | 2.58 | $ | 3,138,926 | $ | 109,773,768 | 3.13 | $ | 3,436,600 | $ | 99,932,782 | 4.87 | $ | 4,869,311 | ||||||||||||||||||||||
Average managed interest-bearing liabilities increased $12.1 billion or 11.0% to $121.9 billion for 2003, as compared to $109.8 billion in 2002. The increase in average managed interest-bearing liabilities was a result of the increase in average securitized loans, average interest-bearing deposits, and average borrowed funds. The decrease in the rate paid on average managed interest-bearing liabilities of 55 basis points to 2.58% for 2003, from 3.13% in 2002, reflects the continued impact of actions by the FOMC throughout 2001, in the fourth quarter of 2002, and the second quarter of 2003, that impacted overall market interest rates.
Managed net interest income increased $914.5 million or 11.1% to $9.1 billion for 2002, as compared to $8.2 billion in 2001. Excluding the change in the estimated value of accrued interest and fees in 2002, managed net interest income would have increased $1.2 billion or 14.5%, for 2002.
Table 23 reconciles average interest-earning assets and average interest-bearing liabilities to average managed interest-earning assets and average managed interest-bearing liabilities, as well as the corresponding yield earned and rate paid.
Average managed interest-earning assets increased $10.9 billion or 11.2% to $108.4 billion for 2002, as compared to $97.5 billion in 2001. The increase in average managed interest-earning assets was primarily the result of the increase in average managed loans and average investment securities and money market instruments. The yield earned on average managed interest-earning assets for 2002 was 11.59% as compared to 13.42% in 2001. The decrease in the yield earned on average managed interest-earning assets for 2002 primarily reflects lower promotional and other interest rates offered to attract and retain Customers and to grow managed loans. The decrease in the yield on average managed interest-earning assets for 2002, as compared to 2001, would have been smaller excluding the change in the estimated value of accrued interest and fees in 2002, which decreased the yield earned on average managed loans by 27 basis points for 2002. See Table 9 for a reconciliation of the yield earned on average managed loans to the yield earned on average managed loans excluding the change in the estimated value of accrued interest and fees in 2002.
Average managed interest-bearing liabilities increased $9.8 billion or 9.8% to $109.8 billion for 2002, as compared to $99.9 billion in 2001. The increase in average managed interest-bearing liabilities was a result of the increase in average securitized loans, average interest-bearing deposits, and average borrowed funds. The decrease in the rate paid on average managed interest-bearing liabilities of 174 basis points to 3.13% for 2002, from 4.87% in 2001, reflects actions by the FOMC throughout 2001 that impacted overall market interest rates and decreased the Corporation’s funding costs.
The Corporation’s managed net interest margin,
on a fully taxable equivalent basis, was 8.39%
for 2003, as compared to 8.42% for 2002. The
managed net interest margin represents managed
net interest income on a fully taxable
equivalent basis expressed as a percentage of
managed average total interest-earning assets.
Excluding the change in the estimated value of
accrued interest and fees in 2002, the managed
net interest margin would have decreased 28
basis points for 2003 as compared to 2002. The
decrease in the managed net interest margin for
2003, excluding the change in the estimated
value of accrued interest and fees in 2002, was
primarily the result of the decrease in the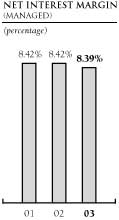 yield earned on managed average
interest-earning assets partially offset by the
decrease in the rate paid on managed average
interest-bearing liabilities. Also, the
increase in lower yielding average investment
securities and money market instruments as a
percentage of total managed average
interest-earning assets further reduced the
managed net interest margin.
yield earned on managed average
interest-earning assets partially offset by the
decrease in the rate paid on managed average
interest-bearing liabilities. Also, the
increase in lower yielding average investment
securities and money market instruments as a
percentage of total managed average
interest-earning assets further reduced the
managed net interest margin.
TABLE 24: RECONCILIATION OF THE NET INTEREST MARGIN RATIO TO THE MANAGED NET INTEREST MARGIN RATIO
(dollars in thousands)
| Year Ended December 31, | 2003 | | | 2002 | | | 2001 | |||||||||||||||||||||||||||||||
| Net | Net | Net | ||||||||||||||||||||||||||||||||||
| Average | Interest | Average | Interest | Average | Interest | |||||||||||||||||||||||||||||||
| Earning | Net Interest | Margin | Earning | Net Interest | Margin | Earning | Net Interest | Margin | ||||||||||||||||||||||||||||
| Assets | Income | Ratio | Assets | Income | Ratio | Assets | Income | Ratio | ||||||||||||||||||||||||||||
Net Interest Margin (a) |
||||||||||||||||||||||||||||||||||||
Investment securities and
money market instruments (b) |
$ | 11,693,550 | $ | 8,257,838 | $ | 6,500,608 | ||||||||||||||||||||||||||||||
Other interest-earning assets (b) |
3,904,013 | 3,869,893 | 3,256,773 | |||||||||||||||||||||||||||||||||
Loan receivables (c) |
28,183,818 | 25,315,200 | 20,339,388 | |||||||||||||||||||||||||||||||||
Total |
$ | 43,781,381 | $ | 2,351,132 | 5.37 | % | $ | 37,442,931 | $ | 2,075,645 | 5.54 | % | $ | 30,096,769 | $ | 1,659,023 | 5.51 | % | ||||||||||||||||||
Securitization Adjustments |
||||||||||||||||||||||||||||||||||||
Investment securities and
money market instruments |
$ | — | $ | — | $ | — | ||||||||||||||||||||||||||||||
Other interest-earning assets |
(3,835,216 | ) | (3,808,179 | ) | (3,197,381 | ) | ||||||||||||||||||||||||||||||
Securitized loans |
81,691,156 | 74,718,731 | 70,560,600 | |||||||||||||||||||||||||||||||||
Total |
$ | 77,855,940 | 7,854,265 | 10.09 | $ | 70,910,552 | 7,044,102 | 9.93 | $ | 67,363,219 | 6,546,802 | 9.72 | ||||||||||||||||||||||||
Managed Net Interest Margin (a) |
||||||||||||||||||||||||||||||||||||
Investment securities and
money market instruments (b) |
$ | 11,693,550 | $ | 8,257,838 | $ | 6,500,608 | ||||||||||||||||||||||||||||||
Other interest-earning assets (b) |
68,797 | 61,714 | 59,392 | |||||||||||||||||||||||||||||||||
Managed loans |
109,874,974 | 100,033,931 | 90,899,988 | |||||||||||||||||||||||||||||||||
Total |
$ | 121,637,321 | 10,205,397 | 8.39 | $ | 108,353,483 | 9,119,747 | 8.42 | $ | 97,459,988 | 8,205,825 | 8.42 | ||||||||||||||||||||||||
| (a) | Net interest margin ratios are presented on a fully taxable equivalent basis. The fully taxable equivalent adjustment for the years ended December 31, 2003, 2002, and 2001 was $759, $1,070, and $1,683, respectively. | |||
| (b) | For purposes of comparability, certain prior period amounts have been reclassified. | |||
| (c) | Loan receivables include loans held for securitization and the loan portfolio. | |||
The Corporation’s managed net interest margin, on a fully taxable equivalent basis, was 8.42% for both 2002 and 2001. Excluding the change in the estimated value of accrued interest and fees in 2002, the managed net interest margin would have increased 25 basis points for 2002 as compared to 2001. The increase in the managed net interest margin for 2002, excluding the change in the estimated value of accrued interest and fees in 2002, primarily reflects actions by the FOMC that impacted overall market interest rates and decreased the Corporation’s funding costs. The net interest margin is reconciled to the managed net interest margin in Table 24 and the reconciliation of the managed net interest margin to the managed net interest margin excluding the change in the estimated value of accrued interest and fees in 2002 is presented in Table 25.
The managed provision for possible credit losses increased $592.6 million or 11.5% to $5.8 billion for 2003, and increased $582.9 million or 12.7% to $5.2 billion for 2002. The increase in the managed provision for possible credit losses was primarily the result of increases in the Corporation’s managed net credit losses and managed loans.
Managed other operating income increased $802.5 million or 22.6% to $4.3 billion for 2003. Excluding the change in the estimated value of accrued interest and fees in 2002, managed other operating income would have increased $816.5 million or 23.1% for 2003. Managed other operating income decreased $34.3 million or 1.0% to $3.5 billion for 2002. Excluding the change in the estimated value of accrued interest and fees in 2002, managed other operating income would have decreased $48.3 million or 1.4% for 2002. The increase in managed other operating income for 2003, excluding the change in the estimated value of accrued interest and fees in 2002, was primarily the result of the net gains from securitization activity, which includes changes in fair value of the interest-only strip receivable and the gains from the sale of loan principal receivables, combined with an increase in credit card fees, insurance income, and interchange income. The decrease in managed other operating income for 2002, excluding the change in the estimated value of accrued interest and fees in 2002, was primarily the result of net losses from securitization activity, which includes changes in fair value of the interest-only strip receivable and the gains from the sale of loan principal receivables, partially offset by an increase in insurance income and interchange income.
50 |
TABLE 25: RECONCILIATION OF THE AS REPORTED NET AND MANAGED NET INTEREST MARGIN RATIOS TO THE NET AND MANAGED NET INTEREST MARGIN RATIOS EXCLUDING THE CHANGE IN THE ESTIMATED VALUE OF ACCRUED INTEREST AND FEES IN 2002 (dollars in thousands)
| Year Ended December 31, 2002 |
||||||||||||
| Net | ||||||||||||
| Average | Interest | |||||||||||
| Earning | Net Interest | Margin | ||||||||||
| Assets | Income | Ratio | ||||||||||
As Reported |
||||||||||||
Net Interest Margin (a) |
||||||||||||
Investment securities and money market instruments (b) |
$ | 8,257,838 | ||||||||||
Other interest-earning assets (b) |
3,869,893 | |||||||||||
Loan receivables (c) |
25,315,200 | |||||||||||
Total |
$ | 37,442,931 | $ | 2,075,645 | 5.54 | % | ||||||
Securitization Adjustments |
||||||||||||
Investment securities and money market instruments |
$ | — | ||||||||||
Other interest-earning assets |
(3,808,179 | ) | ||||||||||
Securitized loans |
74,718,731 | |||||||||||
Total |
$ | 70,910,552 | 7,044,102 | 9.93 | ||||||||
Managed Net Interest Margin (a) |
||||||||||||
Investment securities and money market instruments (b) |
$ | 8,257,838 | ||||||||||
Other interest-earning assets (b) |
61,714 | |||||||||||
Managed loans |
100,033,931 | |||||||||||
Total |
$ | 108,353,483 | 9,119,747 | 8.42 | ||||||||
Impact of the Change in the Estimated Value of Accrued Interest and Fees in 2002 |
||||||||||||
Net Interest Margin (a) |
||||||||||||
Investment securities and money market instruments |
$ | — | ||||||||||
Other interest-earning assets |
43,831 | |||||||||||
Loan receivables (c) |
22,030 | |||||||||||
Total |
$ | 65,861 | 66,278 | |||||||||
Securitization Adjustments |
||||||||||||
Investment securities and money market instruments |
$ | — | ||||||||||
Other interest-earning assets |
(43,831 | ) | ||||||||||
Securitized loans |
71,386 | |||||||||||
Total |
$ | 27,555 | 211,383 | |||||||||
Managed Net Interest Margin (a) |
||||||||||||
Investment securities and money market instruments |
$ | — | ||||||||||
Other interest-earning assets |
— | |||||||||||
Managed loans |
93,416 | |||||||||||
Total |
$ | 93,416 | 277,661 | |||||||||
Excluding the Change in the Estimated Value of Accrued Interest and Fees in 2002 |
||||||||||||
Net Interest Margin (a) |
||||||||||||
Investment securities and money market instruments (b) |
$ | 8,257,838 | ||||||||||
Other interest-earning assets (b) |
3,913,724 | |||||||||||
Loan receivables (c) |
25,337,230 | |||||||||||
Total |
$ | 37,508,792 | 2,141,923 | 5.71 | ||||||||
Securitization Adjustments |
||||||||||||
Investment securities and money market instruments |
$ | — | ||||||||||
Other interest-earning assets |
(3,852,010 | ) | ||||||||||
Securitized loans |
74,790,117 | |||||||||||
Total |
$ | 70,938,107 | 7,255,485 | 10.23 | ||||||||
Managed Net Interest Margin (a) |
||||||||||||
Investment securities and money market instruments (b) |
$ | 8,257,838 | ||||||||||
Other interest-earning assets (b) |
61,714 | |||||||||||
Managed loans |
100,127,347 | |||||||||||
Total |
$ | 108,446,899 | 9,397,408 | 8.67 | ||||||||
| (a) | Net interest margin ratios are presented on a fully taxable equivalent basis. The fully taxable equivalent adjustment for the year ended December 31, 2002 was $1,070. | |||
| (b) | For purposes of comparability, certain prior period amounts have been reclassified. | |||
| (c) | Loan receivables include loans held for securitization and the loan portfolio. | |||
TABLE 26: SECURITIZED LOANS DISTRIBUTION (dollars in thousands)
| December 31, | 2003 | 2002 | 2001 | 2000 | 1999 | |||||||||||||||||||||||||||||||||||
Securitized Loans |
||||||||||||||||||||||||||||||||||||||||
Domestic: |
||||||||||||||||||||||||||||||||||||||||
Credit card |
$ | 67,620,822 | 79.7 | % | $ | 63,886,876 | 81.4 | % | $ | 60,501,860 | 83.1 | % | $ | 57,425,582 | 83.4 | % | $ | 45,851,922 | 84.0 | % | ||||||||||||||||||||
Other consumer |
5,671,832 | 6.7 | 5,677,908 | 7.2 | 5,702,658 | 7.8 | 5,691,769 | 8.3 | 3,987,180 | 7.3 | ||||||||||||||||||||||||||||||
Total domestic securitized loans |
73,292,654 | 86.4 | 69,564,784 | 88.6 | 66,204,518 | 90.9 | 63,117,351 | 91.7 | 49,839,102 | 91.3 | ||||||||||||||||||||||||||||||
Foreign: |
||||||||||||||||||||||||||||||||||||||||
Credit card |
11,576,829 | 13.6 | 8,966,550 | 11.4 | 6,657,969 | 9.1 | 5,650,485 | 8.2 | 4,565,996 | 8.4 | ||||||||||||||||||||||||||||||
Other consumer |
— | — | — | — | — | — | 68,048 | .1 | 186,706 | .3 | ||||||||||||||||||||||||||||||
Total foreign securitized loans |
11,576,829 | 13.6 | 8,966,550 | 11.4 | 6,657,969 | 9.1 | 5,718,533 | 8.3 | 4,752,702 | 8.7 | ||||||||||||||||||||||||||||||
Total securitized loans |
$ | 84,869,483 | 100.0 | % | $ | 78,531,334 | 100.0 | % | $ | 72,862,487 | 100.0 | % | $ | 68,835,884 | 100.0 | % | $ | 54,591,804 | 100.0 | % | ||||||||||||||||||||
OFF-BALANCE SHEET SECURITIZATION TRANSACTION ACTIVITY
During 2003, the Corporation securitized credit card loan principal receivables totaling $13.6 billion, including the securitization of £1.2 billion (approximately $2.0 billion) by MBNA Europe and CAD$1.0 billion (approximately $751.5 million) by MBNA Canada. The total amount of securitized loans was $84.9 billion or 71.6% of managed loans at December 31, 2003, as compared to $78.5 billion or 73.2% at December 31, 2002. The total amount of securitized domestic credit card loans was 78.8% of managed domestic credit card loans at December 31, 2003, as compared to 80.4% at December 31, 2002. Securitized domestic other consumer loans were 47.7% of managed domestic other consumer loans at December 31, 2003, as compared to 47.3% at December 31, 2002. Securitized foreign loans were 55.7% of managed foreign loans at December 31, 2003, as compared to 56.8% at December 31, 2002.
Table 26 presents the Corporation’s securitized loans distribution.
During 2003, there was an increase of $8.5 billion in the Corporation’s loan receivables that occurred when certain securi-tizations matured as scheduled and the trusts used principal payments to pay the investors rather than purchasing new loan
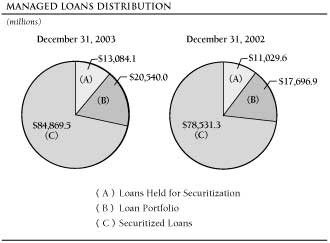
principal receivables from the Corporation. The Corporation’s loan portfolio is expected to increase an additional $14.9 billion during 2004 as a result of estimated maturities of existing securitization transactions when trusts use principal payments to pay investors rather than purchasing new loan principal receivables from the Corporation. This amount is based upon the estimated maturity of outstanding securitization transactions and does not include any future securitization activity. Should the Corporation choose or be unable to securitize these assets in the future, additional on-balance sheet funding and capital would be required.
Table 27 presents the Corporation’s estimated maturities of investor principal.
TABLE 27: ESTIMATED MATURITIES OF INVESTOR PRINCIPAL (dollars in thousands)
2004 (a) |
$ | 14,864,699 | ||
2005 |
12,498,872 | |||
2006 |
11,761,600 | |||
2007 |
15,469,964 | |||
2008 |
10,966,618 | |||
Thereafter |
17,803,237 | |||
Total amortization of investor principal |
83,364,990 | |||
Estimated collectible billed interest and fees included
in securitized loans |
1,504,493 | |||
Total securitized loans |
$ | 84,869,483 | ||
| (a) | The $4.5 billion Emerald Note Program, comprised of short-term commercial paper, is included in the 2004 category based on the possibility that maturing Emerald Notes cannot be re-issued. This event would cause the transaction to begin amortizing, thus creating a liquidity requirement. However, the Corporation expects the Emerald Notes to continue to be re-issued during the course of the program through the scheduled final maturity date. |
The Corporation’s securitization transactions contain provisions which could require that the excess spread generated by the securitized loans be accumulated in the trusts to provide additional credit enhancement to the investors. These provisions require that excess spread be retained once the yields in excess of minimum yield for three consecutive months falls below a range of 6.50% to 4.00% depending on the terms of the particular securitization transaction. At December 31, 2003 and 2002, no excess spread was held by the trusts under these provisions.
52 |
TABLE 28: SECURITIZATION TRUST YIELDS IN EXCESS OF MINIMUM YIELD DATA (dollars in thousands)
| | | For the Three Months Ended December 31, 2003 | | | ||||||||||||||||||||||||||||
| Yield in Excess of Minimum (a) |
||||||||||||||||||||||||||||||
| Number | Average | Average | Series Range | |||||||||||||||||||||||||||
| Investor | of Series | Annualized | Minimum | Weighted | ||||||||||||||||||||||||||
| Principal | in Trust | Yield | Yield | Average | High | Low | ||||||||||||||||||||||||
MBNA Master Credit Card Trust II |
$ | 31,000,757 | 43 | 17.69 | % | 9.27 | % | 8.42 | % | 8.73 | % | 7.60 | % | |||||||||||||||||
MBNA Credit Card Master Note Trust (b) |
32,426,435 | 62 | 17.68 | 9.14 | 8.54 | 8.54 | 8.54 | |||||||||||||||||||||||
MBNA Master Consumer Loan Trust |
5,560,278 | 3 | (c | ) | (c | ) | (c | ) | (c | ) | (c | ) | ||||||||||||||||||
MBNA Triple A Master Trust |
2,000,000 | 2 | 16.74 | 8.75 | 7.99 | 8.02 | 7.98 | |||||||||||||||||||||||
Multiple Asset Note Trust |
1,000,000 | 2 | 18.61 | 8.88 | 9.73 | 9.74 | 9.72 | |||||||||||||||||||||||
U.K. Receivables Trust |
3,222,539 | 6 | 19.57 | 10.63 | 8.94 | 9.49 | 6.76 | |||||||||||||||||||||||
U.K. Receivables Trust II |
5,373,441 | 7 | 17.44 | 10.19 | 7.25 | 7.53 | 6.05 | |||||||||||||||||||||||
Gloucester Credit Card Trust |
2,781,540 | 10 | 19.12 | 9.87 | 9.25 | 9.87 | 7.51 | |||||||||||||||||||||||
| (a) | The Yield in Excess of Minimum Yield represents the trust’s average annualized yield less its average minimum yield. | |
| (b) | MBNA Credit Card Master Note Trust issues a series of notes called the MBNAseries. Through the MBNAseries, MBNA Credit Card Master Note Trust issues specific classes of notes which contribute on a prorated basis to the calculation of the average yield in excess of minimum yield. This average yield in excess of minimum yield impacts the distribution of principal to investors of all classes within the MBNAseries. | |
| (c) | The MBNA Master Consumer Loan Trust yield in excess of minimum yield does not impact the distribution of principal to investors. Distribution to investors for transactions in this trust may begin earlier than the scheduled time if the credit enhancement amount falls below a predetermined contractual level. As a result, its yields are excluded from this Table. |
Distribution of principal to investors may begin sooner if the average annualized yield (generally including interest income, interchange income, charged-off loan recoveries, and other fees) for three consecutive months drops below a minimum yield (generally equal to the sum of the interest rate payable to investors, contractual servicing fees, and principal credit losses during the period) or certain other events occur. If distribution of principal to investors began sooner than expected, the Corporation would likely need to raise additional capital to support loan and asset growth and meet regulatory capital requirements.
Table 28 presents summarized yields for each trust for the three-month period ended December 31, 2003. The yield in excess of minimum yield for each of the trusts is presented on a cash basis and includes various credit card or other fees as specified in the securitization agreements. If the yield in excess of minimum falls below 0% for a contractually specified period, generally a three-month average, the securitizations will begin to amortize earlier than their scheduled contractual maturity date.
OTHER OFF-BALANCE SHEET ARRANGEMENTS
In January 2003, Interpretation No. 46 was issued. In accordance with Interpretation No. 46, the Corporation has determined that MBNA Capital A, MBNA Capital B, MBNA Capital C, MBNA Capital D, and MBNA Capital E (collectively the “statutory trusts”), are variable interest entities and that the Corporation is not the primary beneficiary. See Note 17: Long-Term Debt and Bank Notes of the audited consolidated financial statements for further discussion of the statutory trusts.
The Corporation utilizes certain derivative financial instruments to enhance its ability to manage interest rate risk and foreign currency exchange rate risk that exist as part of its ongoing business operations. See Note 30: Fair Value of Financial Instruments of the audited consolidated financial statements for further detail regarding the Corporation’s derivative financial instruments.
LIQUIDITY AND RATE SENSITIVITY
The Corporation seeks to maintain prudent levels of liquidity, interest rate, and foreign currency exchange rate risk.
LIQUIDITY MANAGEMENT
Liquidity management is the process by which the Corporation manages the use and availability of various funding sources to meet its current and future operating needs. These needs change as loans grow, securitizations mature, debt and deposits mature, and payments on other obligations are made. Because the characteristics of the Corporation’s assets and liabilities change, liquidity management is a dynamic process, affected by the pricing and maturity of investment securities, loans, deposits, securitizations, and other assets and liabilities.
The Corporation manages liquidity at two primary levels. The first level is the liquidity of the parent company, which is the holding company that owns the banking subsidiaries. The second level is the liquidity of the banking subsidiaries. The management of liquidity at both levels is essential because the parent company and banking subsidiaries each have different funding needs and funding sources and each are subject to certain regulatory guidelines and requirements.
The liquidity requirements of the Corporation are met by the proceeds of regular dividend payments from the Bank, the growth in retained earnings from regular operations, and the issuance of unsecured senior medium-term notes and senior notes. The available cash position of the Corporation’s parent-only legal entity is maintained at a level sufficient to meet anticipated cash needs for at least one year. The liquidity of the banking subsidiaries is managed to reflect the anticipated cash required to finance loan demand and to maintain sufficient liquid assets to cover the maturities for the next six months for all off-balance sheet securitizations, unsecured debt, and wholesale money market funding sources. The level of liquid assets, which is comprised of
TABLE 29: ESTIMATED CONTRACTUAL OBLIGATIONS (a) (b) (dollars in thousands)
| | | Estimated
Contractual Obligations at December 31, 2003 |
| | ||||||||||||||
| Within 1 Year | 1-3 Years | 3-5 Years | Over 5 Years | Total | ||||||||||||
Long-term debt and bank notes (par) (c)
|
$ | 2,052,885 | $ | 2,314,300 | $ | 3,018,548 | $ | 4,478,784 | $ | 11,864,517 | ||||||
Minimum
rental payments under noncancelable operating leases |
28,400 | 29,391 | 2,070 | 134 | 59,995 | |||||||||||
Purchase obligations (d)
|
364,347 | 339,904 | 242,928 | 65,698 | 1,012,877 | |||||||||||
Other long-term liabilities reflected in the Corporation’s audited consolidated statements of financial condition (e) |
120,981 | 131,956 | 40,353 | — | 293,290 | |||||||||||
Total estimated contractual obligations
|
$ | 2,566,613 | $ | 2,815,551 | $ | 3,303,899 | $ | 4,544,616 | $ | 13,230,679 | ||||||
| (a) | Note 30: Fair Value of Financial Instruments—Derivative Financial Instruments provides detail on the Corporation’s derivative financial instruments. These amounts are not included in this Table. | |
| (b) | Table 30 provides detail on the maturities of deposits. These amounts are not included in this Table. | |
| (c) | Excludes interest. | |
| (d) | Includes the royalties to endorsing organizations payable in the future subject to certain conditions, Community Reinvestment Act obligations that cannot be canceled, and other purchase obligations. | |
| (e) | Includes amounts accrued for Customer reward programs, and other long-term obligations. |
the investments and money market assets described further in “Investment Securities and Money Market Instruments,” is managed to a size prudent for both anticipated loan receivable growth and overall conditions in the markets for asset-backed securitization, unsecured corporate debt, and short-term borrowed funds. The Corporation, the Bank, MBNA Europe, and MBNA Canada also have access to the credit facilities described further in Note 27: Commitments and Contingencies of the audited consolidated financial statements. Finally, the deposit funding sources are also used to finance loan receivable growth and to maintain a sufficient level of liquid assets.
Table 29 provides a summary of the estimated amounts and maturities of the contractual obligations of the Corporation at December 31, 2003.
If certain terms on the above estimated contractual requirements are not met, there may be an acceleration of the payment due dates noted above. As of December 31, 2003, the Corporation was not in default of any such covenants. The Corporation estimates that it will have $2.6 billion in contractual obligation requirements within the next year.
ASSET SECURITIZATION
At December 31, 2003, the Corporation funded 71.6% of its managed loans through securitization transactions. To maintain an appropriate funding level, the Corporation expects to securitize additional loan principal receivables during 2004. The consumer asset-backed securitization market in the United States exceeded $1.6 trillion at December 31, 2003, with approximately $440 billion of asset-backed securities issued during 2003. An additional $233 billion of consumer asset-backed securities were issued in European markets during 2003. The Corporation is a leading issuer in these markets, which have remained stable through adverse conditions. Despite the size and relative stability of these markets and the Corporation’s position as a leading issuer, if these markets experience difficulties, the Corporation may be unable to securitize its loan principal receivables or to do so at favorable pricing levels. Factors affecting the Corporation’s ability to securitize its loan principal receivables or to do so at favorable pricing
levels include the overall credit quality of the Corporation’s loans, the stability of the market for securitization transactions, and the legal, regulatory, accounting, and tax environments impacting securitization transactions. The Corporation does not believe adverse outcomes from these events are likely to occur. If the Corporation were unable to continue to securitize its loan receivables at current levels, the Corporation would use its investment securities and money market instruments in addition to alternative funding sources to fund increases in loan receivables and meet its other liquidity needs. The resulting change in the Corporation’s current liquidity sources could potentially subject the Corporation to certain risks. These risks would include an increase in the Corporation’s cost of funds, increases in the reserve for possible credit losses and the provision for possible credit losses as more loans would remain in the Corporation’s audited consolidated statements of financial condition, and restrictions on loan growth if the Corporation were unable to find alternative and cost-effective funding sources.
In addition, if the Corporation could not continue to remove the loan principal receivables from the Corporation’s audited consolidated statements of financial condition, the Corporation would likely need to raise additional capital to support loan and asset growth and meet regulatory capital requirements.
Table 27 presents the estimated maturities of investor principal.
STOCK REPURCHASES
To the extent stock options are exercised or restricted shares are awarded from time to time under the Corporation’s Long Term Incentive Plans, the Board of Directors has approved the purchase, on the open market or in privately negotiated transactions, of the number of common shares issued.
During 2003, the Corporation issued 29.2 million common shares upon the exercise of stock options and issuance of restricted stock, and purchased 29.2 million common shares for $618.3 million. The Corporation received $275.8 million in proceeds from the exercise of stock options during 2003.
In the third quarter of 2003, the Corporation issued 50.0 million shares of its common stock in a public offering for approximately $1.1 billion, net of issuance costs. The shares were issued under the Corporation’s existing shelf registration statement. The Corporation used the proceeds to repurchase the same number of shares at the same price from the estate of the Corporation’s former Chairman and Chief Executive Officer. The estate has the right to cause the sale of shares through a registration rights agreement entered into in 1991 at the time of the Corporation’s initial public offering. The issuance and repurchase were done to satisfy the Corporation’s obligation related to the sale of shares by the estate. The sale and repurchase of common stock did not impact total common stock outstanding or capital levels.
FUNDING
To facilitate liquidity management, the Corporation uses a variety of funding sources to establish a maturity pattern that provides a prudent mixture of short-term and long-term funds. The Corporation obtains funds through deposits and debt issuances, and uses securitization of the Corporation’s loan principal receivables as a major funding alternative. In addition, further liquidity is provided to the Corporation through committed credit facilities.
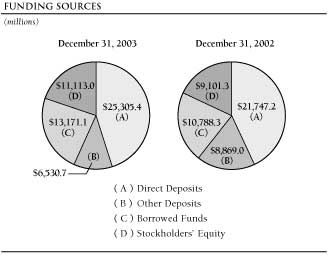
CREDIT FACILITIES
The Corporation, the Bank, MBNA Europe, and MBNA Canada have various credit facilities. These facilities may be used for general corporate purposes and were not drawn upon at December 31, 2003.
Note 27: Commitments and Contingencies to the audited consolidated financial statements provides further detail regarding the Corporation’s credit facilities and is incorporated by this reference into this section.
BORROWED FUNDS
Short-term borrowings used by the Corporation include federal funds purchased and securities sold under repurchase agreements. Federal funds purchased and securities sold under repurchase agreements are overnight borrowings that normally mature within one business day of the transaction date. Other short-term borrowings consist primarily of federal funds purchased that mature in more than one business day, short-term bank notes issued from the global bank note program established by the Bank, short-term deposit notes issued by MBNA Canada, and other transactions with maturities greater than one business day but less than one year. Short-term borrowings were $1.0 billion and $1.3 billion for December 31, 2003 and 2002, respectively.
Other funding programs established by the Corporation for long-term borrowings include senior medium-term notes and senior notes. Other funding programs established by the Corporation’s bank subsidiaries include the Bank’s global bank note program, MBNA Europe’s euro medium-note program, and MBNA Canada’s medium-term deposit note program. MBNA Europe and MBNA Canada’s notes are unconditionally and irrevocably guaranteed in respect to all payments by the Bank.
Long-term debt and bank notes were $12.1 billion and $9.5 billion for December 31, 2003 and 2002, respectively. See Table 29 for estimated maturities of the contractual obligations related to long-term debt and bank notes as of December 31, 2003.
Note 16: Short-Term Borrowings and Note 17: Long-Term Debt and Bank Notes to the audited consolidated financial statements provide further detail regarding the Corporation’s borrowed funds and is incorporated by this reference into this section.
DEPOSITS
The Corporation utilizes deposits to fund loan and other asset growth and to diversify funding sources. The Corporation categorizes its deposits into either direct or other deposits. Direct deposits are deposits marketed to and received from individual Customers without the use of a third-party intermediary, and are an important, stable, low-cost funding source that typically react more slowly to interest rate changes than other deposits. Other deposits, which include brokered deposits, are deposits generally obtained through the use of a third-party intermediary.
Total deposits increased $1.2 billion or 4.0% to $31.8 billion at December 31, 2003, as compared to $30.6 billion at December 31, 2002.
Table 30 provides the maturities of the Corporation’s deposits at December 31, 2003. Included in the deposit maturity category of one year or less are money market deposit accounts, noninterest-bearing deposits, interest-bearing transaction accounts, and savings accounts totaling $10.3 billion. Based on past activity, the Corporation expects to retain a majority of its deposit balances as they mature.
TABLE 30: MATURITIES OF DEPOSITS (dollars in thousands)
December 31, 2003 |
Direct Deposits |
Other Deposits (a) | Total Deposits | |||||||||
Domestic: |
||||||||||||
One year or less |
$ | 16,401,083 | $ | 2,686,220 | $ | 19,087,303 | ||||||
Over one year through
two years |
3,954,095 | 1,871,494 | 5,825,589 | |||||||||
Over two years through
three years |
1,568,129 | 1,044,247 | 2,612,376 | |||||||||
Over three years through
four years |
1,487,057 | 779,926 | 2,266,983 | |||||||||
Over four years through
five years |
830,244 | 121,424 | 951,668 | |||||||||
Over five years |
8,615 | — | 8,615 | |||||||||
Total domestic deposits |
24,249,223 | 6,503,311 | 30,752,534 | |||||||||
Foreign (b) |
1,056,175 | 27,372 | 1,083,547 | |||||||||
Total deposits |
$ | 25,305,398 | $ | 6,530,683 | $ | 31,836,081 | ||||||
| (a) | At December 31, 2003, all other deposits were brokered deposits. | |
| (b) | At December 31, 2003, all foreign deposits had maturities of one year or less. |
Table 31 presents the maturity distribution of the Corporation’s time deposits in amounts of $100,000 or more at December 31, 2003, 2002 and 2001.
Included in the Corporation’s direct deposits at December 31, 2003 and 2002 were noninterest-bearing deposits of $2.4 billion and $915.7 million, representing 7.6% and 3.0% of total deposits, respectively. The increase in noninterest-bearing deposits was a
result of the change in the timing of the remittance of principal collections on securitized loans to the trust. Since the second quarter of 2003, the Corporation is no longer obligated to transfer principal collections to the Corporation’s primary domestic credit card trust on a daily basis. These funds are now retained on behalf of the trust by the Corporation until remittance on a monthly basis. The Corporation also had interest-bearing direct deposits at December 31, 2003 of $22.9 billion, as compared to $20.8 billion at December 31, 2002.
Included in the Corporation’s other deposits at December 31, 2003 and 2002, were brokered deposits of $6.5 billion and $8.3 billion, representing 20.5% and 27.1% of total deposits, respectively. If any of the brokered deposits are not renewed at maturity, the funding they provide could be replaced by funds from maturing investment securities and money market instruments or other funding sources to fund increases in its loan receivables and meet the Corporation’s other liquidity needs. During 2003, other deposits decreased because the Corporation determined it had adequate liquidity from other sources to meet its funding needs. While the Corporation utilized other alternative funding sources during this period, brokered deposits will continue to be part of its funding activities. The Federal Deposit Insurance Corporation Improvement Act of 1991 limits the use of brokered deposits to “well-capitalized” insured depository institutions, and with a waiver from the Federal Deposit Insurance Corporation, to “adequately capitalized” institutions. At December 31, 2003, the Bank and MBNA Delaware were “well-capitalized” as defined under the federal bank regulatory guidelines. Based on the Corporation’s historical access to the brokered deposit market, it expects to replace maturing brokered deposits with new brokered deposits or with the Corporation’s direct deposits.
TABLE 31: TIME DEPOSITS OF $100,000 OR MORE (a) (dollars in thousands)
December 31, |
2003 | 2002 | 2001 | |||||||||||||||||||||||
Three months or less: |
||||||||||||||||||||||||||
Domestic |
$ | 438,832 | 10.2 | % | $ | 548,380 | 13.8 | % | $ | 643,012 | 15.5 | % | ||||||||||||||
Foreign |
852,249 | 19.9 | 611,135 | 15.3 | 711,960 | 17.1 | ||||||||||||||||||||
Total three months or less |
1,291,081 | 30.1 | 1,159,515 | 29.1 | 1,354,972 | 32.6 | ||||||||||||||||||||
Over three months through six months: |
||||||||||||||||||||||||||
Domestic |
360,223 | 8.4 | 479,662 | 12.0 | 745,978 | 18.0 | ||||||||||||||||||||
Foreign |
4,032 | .1 | 22,167 | .6 | 49,266 | 1.2 | ||||||||||||||||||||
Total over three months through six months |
364,255 | 8.5 | 501,829 | 12.6 | 795,244 | 19.2 | ||||||||||||||||||||
Over six months through twelve months: |
||||||||||||||||||||||||||
Domestic |
722,902 | 16.9 | 654,637 | 16.4 | 827,575 | 19.9 | ||||||||||||||||||||
Foreign |
5,626 | .1 | 14,509 | .4 | 3,622 | .1 | ||||||||||||||||||||
Total over six months through twelve months |
728,528 | 17.0 | 669,146 | 16.8 | 831,197 | 20.0 | ||||||||||||||||||||
Over twelve months: |
||||||||||||||||||||||||||
Domestic |
1,900,128 | 44.4 | 1,654,141 | 41.5 | 1,172,604 | 28.2 | ||||||||||||||||||||
Foreign |
— | — | 250 | — | 250 | — | ||||||||||||||||||||
Total over twelve months |
1,900,128 | 44.4 | 1,654,391 | 41.5 | 1,172,854 | 28.2 | ||||||||||||||||||||
Total |
$ | 4,283,992 | 100.0 | % | $ | 3,984,881 | 100.0 | % | $ | 4,154,267 | 100.0 | % | ||||||||||||||
| (a) | This table excludes deposits obtained by a third-party intermediary in amounts of $100,000 or more which were subsequently distributed by intermediaries to individuals in denominations of less than $100,000. |
TABLE 32: INVESTMENT SECURITIES (dollars in thousands, yields on a fully taxable equivalent basis)
| | | Estimated Maturities at December 31, 2003 | | | ||||||||||||||||||||||||||||||||||||||||||||||||||
| Within 1 Year | 1-5 Years | 6-10 Years | Over 10 Years | Total | Amortized | Market | ||||||||||||||||||||||||||||||||||||||||||||||
| Book | Yield | Book | Yield | Book | Yield | Book | Yield | Book | Yield | Cost | Value | |||||||||||||||||||||||||||||||||||||||||
Available-for-Sale |
||||||||||||||||||||||||||||||||||||||||||||||||||||
Domestic: |
||||||||||||||||||||||||||||||||||||||||||||||||||||
U.S. Treasury and other
U.S. government
agencies obligations |
$ | 1,006,504 | 2.54 | % | $ | 1,025,112 | 1.65 | % | $ | – | – | % | $ | – | – | % | $ | 2,031,616 | 2.09 | % | $ | 2,024,520 | $ | 2,031,616 | ||||||||||||||||||||||||||||
State and political
subdivisions of
the United States |
102,685 | 1.96 | – | – | – | – | – | – | 102,685 | 1.96 | 102,685 | 102,685 | ||||||||||||||||||||||||||||||||||||||||
Asset-backed and
other securities |
488,060 | 2.39 | 1,255,420 | 1.44 | 57,388 | 1.33 | 165 | 1.26 | 1,801,033 | 1.70 | 1,796,824 | 1,801,033 | ||||||||||||||||||||||||||||||||||||||||
Total domestic
investment securities
available-for-sale |
1,597,249 | 2.46 | 2,280,532 | 1.54 | 57,388 | 1.33 | 165 | 1.26 | 3,935,334 | 1.91 | 3,924,029 | 3,935,334 | ||||||||||||||||||||||||||||||||||||||||
Foreign |
91,750 | 4.03 | 336,003 | 4.07 | – | – | – | – | 427,753 | 4.06 | 428,040 | 427,753 | ||||||||||||||||||||||||||||||||||||||||
Total investment
securities
available-for-sale |
$ | 1,688,999 | 2.54 | $ | 2,616,535 | 1.86 | $ | 57,388 | 1.33 | $ | 165 | 1.26 | $ | 4,363,087 | 2.12 | $ | 4,352,069 | $ | 4,363,087 | |||||||||||||||||||||||||||||||||
Held-to-Maturity |
||||||||||||||||||||||||||||||||||||||||||||||||||||
Domestic: |
||||||||||||||||||||||||||||||||||||||||||||||||||||
U.S. Treasury and other
U.S. government
agencies obligations |
$ | – | – | $ | – | – | $ | – | – | $ | 335,445 | 5.21 | $ | 335,445 | 5.21 | $ | 335,445 | $ | 336,582 | |||||||||||||||||||||||||||||||||
State and political
subdivisions of
the United States |
135 | 7.23 | – | – | 649 | 6.94 | 6,831 | 7.91 | 7,615 | 7.82 | 7,615 | 7,786 | ||||||||||||||||||||||||||||||||||||||||
Asset-backed and
other securities |
– | – | – | – | – | – | 9,239 | 4.81 | 9,239 | 4.81 | 9,239 | 9,066 | ||||||||||||||||||||||||||||||||||||||||
Total domestic
investment securities
held-to-maturity |
135 | 7.23 | – | – | 649 | 6.94 | 351,515 | 5.25 | 352,299 | 5.26 | 352,299 | 353,434 | ||||||||||||||||||||||||||||||||||||||||
Foreign |
– | – | 1,000 | 5.30 | – | – | – | – | 1,000 | 5.30 | 1,000 | 1,000 | ||||||||||||||||||||||||||||||||||||||||
Total investment
securities
held-to-maturity |
$ | 135 | 7.23 | $ | 1,000 | 5.30 | $ | 649 | 6.94 | $ | 351,515 | 5.25 | $ | 353,299 | 5.26 | $ | 353,299 | $ | 354,434 | |||||||||||||||||||||||||||||||||
INVESTMENT SECURITIES AND MONEY MARKET INSTRUMENTS
The Corporation also held $4.7 billion of investment securities and $4.9 billion of money market instruments at December 31, 2003, compared to $4.1 billion of investment securities and $5.3 billion in money market instruments at December 31, 2002. The investment securities primarily consist of high-quality, AAA-rated securities, most of which can be used as collateral under repurchase agreements. Of the investment securities held at December 31, 2003, $1.7 billion are anticipated to mature within 12 months. The Corporation’s investment securities available-for-sale portfolio, which consists primarily of U.S. Treasury obligations or short-term and variable-rate securities, was $4.4 billion at December 31, 2003, and $3.7 billion at December 31, 2002. These investment securities, along with the money market instruments, provide increased liquidity and flexibility to support the Corporation’s funding requirements. Investment securities and money market instruments remained relatively flat at December 31, 2003, compared to December 31, 2002.
Table 32 presents the summary of investment securities.
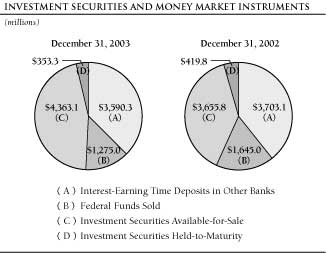
TABLE 33: INTEREST RATE SENSITIVITY SCHEDULE (dollars in thousands)
| December 31, 2003 | | | Subject to Repricing | | | |||||||||||||
| Within 1 Year | 1-5 Years | After 5 Years | Total | |||||||||||||
Interest-Earning Assets |
||||||||||||||||
Interest-earning time deposits in other banks: |
||||||||||||||||
Domestic |
$ | 1,175 | $ | — | $ | — | $ | 1,175 | ||||||||
Foreign |
3,589,154 | — | — | 3,589,154 | ||||||||||||
Total interest-earning time deposits in other banks |
3,590,329 | — | — | 3,590,329 | ||||||||||||
Federal funds sold |
1,275,000 | — | — | 1,275,000 | ||||||||||||
Investment securities (a): |
||||||||||||||||
Available-for-sale: |
||||||||||||||||
Domestic |
2,466,554 | 1,468,780 | — | 3,935,334 | ||||||||||||
Foreign |
91,750 | 336,003 | — | 427,753 | ||||||||||||
Total available-for-sale |
2,558,304 | 1,804,783 | — | 4,363,087 | ||||||||||||
Held-to-maturity: |
||||||||||||||||
Domestic |
135 | — | 352,164 | 352,299 | ||||||||||||
Foreign |
— | 1,000 | — | 1,000 | ||||||||||||
Total held-to-maturity |
135 | 1,000 | 352,164 | 353,299 | ||||||||||||
Other interest-earning assets |
3,904,402 | — | 70,040 | 3,974,442 | ||||||||||||
Loans held for securitization: |
||||||||||||||||
Domestic |
10,285,915 | — | — | 10,285,915 | ||||||||||||
Foreign |
2,798,190 | — | — | 2,798,190 | ||||||||||||
Total loans held for securitization |
13,084,105 | — | — | 13,084,105 | ||||||||||||
Loan portfolio: |
||||||||||||||||
Domestic: |
||||||||||||||||
Credit card |
6,176,434 | 1,728,739 | — | 7,905,173 | ||||||||||||
Other consumer |
4,748,202 | 1,064,607 | 398,207 | 6,211,016 | ||||||||||||
Total domestic loan portfolio |
10,924,636 | 2,793,346 | 398,207 | 14,116,189 | ||||||||||||
Foreign |
3,624,393 | 2,799,390 | — | 6,423,783 | ||||||||||||
Total loan portfolio |
14,549,029 | 5,592,736 | 398,207 | 20,539,972 | ||||||||||||
Total interest-earning assets |
38,961,304 | 7,398,519 | 820,411 | 47,180,234 | ||||||||||||
Interest-Bearing Liabilities |
||||||||||||||||
Interest-bearing deposits: |
||||||||||||||||
Domestic: |
||||||||||||||||
Time deposits |
9,001,744 | 11,656,616 | 8,615 | 20,666,975 | ||||||||||||
Money market deposit accounts |
7,790,726 | — | — | 7,790,726 | ||||||||||||
Interest-bearing transaction accounts |
47,334 | — | — | 47,334 | ||||||||||||
Savings accounts |
49,930 | — | — | 49,930 | ||||||||||||
Total domestic interest-bearing deposits |
16,889,734 | 11,656,616 | 8,615 | 28,554,965 | ||||||||||||
Foreign: |
||||||||||||||||
Time deposits |
861,907 | — | — | 861,907 | ||||||||||||
Total interest-bearing deposits |
17,751,641 | 11,656,616 | 8,615 | 29,416,872 | ||||||||||||
Borrowed funds: |
||||||||||||||||
Short-term borrowings: |
||||||||||||||||
Domestic |
899,779 | — | — | 899,779 | ||||||||||||
Foreign |
125,684 | — | — | 125,684 | ||||||||||||
Total short-term borrowings |
1,025,463 | — | — | 1,025,463 | ||||||||||||
Long-term debt and bank notes: |
||||||||||||||||
Domestic |
868,317 | 3,978,100 | 2,347,874 | 7,194,291 | ||||||||||||
Foreign |
2,696,360 | 1,176,166 | 1,078,811 | 4,951,337 | ||||||||||||
Total long-term debt and bank notes |
3,564,677 | 5,154,266 | 3,426,685 | 12,145,628 | ||||||||||||
Total borrowed funds |
4,590,140 | 5,154,266 | 3,426,685 | 13,171,091 | ||||||||||||
Total interest-bearing liabilities |
22,341,781 | 16,810,882 | 3,435,300 | 42,587,963 | ||||||||||||
Gap before managed adjustments |
16,619,523 | (9,412,363 | ) | (2,614,889 | ) | 4,592,271 | ||||||||||
Managed adjustments (b) |
(25,036,704 | ) | 22,845,190 | 3,460,894 | 1,269,380 | |||||||||||
Gap after managed adjustments |
$ | (8,417,181 | ) | $ | 13,432,827 | $ | 846,005 | $ | 5,861,651 | |||||||
Cumulative gap after managed adjustments |
$ | (8,417,181 | ) | $ | 5,015,646 | $ | 5,861,651 | |||||||||
Cumulative gap after managed adjustments as a % of managed assets |
(5.91 | )% | 3.52 | % | 4.11 | % | ||||||||||
| (a) | Investment securities are presented using estimated maturities. | |||
| (b) | Managed adjustments reflect the impact interest rates have on securitized loans and derivative financial instruments. | |||
INTEREST RATE SENSITIVITY
Interest rate sensitivity refers to the change in earnings resulting from fluctuations in interest rates, variability in the yield earned on interest-earning assets and the rate paid on interest-bearing liabilities, and the differences in repricing intervals between assets
and liabilities. Interest rate changes also impact the estimated value of the interest-only strip receivable and other-interest earning assets, and securitization income. The management of interest rate sensitivity attempts to maximize earnings by minimizing any negative impacts of changing market rates, asset and liability mix,
| and prepayment trends. Interest rate sensitive assets/liabilities have yields/rates that can change within a designated time period as a result of their maturity, a change in an underlying index rate, or the contractual ability of the Corporation to change the yield/rate. | ||||
| Interest rate risk refers to potential changes in current and future net interest income resulting from changes in interest rates and differences in the repricing characteristics between interest rate sensitive assets and liabilities. The Corporation analyzes its level of interest rate risk using several analytical techniques. In addition to on-balance-sheet activities, interest rate risk includes the interest rate sensitivity of securitization income from securitized loans and the impact of interest rate swap agreements and foreign exchange swap agreements. The Corporation uses interest rate swap agreements and foreign exchange swap agreements to change a portion of fixed-rate funding sources to floating-rate funding sources to better match the rate sensitivity of the Corporation’s assets. For this reason, the Corporation analyzes its level of interest rate risk on a managed basis to quantify and capture the full impact of interest rate risk on the Corporation’s earnings. | ||||
| The Corporation’s interest rate risk using the static gap methodology is presented in Table 33. This method reports the difference between interest rate sensitive assets and liabilities at a specific point in time. Management uses the static gap methodology to identify the Corporation’s directional interest rate risk. Interest rate sensitive assets and liabilities are reported based on estimated and contractual repricings. Fixed-rate credit card loans, which may be repriced by the Corporation at any time by giving notice to the Customer, are placed in the table using a seventeen-month repricing schedule. The Corporation also offers variable-rate credit card loans. At December 31, 2003, variable-rate loans made up 7.0% of total managed loans, compared to 6.0% of total managed loans at December 31, 2002. These variable-rate loans are generally indexed to the U.S. Prime Rate published in The Wall Street Journal and reprice quarterly. Including the managed adjustment, results of the gap analysis show that, within one year, the Corporation’s liabilites reprice faster than its assets, indicating an earnings risk from rising interest rates. | ||||
Although the static gap methodology is widely accepted for its simplicity in identifying interest rate risk, it ignores many changes that can occur, such as repricing strategies, market spread adjustments, and anticipated hedging transactions. For these reasons, the Corporation analyzes its level of interest rate risk using several other analytical techniques, including simulation analysis. All of the analytical techniques used by the Corporation to measure interest rate risk include the impact of its financial assets and liabilities, derivative financial instruments, and asset securitizations.
Assumptions in the Corporation’s simulation analysis include cash flows and maturities of interest rate sensitive instruments, changes in market conditions, loan volumes and pricing, consumer preferences, fixed-rate credit card repricings as part of the Corporation’s normal planned business strategy, and management’s capital plans. The analysis also assumes that there is no impact on an annual basis in the value of the interest-only strip receivable. Also included in the analysis are various actions which the Corporation would likely undertake to minimize the impact of adverse movements in interest rates. Based on the simulation analysis at December 31, 2003, the Corporation could experience a decrease in projected net income during the next 12 months of approximately $72 million, if interest rates at the time the simulation analysis was performed increased 100 basis points over the next 12 months evenly distributed on the first day of each of the next four quarters.
These assumptions are inherently uncertain and, as a result, the analysis cannot precisely predict the impact of higher interest rates on net income. Actual results would differ from simulated results as a result of timing, magnitude, and frequency of interest rate changes, changes in market conditions, and management strategies to offset the Corporation’s potential exposure, among other factors. The Corporation has the contractual right to reprice fixed-rate credit card loans at any time by giving notice to the Customer. Accordingly, a key assumption in the simulation analysis is the repricing of fixed-rate credit card loans in response to an upward movement in interest rates, with a lag of approximately 45 days between interest rate movements and fixed-rate credit card loan repricings. The Corporation has repriced its fixed-rate credit card loans on numerous occasions in the past; its ability to do so in the future will depend on changes in interest rates, market conditions, and other factors.
FOREIGN CURRENCY EXCHANGE RATE SENSITIVITY
Foreign currency exchange rate risk refers to the potential changes in current and future earnings or capital arising from movements in foreign exchange rates and occurs as a result of cross-currency investment and funding activities. The Corporation’s foreign currency exchange rate risk is limited to the Corporation’s net investment in its foreign subsidiaries which is unhedged. The Corporation uses forward exchange contracts and foreign exchange swap agreements to reduce its exposure to foreign currency exchange rate risk. Management reviews the foreign currency exchange rate risk of the Corporation on a routine basis. During this review, management considers the net impact to stockholders’ equity under various foreign exchange rate scenarios. At
December 31, 2003, the Corporation could experience a decrease in stockholders’ equity, net of tax, of approximately $192 million as a result of a 10% depreciation of the Corporation’s unhedged capital exposure in foreign subsidiaries to the U.S. dollar position.
CROSS-BORDER OUTSTANDINGS
At December 31, 2003 and 2002 the Corporation had cross-border outstandings in excess of 1% of total consolidated assets in the U.K. of $3.6 billion and $3.7 billion, respectively. At December 31, 2001 the amount was $1.0 billion. The Corporation does not have significant local currency outstanding in the U.K. that is not hedged or funded by local currency borrowings. The cross-border outstandings in the U.K. are primarily short-term in nature.
REGULATORY MATTERS
INTERCHANGE INCOME
Interchange income is a fee paid by a merchant bank to the card-issuing bank through the interchange network as compensation for risk, grace period, and other operating costs. After a lengthy investigation by U.K. regulators of MasterCard interchange rates in the U.K., the regulators issued updated preliminary conclusions on February 11, 2003, finding that the interchange fee paid by merchant acquirers to MasterCard card issuers in the U.K. is anti-competitive and that the agreement between MasterCard’s U.K. members for interchange leads to an unjustifiably high fee being paid to card-issuing banks. A hearing was held on May 21, 2003, and the regulator’s ruling is pending. The ruling may be appealed and the timing of a final ruling is uncertain. Similar regulatory action could be taken against VISA interchange rates in the U.K. In 2002, in response to European Union regulatory action, VISA agreed to reduce its interchange fee on transactions across country lines within the European Union, and in line with this reduction in October 2003, VISA reduced its interchange fee on transactions in the U.K. The Corporation cannot predict if or when interchange rates in the U.K. could be reduced. Any potential impact could also vary based on business strategies or other actions the Corporation will take to attempt to limit the impact.
BASEL COMMITTEE
In April 2003, the Basel Committee on Banking Supervision (the “Committee”) issued a consultative document for public comment, “The New Basel Capital Accord,” which proposes significant
revisions to the current Basel Capital Accord. The proposed new accord would establish a three-part framework for capital adequacy that would include: (1) minimum capital requirements; (2) supervisory review of an institution’s capital adequacy and internal assessment process; and (3) market discipline through increased disclosures regarding capital adequacy.
In August 2003, an advance notice of proposed rulemaking was published by the Office of the Comptroller of the Currency, the Board of Governors of the Federal Reserve System, the Federal Deposit Insurance Corporation and the Office of Thrift Supervision (collectively “the Agencies”). The advance notice of proposed rulemaking was titled “Risk-Based Capital Guidelines; Implementation of New Basel Capital Accord; Internal Ratings-Based Systems for Corporate Credit and Operational Risk Advanced Measurement Approaches for Regulatory Capital; Proposed Rule and Notice” (“Proposed Regulatory Guidance”). The Proposed Regulatory Guidance sets forth for industry comment the Agencies’ views on a proposed framework for implementing the New Basel Capital Accord in the United States. In particular, the Proposed Regulatory Guidance describes significant elements of the Advanced Internal Ratings-Based approach for credit risk and the Advanced Measurement Approaches for operational risk. The Agencies have determined that the advanced risk and capital measurement methodologies of the new accord will be applied on a mandatory basis for large, internationally active banking organizations. Institutions subject to the mandatory application of the advanced approaches would be those institutions with total banking assets of $250 billion or more or those institutions, such as the Corporation, with total on-balance-sheet foreign exposure of $10 billion or more.
The final form of the rules to be adopted by U.S. bank regulators is still to be determined. Adoption of the proposed new accord could lower capital ratios for U.S. banking organizations, such as the Corporation’s banking subsidiaries, due in part to a new capital charge for operational risk and to the final treatment of certain credit risk exposures, including the treatment of credit card loans and asset securitizations, in calculating regulatory capital.
Future changes in laws and regulations and in policies applied by banking or other regulators also could affect the Corporation’s consolidated financial condition and results of operations in future periods.
TABLE 34: MANAGED RECONCILIATION OF THE FIVE-YEAR STATISTICAL SUMMARY
RECONCILIATION OF INCOME STATEMENT DATA FOR THE PERIOD TO MANAGED NET INTEREST
INCOME, MANAGED PROVISION FOR POSSIBLE CREDIT LOSSES, AND MANAGED OTHER
OPERATING INCOME
(dollars in thousands)
| Year Ended December 31, | 2003 | 2002 | 2001 | 2000 | 1999 | |||||||||||||||
Net Interest Income |
||||||||||||||||||||
Net interest income |
$ | 2,350,373 | $ | 2,074,575 | $ | 1,657,340 | $ | 1,395,015 | $ | 1,175,759 | ||||||||||
Securitization adjustments |
7,854,265 | 7,044,102 | 6,546,802 | 4,442,094 | 4,012,042 | |||||||||||||||
Managed net interest income |
$ | 10,204,638 | $ | 9,118,677 | $ | 8,204,142 | $ | 5,837,109 | $ | 5,187,801 | ||||||||||
Provision for Possible Credit Losses |
||||||||||||||||||||
Provision for possible credit losses |
$ | 1,392,701 | $ | 1,340,157 | $ | 1,140,615 | $ | 547,309 | $ | 636,614 | ||||||||||
Securitization adjustments |
4,375,469 | 3,835,383 | 3,452,014 | 2,800,980 | 2,248,535 | |||||||||||||||
Managed provision for possible credit losses |
$ | 5,768,170 | $ | 5,175,540 | $ | 4,592,629 | $ | 3,348,289 | $ | 2,885,149 | ||||||||||
Other Operating Income |
||||||||||||||||||||
Other operating income |
$ | 7,825,480 | $ | 6,752,923 | $ | 6,673,316 | $ | 4,920,403 | $ | 4,193,527 | ||||||||||
Securitization adjustments |
(3,478,796 | ) | (3,208,719 | ) | (3,094,788 | ) | (1,641,114 | ) | (1,763,507 | ) | ||||||||||
Managed other operating income |
$ | 4,346,684 | $ | 3,544,204 | $ | 3,578,528 | $ | 3,279,289 | $ | 2,430,020 | ||||||||||
RECONCILIATION OF THE LOAN RECEIVABLES NET CREDIT LOSS RATIO TO THE MANAGED NET CREDIT LOSS RATIO (dollars in thousands)
| Year Ended December 31, | 2003 | | | 2002 | | | 2001 | |||||||||||||||||||||||||||||||
| Net | Net Credit |
Net | Net Credit |
Net | Net Credit |
|||||||||||||||||||||||||||||||
| Credit | Average | Loss | Credit | Average | Loss | Credit | Average | Loss | ||||||||||||||||||||||||||||
| Losses (a) | Balance | Ratio (a) | Losses (a) | Balance | Ratio (a) | Losses (a) | Balance | Ratio (a) | ||||||||||||||||||||||||||||
Loan receivables (b) |
$ | 1,363,696 | $ | 28,183,818 | 4.84 | % | $ | 1,156,212 | $ | 25,315,200 | 4.57 | % | $ | 855,014 | $ | 20,339,388 | 4.20 | % | ||||||||||||||||||
Securitized loans |
4,375,469 | 81,691,156 | 5.36 | 3,835,383 | 74,718,731 | 5.13 | 3,452,014 | 70,560,600 | 4.89 | |||||||||||||||||||||||||||
Managed loans |
$ | 5,739,165 | $ | 109,874,974 | 5.22 | $ | 4,991,595 | $ | 100,033,931 | 4.99 | $ | 4,307,028 | $ | 90,899,988 | 4.74 | |||||||||||||||||||||
| Year Ended December 31, | 2000 | | | 1999 | |||||||||||||||||||||||||||||||||
| Net Credit | Net Credit | |||||||||||||||||||||||||||||||||||
| Net Credit | Average | Loss | Net Credit | Average | Loss | |||||||||||||||||||||||||||||||
| Losses (a) | Balance | Ratio (a) | Losses (a) | Balance | Ratio (a) | |||||||||||||||||||||||||||||||
Loan receivables (b) |
$ | 599,642 | $ | 17,718,148 | 3.38 | % | $ | 526,488 | $ | 14,422,495 | 3.65 | % | ||||||||||||||||||||||||
Securitized loans |
2,800,980 | 59,726,838 | 4.69 | 2,248,535 | 49,706,760 | 4.52 | ||||||||||||||||||||||||||||||
Managed loans |
$ | 3,400,622 | $ | 77,444,986 | 4.39 | $ | 2,775,023 | $ | 64,129,255 | 4.33 | ||||||||||||||||||||||||||
RECONCILIATION OF THE LOAN RECEIVABLES DELINQUENCY RATIO TO THE MANAGED
DELINQUENCY RATIO
(dollars in thousands)
| December 31, | 2003 | | | 2002 | | | 2001 | |||||||||||||||||||||||||||||||
| Delinquent | Delinquency | Delinquent | Delinquency | Delinquent | Delinquency | |||||||||||||||||||||||||||||||
| Balances (c) | Ending Loans | Ratio (c) | Balances (c) | Ending Loans | Ratio (c) | Balances (c) | Ending Loans | Ratio (c) | ||||||||||||||||||||||||||||
Loan receivables (b) |
$ | 1,289,799 | $ | 33,624,077 | 3.84 | % | $ | 1,251,603 | $ | 28,726,508 | 4.36 | % | $ | 1,150,901 | $ | 24,633,564 | 4.67 | % | ||||||||||||||||||
Securitized loans |
3,913,851 | 84,869,483 | 4.61 | 3,977,908 | 78,531,334 | 5.07 | 3,811,560 | 72,862,487 | 5.23 | |||||||||||||||||||||||||||
Managed loans |
$ | 5,203,650 | $ | 118,493,560 | 4.39 | $ | 5,229,511 | $ | 107,257,842 | 4.88 | $ | 4,962,461 | $ | 97,496,051 | 5.09 | |||||||||||||||||||||
| December 31, | 2000 | | | 1999 | |||||||||||||||||||||||||||||||||
| Delinquent | Delinquency | Delinquent | Delinquency | |||||||||||||||||||||||||||||||||
| Balances (c) | Ending Loans | Ratio (c) | Balances (c) | Ending Loans | Ratio (c) | |||||||||||||||||||||||||||||||
Loan receivables (b) |
$ | 803,680 | $ | 19,954,837 | 4.03 | % | $ | 708,751 | $ | 17,663,709 | 4.01 | % | ||||||||||||||||||||||||
Securitized loans |
3,182,858 | 68,835,884 | 4.62 | 2,508,145 | 54,591,804 | 4.59 | ||||||||||||||||||||||||||||||
Managed loans |
$ | 3,986,538 | $ | 88,790,721 | 4.49 | $ | 3,216,896 | $ | 72,255,513 | 4.45 | ||||||||||||||||||||||||||
TABLE 34: MANAGED RECONCILIATION OF THE FIVE-YEAR STATISTICAL SUMMARY-Continued
RECONCILIATION OF THE NET INTEREST MARGIN RATIO TO THE MANAGED NET INTEREST MARGIN RATIO (dollars in thousands)
| Year Ended December 31, | 2003 | | | 2002 | | | 2001 | |||||||||||||||||||||||||||||||
| Net | Net | Net | ||||||||||||||||||||||||||||||||||
| Average | Interest | Average | Interest | Average | Interest | |||||||||||||||||||||||||||||||
| Earning | Net Interest | Margin | Earning | Net Interest | Margin | Earning | Net Interest | Margin | ||||||||||||||||||||||||||||
| Assets | Income | Ratio | Assets | Income | Ratio | Assets | Income | Ratio | ||||||||||||||||||||||||||||
Net Interest Margin (d) |
||||||||||||||||||||||||||||||||||||
Investment securities and
money market instruments (e) |
$ | 11,693,550 | $ | 8,257,838 | $ | 6,500,608 | ||||||||||||||||||||||||||||||
Other interest-earning assets (e) |
3,904,013 | 3,869,893 | 3,256,773 | |||||||||||||||||||||||||||||||||
Loan receivables (b) |
28,183,818 | 25,315,200 | 20,339,388 | |||||||||||||||||||||||||||||||||
Total |
$ | 43,781,381 | $ | 2,351,132 | 5.37 | % | $ | 37,442,931 | $ | 2,075,645 | 5.54 | % | $ | 30,096,769 | $ | 1,659,023 | 5.51 | % | ||||||||||||||||||
Securitization Adjustments |
||||||||||||||||||||||||||||||||||||
Investment securities and
money market instruments |
$ | — | $ | — | $ | — | ||||||||||||||||||||||||||||||
Other interest-earning assets |
(3,835,216 | ) | (3,808,179 | ) | (3,197,381 | ) | ||||||||||||||||||||||||||||||
Securitized loans |
81,691,156 | 74,718,731 | 70,560,600 | |||||||||||||||||||||||||||||||||
Total |
$ | 77,855,940 | 7,854,265 | 10.09 | $ | 70,910,552 | 7,044,102 | 9.93 | $ | 67,363,219 | 6,546,802 | 9.72 | ||||||||||||||||||||||||
Managed Net Interest Margin (d) |
||||||||||||||||||||||||||||||||||||
Investment securities and
money market instruments (e) |
$ | 11,693,550 | $ | 8,257,838 | $ | 6,500,608 | ||||||||||||||||||||||||||||||
Other interest-earning assets (e) |
68,797 | 61,714 | 59,392 | |||||||||||||||||||||||||||||||||
Managed loans |
109,874,974 | 100,033,931 | 90,899,988 | |||||||||||||||||||||||||||||||||
Total |
$ | 121,637,321 | 10,205,397 | 8.39 | $ | 108,353,483 | 9,119,747 | 8.42 | $ | 97,459,988 | 8,205,825 | 8.42 | ||||||||||||||||||||||||
| Year Ended December 31, | 2000 | | | 1999 | |||||||||||||||||||||||||||||||||
| Net | Net | |||||||||||||||||||||||||||||||||||
| Average | Interest | Average | Interest | |||||||||||||||||||||||||||||||||
| Earning | Net Interest | Margin | Earning | Net Interest | Margin | |||||||||||||||||||||||||||||||
| Assets | Income | Ratio | Assets | Income | Ratio | |||||||||||||||||||||||||||||||
Net Interest Margin (d) |
||||||||||||||||||||||||||||||||||||
Investment securities and
money market instruments (e) |
$ | 5,051,619 | $ | 5,771,007 | ||||||||||||||||||||||||||||||||
Other interest-earning assets (e) |
2,623,168 | 2,042,750 | ||||||||||||||||||||||||||||||||||
Loan receivables (b) |
17,718,148 | 14,422,495 | ||||||||||||||||||||||||||||||||||
Total |
$ | 25,392,935 | $ | 1,397,382 | 5.50 | % | $ | 22,236,252 | $ | 1,177,691 | 5.30 | % | ||||||||||||||||||||||||
Securitization Adjustments |
||||||||||||||||||||||||||||||||||||
Investment securities and
money market instruments |
$ | — | $ | — | ||||||||||||||||||||||||||||||||
Other interest-earning assets |
(2,592,189 | ) | (2,016,616 | ) | ||||||||||||||||||||||||||||||||
Securitized loans |
59,726,838 | 49,706,760 | ||||||||||||||||||||||||||||||||||
Total |
$ | 57,134,649 | 4,442,094 | 7.77 | $ | 47,690,144 | 4,012,042 | 8.41 | ||||||||||||||||||||||||||||
Managed Net Interest Margin (d) |
||||||||||||||||||||||||||||||||||||
Investment securities and
money market instruments (e) |
$ | 5,051,619 | $ | 5,771,007 | ||||||||||||||||||||||||||||||||
Other interest-earning assets (e) |
30,979 | 26,134 | ||||||||||||||||||||||||||||||||||
Managed loans |
77,444,986 | 64,129,255 | ||||||||||||||||||||||||||||||||||
Total |
$ | 82,527,584 | 5,839,476 | 7.08 | $ | 69,926,396 | 5,189,733 | 7.42 | ||||||||||||||||||||||||||||
| (a) | MBNA Corporation’s net credit loss ratio is calculated by dividing annualized net credit losses, which exclude uncollectible accrued interest and fees and fraud losses, for the period by average loans, which include estimated collectible billed interest and fees for the corresponding period. |
| (b) | Loan receivables include loans held for securitization and the loan portfolio. | |||
| (c) | Delinquency represents accruing loans that are 30 days or more past due. | |||
| (d) | Net interest margin ratios are presented on a fully taxable equivalent basis. The fully taxable equivalent adjustment for the year ended December 31, 2003, 2002, 2001, 2000, and 1999 was $759, $1,070, $1,683, $2,367, and $1,932, respectively. |
| (e) | For purposes of comparability, certain prior period amounts have been reclassified. |
MANAGEMENT’S
REPORT ON THE CONSOLIDATED FINANCIAL
STATEMENTS AND INTERNAL CONTROL
The accompanying consolidated financial statements were prepared by management, which is responsible for the integrity and objectivity of the information presented, including amounts that must necessarily be based on judgments and estimates. The consolidated financial statements were prepared in conformity with accounting principles generally accepted in the United States, and in situations where acceptable alternative accounting principles exist, management selected the method that it believed was appropriate in the circumstances. Financial information appearing throughout this Annual Report to Stockholders is consistent with the consolidated financial statements.
Management depends upon MBNA Corporation’s systems of internal control in meeting its responsibilities for reliable consolidated financial statements. In management’s opinion, these systems provide reasonable assurance that assets are safeguarded and that transactions are properly recorded and executed in accordance with management’s authorizations. Judgments are required to assess and balance the relative costs and expected benefits of these controls. As an integral part of the systems of internal control, the Corporation maintains a professional staff of internal auditors who conduct operational and special audits and coordinate audit coverage with the independent auditors. The consolidated financial statements have been audited by the Corporation’s independent auditors, Ernst & Young LLP, whose independent professional opinion appears separately.
The Audit Committee of the Board of Directors, composed solely of outside directors, meets periodically with the internal auditors, the independent auditors, and management to review the work of each and evaluate whether each is properly discharging its responsibilities. The independent auditors have free access to the Audit Committee to discuss the results of their audit work and their evaluations of the adequacy of internal controls and the quality of financial reporting.

REPORT OF INDEPENDENT AUDITORS
Board of Directors and Stockholders
MBNA Corporation
We have audited the accompanying consolidated statements of financial condition of MBNA Corporation and subsidiaries as of December 31, 2003 and 2002, and the related consolidated statements of income, changes in stockholders’ equity, and cash flows for each of the three years in the period ended December 31, 2003. These financial statements are the responsibility of the Corporation’s management. Our responsibility is to express an opinion on these financial statements based on our audits.
We conducted our audits in accordance with auditing standards generally accepted in the United States. Those standards require that we plan and perform the audit to obtain reasonable assurance about whether the financial statements are free of material misstatement. An audit includes examining, on a test basis, evidence supporting the amounts and disclosures in the financial statements. An audit also includes assessing the accounting principles used and significant estimates made by management, as well as evaluating the overall financial statement presentation. We believe that our audits provide a reasonable basis for our opinion.
In our opinion, the financial statements referred to above present fairly, in all material respects, the consolidated financial position of MBNA Corporation and subsidiaries at December 31, 2003 and 2002, and the consolidated results of their operations and their cash flows for each of the three years in the period ended December 31, 2003, in conformity with accounting principles generally accepted in the United States.

Baltimore, Maryland
January 22, 2004
CONSOLIDATED STATEMENTS OF FINANCIAL CONDITION (dollars in thousands, except per share amounts)
| December 31, | 2003 | 2002 | ||||||
Assets |
||||||||
Cash and due from banks |
$ | 660,022 | $ | 721,972 | ||||
Interest-earning time deposits in other banks |
3,590,329 | 3,703,052 | ||||||
Federal funds sold |
1,275,000 | 1,645,000 | ||||||
Investment securities: |
||||||||
Available-for-sale (amortized cost of $4,352,069 and $3,617,505 at December 31, 2003
and 2002, respectively) |
4,363,087 | 3,655,808 | ||||||
Held-to-maturity (market value of $354,434 and $428,472 at December 31, 2003
and 2002, respectively) |
353,299 | 419,760 | ||||||
Loans held for securitization |
13,084,105 | 11,029,627 | ||||||
Loan portfolio: |
||||||||
Credit card |
11,910,507 | 9,484,115 | ||||||
Other consumer |
8,629,465 | 8,212,766 | ||||||
Total loan portfolio |
20,539,972 | 17,696,881 | ||||||
Reserve for possible credit losses |
(1,216,316 | ) | (1,111,299 | ) | ||||
Net loan portfolio |
19,323,656 | 16,585,582 | ||||||
Premises and equipment, net |
2,676,597 | 2,519,101 | ||||||
Accrued income receivable |
443,755 | 371,089 | ||||||
Accounts receivable from securitization |
7,766,477 | 6,926,876 | ||||||
Intangible assets, net |
3,188,368 | 3,188,501 | ||||||
Prepaid expenses and deferred charges |
499,775 | 412,609 | ||||||
Other assets |
1,888,885 | 1,677,769 | ||||||
Total assets |
$ | 59,113,355 | $ | 52,856,746 | ||||
Liabilities |
||||||||
Deposits: |
||||||||
Time deposits |
$ | 21,528,882 | $ | 22,079,031 | ||||
Money market deposit accounts |
7,790,726 | 7,520,119 | ||||||
Noninterest-bearing deposits |
2,419,209 | 915,687 | ||||||
Interest-bearing transaction accounts |
47,334 | 45,414 | ||||||
Savings accounts |
49,930 | 55,965 | ||||||
Total deposits |
31,836,081 | 30,616,216 | ||||||
Short-term borrowings |
1,025,463 | 1,250,103 | ||||||
Long-term debt and bank notes |
12,145,628 | 9,538,173 | ||||||
Accrued interest payable |
319,227 | 286,158 | ||||||
Accrued expenses and other liabilities |
2,673,916 | 2,064,777 | ||||||
Total liabilities |
48,000,315 | 43,755,427 | ||||||
Stockholders’ Equity |
||||||||
Preferred stock ($.01 par value, 20,000,000 shares authorized, 8,573,882 shares issued and outstanding
at December 31, 2003 and 2002) |
86 | 86 | ||||||
Common stock ($.01 par value, 1,500,000,000 shares authorized, 1,277,597,840 shares at December 31, 2003
and 1,277,671,875 shares at December 31, 2002, issued and outstanding) |
12,776 | 12,777 | ||||||
Additional paid-in capital |
2,119,700 | 2,296,568 | ||||||
Retained earnings |
8,571,174 | 6,707,162 | ||||||
Accumulated other comprehensive income |
409,304 | 84,726 | ||||||
Total stockholders’ equity |
11,113,040 | 9,101,319 | ||||||
Total liabilities and stockholders’ equity |
$ | 59,113,355 | $ | 52,856,746 | ||||
The accompanying notes are an integral part of the consolidated financial statements.
CONSOLIDATED STATEMENTS OF INCOME (dollars in thousands, except per share amounts)
| Year Ended December 31, | 2003 | 2002 | 2001 | |||||||||
Interest Income |
||||||||||||
Loan portfolio |
$ | 2,216,256 | $ | 2,037,454 | $ | 1,793,145 | ||||||
Loans held for securitization |
1,112,977 | 1,056,558 | 998,881 | |||||||||
Investment securities: |
||||||||||||
Taxable |
110,370 | 134,411 | 161,013 | |||||||||
Tax-exempt |
1,417 | 1,895 | 3,124 | |||||||||
Time deposits in other banks |
79,259 | 53,133 | 71,341 | |||||||||
Federal funds sold |
33,137 | 35,460 | 56,651 | |||||||||
Other interest income |
305,468 | 359,159 | 387,250 | |||||||||
Total interest income |
3,858,884 | 3,678,070 | 3,471,405 | |||||||||
Interest Expense |
||||||||||||
Deposits |
1,107,806 | 1,255,527 | 1,444,706 | |||||||||
Short-term borrowings |
39,132 | 42,978 | 24,766 | |||||||||
Long-term debt and bank notes |
361,573 | 304,990 | 344,593 | |||||||||
Total interest expense |
1,508,511 | 1,603,495 | 1,814,065 | |||||||||
Net Interest Income |
2,350,373 | 2,074,575 | 1,657,340 | |||||||||
Provision for possible credit losses |
1,392,701 | 1,340,157 | 1,140,615 | |||||||||
Net interest income after provision for possible credit losses |
957,672 | 734,418 | 516,725 | |||||||||
Other Operating Income |
||||||||||||
Securitization income |
6,523,956 | 5,666,352 | 5,722,324 | |||||||||
Interchange |
391,827 | 357,410 | 300,957 | |||||||||
Credit card fees |
513,605 | 385,422 | 295,101 | |||||||||
Other consumer loan fees |
108,226 | 100,862 | 92,447 | |||||||||
Insurance |
231,941 | 181,474 | 145,338 | |||||||||
Other |
55,925 | 61,403 | 117,149 | |||||||||
Total other operating income |
7,825,480 | 6,752,923 | 6,673,316 | |||||||||
Other Operating Expense |
||||||||||||
Salaries and employee benefits |
2,083,120 | 1,947,389 | 1,821,293 | |||||||||
Occupancy expense of premises |
176,114 | 171,989 | 159,075 | |||||||||
Furniture and equipment expense |
351,501 | 334,287 | 304,032 | |||||||||
Other |
2,513,412 | 2,248,260 | 2,190,431 | |||||||||
Total other operating expense |
5,124,147 | 4,701,925 | 4,474,831 | |||||||||
Income Before Income Taxes |
3,659,005 | 2,785,416 | 2,715,210 | |||||||||
Applicable income taxes |
1,320,901 | 1,019,462 | 1,020,919 | |||||||||
Net Income |
$ | 2,338,104 | $ | 1,765,954 | $ | 1,694,291 | ||||||
Earnings Per Common Share |
$ | 1.82 | $ | 1.37 | $ | 1.31 | ||||||
Earnings Per Common Share—Assuming Dilution |
1.79 | 1.34 | 1.28 | |||||||||
Dividends Per Common Share |
.36 | .27 | .24 | |||||||||
The accompanying notes are an integral part of the consolidated financial statements.
CONSOLIDATED STATEMENTS OF CHANGES IN STOCKHOLDERS’ EQUITY (dollars in thousands, except per share amounts)
| Outstanding Shares |
||||||||||||||||||||||||||||||||
| Accumulated | ||||||||||||||||||||||||||||||||
| Additional | Other | Total | ||||||||||||||||||||||||||||||
| Preferred | Common | Preferred | Common | Paid-in | Retained | Comprehensive | Stockholders' | |||||||||||||||||||||||||
| (000) | (000) | Stock | Stock | Capital | Earnings | Income | Equity | |||||||||||||||||||||||||
Balance, December 31, 2000 |
8,574 | 1,277,706 | $ | 86 | $ | 12,777 | $ | 2,721,691 | $ | 3,931,248 | $ | (38,524 | ) | $ | 6,627,278 | |||||||||||||||||
Comprehensive income: |
||||||||||||||||||||||||||||||||
Net income |
– | – | – | – | – | 1,694,291 | – | 1,694,291 | ||||||||||||||||||||||||
Foreign currency translation, net of tax
(accumulated amount of ($75,940) at
December 31, 2001) |
– | – | – | – | – | – | (28,984 | ) | (28,984 | ) | ||||||||||||||||||||||
Net unrealized gains on investment securities
available-for-sale and other financial
instruments, net of tax (accumulated
gain of $27,507 at December 31, 2001) |
– | – | – | – | – | – | 19,075 | 19,075 | ||||||||||||||||||||||||
Other comprehensive income, net of tax |
(9,909 | ) | ||||||||||||||||||||||||||||||
Comprehensive income |
1,684,382 | |||||||||||||||||||||||||||||||
Cash dividends: |
||||||||||||||||||||||||||||||||
Common—$.24 per share |
– | – | – | – | – | (306,672 | ) | – | (306,672 | ) | ||||||||||||||||||||||
Preferred |
– | – | – | – | – | (14,142 | ) | – | (14,142 | ) | ||||||||||||||||||||||
Exercise of stock options and other awards |
– | 15,833 | – | 158 | 83,874 | – | – | 84,032 | ||||||||||||||||||||||||
Stock-based compensation tax benefit |
– | – | – | – | 68,580 | – | – | 68,580 | ||||||||||||||||||||||||
Amortization of deferred compensation expense |
– | – | – | – | 31,355 | – | – | 31,355 | ||||||||||||||||||||||||
Acquisition and retirement of common stock |
– | (15,867 | ) | – | (158 | ) | (375,937 | ) | – | – | (376,095 | ) | ||||||||||||||||||||
Balance, December 31, 2001 |
8,574 | 1,277,672 | 86 | 12,777 | 2,529,563 | 5,304,725 | (48,433 | ) | 7,798,718 | |||||||||||||||||||||||
Comprehensive income: |
||||||||||||||||||||||||||||||||
Net income |
– | – | – | – | – | 1,765,954 | – | 1,765,954 | ||||||||||||||||||||||||
Foreign currency translation, net of tax
(accumulated amount of $64,817 at
December 31, 2002) |
– | – | – | – | – | – | 140,757 | 140,757 | ||||||||||||||||||||||||
Net unrealized losses on investment securities
available-for-sale and other financial
instruments, net of tax (accumulated
gain of $24,185 at December 31, 2002) |
– | – | – | – | – | – | (3,322 | ) | (3,322 | ) | ||||||||||||||||||||||
Minimum benefit plan liability adjustment,
net of tax (accumulated amount of ($4,276)
at December 31, 2002) |
– | – | – | – | – | – | (4,276 | ) | (4,276 | ) | ||||||||||||||||||||||
Other comprehensive income, net of tax |
133,159 | |||||||||||||||||||||||||||||||
Comprehensive income |
1,899,113 | |||||||||||||||||||||||||||||||
Cash dividends: |
||||||||||||||||||||||||||||||||
Common—$.27 per share |
– | – | – | – | – | (349,339 | ) | – | (349,339 | ) | ||||||||||||||||||||||
Preferred |
– | – | – | – | – | (14,178 | ) | – | (14,178 | ) | ||||||||||||||||||||||
Exercise of stock options and other awards |
– | 25,521 | – | 255 | 138,167 | – | – | 138,422 | ||||||||||||||||||||||||
Stock-based compensation tax benefit |
– | – | – | – | 149,914 | – | – | 149,914 | ||||||||||||||||||||||||
Amortization of deferred compensation expense |
– | – | – | – | 94,172 | – | – | 94,172 | ||||||||||||||||||||||||
Acquisition and retirement of common stock |
– | (25,521 | ) | – | (255 | ) | (615,248 | ) | – | – | (615,503 | ) | ||||||||||||||||||||
Balance, December 31, 2002 |
8,574 | 1,277,672 | 86 | 12,777 | 2,296,568 | 6,707,162 | 84,726 | 9,101,319 | ||||||||||||||||||||||||
Comprehensive income: |
||||||||||||||||||||||||||||||||
Net income |
– | – | – | – | – | 2,338,104 | – | 2,338,104 | ||||||||||||||||||||||||
Foreign currency translation, net of tax
(accumulated amount of $417,617 at
December 31, 2003) |
– | – | – | – | – | – | 352,800 | 352,800 | ||||||||||||||||||||||||
Net unrealized losses on investment securities
available-for-sale and other financial
instruments, net of tax (accumulated
gain of $6,901 at December 31, 2003) |
– | – | – | – | – | – | (17,284 | ) | (17,284 | ) | ||||||||||||||||||||||
Minimum benefit plan liability adjustment,
net of tax (accumulated amount of ($15,214)
at December 31, 2003) |
– | – | – | – | – | – | (10,938 | ) | (10,938 | ) | ||||||||||||||||||||||
Other comprehensive income, net of tax |
324,578 | |||||||||||||||||||||||||||||||
Comprehensive income |
2,662,682 | |||||||||||||||||||||||||||||||
Cash dividends: |
||||||||||||||||||||||||||||||||
Common—$.36 per share |
– | – | – | – | – | (460,028 | ) | – | (460,028 | ) | ||||||||||||||||||||||
Preferred |
– | – | – | – | – | (14,064 | ) | – | (14,064 | ) | ||||||||||||||||||||||
Exercise of stock options and other awards |
– | 29,152 | – | 291 | 275,502 | – | – | 275,793 | ||||||||||||||||||||||||
Stock-based compensation tax benefit |
– | – | – | – | 77,915 | – | – | 77,915 | ||||||||||||||||||||||||
Issuance of common stock, net of issuance costs |
– | 50,000 | – | 500 | 1,081,686 | – | – | 1,082,186 | ||||||||||||||||||||||||
Amortization of deferred compensation expense |
– | – | – | – | 88,061 | – | – | 88,061 | ||||||||||||||||||||||||
Acquisition and retirement of common stock |
– | (79,226 | ) | – | (792 | ) | (1,700,032 | ) | – | – | (1,700,824 | ) | ||||||||||||||||||||
Balance, December 31, 2003 |
8,574 | 1,277,598 | $ | 86 | $ | 12,776 | $ | 2,119,700 | $ | 8,571,174 | $ | 409,304 | $ | 11,113,040 | ||||||||||||||||||
The accompanying notes are an integral part of the consolidated financial statements.
CONSOLIDATED STATEMENTS OF CASH FLOWS (dollars in thousands)
| Year Ended December 31, | 2003 | 2002 | 2001 | |||||||||
Operating Activities |
||||||||||||
Net income |
$ | 2,338,104 | $ | 1,765,954 | $ | 1,694,291 | ||||||
Adjustments to reconcile net income to net cash provided by operating activities: |
||||||||||||
Provision for possible credit losses |
1,392,701 | 1,340,157 | 1,140,615 | |||||||||
Depreciation, amortization, and accretion |
861,459 | 779,638 | 715,386 | |||||||||
Benefit for deferred income taxes |
(1,980 | ) | (151,707 | ) | (111,267 | ) | ||||||
(Increase) decrease in accrued income receivable |
(57,524 | ) | 5,282 | (64,944 | ) | |||||||
(Increase) decrease in accounts receivable from securitization |
(698,229 | ) | 602,160 | (418,375 | ) | |||||||
Increase (decrease) in accrued interest payable |
23,700 | 53,861 | (10,468 | ) | ||||||||
Decrease (increase) in other operating activities |
9,570 | 389,809 | (13,342 | ) | ||||||||
Net cash provided by operating activities |
3,867,801 | 4,785,154 | 2,931,896 | |||||||||
Investing Activities |
||||||||||||
Net decrease (increase) in money market instruments |
622,732 | (2,271,289 | ) | (842,624 | ) | |||||||
Proceeds from maturities of investment securities available-for-sale |
1,802,968 | 1,054,876 | 1,673,341 | |||||||||
Proceeds from sale of investment securities available-for-sale |
– | 13,126 | 505 | |||||||||
Purchases of investment securities available-for-sale |
(2,520,608 | ) | (1,606,729 | ) | (2,119,000 | ) | ||||||
Proceeds from maturities of investment securities held-to-maturity |
89,741 | 45,752 | 33,280 | |||||||||
Purchases of investment securities held-to-maturity |
(23,016 | ) | (81,596 | ) | (78,662 | ) | ||||||
Proceeds from securitization of loans |
13,598,329 | 15,373,055 | 12,329,830 | |||||||||
Loan portfolio acquisitions |
(2,232,049 | ) | (4,479,966 | ) | (1,301,628 | ) | ||||||
Increase in loans due to principal payments to investors in the Corporation’s
securitization transactions |
(8,542,510 | ) | (10,195,864 | ) | (8,277,644 | ) | ||||||
Net loan originations |
(8,427,255 | ) | (6,294,442 | ) | (8,615,423 | ) | ||||||
Net purchases of premises and equipment |
(414,833 | ) | (551,208 | ) | (691,567 | ) | ||||||
Net cash used in investing activities |
(6,046,501 | ) | (8,994,285 | ) | (7,889,592 | ) | ||||||
Financing Activities |
||||||||||||
Net increase in money market deposit accounts, noninterest-bearing
deposits, interest-bearing transaction accounts, and savings accounts |
1,739,818 | 1,214,202 | 1,430,101 | |||||||||
Net (decrease) increase in time deposits |
(629,721 | ) | 2,161,613 | 1,353,297 | ||||||||
Net (decrease) increase in short-term borrowings |
(264,713 | ) | (524,606 | ) | 1,626,185 | |||||||
Proceeds from issuance of long-term debt and bank notes |
3,320,585 | 3,749,413 | 2,043,964 | |||||||||
Maturity of long-term debt and bank notes |
(1,270,574 | ) | (1,803,816 | ) | (900,757 | ) | ||||||
Proceeds from exercise of stock options and other awards |
275,793 | 138,422 | 84,032 | |||||||||
Acquisition and retirement of common stock |
(1,700,824 | ) | (615,503 | ) | (376,095 | ) | ||||||
Proceeds from issuance of common stock |
1,082,186 | – | – | |||||||||
Dividends paid |
(435,800 | ) | (350,740 | ) | (312,382 | ) | ||||||
Net cash provided by financing activities |
2,116,750 | 3,968,985 | 4,948,345 | |||||||||
Decrease in Cash and Cash Equivalents |
(61,950 | ) | (240,146 | ) | (9,351 | ) | ||||||
Cash and cash equivalents at beginning of year |
721,972 | 962,118 | 971,469 | |||||||||
Cash and cash equivalents at end of year |
$ | 660,022 | $ | 721,972 | $ | 962,118 | ||||||
Supplemental Disclosures |
||||||||||||
Interest expense paid |
$ | 1,524,959 | $ | 1,589,080 | $ | 1,869,919 | ||||||
Income taxes paid |
$ | 1,002,682 | $ | 1,020,878 | $ | 892,519 | ||||||
The accompanying notes are an integral part of the consolidated financial statements.
NOTES TO THE CONSOLIDATED FINANCIAL STATEMENTS
NOTE 1: BUSINESS AND BASIS OF PRESENTATION
MBNA Corporation (“the Corporation”) is a registered bank holding company, incorporated under the laws of Maryland. It is the parent company of MBNA America Bank, N.A. (“the Bank”), a national bank and the Corporation’s principal subsidiary. The Bank has two wholly owned foreign bank subsidiaries, MBNA Europe Bank Limited (“MBNA Europe”), located in the United Kingdom, and MBNA Canada Bank (“MBNA Canada”), located in Canada. Through the Bank, the Corporation is the largest independent credit card lender in the world and is the leading issuer of credit cards, through endorsed marketing. In addition to its credit card lending, the Corporation also makes other consumer loans which include installment and revolving unsecured loan products and offers insurance and deposit products. The Corporation is also the parent of MBNA America (Delaware), N.A. (“MBNA Delaware”), a national bank, which offers business card products, mortgage loans, aircraft loans, and other specialty loan products.
The accompanying audited consolidated financial statements have been prepared in accordance with accounting principles generally accepted in the United States (“GAAP”) that require management to make estimates and assumptions that affect reported amounts in the financial statements and accompanying notes. These estimates are based on information available as of the date of the consolidated financial statements. Therefore, actual results could differ from these estimates.
For purposes of comparability, certain prior period amounts have been reclassified to conform with the 2003 presentation.
NOTE 2: PRINCIPLES OF CONSOLIDATION
The accompanying audited consolidated financial statements include, after intercompany elimination, the accounts of all subsidiaries of the Corporation, all of which are wholly owned.
The Corporation securitizes its loan principal receivables through trusts that qualify as special-purpose entities as defined by Statement of Financial Accounting Standards No. 140, “Accounting for Transfers and Servicing of Financial Assets and Extinguishments of Liabilities-a replacement of FASB Statement No. 125” (“Statement No. 140”), issued by the Financial Accounting Standards Board (“FASB”). In January 2003, FASB Interpretation No. 46 “Consolidation of Variable Interest Entities” (“Interpretation No. 46”) was issued. Interpretation No. 46 clarified the rules for consolidation by an investor entity for which the investor’s ownership interest changes with changes in the entity’s net asset value. The Corporation’s securitization trusts are specifically exempted from the requirements of Interpretation No. 46 since they are qualified special-purpose entities as defined by Statement No. 140. As a result, the trusts are not subsidiaries of the Corporation and are excluded from the Corporation’s audited consolidated financial statements in accordance with GAAP.
The Corporation also holds Community Development investments in the form of limited partnership interests that qualify under the Community Reinvestment Act. The Corporation holds less than 50% interests in these partnerships and does not control the limited partnerships. The Corporation determined that these partnerships are variable interest entities as defined by Interpretation No. 46. Interpretation No. 46 requires consolidation of a variable interest entity by the primary beneficiary of that entity. The Corporation determined that it is not the primary beneficiary of the limited partnerships, therefore they are not consolidated and are excluded from the Corporation’s audited consolidated financial statements in accordance with GAAP. The Corporation’s investments in these limited partnerships are recorded in other assets in the Corporation’s audited consolidated statements of financial condition.
In the third quarter of 2003, the Corporation determined that MBNA Capital A, MBNA Capital B, MBNA Capital C, MBNA Capital D, and MBNA Capital E (collectively the “statutory trusts”), were variable interest entities as defined by Interpretation No. 46 and the Corporation was not the primary beneficiary. As a result, the statutory trusts were deconsolidated effective July 1, 2003. The deconsolidation of the statutory trusts increased long-term debt and bank notes and the investment in variable interest entities, which is recorded in other assets in the Corporation’s audited consolidated statements of financial condition.
NOTE 3: SIGNIFICANT ACCOUNTING POLICIES
INVESTMENT SECURITIES
Investment securities include both those available-for-sale and those held-to-maturity. Investment securities available-for-sale are reported at market value with unrealized gains and losses, net of tax, reported as a component of other comprehensive income included in stockholders’ equity. Investment securities held-to-maturity are reported at cost (adjusted for amortization of premiums and accretion of discounts). Realized gains and losses and other-than-temporary impairments related to investment securities are determined using the specific identification method and are reported in other operating income as gains or losses on investment securities. The Corporation does not hold investment securities for trading purposes.
ASSET SECURITIZATION
Asset securitization involves the sale to a trust of a pool of loan principal receivables and is accomplished through the public and private issuance of asset-backed securities. The Corporation removes loan principal receivables from the Corporation’s consolidated statements of financial condition for those asset securitizations that qualify as sales in accordance with Statement No. 140. Earnings on the Corporation’s securitized loans, including gains from securitizations, are included in securitization income
and other interest income in the Corporation’s audited consolidated statements of income, and amounts due from the trusts and the Corporation’s retained interests are included in accounts receivable from securitization in the Corporation’s audited consolidated statements of financial condition.
The trusts are qualified special-purpose entities as defined under Statement No. 140. To meet the criteria to be considered a qualifying special-purpose entity, a trust must be demonstrably distinct from the Corporation and have activities that are signifi-cantly limited and entirely specified in the legal documents that established the trust. The Corporation cannot change the activities that the trust can perform. These activities may only be changed by a majority of the beneficial interest holders not including the Corporation. The trusts are administered by an independent trustee.
LOANS HELD FOR SECURITIZATION
Loans held for securitization includes loans that were originated through certain endorsing organizations or financial institutions who have the contractual right to purchase the loans from the Corporation at fair value and the lesser of loan principal receivables eligible for securitization or sale, or loan principal receivables that management intends to securitize or sell within one year. These loans are carried at the lower of aggregate cost or fair value.
RESERVE FOR POSSIBLE CREDIT LOSSES
The Corporation maintains the reserve for possible credit losses at an amount sufficient to absorb losses inherent in the Corporation’s loan principal receivables at the reporting date based on a projection of probable net credit losses. To project probable net credit losses, the Corporation regularly performs a migration analysis of delinquent and current accounts. A migration analysis is a technique used to estimate the likelihood that a loan receivable will progress through the various delinquency stages and ultimately charge off. On a quarterly basis, the Corporation reviews and adjusts, as appropriate, these estimates. The Corporation’s projection of probable net credit losses considers the impact of economic conditions on the borrowers’ ability to repay, past collection experience, the risk characteristics and composition of the portfolio, and other factors. The Corporation then reserves for the projected probable net credit losses based on its projection of these amounts. The Corporation establishes appropriate levels of the reserve for possible credit losses for its products, including domestic credit card, domestic other consumer and foreign loans, based on their risk characteristics. A provision is charged against earnings to maintain the reserve for possible credit losses at an appropriate level. The Corporation records acquired reserves for current period loan acquisitions.
The Corporation works with Customers continually at each stage of delinquency. The Corporation’s policy is to charge off open-end delinquent retail loans by the end of the month in which the account becomes 180 days contractually past due and closed-end
delinquent retail loans by the end of the month in which they become 120 days contractually past due. Delinquent bankrupt accounts are charged off the end of the second calendar month following receipt of notification of filing from the applicable court, but not later than the applicable 180-day or 120-day timeframes described above. Accounts of deceased Customers are charged off when the loss is determined, but not later than the applicable 180-day or 120-day timeframes described above. Accounts failing to make a payment within charge-off policy timeframes are written off. Managers may on an exception basis defer charge off of an account for another month, pending continued payment activity or other special circumstances. Senior manager approval is required on all such exceptions to the above charge-off policies.
The reserve for possible credit losses is a general allowance applicable to the Corporation’s loan receivables and does not include an allocation for credit risk related to securitized loans. Net credit losses on securitized loans are absorbed directly by the related trusts under their respective contractual agreements and do not affect the reserve for possible credit losses.
DELINQUENT LOANS
The entire balance of an account is contractually delinquent if the minimum payment is not received by the specified date on the Customer’s billing statement. Interest and fees continue to accrue on the Corporation’s delinquent loans. Delinquency is reported on accruing loans that are 30 or more days past due.
NONACCRUAL LOANS
On a case-by-case basis, management determines if an account should be placed on nonaccrual status. When loans are classified as nonaccrual, the accrual of interest ceases. In future periods, when a payment is received, it is recorded as a reduction of principal.
LOAN RECEIVABLE FRAUD LOSSES
The Corporation incurs loan receivable fraud losses from the unauthorized use of Customer accounts and counterfeiting. These fraudulent transactions, when identified, are reclassified to other assets from loans and reduced to estimated net recoverable values through a charge to other operating expense.
PREMISES AND EQUIPMENT
Premises and equipment are stated at cost less accumulated depreciation, computed by the straight-line method over the estimated useful lives of the assets.
Buildings are depreciated over a period of 40 years and improvements are depreciated over the shorter of eight years or the remaining useful lives of the buildings that they relate to. Furniture and equipment are depreciated over a range of three years through eight years. Maintenance and repairs are included in other operating expense, while the cost of improvements is capitalized. Land is not depreciated.
Capitalized Software
Purchased software and capitalized costs related to internally developed software are stated at cost less accumulated amortization, computed using the straight-line method over the estimated useful life of the assets which range from three years through five years. Costs incurred during the application development stage related to internally developed software are capitalized in accordance with the American Institute of Certified Public Accountants’ Statement of Position 98-1, “Accounting for the Cost of Computer Software Developed or Obtained for Internal Use” (“SOP 98-1”). Costs incurred during the preliminary project stage and the post implementation stage are expensed as incurred. Capitalized software is included in premises and equipment in the Corporation’s audited consolidated statements of financial condition.
Effective January 1, 2003, the Corporation reclassified capitalized software from other assets to premises and equipment in the Corporation’s audited consolidated statements of financial condition and reclassified computer software expense, which includes amortization of capitalized software, from the other expense component of other operating expense to furniture and equipment expense in the Corporation’s audited consolidated statements of income. Capitalized software was $461.3 million (net of accumulated amortization of $271.9 million) and $330.5 million (net of accumulated amortization of $216.2 million) at December 31, 2003, and 2002, respectively. Computer software expense, including amortization of capitalized software, was $127.3 million, $101.6 million, and $83.2 million for the years ended December 31, 2003, 2002, and 2001, respectively. For purposes of comparability, prior period amounts have been reclassified.
INTANGIBLE ASSETS
The Corporation’s intangible assets include purchased credit card relationships (“PCCRs”) which are carried at net book value. The Corporation records these intangible assets as part of the acquisition of credit card loans and the corresponding Customer relationships. The Corporation’s intangible assets are amortized over the period the assets are expected to contribute to the cash flows of the Corporation which reflect the expected pattern of benefit. PCCRs are amortized using an accelerated method based upon the projected cash flows the Corporation will receive from the Customer relationships during the estimated useful lives of the PCCRs.
The Corporation’s PCCRs are subject to impairment tests in accordance with Statement of Financial Accounting Standards No. 144, “Accounting for the Impairment or Disposal of Long-Lived Assets” (“Statement No. 144”). The Corporation reviews the carrying value of its PCCRs for impairment on a quarterly basis, or sooner whenever events or changes in circumstances indicate that their carrying amount may not be recoverable, by comparing their carrying value to the sum of the undiscounted expected future cash flows from the loans and corresponding credit card relationships. In accordance with Statement No. 144, an impairment exists if the sum of the undiscounted expected future cash flows is less than the carrying amount of the asset. An impairment would result in a write-down
of the PCCRs to estimated fair value based on the discounted future cash flows expected from the PCCRs. The Corporation performs the impairment test on a specific portfolio basis, since it represents the lowest level for which identifiable cash flows are independent of the cash flows of other assets and liabilities.
The Corporation makes certain estimates and assumptions that affect the determination of the expected future cash flows from the loans and corresponding credit card relationships. These estimates and assumptions include levels of account usage and activation, active account attrition, funding costs, credit loss experience, servicing costs, growth in average account balances, interest and fees assessed on loans, and other factors. Significant changes in these estimates and assumptions could result in an impairment of the PCCRs.
Prior to 2002, the Corporation amortized the value of domestic PCCRs over a period of 10 years. In the first quarter of 2002, the Corporation completed a statistical study of the useful lives of its acquired domestic PCCRs. As a result of the study, effective January 1, 2002, the Corporation extended the amortization period of its domestic PCCRs to 15 years to more appropriately match the amortization period with the domestic PCCRs’ estimated useful lives. The Corporation is amortizing the remaining carrying amount as of December 31, 2001 of the domestic PCCRs over the revised remaining amortization period.
As a result of the change in the amortization period for domestic PCCRs, the Corporation’s 2002 income before income taxes increased $100.5 million ($63.7 million after taxes). Excluding the change in the amortization period of the domestic PCCRs, the Corporation’s earnings per common share would have been $1.32 and earnings per common share—assuming dilution would have been $1.30 in 2002.
Prior to 2003, the Corporation amortized the value of its foreign PCCRs over a period of 10 years. Effective January 1, 2003, the Corporation extended the amortization period for its foreign PCCRs to 15 years to more appropriately match the amortization period with the foreign PCCRs’ estimated useful lives. The change in estimate did not have a material impact on the Corporation’s financial condition or results of operations for the year ended December 31, 2003.
The Corporation’s intangible assets had a gross carrying value of $4.9 billion at December 31, 2003 and $4.5 billion at December 31, 2002, and accumulated amortization of $1.7 billion and $1.3 billion at December 31, 2003 and 2002, respectively. In 2003, the Corporation acquired approximately $1.5 billion of credit card loan receivables. As part of these acquisitions, the Corporation recognized $329.3 million of PCCRs.
The Corporation’s intangible asset amortization expense was $411.0 million, $348.7 million, and $381.8 million for the years ended December 31, 2003, 2002, and 2001, respectively.
There were no impairment write-downs of intangible assets for the years ended December 31, 2003 and 2002 and no material impairment write-downs for the year ended December 31, 2001.
The following table presents expected intangible asset amortization expense for the next five years.
EXPECTED INTANGIBLE ASSET AMORTIZATION
(dollars in thousands)
2004 |
$ | 428,610 | ||||||
2005 |
402,419 | |||||||
2006 |
361,889 | |||||||
2007 |
321,905 | |||||||
2008 |
289,745 | |||||||
PREPAID EXPENSES AND DEFERRED CHARGES
The principle components of prepaid expenses and deferred charges include unamortized direct loan origination costs, unamortized debt issuance costs, prepaid employee benefit plan costs, and commissions paid on brokered certificates of deposit. These costs are deferred and amortized over the period the Corporation receives a benefit or the remaining term of the liability. Prepaid expenses and deferred charges also include royalties advanced to the Corporation’s endorsing organizations (see “Royalties to Endorsing Organizations” for further discussion).
COMPREHENSIVE INCOME
The Corporation accounts for comprehensive income in accordance with Statement of Financial Accounting Standards No. 130, “Reporting Comprehensive Income” (“Statement No. 130”). Statement No. 130 established standards for the reporting and presentation of comprehensive income in the financial statements. The Corporation presents comprehensive income in its audited consolidated statements of changes in stockholders’ equity, net of related income taxes.
INCOME TAXES
The Corporation accounts for income taxes using the liability method. Under the liability method, deferred tax assets and liabilities are determined based on the differences between the financial statement carrying amounts and the tax bases of existing assets and liabilities and are measured at the prevailing enacted tax rates that will be in effect when these differences are settled or realized.
STOCK-BASED EMPLOYEE COMPENSATION
The Corporation has two stock-based employee compensation plans, which are more fully described in Note 23: Stock-Based Employee Compensation. The Corporation measures compensation cost for employee stock options and similar instruments using the intrinsic-value-based method of accounting prescribed by Accounting Principles Board Opinion No. 25, “Accounting for Stock Issued to Employees” (“APB Opinion No. 25”), as interpreted by FASB Interpretation No. 44, “Accounting for Certain Transactions Involving Stock Compensation” (“Interpretation No. 44”). All options are granted with an exercise price that is not less than the fair market value of the Corporation’s Common Stock on the date the option is granted. For grants of restricted shares of common stock, the market value of restricted shares at the date of grant is amortized into expense over a 10 year period that approximates the restriction period, or less if the restricted shares had a specific vesting date less than 10 years from the date of grant.
Statement of Financial Accounting Standards No. 123, “Accounting for Stock-Based Compensation,” (“Statement No. 123”), as amended, defines a fair-value-based method of accounting for an employee stock option or similar equity instrument. However, it allows an entity to continue to measure compensation cost for those instruments using the intrinsic-value-based method of accounting prescribed by APB Opinion No. 25. As permitted by Statement No. 123, the Corporation elected to retain the intrinsic-value-based method of accounting for employee stock option grants in accordance with APB Opinion No. 25. Statement No. 123 required certain additional disclosures about stock-based employee compensation arrangements regardless of the method used to account for them. In accordance with Statement No. 123, the Black-Scholes option pricing model is one technique allowed to determine the fair value of employee stock options. The model uses different assumptions that can significantly affect the fair value of the employee stock options and the derived fair value estimates cannot be substantiated by comparison to independent markets.
The following table presents the effect on net income and earnings per common share as required by Statement of Financial Accounting Standards No. 148, “Accounting for Stock-Based
PRO FORMA NET INCOME AND EARNINGS PER COMMON SHARE (dollars in thousands, except per share amounts)
| Year Ended December 31, | 2003 | 2002 | 2001 | |||||||||||||||||
Net Income |
||||||||||||||||||||
As reported |
$ | 2,338,104 | $ | 1,765,954 | $ | 1,694,291 | ||||||||||||||
Add: Stock-based employee compensation expense included in reported net income, net of
related tax effects |
56,271 | 59,705 | 19,565 | |||||||||||||||||
Deduct: Total stock-based employee compensation expense determined under fair value method
for all awards, net of related tax effects |
(130,191 | ) | (134,115 | ) | (94,889 | ) | ||||||||||||||
Pro forma |
$ | 2,264,184 | $ | 1,691,544 | $ | 1,618,967 | ||||||||||||||
Earnings Per Common Share |
||||||||||||||||||||
As reported |
$ | 1.82 | $ | 1.37 | $ | 1.31 | ||||||||||||||
Pro forma |
1.76 | 1.31 | 1.26 | |||||||||||||||||
Earnings Per Common Share— |
||||||||||||||||||||
Assuming Dilution |
||||||||||||||||||||
As reported |
1.79 | 1.34 | 1.28 | |||||||||||||||||
Pro forma |
1.74 | 1.29 | 1.23 | |||||||||||||||||
Compensation-Transition and Disclosure, an amendment of FASB Statement No. 123” (“Statement No. 148”), if the Corporation had applied the fair value recognition provisions of Statement No. 123 to options-based employee compensation.
The Corporation estimated the fair value of each employee stock option grant on the date of grant. The weighted average assumptions used in the Black-Scholes option pricing model for grants in 2003, 2002, and 2001, were: dividend yield of 1.11%, 1.10%, and 1.08%, expected volatility of 35.98%, 34.21%, and 34.00%, and a risk-free interest rate of 3.20%, 4.50%, and 4.61%, respectively. The weighted average expected life was 5.4 years for 2003, 2002, and 2001.
FOREIGN CURRENCY TRANSLATION
The financial statements of the Corporation’s foreign subsidiaries have been translated into U.S. dollars in accordance with GAAP. Assets and liabilities have been translated using the exchange rate at year-end. Income and expense amounts have been translated using the exchange rate for the period in which the transaction took place. The translation gains and losses resulting from the change in exchange rates have been reported as a component of accumulated other comprehensive income included in stockholders’ equity, net of tax.
DERIVATIVE FINANCIAL INSTRUMENTS AND HEDGING ACTIVITIES
The Corporation utilizes certain derivative financial instruments to enhance its ability to manage interest rate risk and foreign currency exchange rate risk that exist as part of its ongoing business operations. Derivative financial instruments are entered into for periods that match the related underlying exposures and do not constitute positions independent of these exposures. The Corporation does not enter into derivative financial instruments for trading purposes, nor is it a party to any leveraged derivative financial instruments. The Corporation can designate derivative financial instruments as either fair value hedges, cash flow hedges, or hedges of net investments. The Corporation also has derivative financial instruments that are not designated as accounting hedges, which reduce its exposure to foreign currency exchange rate risk.
For fair value hedges, the Corporation accounts for changes in the fair value of the derivative and the change in the fair value of the hedged item for the hedged risk as a component of other operating income on the Corporation’s audited consolidated statements of income. The Corporation does not have cash flow hedges or hedges of net investments. For derivative financial instruments that are not designated as accounting hedges, the change in fair value is reported in other operating income in the Corporation’s audited consolidated statements of income. The fair value of derivative assets and liabilities are included gross as a component of other assets or accrued expenses and other liabilities, respectively, in the Corporation’s audited consolidated statements of financial condition. For fair value hedges, the change in the fair value of the hedged item related to the hedged risk is included as part of the carrying value of the related asset or liability in the Corporation’s audited consolidated statements of financial condition.
Net interest income or net interest expense related to outstanding interest rate swap agreements are accrued and recognized in earnings as an adjustment to the related interest income or interest expense of the hedged asset/liability over the term of the hedging relationship. In the event an interest rate swap is terminated prior to its contractual maturity, the remaining unamortized gain or loss included in the carrying amount of the hedged item will be amortized over the remaining life of the hedged item as an adjustment to the yield on the asset/liability.
REVENUE RECOGNITION
Interest income is recognized based upon the amount of loans outstanding and their contractual annual percentage rates. Interest income is included in loan receivables when billed to the Customer. The Corporation accrues unbilled interest income on a monthly basis from the Customer’s statement billing cycle date to the end of the month. The Corporation uses certain estimates and assumptions (for example, estimated yield) in the determination of the accrued unbilled portion of interest income that is included in accrued income receivable in the Corporation’s audited consolidated statements of financial condition. The Corporation also uses certain assumptions and estimates in the valuation of accrued interest on securitized loans which is included in accounts receivable from securitization in the Corporation’s audited consolidated statements of financial condition.
The Corporation also recognizes fees (except annual fees) on loan receivables in earnings as the fees are assessed according to agreements with the Corporation’s Customers. Credit card and other consumer loan fees include annual, late, overlimit, returned check, cash advance, express payment, and other miscellaneous fees. These fees are included in the Corporation’s loan receivables when billed. Annual fees on loan receivables and incremental direct loan origination costs are deferred and amortized on a straight-line basis over the one-year period to which they pertain. The Corporation does not charge an annual fee during the first year the account is originated. The deferred annual fees are included in accrued expenses and other liabilities in the Corporation’s audited consolidated statements of financial condition. Incremental direct loan origination costs are deferred only in the first year and are included in prepaid expenses and deferred charges. At December 31, 2003 and 2002, the incremental direct loan origination costs deferred were $78.8 million and $58.8 million, respectively. The Corporation expenses marketing costs as incurred.
The Corporation adjusts the amount of interest income and fee income recognized in the current period for its estimate of interest and fee income that it does not expect to collect in subsequent periods through adjustments to the respective income statement captions, loan receivables, and accrued income receivable. The estimate of uncollectible interest and fees is based on a migration analysis of delinquent and current loan receivables that will progress through the various delinquency stages and ultimately charge off. The Corporation also adjusts the estimated value of
accrued interest and fees on securitized loans for the amount of uncollectible interest and fees that are not expected to be collected through an adjustment to accounts receivable from securitization and securitization income. This estimate is also based on a migration analysis of delinquent and current securitized loans that will progress through the various delinquency stages and ultimately charge off.
Prior to September 2002, the Corporation accrued interest and fees on loan receivables until the loan receivables were paid or charged off. When loan receivables were charged off, the Corporation deducted the accrued interest and fees related to the loan receivables against current period income. In September 2002, the Corporation implemented the Federal Financial Institutions Examination Council (“FFIEC”) guidance for uncollectible accrued interest and fees for its managed loan portfolio. As a result, the Corporation changed its estimate of the value of accrued interest and fees in September 2002.
In accordance with Accounting Principles Board Opinion No. 20, “Accounting Changes” (“Opinion No. 20”), the change in the estimated value of accrued interest and fees was recorded as a change in accounting estimate in the third quarter of 2002. The change in the estimated value of accrued interest and fees resulted in a decrease to income before income taxes of $263.7 million ($167.2 million after taxes), through a reduction of $66.3 million of interest income and $197.4 million of other operating income. The Corporation’s earnings per common share and earnings per common share—assuming dilution for the year ended December 31, 2002 would have been $1.50 and $1.47, respectively, excluding the change. The difference between the amounts of interest and fees the Corporation was contractually entitled to and the amounts recognized as revenue was $1.2 billion, $1.4 billion, and $858.3 million for the years ended December 31, 2003, 2002, and 2001, respectively.
INTERCHANGE INCOME
Interchange income is a fee paid by a merchant bank to the card-issuing bank through the interchange network as compensation for risk, grace period, and other operating costs. Such fees are set annually by MasterCard International Incorporated and Visa U.S.A. Incorporated and are based on cardholder sales volumes. The Corporation recognizes interchange income as earned.
The Corporation offers to its Customers certain reward programs based on charge volumes. The costs of these reward programs related to loan receivables are deducted from interchange income. The costs of the reward programs related to securitized loans are deducted from securitization income.
INSURANCE INCOME
The Corporation’s insurance income primarily relates to fees received for marketing credit related life and disability insurance and credit protection products. The amount of insurance income recorded is based on the terms of insurance policies and credit protection products. The Corporation recognizes insurance income over the policy or contract period as earned.
ROYALTIES TO ENDORSING ORGANIZATIONS
The Corporation has agreements with thousands of organizations that endorse its loan and deposit products. The organizations grant to the Corporation exclusive rights to market its products to the organizations’ members or customers and provide their endorsements and mailing lists. Some organizations, such as financial institutions, also conduct marketing activities for the Corporation. The Corporation’s endorsing agreements normally have a term of five years. The economic incentives the Corporation pays to the endorsing organizations typically include payments based on new accounts, activation, and revenue sharing.
The Corporation accounts for the portion of its payments to endorsing organizations for new accounts that relate to account originations as direct loan origination costs. The Corporation defers these costs and amortizes them over 12 months. The Corporation accounts for payments to endorsing organizations for marketing efforts they perform on its behalf to activate a new account after the account has been originated as other expenses as incurred. The Corporation accounts for revenue sharing payments as it earns the related revenues. The Corporation deducts these payments related to loan receivables from interest income and payments related to securitized loans from securitization income since it considers them a reduction of the revenue recognized.
The Corporation, in some cases, advances future compensation to be earned by an endorsing organization. The Corporation recognizes advances to an endorsing organization as the organization earns the royalties or over the term of the agreement using the straight-line method, whichever method results in greater amortization of the advance.
STATEMENTS OF CASH FLOWS
The Corporation has presented the audited consolidated statements of cash flows using the indirect method, which involves the reconciliation of net income to net cash flow from operating activities. In addition, the Corporation nets certain cash receipts and cash payments related to deposits placed with and withdrawn from other financial institutions; time deposits accepted and repayments of those deposits; and loans made to Customers and principal collections of those loans. For purposes of the audited consolidated statements of cash flows, cash and cash equivalents include cash and due from banks.
NOTE 4: NEW ACCOUNTING PRONOUNCEMENT
In January 2003, Interpretation No. 46 was issued. In accordance with Interpretation No. 46, the Corporation has determined that MBNA Capital A (registered December 1996), MBNA Capital B (registered January 1997), MBNA Capital C (registered March 1997), MBNA Capital D (registered June 2002), and MBNA Capital E (registered November 2002) (collectively the “statutory trusts”), are variable interest entities and that the Corporation is not the primary beneficiary. The Corporation would not absorb a majority of the statutory trusts’ expected losses if they were to occur. Effective July 1, 2003 the Corporation adopted Interpretation
No. 46 and the statutory trusts were deconsolidated. The Corporation is the owner of all the beneficial ownership interests represented by the common securities of the statutory trusts. The statutory trusts exist for the sole purpose of issuing the series capital securities to investors and the series common securities to the Corporation and investing the proceeds in junior subordinated deferrable interest debentures issued by the Corporation. At July 1, 2003 the statutory trusts had series common securities of $32.9 million and series capital securities of $1.1 billion. The deconsolidation of the statutory trusts increased long-term debt and bank notes and the investment in variable interest entities by $32.9 million, which is included in other assets. These capital securities currently qualify as regulatory capital for the Corporation.
NOTE 5: CASH AND CASH EQUIVALENTS
Cash and cash equivalents include cash and due from banks. The Bank is required by the Federal Reserve Bank to maintain cash reserves against certain categories of average deposit liabilities. During 2003 and 2002, the average amount of these reserves was approximately $1.9 million and $4.7 million, respectively, after deducting currency and coin holdings.
NOTE 6: INTEREST-EARNING TIME DEPOSITS IN OTHER BANKS
Included in the Corporation’s interest-earning time deposits were $30.6 million and $31.3 million at December 31, 2003 and 2002, respectively, which were collateralizing advances provided by an underwriter of MBNA Europe’s securitization transactions. Also, at December 31, 2003, there were $28.5 million of interest-earning time deposits which were collateralizing MBNA Europe’s derivative financial instruments.
NOTE 7: INVESTMENT SECURITIES
For the year ended December 31, 2003, the Corporation wrote-off investment securities held-to-maturity resulting in a realized loss of $131,000 ($84,000 after taxes). For the year ended December 31, 2002, the Corporation sold investment securities available-for-sale resulting in a realized loss of $95,000 ($62,000
ESTIMATED MATURITIES OF INVESTMENT SECURITIES (dollars in thousands)
| Amortized | Market | |||||||
| December 31, 2003 | Cost | Value | ||||||
Investment Securities Available-for-Sale |
||||||||
Domestic: |
||||||||
Due within one year |
$ | 1,590,148 | $ | 1,597,249 | ||||
Due after one year through five years |
2,276,402 | 2,280,532 | ||||||
Due after five years through ten years |
57,313 | 57,388 | ||||||
Due after ten years |
166 | 165 | ||||||
Total domestic investment securities
available-for-sale |
3,924,029 | 3,935,334 | ||||||
Foreign: |
||||||||
Due within one year |
91,688 | 91,750 | ||||||
Due after one year through five years |
336,352 | 336,003 | ||||||
Total foreign investment securities
available-for-sale |
428,040 | 427,753 | ||||||
Total investment securities
available-for-sale |
$ | 4,352,069 | $ | 4,363,087 | ||||
Investment Securities Held-to-Maturity |
||||||||
Domestic: |
||||||||
Due within one year |
$ | 135 | $ | 137 | ||||
Due after one year through five years |
– | – | ||||||
Due after five years through ten years |
649 | 649 | ||||||
Due after ten years |
351,515 | 352,648 | ||||||
Total domestic investment securities
held-to-maturity |
352,299 | 353,434 | ||||||
Foreign: |
||||||||
Due within one year |
– | – | ||||||
Due after one year through five years |
1,000 | 1,000 | ||||||
Total foreign investment securities
held-to-maturity |
1,000 | 1,000 | ||||||
Total investment securities
held-to-maturity |
$ | 353,299 | $ | 354,434 | ||||
after taxes). For the year ended December 31, 2001, the Corporation sold investment securities available-for-sale resulting in a realized loss of $36,000 ($23,000 after taxes). Included in asset-backed and other securities are the Bank’s investment in securities of U.S. government sponsored entities. The Corporation had investment securities with a book value of $1.3 billion and $3.2 billion at December 31, 2003 and 2002, respectively, held in the Bank’s account with the Federal Reserve Bank of Philadelphia, which are available for use as collateral.
UNREALIZED LOSSES ON INVESTMENT SECURITIES (dollars in thousands)
| December 31, 2003 | Less than 12 months | 12 months or more | Total | |||||||||||||||||||||||||
| Fair | Unrealized | Fair | Unrealized | Fair | Unrealized | |||||||||||||||||||||||
| Value | Losses | Value | Losses | Value | Losses | |||||||||||||||||||||||
Investment securities available-for-sale: |
||||||||||||||||||||||||||||
Domestic: |
||||||||||||||||||||||||||||
U.S. Treasury and other U.S. government agencies obligations |
$ | 199,633 | $ | (266 | ) | $ | – | $ | – | $ | 199,633 | $ | (266 | ) | ||||||||||||||
State and political subdivisions of the United States |
– | – | – | – | – | – | ||||||||||||||||||||||
Asset-backed and other securities |
113,669 | (44 | ) | 112,152 | (112 | ) | 225,821 | (156 | ) | |||||||||||||||||||
Total domestic investment securities available-for-sale |
313,302 | (310 | ) | 112,152 | (112 | ) | 425,454 | (422 | ) | |||||||||||||||||||
Foreign |
427,753 | (287 | ) | – | – | 427,753 | (287 | ) | ||||||||||||||||||||
Total investment securities available-for-sale |
$ | 741,055 | $ | (597 | ) | $ | 112,152 | $ | (112 | ) | $ | 853,207 | $ | (709 | ) | |||||||||||||
Investment securities held-to-maturity: |
||||||||||||||||||||||||||||
Domestic: |
||||||||||||||||||||||||||||
U.S. Treasury and other U.S. government agencies obligations |
$ | 202,031 | $ | (3,773 | ) | $ | – | $ | – | $ | 202,031 | $ | (3,773 | ) | ||||||||||||||
State and political subdivisions of the United States |
– | – | – | – | – | – | ||||||||||||||||||||||
Asset-backed and other securities |
8,079 | (211 | ) | – | – | 8,079 | (211 | ) | ||||||||||||||||||||
Total domestic investment securities held-to-maturity |
210,110 | (3,984 | ) | – | – | 210,110 | (3,984 | ) | ||||||||||||||||||||
Foreign |
– | – | – | – | – | – | ||||||||||||||||||||||
Total investment securities held-to-maturity |
$ | 210,110 | $ | (3,984 | ) | $ | – | $ | – | $ | 210,110 | $ | (3,984 | ) | ||||||||||||||
SUMMARY OF INVESTMENT SECURITIES (dollars in thousands)
| Gross | Gross | |||||||||||||||
| Amortized | Unrealized | Unrealized | Market | |||||||||||||
| Cost | Gains | Losses | Value | |||||||||||||
December 31, 2003 |
||||||||||||||||
Investment securities available-for-sale: |
||||||||||||||||
Domestic: |
||||||||||||||||
U.S. Treasury and other U.S. government
agencies obligations |
$ | 2,024,520 | $ | 7,362 | $ | (266 | ) | $ | 2,031,616 | |||||||
State and political subdivisions of the United States |
102,685 | – | – | 102,685 | ||||||||||||
Asset-backed and other securities |
1,796,824 | 4,365 | (156 | ) | 1,801,033 | |||||||||||
Total domestic investment securities available-for-sale |
3,924,029 | 11,727 | (422 | ) | 3,935,334 | |||||||||||
Foreign |
428,040 | – | (287 | ) | 427,753 | |||||||||||
Total investment securities available-for-sale |
$ | 4,352,069 | $ | 11,727 | $ | (709 | ) | $ | 4,363,087 | |||||||
Investment securities held-to-maturity: |
||||||||||||||||
Domestic: |
||||||||||||||||
U.S. Treasury and other U.S. government
agencies obligations |
$ | 335,445 | $ | 4,910 | $ | (3,773 | ) | $ | 336,582 | |||||||
State and political subdivisions of the United States |
7,615 | 171 | – | 7,786 | ||||||||||||
Asset-backed and other securities |
9,239 | 38 | (211 | ) | 9,066 | |||||||||||
Total domestic investment securities held-to-maturity |
352,299 | 5,119 | (3,984 | ) | 353,434 | |||||||||||
Foreign |
1,000 | – | – | 1,000 | ||||||||||||
Total investment securities held-to-maturity |
$ | 353,299 | $ | 5,119 | $ | (3,984 | ) | $ | 354,434 | |||||||
December 31, 2002 |
||||||||||||||||
Investment securities available-for-sale: |
||||||||||||||||
Domestic: |
||||||||||||||||
U.S. Treasury and other U.S. government agencies obligations (a) |
$ | 1,908,384 | $ | 26,850 | $ | – | $ | 1,935,234 | ||||||||
State and political subdivisions of the United States |
101,370 | – | – | 101,370 | ||||||||||||
Asset-backed and other securities (a) |
1,391,465 | 10,607 | (544 | ) | 1,401,528 | |||||||||||
Total domestic investment securities available-for-sale |
3,401,219 | 37,457 | (544 | ) | 3,438,132 | |||||||||||
Foreign |
216,286 | 1,390 | – | 217,676 | ||||||||||||
Total investment securities available-for-sale |
$ | 3,617,505 | $ | 38,847 | $ | (544 | ) | $ | 3,655,808 | |||||||
Investment securities held-to-maturity: |
||||||||||||||||
Domestic: |
||||||||||||||||
U.S. Treasury and other U.S. government agencies obligations (a) |
$ | 400,724 | $ | 9,061 | $ | (504 | ) | $ | 409,281 | |||||||
State and political subdivisions of the United States |
7,289 | 189 | – | 7,478 | ||||||||||||
Asset-backed and other securities (a) |
9,747 | 78 | (125 | ) | 9,700 | |||||||||||
Total domestic investment securities held-to-maturity |
417,760 | 9,328 | (629 | ) | 426,459 | |||||||||||
Foreign |
2,000 | 13 | – | 2,013 | ||||||||||||
Total investment securities held-to-maturity |
$ | 419,760 | $ | 9,341 | $ | (629 | ) | $ | 428,472 | |||||||
December 31, 2001
|
||||||||||||||||
Investment securities available-for-sale: |
||||||||||||||||
Domestic: |
||||||||||||||||
U.S. Treasury and other U.S. government agencies obligations (a) |
$ | 1,657,001 | $ | 20,822 | $ | (699 | ) | $ | 1,677,124 | |||||||
State and political subdivisions of the United States |
105,067 | 41 | – | 105,108 | ||||||||||||
Asset-backed and other securities (a) |
1,149,908 | 9,621 | (845 | ) | 1,158,684 | |||||||||||
Total domestic investment securities available-for-sale |
2,911,976 | 30,484 | (1,544 | ) | 2,940,916 | |||||||||||
Foreign |
165,735 | 470 | (237 | ) | 165,968 | |||||||||||
Total investment securities available-for-sale |
$ | 3,077,711 | $ | 30,954 | $ | (1,781 | ) | $ | 3,106,884 | |||||||
Investment securities held-to-maturity: |
||||||||||||||||
Domestic: |
||||||||||||||||
U.S. Treasury and other U.S. government agencies obligations (a) |
$ | 368,531 | $ | 456 | $ | (15,443 | ) | $ | 353,544 | |||||||
State and political subdivisions of the United States |
6,692 | 1,389 | (9 | ) | 8,072 | |||||||||||
Asset-backed and other securities (a) |
2,082 | – | (105 | ) | 1,977 | |||||||||||
Total domestic investment securities held-to-maturity
|
377,305 | 1,845 | (15,557 | ) | 363,593 | |||||||||||
Foreign |
2,000 | 42 | – | 2,042 | ||||||||||||
Total investment securities held-to-maturity |
$ | 379,305 | $ | 1,887 | $ | (15,557 | ) | $ | 365,635 | |||||||
| (a) | For purposes of comparability, prior period amounts have been reclassified. |
NOTE 8: ASSET SECURITIZATION
Asset securitization removes loan principal receivables from the Corporation’s consolidated statements of financial condition and converts interest income, interchange income, credit card and other consumer loan fees, insurance income, recoveries on charged-off securitized loans in excess of interest paid to investors, gross credit losses, and other trust expenses into securitization income. Asset securitization involves the sale to a trust of a pool of loan principal receivables, and is accomplished through the public and private issuance of asset-backed securities. Certificates representing undivided interests in the trusts are sold by the trusts to investors, while the remaining undivided interest is retained by the Corporation. The Corporation includes the remaining undivided interest of $19.5 billion and $17.7 billion at December 31, 2003 and 2002, respectively, in loan receivables. Loan receivables consist of the Corporation’s loans held for securitization and the loan portfolio. The carrying value of these loan principal receivables approximates fair value. The senior classes of the asset-backed securities generally receive a AAA credit rating at the time of issuance. This AAA credit rating is principally based on the quality of the loan principal receivables, the structure of the transaction, and additional credit enhancement, generally through the sale of lower-rated subordinated classes of asset-backed securities.
ACCOUNTS RECEIVABLE FROM SECURITIZATION
(dollars in thousands)
| December 31, | 2003 | 2002 | ||||||
Sale of new loan principal receivables |
$ | 2,191,335 | $ | 1,813,589 | ||||
Accrued interest and fees
on securitized loans |
1,958,873 | 2,027,281 | ||||||
Interest-only strip receivable |
1,338,061 | 1,129,965 | ||||||
Accrued servicing fees |
777,623 | 667,246 | ||||||
Cash reserve accounts |
607,467 | 473,271 | ||||||
Other subordinated retained interests |
608,550 | 613,659 | ||||||
Other |
284,568 | 201,865 | ||||||
Total accounts receivable
from securitization |
$ | 7,766,477 | $ | 6,926,876 | ||||
During 2003 and 2002, the Corporation sold loan principal receivables in numerous securitization transactions. At December 31, 2003 and 2002, the trusts had approximately $83.4 billion and $77.0 billion, respectively, of investor principal outstanding. The Corporation retains servicing responsibilities for the loans in the trusts and maintains other retained subordinated interests in the securitized assets. These retained subordinated
interests include an interest-only strip receivable, cash reserve accounts, accrued interest and fees on securitized loans, and other subordinated interests and are included in accounts receivable from securitization in the audited consolidated statements of financial condition. The Corporation receives annual contractual servicing fees of approximately 2% of the investor principal outstanding and rights to current and future revenue generated from securitized loans arising after the investors in the trusts receive the return for which they have contracted and credit losses are absorbed. The Corporation does not record a servicing asset or a liability for these rights since the contractual servicing fee approximates its market value. Aside from the Corporation’s remaining undivided interest in the trusts, the investors and providers of credit enhancement have a lien on a portion of the retained subordinated interests. If cash flows allocated to investors in the trusts are insufficient to absorb expenses of the trust, then the retained interests of the Corporation would be used to absorb such deficiencies and may not be realized by the Corporation. The Corporation has no obligation to provide further funding support to either the investors or the trusts if the securitized loans are not paid when due. The Corporation’s retained interests are subordinate to the investors’ interests. The value of the retained interests is subject to credit, payment, and interest rate risks on the transferred financial assets. The retained interests are reported at estimated fair value in accounts receivable from securitization with changes in fair value recorded in earnings.
Accounts receivable from securitization also includes a receivable for the sale of new loan principal receivables that have been transferred to the trusts during the revolving period. The Corporation realizes the receivable for these sales from the trusts in the month following the sale. The Corporation also recognizes a receivable for accrued interest and fees on securitized loans that relate to the rights transferred by the Corporation to the trusts for the cash collection of interest and fees accrued on loan receivables prior to the securitization transaction. As securitized loans are paid off and new loan principal receivables are transferred to the investor interest in the trusts during the revolving period, this receivable is collected and re-established on a monthly basis at an amount that approximates its fair value due to its short-term nature. The Corporation regains the right to keep the collection of the accrued interest and fees from the Customer during the accumulation period of the securitization transaction.
SECURITIZATION CASH FLOWS (dollars in millions)
| Year Ended December 31, | 2003 | 2002 | 2001 | |||||||||||||||||||||
| Credit | Other | Credit | Other | Credit | Other | |||||||||||||||||||
| Card | Consumer | Card | Consumer | Card | Consumer | |||||||||||||||||||
Proceeds from new securitizations |
$ | 13,598 | $ | – | $ | 15,373 | $ | – | $ | 12,330 | $ | – | ||||||||||||
Collections reinvested in revolving-period securitizations |
121,586 | 3,389 | 103,900 | 3,385 | 92,210 | 3,500 | ||||||||||||||||||
Contractual servicing fees received |
1,467 | 56 | 1,339 | 56 | 1,247 | 56 | ||||||||||||||||||
Cash flows received on retained interests |
4,913 | 103 | 4,505 | 244 | 3,886 | 148 | ||||||||||||||||||
SUPPLEMENTAL CREDIT LOSS INFORMATION (dollars in thousands)
| Average | Credit | Net Credit | ||||||||||||||
| Balance | Losses | Recoveries | Losses | |||||||||||||
Year Ended December 31, 2003 |
||||||||||||||||
Managed Loans: |
||||||||||||||||
Credit card |
$ | 95,812,328 | $ | 5,048,429 | $ | (359,680 | ) | $ | 4,688,749 | |||||||
Other consumer |
14,062,646 | 1,124,353 | (73,937 | ) | 1,050,416 | |||||||||||
Total managed loans |
109,874,974 | 6,172,782 | (433,617 | ) | 5,739,165 | |||||||||||
Securitized Loans: |
||||||||||||||||
Credit card |
(76,008,752 | ) | (4,157,742 | ) | 286,828 | (3,870,914 | ) | |||||||||
Other consumer |
(5,682,404 | ) | (535,254 | ) | 30,699 | (504,555 | ) | |||||||||
Total securitized loans |
(81,691,156 | ) | (4,692,996 | ) | 317,527 | (4,375,469 | ) | |||||||||
Loan receivables |
$ | 28,183,818 | $ | 1,479,786 | $ | (116,090 | ) | $ | 1,363,696 | |||||||
Year Ended December 31, 2002 |
||||||||||||||||
Managed Loans: |
||||||||||||||||
Credit card |
$ | 86,378,943 | $ | 4,331,274 | $ | (281,068 | ) | $ | 4,050,206 | |||||||
Other consumer |
13,654,988 | 995,105 | (53,716 | ) | 941,389 | |||||||||||
Total managed loans |
100,033,931 | 5,326,379 | (334,784 | ) | 4,991,595 | |||||||||||
Securitized Loans: |
||||||||||||||||
Credit card |
(69,014,880 | ) | (3,589,724 | ) | 228,463 | (3,361,261 | ) | |||||||||
Other consumer |
(5,703,851 | ) | (497,087 | ) | 22,965 | (474,122 | ) | |||||||||
Total securitized loans |
(74,718,731 | ) | (4,086,811 | ) | 251,428 | (3,835,383 | ) | |||||||||
Loan receivables |
$ | 25,315,200 | $ | 1,239,568 | $ | (83,356 | ) | $ | 1,156,212 | |||||||
Year Ended December 31, 2001 |
||||||||||||||||
Managed Loans: |
||||||||||||||||
Credit card |
$ | 79,008,957 | $ | 3,865,206 | $ | (282,118 | ) | $ | 3,583,088 | |||||||
Other consumer |
11,891,031 | 756,563 | (32,623 | ) | 723,940 | |||||||||||
Total managed loans |
90,899,988 | 4,621,769 | (314,741 | ) | 4,307,028 | |||||||||||
Securitized Loans: |
||||||||||||||||
Credit card |
(64,817,684 | ) | (3,239,729 | ) | 229,768 | (3,009,961 | ) | |||||||||
Other consumer |
(5,742,916 | ) | (457,567 | ) | 15,514 | (442,053 | ) | |||||||||
Total securitized loans |
(70,560,600 | ) | (3,697,296 | ) | 245,282 | (3,452,014 | ) | |||||||||
Loan receivables |
$ | 20,339,388 | $ | 924,473 | $ | (69,459 | ) | $ | 855,014 | |||||||
During 2002, the change in the estimated value of accrued interest and fees in 2002 reduced the carrying value of accrued interest and fees on securitized loans by $295.9 million. The Corporation also adjusted the value of the interest-only strip receivable as a result of the change in the estimated value of the uncollectible accrued interest and fees in 2002. The Corporation had always included an estimate of uncollectible accrued interest and fees in determining the value of the interest-only strip receivable. Since the Corporation now recognizes uncollectible interest and fees in the estimated value of accrued interest and fees on securitized loans, the estimated value of the interest-only strip receivable was adjusted at September 30, 2002. The value of uncollectible accrued interest and fees on securitized loans that are currently owed by the underlying Customer are now considered in the value of accrued interest and fees on securitized loans. Accordingly, the estimated value of the interest-only strip receivable now only considers the impact of uncollectible interest and fees that will be billed to the underlying Customer in the future. This adjustment caused the interest-only strip receivable to increase $123.9 million at September 30, 2002. The net impact of these changes resulted in a $172.0 million reduction to accounts receivable from securitization.
Included in accounts receivable from securitization in the consolidated statements of financial condition at December 31, 2003 and 2002, were $1.2 billion of amounts which are subject to a lien by the investors and providers of credit enhancement in the securitization transactions. The investors and providers of credit enhancement have no other recourse to the Corporation. The Corporation does not receive collateral from any party to the securitization transactions and does not have any risk of counter-party nonperformance.
The gain from the sale of loan principal receivables for new securitization transactions that the Corporation recognizes as sales in accordance with Statement No. 140 is included in securitization income in the Corporation’s audited consolidated statements of income. The gain was $124.5 million (net of securitization transaction costs of $51.2 million) for 2003 (on the sale of $13.6 billion of credit card loan principal receivables in 2003), as compared to $154.6 million (net of securitization transaction costs of $41.7 million) in 2002 (on the sale of $15.5 billion of credit card loan principal receivables in 2002) and a gain of $96.7 million (net of securitization transaction costs of $62.3 million) in 2001 (on the sale of $12.4 billion of credit card
SUPPLEMENTAL LOAN DELINQUENCY INFORMATION (a) (dollars in thousands)
| December 31, | 2003 | 2002 | ||||||||||||||
| Loans | Loans | Loans | Loans | |||||||||||||
| Outstanding | Delinquent | Outstanding | Delinquent | |||||||||||||
Managed Loans |
||||||||||||||||
Credit card |
$ | 104,180,610 | $ | 4,462,900 | $ | 93,326,206 | $ | 4,401,277 | ||||||||
Other consumer |
14,312,950 | 740,750 | 13,931,636 | 828,234 | ||||||||||||
Total managed loans |
118,493,560 | 5,203,650 | 107,257,842 | 5,229,511 | ||||||||||||
Securitized Loans |
||||||||||||||||
Credit card |
(79,197,651 | ) | (3,562,196 | ) | (72,853,426 | ) | (3,576,439 | ) | ||||||||
Other consumer |
(5,671,832 | ) | (351,655 | ) | (5,677,908 | ) | (401,469 | ) | ||||||||
Total securitized loans |
(84,869,483 | ) | (3,913,851 | ) | (78,531,334 | ) | (3,977,908 | ) | ||||||||
Loan receivables |
$ | 33,624,077 | $ | 1,289,799 | $ | 28,726,508 | $ | 1,251,603 | ||||||||
| (a) | Loans delinquent are accruing loans which are 30 days or more past due. |
loan principal receivables in 2001). During the third quarter of 2003, the Corporation began including projected express payment and returned check fees in the determination of the fair value of the interest-only strip receivable. Upon inclusion of projected express payment and returned check fees, the interest-only strip receivable and securitization income increased by approximately $28.9 million for 2003. For the fourth quarter of 2003, this inclusion increased the interest-only strip receivable and securitization income an additional $3.0 million. The Corporation began including express payment fees in the determination of the fair value of the interest-only strip receivable because Customers are increasingly choosing to utilize express payment services to ensure that their payments are received on time and that they do not incur a late fee. The Corporation does not expect the inclusion of these fees to have a material effect on the Corporation’s earnings in subsequent periods.
In accordance with Statement No. 140, the Corporation recognizes an interest-only strip receivable, which represents the contractual right to receive interest and other revenue less certain costs from the trusts over the estimated life of securitized loan principal
receivables. The Corporation uses certain key assumptions and estimates in determining the value of the interest-only strip receivable. These key assumptions and estimates include projections concerning interest income, certain fees, charged-off loan recoveries, gross credit losses, contractual servicing fees, and the interest rate paid to investors. These assumptions are used to determine the excess spread to be earned by the Corporation over the estimated life of the securitized loan principal receivables. Other key assumptions and estimates used by the Corporation include projected loan payment rates, which are used to determine the estimated life of the securitized loan principal receivables, and an appropriate discount rate. The Corporation reviews the key assumptions and estimates used in determining the fair value of the interest-only strip receivable on a quarterly basis and adjusts them as appropriate. If these assumptions change or actual results differ from projected results, the interest-only strip receivable and securitization income would be affected.
The Corporation’s securitization key assumptions and their sensitivities to adverse changes are presented in the below table.
SECURITIZATION KEY ASSUMPTIONS AND SENSITIVITIES (a) (dollars in thousands)
| Year Ended December 31, | 2003 | 2002 | 2001 | ||||||||||||||||||||||
| Credit | Other | Credit | Other | Credit | Other | ||||||||||||||||||||
| Card | Consumer | Card | Consumer | Card | Consumer | ||||||||||||||||||||
Interest-only strip receivable |
$ | 1,254,018 | $ | 84,043 | $ | 1,091,447 | $ | 38,518 | $ | 1,008,419 | $ | 115,644 | |||||||||||||
Weighted average life (in years) |
.33 | .89 | .33 | .87 | .35 | .93 | |||||||||||||||||||
Loan payment rate (weighted average rate) |
14.73 | % | 4.92 | % | 14.44 | % | 5.05 | % | 13.60 | % | 4.67 | % | |||||||||||||
Impact on fair value of 20% adverse change |
$ | 176,185 | $ | 12,785 | $ | 156,897 | $ | 5,835 | $ | 144,892 | $ | 17,304 | |||||||||||||
Impact on fair value of 40% adverse change |
307,198 | 21,980 | 268,019 | 10,081 | 246,857 | 29,870 | |||||||||||||||||||
Gross credit losses (b) (weighted average rate) |
5.23 | % | 9.64 | % | 5.43 | % | 9.83 | % | 5.25 | % | 8.40 | % | |||||||||||||
Impact on fair value of 20% adverse change |
$ | 252,520 | $ | 83,294 | $ | 244,432 | $ | 38,518 | $ | 205,460 | $ | 74,666 | |||||||||||||
Impact on fair value of 40% adverse change |
505,039 | 84,043 | 488,865 | 38,518 | 410,919 | 115,644 | |||||||||||||||||||
Excess spread (c) (weighted average rate) |
5.19 | % | 1.95 | % | 4.84 | % | .91 | % | 5.14 | % | 2.60 | % | |||||||||||||
Impact on fair value of 20% adverse change |
$ | 250,804 | $ | 16,809 | $ | 218,289 | $ | 7,704 | $ | 201,684 | $ | 23,129 | |||||||||||||
Impact on fair value of 40% adverse change |
501,607 | 33,617 | 436,579 | 15,407 | 403,368 | 46,258 | |||||||||||||||||||
Discount rate (weighted average rate) |
9.00 | % | 9.00 | % | 9.00 | % | 9.00 | % | 12.00 | % | 12.00 | % | |||||||||||||
Impact on fair value of 20% adverse change |
$ | 5,495 | $ | 902 | $ | 4,870 | $ | 404 | $ | 6,195 | $ | 1,709 | |||||||||||||
Impact on fair value of 40% adverse change |
10,950 | 1,789 | 9,703 | 801 | 12,326 | 3,378 | |||||||||||||||||||
| (a) | The sensitivities do not reflect actions management might take to offset the impact of possible adverse changes if they were to occur. | |||
| (b) | Gross credit losses exclude the impact of recoveries; however, recoveries are included in the determination of the excess spread. | |||
| (c) | Excess spread includes projections of interest income, certain fees, and charged-off loan recoveries, less gross credit losses, contractual servicing fees, and the interest rate paid to investors. | |||
The adverse changes to the key assumptions and estimates are hypothetical and are presented in accordance with Statement No. 140. The amount of the adverse change has been limited to the recorded amount of the interest-only strip receivable where the hypothetical change exceeds the value of the interest-only strip receivable. The sensitivities do not reflect actions management might take to offset the impact of the possible adverse changes if they were to occur.
NOTE 9: GEOGRAPHICAL DIVERSIFICATION OF LOANS
The Corporation originates credit card and other consumer loans, primarily throughout the United States, the United Kingdom, Ireland, Spain, and Canada. Credit card and other consumer loans originated in the United States are broadly distributed throughout the United States’ geographic regions. Credit card and other consumer loans issued by MBNA Europe are primarily located in the United Kingdom, Ireland and Spain, while MBNA Canada issues credit card and other consumer loans in Canada. The following table details the geographic distribution of the Corporation’s loan receivables, securitized loans, and managed loans.
The Corporation’s loans are generally made on an unsecured basis after reviewing each potential Customer’s credit application and evaluating the applicant’s financial history and ability and willingness to repay. The average credit line to individual Customers is approximately $12,000 and the average balance per account is approximately $3,800 at December 31, 2003.
NOTE 10: RESERVE FOR POSSIBLE CREDIT LOSSES
The Corporation maintains the reserve for possible credit losses at an amount sufficient to absorb losses inherent in the Corporation’s loan principal receivables at the reporting date based on a projection of probable net credit losses.
CHANGES IN THE RESERVE FOR POSSIBLE CREDIT LOSSES (dollars in thousands)
| December 31, | 2003 | 2002 | 2001 | |||||||||
Reserve for possible credit losses,
beginning of year |
$ | 1,111,299 | $ | 833,423 | $ | 527,573 | ||||||
Reserves acquired |
61,116 | 84,878 | 20,748 | |||||||||
Provision for possible
credit losses |
1,392,701 | 1,340,157 | 1,140,615 | |||||||||
Foreign currency translation |
14,896 | 9,053 | (499 | ) | ||||||||
Credit losses |
(1,479,786 | ) | (1,239,568 | ) | (924,473 | ) | ||||||
Recoveries |
116,090 | 83,356 | 69,459 | |||||||||
Net credit losses |
(1,363,696 | ) | (1,156,212 | ) | (855,014 | ) | ||||||
Reserve for possible credit losses,
end of year |
$ | 1,216,316 | $ | 1,111,299 | $ | 833,423 | ||||||
See Note 3: Significant Accounting Policies—Reserve for Possible Credit Losses for further detail on the Corporation’s policy relating to the determination of the reserve for possible credit losses.
GEOGRAPHIC DISTRIBUTION OF LOAN RECEIVABLES, SECURITIZED LOANS, AND MANAGED LOANS
(dollars in thousands)
| Loan Receivables | Securitized Loans | Managed Loans | ||||||||||||||||||||||
December 31, 2003 |
||||||||||||||||||||||||
United States: |
||||||||||||||||||||||||
Northern |
$ | 2,978,085 | 8.9 | % | $ | 9,421,779 | 11.1 | % | $ | 12,399,864 | 10.4 | % | ||||||||||||
Mid-Atlantic |
3,982,186 | 11.8 | 12,471,359 | 14.7 | 16,453,545 | 13.9 | ||||||||||||||||||
Southern |
4,907,262 | 14.6 | 15,200,016 | 17.9 | 20,107,278 | 17.0 | ||||||||||||||||||
Central |
4,158,939 | 12.4 | 12,773,701 | 15.0 | 16,932,640 | 14.3 | ||||||||||||||||||
Western |
4,282,156 | 12.7 | 13,037,909 | 15.4 | 17,320,065 | 14.6 | ||||||||||||||||||
Southwestern |
3,503,874 | 10.4 | 10,239,353 | 12.1 | 13,743,227 | 11.6 | ||||||||||||||||||
United Kingdom/Ireland/Spain |
8,421,986 | 25.0 | 8,738,274 | 10.3 | 17,160,260 | 14.5 | ||||||||||||||||||
Canada |
799,987 | 2.4 | 2,838,555 | 3.3 | 3,638,542 | 3.1 | ||||||||||||||||||
Other |
589,602 | 1.8 | 148,537 | .2 | 738,139 | .6 | ||||||||||||||||||
Total |
$ | 33,624,077 | 100.0 | % | $ | 84,869,483 | 100.0 | % | $ | 118,493,560 | 100.0 | % | ||||||||||||
December 31, 2002 |
||||||||||||||||||||||||
United States: |
||||||||||||||||||||||||
Northern |
$ | 2,631,643 | 9.1 | % | $ | 8,864,417 | 11.3 | % | $ | 11,496,060 | 10.7 | % | ||||||||||||
Mid-Atlantic |
3,682,054 | 12.8 | 12,119,223 | 15.4 | 15,801,277 | 14.7 | ||||||||||||||||||
Southern |
4,418,794 | 15.4 | 14,635,670 | 18.6 | 19,054,464 | 17.8 | ||||||||||||||||||
Central |
3,695,040 | 12.9 | 11,766,278 | 15.0 | 15,461,318 | 14.4 | ||||||||||||||||||
Western |
3,860,223 | 13.4 | 12,372,409 | 15.8 | 16,232,632 | 15.2 | ||||||||||||||||||
Southwestern |
3,132,050 | 10.9 | 9,658,475 | 12.3 | 12,790,525 | 11.9 | ||||||||||||||||||
United Kingdom/Ireland/Spain |
6,264,711 | 21.8 | 7,054,676 | 9.0 | 13,319,387 | 12.4 | ||||||||||||||||||
Canada |
564,217 | 2.0 | 1,911,874 | 2.4 | 2,476,091 | 2.3 | ||||||||||||||||||
Other |
477,776 | 1.7 | 148,312 | .2 | 626,088 | .6 | ||||||||||||||||||
Total |
$ | 28,726,508 | 100.0 | % | $ | 78,531,334 | 100.0 | % | $ | 107,257,842 | 100.0 | % | ||||||||||||
NOTE 11: ACCRUING LOANS PAST DUE 90 DAYS OR MORE (dollars in thousands)
| December 31, | 2003 | 2002 | ||||||
Loan Receivables |
||||||||
Domestic: |
||||||||
Credit card |
$ | 365,668 | $ | 310,413 | ||||
Other consumer |
164,315 | 179,378 | ||||||
Total domestic |
529,983 | 489,791 | ||||||
Foreign |
52,622 | 48,798 | ||||||
Total |
$ | 582,605 | $ | 538,589 | ||||
Securitized Loans |
||||||||
Domestic: |
||||||||
Credit card |
$ | 1,563,719 | $ | 1,429,522 | ||||
Other consumer |
174,314 | 186,256 | ||||||
Total domestic |
1,738,033 | 1,615,778 | ||||||
Foreign |
122,232 | 142,540 | ||||||
Total |
$ | 1,860,265 | $ | 1,758,318 | ||||
Managed Loans |
||||||||
Domestic: |
||||||||
Credit card |
$ | 1,929,387 | $ | 1,739,935 | ||||
Other consumer |
338,629 | 365,634 | ||||||
Total domestic |
2,268,016 | 2,105,569 | ||||||
Foreign |
174,854 | 191,338 | ||||||
Total |
$ | 2,442,870 | $ | 2,296,907 | ||||
The table above excludes nonaccrual loans, which are presented in Note 12: Nonaccrual Loans. The Corporation considers these loans and other factors in determining an appropriate reserve for possible credit losses and the estimate of uncollectible accrued interest and fees.
NOTE 12: NONACCRUAL LOANS (dollars in thousands)
| December 31, | 2003 | 2002 | ||||||
Loan Receivables |
||||||||
Domestic: |
||||||||
Credit card |
$ | 13,114 | $ | 48,318 | ||||
Other consumer |
1,053 | 2,481 | ||||||
Total domestic |
14,167 | 50,799 | ||||||
Foreign |
85,284 | 6,733 | ||||||
Total |
$ | 99,451 | $ | 57,532 | ||||
Nonaccrual loan receivables as a percentage
of ending loan receivables |
.30 | % | .20 | % | ||||
Securitized Loans |
||||||||
Domestic: |
||||||||
Credit card |
$ | 47,772 | $ | 215,605 | ||||
Other consumer |
1,050 | 2,348 | ||||||
Total domestic |
48,822 | 217,953 | ||||||
Foreign |
129,140 | 11,798 | ||||||
Total |
$ | 177,962 | $ | 229,751 | ||||
Nonaccrual securitized loans as a percentage
of ending securitized loans |
.21 | % | .29 | % | ||||
Managed Loans |
||||||||
Domestic: |
||||||||
Credit card |
$ | 60,886 | $ | 263,923 | ||||
Other consumer |
2,103 | 4,829 | ||||||
Total domestic |
62,989 | 268,752 | ||||||
Foreign |
214,424 | 18,531 | ||||||
Total |
$ | 277,413 | $ | 287,283 | ||||
Nonaccrual managed loans as a percentage
of ending managed loans |
.23 | % | .27 | % | ||||
Nonaccrual loans are charged off consistent with the Corporation’s charge-off policy. On a case-by-case basis, management determines if an account should be placed on nonaccrual status. When loans are classified as nonaccrual, the accrual of interest ceases. In future periods when a payment is received, it is recorded as a reduction of principal. The Corporation considers these loans and other factors in determining an appropriate reserve for possible credit losses and the estimate of uncollectible accrued interest and fees.
NOTE 13: PREMISES AND EQUIPMENT
Depreciation expense was $229.2 million, $224.3 million, and $208.0 million for the years ended December 31, 2003, 2002, and 2001, respectively. Amortization expense on capitalized software was $104.3 million, $83.6 million, and $65.7 million for the years ended December 31, 2003, 2002, and 2001, respectively.
SUMMARY OF PREMISES AND EQUIPMENT
(dollars in thousands)
| December 31, | 2003 | 2002 | ||||||
Land |
$ | 207,479 | $ | 220,943 | ||||
Buildings and improvements |
2,159,226 | 1,957,432 | ||||||
Furniture and equipment |
1,285,063 | 1,262,444 | ||||||
Software |
733,279 | 546,615 | ||||||
Total |
4,385,047 | 3,987,434 | ||||||
Accumulated depreciation |
(1,436,507 | ) | (1,252,175 | ) | ||||
Accumulated amortization on software |
(271,943 | ) | (216,158 | ) | ||||
Premises and equipment, net |
$ | 2,676,597 | $ | 2,519,101 | ||||
NOTE 14: LEASE COMMITMENTS
The Corporation leases certain office facilities and equipment under operating lease agreements that provide for payment of property taxes, insurance, and maintenance costs. These leases include renewal options, with certain leases providing purchase options. Rental expense for operating leases was $26.7 million, $29.7 million, and $26.7 million for the years ended December 31, 2003, 2002, and 2001, respectively.
FUTURE MINIMUM RENTAL PAYMENTS UNDER
NONCANCELABLE OPERATING LEASES
(dollars in thousands)
2004 |
$ | 28,400 | ||
2005 |
20,683 | |||
2006 |
8,708 | |||
2007 |
1,898 | |||
2008 |
172 | |||
Thereafter |
134 | |||
Total minimum lease payments |
$ | 59,995 | ||
SUMMARY OF SHORT-TERM BORROWINGS (dollars in thousands)
| Year Ended December 31, | 2003 | 2002 | 2001 | |||||||||
Federal Funds Purchased and Securities Sold Under Repurchased Agreements |
||||||||||||
Balance at year end |
$ | – | $ | – | $ | – | ||||||
Weighted average interest rate at year end |
– | % | – | % | – | % | ||||||
Average balance outstanding during the year |
$ | – | $ | 1,502 | $ | 1,863 | ||||||
Maximum amount outstanding at any month end |
– | – | – | |||||||||
Weighted average interest rate during the year |
– | % | 1.80 | % | 3.76 | % | ||||||
Other Short-Term Borrowings |
||||||||||||
Balance at year end |
$ | 1,025,463 | $ | 1,250,103 | $ | 1,774,816 | ||||||
Weighted average interest rate at year end |
3.75 | % | 3.31 | % | 2.94 | % | ||||||
Average balance outstanding during the year |
$ | 1,141,954 | $ | 1,251,619 | $ | 561,768 | ||||||
Maximum amount outstanding at any month end |
1,246,872 | 1,340,653 | 1,774,816 | |||||||||
Weighted average interest rate during the year |
3.43 | % | 3.43 | % | 4.40 | % | ||||||
NOTE 15: DEPOSITS
Total deposits were $31.8 billion and $30.6 billion at December 31, 2003 and 2002, respectively. The Corporation utilizes deposits to fund loan and other asset growth and to diversify funding sources. Direct deposits are deposits marketed to and received from individual Customers without the use of a third-party intermediary. Other deposits are deposits normally obtained through the use of a third-party intermediary.
Domestic time deposits in amounts of $100,000 or more totaled $3.4 billion and $3.3 billion at December 31, 2003 and 2002, respectively. Foreign time deposits in amount of $100,000 or more totaled $861.9 million and $648.1 million at December 31, 2003 and 2002, respectively. The aggregate amount of deposits by maturity at December 31, 2003 was as follows:
MATURITIES OF DEPOSITS (dollars in thousands)
| Direct | Other | Total | ||||||||||
| December 31, 2003 | Deposits | Deposits (a) | Deposits | |||||||||
Domestic: |
||||||||||||
One year or less |
$ | 16,401,083 | $ | 2,686,220 | $ | 19,087,303 | ||||||
Over one year through
two years |
3,954,095 | 1,871,494 | 5,825,589 | |||||||||
Over two years through
three years |
1,568,129 | 1,044,247 | 2,612,376 | |||||||||
Over three years through
four years |
1,487,057 | 779,926 | 2,266,983 | |||||||||
Over four years through
five years |
830,244 | 121,424 | 951,668 | |||||||||
Over five years |
8,615 | – | 8,615 | |||||||||
Total domestic deposits |
24,249,223 | 6,503,311 | 30,752,534 | |||||||||
Foreign (b) |
1,056,175 | 27,372 | 1,083,547 | |||||||||
Total deposits |
$ | 25,305,398 | $ | 6,530,683 | $ | 31,836,081 | ||||||
| (a) | At December 31, 2003, all other deposits were brokered deposits. | |||
| (b) | At December 31, 2003, all foreign deposits had maturities of one year or less. | |||
NOTE 16: SHORT-TERM BORROWINGS
Federal funds purchased and securities sold under repurchase agreements are overnight borrowings that normally mature within one business day of the transaction date. Other short-term borrowings consist primarily of federal funds purchased that mature in more than one business day, short-term bank notes issued from the global bank note program established by the Bank, short-term deposit notes issued by MBNA Canada, and other transactions with maturities greater than one business day but less than one year.
Included in short-term borrowings at December 31, 2003 are two on-balance-sheet structured financings totaling $900.0 million, which were entered into during 2003. These structured financings are secured by $1.3 billion of domestic other consumer loan receivables. The Corporation has an option to liquidate these structured financings on a monthly basis.
Included in short-term borrowings at December 31, 2002 were two on-balance-sheet structured financings totaling $1.0 billion, which were entered into during 2001. These structured financings were secured by $1.1 billion of domestic other consumer loan receivables. The Corporation liquidated these structured financings in 2003.
The short-term deposit notes issued by MBNA Canada are unconditionally and irrevocably guaranteed as to payment of principal and interest by the Bank. MBNA Canada had CAD$163.0 million (par value), which was approximately $125.9 million of short-term deposit notes at December 31, 2003.
NOTE 17: LONG-TERM DEBT AND BANK NOTES
Long-term debt and bank notes consist of borrowings having an original maturity of one year or more.
Original issue discount and deferred issuance costs are amortized over the terms of the related debt issuances.
The Corporation uses interest rate swap agreements and foreign exchange swap agreements to change a portion of fixed-rate long-term debt and bank notes to floating-rate long-term debt and bank notes to more closely match the rate sensitivity of the Corporation’s assets. The Corporation also uses foreign exchange swap agreements to reduce its foreign currency exchange risk on a portion of long-term debt and bank notes issued by MBNA Europe.
Deposit liabilities have priority over the claims of other unsecured creditors of the Bank, including the holders of obligations, such as bank notes, in the event of liquidation.
6.875% SENIOR NOTES
These notes are direct, unsecured obligations of the Corporation and are not subordinated to any other indebtedness of the
Corporation. Interest on the 6.875% senior notes is payable semiannually. These notes may not be redeemed prior to their stated maturity.
SENIOR MEDIUM-TERM NOTES
These notes are direct, unsecured obligations of the Corporation and are not subordinated to any other indebtedness of the Corporation. These notes may not be redeemed prior to their stated maturities. The Corporation had $2.3 billion (par value) of fixed-rate senior medium-term notes outstanding at December 31, 2003, with rates ranging from 4.625% to 7.50%. Interest on the fixed-rate senior medium-term notes is payable semiannually. The Corporation also had $95.0 million (par value) of floating-rate senior medium-term notes outstanding at December 31, 2003. These floating-rate senior medium-term notes are priced between 95 basis points and 175 basis points over the three-month London Interbank Offered Rate (“LIBOR”). Interest on the floating-rate senior medium-term notes is payable quarterly. At December 31, 2003, the three-month LIBOR was 1.15%.
SUMMARY OF LONG-TERM DEBT AND BANK NOTES (dollars in thousands)
| December 31, | 2003 | 2002 | ||||||
Parent Company |
||||||||
6.875% Senior Notes, maturing in 2005 |
$ | 99,856 | $ | 99,761 | ||||
Fixed-Rate Senior Medium-Term Notes, with a weighted average interest rate of 6.06% and 6.55%, respectively, maturing
in varying amounts from 2004 through 2015 |
2,324,231 | 1,522,701 | ||||||
Floating-Rate Senior Medium-Term Notes, maturing in varying amounts in 2004 |
94,968 | 338,862 | ||||||
Junior Subordinated Deferrable Interest Debentures, series A, with an interest rate of 8.278% maturing in 2026 |
287,576 | — | ||||||
Junior Subordinated Deferrable Interest Debentures, series B, with an interest rate equal to 80 basis points above the
three-month London Interbank Offered Rate, maturing in 2027 |
286,112 | — | ||||||
Junior Subordinated Deferrable Interest Debentures, series C, with an interest rate of 8.25% maturing in 2027 |
35,764 | — | ||||||
Junior Subordinated Deferrable Interest Debentures, series D, with an interest rate of 8.125% maturing in 2032 |
320,362 | — | ||||||
Junior Subordinated Deferrable Interest Debentures, series E, with an interest rate of 8.10% maturing in 2033 |
204,810 | — | ||||||
Total parent company |
3,653,679 | 1,961,324 | ||||||
Subsidiaries |
||||||||
Fixed-Rate Bank Notes, with a weighted average interest rate of 6.65% and 6.66%, respectively, maturing in varying amounts
from 2004 through 2008 |
2,078,640 | 2,139,385 | ||||||
Floating-Rate Bank Notes, maturing in varying amounts from 2004 through 2005 |
154,928 | 364,668 | ||||||
Fixed-Rate Medium-Term Deposit Notes, with a weighted average interest rate of 5.29% and 6.08%, respectively, maturing
in varying amounts from 2004 through 2008 |
612,466 | 338,685 | ||||||
Floating-Rate Medium-Term Deposit Notes, maturing in varying amounts from 2004 through 2006 |
217,068 | 142,563 | ||||||
Fixed-Rate Euro Medium-Term Notes, with a weighted average interest rate of 5.58% and 5.83%, respectively, maturing
from 2004 through 2009 |
3,022,266 | 1,608,198 | ||||||
Floating-Rate Euro Medium-Term Notes, maturing in varying amounts from 2004 through 2008 |
1,099,537 | 511,562 | ||||||
6.75% Subordinated Notes, maturing in 2008 |
274,479 | 281,797 | ||||||
6.625% Subordinated Notes, maturing in 2012 |
533,739 | 548,957 | ||||||
7.125% Subordinated Notes, maturing in 2012 |
498,826 | 511,094 | ||||||
Guaranteed Preferred Beneficial Interests in Corporation’s Junior Subordinated Deferrable Interest Debentures, series A,
with an interest rate of 8.278%, maturing in 2026 |
— | 290,811 | ||||||
Guaranteed Preferred Beneficial Interests in Corporation’s Junior Subordinated Deferrable Interest Debentures, series B,
with an interest rate equal to 80 basis points above the three-month London Interbank Offered Rate, maturing in 2027 |
— | 277,421 | ||||||
Guaranteed Preferred Beneficial Interests in Corporation’s Junior Subordinated Deferrable Interest Debentures, series C,
with an interest rate of 8.25%, maturing in 2027 |
— | 36,562 | ||||||
Guaranteed Preferred Beneficial Interests in Corporation’s Junior Subordinated Deferrable Interest Debentures, series D,
with an interest rate of 8.125%, maturing in 2032 |
— | 319,232 | ||||||
Guaranteed Preferred Beneficial Interests in Corporation’s Junior Subordinated Deferrable Interest Debentures, series E,
with an interest rate of 8.10%, maturing in 2033 |
— | 205,914 | ||||||
Long-term debt and bank notes |
$ | 12,145,628 | $ | 9,538,173 | ||||
BANK NOTES
The bank notes are direct, unconditional, unsecured obligations of the Bank, and are not subordinated to any other obligations of the Bank. The Bank had $2.0 billion (par value) of fixed-rate bank notes outstanding at December 31, 2003, with rates ranging from 5.375% to 7.76%. Interest is payable semiannually. The Bank also had $155.0 million (par value) of floating-rate bank notes outstanding at December 31, 2003, with rates priced between 30 basis points and 60 basis points over the three-month LIBOR. Interest on bank notes is payable quarterly.
MINIMUM ANNUAL MATURITIES OF LONG-TERM DEBT AND BANK NOTES (dollars in thousands)
| MBNA | ||||||||
| Parent | Corporation and | |||||||
| (Par Value) | Company | Subsidiaries | ||||||
2004 |
$ | 130,000 | $ | 2,052,885 | ||||
2005 |
100,000 | 1,504,040 | ||||||
2006 |
— | 810,260 | ||||||
2007 |
700,000 | 1,408,766 | ||||||
2008 |
250,000 | 1,609,782 | ||||||
JUNIOR SUBORDINATED DEFERRABLE INTEREST DEBENTURES
The Corporation, through MBNA Capital A (registered December 1996), MBNA Capital B (registered January 1997), MBNA Capital C (registered March 1997), MBNA Capital D (registered June 2002), and MBNA Capital E (registered November 2002), each a statutory business trust created under the laws of the State of Delaware (collectively the “statutory trusts”), issued capital securities and common securities: series A, series B, series C, series D, and series E, respectively. The Corporation is the owner of all the beneficial ownership interests represented by the common securities of the statutory trusts. The statutory trusts exist for the sole purpose of issuing the series capital securities and the series common securities and investing the proceeds in junior subordinated deferrable interest debentures issued by the Corporation. These securities qualify as regulatory capital for the Corporation.
The junior subordinated deferrable interest debentures are the sole assets of the statutory trusts, and the payments under the junior subordinated deferrable interest debentures are the sole revenues of the statutory trusts. Interest on the series capital securities is payable semiannually or quarterly. The Corporation has the right to defer payment of interest on the junior subordinated deferrable interest debentures at any time, or from time-to-time, for a period not exceeding 10 consecutive semiannual periods or 20 consecutive quarterly periods depending upon the series. If the payment of interest is deferred on the junior subordinated deferrable interest debentures, distributions on the series securities will be deferred and the Corporation also may not be permitted to
declare or pay any cash dividends on the Corporation’s capital stock or interest on debt securities that have equal or less priority than the junior subordinated deferrable interest debentures.
The series capital securities are subject to mandatory redemption, in whole or in part, upon repayment of the junior subordinated deferrable interest debentures at their stated maturity or their earlier redemption. The junior subordinated deferrable interest debentures are redeemable prior to their stated maturity at the option of the Corporation, on or after the contractually specified dates, in whole at any time, or in part from time-to-time, or prior to the contractually specified dates, in whole only within 90 days following the occurrence of certain tax or capital treatment events. The contractually specified early redemption dates for series A, series B, series C, series D, and series E capital securities are December 1, 2006, February 1, 2007, January 15, 2002, October 1, 2007, and February 15, 2008, respectively. These contractually specified early redemption dates are subject to the Corporation having received prior approval from the Board of Governors of the Federal Reserve System. The series capital securities have a preference with respect to cash distributions and amounts payable on liquidation or redemption over the series common securities.
The obligations of the Corporation under the relevant junior subordinated deferrable interest debentures, indenture, trust agreement, and guarantee in the aggregate constitute a full and unconditional guarantee by the Corporation of all statutory trust obligations under the series capital securities issued by the statutory trusts. The junior subordinated deferrable interest debentures are unsecured and rank junior and are subordinate in right of payment to all senior debt obligations of the Corporation.
In January 2003, the FASB issued Interpretation No. 46. In accordance with Interpretation No. 46, the Corporation determined that the statutory trusts, were variable interest entities and that the Corporation was not the primary beneficiary. Effective July 1, 2003, the statutory trusts were deconsolidated. As a result of the decon-solidation, the junior subordinated deferrable interest debentures are included as parent company debt and recorded in long-term debt and bank notes in the Corporation’s consolidated financial statements and the guaranteed preferred beneficial interests in Corporation’s junior subordinated deferrable interest debentures are excluded from the Corporation’s audited consolidated financial statements in accordance with GAAP.
MEDIUM-TERM DEPOSIT NOTES
These notes are direct, unconditional, unsecured obligations of MBNA Canada and are not subordinated to any other obligation of MBNA Canada. At December 31, 2003, MBNA Canada had CAD$790.0 million (par value), which was approximately $610.4 million, of fixed-rate medium-term deposit notes
outstanding, with rates ranging from 3.60% to 6.625%. Interest is payable semiannually. MBNA Canada also had CAD$281.3 million (par value), which was approximately $217.3 million, of floating-rate medium-term deposit notes outstanding at December 31, 2003. These floating-rate medium-term deposit notes are priced between 60 basis points and 105 basis points over the ninety-day bankers acceptance rate. Interest is payable quarterly. The medium-term deposit notes are unconditionally guaranteed as to payment of principal and interest by the Bank, and are not redeemable prior to their stated maturity. At December 31, 2003, the ninety-day bankers acceptance rate was 2.68%.
EURO MEDIUM-TERM NOTES
The euro medium-term notes are unsecured obligations of MBNA Europe. These notes are unconditionally and irrevocably guaranteed in respect to all payments by the Bank.
At December 31, 2003, MBNA Europe had outstanding fixed-rate euro medium-term notes denominated in various currencies. The fixed-rate euro medium-term notes outstanding at December 31, 2003, were £250.0 million (par value), which was approximately $448.0 million with interest payable quarterly, €1.5 billion (par value), which was approximately $1.9 billion with interest payable quarterly, and €500.0 million (par value), which was approximately $631.5 million with interest payable annually. The fixed-rate euro medium term notes had interest rates ranging from 4.50% to 6.50%.
At December 31, 2003, MBNA Europe also had outstanding floating-rate euro medium-term notes denominated in various currencies. The floating-rate euro medium-term notes outstanding at December 31, 2003 were £51.0 million (par value), which was approximately $91.4 million, with interest priced between 58 basis points and 155 basis points over the three-month Sterling LIBOR, €750.0 million (par value), which was approximately $947.3 million, with interest priced between 60 basis points and 105 basis points over the three-month Euro Interbank Offered Rate (“EURIBOR”), HKD130.0 million (par value), which was approximately $16.9 million, with interest priced at 100 basis points over the three-month Hong Kong Interbank Offered Rate (“HIBOR”), and $47.0 million (par value) with interest priced between 50 basis points and 64 basis points over the three-month LIBOR. Interest on these floating-rate euro medium-term notes is payable quarterly.
At December 31, 2003, the three-month Sterling LIBOR was 4.04%, the three-month EURIBOR was 2.12%, and the three-month HIBOR was 1.52%.
6.75% SUBORDINATED NOTES
The 6.75% Subordinated Notes are subordinated to the claims of depositors and other creditors of the Bank, unsecured, and not subject to redemption prior to maturity. Interest is payable semiannually. The 6.75% Subordinated Notes were issued by the Bank in 1998 and qualify as Tier 2 Capital, which is included in Total Capital, under the risk-based capital guidelines for both banks and bank holding companies.
6.625% SUBORDINATED NOTES
The 6.625% Subordinated Notes are subordinated to the claims of depositors and other creditors of the Bank, unsecured, and not subject to redemption prior to maturity. Interest is payable semiannually. The 6.625% Subordinated Notes were issued by the Bank in 2002 and qualify as Tier 2 Capital, which is included in Total Capital, under the risk-based capital guidelines for both banks and bank holding companies.
7.125% SUBORDINATED NOTES
The 7.125% Subordinated Notes are subordinated to the claims of depositors and other creditors of the Bank, unsecured, and not subject to redemption prior to maturity. Interest is payable semiannually. The 7.125% Subordinated Notes were issued by the Bank in 2002 and qualify as Tier 2 Capital, which is included in Total Capital, under the risk-based capital guidelines for both banks and bank holding companies.
NOTE 18: STOCKHOLDERS’ EQUITY
PREFERRED STOCK
The Corporation is authorized to issue 20 million shares of preferred stock with a par value of $.01 per share. The Corporation had 4.5 million shares of 7 1/2% cumulative preferred stock, Series A, outstanding at December 31, 2003 and 2002. The Corporation also had 4.0 million shares of adjustable rate cumulative preferred stock, Series B, outstanding at December 31, 2003 and 2002. Both of the outstanding series of preferred stock have a $25 stated value per share.
Shares of the series preferred stock are not convertible into any other securities of the Corporation. The series preferred stock will not be entitled to the benefits of any sinking fund. All preferred shares rank senior to common shares both as to dividends and liquidation preference, but have no general voting rights. In the event that the equivalent of six full quarterly dividend periods are in arrears, the holders of the outstanding shares of the preferred stock (voting as a single class) will be entitled to vote for the election of two additional directors to serve until all dividends in arrears have been paid in full.
PREFERRED STOCK DIVIDEND SUMMARY
| | | Series A | | | Series B | |||||||||||||||
| Dividend | Dividend per | Dividend | Dividend per | |||||||||||||||
| Declaration Date | Payment Date | Rate | Preferred Share | Rate | Preferred Share | |||||||||||||
January 22, 2004 |
April 15, 2004 | 7.50 | % | $ | .46875 | 5.50 | % | $ | .34380 | |||||||||
October 16, 2003 |
January 15, 2004 | 7.50 | .46875 | 5.50 | .34380 | |||||||||||||
July 24, 2003 |
October 15, 2003 | 7.50 | .46875 | 5.50 | .34380 | |||||||||||||
April 23, 2003 |
July 15, 2003 | 7.50 | .46875 | 5.50 | .34380 | |||||||||||||
January 23, 2003 |
April 15, 2003 | 7.50 | .46875 | 5.50 | .34380 | |||||||||||||
October 17, 2002 |
January 15, 2003 | 7.50 | .46875 | 5.50 | .34380 | |||||||||||||
July 11, 2002 |
October 15, 2002 | 7.50 | .46875 | 5.56 | .34740 | |||||||||||||
April 11, 2002 |
July 15, 2002 | 7.50 | .46875 | 5.90 | .36850 | |||||||||||||
January 10, 2002 |
April 15, 2002 | 7.50 | .46875 | 5.50 | .34380 | |||||||||||||
October 11, 2001 |
January 15, 2002 | 7.50 | .46875 | 5.50 | .34380 | |||||||||||||
July 11, 2001 |
October 15, 2001 | 7.50 | .46875 | 5.60 | .35020 | |||||||||||||
April 10, 2001 |
July 16, 2001 | 7.50 | .46875 | 5.50 | .34380 | |||||||||||||
January 10, 2001 |
April 16, 2001 | 7.50 | .46875 | 5.64 | .35270 | |||||||||||||
The Board of Directors declared the dividends presented in the Preferred Stock Dividend Summary for the Corporation’s Series A and Series B Preferred Stock.
Dividends on the Series A Preferred Stock are cumulative from the date of original issue and are payable quarterly in arrears on January 15, April 15, July 15, and October 15 of each year. The shares of the Series A Preferred Stock are redeemable, in whole or in part, solely at the option of the Corporation, at a price of $25 per share, plus accrued and unpaid dividends.
Dividends on the Series B Preferred Stock are cumulative from the date of original issue and are payable quarterly in arrears on January 15, April 15, July 15, and October 15 of each year. The dividend rate for any dividend period will be equal to 99.0% of the highest of the Treasury Bill Rate, the Ten-Year Constant Maturity Rate, and the Thirty-Year Constant Maturity Rate, as determined in advance of such dividend period, but not less than 5.5% per annum or more than 11.5% per annum. The amount of dividends payable with respect to the Series B Preferred Stock will be adjusted in the event of certain amendments to the Internal Revenue Code of 1986 (“Tax Code”) with respect to the dividends-received deduction. The shares of the Series B Preferred Stock are redeemable, in whole or in part, solely at the option of the Corporation, at a price of $25 per share, plus accrued and unpaid dividends.
The Corporation may, from time-to-time, acquire series preferred stock in the open market by tender offer, exchange offer, or otherwise. The Corporation’s decision to make such acquisitions is dependent on many factors, including market conditions in effect at the time of any contemplated acquisition.
COMMON STOCK
On January 22, 2004, the Corporation’s Board of Directors declared a quarterly dividend of $.12 per common share, payable April 1, 2004, to stockholders of record as of March 15, 2004.
On June 6, 2002, the Corporation announced a three-for-two split of the Corporation’s Common Stock, effected in the form of a dividend, issued July 15, 2002, to stockholders of record as of the close of business on July 1, 2002. Accordingly, all common share and per common share data have been adjusted to reflect this stock split.
In the third quarter of 2003, the Corporation issued 50.0 million shares of its common stock in a public offering for approximately $1.1 billion, net of issuance costs. The shares were issued under the Corporation’s existing shelf registration statement. The Corporation used the proceeds to repurchase the same number of shares at the same price from the estate of the Corporation’s former Chairman and Chief Executive Officer. The estate has the right to cause the sale of shares through a registration rights agreement entered into in 1991 at the time of the Corporation’s initial public offering. The issuance and repurchase were done to satisfy the Corporation’s obligation related to the sale of shares by the estate. The sale and repurchase of common stock did not impact total common stock outstanding or capital levels.
OTHER COMPREHENSIVE INCOME COMPONENTS (dollars in thousands)
| Year Ended December 31, | 2003 | 2002 | 2001 | |||||||||
Before Tax |
||||||||||||
Foreign currency translation |
$ | 352,800 | $ | 140,757 | $ | (28,984 | ) | |||||
Net unrealized (losses) gains on investment securities available-for-sale
and other financial instruments |
(7,283 | ) | (51 | ) | 29,764 | |||||||
Minimum benefit plan liability adjustment |
(16,854 | ) | (6,734 | ) | — | |||||||
Other comprehensive income, before tax |
$ | 328,663 | $ | 133,972 | $ | 780 | ||||||
Applicable Income Tax |
||||||||||||
Foreign currency translation |
$ | — | $ | — | $ | — | ||||||
Net unrealized gains on investment securities available-for-sale
and other financial instruments |
10,001 | 3,271 | 10,689 | |||||||||
Minimum benefit plan liability adjustment |
(5,916 | ) | (2,458 | ) | — | |||||||
Other comprehensive income tax expense |
$ | 4,085 | $ | 813 | $ | 10,689 | ||||||
Net of Tax |
||||||||||||
Foreign currency translation |
$ | 352,800 | $ | 140,757 | $ | (28,984 | ) | |||||
Net unrealized (losses) gains on investment securities available-for-sale
and other financial instruments |
(17,284 | ) | (3,322 | ) | 19,075 | |||||||
Minimum benefit plan liability adjustment |
(10,938 | ) | (4,276 | ) | — | |||||||
Other comprehensive income (loss), net of tax |
$ | 324,578 | $ | 133,159 | $ | (9,909 | ) | |||||
NOTE 19: COMPREHENSIVE INCOME
Statement No. 130 requires the impact of foreign currency translation, unrealized gains or losses on the Corporation’s investment securities available-for-sale and other financial instruments, and changes in certain minimum benefit plan liabilities, to be included in other comprehensive income. The components of other comprehensive income on a before tax and net of tax basis are presented in the above table.
Favorable foreign currency translation for the year ended December 31, 2003 was primarily related to the strengthening of foreign currencies against the U.S. dollar.
NOTE 20: EARNINGS PER COMMON SHARE
Earnings per common share is computed using net income applicable to common stock and weighted average common shares outstanding during the period. Earnings per common share—assuming dilution is computed using net income applicable to
common stock and weighted average common shares outstanding during the period after consideration of the potential dilutive effect of common stock equivalents, based on the treasury stock method using an average market price for the period. There were 34.7 million stock options with an average exercise price of $22.91 per share outstanding at December 31, 2003, which were not included in the computation of earnings per common share—assuming dilution for 2003 as a result of the stock options’ exercise prices being greater than the average market price of the common shares. These stock options expire from 2010 through 2012. There were 20.6 million stock options with an average option price of $23.90 per share outstanding at December 31, 2002, which were not included in the computation of earnings per common share—assuming dilution for 2002 as a result of the stock options’ exercise prices being greater than the average market price of the common shares. These stock options expire from 2010 through 2012. There were 17.0 million stock options with an average price of $21.71 per
COMPUTATION OF EARNINGS PER COMMON SHARE (dollars in thousands, except per share amounts)
| Year Ended December 31, | 2003 | 2002 | 2001 | |||||||||
Earnings per Common Share |
||||||||||||
Net income |
$ | 2,338,104 | $ | 1,765,954 | $ | 1,694,291 | ||||||
Less: preferred stock dividend requirements |
14,064 | 14,178 | 14,142 | |||||||||
Net income applicable to common stock |
$ | 2,324,040 | $ | 1,751,776 | $ | 1,680,149 | ||||||
Weighted average common shares outstanding (000) |
1,278,166 | 1,277,787 | 1,277,745 | |||||||||
Earnings per common share |
$ | 1.82 | $ | 1.37 | $ | 1.31 | ||||||
Earnings
per Common Share—Assuming Dilution |
||||||||||||
Net income |
$ | 2,338,104 | $ | 1,765,954 | $ | 1,694,291 | ||||||
Less: preferred stock dividend requirements |
14,064 | 14,178 | 14,142 | |||||||||
Net income applicable to common stock |
$ | 2,324,040 | $ | 1,751,776 | $ | 1,680,149 | ||||||
Weighted average common shares outstanding (000) |
1,278,166 | 1,277,787 | 1,277,745 | |||||||||
Net effect of dilutive stock options (000) |
16,976 | 24,925 | 36,485 | |||||||||
Weighted average common shares outstanding and common stock equivalents (000) |
1,295,142 | 1,302,712 | 1,314,230 | |||||||||
Earnings per common share-assuming dilution |
$ | 1.79 | $ | 1.34 | $ | 1.28 | ||||||
share outstanding at December 31, 2001, which were not included in the computation of earnings per common share—assuming dilution for 2001 as a result of the stock options’ exercise price being greater than the average market price of the common shares. These stock options expire in 2010 and 2011.
NOTE 21: INCOME TAXES
The following is a reconciliation of the federal statutory income taxes to the Corporation’s reported income taxes:
RECONCILIATION OF FEDERAL STATUTORY INCOME TAXES (dollars in thousands)
| Year Ended December 31, | 2003 | 2002 | 2001 | |||||||||
Income before income taxes |
$ | 3,659,005 | $ | 2,785,416 | $ | 2,715,210 | ||||||
Statutory tax rate |
35 | % | 35 | % | 35 | % | ||||||
Income tax at statutory
tax rate |
1,280,652 | 974,896 | 950,324 | |||||||||
State taxes, net of
federal benefit |
31,321 | 23,951 | 30,321 | |||||||||
Other |
8,928 | 20,615 | 40,274 | |||||||||
Total income taxes |
$ | 1,320,901 | $ | 1,019,462 | $ | 1,020,919 | ||||||
The components of the Corporation’s income tax expense related to continued operations are as follows:
COMPONENTS OF INCOME TAX EXPENSE
(dollars in thousands)
| Year Ended December 31, | 2003 | 2002 | 2001 | |||||||||
Current Income Taxes |
||||||||||||
U.S. federal |
$ | 1,095,826 | $ | 1,017,511 | $ | 1,020,232 | ||||||
U.S. state and local |
48,186 | 36,848 | 46,648 | |||||||||
Foreign |
178,869 | 116,810 | 65,306 | |||||||||
Total current income taxes |
1,322,881 | 1,171,169 | 1,132,186 | |||||||||
Deferred Income Taxes |
||||||||||||
U.S. federal, state, and local |
(669 | ) | (143,601 | ) | (125,324 | ) | ||||||
Foreign |
(1,311 | ) | (8,106 | ) | 14,057 | |||||||
Total deferred income taxes |
(1,980 | ) | (151,707 | ) | (111,267 | ) | ||||||
Total income taxes |
$ | 1,320,901 | $ | 1,019,462 | $ | 1,020,919 | ||||||
Foreign subsidiaries contributed approximately 15.5% in 2003, 14.7% in 2002, and 12.2% in 2001 to consolidated income before income taxes. No U.S. income taxes have been provided on the accumulated undistributed earnings of foreign subsidiaries, totaling $1.3 billion at December 31, 2003, which continue to be reinvested. It is not practicable to determine the amount of any additional U.S. income taxes that might be payable in the event that these earnings are repatriated. The Corporation has foreign tax loss carryforwards, the tax effect of which is $4.1 million, that begin to expire in 2017. At December 31, 2003, the Corporation had a valuation allowance in accordance with Statement of Financial Accounting Standards No. 109 “Accounting for Income Taxes” (“Statement No. 109”) of $4.1 million, related to foreign tax loss carryforwards.
Deferred income taxes reflect the net effects of temporary differences between the carrying amounts of assets and liabilities for financial reporting purposes and the amounts used for income tax purposes. Significant components of the Corporation’s deferred tax assets and liabilities are as follows:
SUMMARY OF DEFERRED TAXES (dollars in thousands)
| December 31, | 2003 | 2002 | ||||||
Deferred Tax Assets |
||||||||
Reserve for possible credit losses and the estimate
of uncollectible accrued interest and fees |
$ | 292,235 | $ | 277,625 | ||||
Intangible assets and other similar items |
108,386 | 107,660 | ||||||
Foreign tax loss carryforwards and tax credits |
4,142 | 2,943 | ||||||
Other deferred tax assets |
432,011 | 377,206 | ||||||
Total deferred tax assets |
836,774 | 765,434 | ||||||
Valuation allowance |
(4,142 | ) | (982 | ) | ||||
Total deferred tax assets less valuation
allowance |
832,632 | 764,452 | ||||||
Deferred Tax Liabilities |
||||||||
Securitizations and related items |
(380,350 | ) | (350,192 | ) | ||||
Other deferred tax liabilities |
(129,252 | ) | (107,842 | ) | ||||
Total deferred tax liabilities |
(509,602 | ) | (458,034 | ) | ||||
Net deferred tax assets |
$ | 323,030 | $ | 306,418 | ||||
NOTE 22: EMPLOYEE BENEFITS
The Corporation has a noncontributory defined benefit pension plan (“Pension Plan”) and a supplemental executive retirement plan (“SERP”).
PENSION PLAN
The Corporation’s Pension Plan covers substantially all people employed by the Corporation in the United States who meet certain age and service requirements. Retirement benefits are based on the number of years of benefit service and a percentage of the participant’s average annual compensation during the five highest paid consecutive years of their last 10 years of employment. The Corporation’s funding policy is to have the market value of the Pension Plan’s assets achieve a target-funded ratio between 100% and 120% on a projected benefit obligation (“PBO”) basis, and that only tax-deductible contributions may be made. This target-funded ratio is intended to accelerate the time frames when the Pension Plan will no longer require additional annual contributions. The target-funded ratio was not achieved in 2003, nor is it likely to be achieved in 2004 as a result of the capital market and interest rate environments, as well as limitations on permissible tax deductible contributions to the Pension Plan. The target-funded ratio is calculated by dividing the fair market value of plan assets by the PBO; at December 31, 2003, the Pension Plan had a target-funded ratio of 73%, based on the fair market value of the Pension Plan’s assets of $378.4 million and a PBO of $517.8 million. At December 31, 2002, the Pension Plan had a target-funded ratio of 66%, based on the fair market value of the Pension Plan’s assets of $263.3 million and a PBO of $397.2 million. As of December 31, 2003 and 2002, the Pension Plan had a funded ratio on an accumulated benefit obligation (“ABO”) basis of 135% and 122%, respectively.
BENEFIT PLAN FINANCIAL INFORMATION (dollars in thousands)
| Pension Plan | SERP Plan | Total | ||||||||||||||||||||||||||
| Year Ended December 31, | 2003 | 2002 | 2003 | 2002 | 2003 | 2002 | ||||||||||||||||||||||
Change in Benefit Obligation |
||||||||||||||||||||||||||||
Net benefit obligation, beginning of year |
$ | 397,182 | $ | 267,422 | $ | 176,580 | $ | 111,584 | $ | 573,762 | $ | 379,006 | ||||||||||||||||
Service cost-benefits earned during the year |
49,775 | 37,813 | 15,090 | 13,115 | 64,865 | 50,928 | ||||||||||||||||||||||
Interest cost on projected benefit obligation |
28,899 | 23,349 | 12,964 | 11,299 | 41,863 | 34,648 | ||||||||||||||||||||||
Actuarial loss |
45,551 | 58,574 | 17,483 | 20,381 | 63,034 | 78,955 | ||||||||||||||||||||||
Plan amendments |
— | 12,155 | 7,218 | 21,672 | 7,218 | 33,827 | ||||||||||||||||||||||
Gross benefits paid |
(3,561 | ) | (2,131 | ) | (1,740 | ) | (1,471 | ) | (5,301 | ) | (3,602 | ) | ||||||||||||||||
Net benefit obligation, end of year |
$ | 517,846 | $ | 397,182 | $ | 227,595 | $ | 176,580 | $ | 745,441 | $ | 573,762 | ||||||||||||||||
Change in Plan Assets |
||||||||||||||||||||||||||||
Fair value of plan assets, beginning of year |
$ | 263,336 | $ | 247,460 | $ | — | $ | — | $ | 263,336 | $ | 247,460 | ||||||||||||||||
Actual return on plan assets |
49,632 | (39,047 | ) | — | — | 49,632 | (39,047 | ) | ||||||||||||||||||||
Employer contributions |
69,000 | 57,054 | 1,740 | 1,471 | 70,740 | 58,525 | ||||||||||||||||||||||
Gross benefits paid |
(3,561 | ) | (2,131 | ) | (1,740 | ) | (1,471 | ) | (5,301 | ) | (3,602 | ) | ||||||||||||||||
Fair value of plan assets, end of year |
$ | 378,407 | $ | 263,336 | $ | — | $ | — | $ | 378,407 | $ | 263,336 | ||||||||||||||||
Funded status |
$ | (139,439 | ) | $ | (133,846 | ) | $ | (227,595 | ) | $ | (176,580 | ) | $ | (367,034 | ) | $ | (310,426 | ) | ||||||||||
Unrecognized net actuarial loss |
196,528 | 185,152 | 43,224 | 25,845 | 239,752 | 210,997 | ||||||||||||||||||||||
Unrecognized prior service cost |
12,400 | 13,485 | 44,399 | 40,359 | 56,799 | 53,844 | ||||||||||||||||||||||
Unrecognized net transition obligation |
— | — | 1,694 | 2,109 | 1,694 | 2,109 | ||||||||||||||||||||||
Net amount recognized |
$ | 69,489 | $ | 64,791 | $ | (138,278 | ) | $ | (108,267 | ) | $ | (68,789 | ) | $ | (43,476 | ) | ||||||||||||
Amounts Recognized in the Consolidated Statements
of Financial Condition |
||||||||||||||||||||||||||||
Prepaid benefit cost |
$ | 69,489 | $ | 64,791 | $ | — | $ | — | $ | 69,489 | $ | 64,791 | ||||||||||||||||
Accrued benefit cost |
— | — | (138,278 | ) | (108,267 | ) | (138,278 | ) | (108,267 | ) | ||||||||||||||||||
Additional minimum liability |
— | — | (69,681 | ) | (49,202 | ) | (69,681 | ) | (49,202 | ) | ||||||||||||||||||
Intangible asset |
— | — | 46,093 | 42,468 | 46,093 | 42,468 | ||||||||||||||||||||||
Accumulated other comprehensive income |
— | — | 23,588 | 6,734 | 23,588 | 6,734 | ||||||||||||||||||||||
Net amount recognized |
$ | 69,489 | $ | 64,791 | $ | (138,278 | ) | $ | (108,267 | ) | $ | (68,789 | ) | $ | (43,476 | ) | ||||||||||||
Significant Assumptions used to Determine Benefit
Obligations, End of Year |
||||||||||||||||||||||||||||
Discount rate |
6.00 | % | 6.75 | % | 6.00 | % | 6.75 | % | ||||||||||||||||||||
Rate of compensation increase |
5.00 | 5.50 | 5.00 | 5.50 | ||||||||||||||||||||||||
Expected rate of return on plan assets |
9.00 | 9.00 | 9.00 | 9.00 | ||||||||||||||||||||||||
SUPPLEMENTAL EXECUTIVE RETIREMENT PLAN
The Corporation’s SERP plan, established in 1991, provides certain officers with supplemental retirement benefits in excess of limits imposed on qualified plans by federal tax law. The SERP plan provides a retirement benefit up to a maximum of 80% of the participants’ highest average salary for any 12 month period during the 72 months preceding retirement. The SERP plan is unfunded, however, the Corporation has life insurance policies on certain participants of the SERP plan with a cash surrender value of $83.9 million and $53.5 million at December 31, 2003 and 2002, respectively.
Financial information for both the Pension Plan and the SERP plan is presented in the above table. MBNA Corporation uses a measurement date of September 30 for both its Pension plan and SERP plan.
BENEFIT PLAN FINANCIAL INFORMATION
In 2003, the Corporation decreased the discount rate used to value its PBO for both the Pension Plan and the SERP plan to 6.00% from 6.75% in 2002, to reflect the current interest rate environment. The change in the discount rate increased the PBO for the Pension
Plan and the SERP plan by approximately $87 million and $16 million, respectively, for the year ended December 31, 2003. Net periodic benefit cost for the Pension Plan and the SERP plan increased by $29.5 million in 2003 as compared to 2002, primarily as a result of a lower than assumed return on plan assets, $11.5 million; a lower assumed discount rate, $9.7 million; and normal operations of the plans including additional participants, $8.3 million. In 2003, the Corporation decreased the expected rate of compensation increase for both the Pension Plan and the SERP plan to 5.00% from 5.50% in 2002 after re-evaluating the expected future rate of compensation increases. This was done to reflect the long-term expectation of compensation rate increases and to maintain an appropriate spread between this assumption and the discount rate assumptions.
In 2003, the Corporation retained its expected return on plan assets assumption for both the Pension Plan and the SERP Plan. The expected return on plan assets assumption was determined based on the Pension Plan and SERP Plan’s asset allocation, a review of historic market performance, historical plan performance and a forecast of expected future asset returns.
COMPONENTS OF NET PERIODIC BENEFIT COST (dollars in thousands)
| Pension Plan | | | SERP Plan | | | Total | ||||||||||||||||||||||||||||||||
| Year Ended December 31, | 2003 | 2002 | 2001 | 2003 | 2002 | 2001 | 2003 | 2002 | 2001 | |||||||||||||||||||||||||||
Service cost-benefits
earned during the year |
$ | 49,775 | $ | 37,813 | $ | 27,043 | $ | 15,090 | $ | 13,115 | $ | 8,656 | $ | 64,865 | $ | 50,928 | $ | 35,699 | ||||||||||||||||||
Interest cost on projected
benefit obligation |
28,899 | 23,349 | 16,844 | 12,964 | 11,299 | 7,846 | 41,863 | 34,648 | 24,690 | |||||||||||||||||||||||||||
Expected return on plan assets |
(26,050 | ) | (25,579 | ) | (25,406 | ) | — | — | — | (26,050 | ) | (25,579 | ) | (25,406 | ) | |||||||||||||||||||||
Net amortization and deferral: |
||||||||||||||||||||||||||||||||||||
Prior service cost |
1,085 | 730 | (112 | ) | 3,136 | 2,598 | 1,221 | 4,221 | 3,328 | 1,109 | ||||||||||||||||||||||||||
Actuarial loss (gain) |
10,593 | 2,910 | (2,131 | ) | 146 | — | — | 10,739 | 2,910 | (2,131 | ) | |||||||||||||||||||||||||
Transition (asset) obligation |
— | (69 | ) | (70 | ) | 415 | 415 | 415 | 415 | 346 | 345 | |||||||||||||||||||||||||
Net amortization
and deferral |
11,678 | 3,571 | (2,313 | ) | 3,697 | 3,013 | 1,636 | 15,375 | 6,584 | (677 | ) | |||||||||||||||||||||||||
Net periodic benefit cost |
$ | 64,302 | $ | 39,154 | $ | 16,168 | $ | 31,751 | $ | 27,427 | $ | 18,138 | $ | 96,053 | $ | 66,581 | $ | 34,306 | ||||||||||||||||||
Assumptions Used to Determine
Net Periodic Benefit Cost
|
||||||||||||||||||||||||||||||||||||
Discount rate |
6.75 | % | 7.50 | % | 8.00 | % | 6.75 | % | 7.50 | % | 8.00 | % | ||||||||||||||||||||||||
Rate of compensation increase |
5.50 | 6.00 | 6.00 | 5.50 | 6.00 | 6.00 | ||||||||||||||||||||||||||||||
Expected return on plan assets |
9.00 | 9.50 | 9.50 | 9.00 | 9.50 | 9.50 | ||||||||||||||||||||||||||||||
Plan amendments adopted during 2003 resulted in a $7.2 million increase in the net benefit obligation. Additional participants in the SERP plan accounted for this increase.
Plan amendments adopted during 2002 resulted in a $33.8 million increase in the net benefit obligation. Additional participants in the SERP plan accounted for $21.7 million of the increase. The remaining $12.1 million was related to the granting of benefit credited service for participants’ pre-acquisition service.
The Corporation anticipates, based on current conditions, that net periodic benefit cost for the Pension Plan and the SERP plan will increase by $20.9 million in 2004 primarily because of a lower assumed discount rate and normal operations of the plans, partially offset by a lower assumed rate of compensation increase.
COMPONENTS OF NET PERIODIC BENEFIT COST
The components of net periodic benefit cost for the Pension Plan and SERP Plan are presented in the above table.
PLAN ASSETS
The Corporation’s Pension Plan asset allocation at December 31, 2003 and 2002, and the target allocation for 2004, are as follows:
| Target | Percentage of Plan | |||||||||||
| Allocation For | Assets at Year End | |||||||||||
| Year Ended December 31, | 2004 | 2003 | 2002 | |||||||||
Asset Category |
||||||||||||
Equity securities |
75 | % | 71 | % | 65 | % | ||||||
Tactical asset allocation |
10 | 10 | 10 | |||||||||
Debt securities |
15 | 19 | 25 | |||||||||
Total |
100 | % | 100 | % | 100 | % | ||||||
The purpose of the tactical asset allocation component of the Pension Plan is to take advantage of opportunities when market conditions are favorable for equity, fixed income or cash. This exposure has historically provided plan assets an opportunity to earn equity-like returns with volatility similar to that of fixed income. All allocations are rebalanced after they migrate +/- 5 percentage points from their target allocation.
The obligations of the Pension Plan are dominated by obligations for active employees. Only 2% of the obligation is attributable to retirees. Because the timing of expected benefit payments is so far in the future and the size of the plan assets are small relative to the Corporation’s assets, the investment strategy is to allocate a large portion of assets to equities, which the Corporation believes will provide the highest return over future periods. The fixed income assets are invested in long duration debt securities in order to better match the duration of the plan obligations.
The Corporation periodically conducts an asset liability modeling study to ensure the investment strategy is aligned with the profile of the obligations. The long-term goals are to maximize the plan funded status, minimize contributions and pension expense, while taking into consideration the potential volatility risks of each of these items.
The projected benefit obligation, accumulated benefit obligation, and fair value of plan assets for the employee benefit plans are presented in the table below.
EMPLOYEE BENEFIT PLAN INFORMATION (dollars in thousands)
| December 31, | 2003 | 2002 | ||||||
Pension Plan |
||||||||
Projected benefit obligation |
$ | 517,846 | $ | 397,182 | ||||
Accumulated benefit obligation |
279,696 | 216,626 | ||||||
Fair value of plan assets |
378,407 | 263,336 | ||||||
SERP Plan |
||||||||
Projected benefit obligation |
$ | 227,595 | $ | 176,580 | ||||
Accumulated benefit obligation |
207,959 | 157,469 | ||||||
Fair value of plan assets |
— | — | ||||||
EXPECTED CASH FLOWS
A summary of the Corporation’s estimated pension benefit cash flows for the next ten years is presented in the following table.
EXPECTED CASH FLOWS (dollars in thousands)
| Pension | SERP | |||||||||||
| Plan | Plan | Total | ||||||||||
Expected Employer
Contributions |
||||||||||||
2004 to plan trusts |
$ | 75,000 | $ | — | $ | 75,000 | ||||||
2004 to plan participants |
— | 3,097 | 3,097 | |||||||||
Expected Benefit Payments |
||||||||||||
2004 |
2,238 | 3,097 | 5,335 | |||||||||
2005 |
3,063 | 7,577 | 10,640 | |||||||||
2006 |
4,134 | 10,891 | 15,025 | |||||||||
2007 |
5,550 | 13,229 | 18,779 | |||||||||
2008 |
7,469 | 14,823 | 22,292 | |||||||||
2009 through 2013 |
87,133 | 111,092 | 198,225 | |||||||||
401(k) PLUS SAVINGS PLAN
The MBNA Corporation 401(k) Plus Savings Plan (“401(k) Plan”) is a defined contribution plan that is intended to qualify under section 401(k) of the Internal Revenue Code. The 401(k) Plan covers substantially all people in the United States who have been employed by the Corporation for one or more years and have completed at least one thousand hours of service in any one-year. For these people, the Corporation automatically contributes 1% of an eligible person’s base salary in cash. Additionally, eligible participants may contribute up to a maximum of 25% of base salary on a pre-tax basis and 15% on an after-tax basis, with the first 6% matched at a rate of 50% by the Corporation in cash. The Corporation recorded $28.6 million, $27.0 million, and $23.1 million to other operating expense for the costs related to the 401(k) Plan for the years ended 2003, 2002, and 2001, respectively.
OTHER PLANS
The Corporation’s foreign bank subsidiaries each have a pension plan for their employees. MBNA Europe has a pension plan that covers substantially all of its people who meet certain age and service requirements. MBNA Europe contributes 6% of an eligible person’s base salary in cash. In addition, eligible participants may contribute up to a maximum of 15% of base salary, with the first 6% matched at a rate of 50% by MBNA Europe in cash. MBNA Canada has a registered retirement savings plan that covers substantially all of its people who meet certain age and service requirements. MBNA Canada contributes 5% of an eligible person’s base salary in cash. In addition, eligible participants may contribute up to a maximum of 10% of base salary, with the first 6% matched at a rate of 50% by MBNA Canada in cash. MBNA Espana contributes 3% on the first €31,284 of salary and 9% on the salary above €31,284. In addition, eligible participates may contribute up to a maximum of 6% of base salary, with the first 3% matched at a rate of 50% by MBNA Espana in cash.
POSTRETIREMENT AND POSTEMPLOYMENT BENEFITS
The Corporation and its subsidiaries provide certain health care and life insurance benefits for certain people upon early retirement through normal retirement age. Initially, a plan was established for people aged 45 and older with at least 10 years of service at December 31, 1993. The plan was closed to future enrollment effective December 31, 1998. The plan was extended on January 1, 1999, to people aged 40 and older with at least five years of service. A person must meet the requirements for early retirement status to be eligible for these benefits. The Corporation records the estimated cost of benefits provided to its former or inactive employees on an accrual basis. The expenses for these benefits are charged to other operating expense and were not material to the Corporation’s audited consolidated financial statements.
At September 30, 2003, a one-percentage-point change in assumed health care cost trend rates would have the following effect:
HEALTHCARE EFFECT (dollars in thousands)
| 1-Percentage | 1-Percentage | |||||||
| Point Increase | Point Decrease | |||||||
Effect on postretirement
benefit obligation |
$ | 4,917 | $ | (4,364 | ) | |||
Effect on total of service cost
and interest cost |
543 | (480 | ) | |||||
NOTE 23: STOCK-BASED EMPLOYEE COMPENSATION
The Corporation’s 1997 Long Term Incentive Plan (“1997 Plan”) and 1991 Long Term Incentive Plan (“1991 Plan”) authorize the issuance of shares of common stock pursuant to incentive and nonqualified stock options and restricted share awards to officers, directors, key employees, consultants, and advisors of the Corporation. Currently, all stock options and restricted stock awards are granted from the 1997 Plan.
The 1997 Plan authorizes, subject to certain exceptions and additional limitations, grants of stock options and restricted shares for an indefinite number of shares of common stock, provided that immediately after the grants, the sum of the number of outstanding stock options and restricted shares does not exceed 10% of fully diluted shares outstanding as defined in the 1997 Plan. At December 31, 2003, 2002, and 2001, the amount of shares of common stock available for future grants under the 1997 Plan were 26.9 million shares, 15.8 million shares, and 11.1 million shares, respectively. The maximum number of restricted stock awards that can be granted in any calendar year is 3 million shares, not including restricted stock awards in lieu of payment of cash bonuses. The maximum number of stock options that can be granted to any one participant in any calendar year is 3.38 million options.
Stock options are granted with an exercise price that is not less than the fair market value of the Corporation’s Common Stock on the date the option is granted, and none may be exercised more than 10 years from the date of grant. Stock options granted to selected officers and key employees of the Corporation normally become exercisable for one-fifth of the common shares subject to the options each year and continue to become exercisable for up to one-fifth per year until they are completely exercisable after five years. Stock options granted to nonemployee directors and certain selected officers are exercisable immediately.
The Corporation granted 1.6 million stock options in 2003, 4.6 million stock options in 2002, and 6.8 million stock options in 2001 which were immediately exercisable following the effective date of the grant. During 2003, 2002, and 2001, there were no performance-based common stock options granted.
Restricted common shares were also issued under the 1997 Plan to the Corporation’s senior officers for a total of 5.4 million common shares, including 2.4 million common shares issued in lieu of
SUMMARY OF STOCK OPTION PLANS ACTIVITY
(shares in thousands)
| Weighted | ||||||||
| Number | Average | |||||||
| of Shares | Exercise Price | |||||||
2003 |
||||||||
Options outstanding, beginning
of year |
110,728 | $ | 16.05 | |||||
Granted |
12,514 | 20.54 | ||||||
Exercised |
(23,708 | ) | 11.63 | |||||
Canceled |
(337 | ) | 19.78 | |||||
Options outstanding, end of year |
99,197 | 17.66 | ||||||
Options exercisable, end of year |
71,526 | 16.17 | ||||||
Weighted average fair value of
options
granted during the year |
$ | 7.02 | ||||||
2002 |
||||||||
Options outstanding, beginning
of year |
113,026 | $ | 12.66 | |||||
Granted |
20,675 | 23.88 | ||||||
Exercised |
(22,521 | ) | 6.15 | |||||
Canceled |
(452 | ) | 19.90 | |||||
Options outstanding, end of year |
110,728 | 16.05 | ||||||
Options exercisable, end of year |
80,748 | 14.11 | ||||||
Weighted average fair value of
options
granted during the year |
$ | 8.37 | ||||||
2001 |
||||||||
Options outstanding, beginning
of year |
101,923 | $ | 9.80 | |||||
Granted |
24,125 | 21.41 | ||||||
Exercised |
(12,961 | ) | 6.48 | |||||
Canceled |
(61 | ) | 11.23 | |||||
Options outstanding, end of year |
113,026 | 12.66 | ||||||
Options exercisable, end of year |
78,890 | 10.82 | ||||||
Weighted average fair value of
options
granted during the year |
$ | 7.50 | ||||||
payment of cash bonuses in 2003, 3.0 million common shares in 2002, and 2.9 million common shares in 2001. The restricted common shares issued had an approximate aggregate market value of $111.4 million, $69.1 million, and $66.9 million at the time of grant for 2003, 2002, and 2001, respectively. The market value of these restricted shares at the date of grant is amortized into expense over a period that approximates the restriction period, which is 10 years, or less if the restricted common shares had a specific vesting date less than 10 years from date of grant. If the restrictions lapse, generally upon death, disability or retirement, or are released sooner, any remaining unamortized market value of the restricted shares is immediately expensed. At December 31, 2003 and 2002, the unamortized compensation expense related to the restricted stock awards was $183.3 million and $158.2 million, respectively.
SUMMARY OF STOCK OPTIONS OUTSTANDING (shares in thousands)
| December 31, 2003 | Options Outstanding | Options Exercisable | ||||||||||||||||||||||||||
| Weighted Average | ||||||||||||||||||||||||||||
| Number | Remaining | Weighted Average | Number | Weighted Average | ||||||||||||||||||||||||
| Range of Exercise Prices | of Shares | Contractual Life | Exercise Price | of Shares | Exercise Price | |||||||||||||||||||||||
$ 1.00 |
to | $ | 4.99 | 4,032 | 1.55 | years | $ | 4.38 | 4,032 | $ | 4.38 | |||||||||||||||||
5.00 |
to | 9.99 | 11,422 | 3.05 | 7.83 | 11,422 | 7.83 | |||||||||||||||||||||
10.00 |
to | 14.99 | 19,481 | 5.16 | 14.20 | 17,599 | 14.23 | |||||||||||||||||||||
15.00 |
to | 19.99 | 12,329 | 5.40 | 17.69 | 12,138 | 17.69 | |||||||||||||||||||||
20.00 |
to | 25.00 | 51,933 | 8.08 | 22.14 | 26,335 | 22.18 | |||||||||||||||||||||
1.00 |
to | 25.00 | 99,197 | 71,526 | ||||||||||||||||||||||||
To the extent stock options are exercised or restricted shares are awarded from time to time under the Corporation’s Long Term Incentive Plans, the Board of Directors has approved the purchase, on the open market or in privately negotiated transactions, of the number of common shares issued. The Corporation considers these stock repurchases in maintaining its liquidity position. During 2003, the Corporation purchased 29.2 million common shares for $618.3 million in connection with the issuance of restricted stock and the exercise of stock options and received $275.8 million in proceeds from the exercise of those stock options. During 2002, the Corporation purchased 25.5 million common shares for $615.5 million in connection with the issuance of restricted stock and the exercise of stock options and received $138.4 million in proceeds from the exercise of those stock options. During 2001, the Corporation purchased 15.9 million common shares for $376.1 million in connection with the issuance of restricted stock and the exercise of stock options and received $84.0 million in proceeds from the exercise of those stock options.
NOTE 24: OTHER OPERATING EXPENSE
OTHER EXPENSE COMPONENT OF OTHER
OPERATING EXPENSE (dollars in thousands)
| Year Ended December 31, | 2003 | 2002 | 2001 | |||||||||
Purchased services |
$ | 582,724 | $ | 544,104 | $ | 498,809 | ||||||
Advertising |
421,965 | 315,393 | 268,897 | |||||||||
Collection |
77,482 | 54,872 | 46,260 | |||||||||
Stationery and supplies |
41,833 | 48,073 | 45,477 | |||||||||
Service bureau |
83,171 | 75,444 | 63,375 | |||||||||
Postage and delivery |
459,592 | 366,129 | 354,226 | |||||||||
Telephone usage |
89,448 | 86,562 | 84,900 | |||||||||
Loan receivable fraud losses |
139,193 | 160,639 | 172,366 | |||||||||
Amortization of intangible assets |
410,973 | 348,727 | 381,792 | |||||||||
Other |
207,031 | 248,317 | 274,329 | |||||||||
Total other expense |
$ | 2,513,412 | $ | 2,248,260 | $ | 2,190,431 | ||||||
NOTE 25: DIVIDEND LIMITATIONS
The payment of dividends in the future and the amount of such dividends, if any, will be at the discretion of the Corporation’s Board of Directors. The payment of preferred and common stock dividends by the Corporation may be limited by certain factors, including regulatory capital requirements, broad enforcement powers of the federal bank regulatory agencies, and tangible net worth maintenance requirements under the Corporation’s revolving credit facilities. The payment of common stock dividends may also be limited by the terms of the Corporation’s preferred stock. If the Corporation has not paid scheduled dividends on the preferred stock, or declared the dividends and set aside funds for payment, the Corporation may not declare or pay any cash dividends on the common stock. In addition, if the Corporation defers interest for consecutive periods covering 10 semiannual periods or 20 consecutive quarterly periods, depending on the
series, on the Corporation’s junior subordinated deferrable interest debentures, the Corporation may not be permitted to declare or pay any cash dividends on the Corporation’s Common Stock or interest on debt securities that have equal or lower priority than the junior subordinated deferrable interest debentures.
RETURN ON AVERAGE TOTAL ASSETS AND AVERAGE STOCKHOLDERS’ EQUITY
| Year Ended December 31, | 2003 | 2002 | 2001 | |||||||||
Return on average total assets |
4.16 | % | 3.67 | % | 4.16 | % | ||||||
Return on average stockholders’ equity |
22.98 | 21.29 | 24.07 | |||||||||
Average stockholders’ equity to average
total assets |
18.09 | 17.22 | 17.27 | |||||||||
Dividend payout ratio |
20.11 | 20.15 | 18.75 | |||||||||
The Corporation is a legal entity separate and distinct from its banking and other subsidiaries. The primary source of funds for payment of preferred and common stock dividends by the Corporation is dividends received from the Bank. The amount of dividends that a national bank may declare in any year is subject to certain regulatory restrictions. Generally, dividends declared in a given year by a national bank are limited to its net profit, as defined by regulatory agencies, for that year, combined with its retained net income for the preceding two years, less any required transfer to surplus or to a fund for the retirement of any preferred stock. In addition, a national bank may not pay any dividends in an amount greater than its undivided profits. Also, a national bank may not declare dividends if such declaration would leave the bank inadequately capitalized. Therefore, the ability of the Bank to declare dividends will depend on its future net income and capital requirements. At December 31, 2003, the amount of undivided profits available for declaration and payment of dividends from the Bank to the Corporation was $4.4 billion. Also, banking regulators have indicated that national banks should generally pay dividends only out of current operating earnings. Following this practice, the amount of undivided profits available for the declaration and payment of dividends from the Bank to the Corporation was $1.8 billion at December 31, 2003. Payment of dividends by the Bank to the Corporation, however, can be further limited by federal bank regulatory agencies.
The Bank’s payment of dividends to the Corporation may also be limited by a tangible net worth requirement under the Corporation’s senior syndicated revolving credit facility (discussed under “Note 27: Commitments and Contingencies”). This facility was not drawn upon at December 31, 2003. If this facility had been drawn upon at December 31, 2003, the amount of retained earnings available for declaration of dividends would have been limited to $3.2 billion.
CAPITAL ADEQUACY (dollars in thousands)
| To Be Well-Capitalized | |||||||||||||||||||||||||
| For Capital | Under Prompt Corrective | ||||||||||||||||||||||||
| Actual | | | Adequacy Purposes | | | Action Provisions | |||||||||||||||||||||
| Amount | Ratio | Amount | Ratio | Amount | Ratio | ||||||||||||||||||||
December 31, 2003 |
|||||||||||||||||||||||||
Tier 1 Capital (to Risk-Weighted Assets): |
|||||||||||||||||||||||||
MBNA Corporation |
$ | 11,998,873 | 18.47 | % | $ | 2,598,126 | 4.00 | % | (a | ) | |||||||||||||||
MBNA America Bank, N.A |
10,286,026 | 16.38 | 2,512,467 | 4.00 | $ | 3,768,700 | 6.00 | % | |||||||||||||||||
MBNA America (Delaware), N.A |
526,630 | 28.38 | 74,214 | 4.00 | 111,321 | 6.00 | |||||||||||||||||||
Total Capital (to Risk-Weighted Assets): |
|||||||||||||||||||||||||
MBNA Corporation |
14,409,042 | 22.18 | 5,196,252 | 8.00 | (a | ) | |||||||||||||||||||
MBNA America Bank, N.A |
12,644,844 | 20.13 | 5,024,933 | 8.00 | 6,281,167 | 10.00 | |||||||||||||||||||
MBNA America (Delaware), N.A |
551,920 | 29.75 | 148,428 | 8.00 | 185,535 | 10.00 | |||||||||||||||||||
Tier 1 Capital (to Average Assets): |
|||||||||||||||||||||||||
MBNA Corporation |
11,998,873 | 20.52 | 2,338,976 | 4.00 | (a | ) | |||||||||||||||||||
MBNA America Bank, N.A |
10,286,026 | 18.52 | 2,221,105 | 4.00 | 2,776,382 | 5.00 | |||||||||||||||||||
MBNA America (Delaware), N.A |
526,630 | 32.47 | 64,870 | 4.00 | 81,088 | 5.00 | |||||||||||||||||||
December 31, 2002 |
|||||||||||||||||||||||||
Tier 1 Capital (to Risk-Weighted Assets): |
|||||||||||||||||||||||||
MBNA Corporation |
$ | 9,466,935 | 15.73 | % | $ | 2,407,978 | 4.00 | % | (a | ) | |||||||||||||||
MBNA America Bank, N.A |
7,596,885 | 12.58 | 2,416,236 | 4.00 | $ | 3,624,354 | 6.00 | % | |||||||||||||||||
MBNA America (Delaware), N.A |
431,918 | 28.06 | 61,579 | 4.00 | 92,368 | 6.00 | |||||||||||||||||||
Total Capital (to Risk-Weighted Assets): |
|||||||||||||||||||||||||
MBNA Corporation |
11,828,100 | 19.65 | 4,815,955 | 8.00 | (a | ) | |||||||||||||||||||
MBNA America Bank, N.A |
9,914,225 | 16.41 | 4,832,472 | 8.00 | 6,040,590 | 10.00 | |||||||||||||||||||
MBNA America (Delaware), N.A |
451,999 | 29.36 | 123,157 | 8.00 | 153,947 | 10.00 | |||||||||||||||||||
Tier 1 Capital (to Average Assets): |
|||||||||||||||||||||||||
MBNA Corporation |
9,466,935 | 18.55 | 2,041,906 | 4.00 | (a | ) | |||||||||||||||||||
MBNA America Bank, N.A |
7,596,885 | 15.81 | 1,921,607 | 4.00 | 2,402,009 | 5.00 | |||||||||||||||||||
MBNA America (Delaware), N.A |
431,918 | 23.21 | 74,446 | 4.00 | 93,058 | 5.00 | |||||||||||||||||||
| (a) Not applicable for bank holding companies. | |||||||||||||||||||||||||
NOTE 26: CAPITAL ADEQUACY
The Corporation is subject to risk-based capital guidelines adopted by the Federal Reserve Board for bank holding companies. The Bank and MBNA Delaware are also subject to similar capital requirements adopted by the Office of the Comptroller of the Currency. Under these requirements, the federal bank regulatory agencies have established quantitative measures to ensure that minimum thresholds for Tier 1 Capital, Total Capital, and Leverage ratios are maintained. Failure to meet these minimum capital requirements can initiate certain mandatory, and possible additional discretionary, actions by the federal bank regulators that, if undertaken, could have a direct material effect on the Corporation’s, the Bank’s, and MBNA Delaware’s consolidated financial statements. Under the capital adequacy guidelines and the regulatory framework for prompt corrective action, the Corporation, the Bank, and MBNA Delaware must meet specific capital guidelines that involve quantitative measures of their assets, liabilities, and certain off-balance-sheet items as calculated under regulatory accounting practices.
The Corporation’s, the Bank’s, and MBNA Delaware’s capital amounts and classification are also subject to qualitative judgments by the federal bank regulators about components, risk weightings, and other factors. At December 31, 2003 and 2002, the Corporation’s, the Bank’s, and MBNA Delaware’s capital exceeded all minimum regulatory requirements to which they are subject, and the Bank and MBNA Delaware were “well-capitalized” as
defined under the federal bank regulatory guidelines. The risk-based capital ratios have been computed in accordance with regulatory accounting practices. At December 31, 2003, no conditions or events had occurred that changed the Corporation’s classification as “adequately capitalized” and the Bank’s or MBNA Delaware’s classification as “well capitalized.”
MBNA Europe and MBNA Canada are regulated by the Financial Services Authority (“FSA”) and the Office of the Superintendent of Financial Institutions (“OSFI”), respectively, in regards to capital adequacy.
NOTE 27: COMMITMENTS AND CONTINGENCIES
A loan commitment, commonly referred to as a line of credit, is an agreement to lend to a Customer subject to the Customer’s compliance with the Customer’s account agreement. The Corporation can reduce or cancel a credit card commitment by providing the required prior notice to the Customer, or without notice if permitted by law. The Corporation had outstanding lines of credit of $681.6 billion and $622.7 billion committed to its Customers at December 31, 2003 and 2002, respectively. Of those total commitments, $563.1 billion and $515.4 billion were unused at December 31, 2003 and 2002, respectively. While these amounts represent the total available lines of credit to Customers, the Corporation has not experienced and does not anticipate that all of its Customers will exercise their entire available line of credit at any given point in time.
Also, the Corporation holds Community Development investments in the form of limited partnership interests that qualify under the Community Reinvestment Act. Unfunded commitments for which the Corporation has accrued for, related to these investments were $110.8 million and $107.3 million at December 31, 2003 and 2002, respectively. The Corporation also had unfunded commitments related to these investments of $41.3 million and $18.6 million at December 31, 2003 and 2002, respectively, which were not accrued for in accordance with GAAP. The Corporation may not cancel these commitments.
The Corporation, the Bank, and their affiliates are commonly subject to various pending or threatened legal proceedings, including certain class actions, arising out of the normal course of business. In view of the inherent difficulty of predicting the outcome of such matters, the Corporation cannot state what the eventual outcome of these matters will be. However, the Corporation believes, based on current knowledge and after consultation with counsel, that the outcome of such matters will not have a material adverse effect on the Corporation’s consolidated financial condition or results of operations. Amounts that have been recognized for such losses as of December 31, 2003 and 2002 and not yet paid are included in the audited consolidated statements of financial condition under accrued expenses and other liabilities and are not material to the audited consolidated financial statements at December 31, 2003 and 2002, respectively.
The Bank, MBNA Europe, and the Corporation have a $2.5 billion senior unsecured syndicated revolving credit facility committed through July 2006, available to the Bank and MBNA Europe with sublimit availability in an amount of $500.0 million for the Corporation. The Bank unconditionally and irrevocably guarantees the obligations of MBNA Europe under the facility. This facility may be used for general corporate purposes and was not drawn upon at December 31, 2003.
Advances from the $2.5 billion senior unsecured syndicated revolving credit facility are subject to covenants and conditions customary in a transaction of this nature. These conditions include requirements for both the Corporation and the Bank to maintain a minimum level of consolidated tangible net worth. These conditions also require the Bank to not permit its managed loan receivables 90 days or more past due plus nonaccruing receivables to exceed 6% of managed receivables, as defined by the agreement, and to maintain its regulatory capital ratios at or above regulatory “well-capitalized” requirements. In addition, these conditions require that the Corporation not permit its double leverage ratio (defined as the sum of the Corporation’s intangible assets and investment in subsidiaries divided by total stockholders’ equity) to exceed 1.25 and to maintain its regulatory capital ratios at or above regulatory minimum requirements. At December 31, 2003, the ratio of the Bank’s managed loan receivables 90 days or more past due plus nonaccruing receivables to managed receivables was 2.36%, the Corporation’s double leverage ratio was 1.04, and the
level of consolidated tangible net worth exceeded the minimum levels required.
MBNA Europe has a £325.0 million (approximately $582.4 million at December 31, 2003) multi-currency syndicated revolving credit facility committed until June 2005. MBNA Europe may take advances under the facility subject to covenants and conditions customary in a transaction of this nature, including requirements for tangible net worth and account delinquencies. This facility is unconditionally and irrevocably guaranteed by the Bank. The facility may be used for general corporate purposes and was not drawn upon at December 31, 2003.
MBNA Canada has a CAD$350.0 million (approximately $270.4 million at December 31, 2003) multi-currency syndicated revolving credit facility committed through July 2004. During 2003, CAD$315.0 million (approximately $243.4 million at December 31, 2003) of the facility was extended to July 2006. MBNA Canada may take advances under the facility subject to covenants and conditions customary in a transaction of this nature. This facility is unconditionally and irrevocably guaranteed by the Bank. This facility may be used for general corporate purposes and was not drawn upon at December 31, 2003.
NOTE 28: FOREIGN ACTIVITIES
SELECTED FOREIGN FINANCIAL DATA
(dollars in thousands)
| Year Ended December 31, | 2003 | 2002 | 2001 | |||||||||
United Kingdom/Ireland/
Spain |
||||||||||||
Total assets |
$ | 11,958,296 | $ | 9,194,940 | $ | 5,654,605 | ||||||
Total income |
1,671,370 | 1,298,322 | 1,011,309 | |||||||||
Income before income taxes |
262,401 | 199,986 | 199,221 | |||||||||
Net income |
198,076 | 148,497 | 149,786 | |||||||||
Canada |
||||||||||||
Total assets |
1,506,838 | 1,064,344 | 883,787 | |||||||||
Total income |
398,420 | 281,327 | 208,663 | |||||||||
Income before income taxes |
143,782 | 93,962 | 42,541 | |||||||||
Net income |
87,897 | 79,123 | 42,541 | |||||||||
Other Foreign |
||||||||||||
Total assets |
2,377,345 | 2,426,402 | 1,000,939 | |||||||||
Total income |
40,068 | 22,029 | 43,111 | |||||||||
Income before income taxes |
(53,776 | ) | (13,973 | ) | (15,212 | ) | ||||||
Net income |
(34,686 | ) | (8,873 | ) | (6,651 | ) | ||||||
Total Foreign |
||||||||||||
Total assets |
15,842,479 | 12,685,686 | 7,539,331 | |||||||||
Total income |
2,109,858 | 1,601,678 | 1,263,083 | |||||||||
Income before income taxes |
352,407 | 279,975 | 226,550 | |||||||||
Net income |
251,287 | 218,747 | 185,676 | |||||||||
Domestic |
||||||||||||
Total assets |
43,270,876 | 40,171,060 | 37,908,614 | |||||||||
Total income |
9,574,506 | 8,829,315 | 8,881,638 | |||||||||
Income before income taxes |
3,306,598 | 2,505,441 | 2,488,660 | |||||||||
Net income |
2,086,817 | 1,547,207 | 1,508,615 | |||||||||
MBNA Corporation |
||||||||||||
Total assets |
59,113,355 | 52,856,746 | 45,447,945 | |||||||||
Total income |
11,684,364 | 10,430,993 | 10,144,721 | |||||||||
Income before income taxes |
3,659,005 | 2,785,416 | 2,715,210 | |||||||||
Net income |
2,338,104 | 1,765,954 | 1,694,291 | |||||||||
The Corporation’s foreign activities are primarily performed through the Bank’s two foreign bank subsidiaries, MBNA Europe, which has branches in Spain and Ireland, and MBNA Canada. The Bank’s net investment in MBNA Europe was $2.5 billion and in MBNA Canada was $443.0 million at December 31, 2003. The Bank also has a foreign branch office that invests in interest-earning time deposits and accepts Eurodollar deposits. This branch also participates in a portion of the remaining undivided interests in loan principal receivables securitized by MBNA Europe.
Because certain foreign operations are integrated with many of the Bank’s domestic operations, certain estimates and assumptions have been made to assign income and expense items between domestic and foreign operations. Amounts are allocated for interest costs to users of funds, capital invested, income taxes, and for other items incurred. The provision for possible credit losses is allocated based on specific charge-off experience and risk characteristics of the foreign loan receivables.
FOREIGN LOAN RECEIVABLES DISTRIBUTION
(dollars in thousands)
| December 31, | 2003 | 2002 | ||||||
Loans Held for Securitization |
||||||||
Credit card |
$ | 2,798,190 | $ | 1,830,914 | ||||
Total loans held for securitization |
2,798,190 | 1,830,914 | ||||||
Loan Portfolio |
||||||||
Credit card |
4,005,334 | 3,070,999 | ||||||
Other consumer |
2,418,449 | 1,927,015 | ||||||
Total loan portfolio |
6,423,783 | 4,998,014 | ||||||
Total loan receivables |
$ | 9,221,973 | $ | 6,828,928 | ||||
NOTE 29: RELATED PARTY TRANSACTIONS
The Corporation’s directors, executive officers, certain members of their immediate families, and certain affiliated companies hold credit cards or other lines of credit issued by the Corporation on the same terms prevailing at the time for those issued to other persons. The outstanding amounts are included in loan receivables in the Corporation’s audited consolidated statements of financial condition and were not material to the Corporation’s financial results.
See Note 18: Stockholders’ Equity—Common Stock for information about a related party transaction pertaining to the 2003 stock issuance.
NOTE 30: FAIR VALUE OF FINANCIAL INSTRUMENTS
The following presents the fair value of financial instruments at December 31, 2003 and 2002, whether or not recognized in the Corporation’s audited consolidated statements of financial condition, for which it is practicable to estimate that value. In addition, the fair value of certain financial instruments and all nonfinancial instruments are excluded from the audited consolidated statements of financial condition in accordance with GAAP. In cases where quoted market prices are not available, fair values are estimated using present value or other valuation techniques. These techniques are significantly affected by the assumptions used, including the discount rate and estimates of future cash
flows. The derived fair value estimates cannot be substantiated by comparison to independent market values and, in many cases, could not be realized in an immediate settlement of the instrument. Accordingly, the aggregate fair value amounts presented do not represent the underlying value of the Corporation.
FINANCIAL ASSETS
Cash and due from banks are carried at an amount that approximates fair value.
Money market instruments include interest-earning time deposits in other banks and federal funds sold. As a result of the short-term nature of these instruments, the carrying amounts reported in the audited consolidated statements of financial condition approximate these assets’ fair values.
The fair value of investment securities is based on the market value of the individual investment security without regard to any premium or discount that may result from concentrations of ownership of a financial instrument, possible tax ramifications, or estimated transaction costs. Market value for investment securities is based on quoted market prices or dealer quotes.
The carrying value of loans held for securitization reported in the audited consolidated statements of financial condition approximates its fair value as a result of the short-term nature of these assets.
The carrying value of the Corporation’s loan portfolio reported in the audited consolidated statements of financial condition approximates its fair value. The loan portfolio includes variable-rate loans, with interest rates that approximate current market rates, and fixed-rate loans, which can be repriced at any time by giving notice to the Customer.
The valuations of loans held for securitization and the loan portfolio do not include the value that relates to estimated cash flows from new and existing loans generated from current Customers over the remaining life of the loan receivables or the value of established Customer relationships. Accordingly, the fair values of loans held for securitization and the loan portfolio do not represent the underlying value of the Corporation’s accounts.
Accrued income receivable includes interest and fee income earned but not yet received from investment securities and money market instruments, loan receivables, interest rate swap agreements, foreign exchange swap agreements, and insurance products. The carrying amount reported in the audited consolidated statements of financial condition approximates the fair value of these assets as a result of their relatively short-term nature.
The fair value of accounts receivable from securitization is determined by a review of each component. The interest-only strip receivable, cash reserve accounts, accrued interest and fees on securitized loans, and other subordinated retained interests are carried at amounts that approximate their fair values. The carrying values of the sale of new loan receivables, accrued servicing fees, and other accounts receivable from securitization reported in the audited consolidated statements of financial condition approximate their fair values as a result of the short-term nature of these assets.
CARRYING VALUES AND ESTIMATED FAIR VALUES OF THE CORPORATION’S FINANCIAL ASSETS (dollars in thousands)
| December 31, | 2003 | | | 2002 | |||||||||||||
| Carrying | Estimated | Carrying | Estimated | |||||||||||||
| Value | Fair Value | Value | Fair Value | |||||||||||||
Financial Assets |
||||||||||||||||
Cash and due from banks |
$ | 660,022 | $ | 660,022 | $ | 721,972 | $ | 721,972 | ||||||||
Money market instruments |
4,865,329 | 4,865,329 | 5,348,052 | 5,348,052 | ||||||||||||
Investment securities: |
||||||||||||||||
Available-for-sale |
4,363,087 | 4,363,087 | 3,655,808 | 3,655,808 | ||||||||||||
Held-to-maturity (a) |
353,299 | 354,434 | 419,760 | 428,472 | ||||||||||||
Loans held for securitization |
13,084,105 | 13,084,105 | 11,029,627 | 11,029,627 | ||||||||||||
Loan portfolio, net of reserve for possible credit losses |
19,323,656 | 19,323,656 | 16,585,582 | 16,585,582 | ||||||||||||
Accrued income receivable |
443,755 | 443,755 | 371,089 | 371,089 | ||||||||||||
Accounts receivable from securitization |
7,766,477 | 7,766,477 | 6,926,876 | 6,926,876 | ||||||||||||
| (a) | For purposes of comparability, certain prior period amounts have been restated. |
FINANCIAL LIABILITIES
The fair value of the Corporation’s deposits is determined by a review of each component. The fair value of money market deposit accounts, noninterest-bearing deposits, interest-bearing transaction accounts, and savings accounts is equal to the amount payable upon demand. The fair value of time deposits is estimated by discounting the future cash flows of the stated maturities using estimated rates currently offered for like deposits. The valuation does not include the benefit that results from the low-cost funding provided by the various deposit liabilities compared to the cost of borrowing funds in the market.
Short-term borrowings include federal funds purchased and securities sold under repurchase agreements, short-term deposit notes, structured financings, and other short-term borrowings. The fair value of federal funds purchased and securities sold under repurchase agreements, short-term deposit notes, and other short-term borrowings approximates the carrying value based upon their short-term nature. The fair value of the Corporation’s structured financings is estimated by discounting the future cash flows of the stated maturities of the structured financings using estimated rates currently offered for similar structured financings.
The fair value of substantially all of the Corporation’s long-term debt and bank notes is estimated by discounting the future cash flows of the stated maturities of the long-term debt and bank notes using estimated rates currently offered for similar debt obligations, except that the fair value of the Corporation’s junior subordinated deferrable interest debentures is based upon its quoted market price.
Accrued interest payable includes interest expensed but not yet paid for deposits, short-term borrowings, long-term debt and bank notes, interest rate swap agreements, and foreign exchange swap agreements. The carrying amount approximates the fair value of these liabilities as a result of their relatively short-term nature.
DERIVATIVE FINANCIAL INSTRUMENTS
By using derivative instruments, the Corporation exposes itself to credit and market risk. If a counterparty fails to fulfill its performance obligations under a derivative contract, the Corporation’s credit risk will equal the fair value gain in the derivative. Generally, when the fair value of the derivative contract is positive, this indicates that the counterparty owes the Corporation, thus creating a repayment risk for the Corporation. When the fair value of a derivative contract is negative, the Corporation owes the coun-terparty and, therefore assumes no repayment risk. In order to minimize the amount of credit risk, the Corporation only enters into derivative financial instruments with counterparties who have credit ratings of investment grade as rated by the major rating agencies. The derivative financial instruments the Corporation uses are interest rate swap agreements, foreign exchange swap agreements and forward exchange contracts.
The fair value of the Corporation’s derivative financial instruments is determined using quoted market prices or dealer quotes. This value generally reflects the estimated amounts that the Corporation would receive or pay to terminate the instruments at the reporting date.
CARRYING VALUES AND ESTIMATED FAIR VALUES OF THE CORPORATION’S FINANCIAL LIABILITIES
(dollars in thousands)
| December 31, | 2003 | | | 2002 | ||||||||||||||
| |
|||||||||||||||||
| Carrying | Estimated | Carrying | Estimated | ||||||||||||||
| Value | Fair Value | Value | Fair Value | ||||||||||||||
Financial Liabilities |
|||||||||||||||||
Deposits |
$ | 31,836,081 | $ | 32,549,248 | $ | 30,616,216 | $ | 31,715,373 | |||||||||
Short-term borrowings |
1,025,463 | 1,053,277 | 1,250,103 | 1,294,866 | |||||||||||||
Long-term debt and bank notes |
12,145,628 | 13,150,079 | 9,538,173 | 10,543,933 | |||||||||||||
Accrued interest payable |
319,227 | 319,227 | 286,158 | 286,158 | |||||||||||||
The Corporation uses interest rate swap agreements to change fixed-rate funding sources to floating-rate funding sources to more closely match the interest rate sensitivity of the Corporation’s assets. Interest rate swap agreements are agreements between counterparties to exchange cash flows based on the difference between two interest rates, applied to a notional principal amount for a specific period. Interest rate swap agreements may subject the Corporation to market risk associated with changes in interest rates, as a result of the change to floating-rate funding sources, as well as the risk of default by a counterparty to the agreement.
The Corporation’s interest rate swap agreements are designated as fair value hedges under Statement No. 133. The fair value of the Corporation’s interest rate swap agreements was a gross asset value of $361.6 million and a gross liability value of $32.7 million at December 31, 2003. At December 31, 2002, the outstanding interest rate swap agreements had a gross asset value of $468.4 million. For the years ended December 31, 2003 and 2002, the Corporation’s hedging ineffectiveness for its interest rate swap agreements was immaterial to the Corporation’s audited consolidated statements of income. At December 31, 2003, the Corporation had interest rate swap agreements maturing in varying amounts from 2004 through 2033.
SIGNIFICANT CLASSES OF DERIVATIVE FINANCIAL INSTRUMENTS (dollars in thousands)
| Weighted Average | ||||||||||||||||||||||||
| National | Maturity | Estimated | ||||||||||||||||||||||
| Amount | Receive Rate (a) | Pay Rate (b) | in Years | Fair Value | ||||||||||||||||||||
December 31, 2003 |
||||||||||||||||||||||||
Interest rate swap agreements |
$ | 9,055,033 | 5.43 | % | 2.03 | % | 6.8 | |||||||||||||||||
Gross unrealized gains |
$ | 361,554 | ||||||||||||||||||||||
Gross unrealized losses |
(32,735 | ) | ||||||||||||||||||||||
Total |
$ | 328,819 | ||||||||||||||||||||||
Forward
exchange contracts—pounds sterling |
1,557,372 | 1.68 | 1.79 | .1 | ||||||||||||||||||||
Gross unrealized gains |
$ | — | ||||||||||||||||||||||
Gross unrealized losses |
(94,016 | ) | ||||||||||||||||||||||
Total |
$ | (94,016 | ) | |||||||||||||||||||||
Forward exchange contracts—euros |
101,034 | 1.17 | 1.26 | .1 | ||||||||||||||||||||
Gross unrealized gains |
$ | — | ||||||||||||||||||||||
Gross unrealized losses |
(7,661 | ) | ||||||||||||||||||||||
Total |
$ | (7,661 | ) | |||||||||||||||||||||
Forward exchange contracts—U.S. dollars |
420,376 | .57 | .56 | .1 | ||||||||||||||||||||
Gross unrealized gains |
$ | — | ||||||||||||||||||||||
Gross unrealized losses |
(6,353 | ) | ||||||||||||||||||||||
Total |
$ | (6,353 | ) | |||||||||||||||||||||
Foreign exchange swap agreements |
4,696,241 | 4.03 | % | 5.10 | % | 2.2 | ||||||||||||||||||
Gross unrealized gains |
$ | 209,712 | ||||||||||||||||||||||
Gross unrealized losses |
(257,242 | ) | ||||||||||||||||||||||
Total |
$ | (47,530 | ) | |||||||||||||||||||||
December 31, 2002 |
||||||||||||||||||||||||
Interest rate swap agreements |
$ | 6,543,943 | 5.71 | % | 2.21 | % | 7.6 | |||||||||||||||||
Gross unrealized gains |
$ | 468,425 | ||||||||||||||||||||||
Gross unrealized losses |
— | |||||||||||||||||||||||
Total |
$ | 468,425 | ||||||||||||||||||||||
Forward exchange contracts—pounds sterling |
1,340,576 | 1.57 | 1.61 | .1 | ||||||||||||||||||||
Gross unrealized gains |
$ | — | ||||||||||||||||||||||
Gross unrealized losses |
(33,488 | ) | ||||||||||||||||||||||
Total |
$ | (33,488 | ) | |||||||||||||||||||||
Forward exchange contracts—euros |
77,296 | 1.01 | 1.05 | .1 | ||||||||||||||||||||
Gross unrealized gains |
$ | — | ||||||||||||||||||||||
Gross unrealized losses |
(4,726 | ) | ||||||||||||||||||||||
Total |
$ | (4,726 | ) | |||||||||||||||||||||
Forward exchange contracts—U.S. dollars |
1,848,448 | .66 | .62 | .1 | ||||||||||||||||||||
Gross unrealized gains |
$ | — | ||||||||||||||||||||||
Gross unrealized losses |
(60,733 | ) | ||||||||||||||||||||||
Total |
$ | (60,733 | ) | |||||||||||||||||||||
Foreign exchange swap agreements |
2,997,399 | 4.45 | % | 5.43 | % | 2.7 | ||||||||||||||||||
Gross unrealized gains |
$ | 66,233 | ||||||||||||||||||||||
Gross unrealized losses |
(101,157 | ) | ||||||||||||||||||||||
Total |
$ | (34,924 | ) | |||||||||||||||||||||
| (a) | Weighted average receive rate represents the rate contracted at the time the derivative financial instruments were entered into. | |||
| (b) | Weighted average pay rate for the forward exchange contracts represents the spot rate for the currency in which the forward exchange contract was denominated at December 31, 2003 and 2002, respectively. | |||
EXPECTED MATURITIES OF DERIVATIVE FINANCIAL INSTRUMENTS (dollars in thousands)
| December 31, 2003 | Within 1 Year | 1-5 Years | 6-10 Years | Over 10 Years | Total | ||||||||||||||||
Interest Rate Swap Agreements |
|||||||||||||||||||||
Notional amount |
$ | 966,494 | $ | 3,922,734 | $ | 3,079,502 | $ | 1,086,303 | $ | 9,055,033 | |||||||||||
Estimated fair value |
15,481 | 193,633 | 102,370 | 17,335 | 328,819 | ||||||||||||||||
Forward Exchange Contracts |
|||||||||||||||||||||
Notional amount |
2,078,782 | — | — | — | 2,078,782 | ||||||||||||||||
Estimated fair value |
(108,030 | ) | — | — | — | (108,030 | ) | ||||||||||||||
Foreign Exchange Swap Agreements |
|||||||||||||||||||||
Notional amount |
1,754,735 | 2,310,004 | 631,502 | — | 4,696,241 | ||||||||||||||||
Estimated fair value |
104,477 | (145,793 | ) | (6,214 | ) | — | (47,530 | ) | |||||||||||||
The Corporation is exposed to foreign currency exchange rate risk as a result of transactions in currencies other than the designated functional currency of its foreign bank subsidiaries. The Corporation uses foreign exchange swap agreements to reduce its exposure to foreign currency exchange rate risk. The foreign exchange swap agreements are primarily related to the issuance of long-term debt and bank notes by the Corporation’s foreign bank subsidiaries. Foreign exchange swap agreements are agreements to exchange principal amounts of different currencies and interest rates, usually at a prevailing exchange rate. When the agreement matures, the underlying principal or notional amount will be re-exchanged at the agreed-upon exchange rate.
The Corporation’s qualifying foreign exchange swap agreements are accounted for as fair value hedges. The fair value of the Corporation’s qualifying foreign exchange swap agreements was a gross unrealized gain of $61.7 million at December 31, 2003, and a gross unrealized gain of $19.4 million at December 31, 2002. The Corporation also enters into foreign exchange swap agreements that are not designated as accounting hedges. The fair value of the Corporation’s foreign exchange swap agreements not designated as accounting hedges was a gross unrealized gain of $148.0 million and a gross unrealized loss of $257.2 million at December 31, 2003. The fair value of the Corporation’s foreign exchange swap agreements not designated as accounting hedges was a gross unrealized gain of $46.8 million and a gross unrealized loss of $101.2 million at December 31, 2002. For the year ended December 31, 2003, the Corporation recognized a net loss of $12.6 million on its foreign exchange swap agreements. For the year ended December 31, 2002, the Corporation recognized a net gain of $22.4 million on its foreign exchange swap agreements. The Corporation’s hedging ineffectiveness for its foreign exchange swap agreements was immaterial to the Corporation’s audited consolidated statements of income for 2003 and 2002. The Corporation’s foreign exchange swap agreements mature in varying amounts from 2004 through 2009.
Under the terms of certain interest rate swap agreements and foreign exchange swap agreements, each party may be required to pledge certain assets if the market value of the interest rate swap agreements and foreign exchange swap agreements exceeds an amount set forth in the agreement or in the event of a change in credit rating. This pledge of collateral is intended to mitigate
counterparty credit risk. There were $28.5 million of interest-earning time deposits pledged by MBNA Europe under the terms of the interest rate swap agreements and foreign exchange swap agreements at December 31, 2003. There were no securities pledged by the Bank under the terms of the interest rate swap agreements and foreign exchange swap agreements at December 31, 2002. The Bank held $36.7 million in deposits received from swap counterparties, that were collateralizing interest rate swap agreements and foreign exchange swap agreements at December 31, 2003. MBNA Europe held an additional $85.1 million in deposits received from swap counter-parties, that were collateralizing interest rate swap agreements and foreign exchange swap agreements at December 31, 2003. At December 31, 2002, the Bank held a $44.7 million deposit received from a swap counterparty, which was collateralizing an interest rate swap agreement. MBNA Europe held an additional $16.8 million in deposits received from swap counterparties, that were collateralizing interest swap agreements and foreign exchange swap agreements at December 31, 2002.
The Corporation enters into transactions and has related assets and liabilities in currencies other than the currency in which the Corporation or its foreign bank subsidiaries operate. As a result, the Corporation is exposed to foreign currency exchange rate risk and enters into forward exchange contracts to reduce its exposure to that risk. Those forward exchange contracts are commitments to buy or sell foreign currency at a future date for a contracted price. Those forward exchange contracts may expose the Corporation to varying degrees of credit and market risk and are subject to the same credit and risk limitations as the Corporation’s other financial instruments.
While the forward exchange contracts reduce the exposure to foreign currency exchange rate movements, the contracts are not accounting hedges under Statement No. 133. The recognized fair value of the open forward exchange contracts at December 31, 2003, was a gross unrealized loss, or a liability, of $108.0 million, which was recognized in the audited consolidated statements of income as a net loss of $108.0 million (pre-tax). The recognized fair value of the open forward exchange contracts at December 31, 2002, was a gross unrealized loss, or a liability, of $98.9 million, which was recognized in the audited consolidated statements of income as a net loss of $98.9 million (pre-tax).
SUMMARY OF ACTIVITY OF DERIVATIVE FINANCIAL INSTRUMENTS (NOTIONAL AMOUNTS) (dollars in thousands)
| Interest Rate | Forward Exchange | Foreign Exchange | ||||||||||||||||||
| Swap Agreements | Contracts | Swap Agreements | Total | |||||||||||||||||
Balance, December 31, 2000 |
$ | 1,754,826 | $ | 1,321,184 | $ | 451,458 | $ | 3,527,468 | ||||||||||||
Additions |
1,578,547 | 9,400,474 | 1,400,671 | 12,379,692 | ||||||||||||||||
Maturities |
(450,000 | ) | (9,278,535 | ) | — | (9,728,535 | ) | |||||||||||||
Balance, December 31, 2001 |
2,883,373 | 1,443,123 | 1,852,129 | 6,178,625 | ||||||||||||||||
Additions |
3,933,176 | 12,619,569 | 1,266,104 | 17,818,849 | ||||||||||||||||
Maturities |
(272,606 | ) | (10,796,372 | ) | (120,834 | ) | (11,189,812 | ) | ||||||||||||
Balance, December 31, 2002 |
6,543,943 | 3,266,320 | 2,997,399 | 12,807,662 | ||||||||||||||||
Additions |
2,674,016 | 16,560,962 | 2,106,430 | 21,341,408 | ||||||||||||||||
Maturities |
(162,926 | ) | (17,748,500 | ) | (407,588 | ) | (18,319,014 | ) | ||||||||||||
Balance, December 31, 2003 |
$ | 9,055,033 | $ | 2,078,782 | $ | 4,696,241 | $ | 15,830,056 | ||||||||||||
The net loss of $108.0 million on the Corporation’s open forward exchange contracts outstanding at December 31, 2003, along with the losses on its matured forward exchange contracts, resulted in a net loss of $168.1 million on the Corporation’s forward exchange contracts in the audited consolidated statements of income for the year ended December 31, 2003. The Corporation recognized an offsetting net gain of $290.6 million on the related foreign denominated assets and liabilities in the audited consolidated statements of income for the year ended December 31, 2003. The
net loss of $98.9 million on the Corporation’s open forward exchange contracts outstanding at December 31, 2002, along with the losses on its matured forward exchange contracts, resulted in a net loss of $185.2 million on the Corporation’s forward exchange contracts in the audited consolidated statements of income for the year ended December 31, 2002. The Corporation recognized an offsetting net gain of $160.0 million on the related foreign denominated assets and liabilities in the audited consolidated statements of income for the year ended December 31, 2002.
NOTE 31: PARENT COMPANY FINANCIAL INFORMATION
The parent company’s investment in subsidiaries represents the total equity of all consolidated subsidiaries, using the equity
method of accounting for investments. The Corporation’s principal subsidiary is the Bank, which constituted 93.1% and 93.0% of the consolidated assets of the Corporation at December 31, 2003 and 2002, respectively.
CONDENSED STATEMENTS OF FINANCIAL CONDITION (dollars in thousands)
| December 31, | 2003 | 2002 | ||||||
Assets |
||||||||
Cash and due from bank subsidiary |
$ | 4,997 | $ | 4,219 | ||||
Interest-earning time deposits due from bank subsidiary |
1,487,196 | 1,097,796 | ||||||
Notes receivable from non-bank subsidiaries |
1,513,745 | 1,490,162 | ||||||
Investment in subsidiaries: |
||||||||
Bank |
11,250,446 | 9,030,463 | ||||||
Non-bank |
267,169 | 268,899 | ||||||
Premises and equipment, net |
167,530 | 197,736 | ||||||
Accrued income receivable |
84,644 | 56,926 | ||||||
Investment in variable interest entities |
32,902 | — | ||||||
Other assets |
379,982 | 362,752 | ||||||
Total assets |
$ | 15,188,611 | $ | 12,508,953 | ||||
Liabilities and Stockholders’ Equity |
||||||||
Long-term debt |
$ | 2,519,055 | $ | 1,961,324 | ||||
Junior subordinated deferrable interest debentures due to variable interest entities |
1,134,624 | 1,162,839 | ||||||
Accrued interest payable |
49,083 | 39,539 | ||||||
Dividends payable |
130,704 | 92,412 | ||||||
Accrued expenses and other liabilities |
242,105 | 151,520 | ||||||
Total liabilities |
4,075,571 | 3,407,634 | ||||||
Stockholders’ equity |
11,113,040 | 9,101,319 | ||||||
Total liabilities and stockholders’ equity |
$ | 15,188,611 | $ | 12,508,953 | ||||
CONDENSED STATEMENTS OF INCOME (dollars in thousands)
| Year Ended December 31, | 2003 | 2002 | 2001 | |||||||||
Operating Income |
||||||||||||
Interest income |
$ | 124,117 | $ | 122,165 | $ | 121,264 | ||||||
Dividends from subsidiaries: |
||||||||||||
Bank |
450,147 | 352,000 | 308,000 | |||||||||
Non-bank |
1,633 | 1,410 | 1,181 | |||||||||
Management fees from subsidiaries |
150,087 | 166,160 | 97,867 | |||||||||
Other |
7,427 | 3,820 | 15,044 | |||||||||
Total operating income |
733,411 | 645,555 | 543,356 | |||||||||
Operating Expense |
||||||||||||
Interest expense |
104,546 | 93,321 | 90,092 | |||||||||
Salaries and employee benefits |
115,595 | 99,479 | 41,249 | |||||||||
Other |
30,179 | 59,388 | 49,652 | |||||||||
Total operating expense |
250,320 | 252,188 | 180,993 | |||||||||
Income before income taxes and equity in undistributed net income of subsidiaries |
483,091 | 393,367 | 362,363 | |||||||||
Applicable income taxes |
5,175 | 22,284 | 24,694 | |||||||||
Equity in undistributed net income of subsidiaries: |
||||||||||||
Bank |
1,846,944 | 1,390,837 | 1,354,094 | |||||||||
Non-bank |
13,244 | 4,034 | 2,528 | |||||||||
Net Income |
$ | 2,338,104 | $ | 1,765,954 | $ | 1,694,291 | ||||||
CONDENSED STATEMENTS OF CASH FLOWS (dollars in thousands)
| Year Ended December 31, | 2003 | 2002 | 2001 | |||||||||
Operating Activities |
||||||||||||
Net income |
$ | 2,338,104 | $ | 1,765,954 | $ | 1,694,291 | ||||||
Adjustments to reconcile net income to net cash provided by operating activities: |
||||||||||||
Equity in undistributed earnings of subsidiaries |
(1,860,188 | ) | (1,394,871 | ) | (1,356,622 | ) | ||||||
Deferred income tax benefit |
(13,719 | ) | (8,560 | ) | (4,658 | ) | ||||||
Depreciation and amortization |
104,444 | 110,883 | 42,688 | |||||||||
Decrease (increase) in other operating activities |
15,894 | (22,683 | ) | 95,984 | ||||||||
Net cash provided by operating activities |
584,535 | 450,723 | 471,683 | |||||||||
Investing Activities |
||||||||||||
Net (increase) decrease in interest-earning time deposits due from bank subsidiary |
(389,400 | ) | (618,000 | ) | 336,500 | |||||||
Net issuance of notes receivable from non-bank subsidiaries |
(23,583 | ) | (3,275 | ) | (176,668 | ) | ||||||
Net sales (purchases) of premises and equipment |
20,605 | (60,888 | ) | (35,771 | ) | |||||||
Net investment in subsidiaries |
(17,925 | ) | (162,214 | ) | (47,285 | ) | ||||||
Proceeds from sale of investment securities available-for-sale |
— | 13,126 | — | |||||||||
Net cash (used in) provided by investing activities |
(410,303 | ) | (831,251 | ) | 76,776 | |||||||
Financing Activities |
||||||||||||
Proceeds from issuance of long-term debt |
1,039,191 | 1,188,959 | 294,562 | |||||||||
Maturity of long-term debt |
(434,000 | ) | (495,000 | ) | (241,000 | ) | ||||||
Proceeds from issuance of junior subordinated deferrable interest debentures to
variable interest entities |
— | 515,464 | — | |||||||||
Proceeds from issuance of common stock |
1,082,186 | — | — | |||||||||
Proceeds from exercise of stock options and other awards |
275,793 | 138,422 | 84,032 | |||||||||
Acquisition and retirement of common stock |
(1,700,824 | ) | (615,503 | ) | (376,095 | ) | ||||||
Dividends paid |
(435,800 | ) | (350,740 | ) | (312,382 | ) | ||||||
Net cash (used in) provided by financing activities |
(173,454 | ) | 381,602 | (550,883 | ) | |||||||
Increase (Decrease) in Cash and Cash Equivalents |
778 | 1,074 | (2,424 | ) | ||||||||
Cash and cash equivalents at beginning of year |
4,219 | 3,145 | 5,569 | |||||||||
Cash and cash equivalents at end of year |
$ | 4,997 | $ | 4,219 | $ | 3,145 | ||||||
Supplemental Disclosures |
||||||||||||
Interest expense paid |
$ | 102,866 | $ | 79,425 | $ | 95,304 | ||||||
Income taxes paid |
$ | — | $ | — | $ | — | ||||||
QUARTERLY DATA (UNAUDITED) (dollars in thousands, except per share amounts)
| Three Months Ended | March 31, | June 30, | September 30, | December 31, | ||||||||||||
2003 |
||||||||||||||||
Interest income |
$ | 944,027 | $ | 959,915 | $ | 969,529 | $ | 985,413 | ||||||||
Interest expense |
388,431 | 380,747 | 369,617 | 369,716 | ||||||||||||
Net interest income |
555,596 | 579,168 | 599,912 | 615,697 | ||||||||||||
Provision for possible credit losses |
378,877 | 345,603 | 334,064 | 334,157 | ||||||||||||
Other operating income |
1,788,009 | 1,851,804 | 2,032,469 | 2,153,198 | ||||||||||||
Other operating expense |
1,287,875 | 1,235,068 | 1,267,389 | 1,333,815 | ||||||||||||
Income before income taxes |
676,853 | 850,301 | 1,030,928 | 1,100,923 | ||||||||||||
Net income |
432,509 | 543,342 | 658,763 | 703,490 | ||||||||||||
Net income applicable to common stock |
428,993 | 539,826 | 655,247 | 699,974 | ||||||||||||
Earnings per common share |
.34 | .42 | .51 | .55 | ||||||||||||
Earnings per
common share—assuming dilution |
.33 | .42 | .51 | .54 | ||||||||||||
Weighted average common shares outstanding (000) |
1,278,980 | 1,278,144 | 1,277,810 | 1,277,748 | ||||||||||||
Weighted average common shares outstanding and common
stock equivalents (000) |
1,292,647 | 1,294,246 | 1,296,312 | 1,297,300 | ||||||||||||
2002 |
||||||||||||||||
Interest income |
$ | 915,701 | $ | 895,618 | $ | 887,423 | $ | 979,328 | ||||||||
Interest expense |
402,425 | 390,801 | 405,152 | 405,117 | ||||||||||||
Net interest income |
513,276 | 504,817 | 482,271 | 574,211 | ||||||||||||
Provision for possible credit losses |
359,393 | 274,932 | 288,195 | 417,637 | ||||||||||||
Other operating income |
1,596,266 | 1,633,629 | 1,668,145 | 1,854,883 | ||||||||||||
Other operating expense |
1,166,695 | 1,141,365 | 1,234,395 | 1,159,470 | ||||||||||||
Income before income taxes |
583,454 | 722,149 | 627,826 | 851,987 | ||||||||||||
Net income |
369,910 | 457,842 | 398,042 | 540,160 | ||||||||||||
Net income applicable to common stock |
366,394 | 454,242 | 394,498 | 536,642 | ||||||||||||
Earnings per common share |
.29 | .36 | .31 | .42 | ||||||||||||
Earnings per
common share—assuming dilution |
.28 | .35 | .30 | .41 | ||||||||||||
Weighted average common shares outstanding (000) |
1,277,995 | 1,277,703 | 1,277,720 | 1,277,734 | ||||||||||||
Weighted average common shares outstanding and common
stock equivalents (000) |
1,311,074 | 1,305,288 | 1,297,412 | 1,297,285 | ||||||||||||
| For the three months ended December 31, 2002, the Corporation increased its provision for possible credit losses and its reserve for possible credit losses by $109.5 million related to its other consumer loan receivables. |
For the three months ended December 31, 2002, the Corporation recognized an additional $51.3 million of deferred compensation expense associated with the immediate vesting of restricted stock awards on the death of a holder of the awards.
For the three months ended September 30, 2002, the Corporation changed its estimated value of accrued interest and fees which resulted in a decrease to income before income taxes of $263.7 million through a reduction of $66.3 million of interest income and $197.4 million of other operating income.
| On June 6, 2002, the Corporation announced a three-for-two split of the Corporation’s Common Stock, effected in the form of a dividend, issued on July 15, 2002, to stockholders of record as of the close of business on July 1, 2002. Accordingly, all common share and per common share data previously reported in the Corporation’s Form 10-Q filed with the Securities and Exchange Commission for March 31, 2002 have been adjusted to reflect the stock split. |
PREFERRED STOCK PRICE RANGE AND DIVIDENDS (UNAUDITED)
| Dividends | ||||||||||||||||
| Declared per | ||||||||||||||||
| High | Low | Close | Preferred Share | |||||||||||||
Series A |
||||||||||||||||
2003 |
||||||||||||||||
Fourth quarter |
$ | 26.60 | $ | 25.25 | $ | 25.85 | $ | .46875 | ||||||||
Third quarter |
26.35 | 25.25 | 25.35 | .46875 | ||||||||||||
Second quarter |
26.35 | 25.25 | 26.00 | .46875 | ||||||||||||
First quarter |
25.45 | 24.60 | 25.20 | .46875 | ||||||||||||
2002 |
||||||||||||||||
Fourth quarter |
25.10 | 24.40 | 25.00 | .46875 | ||||||||||||
Third quarter |
25.50 | 24.18 | 24.85 | .46875 | ||||||||||||
Second quarter |
25.55 | 25.00 | 25.48 | .46875 | ||||||||||||
First quarter |
25.80 | 24.85 | 24.85 | .46875 | ||||||||||||
Series B |
||||||||||||||||
2003 |
||||||||||||||||
Fourth quarter |
26.36 | 25.00 | 25.70 | .34380 | ||||||||||||
Third quarter |
25.75 | 24.55 | 25.10 | .34380 | ||||||||||||
Second quarter |
25.45 | 23.20 | 24.90 | .34380 | ||||||||||||
First quarter |
25.20 | 22.95 | 23.25 | .34380 | ||||||||||||
2002 |
||||||||||||||||
Fourth quarter |
23.60 | 21.45 | 23.35 | .34380 | ||||||||||||
Third quarter |
24.10 | 22.15 | 22.50 | .34740 | ||||||||||||
Second quarter |
24.30 | 22.75 | 23.51 | .36850 | ||||||||||||
First quarter |
24.00 | 22.35 | 22.80 | .34380 | ||||||||||||
The Corporation has two series of preferred stock issued and outstanding, both with a $25 stated value per share. Each series of preferred stock is traded on the New York Stock Exchange, the Series A Preferred Stock under the symbol “KRBpfa” and the Series B Preferred Stock under the symbol “KRBpfb.”
On January 22, 2004, the Corporation’s Board of Directors declared a quarterly dividend of $.46875 per share on the 7½% Cumulative Preferred Stock, Series A, and a quarterly dividend of $.3438 per share on the Adjustable Rate Cumulative Preferred Stock, Series B. Both dividends are payable April 15, 2004 to stockholders of record as of March 31, 2004.
COMMON STOCK PRICE RANGE AND DIVIDENDS (a) (UNAUDITED)
| Dividends | ||||||||||||||||
| Declared per | ||||||||||||||||
| High | Low | Close | Common Share | |||||||||||||
2003 |
||||||||||||||||
Fourth quarter |
$ | 25.45 | $ | 23.50 | $ | 24.85 | $ | .10 | ||||||||
Third quarter |
24.91 | 20.72 | 22.80 | .10 | ||||||||||||
Second quarter |
22.26 | 15.23 | 20.84 | .08 | ||||||||||||
First quarter |
20.75 | 12.15 | 15.05 | .08 | ||||||||||||
2002 |
||||||||||||||||
Fourth quarter |
22.47 | 15.31 | 19.02 | .07 | ||||||||||||
Third quarter |
22.40 | 13.80 | 18.38 | .07 | ||||||||||||
Second quarter |
25.97 | 21.23 | 22.05 | .07 | ||||||||||||
First quarter |
25.93 | 20.77 | 25.71 | .07 | ||||||||||||
| (a) | The common stock price and dividends have been adjusted to reflect the three-for-two stock split of MBNA Corporation’s Common Stock effected in the form of a dividend, issued on July 15, 2002, to stockholders of record as of the close of business on July 1, 2002. |
The Corporation’s Common Stock is traded on the New York Stock Exchange under the symbol “KRB” and is listed as “MBNA” in newspapers. At January 31, 2004, the Corporation had 2,789 common stockholders of record. This figure does not include beneficial owners for whom Cede & Co. or others act as nominees.
On January 22, 2004, the Corporation’s Board of Directors declared a quarterly dividend of $.12 per common share, payable April 1, 2004 to stockholders of record as of March 15, 2004.

MBNA CORPORATION BOARD OF DIRECTORS
James H. Berick, Esq.
|
Bruce L. Hammonds | Randolph D. Lerner, Esq. | William B. Milstead | |||
Retired Partner
|
President and Chief Executive Officer | Chairman | Retired Partner | |||
Squire, Sanders & Dempsey L.L.P.
|
Owner, Cleveland Browns | Ernst & Young, LLP | ||||
| William L. Jews | ||||||
Benjamin R. Civiletti, Esq.
|
President and Chief Executive Officer | Stuart L. Markowitz, M.D. | Michael Rosenthal, Ph.D. | |||
Chairman
|
CareFirst BlueCross BlueShield | Internist and Managing Partner | Professor | |||
Venable LLP
|
Drs. Markowitz, Rosenberg, | Columbia University | ||||
Former Attorney General
|
Norma Lerner | Stein & Associates | ||||
of the United States
|
Investor | Former Associate Dean for | ||||
| Clinical Professor | Academic Administration at | |||||
| Case Western Reserve University, | Columbia College | |||||
| College of Medicine |
MBNA PRINCIPAL OFFICERS
Bruce L. Hammonds
|
Richard K. Struthers | Douglas R. Denton | Vernon H.C. Wright | |||
President and Chief Executive Officer
|
Chairman, MBNA Europe | Chief Technology Officer | Chief Financial Officer | |||
MBNA Corporation
|
and MBNA Canada | MBNA Corporation | ||||
| General Charles C. Krulak | ||||||
John R. Cochran III
|
Lance L. Weaver | Chief Administrative Officer | Kenneth A. Vecchione | |||
Chairman and Chief Executive Officer
|
U.S. Credit Card | Chief Financial Officer | ||||
MBNA America Bank, N.A.
|
Frank P. Bramble, Sr. | MBNA America Bank, N.A. | ||||
| Planning |
MBNA OFFICE LOCATIONS

INTERNATIONAL
|
32 Washington St. | 388 S. Main St. | UNITED KINGDOM | |||
HEADQUARTERS
|
Camden, ME 04843 | Akron, OH 44311 | ||||
| Stansfield House | ||||||
MBNA Corporation
|
274 Front St. | 25875 Science Park Dr. | Chester Business Park | |||
Wilmington, DE 19884
|
Farmington, ME 04938 | Beachwood, OH 44122 | Wrexham Rd. | |||
(800) 441-7048
|
Chester, Cheshire | |||||
| 50 Pleasant St. | 2568 Park Centre Blvd. | CH4 9QQ | ||||
MBNA OFFICES |
Fort Kent, ME 04743 | State College, PA 16801 | United Kingdom | |||
UNITED STATES
|
16 Godfrey Dr. | 16001 N. Dallas Pkwy. | 86 Jermyn St. | |||
| Orono, ME 04473 | Dallas, TX 75248 | London SW1Y 6JD | ||||
75 Enterprise, Suite 200
|
United Kingdom | |||||
Aliso Viejo, CA 92656
|
901 Washington Ave. | |||||
| Portland, ME 04103 | CANADA | |||||
1075 Silver Lake Blvd.
|
SPAIN | |||||
Dover, DE 19904
|
18 Green Hill Dr. | 1600 James Naismith Dr. | ||||
| Presque Isle, ME 04769 | Gloucester, Ontario | C/José Echegaray, 6. | ||||
210 Town Park Drive
|
K1B 5N8 | 28230 Las Rozas | ||||
Kennesaw, GA 30144
|
12 Water St. | Madrid, Spain | ||||
| Rockland, ME 04841 | 1000 de la Gauchetière Suite 4300 | |||||
11333 McCormick Rd.
|
Montréal, Québec | |||||
Hunt Valley, MD 21031 |
100 Main St., Suite 303 | H3B 4W5 | CHINA | |||
1 Hatley Rd.
|
Dover, NH 03820 | IRELAND | (Representative Office) | |||
Belfast, ME 04915
|
320 University Ave. | |||||
| Newark, NJ 07102 | 46 St. Stephen’s Green | Suite 2006, 20th Floor, | ||||
5 Industrial Pkwy.
|
Dublin 2, Ireland | Jin Mao Tower | ||||
Brunswick, ME 04011
|
9 W. 57th St. | 88 Century Blvd. | ||||
| New York, NY 10019 | Dublin Road | Pudong, Shanghai 200121 | ||||
| Carrick-on-Shannon | People’s Republic of China | |||||
| Co Leitrim, Ireland |
SUBSIDIARIES OF MBNA CORPORATION
MBNA AMERICA BANK, N.A.
The principal subsidiary of MBNA Corporation, MBNA America is the largest independent credit card lender in the world. It also provides retail deposit, consumer loan, and insurance products. MBNA America markets its products through thousands of membership organizations and financial institutions and is the recognized industry leader in endorsed marketing.
MBNA DELAWARE
The Corporation is also the parent of MBNA Delaware, a national bank that offers mortgage loans, aircraft loans, and business card products.
SUBSIDIARIES OF MBNA AMERICA BANK, N.A.
MBNA EUROPE BANK LIMITED
MBNA issues credit cards in the United Kingdom, the Republic of Ireland, and Spain. MBNA Europe is headquartered in Chester, England, with business development offices in London, England; Dublin and Carrick-on-Shannon, Ireland; and Las Rozas, Spain.
MBNA CANADA BANK
MBNA issues credit cards in Canada. MBNA Canada is headquartered in Ottawa, Ontario, with a business development office in Montréal, Québec.
MBNA MARKETING SYSTEMS, INC.
MBNA has state-of-the-art telephone sales facilities to support account acquisition and maintains offices in Delaware, Georgia, Maine, Maryland, New Hampshire, New Jersey, Ohio, Pennsylvania, and Texas. In addition to credit cards, MBNA Marketing Systems cross-sells consumer loan, deposit, and insurance products.
MBNA TECHNOLOGY, INC.
MBNA Technology, Inc., headquartered in Dallas, Texas, provides information technology support and services to MBNA America Bank, N.A., and its affiliates.
MBNA.COM
Through a single Web address—www.MBNA.com—Customers can access their existing account information, apply for new credit card or consumer loan accounts, shop for products and services, plan and finance travel, and open certificates of deposit or money market accounts.
INDEPENDENT AUDITORS
Ernst & Young LLP
CORPORATE REGISTRARS AND TRANSFER AGENTS
National City Bank (common stock) (800) 622-6757
The Bank of New York (preferred stock) (212) 815-4302
PRINCIPAL FINANCIAL CONTACTS
For further information about MBNA Corporation or its subsidiaries, please contact:
David
W. Spartin, Senior Vice Chairman
|
Edward H. Murphy, Director, Investor Relations | |
MBNA Corporation
|
MBNA Corporation | |
Wilmington, DE 19884-0141
|
Wilmington, DE 19884-0131 | |
(800) 362-6255 or (302) 456-8588
|
(800) 362-6255 or (302) 432-0202 |
Internet address: www.MBNA.com
COMMON STOCK
Listed on New York Stock
Exchange
Stock Symbol KRB