
Second Quarter Results July 16, 2026 .2
FORWARD-LOOKING STATEMENT This presentation contains forward-looking statements within the meaning of Section 27A of the Securities Act of 1933, as amended, and Section 21E of the Exchange Act of 1934, as amended, including statements regarding economic and geopolitical uncertainty, including uncertainty regarding trade policy developments, trends in labor demand and the future strengthening of such demand, the impact of AI on labor markets, financial outlook, outlook for our business in the regions in which we operate as well as key countries within those regions, the Company’s strategic initiatives and technology investments, including transformation programs and the use of AI to drive innovation, the ability of our PowerSuite platform to develop and deploy our AI capabilities at scale, and the positioning of future growth for our brands, that are forward-looking in nature and, accordingly, are subject to risks and uncertainties. The Company’s actual results may differ materially from those described or contemplated in the forward-looking statements due to numerous factors. These factors include those found in the Company’s reports filed with the SEC, including the information under the heading “Risk Factors” in its Annual Report on Form 10-K for the year ended December 31, 2025, which information is incorporated herein by reference. We caution that any forward-looking statement reflects only our belief at the time the statement is made. The Company assumes no obligation to update or revise any forward-looking statements. We reference certain non-GAAP financial measures, which we believe provide useful information for investors. We include a reconciliation of these measures, where appropriate, to GAAP on the Investor Relations section of our website at manpowergroup.com.
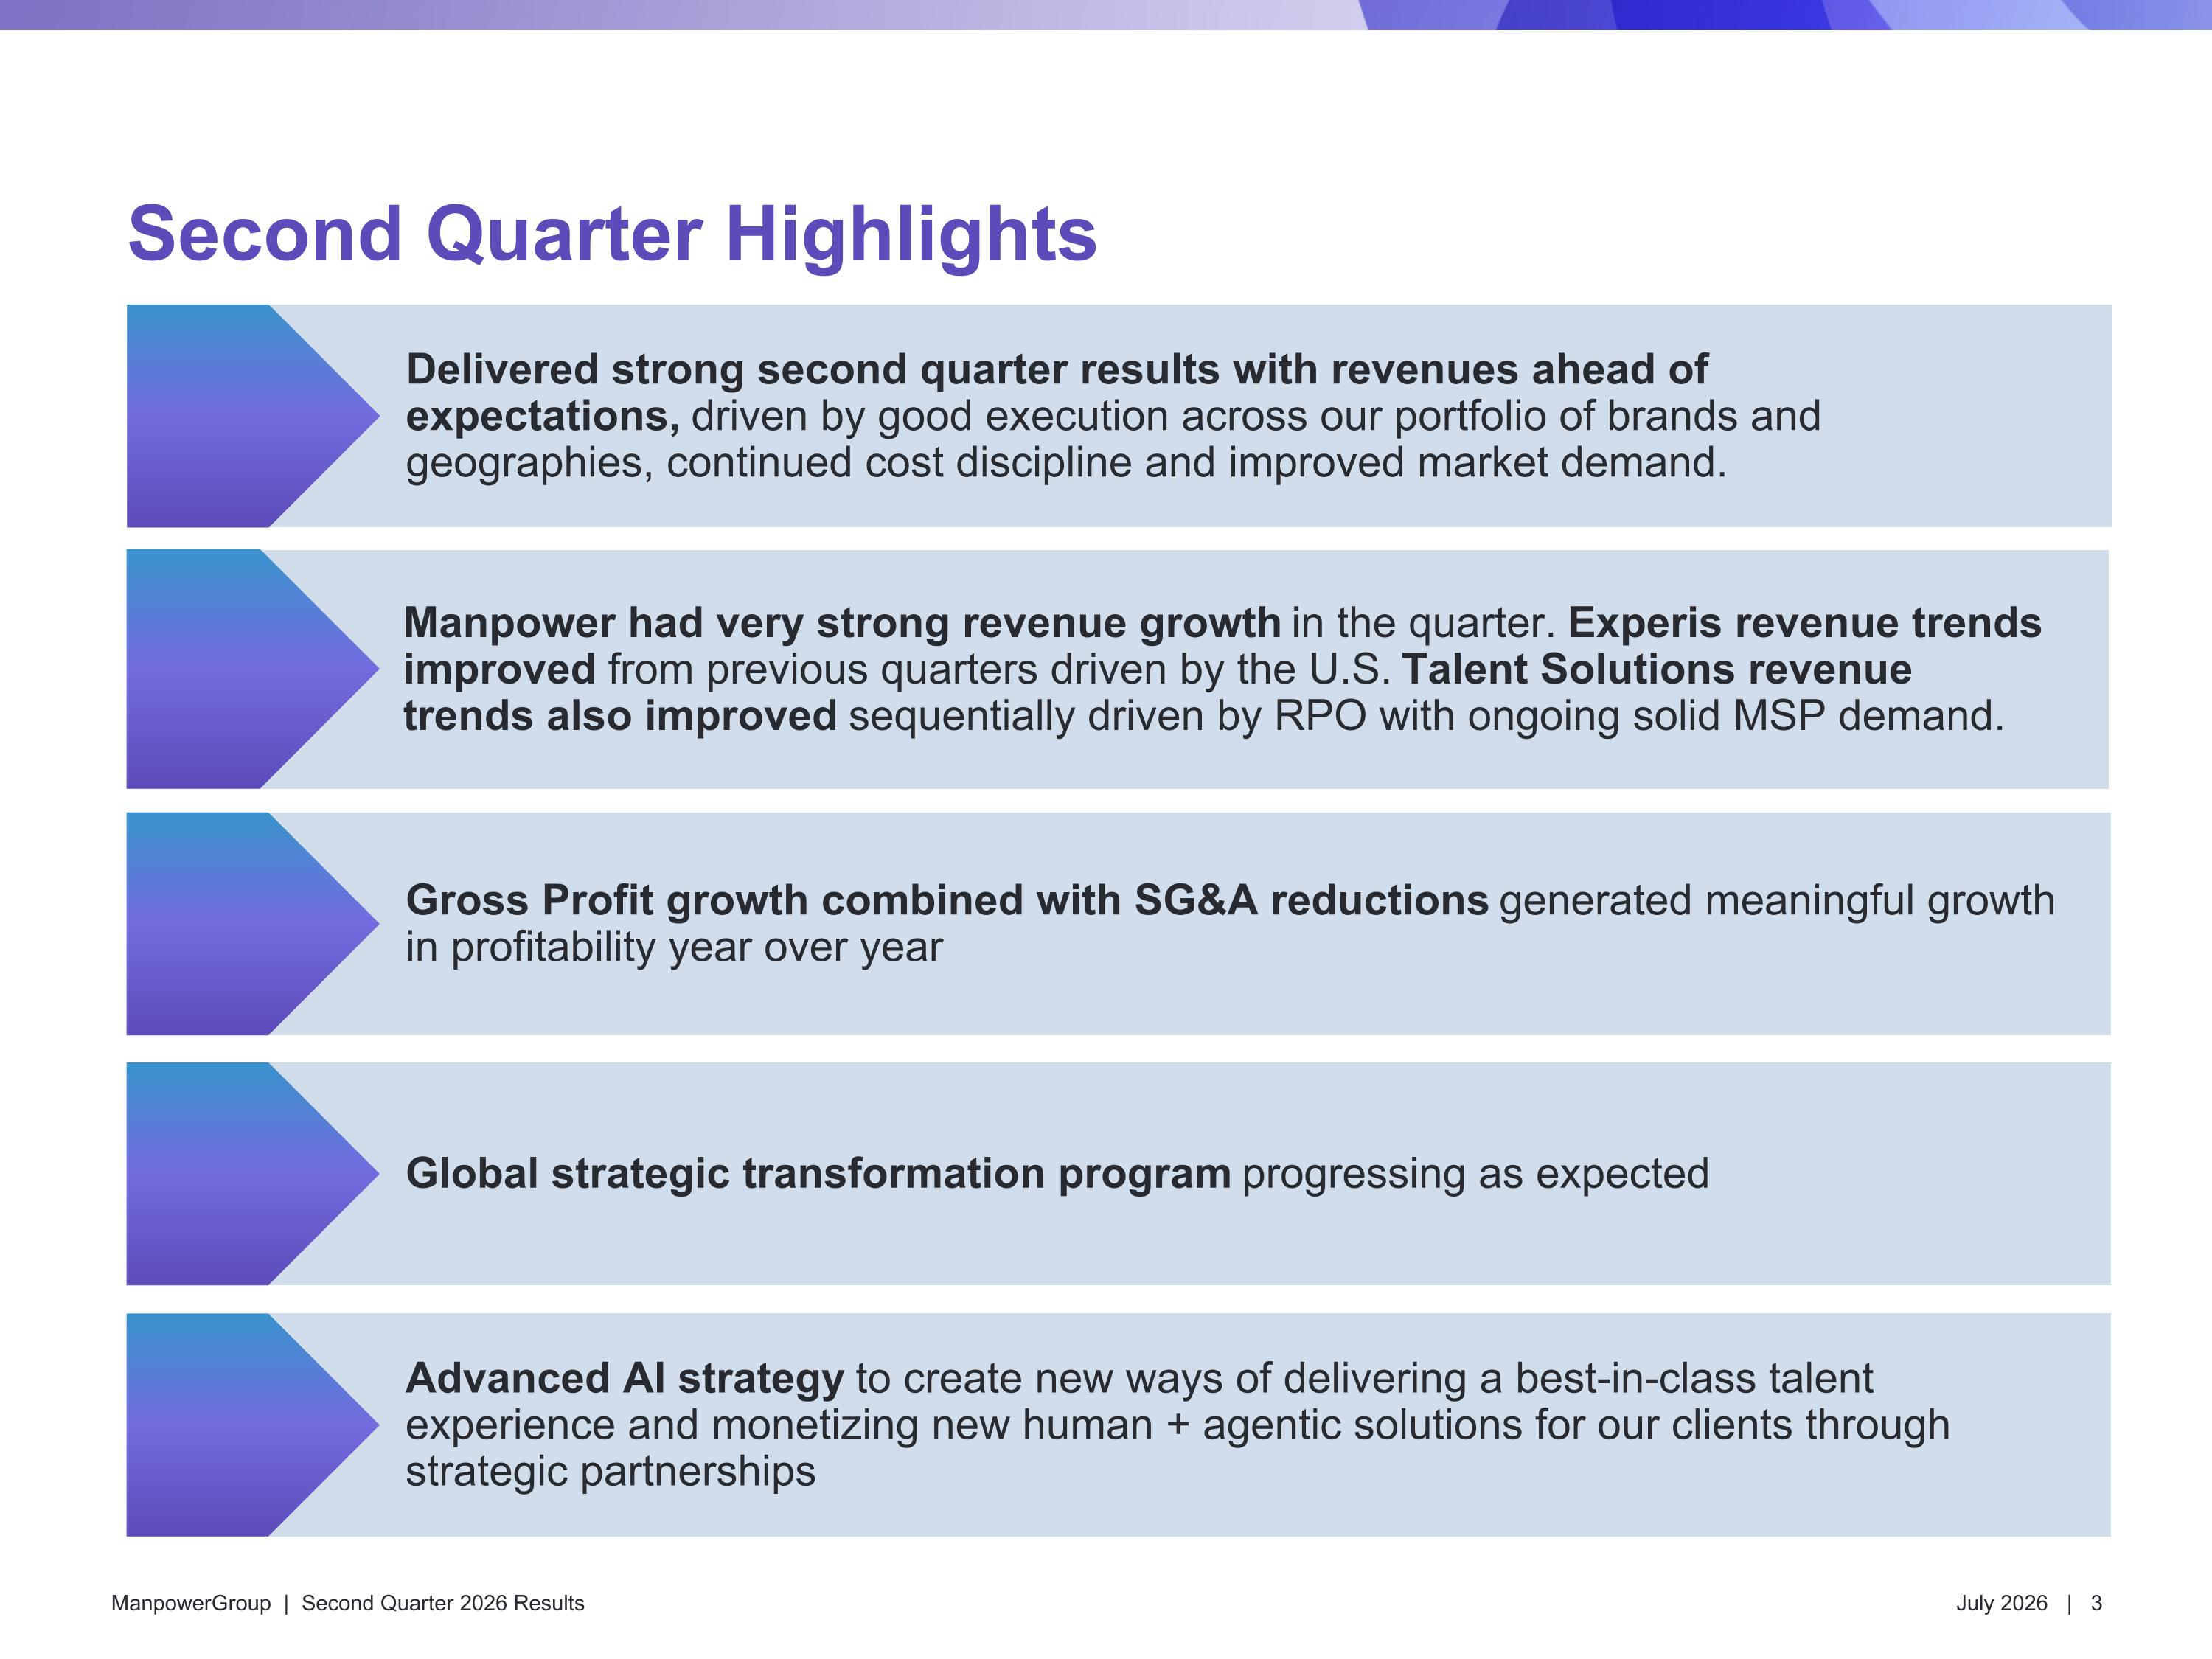
Second Quarter Highlights Manpower had very strong revenue growth in the quarter. Experis revenue trends improved from previous quarters driven by the U.S. Talent Solutions revenue trends also improved sequentially driven by RPO with ongoing solid MSP demand. Gross Profit growth combined with SG&A reductions generated meaningful growth in profitability year over year Delivered strong second quarter results with revenues ahead of expectations, driven by good execution across our portfolio of brands and geographies, continued cost discipline and improved market demand. Global strategic transformation program progressing as expected Advanced AI strategy to create new ways of delivering a best-in-class talent experience and monetizing new human + agentic solutions for our clients through strategic partnerships
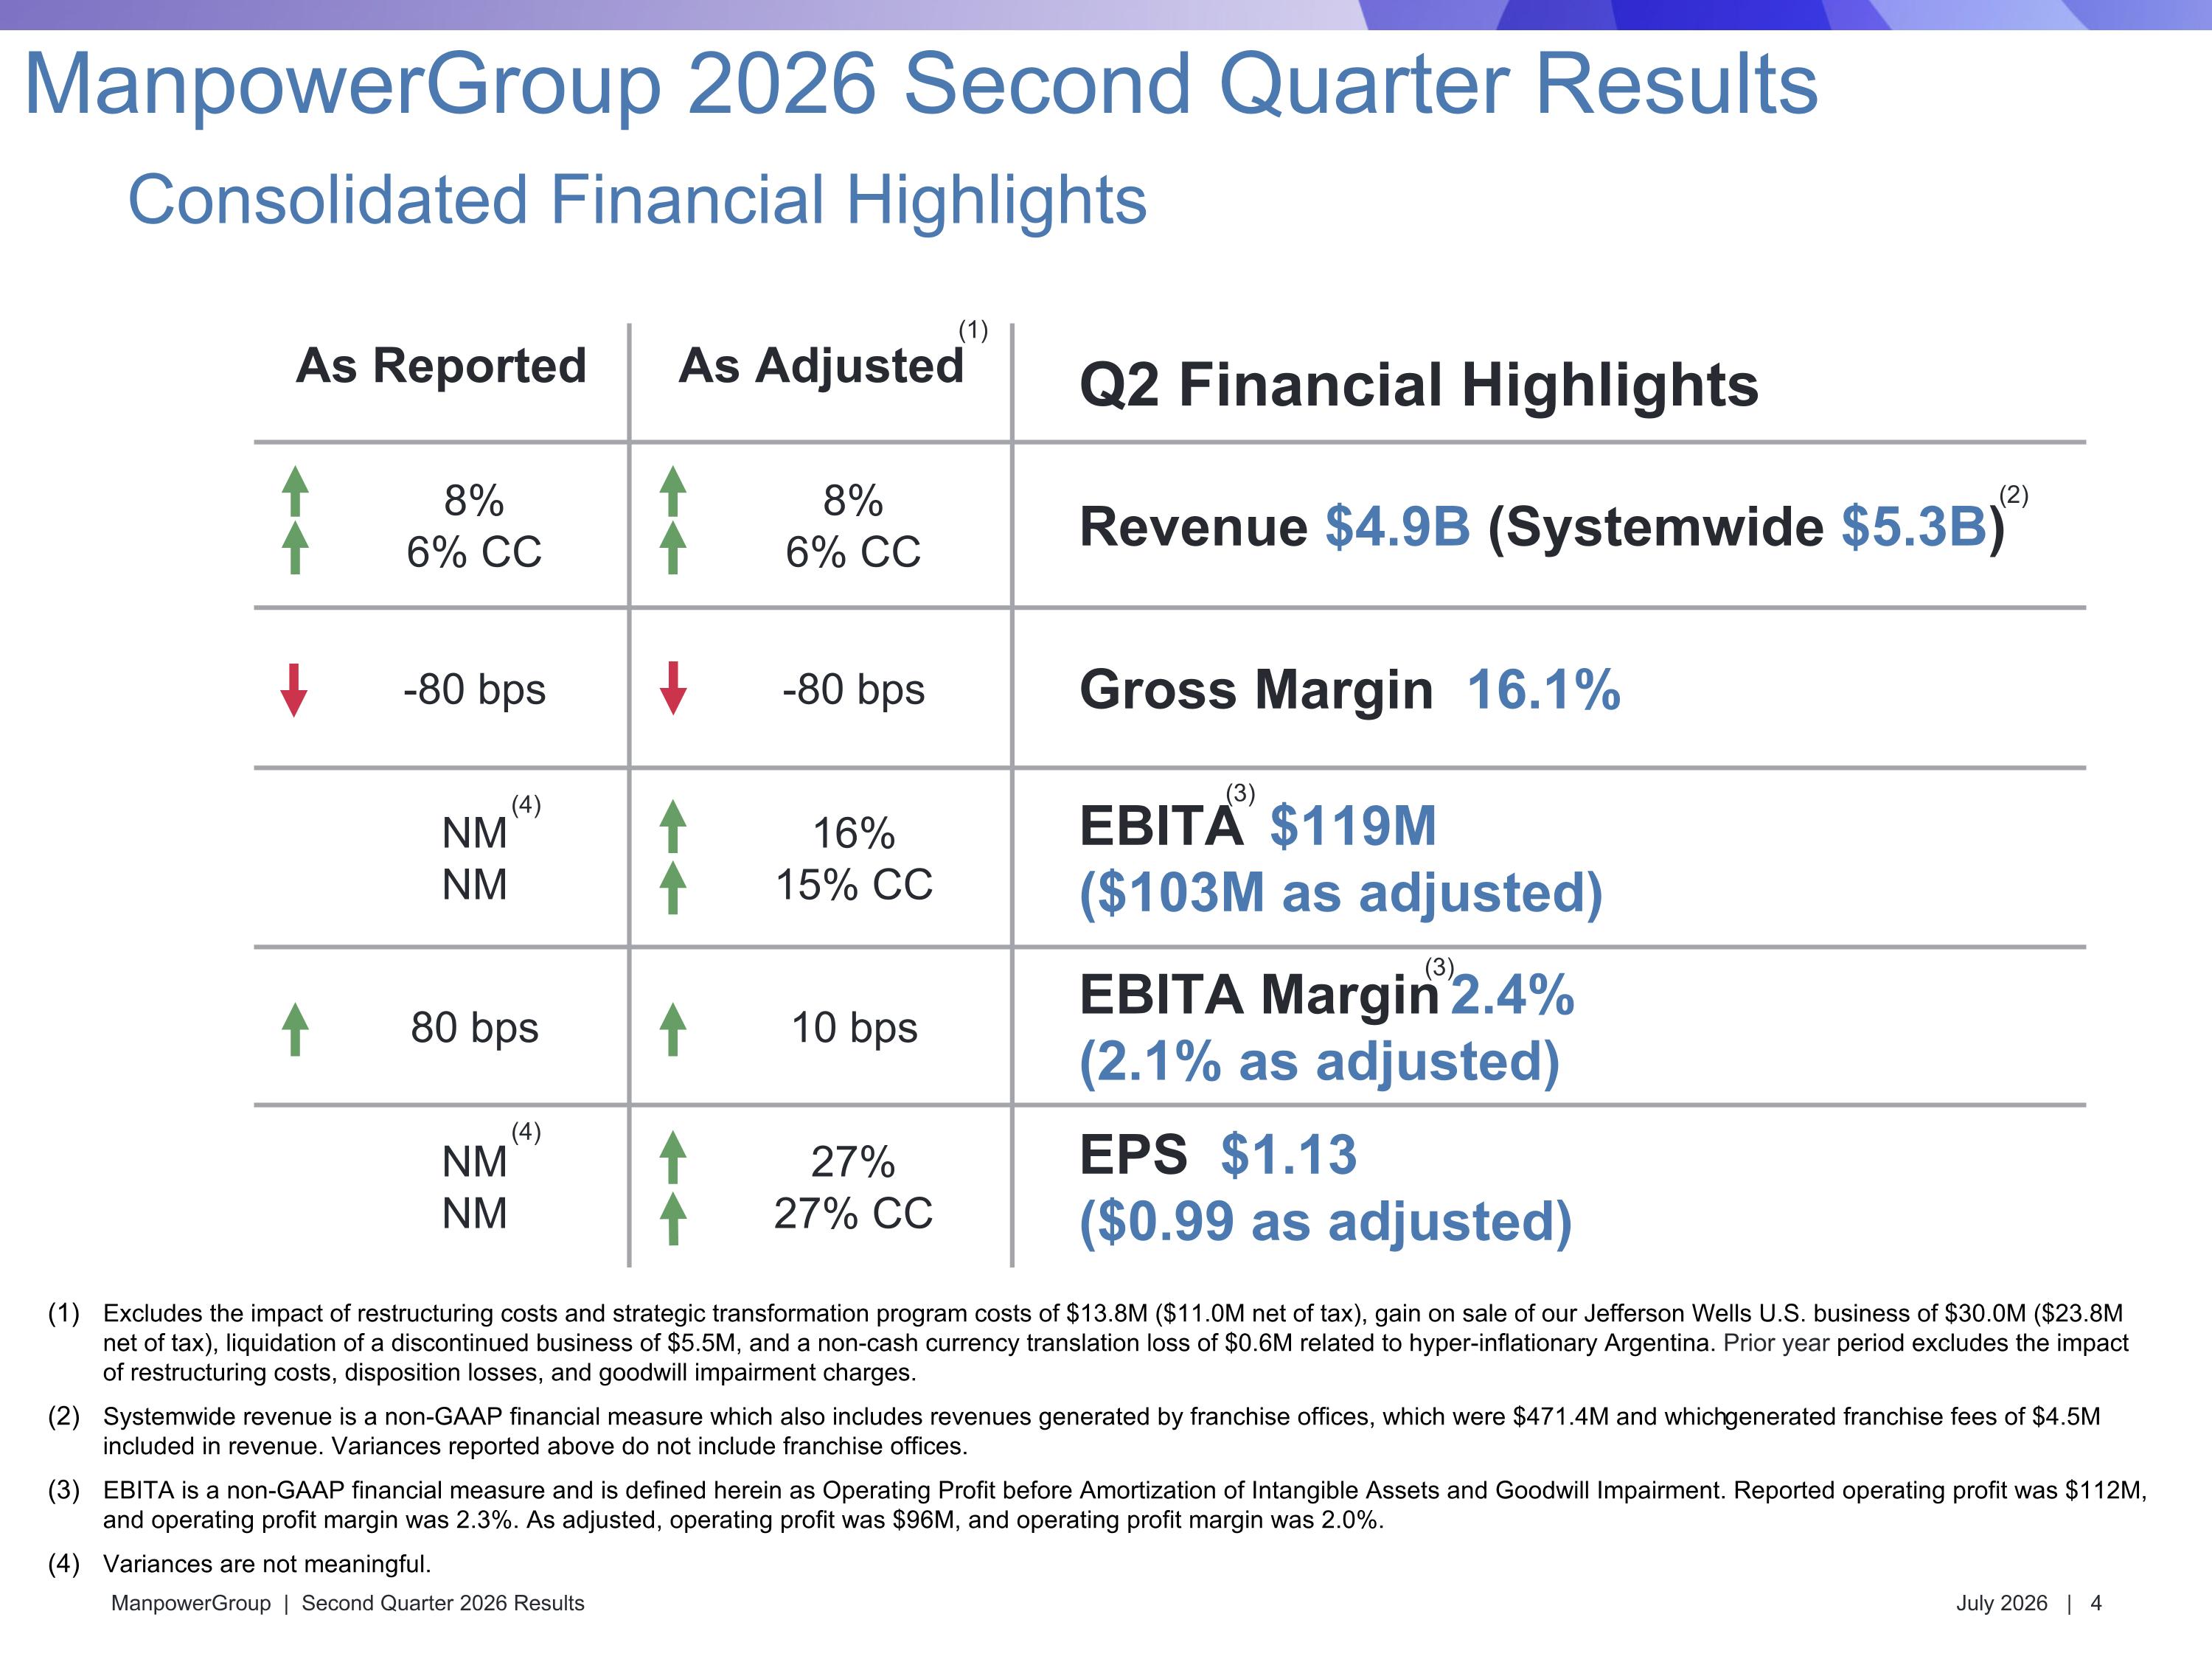
As Reported As Adjusted Q2 Financial Highlights 8% 6% CC 8% 6% CC Revenue $4.9B (Systemwide $5.3B) -80 bps -80 bps Gross Margin 16.1% NM NM 16% 15% CC EBITA $119M ($103M as adjusted) 80 bps 10 bps EBITA Margin 2.4% (2.1% as adjusted) NM NM 27% 27% CC EPS $1.13 ($0.99 as adjusted) Excludes the impact of restructuring costs and strategic transformation program costs of $13.8M ($11.0M net of tax), gain on sale of our Jefferson Wells U.S. business of $30.0M ($23.8M net of tax), liquidation of a discontinued business of $5.5M, and a non-cash currency translation loss of $0.6M related to hyper-inflationary Argentina. Prior year period excludes the impact of restructuring costs, disposition losses, and goodwill impairment charges. Systemwide revenue is a non-GAAP financial measure which also includes revenues generated by franchise offices, which were $471.4M and which generated franchise fees of $4.5M included in revenue. Variances reported above do not include franchise offices. EBITA is a non-GAAP financial measure and is defined herein as Operating Profit before Amortization of Intangible Assets and Goodwill Impairment. Reported operating profit was $112M, and operating profit margin was 2.3%. As adjusted, operating profit was $96M, and operating profit margin was 2.0%. Variances are not meaningful. (3) (3) Consolidated Financial Highlights ManpowerGroup 2026 Second Quarter Results (1) (2) (4) (4)
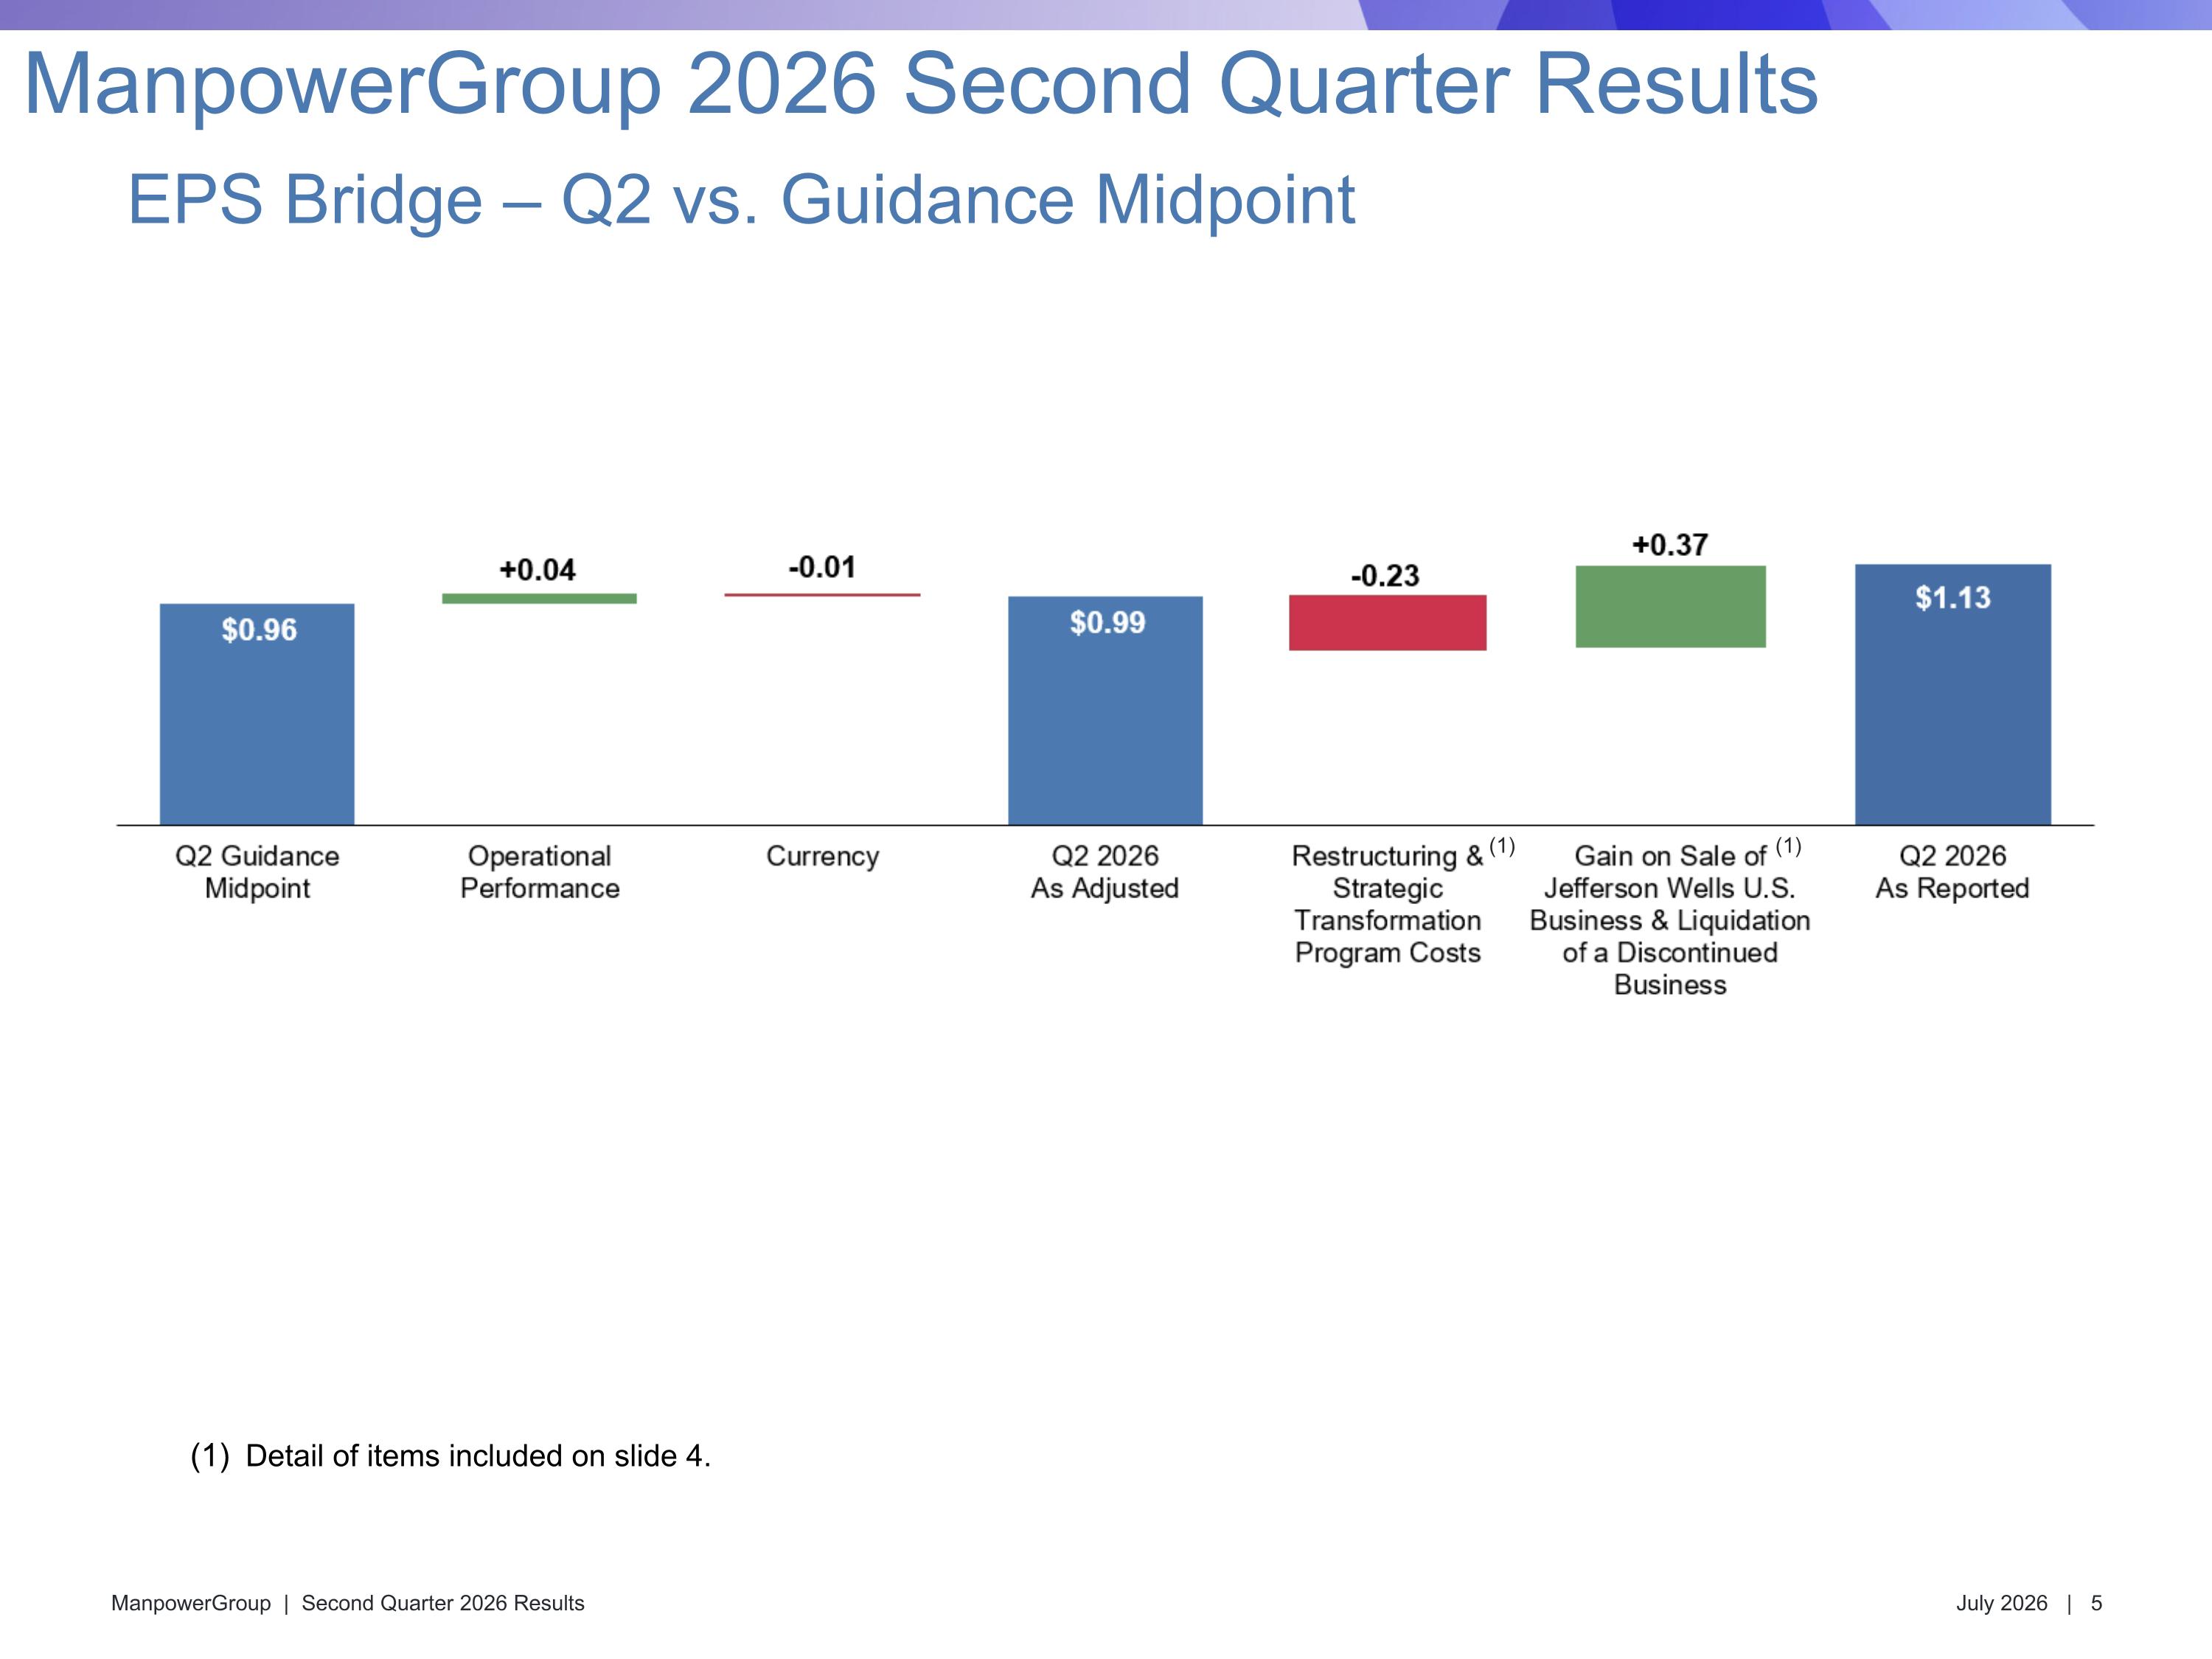
EPS Bridge – Q2 vs. Guidance Midpoint ManpowerGroup 2026 Second Quarter Results (1) Detail of items included on slide 4. (1)
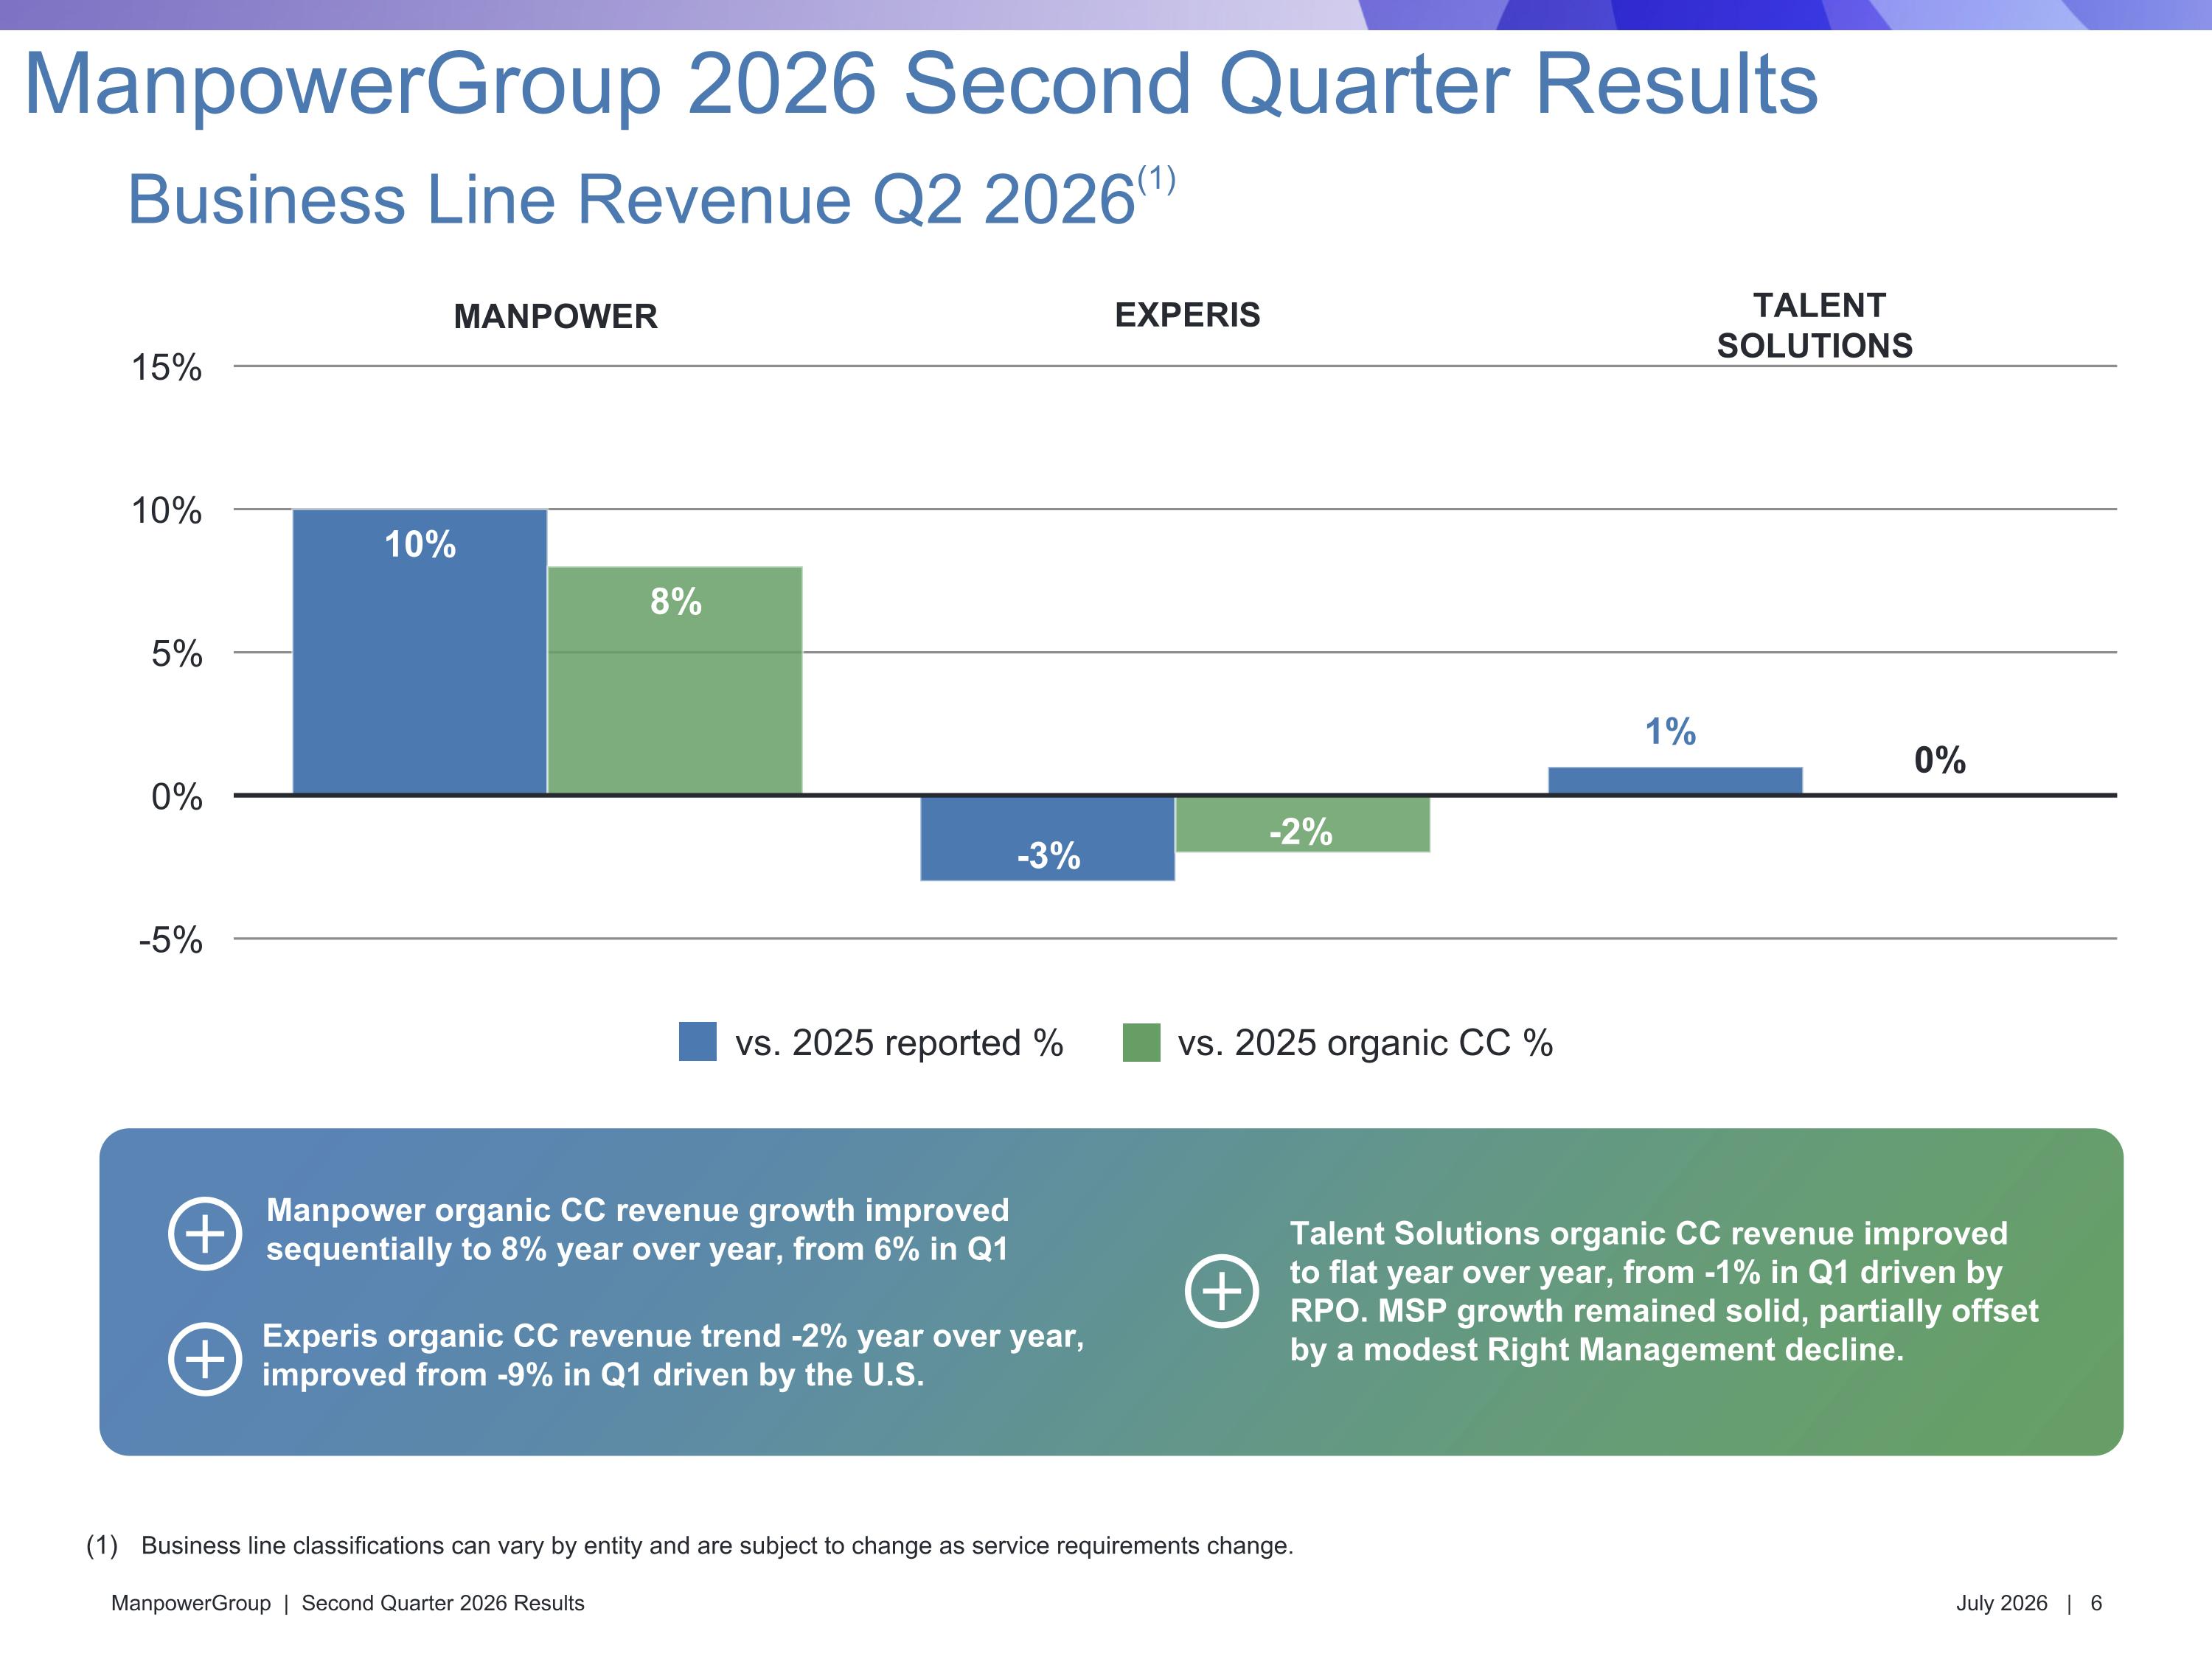
Manpower organic CC revenue growth improved sequentially to 8% year over year, from 6% in Q1 Talent Solutions organic CC revenue improved to flat year over year, from -1% in Q1 driven by RPO. MSP growth remained solid, partially offset by a modest Right Management decline. Experis organic CC revenue trend -2% year over year, improved from -9% in Q1 driven by the U.S. Business line classifications can vary by entity and are subject to change as service requirements change. Business Line Revenue Q2 2026(1) ManpowerGroup 2026 Second Quarter Results vs. 2025 reported % vs. 2025 organic CC % MANPOWER EXPERIS TALENT SOLUTIONS
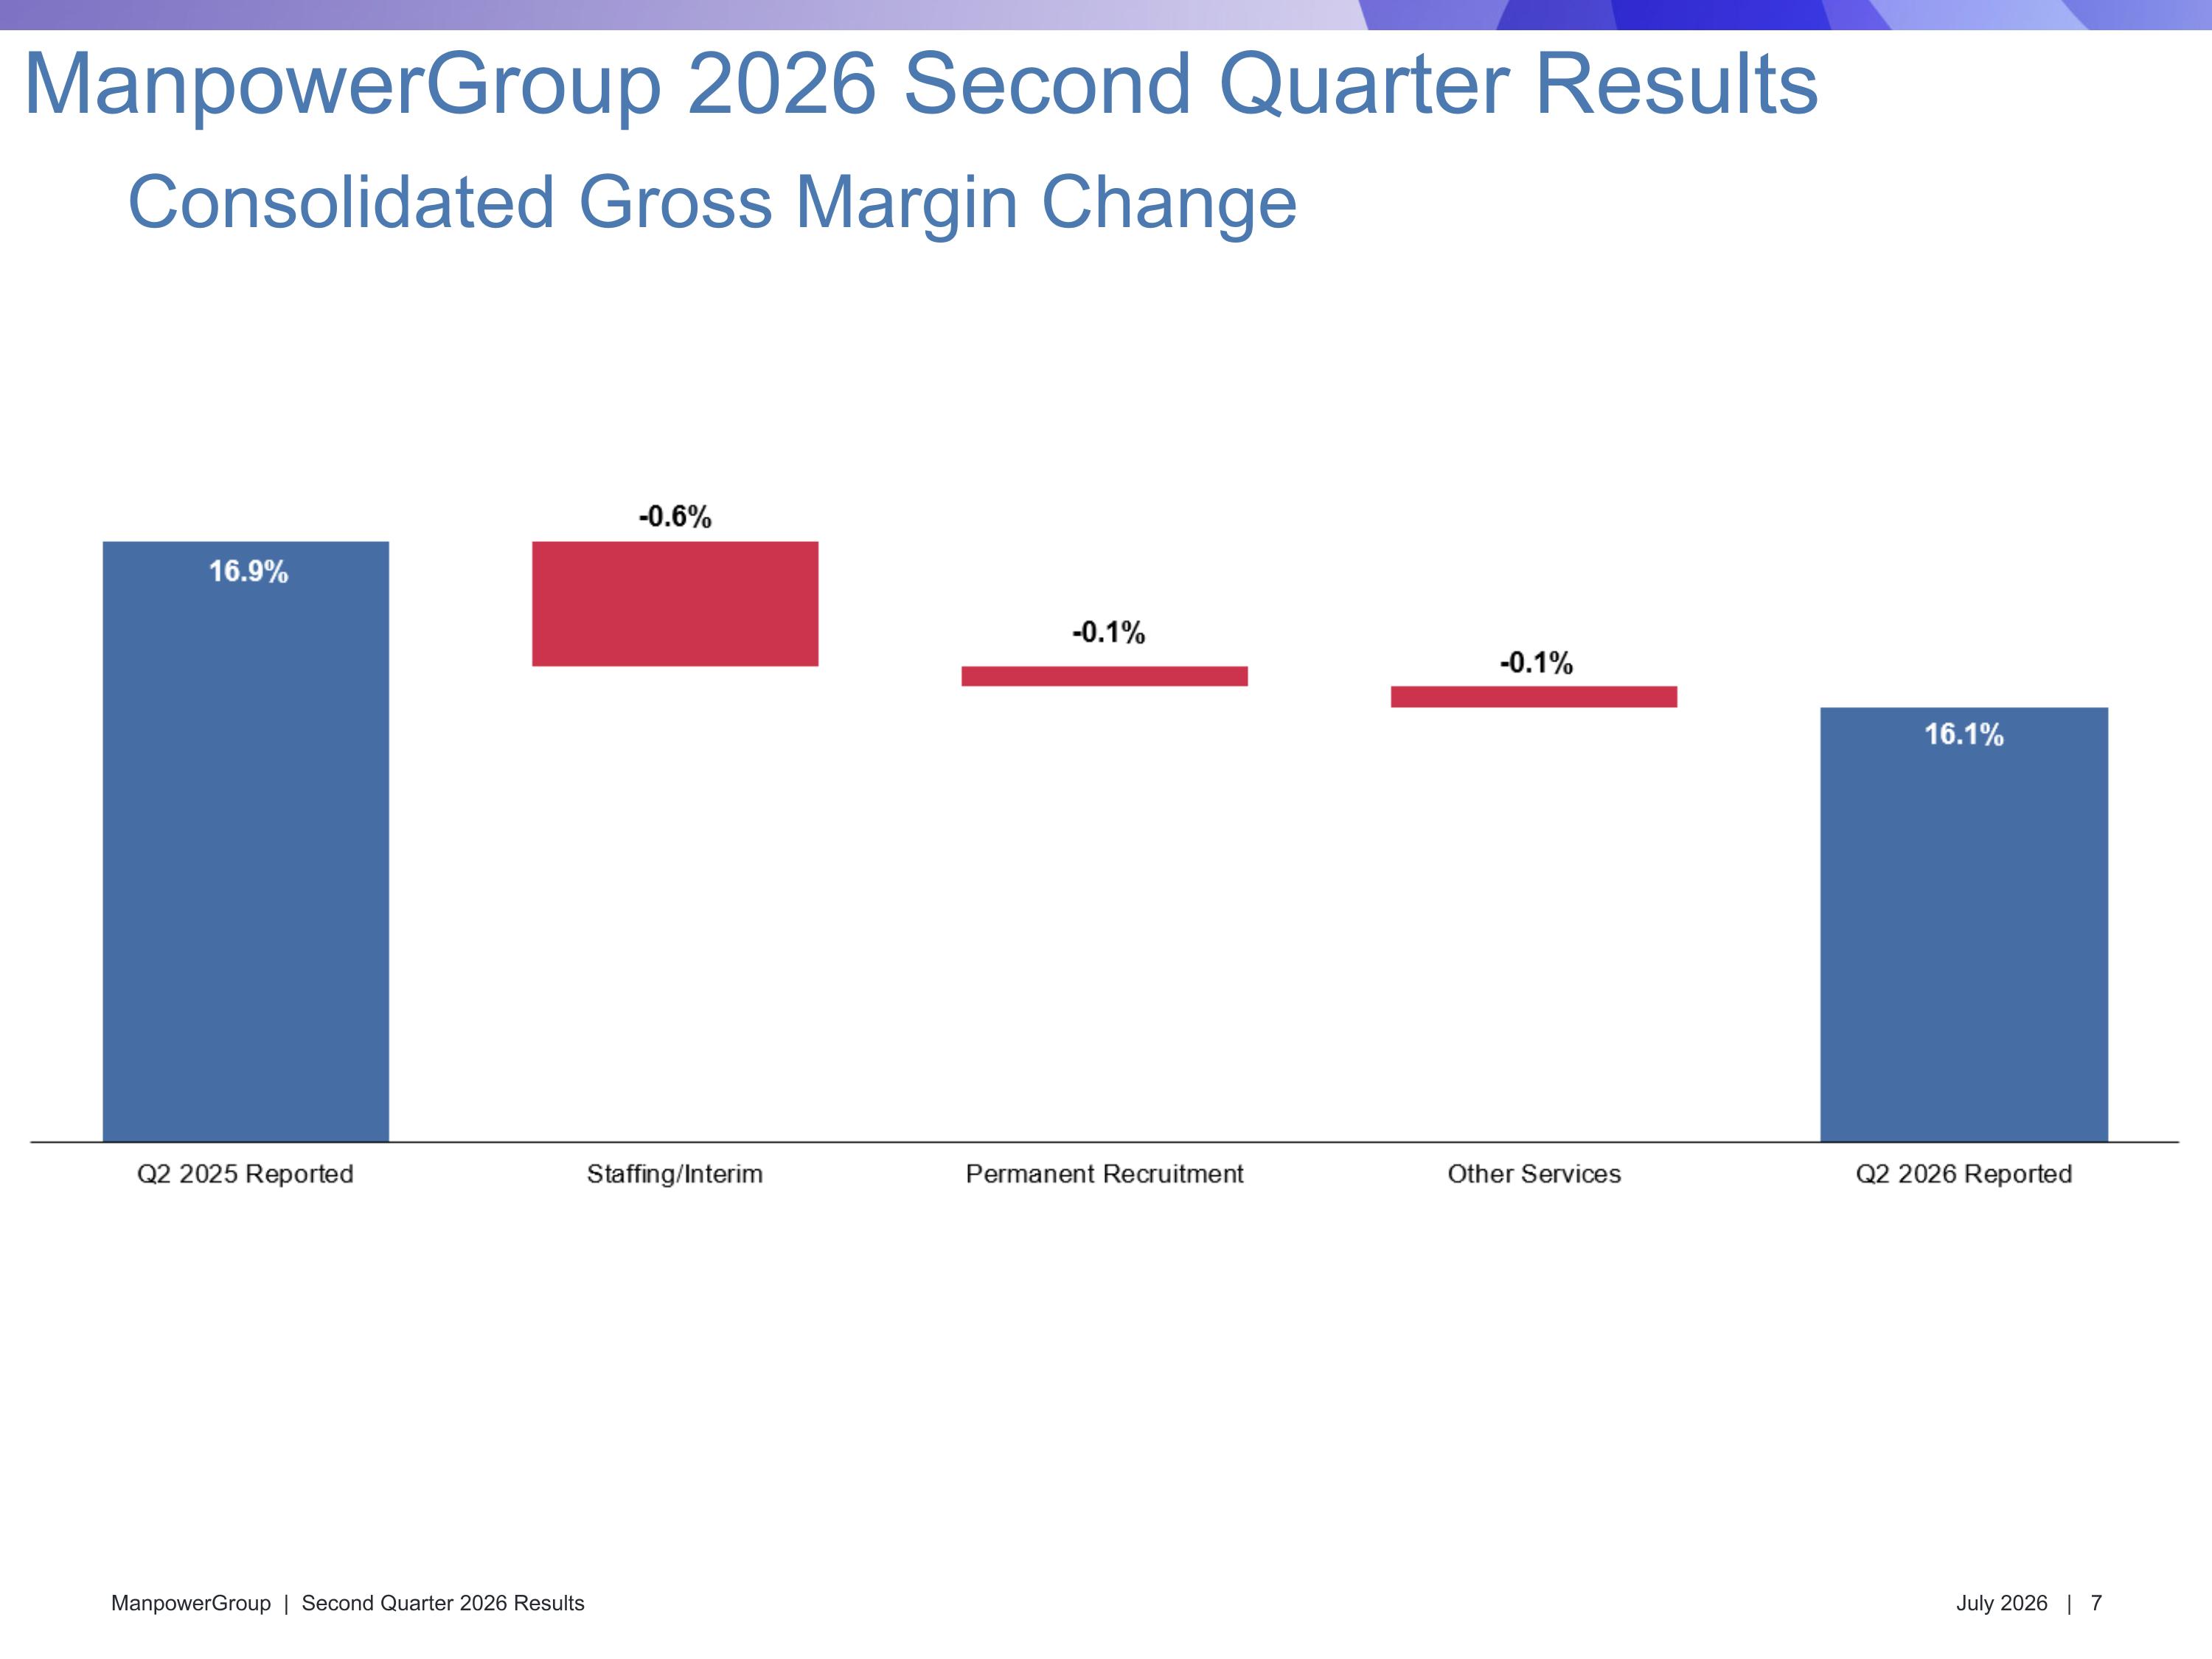
Consolidated Gross Margin Change ManpowerGroup 2026 Second Quarter Results
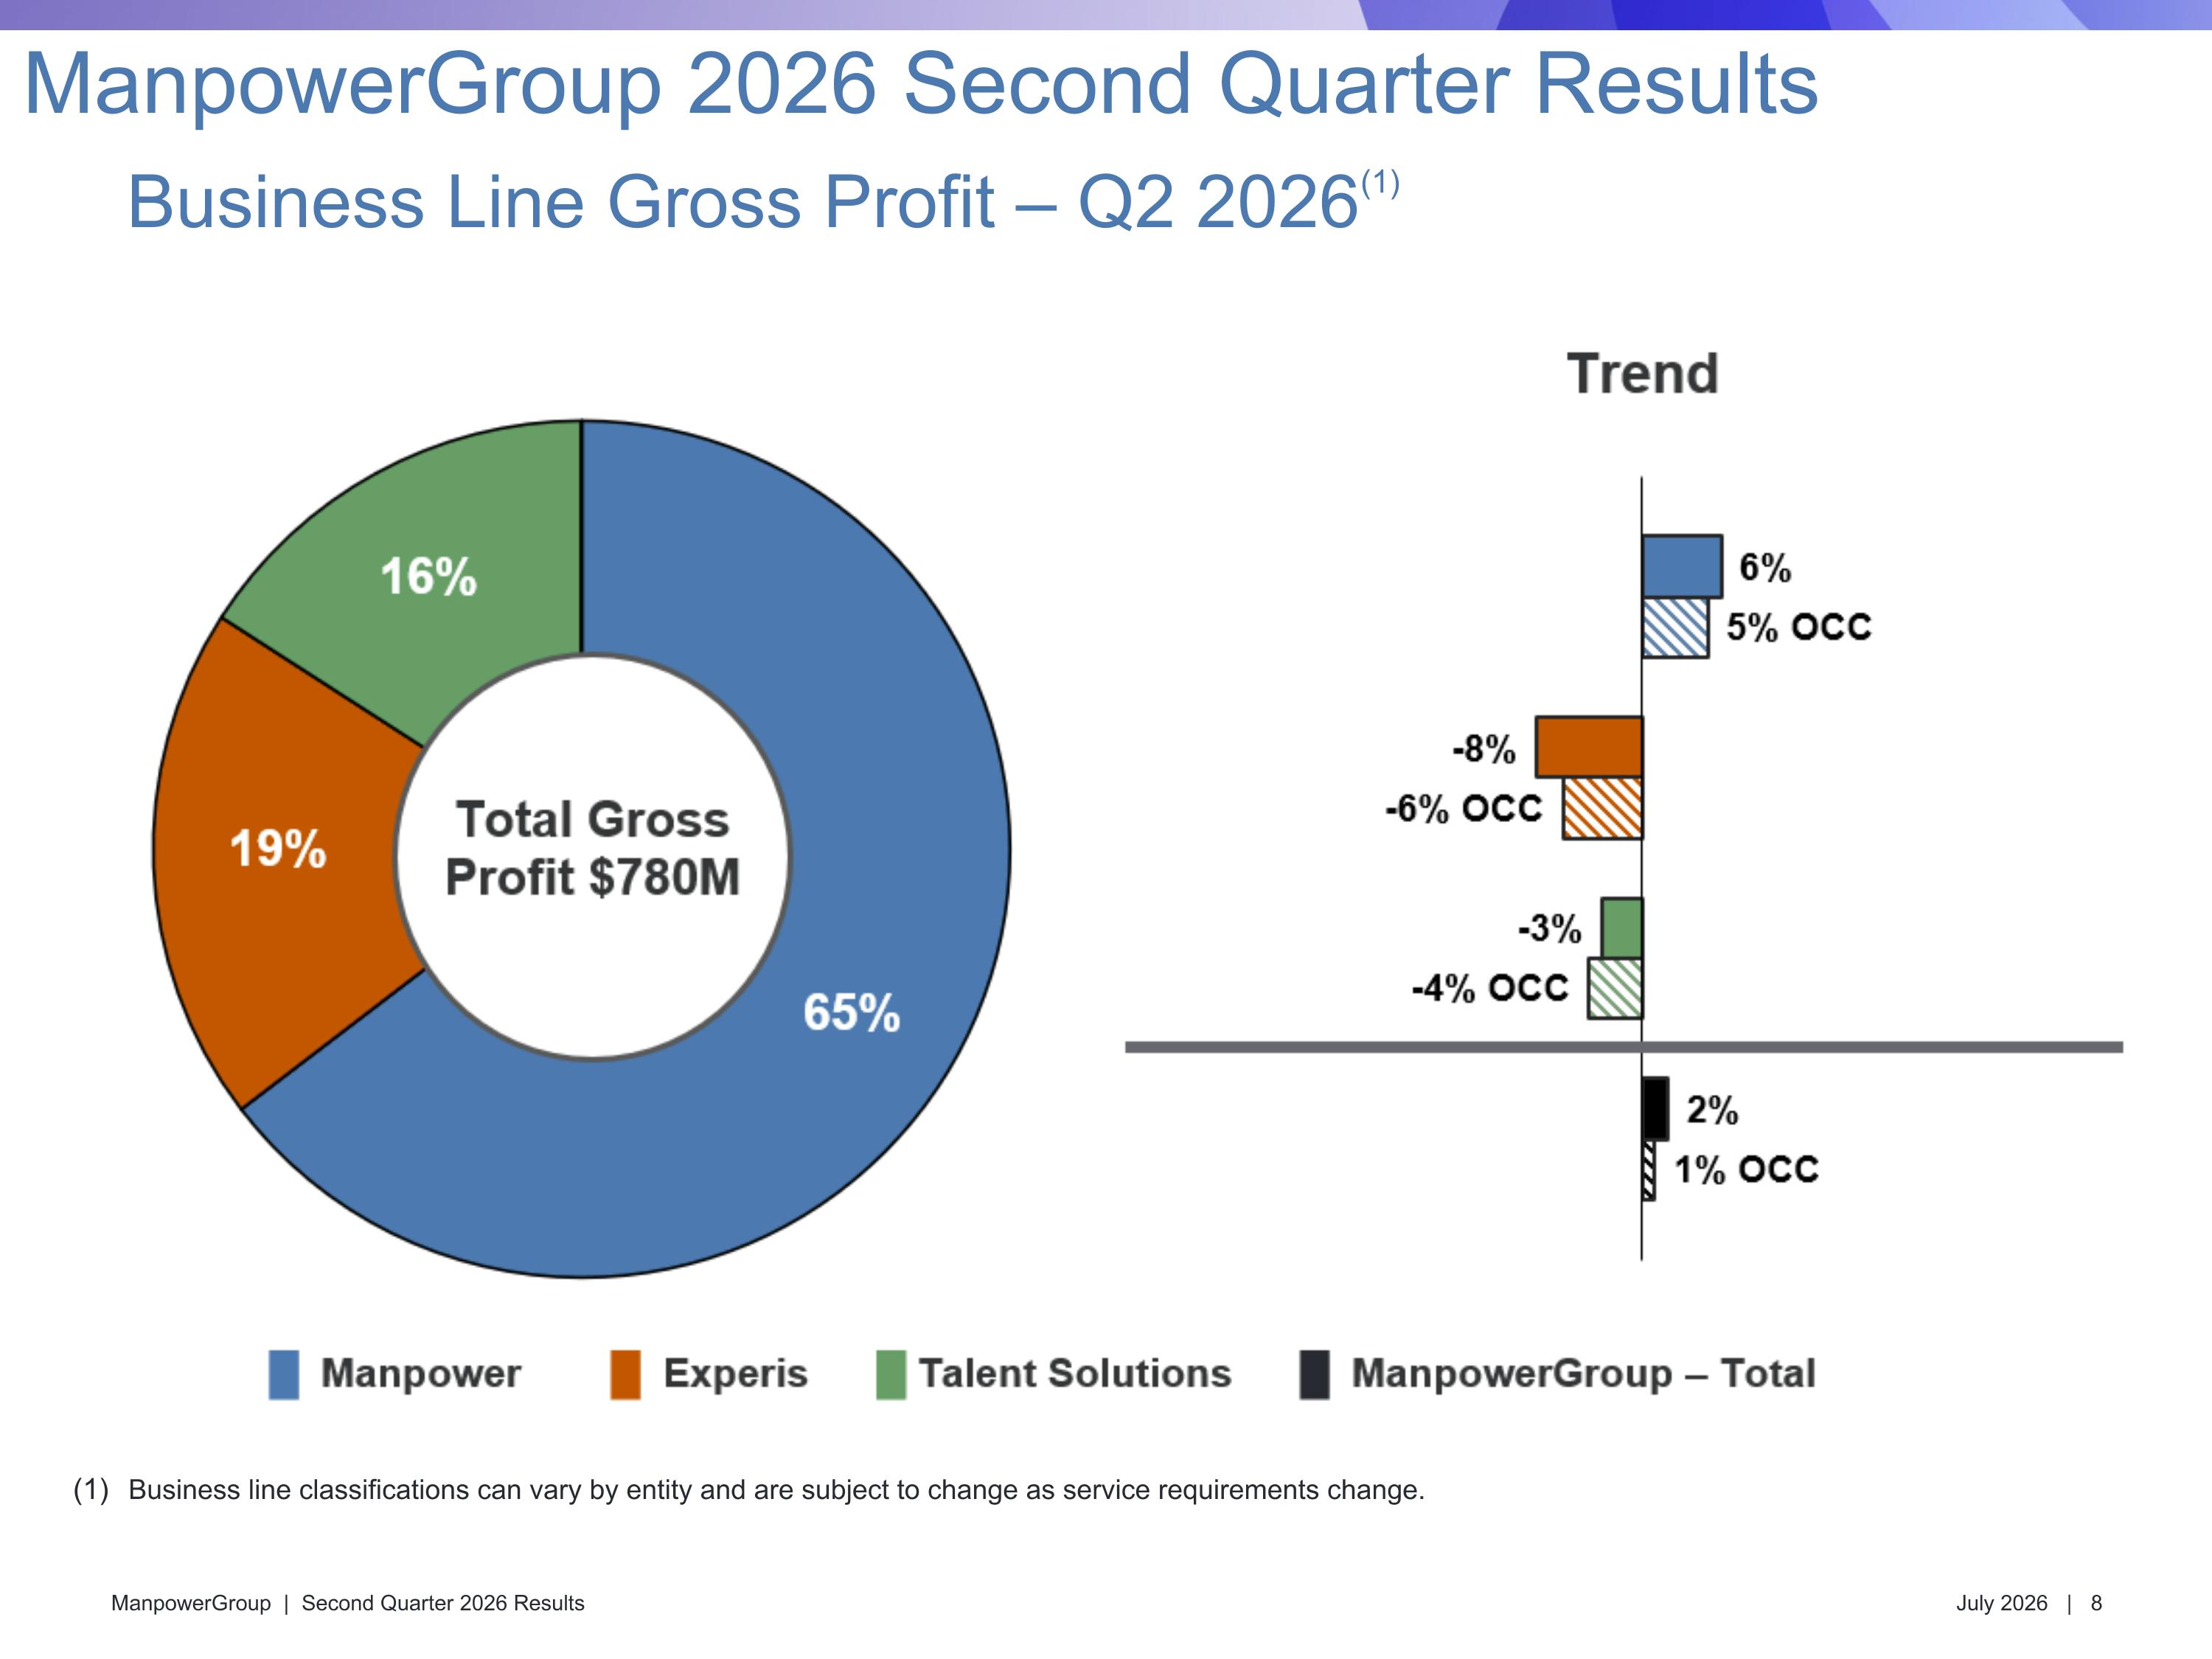
Business line classifications can vary by entity and are subject to change as service requirements change. Business Line Gross Profit – Q2 2026(1) ManpowerGroup 2026 Second Quarter Results
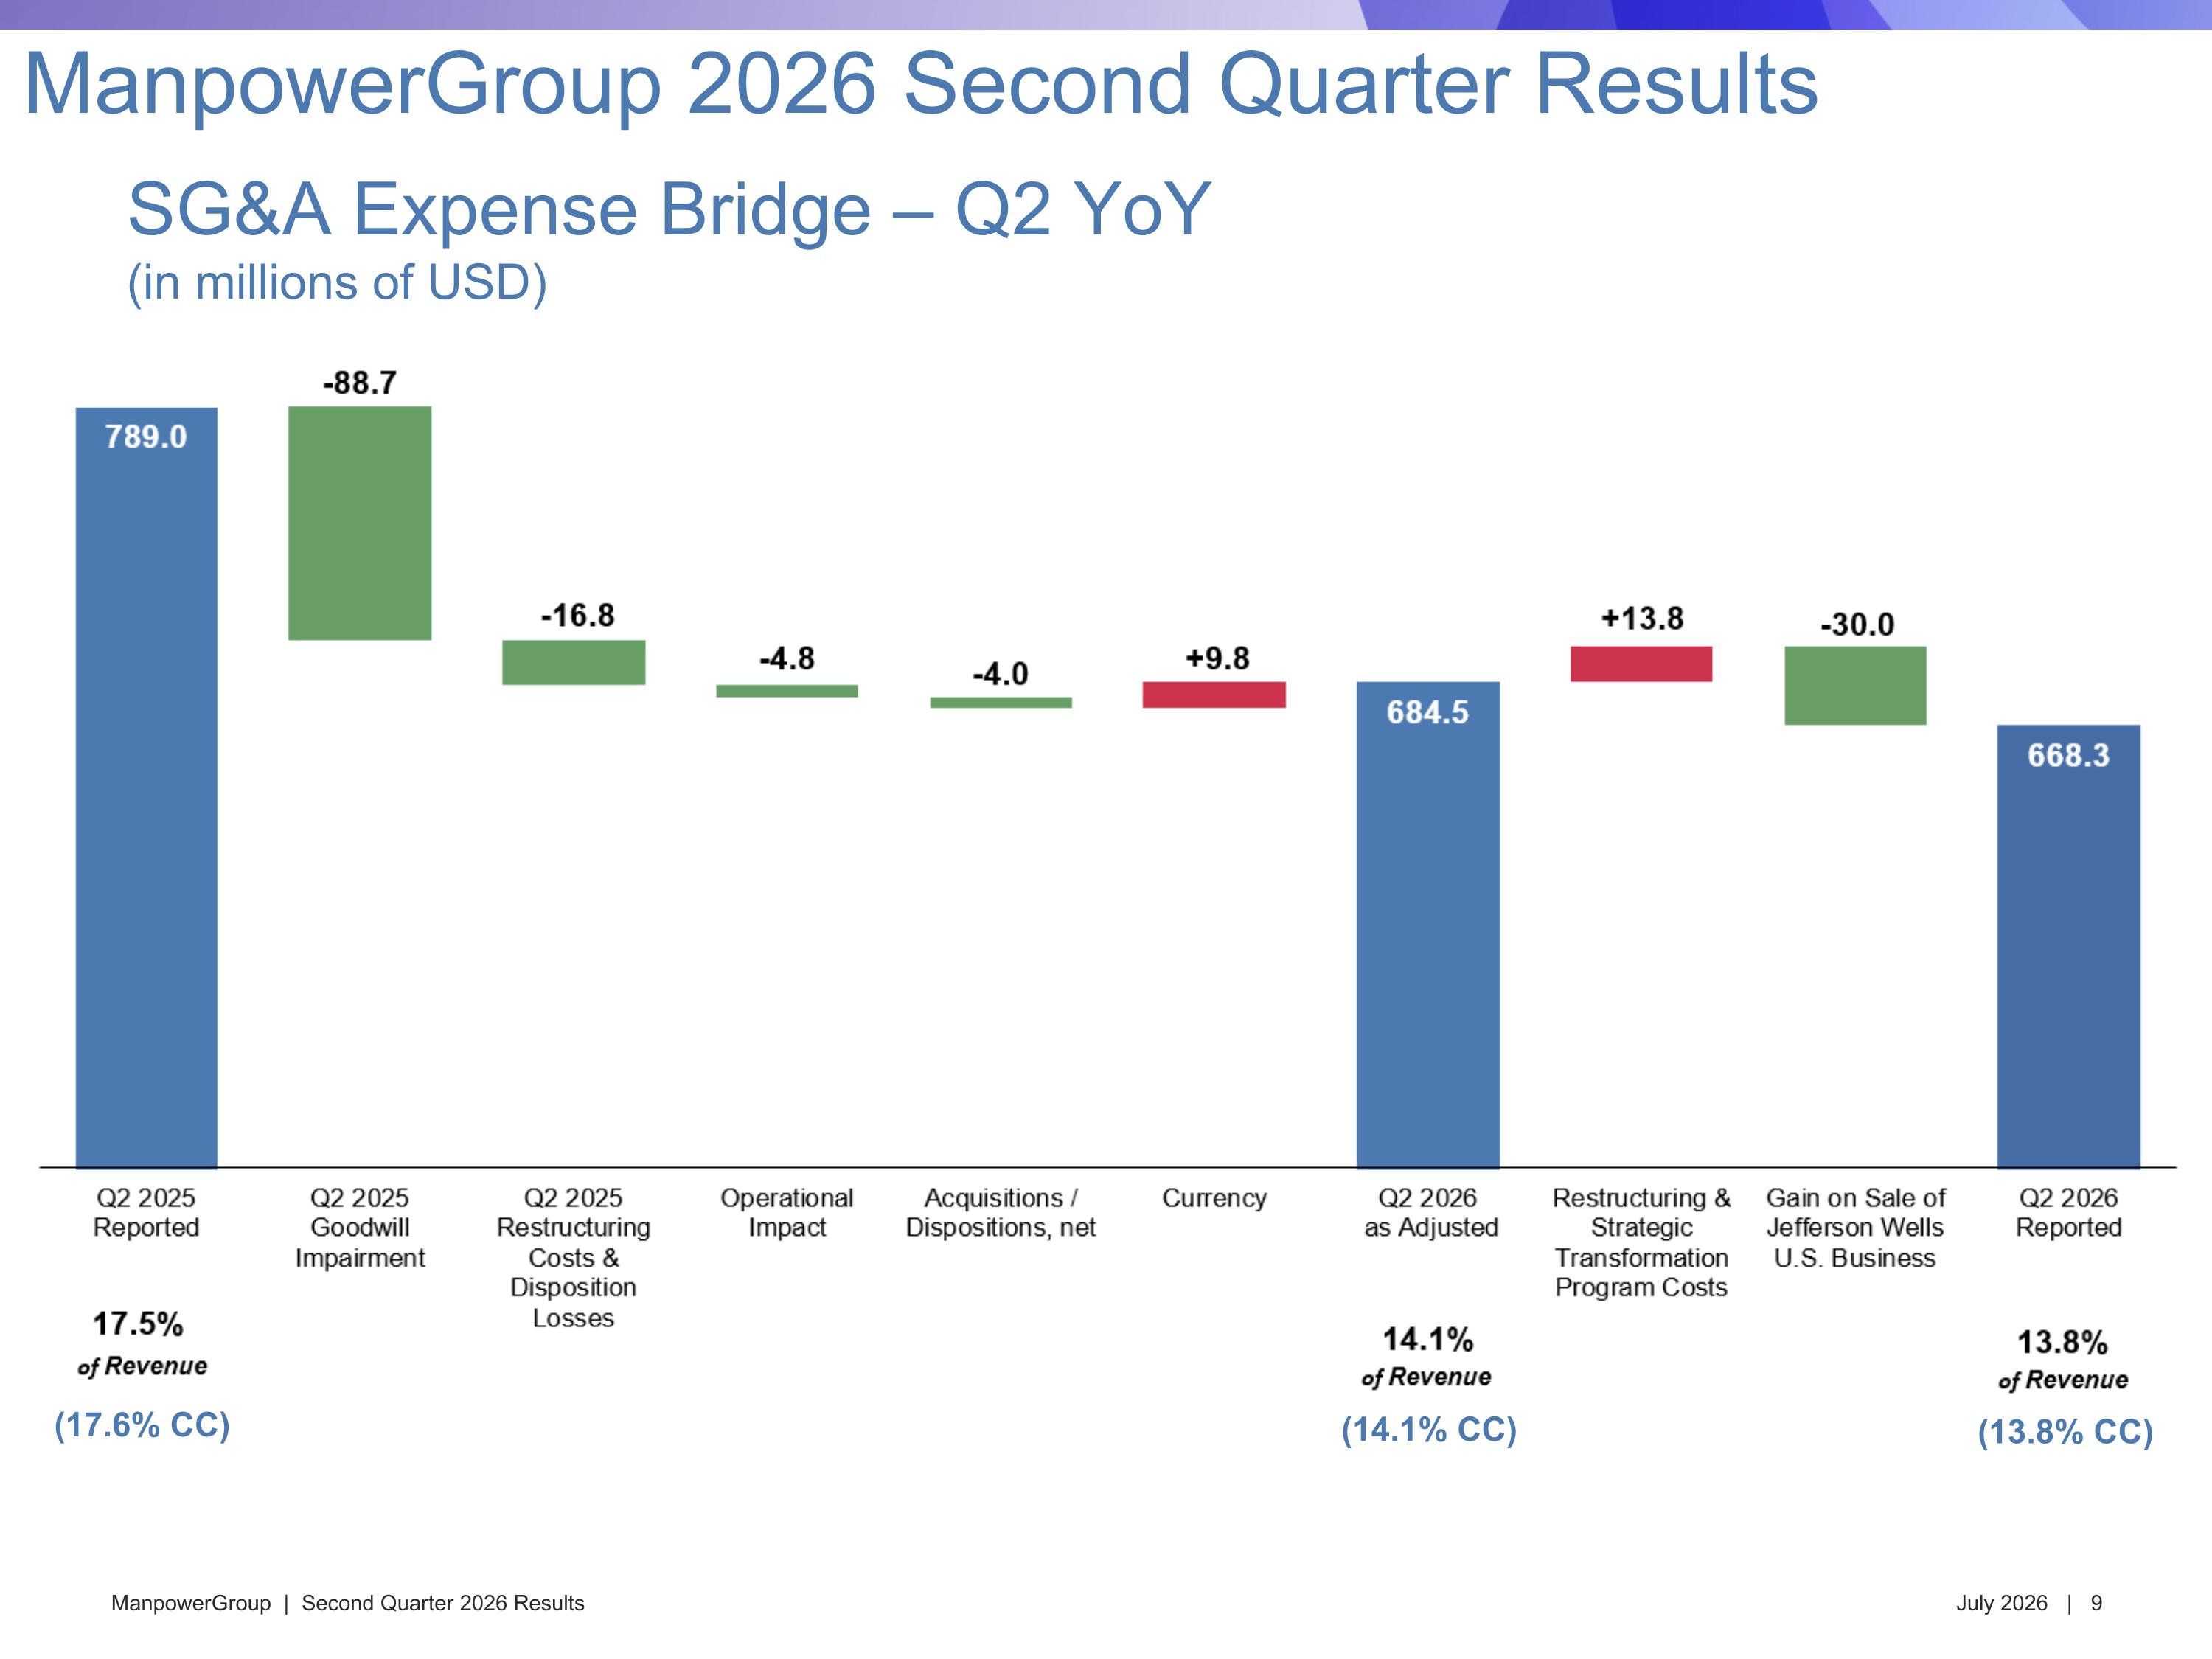
(13.8% CC) (17.6% CC) SG&A Expense Bridge – Q2 YoY (in millions of USD) ManpowerGroup 2026 Second Quarter Results (14.1% CC)
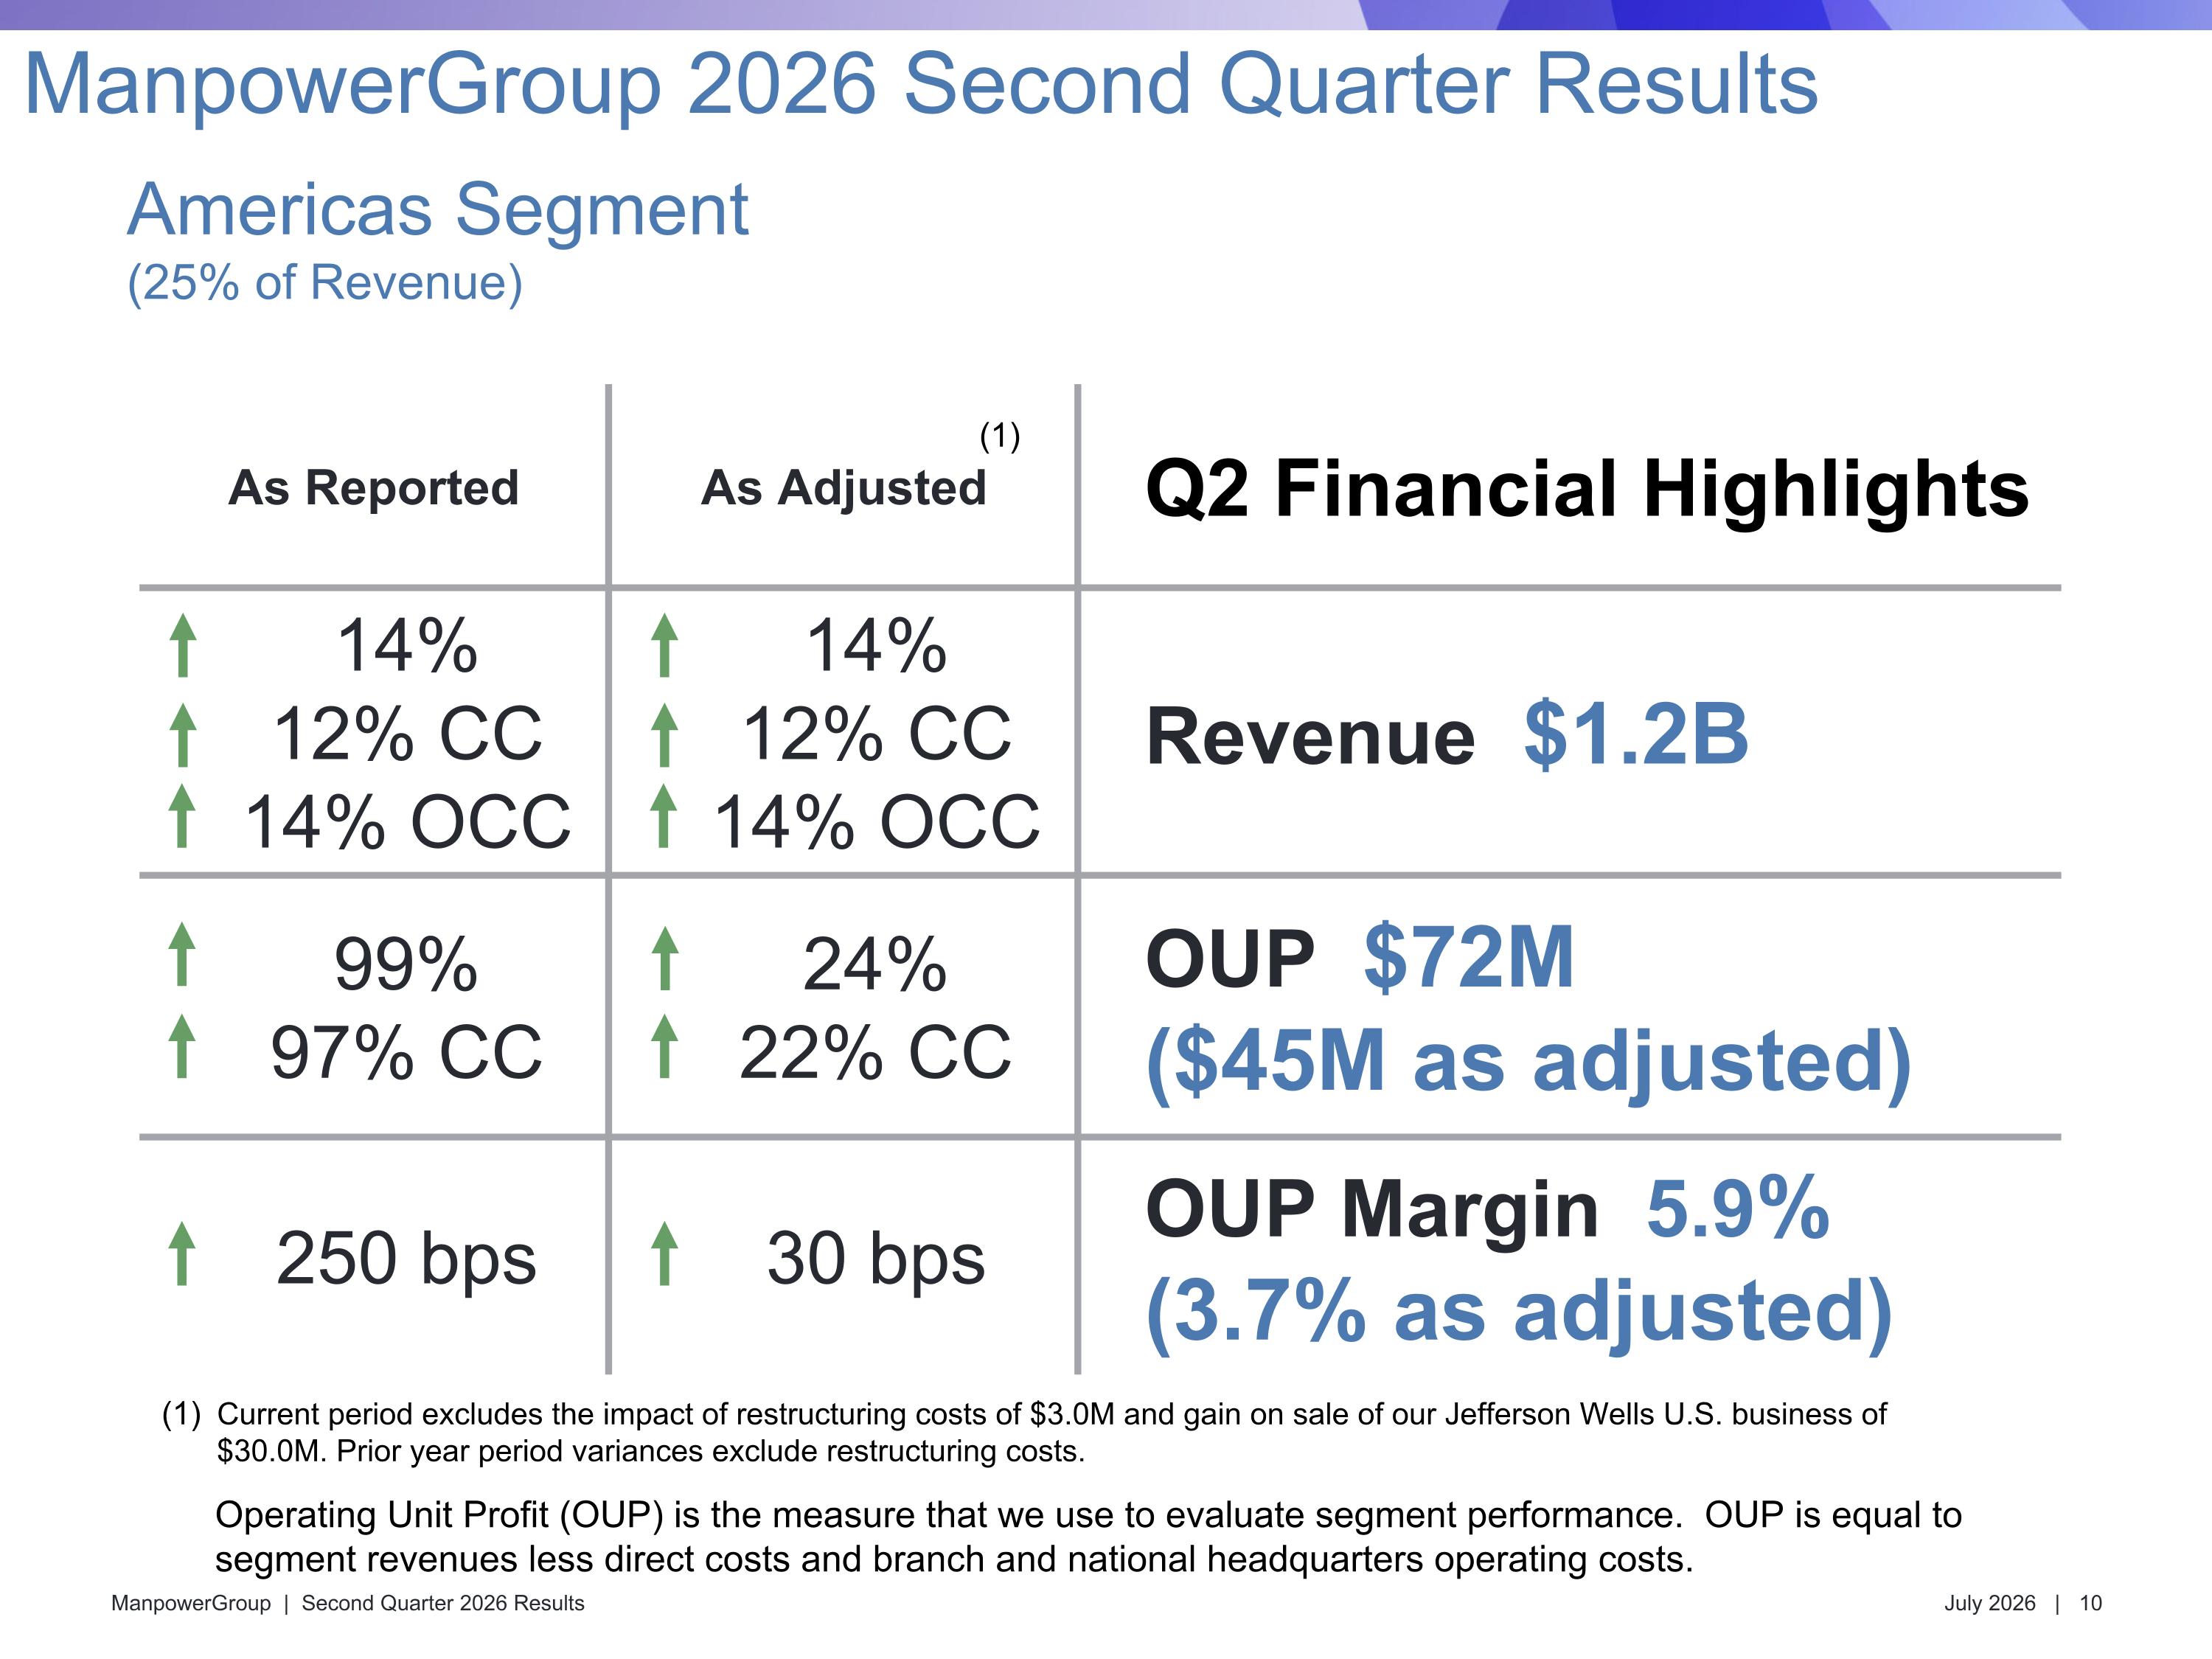
As Reported As Adjusted Q2 Financial Highlights 14% 12% CC 14% OCC 14% 12% CC 14% OCC Revenue $1.2B 99% 97% CC 24% 22% CC OUP $72M ($45M as adjusted) 250 bps 30 bps OUP Margin 5.9% (3.7% as adjusted) Americas Segment (25% of Revenue) ManpowerGroup 2026 Second Quarter Results Operating Unit Profit (OUP) is the measure that we use to evaluate segment performance. OUP is equal to segment revenues less direct costs and branch and national headquarters operating costs. Current period excludes the impact of restructuring costs of $3.0M and gain on sale of our Jefferson Wells U.S. business of $30.0M. Prior year period variances exclude restructuring costs. (1)
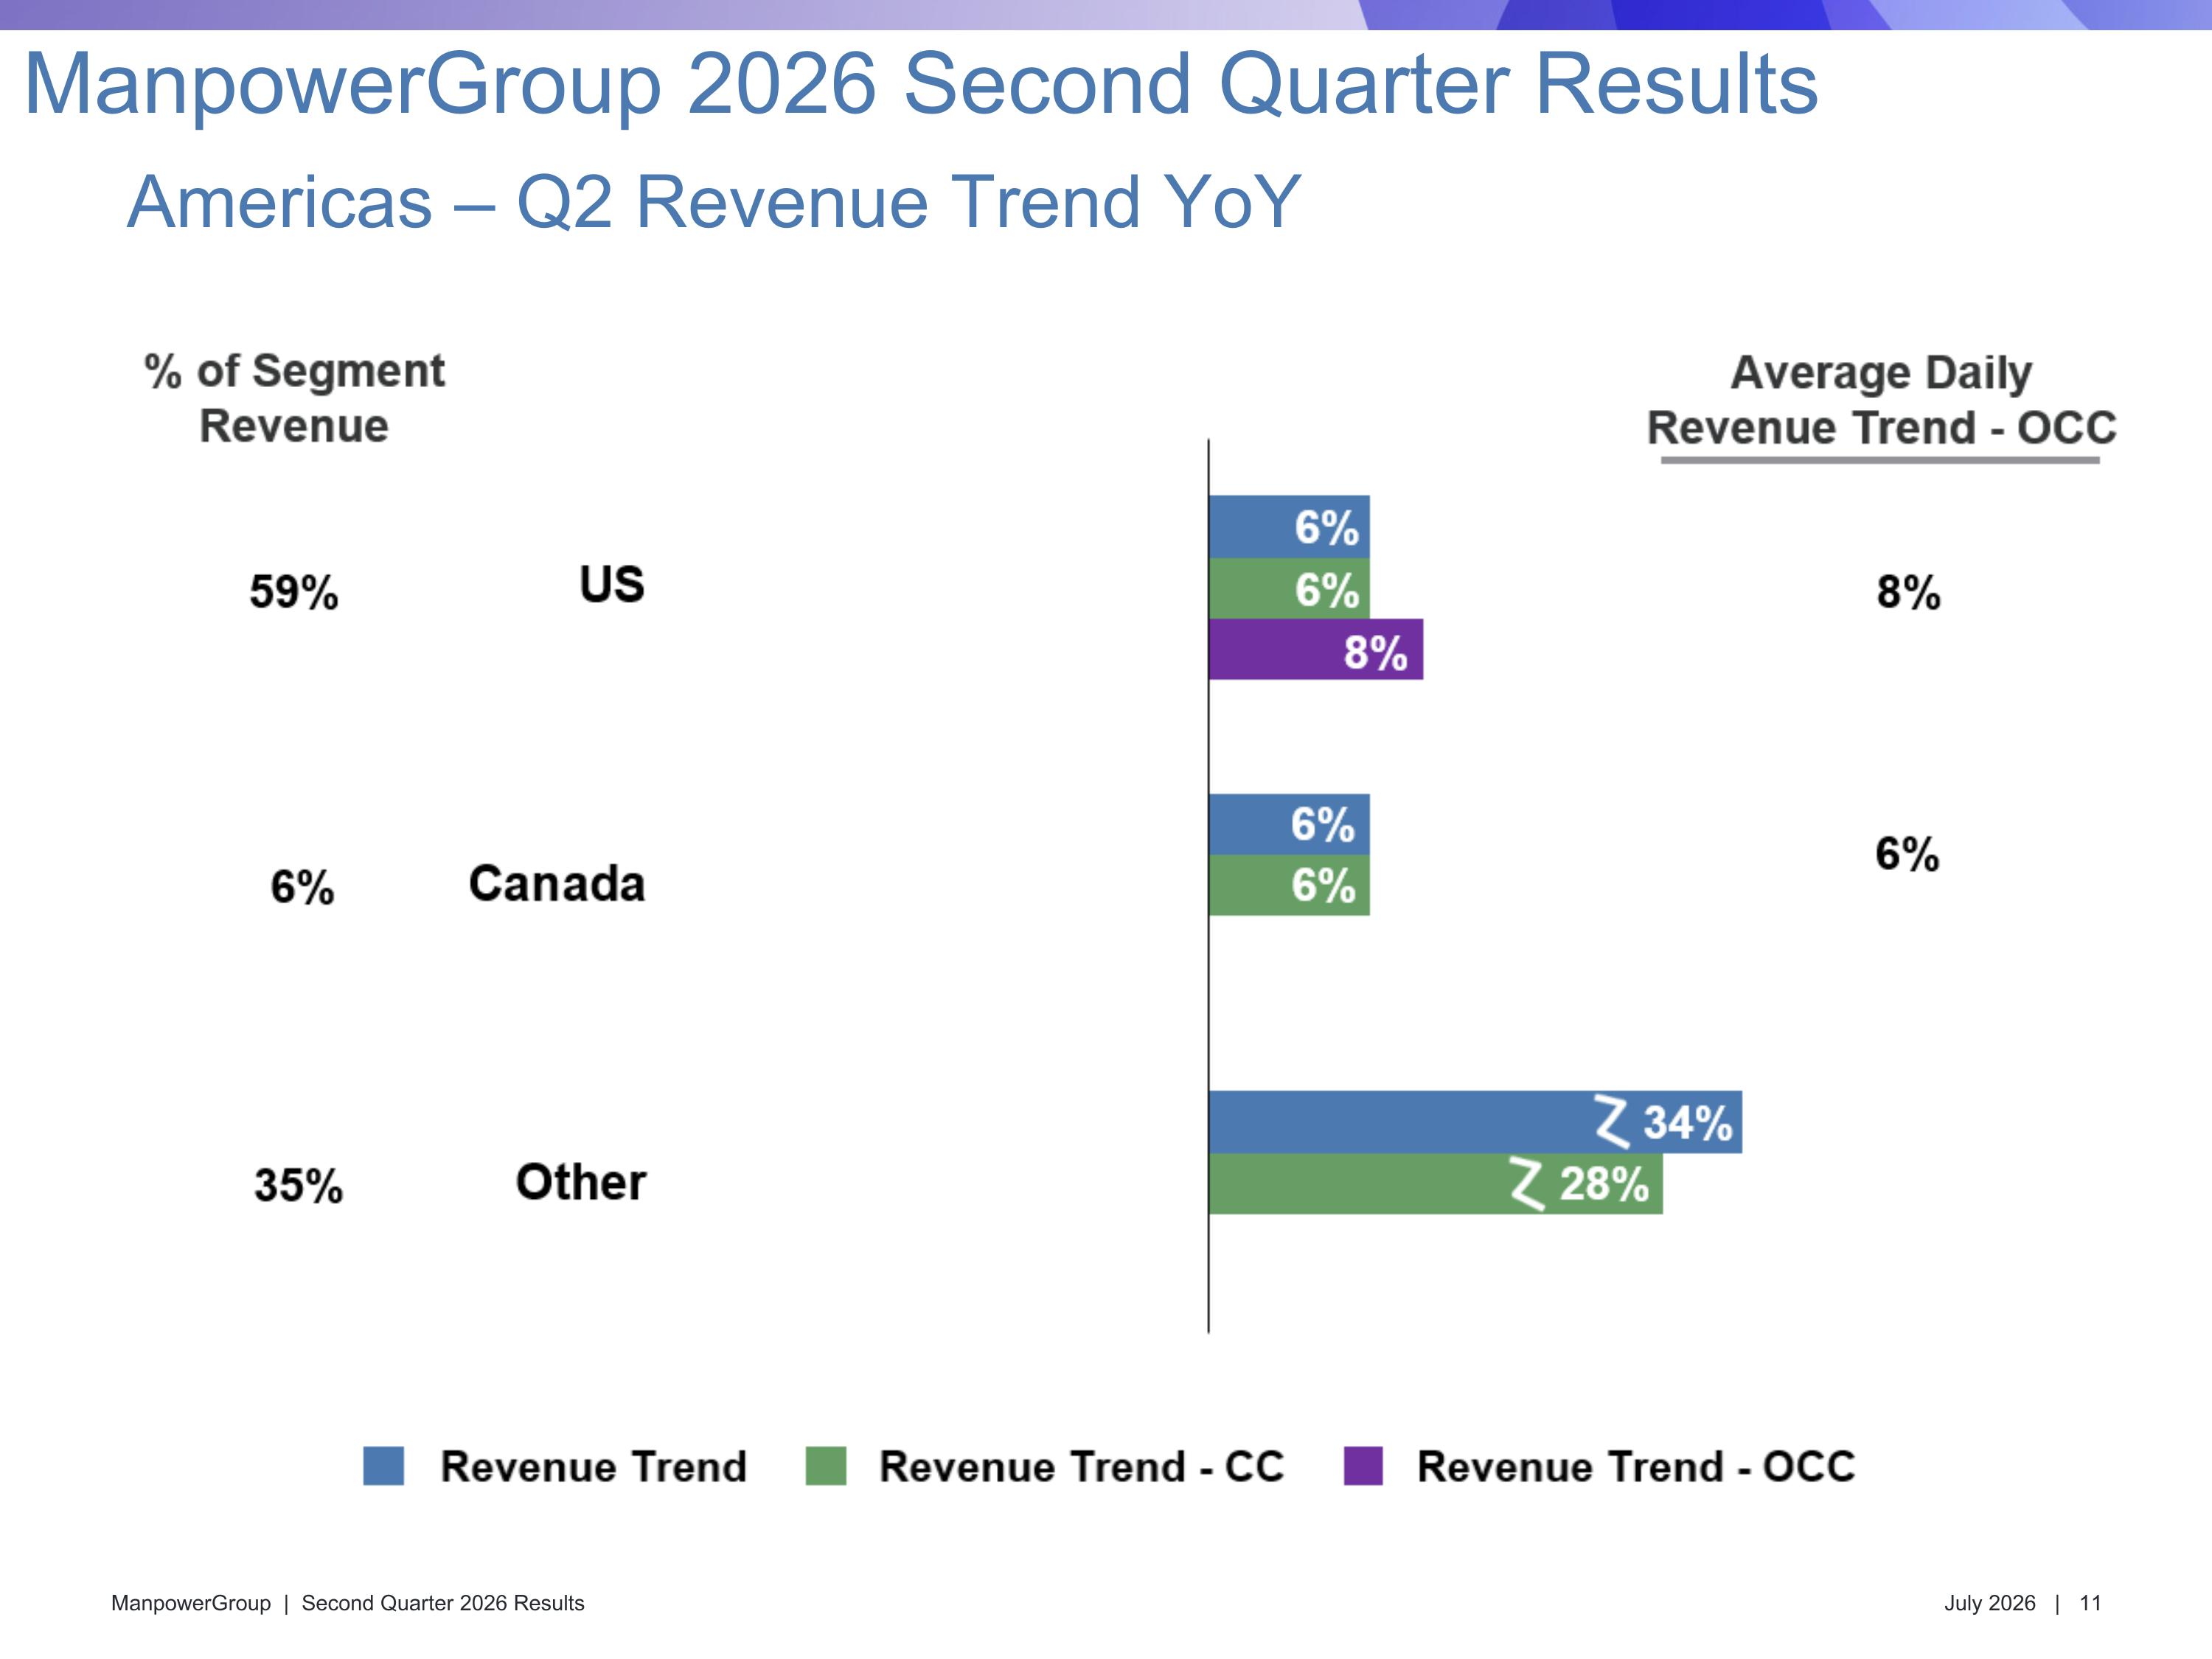
Americas – Q2 Revenue Trend YoY ManpowerGroup 2026 Second Quarter Results
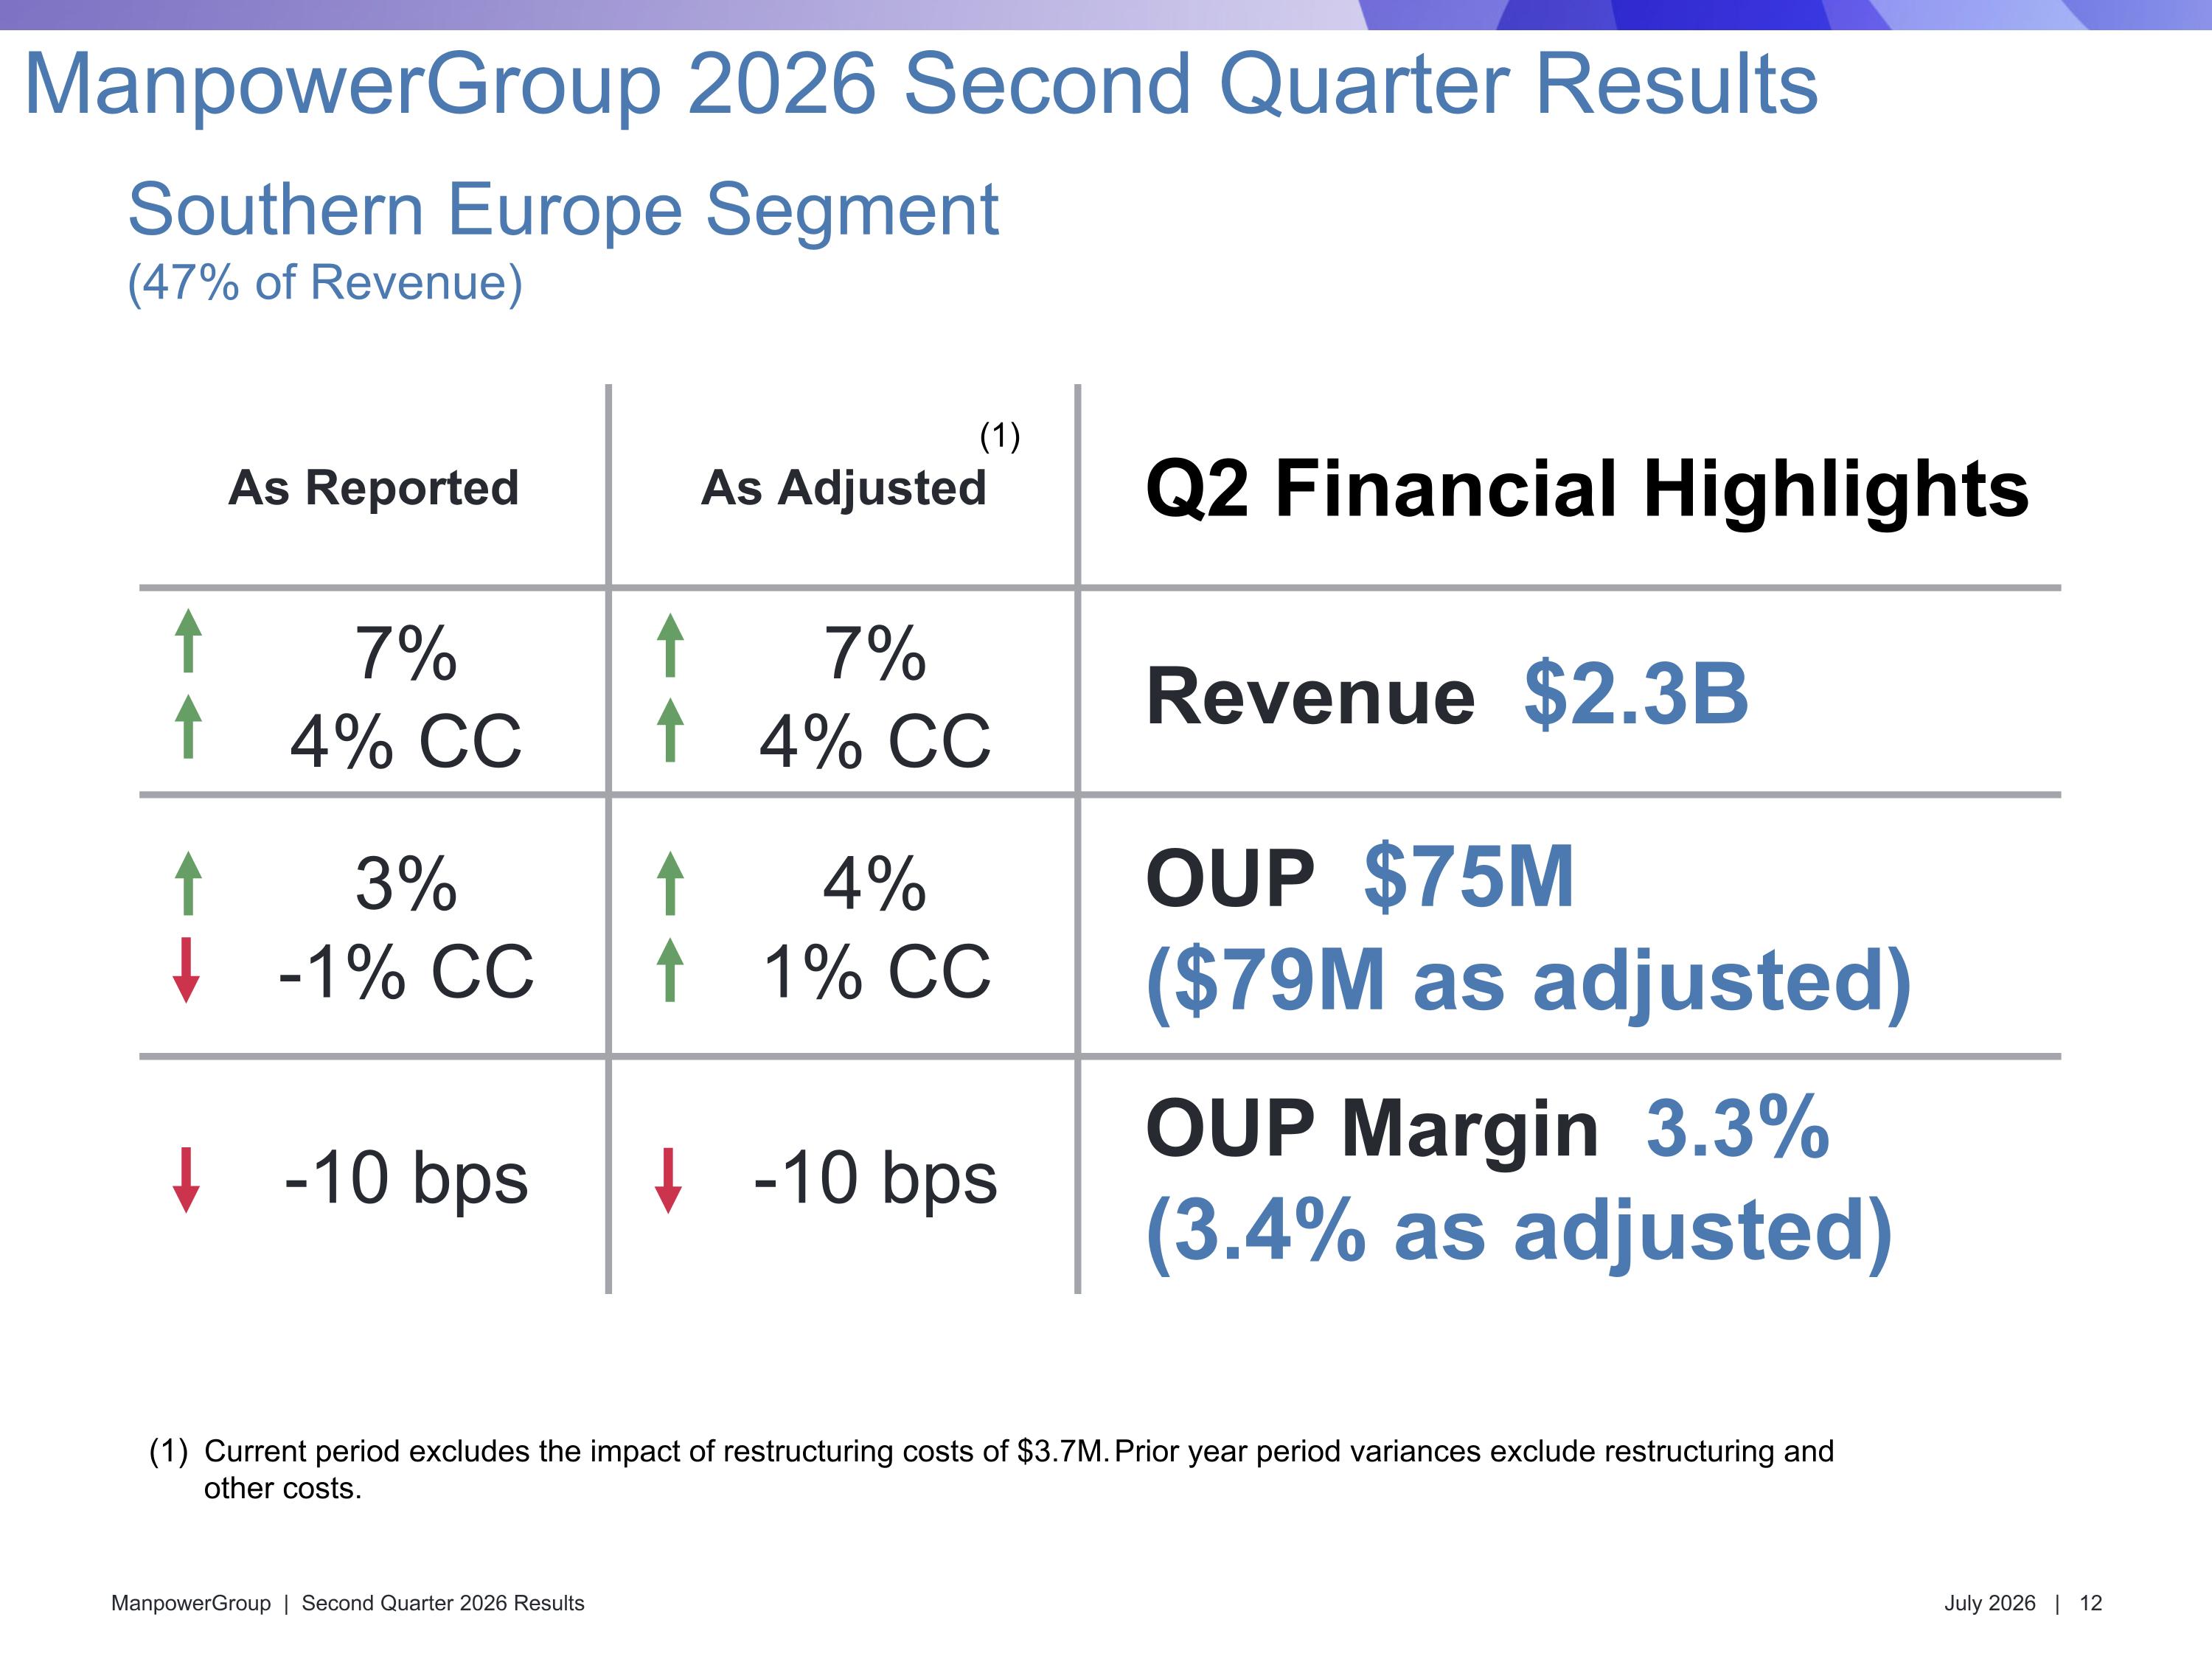
As Reported As Adjusted Q2 Financial Highlights 7% 4% CC 7% 4% CC Revenue $2.3B 3% -1% CC 4% 1% CC OUP $75M ($79M as adjusted) -10 bps -10 bps OUP Margin 3.3% (3.4% as adjusted) Southern Europe Segment (47% of Revenue) ManpowerGroup 2026 Second Quarter Results (1) Current period excludes the impact of restructuring costs of $3.7M. Prior year period variances exclude restructuring and other costs.
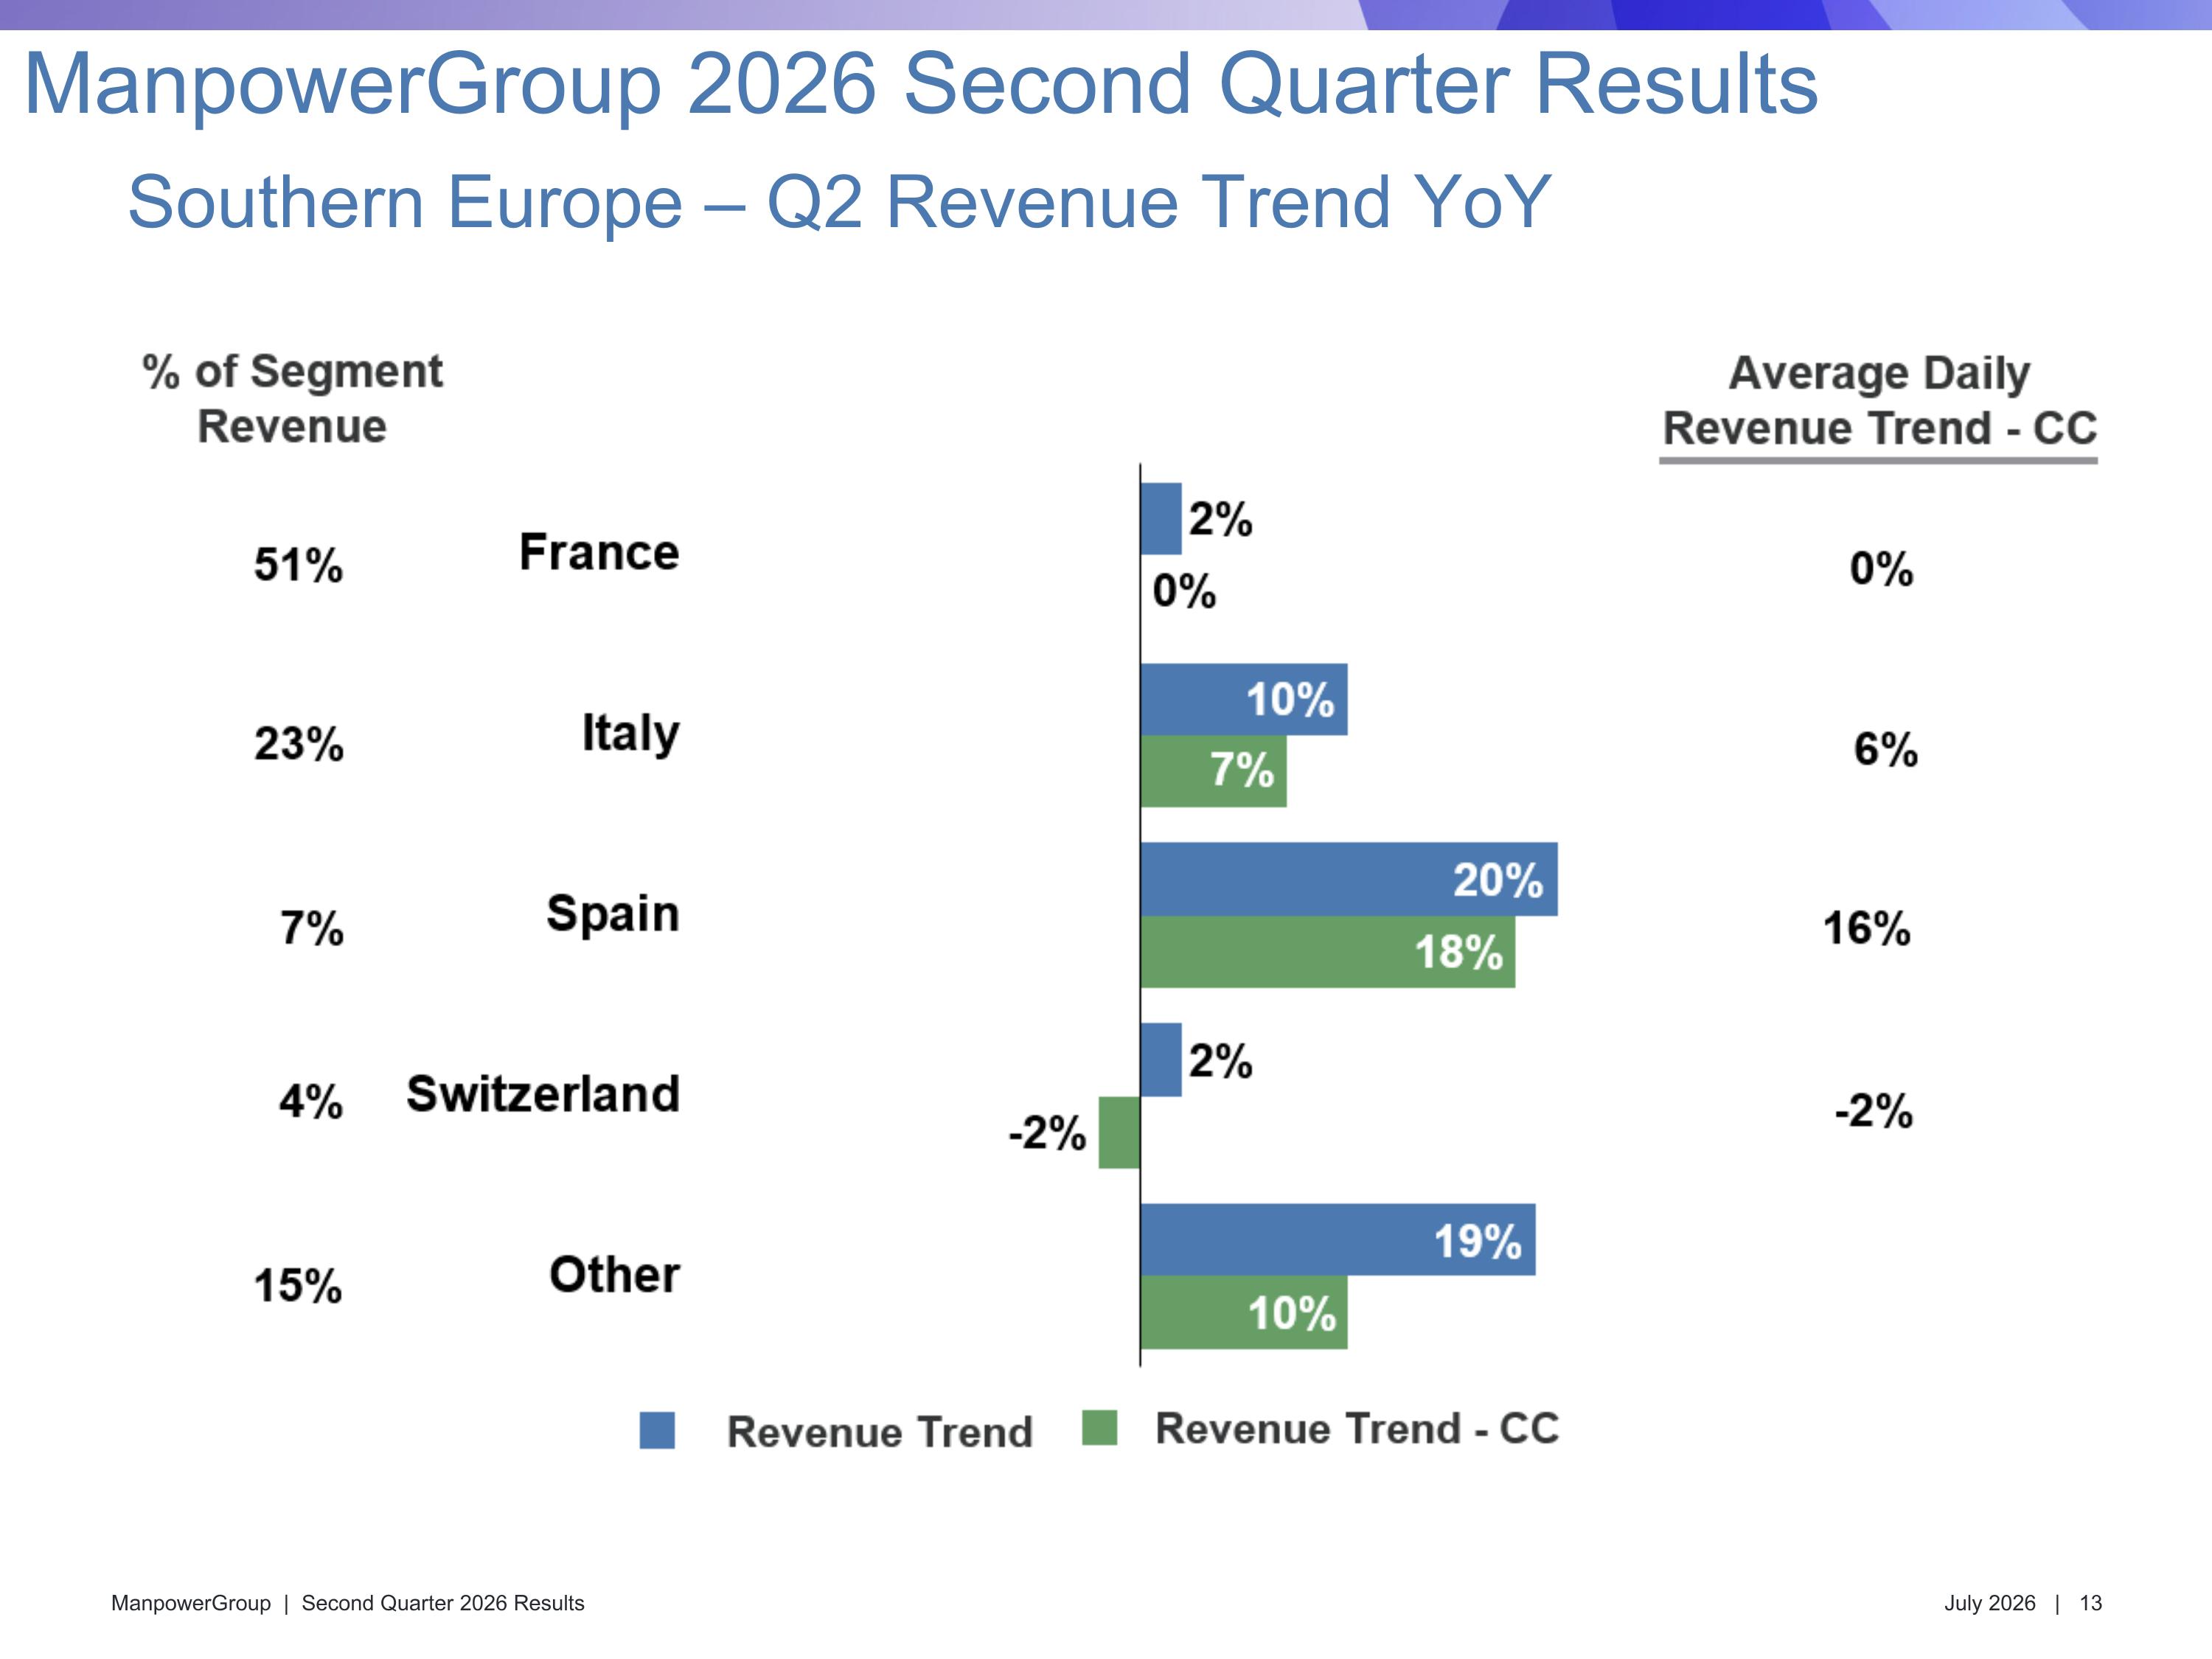
Southern Europe – Q2 Revenue Trend YoY ManpowerGroup 2026 Second Quarter Results
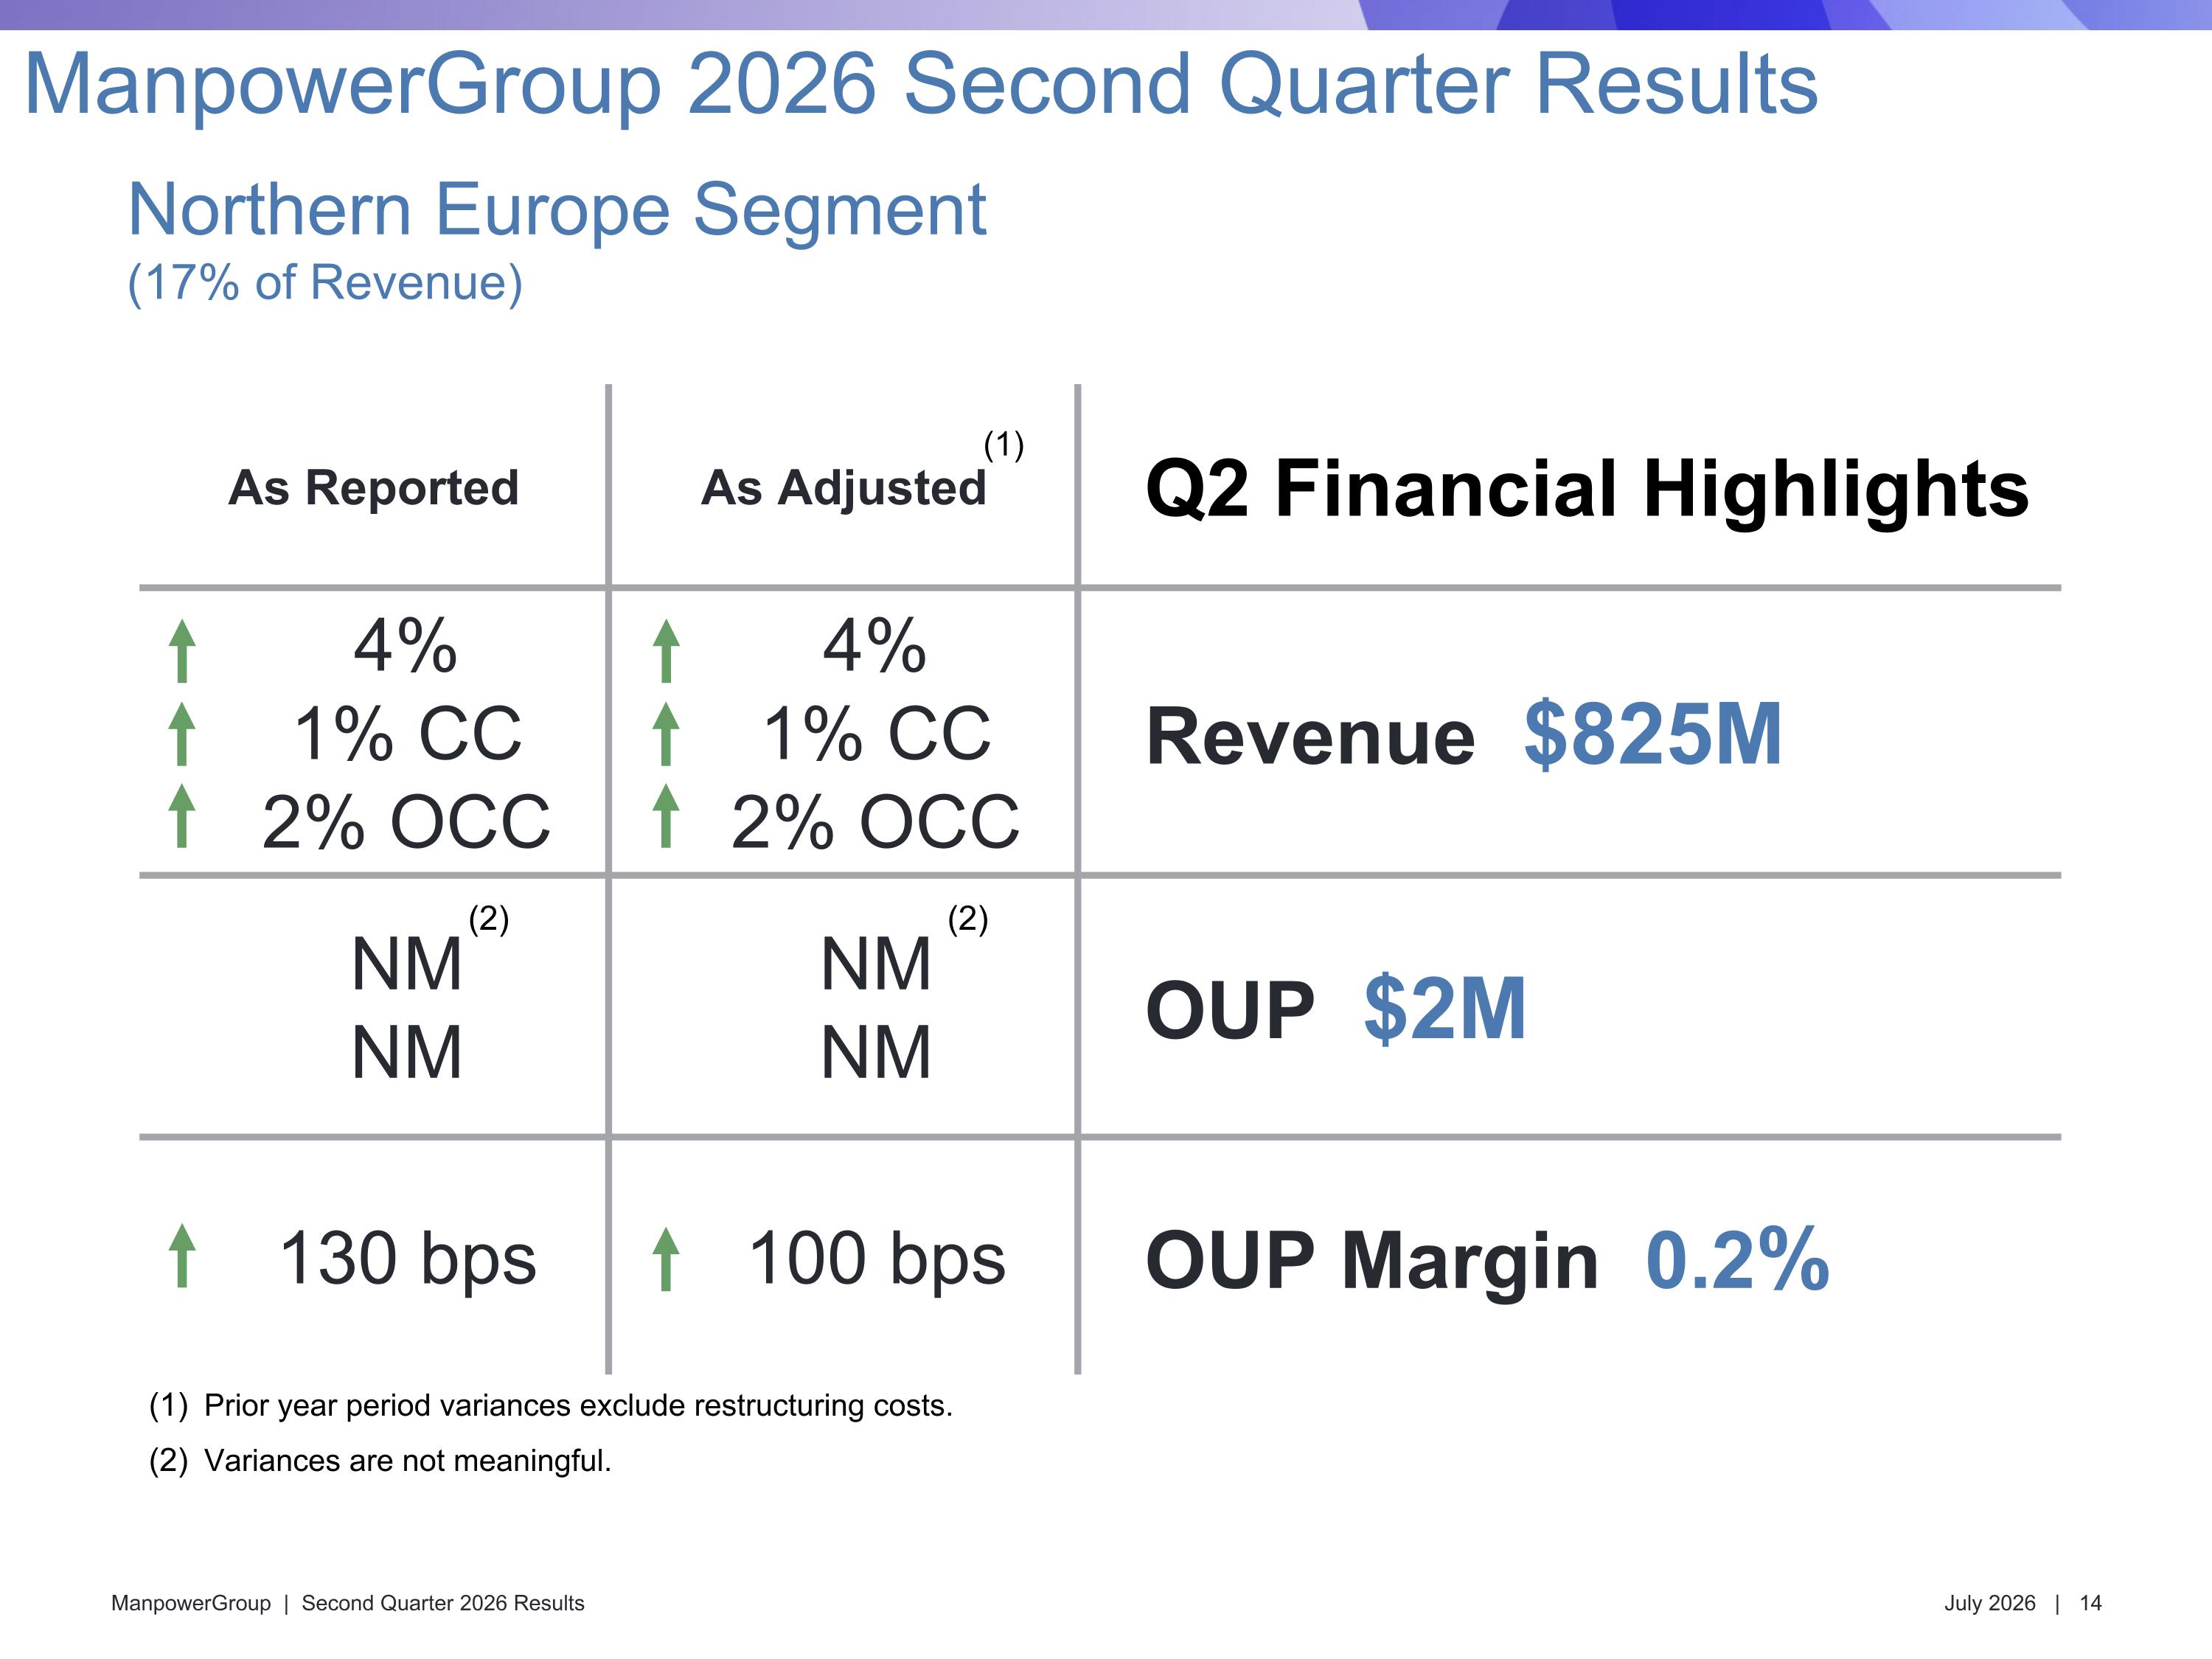
As Reported As Adjusted Q2 Financial Highlights 4% 1% CC 2% OCC 4% 1% CC 2% OCC Revenue $825M NM NM NM NM OUP $2M 130 bps 100 bps OUP Margin 0.2% Northern Europe Segment (17% of Revenue) ManpowerGroup 2026 Second Quarter Results (1) Prior year period variances exclude restructuring costs. Variances are not meaningful. (2) (2)
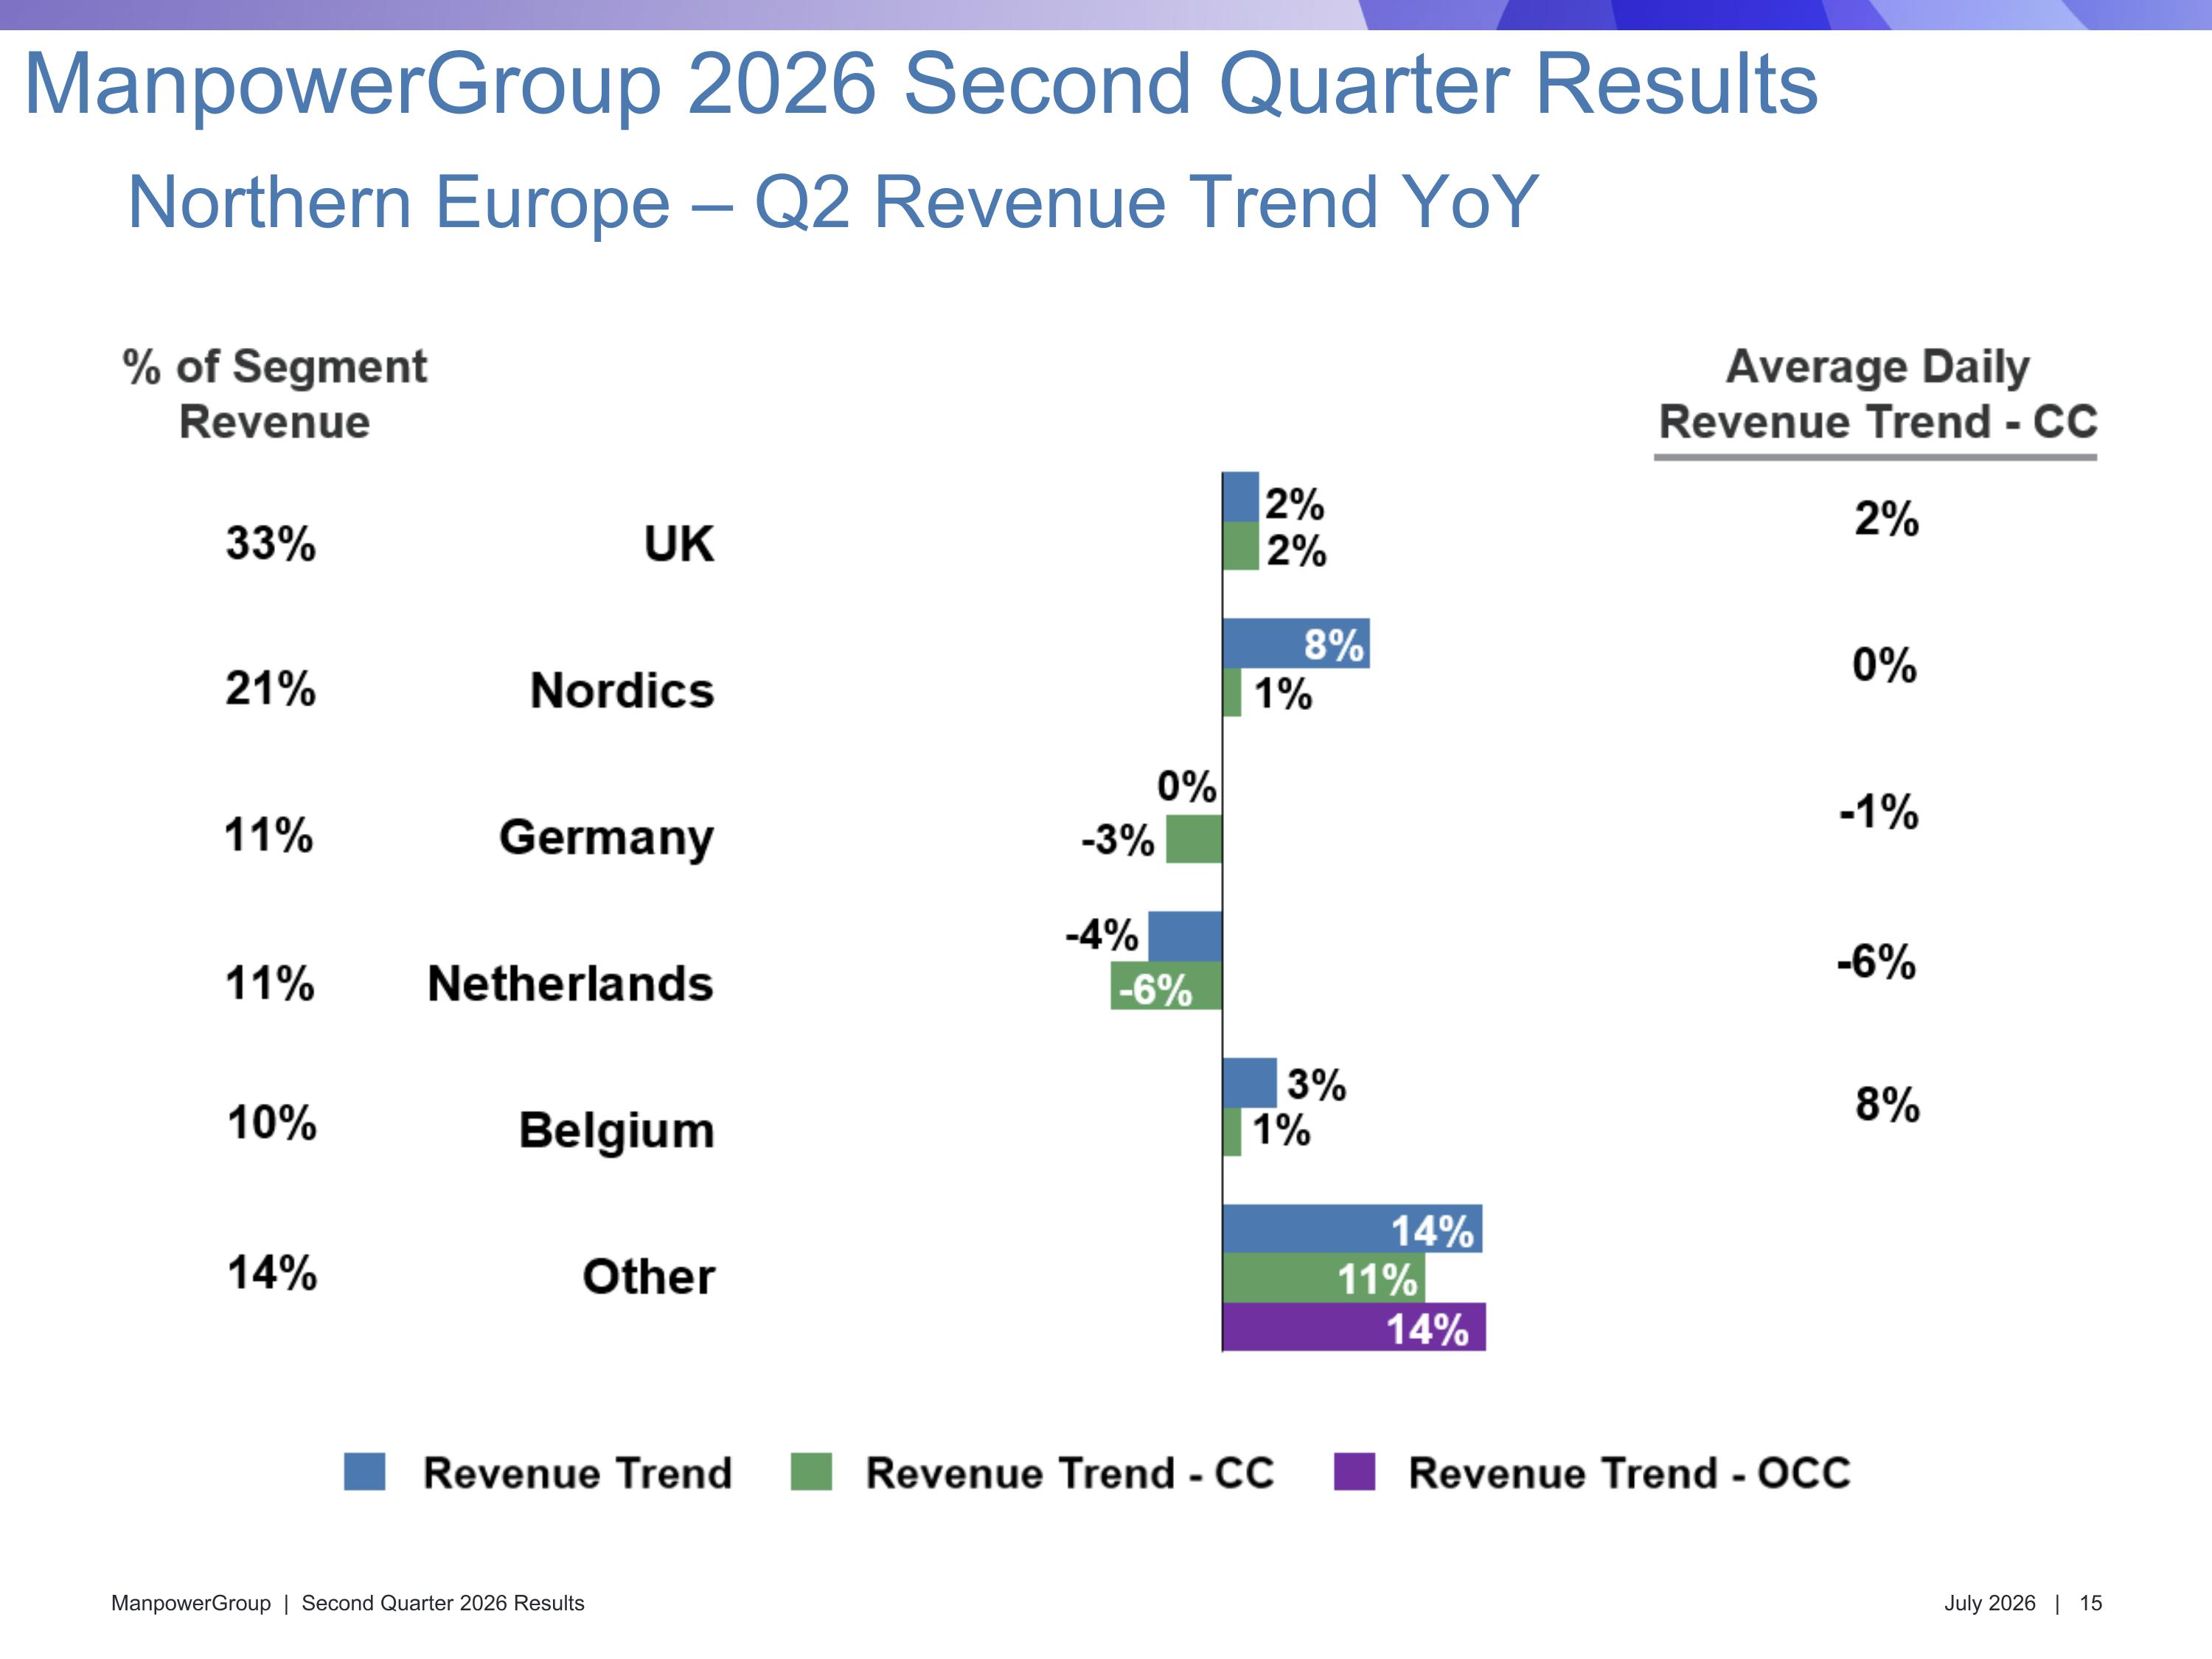
Northern Europe – Q2 Revenue Trend YoY ManpowerGroup 2026 Second Quarter Results -28%
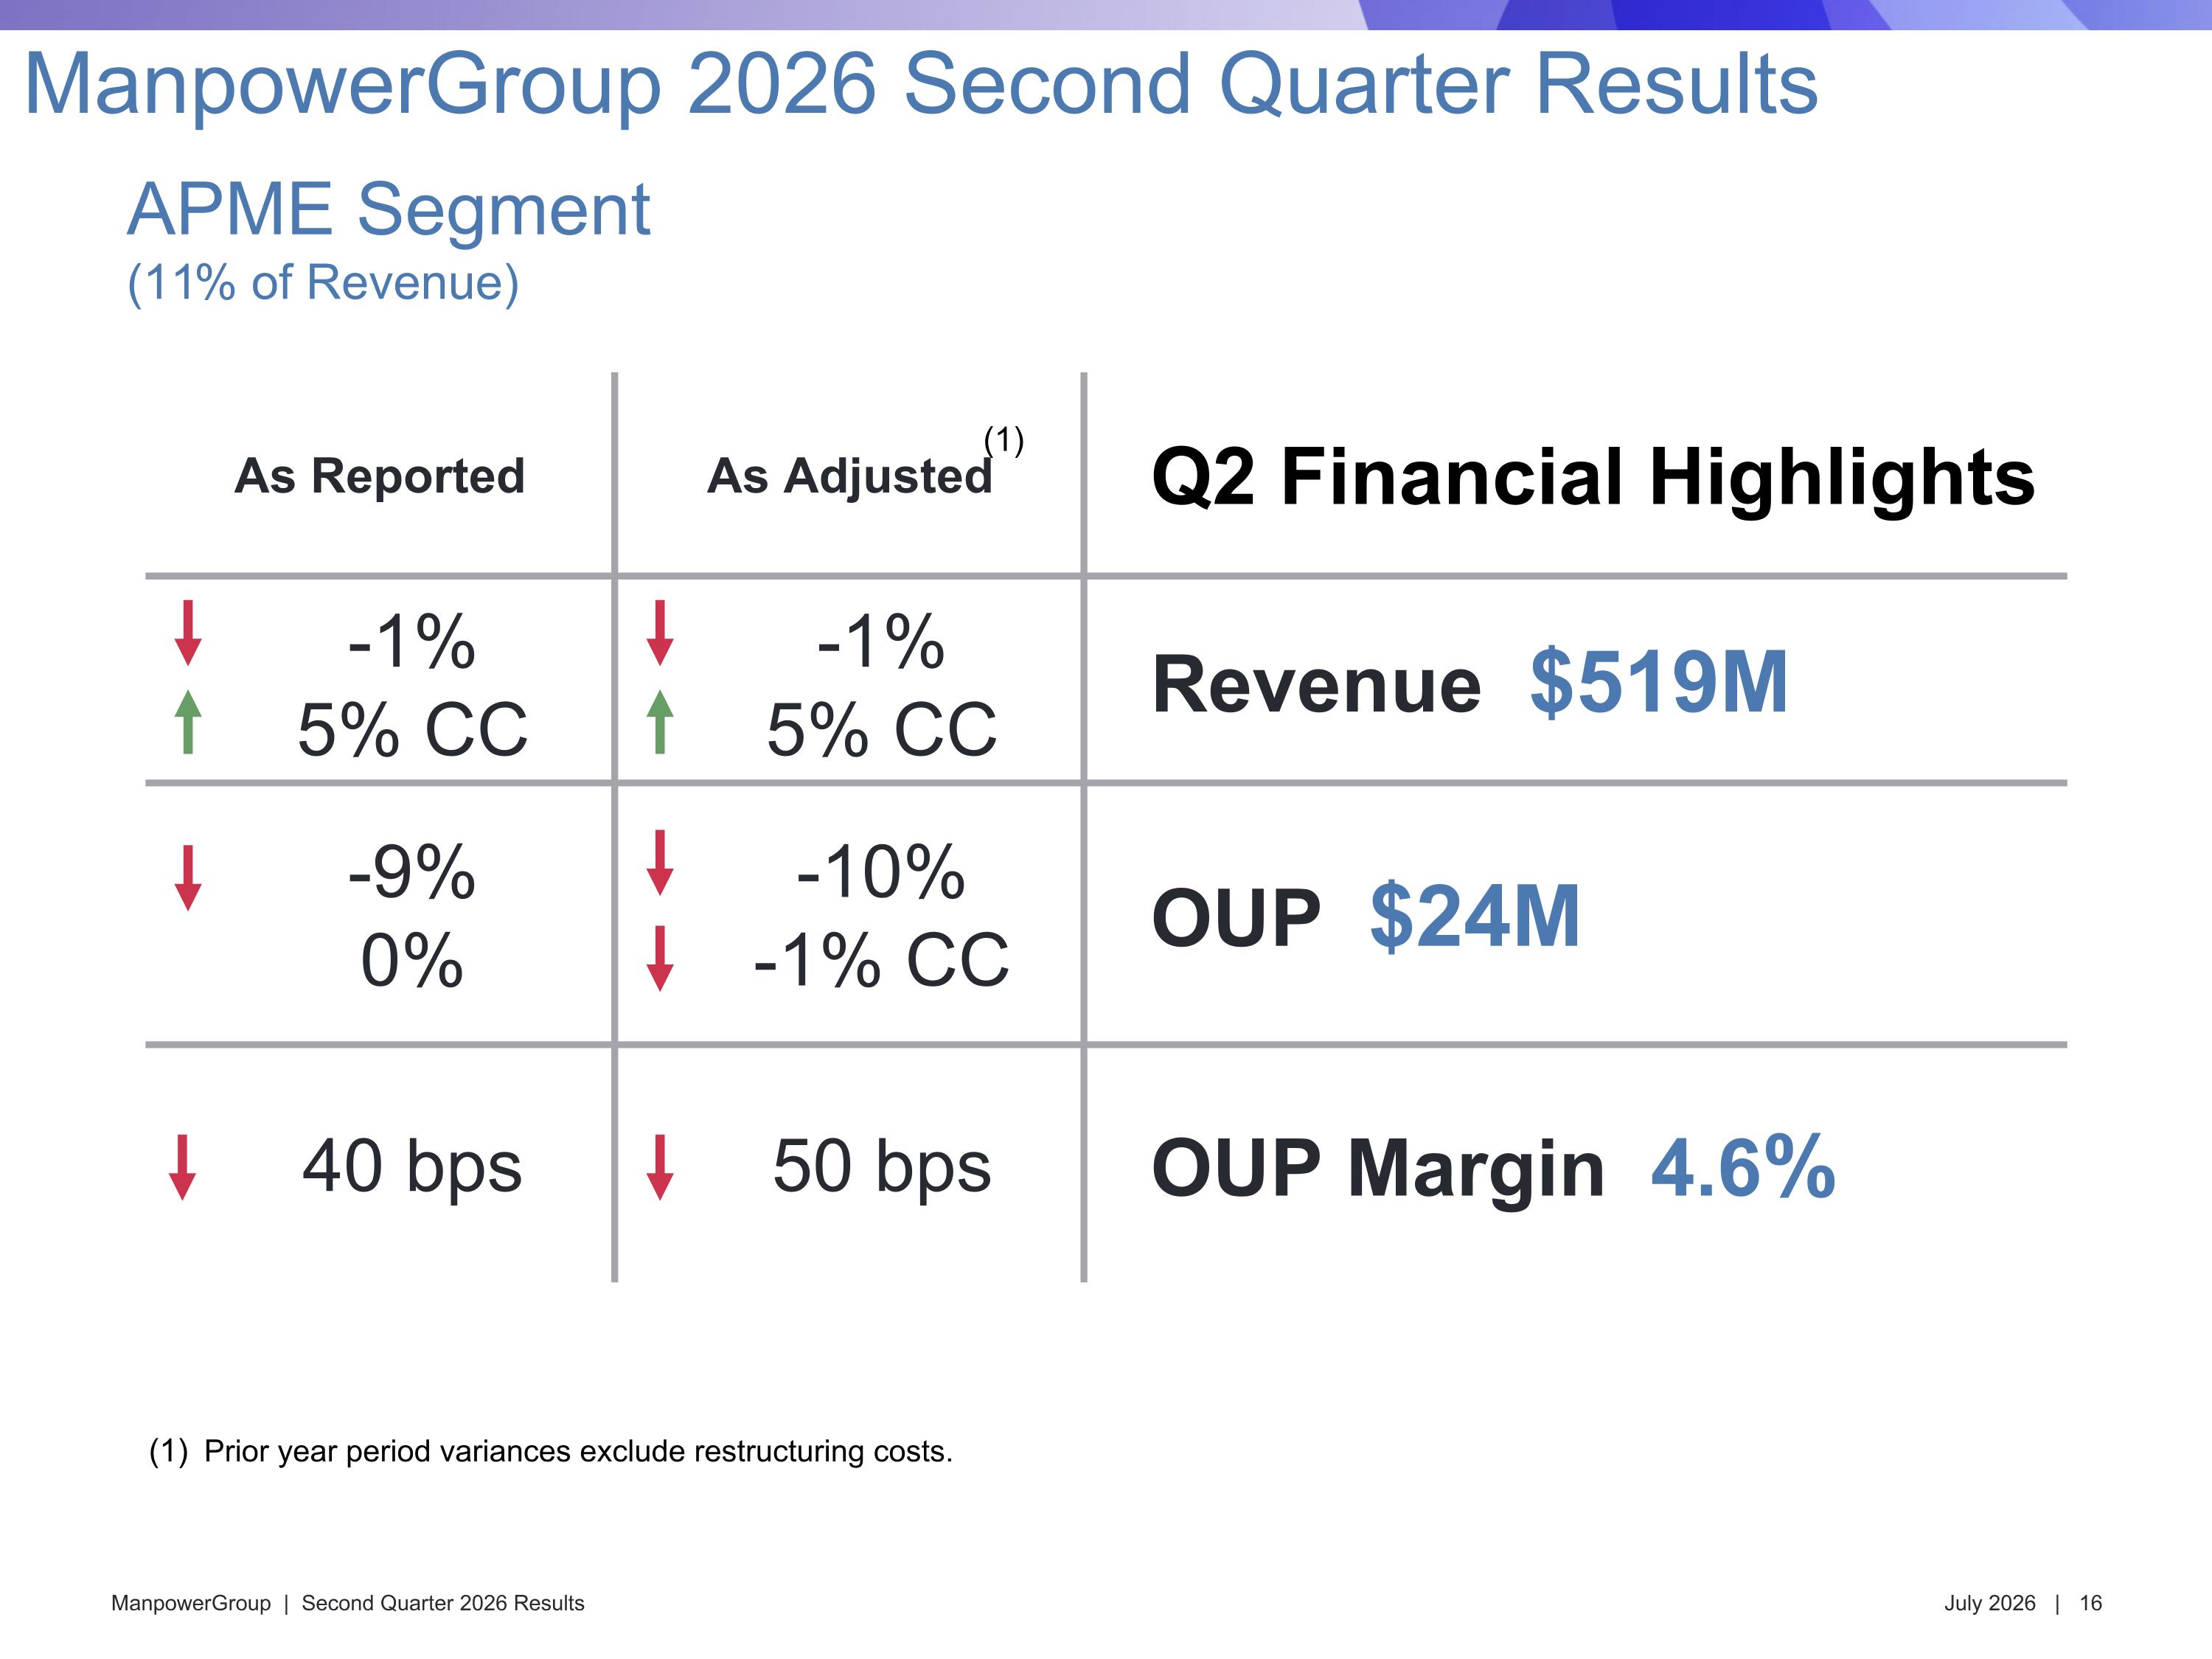
As Reported As Adjusted Q2 Financial Highlights -1% 5% CC -1% 5% CC Revenue $519M -9% 0% -10% -1% CC OUP $24M 40 bps 50 bps OUP Margin 4.6% APME Segment (11% of Revenue) ManpowerGroup 2026 Second Quarter Results Prior year period variances exclude restructuring costs. (1)
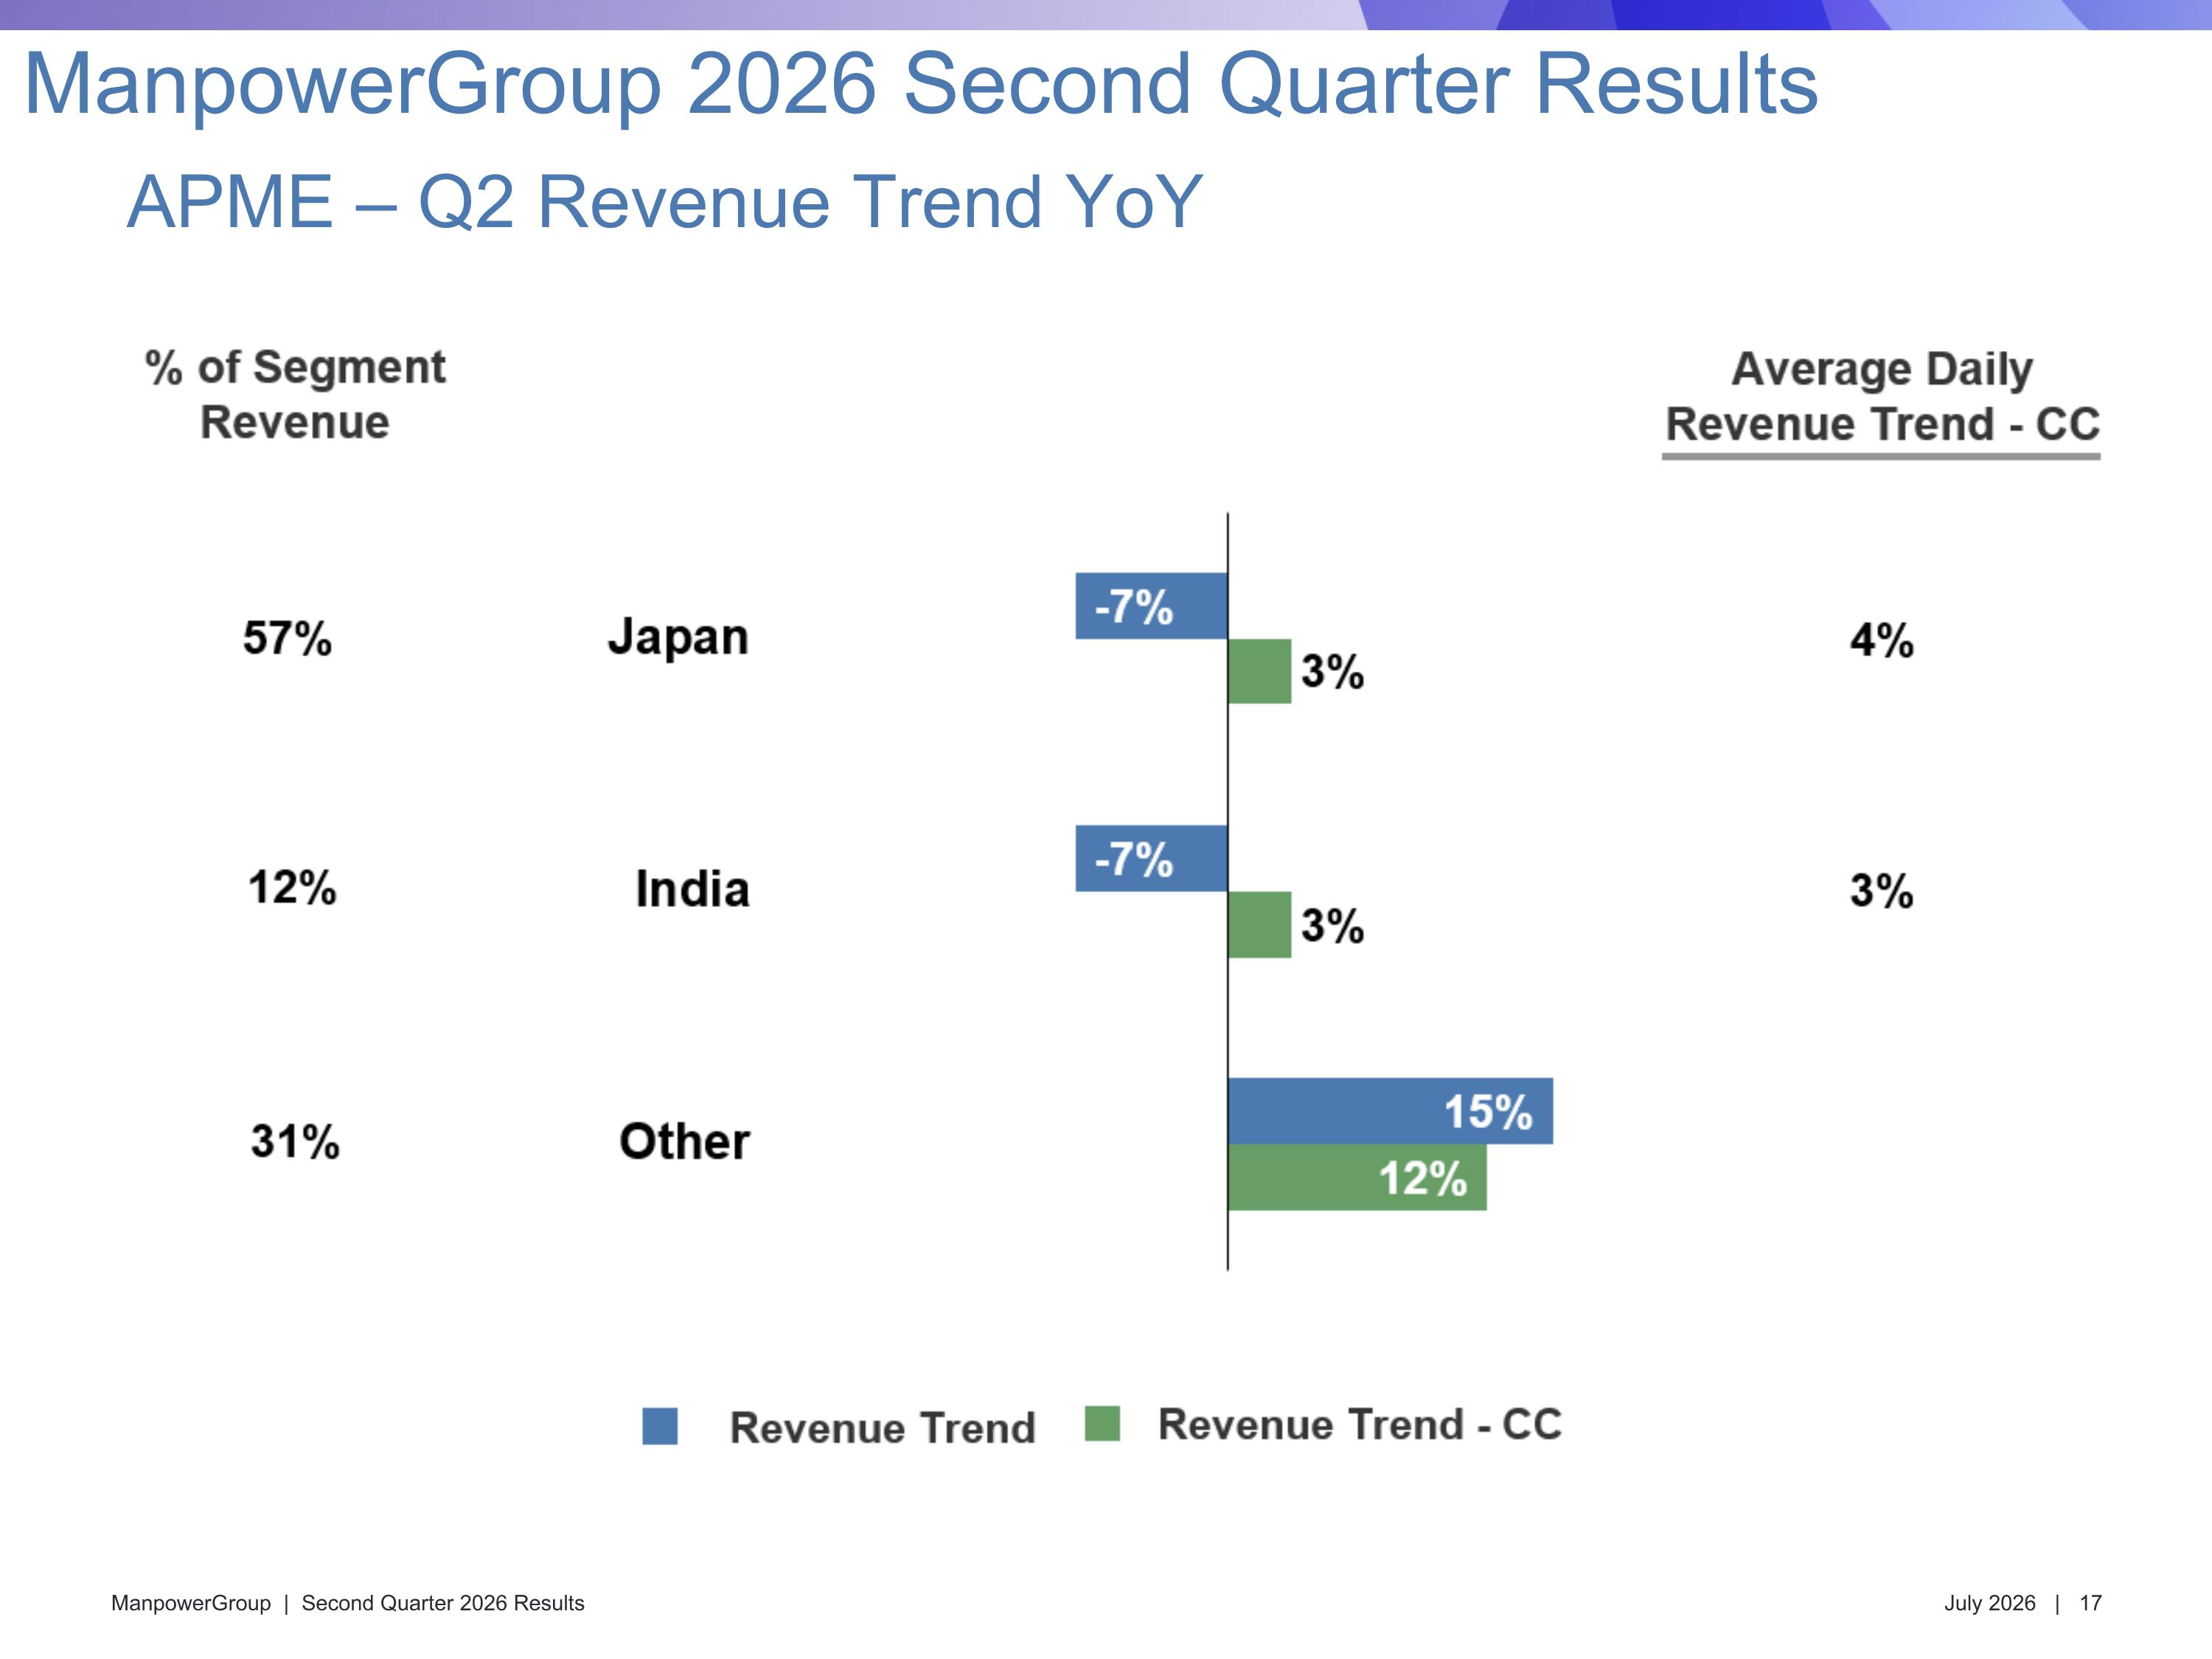
APME – Q2 Revenue Trend YoY ManpowerGroup 2026 Second Quarter Results
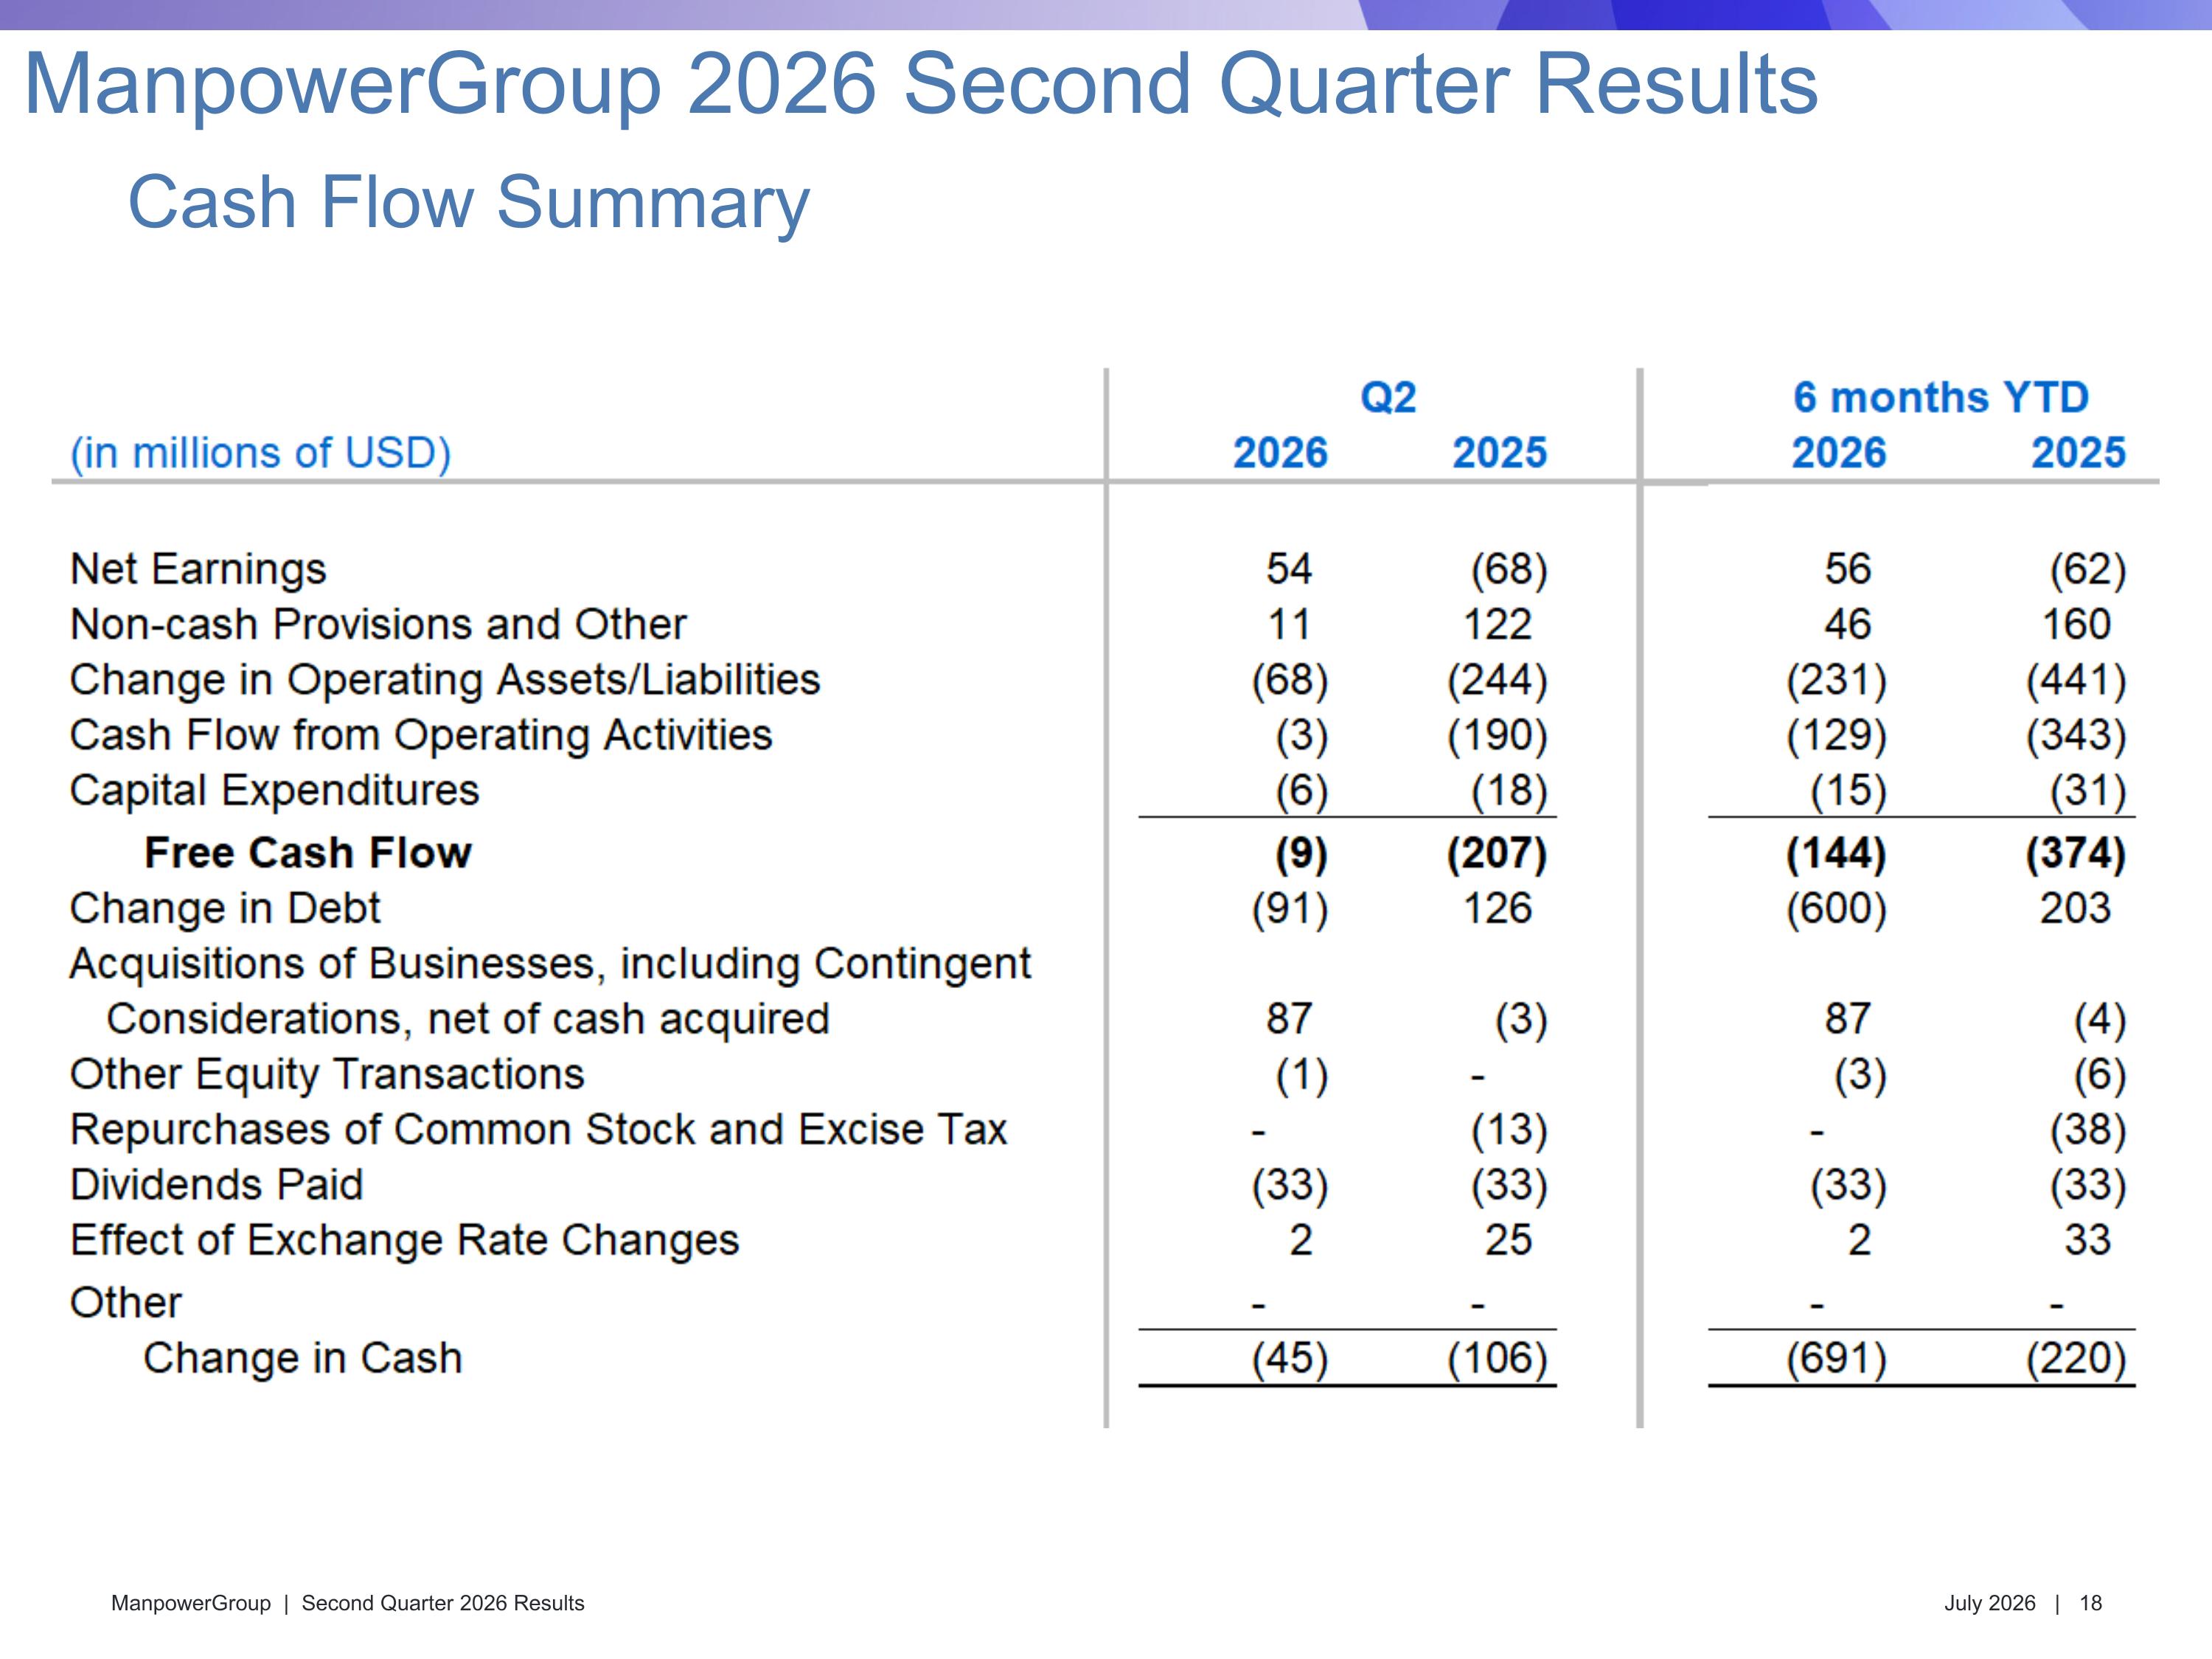
Cash Flow Summary ManpowerGroup 2026 Second Quarter Results
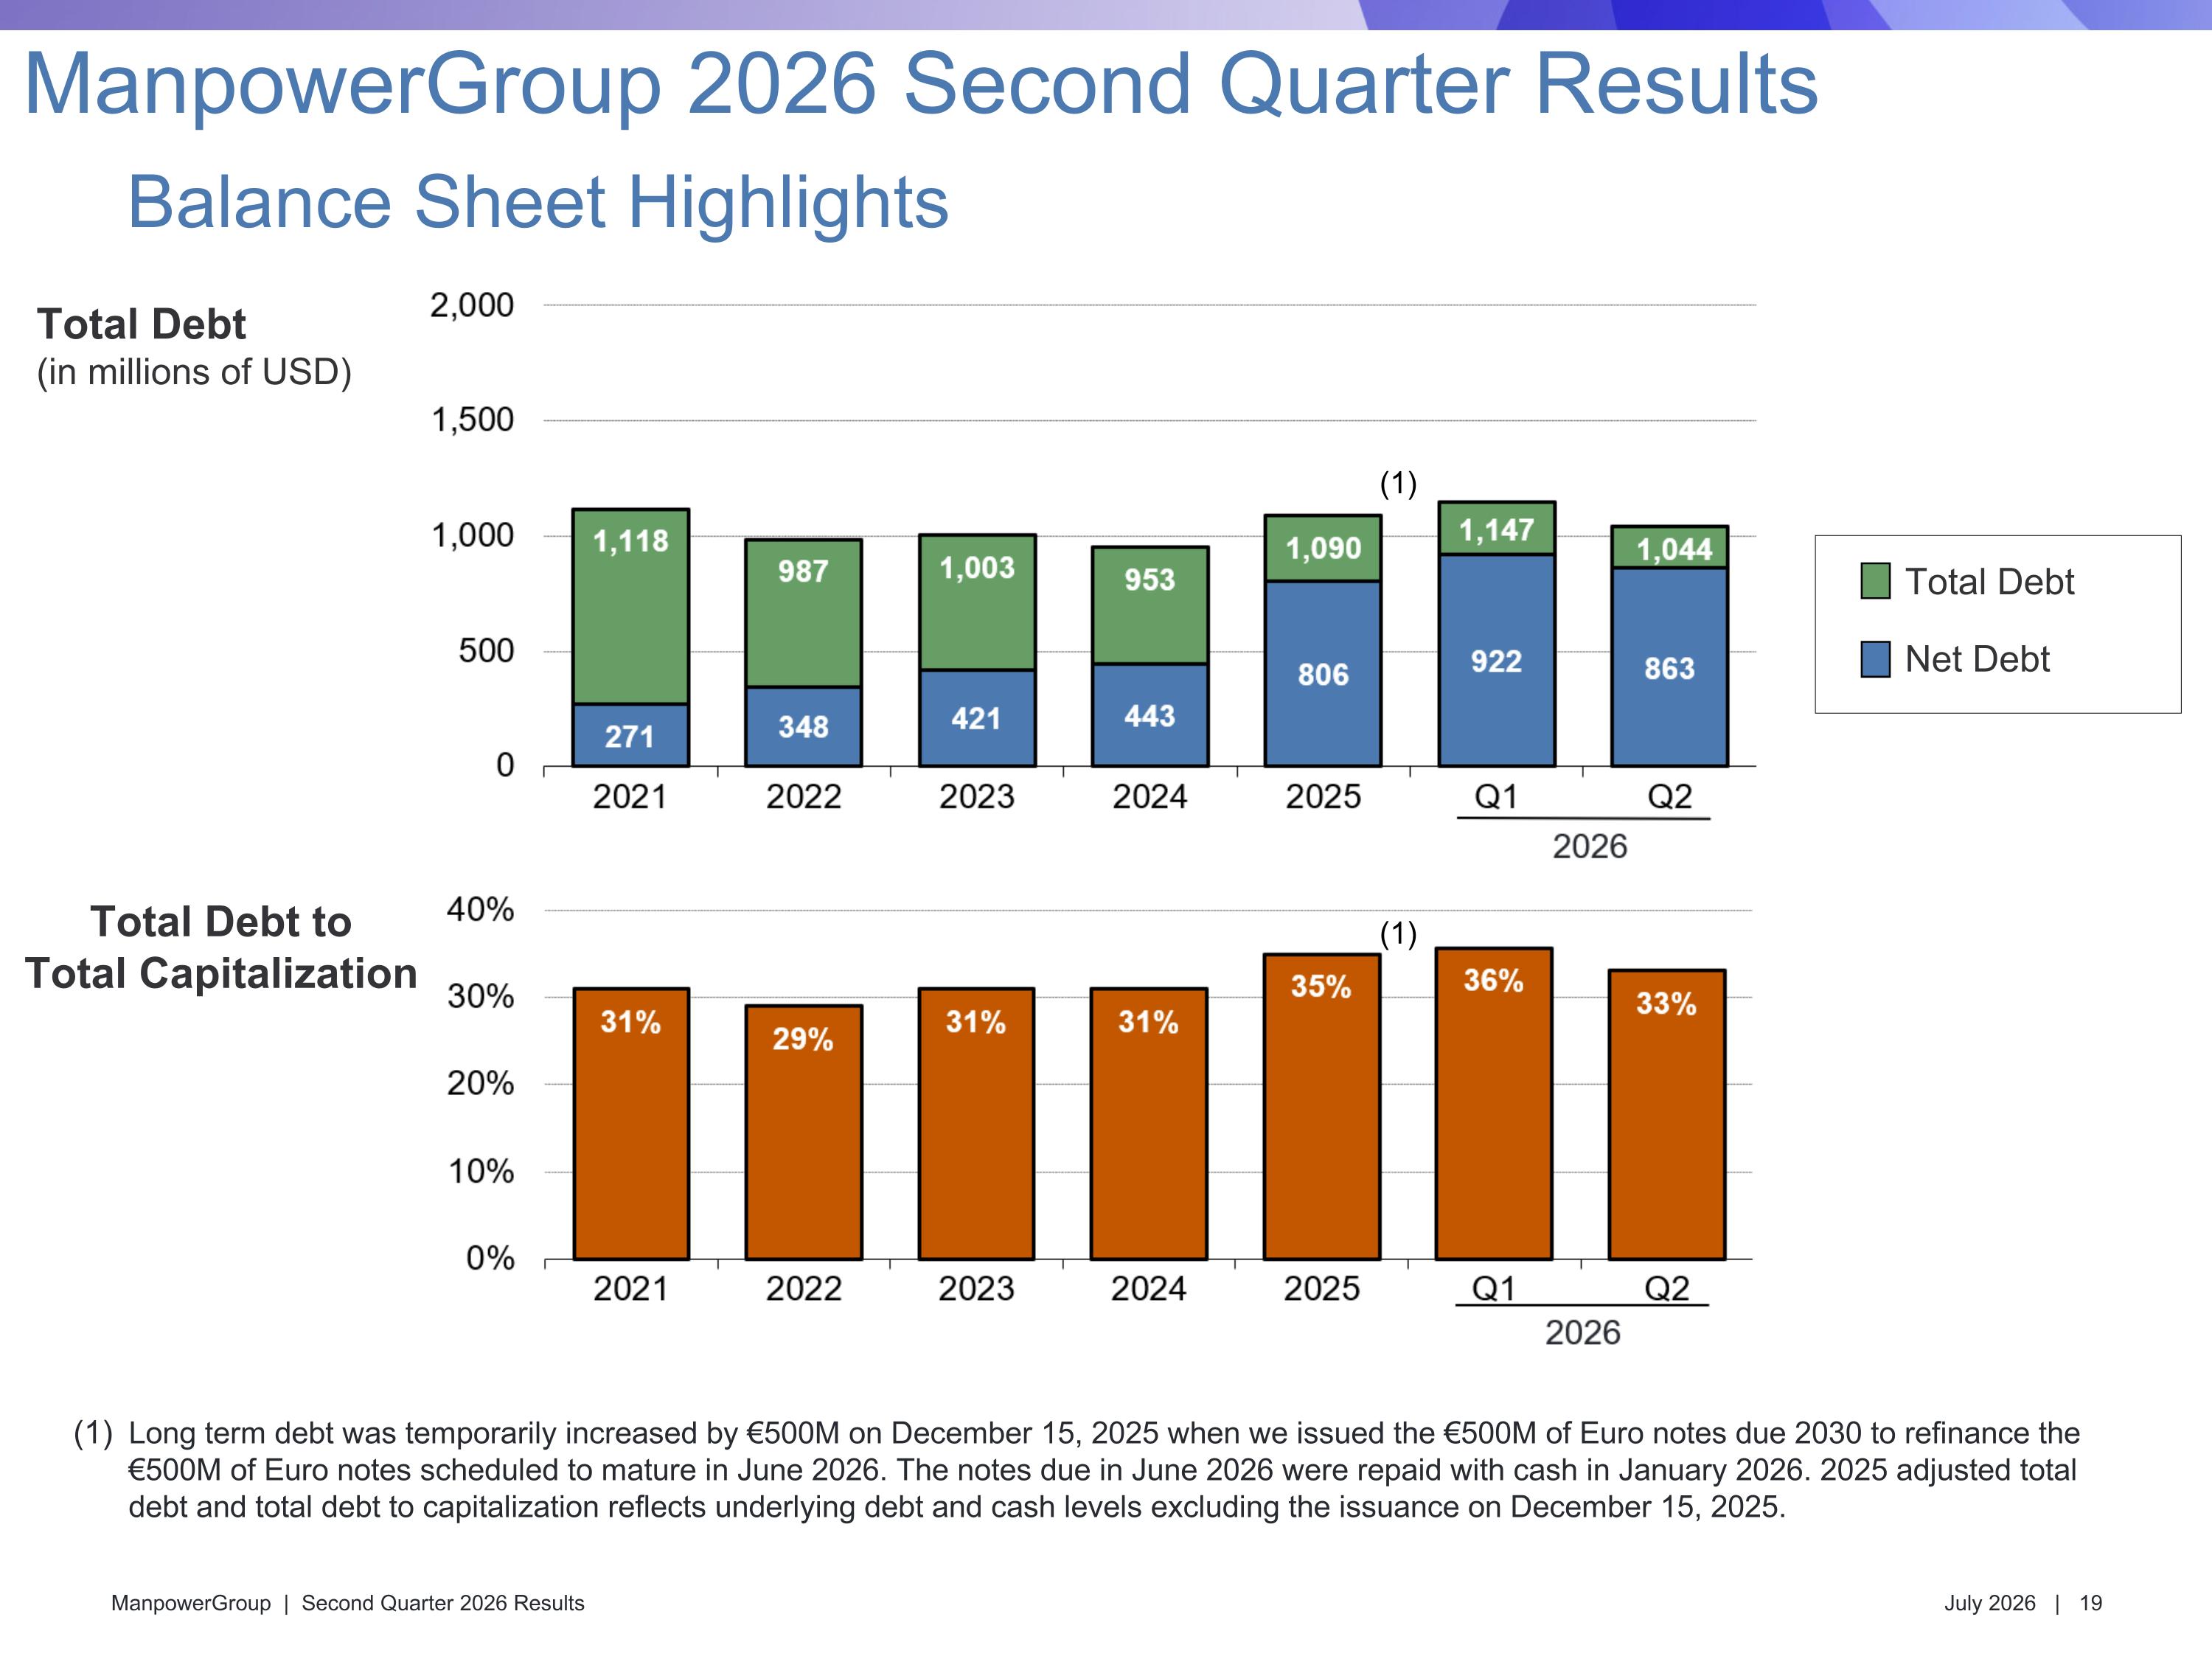
Total Debt (in millions of USD) Total Debt to Total Capitalization Total Debt Net Debt Balance Sheet Highlights ManpowerGroup 2026 Second Quarter Results Long term debt was temporarily increased by €500M on December 15, 2025 when we issued the €500M of Euro notes due 2030 to refinance the €500M of Euro notes scheduled to mature in June 2026. The notes due in June 2026 were repaid with cash in January 2026. 2025 adjusted total debt and total debt to capitalization reflects underlying debt and cash levels excluding the issuance on December 15, 2025. (1) (1)
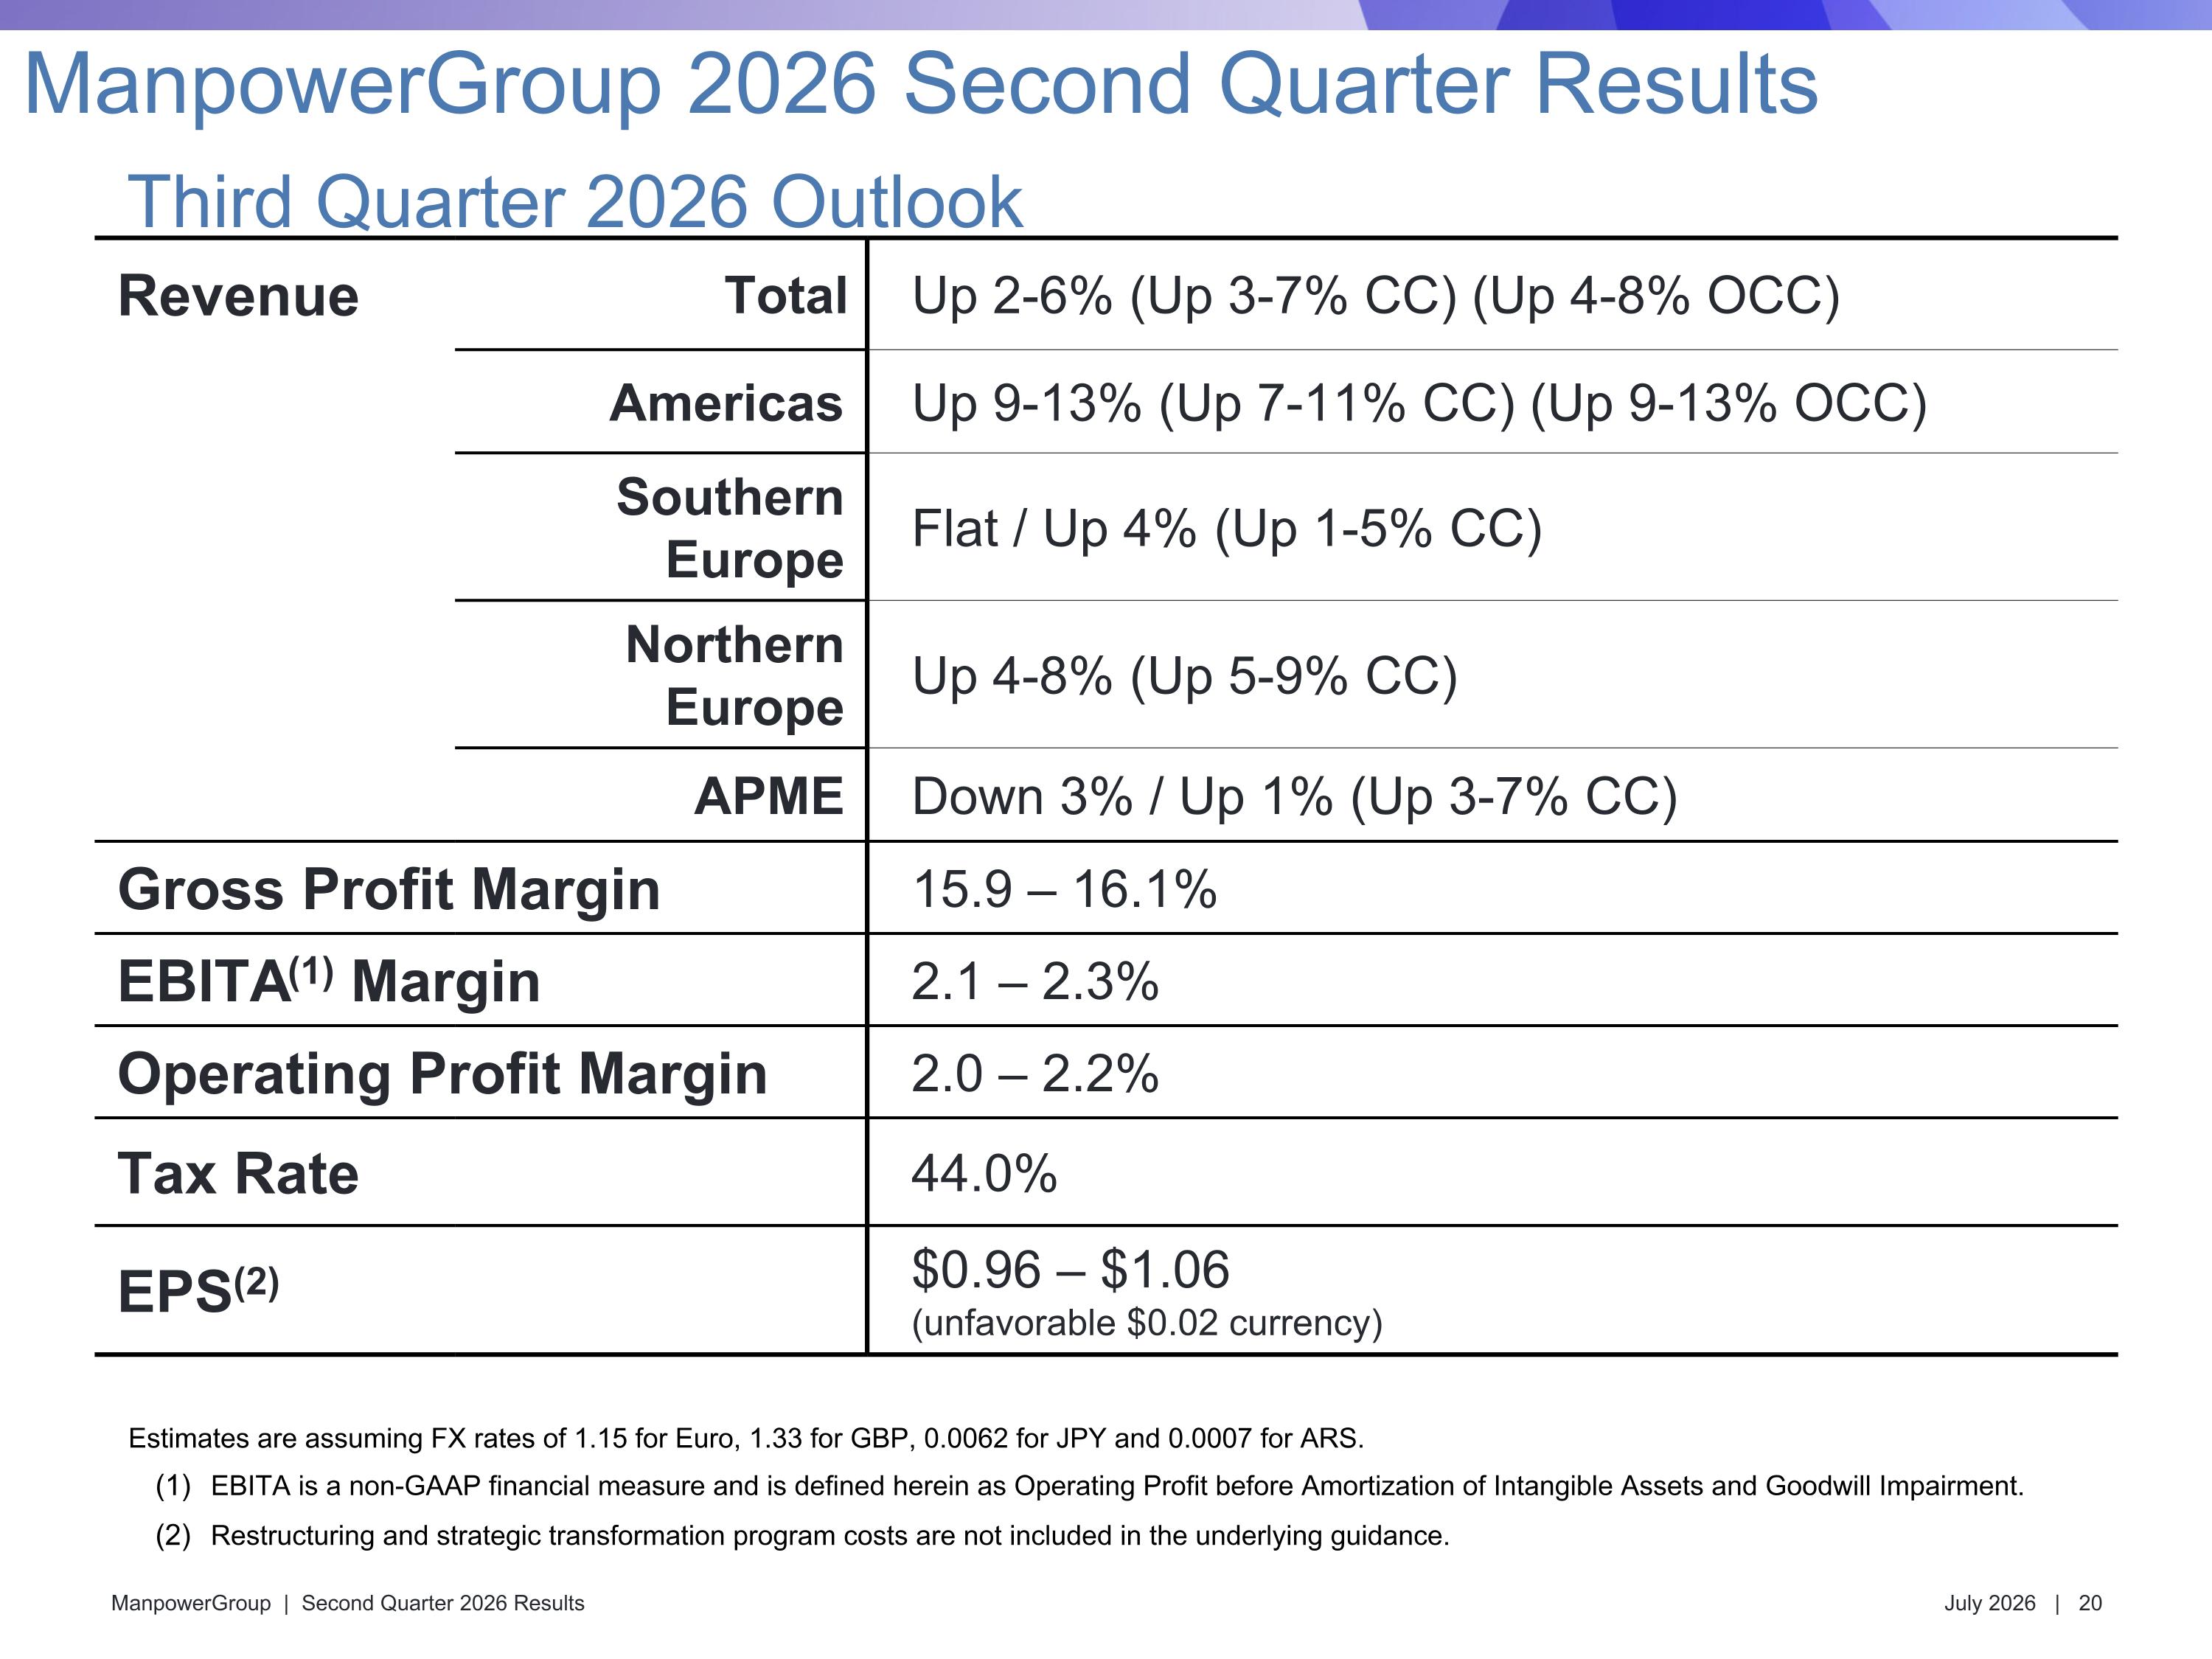
ManpowerGroup 2026 Second Quarter Results Third Quarter 2026 Outlook Revenue Total Up 2-6% (Up 3-7% CC) (Up 4-8% OCC) Americas Up 9-13% (Up 7-11% CC) (Up 9-13% OCC) Southern Europe Flat / Up 4% (Up 1-5% CC) Northern Europe Up 4-8% (Up 5-9% CC) APME Down 3% / Up 1% (Up 3-7% CC) Gross Profit Margin 15.9 – 16.1% EBITA(1) Margin 2.1 – 2.3% Operating Profit Margin 2.0 – 2.2% Tax Rate 44.0% EPS(2) $0.96 – $1.06 (unfavorable $0.02 currency) Estimates are assuming FX rates of 1.15 for Euro, 1.33 for GBP, 0.0062 for JPY and 0.0007 for ARS. EBITA is a non-GAAP financial measure and is defined herein as Operating Profit before Amortization of Intangible Assets and Goodwill Impairment. Restructuring and strategic transformation program costs are not included in the underlying guidance.

Appendix
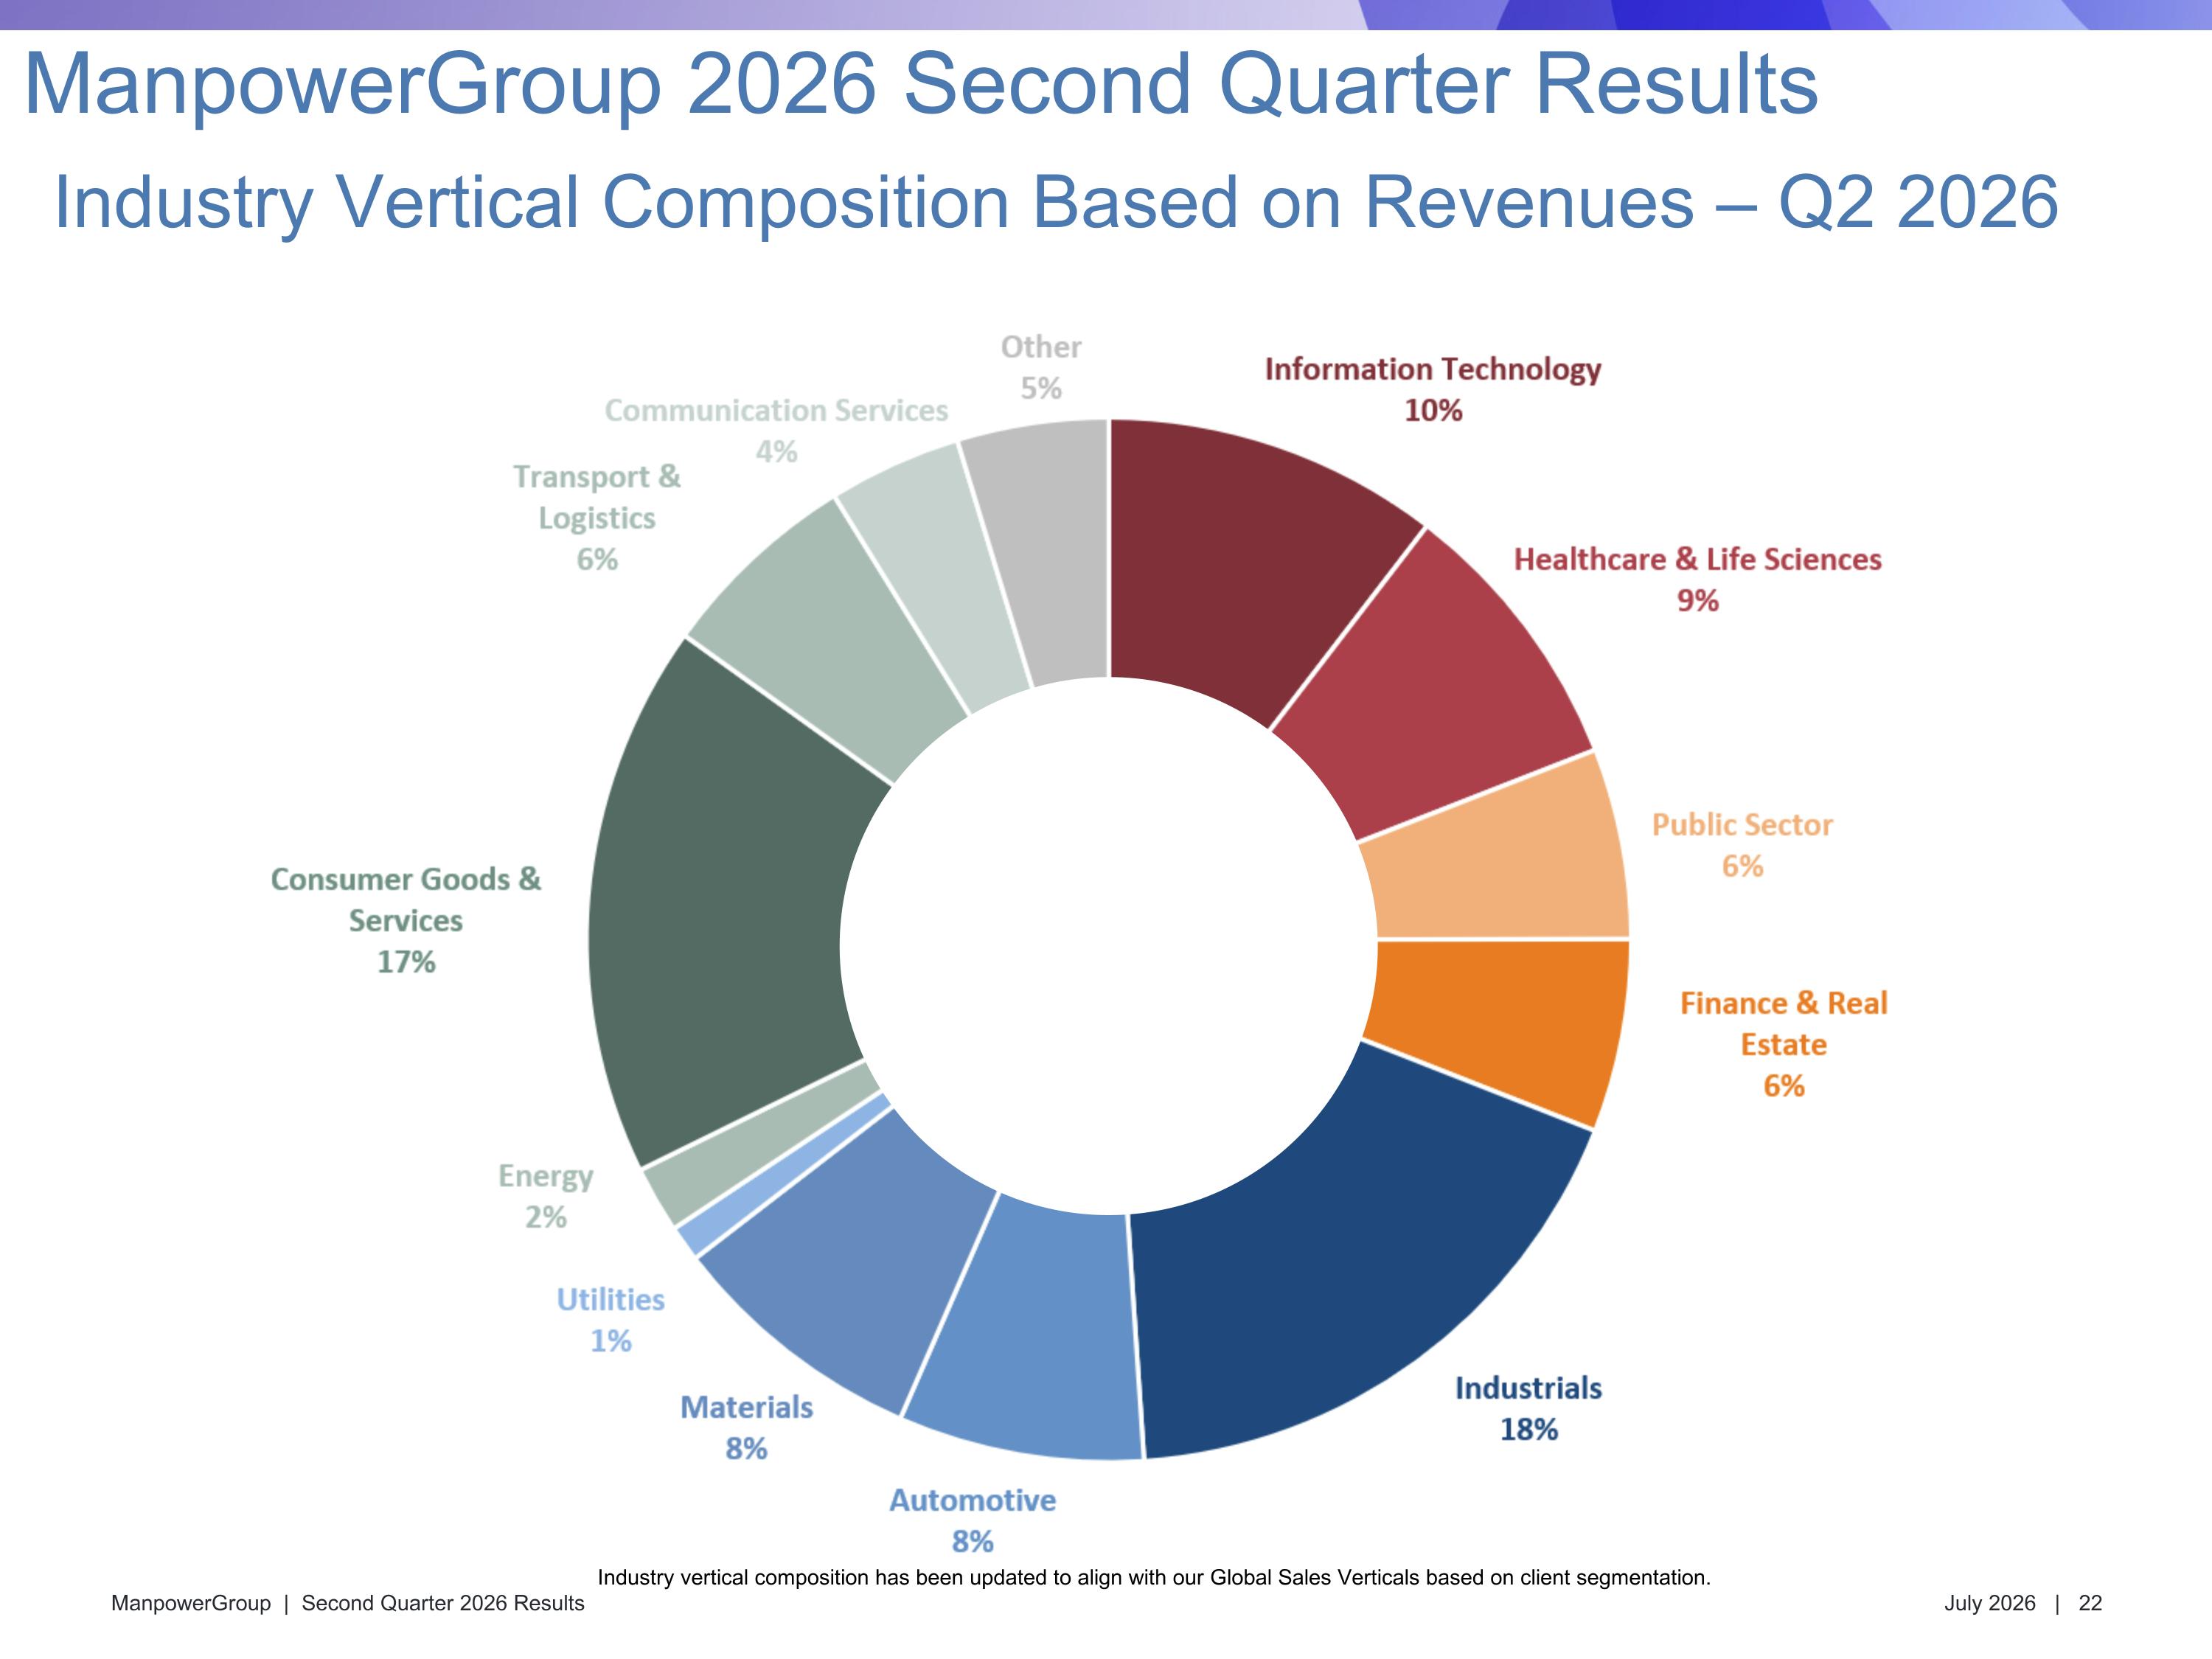
Industry Vertical Composition Based on Revenues – Q2 2026 ManpowerGroup 2026 Second Quarter Results Industry vertical composition has been updated to align with our Global Sales Verticals based on client segmentation.
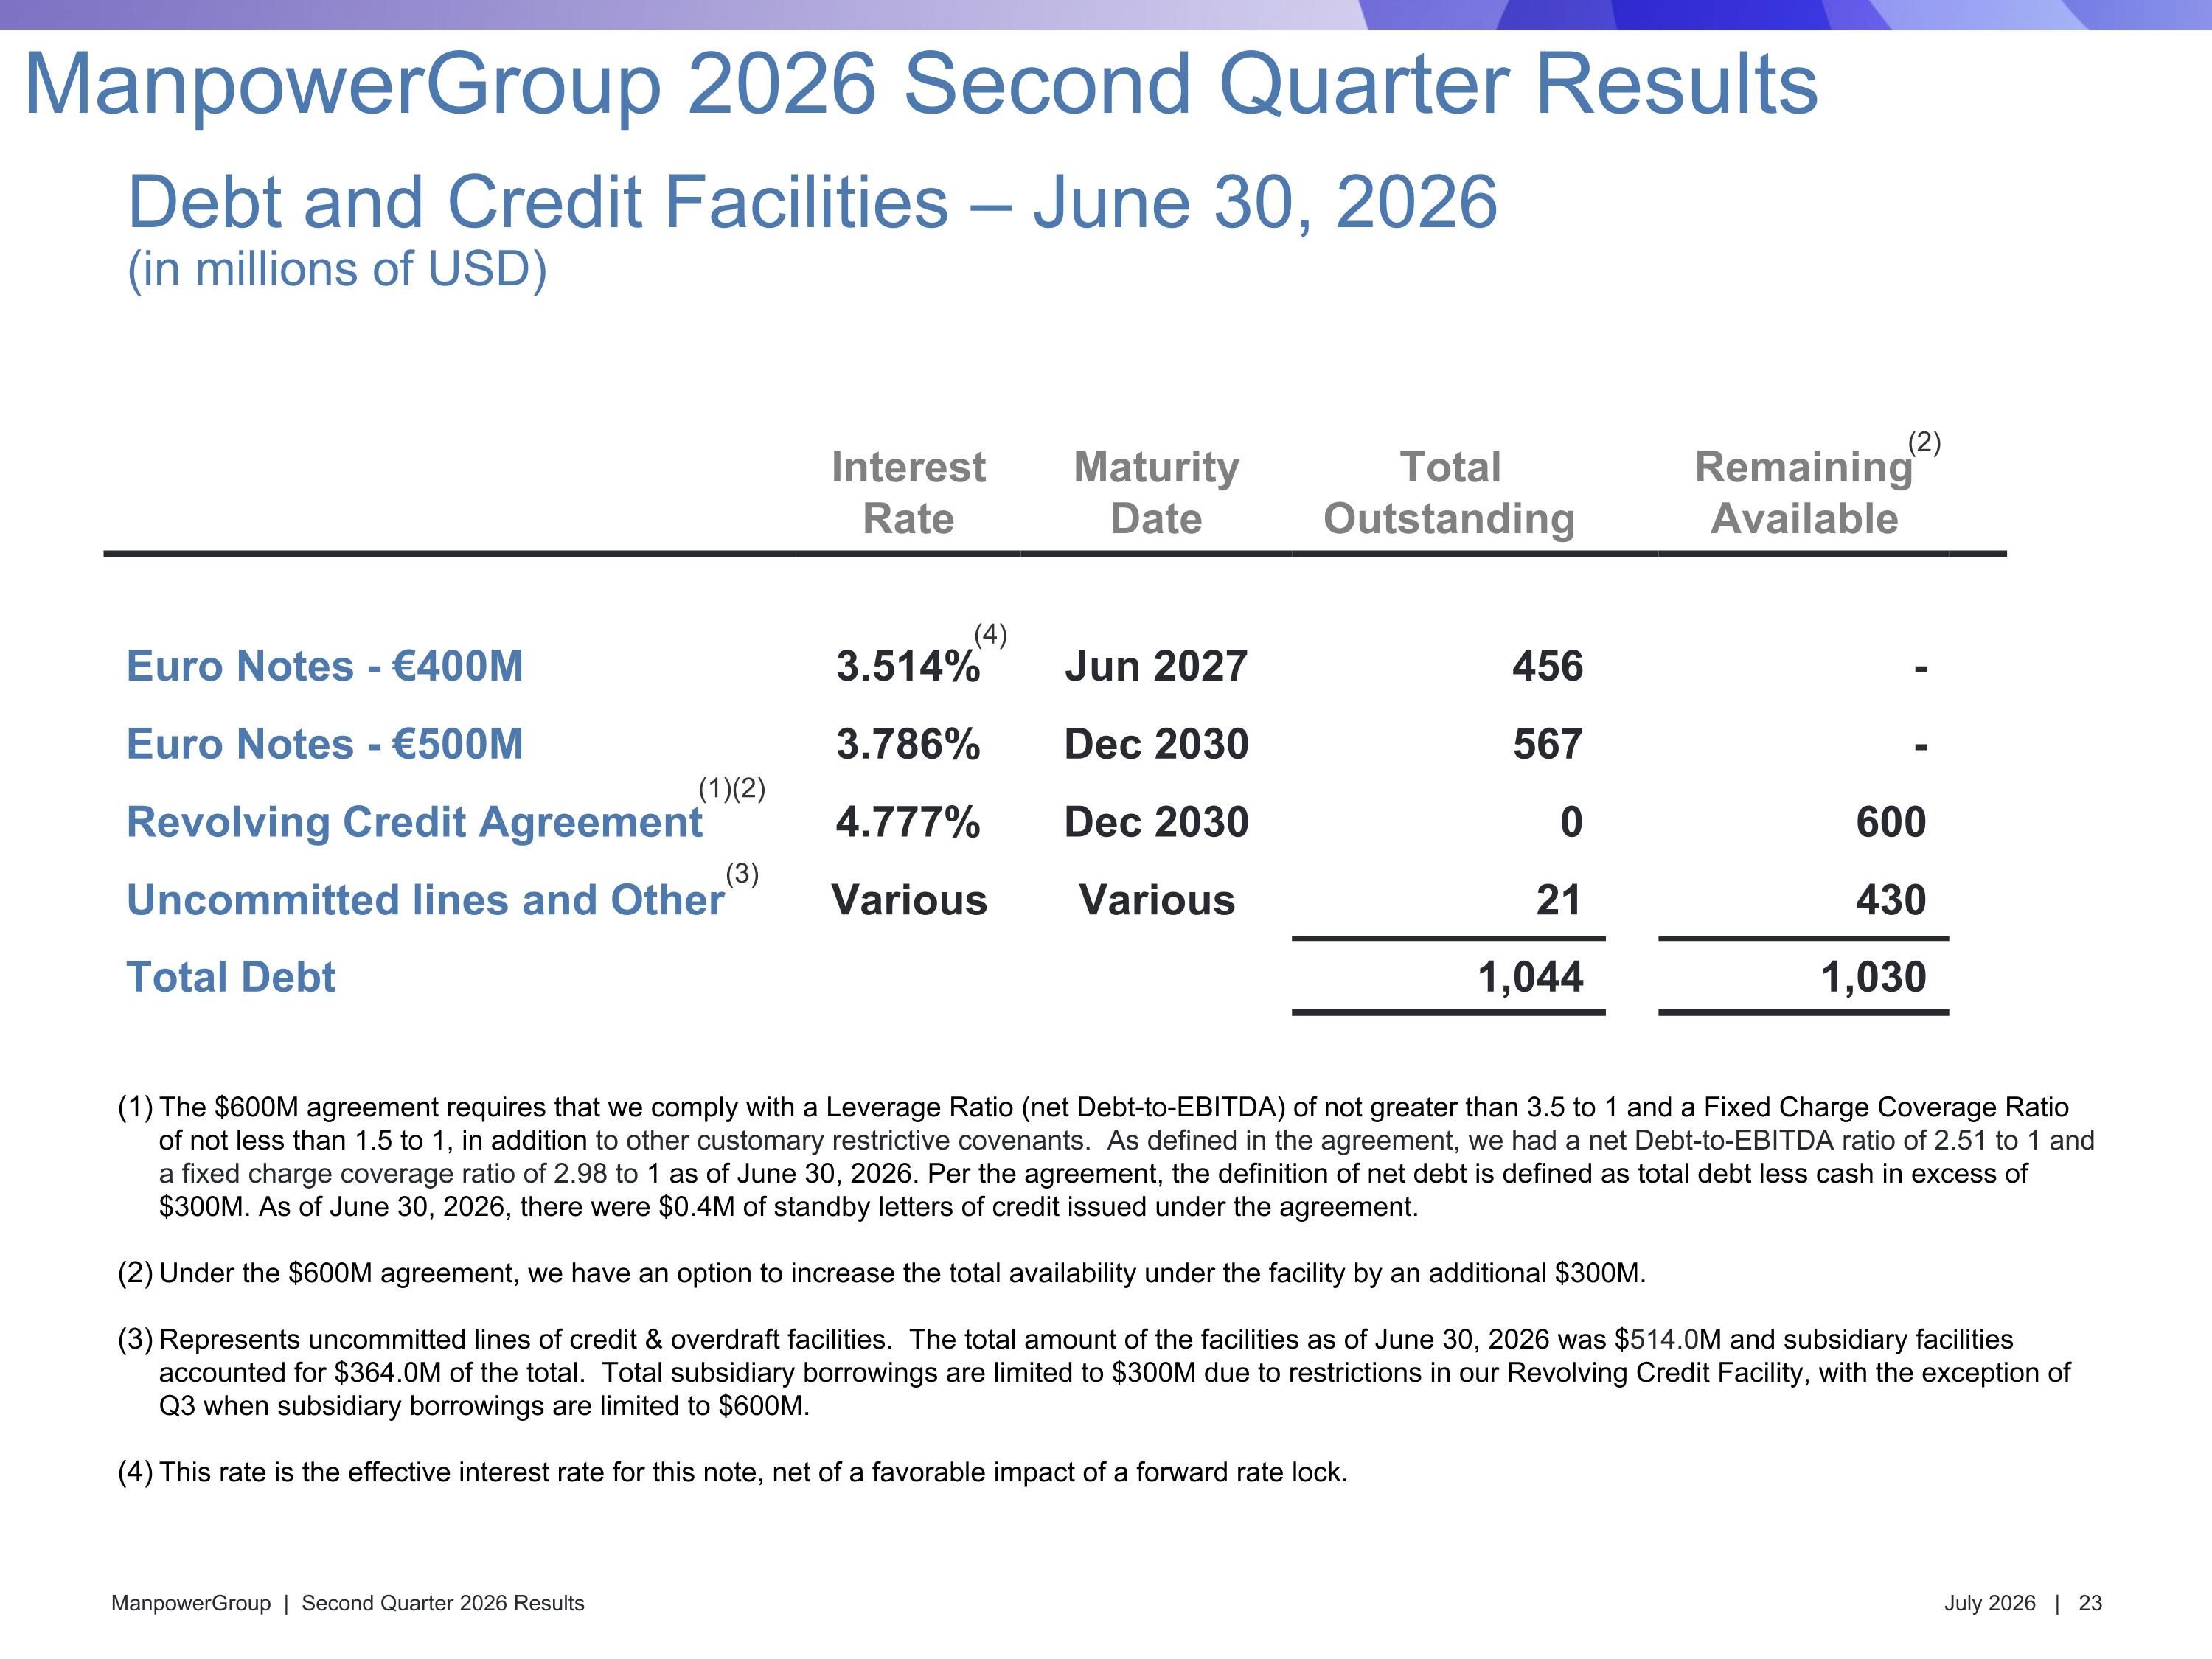
Interest Rate Maturity Date Total Outstanding Remaining Available Euro Notes - €400M 3.514% Jun 2027 456 - Euro Notes - €500M 3.786% Dec 2030 567 - Revolving Credit Agreement 4.777% Dec 2030 0 600 Uncommitted lines and Other Various Various 21 430 Total Debt 1,044 1,030 (3) (1)(2) (4) (2) Debt and Credit Facilities – June 30, 2026 (in millions of USD) ManpowerGroup 2026 Second Quarter Results The $600M agreement requires that we comply with a Leverage Ratio (net Debt-to-EBITDA) of not greater than 3.5 to 1 and a Fixed Charge Coverage Ratio of not less than 1.5 to 1, in addition to other customary restrictive covenants. As defined in the agreement, we had a net Debt-to-EBITDA ratio of 2.51 to 1 and a fixed charge coverage ratio of 2.98 to 1 as of June 30, 2026. Per the agreement, the definition of net debt is defined as total debt less cash in excess of $300M. As of June 30, 2026, there were $0.4M of standby letters of credit issued under the agreement. Under the $600M agreement, we have an option to increase the total availability under the facility by an additional $300M. Represents uncommitted lines of credit & overdraft facilities. The total amount of the facilities as of June 30, 2026 was $514.0M and subsidiary facilities accounted for $364.0M of the total. Total subsidiary borrowings are limited to $300M due to restrictions in our Revolving Credit Facility, with the exception of Q3 when subsidiary borrowings are limited to $600M. This rate is the effective interest rate for this note, net of a favorable impact of a forward rate lock.