
Q3 2025 EARNINGS CALL November 4, 2025
2Sterling | STRL: Third Quarter 2025 DISCLOSURE: Forward-Looking Statements This presentation contains, and the officers and directors of the Company may from time to time make, statements that are considered forward- looking statements within the meaning of the Securities Act of 1933 and the Securities Exchange Act of 1934. These forward-looking statements are subject to a number of risks and uncertainties, many of which are beyond our control, which may include statements about: our business strategy; our financial strategy; our industry outlook; our guidance; our expected margin growth; and our plans, objectives, expectations, forecasts, outlook and intentions. All of these types of statements, other than statements of historical fact included in this presentation, are forward-looking statements. In some cases, forward-looking statements can be identified by terminology such as “may,” “will,” “could,” "would," “should,” “expect,” “plan,” “project,” “intend,” “anticipate,” “believe,” “estimate,” “predict,” “potential,” “pursue,” “target,” "guidance," “continue,” the negative of such terms or other comparable terminology. The forward-looking statements contained in this presentation are largely based on our expectations, which reflect estimates and assumptions made by our management. These estimates and assumptions reflect our best judgment based on currently known market conditions and other factors. Although we believe such estimates and assumptions to be reasonable, they are inherently uncertain and involve a number of risks and uncertainties that are beyond our control. In addition, management’s assumptions about future events may prove to be inaccurate. Management cautions all readers that the forward-looking statements contained in this presentation are not guarantees of future performance, and we cannot assure any reader that such statements will be realized or the forward- looking events and circumstances will occur. Actual results may differ materially from those anticipated or implied in the forward-looking statements due to factors listed in the “Risk Factors” section in our filings with the U.S. Securities and Exchange Commission and elsewhere in those filings. Additional factors or risks that we currently deem immaterial, that are not presently known to us or that arise in the future could also cause our actual results to differ materially from our expected results. Given these uncertainties, investors are cautioned that many of the assumptions upon which our forward-looking statements are based are likely to change after the date the forward-looking statements are made. The forward-looking statements speak only as of the date made, and we undertake no obligation to publicly update or revise any forward- looking statements for any reason, whether as a result of new information, future events or developments, changed circumstances, or otherwise, notwithstanding any changes in our assumptions, changes in business plans, actual experience or other changes. These cautionary statements qualify all forward-looking statements attributable to us or persons acting on our behalf. This presentation may contain the financial measures: adjusted net income, adjusted operating income, EBITDA, adjusted EBITDA, and adjusted EPS, which are not calculated in accordance with U.S. GAAP. When presented, a reconciliation of the non-GAAP financial measures to the most directly comparable GAAP financial measure will be provided in the Appendix to this presentation.
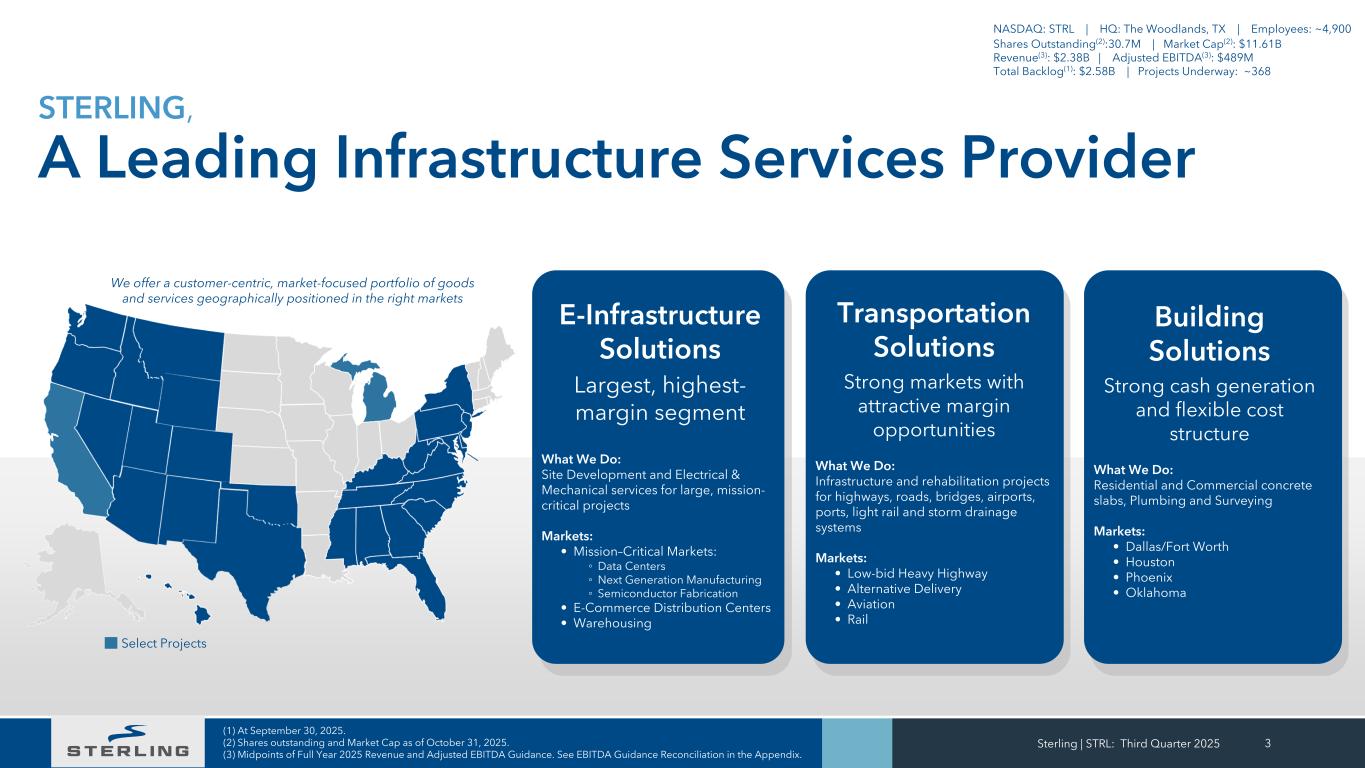
Sterling | STRL: Third Quarter 2025 3 (1) At September 30, 2025. (2) Shares outstanding and Market Cap as of October 31, 2025. (3) Midpoints of Full Year 2025 Revenue and Adjusted EBITDA Guidance. See EBITDA Guidance Reconciliation in the Appendix. We offer a customer-centric, market-focused portfolio of goods and services geographically positioned in the right markets STERLING, A Leading Infrastructure Services Provider E-Infrastructure Solutions Largest, highest- margin segment What We Do: Site Development and Electrical & Mechanical services for large, mission- critical projects Markets: • Mission–Critical Markets: ◦ Data Centers ◦ Next Generation Manufacturing ◦ Semiconductor Fabrication • E-Commerce Distribution Centers • Warehousing Transportation Solutions Strong markets with attractive margin opportunities What We Do: Infrastructure and rehabilitation projects for highways, roads, bridges, airports, ports, light rail and storm drainage systems Markets: • Low-bid Heavy Highway • Alternative Delivery • Aviation • Rail Building Solutions Strong cash generation and flexible cost structure What We Do: Residential and Commercial concrete slabs, Plumbing and Surveying Markets: • Dallas/Fort Worth • Houston • Phoenix • Oklahoma NASDAQ: STRL | HQ: The Woodlands, TX | Employees: ~4,900 Shares Outstanding(2):30.7M | Market Cap(2): $11.61B Revenue(3): $2.38B | Adjusted EBITDA(3): $489M Total Backlog(1): $2.58B | Projects Underway: ~368 Select Projects
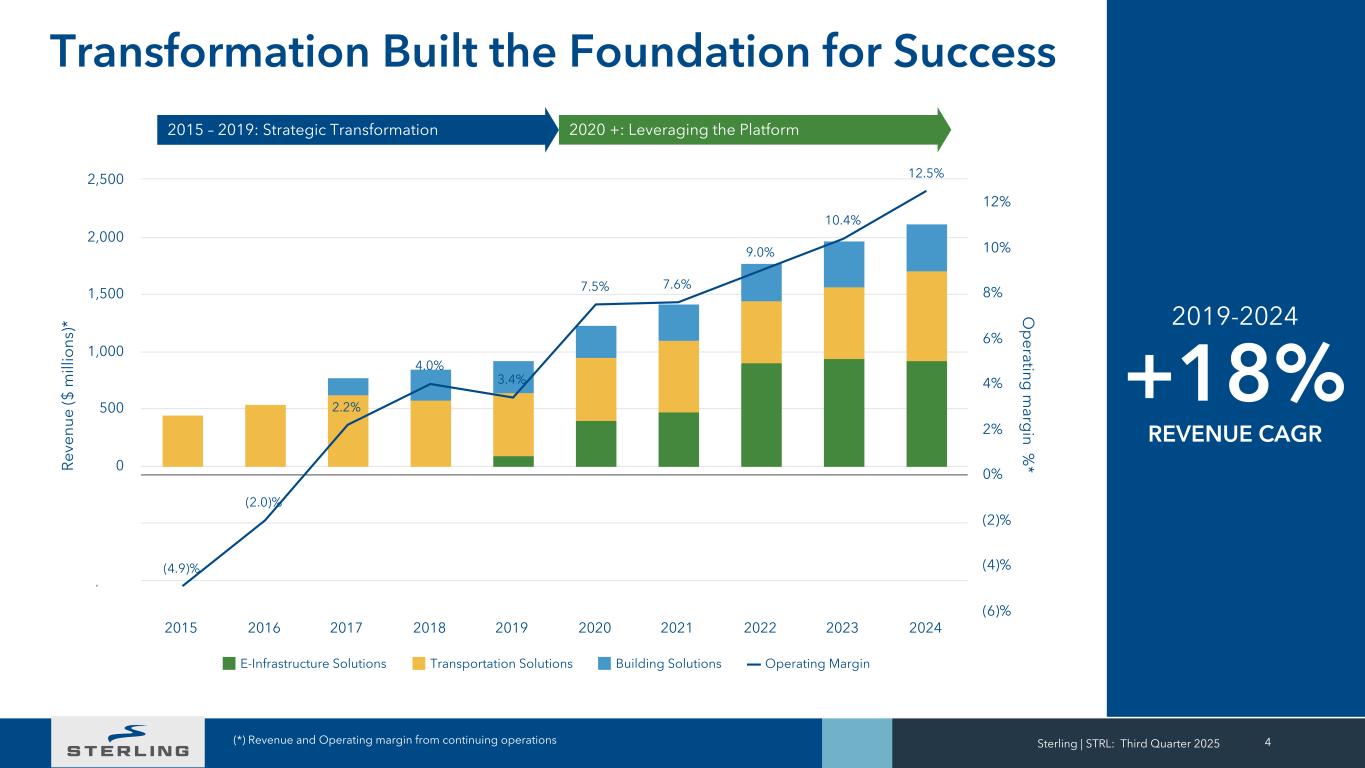
+18% REVENUE CAGR 2019-2024 4 R ev en ue ($ m ill io ns )* O p erating m arg in % * (4.9)% (2.0)% 2.2% 4.0% 3.4% 7.5% 7.6% 9.0% 10.4% 12.5% E-Infrastructure Solutions Transportation Solutions Building Solutions Operating Margin 2015 2016 2017 2018 2019 2020 2021 2022 2023 2024 -1,000 -500 0 500 1,000 1,500 2,000 2,500 (6)% (4)% (2)% 0% 2% 4% 6% 8% 10% 12% 2015 – 2019: Strategic Transformation 2020 +: Leveraging the Platform Transformation Built the Foundation for Success (*) Revenue and Operating margin from continuing operations Sterling | STRL: Third Quarter 2025
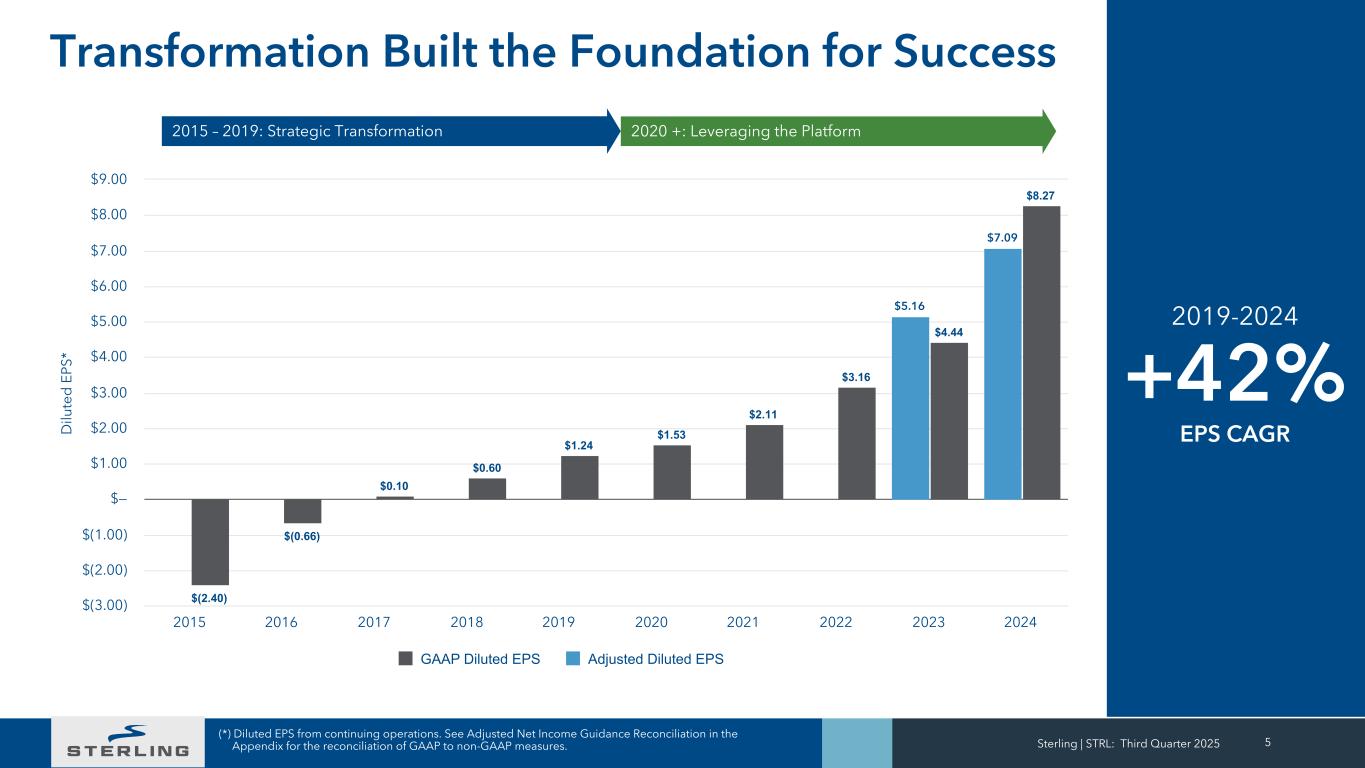
+42% EPS CAGR 2019-2024 5 2015 – 2019: Strategic Transformation 2020 +: Leveraging the Platform Transformation Built the Foundation for Success (*) Diluted EPS from continuing operations. See Adjusted Net Income Guidance Reconciliation in the Appendix for the reconciliation of GAAP to non-GAAP measures. Sterling | STRL: Third Quarter 2025 D ilu te d E PS * $5.16 $7.09 $(2.40) $(0.66) $0.10 $0.60 $1.24 $1.53 $2.11 $3.16 $4.44 $8.27 GAAP Diluted EPS Adjusted Diluted EPS 2015 2016 2017 2018 2019 2020 2021 2022 2023 2024 $(3.00) $(2.00) $(1.00) $— $1.00 $2.00 $3.00 $4.00 $5.00 $6.00 $7.00 $8.00 $9.00
+ Third Quarter 2025 Results Sterling | STRL: Third Quarter 2025 6
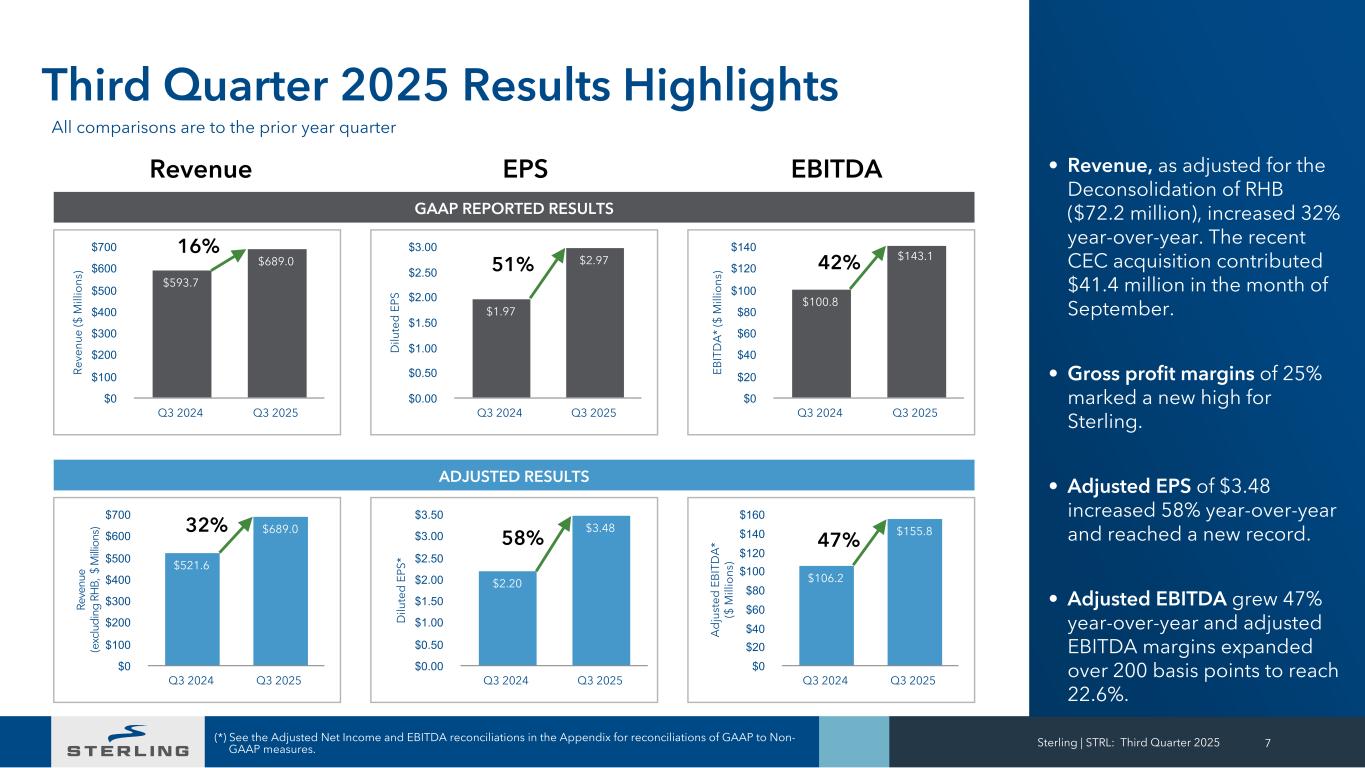
D ilu te d E PS $1.97 $2.97 Q3 2024 Q3 2025 $0.00 $0.50 $1.00 $1.50 $2.00 $2.50 $3.00 A d ju st ed E B IT D A * ($ M ill io ns ) $106.2 $155.8 Q3 2024 Q3 2025 $0 $20 $40 $60 $80 $100 $120 $140 $160 Re ve nu e ($ M ill io ns ) $593.7 $689.0 Q3 2024 Q3 2025 $0 $100 $200 $300 $400 $500 $600 $700 Re ve nu e (e xc lu di ng R H B, $ M ill io ns ) $521.6 $689.0 Q3 2024 Q3 2025 $0 $100 $200 $300 $400 $500 $600 $700 EB IT D A * ($ M ill io ns ) $100.8 $143.1 Q3 2024 Q3 2025 $0 $20 $40 $60 $80 $100 $120 $140 GAAP REPORTED RESULTS D ilu te d E PS * $2.20 $3.48 Q3 2024 Q3 2025 $0.00 $0.50 $1.00 $1.50 $2.00 $2.50 $3.00 $3.50 All comparisons are to the prior year quarter Third Quarter 2025 Results Highlights • Revenue, as adjusted for the Deconsolidation of RHB ($72.2 million), increased 32% year-over-year. The recent CEC acquisition contributed $41.4 million in the month of September. • Gross profit margins of 25% marked a new high for Sterling. • Adjusted EPS of $3.48 increased 58% year-over-year and reached a new record. • Adjusted EBITDA grew 47% year-over-year and adjusted EBITDA margins expanded over 200 basis points to reach 22.6%. (*) See the Adjusted Net Income and EBITDA reconciliations in the Appendix for reconciliations of GAAP to Non- GAAP measures. Sterling | STRL: Third Quarter 2025 7 16% 32% 51% 42% 58% 47% Revenue EPS EBITDA ADJUSTED RESULTS
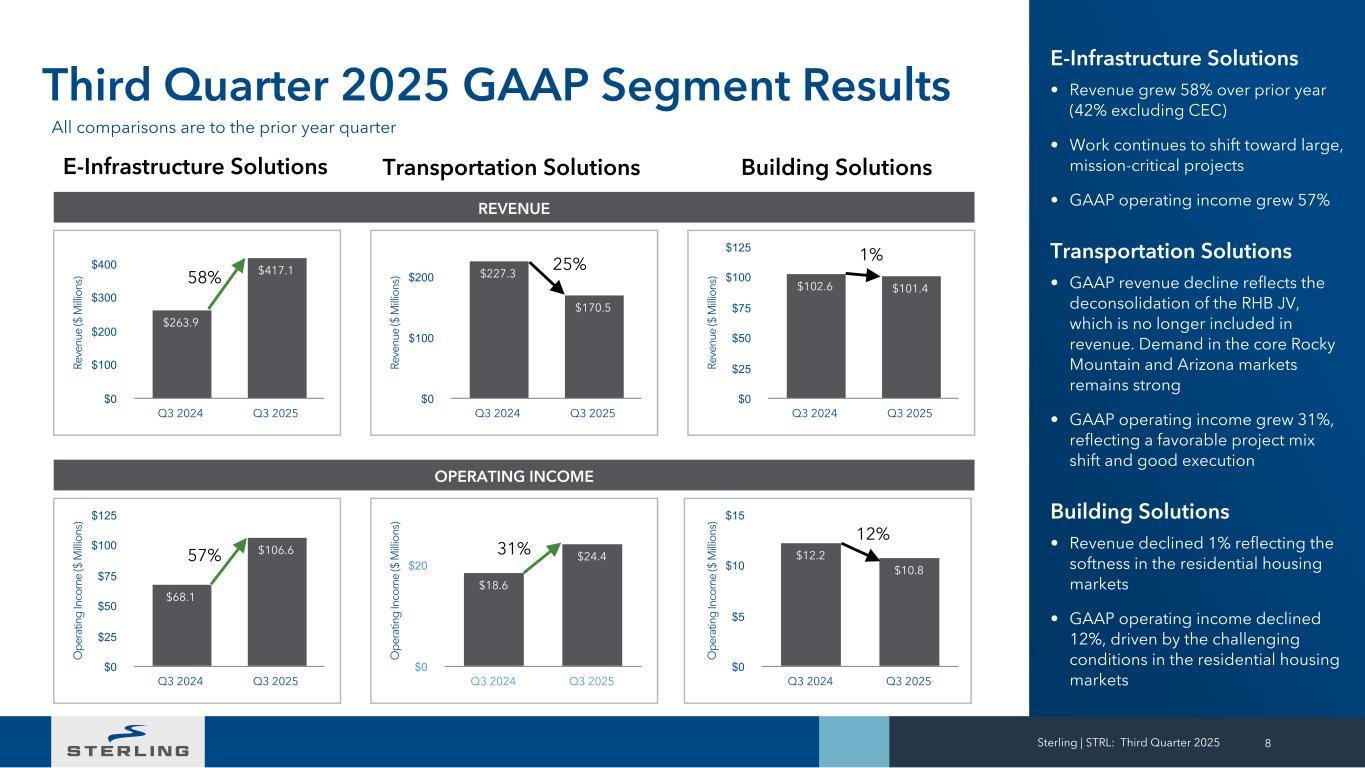
Re ve nu e ($ M ill io ns ) $227.3 $170.5 Q3 2024 Q3 2025 $0 $100 $200 O pe ra tin g In co m e ($ M ill io ns ) $18.6 $24.4 Q3 2024 Q3 2025 $0 $20 Re ve nu e ($ M ill io ns ) $263.9 $417.1 Q3 2024 Q3 2025 $0 $100 $200 $300 $400 Re ve nu e ($ M ill io ns ) $102.6 $101.4 Q3 2024 Q3 2025 $0 $25 $50 $75 $100 $125 O pe ra tin g In co m e ($ M ill io ns ) $12.2 $10.8 Q3 2024 Q3 2025 $0 $5 $10 $15 O pe ra tin g In co m e ($ M ill io ns ) $68.1 $106.6 Q3 2024 Q3 2025 $0 $25 $50 $75 $100 $125 Third Quarter 2025 GAAP Segment Results Sterling | STRL: Third Quarter 2025 8 Transportation Solutions Building Solutions 58% E-Infrastructure Solutions 25% 1% 57% 31% 12% All comparisons are to the prior year quarter REVENUE OPERATING INCOME E-Infrastructure Solutions • Revenue grew 58% over prior year (42% excluding CEC) • Work continues to shift toward large, mission-critical projects • GAAP operating income grew 57% Transportation Solutions • GAAP revenue decline reflects the deconsolidation of the RHB JV, which is no longer included in revenue. Demand in the core Rocky Mountain and Arizona markets remains strong • GAAP operating income grew 31%, reflecting a favorable project mix shift and good execution Building Solutions • Revenue declined 1% reflecting the softness in the residential housing markets • GAAP operating income declined 12%, driven by the challenging conditions in the residential housing markets
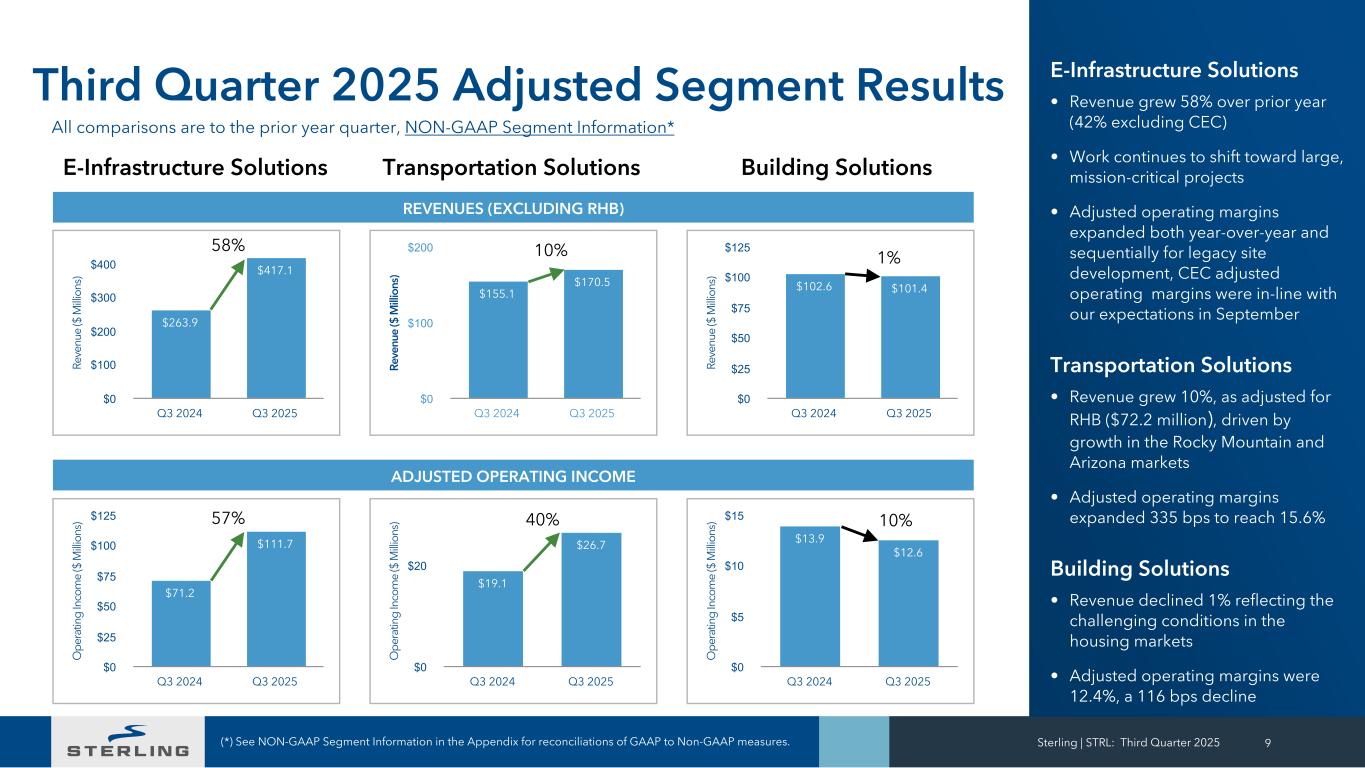
O pe ra tin g In co m e ($ M ill io ns ) $13.9 $12.6 Q3 2024 Q3 2025 $0 $5 $10 $15 REVENUES (EXCLUDING RHB) Re ve nu e ($ M ill io ns ) $102.6 $101.4 Q3 2024 Q3 2025 $0 $25 $50 $75 $100 $125 ADJUSTED OPERATING INCOME Re ve nu e ($ M ill io ns ) $155.1 $170.5 Q3 2024 Q3 2025 $0 $100 $200 Re ve nu e ($ M ill io ns ) $263.9 $417.1 Q3 2024 Q3 2025 $0 $100 $200 $300 $400 O pe ra tin g In co m e ($ M ill io ns ) $19.1 $26.7 Q3 2024 Q3 2025 $0 $20 O pe ra tin g In co m e ($ M ill io ns ) $71.2 $111.7 Q3 2024 Q3 2025 $0 $25 $50 $75 $100 $125 Third Quarter 2025 Adjusted Segment Results (*) See NON-GAAP Segment Information in the Appendix for reconciliations of GAAP to Non-GAAP measures. Sterling | STRL: Third Quarter 2025 9 58% 10% 1% 57% 40% 10% All comparisons are to the prior year quarter, NON-GAAP Segment Information* Building Solutions E-Infrastructure Solutions • Revenue grew 58% over prior year (42% excluding CEC) • Work continues to shift toward large, mission-critical projects • Adjusted operating margins expanded both year-over-year and sequentially for legacy site development, CEC adjusted operating margins were in-line with our expectations in September Transportation Solutions • Revenue grew 10%, as adjusted for RHB ($72.2 million), driven by growth in the Rocky Mountain and Arizona markets • Adjusted operating margins expanded 335 bps to reach 15.6% Building Solutions • Revenue declined 1% reflecting the challenging conditions in the housing markets • Adjusted operating margins were 12.4%, a 116 bps decline Transportation SolutionsE-Infrastructure Solutions
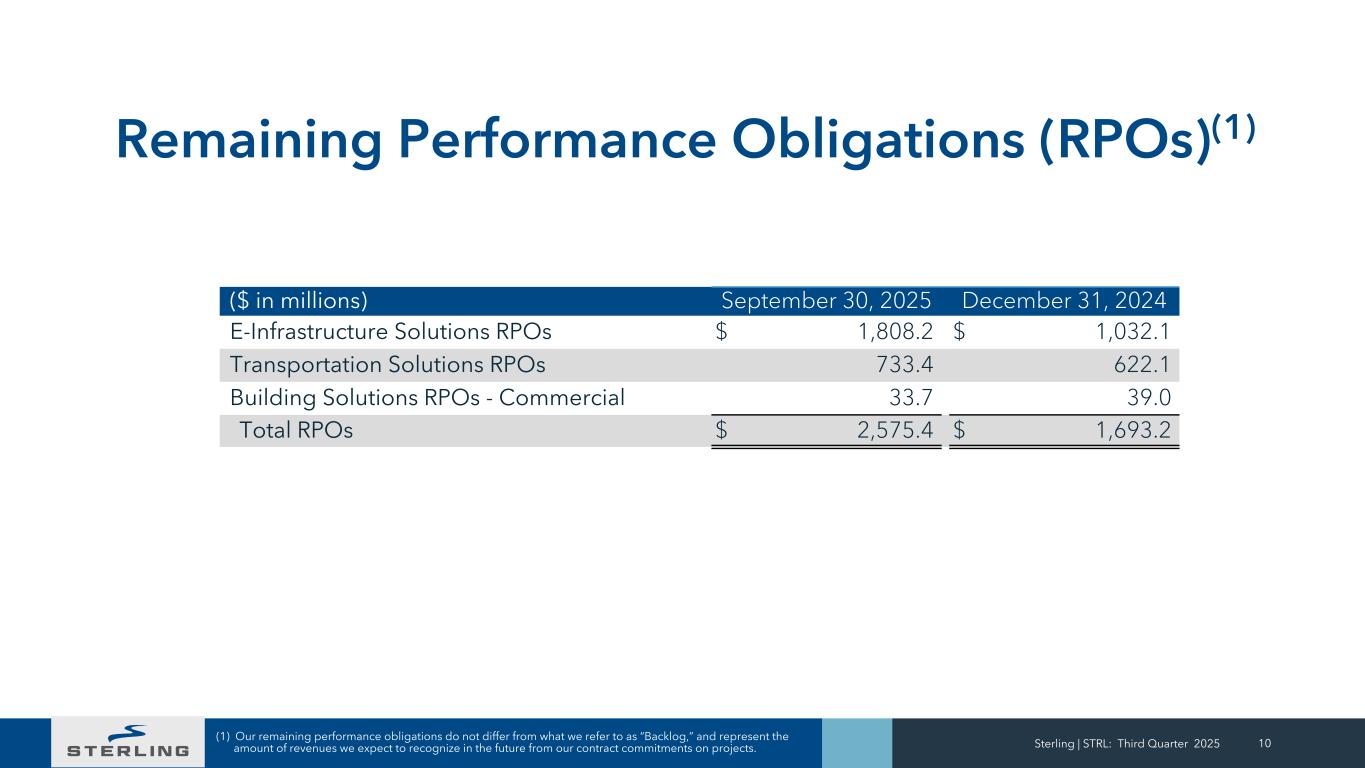
Sterling | STRL: Third Quarter 2025 10 Remaining Performance Obligations (RPOs)(1) ($ in millions) September 30, 2025 December 31, 2024 E-Infrastructure Solutions RPOs $ 1,808.2 $ 1,032.1 Transportation Solutions RPOs 733.4 622.1 Building Solutions RPOs - Commercial 33.7 39.0 Total RPOs $ 2,575.4 $ 1,693.2 (1) Our remaining performance obligations do not differ from what we refer to as “Backlog,” and represent the amount of revenues we expect to recognize in the future from our contract commitments on projects.
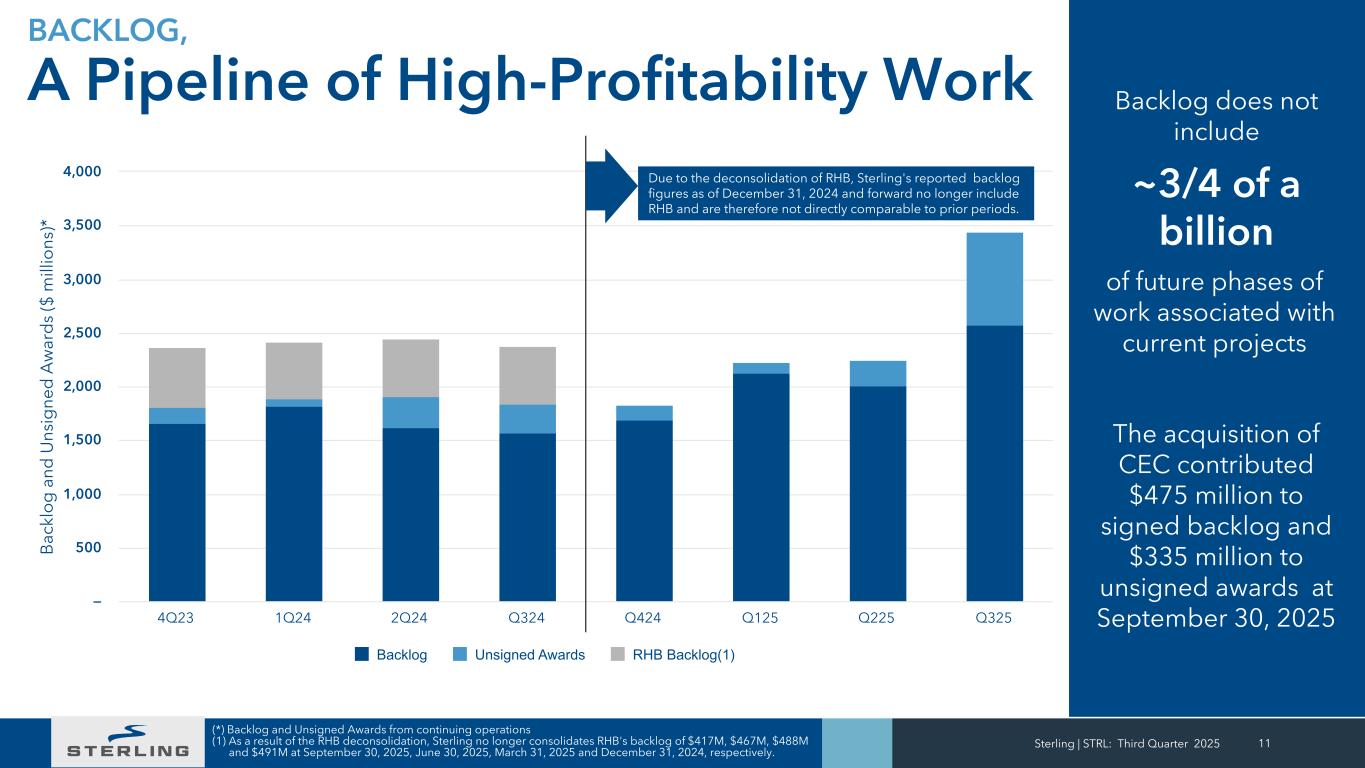
Sterling | STRL: Third Quarter 2025 11 (*) Backlog and Unsigned Awards from continuing operations (1) As a result of the RHB deconsolidation, Sterling no longer consolidates RHB's backlog of $417M, $467M, $488M and $491M at September 30, 2025, June 30, 2025, March 31, 2025 and December 31, 2024, respectively. B ac kl o g a nd U ns ig ne d A w ar d s ($ m ill io ns )* Backlog Unsigned Awards RHB Backlog(1) 4Q23 1Q24 2Q24 Q324 Q424 Q125 Q225 Q325 — 500 1,000 1,500 2,000 2,500 3,000 3,500 4,000 Backlog does not include BACKLOG, A Pipeline of High-Profitability Work ~3/4 of a billion of future phases of work associated with current projects Due to the deconsolidation of RHB, Sterling's reported backlog figures as of December 31, 2024 and forward no longer include RHB and are therefore not directly comparable to prior periods. The acquisition of CEC contributed $475 million to signed backlog and $335 million to unsigned awards at September 30, 2025
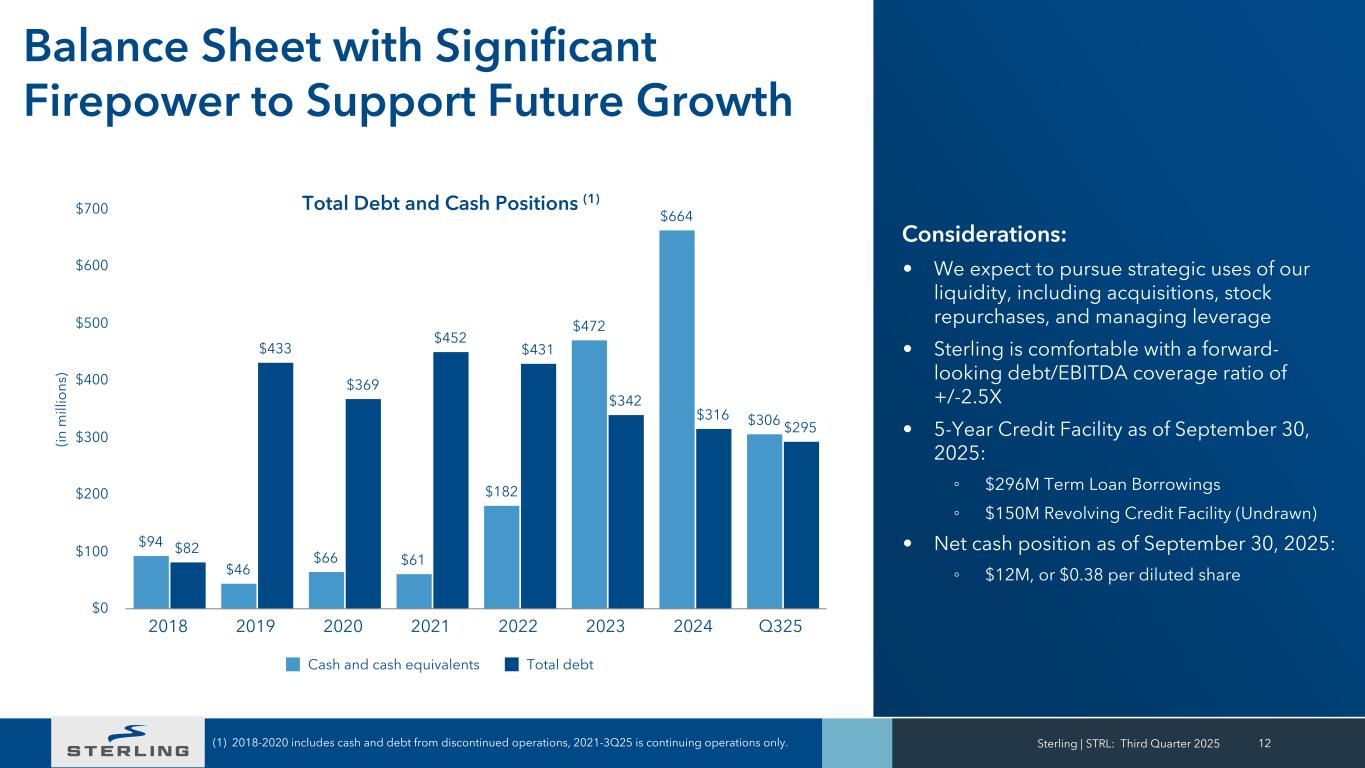
Sterling | STRL: Third Quarter 2025 12(1) 2018-2020 includes cash and debt from discontinued operations, 2021-3Q25 is continuing operations only. (in m ill io ns ) $94 $46 $66 $61 $182 $472 $664 $306 $82 $433 $369 $452 $431 $342 $316 $295 Cash and cash equivalents Total debt 2018 2019 2020 2021 2022 2023 2024 Q325 $0 $100 $200 $300 $400 $500 $600 $700 Total Debt and Cash Positions (1) Balance Sheet with Significant Firepower to Support Future Growth Considerations: • We expect to pursue strategic uses of our liquidity, including acquisitions, stock repurchases, and managing leverage • Sterling is comfortable with a forward- looking debt/EBITDA coverage ratio of +/-2.5X • 5-Year Credit Facility as of September 30, 2025: ◦ $296M Term Loan Borrowings ◦ $150M Revolving Credit Facility (Undrawn) • Net cash position as of September 30, 2025: ◦ $12M, or $0.38 per diluted share
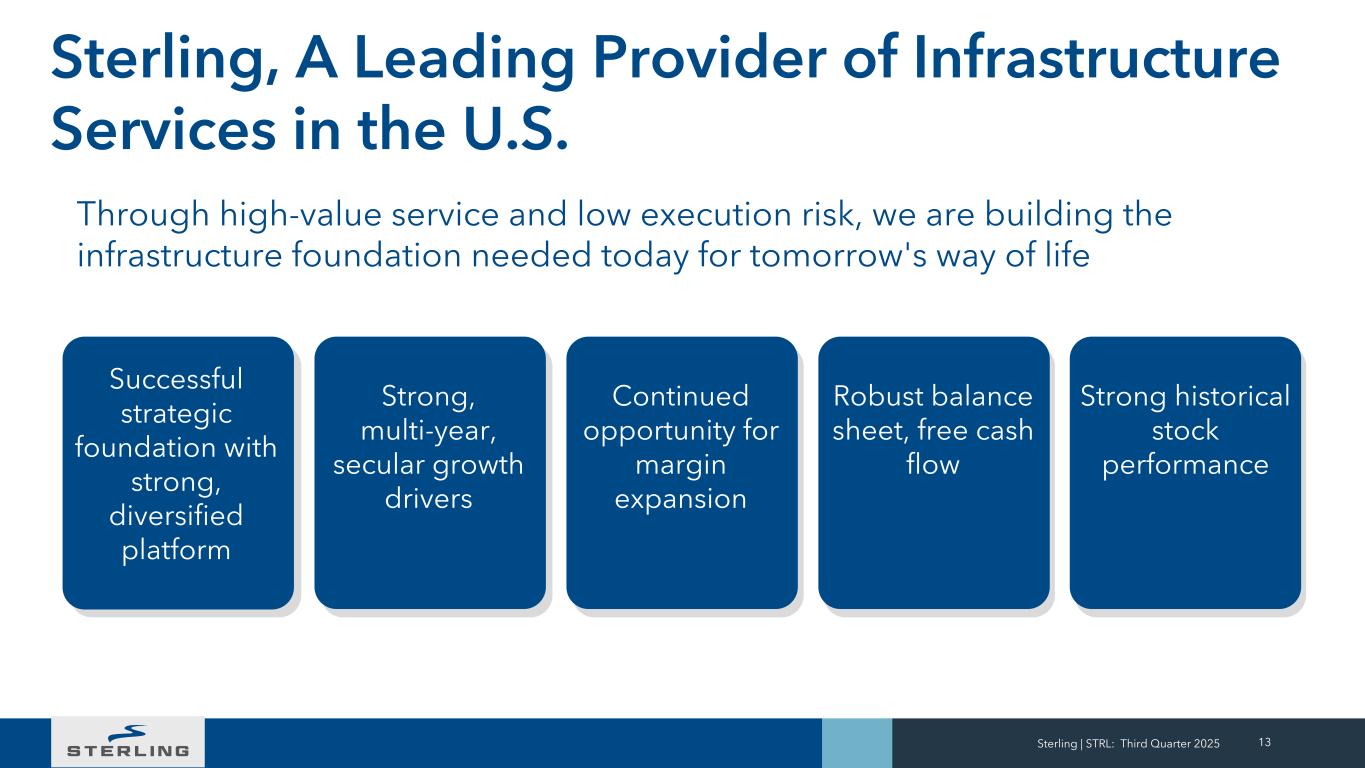
13 Sterling, A Leading Provider of Infrastructure Services in the U.S. Sterling | STRL: Third Quarter 2025 Successful strategic foundation with strong, diversified platform Strong, multi-year, secular growth drivers Continued opportunity for margin expansion Robust balance sheet, free cash flow Strong historical stock performance Through high-value service and low execution risk, we are building the infrastructure foundation needed today for tomorrow's way of life
We build and service the infrastructure that enables our economy to run, our people to move, and our country to grow. Sterling | STRL: Third Quarter 2025 14 Contact Us Sterling Infrastructure, Inc. Noelle Dilts, VP IR and Corporate Strategy Tel: (281) 214-0795 noelle.dilts@strlco.com
+ Appendix Sterling | STRL: Third Quarter 2025 15
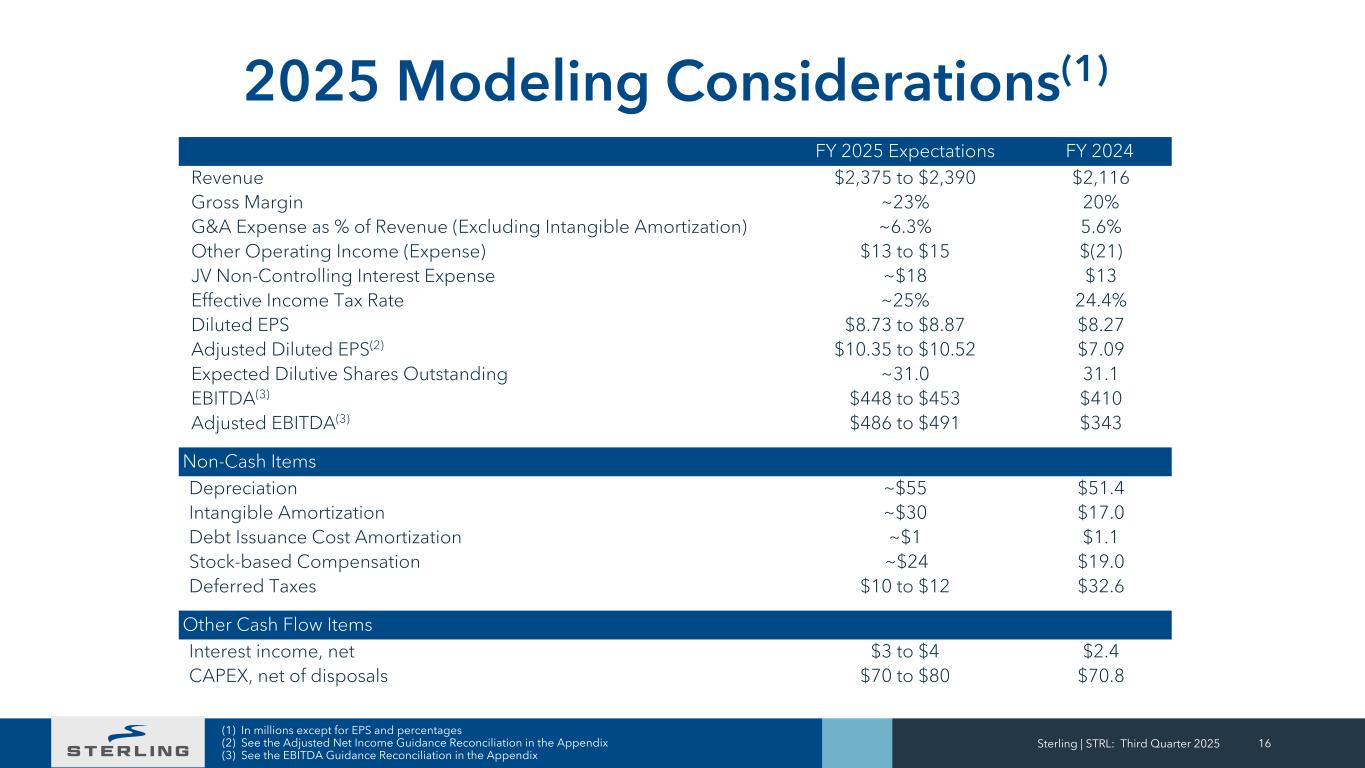
2025 Modeling Considerations(1) Sterling | STRL: Third Quarter 2025 16 (1) In millions except for EPS and percentages (2) See the Adjusted Net Income Guidance Reconciliation in the Appendix (3) See the EBITDA Guidance Reconciliation in the Appendix FY 2025 Expectations FY 2024 Revenue $2,375 to $2,390 $2,116 Gross Margin ~23% 20% G&A Expense as % of Revenue (Excluding Intangible Amortization) ~6.3% 5.6% Other Operating Income (Expense) $13 to $15 $(21) JV Non-Controlling Interest Expense ~$18 $13 Effective Income Tax Rate ~25% 24.4% Diluted EPS $8.73 to $8.87 $8.27 Adjusted Diluted EPS(2) $10.35 to $10.52 $7.09 Expected Dilutive Shares Outstanding ~31.0 31.1 EBITDA(3) $448 to $453 $410 Adjusted EBITDA(3) $486 to $491 $343 Non-Cash Items Depreciation ~$55 $51.4 Intangible Amortization ~$30 $17.0 Debt Issuance Cost Amortization ~$1 $1.1 Stock-based Compensation ~$24 $19.0 Deferred Taxes $10 to $12 $32.6 Other Cash Flow Items Interest income, net $3 to $4 $2.4 CAPEX, net of disposals $70 to $80 $70.8
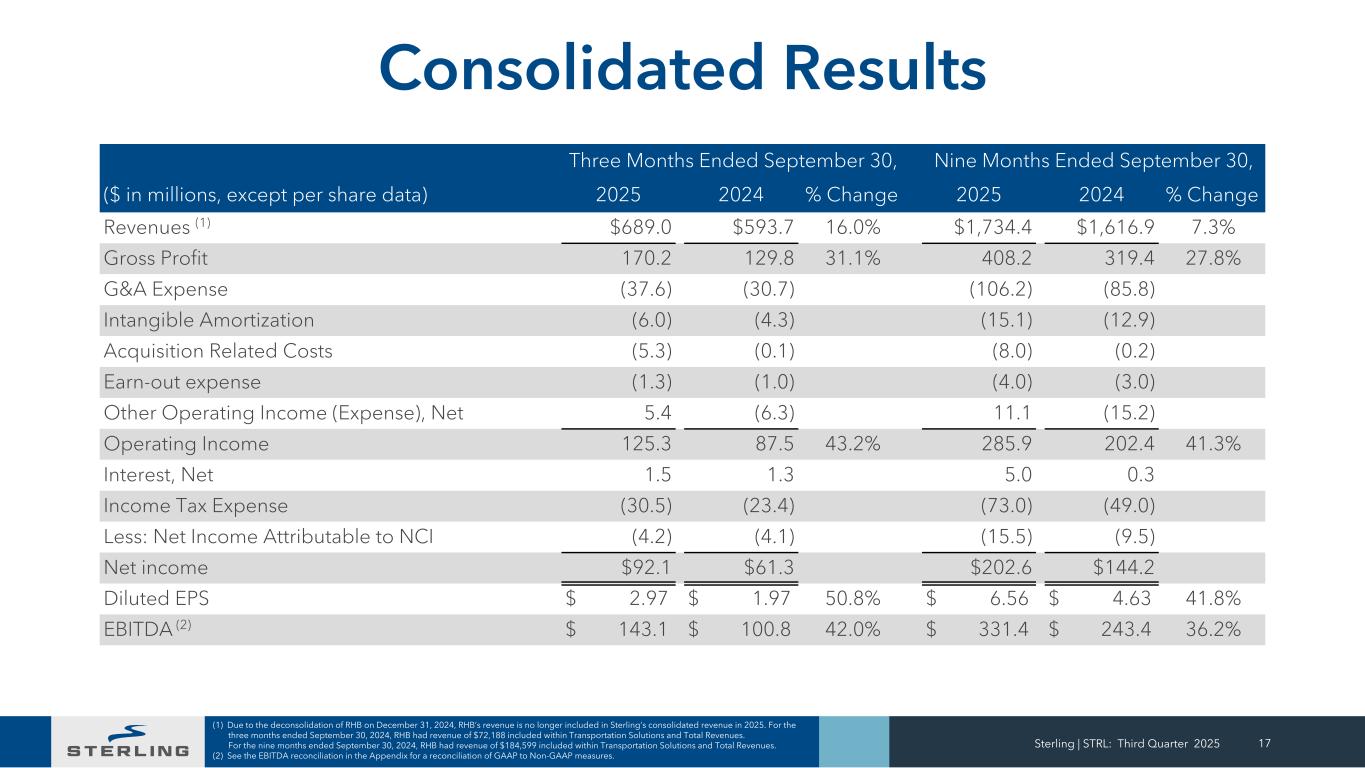
Consolidated Results Three Months Ended September 30, Nine Months Ended September 30, ($ in millions, except per share data) 2025 2024 % Change 2025 2024 % Change Revenues (1) $689.0 $593.7 16.0% $1,734.4 $1,616.9 7.3% Gross Profit 170.2 129.8 31.1% 408.2 319.4 27.8% G&A Expense (37.6) (30.7) (106.2) (85.8) Intangible Amortization (6.0) (4.3) (15.1) (12.9) Acquisition Related Costs (5.3) (0.1) (8.0) (0.2) Earn-out expense (1.3) (1.0) (4.0) (3.0) Other Operating Income (Expense), Net 5.4 (6.3) 11.1 (15.2) Operating Income 125.3 87.5 43.2% 285.9 202.4 41.3% Interest, Net 1.5 1.3 5.0 0.3 Income Tax Expense (30.5) (23.4) (73.0) (49.0) Less: Net Income Attributable to NCI (4.2) (4.1) (15.5) (9.5) Net income $92.1 $61.3 $202.6 $144.2 Diluted EPS $ 2.97 $ 1.97 50.8% $ 6.56 $ 4.63 41.8% EBITDA (2) $ 143.1 $ 100.8 42.0% $ 331.4 $ 243.4 36.2% (1) Due to the deconsolidation of RHB on December 31, 2024, RHB’s revenue is no longer included in Sterling’s consolidated revenue in 2025. For the three months ended September 30, 2024, RHB had revenue of $72,188 included within Transportation Solutions and Total Revenues. For the nine months ended September 30, 2024, RHB had revenue of $184,599 included within Transportation Solutions and Total Revenues. (2) See the EBITDA reconciliation in the Appendix for a reconciliation of GAAP to Non-GAAP measures. Sterling | STRL: Third Quarter 2025 17
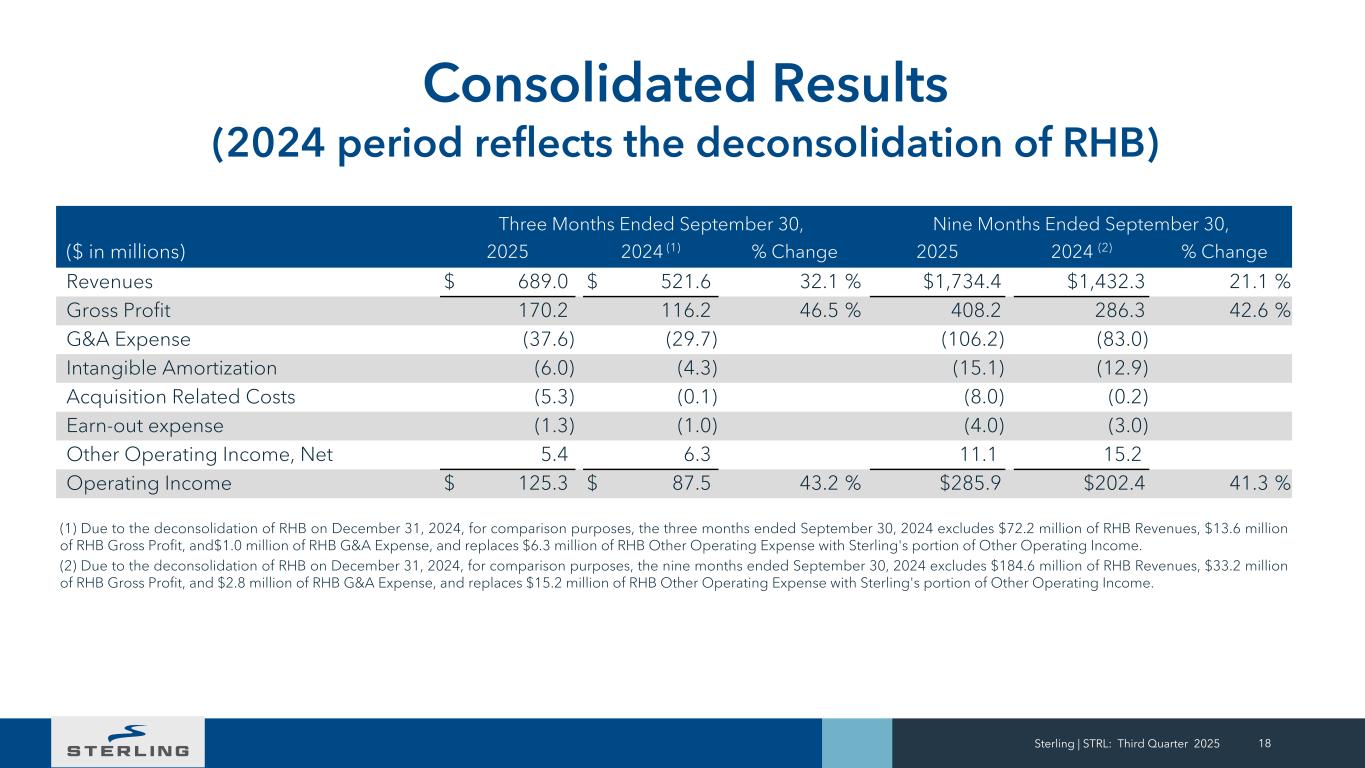
Sterling | STRL: Third Quarter 2025 18 Consolidated Results (2024 period reflects the deconsolidation of RHB) Three Months Ended September 30, Nine Months Ended September 30, ($ in millions) 2025 2024 (1) % Change 2025 2024 (2) % Change Revenues $ 689.0 $ 521.6 32.1 % $1,734.4 $1,432.3 21.1 % Gross Profit 170.2 116.2 46.5 % 408.2 286.3 42.6 % G&A Expense (37.6) (29.7) (106.2) (83.0) Intangible Amortization (6.0) (4.3) (15.1) (12.9) Acquisition Related Costs (5.3) (0.1) (8.0) (0.2) Earn-out expense (1.3) (1.0) (4.0) (3.0) Other Operating Income, Net 5.4 6.3 11.1 15.2 Operating Income $ 125.3 $ 87.5 43.2 % $285.9 $202.4 41.3 % (1) Due to the deconsolidation of RHB on December 31, 2024, for comparison purposes, the three months ended September 30, 2024 excludes $72.2 million of RHB Revenues, $13.6 million of RHB Gross Profit, and$1.0 million of RHB G&A Expense, and replaces $6.3 million of RHB Other Operating Expense with Sterling's portion of Other Operating Income. (2) Due to the deconsolidation of RHB on December 31, 2024, for comparison purposes, the nine months ended September 30, 2024 excludes $184.6 million of RHB Revenues, $33.2 million of RHB Gross Profit, and $2.8 million of RHB G&A Expense, and replaces $15.2 million of RHB Other Operating Expense with Sterling's portion of Other Operating Income.
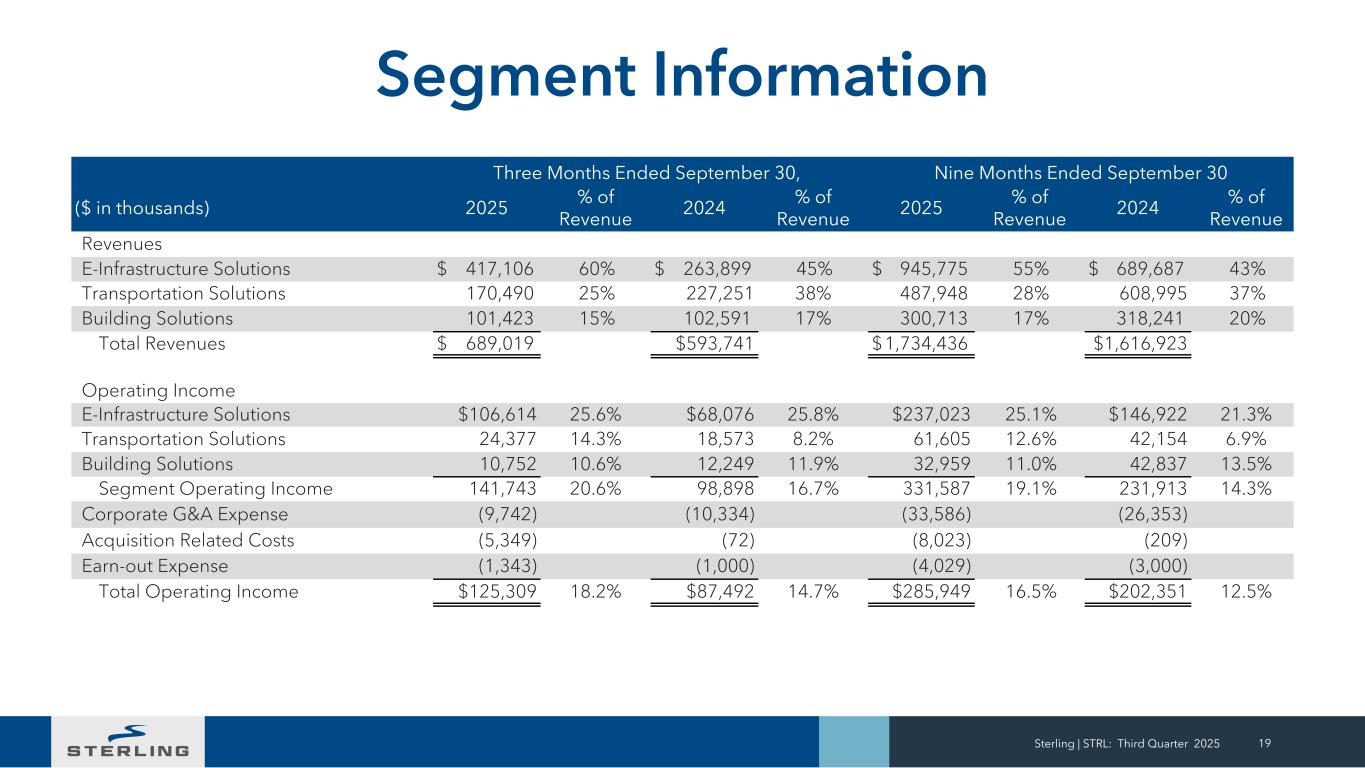
Three Months Ended September 30, Nine Months Ended September 30 ($ in thousands) 2025 % of Revenue 2024 % of Revenue 2025 % of Revenue 2024 % of Revenue Revenues E-Infrastructure Solutions $ 417,106 60% $ 263,899 45% $ 945,775 55% $ 689,687 43% Transportation Solutions 170,490 25% 227,251 38% 487,948 28% 608,995 37% Building Solutions 101,423 15% 102,591 17% 300,713 17% 318,241 20% Total Revenues $ 689,019 $593,741 $ 1,734,436 $1,616,923 Operating Income E-Infrastructure Solutions $106,614 25.6% $68,076 25.8% $237,023 25.1% $146,922 21.3% Transportation Solutions 24,377 14.3% 18,573 8.2% 61,605 12.6% 42,154 6.9% Building Solutions 10,752 10.6% 12,249 11.9% 32,959 11.0% 42,837 13.5% Segment Operating Income 141,743 20.6% 98,898 16.7% 331,587 19.1% 231,913 14.3% Corporate G&A Expense (9,742) (10,334) (33,586) (26,353) Acquisition Related Costs (5,349) (72) (8,023) (209) Earn-out Expense (1,343) (1,000) (4,029) (3,000) Total Operating Income $125,309 18.2% $87,492 14.7% $285,949 16.5% $202,351 12.5% Segment Information Sterling | STRL: Third Quarter 2025 19
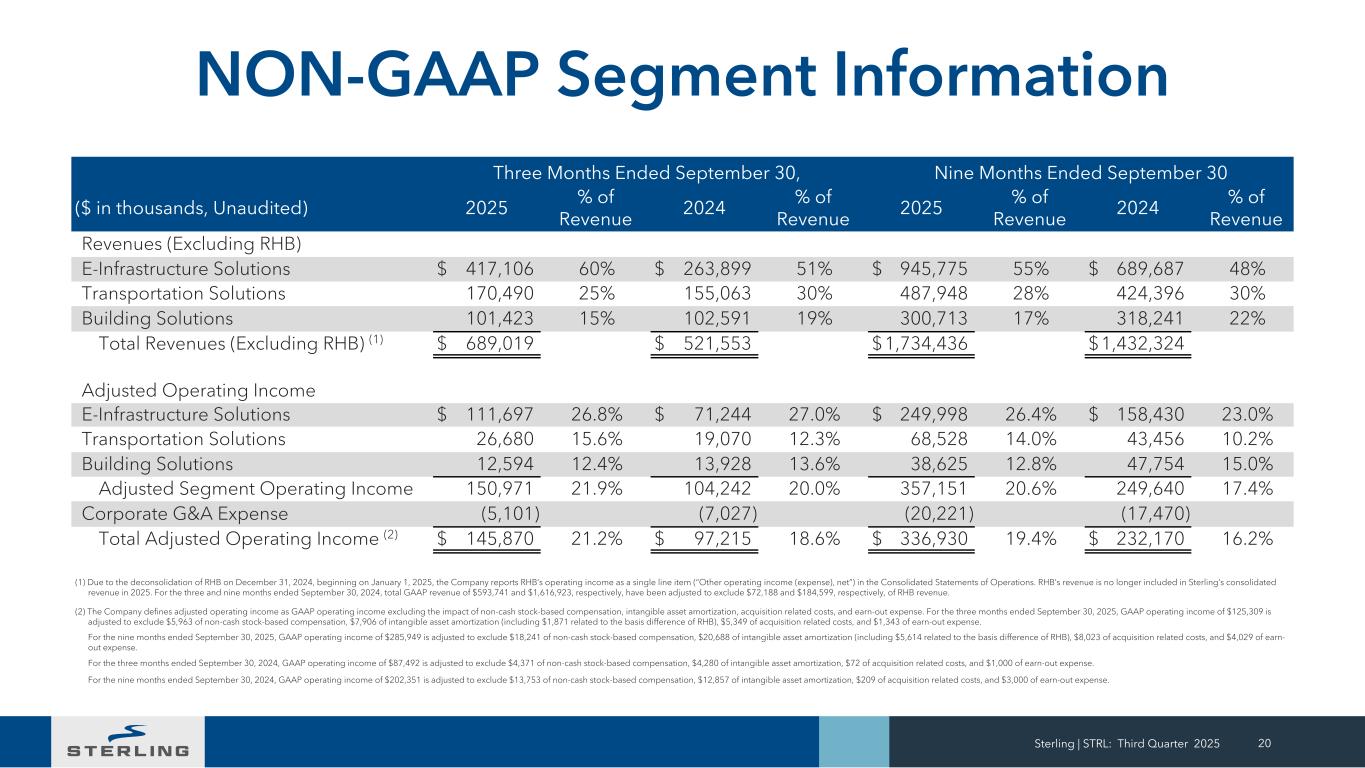
Three Months Ended September 30, Nine Months Ended September 30 ($ in thousands, Unaudited) 2025 % of Revenue 2024 % of Revenue 2025 % of Revenue 2024 % of Revenue Revenues (Excluding RHB) E-Infrastructure Solutions $ 417,106 60% $ 263,899 51% $ 945,775 55% $ 689,687 48% Transportation Solutions 170,490 25% 155,063 30% 487,948 28% 424,396 30% Building Solutions 101,423 15% 102,591 19% 300,713 17% 318,241 22% Total Revenues (Excluding RHB) (1) $ 689,019 $ 521,553 $ 1,734,436 $ 1,432,324 Adjusted Operating Income E-Infrastructure Solutions $ 111,697 26.8% $ 71,244 27.0% $ 249,998 26.4% $ 158,430 23.0% Transportation Solutions 26,680 15.6% 19,070 12.3% 68,528 14.0% 43,456 10.2% Building Solutions 12,594 12.4% 13,928 13.6% 38,625 12.8% 47,754 15.0% Adjusted Segment Operating Income 150,971 21.9% 104,242 20.0% 357,151 20.6% 249,640 17.4% Corporate G&A Expense (5,101) (7,027) (20,221) (17,470) Total Adjusted Operating Income (2) $ 145,870 21.2% $ 97,215 18.6% $ 336,930 19.4% $ 232,170 16.2% (1) Due to the deconsolidation of RHB on December 31, 2024, beginning on January 1, 2025, the Company reports RHB’s operating income as a single line item (“Other operating income (expense), net”) in the Consolidated Statements of Operations. RHB’s revenue is no longer included in Sterling’s consolidated revenue in 2025. For the three and nine months ended September 30, 2024, total GAAP revenue of $593,741 and $1,616,923, respectively, have been adjusted to exclude $72,188 and $184,599, respectively, of RHB revenue. (2) The Company defines adjusted operating income as GAAP operating income excluding the impact of non-cash stock-based compensation, intangible asset amortization, acquisition related costs, and earn-out expense. For the three months ended September 30, 2025, GAAP operating income of $125,309 is adjusted to exclude $5,963 of non-cash stock-based compensation, $7,906 of intangible asset amortization (including $1,871 related to the basis difference of RHB), $5,349 of acquisition related costs, and $1,343 of earn-out expense. For the nine months ended September 30, 2025, GAAP operating income of $285,949 is adjusted to exclude $18,241 of non-cash stock-based compensation, $20,688 of intangible asset amortization (including $5,614 related to the basis difference of RHB), $8,023 of acquisition related costs, and $4,029 of earn- out expense. For the three months ended September 30, 2024, GAAP operating income of $87,492 is adjusted to exclude $4,371 of non-cash stock-based compensation, $4,280 of intangible asset amortization, $72 of acquisition related costs, and $1,000 of earn-out expense. For the nine months ended September 30, 2024, GAAP operating income of $202,351 is adjusted to exclude $13,753 of non-cash stock-based compensation, $12,857 of intangible asset amortization, $209 of acquisition related costs, and $3,000 of earn-out expense. NON-GAAP Segment Information Sterling | STRL: Third Quarter 2025 20
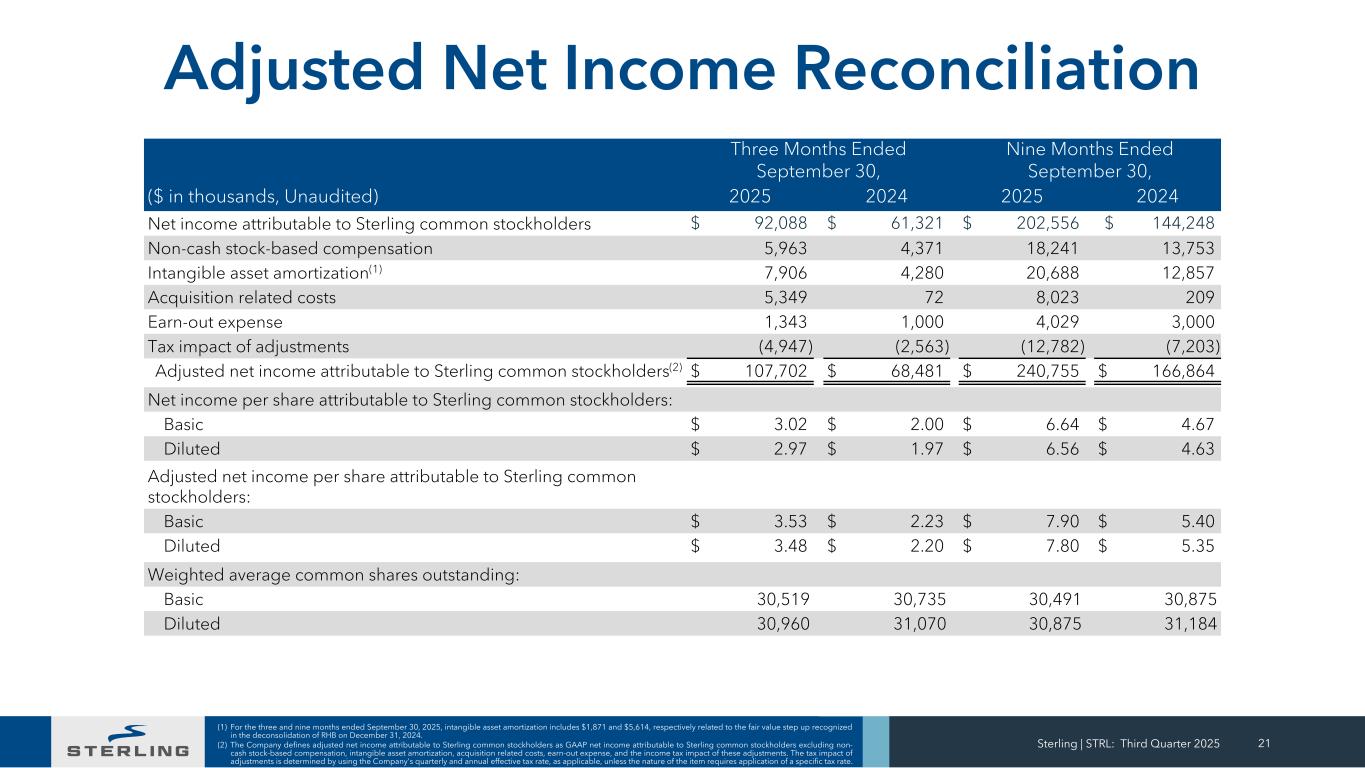
Sterling | STRL: Third Quarter 2025 21 (1) For the three and nine months ended September 30, 2025, intangible asset amortization includes $1,871 and $5,614, respectively related to the fair value step up recognized in the deconsolidation of RHB on December 31, 2024. (2) The Company defines adjusted net income attributable to Sterling common stockholders as GAAP net income attributable to Sterling common stockholders excluding non- cash stock-based compensation, intangible asset amortization, acquisition related costs, earn-out expense, and the income tax impact of these adjustments. The tax impact of adjustments is determined by using the Company's quarterly and annual effective tax rate, as applicable, unless the nature of the item requires application of a specific tax rate. Three Months Ended September 30, Nine Months Ended September 30, ($ in thousands, Unaudited) 2025 2024 2025 2024 Net income attributable to Sterling common stockholders $ 92,088 $ 61,321 $ 202,556 $ 144,248 Non-cash stock-based compensation 5,963 4,371 18,241 13,753 Intangible asset amortization(1) 7,906 4,280 20,688 12,857 Acquisition related costs 5,349 72 8,023 209 Earn-out expense 1,343 1,000 4,029 3,000 Tax impact of adjustments (4,947) (2,563) (12,782) (7,203) Adjusted net income attributable to Sterling common stockholders(2) $ 107,702 $ 68,481 $ 240,755 $ 166,864 Net income per share attributable to Sterling common stockholders: Basic $ 3.02 $ 2.00 $ 6.64 $ 4.67 Diluted $ 2.97 $ 1.97 $ 6.56 $ 4.63 Adjusted net income per share attributable to Sterling common stockholders: Basic $ 3.53 $ 2.23 $ 7.90 $ 5.40 Diluted $ 3.48 $ 2.20 $ 7.80 $ 5.35 Weighted average common shares outstanding: Basic 30,519 30,735 30,491 30,875 Diluted 30,960 31,070 30,875 31,184 Adjusted Net Income Reconciliation
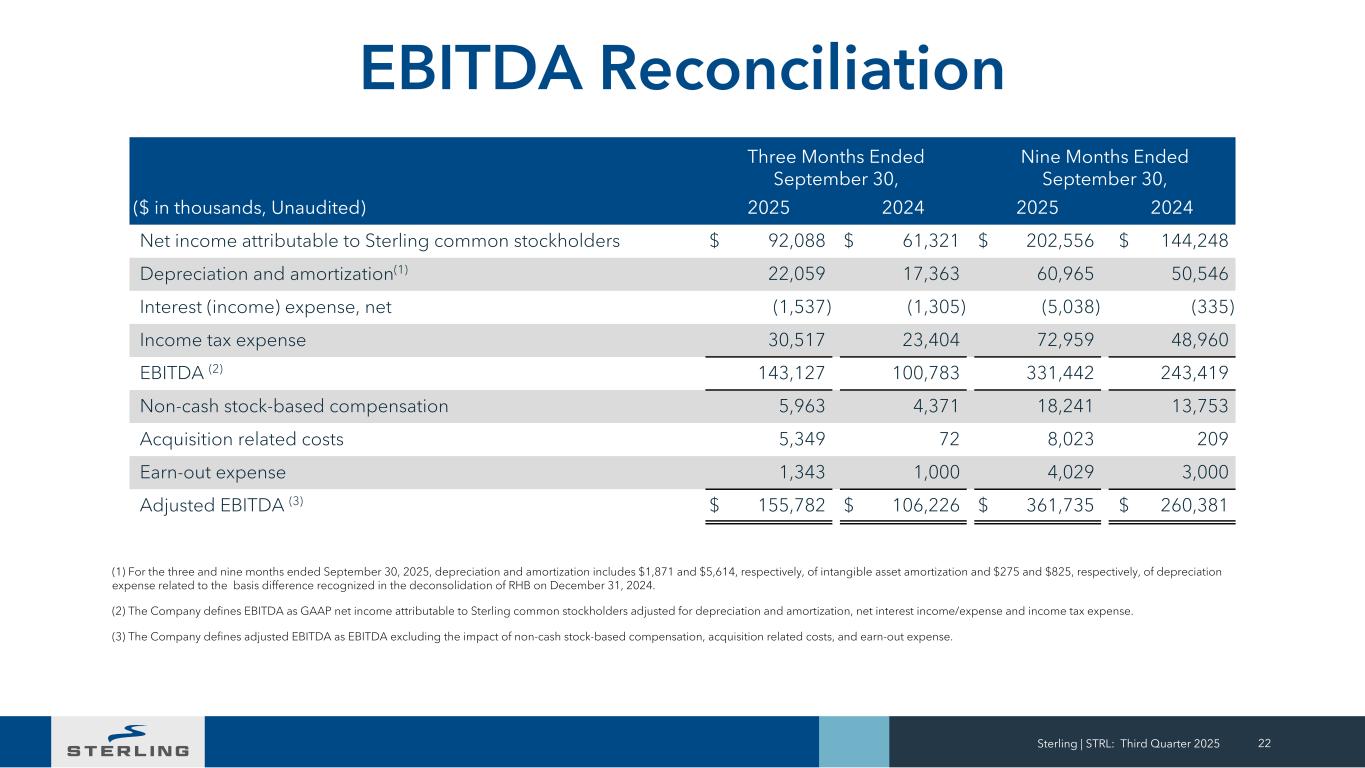
Sterling | STRL: Third Quarter 2025 22 Three Months Ended September 30, Nine Months Ended September 30, ($ in thousands, Unaudited) 2025 2024 2025 2024 Net income attributable to Sterling common stockholders $ 92,088 $ 61,321 $ 202,556 $ 144,248 Depreciation and amortization(1) 22,059 17,363 60,965 50,546 Interest (income) expense, net (1,537) (1,305) (5,038) (335) Income tax expense 30,517 23,404 72,959 48,960 EBITDA (2) 143,127 100,783 331,442 243,419 Non-cash stock-based compensation 5,963 4,371 18,241 13,753 Acquisition related costs 5,349 72 8,023 209 Earn-out expense 1,343 1,000 4,029 3,000 Adjusted EBITDA (3) $ 155,782 $ 106,226 $ 361,735 $ 260,381 (1) For the three and nine months ended September 30, 2025, depreciation and amortization includes $1,871 and $5,614, respectively, of intangible asset amortization and $275 and $825, respectively, of depreciation expense related to the basis difference recognized in the deconsolidation of RHB on December 31, 2024. (2) The Company defines EBITDA as GAAP net income attributable to Sterling common stockholders adjusted for depreciation and amortization, net interest income/expense and income tax expense. (3) The Company defines adjusted EBITDA as EBITDA excluding the impact of non-cash stock-based compensation, acquisition related costs, and earn-out expense. EBITDA Reconciliation
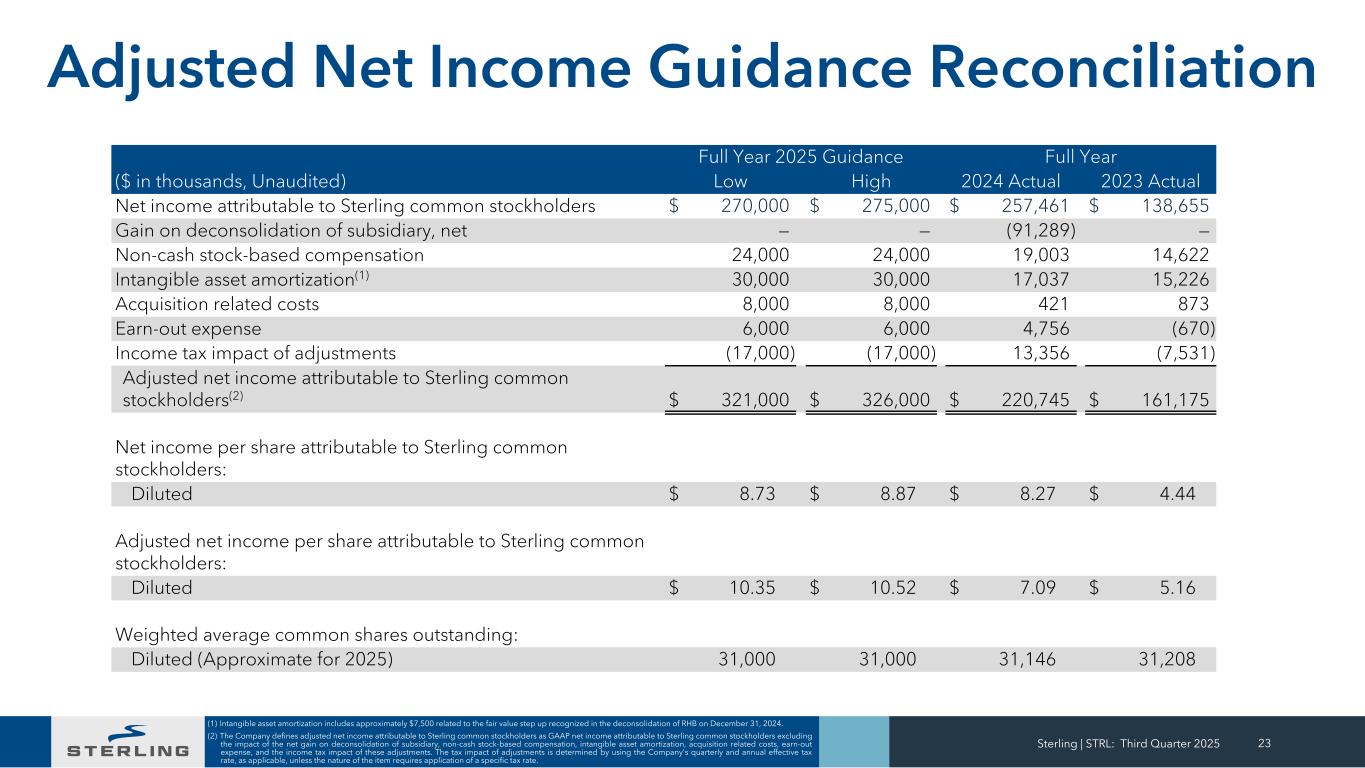
Sterling | STRL: Third Quarter 2025 23 (1) Intangible asset amortization includes approximately $7,500 related to the fair value step up recognized in the deconsolidation of RHB on December 31, 2024. (2) The Company defines adjusted net income attributable to Sterling common stockholders as GAAP net income attributable to Sterling common stockholders excluding the impact of the net gain on deconsolidation of subsidiary, non-cash stock-based compensation, intangible asset amortization, acquisition related costs, earn-out expense, and the income tax impact of these adjustments. The tax impact of adjustments is determined by using the Company's quarterly and annual effective tax rate, as applicable, unless the nature of the item requires application of a specific tax rate. Full Year 2025 Guidance Full Year ($ in thousands, Unaudited) Low High 2024 Actual 2023 Actual Net income attributable to Sterling common stockholders $ 270,000 $ 275,000 $ 257,461 $ 138,655 Gain on deconsolidation of subsidiary, net — — (91,289) — Non-cash stock-based compensation 24,000 24,000 19,003 14,622 Intangible asset amortization(1) 30,000 30,000 17,037 15,226 Acquisition related costs 8,000 8,000 421 873 Earn-out expense 6,000 6,000 4,756 (670) Income tax impact of adjustments (17,000) (17,000) 13,356 (7,531) Adjusted net income attributable to Sterling common stockholders(2) $ 321,000 $ 326,000 $ 220,745 $ 161,175 Net income per share attributable to Sterling common stockholders: Diluted $ 8.73 $ 8.87 $ 8.27 $ 4.44 Adjusted net income per share attributable to Sterling common stockholders: Diluted $ 10.35 $ 10.52 $ 7.09 $ 5.16 Weighted average common shares outstanding: Diluted (Approximate for 2025) 31,000 31,000 31,146 31,208 Adjusted Net Income Guidance Reconciliation
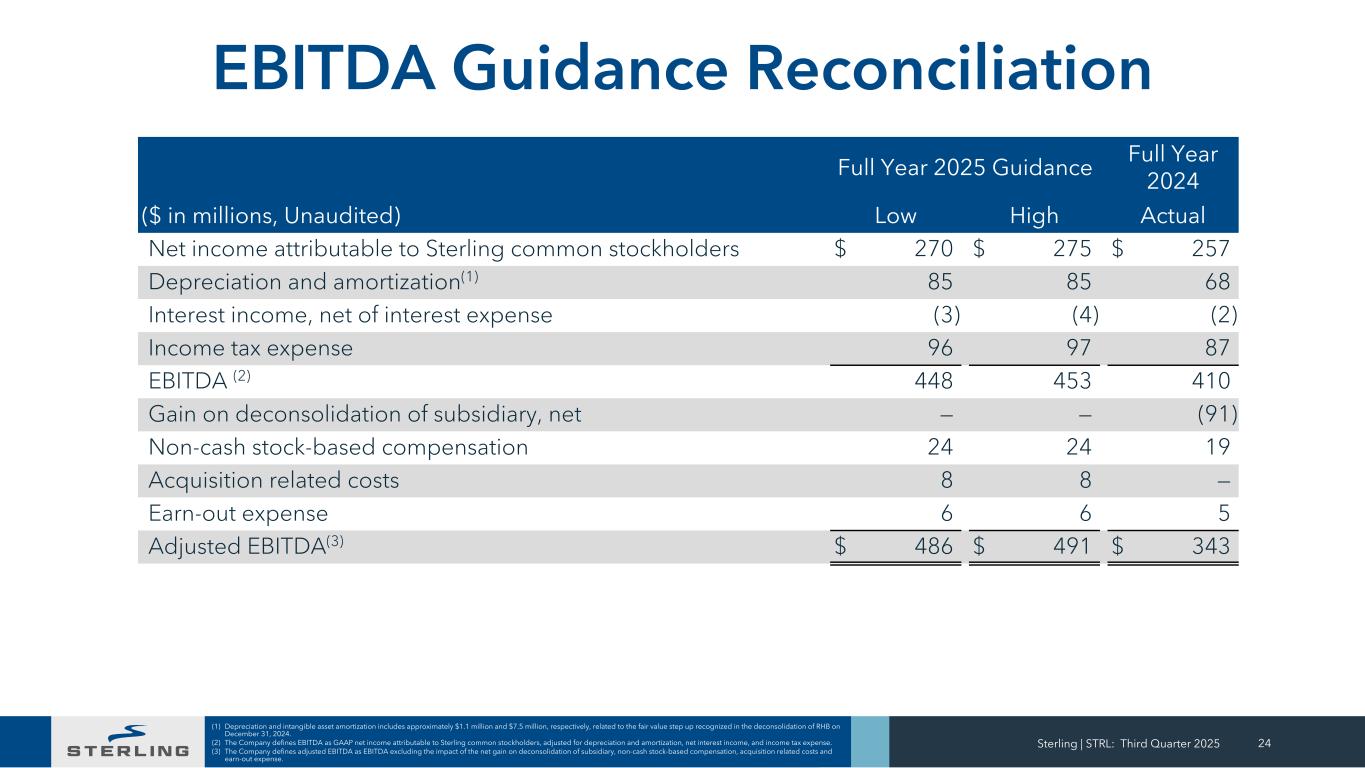
Sterling | STRL: Third Quarter 2025 24 (1) Depreciation and intangible asset amortization includes approximately $1.1 million and $7.5 million, respectively, related to the fair value step up recognized in the deconsolidation of RHB on December 31, 2024. (2) The Company defines EBITDA as GAAP net income attributable to Sterling common stockholders, adjusted for depreciation and amortization, net interest income, and income tax expense. (3) The Company defines adjusted EBITDA as EBITDA excluding the impact of the net gain on deconsolidation of subsidiary, non-cash stock-based compensation, acquisition related costs and earn-out expense. Full Year 2025 Guidance Full Year 2024 ($ in millions, Unaudited) Low High Actual Net income attributable to Sterling common stockholders $ 270 $ 275 $ 257 Depreciation and amortization(1) 85 85 68 Interest income, net of interest expense (3) (4) (2) Income tax expense 96 97 87 EBITDA (2) 448 453 410 Gain on deconsolidation of subsidiary, net — — (91) Non-cash stock-based compensation 24 24 19 Acquisition related costs 8 8 — Earn-out expense 6 6 5 Adjusted EBITDA(3) $ 486 $ 491 $ 343 EBITDA Guidance Reconciliation
We build and service the infrastructure that enables our economy to run, our people to move, and our country to grow. THANK YOU