
Third Quarter 2025 EARNINGS PRESENTATION November 6 | 2025
This document contains forward-looking statements. within the meaning of Section 27A of the Securities Act of 1933, as amended (the “Securities Act”), and Section 21E of the Securities Exchange Act of 1934, as amended (the “Exchange Act”). The Company’s representatives may also make forward-looking statements orally or in writing from time to time. Statements in this document that are not historical facts, including, statements about the Company’s beliefs and expectations, future financial performance, growth, and future prospects, the Company’s strategy, business and economic trends and growth, technological leadership and differentiation, potential and completed acquisitions, anticipated operating efficiencies and synergies and estimates of amounts for redeemable noncontrolling interests and deferred acquisition consideration, constitute forward-looking statements. Forward-looking statements, which are generally denoted by words such as “aim,” “anticipate,” “assume,” “believe,” “continue,” “could,” “create,” “develop,” “estimate,” “expect,” “focus,” “forecast,” “foresee,” “future,” “goal,” “guidance,” “in development,” “intend,” “likely,” “look,” “maintain,” “may,” “ongoing,” “outlook,” “plan,” “possible,” “potential,” “predict,” “probable,” “project,” “should,” “target,” “will,” “would” or the negative of such terms or other variations thereof and terms of similar substance used in connection with any discussion of current plans, estimates and projections are subject to change based on a number of factors, including those outlined in this section. Forward-looking statements in this document are based on certain key expectations and assumptions made by the Company. Although the management of the Company believes that the expectations and assumptions on which such forward-looking statements are based are reasonable, undue reliance should not be placed on the forward-looking statements because the Company can give no assurance that they will prove to be correct. The material assumptions upon which such forward-looking statements are based include, among others, assumptions with respect to general business, economic and market conditions, the competitive environment, anticipated and unanticipated tax consequences and anticipated and unanticipated costs. These forward-looking statements are based on current plans, estimates and projections, and are subject to change based on a number of factors, including those outlined in this section. These forward-looking statements are subject to various risks and uncertainties, many of which are outside the Company’s control. Therefore, you should not place undue reliance on such statements. Forward-looking statements speak only as of the date they are made, and the Company undertakes no obligation to update publicly any of them in light of new information or future events, if any. Forward-looking statements involve inherent risks and uncertainties. A number of important factors could cause actual results to differ materially from those contained in any forward-looking statements. Such risk factors include, but are not limited to, the following: • risks associated with international, national and regional unfavorable economic conditions that could affect the Company or its clients; • demand for the Company’s services, which may precipitate or exacerbate other risks and uncertainties; • inflation and actions taken by central banks to counter inflation; • the Company’s ability to attract new clients and retain existing clients; • the impact of a reduction in client spending and changes in client advertising, marketing and corporate communications requirements; • financial failure of the Company’s clients; • the Company’s ability to retain and attract key employees; • the Company’s ability to compete in the markets in which it operates; • the Company’s ability to achieve its cost saving initiatives; • the Company’s implementation of strategic initiatives; • the Company’s ability to remain in compliance with its debt agreements and the Company’s ability to finance its contingent payment obligations when due and payable, including but not limited to those relating to redeemable noncontrolling interests and deferred acquisition consideration; • the Company’s ability to manage its growth effectively; • the Company’s ability to identify, complete and integrate acquisitions that complement and expand the Company’s business capabilities and realize cost savings, synergies or other anticipated benefits of newly acquired businesses, or that even if realized, such benefits may take longer to realize than expected; • the Company’s ability to identify and complete divestitures and to achieve the anticipated benefits therefrom; • the Company’s ability to develop products incorporating new technologies, including augmented reality, artificial intelligence, and virtual reality, and realize benefits from such products; • the Company’s use of artificial intelligence, including generative artificial intelligence; • adverse tax consequences for the Company, its operations and its stockholders, that may differ from the expectations of the Company, including that recent or future changes in tax laws, potential changes to corporate tax rates in the United States and disagreements with tax authorities on the Company’s determinations that may result in increased tax costs; • adverse tax consequences in connection with the Transactions, including the incurrence of material Canadian federal income tax (including material “emigration tax”); • the Company’s ability to establish and maintain an effective system of internal control over financial reporting, including the risk that the Company’s internal controls will fail to detect misstatements in its financial statements • the Company’s ability to accurately forecast its future financial performance and provide accurate guidance; • the Company’s ability to protect client data from security incidents or cyberattacks; • economic disruptions resulting from war and other geopolitical tensions (such as the ongoing military conflicts between Russia and Ukraine and in the Middle East), terrorist activities and natural disasters; • stock price volatility; and • foreign currency fluctuations. Investors should carefully consider these risk factors, other risk factors described herein, and the additional risk factors outlined in more detail in our 2024 Form 10-K, filed with the Securities and Exchange Commission (the “SEC”) on March 5, 2025, and accessible on the SEC’s website at www.sec.gov, under the caption “Risk Factors,” and in the Company’s other SEC filings. FORWARD LOOKING STATEMENTS & OTHER INFORMATION 2
DEFINITIONS OF NON-GAAP FINANCIAL MEASURES 3 In addition to its reported results, Stagwell Inc. has included in this earnings presentation certain financial results that the Securities and Exchange Commission (SEC) defines as "non-GAAP Financial Measures." Management believes that such non-GAAP financial measures, when read in conjunction with the Company's reported results, can provide useful supplemental information for investors analyzing period to period comparisons of the Company's results. Such non-GAAP financial measures include the following: Pro Forma Results: The Pro Forma amounts presented for each period were prepared by combining the historical standalone statements of operations for each of legacy MDC and SMG. The unaudited pro forma results are provided for illustrative purposes only and do not purport to represent what the actual consolidated results of operations or consolidated financial condition would have been had the combination actually occurred on the date indicated, nor do they purport to project the future consolidated results of operations or consolidated financial condition for any future period or as of any future date. The Company has excluded a quantitative reconciliation of Adjusted Pro Forma EBITDA to net income under the “unreasonable efforts” exception in Item 10(e)(1)(i)(B) of Regulation S-K. 1) Organic Net Revenue: “Organic net revenue growth” and “Organic net revenue decline” reflects the year-over-year change in the Company's reported net revenue attributable to the Company's management of the entities it owns. We calculate organic net revenue growth (decline) by subtracting the net impact of acquisitions (divestitures) and the impact of foreign currency exchange fluctuations from the aggregate year-over-year increase or decrease in the Company's reported net revenue. The net impact of acquisitions (divestitures) reflects the year-over-year change in the Company’s reported net revenue attributable to the impact of all individual entities that were acquired or divested in the current and prior year. We calculate impact of an acquisition as follows: (a) for an entity acquired during the current year, we present the entity’s current period reported revenue as the impact of the acquisition in the current year; and (b) for an entity acquired in the prior year, we present an amount equal to the entity’s current year net revenue for the same period during which we didn’t own the entity in the prior year as the impact of the acquisition in the current year. We calculate impact of a divestiture as follows: (a) for a divestiture in the current year, we present the entity’s prior year net revenue for the same period during which we no longer owned it in the current year as impact of the divestiture in the current year; and (b) for a divestiture in the prior year, we present the entity’s prior year net revenue for the period during which we owned it in the prior year as impact of the divestiture in the current year. We calculate the impact of any acquisition or divestiture without adjusting for foreign currency exchange fluctuations. The impact of foreign currency exchange fluctuations reflects the year-over-year change in the Company’s reported net revenue attributable to changes in foreign currency exchange rates. We calculate the impact of foreign currency exchange fluctuations for the portion of the reporting period in which we recognized revenue from a foreign entity in both the current year and the prior year. The impact is calculated as the difference between (1) reported prior period net revenue (converted to U.S. dollars at historical foreign currency exchange rates) and (2) prior period net revenue converted to U.S. dollars at current period foreign exchange rates. 2) Net New Business: Estimate of annualized revenue for new wins less annualized revenue for losses incurred in the period. 3) Adjusted EBITDA: defined as Net income excluding non-operating income or expense to achieve operating income, plus depreciation and amortization, stock-based compensation, deferred acquisition consideration adjustments, and other items. Other items include restructuring costs, acquisition-related expenses, and nonrecurring items. 4) Adjusted Diluted EPS is defined as (i) Net income (loss) attributable to Stagwell Inc. common shareholders, plus net income attributable to Class C shareholders, excluding amortization expense, impairment and other losses, stock-based compensation, deferred acquisition consideration adjustments, discrete tax items, and other items, divided by (ii) (a) the per weighted average number of common shares outstanding plus (b) the weighted average number of Class C shares outstanding (if dilutive). Other items includes restructuring costs, acquisition-related expenses, and non-recurring items, and subject to the anti-dilution rules. 5) Free Cash Flow: defined as Adjusted EBITDA less capital expenditures, change in net working capital, cash taxes, interest, and distributions to minority interests, but excludes contingent M&A payments. 6) Financial Guidance: The Company provides guidance on a non-GAAP basis as it cannot predict certain elements which are included in reported GAAP results. Included in this earnings presentation are tables reconciling reported Stagwell Inc. results to arrive at certain of these non-GAAP financial measures.
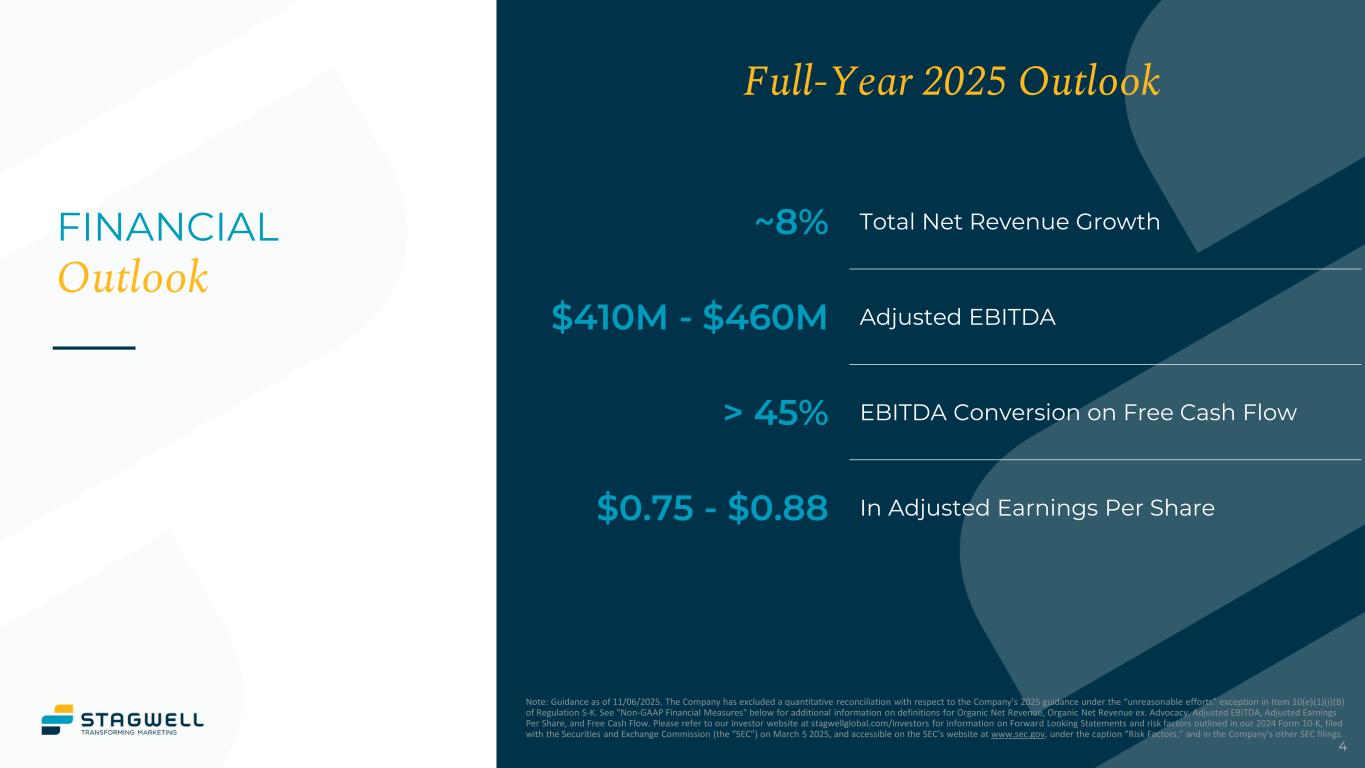
4 FINANCIAL Outlook Full-Year 2025 Outlook ~8% Total Net Revenue Growth $410M - $460M Adjusted EBITDA > 45% EBITDA Conversion on Free Cash Flow $0.75 - $0.88 In Adjusted Earnings Per Share Note: Guidance as of 11/06/2025. The Company has excluded a quantitative reconciliation with respect to the Company’s 2025 guidance under the “unreasonable efforts” exception in Item 10(e)(1)(i)(B) of Regulation S-K. See "Non-GAAP Financial Measures" below for additional information on definitions for Organic Net Revenue, Organic Net Revenue ex. Advocacy, Adjusted EBITDA, Adjusted Earnings Per Share, and Free Cash Flow. Please refer to our investor website at stagwellglobal.com/investors for information on Forward Looking Statements and risk factors outlined in our 2024 Form 10-K, filed with the Securities and Exchange Commission (the “SEC”) on March 5 2025, and accessible on the SEC’s website at www.sec.gov, under the caption “Risk Factors,” and in the Company’s other SEC filings.
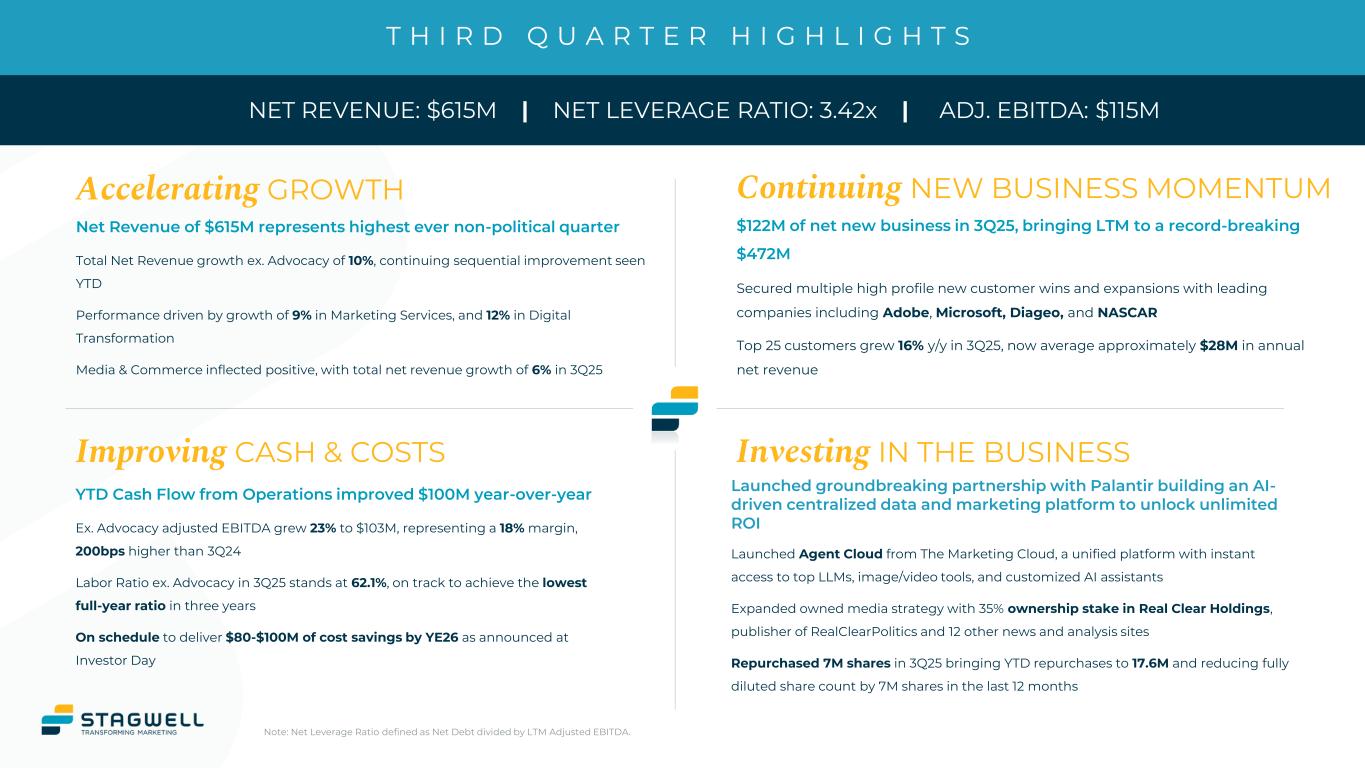
T H I R D Q U A R T E R H I G H L I G H T S NET REVENUE: $615M | NET LEVERAGE RATIO: 3.42x | ADJ. EBITDA: $115M Investing IN THE BUSINESS Accelerating GROWTH Improving CASH & COSTS Continuing NEW BUSINESS MOMENTUM Launched groundbreaking partnership with Palantir building an AI- driven centralized data and marketing platform to unlock unlimited ROI Launched Agent Cloud from The Marketing Cloud, a unified platform with instant access to top LLMs, image/video tools, and customized AI assistants Expanded owned media strategy with 35% ownership stake in Real Clear Holdings, publisher of RealClearPolitics and 12 other news and analysis sites Repurchased 7M shares in 3Q25 bringing YTD repurchases to 17.6M and reducing fully diluted share count by 7M shares in the last 12 months $122M of net new business in 3Q25, bringing LTM to a record-breaking $472M Secured multiple high profile new customer wins and expansions with leading companies including Adobe, Microsoft, Diageo, and NASCAR Top 25 customers grew 16% y/y in 3Q25, now average approximately $28M in annual net revenue Net Revenue of $615M represents highest ever non-political quarter Total Net Revenue growth ex. Advocacy of 10%, continuing sequential improvement seen YTD Performance driven by growth of 9% in Marketing Services, and 12% in Digital Transformation Media & Commerce inflected positive, with total net revenue growth of 6% in 3Q25 YTD Cash Flow from Operations improved $100M year-over-year Ex. Advocacy adjusted EBITDA grew 23% to $103M, representing a 18% margin, 200bps higher than 3Q24 Labor Ratio ex. Advocacy in 3Q25 stands at 62.1%, on track to achieve the lowest full-year ratio in three years On schedule to deliver $80-$100M of cost savings by YE26 as announced at Investor Day Note: Net Leverage Ratio defined as Net Debt divided by LTM Adjusted EBITDA.
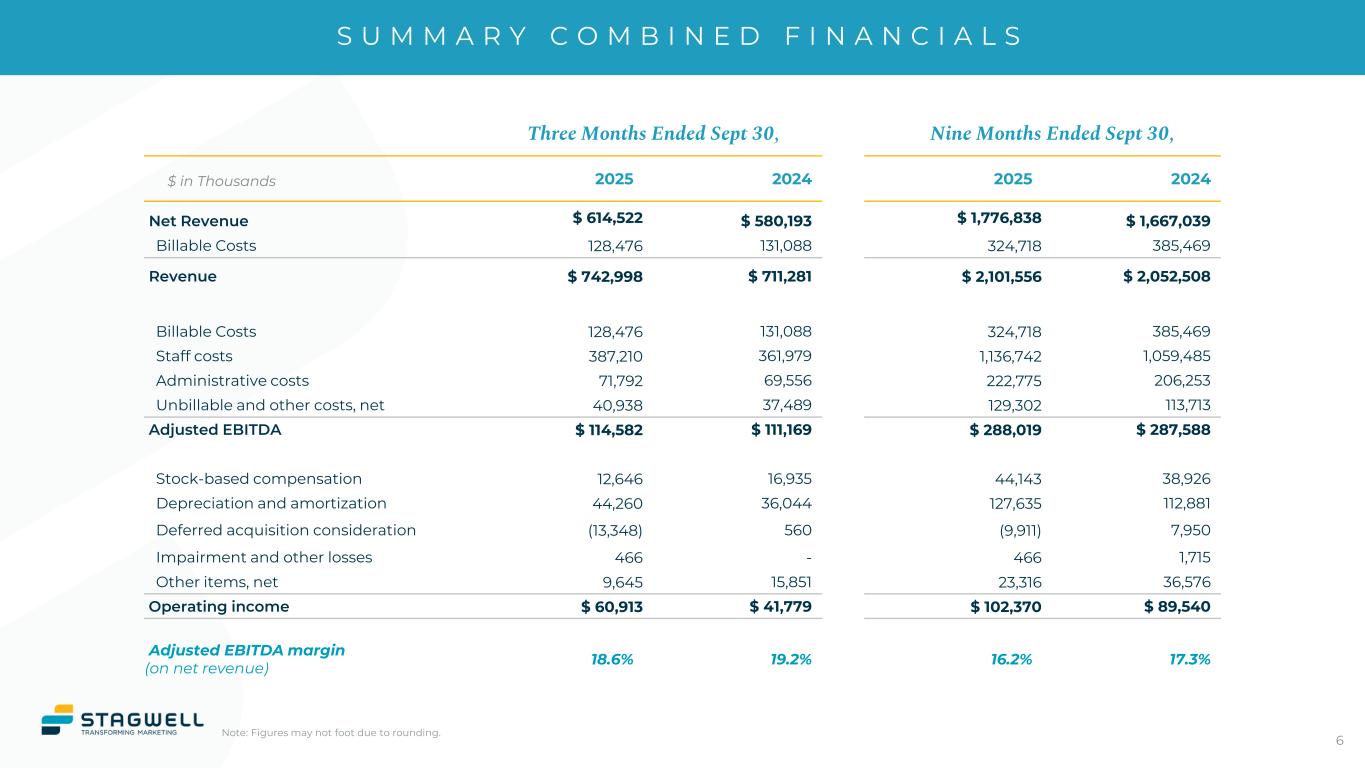
S U M M A R Y C O M B I N E D F I N A N C I A L S Note: Figures may not foot due to rounding. Three Months Ended Sept 30, Nine Months Ended Sept 30, 2025 2024 2025 2024 Net Revenue $ 614,522 $ 580,193 $ 1,776,838 $ 1,667,039 Billable Costs 128,476 131,088 324,718 385,469 Revenue $ 742,998 $ 711,281 $ 2,101,556 $ 2,052,508 Billable Costs 128,476 131,088 324,718 385,469 Staff costs 387,210 361,979 1,136,742 1,059,485 Administrative costs 71,792 69,556 222,775 206,253 Unbillable and other costs, net 40,938 37,489 129,302 113,713 Adjusted EBITDA $ 114,582 $ 111,169 $ 288,019 $ 287,588 Stock-based compensation 12,646 16,935 44,143 38,926 Depreciation and amortization 44,260 36,044 127,635 112,881 Deferred acquisition consideration (13,348) 560 (9,911) 7,950 Impairment and other losses 466 - 466 1,715 Other items, net 9,645 15,851 23,316 36,576 Operating income $ 60,913 $ 41,779 $ 102,370 $ 89,540 Adjusted EBITDA margin (on net revenue) 18.6% 19.2% 16.2% 17.3% 6 $ in Thousands
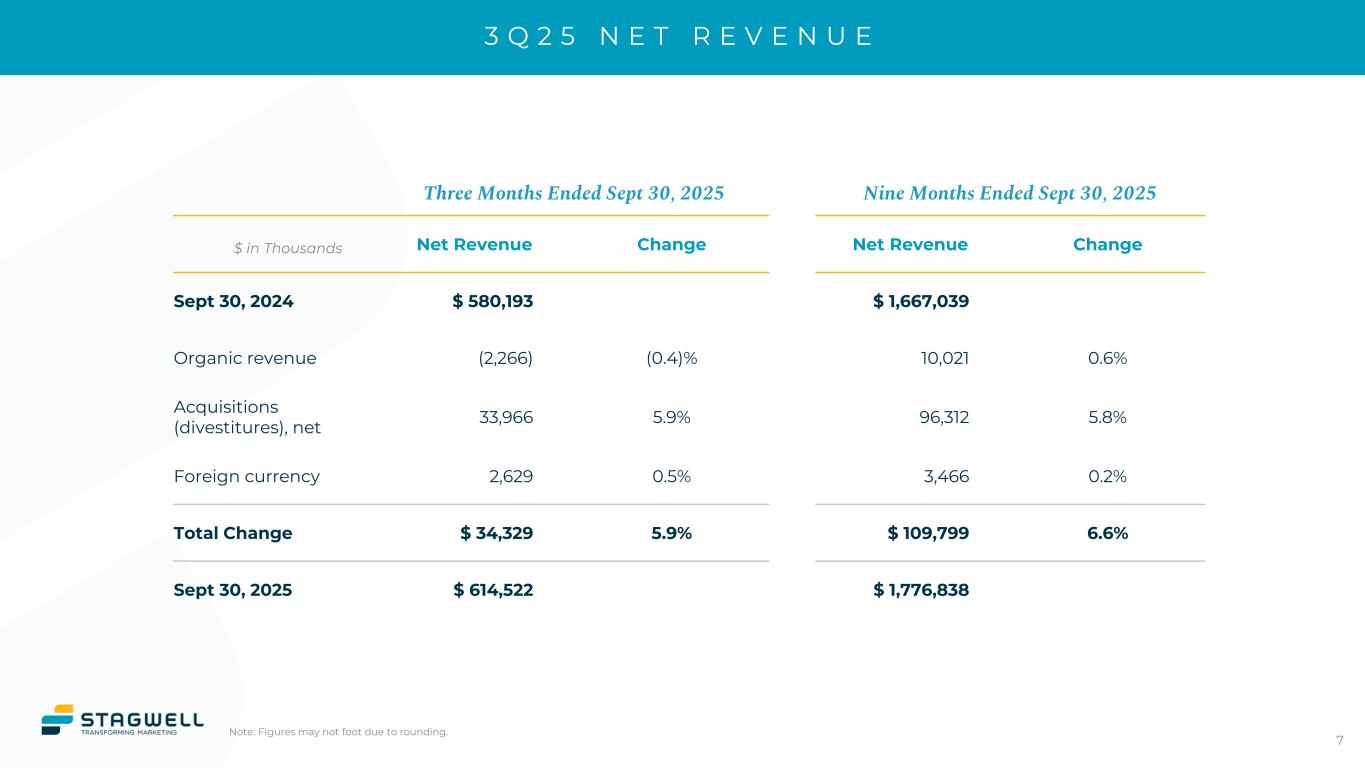
3 Q 2 5 N E T R E V E N U E Note: Figures may not foot due to rounding. Three Months Ended Sept 30, 2025 Nine Months Ended Sept 30, 2025 Net Revenue Change Net Revenue Change Sept 30, 2024 $ 580,193 $ 1,667,039 Organic revenue (2,266) (0.4)% 10,021 0.6% Acquisitions (divestitures), net 33,966 5.9% 96,312 5.8% Foreign currency 2,629 0.5% 3,466 0.2% Total Change $ 34,329 5.9% $ 109,799 6.6% Sept 30, 2025 $ 614,522 $ 1,776,838 7 $ in Thousands
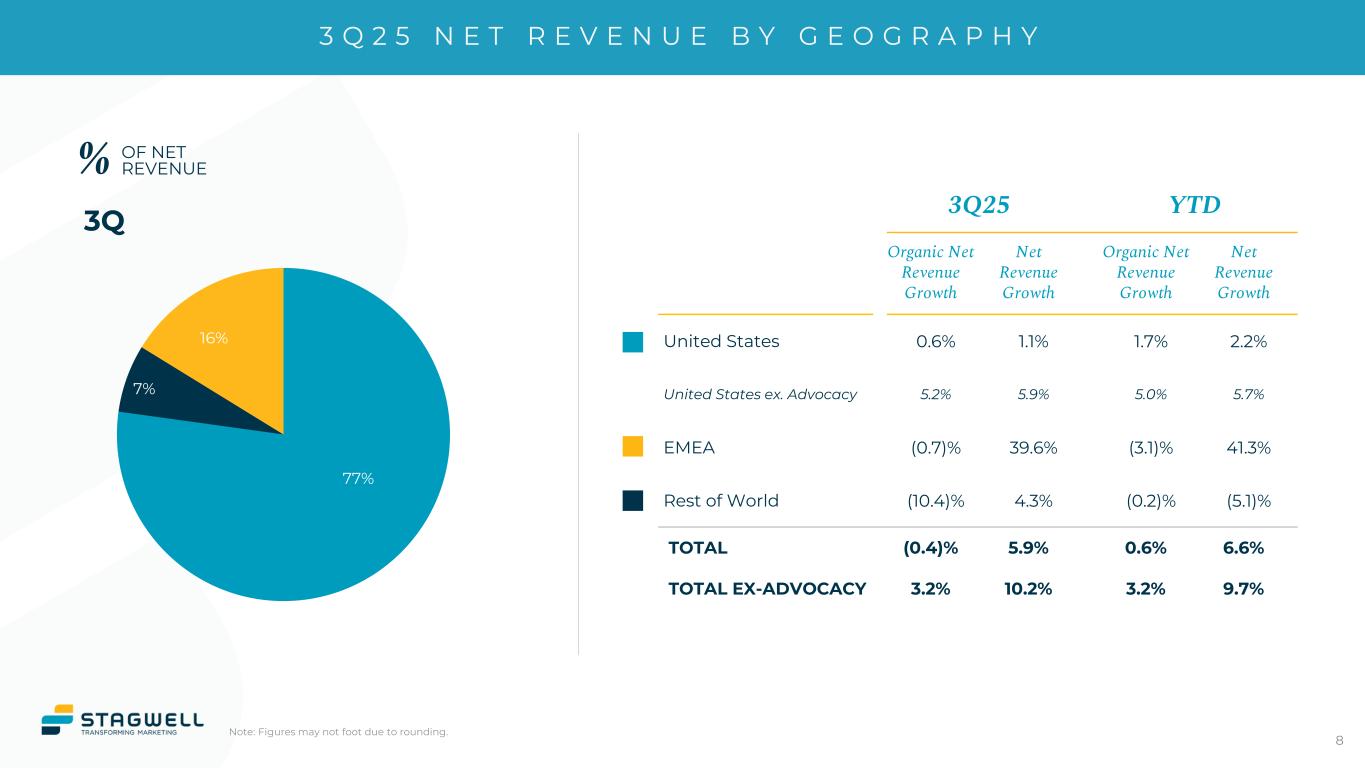
3 Q 2 5 N E T R E V E N U E B Y G E O G R A P H Y Note: Figures may not foot due to rounding. 3Q 8 % OF NET REVENUE 77% 7% 16% 3Q25 YTD Organic Net Revenue Growth Net Revenue Growth Organic Net Revenue Growth Net Revenue Growth United States 0.6% 1.1% 1.7% 2.2% United States ex. Advocacy 5.2% 5.9% 5.0% 5.7% EMEA (0.7)% 39.6% (3.1)% 41.3% Rest of World (10.4)% 4.3% (0.2)% (5.1)% TOTAL (0.4)% 5.9% 0.6% 6.6% TOTAL EX-ADVOCACY 3.2% 10.2% 3.2% 9.7%
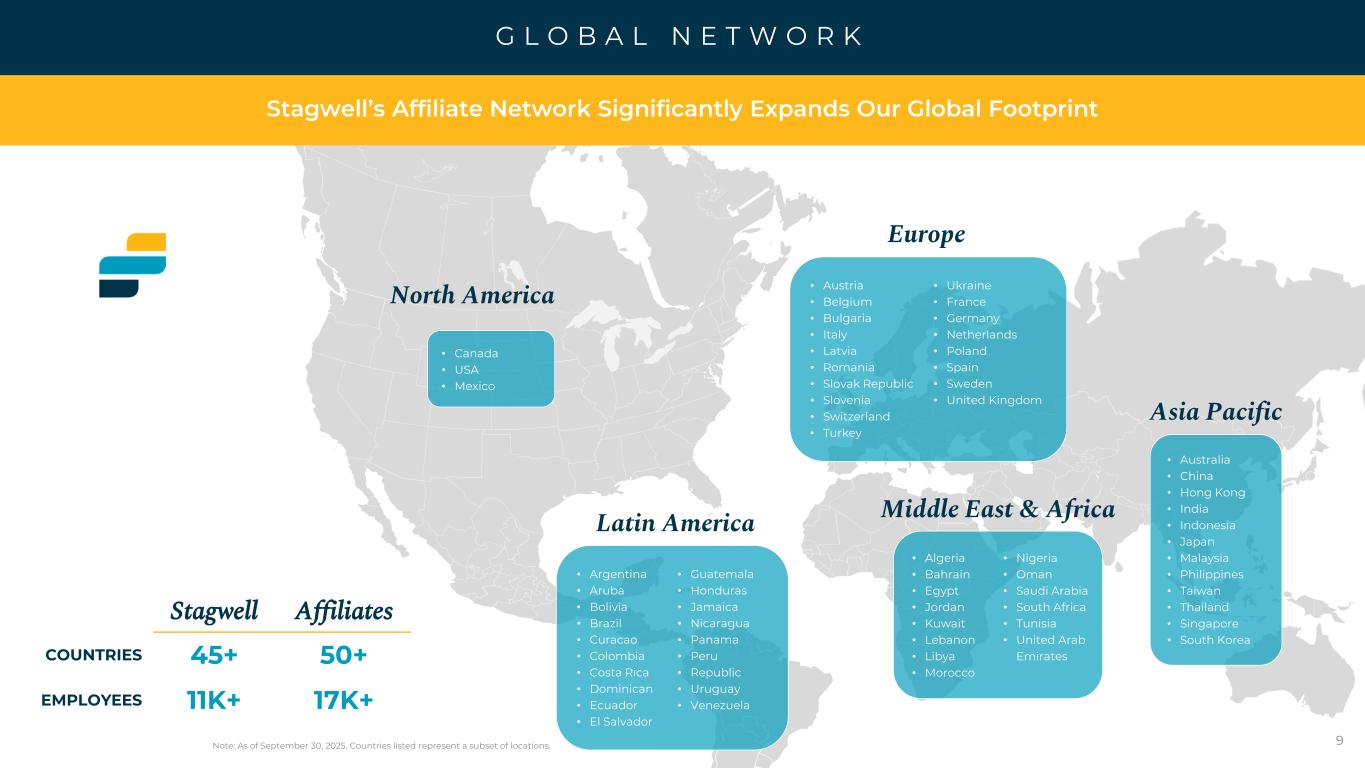
G L O B A L N E T W O R K 9 North America Latin America Europe Asia Pacific • Australia • China • Hong Kong • India • Indonesia • Japan • Malaysia • Philippines • Taiwan • Thailand • Singapore • South Korea Middle East & Africa • Austria • Belgium • Bulgaria • Italy • Latvia • Romania • Slovak Republic • Slovenia • Switzerland • Turkey • Ukraine • France • Germany • Netherlands • Poland • Spain • Sweden • United Kingdom • Argentina • Aruba • Bolivia • Brazil • Curacao • Colombia • Costa Rica • Dominican • Ecuador • El Salvador • Guatemala • Honduras • Jamaica • Nicaragua • Panama • Peru • Republic • Uruguay • Venezuela • Algeria • Bahrain • Egypt • Jordan • Kuwait • Lebanon • Libya • Morocco • Nigeria • Oman • Saudi Arabia • South Africa • Tunisia • United Arab Emirates Stagwell Affiliates COUNTRIES 45+ 50+ EMPLOYEES 11K+ 17K+ Stagwell’s Affiliate Network Significantly Expands Our Global Footprint • Canada • USA • Mexico Note: As of September 30, 2025. Countries listed represent a subset of locations.
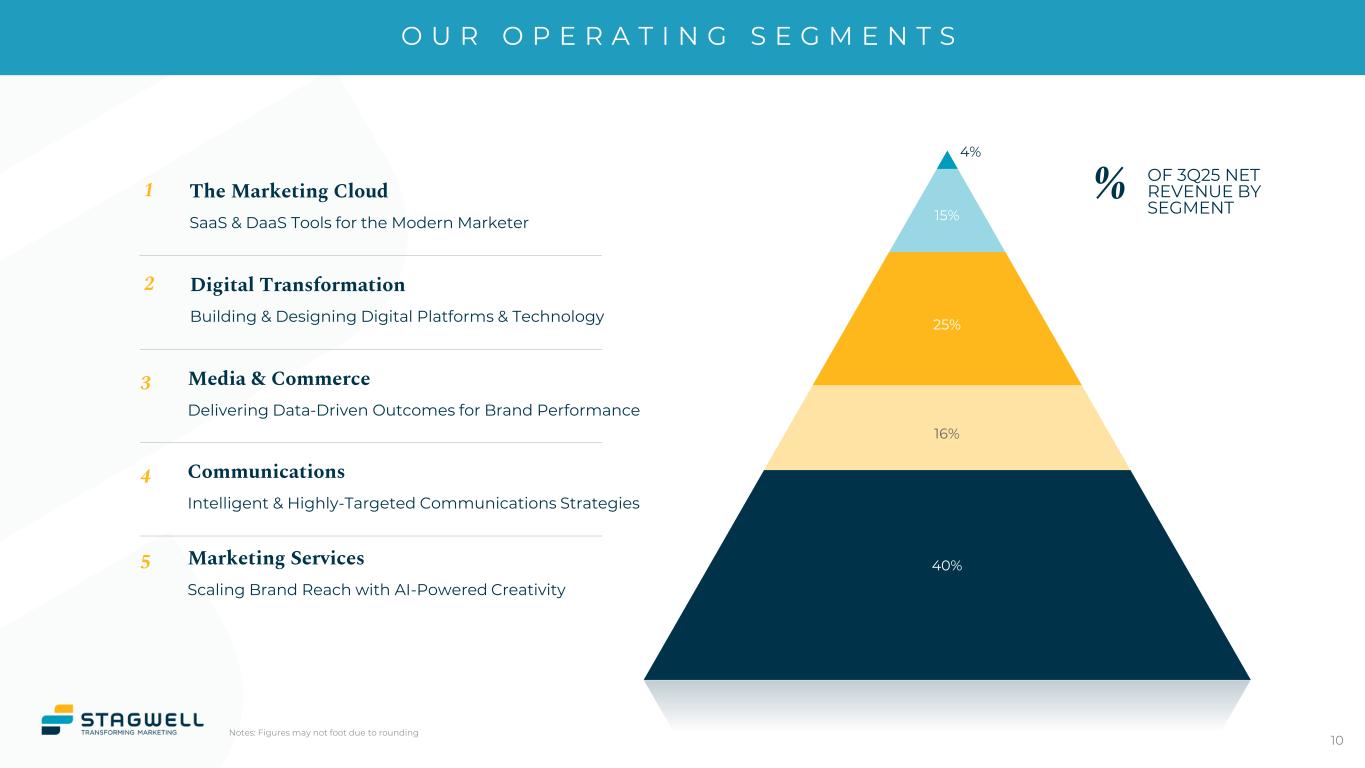
O U R O P E R A T I N G S E G M E N T S Marketing Services Scaling Brand Reach with AI-Powered Creativity Media & Commerce Delivering Data-Driven Outcomes for Brand Performance Communications Intelligent & Highly-Targeted Communications Strategies Digital Transformation Building & Designing Digital Platforms & Technology 2 3 4 5 10 The Marketing Cloud SaaS & DaaS Tools for the Modern Marketer 1 Notes: Figures may not foot due to rounding 4% 15% 25% 16% 40% % OF 3Q25 NET REVENUE BY SEGMENT
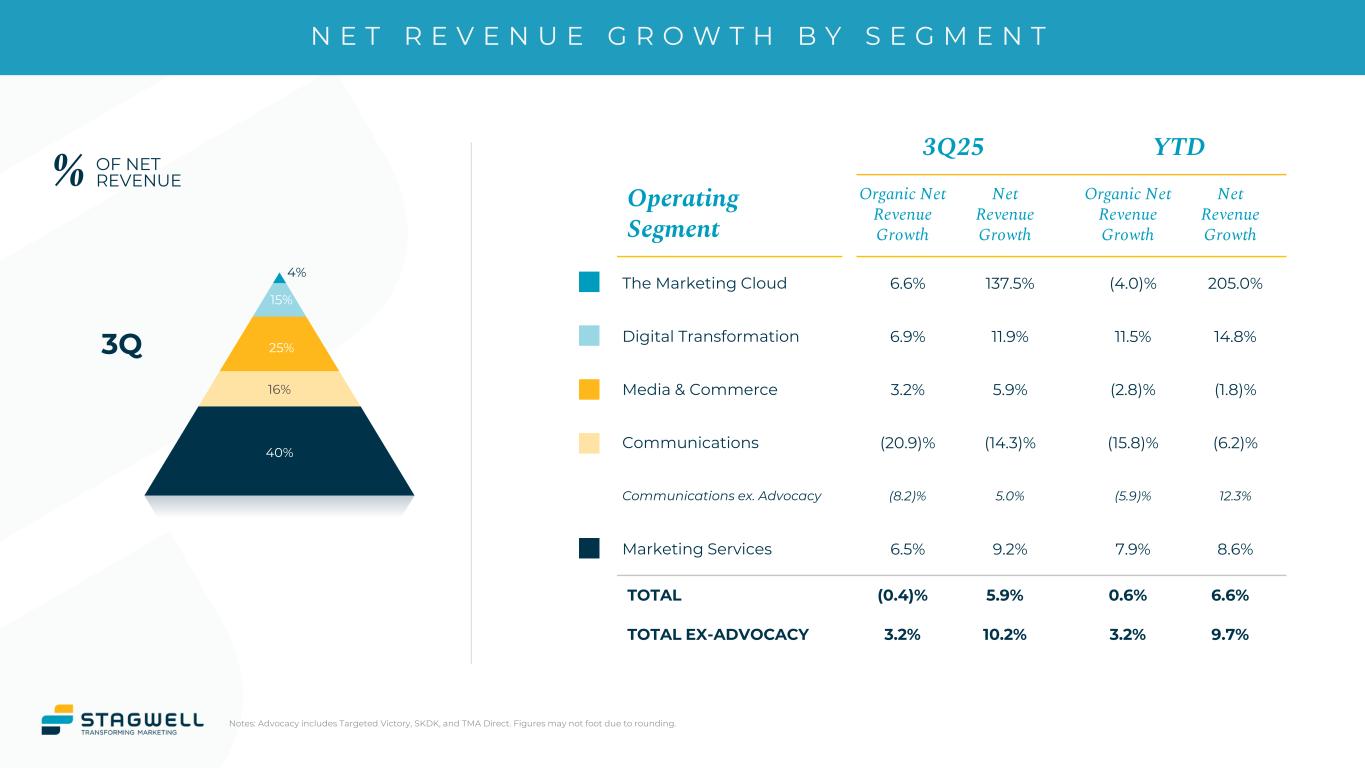
N E T R E V E N U E G R O W T H B Y S E G M E N T Notes: Advocacy includes Targeted Victory, SKDK, and TMA Direct. Figures may not foot due to rounding. 3Q25 YTD Operating Segment Organic Net Revenue Growth Net Revenue Growth Organic Net Revenue Growth Net Revenue Growth The Marketing Cloud 6.6% 137.5% (4.0)% 205.0% Digital Transformation 6.9% 11.9% 11.5% 14.8% Media & Commerce 3.2% 5.9% (2.8)% (1.8)% Communications (20.9)% (14.3)% (15.8)% (6.2)% Communications ex. Advocacy (8.2)% 5.0% (5.9)% 12.3% Marketing Services 6.5% 9.2% 7.9% 8.6% TOTAL (0.4)% 5.9% 0.6% 6.6% TOTAL EX-ADVOCACY 3.2% 10.2% 3.2% 9.7% % OF NET REVENUE 3Q 4% 15% 25% 16% 40%
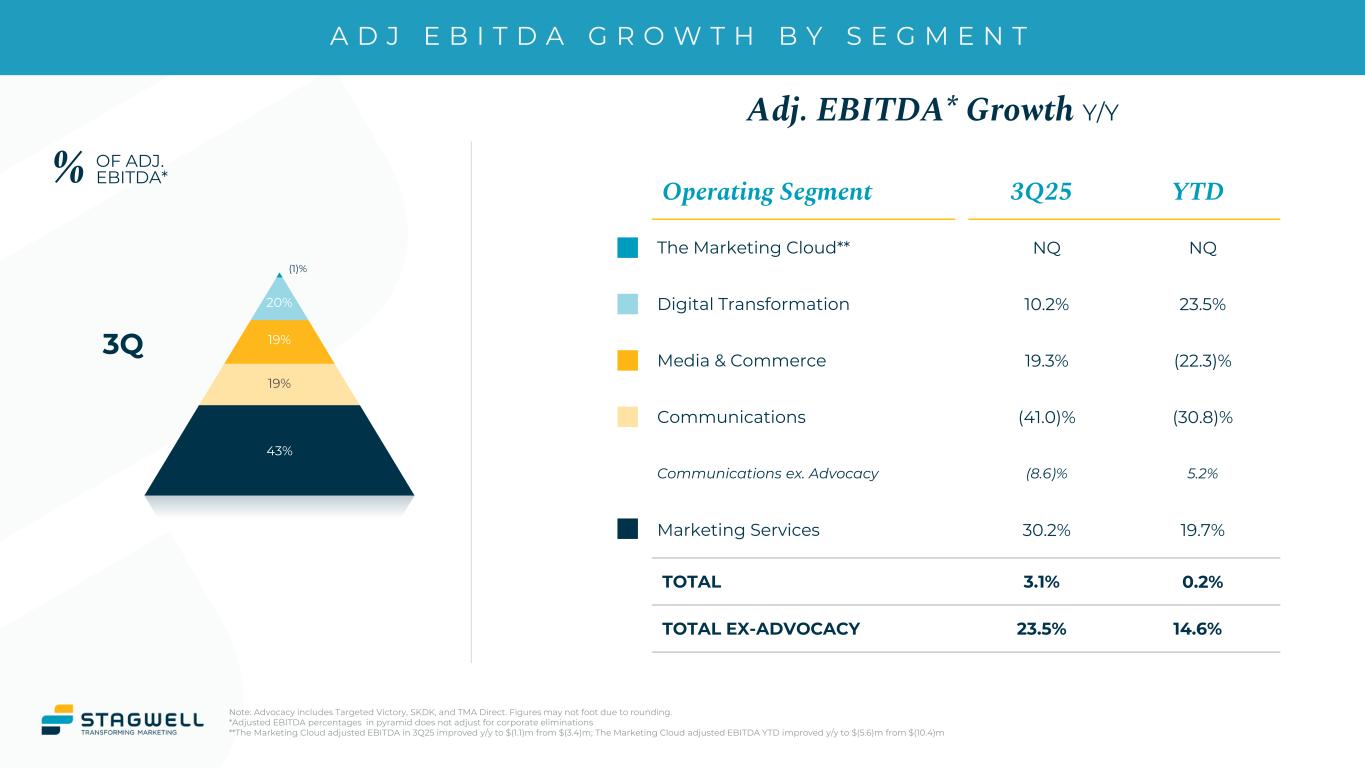
A D J E B I T D A G R O W T H B Y S E G M E N T Note: Advocacy includes Targeted Victory, SKDK, and TMA Direct. Figures may not foot due to rounding. *Adjusted EBITDA percentages in pyramid does not adjust for corporate eliminations **The Marketing Cloud adjusted EBITDA in 3Q25 improved y/y to $(1.1)m from $(3.4)m; The Marketing Cloud adjusted EBITDA YTD improved y/y to $(5.6)m from $(10.4)m Operating Segment 3Q25 YTD The Marketing Cloud** NQ NQ Digital Transformation 10.2% 23.5% Media & Commerce 19.3% (22.3)% Communications (41.0)% (30.8)% Communications ex. Advocacy (8.6)% 5.2% Marketing Services 30.2% 19.7% TOTAL 3.1% 0.2% TOTAL EX-ADVOCACY 23.5% 14.6% % OF ADJ. EBITDA* 3Q Adj. EBITDA* Growth Y/Y (1)% 20% 19% 19% 43%

Three Months Ended, Nine Months Ended, Sept 30, 2025 Sept 30, 2024 % Change Sept 30, 2025 Sept 30, 2024 % Change Total Revenue $743 $711 4.5% $2,102 $2,053 2.4% Advocacy Revenue 57 99 (42.3)% 155 236 (34.4)% Total Ex Advocacy 686 612 12.0% 1,947 1,816 7.2% Three Months Ended, Nine Months Ended, Sept 30, 2025 Sept 30, 2024 % Change Sept 30, 2025 Sept 30, 2024 % Change Total Net Revenue $615 $580 5.9% $1,777 $1,667 6.6% Advocacy Net Revenue 37 56 (33.9)% 105 143 (26.9)% Total Ex Advocacy 578 524 10.2% 1,672 1,524 9.7% Three Months Ended, Nine Months Ended, Sept 30, 2025 Sept 30, 2024 % Change Sept 30, 2025 Sept 30, 2024 % Change Total Adj. EBITDA $115 $111 3.1% $288 $288 0.1% Advocacy Adj. EBITDA 11 28 (58.5)% 29 62 (52.7)% Total Ex Advocacy 103 84 23.5% 259 226 14.6% E X - A D V O C A C Y R E V E N U E , N E T R E V E N U E & A D J U S T E D E B I T D A Note: Advocacy includes Targeted Victory, SKDK, & TMA Direct. Actuals may not foot due to rounding $ in Millions NET REVENUE ADJ. EBITDA 13 REVENUE
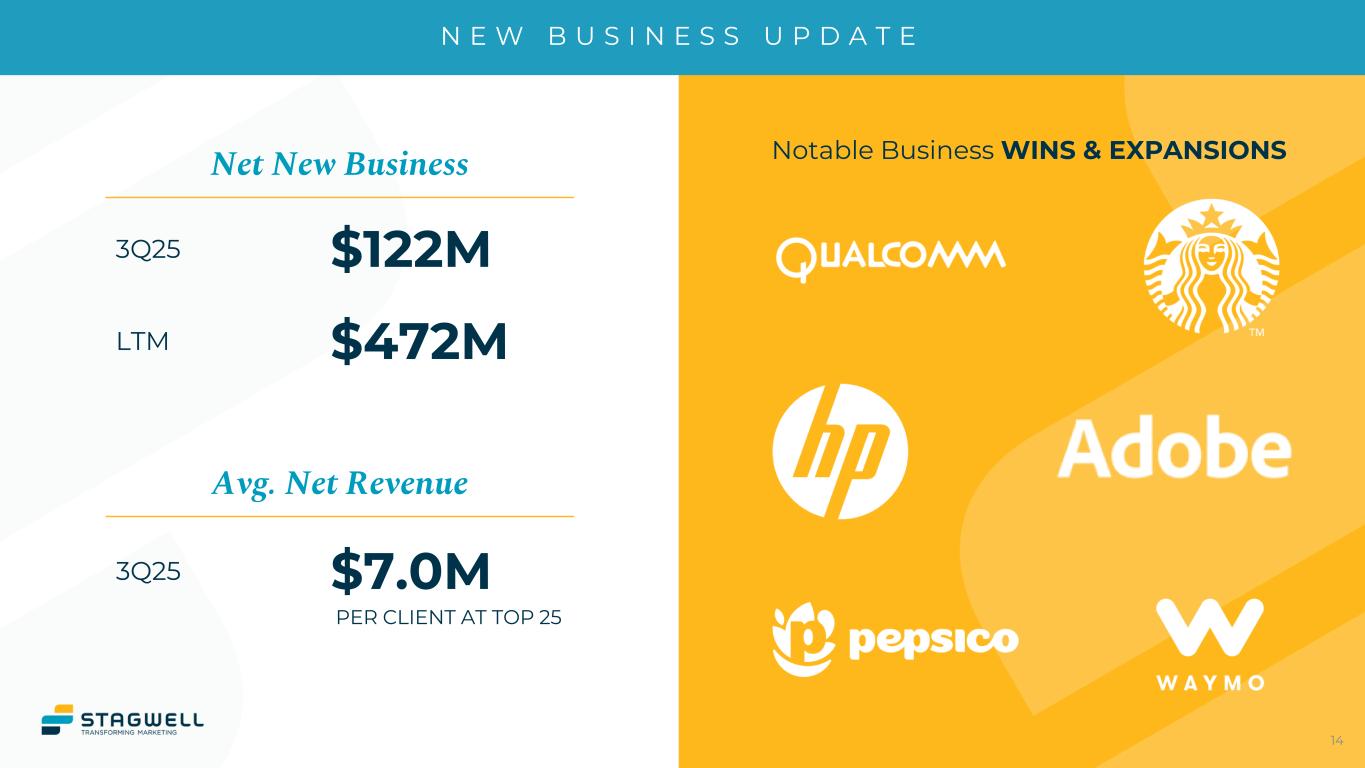
N E W B U S I N E S S U P D A T E 14 PER CLIENT AT TOP 25 Notable Business WINS & EXPANSIONSNet New Business 3Q25 $122M LTM $472M Avg. Net Revenue 3Q25 $7.0M
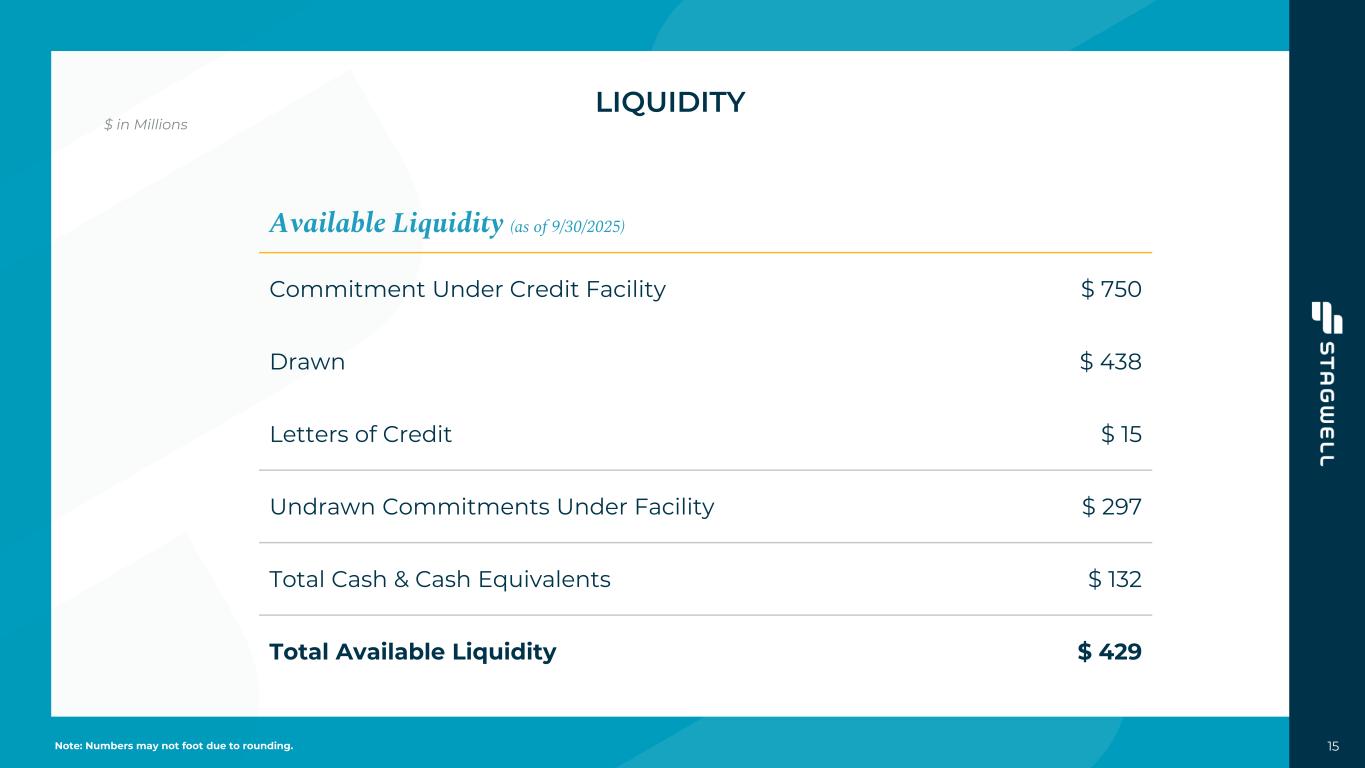
15 LIQUIDITY Available Liquidity (as of 9/30/2025) Commitment Under Credit Facility $ 750 Drawn $ 438 Letters of Credit $ 15 Undrawn Commitments Under Facility $ 297 Total Cash & Cash Equivalents $ 132 Total Available Liquidity $ 429 $ in Millions Note: Numbers may not foot due to rounding.
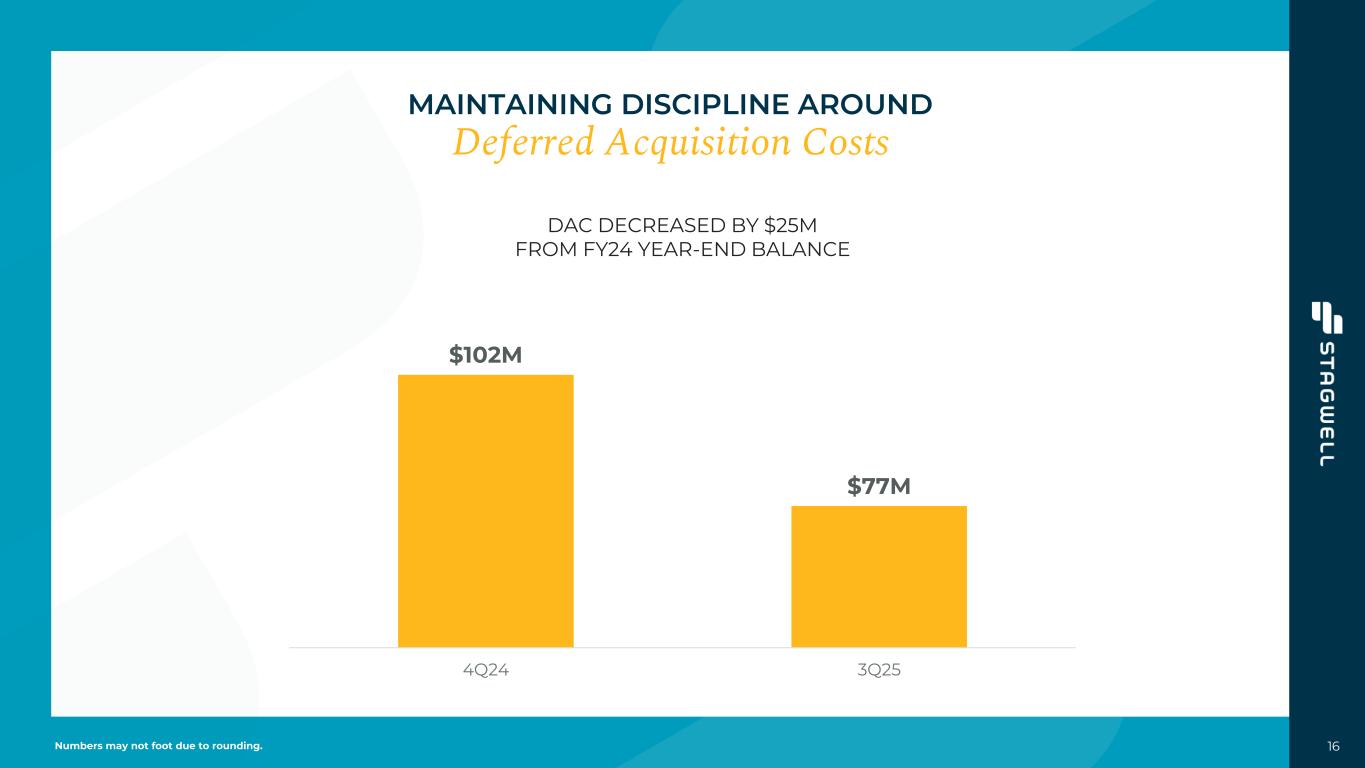
16 MAINTAINING DISCIPLINE AROUND Deferred Acquisition Costs DAC DECREASED BY $25M FROM FY24 YEAR-END BALANCE Numbers may not foot due to rounding. $102M $77M 4Q24 3Q25
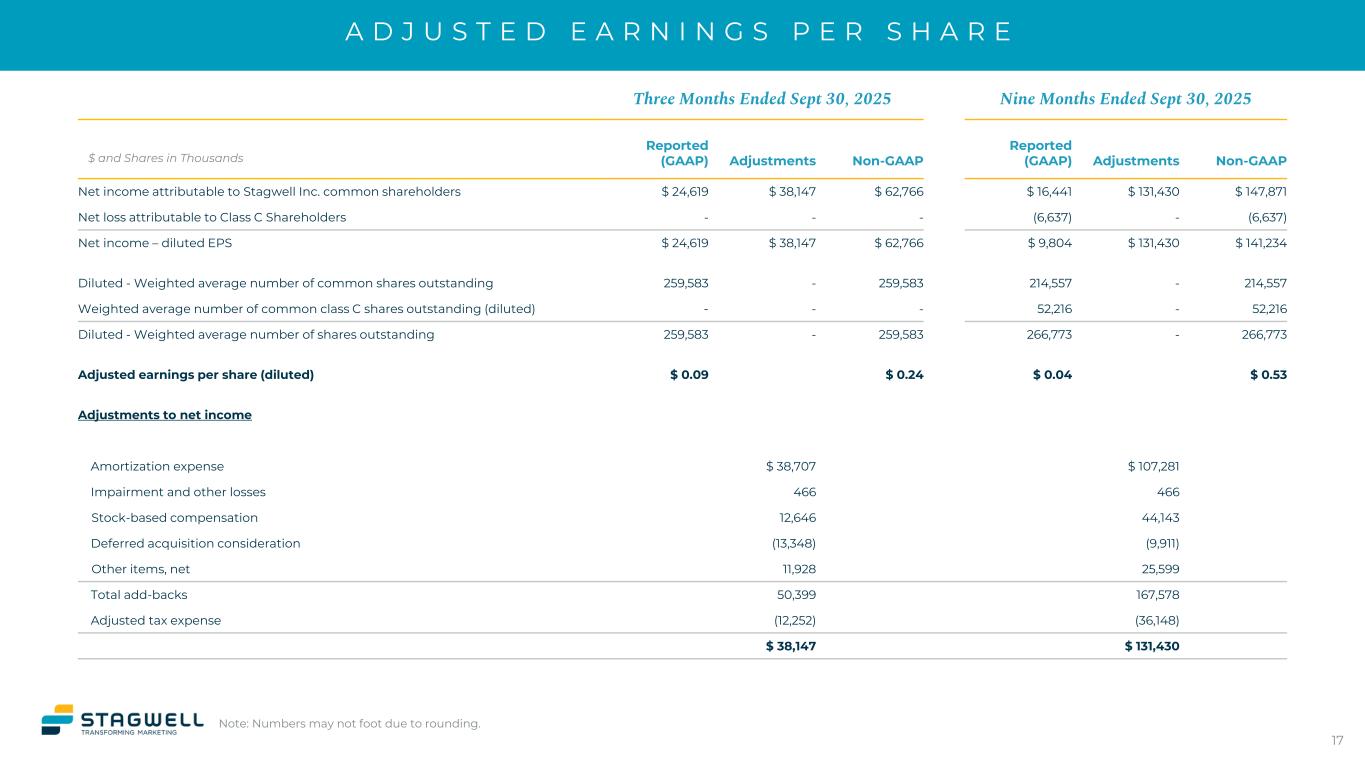
A D J U S T E D E A R N I N G S P E R S H A R E Three Months Ended Sept 30, 2025 Nine Months Ended Sept 30, 2025 Reported (GAAP) Adjustments Non-GAAP Reported (GAAP) Adjustments Non-GAAP Net income attributable to Stagwell Inc. common shareholders $ 24,619 $ 38,147 $ 62,766 $ 16,441 $ 131,430 $ 147,871 Net loss attributable to Class C Shareholders - - - (6,637) - (6,637) Net income – diluted EPS $ 24,619 $ 38,147 $ 62,766 $ 9,804 $ 131,430 $ 141,234 Diluted - Weighted average number of common shares outstanding 259,583 - 259,583 214,557 - 214,557 Weighted average number of common class C shares outstanding (diluted) - - - 52,216 - 52,216 Diluted - Weighted average number of shares outstanding 259,583 - 259,583 266,773 - 266,773 Adjusted earnings per share (diluted) $ 0.09 $ 0.24 $ 0.04 $ 0.53 Adjustments to net income Amortization expense $ 38,707 $ 107,281 Impairment and other losses 466 466 Stock-based compensation 12,646 44,143 Deferred acquisition consideration (13,348) (9,911) Other items, net 11,928 25,599 Total add-backs 50,399 167,578 Adjusted tax expense (12,252) (36,148) $ 38,147 $ 131,430 17 $ and Shares in Thousands Note: Numbers may not foot due to rounding.
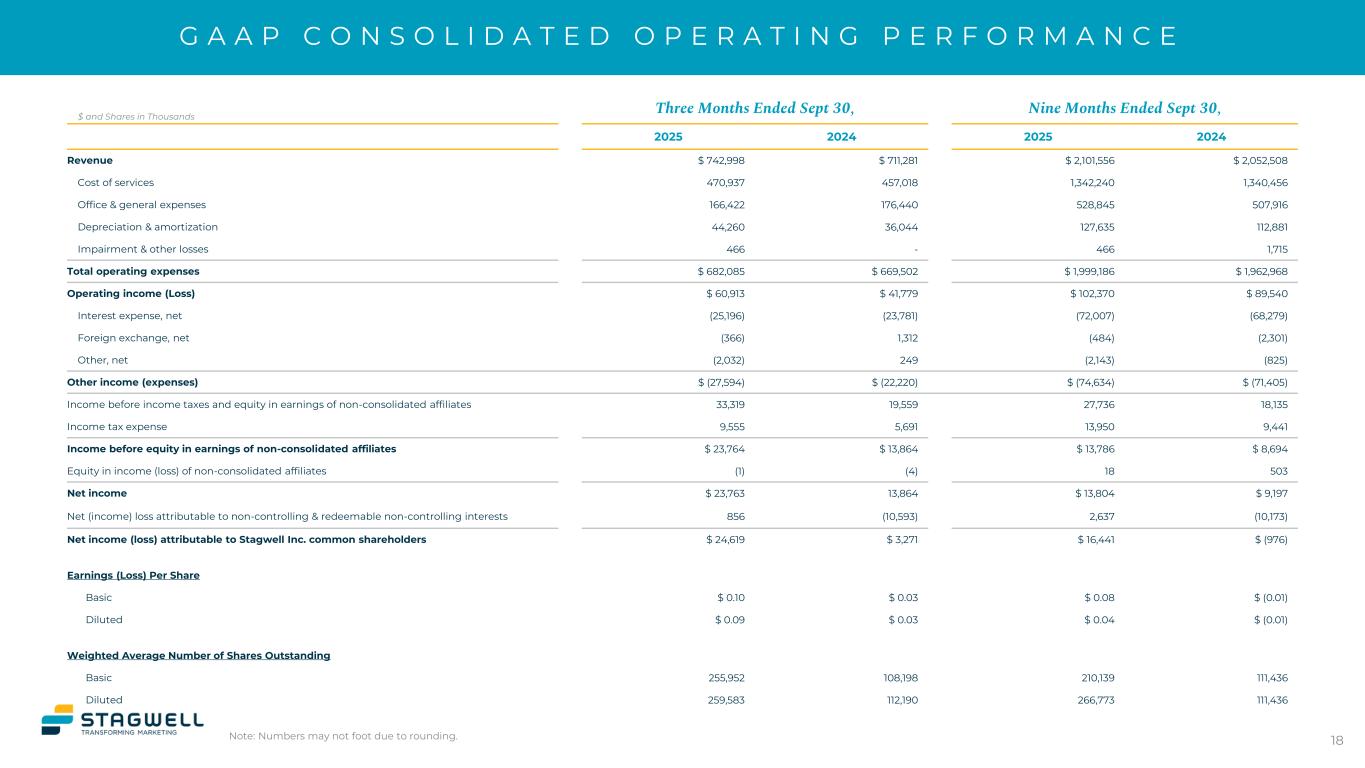
G A A P C O N S O L I D A T E D O P E R A T I N G P E R F O R M A N C E Note: Numbers may not foot due to rounding. 18 $ and Shares in Thousands Three Months Ended Sept 30, Nine Months Ended Sept 30, 2025 2024 2025 2024 Revenue $ 742,998 $ 711,281 $ 2,101,556 $ 2,052,508 Cost of services 470,937 457,018 1,342,240 1,340,456 Office & general expenses 166,422 176,440 528,845 507,916 Depreciation & amortization 44,260 36,044 127,635 112,881 Impairment & other losses 466 - 466 1,715 Total operating expenses $ 682,085 $ 669,502 $ 1,999,186 $ 1,962,968 Operating income (Loss) $ 60,913 $ 41,779 $ 102,370 $ 89,540 Interest expense, net (25,196) (23,781) (72,007) (68,279) Foreign exchange, net (366) 1,312 (484) (2,301) Other, net (2,032) 249 (2,143) (825) Other income (expenses) $ (27,594) $ (22,220) $ (74,634) $ (71,405) Income before income taxes and equity in earnings of non-consolidated affiliates 33,319 19,559 27,736 18,135 Income tax expense 9,555 5,691 13,950 9,441 Income before equity in earnings of non-consolidated affiliates $ 23,764 $ 13,864 $ 13,786 $ 8,694 Equity in income (loss) of non-consolidated affiliates (1) (4) 18 503 Net income $ 23,763 13,864 $ 13,804 $ 9,197 Net (income) loss attributable to non-controlling & redeemable non-controlling interests 856 (10,593) 2,637 (10,173) Net income (loss) attributable to Stagwell Inc. common shareholders $ 24,619 $ 3,271 $ 16,441 $ (976) Earnings (Loss) Per Share Basic $ 0.10 $ 0.03 $ 0.08 $ (0.01) Diluted $ 0.09 $ 0.03 $ 0.04 $ (0.01) Weighted Average Number of Shares Outstanding Basic 255,952 108,198 210,139 111,436 Diluted 259,583 112,190 266,773 111,436
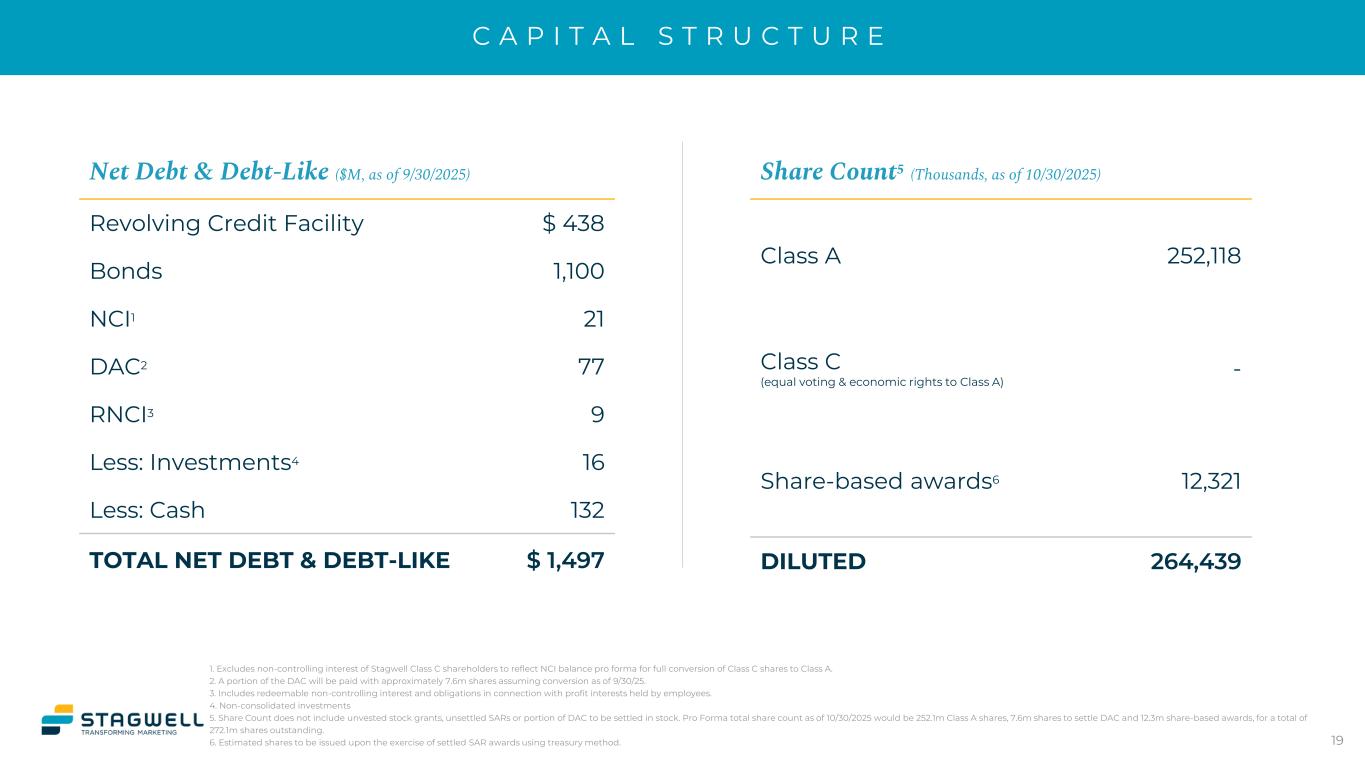
C A P I T A L S T R U C T U R E 1. Excludes non-controlling interest of Stagwell Class C shareholders to reflect NCI balance pro forma for full conversion of Class C shares to Class A. 2. A portion of the DAC will be paid with approximately 7.6m shares assuming conversion as of 9/30/25. 3. Includes redeemable non-controlling interest and obligations in connection with profit interests held by employees. 4. Non-consolidated investments 5. Share Count does not include unvested stock grants, unsettled SARs or portion of DAC to be settled in stock. Pro Forma total share count as of 10/30/2025 would be 252.1m Class A shares, 7.6m shares to settle DAC and 12.3m share-based awards, for a total of 272.1m shares outstanding. 6. Estimated shares to be issued upon the exercise of settled SAR awards using treasury method. Net Debt & Debt-Like ($M, as of 9/30/2025) Revolving Credit Facility $ 438 Bonds 1,100 NCI1 21 DAC2 77 RNCI3 9 Less: Investments4 16 Less: Cash 132 TOTAL NET DEBT & DEBT-LIKE $ 1,497 Share Count5 (Thousands, as of 10/30/2025) Class A 252,118 Class C (equal voting & economic rights to Class A) - Share-based awards6 12,321 DILUTED 264,439 19
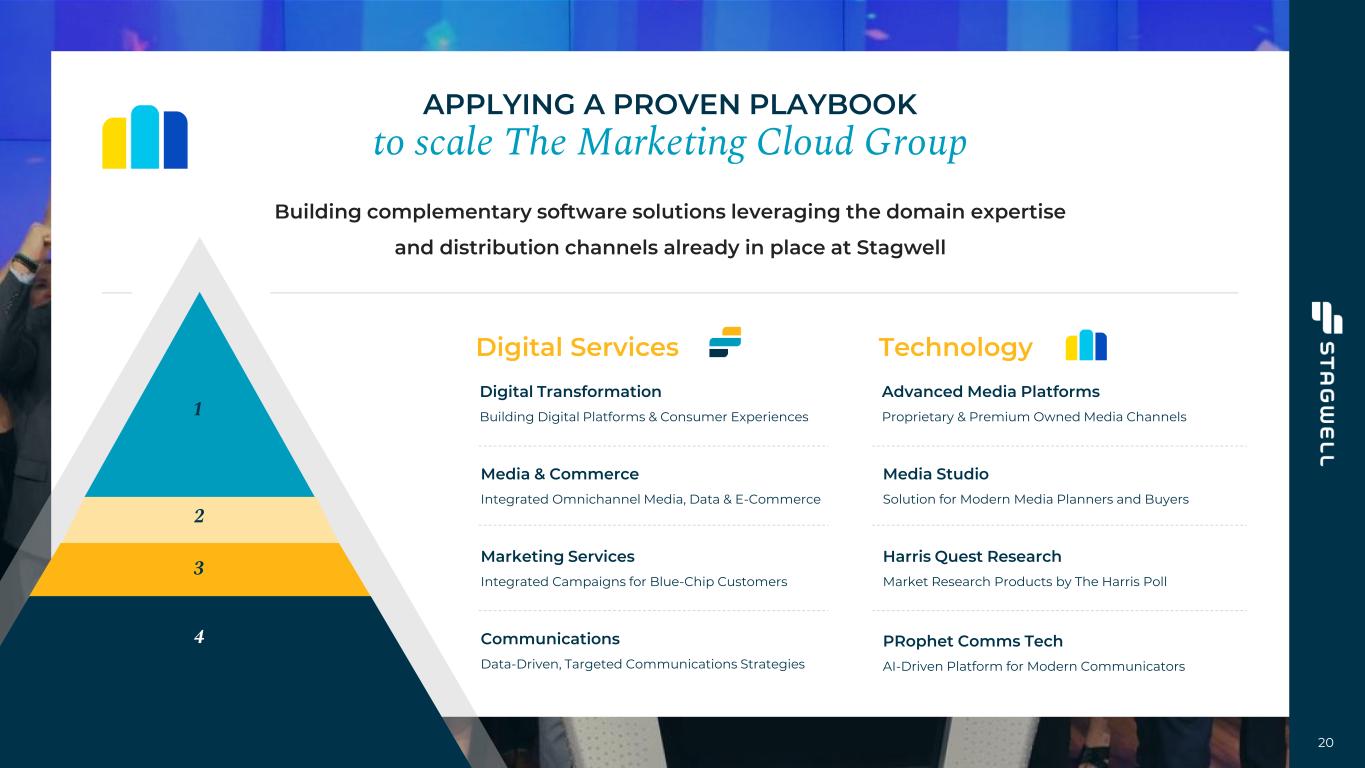
20 APPLYING A PROVEN PLAYBOOK to scale The Marketing Cloud Group Building complementary software solutions leveraging the domain expertise and distribution channels already in place at Stagwell Advanced Media Platforms Proprietary & Premium Owned Media Channels Media Studio Solution for Modern Media Planners and Buyers Harris Quest Research Market Research Products by The Harris Poll PRophet Comms Tech AI-Driven Platform for Modern Communicators Digital Services Technology Digital Transformation Building Digital Platforms & Consumer Experiences Media & Commerce Integrated Omnichannel Media, Data & E-Commerce Marketing Services Integrated Campaigns for Blue-Chip Customers Communications Data-Driven, Targeted Communications Strategies 1 2 3 4
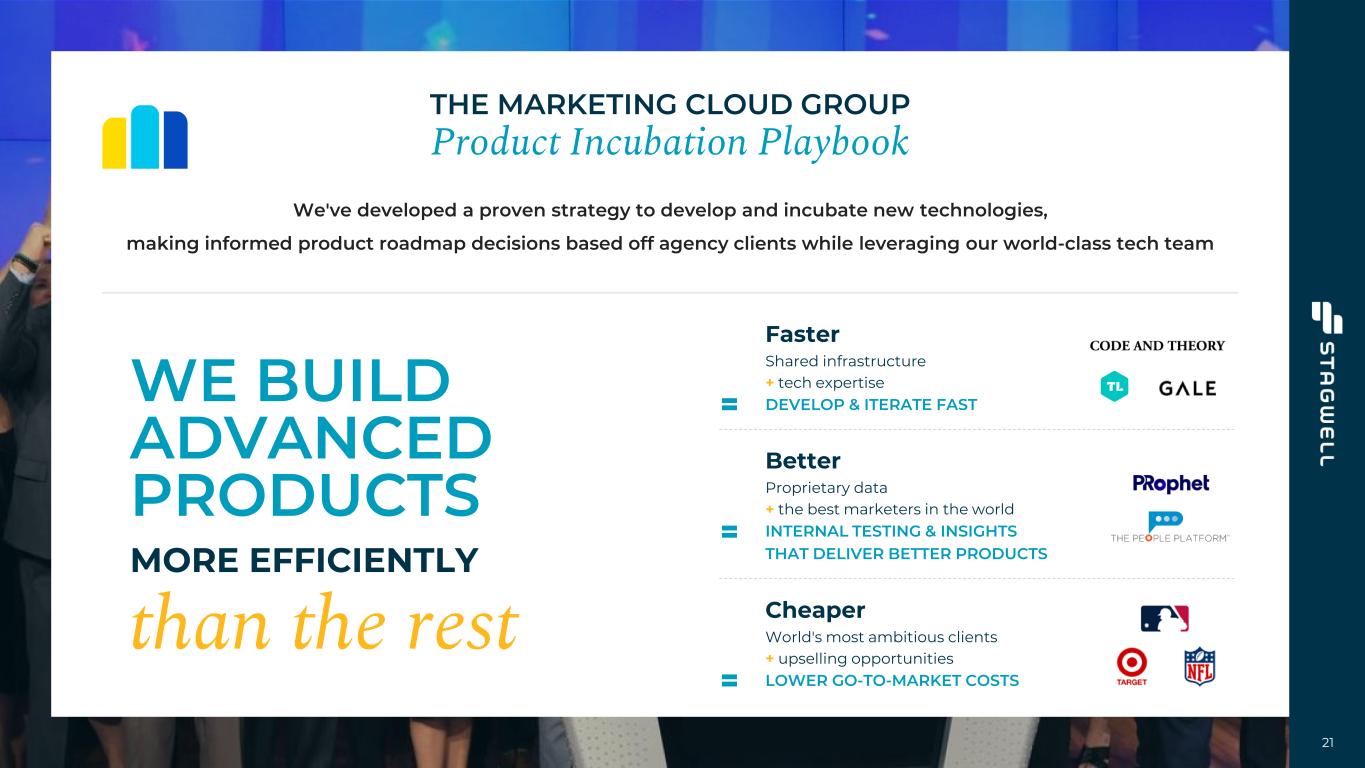
21 We've developed a proven strategy to develop and incubate new technologies, making informed product roadmap decisions based off agency clients while leveraging our world-class tech team THE MARKETING CLOUD GROUP Product Incubation Playbook WE BUILD ADVANCED PRODUCTS MORE EFFICIENTLY than the rest Faster Shared infrastructure + tech expertise DEVELOP & ITERATE FAST Cheaper World's most ambitious clients + upselling opportunities LOWER GO-TO-MARKET COSTS Better Proprietary data + the best marketers in the world INTERNAL TESTING & INSIGHTS THAT DELIVER BETTER PRODUCTS
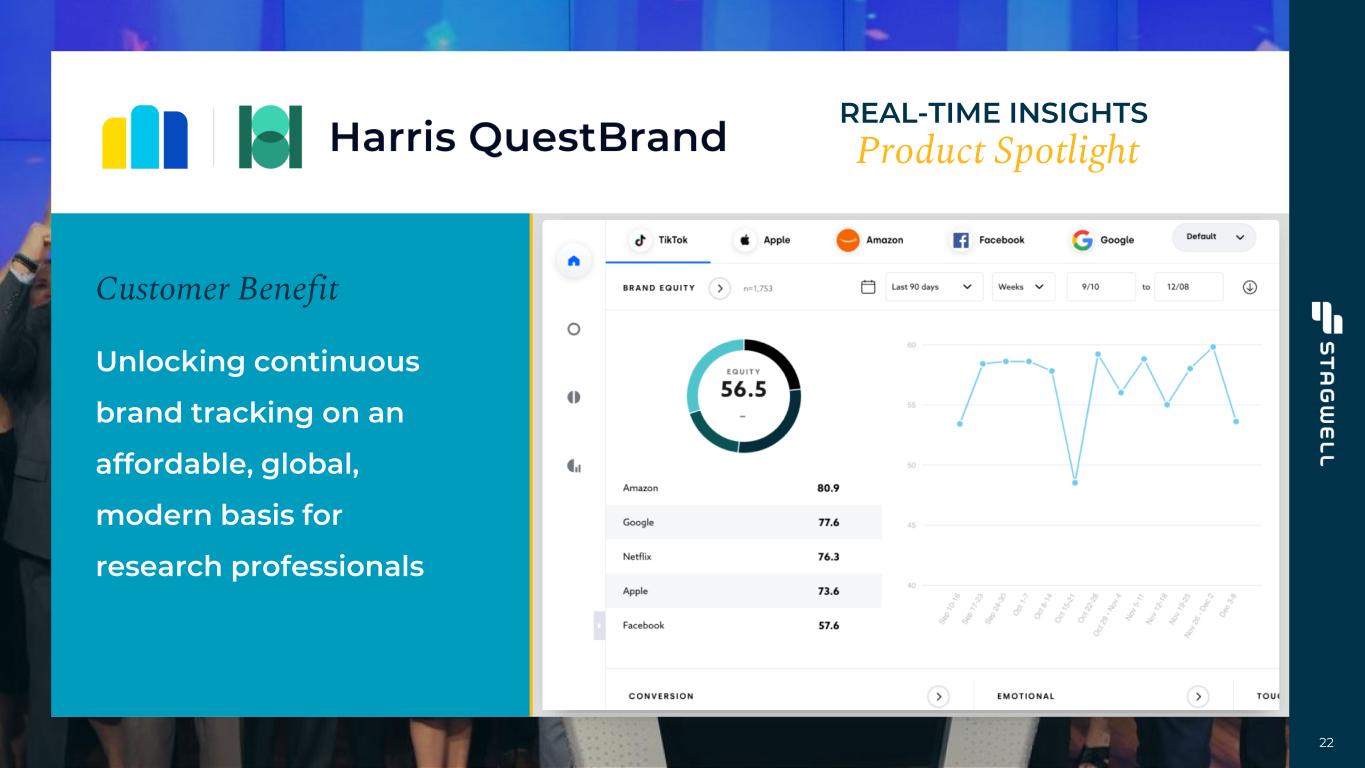
22 REAL-TIME INSIGHTS Product Spotlight Customer Benefit Unlocking continuous brand tracking on an affordable, global, modern basis for research professionals
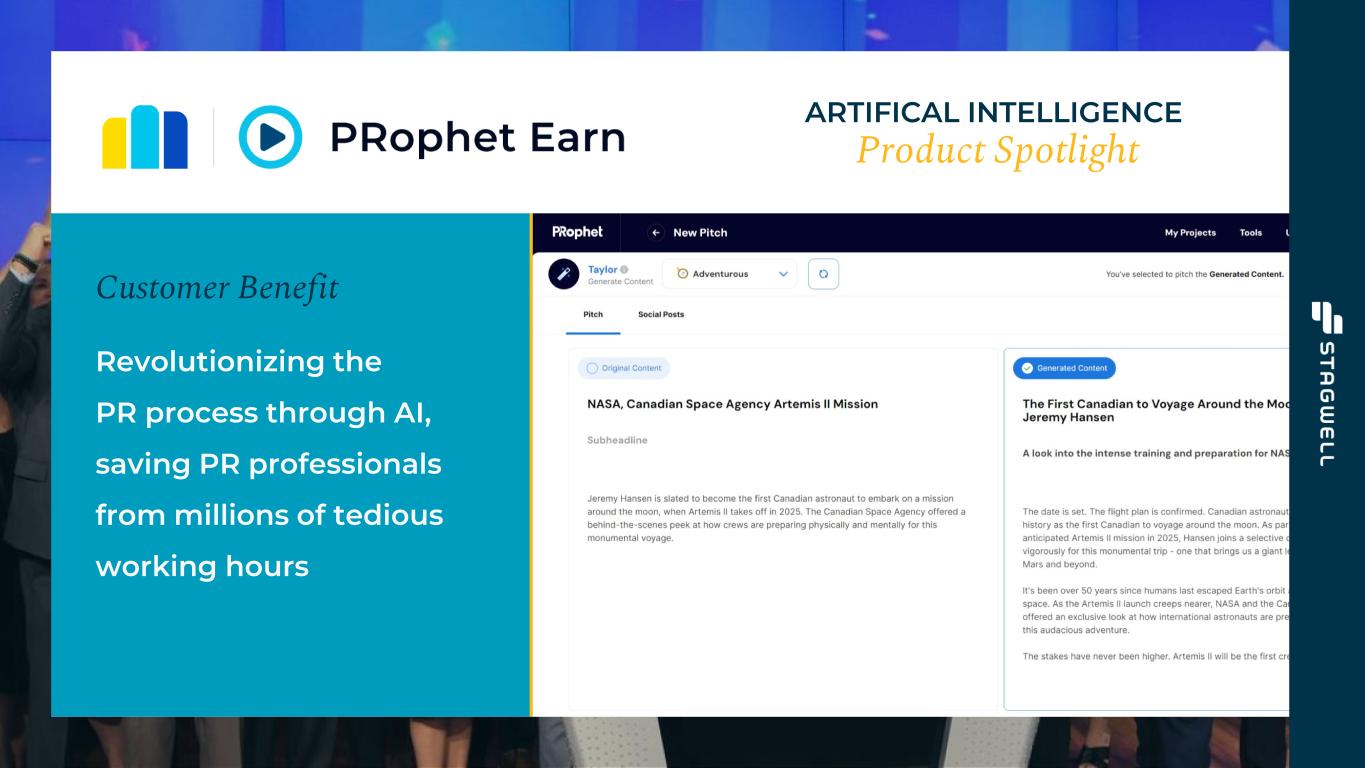
23 ARTIFICAL INTELLIGENCE Product Spotlight Customer Benefit Revolutionizing the PR process through AI, saving PR professionals from millions of tedious working hours

24 AUGMENTED REALITY Product Spotlight Customer Benefit Bringing a whole new level of stadium entertainment and fan engagement to sports and entertainment through shared AR
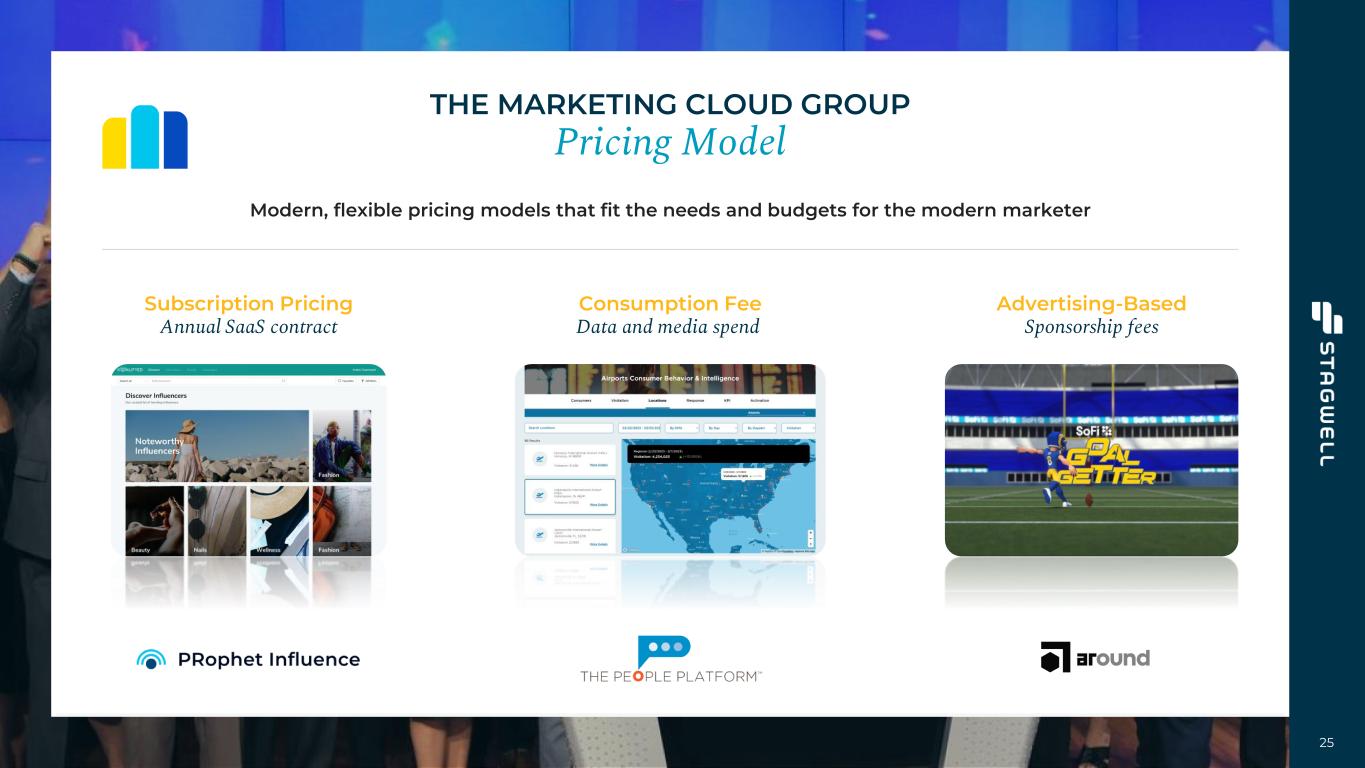
25 THE MARKETING CLOUD GROUP Pricing Model Modern, flexible pricing models that fit the needs and budgets for the modern marketer Subscription Pricing Annual SaaS contract Consumption Fee Data and media spend Advertising-Based Sponsorship fees

Thank You Contact Us: IR@StagwellGlobal.com