.7
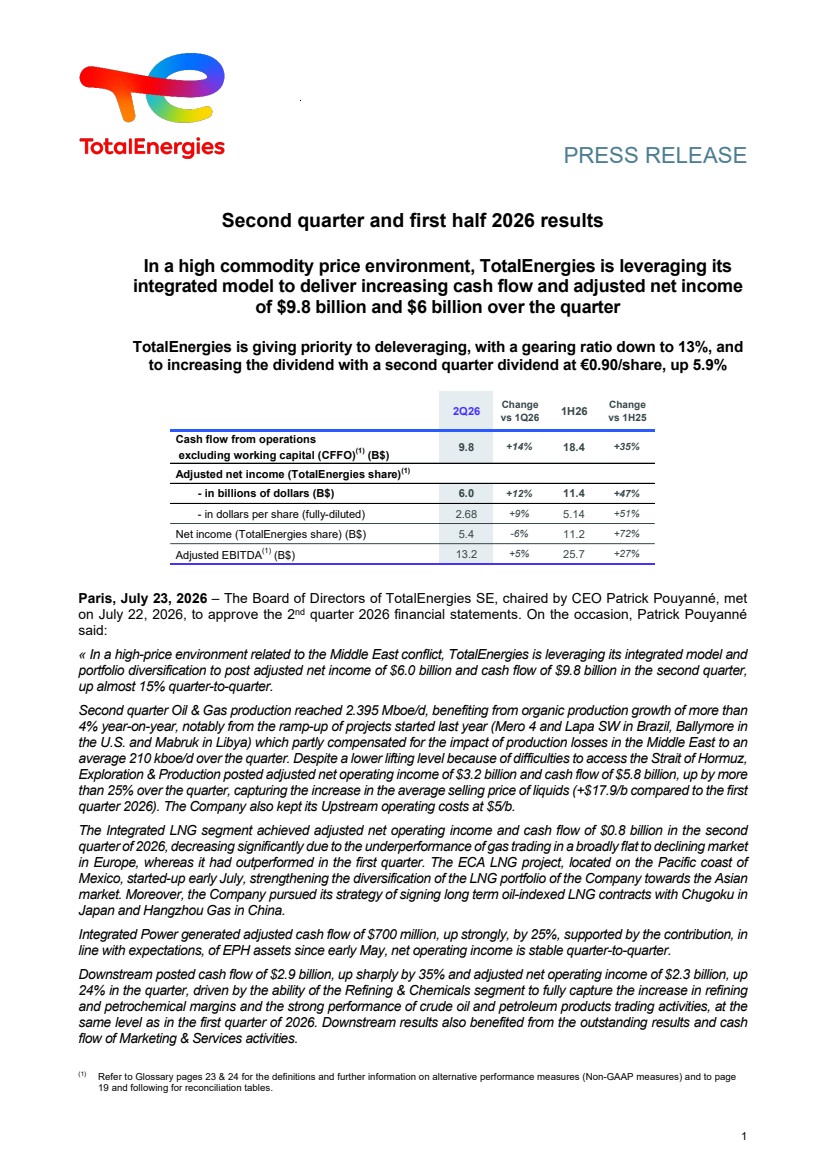
| PRESS RELEASE Second quarter and first half 2026 results In a high commodity price environment, TotalEnergies is leveraging its integrated model to deliver increasing cash flow and adjusted net income of $9.8 billion and $6 billion over the quarter TotalEnergies is giving priority to deleveraging, with a gearing ratio down to 13%, and to increasing the dividend with a second quarter dividend at €0.90/share, up 5.9% 1 Paris, July 23, 2026 – The Board of Directors of TotalEnergies SE, chaired by CEO Patrick Pouyanné, met on July 22, 2026, to approve the 2nd quarter 2026 financial statements. On the occasion, Patrick Pouyanné said: « In a high-price environment related to the Middle East conflict, TotalEnergies is leveraging its integrated model and portfolio diversification to post adjusted net income of $6.0 billion and cash flow of $9.8 billion in the second quarter, up almost 15% quarter-to-quarter. Second quarter Oil & Gas production reached 2.395 Mboe/d, benefiting from organic production growth of more than 4% year-on-year, notably from the ramp-up of projects started last year (Mero 4 and Lapa SW in Brazil, Ballymore in the U.S. and Mabruk in Libya) which partly compensated for the impact of production losses in the Middle East to an average 210 kboe/d over the quarter. Despite a lower lifting level because of difficulties to access the Strait of Hormuz, Exploration & Production posted adjusted net operating income of $3.2 billion and cash flow of $5.8 billion, up by more than 25% over the quarter, capturing the increase in the average selling price of liquids (+$17.9/b compared to the first quarter 2026). The Company also kept its Upstream operating costs at $5/b. The Integrated LNG segment achieved adjusted net operating income and cash flow of $0.8 billion in the second quarter of 2026, decreasing significantly due to the underperformance of gas trading in a broadly flat to declining market in Europe, whereas it had outperformed in the first quarter. The ECA LNG project, located on the Pacific coast of Mexico, started-up early July, strengthening the diversification of the LNG portfolio of the Company towards the Asian market. Moreover, the Company pursued its strategy of signing long term oil-indexed LNG contracts with Chugoku in Japan and Hangzhou Gas in China. Integrated Power generated adjusted cash flow of $700 million, up strongly, by 25%, supported by the contribution, in line with expectations, of EPH assets since early May, net operating income is stable quarter-to-quarter. Downstream posted cash flow of $2.9 billion, up sharply by 35% and adjusted net operating income of $2.3 billion, up 24% in the quarter, driven by the ability of the Refining & Chemicals segment to fully capture the increase in refining and petrochemical margins and the strong performance of crude oil and petroleum products trading activities, at the same level as in the first quarter of 2026. Downstream results also benefited from the outstanding results and cash flow of Marketing & Services activities. (1) Refer to Glossary pages 23 & 24 for the definitions and further information on alternative performance measures (Non-GAAP measures) and to page 19 and following for reconciliation tables. 2Q26 Change vs 1Q26 1H26 Change vs 1H25 Cash flow from operations excluding working capital (CFFO)(1) (B$) 9.8 +14% 18.4 +35% Adjusted net income (TotalEnergies share)(1) - in billions of dollars (B$) 6.0 +12% 11.4 +47% - in dollars per share (fully-diluted) 2.68 +9% 5.14 +51% Net income (TotalEnergies share) (B$) 5.4 -6% 11.2 +72% Adjusted EBITDA(1) (B$) 13.2 +5% 25.7 +27% 1 |
| Net investments in the second quarter amounted to $3.4 billion and $7.9 billion in the first half of 2026, consistent with the annual guidance of $15 billion. The gearing ratio stood at 13.1% at the end of the quarter, an improvement of 2.4 percentage points, benefiting from a $3.3 billion reduction in net debt. Given the Company’s strong cash flow generation in the first half of the year and its ability to deliver growth quarter after quarter, the Board of Directors confirmed the priority to the dividend and to the deleveraging of the Company. It has therefore decided the distribution of a second interim dividend of €0.90/share for fiscal year 2026, up 5.9% compared to 2025. The Board also authorized the continuation of share buybacks up to $1.5 billion for the third quarter. 2 |

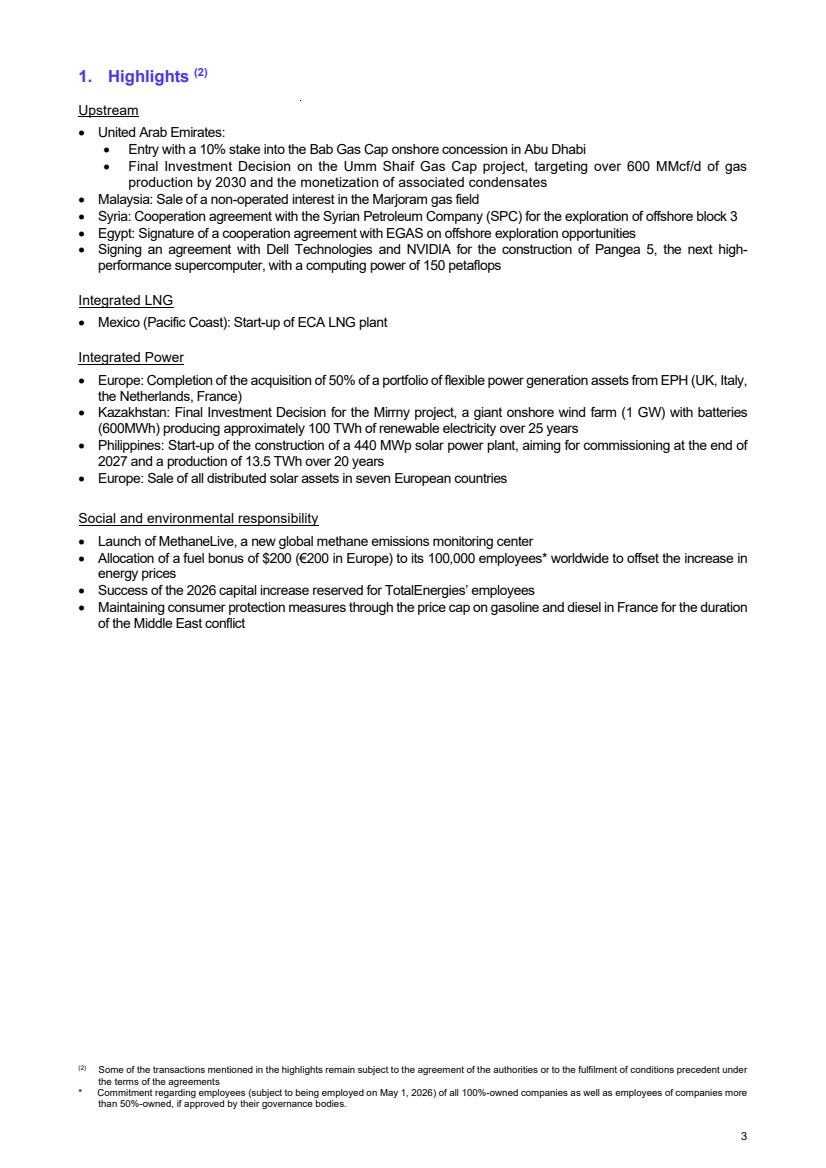
| 1. Highlights (2)* Upstream United Arab Emirates: Entry with a 10% stake into the Bab Gas Cap onshore concession in Abu Dhabi Final Investment Decision on the Umm Shaif Gas Cap project, targeting over 600 MMcf/d of gas production by 2030 and the monetization of associated condensates Malaysia: Sale of a non-operated interest in the Marjoram gas field Syria: Cooperation agreement with the Syrian Petroleum Company (SPC) for the exploration of offshore block 3 Egypt: Signature of a cooperation agreement with EGAS on offshore exploration opportunities Signing an agreement with Dell Technologies and NVIDIA for the construction of Pangea 5, the next high-performance supercomputer, with a computing power of 150 petaflops Integrated LNG Mexico (Pacific Coast): Start-up of ECA LNG plant Integrated Power Europe: Completion of the acquisition of 50% of a portfolio of flexible power generation assets from EPH (UK, Italy, the Netherlands, France) Kazakhstan: Final Investment Decision for the Mirrny project, a giant onshore wind farm (1 GW) with batteries (600MWh) producing approximately 100 TWh of renewable electricity over 25 years Philippines: Start-up of the construction of a 440 MWp solar power plant, aiming for commissioning at the end of 2027 and a production of 13.5 TWh over 20 years Europe: Sale of all distributed solar assets in seven European countries Social and environmental responsibility Launch of MethaneLive, a new global methane emissions monitoring center Allocation of a fuel bonus of $200 (€200 in Europe) to its 100,000 employees* worldwide to offset the increase in energy prices Success of the 2026 capital increase reserved for TotalEnergies’ employees Maintaining consumer protection measures through the price cap on gasoline and diesel in France for the duration of the Middle East conflict (2) Some of the transactions mentioned in the highlights remain subject to the agreement of the authorities or to the fulfilment of conditions precedent under the terms of the agreements * Commitment regarding employees (subject to being employed on May 1, 2026) of all 100%-owned companies as well as employees of companies more than 50%-owned, if approved by their governance bodies. 3 |
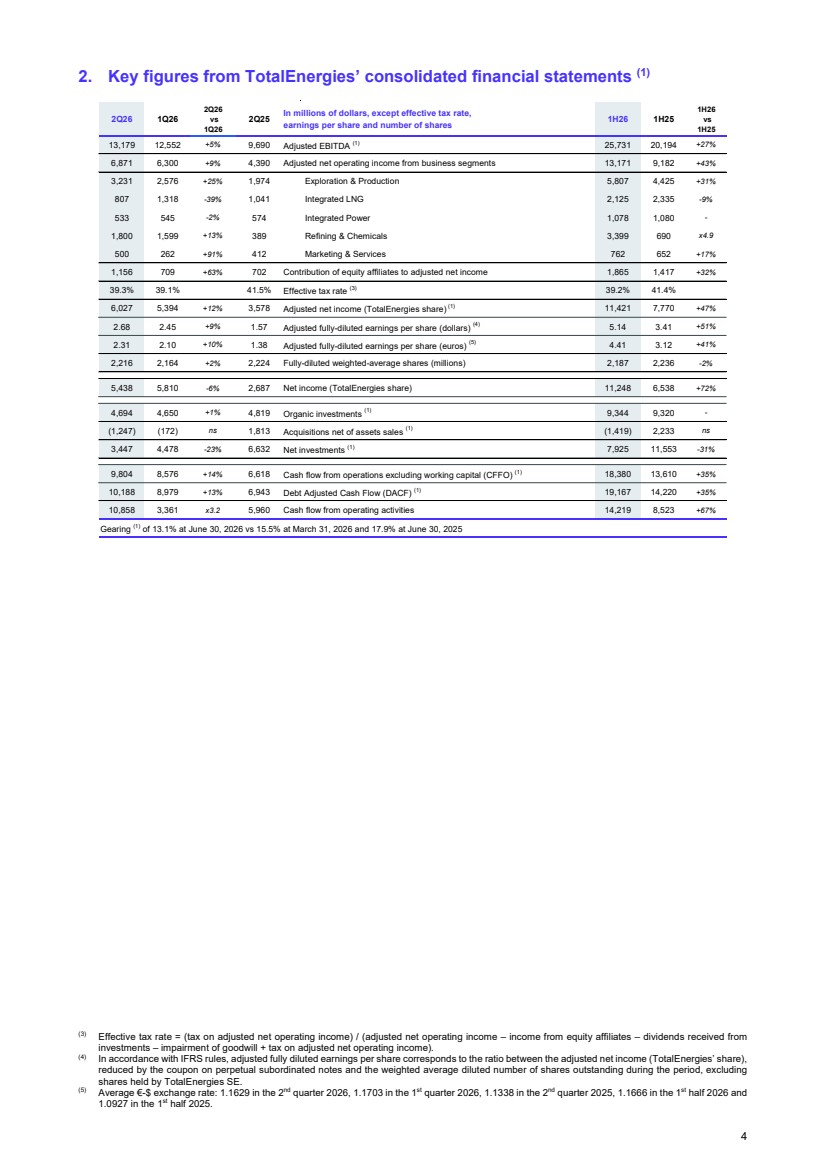
| 2. Key figures from TotalEnergies’ consolidated financial statements (1) * (3) Effective tax rate = (tax on adjusted net operating income) / (adjusted net operating income – income from equity affiliates – dividends received from investments – impairment of goodwill + tax on adjusted net operating income). (4) In accordance with IFRS rules, adjusted fully diluted earnings per share corresponds to the ratio between the adjusted net income (TotalEnergies’ share), reduced by the coupon on perpetual subordinated notes and the weighted average diluted number of shares outstanding during the period, excluding shares held by TotalEnergies SE. (5) Average €-$ exchange rate: 1.1629 in the 2nd quarter 2026, 1.1703 in the 1st quarter 2026, 1.1338 in the 2nd quarter 2025, 1.1666 in the 1st half 2026 and 1.0927 in the 1st half 2025. 2Q26 1Q26 2Q26 vs 1Q26 2Q25 In millions of dollars, except effective tax rate, earnings per share and number of shares 1H26 1H25 1H26 vs 1H25 13,179 12,552 +5% 9,690 Adjusted EBITDA (1) 25,731 20,194 +27% 6,871 6,300 +9% 4,390 Adjusted net operating income from business segments 13,171 9,182 +43% 3,231 2,576 +25% 1,974 Exploration & Production 5,807 4,425 +31% 807 1,318 -39% 1,041 Integrated LNG 2,125 2,335 -9% 533 545 -2% 574 Integrated Power 1,078 1,080 - 1,800 1,599 +13% 389 Refining & Chemicals 3,399 690 x4.9 500 262 +91% 412 Marketing & Services 762 652 +17% 1,156 709 +63% 702 Contribution of equity affiliates to adjusted net income 1,865 1,417 +32% 39.3% 39.1% 41.5% Effective tax rate (3) 39.2% 41.4% 6,027 5,394 +12% 3,578 Adjusted net income (TotalEnergies share) (1) 11,421 7,770 +47% 2.68 2.45 +9% 1.57 Adjusted fully-diluted earnings per share (dollars) (4) 5.14 3.41 +51% 2.31 2.10 +10% 1.38 Adjusted fully-diluted earnings per share (euros) (5) 4.41 3.12 +41% 2,216 2,164 +2% 2,224 Fully-diluted weighted-average shares (millions) 2,187 2,236 -2% 5,438 5,810 -6% 2,687 Net income (TotalEnergies share) 11,248 6,538 +72% 4,694 4,650 +1% 4,819 Organic investments (1) 9,344 9,320 - (1,247) (172) ns 1,813 Acquisitions net of assets sales (1) (1,419) 2,233 ns 3,447 4,478 -23% 6,632 Net investments (1) 7,925 11,553 -31% 9,804 8,576 +14% 6,618 Cash flow from operations excluding working capital (CFFO) (1) 18,380 13,610 +35% 10,188 8,979 +13% 6,943 Debt Adjusted Cash Flow (DACF) (1) 19,167 14,220 +35% 10,858 3,361 x3.2 5,960 Cash flow from operating activities 14,219 8,523 +67% Gearing (1) of 13.1% at June 30, 2026 vs 15.5% at March 31, 2026 and 17.9% at June 30, 2025 4 |
| 3. Key figures of environment, greenhouse gas emissions and production 3.1 Environment – liquids and gas price realizations, refining margins * 3.2 Greenhouse gas emissions (11) Estimated quarterly emissions. First half of 2026 Scope 3(13) Category 11 emissions are estimated at 163 Mt CO2e. (6) Does not include oil, gas and LNG trading activities, respectively. (7) Sales in $ / Sales in volume for consolidated affiliates. (8) Sales in $ / Sales in volume for consolidated affiliates. (9) Sales in $ / Sales in volume for consolidated and equity affiliates. (10) This market indicator for European refining, calculated based on public market prices ($/b), uses a basket of crudes, petroleum product yields and variable costs representative of the European refining system of TotalEnergies. (11) The seven greenhouse gases in the Kyoto protocol, namely CO2, CH4, N2O, HFCs, PFCs, SF6 and NF3, with their respective 100-year time horizon GWP (Global Warming Potential) as described in the most recent IPCC report. HFCs, PFCs, SF6 and NF3 are virtually absent from the Company’s emissions and are not accounted for by the Company. (12) Scope 1+2 GHG emissions are defined as the sum of direct emissions of GHG from sites or activities that are included in the scope of reporting for climate change-related indicators and indirect emissions resulting from the production of electricity, steam, heat or cooling, purchased or acquired, and consumed by the sites or activities included in the scope of reporting for climate change-related indicators, net from potential energy sales, excluding purchased industrial gases (H2). If not stated otherwise, TotalEnergies reports Scope 2 GHG emissions according to the market-based method defined by the GHG Protocol. (13) If not stated otherwise, TotalEnergies reports Scope 3 GHG emissions, category 11, which correspond to indirect GHG emissions related to the direct use phase emissions of sold products over their expected lifetime (i.e., the scope 1 and scope 2 emissions of end users that occur from the combustion of fuels) in accordance with the definition of the GHG Protocol Corporate Value Chain (Scope 3) Accounting and Reporting Standard Supplement. The Company follows the oil & gas industry reporting guidelines published by IPIECA, which comply with the GHG Protocol methodologies. In order to avoid double counting, this methodology accounts for the largest volume in the oil and gas value chains, i.e. the higher of the two production volumes or sales for end use. The highest point for each value chain for the year 2026 will be determined with regard to the achievement over the whole year, with TotalEnergies providing estimates as the quarters progress. A stoichiometric emission factor (oxidation of molecules to carbon dioxide) is applied to these sales or production to obtain an emission volume. In accordance with the Technical Guidance for Calculating Scope 3 Emissions Supplement to the Corporate Value Chain (Scope 3) Accounting and Reporting Standard which defines end users as both consumers and business customers that use final products, and with IPIECA’s Estimating petroleum industry value chain (Scope 3) greenhouse gas emissions guidelines, under which reporting of emissions from fuel purchased for resale to non-end users (e.g. traded) is optional, TotalEnergies does not report emissions associated with trading activities. 2Q26 1Q26 2Q26 vs 1Q26 2Q25 1H26 1H25 1H26 vs 1H25 103.8 81.1 +28% 67.9 Brent ($/b) 92.3 71.9 +28% 2.9 3.5 -17% 3.5 Henry Hub ($/Mbtu) 3.2 3.7 -14% 15.6 13.7 +14% 11.9 TTF ($/Mbtu) 14.7 13.2 +11% 17.5 14.1 +24% 12.2 JKM ($/Mbtu) 15.8 13.1 +20% 91.6 73.7 +24% 65.6 Average price of liquids (6),(7) ($/b) Consolidated subsidiaries 82.2 68.7 +20% 5.55 5.59 -1% 5.63 Average price of gas (6),(8) ($/Mbtu) Consolidated subsidiaries 5.57 6.13 -9% 10.20 8.48 +20% 9.10 Average price of LNG (6),(9) ($/Mbtu) Consolidated subsidiaries and equity affiliates 9.29 9.55 -3% 13.5 11.4 +19% 4.7 European Refining Margin Marker (ERM) (6),(10) ($/b) 12.4 4.3 x2.9 2Q26 1Q26 2Q26 vs 1Q26 2Q25 Scope 1+2 emissions (12) (MtCO2e) 1H26 1H25 1H26 vs 1H25 7.3 7.9 -8% 8.0 Scope 1+2 from operated perimeter (1) 15.1 16.4 -8% 6.4 6.9 -7% 7.1 of which Oil & Gas 13.2 14.3 -8% 0.9 1.0 -10% 0.9 of which CCGT 1.9 2.1 -10% 10.2 10.4 -2% 10.6 Scope 1+2 - ESRS perimeter (1) 20.6 21.7 -5% 2Q26 1Q26 2Q26 vs 1Q26 2Q25 Methane emissions (ktCH4 ) 1H26 1H25 1H26 vs 1H25 4 4 - 6 Methane emissions from operated perimeter (1) 8 11 -27% 5 |
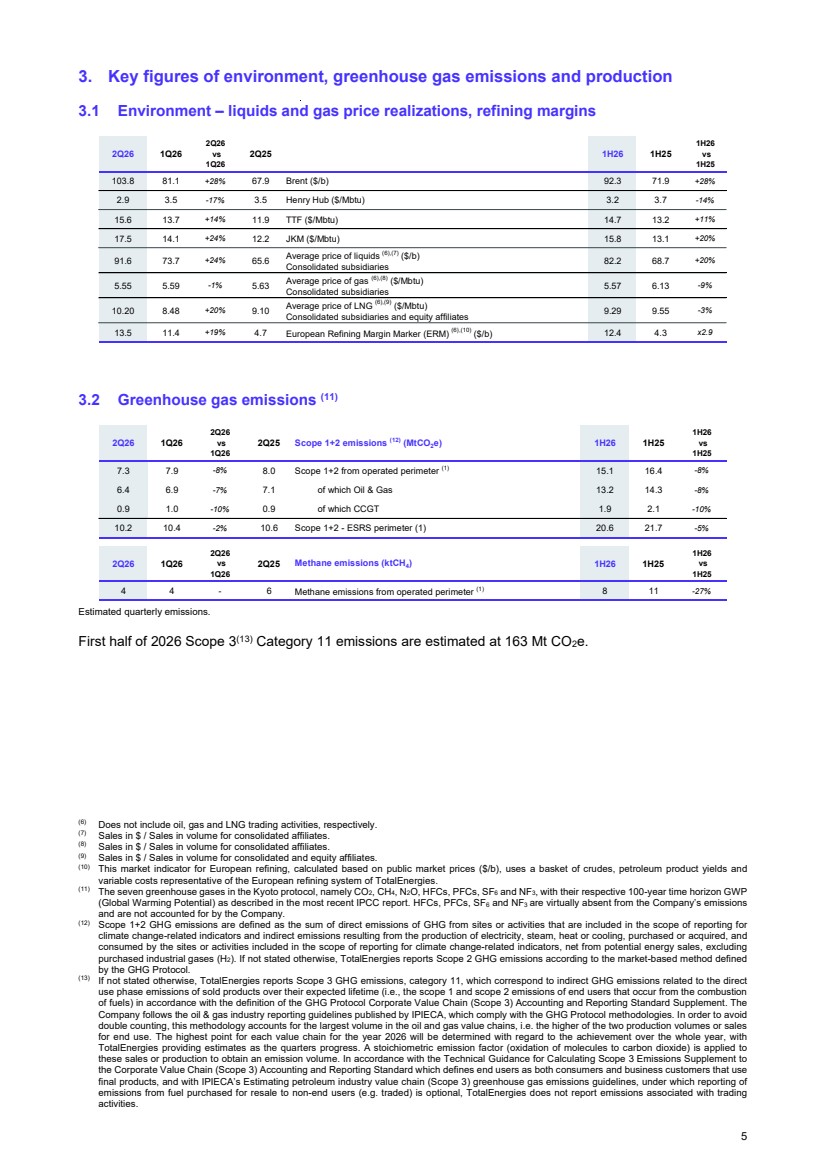
| 3.3 Production (14)* Hydrocarbon production was 2,395 thousand barrels of oil equivalent per day in the second quarter of 2026, down 4% year‑on‑year, due to the following: +4% from project start‑up and ramp‑up of projects, including Mero‑3, Mero‑4 and Lapa SW in Brazil, Anchor and Ballymore in the United States, Begonia and Clov Phase 3 in Angola and Mabruk in Libya, +3% due to improved plant availability, -1% due to pricing effect, -2% due to the natural decline of fields, -8% due to the impact of the conflict in the Middle East. Excluding the impact of the conflict in the Middle East, production was up more than 4% year-on-year, driven by the ramp-up and start-up of new projects and improved facility availability. (14) Company production = E&P production + Integrated LNG production. 2Q26 1Q26 2Q26 vs 1Q26 2Q25 Hydrocarbon production 1H26 1H25 1H26 vs 1H25 2,395 2,553 -6% 2,503 Hydrocarbon production (kboe/d) 2,474 2,531 -2% 1,298 1,326 -2% 1,343 Oil (including bitumen) (kb/d) 1,312 1,349 -3% 1,097 1,227 -11% 1,160 Gas (including condensates and associated NGL) (kboe/d) 1,162 1,182 -2% 2,395 2,553 -6% 2,503 Hydrocarbon production (kboe/d) 2,474 2,531 -2% 1,410 1,481 -5% 1,506 Liquids (kb/d) 1,445 1,511 -4% 5,330 5,799 -8% 5,395 Gas (Mcf/d) 5,563 5,524 +1% 6 |
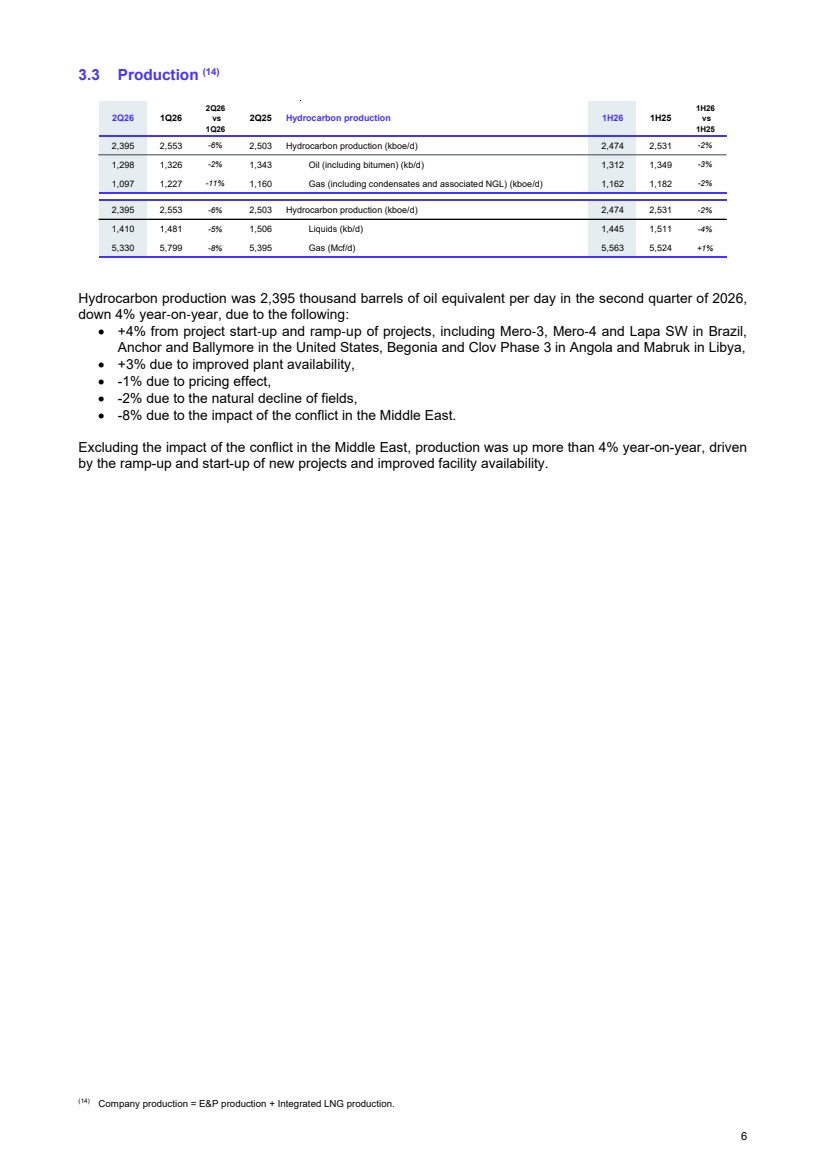
| 4. Analysis of business segments 4.1 Exploration & Production 4.1.1 Production 4.1.2 Results * Adjusted net operating income was $3,231 million, up 25% in the quarter, reflecting in particular the increase in the average selling price of liquids (+$17.9/b compared to the first quarter of 2026, vs +$22.7/b for Brent, reflecting a larger off-take schedule at the end of the quarter, in a bearish oil market,) affected by the effects of accounting for production not lifted. Exploration & Production cash flow from operations excluding working capital (CFFO) was $5,777 million, up 27% in the quarter, for the same reasons. (15) Effective tax rate = (tax on adjusted net operating income) / (adjusted net operating income – income from equity affiliates – dividends received from investments – impairment of goodwill + tax on adjusted net operating income). 2Q26 1Q26 2Q26 vs 1Q26 2Q25 Hydrocarbon production 1H26 1H25 1H26 vs 1H25 1,845 1,948 -5% 1,956 EP (kboe/d) 1,896 1,966 -4% 1,342 1,408 -5% 1,437 Liquids (kb/d) 1,375 1,440 -4% 2,668 2,863 -7% 2,767 Gas (Mcf/d) 2,765 2,807 -1% 2Q26 1Q26 2Q26 vs 1Q26 2Q25 In millions of dollars, except effective tax rate 1H26 1H25 1H26 vs 1H25 3,231 2,576 +25% 1,974 Adjusted net operating income 5,807 4,425 +31% 137 139 -1% 176 including adjusted income from equity affiliates 276 326 -15% 45.4% 49.5% 50.1% Effective tax rate (15) 47.3% 49.7% 2,231 2,724 -18% 3,053 Organic investments (1) 4,955 5,737 -14% (348) (227) ns 162 Acquisitions net of assets sales (1) (575) 278 ns 1,883 2,497 -25% 3,215 Net investments (1) 4,380 6,015 -27% 5,777 4,564 +27% 3,760 Cash flow from operations excluding working capital (CFFO) (1) 10,341 8,051 +28% 5,546 2,969 +87% 3,675 Cash flow from operating activities 8,515 6,941 +23% 7 |
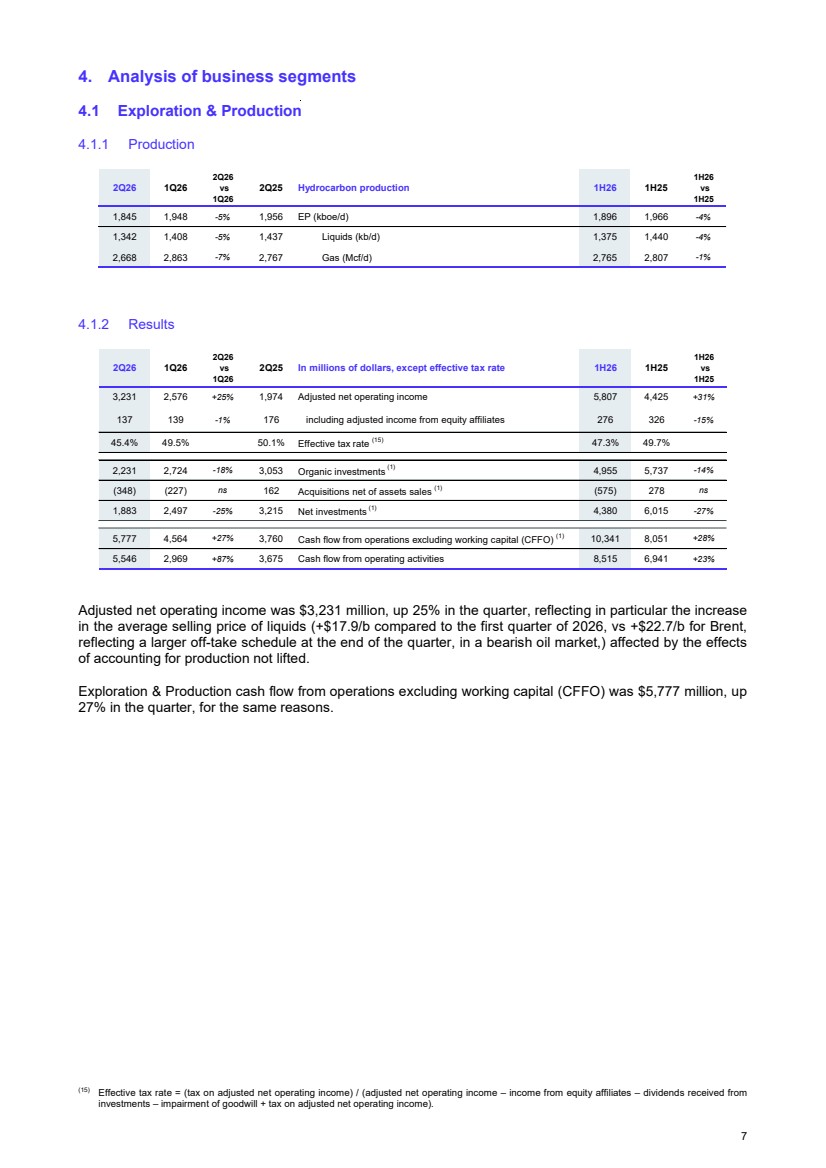
| 4.2 Integrated LNG 4.2.1 Production * The Company’s equity production may be sold by TotalEnergies or by the joint ventures. Hydrocarbon production for LNG decreased by 9% quarter-to-quarter, mainly due to shut-in production in Qatar related to the Middle East conflict. 4.2.2 Results * Sales in $ / Sales in volume for consolidated and equity affiliates. Does not include LNG trading activities. Adjusted net operating income and cash flow from operations excluding working capital (CFFO) for the Integrated LNG segment were $807 million and $833 million, respectively, significantly lower quarter-on-quarter, impacted by the underperformance of gas trading activities in an overall flat, and even bearish, European market, whereas the segment outperformed in the first quarter. 2Q26 1Q26 2Q26 vs 1Q26 2Q25 Hydrocarbon production for LNG 1H26 1H25 1H26 vs 1H25 550 605 -9% 547 Integrated LNG (kboe/d) 578 565 +2% 68 73 -8% 69 Liquids (kb/d) 70 71 -1% 2,662 2,936 -9% 2,628 Gas (Mcf/d) 2,798 2,717 +3% 2Q26 1Q26 2Q26 vs 1Q26 2Q25 Liquefied Natural Gas in Mt 1H26 1H25 1H26 vs 1H25 10.7 12.4 -13% 10.6 Overall LNG sales 23.1 21.2 +9% 3.9 4.1 -6% 3.9 incl. Sales from equity production* 8.0 7.9 +1% 9.8 10.9 -10% 9.4 incl. Sales by TotalEnergies from equity production and third party purchases 20.7 18.8 +10% 2Q26 1Q26 2Q26 vs 1Q26 2Q25 In millions of dollars, except the average price of LNG 1H26 1H25 1H26 vs 1H25 10.20 8.48 +20% 9.10 Average price of LNG ($/Mbtu) * Consolidated subsidiaries and equity affiliates 9.29 9.55 -3% 807 1,318 -39% 1,041 Adjusted net operating income 2,125 2,335 -9% 705 431 +64% 513 including adjusted income from equity affiliates 1,136 1,048 +8% 908 410 x2.2 743 Organic investments (1) 1,318 1,495 -12% 4 92 -96% 110 Acquisitions net of assets sales (1) 96 250 -62% 912 502 +82% 853 Net investments (1) 1,414 1,745 -19% 833 1,785 -53% 1,159 Cash flow from operations excluding working capital (CFFO) (1) 2,618 2,408 +9% 2,137 (1,120) ns 539 Cash flow from operating activities 1,017 2,282 -55% 8 |
| 4.3 Integrated Power 4.3.1 Productions, capacities, clients and sales * Solar, wind, hydroelectric and gas flexible capacities. ** End of period data. *** Includes 17.25% of Adani Green Energy Ltd’s gross capacity, 50% of Clearway Energy Group’s gross capacity and 49% of Casa dos Ventos’ gross capacity. Net electricity production was 14.8 TWh, up 28% year-on-year, driven by an increase of nearly 15% in generation from renewable sources, reflecting growth in installed capacity, and by a 2 TWh increase in production from flexible gas-fired capacity resulting notably from the completion of the transaction with EPH. Gross installed renewable electricity generation capacity reached 37.4 GW at the end of the second quarter of 2026, representing nearly 8 GW of additional capacity year‑on‑year. 4.3.2 Results Integrated Power segment adjusted net operating income was $533 million in the quarter, in line with the first quarter of 2026. Integrated Power segment cash flow from operations excluding working capital (CFFO) amounted to $721 million, supported by the contribution, in line with expectations, of EPH assets since the closing of the transaction on April 29, 2026. It breaks down between production activities, including renewables and gas-fired power plants, for around 60%, and marketing activities, including B2B, B2C and trading, for around 40%. 2Q26 1Q26 2Q26 vs 1Q26 2Q25 Integrated Power 1H26 1H25 1H26 vs 1H25 14.8 11.7 +26% 11.6 Net power production (TWh) * 26.4 22.9 +16% 9.6 8.2 +18% 8.4 o/w production from renewables 17.8 15.2 +17% 5.2 3.5 +47% 3.2 o/w production from gas flexible capacities 8.7 7.7 +12% 33.4 26.8 +24% 24.0 Portfolio of power generation net installed capacity (GW) ** 33.4 24.0 +39% 21.1 19.8 +7% 17.4 o/w renewables 21.1 17.4 +21% 12.2 7.0 +74% 6.5 o/w gas flexible capacities 12.2 6.5 +88% 105.8 109.7 -4% 104.1 Portfolio of renewable power generation gross capacity (GW) **,*** 105.8 104.1 +2% 37.4 35.6 +5% 30.2 o/w installed capacity 37.4 30.2 +24% 6.1 6.1 - 6.0 Clients power - BtB and BtC (Million) ** 6.1 6.0 +2% 2.7 2.7 - 2.7 Clients gas - BtB and BtC (Million) ** 2.7 2.7 -2% 11.6 15.2 -23% 10.5 Sales power - BtB and BtC (TWh) 26.8 25.0 +7% 14.5 31.5 -54% 14.9 Sales gas - BtB and BtC (TWh) 46.0 50.6 -9% 2Q26 1Q26 2Q26 vs 1Q26 2Q25 In millions of dollars 1H26 1H25 1H26 vs 1H25 533 545 -2% 574 Adjusted net operating income 1,078 1,080 - 168 52 x3.2 22 including adjusted income from equity affiliates 220 66 x3.3 920 823 +12% 421 Organic investments (1) 1,743 1,066 +63% (749) (77) ns 1,568 Acquisitions net of assets sales (1) (826) 1,806 ns 171 746 -77% 1,989 Net investments (1) 917 2,872 -68% 721 574 +26% 562 Cash flow from operations excluding working capital (CFFO) (1) 1,295 1,159 +12% (239) (145) ns 799 Cash flow from operating activities (384) 400 ns 9 |
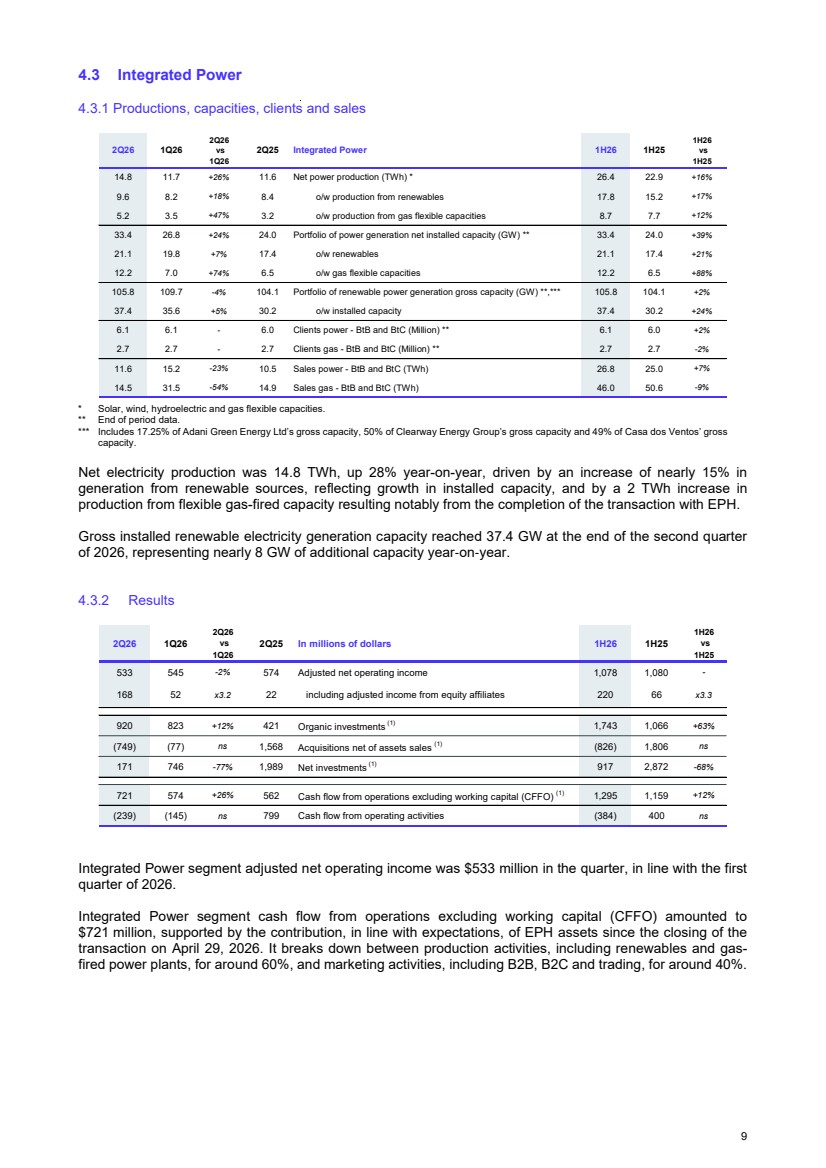
| 4.4 Downstream (Refining & Chemicals and Marketing & Services) 4.4.1 Results 4.5 Refining & Chemicals 4.5.1 Refinery and petrochemicals throughput and utilization rates * Based on distillation capacity at the beginning of the year * Olefins. ** Based on olefins production from steam crackers and their treatment capacity at the start of the year. Refinery throughput was down 12% quarter-on-quarter, notably due to the deliberate decision to maximize distillates production given the higher margins. It was also impacted by the planned shutdown at Donges in France, the events in early April that affected the SATORP refinery in Saudi Arabia which has reached 70% of its nominal capacity since beginning of May and an unplanned shutdown in June of Port Arthur refinery in the United States caused by a tropical storm. 2Q26 1Q26 2Q26 vs 1Q26 2Q25 In millions of dollars 1H26 1H25 1H26 vs 1H25 2,300 1,861 +24% 801 Adjusted net operating income 4,161 1,342 x3.1 540 654 -17% 532 Organic investments (1) 1,194 918 +30% (156) 39 ns (27) Acquisitions net of assets sales (1) (117) (102) ns 384 693 -45% 505 Net investments (1) 1,077 816 +32% 2,877 2,136 +35% 1,483 Cash flow from operations excluding working capital (CFFO) (1) 5,013 2,600 +93% 4,114 2,632 +56% 1,515 Cash flow from operating activities 6,746 100 x67.5 2Q26 1Q26 2Q26 vs 1Q26 2Q25 Refinery throughput and utilization rate 1H26 1H25 1H26 vs 1H25 1,426 1,624 -12% 1,589 Total refinery throughput (kb/d) 1,524 1,569 -3% 354 462 -23% 463 France 408 449 -9% 684 677 +1% 632 Rest of Europe 680 629 +8% 389 485 -20% 494 Rest of world 436 491 -11% 80% 92% 90% Utilization rate based on crude only* 86% 89% 2Q26 1Q26 2Q26 vs 1Q26 2Q25 Petrochemicals production and utilization rate 1H26 1H25 1H26 vs 1H25 1,100 1,183 -7% 1,164 Monomers* (kt) 2,283 2,414 -5% 1,165 1,159 - 1,127 Polymers (kt) 2,324 2,300 +1% 71% 74% 74% Steam cracker utilization rate** 73% 76% 10 |
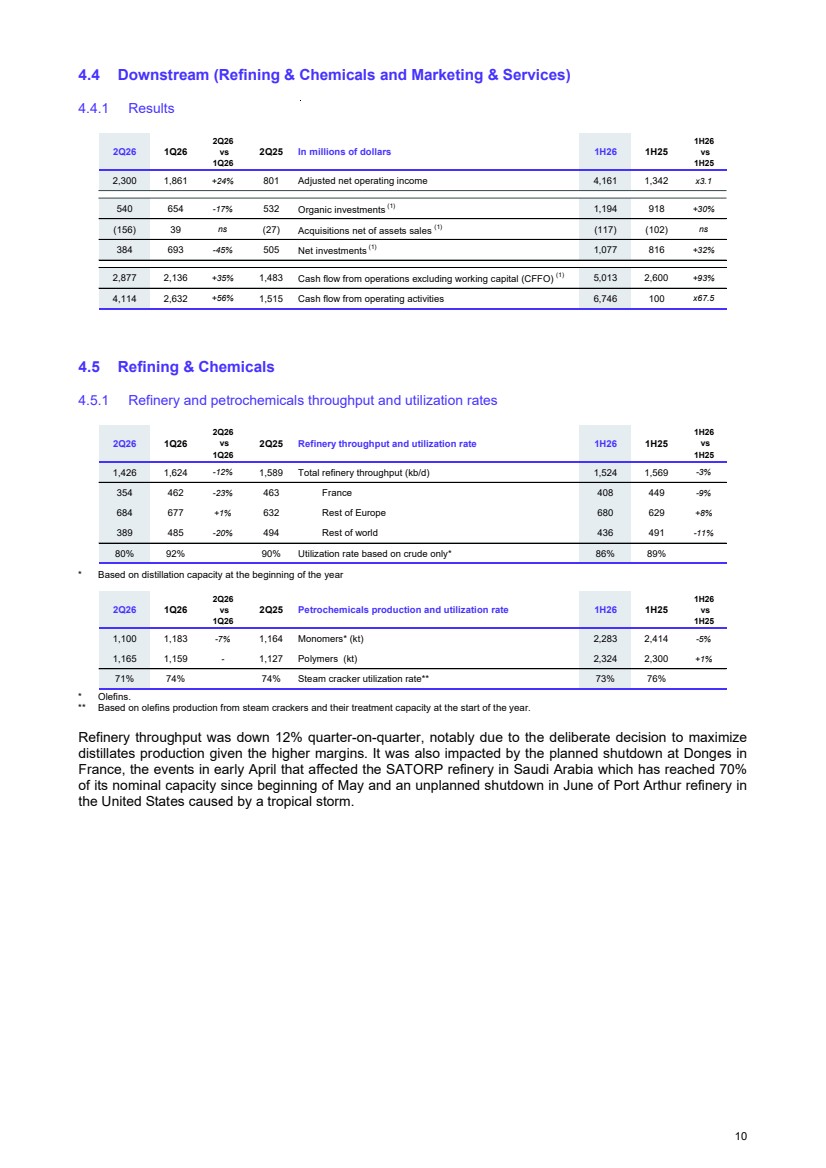
| 4.5.2 Results * This market indicator for European refining, calculated based on public market prices ($/b), uses a basket of crudes, petroleum product yields and variable costs representative of the European refining system of TotalEnergies. Does not include oil trading activities. Refining and Chemicals adjusted net operating income was $1,800 million for the quarter, demonstrating the segment’s ability to capture higher refining and petrochemical margins, in a context where oil trading results were at the same strong level as the first quarter. Cash flow from operations excluding working capital (CFFO) was $2,030 million, for the same reasons. 4.6 Marketing & Services 4.6.1 Petroleum product sales * Excludes trading and bulk refining sales. Sales of petroleum products were down 8% compared to the second quarter of 2025, reflecting in particular the sale of the retail network in Burkina Faso in West Africa, and a drop in demand related to higher prices. 4.6.2 Results Marketing & Services segment adjusted net operating income was $500 million in the quarter, driven by the positive impact of the seasonality in Europe, and up 21% year-on-year reflecting higher unit margins. Cash flow from operations excluding working capital (CFFO) amounted to $847 million in the second quarter of 2026, up 19% year-on-year for the same reasons. 2Q26 1Q26 2Q26 vs 1Q26 2Q25 In millions of dollars, except ERM 1H26 1H25 1H26 vs 1H25 13.5 11.4 +19% 4.7 European Refining Margin Marker (ERM) ($/b) * 12.4 4.3 x2.9 1,800 1,599 +13% 389 Adjusted net operating income 3,399 690 x4.9 366 518 -29% 333 Organic investments (1) 884 569 +55% (1) 75 ns (24) Acquisitions net of assets sales (1) 74 (24) ns 365 593 -38% 309 Net investments (1) 958 545 +76% 2,030 1,716 +18% 772 Cash flow from operations excluding working capital (CFFO) (1) 3,746 1,405 x2.7 3,565 1,564 x2.3 887 Cash flow from operating activities 5,129 (1,096) ns 2Q26 1Q26 2Q26 vs 1Q26 2Q25 Sales in kb/d* 1H26 1H25 1H26 vs 1H25 1,213 1,206 +1% 1,324 Total Marketing & Services sales 1,210 1,295 -7% 732 686 +7% 790 Europe 709 753 -6% 481 520 -8% 534 Rest of world 501 543 -8% 2Q26 1Q26 2Q26 vs 1Q26 2Q25 In millions of dollars 1H26 1H25 1H26 vs 1H25 500 262 +91% 412 Adjusted net operating income 762 652 +17% 174 136 +28% 199 Organic investments (1) 310 349 -11% (155) (36) ns (3) Acquisitions net of assets sales (1) (191) (78) ns 19 100 -81% 196 Net investments (1) 119 271 -56% 847 420 x2 711 Cash flow from operations excluding working capital (CFFO) (1) 1,267 1,195 +6% 549 1,068 -49% 628 Cash flow from operating activities 1,617 1,196 +35% 11 |
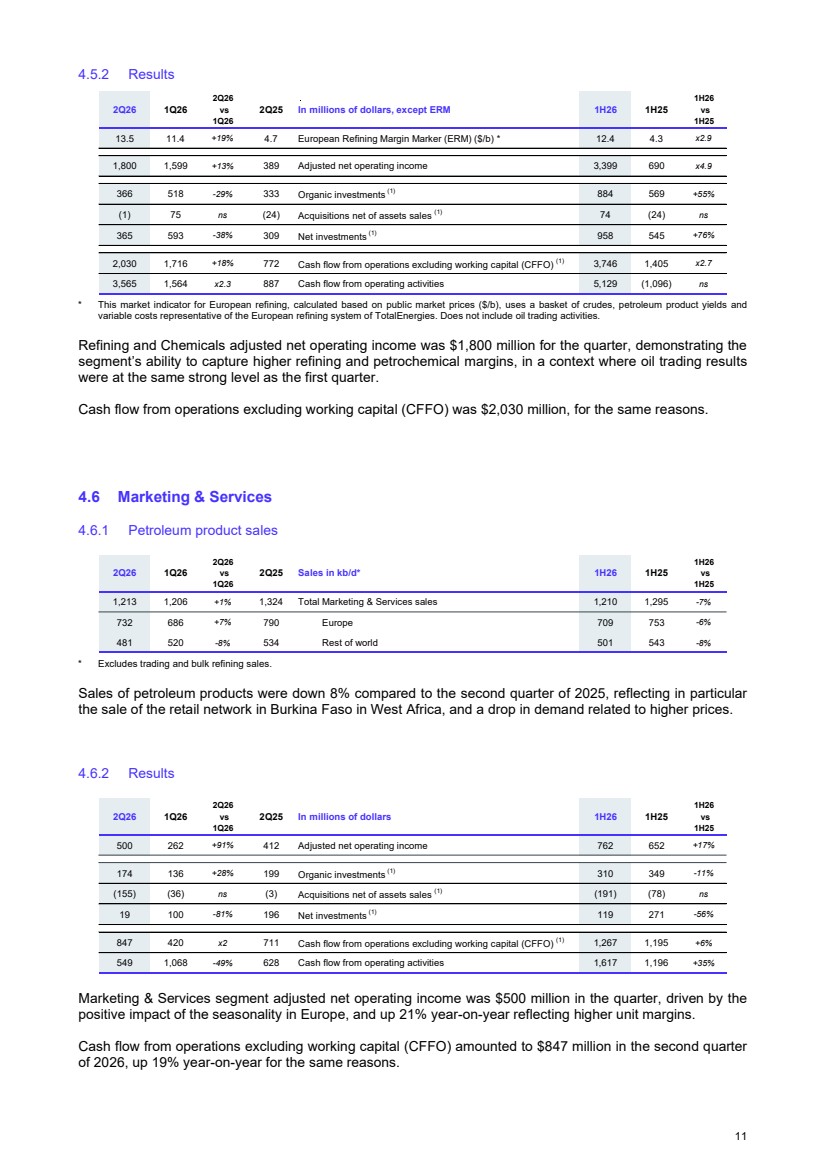
| 5. TotalEnergies results 5.1 Adjusted net operating income from business segments Segment adjusted net operating income was $6,871 million in the second quarter of 2026, compared to $6,300 million in the first quarter of 2026, mainly due to higher oil prices and refining and petrochemical margins as well as significant performance of crude oil and petroleum products trading activities. 5.2 Adjusted net income (1) (TotalEnergies share) Adjusted net income (TotalEnergies share) was $6,027 million in the second quarter of 2026, compared with $5,394 million in the first quarter. Adjusted net income excludes the after‑tax inventory effect, non‑recurring items, and effects of changes in fair‑value. Adjusting items to net income totaled -$0.6 billion in the second quarter, consisting mainly of -$0.4 billion in changes in inventories and fair value effects and restructuring charges. TotalEnergies’ average tax rate was 39.3% in the second quarter versus 39.1% in the first quarter of 2026. 5.3 Adjusted earnings per share Adjusted diluted net earnings per share were as follows: $2.68 in the second quarter of 2026, based on a diluted weighted average number of shares of 2,216 million, compared with $2.45 in the first quarter of 2026, $5.14 in the first half of 2026, based on diluted weighted average number of shares of 2,187 million, compared with $3.41 a year ago. As of June 30, 2026, the number of diluted shares was 2,245 million. TotalEnergies repurchased* the following: 16.9 million shares in the second quarter of 2026, for an amount of $1.5 billion, 26.3 million shares in the first half of 2026, for an amount of $2.25 billion. * 5.4 Acquisitions – asset sales Acquisitions amounted to $141 million in the second quarter of 2026, primarily related to the redetermination of ownership interests in the Johan Sverdrup field in Norway. Divestments amounted to $1,388 million in the second quarter of 2026, mainly reflecting the disposal of the non-operated interest in the Marjoram gas field in Malaysia, the farm-down transactions on battery storage projects in Germany and the divestment of non-core activities in Gas Renewables and Power and Marketing & Services. 5.5 Net cash flow (1) TotalEnergies’ net cash flow was $6,357 million in the second quarter of 2026, compared to $4,098 million in the previous quarter, considering the $1,228 million increase in cash flow from operations excluding working capital (CFFO), combined with a $1,031 million reduction in net investments over the quarter. Cash flow from operating activities was $10,858 million in the second quarter of 2026, for a cash flow from operations excluding working capital (CFFO) of $9,804 million, taking into account the $1.2 billion decrease in working capital, mainly reflecting the impact of the decrease in hydrocarbon prices at the end of the quarter, particularly on inventories. * Net of fees and taxes, including coverage of employees share grant plans. 12 |
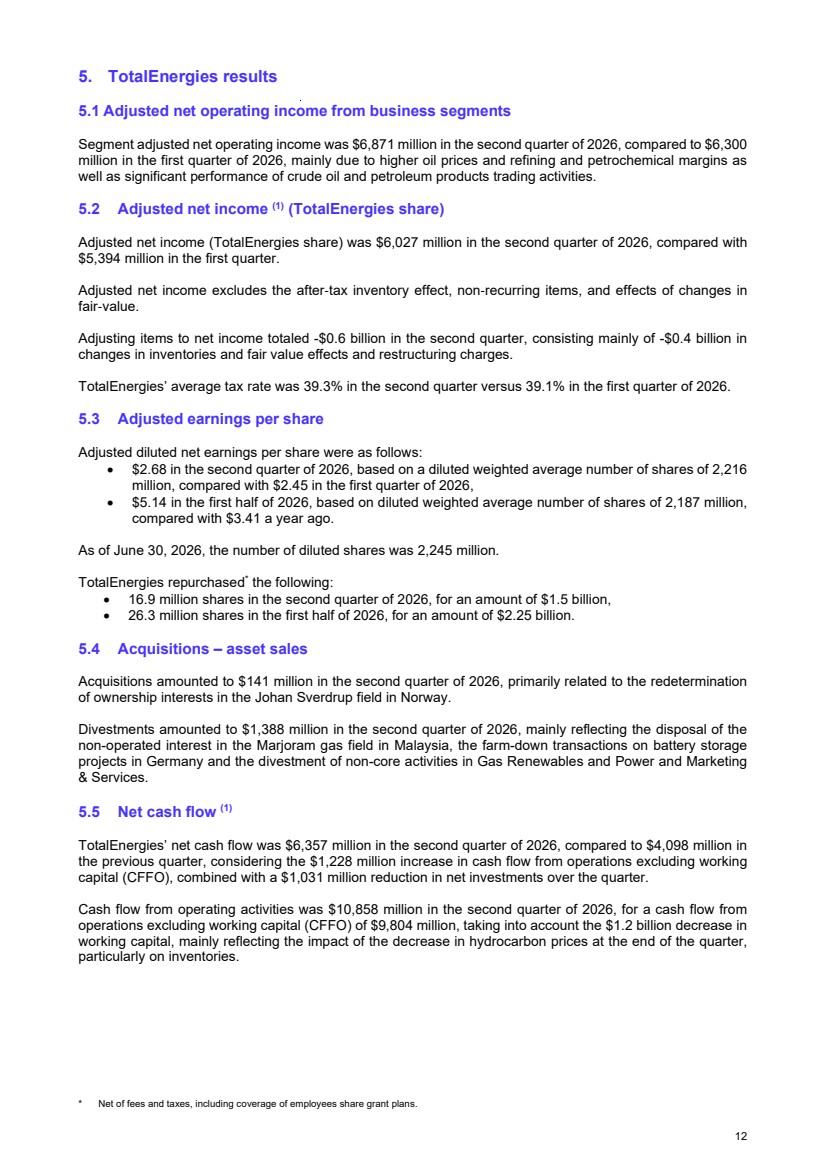
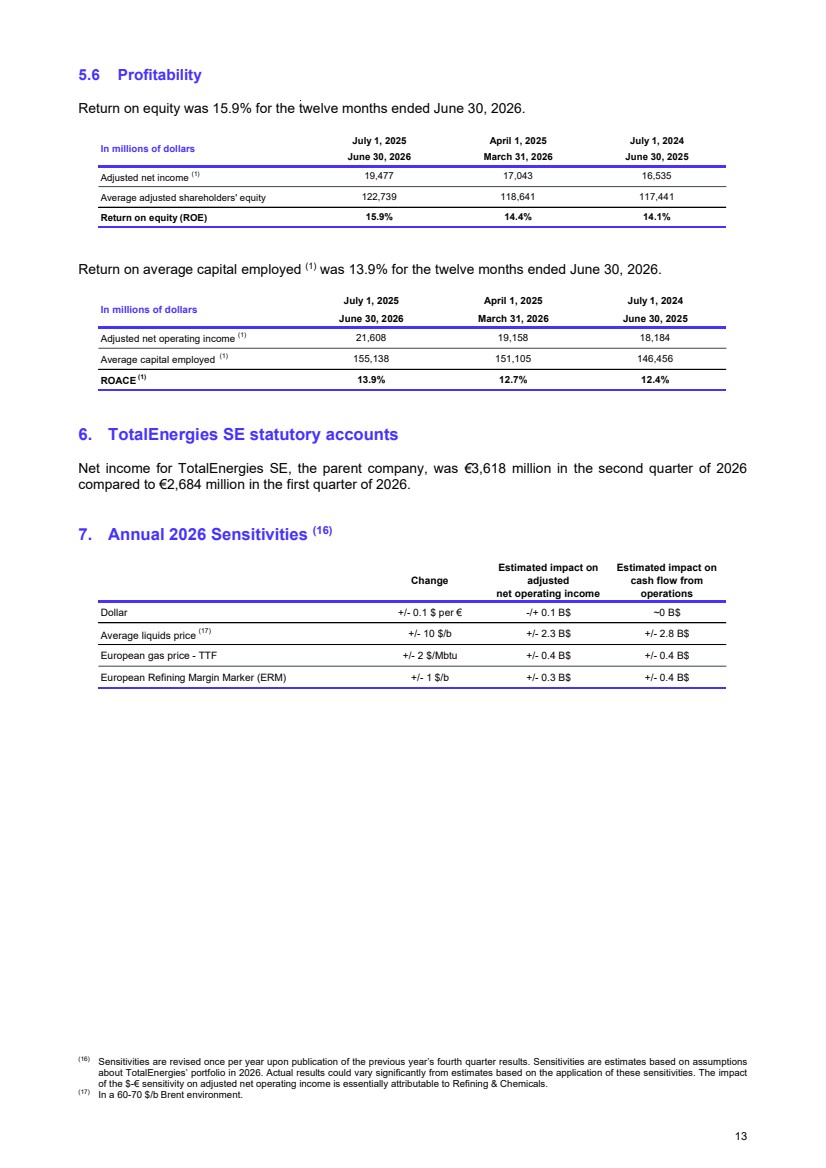
| 5.6 Profitability Return on equity was 15.9% for the twelve months ended June 30, 2026. Return on average capital employed (1) was 13.9% for the twelve months ended June 30, 2026. 6. TotalEnergies SE statutory accounts Net income for TotalEnergies SE, the parent company, was €3,618 million in the second quarter of 2026 compared to €2,684 million in the first quarter of 2026. 7. Annual 2026 Sensitivities (16) (16) Sensitivities are revised once per year upon publication of the previous year’s fourth quarter results. Sensitivities are estimates based on assumptions about TotalEnergies’ portfolio in 2026. Actual results could vary significantly from estimates based on the application of these sensitivities. The impact of the $-€ sensitivity on adjusted net operating income is essentially attributable to Refining & Chemicals. (17) In a 60-70 $/b Brent environment. Adjusted net income (1) Average adjusted shareholders' equity Return on equity (ROE) 15.9% 14.4% 14.1% In millions of dollars July 1, 2025 April 1, 2025 July 1, 2024 June 30, 2026 March 31, 2026 June 30, 2025 16,535 117,441 19,477 17,043 122,739 118,641 Adjusted net operating income (1) Average capital employed (1) ROACE (1) 21,608 19,158 18,184 In millions of dollars July 1, 2025 April 1, 2025 July 1, 2024 June 30, 2026 March 31, 2026 June 30, 2025 155,138 151,105 146,456 13.9% 12.7% 12.4% Change Estimated impact on adjusted net operating income Estimated impact on cash flow from operations Dollar +/- 0.1 $ per € -/+ 0.1 B$ ~0 B$ Average liquids price (17) +/- 10 $/b +/- 2.3 B$ +/- 2.8 B$ European gas price - TTF +/- 2 $/Mbtu +/- 0.4 B$ +/- 0.4 B$ European Refining Margin Marker (ERM) +/- 1 $/b +/- 0.3 B$ +/- 0.4 B$ 13 |
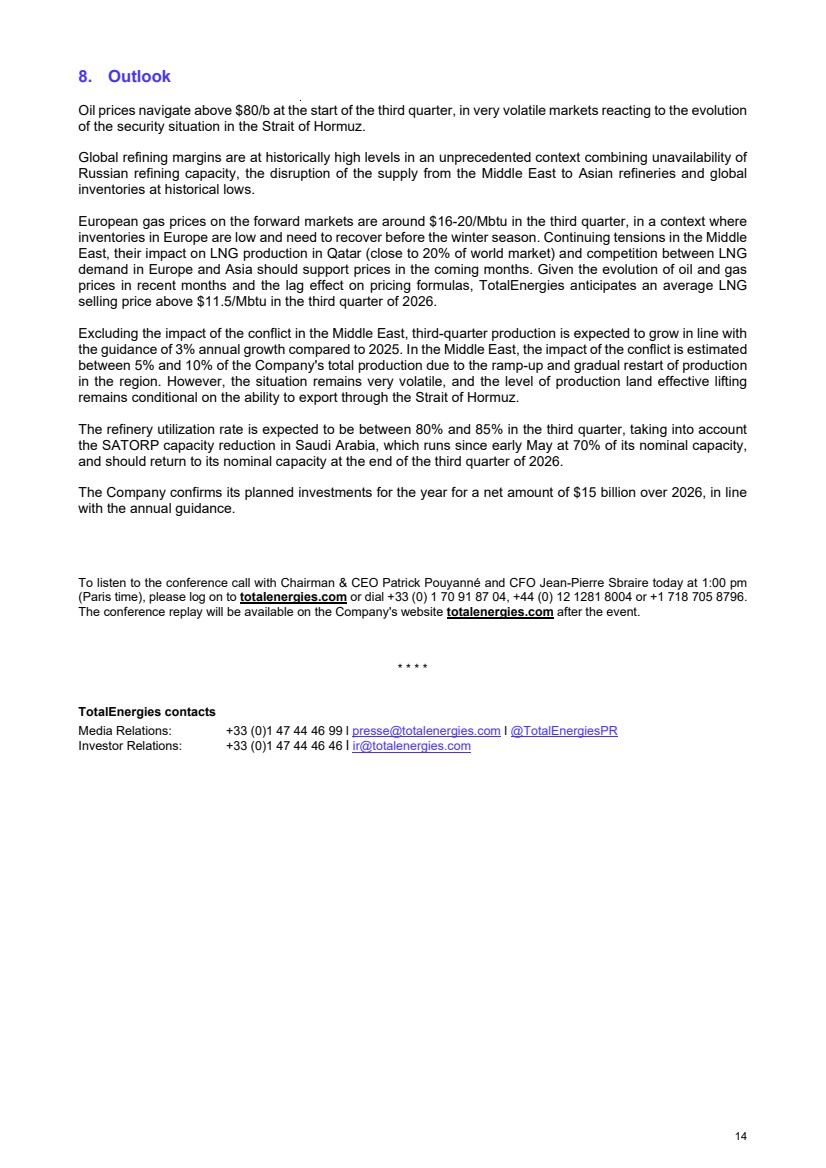
| 8. Outlook Oil prices navigate above $80/b at the start of the third quarter, in very volatile markets reacting to the evolution of the security situation in the Strait of Hormuz. Global refining margins are at historically high levels in an unprecedented context combining unavailability of Russian refining capacity, the disruption of the supply from the Middle East to Asian refineries and global inventories at historical lows. European gas prices on the forward markets are around $16-20/Mbtu in the third quarter, in a context where inventories in Europe are low and need to recover before the winter season. Continuing tensions in the Middle East, their impact on LNG production in Qatar (close to 20% of world market) and competition between LNG demand in Europe and Asia should support prices in the coming months. Given the evolution of oil and gas prices in recent months and the lag effect on pricing formulas, TotalEnergies anticipates an average LNG selling price above $11.5/Mbtu in the third quarter of 2026. Excluding the impact of the conflict in the Middle East, third-quarter production is expected to grow in line with the guidance of 3% annual growth compared to 2025. In the Middle East, the impact of the conflict is estimated between 5% and 10% of the Company's total production due to the ramp-up and gradual restart of production in the region. However, the situation remains very volatile, and the level of production land effective lifting remains conditional on the ability to export through the Strait of Hormuz. The refinery utilization rate is expected to be between 80% and 85% in the third quarter, taking into account the SATORP capacity reduction in Saudi Arabia, which runs since early May at 70% of its nominal capacity, and should return to its nominal capacity at the end of the third quarter of 2026. The Company confirms its planned investments for the year for a net amount of $15 billion over 2026, in line with the annual guidance. To listen to the conference call with Chairman & CEO Patrick Pouyanné and CFO Jean-Pierre Sbraire today at 1:00 pm (Paris time), please log on to totalenergies.com or dial +33 (0) 1 70 91 87 04, +44 (0) 12 1281 8004 or +1 718 705 8796. The conference replay will be available on the Company's website totalenergies.com after the event. * * * * TotalEnergies contacts Media Relations: +33 (0)1 47 44 46 99 l presse@totalenergies.com l @TotalEnergiesPR Investor Relations: +33 (0)1 47 44 46 46 l ir@totalenergies.com 14 |
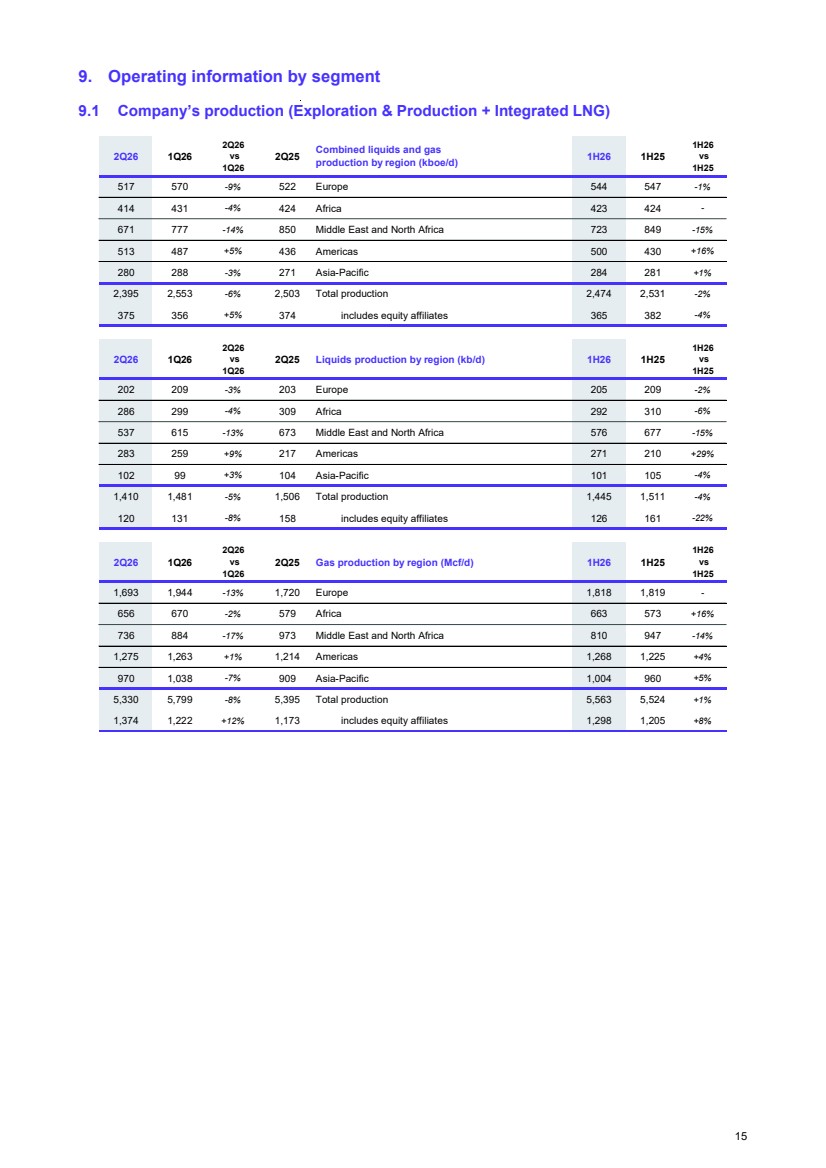
| 9. Operating information by segment 9.1 Company’s production (Exploration & Production + Integrated LNG) 2Q26 1Q26 2Q26 vs 1Q26 2Q25 Combined liquids and gas production by region (kboe/d) 1H26 1H25 1H26 vs 1H25 517 570 -9% 522 Europe 544 547 -1% 414 431 -4% 424 Africa 423 424 - 671 777 -14% 850 Middle East and North Africa 723 849 -15% 513 487 +5% 436 Americas 500 430 +16% 280 288 -3% 271 Asia-Pacific 284 281 +1% 2,395 2,553 -6% 2,503 Total production 2,474 2,531 -2% 375 356 +5% 374 includes equity affiliates 365 382 -4% 2Q26 1Q26 2Q26 vs 1Q26 2Q25 Liquids production by region (kb/d) 1H26 1H25 1H26 vs 1H25 202 209 -3% 203 Europe 205 209 -2% 286 299 -4% 309 Africa 292 310 -6% 537 615 -13% 673 Middle East and North Africa 576 677 -15% 283 259 +9% 217 Americas 271 210 +29% 102 99 +3% 104 Asia-Pacific 101 105 -4% 1,410 1,481 -5% 1,506 Total production 1,445 1,511 -4% 120 131 -8% 158 includes equity affiliates 126 161 -22% 2Q26 1Q26 2Q26 vs 1Q26 2Q25 Gas production by region (Mcf/d) 1H26 1H25 1H26 vs 1H25 1,693 1,944 -13% 1,720 Europe 1,818 1,819 - 656 670 -2% 579 Africa 663 573 +16% 736 884 -17% 973 Middle East and North Africa 810 947 -14% 1,275 1,263 +1% 1,214 Americas 1,268 1,225 +4% 970 1,038 -7% 909 Asia-Pacific 1,004 960 +5% 5,330 5,799 -8% 5,395 Total production 5,563 5,524 +1% 1,374 1,222 +12% 1,173 includes equity affiliates 1,298 1,205 +8% 15 |
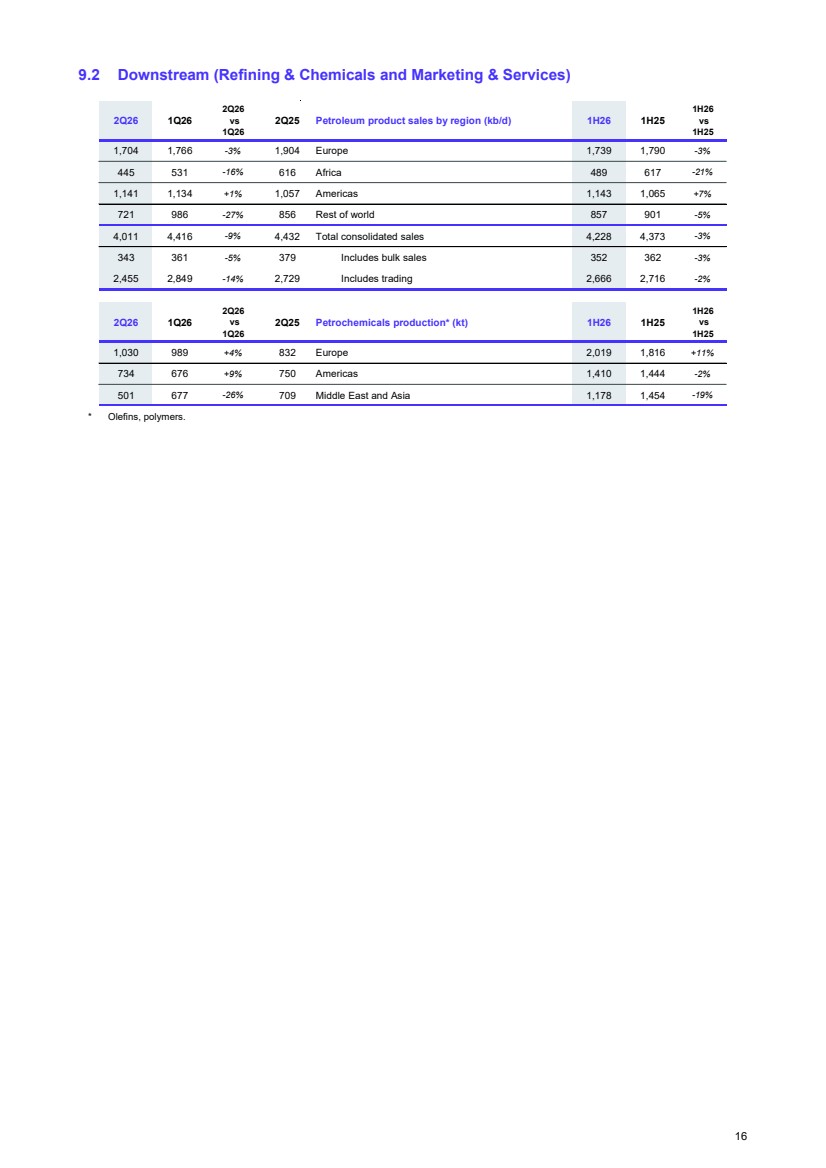
| 9.2 Downstream (Refining & Chemicals and Marketing & Services) * Olefins, polymers. 2Q26 1Q26 2Q26 vs 1Q26 2Q25 Petroleum product sales by region (kb/d) 1H26 1H25 1H26 vs 1H25 1,704 1,766 -3% 1,904 Europe 1,739 1,790 -3% 445 531 -16% 616 Africa 489 617 -21% 1,141 1,134 +1% 1,057 Americas 1,143 1,065 +7% 721 986 -27% 856 Rest of world 857 901 -5% 4,011 4,416 -9% 4,432 Total consolidated sales 4,228 4,373 -3% 343 361 -5% 379 Includes bulk sales 352 362 -3% 2,455 2,849 -14% 2,729 Includes trading 2,666 2,716 -2% 2Q26 1Q26 2Q26 vs 1Q26 2Q25 Petrochemicals production* (kt) 1H26 1H25 1H26 vs 1H25 1,030 989 +4% 832 Europe 2,019 1,816 +11% 734 676 +9% 750 Americas 1,410 1,444 -2% 501 677 -26% 709 Middle East and Asia 1,178 1,454 -19% 16 |
| 9.3 Integrated Power 9.3.1 Net power production 9.3.2 Installed power generation net capacity * (18) End-of-period data. Net power production (TWh) Solar Onshore Wind Offshore Wind Gas Others Total Solar Onshore Wind Offshore Wind Gas Others Total France 0.3 0.2 0.0 0.6 0.0 1.2 0.2 0.4 - 1.2 0.0 1.7 Rest of Europe 0.2 0.4 0.2 2.7 0.4 3.9 0.1 0.6 0.4 1.5 0.1 2.6 Africa 0.0 - - - 0.1 0.1 0.0 - - - 0.1 0.2 Middle East 0.4 - - 0.3 - 0.7 0.2 - - 0.2 - 0.4 North America 1.3 0.6 - 1.4 - 3.4 0.9 0.6 - 0.7 - 2.2 South America 0.1 1.0 - - - 1.1 0.2 0.9 - - - 1.0 India 3.1 0.7 - - - 3.8 2.8 0.3 - - - 3.1 Pacific Asia 0.4 0.0 0.1 - - 0.5 0.3 0.0 0.2 - - 0.5 Total 5.9 2.9 0.3 5.2 0.5 14.8 4.7 2.7 0.6 3.5 0.2 11.7 2Q26 1Q26 Installed power generation net capacity (GW) (18) Solar Onshore Wind Offshore Wind Gas Others Total Solar Onshore Wind Offshore Wind Gas Others Total France 0.8 0.6 0.0 2.7 0.2 4.3 0.8 0.6 - 2.7 0.2 4.2 Rest of Europe 0.8 1.1 0.3 7.3 0.4 9.8 0.6 1.0 0.3 2.1 0.1 4.1 Africa 0.1 - - - 0.1 0.2 0.1 - - - 0.1 0.2 Middle East 0.6 - - 0.3 - 1.0 0.7 - - 0.3 - 1.0 North America 3.1 0.9 - 2.0 0.5 6.5 3.1 0.9 - 2.0 0.5 6.5 South America 0.9 1.2 - - - 2.1 0.5 1.2 - - - 1.7 India 7.2 0.7 - - 0.3 8.1 7.0 0.6 - - 0.1 7.7 Pacific Asia 1.2 0.0 0.2 - - 1.4 1.2 0.0 0.2 - - 1.4 Total 14.8 4.4 0.5 12.2 1.5 33.4 14.0 4.3 0.5 7.0 1.1 26.8 2Q26 1Q26 17 |
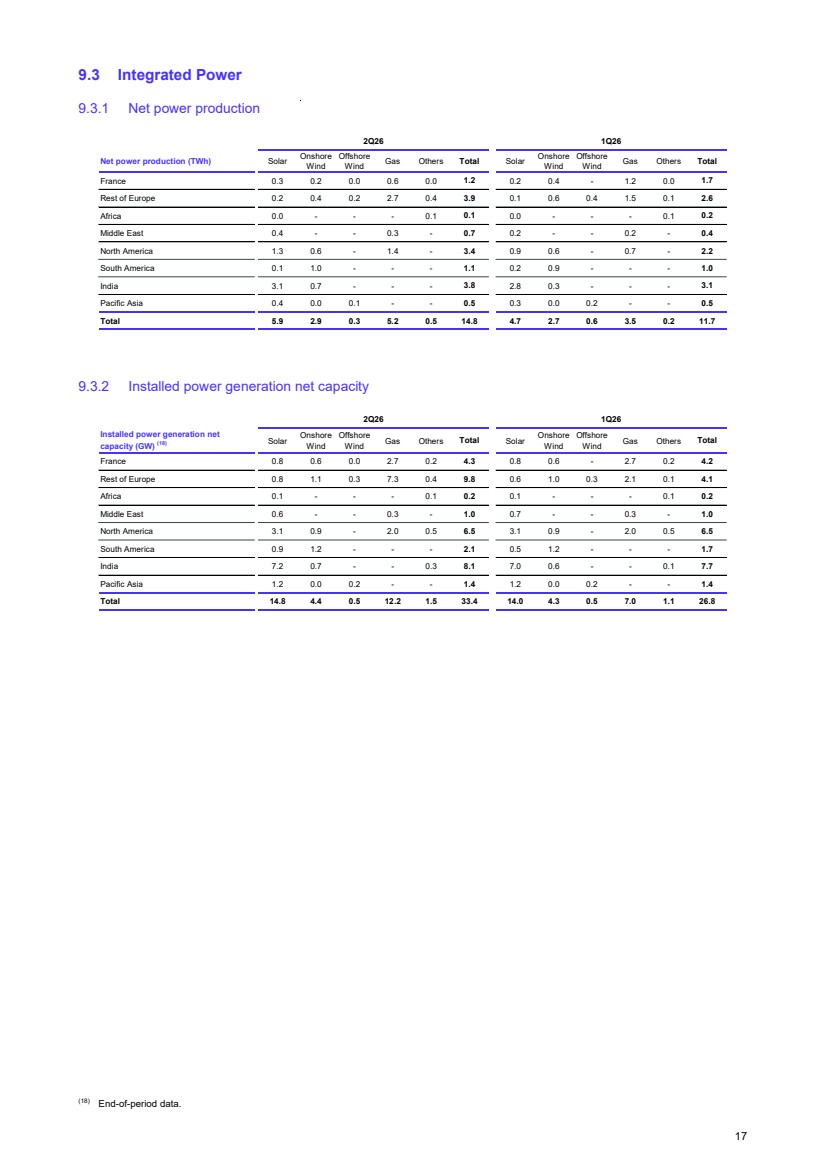
| 9.3.3 Power generation gross capacity from renewables * (19) Includes 17.25% of the gross capacities of Adani Green Energy Limited, 50% of Clearway Energy Group and 49% of Casa dos Ventos. (20) End-of-period data. Installed power generation gross capacity from renewables (GW) (19),(20) Solar Onshore Wind Offshore Wind Other Total Solar Onshore Wind Offshore Wind Other Total France 1.4 0.9 0.0 0.2 2.5 1.3 0.9 0.0 0.2 2.4 Rest of Europe 0.9 1.8 1.1 0.5 4.4 0.7 1.7 1.1 0.3 3.8 Africa 0.4 0.0 0.0 0.4 0.7 0.3 0.0 0.0 0.4 0.7 Middle East 1.6 0.0 0.0 0.0 1.6 1.6 0.0 0.0 0.0 1.6 North America 7.8 2.3 0.0 1.2 11.3 7.8 2.3 0.0 1.2 11.3 South America 1.2 1.9 0.0 0.0 3.0 0.6 1.8 0.0 0.0 2.4 India 10.3 0.7 0.0 0.3 11.2 10.1 0.7 0.0 0.1 10.8 Asia-Pacific 1.9 0.0 0.6 0.0 2.6 1.9 0.0 0.6 0.0 2.5 Total 25.4 7.6 1.8 2.5 37.4 24.3 7.4 1.8 2.1 35.6 Power generation gross capacity from renewables in construction (GW) (19),(20) Solar Onshore Wind Offshore Wind Other Total Solar Onshore Wind Offshore Wind Other Total France 0.1 0.1 0.0 0.0 0.3 0.1 0.1 0.0 0.0 0.3 Rest of Europe 0.7 0.1 0.8 0.7 2.3 0.9 0.1 0.8 0.4 2.1 Africa 0.2 0.2 0.0 0.0 0.3 0.2 0.2 0.0 0.0 0.4 Middle East 1.3 0.2 0.0 0.0 1.5 1.4 0.2 0.0 0.0 1.7 North America 1.8 0.4 0.0 0.3 2.5 0.8 0.1 0.0 0.3 1.2 South America 0.7 0.8 0.0 0.3 1.7 1.1 0.3 0.0 0.3 1.7 India 0.3 0.0 0.0 0.0 0.3 0.3 0.0 0.0 0.0 0.3 Asia-Pacific 0.5 0.0 0.0 0.0 0.5 0.1 0.0 0.0 0.0 0.1 Total 5.6 1.8 0.8 1.3 9.6 4.9 1.0 0.8 1.0 7.7 Power generation gross capacity from renewables in development (GW) (19),(20) Solar Onshore Wind Offshore Wind Other Total Solar Onshore Wind Offshore Wind Other Total France 0.9 0.5 1.5 0.0 2.8 0.8 0.5 1.5 0.0 2.8 Rest of Europe 3.7 1.9 14.3 4.3 24.3 5.2 2.0 14.3 4.2 25.7 Africa 1.1 0.5 0.0 0.0 1.6 1.1 0.5 0.0 0.0 1.6 Middle East 0.8 0.0 0.0 0.0 0.8 1.2 0.0 0.0 0.0 1.2 North America 10.8 3.1 0.0 4.9 18.8 10.8 3.7 4.1 5.0 23.6 South America 0.7 1.0 0.0 0.0 1.8 0.7 1.7 0.0 0.0 2.5 India 1.4 0.0 0.0 0.0 1.4 1.5 0.0 0.0 0.0 1.5 Asia-Pacific 2.6 1.1 2.6 1.1 7.3 2.7 1.1 2.6 1.1 7.5 Total 21.9 8.1 18.4 10.4 58.8 23.9 9.6 22.5 10.3 66.4 2Q26 1Q26 2Q26 1Q26 2Q26 1Q26 18 |
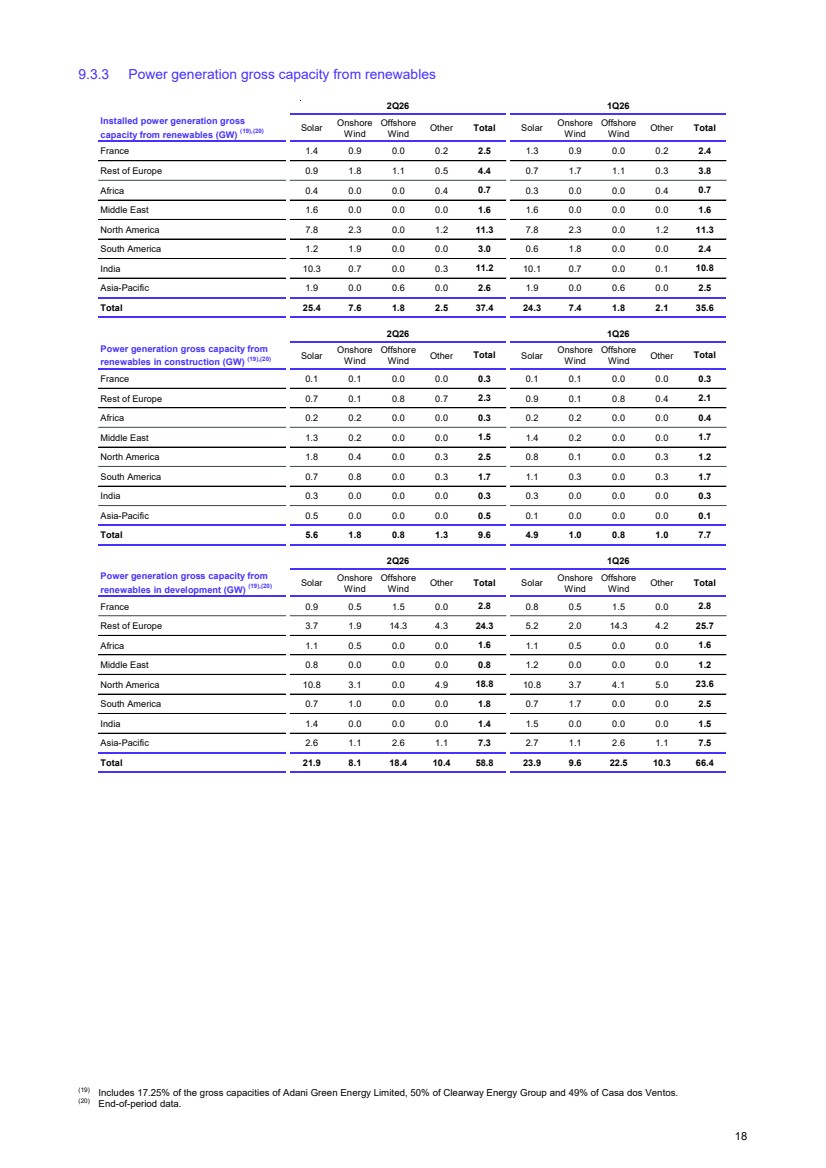
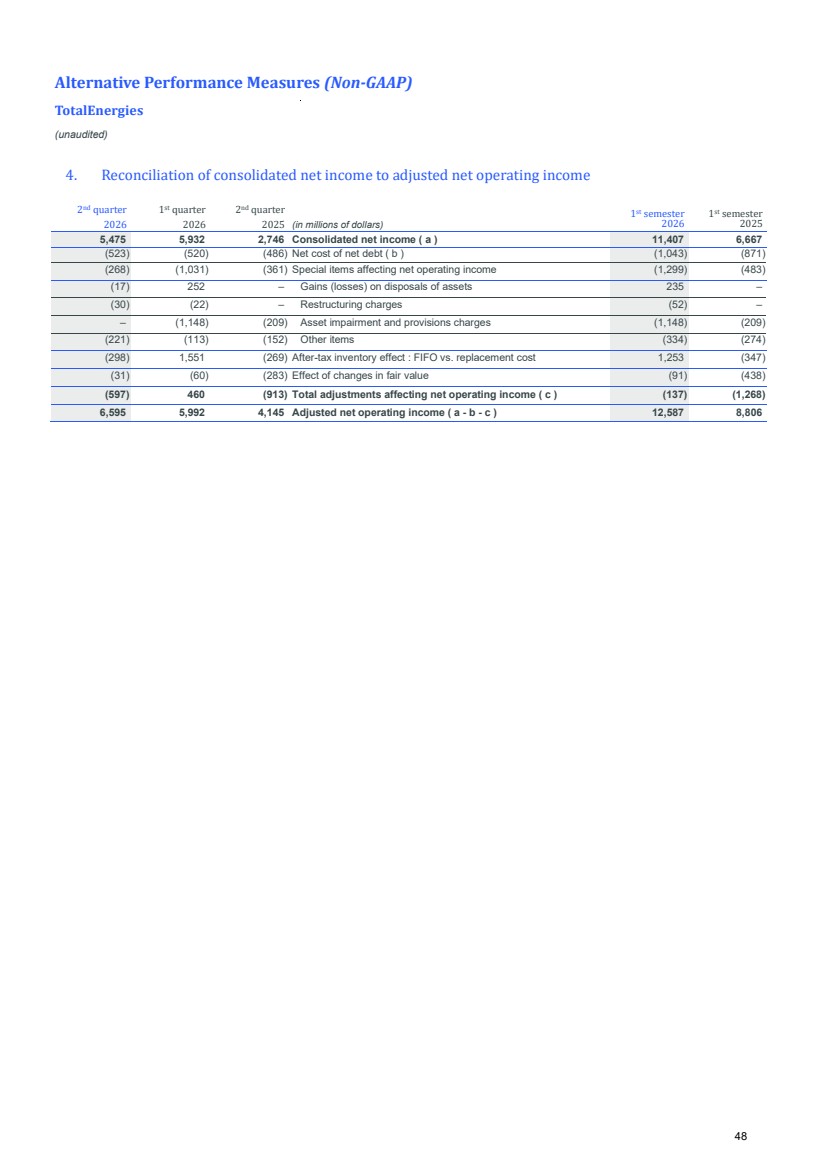
| 10. Alternative Performance Measures (Non-GAAP measures) 10.1 Adjustment items to net income (TotalEnergies share) 2Q26 1Q26 2Q25 In millions of dollars 1H26 1H25 5,438 5,810 2,687 Net income (TotalEnergies share) 11,248 6,538 (268) (1,031) (340) Special items affecting net income (TotalEnergies share) (1,299) (448) (17) 252 - Gain (loss) on asset sales 235 - (30) (22) - Restructuring charges (52) - - (1,148) (209) Impairments (1,148) (209) (221) (113) (131) Other (334) (239) (290) 1,507 (268) After-tax inventory effect : FIFO vs. replacement cost 1,217 (346) (31) (60) (283) Effect of changes in fair value (91) (438) (589) 416 (891) Total adjustments affecting net income (173) (1,232) 6,027 5,394 3,578 Adjusted net income (TotalEnergies share) 11,421 7,770 19 |
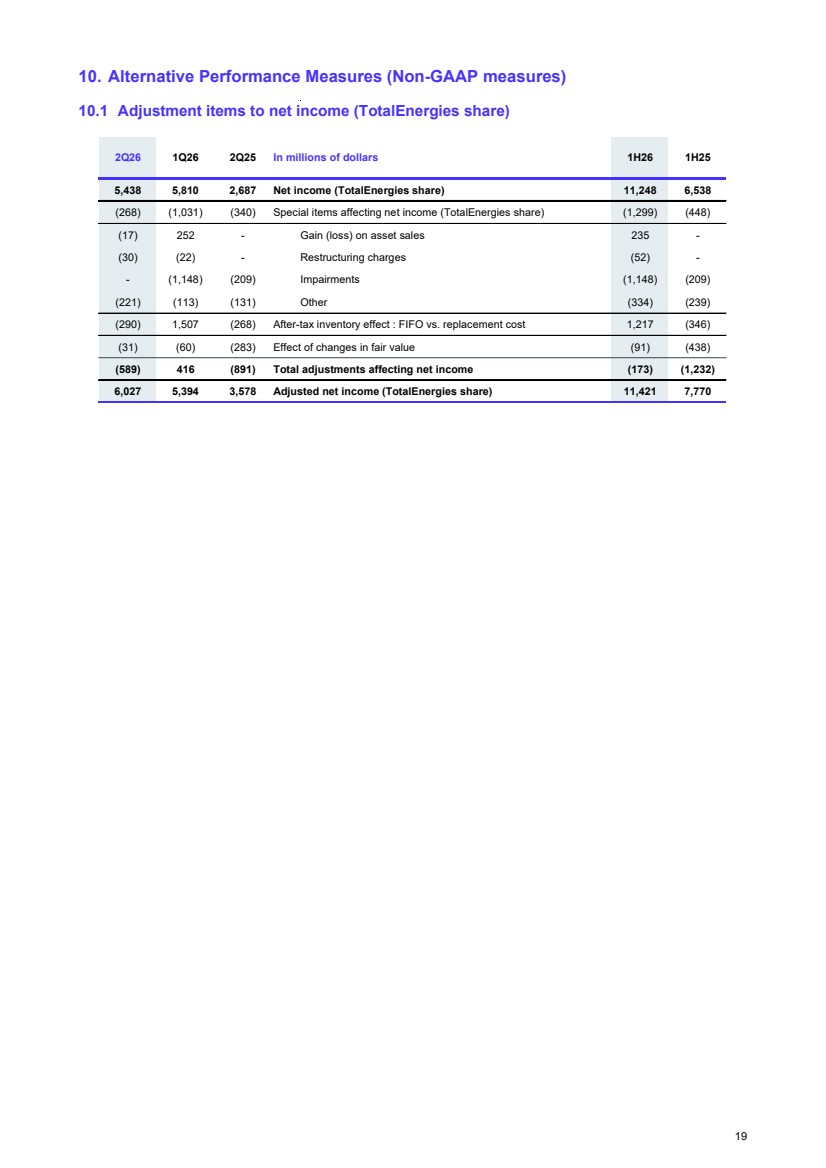
| 10.2 Reconciliation of adjusted EBITDA with consolidated financial statements 10.2.1 Reconciliation of net income (TotalEnergies share) to adjusted EBITDA 10.2.2 Reconciliation of revenues from sales to adjusted EBITDA and net income (TotalEnergies share) 2Q26 1Q26 2Q26 vs 1Q26 2Q25 In millions of dollars 1H26 1H25 1H26 vs 1H25 5,438 5,810 -6% 2,687 Net income (TotalEnergies share) 11,248 6,538 +72% 589 (416) ns 891 Less: adjustment items to net income (TotalEnergies share) 173 1,232 -86% 6,027 5,394 +12% 3,578 Adjusted net income (TotalEnergies share) 11,421 7,770 +47% Adjusted items 45 78 -42% 60 Add: non-controlling interests 123 130 -5% 3,365 3,324 +1% 2,328 Add: income taxes 6,689 5,033 +33% 3,075 3,097 -1% 3,106 Add: depreciation, depletion and impairment of tangible assets and mineral interests 6,172 6,104 +1% 95 90 +6% 96 Add: amortization and impairment of intangible assets 185 179 +3% 817 791 +3% 816 Add: financial interest on debt 1,608 1,541 +4% (245) (222) ns (294) Less: financial income and expense from cash & cash equivalents (467) (563) ns 13,179 12,552 +5% 9,690 Adjusted EBITDA 25,731 20,194 +27% 2Q26 1Q26 2Q26 vs 1Q26 2Q25 In millions of dollars 1H26 1H25 1H26 vs 1H25 Adjusted items 57,334 49,516 +16% 44,676 Revenues from sales 106,850 92,575 +15% (37,734) (29,119) ns (28,533) Purchases, net of inventory variation (66,853) (59,096) ns (7,954) (8,563) ns (7,588) Other operating expenses (16,517) (15,130) ns (95) (133) ns (97) Exploration costs (228) (178) ns 338 185 +83% 544 Other income 523 791 -34% (164) (114) ns (233) Other expense, excluding amortization and impairment of intangible assets (278) (449) ns 482 294 +64% 422 Other financial income 776 716 +8% (184) (223) ns (203) Other financial expense (407) (452) ns 1,156 709 +63% 702 Net income (loss) from equity affiliates 1,865 1,417 +32% 13,179 12,552 +5% 9,690 Adjusted EBITDA 25,731 20,194 +27% Adjusted items (3,075) (3,097) ns (3,106) Less: depreciation, depletion and impairment of tangible assets and mineral interests (6,172) (6,104) ns (95) (90) ns (96) Less: amortization of intangible assets (185) (179) ns (817) (791) ns (816) Less: financial interest on debt (1,608) (1,541) ns 245 222 +10% 294 Add: financial income and expense from cash & cash equivalents 467 563 -17% (3,365) (3,324) ns (2,328) Less: income taxes (6,689) (5,033) ns (45) (78) ns (60) Less: non-controlling interests (123) (130) ns (589) 416 ns (891) Add: adjustment (TotalEnergies share) (173) (1,232) ns 5,438 5,810 -6% 2,687 Net income (TotalEnergies share) 11,248 6,538 +72% 20 |
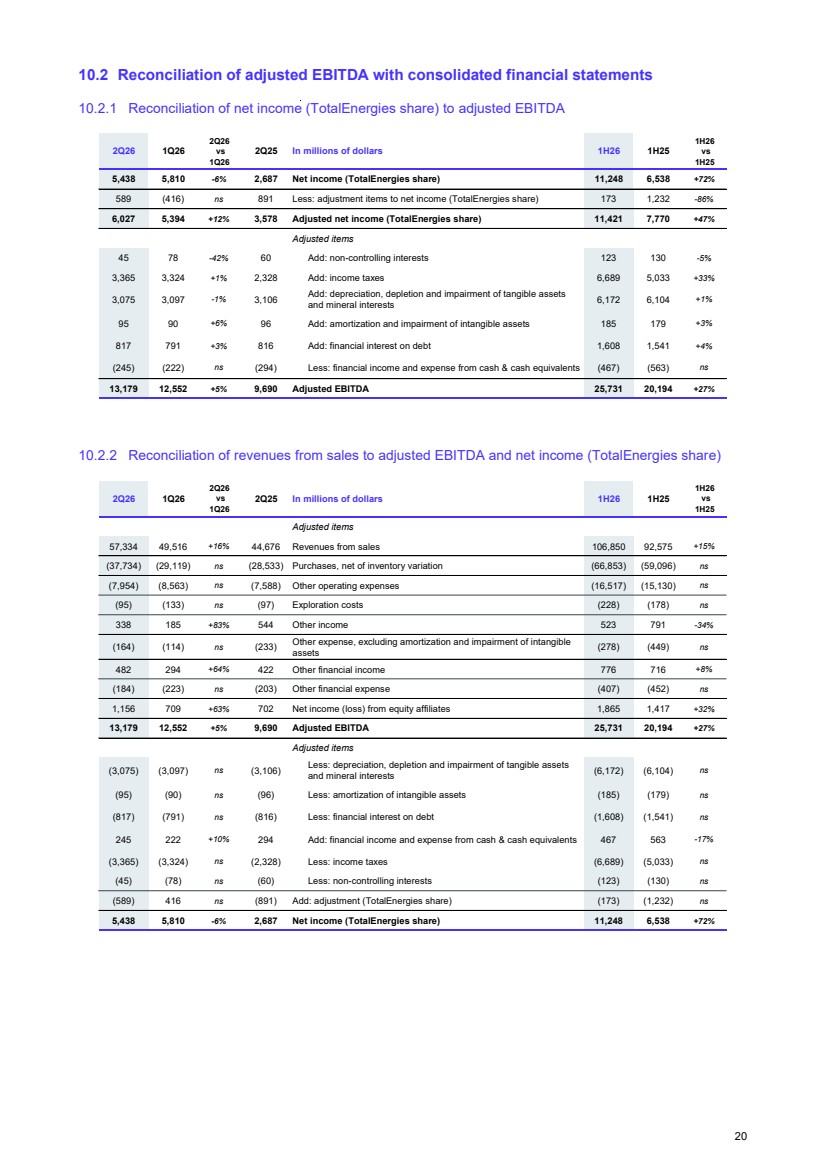
| 10.3 Investments – Divestments Reconciliation of Cash flow used in investing activities to Net investments * Cash flows used in investing activities do not include increases in property, plant and equipment arising from Apache’s carry arrangement on the GranMorgu project in offshore Block 58 in Suriname, which resulted in specific supplier financing recognised as financial debt. These increases amounted to $218 million in the first quarter of 2026, $153 million in the second quarter of 2026 and $371 million in the first half of 2026. Payments to these suppliers are classified as financing cash flows. ** Change in debt from renewable projects (TotalEnergies share and partner share). 10.4 Cash flow Reconciliation of Cash flow from operating activities to Cash flow from operations excluding working capital (CFFO), to DACF and to Net cash flow * Changes in working capital are presented excluding the mark-to-market effect of Integrated LNG and Integrated Power segments’ contracts. 2Q26 1Q26 2Q26 vs 1Q26 2Q25 In millions of dollars 1H26 1H25 1H26 vs 1H25 3 276 4 312 -24% 6 689 Cash flow used in investing activities ( a ) * 7 588 11 494 -34% - - ns - Other transactions with non-controlling interests ( b ) - - ns 57 49 +16% 54 Organic loan repayment from equity affiliates ( c ) 106 60 +77% 50 14 x3,6 (221) Change in debt from renewable projects financing ( d ) ** 64 (221) ns 63 75 -16% 90 Capex linked to capitalized leasing contracts ( e ) 138 198 -30% 1 28 -96% 20 Expenditures related to carbon credits ( f ) 29 22 +32% 3 447 4 478 -23% 6 632 Net investments ( a + b + c + d + e + f = g - i + h ) 7 925 11 553 -31% (1 247) (172) ns 1 813 of which acquisitions net of assets sales ( g - i ) (1 419) 2 233 ns 141 392 -64% 2 106 Acquisitions ( g ) 533 2 942 -82% 1 388 564 x2,5 293 Asset sales ( i ) 1 952 709 x2,8 68 (18) ns 67 Change in debt (partner share) and capital gain from renewable project sales 50 67 -25% 4 694 4 650 1% 4 819 of which organic investments ( h ) 9 344 9 320 - 88 73 +20% 37 Capitalized exploration 162 148 +9% 452 301 +50% 425 Increase in non-current loans 753 993 -24% (1 017) (276) ns (256) Repayment of non-current loans, excluding organic loan repayment from equity affiliates (1 293) (359) ns 118 (4) ns (154) Change in debt from renewable projects (TotalEnergies share) 114 (154) ns 2Q26 1Q26 2Q26 vs 1Q26 2Q25 In millions of dollars 1H26 1H25 1H26 vs 1H25 10,858 3,361 x3.2 5,960 Cash flow from operating activities ( a ) 14,219 8,523 +67% 1,667 (6,993) ns (246) (Increase) decrease in working capital ( b ) * (5,326) (4,562) ns (506) 1,849 ns (272) Inventory effect ( c ) 1,343 (379) ns 50 22 x2.3 86 Capital gain from renewable project sales ( d ) 72 86 -16% 57 49 +16% 54 Organic loan repayments from equity affiliates ( e ) 106 60 +77% 9,804 8,576 +14% 6,618 Cash flow from operations excluding working capital (CFFO) ( f = a - b - c + d + e ) 18,380 13,610 +35% (384) (403) ns (325) Financial charges (787) (610) ns 10,188 8,979 +13% 6,943 Debt Adjusted Cash Flow (DACF) 19,167 14,220 +35% 4,694 4,650 +1% 4,819 Organic investments ( g ) 9,344 9,320 - 5,110 3,926 +30% 1,799 Free cash flow after organic investments ( f - g ) 9,036 4,290 x2.1 3,447 4,478 -23% 6,632 Net investments ( h ) 7,925 11,553 -31% 6,357 4,098 +55% (14) Net cash flow ( f - h ) 10,455 2,057 x5.1 21 |
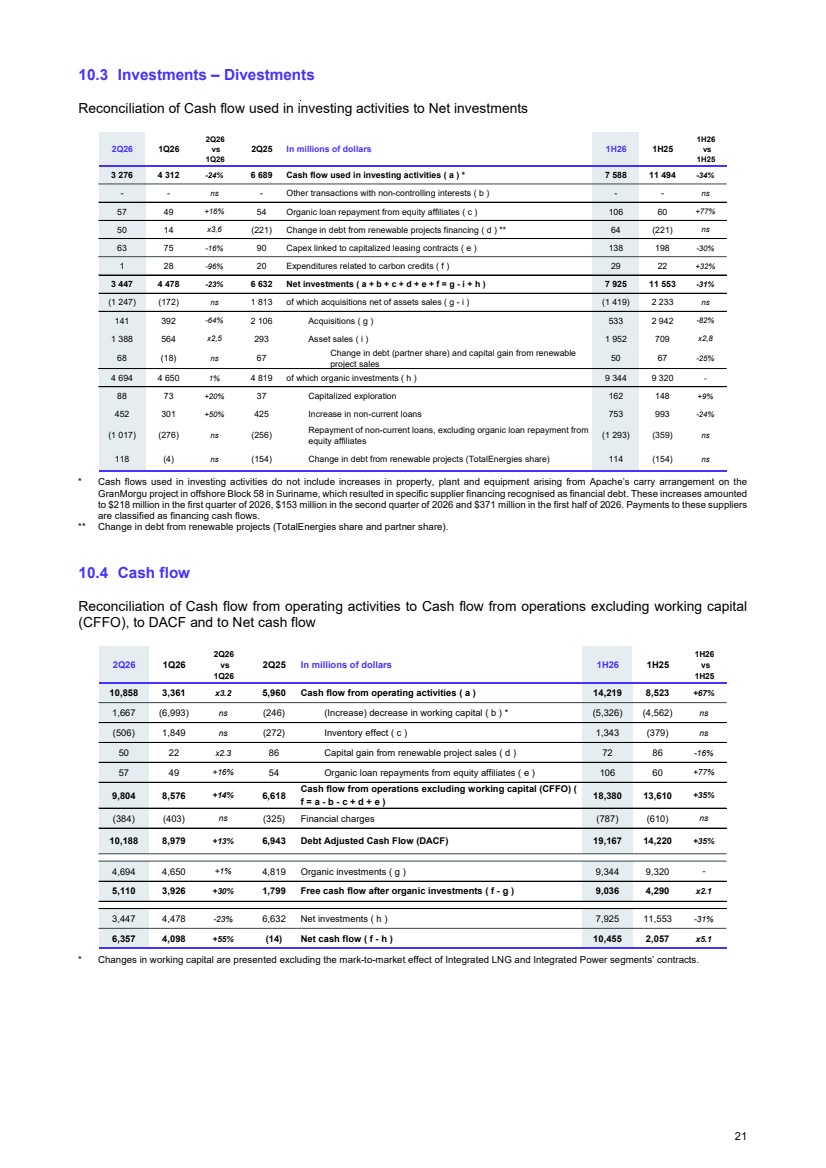
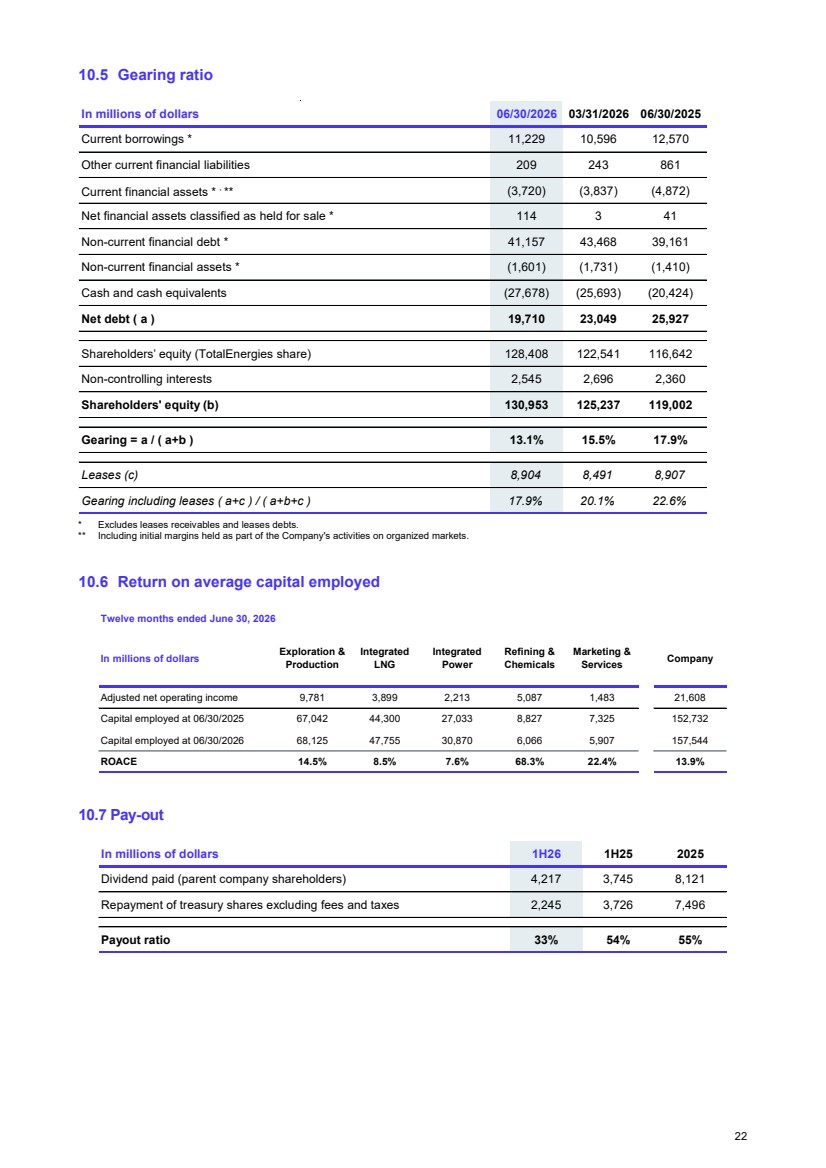
| 10.5 Gearing ratio * Excludes leases receivables and leases debts. ** Including initial margins held as part of the Company's activities on organized markets. 10.6 Return on average capital employed 10.7 Pay-out In millions of dollars 06/30/2026 03/31/2026 06/30/2025 Current borrowings * 11,229 10,596 12,570 Other current financial liabilities 209 243 861 Current financial assets * , ** (3,720) (3,837) (4,872) Net financial assets classified as held for sale * 114 3 41 Non-current financial debt * 41,157 43,468 39,161 Non-current financial assets * (1,601) (1,731) (1,410) Cash and cash equivalents (27,678) (25,693) (20,424) Net debt ( a ) 19,710 23,049 25,927 Shareholders’ equity (TotalEnergies share) 128,408 122,541 116,642 Non-controlling interests 2,545 2,696 2,360 Shareholders' equity (b) 130,953 125,237 119,002 Gearing = a / ( a+b ) 13.1% 15.5% 17.9% Leases (c) 8,904 8,491 8,907 Gearing including leases ( a+c ) / ( a+b+c ) 17.9% 20.1% 22.6% Twelve months ended June 30, 2026 In millions of dollars Exploration & Production Integrated LNG Integrated Power Refining & Chemicals Marketing & Services Company Adjusted net operating income 9,781 3,899 2,213 5,087 1,483 21,608 Capital employed at 06/30/2025 67,042 44,300 27,033 8,827 7,325 152,732 Capital employed at 06/30/2026 68,125 47,755 30,870 6,066 5,907 157,544 ROACE 14.5% 8.5% 7.6% 68.3% 22.4% 13.9% In millions of dollars 1H26 1H25 2025 Dividend paid (parent company shareholders) 4,217 3,745 8,121 Repayment of treasury shares excluding fees and taxes 2,245 3,726 7,496 Payout ratio 33% 54% 55% 22 |
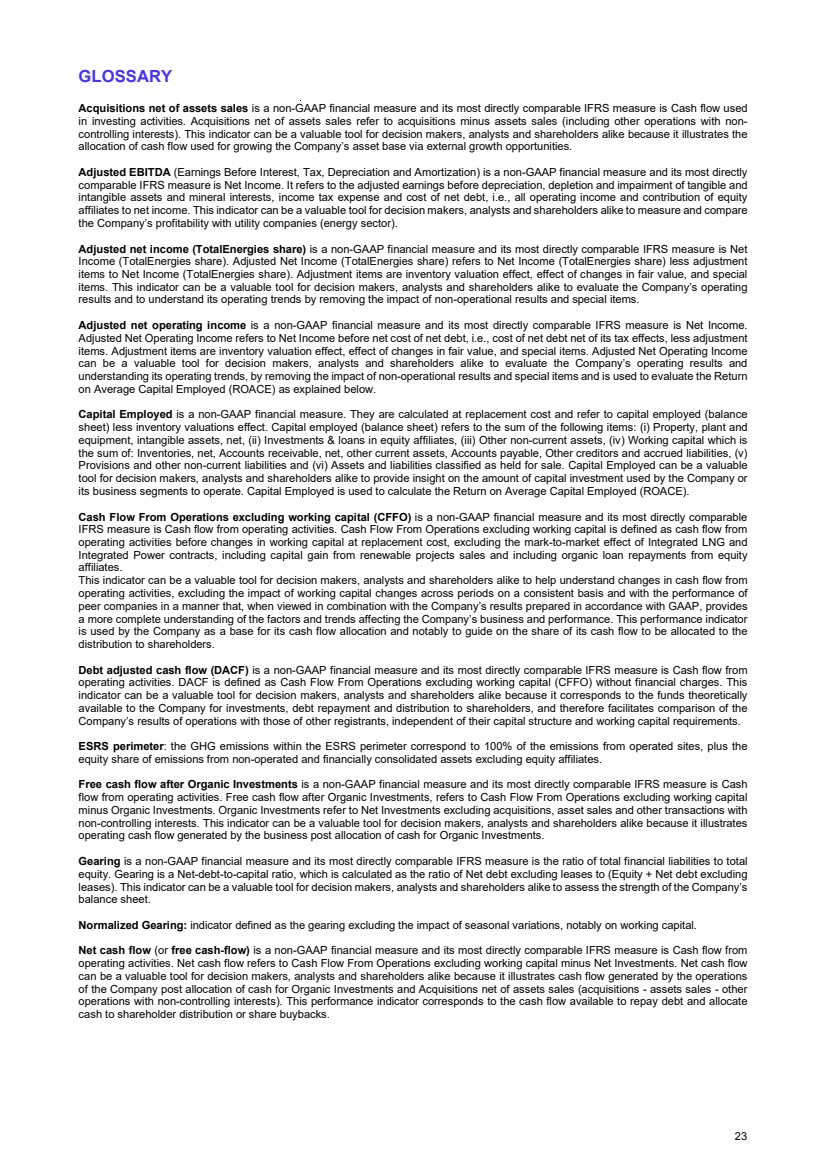
| GLOSSARY Acquisitions net of assets sales is a non-GAAP financial measure and its most directly comparable IFRS measure is Cash flow used in investing activities. Acquisitions net of assets sales refer to acquisitions minus assets sales (including other operations with non-controlling interests). This indicator can be a valuable tool for decision makers, analysts and shareholders alike because it illustrates the allocation of cash flow used for growing the Company’s asset base via external growth opportunities. Adjusted EBITDA (Earnings Before Interest, Tax, Depreciation and Amortization) is a non-GAAP financial measure and its most directly comparable IFRS measure is Net Income. It refers to the adjusted earnings before depreciation, depletion and impairment of tangible and intangible assets and mineral interests, income tax expense and cost of net debt, i.e., all operating income and contribution of equity affiliates to net income. This indicator can be a valuable tool for decision makers, analysts and shareholders alike to measure and compare the Company’s profitability with utility companies (energy sector). Adjusted net income (TotalEnergies share) is a non-GAAP financial measure and its most directly comparable IFRS measure is Net Income (TotalEnergies share). Adjusted Net Income (TotalEnergies share) refers to Net Income (TotalEnergies share) less adjustment items to Net Income (TotalEnergies share). Adjustment items are inventory valuation effect, effect of changes in fair value, and special items. This indicator can be a valuable tool for decision makers, analysts and shareholders alike to evaluate the Company’s operating results and to understand its operating trends by removing the impact of non-operational results and special items. Adjusted net operating income is a non-GAAP financial measure and its most directly comparable IFRS measure is Net Income. Adjusted Net Operating Income refers to Net Income before net cost of net debt, i.e., cost of net debt net of its tax effects, less adjustment items. Adjustment items are inventory valuation effect, effect of changes in fair value, and special items. Adjusted Net Operating Income can be a valuable tool for decision makers, analysts and shareholders alike to evaluate the Company’s operating results and understanding its operating trends, by removing the impact of non-operational results and special items and is used to evaluate the Return on Average Capital Employed (ROACE) as explained below. Capital Employed is a non-GAAP financial measure. They are calculated at replacement cost and refer to capital employed (balance sheet) less inventory valuations effect. Capital employed (balance sheet) refers to the sum of the following items: (i) Property, plant and equipment, intangible assets, net, (ii) Investments & loans in equity affiliates, (iii) Other non-current assets, (iv) Working capital which is the sum of: Inventories, net, Accounts receivable, net, other current assets, Accounts payable, Other creditors and accrued liabilities, (v) Provisions and other non-current liabilities and (vi) Assets and liabilities classified as held for sale. Capital Employed can be a valuable tool for decision makers, analysts and shareholders alike to provide insight on the amount of capital investment used by the Company or its business segments to operate. Capital Employed is used to calculate the Return on Average Capital Employed (ROACE). Cash Flow From Operations excluding working capital (CFFO) is a non-GAAP financial measure and its most directly comparable IFRS measure is Cash flow from operating activities. Cash Flow From Operations excluding working capital is defined as cash flow from operating activities before changes in working capital at replacement cost, excluding the mark-to-market effect of Integrated LNG and Integrated Power contracts, including capital gain from renewable projects sales and including organic loan repayments from equity affiliates. This indicator can be a valuable tool for decision makers, analysts and shareholders alike to help understand changes in cash flow from operating activities, excluding the impact of working capital changes across periods on a consistent basis and with the performance of peer companies in a manner that, when viewed in combination with the Company’s results prepared in accordance with GAAP, provides a more complete understanding of the factors and trends affecting the Company’s business and performance. This performance indicator is used by the Company as a base for its cash flow allocation and notably to guide on the share of its cash flow to be allocated to the distribution to shareholders. Debt adjusted cash flow (DACF) is a non-GAAP financial measure and its most directly comparable IFRS measure is Cash flow from operating activities. DACF is defined as Cash Flow From Operations excluding working capital (CFFO) without financial charges. This indicator can be a valuable tool for decision makers, analysts and shareholders alike because it corresponds to the funds theoretically available to the Company for investments, debt repayment and distribution to shareholders, and therefore facilitates comparison of the Company’s results of operations with those of other registrants, independent of their capital structure and working capital requirements. ESRS perimeter: the GHG emissions within the ESRS perimeter correspond to 100% of the emissions from operated sites, plus the equity share of emissions from non-operated and financially consolidated assets excluding equity affiliates. Free cash flow after Organic Investments is a non-GAAP financial measure and its most directly comparable IFRS measure is Cash flow from operating activities. Free cash flow after Organic Investments, refers to Cash Flow From Operations excluding working capital minus Organic Investments. Organic Investments refer to Net Investments excluding acquisitions, asset sales and other transactions with non-controlling interests. This indicator can be a valuable tool for decision makers, analysts and shareholders alike because it illustrates operating cash flow generated by the business post allocation of cash for Organic Investments. Gearing is a non-GAAP financial measure and its most directly comparable IFRS measure is the ratio of total financial liabilities to total equity. Gearing is a Net-debt-to-capital ratio, which is calculated as the ratio of Net debt excluding leases to (Equity + Net debt excluding leases). This indicator can be a valuable tool for decision makers, analysts and shareholders alike to assess the strength of the Company’s balance sheet. Normalized Gearing: indicator defined as the gearing excluding the impact of seasonal variations, notably on working capital. Net cash flow (or free cash-flow) is a non-GAAP financial measure and its most directly comparable IFRS measure is Cash flow from operating activities. Net cash flow refers to Cash Flow From Operations excluding working capital minus Net Investments. Net cash flow can be a valuable tool for decision makers, analysts and shareholders alike because it illustrates cash flow generated by the operations of the Company post allocation of cash for Organic Investments and Acquisitions net of assets sales (acquisitions - assets sales - other operations with non-controlling interests). This performance indicator corresponds to the cash flow available to repay debt and allocate cash to shareholder distribution or share buybacks. 23 |
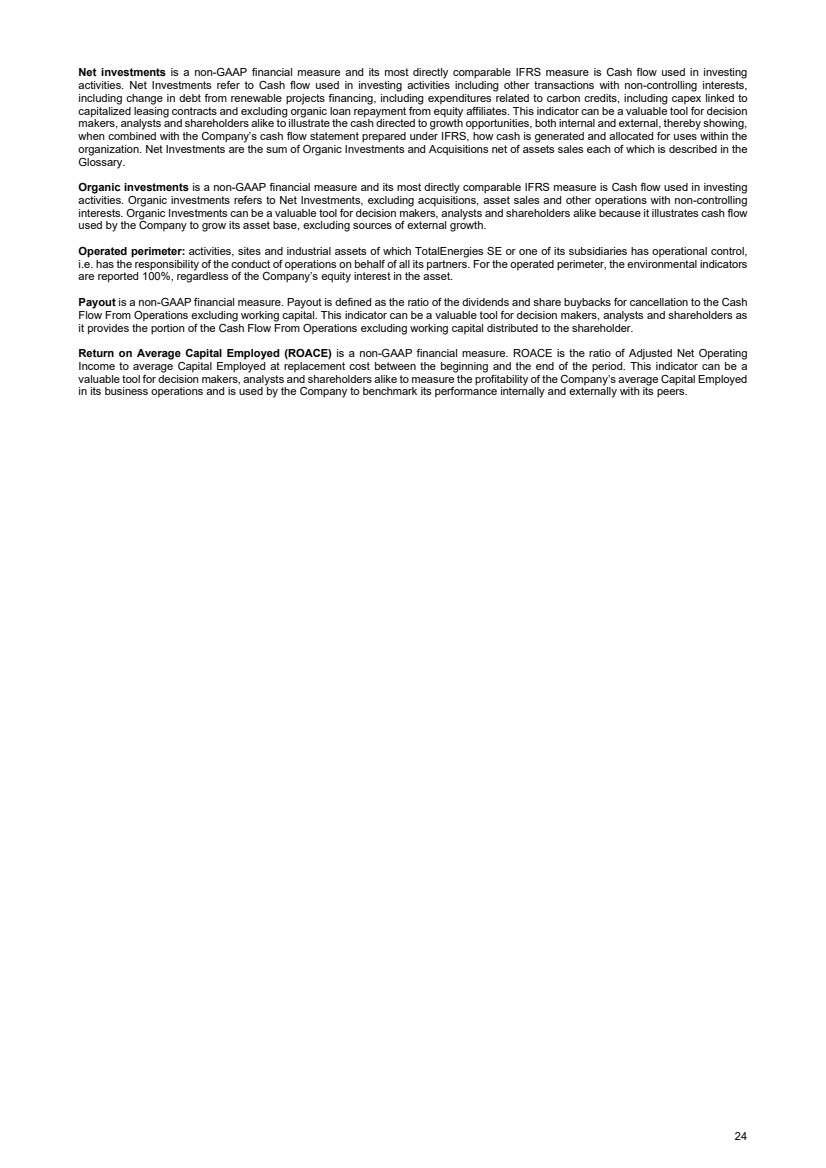
| Net investments is a non-GAAP financial measure and its most directly comparable IFRS measure is Cash flow used in investing activities. Net Investments refer to Cash flow used in investing activities including other transactions with non-controlling interests, including change in debt from renewable projects financing, including expenditures related to carbon credits, including capex linked to capitalized leasing contracts and excluding organic loan repayment from equity affiliates. This indicator can be a valuable tool for decision makers, analysts and shareholders alike to illustrate the cash directed to growth opportunities, both internal and external, thereby showing, when combined with the Company’s cash flow statement prepared under IFRS, how cash is generated and allocated for uses within the organization. Net Investments are the sum of Organic Investments and Acquisitions net of assets sales each of which is described in the Glossary. Organic investments is a non-GAAP financial measure and its most directly comparable IFRS measure is Cash flow used in investing activities. Organic investments refers to Net Investments, excluding acquisitions, asset sales and other operations with non-controlling interests. Organic Investments can be a valuable tool for decision makers, analysts and shareholders alike because it illustrates cash flow used by the Company to grow its asset base, excluding sources of external growth. Operated perimeter: activities, sites and industrial assets of which TotalEnergies SE or one of its subsidiaries has operational control, i.e. has the responsibility of the conduct of operations on behalf of all its partners. For the operated perimeter, the environmental indicators are reported 100%, regardless of the Company’s equity interest in the asset. Payout is a non-GAAP financial measure. Payout is defined as the ratio of the dividends and share buybacks for cancellation to the Cash Flow From Operations excluding working capital. This indicator can be a valuable tool for decision makers, analysts and shareholders as it provides the portion of the Cash Flow From Operations excluding working capital distributed to the shareholder. Return on Average Capital Employed (ROACE) is a non-GAAP financial measure. ROACE is the ratio of Adjusted Net Operating Income to average Capital Employed at replacement cost between the beginning and the end of the period. This indicator can be a valuable tool for decision makers, analysts and shareholders alike to measure the profitability of the Company’s average Capital Employed in its business operations and is used by the Company to benchmark its performance internally and externally with its peers. 24 |
| Disclaimer: Unless otherwise stated, the terms “TotalEnergies”, “TotalEnergies company” and “Company” in this document are used to designate TotalEnergies SE and the consolidated entities directly or indirectly controlled by TotalEnergies SE. Likewise, the words “we”, “us” and “our” may also be used to refer to these entities or their employees. The entities in which TotalEnergies SE directly or indirectly owns a shareholding are separate and independent legal entities. The term “Corporation” as used in this document exclusively refers to TotalEnergies SE, which is the parent company of the Company. This document does not constitute the half-year financial report, which will be separately published in accordance with article L. 451-1-2- III of the French Code monétaire et financier and applicable UK law, and available on the website totalenergies.com. This press release presents the results for the second quarter of 2026 and half-year of 2026 from the consolidated financial statements of TotalEnergies SE as of June 30, 2026 (unaudited). The consolidated financial statements of TotalEnergies SE as of June 30, 2026 have been subject to a limited review by the Statutory Auditors. The notes to the consolidated financial statements (unaudited) are available on the Corporations’ website www.totalenergies.com. This document may contain forward-looking statements (including forward-looking statements within the meaning of the Private Securities Litigation Reform Act of 1995), notably with respect to the financial condition, results of operations, business activities and strategy of TotalEnergies and expectations regarding returns to stockholders, including with respect to future dividends and share buybacks. This document may also contain statements regarding the perspectives, objectives, areas of improvement and goals of TotalEnergies SE, including with respect to climate change and carbon neutrality. An ambition expresses an outcome desired by TotalEnergies, it being specified that the means to be deployed do not depend solely on TotalEnergies. These forward-looking statements may generally be identified by the use of the future or conditional tense or forward-looking words such as “will”, “should”, “could”, “would”, “may”, “likely”, “might”, “envisions”, “intends”, “anticipates”, “believes”, “considers”, “plans”, “expects”, “thinks”, “targets”, “commits”, “aims” or similar terminology. Such forward-looking statements included in this document are based on economic data, estimates and assumptions prepared in a given economic, competitive and regulatory environment and considered to be reasonable by TotalEnergies as of the date of this document. These forward-looking statements are not historical data and should not be interpreted as assurances that the perspectives, objectives or goals announced will be achieved. They are uncertain and may evolve or be modified with a significant difference between the actual results and those initially estimated, due to the uncertainties notably related to the economic, financial, competitive and regulatory environment, or due to the occurrence of risk factors, such as, notably, the price fluctuations in crude oil and natural gas, the evolution of the demand and price of petroleum products, the changes in production results and reserves estimates, the ability to achieve cost reductions and operating efficiencies without unduly disrupting business operations, changes in laws and regulations including those related to the environment and climate, currency fluctuations, technological innovations, meteorological conditions and events, as well as socio-demographic, economic and political developments, changes in market conditions, loss of market share and changes in consumer preferences, pandemics, and other risk factors described from time to time in the Corporation regulatory filings, including its Universal Registration Document filed with the French Autorité des Marchés Financiers, its Annual Report on Form 20 F filed with the United States Securities and Exchange Commission (“SEC”) and its other reports filed or furnished with the SEC. Future interim or final annual dividends payments beyond the interim dividend payable on January 5th, 2027 (or January 22nd, 2027, for holders on the U.S. register) have not yet, respectively, been decided by the Board of Directors or approved by shareholders at a General Meeting. Management’s expectations with respect to such future dividends are “forward-looking statements” and are non-binding. The Board of Directors retains full discretion to decide to distribute an interim dividend and to set the amount and date of the distribution and decide on the dividend to be submitted for approval by shareholders at a General Meeting, based on a number of factors, including TotalEnergies’ financial results, balance sheet strength, cash and liquidity requirements, future prospects, commodity prices, and other factors deemed relevant by the Board. Readers are cautioned not to consider forward-looking statements as certain, but as an expression of the Corporation’s views only as of the date this document is published. TotalEnergies SE and its subsidiaries have no obligation, make no commitment and expressly disclaim any responsibility to investors or any stakeholder to update or revise, particularly as a result of new information or future events, any forward-looking information or statement, objectives or trends contained in this document. In addition, the Corporation has not verified and is under no obligation to verify any third-party data contained in this document or used in the estimates and assumptions or, more generally, forward-looking statements published in this document. The information on risk factors that could have a significant adverse effect on TotalEnergies’ business, financial condition, including its operating income and cash flow, reputation, outlook or the value of financial instruments issued by TotalEnergies is provided in the most recent version of the Universal Registration Document which is filed by TotalEnergies SE with the French Autorité des Marchés Financiers and the annual report on Form 20-F filed with the SEC. Additionally, the developments of climate change and other environmental or social-related issues in this document are based on various frameworks and the interests of various stakeholders which are subject to evolve independently of our will. Moreover, our disclosures on such issues, including disclosures on climate change and other environmental or social-related issues, may include information that is not necessarily “material” under US securities laws for SEC reporting purposes or under applicable securities law. In addition to IFRS measures, certain alternative performance indicators are presented, such as performance indicators excluding the adjustment items described below (adjusted net operating income, adjusted net income), net cash flow, free cash flow after organic investments, normalized gearing, return on equity (ROE), return on average capital employed (ROACE), gearing ratio, cash flow from operations excluding working capital, debt adjusted cash flow, and the payout ratio. These indicators are meant to facilitate the analysis of the financial performance of TotalEnergies and the comparison of income between periods. They allow investors to track the measures used internally to manage and measure the performance of TotalEnergies. Financial information by business segment is reported in accordance with the internal reporting system and shows internal segment information that is used to manage and measure the performance of TotalEnergies. TotalEnergies measures performance at the segment level on the basis of adjusted net operating income. These adjustment items include: (i) Special items Due to their unusual nature or particular significance, certain transactions qualifying as “special items” are excluded from the business segment figures. In general, special items relate to transactions that are significant, infrequent, or unusual. However, in certain instances, transactions such as restructuring costs or assets disposals, which are not considered to be representative of the normal course of business, may qualify as special items although they may have occurred in prior years or are likely to occur in following years. (ii) The inventory valuation effect In accordance with IAS 2, TotalEnergies values inventories of petroleum products in its financial statements according to the First-In, First-Out (FIFO) method and other inventories using the weighted-average cost method. Under the FIFO method, the cost of inventory is based on the historic cost of acquisition or manufacture rather than the current replacement cost. In volatile energy markets, this can have a 25 |
| significant distorting effect on the reported income. Accordingly, the adjusted results of the Refining & Chemicals and Marketing & Services segments are presented according to the replacement cost method. This method is used to assess the segments’ performance and facilitate the comparability of the segments’ performance with those of its main competitors. In the replacement cost method, which approximates the Last-In, First-Out (LIFO) method, the variation of inventory values in the statement of income is, depending on the nature of the inventory, determined using either the month-end prices differential between one period and another or the average prices of the period rather than the historical value. The inventory valuation effect is the difference between the results under the FIFO and the replacement cost methods. (iii) Effect of changes in fair value The effect of changes in fair value presented as an adjustment item reflects, for trading inventories and storage contracts, differences between internal measures of performance used by TotalEnergies’ Executive Committee and the accounting for these transactions under IFRS. IFRS requires that trading inventories be recorded at their fair value using period-end spot prices. In order to best reflect the management of economic exposure through derivative transactions, internal indicators used to measure performance include valuations of trading inventories based on forward prices. TotalEnergies, in its trading activities, enters into storage contracts, whose future effects are recorded at fair value in TotalEnergies’ internal economic performance. IFRS precludes recognition of this fair value effect. Furthermore, TotalEnergies enters into derivative instruments to risk manage certain operational contracts or assets. Under IFRS, these derivatives are recorded at fair value while the underlying operational transactions are recorded as they occur. Internal indicators defer the fair value on derivatives to match with the transaction occurrence. The adjusted results (adjusted net operating income, adjusted net income) are defined as replacement cost results, adjusted for special items, excluding the effect of changes in fair value. Euro amounts presented for the fully adjusted-diluted earnings per share represent dollar amounts converted at the average euro-dollar (€-$) exchange rate for the applicable period and are not the result of financial statements prepared in euros. Cautionary Note to U.S. Investors – U.S. investors are urged to consider closely the disclosure in the Form 20-F of TotalEnergies SE, File N° 1-10888, available from us at 2, place Jean Millier – Arche Nord Coupole/Regnault – 92078 Paris-La Défense Cedex, France, or at the Corporation website totalenergies.com. You can also obtain this form from the SEC by calling 1-800-SEC-0330 or on the SEC’s website sec.gov. 26 |
| TotalEnergies financial statements Second quarter and first half 2026 consolidated accounts, IFRS 27 |
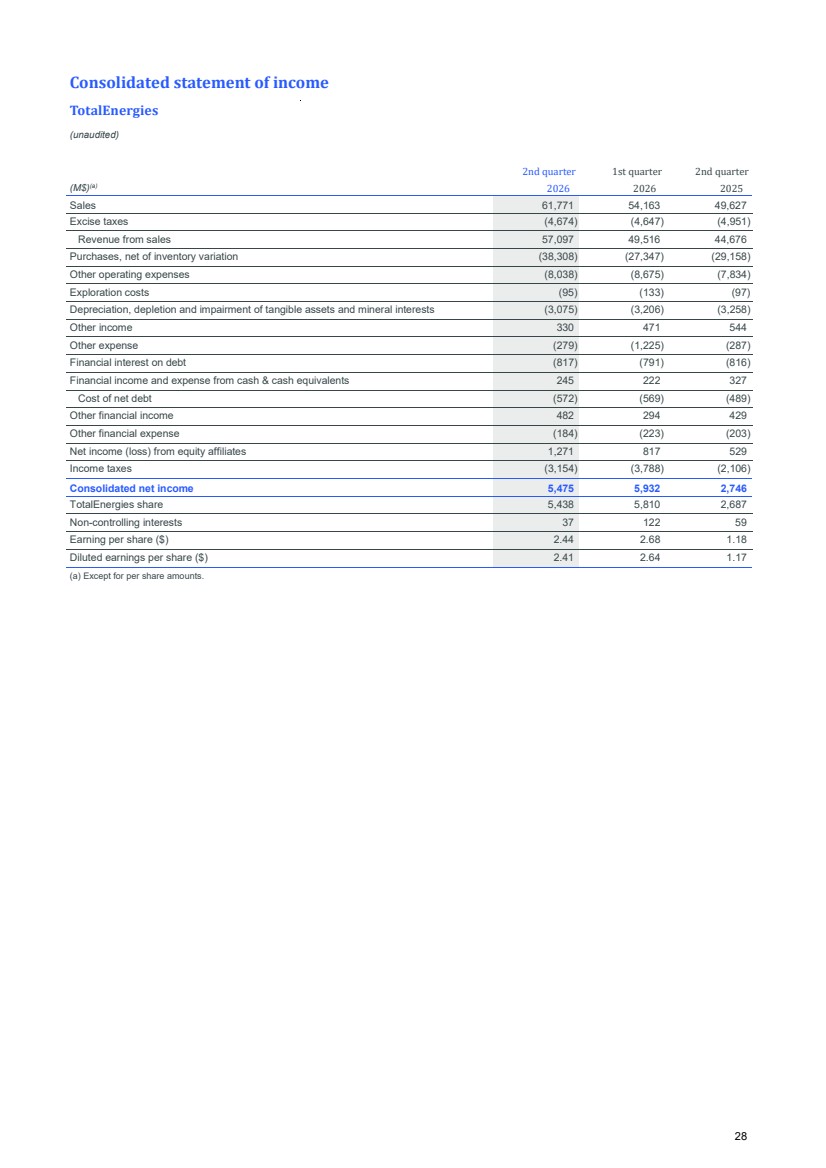
| Consolidated statement of income TotalEnergies (unaudited) 2nd quarter 1st quarter 2nd quarter (M$)(a) 2026 2026 2025 Sales 61,771 54,163 49,627 Excise taxes (4,674) (4,647) (4,951) Revenue from sales 57,097 49,516 44,676 Purchases, net of inventory variation (38,308) (27,347) (29,158) Other operating expenses (8,038) (8,675) (7,834) Exploration costs (95) (133) (97) Depreciation, depletion and impairment of tangible assets and mineral interests (3,075) (3,206) (3,258) Other income 330 471 544 Other expense (279) (1,225) (287) Financial interest on debt (817) (791) (816) Financial income and expense from cash & cash equivalents 245 222 327 Cost of net debt (572) (569) (489) Other financial income 482 294 429 Other financial expense (184) (223) (203) Net income (loss) from equity affiliates 1,271 817 529 Income taxes (3,154) (3,788) (2,106) Consolidated net income 5,475 5,932 2,746 TotalEnergies share 5,438 5,810 2,687 Non-controlling interests 37 122 59 Earning per share ($) 2.44 2.68 1.18 Diluted earnings per share ($) 2.41 2.64 1.17 (a) Except for per share amounts. 28 |
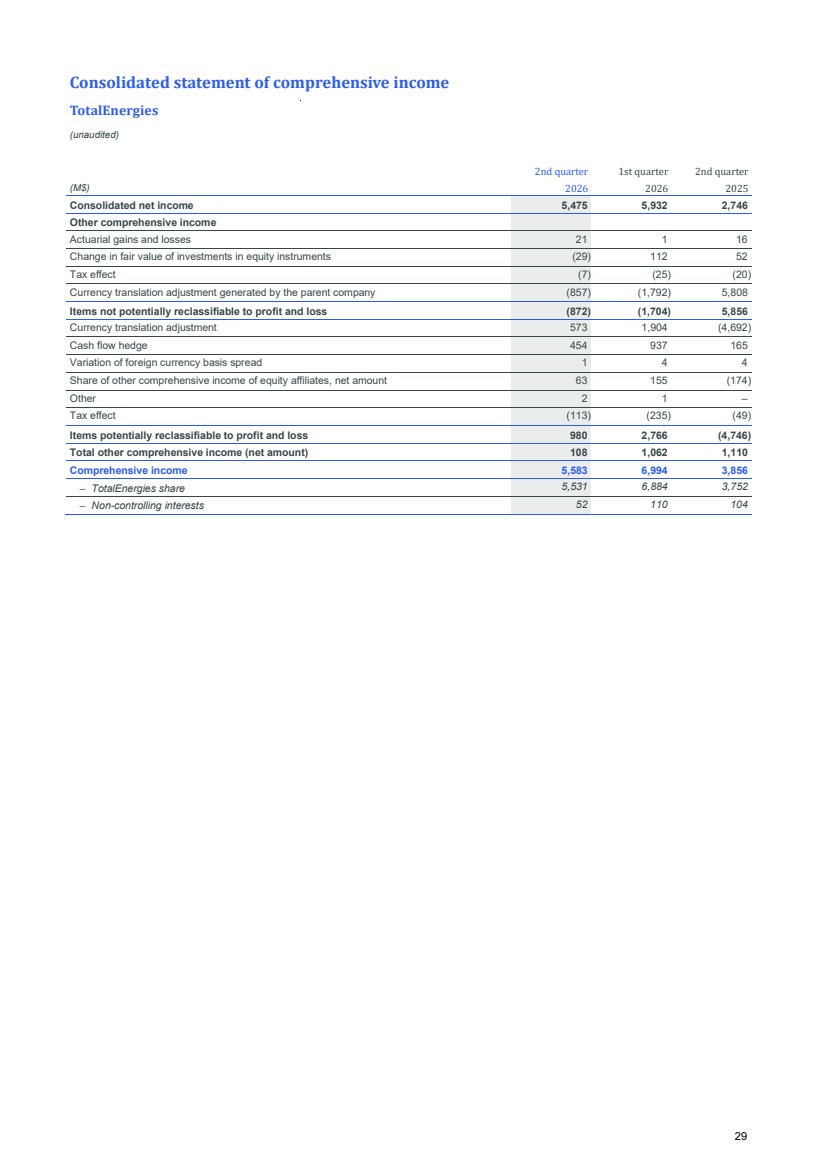
| Consolidated statement of comprehensive income TotalEnergies (unaudited) 2nd quarter 1st quarter 2nd quarter (M$) 2026 2026 2025 Consolidated net income 5,475 5,932 2,746 Other comprehensive income Actuarial gains and losses 21 1 16 Change in fair value of investments in equity instruments (29) 112 52 Tax effect (7) (25) (20) Currency translation adjustment generated by the parent company (857) (1,792) 5,808 Items not potentially reclassifiable to profit and loss (872) (1,704) 5,856 Currency translation adjustment 573 1,904 (4,692) Cash flow hedge 454 937 165 Variation of foreign currency basis spread 1 4 4 Share of other comprehensive income of equity affiliates, net amount 63 155 (174) Other 2 1 – Tax effect (113) (235) (49) Items potentially reclassifiable to profit and loss 980 2,766 (4,746) Total other comprehensive income (net amount) 108 1,062 1,110 Comprehensive income 5,583 6,994 3,856 – TotalEnergies share 5,531 6,884 3,752 – Non-controlling interests 52 110 104 29 |
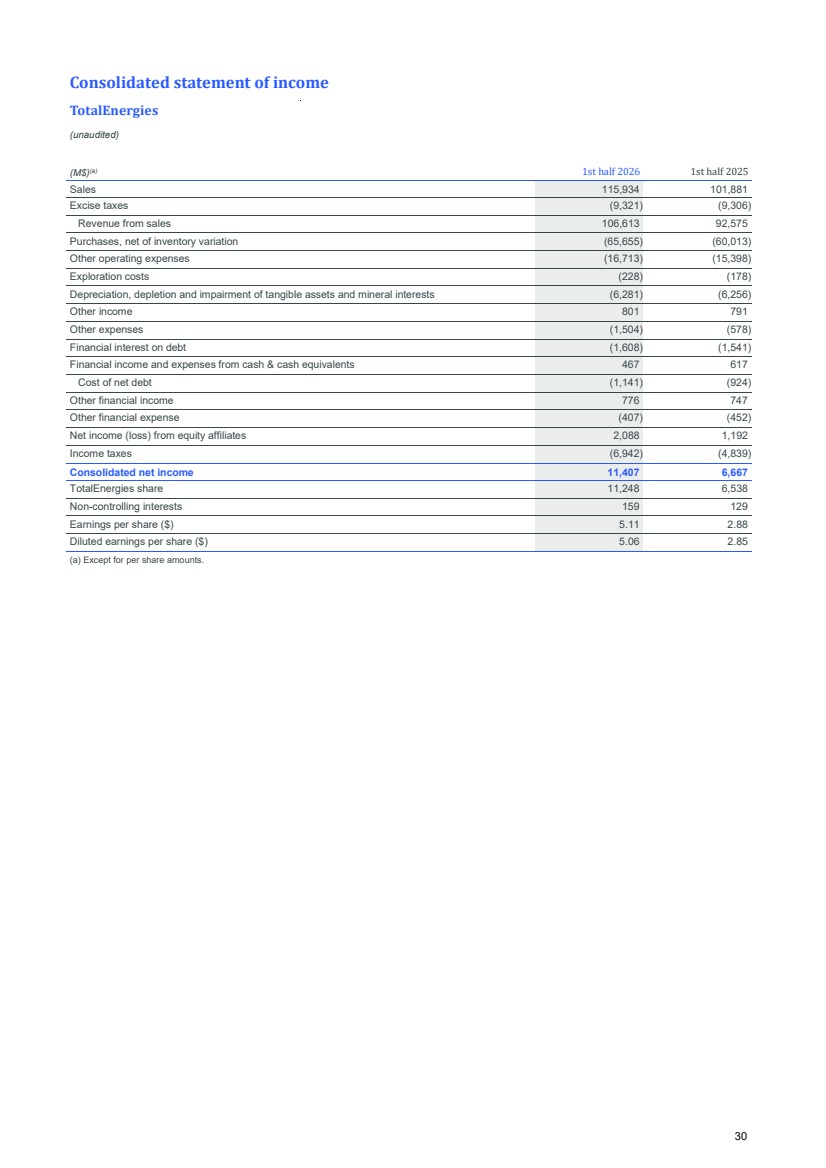
| Consolidated statement of income TotalEnergies (unaudited) (M$)(a) 1st half 2026 1st half 2025 Sales 115,934 101,881 Excise taxes (9,321) (9,306) Revenue from sales 106,613 92,575 Purchases, net of inventory variation (65,655) (60,013) Other operating expenses (16,713) (15,398) Exploration costs (228) (178) Depreciation, depletion and impairment of tangible assets and mineral interests (6,281) (6,256) Other income 801 791 Other expenses (1,504) (578) Financial interest on debt (1,608) (1,541) Financial income and expenses from cash & cash equivalents 467 617 Cost of net debt (1,141) (924) Other financial income 776 747 Other financial expense (407) (452) Net income (loss) from equity affiliates 2,088 1,192 Income taxes (6,942) (4,839) Consolidated net income 11,407 6,667 TotalEnergies share 11,248 6,538 Non-controlling interests 159 129 Earnings per share ($) 5.11 2.88 Diluted earnings per share ($) 5.06 2.85 (a) Except for per share amounts. 30 |
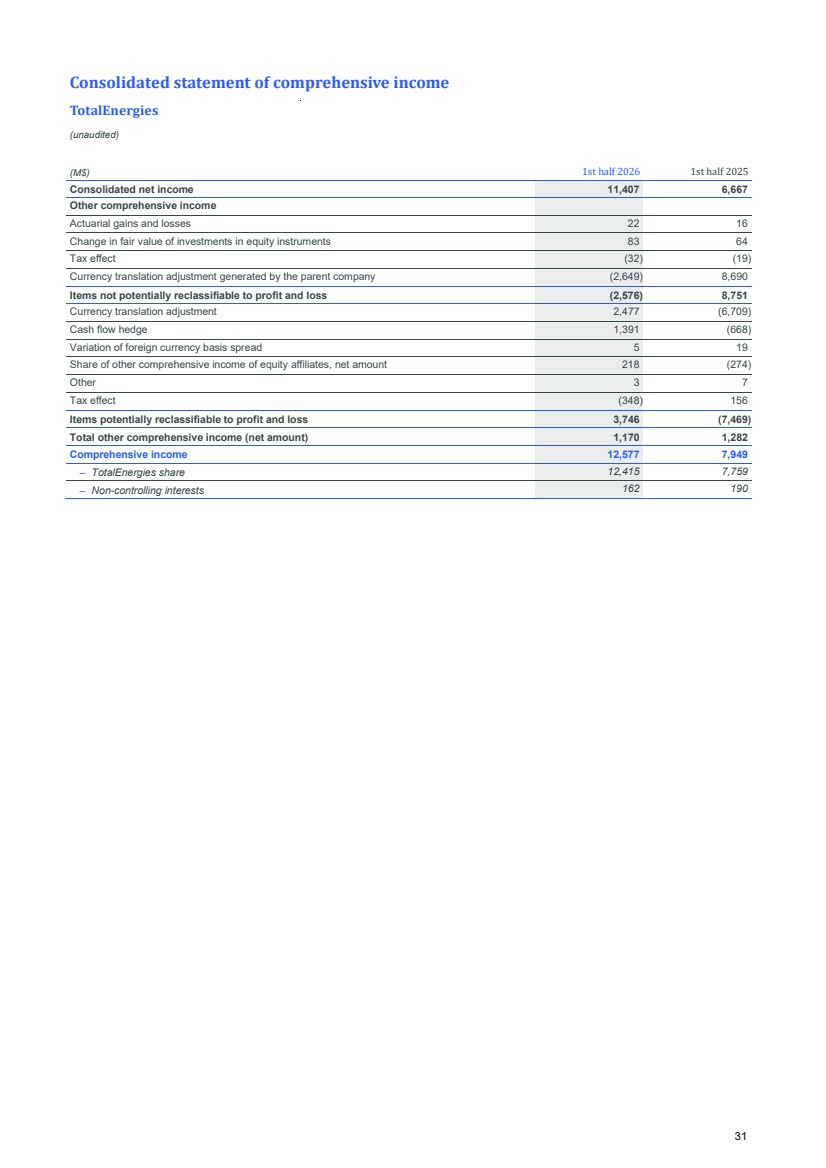
| Consolidated statement of comprehensive income TotalEnergies (unaudited) (M$) 1st half 2026 1st half 2025 Consolidated net income 11,407 6,667 Other comprehensive income Actuarial gains and losses 22 16 Change in fair value of investments in equity instruments 83 64 Tax effect (32) (19) Currency translation adjustment generated by the parent company (2,649) 8,690 Items not potentially reclassifiable to profit and loss (2,576) 8,751 Currency translation adjustment 2,477 (6,709) Cash flow hedge 1,391 (668) Variation of foreign currency basis spread 5 19 Share of other comprehensive income of equity affiliates, net amount 218 (274) Other 3 7 Tax effect (348) 156 Items potentially reclassifiable to profit and loss 3,746 (7,469) Total other comprehensive income (net amount) 1,170 1,282 Comprehensive income 12,577 7,949 – TotalEnergies share 12,415 7,759 – Non-controlling interests 162 190 31 |
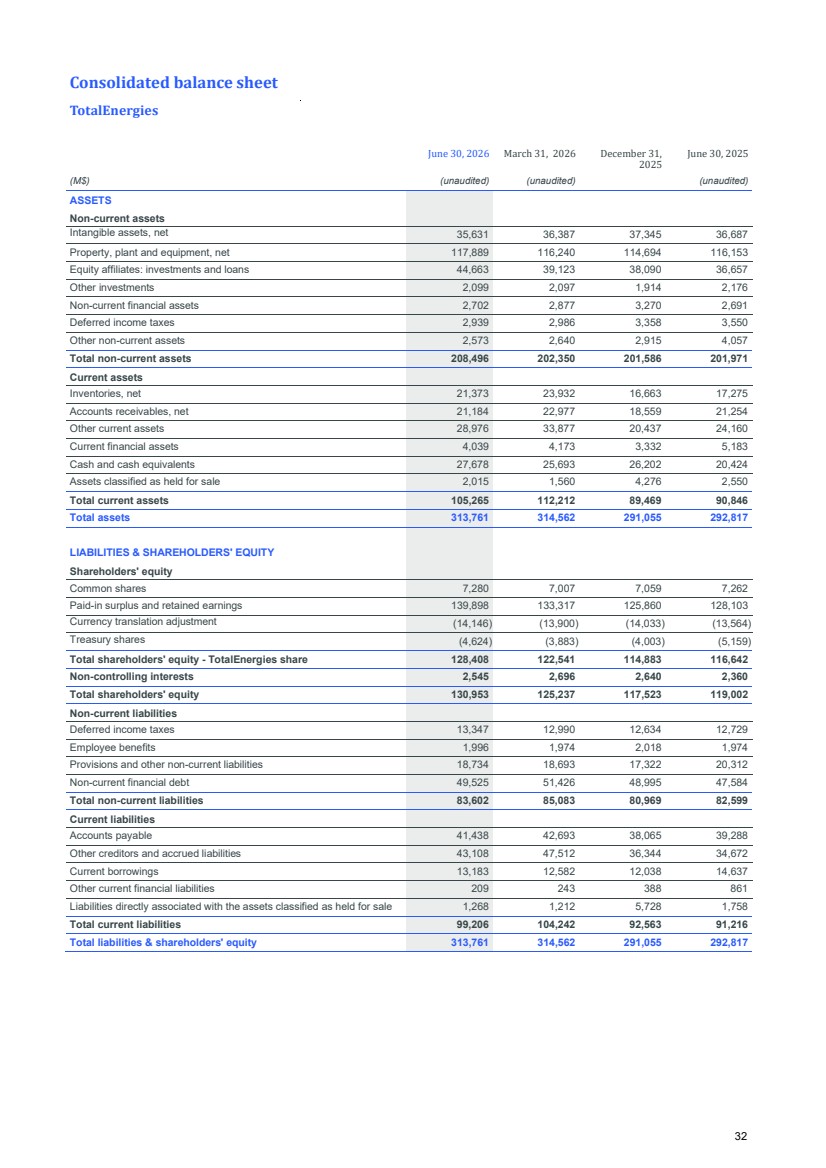
| Consolidated balance sheet TotalEnergies June 30, 2026 March 31, 2026 December 31, 2025 June 30, 2025 (M$) (unaudited) (unaudited) (unaudited) ASSETS Non-current assets Intangible assets, net 35,631 36,387 37,345 36,687 Property, plant and equipment, net 117,889 116,240 114,694 116,153 Equity affiliates: investments and loans 44,663 39,123 38,090 36,657 Other investments 2,099 2,097 1,914 2,176 Non-current financial assets 2,702 2,877 3,270 2,691 Deferred income taxes 2,939 2,986 3,358 3,550 Other non-current assets 2,573 2,640 2,915 4,057 Total non-current assets 208,496 202,350 201,586 201,971 Current assets Inventories, net 21,373 23,932 16,663 17,275 Accounts receivables, net 21,184 22,977 18,559 21,254 Other current assets 28,976 33,877 20,437 24,160 Current financial assets 4,039 4,173 3,332 5,183 Cash and cash equivalents 27,678 25,693 26,202 20,424 Assets classified as held for sale 2,015 1,560 4,276 2,550 Total current assets 105,265 112,212 89,469 90,846 Total assets 313,761 314,562 291,055 292,817 LIABILITIES & SHAREHOLDERS' EQUITY Shareholders' equity Common shares 7,280 7,007 7,059 7,262 Paid-in surplus and retained earnings 139,898 133,317 125,860 128,103 Currency translation adjustment (14,146) (13,900) (14,033) (13,564) Treasury shares (4,624) (3,883) (4,003) (5,159) Total shareholders' equity - TotalEnergies share 128,408 122,541 114,883 116,642 Non-controlling interests 2,545 2,696 2,640 2,360 Total shareholders' equity 130,953 125,237 117,523 119,002 Non-current liabilities Deferred income taxes 13,347 12,990 12,634 12,729 Employee benefits 1,996 1,974 2,018 1,974 Provisions and other non-current liabilities 18,734 18,693 17,322 20,312 Non-current financial debt 49,525 51,426 48,995 47,584 Total non-current liabilities 83,602 85,083 80,969 82,599 Current liabilities Accounts payable 41,438 42,693 38,065 39,288 Other creditors and accrued liabilities 43,108 47,512 36,344 34,672 Current borrowings 13,183 12,582 12,038 14,637 Other current financial liabilities 209 243 388 861 Liabilities directly associated with the assets classified as held for sale 1,268 1,212 5,728 1,758 Total current liabilities 99,206 104,242 92,563 91,216 Total liabilities & shareholders' equity 313,761 314,562 291,055 292,817 32 |
| Consolidated statement of cash flow TotalEnergies (unaudited) 2nd quarter 1st quarter 2nd quarter (M$) 2026 2026 2025 CASH FLOW FROM OPERATING ACTIVITIES Consolidated net income 5,475 5,932 2,746 Depreciation, depletion, amortization and impairment 3,097 4,149 3,360 Non-current liabilities, valuation allowances and deferred taxes 599 591 127 (Gains) losses on disposals of assets (266) (320) (335) Undistributed affiliates' equity earnings (65) (187) (102) (Increase) decrease in working capital 1,663 (6,968) 49 Other changes, net 355 164 115 Cash flow from operating activities 10,858 3,361 5,960 CASH FLOW USED IN INVESTING ACTIVITIES Intangible assets and property, plant and equipment additions (4,232) (4,621) (4,766) Acquisitions of subsidiaries, net of cash acquired (6) (79) (1,627) Investments in equity affiliates and other securities (561) (221) (419) Increase in non-current loans (452) (301) (425) Total expenditures (5,251) (5,222) (7,237) Proceeds from disposals of intangible assets and property, plant and equipment 500 181 69 Proceeds from disposals of subsidiaries, net of cash sold 135 397 154 Proceeds from disposals of non-current investments 266 7 15 Repayment of non-current loans 1,074 325 310 Total divestments 1,975 910 548 Cash flow used in investing activities (3,276) (4,312) (6,689) CASH FLOW FROM FINANCING ACTIVITIES Issuance (repayment) of shares: – Parent company shareholders 363 – 492 – Treasury shares (1,511) (775) (1,707) Dividends paid: – Parent company shareholders (2,094) (2,123) (1,894) – Non-controlling interests (166) (9) (173) Net issuance (repayment) of perpetual subordinated notes – 1,751 – Payments on perpetual subordinated notes (40) (154) (27) Other transactions with non-controlling interests (37) (16) (31) Net issuance (repayment) of non-current debt 84 3,584 257 Increase (decrease) in current borrowings (1,994) (1,283) (356) Increase (decrease) in current financial assets and liabilities 127 (469) 1,287 Cash flow / (used in) financing activities (5,268) 506 (2,152) Net increase (decrease) in cash and cash equivalents 2,314 (445) (2,881) Effect of exchange rates (329) (64) 468 Cash and cash equivalents at the beginning of the period 25,693 26,202 22,837 Cash and cash equivalents at the end of the period 27,678 25,693 20,424 33 |
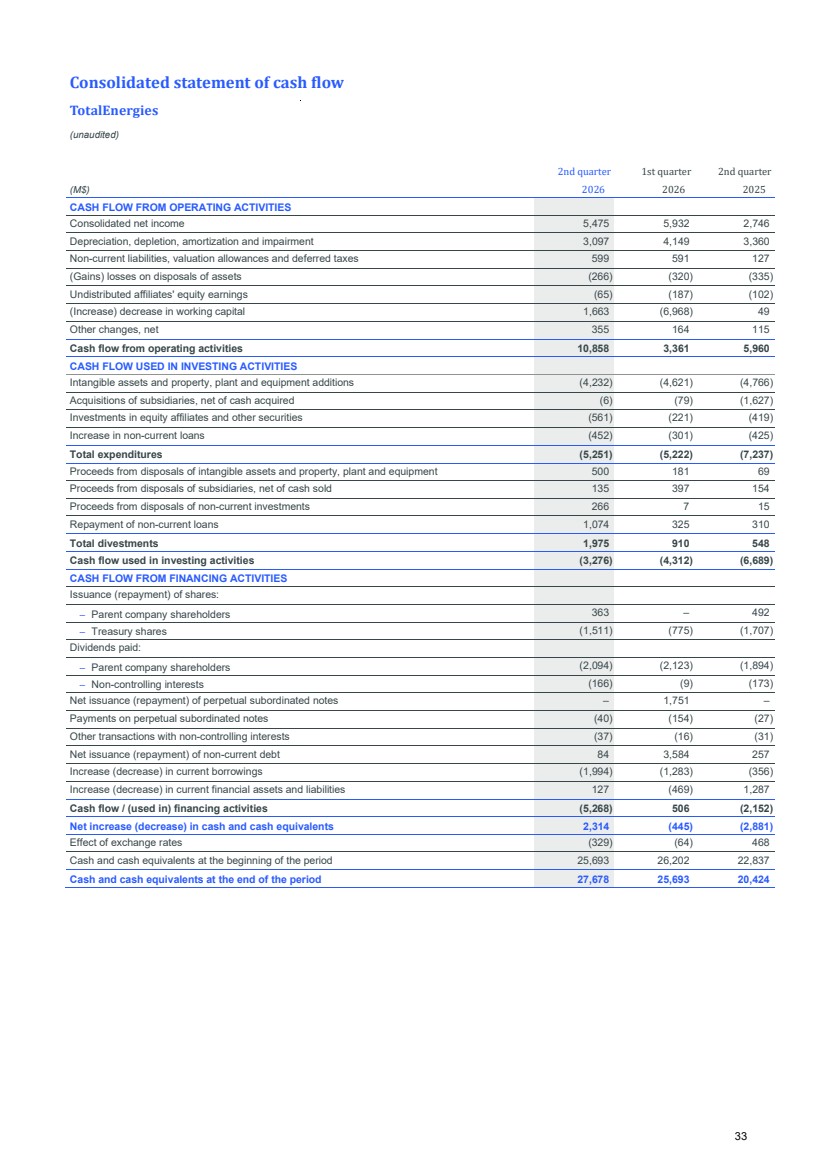
| Consolidated statement of cash flow TotalEnergies (unaudited) (M$) 1st half 2026 1st half 2025 CASH FLOW FROM OPERATING ACTIVITIES Consolidated net income 11,407 6,667 Depreciation, depletion, amortization and impairment 7,246 6,446 Non-current liabilities, valuation allowances and deferred taxes 1,190 336 (Gains) losses on disposals of assets (586) (310) Undistributed affiliates' equity earnings (252) (525) (Increase) decrease in working capital (5,305) (4,183) Other changes, net 519 92 Cash flow from operating activities 14,219 8,523 CASH FLOW USED IN INVESTING ACTIVITIES Intangible assets and property, plant and equipment additions (8,853) (8,988) Acquisitions of subsidiaries, net of cash acquired (85) (1,859) Investments in equity affiliates and other securities (782) (730) Increase in non-current loans (753) (993) Total expenditures (10,473) (12,570) Proceeds from disposals of intangible assets and property, plant and equipment 681 370 Proceeds from disposals of subsidiaries, net of cash sold 532 271 Proceeds from disposals of non-current investments 273 16 Repayment of non-current loans 1,399 419 Total divestments 2,885 1,076 Cash flow used in investing activities (7,588) (11,494) CASH FLOW FROM FINANCING ACTIVITIES Issuance (repayment) of shares: – Parent company shareholders 363 492 – Treasury shares (2,286) (3,859) Dividends paid: – Parent company shareholders (4,217) (3,745) – Non-controlling interests (175) (312) Net issuance (repayment) of perpetual subordinated notes 1,751 (1,139) Payments on perpetual subordinated notes (194) (155) Other transactions with non-controlling interests (53) (51) Net issuance (repayment) of non-current debt 3,668 3,688 Increase (decrease) in current borrowings (3,277) (206) Increase (decrease) in current financial assets and liabilities (342) 2,005 Cash flow / (used in) financing activities (4,762) (3,282) Net increase (decrease) in cash and cash equivalents 1,869 (6,253) Effect of exchange rates (393) 833 Cash and cash equivalents at the beginning of the period 26,202 25,844 Cash and cash equivalents at the end of the period 27,678 20,424 34 |
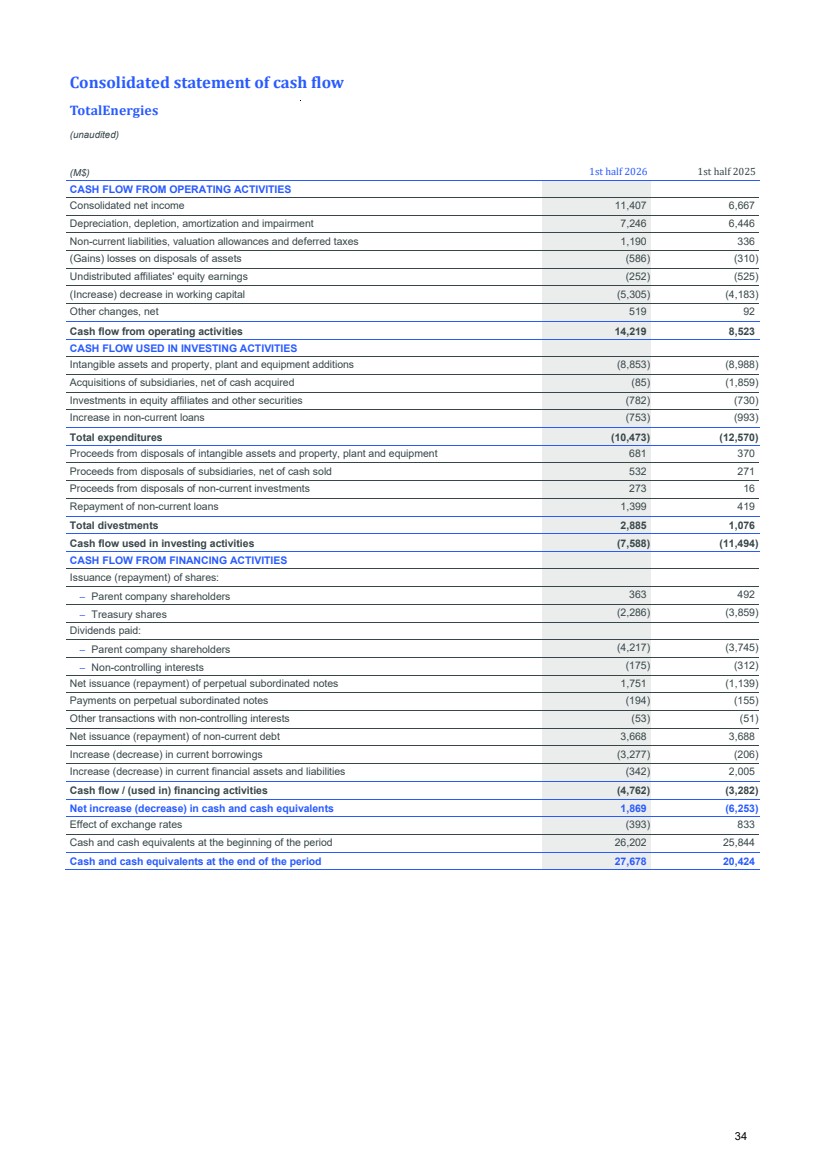
| Consolidated statement of changes in shareholders' equity TotalEnergies (unaudited) Common shares issued Paid-in surplus and retained earnings Currency translation adjustment Treasury shares Shareholders' equity - TotalEnergies Share Non-controlling interests Total shareholders' (M$) Number Amount Number Amount equity As of January 1, 2025 2,397,679,661 7,577 135,496 (15,259) (149,529,818) (9,956) 117,858 2,397 120,255 Net income of the first half 2025 – – 6,538 – – – 6,538 129 6,667 Other comprehensive income – – (474) 1,695 – – 1,221 61 1,282 Comprehensive income – – 6,064 1,695 – – 7,759 190 7,949 Dividend – – (4,072) – – – (4,072) (178) (4,250) Issuance of common shares 11,149,053 30 462 – – – 492 – 492 Purchase of treasury shares – – – – (62,261,210) (4,239) (4,239) – (4,239) Sale of treasury shares(a) – – (414) – 6,214,595 414 – – – Share-based payments – – 340 – – – 340 – 340 Share cancellation (127,622,460) (345) (8,397) – 127,622,460 8,622 (120) – (120) Net issuance (repayment) of perpetual subordinated notes – – (1,219) – – – (1,219) – (1,219) Payments on perpetual subordinated notes – – (156) – – – (156) – (156) Other operations with non-controlling interests – – – – – – – (51) (51) Other items – – (1) – – – (1) 2 1 As of June 30, 2025 2,281,206,254 7,262 128,103 (13,564) (77,953,973) (5,159) 116,642 2,360 119,002 Net income of the second half 2025 – – 6,589 – – – 6,589 101 6,690 Other comprehensive income – – (523) (469) – – (992) 16 (976) Comprehensive income – – 6,066 (469) – – 5,597 117 5,714 Dividend – – (4,063) – – – (4,063) (170) (4,233) Issuance of common shares – – – – – – – – – Purchase of treasury shares – – – – (60,376,084) (3,287) (3,287) – (3,287) Sale of treasury shares(a) – – – – 6,817 – – – – Share-based payments – – 245 – – – 245 – 245 Share cancellation (74,620,711) (203) (4,307) – 74,620,711 4,442 (68) – (68) Net issuance (repayment) of perpetual subordinated notes – – – – – – – – – Payments on perpetual subordinated notes – – (164) – – – (164) – (164) Other operations with non-controlling interests – – (1) – – – (1) 337 336 Other items – – (19) – – 1 (18) (4) (22) As of December 31, 2025 2,206,585,543 7,059 125,860 (14,033) (63,702,529) (4,003) 114,883 2,640 117,523 Net income of the first half 2026 – – 11,248 – – – 11,248 159 11,407 Other comprehensive income – – 1,280 (113) – – 1,167 3 1,170 Comprehensive income – – 12,528 (113) – – 12,415 162 12,577 Dividend – – (4,531) – – – (4,531) (175) (4,706) Issuance of common shares 100,985,040 295 6,092 – – – 6,387 – 6,387 Purchase of treasury shares – – – – (26,319,030) (2,654) (2,654) – (2,654) Sale of treasury shares(a) – – (426) – 6,639,644 426 – – – Share-based payments – – 372 – – – 372 – 372 Share cancellation (25,913,869) (74) (1,564) – 25,913,869 1,607 (31) – (31) Net issuance (repayment) of perpetual subordinated notes – – 1,751 – – – 1,751 – 1,751 Payments on perpetual subordinated notes – – (184) – – – (184) – (184) Other operations with non-controlling interests – – – – – – – (53) (53) Other items – – – – – – – (29) (29) As of June 30, 2026 2,281,656,714 7,280 139,898 (14,146) (57,468,046) (4,624) 128,408 2,545 130,953 (a) Treasury shares related to the performance share grants. 35 |
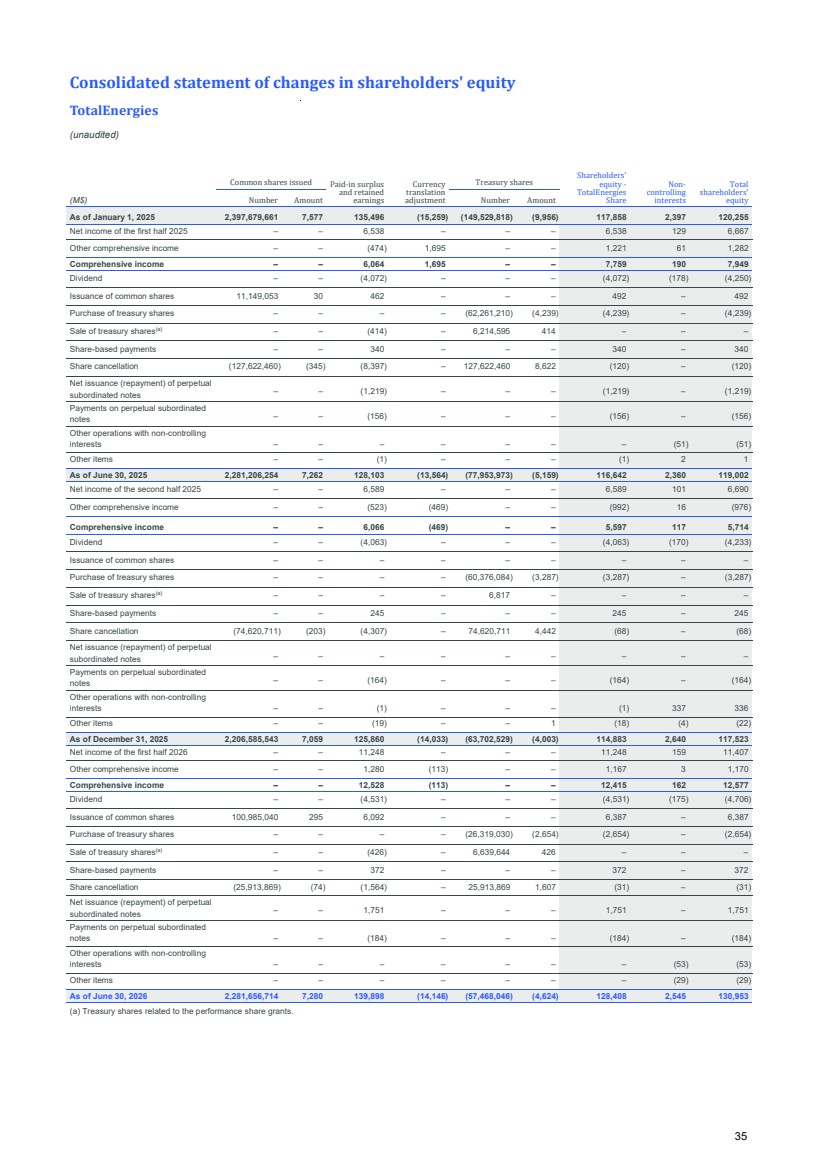
| Information by business segment TotalEnergies (unaudited) 2nd quarter 2026 Exploration & Production Integrated LNG Integrated Power Refining & Chemicals Marketing & Services Corporate Intercompany Total (M$) External sales 1,830 1,880 3,846 28,792 25,422 1 – 61,771 Intersegment sales 9,221 2,258 1,511 11,058 260 41 (24,349) – Excise taxes – – – (164) (4,510) – – (4,674) Revenues from sales 11,051 4,138 5,357 39,686 21,172 42 (24,349) 57,097 Operating expenses (3,629) (3,469) (5,105) (37,806) (20,465) (316) 24,349 (46,441) Depreciation, depletion and impairment of tangible assets and mineral interests (1,920) (413) (74) (404) (233) (31) – (3,075) Net income (loss) from equity affiliates and other items 292 767 302 204 86 (31) – 1,620 Tax on net operating income (2,570) (167) (36) (259) (183) 12 – (3,203) Adjustments(a) (7) 49 (89) (379) (123) (48) – (597) Adjusted net operating income 3,231 807 533 1,800 500 (276) – 6,595 Adjustments(a) (597) Net cost of net debt (523) Non-controlling interests (37) Net income - TotalEnergies share 5,438 (a) Adjustments include special items, inventory valuation effect and the effect of changes in fair value. The management of balance sheet positions (including margin calls) related to centralized markets access for LNG, gas and power activities has been fully included in the Integrated LNG segment. Effects of changes in the fair value of gas and LNG positions are allocated to the net operating income of Integrated LNG segment. Effects of changes in the fair value of power positions are allocated to the net operating income of Integrated Power segment. 2nd quarter 2026 Exploration & Production Integrated LNG Integrated Power Refining & Chemicals Marketing & Services Corporate Intercompany Total (M$) Total expenditures 2,282 874 1,419 385 197 94 – 5,251 Total divestments 460 (36) 1,356 20 178 (3) – 1,975 Cash flow from operating activities 5,546 2,137 (239) 3,565 549 (700) – 10,858 36 |
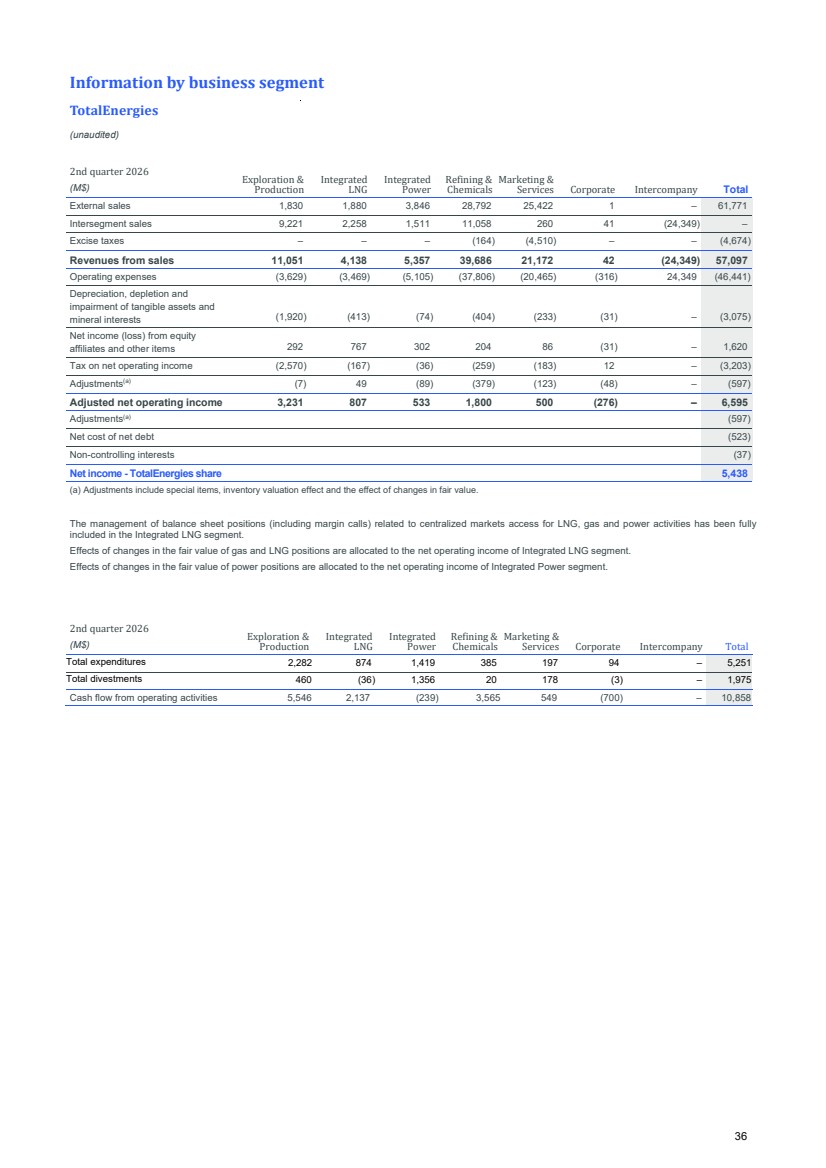
| Information by business segment TotalEnergies (unaudited) 1st quarter 2026 Exploration & Production Integrated LNG Integrated Power Refining & Chemicals Marketing & Services Corporate Intercompany Total (M$) External sales 1,119 2,930 5,441 24,180 20,489 4 – 54,163 Intersegment sales 9,003 2,810 727 8,215 119 33 (20,907) – Excise taxes – – – (167) (4,480) – – (4,647) Revenues from sales 10,122 5,740 6,168 32,228 16,128 37 (20,907) 49,516 Operating expenses (3,289) (4,152) (5,710) (28,670) (14,993) (248) 20,907 (36,155) Depreciation, depletion and impairment of tangible assets and mineral interests (1,965) (421) (163) (403) (230) (24) – (3,206) Net income (loss) from equity affiliates and other items 386 453 (813) 225 (120) 3 – 134 Tax on net operating income (2,426) (316) (53) (696) (247) (99) – (3,837) Adjustments(a) 252 (14) (1,116) 1,085 276 (23) – 460 Adjusted net operating income 2,576 1,318 545 1,599 262 (308) – 5,992 Adjustments(a) 460 Net cost of net debt (520) Non-controlling interests (122) Net income - TotalEnergies share 5,810 (a) Adjustments include special items, inventory valuation effect and the effect of changes in fair value. The management of balance sheet positions (including margin calls) related to centralized markets access for LNG, gas and power activities has been fully included in the Integrated LNG segment. Effects of changes in the fair value of gas and LNG positions are allocated to the net operating income of Integrated LNG segment. Effects of changes in the fair value of power positions are allocated to the net operating income of Integrated Power segment. 1st quarter 2026 Exploration & Production Integrated LNG Integrated Power Refining & Chemicals Marketing & (M$) Services Corporate Intercompany Total Total expenditures 2,860 649 901 616 152 44 – 5,222 Total divestments 462 151 218 23 52 4 – 910 Cash flow from operating activities 2,969 (1,120) (145) 1,564 1,068 (975) – 3,361 37 |
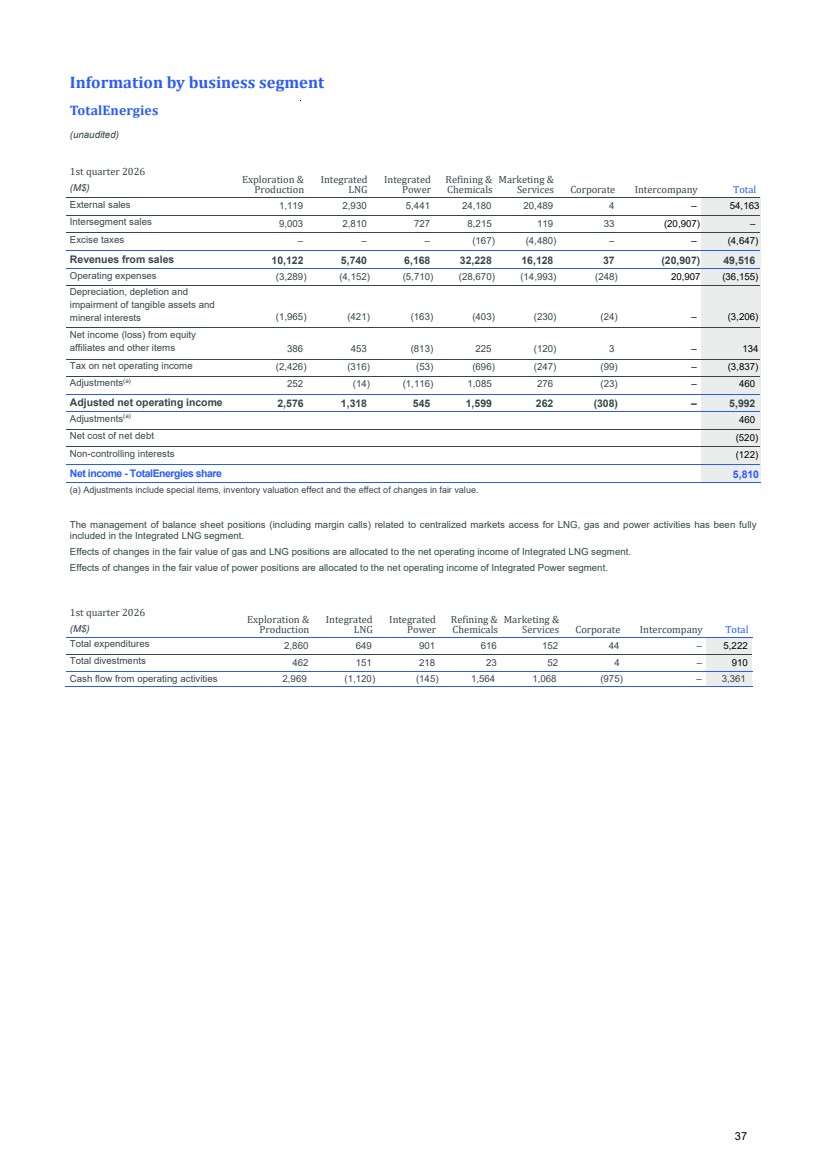
| Information by business segment TotalEnergies (unaudited) 2nd quarter 2025 Exploration & Production Integrated LNG Integrated Power Refining & Chemicals Marketing & Services Corporate Intercompany Total (M$) External sales 1,369 2,586 3,958 21,759 19,944 11 – 49,627 Intersegment sales 8,862 1,869 701 7,006 177 32 (18,647) – Excise taxes – – – (254) (4,697) – – (4,951) Revenues from sales 10,231 4,455 4,659 28,511 15,424 43 (18,647) 44,676 Operating expenses (4,577) (3,632) (4,479) (27,995) (14,751) (302) 18,647 (37,089) Depreciation, depletion and impairment of tangible assets and mineral interests (1,978) (397) (108) (520) (224) (31) – (3,258) Net income (loss) from equity affiliates and other items 58 578 340 (42) 113 (35) – 1,012 Tax on net operating income (1,793) (166) (27) (12) (168) 57 – (2,109) Adjustments(a) (33) (203) (189) (447) (18) (23) – (913) Adjusted net operating income 1,974 1,041 574 389 412 (245) – 4,145 Adjustments(a) (913) Net cost of net debt (486) Non-controlling interests (59) Net income - TotalEnergies share 2,687 (a) Adjustments include special items, inventory valuation effect and the effect of changes in fair value. The management of balance sheet positions (including margin calls) related to centralized markets access for LNG, gas and power activities has been fully included in the Integrated LNG segment. Effects of changes in the fair value of gas and LNG positions are allocated to the net operating income of Integrated LNG segment. Effects of changes in the fair value of power positions are allocated to the net operating income of Integrated Power segment. 2nd quarter 2025 Exploration & Production Integrated LNG Integrated Power Refining & Chemicals Marketing & (M$) Services Corporate Intercompany Total Total expenditures 3,186 877 2,503 351 234 86 – 7,237 Total divestments 80 25 347 42 38 16 – 548 Cash flow from operating activities 3,675 539 799 887 628 (568) – 5,960 38 |
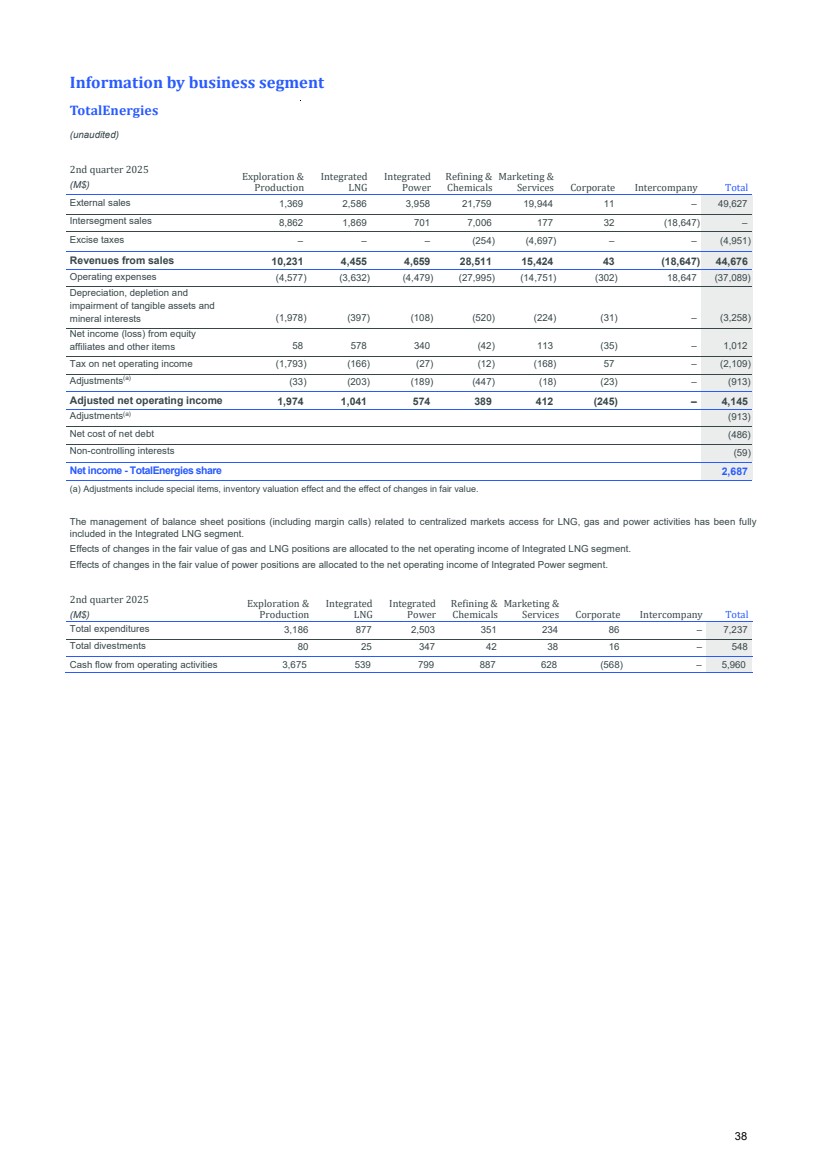
| Information by business segment TotalEnergies (unaudited) 1st half 2026 Exploration & Production Integrated LNG Integrated Power Refining & Chemicals Marketing & Services Corporate Intercompany Total (M$) External sales 2,949 4,810 9,287 52,972 45,911 5 – 115,934 Intersegment sales 18,224 5,068 2,238 19,273 379 74 (45,256) – Excise taxes – – – (331) (8,990) – – (9,321) Revenues from sales 21,173 9,878 11,525 71,914 37,300 79 (45,256) 106,613 Operating expenses (6,918) (7,621) (10,815) (66,476) (35,458) (564) 45,256 (82,596) Depreciation, depletion and impairment of tangible assets and mineral interests (3,885) (834) (237) (807) (463) (55) – (6,281) Net income (loss) from equity affiliates and other items 678 1,220 (511) 429 (34) (28) – 1,754 Tax on net operating income (4,996) (483) (89) (955) (430) (87) – (7,040) Adjustments(a) 245 35 (1,205) 706 153 (71) – (137) Adjusted net operating income 5,807 2,125 1,078 3,399 762 (584) – 12,587 Adjustments(a) (137) Net cost of net debt (1,043) Non-controlling interests (159) Net income - TotalEnergies share 11,248 (a) Adjustments include special items, inventory valuation effect and the effect of changes in fair value. The management of balance sheet positions (including margin calls) related to centralized markets access for LNG, gas and power activities has been fully included in the Integrated LNG segment. Effects of changes in the fair value of gas and LNG positions are allocated to the net operating income of Integrated LNG segment. Effects of changes in the fair value of power positions are allocated to the net operating income of Integrated Power segment. 1st half 2026 Exploration & Production Integrated LNG Integrated Power Refining & Chemicals Marketing & (M$) Services Corporate Intercompany Total Total expenditures 5,142 1,523 2,320 1,001 349 138 – 10,473 Total divestments 922 115 1,574 43 230 1 – 2,885 Cash flow from operating activities 8,515 1,017 (384) 5,129 1,617 (1,675) – 14,219 39 |
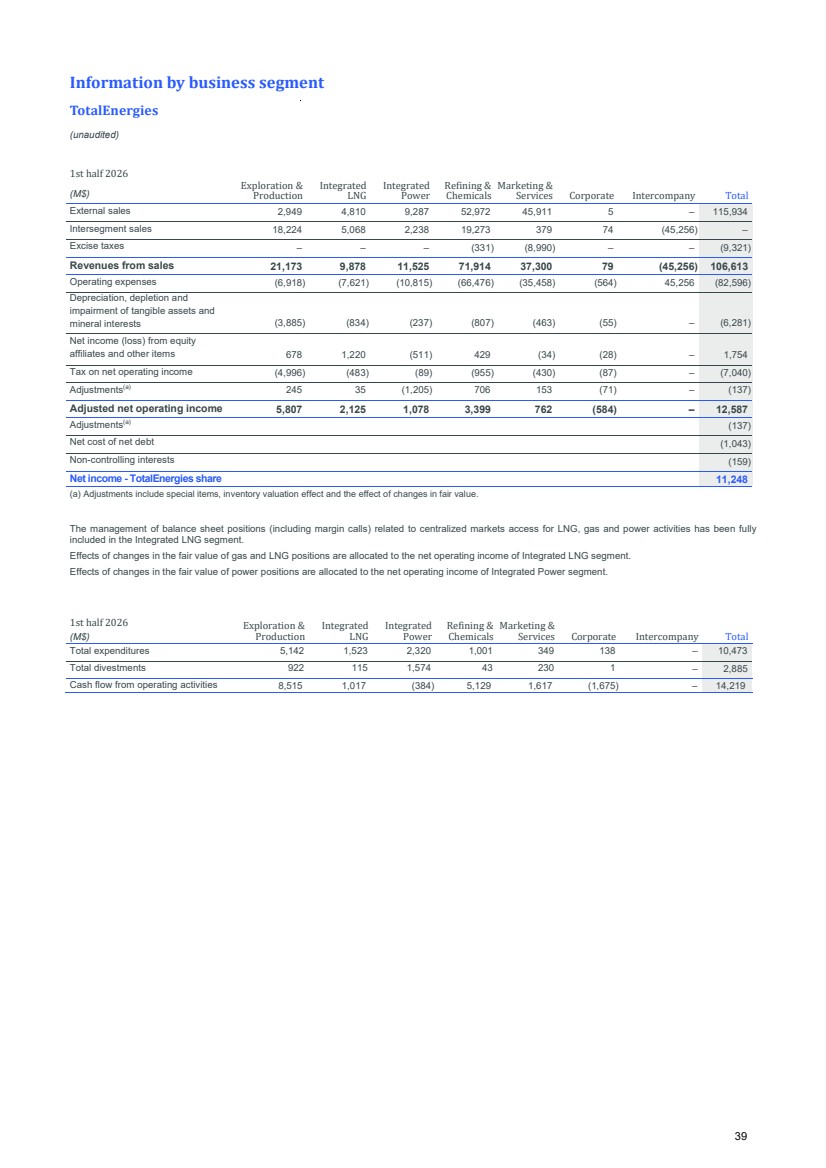
| Information by business segment TotalEnergies (unaudited) 1st half 2025 Exploration & Production Integrated LNG Integrated Power Refining & Chemicals Marketing & Services Corporate Intercompany Total (M$) External sales 2,938 5,674 9,925 44,386 38,945 13 – 101,881 Intersegment sales 17,589 5,121 1,385 13,817 333 57 (38,302) – Excise taxes – – – (366) (8,940) – – (9,306) Revenues from sales 20,527 10,795 11,310 57,837 30,338 70 (38,302) 92,575 Operating expenses (8,377) (8,588) (10,664) (56,643) (29,125) (494) 38,302 (75,589) Depreciation, depletion and impairment of tangible assets and mineral interests (3,928) (788) (183) (859) (441) (57) – (6,256) Net income (loss) from equity affiliates and other items 191 1,143 384 (50) 103 (71) – 1,700 Tax on net operating income (4,121) (441) (100) (95) (266) 131 – (4,892) Adjustments(a) (133) (214) (333) (500) (43) (45) – (1,268) Adjusted net operating income 4,425 2,335 1,080 690 652 (376) – 8,806 Adjustments(a) (1,268) Net cost of net debt (871) Non-controlling interests (129) Net income - TotalEnergies share 6,538 (a) Adjustments include special items, inventory valuation effect and the effect of changes in fair value. The management of balance sheet positions (including margin calls) related to centralized markets access for LNG, gas and power activities has been fully included in the Integrated LNG segment. Effects of changes in the fair value of gas and LNG positions are allocated to the net operating income of Integrated LNG segment. Effects of changes in the fair value of power positions are allocated to the net operating income of Integrated Power segment. 1st half 2025 Exploration & Production Integrated LNG Integrated Power Refining & Chemicals Marketing & Services Corporate Intercompany Total (M$) Total expenditures 6,233 1,779 3,439 593 406 120 – 12,570 Total divestments 438 35 405 48 135 15 – 1,076 Cash flow from operating activities 6,941 2,282 400 (1,096) 1,196 (1,200) – 8,523 40 |
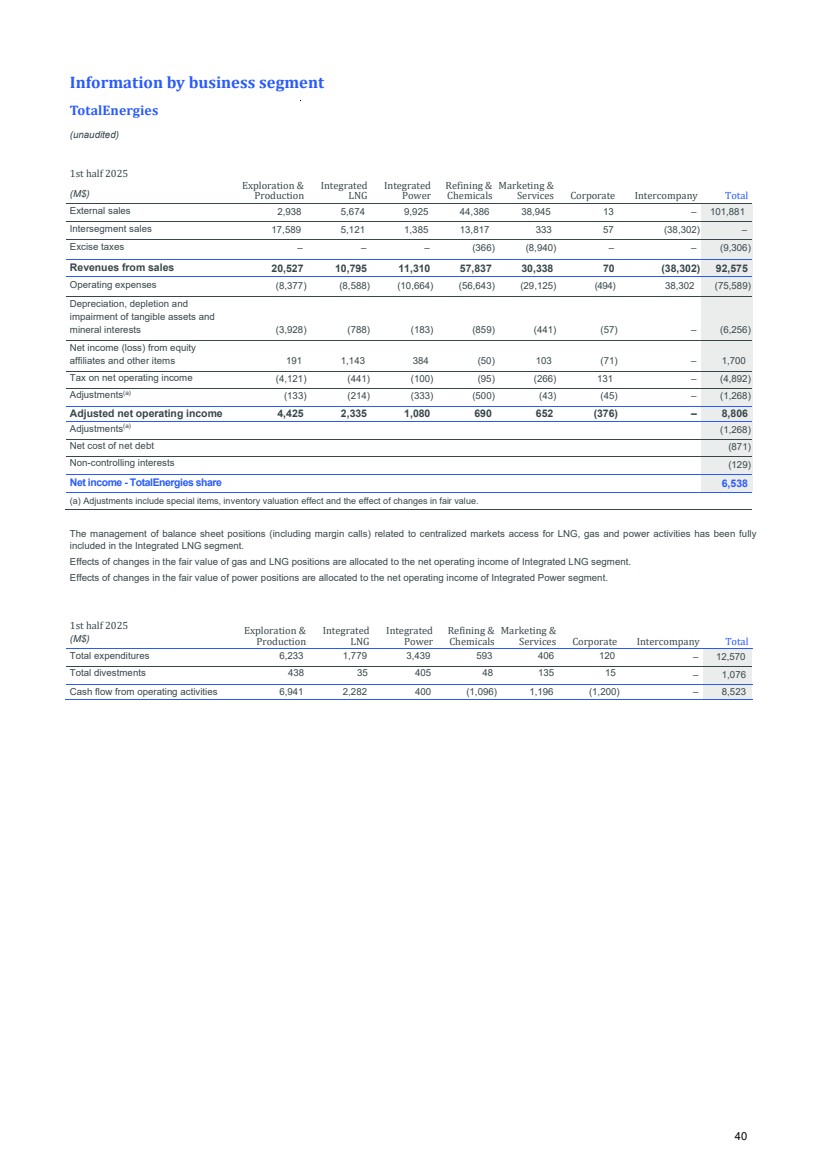
| Non GAAP Financial Measures 41 |
| Alternative Performance Measures (Non-GAAP) TotalEnergies (unaudited) 1. Reconciliation of cash flow used in investigating activities to Net investments 1.1 Exploration & Production 2nd quarter 1st quarter 2nd quarter 2nd quarter 2026 vs (in millions of dollars) 1st semester 2026 1st semester 2025 1st semester 2026 vs 2026 2026 2025 2nd quarter 2025 1st semester 2025 1,822 2,398 3,106 -41% Cash flow used in investing activities ( a ) * 4,220 5,795 -27% – – – ns Other transactions with non-controlling interests ( b ) – – ns – – – ns Organic loan repayment from equity affiliates ( c ) – – ns – – – ns Change in debt from renewable projects financing ( d ) ** – – ns 60 71 89 -33% Capex linked to capitalized leasing contracts ( e ) 131 198 -34% 1 28 20 -95% Expenditures related to carbon credits ( f ) 29 22 32% 1,883 2,497 3,215 -41% Net investments ( a + b + c + d + e + f = g - i + h ) 4,380 6,015 -27% (348) (227) 162 ns of which net acquisitions ( g - i ) (575) 278 ns 105 222 193 -46% Acquisitions ( g ) 327 638 -49% 453 449 31 x14.6 Assets sales ( i ) 902 360 x2.5 – – – ns Change in debt (partner share) and capital gain from renewable project sales – – ns 2,231 2,724 3,053 -27% Of which organic investments ( h ) 4,955 5,737 -14% 64 68 30 x2.1 Capitalized exploration 133 139 -4% 17 52 42 -60% Increase in non-current loans 69 124 -44% (7) (13) (49) ns Repayment of non-current loans, excluding organic loan repayment from equity affiliates (20) (78) ns – – – ns Change in debt from renewable projects (TotalEnergies share) – – ns *Cash flows used in investing activities do not include increases in property, plant and equipment arising from Apache’s carry arrangement on the GranMorgu project in offshore Block 58 in Suriname, which resulted in specific supplier financing recognised as financial debt. These increases amounted to $218 million in the first quarter of 2026, $153 million in the second quarter of 2026, and $371 million in the first half of 2026. Payments to these suppliers are classified as financing cash flows **Change in debt from renewable projects (TotalEnergies share and partner share) 1.2 Integrated LNG 2nd quarter 1st quarter 2nd quarter 2nd quarter 2026 vs (in millions of dollars) 1st semester 2026 1st semester 2025 1st semester 2026 vs 2026 2026 2025 2nd quarter 2025 1st semester 2025 910 498 852 7% Cash flow used in investing activities ( a ) 1,408 1,744 -19% – – – ns Other transactions with non-controlling interests ( b ) – – ns – 1 – ns Organic loan repayment from equity affiliates ( c ) 1 1 ns – – – ns Change in debt from renewable projects financing ( d ) * – – ns 2 3 1 100% Capex linked to capitalized leasing contracts ( e ) 5 – ns – – – ns Expenditures related to carbon credits ( f ) – – ns 912 502 853 7% Net investments ( a + b + c + d + e + f = g - i + h ) 1,414 1,745 -19% 4 92 110 -96% of which net acquisitions ( g - i ) 96 250 -62% 7 92 110 -94% Acquisitions ( g ) 99 254 -61% 3 – – ns Assets sales ( i ) 3 4 -25% – – – ns Change in debt (partner share) and capital gain from renewable project sales – – ns 908 410 743 22% Of which organic investments ( h ) 1,318 1,495 -12% 24 5 7 x3.4 Capitalized exploration 29 9 x3.2 71 69 187 -62% Increase in non-current loans 140 369 -62% 39 (150) (25) ns Repayment of non-current loans, excluding organic loan repayment from equity affiliates (111) (30) ns – – – ns Change in debt from renewable projects (TotalEnergies share) – – ns 42 |
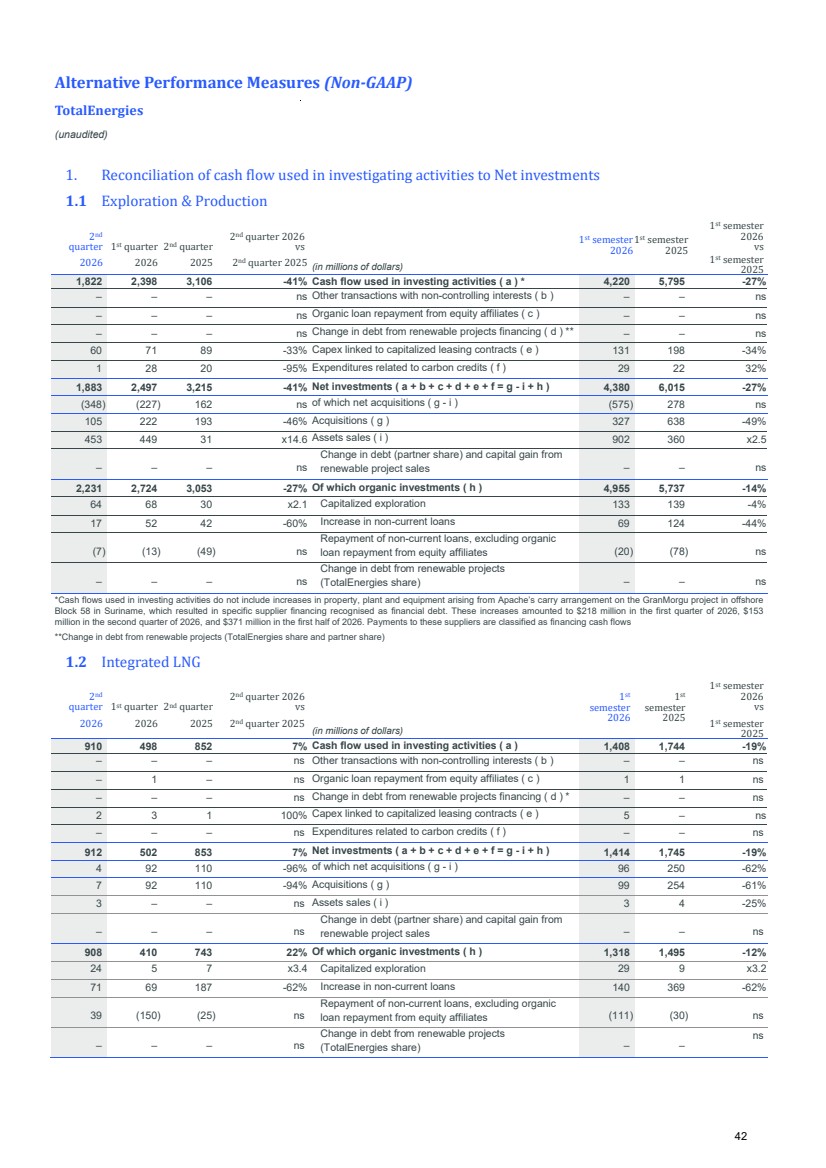
| *Change in debt from renewable projects (TotalEnergies share and partner share) Alternative Performance Measures (Non-GAAP) TotalEnergies (unaudited) 1.3 Integrated Power 2nd quarter 1st quarter 2nd quarter 2nd quarter 2026 vs (in millions of dollars) 1st semester 2026 1st semester 2025 1st semester 2026 vs 2026 2026 2025 2nd quarter 2025 1st semester 2025 63 683 2,156 -97% Cash flow used in investing activities ( a ) 746 3,034 -75% – – – ns Other transactions with non-controlling interests ( b ) – – ns 57 48 54 6% Organic loan repayment from equity affiliates ( c ) 105 59 78% 50 14 (221) ns Change in debt from renewable projects financing ( d ) * 64 (221) ns 1 1 – ns Capex linked to capitalized leasing contracts ( e ) 2 – ns – – – ns Expenditures related to carbon credits ( f ) – – ns 171 746 1,989 -91% Net investments ( a + b + c + d + e + f = g - i + h ) 917 2,872 -68% (749) (77) 1,568 ns of which net acquisitions ( g - i ) (826) 1,806 ns 26 3 1,791 -99% Acquisitions ( g ) 29 2,036 -99% 775 80 223 x3.5 Assets sales ( i ) 855 230 x3.7 68 (18) 67 1% Change in debt (partner share) and capital gain from renewable project sales 50 67 -25% 920 823 421 x2.2 Of which organic investments ( h ) 1,743 1,066 63% – – – ns Capitalized exploration – – ns 320 101 150 x2.1 Increase in non-current loans 421 418 1% (1,014) (72) (137) ns Repayment of non-current loans, excluding organic loan repayment from equity affiliates (1,086) (183) ns 118 (4) (154) ns Change in debt from renewable projects (TotalEnergies share) 114 (154) ns *Change in debt from renewable projects (TotalEnergies share and partner share) 1.4 Refining & Chemicals 2nd quarter 1st quarter 2nd quarter 2nd quarter 2026 vs (in millions of dollars) 1st semester 2026 1st semester 2025 1st semester 2026 vs 2026 2026 2025 2nd quarter 2025 1st semester 2025 365 593 309 18% Cash flow used in investing activities ( a ) 958 545 76% – – – ns Other transactions with non-controlling interests ( b ) – – ns – – – ns Organic loan repayment from equity affiliates ( c ) – – ns – – – ns Change in debt from renewable projects financing ( d ) * – – ns – – – ns Capex linked to capitalized leasing contracts ( e ) – – ns – – – ns Expenditures related to carbon credits ( f ) – – ns 365 593 309 18% Net investments ( a + b + c + d + e + f = g - i + h ) 958 545 76% (1) 75 (24) ns of which net acquisitions ( g - i ) 74 (24) ns – 75 11 ns Acquisitions ( g ) 75 11 x6.8 1 – 35 -97% Assets sales ( i ) 1 35 -97% – – – ns Change in debt (partner share) and capital gain from renewable project sales – – ns 366 518 333 10% Of which organic investments ( h ) 884 569 55% – – – ns Capitalized exploration – – ns 32 69 17 88% Increase in non-current loans 101 27 x3.7 (19) (23) (7) ns Repayment of non-current loans, excluding organic loan repayment from equity affiliates (42) (13) ns – – – ns Change in debt from renewable projects (TotalEnergies share) – – ns *Change in debt from renewable projects (TotalEnergies share and partner share) 43 |
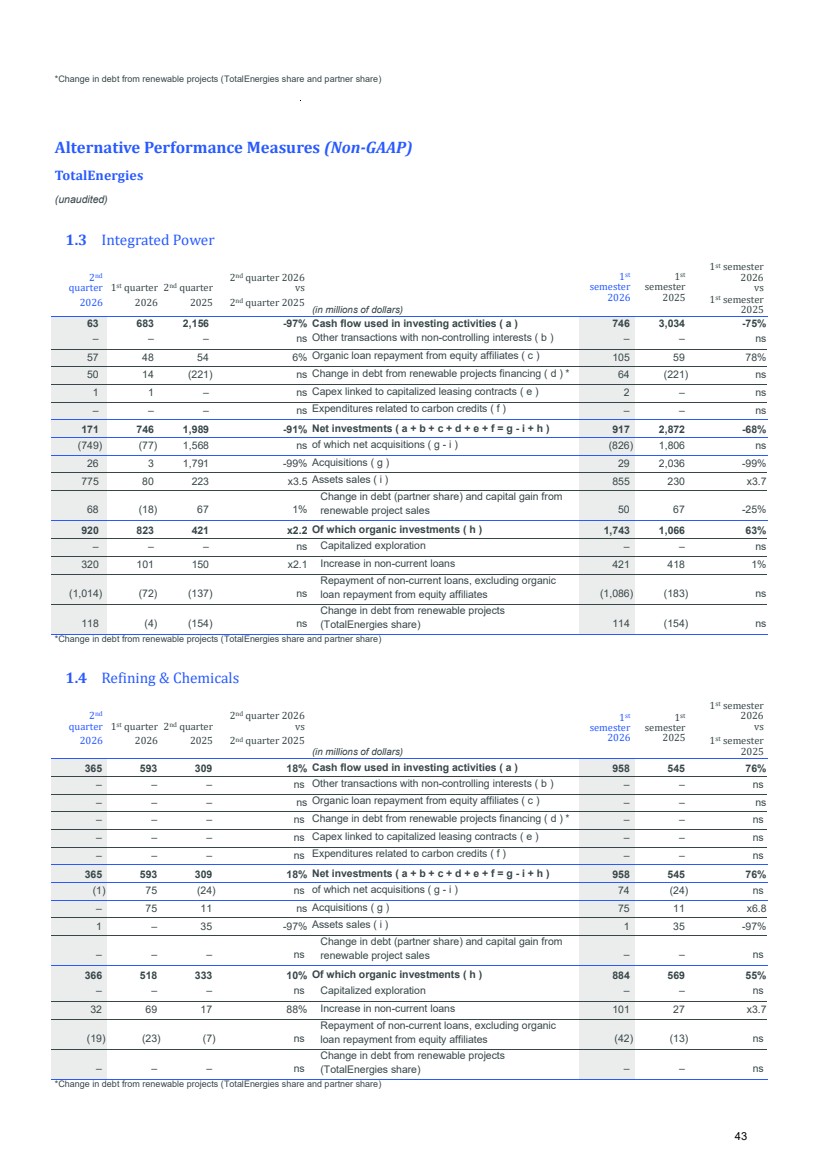
| Alternative Performance Measures (Non-GAAP) TotalEnergies (unaudited) 1.5 Marketing & Services 2nd quarter 1st quarter 2nd quarter 2nd quarter 2026 vs (in millions of dollars) 1st semester 2026 1st semester 2025 1st semester 2026 vs 2026 2026 2025 2nd quarter 2025 1st semester 2025 19 100 196 -90% Cash flow used in investing activities ( a ) 119 271 -56% – – – ns Other transactions with non-controlling interests ( b ) – – ns – – – ns Organic loan repayment from equity affiliates ( c ) – – ns – – – ns Change in debt from renewable projects financing ( d ) * – – ns – – – ns Capex linked to capitalized leasing contracts ( e ) – – ns – – – ns Expenditures related to carbon credits ( f ) – – ns 19 100 196 -90% Net investments ( a + b + c + d + e + f = g - i + h ) 119 271 -56% (155) (36) (3) ns of which net acquisitions ( g - i ) (191) (78) ns – – 1 ns Acquisitions ( g ) – 3 -100% 155 36 4 x38.8 Assets sales ( i ) 191 81 x2.4 – – – ns Change in debt (partner share) and capital gain from renewable project sales – – ns 174 136 199 -13% Of which organic investments ( h ) 310 349 -11% – – – ns Capitalized exploration – – ns 11 10 26 -58% Increase in non-current loans 21 44 -52% (20) (13) (22) ns Repayment of non-current loans, excluding organic loan repayment from equity affiliates (33) (39) ns – – – ns Change in debt from renewable projects (TotalEnergies share) – – ns *Change in debt from renewable projects (TotalEnergies share and partner share) 2. Reconciliation of cash flow from operating activities to CFFO 2.1 Exploration & Production 2nd quarter 1st quarter 2nd quarter 2nd quarter 2026 vs (in millions of dollars) 1st semester 2026 1st semester 2025 1st semester 2026 vs 2026 2026 2025 2nd quarter 2025 1st semester 2025 5,546 2,969 3,675 51% Cash flow from operating activities ( a ) 8,515 6,941 23% (231) (1,595) (85) ns (Increase) decrease in working capital ( b ) (1,826) (1,110) ns – – – ns Inventory effect ( c ) – – ns – – – ns Capital gain from renewable projects sales ( d ) – – ns – – – ns Organic loan repayments from equity affiliates ( e ) – – ns 5,777 4,564 3,760 54% Cash flow from operations excluding working capital (CFFO) ( f = a - b - c + d + e ) 10,341 8,051 28% 44 |
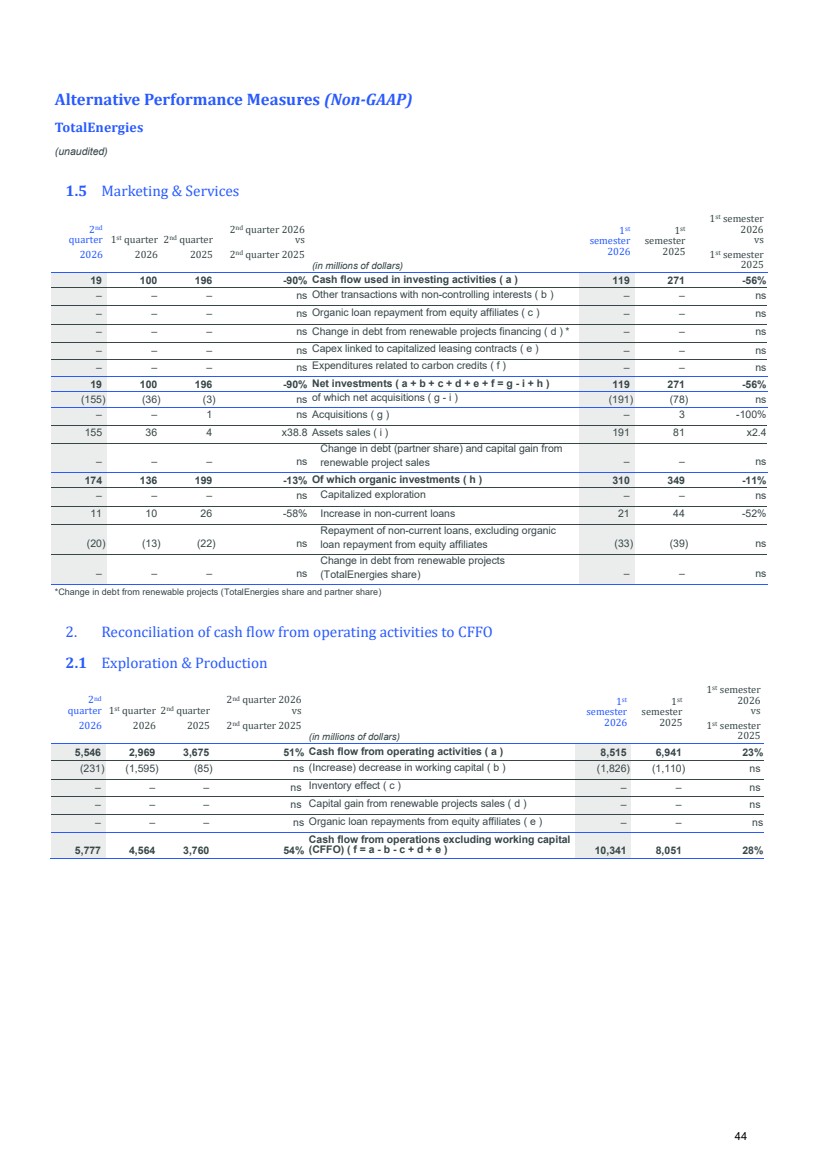
| Alternative Performance Measures (Non-GAAP) TotalEnergies (unaudited) 2.2 Integrated LNG 2nd quarter 1st quarter 2nd quarter 2nd quarter 2026 vs (in millions of dollars) 1st semester 2026 1st semester 2025 1st semester 2026 vs 2026 2026 2025 2nd quarter 2025 1st semester 2025 2,137 (1,120) 539 x4 Cash flow from operating activities ( a ) 1,017 2,282 -55% 1,304 (2,904) (620) ns (Increase) decrease in working capital ( b ) * (1,600) (125) ns – – – ns Inventory effect ( c ) – – ns – – – ns Capital gain from renewable projects sales ( d ) – – ns – 1 – ns Organic loan repayments from equity affiliates ( e ) 1 1 ns 833 1,785 1,159 -28% Cash flow from operations excluding working capital (CFFO) ( f = a - b - c + d + e ) 2,618 2,408 9% *Changes in working capital are presented excluding the mark-to-market effect of Integrated LNG and Integrated Power segments’ contracts. 2.3 Integrated Power 2nd quarter 1st quarter 2nd quarter 2nd quarter 2026 vs (in millions of dollars) 1st semester 2026 1st semester 2025 1st semester 2026 vs 2026 2026 2025 2nd quarter 2025 1st semester 2025 (239) (145) 799 ns Cash flow from operating activities ( a ) (384) 400 ns (853) (649) 377 ns (Increase) decrease in working capital ( b ) * (1,502) (614) ns – – – ns Inventory effect ( c ) – – ns 50 22 86 -42% Capital gain from renewable projects sales ( d ) 72 86 -16% 57 48 54 6% Organic loan repayments from equity affiliates ( e ) 105 59 78% 721 574 562 28% Cash flow from operations excluding working capital (CFFO) ( f = a - b - c + d + e ) 1,295 1,159 12% *Changes in working capital are presented excluding the mark-to-market effect of Integrated LNG and Integrated Power segments’ contracts. 45 |
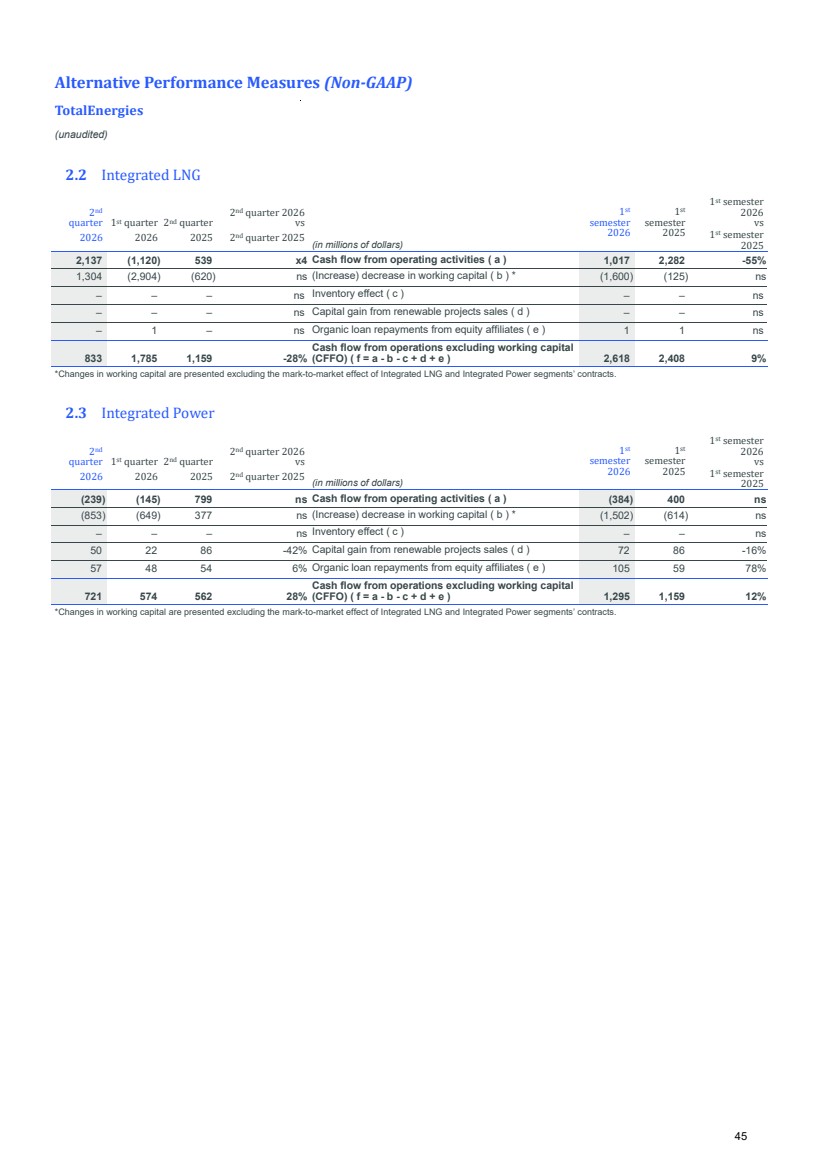
| Alternative Performance Measures (Non-GAAP) TotalEnergies (unaudited) 2.4 Refining & Chemicals 2nd quarter 1st quarter 2nd quarter 2nd quarter 2026 vs (in millions of dollars) 1st semester 2026 1st semester 2025 1st semester 2026 vs 2026 2026 2025 2nd quarter 2025 1st semester 2025 3,565 1,564 887 x4 Cash flow from operating activities ( a ) 5,129 (1,096) ns 1,929 (1,501) 362 x5.3 (Increase) decrease in working capital ( b ) 428 (2,181) ns (394) 1,349 (247) ns Inventory effect ( c ) 955 (320) ns – – – ns Capital gain from renewable projects sales ( d ) – – ns – – – ns Organic loan repayments from equity affiliates ( e ) – – ns 2,030 1,716 772 x2.6 Cash flow from operations excluding working capital (CFFO) ( f = a - b - c + d + e ) 3,746 1,405 x2.7 2.5 Marketing & Services 2nd quarter 1st quarter 2nd quarter 2nd quarter 2026 vs (in millions of dollars) 1st semester 2026 1st semester 2025 1st semester 2026 vs 2026 2026 2025 2nd quarter 2025 1st semester 2025 549 1,068 628 -13% Cash flow from operating activities ( a ) 1,617 1,196 35% (186) 148 (58) ns (Increase) decrease in working capital ( b ) (38) 60 ns (112) 500 (25) ns Inventory effect ( c ) 388 (59) ns – – – ns Capital gain from renewable projects sales ( d ) – – ns – – – ns Organic loan repayments from equity affiliates ( e ) – – ns 847 420 711 19% Cash flow from operations excluding working capital (CFFO) ( f = a - b - c + d + e ) 1,267 1,195 6% 46 |
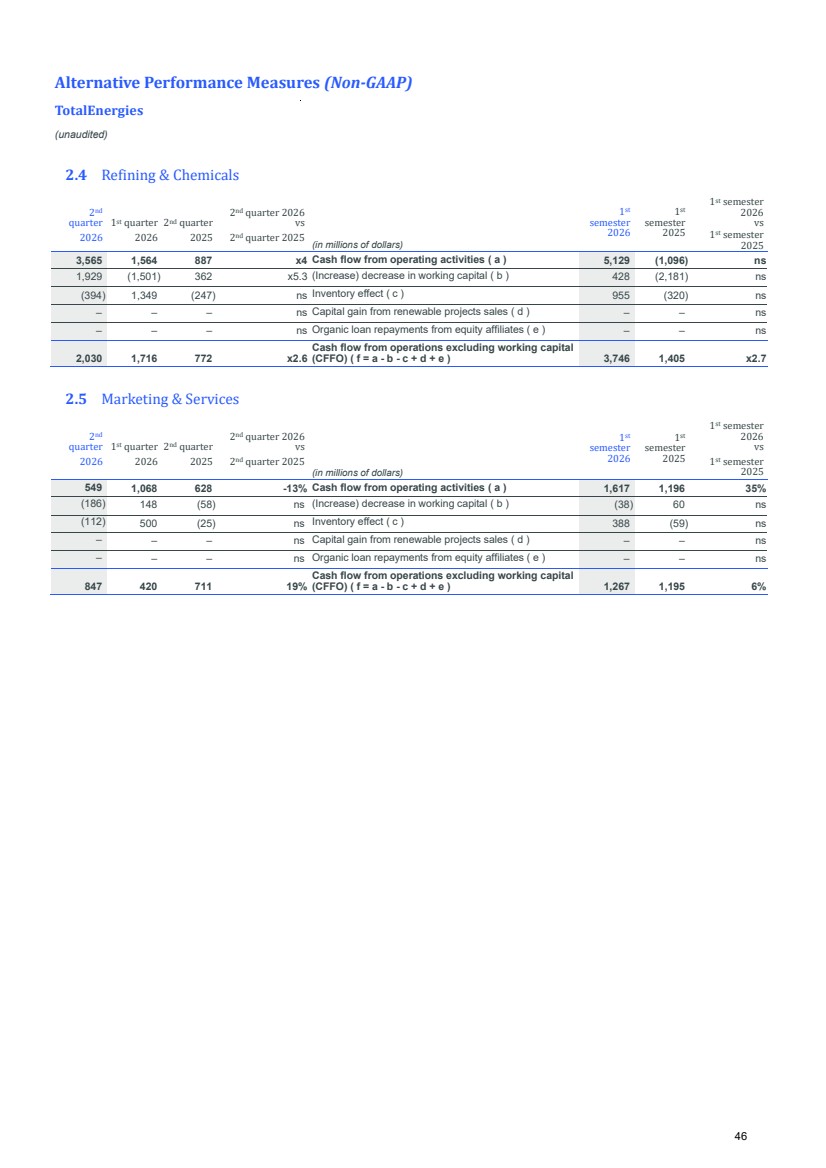
| Alternative Performance Measures (Non-GAAP) TotalEnergies (unaudited) 3. Reconciliation of capital employed (balance sheet) and calculation ROACE (In million of dollars) Exploration & Production Integrated LNG Integrated Power Refining & Chemicals Marketing & Services Corporate InterCompany Company Adjusted net operating income 2nd quarter 2026 3,231 807 533 1,800 500 (276) – 6,595 Adjusted net operating income 1st quarter 2026 2,576 1,318 545 1,599 262 (308) – 5,992 Adjusted net operating income 4th quarter 2025 1,805 922 564 1,001 341 (191) – 4,442 Adjusted net operating income 3rd quarter 2025 2,169 852 571 687 380 (80) – 4,579 Adjusted net operating income ( a ) 9,781 3,899 2,213 5,087 1,483 (855) – 21,608 Balance as of June 30, 2026 Property plant and equipment intangible assets net 87,288 30,311 14,610 13,039 6,738 1,534 – 153,520 Investments & loans in equity affiliates 5,137 18,365 15,740 4,560 861 – – 44,663 Other non-current assets 1,950 2,444 1,389 757 1,062 9 – 7,611 Inventories, net 1,858 1,487 575 13,347 4,106 – – 21,373 Accounts receivable, net 6,136 9,665 3,594 21,974 8,922 1,705 (30,812) 21,184 Other current assets 7,771 13,802 4,185 4,003 3,642 4,644 (9,071) 28,976 Accounts payable (6,332) (11,033) (4,669) (37,582) (11,361) (1,131) 30,670 (41,438) Other creditors and accrued liabilities (12,188) (12,446) (3,674) (8,890) (6,394) (8,729) 9,213 (43,108) Working capital (2,755) 1,475 11 (7,148) (1,085) (3,511) – (13,013) Provisions and other non-current liabilities (23,857) (4,840) (1,381) (3,554) (1,234) 789 – (34,077) Assets and liabilities classified as held for sale - Capital employed 362 – 501 – – – – 863 Capital Employed (Balance sheet) 68,125 47,755 30,870 7,654 6,342 (1,179) – 159,567 Less inventory valuation effect – – – (1,588) (435) – – (2,023) Capital Employed at replacement cost ( b ) 68,125 47,755 30,870 6,066 5,907 (1,179) – 157,544 Balance as of June 30, 2025 Property plant and equipment intangible assets net 85,970 29,063 17,159 12,746 7,139 763 – 152,840 Investments & loans in equity affiliates 4,349 16,955 10,304 3,963 1,086 – – 36,657 Other non-current assets 3,685 2,210 1,771 699 1,089 329 – 9,783 Inventories, net 1,565 1,027 574 10,773 3,336 – – 17,275 Accounts receivable, net 5,841 6,227 4,554 20,019 8,369 1,148 (24,904) 21,254 Other current assets 6,848 8,899 5,206 2,723 2,955 5,627 (8,098) 24,160 Accounts payable (6,884) (7,473) (6,333) (32,438) (9,932) (1,049) 24,821 (39,288) Other creditors and accrued liabilities (9,785) (8,541) (4,484) (5,171) (5,385) (9,487) 8,181 (34,672) Working capital (2,415) 139 (483) (4,094) (657) (3,761) – (11,271) Provisions and other non-current liabilities (25,111) (4,260) (1,719) (3,577) (1,222) 874 – (35,015) Assets and liabilities classified as held for sale - Capital employed 564 193 1 – 84 – – 842 Capital Employed (Balance sheet) 67,042 44,300 27,033 9,737 7,519 (1,795) – 153,836 Less inventory valuation effect – – – (910) (194) – – (1,104) Capital Employed at replacement cost ( c ) 67,042 44,300 27,033 8,827 7,325 (1,795) – 152,732 ROACE as a percentage ( a / average ( b + c )) 14.5% 8.5% 7.6% 68.3% 22.4% – – 13.9% 47 |
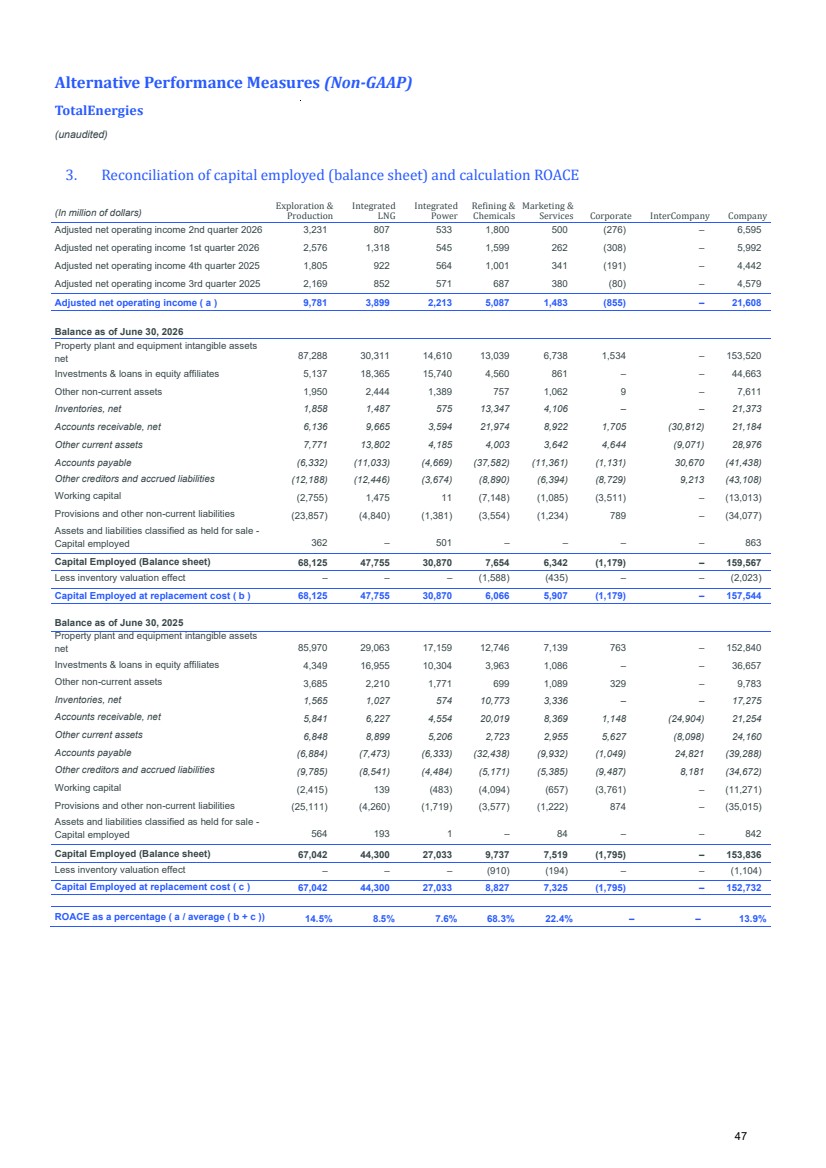
| Alternative Performance Measures (Non-GAAP) TotalEnergies (unaudited) 4. Reconciliation of consolidated net income to adjusted net operating income 2nd quarter 1st quarter 2nd quarter 1st semester 2026 1st semester 2026 2026 2025 (in millions of dollars) 2025 5,475 5,932 2,746 Consolidated net income ( a ) 11,407 6,667 (523) (520) (486) Net cost of net debt ( b ) (1,043) (871) (268) (1,031) (361) Special items affecting net operating income (1,299) (483) (17) 252 – Gains (losses) on disposals of assets 235 – (30) (22) – Restructuring charges (52) – – (1,148) (209) Asset impairment and provisions charges (1,148) (209) (221) (113) (152) Other items (334) (274) (298) 1,551 (269) After-tax inventory effect : FIFO vs. replacement cost 1,253 (347) (31) (60) (283) Effect of changes in fair value (91) (438) (597) 460 (913) Total adjustments affecting net operating income ( c ) (137) (1,268) 6,595 5,992 4,145 Adjusted net operating income ( a - b - c ) 12,587 8,806 48 |