| — Confidential — October 25, 2021 Presentation to the Special Committee Project RETURN |
| 1 — Confidential — Disclaimer This presentation has been prepared by Centerview Partners LLC (“Centerview”) for use solely by the Management and Special Committee of RETURN, Inc.(“RETURN”) in connection with its evaluation of a proposed transaction involving RETURN and for no other purpose. The information contained herein is based upon information supplied by or on behalf of RETURN and publicly available information, and portions of the information contained herein may be based upon statements, estimates and forecasts provided by RETURN. Centerview has relied upon the accuracy and completeness of the foregoing information, and has not assumed any responsibility for any independent verification of such information or for any independent evaluation or appraisal of any of the assets or liabilities (contingent or otherwise) of RETURN or any other entity, or concerning the solvency or fair value of RETURN or any other entity. With respect to financial forecasts, Centerview has assumed that such forecasts have been reasonably prepared on bases reflecting the best currently available estimates and judgments of the Management of RETURN as to the future financial performance of RETURN, and at your direction Centerview has relied upon such forecasts, as provided by RETURN’s Management, with respect to RETURN. Centerview assumes no responsibility for and expresses no view as to such forecasts or the assumptions on which they are based. The information set forth herein is based upon economic, monetary, market and other conditions as in effect on, and the information made available to us as of, the date hereof, unless indicated otherwise and Centerview assumes no obligation to update or otherwise revise these materials. The financial analysis in this presentation is complex and is not necessarily susceptible to a partial analysis or summary description. In performing this financial analysis, Centerview has considered the results of its analysis as a whole and did not necessarily attribute a particular weight to any particular portion of the analysis considered. Furthermore, selecting any portion of Centerview’s analysis, without considering the analysis as a whole, would create an incomplete view of the process underlying its financial analysis. Centerview may have deemed various assumptions more or less probable than other assumptions, so the reference ranges resulting from any particular portion of the analysis described above should not be taken to be Centerview’s view of the actual value of RETURN. These materials and the information contained herein are confidential, were not prepared with a view toward public disclosure, and may not be disclosed publicly or made available to third parties without the prior written consent of Centerview. These materials and any other advice, written or oral, rendered by Centerview are intended solely for the benefit and use of the Management and Special Committee of RETURN (in its capacity as such) in its consideration of the proposed transaction, and are not for the benefit of, and do not convey any rights or remedies for any holder of securities of RETURN or any other person. Centerview will not be responsible for and has not provided any tax, accounting, actuarial, legal or other specialist advice. These materials are not intended to provide the sole basis for evaluating the proposed transaction, and this presentation does not represent a fairness opinion, recommendation, valuation or opinion of any kind, and is necessarily incomplete and should be viewed solely in conjunction with the oral presentation provided by Centerview. |
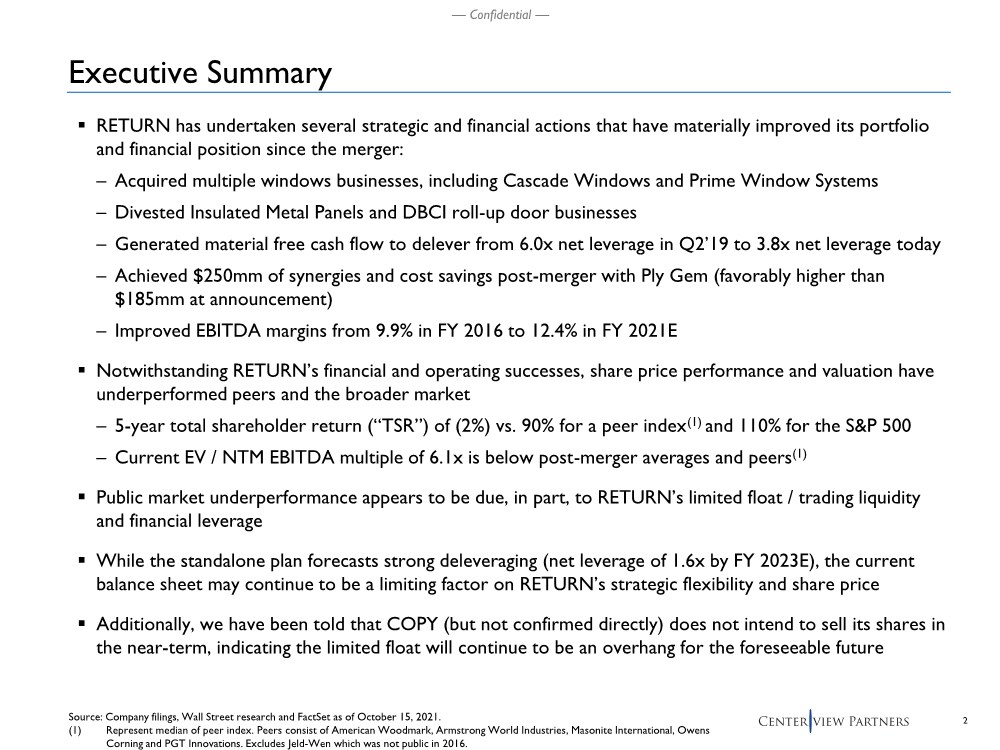
| 2 — Confidential — .. RETURN has undertaken several strategic and financial actions that have materially improved its portfolio and financial position since the merger: – Acquired multiple windows businesses, including Cascade Windows and Prime Window Systems – Divested Insulated Metal Panels and DBCI roll-up door businesses – Generated material free cash flow to delever from 6.0x net leverage in Q2’19 to 3.8x net leverage today – Achieved $250mm of synergies and cost savings post-merger with Ply Gem (favorably higher than $185mm at announcement) – Improved EBITDA margins from 9.9% in FY 2016 to 12.4% in FY 2021E .. Notwithstanding RETURN’s financial and operating successes, share price performance and valuation have underperformed peers and the broader market – 5-year total shareholder return (“TSR”) of (2%) vs. 90% for a peer index(1) and 110% for the S&P 500 – Current EV / NTM EBITDA multiple of 6.1x is below post-merger averages and peers(1) .. Public market underperformance appears to be due, in part, to RETURN’s limited float / trading liquidity and financial leverage .. While the standalone plan forecasts strong deleveraging (net leverage of 1.6x by FY 2023E), the current balance sheet may continue to be a limiting factor on RETURN’s strategic flexibility and share price .. Additionally, we have been told that COPY (but not confirmed directly) does not intend to sell its shares in the near-term, indicating the limited float will continue to be an overhang for the foreseeable future Executive Summary Source: Company filings, Wall Street research and FactSet as of October 15, 2021. (1) Represent median of peer index. Peers consist of American Woodmark, Armstrong World Industries, Masonite International, Owens Corning and PGT Innovations. Excludes Jeld-Wen which was not public in 2016. |
| 3 — Confidential — .. Centerview has had several discussions with RETURN’s leadership team to gain further insight into the Company and the current Management plan, including: – October 13, 2021: Board / Management materials and model review discussion with RETURN’s CFO – October 13, 2021: Project RETURN update call with the Special Committee – October 14, 2021: Business and strategic overview discussion with RETURN’s CEO and CFO .. Today’s presentation provides the Special Committee with Centerview’s perspectives on the following topics: – RETURN’s current market positioning – Review of RETURN Management’s standalone plan – Review of strategic alternatives, including potential engagement with COPY – Preliminary financial analysis of the standalone plan .. Should the Special Committee elect to pursue a specific course of action, Centerview can provide supplemental perspectives on an execution plan Executive Summary (Cont’d) 1 2 3 4 |
| — Confidential — RETURN Current Market Positioning 1 |

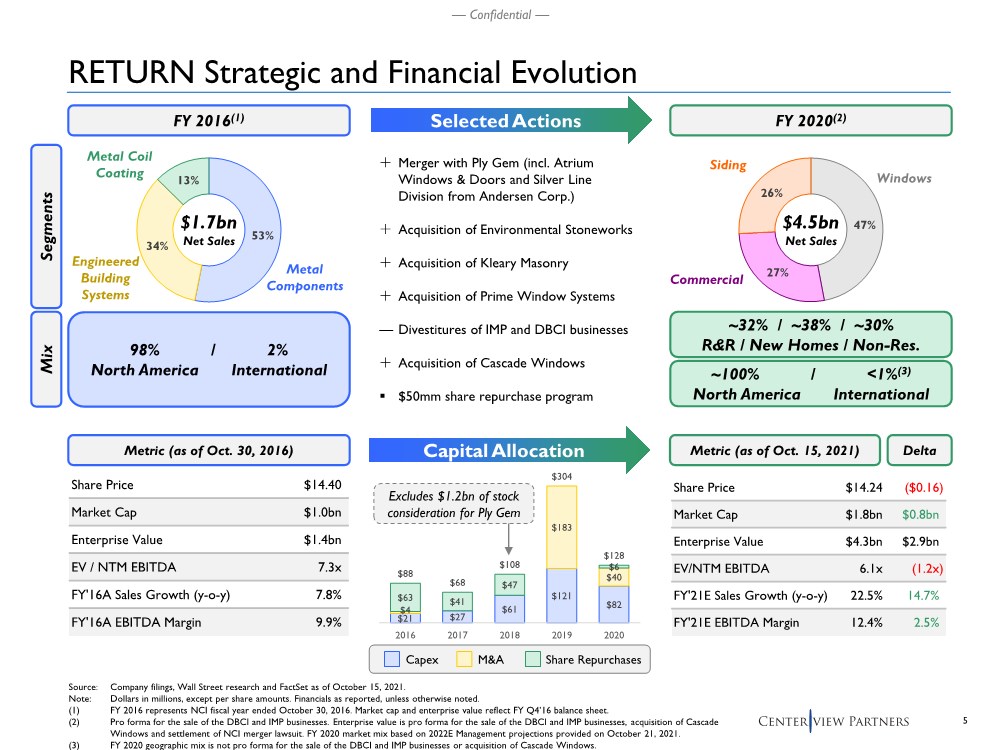
| 5 — Confidential — RETURN Strategic and Financial Evolution FY 2016(1) FY 2020(2) Merger with Ply Gem (incl. Atrium Windows & Doors and Silver Line Division from Andersen Corp.) Acquisition of Environmental Stoneworks Acquisition of Kleary Masonry Acquisition of Prime Window Systems — Divestitures of IMP and DBCI businesses Acquisition of Cascade Windows .. $50mm share repurchase program $21 $27 $61 $121 $82 $4 $183 $40 $63 $41 $47 $6 $88 $68 $108 $304 $128 2016 2017 2018 2019 2020 Source: Company filings, Wall Street research and FactSet as of October 15, 2021. Note: Dollars in millions, except per share amounts. Financials as reported, unless otherwise noted. (1) FY 2016 represents NCI fiscal year ended October 30, 2016. Market cap and enterprise value reflect FY Q4’16 balance sheet. (2) Pro forma for the sale of the DBCI and IMP businesses. Enterprise value is pro forma for the sale of the DBCI and IMP businesses, acquisition of Cascade Windows and settlement of NCI merger lawsuit. FY 2020 market mix based on 2022E Management projections provided on October 21, 2021. (3) FY 2020 geographic mix is not pro forma for the sale of the DBCI and IMP businesses or acquisition of Cascade Windows. Capex M&A Share Repurchases 53% 34% 13% $1.7bn Net Sales 47% 27% 26% $4.5bn Net Sales Metal Components Engineered Building Systems Metal Coil Coating Segments Windows Commercial Siding Mix 98% / 2% North America International ~100% / <1%(3) North America International Metric (as of Oct. 30, 2016) Metric (as of Oct. 15, 2021) Delta ~32%/ ~38% / ~30% R&R / New Homes / Non-Res. Share Price $14.40 Market Cap $1.0bn Enterprise Value $1.4bn EV / NTM EBITDA 7.3x FY'16A Sales Growth (y-o-y) 7.8% FY'16A EBITDA Margin 9.9% Share Price $14.24 ($0.16) Market Cap $1.8bn $0.8bn Enterprise Value $4.3bn $2.9bn EV/NTM EBITDA 6.1x (1.2x) FY'21E Sales Growth (y-o-y) 22.5% 14.7% FY'21E EBITDA Margin 12.4% 2.5% Excludes $1.2bn of stock consideration for Ply Gem Selected Actions Capital Allocation |
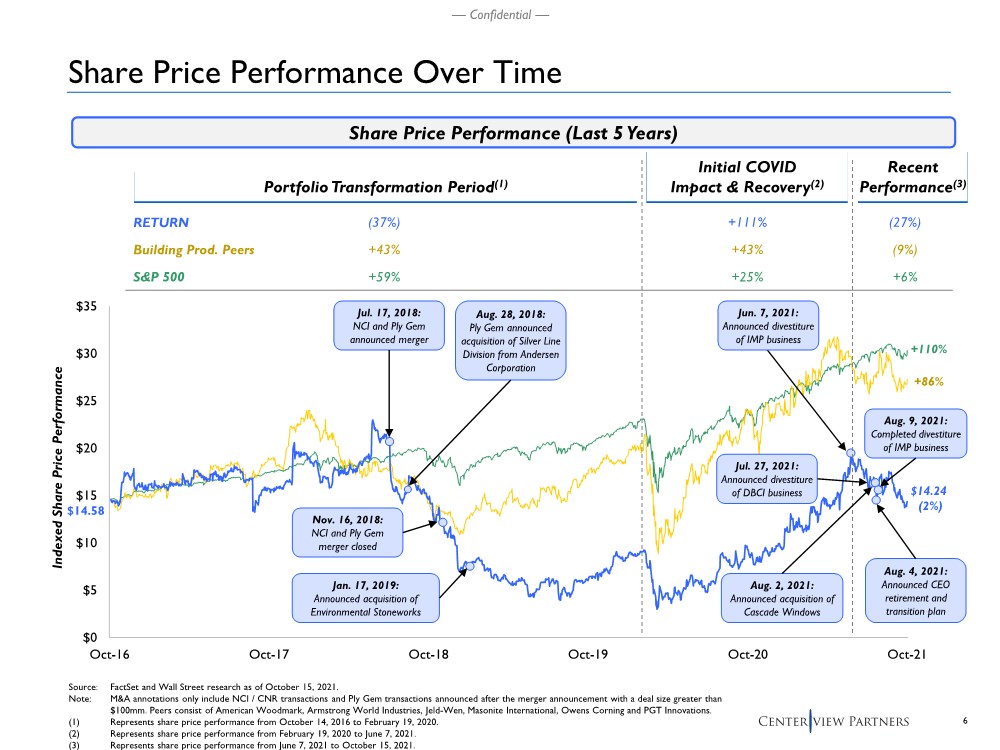
| 6 — Confidential — $0 $5 $10 $15 $20 $25 $30 $35 Oct-16 Oct-17 Oct-18 Oct-19 Oct-20 Oct-21 Share Price Performance Over Time Source: FactSet and Wall Street research as of October 15, 2021. Note: M&A annotations only include NCI / CNR transactions and Ply Gem transactions announced after the merger announcement with a deal size greater than $100mm. Peers consist of American Woodmark, Armstrong World Industries, Jeld-Wen, Masonite International, Owens Corning and PGT Innovations. (1) Represents share price performance from October 14, 2016 to February 19, 2020. (2) Represents share price performance from February 19, 2020 to June 7, 2021. (3) Represents share price performance from June 7, 2021 to October 15, 2021. S&P 500 +43% +59% (37%) +43% +25% +111% Indexed Share Price Performance $14.58 +86% +110% $14.24 (2%) (9%) +6% (27%) Building Prod. Peers Portfolio Transformation Period(1) Initial COVID Impact & Recovery(2) Recent Performance(3) Jul. 17, 2018: NCI and Ply Gem announced merger Nov. 16, 2018: NCI and Ply Gem merger closed Jan. 17, 2019: Announced acquisition of Environmental Stoneworks Jul. 27, 2021: Announced divestiture of DBCI business Aug. 2, 2021: Announced acquisition of Cascade Windows Aug. 4, 2021: Announced CEO retirement and transition plan Aug. 9, 2021: Completed divestiture of IMP business RETURN Share Price Performance (Last 5 Years) Aug. 28, 2018: Ply Gem announced acquisition of Silver Line Division from Andersen Corporation Jun. 7, 2021: Announced divestiture of IMP business |
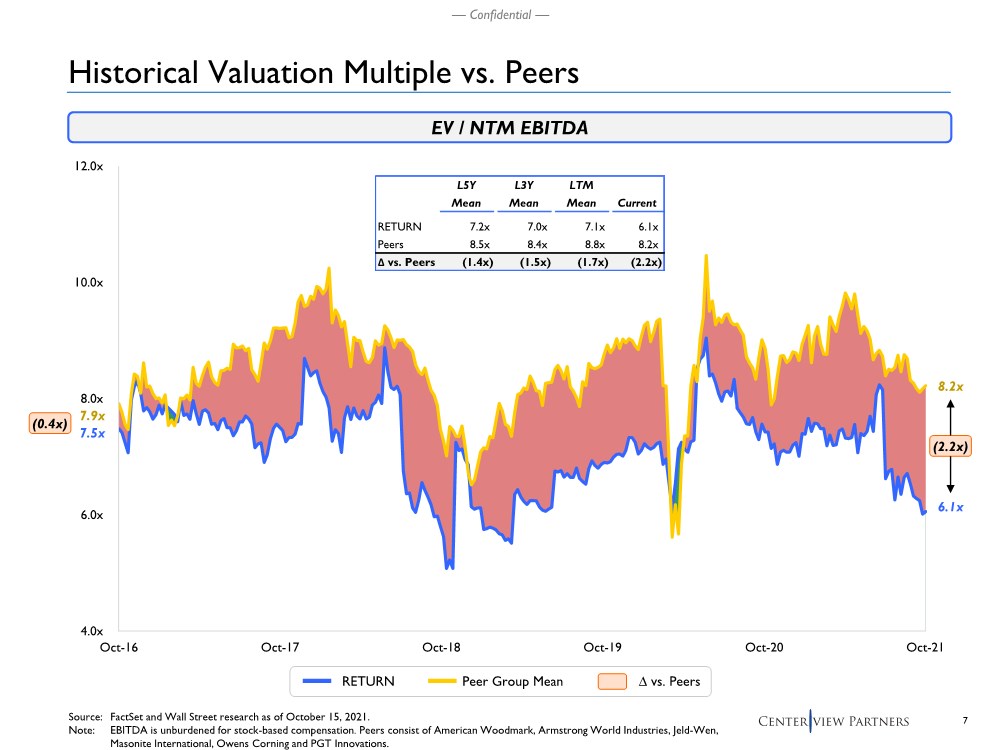
| 7 — Confidential — L5Y L3Y LTM Mean Mean Mean Current RETURN 7.2x 7.0x 7.1x 6.1x Peers 8.5x 8.4x 8.8x 8.2x Δ vs. Peers (1.4x) (1.5x) (1.7x) (2.2x) Historical Valuation Multiple vs. Peers Source: FactSet and Wall Street research as of October 15, 2021. Note: EBITDA is unburdened for stock-based compensation. Peers consist of American Woodmark, Armstrong World Industries, Jeld-Wen, Masonite International, Owens Corning and PGT Innovations. EV / NTM EBITDA 4.0x 6.0x 8.0x 10.0x 12.0x Oct-16 Oct-17 Oct-18 Oct-19 Oct-20 Oct-21 6.1x 8.2x 7.5x 7.9x (0.4x) Peer Group Mean RETURN ∆ vs. Peers (2.2x) |
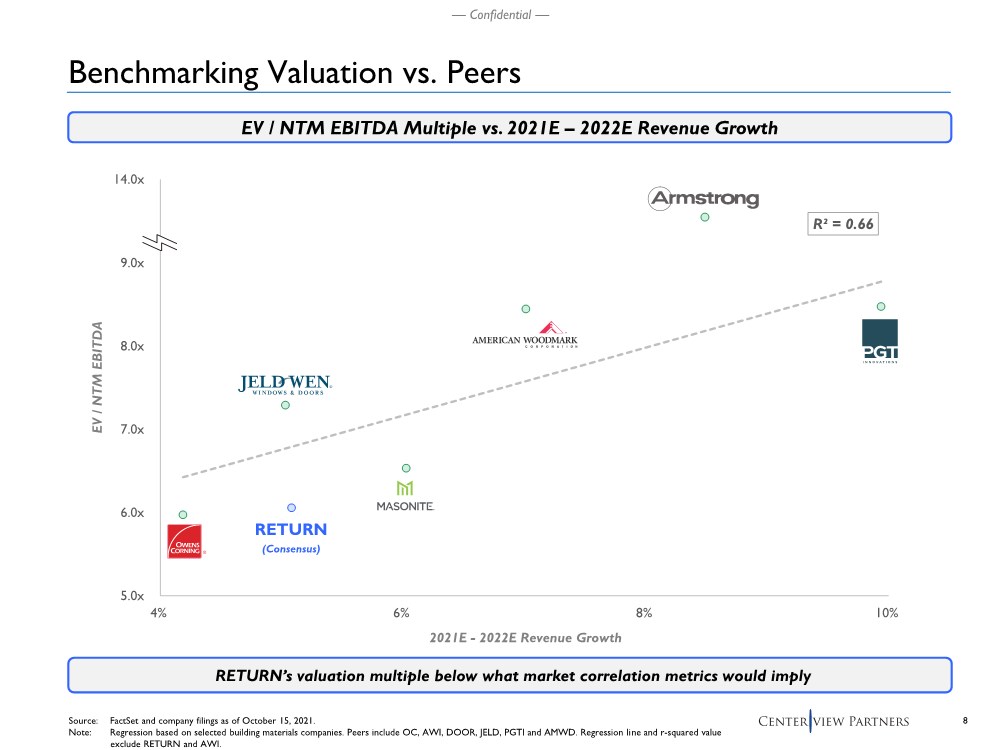
| 8 — Confidential — R² = 0.66 5.0x 6.0x 7.0x 8.0x 9.0x 10.0x 4% 6% 8% 10% Source: FactSet and company filings as of October 15, 2021. Note: Regression based on selected building materials companies. Peers include OC, AWI, DOOR, JELD, PGTI and AMWD. Regression line and r-squared value exclude RETURN and AWI. EV / NTM EBITDA Multiple vs. 2021E – 2022E Revenue Growth EV / NTM EBITDA 2021E - 2022E Revenue Growth Benchmarking Valuation vs. Peers RETURN’s valuation multiple below what market correlation metrics would imply RETURN (Consensus) 14.0x |
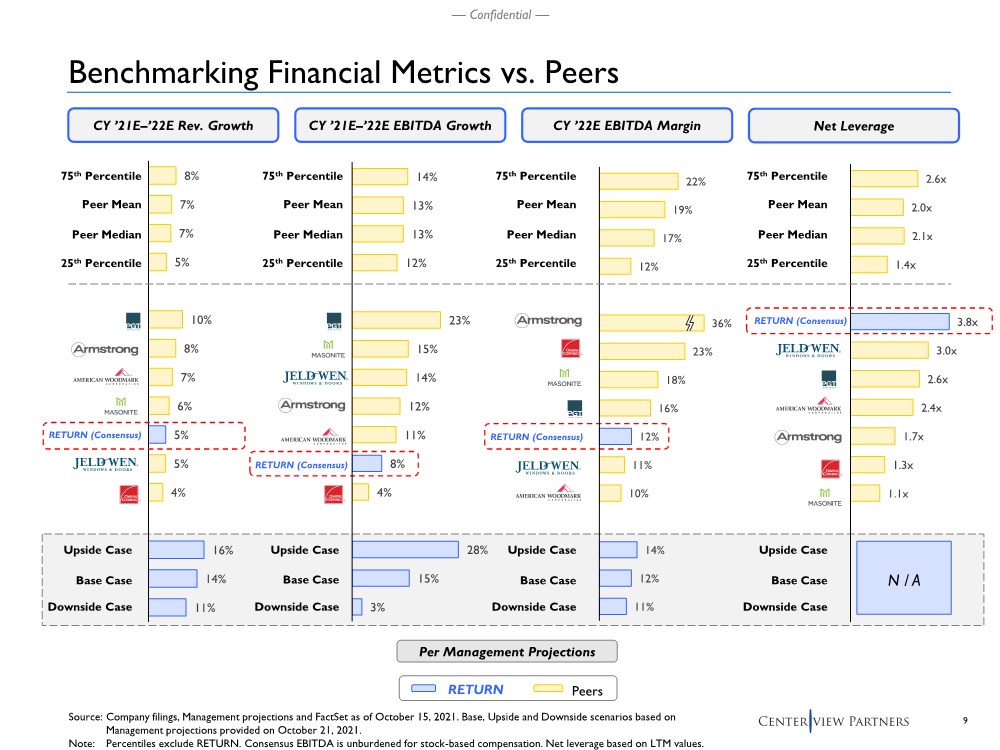
| 9 — Confidential — CY ’21E–’22E Rev. Growth CY ’22E EBITDA Margin CY ’21E–’22E EBITDA Growth Benchmarking Financial Metrics vs. Peers Source: Company filings, Management projections and FactSet as of October 15, 2021. Base, Upside and Downside scenarios based on Management projections provided on October 21, 2021. Note: Percentiles exclude RETURN. Consensus EBITDA is unburdened for stock-based compensation. Net leverage based on LTM values. Base Case Upside Case Downside Case Peers RETURN Per Management Projections 22% 19% 17% 12% 36% 23% 18% 16% 12% 11% 10% 14% 12% 11% 2.6x 2.0x 2.1x 1.4x 3.8x 3.0x 2.6x 2.4x 1.7x 1.3x 1.1x 8% 7% 7% 5% 10% 8% 7% 6% 5% 5% 4% 16% 14% 11% RETURN (Consensus) RETURN (Consensus) RETURN (Consensus) Peer Mean 25th Percentile Peer Median 75th Percentile Net Leverage RETURN (Consensus) Base Case Upside Case Downside Case Base Case Upside Case Downside Case Base Case Upside Case Downside Case Peer Mean 25th Percentile Peer Median 75th Percentile Peer Mean 25th Percentile Peer Median 75th Percentile Peer Mean 25th Percentile Peer Median 75th Percentile N / A 14% 13% 13% 12% 23% 15% 14% 12% 11% 8% 4% 28% 15% 3% |
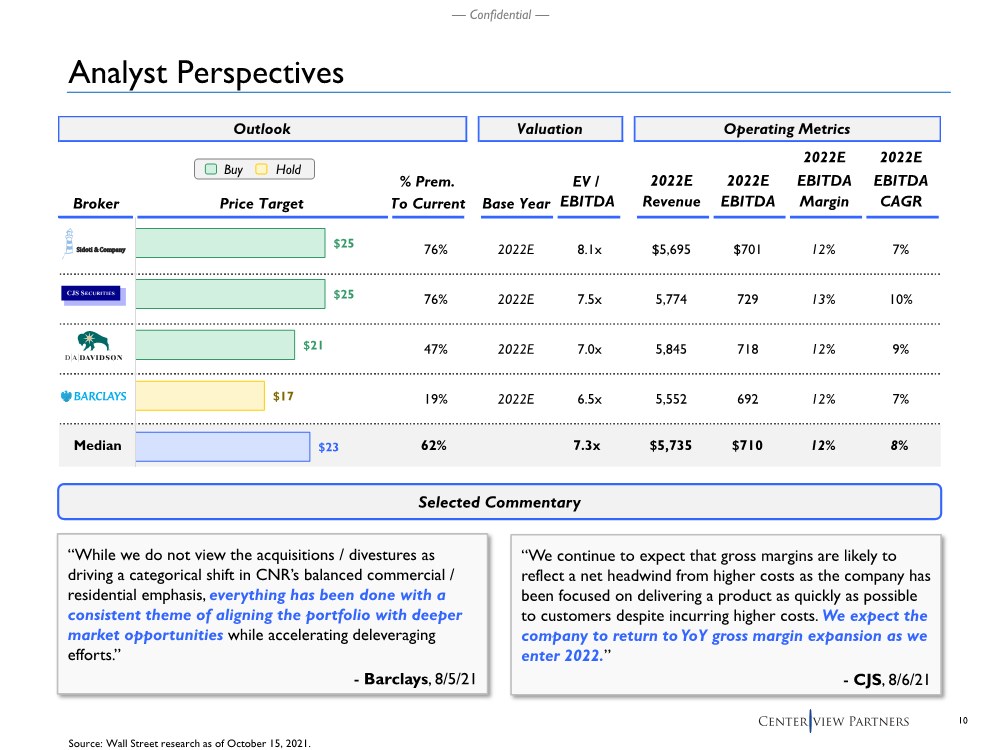
| 10 — Confidential — Outlook Valuation 2022E 2022E % Prem. EV / 2022E 2022E EBITDA EBITDA Broker Price Target To Current Base Year EBITDA Revenue EBITDA Margin CAGR 76% 2022E 8.1x $5,695 $701 12% 7% 76% 2022E 7.5x 5,774 729 13% 10% 47% 2022E 7.0x 5,845 718 12% 9% 19% 2022E 6.5x 5,552 692 12% 7% Median 62% 7.3x $5,735 $710 12% 8% Operating Metrics $25 $25 $21 $17 $23 Analyst Perspectives Selected Commentary Source: Wall Street research as of October 15, 2021. Buy Hold “While we do not view the acquisitions / divestures as driving a categorical shift in CNR’s balanced commercial / residential emphasis, everything has been done with a consistent theme of aligning the portfolio with deeper market opportunities while accelerating deleveraging efforts.” - Barclays, 8/5/21 “We continue to expect that gross margins are likely to reflect a net headwind from higher costs as the company has been focused on delivering a product as quickly as possible to customers despite incurring higher costs. We expect the company to return to YoY gross margin expansion as we enter 2022.” - CJS, 8/6/21 |
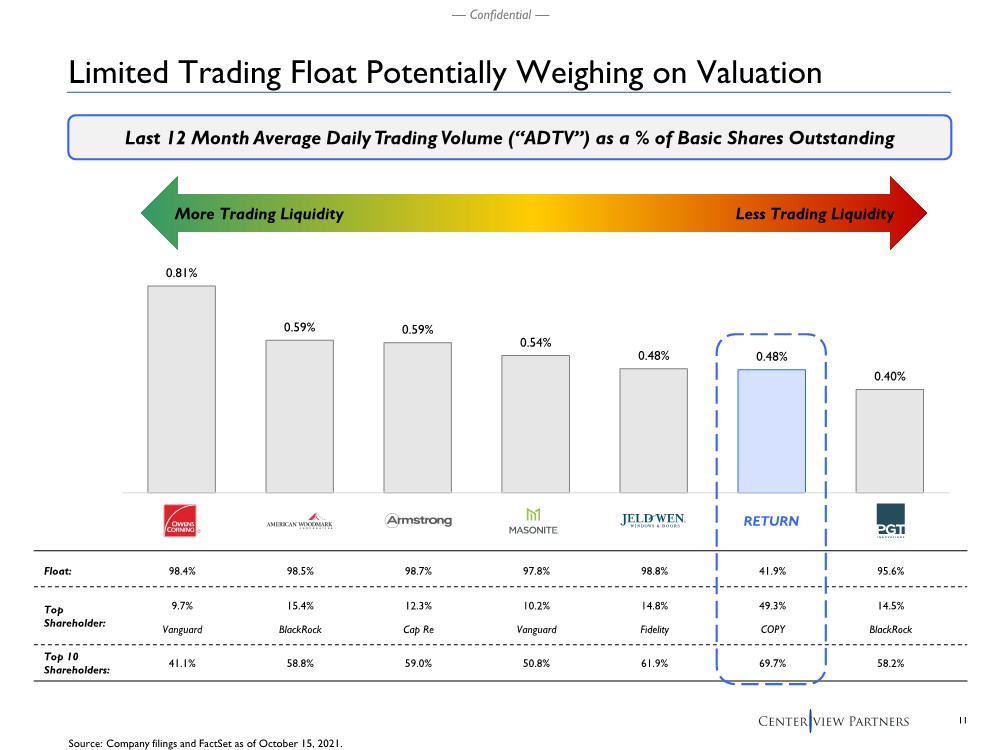
| 11 — Confidential — Limited Trading Float Potentially Weighing on Valuation Source: Company filings and FactSet as of October 15, 2021. Last 12 Month Average DailyTrading Volume (“ADTV”) as a % of Basic Shares Outstanding More Trading Liquidity Less Trading Liquidity 0.81% 0.59% 0.59% 0.54% 0.48% 0.48% 0.40% OC AMWD AWI DOOR JELD CNR PGTI Float: Top Shareholder: Top 10 Shareholders: 98.4% 98.5% 98.7% 97.8% 98.8% 41.9% 95.6% 9.7% 15.4% 12.3% 10.2% 14.8% 49.3% 14.5% Vanguard BlackRock Cap Re Vanguard Fidelity COPY BlackRock 41.1% 58.8% 59.0% 50.8% 61.9% 69.7% 58.2% RETURN |
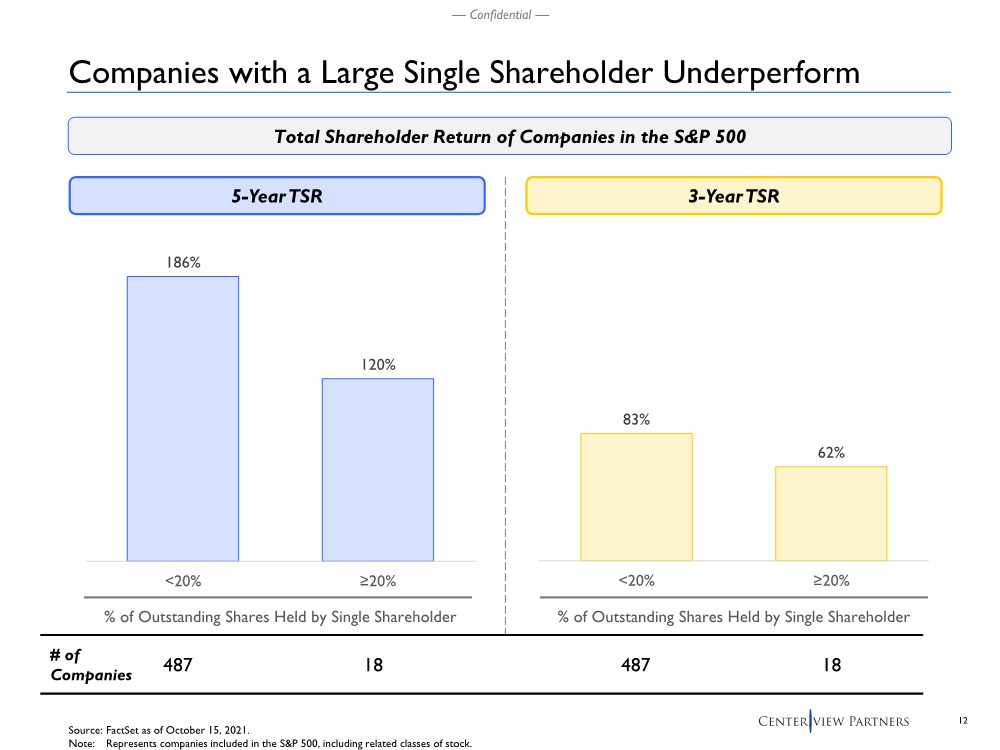
| 12 — Confidential — Companies with a Large Single Shareholder Underperform Total Shareholder Return of Companies in the S&P 500 Source: FactSet as of October 15, 2021. Note: Represents companies included in the S&P 500, including related classes of stock. 5-Year TSR 3-Year TSR 186% 120% <20% ≥20% # of Companies 487 18 487 18 83% 62% <20% ≥20% % of Outstanding Shares Held by Single Shareholder % of Outstanding Shares Held by Single Shareholder |
| — Confidential — Review of Management’s Standalone Plan 2 |
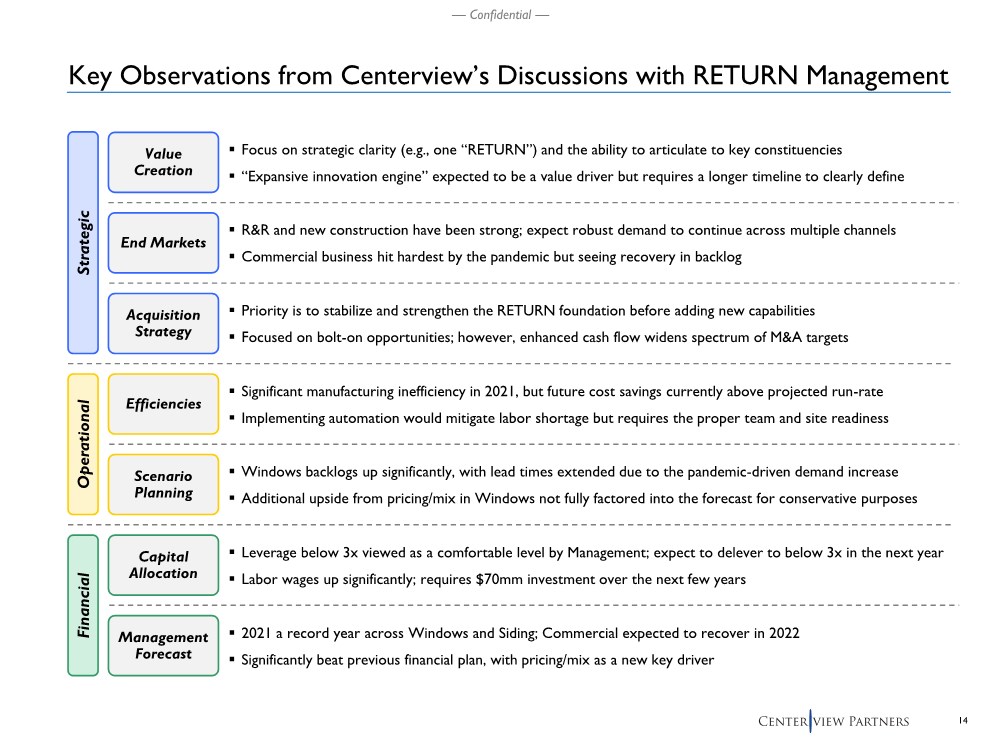
| 14 — Confidential — Key Observations from Centerview’s Discussions with RETURN Management Value Creation Strategic End Markets Efficiencies Capital Allocation Operational Financial Management Forecast Scenario Planning .. Focus on strategic clarity (e.g., one “RETURN”) and the ability to articulate to key constituencies ..“Expansive innovation engine” expected to be a value driver but requires a longer timeline to clearly define Acquisition Strategy .. R&R and new construction have been strong; expect robust demand to continue across multiple channels .. Commercial business hit hardest by the pandemic but seeing recovery in backlog .. Priority is to stabilize and strengthen the RETURN foundation before adding new capabilities .. Focused on bolt-on opportunities; however, enhanced cash flow widens spectrum of M&A targets .. Significant manufacturing inefficiency in 2021, but future cost savings currently above projected run-rate .. Implementing automation would mitigate labor shortage but requires the proper team and site readiness .. Windows backlogs up significantly, with lead times extended due to the pandemic-driven demand increase .. Additional upside from pricing/mix in Windows not fully factored into the forecast for conservative purposes .. Leverage below 3x viewed as a comfortable level by Management; expect to delever to below 3x in the next year .. Labor wages up significantly; requires $70mm investment over the next few years .. 2021 a record year across Windows and Siding; Commercial expected to recover in 2022 .. Significantly beat previous financial plan, with pricing/mix as a new key driver |
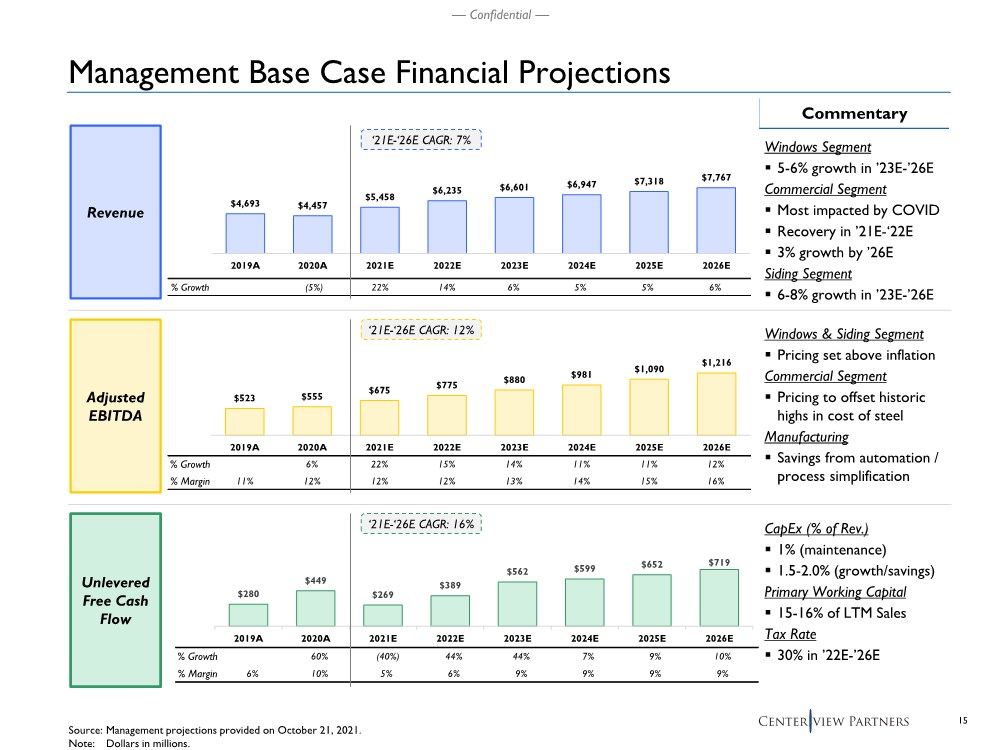
| 15 — Confidential — Management Base Case Financial Projections Source: Management projections provided on October 21, 2021. Note: Dollars in millions. Revenue Adjusted EBITDA Unlevered Free Cash Flow % Growth (5%) 22% 14% 6% 5% 5% 6% $4,693 $4,457 $5,458 $6,235 $6,601 $6,947 $7,318 $7,767 2019A 2020A 2021E 2022E 2023E 2024E 2025E 2026E % Growth 6% 22% 15% 14% 11% 11% 12% % Margin 11% 12% 12% 12% 13% 14% 15% 16% $523 $555 $675 $775 $880 $981 $1,090 $1,216 2019A 2020A 2021E 2022E 2023E 2024E 2025E 2026E % Growth 60% (40%) 44% 44% 7% 9% 10% % Margin 6% 10% 5% 6% 9% 9% 9% 9% $280 $449 $269 $389 $562 $599 $652 $719 2019A 2020A 2021E 2022E 2023E 2024E 2025E 2026E Windows Segment .. 5-6% growth in ’23E-’26E Commercial Segment .. Most impacted by COVID .. Recovery in ’21E-‘22E .. 3% growth by ’26E Siding Segment .. 6-8% growth in ’23E-’26E Commentary ‘21E-‘26E CAGR: 7% ‘21E-‘26E CAGR: 12% ‘21E-‘26E CAGR: 16% Windows & Siding Segment .. Pricing set above inflation Commercial Segment .. Pricing to offset historic highs in cost of steel Manufacturing .. Savings from automation / process simplification CapEx (% of Rev.) .. 1% (maintenance) .. 1.5-2.0% (growth/savings) Primary Working Capital .. 15-16% of LTM Sales Tax Rate .. 30% in ’22E-’26E |
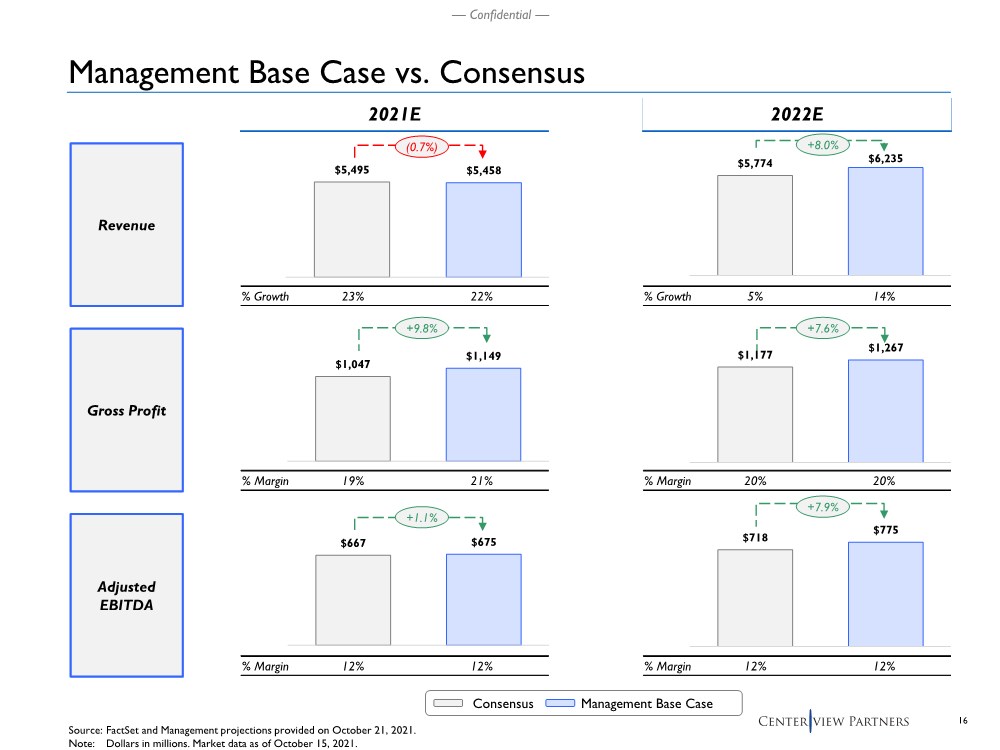
| 16 — Confidential — Management Base Case vs. Consensus Source: FactSet and Management projections provided on October 21, 2021. Note: Dollars in millions. Market data as of October 15, 2021. Revenue Gross Profit 2021E 2022E Consensus Management Base Case % Growth 5% 14% $5,774 $6,235 % Margin 19% 21% $1,047 $1,149 % Margin 20% 20% $1,177 $1,267 % Margin 12% 12% $667 $675 % Margin 12% 12% $718 $775 (0.7%) +8.0% +7.6% +1.1% +9.8% Adjusted EBITDA % Growth 23% 22% $5,495 $5,458 +7.9% |
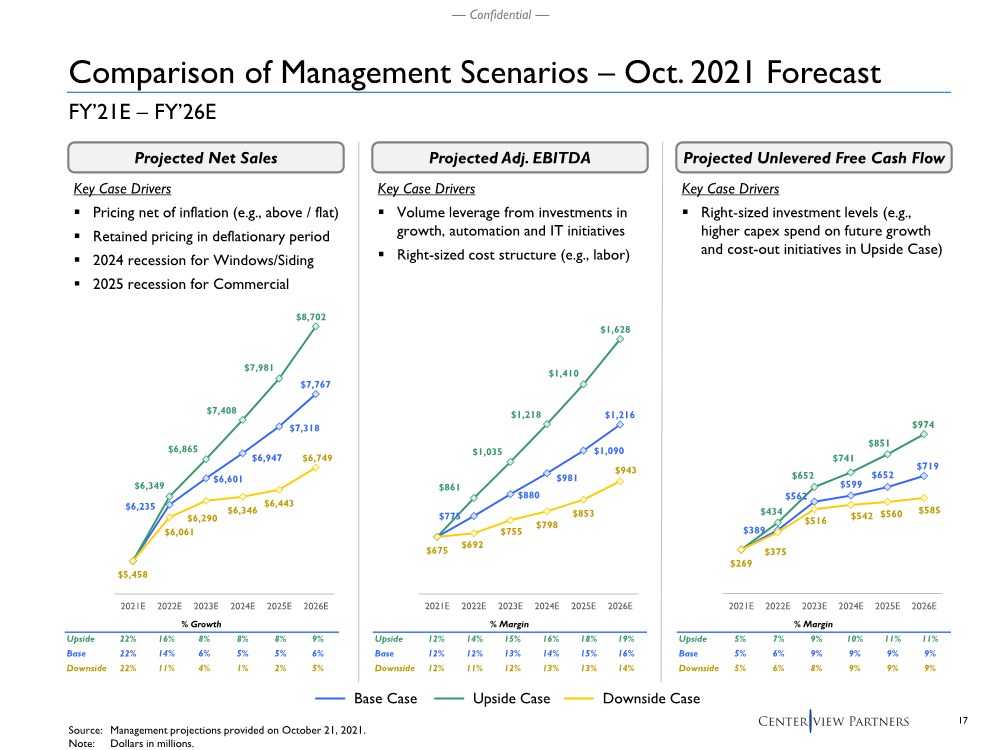
| 17 — Confidential — Comparison of Management Scenarios – Oct. 2021 Forecast Projected Net Sales Projected Adj. EBITDA Projected Unlevered Free Cash Flow Source: Management projections provided on October 21, 2021. Note: Dollars in millions. Base Case Upside Case Downside Case $6,235 $6,601 $6,947 $7,318 $7,767 $6,349 $6,865 $7,408 $7,981 $8,702 $5,458 $6,061 $6,290 $6,346 $6,443 $6,749 $5,000 $5,500 $6,000 $6,500 $7,000 $7,500 $8,000 $8,500 $9,000 2021E 2022E 2023E 2024E 2025E 2026E % Growth % Margin Upside 22% 16% 8% 8% 8% 9% Base 22% 14% 6% 5% 5% 6% Downside 22% 11% 4% 1% 2% 5% 2021E 2022E 2023E 2024E 2025E 2026E % Margin % Margin Upside 12% 14% 15% 16% 18% 19% Base 12% 12% 13% 14% 15% 16% Downside 12% 11% 12% 13% 13% 14% % Margin Upside 5% 7% 9% 10% 11% 11% Base 5% 6% 9% 9% 9% 9% Downside 5% 6% 8% 9% 9% 9% Key Case Drivers .. Pricing net of inflation (e.g., above / flat) .. Retained pricing in deflationary period .. 2024 recession for Windows/Siding .. 2025 recession for Commercial Key Case Drivers .. Volume leverage from investments in growth, automation and IT initiatives .. Right-sized cost structure (e.g., labor) Key Case Drivers .. Right-sized investment levels (e.g., higher capex spend on future growth and cost-out initiatives in Upside Case) FY’21E – FY’26E $775 $880 $981 $1,090 $1,216 $861 $1,035 $1,218 $1,410 $1,628 $675 $692 $755 $798 $853 $943 $400 $600 $800 $1,000 $1,200 $1,400 $1,600 $1,800 2021E 2022E 2023E 2024E 2025E 2026E $389 $562 $599 $652 $719 $434 $652 $741 $851 $974 $269 $375 $516 $542 $560 $585 $-- $200 $400 $600 $800 $1,000 $1,200 $1,400 $1,600 $1,800 2021E 2022E 2023E 2024E 2025E 2026E |
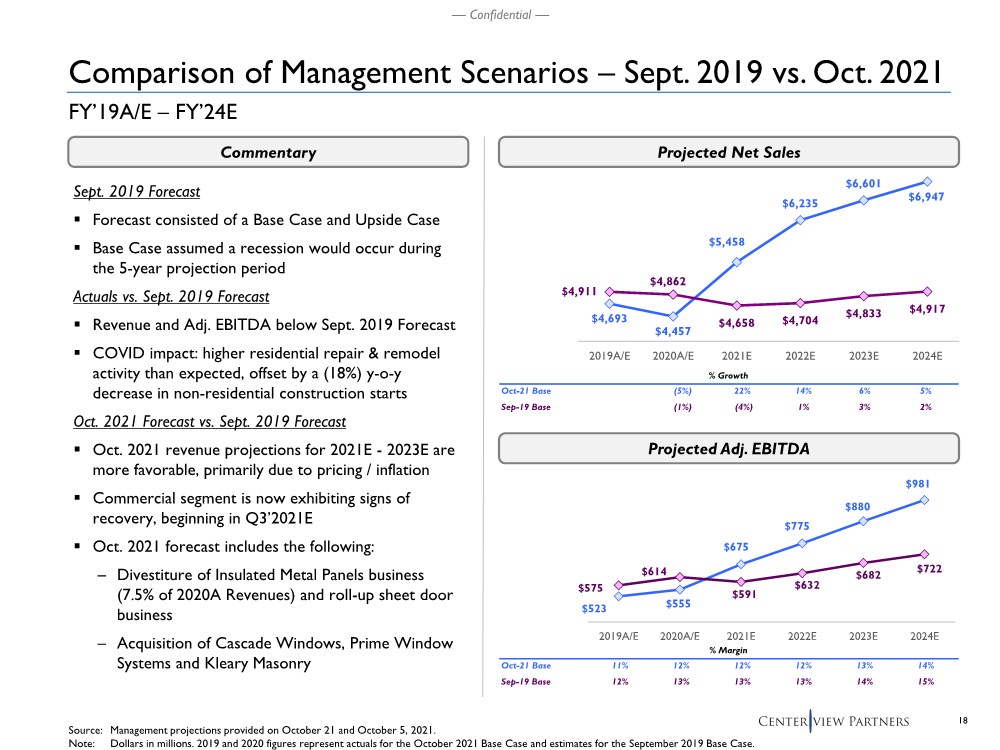
| 18 — Confidential — $4,693 $4,457 $5,458 $6,235 $6,601 $6,947 $4,911 $4,862 $4,658 $4,704 $4,833 $4,917 $4,000 $4,500 $5,000 $5,500 $6,000 $6,500 $7,000 2019A/E 2020A/E 2021E 2022E 2023E 2024E Comparison of Management Scenarios – Sept. 2019 vs. Oct. 2021 Projected Net Sales Source: Management projections provided on October 21 and October 5, 2021. Note: Dollars in millions. 2019 and 2020 figures represent actuals for the October 2021 Base Case and estimates for the September 2019 Base Case. Commentary Sept. 2019 Forecast .. Forecast consisted of a Base Case and Upside Case .. Base Case assumed a recession would occur during the 5-year projection period Actuals vs. Sept. 2019 Forecast .. Revenue and Adj. EBITDA below Sept. 2019 Forecast .. COVID impact: higher residential repair & remodel activity than expected, offset by a (18%) y-o-y decrease in non-residential construction starts Oct. 2021 Forecast vs. Sept. 2019 Forecast .. Oct. 2021 revenue projections for 2021E - 2023E are more favorable, primarily due to pricing / inflation .. Commercial segment is now exhibiting signs of recovery, beginning in Q3’2021E .. Oct. 2021 forecast includes the following: – Divestiture of Insulated Metal Panels business (7.5% of 2020A Revenues) and roll-up sheet door business – Acquisition of Cascade Windows, Prime Window Systems and Kleary Masonry FY’19A/E – FY’24E $523 $555 $675 $775 $880 $981 $575 $614 $591 $632 $682 $722 $400 $500 $600 $700 $800 $900 $1,000 $1,100 $1,200 2019A/E 2020A/E 2021E 2022E 2023E 2024E Projected Adj. EBITDA % Growth % Margin Oct-21 Base (5%) 22% 14% 6% 5% Sep-19 Base (1%) (4%) 1% 3% 2% % Margin % Margin Oct-21 Base 11% 12% 12% 12% 13% 14% Sep-19 Base 12% 13% 13% 13% 14% 15% |
| — Confidential — Review of Strategic Alternatives 3 |
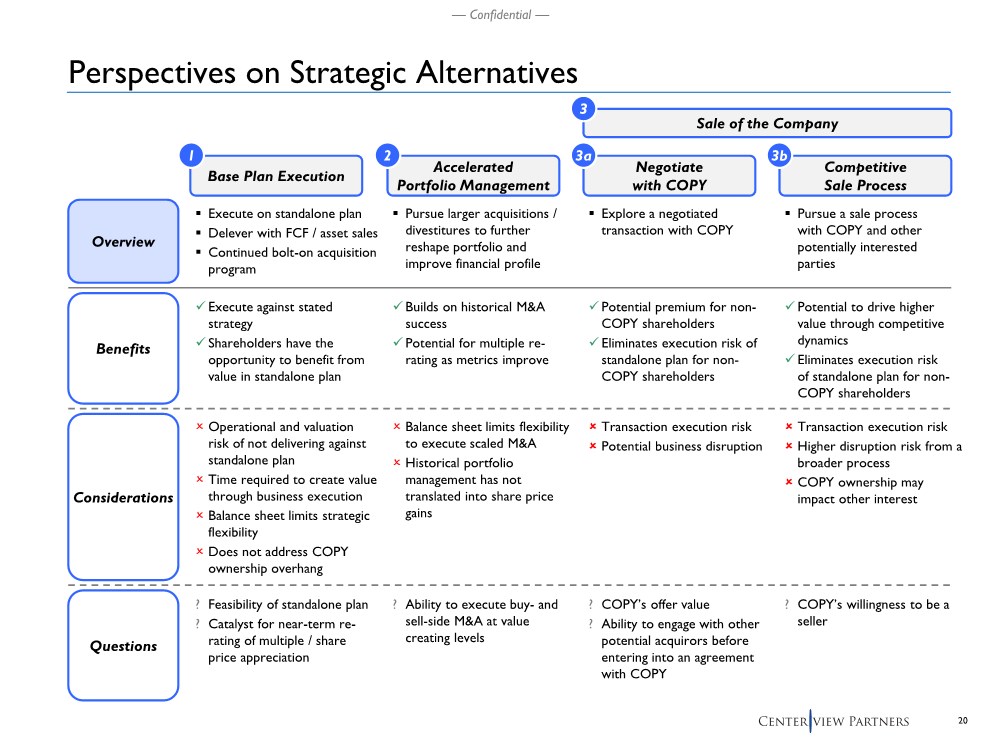
| 20 — Confidential — Base Plan Execution Negotiate with COPY Accelerated Portfolio Management Competitive Sale Process Perspectives on Strategic Alternatives Overview .. Execute on standalone plan .. Delever with FCF / asset sales .. Continued bolt-on acquisition program Execute against stated strategy Shareholders have the opportunity to benefit from value in standalone plan Operational and valuation risk of not delivering against standalone plan Time required to create value through business execution Balance sheet limits strategic flexibility Does not address COPY ownership overhang ? Feasibility of standalone plan ? Catalyst for near-term re- rating of multiple / share price appreciation .. Pursue a sale process with COPY and other potentially interested parties Potential to drive higher value through competitive dynamics Eliminates execution risk of standalone plan for non- COPY shareholders Transaction execution risk Higher disruption risk from a broader process COPY ownership may impact other interest ? COPY’s willingness to be a seller .. Pursue larger acquisitions / divestitures to further reshape portfolio and improve financial profile Balance sheet limits flexibility to execute scaled M&A Historical portfolio management has not translated into share price gains ? Ability to execute buy- and sell-side M&A at value creating levels Benefits Considerations Questions Builds on historical M&A success Potential for multiple re- rating as metrics improve 1 2 3b Sale of the Company 3a 3 .. Explore a negotiated transaction with COPY Potential premium for non- COPY shareholders Eliminates execution risk of standalone plan for non- COPY shareholders Transaction execution risk Potential business disruption ? COPY’s offer value ? Ability to engage with other potential acquirors before entering into an agreement with COPY |
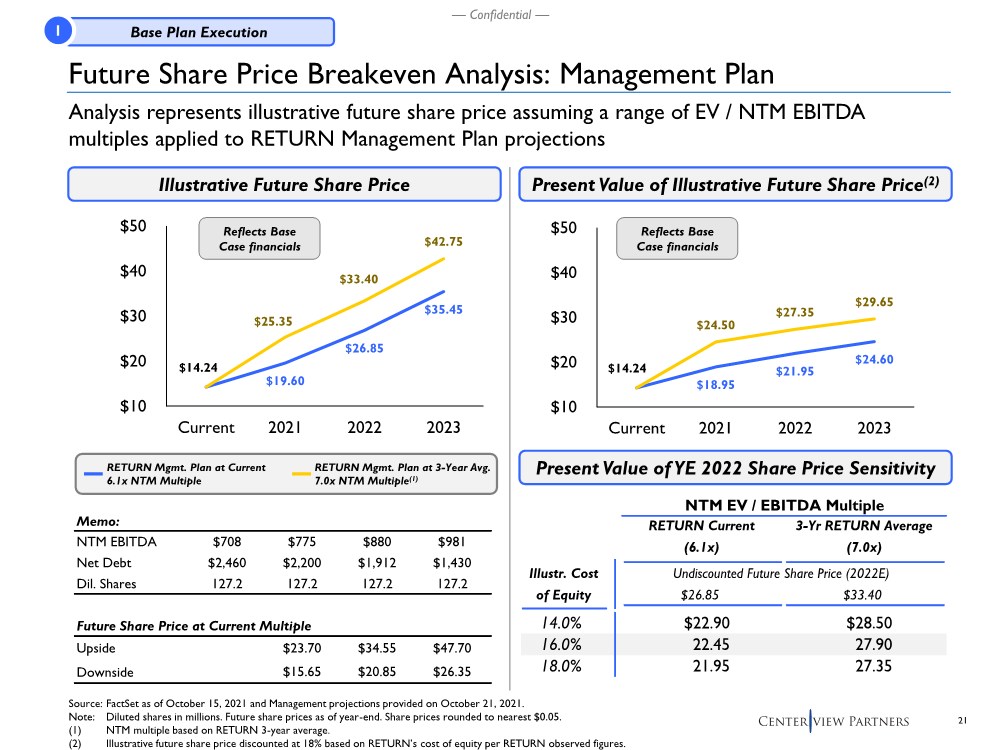
| 21 — Confidential — NTM EV / EBITDA Multiple RETURN Current (6.1x) 3-Yr RETURN Average (7.0x) Illustr. Cost Undiscounted Future Share Price (2022E) of Equity $26.85 $33.40 14.0% $22.90 $28.50 16.0% 22.45 27.90 18.0% 21.95 27.35 $18.95 $21.95 $24.60 $14.24 $24.50 $27.35 $29.65 $10 $20 $30 $40 $50 Current 2021 2022 2023 $19.60 $26.85 $35.45 $14.24 $25.35 $33.40 $42.75 $10 $20 $30 $40 $50 Current 2021 2022 2023 Illustrative Future Share Price Present Value of Illustrative Future Share Price(2) Source: FactSet as of October 15, 2021 and Management projections provided on October 21, 2021. Note: Diluted shares in millions. Future share prices as of year-end. Share prices rounded to nearest $0.05. (1) NTM multiple based on RETURN 3-year average. (2) Illustrative future share price discounted at 18% based on RETURN’s cost of equity per RETURN observed figures. Present Value of YE 2022 Share Price Sensitivity RETURN Mgmt. Plan at Current 6.1x NTM Multiple RETURN Mgmt. Plan at 3-Year Avg. 7.0x NTM Multiple(1) Memo: NTM EBITDA $708 $775 $880 $981 Net Debt $2,460 $2,200 $1,912 $1,430 Dil. Shares 127.2 127.2 127.2 127.2 Future Share Price at Current Multiple Upside $23.70 $34.55 $47.70 Downside $15.65 $20.85 $26.35 Future Share Price Breakeven Analysis: Management Plan Analysis represents illustrative future share price assuming a range of EV / NTM EBITDA multiples applied to RETURN Management Plan projections Base Plan Execution 1 Reflects Base Case financials Reflects Base Case financials |
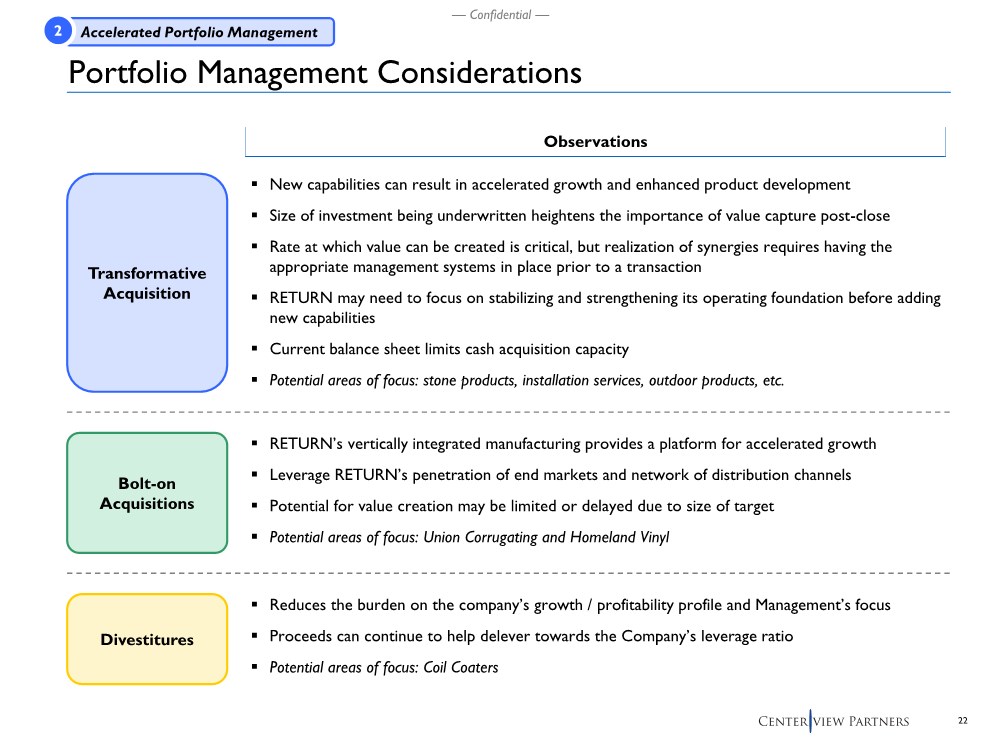
| 22 — Confidential — Portfolio Management Considerations Transformative Acquisition Bolt-on Acquisitions Divestitures Observations .. New capabilities can result in accelerated growth and enhanced product development .. Size of investment being underwritten heightens the importance of value capture post-close .. Rate at which value can be created is critical, but realization of synergies requires having the appropriate management systems in place prior to a transaction .. RETURN may need to focus on stabilizing and strengthening its operating foundation before adding new capabilities .. Current balance sheet limits cash acquisition capacity .. Potential areas of focus: stone products, installation services, outdoor products, etc. .. RETURN’s vertically integrated manufacturing provides a platform for accelerated growth .. Leverage RETURN’s penetration of end markets and network of distribution channels .. Potential for value creation may be limited or delayed due to size of target .. Potential areas of focus: Union Corrugating and Homeland Vinyl .. Reduces the burden on the company’s growth / profitability profile and Management’s focus .. Proceeds can continue to help delever towards the Company’s leverage ratio .. Potential areas of focus: Coil Coaters Accelerated Portfolio Management 2 |
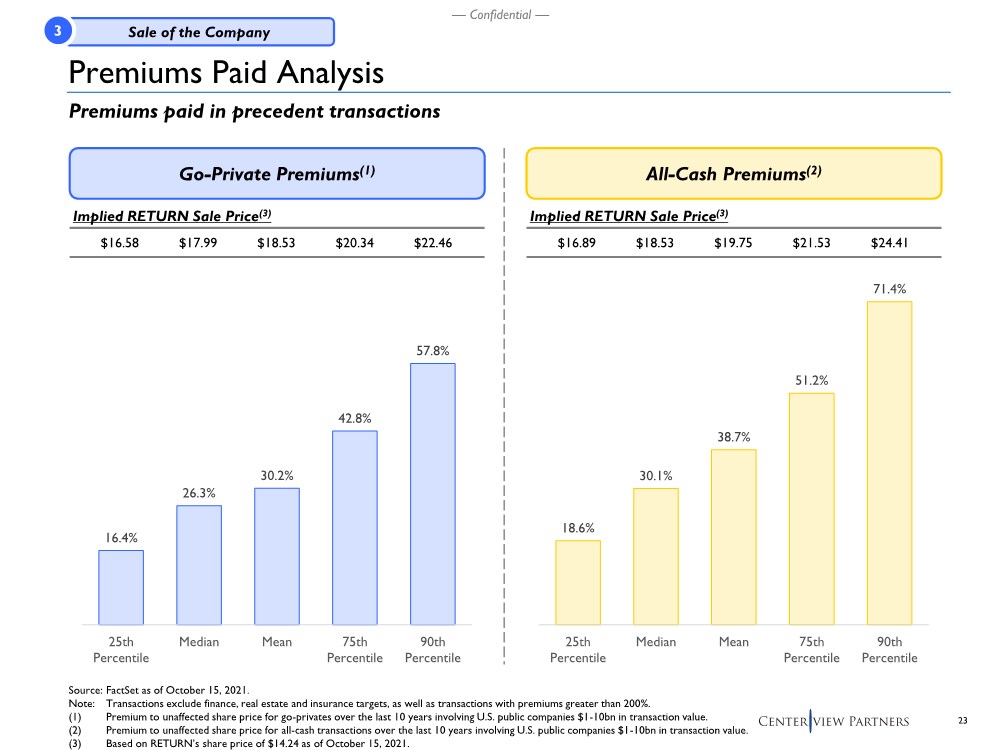
| 23 — Confidential — Premiums Paid Analysis Premiums paid in precedent transactions Source: FactSet as of October 15, 2021. Note: Transactions exclude finance, real estate and insurance targets, as well as transactions with premiums greater than 200%. (1) Premium to unaffected share price for go-privates over the last 10 years involving U.S. public companies $1-10bn in transaction value. (2) Premium to unaffected share price for all-cash transactions over the last 10 years involving U.S. public companies $1-10bn in transaction value. (3) Based on RETURN’s share price of $14.24 as of October 15, 2021. Go-Private Premiums(1) All-Cash Premiums(2) Implied RETURN Sale Price(3) $16.58 $17.99 $18.53 $20.34 $22.46 16.4% 26.3% 30.2% 42.8% 57.8% 25th Percentile Median Mean 75th Percentile 90th Percentile 18.6% 30.1% 38.7% 51.2% 71.4% 25th Percentile Median Mean 75th Percentile 90th Percentile Implied RETURN Sale Price(3) $16.89 $18.53 $19.75 $21.53 $24.41 Sale of the Company 3 |
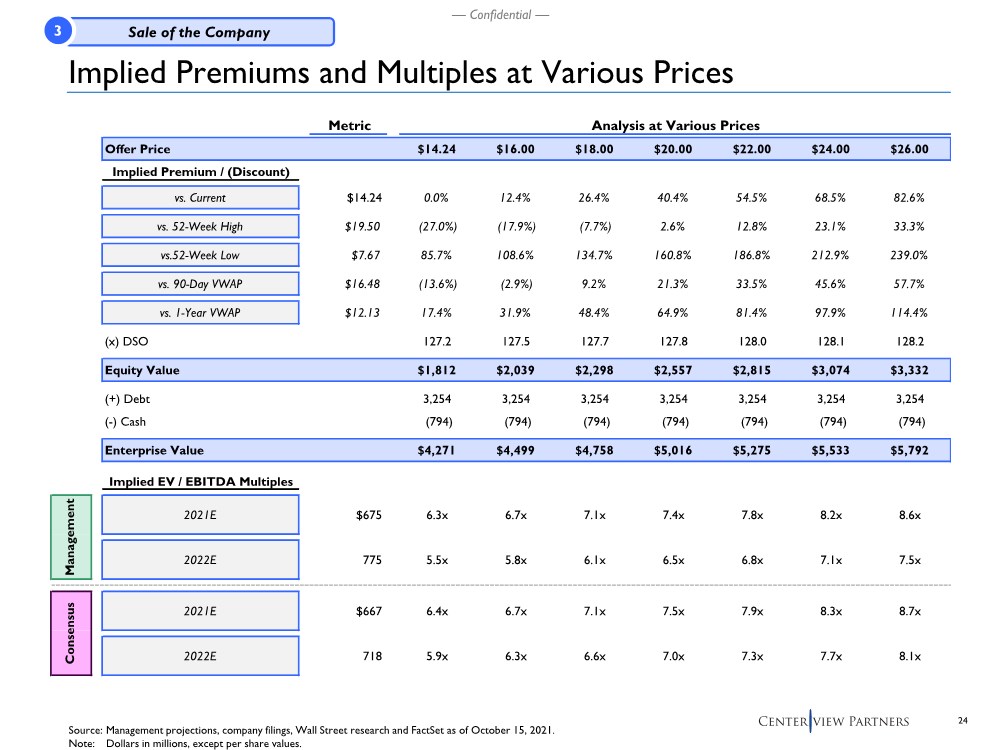
| 24 — Confidential — Implied Premiums and Multiples at Various Prices Source: Management projections, company filings, Wall Street research and FactSet as of October 15, 2021. Note: Dollars in millions, except per share values. Metric Analysis at Various Prices Offer Price $14.24 $16.00 $18.00 $20.00 $22.00 $24.00 $26.00 Implied Premium / (Discount) vs. Current $14.24 0.0% 12.4% 26.4% 40.4% 54.5% 68.5% 82.6% vs. 52-Week High $19.50 (27.0%) (17.9%) (7.7%) 2.6% 12.8% 23.1% 33.3% vs.52-Week Low $7.67 85.7% 108.6% 134.7% 160.8% 186.8% 212.9% 239.0% vs. 90-Day VWAP $16.48 (13.6%) (2.9%) 9.2% 21.3% 33.5% 45.6% 57.7% vs. 1-Year VWAP $12.13 17.4% 31.9% 48.4% 64.9% 81.4% 97.9% 114.4% (x) DSO 127.2 127.5 127.7 127.8 128.0 128.1 128.2 Equity Value $1,812 $2,039 $2,298 $2,557 $2,815 $3,074 $3,332 (+) Debt 3,254 3,254 3,254 3,254 3,254 3,254 3,254 (-) Cash (794) (794) (794) (794) (794) (794) (794) Enterprise Value $4,271 $4,499 $4,758 $5,016 $5,275 $5,533 $5,792 Implied EV / EBITDA Multiples 2021E $675 6.3x 6.7x 7.1x 7.4x 7.8x 8.2x 8.6x 2022E 775 5.5x 5.8x 6.1x 6.5x 6.8x 7.1x 7.5x 2021E $667 6.4x 6.7x 7.1x 7.5x 7.9x 8.3x 8.7x 2022E 718 5.9x 6.3x 6.6x 7.0x 7.3x 7.7x 8.1x Consensus Management Sale of the Company 3 |
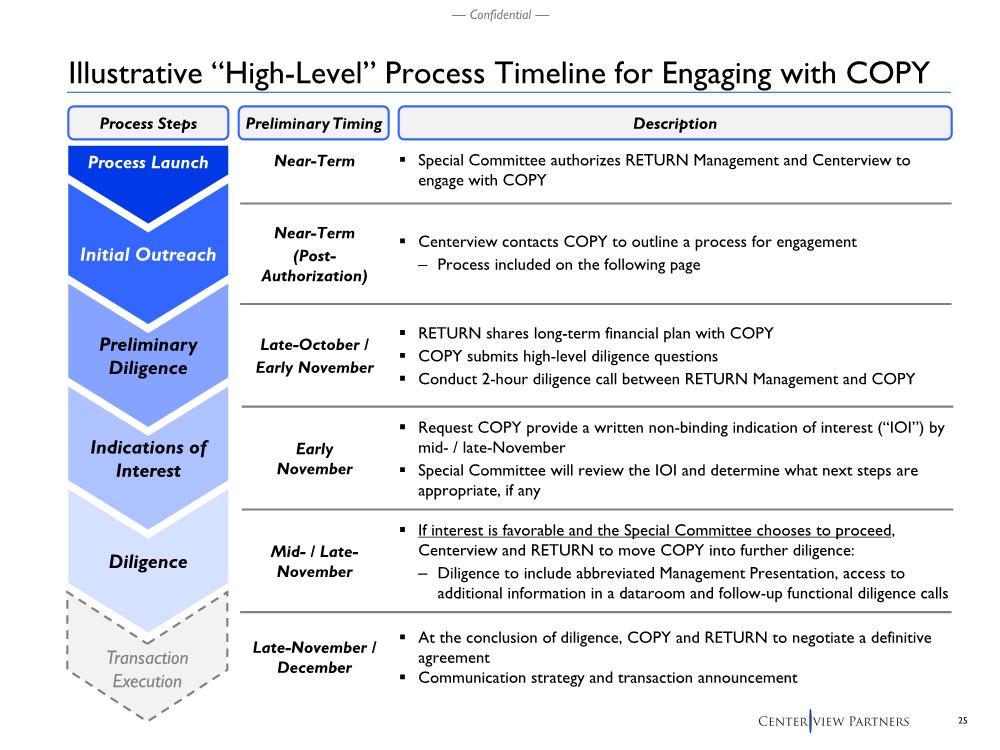
| 25 — Confidential — Illustrative “High-Level” Process Timeline for Engaging with COPY Process Launch Initial Outreach Preliminary Diligence Process Steps Preliminary Timing Description Near-Term Near-Term (Post- Authorization) .. Special Committee authorizes RETURN Management and Centerview to engage with COPY .. Centerview contacts COPY to outline a process for engagement – Process included on the following page .. RETURN shares long-term financial plan with COPY .. COPY submits high-level diligence questions .. Conduct 2-hour diligence call between RETURN Management and COPY Late-October / Early November Transaction Execution .. At the conclusion of diligence, COPY and RETURN to negotiate a definitive agreement .. Communication strategy and transaction announcement Diligence Indications of Interest .. Request COPY provide a written non-binding indication of interest (“IOI”) by mid-/ late-November .. Special Committee will review the IOI and determine what next steps are appropriate, if any .. If interest is favorable and the Special Committee chooses to proceed, Centerview and RETURN to move COPY into further diligence: – Diligence to include abbreviated Management Presentation, access to additional information in a dataroom and follow-up functional diligence calls Late-November / December Mid-/ Late- November Early November |
| 26 — Confidential — .. The Special Committee is open to learning more about COPY’s potential interest in acquiring the shares it does not currently own .. In order to facilitate a fully developed non-binding proposal, the Company is prepared to share its current long-term plan and arrange a due diligence call with Management .. Additionally, the Special Committee will consider authorizing financing discussions with one pre- approved financing source ..The Special Committee expects COPY to complete its confirmation of value in a timely manner and subsequently submit a non-binding proposal for the Special Committee’s review Initial Communication with COPY Potential Messages for the Special Committee’s Consideration |
| — Confidential — Preliminary Financial Analysis 4 |
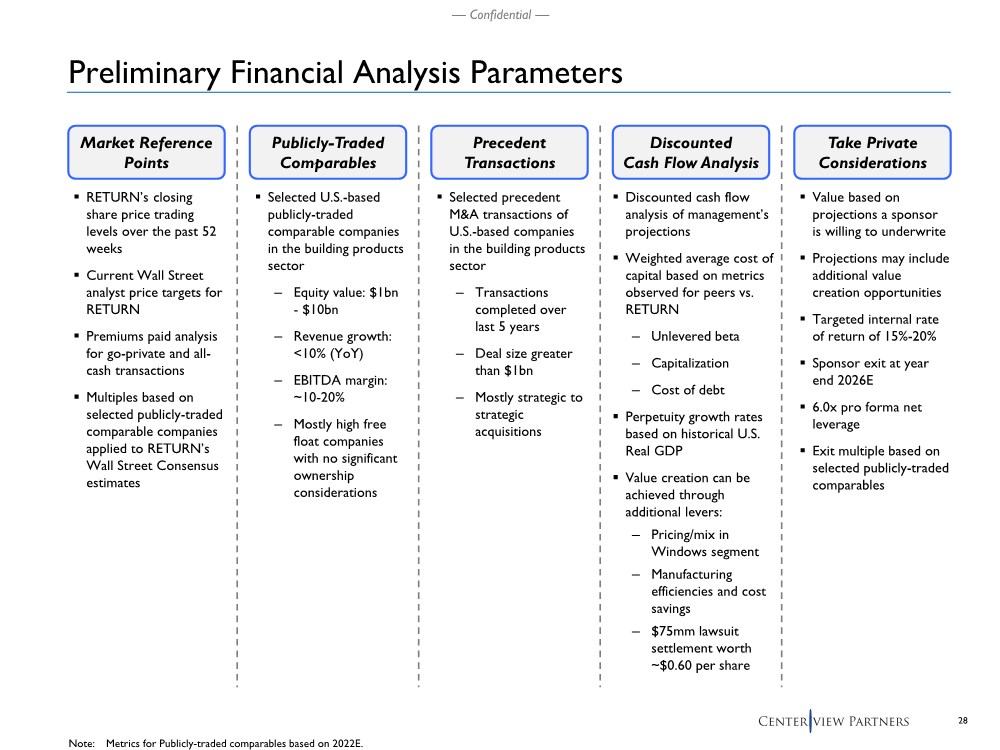
| 28 — Confidential — Market Reference Points Precedent Transactions Publicly-Traded Comparables Discounted Cash Flow Analysis Preliminary Financial Analysis Parameters .. RETURN’s closing share price trading levels over the past 52 weeks .. Current Wall Street analyst price targets for RETURN .. Premiums paid analysis for go-private and all- cash transactions .. Multiples based on selected publicly-traded comparable companies applied to RETURN’s Wall Street Consensus estimates Take Private Considerations ..Selected U.S.-based publicly-traded comparable companies in the building products sector – Equity value: $1bn - $10bn – Revenue growth: <10% (YoY) – EBITDA margin: ~10-20% – Mostly high free float companies with no significant ownership considerations .. Selected precedent M&A transactions of U.S.-based companies in the building products sector – Transactions completed over last 5 years – Deal size greater than $1bn – Mostly strategic to strategic acquisitions .. Discounted cash flow analysis of management’s projections .. Weighted average cost of capital based on metrics observed for peers vs. RETURN – Unlevered beta – Capitalization –Cost of debt .. Perpetuity growth rates based on historical U.S. Real GDP .. Value creation can be achieved through additional levers: –Pricing/mix in Windows segment – Manufacturing efficiencies and cost savings – $75mm lawsuit settlement worth ~$0.60 per share .. Value based on projections a sponsor is willing to underwrite .. Projections may include additional value creation opportunities .. Targeted internal rate of return of 15%-20% .. Sponsor exit at year end 2026E .. 6.0x pro forma net leverage .. Exit multiple based on selected publicly-traded comparables Note: Metrics for Publicly-traded comparables based on 2022E. |
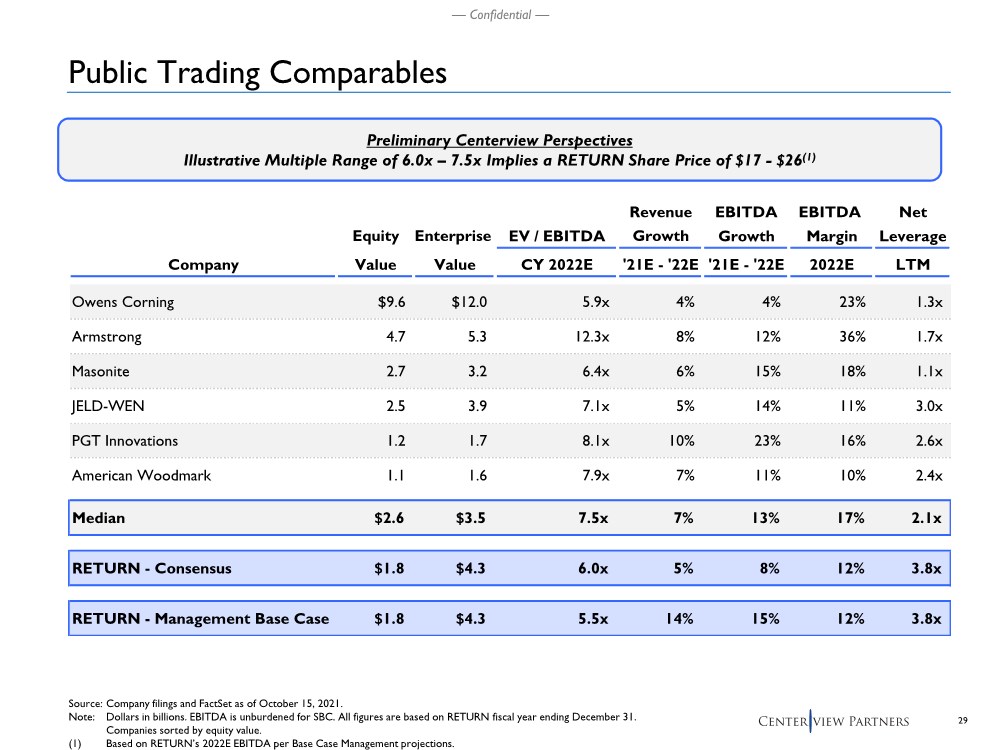
| 29 — Confidential — Public Trading Comparables Source: Company filings and FactSet as of October 15, 2021. Note: Dollars in billions. EBITDA is unburdened for SBC. All figures are based on RETURN fiscal year ending December 31. Companies sorted by equity value. (1) Based on RETURN’s 2022E EBITDA per Base Case Management projections. Revenue EBITDA EBITDA Net Equity Enterprise EV / EBITDA Growth Growth Margin Leverage Company Value Value CY 2022E '21E - '22E '21E - '22E 2022E LTM Owens Corning $9.6 $12.0 5.9x 4% 4% 23% 1.3x Armstrong 4.7 5.3 12.3x 8% 12% 36% 1.7x Masonite 2.7 3.2 6.4x 6% 15% 18% 1.1x JELD-WEN 2.5 3.9 7.1x 5% 14% 11% 3.0x PGT Innovations 1.2 1.7 8.1x 10% 23% 16% 2.6x American Woodmark 1.1 1.6 7.9x 7% 11% 10% 2.4x Median $2.6 $3.5 7.5x 7% 13% 17% 2.1x RETURN - Consensus $1.8 $4.3 6.0x 5% 8% 12% 3.8x RETURN - Management Base Case $1.8 $4.3 5.5x 14% 15% 12% 3.8x Preliminary Centerview Perspectives Illustrative Multiple Range of 6.0x – 7.5x Implies a RETURN Share Price of $17 - $26(1) |
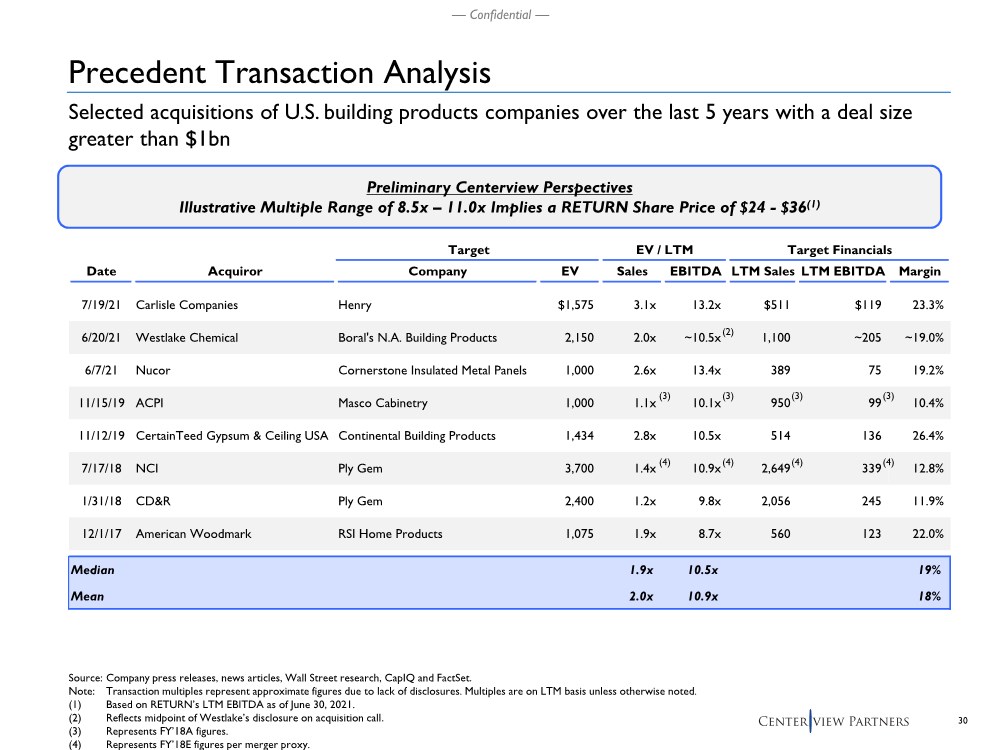
| 30 — Confidential — Precedent Transaction Analysis Source: Company press releases, news articles, Wall Street research, CapIQ and FactSet. Note: Transaction multiples represent approximate figures due to lack of disclosures. Multiples are on LTM basis unless otherwise noted. (1) Based on RETURN’s LTM EBITDA as of June 30, 2021. (2) Reflects midpoint of Westlake’s disclosure on acquisition call. (3) Represents FY’18A figures. (4) Represents FY’18E figures per merger proxy. Selected acquisitions of U.S. building products companies over the last 5 years with a deal size greater than $1bn Target EV / LTM Target Financials Date Acquiror Company EV Sales EBITDA LTM Sales LTM EBITDA Margin 7/19/21 Carlisle Companies Henry $1,575 3.1x 13.2x $511 $119 23.3% 6/20/21 Westlake Chemical Boral's N.A. Building Products 2,150 2.0x ~10.5x 1,100 ~205 ~19.0% 6/7/21 Nucor Cornerstone Insulated Metal Panels 1,000 2.6x 13.4x 389 75 19.2% 11/15/19 ACPI Masco Cabinetry 1,000 1.1x 10.1x 950 99 10.4% 11/12/19 CertainTeed Gypsum & Ceiling USA Continental Building Products 1,434 2.8x 10.5x 514 136 26.4% 7/17/18 NCI Ply Gem 3,700 1.4x 10.9x 2,649 339 12.8% 1/31/18 CD&R Ply Gem 2,400 1.2x 9.8x 2,056 245 11.9% 12/1/17 American Woodmark RSI Home Products 1,075 1.9x 8.7x 560 123 22.0% Median 1.9x 10.5x 19% Mean 2.0x 10.9x 18% (3) (2) (3) (3) (3) (4) (4) (4) (4) Preliminary Centerview Perspectives Illustrative Multiple Range of 8.5x – 11.0x Implies a RETURN Share Price of $24 - $36(1) |
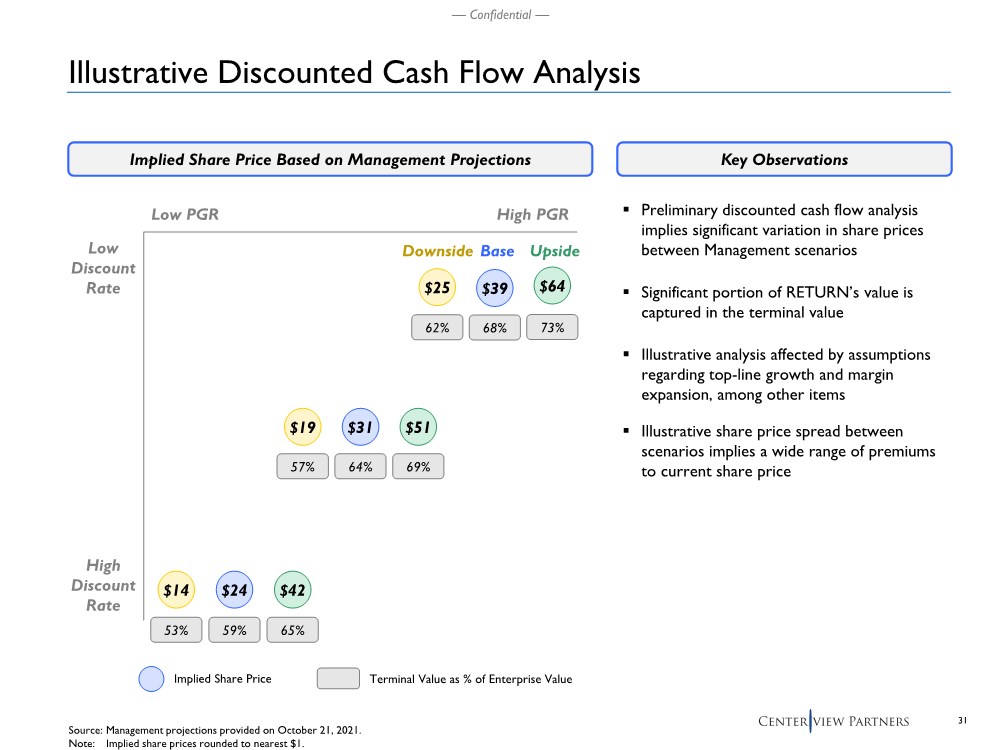
| 31 — Confidential — $64 Illustrative Discounted Cash Flow Analysis Source: Management projections provided on October 21, 2021. Note: Implied share prices rounded to nearest $1. Implied Share Price Based on Management Projections Key Observations High PGR Low PGR Low Discount Rate High Discount Rate .. Preliminary discounted cash flow analysis implies significant variation in share prices between Management scenarios .. Significant portion of RETURN’s value is captured in the terminal value .. Illustrative analysis affected by assumptions regarding top-line growth and margin expansion, among other items .. Illustrative share price spread between scenarios implies a wide range of premiums to current share price $14 Downside Base Upside $31 53% 64% 73% Implied Share Price Terminal Value as % of Enterprise Value $39 68% $25 62% $51 69% $19 57% $24 59% $42 65% |
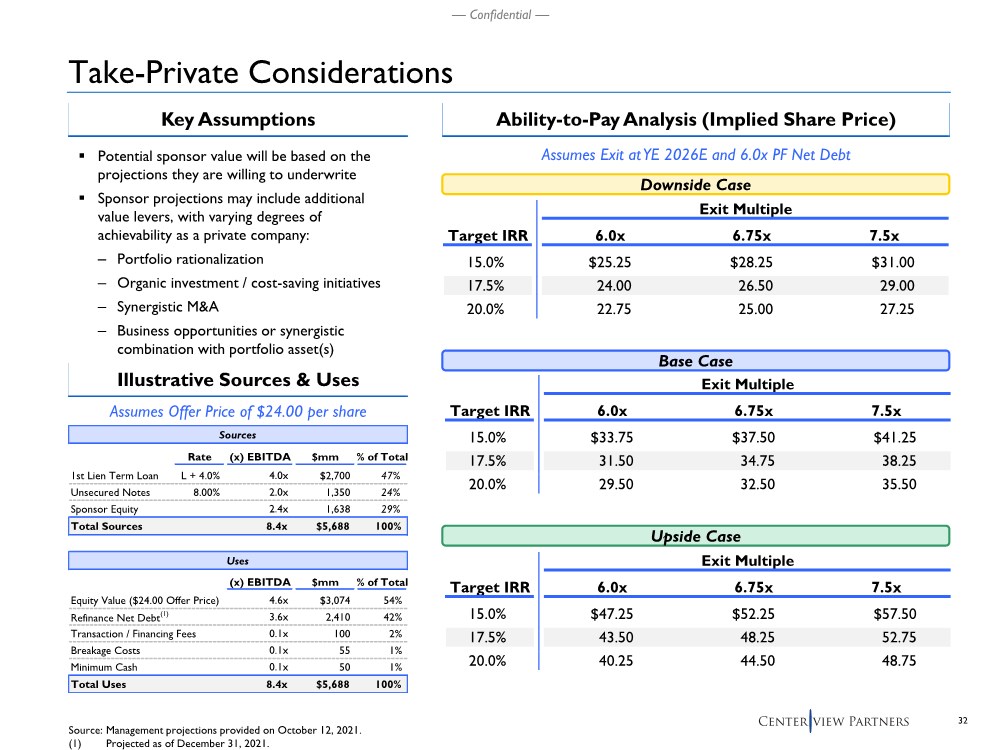
| 32 — Confidential — Take-Private Considerations Source: Management projections provided on October 12, 2021. (1) Projected as of December 31, 2021. .. Potential sponsor value will be based on the projections they are willing to underwrite .. Sponsor projections may include additional value levers, with varying degrees of achievability as a private company: – Portfolio rationalization – Organic investment / cost-saving initiatives – Synergistic M&A – Business opportunities or synergistic combination with portfolio asset(s) Ability-to-Pay Analysis (Implied Share Price) Key Assumptions Assumes Exit at YE 2026E and 6.0x PF Net Debt Base Case Exit Multiple Exit Multiple Target IRR 6.0x 6.75x 7.5x 15.0% $33.75 $37.50 $41.25 17.5% 31.50 34.75 38.25 20.0% 29.50 32.50 35.50 Downside Case Assumes Offer Price of $24.00 per share Illustrative Sources & Uses Upside Case Exit Multiple Exit Multiple Target IRR 6.0x 6.75x 7.5x 15.0% $47.25 $52.25 $57.50 17.5% 43.50 48.25 52.75 20.0% 40.25 44.50 48.75 Exit Multiple Target IRR 6.0x 6.75x 7.5x 15.0% $25.25 $28.25 $31.00 17.5% 24.00 26.50 29.00 20.0% 22.75 25.00 27.25 Rate (x) EBITDA $mm % of Total 1st Lien Term Loan L + 4.0% 4.0x $2,700 47% Unsecured Notes 8.00% 2.0x 1,350 24% Sponsor Equity 2.4x 1,638 29% Total Sources 8.4x $5,688 100% Uses (x) EBITDA $mm % of Total Equity Value ($24.00 Offer Price) 4.6x $3,074 54% Refinance Net Debt(1) 3.6x 2,410 42% Transaction / Financing Fees 0.1x 100 2% Breakage Costs 0.1x 55 1% Minimum Cash 0.1x 50 1% Total Uses 8.4x $5,688 100% Sources |
| — Confidential — Appendix |

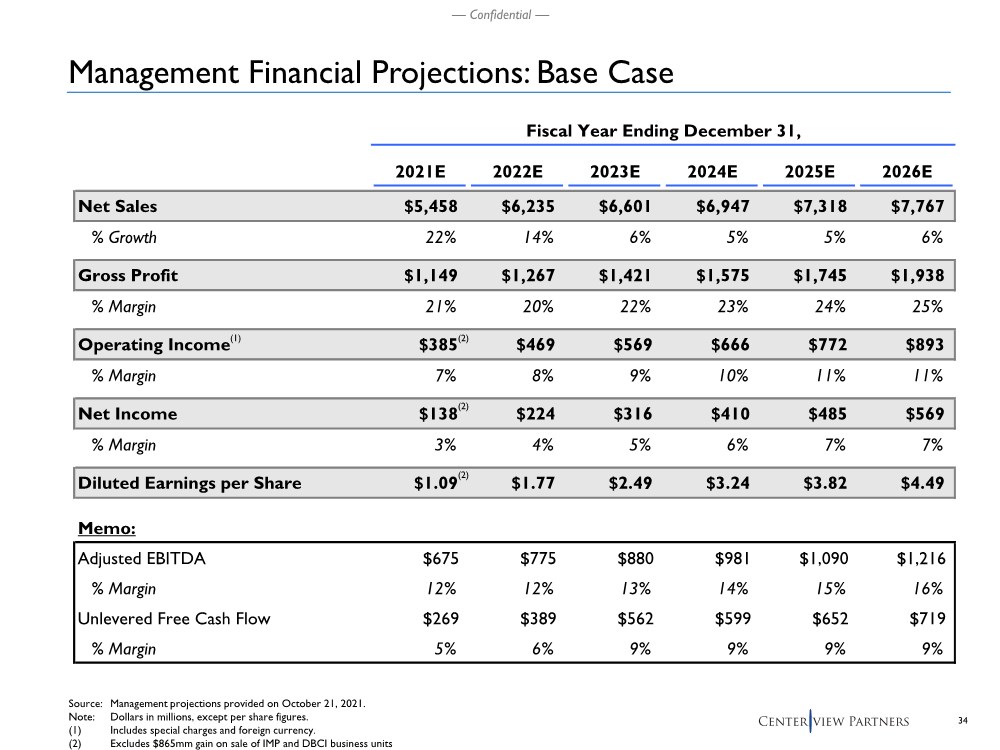
| 34 — Confidential — Fiscal Year Ending December 31, 2021E 2022E 2023E 2024E 2025E 2026E Net Sales $5,458 $6,235 $6,601 $6,947 $7,318 $7,767 % Growth 22% 14% 6% 5% 5% 6% Gross Profit $1,149 $1,267 $1,421 $1,575 $1,745 $1,938 % Margin 21% 20% 22% 23% 24% 25% Operating Income $385 $469 $569 $666 $772 $893 % Margin 7% 8% 9% 10% 11% 11% Net Income $138 $224 $316 $410 $485 $569 % Margin 3% 4% 5% 6% 7% 7% Diluted Earnings per Share $1.09 $1.77 $2.49 $3.24 $3.82 $4.49 Memo: Adjusted EBITDA $675 $775 $880 $981 $1,090 $1,216 % Margin 12% 12% 13% 14% 15% 16% Unlevered Free Cash Flow $269 $389 $562 $599 $652 $719 % Margin 5% 6% 9% 9% 9% 9% Management Financial Projections: Base Case Source: Management projections provided on October 21, 2021. Note: Dollars in millions, except per share figures. (1) Includes special charges and foreign currency. (2) Excludes $865mm gain on sale of IMP and DBCI business units (2) (2) (2) (1) |
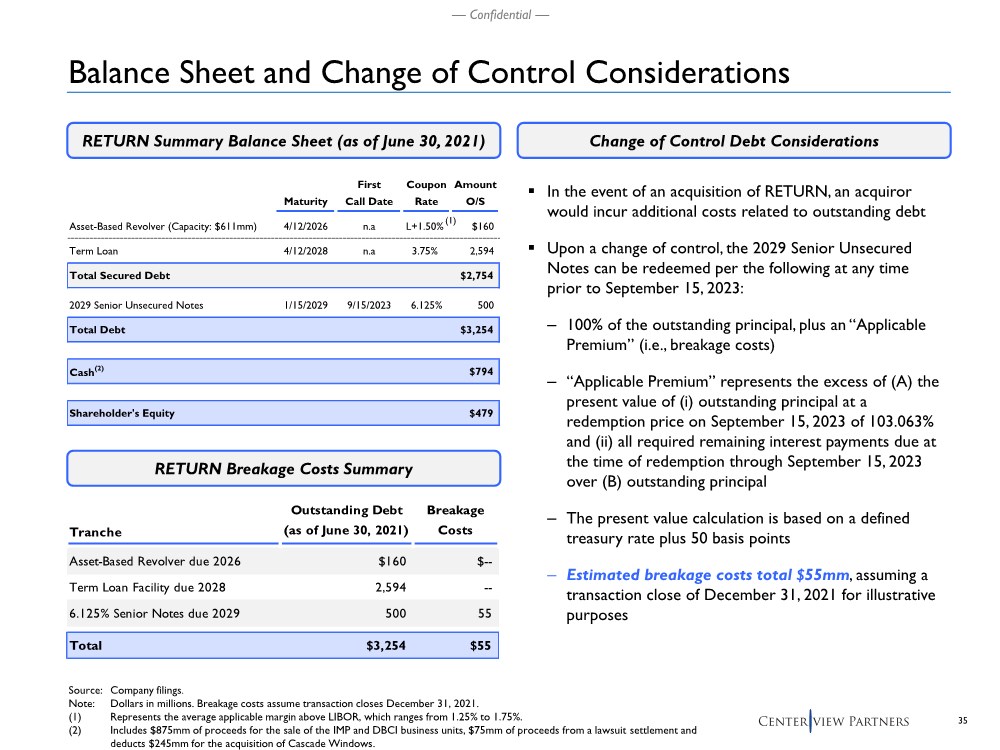
| 35 — Confidential — Balance Sheet and Change of Control Considerations Change of Control Debt Considerations RETURN Summary Balance Sheet (as of June 30, 2021) .. In the event of an acquisition of RETURN, an acquiror would incur additional costs related to outstanding debt .. Upon a change of control, the 2029 Senior Unsecured Notes can be redeemed per the following at any time prior to September 15, 2023: – 100% of the outstanding principal, plus an “Applicable Premium” (i.e., breakage costs) –“Applicable Premium” represents the excess of (A) the present value of (i) outstanding principal at a redemption price on September 15, 2023 of 103.063% and (ii) all required remaining interest payments due at the time of redemption through September 15, 2023 over (B) outstanding principal – The present value calculation is based on a defined treasury rate plus 50 basis points – Estimated breakage costs total $55mm, assuming a transaction close of December 31, 2021 for illustrative purposes Source: Company filings. Note: Dollars in millions. Breakage costs assume transaction closes December 31, 2021. (1) Represents the average applicable margin above LIBOR, which ranges from 1.25% to 1.75%. (2) Includes $875mm of proceeds for the sale of the IMP and DBCI business units, $75mm of proceeds from a lawsuit settlement and deducts $245mm for the acquisition of Cascade Windows. RETURN Breakage Costs Summary (1) First Coupon Amount Maturity Call Date Rate O/S Asset-Based Revolver (Capacity: $611mm) 4/12/2026 n.a L+1.50% $160 Term Loan 4/12/2028 n.a 3.75% 2,594 Total Secured Debt $2,754 2029 Senior Unsecured Notes 1/15/2029 9/15/2023 6.125% 500 Total Debt $3,254 Cash(2) $794 Shareholder's Equity $479 Tranche Outstanding Debt (as of June 30, 2021) Breakage Costs Asset-Based Revolver due 2026 $160 $-- Term Loan Facility due 2028 2,594 -- 6.125% Senior Notes due 2029 500 55 Total $3,254 $55 |
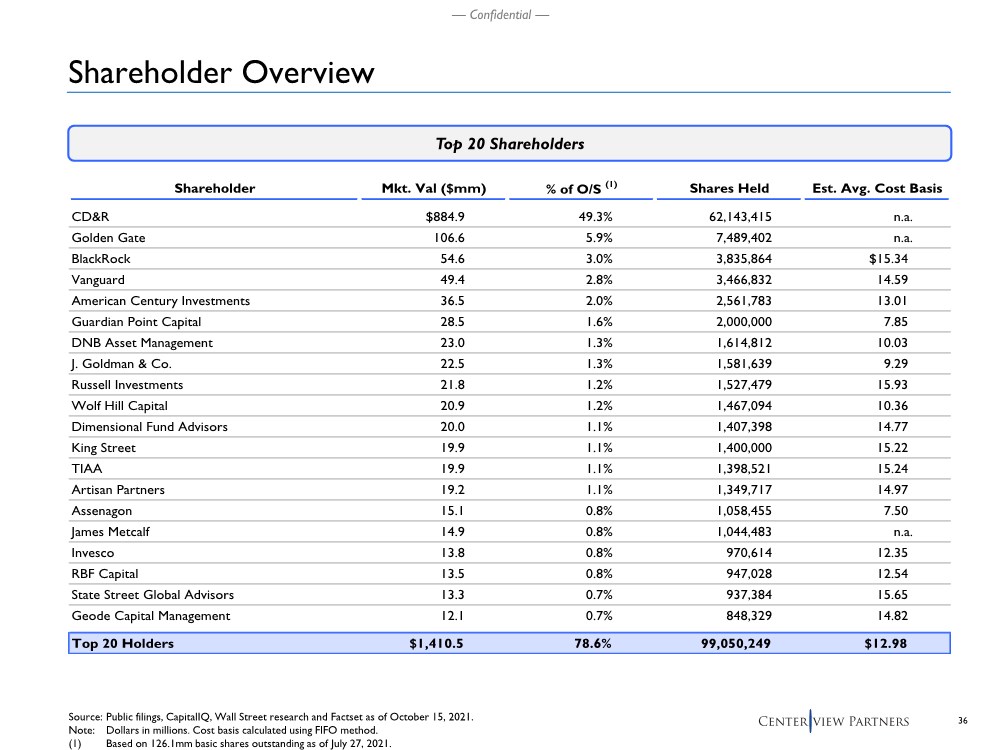
| 36 — Confidential — Shareholder Overview Source: Public filings, CapitalIQ, Wall Street research and Factset as of October 15, 2021. Note: Dollars in millions. Cost basis calculated using FIFO method. (1) Based on 126.1mm basic shares outstanding as of July 27, 2021. Shareholder Mkt. Val ($mm) % of O/S (1) Shares Held Est. Avg. Cost Basis CD&R $884.9 49.3% 62,143,415 n.a. Golden Gate 106.6 5.9% 7,489,402 n.a. BlackRock 54.6 3.0% 3,835,864 $15.34 Vanguard 49.4 2.8% 3,466,832 14.59 American Century Investments 36.5 2.0% 2,561,783 13.01 Guardian Point Capital 28.5 1.6% 2,000,000 7.85 DNB Asset Management 23.0 1.3% 1,614,812 10.03 J. Goldman & Co. 22.5 1.3% 1,581,639 9.29 Russell Investments 21.8 1.2% 1,527,479 15.93 Wolf Hill Capital 20.9 1.2% 1,467,094 10.36 Dimensional Fund Advisors 20.0 1.1% 1,407,398 14.77 King Street 19.9 1.1% 1,400,000 15.22 TIAA 19.9 1.1% 1,398,521 15.24 Artisan Partners 19.2 1.1% 1,349,717 14.97 Assenagon 15.1 0.8% 1,058,455 7.50 James Metcalf 14.9 0.8% 1,044,483 n.a. Invesco 13.8 0.8% 970,614 12.35 RBF Capital 13.5 0.8% 947,028 12.54 State Street Global Advisors 13.3 0.7% 937,384 15.65 Geode Capital Management 12.1 0.7% 848,329 14.82 Top 20 Holders $1,410.5 78.6% 99,050,249 $12.98 Top 20 Shareholders |
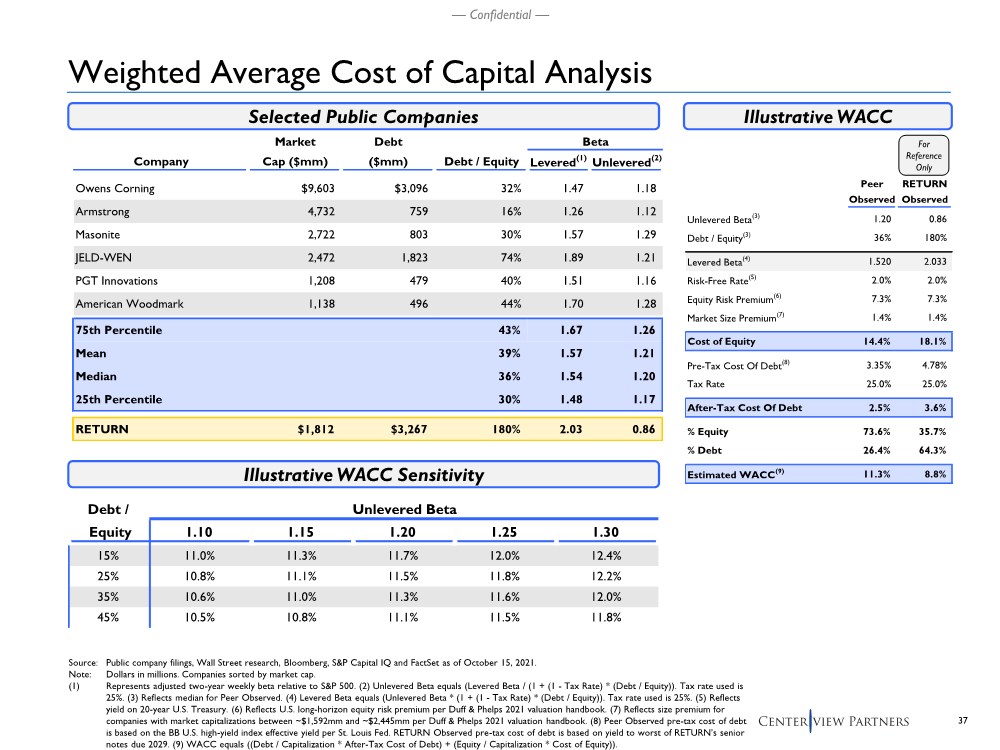
| 37 — Confidential — Debt / Unlevered Beta Equity 1.10 1.15 1.20 1.25 1.30 15% 11.0% 11.3% 11.7% 12.0% 12.4% 25% 10.8% 11.1% 11.5% 11.8% 12.2% 35% 10.6% 11.0% 11.3% 11.6% 12.0% 45% 10.5% 10.8% 11.1% 11.5% 11.8% Weighted Average Cost of Capital Analysis Selected Public Companies Illustrative WACC Illustrative WACC Sensitivity Source: Public company filings, Wall Street research, Bloomberg, S&P Capital IQ and FactSet as of October 15, 2021. Note: Dollars in millions. Companies sorted by market cap. (1) Represents adjusted two-year weekly beta relative to S&P 500. (2) Unlevered Beta equals (Levered Beta / (1 + (1 - Tax Rate) * (Debt / Equity)). Tax rate used is 25%. (3) Reflects median for Peer Observed. (4) Levered Beta equals (Unlevered Beta * (1 + (1 - Tax Rate) * (Debt / Equity)). Tax rate used is 25%. (5) Reflects yield on 20-year U.S. Treasury. (6) Reflects U.S. long-horizon equity risk premium per Duff & Phelps 2021 valuation handbook. (7) Reflects size premium for companies with market capitalizations between ~$1,592mm and ~$2,445mm per Duff & Phelps 2021 valuation handbook. (8) Peer Observed pre-tax cost of debt is based on the BB U.S. high-yield index effective yield per St. Louis Fed. RETURN Observed pre-tax cost of debt is based on yield to worst of RETURN’s senior notes due 2029. (9) WACC equals ((Debt / Capitalization * After-Tax Cost of Debt) + (Equity / Capitalization * Cost of Equity)). Market Debt Beta Company Cap ($mm) ($mm) Debt / Equity Levered(1) Unlevered(2) Owens Corning $9,603 $3,096 32% 1.47 1.18 Armstrong 4,732 759 16% 1.26 1.12 Masonite 2,722 803 30% 1.57 1.29 JELD-WEN 2,472 1,823 74% 1.89 1.21 PGT Innovations 1,208 479 40% 1.51 1.16 American Woodmark 1,138 496 44% 1.70 1.28 75th Percentile 43% 1.67 1.26 Mean 39% 1.57 1.21 Median 36% 1.54 1.20 25th Percentile 30% 1.48 1.17 RETURN $1,812 $3,267 180% 2.03 0.86 Peer RETURN Observed Observed Unlevered Beta(3) 1.20 0.86 Debt / Equity(3) 36% 180% Levered Beta(4) 1.520 2.033 Risk-Free Rate(5) 2.0% 2.0% Equity Risk Premium(6) 7.3% 7.3% Market Size Premium(7) 1.4% 1.4% Cost of Equity 14.4% 18.1% Pre-Tax Cost Of Debt(8) 3.35% 4.78% Tax Rate 25.0% 25.0% After-Tax Cost Of Debt 2.5% 3.6% % Equity 73.6% 35.7% % Debt 26.4% 64.3% Estimated WACC(9) 11.3% 8.8% For Reference Only |