| — Confidential — January 7, 2022 Presentation to the Special Committee Project RETURN |
| 1 — Confidential — Disclaimer This presentation has been prepared by Centerview Partners LLC (“Centerview”) for use solely by the management and Special Committee of RETURN, Inc.(“RETURN”) in connection with its evaluation of a proposed transaction involving RETURN and for no other purpose. The information contained herein is based upon information supplied by or on behalf of RETURN and publicly available information, and portions of the information contained herein may be based upon statements, estimates and forecasts provided by RETURN. Centerview has relied upon the accuracy and completeness of the foregoing information, and has not assumed any responsibility for any independent verification of such information or for any independent evaluation or appraisal of any of the assets or liabilities (contingent or otherwise) of RETURN or any other entity, or concerning the solvency or fair value of RETURN or any other entity. With respect to financial forecasts, Centerview has assumed that such forecasts have been reasonably prepared on bases reflecting the best currently available estimates and judgments of the management of RETURN as to the future financial performance of RETURN, and at your direction Centerview has relied upon such forecasts, as provided by RETURN’s management, with respect to RETURN. Centerview assumes no responsibility for and expresses no view as to such forecasts or the assumptions on which they are based. The information set forth herein is based upon economic, monetary, market and other conditions as in effect on, and the information made available to us as of, the date hereof, unless indicated otherwise and Centerview assumes no obligation to update or otherwise revise these materials. The financial analysis in this presentation is complex and is not necessarily susceptible to a partial analysis or summary description. In performing this financial analysis, Centerview has considered the results of its analysis as a whole and did not necessarily attribute a particular weight to any particular portion of the analysis considered. Furthermore, selecting any portion of Centerview’s analysis, without considering the analysis as a whole, would create an incomplete view of the processunderlying its financial analysis. Centerview may have deemed various assumptions more or less probable than other assumptions, so the reference ranges resulting from any particular portion of theanalysis described above should not be taken to be Centerview’s view of the actual value of RETURN. These materials and the information contained herein are confidential, were not prepared with a view toward public disclosure, and may not be disclosed publicly or made available to third parties without the prior written consent of Centerview. These materials and any other advice, written or oral, rendered by Centervieware intended solely for the benefit and use of the management and Special Committee of RETURN (in its capacity as such) in its consideration of the proposed transaction, and are not for the benefit of, and do not convey any rights or remedies for any holder of securities of RETURN or any other person. Centerview will not be responsible for and has not provided any tax, accounting, actuarial, legal or other specialist advice. These materials are not intended to provide the sole basis for evaluating the proposed transaction, and this presentation does not represent a fairness opinion, recommendation, valuation or opinion of any kind, and is necessarily incomplete and should be viewed solely in conjunction with the oral presentation provided byCenterview. |
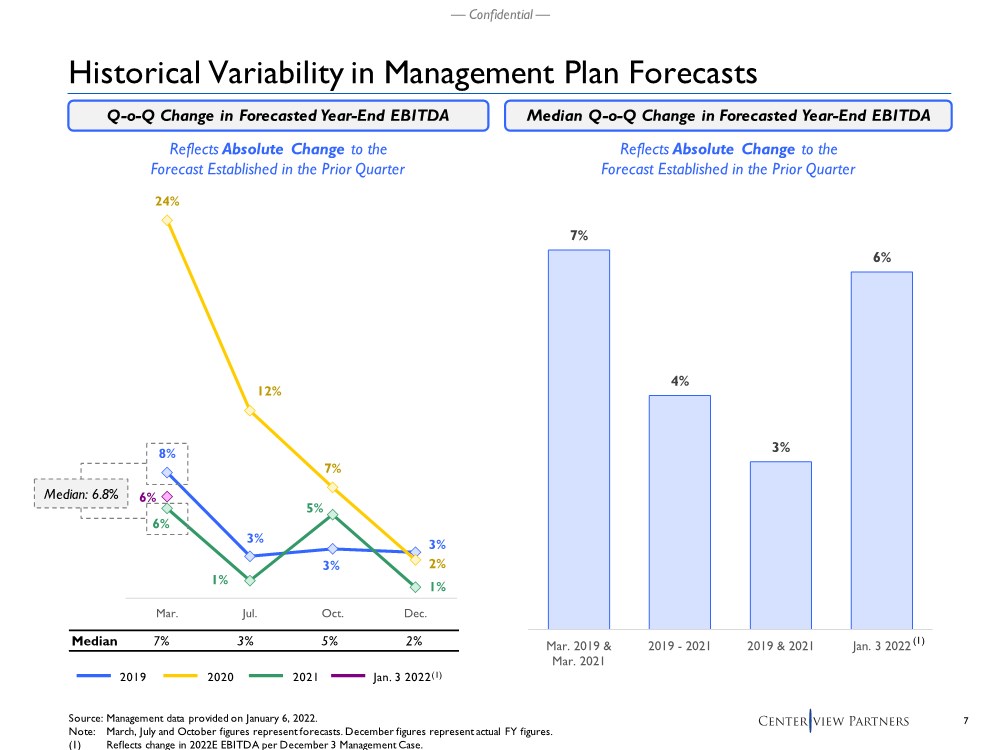
| 2 — Confidential — Situation Update .. Centerview’s last interaction with COPY was on December 22, 2021, where COPY communicated the following: – Prepared to increase their offer for the shares not owned by them from $23.00 to $23.50 per share – Have concerns around assumptions for Windows volume and Materials pricing-cost spread in the projections shared by Management .. On December 28, 2021, Management provided Centerview with historical and projected analyses for the assumptions noted above as supplements to the Management Case shared on December 3, 2021 (referred to herein as the “December 3 Management Case”) – The analyses included annual risk estimates to the December 3 Management Case (referred to herein as the “Potential Risks to December 3 Management Case”) .. On January 3, 2022, Management provided Centerview with a downside sensitivity operating case (referred to herein as the “January 3 Management Case”) .. Centerview’s financial analysis has been updated to reflect the new offer price and January 3 Management Case, along with references to the December 3 Management Case and related Potential Risks .. Centerview has evaluated the historical volatility in the Management budget and forecasting process from 2019 to 2021 – Largest change is consistently in Q1; January 3 Management Case is in-line with historical updates |
| 3 — Confidential — Table of Contents Section 1 ...................................................................................... Recap of COPY’s 12/22/21 Proposal Section 2 ......................................................... Centerview’s Updated Preliminary Financial Analysis Appendix ........................................................................................................... Supplementary Materials |
| — Confidential — Recap of COPY’s 12/22/21 Proposal 1 |
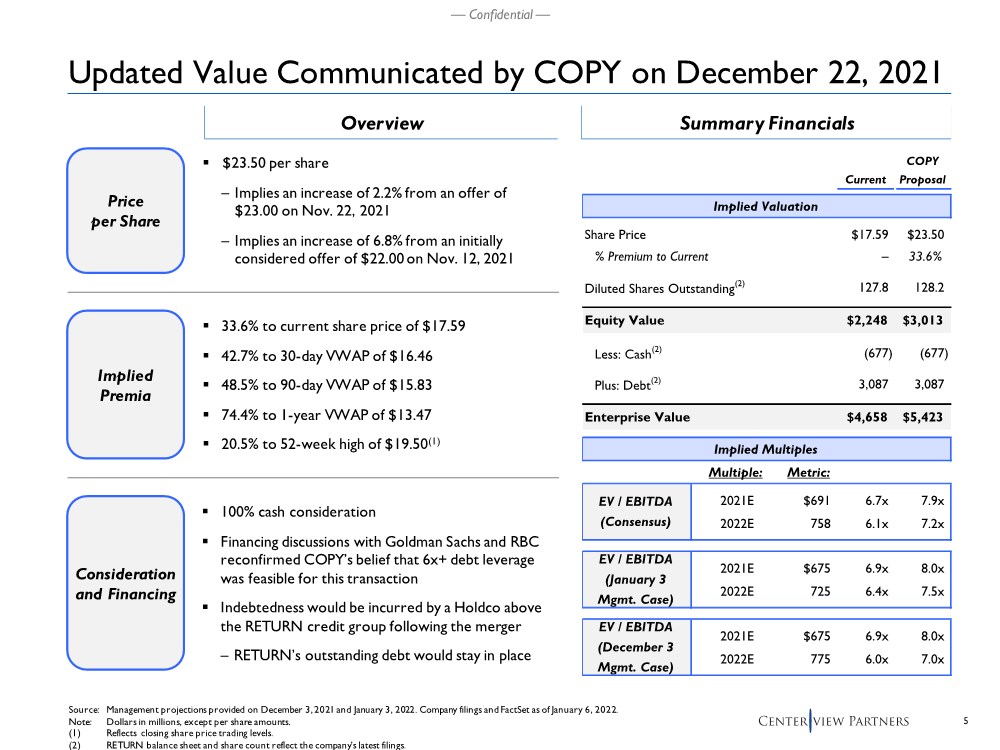
| 5 — Confidential — Updated Value Communicated by COPY on December 22, 2021 Price per Share Implied Premia .. $23.50 per share – Implies an increase of 2.2% from an offer of $23.00 on Nov. 22, 2021 – Implies an increase of 6.8% from an initially considered offer of $22.00 on Nov. 12, 2021 .. 33.6% to current share price of $17.59 .. 42.7% to 30-day VWAP of $16.46 .. 48.5% to 90-day VWAP of $15.83 .. 74.4% to 1-year VWAP of $13.47 .. 20.5% to 52-week high of $19.50(1) Summary Financials Source: Management projections provided on December 3, 2021 and January 3, 2022. Company filings and FactSet as of January 6, 2022. Note: Dollars in millions, except per share amounts. (1) Reflects closing share price trading levels. (2) RETURN balance sheet and share count reflect the company’s latest filings. Overview COPY Current Proposal Implied Valuation Share Price $17.59 $23.50 % Premium to Current – 33.6% Diluted Shares Outstanding(2) 127.8 128.2 Equity Value $2,248 $3,013 Less: Cash(2) (677) (677) Plus: Debt(2) 3,087 3,087 Enterprise Value $4,658 $5,423 Implied Multiples Multiple: Metric: 2021E $691 6.7x 7.9x 2022E 758 6.1x 7.2x 2021E $675 6.9x 8.0x 2022E 725 6.4x 7.5x 2021E $675 6.9x 8.0x 2022E 775 6.0x 7.0x EV / EBITDA (Consensus) EV / EBITDA (January 3 Mgmt. Case) EV / EBITDA (December 3 Mgmt. Case) Consideration and Financing .. 100% cash consideration .. Financing discussions with Goldman Sachs and RBC reconfirmed COPY’s belief that 6x+ debt leverage was feasible for this transaction .. Indebtedness would be incurred by a Holdco above the RETURN credit group following the merger – RETURN’s outstanding debt would stay in place |
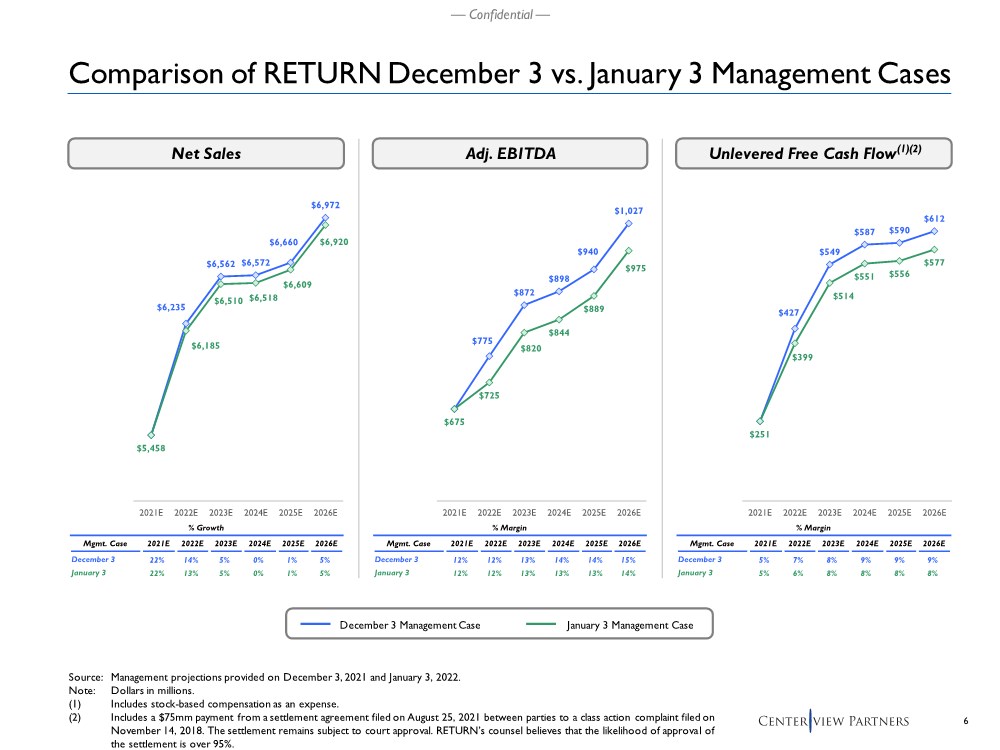
| 6 — Confidential — % Growth % Margin Mgmt. Case 2021E 2022E 2023E 2024E 2025E 2026E December 3 22% 14% 5% 0% 1% 5% January 3 22% 13% 5% 0% 1% 5% $427 $549 $587 $590 $612 $251 $399 $514 $551 $556 $577 $100 $300 $500 $700 2021E 2022E 2023E 2024E 2025E 2026E $6,235 $6,562 $6,572 $6,660 $6,972 $5,458 $6,185 $6,510 $6,518 $6,609 $6,920 $5,000 $5,500 $6,000 $6,500 $7,000 2021E 2022E 2023E 2024E 2025E 2026E Comparison of RETURN December 3 vs. January 3 Management Cases Net Sales Adj. EBITDA Unlevered Free Cash Flow(1)(2) Source: Management projections provided on December 3, 2021 and January 3, 2022. Note: Dollars in millions. (1) Includes stock-based compensation as an expense. (2) Includes a $75mm payment from a settlement agreement filed on August 25, 2021 between parties to a class action complaint filed on November 14, 2018. The settlement remains subject to court approval. RETURN’s counsel believes that the likelihood of approval of the settlement is over 95%. December 3 Management Case January 3 Management Case % Margin % Margin Mgmt. Case 2021E 2022E 2023E 2024E 2025E 2026E December 3 12% 12% 13% 14% 14% 15% January 3 12% 12% 13% 13% 13% 14% % Margin Mgmt. Case 2021E 2022E 2023E 2024E 2025E 2026E December 3 5% 7% 8% 9% 9% 9% January 3 5% 6% 8% 8% 8% 8% $775 $872 $898 $940 $1,027 $675 $725 $820 $844 $889 $975 $500 $600 $700 $800 $900 $1,000 $1,100 2021E 2022E 2023E 2024E 2025E 2026E |
| 7 — Confidential — Median 7% 3% 5% 2% 24% 12% 7% 2% 6% 1% 5% 1% 6% 8% 3% 3% 3% Mar. Jul. Oct. Dec. Median: 6.8% 7% 4% 3% 6% Mar. 2019 & Mar. 2021 2019 - 2021 2019 & 2021 Jan. 3 2022 Historical Variability in Management Plan Forecasts Source: Management data provided on January 6, 2022. Note: March, July and October figures represent forecasts. December figures represent actual FY figures. (1) Reflects change in 2022E EBITDA per December 3 Management Case. Reflects Absolute Change to the Forecast Established in the Prior Quarter Q-o-Q Change in Forecasted Year-End EBITDA Median Q-o-Q Change in Forecasted Year-End EBITDA 2019 2020 2021 Jan. 3 2022(1) (1) Reflects Absolute Change to the Forecast Established in the Prior Quarter |
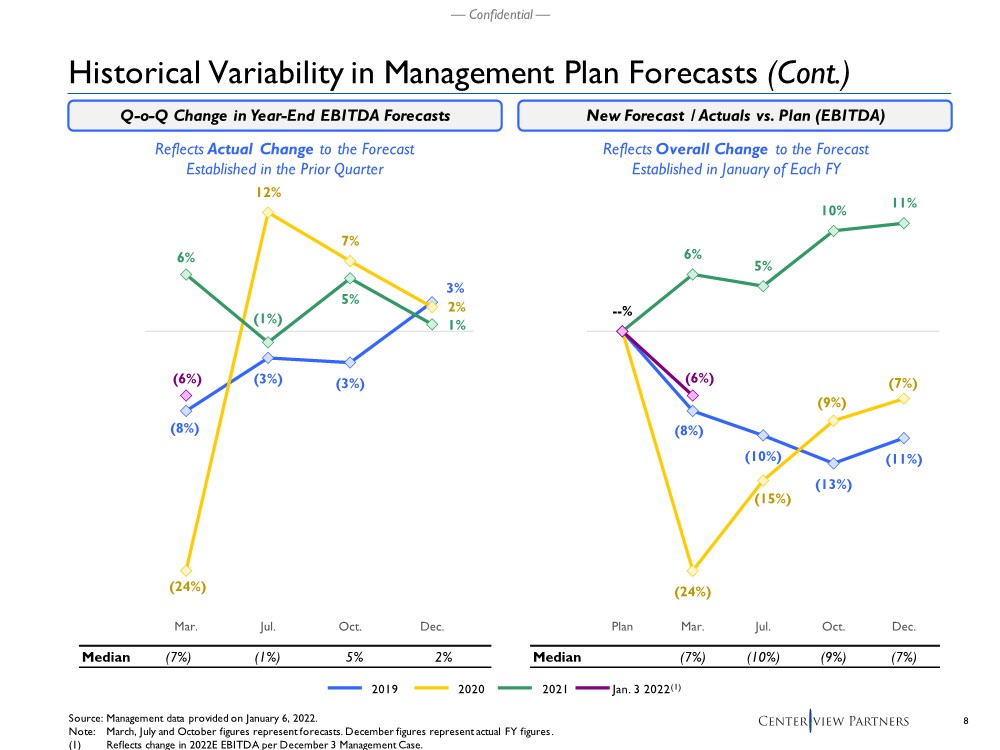
| 8 — Confidential — Historical Variability in Management Plan Forecasts (Cont.) Reflects Actual Change to the Forecast Established in the Prior Quarter Q-o-Q Change in Year-End EBITDA Forecasts New Forecast / Actuals vs. Plan (EBITDA) 2019 2020 2021 Jan. 3 2022(1) Reflects Overall Change to the Forecast Established in January of Each FY Source: Management data provided on January 6, 2022. Note: March, July and October figures represent forecasts. December figures represent actual FY figures. (1) Reflects change in 2022E EBITDA per December 3 Management Case. Median (7%) (10%) (9%) (7%) (8%) (10%) (13%) (11%) (24%) (15%) (9%) (7%) --% 6% 5% 10% 11% (6%) Plan Mar. Jul. Oct. Dec. Median (7%) (1%) 5% 2% (8%) (3%) (3%) 3% (24%) 12% 7% 2% 6% (1%) 5% 1% (6%) Mar. Jul. Oct. Dec. |
| — Confidential — Centerview’s Updated Preliminary Financial Analysis 2 |
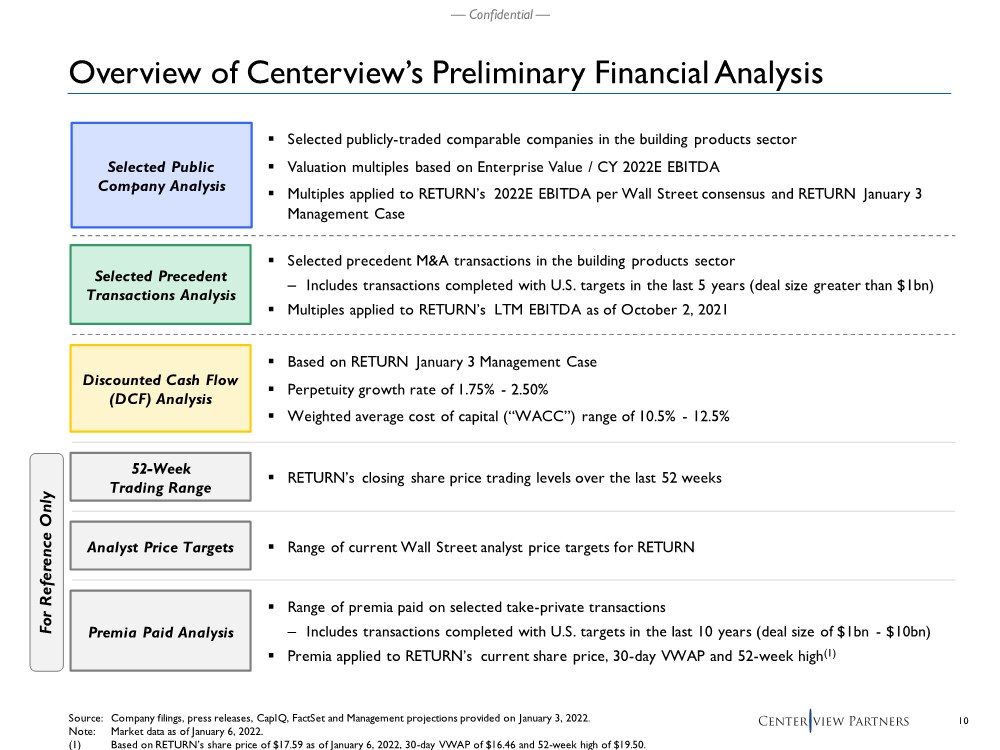
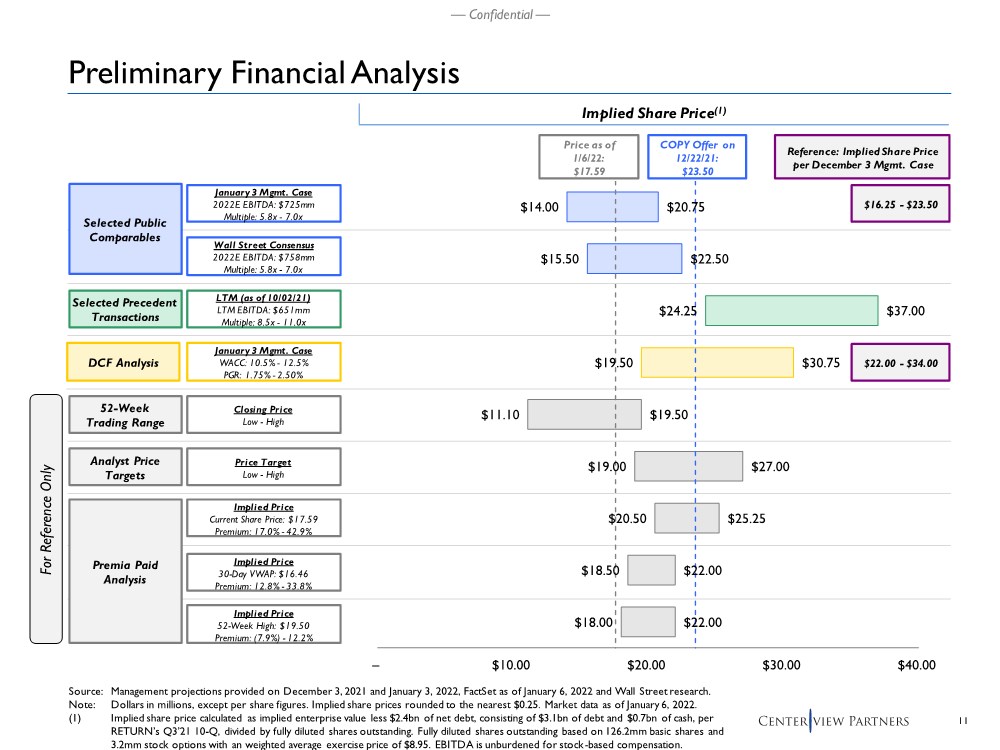
| 10 — Confidential — Source: Company filings, press releases, CapIQ, FactSet and Management projections provided on January 3, 2022. Note: Market data as of January 6, 2022. (1) Based on RETURN’s share price of $17.59 as of January 6, 2022, 30-day VWAP of $16.46 and 52-week high of $19.50. .. Selected publicly-traded comparable companies in the building products sector .. Valuation multiples based on Enterprise Value / CY 2022E EBITDA .. Multiples applied to RETURN’s 2022E EBITDA per Wall Street consensus and RETURN January 3 Management Case .. Based on RETURN January 3 Management Case .. Perpetuity growth rate of 1.75% - 2.50% .. Weighted average cost of capital (“WACC”) range of 10.5% - 12.5% .. Selected precedent M&A transactions in the building products sector – Includes transactions completed with U.S. targets in the last 5 years (deal size greater than $1bn) .. Multiples applied to RETURN’s LTM EBITDA as of October 2, 2021 .. RETURN’s closing share price trading levels over the last 52 weeks 52-Week Trading Range Selected Precedent Transactions Analysis Discounted Cash Flow (DCF) Analysis For Reference Only .. Range of current Wall Street analyst price targets for RETURN Analyst Price Targets Selected Public Company Analysis Premia Paid Analysis .. Range of premia paid on selected take-private transactions – Includes transactions completed with U.S. targets in the last 10 years (deal size of $1bn - $10bn) .. Premia applied to RETURN’s current share price, 30-day VWAP and 52-week high(1) Overview of Centerview’s Preliminary Financial Analysis |
| 11 — Confidential — $14.00 $15.50 $24.25 $19.50 $11.10 $19.00 $20.50 $18.50 $18.00 $20.75 $22.50 $37.00 $30.75 $19.50 $27.00 $25.25 $22.00 $22.00 – $10.00 $20.00 $30.00 $40.00 Source: Management projections provided on December 3, 2021 and January 3, 2022, FactSet as of January 6, 2022 and Wall Street research. Note: Dollars in millions, except per share figures. Implied share prices rounded to the nearest $0.25. Market data as of January 6, 2022. (1) Implied share price calculated as implied enterprise value less $2.4bn of net debt, consisting of $3.1bn of debt and $0.7bn of cash, per RETURN’s Q3’21 10-Q, divided by fully diluted shares outstanding. Fully diluted shares outstanding based on 126.2mm basic shares and 3.2mm stock options with an weighted average exercise price of $8.95. EBITDA is unburdened for stock-based compensation. 52-Week Trading Range Selected Public Comparables Selected Precedent Transactions Implied Share Price(1) LTM (as of 10/02/21) LTM EBITDA: $651mm Multiple: 8.5x - 11.0x January 3 Mgmt. Case WACC: 10.5% - 12.5% PGR: 1.75% - 2.50% Closing Price Low - High January 3 Mgmt. Case 2022E EBITDA: $725mm Multiple: 5.8x - 7.0x Price as of 1/6/22: $17.59 Analyst Price Targets Price Target Low - High For Reference Only DCF Analysis Premia Paid Analysis Implied Price Current Share Price: $17.59 Premium: 17.0% - 42.9% COPY Offer on 12/22/21: $23.50 Preliminary Financial Analysis Implied Price 30-Day VWAP: $16.46 Premium: 12.8% - 33.8% Implied Price 52-Week High: $19.50 Premium: (7.9%) - 12.2% Wall Street Consensus 2022E EBITDA: $758mm Multiple: 5.8x - 7.0x Reference: Implied Share Price per December 3 Mgmt. Case $16.25 - $23.50 $22.00 - $34.00 |
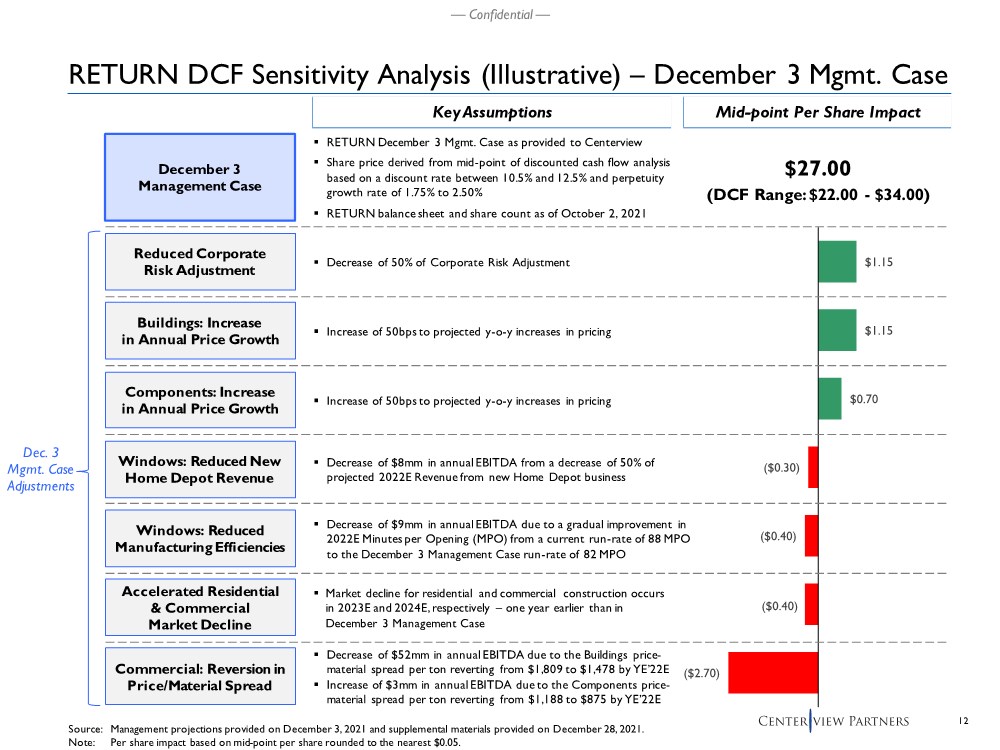
| 12 — Confidential — $1.15 $1.15 $0.70 ($0.30) ($0.40) ($0.40) ($2.70) RETURN DCF Sensitivity Analysis (Illustrative) – December 3 Mgmt. Case Source: Management projections provided on December 3, 2021 and supplemental materials provided on December 28, 2021. Note: Per share impact based on mid-point per share rounded to the nearest $0.05. December 3 Management Case .. RETURN December 3 Mgmt. Case as provided to Centerview .. Share price derived from mid-point of discounted cash flow analysis based on a discount rate between 10.5% and 12.5% and perpetuity growth rate of 1.75% to 2.50% .. RETURN balance sheet and share count as of October 2, 2021 $27.00 (DCF Range: $22.00 - $34.00) Reduced Corporate Risk Adjustment Buildings: Increase in Annual Price Growth .. Decrease of 50% of Corporate Risk Adjustment .. Increase of 50bps to projected y-o-y increases in pricing .. Decrease of $9mm in annual EBITDA due to a gradual improvement in 2022E Minutes per Opening (MPO) from a current run-rate of 88 MPO to the December 3 Management Case run-rate of 82 MPO Key Assumptions Mid-point Per Share Impact .. Decrease of $8mm in annual EBITDA from a decrease of 50% of projected 2022E Revenue from new Home Depot business Components: Increase in Annual Price Growth .. Increase of 50bps to projected y-o-y increases in pricing Dec. 3 Mgmt. Case Adjustments .. Decrease of $52mm in annual EBITDA due to the Buildings price- material spread per ton reverting from $1,809 to $1,478 by YE’22E .. Increase of $3mm in annual EBITDA due to the Components price- material spread per ton reverting from $1,188 to $875 by YE’22E Windows: Reduced Manufacturing Efficiencies Windows: Reduced New Home Depot Revenue Accelerated Residential & Commercial Market Decline Commercial: Reversion in Price/Material Spread .. Market decline for residential and commercial construction occurs in 2023E and 2024E, respectively – one year earlier than in December 3 Management Case |
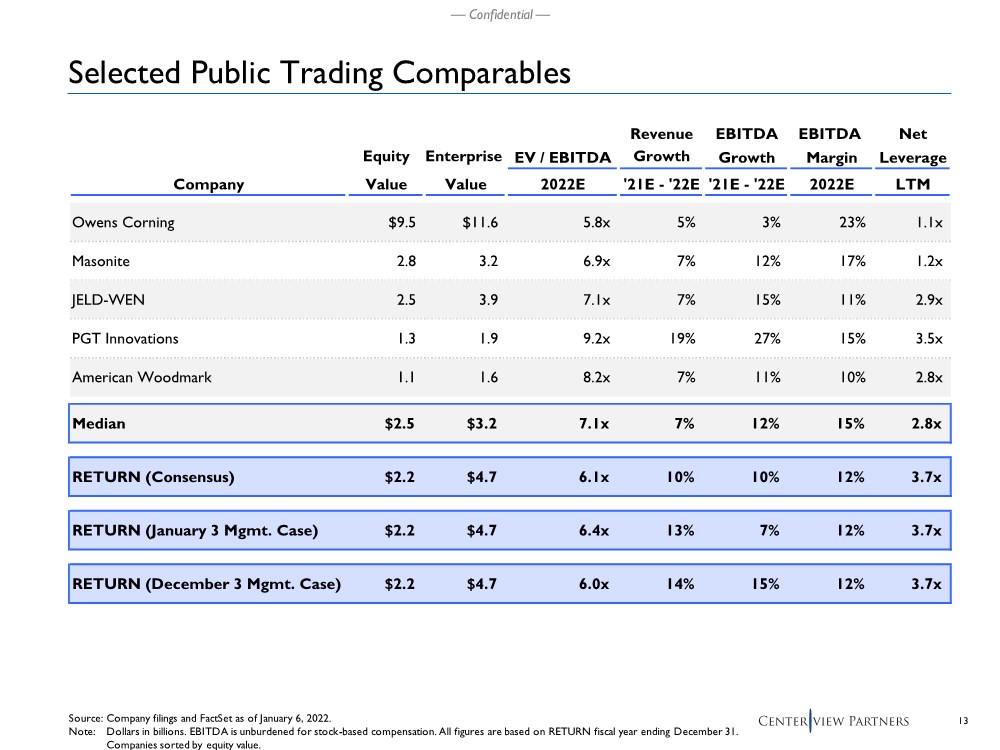
| 13 — Confidential — Selected Public Trading Comparables Source: Company filings and FactSet as of January 6, 2022. Note: Dollars in billions. EBITDA is unburdened for stock-based compensation. All figures are based on RETURN fiscal year ending December 31. Companies sorted by equity value. Revenue EBITDA EBITDA Net Equity Enterprise EV / EBITDA Growth Growth Margin Leverage Company Value Value 2022E '21E - '22E '21E - '22E 2022E LTM Owens Corning $9.5 $11.6 5.8x 5% 3% 23% 1.1x Masonite 2.8 3.2 6.9x 7% 12% 17% 1.2x JELD-WEN 2.5 3.9 7.1x 7% 15% 11% 2.9x PGT Innovations 1.3 1.9 9.2x 19% 27% 15% 3.5x American Woodmark 1.1 1.6 8.2x 7% 11% 10% 2.8x Median $2.5 $3.2 7.1x 7% 12% 15% 2.8x RETURN (Consensus) $2.2 $4.7 6.1x 10% 10% 12% 3.7x RETURN (January 3 Mgmt. Case) $2.2 $4.7 6.4x 13% 7% 12% 3.7x RETURN (December 3 Mgmt. Case) $2.2 $4.7 6.0x 14% 15% 12% 3.7x |
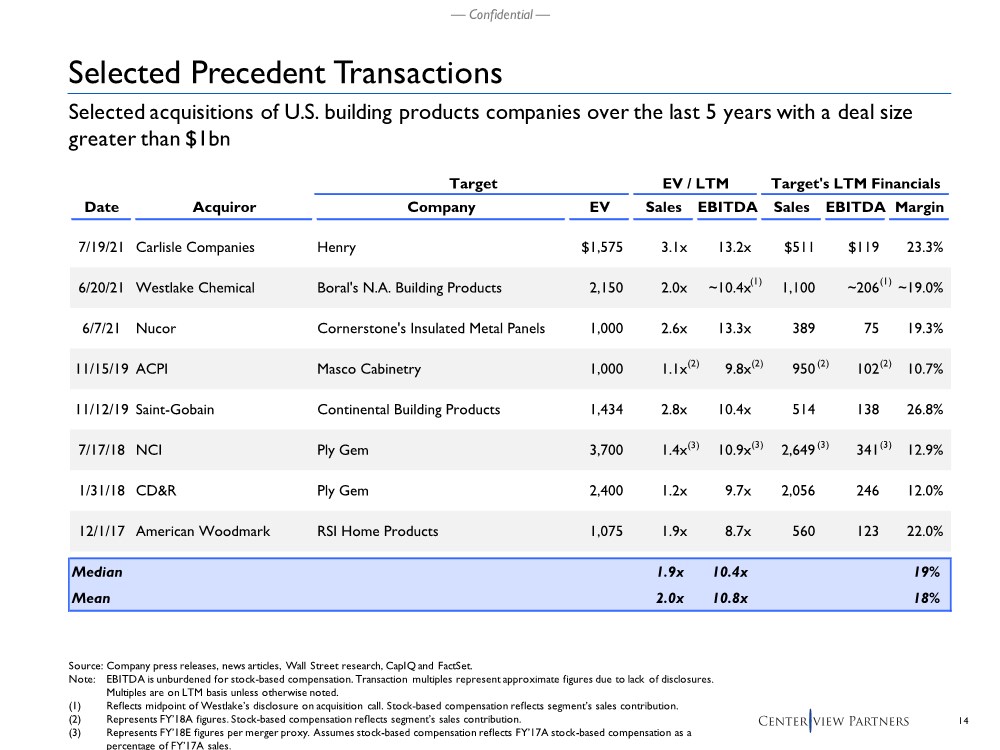
| 14 — Confidential — Target EV / LTM Target's LTM Financials Date Acquiror Company EV Sales EBITDA Sales EBITDA Margin 7/19/21 Carlisle Companies Henry $1,575 3.1x 13.2x $511 $119 23.3% 6/20/21 Westlake Chemical Boral's N.A. Building Products 2,150 2.0x ~10.4x 1,100 ~206 ~19.0% 6/7/21 Nucor Cornerstone's Insulated Metal Panels 1,000 2.6x 13.3x 389 75 19.3% 11/15/19 ACPI Masco Cabinetry 1,000 1.1x 9.8x 950 102 10.7% 11/12/19 Saint-Gobain Continental Building Products 1,434 2.8x 10.4x 514 138 26.8% 7/17/18 NCI Ply Gem 3,700 1.4x 10.9x 2,649 341 12.9% 1/31/18 CD&R Ply Gem 2,400 1.2x 9.7x 2,056 246 12.0% 12/1/17 American Woodmark RSI Home Products 1,075 1.9x 8.7x 560 123 22.0% Median 1.9x 10.4x 19% Mean 2.0x 10.8x 18% Source: Company press releases, news articles, Wall Street research, CapIQ and FactSet. Note: EBITDA is unburdened for stock-based compensation. Transaction multiples represent approximate figures due to lack of disclosures. Multiples are on LTM basis unless otherwise noted. (1) Reflects midpoint of Westlake’s disclosure on acquisition call. Stock-based compensation reflects segment’s sales contribution. (2) Represents FY’18A figures. Stock-based compensation reflects segment’s sales contribution. (3) Represents FY’18E figures per merger proxy. Assumes stock-based compensation reflects FY’17A stock-based compensation as a percentage of FY’17A sales. Selected acquisitions of U.S. building products companies over the last 5 years with a deal size greater than $1bn (2) (1) (2) (2) (2) (3) (3) (3) (3) Selected Precedent Transactions (1) |
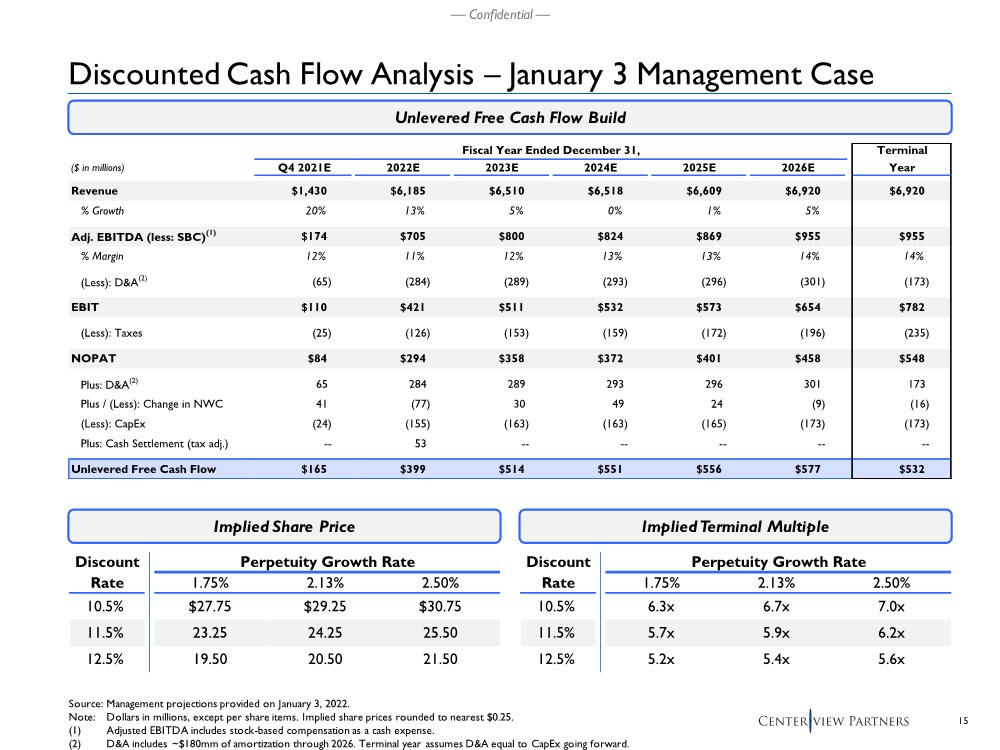
| 15 — Confidential — Discounted Cash Flow Analysis – January 3 Management Case Source: Management projections provided on January 3, 2022. Note: Dollars in millions, except per share items. Implied share prices rounded to nearest $0.25. (1) Adjusted EBITDA includes stock-based compensation as a cash expense. (2) D&A includes ~$180mm of amortization through 2026. Terminal year assumes D&A equal to CapEx going forward. Unlevered Free Cash Flow Build Fiscal Year Ended December 31, Terminal ($ in millions) Q4 2021E 2022E 2023E 2024E 2025E 2026E Year Revenue $1,430 $6,185 $6,510 $6,518 $6,609 $6,920 $6,920 % Growth 20% 13% 5% 0% 1% 5% Adj. EBITDA (less: SBC)(1) $174 $705 $800 $824 $869 $955 $955 % Margin 12% 11% 12% 13% 13% 14% 14% (Less): D&A(2) (65) (284) (289) (293) (296) (301) (173) EBIT $110 $421 $511 $532 $573 $654 $782 (Less): Taxes (25) (126) (153) (159) (172) (196) (235) NOPAT $84 $294 $358 $372 $401 $458 $548 Plus: D&A(2) 65 284 289 293 296 301 173 Plus / (Less): Change in NWC 41 (77) 30 49 24 (9) (16) (Less): CapEx (24) (155) (163) (163) (165) (173) (173) Plus: Cash Settlement (tax adj.) -- 53 -- -- -- -- -- Unlevered Free Cash Flow $165 $399 $514 $551 $556 $577 $532 Implied Share Price Implied Terminal Multiple Discount Perpetuity Growth Rate Rate 1.75% 2.13% 2.50% 10.5% $27.75 $29.25 $30.75 11.5% 23.25 24.25 25.50 12.5% 19.50 20.50 21.50 Discount Perpetuity Growth Rate Rate 1.75% 2.13% 2.50% 10.5% 6.3x 6.7x 7.0x 11.5% 5.7x 5.9x 6.2x 12.5% 5.2x 5.4x 5.6x |
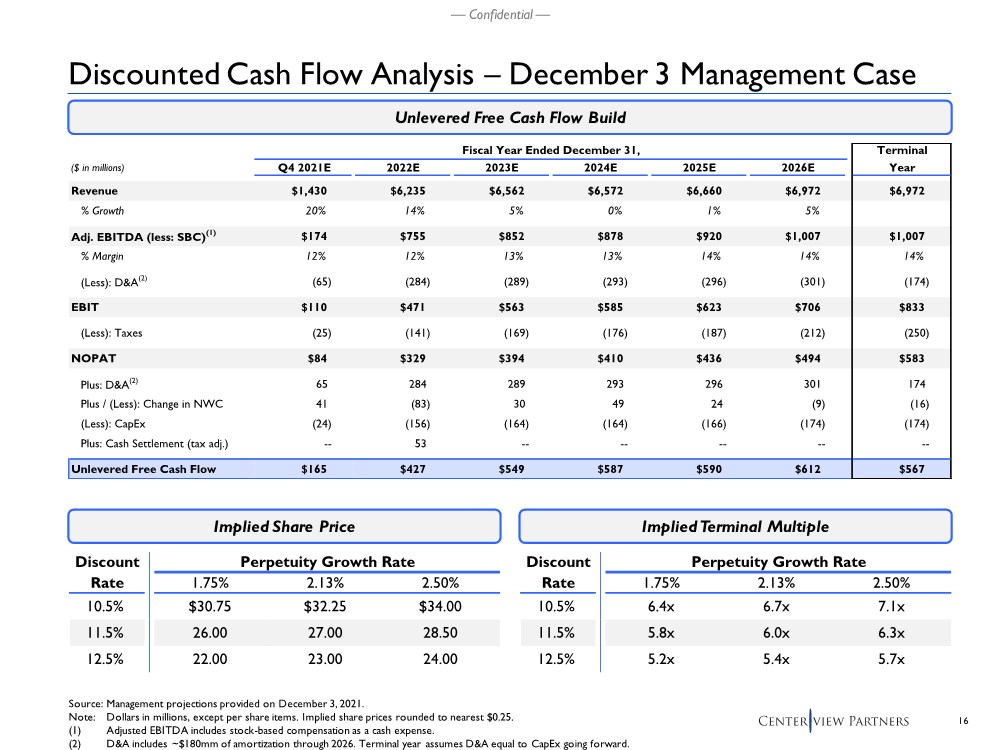
| 16 — Confidential — Discounted Cash Flow Analysis – December 3 Management Case Source: Management projections provided on December 3, 2021. Note: Dollars in millions, except per share items. Implied share prices rounded to nearest $0.25. (1) Adjusted EBITDA includes stock-based compensation as a cash expense. (2) D&A includes ~$180mm of amortization through 2026. Terminal year assumes D&A equal to CapEx going forward. Unlevered Free Cash Flow Build Fiscal Year Ended December 31, Terminal ($ in millions) Q4 2021E 2022E 2023E 2024E 2025E 2026E Year Revenue $1,430 $6,235 $6,562 $6,572 $6,660 $6,972 $6,972 % Growth 20% 14% 5% 0% 1% 5% Adj. EBITDA (less: SBC)(1) $174 $755 $852 $878 $920 $1,007 $1,007 % Margin 12% 12% 13% 13% 14% 14% 14% (Less): D&A(2) (65) (284) (289) (293) (296) (301) (174) EBIT $110 $471 $563 $585 $623 $706 $833 (Less): Taxes (25) (141) (169) (176) (187) (212) (250) NOPAT $84 $329 $394 $410 $436 $494 $583 Plus: D&A(2) 65 284 289 293 296 301 174 Plus / (Less): Change in NWC 41 (83) 30 49 24 (9) (16) (Less): CapEx (24) (156) (164) (164) (166) (174) (174) Plus: Cash Settlement (tax adj.) -- 53 -- -- -- -- -- Unlevered Free Cash Flow $165 $427 $549 $587 $590 $612 $567 Implied Share Price Implied Terminal Multiple Discount Perpetuity Growth Rate Rate 1.75% 2.13% 2.50% 10.5% $30.75 $32.25 $34.00 11.5% 26.00 27.00 28.50 12.5% 22.00 23.00 24.00 Discount Perpetuity Growth Rate Rate 1.75% 2.13% 2.50% 10.5% 6.4x 6.7x 7.1x 11.5% 5.8x 6.0x 6.3x 12.5% 5.2x 5.4x 5.7x |
| — Confidential — Appendix Supplementary Materials |

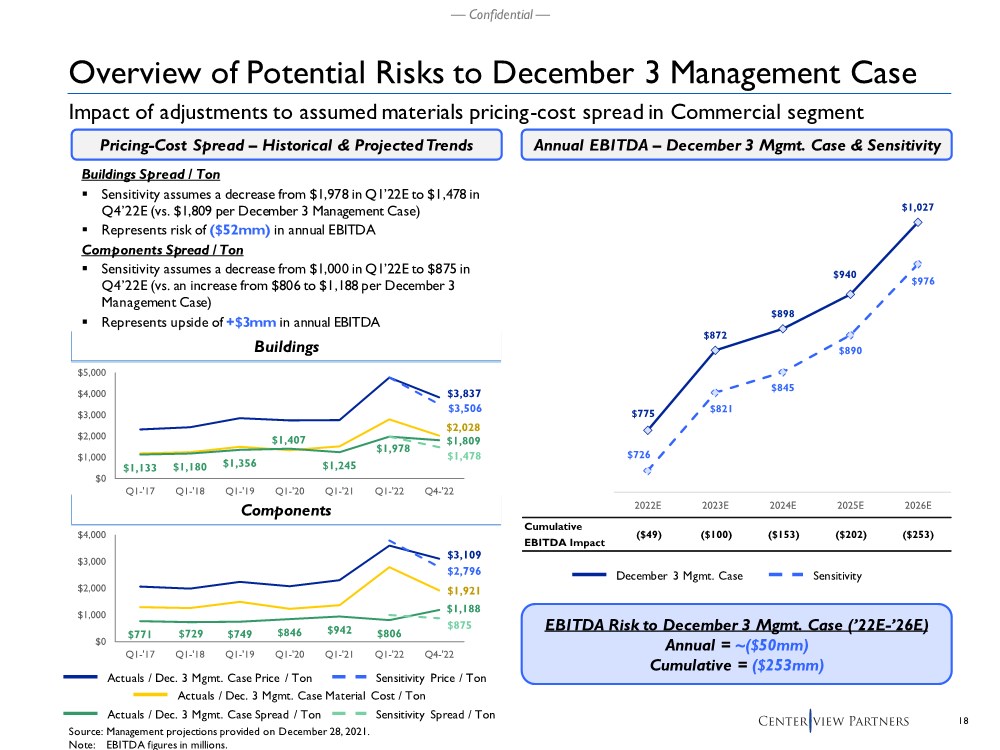
| 18 — Confidential — Components Overview of Potential Risks to December 3 Management Case Source: Management projections provided on December 28, 2021. Note: EBITDA figures in millions. Pricing-Cost Spread – Historical & Projected Trends Buildings Spread / Ton .. Sensitivity assumes a decrease from $1,978 in Q1’22E to $1,478 in Q4’22E (vs. $1,809 per December 3 Management Case) .. Represents risk of ($52mm) in annual EBITDA Components Spread / Ton .. Sensitivity assumes a decrease from $1,000 in Q1’22E to $875 in Q4’22E (vs. an increase from $806 to $1,188 per December 3 Management Case) .. Represents upside of +$3mm in annual EBITDA EBITDA Risk to December 3 Mgmt. Case (’22E-’26E) Annual = ~($50mm) Cumulative = ($253mm) Actuals / Dec. 3 Mgmt. Case Price / Ton Actuals / Dec. 3 Mgmt. Case Material Cost / Ton Sensitivity Price / Ton Actuals / Dec. 3 Mgmt. Case Spread / Ton $3,109 $2,796 $1,921 $771 $729 $749 $846 $942 $806 $1,188 $875 $0 $1,000 $2,000 $3,000 $4,000 Q1-'17 Q1-'18 Q1-'19 Q1-'20 Q1-'21 Q1-'22 Q4-'22 Sensitivity Spread / Ton Impact of adjustments to assumed materials pricing-cost spread in Commercial segment Annual EBITDA – December 3 Mgmt. Case & Sensitivity $3,837 $3,506 $2,028 $1,133 $1,180 $1,356 $1,407 $1,245 $1,978 $1,809 $1,478 $0 $1,000 $2,000 $3,000 $4,000 $5,000 Q1-'17 Q1-'18 Q1-'19 Q1-'20 Q1-'21 Q1-'22 Q4-'22 Buildings December 3 Mgmt. Case Sensitivity Cumulative EBITDA Impact ($49) ($100) ($153) ($202) ($253) $775 $872 $898 $940 $1,027 $726 $821 $845 $890 $976 $700 $800 $900 $1,000 2022E 2023E 2024E 2025E 2026E |
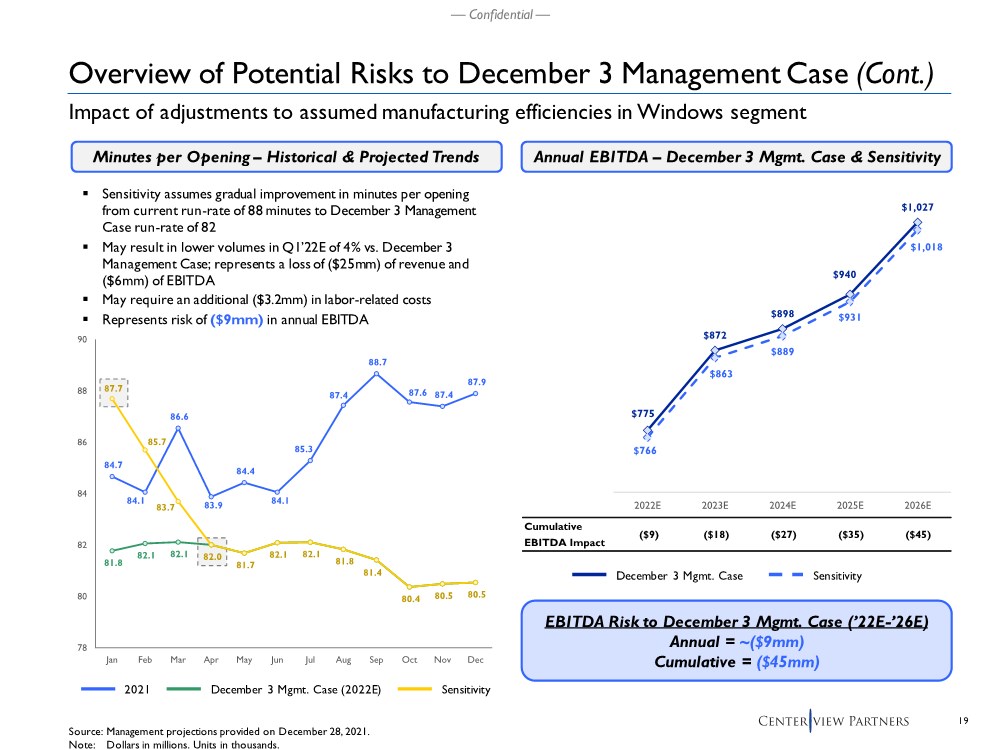
| 19 — Confidential — Overview of Potential Risks to December 3 Management Case (Cont.) Source: Management projections provided on December 28, 2021. Note: Dollars in millions. Units in thousands. .. Sensitivity assumes gradual improvement in minutes per opening from current run-rate of 88 minutes to December 3 Management Case run-rate of 82 .. May result in lower volumes in Q1’22E of 4% vs. December 3 Management Case; represents a loss of ($25mm) of revenue and ($6mm) of EBITDA .. May require an additional ($3.2mm) in labor-related costs .. Represents risk of ($9mm) in annual EBITDA Impact of adjustments to assumed manufacturing efficiencies in Windows segment Minutes per Opening – Historical & Projected Trends Cumulative EBITDA Impact ($9) ($18) ($27) ($35) ($45) $775 $872 $898 $940 $1,027 $766 $863 $889 $931 $1,018 $700 $800 $900 $1,000 2022E 2023E 2024E 2025E 2026E Annual EBITDA – December 3 Mgmt. Case & Sensitivity EBITDA Risk to December 3 Mgmt. Case (’22E-’26E) Annual = ~($9mm) Cumulative = ($45mm) 2021 Sensitivity 84.7 84.1 86.6 83.9 84.4 84.1 85.3 87.4 88.7 87.6 87.4 87.9 81.8 82.1 82.1 87.7 85.7 83.7 82.0 81.7 82.1 82.1 81.8 81.4 80.4 80.5 80.5 78 80 82 84 86 88 90 Jan Feb Mar Apr May Jun Jul Aug Sep Oct Nov Dec December 3 Mgmt. Case (2022E) December 3 Mgmt. Case Sensitivity |
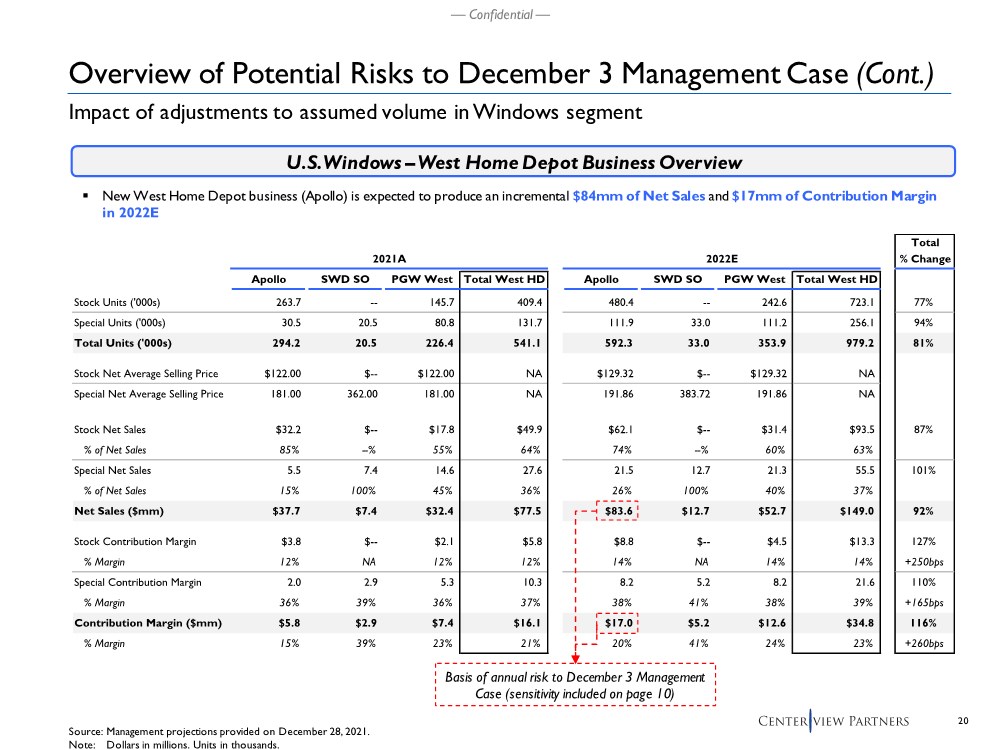
| 20 — Confidential — Source: Management projections provided on December 28, 2021. Note: Dollars in millions. Units in thousands. U.S. Windows –West Home Depot Business Overview .. New West Home Depot business (Apollo) is expected to produce an incremental $84mm of Net Sales and $17mm of Contribution Margin in 2022E Total 2021A 2022E % Change Apollo SWD SO PGW West Total West HD Apollo SWD SO PGW West Total West HD Stock Units ('000s) 263.7 -- 145.7 409.4 480.4 -- 242.6 723.1 77% Special Units ('000s) 30.5 20.5 80.8 131.7 111.9 33.0 111.2 256.1 94% Total Units ('000s) 294.2 20.5 226.4 541.1 592.3 33.0 353.9 979.2 81% Stock Net Average Selling Price $122.00 $-- $122.00 NA $129.32 $-- $129.32 NA Special Net Average Selling Price 181.00 362.00 181.00 NA 191.86 383.72 191.86 NA Stock Net Sales $32.2 $-- $17.8 $49.9 $62.1 $-- $31.4 $93.5 87% % of Net Sales 85% --% 55% 64% 74% --% 60% 63% Special Net Sales 5.5 7.4 14.6 27.6 21.5 12.7 21.3 55.5 101% % of Net Sales 15% 100% 45% 36% 26% 100% 40% 37% Net Sales ($mm) $37.7 $7.4 $32.4 $77.5 $83.6 $12.7 $52.7 $149.0 92% Stock Contribution Margin $3.8 $-- $2.1 $5.8 $8.8 $-- $4.5 $13.3 127% % Margin 12% NA 12% 12% 14% NA 14% 14% +250bps Special Contribution Margin 2.0 2.9 5.3 10.3 8.2 5.2 8.2 21.6 110% % Margin 36% 39% 36% 37% 38% 41% 38% 39% +165bps Contribution Margin ($mm) $5.8 $2.9 $7.4 $16.1 $17.0 $5.2 $12.6 $34.8 116% % Margin 15% 39% 23% 21% 20% 41% 24% 23% +260bps Impact of adjustments to assumed volume in Windows segment Overview of Potential Risks to December 3 Management Case (Cont.) Basis of annual risk to December 3 Management Case (sensitivity included on page 10) |
| 21 — Confidential — NTM EV / EBITDA Multiple RETURN Current (6.1x) 3-Yr RETURN Average (6.9x) Illustr. Cost Undiscounted Future Share Price (2022E) of Equity $27.40 $32.55 14.0% $24.10 $28.60 16.0% 23.65 28.10 18.0% 23.25 27.65 Illustrative Future Share Price Present Value of Illustrative Future Share Price(3) Source: FactSet as of January 6, 2022 and Management projections provided on December 3, 2021. Note: Diluted shares in millions. Future share prices as of year-end. Share prices rounded to nearest $0.05. (1) NTM multiple based on RETURN 3-year average. (2) Reflects Wall Street consensus. (3) Illustrative future share price discounted at 18.0% based on RETURN’s cost of equity per RETURN observed figures. Present Value of YE 2022 Share Price Sensitivity RETURN December 3 Mgmt. Case at Current 6.1x NTM Multiple RETURN December 3 Mgmt. Case at 3-Year Avg. 6.9x NTM Multiple(1) Memo: NTM EBITDA $758 $872 $898 Net Debt 2,410 1,860 1,376 Dil. Shares 127.8 127.8 127.8 Future Share Price Breakeven Analysis – December 3 Management Case Analysis represents illustrative future share price assuming a range of EV / NTM EBITDA multiples applied to RETURN December 3 Management Case projections (2) $23.25 $23.30 $17.59 $27.65 $27.15 $10 $20 $30 $40 Current 2022 2023 $27.40 $32.40 $17.59 $32.55 $37.75 $10 $20 $30 $40 Current 2022 2023 |

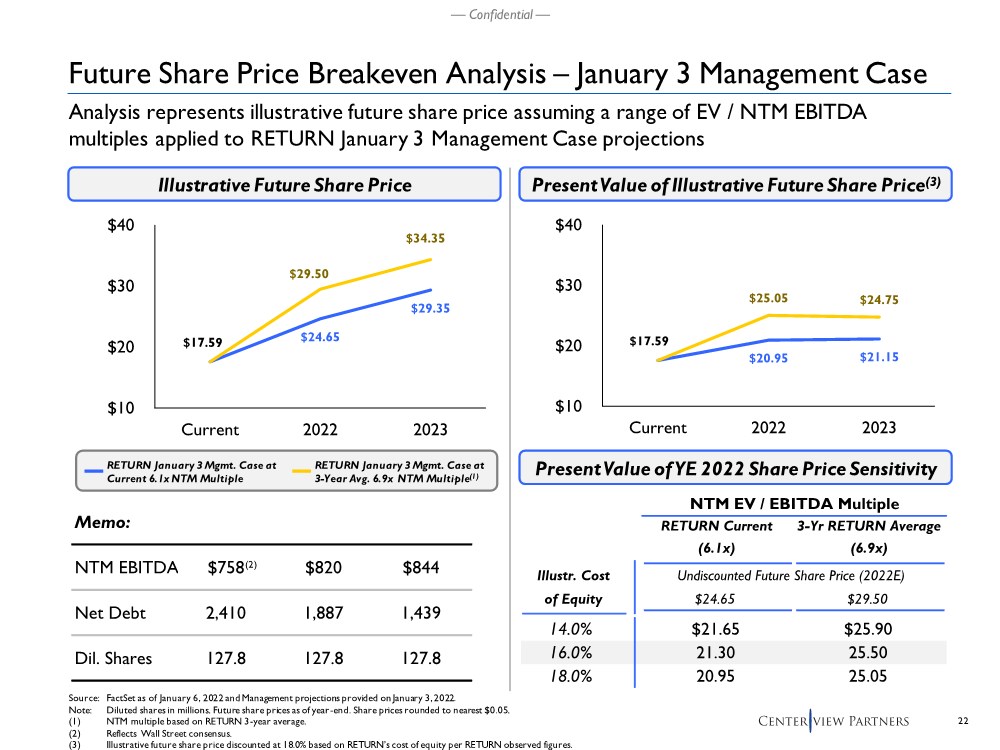
| 22 — Confidential — NTM EV / EBITDA Multiple RETURN Current (6.1x) 3-Yr RETURN Average (6.9x) Illustr. Cost Undiscounted Future Share Price (2022E) of Equity $24.65 $29.50 14.0% $21.65 $25.90 16.0% 21.30 25.50 18.0% 20.95 25.05 $24.65 $29.35 $17.59 $29.50 $34.35 $10 $20 $30 $40 Current 2022 2023 $20.95 $21.15 $17.59 $25.05 $24.75 $10 $20 $30 $40 Current 2022 2023 Illustrative Future Share Price Present Value of Illustrative Future Share Price(3) Source: FactSet as of January 6, 2022 and Management projections provided on January 3, 2022. Note: Diluted shares in millions. Future share prices as of year-end. Share prices rounded to nearest $0.05. (1) NTM multiple based on RETURN 3-year average. (2) Reflects Wall Street consensus. (3) Illustrative future share price discounted at 18.0% based on RETURN’s cost of equity per RETURN observed figures. Present Value of YE 2022 Share Price Sensitivity RETURN January 3 Mgmt. Case at Current 6.1x NTM Multiple RETURN January 3 Mgmt. Case at 3-Year Avg. 6.9x NTM Multiple(1) Memo: NTM EBITDA $758 $820 $844 Net Debt 2,410 1,887 1,439 Dil. Shares 127.8 127.8 127.8 Future Share Price Breakeven Analysis – January 3 Management Case Analysis represents illustrative future share price assuming a range of EV / NTM EBITDA multiples applied to RETURN January 3 Management Case projections (2) |
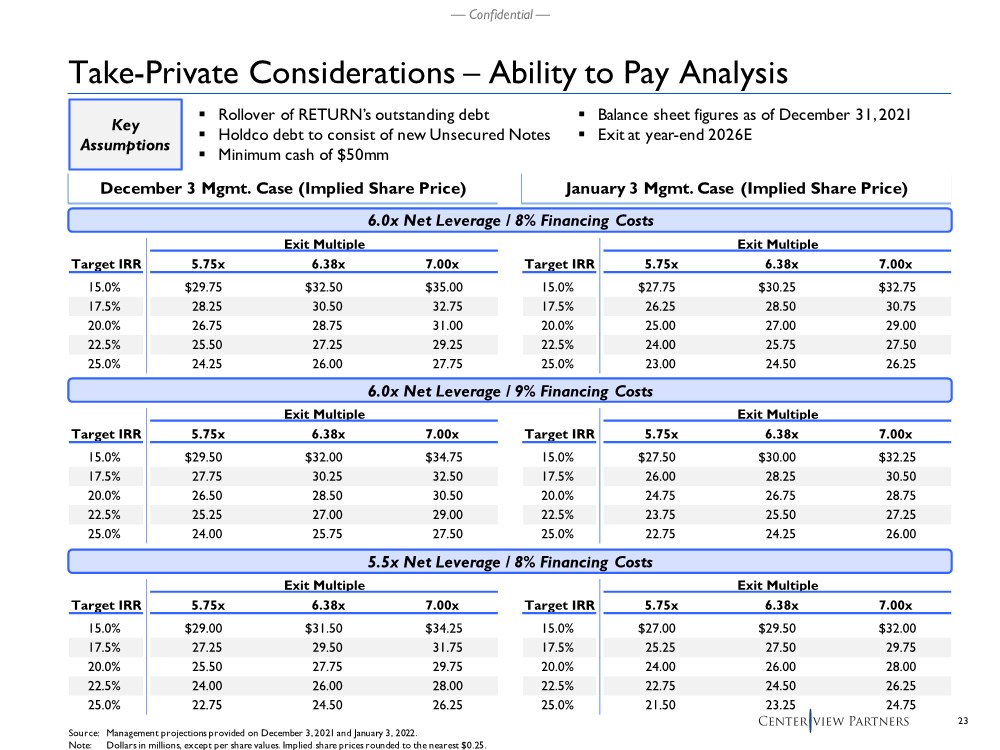
| 23 — Confidential — Take-Private Considerations – Ability to Pay Analysis .. Rollover of RETURN’s outstanding debt .. Holdco debt to consist of new Unsecured Notes .. Minimum cash of $50mm January 3 Mgmt. Case (Implied Share Price) December 3 Mgmt. Case (Implied Share Price) Exit Multiple Target IRR 5.75x 6.38x 7.00x 15.0% $27.75 $30.25 $32.75 17.5% 26.25 28.50 30.75 20.0% 25.00 27.00 29.00 22.5% 24.00 25.75 27.50 25.0% 23.00 24.50 26.25 Source: Management projections provided on December 3, 2021 and January 3, 2022. Note: Dollars in millions, except per share values. Implied share prices rounded to the nearest $0.25. Exit Multiple Target IRR 5.75x 6.38x 7.00x 15.0% $27.00 $29.50 $32.00 17.5% 25.25 27.50 29.75 20.0% 24.00 26.00 28.00 22.5% 22.75 24.50 26.25 25.0% 21.50 23.25 24.75 Exit Multiple Target IRR 5.75x 6.38x 7.00x 15.0% $27.50 $30.00 $32.25 17.5% 26.00 28.25 30.50 20.0% 24.75 26.75 28.75 22.5% 23.75 25.50 27.25 25.0% 22.75 24.25 26.00 6.0x Net Leverage / 8% Financing Costs Exit Multiple Target IRR 5.75x 6.38x 7.00x 15.0% $29.75 $32.50 $35.00 17.5% 28.25 30.50 32.75 20.0% 26.75 28.75 31.00 22.5% 25.50 27.25 29.25 25.0% 24.25 26.00 27.75 5.5x Net Leverage / 8% Financing Costs Exit Multiple Target IRR 5.75x 6.38x 7.00x 15.0% $29.00 $31.50 $34.25 17.5% 27.25 29.50 31.75 20.0% 25.50 27.75 29.75 22.5% 24.00 26.00 28.00 25.0% 22.75 24.50 26.25 6.0x Net Leverage / 9% Financing Costs Exit Multiple Target IRR 5.75x 6.38x 7.00x 15.0% $29.50 $32.00 $34.75 17.5% 27.75 30.25 32.50 20.0% 26.50 28.50 30.50 22.5% 25.25 27.00 29.00 25.0% 24.00 25.75 27.50 Key Assumptions .. Balance sheet figures as of December 31, 2021 .. Exit at year-end 2026E |
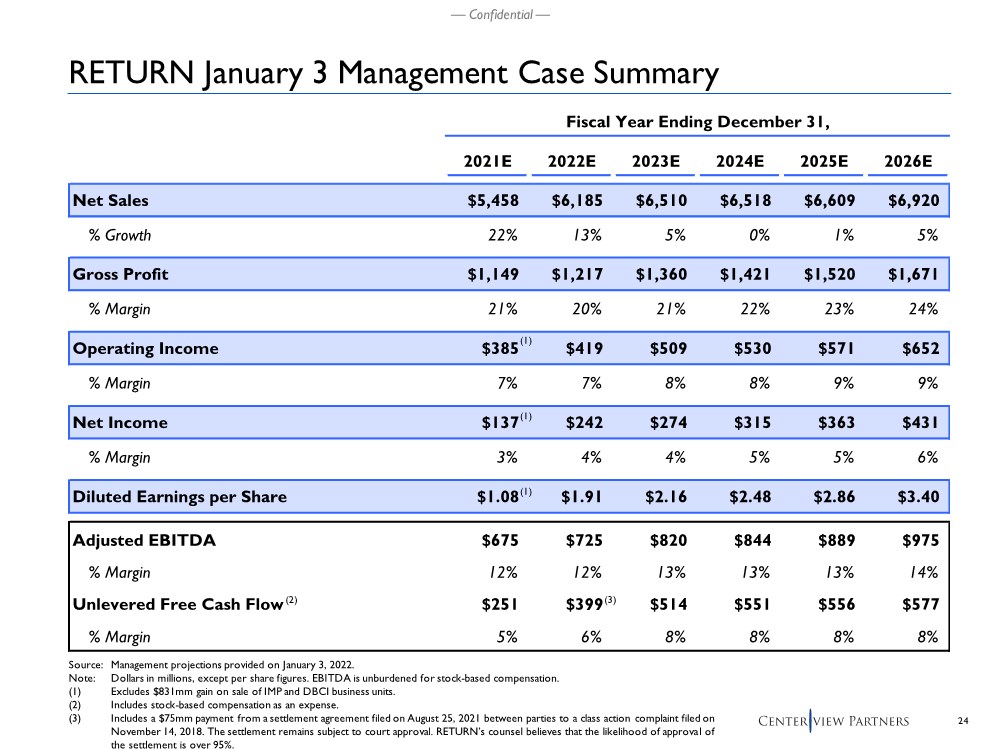
| 24 — Confidential — Fiscal Year Ending December 31, 2021E 2022E 2023E 2024E 2025E 2026E Net Sales $5,458 $6,185 $6,510 $6,518 $6,609 $6,920 % Growth 22% 13% 5% 0% 1% 5% Gross Profit $1,149 $1,217 $1,360 $1,421 $1,520 $1,671 % Margin 21% 20% 21% 22% 23% 24% Operating Income $385 $419 $509 $530 $571 $652 % Margin 7% 7% 8% 8% 9% 9% Net Income $137 $242 $274 $315 $363 $431 % Margin 3% 4% 4% 5% 5% 6% Diluted Earnings per Share $1.08 $1.91 $2.16 $2.48 $2.86 $3.40 Adjusted EBITDA $675 $725 $820 $844 $889 $975 % Margin 12% 12% 13% 13% 13% 14% Unlevered Free Cash Flow $251 $399 $514 $551 $556 $577 % Margin 5% 6% 8% 8% 8% 8% Source: Management projections provided on January 3, 2022. Note: Dollars in millions, except per share figures. EBITDA is unburdened for stock-based compensation. (1) Excludes $831mm gain on sale of IMP and DBCI business units. (2) Includes stock-based compensation as an expense. (3) Includes a $75mm payment from a settlement agreement filed on August 25, 2021 between parties to a class action complaint filed on November 14, 2018. The settlement remains subject to court approval. RETURN’s counsel believes that the likelihood of approval of the settlement is over 95%. (2) (3) RETURN January 3 Management Case Summary (1) (1) (1) |
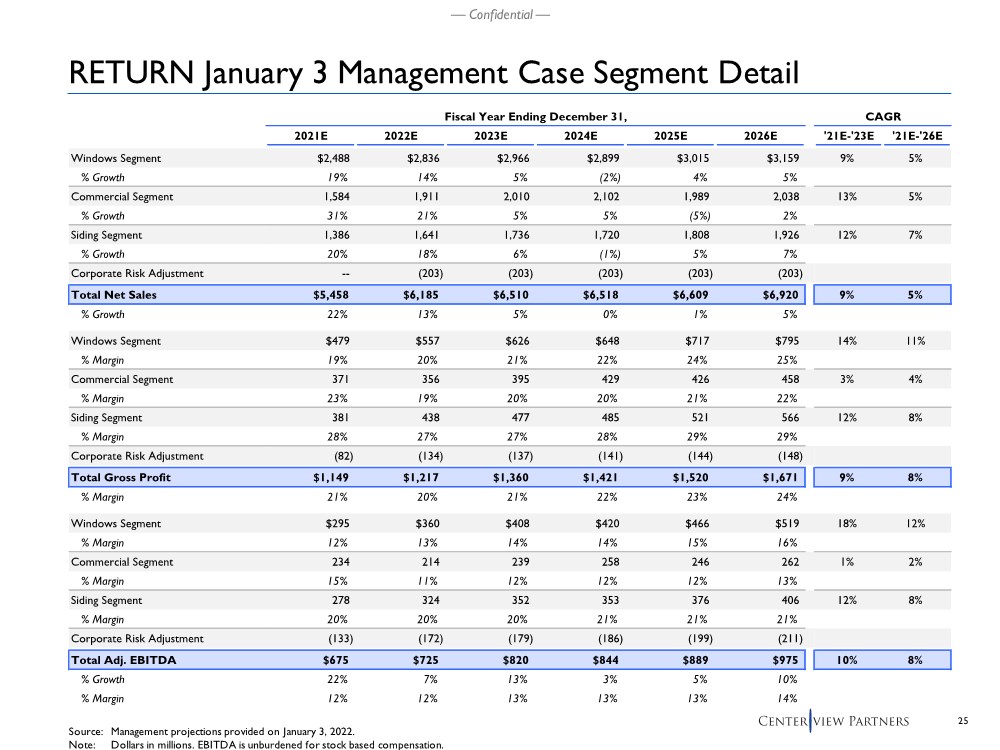
| 25 — Confidential — Source: Management projections provided on January 3, 2022. Note: Dollars in millions. EBITDA is unburdened for stock based compensation. RETURN January 3 Management Case Segment Detail Fiscal Year Ending December 31, CAGR 2021E 2022E 2023E 2024E 2025E 2026E '21E-'23E '21E-'26E Windows Segment $2,488 $2,836 $2,966 $2,899 $3,015 $3,159 9% 5% % Growth 19% 14% 5% (2%) 4% 5% Commercial Segment 1,584 1,911 2,010 2,102 1,989 2,038 13% 5% % Growth 31% 21% 5% 5% (5%) 2% Siding Segment 1,386 1,641 1,736 1,720 1,808 1,926 12% 7% % Growth 20% 18% 6% (1%) 5% 7% Corporate Risk Adjustment -- (203) (203) (203) (203) (203) Total Net Sales $5,458 $6,185 $6,510 $6,518 $6,609 $6,920 9% 5% % Growth 22% 13% 5% 0% 1% 5% Windows Segment $479 $557 $626 $648 $717 $795 14% 11% % Margin 19% 20% 21% 22% 24% 25% Commercial Segment 371 356 395 429 426 458 3% 4% % Margin 23% 19% 20% 20% 21% 22% Siding Segment 381 438 477 485 521 566 12% 8% % Margin 28% 27% 27% 28% 29% 29% Corporate Risk Adjustment (82) (134) (137) (141) (144) (148) Total Gross Profit $1,149 $1,217 $1,360 $1,421 $1,520 $1,671 9% 8% % Margin 21% 20% 21% 22% 23% 24% Windows Segment $295 $360 $408 $420 $466 $519 18% 12% % Margin 12% 13% 14% 14% 15% 16% Commercial Segment 234 214 239 258 246 262 1% 2% % Margin 15% 11% 12% 12% 12% 13% Siding Segment 278 324 352 353 376 406 12% 8% % Margin 20% 20% 20% 21% 21% 21% Corporate Risk Adjustment (133) (172) (179) (186) (199) (211) Total Adj. EBITDA $675 $725 $820 $844 $889 $975 10% 8% % Growth 22% 7% 13% 3% 5% 10% % Margin 12% 12% 13% 13% 13% 14% |
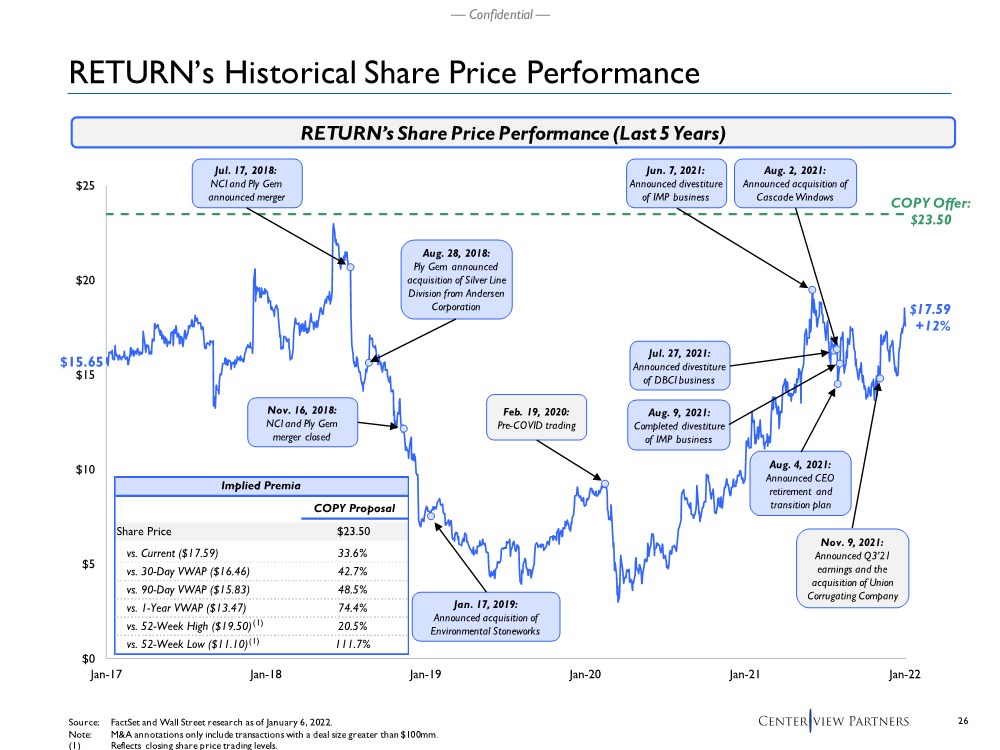
| 26 — Confidential — $0 $5 $10 $15 $20 $25 Jan-17 Jan-18 Jan-19 Jan-20 Jan-21 Jan-22 RETURN’s Historical Share Price Performance Source: FactSet and Wall Street research as of January 6, 2022. Note: M&A annotations only include transactions with a deal size greater than $100mm. (1) Reflects closing share price trading levels. $15.65 $17.59 +12% Jul. 17, 2018: NCI and Ply Gem announced merger Nov. 16, 2018: NCI and Ply Gem merger closed Jan. 17, 2019: Announced acquisition of Environmental Stoneworks Jul. 27, 2021: Announced divestiture of DBCI business Aug. 2, 2021: Announced acquisition of Cascade Windows Aug. 4, 2021: Announced CEO retirement and transition plan Aug. 9, 2021: Completed divestiture of IMP business RETURN’s Share Price Performance (Last 5 Years) Aug. 28, 2018: Ply Gem announced acquisition of Silver Line Division from Andersen Corporation Jun. 7, 2021: Announced divestiture of IMP business Nov. 9, 2021: Announced Q3’21 earnings and the acquisition of Union Corrugating Company Implied Premia COPY Proposal Share Price $23.50 vs. Current ($17.59) 33.6% vs. 30-Day VWAP ($16.46) 42.7% vs. 90-Day VWAP ($15.83) 48.5% vs. 1-Year VWAP ($13.47) 74.4% vs. 52-Week High ($19.50) 20.5% vs. 52-Week Low ($11.10) 111.7% (1) (1) COPY Offer: $23.50 Feb. 19, 2020: Pre-COVID trading |
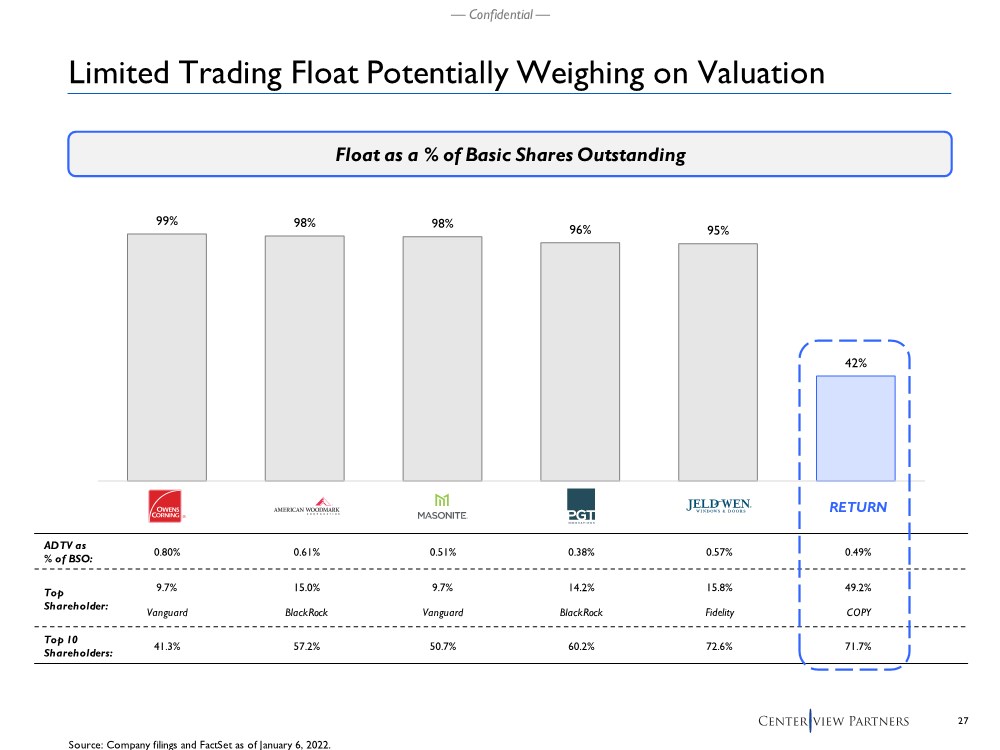
| 27 — Confidential — Limited Trading Float Potentially Weighing on Valuation Source: Company filings and FactSet as of January 6, 2022. Float as a % of Basic Shares Outstanding 99% 98% 98% 96% 95% 42% OC AMWD DOOR PGTI JELD CNR ADTV as % of BSO: Top Shareholder: Top 10 Shareholders: 0.80% 0.61% 0.51% 0.38% 0.57% 0.49% 9.7% 15.0% 9.7% 14.2% 15.8% 49.2% Vanguard BlackRock Vanguard BlackRock Fidelity COPY 41.3% 57.2% 50.7% 60.2% 72.6% 71.7% RETURN |
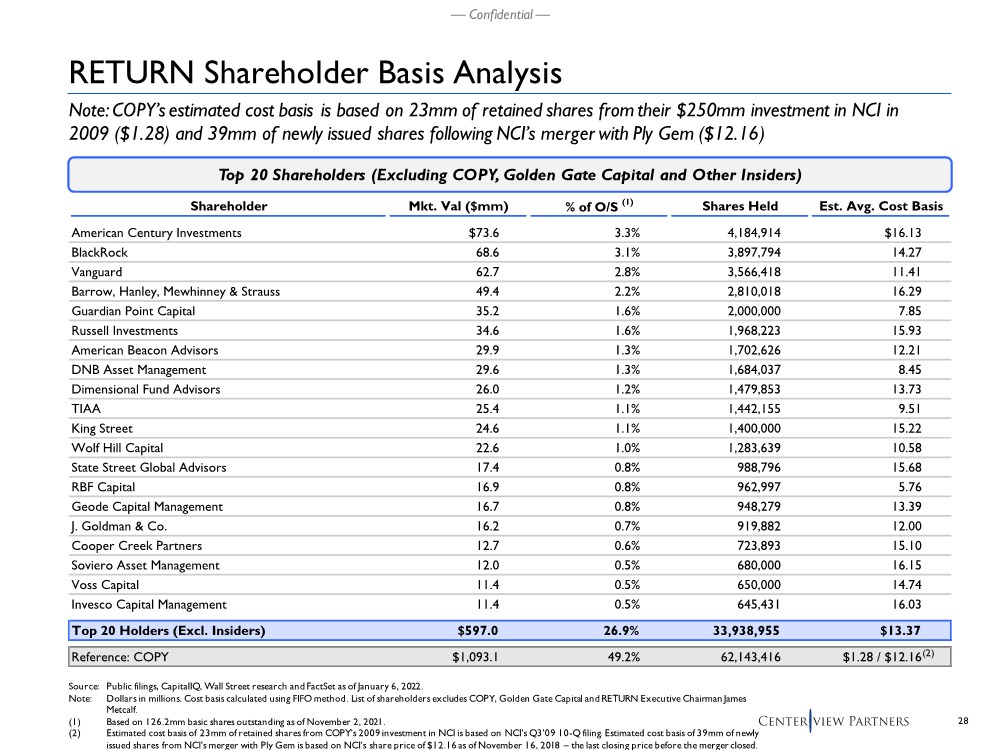
| 28 — Confidential — RETURN Shareholder Basis Analysis Source: Public filings, CapitalIQ, Wall Street research and FactSet as of January 6, 2022. Note: Dollars in millions. Cost basis calculated using FIFO method. List of shareholders excludes COPY, Golden Gate Capital and RETURN Executive Chairman James Metcalf. (1) Based on 126.2mm basic shares outstanding as of November 2, 2021. (2) Estimated cost basis of 23mm of retained shares from COPY’s 2009 investment in NCI is based on NCI’s Q3’09 10-Q filing. Estimated cost basis of 39mm of newly issued shares from NCI’s merger with Ply Gem is based on NCI’s share price of $12.16 as of November 16, 2018 – the last closing price before the merger closed. Shareholder Mkt. Val ($mm) % of O/S (1) Shares Held Est. Avg. Cost Basis American Century Investments $73.6 3.3% 4,184,914 $16.13 BlackRock 68.6 3.1% 3,897,794 14.27 Vanguard 62.7 2.8% 3,566,418 11.41 Barrow, Hanley, Mewhinney & Strauss 49.4 2.2% 2,810,018 16.29 Guardian Point Capital 35.2 1.6% 2,000,000 7.85 Russell Investments 34.6 1.6% 1,968,223 15.93 American Beacon Advisors 29.9 1.3% 1,702,626 12.21 DNB Asset Management 29.6 1.3% 1,684,037 8.45 Dimensional Fund Advisors 26.0 1.2% 1,479,853 13.73 TIAA 25.4 1.1% 1,442,155 9.51 King Street 24.6 1.1% 1,400,000 15.22 Wolf Hill Capital 22.6 1.0% 1,283,639 10.58 State Street Global Advisors 17.4 0.8% 988,796 15.68 RBF Capital 16.9 0.8% 962,997 5.76 Geode Capital Management 16.7 0.8% 948,279 13.39 J. Goldman & Co. 16.2 0.7% 919,882 12.00 Cooper Creek Partners 12.7 0.6% 723,893 15.10 Soviero Asset Management 12.0 0.5% 680,000 16.15 Voss Capital 11.4 0.5% 650,000 14.74 Invesco Capital Management 11.4 0.5% 645,431 16.03 Top 20 Holders (Excl. Insiders) $597.0 26.9% 33,938,955 $13.37 Reference: COPY $1,093.1 49.2% 62,143,416 $1.28 / $12.16 Top 20 Shareholders (Excluding COPY, Golden Gate Capital and Other Insiders) (2) Note: COPY’s estimated cost basis is based on 23mm of retained shares from their $250mm investment in NCI in 2009 ($1.28) and 39mm of newly issued shares following NCI’s merger with Ply Gem ($12.16) |
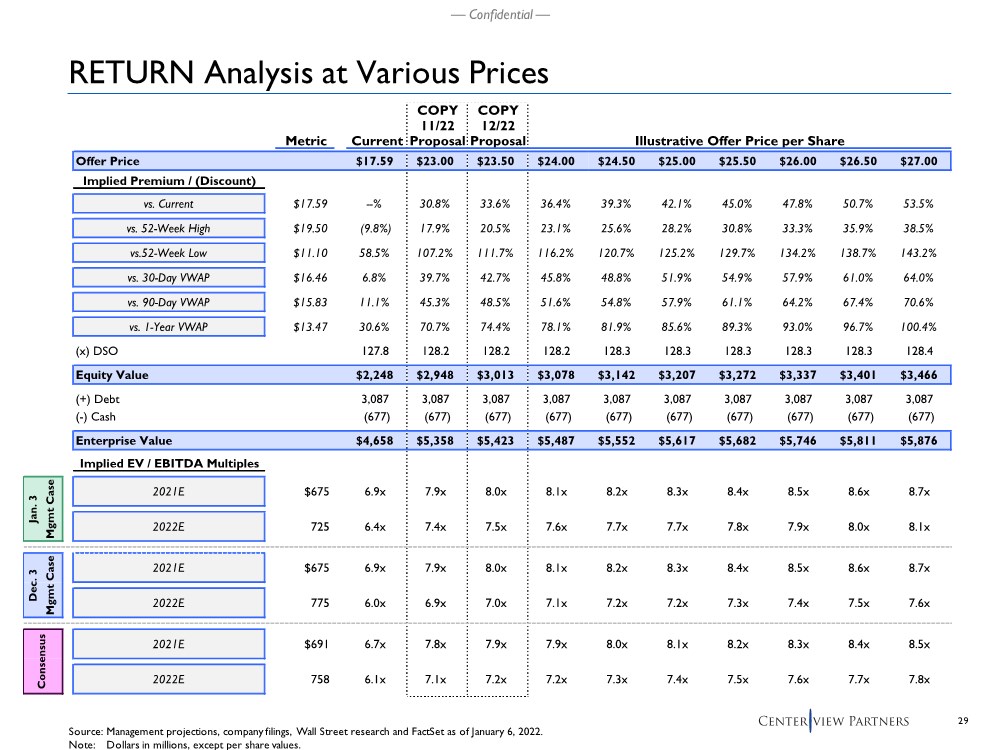
| 29 — Confidential — RETURN Analysis at Various Prices Source: Management projections, company filings, Wall Street research and FactSet as of January 6, 2022. Note: Dollars in millions, except per share values. COPY COPY 11/22 12/22 Metric Current Proposal Proposal Illustrative Offer Price per Share Offer Price $17.59 $23.00 $23.50 $24.00 $24.50 $25.00 $25.50 $26.00 $26.50 $27.00 Implied Premium / (Discount) vs. Current $17.59 --% 30.8% 33.6% 36.4% 39.3% 42.1% 45.0% 47.8% 50.7% 53.5% vs. 52-Week High $19.50 (9.8%) 17.9% 20.5% 23.1% 25.6% 28.2% 30.8% 33.3% 35.9% 38.5% vs.52-Week Low $11.10 58.5% 107.2% 111.7% 116.2% 120.7% 125.2% 129.7% 134.2% 138.7% 143.2% vs. 30-Day VWAP $16.46 6.8% 39.7% 42.7% 45.8% 48.8% 51.9% 54.9% 57.9% 61.0% 64.0% vs. 90-Day VWAP $15.83 11.1% 45.3% 48.5% 51.6% 54.8% 57.9% 61.1% 64.2% 67.4% 70.6% vs. 1-Year VWAP $13.47 30.6% 70.7% 74.4% 78.1% 81.9% 85.6% 89.3% 93.0% 96.7% 100.4% (x) DSO 127.8 128.2 128.2 128.2 128.3 128.3 128.3 128.3 128.3 128.4 Equity Value $2,248 $2,948 $3,013 $3,078 $3,142 $3,207 $3,272 $3,337 $3,401 $3,466 (+) Debt 3,087 3,087 3,087 3,087 3,087 3,087 3,087 3,087 3,087 3,087 (-) Cash (677) (677) (677) (677) (677) (677) (677) (677) (677) (677) Enterprise Value $4,658 $5,358 $5,423 $5,487 $5,552 $5,617 $5,682 $5,746 $5,811 $5,876 Implied EV / EBITDA Multiples 2021E $675 6.9x 7.9x 8.0x 8.1x 8.2x 8.3x 8.4x 8.5x 8.6x 8.7x 2022E 725 6.4x 7.4x 7.5x 7.6x 7.7x 7.7x 7.8x 7.9x 8.0x 8.1x 2021E $675 6.9x 7.9x 8.0x 8.1x 8.2x 8.3x 8.4x 8.5x 8.6x 8.7x 2022E 775 6.0x 6.9x 7.0x 7.1x 7.2x 7.2x 7.3x 7.4x 7.5x 7.6x 2021E $691 6.7x 7.8x 7.9x 7.9x 8.0x 8.1x 8.2x 8.3x 8.4x 8.5x 2022E 758 6.1x 7.1x 7.2x 7.2x 7.3x 7.4x 7.5x 7.6x 7.7x 7.8x Consensus Jan. 3 Mgmt Case Dec. 3 Mgmt Case |
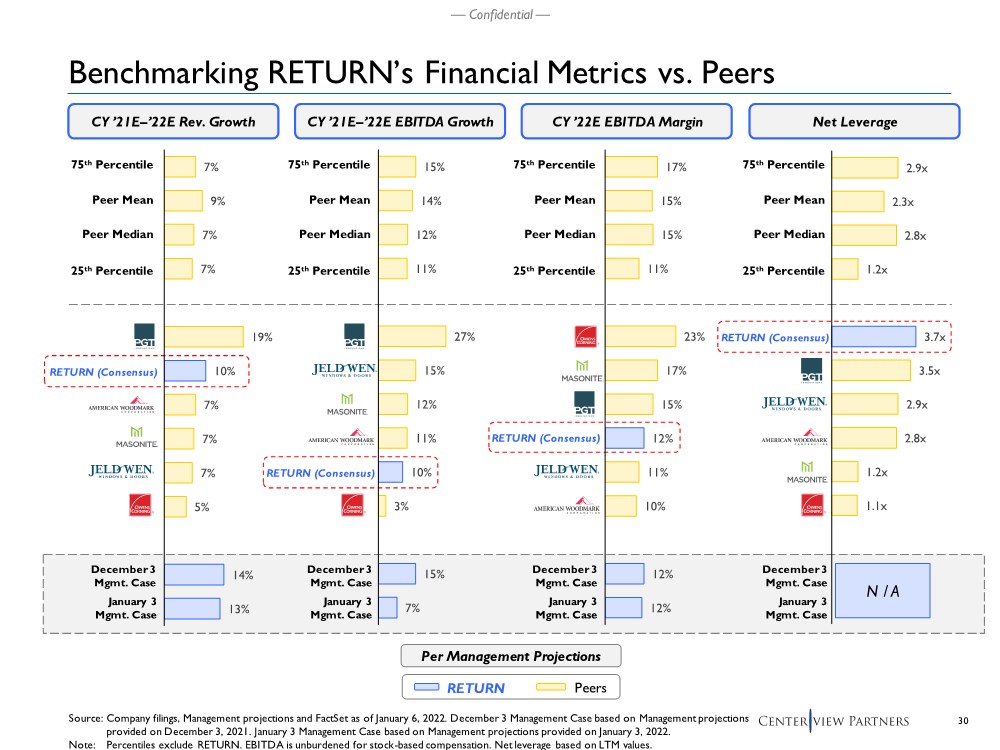
| 30 — Confidential — CY ’21E–’22E Rev. Growth CY ’22E EBITDA Margin CY ’21E–’22E EBITDA Growth Benchmarking RETURN’s Financial Metrics vs. Peers Source: Company filings, Management projections and FactSet as of January 6, 2022. December 3 Management Case based on Management projections provided on December 3, 2021. January 3 Management Case based on Management projections provided on January 3, 2022. Note: Percentiles exclude RETURN. EBITDA is unburdened for stock-based compensation. Net leverage based on LTM values. January 3 Mgmt. Case Peers RETURN Per Management Projections RETURN (Consensus) RETURN (Consensus) RETURN (Consensus) Peer Mean 25th Percentile Peer Median 75th Percentile Net Leverage RETURN (Consensus) Peer Mean 25th Percentile Peer Median 75th Percentile Peer Mean 25th Percentile Peer Median 75th Percentile Peer Mean 25th Percentile Peer Median 75th Percentile January 3 Mgmt. Case January 3 Mgmt. Case 2.9x 2.3x 2.8x 1.2x 3.7x 3.5x 2.9x 2.8x 1.2x 1.1x 17% 15% 15% 11% 23% 17% 15% 12% 11% 10% 12% 12% 15% 14% 12% 11% 27% 15% 12% 11% 10% 3% 15% 7% 7% 9% 7% 7% 19% 10% 7% 7% 7% 5% 14% 13% N / A January 3 Mgmt. Case December 3 Mgmt. Case December 3 Mgmt. Case December 3 Mgmt. Case December 3 Mgmt. Case |
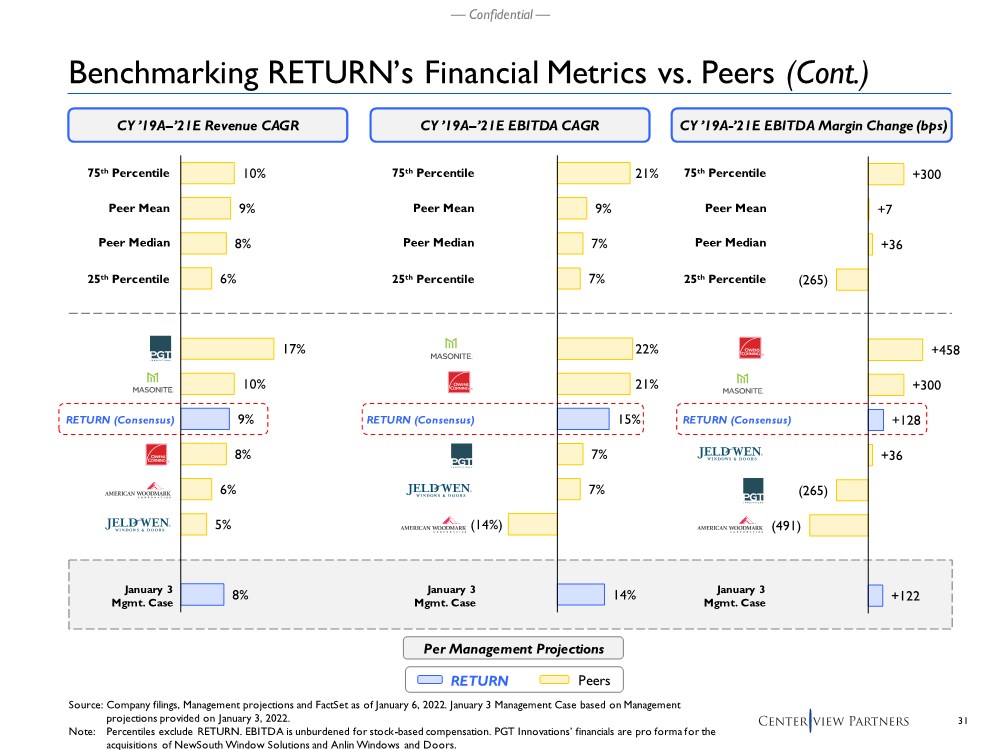
| 31 — Confidential — CY ’19A–’21E Revenue CAGR CY ’19A-’21E EBITDA Margin Change (bps) CY ’19A–’21E EBITDA CAGR Benchmarking RETURN’s Financial Metrics vs. Peers (Cont.) Source: Company filings, Management projections and FactSet as of January 6, 2022. January 3 Management Case based on Management projections provided on January 3, 2022. Note: Percentiles exclude RETURN. EBITDA is unburdened for stock-based compensation. PGT Innovations’ financials are pro forma for the acquisitions of NewSouth Window Solutions and Anlin Windows and Doors. January 3 Mgmt. Case Peers RETURN Per Management Projections RETURN (Consensus) RETURN (Consensus) RETURN (Consensus) Peer Mean 25th Percentile Peer Median 75th Percentile Peer Mean 25th Percentile Peer Median 75th Percentile Peer Mean 25th Percentile Peer Median 75th Percentile January 3 Mgmt. Case January 3 Mgmt. Case 10% 9% 8% 6% 17% 10% 9% 8% 6% 5% 8% 21% 9% 7% 7% 22% 21% 15% 7% 7% (14%) 14% +300 +7 +36 (265) +458 +300 +128 +36 (265) (491) +122 |
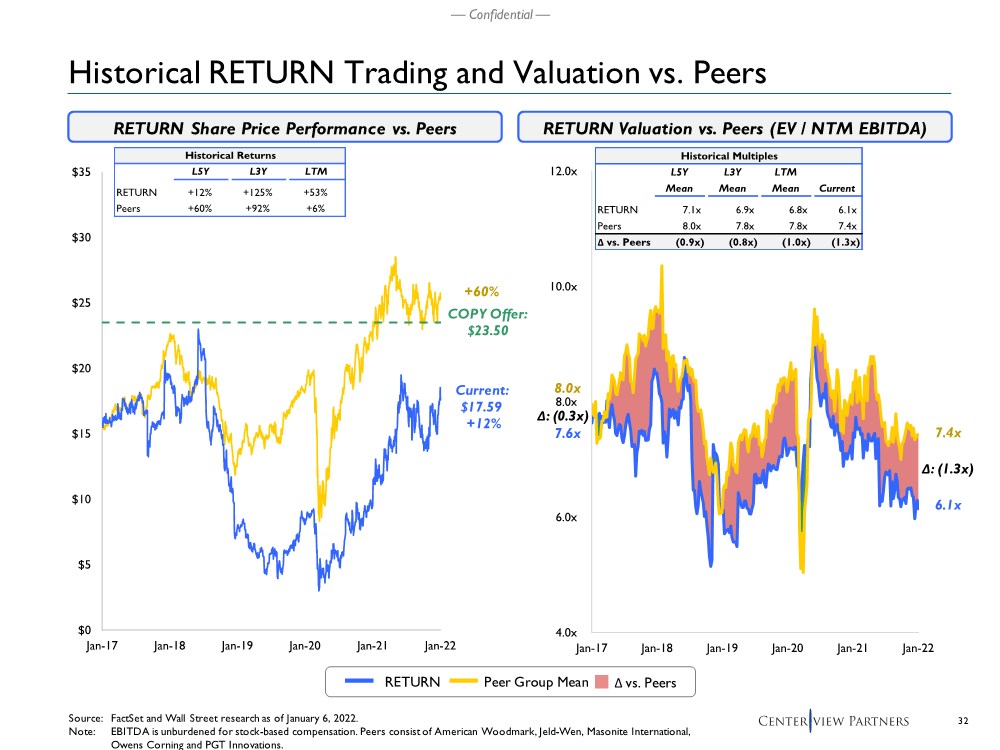
| 32 — Confidential — Historical Multiples L5Y L3Y LTM Mean Mean Mean Current RETURN 7.1x 6.9x 6.8x 6.1x Peers 8.0x 7.8x 7.8x 7.4x Δ vs. Peers (0.9x) (0.8x) (1.0x) (1.3x) 4.0x 6.0x 8.0x 10.0x 12.0x Jan-17 Jan-18 Jan-19 Jan-20 Jan-21 Jan-22 $0 $5 $10 $15 $20 $25 $30 $35 Jan-17 Jan-18 Jan-19 Jan-20 Jan-21 Jan-22 Historical RETURN Trading and Valuation vs. Peers Source: FactSet and Wall Street research as of January 6, 2022. Note: EBITDA is unburdened for stock-based compensation. Peers consist of American Woodmark, Jeld-Wen, Masonite International, Owens Corning and PGT Innovations. RETURN Valuation vs. Peers (EV / NTM EBITDA) 6.1x 7.4x 7.6x 8.0x Current: $17.59 +12% COPY Offer: $23.50 +60% RETURN Share Price Performance vs. Peers Peer Group Mean RETURN Δ vs. Peers Δ: (0.3x) Δ: (1.3x) Historical Returns L5Y L3Y LTM RETURN +12% +125% +53% Peers +60% +92% +6% |
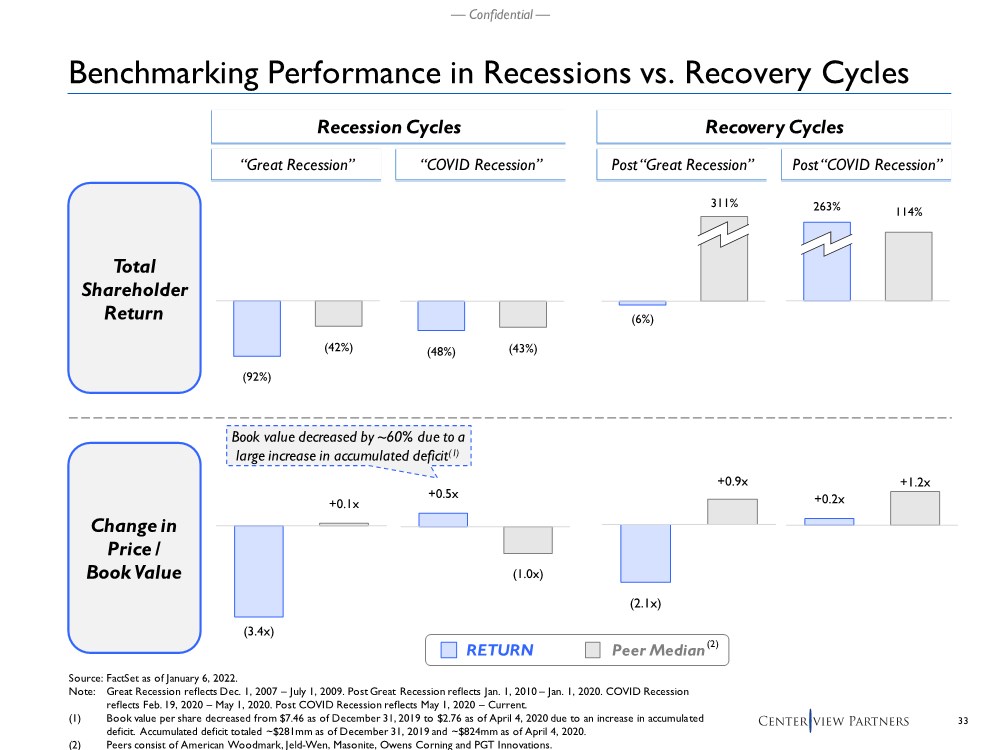
| 33 — Confidential — +0.2x +1.2x (3.4x) +0.1x +0.5x (1.0x) (2.1x) +0.9x 263% 114% (6%) 311% (48%) (43%) (92%) (42%) Benchmarking Performance in Recessions vs. Recovery Cycles Source: FactSet as of January 6, 2022. Note: Great Recession reflects Dec. 1, 2007 – July 1, 2009. Post Great Recession reflects Jan. 1, 2010 – Jan. 1, 2020. COVID Recession reflects Feb. 19, 2020 – May 1, 2020. Post COVID Recession reflects May 1, 2020 – Current. (1) Book value per share decreased from $7.46 as of December 31, 2019 to $2.76 as of April 4, 2020 due to an increase in accumulated deficit. Accumulated deficit totaled ~$281mm as of December 31, 2019 and ~$824mm as of April 4, 2020. (2) Peers consist of American Woodmark, Jeld-Wen, Masonite, Owens Corning and PGT Innovations. Total Shareholder Return Change in Price / Book Value Recession Cycles Recovery Cycles “Great Recession” “COVID Recession” Post “Great Recession” Post “COVID Recession” RETURN Peer Median(2) Book value decreased by ~60% due to a large increase in accumulated deficit(1) |
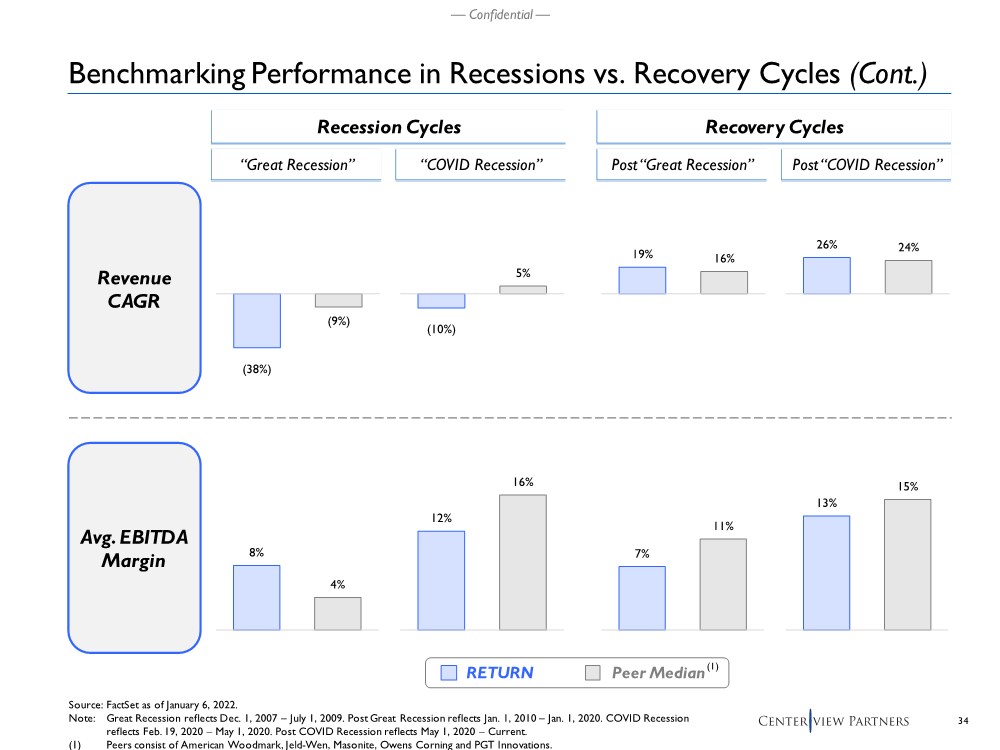
| 34 — Confidential — 26% 24% 19% 16% (10%) 5% (38%) (9%) Benchmarking Performance in Recessions vs. Recovery Cycles (Cont.) Revenue CAGR Source: FactSet as of January 6, 2022. Note: Great Recession reflects Dec. 1, 2007 – July 1, 2009. Post Great Recession reflects Jan. 1, 2010 – Jan. 1, 2020. COVID Recession reflects Feb. 19, 2020 – May 1, 2020. Post COVID Recession reflects May 1, 2020 – Current. (1) Peers consist of American Woodmark, Jeld-Wen, Masonite, Owens Corning and PGT Innovations. RETURN Peer Median(1) 7% 11% 8% 4% 12% 16% 13% 15% Avg. EBITDA Margin Recession Cycles Recovery Cycles “Great Recession” “COVID Recession” Post “Great Recession” Post “COVID Recession” |
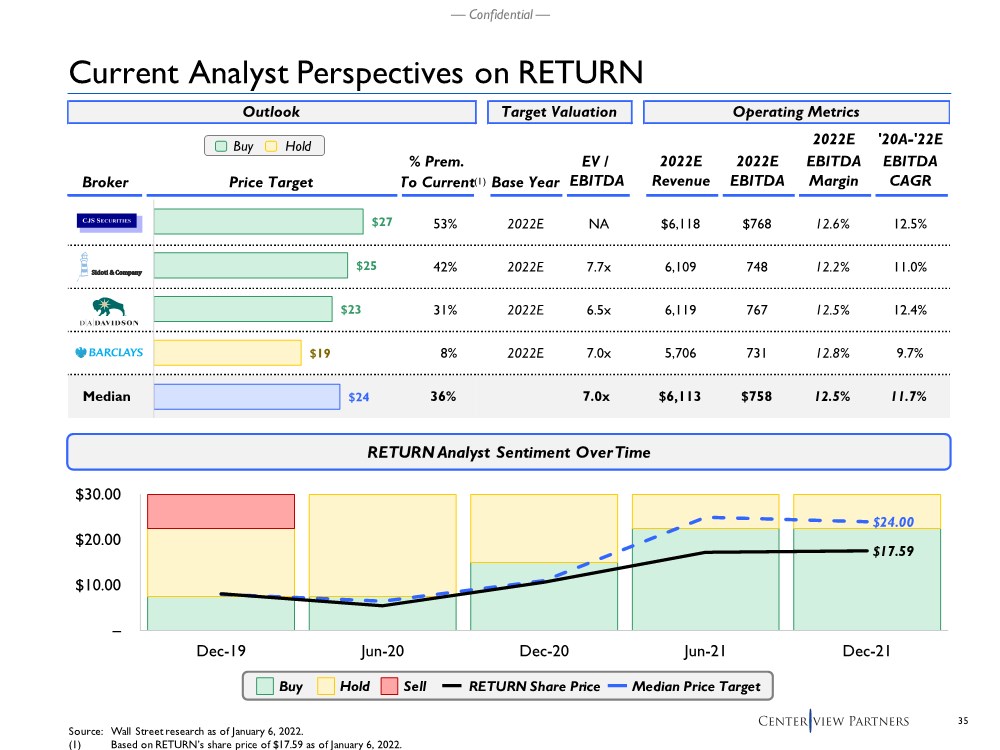
| 35 — Confidential — – $10.00 $20.00 $30.00 Dec-19 Jun-20 Dec-20 Jun-21 Dec-21 Outlook Target Valuation Operating Metrics 2022E '20A-'22E % Prem. EV / 2022E 2022E EBITDA EBITDA Broker Price Target To Current Base Year EBITDA Revenue EBITDA Margin CAGR 53% 2022E NA $6,118 $768 12.6% 12.5% 42% 2022E 7.7x 6,109 748 12.2% 11.0% 31% 2022E 6.5x 6,119 767 12.5% 12.4% 8% 2022E 7.0x 5,706 731 12.8% 9.7% Median 36% 7.0x $6,113 $758 12.5% 11.7% $27 $25 $23 $19 $24 Current Analyst Perspectives on RETURN RETURN Analyst Sentiment Over Time Buy Hold Buy Hold Sell RETURN Share Price Median Price Target $24.00 $17.59 (1) Source: Wall Street research as of January 6, 2022. (1) Based on RETURN’s share price of $17.59 as of January 6, 2022. |
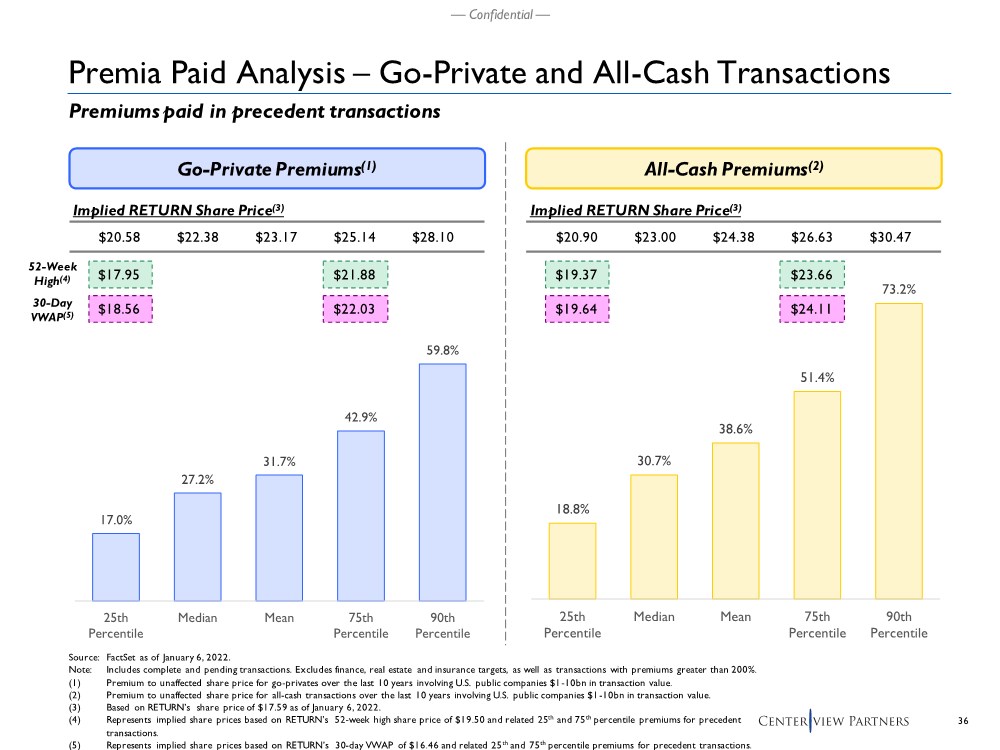
| 36 — Confidential — Premia Paid Analysis – Go-Private and All-Cash Transactions Premiums paid in precedent transactions Source: FactSet as of January 6, 2022. Note: Includes complete and pending transactions. Excludes finance, real estate and insurance targets, as well as transactions with premiums greater than 200%. (1) Premium to unaffected share price for go-privates over the last 10 years involving U.S. public companies $1-10bn in transaction value. (2) Premium to unaffected share price for all-cash transactions over the last 10 years involving U.S. public companies $1-10bn in transaction value. (3) Based on RETURN’s share price of $17.59 as of January 6, 2022. (4) Represents implied share prices based on RETURN’s 52-week high share price of $19.50 and related 25th and 75th percentile premiums for precedent transactions. (5) Represents implied share prices based on RETURN’s 30-day VWAP of $16.46 and related 25th and 75th percentile premiums for precedent transactions. Go-Private Premiums(1) All-Cash Premiums(2) Implied RETURN Share Price(3) $20.58 $22.38 $23.17 $25.14 $28.10 Implied RETURN Share Price(3) $20.90 $23.00 $24.38 $26.63 $30.47 17.0% 27.2% 31.7% 42.9% 59.8% 25th Percentile Median Mean 75th Percentile 90th Percentile 18.8% 30.7% 38.6% 51.4% 73.2% 25th Percentile Median Mean 75th Percentile 90th Percentile $17.95 $21.88 $18.56 $22.03 $23.66 $24.11 $19.37 $19.64 52-Week High(4) 30-Day VWAP(5) |
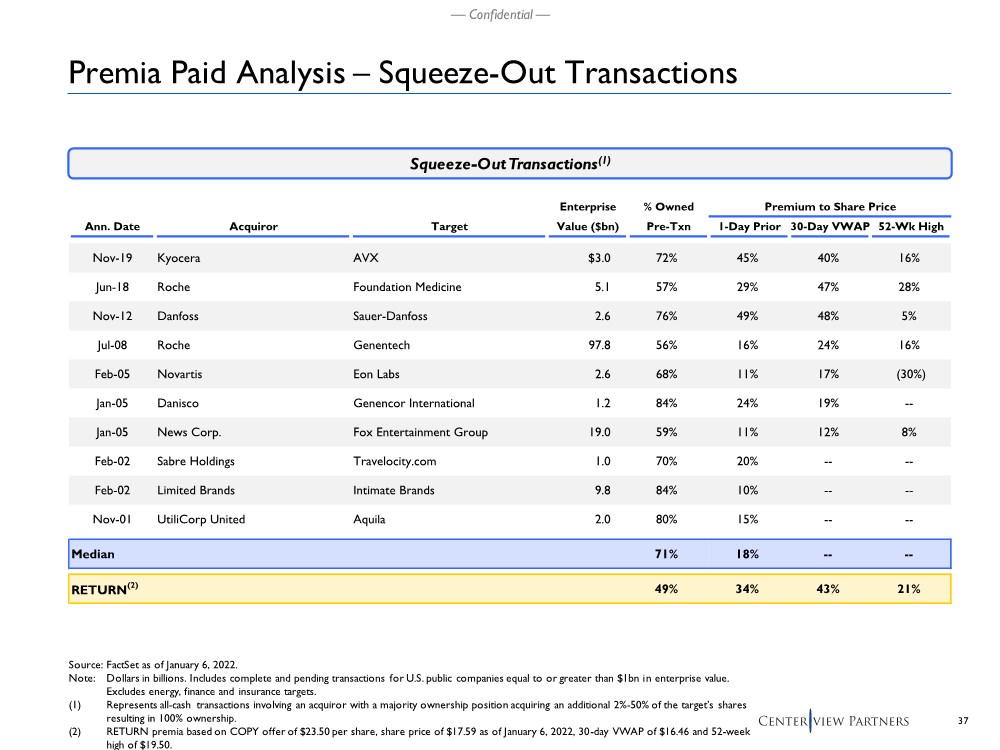
| 37 — Confidential — Source: FactSet as of January 6, 2022. Note: Dollars in billions. Includes complete and pending transactions for U.S. public companies equal to or greater than $1bn in enterprise value. Excludes energy, finance and insurance targets. (1) Represents all-cash transactions involving an acquiror with a majority ownership position acquiring an additional 2%-50% of the target’s shares resulting in 100% ownership. (2) RETURN premia based on COPY offer of $23.50 per share, share price of $17.59 as of January 6, 2022, 30-day VWAP of $16.46 and 52-week high of $19.50. Squeeze-Out Transactions(1) Enterprise % Owned Premium to Share Price Ann. Date Acquiror Target Value ($bn) Pre-Txn 1-Day Prior 30-Day VWAP 52-Wk High Nov-19 Kyocera AVX $3.0 72% 45% 40% 16% Jun-18 Roche Foundation Medicine 5.1 57% 29% 47% 28% Nov-12 Danfoss Sauer-Danfoss 2.6 76% 49% 48% 5% Jul-08 Roche Genentech 97.8 56% 16% 24% 16% Feb-05 Novartis Eon Labs 2.6 68% 11% 17% (30%) Jan-05 Danisco Genencor International 1.2 84% 24% 19% -- Jan-05 News Corp. Fox Entertainment Group 19.0 59% 11% 12% 8% Feb-02 Sabre Holdings Travelocity.com 1.0 70% 20% -- -- Feb-02 Limited Brands Intimate Brands 9.8 84% 10% -- -- Nov-01 UtiliCorp United Aquila 2.0 80% 15% -- -- Median 71% 18% -- -- RETURN(2) 49% 34% 43% 21% Premia Paid Analysis – Squeeze-Out Transactions |
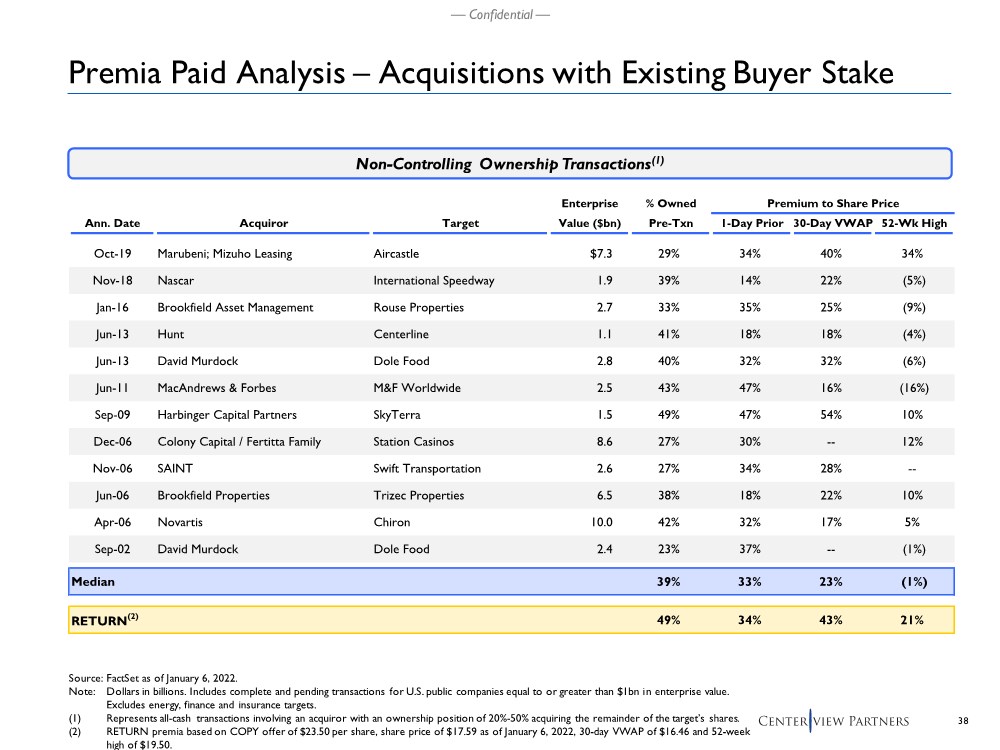
| 38 — Confidential — Source: FactSet as of January 6, 2022. Note: Dollars in billions. Includes complete and pending transactions for U.S. public companies equal to or greater than $1bn in enterprise value. Excludes energy, finance and insurance targets. (1) Represents all-cash transactions involving an acquiror with an ownership position of 20%-50% acquiring the remainder of the target’s shares. (2) RETURN premia based on COPY offer of $23.50 per share, share price of $17.59 as of January 6, 2022, 30-day VWAP of $16.46 and 52-week high of $19.50. Non-Controlling Ownership Transactions(1) Premia Paid Analysis – Acquisitions with Existing Buyer Stake Enterprise % Owned Premium to Share Price Ann. Date Acquiror Target Value ($bn) Pre-Txn 1-Day Prior 30-Day VWAP 52-Wk High Oct-19 Marubeni; Mizuho Leasing Aircastle $7.3 29% 34% 40% 34% Nov-18 Nascar International Speedway 1.9 39% 14% 22% (5%) Jan-16 Brookfield Asset Management Rouse Properties 2.7 33% 35% 25% (9%) Jun-13 Hunt Centerline 1.1 41% 18% 18% (4%) Jun-13 David Murdock Dole Food 2.8 40% 32% 32% (6%) Jun-11 MacAndrews & Forbes M&F Worldwide 2.5 43% 47% 16% (16%) Sep-09 Harbinger Capital Partners SkyTerra 1.5 49% 47% 54% 10% Dec-06 Colony Capital / Fertitta Family Station Casinos 8.6 27% 30% -- 12% Nov-06 SAINT Swift Transportation 2.6 27% 34% 28% -- Jun-06 Brookfield Properties Trizec Properties 6.5 38% 18% 22% 10% Apr-06 Novartis Chiron 10.0 42% 32% 17% 5% Sep-02 David Murdock Dole Food 2.4 23% 37% -- (1%) Median 39% 33% 23% (1%) RETURN(2) 49% 34% 43% 21% |
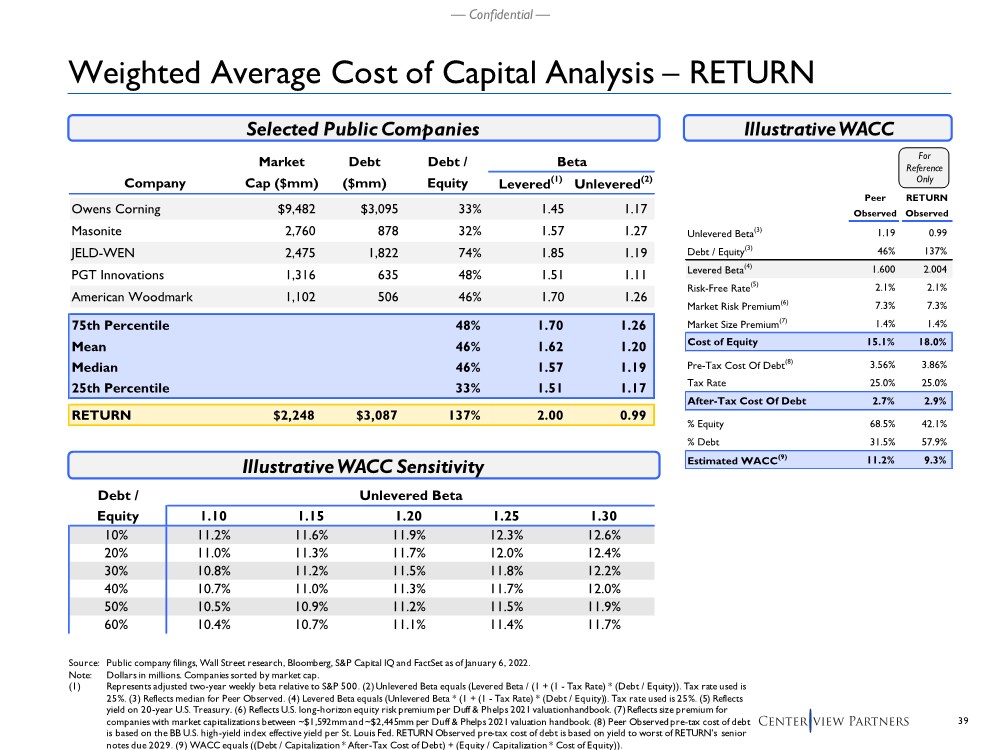
| 39 — Confidential — Debt / Unlevered Beta Equity 1.10 1.15 1.20 1.25 1.30 10% 11.2% 11.6% 11.9% 12.3% 12.6% 20% 11.0% 11.3% 11.7% 12.0% 12.4% 30% 10.8% 11.2% 11.5% 11.8% 12.2% 40% 10.7% 11.0% 11.3% 11.7% 12.0% 50% 10.5% 10.9% 11.2% 11.5% 11.9% 60% 10.4% 10.7% 11.1% 11.4% 11.7% Weighted Average Cost of Capital Analysis – RETURN Selected Public Companies Illustrative WACC IllustrativeWACC Sensitivity Source: Public company filings, Wall Street research, Bloomberg, S&P Capital IQ and FactSet as of January 6, 2022. Note: Dollars in millions. Companies sorted by market cap. (1) Represents adjusted two-year weekly beta relative to S&P 500. (2) Unlevered Beta equals (Levered Beta / (1 + (1 - Tax Rate) * (Debt / Equity)). Tax rate used is 25%. (3) Reflects median for Peer Observed. (4) Levered Beta equals (Unlevered Beta * (1 + (1 - Tax Rate) * (Debt / Equity)). Tax rate used is 25%. (5) Reflects yield on 20-year U.S. Treasury. (6) Reflects U.S. long-horizon equity risk premium per Duff & Phelps 2021 valuation handbook. (7) Reflects size premium for companies with market capitalizations between ~$1,592mm and ~$2,445mm per Duff & Phelps 2021 valuation handbook. (8) Peer Observed pre-tax cost of debt is based on the BB U.S. high-yield index effective yield per St. Louis Fed. RETURN Observed pre-tax cost of debt is based on yield to worst of RETURN’s senior notes due 2029. (9) WACC equals ((Debt / Capitalization * After-Tax Cost of Debt) + (Equity / Capitalization * Cost of Equity)). Market Debt Debt / Beta Company Cap ($mm) ($mm) Equity Levered(1) Unlevered(2) Owens Corning $9,482 $3,095 33% 1.45 1.17 Masonite 2,760 878 32% 1.57 1.27 JELD-WEN 2,475 1,822 74% 1.85 1.19 PGT Innovations 1,316 635 48% 1.51 1.11 American Woodmark 1,102 506 46% 1.70 1.26 75th Percentile 48% 1.70 1.26 Mean 46% 1.62 1.20 Median 46% 1.57 1.19 25th Percentile 33% 1.51 1.17 RETURN $2,248 $3,087 137% 2.00 0.99 Peer RETURN Observed Observed Unlevered Beta(3) 1.19 0.99 Debt / Equity(3) 46% 137% Levered Beta(4) 1.600 2.004 Risk-Free Rate(5) 2.1% 2.1% Market Risk Premium(6) 7.3% 7.3% Market Size Premium(7) 1.4% 1.4% Cost of Equity 15.1% 18.0% Pre-Tax Cost Of Debt(8) 3.56% 3.86% Tax Rate 25.0% 25.0% After-Tax Cost Of Debt 2.7% 2.9% % Equity 68.5% 42.1% % Debt 31.5% 57.9% Estimated WACC(9) 11.2% 9.3% For Reference Only |