| — Confidential — February 9, 2022 Presentation to the Special Committee Project RETURN |
| 1 — Confidential — Disclaimer This presentation has been prepared by Centerview Partners LLC (“Centerview”) for use solely by the management and Special Committee of RETURN, Inc.(“RETURN”) in connection with its evaluation of a proposed transaction involving RETURN and for no other purpose. The information contained herein is based upon information supplied by or on behalf of RETURN and publicly available information, and portions of the information contained herein may be based upon statements, estimates and forecasts provided by RETURN. Centerview has relied upon the accuracy and completeness of the foregoing information, and has not assumed any responsibility for any independent verification of such information or for any independent evaluation or appraisal of any of the assets or liabilities (contingent or otherwise) of RETURN or any other entity, or concerning the solvency or fair value of RETURN or any other entity. With respect to financial forecasts, Centerview has assumed that such forecasts have been reasonably prepared on bases reflecting the best currently available estimates and judgments of the management of RETURN as to the future financial performance of RETURN, and at your direction Centerview has relied upon such forecasts, as provided by RETURN’s management, with respect to RETURN. Centerview assumes no responsibility for and expresses no view as to such forecasts or the assumptions on which they are based. The information set forth herein is based upon economic, monetary, market and other conditions as in effect on, and the information made available to us as of, the date hereof, unless indicated otherwise and Centerview assumes no obligation to update or otherwise revise these materials. The financial analysis in this presentation is complex and is not necessarily susceptible to a partial analysis or summary description. In performing this financial analysis, Centerview has considered the results of its analysis as a whole and did not necessarily attribute a particular weight to any particular portion of the analysis considered. Furthermore, selecting any portion of Centerview’s analysis, without considering the analysis as a whole, would create an incomplete view of the process underlying its financial analysis. Centerview may have deemed various assumptions more or less probable than other assumptions, so the reference ranges resulting from any particular portion of the analysis described above should not be taken to be Centerview’s view of the actual value of RETURN. These materials and the information contained herein are confidential, were not prepared with a view toward public disclosure, and may not be disclosed publicly or made available to third parties without the prior written consent of Centerview. These materials and any other advice, written or oral, rendered by Centerview are intended solely for the benefit and use of the management and Special Committee of RETURN (in its capacity as such) in its consideration of the proposed transaction, and are not for the benefit of, and do not convey any rights or remedies for any holder of securities of RETURN or any other person. Centerview will not be responsible for and has not provided any tax, accounting, actuarial, legal or other specialist advice. These materials are not intended to provide the sole basis for evaluating the proposed transaction, and this presentation does not represent a fairness opinion, recommendation, valuation or opinion of any kind, and is necessarily incomplete and should be viewed solely in conjunction with the oral presentation provided by Centerview. |
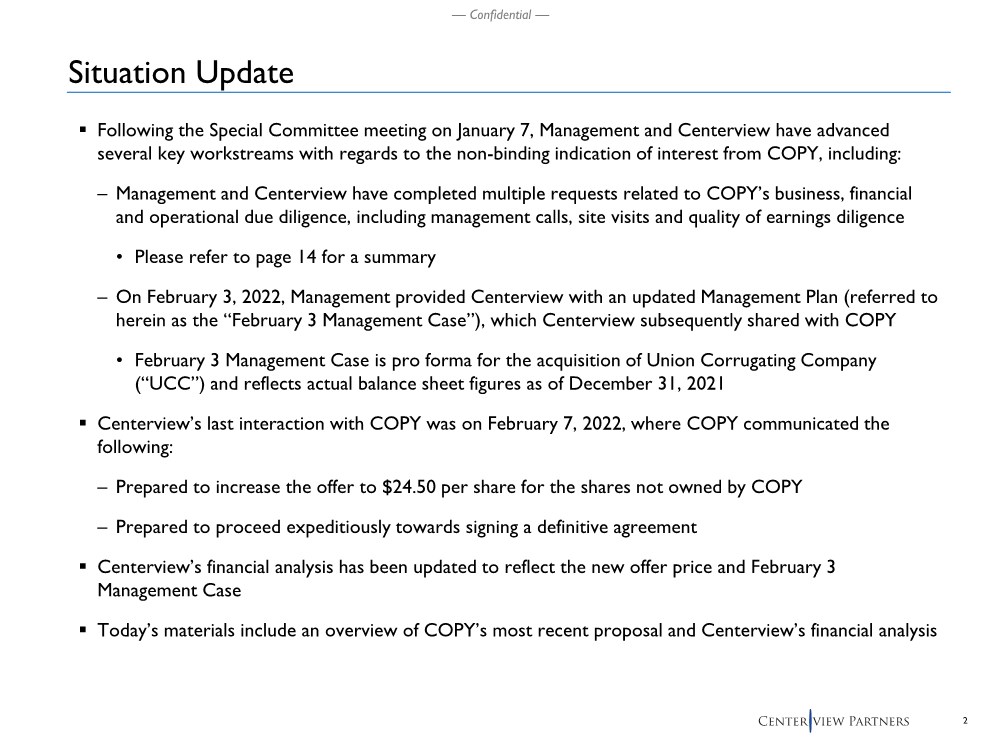
| 2 — Confidential — Situation Update .. Following the Special Committee meeting on January 7, Management and Centerview have advanced several key workstreams with regards to the non-binding indication of interest from COPY, including: – Management and Centerview have completed multiple requests related to COPY’s business, financial and operational due diligence, including management calls, site visits and quality of earnings diligence • Please refer to page 14 for a summary – On February 3, 2022, Management provided Centerview with an updated Management Plan (referred to herein as the “February 3 Management Case”), which Centerview subsequently shared with COPY • February 3 Management Case is pro forma for the acquisition of Union Corrugating Company (“UCC”) and reflects actual balance sheet figures as of December 31, 2021 .. Centerview’s last interaction with COPY was on February 7, 2022, where COPY communicated the following: – Prepared to increase the offer to $24.50 per share for the shares not owned by COPY – Prepared to proceed expeditiously towards signing a definitive agreement .. Centerview’s financial analysis has been updated to reflect the new offer price and February 3 Management Case .. Today’s materials include an overview of COPY’s most recent proposal and Centerview’s financial analysis |
| 3 — Confidential — Table of Contents Section 1 ........................................................................................ Recap of COPY’s 2/7/22 Proposal Section 2 ....................................................... Centerview’s Updated Preliminary Financial Analysis Appendix ....................................................................................................... Supplementary Materials |
| — Confidential — Recap of COPY’s 2/7/22 Proposal 1 |

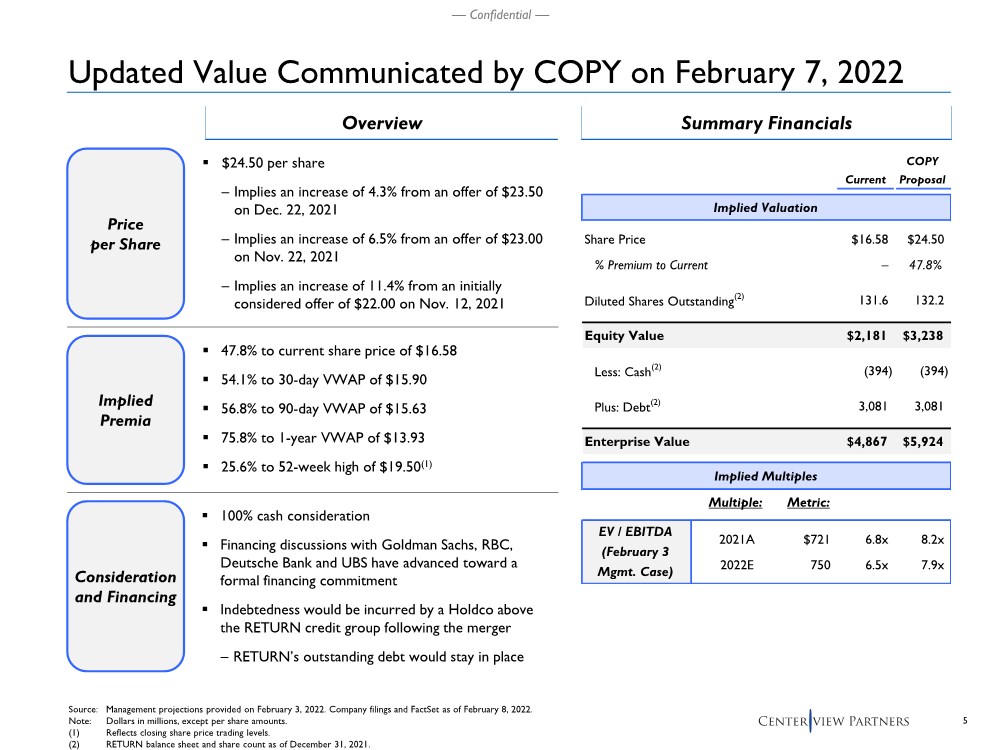
| 5 — Confidential — Updated Value Communicated by COPY on February 7, 2022 Price per Share Implied Premia .. $24.50 per share – Implies an increase of 4.3% from an offer of $23.50 on Dec. 22, 2021 – Implies an increase of 6.5% from an offer of $23.00 on Nov. 22, 2021 – Implies an increase of 11.4% from an initially considered offer of $22.00 on Nov. 12, 2021 .. 47.8% to current share price of $16.58 .. 54.1% to 30-day VWAP of $15.90 .. 56.8% to 90-day VWAP of $15.63 .. 75.8% to 1-year VWAP of $13.93 .. 25.6% to 52-week high of $19.50(1) Summary Financials Source: Management projections provided on February 3, 2022. Company filings and FactSet as of February 8, 2022. Note: Dollars in millions, except per share amounts. (1) Reflects closing share price trading levels. (2) RETURN balance sheet and share count as of December 31, 2021. Overview COPY Current Proposal Implied Valuation Share Price $16.58 $24.50 % Premium to Current – 47.8% Diluted Shares Outstanding(2) 131.6 132.2 Equity Value $2,181 $3,238 Less: Cash(2) (394) (394) Plus: Debt(2) 3,081 3,081 Enterprise Value $4,867 $5,924 Implied Multiples Multiple: Metric: 2021A $721 6.8x 8.2x 2022E 750 6.5x 7.9x EV / EBITDA (February 3 Mgmt. Case) Consideration and Financing .. 100% cash consideration .. Financing discussions with Goldman Sachs, RBC, Deutsche Bank and UBS have advanced toward a formal financing commitment .. Indebtedness would be incurred by a Holdco above the RETURN credit group following the merger – RETURN’s outstanding debt would stay in place |
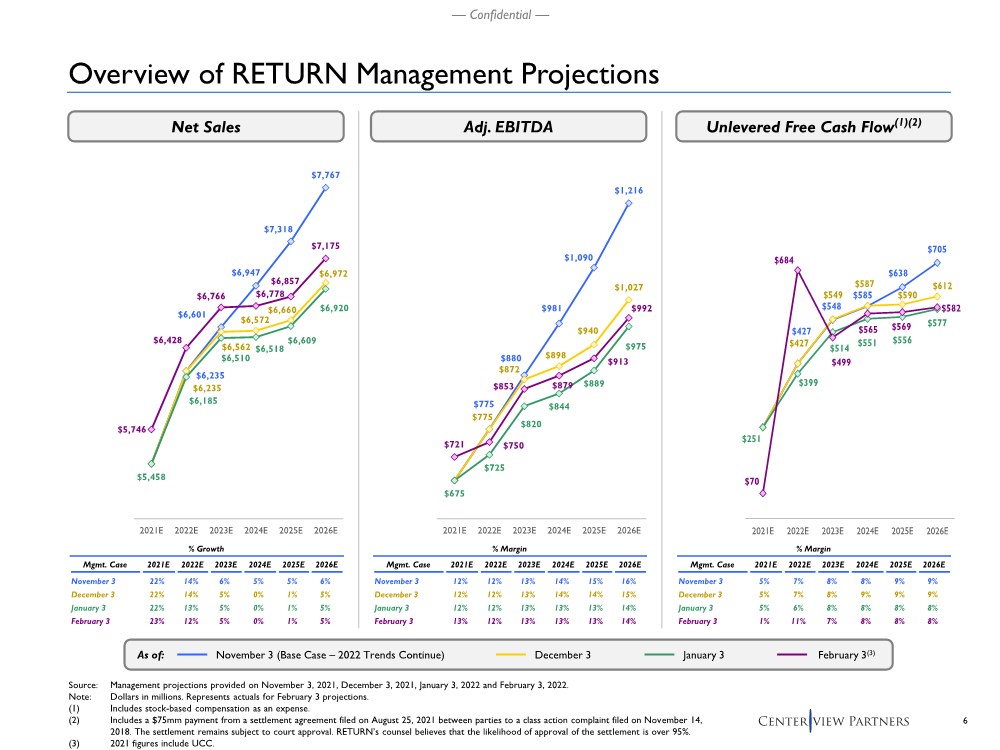
| 6 — Confidential — % Growth % Margin Mgmt. Case 2021E 2022E 2023E 2024E 2025E 2026E November 3 22% 14% 6% 5% 5% 6% December 3 22% 14% 5% 0% 1% 5% January 3 22% 13% 5% 0% 1% 5% February 3 23% 12% 5% 0% 1% 5% % Margin % Margin Mgmt. Case 2021E 2022E 2023E 2024E 2025E 2026E November 3 12% 12% 13% 14% 15% 16% December 3 12% 12% 13% 14% 14% 15% January 3 12% 12% 13% 13% 13% 14% February 3 13% 12% 13% 13% 13% 14% % Margin Mgmt. Case 2021E 2022E 2023E 2024E 2025E 2026E November 3 5% 7% 8% 8% 9% 9% December 3 5% 7% 8% 9% 9% 9% January 3 5% 6% 8% 8% 8% 8% February 3 1% 11% 7% 8% 8% 8% $427 $548 $585 $638 $705 $427 $549 $587 $590 $612 $251 $399 $514 $551 $556 $577 $70 $684 $499 $565 $569 $582 $-- $200 $400 $600 $800 $1,000 2021E 2022E 2023E 2024E 2025E 2026E $775 $880 $981 $1,090 $1,216 $775 $872 $898 $940 $1,027 $675 $725 $820 $844 $889 $975 $721 $750 $853 $879 $913 $992 $600 $700 $800 $900 $1,000 $1,100 $1,200 $1,300 2021E 2022E 2023E 2024E 2025E 2026E $6,235 $6,601 $6,947 $7,318 $7,767 $6,235 $6,562 $6,572 $6,660 $6,972 $5,458 $6,185 $6,510 $6,518 $6,609 $6,920 $5,746 $6,428 $6,766 $6,778 $6,857 $7,175 $5,000 $5,500 $6,000 $6,500 $7,000 $7,500 $8,000 2021E 2022E 2023E 2024E 2025E 2026E Overview of RETURN Management Projections Net Sales Adj. EBITDA Unlevered Free Cash Flow(1)(2) Source: Management projections provided on November 3, 2021, December 3, 2021, January 3, 2022 and February 3, 2022. Note: Dollars in millions. Represents actuals for February 3 projections. (1) Includes stock-based compensation as an expense. (2) Includes a $75mm payment from a settlement agreement filed on August 25, 2021 between parties to a class action complaint filed on November 14, 2018. The settlement remains subject to court approval. RETURN’s counsel believes that the likelihood of approval of the settlement is over 95%. (3) 2021 figures include UCC. January 3 February 3(3) December 3 As of: November 3 (Base Case – 2022 Trends Continue) |
| — Confidential — Centerview’s Updated Preliminary Financial Analysis 2 |
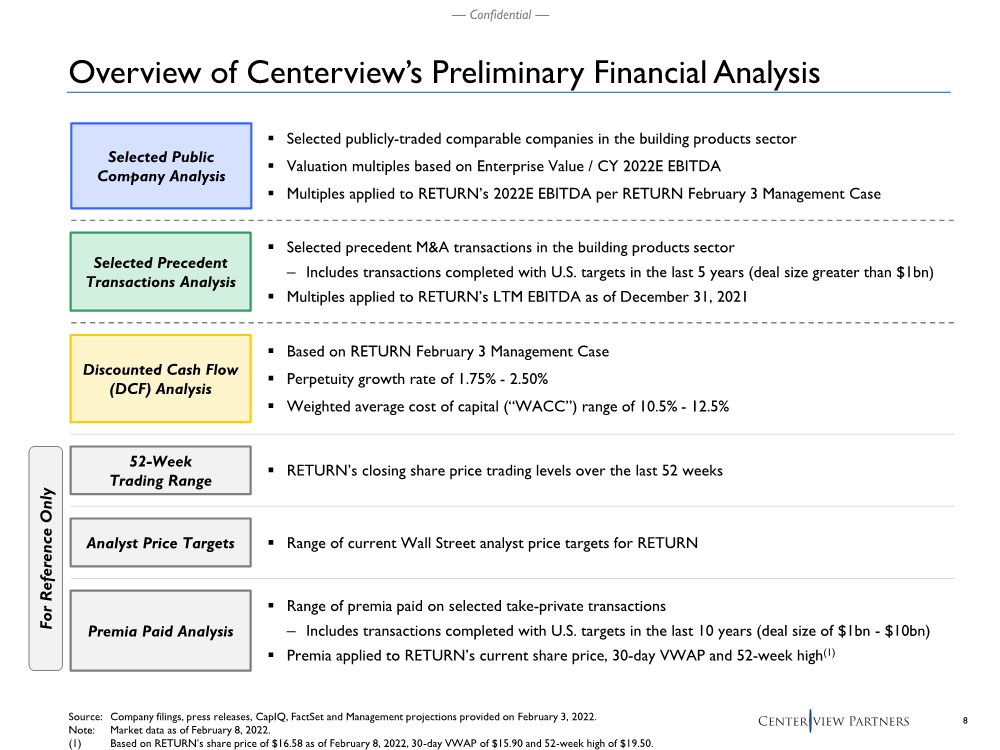
| 8 — Confidential — Source: Company filings, press releases, CapIQ, FactSet and Management projections provided on February 3, 2022. Note: Market data as of February 8, 2022. (1) Based on RETURN’s share price of $16.58 as of February 8, 2022, 30-day VWAP of $15.90 and 52-week high of $19.50. .. Selected publicly-traded comparable companies in the building products sector .. Valuation multiples based on Enterprise Value / CY 2022E EBITDA .. Multiples applied to RETURN’s 2022E EBITDA per RETURN February 3 Management Case .. Based on RETURN February 3 Management Case .. Perpetuity growth rate of 1.75% - 2.50% .. Weighted average cost of capital (“WACC”) range of 10.5% - 12.5% .. Selected precedent M&A transactions in the building products sector – Includes transactions completed with U.S. targets in the last 5 years (deal size greater than $1bn) .. Multiples applied to RETURN’s LTM EBITDA as of December 31, 2021 .. RETURN’s closing share price trading levels over the last 52 weeks 52-Week Trading Range Selected Precedent Transactions Analysis Discounted Cash Flow (DCF) Analysis For Reference Only .. Range of current Wall Street analyst price targets for RETURN Analyst Price Targets Selected Public Company Analysis Premia Paid Analysis .. Range of premia paid on selected take-private transactions – Includes transactions completed with U.S. targets in the last 10 years (deal size of $1bn - $10bn) .. Premia applied to RETURN’s current share price, 30-day VWAP and 52-week high(1) Overview of Centerview’s Preliminary Financial Analysis |
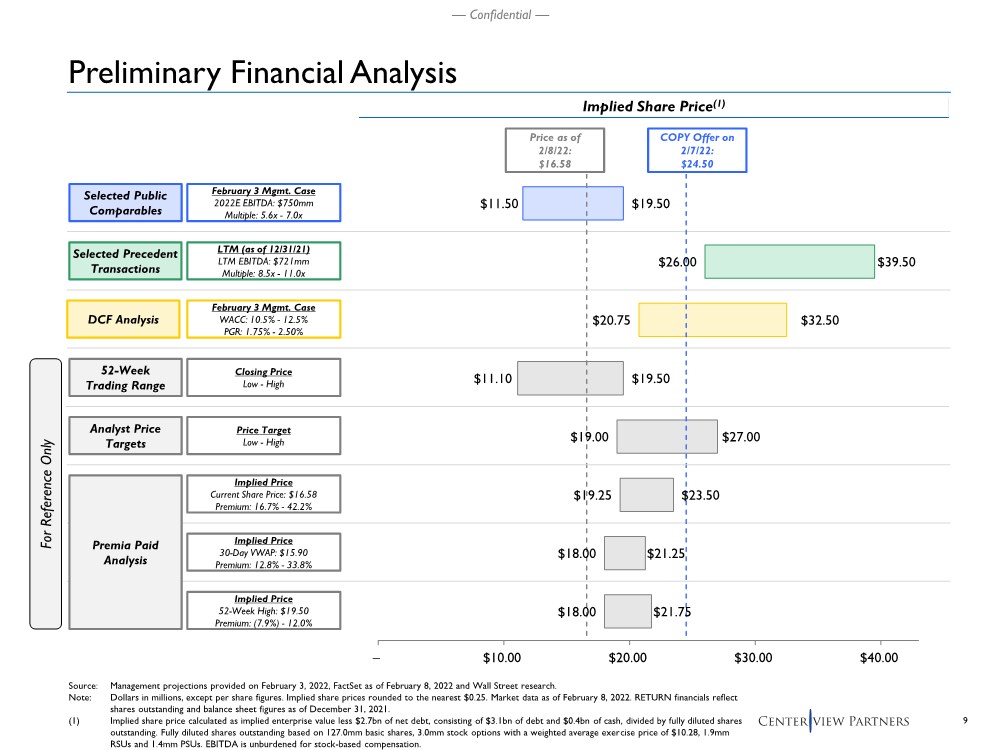
| 9 — Confidential — $11.50 $26.00 $20.75 $11.10 $19.00 $19.25 $18.00 $18.00 $19.50 $39.50 $32.50 $19.50 $27.00 $23.50 $21.25 $21.75 – $10.00 $20.00 $30.00 $40.00 Source: Management projections provided on February 3, 2022, FactSet as of February 8, 2022 and Wall Street research. Note: Dollars in millions, except per share figures. Implied share prices rounded to the nearest $0.25. Market data as of February 8, 2022. RETURN financials reflect shares outstanding and balance sheet figures as of December 31, 2021. (1) Implied share price calculated as implied enterprise value less $2.7bn of net debt, consisting of $3.1bn of debt and $0.4bn of cash, divided by fully diluted shares outstanding. Fully diluted shares outstanding based on 127.0mm basic shares, 3.0mm stock options with a weighted average exercise price of $10.28, 1.9mm RSUs and 1.4mm PSUs. EBITDA is unburdened for stock-based compensation. 52-Week Trading Range Selected Public Comparables Selected Precedent Transactions Implied Share Price(1) LTM (as of 12/31/21) LTM EBITDA: $721mm Multiple: 8.5x - 11.0x February 3 Mgmt. Case WACC: 10.5% - 12.5% PGR: 1.75% - 2.50% Closing Price Low - High February 3 Mgmt. Case 2022E EBITDA: $750mm Multiple: 5.6x - 7.0x Price as of 2/8/22: $16.58 Analyst Price Targets Price Target Low - High For Reference Only DCF Analysis Premia Paid Analysis Implied Price Current Share Price: $16.58 Premium: 16.7% - 42.2% COPY Offer on 2/7/22: $24.50 Preliminary Financial Analysis Implied Price 30-Day VWAP: $15.90 Premium: 12.8% - 33.8% Implied Price 52-Week High: $19.50 Premium: (7.9%) - 12.0% |
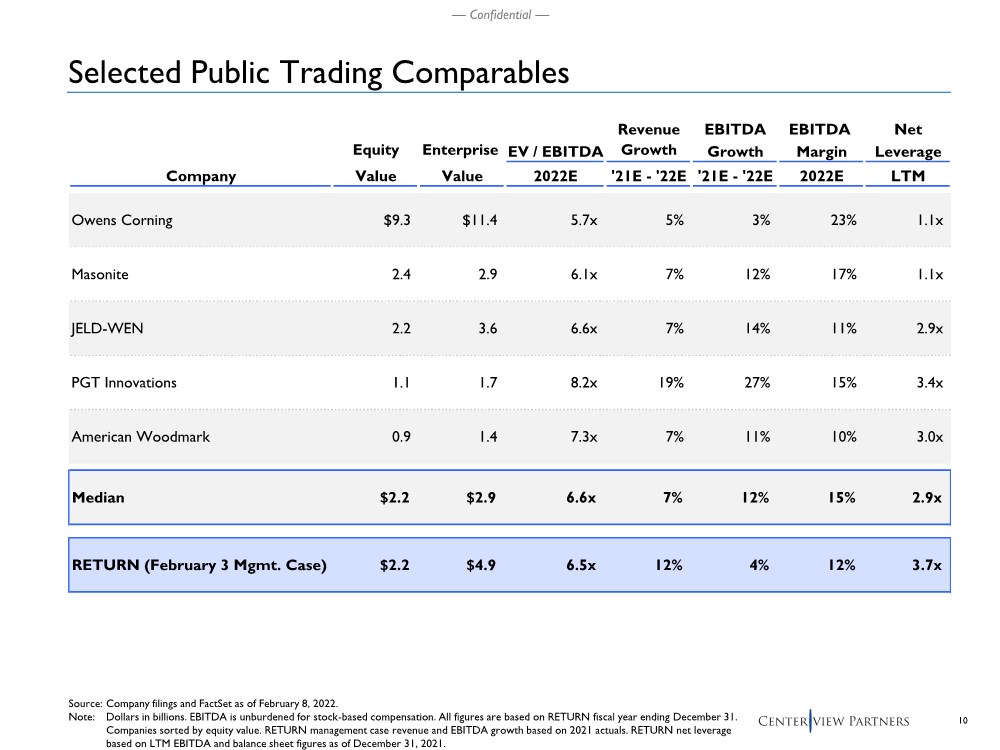
| 10 — Confidential — Selected Public Trading Comparables Source: Company filings and FactSet as of February 8, 2022. Note: Dollars in billions. EBITDA is unburdened for stock-based compensation. All figures are based on RETURN fiscal year ending December 31. Companies sorted by equity value. RETURN management case revenue and EBITDA growth based on 2021 actuals. RETURN net leverage based on LTM EBITDA and balance sheet figures as of December 31, 2021. Revenue EBITDA EBITDA Net Equity Enterprise EV / EBITDA Growth Growth Margin Leverage Company Value Value 2022E '21E - '22E '21E - '22E 2022E LTM Owens Corning $9.3 $11.4 5.7x 5% 3% 23% 1.1x Masonite 2.4 2.9 6.1x 7% 12% 17% 1.1x JELD-WEN 2.2 3.6 6.6x 7% 14% 11% 2.9x PGT Innovations 1.1 1.7 8.2x 19% 27% 15% 3.4x American Woodmark 0.9 1.4 7.3x 7% 11% 10% 3.0x Median $2.2 $2.9 6.6x 7% 12% 15% 2.9x RETURN (February 3 Mgmt. Case) $2.2 $4.9 6.5x 12% 4% 12% 3.7x |
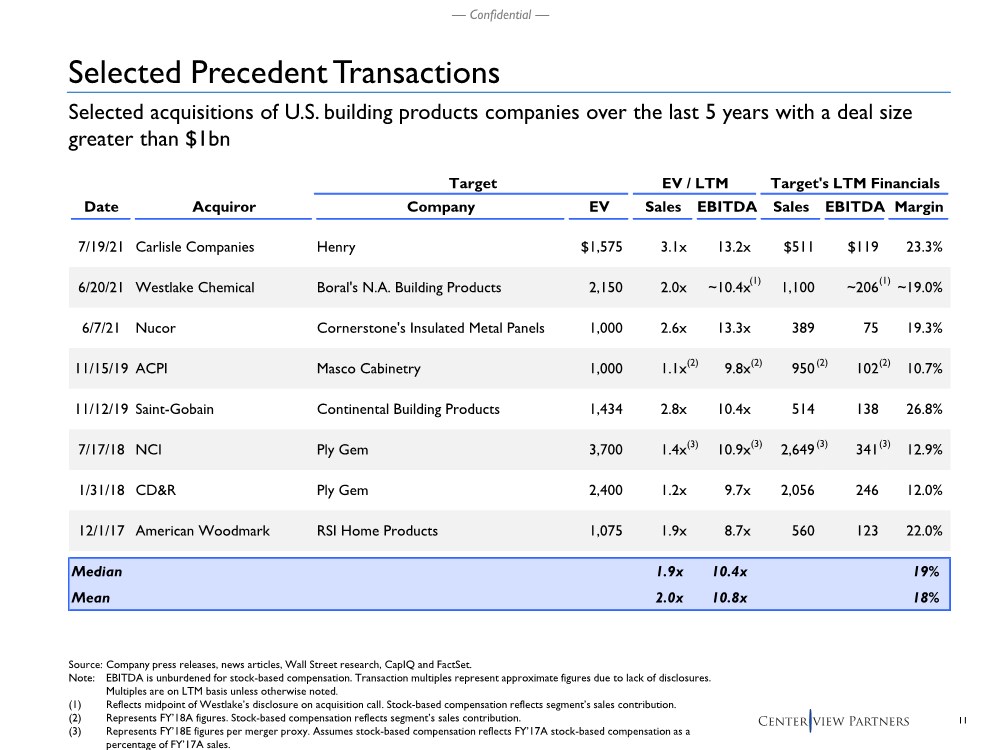
| 11 — Confidential — Target EV / LTM Target's LTM Financials Date Acquiror Company EV Sales EBITDA Sales EBITDA Margin 7/19/21 Carlisle Companies Henry $1,575 3.1x 13.2x $511 $119 23.3% 6/20/21 Westlake Chemical Boral's N.A. Building Products 2,150 2.0x ~10.4x 1,100 ~206 ~19.0% 6/7/21 Nucor Cornerstone's Insulated Metal Panels 1,000 2.6x 13.3x 389 75 19.3% 11/15/19 ACPI Masco Cabinetry 1,000 1.1x 9.8x 950 102 10.7% 11/12/19 Saint-Gobain Continental Building Products 1,434 2.8x 10.4x 514 138 26.8% 7/17/18 NCI Ply Gem 3,700 1.4x 10.9x 2,649 341 12.9% 1/31/18 CD&R Ply Gem 2,400 1.2x 9.7x 2,056 246 12.0% 12/1/17 American Woodmark RSI Home Products 1,075 1.9x 8.7x 560 123 22.0% Median 1.9x 10.4x 19% Mean 2.0x 10.8x 18% Source: Company press releases, news articles, Wall Street research, CapIQ and FactSet. Note: EBITDA is unburdened for stock-based compensation. Transaction multiples represent approximate figures due to lack of disclosures. Multiples are on LTM basis unless otherwise noted. (1) Reflects midpoint of Westlake’s disclosure on acquisition call. Stock-based compensation reflects segment’s sales contribution. (2) Represents FY’18A figures. Stock-based compensation reflects segment’s sales contribution. (3) Represents FY’18E figures per merger proxy. Assumes stock-based compensation reflects FY’17A stock-based compensation as a percentage of FY’17A sales. Selected acquisitions of U.S. building products companies over the last 5 years with a deal size greater than $1bn (2) (1) (2) (2) (2) (3) (3) (3) (3) Selected Precedent Transactions (1) |
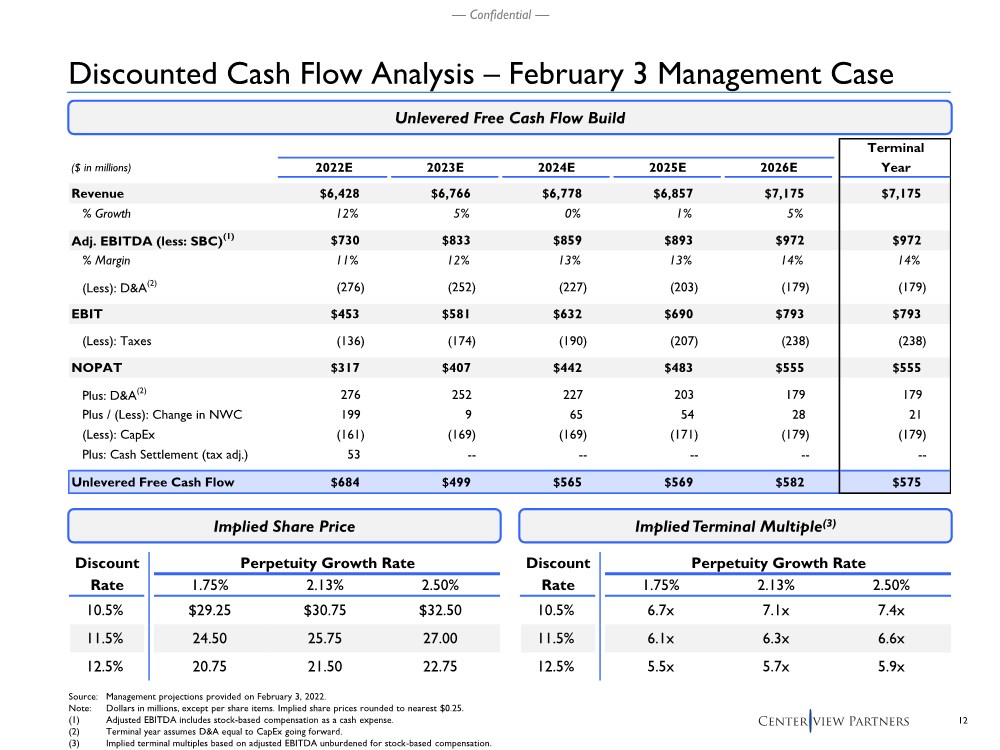
| 12 — Confidential — Discounted Cash Flow Analysis – February 3 Management Case Source: Management projections provided on February 3, 2022. Note: Dollars in millions, except per share items. Implied share prices rounded to nearest $0.25. (1) Adjusted EBITDA includes stock-based compensation as a cash expense. (2) Terminal year assumes D&A equal to CapEx going forward. (3) Implied terminal multiples based on adjusted EBITDA unburdened for stock-based compensation. Unlevered Free Cash Flow Build Terminal ($ in millions) 2022E 2023E 2024E 2025E 2026E Year Revenue $6,428 $6,766 $6,778 $6,857 $7,175 $7,175 % Growth 12% 5% 0% 1% 5% Adj. EBITDA (less: SBC)(1) $730 $833 $859 $893 $972 $972 % Margin 11% 12% 13% 13% 14% 14% (Less): D&A(2) (276) (252) (227) (203) (179) (179) EBIT $453 $581 $632 $690 $793 $793 (Less): Taxes (136) (174) (190) (207) (238) (238) NOPAT $317 $407 $442 $483 $555 $555 Plus: D&A(2) 276 252 227 203 179 179 Plus / (Less): Change in NWC 199 9 65 54 28 21 (Less): CapEx (161) (169) (169) (171) (179) (179) Plus: Cash Settlement (tax adj.) 53 -- -- -- -- -- Unlevered Free Cash Flow $684 $499 $565 $569 $582 $575 Implied Share Price Implied Terminal Multiple(3) Discount Perpetuity Growth Rate Rate 1.75% 2.13% 2.50% 10.5% $29.25 $30.75 $32.50 11.5% 24.50 25.75 27.00 12.5% 20.75 21.50 22.75 Discount Perpetuity Growth Rate Rate 1.75% 2.13% 2.50% 10.5% 6.7x 7.1x 7.4x 11.5% 6.1x 6.3x 6.6x 12.5% 5.5x 5.7x 5.9x |
| — Confidential — Appendix Supplementary Materials |

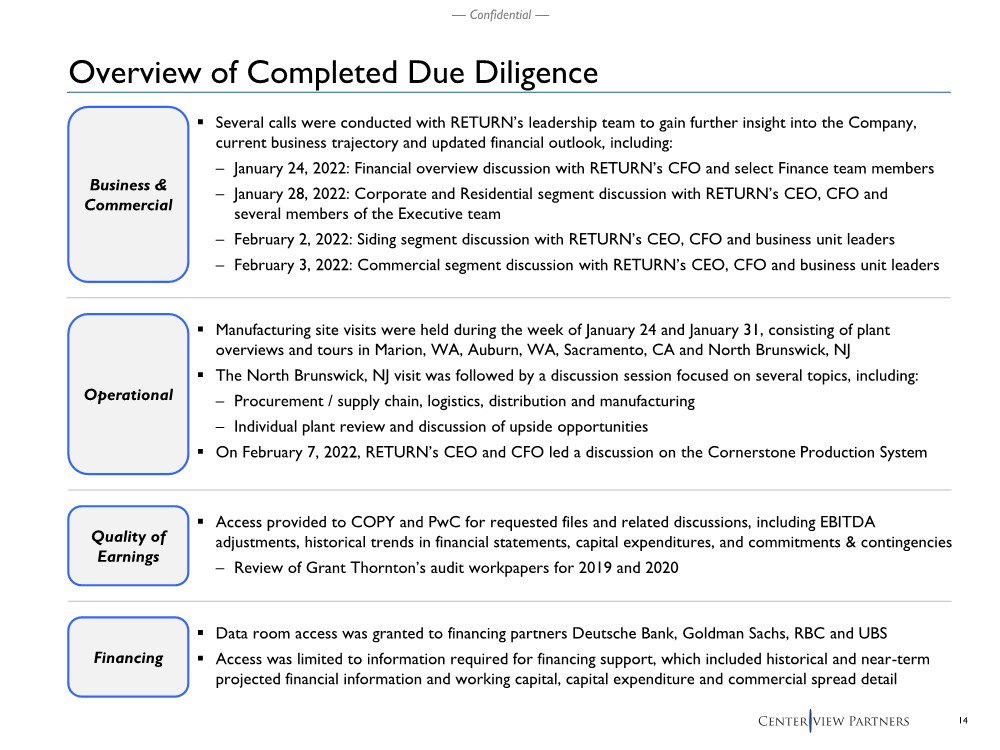
| 14 — Confidential — Overview of Completed Due Diligence .. Several calls were conducted with RETURN’s leadership team to gain further insight into the Company, current business trajectory and updated financial outlook, including: – January 24, 2022: Financial overview discussion with RETURN’s CFO and select Finance team members – January 28, 2022: Corporate and Residential segment discussion with RETURN’s CEO, CFO and several members of the Executive team – February 2, 2022: Siding segment discussion with RETURN’s CEO, CFO and business unit leaders – February 3, 2022: Commercial segment discussion with RETURN’s CEO, CFO and business unit leaders Business & Commercial .. Access provided to COPY and PwC for requested files and related discussions, including EBITDA adjustments, historical trends in financial statements, capital expenditures, and commitments & contingencies – Review of Grant Thornton’s audit workpapers for 2019 and 2020 Quality of Earnings .. Manufacturing site visits were held during the week of January 24 and January 31, consisting of plant overviews and tours in Marion, WA, Auburn, WA, Sacramento, CA and North Brunswick, NJ .. The North Brunswick, NJ visit was followed by a discussion session focused on several topics, including: – Procurement / supply chain, logistics, distribution and manufacturing – Individual plant review and discussion of upside opportunities .. On February 7, 2022, RETURN’s CEO and CFO led a discussion on the Cornerstone Production System Operational Financing .. Data room access was granted to financing partners Deutsche Bank, Goldman Sachs, RBC and UBS .. Access was limited to information required for financing support, which included historical and near-term projected financial information and working capital, capital expenditure and commercial spread detail |
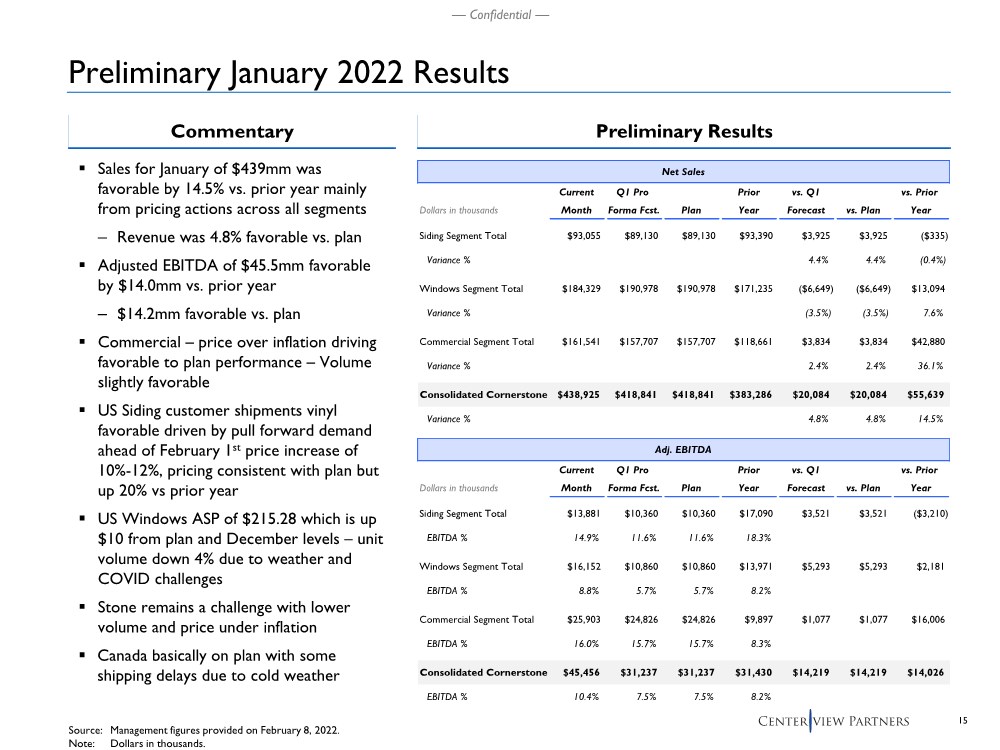
| 15 — Confidential — Preliminary January 2022 Results .. Sales for January of $439mm was favorable by 14.5% vs. prior year mainly from pricing actions across all segments – Revenue was 4.8% favorable vs. plan .. Adjusted EBITDA of $45.5mm favorable by $14.0mm vs. prior year – $14.2mm favorable vs. plan .. Commercial – price over inflation driving favorable to plan performance – Volume slightly favorable .. US Siding customer shipments vinyl favorable driven by pull forward demand ahead of February 1st price increase of 10%-12%, pricing consistent with plan but up 20% vs prior year .. US Windows ASP of $215.28 which is up $10 from plan and December levels – unit volume down 4% due to weather and COVID challenges .. Stone remains a challenge with lower volume and price under inflation .. Canada basically on plan with some shipping delays due to cold weather Preliminary Results Commentary Source: Management figures provided on February 8, 2022. Note: Dollars in thousands. Net Sales Current Q1 Pro Prior vs. Q1 vs. Prior Dollars in thousands Month Forma Fcst. Plan Year Forecast vs. Plan Year Siding Segment Total $93,055 $89,130 $89,130 $93,390 $3,925 $3,925 ($335) Variance % 4.4% 4.4% (0.4%) Windows Segment Total $184,329 $190,978 $190,978 $171,235 ($6,649) ($6,649) $13,094 Variance % (3.5%) (3.5%) 7.6% Commercial Segment Total $161,541 $157,707 $157,707 $118,661 $3,834 $3,834 $42,880 Variance % 2.4% 2.4% 36.1% Consolidated Cornerstone $438,925 $418,841 $418,841 $383,286 $20,084 $20,084 $55,639 Variance % 4.8% 4.8% 14.5% Adj. EBITDA Current Q1 Pro Prior vs. Q1 vs. Prior Dollars in thousands Month Forma Fcst. Plan Year Forecast vs. Plan Year Siding Segment Total $13,881 $10,360 $10,360 $17,090 $3,521 $3,521 ($3,210) EBITDA % 14.9% 11.6% 11.6% 18.3% Windows Segment Total $16,152 $10,860 $10,860 $13,971 $5,293 $5,293 $2,181 EBITDA % 8.8% 5.7% 5.7% 8.2% Commercial Segment Total $25,903 $24,826 $24,826 $9,897 $1,077 $1,077 $16,006 EBITDA % 16.0% 15.7% 15.7% 8.3% Consolidated Cornerstone $45,456 $31,237 $31,237 $31,430 $14,219 $14,219 $14,026 EBITDA % 10.4% 7.5% 7.5% 8.2% |
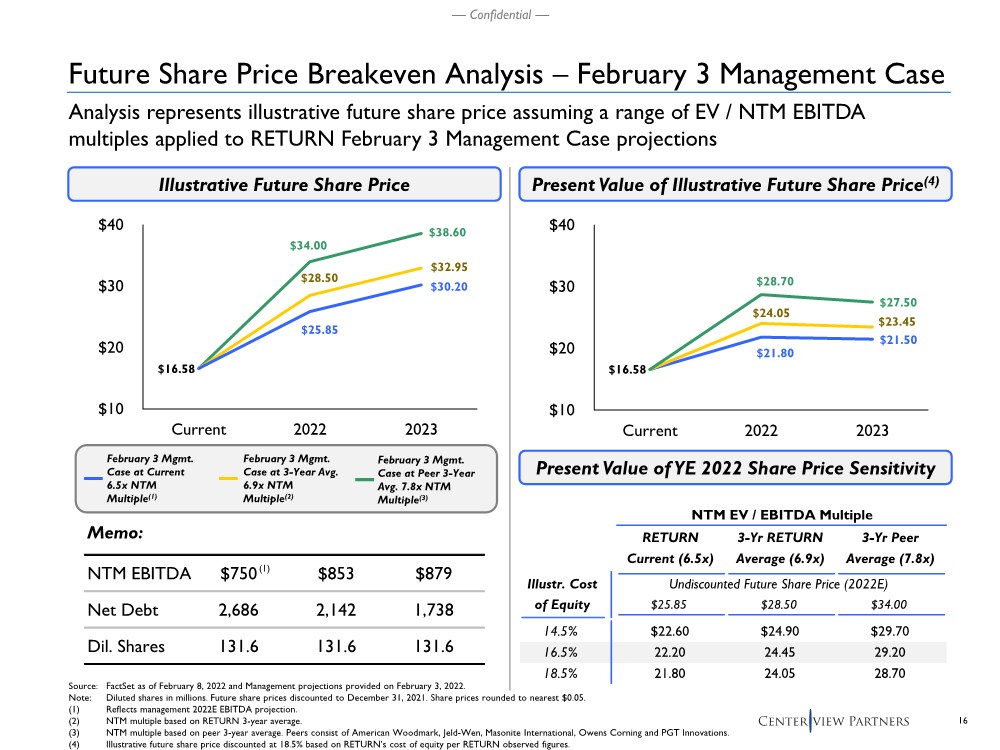
| 16 — Confidential — NTM EV / EBITDA Multiple RETURN Current (6.5x) 3-Yr RETURN Average (6.9x) 3-Yr Peer Average (7.8x) Illustr. Cost Undiscounted Future Share Price (2022E) of Equity $25.85 $28.50 $34.00 14.5% $22.60 $24.90 $29.70 16.5% 22.20 24.45 29.20 18.5% 21.80 24.05 28.70 $21.80 $21.50 $16.58 $24.05 $23.45 $28.70 $27.50 $10 $20 $30 $40 Current 2022 2023 $34.00 $38.60 $16.58 $28.50 $32.95 $25.85 $30.20 $10 $20 $30 $40 Current 2022 2023 Memo: NTM EBITDA $750 $853 $879 Net Debt 2,686 2,142 1,738 Dil. Shares 131.6 131.6 131.6 Illustrative Future Share Price Present Value of Illustrative Future Share Price(4) Source: FactSet as of February 8, 2022 and Management projections provided on February 3, 2022. Note: Diluted shares in millions. Future share prices discounted to December 31, 2021. Share prices rounded to nearest $0.05. (1) Reflects management 2022E EBITDA projection. (2) NTM multiple based on RETURN 3-year average. (3) NTM multiple based on peer 3-year average. Peers consist of American Woodmark, Jeld-Wen, Masonite International, Owens Corning and PGT Innovations. (4) Illustrative future share price discounted at 18.5% based on RETURN’s cost of equity per RETURN observed figures. Present Value of YE 2022 Share Price Sensitivity February 3 Mgmt. Case at Current 6.5x NTM Multiple(1) February 3 Mgmt. Case at 3-Year Avg. 6.9x NTM Multiple(2) Future Share Price Breakeven Analysis – February 3 Management Case Analysis represents illustrative future share price assuming a range of EV / NTM EBITDA multiples applied to RETURN February 3 Management Case projections (1) February 3 Mgmt. Case at Peer 3-Year Avg. 7.8x NTM Multiple(3) |
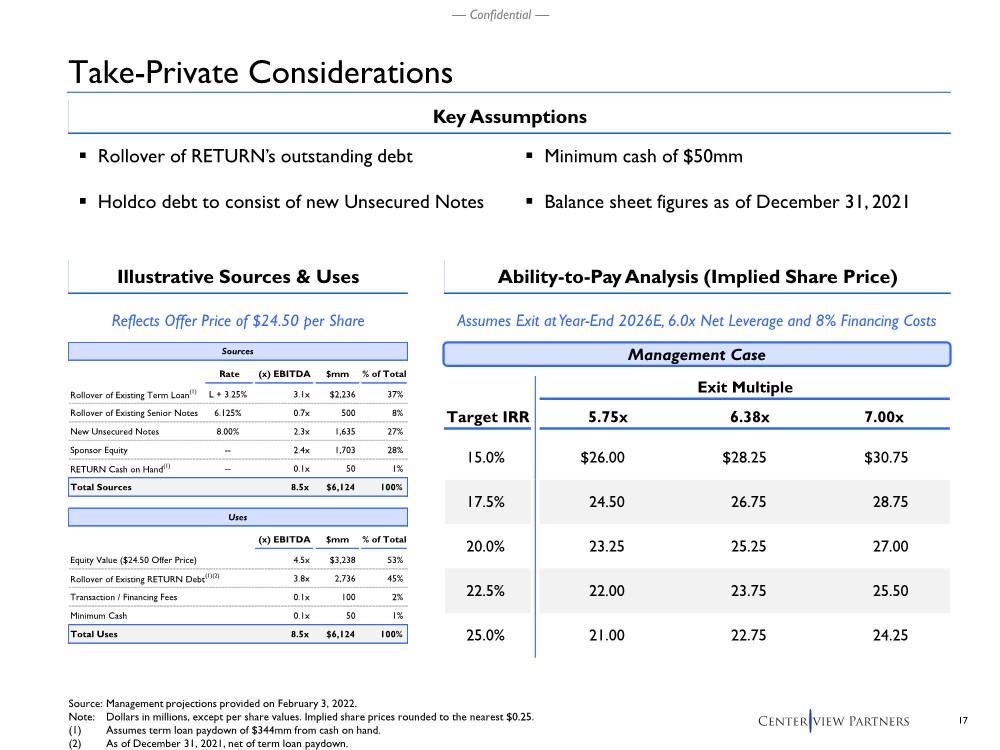
| 17 — Confidential — Take-Private Considerations Source: Management projections provided on February 3, 2022. Note: Dollars in millions, except per share values. Implied share prices rounded to the nearest $0.25. (1) Assumes term loan paydown of $344mm from cash on hand. (2) As of December 31, 2021, net of term loan paydown. .. Rollover of RETURN’s outstanding debt .. Holdco debt to consist of new Unsecured Notes Management Case Ability-to-Pay Analysis (Implied Share Price) Key Assumptions Exit Multiple Target IRR 5.75x 6.38x 7.00x 15.0% $26.00 $28.25 $30.75 17.5% 24.50 26.75 28.75 20.0% 23.25 25.25 27.00 22.5% 22.00 23.75 25.50 25.0% 21.00 22.75 24.25 Reflects Offer Price of $24.50 per Share Illustrative Sources & Uses Rate (x) EBITDA $mm % of Total Rollover of Existing Term Loan(1) L + 3.25% 3.1x $2,236 37% Rollover of Existing Senior Notes 6.125% 0.7x 500 8% New Unsecured Notes 8.00% 2.3x 1,635 27% Sponsor Equity -- 2.4x 1,703 28% RETURN Cash on Hand(1) -- 0.1x 50 1% Total Sources 8.5x $6,124 100% Uses (x) EBITDA $mm % of Total Equity Value ($24.50 Offer Price) 4.5x $3,238 53% Rollover of Existing RETURN Debt(1)(2) 3.8x 2,736 45% Transaction / Financing Fees 0.1x 100 2% Minimum Cash 0.1x 50 1% Total Uses 8.5x $6,124 100% Sources Assumes Exit at Year-End 2026E, 6.0x Net Leverage and 8% Financing Costs .. Minimum cash of $50mm .. Balance sheet figures as of December 31, 2021 |
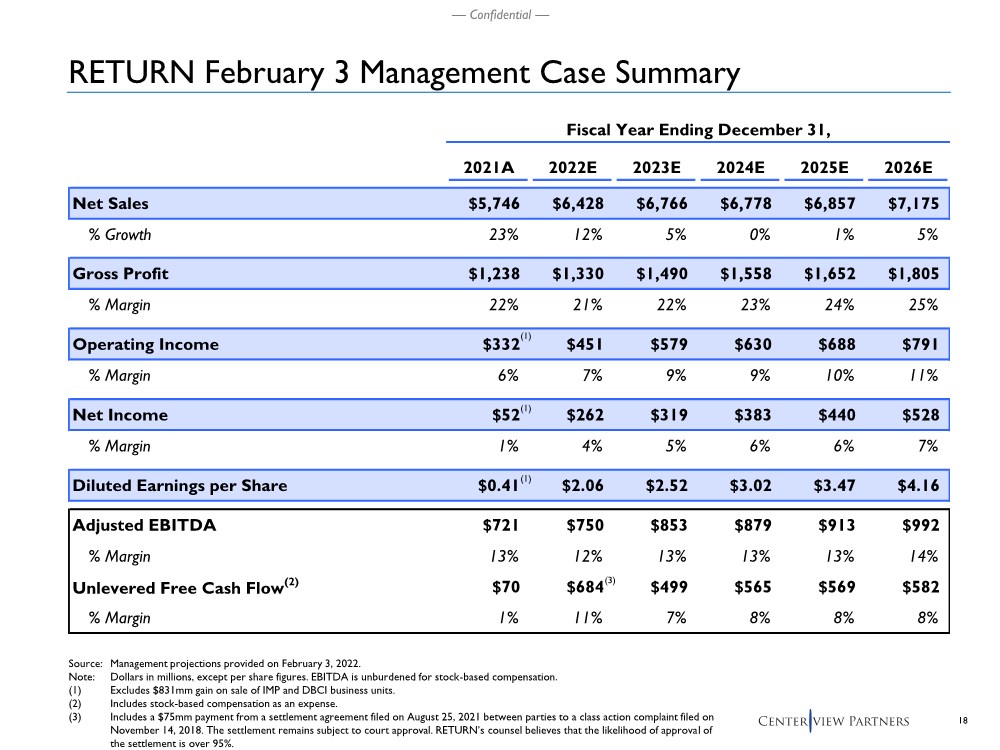
| 18 — Confidential — Fiscal Year Ending December 31, 2021A 2022E 2023E 2024E 2025E 2026E Net Sales $5,746 $6,428 $6,766 $6,778 $6,857 $7,175 % Growth 23% 12% 5% 0% 1% 5% Gross Profit $1,238 $1,330 $1,490 $1,558 $1,652 $1,805 % Margin 22% 21% 22% 23% 24% 25% Operating Income $332 $451 $579 $630 $688 $791 % Margin 6% 7% 9% 9% 10% 11% Net Income $52 $262 $319 $383 $440 $528 % Margin 1% 4% 5% 6% 6% 7% Diluted Earnings per Share $0.41 $2.06 $2.52 $3.02 $3.47 $4.16 Adjusted EBITDA $721 $750 $853 $879 $913 $992 % Margin 13% 12% 13% 13% 13% 14% Unlevered Free Cash Flow(2) $70 $684 $499 $565 $569 $582 % Margin 1% 11% 7% 8% 8% 8% Source: Management projections provided on February 3, 2022. Note: Dollars in millions, except per share figures. EBITDA is unburdened for stock-based compensation. (1) Excludes $831mm gain on sale of IMP and DBCI business units. (2) Includes stock-based compensation as an expense. (3) Includes a $75mm payment from a settlement agreement filed on August 25, 2021 between parties to a class action complaint filed on November 14, 2018. The settlement remains subject to court approval. RETURN’s counsel believes that the likelihood of approval of the settlement is over 95%. (3) RETURN February 3 Management Case Summary (1) (1) (1) |
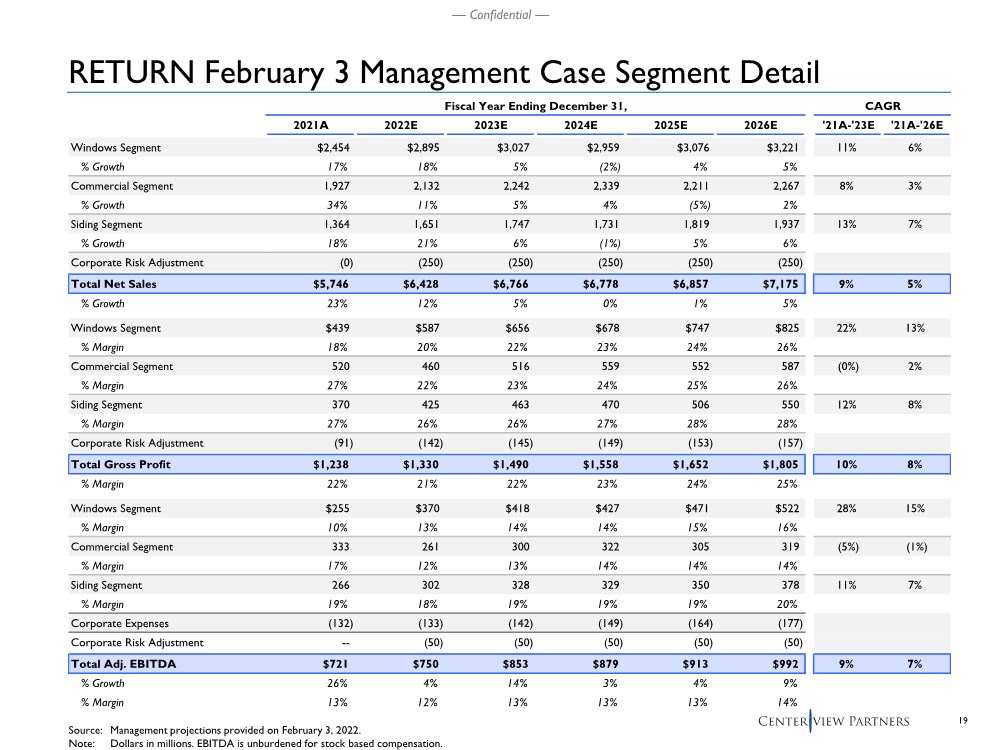
| 19 — Confidential — Source: Management projections provided on February 3, 2022. Note: Dollars in millions. EBITDA is unburdened for stock based compensation. RETURN February 3 Management Case Segment Detail Fiscal Year Ending December 31, CAGR 2021A 2022E 2023E 2024E 2025E 2026E '21A-'23E '21A-'26E Windows Segment $2,454 $2,895 $3,027 $2,959 $3,076 $3,221 11% 6% % Growth 17% 18% 5% (2%) 4% 5% Commercial Segment 1,927 2,132 2,242 2,339 2,211 2,267 8% 3% % Growth 34% 11% 5% 4% (5%) 2% Siding Segment 1,364 1,651 1,747 1,731 1,819 1,937 13% 7% % Growth 18% 21% 6% (1%) 5% 6% Corporate Risk Adjustment (0) (250) (250) (250) (250) (250) Total Net Sales $5,746 $6,428 $6,766 $6,778 $6,857 $7,175 9% 5% % Growth 23% 12% 5% 0% 1% 5% Windows Segment $439 $587 $656 $678 $747 $825 22% 13% % Margin 18% 20% 22% 23% 24% 26% Commercial Segment 520 460 516 559 552 587 (0%) 2% % Margin 27% 22% 23% 24% 25% 26% Siding Segment 370 425 463 470 506 550 12% 8% % Margin 27% 26% 26% 27% 28% 28% Corporate Risk Adjustment (91) (142) (145) (149) (153) (157) Total Gross Profit $1,238 $1,330 $1,490 $1,558 $1,652 $1,805 10% 8% % Margin 22% 21% 22% 23% 24% 25% Windows Segment $255 $370 $418 $427 $471 $522 28% 15% % Margin 10% 13% 14% 14% 15% 16% Commercial Segment 333 261 300 322 305 319 (5%) (1%) % Margin 17% 12% 13% 14% 14% 14% Siding Segment 266 302 328 329 350 378 11% 7% % Margin 19% 18% 19% 19% 19% 20% Corporate Expenses (132) (133) (142) (149) (164) (177) Corporate Risk Adjustment -- (50) (50) (50) (50) (50) Total Adj. EBITDA $721 $750 $853 $879 $913 $992 9% 7% % Growth 26% 4% 14% 3% 4% 9% % Margin 13% 12% 13% 13% 13% 14% |
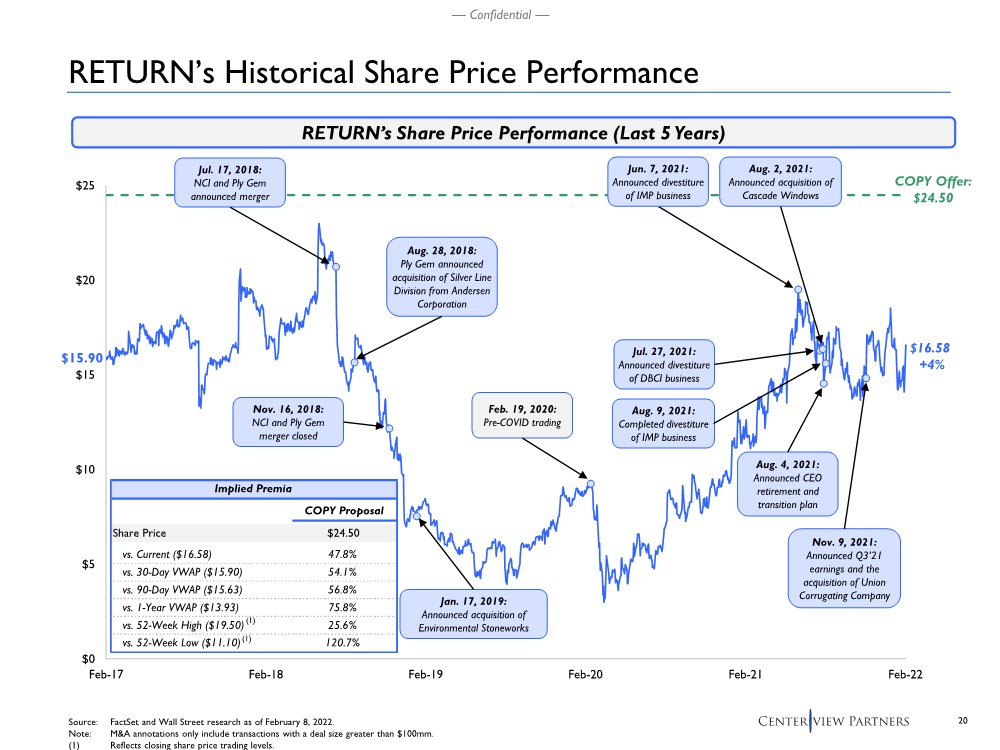
| 20 — Confidential — $0 $5 $10 $15 $20 $25 Feb-17 Feb-18 Feb-19 Feb-20 Feb-21 Feb-22 RETURN’s Historical Share Price Performance Source: FactSet and Wall Street research as of February 8, 2022. Note: M&A annotations only include transactions with a deal size greater than $100mm. (1) Reflects closing share price trading levels. $15.90 $16.58 +4% Jul. 17, 2018: NCI and Ply Gem announced merger Nov. 16, 2018: NCI and Ply Gem merger closed Jan. 17, 2019: Announced acquisition of Environmental Stoneworks Jul. 27, 2021: Announced divestiture of DBCI business Aug. 2, 2021: Announced acquisition of Cascade Windows Aug. 4, 2021: Announced CEO retirement and transition plan Aug. 9, 2021: Completed divestiture of IMP business RETURN’s Share Price Performance (Last 5 Years) Aug. 28, 2018: Ply Gem announced acquisition of Silver Line Division from Andersen Corporation Jun. 7, 2021: Announced divestiture of IMP business Nov. 9, 2021: Announced Q3’21 earnings and the acquisition of Union Corrugating Company Implied Premia COPY Proposal Share Price $24.50 vs. Current ($16.58) 47.8% vs. 30-Day VWAP ($15.90) 54.1% vs. 90-Day VWAP ($15.63) 56.8% vs. 1-Year VWAP ($13.93) 75.8% vs. 52-Week High ($19.50) 25.6% vs. 52-Week Low ($11.10) 120.7% (1) (1) COPY Offer: $24.50 Feb. 19, 2020: Pre-COVID trading |
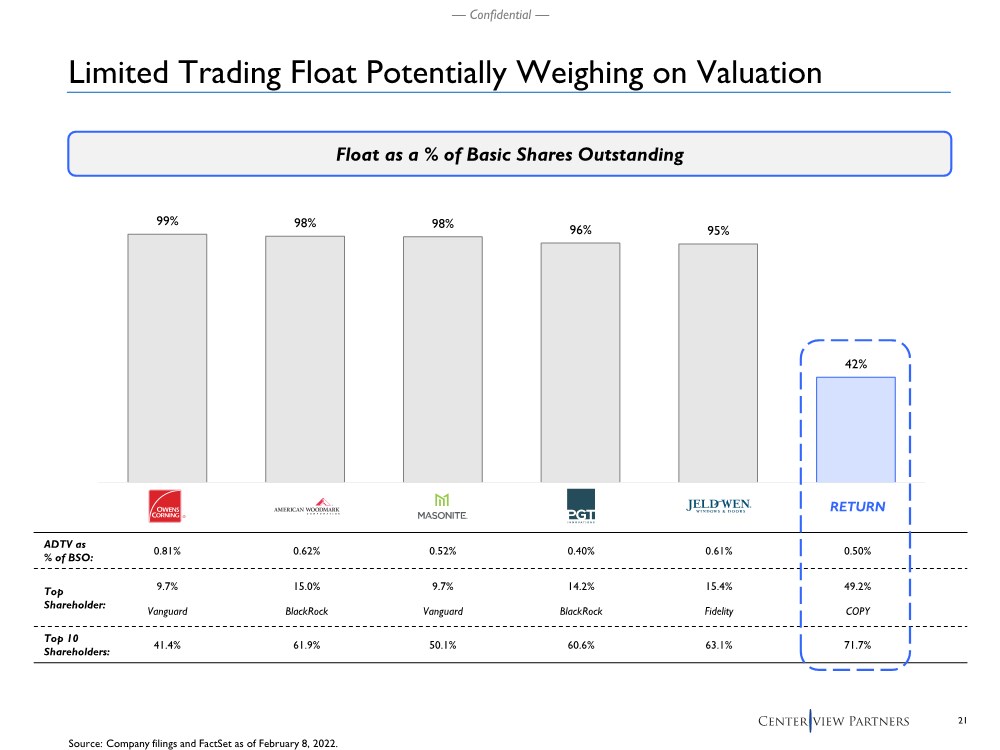
| 21 — Confidential — Limited Trading Float Potentially Weighing on Valuation Source: Company filings and FactSet as of February 8, 2022. Float as a % of Basic Shares Outstanding 99% 98% 98% 96% 95% 42% OC AMWD DOOR PGTI JELD CNR ADTV as % of BSO: Top Shareholder: Top 10 Shareholders: 0.81% 0.62% 0.52% 0.40% 0.61% 0.50% 9.7% 15.0% 9.7% 14.2% 15.4% 49.2% Vanguard BlackRock Vanguard BlackRock Fidelity COPY 41.4% 61.9% 50.1% 60.6% 63.1% 71.7% RETURN |
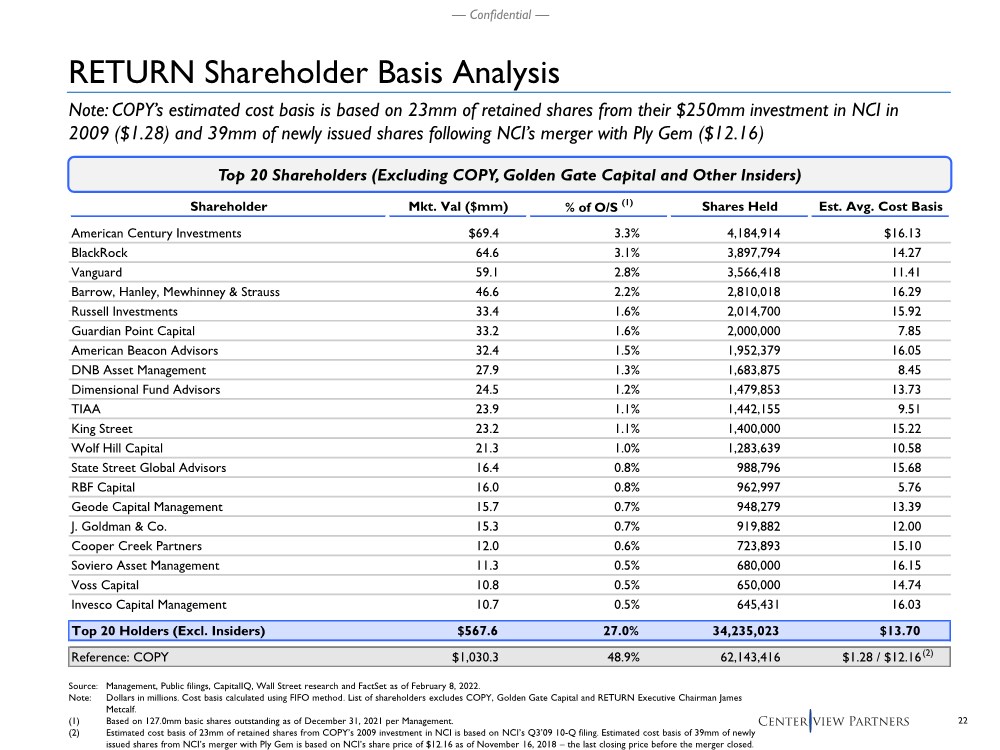
| 22 — Confidential — RETURN Shareholder Basis Analysis Source: Management, Public filings, CapitalIQ, Wall Street research and FactSet as of February 8, 2022. Note: Dollars in millions. Cost basis calculated using FIFO method. List of shareholders excludes COPY, Golden Gate Capital and RETURN Executive Chairman James Metcalf. (1) Based on 127.0mm basic shares outstanding as of December 31, 2021 per Management. (2) Estimated cost basis of 23mm of retained shares from COPY’s 2009 investment in NCI is based on NCI’s Q3’09 10-Q filing. Estimated cost basis of 39mm of newly issued shares from NCI’s merger with Ply Gem is based on NCI’s share price of $12.16 as of November 16, 2018 – the last closing price before the merger closed. Shareholder Mkt. Val ($mm) % of O/S (1) Shares Held Est. Avg. Cost Basis American Century Investments $69.4 3.3% 4,184,914 $16.13 BlackRock 64.6 3.1% 3,897,794 14.27 Vanguard 59.1 2.8% 3,566,418 11.41 Barrow, Hanley, Mewhinney & Strauss 46.6 2.2% 2,810,018 16.29 Russell Investments 33.4 1.6% 2,014,700 15.92 Guardian Point Capital 33.2 1.6% 2,000,000 7.85 American Beacon Advisors 32.4 1.5% 1,952,379 16.05 DNB Asset Management 27.9 1.3% 1,683,875 8.45 Dimensional Fund Advisors 24.5 1.2% 1,479,853 13.73 TIAA 23.9 1.1% 1,442,155 9.51 King Street 23.2 1.1% 1,400,000 15.22 Wolf Hill Capital 21.3 1.0% 1,283,639 10.58 State Street Global Advisors 16.4 0.8% 988,796 15.68 RBF Capital 16.0 0.8% 962,997 5.76 Geode Capital Management 15.7 0.7% 948,279 13.39 J. Goldman & Co. 15.3 0.7% 919,882 12.00 Cooper Creek Partners 12.0 0.6% 723,893 15.10 Soviero Asset Management 11.3 0.5% 680,000 16.15 Voss Capital 10.8 0.5% 650,000 14.74 Invesco Capital Management 10.7 0.5% 645,431 16.03 Top 20 Holders (Excl. Insiders) $567.6 27.0% 34,235,023 $13.70 Reference: COPY $1,030.3 48.9% 62,143,416 $1.28 / $12.16 Top 20 Shareholders (Excluding COPY, Golden Gate Capital and Other Insiders) (2) Note: COPY’s estimated cost basis is based on 23mm of retained shares from their $250mm investment in NCI in 2009 ($1.28) and 39mm of newly issued shares following NCI’s merger with Ply Gem ($12.16) |
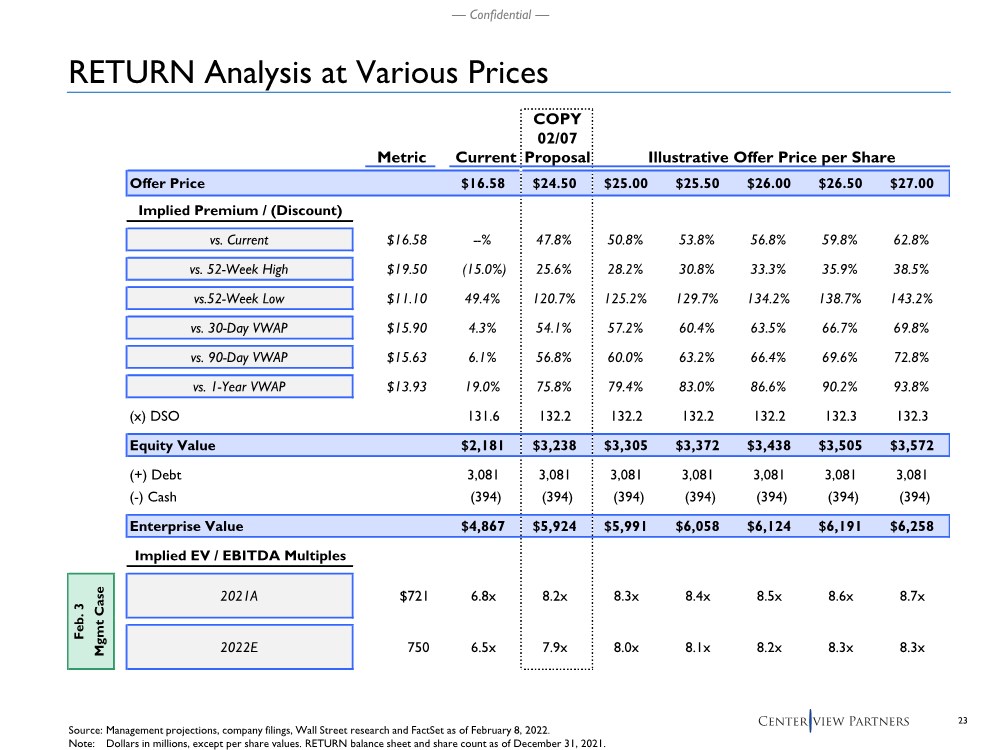
| 23 — Confidential — RETURN Analysis at Various Prices Source: Management projections, company filings, Wall Street research and FactSet as of February 8, 2022. Note: Dollars in millions, except per share values. RETURN balance sheet and share count as of December 31, 2021. COPY 02/07 Metric Current Proposal Illustrative Offer Price per Share Offer Price $16.58 $24.50 $25.00 $25.50 $26.00 $26.50 $27.00 Implied Premium / (Discount) vs. Current $16.58 --% 47.8% 50.8% 53.8% 56.8% 59.8% 62.8% vs. 52-Week High $19.50 (15.0%) 25.6% 28.2% 30.8% 33.3% 35.9% 38.5% vs.52-Week Low $11.10 49.4% 120.7% 125.2% 129.7% 134.2% 138.7% 143.2% vs. 30-Day VWAP $15.90 4.3% 54.1% 57.2% 60.4% 63.5% 66.7% 69.8% vs. 90-Day VWAP $15.63 6.1% 56.8% 60.0% 63.2% 66.4% 69.6% 72.8% vs. 1-Year VWAP $13.93 19.0% 75.8% 79.4% 83.0% 86.6% 90.2% 93.8% (x) DSO 131.6 132.2 132.2 132.2 132.2 132.3 132.3 Equity Value $2,181 $3,238 $3,305 $3,372 $3,438 $3,505 $3,572 (+) Debt 3,081 3,081 3,081 3,081 3,081 3,081 3,081 (-) Cash (394) (394) (394) (394) (394) (394) (394) Enterprise Value $4,867 $5,924 $5,991 $6,058 $6,124 $6,191 $6,258 Implied EV / EBITDA Multiples 2021A $721 6.8x 8.2x 8.3x 8.4x 8.5x 8.6x 8.7x 2022E 750 6.5x 7.9x 8.0x 8.1x 8.2x 8.3x 8.3x Feb. 3 Mgmt Case |
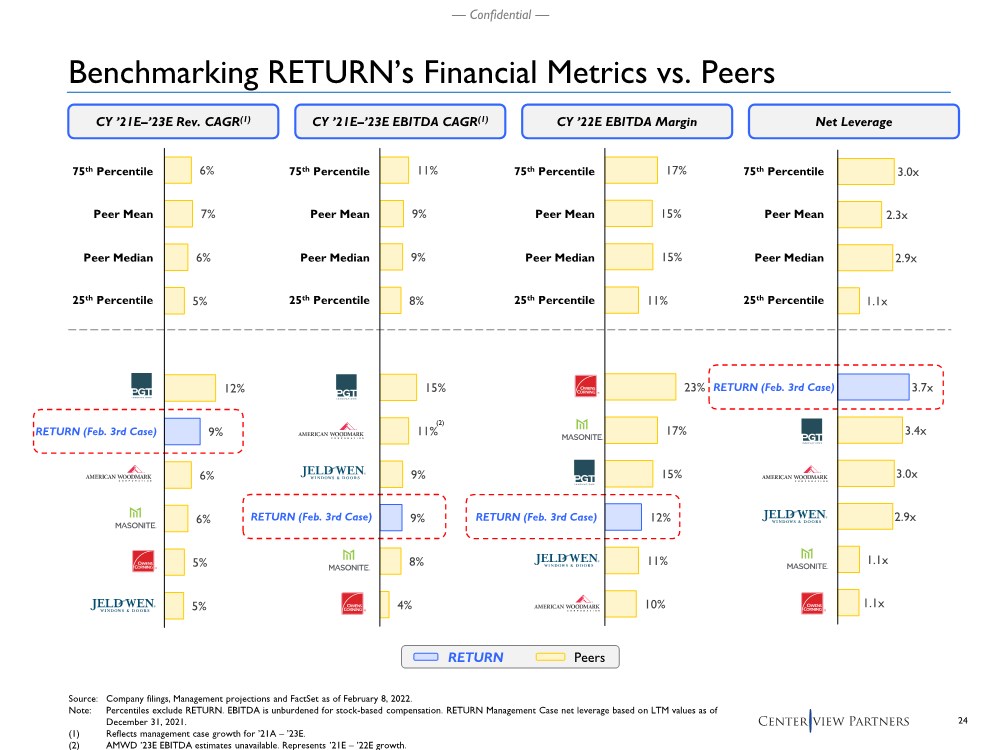
| 24 — Confidential — CY ’21E–’23E Rev. CAGR(1) CY ’22E EBITDA Margin CY ’21E–’23E EBITDA CAGR(1) Benchmarking RETURN’s Financial Metrics vs. Peers Source: Company filings, Management projections and FactSet as of February 8, 2022. Note: Percentiles exclude RETURN. EBITDA is unburdened for stock-based compensation. RETURN Management Case net leverage based on LTM values as of December 31, 2021. (1) Reflects management case growth for ’21A –’23E. (2) AMWD ’23E EBITDA estimates unavailable. Represents ’21E –’22E growth. Peers RETURN RETURN (Feb. 3rd Case) Peer Mean 25th Percentile Peer Median 75th Percentile Net Leverage Peer Mean 25th Percentile Peer Median 75th Percentile Peer Mean 25th Percentile Peer Median 75th Percentile Peer Mean 25th Percentile Peer Median 75th Percentile 3.0x 2.3x 2.9x 1.1x 3.7x 3.4x 3.0x 2.9x 1.1x 1.1x 17% 15% 15% 11% 23% 17% 15% 12% 11% 10% 11% 9% 9% 8% 15% 11% 9% 9% 8% 4% (2) 6% 7% 6% 5% 12% 9% 6% 6% 5% 5% RETURN (Feb. 3rd Case) RETURN (Feb. 3rd Case) RETURN (Feb. 3rd Case) |
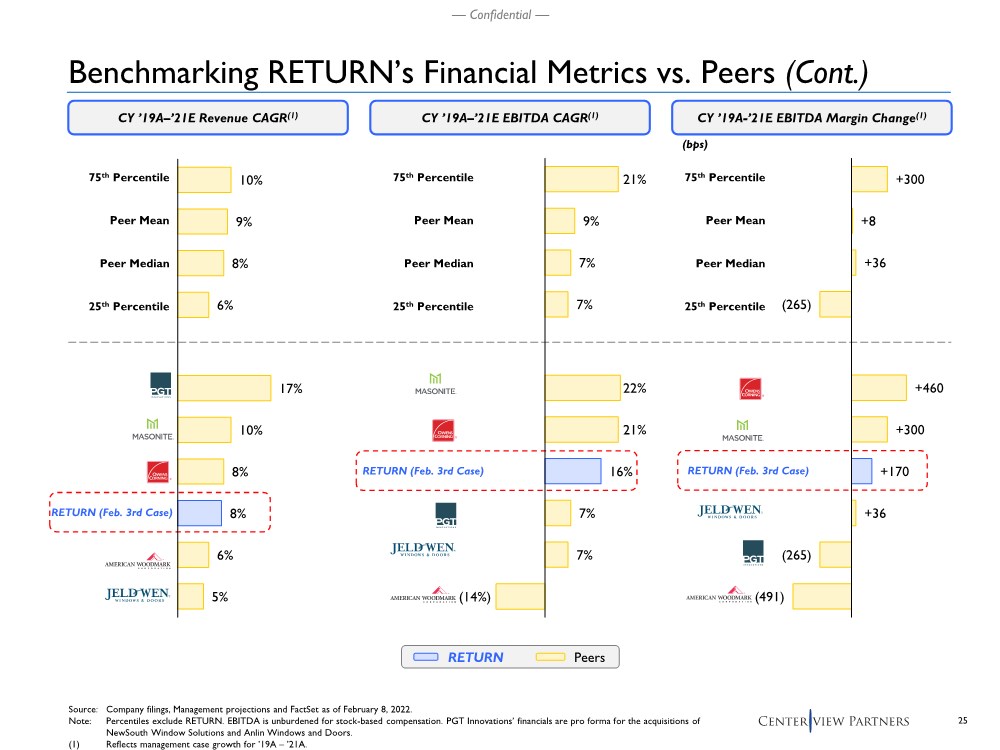
| 25 — Confidential — CY ’19A–’21E Revenue CAGR(1) CY ’19A-’21E EBITDA Margin Change(1) CY ’19A–’21E EBITDA CAGR(1) Benchmarking RETURN’s Financial Metrics vs. Peers (Cont.) Source: Company filings, Management projections and FactSet as of February 8, 2022. Note: Percentiles exclude RETURN. EBITDA is unburdened for stock-based compensation. PGT Innovations’ financials are pro forma for the acquisitions of NewSouth Window Solutions and Anlin Windows and Doors. (1) Reflects management case growth for ’19A –’21A. RETURN (Feb. 3rd Case) RETURN (Feb. 3rd Case) RETURN (Feb. 3rd Case) Peer Mean 25th Percentile Peer Median 75th Percentile Peer Mean 25th Percentile Peer Median 75th Percentile Peer Mean 25th Percentile Peer Median 75th Percentile 10% 9% 8% 6% 17% 10% 8% 8% 6% 5% 21% 9% 7% 7% 22% 21% 16% 7% 7% (14%) +300 +8 +36 (265) +460 +300 +170 +36 (265) (491) (bps) Peers RETURN |
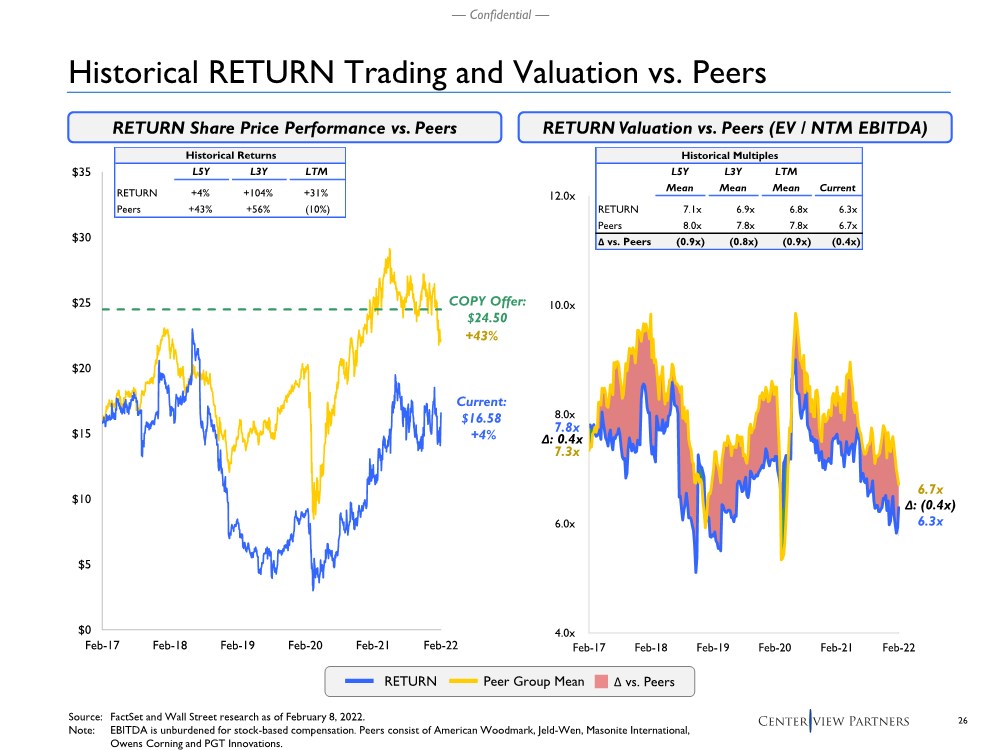
| 26 — Confidential — 4.0x 6.0x 8.0x 10.0x 12.0x Feb-17 Feb-18 Feb-19 Feb-20 Feb-21 Feb-22 Historical Multiples L5Y L3Y LTM Mean Mean Mean Current RETURN 7.1x 6.9x 6.8x 6.3x Peers 8.0x 7.8x 7.8x 6.7x Δ vs. Peers (0.9x) (0.8x) (0.9x) (0.4x) $0 $5 $10 $15 $20 $25 $30 $35 Feb-17 Feb-18 Feb-19 Feb-20 Feb-21 Feb-22 Historical RETURN Trading and Valuation vs. Peers Source: FactSet and Wall Street research as of February 8, 2022. Note: EBITDA is unburdened for stock-based compensation. Peers consist of American Woodmark, Jeld-Wen, Masonite International, Owens Corning and PGT Innovations. RETURN Valuation vs. Peers (EV / NTM EBITDA) 6.3x 6.7x 7.8x 7.3x Current: $16.58 +4% COPY Offer: $24.50 +43% RETURN Share Price Performance vs. Peers Peer Group Mean RETURN Δ vs. Peers Δ: 0.4x Δ: (0.4x) Historical Returns L5Y L3Y LTM RETURN +4% +104% +31% Peers +43% +56% (10%) |
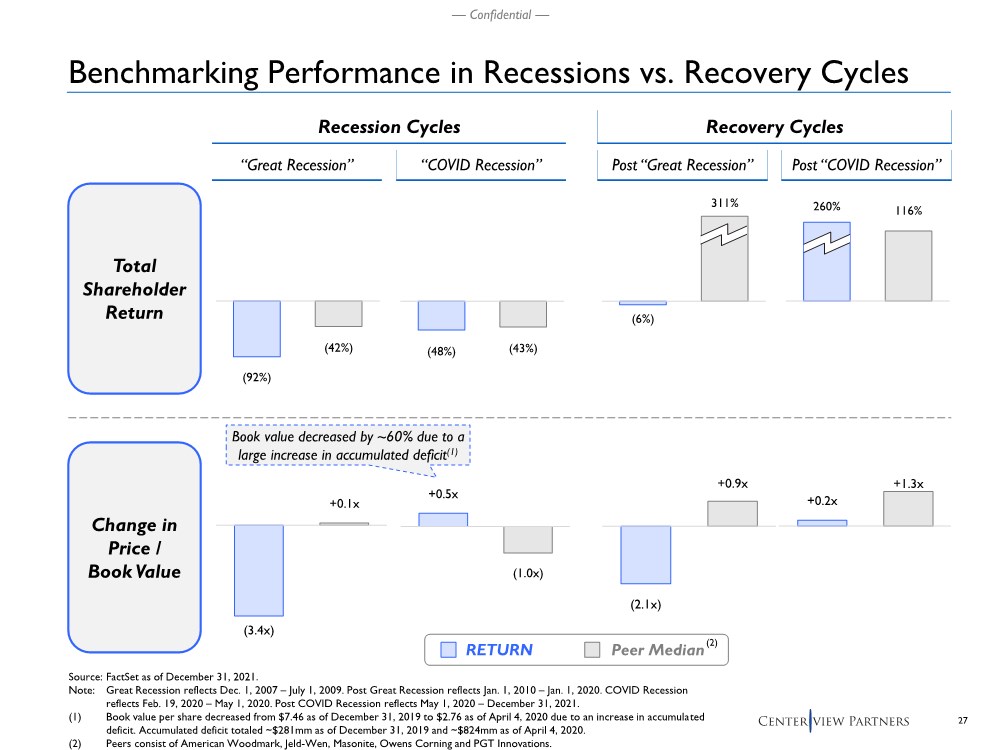
| 27 — Confidential — +0.2x +1.3x +0.5x (1.0x) (2.1x) +0.9x (3.4x) +0.1x (48%) (43%) (92%) (42%) 260% 116% (6%) 311% Benchmarking Performance in Recessions vs. Recovery Cycles Source: FactSet as of December 31, 2021. Note: Great Recession reflects Dec. 1, 2007 – July 1, 2009. Post Great Recession reflects Jan. 1, 2010 – Jan. 1, 2020. COVID Recession reflects Feb. 19, 2020 – May 1, 2020. Post COVID Recession reflects May 1, 2020 – December 31, 2021. (1) Book value per share decreased from $7.46 as of December 31, 2019 to $2.76 as of April 4, 2020 due to an increase in accumulated deficit. Accumulated deficit totaled ~$281mm as of December 31, 2019 and ~$824mm as of April 4, 2020. (2) Peers consist of American Woodmark, Jeld-Wen, Masonite, Owens Corning and PGT Innovations. Total Shareholder Return Change in Price / Book Value Recession Cycles Recovery Cycles “Great Recession” “COVID Recession” Post “Great Recession” Post “COVID Recession” RETURN Peer Median(2) Book value decreased by ~60% due to a large increase in accumulated deficit(1) |
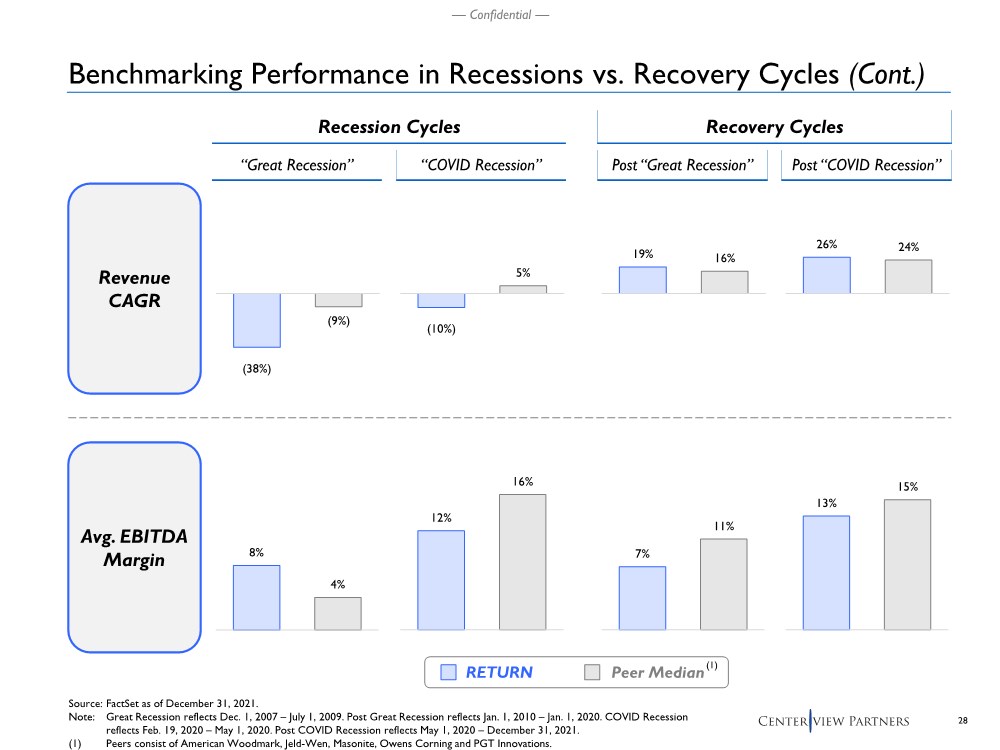
| 28 — Confidential — 26% 24% 19% 16% (10%) 5% (38%) (9%) Benchmarking Performance in Recessions vs. Recovery Cycles (Cont.) Revenue CAGR Source: FactSet as of December 31, 2021. Note: Great Recession reflects Dec. 1, 2007 – July 1, 2009. Post Great Recession reflects Jan. 1, 2010 – Jan. 1, 2020. COVID Recession reflects Feb. 19, 2020 – May 1, 2020. Post COVID Recession reflects May 1, 2020 – December 31, 2021. (1) Peers consist of American Woodmark, Jeld-Wen, Masonite, Owens Corning and PGT Innovations. RETURN Peer Median(1) 7% 11% 8% 4% 12% 16% 13% 15% Avg. EBITDA Margin Recession Cycles Recovery Cycles “Great Recession” “COVID Recession” Post “Great Recession” Post “COVID Recession” |
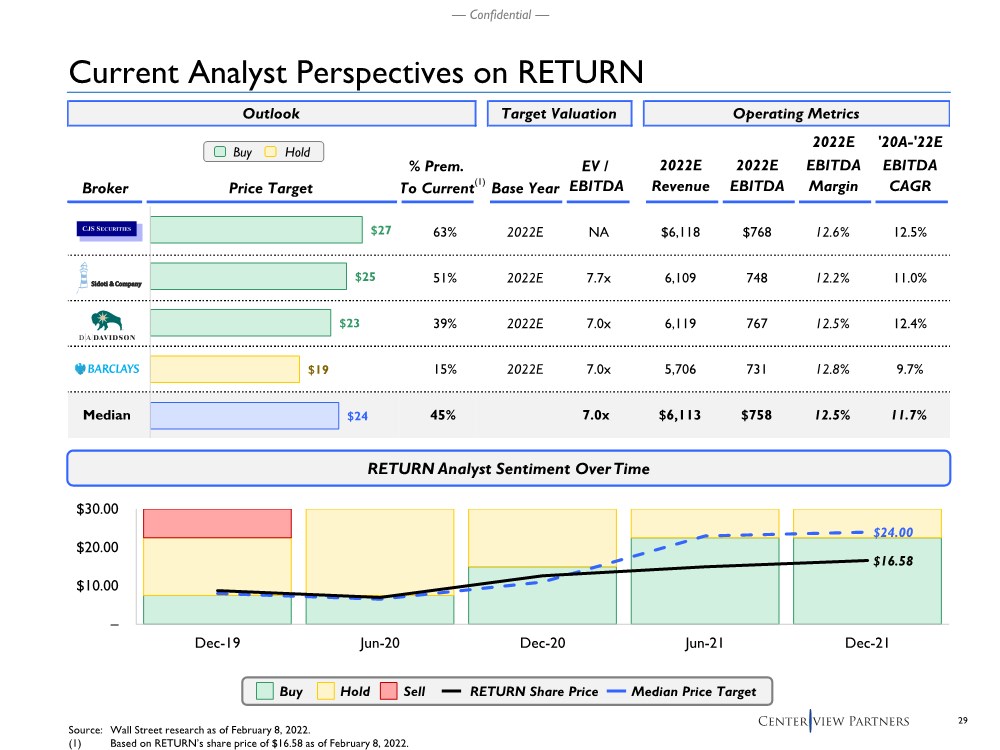
| 29 — Confidential — – $10.00 $20.00 $30.00 Dec-19 Jun-20 Dec-20 Jun-21 Dec-21 Outlook Target Valuation Operating Metrics 2022E '20A-'22E % Prem. EV / 2022E 2022E EBITDA EBITDA Broker Price Target To Current Base Year EBITDA Revenue EBITDA Margin CAGR 63% 2022E NA $6,118 $768 12.6% 12.5% 51% 2022E 7.7x 6,109 748 12.2% 11.0% 39% 2022E 7.0x 6,119 767 12.5% 12.4% 15% 2022E 7.0x 5,706 731 12.8% 9.7% Median 45% 7.0x $6,113 $758 12.5% 11.7% $27 $25 $23 $19 $24 Current Analyst Perspectives on RETURN RETURN Analyst Sentiment Over Time Buy Hold Buy Hold Sell RETURN Share Price Median Price Target $24.00 $16.58 (1) Source: Wall Street research as of February 8, 2022. (1) Based on RETURN’s share price of $16.58 as of February 8, 2022. |
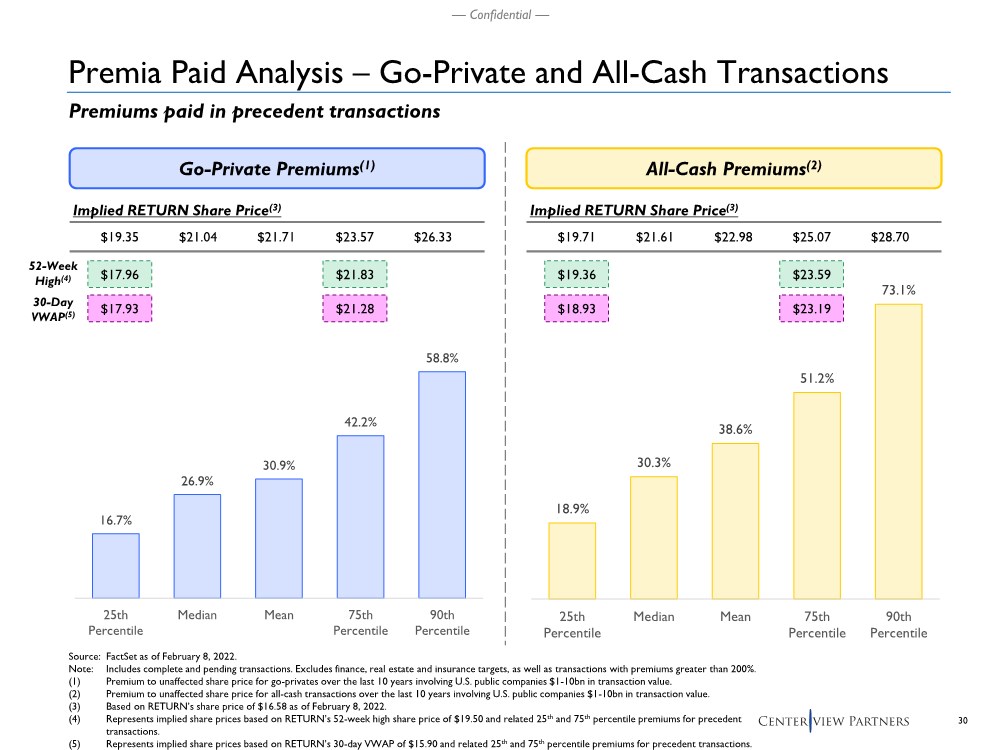
| 30 — Confidential — Premia Paid Analysis – Go-Private and All-Cash Transactions Premiums paid in precedent transactions Source: FactSet as of February 8, 2022. Note: Includes complete and pending transactions. Excludes finance, real estate and insurance targets, as well as transactions with premiums greater than 200%. (1) Premium to unaffected share price for go-privates over the last 10 years involving U.S. public companies $1-10bn in transaction value. (2) Premium to unaffected share price for all-cash transactions over the last 10 years involving U.S. public companies $1-10bn in transaction value. (3) Based on RETURN’s share price of $16.58 as of February 8, 2022. (4) Represents implied share prices based on RETURN’s 52-week high share price of $19.50 and related 25th and 75th percentile premiums for precedent transactions. (5) Represents implied share prices based on RETURN’s 30-day VWAP of $15.90 and related 25th and 75th percentile premiums for precedent transactions. Go-Private Premiums(1) All-Cash Premiums(2) Implied RETURN Share Price(3) $19.35 $21.04 $21.71 $23.57 $26.33 Implied RETURN Share Price(3) $19.71 $21.61 $22.98 $25.07 $28.70 16.7% 26.9% 30.9% 42.2% 58.8% 25th Percentile Median Mean 75th Percentile 90th Percentile 18.9% 30.3% 38.6% 51.2% 73.1% 25th Percentile Median Mean 75th Percentile 90th Percentile $17.96 $21.83 $17.93 $21.28 $23.59 $23.19 $19.36 $18.93 52-Week High(4) 30-Day VWAP(5) |
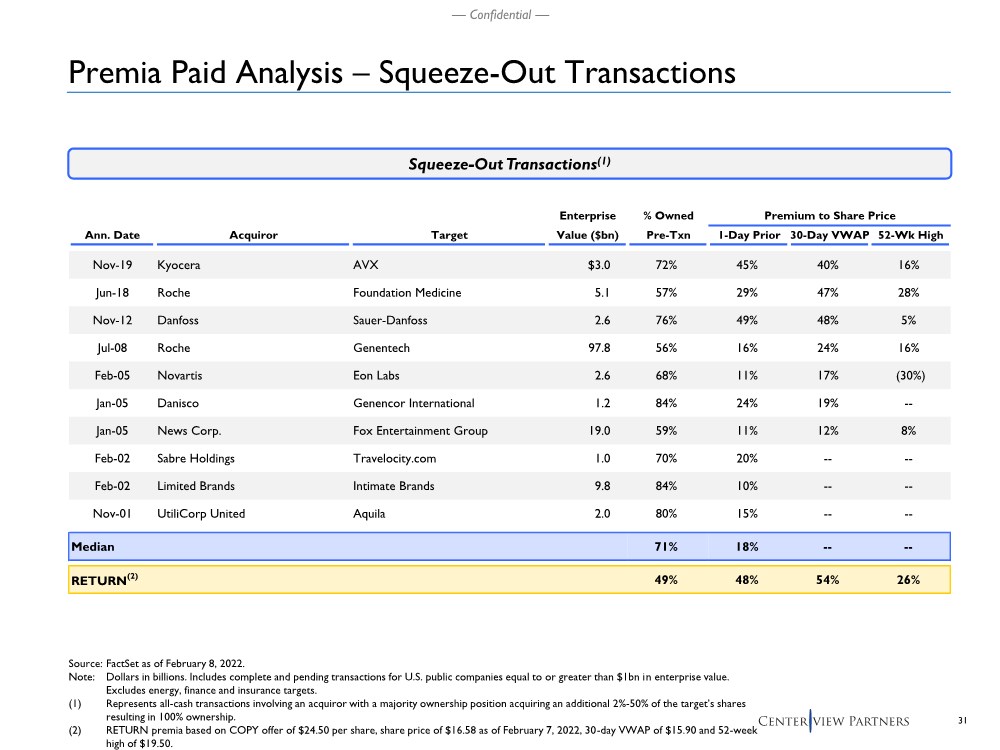
| 31 — Confidential — Source: FactSet as of February 8, 2022. Note: Dollars in billions. Includes complete and pending transactions for U.S. public companies equal to or greater than $1bn in enterprise value. Excludes energy, finance and insurance targets. (1) Represents all-cash transactions involving an acquiror with a majority ownership position acquiring an additional 2%-50% of the target’s shares resulting in 100% ownership. (2) RETURN premia based on COPY offer of $24.50 per share, share price of $16.58 as of February 7, 2022, 30-day VWAP of $15.90 and 52-week high of $19.50. Squeeze-Out Transactions(1) Enterprise % Owned Premium to Share Price Ann. Date Acquiror Target Value ($bn) Pre-Txn 1-Day Prior 30-Day VWAP 52-Wk High Nov-19 Kyocera AVX $3.0 72% 45% 40% 16% Jun-18 Roche Foundation Medicine 5.1 57% 29% 47% 28% Nov-12 Danfoss Sauer-Danfoss 2.6 76% 49% 48% 5% Jul-08 Roche Genentech 97.8 56% 16% 24% 16% Feb-05 Novartis Eon Labs 2.6 68% 11% 17% (30%) Jan-05 Danisco Genencor International 1.2 84% 24% 19% -- Jan-05 News Corp. Fox Entertainment Group 19.0 59% 11% 12% 8% Feb-02 Sabre Holdings Travelocity.com 1.0 70% 20% -- -- Feb-02 Limited Brands Intimate Brands 9.8 84% 10% -- -- Nov-01 UtiliCorp United Aquila 2.0 80% 15% -- -- Median 71% 18% -- -- RETURN(2) 49% 48% 54% 26% Premia Paid Analysis – Squeeze-Out Transactions |
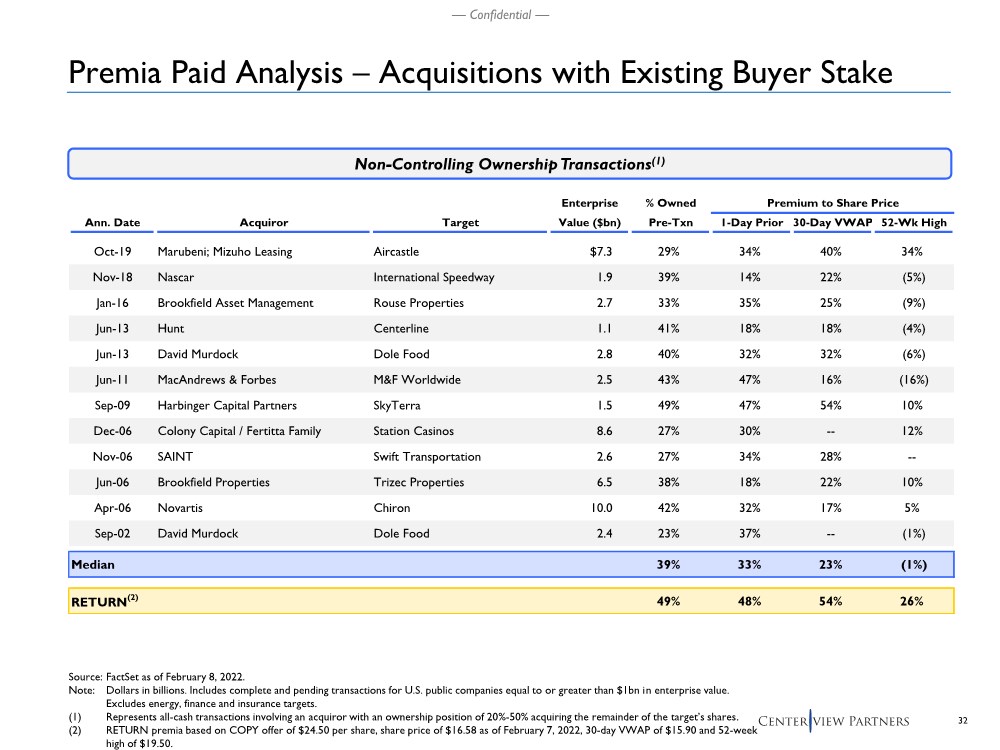
| 32 — Confidential — Source: FactSet as of February 8, 2022. Note: Dollars in billions. Includes complete and pending transactions for U.S. public companies equal to or greater than $1bn in enterprise value. Excludes energy, finance and insurance targets. (1) Represents all-cash transactions involving an acquiror with an ownership position of 20%-50% acquiring the remainder of the target’s shares. (2) RETURN premia based on COPY offer of $24.50 per share, share price of $16.58 as of February 7, 2022, 30-day VWAP of $15.90 and 52-week high of $19.50. Non-Controlling Ownership Transactions(1) Premia Paid Analysis – Acquisitions with Existing Buyer Stake Enterprise % Owned Premium to Share Price Ann. Date Acquiror Target Value ($bn) Pre-Txn 1-Day Prior 30-Day VWAP 52-Wk High Oct-19 Marubeni; Mizuho Leasing Aircastle $7.3 29% 34% 40% 34% Nov-18 Nascar International Speedway 1.9 39% 14% 22% (5%) Jan-16 Brookfield Asset Management Rouse Properties 2.7 33% 35% 25% (9%) Jun-13 Hunt Centerline 1.1 41% 18% 18% (4%) Jun-13 David Murdock Dole Food 2.8 40% 32% 32% (6%) Jun-11 MacAndrews & Forbes M&F Worldwide 2.5 43% 47% 16% (16%) Sep-09 Harbinger Capital Partners SkyTerra 1.5 49% 47% 54% 10% Dec-06 Colony Capital / Fertitta Family Station Casinos 8.6 27% 30% -- 12% Nov-06 SAINT Swift Transportation 2.6 27% 34% 28% -- Jun-06 Brookfield Properties Trizec Properties 6.5 38% 18% 22% 10% Apr-06 Novartis Chiron 10.0 42% 32% 17% 5% Sep-02 David Murdock Dole Food 2.4 23% 37% -- (1%) Median 39% 33% 23% (1%) RETURN(2) 49% 48% 54% 26% |
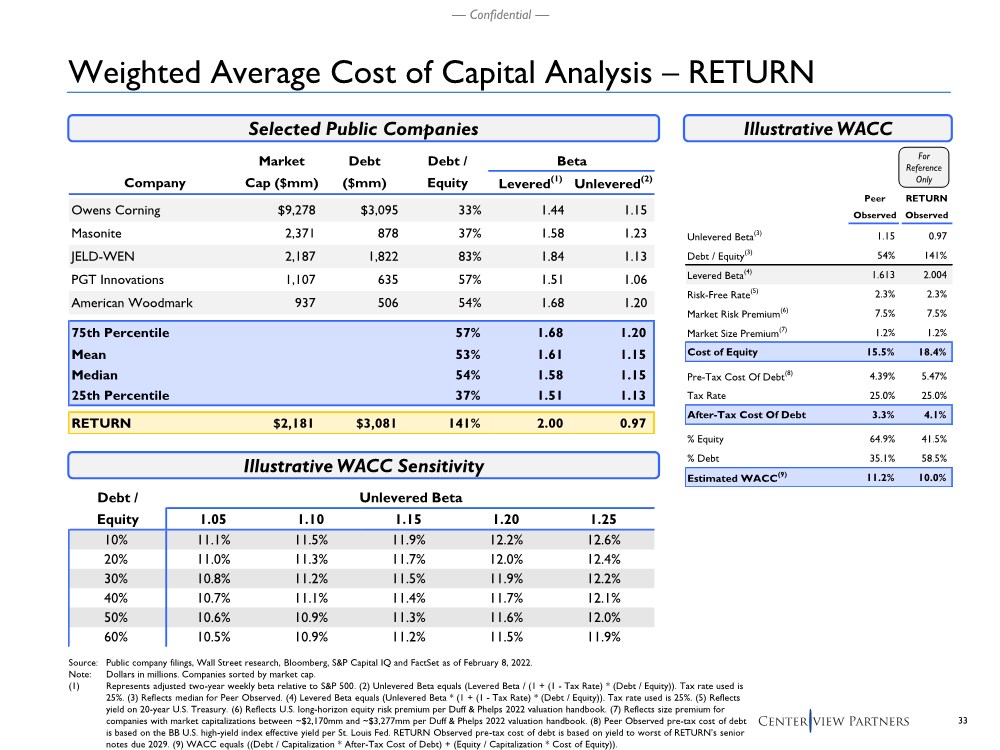
| 33 — Confidential — Debt / Unlevered Beta Equity 1.05 1.10 1.15 1.20 1.25 10% 11.1% 11.5% 11.9% 12.2% 12.6% 20% 11.0% 11.3% 11.7% 12.0% 12.4% 30% 10.8% 11.2% 11.5% 11.9% 12.2% 40% 10.7% 11.1% 11.4% 11.7% 12.1% 50% 10.6% 10.9% 11.3% 11.6% 12.0% 60% 10.5% 10.9% 11.2% 11.5% 11.9% Weighted Average Cost of Capital Analysis – RETURN Selected Public Companies Illustrative WACC Illustrative WACC Sensitivity Source: Public company filings, Wall Street research, Bloomberg, S&P Capital IQ and FactSet as of February 8, 2022. Note: Dollars in millions. Companies sorted by market cap. (1) Represents adjusted two-year weekly beta relative to S&P 500. (2) Unlevered Beta equals (Levered Beta / (1 + (1 - Tax Rate) * (Debt / Equity)). Tax rate used is 25%. (3) Reflects median for Peer Observed. (4) Levered Beta equals (Unlevered Beta * (1 + (1 - Tax Rate) * (Debt / Equity)). Tax rate used is 25%. (5) Reflects yield on 20-year U.S. Treasury. (6) Reflects U.S. long-horizon equity risk premium per Duff & Phelps 2022 valuation handbook. (7) Reflects size premium for companies with market capitalizations between ~$2,170mm and ~$3,277mm per Duff & Phelps 2022 valuation handbook. (8) Peer Observed pre-tax cost of debt is based on the BB U.S. high-yield index effective yield per St. Louis Fed. RETURN Observed pre-tax cost of debt is based on yield to worst of RETURN’s senior notes due 2029. (9) WACC equals ((Debt / Capitalization * After-Tax Cost of Debt) + (Equity / Capitalization * Cost of Equity)). Market Debt Debt / Beta Company Cap ($mm) ($mm) Equity Levered(1) Unlevered(2) Owens Corning $9,278 $3,095 33% 1.44 1.15 Masonite 2,371 878 37% 1.58 1.23 JELD-WEN 2,187 1,822 83% 1.84 1.13 PGT Innovations 1,107 635 57% 1.51 1.06 American Woodmark 937 506 54% 1.68 1.20 75th Percentile 57% 1.68 1.20 Mean 53% 1.61 1.15 Median 54% 1.58 1.15 25th Percentile 37% 1.51 1.13 RETURN $2,181 $3,081 141% 2.00 0.97 Peer RETURN Observed Observed Unlevered Beta(3) 1.15 0.97 Debt / Equity(3) 54% 141% Levered Beta(4) 1.613 2.004 Risk-Free Rate(5) 2.3% 2.3% Market Risk Premium(6) 7.5% 7.5% Market Size Premium(7) 1.2% 1.2% Cost of Equity 15.5% 18.4% Pre-Tax Cost Of Debt(8) 4.39% 5.47% Tax Rate 25.0% 25.0% After-Tax Cost Of Debt 3.3% 4.1% % Equity 64.9% 41.5% % Debt 35.1% 58.5% Estimated WACC(9) 11.2% 10.0% For Reference Only |