Please wait
| |
New York
Menlo Park
Washington DC
São Paulo
London
|
Paris
Madrid
Tokyo
Beijing
Hong Kong
|
| Nora M. Jordan |
|
| |
|
|
|
Davis Polk & Wardwell LLP
450 Lexington Avenue
New York, NY 10017
|
212 450 4000 tel
212 701 5800 fax
nora.jordan@davispolk.com
|
|
|
January 23, 2013
|
| |
|
Re:
|
SPDR® S&P 500® ETF Trust; Filing on Form S-6 for Registration of Securities of Unit Investment Trusts Registered on Form N-8B-2
(Securities Act of 1933 File No. 33-46080; Investment Company Act of 1940 File No. 811-06125)
|
Via Electronic Filing
Michael J. Spratt, Esq.
Kieran Brown, Esq.
Jim O’Connor, Esq.
Securities and Exchange Commission
100 F Street, N.E.
Washington, D.C. 20549
Dear Messrs. Spratt, Brown and O’Connor:
On behalf of SPDR® S&P 500® ETF Trust (the “Trust”), we thank you for the comments Mr. Brown provided to us telephonically on December 11, 2012 as they relate to Post-Effective Amendment (a “PEA”) No. 24 to the Trust’s registration statement on Form S-6 (the “Registration Statement”) filed with the Securities and Exchange Commission (the “SEC”) on October 25, 2012. We are writing to respond to your comments below. Where changes were necessary in response to your comments, they will be reflected in a PEA No. 27 to the Trust’s Registration Statement,1 which will be filed via EDGAR. To facilitate your review, a PDF version of a changed-pages-only marked copy of the proposed PEA No. 27 to the Trust’s Registration Statement, indicating changes to PEA No. 24 in response to your comments, along with other changes, is being provided to you herewith. Capitalized terms not defined herein have the meanings set forth in the Registration Statement.
Registration Statement Facing Sheet/ Sponsor/ Trustee
|
Comment 1
|
Disclose the Internal Revenue Service Employer Identification Number of each of the Trust, the depositor and the trustee of the Trust, as required per Items 1(a), 2 and 3 of Form N-8B-2.
|
|
Response 1
|
The Internal Revenue Service Employer Identification Numbers of the Trust, the depositor and the trustee of the Trust are 13-3574560, 26-4126158 and 04-1867445,
|
1 PEA No. 25 was filed via EDGAR on December 21, 2012 and PEA No. 26 was filed via EDGAR on January 17, 2013 solely to delay the date of effectiveness of the Registration Statement.
respectively, and are now disclosed on the facing sheet and in the “Sponsor” and “Trustee” sections of the Registration Statement.
|
Comment 2
|
In the footnote to the fee table, move the penultimate sentence “Thereafter, the Trustee may discontinue this voluntary waiver policy,” so that it follows the first sentence in such footnote.
|
|
Response 2
|
The requested revision has been made.
|
|
Comment 3
|
In the footnote to the fee table, add disclosure stating whether the waived fees may be recouped.
|
|
Response 3
|
The requested revision has been made to the footnote to the fee table, as follows:
|
|
|
[Until February 1, 2014, State Street Bank and Trust Company, the trustee of the Trust (the “Trustee”), has agreed to waive a portion of its fee to the extent operating expenses exceed [____]% 0.0945%. Any fees waived by the Trustee may not be recouped by the Trustee in subsequent periods. After February 1, 2014, the Trustee may discontinue this fee waiver. Therefore, there is no guarantee that the Trust’s ordinary operating expenses will not exceed 0.0945% of the Trust’s daily net asset value. The fee waiver is calculated after taking into consideration the earnings credit to the Trustee with respect to uninvested cash balances of the Trust. The amount of the earnings credit will be equal to the then current Federal Funds Rate, as reported in nationally distributed publications, multiplied by each day’s daily cash balance, if any, in the Trust’s cash account, reduced by the amount of reserves, if any, for that account required by the Federal Reserve Board of Governors. Thereafter, the Trustee may discontinue this voluntary waiver policy. Therefore, there is no guarantee that the Trust’s ordinary operating expenses will not exceed [____]% of the Trust’s daily NAV.]
|
|
Comment 4
|
Confirm that the Trust will invest, under normal circumstances, at least 80% of the value of its assets in the particular types of investments suggested by the Trust’s name.
|
|
Response 4
|
At least 80% of the Trust’s assets will be invested in securities comprising the S&P 500 Index.
|
Summary—The Trust’s Investments and Portfolio Turnover
|
Comment 5
|
Clarify what is meant by “The Trustee aggregates certain of these adjustments” in the second paragraph under “Summary—The Trust’s Investments and Portfolio Turnover” by rephrasing the wording.
|
|
Response 5
|
As the referenced phrase is contained in the Trust Agreement, we believe it is appropriate to use the same wording in the Registration Statement. The Trustee has confirmed that the referenced phrase means that the Trustee has the ability to wait until the end of a month to make changes to the Portfolio to reflect aggregate changes made by S&P during the month with respect to the identity and/or relative weightings of Index Securities.
|
Summary—Principal Risks of Investing in the Trust
|
Comment 6
|
Regarding the “Index Tracking Risk” under “Summary—Principal Risks of Investing in the Trust,” provide an example of when the Trust would not fully replicate the performance of the Index due to the unavailability of certain Index Securities in the secondary market or due to other extraordinary circumstances.
|
|
Response 6
|
The requested revision has been made to the risk factor, as follows:
|
Index Tracking Risk. While the Trust is intended to track the performance of the Index as closely as possible (i.e., to achieve a high degree of correlation with the Index), the Trust’s return may not match or achieve a high degree of correlation with the return of the Index due to expenses and transaction costs incurred in adjusting the actual balance of the Portfolio. In addition, it is possible that the Trust may not always fully replicate the performance of the Index due to the unavailability of certain Index Securities in the secondary market or due to other extraordinary circumstances (e.g., if trading in a security has been halted).
Purchase and Sale Information
|
Comment 7
|
In the first paragraph under “Purchase and Sale Information,” disclose the ticker symbols (or the equivalent thereof) under which Units are traded on the Singapore Exchange Securities Trading Limited and the Tokyo Stock Exchange.
|
|
Response 7
|
The requested revisions have been made to the first paragraph under “Purchase and Sale Information”, as follows:
|
Individual Units of the Trust may be purchased and sold on NYSE Arca, Inc. (the “Exchange”), under the market symbol “SPY”, through your broker-dealer at market prices. Units trade at market prices that may be greater than net asset value (“NAV”) (premium) or less than NAV (discount). Units are also listed and traded on the Singapore Exchange Securities Trading Limited (stock code S27) and the Tokyo Stock Exchange (code 1557). In the future, Units may be listed and traded on other non-U.S. exchanges. Units may be purchased on other trading markets or venues in addition to the Exchange, the Singapore Exchange Securities Trading Limited and the Tokyo Stock Exchange.
Dividends and Distributions—Dividends and Capital Gains
|
Comment 8
|
The first paragraph under “Dividends and Distributions—Dividends and Capital Gains” contains a sentence stating that “Because of such fees and expenses, the dividend yield for Units is ordinarily less than that of the Index.” Delete the word “ordinarily” from such sentence or explain when the dividend yield would not be less than that of the Index.
|
|
Response 8
|
As noted in the Registration Statement in the last paragraph under “Federal Income Taxes – Taxation of the Trust”, “[i]n order to meet the distribution requirements necessary to be exempt from U.S. federal income tax on its distributed income, the Trust may be required to make distributions in excess of the yield performance of the Portfolio Securities and may be required to sell securities in order to do so.” Accordingly, the word “ordinarily” is being retained and no changes are otherwise
|
being made since there could be instances where the dividend yield for Units is greater than that of the Index.
Report of Independent Registered Public Accounting Firm
|
Comment 9
|
In the following sentence under Note 3 to the Trust’s financial statements, change “2013” to “2014”: [The Trustee voluntarily agreed to waive a portion of its fee, as needed, for one year through [February 1, 2013], so that the total operating expenses would not exceed [9.45/100 of 1% (0.0945%)] per annum of the daily net asset value. The total amount of such waivers by the Trustee for the years ended September 30, 2010, September 30, 2011 and September 30, 2012 was $10,128,612, $12,589,426 and $[_______], respectively.]
|
|
Response 9
|
We respectfully submit that the requested change should not be made because the disclosure relates to the time period referred to in the audited financial statements, which covers the period ended September 30, 2012.
|
|
|
Portfolio Adjustments—Adjustments to the Portfolio Deposit
|
|
Comment 10
|
Correct footnote number 2 referencing “Business Day” to footnote number 1, as the footnote next to “Business Day” appears to refer to footnote number 1 at the bottom of the page.
|
|
Response 10
|
Footnote number 2 referencing “Business Day” has been changed to an asterisk (*) and the text of the footnote at the bottom of the page has been changed to an asterisk (*) as well.
|
|
Comment 11
|
Disclose whether the recoupment by the Sponsor in the second paragraph under “Expenses of the Trust” has a time limit.
|
|
Response 11
|
Disclosure regarding the voluntary undertaking by the Sponsor to cap ordinary operating expenses of the Trust, to which the language regarding recoupment relates, has been deleted from the Registration Statement (along with the language on recoupment) as the voluntary undertaking is no longer in effect.
|
|
Comment 12
|
Disclose the aggregate dollar amount of fees paid to the Trustee for the fiscal year ended September 30, 2012 under “Expenses of the Trust—Trustee Fee Scale.”
|
|
Response 12
|
The requested revision has been made to the first paragraph under “Expenses of the Trust—Trustee Fee Scale” as follows:
|
As of September 30, 2012, and as of December 31, 2012, the NAVnet asset value of the Trust was $[_____]118,164,619,076 and $[_____]126,532,338,397, respectively. No representation is made as to the actual NAVnet asset value of the Trust on any future date, as it is subject to change at any time due to fluctuations in the market value of the Portfolio Securities, or to creations or redemptions made in the future. For the fiscal year ended September 30, 2012, the aggregate dollar amount of net fees paid to the Trustee was $39,664,699.
|
Comment 13
|
The Registration Statement states that the “Adjustment Amount is calculated at the end of each quarter and applied against the Trustee’s fee for the following quarter,” and goes on to describe the calculation process. Please provide an example.
|
|
Response 13
|
An example of how the Adjustment Amount was calculated during the year ended September 30, 2012 has been added to the end of “Expenses of the Trust—Trustee Fee Scale” as follows:
|
For example, during the year ended September 30, 2012, the Adjustment Amount included an excess of net transaction fees from processing orders of $4,169,916 and a Trustee earnings credit of $432,359. Thus, the Adjustment Amount reduced the Trustee’s fee by $4,602,275.
|
Comment 14
|
Clarify what is meant by “If Portfolio Securities are listed on one or more national securities exchanges, such evaluation is generally based on the closing sale price on that day (unless the Trustee deems such price inappropriate as a basis for evaluation) on the exchange which is deemed to be the principal market therefor or, if there is no such appropriate closing sale price on such exchange, at the closing bid price (unless the Trustee deems such price inappropriate as a basis for evaluation),” in the second paragraph under “Determination of NAV.” Alternatively, if such disclosure tracks the terms of the Trust Agreement, so state.
|
|
Response 14
|
The referenced sentence tracks the terms of the Trust Agreement. We note that all of the Portfolio Securities are listed on one or more national securities exchanges and therefore, under normal circumstances, the closing sale price is available.
|
|
Comment 15
|
Revise the first sentence in the third paragraph under “Sponsor” to clarify that the resignation of the Sponsor is one of the circumstances under which the Trustee may appoint a successor Sponsor, agree to act as Sponsor itself, or terminate the Trust Agreement and liquidate the Trust.
|
|
Response 15
|
The requested revision has been made as follows:
|
If at any time the Sponsor fails to undertake or perform or becomes incapable of undertaking or performing any of the duties which by the terms of the Trust Agreement are required to be undertaken or performed by it, and such failure is not cured within fifteen (15) Business Days following receipt of notice from the Trustee of such failure, or if the Sponsor resigns, or if the Sponsor is adjudged bankrupt or insolvent, or a receiver of the Sponsor or of its property is appointed, or a trustee or liquidator or any public officer takes charge or control of the Sponsor or of its property or affairs for the purpose of rehabilitation, conservation or liquidation, the Trustee may appoint a successor Sponsor, agree to act as Sponsor itself, or terminate the Trust Agreement and liquidate the Trust. Upon the Trustee’s and a successor Sponsor’s execution of an instrument of appointment and assumption, the successor Sponsor succeeds to all of the rights, powers, duties and obligations of the original Sponsor. The successor Sponsor shall not be under any liability under the Trust Agreement for
occurrences or omissions prior to the execution of such instrument. Any successor Sponsor may be compensated at rates deemed by the Trustee to be reasonable, but not exceeding the amounts prescribed by the SEC.
|
Comment 16
|
Disclose the information required by Item 28(a) and (b) of Form N-8B-2 (i.e., the following information about the depositor’s officers, directors or partners: name, principal business address, nature of relationship with the depositor, ownership of all securities of the depositor, ownership of all securities of the trust, other companies of which each of such persons if presently an officer, director or partner, as well as a brief statement of the business experience during the last five years of each officer, director or partner of the depositor).
|
|
Response 16
|
The requested disclosure has been made under “Sponsor” as follows:
|
The following information is being provided with respect to each officer and member of the Sponsor as at January 23, 2012.
|
Name
|
Nature of Relationship or Affiliation with Sponsor
|
|
Joseph Mecane
|
President
|
|
Laura Morrison
|
Senior Vice President
|
|
Janet McGinness
|
Secretary
|
|
NYSE MKT, LLC
|
Member
|
The principal business address for each of the officers and members listed above is c/o NYSE Euronext, 11 Wall Street, New York, New York 10005. None of the officers listed above either directly or indirectly owns, controls or holds with power to vote any of the outstanding limited liability company interests of the Sponsor. All of the outstanding limited liability company interests of the Sponsor are owned by NYSE MKT, LLC as the sole member of the Sponsor.
None of the individuals listed above either directly or indirectly owns, controls or holds with power to vote any of the outstanding Units of the Trust.
|
Other Companies of which Each of the Persons2 Named Above is Presently an Officer, Director or Partner
|
|
Person Named Above
|
Name and Principal Business Address of such Other Company
|
Nature of Business of such Other Company
|
Nature of Affiliation with such Other Company
|
|
Joseph Mecane
|
NYSE Euronext,
11 Wall Street,
New York,
New York 10005
|
Global operator of financial markets and provider of trading technologies.
|
Executive Vice President
|
| |
New York Block Exchange LLC,
11 Wall Street,
New York,
New York 10005
|
Subsidiary of global operator of financial markets and provider of trading technologies.
|
Director
|
| |
NYSE Amex
Options LLC,
|
Subsidiary of global operator of financial markets and provider of trading technologies.
|
Director
|
2 Exclude persons whose affiliation with the Sponsor arises solely by virtue of stock ownership (as defined under Section 2(a)(3)(A) of the Investment Company Act of 1940).
| |
11 Wall Street,
New York,
New York 10005
|
markets and provider of trading technologies. |
|
| |
NYSE IP LLC,
11 Wall Street,
New York,
New York 10005
|
Subsidiary of global operator of financial markets and provider of trading technologies.
|
Chief Executive Officer
|
| |
NYSE MKT, LLC,
11 Wall Street,
New York,
New York 10005
|
Subsidiary of global operator of financial markets and provider of trading technologies.
|
President and Chief Executive Officer
|
|
Laura Morrison
|
NYSE Euronext,
11 Wall Street,
New York,
New York 10005
|
Global operator of financial markets and provider of trading technologies.
|
Senior Vice President
|
| |
The Borough of Manhattan Community College Foundation,
c/o the City University of New York,
199 Chambers Street,
New York,
New York 10007
|
Not-for-profit organization whose sole business is to support the Borough of Manhattan Community College.
|
Director, Treasurer and Secretary
|
|
Janet McGinness3
|
NYSE Euronext,
11 Wall Street,
New York,
New York 10005
|
Subsidiary of global operator of financial markets and provider of trading technologies.
|
Senior Vice President and Secretary
|
Joseph Mecane has been employed by NYSE Euronext (or its predecessors) since May 2008. From November 2004 until May 2008, Mr. Mecane was a Managing Director in the Equities Division of UBS Investment Bank, where he was responsible for overseeing the firm’s wholesale and retail trade-execution business. Laura Morrison has been employed by NYSE Euronext (or its predecessors) since 1995. Janet McGinness has been employed by NYSE Euronext (or its predecessors) since 2006.
|
Comment 17
|
Disclose the general character of the general business engaged in by the depositor under “Sponsor”.
|
|
Response 17
|
The first paragraph under “Sponsor” has been revised with the requested information as follows:
|
The Sponsor is a Delaware limited liability company incorporated on April 6, 1998 with offices c/o NYSE Euronext, 11 Wall Street, New York, New York 10005. The Sponsor’s Internal Revenue Service Employer Identification Number is 26-4126158. The Sponsor’s sole business activity is to act as the sponsor of the Trust and two other ETFs. On October 1, 2008, the Sponsor became an indirect wholly-owned
3 In addition to her positions with the Sponsor and NYSE Euronext, Ms. McGinness is a Director and/or an officer (e.g., Senior Vice President, Vice President, Associate General Counsel, Secretary, Assistant Secretary) of 25 other subsidiaries of NYSE Euronext.
subsidiary of NYSE Euronext following the acquisition by NYSE Euronext of the American Stock Exchange LLC and all of its subsidiaries. NYSE Euronext is a “control person” of the Sponsor as such term is defined in the Securities Act of 1933.
|
Comment 18
|
Confirm whether a notice to shareholders is required to be provided upon the resignation of the Sponsor, the Sponsor’s failure to undertake its duties or if the Sponsor is adjudged bankrupt.
|
|
Response 18
|
The terms of the Trust Agreement do not require that a notice to shareholders be provided upon the resignation of the Sponsor, the Sponsor’s failure to undertake its duties or if the Sponsor is adjudged bankrupt.
|
|
Comment 19
|
Disclose the amount of the flat annual fee that the Sponsor pays the Distributor under “Distributor.”
|
|
Response 19
|
The first paragraph under “Distributor” has been revised with the requested information as follows:
|
The Distributor is a corporation organized under the laws of the State of Colorado and is located at 1290 Broadway, Suite 1100, Denver, CO 80203. The Distributor is a registered broker-dealer and a member of the Financial Industry Regulatory Authority (“FINRA”). The Sponsor pays the Distributor for its services a flat annual fee of $25,000. The Sponsor will not seek reimbursement for such payment from the Trust without obtaining prior exemptive relief from the SEC.
|
Comment 20
|
The “Distribution” section states that the Sponsor will not seek reimbursement from the Trust for the payment that the Sponsor makes to the Distributor without obtaining prior exemptive relief from the SEC. Confirm whether the Sponsor intends to seek such relief.
|
|
Response 20
|
At this time, the Sponsor does not intend to seek such relief.
|
|
|
Trust Agreement—Termination of the Trust Agreement
|
|
Comment 21
|
Under “Trust Agreement—Termination of the Trust Agreement,” the Registration Statement states that the adjustment for inflation in accordance with the CPI-U is to take effect at the end of the fourth year following January 22, 1993. Revise this disclosure from future tense to past tense, if applicable.
|
|
Response 21
|
The first paragraph under “Trust Agreement—Termination of the Trust Agreement” has been revised to clarify that the adjustment took place and is ongoing, as follows:
|
The Trust Agreement provides that the Sponsor has the discretionary right to direct the Trustee to terminate the Trust if at any time the NAVnet asset value of the Trust is less than $350,000,000, as such dollar amount shall be adjusted for inflation in accordance with the CPI-U. This adjustment is to take effect at the end of the fourth year following January 22, 1993 and at the end of each year thereafter and to be made so as to reflect the percentage increase in consumer prices as set forth in the CPI-U for the twelve month period ending in the last month of the preceding fiscal yearfrom (and including) 1997.
|
Comment 22
|
Disclose whether the code of ethics adopted by the Trust in compliance with Rule 17j-1 requirements under the Investment Company Act of 1940 permits personnel subject to the code to invest in securities, including securities that may be purchased or held by the Trust.
|
|
Response 22
|
The first paragraph under “Code of Ethics” has been revised with the requested disclosure as follows:
|
The Trust has adopted a code of ethics in compliance with Rule 17j-1 requirements under the Investment Company Act of 1940. Subject to pre-clearance, reporting, certification and other conditions and standards, the code permits personnel subject to the code, if any, to invest in Index Securities for their own accounts. The code is designed to prevent fraud, deception and misconduct against the Trust and to provide reasonable standards of conduct. The code is on file with the SEC and you may obtain a copy by visiting the SEC at the address listed on the back cover of this prospectus. The code is also available on the SEC’s Internet site at http://www.sec.gov. A copy may be obtained, after paying a duplicating fee, by electronic request at publicinfo@sec.gov, or by writing the SEC at the address listed on the back cover of this prospectus.
Thank you very much for your assistance with this matter. Please do not hesitate to contact me (212-450-4684) or Aaron Schlaphoff (212-450-4791) if you have any questions.
Very truly yours,
/s/ Nora M. Jordan
Nora M. Jordan
As filed with the Securities and Exchange Commission on October 25January 23, 20122013
File No. 33-46080
SECURITIES AND EXCHANGE COMMISSION
WASHINGTON, D.C. 20549
POST EFFECTIVE AMENDMENT NO. 2427
TO
Form S-6
FOR REGISTRATION UNDER THE SECURITIES ACT OF 1933 OF
SECURITIES OF UNIT INVESTMENT TRUSTS REGISTERED
ON FORM N-8B-2
|
A.
|
Exact name of Trust:
|
| |
SPDR S&P 500 ETF TRUST
|
| |
(formerly known as SPDR TRUST SERIES 1 prior to January 27, 2010)
|
| |
(I.R.S. Employer Identification Number: 13-3574560)
|
|
B.
|
Name of Depositor:
|
| |
PDR SERVICES LLC
|
|
C.
|
Complete address of Depositor's principal executive office:
|
| |
PDR SERVICES LLC
|
| |
c/o NYSE Euronext
|
| |
11 Wall Street
|
| |
New York, New York 10005
|
|
D.
|
Name and complete address of agent for service:
|
| |
Marija Willen, Esq.
|
| |
PDR SERVICES LLC
|
| |
c/o NYSE Euronext
|
| |
11 Wall Street
|
| |
New York, New York 10005
|
| |
Copy to:
|
| |
Nora M. Jordan, Esq.
|
| |
Davis Polk & Wardwell LLP
|
| |
450 Lexington Avenue
|
| |
New York, New York 10017
|
| |
|
| |
It is proposed that this filing will become effective:
|
| |
[X] 60 days after immediately upon filing pursuant to paragraph (a)(1b) of Rule 485.
|
| |
|
|
E.
|
Title of securities being registered:
|
| |
An indefinite number of Units pursuant to Rule 24f-2 under the Investment Company Act of 1940.
|
|
F.
|
Approximate date of proposed public offering:
|
| |
AS SOON AS PRACTICABLE AFTER THE EFFECTIVE DATE OF THE REGISTRATION STATEMENT.
|
| |
Check box if it is proposed that this filing will become effective on [date] at [time] pursuant to paragraph (b) of Rule 485487.
|
|
Form N-8B-2
|
|
Form S-6
|
|
Item Number
|
|
Heading in Prospectus
|
|
(i) Other principal features of the securities
|
|
Summary—The Trust’s Investments and Portfolio Turnover; Summary—Redemption of Units; Summary—Amendments to the Trust Agreement; Purchases and Redemptions of Creation Units; Trust Agreement
|
|
11. Type of securities comprising units
|
|
Summary—The Trust’s Investments and Portfolio Turnover; Portfolio Adjustments
|
|
12. Certain information regarding securities comprising periodic payment certificates
|
|
*
|
|
13. (a) Certain information regarding loads, fees, expenses and charges
|
|
Summary—Fees and Expenses of the Trust; Summary—The Trust’s Investments and Portfolio Turnover; Expenses of the Trust; Purchases and Redemptions of Creation Units—Redemption
|
|
(b) Certain information regarding periodic payment plan certificates
|
|
*
|
|
(c) Certain percentages
|
|
Same as set forth in 13(a)
|
|
(d) Reasons for certain differences in prices
|
|
*
|
|
(e) Certain other loads, fees, or charges payable by holders
|
|
*
|
|
(f) Certain profits receivable by depositor, principal underwriters, custodian, trustee or affiliated persons
|
|
Summary—The Trust’s Investments and Portfolio Turnover; Portfolio Adjustments—Adjustments to the Portfolio Deposit
|
|
(g) Ratio of annual charges and deductions to income
|
|
*
|
|
14. Issuance of Trust’s securities
|
|
Purchases and Redemptions of Creation Units—Purchase (Creation)
|
|
15. Receipt and handling of payments from purchasers
|
|
Purchases and Redemptions of Creation Units
|
|
16. Acquisition and disposition of underlying securities
|
|
Purchases and Redemptions of Creation Units;
|
| |
|
Portfolio Adjustments; Trust Agreement
|
|
17. (a) Withdrawal or redemption by holders
|
|
Trust Agreement; Purchases and Redemptions of Creation Units—Redemption
|
|
(b) Persons entitled or required to redeem or repurchase securities
|
|
Same as set forth in 17(a)
|
|
(c) Cancellation or resale of repurchased or redeemed securities
|
|
Same as set forth in 17(a)
|
|
18. (a) Receipt, custody and disposition of income
|
|
Additional Information Regarding Dividends and Distributions—General Policies
|
|
(b) Reinvestment of distributions
|
|
Dividends and Distributions—No Dividend Reinvestment Service
|
|
(c) Reserves or special funds
|
|
Same as set forth in 18(a)
|
|
(d) Schedule of distributions
|
|
*
|
|
19. Records, accounts and reports
|
|
The S&P 500 Index; Additional Information Regarding Dividends and Distributions—General Policies;
|
| |
|
Investments by Investment Companies; Expenses of the Trust
|
|
20. Certain miscellaneous provisions of Trust Agreement
|
|
|
|
(a) Amendments
|
|
Trust Agreement—Amendments to the Trust Agreement
|
|
(b) Extension or termination
|
|
Trust Agreement—Amendments to the Trust Agreement; Trust Agreement—Termination of the Trust Agreement; Organization of the Trust
|
|
(c) Removal or resignation of trustee
|
|
Trustee
|
|
(d) Successor trustee
|
|
Same as set forth in 20(c)
|
|
(e) Removal or resignation of depositor
|
|
Sponsor
|
|
(f) Successor depositor
|
|
Same as set forth in 20(e)
|
|
21. Loans to security holders
|
|
*
|
|
22. Limitations on liabilities
|
|
Trustee; Sponsor
|
|
23. Bonding arrangements
|
|
*
|
|
24. Other material provisions of Trust Agreement
|
|
*
|
| |
|
|
|
III. Organization, Personnel and Affiliated Persons of Depositor
|
|
|
|
25. Organization of depositor
|
|
Sponsor
|
|
26.Fees received by depositor
|
|
*
|
|
Form N-8B-2
|
|
Form S-6
|
|
Item Number
|
|
Heading in Prospectus
|
|
26. Fees received by depositor
|
|
*
|
|
27. Business of depositor
|
|
Sponsor
|
|
28. Certain information as to officials and affiliated persons of depositor
|
|
Sponsor
|
|
29. Ownership of voting securities of depositor
|
|
Sponsor
|
|
30. Persons controlling depositor
|
|
Sponsor
|
|
31. Payments by depositor for certain services rendered to Trust
|
|
*
|
|
32. Payments by depositor for certain other services rendered to Trust
|
|
*
|
|
33. Remuneration of employees of depositor for certain services rendered to Trust
|
|
*
|
|
34. Compensation of other persons for certain services rendered to Trust
|
|
*
|
| |
|
|
|
IV. Distribution and Redemption of Securities
|
|
|
|
35. Distribution of Trust’s securities in states
|
|
*
|
|
36. Suspension of sales of Trust’s securities
|
|
*
|
|
37. Denial or revocation of authority to distribute
|
|
*
|
|
38. (a) Method of distribution
|
|
Purchases and Redemptions of Creation Units—Purchase (Creation)
|
|
(b) Underwriting agreements
|
|
Purchases and Redemptions of Creation Units
|
|
(c) Selling agreements
|
|
Same as set forth in 38(b)
|
|
39. (a) Organization of principal underwriter
|
|
Distributor
|
|
(b) NASD membership of principal underwriter
|
|
Distributor
|
|
40. Certain fees received by principal underwriters
|
|
*
|
|
41. (a) Business of principal underwriters
|
|
Purchases and Redemptions of Creation Units; Distributor
|
|
(b) Branch offices of principal underwriters
|
|
*
|
|
(c) Salesmen of principal underwriters
|
|
*
|
|
42. Ownership of Trust’s securities by certain persons
|
|
*
|
|
43. Certain brokerage commissions received by principal underwriters
|
|
*
|
|
44. (a) Method of valuation for determining offering price
|
|
Portfolio Adjustments; Determination of NAV Net Asset Value
|
|
(b) Schedule as to components of offering price
|
|
*
|
|
(c) Variation in offering price to certain persons
|
|
*
|
|
45.Suspension of redemption rights
|
|
*
|
|
46.(a) Certain information regarding redemption or withdrawal valuation
|
|
Determination of NAV Net Asset Value; Purchases and Redemptions of Creation Units—Redemption
|
|
(b) Schedule as to components of redemption price
|
|
*
|
|
47.Maintenance of position in underlying securities
|
|
Purchases and Redemptions of Creation Units; Portfolio Adjustments; Determination of NAV Net Asset Value; Additional Information Regarding Dividends and Distributions—General Policies
|
| |
|
|
|
V. Information Concerning the Trustee or Custodian
|
|
|
|
48.Organization and regulation of trustee
|
|
Trustee
|
|
49.Fees and expenses of trustee
|
|
Summary—Fees and Expenses of the Trust; Expenses of the Trust; Purchases and Redemptions of Creation Units—Redemption
|
|
50.Trustee’s lien
|
|
Expenses of the Trust; Purchases and Redemptions of Creation Units—Redemption
|
| |
|
|
|
VI. Information Concerning Insurance of Holders of Securities
|
|
|
|
51. (a) Name and address of insurance company
|
|
*
|
|
(b) Types of policies
|
|
*
|
|
(c) Types of risks insured and excluded
|
|
*
|
|
(d) Coverage
|
|
*
|
|
(e) Beneficiaries
|
|
*
|
|
(f) Terms and manner of cancellation
|
|
*
|
|
(g) Method of determining premiums
|
|
*
|
[SPDR Logo]
Prospectus Dated October 25, 2012
Subject to Completion
SPDR® S&P 500® ETF Trust (“SPY” or the “Trust”)
(A Unit Investment Trust)
Principal U.S. Listing Exchange for SPDR® S&P 500® ETF Trust: NYSE Arca, Inc.
under the symbol “SPY”
[Prospectus Dated January ___23, 2013]
The U.S. Securities and Exchange Commission has not approved or disapproved these securities or passed upon the accuracy or adequacy of this prospectus. Any representation to the contrary is a criminal offense. Securities of the Trust (“Units”) are not guaranteed or insured by the Federal Deposit Insurance Corporation or any other agency of the U.S. Government, nor are such Units deposits or obligations of any bank. Such Units of the Trust involve investment risks, including the loss of principal.
COPYRIGHT [2013] PDR Services LLC
Page
|
Summary
|
1
|
|
Investment Objective
|
1
|
|
Fees and Expenses of the Trust
|
1
|
|
The Trust’s Investments and Portfolio Turnover
|
12
|
|
Dividends
|
2
|
|
Redemption of Units
|
23
|
|
Voting Rights; Book-Entry-Only-System
|
23
|
|
Amendments to the Trust Agreement
|
23
|
|
Principal Risks of Investing in the Trust
|
23
|
|
Trust Performance
|
34
|
|
Purchase and Sale Information
|
45
|
|
Tax Information
|
45
|
|
The S&P 500 Index
|
45
|
|
Dividends and Distributions
|
67
|
|
Dividends and Capital Gains
|
67
|
|
No Dividend Reinvestment Service
|
67
|
|
Federal Income Taxes
|
67
|
|
Taxation of the Trust
|
78
|
|
Tax Consequences to U.S. Holders
|
89
|
|
Tax Consequences to Non-U.S. Holders
|
1011
|
|
Report of Independent Registered Public Accounting Firm
|
1213
|
|
Statement of Assets and Liabilities
|
1314
|
|
Statements of Operations
|
1415
|
|
Statements of Changes in Net Assets
|
1516
|
|
Financial Highlights
|
1617
|
|
Notes to Financial Statements
|
1718
|
|
Other Information
|
23
|
|
Schedule of Investments
|
24
|
|
Organization of the Trust
|
3635
|
|
Purchases and Redemptions of Creation Units
|
3635
|
|
Purchase (Creation)
|
3635
|
|
Redemption
|
3938
|
|
Book-Entry-Only System
|
4241
|
|
Portfolio Adjustments
|
4342
|
|
Adjustments to the Portfolio Deposit
|
4544
|
|
Exchange Listing and Trading
|
4645
|
|
Secondary Trading on Exchanges
|
4745
|
|
Trading Prices of Units
|
4745
|
|
Continuous Offering of Units
|
4746
|
|
Expenses of the Trust
|
4846
|
|
Trustee Fee Scale
|
4948
|
|
Determination of NAVNet Asset Value
|
5048
|
|
Additional Risk Information
|
5049
|
|
Additional Information Regarding Dividends and Distributions
|
5150
|
|
General Policies
|
5150
|
|
Investments by Investment Companies
|
5351
|
|
Annual Reports
|
5351
|
|
Benefit Plan Investor Considerations
|
5352
|
|
Index License
|
5452
|
|
Sponsor
|
5553
|
|
Trustee
|
56
|
|
Depository
|
5657
|
|
Distributor
|
57
|
|
Trust Agreement
|
57
|
|
Amendments to the Trust Agreement
|
57
|
|
Termination of the Trust Agreement
|
5758
|
|
Legal Opinion
|
5859
|
|
[Independent Registered Public Accounting Firm and Financial Statements]
|
5859
|
|
Code of Ethics
|
5859
|
|
Information and Comparisons Relating to Secondary Market Trading and Performance
|
5859
|
“Standard & Poor’s®”, “S&P®”, “S&P 500®”, “Standard & Poor’s 500®”, “500®”, “Standard & Poor’s Depositary Receipts®”, “SPDR®” and “SPDRs®” are trademarks of Standard & Poor’s Financial Services LLC and have been licensed for use by S&P Dow Jones Indices LLC (“S&P”) and sublicensed for use by State Street Global Markets, LLC. The Trust is permitted to use these trademarks pursuant to a sublicense from State Street Global Markets, LLC. The Trust is not sponsored, endorsed, sold or promoted by S&P, its affiliates or its third party licensors.
SUMMARY
Investment Objective
SPDR® S&P 500® ETF Trust (the “Trust”) seeks to provide investment results that, before expenses, correspond generally to the price and yield performance of the S&P 500® Index (the “Index”).
Fees and Expenses of the Trust
This table estimates the fees and expenses that the Trust pays on an annual basis, which you therefore pay indirectly when you buy and hold Units. It does not reflect brokerage commissions that you may pay for purchases and sales of Units on the secondary markets.
|
Unitholder Fees:
|
None
|
|
(fees paid directly from your investment)
|
|
[Estimated Annual Trust Ordinary Operating Expenses:
(expenses that you pay each year as a percentage of the value of your investment)
|
Current Estimated Annual Trust Ordinary Operating Expenses
|
As a % of Trust Average
Net Assets
|
|
Trustee’s Fee*
|
[____]0.0560%
|
|
S&P License Fee
|
[____]0.0306%
|
|
Marketing
|
[____]0.0200%
|
|
Other Operating Expenses
|
[____]0.0036%
|
|
Total
|
[____]0.1102%
|
|
Trustee Waiver*
|
[____](0.0157) %
|
|
Net Expenses After Waiver
|
[____]0.0945%
|
Future expense accruals will depend primarily on the level of the Trust’s net assets and the level of expenses.]
_____________________________
|
|
*
|
[Until February 1, 2014, State Street Bank and Trust Company, the trustee of the Trust (the “Trustee”), has agreed to waive a portion of its fee to the extent operating expenses exceed [____]% 0.0945%. Any fees waived by the Trustee may not be recouped by the Trustee in subsequent periods. After February 1, 2014, the Trustee may discontinue this fee waiver. Therefore, there is no guarantee that the Trust’s ordinary operating expenses will not exceed 0.0945% of the Trust’s daily net asset value. The fee waiver is calculated after taking into consideration the earnings credit to the Trustee with respect to uninvested cash balances of the Trust. The amount of the earnings credit will be equal to the then current Federal Funds Rate, as reported in nationally distributed publications, multiplied by each day’s daily cash balance, if any, in the Trust’s cash account, reduced by the amount of reserves, if any, for that account required by the Federal Reserve Board of Governors. Thereafter, the Trustee may discontinue this voluntary waiver policy. Therefore, there is no guarantee that the Trust’s ordinary operating expenses will not exceed [____]% of the Trust’s daily NAV.]
|
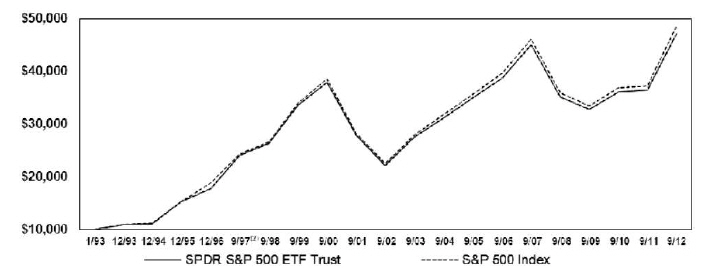
Growth of $10,000 Investment Since Inception(1)
[LINE GRAPH TO BE PROVIDED]
____________
|
(1)
|
Past performance is not necessarily an indication of how the Trust will perform in the future.
|
|
(2)
|
Effective as of September 30, 1997, the Trust’s fiscal year end changed from December 31 to September 30.
|
The Trust’s Investments and Portfolio Turnover
The Trust seeks to achieve its investment objective by holding a portfolio of the common stocks that are included in the Index (the “Portfolio”), with the weight of each stock in the Portfolio substantially corresponding to the weight of such stock in the Index.
In this prospectus, the term “Portfolio Securities” refers to the common stocks that are actually held by the Trust and make up the Trust’s Portfolio, while the term “Index Securities” refers to the common stocks that are included in the Index, as determined by the index provider, S&P Dow Jones Indices LLC (“S&P”). At any time, the Portfolio will consist of as many of the Index Securities as is practicable. To maintain the correspondence between the composition and weightings of Portfolio Securities and Index Securities, the Trustee adjusts the Portfolio from time to time to conform to periodic changes made by S&P to the identity and/or relative weightings of Index Securities in the Index. The Trustee aggregates certain of these adjustments and makes changes to the Portfolio at least monthly, or more frequently in the case of significant changes to the Index.
The Trust may pay transaction costs, such as brokerage commissions, when it buys and sells securities (or “turns over” its Portfolio). Such transaction costs may be higher if there are significant rebalancings of Index Securities in the Index, which may also result in higher taxes when Units are held in a taxable account. These costs, which are not reflected in estimated annual Trust ordinary operating expenses, affect the Trust’s performance. During the most recent fiscal year, the Trust’s portfolio turnover rate was [____]3.80% of the average value of its portfolio. The Trust’s portfolio turnover rate does not include securities received or delivered from processing creations or redemptions of Units. Portfolio turnover will be a function of changes to the Index as well as requirements of the Trust Agreement (as defined below in “Organization of the Trust”).
Although the Trust may fail to own certain Index Securities at any particular time, the Trust generally will be substantially invested in Index Securities, which should result in a close correspondence between the performance of the Index and the performance of the Trust. See “The S&P 500 Index” below for more information regarding the Index. The Trust does not hold or trade futures or swaps and is not a commodity pool.
Dividends
Payments of dividends are made quarterly, on the last Business Day (as defined in “Purchases and Redemptions of Creation Units—Purchase (Creation)”) of April, July, October and January. See “Dividends and Distributions” and “Additional Information Regarding Dividends and Distributions.”
Redemption of Units
Only certain institutional investors (typically market makers or other broker-dealers) are permitted to purchase or redeem Units directly with the Trust, and they may do so only in large blocks of 50,000 Units known as “Creation Units.” See “Purchases and Redemptions of Creation Units—Redemption” and “Trust Agreement” for more information regarding the rights of Beneficial Owners (as defined in “Book-Entry-Only System”).
Voting Rights; Book-Entry-Only-System
Beneficial Owners shall not have the right to vote concerning the Trust, except with respect to termination and as otherwise expressly set forth in the Trust Agreement. See “Trust Agreement.” Units are represented by one or more global securities registered in the name of Cede & Co., as nominee for The Depository Trust Company (“DTC”) and deposited with, or on behalf of, DTC. See “Book-Entry-Only System.”
Amendments to the Trust Agreement
The Trust Agreement (as defined below in “Organization of the Trust”) may be amended from time to time by the Trustee and PDR Services, LLC (the “Sponsor”) without the consent of any Beneficial Owners under certain circumstances described herein. The Trust Agreement may also be amended by the Sponsor and the Trustee with the consent of the Beneficial Owners to modify the rights of Beneficial Owners under certain circumstances. Promptly after the execution of an amendment to the Trust Agreement, the Trustee arranges for written notice to be provided to Beneficial Owners. See “Trust Agreement—Amendments to the Trust Agreement.”
Principal Risks of Investing in the Trust
As with all investments, there are certain risks of investing in the Trust, and you could lose money on an investment in the Trust. Prospective investors should carefully consider the risk factors described below, as well as the additional risk factors under “Additional Risk Information” and the other information included in this prospectus, before deciding to invest in Units.
Passive Strategy/Index Risk. The Trust is not actively managed. Rather, the Trust attempts to track the performance of an unmanaged index of securities. This differs from an actively managed fund, which typically seeks to outperform a benchmark index. As a result, the Trust will hold constituent securities of the Index regardless of the current or projected performance of a specific security or a particular industry or market sector. Maintaining investments in securities regardless of market conditions or the performance of individual securities could cause the Trust’s return to be lower than if the Trust employed an active strategy.
Index Tracking Risk. While the Trust is intended to track the performance of the Index as closely as possible (i.e., to achieve a high degree of correlation with the Index), the Trust’s return may not match or achieve a high degree of correlation with the return of the Index due to expenses and transaction costs incurred in adjusting the actual balance of the Portfolio. In addition, it is possible that the Trust may not always fully replicate the performance of the Index due to the unavailability of certain Index Securities in the secondary market or due to other extraordinary circumstances (e.g., if trading in a security has been halted).
Equity Investing Risk. An investment in the Trust involves risks similar to those of investing in any fund of equity securities, such as market fluctuations caused by such factors as economic and political developments, changes in interest rates and perceived trends in securities prices.
An investment in the Trust is subject to the risks of any investment in a broadly based portfolio of common stocks, including the risk that the general level of stock prices may decline, thereby adversely affecting the value of such investment. The value of Portfolio Securities may fluctuate in accordance with changes in the financial
condition of the issuers of Portfolio Securities, the value of common stocks generally and other factors. The identity and weighting of Index Securities and the Portfolio Securities change from time to time.
The financial condition of issuers of Portfolio Securities may become impaired or the general condition of the stock market may deteriorate, either of which may cause a decrease in the value of the Portfolio and thus in the value of Units. Since the Trust is not actively managed, the adverse financial condition of an issuer will not result in its elimination from the Trust unless such issuer is removed from the Index. Common stocks are susceptible to general stock market fluctuations and to volatile increases and decreases in value as market confidence in and perceptions of their issuers change. These investor perceptions are based on various and unpredictable factors including expectations regarding government, economic, monetary and fiscal policies, inflation and interest rates, economic expansion or contraction, and global or regional political, economic and banking crises.
Holders of common stocks of any given issuer incur more risk than holders of preferred stocks and debt obligations of the issuer because the rights of common stockholders, as owners of the issuer, generally are subordinate to the rights of creditors of, or holders of debt obligations or preferred stocks issued by, such issuer. Further, unlike debt securities that typically have a stated principal amount payable at maturity, or preferred stocks that typically have a liquidation preference and may have stated optional or mandatory redemption provisions, common stocks have neither a fixed principal amount nor a maturity. Common stock values are subject to market fluctuations as long as the common stock remains outstanding. The value of the Portfolio will fluctuate over the entire life of the Trust.
There can be no assurance that the issuers of Portfolio Securities will pay dividends. Distributions generally depend upon the declaration of dividends by the issuers of Portfolio Securities and the declaration of such dividends generally depends upon various factors, including the financial condition of the issuers and general economic conditions.
Trust Performance
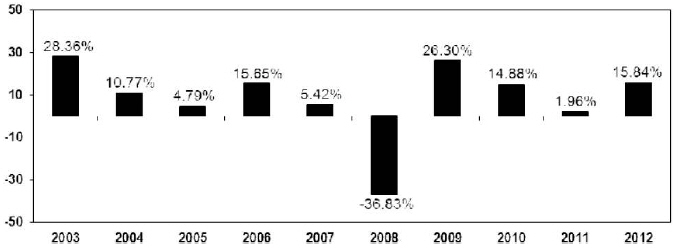
The following bar chart and table provide an indication of the risks of investing in the Trust by showing changes in the Trust’s performance based on net assets from year to year and by showing how the Trust’s average annual return for certain time periods compares with the average annual return of the Index. The Trust’s past performance (before and after taxes) is not necessarily an indication of how the Trust will perform in the future. Updated performance information is available online at http://www.spdrs.com.
The total returns in the bar chart, as well as the total and after-tax returns presented in the table, have been calculated assuming that the reinvested price for the last income distribution made in eachthe last calendar year shown below (i.e.g. [ 12/1621/12]) was the net asset value per Unit (“NAV”) on the last Business Day of such year (i.e.g. [ 12/3031/12]), rather than the actual reinvestment price for such distribution which was the NAV on the last Business Day of January of the following calendar year (e.g. [1/31/13]). Therefore, the actual performance calculation for anythe last calendar year may be different from that shown below in the bar chart and table.
Annual Total Return (years ended 12/31)
|
|
[BAR CHART TO BE PROVIDED]
|
Highest Quarterly Return: [________________]15.84% for the quarter ended June 30, 2009
Lowest Quarterly Return: [________________]-21.92% for the quarter ended December 31, 2008
Average Annual Total Returns* * (for periods ending December 31, 2012)
The after-tax returns presented in the table are calculated using the highest historical individual federal marginal income tax rates and do not reflect the impact of state and local taxes. Your actual after-tax returns will depend on your specific tax situation and may differ from those shown below. After-tax returns are not relevant to investors who hold Units through tax-deferred arrangements, such as 401(k) plans or individual retirement accounts. The returns after taxes can exceed the return before taxes due to an assumed tax benefit for a holder of Units from realizing a capital loss on a sale of Trust Units.
|
|
Past
One Year
|
Past
Five Years
|
Past
Ten Years
|
|
Trust
|
|
|
|
|
Return Before Taxes
|
[___]15.84%
|
[___]1.60%
|
[___]7.00%
|
|
Return After Taxes on Distributions
|
[___]15.41%
|
[___]1.22%
|
[___]6.65%
|
|
Return After Taxes on Distributions and Sale or Redemption of Creation Units
|
[___]10.74%
|
[___]1.26%
|
[___]6.08%
|
|
Index (reflects no deduction for fees, expenses or taxes)
|
[___]16.00%
|
[___]1.66%
|
[___]7.10%
|
__________________________
|
|
*Total returns assume that dividends and capital gain distributions have been reinvested in the Trust at the net asset value per Unit.
|
PURCHASE AND SALE INFORMATION
Individual Units of the Trust may be purchased and sold on NYSE Arca, Inc. (the “Exchange”), under the market symbol “SPY”, through your broker-dealer at market prices. Units trade at market prices that may be greater than net asset value (“NAV”) (premium) or less than NAV (discount). Units are also listed and traded on the Singapore Exchange Securities Trading Limited (stock code S27) and the Tokyo Stock Exchange (code 1557). In the future, Units may be listed and traded on other non-U.S. exchanges. Units may be purchased on other trading
|
*
|
Total returns assume that dividends and capital gain distributions have been reinvested in the Trust at the NAV.
|
markets or venues in addition to the Exchange, the Singapore Exchange Securities Trading Limited and the Tokyo Stock Exchange.
Only certain institutional investors (typically market makers or other broker-dealers) are permitted to purchase or redeem Units directly with the Trust, and they may do so only in large blocks of 50,000 Units known as “Creation Units.” Creation Unit transactions are conducted in exchange for the deposit or delivery of in-kind securities and/or cash constituting a substantial replication of the securities included in the Index.
TAX INFORMATION
The Trust will make distributions that are expected to be taxable currently to you as ordinary income and/or capital gains, unless you are investing through a tax-deferred arrangement, such as a 401(k) plan or individual retirement account.
THE S&P 500 INDEX
The Index is composed of five hundred (500) selected stocks, all of which are listed on national stock exchanges and spans over 25 separate industry groups. As of [December 31, 2012], the five largest industry groups represented in the Index were: [_________] [_____]%; [_________] [_____]%; [_________] [_____]%; [_________] [_____]% and [_________] [_____]Information Technology 19.0%; Financials 15.6%; Health Care 12.0%; Consumer Discretionary 11.5% and Energy 11.0%. Since 1968, the Index has been a component of the U.S. Commerce Department’s list of Leading Indicators that track key sectors of the U.S. economy. Current information regarding the market value of the Index is available from market information services. The Index is determined, comprised and calculated without regard to the Trust.
S&P is not responsible for and does not participate in the creation or sale of Units or in the determination of the timing, pricing, or quantities and proportions of purchases or sales of Index Securities or Portfolio Securities by the Trust. The information in this prospectus concerning S&P and the Index has been obtained from sources that the Sponsor believes to be reliable, but the Sponsor takes no responsibility for the accuracy of such information.
The following table shows the actual performance of the Index for the years 1960 through 2012. The results shown should not be considered representative of the income yield or capital gain or loss that may be generated by the Index in the future. THE RESULTS SHOULD NOT BE CONSIDERED REPRESENTATIVE OF THE PERFORMANCE OF THE TRUST.
|
Year
|
Calendar
Year-End
Index Value**
|
Calendar
Year-End Index
Value 1960=100
|
Change In
Index for
Calendar Year
|
Calendar
Year-End
Yield***
|
|
1960
|
58.11
|
100.00
|
—%
|
3.47%
|
|
1961
|
71.55
|
123.13
|
23.13
|
2.98
|
|
1962
|
63.10
|
108.59
|
-11.81
|
3.37
|
|
1963
|
75.02
|
129.10
|
18.89
|
3.17
|
|
1964
|
84.75
|
145.84
|
12.97
|
3.01
|
|
1965
|
92.43
|
159.06
|
9.06
|
3.00
|
|
1966
|
80.33
|
138.24
|
-13.09
|
3.40
|
|
1967
|
96.47
|
166.01
|
20.09
|
3.20
|
|
1968
|
103.86
|
178.73
|
7.66
|
3.07
|
|
1969
|
92.06
|
158.42
|
-11.36
|
3.24
|
|
1970
|
92.15
|
158.58
|
0.10
|
3.83
|
|
1971
|
102.09
|
175.68
|
10.79
|
3.14
|
|
1972
|
118.05
|
203.15
|
15.63
|
2.84
|
|
1973
|
97.55
|
167.87
|
-17.37
|
3.06
|
|
1974
|
68.56
|
117.98
|
-29.72
|
4.47
|
|
1975
|
90.19
|
155.21
|
31.55
|
4.31
|
|
*
|
Source: S&P. Reflects no deduction for fees, expenses or taxes.
|
|
**
|
Source: S&P. Yields are obtained by dividing the aggregate cash dividends by the aggregate market value of the stocks in the Index.
|
|
Year
|
Calendar
Year-End
Index Value**
|
Calendar
Year-End Index
Value 1960=100
|
Change In
Index for
Calendar Year
|
Calendar
Year-End
Yield***
|
|
1976
|
107.46
|
184.93
|
19.15
|
3.77
|
|
1977
|
95.10
|
163.66
|
-11.50
|
4.62
|
|
1978
|
96.11
|
165.39
|
1.06
|
5.28
|
|
1979
|
107.94
|
185.75
|
12.31
|
5.47
|
|
1980
|
135.76
|
233.63
|
25.77
|
5.26
|
|
1981
|
122.55
|
210.89
|
-9.73
|
5.20
|
|
1982
|
140.64
|
242.02
|
14.76
|
5.81
|
|
1983
|
164.93
|
283.82
|
17.27
|
4.40
|
|
1984
|
167.24
|
287.80
|
1.40
|
4.64
|
|
1985
|
211.28
|
363.59
|
26.33
|
4.25
|
|
1986
|
242.17
|
416.75
|
14.62
|
3.49
|
|
1987
|
247.08
|
425.19
|
2.03
|
3.08
|
|
1988
|
277.72
|
477.92
|
12.40
|
3.64
|
|
1989
|
353.40
|
608.15
|
27.25
|
3.45
|
|
1990
|
330.22
|
568.26
|
-6.56
|
3.61
|
|
1991
|
417.09
|
717.76
|
26.31
|
3.24
|
|
1992
|
435.71
|
749.80
|
4.46
|
2.99
|
|
1993
|
464.45
|
802.70
|
7.06
|
2.78
|
|
1994
|
459.27
|
790.34
|
-1.54
|
2.82
|
|
1995
|
615.93
|
1,059.92
|
34.11
|
2.56
|
|
1996
|
740.74
|
1,274.70
|
20.26
|
2.19
|
|
1997
|
970.43
|
1,669.99
|
31.01
|
1.77
|
|
1998
|
1,229.23
|
2,115.35
|
26.67
|
1.49
|
|
1999
|
1,469.25
|
2,528.39
|
19.53
|
1.14
|
|
2000
|
1,320.28
|
2,272.04
|
-10.14
|
1.19
|
|
2001
|
1,148.08
|
1,975.70
|
-13.04
|
1.36
|
|
2002
|
879.82
|
1,514.06
|
-23.37
|
1.81
|
|
2003
|
1,111.92
|
1,913.47
|
26.38
|
1.63
|
|
2004
|
1,211.92
|
2,085.56
|
8.99
|
1.72
|
|
2005
|
1,248.29
|
2,148.15
|
3.00
|
1.86
|
|
2006
|
1,418.30
|
2,440.72
|
13.62
|
1.81
|
|
2007
|
1,468.36
|
2,526.86
|
3.53
|
1.89
|
|
2008
|
903.25
|
1,554.38
|
-38.49
|
3.14
|
|
2009
|
1,115.10
|
1,918.95
|
23.45
|
1.95
|
|
2010
|
1,257.64
|
2,164.24
|
12.78
|
1.87
|
|
2011
|
1,257.60
|
2,164.17
|
-0.003
|
2.23
|
|
2012
|
[_____] 1,426.19
|
[_____] 2,454.29
|
[_____] 13.41
|
[_____] 2.19
|
____________
|
*
|
Source: S&P. Reflects no deduction for fees, expenses or taxes.
|
| |
|
|
**
|
Source: S&P. Yields are obtained by dividing the aggregate cash dividends by the aggregate market value of the stocks in the Index.
|
DIVIDENDS AND DISTRIBUTIONS
Dividends and Capital Gains
Unitholders (as defined below in “Federal Income Taxes—Taxation of the Trust”) receive on the last Business Day of April, July, October and January an amount corresponding to the amount of any cash dividends declared on the Portfolio Securities during the applicable period, net of fees and expenses associated with operation of the Trust, and taxes, if applicable. Because of such fees and expenses, the dividend yield for Units is ordinarily less than that of the Index. Investors should consult their tax advisors regarding tax consequences associated with Trust dividends, as well as those associated with Unit sales or redemptions.
least equal to the sum of (i) 98% of its ordinary taxable income for the calendar year, (ii) 98.2% of its capital gain net income for the one-year period ended on October 31 of the calendar year and (iii) any ordinary income and capital gains for previous years that were not distributed during those years. For purposes of determining whether the Trust has met this distribution requirement, (i) certain ordinary gains and losses that would otherwise be taken into account for the portion of the calendar year after October 31 will be treated as arising on January 1 of the following calendar year and (ii) the Trust will be deemed to have distributed any income or gains on which it has paid U.S. federal income tax.
If the Trust failed to qualify as a RIC or failed to satisfy the 90% distribution requirement in any taxable year, the Trust would be subject to U.S. federal income tax at regular corporate rates on its taxable income, including its net capital gain, even if such income were distributed to its Unitholders, and all distributions out of earnings and profits would be taxable as dividend income. Such distributions generally would be eligible for the dividends-received deduction in the case of corporate U.S. Holders and, prior to January 1, 2013, would have constitutedconstitute “qualified dividend income” for individual U.S. Holders. See “Federal Income Taxes—Tax Consequences to U.S. Holders—Distributions.” In addition, the Trust could be required to recognize unrealized gains, pay taxes and make distributions (which could be subject to interest charges) before requalifying for taxation as a RIC. If the Trust fails to satisfy the income test or diversification test described above, however, it may be able to avoid losing its status as a RIC by timely curing such failure, paying a tax and/or providing notice of such failure to the U.S. Internal Revenue Service (the “IRS”).
In order to meet the distribution requirements necessary to be exempt from U.S. federal income tax on its distributed income, the Trust may be required to make distributions in excess of the yield performance of the Portfolio Securities and may be required to sell securities in order to do so.
Tax Consequences to U.S. Holders
Distributions. Distributions of the Trust’s ordinary income and net short-term capital gains will, except as described below with respect to distributions of “qualified dividend income,” generally be taxable to U.S. Holders as ordinary income to the extent such distributions are paid out of the Trust’s current or accumulated earnings and profits, as determined for U.S. federal income tax purposes. Distributions (or deemed distributions, as described below), if any, of net capital gains will be taxable as long-term capital gains, regardless of the length of time the U.S. Holder has owned Units. A distribution of an amount in excess of the Trust’s current and accumulated earnings and profits will be treated as a return of capital that will be applied against and reduce the U.S. Holder’s basis in its Units. To the extent that the amount of any such distribution exceeds the U.S. Holder’s basis in its Units, the excess will be treated as gain from a sale or exchange of the Units.
The ultimate tax characterization of the distributions that the Trust makes during any taxable year cannot be determined until after the end of the taxable year. As a result, it is possible that the Trust will make total distributions during a taxable year in an amount that exceeds its current and accumulated earnings and profits. Return-of-capital distributions may result if, for example, the Trust makes distributions of cash amounts deposited in connection with Portfolio Deposits (as defined below in “Purchases and Redemptions of Creation Units—Purchase (Creation)”). Return-of-capital distributions may be more likely to occur in periods during which the number of outstanding Units fluctuates significantly. Unitholders will be notified annually as to the U.S. federal tax status of distributions.
Distributions of “qualified dividend income” to an individual or other non-corporate U.S. Holder during a taxable year of such U.S. Holder beginning before January 1, 2013 werewill be treated as “qualified dividend income” and werewill therefore be taxed at rates applicable to long-term capital gains, provided that the U.S. Holder metmeets certain holding period and other requirements with respect to its Units and that the Trust metmeets certain holding period and other requirements with respect to the underlying shares of stock. It is unclear whether any legislation will be enacted that would extend this treatment to taxable years beginning on or after January 1, 2013. “Qualified dividend income” generally includes dividends from domestic corporations and dividends from foreign corporations that meet certain specified criteria.
Creation Units—Purchase (Creation)”) to the Trust, a U.S. Holder will generally recognize gain or loss with respect to each stock included in the Portfolio Deposit in an amount equal to the difference, if any, between the amount realized with respect to such stock and the U.S. Holder’s basis in the stock. The amount realized with respect to each stock included in a Portfolio Deposit is determined by allocating among all of the stocks included in the Portfolio Deposit an amount equal to the fair market value of the Creation Units received (determined as of the date of transfer of the Portfolio Deposit) plus the amount of any cash received from the Trust, reduced by the amount of any cash that the U.S. Holder pays to the Trust. This allocation is made among such stocks in accordance with their relative fair market values as of the date of transfer of the Portfolio Deposit. The IRS may assert that any loss resulting from the transfer of a Portfolio Deposit to the Trust may not be deducted on the ground that there has been no material change in the economic position of the U.S. Holder. The Trust will not recognize gain or loss for U.S. federal income tax purposes on the issuance of Creation Units in exchange for Portfolio Deposits.
Backup Withholding and Information Returns. Payments on the Units and proceeds from a sale or other disposition of Units will be subject to information reporting, unless the U.S. Holder is an exempt recipient. A U.S. Holder will be subject to backup withholding on all such amounts unless (i) the U.S. Holder is an exempt recipient or (ii) the U.S. Holder provides its correct taxpayer identification number (generally, on IRS Form W-9) and certifies that it is not subject to backup withholding. Backup withholding is not an additional tax. Any amounts withheld pursuant to the backup withholding rules will be allowed as a credit against the U.S. Holder’s U.S. federal income tax liability and may entitle the U.S. Holder to a refund, provided that the required information is furnished to the IRS on a timely basis.
Tax Consequences to Non-U.S. Holders
A “Non-U.S. Holder” is a person that, for U.S. federal income tax purposes, is a beneficial owner of Units and is a nonresident alien individual, a foreign corporation, a foreign trust or a foreign estate. The discussion below does not apply to a Non-U.S. Holder who is a nonresident alien individual and is present in the United States for 183 days or more during any taxable year. Such Non-U.S. Holders should consult their tax advisors with respect to the particular tax consequences to them of an investment in the Trust. The U.S. federal income taxation of a Non-U.S. Holder depends on whether the income that the Non-U.S. Holder derives from the Trust is “effectively connected” with a trade or business that the Non-U.S. Holder conducts in the United States.
If the income that a Non-U.S. Holder derives from the Trust is not “effectively connected” with a U.S. trade or business conducted by such Non-U.S. Holder, distributions of “investment company taxable income” to such Non-U.S. Holder will generally be subject to U.S. federal withholding tax at a rate of 30% (or lower rate under an applicable tax treaty). Provided that certain requirements wereare satisfied, this withholding tax waswill not be imposed on dividends paid by the Trust in its taxable years beginning before January 1, 20122014 to the extent that the underlying income out of which the dividends wereare paid consistedconsists of U.S.-source interest income or short-term capital gains that would not have been subject to U.S. withholding tax if received directly by the Non-U.S. Holder (“interest-related dividends” and “short-term capital gain dividends,” respectively). It is unclear whether any legislation will be enacted that would extend this exemption from withholding to the Trust’s taxable years beginning on or after January 1, 20122014.
A Non-U.S. Holder whose income from the Trust is not “effectively connected” with a U.S. trade or business will generally be exempt from U.S. federal income tax on capital gain dividends and any amounts retained by the Trust that are designated as undistributed capital gains. In addition, such a Non-U.S. Holder will generally be exempt from U.S. federal income tax on any gains realized upon the sale or exchange of Units.
If the income from the Trust is “effectively connected” with a U.S. trade or business carried on by a Non-U.S. Holder (and, if required by an applicable tax treaty, is attributable to a U.S. permanent establishment maintained by the Non-U.S. Holder), any distributions of “investment company taxable income,” any capital gain dividends, any amounts retained by the Trust that are designated as undistributed capital gains and any gains realized upon the sale or exchange of Units will be subject to U.S. federal income tax, on a net income basis, at the rates applicable to U.S. Holders. A Non-U.S. Holder that is a corporation may also be subject to the U.S. branch profits tax.
Information returns will be filed with the IRS in connection with certain payments on the Units and may be filed
in connection with payments of the proceeds from a sale or other disposition of Units. A Non-U.S. Holder may be subject to backup withholding on net capital gain distributions that are otherwise exempt from withholding tax or on the proceeds from a redemption or other disposition of Units if such Non-U.S. Holder does not certify its non-U.S. status under penalties of perjury or otherwise establish an exemption. Backup withholding is not an additional tax. Any amounts withheld pursuant to the backup withholding rules will be allowed as a credit against the Non-U.S. Holder’s U.S. federal income tax liability, if any, and may entitle the Non-U.S. Holder to a refund, provided that the required information is furnished to the IRS on a timely basis.
In order to qualify for the exemption from U.S. withholding on interest-related dividends and short-term capital gain dividends, to qualify for an exemption from U.S. backup withholding and to qualify for a reduced rate of U.S. withholding tax on Trust distributions pursuant to an income tax treaty, a Non-U.S. Holder must generally deliver to the withholding agent a properly executed IRS form (generally, Form W-8BEN). In order to claim a refund of any Trust-level taxes imposed on undistributed net capital gainsgain, any withholding taxes or any backup withholding, a Non-U.S. Holder must obtain a U.S. taxpayer identification number and file a U.S. federal income tax return, even if the Non-U.S. Holder would not otherwise be required to obtain a U.S. taxpayer identification number or file a U.S. income tax return.
Sections 1471 through 1474 of the Code (“FATCA”) generally impose withholding at a rate of 30% on payments to certain foreign entities (including financial intermediaries) of dividends on, and gross proceeds from the sale or other disposition of, U.S. common stock, unless various U.S. information reporting and due diligence requirements (generally relating to ownership by U.S. persons of interests in or accounts with those entities) have been satisfied. Under current guidance, withholdingWithholding taxes under FATCA will be imposed on dividends beginning on January 1, 2014, and on gross proceeds from dispositions beginning on January 1, 20152017. Non-U.S. Holders should consult their tax advisors regarding the possible implications of FATCA on their investment in Units.
REPORT OF INDEPENDENT REGISTERED PUBLIC ACCOUNTING FIRM
[To the Trustee and Unitholders of SPDR S&P 500 ETF Trust]
[In our opinion, the accompanying statement of assets and liabilities, including the schedule of investments, and the related statements of operations and of changes in net assets and the financial highlights present fairly, in all material respects, the financial position of SPDR S&P 500 ETF Trust (the “Trust”) at [September 30, 2012], the results of its operations, the changes in its net assets and the financial highlights for the periods indicated, in conformity with accounting principles generally accepted in the United States of America. These financial statements and financial highlights (hereafter referred to as “financial statements”) are the responsibility of the Trustee; our responsibility is to express an opinion on these financial statements based on our audits. We conducted our audits of these financial statements in accordance with the standards of the Public Company Accounting Oversight Board (United States). Those standards require that we plan and perform the audit to obtain reasonable assurance about whether the financial statements are free of material misstatement. An audit includes examining, on a test basis, evidence supporting the amounts and disclosures in the financial statements, assessing the accounting principles used and significant estimates made by management, and evaluating the overall financial statement presentation. We believe that our audits, which included confirmation of securities at [September 30, 2012] by correspondence with the custodian and brokers, provide a reasonable basis for our opinion.]
[_________________]
PricewaterhouseCoopers LLP
[Boston, Massachusetts]
[___________November 27, 2012]
SPDR S&P 500 ETF Trust
Statement of Assets and Liabilities
[September 30, 2012]
|
[Assets]
|
|
|
[Investments in unaffiliated issuers, at value]
|
$[___________]117,874,630,471
|
|
[Investments in affiliates of the Trustee and the Sponsor, at value]
|
[___________]242,343,415
|
|
[Total investments]
|
[___________]118,116,973,886
|
|
[Cash]
|
[___________]562,995,481
|
|
Receivable for investments sold
|
47,192,662
|
|
[Dividends receivable — unaffiliated issuers]
|
[___________]141,557,038
|
|
[Dividends receivable — affiliates of the Trustee and the Sponsor]affiliated issuers
|
[___________]1,078,457
|
|
[Total Assets]
|
[___________]118,869,797,524
|
|
[Liabilities]
|
|
|
Payable for investments purchased
|
54,855,068
|
|
[Payable for units of fractional undivided interest (“Units”) redeemed in-kind]
|
[___________]249,568
|
|
[Income distribution payable]
|
[___________]622,376,885
|
|
[Accrued Trustee expense]
|
[___________]2,681,891
|
|
[Accrued expenses and other liabilities]
|
[___________]25,015,036
|
|
[Total Liabilities]
|
[___________]705,178,448
|
|
[Net Assets]
|
$[___________]118,164,619,076
|
|
[Net Assets Consist of:]
|
|
|
[Paid in Capital (Note [4])]
|
$[___________]128,375,117,286
|
|
[Distribution in excess of net investment income]
|
[___________](615,214,265)
|
|
[Accumulated net realized loss on investments]
|
[___________](7,019,654,114)
|
|
[Net unrealized depreciation on investments]
|
[___________](2,575,629,831)
|
|
[Net Assets]
|
$[___________]118,164,619,076
|
|
[Net asset value per Unit]
|
$[___________]144.00
|
|
[Units outstanding, unlimited Units authorized, $0.00 par value]
|
[___________]820,582,116
|
|
[Cost of Investments:]
|
|
|
[Unaffiliated issuers]
|
$[___________]120,405,448,243
|
|
[Affiliates of the Trustee and the Sponsor]
|
[___________]287,155,474
|
|
[Total Cost of Investments]
|
$[___________]120,692,603,717
|
[See accompanying notes to financial statements.]
SPDR S&P 500 ETF Trust
Statements of Operations
| |
For the Year Ended
|
For the Year Ended
|
For the Year Ended
|
|
|
For the
Year Ended
September 30,
|
For the
Year Ended
September 30,
|
For the
Year Ended
September 30,
|
|
[Investment Income]
|
|
|
|
|
[Dividend income — unaffiliated issuers]
|
$ [_________] 2,135,559,412
|
$[_________] 1,783,414,525
|
$ [_________] 1,516,348,569
|
|
[Dividend income — affiliates of the Trustee and the Sponsor]
|
|
|
|
|
[Total Investment Income]
|
[_________]2,141,866,046
|
[_________]1,787,993,687
|
[_________]1,516,504,492
|
|
[Expenses]
|
|
|
|
|
[Trustee expense]
|
[_________]55,224,103
|
[_________]49,583,282
|
[_________]40,693,484
|
|
[S&P license fee]
|
[_________]30,163,235
|
[_________]27,574,288
|
[_________]21,931,368
|
|
[Marketing expense]
|
[_________]19,708,823
|
[_________]17,790,322
|
[_________]14,620,912
|
|
[Legal and audit services]
|
[_________]895,131
|
[_________]262,513
|
[_________]422,917
|
|
[Other expenses]
|
|
|
|
|
[Total Expenses]
|
[_________]108,683,594
|
[_________]96,648,699
|
[_________]79,212,422
|
|
[Trustee expense waiver]
|
|
|
|
|
[Net Expenses]
|
|
|
|
|
[Net Investment Income]
|
|
|
|
|
[Realized and Unrealized Gain (Loss) on Investments]
|
|
|
|
|
[Net realized gain (loss) on:]
|
|
|
|
|
[Investment transactions — unaffiliated issuers]
|
[_________]8,742,019,176
|
[_________]12,378,051,573
|
[_________]16,730,164,234
|
|
[Investment transactions — affiliates of the Trustee and the Sponsor]
|
[_________](418,387)
|
[_________]14,104,238
|
[_________]8,836,491
|
|
[Net change in unrealized appreciation (depreciation) on:]
|
|
|
|
|
[Investment transactions — unaffiliated issuers]
|
[_________]13,032,032,478
|
[_________](13,392,528,820)
|
[_________](11,825,602,638)
|
|
[Investment transactions — affiliates of the Trustee and the Sponsor]
|
|
|
|
|
[Net Realized and Unrealized Gain (Loss) on Investments]
|
[_________]21,809,562,202
|
[_________](1,050,057,995)
|
|
|
[Net increase (decrease) in net assets resulting from operations]
|
$ [_________] 23,858,304,058
|
$ [_________] 653,876,419
|
$ [_________] 6,294,793,963
|
[See accompanying notes to financial statements.]
SPDR S&P 500 ETF Trust
Statements of Changes in Net Assets
| |
For the Year Ended
|
For the Year Ended
|
For the Year Ended
|
|
|
For the
Year Ended
September 30,
|
For the
Year Ended
September 30,
|
For the
Year Ended
September 30,
|
|
[Increase (decrease) in net assets resulting from operations:]
|
|
|
|
|
[Net investment income]
|
$ [________] 2,048,741,856
|
$ [________] 1,703,934,414
|
$ [________] 1,447,420,682
|
|
[Net realized gain (loss) on investment transactions]
|
[________]8,741,600,789
|
[________]12,392,155,811
|
[________]16,739,000,725
|
|
[Net change in unrealized appreciation (depreciation)]
|
|
[________](13,442,213,806)
|
[________](11,891,627,444)
|
|
[Net Increase increase (decrease) in net assets resulting from operations:]
|
|
|
|
|
[Net equalization credits and charges]
|
|
|
|
|
[Distributions to Unitholders from net investment income]
|
[________](2,209,395,148)
|
[________](1,859,515,384)
|
[________](1,549,861,683)
|
|
[Increase (decrease) in net assets from Unit transactions:]
|
|
|
|
|
[Proceeds from sale of Units]
|
[________]412,781,633,972
|
[________]442,329,234,719
|
[________]400,829,082,743
|
|
[Proceeds from reinvestment of distributions]
|
[________]—
|
[________]—
|
[________]2,216,596
|
|
[Cost of Units repurchased]
|
[________](397,131,183,744)
|
[________](438,449,217,218)
|
[________](399,041,216,070)
|
|
[Net income equalization (Note [2])]
|
|
|
|
|
[Net Increase increase (decrease) in net assets from issuance and redemption of Units]
|
|
|
|
|
[Net Increase increase (decrease) in net assets during the period]
|
[________]37,299,359,138
|
[________]2,674,378,536
|
[________]6,535,015,549
|
|
[Net assets at beginning of period]
|
|
|
|
|
[Net assets at end of period*]
|
$[________]118,164,619,076
|
$[________] 80,865,259,938
|
$[________]78,190,881,402
|
|
[Unit transactions:]
|
|
|
|
|
[Units sold]
|
[________]3,116,800,000
|
[________]3,550,100,000
|
[________]3,614,350,000
|
|
[Units issued from reinvestment of distributions]
|
[________]—
|
[________]—
|
[________]21,395
|
|
[Units redeemed]
|
[________](3,011,050,000)
|
[________](3,520,350,000)
|
[________](3,607,000,000)
|
|
[Net increase (decrease)]
|
|
|
|
|
[*Includes undistributed (distribution in excess of) net investment income]
|
$[________] (615,214,265)
|
|
$[________] (426,704,977)
|
[See accompanying notes to financial statements.]
SPDR S&P 500 ETF Trust
Financial Highlights
Selected data for a Unit outstanding throughout each yearperiod
|
|
For the
For the Year Ended
|
For the
For the Year Ended
|
For the
For the Year Ended
|
For the
For the Year Ended
|
For the
For the Year Ended
|
|
[Net asset value, beginning of year]
|
|
|
|
|
|
|
[Investment Operations operations:]
|
|
|
|
|
|
|
[Net investment income(1)]
|
[____]2.77
|
[____]2.42
|
[____]2.20
|
[____]2.32
|
[____]2.72
|
|
[Net realized and unrealized gain (loss) on investments]
|
|
|
|
|
|
|
[Total from investment operations]
|
|
|
|
|
|
|
[Net equalization credits and charges(1)]
|
|
|
|
|
|
|
[Less distributions from:]
|
|
|
|
|
|
|
[Net investment income]
|
|
|
|
|
|
|
[Net asset value, end of year]
|
|
|
|
|
|
|
[Total investment return(2)]
|
[____]29.96%
|
[____]1.01%
|
[____]10.08%
|
[____](6.90)%
|
[____](21.84)%
|
|
[Ratios and supplemental data]
|
|
|
|
|
|
|
[Ratio to average net assets:]
|
|
|
|
|
|
|
[Net investment income]
|
[____]2.08%
|
[____]1.92%
|
[____]1.98%
|
[____]2.58%
|
[____]1.99%
|
|
[Total expenses(3)]
|
[____]0.09%
|
[____]0.09%
|
[____]0.09%
|
[____]0.09%
|
[____]0.09%
|
|
[Total expenses] excluding Trustee earnings credit]
|
[____]0.11%
|
[____]0.11%
|
[____]0.11%
|
[____]0.10%
|
[____]0.11%
|
|
[Total expenses excluding Trustee earnings credit and fee waivers]
|
[____]0.11%
|
[____]0.11%
|
[____]0.11%
|
[____]0.10%
|
[____]0.11%
|
|
[Portfolio turnover rate(4)]
|
[____]3.80%
|
[____]3.72%
|
[____]5.38%
|
[____]6.68%
|
[____]4.56%
|
|
[Net assets, end of year (000’s)]
|
$ [________]118,164,619
|
$ [________]80,865,260
|
$ [________]78,190,881
|
$ [________]71,655,866
|
$ [________]92,963,266
|
|
[(1)
|
Per Unit numbers have been calculated using the average shares method, which more appropriately presents per Unit data for the year.]
|
| |
|
|
[(2)
|
Total return is calculated assuming a purchase of a Unit at net asset value per Unit on the first day and a sale at net asset value per Unit on the last day of each period reported. Distributions are assumed, for the purposes of this calculation, to be reinvested at the net asset value per Unit on the respective payment dates of the Trust. Broker commission charges are not included in this calculation.]
|
| |
|
|
[(3)
|
Net of expenses waived by the Trustee.]
|
| |
|
|
[(4)
|
Portfolio turnover rate does not include securities received or delivered from processing creations or redemptions of Units.]
|
|
(1)
|
Per Unit numbers have been calculated using the average shares method, which more appropriately presents per Unit data for the year.
|
|
(2)
|
Total return is calculated assuming a purchase of a Unit at net asset value per Unit on the first day and a sale at net asset value per Unit on the last day of each period reported. Distributions are assumed, for the purposes of this calculation, to be reinvested at the net asset value per Unit on the respective payment dates of the Trust. Broker commission charges are not included in this calculation.
|
|
(3)
|
Net of expenses waived by the Trustee.
|
|
(4)
|
Portfolio turnover rate does not include securities received or delivered from processing creations or redemptions of Units.
|
[See accompanying notes to financial statements.]
SPDR S&P 500 ETF Trust
Notes to Financial Statements
[September 30, 2012]
[NOTENote 1—ORGANIZATION]Organization
[SPDR S&P 500 ETF Trust (the “Trust”) is a unit investment trust created under the laws of the State of New York and registered under the Investment Company Act of 1940, as amended. The Trust was created to provide investors with the opportunity to purchase a security representing a proportionate undivided interest in a portfolio of securities consisting of substantially all of the component common stocks, in substantially the same weighting, which comprise the Standard & Poor’s 500 Index (the “S&P 500 Index”). Each unit of fractional undivided interest in the Trust is referred to as a “Unit”. The Trust commenced operations on January 22, 1993 upon the initial issuance of 150,000 Units (equivalent to three “Creation Units” — see Note 4) in exchange for a portfolio of securities assembled to reflect the intended portfolio composition of the Trust.]
[Under the Amended and Restated Standard Terms and Conditions of the Trust, as amended (the “Trust Agreement”), PDR Services, LLC, as Sponsorsponsor of the Trust (the “Sponsor”), and State Street Bank and Trust Company, as Trusteetrustee of the Trust (the “Trustee”), are indemnified against certain liabilities arising out of the performance of their duties to the Trust. Additionally, in the normal course of business, the Trust enters into contracts that contain general indemnification clauses. The Trust’s maximum exposure under these arrangements is unknown as this would involve future claims that may be made against the Trust that have not yet occurred. However, based on experience, the Trust expects the risk of material loss to be remote.]
[On February 15, 2011, NYSE Euronext (the parent of the Sponsor) and Deutsche Börse AG announced that they have entered into a business combination agreement which was subsequently approved by their shareholders. This transaction is subject to approval by the relevant regulatory authorities in the U.S. and Europe, and other closing conditions.]
[NOTENote 2 —SIGNIFICANT ACCOUNTING POLICIES] Significant Accounting Policies
[The following is a summary of significant accounting policies followed by the Trust in the preparation of its financial statements:]
[The preparation of financial statements in accordance with U.S. generally accepted accounting principles requires management to make estimates and assumptions that affect the reported amounts and disclosures in the financial statements. Actual results could differ from those estimates. TheseThe financial statements are presented in United States dollars.]
SPDR S&P 500 ETF Trust
Notes to Financial Statements
[September 30, 2012]
[NOTE 2—SIGNIFICANT ACCOUNTING POLICIES – (continued)]
[Security Valuation]
[The value of the Trust’s portfolio securities is based on the market price of the securities, which generally means a valuation obtained from an exchange or other market (or based on a price quotation or other equivalent indication of value supplied by an exchange or other market) or a valuation obtained from an independent pricing service. If a security’s market price is not readily available or does not otherwise accurately reflect the fair value of the security, the security will be valued by another method that the Trustee believes will better reflect fair value in accordance with the Trust’s valuation policies and procedures. The Trustee has established a Pricing and Investment Committee (the “Committee”) for the purpose of valuing securities for which market quotations are not readily available or do not otherwise accurately reflect the fair value of the security. The Committee, subject to oversight by the Trustee, may use fair value pricing in a variety of circumstances, including but not limited to, situations when trading in a security has been suspended or halted. Accordingly, the Trust’s net asset value (“NAV”) may reflect certain portfolio securities’ fair values rather than their market prices. Fair value pricing involves subjective judgments and it is possible that the fair value determination for a security is materially different than the value that could be received on the sale of the security.]
[The Trust continues to follow the authoritative guidance for fair value measurements and the fair value option for financial assets and financial liabilities. The guidance for the fair value option for financial assets and financial liabilities provides the Trust with the irrevocable option to measure many financial assets and liabilities at fair value with changes in fair value recognized in earnings. The guidance also establishes a hierarchy for inputs used in measuring fair value that maximizes the use of observable inputs and minimizes the use of unobservable inputs by requiring that the most observable inputs be used when available. The guidance establishes three levels of inputs that may be used to measure fair value:]
SPDR S&P 500 ETF Trust
Notes to Financial Statements (continued)
September 30, 2012
Note 2 – Significant Accounting Policies – (continued)
|
|
•·
|
[Level 1 — quoted prices in active markets for identical investments]
|
|
|
•·
|
[Level 2 — other significant observable inputs (including, but not limited to, quoted prices for similar investments, interest rates, prepayment speeds, credit risk, etc.)]
|
|
|
•·
|
[Level 3 — significant unobservable inputs (including the Trust’s own assumptions in determining the fair value of investments)]
|
[Investments that use Level 2 or Level 3 inputs may include, but are not limited to: (i) an unlisted security related to corporate actions; (ii) a restricted security (i.e.g., one that may not be publicly sold without registration under the Securities Act of 1933, as amended); (iii) a security whose trading has been suspended or which has been de-listed from its primary trading exchange; (iv) a security that is thinly traded; (v) a security in default or bankruptcy proceedings for which there is no current market quotation; (vi) a security affected by currency controls or restrictions; and (vii) a security affected by a significant event (i.e.g., an event that occurs after the close of the markets on which the security is traded but before the time as of which the Trust’s net assets are computed and that may materially affect the value of the Trust’s investments). Examples of events that may be “significant events” are government actions, natural disasters, armed conflicts, acts of terrorism, and significant market fluctuations.]
[Fair value pricing could result in a difference between the prices used to calculate the Trust’s net asset valueNAV and the prices used by the S&P 500 Index, which, in turn, could result in a difference between the Trust’s performance and the performance of the S&P 500 Index. The inputs or methodology used for valuation are not necessarily an indication of the risk associated with investing in those investments. The typetypes of inputs used to value each security isare identified in the Schedule of Investments, which also includes a breakdown of the Trust’s investmentinvestments by industry.]
SPDR S&P 500 ETF Trust
Notes to Financial Statements
[September 30, 2012]
The Trust did not hold any investments valued using Level 2 or Level 3 inputs as of September 30, 2012 and did not have any transfers between levels for the year ended September 30, 2012.
[NOTE 2—SIGNIFICANT ACCOUNTING POLICIES – (continued)]
[Subsequent Events]
[Events or transactions occurring after the year end through the date the financial statements were issued have been evaluated by management in the preparation of the financial statements and no items were noted requiring additional disclosure or adjustment.]
[Investment Risk]
[The Trust’s investments are exposed to risks, such as market risk. Due to the level of risk associated with certain investments it is at least reasonably possible that changes in the values of investment securities will occur in the near term and that such changes could materially affect the amounts reported in the financial statements.]
[An investment in the Trust involves risks similar to those of investing in any fund of equity securities, such as market fluctuations caused by such factors as economic and political developments, changes in interest rates and perceived trends in stock prices. The value of a Unit will decline, more or less, in correlation with any decline in value of the S&P 500 Index. The values of equity securities could decline generally or could underperform other investments. The Trust would not sell an equity security because the security’s issuer was in financial trouble unless that security were removed from the S&P 500 Index.]
[Investment Transactions]
[Investment transactions are recorded on the trade date. Realized gains and losses from the sale or disposition of securities are recorded on the identified cost basis. Dividend income is recorded on the ex-dividend date.]
SPDR S&P 500 ETF Trust
Notes to Financial Statements (continued)
September 30, 2012
Note 2 – Significant Accounting Policies – (continued)
[Distributions to Unitholders]
[The Trust declares and distributes dividends from net investment income to its holders of Units (“Unitholders”) quarterly. The Trust declares and distributes net realized capital gains, if any, at least annually.]
[Broker-dealers, at their own discretion, may offer a dividend reinvestment service under which additional Units may be purchased in the secondary market at current market prices. Investors should consult their broker-dealer for further information regarding any dividend reinvestment service offered by such broker-dealer.]
[Equalization]
[The Trust follows the accounting practice known as “Equalization” by which a portion of the proceeds from sales and costs of reacquiring the Trust’s Units, equivalent on a per Unit basis to the amount of distributable net investment income on the date of the transaction, is credited or charged to undistributed net investment income. As a result, undistributed net investment income per Unit is unaffected by sales or reacquisitions of the Trust’s Units.]
[U.S. Federal Income Tax and Certain Other Tax Matters]
[For U.S. federal income tax purposes, the Trust has qualified as a “regulated investment company” under Subchapter M of the Internal Revenue Code of 1986, as amended (a “RIC”) and intends to continue to qualify as
a RIC. As a RIC, the Trust will generally not be subject to U.S. federal income tax for any taxable year on income, including net capital gains, that it distributes to its Unitholders, provided that it distributes on a timely basis at least 90% of its “investment company taxable income” (generally, its taxable income other than net capital gain) for such taxable year. In addition, provided that the Trust distributes during each calendar year substantially all of its ordinary income and capital gains, the Trust will not be subject to U.S. federal excise tax.]
SPDR S&P 500 ETF Trust
Notes to Financial Statements
[September 30, 2012]
[NOTE 2—SIGNIFICANT ACCOUNTING POLICIES – (continued)]
[The Trust has reviewed the tax positions for the open tax years as of September 30, 2012 and has determined that no provision for income tax is required in the Trust’s financial statements. The Trust’s U.S. federal tax returns for the prior three fiscal years remain subject to examination by the Trust’s major tax jurisdictions, which include the United States of America and the State of New York. The Trust would recognize interest and penalties, if any, related to tax liabilities as income tax expense in the Statements of Operations. There were no such expenses for the year ending September 30, 2012.]
[Under rules in effect for taxable years beginning before December 22, 2010, the capital loss carryforward period of a RIC was limited to eight years. Capital loss carryforwards of RICs for subsequent taxable years may be carried forward indefinitely, but capital loss carryforwards generated in taxable years subject to the prior rules must be fully used before those generated in subsequent taxable years. Therefore, under certain circumstances, capital loss carryforwards available as of the report date, as described below, may expire unused.]
[At [September 30, 2012], the Trust had the following capital loss carryforwards that may be usedutilized to offset any net realized gains, expiring September 30:]
|
[2013]
|
$ [380,379,645]
|
|
[2014]
|
[1,174,140,896]
|
|
[2015]
|
[1,056,971,322]
|
|
[2016]
|
[917,820,735]
|
|
[2017]
|
[2,553,965,847]
|
|
[2018]
|
[188,539,023]
|
|
[2019]Non-Expiring – Short Term
|
[_________]378,595,650
|
|
Non-Expiring – Long Term
|
345,451,782
|
SPDR S&P 500 ETF Trust
Notes to Financial Statements (continued)
September 30, 2012
Note 2 – Significant Accounting Policies – (continued)
[During the tax year ended September 30, 2012, the Trust utilized capital loss carryforwards of $[_______]0 and had $[_______]445,024,832 of capital loss carryforwards expire.]
[During the year ended September 30, 2012, the Trust reclassified $[_________]9,190,902,066 of non-taxable security gains realized from the in-kind redemption of Creation Units (Note 4) as an increase to paid in capital in the Statement of Assets and Liabilities. At September 30, 2012, the cost of investments for U.S. federal income tax purposes was $[_________]120,716,392,931. Accordingly, gross unrealized appreciation was $[_________]5,196,171,442 and gross unrealized depreciation was $[_________]7,795,590,487, resulting in net unrealized depreciation of $[_________]2,599,419,045.]
[The tax character of distributions paid during the year ended September 30, 2012 was $[_______]2,209,395,148 of ordinary income.]
[The tax character of distributions paid during the year ended September 30, 2011 was $1,859,515,384 of ordinary income.]
[The tax character of distributions paid during the year ended September 30, 2010 was $1,549,861,683 of ordinary income.]
[As of September 30, 2012, the components of distributable earnings (excluding unrealized appreciation/(depreciation)) were undistributed ordinary income of $[_______]7,162,620, undistributed long-term capital gain of $[_______]0 and unrealized depreciation of $[_______]2,599,419,045.]
[Capital losses realized by the Trust after October 31 and ordinary income losses realized by the Trust after December 31, may be deferred and treated as occurring on the first day of the following fiscal year. The Trust incurred losses of $[_______] during the period November 1, 2011 through September 30, 2012 that are deferred for tax purposes untilelected for U.S. federal income tax purposes to defer the following current year post October 31 and post December 31 losses, as applicable, as though the losses were incurred on the first day of the next fiscal year 2013.]:
|
Post October Loss Deferral
|
$0
|
|
Late Year Ordinary Loss Deferral
|
0
|
Note 3 — Transactions with the Trustee and Sponsor
SPDR S&P 500 ETF Trust
Notes to Financial Statements
[September 30, 2012]
[NOTE 3—TRANSACTIONS WITH THE TRUSTEE AND SPONSOR]
[In accordance with the Trust Agreement, the Trustee maintains the Trust’s accounting records, acts as custodian and transfer agent to the Trust, and provides administrative services, including filing of certain regulatory reports. The Trustee is also responsible for determining the composition of the portfolio of securities which must be delivered and/or received in exchange for the issuance and/or redemption of Creation Units of the Trust, and for adjusting the composition of the Trust’s portfolio from time to time to conform to changes in the composition and/or weighting structure of the S&P 500 Index. For these services, the Trustee received a fee at the following annual rates for the year ended September 30, 2012:]
[Net asset value of the Trust]
|
[Fee as a percentage of net asset value of the Trust]
|
|
[$0 –$499,999,999]
|
[10/100 of 10.10% per annum plus or minus the Adjustment Amount]
|
|
[$500,000,000 –$2,499,999,999]
|
[8/100 of 1 0.08% per annum plus or minus the Adjustment Amount]
|
|
[$2,500,000,000 – and above]
|
[6/100 of 1 0.06% per annum plus or minus the Adjustment Amount]
|
[The Adjustment Amount is the sum of (a) the excess or deficiency of transaction fees received by the Trustee, less the expenses incurred in processing orders for creation and redemption of Units and (b) the amounts earned by the Trustee with respect to the cash held by the Trustee for the benefit of the Trust. During the year ended [September 30, 2012], the Adjustment Amount reduced the Trustee’s fee by $[_______]4,602,275. The Adjustment Amount included an excess of net transaction fees from processing orders of $[_______]4,169,916 and a Trustee earnings credit of $[_______]432,359.]
SPDR S&P 500 ETF Trust
Notes to Financial Statements (continued)
September 30, 2012
Note 3 – Transactions with the Trustee and Sponsor – (continued)
[The Trustee voluntarily agreed to waive a portion of its fee, as needed, for one year through [until February 1, 2013], so that the total operating expenses would not exceed [9.45/100 of 1% (0.0945%)] per annum of the daily net asset valueNAV. The total amount of such waivers by the Trustee for the years ended September 30, 2010, September 30, 2011 and September 30, 2012 was $10,128,612, $12,589,426 and $[_______], respectivelyare identified in the Statements of Operations. The Trustee has not entered into an agreement with the Trust to recapture waived fees in subsequent periods and the Trustee may discontinue the voluntary waiver.]
[S&P Dow Jones Indices LLC (“S&P”), per a license from Standard and& Poor’s Financial Services LLC, and State Street Global Markets, LLC (“SSGM” or the “Marketing Agent”) have entered into a License Agreement. The License Agreement grants SSGM, an affiliate of the Trustee, a license to use the S&P 500 Index and to use certain trade names and trademarks of S&P in connection with the portfolioTrust. The S&P 500 Index also serves as a basis for determining the composition of the portfolio. The Trustee, on behalf of the Trust, NYSE Arca, Inc. (“NYSE Arca”) and the Sponsor have each received a sublicense from SSGM and S&P for the use of the S&P 500 Index and suchcertain trade names and trademarks in connection with their rights and duties with respect to the Trust. The License Agreement may be amended without the consent of any of the owners of beneficial interests of Units. Currently, the License Agreement is scheduled to terminate on December 31, 2017, but its term may be extended without the consent of any of the owners of beneficial interests of Units. Pursuant to such arrangements and in accordance with the Trust Agreement, the Trust reimburses the Sponsor for payment of fees under the License Agreement to S&P equal to 0.03% of the daily size of the Trust (based on Unit closing price and outstanding Units) plus an annual fee of $600,000.]
[The Sponsor has entered into an agreement with the Marketing Agent pursuant to which the Marketing Agent has agreed to market and promote the Trust. The Marketing Agent is reimbursed by the Sponsor for the expenses it incurs for providing such services out of amounts that the Trust reimburses the Sponsor. Expenses incurred by the Marketing Agent include, but are not limited to: printing and distribution of marketing materials describing the Trust, associated legal, consulting, advertising and marketing costs and other out-of-pocket expenses.]
SPDR S&P 500 ETF Trust
Notes to Financial Statements
[September 30, 2012]
[NOTE 3—TRANSACTIONS WITH THE TRUSTEE AND SPONSOR – (continued)]
[Investments in Affiliates of the Trustee and the Sponsor]
[The Trust has invested in companies that may be considered affiliates of the Trustee (State Street Corp.) and Sponsor (NYSE Euronext). Such investments were made according to the representative portion of the S&P 500 Index. The market value of these investments at September 30, 2012 is listed in the Schedule of Investments.]
[NOTENote 4 —UNITHOLDER TRANSACTIONS] Unitholder Transactions
[Units are issued and redeemed by the Trust only in Creation Unit size aggregations of 50,000 Units. Such transactions are only permitted on an in-kind basis, with a separate cash payment whichthat is equivalent to the undistributed net investment income per Unit (income equalization) and a balancing cash component to equate the transaction to the net asset valueNAV per Unit of the Trust on the transaction date. A transaction fee of $3,000 is currently charged in connection with each creation or redemption of Creation Units through the clearing process per participating party per day, regardless of the number of Creation Units created or redeemed. In the case of redemptions outside the clearing process, the transaction fee plus an additional amount not to exceed three (3) times the transaction fee applicable for one Creation Unit per Creation Unit redeemed, and such amount is are deducted from the amount delivered to the redeemer. Transaction fees are received by the Trustee and used to defray the expense of processing orders.]
[NOTENote 5 —INVESTMENT TRANSACTIONS] Investment Transactions
[For the year ended September 30, 2012, the Trust had in-kind contributions, in-kind redemptions, purchases and sales of investment securities of $[_______], $[_______], $[_______], and $[_______]165,220,876,841, $149,670,178,338, $3,974,999,740, and $3,771,861,069, respectively. Net realized gain (loss) on investment transactions in the StatementStatements of Operations includes net gains resulting from in-kind transactions of $[_______]9,217,362,190.]
SPDR S&P 500 ETF Trust
Other Information
September 30, 2012 (Unaudited)
[For U.S. federal income tax purposes, the percentage of Trust distributions that qualify for the corporate dividends paidreceived deduction for the fiscal year ended September 30, 2012 is [_______]98.32%.]
[For the fiscal year ended September 30, 2012, certain dividends paid by the Trust may be designated as qualified dividend income for U.S. federal income tax purposes and subject to a maximum U.S. federal income tax rate of 15%. Complete information will be reported in conjunction with your 2012 Form 1099-DIV.]
SPDR S&P 500 ETF Trust
Other Information
[September 30, 2012 (Unaudited)]
[FREQUENCY DISTRIBUTION OF DISCOUNTS AND PREMIUMS]
[Bid/Ask Price(1) vs Net Asset Value]
[AS OF SEPTEMBERAs of September 30, 2012]
|
|
|
|
| |
Bid/Ask Price |
|
Bid/Ask Price
|
|
| |
Above NAVAbove NAV |
|
Below NAVBelow NAV |
|
|
|
|
|
|
|
|
|
[2012]
|
[__]0
|
[__]0
|
[__]0
|
[__]0
|
[__]0
|
[__]0
|
|
[2011]
|
[0]
|
[0]
|
[0]
|
[0]
|
[0]
|
[0]
|
|
[2010]
|
[0]
|
[0]
|
[0]
|
[0]
|
[0]
|
[0]
|
|
[2009]
|
[0]
|
[0]
|
[0]
|
[0]
|
[0]
|
[0]
|
|
[2008]
|
[3]
|
[4]
|
[1]
|
[5]
|
[1]
|
[0]
|
[Comparison of Total Returns Based on NAV and Bid/Ask Price (1)]
[The table below is provided to compare the Trust’s total pre-tax return at NAV with the total pre-tax returns based on bid/ask price and the performance of the S&P 500 Index. Past performance is not necessarily an indication of how the Trust will perform in the future.]
|
[Cumulative Total Return]
|
|
|
|
|
|
|
SPDR S&P 500 ETF Trust
|
|
|
|
|
[Return Based on NAV]
|
[___]29.96%
|
[___]5.08%
|
[___]114.02%
|
|
[Return Based on Bid/Ask Price]
|
[___]29.84%
|
[___]4.98%
|
[___]114.37%
|
|
[S&P 500 Index]
|
[___]30.20%
|
[___]5.37%
|
[___]116.15%
|
|
[Average Annual Total Return]
|
|
|
|
|
|
|
SPDR S&P 500 ETF Trust
|
|
|
|
|
[Return Based on NAV]
|
[___]29.96%
|
[___]1.00%
|
[___]7.91%
|
|
[Return Based on Bid/Ask Price]
|
[___]29.84%
|
[___]0.98%
|
[___]7.92%
|
|
[S&P 500 Index]
|
[___]30.20%
|
[___]1.05%
|
[___]8.01%
|
|
[(1)
|
Currently, the bid/ask price is the midpoint of the best bid and best offer prices on NYSE Arca at the time the Trust’s NAV is calculated, ordinarily 4:00 p.m. Through November 28, 2008, the bid/ask price was the midpoint of the best bid and best offer prices on NYSE Alternext US (formerly the American Stock Exchange and now NYSE MKT) at the close of trading, ordinarily 4:00 p.m.]
|
|
(1)
|
Currently, the bid/ask price is the midpoint of the best bid and best offer prices on NYSE Arca at the time the Trust's NAV is calculated, ordinarily 4:00 p.m. Through November 28, 2008, the bid/ask price was the midpoint of the best bid and best offer prices on NYSE Alternext US (formerly the American Stock Exchange and now NYSE MKT) at the close of trading, ordinarily 4:00 p.m.
|
SPDR S&P 500 ETF Trust
Schedule of Investments
[September 30, 2012]
|
|
|
|
|
[___________________]3M Co.
|
[__________]5,841,514
|
$[_________]539,872,724
|
|
[___________________]Abbott Laboratories
|
[__________]14,390,925
|
[_________]986,641,818
|
|
[___________________]Abercrombie & Fitch Co. (Class A)
|
[__________]750,202
|
[_________]25,446,852
|
|
[___________________]Accenture PLC (Class A)
|
[__________]5,833,456
|
[_________]408,516,924
|
|
[___________________]ACE, Ltd.
|
[__________]3,109,291
|
[_________]235,062,400
|
|
[___________________]Adobe Systems, Inc.(a)
|
[__________]4,503,476
|
[_________]146,182,831
|
|
[___________________]Advanced Micro Devices, Inc.(a)
|
[__________]5,204,521
|
[_________]17,539,236
|
|
[___________________]Aetna, Inc.
|
[__________]3,065,196
|
[_________]121,381,762
|
|
[___________________]AFLAC, Inc.
|
[__________]4,293,820
|
[_________]205,588,102
|
|
[___________________]Agilent Technologies, Inc.
|
[__________]3,195,082
|
[_________]122,850,903
|
|
[___________________]AGL Resources, Inc.
|
[__________]1,058,421
|
[_________]43,300,003
|
|
[___________________]Air Products & Chemicals, Inc.
|
[__________]1,941,255
|
[_________]160,541,789
|
|
[___________________]Airgas, Inc.
|
[__________]628,190
|
[_________]51,700,037
|
|
[___________________]Akamai Technologies, Inc.(a)
|
[__________]1,624,130
|
[_________]62,139,214
|
|
[___________________]Alcoa, Inc.
|
[__________]9,670,997
|
[_________]85,588,323
|
|
[___________________]Alexion Pharmaceuticals, Inc.(a)
|
[__________]1,770,179
|
[_________]202,508,478
|
|
[___________________]Allegheny Technologies, Inc.
|
[__________]953,882
|
[_________]30,428,836
|
|
[___________________]Allergan, Inc.
|
[__________]2,820,121
|
[_________]258,266,681
|
|
[___________________]Alpha Natural Resources, Inc.(a)
|
[__________]1,991,206
|
[_________]13,082,223
|
|
[___________________]Altera Corp.
|
[__________]2,916,700
|
[_________]99,124,050
|
|
[___________________]Altria Group, Inc.
|
[__________]18,640,543
|
[_________]622,407,731
|
|
[___________________]Amazon.com, Inc.(a)
|
[__________]3,316,033
|
[_________]843,333,513
|
|
[___________________]Ameren Corp.
|
[__________]2,224,941
|
[_________]72,688,822
|
|
[___________________]American Electric Power Co., Inc.
|
[__________]4,446,279
|
[_________]195,369,499
|
|
[___________________]American Express Co.
|
[__________]9,063,866
|
[_________]515,371,421
|
|
[___________________]American International Group, Inc.(a)
|
[__________]10,694,095
|
[_________]350,659,375
|
|
[___________________]American Tower Corp.
|
[__________]3,623,457
|
[_________]258,678,595
|
|
[___________________]Ameriprise Financial, Inc.
|
[__________]1,932,190
|
[_________]109,535,851
|
SPDR S&P 500 ETF Trust
Schedule of Investments (continued)
September 30, 2012
|
[___________________]AmerisourceBergen Corp.
|
[__________]2,276,824
|
[_________]88,135,857
|
|
[___________________]Amgen, Inc.
|
[__________]7,068,816
|
[_________]596,042,565
|
|
[___________________]Amphenol Corp. (Class A)
|
[__________]1,468,506
|
[_________]86,465,633
|
|
[___________________]Anadarko Petroleum Corp.
|
[__________]4,581,924
|
[_________]320,368,126
|
|
[___________________]Analog Devices, Inc.
|
[__________]2,740,909
|
[_________]107,416,224
|
|
[___________________]Aon PLC
|
[__________]2,962,900
|
[_________]154,930,041
|
|
[___________________]Apache Corp.
|
[__________]3,587,403
|
[_________]310,202,737
|
|
[___________________]Apartment Investment & Management Co. (Class A)
|
[__________]1,333,808
|
[_________]34,665,670
|
|
[___________________]Apollo Group, Inc. (Class A)(a)
|
[__________]915,381
|
[_________]26,591,818
|
|
[___________________]Apple, Inc.
|
[__________]8,595,329
|
[_________]5,735,319,229
|
|
[___________________]Applied Materials, Inc.
|
[__________]11,350,395
|
[_________]126,727,160
|
|
[___________________]Archer-Daniels-Midland Co.
|
[__________]6,039,172
|
[_________]164,144,695
|
|
[___________________]Assurant, Inc.
|
[__________]735,726
|
[_________]27,442,580
|
|
[___________________]AT&T, Inc.
|
[__________]52,915,205
|
[_________]1,994,903,228
|
|
[___________________]Autodesk, Inc.(a)
|
[__________]2,059,590
|
[_________]68,728,518
|
|
[___________________]Automatic Data Processing, Inc.
|
[__________]4,435,506
|
[_________]260,186,782
|
|
[___________________]AutoNation, Inc.(a)
|
[__________]377,122
|
[_________]16,468,918
|
|
[___________________]Autozone, Inc.(a)
|
[__________]341,563
|
[_________]126,265,594
|
|
[___________________]AvalonBay Communities, Inc.
|
[__________]888,469
|
[_________]120,822,899
|
|
[___________________]Avery Dennison Corp.
|
[__________]949,058
|
[_________]30,199,026
|
|
[___________________]Avon Products, Inc.
|
[__________]3,961,728
|
[_________]63,189,562
|
|
[___________________]Baker Hughes, Inc.
|
[__________]4,030,539
|
[_________]182,301,279
|
|
[___________________]Ball Corp.
|
[__________]1,411,276
|
[_________]59,711,088
|
|
[___________________]Bank of America Corp.
|
[__________]98,820,299
|
[_________]872,583,240
|
|
[___________________]Baxter International, Inc.
|
[__________]5,018,558
|
[_________]302,418,305
|
|
[___________________]BB&T Corp.
|
[__________]6,410,601
|
[_________]212,575,529
|
|
[___________________]Beam, Inc.
|
[__________]1,452,292
|
[_________]83,564,882
|
|
[___________________]Becton, Dickinson & Co.
|
[__________]1,838,210
|
[_________]144,409,778
|
|
[___________________]Bed Bath & Beyond, Inc.(a)
|
[__________]2,108,989
|
[_________]132,866,307
|
SPDR S&P 500 ETF Trust
Schedule of Investments (continued)
September 30, 2012
|
[___________________][__________][_________]See accompanying notes to financial statements.
|
|
[___________________]Bemis Co., Inc.
|
[__________]931,217
|
[_________]$ 29,305,399
|
|
[___________________]Berkshire Hathaway, Inc. (Class B)(a)
|
[__________]16,803,224
|
[_________]1,482,044,357
|
|
[___________________]Best Buy Co., Inc.
|
[__________]2,516,604
|
[_________]43,260,423
|
|
[___________________]Big Lots, Inc.(a)
|
[__________]589,010
|
[_________]17,422,916
|
|
[___________________]Biogen Idec, Inc.(a)
|
[__________]2,168,531
|
[_________]323,609,881
|
|
[___________________]BlackRock, Inc.
|
[__________]1,173,527
|
[_________]209,239,864
|
|
[___________________]BMC Software, Inc.(a)
|
[__________]1,347,671
|
[_________]55,914,870
|
|
[___________________]BorgWarner, Inc.(a)
|
[__________]1,039,085
|
[_________]71,811,164
|
|
[___________________]Boston Properties, Inc.
|
[__________]1,382,334
|
[_________]152,899,964
|
|
[___________________]Boston Scientific Corp.(a)
|
[__________]12,979,338
|
[_________]74,501,400
|
|
[___________________]Bristol-Myers Squibb Co.
|
[__________]15,397,670
|
[_________]519,671,362
|
|
[___________________]Broadcom Corp. (Class A)(a)
|
[__________]4,712,800
|
[_________]162,968,624
|
|
[___________________]Brown-Forman Corp. (Class B)
|
[__________]1,388,307
|
[_________]90,587,032
|
|
[___________________]C.H. Robinson Worldwide, Inc.
|
[__________]1,475,026
|
[_________]86,362,772
|
|
[___________________]C.R. Bard, Inc.
|
[__________]715,795
|
[_________]74,907,947
|
|
[___________________]CA, Inc.
|
[__________]3,207,875
|
[_________]82,650,899
|
|
[___________________]Cablevision Systems Corp. (Class A)
|
[__________]1,945,068
|
[_________]30,829,328
|
|
[___________________]Cabot Oil & Gas Corp.
|
[__________]1,925,542
|
[_________]86,456,836
|
|
[___________________]Cameron International Corp.(a)
|
[__________]2,258,332
|
[_________]126,624,675
|
|
[___________________]Campbell Soup Co.
|
[__________]1,617,749
|
[_________]56,330,020
|
|
[___________________]Capital One Financial Corp.
|
[__________]5,327,473
|
[_________]303,719,236
|
|
[___________________]Cardinal Health, Inc.
|
[__________]3,136,152
|
[_________]122,215,843
|
|
[___________________]CareFusion Corp.(a)
|
[__________]2,006,371
|
[_________]56,960,873
|
|
[___________________]CarMax, Inc.(a)
|
[__________]2,093,961
|
[_________]59,259,096
|
|
[___________________]Carnival Corp.
|
[__________]4,093,306
|
[_________]149,160,071
|
|
[___________________]Caterpillar, Inc.
|
[__________]5,990,128
|
[_________]515,390,613
|
|
[___________________]CBRE Group, Inc. (Class A)(a)
|
[__________]2,769,528
|
[_________]50,987,010
|
|
[___________________]CBS Corp. (Class B)
|
[__________]5,466,857
|
[_________]198,610,915
|
SPDR S&P 500 ETF Trust
Schedule of Investments (continued)
September 30, 2012
|
[___________________]Celgene Corp.(a)
|
[__________]3,987,366
|
[_________]304,634,762
|
|
[___________________]CenterPoint Energy, Inc.
|
[__________]3,879,085
|
[_________]82,624,511
|
|
[___________________]CenturyLink, Inc.
|
[__________]5,709,306
|
[_________]230,655,962
|
|
[___________________]Cerner Corp.(a)
|
[__________]1,324,864
|
[_________]102,557,722
|
|
[___________________]CF Industries Holdings, Inc.
|
[__________]575,314
|
[_________]127,857,783
|
|
[___________________]Chesapeake Energy Corp.
|
[__________]4,782,519
|
[_________]90,246,134
|
|
[___________________]Chevron Corp.
|
[__________]17,993,658
|
[_________]2,097,340,776
|
|
[___________________]Chipotle Mexican Grill, Inc.(a)
|
[__________]287,546
|
[_________]91,307,357
|
|
[___________________]Chubb Corp.
|
[__________]2,448,063
|
[_________]186,738,246
|
|
[___________________]CIGNA Corp.
|
[__________]2,644,154
|
[_________]124,724,744
|
|
[___________________]Cincinnati Financial Corp.
|
[__________]1,344,061
|
[_________]50,926,471
|
|
[___________________]Cintas Corp.
|
[__________]1,010,219
|
[_________]41,873,578
|
|
[___________________]Cisco Systems, Inc.
|
[__________]48,494,323
|
[_________]925,756,626
|
|
[___________________]Citigroup, Inc.
|
[__________]26,889,619
|
[_________]879,828,334
|
|
[___________________]Citrix Systems, Inc.(a)
|
[__________]1,714,300
|
[_________]131,263,951
|
|
[___________________]Cliffs Natural Resources, Inc.
|
[__________]1,294,228
|
[_________]50,643,142
|
|
[___________________]Clorox Co.
|
[__________]1,183,127
|
[_________]85,244,300
|
|
[___________________]CME Group, Inc.
|
[__________]2,809,326
|
[_________]160,974,380
|
|
[___________________]CMS Energy Corp.
|
[__________]2,429,141
|
[_________]57,206,271
|
|
[___________________]Coach, Inc.
|
[__________]2,607,613
|
[_________]146,078,480
|
|
[___________________]Coca-Cola Enterprises, Inc.
|
[__________]2,542,092
|
[_________]79,491,217
|
|
[___________________]Cognizant Technology Solutions Corp. (Class A)(a)
|
[__________]2,753,671
|
[_________]192,536,676
|
|
[___________________]Colgate-Palmolive Co.
|
[__________]4,092,189
|
[_________]438,764,505
|
|
[___________________]Comcast Corp. (Class A)
|
[__________]24,539,536
|
[_________]877,779,203
|
|
[___________________]Comerica, Inc.
|
[__________]1,783,183
|
[_________]55,367,832
|
|
[___________________]Computer Sciences Corp.
|
[__________]1,393,270
|
[_________]44,877,227
|
|
[___________________]ConAgra Foods, Inc.
|
[__________]3,732,029
|
[_________]102,966,680
|
|
[___________________]ConocoPhillips
|
[__________]11,145,283
|
[_________]637,287,282
|
|
[___________________]CONSOL Energy, Inc.
|
[__________]2,087,353
|
[_________]62,724,958
|
SPDR S&P 500 ETF Trust
Schedule of Investments (continued)
September 30, 2012
|
[___________________]Consolidated Edison, Inc.
|
[__________]2,685,843
|
[_________]160,855,137
|
|
[___________________]Constellation Brands, Inc. (Class A)(a)
|
[__________]1,382,135
|
[_________]44,712,067
|
|
See accompanying notes to financial statements.
|
|
[___________________]Cooper Industries PLC
|
[__________]1,465,866
|
[_________]$ 110,027,902
|
|
[___________________]Corning, Inc.
|
[__________]13,768,710
|
[_________]181,058,537
|
|
[___________________]Costco Wholesale Corp.
|
[__________]3,964,375
|
[_________]396,933,047
|
|
[___________________]Coventry Health Care, Inc.
|
[__________]1,214,201
|
[_________]50,620,040
|
|
[___________________]Covidien PLC
|
[__________]4,402,570
|
[_________]261,600,709
|
|
[___________________]Crown Castle International Corp.(a)
|
[__________]2,681,244
|
[_________]171,867,740
|
|
[___________________]CSX Corp.
|
[__________]9,536,032
|
[_________]197,872,664
|
|
[___________________]Cummins, Inc.
|
[__________]1,626,243
|
[_________]149,955,867
|
|
[___________________]CVS Caremark Corp.
|
[__________]11,667,482
|
[_________]564,939,478
|
|
[___________________]D.R. Horton, Inc.
|
[__________]2,509,585
|
[_________]51,797,834
|
|
[___________________]Danaher Corp.
|
[__________]5,354,385
|
[_________]295,294,333
|
|
[___________________]Darden Restaurants, Inc.
|
[__________]1,164,333
|
[_________]64,911,565
|
|
[___________________]DaVita, Inc.(a)
|
[__________]782,272
|
[_________]81,051,202
|
|
[___________________]Dean Foods Co.(a)
|
[__________]1,646,773
|
[_________]26,924,739
|
|
[___________________]Deere & Co.
|
[__________]3,600,163
|
[_________]296,977,446
|
|
[___________________]Dell, Inc.
|
[__________]13,481,552
|
[_________]132,928,103
|
|
[___________________]Denbury Resources, Inc.(a)
|
[__________]3,536,598
|
[_________]57,151,424
|
|
[___________________]DENTSPLY International, Inc.
|
[__________]1,266,291
|
[_________]48,296,339
|
|
[___________________]Devon Energy Corp.
|
[__________]3,454,028
|
[_________]208,968,694
|
|
[___________________]Diamond Offshore Drilling, Inc.
|
[__________]625,316
|
[_________]41,152,046
|
|
[___________________]DIRECTV(a)
|
[__________]5,761,520
|
[_________]302,249,339
|
|
[___________________]Discover Financial Services
|
[__________]4,721,336
|
[_________]187,578,679
|
|
[___________________]Discovery Communications, Inc. (Class A)(a)
|
[__________]2,266,195
|
[_________]135,133,208
|
|
[___________________]Dollar Tree, Inc.(a)
|
[__________]2,103,781
|
[_________]101,560,028
|
|
[___________________]Dominion Resources, Inc.
|
[__________]5,257,031
|
[_________]278,307,221
|
|
[___________________]Dover Corp.
|
[__________]1,664,697
|
[_________]99,032,825
|
SPDR S&P 500 ETF Trust
Schedule of Investments (continued)
September 30, 2012
|
[___________________]Dr. Pepper Snapple Group, Inc.
|
[__________]1,921,964
|
[_________]85,585,057
|
|
[___________________]DTE Energy Co.
|
[__________]1,574,722
|
[_________]94,388,837
|
|
[___________________]Duke Energy Corp.
|
[__________]6,456,335
|
[_________]418,370,508
|
|
[___________________]Dun & Bradstreet Corp.
|
[__________]407,352
|
[_________]32,433,366
|
|
[___________________]E*TRADE Financial Corp.(a)
|
[__________]2,267,732
|
[_________]19,978,719
|
|
[___________________]E. I. du Pont de Nemours & Co.
|
[__________]8,532,308
|
[_________]428,919,123
|
|
[___________________]Eastman Chemical Co.
|
[__________]1,383,621
|
[_________]78,880,233
|
|
[___________________]Eaton Corp.
|
[__________]3,095,627
|
[_________]146,299,332
|
|
[___________________]eBay, Inc.(a)
|
[__________]10,633,226
|
[_________]514,754,471
|
|
[___________________]Ecolab, Inc.
|
[__________]2,418,693
|
[_________]156,755,493
|
|
[___________________]Edison International
|
[__________]2,987,592
|
[_________]136,503,078
|
|
[___________________]Edwards Lifesciences Corp.(a)
|
[__________]1,060,882
|
[_________]113,906,900
|
|
[___________________]Electronic Arts, Inc.(a)
|
[__________]2,886,551
|
[_________]36,630,332
|
|
[___________________]Eli Lilly & Co.
|
[__________]9,363,780
|
[_________]443,936,810
|
|
[___________________]EMC Corp.(a)
|
[__________]19,244,632
|
[_________]524,801,115
|
|
[___________________]Emerson Electric Co.
|
[__________]6,670,340
|
[_________]321,977,312
|
|
[___________________]Ensco PLC (Class A)
|
[__________]2,127,790
|
[_________]116,092,222
|
|
[___________________]Entergy Corp.
|
[__________]1,608,206
|
[_________]111,448,676
|
|
[___________________]EOG Resources, Inc.
|
[__________]2,476,070
|
[_________]277,443,643
|
|
[___________________]EQT Corp.
|
[__________]1,371,976
|
[_________]80,946,584
|
|
[___________________]Equifax, Inc.
|
[__________]1,090,939
|
[_________]50,815,939
|
|
[___________________]Equity Residential
|
[__________]2,760,116
|
[_________]158,789,473
|
|
[___________________]Exelon Corp.
|
[__________]7,826,683
|
[_________]278,473,381
|
|
[___________________]Expedia, Inc.
|
[__________]873,559
|
[_________]50,526,653
|
|
[___________________]Expeditors International of Washington, Inc.
|
[__________]1,905,559
|
[_________]69,286,125
|
|
[___________________]Express Scripts Holding Co.(a)
|
[__________]7,433,349
|
[_________]465,847,982
|
|
[___________________]Exxon Mobil Corp.
|
[__________]42,331,566
|
[_________]3,871,221,711
|
|
[___________________]F5 Networks, Inc.(a)
|
[__________]720,167
|
[_________]75,401,485
|
|
[___________________]Family Dollar Stores, Inc.
|
[__________]892,461
|
[_________]59,170,164
|
SPDR S&P 500 ETF Trust
Schedule of Investments (continued)
September 30, 2012
|
[___________________]Fastenal Co.
|
[__________]2,475,555
|
[_________]106,424,109
|
|
[___________________]Federated Investors, Inc. (Class B)
|
[__________]835,317
|
[_________]17,282,709
|
|
[___________________]FedEx Corp.
|
[__________]2,681,555
|
[_________]226,913,184
|
|
[___________________]Fidelity National Information Services, Inc.
|
[__________]2,294,434
|
[_________]71,632,229
|
|
See accompanying notes to financial statements.
|
|
[___________________]Fifth Third Bancorp
|
[__________]8,342,255
|
[_________]$ 129,388,375
|
|
[___________________]First Horizon National Corp.
|
[__________]2,291,130
|
[_________]22,063,582
|
|
[___________________]First Solar, Inc.(a)
|
[__________]531,429
|
[_________]11,768,495
|
|
[___________________]FirstEnergy Corp.
|
[__________]3,834,971
|
[_________]169,122,221
|
|
[___________________]Fiserv, Inc.(a)
|
[__________]1,239,179
|
[_________]91,736,421
|
|
[___________________]FLIR Systems, Inc.
|
[__________]1,398,055
|
[_________]27,926,149
|
|
[___________________]Flowserve Corp.
|
[__________]463,554
|
[_________]59,214,388
|
|
[___________________]Fluor Corp.
|
[__________]1,536,092
|
[_________]86,451,258
|
|
[___________________]FMC Corp.
|
[__________]1,245,894
|
[_________]68,997,610
|
|
[___________________]FMC Technologies, Inc.(a)
|
[__________]2,160,241
|
[_________]100,019,158
|
|
[___________________]Ford Motor Co.
|
[__________]34,973,144
|
[_________]344,835,200
|
|
[___________________]Forest Laboratories, Inc.(a)
|
[__________]2,149,348
|
[_________]76,538,282
|
|
[___________________]Fossil, Inc.(a)
|
[__________]501,811
|
[_________]42,503,392
|
|
[___________________]Franklin Resources, Inc.
|
[__________]1,285,119
|
[_________]160,729,833
|
|
[___________________]Freeport-McMoRan Copper & Gold, Inc.
|
[__________]8,704,267
|
[_________]344,514,888
|
|
[___________________]Frontier Communications Corp.
|
[__________]8,952,121
|
[_________]43,865,393
|
|
[___________________]GameStop Corp. (Class A)
|
[__________]1,182,864
|
[_________]24,840,144
|
|
[___________________]Gannett Co., Inc.
|
[__________]2,148,088
|
[_________]38,128,562
|
|
[___________________]General Dynamics Corp.
|
[__________]3,045,520
|
[_________]201,369,782
|
|
[___________________]General Electric Co.
|
[__________]96,826,793
|
[_________]2,198,936,469
|
|
[___________________]General Mills, Inc.
|
[__________]5,944,316
|
[_________]236,880,993
|
|
[___________________]Genuine Parts Co.
|
[__________]1,415,443
|
[_________]86,384,486
|
|
[___________________]Genworth Financial, Inc. (Class A)(a)
|
[__________]4,410,197
|
[_________]23,065,330
|
|
[___________________]Gilead Sciences, Inc.(a)
|
[__________]6,937,647
|
[_________]460,174,126
|
SPDR S&P 500 ETF Trust
Schedule of Investments (continued)
September 30, 2012
|
[___________________]Google, Inc. (Class A)(a)
|
[__________]2,427,195
|
[_________]1,831,318,627
|
|
[___________________]H&R Block, Inc.
|
[__________]2,488,709
|
[_________]43,129,327
|
|
[___________________]H.J. Heinz Co.
|
[__________]2,936,235
|
[_________]164,282,348
|
|
[___________________]Halliburton Co.
|
[__________]8,506,274
|
[_________]286,576,371
|
|
[___________________]Harley-Davidson, Inc.
|
[__________]2,102,097
|
[_________]89,065,850
|
|
[___________________]Harman International Industries, Inc.
|
[__________]627,428
|
[_________]28,962,076
|
|
[___________________]Harris Corp.
|
[__________]1,033,425
|
[_________]52,932,029
|
|
[___________________]Hartford Financial Services Group, Inc.
|
[__________]3,996,759
|
[_________]77,696,995
|
|
[___________________]Hasbro, Inc.
|
[__________]1,050,479
|
[_________]40,096,783
|
|
[___________________]HCP, Inc.
|
[__________]3,936,814
|
[_________]175,109,487
|
|
[___________________]Health Care REIT, Inc.
|
[__________]2,331,302
|
[_________]134,632,691
|
|
[___________________]Helmerich & Payne, Inc.
|
[__________]961,706
|
[_________]45,786,823
|
|
[___________________]Hess Corp.
|
[__________]2,747,851
|
[_________]147,614,556
|
|
[___________________]Hewlett-Packard Co.
|
[__________]18,030,949
|
[_________]307,607,990
|
|
[___________________]Honeywell International, Inc.
|
[__________]7,157,273
|
[_________]427,647,062
|
|
[___________________]Hormel Foods Corp.
|
[__________]1,246,179
|
[_________]36,438,274
|
|
[___________________]Hospira, Inc.(a)
|
[__________]1,484,728
|
[_________]48,728,773
|
|
[___________________]Host Hotels & Resorts, Inc.
|
[__________]6,625,051
|
[_________]106,332,069
|
|
[___________________]Hudson City Bancorp, Inc.
|
[__________]4,358,335
|
[_________]34,692,347
|
|
[___________________]Humana, Inc.
|
[__________]1,481,369
|
[_________]103,918,035
|
|
[___________________]Huntington Bancshares, Inc.
|
[__________]7,773,611
|
[_________]53,637,916
|
|
[___________________]Illinois Tool Works, Inc.
|
[__________]3,962,392
|
[_________]235,643,452
|
|
[___________________]Ingersoll-Rand PLC
|
[__________]2,688,262
|
[_________]120,487,903
|
|
[___________________]Integrys Energy Group, Inc.
|
[__________]696,678
|
[_________]36,366,592
|
|
[___________________]Intel Corp.
|
[__________]45,880,402
|
[_________]1,040,567,517
|
|
[___________________]IntercontinentalExchange, Inc.(a)
|
[__________]660,476
|
[_________]88,114,103
|
|
[___________________]International Business Machines Corp.
|
[__________]9,862,947
|
[_________]2,046,068,355
|
|
[___________________]International Flavors & Fragrances, Inc.
|
[__________]729,319
|
[_________]43,452,826
|
|
[___________________]International Game Technology
|
[__________]2,421,625
|
[_________]31,699,071
|
SPDR S&P 500 ETF Trust
Schedule of Investments (continued)
September 30, 2012
|
[___________________]International Paper Co.
|
[__________]4,010,011
|
[_________]145,643,600
|
|
[___________________]Intuit, Inc.
|
[__________]2,534,115
|
[_________]149,208,691
|
|
[___________________]Intuitive Surgical, Inc.(a)
|
[__________]366,140
|
[_________]181,469,968
|
|
[___________________]Invesco, Ltd.
|
[__________]4,059,288
|
[_________]101,441,607
|
|
[___________________]Iron Mountain, Inc.
|
[__________]1,388,118
|
[_________]47,348,705
|
|
[___________________]J.C. Penney Co., Inc.
|
[__________]1,290,186
|
[_________]31,338,618
|
|
[___________________][__________][_________]See accompanying notes to financial statements.
|
|
[___________________]Jabil Circuit, Inc.
|
[__________]1,713,563
|
[_________]32,077,899
|
|
[___________________]Jacobs Engineering Group, Inc.(a)
|
[__________]1,189,865
|
[_________]48,106,242
|
|
[___________________]JDS Uniphase Corp.(a)
|
[__________]2,045,092
|
[_________]25,328,464
|
|
[___________________]Johnson & Johnson
|
[__________]25,279,291
|
[_________]1,741,995,943
|
|
[___________________]Johnson Controls, Inc.
|
[__________]6,270,463
|
[_________]171,810,686
|
|
[___________________]Joy Global, Inc.
|
[__________]958,852
|
[_________]53,753,243
|
|
[___________________]JPMorgan Chase & Co.
|
[__________]34,834,535
|
[_________]1,410,101,977
|
|
[___________________]Juniper Networks, Inc.(a)
|
[__________]4,765,887
|
[_________]81,544,327
|
|
[___________________]Kellogg Co.
|
[__________]2,263,357
|
[_________]116,925,023
|
|
[___________________]KeyCorp
|
[__________]8,561,409
|
[_________]74,826,715
|
|
[___________________]Kimberly-Clark Corp.
|
[__________]3,620,555
|
[_________]310,571,208
|
|
[___________________]Kimco Realty Corp.
|
[__________]3,731,465
|
[_________]75,636,796
|
|
[___________________]Kinder Morgan, Inc.
|
[__________]5,230,464
|
[_________]185,786,081
|
|
[___________________]KLA-Tencor Corp.
|
[__________]1,504,194
|
[_________]71,757,575
|
|
[___________________]Kohl’s Corp.
|
[__________]1,982,255
|
[_________]101,531,101
|
|
[___________________]Kraft Foods, Inc. (Class A)
|
[__________]16,272,625
|
[_________]672,873,044
|
|
[___________________]L-3 Communications Holdings, Inc.
|
[__________]884,961
|
[_________]63,460,553
|
|
[___________________]Laboratory Corp. of America Holdings(a)
|
[__________]879,857
|
[_________]81,360,377
|
|
[___________________]Lam Research Corp.(a)
|
[__________]1,652,988
|
[_________]52,540,224
|
|
[___________________]Legg Mason, Inc.
|
[__________]1,121,105
|
[_________]27,668,871
|
|
[___________________]Leggett & Platt, Inc.
|
[__________]1,280,789
|
[_________]32,083,764
|
|
[___________________]Lennar Corp. (Class A)
|
[__________]1,492,981
|
[_________]51,910,949
|
SPDR S&P 500 ETF Trust
Schedule of Investments (continued)
September 30, 2012
|
[___________________]Leucadia National Corp.
|
[__________]1,775,269
|
[_________]40,387,370
|
|
[___________________]Life Technologies Corp.(a)
|
[__________]1,620,948
|
[_________]79,231,938
|
|
[___________________]Limited Brands, Inc.
|
[__________]2,193,160
|
[_________]108,035,062
|
|
[___________________]Lincoln National Corp.
|
[__________]2,591,218
|
[_________]62,681,563
|
|
[___________________]Linear Technology Corp.
|
[__________]2,089,976
|
[_________]66,565,736
|
|
[___________________]Lockheed Martin Corp.
|
[__________]2,468,552
|
[_________]230,513,386
|
|
[___________________]Loews Corp.
|
[__________]2,864,786
|
[_________]118,201,070
|
|
[___________________]Lorillard, Inc.
|
[__________]1,197,704
|
[_________]139,472,631
|
|
[___________________]Lowe’s Cos., Inc.
|
[__________]10,464,361
|
[_________]316,442,277
|
|
[___________________]LSI Corp.(a)
|
[__________]5,155,411
|
[_________]35,623,890
|
|
[___________________]LyondellBasell Industries NV (Class A)
|
[__________]3,106,743
|
[_________]160,494,343
|
|
[___________________]M & T Bank Corp.
|
[__________]1,104,593
|
[_________]105,113,070
|
|
[___________________]Macy’s, Inc.
|
[__________]3,739,814
|
[_________]140,691,803
|
|
[___________________]Marathon Oil Corp.
|
[__________]6,464,646
|
[_________]191,159,582
|
|
[___________________]Marathon Petroleum Corp.
|
[__________]3,094,270
|
[_________]168,916,199
|
|
[___________________]Marriott International, Inc. (Class A)
|
[__________]2,310,722
|
[_________]90,349,230
|
|
[___________________]Marsh & McLennan Cos., Inc.
|
[__________]4,990,343
|
[_________]169,322,338
|
|
[___________________]Masco Corp.
|
[__________]3,226,083
|
[_________]48,552,549
|
|
[___________________]MasterCard, Inc. (Class A)
|
[__________]984,105
|
[_________]444,303,725
|
|
[___________________]Mattel, Inc.
|
[__________]3,126,523
|
[_________]110,929,036
|
|
[___________________]McCormick & Co., Inc.
|
[__________]1,196,005
|
[_________]74,200,150
|
|
[___________________]McDonald’s Corp.
|
[__________]9,248,695
|
[_________]848,567,766
|
|
[___________________]McKesson Corp.
|
[__________]2,164,113
|
[_________]186,178,641
|
|
[___________________]Mead Johnson Nutrition Co.
|
[__________]1,868,346
|
[_________]136,912,395
|
|
[___________________]MeadWestvaco Corp.
|
[__________]1,591,723
|
[_________]48,706,724
|
|
[___________________]Medtronic, Inc.
|
[__________]9,356,595
|
[_________]403,456,376
|
|
[___________________]Merck & Co., Inc.
|
[__________]27,926,734
|
[_________]1,259,495,703
|
|
[___________________]MetLife, Inc.
|
[__________]9,740,516
|
[_________]335,658,181
|
|
[___________________]MetroPCS Communications, Inc.(a)
|
[__________]2,895,609
|
[_________]33,907,581
|
SPDR S&P 500 ETF Trust
Schedule of Investments (continued)
September 30, 2012
|
[___________________]Microchip Technology, Inc.
|
[__________]1,757,583
|
[_________]57,543,267
|
|
[___________________]Micron Technology, Inc.(a)
|
[__________]9,325,896
|
[_________]55,815,488
|
|
[___________________]Microsoft Corp.
|
[__________]69,173,970
|
[_________]2,060,000,827
|
|
[___________________]Molex, Inc.
|
[__________]1,233,122
|
[_________]32,406,446
|
|
[___________________]Molson Coors Brewing Co. (Class B)
|
[__________]1,426,864
|
[_________]64,280,223
|
|
[___________________]Monsanto Co.
|
[__________]4,886,971
|
[_________]444,812,100
|
|
[___________________]Monster Beverage Corp.(a)
|
[__________]1,407,560
|
[_________]76,233,450
|
|
[___________________]Moody’s Corp.
|
[__________]1,770,616
|
[_________]78,208,109
|
|
See accompanying notes to financial statements.
|
|
[___________________]Morgan Stanley
|
[__________]12,703,252
|
[_________]$ 212,652,438
|
|
[___________________]Motorola Solutions, Inc.
|
[__________]2,652,419
|
[_________]134,079,780
|
|
[___________________]Murphy Oil Corp.
|
[__________]1,741,954
|
[_________]93,525,510
|
|
[___________________]Mylan, Inc.(a)
|
[__________]3,680,887
|
[_________]89,813,643
|
|
[___________________]Nabors Industries, Ltd.(a)
|
[__________]2,590,415
|
[_________]36,343,522
|
|
[___________________]National-Oilwell Varco, Inc.
|
[__________]3,910,008
|
[_________]313,230,741
|
|
[___________________]NetApp, Inc.(a)
|
[__________]3,293,353
|
[_________]108,285,447
|
|
[___________________]Netflix, Inc.(a)
|
[__________]500,313
|
[_________]27,237,040
|
|
[___________________]Newell Rubbermaid, Inc.
|
[__________]2,612,461
|
[_________]49,871,880
|
|
[___________________]Newfield Exploration Co.(a)
|
[__________]1,237,590
|
[_________]38,761,319
|
|
[___________________]Newmont Mining Corp.
|
[__________]4,549,355
|
[_________]254,809,374
|
|
[___________________]News Corp. (Class A)
|
[__________]18,680,105
|
[_________]458,222,976
|
|
[___________________]NextEra Energy, Inc.
|
[__________]3,875,541
|
[_________]272,566,799
|
|
[___________________]NIKE, Inc. (Class B)
|
[__________]3,370,822
|
[_________]319,924,716
|
|
[___________________]NiSource, Inc.
|
[__________]2,579,244
|
[_________]65,719,137
|
|
[___________________]Noble Corp.(a)
|
[__________]2,316,168
|
[_________]82,872,491
|
|
[___________________]Noble Energy, Inc.
|
[__________]1,630,557
|
[_________]151,168,939
|
|
[___________________]Nordstrom, Inc.
|
[__________]1,446,882
|
[_________]79,838,949
|
|
[___________________]Norfolk Southern Corp.
|
[__________]2,955,806
|
[_________]188,077,936
|
|
[___________________]Northeast Utilities
|
[__________]2,877,356
|
[_________]110,001,320
|
SPDR S&P 500 ETF Trust
Schedule of Investments (continued)
September 30, 2012
|
[___________________]Northern Trust Corp.
|
[__________]2,010,519
|
[_________]93,318,239
|
|
[___________________]Northrop Grumman Corp.
|
[__________]2,276,950
|
[_________]151,257,789
|
|
[___________________]NRG Energy, Inc.
|
[__________]2,081,190
|
[_________]44,516,654
|
|
[___________________]Nucor Corp.
|
[__________]2,910,848
|
[_________]111,369,044
|
|
[___________________]NVIDIA Corp.(a)
|
[__________]5,680,140
|
[_________]75,773,068
|
|
[___________________]NYSE Euronext(b)
|
[__________]2,305,912
|
[_________]56,840,731
|
|
[___________________]O’Reilly Automotive, Inc.(a)
|
[__________]1,079,001
|
[_________]90,226,064
|
|
[___________________]Occidental Petroleum Corp.
|
[__________]7,427,050
|
[_________]639,171,923
|
|
[___________________]Omnicom Group, Inc.
|
[__________]2,471,812
|
[_________]127,446,627
|
|
[___________________]Oneok, Inc.
|
[__________]1,867,340
|
[_________]90,211,195
|
|
[___________________]Oracle Corp.
|
[__________]34,932,798
|
[_________]1,100,033,809
|
|
[___________________]Owens-Illinois, Inc.(a)
|
[__________]1,474,734
|
[_________]27,666,010
|
|
[___________________]PACCAR, Inc.
|
[__________]3,229,348
|
[_________]129,254,654
|
|
[___________________]Pall Corp.
|
[__________]1,046,192
|
[_________]66,422,730
|
|
[___________________]Parker-Hannifin Corp.
|
[__________]1,365,505
|
[_________]114,128,908
|
|
[___________________]Patterson Cos., Inc.
|
[__________]792,192
|
[_________]27,124,654
|
|
[___________________]Paychex, Inc.
|
[__________]2,960,351
|
[_________]98,550,085
|
|
[___________________]Peabody Energy Corp.
|
[__________]2,468,706
|
[_________]55,027,457
|
|
[___________________]Pentair, Inc.(a)
|
[__________]922,200
|
[_________]41,047,122
|
|
[___________________]People’s United Financial, Inc.
|
[__________]3,262,228
|
[_________]39,603,448
|
|
[___________________]Pepco Holdings, Inc.
|
[__________]2,040,477
|
[_________]38,565,015
|
|
[___________________]PepsiCo, Inc.
|
[__________]14,271,799
|
[_________]1,010,015,215
|
|
[___________________]PerkinElmer, Inc.
|
[__________]1,021,756
|
[_________]30,111,149
|
|
[___________________]Perrigo Co.
|
[__________]807,009
|
[_________]93,750,236
|
|
[___________________]Pfizer, Inc.
|
[__________]68,495,163
|
[_________]1,702,104,801
|
|
[___________________]PG&E Corp.
|
[__________]3,909,832
|
[_________]166,832,531
|
|
[___________________]Philip Morris International, Inc.
|
[__________]15,460,752
|
[_________]1,390,540,035
|
|
[___________________]Phillips 66
|
[__________]5,748,340
|
[_________]266,550,526
|
|
[___________________]Pinnacle West Capital Corp.
|
[__________]978,661
|
[_________]51,673,301
|
SPDR S&P 500 ETF Trust
Schedule of Investments (continued)
September 30, 2012
|
[___________________]Pioneer Natural Resources Co.
|
[__________]1,128,317
|
[_________]117,796,295
|
|
[___________________]Pitney Bowes, Inc.
|
[__________]1,825,817
|
[_________]25,232,791
|
|
[___________________]Plum Creek Timber Co., Inc.
|
[__________]1,454,959
|
[_________]63,785,403
|
|
[___________________]PNC Financial Services Group, Inc.
|
[__________]4,854,477
|
[_________]306,317,499
|
|
[___________________]PPG Industries, Inc.
|
[__________]1,399,984
|
[_________]160,774,163
|
|
[___________________]PPL Corp.
|
[__________]5,325,389
|
[_________]154,702,550
|
|
[___________________]Praxair, Inc.
|
[__________]2,734,355
|
[_________]284,044,797
|
|
[___________________]Precision Castparts Corp.
|
[__________]1,332,709
|
[_________]217,684,688
|
|
[___________________]priceline.com, Inc.(a)
|
[__________]456,802
|
[_________]282,637,101
|
|
[___________________]Principal Financial Group, Inc.
|
[__________]2,547,631
|
[_________]68,633,179
|
|
See accompanying notes to financial statements.
|
|
[___________________]ProLogis, Inc.
|
[__________]4,224,153
|
[_________]$ 147,972,080
|
|
[___________________]Prudential Financial, Inc.
|
[__________]4,253,503
|
[_________]231,858,449
|
|
[___________________]Public Service Enterprise Group, Inc.
|
[__________]4,639,282
|
[_________]149,292,095
|
|
[___________________]Public Storage, Inc.
|
[__________]1,321,435
|
[_________]183,904,109
|
|
[___________________]Pulte Group, Inc.(a)
|
[__________]3,036,486
|
[_________]47,065,533
|
|
[___________________]QEP Resources, Inc.
|
[__________]1,593,828
|
[_________]50,460,594
|
|
[___________________]QUALCOMM, Inc.
|
[__________]15,620,995
|
[_________]976,155,978
|
|
[___________________]Quanta Services, Inc.(a)
|
[__________]1,911,473
|
[_________]47,213,383
|
|
[___________________]Quest Diagnostics, Inc.
|
[__________]1,455,870
|
[_________]92,345,834
|
|
[___________________]R.R. Donnelley & Sons Co.
|
[__________]1,671,714
|
[_________]17,720,168
|
|
[___________________]Ralph Lauren Corp.
|
[__________]560,193
|
[_________]84,717,987
|
|
[___________________]Range Resources Corp.
|
[__________]1,472,689
|
[_________]102,896,780
|
|
[___________________]Raytheon Co.
|
[__________]3,024,017
|
[_________]172,852,812
|
|
[___________________]Red Hat, Inc.(a)
|
[__________]1,769,809
|
[_________]100,772,924
|
|
[___________________]Regions Financial Corp.
|
[__________]12,797,378
|
[_________]92,269,095
|
|
[___________________]Republic Services, Inc.
|
[__________]2,746,472
|
[_________]75,555,445
|
|
[___________________]Reynolds American, Inc.
|
[__________]3,010,261
|
[_________]130,464,712
|
|
[___________________]Robert Half International, Inc.
|
[__________]1,294,071
|
[_________]34,461,111
|
SPDR S&P 500 ETF Trust
Schedule of Investments (continued)
September 30, 2012
|
[___________________]Rockwell Automation, Inc.
|
[__________]1,289,223
|
[_________]89,665,460
|
|
[___________________]Rockwell Collins, Inc.
|
[__________]1,316,916
|
[_________]70,639,374
|
|
[___________________]Roper Industries, Inc.
|
[__________]896,888
|
[_________]98,559,022
|
|
[___________________]Ross Stores, Inc.
|
[__________]2,048,208
|
[_________]132,314,237
|
|
[___________________]Rowan Companies PLC (Class A)(a)
|
[__________]1,125,889
|
[_________]38,021,272
|
|
[___________________]Ryder System, Inc.
|
[__________]460,982
|
[_________]18,005,957
|
|
[___________________]Safeway, Inc.
|
[__________]2,177,258
|
[_________]35,032,081
|
|
[___________________]SAIC, Inc.
|
[__________]2,506,860
|
[_________]30,182,594
|
|
[___________________]Salesforce.com, Inc.(a)
|
[__________]1,174,169
|
[_________]179,283,865
|
|
[___________________]SanDisk Corp.(a)
|
[__________]2,200,556
|
[_________]95,570,147
|
|
[___________________]SCANA Corp.
|
[__________]1,201,374
|
[_________]57,990,323
|
|
[___________________]Schlumberger, Ltd.
|
[__________]12,169,868
|
[_________]880,246,552
|
|
[___________________]Scripps Networks Interactive (Class A)
|
[__________]792,406
|
[_________]48,519,019
|
|
[___________________]Seagate Technology PLC
|
[__________]3,206,527
|
[_________]99,402,337
|
|
[___________________]Sealed Air Corp.
|
[__________]1,736,948
|
[_________]26,853,216
|
|
[___________________]Sempra Energy
|
[__________]2,063,615
|
[_________]133,082,531
|
|
[___________________]Sherwin-Williams Co.
|
[__________]777,010
|
[_________]115,704,559
|
|
[___________________]Sigma-Aldrich Corp.
|
[__________]1,096,726
|
[_________]78,931,370
|
|
[___________________]Simon Property Group, Inc.
|
[__________]2,781,658
|
[_________]422,283,501
|
|
[___________________]SLM Corp.
|
[__________]4,420,017
|
[_________]69,482,667
|
|
[___________________]Snap-on, Inc.
|
[__________]523,986
|
[_________]37,658,874
|
|
[___________________]Southern Co.
|
[__________]8,020,558
|
[_________]369,667,518
|
|
[___________________]Southwest Airlines Co.
|
[__________]6,970,113
|
[_________]61,127,891
|
|
[___________________]Southwestern Energy Co.(a)
|
[__________]3,167,639
|
[_________]110,170,484
|
|
[___________________]Spectra Energy Corp.
|
[__________]5,986,563
|
[_________]175,765,490
|
|
[___________________]Sprint Nextel Corp.(a)
|
[__________]27,512,293
|
[_________]151,867,857
|
|
[___________________]St. Jude Medical, Inc.
|
[__________]2,850,482
|
[_________]120,090,807
|
|
[___________________]Stanley Black & Decker, Inc.
|
[__________]1,539,336
|
[_________]117,374,370
|
|
[___________________]Staples, Inc.
|
[__________]6,258,252
|
[_________]72,095,063
|
SPDR S&P 500 ETF Trust
Schedule of Investments (continued)
September 30, 2012
|
[___________________]Starbucks Corp.
|
[__________]6,968,631
|
[_________]353,658,023
|
|
[___________________]Starwood Hotels & Resorts Worldwide, Inc.
|
[__________]1,781,489
|
[_________]103,255,102
|
|
[___________________]State Street Corp.(c)
|
[__________]4,420,941
|
[_________]185,502,684
|
|
[___________________]Stericycle, Inc.(a)
|
[__________]774,302
|
[_________]70,089,817
|
|
[___________________]Stryker Corp.
|
[__________]2,657,107
|
[_________]147,894,576
|
|
[___________________]Sunoco, Inc.
|
[__________]959,532
|
[_________]44,934,884
|
|
[___________________]SunTrust Banks, Inc.
|
[__________]4,937,742
|
[_________]139,589,966
|
|
[___________________]Symantec Corp.(a)
|
[__________]6,545,266
|
[_________]117,814,788
|
|
[___________________]Sysco Corp.
|
[__________]5,378,759
|
[_________]168,193,794
|
|
[___________________]T. Rowe Price Group, Inc.
|
[__________]2,315,953
|
[_________]146,599,825
|
|
[___________________]Target Corp.
|
[__________]5,986,137
|
[_________]379,940,115
|
|
[___________________]TE Connectivity, Ltd.
|
[__________]3,922,819
|
[_________]133,415,074
|
|
See accompanying notes to financial statements.
|
|
[___________________]TECO Energy, Inc.
|
[__________]1,933,072
|
[_________]$ 34,292,697
|
|
[___________________]Tenet Healthcare Corp.(a)
|
[__________]3,715,518
|
[_________]23,296,298
|
|
[___________________]Teradata Corp.(a)
|
[__________]1,531,623
|
[_________]115,499,690
|
|
[___________________]Teradyne, Inc.(a)
|
[__________]1,672,564
|
[_________]23,783,860
|
|
[___________________]Tesoro Corp.
|
[__________]1,271,868
|
[_________]53,291,269
|
|
[___________________]Texas Instruments, Inc.
|
[__________]10,433,882
|
[_________]287,453,449
|
|
[___________________]Textron, Inc.
|
[__________]2,544,744
|
[_________]66,595,950
|
|
[___________________]The AES Corp.(a)
|
[__________]5,838,202
|
[_________]64,045,076
|
|
[___________________]The Allstate Corp.
|
[__________]4,461,279
|
[_________]176,711,261
|
|
[___________________]The Bank of New York Mellon Corp.
|
[__________]10,797,685
|
[_________]244,243,635
|
|
[___________________]The Boeing Co.
|
[__________]6,216,145
|
[_________]432,768,015
|
|
[___________________]The Charles Schwab Corp.
|
[__________]10,045,187
|
[_________]128,477,942
|
|
[___________________]The Coca-Cola Co.
|
[__________]35,510,532
|
[_________]1,346,914,479
|
|
[___________________]The Dow Chemical Co.
|
[__________]10,985,991
|
[_________]318,154,299
|
|
[___________________]The Estee Lauder Cos., Inc. (Class A)
|
[__________]2,198,790
|
[_________]135,379,500
|
|
[___________________]The Gap, Inc.
|
[__________]2,739,783
|
[_________]98,029,436
|
SPDR S&P 500 ETF Trust
Schedule of Investments (continued)
September 30, 2012
|
[___________________]The Goldman Sachs Group, Inc.
|
[__________]4,138,980
|
[_________]470,519,246
|
|
[___________________]The Goodyear Tire & Rubber Co.(a)
|
[__________]2,189,756
|
[_________]26,693,126
|
|
[___________________]The Hershey Co.
|
[__________]1,381,293
|
[_________]97,919,861
|
|
[___________________]The Home Depot, Inc.
|
[__________]13,855,904
|
[_________]836,480,924
|
|
[___________________]The Interpublic Group of Cos., Inc.
|
[__________]4,040,305
|
[_________]44,928,192
|
|
[___________________]The JM Smucker Co.
|
[__________]1,025,376
|
[_________]88,520,710
|
|
[___________________]The Kroger Co.
|
[__________]5,086,954
|
[_________]119,746,897
|
|
[___________________]The McGraw-Hill Cos., Inc.
|
[__________]2,569,269
|
[_________]140,256,395
|
|
[___________________]The Mosaic Co.
|
[__________]2,539,378
|
[_________]146,293,567
|
|
[___________________]The NASDAQ OMX Group, Inc.
|
[__________]1,110,575
|
[_________]25,870,845
|
|
[___________________]The Procter & Gamble Co.
|
[__________]25,253,126
|
[_________]1,751,556,819
|
|
[___________________]The Progressive Corp.
|
[__________]5,146,818
|
[_________]106,745,005
|
|
[___________________]The Travelers Cos., Inc.
|
[__________]3,522,312
|
[_________]240,433,017
|
|
[___________________]The Walt Disney Co.
|
[__________]16,451,724
|
[_________]860,096,131
|
|
[___________________]The Washington Post Co. (Class B)
|
[__________]44,014
|
[_________]15,978,402
|
|
[___________________]The Western Union Co.
|
[__________]5,565,120
|
[_________]101,396,486
|
|
[___________________]The Williams Cos., Inc.
|
[__________]5,744,321
|
[_________]200,878,905
|
|
[___________________]Thermo Fisher Scientific, Inc.
|
[__________]3,334,377
|
[_________]196,161,399
|
|
[___________________]Tiffany & Co.
|
[__________]1,092,911
|
[_________]67,629,333
|
|
[___________________]Time Warner Cable, Inc.
|
[__________]2,833,503
|
[_________]269,352,795
|
|
[___________________]Time Warner, Inc.
|
[__________]8,689,386
|
[_________]393,889,867
|
|
[___________________]Titanium Metals Corp.
|
[__________]749,037
|
[_________]9,610,145
|
|
[___________________]TJX Cos., Inc.
|
[__________]6,750,555
|
[_________]302,357,358
|
|
[___________________]Torchmark Corp.
|
[__________]893,527
|
[_________]45,882,611
|
|
[___________________]Total System Services, Inc.
|
[__________]1,460,947
|
[_________]34,624,444
|
|
[___________________]TripAdvisor, Inc.(a)
|
[__________]1,003,633
|
[_________]33,049,635
|
|
[___________________]Tyco International, Ltd.
|
[__________]4,217,289
|
[_________]237,264,679
|
|
[___________________]Tyson Foods, Inc. (Class A)
|
[__________]2,643,001
|
[_________]42,340,876
|
|
[___________________]U.S. Bancorp
|
[__________]17,378,992
|
[_________]596,099,426
|
SPDR S&P 500 ETF Trust
Schedule of Investments (continued)
September 30, 2012
|
[___________________]Union Pacific Corp.
|
[__________]4,343,364
|
[_________]515,557,307
|
|
[___________________]United Parcel Service, Inc. (Class B)
|
[__________]6,591,084
|
[_________]471,723,882
|
|
[___________________]United States Steel Corp.
|
[__________]1,293,839
|
[_________]24,673,510
|
|
[___________________]United Technologies Corp.
|
[__________]7,703,835
|
[_________]603,133,242
|
|
[___________________]UnitedHealth Group, Inc.
|
[__________]9,470,222
|
[_________]524,745,001
|
|
[___________________]Unum Group
|
[__________]2,595,951
|
[_________]49,894,178
|
|
[___________________]Urban Outfitters, Inc.(a)
|
[__________]1,001,451
|
[_________]37,614,500
|
|
[___________________]V.F. Corp.
|
[__________]805,985
|
[_________]128,441,770
|
|
[___________________]Valero Energy Corp.
|
[__________]5,020,353
|
[_________]159,044,783
|
|
[___________________]Varian Medical Systems, Inc.(a)
|
[__________]1,017,145
|
[_________]61,354,186
|
|
[___________________]Ventas, Inc.
|
[__________]2,707,309
|
[_________]168,529,985
|
|
[___________________]VeriSign, Inc.(a)
|
[__________]1,440,085
|
[_________]70,117,739
|
|
[___________________]Verizon Communications, Inc.
|
[__________]26,121,831
|
[_________]1,190,371,839
|
|
[___________________]Viacom, Inc. (Class B)
|
[__________]4,350,034
|
[_________]233,118,322
|
|
See accompanying notes to financial statements.
|
|
[___________________]Visa, Inc. (Class A)
|
[__________]4,788,707
|
[_________]643,027,576
|
|
[___________________]Vornado Realty Trust
|
[__________]1,553,049
|
[_________]125,874,621
|
|
[___________________]Vulcan Materials Co.
|
[__________]1,186,363
|
[_________]56,114,970
|
|
[___________________]W.W. Grainger, Inc.
|
[__________]554,301
|
[_________]115,499,699
|
|
[___________________]Wal-Mart Stores, Inc.
|
[__________]15,418,913
|
[_________]1,137,915,779
|
|
[___________________]Walgreen Co.
|
[__________]7,859,239
|
[_________]286,390,669
|
|
[___________________]Waste Management, Inc.
|
[__________]4,000,254
|
[_________]128,328,148
|
|
[___________________]Waters Corp.(a)
|
[__________]810,647
|
[_________]67,551,215
|
|
[___________________]Watson Pharmaceuticals, Inc.(a)
|
[__________]1,170,335
|
[_________]$ 99,665,729
|
|
[___________________]WellPoint, Inc.
|
[__________]2,994,363
|
[_________]173,702,998
|
|
[___________________]Wells Fargo & Co.
|
[__________]45,110,778
|
[_________]1,557,675,164
|
|
[___________________]Western Digital Corp.
|
[__________]2,099,105
|
[_________]81,298,337
|
|
[___________________]Weyerhaeuser Co.
|
[__________]4,931,280
|
[_________]128,903,659
|
|
[___________________]Whirlpool Corp.
|
[__________]711,069
|
[_________]58,954,731
|
SPDR S&P 500 ETF Trust
Schedule of Investments (continued)
September 30, 2012
|
[___________________]Whole Foods Market, Inc.
|
[__________]1,573,440
|
[_________]153,253,056
|
|
[___________________]Windstream Corp.
|
[__________]5,323,590
|
[_________]53,821,495
|
|
[___________________]Wisconsin Energy Corp.
|
[__________]2,089,818
|
[_________]78,723,444
|
|
[___________________]WPX Energy, Inc.(a)
|
[__________]1,770,629
|
[_________]29,374,735
|
|
[___________________]Wyndham Worldwide Corp.
|
[__________]1,322,459
|
[_________]69,402,648
|
|
[___________________]Wynn Resorts, Ltd.
|
[__________]722,352
|
[_________]83,388,315
|
|
[___________________]Xcel Energy, Inc.
|
[__________]4,470,595
|
[_________]123,880,187
|
|
[___________________]Xerox Corp.
|
[__________]12,232,066
|
[_________]89,783,365
|
|
[___________________]Xilinx, Inc.
|
[__________]2,385,490
|
[_________]79,699,221
|
|
[___________________]XL Group PLC
|
[__________]2,830,430
|
[_________]68,015,233
|
|
[___________________]Xylem, Inc.
|
[__________]1,667,460
|
[_________]41,936,619
|
|
[___________________]Yahoo!, Inc.(a)
|
[__________]9,588,095
|
[_________]153,169,818
|
|
[___________________]Yum! Brands, Inc.
|
[__________]4,169,406
|
[_________]276,598,394
|
|
[___________________]Zimmer Holdings, Inc.
|
[__________]1,599,432
|
[_________]108,153,592
|
|
Zions Bancorporation
|
|
|
| |
|
|
|
[Total Common Stocks(d)]
[(Cost $[________________])]
|
|
$[_________]118,116,973,886
|
|
(Cost $120,692,603,717)
|
|
|
|
[(a)
|
Non-income producing security.]
|
|
[(b)
|
Affiliate of the TrusteeSponsor. See the table below for more information.]
|
|
[(c)
|
Affiliate of the Sponsor.]Trustee. See the table below for more information.
|
|
[(d)
|
The values of the securities of the Trust are determined based on Level 1 inputs. (Note [2])]
|
[REIT = Real Estate Investment Trust]
[Investments in Affiliates of the Trustee and the Sponsor]
[SPDR S&P 500 ETF Trust has invested in companies that may be considered affiliates of the Trustee (State Street Corp.) and the Sponsor (NYSE Euronext). Amounts related to these investments at September 30, 2012, and for the year then ended are (Note [3]):]
| |
|
|
|
|
|
[Number
|
|
|
|
| |
[Number of
|
|
|
|
|
of Shares
|
|
|
|
| |
Number of
Shares Held
at 9/30/11
|
|
|
|
|
Number of
Shares Held at
at 9/30/12
|
|
|
|
|
|
|
|
|
|
|
|
|
|
|
|
|
[State Street Corp.]
|
[_______]3,942,241
|
$[_______]183,476,808
|
$[_______]126,782,471
|
$[_______]283,069,965
|
[_______]6,766,009
|
$[_______]258,571,619
|
[_______]6,287,309
|
[_______]4,420,941
|
$[_______]185,502,684
|
$[_______]3,785,256
|
$[_______]801,455
|
SPDR S&P 500 ETF Trust
Schedule of Investments (continued)
September 30, 2012
|
[NYSE Euronext]
|
[_______]2,043,815
|
[_______]71,544,918
|
[_______]47,498,261
|
[_______]95,171,941
|
[_______]3,550,580
|
[_______]87,118,153
|
[_______]3,288,483
|
[_______]2,305,912
|
[_______]56,840,731
|
[_______]2,521,378
|
[_______](1,219,842)
|
[See accompanying notes to financial statements.]
SPDR S&P 500 ETF Trust
Schedule of Investments (continued)
September 30, 2012
[INDUSTRY BREAKDOWN AS OF SEPTEMBER 30, 2012*]
|
|
[Percent of Net Assets**]
|
|
[_______________________]Oil, Gas & Consumable Fuels
|
[____]9.39%
|
|
[_______________________]Pharmaceuticals
|
[____]6.20
|
|
[_______________________]Computers & Peripherals
|
[____]6.00
|
|
[_______________________]IT Services
|
[____]3.88
|
|
[_______________________]Insurance
|
[____]3.78
|
|
[_______________________]Software
|
[____]3.58
|
|
[_______________________]Media
|
[____]3.53
|
|
[_______________________]Diversified Financial Services
|
[____]3.06
|
|
[_______________________]Diversified Telecommunication Services
|
[____]2.97
|
|
[_______________________]Commercial Banks
|
[____]2.86
|
|
[_______________________]Industrial Conglomerates
|
[____]2.77
|
|
[_______________________]Beverages
|
[____]2.44
|
|
[_______________________]Food & Staples Retailing
|
[____]2.42
|
|
[_______________________]Chemicals
|
[____]2.39
|
|
[_______________________]Aerospace & Defense
|
[____]2.23
|
|
[_______________________]Internet Software & Services
|
[____]2.23
|
|
[_______________________]Household Products
|
[____]2.19
|
|
[_______________________]Specialty Retail
|
[____]2.11
|
|
[_______________________]Real Estate Investment Trusts (REITs)
|
[____]2.08
|
|
[_______________________]Semiconductors & Semiconductor Equipment
|
[____]2.01
|
|
[_______________________]Electric Utilities
|
[____]1.95
|
|
[_______________________]Tobacco
|
[____]1.93
|
|
[_______________________]Communications Equipment
|
[____]1.92
|
|
[_______________________]Health Care Providers & Services
|
[____]1.92
|
|
[_______________________]Energy Equipment & Services
|
[____]1.90
|
|
[_______________________]Machinery
|
[____]1.88
|
|
[_______________________]Hotels, Restaurants & Leisure
|
[____]1.83
|
|
[_______________________]Capital Markets
|
[____]1.80
|
|
[_______________________]Health Care Equipment & Supplies
|
[____]1.78
|
|
[_______________________]Food Products
|
[____]1.71
|
|
[_______________________]Biotechnology
|
[____]1.60
|
|
[_______________________]Multi-Utilities
|
[____]1.35
|
|
[_______________________]Internet & Catalog Retail
|
[____]1.05
|
|
[_______________________]Consumer Finance
|
[____]0.91
|
|
[_______________________]Road & Rail
|
[____]0.78
|
|
[_______________________]Metals & Mining
|
[____]0.77
|
|
[_______________________]Multiline Retail
|
[____]0.77
|
|
[_______________________]Air Freight & Logistics
|
[____]0.72
|
|
[_______________________]Textiles, Apparel & Luxury Goods
|
[____]0.61
|
|
[_______________________]Electrical Equipment
|
[____]0.52
|
|
[_______________________]Life Sciences Tools & Services
|
[____]0.42
|
|
[_______________________]Electronic Equipment, Instruments & Components
|
[____]0.42
|
|
[_______________________]Commercial Services & Supplies
|
[____]0.37
|
|
[_______________________]Automobiles
|
[____]0.37
|
|
[_______________________]Wireless Telecommunication Services
|
[____]0.30
|
|
[_______________________]Household Durables
|
[____]0.27
|
|
[_______________________]Auto Components
|
[____]0.23
|
|
[_______________________]Trading Companies & Distributors
|
[____]0.19
|
|
[_______________________]Personal Products
|
[____]0.17
|
SPDR S&P 500 ETF Trust
Schedule of Investments (continued)
September 30, 2012
|
[_______________________]Paper & Forest Products
|
[____]0.16
|
|
See accompanying notes to financial statements.
|
|
[_______________________]Construction & Engineering
|
[____]0.15%
|
|
[_______________________]Leisure Equipment & Products
|
[____]0.13
|
|
[_______________________]Containers & Packaging
|
[____]0.12
|
|
[_______________________]Gas Utilities
|
[____]0.11
|
|
[_______________________]Professional Services
|
[____]0.10
|
|
[_______________________]Independent Power Producers & Energy Traders
|
[____]0.09
|
|
[_______________________]Health Care Technology
|
[____]0.09
|
|
[_______________________]Office Electronics
|
[____]0.08
|
|
[_______________________]Distributors
|
[____]0.07
|
|
[_______________________]Thrifts & Mortgage Finance
|
[____]0.06
|
|
[_______________________]Diversified Consumer Services
|
[____]0.06
|
|
[_______________________]Airlines
|
[____]0.05
|
|
[_______________________]Construction Materials
|
[____]0.05
|
|
[_______________________]Real Estate Management & Development
|
[____]0.04
|
|
[_______________________]Building Products
|
[____]0.04
|
|
[_______________________]Other Assets & Liabilities
|
|
|
[TOTAL]Total
|
|
____________
|
[*
|
SPDR S&P 500 ETF Trust’s industry breakdown is expressed as a percentage of Total Net Assets and may change over time. ]
|
| |
|
|
[**
|
Each security is valued based on Level 1 inputs. (Note [2])]
|
|
*
|
SPDR S&P 500 ETF Trust’s industry breakdown is expressed as a percent of total net assets and may change over time.
|
|
**
|
Each security is valued based on Level 1 inputs. (Note 2)
|
[See accompanying notes to financial statements.]
SPDR S&P 500 ETF Trust
Schedule of Investments (continued)
September 30, 2012
applicable for one Creation Unit is charged for creations outside the Clearing Process, in part due to the increased expense associated with settlement.
The Trustee, at the direction of the Sponsor, may increase, reduce or waive the Transaction Fee (and/or the additional amounts charged in connection with creations and/or redemptions outside the Clearing Process) for certain lot-size creations and/or redemptions of Creation Units. The Sponsor has the right to vary the lot-size of Creation Units subject to such an increase, a reduction or waiver. The existence of any such variation shall be disclosed in the then current prospectus.
The Trustee makes available to NSCC before the commencement of trading on each business day that the New York Stock Exchange LLC (the “NYSE”) is open for business (“Business Day”) a list of the names and required number of shares of each of the Index Securities in the current Portfolio Deposit as well as the amount of the Dividend Equivalent Payment for the previous Business Day. The identity and weightings of the Index Securities to be delivered as part of a Portfolio Deposit are determined daily and reflect the relative weighting of the current Index. The value of such Index Securities, together with the Cash Component, is equal to the NAVnet asset value of the Trust on a per Creation Unit basis at the close of business on the day of the creation request. The identity of each Index Security required for a Portfolio Deposit, as in effect on September 30, 2012, is set forth in the above Schedule of Investments. The Sponsor makes available every 15 seconds throughout the trading day at the Exchange a number representing, on a per Unit basis, the sum of the Dividend Equivalent Payment effective through and including the previous Business Day, plus the current value of the securities portion of a Portfolio Deposit as in effect on such day (which value occasionally may include a cash-in-lieu amount to compensate for the omission of a particular Index Security from such Portfolio Deposit). Such information is calculated based upon the best information available to the Sponsor and may be calculated by other persons designated to do so by the Sponsor. The inability of the Sponsor to provide such information will not by itself result in a halt in the trading of Units on the Exchange.
If the Trustee determines that one or more Index Securities are likely to be unavailable, or available in insufficient quantity, for delivery upon creation of Creation Units, the Trustee may permit, in lieu thereof, the cash equivalent value of one or more of these Index Securities to be included in the Portfolio Deposit as a part of the Cash Component. If a creator is restricted by regulation or otherwise from investing or engaging in a transaction in one or more Index Securities, the Trustee may permit, in lieu of the inclusion of such Index Securities in the stock portion of the Portfolio Deposit, the cash equivalent value of such Index Securities to be included in the Portfolio Deposit based on the market value of such Index Securities as of the closing time of the regular trading session on the NYSE (“Closing Time”) (ordinarily 4:00 p.m. New York time) (the “Evaluation Time”) on the date such creation order is deemed received by the Distributor as part of the Cash Component.
Procedures for Purchase of Creation Units. All creation orders must be placed in Creation Units and must be received by the Trustee by no later than the Closing Time (ordinarily 4:00 p.m. New York time) in each case on the date such order is placed, in order for creation to be effected based on the NAV of the Trust as determined on such date. Orders must be transmitted by telephone, through the Internet or by other transmission method(s) acceptable to the Distributor and the Trustee, pursuant to procedures set forth in the Participant Agreement and/or described in this prospectus. In addition, orders submitted through the Internet must also comply with the terms and provisions of the State Street Fund Connect Buy-Side User Agreement and other applicable agreements and documents, including but not limited to the applicable Fund Connect User Guide or successor documents. State Street Global Markets, LLC (“SSGM”) may assist Authorized Participants in assembling shares to purchase Creation Units (or upon redemption), for which it may receive commissions or other fees from such Authorized Participants. Severe economic or market disruptions or changes, or telephone or other communication failure, may impede the ability to reach the Distributor, the Trustee, a Participating Party or a DTC Participant.
Units may be created in advance of receipt by the Trustee of all or a portion of the Portfolio Deposit. In these circumstances, the initial deposit will have a value greater than the NAV of the Units on the date the order is placed in proper form, because in addition to available Index Securities, cash collateral must be deposited with the Trustee in an amount equal to the sum of (a) the Cash Component, plus (b) 115% of the market value of the undelivered Index Securities (“Additional Cash Deposit”). The Trustee holds such Additional Cash Deposit as collateral in an account separate and apart from the Trust. An order will be deemed received on the Business Day
SPDR S&P 500 ETF Trust
Schedule of Investments (continued)
September 30, 2012
proceeds shall be held by the Trustee and applied in accordance with the guidelines applicable to Misweighting (as defined below under “Portfolio Adjustments”).
All redemption orders must be transmitted to the Trustee by telephone, through the Internet or by other transmission methods acceptable to the Trustee, pursuant to procedures set forth in the Participant Agreement and/or described in this prospectus, so as to be received by the Trustee not later than the Closing Time on the Transmittal Date. In addition, orders submitted through the Internet must also comply with the terms and provisions of the State Street Fund Connect Buy-Side User Agreement and other applicable agreements and documents, including but not limited to the applicable Fund Connect User Guide or successor documents. Severe economic or market disruption or changes, or telephone or other communication failure, may impede the ability to reach the Trustee, a Participating Party, or a DTC Participant.
The calculation of the value of the stocks and the Cash Redemption Payment to be delivered to the redeeming Beneficial Owner is made by the Trustee according to the procedures set forth under “Purchases and Redemptions of Creation Units—Redemption—Procedures for Redemption of Creation Units,” “Portfolio Adjustments—Adjustments to the Portfolio Deposit” and “Determination of NAVNet Asset Value” and is computed as of the Evaluation Time on the Business Day on which a redemption order is deemed received by the Trustee. Therefore, if a redemption order in proper form is submitted to the Trustee by a DTC Participant not later than the Closing Time on the Transmittal Date, and the requisite Units are delivered to the Trustee prior to DTC Cut-Off Time (as defined below in “Purchases and Redemptions of Creation Units—Redemption—Placement of Redemption Orders Outside Clearing Process”) on such Transmittal Date, then the value of the stocks and the Cash Redemption Payment to be delivered to the Beneficial Owner will be determined by the Trustee as of the Evaluation Time on such Transmittal Date. If, however, a redemption order is submitted not later than the Closing Time on a Transmittal Date but either (a) the requisite Units are not delivered by DTC Cut-Off Time on the next Business Day immediately following such Transmittal Date or (b) the redemption order is not submitted in proper form, then the redemption order is not deemed received as of such Transmittal Date. In such case, the value of the stocks and the Cash Redemption Payment to be delivered to the Beneficial Owner will be computed as of the Evaluation Time on the Business Day that such order is deemed received by the Trustee (i.e., the Business Day on which the Units are delivered through DTC to the Trustee by DTC Cut-Off Time on such Business Day pursuant to a properly submitted redemption order).
The Trustee may suspend the right of redemption, or postpone the date of payment of the NAV for more than five (5) Business Days following the date on which the request for redemption is deemed received by the Trustee, (a) for any period during which the NYSE is closed, (b) for any period during which an emergency exists as a result of which disposal or evaluation of the Portfolio Securities is not reasonably practicable, or (c) for such other period as the SEC may by order permit for the protection of Beneficial Owners. Neither the Sponsor nor the Trustee is liable to any person or in any way for any loss or damages that may result from any such suspension or postponement.
SPDR S&P 500 ETF Trust
Schedule of Investments (continued)
September 30, 2012
PORTFOLIO ADJUSTMENTS
The Index is a float-adjusted capitalization weighted index of 500 securities calculated under the auspices of the S&P Index Committee of S&P. At any moment in time, the value of the Index equals the aggregate market value of the available float shares outstanding in each of the component 500 Index Securities, evaluated at their respective last sale prices on their respective listing exchange, divided by a scaling factor (“divisor”) which yields a resulting index value in the reported magnitude.
Periodically (typically, several times per quarter), S&P may determine that total shares outstanding have changed in one or more component Index Securities due to secondary offerings, repurchases, conversions or other corporate actions. S&P may also determine that the available float shares of one or more of the Index Securities has changed due to corporate actions, purchases or sales of securities by holders or other events. S&P may periodically (ordinarily, several times per quarter) replace one or more Index Securities due to mergers, acquisitions, bankruptcies, or other market conditions, or if the issuers of such Index Securities fail to meet the criteria for inclusion in the Index. In 2012, there were [___]18 company changes to the Index. Ordinarily, whenever there is a change in shares outstanding or a change in an Index Security of the Index, S&P adjusts the divisor to ensure that there is no discontinuity in the value of the Index.
The Trustee aggregates certain adjustments and makes conforming changes to the Portfolio at least monthly. The Trustee directs its stock transactions only to brokers or dealers, which may include affiliates of the Trustee, from whom it expects to obtain the most favorable prices for execution of orders. Adjustments are made more frequently in the case of significant changes to the Index. Specifically, the Trustee is required to adjust the composition of the Portfolio whenever there is a change in the identity of any Index Security (i.e., a substitution of one security for another) within three (3) Business Days before or after the day on which the change is scheduled to take effect. If the transaction costs incurred by the Trust in adjusting the Portfolio would exceed the expected variation between the composition of the Portfolio and the Index (“Misweighting”), it may not be efficient identically to replicate the share composition of the Index. Minor Misweighting generally is permitted within the guidelines set forth below. The Trustee is required to adjust the composition of the Portfolio at any time that the weighting of any stock in the Portfolio varies in excess of one hundred and fifty percent (150%) of a specified percentage, which percentage varies from 0.08% to 0.02%, depending on the NAVnet asset value of the Trust (in each case, “Misweighting Amount”), from the weighting of the Index Security in the Index.
The Trust is not managed and therefore the adverse financial condition of an issuer does not require the sale of stocks from the Portfolio. The Trustee on a non-discretionary basis adjusts the composition of the Portfolio to conform to changes in the composition and/or weighting structure of Index Securities in the Index. To the extent that the method of determining the Index is changed by S&P in a manner that would affect the adjustments provided for herein, the Trustee and the Sponsor have the right to amend the Trust Agreement, without the consent of DTC or Beneficial Owners, to conform the adjustments to such changes and to maintain the objective of tracking the Index.
The Trustee examines each stock in the Portfolio on each Business Day, comparing its weighting to the weighting of the corresponding Index Security, based on prices at the close of the market on the preceding Business Day (a “Weighting Analysis”). If there is a Misweighting in any stock in the Portfolio in excess of one hundred and fifty percent (150%) of the applicable Misweighting Amount, the Trustee calculates an adjustment to the Portfolio in order to bring the Misweighting within the Misweighting Amount, based on prices at the close of the market on the day on which such Misweighting occurs. Also, on a monthly basis, the Trustee performs a Weighting Analysis for each stock in the Portfolio, and in any case where there exists a Misweighting exceeding one hundred percent (100%) of the applicable Misweighting Amount, the Trustee calculates an adjustment to the Portfolio in order to bring the Misweighting within the applicable Misweighting Amount, based on prices at the close of the market on the day on which such Misweighting occurs. In the case of any adjustment to the Portfolio because of a Misweighting, the purchase or sale of stock necessitated by the adjustment is made within three (3) Business Days of the day on which such Misweighting is determined. In addition to the foregoing adjustments, the Trustee may make additional periodic adjustments to Portfolio Securities that may be misweighted by an amount within the applicable Misweighting Amount.
SPDR S&P 500 ETF Trust
Schedule of Investments (continued)
September 30, 2012
The foregoing guidelines with respect to Misweighting also apply to any Index Security that (a) is likely to be unavailable for delivery or available in insufficient quantity for delivery or (b) cannot be delivered to the Trustee due to restrictions prohibiting a creator from engaging in a transaction involving such Index Security. Upon receipt of an order for a Creation Unit that involves such an Index Security, the Trustee determines whether the substitution of cash for the stock would cause a Misweighting in the Portfolio. If a Misweighting results, the Trustee will purchase the required number of shares of the Index Security on the opening of the market on the following Business Day. If a Misweighting does not result and the Trustee does not hold cash in excess of the permitted amounts, the Trustee may hold the cash or, if such excess would result, make the required adjustments to the Portfolio.
As a result of the purchase and sale of stock in accordance with these requirements, or the creation of Creation Units, the Trust may hold some amount of residual cash (other than cash held temporarily due to timing differences between the sale and purchase of stock or cash delivered in lieu of Index Securities or undistributed income or undistributed capital gains). This amount may not exceed for more than two (2) consecutive Business Days 0.5% of the value of the Portfolio. If the Trustee has made all required adjustments and is left with cash in excess of 0.5% of the value of the Portfolio, the Trustee will use such cash to purchase additional Index Securities that are underweighted in the Portfolio as compared to their relative weightings in the Index, such that the Misweighting of such Index Securities will not be in excess of the applicable Misweighting Amount.
All portfolio adjustments are made as described herein unless such adjustments would cause the Trust to lose its status as a “regulated investment company” under Subchapter M of the Code. Additionally, the Trustee is required to adjust the composition of the Portfolio at any time to insure the continued qualification of the Trust as a regulated investment company.
The Trustee relies on industry sources for information as to the composition and weightings of Index Securities. If the Trustee becomes incapable of obtaining or processing such information or NSCC is unable to receive such information from the Trustee on any Business Day, the Trustee shall use the composition and weightings of Index Securities for the most recently effective Portfolio Deposit for the purposes of all adjustments and determinations (including, without limitation, determination of the stock portion of the Portfolio Deposit) until the earlier of (a) such time as current information with respect to Index Securities is available or (b) three (3) consecutive Business Days have elapsed. If such current information is not available and three (3) consecutive Business Days have elapsed, the composition and weightings of Portfolio Securities (as opposed to Index Securities) shall be used for the purposes of all adjustments and determinations (including, without limitation, determination of the stock portion of the Portfolio Deposit) until current information with respect to Index Securities is available.
If the Trust is terminated, the Trustee shall use the composition and weightings of Portfolio Securities as of such notice date for the determination of all redemptions or other purposes.
From time to time S&P may adjust the composition of the Index because of a merger or acquisition involving one or more Index Securities. In such cases, the Trust, as shareholder of an issuer that is the object of such merger or acquisition activity, may receive various offers from would-be acquirors of the issuer. The Trustee is not permitted to accept any such offers until such time as it has been determined that the stocks of the issuer will be removed from the Index. As stocks of an issuer are often removed from the Index only after the consummation of a merger or acquisition of such issuer, in selling the securities of such issuer the Trust may receive, to the extent that market prices do not provide a more attractive alternative, whatever consideration is being offered to the shareholders of such issuer that have not tendered their shares prior to such time. Any cash received in such transactions is reinvested in Index Securities in accordance with the criteria set forth above. Any stocks received as a part of the consideration that are not Index Securities are sold as soon as practicable and the cash proceeds of such sale are reinvested in accordance with the criteria set forth above.
Adjustments to the Portfolio Deposit
On each Business Day (each such day, an “Adjustment Day”), the number of shares and identity of each Index Security required for a Portfolio Deposit are adjusted in accordance with the following procedure. At the close of the market the Trustee calculates the NAVnet asset value of the Trust. The NAVnet asset value of the Trust is divided by the number of outstanding Units multiplied by 50,000 Units in one Creation Unit, resulting in the
SPDR S&P 500 ETF Trust
Schedule of Investments (continued)
September 30, 2012
NAVnet asset value per Creation Unit (“NAV Amount”). The Trustee then calculates the number of shares (without rounding) of each of the component stocks of the Index in a Portfolio Deposit for the following Business Day (“Request Day”), such that (a) the market value at the close of the market on the Adjustment Day of the stocks to be included in the Portfolio Deposit on Request Day, together with the Dividend Equivalent Payment effective for requests to create or redeem on the Adjustment Day, equals the NAV Amount and (b) the identity and weighting of each of the stocks in a Portfolio Deposit mirrors proportionately the identity and weightings of the stocks in the Index, each as in effect on Request Day. For each stock, the number resulting from such calculation is rounded to the nearest whole share, with a fraction of 0.50 being rounded up. The identities and weightings of the stocks so calculated constitute the stock portion of the Portfolio Deposit effective on Request Day and thereafter until the next subsequent Adjustment Day, as well as Portfolio Securities to be delivered by the Trustee in the event of request for redemption on the Request Day and thereafter until the following Adjustment Day.
In addition to the foregoing adjustments, if a corporate action such as a stock split, stock dividend or reverse split occurs with respect to any Index Security that does not result in an adjustment to the Index divisor, the Portfolio Deposit shall be adjusted to take into account the corporate action in each case rounded to the nearest whole share.
On the Request Day and on each day that a request for the creation or redemption is deemed received, the Trustee calculates the market value of the stock portion of the Portfolio Deposit as in effect on the Request Day as of the close of the market and adds to that amount the Dividend Equivalent Payment effective for requests to create or redeem on Request Day (such market value and Dividend Equivalent Payment are collectively referred to herein as “Portfolio Deposit Amount”). The Trustee then calculates the NAV Amount, based on the close of the market on the Request Day. The difference between the NAV Amount so calculated and the Portfolio Deposit Amount is the “Balancing Amount.” The Balancing Amount serves the function of compensating for any differences between the value of the Portfolio Deposit Amount and the NAV Amount at the close of trading on Request Day due to, for example, (a) differences in the market value of the securities in the Portfolio Deposit and the market value of the securities on Request Day and (b) any variances from the proper composition of the Portfolio Deposit.
On any Adjustment Day on which (a) no change in the identity and/or share weighting of any Index Security is scheduled to take effect that would cause the Index divisor to be adjusted after the close of the market on that Business Day,1* and (b) no stock split, stock dividend or reverse stock split with respect to any Index Security has been declared to take effect on the corresponding Request Day, the Trustee may forego making any adjustment to the stock portion of the Portfolio Deposit and use the composition and weightings of Index Securities for the most recently effective Portfolio Deposit for the Request Day following such Adjustment Day. In addition, the Trustee may calculate the adjustment to the number of shares and identity of Index Securities in a Portfolio Deposit as described above except that such calculation would be employed two (2) Business Days rather than one (1) Business Day before the Request Day.
The Dividend Equivalent Payment and the Balancing Amount in effect at the close of business on the Request Date are collectively referred to as the Cash Component or the Cash Redemption Payment. If the Balancing Amount is a positive number (i.e., if the NAV Amount exceeds the Portfolio Deposit Amount) then, with respect to creation, the Balancing Amount increases the Cash Component of the then-effective Portfolio Deposit transferred to the Trustee by the creator. With respect to redemptions, the Balancing Amount is added to the cash transferred to the redeemer by the Trustee. If the Balancing Amount is a negative number (i.e., if the NAV Amount is less than the Portfolio Deposit Amount) then, with respect to creation, this amount decreases the Cash Component of the then-effective Portfolio Deposit to be transferred to the Trustee by the creator or, if such cash portion is less than the Balancing Amount, the difference must be paid by the Trustee to the creator. With respect to redemptions, the Balancing Amount is deducted from the cash transferred to the redeemer or, if such cash is less than the Balancing Amount, the difference must be paid by the redeemer to the Trustee.
1* S&P publicly announces changes in the identity and/or weighting of Index Securities in advance of the actual change. The announcements regarding changes in the index components are made after the close of trading on such day.
SPDR S&P 500 ETF Trust
Schedule of Investments (continued)
September 30, 2012
CONTINUOUS OFFERING OF UNITS
Creation Units are offered continuously to the public by the Trust through the Distributor. Persons making Portfolio Deposits and creating Creation Units will receive no fees, commissions or other form of compensation or inducement of any kind from the Sponsor or the Distributor, and no such person has any obligation or responsibility to the Sponsor or Distributor to effect any sale or resale of Units.
Because new Units can be created and issued on an ongoing basis, at any point during the life of the Trust, a “distribution,” as such term is used in the Securities Act of 1933, may be occurring. Broker-dealers and other persons are cautioned that some of their activities may result in their being deemed participants in a distribution in a manner which could render them statutory underwriters and subject them to the prospectus-delivery and liability provisions of the Securities Act of 1933. For example, a broker-dealer firm or its client may be deemed a statutory underwriter if it takes Creation Units after placing a creation order with a distributor, breaks them down into the constituent Units and sells the Units directly to its customers; or if it chooses to couple the creation of a supply of new Units with an active selling effort involving solicitation of secondary market demand for Units. A determination of whether one is an underwriter must take into account all the facts and circumstances pertaining to the activities of the broker-dealer or its client in the particular case, and the examples mentioned above should not be considered a complete description of all the activities that could lead to categorization as an underwriter.
Broker-dealer firms should also note that dealers who are not “underwriters” but are effecting transactions in Units, whether or not participating in the distribution of Units, generally are required to deliver a prospectus. This is because the prospectus delivery exemption in Section 4(3) of the Securities Act of 1933 is not available in respect of such transactions as a result of Section 24(d) of the Investment Company Act of 1940. As a result, broker-dealer firms should note that dealers who are not “underwriters” but are participating in a distribution (as contrasted with engaging in ordinary secondary market transactions), and thus dealing with the Units that are part of an overallotment within the meaning of Section 4(3)(C) of the Securities Act of 1933 will be unable to take advantage of the prospectus delivery exemption provided by Section 4(3) of the Securities Act of 1933. For delivery of prospectuses to exchange members, the prospectus delivery mechanism of Rule 153 under the Securities Act of 1933 is only available with respect to transactions on a national exchange.
The Sponsor intends to qualify Units in states selected by the Sponsor and through broker-dealers who are members of FINRA. Persons intending to create or redeem Creation Units in transactions not involving a broker-dealer registered in such person’s state of domicile or residence should consult their legal adviser regarding applicable broker-dealer or securities regulatory requirements under the state securities laws prior to such creation or redemption.
EXPENSES OF THE TRUST
Ordinary operating expenses of the Trust are currently being accrued at an annual rate of [_____]0.0945%. Future accruals will depend primarily on the level of the Trust’s net assets and the level of Trust expenses. The Trustee has agreed to waive a portion of its fee until [February 1, 2014] to the extent operating expenses exceed [_____]0.0945% after taking into consideration the earnings credit with respect to uninvested cash balances of the Trust. Thereafter, the Trustee may discontinue this voluntary waiver policy. The Trustee’s fee waiver will be calculated after earnings credits are applied. The amount of the earnings credit will be equal to the then current Federal Funds Rate, as reported in nationally distributed publications, multiplied by each day’s daily cash balance, if any, in the Trust’s cash account, reduced by the amount of reserves, if any, for that account required by the Federal Reserve Board of Governors. Therefore, there is no guarantee that the Trust’s ordinary operating expenses will not exceed [_____]0.0945% of the Trust’s daily NAVnet asset value.
Until further notice, the Sponsor has undertaken that it will not permit the ordinary operating expenses of the Trust, as calculated by the Trustee, to exceed an amount that is [0.1845]% per annum of the daily NAV of the Trust. To the extent the ordinary operating expenses of the Trust do exceed such [0.1845]% amount, the Sponsor will reimburse the Trust for, or assume, the excess. The Sponsor retains the ability to be repaid by the Trust for expenses so reimbursed or assumed to the extent that subsequently during the fiscal year expenses fall below the [0.1845]% per annum level on any given day. For purposes of this undertaking, ordinary operating expenses of
SPDR S&P 500 ETF Trust
Schedule of Investments (continued)
September 30, 2012
the Trust do not include taxes, brokerage commissions and any extraordinary non-recurring expenses, including the cost of any litigation to which the Trust or the Trustee may be a party. The Sponsor may discontinue this undertaking or renew it for a specified period of time, or may choose to reimburse or assume certain Trust expenses in later periods to keep Trust expenses at a level it believes to be attractive to investors. In any event, on any day and during any period over the life of the Trust, total fees and expenses of the Trust may exceed [0.1845]% per annum.
Subject to any applicable cap, the Sponsor may charge the Trust a special fee for certain services the Sponsor may provide to the Trust which would otherwise be provided by the Trustee in an amount not to exceed the actual cost of providing such services. The Sponsor or the Trustee from time to time may voluntarily assume some expenses or reimburse the Trust so that total expenses of the Trust are reduced. Neither the Sponsor nor the Trustee is obligated to do so and either one or both parties may discontinue any voluntary assumption of expenses or reimbursement at any time without notice.
The following charges are or may be accrued and paid by the Trust: (a) the Trustee’s fee; (b) fees payable to transfer agents for the provision of transfer agency services; (c) fees of the Trustee for extraordinary services performed under the Trust Agreement; (d) various governmental charges; (e) any taxes, fees and charges payable by the Trustee with respect to Units (whether in Creation Units or otherwise); (f) expenses and costs of any action taken by the Trustee or the Sponsor to protect the Trust and the rights and interests of Beneficial Owners of Units (whether in Creation Units or otherwise); (g) indemnification of the Trustee or the Sponsor for any losses, liabilities or expenses incurred by it in the administration of the Trust; (h) expenses incurred in contacting Beneficial Owners of Units during the life of the Trust and upon termination of the Trust; and (i) other out-of-pocket expenses of the Trust incurred pursuant to actions permitted or required under the Trust Agreement.
In addition, the following expenses are or may be charged to the Trust: (a) reimbursement to the Sponsor of amounts paid by it to S&P in respect of annual licensing fees pursuant to the License Agreement; (b) federal and state annual registration fees for the issuance of Units; and (c) expenses of the Sponsor relating to the printing and distribution of marketing materials describing Units and the Trust (including, but not limited to, associated legal, consulting, advertising, and marketing costs and other out-of-pocket expenses such as printing). Pursuant to the provisions of an exemptive order, the expenses set forth in this paragraph may be charged to the Trust by the Trustee in an amount equal to the actual costs incurred, but in no case shall such charges exceed 0.20% per annum of the daily NAVnet asset value of the Trust.
With respect to the marketing expenses described in item (c) above, the Sponsor has entered into an agreement with SSGM, an affiliate of the Trustee, pursuant to which SSGM has agreed to market and promote the Trust. SSGM is reimbursed by the Sponsor for the expenses it incurs for providing such services out of amounts that the Trust reimburses the Sponsor. SSGM separately receives fees from the Trustee for providing on-line creation and redemption functionality to Authorized Participants through its Fund Connect application.
If the income received by the Trust in the form of dividends and other distributions on Portfolio Securities is insufficient to cover Trust expenses, the Trustee may make advances to the Trust to cover such expenses. Otherwise, the Trustee may sell Portfolio Securities in an amount sufficient to pay such expenses. The Trustee may reimburse itself in the amount of any such advance, together with interest thereon at a percentage rate equal to the then current overnight federal funds rate, by deducting such amounts from (a) dividend payments or other income of the Trust when such payments or other income is received, (b) the amounts earned or benefits derived by the Trustee on cash held by the Trustee for the benefit of the Trust, and (c) the sale of Portfolio Securities. Notwithstanding the foregoing, if any advance remains outstanding for more than forty-five (45) Business Days, the Trustee may sell Portfolio Securities to reimburse itself for such advance and any accrued interest thereon. These advances will be secured by a lien on the assets of the Trust in favor of the Trustee. The expenses of the Trust are reflected in the NAV of the Trust.
For services performed under the Trust Agreement, the Trustee is paid a fee at an annual rate of 0.06% to 0.10% of the NAVnet asset value of the Trust, as shown below, depending on the NAVnet asset value of the Trust, plus or minus the Adjustment Amount (as defined below). The compensation is computed on each Business Day based on the NAVnet asset value of the Trust on such day, and the amount thereof is accrued daily and paid monthly. To the extent that the amount of the Trustee’s compensation, before any adjustment in respect of the Adjustment
SPDR S&P 500 ETF Trust
Schedule of Investments (continued)
September 30, 2012
Amount, is less than specified amounts, the Sponsor has agreed to pay the amount of any such shortfall. The Trustee also may waive all or a portion of such fee.
Trustee Fee Scale
|
NAVNet Asset Value of the Trust
|
Fee as a Percentage of
NAVNet Asset Value of the Trust
|
|
$0–$499,999,999
|
0.10% per annum plus or minus the Adjustment Amount*
|
|
$500,000,000–$2,499,999,999
|
0.08% per annum plus or minus the Adjustment Amount*
|
|
$2,500,000,000 and above
|
0.06% per annum plus or minus the Adjustment Amount*
|
____________
|
*
|
The fee indicated applies to that portion of the NAV net asset value of the Trust that falls in the size category indicated.
|
As of September 30, 2012, and as of December 31, 2012, the NAVnet asset value of the Trust was $[_____]118,164,619,076 and $[_____]126,532,338,397, respectively. No representation is made as to the actual NAVnet asset value of the Trust on any future date, as it is subject to change at any time due to fluctuations in the market value of the Portfolio Securities, or to creations or redemptions made in the future. For the fiscal year ended September 30, 2012, the aggregate dollar amount of net fees paid to the Trustee was $39,664,699.
The Adjustment Amount is calculated at the end of each quarter and applied against the Trustee’s fee for the following quarter. “Adjustment Amount” is an amount which is intended, depending upon the circumstances, either to (a) reduce the Trustee’s fee by the amount that the Transaction Fees paid on creation and redemption exceed the costs of those activities, and by the amount of excess earnings on cash held for the benefit of the Trust** or (b) increase the Trustee’s fee by the amount that the Transaction Fee (plus additional amounts paid in connection with creations or redemptions outside the Clearing Process), paid on creations or redemptions, falls short of the actual costs of these activities. If in any quarter the Adjustment Amount exceeds the fee payable to the Trustee as set forth above, the Trustee uses such excess amount to reduce other Trust expenses, subject to certain federal tax limitations. To the extent that the amount of such excess exceeds the Trust’s expenses for such quarter, any remaining excess is retained by the Trustee as part of its compensation. If in any quarter the costs of processing creations and redemptions exceed the amounts charged as a Transaction Fee (plus the additional amounts paid in connection with creations or redemptions outside the Clearing Process) net of the excess earnings, if any, on cash held for the benefit of the Trust, the Trustee will augment the Trustee’s fee by the resulting Adjustment Amount. The net Adjustment Amount is usually a credit to the Trust. The amount of the earnings credit will be equal to the then current Federal Funds Rate, as reported in nationally distributed publications, multiplied by each day’s daily cash balance in the Trust’s cash account, reduced by the amount of reserves for that account required by the Federal Reserve Board of Governors.
For example, during the year ended September 30, 2012, the Adjustment Amount included an excess of net transaction fees from processing orders of $4,169,916 and a Trustee earnings credit of $432,359. Thus, the Adjustment Amount reduced the Trustee’s fee by $4,602,275.
DETERMINATION OF NAVNET ASSET VALUE
The NAVnet asset value of the Trust is computed as of the Evaluation Time, as shown under “Portfolio Adjustments—Adjustments to the Portfolio Deposit” on each Business Day. The NAVnet asset value of the Trust on a per Unit basis is determined by subtracting all liabilities (including accrued expenses and dividends payable) from the total value of the Portfolio and other assets and dividing the result by the total number of outstanding Units. For the most recent NAVnet asset value information, please go to www.spdrs.com.
The value of the Portfolio is determined by the Trustee in good faith in the following manner. If Portfolio Securities are listed on one or more national securities exchanges, such evaluation is generally based on the
** The excess earnings on cash amount is currently calculated, and applied, on a monthly basis.
SPDR S&P 500 ETF Trust
Schedule of Investments (continued)
September 30, 2012
closing sale price on that day (unless the Trustee deems such price inappropriate as a basis for evaluation) on the exchange which is deemed to be the principal market therefor or, if there is no such appropriate closing sale price on such exchange, at the closing bid price (unless the Trustee deems such price inappropriate as a basis for evaluation). If the securities are not so listed or, if so listed and the principal market therefor is other than on such exchange or there is no such closing bid price available, such evaluation shall generally be made by the Trustee in good faith based on the closing price on the over-the-counter market (unless the Trustee deems such price inappropriate as a basis for evaluation) or if there is no such appropriate closing price, (a) on current bid prices, (b) if bid prices are not available, on the basis of current bid prices for comparable securities, (c) by the Trustee’s appraising the value of the securities in good faith on the bid side of the market, or (d) by any combination thereof.
ADDITIONAL RISK INFORMATION
The following section identifies additional risks. Prospective investors should carefully consider the additional information described below together with the information identified under “Summary—Principal Risks of Investing in the Trust.”
A liquid trading market for certain Portfolio Securities may not exist. Although all of the Portfolio Securities are listed on a national securities exchange, the existence of a liquid trading market for certain Portfolio Securities may depend on whether dealers will make a market in such stocks. There can be no assurance that a market will be made or maintained for any Portfolio Securities, or that any such market will be or remain liquid. The price at which Portfolio Securities may be sold and the value of the Portfolio will be adversely affected if trading markets for Portfolio Securities are limited or absent.
Asset Category Risk. The Portfolio Securities may underperform the returns of other securities or indexes that track other industries, groups of industries, markets, asset classes or sectors. Various types of securities or indexes tend to experience cycles of outperformance and underperformance in comparison to the general securities markets.
Trading Issues. Units are listed for trading on the Exchange under the market symbol “SPY” and are listed or traded on certain non-U.S. stock exchanges other than the Exchange. Trading in Units on the Exchange may be halted due to market conditions or for reasons that, in the view of the Exchange, make trading in Units inadvisable. In addition, trading in Units on the Exchange is subject to trading halts caused by extraordinary market volatility pursuant to Exchange “circuit breaker” rules. There can be no assurance that the requirements of the Exchange necessary to maintain the listing of the Trust will continue to be met or will remain unchanged or that the Units will trade with any volume, or at all, on any stock exchange. Investors are subject to the execution and settlement risks and market standards of the market where they or their broker direct their trades for execution. The Trust will be terminated if the Units are delisted from the Exchange.
Fluctuation of NAV; Unit Premiums and Discounts. The NAV of the Units will generally fluctuate with changes in the market value of the Trust’s securities holdings. The market prices of Units will generally fluctuate in accordance with changes in the Trust’s NAV and supply and demand of Units on the Exchange or any other exchange on which Units are traded. It cannot be predicted whether Units will trade below, at or above their NAV. Price differences may be due, in large part, to the fact that supply and demand forces at work in the secondary trading market for Units will be closely related to, but not identical to, the same forces influencing the prices of the securities of the Index trading individually or in the aggregate at any point in time. The market prices of Units may deviate significantly from the NAV of the Units during periods of market volatility. While the creation/redemption feature is designed to make it likely that Units normally will trade close to the Trust’s NAV, disruptions to creations and redemptions and/or market volatility may result in trading prices that differ significantly from the Trust’s NAV. If an investor purchases Units at a time when the market price is at a premium to the NAV of the Units or sells at a time when the market price is at a discount to the NAV of the Units, then the investor may sustain losses that are in addition to any losses caused by a decrease in NAV.
Costs of Buying or Selling Units. Investors buying or selling Units in the secondary market will pay brokerage commissions or other charges imposed by brokers as determined by that broker. Brokerage commissions are often
SPDR S&P 500 ETF Trust
Schedule of Investments (continued)
September 30, 2012
Any additional distributions the Trust may need to make so as to continue to qualify as a RIC under the Code and to avoid U.S. federal excise tax would consist of (a) an increase in the distribution scheduled for January to include any amount by which the Trust’s estimated “investment company taxable income” (determined prior to the deduction for dividends paid by the Trust) and net capital gains for a year exceeded the amount of Trust taxable income previously distributed with respect to such year or, if greater, the minimum amount required to avoid imposition of such excise tax, and (b) a distribution soon after actual annual “investment company taxable income” (determined prior to the deduction for dividends paid by the Trust) and net capital gain of the Trust have been computed, of the amount, if any, by which such actual income and gain exceeds the distributions already made. The NAVnet asset value of the Trust is reduced in direct proportion to the amount of such additional distributions. The magnitude of the additional distributions, if any, depends upon a number of factors, including the level of redemption activity experienced by the Trust. Because substantially all proceeds from the sale of stocks in connection with adjustments to the Portfolio are used to purchase shares of Index Securities, the Trust may have no cash or insufficient cash with which to pay such additional distributions. In that case, the Trustee will have to sell shares of Portfolio Securities sufficient to produce the cash required to make such additional distributions. In selecting the stocks to be sold to produce cash for such distributions, the Trustee chooses among the stocks that are over-weighted in the Portfolio relative to their weightings in the Index first and then from among all other stocks in such a manner to maintain the weightings of Portfolio Securities within the applicable Misweighting Amount.
As specified in the Trust Agreement, the Trustee may declare special dividends if the Trustee deems such action necessary or advisable to preserve the status of the Trust as a RIC or to avoid imposition of income or excise taxes on undistributed income or deems such action otherwise advantageous to the Trust. The Trust Agreement also permits the Trustee to vary the frequency with which periodic distributions are made (e.g., from quarterly to monthly) if it is determined by the Sponsor and the Trustee that such a variance would be advisable to facilitate compliance with the rules and regulations applicable to RICs or would otherwise be advantageous to the Trust. In addition, the Trust Agreement permits the Trustee to change the regular ex-dividend date for Units to another date within the month or quarter if it is determined by the Sponsor and the Trustee that such a change would be advantageous to the Trust. Notice of any such variance or change shall be provided to Beneficial Owners via DTC and the DTC Participants.
All distributions are made by the Trustee through DTC and the DTC Participants to Beneficial Owners as recorded on the book entry system of DTC and the DTC Participants. With each distribution, the Trustee furnishes for distribution to Beneficial Owners a statement setting forth the amount being distributed, expressed as a dollar amount per Unit.
The settlement date for the creation of Units or the purchase of Units in the secondary market must occur on or before the Record Date in order for such creator or purchaser to receive a distribution on the next Dividend Payment Date. If the settlement date for such creation or a secondary market purchase occurs after the Record Date, the distribution will be made to the prior securityholder or Beneficial Owner as of such Record Date.
As soon as practicable after notice of termination of the Trust, the Trustee will distribute via DTC and the DTC Participants to each Beneficial Owner redeeming Creation Units before the termination date specified in such notice a portion of Portfolio Securities and cash as described above. Otherwise, the Trustee will distribute to each Beneficial Owner (whether in Creation Unit size aggregations or otherwise), as soon as practicable after termination of the Trust, such Beneficial Owner’s pro rata share of the NAVnet asset value of the Trust.
INVESTMENTS BY INVESTMENT COMPANIES
Purchases of Units by investment companies are subject to restrictions pursuant to Section 12(d)(1) of the Investment Company Act of 1940. The Trust has received an SEC order that permits registered investment companies to invest in Units beyond these limits, subject to certain conditions and terms. One such condition is that registered investment companies relying on the order must enter into a written agreement with the Trust. Registered investment companies wishing to learn more about the order and the agreement should telephone 1-866-732-8673.
SPDR S&P 500 ETF Trust
Schedule of Investments (continued)
September 30, 2012
the administration, marketing or trading of financial products. WITHOUT LIMITING ANY OF THE FOREGOING, IN NO EVENT SHALL S&P OR ITS AFFILIATES HAVE ANY LIABILITY FOR ANY SPECIAL, PUNITIVE, INDIRECT, OR CONSEQUENTIAL DAMAGES (INCLUDING, BUT NOT LIMITED TO, LOST PROFITS), EVEN IF NOTIFIED OF THE POSSIBILITY OF SUCH DAMAGES.
SPONSOR
The Sponsor is a Delaware limited liability company incorporated on April 6, 1998 with offices c/o NYSE Euronext, 11 Wall Street, New York, New York 10005. The Sponsor’s Internal Revenue Service Employer Identification Number is 26-4126158. The Sponsor’s sole business activity is to act as the sponsor of the Trust and two other ETFs. On October 1, 2008, the Sponsor became an indirect wholly-owned subsidiary of NYSE Euronext following the acquisition by NYSE Euronext of the American Stock Exchange LLC and all of its subsidiaries. NYSE Euronext is a “control person” of the Sponsor as such term is defined in the Securities Act of 1933.
The Sponsor, at its own expense, may from time to time provide additional promotional incentives to brokers who sell Units to the public. In certain instances, these incentives may be provided only to those brokers who meet certain threshold requirements for participation in a given incentive program, such as selling a significant number of Units within a specified period.
If at any time the Sponsor fails to undertake or perform or becomes incapable of undertaking or performing any of the duties which by the terms of the Trust Agreement are required to be undertaken or performed by it, and such failure is not cured within fifteen (15) Business Days following receipt of notice from the Trustee of such failure, or if the Sponsor resigns, or if the Sponsor is adjudged bankrupt or insolvent, or a receiver of the Sponsor or of its property is appointed, or a trustee or liquidator or any public officer takes charge or control of the Sponsor or of its property or affairs for the purpose of rehabilitation, conservation or liquidation, the Trustee may appoint a successor Sponsor, agree to act as Sponsor itself, or terminate the Trust Agreement and liquidate the Trust. Upon the Trustee’s and a successor Sponsor’s execution of an instrument of appointment and assumption, the successor Sponsor succeeds to all of the rights, powers, duties and obligations of the original Sponsor. The successor Sponsor shall not be under any liability under the Trust Agreement for occurrences or omissions prior to the execution of such instrument. Any successor Sponsor may be compensated at rates deemed by the Trustee to be reasonable, but not exceeding the amounts prescribed by the SEC.
The Sponsor may resign by executing and delivering to the Trustee an instrument of resignation. Such resignation shall become effective upon the appointment of a successor Sponsor and the acceptance of appointment by the successor Sponsor, unless the Trustee either agrees to act as Sponsor or terminates the Trust Agreement and liquidates the Trust. The Trustee shall terminate the Trust Agreement and liquidate the Trust if, within sixty (60) days following the date on which a notice of resignation was delivered by the Sponsor, a successor Sponsor has not been appointed or the Trustee has not agreed to act as Sponsor.
The Trust Agreement provides that the Sponsor is not liable to the Trustee, the Trust or to the Beneficial Owners of Units for taking or refraining from taking any action in good faith, or for errors in judgment, but is liable only for its own gross negligence, bad faith, willful misconduct or willful malfeasance in the performance of its duties or its reckless disregard of its obligations and duties under the Trust Agreement. The Sponsor is not liable or responsible in any way for depreciation or loss incurred by the Trust because of the purchase or sale of any Portfolio Securities. The Trust Agreement further provides that the Sponsor and its directors, shareholders, officers, employees, subsidiaries and affiliates under common control with the Sponsor shall be indemnified from the assets of the Trust and held harmless against any loss, liability or expense incurred without gross negligence, bad faith, willful misconduct or willful malfeasance on the part of any such party arising out of or in connection with the performance of its duties or reckless disregard of its obligations and duties under the Trust Agreement, including the payment of the costs and expenses (including counsel fees) of defending against any claim or liability.
The following information is being provided with respect to each officer and member of the Sponsor as at January 23, 2012.
SPDR S&P 500 ETF Trust
Schedule of Investments (continued)
September 30, 2012
|
Name
|
Nature of Relationship or Affiliation with Sponsor
|
|
Joseph Mecane
|
President
|
|
Laura Morrison
|
Senior Vice President
|
|
Janet McGinness
|
Secretary
|
|
NYSE MKT, LLC
|
Member
|
The principal business address for each of the officers and members listed above is c/o NYSE Euronext, 11 Wall Street, New York, New York 10005. None of the officers listed above either directly or indirectly owns, controls or holds with power to vote any of the outstanding limited liability company interests of the Sponsor. All of the outstanding limited liability company interests of the Sponsor are owned by NYSE MKT, LLC as the sole member of the Sponsor.
None of the individuals listed above either directly or indirectly owns, controls or holds with power to vote any of the outstanding Units of the Trust.
|
Other Companies of which Each of the Persons1 Named Above is Presently an Officer, Director or Partner
|
|
Person Named Above
|
Name and Principal Business Address of such Other Company
|
Nature of Business of such Other Company
|
Nature of Affiliation with such Other Company
|
|
Joseph Mecane
|
NYSE Euronext,
11 Wall Street,
New York,
New York 10005
|
Global operator of financial markets and provider of trading technologies.
|
Executive Vice President
|
| |
New York Block
Exchange LLC,
11 Wall Street,
New York,
New York 10005
|
Subsidiary of global operator of financial markets and provider of trading technologies.
|
Director
|
| |
NYSE Amex
Options LLC,
11 Wall Street,
New York,
New York 10005
|
Subsidiary of global operator of financial markets and provider of trading technologies.
|
Director
|
| |
NYSE IP LLC,
11 Wall Street,
New York,
New York 10005
|
Subsidiary of global operator of financial markets and provider of trading technologies.
|
Chief Executive Officer
|
| |
NYSE MKT, LLC,
11 Wall Street,
New York,
New York 10005
|
Subsidiary of global operator of financial markets and provider of trading technologies.
|
President and Chief Executive Officer
|
|
Laura Morrison
|
NYSE Euronext,
11 Wall Street,
|
Global operator of financial markets and provider of trading technologies.
|
Senior Vice President
|
1 Exclude persons whose affiliation with the Sponsor arises solely by virtue of stock ownership (as defined under Section 2(a)(3)(A) of the Investment Company Act of 1940).
SPDR S&P 500 ETF Trust
Schedule of Investments (continued)
September 30, 2012
| |
New York,
New York 10005
|
|
|
| |
The Borough of Manhattan Community College Foundation,
c/o the City University of
New York,
199 Chambers Street,
New York,
New York 10007
|
Not-for-profit organization whose sole business is to support the Borough of Manhattan Community College.
|
Director, Treasurer and Secretary
|
|
Janet McGinness2
|
NYSE Euronext,
11 Wall Street,
New York,
New York 10005
|
Subsidiary of global operator of financial markets and provider of trading technologies.
|
Senior Vice President and Secretary
|
Joseph Mecane has been employed by NYSE Euronext (or its predecessors) since May 2008. From November 2004 until May 2008, Mr. Mecane was a Managing Director in the Equities Division of UBS Investment Bank, where he was responsible for overseeing the firm’s wholesale and retail trade-execution business. Laura Morrison has been employed by NYSE Euronext (or its predecessors) since 1995. Janet McGinness has been employed by NYSE Euronext (or its predecessors) since 2006.
TRUSTEE
The Trustee is a bank and trust company organized under the laws of the Commonwealth of Massachusetts with its principal place of business at One Lincoln Street, Boston, Massachusetts 02111. The Trustee’s Internal Revenue Service Employer Identification Number is 04-1867445. The Trustee is subject to applicable federal and state banking laws and to supervision and examination by the Federal Reserve as well as by the Massachusetts Commissioner of Banks, the FDIC, and the regulatory authorities of those states and countries in which a branch of the Trustee is located.
The Trustee may resign and be discharged of the Trust created by the Trust Agreement by executing a notice of resignation in writing and filing such notice with the Sponsor and mailing a copy of the notice of resignation to all DTC Participants reflected on the records of DTC as owning Units for distribution to Beneficial Owners as provided above not less than sixty (60) days before the date such resignation is to take effect. Such resignation becomes effective upon the acceptance of the appointment as Trustee for the Trust by the successor Trustee. The Sponsor, upon receiving notice of such resignation, is obligated to use its best efforts promptly to appoint a successor Trustee in the manner and meeting the qualifications provided in the Trust Agreement. If no successor is appointed within sixty (60) days after the date such notice of resignation is given, the Trustee shall terminate the Trust Agreement and liquidate the Trust.
If the Trustee becomes incapable of acting as such, or fails to undertake or perform or becomes incapable of undertaking or performing any of the duties which by the terms of the Trust Agreement are required to be undertaken or performed by it, and such failure is not be cured within fifteen (15) Business Days following
2 In addition to her positions with the Sponsor and NYSE Euronext, Ms. McGinness is a Director and/or an officer (e.g., Senior Vice President, Vice President, Associate General Counsel, Secretary, Assistant Secretary) of 25 other subsidiaries of NYSE Euronext.
SPDR S&P 500 ETF Trust
Schedule of Investments (continued)
September 30, 2012
receipt of notice from the Sponsor of such failure, or is adjudged bankrupt or insolvent, or a receiver of the Trustee or its property is appointed, or a trustee or liquidator or any public officer takes charge or control of such Trustee or of its property or affairs for the purposes of rehabilitation, conservation or liquidation, then the Sponsor may remove the Trustee and appoint a successor Trustee as provided in the Trust Agreement. The Sponsor shall mail notice of such appointment of a successor Trustee via the DTC Participants to Beneficial Owners. Upon a successor Trustee’s execution of a written acceptance and acknowledgement of an instrument accepting appointment as Trustee for the Trust, the successor Trustee becomes vested with all the rights, powers, duties and obligations of the original Trustee. A successor Trustee must be (a) a bank, trust company, corporation or national banking association organized and doing business under the laws of the United States or any state thereof; (b) authorized under such laws to exercise corporate trust powers; and (c) at all times have an aggregate capital, surplus and undivided profits of not less than $50,000,000.
Beneficial Owners of 51% of the then outstanding Units may at any time remove the Trustee by written instrument(s) delivered to the Trustee and the Sponsor. The Sponsor shall thereupon use its best efforts to appoint a successor Trustee as described above and in the Trust Agreement.
The Trust Agreement limits the Trustee’s liabilities. It provides, among other things, that the Trustee is not liable for (a) any action taken in reasonable reliance on properly executed documents or for the disposition of monies or securities or for the evaluations required to be made thereunder, except by reason of its own gross negligence, bad faith, willful malfeasance, willful misconduct, or reckless disregard of its duties and obligations; (b) depreciation or loss incurred by reason of the sale by the Trustee of any Portfolio Securities; (c) any action the Trustee takes where the Sponsor fails to act; and (d) any taxes or other governmental charges imposed upon or in respect of Portfolio Securities or upon the interest thereon or upon it as Trustee or upon or in respect of the Trust which the Trustee may be required to pay under any present or future law of the United States of America or of any other taxing authority having jurisdiction.
The Trustee and its directors, subsidiaries, shareholders, officers, employees, and affiliates under common control with the Trustee will be indemnified from the assets of the Trust and held harmless against any loss, liability or expense incurred without gross negligence, bad faith, willful misconduct, willful malfeasance on the part of such party or reckless disregard of its duties and obligations arising out of or in connection with its acceptance or administration of the Trust, including the costs and expenses (including counsel fees) of defending against any claim or liability.
DEPOSITORY
DTC is a limited purpose trust company and member of the Federal Reserve System.
DISTRIBUTOR
The Distributor is a corporation organized under the laws of the State of Colorado and is located at 1290 Broadway, Suite 1100, Denver, CO 80203. The Distributor is a registered broker-dealer and a member of the Financial Industry Regulatory Authority (“FINRA”). The Sponsor pays the Distributor for its services a flat annual fee of $25,000. The Sponsor will not seek reimbursement for such payment from the Trust without obtaining prior exemptive relief from the SEC.
TRUST AGREEMENT
Beneficial Owners shall not (a) have the right to vote concerning the Trust, except with respect to termination and as otherwise expressly set forth in the Trust Agreement, (b) in any manner control the operation and management of the Trust, or (c) be liable to any other person by reason of any action taken by the Sponsor or the Trustee. The Trustee has the right to vote all of the voting stocks in the Trust. The Trustee votes the voting stocks of each issuer in the same proportionate relationship as all other shares of each such issuer are voted to the extent permissible and, if not permitted, abstains from voting. The Trustee shall not be liable to any person for any action or failure to take any action with respect to such voting matters.
The death or incapacity of any Beneficial Owner does not operate to terminate the Trust nor entitle such
SPDR S&P 500 ETF Trust
Schedule of Investments (continued)
September 30, 2012
Beneficial Owner’s legal representatives or heirs to claim an accounting or to take any action or proceeding in any court for a partition or winding up of the Trust.
Amendments to the Trust Agreement
The Trust Agreement may be amended from time to time by the Trustee and the Sponsor without the consent of any Beneficial Owners (a) to cure any ambiguity or to correct or supplement any provision that may be defective or inconsistent or to make such other provisions as will not adversely affect the interests of Beneficial Owners; (b) to change any provision as may be required by the SEC; (c) to add or change any provision as may be necessary or advisable for the continuing qualification of the Trust as a “regulated investment company” under the Code; (d) to add or change any provision as may be necessary or advisable if NSCC or DTC is unable or unwilling to continue to perform its functions; and (e) to add or change any provision to conform the adjustments to the Portfolio and the Portfolio Deposit to changes, if any, made by S&P in its method of determining the Index. The Trust Agreement may also be amended by the Sponsor and the Trustee with the consent of the Beneficial Owners of 51% of the outstanding Units to add provisions to, or change or eliminate any of the provisions of, the Trust Agreement or to modify the rights of Beneficial Owners, although the Trust Agreement may not be amended without the consent of the Beneficial Owners of all outstanding Units if such amendment would (a) permit the acquisition of any securities other than those acquired in accordance with the terms and conditions of the Trust Agreement; (b) reduce the interest of any Beneficial Owner in the Trust; or (c) reduce the percentage of Beneficial Owners required to consent to any such amendment.
Promptly after the execution of an amendment, the Trustee inquires of each DTC Participant, either directly or through a third party, as to the number of Beneficial Owners for whom such DTC Participant holds Units, and provides each such DTC Participant or third party with sufficient copies of a written notice of the substance of such amendment for transmittal by each such DTC Participant to Beneficial Owners.
Termination of the Trust Agreement
The Trust Agreement provides that the Sponsor has the discretionary right to direct the Trustee to terminate the Trust if at any time the NAVnet asset value of the Trust is less than $350,000,000, as such dollar amount shall be adjusted for inflation in accordance with the CPI-U. This adjustment is to take effect at the end of the fourth year following January 22, 1993 and at the end of each year thereafter and to be made so as to reflect the percentage increase in consumer prices as set forth in the CPI-U for the twelve month period ending in the last month of the preceding fiscal yearfrom (and including) 1997.
The Trust may be terminated (a) by the agreement of the Beneficial Owners of 66 2/3% of outstanding Units; (b) if DTC is unable or unwilling to continue to perform its functions as set forth under the Trust Agreement and a comparable replacement is unavailable; (c) if NSCC no longer provides clearance services with respect to Units, or if the Trustee is no longer a participant in NSCC; (d) if S&P ceases publishing the Index; or (e) if the License Agreement is terminated. The Trust will be terminated if Units are delisted from the Exchange. The Trust is scheduled to terminate on the first to occur of (a) January 22, 2118 or (b) the date 20 years after the death of the last survivor of eleven persons named in the Trust Agreement, the oldest of whom was born in 1990 and the youngest of whom was born in 1993.
The Trust will terminate if either the Sponsor or the Trustee resigns and a successor is not appointed. The Trust will also terminate if the Trustee is removed or the Sponsor fails to undertake or perform or becomes incapable of undertaking or performing any of the duties required under the Trust Agreement and a successor is not appointed. The dissolution of the Sponsor or its ceasing to exist as a legal entity for any cause whatsoever, however, will not cause the termination of the Trust Agreement or the Trust unless the Trust is terminated as described above.
Prior written notice of the termination of the Trust must be given at least twenty (20) days before termination of the Trust to all Beneficial Owners. The notice must set forth the date on which the Trust will be terminated, the period during which the assets of the Trust will be liquidated, the date on which Beneficial Owners of Units (whether in Creation Unit size aggregations or otherwise) will receive in cash the NAV of the Units held, and the date upon which the books of the Trust shall be closed. The notice shall further state that, as of the date thereof
SPDR S&P 500 ETF Trust
Schedule of Investments (continued)
September 30, 2012
and thereafter, neither requests to create additional Creation Units nor Portfolio Deposits will be accepted, and that, as of the date thereof and thereafter, the portfolio of stocks delivered upon redemption shall be identical in composition and weighting to Portfolio Securities as of such date rather than the stock portion of the Portfolio Deposit as in effect on the date request for redemption is deemed received. Beneficial Owners of Creation Units may, in advance of the Termination Date, redeem in kind directly from the Trust.
Within a reasonable period after the Termination Date, the Trustee shall, subject to any applicable provisions of law, sell all of the Portfolio Securities not already distributed to redeeming Beneficial Owners of Creation Units. The Trustee shall not be liable or responsible in any way for depreciation or loss incurred because of any such sale. The Trustee may suspend such sales upon the occurrence of unusual or unforeseen circumstances, including but not limited to a suspension in trading of a stock, the closing or restriction of trading on a stock exchange, the outbreak of hostilities or the collapse of the economy. The Trustee shall deduct from the proceeds of sale its fees and all other expenses and transmit the remaining amount to DTC for distribution, together with a final statement setting forth the computation of the gross amount distributed. Units not redeemed before termination of the Trust will be redeemed in cash at NAV based on the proceeds of the sale of Portfolio Securities, with no minimum aggregation of Units required.
LEGAL OPINION
The legality of the Units offered hereby has been passed upon by [_________________]Davis Polk & Wardwell LLP, New York, New York.
INDEPENDENT REGISTERED PUBLIC ACCOUNTING FIRM
AND FINANCIAL STATEMENTS
The financial statements as of September 30, 2012 included in this prospectus have been so included in reliance upon the report of [_____________]PricewaterhouseCoopers LLP, independent registered public accounting firm, [_____________]125 High Street, Boston, Massachusetts, given on the authority of said firm as experts in auditing and accounting.
CODE OF ETHICS
The Trust has adopted a code of ethics in compliance with Rule 17j-1 requirements under the Investment Company Act of 1940. Subject to pre-clearance, reporting, certification and other conditions and standards, the code permits personnel subject to the code, if any, to invest in Index Securities for their own accounts. The code is designed to prevent fraud, deception and misconduct against the Trust and to provide reasonable standards of conduct. The code is on file with the SEC and you may obtain a copy by visiting the SEC at the address listed on the back cover of this prospectus. The code is also available on the SEC’s Internet site at http://www.sec.gov. A copy may be obtained, after paying a duplicating fee, by electronic request at publicinfo@sec.gov, or by writing the SEC at the address listed on the back cover of this prospectus.
INFORMATION AND COMPARISONS RELATING TO
SECONDARY MARKET TRADING AND PERFORMANCE
One important difference between Units and conventional mutual fund shares is that Units are available for purchase or sale on an intraday basis on the Exchange. An investor who buys at market prices. In contrast, shares in a conventional mutual fund will buy or sell sharesmay be purchased or redeemed only at a price at, or related to, the closing NAVnet asset value per share, as determined by the fund. In contrast, Units are not offered for purchase or redeemed for cash at a fixed relationship to closing NAV. The tables below illustrate The table below illustrates the distribution relationship of Units closing prices to NAV for the period January 29, 1993 (the first trading date of the Trust) through December 31, 2012, the distribution relationships of high, low and closing prices over the same period, and distribution of bid/ask spreads to NAV for 2012. These tablesThis table should help investors evaluate some of the advantages and disadvantages of Units relative to funds soldmutual fund shares purchased and redeemed at prices at, or related to, the closing NAVnet asset value per share. Specifically, the tables illustratetable illustrates in an approximate way the risks of buyingpurchasing or selling Units at prices
SPDR S&P 500 ETF Trust
Schedule of Investments (continued)
September 30, 2012
less favorable than closing NAV and, correspondingly, the opportunities to buypurchase or sell at prices more favorable than closing NAV.
An investor may wish to evaluate the opportunity to buy or sell Units in the secondary market on an intraday basis versus the assurance of a transaction at or related to closing NAV that is provided by a mutual fund. To assist investors in making this comparison, the table immediately below illustrates the distribution of percentage ranges between the high and the low price each day and between each extreme daily value and the closing NAV for all trading days from January 29, 1993 through December 31, 2012. The investor may wish to compare these ranges with the average bid/ask spread on Units and add any commissions charged by a broker. The trading ranges for this period will not necessarily be typical of trading ranges in future years and the bid/ask spread on Units may vary materially over time and may be significantly greater at times in the future. There is some evidence, for example, that the bid/ask spread will widen in markets that are more volatile and narrow when markets are less volatile. Consequently, the investor should expect wider bid/ask spreads to be associated with wider daily spread ranges.
SPDR S&P 500 ETF Trust
Schedule of Investments (continued)
September 30, 2012
[Daily Percentage Price Ranges: Average and Frequency Distribution for
the Trust and the Index:
Highs and Lows vs. Close*
(from 1/29/1993** through 12/31/2012)]
INDEX
| |
|
Intraday High Value Above Closing Value
|
Intraday Low Value
|
| |
Daily % Price Range
|
Above Closing Value
|
Below Closing Value
|
|
Range
|
Frequency
|
% of Total
|
Frequency
|
% of Total
|
Frequency
|
% of Total
|
|
0—0.25%
|
[__]
|
[__]%
|
[__]
|
[__]%
|
[__]
|
[__]%
|
|
0.25—0.5%
|
[__]
|
[__]%
|
[__]
|
[__]%
|
[__]
|
[__]%
|
|
0.5—1.0%
|
[__]
|
[__]%
|
[__]
|
[__]%
|
[__]
|
[__]%
|
|
1.0—1.5%
|
[__]
|
[__]%
|
[__]
|
[__]%
|
[__]
|
[__]%
|
|
1.5—2.0%
|
[__]
|
[__]%
|
[__]
|
[__]%
|
[__]
|
[__]%
|
|
2.0—2.5%
|
[__]
|
[__]%
|
[__]
|
[__]%
|
[__]
|
[__]%
|
|
2.5—3.0%
|
[__]
|
[__]%
|
[__]
|
[__]%
|
[__]
|
[__]%
|
|
3.0—3.5%
|
[__]
|
[__]%
|
[__]
|
[__]%
|
[__]
|
[__]%
|
|
>3.5%
|
[__]
|
[__]%
|
[__]
|
[__]%
|
[__]
|
[__]%
|
|
Total
|
[__]
|
100.00%
|
[__]
|
100.00%
|
[__]
|
100.00%
|
Average Daily Range: [____]%
TRUST
| |
|
Intraday High Value Above Closing Value
|
Intraday Low Value
|
| |
Daily % Price Range
|
Above Closing Value
|
Below Closing Value
|
|
Range
|
Frequency
|
% of Total
|
Frequency
|
% of Total
|
Frequency
|
% of Total
|
|
0—0.25%
|
[__]
|
[__]%
|
[__]
|
[__]%
|
[__]
|
[__]%
|
|
0.25—0.5%
|
[__]
|
[__]%
|
[__]
|
[__]%
|
[__]
|
[__]%
|
|
0.5—1.0%
|
[__]
|
[__]%
|
[__]
|
[__]%
|
[__]
|
[__]%
|
|
1.0—1.5%
|
[__]
|
[__]%
|
[__]
|
[__]%
|
[__]
|
[__]%
|
|
1.5—2.0%
|
[__]
|
[__]%
|
[__]
|
[__]%
|
[__]
|
[__]%
|
|
2.0—2.5%
|
[__]
|
[__]%
|
[__]
|
[__]%
|
[__]
|
[__]%
|
|
2.5—3.0%
|
[__]
|
[__]%
|
[__]
|
[__]%
|
[__]
|
[__]%
|
|
3.0—3.5%
|
[__]
|
[__]%
|
[__]
|
[__]%
|
[__]
|
[__]%
|
|
>3.5%
|
[__]
|
[__]%
|
[__]
|
[__]%
|
[__]
|
[__]%
|
|
Total
|
[__]
|
100.00%
|
[__]
|
100.00%
|
[__]
|
100.00%
|
Average Daily Range: [____]%
____________
|
*
|
Source: Bloomberg
|
| |
|
|
**
|
The first day of trading.
|
SPDR S&P 500 ETF Trust
Schedule of Investments (continued)
September 30, 2012
[Frequency Distribution of Discounts and Premiums for the Trust:
ClosingBid/Ask Price vs. NAV as of 12/31/12(1)(2)]
| |
|
Calendar
|
Calendar
|
Calendar
|
Calendar
|
Calendar
|
|
From
|
| |
|
Quarter
|
Quarter
|
Quarter
|
Quarter
|
Quarter
|
Calendar
|
1/29/1993
|
| |
|
Ending
|
Ending
|
Ending
|
Ending
|
Ending
|
Year
|
through
|
|
Range
|
|
3/31/2012
|
3/31/2012
|
6/30/2012
|
9/30/2012
|
12/31/2012
|
2012
|
12/31/2012
|
|
> 200
|
Days
|
Days0
|
[__]
|
[__]0
|
[__]0
|
[__]0
|
[__]0
|
[__]
|
|
Basis Points
|
%
|
0.0%
|
[__]
|
[__]0.0%
|
[__]0.0%
|
[__]0.0%
|
[__]0.0%
|
[__]
|
|
150—200
|
Days
|
Days0
|
[__]
|
[__]0
|
[__]0
|
[__]0
|
[__]0
|
[__]
|
|
Basis Points
|
%
|
0.0%
|
[__]
|
[__]0.0%
|
[__]0.0%
|
[__]0.0%
|
[__]0.0%
|
[__]
|
|
100—150
|
Days
|
Days0
|
[__]
|
[__]0
|
[__]0
|
[__]0
|
[__]0
|
[__]
|
|
Basis Points
|
%
|
0.0%
|
[__]
|
[__]0.0%
|
[__]0.0%
|
[__]0.0%
|
[__]0.0%
|
[__]
|
|
50—100
|
Days
|
Days0
|
[__]
|
[__]0
|
[__]0
|
[__]0
|
[__]0
|
[__]
|
|
Basis Points
|
%
|
0.0%
|
[__]
|
[__]0.0%
|
[__]0.0%
|
[__]0.0%
|
[__]0.0%
|
[__]
|
|
25—50
|
Days
|
Days0
|
[__]
|
[__]0
|
[__]0
|
[__]0
|
[__]0
|
[__]
|
|
Basis Points
|
%
|
[__]
|
[__]
|
[__]
|
[__]
|
[__]
|
[__]
|
|
0—25
|
Days
|
[__]
|
[__]
|
[__]
|
[__]
|
[__]
|
[__]
|
|
Basis Points
|
%
|
[__]
|
[__]
|
[__]
|
[__]
|
[__]
|
[__]
|
|
Total Days
|
Days
|
[__]
|
[__]
|
[__]
|
[__]
|
[__]
|
[__]
|
|
at Premium
|
%
|
[__]
|
[__]
|
[__]
|
[__]
|
[__]
|
[__]
|
|
Closing Price
|
Days
|
[__]
|
[__]
|
[__]
|
[__]
|
[__]
|
[__]
|
|
Equal to NAV
|
%
|
[__]
|
[__]
|
[__]
|
[__]
|
[__]
|
[__]
|
|
Total Days
|
Days
|
[__]
|
[__]
|
[__]
|
[__]
|
[__]
|
[__]
|
|
at Discount
|
%
|
[__]
|
[__]
|
[__]
|
[__]
|
[__]
|
[__]
|
|
0— -25
|
Days
|
[__]
|
[__]
|
[__]
|
[__]
|
[__]
|
[__]
|
|
Basis Points
|
%
|
0.0%
|
[__]
|
[__]0.0%
|
[__]0.0%
|
[__]0.0%
|
[__]0.0%
|
[__]
|
|
-25— -50
|
Days
|
[__]
|
[__]
|
[__]
|
[__]
|
[__]
|
[__]
|
|
Basis Points
|
%
|
[__]
|
[__]
|
[__]
|
[__]
|
[__]
|
[__]
|
|
-500— -10025
|
Days
|
Days28
|
[__]
|
[__]29
|
[__]33
|
[__]31
|
[__]121
|
[__]
|
|
Basis Points
|
%
|
[__]
|
[__]
|
[__]
|
[__]
|
[__]
|
[__]
|
|
-100— -150
|
Days
|
[__]
|
[__]
|
[__]
|
[__]
|
[__]
|
[__]
|
|
Basis Points
|
%
|
[__]
|
[__]
|
[__]
|
[__]
|
[__]
|
[__]
|
|
-150— -200
|
Days
|
[__]
|
[__]
|
[__]
|
[__]
|
[__]
|
[__]
|
|
Basis Points
|
%
|
[__]
|
[__]
|
[__]
|
[__]
|
[__]
|
[__]
|
|
< -200
|
Days
|
[__]
|
[__]
|
[__]
|
[__]
|
[__]
|
[__]
|
|
Basis Points
|
%
|
[__]
|
[__]
|
[__]
|
[__]
|
[__]
|
[__]
|
[Close was within [0.25]% of NAV better than [___]% of the time from January 29, 1993 (the first day of trading) through December 31, 2012.]
____________
|
(1)
|
[Source: NYSE Euronext]
|
| |
|
|
(2)
|
[Currently, the closing price is the last price on NYSE Arca. Through November 28, 2008, the closing price was the last price on NYSE Alternext US (formerly the American Stock Exchange and now NYSE MKT).]
|
SPDR S&P 500 ETF Trust
Schedule of Investments (continued)
September 30, 2012
Frequency Distribution of Discounts and Premiums for the Trust:
Bid/Ask Price vs. NAV as of 12/31/12(1)(2)
| |
|
Calendar
|
Calendar
|
Calendar
|
Calendar
|
|
[From
|
| |
|
Quarter
|
Quarter
|
Quarter
|
Quarter
|
Calendar
|
1/29/1993
|
| |
|
Ending
|
Ending
|
Ending
|
Ending
|
Year
|
through
|
|
Range
|
|
3/31/2012
|
6/30/2012
|
9/30/2012
|
12/31/2012
|
2012
|
12/31/2012]
|
|
> 200
|
Days
|
[__]
|
[__]
|
[__]
|
[__]
|
[__]
|
[__]
|
|
Basis Points
|
%
|
[__]45.2%
|
[__]
|
[__]46.0%
|
52.4%
|
[__]50.0%
|
[__]48.4%
|
[__]
|
|
150—200
|
Days
|
[__]
|
[__]
|
[__]
|
[__]
|
[__]
|
[__]
|
|
Basis Points
|
%
|
[__]
|
[__]
|
[__]
|
[__]
|
[__]
|
[__]
|
|
100—150
|
Days
|
[__]
|
[__]
|
[__]
|
[__]
|
[__]
|
[__]
|
|
Basis Points
|
%
|
[__]
|
[__]
|
[__]
|
[__]
|
[__]
|
[__]
|
|
50—100
|
Days
|
[__]
|
[__]
|
[__]
|
[__]
|
[__]
|
[__]
|
|
Basis Points
|
%
|
[__]
|
[__]
|
[__]
|
[__]
|
[__]
|
[__]
|
|
25—50
|
Days
|
[__]
|
[__]
|
[__]
|
[__]
|
[__]
|
[__]
|
|
Basis Points
|
%
|
[__]
|
[__]
|
[__]
|
[__]
|
[__]
|
[__]
|
|
0—25
|
Days
|
[__]
|
[__]
|
[__]
|
[__]
|
[__]
|
[__]
|
|
Basis Points
|
%
|
[__]
|
[__]
|
[__]
|
[__]
|
[__]
|
[__]
|
|
Total Days
|
Days
|
[__]28
|
[__]
|
[__]29
|
33
|
[__]31
|
[__]121
|
[__]
|
|
at Premium
|
%
|
[__]45.2%
|
[__]
|
[__]46.0%
|
52.4%
|
[__]50.0%
|
[__]48.4%
|
[__]
|
|
Closing Price
|
Days
|
[__]0
|
[__]
|
[__]0
|
0
|
[__]0
|
[__]0
|
[__]
|
|
Equal to NAV
|
%
|
[__]0.0%
|
[__]
|
[__]0.0%
|
0.0%
|
[__]0.0%
|
[__]0.0%
|
[__]
|
|
Total Days
|
Days
|
[__]34
|
[__]
|
[__]34
|
30
|
[__]31
|
[__]129
|
[__]
|
|
at Discount
|
%
|
[__]54.8%
|
[__]
|
[__]54.0%
|
47.6%
|
[__]50.0%
|
[__]51.6%
|
[__]
|
|
0— -25
|
Days
|
[__]34
|
[__]
|
[__]34
|
30
|
[__]31
|
[__]129
|
[__]
|
|
Basis Points
|
%
|
[__]54.8%
|
[__]
|
[__]54.0%
|
47.6%
|
[__]50.0%
|
[__]51.6%
|
[__]
|
|
-25— -50
|
Days
|
[__]0
|
[__]
|
[__]0
|
0
|
[__]0
|
[__]0
|
[__]
|
|
Basis Points
|
%
|
[__]0.0%
|
[__]
|
[__]0.0%
|
0.0%
|
[__]0.0%
|
[__]0.0%
|
[__]
|
|
-50— -100
|
Days
|
[__]0
|
[__]
|
[__]0
|
0
|
[__]0
|
[__]0
|
[__]
|
|
Basis Points
|
%
|
[__]0.0%
|
[__]
|
[__]0.0%
|
0.0%
|
[__]0.0%
|
[__]0.0%
|
[__]
|
|
-100— -150
|
Days
|
[__]0
|
[__]
|
[__]0
|
0
|
[__]0
|
[__]0
|
[__]
|
|
Basis Points
|
%
|
[__]0.0%
|
[__]
|
[__]0.0%
|
0.0%
|
[__]0.0%
|
[__]0.0%
|
[__]
|
|
-150— -200
|
Days
|
[__]0
|
[__]
|
[__]0
|
0
|
[__]0
|
[__]0
|
[__]
|
|
Basis Points
|
%
|
[__]0.0%
|
[__]
|
[__]0.0%
|
0.0%
|
[__]0.0%
|
[__]0.0%
|
[__]
|
|
< -200
|
Days
|
[__]0
|
[__]
|
[__]0
|
0
|
[__]0
|
[__]0
|
[__]
|
|
Basis Points
|
%
|
[__]0.0%
|
[__]
|
[__]0.0%
|
0.0%
|
[__]0.0%
|
[__]0.0%
|
[__]
|
[Close was within [0.25]% of NAV better than [___]91% of the time from January 29, 1993 (the first day of trading) through December 31,throughout 2012.]
____________
|
(1)
|
[Source: NYSE Euronext]
|
| |
|
|
(2)
|
[Currently, the bid/ask price is the midpoint of the best bid and best offer prices on NYSE Arca at the time the Trust’s NAV is calculated, ordinarily 4:00 p.m. Through November 28, 2008, the bid/ask price was the midpoint of the best bid and best offer prices on NYSE Alternext US (formerly the American Stock Exchange and now NYSE MKT) at the close of trading, ordinarily 4:00 p.m.]
|
SPDR S&P 500 ETF Trust
Schedule of Investments (continued)
September 30, 2012
Comparison of Total Returns Based on NAV and Bid/Ask Price(1)
as of 12/31/12*
The table below is provided to compare the Trust’s total pre-tax returns at NAV with the total pre-tax returns based on bid/ask price and the performance of the Index. Past performance is not necessarily an indication of how the Trust will perform in the future.
Cumulative Total Return
|
|
1 Year
|
|
5 Year
|
|
10 Year
|
|
Trust
|
|
|
|
|
|
|
Return Based on NAV (2)(3)(4)(5)
|
[__]15.84%
|
|
[__]8.25%
|
|
[__]96.63%
|
|
Return Based on Bid/Ask Price (2)(3)(4)(5)
|
[__]15.93%
|
|
[__]8.44%
|
|
[__]96.81%
|
|
Index
|
[__]16.00%
|
|
[__]8.59%
|
|
[__]98.58%
|
Average Annual Total Return**
|
|
1 Year
|
|
5 Year
|
|
10 Year
|
|
Trust
|
|
|
|
|
|
|
Return Based on NAV (2)(3)(4)(5)
|
[__]15.84%
|
|
[__]1.60%
|
|
[__]7.00%
|
|
Return Based on Bid/Ask Price (2)(3)(4)(5)
|
[__]15.93%
|
|
[__]1.63%
|
|
[__]7.00%
|
|
Index
|
[__]16.00%
|
|
[__]1.66%
|
|
[__]7.10%
|
____________
|
(1)
|
[Currently, the bid/ask price is the midpoint of the best bid and best offer prices on NYSE Arca at the time the Trust’s NAV is calculated, ordinarily 4:00 p.m. Through November 28, 2008, the bid/ask price was the midpoint of the best bid and best offer prices on NYSE Alternext US (formerly the American Stock Exchange and now NYSE MKT) at the close of trading, ordinarily 4:00 p.m.]
|
| |
|
|
(2)
|
Total return figures have been calculated in the manner described above in “Summary—Trust Performance.”
|
| |
|
|
(3)
|
Includes all applicable ordinary operating expenses set forth above in “Summary—Fees and Expenses of the Trust.”
|
| |
|
|
(4)
|
Does not include the Transaction Fee which is payable to the Trustee only by persons purchasing and redeeming Creation Units as discussed above in “Purchases and Redemptions of Creation Units.” If these amounts were reflected, returns to such persons would be less than those shown.
|
| |
|
|
(5)
|
Does not include brokerage commissions and charges incurred only by persons who make purchases and sales of Units in the secondary market as discussed above in “Exchange Listing and Trading—Secondary Trading on Exchanges.” If these amounts were reflected, returns to such persons would be less than those shown.
|
|
*
|
Source: NYSE Euronext and State Street Bank and Trust Company.
|
| |
|
|
**
|
Total returns assume that dividends and capital gain distributions have been reinvested in the Trust at the net asset value per UnitNAV.
|
SPDR S&P 500 ETF TRUST (“SPY”)
SPONSOR: PDR SERVICES LLC
This prospectus does not include all of the information with respect to SPY set forth in its Registration Statement filed with the SEC in Washington, D.C. under the:
|
|
•
|
Securities Act of 1933 (File No. 33-46080) and
|
|
|
•
|
Investment Company Act of 1940 (File No. 811-06125).
|
To obtain copies from the SEC at prescribed rates—
WRITE: Public Reference Section of the SEC
100 F Street, N.E., Washington, D.C. 20549
CALL: 1-800-SEC-0330
VISIT: http://www.sec.gov
No person is authorized to give any information or make any representation about SPY not contained in this prospectus, and you should not rely on any other information. Read and keep both parts of this prospectus for future reference.
PDR Services LLC has filed a registration statement on Form S-6 and Form N-8B-2 with the SEC covering the Units. While this prospectus is a part of the registration statement on Form S-6, it does not contain all the exhibits filed as part of the registration statement on Form S-6. You should consider reviewing the full text of those exhibits.
Prospectus dated [January __]23, 2013
|
EX-99.A4(3)
|
— Sublicense Agreement entered into as of November 1, 2005 by and among PDR Services LLC, as Sublicensee, State Street Global Markets, LLC, as Licensee, and Standard & Poor’s (12)
|
|
EX-99.A4(4)
|
— Sublicense Agreement entered into as of November 1, 2005 by and among State Street Bank and Trust Company, as Sublicensee, State Street Global Markets, LLC, as Licensee, and Standard & Poor’s (12)
|
|
EX-99.A6(1)
|
— Amended and Restated Certificate of Formation of PDR Services LLC (1)
|
|
EX-99.A6(2)
|
— Amended and Restated Limited Liability Company Agreement of PDR Services LLC (1)
|
|
EX-99.A9(1)
|
— Chief Compliance Officer Services Agreement dated and effective October 5, 2004 (10)
|
|
EX-99.A9(2)
|
— Addendum to Chief Compliance Officer Services Agreements dated and effective September 1, 2006 (10)
|
|
EX-99.A9(3)
|
— Amendment to Chief Compliance Officer Services Agreement dated October 1, 2009 (10)
|
|
EX-99.A9(4)
|
— Depository Agreement among State Street Bank and Trust Company, as Trustee, PDR Services Corporation, as Sponsor and The Depository Trust Company as the Depository, dated January 14, 1993 (6)
|
|
EX-99.A9(5)
|
— Trustee Fee Waiver Agreement (1)
|
|
EX-99.A11
|
— Code of Ethics dated and effective January 26, 2012 (10)
|
|
EX-99.C1
|
— Consent of Independent Registered Public Accounting Firm (1)
|
(1) To be filed by amendmentFiled herewith.
(2) Filed on January 28, 2004 with registrant’s Registration Statement on Form S-6 (File Nos. 33-46080 and 811-06125) and incorporated by reference herein.
(3) Filed on January 28, 2005 with registrant’s Registration Statement on Form S-6 (File Nos. 33-46080 and 811-06125) and incorporated by reference herein.
(4) Filed on February 24, 2009 with registrant’s Registration Statement on Form S-6 (File Nos. 33-46080 and 811-06125) and incorporated by reference herein.
(5) Filed on January 27, 2010 with registrant’s Registration Statement on Form S-6 (File Nos. 33-46080 and 811-06125) and incorporated by reference herein.
(6) Filed on January 22, 1993 with registrant’s Registration Statement on Form S-6 (File Nos. 33-46080 and 811-06125) and incorporated by reference herein.
(7) Filed on January 19, 1996 with registrant’s Registration Statement on Form S-6 (File Nos. 33-46080 and 811-06125) and incorporated by reference herein.
(8) Filed on September 30, 1997 with registrant’s Registration Statement on Form S-6 (File Nos. 33-46080 and 811-06125) and incorporated by reference herein.
(9) Filed on January 25, 1999 with registrant’s Registration Statement on Form S-6 (File Nos. 33-46080 and 811-06125) and incorporated by reference herein.
(10) Filed on January 25, 2012 with registrant’s Registration Statement on Form S-6 (File Nos. 33-46080 and 811-06125) and incorporated by reference herein.
(11) Filed on January 26, 2011 with registrant’s Registration Statement on Form S-6 (File Nos. 33-46080 and 811-06125) and incorporated by reference herein.
(12) Filed on January 26, 2007 with registrant’s Registration Statement on Form S-6 (File Nos. 33-46080 and 811-06125) and incorporated by reference herein.
FINANCIAL STATEMENTS
|
1.
|
Statement of Financial Condition of the Trust as shown in the current prospectus for this series herewith.
|
|
2.
|
Financial Statements of the Depositor:
|
PDR Services LLC—Financial Statements, as part of NYSE Euronext’s current consolidated financial statements incorporated by reference to Form 10-K dated [__________]February 28, 20132012.
SIGNATURES
Pursuant to the requirements of the Securities Act of 1933, the registrant, SPDR S&P 500 ETF Trust, certifies that it meets all of the requirements for effectiveness of this Post Effective Amendment to the Registration Statement pursuant to Rule 485(b) under the Securities Act of 1933 and has duly caused this amendmentPost Effective Amendment to the Registration Statement to be signed on its behalf by the undersigned thereunto duly authorized, in the City of New York, and State of New York, on the 25th23rd day of OctoberJanuary, 20122013.
| |
SPDR S&P 500 ETF TRUST
(Registrant)
|
|
| |
By:
|
PDR Services LLC
|
|
|
|
By:
|
/s/ JoeJoseph Mecane |
|
| |
|
Name: JoeJoseph Mecane |
|
| |
|
Title: President |
|
| |
|
|
|
Pursuant to the requirements of the Securities Act of 1933, this amendmentPost Effective Amendment to the Registration Statement has been signed below on behalf of PDR Services LLC, the Depositor, by the following persons in the capacities and on the date indicated.
PDR SERVICES LLC
|
Name
|
Title/Office
|
Date
|
| |
|
|
|
/s/ JoeJoseph Mecane
|
President of PDR Services LLC*
|
January 23, 2013
|
|
JoeJoseph Mecane
|
|
|
| |
|
|
|
/s/ Laura Morrison
|
Senior Vice President of PDR Services LLC
|
January 23, 2013
|
|
Laura Morrison
|
|
|
____________
|
*
|
The President of PDR Services LLC also undertakes all the duties and responsibilities of, and performs all functions of, the principal financial officer of PDR Services LLC.
|
EXHIBIT INDEX
|
EX-99.2
|
— Opinion of Counsel as to legality of securities being registered and consent of Counsel (1)
|
|
EX-99.A1(1)
|
— Amended and Restated Standard Terms and Conditions of Trust dated as of January 1, 2004 and effective January 27, 2004, between PDR Services LLC, as Sponsor and State Street Bank and Trust Company, as Trustee (2)
|
|
EX-99.A1(2)
|
— Amendment No. 1 dated as of November 1, 2004 and effective November 8, 2004 to the Amended and Restated Standard Terms and Conditions of Trust dated as of January 1, 2004 and effective January 27, 2004, between PDR Services LLC, as Sponsor and State Street Bank and Trust Company, as Trustee (3)
|
|
EX-99.A1(3)
|
— Amendment No. 2 dated as of February 1, 2009 and effective February 13, 2009 to the Amended and Restated Standard Terms and Conditions of Trust dated as of January 1, 2004 and effective January 27, 2004, as amended, between PDR Services LLC, as Sponsor, and State Street Bank and Trust Company, as Trustee (4)
|
|
EX-99.A1(4)
|
— Amendment No. 3 dated as of November 23, 2009 and effective January 27, 2010 to the Amended and Restated Standard Terms and Conditions of Trust dated as of January 1, 2004 and effective January 27, 2004, as amended, between PDR Services LLC, as Sponsor, and State Street Bank and Trust Company, as Trustee (5)
|
|
EX-99.A1(5)
|
— Trust Indenture and Agreement dated January 22, 1993 and effective January 22, 1993 between PDR Services Corporation, as Sponsor and State Street Bank and Trust Company, as Trustee (6)
|
|
EX-99.A1(6)
|
— Amendment dated as of January 19, 1996 to the Trust Indenture and Agreement dated January 22, 1993 between PDR Services Corporation, as Sponsor and State Street Bank and Trust Company, as Trustee (7)
|
|
EX-99.A1(7)
|
— Amendment dated as of September 1, 1997 and effective September 30, 1997 to the Trust Indenture and Agreement dated January 22, 1993 between PDR Services Corporation, as Sponsor, and State Street Bank and Trust Company, as Trustee (8)
|
|
EX-99.A1(8)
|
— Amendment dated as of January 1, 1999 and effective January 25, 1999 to the Trust Indenture and Agreement dated January 22, 1993 between PDR Services LLC, as Sponsor and State Street Bank and Trust Company, as Trustee (9)
|
|
EX-99.A3
|
— Distribution Agreement dated and effective November 1, 2011 (10)
|
|
EX-99.A4(1)
|
— Form of Global Certificates (5)
|
|
EX-99.A4(2)
|
— Form of Participant Agreement (11)
|
|
EX-99.A4(3)
|
— Sublicense Agreement entered into as of November 1, 2005 by and among PDR Services LLC, as Sublicensee, State Street Global Markets, LLC, as Licensee, and Standard & Poor’s (12)
|
|
EX-99.A4(4)
|
— Sublicense Agreement entered into as of November 1, 2005 by and among State Street Bank and Trust Company, as Sublicensee, State Street Global Markets, LLC, as Licensee, and Standard & Poor’s (12)
|
|
EX-99.A6(1)
|
— Amended and Restated Certificate of Formation of PDR Services LLC (1)
|
|
EX-99.A6(2)
|
— Amended and Restated Limited Liability Company Agreement of PDR Services LLC (1)
|
|
EX-99.A9(1)
|
— Chief Compliance Officer Services Agreement dated and effective October 5, 2004 (10)
|
|
EX-99.A9(2)
|
— Addendum to Chief Compliance Officer Services Agreements dated and effective September 1, 2006 (10)
|
|
EX-99.A9(3)
|
— Amendment to Chief Compliance Officer Services Agreement dated October 1, 2009 (10)
|
|
EX-99.A9(4)
|
— Depository Agreement among State Street Bank and Trust Company, as Trustee, PDR Services Corporation, as Sponsor and The Depository Trust Company as the Depository, dated January 14, 1993 (6)
|
|
EX-99.A9(5)
|
— Trustee Fee Waiver Agreement (1)
|
|
EX-99.A11
|
— Code of Ethics dated and effective January 26, 2012 (10)
|
|
EX-99.C1
|
— Consent of Independent Registered Public Accounting Firm (1)
|
(1) To be filed by amendmentFiled herewith.
(2) Filed on January 28, 2004 with registrant’s Registration Statement on Form S-6 (File Nos. 33-46080 and 811-06125) and incorporated by reference herein.
(3) Filed on January 28, 2005 with registrant’s Registration Statement on Form S-6 (File Nos. 33-46080 and 811-06125) and incorporated by reference herein.
(4) Filed on February 24, 2009 with registrant’s Registration Statement on Form S-6 (File Nos. 33-46080 and 811-06125) and incorporated by reference herein.
(5) Filed on January 27, 2010 with registrant’s Registration Statement on Form S-6 (File Nos. 33-46080 and 811-06125) and incorporated by reference herein.
(6) Filed on January 22, 1993 with registrant’s Registration Statement on Form S-6 (File Nos. 33-46080 and 811-06125) and incorporated by reference herein.
(7) Filed on January 19, 1996 with registrant’s Registration Statement on Form S-6 (File Nos. 33-46080 and 811-06125) and incorporated by reference herein.
(8) Filed on September 30, 1997 with registrant’s Registration Statement on Form S-6 (File Nos. 33-46080 and 811-06125) and incorporated by reference herein.
(9) Filed on January 25, 1999 with registrant’s Registration Statement on Form S-6 (File Nos. 33-46080 and 811-06125) and incorporated by reference herein.
(10) Filed on January 25, 2012 with registrant’s Registration Statement on Form S-6 (File Nos. 33-46080 and 811-06125) and incorporated by reference herein.
(11) Filed on January 26, 2011 with registrant’s Registration Statement on Form S-6 (File Nos. 33-46080 and 811-06125) and incorporated by reference herein.
(12) Filed on January 26, 2007 with registrant’s Registration Statement on Form S-6 (File Nos. 33-46080 and 811-06125) and incorporated by reference herein.