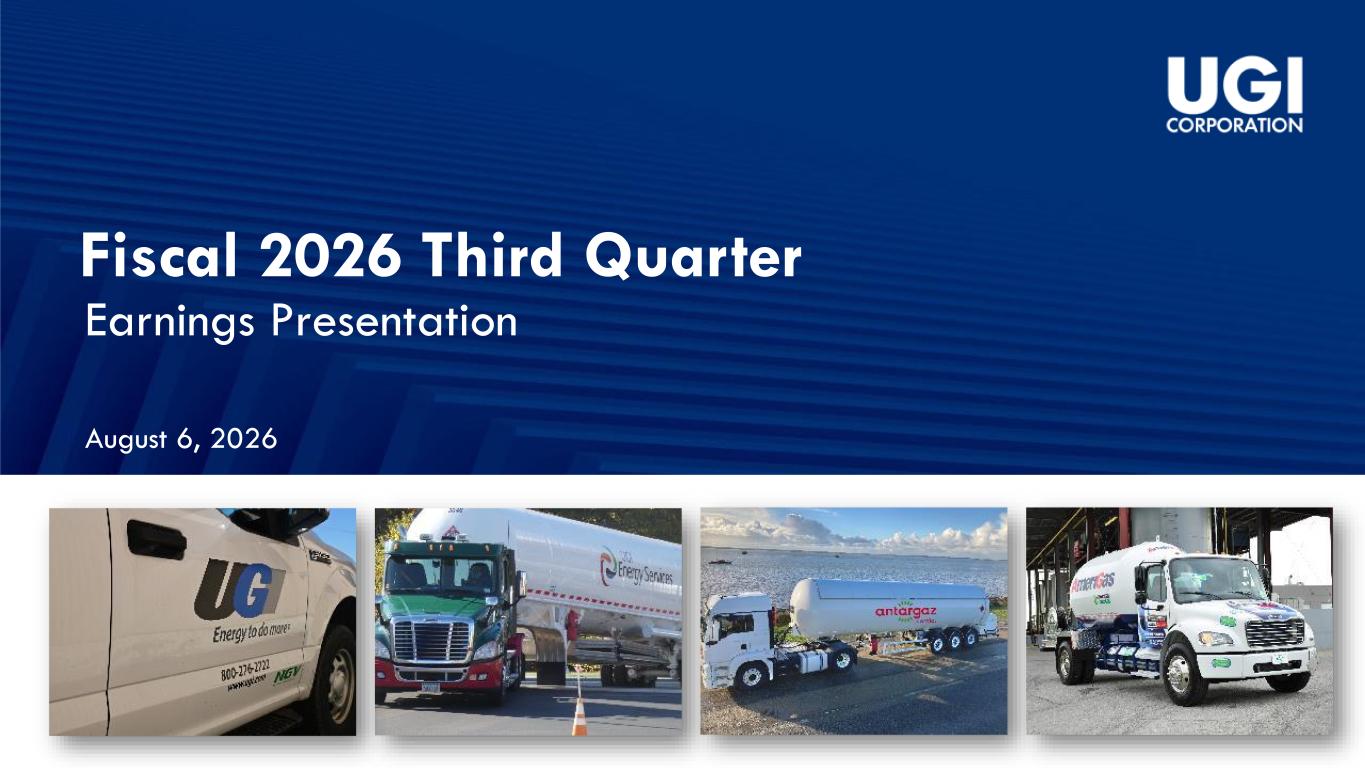
Fiscal 2026 Third Quarter Earnings Presentation August 6, 2026
About This Presentation This presentation contains statements, estimates and projections that are forward-looking statements (as defined in Section 21E of the Securities Exchange Act of 1934, as amended, and Section 27A of the Securities Act of 1933, as amended). Such statements use forward-looking words such as “believe,” “plan,” “anticipate,” “continue,” “estimate,” “expect,” “may,” or other similar words and terms of similar meaning, although not all forward-looking statements contain such words. These statements discuss plans, strategies, events or developments that we expect or anticipate will or may occur in the future. Management believes that these are reasonable as of today’s date only. Actual results may differ significantly because of risks and uncertainties that are difficult to predict and many of which are beyond management’s control; accordingly, there is no assurance that results will be realized. You should read UGI’s Annual Report on Form 10-K and Quarterly Reports on Form 10-Q for a more extensive list of factors that could affect results. We undertake no obligation (and expressly disclaim any obligation) to update publicly any forward-looking statement, whether as a result of new information or future events, except as required by the federal securities laws. Management uses “UGI Corporation adjusted net income”, “UGI Corporation adjusted diluted earnings per share (“EPS”)”, “UGI Corporation adjusted EBITDA”, “UGI International free cash flow”, “UGI International adjusted EBITDA” “UGI Energy Services adjusted EBITDA” and “AmeriGas Propane adjusted EBITDA”, each of which are non-GAAP financial measures, when evaluating UGI's overall performance. Management believes that these non-GAAP measures provide meaningful information to investors about UGI’s performance because they eliminate the impacts of (1) gains and losses on commodity and certain foreign currency derivative instruments not associated with current-period transactions and (2) other significant discrete items that can affect the comparison of period- over-period results. Volatility in net income attributable to UGI can occur as a result of gains and losses on commodity and certain foreign currency derivative instruments not associated with current-period transactions but included in earnings in accordance with U.S. generally accepted accounting principles (“GAAP”). Non-GAAP financial measures are not in accordance with, or an alternative to, GAAP and should be considered in addition to, and not as a substitute for, the comparable GAAP measures. The tables in the Appendix reconcile UGI Corporation adjusted net income, UGI Corporation adjusted diluted EPS, UGI Corporation adjusted EBITDA, UGI International free cash flow, UGI International adjusted EBITDA, UGI Energy Services adjusted EBITDA and AmeriGas Propane adjusted EBITDA to their nearest GAAP measures. 2
Bob Flexon President & Chief Executive Officer Sean O’Brien Chief Financial Officer
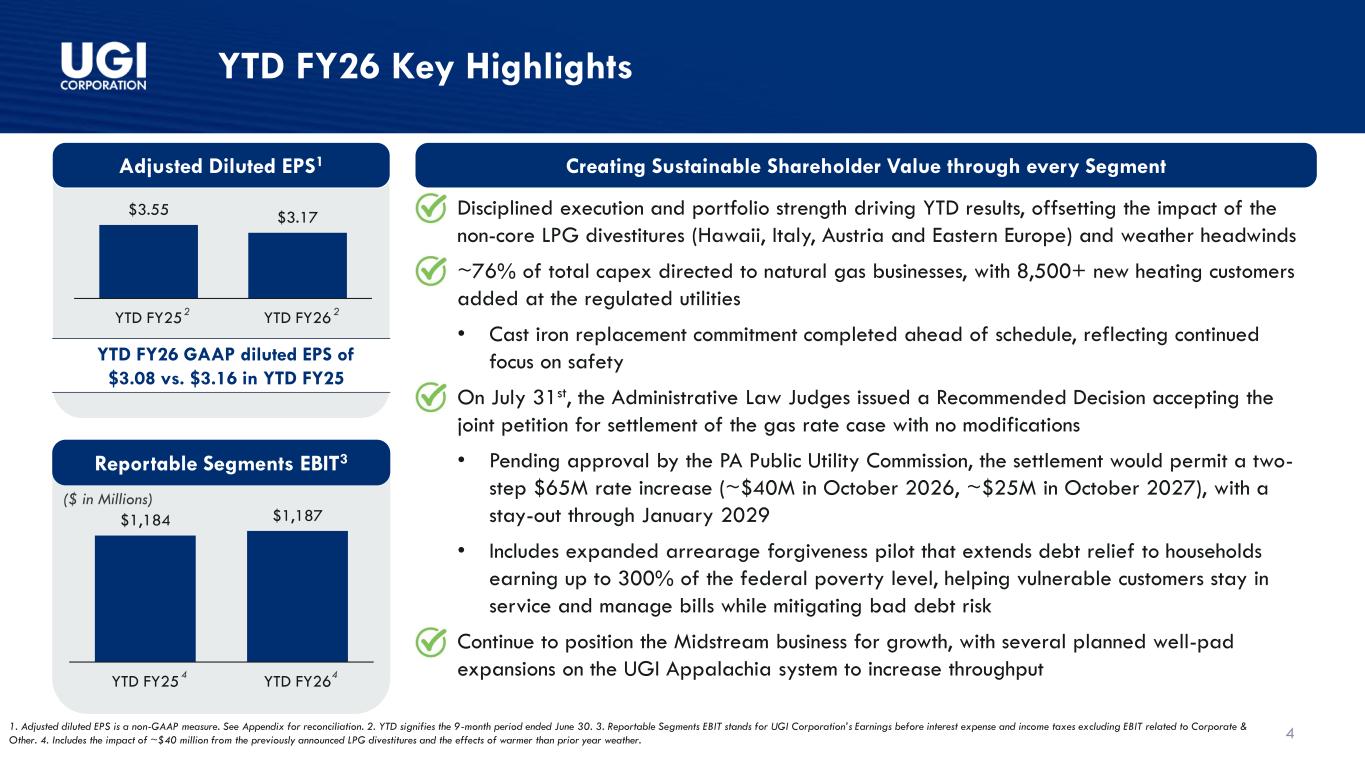
($ in Millions) $1,184 $1,187 YTD FY25 YTD FY26 4 YTD FY26 Key Highlights Reportable Segments EBIT3 1. Adjusted diluted EPS is a non-GAAP measure. See Appendix for reconciliation. 2. YTD signifies the 9-month period ended June 30. 3. Reportable Segments EBIT stands for UGI Corporation’s Earnings before interest expense and income taxes excluding EBIT related to Corporate & Other. 4. Includes the impact of ~$40 million from the previously announced LPG divestitures and the effects of warmer than prior year weather. Adjusted Diluted EPS1 $3.55 $3.17 YTD FY25 YTD FY26 YTD FY26 GAAP diluted EPS of $3.08 vs. $3.16 in YTD FY25 22 • Disciplined execution and portfolio strength driving YTD results, offsetting the impact of the non-core LPG divestitures (Hawaii, Italy, Austria and Eastern Europe) and weather headwinds • ~76% of total capex directed to natural gas businesses, with 8,500+ new heating customers added at the regulated utilities • Cast iron replacement commitment completed ahead of schedule, reflecting continued focus on safety • On July 31st, the Administrative Law Judges issued a Recommended Decision accepting the joint petition for settlement of the gas rate case with no modifications • Pending approval by the PA Public Utility Commission, the settlement would permit a two- step $65M rate increase (~$40M in October 2026, ~$25M in October 2027), with a stay-out through January 2029 • Includes expanded arrearage forgiveness pilot that extends debt relief to households earning up to 300% of the federal poverty level, helping vulnerable customers stay in service and manage bills while mitigating bad debt risk • Continue to position the Midstream business for growth, with several planned well-pad expansions on the UGI Appalachia system to increase throughput Creating Sustainable Shareholder Value through every Segment 44
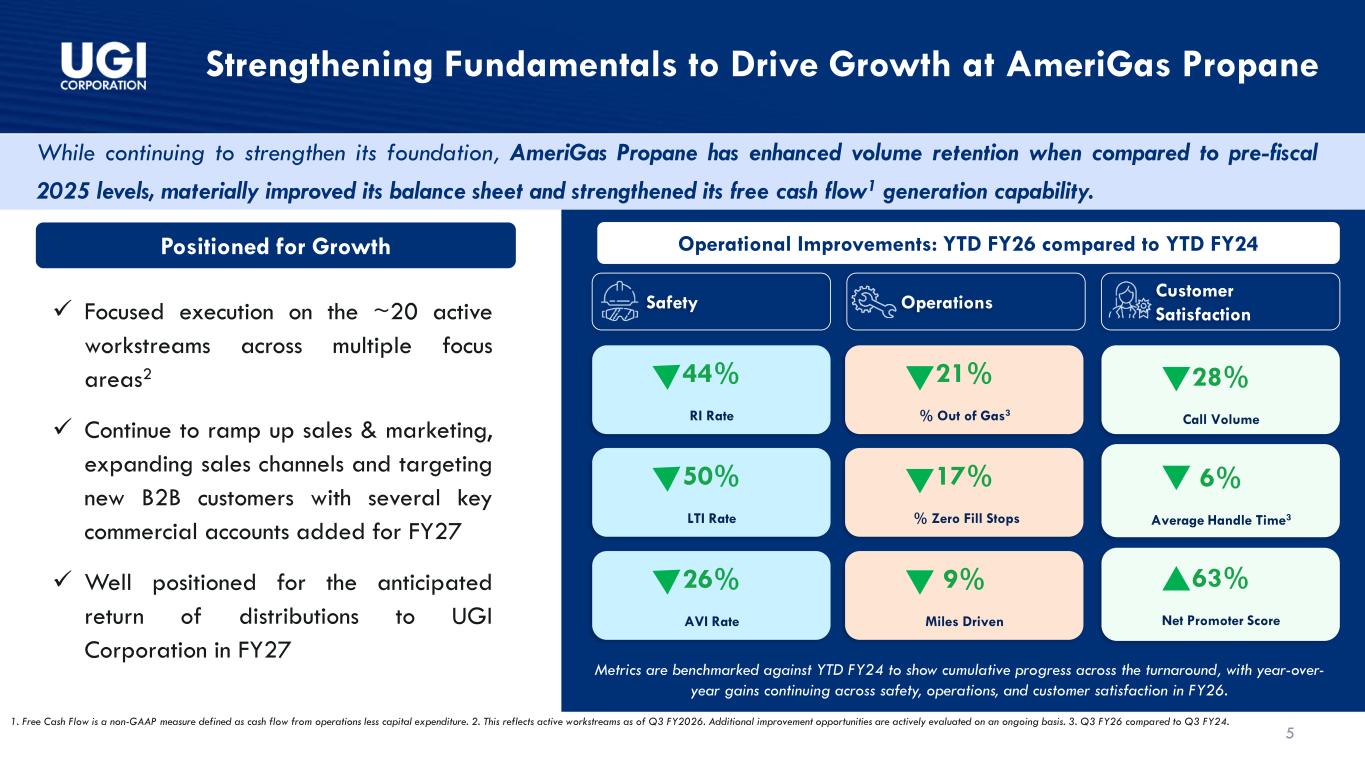
5 Strengthening Fundamentals to Drive Growth at AmeriGas Propane While continuing to strengthen its foundation, AmeriGas Propane has enhanced volume retention when compared to pre-fiscal 2025 levels, materially improved its balance sheet and strengthened its free cash flow1 generation capability. 1. Free Cash Flow is a non-GAAP measure defined as cash flow from operations less capital expenditure. 2. This reflects active workstreams as of Q3 FY2026. Additional improvement opportunities are actively evaluated on an ongoing basis. 3. Q3 FY26 compared to Q3 FY24. Positioned for Growth ✓ Focused execution on the ~20 active workstreams across multiple focus areas2 ✓ Continue to ramp up sales & marketing, expanding sales channels and targeting new B2B customers with several key commercial accounts added for FY27 ✓ Well positioned for the anticipated return of distributions to UGI Corporation in FY27 Operational Improvements: YTD FY26 compared to YTD FY24 Safety Operations Customer Satisfaction 44% RI Rate 50% LTI Rate 26% AVI Rate 21% % Out of Gas3 17% % Zero Fill Stops 9% Miles Driven 28% Call Volume 63% Net Promoter Score 6% Average Handle Time3 Metrics are benchmarked against YTD FY24 to show cumulative progress across the turnaround, with year-over- year gains continuing across safety, operations, and customer satisfaction in FY26.
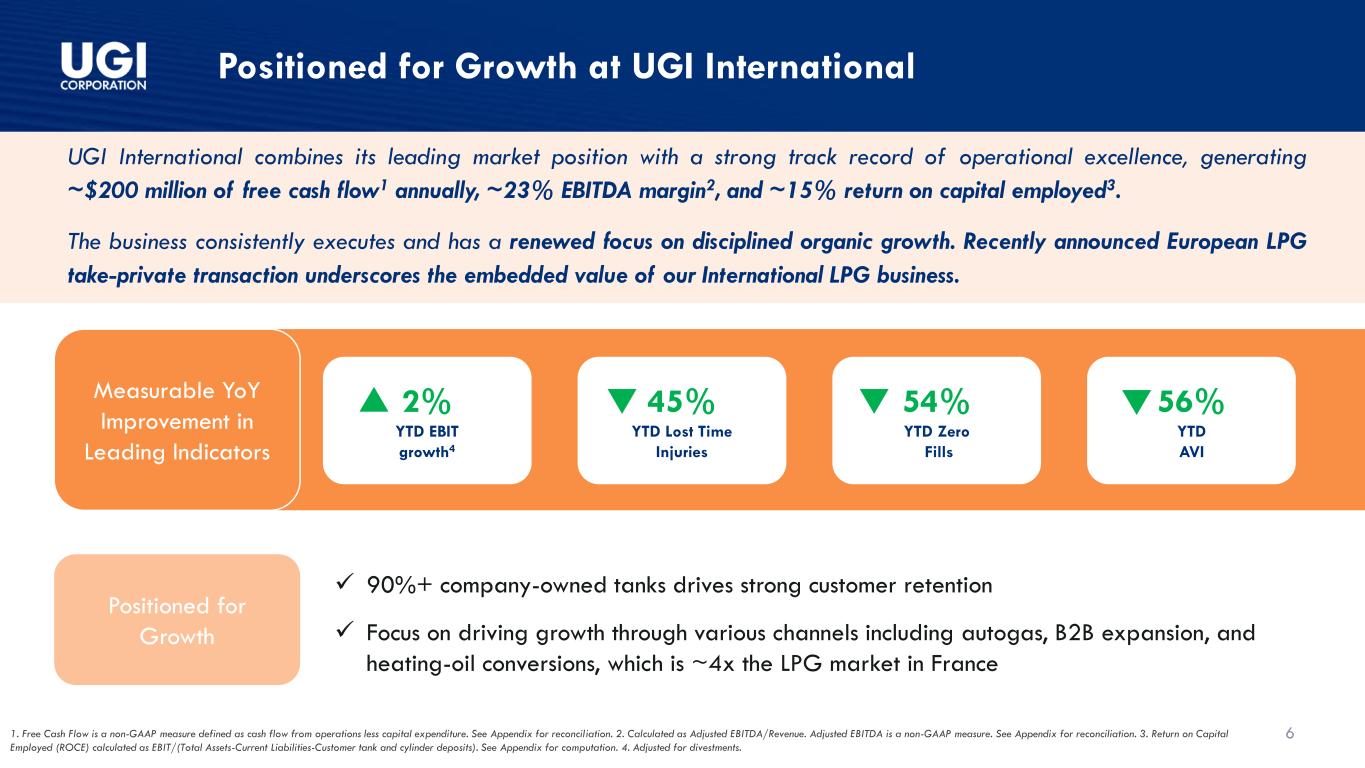
6 Positioned for Growth at UGI International Positioned for Growth UGI International combines its leading market position with a strong track record of operational excellence, generating ~$200 million of free cash flow1 annually, ~23% EBITDA margin2, and ~15% return on capital employed3. The business consistently executes and has a renewed focus on disciplined organic growth. Recently announced European LPG take-private transaction underscores the embedded value of our International LPG business. Measurable YoY Improvement in Leading Indicators ✓ 90%+ company-owned tanks drives strong customer retention ✓ Focus on driving growth through various channels including autogas, B2B expansion, and heating-oil conversions, which is ~4x the LPG market in France 1. Free Cash Flow is a non-GAAP measure defined as cash flow from operations less capital expenditure. See Appendix for reconciliation. 2. Calculated as Adjusted EBITDA/Revenue. Adjusted EBITDA is a non-GAAP measure. See Appendix for reconciliation. 3. Return on Capital Employed (ROCE) calculated as EBIT/(Total Assets-Current Liabilities-Customer tank and cylinder deposits). See Appendix for computation. 4. Adjusted for divestments. 2% YTD EBIT growth4 45% YTD Lost Time Injuries 54% YTD Zero Fills 56% YTD AVI
Q3 and YTD FY26 Financial Update
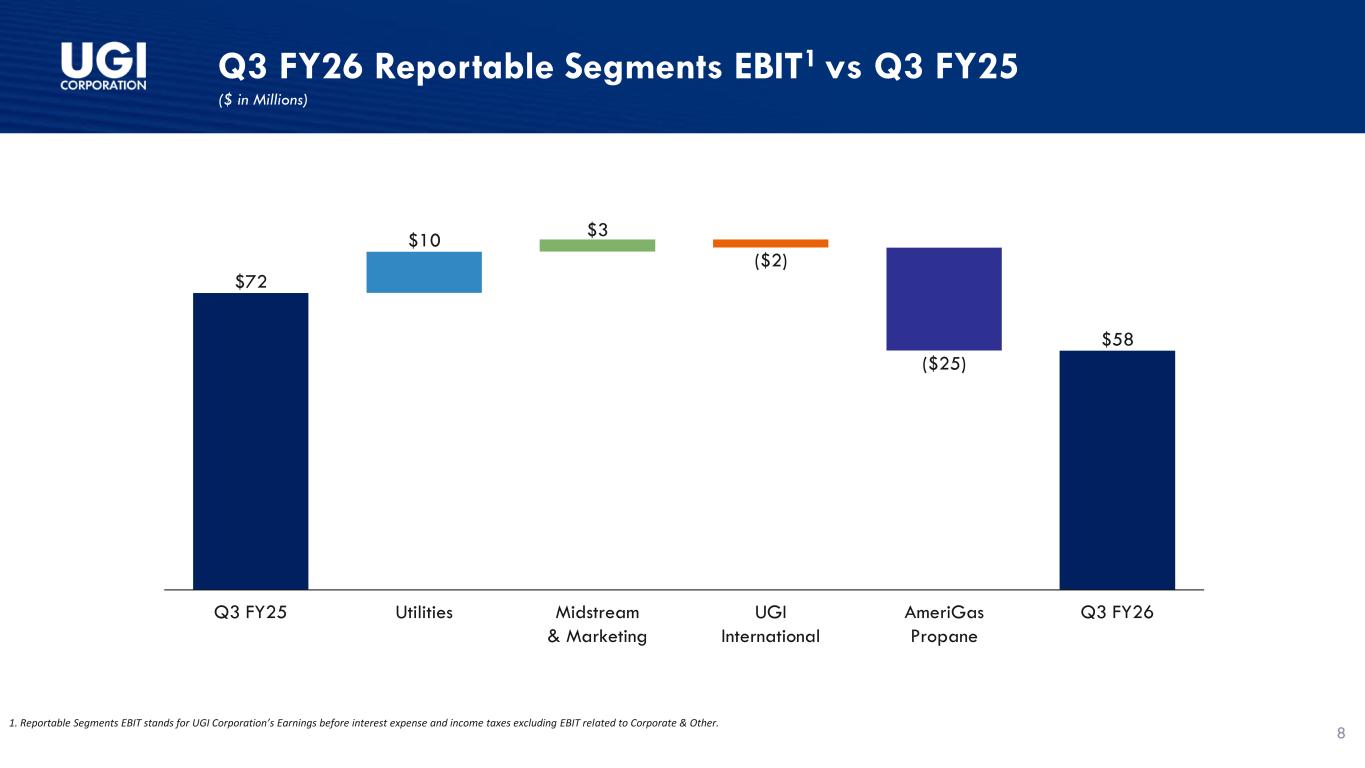
Q3 FY26 Reportable Segments EBIT1 vs Q3 FY25 ($ in Millions) 8 $72 $10 $3 ($2) ($25) $58 Q3 FY25 Utilities Midstream & Marketing UGI International AmeriGas Propane Q3 FY26 1. Reportable Segments EBIT stands for UGI Corporation’s Earnings before interest expense and income taxes excluding EBIT related to Corporate & Other.
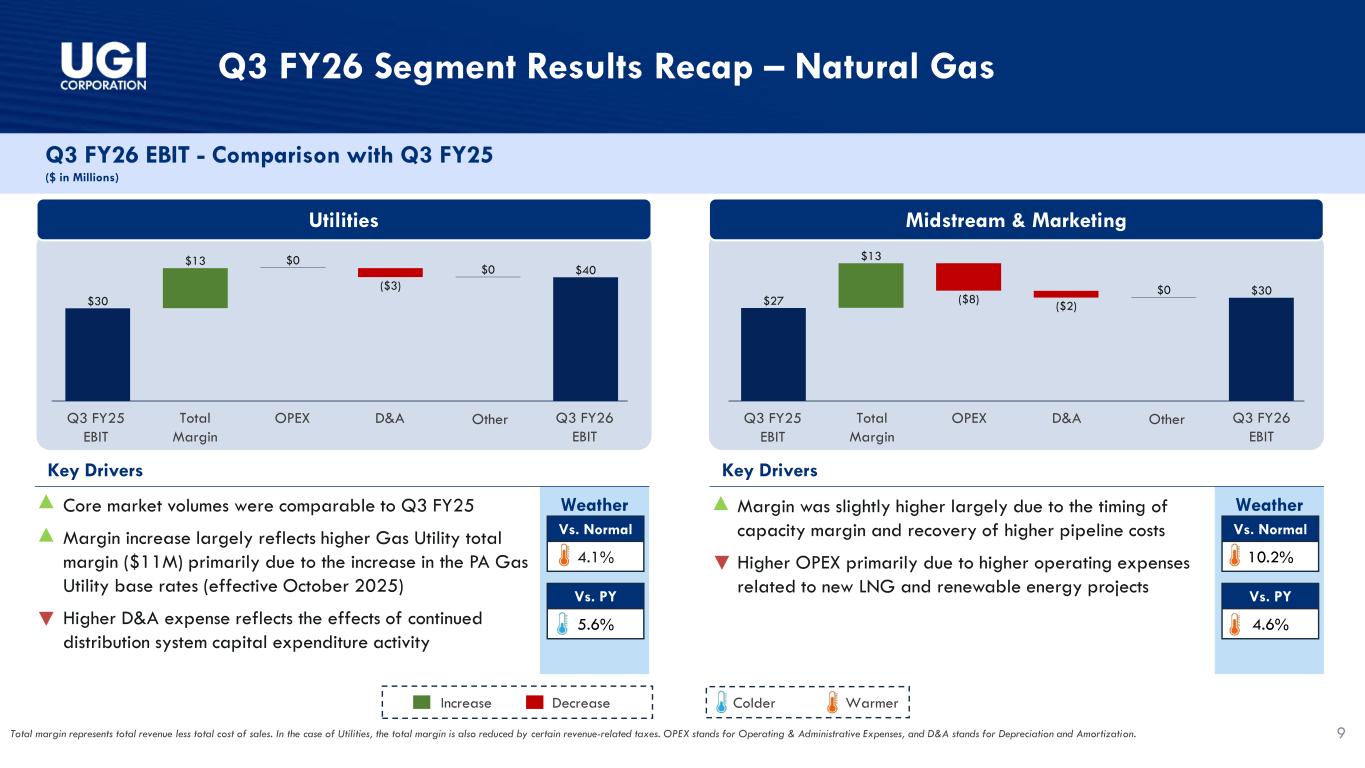
Q3 FY26 Segment Results Recap – Natural Gas Q3 FY26 EBIT - Comparison with Q3 FY25 ($ in Millions) Utilities Midstream & Marketing Weather Total margin represents total revenue less total cost of sales. In the case of Utilities, the total margin is also reduced by certain revenue-related taxes. OPEX stands for Operating & Administrative Expenses, and D&A stands for Depreciation and Amortization. Key Drivers • Core market volumes were comparable to Q3 FY25 • Margin increase largely reflects higher Gas Utility total margin ($11M) primarily due to the increase in the PA Gas Utility base rates (effective October 2025) • Higher D&A expense reflects the effects of continued distribution system capital expenditure activity 4.1% 5.6% Vs. Normal Vs. PY Increase Decrease WarmerColder Weather Key Drivers • Margin was slightly higher largely due to the timing of capacity margin and recovery of higher pipeline costs • Higher OPEX primarily due to higher operating expenses related to new LNG and renewable energy projects 10.2% 4.6% Vs. Normal Vs. PY Q3 FY25 EBIT Q3 FY26 EBIT Total Margin OPEX D&A Other Q3 FY25 EBIT Q3 FY26 EBIT Total Margin OPEX D&A Other 9 $30 $13 $0 ($3) $0 $40 $27 $13 ($8) ($2) $0 $30
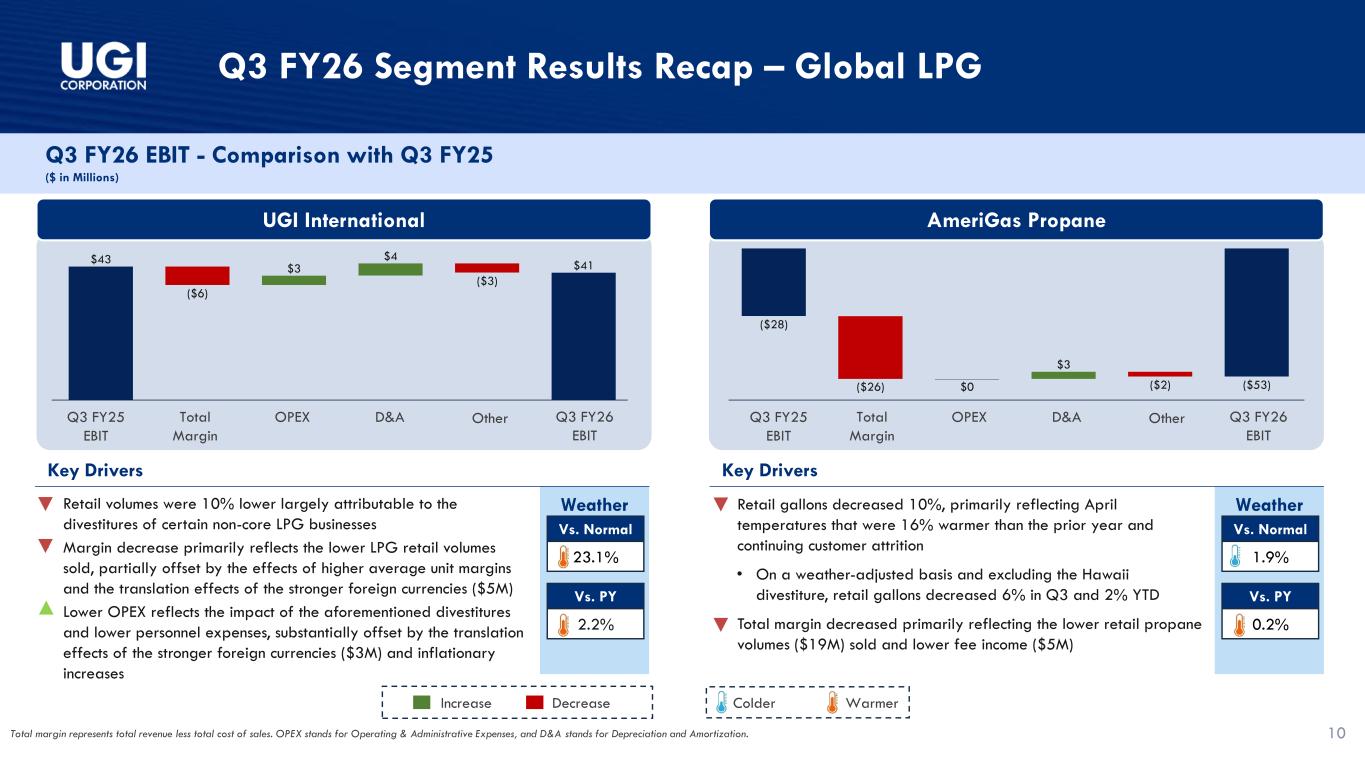
Q3 FY26 Segment Results Recap – Global LPG Q3 FY26 EBIT - Comparison with Q3 FY25 ($ in Millions) UGI International AmeriGas Propane Weather Key Drivers • Retail volumes were 10% lower largely attributable to the divestitures of certain non-core LPG businesses • Margin decrease primarily reflects the lower LPG retail volumes sold, partially offset by the effects of higher average unit margins and the translation effects of the stronger foreign currencies ($5M) • Lower OPEX reflects the impact of the aforementioned divestitures and lower personnel expenses, substantially offset by the translation effects of the stronger foreign currencies ($3M) and inflationary increases Increase Decrease WarmerColder Weather Key Drivers • Retail gallons decreased 10%, primarily reflecting April temperatures that were 16% warmer than the prior year and continuing customer attrition • On a weather-adjusted basis and excluding the Hawaii divestiture, retail gallons decreased 6% in Q3 and 2% YTD • Total margin decreased primarily reflecting the lower retail propane volumes ($19M) sold and lower fee income ($5M) 23.1% 2.2% Vs. Normal Vs. PY 1.9% 0.2% Vs. Normal Vs. PY Q3 FY25 EBIT Q3 FY26 EBIT Total Margin OPEX D&A Other Q3 FY25 EBIT Q3 FY26 EBIT Total Margin OPEX D&A Other Total margin represents total revenue less total cost of sales. OPEX stands for Operating & Administrative Expenses, and D&A stands for Depreciation and Amortization. 10 $43 ($6) $3 $4 ($3) $41 ($28) ($26) $0 $3 ($2) ($53)
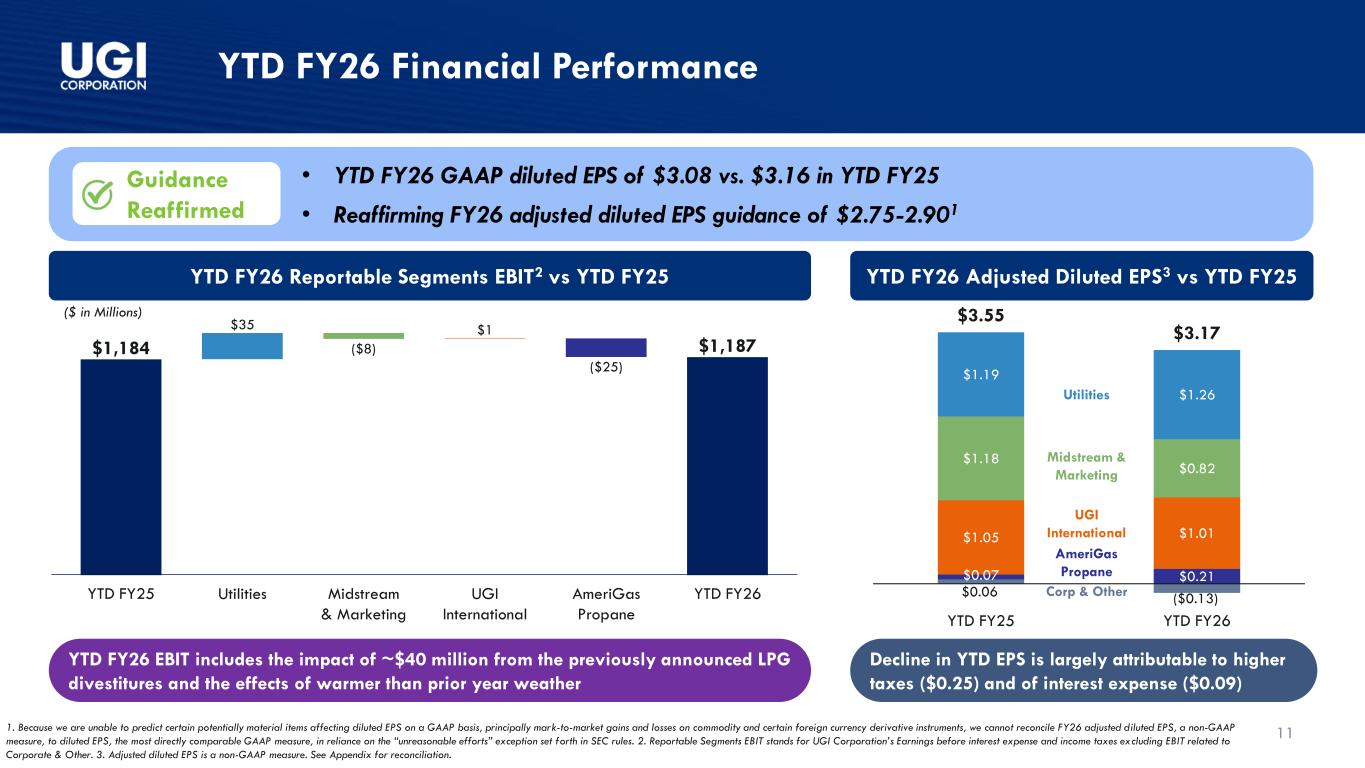
11 YTD FY26 Financial Performance $0.06 ($0.13) $0.07 $0.21 $1.05 $1.01 $1.18 $0.82 $1.19 $1.26 $3.55 $3.17 YTD FY25 YTD FY26 YTD FY26 Adjusted Diluted EPS3 vs YTD FY25 • YTD FY26 GAAP diluted EPS of $3.08 vs. $3.16 in YTD FY25 • Reaffirming FY26 adjusted diluted EPS guidance of $2.75-2.901 YTD FY26 Reportable Segments EBIT2 vs YTD FY25 $35 ($8) $1 ($25) $1,184 $1,187 YTD FY25 Utilities Midstream & Marketing UGI International AmeriGas Propane YTD FY26 Utilities Midstream & Marketing UGI International AmeriGas Propane Corp & Other 1. Because we are unable to predict certain potentially material items affecting diluted EPS on a GAAP basis, principally mark-to-market gains and losses on commodity and certain foreign currency derivative instruments, we cannot reconcile FY26 adjusted diluted EPS, a non-GAAP measure, to diluted EPS, the most directly comparable GAAP measure, in reliance on the “unreasonable efforts” exception set forth in SEC rules. 2. Reportable Segments EBIT stands for UGI Corporation’s Earnings before interest expense and income taxes excluding EBIT related to Corporate & Other. 3. Adjusted diluted EPS is a non-GAAP measure. See Appendix for reconciliation. ($ in Millions) Guidance Reaffirmed YTD FY26 EBIT includes the impact of ~$40 million from the previously announced LPG divestitures and the effects of warmer than prior year weather Decline in YTD EPS is largely attributable to higher taxes ($0.25) and of interest expense ($0.09)
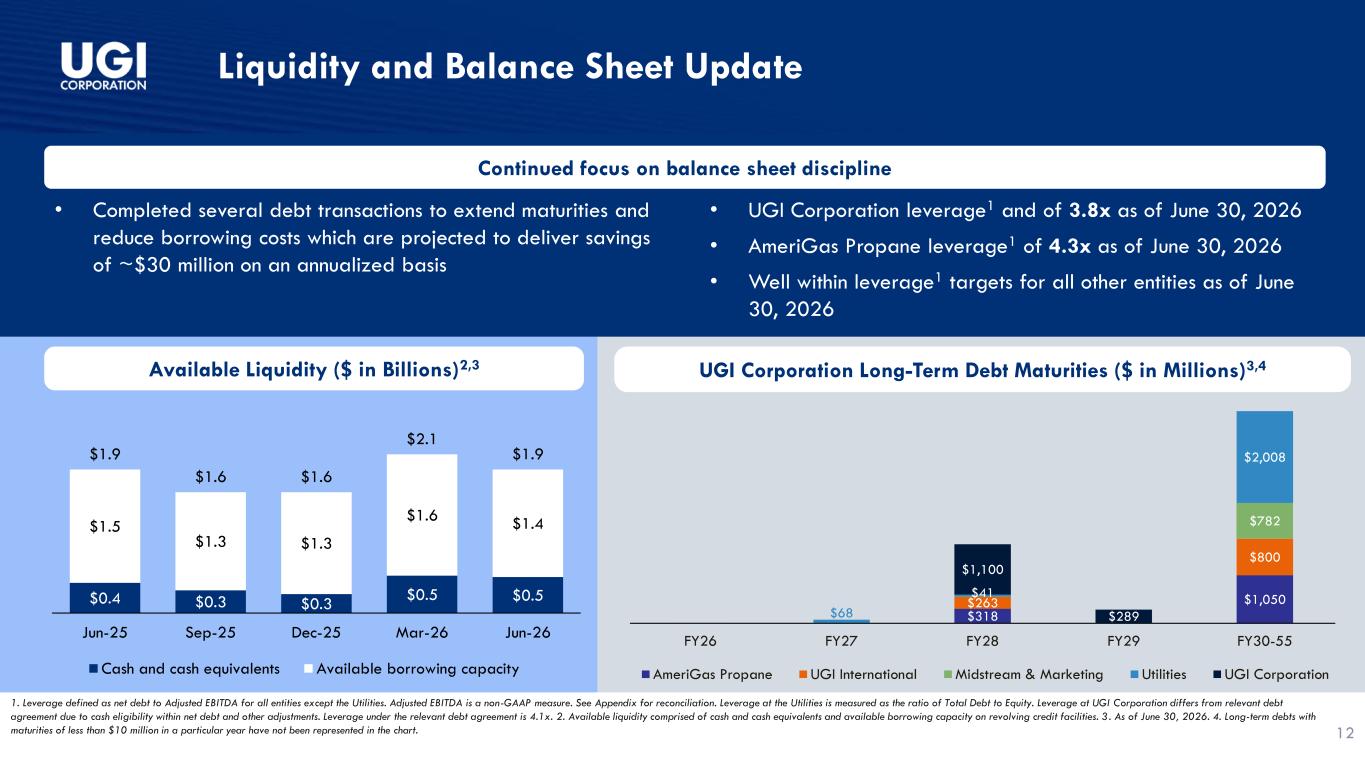
$318 $1,050 $263 $800 $782 $68 $41 $2,008 $1,100 $289 FY26 FY27 FY28 FY29 FY30-55 AmeriGas Propane UGI International Midstream & Marketing Utilities UGI Corporation Liquidity and Balance Sheet Update 1. Leverage defined as net debt to Adjusted EBITDA for all entities except the Utilities. Adjusted EBITDA is a non-GAAP measure. See Appendix for reconciliation. Leverage at the Utilities is measured as the ratio of Total Debt to Equity. Leverage at UGI Corporation differs from relevant debt agreement due to cash eligibility within net debt and other adjustments. Leverage under the relevant debt agreement is 4.1x. 2. Available liquidity comprised of cash and cash equivalents and available borrowing capacity on revolving credit facilities. 3. As of June 30, 2026. 4. Long-term debts with maturities of less than $10 million in a particular year have not been represented in the chart. 12 UGI Corporation Long-Term Debt Maturities ($ in Millions)3,4Available Liquidity ($ in Billions)2,3 $0.4 $0.3 $0.3 $0.5 $0.5 $1.5 $1.3 $1.3 $1.6 $1.4 $1.9 $1.6 $1.6 $2.1 $1.9 Jun-25 Sep-25 Dec-25 Mar-26 Jun-26 Cash and cash equivalents Available borrowing capacity Continued focus on balance sheet discipline • Completed several debt transactions to extend maturities and reduce borrowing costs which are projected to deliver savings of ~$30 million on an annualized basis • UGI Corporation leverage1 and of 3.8x as of June 30, 2026 • AmeriGas Propane leverage1 of 4.3x as of June 30, 2026 • Well within leverage1 targets for all other entities as of June 30, 2026
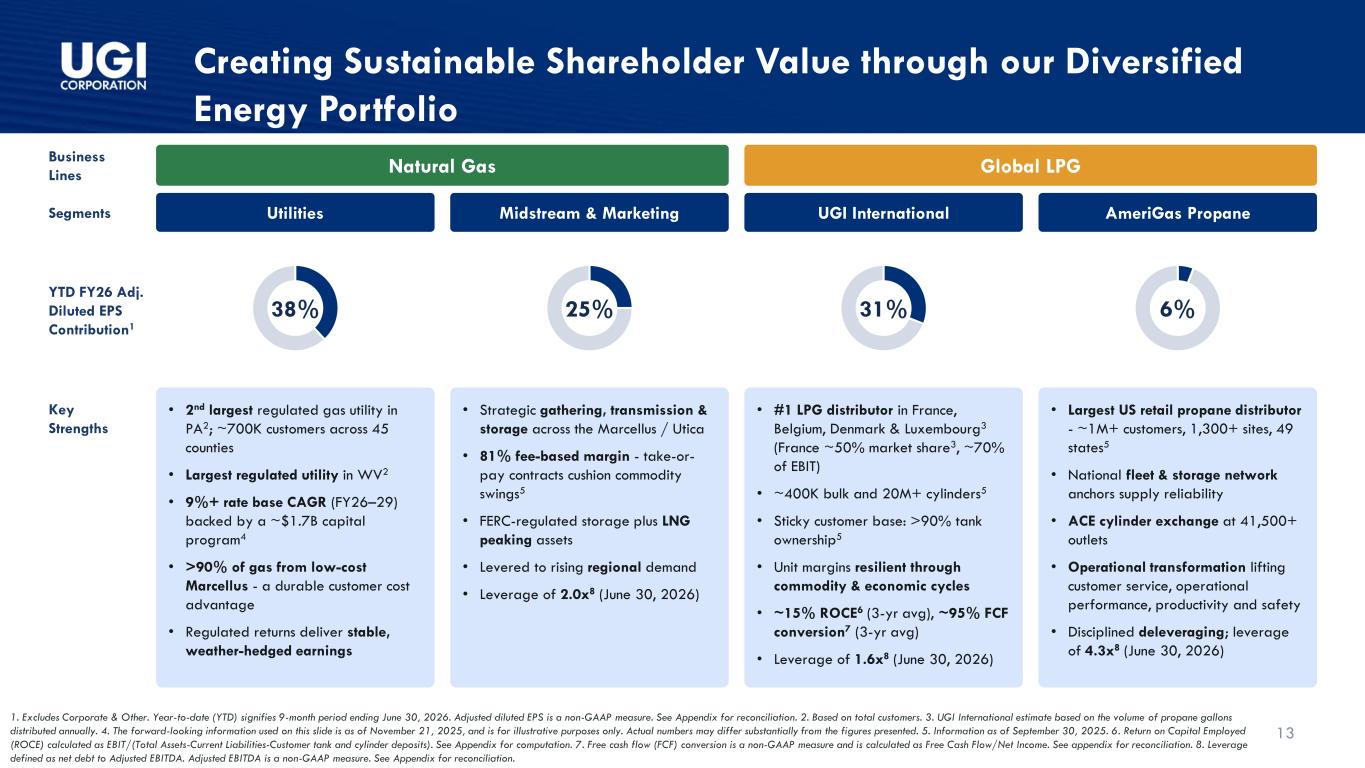
13 Creating Sustainable Shareholder Value through our Diversified Energy Portfolio Business Lines Segments YTD FY26 Adj. Diluted EPS Contribution1 Key Strengths Natural Gas Global LPG Utilities Midstream & Marketing UGI International AmeriGas Propane 38% 25% 31% 6% • 2nd largest regulated gas utility in PA2; ~700K customers across 45 counties • Largest regulated utility in WV2 • 9%+ rate base CAGR (FY26–29) backed by a ~$1.7B capital program4 • >90% of gas from low-cost Marcellus - a durable customer cost advantage • Regulated returns deliver stable, weather-hedged earnings • Strategic gathering, transmission & storage across the Marcellus / Utica • 81% fee-based margin - take-or- pay contracts cushion commodity swings5 • FERC-regulated storage plus LNG peaking assets • Levered to rising regional demand • Leverage of 2.0x8 (June 30, 2026) • #1 LPG distributor in France, Belgium, Denmark & Luxembourg3 (France ~50% market share3, ~70% of EBIT) • ~400K bulk and 20M+ cylinders5 • Sticky customer base: >90% tank ownership5 • Unit margins resilient through commodity & economic cycles • ~15% ROCE6 (3-yr avg), ~95% FCF conversion7 (3-yr avg) • Leverage of 1.6x8 (June 30, 2026) • Largest US retail propane distributor - ~1M+ customers, 1,300+ sites, 49 states5 • National fleet & storage network anchors supply reliability • ACE cylinder exchange at 41,500+ outlets • Operational transformation lifting customer service, operational performance, productivity and safety • Disciplined deleveraging; leverage of 4.3x8 (June 30, 2026) 1. Excludes Corporate & Other. Year-to-date (YTD) signifies 9-month period ending June 30, 2026. Adjusted diluted EPS is a non-GAAP measure. See Appendix for reconciliation. 2. Based on total customers. 3. UGI International estimate based on the volume of propane gallons distributed annually. 4. The forward-looking information used on this slide is as of November 21, 2025, and is for illustrative purposes only. Actual numbers may differ substantially from the figures presented. 5. Information as of September 30, 2025. 6. Return on Capital Employed (ROCE) calculated as EBIT/(Total Assets-Current Liabilities-Customer tank and cylinder deposits). See Appendix for computation. 7. Free cash flow (FCF) conversion is a non-GAAP measure and is calculated as Free Cash Flow/Net Income. See appendix for reconciliation. 8. Leverage defined as net debt to Adjusted EBITDA. Adjusted EBITDA is a non-GAAP measure. See Appendix for reconciliation.

Q & Q A

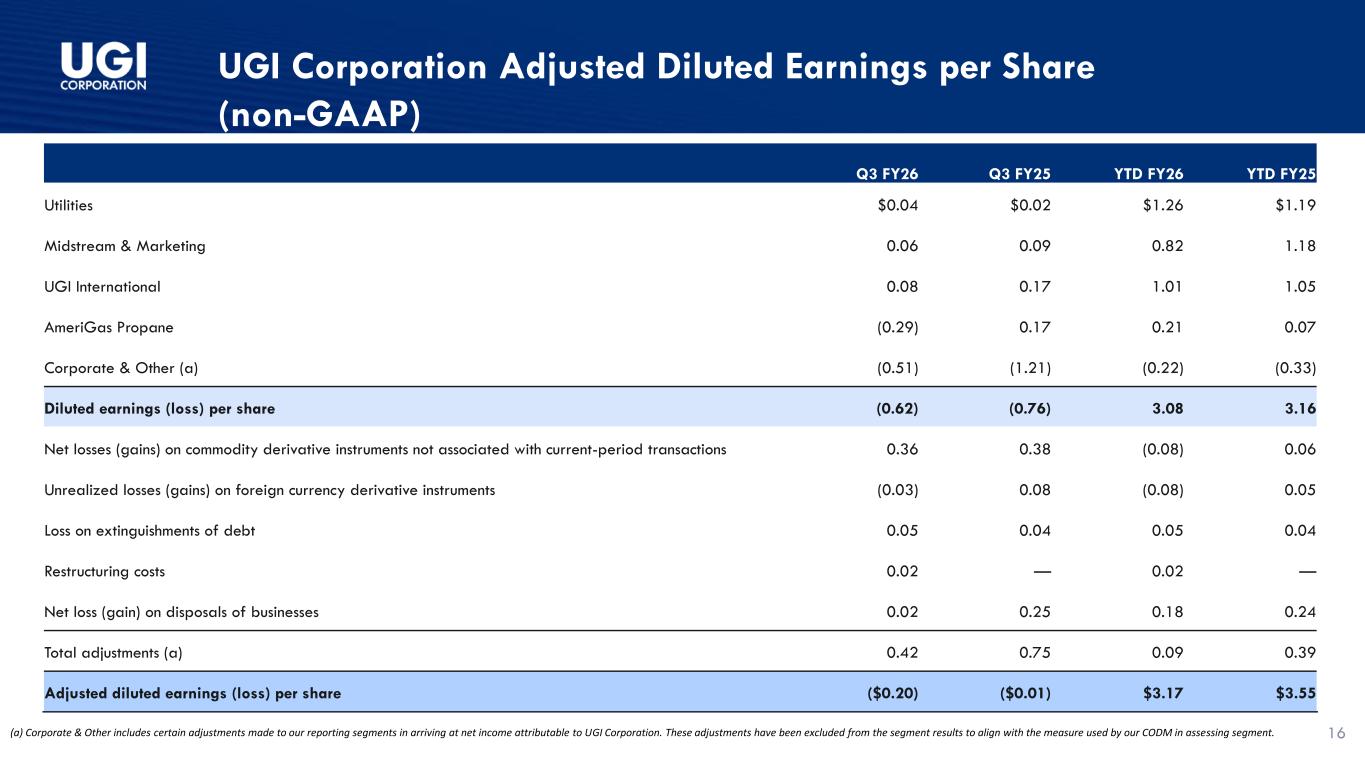
UGI Corporation Adjusted Diluted Earnings per Share (non-GAAP) (a) Corporate & Other includes certain adjustments made to our reporting segments in arriving at net income attributable to UGI Corporation. These adjustments have been excluded from the segment results to align with the measure used by our CODM in assessing segment. 16 Q3 FY26 Q3 FY25 YTD FY26 YTD FY25 Utilities $0.04 $0.02 $1.26 $1.19 Midstream & Marketing 0.06 0.09 0.82 1.18 UGI International 0.08 0.17 1.01 1.05 AmeriGas Propane (0.29) 0.17 0.21 0.07 Corporate & Other (a) (0.51) (1.21) (0.22) (0.33) Diluted earnings (loss) per share (0.62) (0.76) 3.08 3.16 Net losses (gains) on commodity derivative instruments not associated with current-period transactions 0.36 0.38 (0.08) 0.06 Unrealized losses (gains) on foreign currency derivative instruments (0.03) 0.08 (0.08) 0.05 Loss on extinguishments of debt 0.05 0.04 0.05 0.04 Restructuring costs 0.02 — 0.02 — Net loss (gain) on disposals of businesses 0.02 0.25 0.18 0.24 Total adjustments (a) 0.42 0.75 0.09 0.39 Adjusted diluted earnings (loss) per share ($0.20) ($0.01) $3.17 $3.55
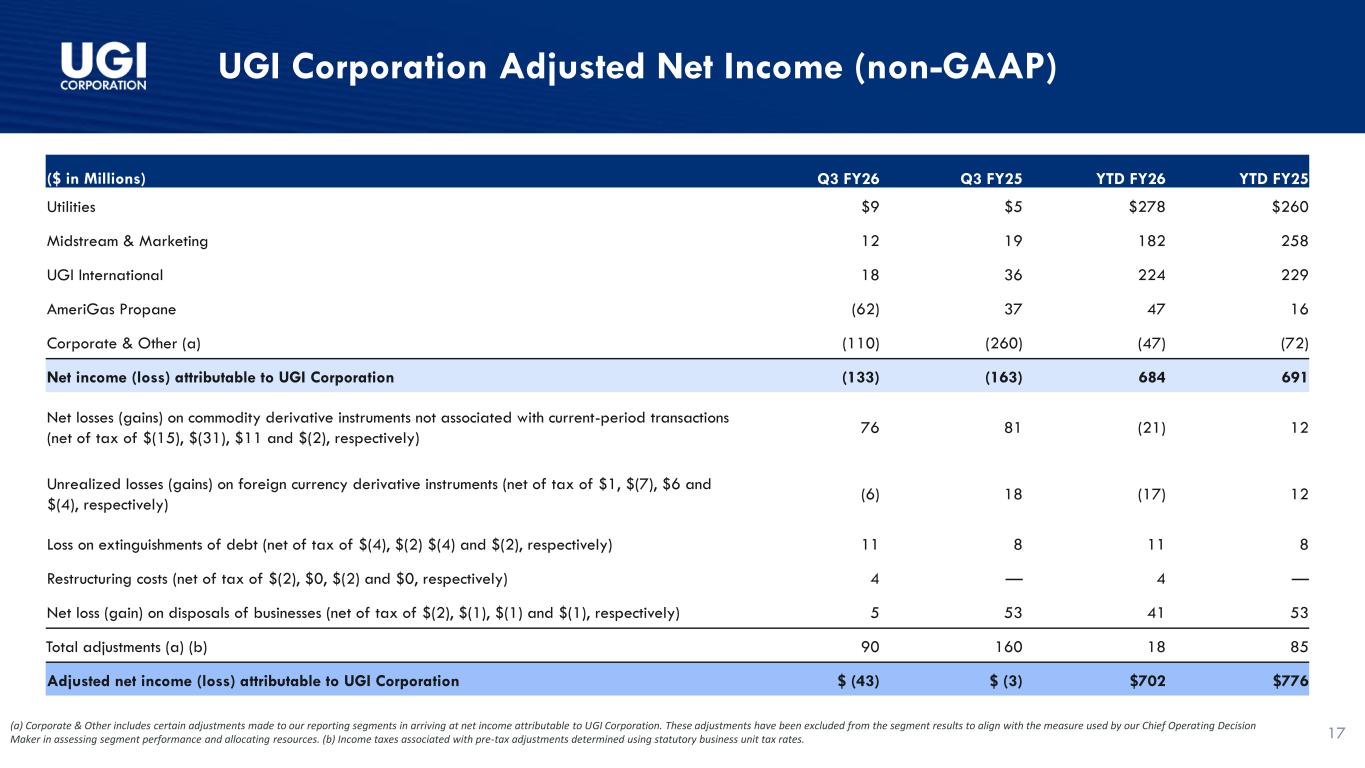
UGI Corporation Adjusted Net Income (non-GAAP) (a) Corporate & Other includes certain adjustments made to our reporting segments in arriving at net income attributable to UGI Corporation. These adjustments have been excluded from the segment results to align with the measure used by our Chief Operating Decision Maker in assessing segment performance and allocating resources. (b) Income taxes associated with pre-tax adjustments determined using statutory business unit tax rates. 17 ($ in Millions) Q3 FY26 Q3 FY25 YTD FY26 YTD FY25 Utilities $9 $5 $278 $260 Midstream & Marketing 12 19 182 258 UGI International 18 36 224 229 AmeriGas Propane (62) 37 47 16 Corporate & Other (a) (110) (260) (47) (72) Net income (loss) attributable to UGI Corporation (133) (163) 684 691 Net losses (gains) on commodity derivative instruments not associated with current-period transactions (net of tax of $(15), $(31), $11 and $(2), respectively) 76 81 (21) 12 Unrealized losses (gains) on foreign currency derivative instruments (net of tax of $1, $(7), $6 and $(4), respectively) (6) 18 (17) 12 Loss on extinguishments of debt (net of tax of $(4), $(2) $(4) and $(2), respectively) 11 8 11 8 Restructuring costs (net of tax of $(2), $0, $(2) and $0, respectively) 4 — 4 — Net loss (gain) on disposals of businesses (net of tax of $(2), $(1), $(1) and $(1), respectively) 5 53 41 53 Total adjustments (a) (b) 90 160 18 85 Adjusted net income (loss) attributable to UGI Corporation $ (43) $ (3) $702 $776
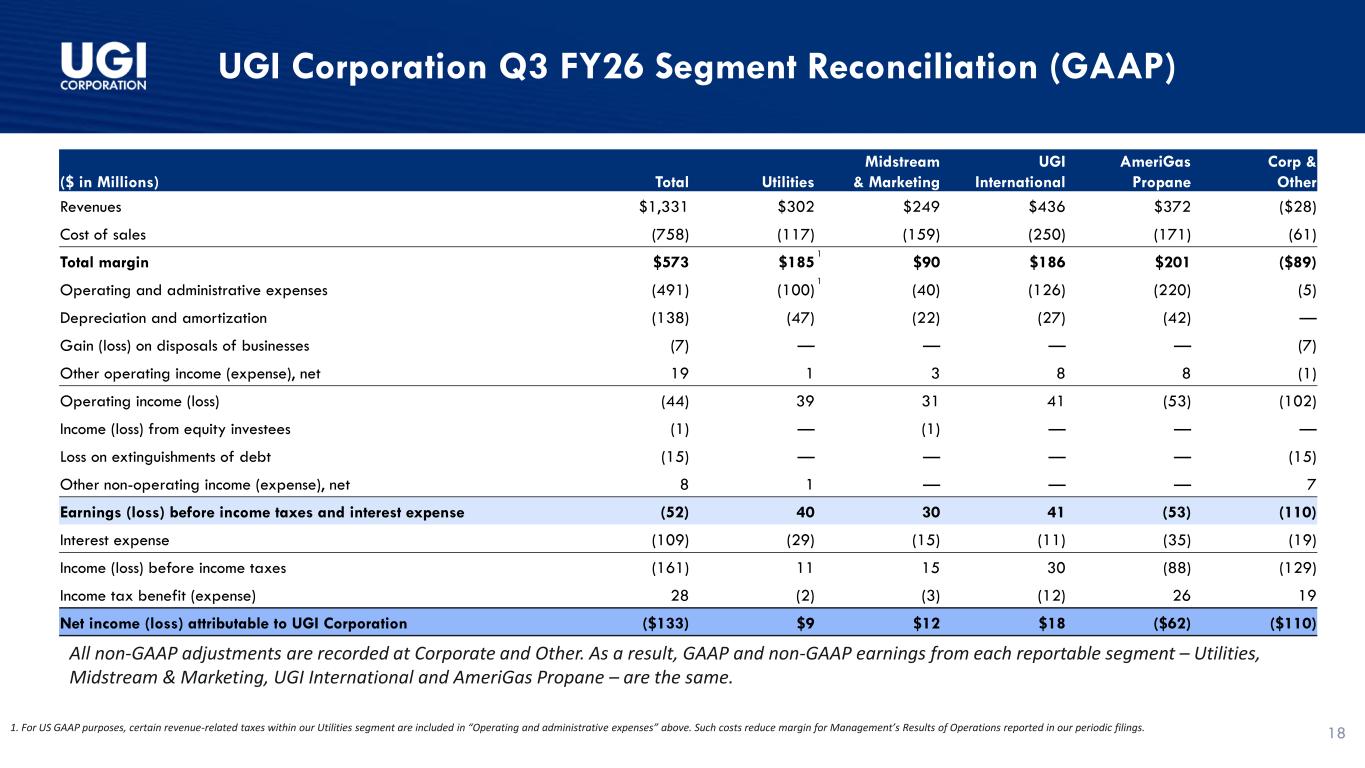
UGI Corporation Q3 FY26 Segment Reconciliation (GAAP) 1. For US GAAP purposes, certain revenue-related taxes within our Utilities segment are included in “Operating and administrative expenses” above. Such costs reduce margin for Management’s Results of Operations reported in our periodic filings. 1 1 All non-GAAP adjustments are recorded at Corporate and Other. As a result, GAAP and non-GAAP earnings from each reportable segment – Utilities, Midstream & Marketing, UGI International and AmeriGas Propane – are the same. 18 ($ in Millions) Total Utilities Midstream & Marketing UGI International AmeriGas Propane Corp & Other Revenues $1,331 $302 $249 $436 $372 ($28) Cost of sales (758) (117) (159) (250) (171) (61) Total margin $573 $185 $90 $186 $201 ($89) Operating and administrative expenses (491) (100) (40) (126) (220) (5) Depreciation and amortization (138) (47) (22) (27) (42) — Gain (loss) on disposals of businesses (7) — — — — (7) Other operating income (expense), net 19 1 3 8 8 (1) Operating income (loss) (44) 39 31 41 (53) (102) Income (loss) from equity investees (1) — (1) — — — Loss on extinguishments of debt (15) — — — — (15) Other non-operating income (expense), net 8 1 — — — 7 Earnings (loss) before income taxes and interest expense (52) 40 30 41 (53) (110) Interest expense (109) (29) (15) (11) (35) (19) Income (loss) before income taxes (161) 11 15 30 (88) (129) Income tax benefit (expense) 28 (2) (3) (12) 26 19 Net income (loss) attributable to UGI Corporation ($133) $9 $12 $18 ($62) ($110)
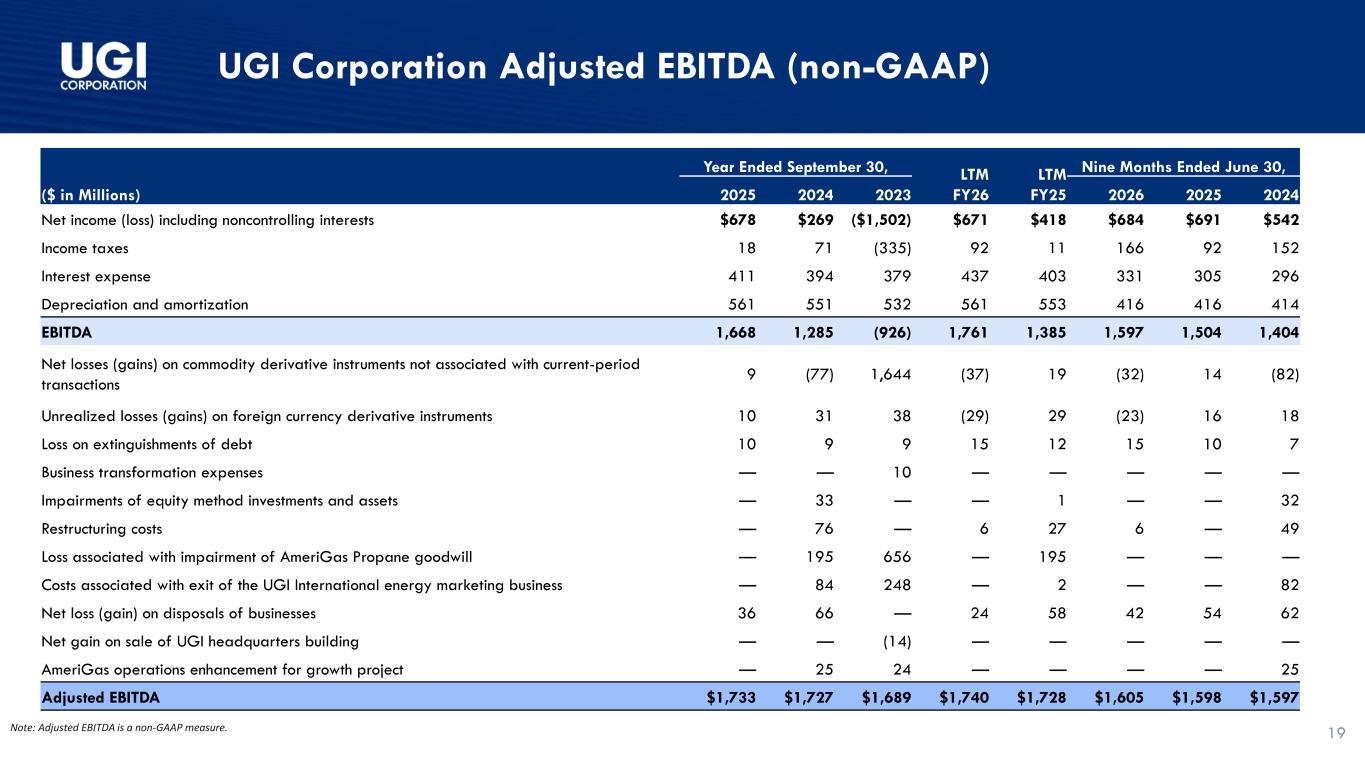
UGI Corporation Adjusted EBITDA (non-GAAP) 19Note: Adjusted EBITDA is a non-GAAP measure. ($ in Millions) Year Ended September 30, LTM FY26 LTM FY25 Nine Months Ended June 30, 2025 2024 2023 2026 2025 2024 Net income (loss) including noncontrolling interests $678 $269 ($1,502) $671 $418 $684 $691 $542 Income taxes 18 71 (335) 92 11 166 92 152 Interest expense 411 394 379 437 403 331 305 296 Depreciation and amortization 561 551 532 561 553 416 416 414 EBITDA 1,668 1,285 (926) 1,761 1,385 1,597 1,504 1,404 Net losses (gains) on commodity derivative instruments not associated with current-period transactions 9 (77) 1,644 (37) 19 (32) 14 (82) Unrealized losses (gains) on foreign currency derivative instruments 10 31 38 (29) 29 (23) 16 18 Loss on extinguishments of debt 10 9 9 15 12 15 10 7 Business transformation expenses — — 10 — — — — — Impairments of equity method investments and assets — 33 — — 1 — — 32 Restructuring costs — 76 — 6 27 6 — 49 Loss associated with impairment of AmeriGas Propane goodwill — 195 656 — 195 — — — Costs associated with exit of the UGI International energy marketing business — 84 248 — 2 — — 82 Net loss (gain) on disposals of businesses 36 66 — 24 58 42 54 62 Net gain on sale of UGI headquarters building — — (14) — — — — — AmeriGas operations enhancement for growth project — 25 24 — — — — 25 Adjusted EBITDA $1,733 $1,727 $1,689 $1,740 $1,728 $1,605 $1,598 $1,597
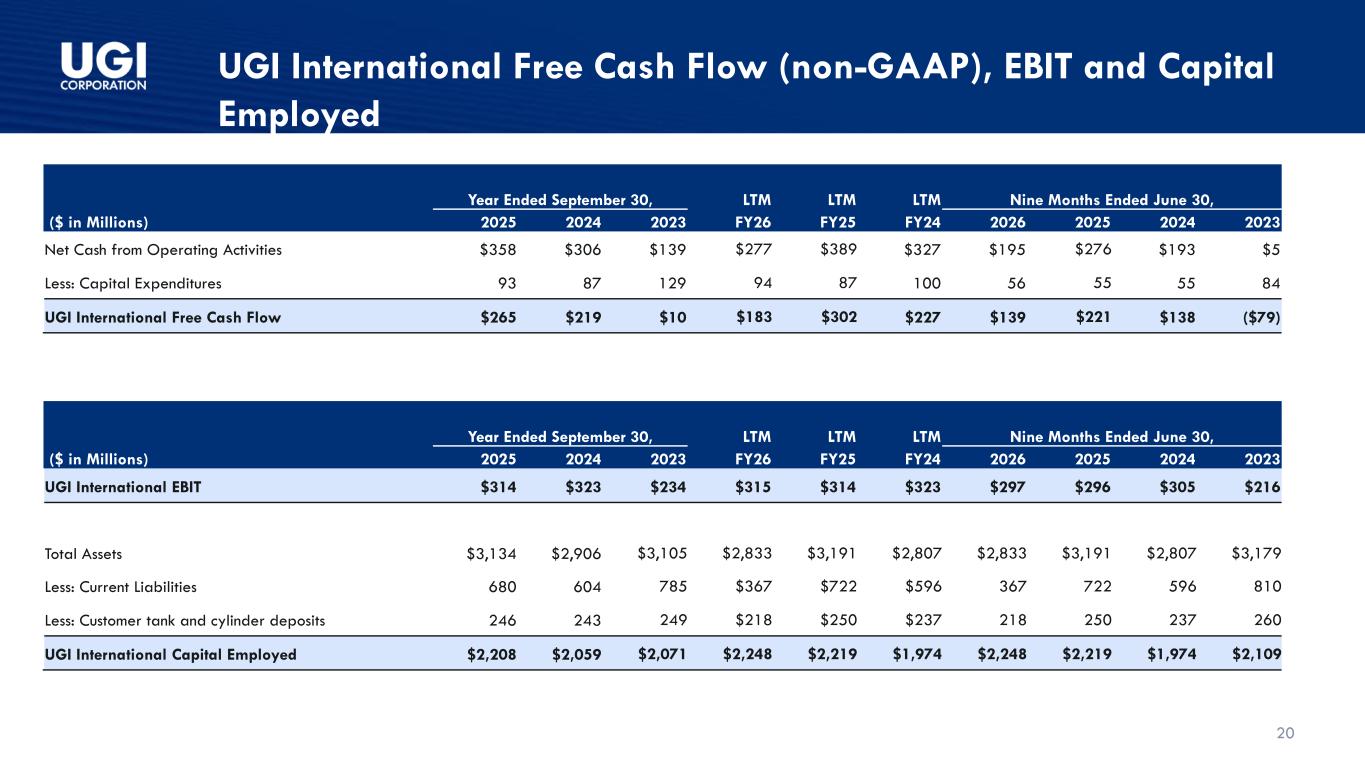
20 UGI International Free Cash Flow (non-GAAP), EBIT and Capital Employed ($ in Millions) Year Ended September 30, LTM LTM LTM Nine Months Ended June 30, 2025 2024 2023 FY26 FY25 FY24 2026 2025 2024 2023 UGI International EBIT $314 $323 $234 $315 $314 $323 $297 $296 $305 $216 Total Assets $3,134 $2,906 $3,105 $2,833 $3,191 $2,807 $2,833 $3,191 $2,807 $3,179 Less: Current Liabilities 680 604 785 $367 $722 $596 367 722 596 810 Less: Customer tank and cylinder deposits 246 243 249 $218 $250 $237 218 250 237 260 UGI International Capital Employed $2,208 $2,059 $2,071 $2,248 $2,219 $1,974 $2,248 $2,219 $1,974 $2,109 ($ in Millions) Year Ended September 30, LTM LTM LTM Nine Months Ended June 30, 2025 2024 2023 FY26 FY25 FY24 2026 2025 2024 2023 Net Cash from Operating Activities $358 $306 $139 $277 $389 $327 $195 $276 $193 $5 Less: Capital Expenditures 93 87 129 94 87 100 56 55 55 84 UGI International Free Cash Flow $265 $219 $10 $183 $302 $227 $139 $221 $138 ($79)
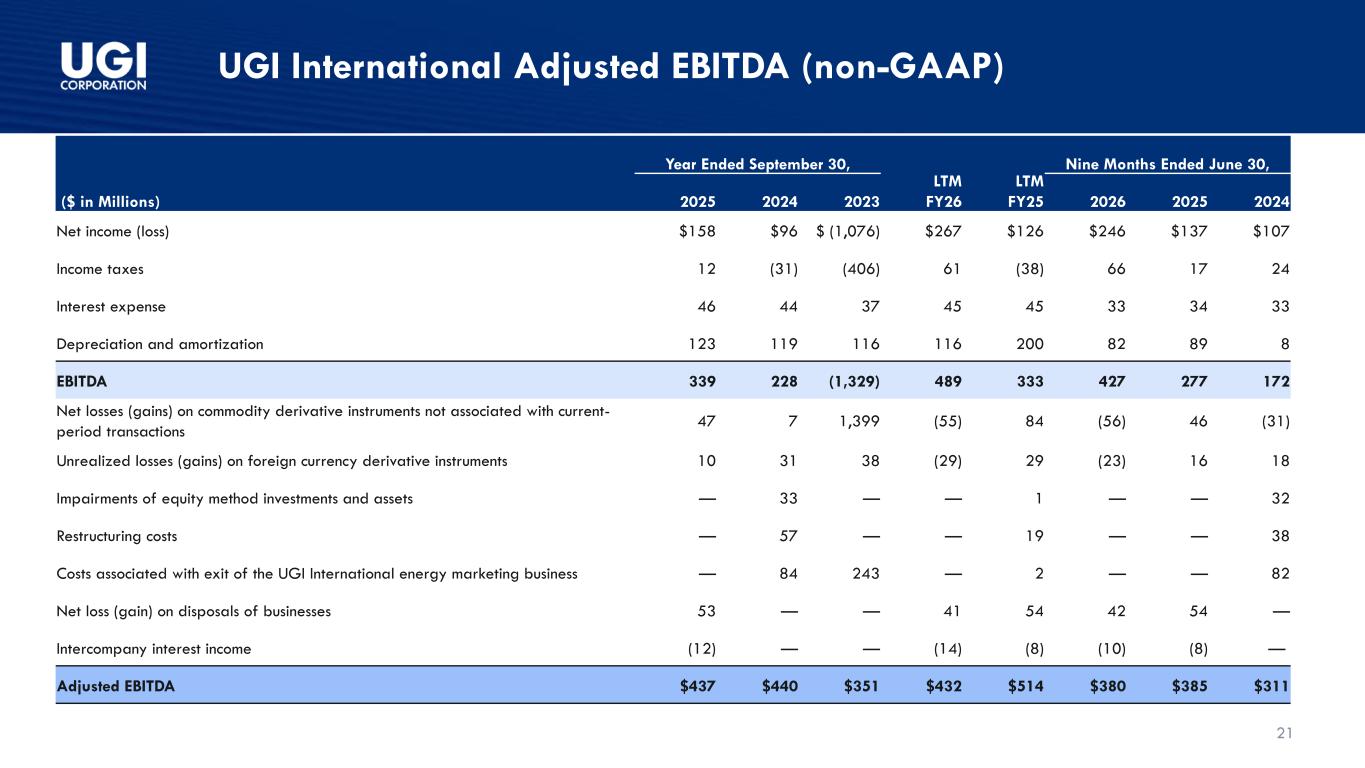
21 UGI International Adjusted EBITDA (non-GAAP) Year Ended September 30, LTM FY26 LTM FY25 Nine Months Ended June 30, ($ in Millions) 2025 2024 2023 2026 2025 2024 Net income (loss) $158 $96 $ (1,076) $267 $126 $246 $137 $107 Income taxes 12 (31) (406) 61 (38) 66 17 24 Interest expense 46 44 37 45 45 33 34 33 Depreciation and amortization 123 119 116 116 200 82 89 8 EBITDA 339 228 (1,329) 489 333 427 277 172 Net losses (gains) on commodity derivative instruments not associated with current- period transactions 47 7 1,399 (55) 84 (56) 46 (31) Unrealized losses (gains) on foreign currency derivative instruments 10 31 38 (29) 29 (23) 16 18 Impairments of equity method investments and assets — 33 — — 1 — — 32 Restructuring costs — 57 — — 19 — — 38 Costs associated with exit of the UGI International energy marketing business — 84 243 — 2 — — 82 Net loss (gain) on disposals of businesses 53 — — 41 54 42 54 — Intercompany interest income (12) — — (14) (8) (10) (8) — Adjusted EBITDA $437 $440 $351 $432 $514 $380 $385 $311
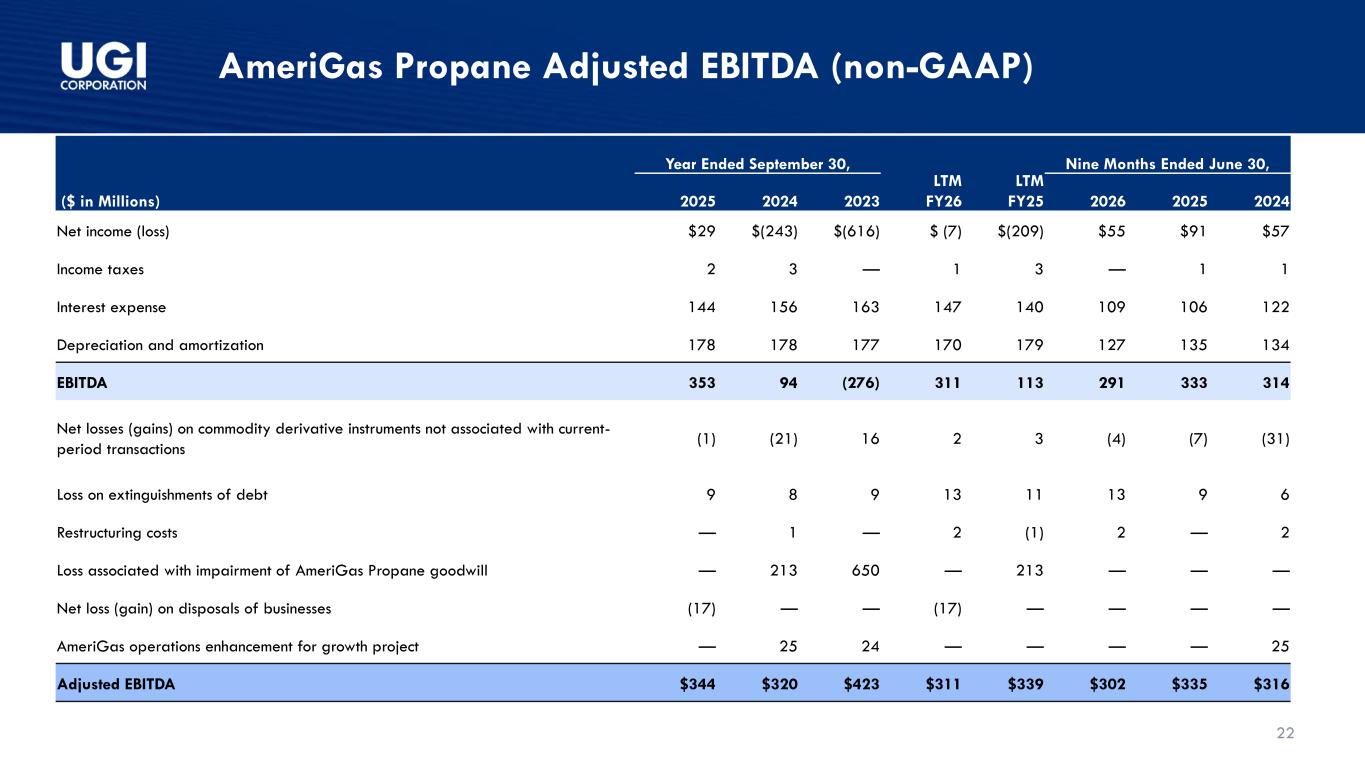
22 AmeriGas Propane Adjusted EBITDA (non-GAAP) Year Ended September 30, LTM FY26 LTM FY25 Nine Months Ended June 30, ($ in Millions) 2025 2024 2023 2026 2025 2024 Net income (loss) $29 $(243) $(616) $ (7) $(209) $55 $91 $57 Income taxes 2 3 — 1 3 — 1 1 Interest expense 144 156 163 147 140 109 106 122 Depreciation and amortization 178 178 177 170 179 127 135 134 EBITDA 353 94 (276) 311 113 291 333 314 Net losses (gains) on commodity derivative instruments not associated with current- period transactions (1) (21) 16 2 3 (4) (7) (31) Loss on extinguishments of debt 9 8 9 13 11 13 9 6 Restructuring costs — 1 — 2 (1) 2 — 2 Loss associated with impairment of AmeriGas Propane goodwill — 213 650 — 213 — — — Net loss (gain) on disposals of businesses (17) — — (17) — — — — AmeriGas operations enhancement for growth project — 25 24 — — — — 25 Adjusted EBITDA $344 $320 $423 $311 $339 $302 $335 $316
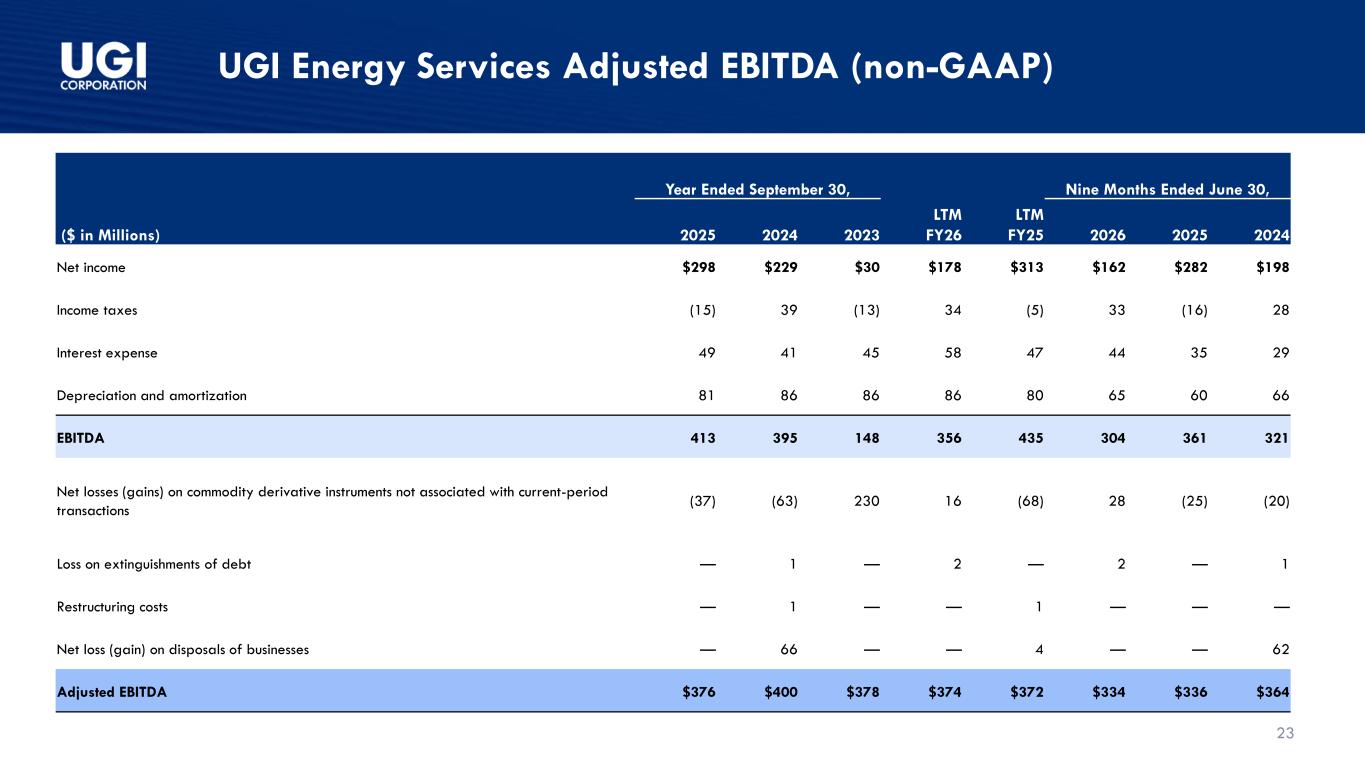
23 UGI Energy Services Adjusted EBITDA (non-GAAP) Year Ended September 30, LTM FY26 LTM FY25 Nine Months Ended June 30, ($ in Millions) 2025 2024 2023 2026 2025 2024 Net income $298 $229 $30 $178 $313 $162 $282 $198 Income taxes (15) 39 (13) 34 (5) 33 (16) 28 Interest expense 49 41 45 58 47 44 35 29 Depreciation and amortization 81 86 86 86 80 65 60 66 EBITDA 413 395 148 356 435 304 361 321 Net losses (gains) on commodity derivative instruments not associated with current-period transactions (37) (63) 230 16 (68) 28 (25) (20) Loss on extinguishments of debt — 1 — 2 — 2 — 1 Restructuring costs — 1 — — 1 — — — Net loss (gain) on disposals of businesses — 66 — — 4 — — 62 Adjusted EBITDA $376 $400 $378 $374 $372 $334 $336 $364

Investor Relations: Tameka Morris morrista@ugicorp.com Arnab Mukherjee mukherjeea@ugicorp.com