.2 Q1 Results Presentation May 28, 2026 1
Cautionary Statement Regarding Forward-Looking Information This presentation contains “forward-looking statements” within the meaning of the Private Securities Litigation Reform Act of 1995. The Company intends forward-looking terminology such as “believes,” “expects,” “may,” “will,” “should,” “anticipates,” “plans,” or similar expressions to identify forward-looking statements. Forward-looking statements include, but are not limited to the information under 2026 Outlook, comments about Kohl's adequacy of capital resources, statements regarding our 2026 areas of focus and future initiatives, and statements regarding the impact of macroeconomic events and our response to such events, including tariffs. Such statements are subject to certain risks and uncertainties, which could cause the Company's actual results to differ materially from those anticipated by the forward-looking statements. These risks and uncertainties include, but are not limited to, risks described more fully in Item 1A in the Company’s Annual Report on Form 10-K, which are expressly incorporated herein by reference and other factors as may periodically be described in the Company’s filings with the SEC. Forward-looking statements relate to the date initially made, and Kohl’s undertakes no obligation to update them. Non-GAAP Financial Measures This presentation contains certain financial measures that are not prepared in accordance with generally accepted accounting principles (GAAP), including adjusted EBITDA, adjusted EBITDAR, our leverage ratio (expressed as net debt + leases / EBITDAR), and free cash flow and adjusted free cash flow. These non-GAAP financial measures are provided as additional insight into our operational performance and do not purport to be substitutes for, or superior to operating income, net income, total debt and lease liabilities as reported on the balance sheet, or operating cash flow as measures of operating performance or liquidity. We believe these adjusted measures are useful, as they are more representative of our core business, enhance comparability across reporting periods and to industry peers, and align with the measures used by management to evaluate the Company’s performance. We caution investors that non-GAAP measures should not be viewed in isolation and should be evaluated in addition to, and not as an alternative for, our results reported in accordance with GAAP. Because companies may use different calculation methods, these measures may not be comparable to other similarly titled measures reported by other companies. A reconciliation of each non-GAAP measure to the most directly comparable GAAP measure is included in this presentation. 2

Table of Contents 2026 Key Initiatives 6 Q1 2026 Results 10 2026 Outlook 15 3
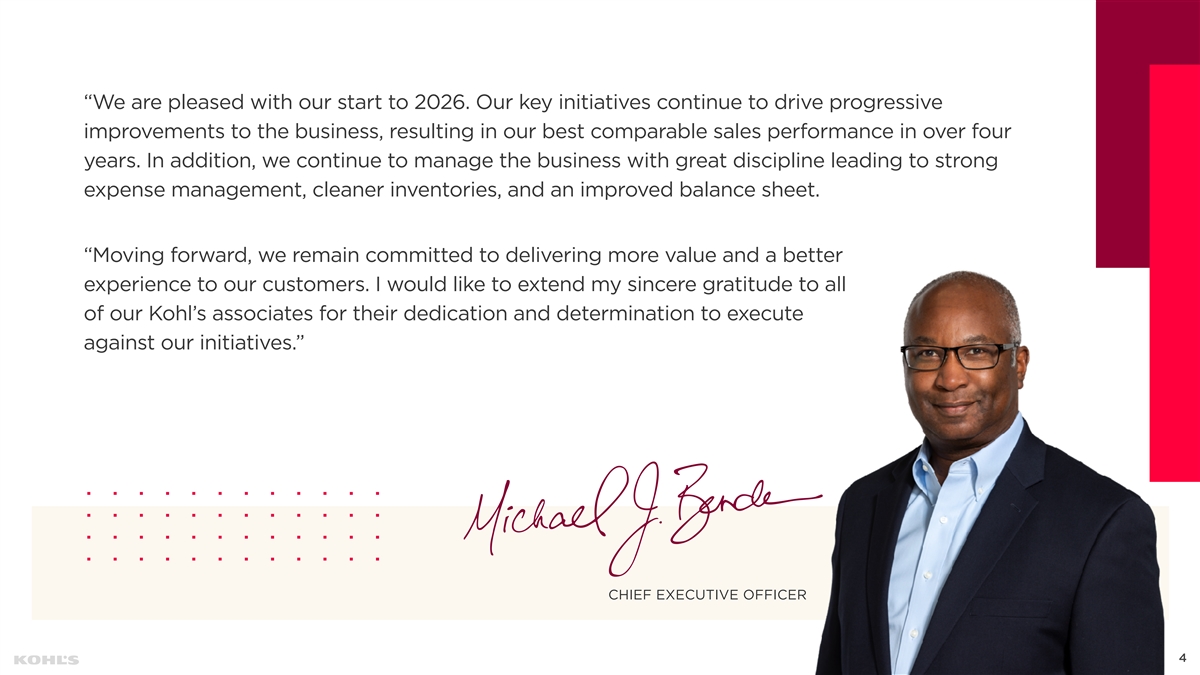
“We are pleased with our start to 2026. Our key initiatives continue to drive progressive improvements to the business, resulting in our best comparable sales performance in over four years. In addition, we continue to manage the business with great discipline leading to strong expense management, cleaner inventories, and an improved balance sheet. “Moving forward, we remain committed to delivering more value and a better experience to our customers. I would like to extend my sincere gratitude to all of our Kohl’s associates for their dedication and determination to execute against our initiatives.” CHIEF EXECUTIVE OFFICER 4
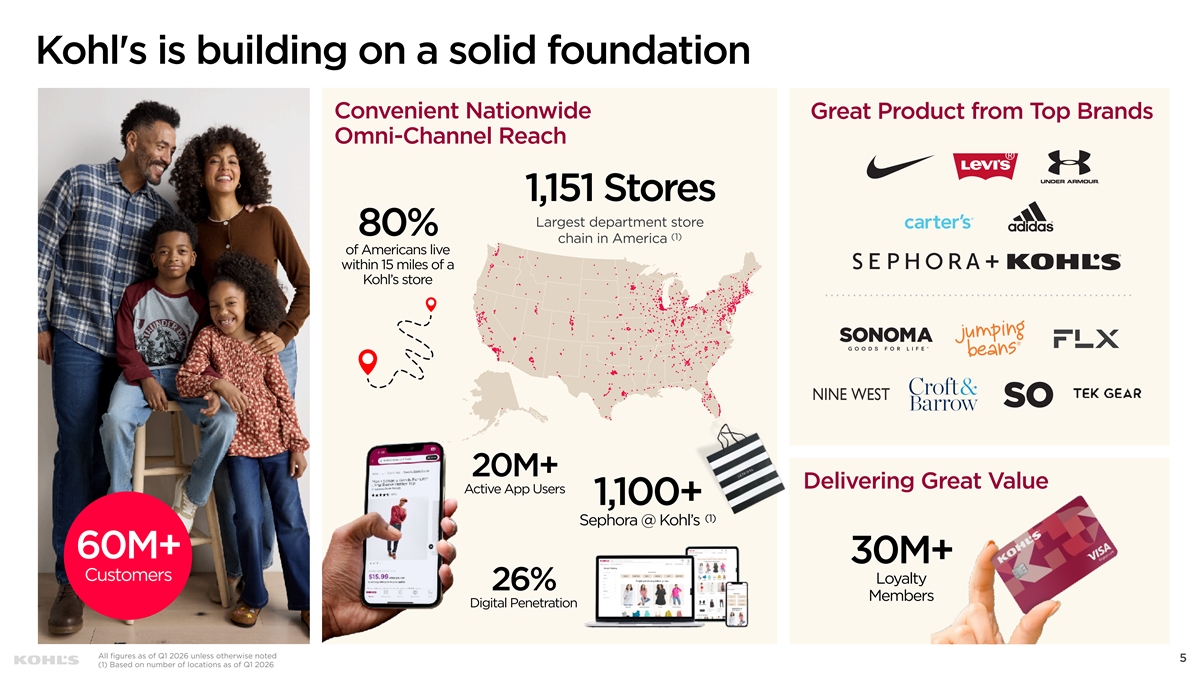
Kohl's is building on a solid foundation Convenient Nationwide Great Product from Top Brands Omni-Channel Reach 1,151 Stores Largest department store 80% (1) chain in America of Americans live within 15 miles of a Kohl’s store 20M+ Delivering Great Value Active App Users 1,100+ (1) Sephora @ Kohl’s 60M+ 30M+ Customers Loyalty 26% Members Digital Penetration All figures as of Q1 2026 unless otherwise noted 5 (1) Based on number of locations as of Q1 2026
2026 KEY INITIATIVES 6
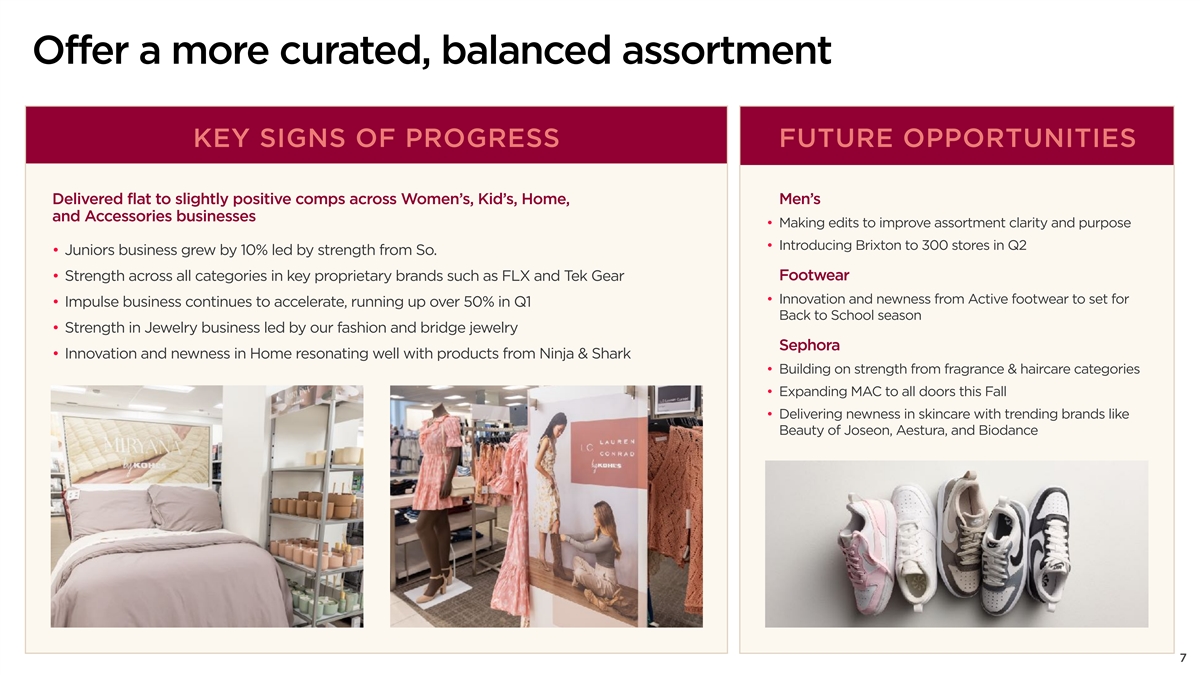
Offer a more curated, balanced assortment KEY SIGNS OF PROGRESS FUTURE OPPORTUNITIES Delivered flat to slightly positive comps across Women’s, Kid’s, Home, Men’s and Accessories businesses • Making edits to improve assortment clarity and purpose • Introducing Brixton to 300 stores in Q2 • Juniors business grew by 10% led by strength from So. Footwear • Strength across all categories in key proprietary brands such as FLX and Tek Gear • Innovation and newness from Active footwear to set for • Impulse business continues to accelerate, running up over 50% in Q1 Back to School season • Strength in Jewelry business led by our fashion and bridge jewelry Sephora • Innovation and newness in Home resonating well with products from Ninja & Shark • Building on strength from fragrance & haircare categories • Expanding MAC to all doors this Fall • Delivering newness in skincare with trending brands like Beauty of Joseon, Aestura, and Biodance 7
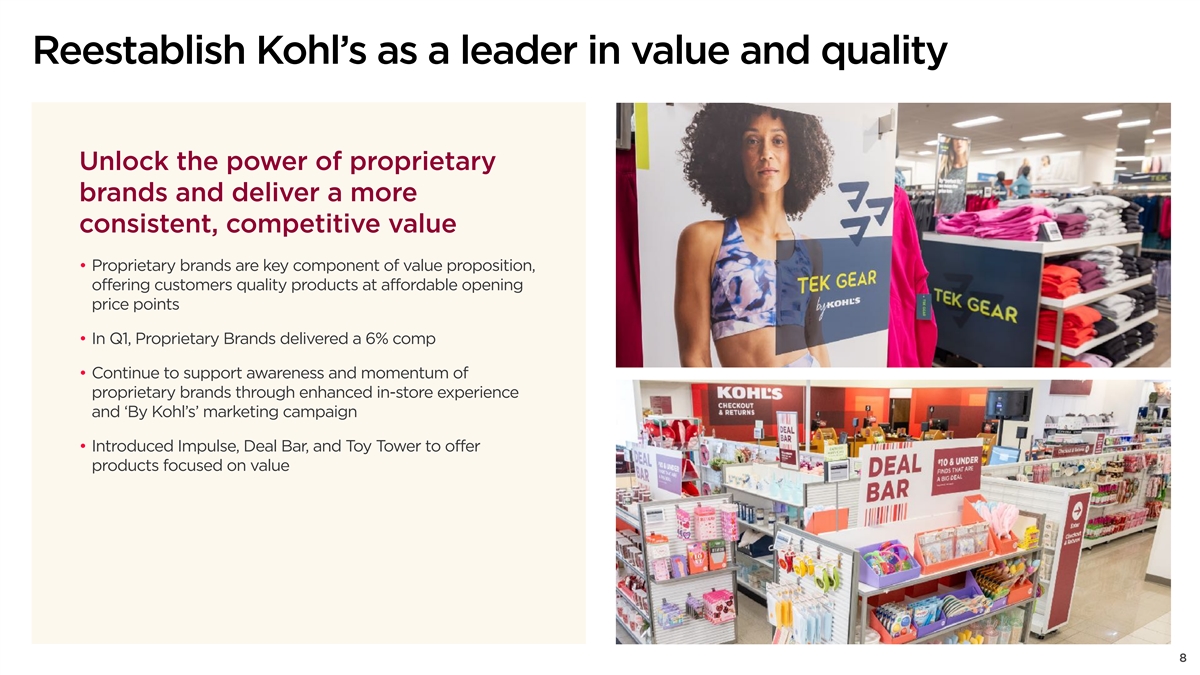
Reestablish Kohl’s as a leader in value and quality Unlock the power of proprietary brands and deliver a more consistent, competitive value • Proprietary brands are key component of value proposition, offering customers quality products at affordable opening price points • In Q1, Proprietary Brands delivered a 6% comp • Continue to support awareness and momentum of proprietary brands through enhanced in-store experience and ‘By Kohl’s’ marketing campaign • Introduced Impulse, Deal Bar, and Toy Tower to offer products focused on value 8
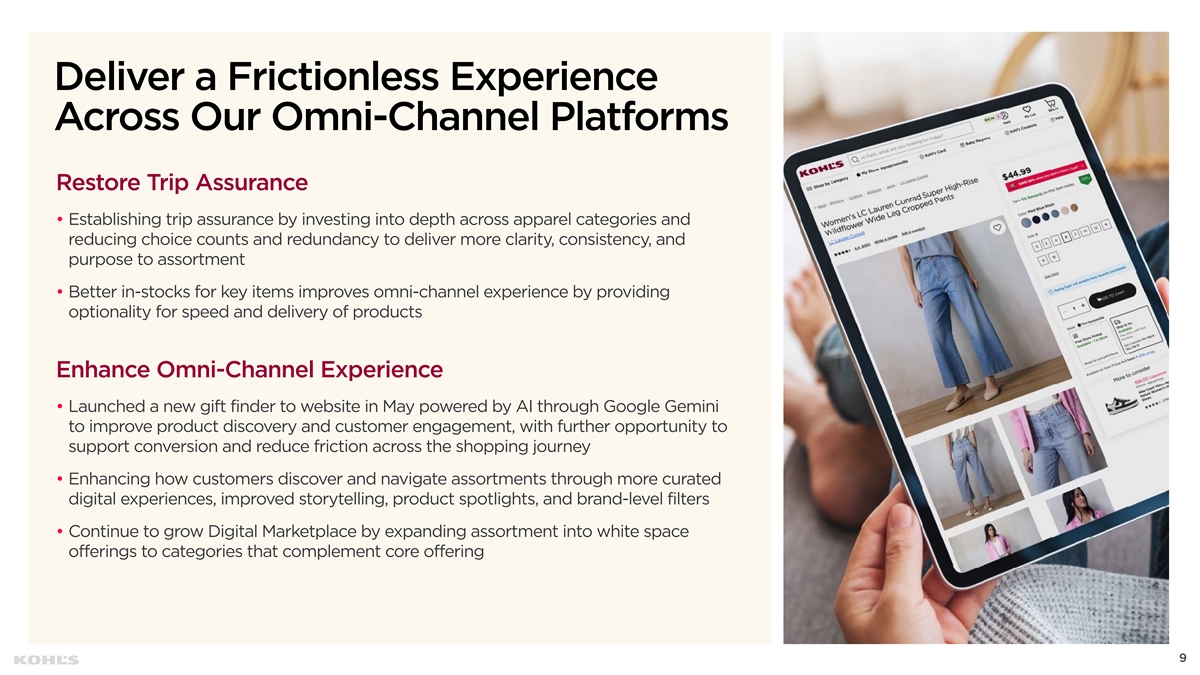
Deliver a Frictionless Experience Across Our Omni-Channel Platforms Restore Trip Assurance • Establishing trip assurance by investing into depth across apparel categories and reducing choice counts and redundancy to deliver more clarity, consistency, and purpose to assortment • Better in-stocks for key items improves omni-channel experience by providing optionality for speed and delivery of products Enhance Omni-Channel Experience • Launched a new gift finder to website in May powered by AI through Google Gemini to improve product discovery and customer engagement, with further opportunity to support conversion and reduce friction across the shopping journey • Enhancing how customers discover and navigate assortments through more curated digital experiences, improved storytelling, product spotlights, and brand-level filters • Continue to grow Digital Marketplace by expanding assortment into white space offerings to categories that complement core offering 9
Q1 2026 RESULTS 10
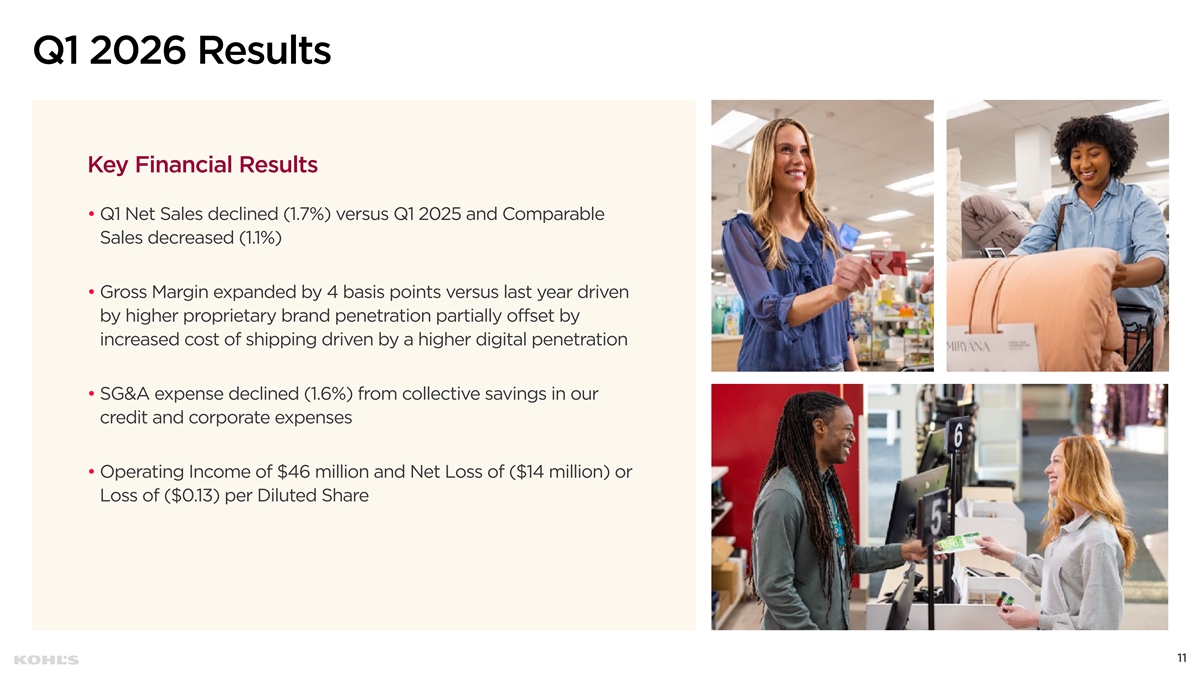
Q1 2026 Results Key Financial Results • Q1 Net Sales declined (1.7%) versus Q1 2025 and Comparable Sales decreased (1.1%) • Gross Margin expanded by 4 basis points versus last year driven by higher proprietary brand penetration partially offset by increased cost of shipping driven by a higher digital penetration • SG&A expense declined (1.6%) from collective savings in our credit and corporate expenses • Operating Income of $46 million and Net Loss of ($14 million) or Loss of ($0.13) per Diluted Share 11 11
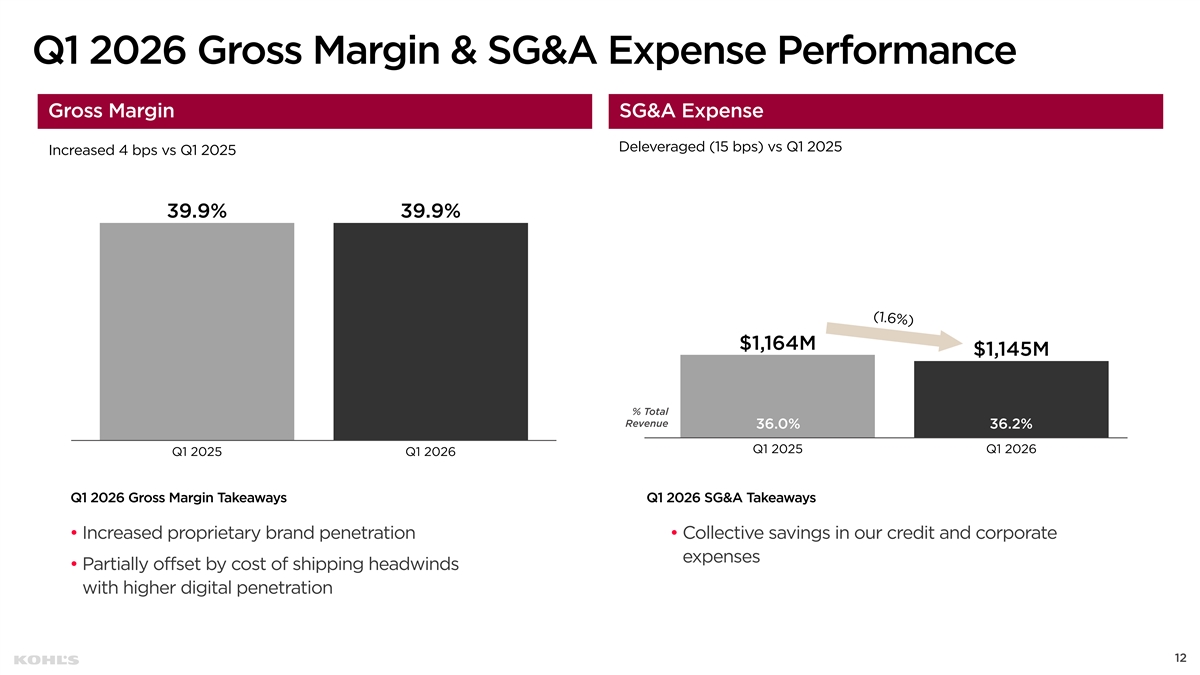
(1.6%) Q1 2026 Gross Margin & SG&A Expense Performance Gross Margin SG&A Expense Deleveraged (15 bps) vs Q1 2025 Increased 4 bps vs Q1 2025 39.9% 39.9% $1,164M $1,145M % Total Revenue 36.0% 36.2% Q1 2025 Q1 2026 Q1 2025 Q1 2026 Q1 2026 Gross Margin Takeaways Q1 2026 SG&A Takeaways • Increased proprietary brand penetration • Collective savings in our credit and corporate expenses • Partially offset by cost of shipping headwinds with higher digital penetration 12
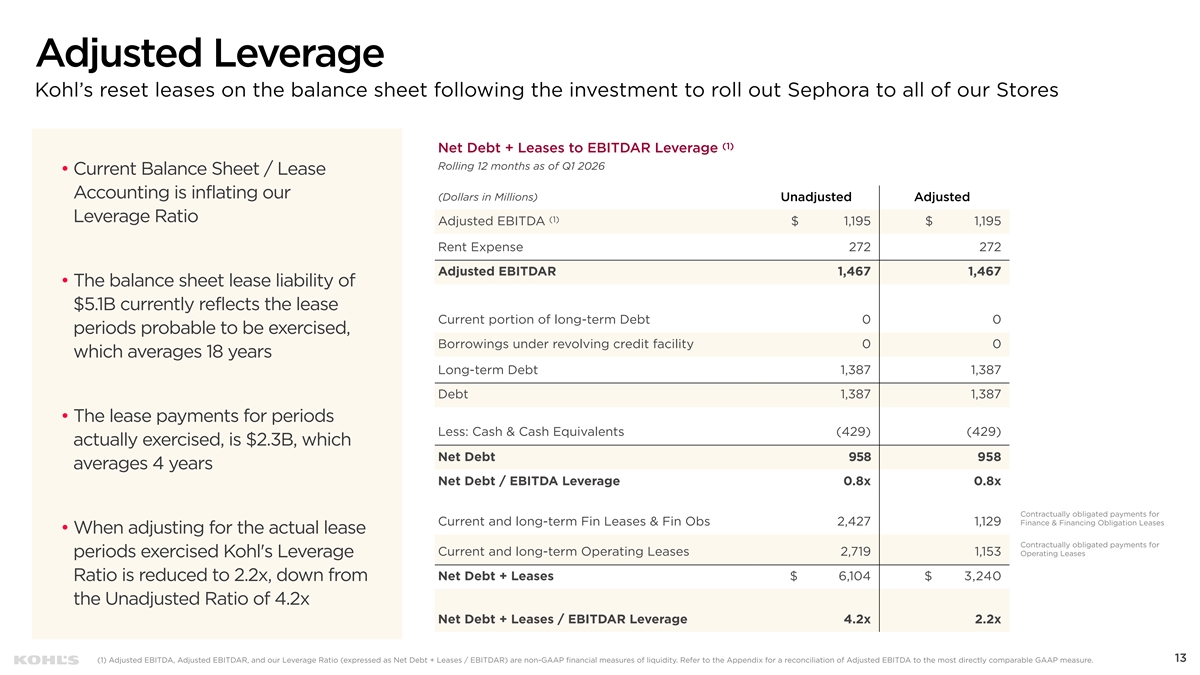
Adjusted Leverage Kohl’s reset leases on the balance sheet following the investment to roll out Sephora to all of our Stores (1) Net Debt + Leases to EBITDAR Leverage Rolling 12 months as of Q1 2026 • Current Balance Sheet / Lease Accounting is inflating our (Dollars in Millions) Unadjusted Adjusted Leverage Ratio (1) Adjusted EBITDA $ 1,195 $ 1,195 Rent Expense 272 272 Adjusted EBITDAR 1,467 1,467 • The balance sheet lease liability of $5.1B currently reflects the lease Current portion of long-term Debt 0 0 periods probable to be exercised, Borrowings under revolving credit facility 0 0 which averages 18 years Long-term Debt 1,387 1,387 Debt 1,387 1,387 • The lease payments for periods Less: Cash & Cash Equivalents (429) (429) actually exercised, is $2.3B, which Net Debt 958 958 averages 4 years Net Debt / EBITDA Leverage 0.8x 0.8x Contractually obligated payments for Finance & Financing Obligation Leases Current and long-term Fin Leases & Fin Obs 2,427 1,129 • When adjusting for the actual lease Contractually obligated payments for Current and long-term Operating Leases 2,719 1,153 Operating Leases periods exercised Kohl's Leverage Net Debt + Leases $ 6,104 $ 3,240 Ratio is reduced to 2.2x, down from the Unadjusted Ratio of 4.2x Net Debt + Leases / EBITDAR Leverage 4.2x 2.2x 13 (1) Adjusted EBITDA, Adjusted EBITDAR, and our Leverage Ratio (expressed as Net Debt + Leases / EBITDAR) are non-GAAP financial measures of liquidity. Refer to the Appendix for a reconciliation of Adjusted EBITDA to the most directly comparable GAAP measure.
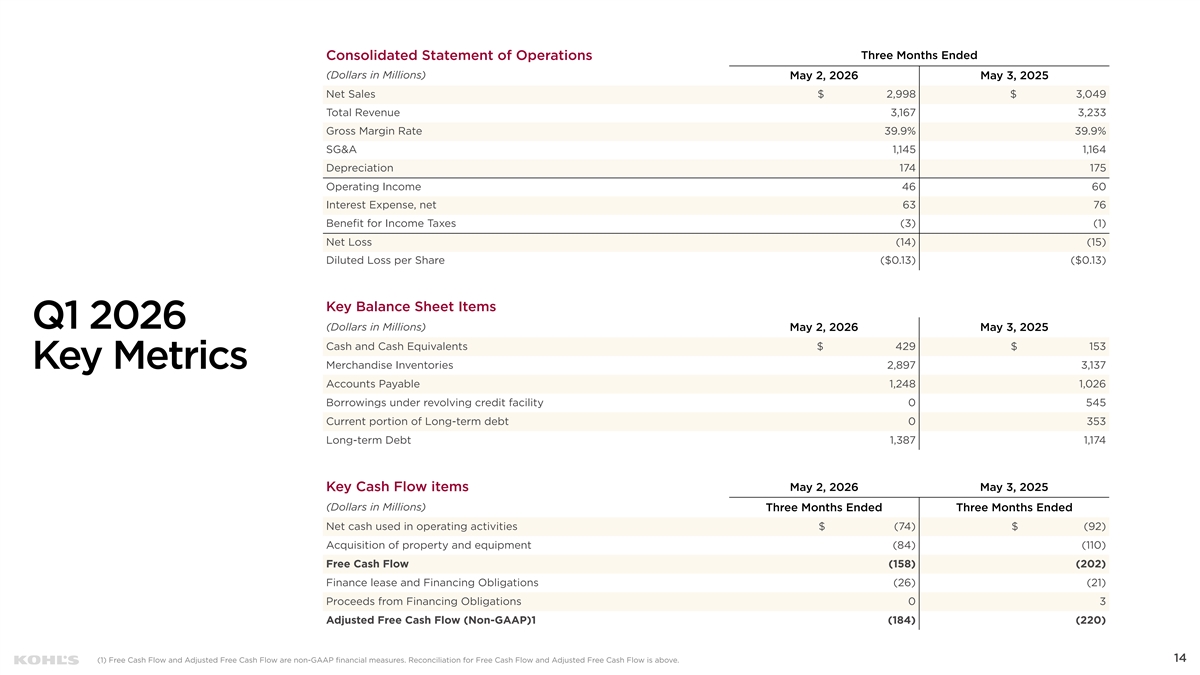
Three Months Ended Consolidated Statement of Operations (Dollars in Millions) May 2, 2026 May 3, 2025 Net Sales $ 2,998 $ 3,049 Total Revenue 3,167 3,233 Gross Margin Rate 39.9% 39.9% SG&A 1,145 1,164 Depreciation 174 175 Operating Income 46 60 Interest Expense, net 63 76 Benefit for Income Taxes (3) (1) Net Loss (14) (15) Diluted Loss per Share ($0.13) ($0.13) Key Balance Sheet Items Q1 2026 (Dollars in Millions) May 2, 2026 May 3, 2025 Cash and Cash Equivalents $ 429 $ 153 Key Metrics Merchandise Inventories 2,897 3,137 Accounts Payable 1,248 1,026 Borrowings under revolving credit facility 0 545 Current portion of Long-term debt 0 353 Long-term Debt 1,387 1,174 May 2, 2026 May 3, 2025 Key Cash Flow items (Dollars in Millions) Three Months Ended Three Months Ended Net cash used in operating activities $ (74) $ (92) Acquisition of property and equipment (84) (110) Free Cash Flow (158) (202) Finance lease and Financing Obligations (26) (21) Proceeds from Financing Obligations 0 3 Adjusted Free Cash Flow (Non-GAAP)1 (184) (220) 14 (1) Free Cash Flow and Adjusted Free Cash Flow are non-GAAP financial measures. Reconciliation for Free Cash Flow and Adjusted Free Cash Flow is above.
2026 OUTLOOK 15
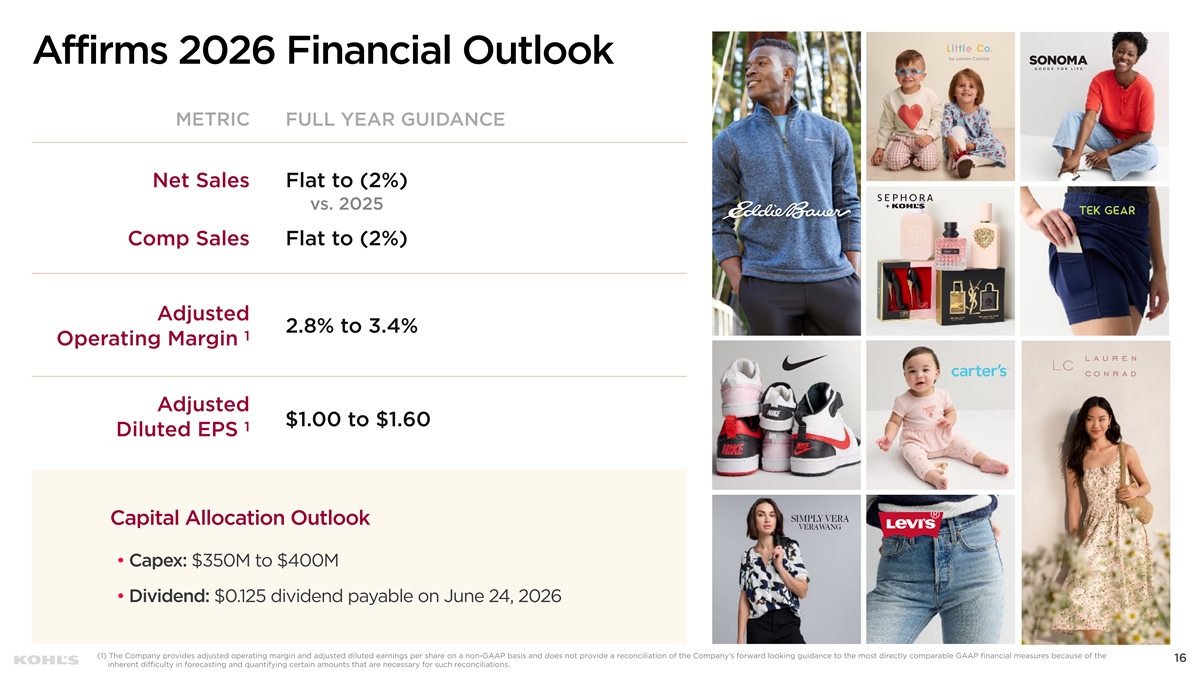
Affirms 2026 Financial Outlook METRIC FULL YEAR GUIDANCE Net Sales Flat to (2%) vs. 2025 Comp Sales Flat to (2%) Adjusted 2.8% to 3.4% 1 Operating Margin Adjusted $1.00 to $1.60 1 Diluted EPS Capital Allocation Outlook • Capex: $350M to $400M • Dividend: $0.125 dividend payable on June 24, 2026 (1) The Company provides adjusted operating margin and adjusted diluted earnings per share on a non-GAAP basis and does not provide a reconciliation of the Company’s forward looking guidance to the most directly comparable GAAP financial measures because of the 16 inherent difficulty in forecasting and quantifying certain amounts that are necessary for such reconciliations.
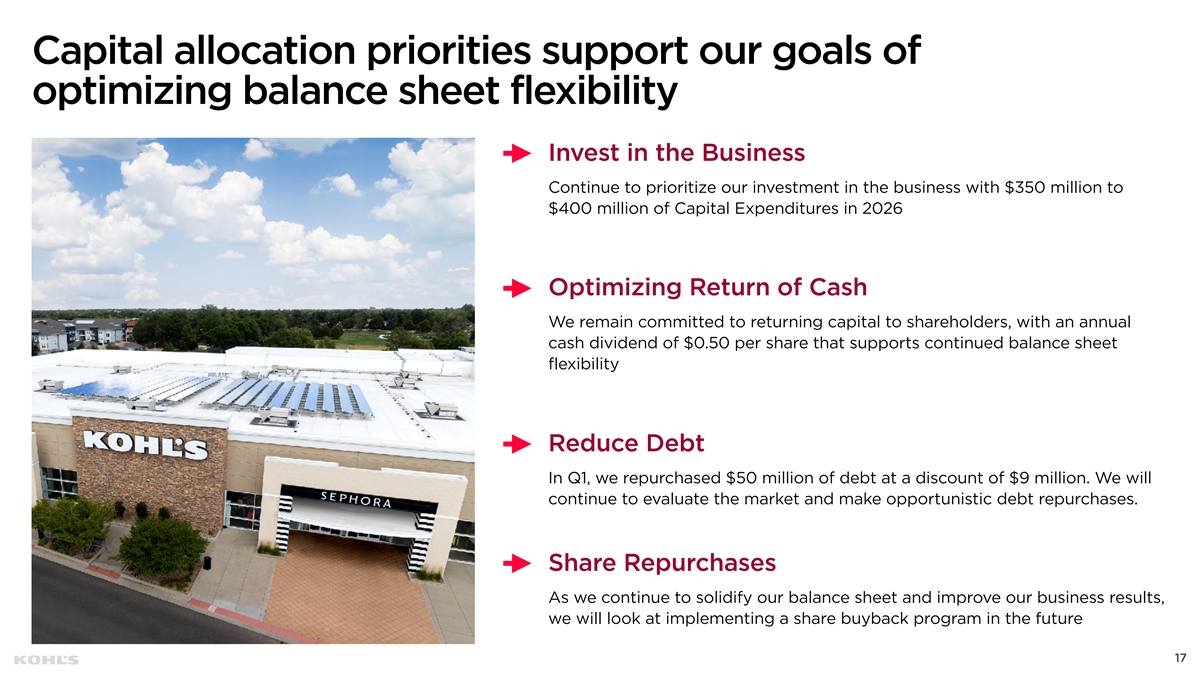
Capital allocation priorities support our goals of optimizing balance sheet flexibility Invest in the Business Continue to prioritize our investment in the business with $350 million to $400 million of Capital Expenditures in 2026 Optimizing Return of Cash We remain committed to returning capital to shareholders, with an annual cash dividend of $0.50 per share that supports continued balance sheet flexibility Reduce Debt In Q1, we repurchased $50 million of debt at a discount of $9 million. We will continue to evaluate the market and make opportunistic debt repurchases. Share Repurchases As we continue to solidify our balance sheet and improve our business results, we will look at implementing a share buyback program in the future 17
APPENDIX 18
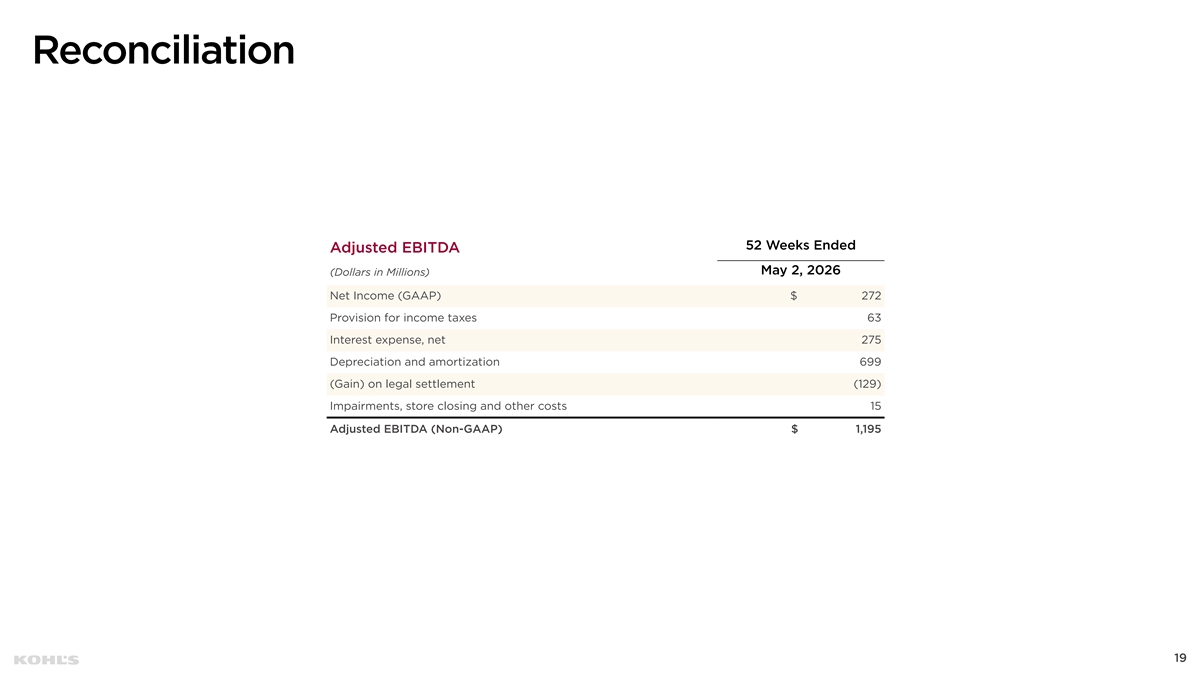
Reconciliation 52 Weeks Ended Adjusted EBITDA May 2, 2026 (Dollars in Millions) Net Income (GAAP) $ 272 Provision for income taxes 63 Interest expense, net 275 Depreciation and amortization 699 (Gain) on legal settlement (129) Impairments, store closing and other costs 15 Adjusted EBITDA (Non-GAAP) $ 1,195 19