| © 2025 FuelCell Energy 1 Fourth Quarter and Full Fiscal Year 2025 Financial Results & Business Update A rendering of a 50-MW FuelCell Energy data center installation © 2025 FuelCell Energy .2 |
| © 2025 FuelCell Energy This presentation contains forward-looking statements within the meaning of the safe harbor provisions of the Private Securities Litigation Reform Act of 1995 regarding future events or our future financial performance that involve certain contingencies and uncertainties. The forward-looking statements include, without limitation, statements with respect to the Company’s anticipated financial results and statements regarding the Company’s plans and expectations regarding the continuing development, commercialization and financing of its current and future fuel cell technologies, the expected timing of completion of the Company’s ongoing projects, the expected timing of module replacements, the Company’s business plans and strategies, the Company’s plan to reduce operating costs, the Company’s plans and ability to achieve positive Adjusted EBITDA, the capabilities of the Company’s products, and the markets in which the Company expects to operate. Projected and estimated numbers contained herein are not forecasts and may not reflect actual results. These forward-looking statements are not guarantees of future performance, and all forward-looking statements are subject to risks and uncertainties, known and unknown, that could cause actual results and future event to differ materially from those projected. Factors that could cause such a difference include, without limitation: general risks associated with product development and manufacturing; general economic conditions; changes in interest rates, which may impact project financing; supply chain disruptions; changes in the utility regulatory environment; changes in the utility industry and the markets for distributed generation, distributed hydrogen, and fuel cell power plants configured for carbon capture or carbon separation; potential volatility of commodity prices that may adversely affect our projects; availability of government subsidies and economic incentives for alternative energy technologies; our ability to remain in compliance with U.S. federal and state and foreign government laws and regulations; our ability to maintain compliance with the listing rules of The Nasdaq Stock Market; rapid technological change; competition; the risk that our bid awards will not convert to contracts or that our contracts will not convert to revenue; market acceptance of our products; changes in accounting policies or practices adopted voluntarily or as required by accounting principles generally accepted in the United States; factors affecting our liquidity position and financial condition; government appropriations; the ability of the government and third parties to terminate their development contracts at any time; the ability of the government to exercise “march -in” rights with respect to certain of our patents; our ability to successfully market and sell our products internationally; delays in our timeline for bringing commercially viable products to market; our ability to develop additional commercially viable products in the future; our ability to implement our strategy; our ability to reduce our levelized cost of energy and deliver on our cost reduction strategy generally; our ability to protect our intellectual property; litigation and other proceedings; the risk that commercialization of our new products will not occur when anticipated or, if it does, that we will not have adequate capacity to satisfy demand; our need for and the availability of additional financing; our ability to generate positive cash flow from operations; our ability to service our long-term debt; our ability to increase the output and longevity of our platforms and to meet the performance requirements of our contracts; our ability to expand our customer base and maintain relationships with our largest customers and strategic business allies; the risk that our restructuring plans will not result in the intended benefits or savings; the risk that our restructuring plans will result in unanticipated costs; the risk that our restructuring plans will yield unintended consequences to our remaining workforce and results of operations; our ability to reduce operating costs; and our ability to achieve positive Adjusted EBITDA, as well as other risks set forth in the Company’s filings with the Securities and Exchange Commission (“SEC”), including the Company’s Annual Report on Form 10-K for the fiscal year ended October 31, 2025. The forward-looking statements contained herein speak only as of the date of this presentation. The Company expressly disclaims any obligation or undertaking to release publicly any updates or revisions to any such statement contained herein to reflect any change in the Company’s expectations or any change in events, conditions or circumstances on which any such statement is based. The Company refers to non-GAAP financial measures in this presentation. The Company believes that this information is useful to understanding its operating results and assessing performance and highlighting trends on an overall basis. Please refer to Company’s earnings release and the appendix to this presentation for further disclosure and reconciliation of non-GAAP financial measures. (As used herein, the term “GAAP” refers to generally accepted accounting principles in the U.S.) The information set forth in this presentation is qualified by reference to, and should be read in conjunction with, our Annual Report on Form 10-K for the fiscal year ended October 31, 2025, filed with the SEC on December 18, 2025, and our earnings release for the fourth quarter and fiscal year ended October 31, 2025, filed as an exhibit to our Current Report on Form 8-K filed with the SEC on December 18, 2025. Safe Harbor Statement 2 |
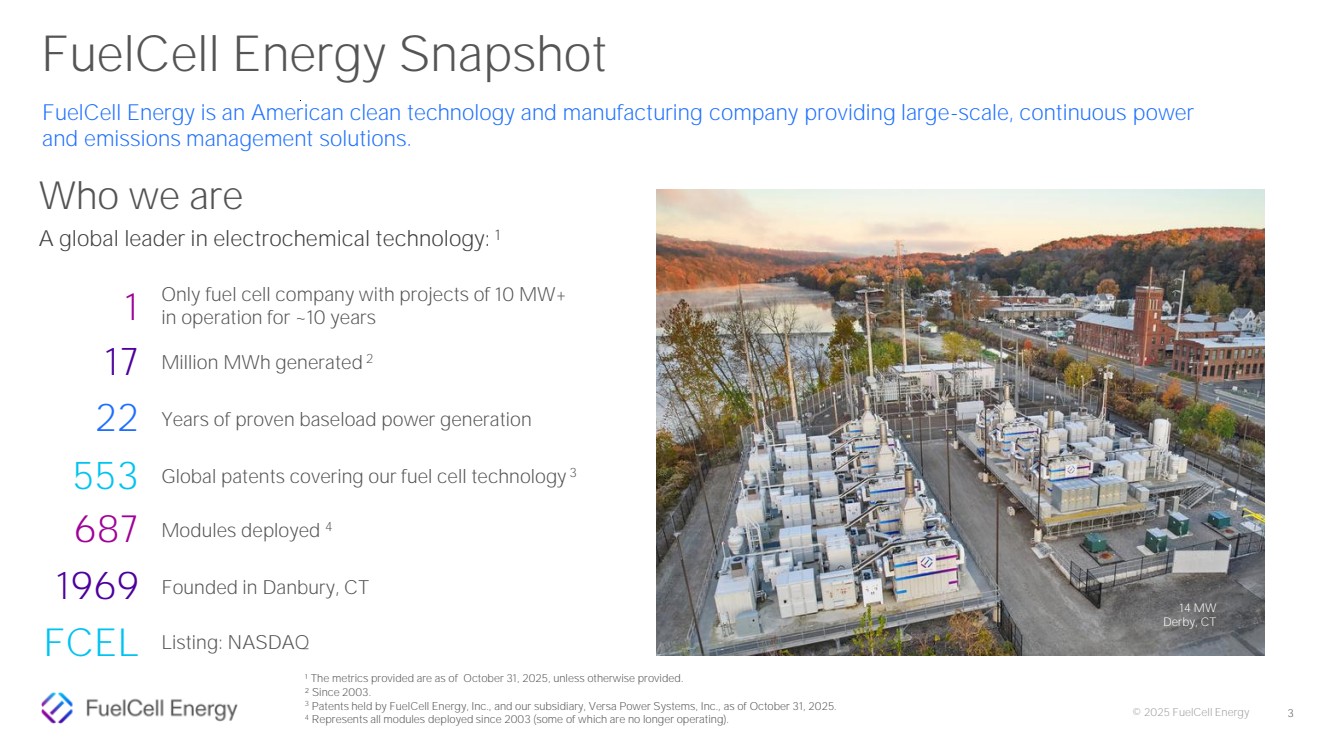
| © 2025 FuelCell Energy FuelCell Energy is an American clean technology and manufacturing company providing large-scale, continuous power and emissions management solutions. A global leader in electrochemical technology: 1 Who we are ¹ The metrics provided are as of October 31, 2025, unless otherwise provided. ² Since 2003. 3 Patents held by FuelCell Energy, Inc., and our subsidiary, Versa Power Systems, Inc., as of October 31, 2025. 4 Represents all modules deployed since 2003 (some of which are no longer operating). 14 MW Derby, CT 1969 22 553 17 1 FCEL Years of proven baseload power generation Founded in Danbury, CT Global patents covering our fuel cell technology 3 Million MWh generated 2 Only fuel cell company with projects of 10 MW+ in operation for ~10 years Listing: NASDAQ 687 Modules deployed 4 FuelCell Energy Snapshot 3 |
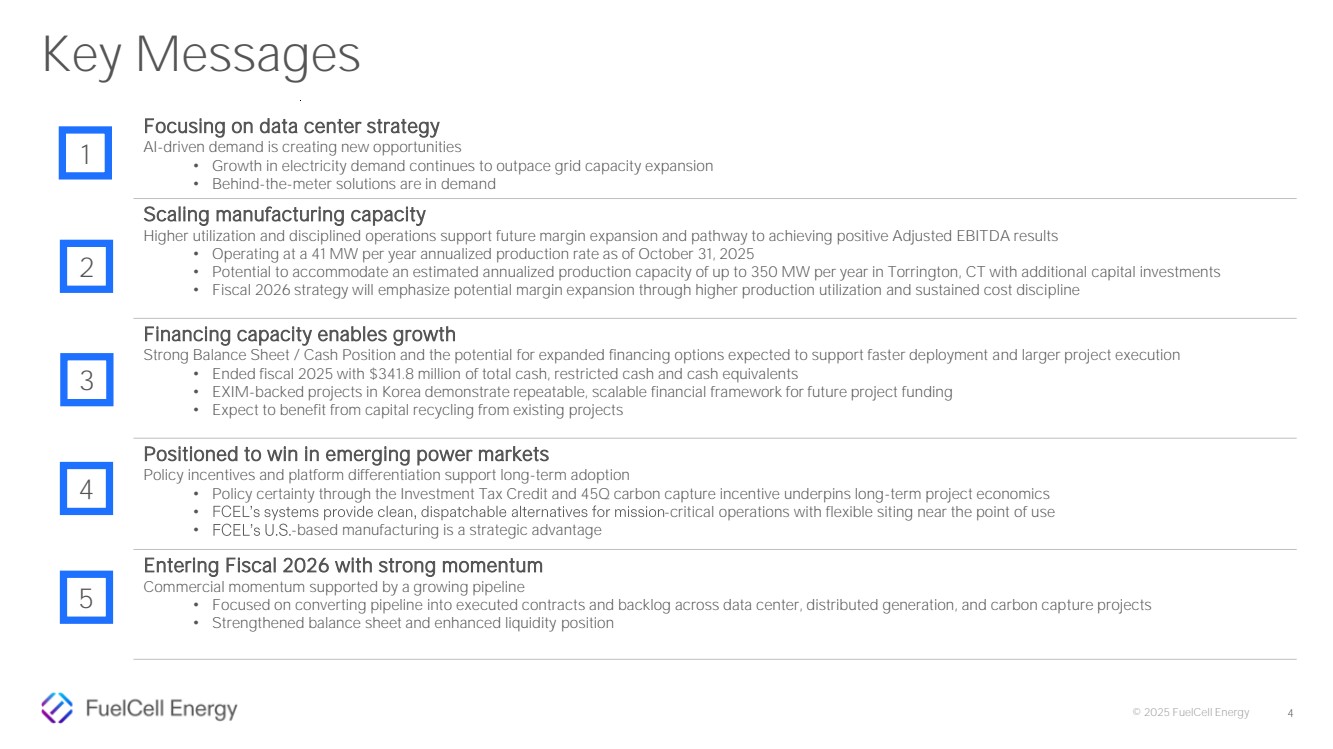
| © 2025 FuelCell Energy 4 Focusing on data center strategy AI-driven demand is creating new opportunities • Growth in electricity demand continues to outpace grid capacity expansion • Behind-the-meter solutions are in demand Scaling manufacturing capacity Higher utilization and disciplined operations support future margin expansion and pathway to achieving positive Adjusted EBITDA results • Operating at a 41 MW per year annualized production rate as of October 31, 2025 • Potential to accommodate an estimated annualized production capacity of up to 350 MW per year in Torrington, CT with additional capital investments • Fiscal 2026 strategy will emphasize potential margin expansion through higher production utilization and sustained cost discipline Financing capacity enables growth Strong Balance Sheet / Cash Position and the potential for expanded financing options expected to support faster deployment and larger project execution • Ended fiscal 2025 with $341.8 million of total cash, restricted cash and cash equivalents • EXIM-backed projects in Korea demonstrate repeatable, scalable financial framework for future project funding • Expect to benefit from capital recycling from existing projects Positioned to win in emerging power markets Policy incentives and platform differentiation support long-term adoption • Policy certainty through the Investment Tax Credit and 45Q carbon capture incentive underpins long-term project economics • FCEL’s systems provide clean, dispatchable alternatives for mission -critical operations with flexible siting near the point of use • FCEL’s U.S. -based manufacturing is a strategic advantage Entering Fiscal 2026 with strong momentum Commercial momentum supported by a growing pipeline • Focused on converting pipeline into executed contracts and backlog across data center, distributed generation, and carbon capture projects • Strengthened balance sheet and enhanced liquidity position Key Messages 2 3 1 4 5 |
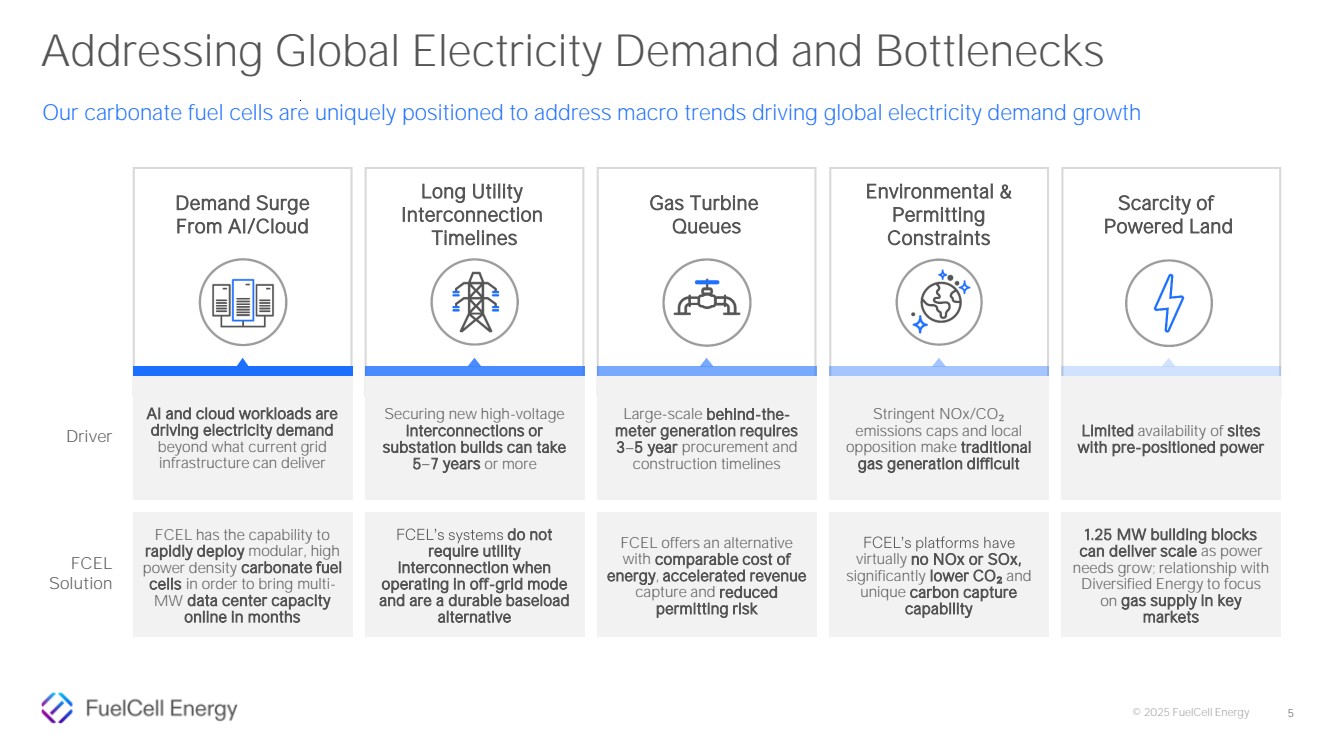
| © 2025 FuelCell Energy 5 Our carbonate fuel cells are uniquely positioned to address macro trends driving global electricity demand growth Addressing Global Electricity Demand and Bottlenecks AI and cloud workloads are driving electricity demand beyond what current grid infrastructure can deliver Demand Surge From AI/Cloud FCEL has the capability to rapidly deploy modular, high power density carbonate fuel cells in order to bring multi-MW data center capacity online in months Securing new high-voltage interconnections or substation builds can take 5–7 years or more Long Utility Interconnection Timelines FCEL’s systems do not require utility interconnection when operating in off-grid mode and are a durable baseload alternative Large-scale behind-the-meter generation requires 3–5 year procurement and construction timelines Gas Turbine Queues FCEL offers an alternative with comparable cost of energy, accelerated revenue capture and reduced permitting risk Environmental & Permitting Constraints FCEL’s platforms have virtually no NOx or SOx, significantly lower CO₂ and unique carbon capture capability Limited availability of sites with pre-positioned power Scarcity of Powered Land 1.25 MW building blocks can deliver scale as power needs grow; relationship with Diversified Energy to focus on gas supply in key markets Driver FCEL Solution Stringent NOx/CO₂ emissions caps and local opposition make traditional gas generation difficult |
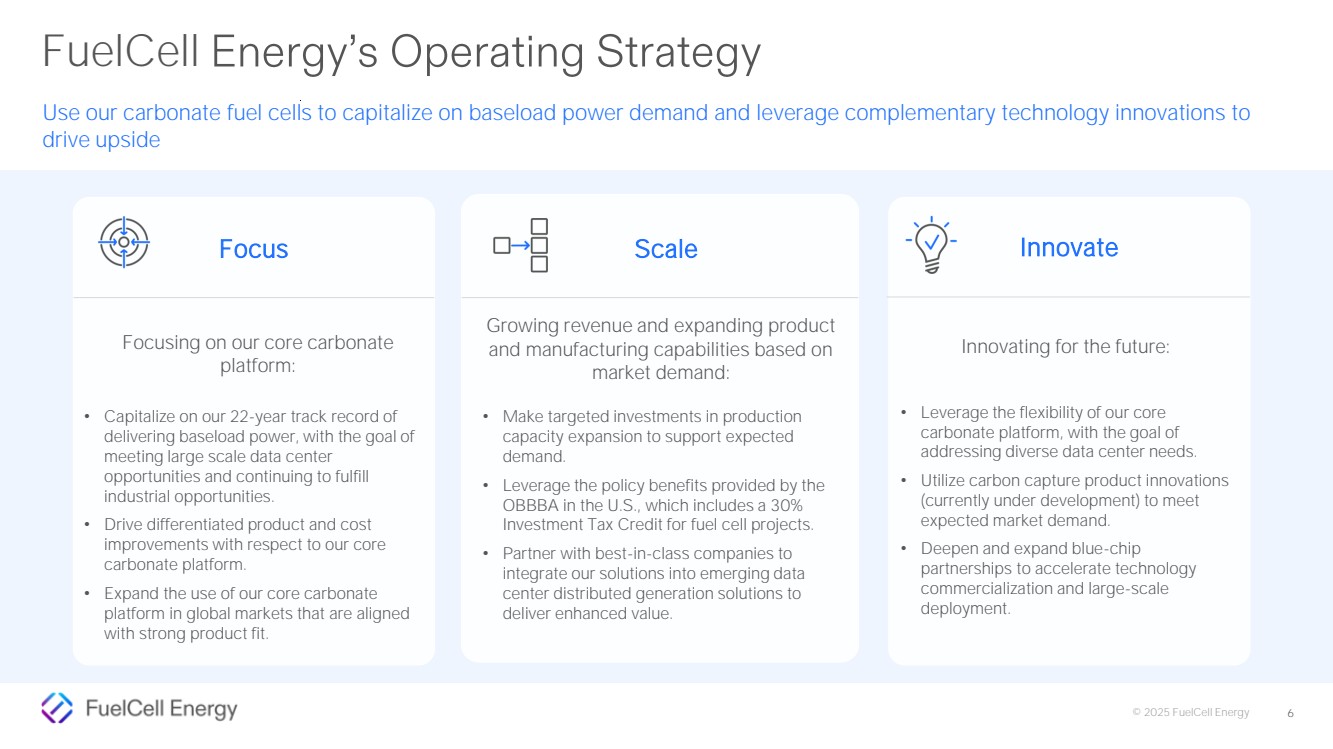
| © 2025 FuelCell Energy 6 Use our carbonate fuel cells to capitalize on baseload power demand and leverage complementary technology innovations to drive upside FuelCell Energy’s Operating Strategy • Make targeted investments in production capacity expansion to support expected demand. • Leverage the policy benefits provided by the OBBBA in the U.S., which includes a 30% Investment Tax Credit for fuel cell projects. • Partner with best-in-class companies to integrate our solutions into emerging data center distributed generation solutions to deliver enhanced value. Growing revenue and expanding product and manufacturing capabilities based on market demand: • Capitalize on our 22-year track record of delivering baseload power, with the goal of meeting large scale data center opportunities and continuing to fulfill industrial opportunities. • Drive differentiated product and cost improvements with respect to our core carbonate platform. • Expand the use of our core carbonate platform in global markets that are aligned with strong product fit. Focusing on our core carbonate platform: • Leverage the flexibility of our core carbonate platform, with the goal of addressing diverse data center needs. • Utilize carbon capture product innovations (currently under development) to meet expected market demand. • Deepen and expand blue-chip partnerships to accelerate technology commercialization and large-scale deployment. Innovating for the future: Focus Scale Innovate |
| © 2025 FuelCell Energy Commercial Update 7 |

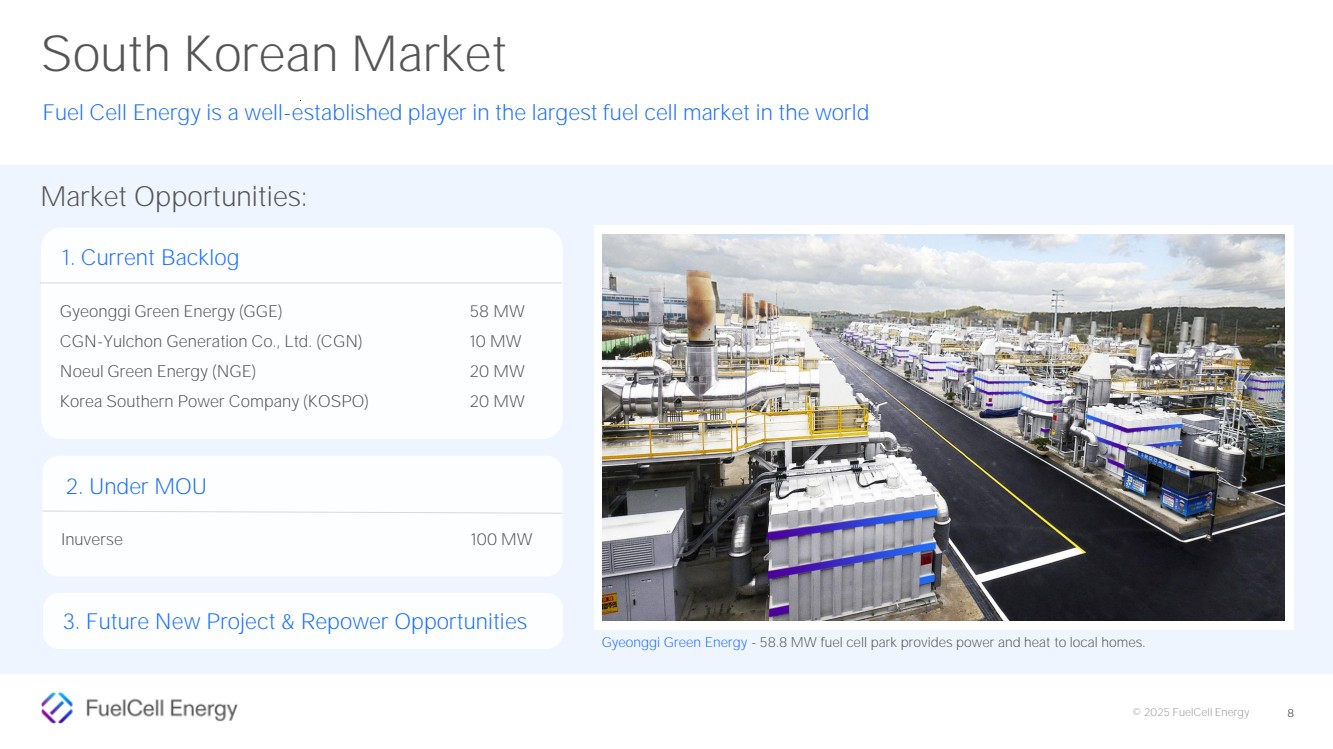
| © 2025 FuelCell Energy 8 Market Opportunities: South Korean Market Fuel Cell Energy is a well-established player in the largest fuel cell market in the world Gyeonggi Green Energy - 58.8 MW fuel cell park provides power and heat to local homes. 2. Under MOU 1. Current Backlog Gyeonggi Green Energy (GGE) CGN-Yulchon Generation Co., Ltd. (CGN) Noeul Green Energy (NGE) Korea Southern Power Company (KOSPO) 3. Future New Project & Repower Opportunities 58 MW 10 MW 20 MW 20 MW Inuverse 100 MW |
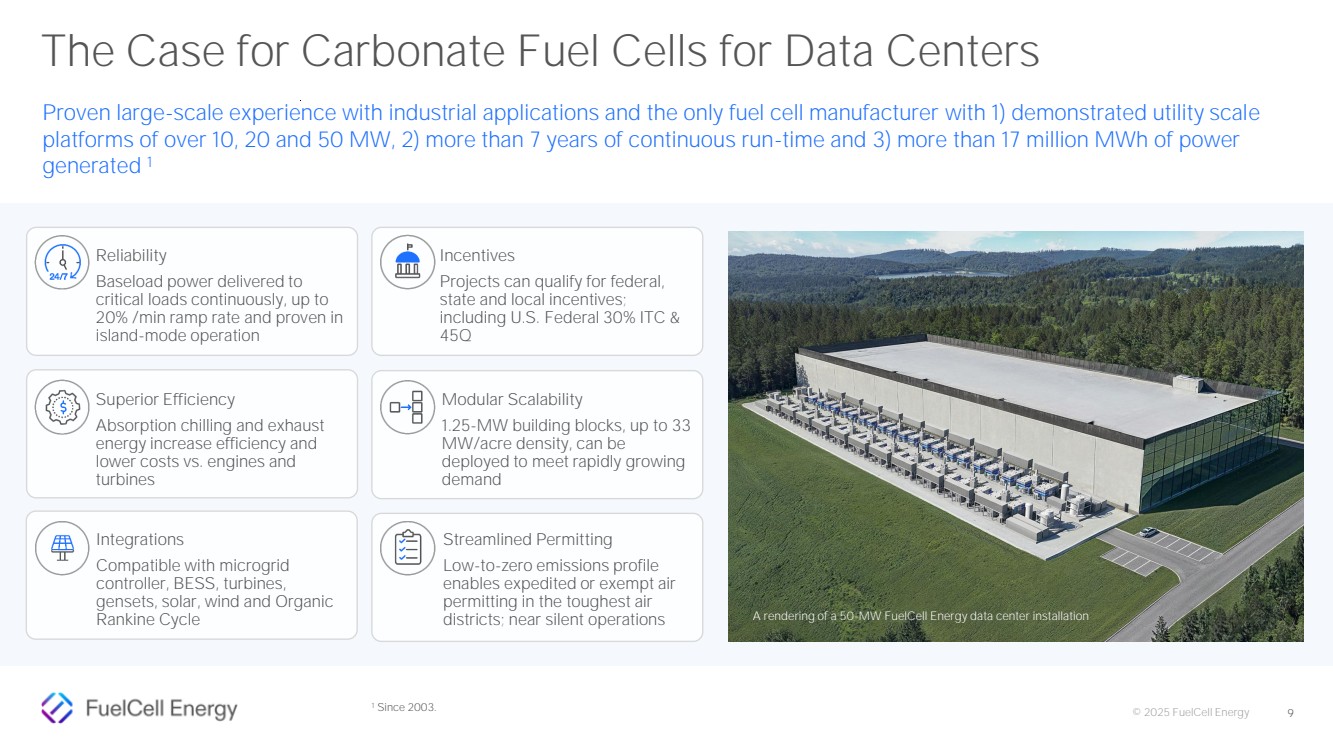
| © 2025 FuelCell Energy 9 Incentives Projects can qualify for federal, state and local incentives; including U.S. Federal 30% ITC & 45Q Integrations Compatible with microgrid controller, BESS, turbines, gensets, solar, wind and Organic Rankine Cycle Modular Scalability 1.25-MW building blocks, up to 33 MW/acre density, can be deployed to meet rapidly growing demand Superior Efficiency Absorption chilling and exhaust energy increase efficiency and lower costs vs. engines and turbines Streamlined Permitting Low-to-zero emissions profile enables expedited or exempt air permitting in the toughest air districts; near silent operations Reliability Baseload power delivered to critical loads continuously, up to 20% /min ramp rate and proven in island-mode operation A rendering of a 50-MW FuelCell Energy data center installation The Case for Carbonate Fuel Cells for Data Centers Proven large-scale experience with industrial applications and the only fuel cell manufacturer with 1) demonstrated utility scale platforms of over 10, 20 and 50 MW, 2) more than 7 years of continuous run-time and 3) more than 17 million MWh of power generated 1 1 Since 2003. |
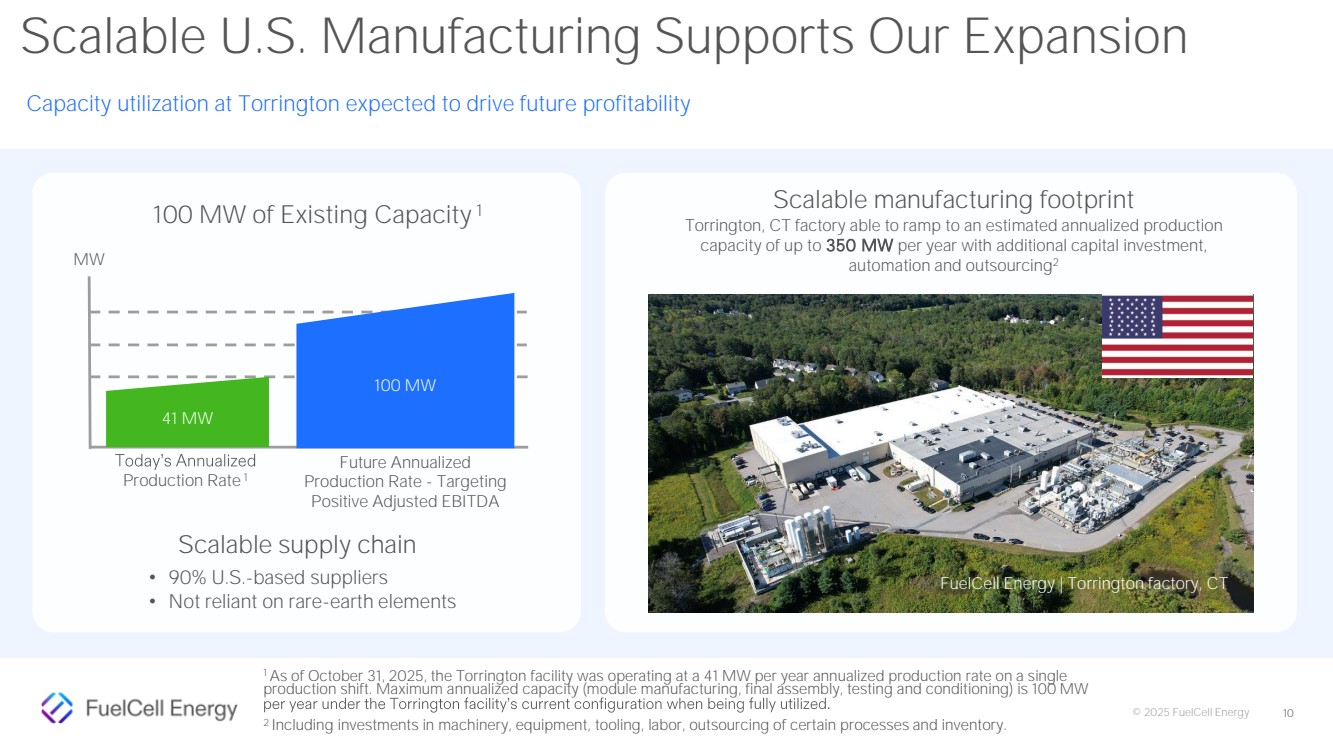
| © 2025 FuelCell Energy Scalable U.S. Manufacturing Supports Our Expansion Capacity utilization at Torrington expected to drive future profitability 10 Scalable manufacturing footprint Torrington, CT factory able to ramp to an estimated annualized production capacity of up to 350 MW per year with additional capital investment, automation and outsourcing2 FuelCell Energy | Torrington factory, CT 100 MW of Existing Capacity 1 MW 41 MW 100 MW Scalable supply chain Today’s Annualized Production Rate 1 Future Annualized Production Rate - Targeting Positive Adjusted EBITDA • 90% U.S.-based suppliers • Not reliant on rare-earth elements 1 As of October 31, 2025, the Torrington facility was operating at a 41 MW per year annualized production rate on a single production shift. Maximum annualized capacity (module manufacturing, final assembly, testing and conditioning) is 100 MW per year under the Torrington facility’s current configuration when being fully utilized. 2 Including investments in machinery, equipment, tooling, labor, outsourcing of certain processes and inventory. |
| © 2025 FuelCell Energy Financial Update 11 |

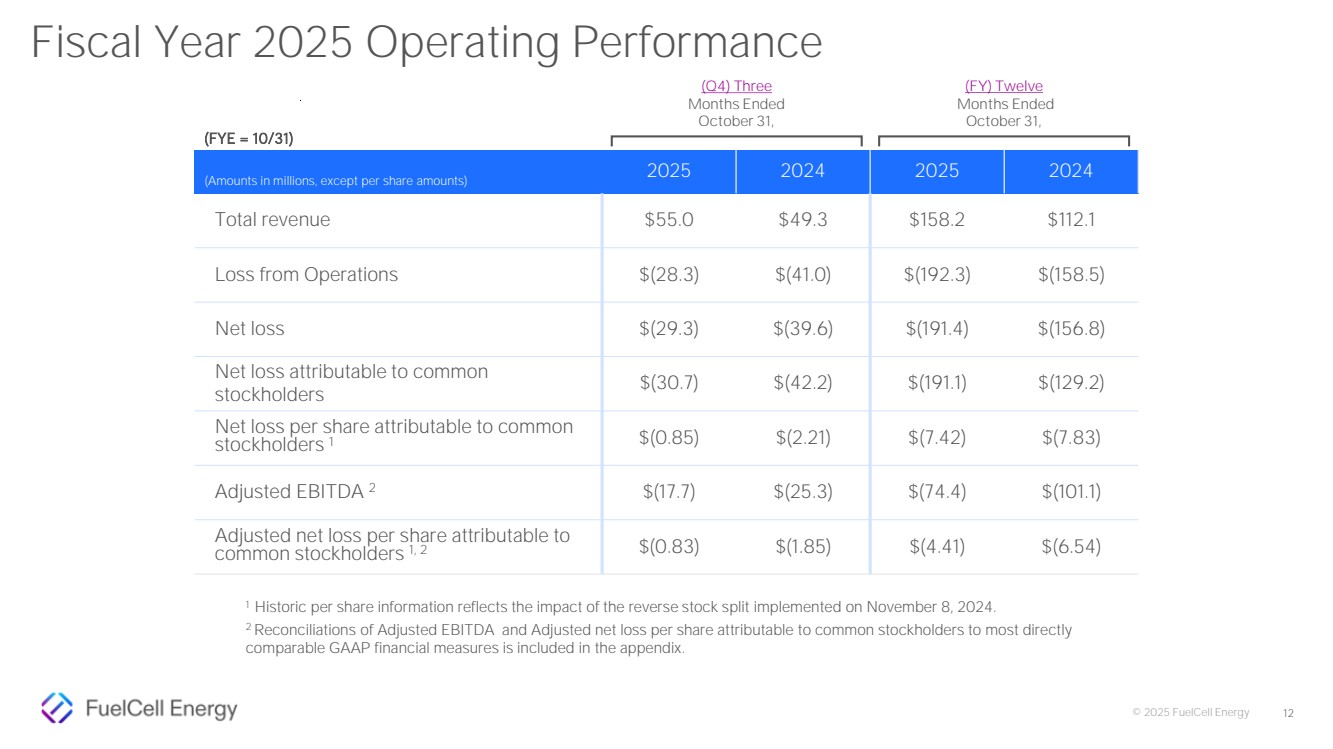
| © 2025 FuelCell Energy (Amounts in millions, except per share amounts) 2025 2024 2025 2024 Total revenue $55.0 $49.3 $158.2 $112.1 Loss from Operations $(28.3) $(41.0) $(192.3) $(158.5) Net loss $(29.3) $(39.6) $(191.4) $(156.8) Net loss attributable to common stockholders $(30.7) $(42.2) $(191.1) $(129.2) Net loss per share attributable to common stockholders 1 $(0.85) $(2.21) $(7.42) $(7.83) Adjusted EBITDA 2 $(17.7) $(25.3) $(74.4) $(101.1) Adjusted net loss per share attributable to common stockholders 1, 2 $(0.83) $(1.85) $(4.41) $(6.54) 12 Fiscal Year 2025 Operating Performance (FYE = 10/31) (Q4) Three Months Ended October 31, (FY) Twelve Months Ended October 31, 1 Historic per share information reflects the impact of the reverse stock split implemented on November 8, 2024. 2 Reconciliations of Adjusted EBITDA and Adjusted net loss per share attributable to common stockholders to most directly comparable GAAP financial measures is included in the appendix. |
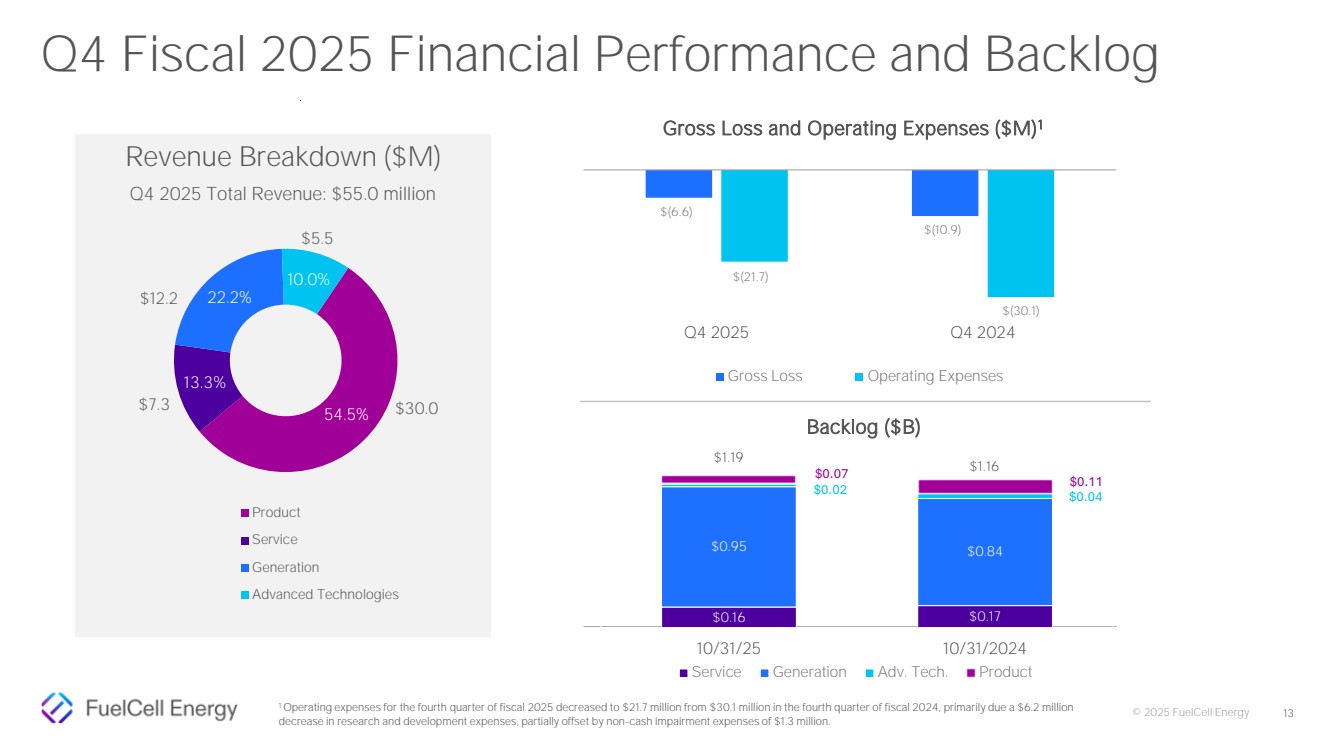
| © 2025 FuelCell Energy $(6.6) $(10.9) $(21.7) $(30.1) Q4 2025 Q4 2024 13 Revenue Breakdown ($M) Q4 2025 Total Revenue: $55.0 million 54.5% 13.3% 22.2% 10.0% Product Service Generation Advanced Technologies $5.5 $7.3 $30.0 $12.2 Gross Loss and Operating Expenses ($M)1 Gross Loss Operating Expenses $0.16 $0.17 $0.95 $0.84 $0.02 $0.04 $0.07 $0.11 10/31/25 10/31/2024 Service Generation Adv. Tech. Product $1.16 $1.19 Backlog ($B) 1 Operating expenses for the fourth quarter of fiscal 2025 decreased to $21.7 million from $30.1 million in the fourth quarter of fiscal 2024, primarily due a $6.2 million decrease in research and development expenses, partially offset by non-cash impairment expenses of $1.3 million. Q4 Fiscal 2025 Financial Performance and Backlog |
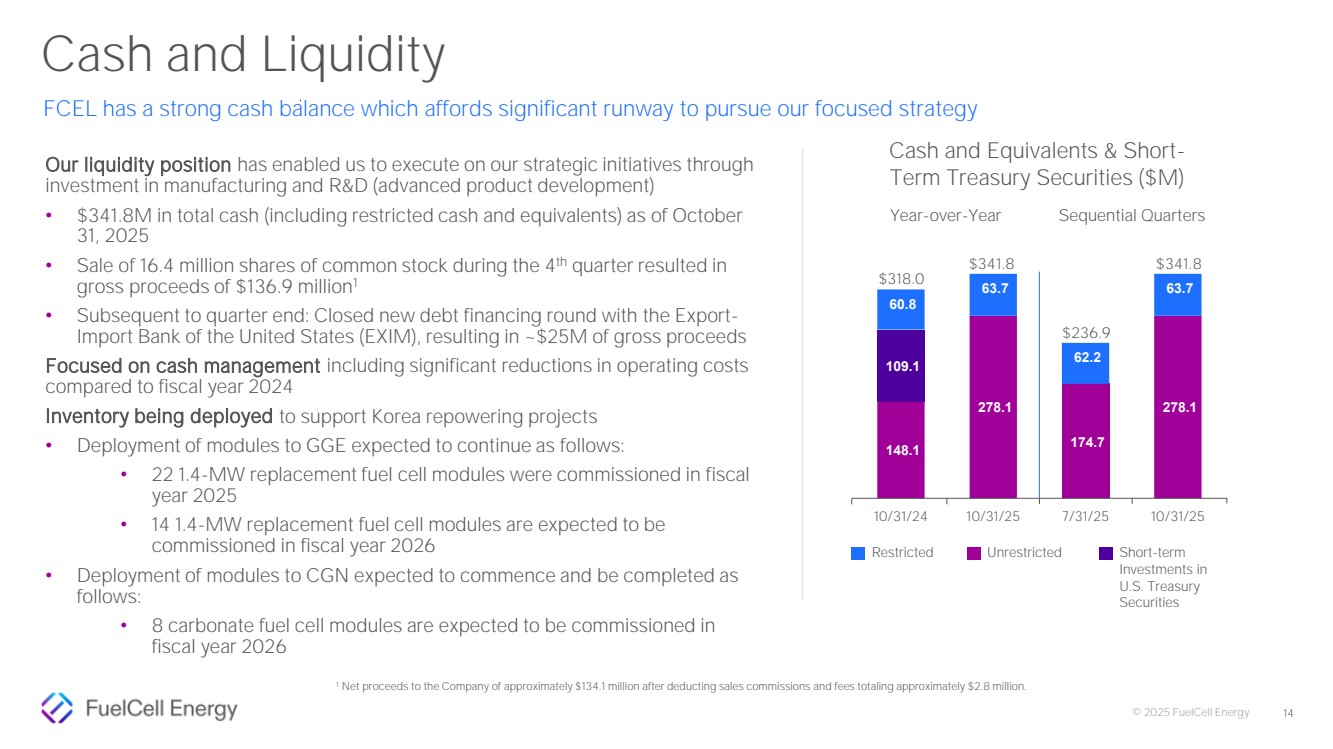
| © 2025 FuelCell Energy Our liquidity position has enabled us to execute on our strategic initiatives through investment in manufacturing and R&D (advanced product development) • $341.8M in total cash (including restricted cash and equivalents) as of October 31, 2025 • Sale of 16.4 million shares of common stock during the 4 th quarter resulted in gross proceeds of $136.9 million1 • Subsequent to quarter end: Closed new debt financing round with the Export-Import Bank of the United States (EXIM), resulting in ~$25M of gross proceeds Focused on cash management including significant reductions in operating costs compared to fiscal year 2024 Inventory being deployed to support Korea repowering projects • Deployment of modules to GGE expected to continue as follows: • 22 1.4-MW replacement fuel cell modules were commissioned in fiscal year 2025 • 14 1.4-MW replacement fuel cell modules are expected to be commissioned in fiscal year 2026 • Deployment of modules to CGN expected to commence and be completed as follows: • 8 carbonate fuel cell modules are expected to be commissioned in fiscal year 2026 148.1 278.1 174.7 278.1 109.1 60.8 63.7 62.2 63.7 10/31/24 10/31/25 7/31/25 10/31/25 Cash and Equivalents & Short-Term Treasury Securities ($M) Restricted Short-term Investments in U.S. Treasury Securities Unrestricted $318.0 $341.8 $341.8 Year-over-Year Sequential Quarters $236.9 1 Net proceeds to the Company of approximately $134.1 million after deducting sales commissions and fees totaling approximately $2.8 million. 14 Cash and Liquidity FCEL has a strong cash balance which affords significant runway to pursue our focused strategy |
| © 2025 FuelCell Energy Thank you 15 |

| © 2025 FuelCell Energy Appendix 16 |

| © 2025 FuelCell Energy 17 Non-GAAP Financial Measures Financial results are presented in accordance with accounting principles generally accepted in the United States (“GAAP”). Management also uses non-GAAP measures to analyze and make operating decisions on the business. Earnings before interest, taxes, depreciation and amortization (“EBITDA”), Adjusted EBITDA, Adjusted net loss attributable to common stockholders and Adjusted net loss per share attributable to common stockholders are non-GAAP measures of operations and operating performance by the Company. These supplemental non-GAAP measures are provided to assist readers in assessing operating performance. Management believes EBITDA, Adjusted EBITDA, Adjusted net loss attributable to common stockholders and Adjusted net loss per share attributable to common stockholders are useful in assessing performance and highlighting trends on an overall basis. Management also believes these measures are used by companies in the fuel cell sector and by securities analysts and investors when comparing the results of the Company with those of other companies. EBITDA differs from the most comparable GAAP measure, net loss attributable to the Company, primarily because it does not include finance expense, income taxes and depreciation of property, plant and equipment and project assets. Adjusted EBITDA adjusts EBITDA for stock-based compensation, impairment and restructuring expenses, non-cash (gain) loss on derivative instruments and other unusual items, which are considered either non-cash or non-recurring. Adjusted net loss attributable to common stockholders and Adjusted net loss per share attributable to common stockholders differ from the most comparable GAAP measures, Net loss attributable to common stockholders and Net loss per share attributable to common stockholders, primarily because they do not include stock-based compensation, impairment and restructuring expenses, non-cash (gain) loss on derivative instruments and other unusual items, which are considered either non-cash or non-recurring. While management believes that these non-GAAP financial measures provide useful supplemental information to investors, there are limitations associated with the use of these measures. The measures are not prepared in accordance with GAAP and may not be directly comparable to similarly titled measures of other companies due to differences in the exact method of calculation. The Company’s non -GAAP financial measures are not meant to be considered in isolation or as a substitute for comparable GAAP financial measures and should be read only in conjunction with the Company’s consolidated financial statements prepared in accordance with GAAP. On the following slides, we calculate EBITDA and Adjusted EBITDA and reconcile these figures to the GAAP financial statement measure Net loss; we calculate Adjusted net loss attributable to common stockholders and reconcile that figure to the GAAP financial statement measure Net loss attributable to common stockholders; and we calculate Adjusted net loss per share attributable to common stockholders. |
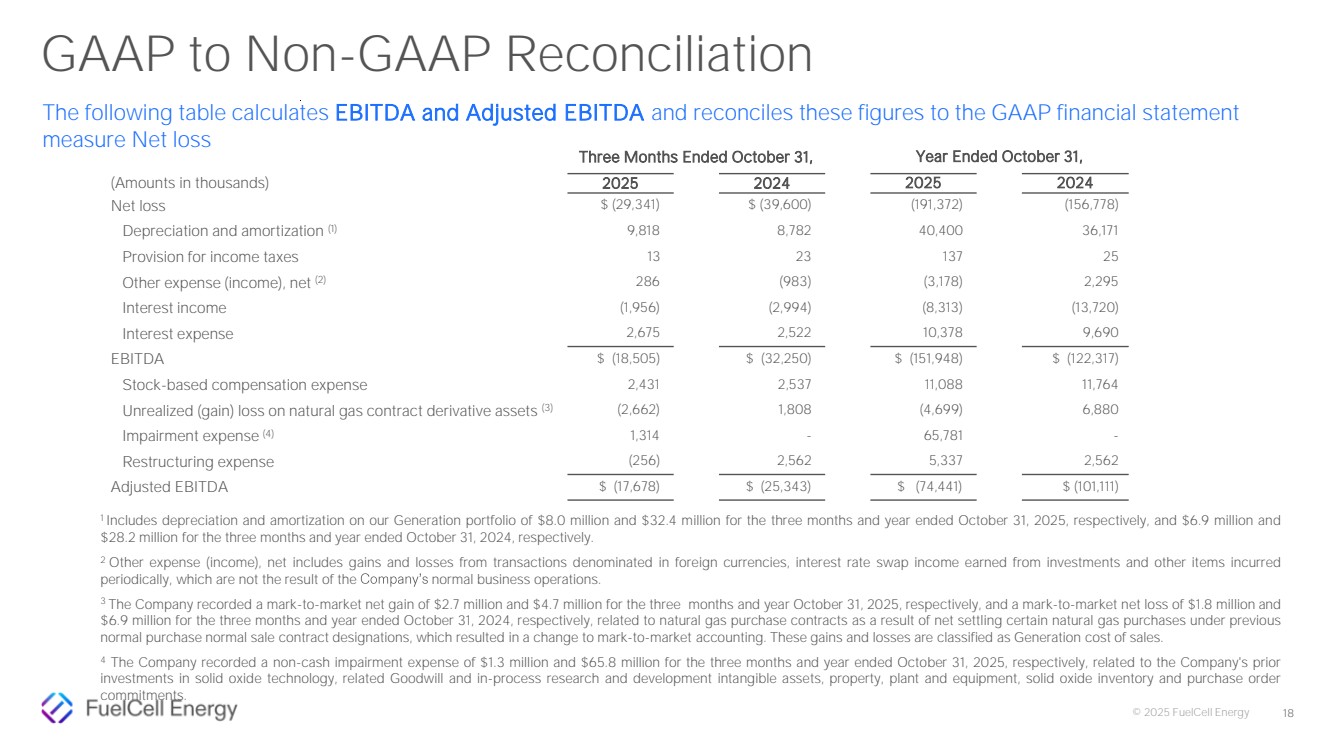
| © 2025 FuelCell Energy 18 1 Includes depreciation and amortization on our Generation portfolio of $8.0 million and $32.4 million for the three months and year ended October 31, 2025, respectively, and $6.9 million and $28.2 million for the three months and year ended October 31, 2024, respectively. 2 Other expense (income), net includes gains and losses from transactions denominated in foreign currencies, interest rate swap income earned from investments and other items incurred periodically, which are not the result of the Company’s normal business operations. 3 The Company recorded a mark-to-market net gain of $2.7 million and $4.7 million for the three months and year October 31, 2025, respectively, and a mark-to-market net loss of $1.8 million and $6.9 million for the three months and year ended October 31, 2024, respectively, related to natural gas purchase contracts as a result of net settling certain natural gas purchases under previous normal purchase normal sale contract designations, which resulted in a change to mark-to-market accounting. These gains and losses are classified as Generation cost of sales. 4 The Company recorded a non-cash impairment expense of $1.3 million and $65.8 million for the three months and year ended October 31, 2025, respectively, related to the Company's prior investments in solid oxide technology, related Goodwill and in-process research and development intangible assets, property, plant and equipment, solid oxide inventory and purchase order commitments. GAAP to Non-GAAP Reconciliation The following table calculates EBITDA and Adjusted EBITDA and reconciles these figures to the GAAP financial statement measure Net loss Three Months Ended October 31, Year Ended October 31, (Amounts in thousands) 2025 2024 2025 2024 Net loss $ (29,341) $ (39,600) (191,372) (156,778) Depreciation and amortization (1) 9,818 8,782 40,400 36,171 Provision for income taxes 13 23 137 25 Other expense (income), net (2) 286 (983) (3,178) 2,295 Interest income (1,956) (2,994) (8,313) (13,720) Interest expense 2,675 2,522 10,378 9,690 EBITDA $ (18,505) $ (32,250) $ (151,948) $ (122,317) Stock-based compensation expense 2,431 2,537 11,088 11,764 Unrealized (gain) loss on natural gas contract derivative assets (3) (2,662) 1,808 (4,699) 6,880 Impairment expense (4) 1,314 - 65,781 - Restructuring expense (256) 2,562 5,337 2,562 Adjusted EBITDA $ (17,678) $ (25,343) $ (74,441) $ (101,111) |
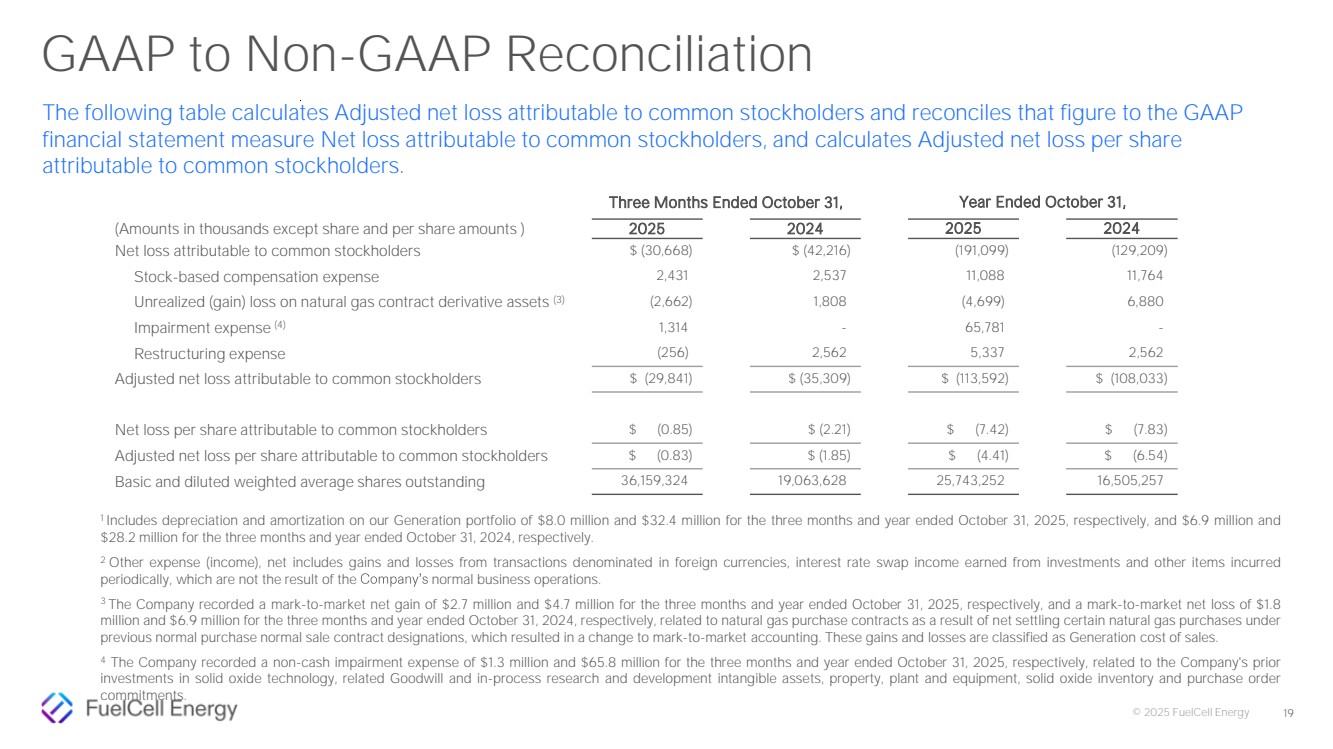
| © 2025 FuelCell Energy 19 GAAP to Non-GAAP Reconciliation The following table calculates Adjusted net loss attributable to common stockholders and reconciles that figure to the GAAP financial statement measure Net loss attributable to common stockholders, and calculates Adjusted net loss per share attributable to common stockholders. Three Months Ended October 31, Year Ended October 31, (Amounts in thousands except share and per share amounts ) 2025 2024 2025 2024 Net loss attributable to common stockholders $ (30,668) $ (42,216) (191,099) (129,209) Stock-based compensation expense 2,431 2,537 11,088 11,764 Unrealized (gain) loss on natural gas contract derivative assets (3) (2,662) 1,808 (4,699) 6,880 Impairment expense (4) 1,314 - 65,781 - Restructuring expense (256) 2,562 5,337 2,562 Adjusted net loss attributable to common stockholders $ (29,841) $ (35,309) $ (113,592) $ (108,033) Net loss per share attributable to common stockholders $ (0.85) $ (2.21) $ (7.42) $ (7.83) Adjusted net loss per share attributable to common stockholders $ (0.83) $ (1.85) $ (4.41) $ (6.54) Basic and diluted weighted average shares outstanding 36,159,324 19,063,628 25,743,252 16,505,257 1 Includes depreciation and amortization on our Generation portfolio of $8.0 million and $32.4 million for the three months and year ended October 31, 2025, respectively, and $6.9 million and $28.2 million for the three months and year ended October 31, 2024, respectively. 2 Other expense (income), net includes gains and losses from transactions denominated in foreign currencies, interest rate swap income earned from investments and other items incurred periodically, which are not the result of the Company’s normal business operations. 3 The Company recorded a mark-to-market net gain of $2.7 million and $4.7 million for the three months and year ended October 31, 2025, respectively, and a mark-to-market net loss of $1.8 million and $6.9 million for the three months and year ended October 31, 2024, respectively, related to natural gas purchase contracts as a result of net settling certain natural gas purchases under previous normal purchase normal sale contract designations, which resulted in a change to mark-to-market accounting. These gains and losses are classified as Generation cost of sales. 4 The Company recorded a non-cash impairment expense of $1.3 million and $65.8 million for the three months and year ended October 31, 2025, respectively, related to the Company's prior investments in solid oxide technology, related Goodwill and in-process research and development intangible assets, property, plant and equipment, solid oxide inventory and purchase order commitments. |
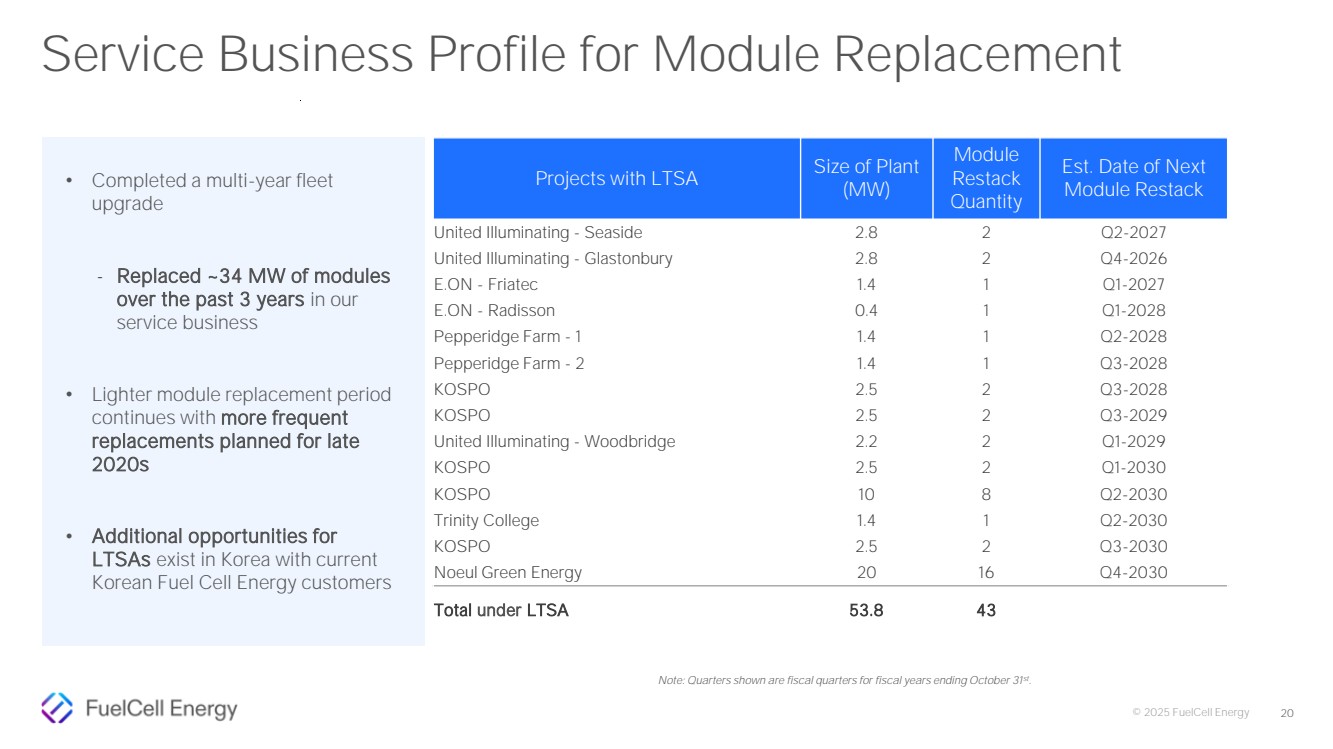
| © 2025 FuelCell Energy 20 Note: Quarters shown are fiscal quarters for fiscal years ending October 31st . Service Business Profile for Module Replacement Projects with LTSA Size of Plant (MW) Module Restack Quantity Est. Date of Next Module Restack United Illuminating - Seaside 2.8 2 Q2-2027 United Illuminating - Glastonbury 2.8 2 Q4-2026 E.ON - Friatec 1.4 1 Q1-2027 E.ON - Radisson 0.4 1 Q1-2028 Pepperidge Farm - 1 1.4 1 Q2-2028 Pepperidge Farm - 2 1.4 1 Q3-2028 KOSPO 2.5 2 Q3-2028 KOSPO 2.5 2 Q3-2029 United Illuminating - Woodbridge 2.2 2 Q1-2029 KOSPO 2.5 2 Q1-2030 KOSPO 10 8 Q2-2030 Trinity College 1.4 1 Q2-2030 KOSPO 2.5 2 Q3-2030 Noeul Green Energy 20 16 Q4-2030 Total under LTSA 53.8 43 • Completed a multi-year fleet upgrade - Replaced ~34 MW of modules over the past 3 years in our service business • Lighter module replacement period continues with more frequent replacements planned for late 2020s • Additional opportunities for LTSAs exist in Korea with current Korean Fuel Cell Energy customers |
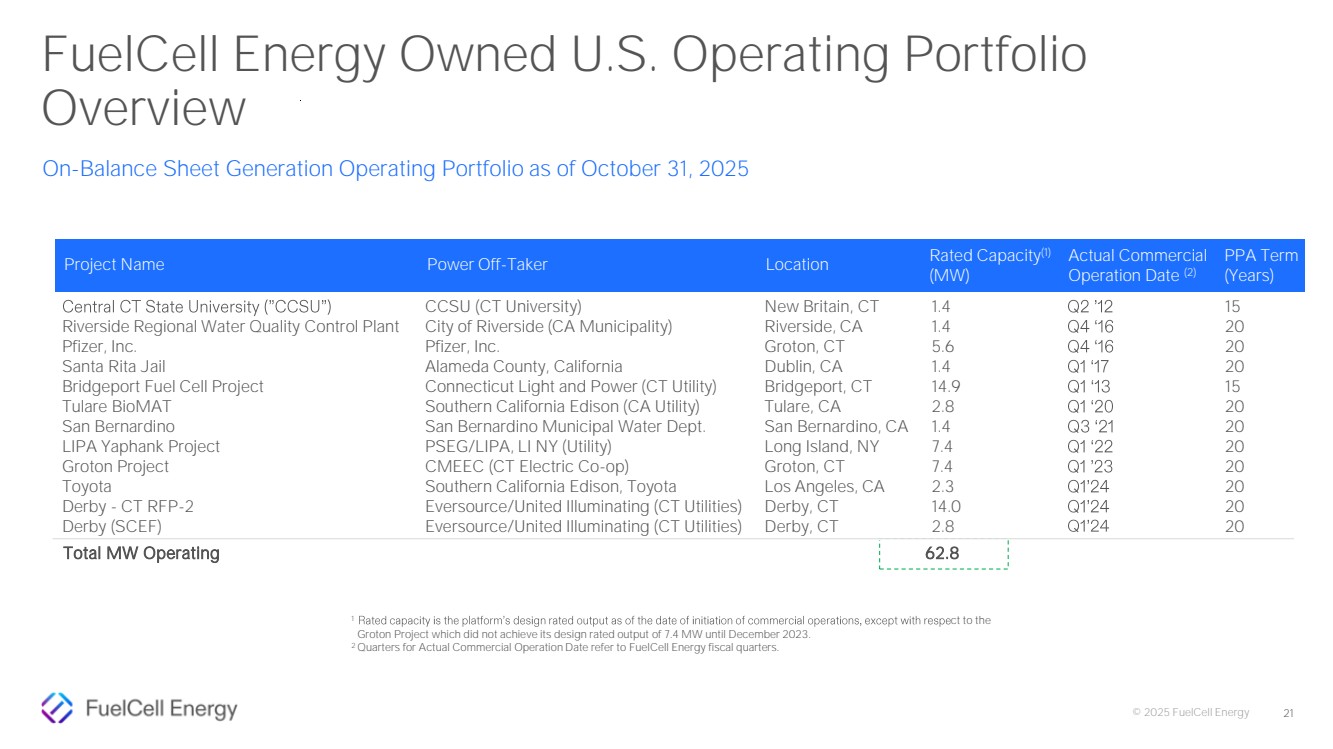
| © 2025 FuelCell Energy 21 1 Rated capacity is the platform’s design rated output as of the date of initiation of commercial operations, except with respe ct to the Groton Project which did not achieve its design rated output of 7.4 MW until December 2023. 2 Quarters for Actual Commercial Operation Date refer to FuelCell Energy fiscal quarters. Central CT State University (”CCSU”) Riverside Regional Water Quality Control Plant Pfizer, Inc. Santa Rita Jail Bridgeport Fuel Cell Project Tulare BioMAT San Bernardino LIPA Yaphank Project Groton Project Toyota Derby - CT RFP-2 Derby (SCEF) CCSU (CT University) City of Riverside (CA Municipality) Pfizer, Inc. Alameda County, California Connecticut Light and Power (CT Utility) Southern California Edison (CA Utility) San Bernardino Municipal Water Dept. PSEG/LIPA, LI NY (Utility) CMEEC (CT Electric Co-op) Southern California Edison, Toyota Eversource/United Illuminating (CT Utilities) Eversource/United Illuminating (CT Utilities) New Britain, CT Riverside, CA Groton, CT Dublin, CA Bridgeport, CT Tulare, CA San Bernardino, CA Long Island, NY Groton, CT Los Angeles, CA Derby, CT Derby, CT 1.4 1.4 5.6 1.4 14.9 2.8 1.4 7.4 7.4 2.3 14.0 2.8 Q2 ’12 Q4 ‘16 Q4 ‘16 Q1 ‘17 Q1 ‘13 Q1 ‘20 Q3 ‘21 Q1 ‘22 Q1 ’23 Q1’24 Q1’24 Q1’24 15 20 20 20 15 20 20 20 20 20 20 20 62.8 Project Name Power Off-Taker Location Rated Capacity(1) (MW) Actual Commercial Operation Date (2) PPA Term (Years) Total MW Operating FuelCell Energy Owned U.S. Operating Portfolio Overview On-Balance Sheet Generation Operating Portfolio as of October 31, 2025 |