| © 2025 FuelCell Energy 1 Third Quarter of Fiscal Year 2025 Financial Results & Business Update A rendering of a 50-MW FuelCell Energy data center installation © 2025 FuelCell Energy .2 |
| © 2025 FuelCell Energy This presentation contains forward-looking statements within the meaning of the safe harbor provisions of the Private Securities Litigation Reform Act of 1995 regarding future events or our future financial performance that involve certain contingencies and uncertainties. The forward-looking statements include, without limitation, statements with respect to the anticipated financial results and statements regarding the plans and expectations regarding the continuing development, commercialization and financing of its current and future fuel cell technologies, the expected timing of completion of the ongoing projects, the expected timing of module replacements, the business plans and strategies, the implementation, effect, and potential impact of the restructuring plans, the plan to reduce operating costs, the plans and ability to achieve positive Adjusted EBITDA, the capabilities of the products, and the markets in which the Company expects to operate. Projected and estimated numbers contained herein are not forecasts and may not reflect actual results. These forward-looking statements are not guarantees of future performance, and all forward-looking statements are subject to risks and uncertainties, known and unknown, that could cause actual results and future events to differ materially from those projected. Factors that could cause such a difference include, without limitation: general risks associated with product development and manufacturing; general economic conditions; changes in interest rates, which may impact project financing; supply chain disruptions; changes in the utility regulatory environment; changes in the utility industry and the markets for distributed generation, distributed hydrogen, and fuel cell power plants configured for carbon capture or carbon separation; potential volatility of commodity prices that may adversely affect our projects; availability of government subsidies and economic incentives for alternative energy technologies; our ability to remain in compliance with U.S. federal and state and foreign government laws and regulations; our ability to maintain compliance with the listing rules of The Nasdaq Stock Market; rapid technological change; competition; the risk that our bid awards will not convert to contracts or that our contracts will not convert to revenue; market acceptance of our products; changes in accounting policies or practices adopted voluntarily or as required by accounting principles generally accepted in the United States; factors affecting our liquidity position and financial condition; government appropriations; the ability of the government and third parties to terminate their development contracts at any time; the ability of the government to exercise - rights with respect to certain of our patents; our ability to successfully market and sell our products internationally; our ability to develop additional commercially viable products; our ability to implement our strategy; our ability to reduce our levelized cost of energy and deliver on our cost reduction strategy generally; our ability to protect our intellectual property; litigation and other proceedings; the risk that commercialization of our new products will not occur when anticipated or, if it does, that we will not have adequate capacity to satisfy demand; our need for and the availability of additional financing; our ability to generate positive cash flow from operations; our ability to service our long-term debt; our ability to increase the output and longevity of our platforms and to meet the performance requirements of our contracts; our ability to expand our customer base and maintain relationships with our largest customers and strategic business allies; the risk that our restructuring plans and workforce reductions will not result in the intended benefits or savings; the risk that our restructuring plans and workforce reductions will result in unanticipated costs; the risk that our restructuring plans will yield unintended consequences to our remaining workforce and results of operations; our ability to reduce operating costs; and our ability to achieve positive Adjusted EBITDA in the future, as well as other risks set forth in the filings with the Securities and Exchange Commission including the Annual Report on Form 10-K for the fiscal year ended October 31, 2024 and the Quarterly Report on Form 10-Q for the fiscal quarter ended July 31, 2025. The forward-looking statements contained herein speak only as of the date of this presentation. The Company expressly disclaims any obligation or undertaking to release publicly any updates or revisions to any such statement contained herein to reflect any change in the expectations or any change in events, conditions or circumstances on which any such statement is based. The Company refers to non-GAAP financial measures in this presentation. The Company believes that this information is useful to understanding its operating results and assessing performance and highlighting trends on an overall basis. Please refer to the earnings release and the appendix to this presentation for further disclosure and reconciliation of non-GAAP financial measures. (As used herein, the term refers to generally accepted accounting principles in the U.S.) The information set forth in this presentation is qualified by reference to, and should be read in conjunction with, our Annual Report on Form 10-K for the fiscal year ended October 31, 2024, filed with the SEC on December 27, 2024, our Quarterly Report on Form 10-Q for the quarter ended July 31, 2025, filed with the SEC on September 9, 2025, and our earnings release for the third quarter of fiscal year 2025, filed as an exhibit to our Current Report on Form 8-K filed with the SEC on September 9, 2025. Safe Harbor Statement 2 |
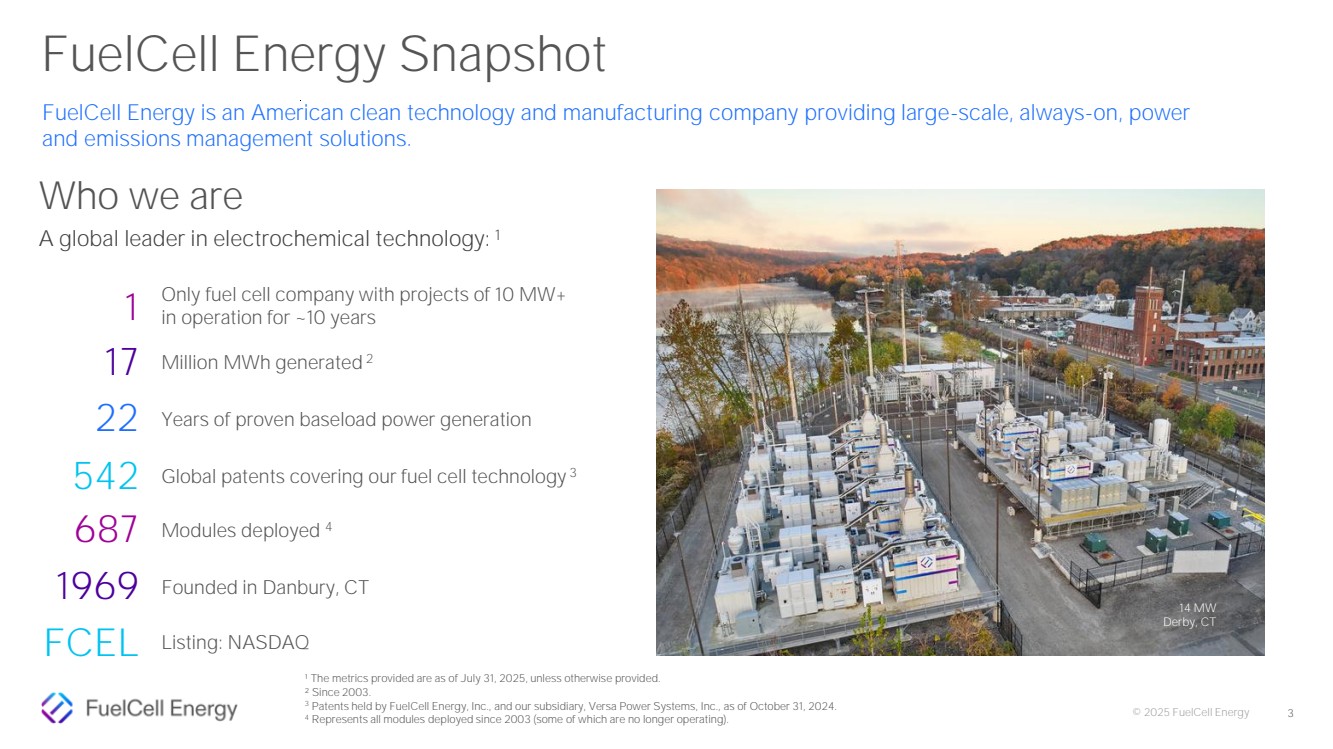
| © 2025 FuelCell Energy FuelCell Energy is an American clean technology and manufacturing company providing large-scale, always-on, power and emissions management solutions. A global leader in electrochemical technology: 1 Who we are ¹ The metrics provided are as of July 31, 2025, unless otherwise provided. ² Since 2003. 3 Patents held by FuelCell Energy, Inc., and our subsidiary, Versa Power Systems, Inc., as of October 31, 2024. 4 Represents all modules deployed since 2003 (some of which are no longer operating). 14 MW Derby, CT 1969 22 542 17 1 FCEL Years of proven baseload power generation Founded in Danbury, CT Global patents covering our fuel cell technology 3 Million MWh generated 2 Only fuel cell company with projects of 10 MW+ in operation for ~10 years Listing: NASDAQ 687 Modules deployed 4 FuelCell Energy Snapshot 3 |
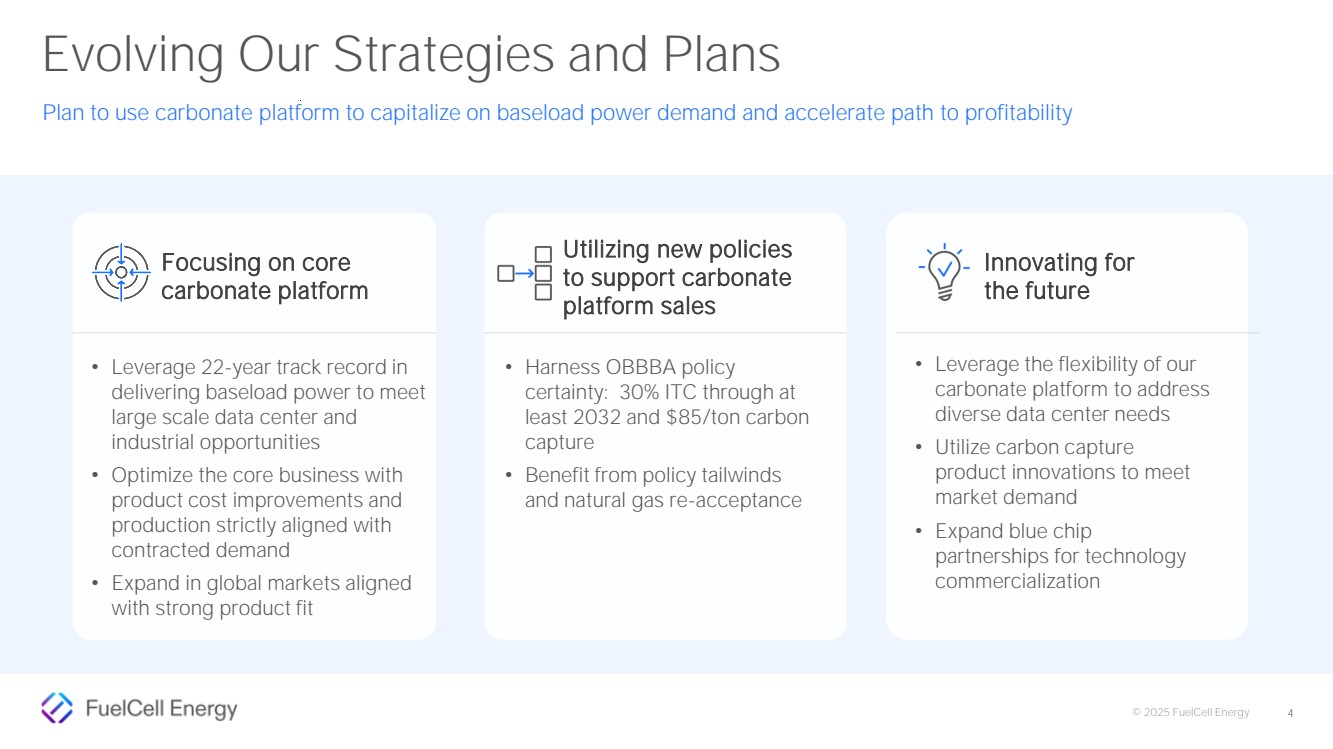
| © 2025 FuelCell Energy Utilizing new policies to support carbonate platform sales Focusing on core carbonate platform • Leverage 22-year track record in delivering baseload power to meet large scale data center and industrial opportunities • Optimize the core business with product cost improvements and production strictly aligned with contracted demand • Expand in global markets aligned with strong product fit Innovating for the future • Leverage the flexibility of our carbonate platform to address diverse data center needs • Utilize carbon capture product innovations to meet market demand • Expand blue chip partnerships for technology commercialization • Harness OBBBA policy certainty: 30% ITC through at least 2032 and $85/ton carbon capture • Benefit from policy tailwinds and natural gas re-acceptance 4 Plan to use carbonate platform to capitalize on baseload power demand and accelerate path to profitability Evolving Our Strategies and Plans |
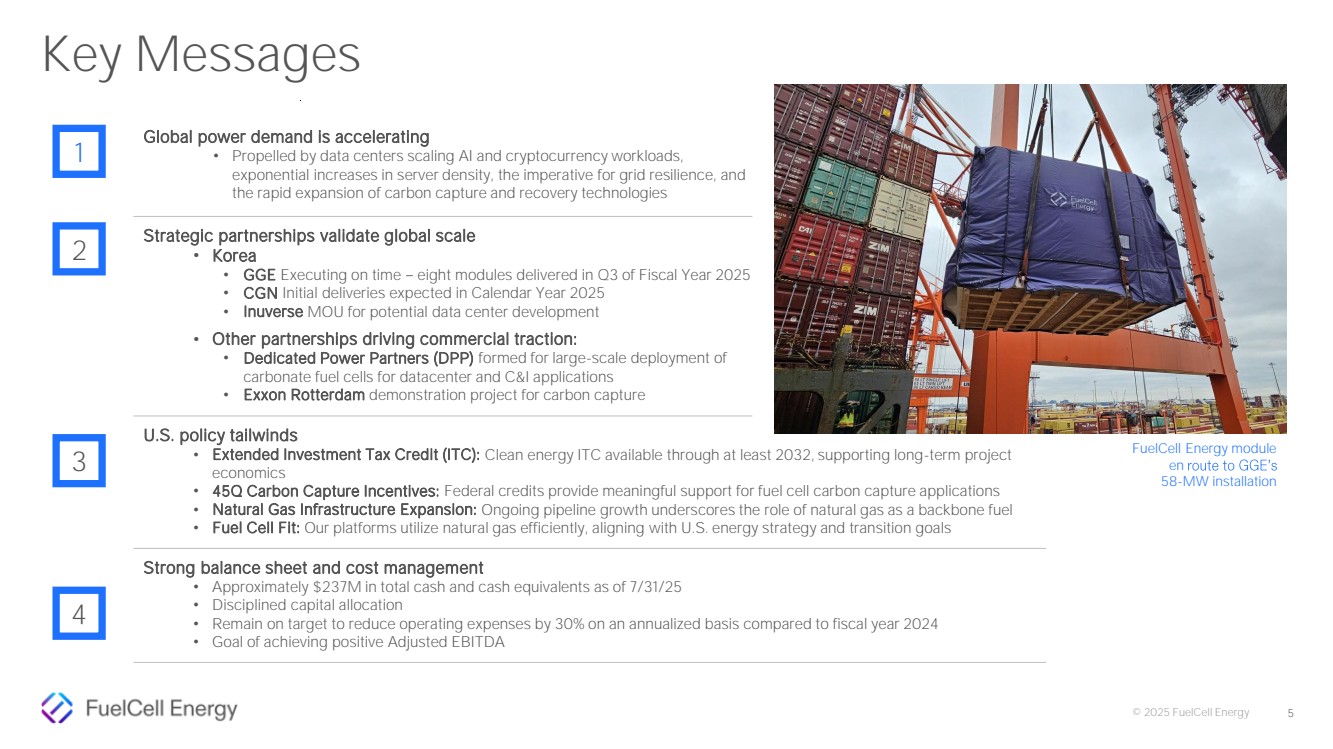
| © 2025 FuelCell Energy 5 Global power demand is accelerating • Propelled by data centers scaling AI and cryptocurrency workloads, exponential increases in server density, the imperative for grid resilience, and the rapid expansion of carbon capture and recovery technologies Strategic partnerships validate global scale • Korea • GGE Executing on time eight modules delivered in Q3 of Fiscal Year 2025 • CGN Initial deliveries expected in Calendar Year 2025 • Inuverse MOU for potential data center development • Other partnerships driving commercial traction: • Dedicated Power Partners (DPP) formed for large-scale deployment of carbonate fuel cells for datacenter and C&I applications • Exxon Rotterdam demonstration project for carbon capture U.S. policy tailwinds • Extended Investment Tax Credit (ITC): Clean energy ITC available through at least 2032, supporting long-term project economics • 45Q Carbon Capture Incentives: Federal credits provide meaningful support for fuel cell carbon capture applications • Natural Gas Infrastructure Expansion: Ongoing pipeline growth underscores the role of natural gas as a backbone fuel • Fuel Cell Fit: Our platforms utilize natural gas efficiently, aligning with U.S. energy strategy and transition goals Strong balance sheet and cost management • Approximately $237M in total cash and cash equivalents as of 7/31/25 • Disciplined capital allocation • Remain on target to reduce operating expenses by 30% on an annualized basis compared to fiscal year 2024 • Goal of achieving positive Adjusted EBITDA FuelCell Energy module en 58-MW installation Key Messages 2 3 1 4 |
| © 2025 FuelCell Energy Commercial Update 6 |

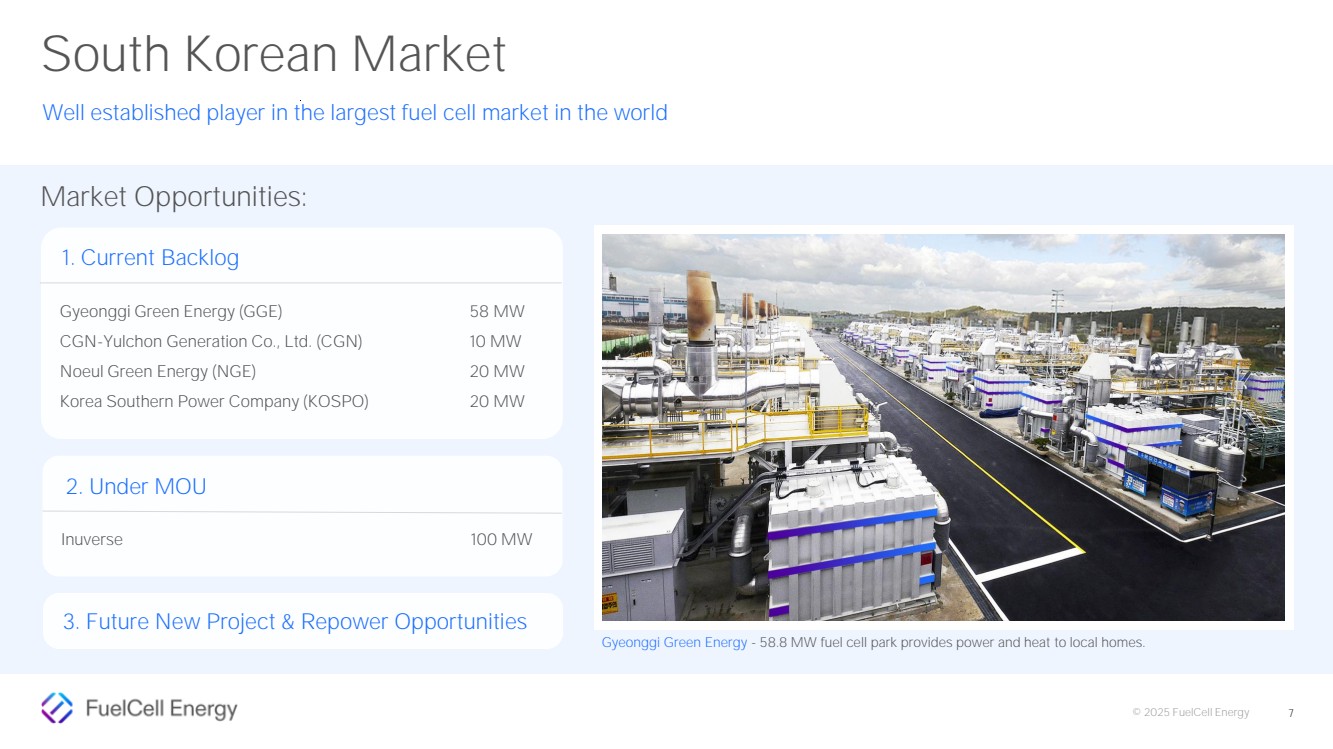
| © 2025 FuelCell Energy 7 Market Opportunities: South Korean Market Well established player in the largest fuel cell market in the world Gyeonggi Green Energy - 58.8 MW fuel cell park provides power and heat to local homes. 2. Under MOU 1. Current Backlog Gyeonggi Green Energy (GGE) CGN-Yulchon Generation Co., Ltd. (CGN) Noeul Green Energy (NGE) Korea Southern Power Company (KOSPO) 3. Future New Project & Repower Opportunities 58 MW 10 MW 20 MW 20 MW Inuverse 100 MW |
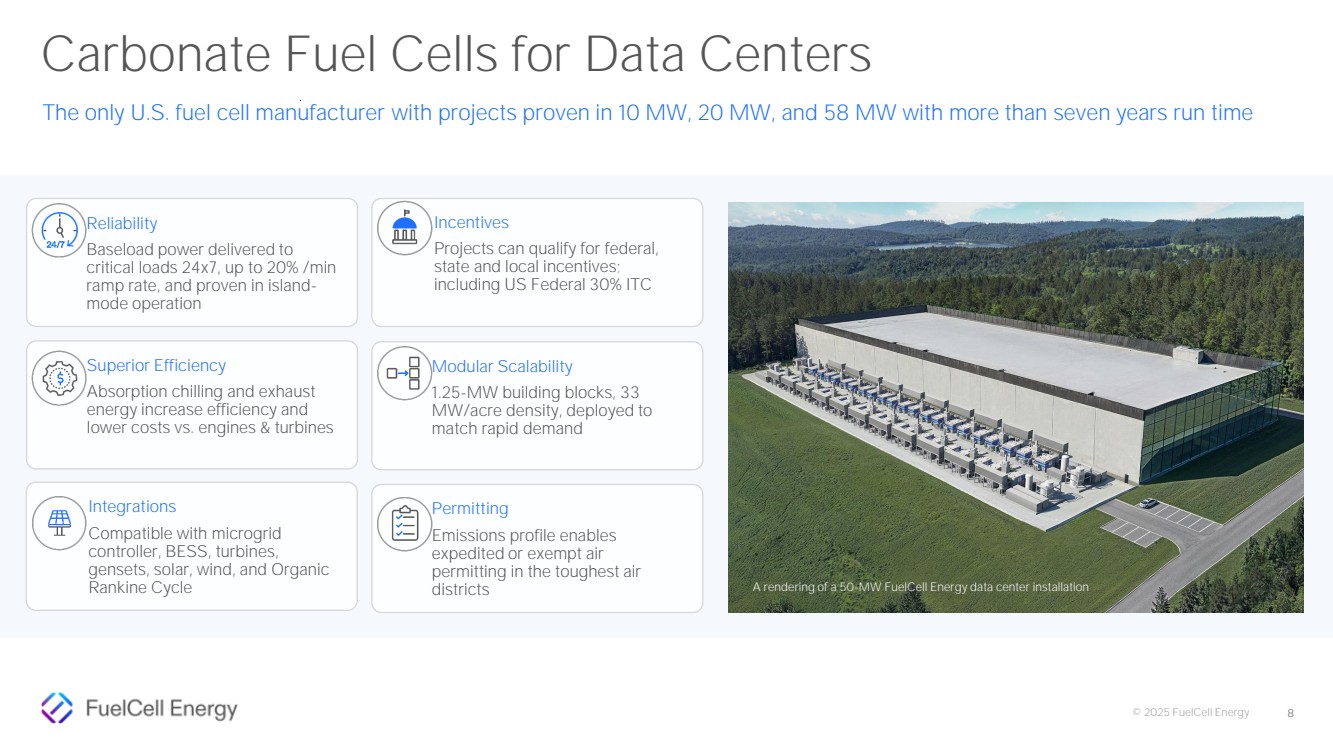
| © 2025 FuelCell Energy Carbonate Fuel Cells for Data Centers The only U.S. fuel cell manufacturer with projects proven in 10 MW, 20 MW, and 58 MW with more than seven years run time 8 Incentives Projects can qualify for federal, state and local incentives; including US Federal 30% ITC Integrations Compatible with microgrid controller, BESS, turbines, gensets, solar, wind, and Organic Rankine Cycle Modular Scalability 1.25-MW building blocks, 33 MW/acre density, deployed to match rapid demand Superior Efficiency Absorption chilling and exhaust energy increase efficiency and lower costs vs. engines & turbines Permitting Emissions profile enables expedited or exempt air permitting in the toughest air districts Reliability Baseload power delivered to critical loads 24x7, up to 20% /min ramp rate, and proven in island-mode operation A rendering of a 50-MW FuelCell Energy data center installation |
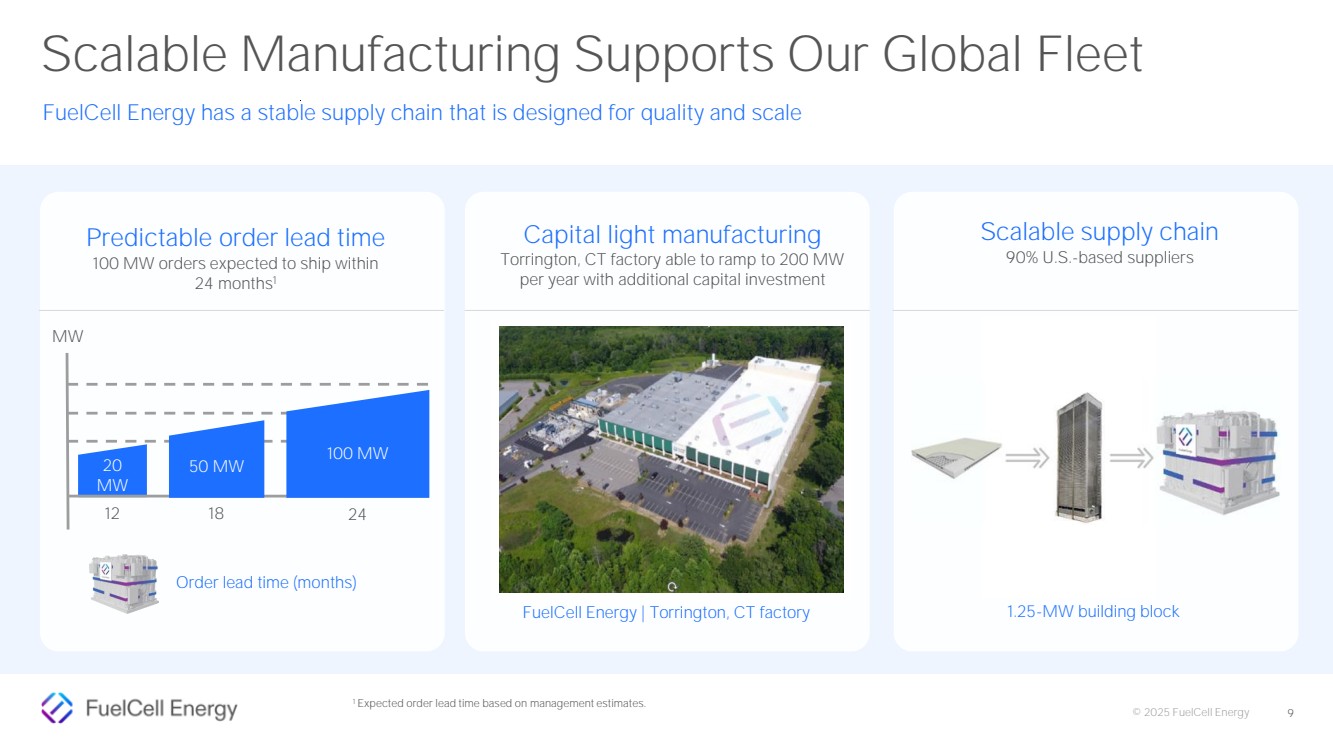
| © 2025 FuelCell Energy Scalable Manufacturing Supports Our Global Fleet FuelCell Energy has a stable supply chain that is designed for quality and scale 9 12 18 24 Predictable order lead time 100 MW orders expected to ship within 24 months1 Scalable supply chain 90% U.S.-based suppliers 20 MW Order lead time (months) Capital light manufacturing Torrington, CT factory able to ramp to 200 MW per year with additional capital investment FuelCell Energy | Torrington, CT factory 1.25-MW building block MW 50 MW 100 MW 1 Expected order lead time based on management estimates. |
| © 2025 FuelCell Energy Financial Update 10 |

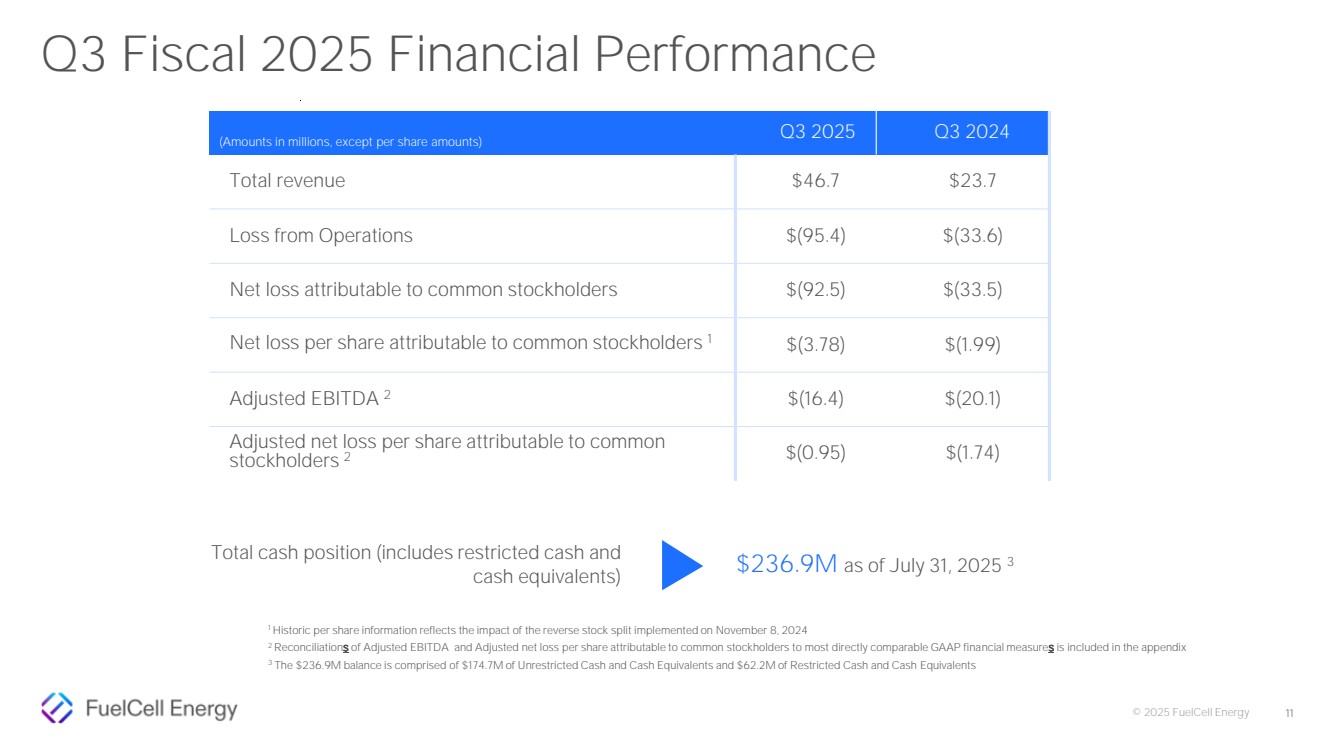
| © 2025 FuelCell Energy 1 Historic per share information reflects the impact of the reverse stock split implemented on November 8, 2024 2 Reconciliations of Adjusted EBITDA and Adjusted net loss per share attributable to common stockholders to most directly comparable GAAP financial measures is included in the appendix 3 The $236.9M balance is comprised of $174.7M of Unrestricted Cash and Cash Equivalents and $62.2M of Restricted Cash and Cash Equivalents Total cash position (includes restricted cash and cash equivalents) $236.9M as of July 31, 2025 3 (Amounts in millions, except per share amounts) Q3 2025 Q3 2024 Total revenue $46.7 $23.7 Loss from Operations $(95.4) $(33.6) Net loss attributable to common stockholders $(92.5) $(33.5) Net loss per share attributable to common stockholders 1 $(3.78) $(1.99) Adjusted EBITDA 2 $(16.4) $(20.1) Adjusted net loss per share attributable to common stockholders 2 $(0.95) $(1.74) 11 Q3 Fiscal 2025 Financial Performance |
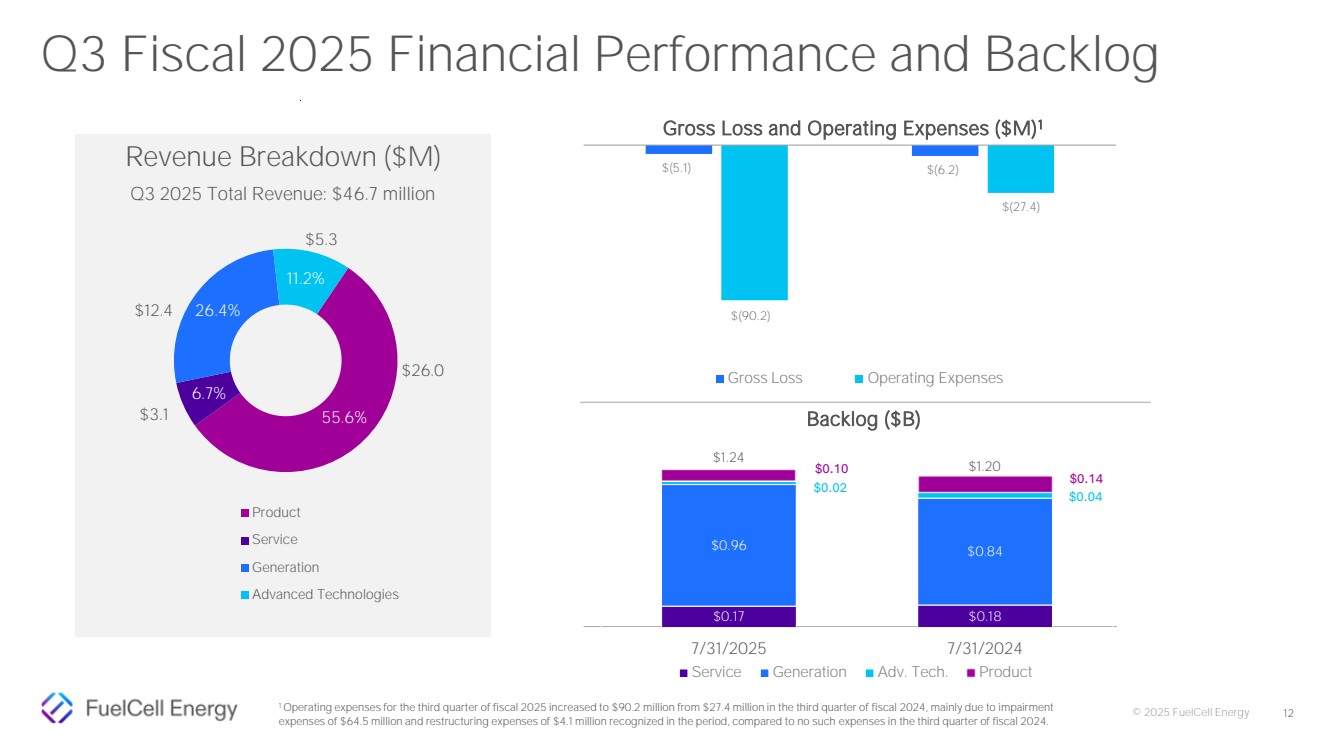
| © 2025 FuelCell Energy $(5.1) $(6.2) $(90.2) $(27.4) Q3 2025 Q3 2024 12 Revenue Breakdown ($M) Q3 2025 Total Revenue: $46.7 million 55.6% 6.7% 26.4% 11.2% Product Service Generation Advanced Technologies $5.3 $3.1 $26.0 $12.4 Gross Loss and Operating Expenses ($M)1 Gross Loss Operating Expenses $0.17 $0.18 $0.96 $0.84 $0.02 $0.04 $0.10 $0.14 7/31/2025 7/31/2024 Service Generation Adv. Tech. Product $1.20 $1.24 Backlog ($B) 1 Operating expenses for the third quarter of fiscal 2025 increased to $90.2 million from $27.4 million in the third quarter of fiscal 2024, mainly due to impairment expenses of $64.5 million and restructuring expenses of $4.1 million recognized in the period, compared to no such expenses in the third quarter of fiscal 2024. Q3 Fiscal 2025 Financial Performance and Backlog |
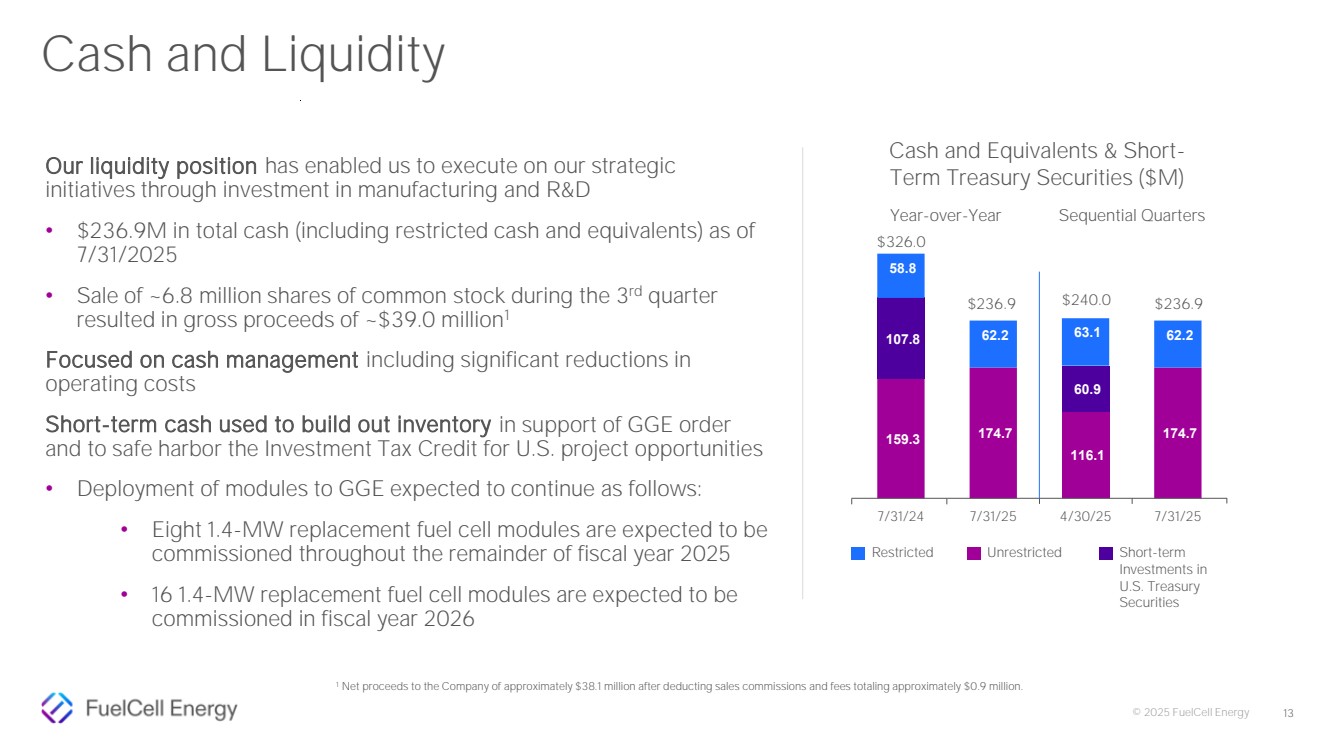
| © 2025 FuelCell Energy Our liquidity position has enabled us to execute on our strategic initiatives through investment in manufacturing and R&D • $236.9M in total cash (including restricted cash and equivalents) as of 7/31/2025 • Sale of ~6.8 million shares of common stock during the 3 rd quarter resulted in gross proceeds of ~$39.0 million1 Focused on cash management including significant reductions in operating costs Short-term cash used to build out inventory in support of GGE order and to safe harbor the Investment Tax Credit for U.S. project opportunities • Deployment of modules to GGE expected to continue as follows: • Eight 1.4-MW replacement fuel cell modules are expected to be commissioned throughout the remainder of fiscal year 2025 • 16 1.4-MW replacement fuel cell modules are expected to be commissioned in fiscal year 2026 159.3 174.7 116.1 174.7 107.8 60.9 58.8 62.2 63.1 62.2 7/31/24 7/31/25 4/30/25 7/31/25 Cash and Equivalents & Short-Term Treasury Securities ($M) Restricted Short-term Investments in U.S. Treasury Securities Unrestricted $326.0 $236.9 $236.9 Year-over-Year Sequential Quarters $240.0 1 Net proceeds to the Company of approximately $38.1 million after deducting sales commissions and fees totaling approximately $0.9 million. 13 Cash and Liquidity |
| © 2025 FuelCell Energy Thank you 14 |

| © 2025 FuelCell Energy Appendix 15 |

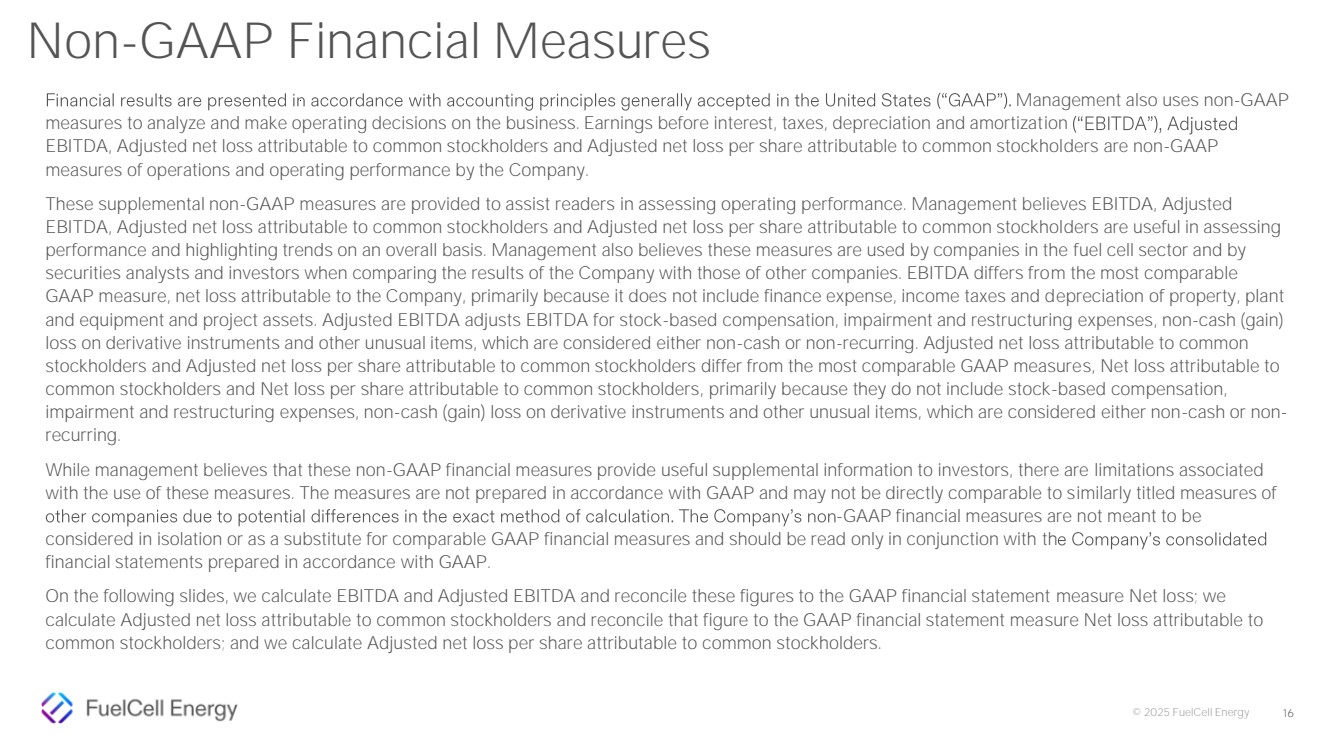
| © 2025 FuelCell Energy 16 Non-GAAP Financial Measures Management also uses non-GAAP measures to analyze and make operating decisions on the business. Earnings before interest, taxes, depreciation and amortization EBITDA, Adjusted net loss attributable to common stockholders and Adjusted net loss per share attributable to common stockholders are non-GAAP measures of operations and operating performance by the Company. These supplemental non-GAAP measures are provided to assist readers in assessing operating performance. Management believes EBITDA, Adjusted EBITDA, Adjusted net loss attributable to common stockholders and Adjusted net loss per share attributable to common stockholders are useful in assessing performance and highlighting trends on an overall basis. Management also believes these measures are used by companies in the fuel cell sector and by securities analysts and investors when comparing the results of the Company with those of other companies. EBITDA differs from the most comparable GAAP measure, net loss attributable to the Company, primarily because it does not include finance expense, income taxes and depreciation of property, plant and equipment and project assets. Adjusted EBITDA adjusts EBITDA for stock-based compensation, impairment and restructuring expenses, non-cash (gain) loss on derivative instruments and other unusual items, which are considered either non-cash or non-recurring. Adjusted net loss attributable to common stockholders and Adjusted net loss per share attributable to common stockholders differ from the most comparable GAAP measures, Net loss attributable to common stockholders and Net loss per share attributable to common stockholders, primarily because they do not include stock-based compensation, impairment and restructuring expenses, non-cash (gain) loss on derivative instruments and other unusual items, which are considered either non-cash or non-recurring. While management believes that these non-GAAP financial measures provide useful supplemental information to investors, there are limitations associated with the use of these measures. The measures are not prepared in accordance with GAAP and may not be directly comparable to similarly titled measures of -GAAP financial measures are not meant to be considered in isolation or as a substitute for comparable GAAP financial measures and should be read only in conjunction with th financial statements prepared in accordance with GAAP. On the following slides, we calculate EBITDA and Adjusted EBITDA and reconcile these figures to the GAAP financial statement measure Net loss; we calculate Adjusted net loss attributable to common stockholders and reconcile that figure to the GAAP financial statement measure Net loss attributable to common stockholders; and we calculate Adjusted net loss per share attributable to common stockholders. |
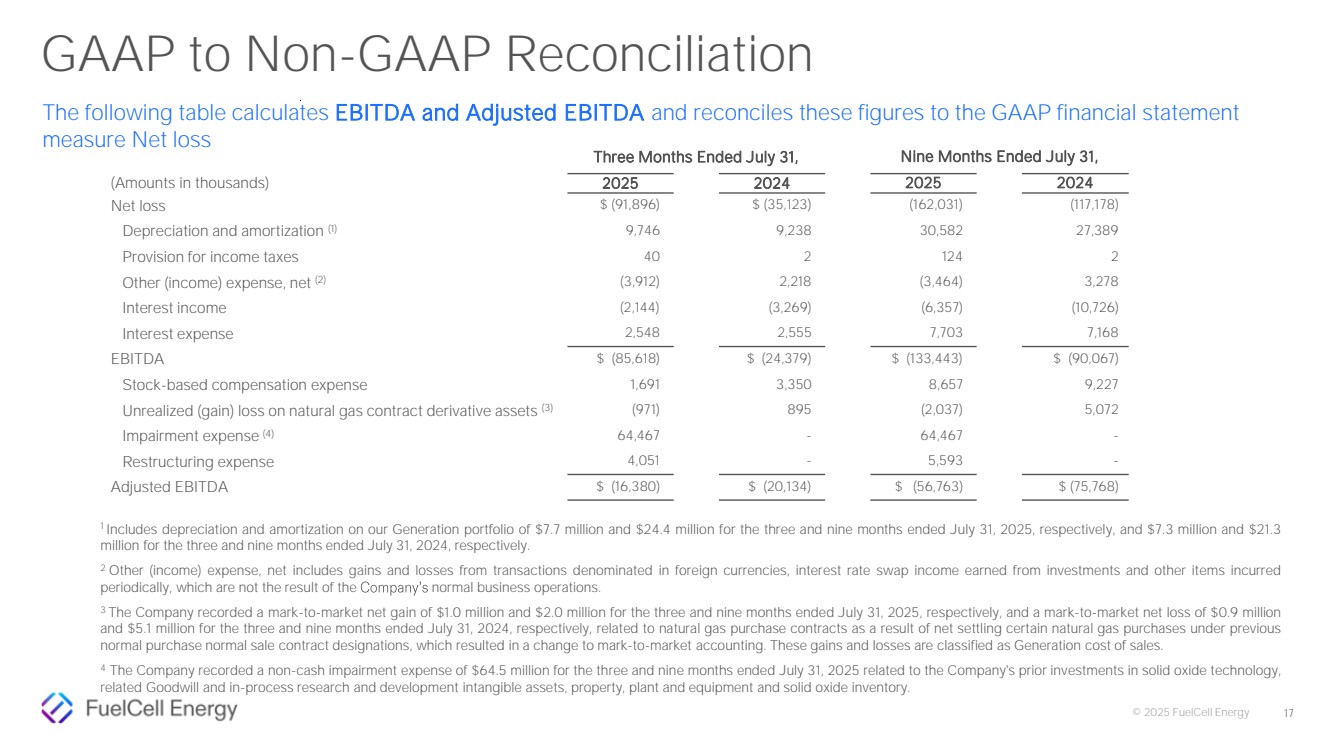
| © 2025 FuelCell Energy 17 1 Includes depreciation and amortization on our Generation portfolio of $7.7 million and $24.4 million for the three and nine months ended July 31, 2025, respectively, and $7.3 million and $21.3 million for the three and nine months ended July 31, 2024, respectively. 2 Other (income) expense, net includes gains and losses from transactions denominated in foreign currencies, interest rate swap income earned from investments and other items incurred periodically, which are not the result of the normal business operations. 3 The Company recorded a mark-to-market net gain of $1.0 million and $2.0 million for the three and nine months ended July 31, 2025, respectively, and a mark-to-market net loss of $0.9 million and $5.1 million for the three and nine months ended July 31, 2024, respectively, related to natural gas purchase contracts as a result of net settling certain natural gas purchases under previous normal purchase normal sale contract designations, which resulted in a change to mark-to-market accounting. These gains and losses are classified as Generation cost of sales. 4 The Company recorded a non-cash impairment expense of $64.5 million for the three and nine months ended July 31, 2025 related to the Company's prior investments in solid oxide technology, related Goodwill and in-process research and development intangible assets, property, plant and equipment and solid oxide inventory. GAAP to Non-GAAP Reconciliation The following table calculates EBITDA and Adjusted EBITDA and reconciles these figures to the GAAP financial statement measure Net loss Three Months Ended July 31, Nine Months Ended July 31, (Amounts in thousands) 2025 2024 2025 2024 Net loss $ (91,896) $ (35,123) (162,031) (117,178) Depreciation and amortization (1) 9,746 9,238 30,582 27,389 Provision for income taxes 40 2 124 2 Other (income) expense, net (2) (3,912) 2,218 (3,464) 3,278 Interest income (2,144) (3,269) (6,357) (10,726) Interest expense 2,548 2,555 7,703 7,168 EBITDA $ (85,618) $ (24,379) $ (133,443) $ (90,067) Stock-based compensation expense 1,691 3,350 8,657 9,227 Unrealized (gain) loss on natural gas contract derivative assets (3) (971) 895 (2,037) 5,072 Impairment expense (4) 64,467 - 64,467 - Restructuring expense 4,051 - 5,593 - Adjusted EBITDA $ (16,380) $ (20,134) $ (56,763) $ (75,768) |
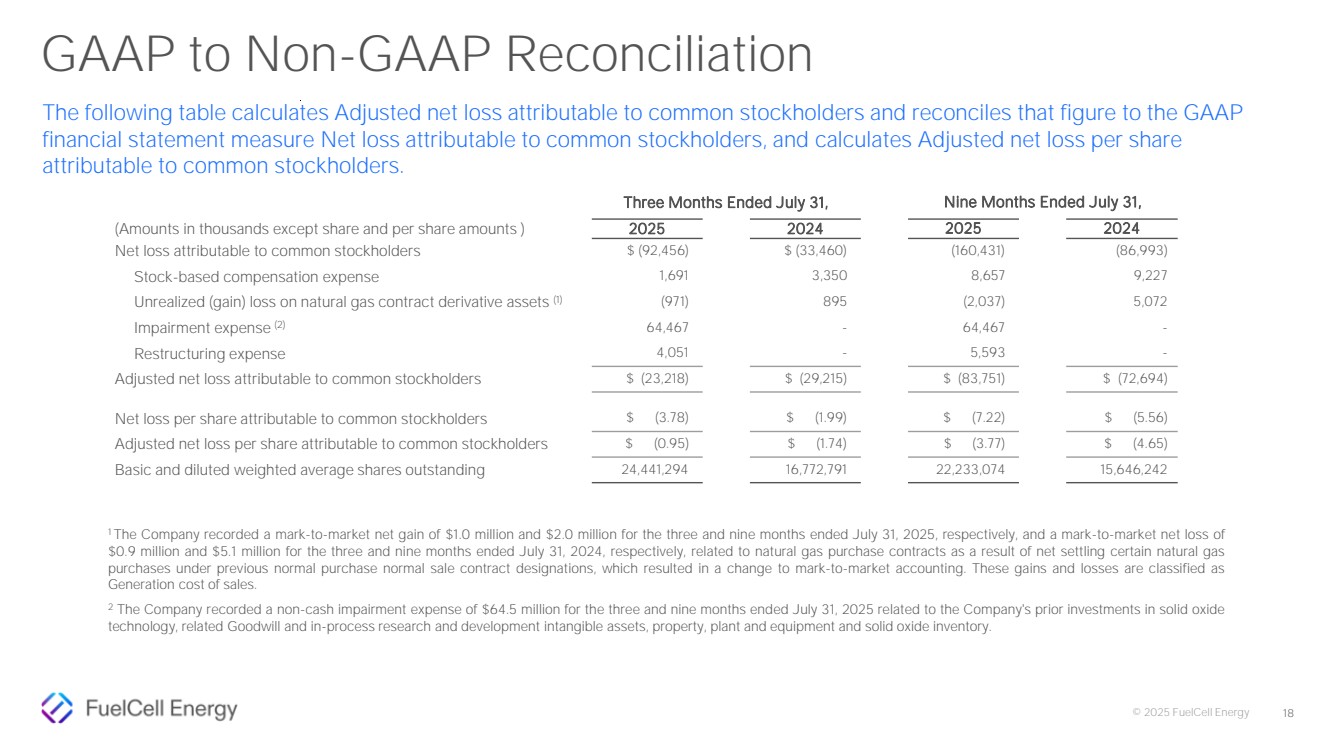
| © 2025 FuelCell Energy 18 1 The Company recorded a mark-to-market net gain of $1.0 million and $2.0 million for the three and nine months ended July 31, 2025, respectively, and a mark-to-market net loss of $0.9 million and $5.1 million for the three and nine months ended July 31, 2024, respectively, related to natural gas purchase contracts as a result of net settling certain natural gas purchases under previous normal purchase normal sale contract designations, which resulted in a change to mark-to-market accounting. These gains and losses are classified as Generation cost of sales. 2 The Company recorded a non-cash impairment expense of $64.5 million for the three and nine months ended July 31, 2025 related to the Company's prior investments in solid oxide technology, related Goodwill and in-process research and development intangible assets, property, plant and equipment and solid oxide inventory. GAAP to Non-GAAP Reconciliation The following table calculates Adjusted net loss attributable to common stockholders and reconciles that figure to the GAAP financial statement measure Net loss attributable to common stockholders, and calculates Adjusted net loss per share attributable to common stockholders. Three Months Ended July 31, Nine Months Ended July 31, (Amounts in thousands except share and per share amounts ) 2025 2024 2025 2024 Net loss attributable to common stockholders $ (92,456) $ (33,460) (160,431) (86,993) Stock-based compensation expense 1,691 3,350 8,657 9,227 Unrealized (gain) loss on natural gas contract derivative assets (1) (971) 895 (2,037) 5,072 Impairment expense (2) 64,467 - 64,467 - Restructuring expense 4,051 - 5,593 - Adjusted net loss attributable to common stockholders $ (23,218) $ (29,215) $ (83,751) $ (72,694) Net loss per share attributable to common stockholders $ (3.78) $ (1.99) $ (7.22) $ (5.56) Adjusted net loss per share attributable to common stockholders $ (0.95) $ (1.74) $ (3.77) $ (4.65) Basic and diluted weighted average shares outstanding 24,441,294 16,772,791 22,233,074 15,646,242 |
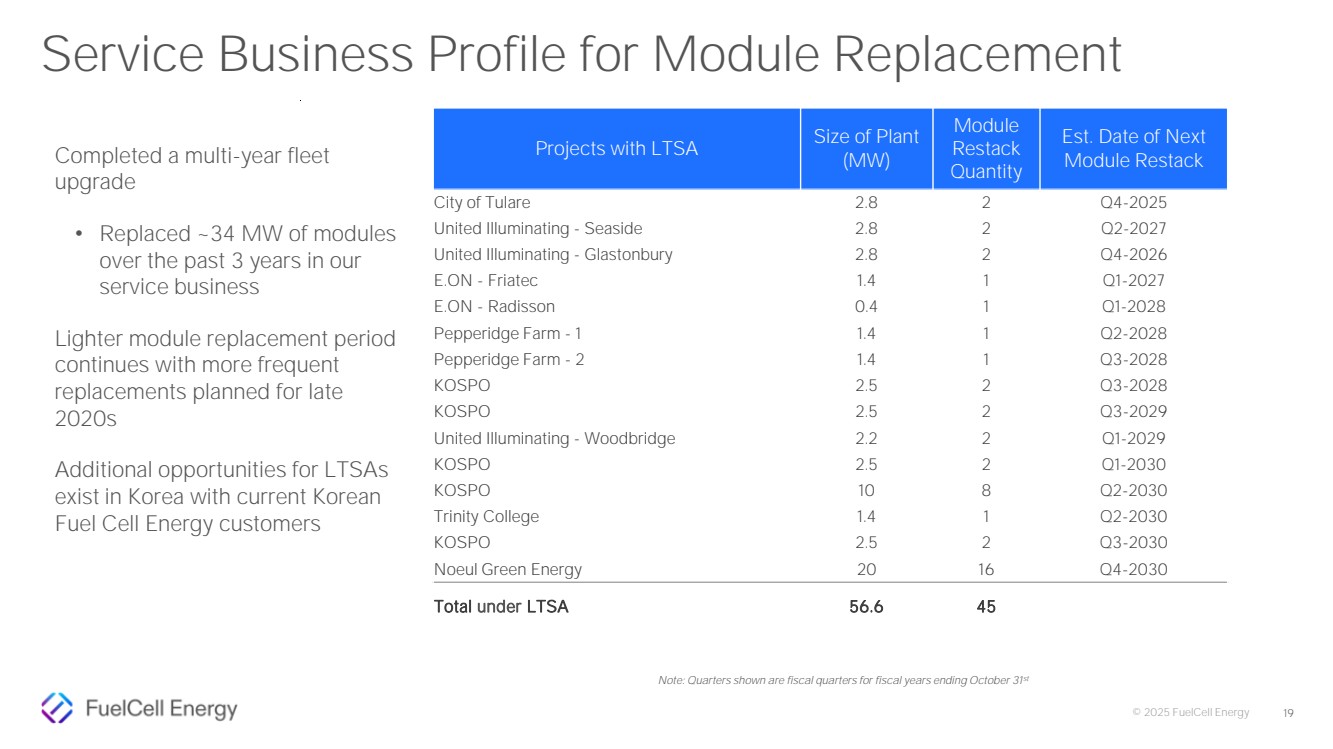
| © 2025 FuelCell Energy 19 Completed a multi-year fleet upgrade • Replaced ~34 MW of modules over the past 3 years in our service business Lighter module replacement period continues with more frequent replacements planned for late 2020s Additional opportunities for LTSAs exist in Korea with current Korean Fuel Cell Energy customers Note: Quarters shown are fiscal quarters for fiscal years ending October 31st Service Business Profile for Module Replacement Projects with LTSA Size of Plant (MW) Module Restack Quantity Est. Date of Next Module Restack City of Tulare 2.8 2 Q4-2025 United Illuminating - Seaside 2.8 2 Q2-2027 United Illuminating - Glastonbury 2.8 2 Q4-2026 E.ON - Friatec 1.4 1 Q1-2027 E.ON - Radisson 0.4 1 Q1-2028 Pepperidge Farm - 1 1.4 1 Q2-2028 Pepperidge Farm - 2 1.4 1 Q3-2028 KOSPO 2.5 2 Q3-2028 KOSPO 2.5 2 Q3-2029 United Illuminating - Woodbridge 2.2 2 Q1-2029 KOSPO 2.5 2 Q1-2030 KOSPO 10 8 Q2-2030 Trinity College 1.4 1 Q2-2030 KOSPO 2.5 2 Q3-2030 Noeul Green Energy 20 16 Q4-2030 Total under LTSA 56.6 45 |
| © 2025 FuelCell Energy 20 1 ct to the Groton Project which did not achieve its design rated output of 7.4 MW until December 2023 2 Quarters for Actual Commercial Operation Date refer to FuelCell Energy fiscal quarters Riverside Regional Water Quality Control Plant Pfizer, Inc. Santa Rita Jail Bridgeport Fuel Cell Project Tulare BioMAT San Bernardino LIPA Yaphank Project Groton Project Toyota Derby - CT RFP-2 Derby (SCEF) CCSU (CT University) City of Riverside (CA Municipality) Pfizer, Inc. Alameda County, California Connecticut Light and Power (CT Utility) Southern California Edison (CA Utility) San Bernardino Municipal Water Dept. PSEG/LIPA, LI NY (Utility) CMEEC (CT Electric Co-op) Southern California Edison, Toyota Eversource/United Illuminating (CT Utilities) Eversource/United Illuminating (CT Utilities) New Britain, CT Riverside, CA Groton, CT Dublin, CA Bridgeport, CT Tulare, CA San Bernardino, CA Long Island, NY Groton, CT Los Angeles, CA Derby, CT Derby, CT 1.4 1.4 5.6 1.4 14.9 2.8 1.4 7.4 7.4 2.3 14.0 2.8 15 20 20 20 15 20 20 20 20 20 20 20 62.8 Project Name Power Off-Taker Location Rated Capacity(1) (MW) Actual Commercial Operation Date (2) PPA Term (Years) Total MW Operating FuelCell Energy Owned U.S. Operating Portfolio Overview On-Balance Sheet Generation Operating Portfolio as of July 31, 2025 |
