Please wait
.3
Management's Discussion and Analysis
February 19, 2026
1
Teck 2025 Management's Discussion and Analysis
Management’s Discussion and Analysis
Our business involves exploring for, acquiring, developing and producing metals essential to global development and the energy transition. We are organized into two regional business units — North America and Latin America (LATAM) — and we have a dedicated Projects group to develop and execute brownfield and greenfield projects. This framework provides Teck with a streamlined executive leadership team and regional structure to deliver on our strategy of copper growth, balanced with returns to shareholders and a strong balance sheet. It positions Teck to drive efficient and effective operational performance while responsibly capitalizing on value-accretive growth opportunities to maximize value for shareholders. Our reported segmented financial results and summary information contained in our Management’s Discussion and Analysis will continue to be disclosed on a commodity basis for our copper and zinc operations.
Through our interests in mining and processing operations in Canada, the United States (U.S.), Chile and Peru, we are a top 10 copper producer in the Americas and the largest net zinc miner globally, with production from a premium portfolio of long-life, high-quality assets in stable, well-understood jurisdictions. We also produce lead, silver, molybdenum and various specialty and other metals, chemicals and fertilizers. We actively explore for copper, zinc and nickel.
This Management’s Discussion and Analysis of our results of operations is prepared as at February 18, 2026 and should be read in conjunction with our audited annual consolidated financial statements for the year ended December 31, 2025. Unless the context otherwise dictates, a reference to Teck, Teck Resources, the Company, us, we or our refers to Teck Resources Limited and its consolidated subsidiaries. All dollar amounts are in Canadian dollars, unless otherwise stated, and are based on our 2025 audited annual consolidated financial statements that are prepared in accordance with IFRS® Accounting Standards as issued by the International Accounting Standards Board (IASB) (IFRS Accounting Standards). In addition, we use certain financial measures, which are identified throughout the Management’s Discussion and Analysis in this report, that are not measures recognized under IFRS Accounting Standards and that do not have a standardized meaning prescribed by IFRS Accounting Standards. See “Use of Non-GAAP Financial Measures and Ratios” on page 59 for an explanation of these financial measures and reconciliation to the most directly comparable financial measures under IFRS Accounting Standards.
This Management’s Discussion and Analysis contains certain forward-looking information and forward-looking statements. You should review the cautionary statement on forward-looking statements under the heading “Cautionary Statement on Forward-Looking Statements” on page 70, which forms part of this Management’s Discussion and Analysis, as well as the risk factors discussed in our most recent Annual Information Form.
Additional information about us, including our most recent Annual Information Form, is available on our website at www.teck.com, under Teck’s profile at www.sedarplus.ca (SEDAR+), and on the EDGAR section of the United States Securities and Exchange Commission (SEC) website at www.sec.gov.
2
Teck 2025 Management's Discussion and Analysis
Segmented Results
The following table shows a summary of our production of our principal products for the last five years and our guidance for production in 2026.
Five-Year Production Record and 2026 Production Guidance
| | | | | | | | | | | | | | | | | | | | | | | |
| Principal Products | | 2021 | 2022 | 2023 | 2024 | 2025 | 2026 Guidance |
| | | | |
|
|
|
Copper1 | thousand tonnes | 287 | | 270 | | 296 | | 446 | | 454 | | 455 – 530 |
| | | | |
| | |
| Zinc | | | | |
| | |
Contained in concentrate1 | thousand tonnes | 607 | | 650 | | 644 | | 616 | | 565 | | 410 – 460 |
| Refined | thousand tonnes | 279 | | 249 | | 267 | | 256 | | 230 | | 190 – 230 |
| | | | | |
|
|
Note:
1.We include 100% of production and sales from our Quebrada Blanca and Carmen de Andacollo mines in our production and sales volumes, even though we do not own 100% of these operations, because we fully consolidate their results in our financial statements. We include 22.5% of production and sales from Antamina, representing our proportionate ownership interest in this operation. Zinc contained in concentrate production includes co-product zinc production from our 22.5% interest in Antamina.
3
Teck 2025 Management's Discussion and Analysis
Average commodity prices and exchange rates for the past three years, which are key drivers of our profit, are summarized in the following table.
| | | | | | | | | | | | | | | | | |
| US$ |
| 2025 | % chg | 2024 | % chg | 2023 |
| Copper (LME cash — $/pound) | $ | 4.51 | | +9% | $ | 4.15 | | +8% | $ | 3.85 | |
| Zinc (LME cash — $/pound) | 1.30 | | +3% | 1.26 | | +5% | 1.20 | |
| Exchange rate (Bank of Canada) | | | | | |
| US$1 = CAD$ | 1.40 | | +2% | 1.37 | | +1% | 1.35 | |
| CAD$1 = US$ | 0.72 | | -2% | 0.73 | | -1% | 0.74 | |
Our revenue, gross profit and gross profit before depreciation and amortization, by segment, for the past three years are summarized in the following table.
| | | | | | | | | | | | | | | | | | | | | | | | | | | | | |
| Revenue | Gross Profit | Gross Profit Before Depreciation and Amortization1 |
| ($ in millions) | 2025 | 2024 | 2023 | 2025 | 2024 | 2023 | 2025 | 2024 | 2023 |
| Copper | $ | 6,619 | | $ | 5,542 | | $ | 3,425 | | $ | 1,773 | | $ | 1,045 | | $ | 712 | | $ | 3,196 | | $ | 2,401 | | $ | 1,265 | |
| Zinc | 4,137 | | 3,523 | | 3,051 | | 884 | | 562 | | 400 | | 1,143 | | 871 | | 708 | |
| Total | $ | 10,756 | | $ | 9,065 | | $ | 6,476 | | $ | 2,657 | | $ | 1,607 | | $ | 1,112 | | $ | 4,339 | | $ | 3,272 | | $ | 1,973 | |
Note:
1.This is a non-GAAP financial measure or ratio. See “Use of Non-GAAP Financial Measures and Ratios” for further information.
4
Teck 2025 Management's Discussion and Analysis
Copper
In 2025, we produced 453,500 tonnes of copper from our Quebrada Blanca and Carmen de Andacollo operations in Chile, our Highland Valley Copper Operations in Canada and our 22.5% interest in Antamina in Peru.
In 2025, our copper segment accounted for 62% of our revenue and 67% of our gross profit.
| | | | | | | | | | | | | | | | | | | | | | | | | | | | | |
| Revenue | Gross Profit (Loss) | Gross Profit (Loss) Before Depreciation and Amortization1 |
| ($ in millions) | 2025 | 2024 | 2023 | 2025 | 2024 | 2023 | 2025 | 2024 | 2023 |
| Quebrada Blanca | $ | 2,475 | | $ | 2,376 | | $ | 595 | $ | 171 | | $ | 38 | | $ | (142) | $ | 860 | | $ | 766 | | $ | (61) |
| Highland Valley Copper | 1,883 | | 1,303 | | 1,125 | | 499 | | 221 | | 237 | | 850 | | 471 | | 391 | |
| Antamina | 1,545 | | 1,436 | | 1,296 | | 837 | | 737 | | 657 | | 1,101 | | 1,038 | | 899 | |
| Carmen de Andacollo | 716 | | 427 | | 409 | 263 | | 44 | | (32) | 382 | | 121 | | 44 |
| Other | — | | — | | — | | 3 | | 5 | | (8) | 3 | | 5 | | (8) |
| Total | $ | 6,619 | | $ | 5,542 | | $ | 3,425 | | $ | 1,773 | | $ | 1,045 | | $ | 712 | | $ | 3,196 | | $ | 2,401 | | $ | 1,265 | |
Note:
1.This is a non-GAAP financial measure or ratio. See “Use of Non-GAAP Financial Measures and Ratios” for further information.
| | | | | | | | | | | | | | | | | | | | |
| Production1 | Sales1 |
| (thousand tonnes) | 2025 | 2024 | 2023 | 2025 | 2024 | 2023 |
| Quebrada Blanca | 190 | | 208 | | 63 | | 173 | | 197 | | 57 | |
| Highland Valley Copper | 127 | | 102 | | 99 | | 126 | | 103 | | 98 | |
| Antamina | 86 | | 96 | | 95 | | 85 | | 98 | | 95 | |
| Carmen de Andacollo | 51 | | 40 | | 39 | | 53 | | 37 | | 41 | |
| Total | 454 | | 446 | | 296 | | 437 | | 435 | | 291 | |
Note:
1.We include 100% of production and sales from our Quebrada Blanca and Carmen de Andacollo mines in our production and sales volumes, even though we do not own 100% of these operations, because we fully consolidate their results in our financial statements. We include 22.5% of production and sales from Antamina, representing our proportionate ownership interest in the operation.
Operations
Quebrada Blanca
Quebrada Blanca Operations (QB) is located in the Tarapacá Region of northern Chile. We have a 60% indirect interest in Compañía Minera Teck Quebrada Blanca S.A. (QBSA). A 30% interest is owned indirectly by Sumitomo Metal Mining Co., Ltd. and Sumitomo Corporation (together referred to as SMM/SC), and 10% is owned by Corporación Nacional del Cobre de Chile (Codelco). Codelco’s 10% preference share interest in QBSA does not require Codelco to fund capital spending, which is funded by Teck and SMM/SC on a pro rata basis.
QB’s gross profit in 2025 was $171 million, compared with gross profit of $38 million in 2024 and a gross loss of $142 million in 2023. Gross profit in 2025 increased from 2024 primarily due to higher copper prices,
5
Teck 2025 Management's Discussion and Analysis
higher molybdenum production resulting in higher by-product revenue, and lower smelter processing charges, partly offset by reduced sales volumes. Operating costs were consistent year over year, driven by lower energy costs resulting from lower production, and were partially offset by higher labour costs resulting primarily from new three-year collective bargaining agreements signed in 2024 and 2025.
QB produced 190,000 tonnes of copper in 2025 compared to 207,800 tonnes of copper in 2024. Copper production in 2025 was constrained by the pace of development of the TMF, requiring downtime in the concentrator to manage the rate of tailings rise. Ultimately, a sand wedge will be constructed using hydraulically placed sand, which will enable steady-state TMF development. While sand being produced in 2025 met design specifications, slow drainage caused by the presence of ultra fines delayed progress in development of the sand wedge. As a result, the mechanical construction of rock benches continues to be required, which led to additional downtime in 2025, particularly in the third quarter, and is expected to result in incremental downtime in 2026, as reflected in our previously disclosed 2026 annual production guidance for QB. We continue to expect that, from 2027 onwards, the TMF development should no longer be a constraint on production levels that are able to be achieved. During the fourth quarter of 2025, QB achieved progressive improvement in sand drainage rates. We completed the full replacement of the cyclone technology, which reduced the amount of ultra fines present in the sand, and successfully implemented refined sand placement improvements. The sand wedge development is progressing per plan and, with improved sand drainage rates, we expect completion of the sand wedge in 2026. Work also advanced in the fourth quarter on the construction of the remaining rock benches, in line with expectations.
Production in the first three quarters of 2025 was impacted by TMF-related downtime, noted above, with the best quarterly production of the year achieved in the fourth quarter due to continuous operations as sand deposition rate improvements and construction of the rock benches advanced. Throughput improved progressively through the fourth quarter, with December achieving the highest monthly rate of throughput in 2025, in line with rates achieved in the fourth quarter of 2024. Recoveries remained consistent over the quarter and within plan based on the type of ore being processed. Copper grades continued to align with plan and were 0.59% on average in the fourth quarter.
On June 2, 2025, Teck announced an outage of the shiploader at QB's port facility. Shiploader repairs at QB's port facility were completed at the end of January 2026. The first successful shipments were loaded in early February and normal operation of the shiploader has resumed. We were able to use alternative ports to ship material while the shiploader was under repair.
QB's third labour union ratified a new three-year collective bargaining agreement in early April 2025, completing all labour negotiations for QB's workforce. Labour agreements are now in place through 2028 across QB.
Production in 2026 at QB will continue to be constrained by TMF development. Consistent with our operating plans, we plan to continue to have quarterly maintenance shutdowns. Our previously disclosed annual 2026 copper production guidance for QB of between 200,000 and 235,000 tonnes is unchanged.
6
Teck 2025 Management's Discussion and Analysis
Our previously disclosed annual 2027 and 2028 copper production guidance for QB of between 240,000 and 275,000 tonnes and between 220,000 and 255,000 tonnes, respectively, is unchanged. Our 2028 copper production for QB is expected to be impacted by mining in a lower-grade pit, as previously disclosed. Grades are anticipated to increase in years beyond 2028, during which we expect to complete the implementation of optimization initiatives to enable an incremental 5%–10% improvement in throughput. At the same time, we will continue progressing work towards achieving design recoveries. Consistent with our previous disclosures, debottlenecking the QB plant (increasing throughput to between 165,000 and 185,000 tonnes per day) has not been embedded into guidance as we focus on ramping up the asset. While study work on the QB debottlenecking continues, we do not expect to submit a Declaration of Environmental Impact (DIA) permit application before the end of 2026.
Molybdenum production is expected to be between 2,800 and 3,400 tonnes in 2026, 4,700 and 5,600 tonnes in 2027, and 5,300 and 6,300 tonnes in 2028, as previously disclosed. Performance is expected to improve as the copper circuit stabilizes.
Highland Valley Copper
Highland Valley Copper Operations (HVC) is located in south-central B.C., Canada. Gross profit was $499 million in 2025, compared with $221 million in 2024 and $237 million in 2023. Gross profit in 2025 increased from 2024 primarily due to higher copper sales volumes and prices, partially offset by higher operating costs due to increased mine and mill tonnage.
Copper production in 2025 from HVC increased to 127,100 tonnes compared with 102,400 tonnes produced in 2024. The higher production in 2025 was primarily a result of higher grades and mill throughput as we mine a higher proportion of higher-grade Lornex ore, as expected in the mine plan, which was partly offset by mill availability.
Our previously disclosed annual 2026 copper production guidance for HVC of between 115,000 and 135,000 tonnes is unchanged. Copper production is expected to be between 135,000 and 155,000 tonnes in 2027 and between 100,000 and 120,000 tonnes in 2028, as previously disclosed. Molybdenum production in 2026 is expected to be between 1,500 and 1,800 tonnes, 1,800 and 2,000 tonnes in 2027, and 3,000 and 3,400 tonnes in 2028, as previously disclosed.
In 2025, the HVC MLE project was sanctioned, as outlined below. This will extend the life of mine from 2028 to 2046 and is reflected in the production guidance ranges noted above from 2026 to 2028.
Highland Valley Copper Mine Life Extension (HVC MLE) Project
On July 23, 2025, our Board sanctioned the construction of the HVC MLE project. This followed the issuance of an Environmental Assessment Certificate and other required permits from the B.C. Government for the project on June 17, 2025. HVC MLE will extend the life of Highland Valley Copper from 2028 to 2046, with average copper production of 132,000 tonnes per year over the life of the mine.
7
Teck 2025 Management's Discussion and Analysis
Following Board sanctioning in July 2025, HVC MLE has entered execution, and detailed engineering is over 80% complete. Procurement activities are ongoing, with a significant volume of materials already delivered to the site. Construction activities are ramping up across multiple work fronts, supported by strong early productivity indicators. Site establishment is substantially complete, and work has begun on major scopes, including earthworks, pipelines, landfill and a warehouse.
HVC MLE total project capital cost is estimated to be between $2.1 and $2.4 billion and is expected to
be spent between 2025 and 2028, which is unchanged from our previous disclosures. HVC MLE project capital expenditures were $330 million in 2025 and 2026 project capital expenditures are expected to be between $900 million and $1.2 billion.
Antamina
We have a 22.5% share interest in Compañía Minera Antamina S.A. (Antamina), a copper-zinc mine in Peru. The other shareholders are BHP (33.75%), Glencore (33.75%) and Mitsubishi Corporation (10%). Our share of gross profit in 2025 was $837 million compared with $737 million in 2024 and $657 million in 2023. Gross profit in 2025 was higher than 2024 as a result of higher copper and zinc prices, as well as higher zinc sales volumes driven by increased production. Operating costs year over year were consistent.
On a 100% basis, Antamina’s copper production in 2025 was 381,800 tonnes compared with 426,900 tonnes produced in 2024, reflecting reduced treatment of copper-only ore, resulting in lower mill feed. Zinc production in 2025 increased significantly to 454,800 tonnes from 267,900 tonnes produced in 2024 as a result of processing a greater amount of copper-zinc ore in 2025. Molybdenum production in 2025 was 2,500 tonnes, which was 69% lower than the 8,100 tonnes produced in 2024.
Pursuant to a long-term streaming agreement made in 2015, Teck delivers an equivalent of 22.5% of payable silver sold by Antamina to a subsidiary of Franco-Nevada Corporation (FNC). FNC pays a cash price of 5% of the spot price at the time of each delivery, in addition to an upfront acquisition price previously paid. In 2025, approximately 3.0 million ounces of silver were delivered under the agreement. After 86 million ounces of silver have been delivered under the agreement, the stream will be reduced by one-third. A total of 32.2 million ounces of silver have been delivered under the agreement from the effective date in 2015 to December 31, 2025.
Our 22.5% share of copper production at Antamina will remain relatively stable over the next few years and zinc production is expected to decline, as expected in the mine plan, and consistent with our previous disclosures. Our 22.5% share of 2026 production at Antamina is expected to be between 95,000 and 105,000 tonnes of copper, between 35,000 and 45,000 tonnes of zinc, and between 700 and 1,000 tonnes of molybdenum. Our share of annual copper production is expected to be between 85,000 and 95,000 tonnes in 2027 and between 80,000 and 90,000 tonnes in 2028. Our share of annual zinc production is expected to be between 35,000 and 45,000 tonnes in 2027 and between 45,000 and 55,000 tonnes in 2028. Our share of annual molybdenum production is expected to be between 900 and 1,200 tonnes in 2027 and between 400 and 600 tonnes in 2028.
8
Teck 2025 Management's Discussion and Analysis
Carmen de Andacollo
We have a 90% interest in the Carmen de Andacollo mine, which is located in the Coquimbo Region of central Chile. The remaining 10% is owned by ENAMI, a state-owned Chilean mining company. Carmen de Andacollo's gross profit was $263 million in 2025 compared to a gross profit of $44 million in 2024 and gross loss of $32 million in 2023. The increase in gross profit in 2025 was primarily due to higher copper sales volumes and prices, and improved operational efficiency, partly offset by higher operating costs driven by higher production compared to 2024.
Carmen de Andacollo produced 50,500 tonnes of copper in 2025, higher than the 39,700 tonnes produced in 2024, despite a SAG mill structural failure in the second quarter that resulted in the mill being shut down for approximately one month. Mill throughput was higher year over year due to increased water availability in 2025. Gold production of 35,900 ounces in 2025 was higher than the 20,800 ounces produced in 2024, with 100% of the gold produced for the account of RGLD Gold AG, a wholly owned subsidiary of Royal Gold, Inc. In effect, 100% of gold production from the mine has been sold to Royal Gold, Inc., who pays a cash price of 15% of the monthly average gold price at the time of each delivery, in addition to an upfront acquisition price previously paid.
Drought conditions remain a risk to our annual production guidance for 2027 to 2028. As previously disclosed, annual copper production is expected to be between 45,000 and 55,000 tonnes in 2026, between 45,000 and 55,000 tonnes in 2027, and between 35,000 and 45,000 tonnes in 2028.
Copper Unit Costs
The following table presents our copper unit costs for the past three years. Unit costs for 2025 and 2024 include QB. Unit costs in 2023 exclude QB due to the construction and ramp-up phases of the operation during 2023.
Total cash unit costs1 in 2025 were US$2.55 per pound, similar to US$2.54 per pound in 2024. Consistent total cash unit costs1 were driven by increased copper production at Highland Valley Copper and lower smelter processing costs, offsetting lower QB production levels in 2025. Total cash unit costs1 in 2024 of US$2.54 per pound were higher than 2023 total cash unit costs1 of US$2.27 per pound due to continued ramp-up of QB production during 2024, which impacted both cost and production. This resulted in elevated total cash unit costs1 in 2024 compared to the total cash unit costs1 in 2023.
Net cash unit costs1 in 2025 were US$2.03 per pound, compared with US$2.20 per pound in 2024. The reduction is due to increased by-product credits from higher Antamina zinc and QB molybdenum production in 2025. Net cash unit costs1 in 2024 were US$2.20 per pound compared with US$1.87 per pound in 2023, primarily as a result of the elevated operating costs at QB as described above, as well as reduced zinc by-product credits from Antamina due to lower zinc production, as expected in the mine plan.
1 This is a non-GAAP financial measure or ratio. See “Use of Non-GAAP Financial Measures and Ratios” for further information.
9
Teck 2025 Management's Discussion and Analysis
| | | | | | | | | | | |
| (amounts reported in US$ per pound) | 2025 | 2024 | 20232 |
Adjusted cash cost of sales1 | $ | 2.50 | | $ | 2.34 | | $ | 2.04 | |
| Smelter processing charges | 0.05 | | 0.20 | | 0.23 | |
Total cash unit costs1 | $ | 2.55 | | $ | 2.54 | | $ | 2.27 | |
Cash margin for by-products1 | (0.52) | | (0.34) | | (0.40) | |
Net cash unit costs1 | $ | 2.03 | | $ | 2.20 | | $ | 1.87 | |
Notes:
1.This is a non-GAAP financial measure or ratio. See “Use of Non-GAAP Financial Measures and Ratios” for further information.
2. Excludes Quebrada Blanca.
Projects and Copper Growth
As outlined above, in the third quarter of 2025, Teck announced Board approval for construction of the HVC MLE project, extending the life of Canada’s largest copper mine from 2028 through to 2046.
In line with our Comprehensive Operational Review, we have made the decision to postpone sanctioning of further copper growth projects, with adjusted timelines reflecting our prioritization of QB. However, we continue to advance our copper growth portfolio by progressing high-value projects toward sanction readiness. This includes advancing permitting, securing land access, and defining the business cases for Zafranal and San Nicolás. Feasibility studies, detailed engineering and early works are underway to position these projects for future sanction decisions.
These efforts will continue throughout 2026 and are reflected in our copper growth capital expenditure guidance of between $1.3 and $1.6 billion, including between $900 million and $1.2 billion relating to HVC MLE.
Zafranal
•Activities: In 2025, Zafranal made progress on the feasibility study, engineering and design activities. Work also began on the hydrogeological studies for the Well Field Majes area, with solid progress achieved by 2025 year-end. The construction permit application was submitted during the year, and the first stage received approval.
•Targeted upcoming milestones: In 2026 we will focus on identifying, evaluating and implementing opportunities to enhance the business case and on preparing for a future sanction decision. Zafranal will transition to asset preservation while this work is undertaken. Early work activities will cease within the first quarter of 2026, and contractors will continue to demobilize from the site by the end of the first quarter of 2026. Progress continues across key components, including permitting, land access, and feasibility study and engineering design.
Minas de San Nicolás
•Activities: 2025 activities included advancing the feasibility study and continued support of the Mexican Environmental Impact Assessment (Manifestación de Impacto Ambiental Regional, or MIA-R) permit application and the Change of Land Use (Estudios Técnicos Justificativos, or ETJ) permit application.
10
Teck 2025 Management's Discussion and Analysis
•Targeted upcoming milestones: All actions related to the MIA-R and ETJ permits are complete and a regulatory decision is expected in the first half of 2026. In the meantime, engineering continues for critical infrastructure to provide greater confidence in the feasibility study, to further de-risk the execution strategy and position the project for a potential sanction decision.
Markets
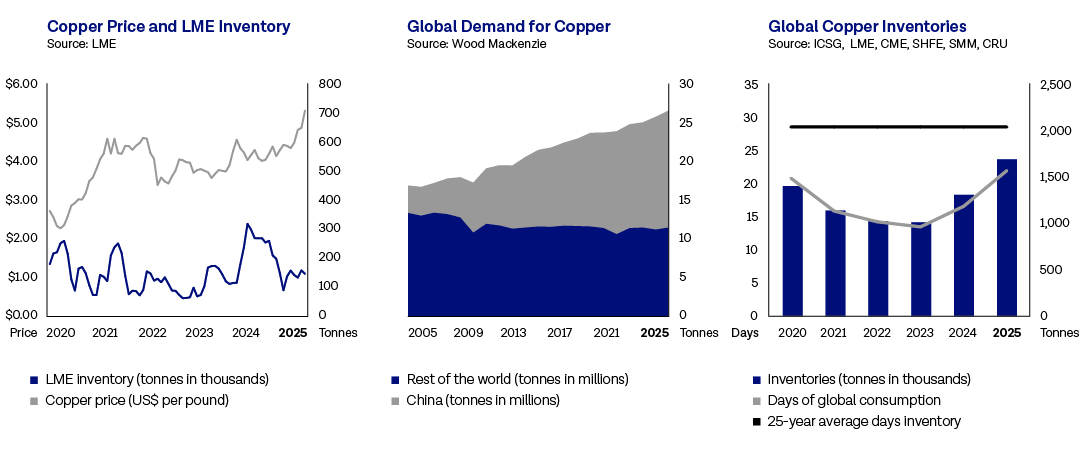
Copper prices on the London Metal Exchange (LME) averaged US$4.51 per pound in 2025, up 8.7% from an average of US$4.15 per pound in 2024. This was the highest annual average price in history. LME copper prices ended 2025 at US$5.67 per pound, up 44% compared to the closing price at the end of 2024.
Global copper stocks on the LME, Chicago Mercantile Exchange (CME) and Shanghai Futures Exchange (SHFE) were up 69.5% or 305,200 tonnes during the year, ending 2025 at 744,200 tonnes. This was primarily due to a significant rise in CME inventory, which was up by more than 369,000 tonnes over the year, owing to a persistent CME price premium over LME levels. Estimated total reported global stocks, including producer, consumer, merchant and terminal stocks, stood at an estimated 21.5 days of global consumption, versus the 25-year average of 25.9 days.
In 2025, global copper mine production increased 1.3%, according to Benchmark Mineral Intelligence, with total production estimated at 23.4 million tonnes. This was well below the level of capacity addition at smelters, leading to historically low spot treatment and refining charges, and global smelter capacity utilization falling to approximately 75%, the lowest in recent history.
Chinese imports of copper concentrates increased 7.9% from 2024 levels to reach over 7.5 million tonnes of contained copper. Scrap imports into China rose 3.6% in the year, while Benchmark Mineral Intelligence’s estimate of global copper scrap availability increased 7.8% in 2025 due to stronger prices and smelters’ need to offset a lack of concentrate supply. Availability of copper raw materials is expected to remain constrained relative to smelter needs in 2026.
China’s refined cathode imports in 2025 were 8.2% lower than 2024, totalling 3.1 million tonnes in 2025, continuing the decade-long import trend of approximately 3 million tonnes. With an increase in refined production, Benchmark Mineral Intelligence estimates that refined copper consumption grew in China by 3.8% in 2025, equivalent to 2024’s growth, supported by strong growth in energy transition-related areas that more than offset ongoing construction weakness. Ex-China demand grew approximately 1% over the year, despite another year of strong growth in India.
Benchmark Mineral Intelligence estimates global refined copper production grew 1.6% in 2025, and will increase by 0.8% in 2026, reaching 27.7 million tonnes. Demand in 2026 is forecast to increase 2.1% to 27.9 million tonnes, putting the metal market into deficit. Demand forecasts for 2026 are currently below trend, as Chinese copper consumption growth slows and higher prices put pressure on downstream copper consumers. Additionally, U.S. tariff policies continue to redirect trade patterns, and promote market regionalization.
11
Teck 2025 Management's Discussion and Analysis
Outlook
Our 2026–2028 annual production and 2026 annual cost guidance for our copper segment is outlined in our guidance tables on pages 43–44 and is unchanged from our previously disclosed guidance.
Total copper production in 2026 is expected to be between 455,000 and 530,000 tonnes, compared to the 453,500 tonnes produced in 2025. Copper production guidance is outlined for each operation above.
Annual production plans are based on mine plans, which contain normal grade variability and periodic planned maintenance shutdowns, which are reflected in our annual production guidance for our operations. In 2026, quarterly production is generally expected to be consistent quarter over quarter, but we expect slightly lower grades and recoveries at QB in the first half of the 2026 based on the current mine plan. In the second half of 2026, grades and recoveries are expected to improve at QB. We also expect lower mill throughput and recoveries at HVC in the fourth quarter of 2026 as we process less Lornex ore and more ore from the Bethlehem and Highmont pits.
2026 sustaining capital expenditures in our copper segment are expected to be between $1.2 and $1.3 billion. The 2026 guidance includes $390 to $460 million for QB TMF development work, which is unchanged from our previous disclosures.
2026 capitalized stripping costs in our copper segment are expected to increase compared to 2025 to between $450 and $550 million as stripping activities increase to enable the HVC Mine Life Extension where capitalized stripping costs are expected to remain at elevated levels through 2029.
12
Teck 2025 Management's Discussion and Analysis
Our 2026 growth capital expenditure guidance of between $1.3 and $1.6 billion includes between $900 million and $1.2 billion relating to HVC MLE. The remaining growth capital primarily relates to our other near-term copper growth projects, including Zafranal, and is focused on advancing engineering, feasibility studies and permitting.
Our 2026 copper net cash unit costs1, including QB, are expected to be between US$1.85 and $2.20 per pound, in line with our 2025 net cash unit costs1, reflecting strong cost discipline across our operations and an increase in copper production. We continue to review a range of measures to optimize operating costs across our portfolio in light of revised production profiles.
In 2026, QB's net cash unit costs1 are expected to be between US$2.25 and US$2.70 per pound, a reduction from our 2025 QB net cash unit costs1 of US$2.67 per pound. The improvement in QB's net cash unit costs1 is primarily due to an increase in copper and molybdenum production expected in 2026, further enhanced by the return of the QB shiploader to service early in 2026. We will continue working on identifying opportunities to further optimize the cost base.
Total copper production is expected to be between 505,000 and 580,000 tonnes in 2027 and 435,000 and 510,000 tonnes in 2028.
1 This is a non-GAAP financial measure or ratio. See “Use of Non-GAAP Financial Measures and Ratios” for further information.
13
Teck 2025 Management's Discussion and Analysis
Zinc
We are one of the world’s largest producers of mined zinc, primarily from our Red Dog Operations in Alaska, and the Antamina copper mine in northern Peru, which has significant zinc co-product production. Our metallurgical complex in Trail, B.C. is one of the world’s largest integrated zinc and lead smelting and refining operations. In 2025, we produced 565,000 tonnes of zinc in concentrate, while our Trail Operations produced 229,900 tonnes of refined zinc.
In 2025, our zinc segment accounted for 38% of revenue and 33% of our gross profit.
| | | | | | | | | | | | | | | | | | | | | | | | | | | | | |
| Revenue | Gross Profit (Loss) | Gross Profit (Loss) Before Depreciation and Amortization1 |
| ($ in millions) | 2025 | 2024 | 2023 | 2025 | 2024 | 2023 | 2025 | 2024 | 2023 |
| Red Dog | $ | 2,182 | | $ | 2,059 | | $ | 1,596 | | $ | 588 | | $ | 620 | | $ | 408 | | $ | 846 | | $ | 851 | | $ | 611 | |
Trail Operations | 2,489 | | 2,003 | | 1,992 | | 281 | | (66) | | (2) | | 282 | | 12 | | 103 | |
| Other | 9 | | 8 | | 6 | 15 | | 8 | | (6) | | 15 | | 8 | | (6) | |
| Intra-segment | (543) | | (547) | | (543) | | — | | — | | — | | — | | — | | — | |
| Total | $ | 4,137 | | $ | 3,523 | | $ | 3,051 | | $ | 884 | | $ | 562 | | $ | 400 | | $ | 1,143 | | $ | 871 | | $ | 708 | |
Note:
1.This is a non-GAAP financial measure or ratio. See “Use of Non-GAAP Financial Measures and Ratios” for further information.
| | | | | | | | | | | | | | | | | | | | |
| Production | Sales |
| (thousand tonnes) | 2025 | 2024 | 2023 | 2025 | 2024 | 2023 |
| Refined zinc | | | | | | |
| Trail Operations | 230 | | 256 | | 267 | | 224 | | 260 | | 258 | |
| | | | | | |
| Contained in concentrate | | | | | | |
| Red Dog | 463 | | 556 | | 540 | | 535 | | 574 | | 553 | |
Antamina1 | 102 | | 60 | | 104 | | 101 | | 61 | | 107 | |
| Total | 565 | | 616 | | 644 | | 636 | | 635 | | 660 | |
Note:
1.Co-product zinc production from our 22.5% interest in Antamina.
Operations
Red Dog
Our Red Dog Operations, located in northwest Alaska, is one of the world’s largest zinc mines and includes lead, silver and germanium, among other by-products. Gross profit in 2025 was $588 million compared with $620 million in 2024 and $408 million in 2023. The decrease in gross profit in 2025 compared with 2024 was
14
Teck 2025 Management's Discussion and Analysis
primarily due to reduced sales volumes resulting from lower production as zinc grades decreased, and higher operating costs, which were partially offset by lower treatment charges and increased by-product revenues from silver.
In 2025, zinc production at Red Dog was 462,700 tonnes, compared with 555,600 tonnes produced in 2024. Production in 2025 decreased due to lower grades and recoveries, as expected in the mine plan. Lead production in 2025 of 107,000 tonnes was similar to 109,100 tonnes produced in 2024, as increased mill throughput and recoveries were largely offset by lower grades.
Red Dog’s location exposes the operation to severe weather and winter ice conditions, which can significantly affect production, sales volumes and operating costs. In addition, the mine’s bulk supply deliveries and all concentrate shipments occur during a short ocean shipping season that normally runs from early July to late October. This short shipping season means that Red Dog’s sales volumes are usually higher in the last six months of the year, resulting in significant variability in its quarterly profit, depending on metal prices.
The 2025 Red Dog concentrate shipping season commenced on July 11, 2025, and was completed on October 21, 2025. A total of 1.2 million wet metric tonnes of zinc and lead concentrate was safely transloaded from our coastal barges onto 22 ships for delivery to our global customers.
In accordance with the operating agreement governing the Red Dog mine between Teck and NANA Regional Corporation, Inc. (NANA), we pay a royalty on net proceeds of production to NANA, which increased from 35% to 40% in October 2022. This royalty increases by 5% every fifth year to a maximum of 50%, with the next adjustment to 45% anticipated to occur in October 2027. The NANA royalty expense in 2025 was US$372 million compared with US$327 million in 2024. NANA has advised us that it ultimately shares approximately 60% of the royalty, net of allowable costs, with other Regional Alaska Native Corporations pursuant to section 7(i) of the Alaska Native Claims Settlement Act.
As previously disclosed, grades at Red Dog are expected to reduce as the operation nears the end of mine life. We are currently mining in the Aqqaluk and Qanaiyaq pits, with the latter expected to be depleted in 2026. Higher-than-average precipitation events have caused slippage along a known fault in the Aqqaluk pit, requiring mining in areas with lower grade, resulting in lower production of zinc in concentrate expected in 2026, 2027 and 2028. Our previously disclosed guidance is unchanged and in 2026, Red Dog is expected to produce zinc in concentrate of between 375,000 and 415,000 tonnes and between 70,000 and 90,000 tonnes of lead. Annual zinc production is expected to be between 330,000 and 370,000 tonnes in 2027 and between 230,000 and 270,000 tonnes in 2028. Beyond 2028, production is expected to continue at similar levels through the end of mine life in 2032. Annual lead production is expected to be between 60,000 and 80,000 tonnes in 2027 and between 50,000 and 65,000 tonnes in 2028.
15
Teck 2025 Management's Discussion and Analysis
Red Dog Mine Life Extension (Red Dog MLE)
We are focused on the Red Dog MLE project, formerly known as the Red Dog Anarraaq and Aktigiruq Extension Program (AAEP), which is located in the Red Dog district in Alaska, where we have several high-quality opportunities located between 10 and 20 kilometres from our existing Red Dog Operations. The project is currently in the prefeasibility study stage. In 2025, we advanced construction of an all-season road to access and drill the deposits, which are critical to the extension of the mine life of Red Dog. In 2026, we expect growth capital expenditures of between $200 and $250 million, focused on completing the all-season road access, continuing drilling of the deposit and advancing the prefeasibility study.
16
Teck 2025 Management's Discussion and Analysis
Trail Operations
Our Trail Operations in southern B.C. produces refined zinc and lead, and critical minerals such as germanium, indium and antimony as well as chemicals and fertilizer products.
Trail Operations' gross profit in 2025 was $281 million compared to a gross loss of $66 million in 2024 and a gross loss of $2 million in 2023. The gross profit in 2025 is primarily from by-product pricing such as silver, germanium and indium and the implementation of initiatives to improve profitability and cash flows, including driving higher by-product production through the processing of stockpiled residues and improved commodity prices. Our focus at Trail has been on improving its profitability and cash generation, through prioritizing processing of residues over maximizing refined zinc production. Processing residues enables us to reduce concentrate purchases in a low treatment charge environment, improving profitability.
As a result of our focus on improving profitability at Trail, as noted above, refined zinc production in 2025 decreased to 229,900 tonnes compared with 256,000 tonnes in 2024, as planned. Refined lead production in 2025 was 80,100 tonnes compared with 61,100 tonnes in 2024. Silver production was 11.4 million ounces in 2025 compared to 8.6 million ounces in 2024. The increase in both lead and silver production between 2025 and 2024 is attributable to our operating strategy focused on maximizing production of high-margin by-products.
In the third quarter of 2024, as a result of the challenging environment for treatment charges due to a global shortage of zinc concentrate and continued operating losses, combined with the fire in the electrolytic plant affecting expected operations in the fourth quarter, we recorded a pre-tax impairment charge of $1.1 billion on our Trail Operations, as previously disclosed.
Our recycling process treated 23,500 tonnes of material in 2025, and we plan to treat approximately 29,000 tonnes in 2026. Our focus remains on treating lead acid batteries and cathode ray tube glass, plus small quantities of zinc alkaline batteries and other post-consumer waste.
As previously disclosed, refined zinc production at our Trail Operations is expected to be between 190,000 and 230,000 tonnes in 2026, compared to 229,900 tonnes in 2025. We expect residues to continue to be available for processing through 2026, and we remain focused on continuing to implement a range of initiatives to further improve cash generation and on assessing whether residues can be processed for an extended period of time beyond 2026. We assume a return to full annual production levels of 260,000 to 300,000 tonnes of refined zinc production in 2027 and 2028, consistent with the capacity of our Trail Operations, subject to market conditions and optimizing for value and financial outcomes.
17
Teck 2025 Management's Discussion and Analysis
Zinc Unit Costs
The following table presents our zinc unit costs for the past three years for our Red Dog Operations only.
Total cash unit costs1 for Red Dog were US$0.60 per pound in 2025 compared with US$0.61 per pound in 2024 and US$0.68 per pound in 2023. Total cash unit costs1 in 2025 decreased slightly from 2024 levels primarily as a result of reduced smelter processing charges, largely offset by lower zinc production volumes driving increased costs per pound. Total cash unit costs1 in 2024 decreased from 2023 levels primarily as a result of reduced smelter processing charges, partly offset by higher key consumable costs that increased due to inflationary impacts despite our focused efforts on managing our controllable operating expenditures.
Net cash unit costs1 for Red Dog were US$0.33 per pound in 2025 compared with US$0.39 per pound in 2024 and US$0.55 per pound in 2023. Net cash unit costs1 in 2025 decreased from 2024 due to higher by-product revenues from silver and germanium and lower smelter processing charges. Net cash unit costs1 in 2024 decreased from 2023 partly due to higher by-product revenues from lead and silver, and lower smelter processing charges.
| | | | | | | | | | | |
| (amounts reported in US$ per pound) | 2025 | 2024 | 2023 |
Adjusted cash cost of sales1 | $ | 0.50 | | $ | 0.44 | | $ | 0.42 | |
| Smelter processing charges | 0.10 | | 0.17 | | 0.26 | |
Total cash unit costs1 | $ | 0.60 | | $ | 0.61 | | $ | 0.68 | |
Cash margin for by-products1 | (0.27) | | (0.22) | | (0.13) | |
Net cash unit costs1 | $ | 0.33 | | $ | 0.39 | | $ | 0.55 | |
Note:
1.This is a non-GAAP financial measure or ratio. See “Use of Non-GAAP Financial Measures and Ratios” for further information.
1 This is a non-GAAP financial measure or ratio. See “Use of Non-GAAP Financial Measures and Ratios” for further information.
18
Teck 2025 Management's Discussion and Analysis
Markets
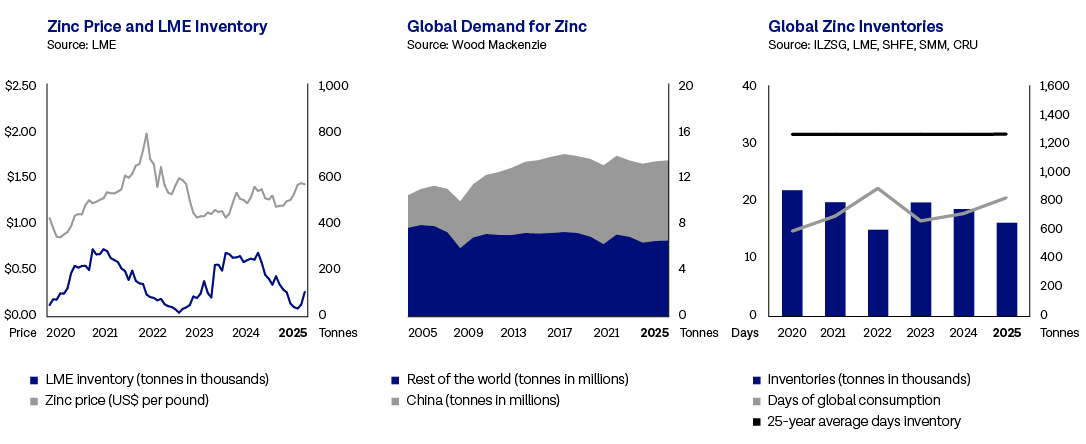
Zinc prices on the LME averaged US$1.30 per pound during 2025, increasing 3.2% from US$1.26 per pound in 2024 and ending 2025 at US$1.40 per pound.
Zinc stocks on the LME fell by 127,300 tonnes in 2025 (-54.2%), while SHFE stocks rose by 42,700 tonnes (+141%), finishing the year at a combined 179,300 tonnes, a drop of 85,000 tonnes from end of 2024 levels. Total reported global stocks, which include producer, consumer, merchant and terminal stocks, fell by approximately 88,200 tonnes in 2025 to just under 183,900 tonnes at year-end, representing an estimated 4.7 days of global demand, compared to 7.1 days at the end of 2024 and the 25-year average of 15.7 days.
In 2025, global zinc mine production increased for the first year since 2021, rising by 4.7% according to industry consultant Wood Mackenzie, with total mine production of 12.8 million tonnes. Despite this, zinc mine production has not grown materially since 2011, remaining at or below 13 million tonnes per year. Wood Mackenzie expects global zinc mine production to grow just 0.1% in 2026, staying at 12.8 million tonnes after a production adjustment for potential disruptions.
Wood Mackenzie data shows global refined zinc production grew by 2.6% in 2025 to 13.7 million tonnes, as refined production in China rebounded from the feed constraints of 2024, up 9.7% year over year. This was supported by a 30% increase in Chinese zinc concentrate imports. However, as domestic self-sufficiency increased Chinese zinc metal imports were down 39% over 2024 levels. Wood Mackenzie estimates refined zinc production will grow a further 1.3% in 2026.
Global refined zinc demand rose 1.6% in 2025 to 13.7 million tonnes, with demand in China lagging global growth at 0.7% or approximately 7.0 million tonnes. India moved past the U.S. to become the second-largest zinc consumer globally, growing 4.9% to around 850,000 tonnes of demand due to its rising middle class, growing auto sector infrastructure investment and increased use of galvanized steel in numerous applications. Demand in Europe rose by 1.8% due to normalization in energy prices and infrastructure investment, offsetting a weakening auto sector. In North America, demand fell by 5.4% in 2025, according to Wood Mackenzie, based on a weakened auto sector further hampered by tariffs, persisting inflationary pressures and a stalled energy transition infrastructure rollout. In 2026, Wood Mackenzie expects demand for zinc to grow globally by 1.1% to 13.8 million tonnes, with growth coming primarily from China, India, Europe and the Middle East.
As a result, Wood Mackenzie estimates the global zinc metal market moved into a 40,000-tonne surplus in 2025, easing from a 2024 deficit of 224,000 tonnes. For 2026, another small surplus of 63,000 tonnes is anticipated, using Wood Mackenzie figures.
19
Teck 2025 Management's Discussion and Analysis
Outlook
Our 2026–2028 annual production and 2026 annual cost guidance for our zinc segment are outlined in our guidance tables on pages 43–44, and is unchanged from our previously disclosed guidance. As disclosed on January 20, 2026, the 2026 annual zinc in concentrate production guidance for Antamina was updated to 35,000 to 45,000 tonnes, reflecting an updated mine plan, finalized in the fourth quarter of 2025.
As Red Dog approaches end of mine life, 2026 marks a shift in zinc grades as we expect to complete mining our higher-grade material from the Qanaiyaq pit and to move to lower-grade Aqqaluk ore in the fourth quarter.
Total zinc in concentrate production in 2026 is expected to be between 410,000 and 460,000 tonnes, compared to 565,000 tonnes in 2025. Production in each of the next two years is expected to decrease, primarily due to declining grades at Red Dog. Annual zinc in concentrate production is expected to be between 365,000 and 415,000 tonnes in 2027 and between 275,000 and 325,000 tonnes in 2028. Beyond 2028, production is expected to continue at similar levels through the end of Red Dog's mine life.
Refined zinc production is expected to be between 190,000 and 230,000 tonnes in 2026 compared to 229,900 tonnes in 2025, as outlined above.
We expect sales of zinc in concentrate at Red Dog to be in the range of between 40,000 and 50,000 tonnes in the first quarter of 2026, reflecting the seasonality of Red Dog sales.
Our 2026 annual sustaining capital expenditures in our zinc segment are expected to be between $150 and $200 million, similar to 2025. Capitalized stripping costs in 2026 are expected to decrease to between $5 and $10 million as Red Dog nears the end of mine life.
20
Teck 2025 Management's Discussion and Analysis
As outlined above, Red Dog MLE has several high-quality opportunities that could extend the mine life of Red Dog beyond 2032. The expected 2026 capital spend for these activities is between $200 and $250 million.
Our 2026 zinc net cash unit costs1 are expected to be between US$0.65 and $0.75 per pound, which is higher than our 2025 net cash unit costs1 of US$0.33 per pound, primarily due to the effect of lower zinc production expected in 2026, mostly from lower grades.
1 This is a non-GAAP financial measure or ratio. See “Use of Non-GAAP Financial Measures and Ratios” for further information.
21
Teck 2025 Management's Discussion and Analysis
Exploration
Exploration plays three critical roles at Teck:
•Discovery of new orebodies through early-stage greenfield exploration on Teck-owned properties and third-party properties via option and earn-in agreements
•Brownfield exploration and drilling activities at existing Teck projects and operations
•Pursuit, evaluation and acquisition of third-party exploration and development opportunities
Throughout 2025, we conducted exploration around our existing operations and globally in nine countries through our six regional offices. Exploration expenditures in 2025 were $90 million, focused on copper, nickel and zinc. This compares with expenditures in 2024 of $87 million, and includes the completion of drilling programs in Argentina, Armenia, Australia, Canada, Chile, Kazakhstan, Peru, Türkiye and the U.S. We continue to work closely with local communities in the areas we operate and, in 2025, we experienced no significant access issues or project delays and were able to drill more projects than originally planned.
Work continued at QB in 2025 on project de-risking activities (e.g., geotechnical and infill drilling) in support of future expansions and on advanced drilling to de-risk production.
Early-stage copper exploration in 2025 focused primarily on advancing projects targeting economic porphyry-style mineralization in Argentina, Armenia, Kazakhstan and Peru, and on evaluating new opportunities in South America, Europe, central Asia and southern Africa. In 2026, we plan to drill early-stage copper projects in Argentina and Peru.
In 2025, we continued to grow our portfolio of nickel-copper exploration opportunities, with initial drilling conducted on projects in Australia and Canada, and work completed to define targets for drilling in the U.S. In 2026, we will continue to advance this portfolio.
Zinc exploration in 2025 was concentrated on an advanced-stage project in the Red Dog district in Alaska. We continued to advance a zinc-copper-silver project in eastern Türkiye. In 2026, we plan to continue drilling advanced-stage projects in the Red Dog mine district in Alaska.
Teck’s exploration strategy is underpinned by an agile commercial mindset whereby we manage and refresh a portfolio of commercial assets such as retained project royalties and equity in junior exploration companies. In 2025, investments were made in exploration companies with copper portfolios in Canada, Colombia, Kazakhstan, Peru and the U.S., and nickel portfolios in Canada. Additionally, exploration agreements were signed with exploration companies with projects in Armenia, Peru, the U.S. and Zambia.
22
Teck 2025 Management's Discussion and Analysis
Financial Overview
Financial Summary
| | | | | | | | | | | |
| ($ in millions, except per share data) | 2025 | 2024 | 2023 |
| Revenue and profit | | | |
| Revenue | $ | 10,756 | | $ | 9,065 | | $ | 6,476 | |
| Gross profit | $ | 2,657 | | $ | 1,607 | | $ | 1,112 | |
Gross profit before depreciation and amortization1 | $ | 4,339 | | $ | 3,272 | | $ | 1,973 | |
Profit (loss) from continuing operations before taxes | $ | 1,656 | | $ | (718) | | $ | (75) | |
Adjusted EBITDA1 | $ | 4,333 | | $ | 2,933 | | $ | 1,436 | |
Profit (loss) from continuing operations attributable to shareholders | $ | 1,401 | | $ | (467) | | $ | (118) | |
Profit attributable to shareholders | $ | 1,401 | | $ | 406 | | $ | 2,409 | |
| | | |
| Cash flow | | | |
| Cash flow from operations | $ | 1,479 | | $ | 2,790 | | $ | 4,084 | |
Expenditures on property, plant and equipment | $ | 1,838 | | $ | 2,262 | | $ | 3,885 | |
Capitalized stripping costs | $ | 224 | | $ | 373 | | $ | 455 | |
| | | |
| Balance sheet | | | |
Cash and cash equivalents | $ | 5,012 | | $ | 7,587 | | $ | 744 | |
| Total assets | $ | 45,436 | | $ | 47,037 | | $ | 56,193 | |
| Debt and lease liabilities, including current portion | $ | 4,862 | | $ | 5,482 | | $ | 7,595 | |
| | | |
| Per share amounts | | | |
Basic earnings (loss) per share from continuing operations | $ | 2.84 | | $ | (0.90) | | $ | (0.23) | |
Diluted earnings (loss) per share from continuing operations | $ | 2.83 | | $ | (0.90) | | $ | (0.23) | |
Basic earnings per share | $ | 2.84 | | $ | 0.79 | | $ | 4.65 | |
Diluted earnings per share | $ | 2.83 | | $ | 0.78 | | $ | 4.59 | |
| Dividends declared per share | $ | 0.50 | | $ | 1.00 | | $ | 1.00 | |
Note:
1.This is a non-GAAP financial measure or ratio. See “Use of Non-GAAP Financial Measures and Ratios” for further information.
Our revenue and profit depend on the prices for the commodities we produce, sell and use in our production processes. Commodity prices are determined by the supply of and demand for those commodities, which are influenced by global economic conditions. We normally sell the products that we produce at prevailing market prices. Prices for our products can fluctuate significantly, and that volatility can have a material effect on our financial results.
Foreign exchange rate movements can also have a significant effect on our results and cash flows, as substantial portions of our operating costs are incurred in Canadian dollars and the Chilean peso, and most of our revenue and debt is denominated in U.S. dollars. We determine our financial results in local currency and report those results in Canadian dollars; accordingly, our reported operating results and cash flows are affected by changes in the Canadian dollar exchange rate relative to the U.S. dollar, as well as the Peruvian sol and Chilean peso.
23
Teck 2025 Management's Discussion and Analysis
In 2025, our profit from continuing operations attributable to shareholders was $1.4 billion, or $2.84 per share compared with a loss from continuing operations attributable to shareholders of $467 million, or $0.90 per share in 2024. Our profit improved in 2025 due to higher commodity prices, particularly for copper, reduced smelter processing charges for copper and zinc, higher by-product revenues and improved profitability from our Trail Operations. Our loss in 2024 included an $828 million non-cash, after-tax impairment charge on our Trail Operations, primarily the result of a challenging environment for treatment charges due to a global shortage of zinc concentrate and continued operating losses.
In 2024, we completed the sale of 23% of the steelmaking coal business, Elk Valley Resources (EVR) to Nippon Steel Corporation (NSC) and POSCO for upfront proceeds of US$1.3 billion in January, and the remaining 77% of EVR to Glencore plc (Glencore) for proceeds of US$7.3 billion on July 11, 2024. As a result of the completion of the sale of our steelmaking coal business, results from that business have been presented as discontinued operations for 2024 and 2023 in this 2025 Management's Discussion and Analysis and in our 2025 annual audited consolidated financial statements. Further detail is provided in the Discontinued Operations section below.
Our profit and loss over the past three years includes items that we segregate for additional disclosure to investors so that the underlying profit of the company may be more clearly understood. Our adjusted profit from continuing operations attributable to shareholders1 presented in the table below excludes results from EVR for 2024 and 2023, as results from EVR have been classified and presented as discounted operations in these periods.
Our adjusted EBITDA1, taking into account the items identified in the table below, was $4.3 billion in 2025 compared with $2.9 billion in 2024. Our adjusted profit from continuing operations attributable to shareholders1, which takes these items into account, was $1.5 billion in 2025 compared with $605 million in 2024, or $3.10 and $1.17 per share, respectively. These items adjusted are described below and summarized in the table that follows.
The most significant after-tax adjustments to profit in 2025 were a $172 million charge for environmental costs primarily related to the remeasurement of decommissioning and restoration provisions for closed operations, commodity derivative gains of $105 million, and an $86 million gain from changes to the carrying value of the financial liability associated with the preferential dividend stream to Codelco.
In 2024, the most significant after-tax adjustments to profit were an impairment charge of $828 million on our Trail Operations, as outlined below, foreign exchange gains of $137 million, and $178 million of tax charges, primarily related to the derecognition of deferred tax assets.
1 This is a non-GAAP financial measure or ratio. See “Use of Non-GAAP Financial Measures and Ratios” for further information.
24
Teck 2025 Management's Discussion and Analysis
The following table shows the effect of the above-noted items on our profit and loss.
| | | | | | | | | | | |
| ($ in millions, except per share data) | 2025 | 2024 | 2023 |
| Profit (loss) from continuing operations attributable to shareholders | $ | 1,401 | | $ | (467) | | $ | (118) | |
| | | |
| Add (deduct) on an after-tax basis: | | | |
| Asset impairment | — | | 828 | | — | |
QB variable consideration to IMSA and Codelco | (86) | | 32 | | 95 | |
Environmental costs | 172 | | 3 | | 88 | |
Share-based compensation | 52 | | 72 | | 63 | |
Commodity derivatives | (105) | | (65) | | 9 | |
| Foreign exchange (gains) losses | 37 | | (137) | | (8) | |
Tax items | (82) | | 178 | | 69 | |
| Other | 144 | | 161 | | 91 | |
Adjusted profit from continuing operations attributable to shareholders1 | $ | 1,533 | | $ | 605 | | $ | 289 | |
| Basic earnings (loss) per share from continuing operations | $ | 2.84 | | $ | (0.90) | | $ | (0.23) | |
| Diluted earnings (loss) per share from continuing operations | $ | 2.83 | | $ | (0.90) | | $ | (0.23) | |
Adjusted basic earnings per share from continuing operations1 | $ | 3.10 | | $ | 1.17 | | $ | 0.56 | |
Adjusted diluted earnings per share from continuing operations1 | $ | 3.09 | | $ | 1.16 | | $ | 0.55 | |
Note:
1.This is a non-GAAP financial measure or ratio. See “Use of Non-GAAP Financial Measures and Ratios” for further information.
Cash flow from operations in 2025 was $1.5 billion compared with $2.8 billion in 2024 and $4.1 billion in 2023. Cash flow from operations in 2025 benefited from higher profit from continuing operations and lower cash taxes paid than 2024; however, cash flow from operations in 2024 included cash flows from the steelmaking coal business up to the closing date of the sale on July 11, 2024. Changes in cash flow from operations are also impacted by varying commodity prices, changes in sales volumes of our principal products and, to some extent, changes in foreign exchange rates and changes in working capital items.
At December 31, 2025, our cash balance was $5.0 billion. Total debt was $4.9 billion and our net debt to net debt-plus-equity ratio1 was negative 1% at December 31, 2025, compared with negative 8% at December 31, 2024 and 19% at the end of 2023.
Gross Profit
Our gross profit is made up of our revenue less the operating expenses at our producing operations, including depreciation and amortization. Income and expenses from our business activities that do not produce commodities for sale are included in our other operating income and expenses or in our non-operating income and expenses.
1 This is a non-GAAP financial measure or ratio. See “Use of Non-GAAP Financial Measures and Ratios” for further information.
25
Teck 2025 Management's Discussion and Analysis
Our principal commodities are copper and zinc, which accounted for 54% and 24% of our revenue, respectively, in 2025. Silver and lead are significant by-products of our zinc operations, accounting for 13% of our 2025 revenue. We also produce a number of other by-products, including molybdenum, germanium, gold, various specialty metals, chemicals and fertilizers, which in total accounted for 9% of our revenue in 2025.
Our revenue is affected by sales volumes, which are determined by our production levels and by demand for the commodities we produce, commodity prices and currency exchange rates.
Our revenue was $10.8 billion in 2025 compared with $9.1 billion in 2024 and $6.5 billion in 2023. The increase in 2025 compared to 2024 was primarily due to higher commodity prices, particularly copper. Average prices for copper (LME) increased by 9% in 2025 compared with 2024, and average zinc (LME) prices increased by 3%. Prices for silver, lead and our other various by-products also increased in 2025 as compared with 2024 levels.
Our cost of sales includes all of the expenses required to produce our products, such as labour, energy, operating supplies, concentrates purchased for our Trail Operations’ refining and smelting activities, royalties, and marketing and distribution costs required to sell and transport our products to various delivery points. Our cost of sales also includes depreciation and amortization expense. Due to the geographic locations of many of our operations, we are highly dependent on third parties for the provision of rail, port and other distribution services. In certain circumstances, we negotiate prices and other terms for the provision of these services where we may not have viable alternatives to using specific providers or may not have access to regulated rate-setting mechanisms or appropriate remedies for service failures. Contractual disputes, demurrage charges, availability of vessels and railcars, weather problems and other factors, as well as rail and port capacity issues, can have a material effect on our ability to transport materials from our suppliers and to our customers in accordance with schedules and contractual commitments.
Our costs are dictated mainly by our production volumes; by the costs for labour, operating supplies and concentrate purchases; by strip ratios, haul distances and ore grades; by distribution costs, commodity prices, foreign exchange rates and costs related to non-routine maintenance projects; and by our ability to manage these costs. Production volumes mainly affect our variable operating and distribution costs. In addition, production affects our sales volumes; when combined with commodity prices, this affects profitability and our royalty expenses.
Our cost of sales was $8.1 billion in 2025, compared with $7.5 billion in 2024 and $5.4 billion in 2023. The increase in cost of sales in 2025 compared to 2024 was partly due to an increase in cost of sales at Highland Valley Copper of approximately $300 million, reflecting a 23% increase in sales volumes in 2025 over 2024 levels. In addition, concentrate purchase costs increased at Trail, reflecting higher commodity prices and the impact of lower zinc treatment charges.
26
Teck 2025 Management's Discussion and Analysis
Other Expenses
| | | | | | | | | | | |
| ($ in millions) | 2025 | 2024 | 2023 |
| General and administration | $ | 269 | | $ | 275 | | $ | 296 | |
| Exploration | 90 | | 87 | | 86 | |
| Research and innovation | 35 | | 50 | | 117 | |
| Asset impairment | — | | 1,053 | | — | |
| Other operating (income) expense | 15 | | 151 | | 391 | |
| Finance income | (271) | | (234) | | (110) | |
| Finance expense | 912 | | 953 | | 160 | |
| Non-operating (income) expense | (52) | | (7) | | 249 | |
| Share of (profit) loss of joint venture and associate | 3 | | (3) | | (2) | |
| $ | 1,001 | | $ | 2,325 | | $ | 1,187 | |
In 2025, general and administration expenses decreased to $269 million compared with $275 million in 2024 and $296 million in 2023. Research and innovation expenses decreased to $35 million compared with $50 million in 2024 and $117 million in 2023. The reduction in these corporate costs is the result of our continued actions taken across our business to reduce structural costs. Since 2023, we have reduced general and administration and research and innovation costs by $109 million or 26%.
Our exploration expenses in 2025 of $90 million — focused on copper, nickel and zinc — were similar to expenditures in 2024 of $87 million.
We must continually replace our reserves as they are depleted in order to maintain production levels over the long term. We try to do this through our exploration and development programs and through acquisition of interests in new properties or in companies that own them. Exploration for minerals is highly speculative, and the projects involve many risks. The vast majority of exploration projects are unsuccessful and there are no assurances that current or future exploration programs will find deposits that are ultimately brought into production.
Other operating income and expense includes items we consider to be related to the operation of our business, such as settlement pricing adjustments (which are further described below), share-based compensation, gains or losses on commodity derivatives, gains or losses on the sale of operating or exploration assets, and provisions for various costs at our closed properties. Significant items in 2025 included $512 million of positive pricing adjustments primarily reflecting rising copper prices in the year, particularly in the fourth quarter, $144 million of gains on commodity derivatives, $208 million of environmental costs primarily related to the remeasurement of our decommissioning and restoration provisions for closed operations, and $66 million of share-based compensation expense relating to an increase in our share price in the year. Significant items in 2024 included $65 million of positive pricing adjustments, $91 million of share-based compensation expense relating to an increase in our share price, and $90 million of gains on commodity derivatives.
27
Teck 2025 Management's Discussion and Analysis
Revenue, including revenue from the sale of by-products, is recognized at the point in time when the customer obtains control of the product. Control is achieved when a product is delivered to the customer, we have a present right to payment for the product, significant risks and rewards of ownership have transferred to the customer according to contract terms and there is no unfulfilled obligation that could affect the customer’s acceptance of the product.
For copper, zinc and lead concentrate sales, control of the product generally transfers to the customer when an individual shipment parcel is loaded onto a carrier accepted by the customer. Additionally, for a minority of copper concentrate sales, control of the product transfers to the customer when an individual shipment parcel is delivered to a specified location. A minority of zinc concentrate sales are made on consignment. For consignment transactions, control of the product transfers to the customer and revenue is recognized at the time the product is consumed in the customer’s process.
The majority of our metal concentrates are sold under pricing arrangements where final prices are determined by quoted market prices in a period subsequent to the date of sale. For these sales, revenue is recorded based on the estimated consideration to be received at the date of sale, with reference to relevant commodity market prices.
For sales of refined metals, control of the product transfers to the customer when the product is loaded onto a carrier accepted by the customer. For these products, loading generally coincides with the transfer of title. Our refined metals are sold under spot or average pricing contracts. For spot sales contracts, pricing is final when revenue is recognized. For refined metal sales contracts where pricing is not finalized when revenue is recognized, revenue is recorded based on the estimated consideration to be received at the date of sale with reference to commodity market prices.
Adjustments are made to settlement receivables in subsequent periods based on movements in quoted commodity prices up to the date of final pricing. This adjustment mechanism is based on the market price of the commodity; accordingly, the changes in value of the settlement receivables are not considered to be revenue from contracts with customers. The changes in fair value of settlement receivables related to price changes are recorded in other operating income (expense).
The following table outlines our outstanding receivable positions, which were subject to provisional pricing terms at December 31, 2025 and 2024, respectively.
| | | | | | | | | | | | | | |
| Outstanding at | Outstanding at |
| December 31, 2025 | December 31, 2024 |
(payable pounds in millions) | Pounds | US$/lb. | Pounds | US$/lb. |
Copper | 214 | 5.64 | 178 | 3.97 |
Zinc | 189 | 1.41 | 141 | 1.34 |
Our finance income increased to $271 million in 2025 compared with $234 million in 2024 and $110 million in 2023. The increase in finance income in 2025 is a result of higher investment income on our higher average
28
Teck 2025 Management's Discussion and Analysis
cash balance during 2025, as compared to 2024 when the proceeds from the sale of the steelmaking coal business were received in July 2024.
Our finance expense includes the interest expense on our debt; on advances to QBSA from SMM/SC and on lease liabilities, letters of credit and standby fees; the interest components of our pension obligations; and accretion on our decommissioning and restoration provisions, less any interest that we capitalize against our development projects. Our finance expense was $912 million in 2025 compared with $953 million in 2024. The reduction in our finance expense reflects a full year of lower debt balances in 2025, as we significantly reduced our debt during 2024, and our continued reduction of the QB project financing facility through scheduled semi-annual repayments. These items were partly offset by a reduction in the amount of interest capitalized on our various projects.
Non-operating income (expense) includes items that arise from financial and other matters, and includes such items as foreign exchange gains or losses, debt refinancing costs, and changes in the carrying value of the financial liability relating to QB variable consideration to Inversiones Mineras S.A. (IMSA) and Codelco, as outlined below.
In 2025, non-operating expenses included $41 million of foreign exchange losses and a $142 million gain associated with QB variable consideration to IMSA and Codelco. The $142 million gain was due to the revaluation of the financial liability for the preferential dividend stream related to Codelco's interest in QBSA, which is most significantly affected by copper prices and the interest rate on the subordinated loans provided by us and SMM/SC to QBSA, which affects the timing of when QBSA repays the loans. There was no gain or expense relating to the revaluation of the derivative financial liability that arose from our 2018 acquisition of an additional 13.5% interest in QBSA through the purchase of IMSA, a private Chilean company and former QBSA shareholder. The purchase price at the date of acquisition included additional amounts that may become payable to the extent that average copper prices exceed US$3.15 per pound in each of the first three years following commencement of commercial production, as defined in the acquisition agreement, up to a cumulative maximum of US$100 million if commencement of commercial production occurred prior to January 21, 2024, or up to a lesser maximum in certain circumstances thereafter. Commencement of commercial production occurred in March of 2024, which reduced our cumulative maximum payment to US$97 million. The derivative liability was reduced in April 2025 as a result of a US$50 million payment to IMSA.
In 2024, non-operating expenses included $146 million of foreign exchange gains and $51 million of expenses associated with QB variable consideration to IMSA and Codelco. Of the $51 million, $44 million was due to the revaluation of the financial liability for the preferential dividend stream related to Codelco's interest in QBSA, as outlined above.
29
Teck 2025 Management's Discussion and Analysis
Income Taxes
Provision for income and resource taxes from continuing operations for the year was $584 million, or 35% of pre-tax earnings. Our effective tax rate was higher than the Canadian statutory income tax rate of 27%, primarily due to resource taxes. We expect our average long-term effective tax rate to be in the range of 39% to 41%, but quarterly and annual results may vary due to the relative amount of operating margins, the scope and timing of development expenditures for the HVC and Red Dog MLE and other copper growth projects, certain corporate and finance expenses that are not deductible for resource tax purposes, the statutory tax rates in the jurisdictions in which we operate, and other factors. We are subject to and pay income and resource taxes in all jurisdictions that we operate in.
Discontinued Operations
On July 11, 2024, we completed the sale of our remaining 77% interest in our steelmaking coal business, EVR, to Glencore and received transaction proceeds of US$7.3 billion, excluding customary closing adjustments. As a result of the sale of EVR in July 2024, results from EVR were classified and presented as discontinued operations for 2024 and 2023.
For the year ended December 31, 2025, we did not have any operations classified as discontinued operations; therefore, no profit or loss from discontinued operations was recorded in 2025. This compares with profit from discontinued operations of $1.2 billion in 2024, which included operating results from EVR for the period up to the sale date of July 11, 2024 and an after-tax gain of $81 million on the sale of EVR, which is net of taxes of $897 million. Profit from discontinued operations was higher in 2023, as it included a full 12 months of EVR results as compared to 2024, which included EVR results up to the July 11, 2024 sale.
Transactions
Merger of Equals with Anglo American
On September 9, 2025, we announced the merger of equals (the Merger), whereby Teck and Anglo American plc (Anglo American) have agreed to combine the two companies by way of a plan of arrangement to form Anglo Teck plc (Anglo Teck), a global critical minerals champion and top five global copper producer, headquartered in Canada. On September 9, 2025, Teck and Anglo American entered into an arrangement agreement, as amended on November 10, 2025 (the Arrangement Agreement), whereby Anglo American will issue 1.3301 ordinary shares (or, in the case of electing eligible Canadian Teck shareholders, 1.3301 exchangeable shares) to existing Teck shareholders in exchange for each outstanding Teck Class A common share and Class B subordinate voting share. Following the closing of the Merger, Anglo American shareholders will own approximately 62.4% and Teck shareholders will own approximately 37.6% of the combined business.
On December 9, 2025, the Merger was approved as required by Teck Class A common shareholders and Teck Class B subordinate voting shareholders.
30
Teck 2025 Management's Discussion and Analysis
On December 12, 2025, Teck obtained a final order from the Supreme Court of British Columbia approving the Merger. Additionally, on December 15, 2025, Teck received regulatory approval from the Government of Canada under the Investment Canada Act for the Merger.
The Merger remains subject to customary closing conditions for a transaction of this nature, including regulatory approvals in multiple jurisdictions globally. The parties continue to work collaboratively toward securing the required approvals and advancing the transaction to completion.
Sale of Steelmaking Coal Business
On January 3, 2024, we completed the sale of a minority stake of our interest in our steelmaking coal business, EVR, to NSC and POSCO. NSC acquired a 20% interest in EVR in exchange for its 2.5% interest in Elkview Operations plus $1.7 billion (US$1.3 billion) in cash. POSCO exchanged its 2.5% interest in Elkview Operations and its 20% interest in Greenhills Operations for a 3% interest in EVR. These transactions were accounted for as equity transactions with non-controlling interests, reducing retained earnings by $1.5 billion and increasing non-controlling interest balances. In determining the net assets of EVR to calculate the non-controlling interests and the related adjustment to retained earnings, we included the steelmaking coal business' goodwill balance and excluded deferred income tax liabilities not attributable to the non-controlling interests.
On July 11, 2024, we completed the sale of our remaining 77% interest in our steelmaking coal business to Glencore. We received cash proceeds of $9.9 billion (US$7.3 billion) and correspondingly derecognized $20 billion of assets (including $17 billion of property, plant and equipment and $256 million of cash), $8 billion of liabilities (including $2 billion of decommissioning and restoration provisions) and $3 billion of non-controlling interests related to the steelmaking coal business. This resulted in a gain (net of taxes of $897 million) of approximately $81 million, which is presented in profit from discontinued operations. Settlement of customary closing adjustments were recorded as part of discontinued operations in 2024.
31
Teck 2025 Management's Discussion and Analysis
Financial Position and Liquidity
Our liquidity remained strong at $9.1 billion as at December 31, 2025, including $5.0 billion of cash. At December 31, 2025, total debt was $4.9 billion and our net debt to net debt-plus-equity ratio1 was negative 1% compared with negative 8% at December 31, 2024.
We maintain various committed and uncommitted credit facilities for liquidity and for the issuance of letters of credit, including a US$3.0 billion sustainability-linked facility, which was undrawn as at December 31, 2025.
At December 31, 2025, the principal balance of our term notes was approximately US$1.0 billion. As at December 31, 2025, US$1.6 billion was outstanding under the US$2.5 billion QB project financing facility held by QBSA and Antamina's US$1.0 billion loan facility agreement, of which our 22.5% share is US$225 million, was fully drawn. The Antamina facilities are non-recourse to us and the other Antamina owners.
Our $3.0 billion revolving credit facility continues to have pricing adjustments that are aligned with our sustainability performance and strategy. Our sustainability performance over the term of the facility is measured by greenhouse gas (GHG) intensity, percentage of women in our workforce and safety.
The QB project finance facility was guaranteed pre-final completion on a several basis by Teck and SMM/SC pro rata to the respective equity interests in the Series A shares of QBSA. The project achieved completion under the facility in March 2025 and, as a result, these guarantees have been released.
In June of 2025, Antamina entered into an updated US$1.0 billion loan agreement maturing in June 2030, replacing the five-year agreement entered into 2021. Our 22.5% share of the loan is US$225 million. The loan is non-recourse to us and to the other Antamina owners.
Our outstanding debt and lease liabilities were $4.9 billion at December 31, 2025, compared with $5.5 billion at the end of 2024 and $7.6 billion at the end of 2023. The decrease in 2025 was mainly due to two semi-annual repayments of US$147 million on the QB project financing.
We maintain investment grade ratings of Baa3 and BBB- with stable outlooks from Moody’s and S&P, respectively.
1 This is a non-GAAP financial measure or ratio. See “Use of Non-GAAP Financial Measures and Ratios” for further information.
32
Teck 2025 Management's Discussion and Analysis
Our debt balances and credit ratios are summarized in the following table:
| | | | | | | | | | | |
| December 31, | December 31, | December 31, |
| 2025 | 2024 | 2023 |
| Term notes | $ | 1,029 | | $ | 1,044 | | $ | 2,470 | |
QB senior limited recourse project finance facility | 1,618 | | 1,912 | | 2,206 | |
| Lease liabilities | 699 | | 661 | | 802 | |
| Carmen de Andacollo short-term loans | — | | — | | 95 | |
| Antamina credit facilities | 225 | | 225 | | 225 | |
| | | |
| Less unamortized fees and discounts | (24) | | (32) | | (56) | |
Debt and lease liabilities (US$ in millions) | $ | 3,547 | | $ | 3,810 | | $ | 5,742 | |
| | |
|
Debt and lease liabilities (Canadian $ equivalent)1 | 4,862 | | 5,482 | | 7,595 | |
Less cash and cash equivalents | (5,012) | | (7,587) | | (744) | |
Net debt (cash)2 (A) | $ | (150) | | $ | (2,105) | | $ | 6,851 | |
Equity (B) | $ | 26,007 | | $ | 27,096 | | $ | 28,292 | |
Net debt to net debt-plus-equity ratio2 (A/(A+B)) | (1) | % | (8) | % | 19 | % |
Net debt to adjusted EBITDA ratio2 | — | | (0.7)x | 1.1x |
| Weighted average coupon rate on the term notes | 5.6 | % | 5.6 | % | 5.4 | % |
Notes:
1.Translated at period end exchange rates.
2.This is a non-GAAP financial measure or ratio. See “Use of Non-GAAP Financial Measures and Ratios” for further information.
At December 31, 2025, the weighted average maturity of our term notes is approximately 13.1 years and the weighted average coupon rate is approximately 5.6%.
Our cash position decreased from $7.6 billion at the end of 2024 to $5.0 billion at December 31, 2025. Cash flow from operations was $1.5 billion in 2025. Significant cash outflows in 2025 included $1.8 billion of capital expenditures, of which $1.0 billion related to sustaining capital and $330 million related to HVC MLE, $224 million of capitalized stripping costs, $246 million of dividends, $1.0 billion of share buybacks, and $686 million of interest and finance charges. Higher profit from increased commodity prices, improved profitability from our Trail Operations, and lower cash taxes were offset by a reduction in cash inflows from working capital changes compared to the prior year.
Borrowing under our primary committed revolving credit facility is subject to our compliance with the covenants in the agreement and our ability to make certain representations and warranties at the time of the borrowing request. Our US$3.0 billion sustainability-linked facility does not contain an earnings- or cash flow-based financial covenant, a credit rating trigger or a general material adverse borrowing condition. The only financial covenant under our credit agreements is a requirement for our adjusted net debt to capitalization ratio not to exceed 60%. We do not exceed the required adjusted net debt to capitalization ratio at December 31, 2025, as outlined above.
In addition to our US$3.0 billion sustainability-linked facility, we maintain uncommitted bilateral credit facilities primarily for the issuance of letters of credit to support our future reclamation obligations. At December 31, 2025, we had $2.0 billion of letters of credit outstanding. We also had $549 million in surety bonds
33
Teck 2025 Management's Discussion and Analysis
outstanding at December 31, 2025, mostly to support current and future reclamation obligations. At December 31 2024, there were $1.5 billion of outstanding letters of credit and $441 million of outstanding surety bonds.
Under the terms of the silver streaming agreement relating to Antamina, if there is an event of default under the agreement or Teck insolvency, Teck Base Metals Ltd., our subsidiary that holds our interest in Antamina, is restricted from paying dividends or making other distributions to Teck to the extent that there are unpaid amounts under the agreement. In addition, the QB project finance arrangements include customary restrictions on the payment of dividends and other distributions from the project company.
Early repayment of borrowings under our US$3.0 billion credit facility, outstanding public debt and the QB project finance arrangements may be required if an event of default under the relevant agreement occurs. In addition, we are required to offer to repay indebtedness outstanding under our revolving credit facility and certain of our public debt in the event of a change of control, as determined under the relevant agreements.
34
Teck 2025 Management's Discussion and Analysis
Capital Allocation Framework
Our capital allocation framework describes how we allocate funds to sustaining and growth capital, maintaining solid investment grade credit metrics and returning excess cash to shareholders. This framework reflects our intention to make additional returns to shareholders by supplementing our base dividend with at least an additional 30% of available cash flow after certain other repayments and expenditures have been made. For this purpose, we define available cash flow (ACF) as cash flow from operating activities after interest and finance charges, lease payments and distributions to non-controlling interests less: (i) sustaining capital and capitalized production stripping; (ii) committed growth capital; (iii) any cash required to adjust the capital structure to maintain solid investment grade credit metrics; (iv) our base $0.50 per share annual dividend; and (v) any share repurchases executed under our annual buyback authorization. Proceeds from any asset sales may also be used to supplement available cash flow. Any additional cash returns may be made through share repurchases and/or supplemental dividends depending on market conditions at the relevant time. In connection with the Merger with Anglo American, certain capital allocation actions are subject to the terms of the arrangement agreement.
Our results can be highly variable, as they are dependent on commodity prices and various other factors. Investors should not assume that there will be available cash or any supplemental returns in any given year.
In 2025, we returned cash to shareholders through dividends and share buybacks. In 2025, we paid our base dividend totalling $246 million. During the interim period prior to the closing of the Merger, the arrangement agreement restricts Teck from declaring or paying additional dividend amounts exceeding $0.125 per share per fiscal quarter without the prior approval of Anglo American. During 2025, we purchased $1.0 billion of our Class B subordinate voting shares. We have not executed share buybacks since July 25, 2025, as Teck is restricted from issuing or repurchasing securities under the Merger arrangement agreement, and we did not renew our normal course issuer bid in the fourth quarter of 2025. Since 2020, we have returned $6.1 billion to shareholders, including $4.1 billion of Class B subordinate voting share buybacks.
On February 18, 2026, the Board approved the payment of our quarterly base dividend of $0.125 per share payable on March 31, 2026 to shareholders of record on March 13, 2026.
Operating Cash Flow
Cash flow from operations in 2025 was $1.5 billion compared with $2.8 billion in 2024 and $4.1 billion in 2023. Cash flow from operations in 2025 benefited from higher profit from continuing operations and lower cash taxes paid than in 2024; however, cash flow from operations in 2024 included cash flows from the steelmaking coal business up to the closing date of the sale on July 11, 2024. Changes in cash flow from operations are also impacted by varying commodity prices, changes in sales volumes of our principal products and, to some extent, changes in foreign exchange rates and changes in working capital items.
Changes in non-cash working capital items resulted in a use of cash of $978 million in 2025 compared with $276 million in 2024. The use of cash in 2025 primarily related to a $957 million increase in our trade receivables balance, largely reflecting higher commodity prices, particularly for copper as a result of the
35
Teck 2025 Management's Discussion and Analysis
sharp increase in prices at the end of the year, and the timing of sales. This compares with 2024 where the use of cash related to a reduction of accounts payable, partly offset by lower trade receivables and inventory levels.
Investing Activities
Expenditures on property, plant and equipment were $1.8 billion in 2025, including $801 million on growth projects, of which $1.0 billion related to sustaining capital, $330 million related to the HVC MLE project, $187 million related to Zafranal, and $127 million related to Red Dog MLE. The largest component of sustaining capital expenditures was $611 million at our QB Operations, primarily for continued TMF development and ongoing construction of the truck shop, $123 million at Antamina and $96 million at HVC.
Capitalized stripping costs decreased to $224 million in 2025 compared with $373 million in 2024, with the reduction reflecting lower capitalized stripping at all of our operations, but primarily at Highland Valley Copper with the completion of waste stripping on the Lornex pit in 2024.
Capital expenditures for 2025 are summarized in the tables on page 46.
Expenditures on investments and other assets in 2025 were $187 million, which included $91 million for marketable securities and our $55 million (US$40 million) investment in Bunker Hill, as part of Trail's margin optimization.
In 2024, we received total cash proceeds of $11.6 billion from the sale of our steelmaking coal business to Glencore and NSC/POSCO.
Proceeds from interest and dividend income were $251 million in 2025, $194 million in 2024 and $97 million in 2023.
Financing Activities
In 2025, debt proceeds totalled $308 million, while debt repayments totalled $733 million. Debt repayments in 2025 primarily included scheduled semi-annual repayments totalling $404 million (US$294 million) on the QB project financing facility.
In 2024, debt proceeds totalled $77 million, while debt repayments totalled $2.5 billion (US$1.8 billion). Debt repayments included the purchase of US$1.4 billion of our public notes through a bond tender offer and open market repurchases, the repayment of US$120 million of short-term loans at Carmen de Andacollo and scheduled semi-annual repayments totalling US$294 million on the QB project financing facility.
In 2025, we purchased US$15 million aggregate principal amount of our outstanding term notes (US$1 million of the 3.9% notes due 2030, US$7 million of the 6.125% notes due 2035, US$4 million of the 6.0%
36
Teck 2025 Management's Discussion and Analysis
notes due 2040, and US$3 million of the 6.25% notes due 2041) via open market repurchases. The total cash cost of the purchases was $22 million (US$15 million), which was funded from cash on hand.
In 2024, we purchased US$1.4 billion aggregate principal amount of our outstanding term notes pursuant to the cash tender offers made on July 4, 2024, and through open market purchases in the third and fourth quarters of 2024. The total principal amount of the notes purchased comprised US$360 million of the 3.9% notes due 2030, US$149 million of the 6.125% notes due 2035, US$279 million of the 6.0% notes due 2040, US$151 million of the 6.25% notes due 2041, US$228 million of the 5.2% notes due 2042 and US$259 million of the 5.4% notes due 2043. The total cash cost of the purchases was $2.0 billion (US$1.4 billion), which was funded from cash on hand.
During 2025, we paid $246 million in respect of our regular base quarterly dividend of $0.125 per share.
In November 2024, we renewed our regulatory approval to conduct a normal course issuer bid, under which we were able to purchase up to 40 million Class B subordinate voting shares during the period from November 22, 2024 to November 21, 2025. In 2025, we purchased approximately 18.8 million Class B shares for cancellation at a cost of $1.0 billion under our normal course issuer bid. As a result of the proposed merger transaction with Anglo American, we have not executed share buybacks since July 25, 2025, as we are restricted from issuing or repurchasing securities under the Merger arrangement agreement, and we did not renew our normal course issuer bid in the fourth quarter of 2025.
37
Teck 2025 Management's Discussion and Analysis
Quarterly Profit (Loss) and Cash Flow
| | | | | | | | | | | | | | | | | | | | | | | | | | |
| ($ in millions except per share data) | 2025 | 2024 |
| Q4 | Q3 | Q2 | Q1 | Q4 | Q3 | Q2 | Q1 |
| Revenue | $ | 3,058 | | $ | 3,385 | | $ | 2,023 | | $ | 2,290 | | $ | 2,786 | | $ | 2,858 | | $ | 1,802 | | $ | 1,619 | |
| Gross profit | $ | 990 | | $ | 660 | | $ | 471 | | $ | 536 | | $ | 542 | | $ | 478 | | $ | 418 | | $ | 169 | |
Profit (loss) attributable to shareholders | $ | 544 | | $ | 281 | | $ | 206 | | $ | 370 | | $ | 399 | | $ | (699) | | $ | 363 | | $ | 343 | |
Basic earnings (loss) per share | $ | 1.11 | | $ | 0.58 | | $ | 0.42 | | $ | 0.74 | | $ | 0.78 | | $ | (1.35) | | $ | 0.70 | | $ | 0.66 | |
Diluted earnings (loss) per share | $ | 1.11 | | $ | 0.57 | | $ | 0.41 | | $ | 0.73 | | $ | 0.78 | | $ | (1.35) | | $ | 0.69 | | $ | 0.65 | |
| Cash flow from operations | $ | 1,259 | | $ | 647 | | $ | 88 | | $ | (515) | | $ | 1,288 | | $ | 134 | | $ | 1,326 | | $ | 42 | |
Gross profit from our copper segment increased to $747 million in the fourth quarter, compared with $299 million in the same period last year. The increase in gross profit was primarily due to significantly higher copper prices and lower smelter processing charges. These items were partially offset by reduced copper sales volumes and higher logistic costs at QB, reflecting the use of alternative shipping arrangements while the shiploader was under repair. Gross profit before depreciation and amortization1 increased to $1.1 billion in the fourth quarter compared with $732 million in the fourth quarter of 2024. The increase was primarily driven by significantly higher copper prices, combined with higher sales volumes from HVC, Antamina, and Carmen de Andacollo.
Copper production increased to 134,200 tonnes in the fourth quarter, an increase of 10% over the same period last year. Excluding QB, copper production increased compared to the same period last year, supported by higher throughput and grades at Highland Valley Copper, higher grades at Antamina and higher throughput at Carmen de Andacollo. QB produced 55,400 tonnes of copper in the fourth quarter compared with 60,700 tonnes in the same period last year as TMF development work continued, as outlined above. QB's production in the fourth quarter improved significantly from the 39,600 tonnes produced in the third quarter of 2025, driven by less TMF-related downtime, a focus on operational stability initiatives and progress towards steady-state operations. As previously disclosed, an extended shutdown for TMF development was taken in September 2025, significantly reducing production at QB in the third quarter of 2025.
Gross profit from our zinc segment of $243 million in the fourth quarter was consistent with the same period last year. Lower zinc sales volumes from Red Dog in the quarter, due to the timing of shipments, were largely offset by higher by-product revenues at both Red Dog and Trail, as well as lower royalty expense at Red Dog. Gross profit before depreciation and amortization1 at Trail improved significantly in the fourth quarter to $106 million from $15 million in the same period last year due to the continued implementation of initiatives to enhance profitability and cash flow, including higher by-product revenue related to silver and germanium.
1 This is a non-GAAP financial measure or ratio. See “Use of Non-GAAP Financial Measures and Ratios” for further information.
38
Teck 2025 Management's Discussion and Analysis
Zinc production at Red Dog in the fourth quarter decreased by 41,100 tonnes from the same period last year to 87,300 tonnes, primarily due to lower grades and recoveries, as expected in the mine plan. Red Dog's lead production of 27,100 tonnes increased by 1,800 tonnes compared to the same period last year due to higher recoveries. Zinc sales volumes from Red Dog of 136,600 tonnes in the fourth quarter were 47,400 tonnes lower than the same period last year, due to the timing of sales, and were at the high end of our previously disclosed guidance range of 125,000 to 140,000 tonnes.
Refined zinc production at Trail Operations in the fourth quarter was 68,100 tonnes, an increase of 6,000 tonnes compared to the same period last year, which was impacted by a localized fire in the electrolytic zinc plant last year.
Our profitability improved in the fourth quarter compared to the same period last year, primarily driven by significantly higher copper prices, increased by-product revenues, lower smelter processing charges and improved profitability from our Trail Operations. These items were partially offset by higher unit operating costs and lower sales volumes from Red Dog due to the timing of shipments, as anticipated. Our profit from continuing operations attributable to shareholders was $544 million in the fourth quarter compared with $385 million in the same period last year.
Our operating cash flows from continuing operations were $1.3 billion in the fourth quarter, consistent with the same period last year. Higher profit from increased commodity prices and lower smelter processing charges, combined with lower cash taxes paid were offset by a reduction in cash inflows from working capital changes compared to the prior year.
During the fourth quarter, changes in working capital items resulted in a source of cash of $201 million compared to a source of cash of $757 million in the same period last year. In the fourth quarter, Red Dog's trade receivables were reduced by approximately $700 million, as anticipated. However, this was largely offset by an increase in trade receivables at our copper operations due to the significant increase in copper prices at year-end as well as the timing of sales. Further, we had a short-term buildup in inventory at QB resulting from weather and sea conditions in December.
Outlook
Sales of our products are denominated in U.S. dollars while a large portion of our expenses and capital expenditures are incurred in local currencies, particularly the Canadian dollar and the Chilean peso. Foreign exchange fluctuations can have a significant effect on our capital costs and operating margins, unless such fluctuations are offset by related changes to commodity prices.
Our U.S. dollar denominated debt is subject to revaluation based on changes in the Canadian/U.S. dollar exchange rate. As at December 31, 2025, approximately $300 million of our U.S. dollar denominated debt is designated as a hedge against our foreign operations that have a U.S. dollar functional currency. As a result,
39
Teck 2025 Management's Discussion and Analysis
any foreign exchange gains or losses arising on that amount of our U.S. dollar debt are recorded in other comprehensive income, with the remainder being charged to profit.
Commodity markets are volatile. Prices can change rapidly and customers can alter shipment plans. This can have a substantial effect on our business and financial results. Continued uncertainty in global markets arising from the macroeconomic outlook and government policy changes, including the imposition of tariffs and the potential for trade disputes, may have a significant positive or negative effect on the prices of the various products we produce, which could affect our business and financial results.
We remain confident in the longer-term outlook for our major commodities; however, ongoing uncertainty related to global economic growth, current geopolitical uncertainty, and the potential impact of monetary policy aimed at curtailing inflation in various jurisdictions may have an impact on demand and prices for our commodities, on our suppliers and employees, and on global financial markets in the future, which could be material.
We continue to closely monitor the situation with regard to imposition of import tariffs by the United States, and reciprocal measures put in place by other countries. As we do not typically sell our copper concentrate into the United States, our copper business is not directly affected; however, the resulting price dislocation between the LME and the CME from the expectation of tariffs has skewed the typical geographical distribution of copper cathode inventory. This increases the likelihood of copper price volatility. We sell refined zinc and lead, and specialty metals such as germanium, indium and sulphur products from Canada into the United States from our Trail Operations in B.C. These products are compliant with the Canada-United States-Mexico Agreement (CUSMA). Where necessary, we have worked proactively with our global customers to reposition zinc and lead concentrate from our Red Dog Operations impacted by Chinese reciprocal tariffs.
Commodity Prices and Sensitivities
Commodity prices are a key driver of our profit and cash flows. On the supply side, the depleting nature of ore reserves, difficulties in finding new orebodies, the permitting processes and the availability of skilled resources to develop projects, as well as infrastructure constraints, political risk and significant cost inflation, may continue to have a moderating effect on the growth in future production for the industry as a whole.
The sensitivity of our annualized profit (loss) from continuing operations attributable to shareholders and adjusted EBITDA1 to changes in the Canadian/U.S. dollar exchange rate and commodity prices, before pricing adjustments, based on our current balance sheet, our 2026 mid-range production estimates, current commodity prices and a Canadian/U.S. dollar exchange rate of $1.40, is as follows. Our U.S. dollar exchange sensitivity excludes foreign exchange gain/losses on our U.S. dollar cash and debt balances, and these amounts are excluded from our profit (loss) attributable to shareholders and adjusted EBITDA1 calculations in the table below.
1 This is a non-GAAP financial measure or ratio. See “Use of Non-GAAP Financial Measures and Ratios” for further information.
40
Teck 2025 Management's Discussion and Analysis
| | | | | | | | | | | | | | |
| 2026 Mid-Range Production Estimates1 | Change | Estimated Effect of Change On Profit Attributable to Shareholders2
($ in millions) | Estimated Effect on Adjusted EBITDA2,4
($ in millions) |
| US$ exchange | | CAD$0.01 | $ | 22 | | $ | 44 | |
| Copper (000’s tonnes) | 492.5 | | US$0.01/lb. | $ | 8 | | $ | 14 | |
Zinc (000’s tonnes)3 | 665.0 | | US$0.01/lb. | $ | 7 | | $ | 9 | |
Notes:
1.Production estimates are subject to change based on market and operating conditions.
2.The effect on our profit (loss) attributable to shareholders and on adjusted EBITDA of commodity price and exchange rate movements will vary from quarter to quarter depending on sales volumes. Our estimate of the sensitivity of profit (loss) attributable to shareholders and adjusted EBITDA to changes in the U.S. dollar exchange rate is sensitive to commodity price assumptions.
3.Zinc includes 210,000 tonnes of refined zinc and 455,000 tonnes of zinc contained in concentrate.
4.This is a non-GAAP financial measure or ratio. See “Use of Non-GAAP Financial Measures and Ratios” for further information.
41
Teck 2025 Management's Discussion and Analysis
Guidance
Our 2025 annual production of copper, zinc in concentrate and refined zinc, and our 2025 copper and zinc net cash unit costs1 were within our previously disclosed guidance ranges.
On January 20, 2026, we reaffirmed our previously disclosed 2026 annual guidance for all Teck-operated sites and updated our 2026 annual zinc in concentrate production guidance for Antamina to 35,000 to 45,000 tonnes, reflecting an updated mine plan finalized in the fourth quarter of 2025.
Our annual guidance ranges below reflect our operating plans which incorporate defining ranges of outcomes for key inputs and value drivers, and assessment and quantification of risks to establish production and cost ranges for each operation, based on proven performance. The guidance ranges include known risks and uncertainties. Events such as extreme weather, unplanned operational shutdowns and other disruptions could impact actual results beyond these estimates. Our unit costs are calculated based on production guidance volumes; variances from estimated production ranges will impact unit costs. Further details on the assumptions embedded in the production guidance ranges are outlined in the Outlook section of the Copper and Zinc Segments, noted above.
Production Guidance
Total copper production in 2026 is expected to increase to between 455,000 and 530,000 tonnes compared to 453,500 tonnes produced in 2025. Our 2026 annual QB production is expected to increase to between 200,000 and 235,000 tonnes. Annual production plans are based on mine plans, which contain normal grade variability. In 2026, quarterly production is generally expected to be consistent quarter over quarter, but we expect slightly lower grades and recoveries at QB in the first half of 2026, based on the current mine plan. In the second half of 2026, grades and recoveries are expected to improve at QB, and we expect lower mill throughput and recovery at HVC in the fourth quarter as we process less Lornex ore and more ore from the Bethlehem and Highmont pits.
Total zinc in concentrate production in 2026 is expected to be between 410,000 and 460,000 tonnes, compared to 565,000 tonnes in 2025. We expect lead production from Red Dog to be between 70,000 and 90,000 tonnes in 2026. We expect Trail Operations to produce between 190,000 and 230,000 tonnes of refined zinc in 2026.
42
Teck 2025 Management's Discussion and Analysis
Production Guidance
The table below shows our share of production of our principal products for 2025, our guidance for production in 2026 and our guidance for production for the following two years.
| | | | | | | | | | | | | | |
Units in thousand tonnes | 2025 | 2026 Guidance | 2027 Guidance | 2028 Guidance |
| Principal Products |
|
| | |
|
|
| | |
Copper1,2 |
|
| | |
| Quebrada Blanca | 190.0 | | 200 – 235 | 240 – 275 | 220 – 255 |
| Highland Valley Copper | 127.1 | | 115 – 135 | 135 – 155 | 100 – 120 |
| Antamina | 85.9 | | 95 – 105 | 85 – 95 | 80 – 90 |
| Carmen de Andacollo | 50.5 | | 45 – 55 | 45 – 55 | 35 – 45 |
| 453.5 | | 455 – 530 | 505 – 580 | 435 – 510 |
Zinc1,2,3 |
|
| | |
| Red Dog | 462.7 | | 375 – 415 | 330 – 370 | 230 – 270 |
| Antamina | 102.3 | | 35 – 45 | 35 – 45 | 45 – 55 |
| 565.0 | | 410 – 460 | 365 – 415 | 275 – 325 |
Refined Zinc |
|
| | |
| Trail Operations | 229.9 | | 190 – 230 | 260 – 300 | 260 – 300 |
|
|
| | |
| Other Products |
|
| | |
Lead1 |
|
| | |
| Red Dog | 107.0 | | 70 – 90 | 60 – 80 | 50 – 65 |
|
|
| | |
Molybdenum1,2 |
|
| | |
| Quebrada Blanca | 1.9 | | 2.8 – 3.4 | 4.7 – 5.6 | 5.3 – 6.3 |
| Highland Valley Copper | 1.4 | | 1.5 – 1.8 | 1.8 – 2.0 | 3.0 – 3.4 |
| Antamina | 0.6 | | 0.7 – 1.0 | 0.9 – 1.2 | 0.4 – 0.6 |
| 3.9 | | 5.0 – 6.2 | 7.4 – 8.8 | 8.7 – 10.3 |
Notes:
1.Metal contained in concentrate.
2.We include 100% of production from our Quebrada Blanca and Carmen de Andacollo mines in our production volumes, even though we do not own 100% of these operations, because we fully consolidate their results in our financial statements. We include 22.5% of production from Antamina, representing our proportionate ownership interest in this operation.
3.Total zinc includes co-product zinc production from our 22.5% proportionate interest in Antamina.
43
Teck 2025 Management's Discussion and Analysis
Sales Guidance
The table below shows our fourth quarter 2025 sales volumes and our sales guidance for the first quarter of 2026 for zinc in concentrate sales at Red Dog.
| | | | | | | | |
| Q4 2025 | Q1 2026 Guidance |
Zinc (thousand tonnes)1 |
|
|
| Red Dog | 137 | | 40 – 50 |
Note:
1.Metal contained in concentrate.
Unit Cost Guidance
The table below reports our unit costs for 2025 and our guidance for unit costs for selected products in 2026.
| | | | | | | | |
| (Per unit costs) | 2025 | 2026 Guidance |
Copper1 |
|
|
Total cash unit costs4 (US$/lb.) | 2.55 | | 2.25 – 2.55 |
Net cash unit costs3,4 (US$/lb.) | 2.03 | | 1.85 – 2.20 |
Zinc2 | | |
Total cash unit costs4 (US$/lb.) | 0.60 | | 0.80 – 0.90 |
Net cash unit costs3,4 (US$/lb.) | 0.33 | | 0.65 – 0.75 |
Notes:
1.Copper unit costs are reported in U.S. dollars per payable pound of metal contained in concentrate. Copper net cash unit costs include adjusted cash cost of sales and smelter processing charges, less cash margins for by-products including co-products. Guidance for 2026 assumes a zinc price of US$1.25 per pound, a molybdenum price of US$20 per pound, a silver price of US$36 per ounce, a gold price of US$3,375 per ounce, a Canadian/U.S. dollar exchange rate of $1.38 and a Chilean peso/U.S. dollar exchange rate of 925.
2.Zinc unit costs are reported in U.S. dollars per payable pound of metal contained in concentrate. Zinc net cash unit costs are mine costs including adjusted cash cost of sales and smelter processing charges, less cash margins for by-products. Guidance for 2026 assumes a lead price of US$0.90 per pound, a silver price of US$36 per ounce and a Canadian/U.S. dollar exchange rate of $1.38. By-products include both by-products and co-products.
3.After co-product and by-product margins.
4.This is a non-GAAP financial measure or ratio. See “Use of Non-GAAP Financial Measures and Ratios” for further information.
44
Teck 2025 Management's Discussion and Analysis
Capital Expenditure Guidance
Our 2026 sustaining capital expenditures in our copper segment are expected to be between $1.2 and $1.3 billion. The 2026 guidance includes $390 to $460 million for QB TMF development work, which is unchanged from our previous disclosures. Our 2026 capitalized stripping costs in our copper segment are expected to increase compared to 2025 to between $450 and $550 million as stripping activities increase to enable the HVC Mine Life Extension where capitalized stripping costs are expected to remain at elevated levels through 2029.
Our 2026 copper growth capital expenditure guidance of between $1.3 and $1.6 billion includes between $900 million and $1.2 billion relating to HVC MLE. The remaining growth capital primarily relates to our other near-term copper growth projects, including Zafranal, and is focused on advancing engineering, feasibility studies and permitting. We also expect to continue to progress our medium- to long-term portfolio options with prudent investments to advance the path to value, including for NewRange, Galore Creek, Schaft Creek and NuevaUnión.
Our 2026 annual sustaining capital expenditures in our zinc segment are expected to be between $150 and $200 million. Capitalized stripping costs in 2026 are expected to decrease to between $5 and $10 million as Red Dog nears the end of mine life.
Our 2026 growth capital expenditure guidance for zinc relates to the Red Dog MLE project as we assess several high-quality opportunities that could extend the mine life of Red Dog beyond 2032. The project is currently in the prefeasibility study stage, and we are progressing the construction of an all-season road to access and drill the deposits, which are critical to the extension of the mine life of Red Dog. In 2026, we expect growth capital expenditures of between $200 and $250 million, focused on completing the all-season road access, continuing drilling of the deposit and advancing the prefeasibility study.
45
Teck 2025 Management's Discussion and Analysis
The table below reports our capital expenditures for 2025 and our guidance for capital expenditure in 2026.
| | | | | | | | | | | |
| (Teck’s share in $ millions) | 2025 | | 2026 Guidance |
| Sustaining |
| |
|
Copper1 | $ | 895 | | $ | 1,150 – 1,300 |
| Zinc | 126 | | | 150 – 200 |
| $ | 1,021 | | $ | 1,300 – 1,500 |
Growth | | | |
HVC MLE | $ | 330 | | $ | 900 – 1,200 |
Copper2 | 338 | | | 370 – 430 |
| Zinc | 133 | | | 200 – 250 |
| $ | 471 | | $ | 1,470 – 1,880 |
| Total | | | |
| Copper | $ | 1,563 | | $ | 2,420 – 2,930 |
| Zinc | 259 | | | 350 – 450 |
| Corporate | 16 | | | 10 – 20 |
Total before partner contributions | $ | 1,838 | | $ | 2,780 – 3,400 |
| Partner contributions to capital expenditures | (250) | | | (300) – (350) |
Total, net of partner contributions | $ | 1,588 | | $ | 2,480 – 3,050 |
Notes:
1.The 2026 copper sustaining guidance includes $390 to $460 million for QB TMF development work, which is unchanged from our previous disclosures.
2.Copper growth capital guidance includes feasibility studies, advancing detailed engineering work, and progressing permitting for San Nicolás and Zafranal and project execution planning for San Nicolás. We also expect to continue to progress our medium- to long-term portfolio options with prudent investments to advance the path to value including for NewRange, Galore Creek, Schaft Creek and NuevaUnión.
Capital Expenditure Guidance — Capitalized Stripping
| | | | | | | | | | | |
| (Teck’s share in CAD$ millions) | 2025 | | 2026 Guidance |
Capitalized Stripping |
| |
|
Copper | $ | 176 | | $ | 450 – 550 |
| Zinc | 48 | | | 5 – 10 |
| $ | 224 | | $ | 455 – 560 |
Risk Factors
Financial risk factors to which Teck is exposed to include, but are not limited to the risk factors listed in Note 32 of Teck’s consolidated financial statements for the years ended December 31, 2025 and 2024 – Financial Instruments and Financial Risk Management. Other risk factors that may affect Teck’s future financial results are disclosed in more detail in Teck’s Annual Information Form available on our website at www.teck.com, under Teck’s profile at www.sedarplus.ca (SEDAR+), and on the EDGAR section of the United States Securities and Exchange Commission (SEC) website at www.sec.gov.
46
Teck 2025 Management's Discussion and Analysis
Other Information
Climate Change and Carbon Pricing
As part of ongoing global efforts to address climate change, regulations to control greenhouse gas emissions are evolving. Regulatory uncertainty and resulting uncertainty regarding the costs of technology required to comply with current or anticipated regulations make it difficult to predict the ultimate costs of compliance.
Our operations in British Columbia are subject to an Output-Based Pricing System (OBPS), which places a price on GHG emissions. Under the OBPS, industrial facilities whose emissions exceed their permitted amounts will have a compliance obligation. OBPS compliance obligations will be met through payments or the use of offsets or credits.
We may in the future face similar emissions regulation or taxation for our activities in other jurisdictions. Similarly, customers of some of our products may also be subject to new emissions costs or taxation in the future in the jurisdictions where the products are ultimately used.
We are taking action to reduce greenhouse gas emissions by improving our energy efficiency and implementing low-carbon technologies at our operations where feasible. We have established a set of actions that progress our decarbonization goals and ambitions. Our objective is to deliver significant and cost-competitive emissions reductions. We routinely evaluate existing and emerging abatement opportunities as the pace of low-carbon technology maturation continues to accelerate, and as options that were not feasible a few years ago approach commercialization. The cost of progressively reducing our Scope 1 and Scope 2 emissions in accordance with our publicly stated carbon reduction targets through carbon reduction activities or by acquiring the equivalent amount of future credits (to the extent permitted by regulation) is a function of several evolving factors, including technology development and the pace of commercialization, the regulatory environment for subsidies and incentives, and the markets for carbon credits and offsets.
Financial Instruments and Derivatives
We hold a number of financial instruments, derivatives and contracts containing embedded derivatives, which are recorded on our consolidated balance sheet at fair value with gains and losses in each period included in other comprehensive income in the year and profit for the period, as appropriate. The most significant of these instruments are investments in marketable securities and metal-related forward contracts, including those embedded in our silver and gold streaming arrangements, QB variable consideration to IMSA and Codelco and settlement receivables. All are subject to varying rates of taxation, depending on their nature and jurisdiction. Further information about our financial instruments, derivatives and contracts containing embedded derivatives and associated risks is outlined in Note 32 in our 2025 audited annual consolidated financial statements.
47
Teck 2025 Management's Discussion and Analysis
Areas of Judgment and Estimation Uncertainty
In preparing our consolidated financial statements, we make judgments in applying our accounting policies. The judgments that have the most significant effect on the amounts recognized in our consolidated financial statements are outlined below.
In addition, we make assumptions about the future in deriving estimates used in preparing our consolidated financial statements. We have outlined information below about assumptions and other sources of estimation uncertainty as at December 31, 2025 that have a risk of resulting in a material adjustment to the carrying amounts of assets and liabilities within the next year.
a) Areas of Judgment
Assessment of Impairment and Impairment Reversal Indicators
Judgment is required in assessing whether certain factors would be considered an indicator of impairment or impairment reversal. We consider both internal and external information to determine whether there is an indicator of impairment or impairment reversal present and, accordingly, whether impairment testing is required. The information we consider in assessing whether there is an indicator of impairment or impairment reversal includes, but is not limited to, market transactions for similar assets, commodity prices, treatment charges, zinc premiums, discount rates, foreign exchange rates, our market capitalization, reserves and resources, operating results, mine plans and operating plans.
In the third quarter of 2025, as a result of continuing challenges with the pace of development of the TMF resulting in near-term production constraints and higher TMF-related capital expenditures, we performed an impairment test for our Quebrada Blanca cash-generating unit (Quebrada Blanca CGU).
In the third quarter of 2024, as a result of the challenging environment for treatment charges due to a global shortage of zinc concentrate, continued operating losses, combined with a fire in the electrolytic zinc plant affecting expected operations in the fourth quarter of 2024, we identified impairment indicators at our Trail Operations cash-generating unit (Trail CGU) and consequently performed an impairment test.
Property, Plant and Equipment — Determination of Available for Use Date
Judgment is required in determining the date that property, plant and equipment is available for use. An asset is available for use when it is in the location and condition necessary to operate in the manner intended by management.
We consider several factors when assessing the timing of when assets become available for use, the most significant of which are the status of asset commissioning and whether the assets are capable of operating near design capacity to ensure a reliable and consistent throughput rate to produce the expected quantity of outputs.
48
Teck 2025 Management's Discussion and Analysis
QB consists of property, plant and equipment that became available for use at different dates, with the majority of its assets becoming available for use in December of 2023. In May of 2024, the shiploader and related infrastructure at QB became available for use. In August of 2025, the molybdenum plant at QB became available for use.
In June of 2024, the KIVCET boiler at our Trail Operations became available for use.
Joint Arrangements
We are a party to a number of arrangements over which we do not have control. Judgment is required in determining whether joint control over these arrangements exists and, if so, which parties have joint control and whether each arrangement is a joint venture or a joint operation. In assessing whether we have joint control, we analyze the activities of each arrangement and determine which activities most significantly affect the returns of the arrangement over its life. These activities are determined to be the relevant activities of the arrangement. If unanimous consent is required over the decisions about the relevant activities, the parties whose consent is required would have joint control over the arrangement. The judgments around which activities are considered the relevant activities of the arrangement are subject to analysis by each of the parties to the arrangement and may be interpreted differently. When performing this assessment, we generally consider decisions about activities such as managing the asset while it is being designed, developed and constructed, during its operating life and during the closure period. We may also consider other activities, including the approval of budgets, expansion and disposition of assets, financing, significant operating and capital expenditures, appointment of key management personnel, representation on the board of directors and other items. When circumstances or contractual terms change, we reassess the control group and the relevant activities of the arrangement.
If we have joint control over the arrangement, an assessment of whether the arrangement is a joint venture or a joint operation is required. This assessment is based on whether we have rights to the assets, and obligations for the liabilities, relating to the arrangement or whether we have rights to the net assets of the arrangement. In making this determination, we review the legal form of the arrangement, the terms of the contractual arrangement and other facts and circumstances. In a situation where the legal form and the terms of the contractual arrangement do not give us rights to the assets and obligations for the liabilities, an assessment of other facts and circumstances is required, including whether the activities of the arrangement are primarily designed for the provision of output to the parties and whether the parties are substantially the only source of cash flows contributing to the arrangement. The consideration of other facts and circumstances may result in the conclusion that a joint arrangement is a joint operation. This conclusion requires judgment and is specific to each arrangement. Other facts and circumstances have led us to conclude that Antamina, NewRange and San Nicolás are joint operations for the purposes of our consolidated financial statements. The other facts and circumstances considered for these arrangements include the provision of output to the parties of the joint arrangements and the funding obligations. For Antamina, NewRange and San Nicolás, we take our share of the output from the assets directly over the life of the arrangement. We have concluded that this gives us direct rights to the assets and obligations for the liabilities of these arrangements proportionate to our ownership interests.
49
Teck 2025 Management's Discussion and Analysis
Streaming Transactions
When we enter into a long-term streaming arrangement linked to production at specific operations, judgment is required in assessing the appropriate accounting treatment for the transaction on the closing date and in future periods. We consider the specific terms of each arrangement to determine whether we have disposed of an interest in the reserves and resources of the respective operation or executed some other form of arrangement. This assessment considers what the counterparty is entitled to and the associated risks and rewards attributable to them over the life of the operation. These include the contractual terms related to the total production over the life of the arrangement as compared to the expected production over the life of the mine, the percentage being sold, the percentage of payable metals produced, the commodity price referred to in the ongoing payment and any guarantee relating to the upfront payment if production ceases.
For our silver and gold streaming arrangements at Antamina and Carmen de Andacollo, respectively, there is no guarantee associated with the upfront payment. We have concluded that control of the rights to the silver and gold mineral interests were transferred to the buyers when the contracts came into effect. Therefore, we consider these arrangements a disposition of a mineral interest.
Based on our judgment, control of the interest in the reserves and resources transferred to the buyer when the contracts were executed. At that time, we recognized the amount of the gain related to the disposition of the reserves and resources, as we had the right to payment, the customer was entitled to the commodities, the buyer had no recourse in requiring Teck to mine the product, and the buyer had significant risks and rewards of ownership of the reserves and resources.
We recognize the amount of consideration related to refining, mining and delivery services as the work is performed.
Deferred Tax Assets and Liabilities
Judgment is required in assessing whether deferred tax assets and certain deferred tax liabilities are recognized on the balance sheet and what tax rate is expected to be applied in the year when the related temporary differences reverse. We also evaluate the recoverability of deferred tax assets based on an assessment of our ability to use the underlying future tax deductions before they expire against future taxable profits or capital gains. Deferred tax liabilities arising from temporary differences on investments in subsidiaries, joint ventures and associates are recognized unless the reversal of the temporary differences is not expected to occur in the foreseeable future and can be controlled. Judgment is also required on the application of income tax legislation. These judgments are subject to risk and uncertainty and could result in an adjustment to the deferred tax provision.
50
Teck 2025 Management's Discussion and Analysis
b) Sources of Estimation Uncertainty
Impairment Testing
For required impairment testing, discounted cash flow models are used to determine the recoverable amount of respective CGUs. These models are prepared internally or with assistance from third-party advisors when required. When relevant market transactions for comparable assets are available, these are considered in determining the recoverable amount of assets.
Significant assumptions used in preparing the discounted cash flow model for our Quebrada Blanca CGU’s September 2025 impairment test and October 2025 goodwill impairment test include long-term copper price, discount rate, our assumptions about throughput optimization and asset expansion, recovery rates, operating costs and capital expenditures estimates, reserves and resources, mine production rates and the fair value per pound of copper equivalent used in the determination of the in situ value.
Significant assumptions used in preparing the discounted cash flow model for our Trail CGU impairment test in 2024 include the long-term zinc price, long-term zinc treatment charges, long-term zinc premiums, U.S. dollar to Canadian dollar foreign exchange rates, zinc production rates, operating costs, capital costs and discount rate.
Our financial statements outline the significant inputs used when performing goodwill and other asset impairment testing. These inputs are based on management’s best estimates of what an independent market participant would consider appropriate. Changes in these inputs may alter the results of impairment testing, the amount of the impairment charges or reversals recorded in the consolidated statements of income (loss) and the resulting carrying values of assets.
Impairment Testing – Quebrada Blanca CGU - 2025
In the third quarter of 2025, as a result of continuing challenges with the pace of development of the TMF resulting in near-term production constraints and higher TMF-related capital expenditures, we performed an impairment test for our Quebrada Blanca CGU. Consistent with the methodology used to perform our annual goodwill impairment testing, we used a discounted cash flow model to calculate the FVLCD for our Quebrada Blanca CGU. Cash flow projections used in the analysis as at September 30, 2025 cover the current expected mine life of Quebrada Blanca and a projected asset expansion, totalling 44 years, with an estimate of in situ value applied to the remaining resources. The recoverable amount incorporated inputs from the study in progress for the Quebrada Blanca asset expansion, which includes the current expected technical performance of the deposit, along with estimated operating costs and capital expenditures for the life of the operation.
The determination of the FVLCD utilized the following significant assumptions: long-term copper price, discount rate, our assumptions about throughput optimization and asset expansion, recovery rates, operating costs and capital expenditures estimates, reserves and resources, mine production rates and the fair value per pound of copper equivalent used in the determination of the in situ value. The fair value measurement was categorized as a Level 3 measurement based on the inputs used in the discounted cash flow model.
51
Teck 2025 Management's Discussion and Analysis
As at September 30, 2025, the recoverable amount of our Quebrada Blanca CGU was greater than its carrying value by approximately US$900 million.
Annual Goodwill Impairment Testing – Quebrada Blanca CGU - 2025
Our Quebrada Blanca CGU has goodwill allocated to it. We performed our annual goodwill impairment testing at October 31, 2025, calculating the recoverable amount on a FVLCD basis and did not identify any goodwill impairment losses. The significant assumptions used and judgments made for the October 31, 2025 annual goodwill impairment test were consistent with that used for the September 2025 impairment testing, as no material changes to the significant assumptions used and judgments made were identified during the time interval. The sensitivity analysis performed for the September 2025 impairment testing remains applicable for the October 2025 goodwill impairment testing.
Impairment Testing – Trail CGU – 2024
In the third quarter of 2024, as a result of the challenging environment for treatment charges due to a global shortage of zinc concentrate, continued operating losses, combined with a fire in the electrolytic zinc plant affecting expected operations in the fourth quarter of 2024, we identified impairment indicators at our Trail CGU and consequently performed an impairment test. Using a discounted cash flow model to estimate the FVLCD, the estimated post-tax recoverable amount of the Trail CGU of $666 million was lower than our carrying value. As a result, we recorded a non-cash, pre-tax asset impairment for our Trail CGU of $1.1 billion (after-tax $828 million). The impairment affected the profit (loss) of our zinc reportable segment and our corporate activities.
Key assumptions used in the analysis included the long-term zinc price, long-term zinc treatment charges, long-term zinc premiums, U.S. dollar to Canadian dollar foreign exchange rates, zinc production rates, operating costs, capital costs and discount rate. The discount rate used was 5.5%. The FVLCD estimates are classified as a Level 3 measurement within the fair value measurement hierarchy.
Estimated Recoverable Reserves and Resources
Mineral reserve and resource estimates are based on various assumptions relating to operating matters as set forth in National Instrument 43-101, Standards of Disclosure for Mineral Projects. Assumptions used include production costs, mining and processing recoveries, cut-off grades, sales volumes, long-term commodity prices, exchange rates, inflation rates, tax and royalty rates and capital costs. Cost estimates are based on prefeasibility or feasibility study estimates or operating history. Estimates are prepared by or under the supervision of appropriately qualified persons, but will be affected by forecasted commodity prices, inflation rates, exchange rates, capital and production costs and recoveries, among other factors. Estimated recoverable reserves and resources are used in performing impairment testing, to determine the depreciation of property, plant and equipment at operating mine sites, in accounting for capitalized production stripping costs and also in forecasting the timing of settlement of decommissioning and restoration costs. Changes in
52
Teck 2025 Management's Discussion and Analysis
reserve and resource estimates are most significant to estimating the recoverable amount in impairment tests.
Decommissioning and Restoration Provisions
Decommissioning and restoration provisions (DRPs) are based on future cost estimates, using information available at the balance sheet date, that are developed by management’s experts. DRPs represent the present value of estimated costs of future decommissioning and other site restoration activities, including costs associated with the management of water and water quality in and around each closed site. DRPs are adjusted at each reporting period for changes to factors such as the expected amount of cash flows required to discharge the liability, the timing of such cash flows and the credit-adjusted discount rate. DRPs require significant estimates and assumptions, including the requirements of the relevant legal and regulatory framework and the timing, extent and costs of required decommissioning and restoration activities. Our estimates of the costs associated with the management of water and water quality in and around each closed site include assumptions with respect to the volume and location of water to be treated, the methods used to treat the water and the related water treatment costs. Changes in the estimated life of mine can affect the timing of decommissioning activities and the related cost estimates. This may result in future actual expenditures differing materially from the amounts currently recorded as part of provisions in the consolidated balance sheets. To the extent the actual costs differ from these estimates, adjustments will be recorded, and the consolidated statements of income (loss) may be affected.
Financial Liabilities
We have a financial liability for the preferential dividend stream from QBSA to Codelco. This financial liability is significantly affected by copper prices, the interest rate on the subordinated loans provided by us and Sumitomo Metal Mining Co., Ltd. and Sumitomo Corporation (together referred to as SMM/SC) to QBSA, operating cost estimates and capital expenditure estimates, which all affect the timing of when QBSA repays the loans. A floating interest rate is used based on the Secured Overnight Financing Rate (Term SOFR) plus an applicable margin. To the extent these significant inputs differ from our estimates, adjustments will be recorded and the consolidated statements of income (loss) will be affected.
Provision for Income Taxes
We calculate current and deferred tax provisions for each of the jurisdictions in which we operate. Actual amounts of income tax expense are not final until tax returns are filed and accepted by the relevant authorities. This occurs subsequent to the issuance of our consolidated financial statements and the final determination of actual amounts may not be completed for a number of years. Therefore, profit (loss) in subsequent periods will be affected by the amount that estimates differ from the final tax assessment.
Deferred Tax Assets and Liabilities
53
Teck 2025 Management's Discussion and Analysis
Assumptions about the generation of future taxable profits and repatriation of retained earnings depend on management’s estimates of future production and sales volumes, commodity prices, reserves and resources, operating costs, decommissioning and restoration costs, capital expenditures, dividends and other capital management transactions. These estimates could result in an adjustment to the deferred tax provision and a corresponding adjustment to profit (loss).
54
Teck 2025 Management's Discussion and Analysis
Adoption of New Accounting Standards and Amendments
New IFRS Accounting Standards and Amendments
Amendments to IFRS 9 and IFRS 7 – Contracts Referencing Nature-dependent Electricity
In December 2024, the IASB issued Contracts Referencing Nature-dependent Electricity – Amendments to IFRS 9 and IFRS 7. These amendments aimed to ensure that nature-dependent electricity contracts, where contractual features can expose a company to variability in the underlying amount of electricity because the source of electricity generation depends on uncontrollable natural conditions, are appropriately reflected in the financial statements. The amendments include clarifying the application of the “own use” requirements to these contracts in assessing whether derivative accounting is required, permitting hedge accounting if these contracts are used as hedging instruments and requiring new disclosures that discuss the effect of these contracts on a company’s financial performance and cash flows.
The amendments are effective for annual periods beginning on or after January 1, 2026, with early application permitted. The clarifications regarding the “own use” requirements are applied retrospectively, but the guidance permitting hedge accounting is applied prospectively to new hedging relationships designated on or after the date of initial application. We do not expect these amendments to have a material effect on our financial statements.
Amendments to IFRS 9 and IFRS 7 – Amendments to the Classification and Measurement of Financial Instruments
In May 2024, the IASB issued Amendments to the Classification and Measurement of Financial Instruments – Amendments to IFRS 9 and IFRS 7. These amendments updated classification and measurement requirements in IFRS 9 Financial Instruments and related disclosure requirements in IFRS 7 Financial Instruments: Disclosures. The IASB clarified the recognition and derecognition date of certain financial assets and liabilities, and amended the requirements related to settling financial liabilities using an electronic payment system. It also clarified how to assess the contractual cash flow characteristics of financial assets in determining whether they meet the solely payments of principal and interest criterion, including financial assets that have environmental, social and corporate governance (ESG)-linked features and other similar contingent features. The IASB added disclosure requirements for financial instruments with contingent features that do not relate directly to basic lending risks and costs, and amended disclosures relating to equity instruments designated at fair value through other comprehensive income.
The amendments are effective for annual periods beginning on or after January 1, 2026, with early application permitted. For financial liabilities settled in cash using an electronic payment system, we expect to apply the election to deem these financial liabilities to be discharged before the settlement date. For equity instruments designated at fair value through other comprehensive income, we will separately present the fair value gain or loss on investments derecognized during the period and on investments held at the end of the
55
Teck 2025 Management's Discussion and Analysis
period in the statement of comprehensive income (loss). We are continuing to assess the impact of these amendments on our consolidated financial statements.
IFRS 18 – Presentation and Disclosure in Financial Statements
In April 2024, the IASB issued IFRS 18, Presentation and Disclosure in Financial Statements (IFRS 18), which replaces IAS 1, Presentation of Financial Statements. IFRS 18 introduces a specified structure for the income statement by requiring income and expenses to be presented into the three main categories of operating, investing and financing, and by specifying certain defined totals and subtotals. An entity may use certain subtotals of income and expenses in public communications outside the financial statements to communicate management’s view of an aspect of the financial performance of the entity as a whole to users, and these subtotals are not specifically required by IFRS Accounting Standards. IFRS 18 requires companies to disclose explanations around these measures, which are referred to as management-defined performance measures (MPMs). IFRS 18 also provides additional guidance on principles of aggregation and disaggregation that apply to the primary financial statements and the notes. IFRS 18 will not affect the recognition and measurement of items in the financial statements, nor will it affect which items are classified in other comprehensive income (loss) and how these items are classified. The standard is effective for reporting periods beginning on or after January 1, 2027 including for interim financial statements. Retrospective application is required and early application is permitted.
We are currently assessing and quantifying the effect of this standard on our financial statements. The standard is expected to result in changes to the presentation of our consolidated statements of income, by requiring all income and expenses to be classified into the three main categories of operating, investing and financing. Specifically, we anticipate changes to the presentation of certain income and expense items, for example, that foreign exchange gains and losses will be classified in the same category as the items that gave rise to the exchange difference, rather than being combined into one line. The cash flow statement will begin with the new IFRS 18-specified subtotal of operating profit. We will also have enhanced note disclosures on any identified MPMs, such as adjusted EBITDA. We expect to apply IFRS 18 on its effective date with full retrospective application, including restated comparative information.
Outstanding Share Data
As at February 18, 2026, there were approximately 481.5 million Class B subordinate voting shares and 7.6 million Class A common shares outstanding. In addition, there were approximately 4.4 million share options outstanding with exercise prices ranging between $5.34 and $70.34 per share. More information on these instruments, and the terms of their conversion, is set out in Note 27 in our 2025 audited annual consolidated financial statements.
56
Teck 2025 Management's Discussion and Analysis
Contractual and Other Obligations
| | | | | | | | | | | | | | | | | |
($ in millions) | Less than 1 Year | 2–3
Years | 4–5 Years | More than 5 Years | Total |
Debt - Principal and interest payments | $ | 614 | | $ | 1,132 | | $ | 1,513 | | $ | 2,090 | | $ | 5,349 | |
Leases - Principal and interest payments1 | 220 | | 262 | | 140 | | 961 | | 1,583 | |
Codelco preferential dividend liability | — | | — | | — | | 559 | | 559 | |
QB advances from SMM/SC and estimated interest payments | 360 | | 691 | | 676 | | 5,586 | | 7,313 | |
QB variable consideration to IMSA | 62 | | — | | — | | — | | 62 | |
Minimum purchase obligations2 | | | | | |
| Concentrate, equipment, supply and other purchases | 1,300 | | 1,152 | | 87 | | 84 | | 2,623 | |
| Shipping and distribution | 49 | | 56 | | 47 | | 105 | | 257 | |
| Energy contracts | 550 | | 1,042 | | 1,078 | | 5,278 | | 7,948 | |
NAB PILT and VIF payments7 | 51 | | 103 | | 103 | | 51 | | 308 | |
Pension funding3 | 5 | | — | | — | | — | | 5 | |
Other non-pension post-retirement benefits4 | 12 | | 25 | | 28 | | 227 | | 292 | |
Decommissioning and restoration provisions5 | 199 | | 254 | | 221 | | 1,601 | | 2,275 | |
Other long-term liabilities6 | 46 | | 205 | | 24 | | 36 | | 311 | |
| Downstream pipeline take-or-pay toll commitment | 33 | | 69 | | 74 | | 198 | | 374 | |
| $ | 3,501 | | $ | 4,991 | | $ | 3,991 | | $ | 16,776 | | $ | 29,259 | |
Notes:
1.We lease road and port facilities from the Alaska Industrial Development and Export Authority, through which it ships metal concentrates produced at the Red Dog mine. Minimum lease payments are US$6 million for the following 14 years and are subject to deferral and abatement for force majeure events.
2.The majority of our minimum purchase obligations are subject to continuing operations and force majeure provisions.
3.As at December 31, 2025, the company had a net pension asset of $257 million, based on actuarial estimates prepared on a going concern basis. The amount of minimum funding for 2026 in respect of defined benefit pension plans is $5 million. The timing and amount of additional funding after 2025 is dependent upon future returns on plan assets, discount rates and other actuarial assumptions.
4.We had a discounted, actuarially determined liability of $292 million in respect of other non-pension post-retirement benefits as at December 31, 2025. Amounts shown are estimated expenditures in the indicated years.
5.We accrue decommissioning and restoration obligations over the life of our mining operations, and amounts shown are estimated expenditures in the indicated years at present value, assuming credit-adjusted risk-free discount rates between 6.14% and 7.09% and an inflation factor of 2.00%.
6.Other long-term liabilities include amounts for other environmental obligations costs and other liabilities.
7.On January 27, 2026, Teck Alaska entered into a six‑year agreement with the Northwest Arctic Borough (NAB) for payments in lieu of taxes (PILT), replacing the prior agreement that expired on December 31, 2025. Payments under the agreement are based on a percentage of land, buildings and equipment at cost less accumulated depreciation. The effective date of this agreement was January 1, 2026 and the agreement expires on December 31, 2031, subject to one‑year extensions by mutual agreement. On January 27, 2026, Teck Alaska also entered into a six‑year agreement with the NAB for payments to a village improvement fund (VIF), replacing the prior agreement that expired on December 31, 2025. Payments under the agreement are based on a percentage of earnings before income taxes, subject to annual minimum and maximum payment amounts. The effective date of this agreement was January 1, 2026 and the agreement expires on December 31, 2031, subject to one‑year extensions by mutual agreement.
57
Teck 2025 Management's Discussion and Analysis
Disclosure Controls and Internal Control Over Financial Reporting
Disclosure Controls and Procedures
Disclosure controls and procedures are designed to provide reasonable assurance that information required to be disclosed in reports filed or submitted by us under U.S. and Canadian securities legislation is recorded, processed, summarized and reported within the time periods specified in those rules, and include controls and procedures designed to ensure that information required to be disclosed in reports filed or submitted by us under U.S. and Canadian securities legislation is accumulated and communicated to management, including the Chief Executive Officer and Chief Financial Officer, as appropriate, to permit timely decisions regarding required disclosure. Management, including the Chief Executive Officer and Chief Financial Officer, has evaluated the effectiveness of the design and operation of our disclosure controls and procedures, as defined in the rules of the U.S. Securities and Exchange Commission and the Canadian Securities Administrators, as at December 31, 2025. Based on this evaluation, the Chief Executive Officer and Chief Financial Officer have concluded that our disclosure controls and procedures were effective as at December 31, 2025.
Management’s Report on Internal Control Over Financial Reporting
Our management is responsible for establishing and maintaining adequate internal control over financial reporting. Any system of internal control over financial reporting, no matter how well-designed, has inherent limitations. Therefore, even those systems determined to be effective can provide only reasonable assurance with respect to financial statement preparation and presentation. There have been no significant changes in our internal controls during the year ended December 31, 2025 that have materially affected, or are reasonably likely to materially affect, internal control over financial reporting.
Management has used the Committee of Sponsoring Organizations of the Treadway Commission (COSO) 2013 framework to evaluate the effectiveness of our internal control over financial reporting. Based on this assessment, management has concluded that as at December 31, 2025, our internal control over financial reporting was effective.
The effectiveness of our internal controls over financial reporting as at December 31, 2025, has been audited by PricewaterhouseCoopers LLP, an independent registered public accounting firm, who have expressed their opinion in their report included with our annual consolidated financial statements.
58
Teck 2025 Management's Discussion and Analysis
Use of Non-GAAP Financial Measures and Ratios
Our financial statements are prepared in accordance with IFRS® Accounting Standards as issued by the International Accounting Standards Board (IASB). This document refers to a number of non-GAAP financial measures and non-GAAP ratios which are not measures recognized under IFRS Accounting Standards and do not have a standardized meaning prescribed by IFRS Accounting Standards or by Generally Accepted Accounting Principles (GAAP) in the United States.
The non-GAAP financial measures and non-GAAP ratios described below do not have standardized meanings under IFRS Accounting Standards, may differ from those used by other issuers, and may not be comparable to similar financial measures and ratios reported by other issuers. These financial measures and ratios have been derived from our financial statements and applied on a consistent basis as appropriate. We disclose these financial measures and ratios because we believe they assist readers in understanding the results of our operations and financial position and provide further information about our financial results to investors. These measures should not be considered in isolation or used as a substitute for other measures of performance prepared in accordance with IFRS Accounting Standards.
Adjusted profit from continuing operations attributable to shareholders: For adjusted profit from continuing operations attributable to shareholders, we adjust profit from continuing operations attributable to shareholders as reported to remove the after-tax effect of certain types of transactions that reflect measurement changes on our balance sheet or are not indicative of our normal operating activities.
EBITDA: EBITDA is profit before net finance expense, provision for income taxes, and depreciation and amortization.
Adjusted EBITDA: Adjusted EBITDA is EBITDA before the pre-tax effect of the adjustments that we make to adjusted profit from continuing operations attributable to shareholders as described above.
Adjusted profit from continuing operations attributable to shareholders, EBITDA and Adjusted EBITDA highlight items and allow us and readers to analyze the rest of our results more clearly. We believe that disclosing these measures assists readers in understanding the ongoing cash-generating potential of our business in order to provide liquidity to fund working capital needs, service outstanding debt, fund future capital expenditures and investment opportunities, and pay dividends.
Gross profit before depreciation and amortization: Gross profit before depreciation and amortization is gross profit with depreciation and amortization expense added back. We believe this measure assists us and readers to assess our ability to generate cash flow from our reportable segments or overall operations.
Gross profit margins before depreciation and amortization: Gross profit margins before depreciation and amortization are gross profit before depreciation and amortization, divided by revenue for each respective
59
Teck 2025 Management's Discussion and Analysis
reportable segment. We believe this measure assists us and readers to compare margins on a percentage basis among our reportable segments.
Total cash unit costs: Total cash unit costs for our copper and zinc operations includes adjusted cash costs of sales, as described below, plus the smelter and refining charges added back in determining adjusted revenue. This presentation allows a comparison of total cash unit costs, including smelter charges, to the underlying price of copper or zinc in order to assess the margin for the mine on a per unit basis.
Net cash unit costs: Net cash unit costs of principal product, after deducting co-product and by-product margins, are also a common industry measure. By deducting the co- and by-product margin per unit of the principal product, the margin for the mine on a per unit basis may be presented in a single metric for comparison to other operations.
Adjusted cash cost of sales: Adjusted cash cost of sales for our copper and zinc operations is defined as the cost of the product delivered to the port of shipment, excluding depreciation and amortization charges, any one-time collective agreement charges or inventory write-down provisions and by-product cost of sales. It is common practice in the industry to exclude depreciation and amortization, as these costs are non-cash, and discounted cash flow valuation models used in the industry substitute expectations of future capital spending for these amounts.
Cash margins for by-products: Cash margins for by-products is revenue from by- and co-products, less any associated cost of sales of the by- and co-products. In addition, for our copper operations, by-product cost of sales also includes cost recoveries associated with our streaming transactions.
Adjusted revenue: Adjusted revenue for our copper and zinc operations excludes the revenue from co-products and by-products, but adds back the processing and refining charges to arrive at the value of the underlying payable pounds of copper and zinc. Readers may compare this on a per unit basis with the price of copper and zinc on the LME.
The debt-related measures outlined below are disclosed as we believe they provide readers with information that allows them to assess our credit capacity and the ability to meet our short- and long-term financial obligations.
Total debt: Total debt is the sum of debt plus lease liabilities, including the current portions of debt and lease liabilities.
Net debt (cash): Net debt (cash) is total debt, less cash and cash equivalents. Net cash is the amount by which our cash balance exceeds our total debt balance.
Net debt to net debt-plus-equity ratio: Net debt to net debt-plus-equity ratio is net debt divided by the sum of net debt plus total equity, expressed as a percentage.
60
Teck 2025 Management's Discussion and Analysis
Net debt to adjusted EBITDA ratio: Net debt to adjusted EBITDA ratio is net debt divided by adjusted EBITDA for the 12 months ended at the reporting period, expressed as the number of times adjusted EBITDA needs to be earned to repay the net debt.
Adjusted net debt to capitalization ratio: Adjusted net debt to capitalization ratio is net debt plus other financial obligations divided by the sum of total debt, equity attributable to shareholders of the company and other financial obligations.
Adjusted basic earnings per share from continuing operations: Adjusted basic earnings per share from continuing operations is adjusted profit from continuing operations attributable to shareholders divided by average number of shares outstanding in the period.
Adjusted diluted earnings per share from continuing operations: Adjusted diluted earnings per share from continuing operations is adjusted profit from continuing operations attributable to shareholders divided by average number of fully diluted shares in a period.
Total cash unit costs per pound: Total cash unit costs per pound is a non-GAAP ratio comprised of adjusted cash cost of sales divided by payable pounds sold plus smelter processing charges divided by payable pounds sold.
Net cash unit costs per pound: Net cash unit costs per pound is a non-GAAP ratio comprised of (adjusted cash cost of sales plus smelter processing charges less cash margin for by-products) divided by payable pounds sold. There is no similar financial measure in our consolidated financial statements with which to compare. Adjusted cash cost of sales is a non-GAAP financial measure.
Cash margins for by-products per pound: Cash margins for by-products per pound is a non-GAAP ratio comprised of cash margins for by-products divided by payable pounds sold.
61
Teck 2025 Management's Discussion and Analysis
Profit (Loss) from Continuing Operations Attributable to Shareholders and Adjusted Profit from Continuing Operations Attributable to Shareholders
| | | | | | | | | | | |
| ($ in millions, except per share data) | 2025 | 2024 | 2023 |
| Profit (loss) from continuing operations attributable to shareholders | $ | 1,401 | | $ | (467) | | $ | (118) | |
| | | |
| Add (deduct) on an after-tax basis: | | | |
| Asset impairment | — | | 828 | | — | |
QB variable consideration to IMSA and Codelco | (86) | | 32 | | 95 | |
Environmental costs | 172 | | 3 | | 88 | |
Share-based compensation | 52 | | 72 | | 63 | |
Commodity derivatives | (105) | | (65) | | 9 | |
| Foreign exchange (gains) losses | 37 | | (137) | | (8) | |
Tax items | (82) | | 178 | | 69 | |
| Other | 144 | | 161 | | 91 | |
| Adjusted profit from continuing operations attributable to shareholders | $ | 1,533 | | $ | 605 | | $ | 289 | |
| Basic earnings (loss) per share from continuing operations | $ | 2.84 | | $ | (0.90) | | $ | (0.23) | |
| Diluted earnings (loss) per share from continuing operations | $ | 2.83 | | $ | (0.90) | | $ | (0.23) | |
| Adjusted basic earnings per share from continuing operations | $ | 3.10 | | $ | 1.17 | | $ | 0.56 | |
| Adjusted diluted earnings per share from continuing operations | $ | 3.09 | | $ | 1.16 | | $ | 0.55 | |
62
Teck 2025 Management's Discussion and Analysis
Reconciliation of Basic Earnings (Loss) per share from Continuing Operations to Adjusted Basic Earnings per share from Continuing Operations
| | | | | | | | | | | |
(Per share amounts) | 2025 | 2024 | 2023 |
| Basic earnings (loss) per share from continuing operations | $ | 2.84 | | $ | (0.90) | | $ | (0.23) | |
Add (deduct): | | | |
| Asset impairment | — | | 1.60 | | — | |
QB variable consideration to IMSA and Codelco | (0.17) | | 0.06 | | 0.18 | |
Environmental costs | 0.35 | | 0.01 | | 0.17 | |
Share-based compensation | 0.11 | | 0.14 | | 0.12 | |
Commodity derivatives | (0.21) | | (0.13) | | 0.02 | |
| Foreign exchange (gains) losses | 0.07 | | (0.27) | | (0.01) | |
Tax items | (0.16) | | 0.34 | | 0.13 | |
| Other | 0.27 | | 0.32 | | 0.18 | |
| Adjusted basic earnings per share from continuing operations | $ | 3.10 | | $ | 1.17 | | $ | 0.56 | |
Reconciliation of Diluted Earnings (Loss) per share from Continuing Operations to Adjusted Diluted Earnings per share from Continuing Operations
| | | | | | | | | | | |
| (Per share amounts) | 2025 | 2024 | 2023 |
| Diluted earnings (loss) per share from continuing operations | $ | 2.83 | | $ | (0.90) | | $ | (0.23) | |
Add (deduct): | | | |
| Asset impairment | — | | 1.58 | | — | |
QB variable consideration to IMSA and Codelco | (0.17) | | 0.06 | | 0.18 | |
Environmental costs | 0.35 | | 0.01 | | 0.17 | |
Share-based compensation | 0.10 | | 0.14 | | 0.12 | |
Commodity derivatives | (0.21) | | (0.13) | | 0.02 | |
| Foreign exchange (gains) losses | 0.07 | | (0.26) | | (0.01) | |
Tax items | (0.16) | | 0.34 | | 0.13 | |
| Other | 0.28 | | 0.32 | | 0.17 | |
| Adjusted diluted earnings per share from continuing operations | $ | 3.09 | | $ | 1.16 | | $ | 0.55 | |
63
Teck 2025 Management's Discussion and Analysis
Reconciliation of EBITDA, Adjusted EBITDA, Net Debt to Adjusted EBITDA and Adjusted Net Debt to Capitalization Ratio
| | | | | | | | | | | |
| ($ in millions) | 2025 | 2024 | 2023 |
| Profit (loss) from continuing operations before taxes | $ | 1,656 | | $ | (718) | | $ | 3,944 | |
Net finance expense | 641 | | 719 | | 162 | |
Depreciation and amortization | 1,757 | | 1,726 | | 1,931 | |
| EBITDA | $ | 4,054 | | $ | 1,727 | | $ | 6,037 | |
| Add (deduct): | | | |
| Asset impairment | — | | 1,053 | | — | |
QB variable consideration to IMSA and Codelco | (142) | | 51 | | 156 | |
Environmental costs | 208 | | — | | 168 | |
Share-based compensation | 66 | | 91 | | 107 | |
Commodity derivatives | (144) | | (90) | | 12 | |
| Foreign exchange (gains) losses | 41 | | (146) | | 29 | |
| Other | 250 | | 247 | | (142) | |
Adjusted EBITDA1 | $ | 4,333 | | $ | 2,933 | | $ | 6,367 | |
| | | |
Total debt | $ | 4,862 | | $ | 5,482 | | $ | 7,595 | |
Less: cash and cash equivalents | (5,012) | | (7,587) | | (744) | |
Net debt (cash) | $ | (150) | | $ | (2,105) | | $ | 6,851 | |
| Debt to adjusted EBITDA ratio | 1.1 | | 1.9 | | 1.2 | |
| Net debt to adjusted EBITDA ratio | — | | (0.7) | | 1.1 | |
| Equity attributable to shareholders of the company | $ | 25,096 | | $ | 26,077 | | $ | 26,988 | |
| Other financial obligations | $ | 18 | | $ | 36 | | $ | 268 | |
| Adjusted net debt to capitalization ratio | — | | (0.07) | | 0.20 | |
Note:
1.Amounts for year ended December 31, 2023 is as previously reported.
64
Teck 2025 Management's Discussion and Analysis
Reconciliation of Gross Profit Before Depreciation and Amortization
| | | | | | | | | | | |
| ($ in millions) | 2025 | 2024 | 2023 |
| Gross profit | $ | 2,657 | | $ | 1,607 | | $ | 1,112 | |
Depreciation and amortization1 | 1,682 | | 1,665 | | 861 | |
| Gross profit before depreciation and amortization | $ | 4,339 | | $ | 3,272 | | $ | 1,973 | |
| | | |
| Reported as: | | | |
| Copper | | | |
| Quebrada Blanca | $ | 860 | | $ | 766 | | $ | (61) | |
| Highland Valley Copper | 850 | | 471 | | 391 | |
| Antamina | 1,101 | | 1,038 | | 899 | |
| Carmen de Andacollo | 382 | | 121 | | 44 | |
| Other | 3 | | 5 | | (8) | |
| 3,196 | | 2,401 | | 1,265 | |
| | | |
| Zinc | | | |
| Trail Operations | 282 | | 12 | | 103 | |
| Red Dog | 846 | | 851 | | 611 | |
| Other | 15 | | 8 | | (6) | |
| 1,143 | | 871 | | 708 | |
| | | |
Gross profit before depreciation and amortization | $ | 4,339 | | $ | 3,272 | | $ | 1,973 | |
Note:
1.Depreciation and amortization recognized in cost of sales.
65
Teck 2025 Management's Discussion and Analysis
Copper Unit Cost Reconciliation
| | | | | | | | | | | |
(CAD$ in millions, except where noted) | 2025 | 2024 | 20231 |
| Revenue as reported | $ | 6,619 | | $ | 5,542 | | $ | 3,425 | |
Less: | | | |
Quebrada Blanca revenue as reported | — | | — | | (595) | |
| By-product revenue (A) | (790) | | (507) | | (397) | |
| Smelter processing charges (B) | 63 | | 262 | | 156 | |
| Adjusted revenue | $ | 5,892 | | $ | 5,297 | | $ | 2,589 | |
| | | |
| Cost of sales as reported | $ | 4,846 | | $ | 4,497 | | $ | 2,713 | |
Less: Quebrada Blanca cost of sales as reported | — | | — | | (737) | |
| $ | 4,846 | | $ | 4,497 | | $ | 1,976 | |
| Less: | | | |
| Depreciation and amortization | (1,423) | | (1,356) | | (472) | |
Inventory write-down | (10) | | (41) | | — | |
Labour settlement charges | (57) | | (29) | | (9) | |
Other | — | | (31) | | — | |
| By-product cost of sales (C) | (119) | | (82) | | (125) | |
| Adjusted cash cost of sales (D) | $ | 3,237 | | $ | 2,958 | | $ | 1,370 | |
| | | |
Payable pounds sold (millions)1 (E) | 928.9 | | 924.5 | | 498.0 | |
| Per unit amounts — CAD$/pound | | | |
| Adjusted cash cost of sales (D/E) | $ | 3.49 | | $ | 3.20 | | $ | 2.75 | |
| Smelter processing charges (B/E) | 0.07 | | 0.28 | | 0.31 | |
| Total cash unit costs — CAD$/pound | $ | 3.56 | | $ | 3.48 | | $ | 3.06 | |
| Cash margins for by-products — ((A−C)/E) | (0.73) | | (0.46) | | (0.54) | |
| Net cash unit costs — CAD$/pound | $ | 2.83 | | $ | 3.02 | | $ | 2.52 | |
| | | |
US$ amounts2 | | | |
| Average exchange rate (CAD$ per US$1.00) | $ | 1.40 | | $ | 1.37 | | $ | 1.35 | |
| Per unit amounts — US$/pound | | | |
| Adjusted cash cost of sales | $ | 2.50 | | $ | 2.34 | | $ | 2.04 | |
| Smelter processing charges | 0.05 | | 0.20 | | 0.23 | |
| Total cash unit costs — US$/pound | $ | 2.55 | | $ | 2.54 | | $ | 2.27 | |
| Cash margins for by-products | (0.52) | | (0.34) | | (0.40) | |
| Net cash unit costs — US$/pound | $ | 2.03 | | $ | 2.20 | | $ | 1.87 | |
Notes:
1.Excludes Quebrada Blanca in 2023.
2.Average period exchange rates are used to convert to US$ per pound equivalent.
66
Teck 2025 Management's Discussion and Analysis
Copper Unit Cost Reconciliation, QB
| | | | | |
(CAD$ in millions, except where noted) | 2025 |
| Revenue as reported | $ | 6,619 | |
Less: | |
Highland Valley Copper revenue as reported | (1,883) | |
Antamina revenue as reported | (1,545) | |
Carmen de Andacollo revenue as reported | (716) | |
| By-product revenue (A) | (220) | |
| Smelter processing charges (B) | 35 | |
| Adjusted revenue | $ | 2,290 | |
| |
| Cost of sales as reported | $ | 4,846 | |
Less: Highland Valley Copper cost of sales as reported | (1,384) | |
Less: Antamina cost of sales as reported | (708) | |
Less: Carmen de Andacollo cost of sales as reported | (453) | |
Less: Other cost of sales as reported | 3 | |
| $ | 2,304 | |
| Less: | |
| Depreciation and amortization | (689) | |
Inventory write-down | (7) | |
| Labour settlement charges | (53) | |
| Adjusted cash cost of sales (D) | $ | 1,555 | |
| |
Payable pounds sold (millions) (E) | 367.0 | |
| Per unit amounts — CAD$/pound | |
| Adjusted cash cost of sales (D/E) | $ | 4.24 | |
| Smelter processing charges (B/E) | 0.09 | |
| Total cash unit costs — CAD$/pound | $ | 4.33 | |
Cash margins for by-products — (A/E) | (0.60) | |
| Net cash unit costs — CAD$/pound | $ | 3.73 | |
| |
US$ amounts1 | |
| Average exchange rate (CAD$ per US$1.00) | $ | 1.40 | |
| Per unit amounts — US$/pound | |
| Adjusted cash cost of sales | $ | 3.03 | |
| Smelter processing charges | 0.07 | |
| Total cash unit costs — US$/pound | $ | 3.10 | |
| Cash margins for by-products | (0.43) | |
| Net cash unit costs — US$/pound | $ | 2.67 | |
Note:
1.Average period exchange rates are used to convert to US$ per pound equivalent.
67
Teck 2025 Management's Discussion and Analysis
Copper Unit Cost Reconciliation, Excluding QB
| | | | | | | | | | | |
(CAD$ in millions, except where noted) | 2025 | 2024 | 2023 |
| Revenue as reported | $ | 6,619 | | $ | 5,542 | | $ | 3,425 | |
Less: | | | |
Quebrada Blanca revenue as reported | (2,475) | | (2,376) | | (595) | |
| By-product revenue (A) | (570) | | (402) | | (397) | |
| Smelter processing charges (B) | 28 | | 138 | | 156 | |
| Adjusted revenue | $ | 3,602 | | $ | 2,902 | | $ | 2,589 | |
| | | |
| Cost of sales as reported | $ | 4,846 | | $ | 4,497 | | $ | 2,713 | |
Less: Quebrada Blanca cost of sales as reported | (2,304) | | (2,338) | | (737) | |
| $ | 2,542 | | $ | 2,159 | | $ | 1,976 | |
| Less: | | | |
| Depreciation and amortization | (734) | | (628) | | (472) | |
Inventory write-down | (3) | | (6) | | — | |
| Labour settlement charges | (4) | | (25) | | (9) | |
Other | — | | (5) | | — | |
| By-product cost of sales (C) | (119) | | (82) | | (125) | |
| Adjusted cash cost of sales (D) | $ | 1,682 | | $ | 1,413 | | $ | 1,370 | |
| | | |
Payable pounds sold (millions) (E) | 561.9 | | 505.2 | | 498.0 | |
| Per unit amounts — CAD$/pound | | | |
| Adjusted cash cost of sales (D/E) | $ | 2.99 | | $ | 2.80 | | $ | 2.75 | |
| Smelter processing charges (B/E) | 0.05 | | 0.27 | | 0.31 | |
| Total cash unit costs — CAD$/pound | $ | 3.04 | | $ | 3.07 | | $ | 3.06 | |
| Cash margins for by-products — ((A−C)/E) | (0.80) | | (0.63) | | (0.54) | |
| Net cash unit costs — CAD$/pound | $ | 2.24 | | $ | 2.44 | | $ | 2.52 | |
| | | |
US$ amounts1 | | | |
| Average exchange rate (CAD$ per US$1.00) | $ | 1.40 | | $ | 1.37 | | $ | 1.35 | |
| Per unit amounts — US$/pound | | | |
| Adjusted cash cost of sales | $ | 2.14 | | $ | 2.04 | | $ | 2.04 | |
| Smelter processing charges | 0.04 | | 0.20 | | 0.23 | |
| Total cash unit costs — US$/pound | $ | 2.18 | | $ | 2.24 | | $ | 2.27 | |
| Cash margins for by-products | (0.58) | | (0.46) | | (0.40) | |
| Net cash unit costs — US$/pound | $ | 1.60 | | $ | 1.78 | | $ | 1.87 | |
Note:
1.Average period exchange rates are used to convert to US$ per pound equivalent.
68
Teck 2025 Management's Discussion and Analysis
Zinc Unit Cost Reconciliation (Mining Operations1)
| | | | | | | | | | | |
(CAD$ in millions, except where noted) | 2025 | 2024 | 2023 |
| Revenue as reported | $ | 4,137 | | $ | 3,523 | | $ | 3,051 | |
| Less: | | | |
| Trail Operations revenues as reported | (2,489) | | (2,003) | | (1,992) | |
| Other revenues as reported | (9) | | (8) | | (6) | |
| Add back: Intra-segment revenues as reported | 543 | | 547 | | 543 | |
| $ | 2,182 | | $ | 2,059 | | $ | 1,596 | |
| By-product revenues (A) | (509) | | (434) | | (320) | |
| Smelter processing charges (B) | 150 | | 258 | | 365 | |
| Adjusted revenue | $ | 1,823 | | $ | 1,883 | | $ | 1,641 | |
| | | |
| Cost of sales as reported | $ | 3,253 | | $ | 2,961 | | $ | 2,651 | |
| Less: | | | |
| Trail Operations cost of sales as reported | (2,208) | | (2,069) | | (1,994) | |
| Other costs of sales as reported | 6 | | — | | (12) | |
| Add back: Intra-segment purchases as reported | 543 | | 547 | | 543 | |
| $ | 1,594 | | $ | 1,439 | | $ | 1,188 | |
| Less: | | | |
| Depreciation and amortization | (258) | | (231) | | (203) | |
| Royalty costs | (515) | | (448) | | (262) | |
| By-product cost of sales (C) | (123) | | (107) | | (126) | |
| Adjusted cash cost of sales (D) | $ | 698 | | $ | 653 | | $ | 597 | |
| | | |
| Payable pounds sold (millions) (E) | 1,004.4 | | 1,078.6 | | 1,042.8 | |
Per unit amounts — CAD$/pound | | | |
| Adjusted cash cost of sales (D/E) | $ | 0.69 | | $ | 0.61 | | $ | 0.57 | |
| Smelter processing charges (B/E) | 0.15 | | 0.23 | | 0.35 | |
Total cash unit costs — CAD$/pound | $ | 0.84 | | $ | 0.84 | | $ | 0.92 | |
Cash margins for by-products — ((A−C)/E) | (0.38) | | (0.30) | | (0.18) | |
Net cash unit costs — CAD$/pound | $ | 0.46 | | $ | 0.54 | | $ | 0.74 | |
| | | |
US$ amounts2 | | | |
| Average exchange rate (CAD$ per US$1.00) | $ | 1.40 | | $ | 1.37 | | $ | 1.35 | |
Per unit amounts — US$/pound | | | |
| Adjusted cash cost of sales | $ | 0.50 | | $ | 0.44 | | $ | 0.42 | |
| Smelter processing charges | 0.10 | | 0.17 | | 0.26 | |
Total cash unit costs — US$/pound | $ | 0.60 | | $ | 0.61 | | $ | 0.68 | |
| Cash margins for by-products | (0.27) | | (0.22) | | (0.13) | |
Net cash unit costs — US$/pound | $ | 0.33 | | $ | 0.39 | | $ | 0.55 | |
Notes:
1.Red Dog Mining Operations.
2.Average period exchange rates are used to convert to US$ per pound equivalent.
69
Teck 2025 Management's Discussion and Analysis
Cautionary Statement on Forward-Looking Statements
This Annual Report contains certain forward-looking information and forward-looking statements as defined in applicable securities laws (collectively referred to as forward-looking statements). These statements relate to future events or our future performance. All statements other than statements of historical fact are forward-looking statements. The use of any of the words “anticipate”, “can”, “could”, “plan”, “continue”, “estimate”, “expect”, “may”, “will”, “would”, “project”, “predict”, “likely”, “potential”, “should”, “believe” and similar expressions is intended to identify forward-looking statements. These statements involve known and unknown risks, uncertainties and other factors that may cause actual results or events to differ materially from those anticipated in such forward-looking statements. These statements speak only as of the date of this Annual Report.
These forward-looking statements include, but are not limited to, statements concerning: our focus and strategy, including being a pure-play energy transition metals company; anticipated global and regional supply, demand and market outlook for our commodities; our business, assets and strategy going forward, including with respect to future and ongoing project development; our expectations with respect to a disciplined execution of our business plans; our ability to complete the Merger with Anglo American, including timing of completion, the ability to meet customary closing conditions and our ability to receive applicable approvals; our expectations with respect to the Merger with Anglo American; our ability to achieve corporate synergies with Anglo American and potential synergies between QB and Collahuasi; our ability to execute our copper growth strategy in a value accretive manner; the timing and format of any cash returns to shareholders; our expectations regarding cost, timing and completion of HVC MLE; our expectations regarding our Comprehensive Operational Review and updated outlook, including any progress of the QB Action Plan; our expectations regarding cost, timing and completion of TMF development initiatives and installation of remaining permanent tailings infrastructure and water management at our QB Operations; the occurrence and length of any potential downtime at QB; our ability to raise improve and support construction of the sand dam, including the construction of a sand wedge; our expectations regarding improved sand drainage, including paddock design and sand placement; our expectations with respect to improved recoveries at QB and achieve design rates in the mine, concentrator and molybdenum plant; the continued ramp-up to consistent production and future optimization and debottlenecking of our QB Operations; our expectations with respect to the normal operation of the shiploader; our expectations with respect to no longer needing alternative port arrangements for shipping at QB; our expectations with respect to operations at Carmen de Andacollo; our expectations with respect to Teck's updated operating strategy and production at Trail; our expectations with respect to the production and sales volume at Red Dog; our expectations with respect to shipment conditions, weather and sea conditions for our Red Dog Operations; potential raw material constraints on our business; our expectations with respect to the occurrence, timing and length of required maintenance shutdowns and equipment replacement; expectations regarding inflationary pressures and our ability to manage controllable operating expenditures; the uncertainty surrounding the status of various worldwide tariffs and their impact on the mining industry; expectations with respect to the potential impact of any tariffs, countervailing duties or other trade restrictions, including the impact on trade flows, demand for our products and general economic conditions and our ability to manage our sale arrangements to minimize any impacts or maintain compliance with any exemptions provided; expectations with respect to
70
Teck 2025 Management's Discussion and Analysis
execution of our copper growth strategy, including the timing and occurrence of any sanction decisions and prioritization and amount of planned growth capital expenditures; expectations regarding advancement of our copper growth portfolio projects, including advancement of study, permitting, execution planning, detailed engineering and design, risk mitigation, and advanced early works, community and Indigenous engagement, completion of updated cost estimates, tendering processes, and timing for receipt of permits related to QB optimization, QB Asset Expansion, the Red Dog MLE, the HVC MLE, San Nicolás and Zafranal projects, as applicable; our expectations with respect to the timing of completion and cost of the HVC MLE; our expectations and results with respect to the royalties on our operations; expectations with respect to timing and outcome of the regulatory approvals process for our copper growth projects; expectations for copper growth capital expenditures to progress our medium- to long-term projects, including Galore Creek, Schaft Creek, NewRange and NuevaUnión; our expectations regarding safety rates at our operations; expectations regarding our effective tax rate; expectations regarding after-tax impairments; liquidity and availability of borrowings under our credit facilities; requirements to post and our ability to obtain additional credit for posting security for reclamation at our sites; expectations for our general and administration and research and innovation costs and costs related to the enterprise resource planning system; profit and loss expectations; our expectations with respect to potential results of any litigation, arbitration or regulatory action; copper price market trends and expectations; our expectations with respect to foreign demand for our materials; our ability to continue to declare dividends; mineral grades; all guidance appearing in this document including but not limited to the production, sales, cost, unit cost, capital expenditure, capitalized stripping, operating outlook, and other guidance under the headings “Guidance” and "Outlook" and as discussed elsewhere in the various reportable segment sections; our expectations regarding inflationary pressures and increased key input costs; and expectations regarding the adoption of new accounting standards and the impact of new accounting developments.
These forward-looking statements are based on the information available at the time those statements are made and are of good faith belief of the officers and directors of Teck as of the time with respect to future events and are subject to a number of assumptions, including, but not limited to, assumptions disclosed elsewhere in this document and assumptions regarding general business and economic conditions, interest rates, commodity and power prices; the completion of the Merger with Anglo American; completion of the QB Action Plan; the potential corporate synergies between Anglo American and Teck; acts of foreign or domestic governments and the outcome of legal proceedings, including expectations with respect to the claims for indemnification from NSC and Glencore in connection with the sale of the steelmaking coal business; the imposition of tariffs, import or export restrictions, or other trade barriers or retaliatory measures by foreign or domestic governments; the continued operation of QB in accordance with our expectations; our ability to advance TMF development initiatives as expected and the occurrence and length of any potential maintenance downtime; expectations with respect to the restart of the shiploader at QB; expectations with respect to availability of alternative port arrangements; expectations and assumptions with respect to HVC MLE capital cost estimate and expected project economics; expectations with respect to the timing and completion of the HVC MLE; the possibility that our business may not perform as expected or in a manner consistent with historical performance; the supply and demand for, deliveries of, and the level and volatility of prices of copper and zinc and our other metals and minerals, as well as steel, crude oil, natural gas and other petroleum products; the timing of the receipt of permits and other regulatory and governmental approvals for
71
Teck 2025 Management's Discussion and Analysis
our development projects and other operations, including mine life extensions; positive results from the studies on our expansion and development projects; our ability to secure adequate transportation, including rail and port services, for our products; our costs of production and our production and productivity levels, as well as those of our competitors; continuing availability of water and power resources for our operations; changes in credit market conditions and conditions in financial markets generally; the availability of funding to refinance our borrowings as they become due or to finance our development projects on reasonable terms; availability of letters of credit and other forms of financial assurance acceptable to regulators for reclamation and other bonding requirements; our ability to procure equipment and operating supplies in sufficient quantities and on a timely basis; the availability of qualified employees and contractors for our operations, including our new developments and our ability to attract and retain skilled employees; the satisfactory negotiation of collective agreements with unionized employees; our ability to improve or maintain the annual HPI frequency rate at Teck-controlled operations; the impact of changes in Canadian-U.S. dollar, Canadian dollar-Chilean peso and other foreign exchange rates on our costs and results; engineering and construction timetables and capital costs for our development and expansion projects; operating costs and capital expenditure estimates for our operations; our ability to develop technology and obtain the benefits of technology for our operations and development projects; closure costs; environmental compliance costs; market competition; the accuracy of our mineral reserve and resource estimates (including with respect to size, grade and recoverability) and the geological, operational and price assumptions on which these are based; tax benefits and statutory and effective tax rates; the outcome of our copper, zinc and lead concentrate treatment and refining charge negotiations with customers; favourable weather conditions for shipment and operations; the resolution of environmental, regulatory and other proceedings or disputes; our ability to obtain, comply with and renew permits, licences and leases in a timely manner; and our ongoing relations with our employees and with our business and joint venture partners.
Statements regarding the availability of our credit facilities are based on assumptions that we will be able to satisfy the conditions for borrowing at the time of a borrowing request and that the facilities are not otherwise terminated or accelerated due to an event of default. Assumptions regarding the costs and benefits of our projects include assumptions that the relevant project is constructed, commissioned and operated in accordance with current expectations. Expectations regarding our operations are based on numerous assumptions regarding the operations. Our Guidance tables include disclosure and footnotes with further assumptions relating to our guidance, and assumptions for certain other forward-looking statements accompany those statements within the document. Statements concerning future production costs or volumes are based on numerous assumptions regarding operating matters and on assumptions that demand for products develops as anticipated, that customers and other counterparties perform their contractual obligations, that operating and capital plans will not be disrupted by issues such as mechanical failure, unavailability of parts and supplies, labour disturbances, interruption in transportation or utilities, or adverse weather conditions, and that there are no material unanticipated variations in the cost of energy or supplies. The foregoing list of assumptions is not exhaustive. Events or circumstances could cause actual results to vary materially.
Factors that may cause actual results to vary materially include, but are not limited to, changes in commodity and power prices; changes in market demand for our products; changes in interest and currency exchange
72
Teck 2025 Management's Discussion and Analysis
rates; acts of governments and the outcome of legal proceedings, including indemnification claims; ability for Teck to satisfy all conditions precedent for closing of the Merger; ability for Teck to receive necessary approvals to complete the Merger; costs related to the Merger; the imposition of tariffs, import or export restrictions, or other trade barriers or retaliatory measures by foreign or domestic governments; inaccurate geological and metallurgical assumptions (including with respect to the size, grade and recoverability of mineral reserves and resources); operational difficulties (including failure of plant, equipment or processes to operate in accordance with specifications or expectations, cost escalation, unavailability of labour, materials and equipment); government action or delays in the receipt of government approvals; changes in royalty or tax rates; industrial disturbances or other job action; adverse weather conditions; unanticipated events related to health, safety and environmental matters; union labour disputes; political risk; social unrest; failure of customers or counterparties (including logistics suppliers) to perform their contractual obligations; changes in our credit ratings; unanticipated increases in costs to construct our development projects; difficulty in obtaining permits; inability to address concerns regarding permits or environmental impact assessments; changes in laws and mining regulations; potential changes to the CUSMA; changes in Canadian property law and ownership title; and changes or further deterioration in general economic conditions. The amount and timing of capital expenditures is dependent upon, among other matters, being able to secure permits, equipment, supplies, materials and labour on a timely basis and at expected costs. Certain operations and projects are not controlled by us; schedules and costs may be adjusted by our partners, and timing of spending and operation of the operation or project is not in our control. Certain of our other operations and projects are operated through joint arrangements where we may not have control over all decisions, which may cause outcomes to differ from current expectations. Ongoing monitoring may reveal unexpected environmental conditions at our operations and projects that could require additional remedial measures. Production at our QB and Red Dog operations may also be impacted by water levels at site. Sales to China may be impacted by general and specific port restrictions, Chinese regulation and policies, and normal production and operating risks.
We assume no obligation to update forward-looking statements except as required under securities laws. Further information concerning risks, assumptions and uncertainties associated with these forward-looking statements and our business can be found in our Annual Information Form for the year ended December 31, 2025 filed under our profile on SEDAR+ (www.sedarplus.ca) and on EDGAR (www.sec.gov) under cover of Form 40-F, as well as subsequent filings that can also be found under our profile.
Scientific and technical information in this annual report regarding our material properties was reviewed, approved and verified by Jason Sangha, P.Eng., Vice President, Technical & Planning, an officer of Teck and a Qualified Person as defined under National Instrument 43-101.
73
Teck 2025 Management's Discussion and Analysis