Management’s Discussion and Analysis
February 26, 2020
|
Principal Products
|
2015
|
2016
|
2017
|
2018
|
2019
|
2020
estimate(3)
|
|||||||||||||||||||
|
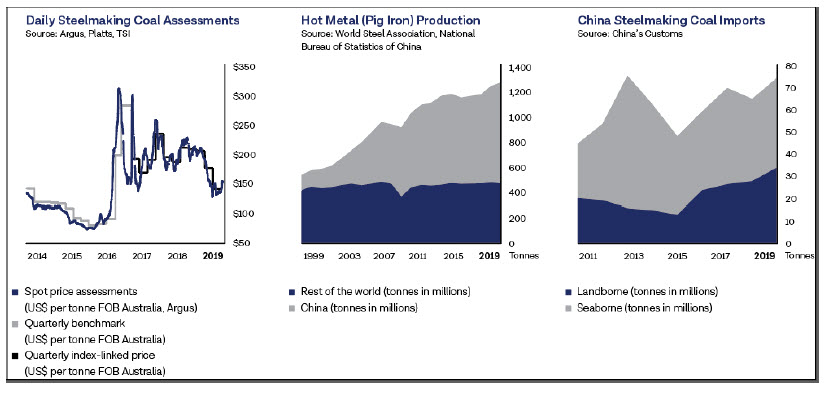
Steelmaking coal
|
million tonnes
|
25.3
|
27.6
|
26.6
|
26.2
|
25.7
|
24.0
|
||||||||||||||||||
|
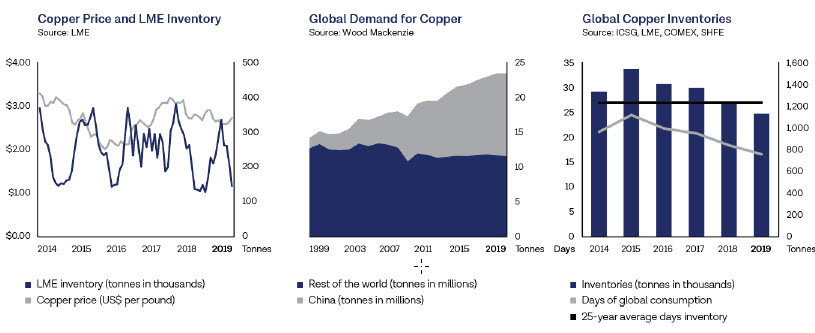
Copper(1)
|
thousand tonnes
|
358
|
324
|
287
|
294
|
297
|
293
|
||||||||||||||||||
|
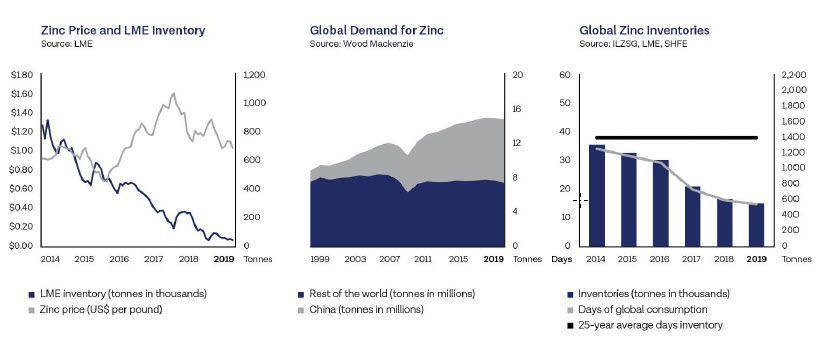
Zinc
|
|||||||||||||||||||||||||
|
Contained in concentrate(1)
|
thousand tonnes
|
658
|
662
|
659
|
705
|
640
|
620
|
||||||||||||||||||
|
Refined
|
thousand tonnes
|
307
|
312
|
310
|
303
|
287
|
310
|
||||||||||||||||||
|
Bitumen(1)(2)
|
million barrels
|
–
|
–
|
–
|
6.8
|
12.3
|
13.0
|
||||||||||||||||||
| (1) |
We include 100% of production and sales from our Quebrada Blanca and Carmen de Andacollo mines in our production and sales volumes, even though we do not own 100% of these operations, because we fully
consolidate their results in our financial statements. We include 22.5% and 21.3% of production and sales from Antamina and Fort Hills, respectively, representing our proportionate ownership interest in these operations. Zinc contained
in concentrate production includes co-product zinc production from our 22.5% interest in Antamina.
|
| (2) |
Fort Hills bitumen results for the year ended December 31, 2018 are included from June 1, 2018.
|
| (3) |
Production estimates for 2020 represent the midpoint of our production guidance range.
|
|
US$
|
CAD$
|
|||||||||||||||||||||||||||||||||||||||
|
2019
|
% chg
|
2018
|
% chg
|
2017
|
2019
|
% chg
|
2018
|
% chg
|
2017
|
|||||||||||||||||||||||||||||||
|
Steelmaking coal (realized — $/tonne)
|
164
|
-12
|
%
|
187
|
+7
|
%
|
174
|
218
|
-10
|
%
|
243
|
+8
|
%
|
226
|
||||||||||||||||||||||||||
|
Copper (LME cash — $/pound)
|
2.72
|
-8
|
%
|
2.96
|
+6
|
%
|
2.80
|
3.62
|
-6
|
%
|
3.84
|
+5
|
%
|
3.64
|
||||||||||||||||||||||||||
|
Zinc (LME cash — $/pound)
|
1.16
|
-13
|
%
|
1.33
|
+2
|
%
|
1.31
|
1.54
|
-10
|
%
|
1.72
|
+1
|
%
|
1.70
|
||||||||||||||||||||||||||
|
Blended bitumen (realized — $/barrel)(1)
|
45.20
|
+29
|
%
|
35.12
|
–
|
–
|
60.12
|
+30
|
%
|
46.14
|
–
|
–
|
||||||||||||||||||||||||||||
|
Exchange rate (Bank of Canada)
|
||||||||||||||||||||||||||||||||||||||||
|
US$1 = CAD$
|
1.33
|
+2
|
%
|
1.30
|
0
|
%
|
1.30
|
|||||||||||||||||||||||||||||||||
|
CAD$1 = US$
|
0.75
|
-3
|
%
|
0.77
|
0
|
%
|
0.77
|
|||||||||||||||||||||||||||||||||
| (1) |
Fort Hills blended bitumen results for the year ended December 31, 2018 are included from June 1, 2018.
|
|
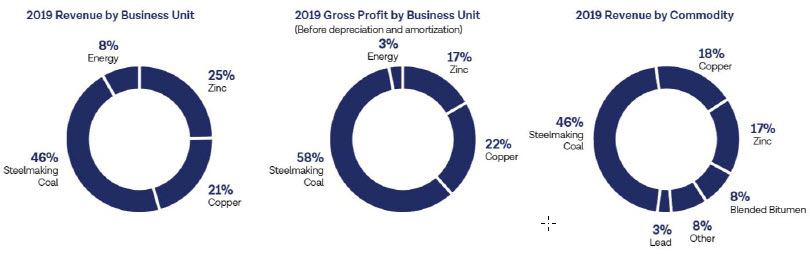
Revenues
|
Gross Profit (Loss)
Before Depreciation
and Amortization(1)(2)
|
Gross Profit (Loss)
|
||||||||||||||||||||||||||||||||||
|
($ in millions)
|
2019
|
2018
|
2017
|
2019
|
2018
|
2017
|
2019
|
2018
|
2017
|
|||||||||||||||||||||||||||
|
Steelmaking coal
|
$
|
5,522
|
$
|
6,349
|
$
|
6,014
|
$
|
2,904
|
$
|
3,770
|
$
|
3,732
|
$
|
2,112
|
$
|
3,040
|
$
|
3,014
|
||||||||||||||||||
|
Copper
|
2,469
|
2,714
|
2,400
|
1,080
|
1,355
|
1,154
|
617
|
877
|
586
|
|||||||||||||||||||||||||||
|
Zinc
|
2,968
|
3,094
|
3,496
|
831
|
1,085
|
1,173
|
601
|
869
|
967
|
|||||||||||||||||||||||||||
|
Energy(3)
|
975
|
407
|
–
|
144
|
(106
|
)
|
–
|
10
|
(165
|
)
|
–
|
|||||||||||||||||||||||||
|
Total
|
$
|
11,934
|
$
|
12,564
|
$
|
11,910
|
$
|
4,959
|
$
|
6,104
|
$
|
6,059
|
$
|
3,340
|
$
|
4,621
|
$
|
4,567
|
||||||||||||||||||
| (1) |
Non-GAAP Financial Measure. See “Use of Non-GAAP Financial Measures” section for further information.
|
| (2) |
See “Use of Non-GAAP Financial Measures” section for reconciliation.
|
| (3) |
Fort Hills blended bitumen results for the year ended December 31, 2018 are included from June 1, 2018.
|
|
1
|
Non-GAAP Financial Measure. See “Use of Non-GAAP Financial Measures” section for further information.
|
|
2
|
See “Use of Non-GAAP Financial Measures” section for reconciliation.
|
|
($ in millions)
|
2019
|
2018
|
2017
|
|||||||||
|
Revenues
|
$
|
5,522
|
$
|
6,349
|
$
|
6,014
|
||||||
|
Gross profit before depreciation and amortization(1)(2)
|
$
|
2,904
|
$
|
3,770
|
$
|
3,732
|
||||||
|
Gross profit
|
$
|
2,112
|
$
|
3,040
|
$
|
3,014
|
||||||
|
Production (million tonnes)
|
25.7
|
26.2
|
26.6
|
|||||||||
|
Sales (million tonnes)
|
25.0
|
26.0
|
26.5
|
|||||||||
| (1) |
Non-GAAP Financial Measure. See “Use of Non-GAAP Financial Measures” section for further information.
|
| (2) |
See “Use of Non-GAAP Financial Measures” section for reconciliation.
|
|
1
|
Non-GAAP Financial Measure. See “Use of Non-GAAP Financial Measures” section for further information.
|
|
2
|
See “Use of Non-GAAP Financial Measures” section for reconciliation.
|
|
Revenues
|
Gross Profit (Loss)
Before Depreciation
and Amortization(1)(2)
|
Gross Profit (Loss)
|
||||||||||||||||||||||||||||||||||
|
($ in millions)
|
2019
|
2018
|
2017
|
2019
|
2018
|
2017
|
2019
|
2018
|
2017
|
|||||||||||||||||||||||||||
|
Highland Valley Copper
|
$
|
1,005
|
$
|
941
|
$
|
733
|
$
|
395
|
$
|
343
|
$
|
213
|
$
|
196
|
$
|
164
|
$
|
18
|
||||||||||||||||||
|
Antamina
|
900
|
1,061
|
936
|
614
|
794
|
670
|
457
|
652
|
534
|
|||||||||||||||||||||||||||
|
Carmen de Andacollo
|
394
|
488
|
549
|
89
|
193
|
222
|
23
|
121
|
142
|
|||||||||||||||||||||||||||
|
Quebrada Blanca
|
170
|
224
|
182
|
(18
|
)
|
26
|
50
|
(59
|
)
|
(59
|
)
|
(107
|
)
|
|||||||||||||||||||||||
|
Other
|
–
|
–
|
–
|
–
|
(1
|
)
|
(1
|
)
|
–
|
(1
|
)
|
(1
|
)
|
|||||||||||||||||||||||
|
Total
|
$
|
2,469
|
$
|
2,714
|
$
|
2,400
|
$
|
1,080
|
$
|
1,355
|
$
|
1,154
|
$
|
617
|
$
|
877
|
$
|
586
|
||||||||||||||||||
| (1) |
Non-GAAP Financial Measure. See “Use of Non-GAAP Financial Measures” section for further information.
|
| (2) |
See “Use of Non-GAAP Financial Measures” section for reconciliation.
|
|
Production(1)
|
Sales(1)
|
|||||||||||||||||||||||
|
(thousand tonnes)
|
2019
|
2018
|
2017
|
2019
|
2018
|
2017
|
||||||||||||||||||
|
Highland Valley Copper
|
121
|
101
|
93
|
124
|
103
|
89
|
||||||||||||||||||
|
Antamina
|
101
|
100
|
95
|
101
|
99
|
94
|
||||||||||||||||||
|
Carmen de Andacollo
|
54
|
67
|
76
|
55
|
64
|
77
|
||||||||||||||||||
|
Quebrada Blanca
|
21
|
26
|
23
|
21
|
26
|
23
|
||||||||||||||||||
|
Total
|
297
|
294
|
287
|
301
|
292
|
283
|
||||||||||||||||||
| (1) |
We include 100% of production and sales from our Quebrada Blanca and Carmen de Andacollo mines in our production and sales volumes, even though we do not own 100% of these operations, because we fully
consolidate their results in our financial statements. We include 22.5% of production and sales from Antamina, representing our proportionate ownership interest in the operation.
|
|
Revenues
|
Gross Profit (Loss)
Before Depreciation
and Amortization(1)(2)
|
Gross Profit (Loss)
|
||||||||||||||||||||||||||||||||||
|
($ in millions)
|
2019
|
2018
|
2017
|
2019
|
2018
|
2017
|
2019
|
2018
|
2017
|
|||||||||||||||||||||||||||
|
Red Dog
|
$
|
1,594
|
$
|
1,696
|
$
|
1,752
|
$
|
837
|
$
|
990
|
$
|
971
|
$
|
696
|
$
|
864
|
$
|
874
|
||||||||||||||||||
|
Trail Operations
|
1,829
|
1,942
|
2,266
|
–
|
91
|
209
|
(86
|
)
|
16
|
131
|
||||||||||||||||||||||||||
|
Pend Oreille
|
56
|
98
|
105
|
(4
|
)
|
(5
|
)
|
19
|
(7
|
)
|
(20
|
)
|
(12
|
)
|
||||||||||||||||||||||
|
Other
|
8
|
8
|
8
|
(2
|
)
|
9
|
(26
|
)
|
(2
|
)
|
9
|
(26
|
)
|
|||||||||||||||||||||||
|
Intra-segment
|
(519
|
)
|
(650
|
)
|
(635
|
)
|
–
|
–
|
–
|
–
|
–
|
–
|
||||||||||||||||||||||||
|
Total
|
$
|
2,968
|
$
|
3,094
|
$
|
3,496
|
$
|
831
|
$
|
---1,085
|
$
|
1,173
|
$
|
601
|
$
|
869
|
$
|
967
|
||||||||||||||||||
| (1) |
Non-GAAP Financial Measure. See “Use of Non-GAAP Financial Measures” section for further information.
|
| (2) |
See “Use of Non-GAAP Financial Measures” section for reconciliation.
|
|
Production
|
Sales
|
|||||||||||||||||||||||
|
(thousand tonnes)
|
2019
|
2018
|
2017
|
2019
|
2018
|
2017
|
||||||||||||||||||
|
Refined zinc
|
||||||||||||||||||||||||
|
Trail Operations
|
287
|
303
|
310
|
284
|
304
|
309
|
||||||||||||||||||
|
Contained in concentrate
|
||||||||||||||||||||||||
|
Red Dog
|
553
|
583
|
542
|
561
|
521
|
534
|
||||||||||||||||||
|
Pend Oreille
|
19
|
30
|
33
|
20
|
30
|
32
|
||||||||||||||||||
|
Antamina(1)
|
68
|
92
|
84
|
68
|
93
|
85
|
||||||||||||||||||
|
Total
|
640
|
705
|
659
|
649
|
644
|
651
|
||||||||||||||||||
| (1) |
Co-product zinc production from our 22.5% interest in Antamina.
|
|
($ in millions)
|
2019
|
2018(2)
|
||||||
|
Blended bitumen price (realized US$/bbl)(3)(4)
|
$
|
45.20
|
$
|
35.12
|
||||
|
Bitumen price (realized CAD$/bbl)(3)(4)
|
$
|
52.21
|
$
|
32.81
|
||||
|
Operating netback (CAD$/bbl)(3)(4)
|
$
|
11.85
|
$
|
(10.95
|
)
|
|||
|
Production (million bitumen barrels)
|
12.3
|
6.8
|
||||||
|
Production (average barrels per day)
|
33,593
|
31,955
|
||||||
|
Sales (million blended bitumen barrels)
|
16.0
|
8.8
|
||||||
|
Gross profit (loss) before depreciation and amortization(3)(4)
|
$
|
144
|
$
|
(106
|
)
|
|||
|
Gross profit (loss)
|
$
|
10
|
$
|
(165
|
)
|
|||
| (1) |
Fort Hills figures presented at our ownership interest of 21.3%.
|
| (2) |
Fort Hills financial results included from June 1, 2018.
|
| (3) |
Non-GAAP Financial Measure. See “Use of Non-GAAP Financial Measures” section for further information.
|
| (4) |
See “Use of Non-GAAP Financial Measures” section for reconciliation.
|
|
(Amounts reported in CAD$ per barrel of bitumen sold)
|
2019
|
2018(3)
|
||||||
|
Bitumen price realized(1)(2)(4)
|
$
|
52.21
|
$
|
32.81
|
||||
|
Crown royalties(5)
|
(1.50
|
)
|
(2.04
|
)
|
||||
|
Transportation costs for FRB(6)
|
(9.62
|
)
|
(8.83
|
)
|
||||
|
Adjusted operating costs(1)(2)(7)
|
(29.24
|
)
|
(32.89
|
)
|
||||
|
Operating netback(1)(2)
|
$
|
11.85
|
$
|
(10.95
|
)
|
|||
| (1) |
Non-GAAP measure. See “Use of Non-GAAP Financial Measures” section for further information.
|
| (2) |
See “Use of Non-GAAP Financial Measures” section for reconciliation.
|
| (3) |
Fort Hills financial results included from June 1, 2018.
|
| (4) |
Bitumen price realized represents the realized petroleum revenue (blended bitumen sales revenue) net of diluent expense, expressed on a per barrel basis. Blended bitumen sales revenue represents revenue from
our share of the heavy crude oil blend known as Fort Hills Reduced Carbon Life Cycle Dilbit Blend (FRB), sold at the Hardisty and U.S. Gulf Coast market hubs. FRB is comprised of bitumen produced from the Fort Hills oil sands mining and
processing operations blended with purchased diluent. The cost of blending is affected by the amount of diluent required and the cost of purchasing, transporting and blending the diluent. A portion of diluent expense is effectively
recovered in the sales price of the blended product. Diluent expense is also affected by Canadian and U.S. benchmark pricing and changes in the value of the Canadian dollar relative to the U.S. dollar.
|
| (5) |
The royalty rate applicable to pre-payout oil sands operations starts at 1% of gross revenue and increases for every dollar by which the WTI crude oil price in Canadian dollars exceeds $55 per barrel, to a
maximum of 9% when the WTI crude oil price is $120 per barrel or higher. Fort Hills is currently in the pre-payout phase.
|
| (6) |
Transportation costs represent pipeline and storage costs downstream of the East Tank Farm blending facility. We use various pipeline and storage facilities to transport and sell our blend to customers
throughout North America. Sales to the U.S. markets require additional transportation costs, but realize higher selling prices.
|
| (7) |
Adjusted operating costs represent the costs to produce a barrel of bitumen from the Fort Hills mine and processing operation.
|
| • |
At our Highland Valley Copper Operations and our Red Dog Operations, we implemented artificial intelligence to analyze sensor data from the processing plant and provide automated recommendations to plant
operators to maximize efficiency across grinding and flotation, leading to improved throughput and recoveries. At Highland Valley Copper, this, together with blasting improvements, resulted in throughput improvement of approximately
2.5% and copper recovery improvement of approximately 2%, which is expected to result in an estimated annual increase in copper production of approximately 8,000 tonnes from 2020 onward. At Red Dog, this resulted in throughput
improvements of approximately 5%, which is expected to result in an estimated annual increase in zinc production of approximately 24,000 tonnes from 2020 onward.
|
|
1
|
Non-GAAP Financial Measure. See “Use of Non-GAAP Financial Measures” section for further information.
|
|
2
|
At prices in effect when the program was implemented on May 31, 2019, the annualized EBITDA improvements associated with these initiatives would have been $184 million, in
consideration of commodity prices of US$204 per tonne for steelmaking coal, US$2.62 per pound for copper, US$1.22 per pound for zinc and a US/CDN exchange rate of 1.35. Based on December 31, 2019 commodity prices of US$136.50 per tonne
for steelmaking coal, US$2.79 per pound for copper, US$1.04 per pound for zinc and a US/CDN exchange rate of 1.30, the equivalent annualized EBITDA improvement is $160 million.
|
| • |
At our steelmaking coal operations, we implemented machine learning algorithms to analyze haul truck data to improve haul truck cycle times. This project gathers sensor data from trucks to identify factors
affecting cycle times including road conditions, operator performance, truck speeds, queues and other metrics in order to provide data-driven recommendations to improve cycle times. This results in additional truck hours and could
increase our steelmaking coal production.
|
| • |
At our steelmaking coal operations, we are analyzing data from digitally connected drill platforms to improve the efficiency of blasting. This results in optimized drill hole placement, a 10-15% reduction in
explosives use, and material that is easier for shovels to move. We are using a similar process at our base metals operations to optimize the size of the ore and improve mill throughput.
|
|
($ in millions, except per share data)
|
2019
|
2018
|
2017
|
|||||||||
|
Revenues and profit
|
||||||||||||
|
Revenues
|
$
|
11,934
|
$
|
12,564
|
$
|
11,910
|
||||||
|
Gross profit before depreciation and amortization(1)(2)
|
$
|
4,959
|
$
|
6,104
|
$
|
6,059
|
||||||
|
Gross profit
|
$
|
3,340
|
$
|
4,621
|
$
|
4,567
|
||||||
|
EBITDA(1)(2)
|
$
|
1,352
|
$
|
6,174
|
$
|
5,589
|
||||||
|
Profit (loss) attributable to shareholders
|
$
|
(605
|
)
|
$
|
3,107
|
$
|
2,460
|
|||||
|
Cash flow
|
||||||||||||
|
Cash flow from operations
|
$
|
3,484
|
$
|
4,438
|
$
|
5,049
|
||||||
|
Property, plant and equipment expenditures
|
$
|
2,788
|
$
|
1,906
|
$
|
1,621
|
||||||
|
Capitalized production stripping costs
|
$
|
680
|
$
|
707
|
$
|
678
|
||||||
|
Investment expenditures
|
$
|
178
|
$
|
284
|
$
|
309
|
||||||
|
Balance sheet
|
||||||||||||
|
Cash balances
|
$
|
1,026
|
$
|
1,734
|
$
|
952
|
||||||
|
Total assets
|
$
|
39,350
|
$
|
39,626
|
$
|
37,028
|
||||||
|
Debt and lease liabilities, including current portion
|
$
|
4,834
|
$
|
5,519
|
$
|
6,369
|
||||||
|
Per share amounts
|
||||||||||||
|
Profit (loss) attributable to shareholders
|
$
|
(1.08
|
)
|
$
|
5.41
|
$
|
4.26
|
|||||
|
Dividends declared
|
$
|
0.20
|
$
|
0.30
|
$
|
0.60
|
||||||
| (1) |
Non-GAAP Financial Measures. See “Use of Non-GAAP Financial Measures” section for further information.
|
| (2) |
See “Use of Non-GAAP Financial Measures” section for reconciliation.
|
|
1
|
Non-GAAP Financial Measure. See “Use of Non-GAAP Financial Measures” section for further information.
|
|
2
|
See “Use of Non-GAAP Financial Measures” section for reconciliation.
|
|
($ in millions, except per share data)
|
2019
|
2018
|
2017
|
|||||||||
|
Profit (loss) attributable to shareholders
|
$
|
(605
|
)
|
$
|
3,107
|
$
|
2,460
|
|||||
|
Add (deduct):
|
||||||||||||
|
Asset impairments (reversals)
|
2,052
|
30
|
(100
|
)
|
||||||||
|
Debt redemption or purchase loss
|
166
|
19
|
159
|
|||||||||
|
Debt prepayment option loss (gain)
|
(77
|
)
|
31
|
(38
|
)
|
|||||||
|
Gain on sale of Waneta Dam
|
–
|
(812
|
)
|
–
|
||||||||
|
Taxes and other
|
16
|
(3
|
)
|
39
|
||||||||
|
Adjusted profit attributable to shareholders(1)(2)
|
$
|
1,552
|
$
|
2,372
|
$
|
2,520
|
||||||
|
Adjusted basic earnings per share(1)(2)
|
$
|
2.77
|
$
|
4.13
|
$
|
4.36
|
||||||
|
Adjusted diluted earnings per share(1)(2)
|
$
|
2.75
|
$
|
4.07
|
$
|
4.30
|
||||||
|
Weighted average diluted shares outstanding (millions)
|
565.3
|
582.1
|
586.4
|
|||||||||
| (1) |
Non-GAAP Financial Measures. See “Use of Non-GAAP Financial Measures” section for further information.
|
| (2) |
See “Use of Non-GAAP Financial Measures” section for reconciliation.
|
|
1
|
Non-GAAP Financial Measure. See “Use of Non-GAAP Financial Measures” section for further information.
|
|
($ in millions)
|
2019
|
2018
|
2017
|
|||||||||
|
General and administration
|
$
|
161
|
$
|
142
|
$
|
116
|
||||||
|
Exploration
|
67
|
69
|
58
|
|||||||||
|
Research and innovation
|
67
|
35
|
55
|
|||||||||
|
Asset impairments (impairment reversal)
|
2,690
|
41
|
(163
|
)
|
||||||||
|
Other operating expense (income)
|
505
|
(450
|
)
|
230
|
||||||||
|
Finance income
|
(48
|
)
|
(33
|
)
|
(17
|
)
|
||||||
|
Finance expense
|
266
|
252
|
229
|
|||||||||
|
Non-operating expense
|
97
|
52
|
151
|
|||||||||
|
Share of losses (income) of associates and joint ventures
|
3
|
3
|
(6
|
)
|
||||||||
|
$
|
3,808
|
$
|
111
|
$
|
653
|
|||||||
|
($ in millions)
|
2019
|
2018
|
2017
|
|||||||||
|
Fort Hills
|
$
|
1,241
|
$
|
–
|
$
|
(207
|
)
|
|||||
|
Frontier project
|
1,129
|
–
|
–
|
|||||||||
|
Cardinal River Operations
|
289
|
–
|
–
|
|||||||||
|
Other
|
31
|
41
|
44
|
|||||||||
|
$
|
2,690
|
$
|
41
|
$
|
(163
|
)
|
||||||
|
Outstanding at
|
Outstanding at
|
|||||||||||||||
|
December 31, 2019
|
December 31, 2018
|
|||||||||||||||
|
(payable pounds in millions)
|
Pounds
|
US$/lb.
|
Pounds
|
US$/lb.
|
||||||||||||
|
Copper
|
65
|
$
|
2.80
|
93
|
$
|
2.70
|
||||||||||
|
Zinc
|
239
|
$
|
1.04
|
208
|
$
|
1.12
|
||||||||||
|
2019
|
2018
|
2017
|
||||||||||
|
Term notes face value
|
$
|
3,209
|
$
|
3,809
|
$
|
4,831
|
||||||
|
Unamortized fees and discounts
|
(31
|
)
|
(31
|
)
|
(40
|
)
|
||||||
|
Other
|
544
|
268
|
286
|
|||||||||
|
Debt (US$ in millions)
|
$
|
3,722
|
$
|
4,046
|
$
|
5,077
|
||||||
|
Debt (CAD$ equivalent)(1) (A)
|
$
|
4,834
|
$
|
5,519
|
$
|
6,369
|
||||||
|
Less cash balances
|
(1,026
|
)
|
(1,734
|
)
|
(952
|
)
|
||||||
|
Net debt(2) (B)
|
$
|
3,808
|
$
|
3,785
|
$
|
5,417
|
||||||
|
Equity (C)
|
$
|
22,074
|
$
|
23,018
|
$
|
19,993
|
||||||
|
Debt to debt-plus-equity ratio(2) (A/(A+C))
|
18
|
%
|
19
|
%
|
24
|
%
|
||||||
|
Net debt to net-debt-plus-equity ratio(2) (B/(B+C))
|
15
|
%
|
14
|
%
|
21
|
%
|
||||||
|
Debt to EBITDA ratio(2)(3)
|
3.6
|
x
|
0.9
|
x
|
1.1
|
x
|
||||||
|
Net debt to EBITDA ratio(2)(3)
|
2.8
|
x
|
0.6
|
x
|
1.0
|
x
|
||||||
|
Average interest rate
|
5.6
|
%
|
6.1
|
%
|
5.7
|
%
|
||||||
| (1) |
Translated at year-end exchange rates.
|
| (2) |
Non-GAAP Financial Measure. See “Use of Non-GAAP Financial Measures” section for further information.
|
| (3) |
Non-GAAP Financial Measure. See “Use of Non-GAAP Financial Measures” section for reconciliation.
|
|
1
|
Non-GAAP Financial Measure. See “Use of Non-GAAP Financial Measures” section for further information.
|
|
2
|
See “Use of Non-GAAP Financial Measures” section for reconciliation.
|
|
($ in millions except per share data)
|
2019
|
2018
|
||||||||||||||||||||||||||||||
|
Q4
|
Q3
|
Q2
|
Q1
|
Q4
|
Q3
|
Q2
|
Q1
|
|||||||||||||||||||||||||
|
Revenue
|
$
|
2,655
|
$
|
3,035
|
$
|
3,138
|
$
|
3,106
|
$
|
3,247
|
$
|
3,209
|
$
|
3,016
|
$
|
3,092
|
||||||||||||||||
|
Gross profit
|
460
|
787
|
1,051
|
1,042
|
1,011
|
1,009
|
1,241
|
1,360
|
||||||||||||||||||||||||
|
EBITDA (loss)(1)
|
(1,884
|
)
|
1,032
|
808
|
1,396
|
1,152
|
2,064
|
1,403
|
1,555
|
|||||||||||||||||||||||
|
Profit (loss) attributable to shareholders
|
(1,835
|
)
|
369
|
231
|
630
|
433
|
1,281
|
634
|
759
|
|||||||||||||||||||||||
|
Basic earnings (loss) per share
|
$
|
(3.33
|
)
|
$
|
0.66
|
$
|
0.41
|
$
|
1.11
|
$
|
0.75
|
$
|
2.23
|
$
|
1.10
|
$
|
1.32
|
|||||||||||||||
|
Diluted earnings (loss) per share
|
$
|
(3.33
|
)
|
$
|
0.66
|
$
|
0.41
|
$
|
1.10
|
$
|
0.75
|
$
|
2.20
|
$
|
1.09
|
$
|
1.30
|
|||||||||||||||
|
Cash flow from operations
|
$
|
782
|
$
|
1,062
|
$
|
1,120
|
$
|
520
|
$
|
1,337
|
$
|
877
|
$
|
1,105
|
$
|
1,119
|
||||||||||||||||
| (1) |
Non-GAAP Financial Measure. See “Use of Non-GAAP Financial Measures” section for further information.
|
| (2) |
See “Use of Non-GAAP Financial Measures” section for reconciliation.
|
|
2020 Mid-Range Production Estimates(1)
|
Change
|
Estimated Effect of Change On Profit(2)
($ in millions) |
Estimated Effect on EBITDA(2)
($ in millions) |
||||||||||
|
US$ exchange
|
CAD$0.01
|
$
|
37
|
$
|
58
|
||||||||
|
Steelmaking coal (million tonnes)
|
24.0
|
US$1/tonne
|
$
|
18
|
$
|
28
|
|||||||
|
Copper (thousand tonnes)
|
292.5
|
US$0.01/lb.
|
$
|
5
|
$
|
8
|
|||||||
|
Zinc (thousand tonnes)(3)
|
930.0
|
US$0.01/lb.
|
$
|
10
|
$
|
13
|
|||||||
|
WCS (million bbl)(4)
|
13.0
|
US$1/bbl
|
$
|
12
|
$
|
17
|
|||||||
|
WTI(5)
|
US$1/bbl
|
$
|
9
|
$
|
12
|
||||||||
| (1) |
All production estimates are subject to change based on market and operating conditions.
|
| (2) |
The effect on our profit attributable to shareholders and on EBITDA of commodity price and exchange rate movements will vary from quarter to quarter depending on sales volumes. Our estimate of the
sensitivity of profit and EBITDA to changes in the U.S. dollar exchange rate is sensitive to commodity price assumptions. EBITDA is a Non-GAAP Financial Measure. See “Use of Non-GAAP Financial Measures” section for further information
and reconciliation.
|
| (3) |
Zinc includes 310,000 tonnes of refined zinc and 620,000 tonnes of zinc contained in concentrate.
|
| (4) |
Bitumen volumes from our energy business unit.
|
| (5) |
Our WTI oil price sensitivity takes into account our interest in Fort Hills for respective change in revenue, partially offset by the effect of the change in diluent purchase costs as well as the effect on
the change in operating costs across our business units, as our operations use a significant amount of diesel fuel.
|
|
Units in thousand tonnes (excluding steelmaking coal, bitumen, molybdenum and refined silver)
|
2019
|
2020
Guidance
|
Three-Year
Guidance
2021–2023
|
|||||||||
|
Principal Products
|
||||||||||||
|
Steelmaking coal (million tonnes)
|
25.7
|
23.0–25.0
|
26.0–27.0
|
|||||||||
|
Copper(1)(2)(3)
|
||||||||||||
|
Highland Valley Copper
|
121.3
|
133–138
|
155–165
|
|||||||||
|
Antamina
|
100.9
|
88–92
|
90
|
|||||||||
|
Carmen de Andacollo
|
54.0
|
57–62
|
55–60
|
|||||||||
|
Quebrada Blanca(5)
|
21.1
|
7–8
|
–
|
|||||||||
|
297.3
|
285–300
|
300–315
|
||||||||||
|
Zinc(1)(2)(4)
|
||||||||||||
|
Red Dog
|
552.4
|
500–535
|
500–540
|
|||||||||
|
Antamina
|
68.3
|
100–105
|
90–100
|
|||||||||
|
Pend Oreille
|
19.4
|
–
|
–
|
|||||||||
|
640.1
|
600–640
|
590–640
|
||||||||||
|
Refined zinc
|
||||||||||||
|
Trail Operations
|
287.4
|
305–315
|
310–315
|
|||||||||
|
Bitumen (million barrels)(2)(6)
|
||||||||||||
|
Fort Hills
|
12.3
|
12–14
|
14
|
|||||||||
|
Other Products
|
||||||||||||
|
Lead(1)
|
||||||||||||
|
Red Dog
|
102.8
|
95–100
|
80–90
|
|||||||||
|
Refined lead
|
||||||||||||
|
Trail Operations
|
69.0
|
60–70
|
65–70
|
|||||||||
|
Molybdenum (million pounds)(1)(2)
|
||||||||||||
|
Highland Valley Copper
|
6.6
|
4.5–5.5
|
3.5–5.0
|
|||||||||
|
Antamina
|
1.8
|
2.0
|
2.0–3.0
|
|||||||||
|
8.4
|
6.5–7.5
|
5.5–8.0
|
||||||||||
|
Refined Silver (million ounces)
|
||||||||||||
|
Trail Operations
|
14.0
|
10–12
|
N/A
|
|||||||||
| (1) |
Metal contained in concentrate.
|
| (2) |
We include 100% of production and sales from our Quebrada Blanca and Carmen de Andacollo mines in our production and sales volumes, even though we do not own 100% of these operations, because we fully
consolidate their results in our financial statements. We include 22.5% and 21.3% of production and sales from Antamina and Fort Hills, respectively, representing our proportionate ownership interest in these operations.
|
| (3) |
Copper production includes cathode production at Quebrada Blanca and Carmen de Andacollo.
|
| (4) |
Total zinc includes co-product zinc production from our 22.5% proportionate interest in Antamina.
|
| (5) |
Excludes production from QB2 for three-year guidance 2021–2023.
|
| (6) |
The 2021–2023 bitumen production guidance does not include potential near-term debottlenecking opportunities. See energy business unit for more information.
|
|
Q4 2019
|
Q1 2020
Guidance
|
|||||||
|
Steelmaking coal (million tonnes)
|
6.3
|
4.8–5.2
|
||||||
|
Zinc (thousand tonnes)(1)
|
||||||||
|
Red Dog
|
174
|
135–140
|
||||||
|
(1)
|
Metal contained in concentrate.
|
|
(Per unit costs — CAD$/tonne)
|
2019
|
2020
Guidance |
||||||
|
Steelmaking coal(1)
|
||||||||
|
Adjusted site cost of sales(5)
|
$
|
65
|
$
|
63–67
|
||||
|
Transportation costs
|
39
|
40–43
|
||||||
|
Inventory write-down
|
1
|
–
|
||||||
|
Unit costs(5)
|
$
|
105
|
$
|
103–110
|
||||
|
Copper(2)
|
||||||||
|
Total cash unit costs(5) (US$/lb.)
|
$
|
1.68
|
$
|
1.55–1.65
|
||||
|
Net cash unit costs(3)(5) (US$/lb.)
|
$
|
1.39
|
$
|
1.25–1.35
|
||||
|
Zinc(4)
|
||||||||
|
Total cash unit costs(5) (US$/lb.)
|
$
|
0.51
|
$
|
0.55–0.60
|
||||
|
Net cash unit costs(3)(5) (US$/lb.)
|
$
|
0.34
|
$
|
0.40–0.45
|
||||
|
Energy (bitumen)
|
||||||||
|
Adjusted operating costs(5) (CAD$/barrel)
|
$
|
29.24
|
$
|
26–29
|
||||
|
(1)
|
Steelmaking coal unit costs are reported in Canadian dollars per tonne. Steelmaking coal unit cost of sales include site costs, transport costs, and other and does not include capitalized stripping or
capital expenditures. See “Use of Non-GAAP Financial Measures” section for further information and reconciliation.
|
| (2) |
Copper unit costs are reported in U.S. dollars per payable pound of metal contained in concentrate. Copper net cash unit costs include adjusted cash cost of sales and smelter processing charges, less cash
margins for by-products including co-products. Assumes a zinc price of US$1.05 per pound, a molybdenum price of US$11 per pound, a silver price of US$16.00 per ounce, a gold price of US$1,300 per ounce and a Canadian/U.S. dollar
exchange rate of $1.32. See “Use of Non-GAAP Financial Measures section” for further information and reconciliation.
|
| (3) |
After co-product and by-product margins.
|
| (4) |
Zinc unit costs are reported in U.S. dollars per payable pound of metal contained in concentrate. Zinc net cash unit costs are mine costs including adjusted cash cost of sales and smelter processing charges,
less cash margins for by-products. Assumes a lead price of US$0.90 per pound, a silver price of US$16.00 per ounce and a Canadian/U.S. dollar exchange rate of $1.32. By-products include both by-products and co-products. See “Use of
Non-GAAP Financial Measures” section for further information and reconciliation.
|
| (5) |
Non-GAAP Financial Measure. See “Use of Non-GAAP Financial Measures” section for further information.
|
|
(Teck’s share in $ millions)
|
2019
|
2020 Guidance
|
||||||
|
Sustaining
|
||||||||
|
Steelmaking coal(1)
|
$
|
403
|
$
|
475
|
||||
|
Copper
|
184
|
175
|
||||||
|
Zinc
|
138
|
160
|
||||||
|
Energy
|
45
|
100
|
||||||
|
Corporate
|
16
|
10
|
||||||
|
$
|
786
|
$
|
920
|
|||||
|
Major Enhancement
|
||||||||
|
Steelmaking coal(3)
|
$
|
347
|
$
|
530
|
||||
|
Copper
|
46
|
50
|
||||||
|
Zinc
|
90
|
15
|
||||||
|
Energy
|
105
|
50
|
||||||
|
RACE21TM (2)
|
6
|
85
|
||||||
|
$
|
594
|
$
|
730
|
|||||
|
New Mine Development
|
||||||||
|
Copper(4)
|
$
|
115
|
$
|
50
|
||||
|
Zinc
|
32
|
5
|
||||||
|
Energy
|
41
|
25
|
||||||
|
$
|
188
|
$
|
80
|
|||||
|
Total
|
||||||||
|
Steelmaking coal
|
$
|
750
|
$
|
1,005
|
||||
|
Copper
|
345
|
275
|
||||||
|
Zinc
|
260
|
180
|
||||||
|
Energy
|
191
|
175
|
||||||
|
Corporate
|
16
|
10
|
||||||
|
RACE21TM (2)
|
6
|
85
|
||||||
|
$
|
1,568
|
$
|
1,730
|
|||||
|
QB2 capital expenditures
|
1,220
|
2,420
|
||||||
|
Total before SMM/SC contributions
|
$
|
2,788
|
$
|
4,150
|
||||
|
Estimated SMM/SC contributions to capital expenditures(5)
|
(1,035
|
)
|
(660
|
)
|
||||
|
Estimated QB2 project financing draw
|
–
|
(1,760
|
)
|
|||||
|
Total Teck spend
|
$
|
1,753
|
$
|
1,730
|
||||
| (1) |
Steelmaking coal sustaining capital includes Teck’s share of water treatment capital of $290 million in 2020. 2019 includes $176 million of water treatment capital.
|
| (2) |
RACE21TM capital expenditures for 2020 include $65 million relating to steelmaking coal, $5 million relating to
copper, $5 million relating to zinc and the remainder relating to corporate projects. We also expect to spend approximately $70 million on RACE21TM for
research and innovation expenses and intangible assets in 2020.
|
| (3) |
Steelmaking coal major enhancement capital guidance includes $390 million relating to the facility upgrade at Neptune Bulk Terminals.
|
| (4) |
Copper new mine development guidance for 2020 includes early scoping studies for QB3, Zafranal, San Nicolás and Galore Creek.
|
| (5) |
Total SMM/SC contributions were $1.7 billion.
|
|
(Teck’s share in CAD$ millions)
|
2019
|
2020 Guidance
|
||||||
|
Capitalized Stripping
|
||||||||
|
Steelmaking coal
|
$
|
443
|
$
|
370
|
||||
|
Copper
|
192
|
200
|
||||||
|
Zinc
|
45
|
55
|
||||||
|
$
|
680
|
$
|
625
|
|||||
| a) |
Areas of Judgment
|
| b) |
Sources of Estimation Uncertainty
|
|
($ in millions)
|
2019
|
2018
|
||||||
|
Steelmaking coal CGU
|
$
|
289
|
$
|
–
|
||||
|
Fort Hills CGU
|
1,241
|
–
|
||||||
|
Frontier Oil Sands Project
|
1,129
|
–
|
||||||
|
Other
|
31
|
41
|
||||||
|
Total
|
$
|
2,690
|
$
|
41
|
||||
|
2019
|
2018
|
|
|
Steelmaking coal prices
|
Current price used in initial year, increased to a long-term price in 2024 of US$150 per tonne
|
Current price used in initial year, decreased to a long-term price in 2023 of US$150 per tonne
|
|
Copper prices
|
Current price used in initial year, increased to a long-term price in 2024 of US$3.00 per pound
|
Current price used in initial year, increased to a long-term price in 2023 of US$3.00 per pound
|
|
WCS oil prices
|
Current price used in initial year, increased to a long-term price in 2024 of US$50 per barrel
|
N/A
|
|
Discount rate
|
5.4%–6.0%
|
6.0%
|
|
Long-term foreign exchange rate
|
1 U.S. to 1.30 Canadian dollars
|
1 U.S. to 1.25 Canadian dollars
|
|
Inflation rate
|
2%
|
2%
|
|
($ in millions)
|
Less than
1 Year |
2–3
Years |
4–5
Years |
More than
5 Years |
Total
|
|||||||||||||||
|
Debt – Principal and interest payments
|
$
|
264
|
$
|
858
|
$
|
696
|
$
|
6,595
|
$
|
8,413
|
||||||||||
|
Leases – Principal and interest payments(1)
|
171
|
204
|
115
|
715
|
1,205
|
|||||||||||||||
|
Minimum purchase obligations(2)
|
||||||||||||||||||||
|
Concentrate, equipment, supply and other purchases
|
677
|
465
|
58
|
34
|
1,234
|
|||||||||||||||
|
Shipping and distribution
|
415
|
472
|
374
|
1,042
|
2,303
|
|||||||||||||||
|
Energy contracts
|
290
|
674
|
1,028
|
5,343
|
7,335
|
|||||||||||||||
|
NAB PILT and VIF payments(7)
|
40
|
86
|
86
|
88
|
300
|
|||||||||||||||
|
Pension funding(3)
|
24
|
–
|
–
|
–
|
24
|
|||||||||||||||
|
Other non-pension post-retirement benefits(4)
|
13
|
27
|
30
|
334
|
404
|
|||||||||||||||
|
Decommissioning and restoration provision(5)
|
90
|
203
|
101
|
1,840
|
2,234
|
|||||||||||||||
|
Other long-term liabilities(6)
|
35
|
95
|
53
|
53
|
236
|
|||||||||||||||
|
$
|
2,019
|
$
|
3,084
|
$
|
2,541
|
$
|
16,044
|
$
|
23,688
|
|||||||||||
| (1) |
We lease road and port facilities from the Alaska Industrial Development and Export Authority, through which it ships metal concentrates produced at the Red Dog mine. Minimum lease payments are US$18 million
for the next 2 years and US$6 million for the following 19 years and are subject to deferral and abatement for force majeure events.
|
| (2) |
The majority of our minimum purchase obligations are subject to continuing operations and force majeure provisions.
|
| (3) |
As at December 31, 2019, the company had a net pension asset of $259 million, based on actuarial estimates prepared on a going concern basis. The amount of minimum funding for 2020 in respect of defined
benefit pension plans is $24 million. The timing and amount of additional funding after 2020 is dependent upon future returns on plan assets, discount rates and other actuarial assumptions.
|
| (4) |
We had a discounted, actuarially determined liability of $404 million in respect of other non-pension post-retirement benefits as at December 31, 2019. Amounts shown are estimated expenditures in the
indicated years.
|
| (5) |
We accrue environmental and reclamation obligations over the life of our mining operations, and amounts shown are estimated expenditures in the indicated years at fair value, assuming credit-adjusted
risk-free discount rates between 5.03% and 6.69% and an inflation factor of 2.00%.
|
| (6) |
Other long-term liabilities include amounts for post-closure, environmental costs and other items.
|
|
(7)
|
On April 25, 2017, Teck Alaska entered into a 10-year agreement with the Northwest Arctic Borough (NAB) for payments in lieu of taxes (PILT). Payments under the agreement are based on a percentage
of land, buildings and equipment at cost less accumulated depreciation. The effective date of this agreement was January 1, 2016 and this agreement expires on December 31, 2025. On April 25, 2017, Teck Alaska entered into a
10-year agreement with the NAB for payments to a village improvement fund (VIF). Payments under the agreement are based on a percentage of earnings before income taxes, with 2017–2025 having minimum payments of $4 million and
maximum payments of $8 million. The effective date of this agreement was January 1, 2016 and this agreement expires on December 31, 2025.
|
|
(Per share amounts)
|
2019
|
2018
|
||||||
|
Earnings (loss) per share
|
$
|
(1.08
|
)
|
$
|
5.41
|
|||
|
Add (deduct):
|
||||||||
|
Asset impairments
|
3.67
|
0.05
|
||||||
|
Debt redemption or purchase loss
|
0.29
|
0.03
|
||||||
|
Debt prepayment option loss (gain)
|
(0.14
|
)
|
0.06
|
|||||
|
Gain on sale of Waneta Dam
|
–
|
(1.41
|
)
|
|||||
|
Taxes and other
|
0.03
|
(0.01
|
)
|
|||||
|
Adjusted basic earnings per share
|
$
|
2.77
|
$
|
4.13
|
||||
|
(Per share amounts)
|
2019
|
2018
|
||||||
|
Diluted earnings (loss) per share
|
$
|
(1.08
|
)
|
$
|
5.34
|
|||
|
Add (deduct):
|
||||||||
|
Asset impairments
|
3.63
|
0.05
|
||||||
|
Debt redemption or purchase loss
|
0.29
|
0.03
|
||||||
|
Debt prepayment option loss (gain)
|
(0.13
|
)
|
0.05
|
|||||
|
Gain on sale of Waneta Dam
|
–
|
(1.39
|
)
|
|||||
|
Taxes and other
|
0.04
|
(0.01
|
)
|
|||||
|
Adjusted diluted earnings per share
|
$
|
2.75
|
$
|
4.07
|
||||
|
($ in millions)
|
2019
|
2018
|
||||||
|
Profit (loss) attributable to shareholders
|
$
|
(605
|
)
|
$
|
3,107
|
|||
|
Finance expense net of finance income
|
218
|
219
|
||||||
|
Provision for income taxes
|
120
|
1,365
|
||||||
|
Depreciation and amortization
|
1,619
|
1,483
|
||||||
|
EBITDA
|
$
|
1,352
|
$
|
6,174
|
||||
|
Total debt at period end
|
$
|
4,834
|
$
|
5,519
|
||||
|
Less: cash and cash equivalents at period end
|
(1,026
|
)
|
(1,734
|
)
|
||||
|
Net debt
|
$
|
3,808
|
$
|
3,785
|
||||
|
Debt to EBITDA ratio
|
3.6
|
0.9
|
||||||
|
Net Debt to EBITDA ratio
|
2.8
|
0.6
|
||||||
|
Equity attributable to shareholders of the company
|
21,304
|
22,884
|
||||||
|
Net debt to capitalization ratio
|
0.15
|
0.13
|
||||||
|
($ in millions)
|
2019
|
2018
|
||||||
|
Profit (loss) attributable to shareholders
|
$
|
(605
|
)
|
$
|
3,107
|
|||
|
Finance expense net of finance income
|
218
|
219
|
||||||
|
Provision for income taxes
|
120
|
1,365
|
||||||
|
Depreciation and amortization
|
1,619
|
1,483
|
||||||
|
EBITDA
|
$
|
1,352
|
$
|
6,174
|
||||
|
Add (deduct):
|
||||||||
|
Asset impairments
|
2,678
|
41
|
||||||
|
Debt redemption or purchase loss
|
224
|
26
|
||||||
|
Debt prepayment option (gains) losses
|
(105
|
)
|
42
|
|||||
|
Gain on sale of Waneta Dam
|
–
|
(888
|
)
|
|||||
|
Taxes and other
|
104
|
(5
|
)
|
|||||
|
Adjusted EBITDA
|
$
|
4,253
|
$
|
5,390
|
||||
|
($ in millions)
|
2019
|
2018
|
2017
|
|||||||||
|
Gross profit
|
$
|
3,340
|
$
|
4,621
|
$
|
4,567
|
||||||
|
Depreciation and amortization
|
1,619
|
1,483
|
1,492
|
|||||||||
|
Gross profit before depreciation and amortization
|
$
|
4,959
|
$
|
6,104
|
$
|
6,059
|
||||||
|
|
||||||||||||
|
Reported as:
|
||||||||||||
|
Steelmaking coal
|
$
|
2,904
|
$
|
3,770
|
$
|
3,732
|
||||||
|
|
||||||||||||
|
Copper
|
||||||||||||
|
Highland Valley Copper
|
395
|
343
|
213
|
|||||||||
|
Antamina
|
614
|
794
|
670
|
|||||||||
|
Quebrada Blanca
|
(18
|
)
|
26
|
50
|
||||||||
|
Carmen de Andacollo
|
89
|
193
|
222
|
|||||||||
|
Other
|
–
|
(1
|
)
|
(1
|
)
|
|||||||
|
|
$
|
1,080
|
$
|
1,355
|
$
|
1,154
|
||||||
|
|
||||||||||||
|
Zinc
|
||||||||||||
|
Trail Operations
|
–
|
91
|
209
|
|||||||||
|
Red Dog
|
837
|
990
|
971
|
|||||||||
|
Pend Oreille
|
(4
|
)
|
(5
|
)
|
19
|
|||||||
|
Other
|
(2
|
)
|
9
|
(26
|
)
|
|||||||
|
|
$
|
831
|
$
|
1,085
|
$
|
1,173
|
||||||
|
|
||||||||||||
|
Energy(1)
|
$
|
144
|
$
|
(106
|
)
|
$
|
–
|
|||||
|
Gross profit before depreciation and amortization
|
$
|
4,959
|
$
|
6,104
|
$
|
6,059
|
||||||
| (1) |
Energy results for the year ended December 31, 2018 are included from June 1, 2018.
|
|
(CAD$ in millions, except where noted)
|
2019
|
2018
|
||||||
|
Cost of sales as reported
|
$
|
3,410
|
$
|
3,309
|
||||
|
Less:
|
||||||||
|
Transportation
|
(976
|
)
|
(975
|
)
|
||||
|
Depreciation and amortization
|
(792
|
)
|
(730
|
)
|
||||
|
Inventory write-downs
|
(32
|
)
|
–
|
|||||
|
Adjusted site cost of sales
|
$
|
1,610
|
$
|
1,604
|
||||
|
Tonnes sold (millions)
|
25.0
|
26.0
|
||||||
|
Per unit amounts — CAD$/tonne
|
||||||||
|
Adjusted site cost of sales
|
$
|
65
|
$
|
62
|
||||
|
Transportation
|
39
|
37
|
||||||
|
Inventory write-down
|
1
|
–
|
||||||
|
Unit costs — CAD$/tonne
|
$
|
105
|
$
|
99
|
||||
|
US$ amounts(1)
|
||||||||
|
Average exchange rate (CAD$ per US$1.00)
|
$
|
1.33
|
$
|
1.30
|
||||
|
Per unit amounts — US$/tonne
|
||||||||
|
Adjusted site cost of sales
|
$
|
49
|
$
|
47
|
||||
|
Transportation
|
29
|
29
|
||||||
|
Inventory write-down
|
1
|
–
|
||||||
|
Unit costs — US$/tonne
|
$
|
79
|
$
|
76
|
||||
| (1) |
Average period exchange rates are used to convert to US$/tonne equivalent.
|
|
(CAD$ in millions, except where noted)
|
2019
|
2018
|
||||||
|
Revenue as reported
|
$
|
2,469
|
$
|
2,714
|
||||
|
By-product revenue (A)
|
(311
|
)
|
(472
|
)
|
||||
|
Smelter processing charges (B)
|
164
|
157
|
||||||
|
Adjusted revenue
|
$
|
2,322
|
$
|
2,399
|
||||
|
Cost of sales as reported
|
$
|
1,852
|
$
|
1,837
|
||||
|
Less:
|
||||||||
|
Depreciation and amortization
|
(463
|
)
|
(478
|
)
|
||||
|
Inventory write-downs
|
(24
|
)
|
(44
|
)
|
||||
|
Labour settlement and strike costs
|
(35
|
)
|
(5
|
)
|
||||
|
By-product cost of sales (C)
|
(58
|
)
|
(61
|
)
|
||||
|
Adjusted cash cost of sales (D)
|
$
|
1,272
|
$
|
1,249
|
||||
|
Payable pounds sold (millions) (E)
|
641.7
|
622.9
|
||||||
|
Per unit amounts — CAD$/pound
|
||||||||
|
Adjusted cash cost of sales (D/E)
|
$
|
1.98
|
$
|
2.01
|
||||
|
Smelter processing charges (B/E)
|
0.26
|
0.25
|
||||||
|
Total cash unit costs — CAD$/pound
|
$
|
2.24
|
$
|
2.26
|
||||
|
Cash margins for by-products — ((A−C)/E)
|
(0.39
|
)
|
(0.66
|
)
|
||||
|
Net cash unit costs — CAD$/pound
|
$
|
1.85
|
$
|
1.60
|
||||
|
US$ amounts(1)
|
||||||||
|
Average exchange rate (CAD$ per US$1.00)
|
$
|
1.33
|
$
|
1.30
|
||||
|
Per unit amounts — US$/pound
|
||||||||
|
Adjusted cash cost of sales
|
$
|
1.49
|
$
|
1.55
|
||||
|
Smelter processing charges
|
0.19
|
0.19
|
||||||
|
Total cash unit costs — US$/pound
|
$
|
1.68
|
$
|
1.74
|
||||
|
Cash margins for by-products
|
(0.29
|
)
|
(0.51
|
)
|
||||
|
Net cash unit costs — US$/pound
|
$
|
1.39
|
$
|
1.23
|
||||
| (1) |
Average period exchange rates are used to convert to US$/pound equivalent.
|
|
(CAD$ in millions, except where noted)
|
2019
|
2018
|
||||||
|
Revenue as reported
|
$
|
2,968
|
$
|
3,094
|
||||
|
Less:
|
||||||||
|
Trail Operations revenues as reported
|
(1,829
|
)
|
(1,942
|
)
|
||||
|
Other revenues as reported
|
(8
|
)
|
(8
|
)
|
||||
|
Add back: Intra-segment revenues as reported
|
519
|
650
|
||||||
|
$
|
1,650
|
$
|
1,794
|
|||||
|
By-product revenues (A)
|
(317
|
)
|
(316
|
)
|
||||
|
Smelter processing charges (B)
|
308
|
255
|
||||||
|
Adjusted revenue
|
$
|
1,641
|
$
|
1,733
|
||||
|
Cost of sales as reported
|
$
|
2,367
|
$
|
2,225
|
||||
|
Less:
|
||||||||
|
Trail Operations cost of sales as reported
|
(1,915
|
)
|
(1,926
|
)
|
||||
|
Other costs of sales as reported
|
(10
|
)
|
1
|
|||||
|
Add back: Intra-segment purchases as reported
|
519
|
650
|
||||||
|
961
|
950
|
|||||||
|
Less:
|
||||||||
|
Depreciation and amortization
|
(144
|
)
|
(141
|
)
|
||||
|
Severance charge
|
(4
|
)
|
–
|
|||||
|
Royalty costs
|
(307
|
)
|
(328
|
)
|
||||
|
By-product cost of sales (C)
|
(75
|
)
|
(70
|
)
|
||||
|
Adjusted cash cost of sales (D)
|
$
|
431
|
$
|
411
|
||||
|
Payable pounds sold (millions) (E)
|
1,094.2
|
1,035.5
|
||||||
|
Per unit amounts — CAD$/pound
|
||||||||
|
Adjusted cash cost of sales (D/E)
|
$
|
0.40
|
$
|
0.40
|
||||
|
Smelter processing charges (B/E)
|
0.28
|
0.25
|
||||||
|
Total cash unit costs — CAD$/pound
|
$
|
0.68
|
$
|
0.65
|
||||
|
Cash margins for by-products — ((A−C)/E)
|
(0.22
|
)
|
(0.24
|
)
|
||||
|
Net cash unit costs — CAD$/pound
|
$
|
0.46
|
$
|
0.41
|
||||
|
US$ amounts(2)
|
||||||||
|
Average exchange rate (CAD$ per US$1.00)
|
$
|
1.33
|
$
|
1.30
|
||||
|
Per unit amounts — US$/pound
|
||||||||
|
Adjusted cash cost of sales
|
$
|
0.30
|
$
|
0.30
|
||||
|
Smelter processing charges
|
0.21
|
0.19
|
||||||
|
Total cash unit costs — US$/pound
|
$
|
0.51
|
$
|
0.49
|
||||
|
Cash margins for by-products
|
(0.17
|
)
|
(0.18
|
)
|
||||
|
Net cash unit costs — US$/pound
|
$
|
0.34
|
$
|
0.31
|
||||
| (1) |
Red Dog and Pend Oreille.
|
| (2) |
Average period exchange rates are used to convert to US$/pound equivalent.
|
|
(CAD$ in millions, except where noted)
|
2019
|
2018
|
||||||
|
Revenue as reported
|
$
|
975
|
$
|
407
|
||||
|
Less:
|
||||||||
|
Cost of diluent for blending
|
(322
|
)
|
(181
|
)
|
||||
|
Non-proprietary product revenue
|
(32
|
)
|
(18
|
)
|
||||
|
Add back: Crown royalties (D)
|
18
|
14
|
||||||
|
Adjusted revenue (A)
|
$
|
639
|
$
|
222
|
||||
|
Cost of sales as reported
|
$
|
965
|
$
|
572
|
||||
|
Less:
|
||||||||
|
Depreciation and amortization
|
(134
|
)
|
(59
|
)
|
||||
|
Inventory write-downs
|
–
|
(34
|
)
|
|||||
|
Cash cost of sales
|
$
|
831
|
$
|
479
|
||||
|
Less:
|
||||||||
|
Cost of diluent for blending
|
(322
|
)
|
(181
|
)
|
||||
|
Cost of non-proprietary product purchased
|
(31
|
)
|
(12
|
)
|
||||
|
Transportation costs for FRB (C)
|
(118
|
)
|
(60
|
)
|
||||
|
Operating cost adjustment(4)
|
(2
|
)
|
(3
|
)
|
||||
|
Adjusted operating costs (E)
|
$
|
358
|
$
|
223
|
||||
|
Blended bitumen barrels sold (thousands)
|
16,023
|
8,746
|
||||||
|
Less diluent barrels included in blended bitumen (thousands)
|
(3,788
|
)
|
(1,965
|
)
|
||||
|
Bitumen barrels sold (thousands) (B)
|
12,235
|
6,781
|
||||||
|
Per barrel amounts — CAD$
|
||||||||
|
Bitumen price realized (A/B)(3)
|
$
|
52.21
|
$
|
32.81
|
||||
|
Crown royalties (D/B)
|
(1.50
|
)
|
(2.04
|
)
|
||||
|
Transportation costs for FRB (C/B)
|
(9.62
|
)
|
(8.83
|
)
|
||||
|
Adjusted operating costs (E/B)
|
(29.24
|
)
|
(32.89
|
)
|
||||
|
Operating netback — CAD$ per barrel
|
$
|
11.85
|
$
|
(10.95
|
)
|
|||
| (1) |
Calculated per unit amounts may differ due to rounding.
|
| (2) |
Fort Hills financial results included from June 1, 2018.
|
| (3) |
Bitumen price realized represents the realized petroleum revenue (blended bitumen sales revenue) net of diluent expense, expressed on a per barrel basis. Blended bitumen sales revenue represents revenue from
our share of the heavy crude oil blend known as Fort Hills Reduced Carbon Life Cycle Dilbit Blend (FRB), sold at the Hardisty and U.S. Gulf Coast market hubs. FRB is comprised of bitumen produced from Fort Hills blended with purchased
diluent. The cost of blending is affected by the amount of diluent required and the cost of purchasing, transporting and blending the diluent. A portion of diluent expense is effectively recovered in the sales price of the blended
product. Diluent expense is also affected by Canadian and U.S. benchmark pricing and changes in the value of the Canadian dollar relative to the U.S. dollar.
|
| (4) |
Reflects adjustments for costs not directly attributed to the production of Fort Hills bitumen, including transportation for non-proprietary product purchased.
|
|
(CAD$ in millions, except where noted)
|
2019
|
2018
|
||||||
|
Revenue as reported
|
$
|
975
|
$
|
407
|
||||
|
Less: non-proprietary product revenue
|
(32
|
)
|
(18
|
)
|
||||
|
Add back: Crown royalties
|
18
|
14
|
||||||
|
Blended bitumen revenue (A)
|
$
|
961
|
$
|
403
|
||||
|
Blended bitumen barrels sold (thousands) (B)
|
16,023
|
8,746
|
||||||
|
Blended bitumen price realized — (CAD$/barrel) (A/B) = D(1)
|
$
|
59.97
|
$
|
46.14
|
||||
|
Average exchange rate (CAD$ per US$1.00) (C)
|
1.33
|
1.31
|
||||||
|
Blended bitumen price realized — (US$/barrel) (D/C)(1)
|
$
|
45.20
|
$
|
35.12
|
||||
| (1) |
Calculated per unit amounts may differ due to rounding.
|
| (2) |
Results for the year ended December 31, 2018 are effective from June 1, 2018.
|
|
($ in millions)
|
2019
|
2018
|
||||||||||||||||||||||||||||||
|
|
Q4
|
Q3
|
Q2
|
Q1
|
Q4
|
Q3
|
Q2
|
Q1
|
||||||||||||||||||||||||
|
Profit (loss) attributable to shareholders
|
$
|
(1,835
|
)
|
$
|
369
|
$
|
231
|
$
|
630
|
$
|
433
|
$
|
1,281
|
$
|
634
|
$
|
759
|
|||||||||||||||
|
Finance expense, net of finance income
|
46
|
56
|
62
|
54
|
58
|
74
|
48
|
39
|
||||||||||||||||||||||||
|
Provision for (recovery of) income taxes
|
(510
|
)
|
171
|
120
|
339
|
261
|
329
|
368
|
407
|
|||||||||||||||||||||||
|
Depreciation and amortization
|
415
|
436
|
395
|
373
|
400
|
380
|
353
|
350
|
||||||||||||||||||||||||
|
EBITDA (loss)
|
$
|
(1,884
|
)
|
$
|
1,032
|
$
|
808
|
$
|
1,396
|
$
|
1,152
|
$
|
2,064
|
$
|
1,403
|
$
|
1,555
|
|||||||||||||||