.3 FTI Consulting, Inc. Second Quarter 2025 Earnings Conference Call July 24, 2025
Cautionary Note About Forward-Looking Statements This presentation includes forward-looking statements within the meaning of Section 27A of the Securities Act of 1933, as amended, and Section 21E of the Securities Exchange Act of 1934, as amended, that involve uncertainties and risks. Forward-looking statements include statements concerning our plans, initiatives, projections, prospects, policies, processes and practices, objectives, goals, commitments, strategies, future events, future revenues, future results and performance, future capital allocations and expenditures, expectations, plans or intentions relating to acquisitions, share repurchases and other matters, business trends, new, or changes to, laws and regulations, including U.S. and foreign tax laws, scientific or technological developments, including relating to new and emerging technologies, such as artificial intelligence and machine learning and other information that is not historical. Forward-looking statements often contain words such as estimates, expects, anticipates, projects, plans, intends, believes, commits, aspires, forecasts, future, goal, seeks and variations of such words or similar expressions. All forward-looking statements, including, without limitation, management’s financial guidance and examination of operating trends, are based upon our historical performance and our current plans, estimates, intentions and expectations at the time we make them, and various assumptions. Our actual financial results, performance or achievements and outcomes could differ materially from those expressed in, or implied by, any forward-looking statements. Further, unaudited quarterly results are subject to normal year-end adjustments. The Company has experienced fluctuating revenues, operating income and cash flows in prior periods and expects that this will occur from time to time in the future. Other factors that could cause such differences include declines in demand for, or changes in, the mix of services and products that we offer; the mix of the geographic locations where our clients are located or where services are performed; fluctuations in the price per share of our common stock; adverse financial, real estate or other market and general economic conditions; the impact of public health crises and related events that are beyond our control, which could affect our segments, practices and the geographic regions in which we conduct business differently and adversely; and other future events, which could impact each of our segments, practices and the geographic regions in which we conduct business differently and could be outside of our control; the pace and timing of the consummation and integration of future acquisitions; the Company’s ability to realize cost savings and efficiencies; competitive and general economic conditions; retention of staff and clients; new laws and regulations or changes thereto; and other risks described under the heading Item 1A, Risk Factors in the Company’s Annual Report on Form 10-K for the year ended December 31, 2024 filed with the SEC on February 20, 2025 and in the Company’s other filings with the SEC. We are under no duty to update any of the forward-looking statements to conform such statements to actual results or events and do not intend to do so. 2
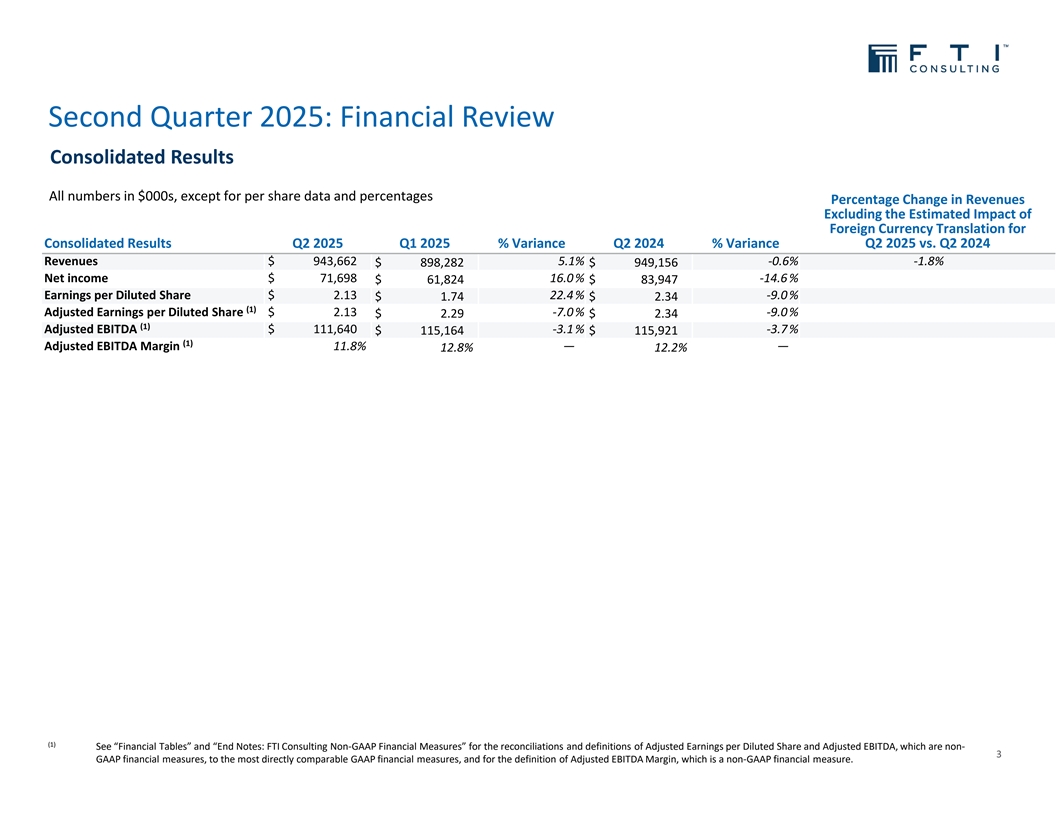
Second Quarter 2025: Financial Review Consolidated Results All numbers in $000s, except for per share data and percentages Percentage Change in Revenues Excluding the Estimated Impact of Foreign Currency Translation for Consolidated Results Q2 2025 Q1 2025 % Variance Q2 2024 % Variance Q2 2025 vs. Q2 2024 Revenues $ 943,662 5.1% -0.6% -1.8% $ 898,282 $ 949,156 Net income $ 71,698 16.0 % -14.6 % $ 61,824 $ 83,947 Earnings per Diluted Share $ 2.13 22.4 % -9.0 % $ 1.74 $ 2.34 (1) Adjusted Earnings per Diluted Share $ 2.13 -7.0 % -9.0 % $ 2.29 $ 2.34 (1) Adjusted EBITDA $ 111,640 -3.1 % -3.7 % $ 115,164 $ 115,921 (1) Adjusted EBITDA Margin 11.8% — — 12.8% 12.2% (1) See “Financial Tables” and “End Notes: FTI Consulting Non-GAAP Financial Measures” for the reconciliations and definitions of Adjusted Earnings per Diluted Share and Adjusted EBITDA, which are non- 3 GAAP financial measures, to the most directly comparable GAAP financial measures, and for the definition of Adjusted EBITDA Margin, which is a non-GAAP financial measure.
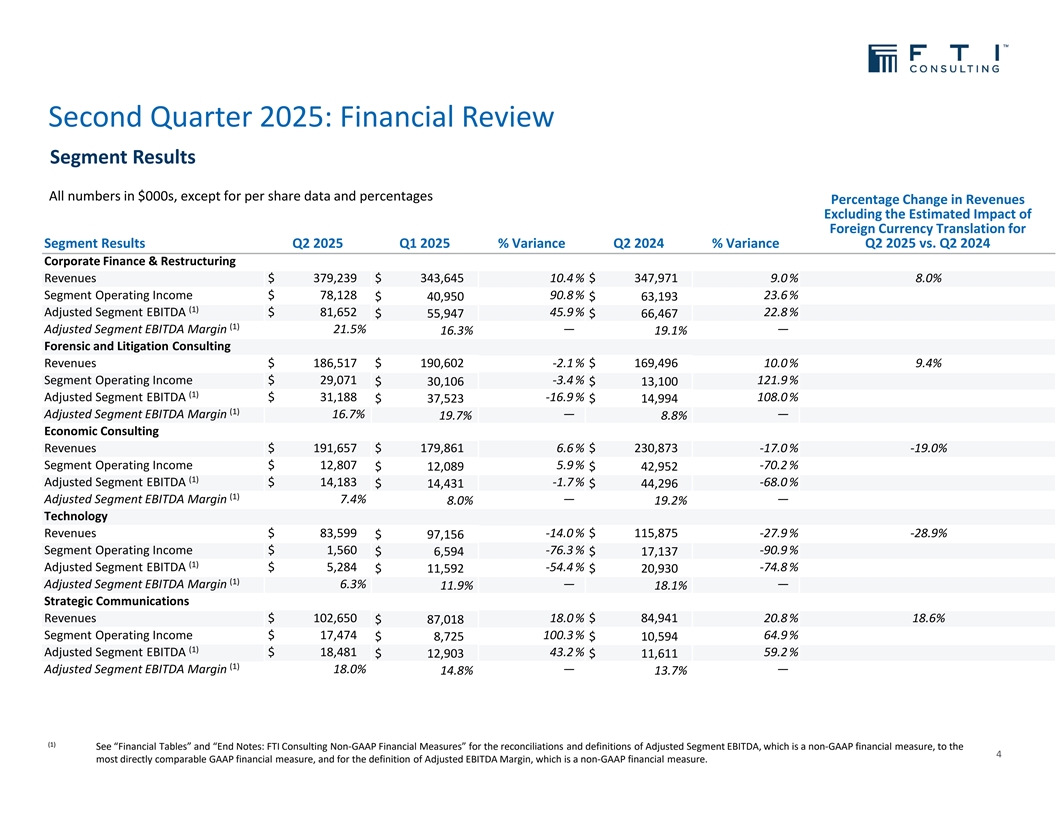
Second Quarter 2025: Financial Review Segment Results All numbers in $000s, except for per share data and percentages Percentage Change in Revenues Excluding the Estimated Impact of Foreign Currency Translation for Segment Results Q2 2025 Q1 2025 % Variance Q2 2024 % Variance Q2 2025 vs. Q2 2024 Corporate Finance & Restructuring Revenues $ 379,239 $ 343,645 10.4 % $ 347,971 9.0 % 8.0% Segment Operating Income $ 78,128 90.8 % 23.6 % $ 40,950 $ 63,193 (1) Adjusted Segment EBITDA $ 81,652 45.9 % 22.8 % $ 55,947 $ 66,467 (1) Adjusted Segment EBITDA Margin 21.5% — — 16.3% 19.1% Forensic and Litigation Consulting Revenues $ 186,517 $ 190,602 -2.1 % $ 169,496 10.0 % 9.4% Segment Operating Income $ 29,071 -3.4 % 121.9 % $ 30,106 $ 13,100 (1) Adjusted Segment EBITDA $ 31,188 -16.9 % 108.0 % $ 37,523 $ 14,994 (1) Adjusted Segment EBITDA Margin 16.7% — — 19.7% 8.8% Economic Consulting Revenues $ 191,657 $ 179,861 6.6 % $ 230,873 -17.0 % -19.0% Segment Operating Income $ 12,807 5.9 % -70.2 % $ 12,089 $ 42,952 (1) Adjusted Segment EBITDA $ 14,183 -1.7 % -68.0 % $ 14,431 $ 44,296 (1) Adjusted Segment EBITDA Margin 7.4% — — 8.0% 19.2% Technology Revenues $ 83,599 -14.0 % $ 115,875 -27.9 % -28.9% $ 97,156 Segment Operating Income $ 1,560 -76.3 % -90.9 % $ 6,594 $ 17,137 (1) Adjusted Segment EBITDA $ 5,284 -54.4 % -74.8 % $ 11,592 $ 20,930 (1) Adjusted Segment EBITDA Margin 6.3% — — 11.9% 18.1% Strategic Communications Revenues $ 102,650 18.0 % $ 84,941 20.8 % 18.6% $ 87,018 Segment Operating Income $ 17,474 100.3 % 64.9 % $ 8,725 $ 10,594 (1) Adjusted Segment EBITDA $ 18,481 43.2 % 59.2 % $ 12,903 $ 11,611 (1) Adjusted Segment EBITDA Margin 18.0% — — 14.8% 13.7% (1) See “Financial Tables” and “End Notes: FTI Consulting Non-GAAP Financial Measures” for the reconciliations and definitions of Adjusted Segment EBITDA, which is a non-GAAP financial measure, to the 4 most directly comparable GAAP financial measure, and for the definition of Adjusted EBITDA Margin, which is a non-GAAP financial measure.
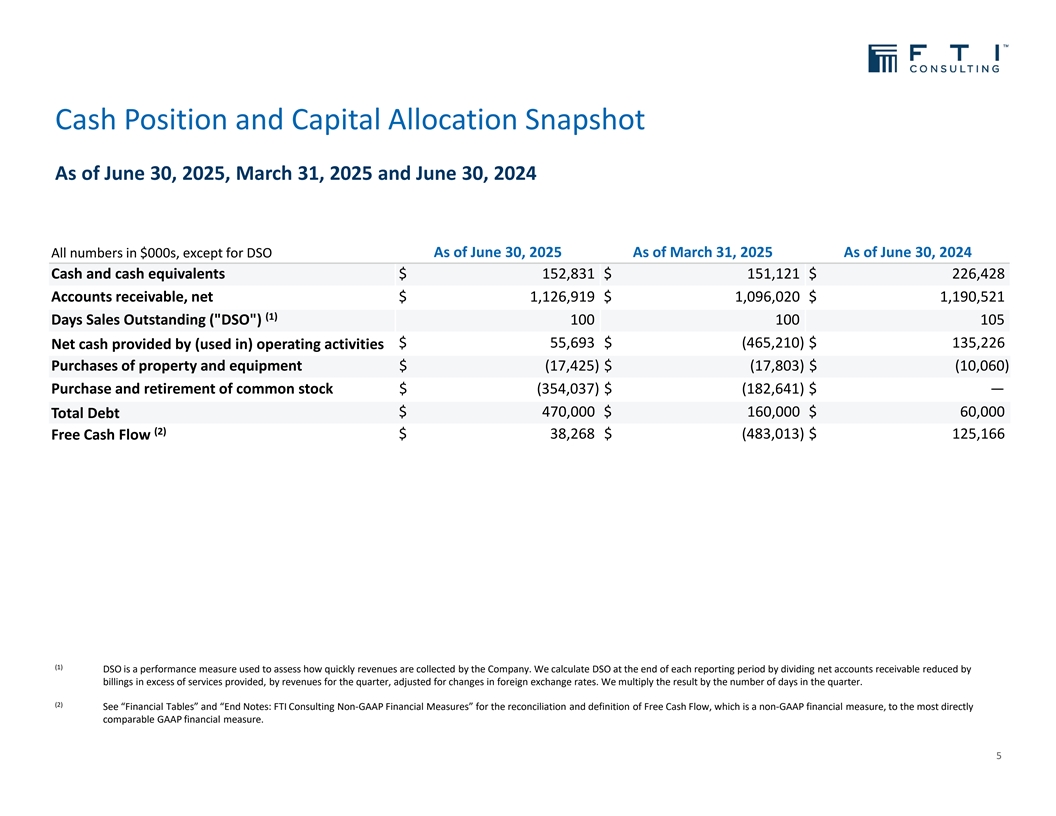
Cash Position and Capital Allocation Snapshot As of June 30, 2025, March 31, 2025 and June 30, 2024 All numbers in $000s, except for DSO As of June 30, 2025 As of March 31, 2025 As of June 30, 2024 Cash and cash equivalents $ 152,831 $ 151,121 $ 226,428 Accounts receivable, net $ 1,126,919 $ 1,096,020 $ 1,190,521 (1) Days Sales Outstanding ( DSO ) 100 100 105 $ 55,693 $ (465,210) $ 135,226 Net cash provided by (used in) operating activities Purchases of property and equipment $ (17,425) $ (17,803) $ (10,060) Purchase and retirement of common stock $ (354,037) $ (182,641) $ — $ 470,000 $ 160,000 $ 60,000 Total Debt (2) $ 38,268 $ (483,013) $ 125,166 Free Cash Flow (1) DSO is a performance measure used to assess how quickly revenues are collected by the Company. We calculate DSO at the end of each reporting period by dividing net accounts receivable reduced by billings in excess of services provided, by revenues for the quarter, adjusted for changes in foreign exchange rates. We multiply the result by the number of days in the quarter. (2) See “Financial Tables” and “End Notes: FTI Consulting Non-GAAP Financial Measures” for the reconciliation and definition of Free Cash Flow, which is a non-GAAP financial measure, to the most directly comparable GAAP financial measure. 5

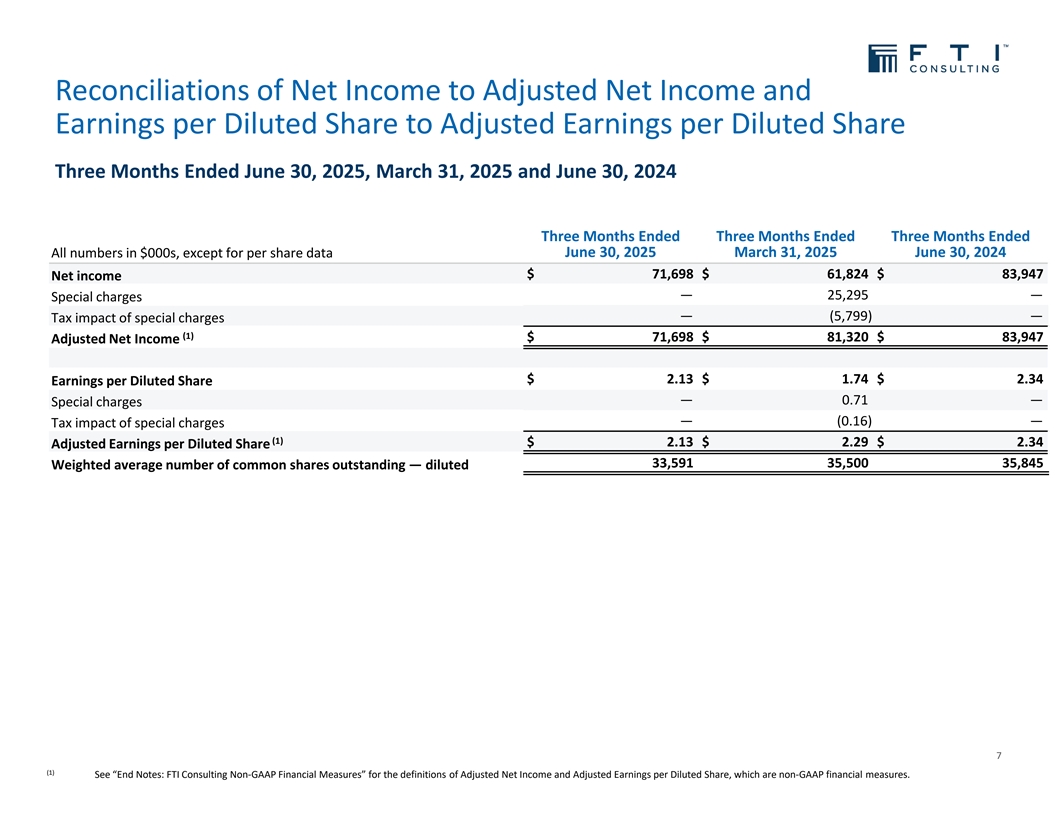
Reconciliations of Net Income to Adjusted Net Income and Earnings per Diluted Share to Adjusted Earnings per Diluted Share Three Months Ended June 30, 2025, March 31, 2025 and June 30, 2024 Three Months Ended Three Months Ended Three Months Ended All numbers in $000s, except for per share data June 30, 2025 March 31, 2025 June 30, 2024 $ 71,698 $ 61,824 $ 83,947 Net income — 25,295 — Special charges — (5,799) — Tax impact of special charges (1) $ 71,698 $ 81,320 $ 83,947 Adjusted Net Income $ 2.13 $ 1.74 $ 2.34 Earnings per Diluted Share — 0.71 — Special charges — (0.16) — Tax impact of special charges (1) $ 2.13 $ 2.29 $ 2.34 Adjusted Earnings per Diluted Share 33,591 35,500 35,845 Weighted average number of common shares outstanding — diluted 7 (1) See “End Notes: FTI Consulting Non-GAAP Financial Measures” for the definitions of Adjusted Net Income and Adjusted Earnings per Diluted Share, which are non-GAAP financial measures.
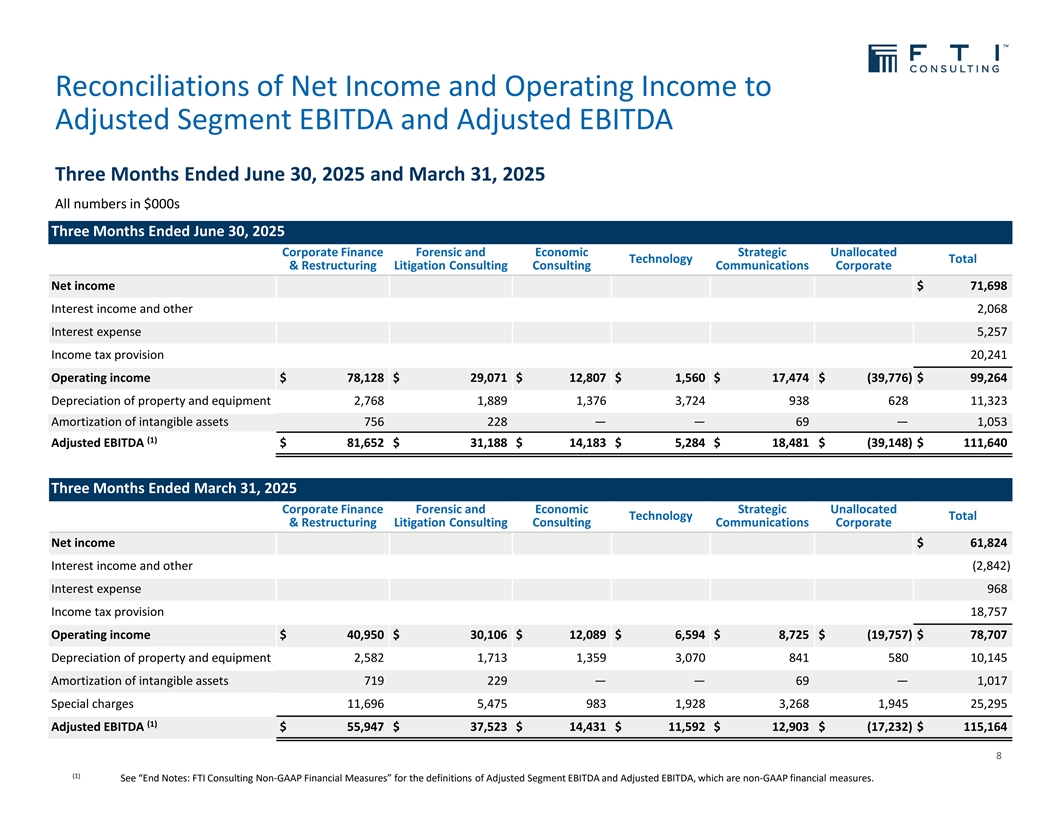
Reconciliations of Net Income and Operating Income to Adjusted Segment EBITDA and Adjusted EBITDA Three Months Ended June 30, 2025 and March 31, 2025 All numbers in $000s Three Months Ended June 30, 2025 Corporate Finance Forensic and Economic Strategic Unallocated Technology Total & Restructuring Litigation Consulting Consulting Communications Corporate Net income $ 71,698 Interest income and other 2,068 Interest expense 5,257 Income tax provision 20,241 Operating income $ 78,128 $ 29,071 $ 12,807 $ 1,560 $ 17,474 $ (39,776) $ 99,264 Depreciation of property and equipment 2,768 1,889 1,376 3,724 938 628 11,323 Amortization of intangible assets 756 228 — — 69 — 1,053 (1) Adjusted EBITDA $ 81,652 $ 31,188 $ 14,183 $ 5,284 $ 18,481 $ (39,148) $ 111,640 Three Months Ended March 31, 2025 Corporate Finance Forensic and Economic Strategic Unallocated Technology Total & Restructuring Litigation Consulting Consulting Communications Corporate Net income $ 61,824 Interest income and other (2,842) Interest expense 968 Income tax provision 18,757 Operating income $ 40,950 $ 30,106 $ 12,089 $ 6,594 $ 8,725 $ (19,757) $ 78,707 Depreciation of property and equipment 2,582 1,713 1,359 3,070 841 580 10,145 Amortization of intangible assets 719 229 — — 69 — 1,017 Special charges 11,696 5,475 983 1,928 3,268 1,945 25,295 (1) Adjusted EBITDA $ 55,947 $ 37,523 $ 14,431 $ 11,592 $ 12,903 $ (17,232) $ 115,164 8 (1) See “End Notes: FTI Consulting Non-GAAP Financial Measures” for the definitions of Adjusted Segment EBITDA and Adjusted EBITDA, which are non-GAAP financial measures.
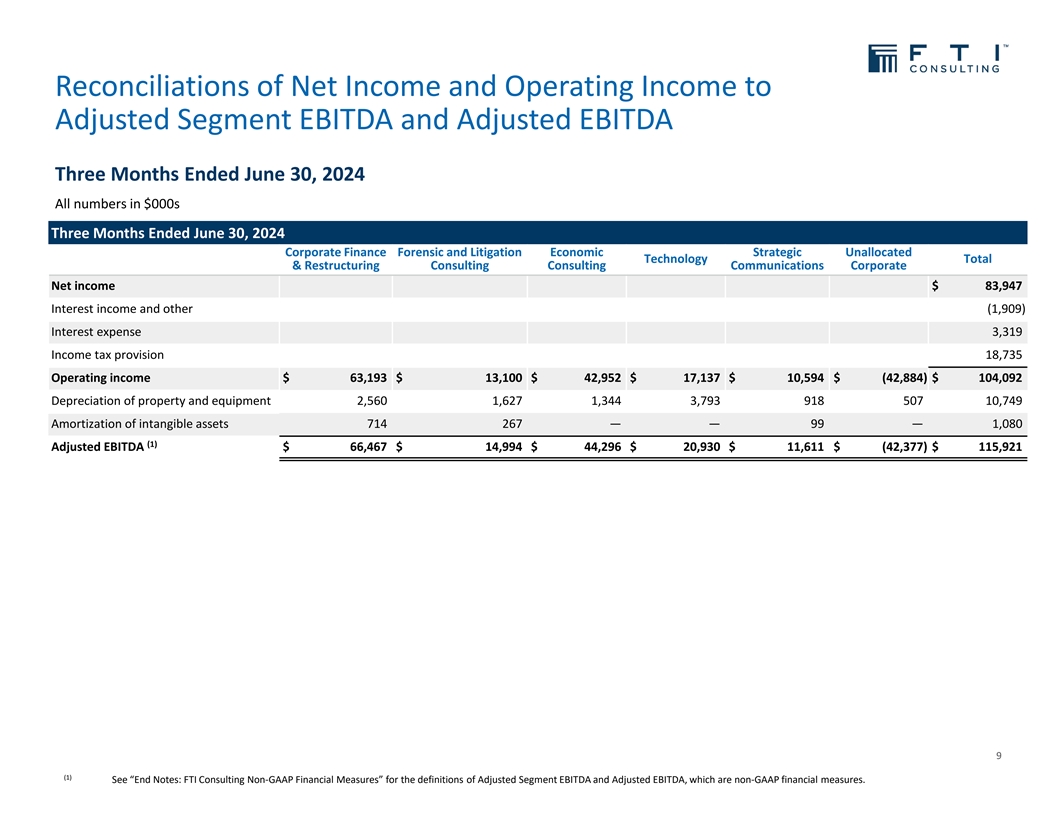
Reconciliations of Net Income and Operating Income to Adjusted Segment EBITDA and Adjusted EBITDA Three Months Ended June 30, 2024 All numbers in $000s Three Months Ended June 30, 2024 Corporate Finance Forensic and Litigation Economic Strategic Unallocated Technology Total & Restructuring Consulting Consulting Communications Corporate Net income $ 83,947 Interest income and other (1,909) Interest expense 3,319 Income tax provision 18,735 Operating income $ 63,193 $ 13,100 $ 42,952 $ 17,137 $ 10,594 $ (42,884) $ 104,092 Depreciation of property and equipment 2,560 1,627 1,344 3,793 918 507 10,749 Amortization of intangible assets 714 267 — — 99 — 1,080 (1) Adjusted EBITDA $ 66,467 $ 14,994 $ 44,296 $ 20,930 $ 11,611 $ (42,377) $ 115,921 9 (1) See “End Notes: FTI Consulting Non-GAAP Financial Measures” for the definitions of Adjusted Segment EBITDA and Adjusted EBITDA, which are non-GAAP financial measures.
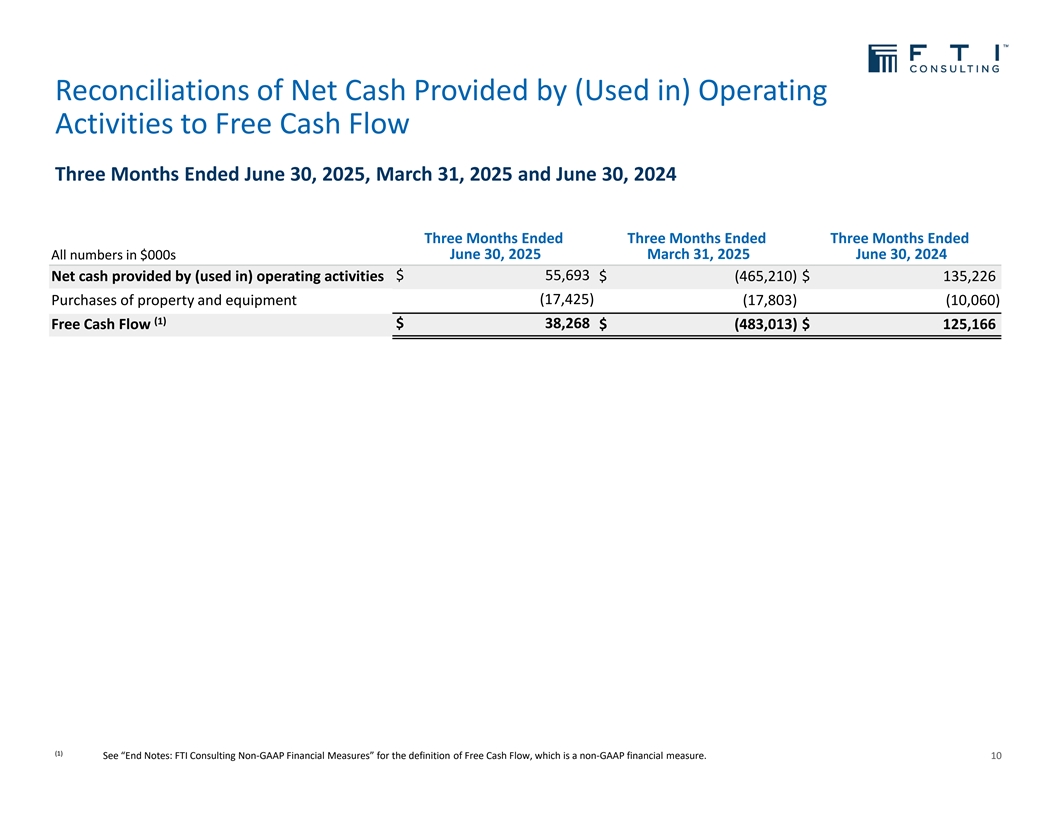
Reconciliations of Net Cash Provided by (Used in) Operating Activities to Free Cash Flow Three Months Ended June 30, 2025, March 31, 2025 and June 30, 2024 Three Months Ended Three Months Ended Three Months Ended June 30, 2025 March 31, 2025 June 30, 2024 All numbers in $000s $ 55,693 Net cash provided by (used in) operating activities $ (465,210) $ 135,226 (17,425) Purchases of property and equipment (17,803) (10,060) (1) $ 38,268 Free Cash Flow $ (483,013) $ 125,166 (1) See “End Notes: FTI Consulting Non-GAAP Financial Measures” for the definition of Free Cash Flow, which is a non-GAAP financial measure. 10
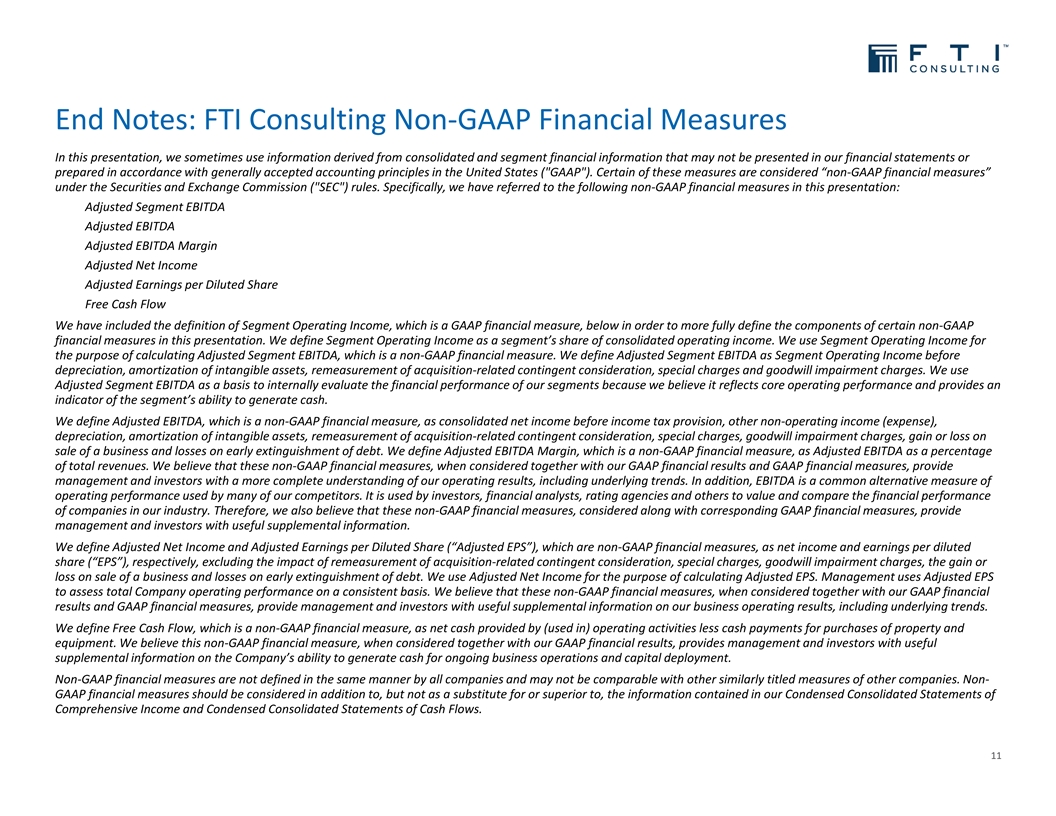
End Notes: FTI Consulting Non-GAAP Financial Measures In this presentation, we sometimes use information derived from consolidated and segment financial information that may not be presented in our financial statements or prepared in accordance with generally accepted accounting principles in the United States ( GAAP ). Certain of these measures are considered “non-GAAP financial measures” under the Securities and Exchange Commission ( SEC ) rules. Specifically, we have referred to the following non-GAAP financial measures in this presentation: Adjusted Segment EBITDA Adjusted EBITDA Adjusted EBITDA Margin Adjusted Net Income Adjusted Earnings per Diluted Share Free Cash Flow We have included the definition of Segment Operating Income, which is a GAAP financial measure, below in order to more fully define the components of certain non-GAAP financial measures in this presentation. We define Segment Operating Income as a segment’s share of consolidated operating income. We use Segment Operating Income for the purpose of calculating Adjusted Segment EBITDA, which is a non-GAAP financial measure. We define Adjusted Segment EBITDA as Segment Operating Income before depreciation, amortization of intangible assets, remeasurement of acquisition-related contingent consideration, special charges and goodwill impairment charges. We use Adjusted Segment EBITDA as a basis to internally evaluate the financial performance of our segments because we believe it reflects core operating performance and provides an indicator of the segment’s ability to generate cash. We define Adjusted EBITDA, which is a non-GAAP financial measure, as consolidated net income before income tax provision, other non-operating income (expense), depreciation, amortization of intangible assets, remeasurement of acquisition-related contingent consideration, special charges, goodwill impairment charges, gain or loss on sale of a business and losses on early extinguishment of debt. We define Adjusted EBITDA Margin, which is a non-GAAP financial measure, as Adjusted EBITDA as a percentage of total revenues. We believe that these non-GAAP financial measures, when considered together with our GAAP financial results and GAAP financial measures, provide management and investors with a more complete understanding of our operating results, including underlying trends. In addition, EBITDA is a common alternative measure of operating performance used by many of our competitors. It is used by investors, financial analysts, rating agencies and others to value and compare the financial performance of companies in our industry. Therefore, we also believe that these non-GAAP financial measures, considered along with corresponding GAAP financial measures, provide management and investors with useful supplemental information. We define Adjusted Net Income and Adjusted Earnings per Diluted Share (“Adjusted EPS”), which are non-GAAP financial measures, as net income and earnings per diluted share (“EPS”), respectively, excluding the impact of remeasurement of acquisition-related contingent consideration, special charges, goodwill impairment charges, the gain or loss on sale of a business and losses on early extinguishment of debt. We use Adjusted Net Income for the purpose of calculating Adjusted EPS. Management uses Adjusted EPS to assess total Company operating performance on a consistent basis. We believe that these non-GAAP financial measures, when considered together with our GAAP financial results and GAAP financial measures, provide management and investors with useful supplemental information on our business operating results, including underlying trends. We define Free Cash Flow, which is a non-GAAP financial measure, as net cash provided by (used in) operating activities less cash payments for purchases of property and equipment. We believe this non-GAAP financial measure, when considered together with our GAAP financial results, provides management and investors with useful supplemental information on the Company’s ability to generate cash for ongoing business operations and capital deployment. Non-GAAP financial measures are not defined in the same manner by all companies and may not be comparable with other similarly titled measures of other companies. Non- GAAP financial measures should be considered in addition to, but not as a substitute for or superior to, the information contained in our Condensed Consolidated Statements of Comprehensive Income and Condensed Consolidated Statements of Cash Flows. 11

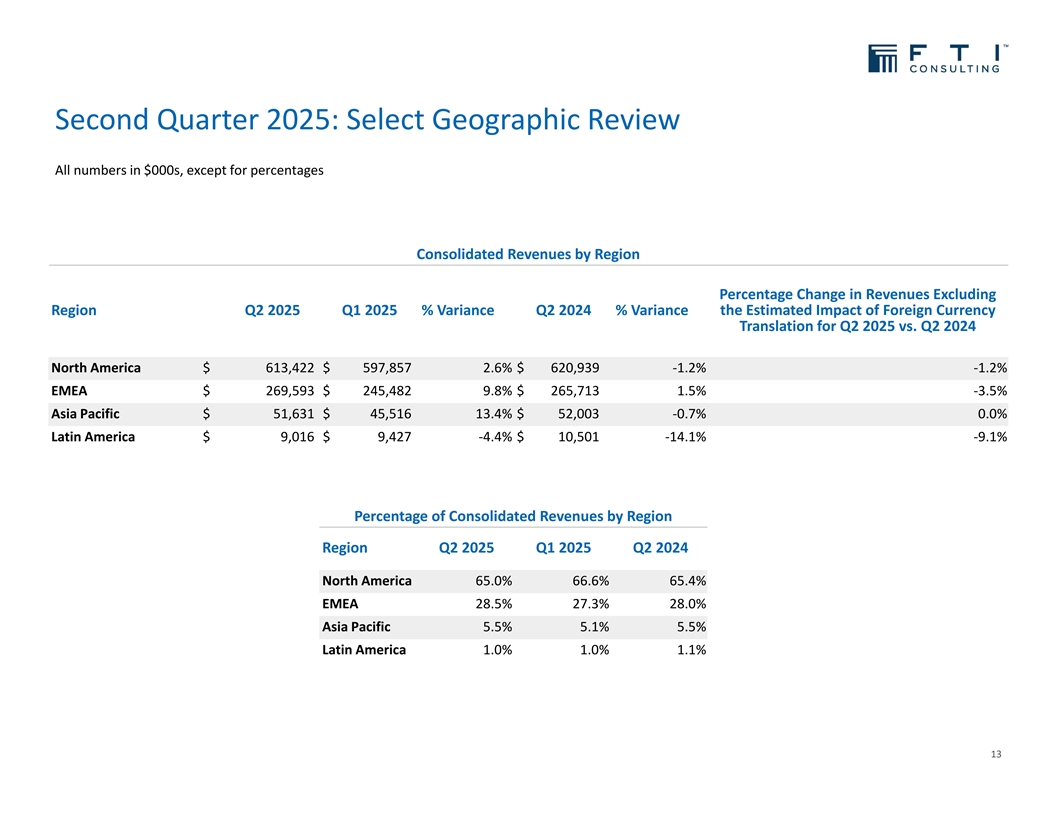
Second Quarter 2025: Select Geographic Review All numbers in $000s, except for percentages Consolidated Revenues by Region Percentage Change in Revenues Excluding the Estimated Impact of Foreign Currency Region Q2 2025 Q1 2025 % Variance Q2 2024 % Variance Translation for Q2 2025 vs. Q2 2024 North America $ 613,422 $ 597,857 2.6% $ 620,939 -1.2% -1.2% EMEA $ 269,593 $ 245,482 9.8% $ 265,713 1.5% -3.5% Asia Pacific $ 51,631 $ 45,516 13.4% $ 52,003 -0.7% 0.0% Latin America $ 9,016 $ 9,427 -4.4% $ 10,501 -14.1% -9.1% Percentage of Consolidated Revenues by Region Region Q2 2025 Q1 2025 Q2 2024 North America 65.0% 66.6% 65.4% EMEA 28.5% 27.3% 28.0% Asia Pacific 5.5% 5.1% 5.5% Latin America 1.0% 1.0% 1.1% 13

Second Quarter 2025 Select Awards & Accolades 14

TM Experts with Impact 15