.3
FTI Consulting, Inc. Fourth Quarter and Full Year 2025 Earnings Conference Call February 26, 2026
.3
FTI Consulting, Inc. Fourth Quarter and Full Year 2025 Earnings Conference Call February 26, 2026
Cautionary Note About Forward-Looking Statements This presentation includes “forward-looking statements” within the meaning of Section 27A of the Securities Act of 1933, as amended, and Section 21E of the Securities Exchange Act of 1934, as amended. All statements other than statements of historical fact, including among other things, statements about future events, anticipated growth, industry prospects, our future results of operations and financial position, business strategy and plans and objectives of management for future operations, are forward-looking statements. Forward-looking statements often contain words such as “may,” “might,” “will,” “should,” “could,” “would,” “estimates,” “expects,” “anticipates,” “projects,” “plans,” “intends,” “believes,” “commits,” “aspires,” “forecasts,” “future,” “goal,” “seeks” and variations of such words or similar expressions. There are a number of risks, uncertainties and other factors that could cause our actual results to differ materially from the forward-looking statements contained in, or implied by, this presentation. Although we believe that the expectations and assumptions reflected in these forward-looking statements are reasonable, we can provide no assurance that these expectations and assumptions will prove to be correct. These forward-looking statements relate to future events, results and outcomes, are inherently uncertain and involve known and unknown risks, uncertainties and other factors that may cause our actual results and outcomes, and the timing of our results and outcomes, to differ materially from those expressed or implied by these forward-looking statements. Moreover, we operate in a very competitive and rapidly changing environment, and new risks emerge from time to time. It is not possible for our management to predict all risks, nor can we assess the impact of all factors on our business or the extent to which any factor, or combination of factors, may cause actual results or outcomes to differ materially from those contained in any forward-looking statements. Important factors that could cause our actual results or outcomes to differ materially from the forward-looking statements we make in this presentation include those set forth under the heading “Risk Factors” in Part I, Item 1A in the Company’s Annual Report on Form 10-K for the year ended December 31, 2025 filed with the SEC on February 26, 2026 as well as in other information that we file with the SEC from time to time. All forward-looking statements are presented as of the date of this presentation and are expressly qualified in their entirety by the cautionary statements included herein. Except as required by law, we undertake no obligation to publicly update or revise any forward-looking statement for any reason. 2
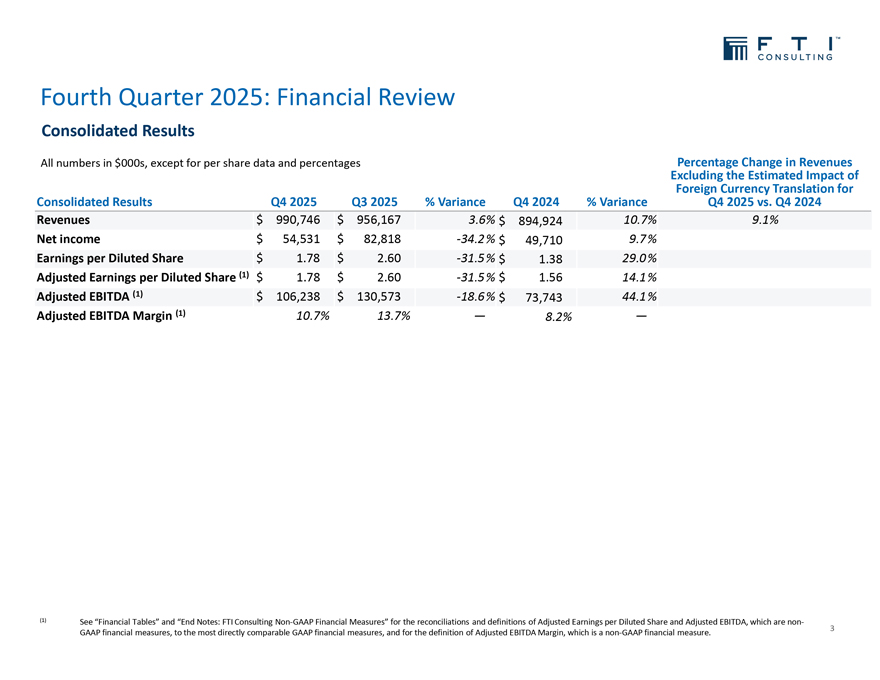
Fourth Quarter 2025: Financial Review Consolidated Results ues Excluding Foreign Currency the Estimated Translation Impact Consolidated Results Q4 2025 Q3 2025 % Variance Q4 2024 % Variance Q4 2025 vs. Q4 2024 Revenues $ 990,746 $ 956,167 3.6% $ 894,924 10.7% 9.1% Net income $ 54,531 $ 82,818 -34.2% $ 49,710 9.7%Earnings per Diluted Share $ 1.78 $ 2.60 -31.5% $ 1.38 29.0% Adjusted Earnings per Diluted Share (1) $ 1.78 $ 2.60 -31.5% $ 1.56 14.1%Adjusted EBITDA (1) $ 106,238 $ 130,573 -18.6% $ 73,743 44.1%Adjusted EBITDA Margin (1) 10.7% 13.7% — 8.2% —(1) See “Financial Tables” and “End Notes: FTI Consulting Non-GAAP Financial Measures” for the reconciliations and definitions of Adjusted Earnings per Diluted Share and Adjusted EBITDA, which are non- 3 GAAP financial measures, to the most directly comparable GAAP financial measures, and for the definition of Adjusted EBITDA Margin, which is a non-GAAP financial measure.
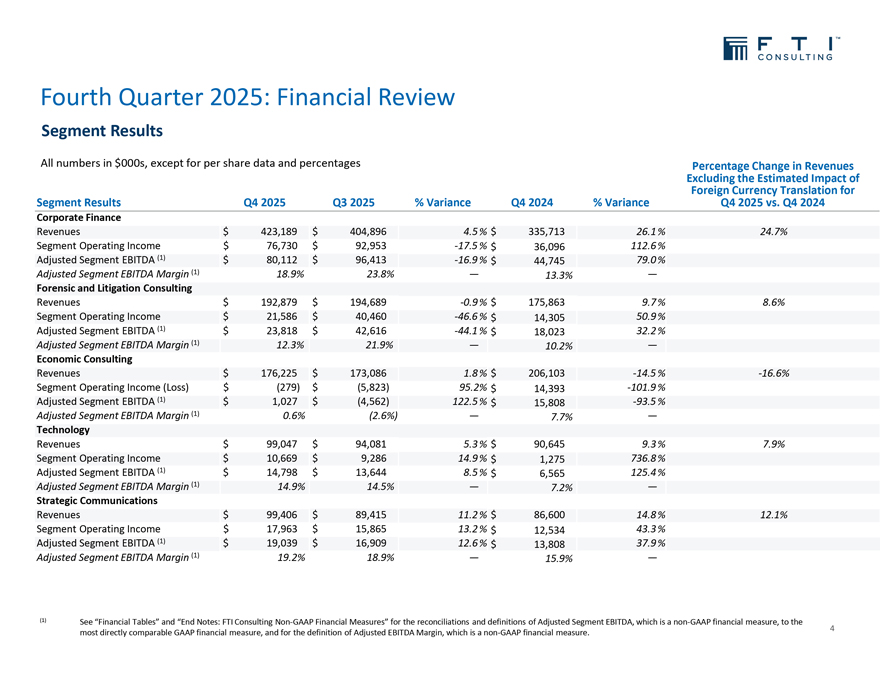
Fourth Quarter 2025: Financial Review Segment Results nues Excluding the Estimated Impact of Foreign Currency Translation for Segment Results Q4 2025 Q3 2025 % Variance Q4 2024 % Variance Q4 2025 vs. Q4 2024 Corporate Finance Revenues $ 423,189 $ 404,896 4.5% $ 335,713 26.1% 24.7% Segment Operating Income $ 76,730 $ 92,953 -17.5 % $ 36,096 112.6% Adjusted Segment EBITDA (1) $ 80,112 $ 96,413 -16.9 % $ 44,745 79.0% Adjusted Segment EBITDA Margin (1) 18.9% 23.8% — 13.3% — Forensic and Litigation Consulting Revenues $ 192,879 $ 194,689 -0.9% $ 175,863 9.7% 8.6% Segment Operating Income $ 21,586 $ 40,460 -46.6 % $ 14,305 50.9% Adjusted Segment EBITDA (1) $ 23,818 $ 42,616 -44.1 % $ 18,023 32.2% Adjusted Segment EBITDA Margin (1) 12.3% 21.9% — 10.2% — Economic Consulting Revenues $ 176,225 $ 173,086 1.8% $ 206,103 -14.5 % -16.6% Segment Operating Income (Loss) $ (279) $ (5,823) 95.2% $ 14,393 -101.9 % Adjusted Segment EBITDA (1) $ 1,027 $ (4,562) 122.5% $ 15,808 -93.5 % Adjusted Segment EBITDA Margin (1) 0.6% (2.6%) — 7.7% — Technology Revenues $ 99,047 $ 94,081 5.3% $ 90,645 9.3% 7.9% Segment Operating Income $ 10,669 $ 9,286 14.9% $ 1,275 736.8% Adjusted Segment EBITDA (1) $ 14,798 $ 13,644 8.5% $ 6,565 125.4% Adjusted Segment EBITDA Margin (1) 14.9% 14.5% — 7.2% — Strategic Communications Revenues $ 99,406 $ 89,415 11.2% $ 86,600 14.8% 12.1% Segment Operating Income $ 17,963 $ 15,865 13.2% $ 12,534 43.3% Adjusted Segment EBITDA (1) $ 19,039 $ 16,909 12.6% $ 13,808 37.9% Adjusted Segment EBITDA Margin (1) 19.2% 18.9% — 15.9% — (1) See “Financial Tables” and “End Notes: FTI Consulting Non-GAAP Financial Measures” for the reconciliations and definitions of Adjusted Segment EBITDA, which is a non-GAAP financial measure, to the 4 most directly comparable GAAP financial measure, and for the definition of Adjusted EBITDA Margin, which is a non-GAAP financial measure.
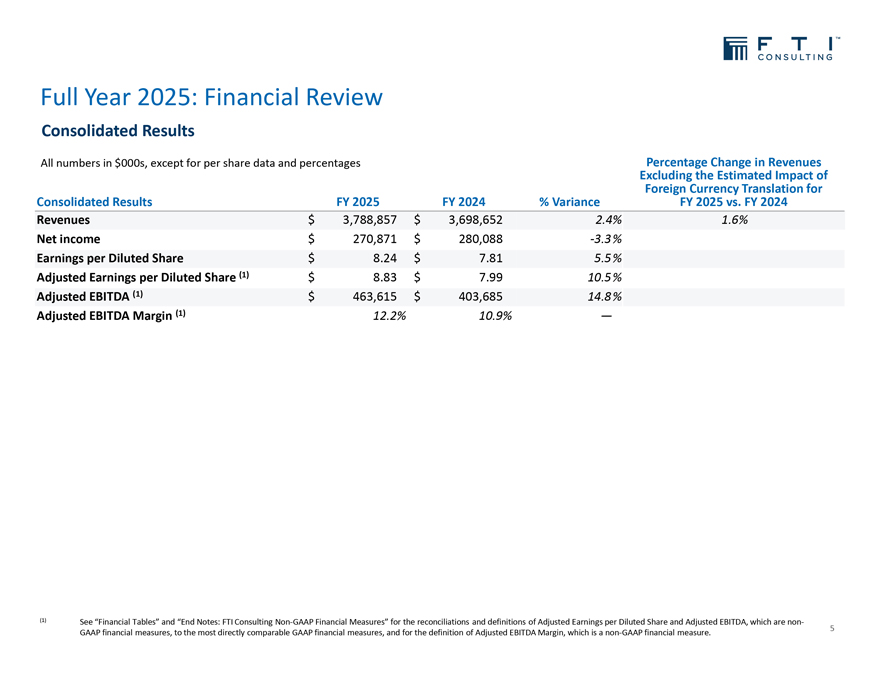
Full Year 2025: Financial Review Consolidated Results Excluding Foreign Currency the Estimated Translation Impact for of Consolidated Results FY 2025 FY 2024 % Variance FY 2025 vs. FY 2024 Revenues $ 3,788,857 $ 3,698,652 2.4% 1.6% Net income $ 270,871 $ 280,088 -3.3% Earnings per Diluted Share $ 8.24 $ 7.81 5.5% Adjusted Earnings per Diluted Share (1) $ 8.83 $ 7.99 10.5% Adjusted EBITDA (1) $ 463,615 $ 403,685 14.8% Adjusted EBITDA Margin (1) 12.2% 10.9% — (1) See “Financial Tables” and “End Notes: FTI Consulting Non-GAAP Financial Measures” for the reconciliations and definitions of Adjusted Earnings per Diluted Share and Adjusted EBITDA, which are non- 5 GAAP financial measures, to the most directly comparable GAAP financial measures, and for the definition of Adjusted EBITDA Margin, which is a non-GAAP financial measure.
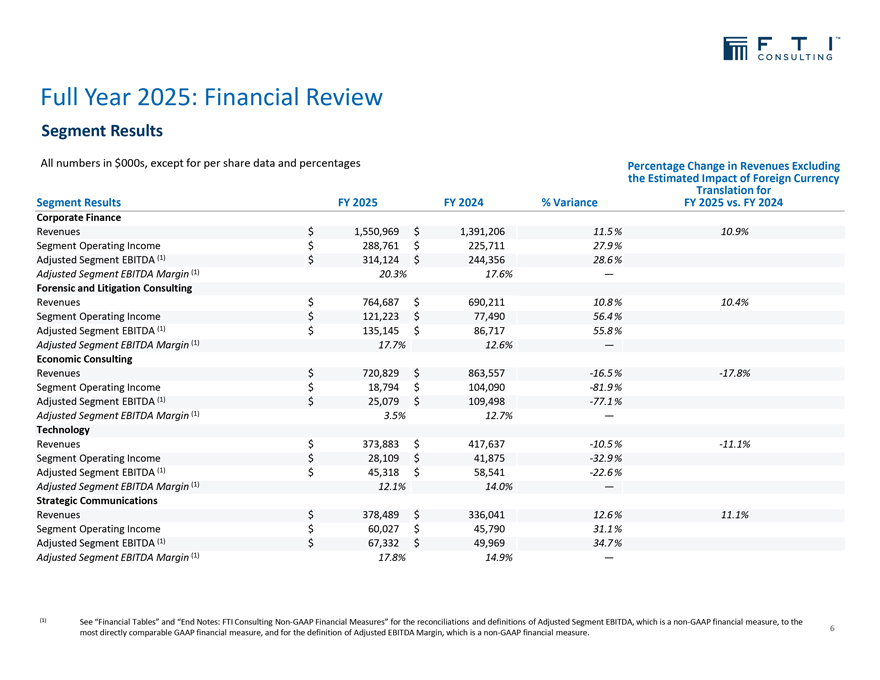
Full Year 2025: Financial Review Segment Results ng the Estimated Impact of Foreign Currency Translation for Segment Results FY 2025 FY 2024 % Variance FY 2025 vs. FY 2024 Corporate Finance Revenues $ 1,550,969 $ 1,391,206 11.5% 10.9% Segment Operating Income $ 288,761 $ 225,711 27.9% Adjusted Segment EBITDA (1) $ 314,124 $ 244,356 28.6% Adjusted Segment EBITDA Margin (1) 20.3% 17.6% — Forensic and Litigation Consulting Revenues $ 764,687 $ 690,211 10.8% 10.4% Segment Operating Income $ 121,223 $ 77,490 56.4% Adjusted Segment EBITDA (1) $ 135,145 $ 86,717 55.8% Adjusted Segment EBITDA Margin (1) 17.7% 12.6% — Economic Consulting Revenues $ 720,829 $ 863,557 -16.5 % -17.8% Segment Operating Income $ 18,794 $ 104,090 -81.9 % Adjusted Segment EBITDA (1) $ 25,079 $ 109,498 -77.1 % Adjusted Segment EBITDA Margin (1) 3.5% 12.7% — Technology Revenues $ 373,883 $ 417,637 -10.5 % -11.1% Segment Operating Income $ 28,109 $ 41,875 -32.9 % Adjusted Segment EBITDA (1) $ 45,318 $ 58,541 -22.6 % Adjusted Segment EBITDA Margin (1) 12.1% 14.0% — Strategic Communications Revenues $ 378,489 $ 336,041 12.6% 11.1% Segment Operating Income $ 60,027 $ 45,790 31.1% Adjusted Segment EBITDA (1) $ 67,332 $ 49,969 34.7% Adjusted Segment EBITDA Margin (1) 17.8% 14.9% — (1) See “Financial Tables” and “End Notes: FTI Consulting Non-GAAP Financial Measures” for the reconciliations and definitions of Adjusted Segment EBITDA, which is a non-GAAP financial measure, to the 6 most directly comparable GAAP financial measure, and for the definition of Adjusted EBITDA Margin, which is a non-GAAP financial measure.
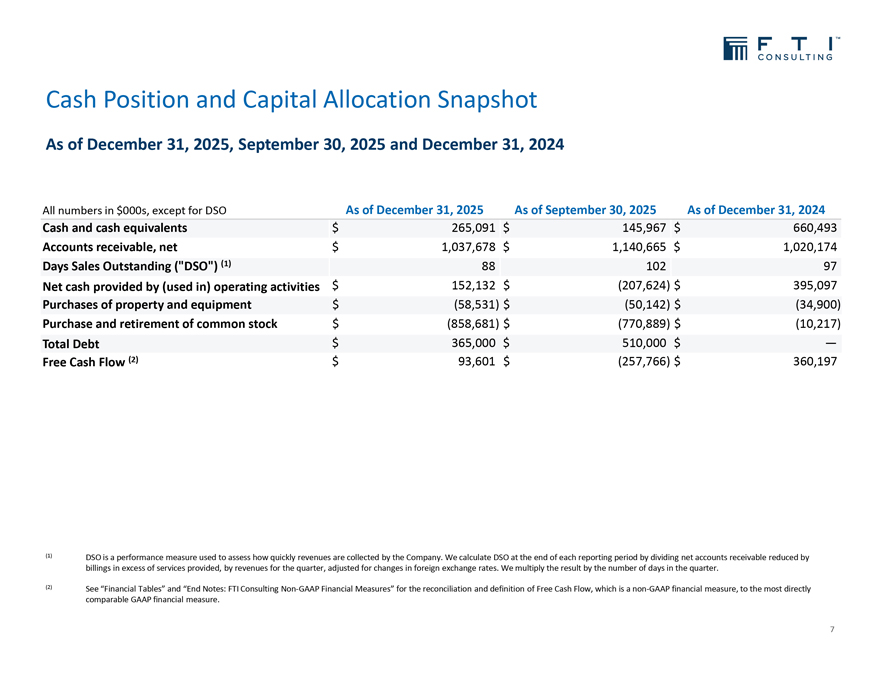
Cash Position and Capital Allocation Snapshot As of December 31, 2025, September 30, 2025 and December 31, 2024 All numbers in $000s, except for DSO As of December 31, 2025 As of September 30, 2025 As of December 31, 2024 Cash and cash equivalents $ 265,091 $ 145,967 $ 660,493 Accounts receivable, net $ 1,037,678 $ 1,140,665 $ 1,020,174 Days Sales Outstanding (“DSO”) (1) 88 102 97 Net cash provided by (used in) operating activities $ 152,132 $ (207,624) $ 395,097 Purchases of property and equipment $ (58,531) $ (50,142) $ (34,900) Purchase and retirement of common stock $ (858,681) $ (770,889) $ (10,217) Total Debt $ 365,000 $ 510,000 $ —Free Cash Flow (2) $ 93,601 $ (257,766) $ 360,197 (1) DSO is a performance measure used to assess how quickly revenues are collected by the Company. We calculate DSO at the end of each reporting period by dividing net accounts receivable reduced by billings in excess of services provided, by revenues for the quarter, adjusted for changes in foreign exchange rates. We multiply the result by the number of days in the quarter. (2) See “Financial Tables” and “End Notes: FTI Consulting Non-GAAP Financial Measures” for the reconciliation and definition of Free Cash Flow, which is a non-GAAP financial measure, to the most directly comparable GAAP financial measure. 7

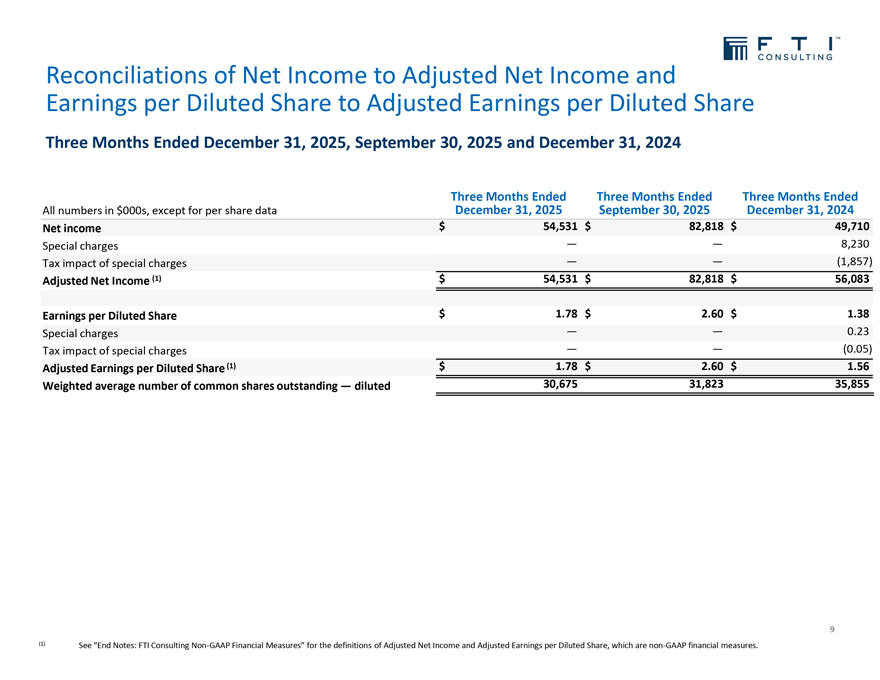
Reconciliations Earnings per Diluted of Net Share Income to Adjusted to Adjusted Earnings Net Income per Diluted and Share Three Months Ended December 31, 2025, September 30, 2025 and December 31, 2024 Three Months Ended Three Months Ended Three Months Ended All numbers in $000s, except for per share data December 31, 2025 September 30, 2025 December 31, 2024 Net income $ 54,531 $ 82,818 $ 49,710 Special charges — — 8,230 Tax impact of special charges — — (1,857) Adjusted Net Income (1) $ 54,531 $ 82,818 $ 56,083 Earnings per Diluted Share $ 1.78 $ 2.60 $ 1.38 Special charges — — 0.23 Tax impact of special charges — — (0.05) Adjusted Earnings per Diluted Share (1) $ 1.78 $ 2.60 $ 1.56 Weighted average number of common shares outstanding — diluted 30,675 31,823 35,855 9 (1) See “End Notes: FTI Consulting Non-GAAP Financial Measures” for the definitions of Adjusted Net Income and Adjusted Earnings per Diluted Share, which are non-GAAP financial measures.
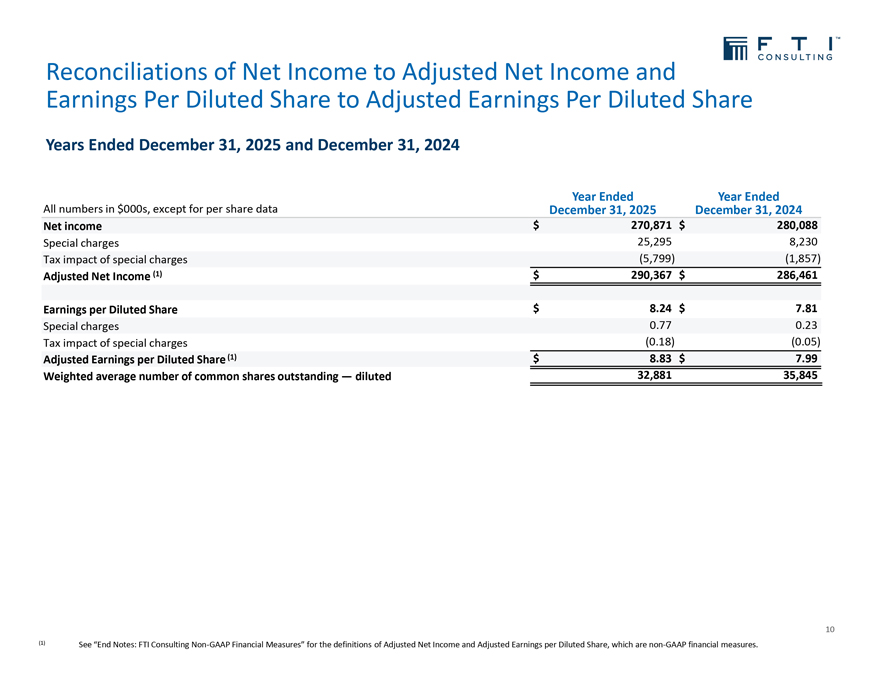
Reconciliations Earnings Per Diluted of Net Share Income to Adjusted to Adjusted Earnings Net Income Per Diluted and Share Years Ended December 31, 2025 and December 31, 2024 Year Ended Year Ended All numbers in $000s, except for per share data December 31, 2025 December 31, 2024 Net income $ 270,871 $ 280,088 Special charges 25,295 8,230 Tax impact of special charges (5,799) (1,857) Adjusted Net Income (1) $ 290,367 $ 286,461 Earnings per Diluted Share $ 8.24 $ 7.81 Special charges 0.77 0.23 Tax impact of special charges (0.18) (0.05) Adjusted Earnings per Diluted Share (1) $ 8.83 $ 7.99 Weighted average number of common shares outstanding — diluted 32,881 35,845 10 (1) See “End Notes: FTI Consulting Non-GAAP Financial Measures” for the definitions of Adjusted Net Income and Adjusted Earnings per Diluted Share, which are non-GAAP financial measures.
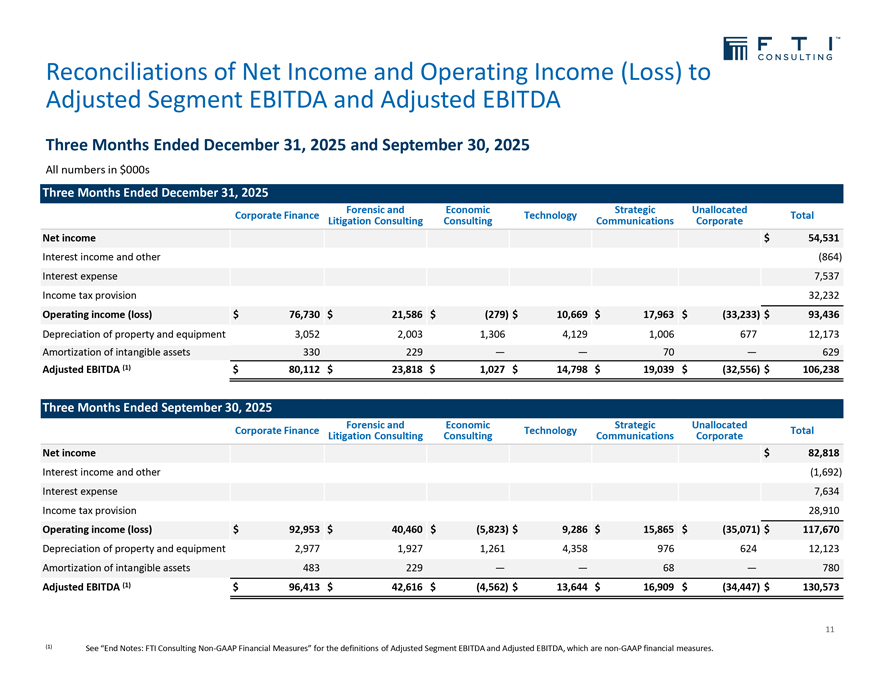
Adjusted Reconciliations Segment of Net EBITDA Income and and Adjusted Operating EBITDA Income (Loss) to Three Months Ended December 31, 2025 and September 30, 2025 All numbers in $000s Three Months Ended December 31, 2025 Corporate Finance Litigation Forensic Consulting and Consulting Economic Technology Communications Strategic Unallocated Corporate Total Net income $ 54,531 Interest income and other (864) Interest expense 7,537 Income tax provision 32,232 Operating income (loss) $ 76,730 $ 21,586 $ (279) $ 10,669 $ 17,963 $ (33,233) $ 93,436 Depreciation of property and equipment 3,052 2,003 1,306 4,129 1,006 677 12,173 Amortization of intangible assets 330 229 — — 70 — 629 Adjusted EBITDA (1) $ 80,112 $ 23,818 $ 1,027 $ 14,798 $ 19,039 $ (32,556) $ 106,238 Three Months Ended September 30, 2025 Corporate Finance Litigation Forensic Consulting and Consulting Economic Technology Communications Strategic Unallocated Corporate Total Net income $ 82,818 Interest income and other (1,692) Interest expense 7,634 Income tax provision 28,910 Operating income (loss) $ 92,953 $ 40,460 $ (5,823) $ 9,286 $ 15,865 $ (35,071) $ 117,670 Depreciation of property and equipment 2,977 1,927 1,261 4,358 976 624 12,123 Amortization of intangible assets 483 229 — — 68 — 780 Adjusted EBITDA (1) $ 96,413 $ 42,616 $ (4,562) $ 13,644 $ 16,909 $ (34,447) $ 130,573 11 (1) See “End Notes: FTI Consulting Non-GAAP Financial Measures” for the definitions of Adjusted Segment EBITDA and Adjusted EBITDA, which are non-GAAP financial measures.
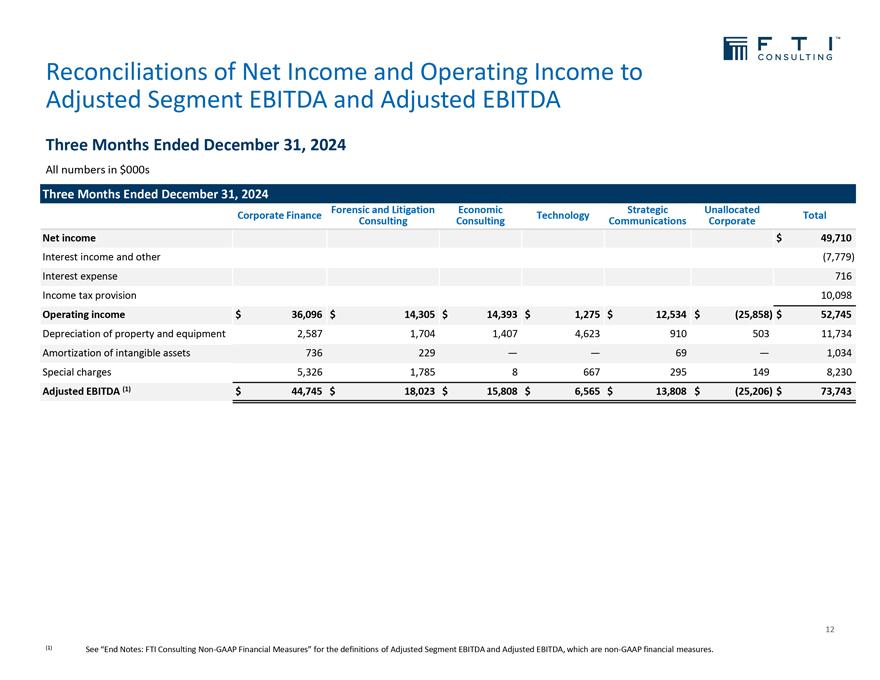
Adjusted Reconciliations Segment of Net EBITDA Income and and Adjusted Operating EBITDA Income to Three Months Ended December 31, 2024 All numbers in $000s Three Months Ended December 31, 2024 Corporate Finance Forensic Consulting and Litigation Consulting Economic Technology Communications Strategic Unallocated Corporate Total Net income $ 49,710 Interest income and other (7,779) Interest expense 716 Income tax provision 10,098 Operating income $ 36,096 $ 14,305 $ 14,393 $ 1,275 $ 12,534 $ (25,858) $ 52,745 Depreciation of property and equipment 2,587 1,704 1,407 4,623 910 503 11,734 Amortization of intangible assets 736 229 — — 69 — 1,034 Special charges 5,326 1,785 8 667 295 149 8,230 Adjusted EBITDA (1) $ 44,745 $ 18,023 $ 15,808 $ 6,565 $ 13,808 $ (25,206) $ 73,743 12 (1) See “End Notes: FTI Consulting Non-GAAP Financial Measures” for the definitions of Adjusted Segment EBITDA and Adjusted EBITDA, which are non-GAAP financial measures.
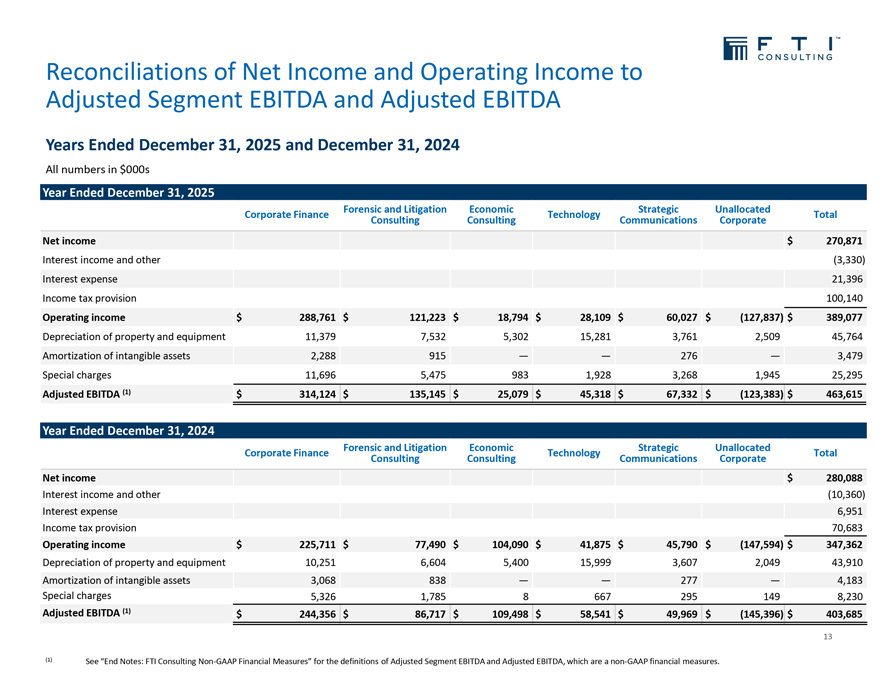
Adjusted Reconciliations Segment of Net EBITDA Income and and Adjusted Operating EBITDA Income to Years Ended December 31, 2025 and December 31, 2024 All numbers in $000s Year Ended December 31, 2025 Corporate Finance Forensic Consulting and Litigation Consulting Economic Technology Communications Strategic Unallocated Corporate Total Net income $ 270,871 Interest income and other (3,330) Interest expense 21,396 Income tax provision 100,140 Operating income $ 288,761 $ 121,223 $ 18,794 $ 28,109 $ 60,027 $ (127,837) $ 389,077 Depreciation of property and equipment 11,379 7,532 5,302 15,281 3,761 2,509 45,764 Amortization of intangible assets 2,288 915 — — 276 — 3,479 Special charges 11,696 5,475 983 1,928 3,268 1,945 25,295 Adjusted EBITDA (1) $ 314,124 $ 135,145 $ 25,079 $ 45,318 $ 67,332 $ (123,383) $ 463,615 Year Ended December 31, 2024 Corporate Finance Forensic Consulting and Litigation Consulting Economic Technology Communications Strategic Unallocated Corporate Total Net income $ 280,088 Interest income and other (10,360) Interest expense 6,951 Income tax provision 70,683 Operating income $ 225,711 $ 77,490 $ 104,090 $ 41,875 $ 45,790 $ (147,594) $ 347,362 Depreciation of property and equipment 10,251 6,604 5,400 15,999 3,607 2,049 43,910 Amortization of intangible assets 3,068 838 — — 277 — 4,183 Special charges 5,326 1,785 8 667 295 149 8,230 Adjusted EBITDA (1) $ 244,356 $ 86,717 $ 109,498 $ 58,541 $ 49,969 $ (145,396) $ 403,685 13 (1) See “End Notes: FTI Consulting Non-GAAP Financial Measures” for the definitions of Adjusted Segment EBITDA and Adjusted EBITDA, which are a non-GAAP financial measures.
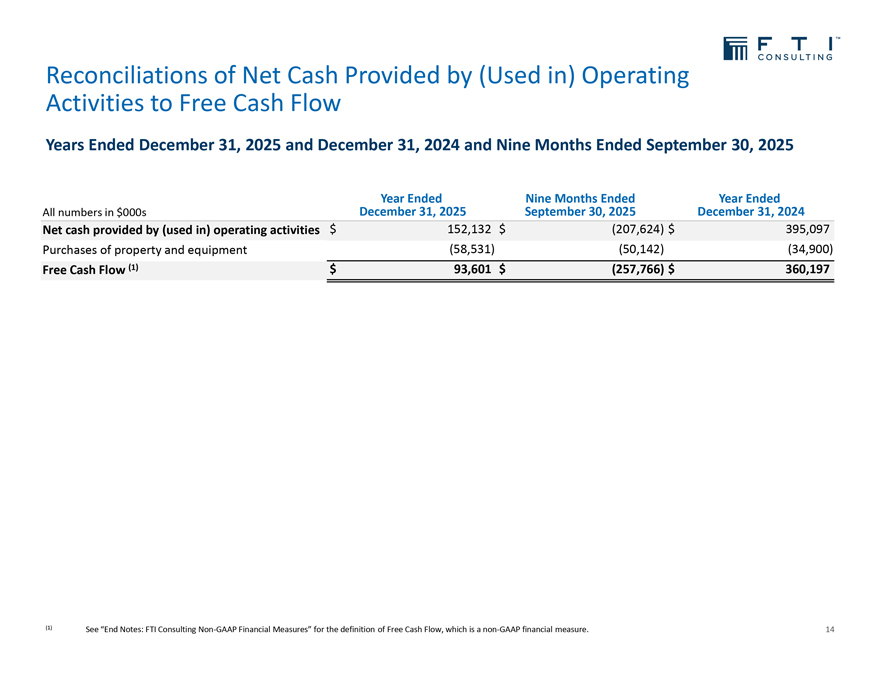
Activities Reconciliations to Free of Cash Net Cash Flow Provided by (Used in) Operating Years Ended December 31, 2025 and December 31, 2024 and Nine Months Ended September 30, 2025 Year Ended Nine Months Ended Year Ended All numbers in $000s December 31, 2025 September 30, 2025 December 31, 2024 Net cash provided by (used in) operating activities $ 152,132 $ (207,624) $ 395,097 Purchases of property and equipment (58,531) (50,142) (34,900) Free Cash Flow (1) $ 93,601 $ (257,766) $ 360,197 (1) See “End Notes: FTI Consulting Non-GAAP Financial Measures” for the definition of Free Cash Flow, which is a non-GAAP financial measure. 14
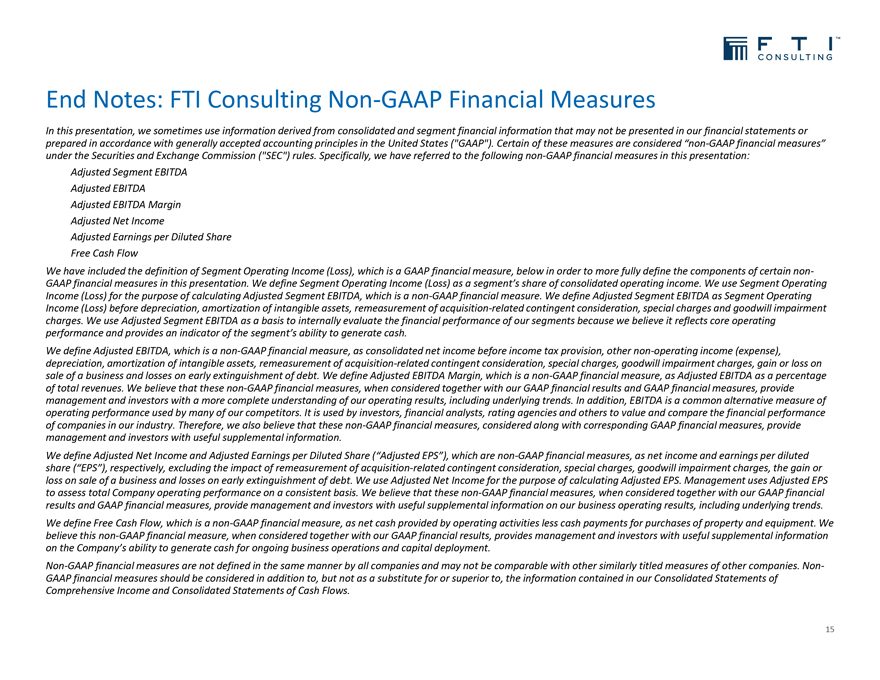
End Notes: FTI Consulting Non-GAAP Financial Measures In this presentation, we sometimes use information derived from consolidated and segment financial information that may not be presented in our financial statements or prepared in accordance with generally accepted accounting principles in the United States (“GAAP”). Certain of these measures are considered “non-GAAP financial measures” under the Securities and Exchange Commission (“SEC”) rules. Specifically, we have referred to the following non-GAAP financial measures in this presentation: Adjusted Segment EBITDA Adjusted EBITDA Adjusted EBITDA Margin Adjusted Net Income Adjusted Earnings per Diluted Share Free Cash Flow We have included the definition of Segment Operating Income (Loss), which is a GAAP financial measure, below in order to more fully define the components of certain non-GAAP financial measures in this presentation. We define Segment Operating Income (Loss) as a segment’s share of consolidated operating income. We use Segment Operating Income (Loss) for the purpose of calculating Adjusted Segment EBITDA, which is a non-GAAP financial measure. We define Adjusted Segment EBITDA as Segment Operating Income (Loss) before depreciation, amortization of intangible assets, remeasurement of acquisition-related contingent consideration, special charges and goodwill impairment charges. We use Adjusted Segment EBITDA as a basis to internally evaluate the financial performance of our segments because we believe it reflects core operating performance and provides an indicator of the segment’s ability to generate cash. We define Adjusted EBITDA, which is a non-GAAP financial measure, as consolidated net income before income tax provision, other non-operating income (expense), depreciation, amortization of intangible assets, remeasurement of acquisition-related contingent consideration, special charges, goodwill impairment charges, gain or loss on sale of a business and losses on early extinguishment of debt. We define Adjusted EBITDA Margin, which is a non-GAAP financial measure, as Adjusted EBITDA as a percentage of total revenues. We believe that these non-GAAP financial measures, when considered together with our GAAP financial results and GAAP financial measures, provide management and investors with a more complete understanding of our operating results, including underlying trends. In addition, EBITDA is a common alternative measure of operating performance used by many of our competitors. It is used by investors, financial analysts, rating agencies and others to value and compare the financial performance of companies in our industry. Therefore, we also believe that these non-GAAP financial measures, considered along with corresponding GAAP financial measures, provide management and investors with useful supplemental information. We define Adjusted Net Income and Adjusted Earnings per Diluted Share (“Adjusted EPS”), which are non-GAAP financial measures, as net income and earnings per diluted share (“EPS”), respectively, excluding the impact of remeasurement of acquisition-related contingent consideration, special charges, goodwill impairment charges, the gain or loss on sale of a business and losses on early extinguishment of debt. We use Adjusted Net Income for the purpose of calculating Adjusted EPS. Management uses Adjusted EPS to assess total Company operating performance on a consistent basis. We believe that these non-GAAP financial measures, when considered together with our GAAP financial results and GAAP financial measures, provide management and investors with useful supplemental information on our business operating results, including underlying trends. We define Free Cash Flow, which is a non-GAAP financial measure, as net cash provided by operating activities less cash payments for purchases of property and equipment. We believe this non-GAAP financial measure, when considered together with our GAAP financial results, provides management and investors with useful supplemental information on the Company’s ability to generate cash for ongoing business operations and capital deployment. Non-GAAP financial measures are not defined in the same manner by all companies and may not be comparable with other similarly titled measures of other companies. Non-GAAP financial measures should be considered in addition to, but not as a substitute for or superior to, the information contained in our Consolidated Statements of Comprehensive Income and Consolidated Statements of Cash Flows. 15
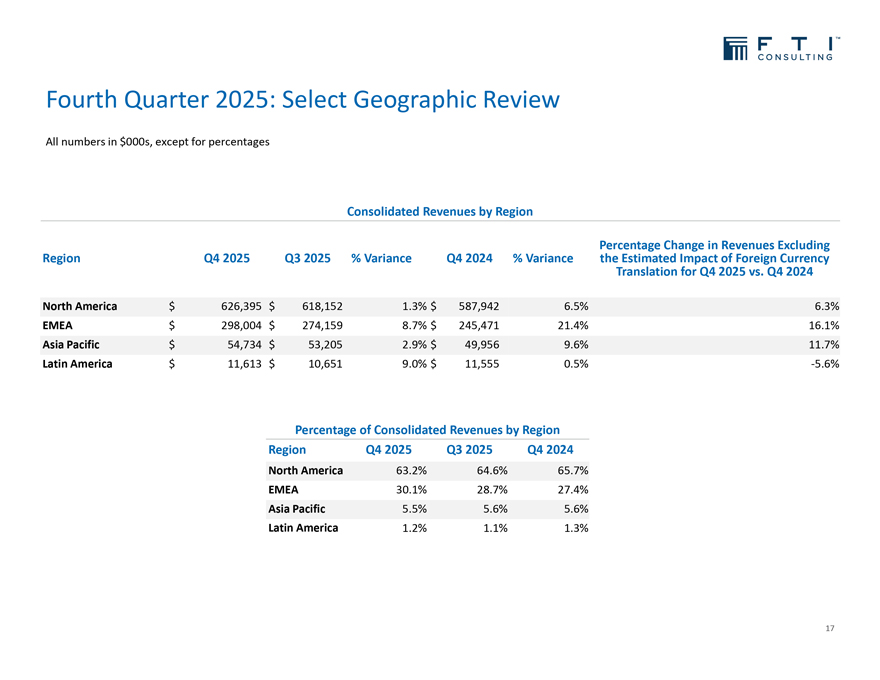
Fourth Quarter 2025: Select Geographic Review All numbers in $000s, except for percentages Consolidated Revenues by Region Percentage Change in Revenues Excluding Region Q4 2025 Q3 2025 % Variance Q4 2024 % Variance theTranslation Estimated Impact for Q4 2025 of Foreign vs. Q4 Currency 2024 North America $ 626,395 $ 618,152 1.3% $ 587,942 6.5% 6.3% EMEA $ 298,004 $ 274,159 8.7% $ 245,471 21.4% 16.1% Asia Pacific $ 54,734 $ 53,205 2.9% $ 49,956 9.6% 11.7% Latin America $ 11,613 $ 10,651 9.0% $ 11,555 0.5% -5.6% Percentage of Consolidated Revenues by Region Region Q4 2025 Q3 2025 Q4 2024 North America 63.2% 64.6% 65.7% EMEA 30.1% 28.7% 27.4% Asia Pacific 5.5% 5.6% 5.6% Latin America 1.2% 1.1% 1.3% 17
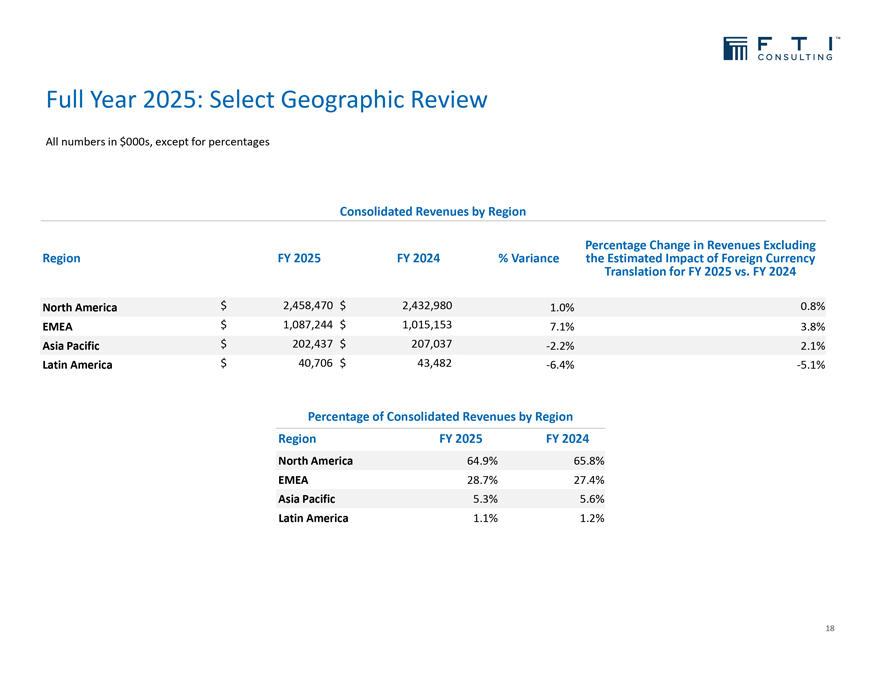
Full Year 2025: Select Geographic Review All numbers in $000s, except for percentages Consolidated Revenues by Region Percentage Change in Revenues Excluding Region FY 2025 FY 2024 % Variance the Translation Estimated Impact for FY 2025 of Foreign vs. FY Currency 2024 North America $ 2,458,470 $ 2,432,980 1.0% 0.8% EMEA $ 1,087,244 $ 1,015,153 7.1% 3.8% Asia Pacific $ 202,437 $ 207,037 -2.2% 2.1% Latin America $ 40,706 $ 43,482 -6.4% -5.1% Percentage of Consolidated Revenues by Region Region FY 2025 FY 2024 North America 64.9% 65.8% EMEA 28.7% 27.4% Asia Pacific 5.3% 5.6% Latin America 1.1% 1.2% 18
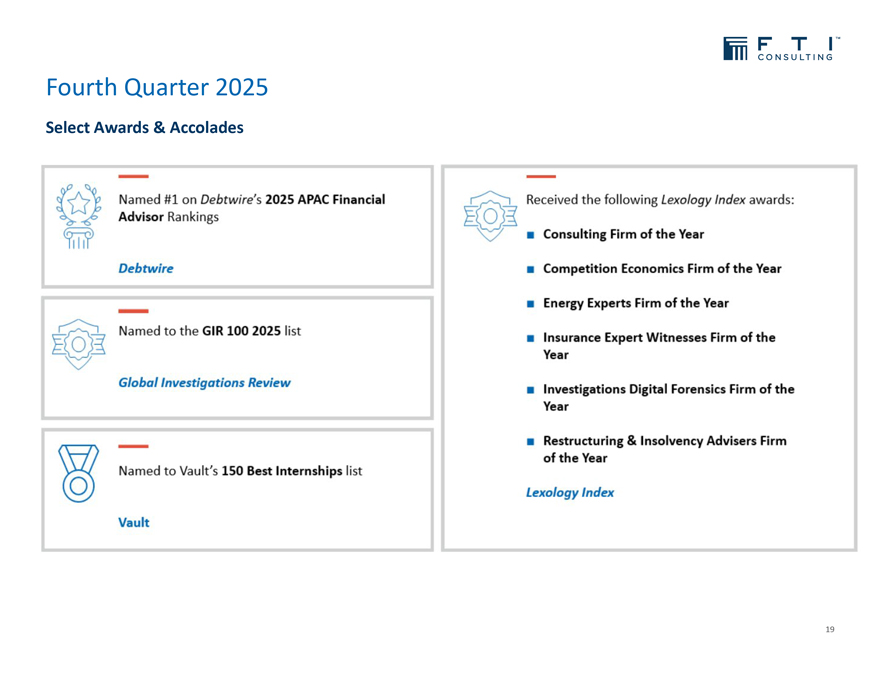
Fourth Quarter 2025 Select Awards & Accolades 19

Experts with ImpactTM 20