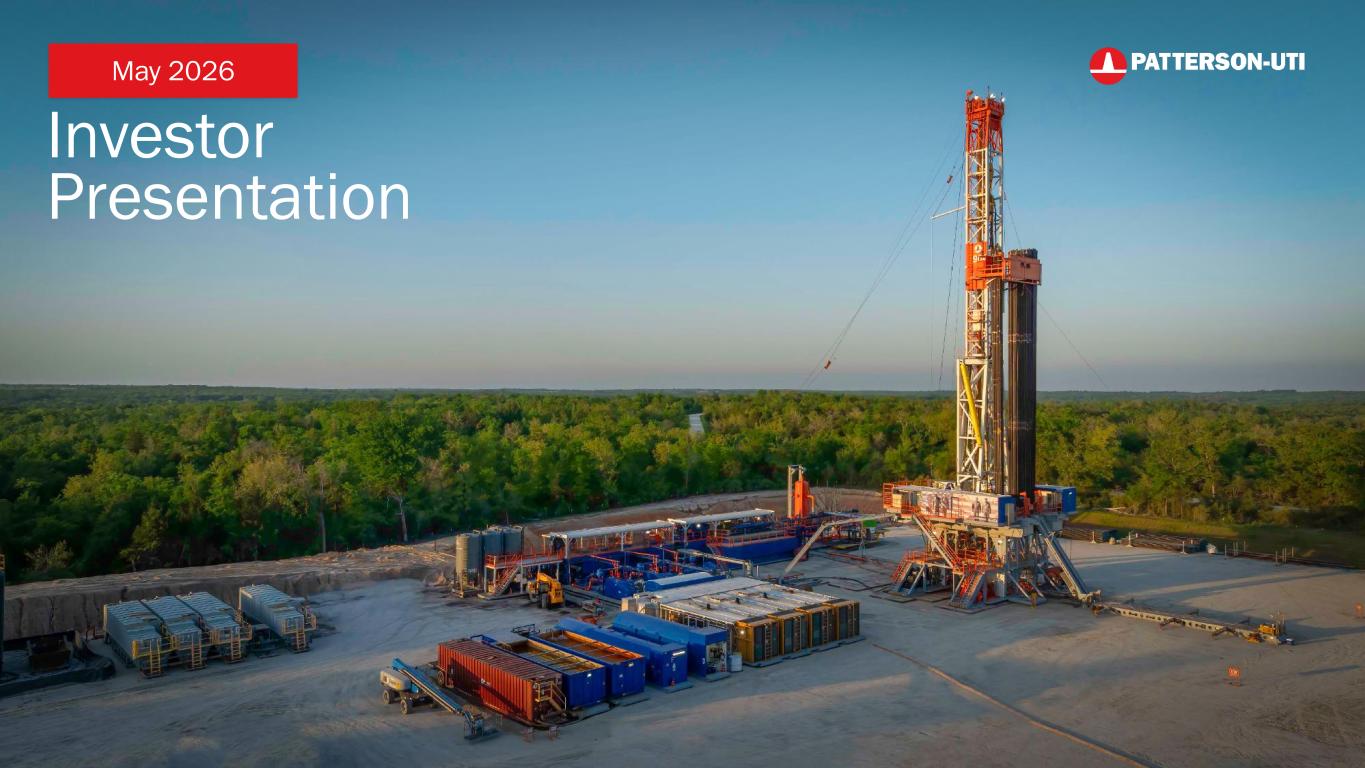
Investor Presentation May 2026
2Investor Presentation Patterson-UTI This material and any oral statements made in connection with this material include "forward-looking statements" within the meaning of the Securities Act of 1933 and the Securities Exchange Act of 1934. Statements made which provide the Company’s or management’s intentions, beliefs, expectations or predictions for the future are forward-looking statements and are inherently uncertain. The opinions, forecasts, projections or other statements other than statements of historical fact, including, without limitation, plans and objectives of management of the Company are forward-looking statements. It is important to note that actual results could differ materially from those discussed in such forward-looking statements. Important factors that could cause actual results to differ materially include the risk factors and other cautionary statements contained from time to time in the Company’s SEC filings, which may be obtained by contacting the Company or the SEC. These filings are also available through the Company’s website at http://www.patenergy.com or through the SEC’s Electronic Data Gathering and Analysis Retrieval System (EDGAR) at http://www.sec.gov. We undertake no obligation to publicly update or revise any forward-looking statement. Reconciliation of Non-GAAP Financial Measures Statements made in this presentation include non-U.S. GAAP financial measures. The required reconciliations to U.S. GAAP financial measures are included on our website and/or at the end of this presentation. Forward Looking Statements & Disclosures
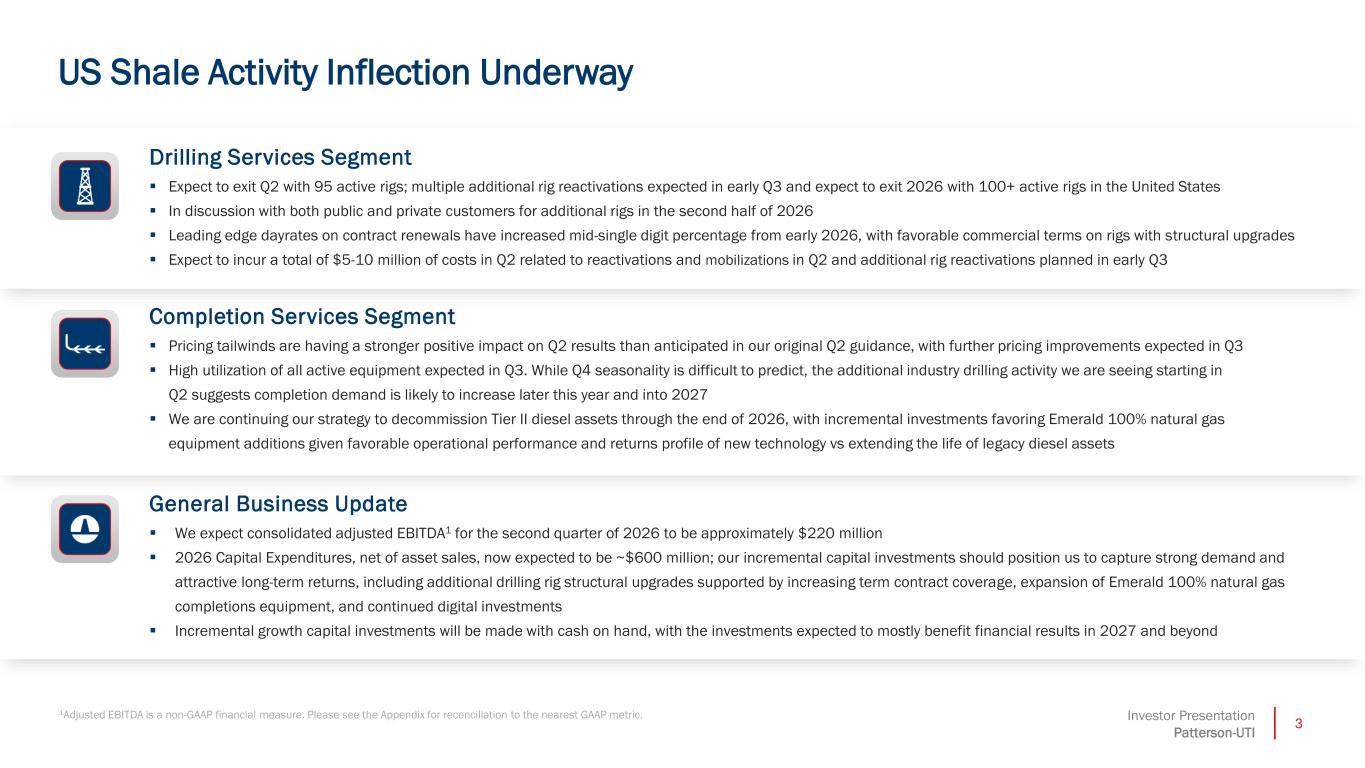
3Investor Presentation Patterson-UTI Z Z 1Adjusted EBITDA is a non-GAAP financial measure. Please see the Appendix for reconciliation to the nearest GAAP metric. Z US Shale Activity Inflection Underway Drilling Services Segment ▪ Expect to exit Q2 with 95 active rigs; multiple additional rig reactivations expected in early Q3 and expect to exit 2026 with 100+ active rigs in the United States ▪ In discussion with both public and private customers for additional rigs in the second half of 2026 ▪ Leading edge dayrates on contract renewals have increased mid-single digit percentage from early 2026, with favorable commercial terms on rigs with structural upgrades ▪ Expect to incur a total of $5-10 million of costs in Q2 related to reactivations and mobilizations in Q2 and additional rig reactivations planned in early Q3 Completion Services Segment ▪ Pricing tailwinds are having a stronger positive impact on Q2 results than anticipated in our original Q2 guidance, with further pricing improvements expected in Q3 ▪ High utilization of all active equipment expected in Q3. While Q4 seasonality is difficult to predict, the additional industry drilling activity we are seeing starting in Q2 suggests completion demand is likely to increase later this year and into 2027 ▪ We are continuing our strategy to decommission Tier II diesel assets through the end of 2026, with incremental investments favoring Emerald 100% natural gas equipment additions given favorable operational performance and returns profile of new technology vs extending the life of legacy diesel assets General Business Update ▪ We expect consolidated adjusted EBITDA1 for the second quarter of 2026 to be approximately $220 million ▪ 2026 Capital Expenditures, net of asset sales, now expected to be ~$600 million; our incremental capital investments should position us to capture strong demand and attractive long-term returns, including additional drilling rig structural upgrades supported by increasing term contract coverage, expansion of Emerald 100% natural gas completions equipment, and continued digital investments ▪ Incremental growth capital investments will be made with cash on hand, with the investments expected to mostly benefit financial results in 2027 and beyond
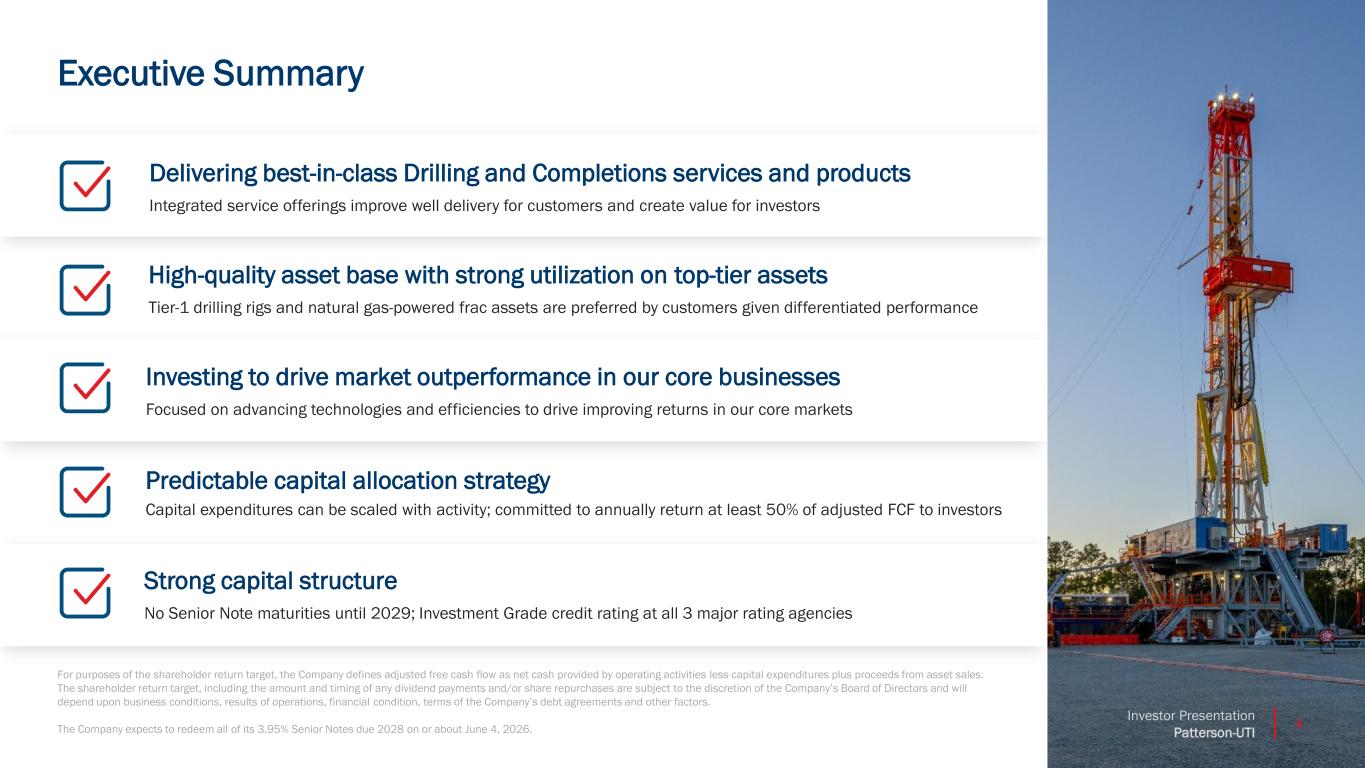
4Investor Presentation Patterson-UTI Executive Summary For purposes of the shareholder return target, the Company defines adjusted free cash flow as net cash provided by operating activities less capital expenditures plus proceeds from asset sales. The shareholder return target, including the amount and timing of any dividend payments and/or share repurchases are subject to the discretion of the Company’s Board of Directors and will depend upon business conditions, results of operations, financial condition, terms of the Company’s debt agreements and other factors. The Company expects to redeem all of its 3.95% Senior Notes due 2028 on or about June 4, 2026. Delivering best-in-class Drilling and Completions services and products Integrated service offerings improve well delivery for customers and create value for investors High-quality asset base with strong utilization on top-tier assets Tier-1 drilling rigs and natural gas-powered frac assets are preferred by customers given differentiated performance Investing to drive market outperformance in our core businesses Focused on advancing technologies and efficiencies to drive improving returns in our core markets Predictable capital allocation strategy Capital expenditures can be scaled with activity; committed to annually return at least 50% of adjusted FCF to investors Strong capital structure No Senior Note maturities until 2029; Investment Grade credit rating at all 3 major rating agencies

Who We Are
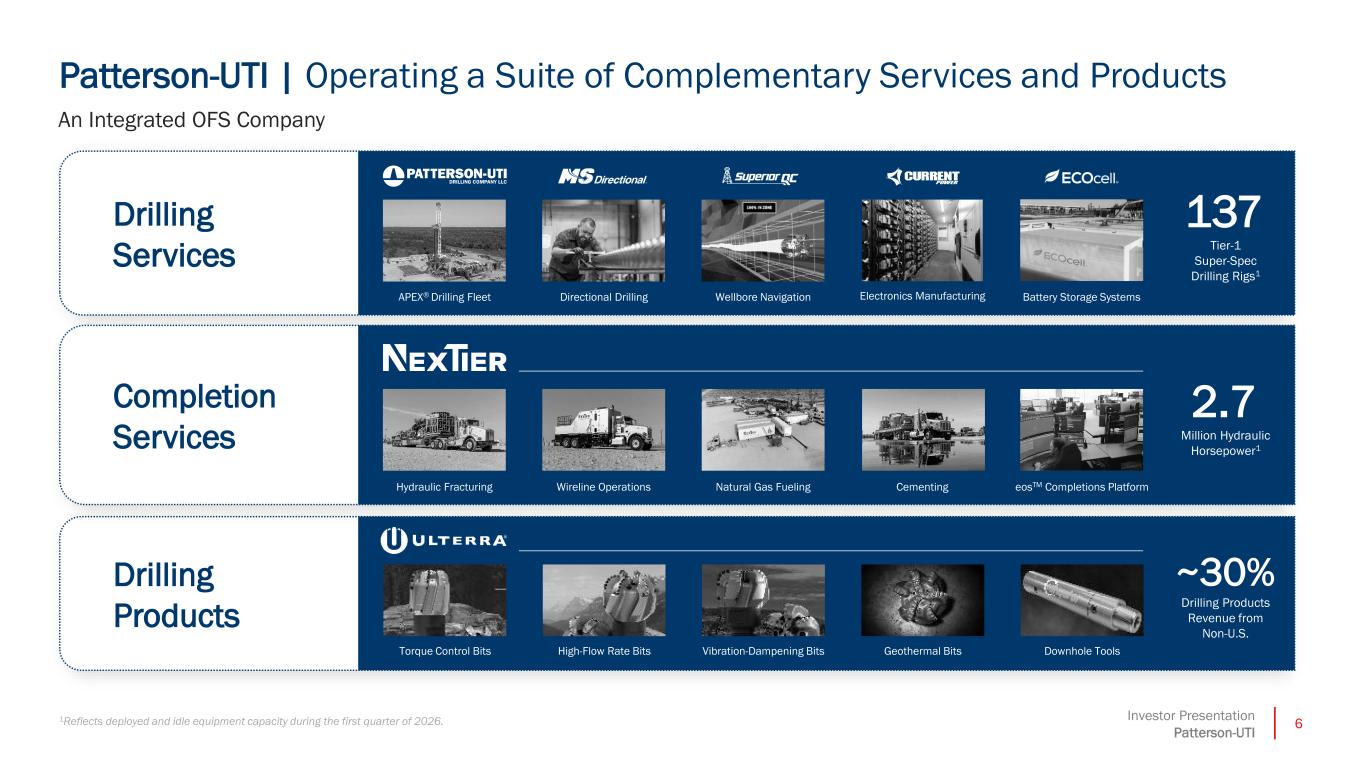
6Investor Presentation Patterson-UTI Z Z Z Hydraulic Fracturing Wireline Operations Natural Gas Fueling Cementing eosTM Completions Platform 2.7 Million Hydraulic Horsepower1 1Reflects deployed and idle equipment capacity during the first quarter of 2026. 137 Tier-1 Super-Spec Drilling Rigs1 APEX® Drilling Fleet Wellbore Navigation Battery Storage SystemsElectronics ManufacturingDirectional Drilling Torque Control Bits High-Flow Rate Bits Vibration-Dampening Bits Geothermal Bits Downhole Tools ~30% Drilling Products Revenue from Non-U.S. Patterson-UTI | Operating a Suite of Complementary Services and Products An Integrated OFS Company Drilling Services Completion Services Drilling Products
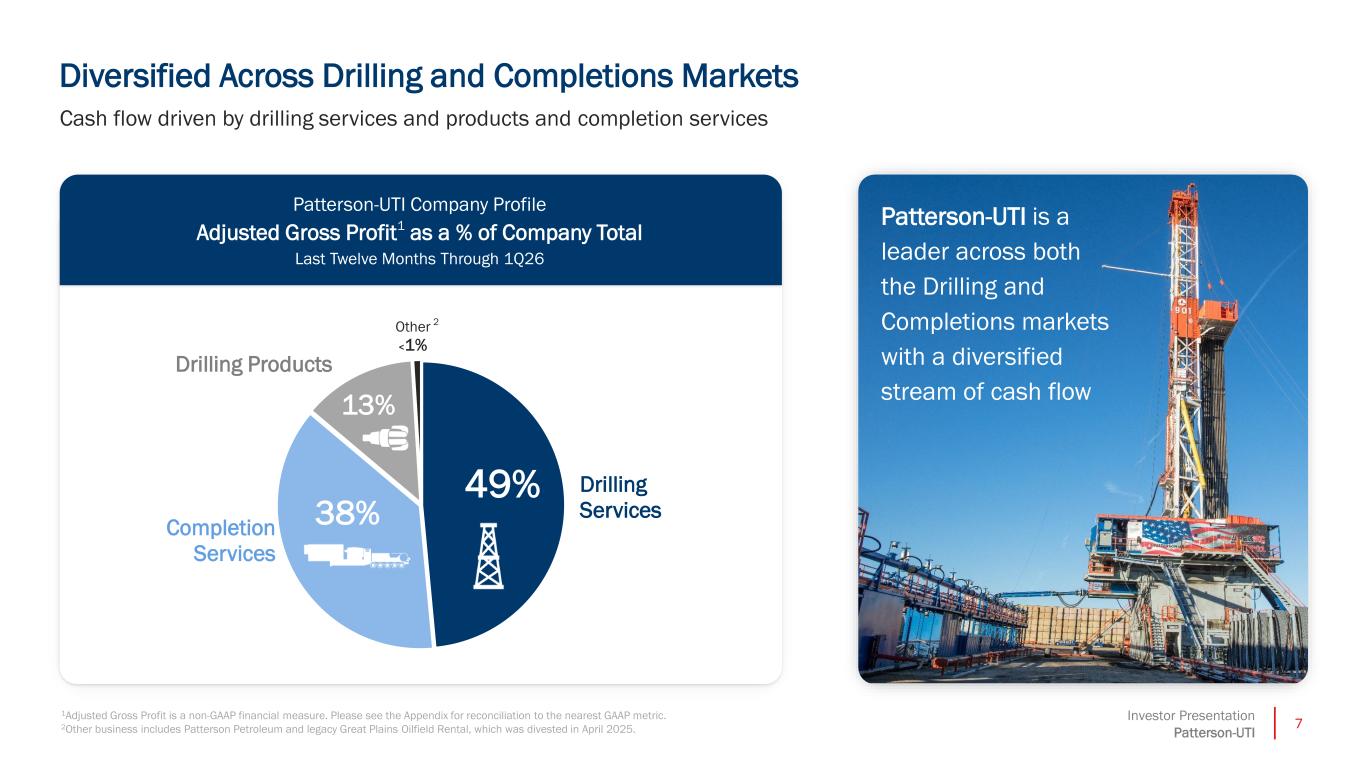
7Investor Presentation Patterson-UTI Diversified Across Drilling and Completions Markets 1Adjusted Gross Profit is a non-GAAP financial measure. Please see the Appendix for reconciliation to the nearest GAAP metric. 2Other business includes Patterson Petroleum and legacy Great Plains Oilfield Rental, which was divested in April 2025. Cash flow driven by drilling services and products and completion services Drilling Services Completion Services Drilling Products Other <1% 49% 13% 38% 2 Patterson-UTI is a leader across both the Drilling and Completions markets with a diversified stream of cash flow Patterson-UTI Company Profile Adjusted Gross Profit1 as a % of Company Total Last Twelve Months Through 1Q26

Business Overview
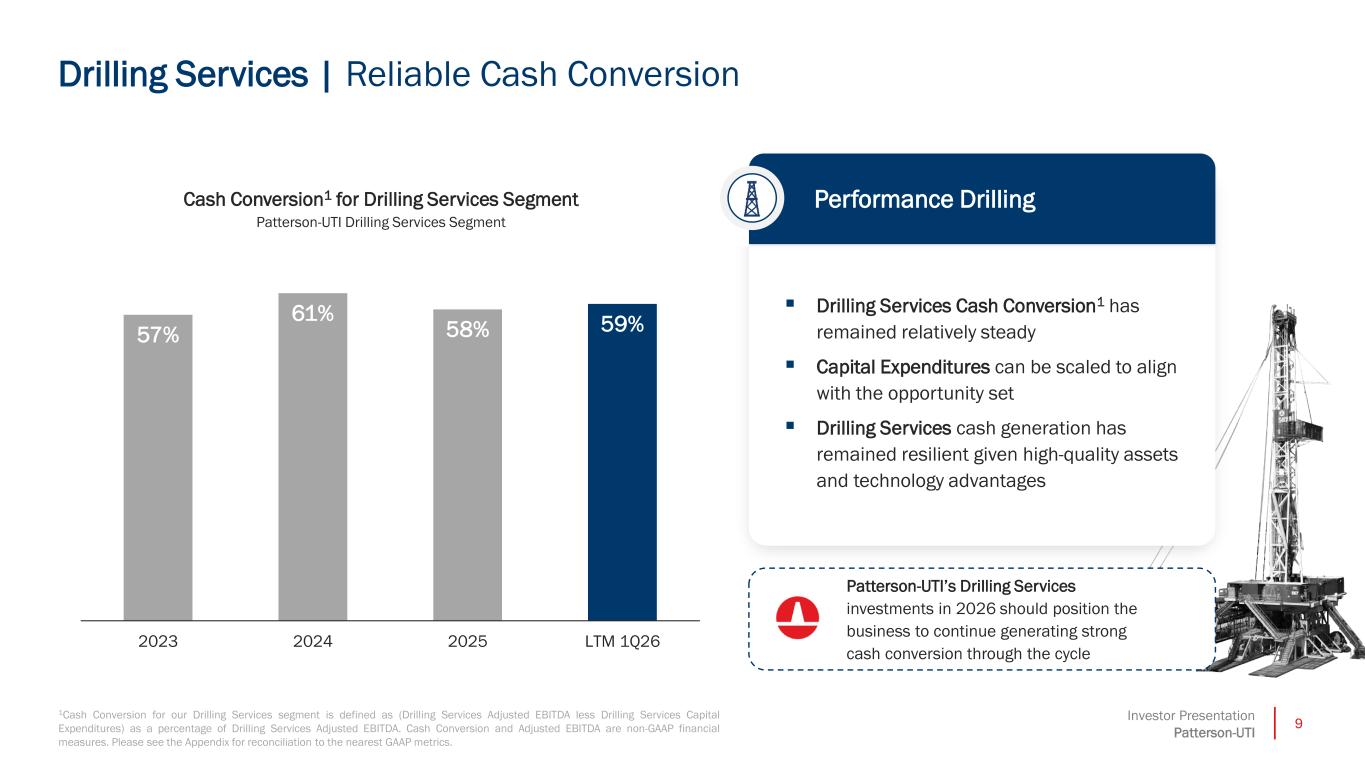
9Investor Presentation Patterson-UTI Cash Conversion1 for Drilling Services Segment Patterson-UTI Drilling Services Segment 1Cash Conversion for our Drilling Services segment is defined as (Drilling Services Adjusted EBITDA less Drilling Services Capital Expenditures) as a percentage of Drilling Services Adjusted EBITDA. Cash Conversion and Adjusted EBITDA are non-GAAP financial measures. Please see the Appendix for reconciliation to the nearest GAAP metrics. 57% 61% 58% 59% 2023 2024 2025 LTM 1Q26 Performance Drilling ▪ Drilling Services Cash Conversion1 has remained relatively steady ▪ Capital Expenditures can be scaled to align with the opportunity set ▪ Drilling Services cash generation has remained resilient given high-quality assets and technology advantages Patterson-UTI’s Drilling Services investments in 2026 should position the business to continue generating strong cash conversion through the cycle Drilling Services | Reliable Cash Conversion
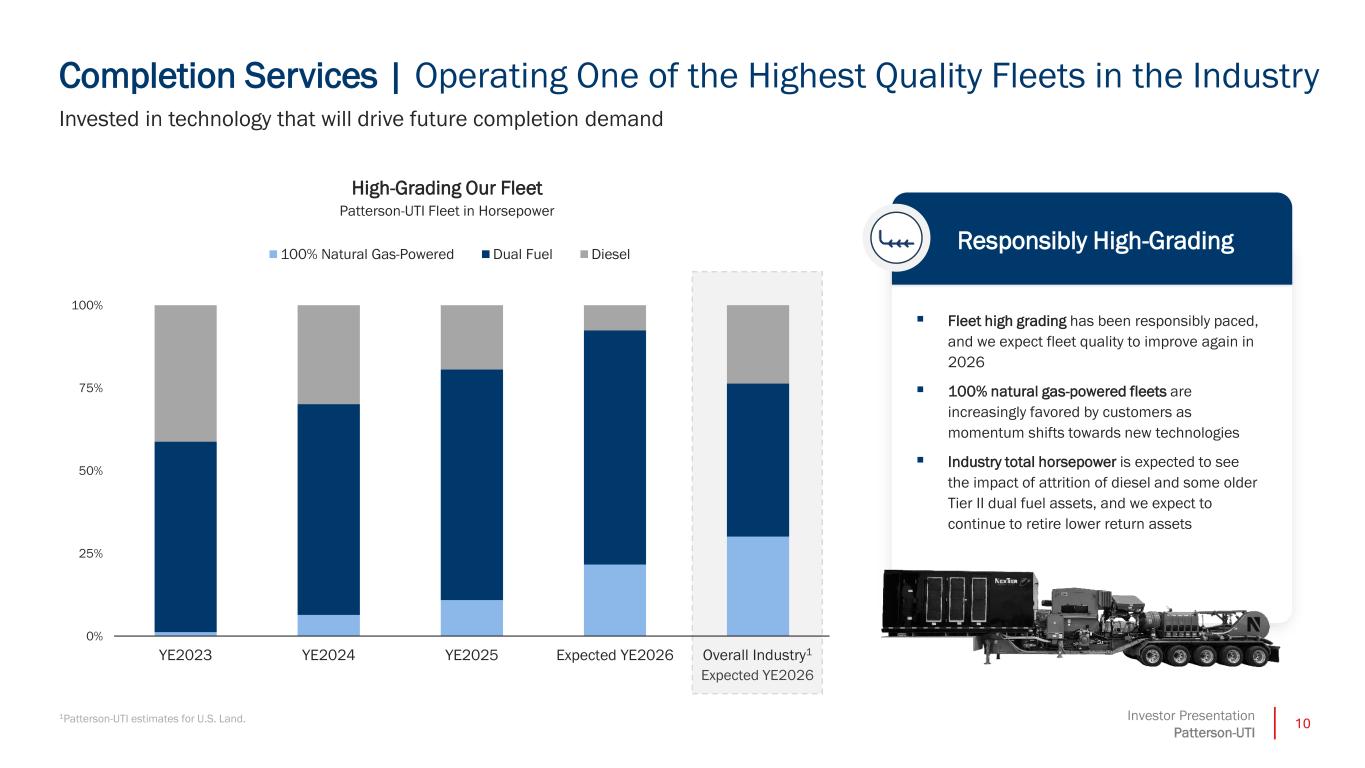
10Investor Presentation Patterson-UTI Invested in technology that will drive future completion demand Responsibly High-Grading ▪ Fleet high grading has been responsibly paced, and we expect fleet quality to improve again in 2026 ▪ 100% natural gas-powered fleets are increasingly favored by customers as momentum shifts towards new technologies ▪ Industry total horsepower is expected to see the impact of attrition of diesel and some older Tier II dual fuel assets, and we expect to continue to retire lower return assets High-Grading Our Fleet Patterson-UTI Fleet in Horsepower Completion Services | Operating One of the Highest Quality Fleets in the Industry 1Patterson-UTI estimates for U.S. Land. 0% 25% 50% 75% 100% YE2023 YE2024 YE2025 Expected YE2026 Overall Industry 100% Natural Gas-Powered Dual Fuel Diesel Overal Industry1 Expected YE2026
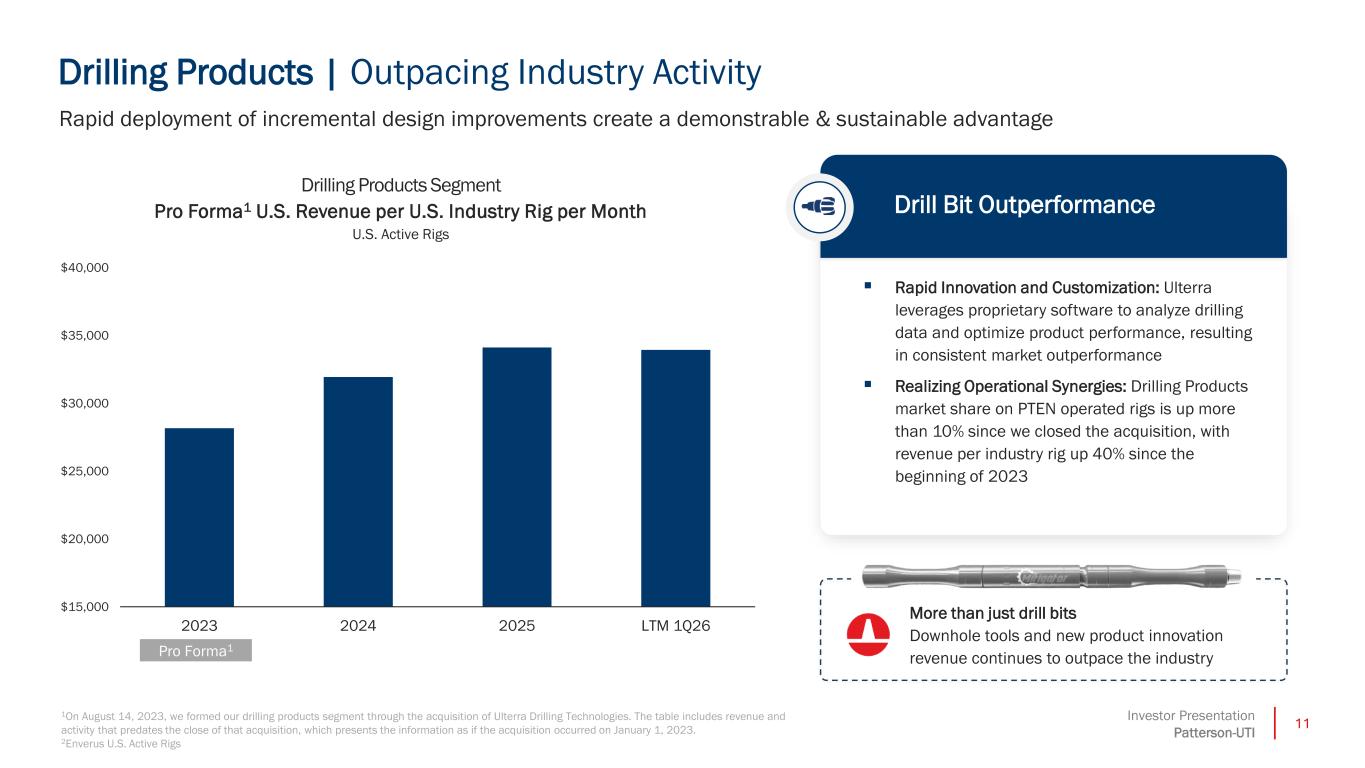
11Investor Presentation Patterson-UTI Rapid deployment of incremental design improvements create a demonstrable & sustainable advantage 1On August 14, 2023, we formed our drilling products segment through the acquisition of Ulterra Drilling Technologies. The table includes revenue and activity that predates the close of that acquisition, which presents the information as if the acquisition occurred on January 1, 2023. 2Enverus U.S. Active Rigs Drill Bit Outperformance ▪ Rapid Innovation and Customization: Ulterra leverages proprietary software to analyze drilling data and optimize product performance, resulting in consistent market outperformance ▪ Realizing Operational Synergies: Drilling Products market share on PTEN operated rigs is up more than 10% since we closed the acquisition, with revenue per industry rig up 40% since the beginning of 2023 $15,000 $20,000 $25,000 $30,000 $35,000 $40,000 2023 2024 2025 LTM 1Q26 Pro Forma1 Drilling Products Segment Pro Forma1 U.S. Revenue per U.S. Industry Rig per Month U.S. Active Rigs More than just drill bits Downhole tools and new product innovation revenue continues to outpace the industry Drilling Products | Outpacing Industry Activity
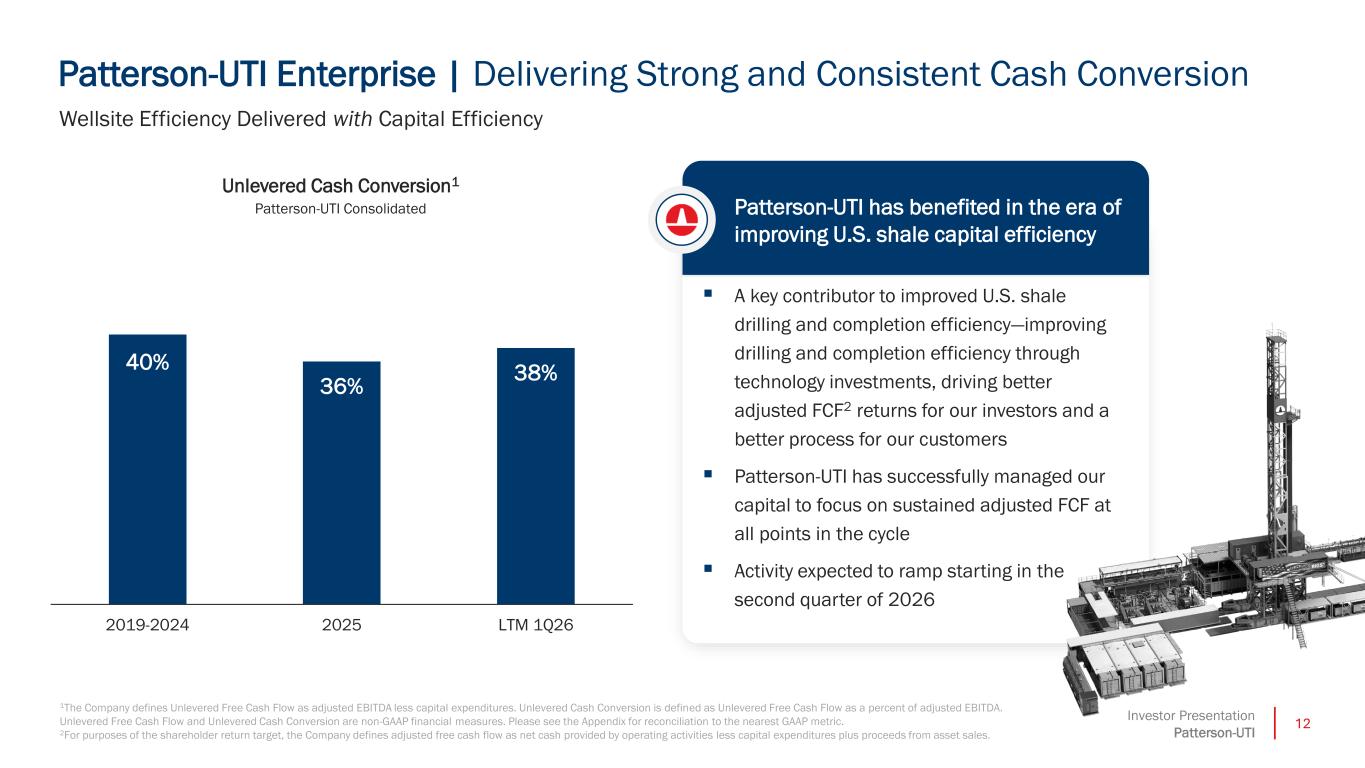
12Investor Presentation Patterson-UTI 40% 36% 38% $- 2019-2024 2025 LTM 1Q26 Patterson-UTI has benefited in the era of improving U.S. shale capital efficiency ▪ A key contributor to improved U.S. shale drilling and completion efficiency—improving drilling and completion efficiency through technology investments, driving better adjusted FCF2 returns for our investors and a better process for our customers ▪ Patterson-UTI has successfully managed our capital to focus on sustained adjusted FCF at all points in the cycle ▪ Activity expected to ramp starting in the second quarter of 2026 Wellsite Efficiency Delivered with Capital Efficiency Unlevered Cash Conversion1 Patterson-UTI Consolidated 1The Company defines Unlevered Free Cash Flow as adjusted EBITDA less capital expenditures. Unlevered Cash Conversion is defined as Unlevered Free Cash Flow as a percent of adjusted EBITDA. Unlevered Free Cash Flow and Unlevered Cash Conversion are non-GAAP financial measures. Please see the Appendix for reconciliation to the nearest GAAP metric. 2For purposes of the shareholder return target, the Company defines adjusted free cash flow as net cash provided by operating activities less capital expenditures plus proceeds from asset sales. Patterson-UTI Enterprise | Delivering Strong and Consistent Cash Conversion
Operational Excellence
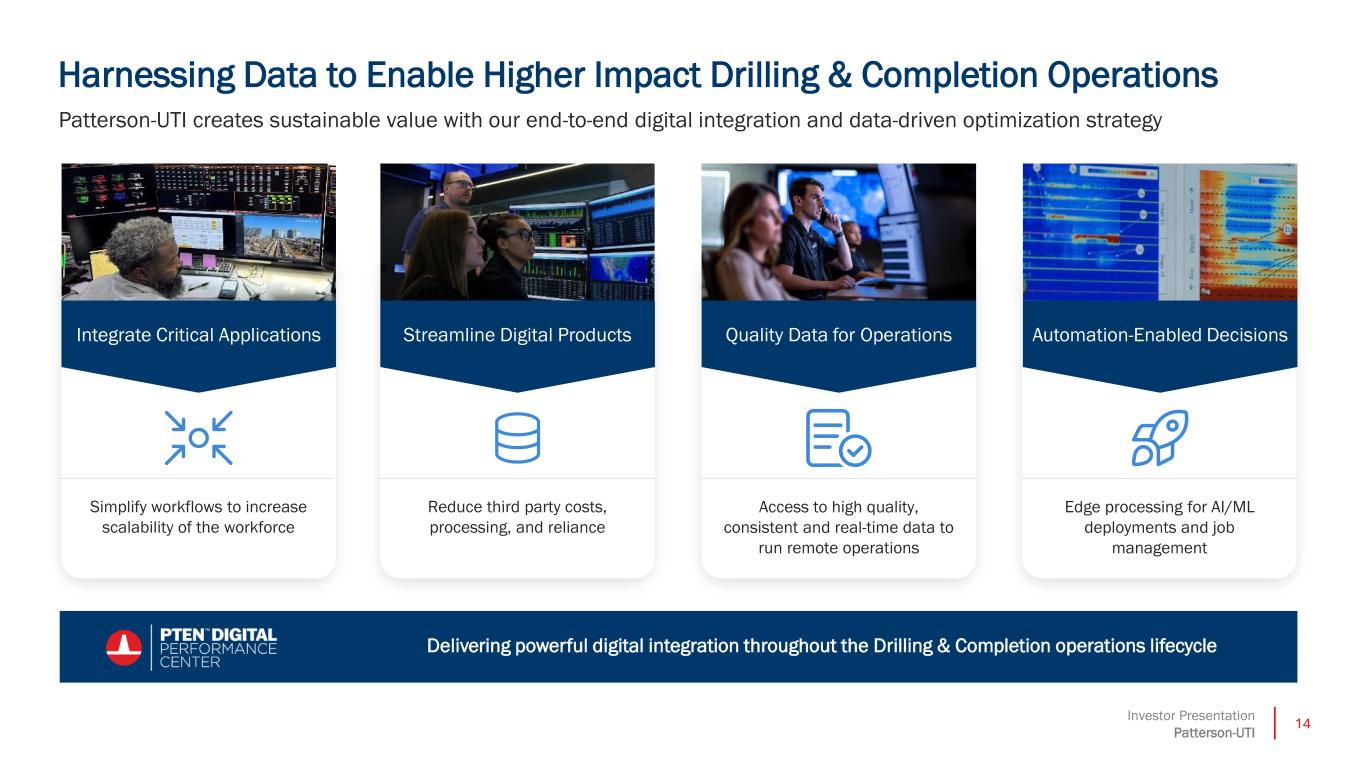
14Investor Presentation Patterson-UTI Harnessing Data to Enable Higher Impact Drilling & Completion Operations Patterson-UTI creates sustainable value with our end-to-end digital integration and data-driven optimization strategy Simplify workflows to increase scalability of the workforce Access to high quality, consistent and real-time data to run remote operations Edge processing for AI/ML deployments and job management Reduce third party costs, processing, and reliance Delivering powerful digital integration throughout the Drilling & Completion operations lifecycle Integrate Critical Applications Streamline Digital Products Quality Data for Operations Automation-Enabled Decisions
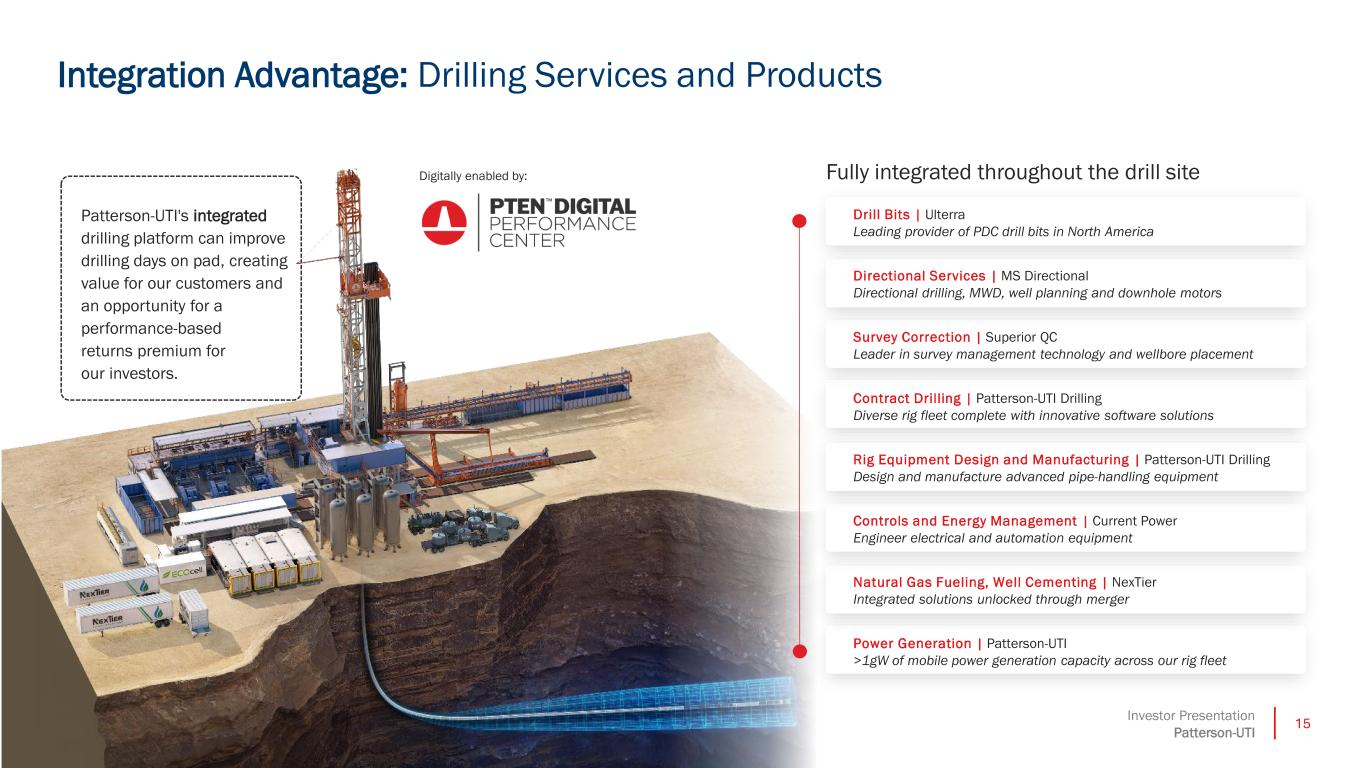
15Investor Presentation Patterson-UTI Patterson-UTI's integrated drilling platform can improve drilling days on pad, creating value for our customers and an opportunity for a performance-based returns premium for our investors. Integration Advantage: Drilling Services and Products Digitally enabled by: Contract Drilling | Patterson-UTI Drilling Diverse rig fleet complete with innovative software solutions Natural Gas Fueling, Well Cementing | NexTier Integrated solutions unlocked through merger Drill Bits | Ulterra Leading provider of PDC drill bits in North America Directional Services | MS Directional Directional drilling, MWD, well planning and downhole motors Survey Correction | Superior QC Leader in survey management technology and wellbore placement Power Generation | Patterson-UTI >1gW of mobile power generation capacity across our rig fleet Controls and Energy Management | Current Power Engineer electrical and automation equipment Rig Equipment Design and Manufacturing | Patterson-UTI Drilling Design and manufacture advanced pipe-handling equipment Fully integrated throughout the drill site
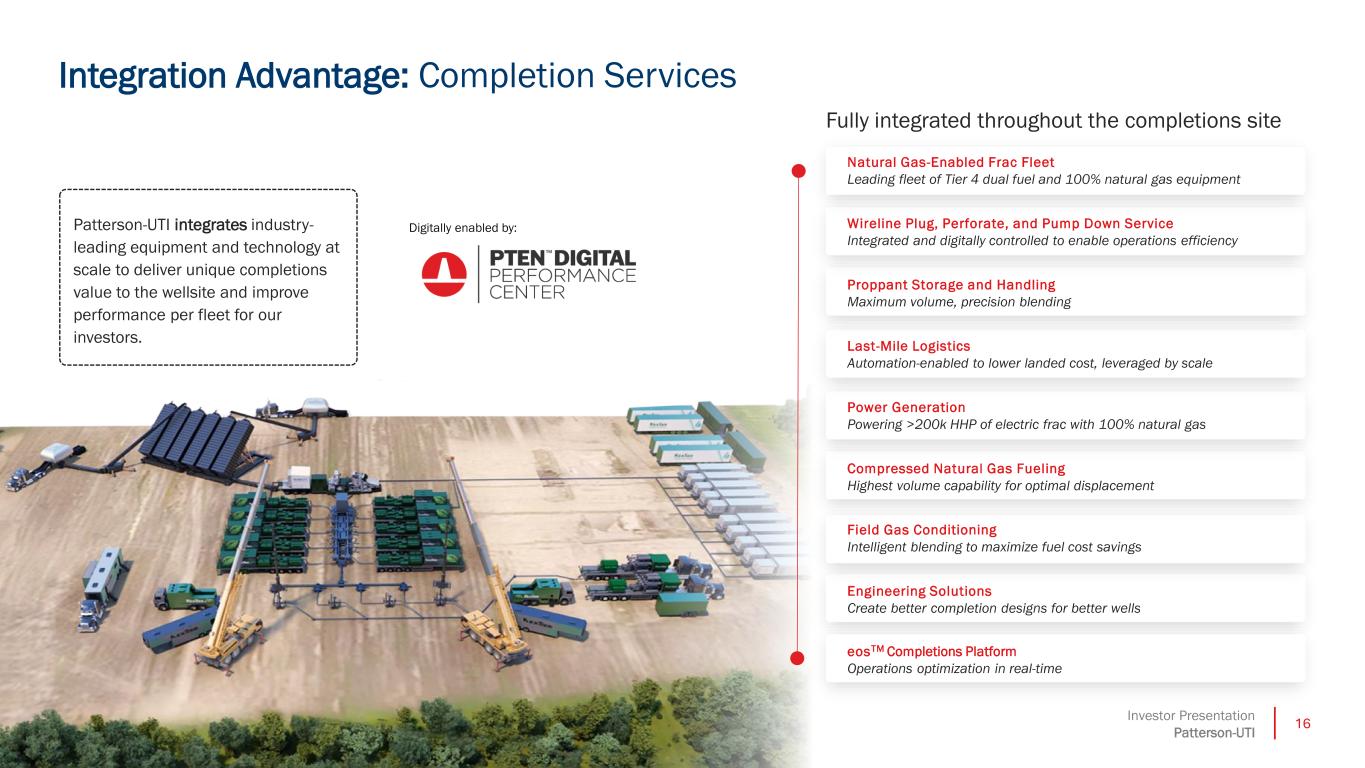
16Investor Presentation Patterson-UTI Integration Advantage: Completion Services Patterson-UTI integrates industry- leading equipment and technology at scale to deliver unique completions value to the wellsite and improve performance per fleet for our investors. Digitally enabled by: Proppant Storage and Handling Maximum volume, precision blending Field Gas Conditioning Intelligent blending to maximize fuel cost savings Natural Gas-Enabled Frac Fleet Leading fleet of Tier 4 dual fuel and 100% natural gas equipment Wireline Plug, Perforate, and Pump Down Service Integrated and digitally controlled to enable operations efficiency Power Generation Powering >200k HHP of electric frac with 100% natural gas Engineering Solutions Create better completion designs for better wells Compressed Natural Gas Fueling Highest volume capability for optimal displacement Last-Mile Logistics Automation-enabled to lower landed cost, leveraged by scale Fully integrated throughout the completions site eosTM Completions Platform Operations optimization in real-time

Capital Allocation Framework
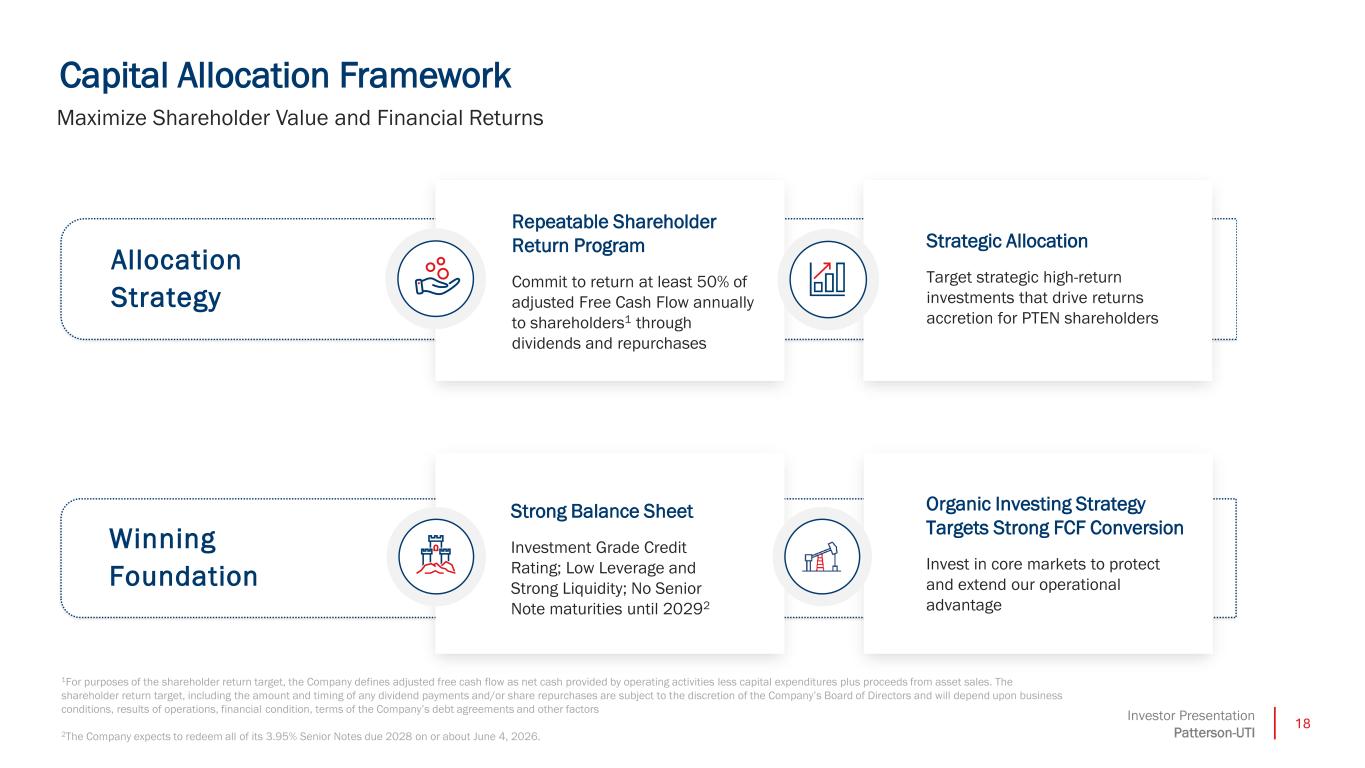
18Investor Presentation Patterson-UTI Organic Investing Strategy Targets Strong FCF Conversion Invest in core markets to protect and extend our operational advantage Strategic Allocation Target strategic high-return investments that drive returns accretion for PTEN shareholders Winning Foundation Allocation Strategy Strong Balance Sheet Investment Grade Credit Rating; Low Leverage and Strong Liquidity; No Senior Note maturities until 20292 Repeatable Shareholder Return Program Commit to return at least 50% of adjusted Free Cash Flow annually to shareholders1 through dividends and repurchases Capital Allocation Framework Maximize Shareholder Value and Financial Returns 1For purposes of the shareholder return target, the Company defines adjusted free cash flow as net cash provided by operating activities less capital expenditures plus proceeds from asset sales. The shareholder return target, including the amount and timing of any dividend payments and/or share repurchases are subject to the discretion of the Company’s Board of Directors and will depend upon business conditions, results of operations, financial condition, terms of the Company’s debt agreements and other factors 2The Company expects to redeem all of its 3.95% Senior Notes due 2028 on or about June 4, 2026.
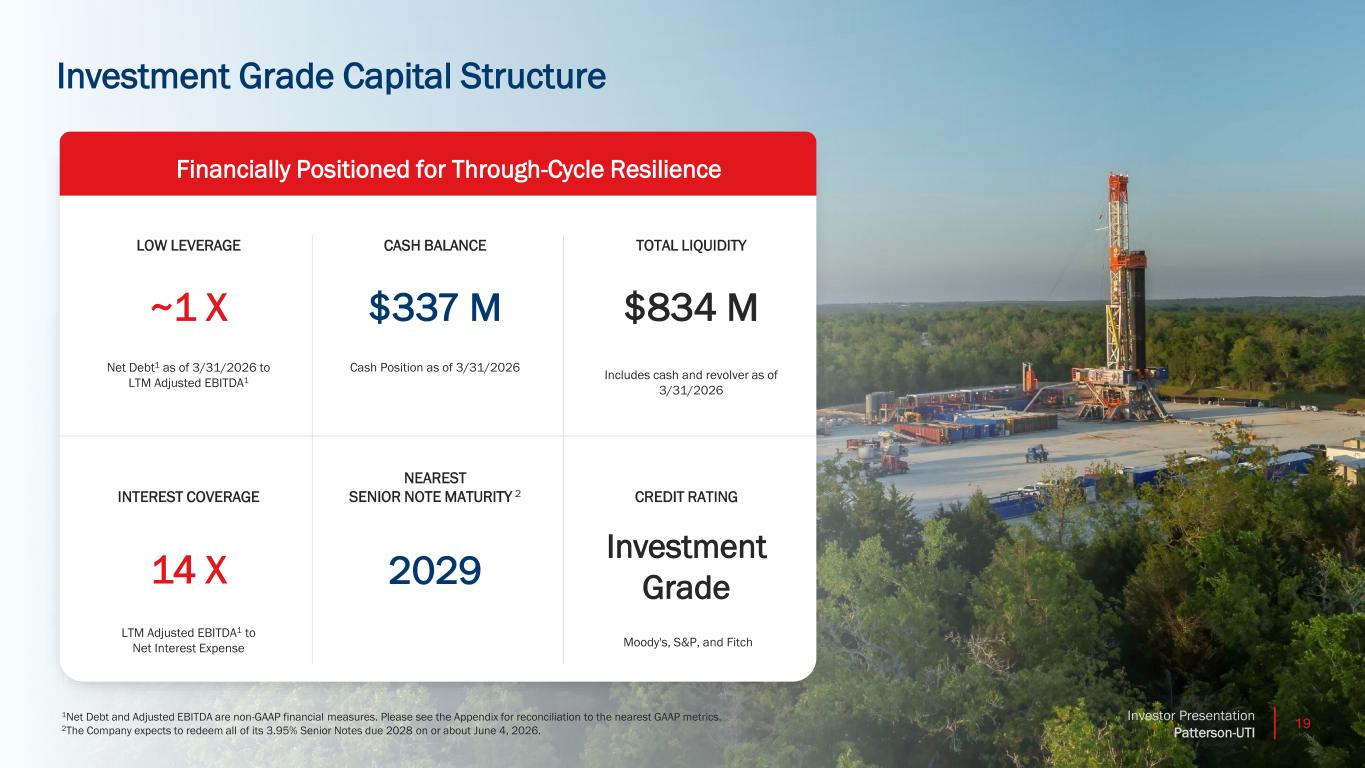
19Investor Presentation Patterson-UTI Z TOTAL LIQUIDITY $834 M Includes cash and revolver as of 3/31/2026 LOW LEVERAGE ~1 X Net Debt1 as of 3/31/2026 to LTM Adjusted EBITDA1 CASH BALANCE $337 M Cash Position as of 3/31/2026 INTEREST COVERAGE 14 X LTM Adjusted EBITDA1 to Net Interest Expense NEAREST SENIOR NOTE MATURITY 2 2029 CREDIT RATING Investment Grade Moody's, S&P, and Fitch Financially Positioned for Through-Cycle Resilience 1Net Debt and Adjusted EBITDA are non-GAAP financial measures. Please see the Appendix for reconciliation to the nearest GAAP metrics. 2The Company expects to redeem all of its 3.95% Senior Notes due 2028 on or about June 4, 2026. Investment Grade Capital Structure
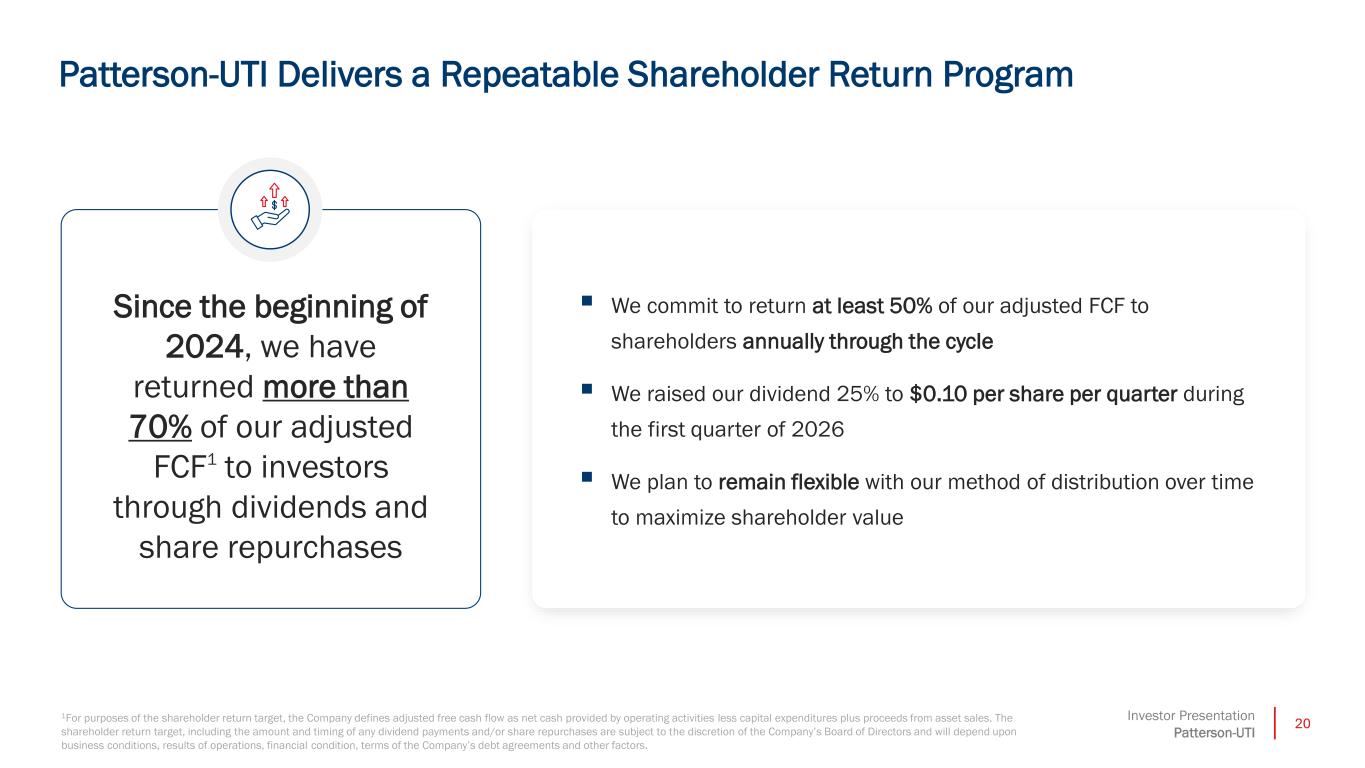
20Investor Presentation Patterson-UTI Patterson-UTI Delivers a Repeatable Shareholder Return Program 1For purposes of the shareholder return target, the Company defines adjusted free cash flow as net cash provided by operating activities less capital expenditures plus proceeds from asset sales. The shareholder return target, including the amount and timing of any dividend payments and/or share repurchases are subject to the discretion of the Company’s Board of Directors and will depend upon business conditions, results of operations, financial condition, terms of the Company’s debt agreements and other factors. Since the beginning of 2024, we have returned more than 70% of our adjusted FCF1 to investors through dividends and share repurchases ▪ We commit to return at least 50% of our adjusted FCF to shareholders annually through the cycle ▪ We raised our dividend 25% to $0.10 per share per quarter during the first quarter of 2026 ▪ We plan to remain flexible with our method of distribution over time to maximize shareholder value
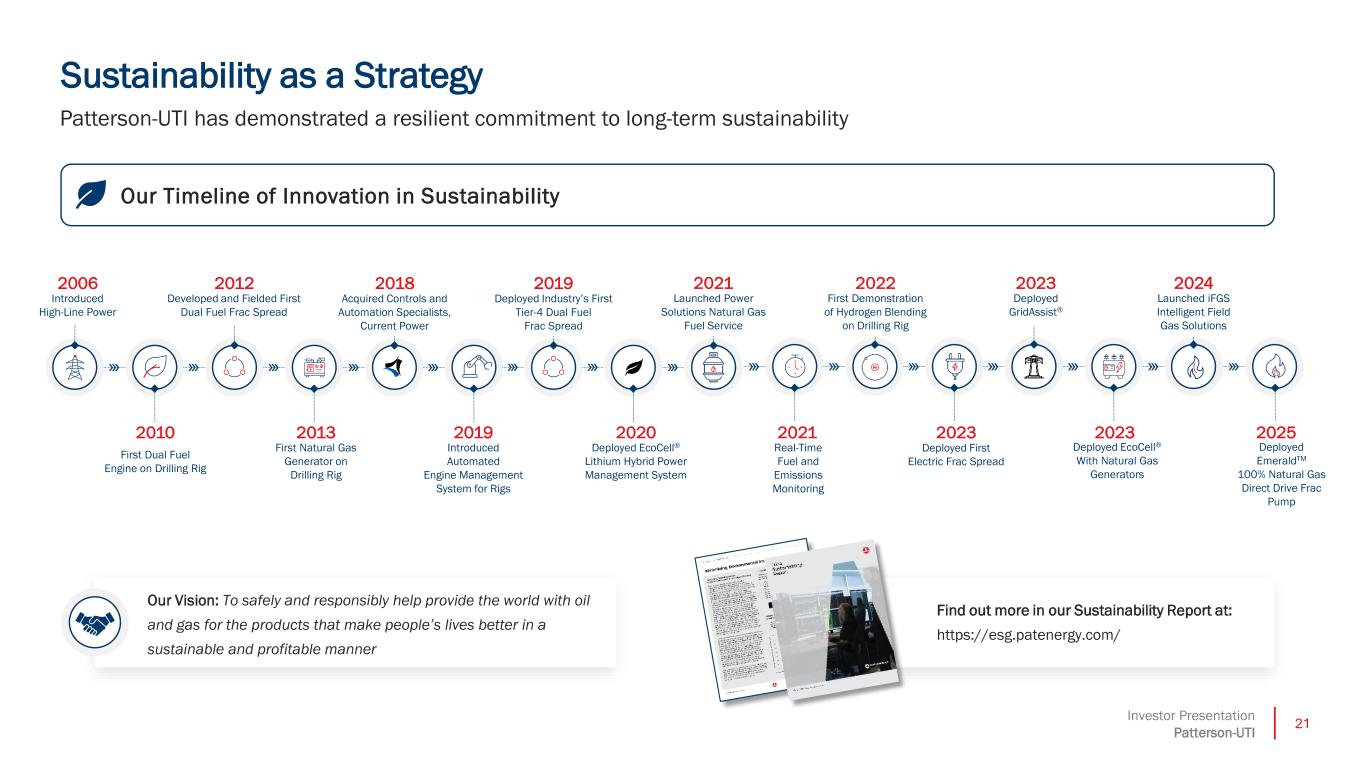
21Investor Presentation Patterson-UTI Sustainability as a Strategy Our Vision: To safely and responsibly help provide the world with oil and gas for the products that make people’s lives better in a sustainable and profitable manner Find out more in our Sustainability Report at: https://esg.patenergy.com/ Patterson-UTI has demonstrated a resilient commitment to long-term sustainability Our Timeline of Innovation in Sustainability 2006 Introduced High-Line Power 2010 First Dual Fuel Engine on Drilling Rig 2012 Developed and Fielded First Dual Fuel Frac Spread 2018 Acquired Controls and Automation Specialists, Current Power 2019 Deployed Industry’s First Tier-4 Dual Fuel Frac Spread 2021 Launched Power Solutions Natural Gas Fuel Service 2022 First Demonstration of Hydrogen Blending on Drilling Rig 2023 Deployed GridAssist® 2024 Launched iFGS Intelligent Field Gas Solutions 2013 First Natural Gas Generator on Drilling Rig 2019 Introduced Automated Engine Management System for Rigs 2020 Deployed EcoCell® Lithium Hybrid Power Management System 2021 Real-Time Fuel and Emissions Monitoring 2023 Deployed First Electric Frac Spread 2023 Deployed EcoCell® With Natural Gas Generators 2025 Deployed EmeraldTM 100% Natural Gas Direct Drive Frac Pump
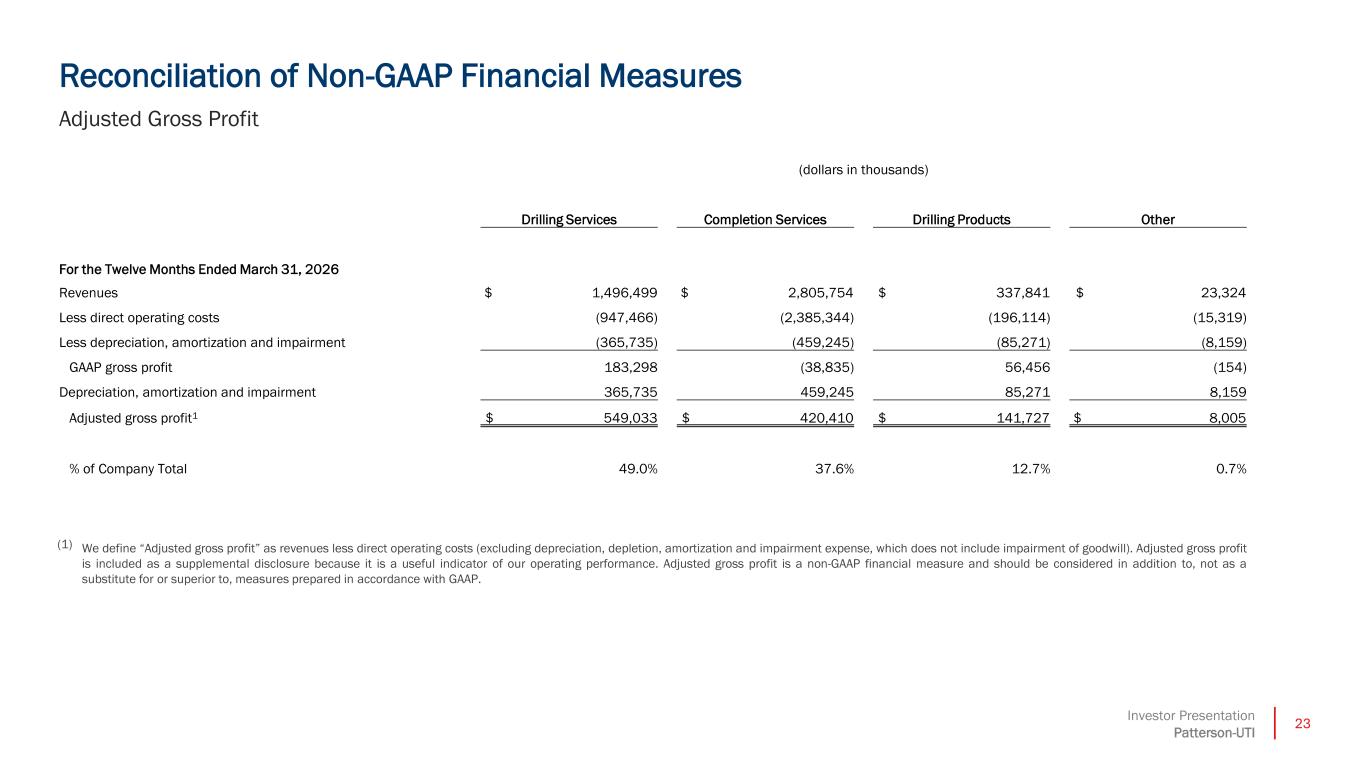
23Investor Presentation Patterson-UTI (1) We define “Adjusted gross profit” as revenues less direct operating costs (excluding depreciation, depletion, amortization and impairment expense, which does not include impairment of goodwill). Adjusted gross profit is included as a supplemental disclosure because it is a useful indicator of our operating performance. Adjusted gross profit is a non-GAAP financial measure and should be considered in addition to, not as a substitute for or superior to, measures prepared in accordance with GAAP. (dollars in thousands) Drilling Services Completion Services Drilling Products Other For the Twelve Months Ended March 31, 2026 Revenues $ 1,496,499 $ 2,805,754 $ 337,841 $ 23,324 Less direct operating costs (947,466) (2,385,344) (196,114) (15,319) Less depreciation, amortization and impairment (365,735) (459,245) (85,271) (8,159) GAAP gross profit 183,298 (38,835) 56,456 (154) Depreciation, amortization and impairment 365,735 459,245 85,271 8,159 Adjusted gross profit1 $ 549,033 $ 420,410 $ 141,727 $ 8,005 % of Company Total 49.0% 37.6% 12.7% 0.7% Reconciliation of Non-GAAP Financial Measures Adjusted Gross Profit
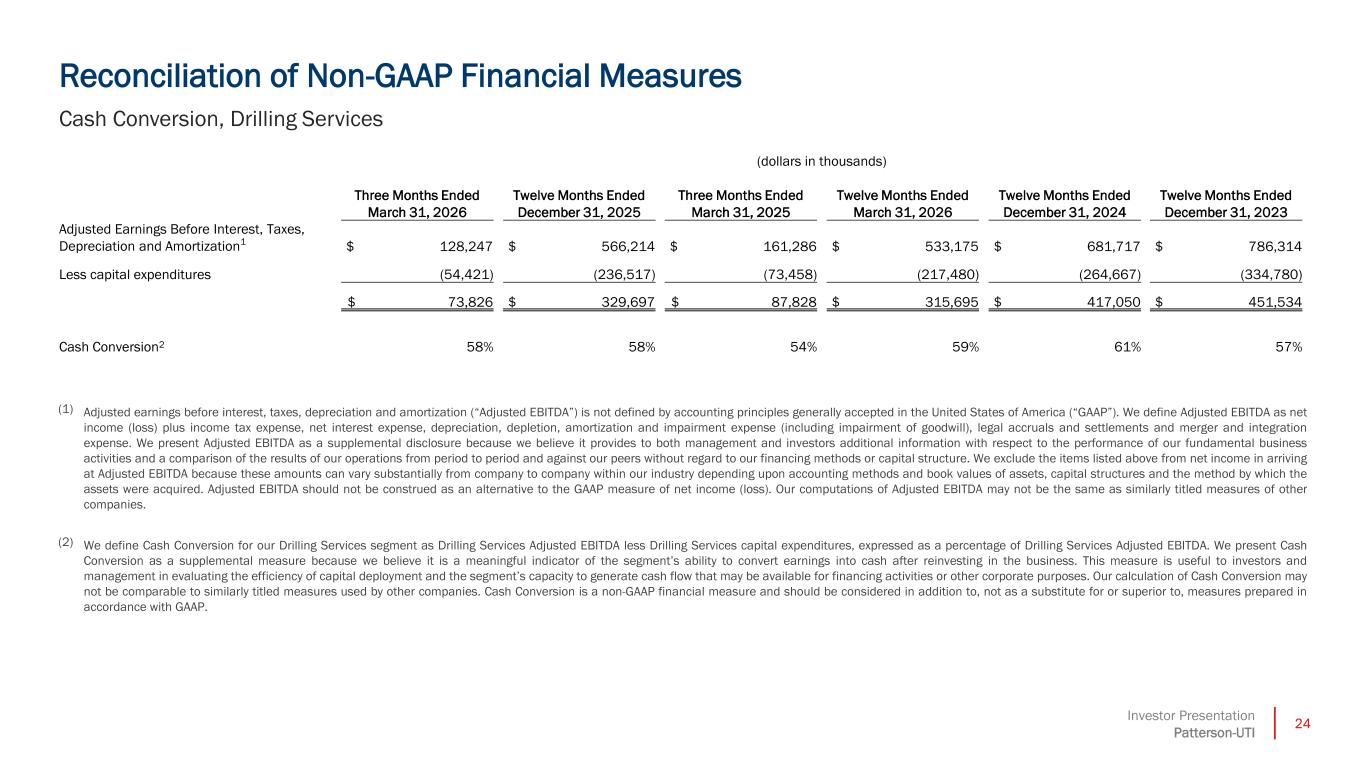
24Investor Presentation Patterson-UTI Reconciliation of Non-GAAP Financial Measures Cash Conversion, Drilling Services (1) Adjusted earnings before interest, taxes, depreciation and amortization (“Adjusted EBITDA”) is not defined by accounting principles generally accepted in the United States of America (“GAAP”). We define Adjusted EBITDA as net income (loss) plus income tax expense, net interest expense, depreciation, depletion, amortization and impairment expense (including impairment of goodwill), legal accruals and settlements and merger and integration expense. We present Adjusted EBITDA as a supplemental disclosure because we believe it provides to both management and investors additional information with respect to the performance of our fundamental business activities and a comparison of the results of our operations from period to period and against our peers without regard to our financing methods or capital structure. We exclude the items listed above from net income in arriving at Adjusted EBITDA because these amounts can vary substantially from company to company within our industry depending upon accounting methods and book values of assets, capital structures and the method by which the assets were acquired. Adjusted EBITDA should not be construed as an alternative to the GAAP measure of net income (loss). Our computations of Adjusted EBITDA may not be the same as similarly titled measures of other companies. (2) We define Cash Conversion for our Drilling Services segment as Drilling Services Adjusted EBITDA less Drilling Services capital expenditures, expressed as a percentage of Drilling Services Adjusted EBITDA. We present Cash Conversion as a supplemental measure because we believe it is a meaningful indicator of the segment’s ability to convert earnings into cash after reinvesting in the business. This measure is useful to investors and management in evaluating the efficiency of capital deployment and the segment’s capacity to generate cash flow that may be available for financing activities or other corporate purposes. Our calculation of Cash Conversion may not be comparable to similarly titled measures used by other companies. Cash Conversion is a non-GAAP financial measure and should be considered in addition to, not as a substitute for or superior to, measures prepared in accordance with GAAP. (dollars in thousands) Three Months Ended March 31, 2026 Twelve Months Ended December 31, 2025 Three Months Ended March 31, 2025 Twelve Months Ended March 31, 2026 Twelve Months Ended December 31, 2024 Twelve Months Ended December 31, 2023 Adjusted Earnings Before Interest, Taxes, Depreciation and Amortization1 $ 128,247 $ 566,214 $ 161,286 $ 533,175 $ 681,717 $ 786,314 Less capital expenditures (54,421) (236,517) (73,458) (217,480) (264,667) (334,780) $ 73,826 $ 329,697 $ 87,828 $ 315,695 $ 417,050 $ 451,534 Cash Conversion2 58% 58% 54% 59% 61% 57%
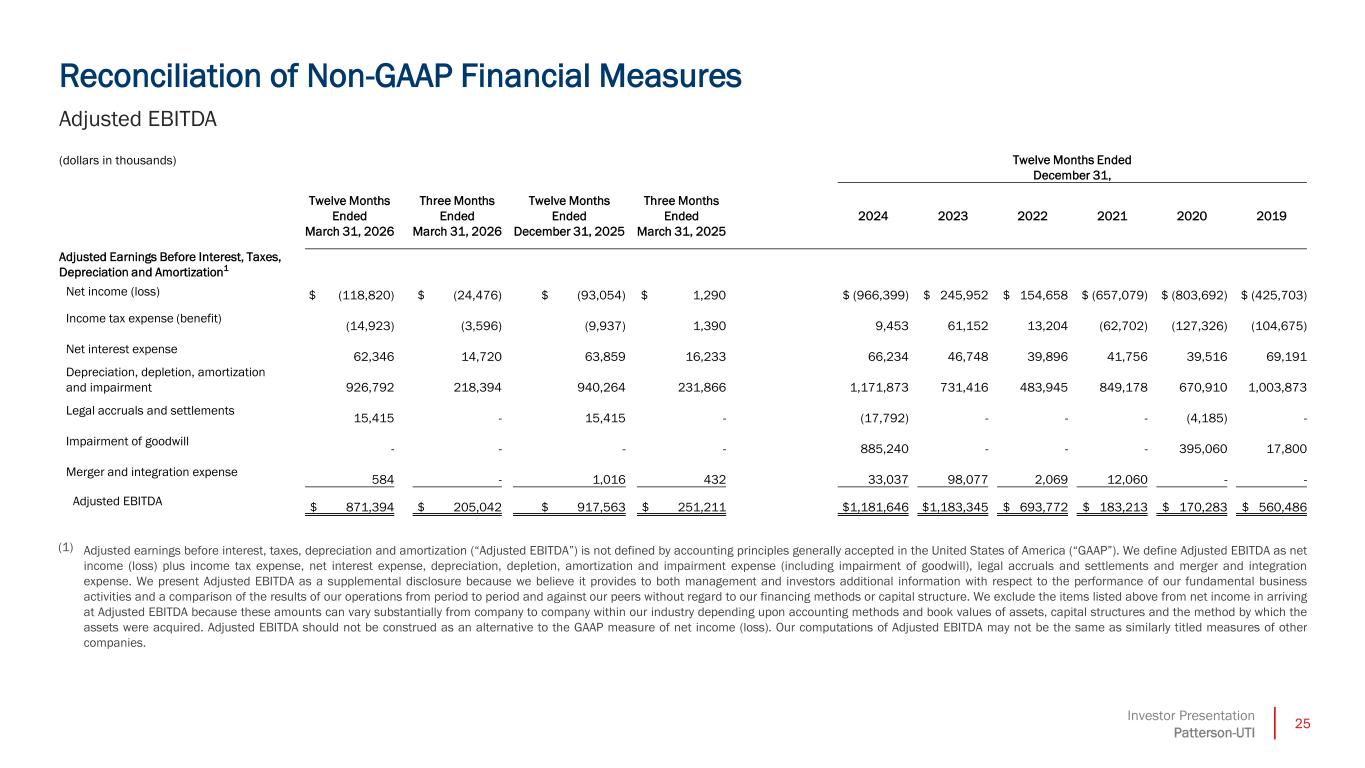
25Investor Presentation Patterson-UTI Reconciliation of Non-GAAP Financial Measures Adjusted EBITDA (1) Adjusted earnings before interest, taxes, depreciation and amortization (“Adjusted EBITDA”) is not defined by accounting principles generally accepted in the United States of America (“GAAP”). We define Adjusted EBITDA as net income (loss) plus income tax expense, net interest expense, depreciation, depletion, amortization and impairment expense (including impairment of goodwill), legal accruals and settlements and merger and integration expense. We present Adjusted EBITDA as a supplemental disclosure because we believe it provides to both management and investors additional information with respect to the performance of our fundamental business activities and a comparison of the results of our operations from period to period and against our peers without regard to our financing methods or capital structure. We exclude the items listed above from net income in arriving at Adjusted EBITDA because these amounts can vary substantially from company to company within our industry depending upon accounting methods and book values of assets, capital structures and the method by which the assets were acquired. Adjusted EBITDA should not be construed as an alternative to the GAAP measure of net income (loss). Our computations of Adjusted EBITDA may not be the same as similarly titled measures of other companies. (dollars in thousands) Twelve Months Ended December 31, Twelve Months Ended March 31, 2026 Three Months Ended March 31, 2026 Twelve Months Ended December 31, 2025 Three Months Ended March 31, 2025 2024 2023 2022 2021 2020 2019 Adjusted Earnings Before Interest, Taxes, Depreciation and Amortization1 Net income (loss) $ (118,820) $ (24,476) $ (93,054) $ 1,290 $ (966,399) $ 245,952 $ 154,658 $ (657,079) $ (803,692) $ (425,703) Income tax expense (benefit) (14,923) (3,596) (9,937) 1,390 9,453 61,152 13,204 (62,702) (127,326) (104,675) Net interest expense 62,346 14,720 63,859 16,233 66,234 46,748 39,896 41,756 39,516 69,191 Depreciation, depletion, amortization and impairment 926,792 218,394 940,264 231,866 1,171,873 731,416 483,945 849,178 670,910 1,003,873 Legal accruals and settlements 15,415 - 15,415 - (17,792) - - - (4,185) - Impairment of goodwill - - - - 885,240 - - - 395,060 17,800 Merger and integration expense 584 - 1,016 432 33,037 98,077 2,069 12,060 - - Adjusted EBITDA $ 871,394 $ 205,042 $ 917,563 $ 251,211 $1,181,646 $1,183,345 $ 693,772 $ 183,213 $ 170,283 $ 560,486
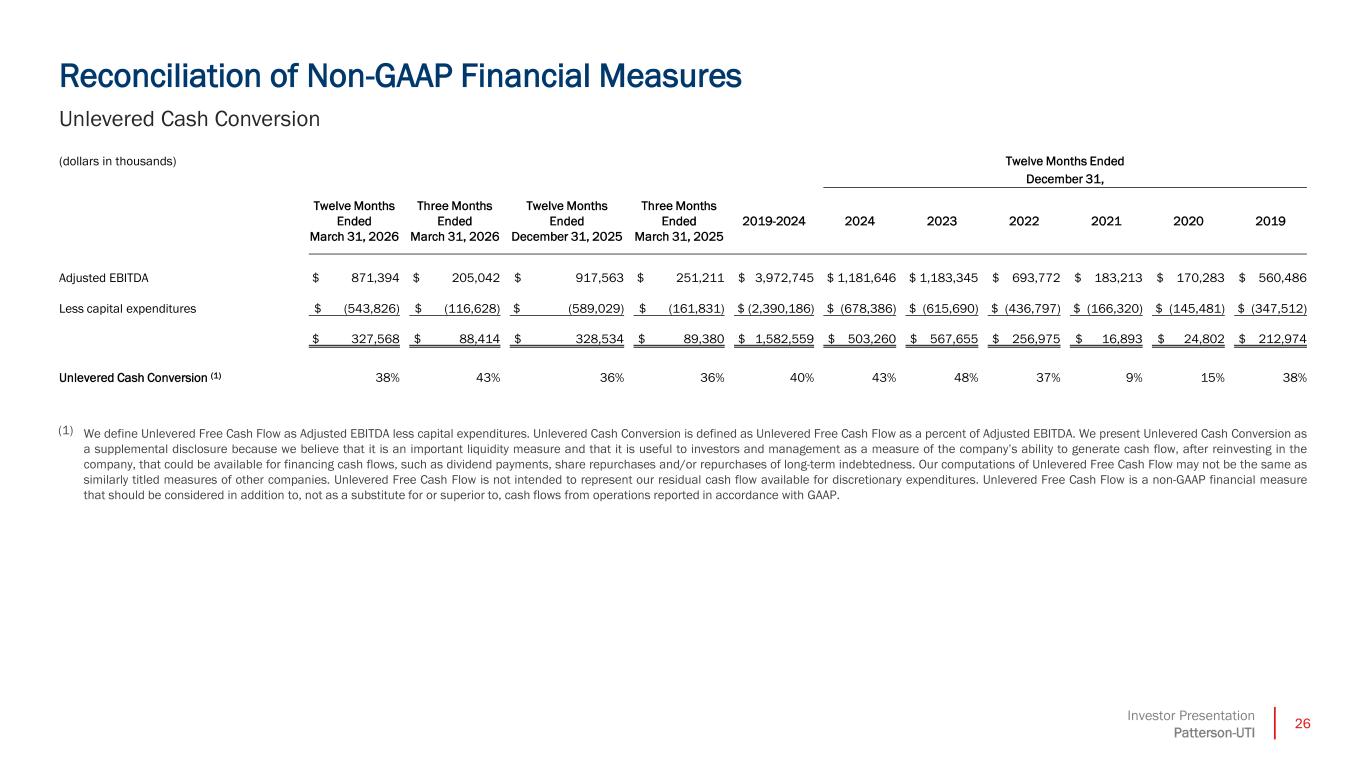
26Investor Presentation Patterson-UTI Reconciliation of Non-GAAP Financial Measures Unlevered Cash Conversion (1) We define Unlevered Free Cash Flow as Adjusted EBITDA less capital expenditures. Unlevered Cash Conversion is defined as Unlevered Free Cash Flow as a percent of Adjusted EBITDA. We present Unlevered Cash Conversion as a supplemental disclosure because we believe that it is an important liquidity measure and that it is useful to investors and management as a measure of the company’s ability to generate cash flow, after reinvesting in the company, that could be available for financing cash flows, such as dividend payments, share repurchases and/or repurchases of long-term indebtedness. Our computations of Unlevered Free Cash Flow may not be the same as similarly titled measures of other companies. Unlevered Free Cash Flow is not intended to represent our residual cash flow available for discretionary expenditures. Unlevered Free Cash Flow is a non-GAAP financial measure that should be considered in addition to, not as a substitute for or superior to, cash flows from operations reported in accordance with GAAP. (dollars in thousands) Twelve Months Ended December 31, Twelve Months Ended March 31, 2026 Three Months Ended March 31, 2026 Twelve Months Ended December 31, 2025 Three Months Ended March 31, 2025 2019-2024 2024 2023 2022 2021 2020 2019 Adjusted EBITDA $ 871,394 $ 205,042 $ 917,563 $ 251,211 $ 3,972,745 $ 1,181,646 $ 1,183,345 $ 693,772 $ 183,213 $ 170,283 $ 560,486 Less capital expenditures $ (543,826) $ (116,628) $ (589,029) $ (161,831) $ (2,390,186) $ (678,386) $ (615,690) $ (436,797) $ (166,320) $ (145,481) $ (347,512) $ 327,568 $ 88,414 $ 328,534 $ 89,380 $ 1,582,559 $ 503,260 $ 567,655 $ 256,975 $ 16,893 $ 24,802 $ 212,974 Unlevered Cash Conversion (1) 38% 43% 36% 36% 40% 43% 48% 37% 9% 15% 38%
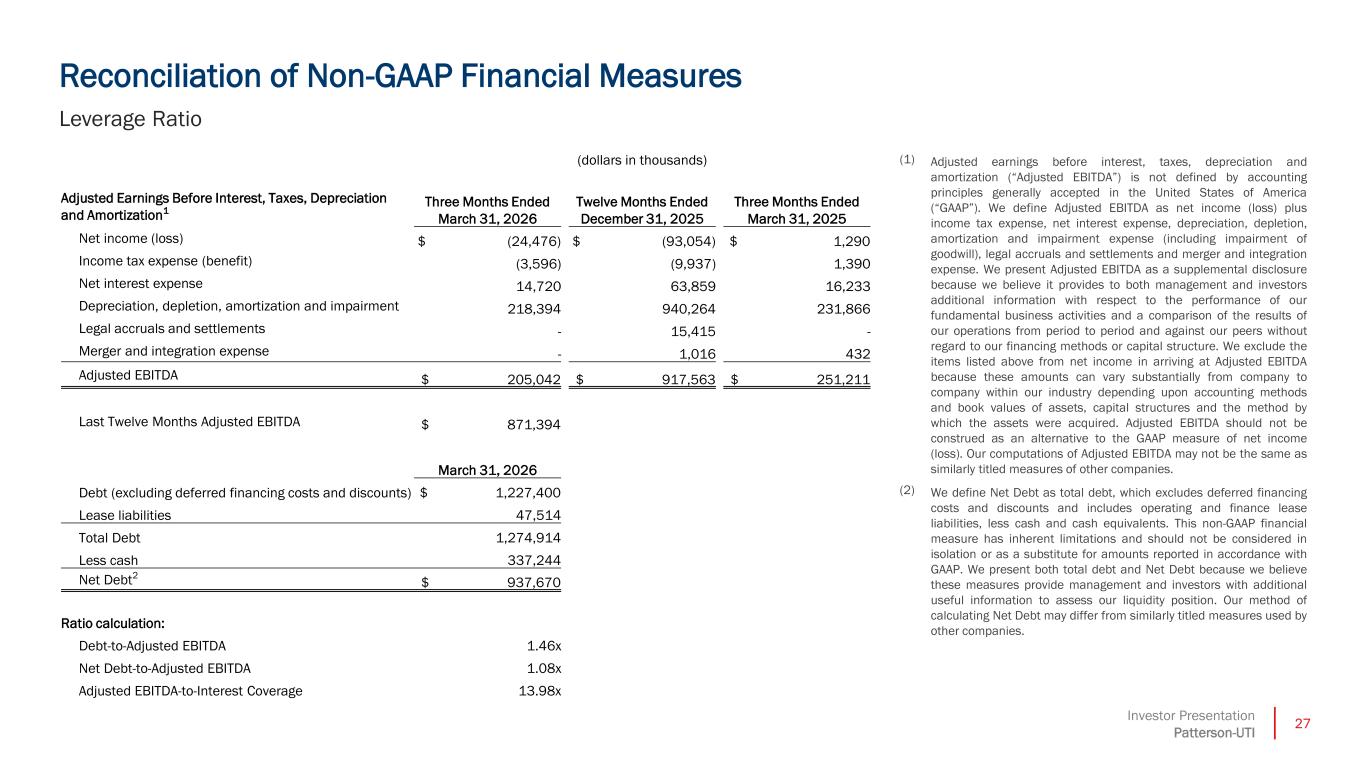
27Investor Presentation Patterson-UTI Reconciliation of Non-GAAP Financial Measures (1) Adjusted earnings before interest, taxes, depreciation and amortization (“Adjusted EBITDA”) is not defined by accounting principles generally accepted in the United States of America (“GAAP”). We define Adjusted EBITDA as net income (loss) plus income tax expense, net interest expense, depreciation, depletion, amortization and impairment expense (including impairment of goodwill), legal accruals and settlements and merger and integration expense. We present Adjusted EBITDA as a supplemental disclosure because we believe it provides to both management and investors additional information with respect to the performance of our fundamental business activities and a comparison of the results of our operations from period to period and against our peers without regard to our financing methods or capital structure. We exclude the items listed above from net income in arriving at Adjusted EBITDA because these amounts can vary substantially from company to company within our industry depending upon accounting methods and book values of assets, capital structures and the method by which the assets were acquired. Adjusted EBITDA should not be construed as an alternative to the GAAP measure of net income (loss). Our computations of Adjusted EBITDA may not be the same as similarly titled measures of other companies. (2) We define Net Debt as total debt, which excludes deferred financing costs and discounts and includes operating and finance lease liabilities, less cash and cash equivalents. This non-GAAP financial measure has inherent limitations and should not be considered in isolation or as a substitute for amounts reported in accordance with GAAP. We present both total debt and Net Debt because we believe these measures provide management and investors with additional useful information to assess our liquidity position. Our method of calculating Net Debt may differ from similarly titled measures used by other companies. Leverage Ratio (dollars in thousands) Adjusted Earnings Before Interest, Taxes, Depreciation and Amortization1 Three Months Ended March 31, 2026 Twelve Months Ended December 31, 2025 Three Months Ended March 31, 2025 Net income (loss) $ (24,476) $ (93,054) $ 1,290 Income tax expense (benefit) (3,596) (9,937) 1,390 Net interest expense 14,720 63,859 16,233 Depreciation, depletion, amortization and impairment 218,394 940,264 231,866 Legal accruals and settlements - 15,415 - Merger and integration expense - 1,016 432 Adjusted EBITDA $ 205,042 $ 917,563 $ 251,211 Last Twelve Months Adjusted EBITDA $ 871,394 March 31, 2026 Debt (excluding deferred financing costs and discounts) $ 1,227,400 Lease liabilities 47,514 Total Debt 1,274,914 Less cash 337,244 Net Debt2 $ 937,670 Ratio calculation: Debt-to-Adjusted EBITDA 1.46x Net Debt-to-Adjusted EBITDA 1.08x Adjusted EBITDA-to-Interest Coverage 13.98x