
(Mark One) | |
[X] | Annual Report Pursuant to Section 13 or 15(d) of the Securities Exchange Act of 1934 |
[ ] | Transition report pursuant to Section 13 or 15(d) of the Securities Exchange Act of 1934 |
Delaware | 36-3681151 | |
(State or other jurisdiction of incorporation or organization) | (I.R.S. Employer Identification No.) | |
Title of each class | Name of each exchange on which registered | ||
Common Stock, No Par Value | Nasdaq Global Select Stock Market | ||
10% Trust Preferred Securities of PrivateBancorp Capital Trust IV | Nasdaq Global Select Stock Market | ||
7.125% Subordinated Debentures due 2042 | New York Stock Exchange | ||
• | Since 2010, has served as Executive Vice President, Managing Director and Chief Financial Officer of Ryan Specialty Group, LLC, joining as part of the founding team together with the founder and former executive chairman of Aon Corp. |
• | Prior to Ryan Specialty, spent nearly eight years with Aon plc (f/k/a Aon Corp.) (NYSE: AON) as Senior Vice President, Chief Risk Officer and Treasurer. |
• | Currently serves on the board of GATX Corporation (NYSE: GATX), a lessor and operator of assets in the rail and marine markets. |
• | Earlier in career, served as Vice President of Finance at the University of Chicago Hospitals and Health System and as budget director for the City of Chicago. |
• | Served on the board of directors of the Federal Home Loan Bank of Chicago from 2008 until joining the our Board in 2015. |
• | Since 2008, has served as the Chief Executive Officer of Norman Bobins Consulting LLC. |
• | Currently serves on the boards of AAR Corp (NYSE: AIR), an aerospace and defense products and services provider, Omega Healthcare Investors, Inc. (NYSE: OHI), a real estate investment trust focusing on the healthcare industry, REEF |
• | Retired in 2007 as Chairman, Chief Executive Officer and President of LaSalle Bank, N.A., which was the 15th largest bank in the United States at the time of its acquisition by Bank of America Corp. He joined LaSalle Bank in 1990 through its acquisition of Exchange National Bank of Chicago. |
• | Prior to its acquisition by LaSalle Bank in 1990, was Senior Executive Vice President and Chief Lending Officer at Exchange National Bank for nine years. Prior to that, was with American National Bank and Trust Company as Senior Vice President, holding various commercial lending positions over 14 years. |
• | Recognized civic leader in Chicago, serving on the boards or advisory councils of a number of civic, philanthropic and other non-profit organizations. |
• | Among others, currently serves on the boards of The Field Museum, Illinois Sports Facility Authority, Navy Pier, Inc. (the non-profit maintaining and overseeing the redevelopment of Chicago’s Navy Pier) and WTTW Communications, Inc. (the public television network in Chicago). |
• | Former member of the Board of Education of the City of Chicago, having been appointed by Mayor Daley for four consecutive four-year terms. |
• | Since 2007, has been the President of Cambium, LLC, a business and financial advisory firm serving small and medium-sized businesses. |
• | Currently serves on the board of directors of Health Care Service Corp., the largest customer-owned health insurer in the United States and an independent licensee of the Blue Cross and Blue Shield Association, and Ulta Beauty, Inc. (NASDAQ: ULTA), a beauty products retailer. Also serves on the board of directors of Strategic Marketing, Inc., a privately-held company. |
• | Prior public company director experience includes Integrys Energy Group, Inc. (NYSE: TEG) (from 2011 to 2015), Molex, Inc. (NASDAQ: MOLX) (from 2003 to 2013), Bucyrus International, Inc. (NASDAQ: BUCY) (from 2009 to 2011), Coldwater Creek, Inc. (NASDAQ: CWTR) (from 1997 to 2004), and CDW Corp. (NASDAQ: CDW) (from 1996 to 2007). |
• | In 1997, co-founded Svoboda, Collins L.L.C., a private equity firm, serving as Managing Director from 1998 through 2006. Has served as an Advisory Board Member for Svoboda Capital Partners LLC (successor to Svoboda, Collins) from 2007 through the present. |
• | Began her career with William Blair & Company, LLC, advancing to the position of Principal in the Corporate Finance Department. |
• | Serves on the boards of a number of civic, philanthropic and other non-profit organizations, including the Erikson Institute (as Chairman), the Chicago Public Library Foundation, the Museum of Science and Industry, Navy Pier, Inc. (the non-profit maintaining and overseeing the redevelopment of Chicago’s Navy Pier) and WTTW Communications, Inc. (the public television network in Chicago). |
• | Retired in May 2015 as Chairman, President and Chief Executive Officer of Rolls-Royce North America Inc., a subsidiary of Rolls-Royce plc (LSE: RR), where he also served as a director for many years. In leadership role at Rolls-Royce over 18 years, oversaw all Rolls-Royce companies and business units in North America, encompassing nearly 8,000 people at more than 60 locations throughout the U.S. and Canada. |
• | Previously, enjoyed a long and successful career with United Air Lines, Inc. In more than 28 years with the carrier, held a wide range of increasingly senior positions offering breadth and depth into all facets of airline management, including marketing, sales and daily operations. |
• | Currently the independent lead director of The Priceline Group, Inc. (NASDAQ: PCLN), a major online travel and restaurant reservation provider. |
• | Served on the Board of Regents of St. Mary’s College until early 2017. |
• | Founder and CEO of Nia Enterprises, LLC, a Chicago-based online research, marketing and digital consulting firm. |
• | From June 2016 to March 2017, served as Chief Executive Officer of Ebony Media Operations LLC, the leading African-American publishing, digital, mobile and events company connecting advertisers and consumers for over 70 years, consisting of global brands Ebony, Ebony.com and Jet.mag.com with over 10 million readers. |
• | From January 2013 to June 2016, served as Chief Operating Officer of Johnson Publishing Company (a predecessor to Ebony Media Operations) and President of its digital business unit, JPC Digital. |
• | Previously, served as a Worldwide Senior Vice President and General Manager for Open Port Technology and as Vice President for the Americas and a founding member of the Network Systems Division for 3Com (formerly U.S. Robotics). |
• | Since 2007, has served on the board of directors for Deluxe Corporation (NYSE: DLX), a business services and products provider for small businesses and financial services firms, currently serving on its finance and compensation committees. |
• | Serves as a director of the University of Chicago Medical Center, the Shedd Aquarium, the Chicago Public Library Foundation and the Gaylord and Dorothy Donnelley Foundation. |
• | Previously served for ten years as an Associate Adjunct Professor of Entrepreneurship at the Kellogg School of Management at Northwestern University. |
• | Chairman and former Chief Executive Officer and President of PVS Chemicals, a global manufacturer, distributor and marketer of chemicals based in Detroit, Michigan. |
• | Before joining PVS Chemicals in 1972, held positions with First National Bank of Chicago in London and Dublin. |
• | From April 2005 until October 2007, was chairman of the board of LaSalle Bank Midwest, N.A., an affiliate of LaSalle Bank, N.A. |
• | Since 2012, has served on the board of directors of DTE Energy Co. (NYSE: DTE), an electric and gas utility based in Detroit, Michigan. |
• | Served on the board of directors of the Amerisure Companies, a commercial property and casualty insurer, from 1982 until 2016, including as chairman from 1996 through the end of his tenure. |
• | Recognized civic leader in his hometown of Detroit, Michigan, serving on the boards or advisory councils of a number of civic, philanthropic and other non-profit organizations. |
• | Among others, currently serves on the boards of the Detroit Symphony Orchestra (Chairman Emeritus), the Detroit Economic Club, the Community Foundation for Southeastern Michigan (Chairman) and Detroit Public Television (Chairman Emeritus). |
• | Also is a member of the advisory council of the University of Chicago Graduate School of Business. |
• | Chairman and Chief Executive Officer of Mesirow Financial Holdings, Inc., a privately-held diversified financial services firm headquartered in Chicago, a position held since March 2011. |
• | Joined Mesirow Financial in 1972 and has held a number of positions, including president and chief operating officer (from March 2006 through March 2011) and president of its Insurance Services Division for 25 years. |
• | Actively involved as a board or advisory member with a wide array of civic, philanthropic and other nonprofit organizations in the Chicago area. |
• | Among others, currently serves on the boards of World Business Chicago (appointed by Mayor Rahm Emanuel), Rush University Medical Center, Big Shoulders Fund, and Illinois Sports Facilities Authority. |
• | Member of the United States Holocaust Memorial Museum Council (appointed by former President Barack Obama). |
• | Served as President of Hyatt Hotels Corporation from 2003 until retirement in 2006. Also served as its Chief Operating Officer beginning in 2000. |
• | Currently serves as a director of Sally Beauty Holdings Inc. (NYSE: SBH), a beauty supply distributor, serving on its compensation committee (as chairman) and nominating and corporate governance committee. Also currently serves on the board of advisors of First Hospitality Group, Inc., a privately held company engaged in the ownership, development and management of hotels nationally. |
• | Previously served as a director of WMS Industries, Inc. (NYSE: WMS), a manufacturer and distributor of gaming machines, serving as lead director and as a member of its audit, compensation and ethics committees until the company was acquired in October 2013. |
• | Joined the Company and the Bank in 2007 as our President and CEO and as a director. |
• | Prior to joining us, served as President and CEO of LaSalle Bank, N.A., and President of LaSalle Bank Midwest, N.A., until their acquisition by Bank of America Corporation. |
• | Began career with American National Bank and joined Exchange National Bank of Chicago in 1981, which was acquired by LaSalle Bank in 1990. |
• | Involved in many civic and philanthropic organizations in Chicago, including serving on the boards of World Business Chicago (appointed by Mayor Rahm Emanuel), the Museum of Science and Industry, Northwestern Memorial Hospital, Big Shoulders Fund and participating as a member of the Economic Club of Chicago and the Executives Club of Chicago. |
• | Also a member of the Dean’s Advisory Council at Indiana University’s Kelley School of Business and a life member of the Global Advisory Board for the Kellogg School of Management at Northwestern University. |
• | From 1986 until retirement in 2000, held the position of Executive Vice President and CFO of Van Kampen Investments, Inc., a mutual fund company that was acquired by Morgan Stanley in 1996. |
• | Prior to Van Kampen, was a Partner at the accounting firm KPMG LLP (formerly Peat, Marwick, Mitchell & Co.). He is a Certified Public Accountant. |
• | Currently a member of the board of trustees of mutual funds in the Calamos Investments family and Jackson National Life Funds family. |
• | Previously served as a director of Alliance Bancorp, Inc. and its predecessor, Hinsdale Financial Corp., publicly traded banking organizations based in the Chicago area, from 1986 until 2001, and as a member of the board of directors of Howe Barnes Hoefer & Arnett, Inc., a broker-dealer firm later acquired by Raymond James Financial, Inc. |
• | Serves on the board of directors of Christian Brothers Investment Services, Inc., which provides investment management services to Catholic institutions worldwide. Currently serves as Chairman (since February 2016). |
• | Also serves on the board of trustees of Lewis University. |
• | From 1985 until its acquisition in 2016 by a private equity group, served as Chairman and CEO of Evans Food Group, Ltd., a privately-held snack food manufacturer and distributor and one of the largest Hispanic-owned companies in the Chicago area. Currently remains a director of the company. |
• | Served as a director of Walgreens Boots Alliance, Inc. (NASDAQ: WBA) (and its predecessor, Walgreen Co. (NASDAQ: WAG)) from January 2008 through May 2015, most recently serving on its audit and nominating committees. |
• | Recognized civic leader in Chicago, serving on the boards of, among others, Rush University Medical Center, Chicago Transit Authority, The Field Museum, Chicago Symphony Orchestra and Ravinia Festival. |
• | Also very active in Latino community affairs, serving as chairman of the advisory board of Chicago of Nafinsa ProMexico, the largest development bank in Mexico, and on the board of ABC Holding, the second largest Sociedad Financiera de Objeto Limitado (a type of financial institution) in Mexico, which focuses on developing low income housing. |
• | Major Risks Overseen: financial statements, systems and reporting; internal controls; internal and external audit; legal and compliance risk; related party transactions. |
• | Oversees the internal audit function; Director of Internal Audit reports directly to the Committee. |
• | Oversees the independent credit review function, which is designed to ensure credit policies and processes are functioning effectively and risk ratings and regulatory credit classifications are accurate. |
• | Receives reporting on the internal audit program, credit review program and compliance program no less frequently than quarterly. |
Effect of Merger Agreement with CIBC | Summarizes the impact our June 29, 2016 merger agreement, as subsequently amended on March 30, 2017, with Canadian Imperial Bank of Commerce, or CIBC, and subsequent merger-related activities had on 2016 compensation. |
Pay for Performance Analysis | Summarizes 2016 operating performance and total stockholder return, our CEO’s 2016 pay, and key 2016 executive compensation decisions. |
Compensation Program Highlights | Indicates the compensation and compensation-related governance “best practices” we follow. |
What We Pay and Why We Pay It | Discusses our compensation philosophy, pay mix, the structure of our 2016 program and the rationales underlying the Compensation Committee’s 2016 pay decisions. |
How We Make Compensation Decisions | Describes the Committee’s procedures for making compensation analyses and decisions, including its use of an independent compensation consultant, how the Committee incorporates risk considerations in its incentive compensation decisions, how it defines our peer group and how it uses peer group data. |
Additional Information | Describes our clawback policies, employment agreements, practices regarding tax deductibility of compensation, the Committee’s consideration of say-on-pay votes and our investor outreach. |
• | Under the merger agreement, CIBC agreed that when determining the level of achievement against the pre-established performance metrics under the 2016 annual bonus program or the performance share unit (“PSU”) component of our long-term incentive plan, the Committee could adjust our results for costs, expenses and nonrecurring charges associated with the merger agreement and merger-related activities. The Committee made such adjustment in determining the corporate pool funding percentage under our 2016 annual incentive program. Such adjustments did not materially impact the corporate pool funding percentage and had no impact on the amounts earned under the PSU awards. |
• | Additionally, under the merger agreement, CIBC agreed that with respect to our outstanding PSUs that had performance periods that had not ended prior to the date of the merger agreement and that end prior to the closing, the Committee is permitted to certify the level of achievement of performance at the maximum level if the closing had not occurred by year-end 2016. This provision did not impact the Committee’s certification in February 2017 of performance under the PSUs granted in 2014 as the actual performance for the period 2014–2016 exceeded the maximum level. If the CIBC merger is completed, performance under our outstanding PSUs that were granted in 2015 and 2016 also will be certified at the maximum level prior to the closing in accordance with the merger agreement. |
• | In anticipation of the CIBC merger, the Committee eliminated the additional delayed settlement feature of time-vested restricted stock units (“RSUs”) granted to our executive officers as the mandatory deferral component of the 2016 annual bonus program, made annual awards under our long-term incentive plan in early 2017 entirely in the form of RSUs rather than PSUs, and made certain other changes to the terms of our equity awards. |
• | The negotiation of the merger agreement and merger-related activities required significant attention and focus of our CEO and certain other executive officers, which was in addition to these officers’ day-to-day obligations executing our strategic and business plans. The important contributions of our CEO and those executive officers to our successful entry into the merger agreement and the strong performance of our business were recognized in the compensation decisions made by the Committee. |
• | The eighth consecutive year of improving our bottom line results while continuing our growth. |
• | Earnings per share were up 11% to $2.57 in 2016 from $2.32 in 2015 and net income increased 12% compared to 2015. |
• | We increased total loans by 13% and total deposits by 12% during 2016 to $15.1 billion and $16.1 billion, respectively. |
• | Credit quality remained strong, with our nonperforming loans representing 0.56% of total loans at year end. |
• | Our return on average assets (“ROA”) for 2016 was 1.13%, consistent with 2015 and fourth highest among our 20 peers. |
• | Our return on average common equity (“ROE”) for 2016 was 11.4%, also fourth highest among our 20 peers. |
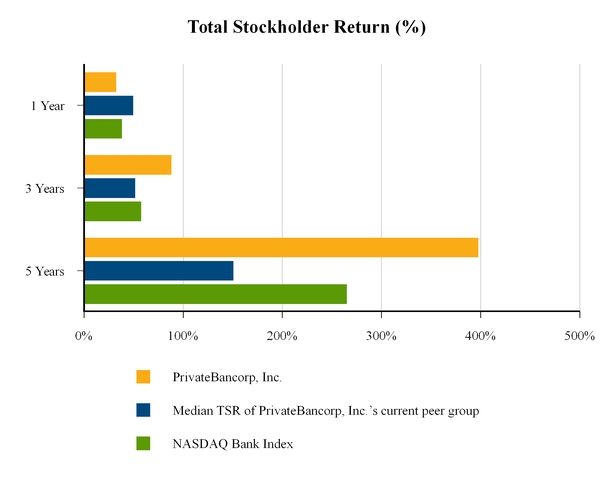
* | The published industry total return index used for this comparison is the Center for Research in Security Prices index for NASDAQ Bank Stocks. TSR is the total return of common stock over a specified period, expressed as a percentage (calculated based on the change in stock price over the measurement period, assuming reinvestment of dividends). |
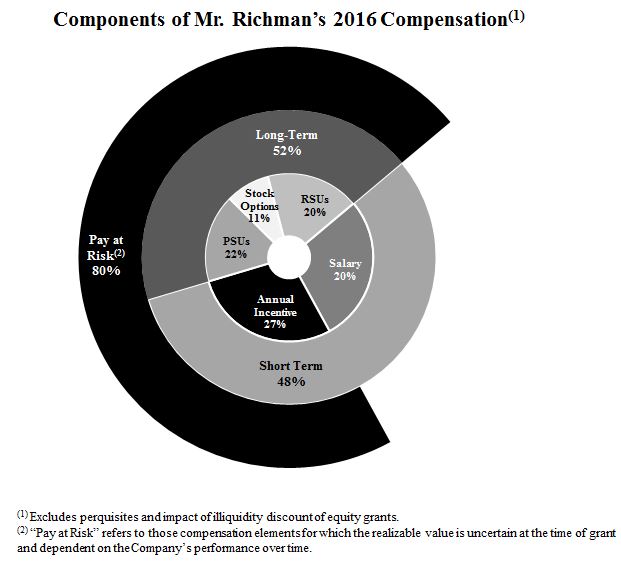
Comparison of 2015 and 2016 CEO Compensation | |||||||
Base Salary | Annual Incentive | Long-Term Equity Incentive | TOTAL | ||||
2015 CEO Compensation | $1,000,000 | $1,700,000 | $1,600,000 | $4,300,000 | |||
2016 CEO Compensation | $1,030,000 | $1,850,000 | $2,200,000 | $5,080,000 | |||
• | Our 2016 annual incentive plan continued to focus our executives on strategic imperatives to improve earnings, strengthen our balance sheet, increase fee income, and continue to develop an improved deposit funding base. The Committee chose metrics and assigned relative weightings to create balanced incentives among driving profitability and continuing efforts to develop appropriate funding sources, all while maintaining a strong balance sheet from both a credit quality and capital adequacy perspective. |
• | We exceeded target performance on all four performance metrics under our 2016 annual incentive plan, exceeding the “superior” performance level in three of the metrics. Based on the above-target performance for all four performance metrics, the Committee approved a corporate-wide 2016 bonus pool funding at 117.3% of target. |
• | We continued our historical practice of deferring 25% of each executive’s annual incentive in the form of RSUs. These RSUs granted in February 2017 vest ratably over three years. In accordance with the merger agreement and in a departure from recent practice, the shares of stock underlying the RSUs will be distributed ratably on the vesting dates. In recent years, the shares of stock underling the RSUs were distributed to executives three years after the last vesting date. |
• | We increased the portion of our named executive officers’ aggregate 2016 total direct pay that is variable pay at risk from 71% in 2015 to 73% in 2016. |
• | We maintained the mix of executives’ 2016 long-term equity awards at 50% performance share units (“PSUs”), 25% RSUs and 25% stock options to continue to emphasize performance-based compensation. Unlike RSUs which vest over time based solely on continued employment at a quantity equal to the number granted, the vesting and ultimate value of the PSUs depends on our three-year performance against two metrics as described in the immediately following bullet. |
• | Consistent with our 2015 PSU design, the PSUs granted in early 2016 provided that the amount earned at the end of the performance period will depend on both our cumulative earnings per share against a three-year target and our stock price performance relative to other banks within a pre-selected reported banking company index. Shares earned based on our 2016-2018 cumulative EPS performance can range from 0% to 150% of target and those earned shares will then be adjusted up or down by 33% based on our three-year relative TSR performance. |
• | As in 2015, earned 2016 PSUs will not settle for two years after vesting, thereby reducing costs (due to a lack-of-marketability accounting discount), reinforcing long-term alignment, balancing risk and providing us the opportunity to recoup (clawback) some or all of the value of the PSUs if an executive engaged in inappropriate or excessively risky behavior. |
• | The RSUs granted to our executives as part of their 2016 long-term incentives in early 2016 vest ratably over three years. However, to enhance long-term alignment, awards to executives other than Mr. Richman include a delayed settlement feature under which, for all executives other than our CEO, the shares underlying the RSUs will generally not be distributed to the executives until early 2022 (three years after the final tranche vests). Settlement of the RSUs granted to Mr. Richman in early 2016 as part of his long-term incentive provide similar long-term alignment, with a delay of distribution until he resigns or otherwise separates from the Company for any reason or, if earlier, until the tax benefits associated with such distribution of the vested shares would not be limited. |
• | During 2016, the Committee enhanced and formalized its consideration of risks relating to incentive compensation and believes it has structured an executive compensation program with incentives that appropriately balance risk and financial results in a manner that does not encourage executives to expose the Company to imprudent or excessive risks. For more information, see “—How We Make Compensation Decisions – Risk Considerations.” |
Practices We Followed in 2016 | |
ü | Pay for performance – A significant percentage of total 2016 compensation for executives (80% for our CEO) is variable “pay at risk,” the value of which will depend upon Company performance and/or stock price performance. |
ü | Linkage between performance measures and strategic objectives – Performance measures for incentives are linked to financial plans, profitability and other strategic objectives we believe will enhance long-term stockholder value. |
ü | Post-vesting delayed settlement for executive officers – To enhance alignment with creation of long-term stockholder value, assist in balancing risk and reward and manage expense associated with long-term incentives, we have embedded a significant post-vesting delayed settlement feature in our awards. Shares underlying RSUs granted in 2016 to executive officers generally will not be settled (or distributed to them) until early 2022 (three years after the final tranche vests) so that the executives may not sell such shares until approximately six years from grant. Similarly, 2016 PSUs earned after a three-year performance period are not settled (and therefore the underlying shares of common stock may not be sold) for an additional two years after vesting. In connection with the merger agreement, the awards we granted in early 2017 did not include any post-vesting delayed settlement feature. |
ü | Clawback policies – We have the right to recoup annual and long-term incentive compensation from our executive officers and others. See “—Additional Information – Clawback Policies” below. |
ü | Periodic compensation risk reviews – The Committee periodically (but at least annually) reviews the risks associated with behaviors incented by our compensation plans as well as related mitigating controls to confirm that our compensation policies and practices are not reasonably likely to have a material adverse effect on the Company. |
ü | Independent compensation consultant – The Committee retains an independent compensation consultant to review and advise on our executive compensation program and practices. |
ü | “Double trigger” for executives’ severance – Our executives’ employment agreements entitle them to severance benefits upon a change in control, but only if they are involuntarily terminated without cause or they voluntarily resign for good reason within two years following, or six months prior to, the change in control. In the case of Mr. Richman, “good reason” includes his voluntary termination of employment during the 90-day period beginning on the first anniversary of a change in control; however, Mr. Richman agreed to relinquish this right under a new employment agreement with CIBC, which will become effective upon consummation of the merger. |
ü | No automatic vesting of equity on a change in control – Under our equity plan, if outstanding awards are assumed or replaced with an award of equal or greater value upon a change in control, and meet certain other requirements, such awards will not vest automatically but will remain outstanding. However, if within two years of the change in control, an employee is involuntarily terminated other than for cause, then his or her unvested awards vest fully upon such termination. |
ü | Robust stock ownership guidelines – The Board believes that significant stock ownership by executives and directors aligns their interests with stockholders and promotes long-term business objectives. All of our executives and directors have exceeded the guideline level applicable to them other than our three newest directors and one of our executive officers (who is not a named executive officer), each of whom is still in the accumulation period. See “Corporate Governance—Stock Ownership Guidelines.” |
ü | Anti-Hedging & Pledging Policy – The policy, applicable to directors and executive officers, prohibits both hedging and pledging of our stock. None of our executives or directors has outstanding hedges or pledges of our stock. See “Corporate Governance—Anti-Hedging & Pledging Policy.” |
• | Enable us to appropriately compete for and retain talented employees; |
• | Reward performance and focus on long-term stockholder value creation by emphasizing variable pay; |
• | Reflect an appropriate mix of cash and equity; |
• | Reflect good corporate governance and compensation practices; |
• | Take into consideration an assessment of the risk profile of our compensation programs to reduce unnecessary or excessive risks and to confirm that any such risks are not reasonably likely to have a material adverse effect on us; |
• | Link rewards to behaviors that are demonstrative of our values and further our strategic objectives, while also taking into account the long-term safety and soundness of our company; |
• | Consider the risk-management effectiveness of our executives; and |
• | Contain appropriate risk clawbacks. |
Element | Why We Pay this Element | How Size is Determined/Links to Performance | ||||
Fixed | Base Salary | Fixed pay for knowledge, skills and abilities | Ÿ | Set upon an executive’s hire at competitive levels in consideration of knowledge, skills, abilities, experience and job scope. | ||
Ÿ | Executive salaries are reviewed annually to consider merit increases and market adjustments. This review includes an assessment of compensation survey data and comparative proxy peer group information. Comparative salary information is only one among several factors used to set salaries. | |||||
Variable | Annual Incentive | Drives the achievement of key business results as determined by the Board | Ÿ | Annual incentive targets (expressed as a percentage of base salary) are set forth in each executive’s employment agreement. | ||
Ÿ | Actual payouts are generally based on the Company’s performance against metrics chosen to drive our strategic priorities, individual performance, performance of the business unit or support group overseen by that executive, individual contributions to the Company’s strategic progress, an assessment of competitive pay practices and an assessment of various risk matters. | |||||
Ÿ | 75% of the award paid in cash as an annual incentive and 25% deferred in the form of RSUs that vest ratably over three years. | |||||
Long-Term Equity Awards | Ÿ | Motivates and rewards behaviors critical to our long-term success | 2016 Long-Term Incentive Comprised of Three Vehicles – Aggregate dollar value of the long-term awards determined in consideration of Company performance trends, individual and business unit performance and competitive market practices | |||
PSUs – 50% of each executive’s 2016 long-term equity award | ||||||
Ÿ | Number of shares to be earned is based in part on three-year cumulative EPS (2016-2018). PSUs will convert into common stock at 0-150% of target level based on performance against a pre-determined cumulative EPS metric. After assessment of EPS performance against that metric, the number of shares to be issued upon settlement will be further adjusted by reference to a total stockholder return factor that can range from 0.67 to 1.33 based on our three-year TSR during the performance period relative to the banks in the KRX index. | |||||
Ÿ | Aligns executives’ interests with long-term stockholder value | |||||
Ÿ | Delayed settlement in common stock in 2021 (two years after vesting), subject to any application of the PSUs’ clawback provisions. | |||||
Ÿ | Encourages retention through the use of both multi-year performance-based and time-based vesting schedules, as well as delayed settlement after vesting for RSUs and PSUs | |||||
RSUs – 25% of each executive’s 2016 long-term equity award | ||||||
Ÿ | Three-year ratable vest. | |||||
Ÿ | Delayed settlement feature under which executive officers (other than our CEO) will generally not receive the underlying shares until 2022 (three years after the last vesting date). The CEO will generally not receive the underlying shares until he resigns or otherwise separates from the Company. | |||||
Options – 25% of each executive’s 2016 long-term equity award | ||||||
Ÿ | Cliff vest 100% in 2019, three years after grant. | |||||
Ÿ | Balances risk | |||||
Name | 2015 Base Salary (1) | 2016 Base Salary(2) | ||||||
Larry D. Richman | $ | 1,000,000 | $ | 1,030,000 | ||||
Kevin M. Killips | 545,000 | 560,000 | ||||||
Bruce R. Hague | 500,000 | 512,500 | ||||||
Bruce S. Lubin | 495,000 | 510,000 | ||||||
Karen B. Case | 410,000 | 450,000 | ||||||
Name | Target Annual Incentive Opportunity, as a % of 2016 Base Salary (%) (1) | 2016 Annual Incentive Award Allocation ($) | 2016 Annual Incentive Award Allocation, as a % of 2016 Base Salary (%) | ||||||
Larry D. Richman | 125 | 1,850,000 | 180 | ||||||
Kevin M. Killips | 90 | 700,000 | 125 | ||||||
Bruce R. Hague | 110 | 625,000 | 122 | ||||||
Bruce S. Lubin | 90 | 625,000 | 123 | ||||||
Karen B. Case | 90 | 594,000 | 132 | ||||||
2016 Annual Corporate Incentive Program | ||||||||||||||||
Metric Weighting | Threshold | Target | Superior | Maximum | 2016 Actual | |||||||||||
Pool Funding Percentage | 40% | 100% | 125% | 150% | 117.3 | % | ||||||||||
2016 Corporate Bonus Pool Metrics: (Dollars in millions except per share amounts) | ||||||||||||||||
Diluted earnings per share(1) | 50% | $1.76 | $2.50 | $2.81 | $2.97 | $2.62(1) | ||||||||||
Average criticized loans as a percentage of average loans | 15% | 3.45 | % | 2.77 | % | 2.43 | % | 2.02 | % | 2.41 | % | |||||
Average non-brokered deposits(2) | 20% | $8,387 | $8,937 | $9,166 | $9,338 | $9,378 | ||||||||||
Total non-interest income, excluding mortgage banking revenue and security gains/losses | 15% | $95.9 | $115.3 | $123.4 | $132.0 | $130.8(1) | ||||||||||
2016 Long-Term Incentive Awards | |||||||||||||||
Name | Aggregate Value of 2016 Long-Term Incentive ($)(1) | % of 2015 Base Salary | PSUs [50% of Award Value] (# at Target) | RSUs(2) [25% of Award Value] (#) | Options(3) [25% of Award Value] (#) | ||||||||||
Larry D. Richman | 2,200,000 | 220 | 28,416 | 16,115 | 35,722 | ||||||||||
Kevin M. Killips | 490,000 | 90 | 6,329 | 3,589 | 7,511 | ||||||||||
Bruce R. Hague | 400,000 | 80 | 5,167 | 2,930 | 6,131 | ||||||||||
Bruce S. Lubin | 440,000 | 89 | 5,683 | 3,223 | 6,744 | ||||||||||
Karen B. Case | 365,000 | 89 | 4,715 | 2,674 | 5,595 | ||||||||||
(1) | Prior to the accounting valuation impacts of (a) lack of marketability discounts associated with delayed settlement of vested shares under the PSUs and RSUs and (b) the TSR performance factor for PSUs. |
(2) | One-third of the RSUs vested on March 1, 2017, and the remaining two-thirds will vest in equal portions on March 1, 2018 and March 1, 2019. For all executives other than Mr. Richman, the shares underlying vested RSUs comprising a portion of this 2016 long-term equity incentive award are generally not distributable until the earliest of March 1, 2022, the holder’s death or disability, or in certain instances relating to a change in control as defined in IRC Section 409A, in each case, subject to clawback provisions. For Mr. Richman, the underlying shares are generally not settled until he resigns or otherwise separates from the Company. |
(3) | The exercise price of the options is $34.13, the closing price of our common stock on the grant date. The options vest 100% on March 1, 2019. |
Name | Minimum # of Shares of Common Stock into which 2015 PSUs will Settle (subject to continued employment) | ||
Larry D. Richman | 7,566 | ||
Kevin M. Killips | 2,246 | ||
Bruce R. Hague | 1,773 | ||
Bruce S. Lubin | 1,986 | ||
Karen B. Case | 1,631 | ||
2014 PSU Earnout Schedule | |||
Threshold | Target | Superior | |
Performance Metric: Cumulative EPS (adjusted) 2013-2015 | $4.66 | $5.35 | $5.70 |
% of Target PSUs earned | 50% | 100% | 150% |
Name | # of Shares of Common Stock into which 2014 PSUs will Settle (subject to any application of clawback) | |
Larry D. Richman | 39,128 | |
Kevin M. Killips | 14,986 | |
Bruce R. Hague | 11,656 | |
Bruce S. Lubin | 13,320 | |
Karen B. Case | 10,822 | |
• | An assessment by the Risk and Compliance departments for the Committee of our incentive programs in the context of applicable regulatory guidance. This assessment concluded that our incentive programs, including our executive compensation programs, generally conform to the principles set forth in applicable regulatory expectations. |
• | The addition of specific objectives relating to risk and compliance considerations in many executives’ 2016 performance objectives at the recommendation of the Risk and Compliance departments. |
• | The addition of a formal assessment by the Risk department, at the direction of the Company’s Chief Risk Officer, of certain risk- and compliance-related actions taken by the specific lines of business, and certain individuals, prior to finalization of the allocation of the annual incentive bonus pool to the lines of business and support groups. No factors arose from this assessment that indicated any changes to the proposed allocations to our named executive officers should be made. |
• | The presentation to the CEO by the Chief Risk Officer of his judgment of executive accountability relating to certain risk- or compliance-related matters that arose during the year. The CEO then discussed each of these risk considerations regarding each executive officer with the Committee prior to the Committee approving executives’ incentive awards. |
Summary of Key Risk Mitigation Factors in 2016 Executive Compensation Program | ||||
Risk Mitigation Factor | Description | |||
Annual Incentives | Ÿ Multiple Performance Metrics | To ensure executive focus remained on various equally important parts of our operations, our 2016 annual incentive plan contained four metrics based on profitability, granularity of deposits, credit quality and non-interest income. | ||
Ÿ Deferral Feature | 25% of the 2016 award is deferred in RSUs which vest over three years. This focuses executives on the Company’s long-term success. | |||
Ÿ Clawbacks | Applicable clawbacks are set forth in various laws and regulations, as well as our omnibus incentive plan. | |||
Ÿ Award Cap | Our annual incentive program limits the size of executives’ annual incentives to 125% of the product of their target award and the Company’s annual incentive bonus pool funding percentage. | |||
Long-Term Equity Incentives | Ÿ Multiple Performance Factors | Our PSUs have both an absolute EPS metric, and TSR relative to a pre-established index. | ||
Ÿ Long Performance Period | Our PSUs have a three-year performance period, which balances the incentivizing nature of the award with an executive’s focus on the long-term success and stability of the organization. | |||
Ÿ Clawbacks | In addition to the applicable clawbacks described above, our PSUs contain a risk-based clawback. See “—Additional Information – Clawback Policies.” | |||
Ÿ Stock Ownership Guidelines and Anti-Hedging/Pledging Policy | Together, these ensure executives maintain the risk of ownership in a significant number of shares to align their interests with those of stockholders. | |||
Ÿ Deferred Settlement on Executives RSUs and PSUs | The underlying shares are not distributed to executives until, in most cases, three years (for RSUs) or two years (for PSUs) after vesting. For our CEO, the shares underlying his 2016 RSUs granted as part of his long-term incentive award will generally not settle until he resigns or otherwise separates from the Company. | |||
Ÿ 3-Year Cliff Vesting on Options | Focuses executives on the long-term value of the Company. | |||
• | in collaboration with management, develops our executive compensation philosophy and monitors the overall effectiveness of our executive program; |
• | reviews and approves the compensation of our CEO and other executive officers; |
• | approves an annual bonus plan, including setting metrics; |
• | administers our long-term incentive program, including granting of equity and setting vesting and other terms; |
• | establishes, and reviews compliance with, executive stock ownership guidelines; |
• | reviews and approves our peer group; |
• | has authority and funding to retain and pay for an independent compensation consultant; |
• | considers the independence of its compensation advisers prior to engaging or receiving advice from them; and |
• | reviews compensation plans to ensure they do not incentivize imprudent risk-taking. |
• | desirable mix of fixed to variable pay; short- to long-term incentives; and cash to equity; |
• | comparative factors, including local market conditions, compensation survey data, peers’ proxy compensation information, peers’ relative performance data and competitive trends in executive compensation in our industry; |
• | our financial performance and, where applicable, the financial performance of business units overseen by an executive; |
• | stockholder return; |
• | incentive, motivation and retention considerations; |
• | individual performance and total compensation data, including a history of all cash, equity, perquisites and benefits, compiled for each executive; |
• | risks to the Company resulting from actions taken by executives; |
• | tax, accounting and other factors affecting our cost of compensation; |
• | equity burn rate and share utilization considerations; |
• | applicable regulatory guidance; |
• | the results of annual stockholder vote results on “say on pay” proposals; |
• | guidelines, analyses and commentary of various proxy advisory firms; |
• | recommendations of the CEO with respect to other executive officers; |
• | insights from the Committee’s compensation consultant; and |
• | alignment of performance factors with long-term strategic goals. |
• | prepared pay-for-performance analyses for the Committee; |
• | advised the Committee on executive compensation planning for 2016 and 2017, including various planning actions in connection with the merger; |
• | kept the Committee abreast of key executive compensation and regulatory practices; |
• | reviewed executive officer pay recommendations; |
• | reviewed this Compensation Discussion and Analysis; |
• | assisted the Committee with its review of director compensation; and |
• | prepared various executive compensation and Company performance comparisons against peers and market to assist the Committee in fulfilling its duties. |
Factors Considered in Assessing Compensation Consultant Independence | |
WTW provided no services to the Company other than executive compensation advice | No relationships exist between any individual advisor at WTW and any Committee member |
Fees received by WTW from work for the Committee were an insignificant portion of its annual revenues | No relationships exist between WTW (or its employees working on the engagement for the Committee) with our executive officers |
WTW’s policies and procedures designed to prevent conflicts of interest | No individuals at WTW who advise the Committee directly own our common stock |
Associated Banc-Corp | Fulton Financial Corporation | Sterling Bancorp |
Boston Private Financial Holdings, Inc. | Hancock Holding Co. | Texas Capital Bancshares Inc. |
Commerce Bancshares Inc. | IBERIABANK Corporation | UMB Financial Corp. |
Cullen/Frost Bankers Inc. | MB Financial Inc. | Webster Financial Corporation |
First Horizon National Corp. | PacWest Bancorp | Western Alliance Bancorp |
First Midwest Bancorp Inc. | Prosperity Bancshares, Inc. | Wintrust Financial Corp. |
FirstMerit Corp.(1) | Signature Bank | |
(1) | FirstMerit Corp. was acquired in August 2016, but was part of the peer group that was used in connection with 2016 compensation decisions made in early 2016. |
• | Asset sizes ranging from $7.5 billion to $33.5 billion (average of $20.7 billion) compared to the Company’s assets of $17.3 billion; |
• | Market capitalization ranging from $946 million to $8.0 billion (average of $3.1 billion) compared to the Company’s market capitalization of $3.2 billion; and |
• | Loan portfolios with strong concentrations in the commercial sector. |
Name and Principal Position | Year | Salary ($) | Bonus ($) | Stock Awards(1) ($) | Option Awards(2) ($) | Non-Equity Incentive Plan Compensation ($) | Change in Pension Value & Nonqualified Deferred Compensation Earnings(3) ($) | All Other Compensation ($) | Total ($) | |||||||||||||||||
Larry D. Richman President and CEO (Principal Executive Officer) | 2016 | 1,025,000 | — | 1,627,862 | 554,727 | 1,387,500 | (4) | — | 190,595 | (7) | 4,785,684 | |||||||||||||||
2015 | 995,833 | — | 1,252,621 | 404,047 | 1,275,000 | (5) | — | 128,036 | 4,055,537 | |||||||||||||||||
2014 | 970,833 | — | 729,037 | 292,308 | 978,961 | (6) | — | 135,641 | 3,106,780 | |||||||||||||||||
Kevin M. Killips Chief Financial Officer (Principal Financial Officer) | 2016 | 557,500 | — | 396,657 | 123,556 | 525,000 | (4) | — | 19,147 | (8) | 1,621,860 | |||||||||||||||
2015 | 542,500 | — | 390,186 | 119,956 | 457,500 | (5) | — | 18,502 | 1,528,644 | |||||||||||||||||
2014 | 527,500 | — | 278,075 | 111,946 | 416,250 | (6) | — | 18,938 | 1,352,709 | |||||||||||||||||
Bruce R. Hague President, National Commercial Banking | 2016 | 510,417 | — | 336,844 | 100,855 | 468,750 | (4) | — | 57,033 | (8) | 1,473,899 | |||||||||||||||
2015 | 498,083 | — | 318,783 | 94,692 | 431,250 | (5) | — | 55,968 | 1,398,776 | |||||||||||||||||
2014 | 486,500 | — | 216,298 | 87,075 | 375,000 | (6) | — | 56,486 | 1,221,359 | |||||||||||||||||
Bruce S. Lubin President, Illinois Commercial Banking | 2016 | 507,500 | — | 365,012 | 110,939 | 468,750 | (4) | — | 39,894 | (8) | 1,492,095 | |||||||||||||||
2015 | 492,500 | — | 355,308 | 106,065 | 450,000 | (5) | — | 39,331 | 1,443,204 | |||||||||||||||||
2014 | 477,500 | — | 247,173 | 99,511 | 412,500 | (6) | — | 39,836 | 1,276,520 | |||||||||||||||||
Karen B. Case President, Commercial Real Estate Banking | 2016 | 443,334 | — | 298,978 | 92,038 | 445,500 | (4) | — | 41,528 | (8) | 1,321,378 | |||||||||||||||
2015 | 404,250 | — | 287,337 | 87,120 | 356,250 | (5) | — | 37,392 | 1,172,349 | |||||||||||||||||
2014 | 372,833 | — | 200,824 | 80,851 | 311,250 | (6) | — | 40,812 | 1,006,570 | |||||||||||||||||
(1) | For 2016, 2015 and 2014, amounts represent the aggregate grant date fair value of time-vested restricted stock units (“RSUs”) and performance share units (“PSUs”) granted in such years, each as computed in accordance with FASB ASC Topic 718. Grant date fair value for all RSU awards is determined based on the closing price-per-share of our Common Stock on the date of grant adjusted for a lack of marketability discount due to delayed settlement of the awards. Lack of marketability discounts in 2016, 2015 and 2014 range from 18%-32%. The amounts do not reflect amounts actually paid to, or realized by, the named executive officers in any such year. |
Name | Year | Grant Date Fair Value of PSUs Assuming Probable Outcomes at Time of Grant ($) | Grant Date Fair Value of PSUs Assuming Achievement of Maximum Performance Levels ($) | |||
Larry D. Richman | 2016 | 921,815 | 1,843,630 | |||
2015 | 696,552 | 1,393,104 | ||||
2014 | 508,664 | 1,017,328 | ||||
Kevin M. Killips | 2016 | 205,313 | 410,626 | |||
2015 | 206,782 | 413,564 | ||||
2014 | 194,818 | 389,636 | ||||
Bruce R. Hague | 2016 | 167,617 | 335,234 | |||
2015 | 163,267 | 326,534 | ||||
2014 | 151,528 | 303,056 | ||||
Bruce S. Lubin | 2016 | 184,356 | 368,712 | |||
2015 | 182,851 | 365,702 | ||||
2014 | 173,160 | 346,320 | ||||
Karen B. Case | 2016 | 152,955 | 305,910 | |||
2015 | 150,191 | 300,382 | ||||
2014 | 140,686 | 281,372 | ||||
(2) | Amounts represent the value of time-vested stock options granted during 2016, 2015 and 2014 computed in accordance with FASB ASC Topic 718. The Company’s accounting policy and assumptions for stock-based compensation are described in Notes 1 and 15 to the Company’s audited financial statements included in its 2016 Annual Report on Form 10-K. |
(3) | The Named Executive Officers who participate in the Deferred Compensation Plan did not earn interest at a rate exceeding 120% of the Applicable Federal Rate. |
(4) | Portions of the annual incentives awarded to the Named Executive Officers for 2016 were granted as time-vested RSUs. The grants were made in February 2017 and do not appear in the Summary Compensation Table, which reflects only cash incentive compensation earned in 2016 and stock awards granted during 2016. The value of such RSUs made in February 2017 under the Company’s 2016 annual incentive plan were as follows: Mr. Richman - $462,500; Mr. Killips - $175,000; Mr. Hague - $156,250; Mr. Lubin - $156,250 and Ms. Case - $148,500. |
(5) | Portions of the annual incentives awarded to the Named Executive Officers for 2015 were granted as time-vested RSUs. Because such grants were made in February 2016, they appear in the total for “Stock Awards” for 2016. The values of such RSUs made in February 2016 under the Company’s 2015 annual incentive plan were as follows: Mr. Richman - $287,164, Mr. Killips - $103,039; Mr. Hague - $97,136; Mr. Lubin - $101,356 and Ms. Case - $80,231. These values reflect an adjustment for a lack of marketability discount resulting from the delayed settlement of the awards. |
(6) | Portions of the annual incentives awarded to the Named Executive Officers for 2014 were granted as time-vested RSUs. Because such grants were made in February 2015, they appear in the total for “Stock Awards” for 2015. The values of such RSUs made in February 2015 under the Company’s 2014 annual incentive plan were as follows: Mr. Richman - $226,364; Mr. Killips - $96,243; Mr. Hague - $86,706; Mr. Lubin - $95,389 and Ms. Case - $73,834. These values reflect an adjustment for a lack of marketability discount resulting from the delayed settlement of the awards. |
(7) | In addition to an allowance for club membership dues totaling $25,730, matching contributions to the Company’s 401(k) plan, parking benefits, and restricted stock dividends, this amount also includes the $144,709 incremental cost to the Company of providing an employee as a driver for Mr. Richman. This amount represents approximately 75% of the total compensation and benefits costs incurred by the Bank which are estimated to be attributable to the employee and his driving-related duties (including compensation and benefits-related costs incurred for a former driver), plus maintenance, operating, insurance, other driver services and other costs paid by the Company. The driver uses Mr. Richman’s personal car for these purposes. |
(8) | For Messrs. Killips, Hague, and Lubin and Ms. Case, this amount includes an allowance for club membership dues, restricted stock dividends, parking benefits, and matching contributions to the Company’s 401(k) plan (except for Mr. Killips). Club membership allowances for 2016 totaled $43,833 and $26,890 for Messrs. Hague and Lubin, respectively, and $28,800 for Ms. Case. |
2016 Grants of Plan-Based Awards | ||||||||||||||||||||||||
Estimated Future Payouts Under Equity and Non-Equity Incentive Plan Awards(2) | Estimated Future Payouts Under Equity and Non-Equity Incentive Plan Awards(3) | All Other Stock Awards: Number of Shares of Stock or Units | All Other Option Awards: Number of Securities Underlying Options | Exercise or Base Price of Option Awards | Grant Date Fair Value of Stock and Option Awards(4) | |||||||||||||||||||
Grant | Threshold | Target | Maximum | Threshold | Target | Maximum | ||||||||||||||||||
Name | Type of Award | Date(1) | ($) | ($) | ($) | (#) | (#) | (#) | (#) | (#) | ($/Sh) | ($) | ||||||||||||
Larry D. Richman | 2016 Cash Incentive(5) | 3/15/2016 | 386,250 | 965,625 | 1,810,547 | — | — | — | — | — | — | — | ||||||||||||
2016 PSU Incentive | 3/15/2016 | — | — | — | 9,519 | 28,416 | 56,832 | — | — | — | 921,815 | (6) | ||||||||||||
2015 Bonus Deferral(8) | 2/19/2016 | 12,452 | 287,164 | (7) | ||||||||||||||||||||
2016 Long-Term Incentive | 2/19/2016 | — | — | — | — | — | — | 16,115 | — | — | 418,884 | (7) | ||||||||||||
2016 Long-Term Incentive | 2/19/2016 | — | — | — | — | — | — | — | 33,722 | $34.13 | 554,727 | (7) | ||||||||||||
Kevin M. Killips | 2016 Cash Incentive(5) | 3/15/2016 | 151,200 | 378,000 | 708,750 | — | — | — | — | — | — | — | ||||||||||||
2016 PSU Incentive | 3/15/2016 | — | — | — | 2,120 | 6,329 | 12,658 | — | — | — | 205,313 | (6) | ||||||||||||
2015 Bonus Deferral(8) | 2/19/2016 | 4,468 | 103,039 | (7) | ||||||||||||||||||||
2016 Long-Term Incentive | 2/19/2016 | — | — | — | — | — | — | 3,589 | — | — | 88,305 | (7) | ||||||||||||
2016 Long-Term Incentive | 2/19/2016 | — | — | — | — | — | — | — | 7,511 | $34.13 | 123,556 | (7) | ||||||||||||
Bruce R. Hague | 2016 Cash Incentive(5) | 3/15/2016 | 169,125 | 422,813 | 792,773 | — | — | — | — | — | — | — | ||||||||||||
2016 PSU Incentive | 3/15/2016 | — | — | — | 1,731 | 5,167 | 10,334 | — | — | — | 167,617 | (6) | ||||||||||||
2015 Bonus Deferral(8) | 2/19/2016 | 4,212 | 97,136 | (7) | ||||||||||||||||||||
2016 Long-Term Incentive | 2/19/2016 | — | — | — | — | — | — | 2,930 | — | — | 72,091 | (7) | ||||||||||||
2016 Long-Term Incentive | 2/19/2016 | — | — | — | — | — | — | — | 6,131 | $34.13 | 100,855 | (7) | ||||||||||||
Bruce S. Lubin | 2016 Cash Incentive(5) | 3/15/2016 | 137,700 | 344,250 | 645,469 | — | — | — | — | — | — | — | ||||||||||||
2016 PSU Incentive | 3/15/2016 | — | — | — | 1,904 | 5,683 | 11,366 | — | — | — | 184,357 | (6) | ||||||||||||
2015 Bonus Deferral(8) | 2/19/2016 | 4,395 | 101,356 | (7) | ||||||||||||||||||||
2016 Long-Term Incentive | 2/19/2016 | — | — | — | — | — | — | 3,223 | — | — | 79,300 | (7) | ||||||||||||
2016 Long-Term Incentive | 2/19/2016 | — | — | — | — | — | — | — | 6,744 | $34.13 | 110,939 | (7) | ||||||||||||
Karen B. Case | 2016 Cash Incentive(5) | 3/15/2016 | 121,500 | 303,750 | 569,531 | — | — | — | — | — | — | — | ||||||||||||
2016 PSU Incentive | 3/15/2016 | — | — | — | 1,580 | 4,715 | 9,430 | — | — | — | 152,955 | (6) | ||||||||||||
2015 Bonus Deferral(8) | 2/19/2016 | 3,479 | 80,231 | (7) | ||||||||||||||||||||
2016 Long-Term Incentive | 2/19/2016 | — | — | — | — | — | — | 2,674 | — | — | 65,792 | (7) | ||||||||||||
2016 Long-Term Incentive | 2/19/2016 | — | — | — | — | — | — | — | 5,595 | $34.13 | 92,038 | (7) | ||||||||||||
(1) | On February 5, 2016, the Committee approved the grants (effective February 19, 2016) of (a) time-vested restricted stock units and stock options comprising 50% of each named executive officer’s 2016 long-term incentive award and (b) time-vested restricted stock units that represented 25% of each executive’s |
(2) | Estimated future payout amounts reflect 75% (portion of named executive officers’ annual bonus opportunities paid in cash) of the potential aggregate bonus pool funding at threshold, target and maximum levels of performance and assume like percentage payouts to named executive officers. The remaining 25% of the annual bonus opportunity is intended to be awarded as time-vested RSUs. See footnote 5 for additional information on both of these elements of the annual bonus. The “threshold” level payout does not denote a minimum bonus as individual bonuses are not guaranteed regardless of the level of plan funding. For annual incentive awards, threshold payout of 40% of target reflects the Company meeting the minimum standard for all of the plan’s metrics, while the “maximum” level payout represents the Company achieving maximum performance on all metrics with that amount multiplied by 125%, which was the cap on the executives’ 2016 annual incentive bonuses. |
(3) | The estimated future payout amounts reflect the payouts that are to be to be settled in shares of our common stock based on achieving pre-established threshold, target and maximum levels of cumulative earnings per share and relative total stockholder returns (measured against other banking companies), over the three-year performance period of 2016-2018. Performance below the threshold level of cumulative earnings per share goals will result in no payouts on the performance units. Solely for purposes of this table, total stockholder return performance relative to the pre-determined index is considered as follows: threshold is based on bottom fifth performance, target is based on median performance and maximum is based on top fifth performance. For more information regarding the terms of these PSUs, see the section titled “Long-Term Incentives” in the Compensation Discussion and Analysis. |
(4) | The grant date fair values of all PSUs and RSUs reflect lack of marketability discounts ranging from 20% - 32% due to the transfer restrictions on the shares underlying the awards that result from the delayed settlement of the awards. |
(5) | A total of 75% of the 2016 annual incentive award was paid in cash in early 2017. These amounts totaled $1,387,500, $525,000, $468,750, $468,750 and $445,500 for Messrs. Richman, Killips, Hague and Lubin and Ms. Case, respectively. The remaining 25% was granted in February 2017 as time-vested RSUs which will be reflected in the “All Other Stock Awards” column in our 2018 Proxy Statement. |
(6) | Represents the grant date fair value of the PSU awards determined in accordance with FASB ASC Topic 718 based on the probable outcome of the performance condition at the time of grant, adjusted for a lack of marketability discount due to delayed settlement. |
(7) | Represents the grant date fair value of the time-vested RSU awards and time-vested stock options determined in accordance with FASB ASC Topic 718, adjusted in the case of RSUs for a lack of marketability discount due to delayed settlement. |
(8) | 75% of the executive’s 2015 annual incentive award was paid in cash in early 2016. The remaining 25%, reported as the “2015 Bonus Deferral” in this table, was granted effective February 19, 2016 as time-vested RSUs that vest ratably over three years and are settled three years following the last vesting date. |
Option Awards | Stock Awards | |||||||||||||||||||||||
Name | Number of Securities Underlying Unexercised Options (#) Exercisable | Number of Securities Underlying Unexercised Options (#) Unexercisable | Option Exercise Price ($) | Option Expiration Date | Number of Shares/ Units of Stock that have not Vested (#)(1) | Market Value of Shares/ Units that have not Vested ($)(2) | Equity Incentive Plan Awards: Number of Unearned Shares/ Units/ Rights That Have Not Vested (#) (1) | Equity Incentive Plan Awards: Market or Payout Value of Unearned Shares, Units or Other Rights That Have Not Vested ($) (2) | ||||||||||||||||
Larry D. Richman | 234,375 | — | 26.10 | 11/1/2017 | 3,505 | (4)(5) | 189,936 | — | — | |||||||||||||||
54,305 | — | 17.95 | 2/22/2023 | 7,584 | (4)(5) | 410,977 | — | — | ||||||||||||||||
— | 23,999 | (3) | 27.94 | 2/21/2024 | 6,187 | (4)(6) | 335,274 | — | — | |||||||||||||||
— | 25,508 | (3) | 35.16 | 2/20/2025 | 16,115 | (4)(5) | 873,272 | — | — | |||||||||||||||
— | 33,722 | (3) | 34.13 | 2/19/2026 | 12,452 | (4)(6) | 674,774 | — | — | |||||||||||||||
— | — | — | — | 39,128 | (7) | 2,120,346 | — | — | ||||||||||||||||
— | — | — | — | 7,566 | (8) | 410,002 | 37,606 | (8) | 2,037,869 | |||||||||||||||
28,416 | (9) | 1,539,863 | ||||||||||||||||||||||
Kevin M. Killips | 42,641 | — | 14.30 | 2/10/2019 | 1,342 | (4)(6) | 72,723 | — | — | |||||||||||||||
24,547 | — | 14.99 | 4/1/2021 | 2,251 | (4)(6) | 121,982 | — | — | ||||||||||||||||
23,958 | — | 17.95 | 2/22/2023 | 2,630 | (4)(6) | 142,520 | — | — | ||||||||||||||||
— | 9,191 | (3) | 27.94 | 2/21/2024 | 3,589 | (4)(6) | 194,488 | — | — | |||||||||||||||
— | 7,573 | (3) | 35.16 | 2/20/2025 | 4,468 | (4)(6) | 242,121 | — | — | |||||||||||||||
— | 7,511 | (3) | 34.13 | 2/19/2026 | 14,986 | (7) | 812,091 | — | — | |||||||||||||||
— | — | — | — | 2,246 | (8) | 121,711 | 11,164 | (8) | 604,977 | |||||||||||||||
— | — | — | — | 6,329 | (9) | 342,969 | ||||||||||||||||||
Bruce R. Hague | — | 7,149 | (3) | 27.94 | 2/21/2024 | 1,044 | (4)(6) | 56,574 | — | — | ||||||||||||||
— | 5,978 | (3) | 35.16 | 2/20/2025 | 1,777 | (4)(6) | 96,296 | — | — | |||||||||||||||
— | 6,131 | (3) | 34.13 | 2/19/2026 | 2,370 | (4)(6) | 128,430 | — | — | |||||||||||||||
— | — | — | — | 2,930 | (4)(6) | 158,777 | — | — | ||||||||||||||||
— | — | — | — | 4,212 | (4)(6) | 228,248 | — | — | ||||||||||||||||
— | — | — | — | 11,656 | (7) | 631,639 | — | — | ||||||||||||||||
— | — | — | — | 1,773 | (8) | 96,079 | 8,815 | (8) | 477,685 | |||||||||||||||
5,167 | (9) | 280,000 | ||||||||||||||||||||||
Bruce S. Lubin | 78,125 | — | 26.10 | 11/1/2017 | 1,193 | (4)(6) | 64,649 | — | — | |||||||||||||||
23,103 | — | 14.99 | 4/1/2021 | 1,990 | (4)(6) | 107,838 | — | — | ||||||||||||||||
21,562 | — | 17.95 | 2/22/2023 | 2,607 | (4)(6) | 141,273 | — | — | ||||||||||||||||
— | 8,170 | (3) | 27.94 | 2/21/2024 | 3,223 | (4)(6) | 174,654 | — | — | |||||||||||||||
— | 6,696 | (3) | 35.16 | 2/20/2025 | 4,395 | (4)(6) | 238,165 | — | — | |||||||||||||||
— | 6,744 | (3) | 34.13 | 2/19/2026 | 13,320 | (7) | 721,811 | — | — | |||||||||||||||
— | — | — | — | 1,986 | (8) | 107,621 | 9,872 | (8) | 534,964 | |||||||||||||||
5,683 | (9) | 307,961 | ||||||||||||||||||||||
Karen B. Case | 78,125 | — | 26.10 | 11/1/2017 | 969 | (4)(6) | 52,510 | — | — | |||||||||||||||
14,440 | — | 14.99 | 4/1/2021 | 1,635 | (4)(6) | 88,601 | — | — | ||||||||||||||||
15,015 | — | 14.39 | 2/22/2022 | 1,967 | (4)(6) | 106,592 | — | — | ||||||||||||||||
13,420 | — | 17.95 | 2/22/2023 | 2,674 | (4)(6) | 144,904 | — | — | ||||||||||||||||
— | 6,638 | (3) | 27.94 | 2/21/2024 | 3,479 | (4)(6) | 188,527 | — | — | |||||||||||||||
— | 5,500 | (3) | 35.16 | 2/20/2025 | 10,822 | (7) | 586,444 | — | — | |||||||||||||||
— | 5,595 | (3) | 34.13 | 2/19/2026 | 1,631 | (8) | 88,384 | 8,109 | (8) | 439,427 | ||||||||||||||
4,715 | (9) | 255,506 | ||||||||||||||||||||||
(1) | Holders of unvested RSU awards granted in 2014, 2015 and 2016, and unvested PSU awards are entitled to dividend equivalent rights which are paid to the holder only upon settlement. Holders of restricted stock (but not RSUs or PSUs) have voting rights as if the underlying shares were beneficially owned by the holder. |
(2) | Amounts represent the value of outstanding stock unit awards based on the closing price of our common stock on December 31, 2016, $54.19 per share, without regard to any lack of marketability discount associated with delayed settlement. |
(3) | The vesting schedule for stock options for each named executive officer is as follows: |
Vesting Date | Larry D. Richman | Kevin M. Killips | Bruce R. Hague | Bruce S. Lubin | Karen B. Case | ||||||||||
3/1/2017 | 23,999 | 9,191 | 7,149 | 8,170 | 6,638 | ||||||||||
3/1/2018 | 25,508 | 7,573 | 5,978 | 6,696 | 5,500 | ||||||||||
3/1/2019 | 33,722 | 7,511 | 6,131 | 6,744 | 5,595 | ||||||||||
Total | 83,229 | 24,275 | 19,258 | 21,610 | 17,733 | ||||||||||
(4) | The vesting schedule for RSUs for each named executive officer is as follows: |
Vesting Date | Larry D. Richman | Kevin M. Killips | Bruce R. Hague | Bruce S. Lubin | Karen B. Case | ||||||||||
3/1/2017 | 19,914 | 6,470 | 5,499 | 6,032 | 4,823 | ||||||||||
3/1/2018 | 16,408 | 5,125 | 4,454 | 4,837 | 3,851 | ||||||||||
3/1/2019 | 9,521 | 2,685 | 2,380 | 2,539 | 2,050 | ||||||||||
Total | 45,843 | 14,280 | 12,333 | 13,408 | 10,724 | ||||||||||
(5) | After vesting, the shares underlying Mr. Richman’s RSUs are distributable to him by reference to the earlier of (a) his resignation or other termination of his employment with the Company for any reason or (b) the date limitations on tax deductibility of executive compensation expense under Section 162(m) of the Internal Revenue Code no longer apply to him. |
(6) | The shares underlying the referenced RSUs are distributable three years following the last vesting date. |
(7) | Represents PSUs with a three-year performance period ending December 31, 2016. The Committee certified in early 2017 that the material terms of the PSUs as they relate to the (a) 2014-2016 Cumulative EPS (adjusted) performance metric and (b) the relative TSR factor (measured against other banking companies), had both been satisfied with achievement for both at the “superior” level under the PSUs. As a result, the PSUs vested pursuant to their terms on February 28, 2017 (subject to all terms of the applicable award agreement) in the amounts indicated (settlement of which in shares of common stock will be two years later subject to all other conditions of the PSUs, including, without limitation, any application of the clawback provision). |
(8) | Represents PSUs with a three-year performance period ending December 31, 2017. The shares underlying the PSUs will convert into shares of common stock on a one-to-one basis approximately two years following the vesting date. The number of PSUs earned will be based on the Company’s performance relative to pre-established threshold, target and maximum cumulative earnings per share goals for the three-year performance period. If the threshold (minimum) performance level is not achieved, the PSUs will be forfeited. After considering performance against the EPS metric, the number of PSUs will be further adjusted upward or downward by reference to a TSR factor which will be based on the Company’s TSR percentile ranking over the same three-year performance period as measured against an index of other banking companies. Pursuant to their terms, because cumulative EPS for the two years ended December 31, 2016 exceeded a pre-established level, the award will vest (assuming continued employment) at not less than 33.5% of the target award. As a result, this 33.5% amount is shown in the “Number of Shares/Units of Stock that have not Vested” column because, while not yet vested, these are no longer subject to performance-based vesting. The number of PSUs shown in the “Equity Incentive Plan Awards” column represents the maximum number of PSUs, minus the 33.5% amount, as performance is tracking above target level as of December 31, 2016. See “Compensation Discussion and Analysis—What We Pay and Why We Pay It – Minimum Vesting Levels for PSUs Awarded to Executive Officers in 2015” for more information. |
(9) | Represents PSUs with a three-year performance period ending December 31, 2018. The shares underlying the PSUs will convert into shares of common stock on a one-to-one basis approximately two years following the vesting date. The number of PSUs earned will be based on the Company’s performance relative to pre-established threshold, target and maximum cumulative earnings per share goals for the three-year performance period. If the threshold (minimum) performance level is not achieved, the PSUs will be forfeited. After considering performance against the EPS metric, the number of PSUs will be further adjusted upward or downward by reference to a TSR factor which will be based on the Company’s TSR percentile ranking over the same three-year performance period as measured against an index of other banking companies. In this table, the target number of PSUs is shown as performance is tracking between threshold and target level performance as of December 31, 2016. For additional terms relating to these PSUs, see “Compensation Discussion and Analysis—What We Pay and Why We Pay It – Long-Term Incentives.” |
Option Awards | Stock Awards | |||||||||||
Name | Number of Shares Acquired on Exercise (#) | Value Realized on Exercise ($) | Number of Shares Acquired on Vesting (#)(1) | Value Realized on Vesting(1) (2) ($) | ||||||||
Larry D. Richman | — | — | 74,791 | (3) (4) | 3,419,906 | |||||||
Kevin M. Killips | — | — | 29,534 | (4) | 1,342,220 | |||||||
Bruce R. Hague | 17,806 | 462,433 | 19,554 | (4) | 919,442 | |||||||
Bruce S. Lubin | — | — | 26,814 | (4) | 1,213,532 | |||||||
Karen B. Case | — | — | 16,899 | (4) | 807,890 | |||||||
(1) | Includes PSUs granted in 2014 for which the three-year performance period ended on December 31, 2016. These PSUs vested at the superior level on February 28, 2017. While vested, the PSUs will not convert into shares of common stock (on a one-to-one basis) until two years after vesting. Nonetheless, per SEC guidance, they are included in the number of shares acquired on vesting because the performance period ended during 2016. The value realized by each executive officer is determined based on the closing price of our common stock on December 31, 2016, $54.19 per share. |
(2) | In addition to amounts included pursuant to footnote 1, amounts include the aggregate dollar amount realized by the named executive officer upon the vesting of stock awards during 2016. The dollar amount represents the number of shares acquired or earned on vesting multiplied by the market closing price of our common stock on the vesting date. |
(3) | Includes 32,570 RSUs that vested but for which settlement is deferred as described in footnote 5 of the table immediately above. |
(4) | Includes RSUs that vested but for which settlement in common stock is deferred as described in footnote 6 of the table immediately above. The number of RSUs vested were 3,094; 3,784; 3,118; 3,493; and 2,771 for Messrs. Richman, Killips, Hague and Lubin and Ms. Case, respectively. |
• | Amounts shown as “Registrant Contributions” represent the RSUs vesting March 1, 2016 and PSUs vesting February 28, 2016 and attendant dividend equivalents accrued through the vest date; |
• | Amounts shown as “Aggregate Earnings” reflect the change in market value during 2016 of the shares of Common Stock underlying Vested and Unsettled RSUs and PSUs, as well as dividend equivalents earned during 2016; and |
• | Amounts shown as “Aggregate Balance” reflect the market value of the shares of Common Stock underlying Vested and Unsettled RSUs and PSUs, as well as accumulated dividend equivalents as of December 31, 2016. |
Name | Plan or Award | Executive Contributions in Last FY(1) ($) | Registrant Contributions in Last FY ($) | Aggregate Earnings in Last FY(2) ($) | Aggregate Withdrawals/ Distributions ($) | Aggregate Balance at Last FYE (3) ($) | |||||||||||
Larry D. Richman | Vested and Unsettled RSUs and PSUs | — | 2,118,976 | 1,783,318 | (3,033 | ) | 6,116,510 | ||||||||||
DCP Plan | — | — | — | — | — | ||||||||||||
Kevin M. Killips | Vested and Unsettled RSUs and PSUs | — | 457,681 | 254,789 | — | 767,627 | |||||||||||
DCP Plan | — | — | — | — | — | ||||||||||||
Bruce A. Hague | Vested and Unsettled RSUs and PSUs | — | 475,217 | 261,229 | — | 779,354 | |||||||||||
DCP Plan | 25,521 | — | 75,342 | — | 318,302 | ||||||||||||
Bruce S. Lubin | Vested and Unsettled RSUs and PSUs | — | 416,042 | 231,169 | — | 696,243 | |||||||||||
DCP Plan | — | — | 5,900 | — | 222,967 | ||||||||||||
Karen B. Case | Vested and Unsettled RSUs and PSUs | — | 324,215 | 180,601 | — | 544,683 | |||||||||||
DCP Plan | 199,896 | — | 27,707 | — | 697,244 | ||||||||||||
(1) | The balances reported in this column, $25,521 for Mr. Hague and $110,833 for Ms. Case are disclosed in the Summary Compensation Table as a portion of the salary earned in 2016 and the amount of $89,063 with respect to Ms. Case was disclosed in the prior year Summary Compensation Table as a portion of the non-equity incentive plan compensation for 2015. |
(2) | Aggregate earnings include changes in the market value of the shares of common stock underlying Vested and Unsettled RSUs during 2016 and dividend equivalents earned on such units. With respect to our DCP Plan, aggregate earnings represents change in value of DCP investments, including earnings credited on the DCP investments. Of the balances reported in this column for Vested and Unsettled RSUs for Mr. Richman, $3,033 is included in the Summary Compensation Table as a part of all other compensation for 2016 as dividends paid on certain Vested and Unsettled RSUs. All other earnings are not above-market or preferential and thus are not reported in the Summary Compensation Table. |
(3) | Of the aggregate balances reported in this column at the end of 2016 for the DCP Plan, $82,283, $194,958 and $167,900 (net of distributions) with respect to Messrs. Hague and Lubin, and Ms. Case, respectively, were included in the Summary Compensation Tables in previous years as a portion of salary and/or non-equity plan compensation earned in the relevant year. With respect to the balances reported in this column at the end of 2016 for the Vested and Unsettled RSUs, $1,637,217, $255,702, $252,268, $232,396 and $182,267 for Messrs. Richman, Killips, Hague and Lubin and Ms. Case, respectively, were included in the Summary Compensation Tables in previous years, representing the grant date fair value of the stock award adjusted for a lack of marketability discount due to the delayed settlement of the awards. |
General Provisions | • | Title, duties and responsibilities |
Compensation Provisions | • | Minimum level of base salary, subject to review and possible increase from time-to-time; decreases in base salary are limited to across-the-board salary reductions applicable to senior executives |
• | Participation in annual incentive plan with minimum target opportunity, equity awards, and other benefit and fringe benefit plans | |
Severance Protection | • | Triggered in event of involuntary termination without cause or voluntary resignation for good reason. Good reason generally means: (a) a diminution in duties or seniority, (b) requiring the executive to relocate more than 50 miles from Chicago, (c) in the case of Mr. Richman, not re-electing him as a director, or (d) in the case of a named executive officer other than Mr. Richman, reducing base salary or target annual bonus opportunity (other than a proportionate reduction applicable to all executives unless that proportionate reduction occurs within two years of a change of control). |
• | Severance benefits based on 100% (150% for Mr. Richman) of the sum of base salary plus the average annual bonus for the prior three years; plus a pro rata bonus for the year of termination based on the prior year’s bonus; subsidized health insurance coverage for 12 months (18 months for Mr. Richman) | |
Change in Control Protection | • | Triggered in event of involuntary termination without cause or voluntary resignation for good reason within two years following or six months prior to a change in control; in the case of Mr. Richman, “good reason” would include his voluntary termination of employment during the 90-day period beginning on the first anniversary of the date of a change in control |
• | Severance benefits equal to a multiple (300% - Richman; 200% - Killips, Hague, Lubin, Case) of the sum of base salary and the higher of the prior year’s bonus or the average of the last three years’ annual bonuses, plus a pro rata bonus for the year of termination based on the prior year’s bonus, subsidized health insurance coverage for 24 months (36 months for Mr. Richman) and outplacement assistance | |
• | Full golden parachute excise tax gross-up if “parachute” payments exceed the threshold level for the golden parachute tax by more than 10%; if the excess is less than 10%, the payments will be reduced below the threshold (except in the case of Mr. Richman who is entitled to full golden parachute excise tax gross-up in all circumstances in which “parachute” payments exceed the threshold level for the golden parachute tax) | |
Confidentiality and Restrictive Covenants | • | Obligated to not disclose or misuse confidential information |
• | While employed with the Company and for one year thereafter, precluded from (a) soliciting clients or customers to not do business with the Company, (b) soliciting employees to terminate their employment with the Company and (c) joining a competing financial institution | |
• | Breach of non-competition provision results in forfeiture of initial equity award received upon joining the Company and obligation to return any shares from such award then held or amounts realized upon sale of shares from those awards received during the three-year period preceding the date of termination | |
• | Breach of other commitments subjects executive to suit for injunctive relief and damages | |
• | benefits accrued under the Company’s KSOP in which all employees are eligible to participate; |
• | accrued vacation pay, health plan continuation and other similar amounts payable when employment terminates under programs applicable to the Company’s salaried employees generally; |
• | balances accrued under our Deferred Compensation Plan; |
• | stock options that have vested and are exercisable; and |
• | restricted stock or restricted stock units that have vested (regardless of whether or not such underlying shares have been settled). |
Restricted Stock Units | Options | Performance Share Units | ||||||||||||||||
Name | Number(1) (#) | Value(2) ($) | Number (#) | Value(3) ($) | Number(4) (#) | Value(2) ($) | ||||||||||||
Larry D. Richman | 26,275 | 1,423,842 | 24,955 | 484,542 | 24,529 | 1,329,227 | ||||||||||||
Kevin M. Killips | 9,033 | 489,498 | 6,714 | 129,916 | 6,580 | 356,570 | ||||||||||||
Bruce R. Hague | 8,135 | 440,836 | 5,356 | 103,679 | 5,251 | 284,552 | ||||||||||||
Bruce S. Lubin | 8,727 | 472,916 | 5,965 | 115,443 | 5,847 | 316,849 | ||||||||||||
Karen B. Case | 6,871 | 372,339 | 4,915 | 95,133 | 4,819 | 261,142 | ||||||||||||
(4) | The number of PSUs earned will be based on the Company’s performance relative to pre-established threshold, target and maximum cumulative earnings per share goals for the three-year period ending December 2017 (for PSUs granted in 2015) and December 2018 (for PSUs granted in 2016), as adjusted based on relative TSR for these same periods compared to the performance of other banking companies included in a pre-determined index. In this table, it is assumed PSUs granted in 2015 and 2016 will vest at target, with retirement on December 31, 2016. The shares underlying vested PSUs would convert into shares of common stock on a one-to-one basis approximately two years following the vesting date and would be distributed at that time. |
Long-Term Disability Benefits(1) | ||||||||
Name | Monthly Amount ($) | Months of Coverage (#) | Total Payments ($) | |||||
Larry D. Richman | 20,000 | 15 | 300,000 | |||||
Kevin M. Killips | 20,000 | 40 | 800,000 | |||||
Bruce R. Hague | 20,000 | 45 | 900,000 | |||||
Bruce S. Lubin | 20,000 | 30 | 600,000 | |||||
Karen B. Case | 20,000 | 100 | 2,000,000 | |||||
(1) | Long-term disability benefits are an obligation of the Company’s disability insurance carrier and, therefore, the benefits are not an obligation of the Company. Amounts do not include short-term disability benefits which would equal approximately three months of continued salary payments. |
Restricted Stock Units | Options | Performance Share Units | ||||||||||||||||
Name | Number(1) (#) | Value(2) ($) | Number (#) | Value(3) ($) | Number(4) (#) | Value(2) ($) | ||||||||||||
Larry D. Richman | 45,843 | 2,484,232 | 59,230 | 1,161,881 | 63,657 | 3,449,573 | ||||||||||||
Kevin M. Killips | 14,280 | 773,833 | 15,084 | 294,785 | 21,566 | 1,168,662 | ||||||||||||
Bruce R. Hague | 12,333 | 668,325 | 12,109 | 236,749 | 16,907 | 916,190 | ||||||||||||
Bruce S. Lubin | 13,408 | 726,580 | 13,440 | 262,710 | 19,167 | 1,038,660 | ||||||||||||
Karen B. Case | 10,724 | 581,134 | 11,095 | 216,901 | 15,641 | 847,586 | ||||||||||||
(1) | Total number of unvested RSUs that would become immediately vested upon death as of December 31, 2016. For additional information on these unvested shares, see the “Outstanding Equity Awards as of December 31, 2016” table. |
(2) | Represents the value of shares based on the closing price of our common stock on December 31, 2016 of $54.19. |
(3) | The value of the accelerated options is based on the difference between $54.19, the closing stock price on December 31, 2016, and the exercise price of each stock option. |
(4) | The number of PSUs earned will be based on the Company’s performance relative to pre-established threshold, target and maximum cumulative earnings per share goals for the applicable three-year performance period as adjusted based on relative TSR performance compared to the performance of other banking companies included in a pre-determined index for the same period. In this table, it is assumed “superior” level of achievement for PSUs granted in 2014 (as certified by the Compensation Committee in February 2017), and for PSUs granted in 2015 and 2016 target level performance, with death on December 31, 2016. The shares underlying vested PSUs would convert into common shares on a one-to-one basis approximately two years following the vesting date and would be distributed at that time. |
Salary and Bonus Continuation | ||||||||||||||||||
Name | Monthly Amount ($) | Number of Months (#) | Total Continuation Payments ($) | Pro-Rata Annual Bonus ($) | Medical Benefits(1) ($) | Total ($) | ||||||||||||
Larry D. Richman | 202,449 | 18 | 3,644,077 | 1,700,000 | 15,885 | 5,359,962 | ||||||||||||
Kevin M. Killips | 92,663 | 12 | 1,111,953 | 610,000 | 5,361 | 1,727,314 | ||||||||||||
Bruce R. Hague | 85,167 | 12 | 1,022,009 | 575,000 | 10,590 | 1,607,599 | ||||||||||||
Bruce S. Lubin | 87,767 | 12 | 1,053,202 | 600,000 | 10,590 | 1,663,792 | ||||||||||||
Karen B. Case | 72,282 | 12 | 867,379 | 475,000 | 10,590 | 1,352,969 | ||||||||||||
(1) | Reflects amount of health benefit continuation (COBRA) premium payable by the Company during the salary continuation period. |
Severance Payments | Equity Awards(6) | ||||||||||||||||||||||||||
Cash Lump | Tax Gross-Up | Total Severance | Options | Restricted Shares, RSUs and PSUs | Other | Total | |||||||||||||||||||||
Name | Sum ($) | Payment ($) | Payments ($) | Number(1) (#) | Value(2) ($) | Number(3) (#) | Value(4) ($) | Benefits(5) ($) | Value ($) | ||||||||||||||||||
Larry D. Richman | 9,890,000 | 4,828,865 | 14,718,865 | 83,229 | 1,791,854 | 135,973 | 7,368,377 | 61,770 | 23,940,866 | ||||||||||||||||||
Kevin M. Killips | 2,950,000 | — | 2,950,000 | 24,275 | 536,049 | 42,300 | 2,292,237 | 35,722 | 5,814,008 | ||||||||||||||||||
Bruce R. Hague | 2,750,000 | — | 2,750,000 | 19,258 | 424,410 | 34,450 | 1,866,846 | 46,180 | 5,087,436 | ||||||||||||||||||
Bruce S. Lubin | 2,820,000 | — | 2,820,000 | 21,610 | 477,172 | 38,340 | 2,077,645 | 46,180 | 5,420,997 | ||||||||||||||||||
Karen B. Case | 2,325,000 | — | 2,325,000 | 17,733 | 391,148 | 31,131 | 1,686,989 | 46,180 | 4,449,317 | ||||||||||||||||||
(1) | Total number of unvested stock options as of December 31, 2016 that would become immediately vested upon a change in control and termination of employment assuming no replacement award is provided. |
(2) | Represents the value of unvested stock options based on the difference between $54.19, the closing stock price on December 31, 2016, and the exercise price of each stock option. |
(3) | The total number of unvested RSUs and PSUs as of December 31, 2016 that would become immediately vested upon a change in control and termination of employment assuming no replacement award is provided. In the case of PSUs, the number of PSUs earned is equal to those at “target” level performance or if greater, the amount determined by the Committee to have been earned based on performance through the date of the Change of Control. In this table, it is assumed “superior” level of achievement for PSUs granted in 2014 (as certified by the Compensation Committee in February 2017), and for PSUs granted in 2015 and 2016, target level performance. |
(4) | Represents the value of RSUs and PSUs based on $54.19, the closing stock price on December 31, 2016. |
(5) | Reflects the amount of health benefit continuation (COBRA) premium to be paid by Company during the coverage continuation period and the estimated value of outplacement assistance. The employment agreement for each executive officer provides that in the event of termination due to a change-in-control, the executive may maintain COBRA medical coverage at reduced rates for up to 36 months, in the case of Mr. Richman, and 24 months in the case of Messrs. Killips, Hague and Lubin and Ms. Case. Additionally, Mr. Richman is entitled to outplacement assistance for 24 months and the other named executive officers would receive such assistance for 12 months. |
(6) | The amounts reflected in the table include the value of certain equity awards that would vest upon retirement in the ordinary course and independent of any change in control. See the discussion in “Voluntary Resignation; Retirement.” |
Structure of Non-Employee Director Compensation | |||
Cash Retainers (1) | |||
Board Member | $ | 50,000 | |
Committee Member (2) | $ | 10,000 | |
Non-Executive Chairman | $ | 60,000 | |
Chair of the Audit, Business Risk & Compensation Committees | $ | 15,000 | |
Chair of the Corporate Governance Committee | $ | 10,000 | |
Chair of The PrivateBank and Trust Company (the “Bank”)(3) | $ | 50,000 | |
Chair of the Trust Committee of the Bank | $ | 10,000 | |
Equity Retainer (in the form of RSUs) | $ | 50,000 | |
Non-Employee Director Compensation | ||||||||||||||||||
Name | Fees Paid in Cash ($) | Stock Awards(1)(2) ($) | Option Awards(3) ($) | Change in Pension Value and Nonqualified Deferred Compensation Earnings(4) ($) | All Other Compensation(5) ($) | Total ($) | ||||||||||||
Diane M. Aigotti | 70,000 | 37,363 | 77 | 107,440 | ||||||||||||||
Norman R. Bobins(6) | 580,000 | 37,363 | — | — | 868 | (8) | 618,231 | |||||||||||
Michelle L. Collins | 70,000 | 37,363 | — | — | 119 | 107,482 | ||||||||||||
James M. Guyette | 130,000 | 37,363 | — | — | 850 | 168,213 | ||||||||||||
Ralph B. Mandell(7) | 22,500 | — | — | — | 77,915 | (9) | 100,415 | |||||||||||
Cheryl Mayberry McKissack | 90,000 | 37,363 | — | — | 850 | 128,213 | ||||||||||||
James B. Nicholson | 95,000 | 37,363 | — | — | 797 | 133,160 | ||||||||||||
Richard S. Price | 70,000 | 37,363 | 77 | 107,440 | ||||||||||||||
Edward W. Rabin | 85,000 | 37,363 | — | — | 850 | 123,213 | ||||||||||||
William R. Rybak | 95,000 | 37,363 | — | — | 850 | 133,213 | ||||||||||||
Alejandro Silva | 80,000 | 37,363 | — | — | 850 | 118,213 | ||||||||||||
(1) | Represents the aggregate grant date fair value computed in accordance with FASB ASC Topic 718 as determined based on the closing price-per-share of our common stock on the date of grant adjusted for a 25% lack of marketability discount for each director due to transfer restrictions on the shares underlying the RSUs that result from delayed settlement of the award. |
(2) | The stock award is represented by 1,223 RSUs for each director. As of December 31, 2016 for each director, 50% of the units had vested, an additional 25% is scheduled to vest on March 1, 2017 and the remaining 25% is scheduled to vest on June 1, 2017. Distribution of the common stock underlying the RSUs will occur upon a director’s termination of service for any reason. |
(3) | The following table lists outstanding vested option awards and unvested stock awards held by each of the non-employee directors listed above as of December 31, 2016. As of that date, our non-employee directors do not hold any unvested option awards. |
Name | Outstanding Vested Option Awards (#) | Outstanding Unvested RSU Awards (#) | ||||
Diane M. Aigotti | — | 611 | ||||
Norman R. Bobins | 62,500 | 611 | ||||
Michelle L. Collins | — | 611 | ||||
James M. Guyette | 3,000 | 611 | ||||
Ralph B. Mandell | — | — | ||||
Cheryl Mayberry McKissack | 3,000 | 611 | ||||
James B. Nicholson | — | 611 | ||||
Richard S. Price | — | 611 | ||||
Edward W. Rabin | 3,000 | 611 | ||||
William R. Rybak | 3,000 | 611 | ||||
Alejandro Silva | 3,000 | 611 | ||||
(4) | In 2016, no interest was earned under the Deferred Compensation Plan at a rate that exceeded 120% of the Applicable Federal Rate. |
(5) | Amounts shown for each director, other than Mr. Mandell, consist solely of dividend equivalents paid on RSU awards. See note 9 below for a description of Mr. Mandell’s amounts. |
(6) | See “—Compensation of Mr. Bobins” below for a discussion of Mr. Bobins’s compensation arrangements. |
(7) | Mr. Mandell retired from the Board effective May 19, 2016. |
(8) | The amount shown under “All Other Compensation” for Mr. Bobins does not include any expense allocation for office space made available to Mr. Bobins within existing leased space at no incremental cost to the Company. The amount also excludes the |
(9) | Includes the value of parking benefits provided to Mr. Mandell and dividends paid on RSU awards in 2016. Also includes the value ($74,008 based on the aggregate incremental cost to the Company) of office space located within our headquarters that we provided to Mr. Mandell through December 21, 2016. The value of such office space was calculated by multiplying the aggregate per-square-foot occupancy expense for our headquarters (which includes, among other things, rent, janitorial services, computers, furniture and utilities) by the square footage provided to him. |
Number of Common Shares Beneficially Owned (#) | Vested but Unsettled RSUs (#)(1) | Vested but Unsettled PSUs(#)(1) | Exercisable Options (#) | Total Amount of Beneficial Ownership (#)(2) | Total Percentage Ownership(2)(3) | ||||||||||||
5% or Greater Stockholders | |||||||||||||||||
BlackRock, Inc. 55 East 52nd Street New York, NY 10055 | 7,993,628 | (4) | — | — | — | 7,993,628 | 9.95 | % | |||||||||
The Vanguard Group 100 Vanguard Boulevard Malvern, PA 19355 | 5,978,691 | (5) | — | — | — | 5,978,691 | 7.44 | % | |||||||||
State Street Corporation One Lincoln Street Boston, MA 02111 | 4,190,424 | (6) | — | — | — | 4,190,424 | 5.22 | % | |||||||||
Directors | |||||||||||||||||
Larry D. Richman** | 320,500 | 109,623 | (16) | 62,201 | 312,679 | 805,003 | 1.00 | % | |||||||||
Diane M. Aigotti | 507 | (7) | 1,918 | — | — | 2,425 | * | ||||||||||
Norman R. Bobins | 66,846 | (8) | 21,709 | — | 62,500 | 151,055 | * | ||||||||||
Michelle L. Collins | — | 2,980 | — | — | 2,980 | * | |||||||||||
James M. Guyette | 132,013 | (9) | 21,250 | — | 3,000 | 156,263 | * | ||||||||||
Cheryl Mayberry McKissack | 5,300 | 21,250 | — | 3,000 | 29,550 | * | |||||||||||
James B. Nicholson | 39,197 | (10) | 19,915 | — | — | 59,112 | * | ||||||||||
Richard S. Price | — | 1,918 | — | — | 1,918 | * | |||||||||||
Edward W. Rabin, Jr. | 25,049 | (11) | 21,250 | — | 3,000 | 49,299 | * | ||||||||||
William R. Rybak | 21,875 | (12) | 21,250 | — | 3,000 | 46,125 | * | ||||||||||
Alejandro Silva | 30,563 | (13) | 21,250 | — | 3,000 | 54,813 | * | ||||||||||
Total Directors | 641,850 | 264,313 | 62,201 | 390,179 | 1,358,543 | 1.68 | % | ||||||||||
Non-director Named Executive Officers | |||||||||||||||||
Kevin M. Killips | 112,568 | 5,126 | (17) | 23,991 | 100,337 | 242,022 | * | ||||||||||
Bruce R. Hague | 106,531 | (14) | 4,162 | (17) | 21,840 | 7,149 | 139,682 | * | |||||||||
Bruce S. Lubin | 99,734 | 4,686 | (17) | 21,451 | 130,960 | 256,831 | * | ||||||||||
Karen B. Case | 65,506 | (15) | 3,741 | (17) | 17,108 | 127,638 | 213,993 | * | |||||||||
Total Directors and Executive Officers (19 persons) | 1,171,446 | (18) | 293,418 | (19) | 198,335 | 971,373 | 2,634,572 | 3.23 | % | ||||||||
* | Less than 1% |
** | Denotes person who serves as a director and who is also a named executive officer. |
(1) | Excludes unvested restricted stock units (“RSUs”) and performance share units (“PSUs”) and includes RSUs and PSUs that have vested but not yet settled. While recipients of RSUs and PSUs have no voting power with respect to the underlying shares until the units settle (and no executive’s RSUs or PSUs are scheduled to settle within 60 days of the date of this table), they are included because the structure of the Company’s director and executive compensation programs place significant emphasis on the use of RSUs and PSUs with delayed settlement features. To exclude vested RSUs and PSUs (which the recipient has a legal right to receive in the future) solely because there are no current voting rights would not accurately reflect their financial interest in the |
(2) | Beneficial ownership is determined in accordance with Rule 13d-3 promulgated under the Securities Exchange Act of 1934, as amended, subject to footnote (1) above. |
(3) | Based upon 80,023,178 total shares outstanding as of March 24, 2017. |
(4) | Based on information included in a Schedule 13G/A filed on January 9, 2017 by BlackRock, Inc. |
(5) | Based on information included in a Schedule 13G/A filed on February 13, 2017 by The Vanguard Group. |
(6) | Based on information included in a Schedule 13G filed on February 8, 2017 by State Street Corporation. |
(7) | Represents 507 shares held in the deferred compensation plan for Ms. Aigotti’s account. |
(8) | Includes 18,470 shares owned by The Robert Thomas Bobins Foundation, a private foundation for which Mr. Bobins and his spouse are trustees. Mr. Bobins is deemed to have shared voting and investment power over these shares. |
(9) | Includes 7,300 shares held by Mr. Guyette’s spouse and 8,652 shares held in the Company’s deferred compensation plan for Mr. Guyette’s account. |
(10) | Includes 10,372 shares held in the Company’s deferred compensation plan for Mr. Nicholson’s account. |
(11) | Includes 4,937 shares held in the Company’s deferred compensation plan for Mr. Rabin’s account. |
(12) | Includes 2,610 shares held by Mr. Rybak’s spouse. |
(13) | Includes 16,922 shares held in the Company’s deferred compensation plan for Mr. Silva’s account. |
(14) | Includes 1,300 shares held by Mr. Hague’s spouse and 5,874 shares in the Company’s deferred compensation plan for Mr. Hague’s account. |
(15) | Includes 964 shares held in the Company’s deferred compensation plan for Ms. Case’s account. |
(16) | Excludes 89,320 unvested RSUs for Mr. Richman, which will vest over the next three years on the basis of continued employment. |
(17) | Excludes the following unvested RSUs, which will vest over the next three years on the basis of continued employment: Mr. Killips (24,461); Mr. Hague (17,042); Mr. Lubin (18,901); and Ms. Case (16,166). |
(18) | Includes an aggregate 57,948 deferred stock units held in the deferred compensation plan representing rights to receive shares of PrivateBancorp common stock. Participants have no right to vote with respect to the deferred stock units. |
(19) | Excludes a total of 139,663 unvested RSUs granted to non-director executive officers, which will vest over the next three years on the basis of continued employment. |
• | the Company is a participant; |
• | the aggregate amount involved exceeds, or is expected to exceed, $120,000; and |
• | a “related person” (directors, director nominees, executive officers, stockholders holding 5% or more of our voting securities or any of their immediate family members or certain affiliated entities) has a direct or indirect material interest. |
• | The banking products and services, including loans and lines of credit, provided by the Bank to several of our directors and, in some cases, to their affiliated entities and/or immediate family members. In each case, the Bank provides these products and services in the ordinary course of its business on a non-preferential basis and, in the case of outstanding credit relationships, they do not involve more than the normal risk of collectability. The revenue we earn from these banking relationships is significantly below the quantitative thresholds in Nasdaq listing rules. |
• | The amount of the Bank’s contributions to charitable institutions or other non-profit organizations for which certain of our directors serve as an officer, director or trustee. |
• | The ordinary course of business services that we purchase from certain subsidiaries of Mesirow Financial Holdings, Inc., where Mr. Price serves as Chairman and CEO. These transactions are described under “Transactions with Related Persons.” The aggregate revenue earned by Mesirow from these relationships in 2016 was substantially less than 1% of its consolidated annual revenues. These relationships have been in place for a number of years prior to Mr. Price joining our Board in August 2015. Additionally, Mr. Price, as CEO of the holding company, does not have direct involvement with the foregoing transactions, nor is his compensation directly or materially affected by the revenue earned by Mesirow from such transactions. Furthermore, as described above under “Transactions with Related Persons,” most of the revenue earned in recent years by Mesirow from business with us was generated by its insurance services business, which Mesirow sold to an unrelated entity in July 2016. |
• | Ms. Collins sits on the board of directors of Health Care Service Corp., a large customer-owned health insurance organization that is the parent company of BlueCross BlueShield of Illinois, our employee healthcare benefits provider. We have contracted with this organization for our healthcare benefits program for many years prior to Ms. Collins joining the Board in November 2014 and have continued to negotiate our contracts on an arm’s length basis. Ms. Collins does not have any involvement with our relationship with BlueCross BlueShield of Illinois and is not an executive there. |
2016 | 2015 | |||||||
Audit Fees | $ | 1,962,800 | $ | 1,851,000 | ||||
Audit-Related Fees | 181,190 | 167,041 | ||||||
Tax Fees | ||||||||
Compliance | 277,550 | 311,553 | ||||||
Planning and Advice | 150,169 | 24,100 | ||||||
All Other Fees | — | — | ||||||
Total | $ | 2,571,709 | $ | 2,353,694 | ||||
(a) (1) | Financial Statements | |
Report of Independent Registered Public Accounting Firm. | ||
Consolidated Statements of Financial Condition as of December 31, 2016 and 2015. | ||
Consolidated Statements of Income for the years ended December 31, 2016, 2015, and 2014. | ||
Consolidated Statements of Comprehensive Income for the years ended December 31, 2016, 2015, and 2014. | ||
Consolidated Statements of Changes in Equity for the years ended December 31, 2016, 2015, and 2014. | ||
Consolidated Statements of Cash Flows for the years ended December 31, 2016, 2015, and 2014. | ||
Notes to Consolidated Financial Statements. | ||
(a) (2) | Financial Statement Schedules | |
All financial statement schedules for the Registrant and its subsidiaries required by Item 8 and Item 15 of this Form 10-K are omitted because of the absence of conditions under which they are required, or because the information is set forth in the consolidated financial statements or the notes thereto. | ||
(a) (3) | Exhibits | |
See Exhibit Index filed at the end of this report, which is incorporated herein by reference. | ||
By: | /s/ Larry D. Richman | |||
Larry D. Richman | ||||
President and Chief Executive Officer | ||||
Date: | May 1, 2017 | |||
Signatures | Title | ||
/s/ Larry D. Richman | President, Chief Executive Officer and Director | ||
Larry D. Richman | |||
/s/ Kevin M. Killips | Chief Financial Officer and Principal Financial Officer | ||
Kevin M. Killips | |||
/s/ Paul E. Carey | Controller, Chief Accounting Officer and Principal Accounting Officer | ||
Paul E. Carey | |||
* | Chairman and Director | ||
James M. Guyette | |||
* | Director | ||
Diane M. Aigotti | |||
* | Director | ||
Norman R. Bobins | |||
* | Director | ||
Michelle L. Collins | |||
* | Director | ||
Cheryl Mayberry McKissack | |||
* | Director | ||
James B. Nicholson | |||
* | Director | ||
Richard S. Price | |||
* | Director | ||
Edward W. Rabin, Jr. | |||
* | Director | ||
William R. Rybak | |||
* | Director | ||
Alejandro Silva | |||
* Signed pursuant to power of attorney. | |||
Exhibit Number | Description of Documents |
2.1 | Agreement and Plan of Merger, dated as of June 29,2016, by and among Canadian Imperial Bank of Commerce, PrivateBancorp, Inc. and CIBC Holdco Inc. is incorporated herein by reference to Exhibit 2.1 to the Current Report on Form 8-K (File Np. 001-34066) filed on July 7, 2016. |
3.1 | Restated Certificate of Incorporation of PrivateBancorp, Inc., dated August 6, 2013 is incorporated herein by reference to Exhibit 3.1 to the Quarterly Report on Form 10-Q (File No. 001-34006) filed on August 7, 2013. |
3.2 | Amended and Restated By-laws of PrivateBancorp, Inc. are incorporated herein by reference to Exhibit 3.5 to the Annual Report on Form 10-K (File No. 001-34066) filed on March 1, 2010. |
3.3 | Amendment to Amended and Restated By-laws of PrivateBancorp, Inc., is incorporated herein by reference to Exhibit 3.1 to the Current Report on Form 8-K (File No. 001-34066) filed on May 24, 2013. |
4.1 | Certain instruments defining the rights of the holders of long-term debt of PrivateBancorp, Inc. and certain of its subsidiaries, none of which authorize a total amount of securities in excess of 10% of the total assets of PrivateBancorp, Inc. and its subsidiaries on a consolidated basis, have not been filed as exhibits. PrivateBancorp, Inc. hereby agrees to furnish a copy of any of these agreements to the SEC upon request. |
10.1 | PrivateBancorp, Inc. Incentive Compensation Plan, as amended, is incorporated herein by reference to Appendix A to the Proxy Statement for its 2005 Annual Meeting of Stockholders (File No. 000-25887) filed on March 11, 2005. |
10.2 | Form of Director Stock Option Agreement pursuant to the PrivateBancorp, Inc. Incentive Compensation Plan is incorporated herein by reference to Exhibit 10.30 to the Annual Report on Form 10-K (File No. 000-25887) filed on March 10, 2005. |
10.3 | Form of Non-qualified Stock Option Agreement pursuant to the PrivateBancorp, Inc. Incentive Compensation Plan is incorporated herein by reference to Exhibit 10.2 to the Quarterly Report on Form 10-Q (File No. 000-25887) filed on November 9, 2006. |
10.4 | PrivateBancorp, Inc. Strategic Long-Term Incentive Plan is incorporated herein by reference to Exhibit 99.1 to the Form S-8 Registration Statement (File No. 333-147451) filed on November 16, 2007. |
10.5 | Form of Non-qualified Inducement Performance Stock Option Agreement pursuant to the PrivateBancorp, Inc. Strategic Long-Term Incentive Compensation Plan is herein incorporated by reference to Exhibit 10.20 to the Annual Report on Form 10-K (File No. 000-25887) filed on February 29, 2008. |
10.6 | Form of Non-qualified Inducement Time-Vested Stock Option Agreement pursuant to the PrivateBancorp, Inc. Strategic Long-Term Incentive Compensation Plan is incorporated herein by reference to Exhibit 10.21 to the Annual Report on Form 10-K (File No. 000-25887) filed on February 29, 2008. |
10.7 | PrivateBancorp, Inc. 2007 Long-Term Incentive Compensation Plan is incorporated herein by reference to Exhibit 99.1 to the Form S-8 Registration Statement (File No. 333-151178) filed on May 23, 2008. |
10.8 | Form of Non-employee Director Restricted Stock Award Agreement pursuant to the PrivateBancorp, Inc. 2007 Long-Term Incentive Compensation Plan is incorporated herein by reference to Exhibit 10.1 to the Quarterly Report on Form 10-Q (File No. 001-34066) filed on August 11, 2008. |
10.9 | Form of Employee Non-qualified Stock Option Agreement pursuant to the PrivateBancorp, Inc. 2007 Long-Term Incentive Compensation Plan is incorporated herein by reference to Exhibit 10.2 to the Quarterly Report on Form 10-Q (File No. 001-34066) filed on August 11, 2008. |
10.10 | Form of Amendment Agreement dated as of January 28, 2010 by and between PrivateBancorp, Inc. and certain officers including Larry D. Richman, C. Brant Ahrens, Bruce R. Hague and Bruce S. Lubin to amend each such officer’s agreements evidencing an award of performance shares granted under the PrivateBancorp, Inc. Strategic Long-Term Incentive Compensation Plan and/or the PrivateBancorp, Inc. 2007 Long-Term Incentive Compensation Plan is incorporated herein by reference to Exhibit 10.23 to the Annual Report on Form 10-K (File No. 001-34066) filed on March 1, 2010. |
10.11 | PrivateBancorp, Inc. 2009 Deferred Compensation Plan is incorporated herein by reference to Exhibit 99.1 to the Form S-8 Registration Statement (File No. 333-174840) filed on June 10, 2011. |
10.12 | Form of Amendment Agreement to Stock Option Agreement pursuant to the PrivateBancorp, Inc. 2007 Long-Term Incentive Compensation Plan by and between PrivateBancorp, Inc. and each of Bruce Lubin and Kevin Killips, effective December 29, 2011 is incorporated herein by reference to Exhibit 10.41 to the Annual Report on Form 10-K (File No. 001-34066) filed on February 28, 2012. |
10.13 | PrivateBancorp, Inc. 2011 Amended and Restated Incentive Compensation Plan is incorporated herein by reference to Appendix A to the Proxy Statement for its 2014 Annual Meeting of Stockholders (File No. 001-34066) filed on April 11, 2014. |
10.14 | Form of Stock Option Agreement pursuant to the PrivateBancorp, Inc. 2011 Incentive Compensation Plan is incorporated herein by reference to Exhibit 10.3 to the Quarterly Report on Form 10-Q (File No. 001-34066) filed on August 9, 2011. |
10.15 | Form of Executive Officer Stock Option Award Agreement for option awards made beginning in 2013 pursuant to the PrivateBancorp, Inc. 2011 Incentive Compensation Plan is incorporated herein by reference to Exhibit 10.5 to the Quarterly Report on Form 10-Q (File No. 001-34066) filed on May 9, 2013. |
10.16 | Form of Executive Officer Stock Option Award Agreement for option awards made beginning February 2015 pursuant to the PrivateBancorp, Inc. Amended and Restated 2011 Incentive Compensation Plan is incorporated herein by reference to Exhibit 10.1 to the Quarterly Report on Form 10-Q (File No. 001-34066) filed on May 8, 2015. |
10.17 | Form of Performance Share Unit Award Agreement pursuant to the PrivateBancorp, Inc. 2011 Incentive Compensation Plan is incorporated herein by reference to Exhibit 10.2 to the Quarterly Report on Form 10-Q (File No. 001-34066) filed on May 9, 2013. |
10.18 | Form of Performance Stock Unit Award Agreement for Executive Officers pursuant to the PrivateBancorp, Inc. 2011 Incentive Compensation Plan, for PSU awards granted in 2014 is incorporated herein by reference to Exhibit 10.2 to the Quarterly Report on Form 10-Q (File No. 001-34066) filed on May 6, 2014. |
10.19 | Form of Performance Share Unit Award Agreement for Executive Officers’ awards beginning March 2015 pursuant to the PrivateBancorp, Inc. Amended and Restated 2011 Incentive Compensation Plan is incorporated herein by reference to Exhibit 10.5 to the Quarterly Report on Form 10-Q (File No. 001-34066) filed on May 8, 2015. |
10.20 | Form of Restricted Stock Award Agreement pursuant to the PrivateBancorp, Inc. 2011 Incentive Compensation Plan is incorporated herein by reference to Exhibit 10.2 to the Quarterly Report on Form 10-Q (File No. 001-34066) filed on August 9, 2011. |
10.21 | Form of TARP-Compliant Restricted Stock Award Agreement for certain non-CEO TARP-compliant 2012 incentive compensation awards pursuant to the PrivateBancorp, Inc. 2011 Incentive Compensation Plan is incorporated herein by reference to Exhibit 10.3 to the Quarterly Report on Form 10-Q (File No. 001-34066) filed on May 9, 2013. |
10.22 | Form of Executive Officer Restricted Stock Award Agreement for equity awards beginning in 2013 made pursuant to the PrivateBancorp, Inc. 2011 Incentive Compensation Plan is incorporated herein by reference to Exhibit 10.4 to the Quarterly Report in Form 10-Q (File No 001.34066) filed on May 9, 2013. |
10.23 | Form of Restricted Stock Unit Award Agreement for the Chief Executive Officer’s long-term incentive award beginning in 2013 made pursuant to the PrivateBancorp, Inc. 2011 Incentive Compensation Plan is incorporated herein by reference to Exhibit 10.6 to the Quarterly Report on Form 10-Q (File No. 001-34066) filed on May 9, 2013. |
10.24 | Form of Restricted Stock Unit Award Agreement for Executive Officers other than the CEO, pursuant to the PrivateBancorp, Inc. 2011 Incentive Compensation Plan, for awards beginning February 2014 is incorporated herein by reference to Exhibit 10.1 to the Quarterly Report on Form 10-Q (File No. 001-34066) filed on May 6, 2014. |
10.25 | Form of Restricted Stock Unit Award Agreement for all Executive Officers’ annual incentive deferral awards beginning February 2015 made pursuant to the PrivateBancorp, Inc. Amended and Restated 2011 Incentive Compensation Plan is incorporated herein by reference to Exhibit 10.2 to the Quarterly Report on Form 10-Q (File No. 001-34066) filed on May 8, 2015. |
10.26 | Form of Restricted Stock Unit Award Agreement for Executive Officers’ (other than the CEO) long-term incentive awards beginning February 2015 made pursuant to the PrivateBancorp, Inc. Amended and Restated 2011 Incentive Compensation Plan is incorporated herein by reference to Exhibit 10.3 to the Quarterly Report on Form 10-Q (File No. 001-34066) filed on May 8, 2015. |
10.27 | Form of Restricted Stock Unit Award Agreement for the Chief Executive Officer’s long-term incentive award beginning February 2015 made pursuant to the PrivateBancorp, Inc. Amended and Restated 2011 Incentive Compensation Plan is incorporated herein by reference to Exhibit 10.4 to the Quarterly Report on Form 10-Q (File No. 001-34066) filed on May 8, 2015. |
10.28 | Form of Restricted Stock Unit Award Agreement for annual incentive deferral awards granted in February 2017 made pursuant to the PrivateBancorp, Inc. Amended and Restated 2011 Incentive Compensation Plan (previously filed with the Original Form 10-K on March 1, 2017). |
10.29 | Form of Restricted Stock Unit Award Agreement for long-term incentive awards granted in February 2017 made pursuant to the PrivateBancorp, Inc. Amended and Restated 2011 Incentive Compensation Plan (previously filed with the Original Form 10-K on March 1, 2017). |
10.30 | Employment Term Sheet Agreement among Larry D. Richman, PrivateBancorp, Inc. and The PrivateBank and Trust Company dated October 30, 2007 is incorporated herein by reference to Exhibit 10.7 to the Annual Report on Form 10-K (File No. 000-25887) filed on February 29, 2008. |
10.31 | Employment Term Sheet Agreement among Karen B. Case, PrivateBancorp, Inc. and The PrivateBank and Trust Company dated October 29, 2007 is incorporated herein by reference to Exhibit 10.8 to the Annual Report on Form 10-K (File No.000-25887) filed on February 29, 2008. |
10.32 | Employment Term Sheet Agreement among Bruce R. Hague, PrivateBancorp, Inc. and The PrivateBank and Trust Company dated October 25, 2007 is incorporated herein by reference to Exhibit 10.9 to the Annual Report on Form 10-K (File No. 000-25887) filed on February 29, 2008. |
10.33 | Employment Term Sheet Agreement among Bruce S. Lubin, PrivateBancorp, Inc. and The PrivateBank and Trust Company dated October 24, 2007 is incorporated herein by reference to Exhibit 10.11 to the Annual Report on Form 10-K (File No. 000-25887) filed on February 29, 2008. |
10.34 | Employment Term Sheet Agreement among Kevin M. Killips, PrivateBancorp, Inc. and The PrivateBank and Trust Company dated February 6, 2009 is incorporated herein by reference to Exhibit 10.1 to the Current Report on Form 8-K (File No. 000-25887) filed on February 9, 2009. |
10.35 | Amendment to Term Sheet for certain employees, including all executive officers, dated December 28, 2012 is incorporated herein by reference to Exhibit 10.40 to the Annual Report on Form 10-K (File No. 001-34066) filed on February 22, 2013. |
10.36 | Form of Indemnification Agreement by and between PrivateBancorp, Inc. and its directors and executive officers is incorporated herein by reference to Exhibit 10.10 to the Form S-1/A Registration Statement (File No. 333-77147) filed on June 15, 1999. |
10.37 | Summary of Compensation Arrangement with Norman R. Bobins, adopted July 2011, effective as of January 1, 2011 is incorporated herein by reference to Exhibit 10.1 to the Quarterly Report on Form 10-Q (File No. 001-34066) filed on November 8, 2011. |
10.38 | Employee Leasing Agreement by and between The PrivateBank and Trust Company and Norman Bobins Consulting LLC, entered into October 2011, effective as of January 1, 2011 is incorporated herein by reference to Exhibit 10.2 to the Quarterly Report on Form 10-Q (File No. 001-34066) filed on November 8, 2011. |
11 | Statement re: Computation of Per Share Earnings - The computation of basic and diluted earnings per share is included in Note 14 of the Company’s Notes to Consolidated Financial Statements included in “Item 8. Financial Statements and Supplementary Data” included in the Original Form 10-K filed on March 1, 2017. |
12 | Statement re: Computation of Ratio of Earnings to Fixed Charges (previously filed with the Original Form 10-K on March 1, 2017). |
21 | Subsidiaries of the Registrant (previously filed with the Original Form 10-K on March 1, 2017). |
23 | Consent of Independent Registered Public Accounting Firm (previously filed with the Original Form 10-K on March 1, 2017). |
24 | Power of Attorney is incorporated by reference to the original signature page to the Original Form 10-K filed on March 1, 2017. |
31.1 (a) | Certification of Chief Executive Officer pursuant to 18 U.S.C. Section 1350, as adopted pursuant to Section 302 of the Sarbanes-Oxley Act of 2002. |
31.2 (a) | Certification of Chief Financial Officer pursuant to 18 U.S.C. Section 1350, as adopted pursuant to Section 302 of the Sarbanes-Oxley Act of 2002. |
32 | Certification of Chief Executive Officer and Chief Financial Officer pursuant to 18 U.S.C. Section 1350, as adopted pursuant to Section 906 of the Sarbanes-Oxley Act of 2002 (previously furnished with the Original Form 10-K on March 1, 2017. |
101 | The following financial statements from the Original Form 10-K filed on March 1, 2017, formatted in Extensive Business Reporting Language (XBRL): (i) Consolidated Statements of Financial Condition, (ii) Consolidated Statements of Income, (iii) Consolidated Statements of Comprehensive Income, (iv) Consolidated Statements of Changes in Equity, (v) Consolidated Statements of Cash Flows, and (vi) the Notes to Consolidated Financial Statements. |
(a) | Filed herewith. |