1 Source: Sensor Tower. Combined revenue and active users across Apple App Store and Google Play Store.
 | 1 |
.2
Q2 2025 Match Group Prepared Remarks
Since stepping into the CEO role six months ago,
my goal has been to confront the hard truths, take
decisive action, and reshape Match Group and
Tinder into an innovative product-and-engineering-
first company, optimized for user outcomes and
built for the long term.
Over the last six months, that is exactly what we
have done.
This is a three-phase turnaround: first we Reset the
company, then we Revitalize the products, and last,
we undergo a Resurgence with our audience – and
investors.
Phase One - “Reset”
Let’s start with a recap of Phase One.
I spent the first few months of this “Reset” phase learning the businesses, getting to
know our teams, and rebooting the culture to emphasize urgency and
accountability.
Match Group is a multi-brand company with over 20 different apps in the dating and
human connection space. Some of them, like Hinge and Azar®, are growing rapidly
and simply need more resources and time to achieve their full potential. Other
brands need more focused attention in order to improve their results. Tinder needs a
lot of work, and it is therefore my primary focus.
As the largest dating app in the world by revenue and usage1, Tinder has
unparalleled brand awareness and scale. But the product had grown stale through a
lack of innovation and a focus on short-term monetization. To address this, we acted
quickly by installing new management, improving the product roadmap, and
placing Tinder under my direct leadership given its central role in Match Group’s
performance.
We started by fixing what wasn’t working at Tinder, beginning with organizational
design. We flattened the org by removing over 20% of managers and reducing the
size of teams. We then created autonomous product and engineering pods with
greater accountability. We retooled the culture to prioritize urgency and user
outcomes. We doubled our release cadence – we now ship new code to production
| 2 |
every week instead of every two weeks. We have changed decision-making so it is
informed by data but no longer burdened by analysis paralysis. We broke down silos
between Tinder and other Match Group brands in order to gain the benefits of our
company’s scale and centralized core functions like shared data and content
moderation. We now allow nearly 1,000 engineers at Match Group, across all of our
brands, to see one another’s code in a shared GitHub repository, allowing for
unprecedented cross-brand visibility and collaboration. In addition to rolling out
Cursor and other artificial intelligence (“AI”) coding assistants globally, we created a
centralized AI group building shared AI tooling for all of our brands.
The most important changes at Tinder centered around our product strategy and
roadmap, which we realigned to prioritize low-pressure ways to connect.
An important part of Phase One’s “Reset” was communicating with employees and
shareholders about what needed to change, both internally in our culture and across
our products. I shared that directly with employees in a company-wide letter in
March and then, when I took the helm at Tinder, followed through with new product
principles that are already showing up in how we operate.
We are now guided by a commitment to speed, accountability, and relentless
product execution. We also aligned all of our brands around a single organizing
principle: delivering real user outcomes.
We now think about those outcomes across a broad spectrum, from casual to
serious, romantic to platonic, and we are building apps that support the full range of
user preferences. We have crystallized our brand strategy such that Hinge is
singularly focused on winning in the intentioned dating category, Tinder is focused
on winning in the casual connections category, our E&E brands are focused on
unleashing the power of a unified platform and supporting communities with
shared identities, and MG Asia is focused on launching and growing our brands in
Asia and expanding Azar’s low-pressure, 1-1 video service globally.
Phase Two - “Revitalize”
With Phase One complete, we’ve now entered Phase Two: “Revitalize”, where the
product begins to reflect our renewed commitment to users and user outcomes.
I’m going to talk through the rapid product acceleration at Tinder, the tremendous
momentum and growth at Hinge, and how we’re scaling new brands across the
portfolio with focus and intention.
| 3 |
Tinder®
The product roadmap aims to solve three core user pain points: authenticity, dating
fatigue, and outcomes.
In just the last few months, there has been a burst of energy and urgency to launch
several initiatives at Tinder.
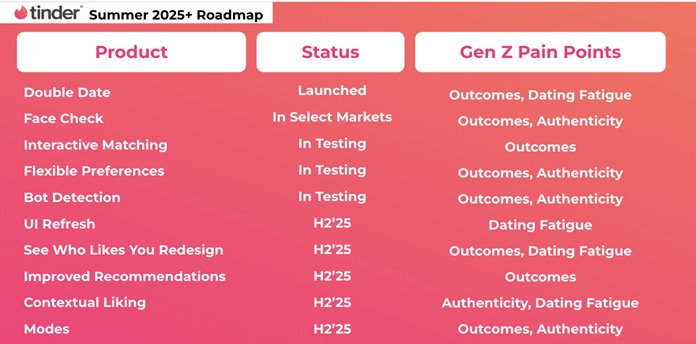
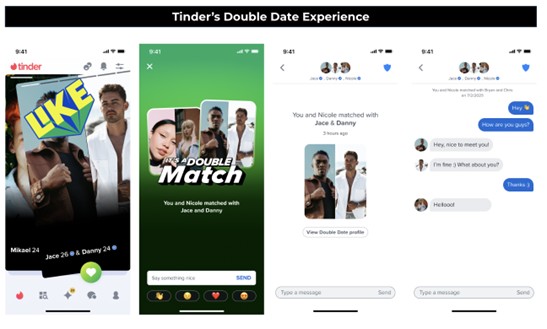
•We launched Double Date globally in June, giving users a new, social way to
connect as a pair. Rolled out six months ahead of schedule, it’s showing strong
early traction with 92% of Double Date users under 30. Women who are
pairing up are three times more likely to send a Like and four times more
likely to match compared to when using Tinder solo.
•In New Zealand, we’ve piloted an Interactive Matching product (sometimes
referred to as “daily drop” or “AI-enabled discovery”), which is a whole new way
to use Tinder that goes deeper to deliver high-quality, personalized matches.
We are expanding this to other regions shortly.
•We’ve made substantial progress in Trust & Safety by expanding our Face
Check service, a facial liveness check feature that helps confirm users are real
and match their profile photos, to new markets, including California.
•At the same time, we’ve made strides on authenticity by enhancing our Bot
Detection systems, reducing false positives, meaning fewer legitimate users
are being mistakenly flagged, while also further reducing bad actors. With
more sophisticated detection models in place, we’re making the platform
safer and more trustworthy at scale.
| 4 |
•We’ve started testing a more flexible Preferences system, like height as a
premium preference option, which gives users more control over their
matches.
This builds on what I shared in February: long-term investments to strengthen the
ecosystem and drive sustainable value. Here’s what we have planned through the
end of the year on Tinder:
•We’re testing major updates to our Recommendations engine to show users
more compatible matches.
•We’re rolling out Contextual Liking and Messaging, giving users a low
pressure way to engage by reacting to specific parts of a profile. This makes
likes more purposeful and increases the chances of starting a real
conversation.
•We’re on track to test version one of a redesigned See Who Likes You tab this
fall with the dual goal of helping users connect with people they’re more likely
to be interested in, as well as to drive more revenue.
•We’re preparing to introduce a feature called Modes, a new navigation system
that lets users toggle between different dating goals and discovery
experiences in real time for serendipitous connections.
•We’ll expand our Interactive Matching product, with additional geographies
coming online by year-end.
•And we’ll take the first steps toward a User Interface (“UI”) refresh in Q3, with
a cleaner, faster, and more modern look across the entire app.
| 5 |
For the first time in a long time, Tinder’s pace of product innovation is strong. To
track progress, I am focused on metrics connected with user outcomes — things like
match rate, contact exchange, and inferred IRL meetups. Many of these deeper
signals are trending up, and we’re actively exploring ways to give investors more
visibility into these metrics.
Hinge®
This focus on real-world outcomes applies across the portfolio, and nowhere is that
clearer than at Hinge. Simply put, Hinge is crushing it. Hinge’s success should put to
rest any doubts about whether the online dating category is out of favor among
users. Hinge shows that a great team that is highly motivated can build great
products which attract huge audiences and create significant revenue and
shareholder value. This is the formula we are following in the turnaround at Hinge’s
sister brand, Tinder, and Hinge’s success gives me pride in Hinge but also confidence
in Tinder.
At Hinge, everything ladders up to one north star: Getting Users on More Great
Dates. It’s how we measure success and stay focused on delivering real-world
outcomes. And it’s been a huge driver of our success. As a result, Hinge is well-
positioned to deliver accelerating year-over-year (“Y/Y”) revenue growth in each
subsequent quarter of 2025, a particularly impressive accomplishment at a business
of this scale, while also continuing to expand margins.
So how is Hinge achieving this? As one might expect, it’s the tried and true
combination of product innovation leading to audience growth. Let’s start with the
product. Over the past several months, Hinge has rolled out a number of core
initiatives designed to keep intentionality front and center in our users' dating
experience.
•We launched a new AI-powered Recommendation Algorithm in March that
is driving a 15% increase in matches and contact exchanges, driving
meaningfully more great dates for our users. And it’s important to note that
while we are creating more value for users, we are also observing meaningful
upticks in payer conversion.
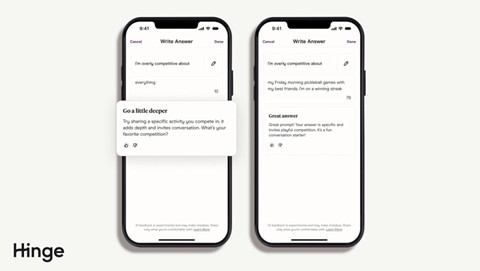
•We rolled out Prompt Feedback, a first-of-its-kind AI feature that gives users
real-time suggestions during onboarding to help them better express
themselves on their profile. This reduced generic answers by a third and more
than doubled thoughtful, high-quality responses, helping spark better first
impressions and more meaningful connections.
•We rebuilt our notifications platform, unlocking faster delivery & robust
metrics tracking. This has enabled us to launch Chat-Specific Notifications,
helping users maintain momentum with matches they’re most interested in.
| 6 |
Over the second half of 2025, Hinge will continue to develop its product strategies to
address user needs.
•In the first half of 2025, users’ Discover experience became more personalized
and relevant to their preferences. In the second half, we plan to noticeably
improve Recommendations throughout the app experience as more of our
algorithms are powered by AI. Users will see and feel this difference in
experiences, including Boost, Standouts, Most Compatible, and more.
•In the first half of 2025, we experimented with different coaching capabilities
and dogfooded several AI-powered features. In the second half, these
experiences will move into test and include:
◦Warm Intros, which will highlight small yet meaningful details on
select profiles to give daters a deeper consideration of compatibility.
◦And Conversation Starters, which offer personalized prompts to help
daters break the ice and spark more meaningful conversations.
Turning now to user growth, Hinge is growing users in every geography it operates
in. Hinge grew its MAU by nearly 20% Y/Y in the first half of the year.

2 European Expansion markets include Austria, Denmark, Finland, France, Germany, Italy, Netherlands, Norway,
Spain, Sweden, and Switzerland.
| 7 |
In European markets, its momentum continues to build as we enter our third year of
expansion, with MAU up more than 60% Y/Y in European Expansion2 markets in the
first half of 2025. This growth is driven by brand campaigns tailored to local dating
culture, boosting awareness and perception.
While there is still much more room for growth in Europe, we are excited to further
Hinge’s growth ambitions with planned launches in Mexico and Brazil later this year.
With strong user growth and continued product innovation, Hinge is delivering on
its mission for users. It has become the most reliable growth engine in our portfolio,
and one of the most exciting businesses in consumer tech today.
Strategic Growth Drivers
Across the rest of our portfolio, we’re applying the same focus: building for distinct
audiences, prioritizing user outcomes, and driving urgency.
With a stronger financial foundation from our recent restructuring, favorable foreign
exchange (“FX”) trends, and reduced in-app purchase (“IAP”) fees through alternative
payments testing, we believe we are in a position to reinvest savings while still
delivering on our revenue and margin targets. I am excited by our plan to allocate
approximately $50 million in the second half of 2025 toward product testing at
Tinder, geographic expansion for Hinge, Azar, and The League®, and early-stage bets
like Archer®, HER, and a new dating app concept.
These investments reflect our commitment to delivering more value to users
through product innovation and to driving long-term, sustainable growth across the
portfolio.
Phase Three - “Resurgence”
In 2026 and 2027, we expect to enter the third phase of our product evolution:
“Resurgence”.
We intend to transform Tinder into a low-pressure, serendipitous experience
designed for Gen Z. We expect Hinge to extend its leadership in intentioned dating,
powered by both continued AI innovation and international growth. And across the
board, we believe the category will enter a new era — with renewed trust, strong
demand, and long-term growth potential.
We are operating like a company that is just getting started. And we believe the best
chapters of this category and company are still ahead.
We are moving with urgency. We are obsessed with product. And we are building for
the long term.
| 8 |
Q2 2025 Financial Performance
We are pleased with the Q2 results, as both Match Group Total Revenue and
Adjusted Operating Income (“AOI”) exceeded the high-end of our guidance,
excluding a $14 million charge for a preliminary settlement with the Federal Trade
Commission relating to a case filed in September 2019 (“legal settlement charge”),
which we did not anticipate at the time of May earnings.
The team is executing well against the three-part turnaround Spencer laid out to
drive sustainable long-term user growth, revenue growth, and profitability.
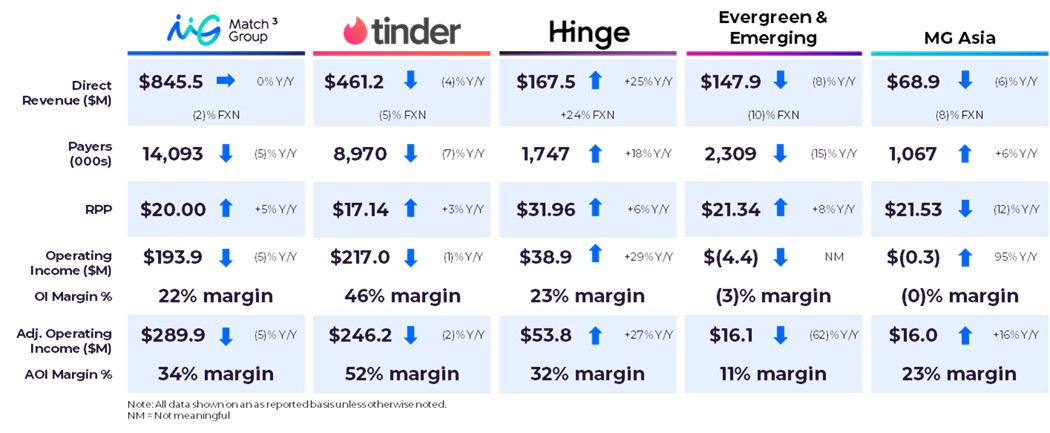
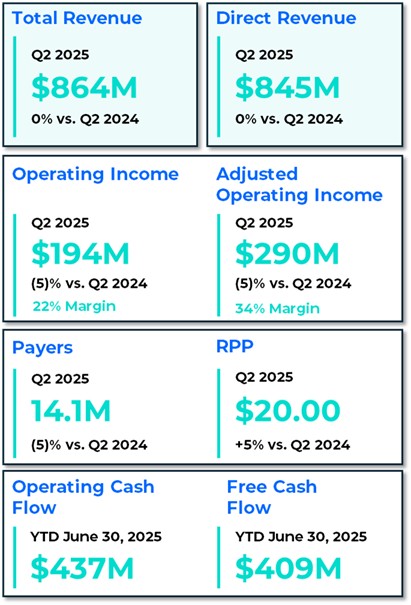
In Q2, Match Group’s Total Revenue was $864 million, flat Y/Y, down 1% Y/Y on an FX
neutral basis (“FXN”). FX was in-line with our expectations at the time of our last
earnings call. Excluding the exit of our live streaming businesses (“Ex-Live”), Total
Revenue was up 1% Y/Y and flat Y/Y FXN. Payers declined 5% Y/Y to 14.1 million, while
RPP grew 5% to $20.00. Indirect revenue was up 15% Y/Y, driven by continued
strength in the advertising business.
In Q2, Match Group’s Operating Income (“OI”) was $194 million, down 5% Y/Y,
representing an OI margin of 22%, and AOI was $290 million, down 5% Y/Y,
representing an AOI margin of 34%. Excluding costs associated with restructuring of
our operations of $18 million and the legal settlement charge of $14 million, OI
increased 10% Y/Y, representing an OI margin of 26% and AOI increased 5% Y/Y,
representing an AOI margin of 37%.
•Tinder Direct Revenue in Q2 was $461 million, down 4% Y/Y and down 5% Y/Y
FXN. Payers declined 7% Y/Y to 9.0 million and RPP grew 3% Y/Y to $17.14. OI in
the quarter was $217 million, down 1% Y/Y, representing an OI margin of 46%.
AOI in the quarter was $246 million, down 2% Y/Y, representing an AOI margin
| 9 |
of 52%. OI and AOI were negatively impacted by costs associated with
restructuring of our operations.
•Hinge continued its strong momentum in Q2 with Direct Revenue of $168
million, up 25% Y/Y and up 24% Y/Y FXN. Payers grew 18% Y/Y to 1.7 million and
RPP grew 6% to $31.96, driven by strong user growth across all markets
combined with continued monetization optimizations. OI was $39 million in
the quarter, up 29% Y/Y, representing an OI margin of 23%. AOI was $54
million, up 27% Y/Y, representing an AOI margin of 32%.
•E&E Direct Revenue in Q2 was $148 million, down 8% Y/Y and down 10% Y/Y
FXN. Ex-Live, E&E Direct Revenue in Q2 was down 6% Y/Y and down 8% Y/Y
FXN. Payers declined 15% Y/Y to 2.3 million, while RPP rose 8% Y/Y to $21.34. In
Q2, E&E delivered an Operating Loss of $(4) million, a decrease of $24 million
Y/Y, and AOI of $16 million, down 62% Y/Y, representing an AOI margin of 11%.
OI and AOI were negatively impacted by the legal settlement charge and
costs associated with restructuring of our operations.
•MG Asia delivered Direct Revenue in Q2 of $69 million, down 6% Y/Y and down
8% Y/Y FXN. Ex-Live, Direct Revenue in Q2 was up 3% Y/Y and up 2% Y/Y FXN.
Azar Direct Revenue was up 3% Y/Y and up 6% Y/Y FXN. Pairs® Direct Revenue
was up 3% Y/Y and down 5% Y/Y FXN. Across MG Asia, Payers increased 6% Y/Y
to 1.1 million, while RPP declined 12% Y/Y to $21.53, partially due to the exit of
Hakuna mid-last year. MG Asia had an Operating Loss of $(0.3) million in the
quarter, an improvement of $5 million Y/Y, and delivered AOI of $16 million, up
16% Y/Y, representing an AOI margin of 23%.
Consolidated Operating Costs and Expenses
Including stock-based compensation (“SBC”) expense, total expenses were up 2% Y/Y
in Q2. Cost of revenue decreased 1% Y/Y and represented 28% of Total Revenue, flat Y/
Y, driven by reduced variable expenses from the shutdown of our live streaming
services mid-last year and lower web services costs at Tinder, offset by an increase in
IAP fees, primarily at Hinge. Selling and marketing costs decreased $6 million, or 4%
Y/Y, due to lower marketing spend at Tinder and E&E, and was down one point Y/Y as
a percentage of Total Revenue at 17%. General and administrative costs increased
19% Y/Y, up three points Y/Y as a percentage of Total Revenue to 16%, driven primarily
by costs associated with restructuring of our operations and the legal settlement
charge. Product development costs grew 1% Y/Y and were flat Y/Y as a percent of
Total Revenue at 13%. Depreciation and amortization decreased by $3 million Y/Y to
$29 million.
3 Leverage is calculated utilizing the non-GAAP measure Adjusted Operating Income as the denominator. For a
reconciliation of the non-GAAP measure for each period presented, see page 13.
| 10 |
Capital Allocation & Liquidity
Our gross leverage was 2.8x and net leverage3 was 2.5x at the end of Q2. We ended
the quarter with $340 million of cash, cash equivalents, and short-term investments
on hand. In Q2, we repurchased 7.6 million of our shares at an average price of $29.45
per share on a trade date basis for a total of $225 million and paid $47 million in
dividends, deploying nearly 120% of our Free Cash Flow for capital return to
shareholders. We maintain our commitment to target returning 100% of Free Cash
Flow to shareholders on a full year basis through share buybacks and the dividend.
Financial Guidance
Q3 2025
We expect Q3 Total Revenue for Match Group of $910 million to $920 million, up 2%
to 3% Y/Y. This range assumes a one-point Y/Y tailwind from FX. FXN, we expect Total
Revenue to be up 1% to 2% Y/Y. We expect Match Group AOI of $330 million to $335
million in Q3, representing a Y/Y decline of 3%, and AOI margin of 36% at the
midpoints of the ranges. The expected Y/Y decline in AOI is driven by an expected
17% Y/Y increase in marketing spend due to the timing of brand campaigns at Tinder
and Hinge and our savings reinvestments.
Total Revenue | Adjusted Operating Income | |||
Q3 2025 | $910 to $920 million | $330 to $335 million |
Full Year 2025 Guidance
For the full year 2025, we expect Match Group Total Revenue to be towards the high-
end of our guidance range primarily due to positive FX impacts. We now expect a
nearly half-point tailwind from FX, which is nearly three points better than we
expected when we provided our initial outlook in February. FXN Ex-Live, we expect
Total Revenue growth to be within the initial guidance range we provided in
February. We expect Y/Y Indirect Revenue growth in the mid-teens given strong
performance in the first half of the year.
We expect to achieve our 36.5% AOI margin target after excluding an expected $25
million in costs associated with restructuring of our operations (of which $18 million
was realized in Q2) and the $14 million legal settlement charge, which would equate
to an approximately 35.4% AOI margin on an as reported basis. Our margin
expectations include the approximately $50 million of reinvestments Spencer
| 11 |
outlined earlier. We will continue to monitor the return on these investments, as well
as business and FX trends, as the year progresses.
We expect Free Cash Flow of $1.06 to $1.09 billion, a meaningful improvement from
our initial guidance in February, driven by an increase in Free Cash Flow conversion,
partially due to expected lower cash taxes from the new U.S. tax law. We expect
capital expenditures of $55 to $65 million.
We expect SBC expense to be $260 to $270 million, an improvement from the
guidance we provided at our last earnings in May due to restructuring of our
operations and our continued focus on managing headcount costs.
We continue to test alternative payments across our brands, including Tinder, and
expect to have an alternative payment option in test at Hinge by late Q3. Additional
savings from further rollout and optimizations of alternative payments is not
included in our guidance and could provide margin upside or fund growth
initiatives.
In June, Canada announced its intention to rescind its Digital Services Tax. If, and
when, it enacts the change into law we expect a one-time benefit to AOI related to
expenses accrued in prior periods. We anticipate this change could be enacted into
law as soon as September; however, we have not included it in our AOI guidance.
Other Updates
we plan to make changes to how we report certain financial measures and metrics
to better align ourselves with our tech peers.
Starting next quarter, we will rename our non-GAAP profitability measure from
Adjusted Operating Income to Adjusted EBITDA. There is no numerical difference
between Adjusted EBITDA and AOI. We plan to continue to include discrete
expenses, such as restructuring costs, but intend to reference such expenses, if
significant, in our earnings materials.
We also plan to change our MAU definition from a last 28-day to a calendar month
basis. We plan to provide a reconciliation of MAU using both definitions.
| 12 |
Appendix
Reconciliations of GAAP to Non-GAAP Measures
Reconciliation of Operating Income to Adjusted Operating Income
Three Months Ended June 30, 2025 | |||||||||||||
Tinder | Hinge | E&E | MG Asia | Corporate & unallocated costs | Eliminations | Total Match Group | |||||||
(Dollars in thousands) | |||||||||||||
Operating Income (Loss) | $216,968 | $38,926 | $(4,397) | $(262) | $(57,314) | $— | $193,921 | ||||||
Stock-based compensation expense | 23,722 | 14,044 | 10,409 | 5,652 | 13,640 | — | 67,467 | ||||||
Depreciation | 5,524 | 865 | 6,500 | 3,623 | 1,549 | — | 18,061 | ||||||
Amortization of intangibles | — | — | 3,559 | 6,939 | — | — | 10,498 | ||||||
Adjusted Operating Income (Loss) | $246,214 | $53,835 | $16,071 | $15,952 | $(42,125) | $— | $289,947 | ||||||
Revenue | $476,701 | $167,505 | $151,349 | $69,155 | $— | $(972) | $863,738 | ||||||
Operating Income Margin | 46% | 23% | (3)% | —% | NA | NA | 22% | ||||||
Adjusted Operating Income Margin | 52% | 32% | 11% | 23% | NA | NA | 34% | ||||||
Three Months Ended June 30, 2024 | |||||||||||||
Tinder | Hinge | E&E | MG Asia | Corporate & unallocated costs | Eliminations | Total Match Group | |||||||
(Dollars in thousands) | |||||||||||||
Operating Income (Loss) | $218,530 | $30,214 | $19,636 | $(5,365) | $(58,489) | $— | $204,526 | ||||||
Stock-based compensation expense | 23,415 | 11,464 | 14,620 | 6,758 | 13,610 | — | 69,867 | ||||||
Depreciation | 9,752 | 547 | 5,154 | 4,336 | 1,303 | — | 21,092 | ||||||
Amortization of intangibles | — | — | 2,906 | 8,046 | — | — | 10,952 | ||||||
Adjusted Operating Income (Loss) | $251,697 | $42,225 | $42,316 | $13,775 | $(43,576) | $— | $306,437 | ||||||
Revenue | $492,908 | $133,569 | $163,757 | $73,838 | $— | $(6) | $864,066 | ||||||
Operating Income (Loss) Margin | 44% | 23% | 12% | (7)% | NA | NA | 24% | ||||||
Adjusted Operating Income Margin | 51% | 32% | 26% | 19% | NA | NA | 35% | ||||||
| 13 |
Reconciliation of Operating Income to Adjusted Operating Income used
in Leverage Ratios
Twelve months ended June 30, 2025 | |
(In thousands) | |
Operating Income | $800,562 |
Stock-based compensation expense | 271,555 |
Depreciation | 85,676 |
Impairments and amortization of intangibles | 73,832 |
Adjusted Operating Income | $1,231,625 |
Reconciliation of Forecasted Operating Income to Forecasted Adjusted
Operating Income
Three Months Ended September 30, 2025 | |
(In millions) | |
Operating Income | $241 to $246 |
Stock-based compensation expense | 63 |
Depreciation and amortization of intangibles | 26 |
Adjusted Operating Income | $330 to $335 |
Revenue | $910 to $920 |
Operating Income Margin (at the mid-point of the ranges) | 27% |
Adjusted Operating Income Margin (at the mid-point of the ranges) | 36% |
Reconciliation of Operating Cash Flow to Free Cash Flow
Six Months Ended June 30, 2025 | |
(In thousands) | |
Net cash provided by operating activities | $436,959 |
Capital expenditures | (28,297) |
Free Cash Flow | $408,662 |
Reconciliation of Forecasted Operating Cash Flow to Free Cash Flow
Year Ended December 31, 2025 | |
(In millions) | |
Net cash provided by operating activities | $1,125 to $1,145 |
Capital expenditures | (55 to 65) |
Free Cash Flow | $1,060 to $1,090 |
| 14 |
Reconciliation of GAAP Revenue to Non-GAAP Revenue, Excluding
Foreign Exchange Effects
Three Months Ended June 30, | |||||||
2025 | $ Change | % Change | 2024 | ||||
(Dollars in millions, rounding differences may occur) | |||||||
Total Revenue, as reported | $863.7 | $(0.3) | —% | $864.1 | |||
Foreign exchange effects | (11.2) | ||||||
Total Revenue, excluding foreign exchange effects | $852.5 | $(11.5) | (1)% | $864.1 | |||
Total Revenue, excluding Hakuna and other of our live streaming services, as reported | $863.7 | $9.6 | 1% | $854.1 | |||
Foreign exchange effects | (11.2) | ||||||
Total Revenue, excluding Hakuna and other of our live streaming services, excluding foreign exchange effects | $852.5 | $(1.6) | —% | $854.1 | |||
Direct Revenue, as reported | $845.5 | $(2.7) | —% | $848.1 | |||
Foreign exchange effects | (11.1) | ||||||
Direct Revenue, excluding foreign exchange effects | $834.3 | $(13.8) | (2)% | $848.1 | |||
Tinder Direct Revenue, as reported | $461.2 | $(18.8) | (4)% | $479.9 | |||
Foreign exchange effects | (6.2) | ||||||
Tinder Direct Revenue, excluding foreign exchange effects | $454.9 | $(25.0) | (5)% | $479.9 | |||
Hinge Direct Revenue, as reported | $167.5 | $33.9 | 25% | $133.6 | |||
Foreign exchange effects | (1.6) | ||||||
Hinge Direct Revenue, excluding foreign exchange effects | $165.9 | $32.4 | 24% | $133.6 | |||
E&E Direct Revenue, as reported | $147.9 | $(13.1) | (8)% | $160.9 | |||
Foreign exchange effects | (2.2) | ||||||
E&E Direct Revenue, excluding foreign exchange effects | $145.6 | $(15.3) | (10)% | $160.9 | |||
E&E, excluding live streaming, Direct Revenue, as reported | $147.9 | $(10.0) | (6)% | $157.9 | |||
Foreign exchange effects | (2.2) | ||||||
E&E, excluding live streaming, Direct Revenue, excluding foreign exchange effects | $145.6 | $(12.2) | (8)% | $157.9 | |||
MG Asia Direct Revenue, as reported | $68.9 | $(4.8) | (6)% | $73.7 | |||
Foreign exchange effects | (1.1) | ||||||
MG Asia Direct Revenue, excluding foreign exchange effects | $67.8 | $(5.8) | (8)% | $73.7 | |||
MG Asia Direct Revenue excluding Hakuna, as reported | $68.9 | $2.1 | 3% | $66.8 | |||
Foreign exchange effects | (1.1) | ||||||
MG Asia Direct Revenue excluding Hakuna, excluding foreign exchange effects | $67.8 | $1.0 | 2% | $66.8 | |||
Azar Direct Revenue | $40.3 | $1.3 | 3% | $38.9 | |||
Foreign exchange effects | 1.0 | ||||||
Azar Direct Revenue, excluding foreign exchange effects | $41.3 | $2.3 | 6% | $38.9 | |||
Pairs Direct Revenue, as reported | $28.7 | $0.8 | 3% | $27.9 | |||
Foreign exchange effects | (2.1) | ||||||
Pairs Direct Revenue, excluding foreign exchange effects | $26.6 | $(1.3) | (5)% | $27.9 | |||
| 15 |
Non-GAAP Financial Measures
Match Group reports Adjusted Operating Income, Adjusted Operating Income Margin, Free Cash Flow,
and Revenue Excluding Foreign Exchange Effects, all of which are supplemental measures to U.S.
generally accepted accounting principles (“GAAP”). The Adjusted Operating Income, Adjusted
Operating Income Margin, and Free Cash Flow measures are among the primary metrics by which we
evaluate the performance of our business, on which our internal budget is based and by which
management is compensated. Revenue Excluding Foreign Exchange Effects provides a comparable
framework for assessing the performance of our business without the effect of exchange rate
differences when compared to prior periods. We believe that investors should have access to the same
set of tools that we use in analyzing our results. These non-GAAP measures should be considered in
addition to results prepared in accordance with GAAP but should not be considered a substitute for or
superior to GAAP results. Match Group endeavors to compensate for the limitations of the non-GAAP
measures presented by providing the comparable GAAP measures and descriptions of the reconciling
items, including quantifying such items, to derive the non-GAAP measures. We encourage investors to
examine the reconciling adjustments between the GAAP and non-GAAP measures, which we describe
below. Interim results are not necessarily indicative of the results that may be expected for a full year.
Definitions of Non-GAAP Measures
Adjusted Operating Income is defined as operating income excluding: (1) stock-based compensation
expense; (2) depreciation; and (3) acquisition-related items consisting of (i) amortization of intangible
assets and impairments of goodwill and intangible assets, if applicable, and (ii) gains and losses
recognized on changes in the fair value of contingent consideration arrangements, as applicable. We
believe Adjusted Operating Income is useful to analysts and investors as this measure allows a more
meaningful comparison between our performance and that of our competitors. The above items are
excluded from our Adjusted Operating Income measure because they are non-cash in nature. Adjusted
Operating Income has certain limitations because it excludes certain expenses.
Adjusted Operating Income Margin is defined as Adjusted Operating Income divided by revenues. We
believe Adjusted Operating Income Margin is useful for analysts and investors as this measure allows a
more meaningful comparison between our performance and that of our competitors. Adjusted
Operating Income Margin has certain limitations in that it does not take into account the impact to our
consolidated statement of operations of certain expenses.
Free Cash Flow is defined as net cash provided by operating activities, less capital expenditures. We
believe Free Cash Flow is useful to investors because it represents the cash that our operating
businesses generate, before taking into account non-operational cash movements. Free Cash Flow has
certain limitations in that it does not represent the total increase or decrease in the cash balance for the
period, nor does it represent the residual cash flow for discretionary expenditures. Therefore, we think it
is important to evaluate Free Cash Flow along with our consolidated statement of cash flows.
We look at Free Cash Flow as a measure of the strength and performance of our businesses, not for
valuation purposes. In our view, applying “multiples” to Free Cash Flow is inappropriate because it is
subject to timing, seasonality and one-time events. We manage our business for cash, and we think it is
of utmost importance to maximize cash – but our primary valuation metric is Adjusted Operating
Income.
Revenue Excluding Foreign Exchange Effects is calculated by translating current period revenues
using prior period exchange rates. The percentage change in Revenue Excluding Foreign Exchange
Effects is calculated by determining the change in current period revenues over prior period revenues
where current period revenues are translated using prior period exchange rates. We believe the impact
of foreign exchange rates on Match Group, due to its global reach, may be an important factor in
| 16 |
understanding period over period comparisons if movement in rates is significant. Since our results are
reported in U.S. dollars, international revenues are favorably impacted as the U.S. dollar weakens relative
to other currencies, and unfavorably impacted as the U.S. dollar strengthens relative to other currencies.
We believe the presentation of revenue excluding foreign exchange effects in addition to reported
revenue helps improve the ability to understand Match Group’s performance because it excludes the
impact of foreign currency volatility that is not indicative of Match Group’s core operating results.
Non-Cash Expenses That Are Excluded From Our Non-GAAP Measures
Stock-based compensation expense consists principally of expense associated with the grants of
RSUs, performance-based RSUs, and market-based awards. These expenses are not paid in cash, and
we include the related shares in our fully diluted shares outstanding using the treasury stock method;
however, performance-based RSUs and market-based awards are included only to the extent the
applicable performance or market condition(s) have been met (assuming the end of the reporting
period is the end of the contingency period). To the extent stock-based awards are settled on a net
basis, we remit the required tax-withholding amounts from our current funds.
Depreciation is a non-cash expense relating to our property and equipment and is computed using the
straight-line method to allocate the cost of depreciable assets to operations over their estimated useful
lives, or, in the case of leasehold improvements, the lease term, if shorter.
Amortization of intangible assets and impairments of goodwill and intangible assets are non-cash
expenses related primarily to acquisitions. At the time of an acquisition, the identifiable definite-lived
intangible assets of the acquired company, such as customer lists, trade names and technology, are
valued and amortized over their estimated lives. Value is also assigned to (i) acquired indefinite-lived
intangible assets, which consist of trade names and trademarks, and (ii) goodwill, which are not subject
to amortization. An impairment is recorded when the carrying value of an intangible asset or goodwill
exceeds its fair value. We believe that intangible assets represent costs incurred by the acquired
company to build value prior to acquisition and the related amortization and impairment charges of
intangible assets or goodwill, if applicable, are not ongoing costs of doing business.
Additional Definitions
Tinder consists of the world-wide activity of the brand Tinder®.
Hinge consists of the world-wide activity of the brand Hinge®.
Evergreen & Emerging (“E&E”) consists of the world-wide activity of our Evergreen brands including
Match®, Meetic®, OkCupid®, Plenty Of Fish®, and a number of demographically focused brands and our
Emerging brands including BLK®, ChispaTM, The League®, Archer®, Upward®, YuzuTM, Salams®, HER, and
other smaller brands.
Match Group Asia (“MG Asia”) consists of the world-wide activity of the brands Pairs® and Azar®.
Direct Revenue is revenue that is received directly from end users of our services and includes both
subscription and à la carte revenue.
Indirect Revenue is revenue that is not received directly from end users of our services, a majority of
which is advertising revenue.
Payers are unique users at a brand level in a given month from whom we earned Direct Revenue.
When presented as a quarter-to-date or year-to-date value, Payers represents the average of the
monthly values for the respective period presented. At a consolidated level and a business unit level to
the extent a business unit consists of multiple brands, duplicate Payers may exist when we earn
| 17 |
revenue from the same individual at multiple brands in a given month, as we are unable to identify
unique individuals across brands in the Match Group portfolio.
Revenue Per Payer (“RPP”) is the average monthly revenue earned from a Payer and is Direct Revenue
for a period divided by the Payers in the period, further divided by the number of months in the period.
Monthly Active User (“MAU”) is a unique registered user at a brand level who has visited the brand’s
app or, if applicable, their website in the last 28 days as of the measurement date. At a consolidated
level and a business unit level to the extent a business unit consists of multiple brands, duplicate users
will exist within MAU when the same individual visits multiple brands in a given month.
Leverage on a gross basis is calculated as principal debt balance divided by Adjusted Operating
Income for the period referenced.
Leverage on a net basis is calculated as principal debt balance less cash and cash equivalents and
short-term investments divided by Adjusted Operating Income for the period referenced.
Safe Harbor Statement Under the Private Securities Litigation Reform Act
of 1995
These prepared remarks and our conference call, which will be held at 5:00 p.m. Eastern Time on
August 5, 2025, may contain “forward-looking statements” within the meaning of the Private Securities
Litigation Reform Act of 1995. All statements that are not historical facts are “forward looking
statements.” The use of words such as “anticipates,” “estimates,” “expects,” “plans,” “believes,” “will,” and
“would,” among others, generally identify forward-looking statements. These forward-looking
statements include, among others, statements relating to: Match Group’s future financial performance,
Match Group’s business prospects and strategy, anticipated trends, and other similar matters. These
forward-looking statements are based on management’s current expectations and assumptions about
future events, which are inherently subject to uncertainties, risks and changes in circumstances that
are difficult to predict. Actual results could differ materially from those contained in these forward-
looking statements for a variety of reasons, including, among others: our ability to maintain or grow the
size of our user base and convert users to paying users, the success of our product strategies,
competition, our ability to realize reductions in in-app purchase fees, the limited operating history of
some of our brands, our ability to attract users to our services through cost-effective marketing and
related efforts, our ability to distribute our services through third parties and offset related fees, risks
relating to our use of artificial intelligence, foreign currency exchange rate fluctuations (including
anticipated gains from fluctuations), the integrity and scalability of our systems and infrastructure (and
those of third parties) and our ability to adapt ours to changes in a timely and cost-effective manner,
our ability to protect our systems from cyberattacks and to protect personal and confidential user
information, impacts to our offices and employees from more frequent extreme weather events, risks
relating to certain of our international operations and acquisitions, damage to our brands' reputations
as a result of inappropriate actions by users of our services, and macroeconomic conditions. Certain of
these and other risks and uncertainties are discussed in Match Group’s filings with the Securities and
Exchange Commission. Other unknown or unpredictable factors that could also adversely affect Match
Group’s business, financial condition and results of operations may arise from time to time. In light of
these risks and uncertainties, these forward-looking statements may not prove to be accurate.
Accordingly, you should not place undue reliance on these forward-looking statements, which only
reflect the views of Match Group management as of the date of this press release. Match Group does
not undertake to update these forward-looking statements.