1 We have updated the title of our primary non-GAAP measure to “Adjusted EBITDA” from our previous title
“Adjusted Operating Income.” We believe this updated title better aligns with our peers. Numerically, Adjusted
EBITDA is the same as Adjusted Operating Income; however, the starting point of the reconciliation to the most
comparable GAAP financial measure has changed from operating income to net income. See below for the full
definition of Adjusted EBITDA and a reconciliation of net income attributable to Match Group, Inc. shareholders to
Adjusted EBITDA.
 | 1 |
.2
Q3 2025 Match Group Prepared Remarks
Since joining Match Group in
February, my focus has been clear:
confront challenges directly, move
with urgency, and rebuild the
company around product
excellence and long-term growth.
The work on our three-part
turnaround is well underway and
focused on Reset, Revitalize, and
Resurgence. We’ve successfully
completed the “Reset” phase,
instilling a culture of speed,
accountability, and outcomes, and
this shift has come to life across our
products, teams, and users.
That progress is reflected in this
quarter’s results: we delivered on our
revenue expectations and exceeded
our Adjusted EBITDA1 goals,
excluding a legal settlement. At
Tinder® and Hinge®, momentum
continues to build as we make
progress in our “Revitalization”
phase. We’re starting to see green
shoots and believe continued
progress will come from delivering experiences that solve user pain points, deepen
engagement, and improve user outcomes.
We believe our business model thrives when user outcomes improve. Better
outcomes, driven by higher-quality experiences, better matches, and more
meaningful connections, build confidence in our product and drive new users
through positive word of mouth. User success builds trust in the category and in
Match Group’s apps. By getting the user experience right, we will further deliver real
success stories, which we use in marketing to amplify growth by driving new user
2 Represents Match Group’s product-driven user outcome philosophy to drive category growth.
3 Source: Match Group survey of 2,491 U.S. adults conducted October 2025; “Using a scale of 1 to 10, please rate how
much more likely you would be to recommend a dating app based on the following—with 1 being “not at all more
likely” and 10 being “much more likely.” A family member or friend recommended the app after seeing good reviews
about it.”
| 2 |
acquisition and reactivations. Our marketing strategy, especially at Tinder and Hinge,
is focused on fueling category consideration, bringing in new and lapsed users
through product-led storytelling that reflects real experiences happening across our
brands. We estimate there are roughly 250 million actively dating singles worldwide
not currently on dating apps. Re-engaging the 30 million lapsed users and attracting
the 220 million potential first-time entrants expands our user base, building a
healthier, more efficient growth engine that compounds over time, and we are
investing to capture this large addressable market. Hinge continues to prove that
with the right product experience and brand positioning, we can win with Gen Z and
drive real growth at scale. Soon, we believe Tinder will too.
2,3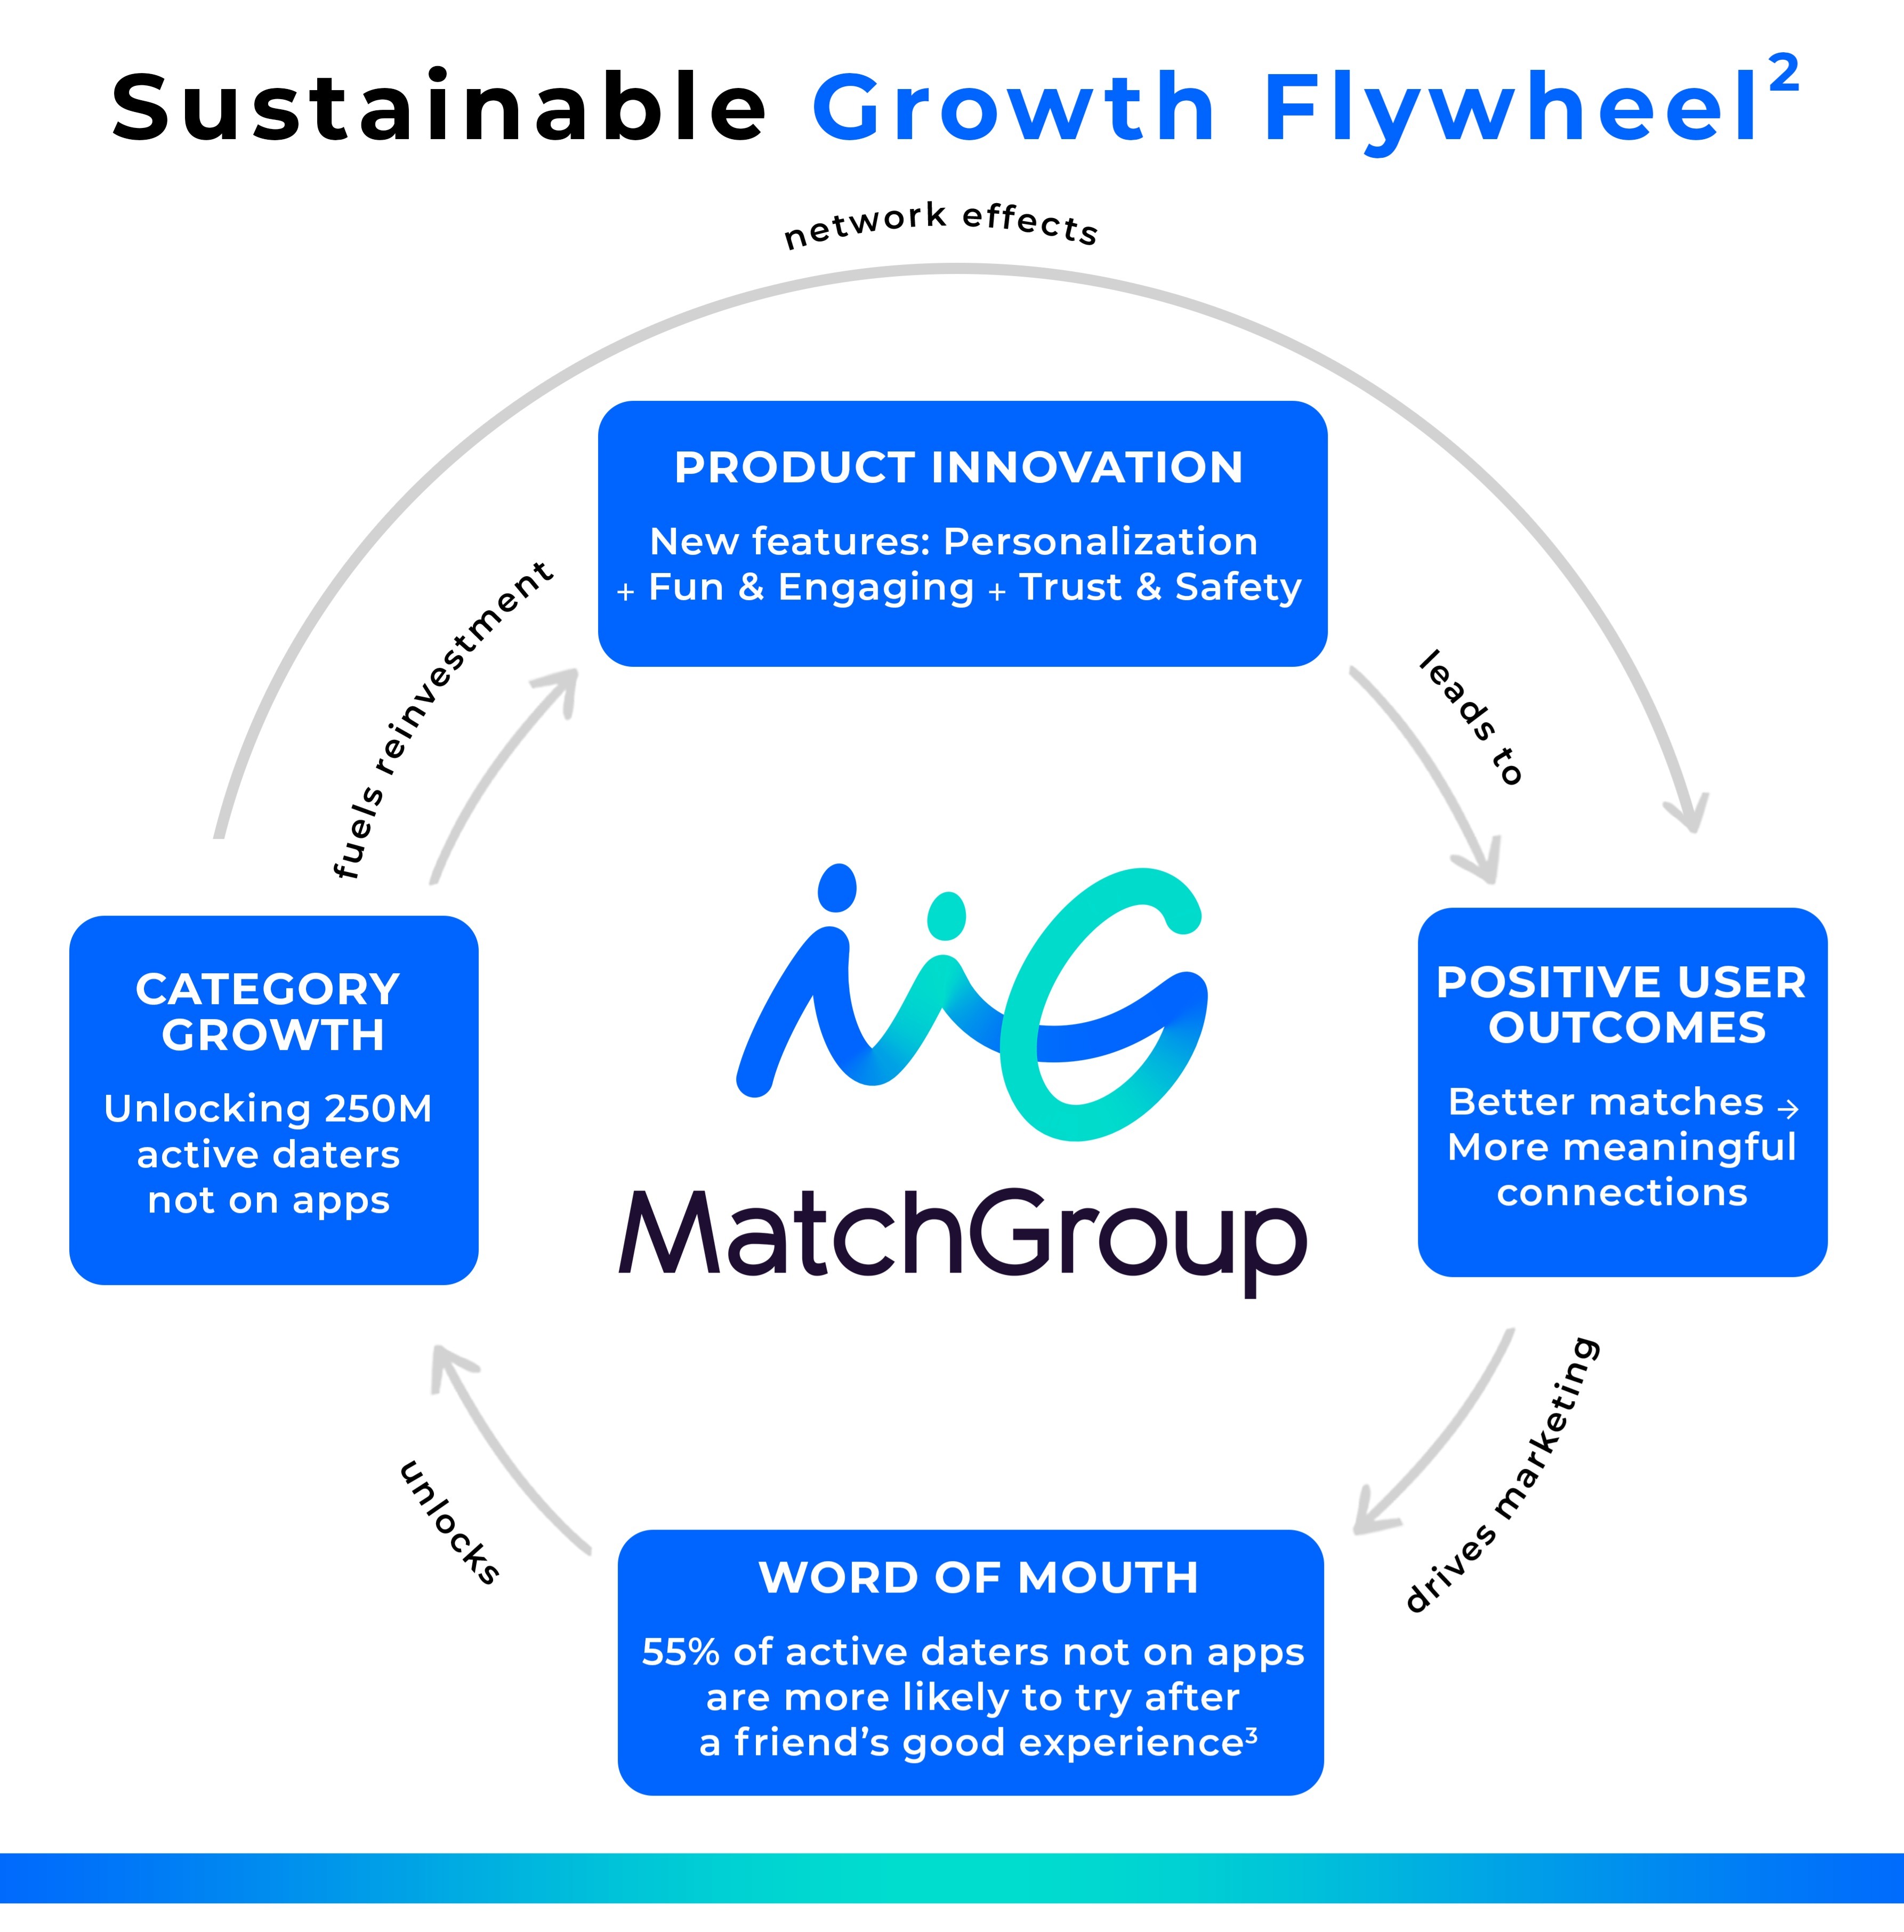
We’ll walk through three proof points today. First, our product progress, where our
obsession with outcomes is showing up across our brands, especially at Tinder and
Hinge. Second, the essential work we’re doing to strengthen trust and authenticity
across the ecosystem. And third, the financial discipline and operational rigor that
are now showing up in how we execute.
| 3 |
Product: Different Paths, One Shared Goal
Across Match Group, our brands share one goal: delivering better user outcomes. I
want to highlight the progress at our two flagship brands, Tinder and Hinge, and
how each is building affinity with users in different segments.
At Tinder, our focus this year has been to accelerate innovation, rebuild trust, and
ship great products so we can reintroduce Tinder in 2026 to our core audience, Gen
Z. Our new mission statement, Tinder is the most fun way to spark something new
with someone new, captures the energy and the sense of possibilities we want every
user to feel. Guided by new personas – prototypical user archetypes – that reflect real
people and their motivations, we’re creating experiences that feel more personal
and more aligned with what users want.
We’ve clarified what Tinder stands for and who we’re building it for, and that focus is
already paying off. Users are seeing and feeling the difference through updates that
are reshaping the Tinder experience in the following ways:
•First, we’re building a product and
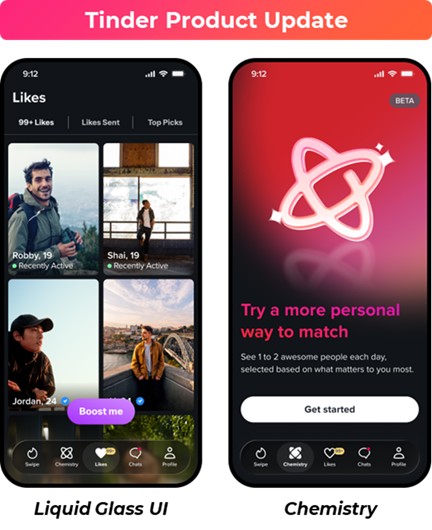
design-led culture. Our new Liquid
Glass refresh planned on iOS this
quarter will make the app more
modern, fluid, and visually appealing,
further bringing our mission to life
every time you open the app.
•Second, ChemistryTM is redefining
how people connect. Powered by AI,
this Interactive Matching feature, now
known as Chemistry, is a major pillar
of Tinder’s upcoming 2026 product
experience. It gets to know users
through interactive questions and,
with permission, learns from their
camera roll to better understand their
interests and personality. Using deep
learning, Chemistry combats “swipe
fatigue” by surfacing a few highly relevant profiles each day, driving more
compatible matches and engaging conversations. Chemistry is now live in
New Zealand and Australia, with plans to expand to additional countries in the
coming months.
•Third, Modes are powering a new social energy on Tinder. Our new Modes
navigation gives users more choice in how they use Tinder, from meeting new
| 4 |
people with a friend to connecting within their college community. Since
launching Modes in September, Double Date adoption is up 30% in the U.S.,
while College Mode is gaining traction, with one in four eligible students using
it and over 8% engaging daily as of October. Modes makes the ‘fun’ part of our
mission real, giving people new ways to spark something together and
redefining Tinder as a fun, social, and low-pressure way to meet new people.
◦We’re also seeing this momentum reflected in our marketing. The
Double Date Island campaign across Europe drove the highest brand
consideration lift of the year, boosted downloads, and particularly
resonated with Gen-Z. It proved that when we connect product
innovation with authentic, social-first storytelling, we can reignite
excitement and bring new energy back to Tinder.
•Fourth, evaluating profiles is becoming more meaningful and holistic.
We’ve started testing several new features resonating with Gen Z by giving
users more information to evaluate and connect with potential matches. Bio
information now appears on the first photo card, and prompts content is
integrated into the photo carousel. These improvements let users learn more
about a potential match before deciding to Swipe RightTM. We’ve also started
testing features like Contextual Likes and Open Messaging, and we’ve fully
rolled out Prompts on Photos, to let users share why they swiped right,
making interactions more intentional and authentic.
•Finally, app performance is a major focus and a key driver of user
experience. On Android, Tinder startup times are now 38% faster, and crash
rates reduced by more than 32%. On iOS, app stability is up more than 57%.
We’re also removing long-running tests and unused features to make the app
leaner. As we bring load times closer to one second on iOS and Android,
Tinder already feels faster and smoother. Our app performance work on iOS
and Android is in service of the ‘fun’ part of our mission, because no one enjoys
a slow, buggy app.
You can feel the energy across Tinder. During our Hack Week last week, teams
brought incredible innovation and creativity, building some of the most exciting
products and prototypes we’ve seen in years. The company feels electric.
Meanwhile, Hinge continues to be one of the best (and most undiscovered) stories in
consumer tech, powered by a clear mission, motivated team, leading product
experience, and sustained momentum. Hinge’s “Designed to be Deleted®”
philosophy drives a focus on user outcomes; specifically, helping people go out on
‘great dates’, our north star. This clarity of purpose has resulted in category-leading
growth in both users and revenue.
| 5 |
Hinge is leading the way on AI innovation in dating with category-first AI features
that drive better connections and more real-world outcomes. This quarter brought
both wins and learnings. Conversation Starters, which offers personalized prompts
for first messages, was a clear win, driving approximately 10% more likes with
comments and stronger engagement overall during the test, particularly with
women. Updates to our Recommendation System improved matching quality
through rigorous testing and provided valuable insights that are already refining our
approach. Warm Intros, designed to surface compatibility cues, didn’t resonate and
we won’t move forward with it. While understanding compatibility remains a key
focus, Hinge continues to prioritize user outcomes over simply launching new tools,
reflecting our principled approach to innovation.
As we look ahead to the next few quarters, Hinge has an exciting slate of category-
first features that showcase our leadership in product innovation and user
experience.
•First Impressions is helping daters lead with personality. This new feature
introduces prompts above photos, giving users more ways to express who
they are and add depth to their profiles. A similar experience in the Standouts
earlier this year was well received, and we’re eager to see how users respond
as we continue making Hinge more personal and expressive.
•Preferences will become more meaningful. Reimagined preferences will
take a new look at how daters express what they’re looking for, capturing
compatibility with greater nuance and intentionality. This update addresses
key user pain points, helping people share what truly matters and find better
matches faster.
These are just a few ways Hinge continues to drive innovation in service of user
outcomes.
The next pillar of our strategy is centered on deepening trust in the category.
Trust and Authenticity and the Ways In Which It Strengthens the
Foundation of Our Ecosystem
In dating apps, everything depends on the integrity of the ecosystem. No matter
how many new features we launch, people use our apps to meet other new people,
and that only works when they feel safe, respected, and confident in being
themselves. Building and maintaining that trust is core to our long-term success,
which is why we’re doubling down on trust and safety across our platforms.
Nowhere is that more evident than at Tinder, where we’re integrating safety directly
into the product experience like never before. The centerpiece of this effort is Face
Check™, our new facial verification feature that helps confirm users are real and
4 Based on a random weighted sample of in-app profile views. Bad actors include accounts that engage in
deceptive or harmful behaviors, including spam, scam attempts, or operating automated fake profiles (bots).
| 6 |
match their profile photos. It’s now required for all new users in California, Colombia,
Canada, India, Australia, and Southeast Asia, and will roll out to additional U.S. states
and countries in the coming months.
4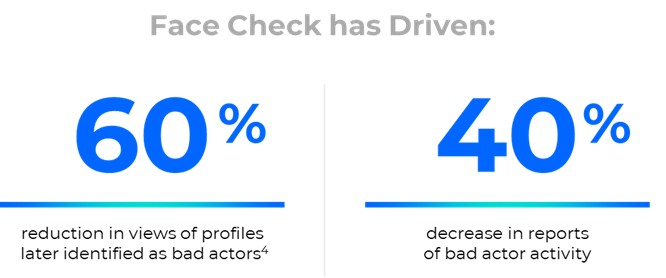
Face Check sets a new standard for authenticity. Using only a short video selfie, it
helps confirm a user is real and matches their profile photos. We built this
technology with care, ensuring it delivers meaningful improvements to trust and
safety while keeping the user experience seamless. Early results are strong and
reinforce our confidence in the long-term benefits to the broader ecosystem. We
have seen a 60% reduction in user views of profiles later identified as bad actors4, and
a 40% decrease in reports of bad actor activity. Our ongoing optimization efforts
have resulted in only low-single-digit impacts to MAU and revenue in test markets,
which lessens over time. Early Net Promoter Scores results show a clear and
sustained improvement in user trust and satisfaction in key test markets, with scores
up roughly 10 points for men and 5 points for women in key markets where Face
Check has launched. This is just the beginning. We plan to expand Face Check
across the portfolio, with testing on Hinge beginning in the next few months.
We’re also expanding safety beyond verification into everyday user interactions.
Tinder and Hinge have introduced new, fairer enforcement tools to educate users
and promote better behavior through faster and more consistent moderation. This
approach calibrates responses based on severity, helping create a safer and more
respectful community. We’re also enhancing our “Are You Sure?” feature, which
prompts users to pause before sending potentially offensive or disengaging
messages, with large language models (“LLM”) to make it smarter and more
effective at encouraging better conversations in real time. Originally developed at
Tinder and later enhanced by Hinge, this LLM-powered version improves accuracy
and tone. Now, Tinder is incorporating those learnings back into its own experience:
a great example of how our portfolio of brands innovate together, share insights, and
make each other stronger.
| 7 |
Within Hinge, these principles come together through our product design and user
experience. Beyond moderation, Hinge continues to refine the onboarding
experience to build confidence and trust early in the user journey. Recent updates
include clearer guidance during setup, refreshed Community Guidelines and Help
Center, and the introduction of an AI-powered chatbot that quickly answers
commonly asked questions. Together, these updates reinforce Hinge’s position as a
dating app grounded in authenticity and safety, where people can show up as their
true selves and form meaningful relationships.
Financial and Operational Rigor and How it Translates Into Results
The same discipline driving product innovation is also reflected in how we execute
day-to-day. We are operating with sharper focus and accountability across the
company, hitting deadlines, shipping Match Group-wide features, such as alternative
payments, faster, and acting like a more nimble and decisive company. These
improvements are creating operational momentum and financial optionality as we
plan for 2026.
You can see this strategy in action through Project Aurora, our large-scale test in
Australia that brings together many of Tinder’s biggest advancements into a faster,
safer, and more personal experience. As part of this work, we’re overhauling the
recommendations engine to better align with user outcomes, improving both
match quality and overall satisfaction. We’re being thoughtful with our tests,
prioritizing user trust, outcomes, and long-term impact over quick wins. We may see
some short-term revenue and Adjusted EBITDA impacts from these tests, which
we’ve included in our guidance, as we trade short-term monetization for a better
user experience and improved user outcomes. These tests will help us refine our
strategy and further validate that improved user outcomes will drive more
sustainable user and revenue growth over the long term, which in turn will drive
increased shareholder value. We will share more on these results next quarter.
At Hinge, momentum continues to build
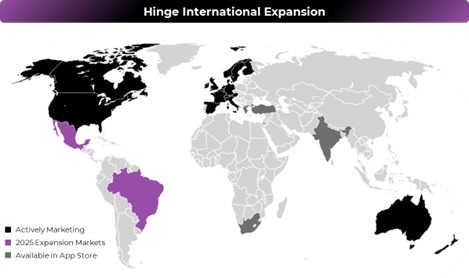
as the product delivers meaningful
outcomes for users. Revenue, Adjusted
EBITDA, and user growth remain strong,
supported by continued innovation and
disciplined execution. Hinge’s
international expansion remains on track
with a successful Mexico launch in
September and with Brazil planned for
Q4. The team is actively working on plans
for new expansion markets in 2026 as
well.
| 8 |
Hinge launched alternative payments testing ahead of schedule in Q3 with strong
early results. We plan to fully roll out alternative payments across our major apps,
including Tinder and Hinge, in the U.S. in Q4. Strong initial performance at Hinge
and ongoing optimizations at Tinder and E&E have increased adoption of web
payments, and we now expect to generate approximately $14 million of savings in
Q4 2025 and approximately $90 million in 2026. We have seen some impact to gross
revenue in some of our tests at Tinder and Hinge, which we are continuing to
optimize for.
We are also seeing early success from our recent acquisition of HER™, which
expands our reach among queer women and gender-diverse communities. The
team has already delivered strong results, with algorithmic improvements and
monetization optimizations driving over 20% revenue increase in test markets. This
success highlights the opportunity to scale high-potential brands across our
portfolio and deepen our presence in key segments of the dating market.
That same disciplined approach to growth is reflected in how we manage the
business. Our financial discipline earlier this year generated approximately $100
million of annualized savings, allowing us to reinvest approximately $50 million
across the portfolio to test user-first features, strengthening marketing, and
expanding our international footprint. The early results from our Q3 investments are
instilling confidence in our strategy, and we’re executing well against our Q4 plans.
The learnings from these investments and the ongoing benefits of our cost savings
efforts will help inform how we prioritize and deploy capital in 2026. Together, these
steps are setting the foundation for the next phase of the turnaround and the
“Resurgence” we expect to take hold in 2026 and 2027.
Conclusion
We’re entering this next chapter with real progress and a clear path forward. At
Tinder, our new measure of success, Sparks, tracks six-way conversations, meaning
at least six total messages exchanged between two users. This has become one of
the clearest indicators that a genuine connection is forming. While the total number
of Sparks is lower year-over-year (“Y/Y”) due to a smaller MAU base, Sparks coverage,
or the proportion of users in the ecosystem having these deeper conversations,
continues to improve and is up year-over-year. This shows that more users are
having better experiences on the platform, an early but encouraging sign that our
focus on improving product quality and user outcomes is taking hold.
Match Group holds a unique position in solving one of the most important
challenges of our time: helping people connect in a world that increasingly feels
disconnected. Our focus is on fostering genuine human connection, while ensuring
technology strengthens relationships and is the social fabric that brings people
together.
| 9 |
Q3 2025 Financial Performance
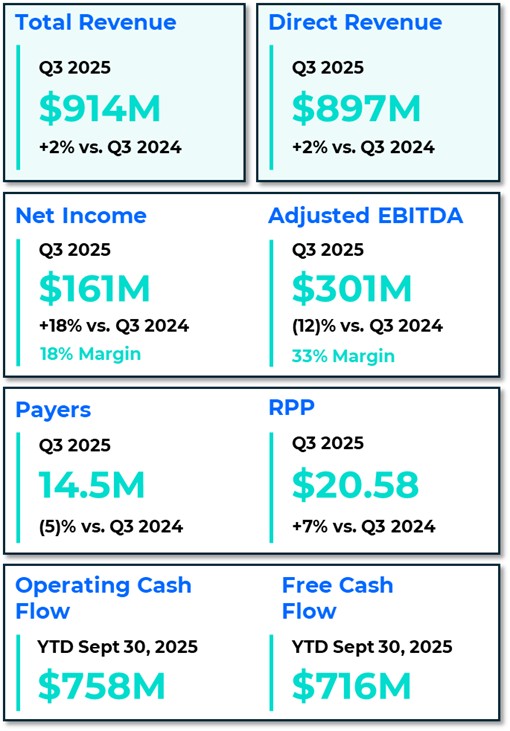
We’re pleased with our Q3 results, as Match Group Total Revenue was in-line with
our expectations for the quarter, and Adjusted EBITDA meaningfully exceeded our
expectations excluding a $61 million charge to settle the Candelore v. Tinder, Inc.
case on a class-wide basis (“legal settlement charge”). Candelore is a 10-year-old case
involving Tinder's former age-based pricing. The parties are preparing a long-form
agreement reflecting the settlement terms and will then seek approval of the
settlement by the Court.
In Q3, Match Group’s Total Revenue was $914 million, up 2% Y/Y, up 1% Y/Y on a
foreign exchange (“FX”) neutral basis (“FXN”). FX was $4 million better than expected
at the time of our last earnings call. Payers declined 5% Y/Y to 14.5 million, while RPP
increased 7% Y/Y to $20.58. Indirect revenue of $18 million was up 8% Y/Y driven
primarily by strength in our third-party advertising business.
In Q3, Match Group’s Adjusted EBITDA was $301 million, down 12% Y/Y, representing
an Adjusted EBITDA Margin of 33%. Excluding the $61 million legal settlement
charge and $2 million of restructuring costs (included in the $25 million of
restructuring costs announced in May), Adjusted EBITDA would have been $364
million, up 6% Y/Y, representing an Adjusted EBITDA margin of 40%.
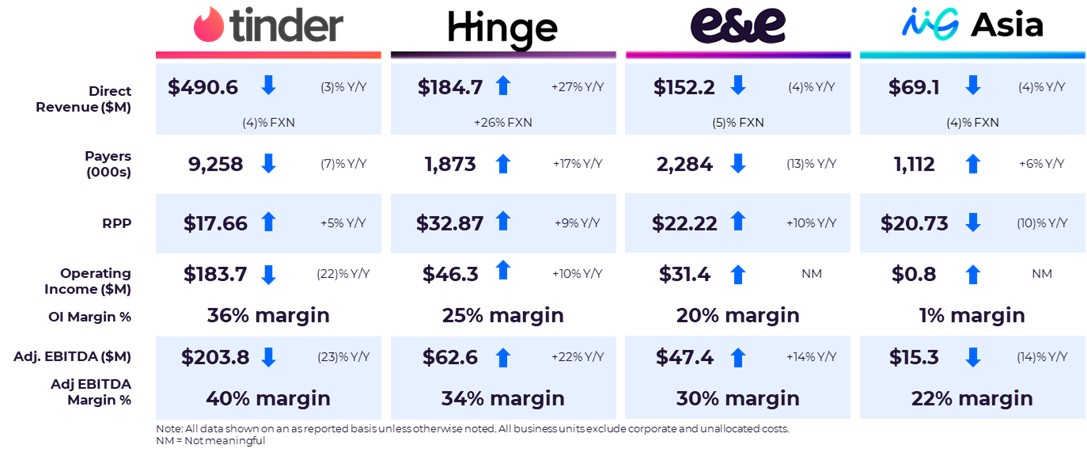
•Tinder Direct Revenue in Q3 was $491 million, down 3% Y/Y and down 4% Y/Y
FXN. Q3 Direct Revenue includes an approximately $3 million negative impact
from user experience testing in the quarter. Payers declined 7% Y/Y to 9.3
million and RPP increased 5% Y/Y to $17.66. Adjusted EBITDA in the quarter
was $204 million, down 23% Y/Y, representing an Adjusted EBITDA margin of
40%. Excluding the legal settlement charge, Adjusted EBITDA would have
been $264 million, representing an Adjusted EBITDA margin of 52%.
| 10 |
•Hinge continued its strong momentum in Q3 with Direct Revenue of $185
million, up 27% Y/Y and up 26% Y/Y FXN. Payers increased 17% Y/Y to 1.9 million,
and RPP increased 9% to $32.87. Adjusted EBITDA was $63 million, up 22% Y/Y,
representing an Adjusted EBITDA Margin of 34%.
•E&E Direct Revenue in Q3 was $152 million, down 4% Y/Y and down 5% Y/Y
FXN. Payers decreased 13% Y/Y to 2.3 million, while RPP increased 10% Y/Y to
$22.22. Adjusted EBITDA was $47 million, up 14% Y/Y, representing an
Adjusted EBITDA Margin of 30%.
•MG Asia delivered Direct Revenue in Q3 of $69 million, down 4% Y/Y on both
an as reported and FXN basis. Excluding the exit of our live streaming
businesses, MG Asia Direct Revenue in Q3 was flat Y/Y on both an as reported
and FXN basis. Azar® Direct Revenue was flat Y/Y and up 2% Y/Y FXN. Azar
Direct Revenue was negatively impacted by an estimated $3 million after Azar
was blocked in Turkey by Turkish regulators in late August. We’re pursuing all
available legal remedies and working with Turkish regulators to get Azar
unblocked; however, it is unclear at this time when that may happen. Pairs™
Direct Revenue was down 1% Y/Y and down 2% Y/Y FXN. Across MG Asia,
Payers increased 6% Y/Y to 1.1 million, while RPP declined 10% Y/Y to $20.73,
partially due to the exit of Hakuna® mid-last year. Adjusted EBITDA was $15
million, down 14% Y/Y, representing an Adjusted EBITDA Margin of 22%.
Consolidated Operating Costs and Expenses
Including stock-based compensation expense, total expenses were up 1% Y/Y in Q3.
Cost of revenue decreased 2% Y/Y and represented 27% of Total Revenue, down one
point Y/Y, driven by reduced variable expenses from the shutdown of our live
streaming services mid-last year, lower web services costs, and lower employee
compensation expense from our restructuring efforts. Selling and marketing costs
increased $12 million, or 8% Y/Y, and represented 19% of Total Revenue, up one point
Y/Y, primarily due to increased marketing spend at Tinder, Hinge, and MG Asia,
partially offset by lower employee compensation expense from our restructuring
efforts. General and administrative costs increased 42% Y/Y, up 5 points Y/Y as a
percentage of Total Revenue to 16%, driven primarily by the legal settlement charge,
partially offset by lower employee compensation expense from our restructuring
efforts. Product development costs increased 1% Y/Y and were flat Y/Y as a percent of
Total Revenue at 11%. Depreciation and amortization decreased by $44 million Y/Y to
$24 million due to impairments of intangible assets at E&E and MG Asia in the prior
year quarter and lower internally developed capitalized software costs, primarily at
Tinder and MG Asia.
5 Leverage is calculated utilizing the non-GAAP measure Adjusted EBITDA as the denominator. For a reconciliation
of the non-GAAP measure for each period presented, see page 15.
6 Diluted shares outstanding is calculated using the methods and assumptions described in our press release issued
November 4, 2025; these are different from GAAP dilution, which is calculated based on the treasury stock method.
See page 10 of the press release for additional information. Diluted shares outstanding is reported at the time of each
respective quarter’s earnings release.
| 11 |
Capital Allocation & Liquidity
Our trailing twelve-month gross leverage was 3.4x and net leverage5 was 2.5x at the
end of Q3. We ended the quarter with $1.1 billion of cash, cash equivalents, and short-
term investments on hand. In August, we issued $700 million of 6.125% senior notes
due 2033. The proceeds from these notes will be used to repay all of the
exchangeable senior notes coming due in 2026 on or before maturity and for
general corporate purposes. In September, we repurchased $76 million of the 2026
exchangeable senior notes at a discount to par.
Year-to-date through Q3, we delivered Operating Cash Flow of $758 million and Free
Cash Flow of $716 million. We repurchased 17.4 million shares at an average price of
$32 per share on a trade date basis for a total of $550 million and paid $141 million in
dividends, deploying nearly 100% of free cash flow for capital return to shareholders.
In October, we repurchased an additional 3.0 million shares of our common stock for
$100 million on a trade date basis at an average price of $33 per share. As of October
31, 2025, we’ve reduced diluted shares outstanding by 8% Y/Y6. We maintain our
commitment to target returning 100% of Free Cash Flow to shareholders through
buybacks and the dividend.
Financial Guidance
Q4 2025
We expect Q4 Total Revenue for Match Group of $865 million to $875 million, up 1%
to 2% Y/Y. This range assumes a nearly two and a half-point Y/Y tailwind from FX.
FXN, we expect Total Revenue to be down 1% to 2% Y/Y. We expect Match Group
Adjusted EBITDA of $350 million to $355 million in Q4, representing a Y/Y increase of
9%, and an Adjusted EBITDA margin of 41% at the midpoints of the ranges.
Total Revenue | Adjusted EBITDA | |||
Q4 2025 | $865 to $875 million | $350 to $355 million |
Q4 Total Revenue guidance reflects continued strong performance at Hinge, and
Tinder performance that is in-line with the expectations we had at our last earnings
in August, including an expected $14 million negative impact to Tinder Direct
Revenue from user experience testing. It also reflects weaker-than-expected
| 12 |
performance at E&E and assumes a continuation of Azar’s block in Turkey. E&E saw
weaker trends in Q3, which we are working quickly to address, and we no longer
expect Emerging brands’ Direct Revenue growth to offset Evergreen brands’
declines in 2025. We expect an estimated $9 million negative impact to MG Asia
Direct Revenue from Azar’s block in Turkey. We expect Indirect Revenue to be
approximately $15 million in the quarter.
Our Q4 Adjusted EBITDA guidance includes $4 million of restructuring-related costs
(included in the $25 million of restructuring-related costs announced in May) and an
$8 million positive impact from an expected sale of one of our two office buildings in
LA that was not fully utilized.
We are increasing our 2025 full year Free Cash Flow guidance to $1.11 to $1.14 billion,
which assumes the Candelore settlement will not be paid until Q1 2026.
We now expect our 2025 full year tax rate to be in the high teens.
| 13 |
Appendix
Reconciliations of GAAP to Non-GAAP Measures
Reconciliation of Net Income to Adjusted EBITDA
Three Months Ended September 30, 2025 | |||||||||||||
Tinder | Hinge | E&E | MG Asia | Corporate & unallocated costs | Eliminations | Total Match Group | |||||||
(Dollars in thousands) | |||||||||||||
Net income attributable to Match Group, Inc. shareholders | $160,749 | ||||||||||||
Add back: | |||||||||||||
Net income attributable to noncontrolling interests(a) | 7 | ||||||||||||
Income tax provision(a) | 32,882 | ||||||||||||
Other income, net(a) | (9,328) | ||||||||||||
Interest expense(a) | 37,024 | ||||||||||||
Operating income (loss)(b) | $183,743 | $46,314 | $31,447 | $801 | $(40,971) | $— | $221,334 | ||||||
Stock-based compensation expense | 17,624 | 15,238 | 5,956 | 5,332 | 12,156 | — | 56,306 | ||||||
Depreciation | 2,451 | 1,071 | 6,268 | 3,938 | 1,117 | — | 14,845 | ||||||
Amortization of intangibles | — | — | 3,702 | 5,219 | — | — | 8,921 | ||||||
Adjusted EBITDA | $203,818 | $62,623 | $47,373 | $15,290 | $(27,698) | $— | $301,406 | ||||||
Revenue | $505,344 | $184,671 | $156,252 | $69,364 | $— | $(1,356) | $914,275 | ||||||
Net Income Margin | 18% | ||||||||||||
Operating Income Margin(b) | 36% | 25% | 20% | 1% | NA | NA | 24% | ||||||
Adjusted EBITDA Margin | 40% | 34% | 30% | 22% | NA | NA | 33% | ||||||
| 14 |
Reconciliation of Net Income to Adjusted EBITDA (continued)
Three Months Ended September 30, 2024 | |||||||||||||
Tinder | Hinge | E&E | MG Asia | Corporate & unallocated costs | Eliminations | Total Match Group | |||||||
(Dollars in thousands) | |||||||||||||
Net income attributable to Match Group, Inc. shareholders | $136,468 | ||||||||||||
Add back: | |||||||||||||
Net income attributable to redeemable noncontrolling interestsa | 13 | ||||||||||||
Income tax provisiona | 41,159 | ||||||||||||
Other income, neta | (7,100) | ||||||||||||
Interest expensea | 40,120 | ||||||||||||
Operating income (loss)(b) | $234,304 | $42,207 | $3,110 | $(18,895) | $(50,066) | $— | $210,660 | ||||||
Stock-based compensation expense | 22,601 | 8,599 | 13,310 | 5,844 | 14,134 | — | 64,488 | ||||||
Depreciation | 9,420 | 620 | 5,918 | 8,031 | 1,313 | — | 25,302 | ||||||
Impairments and amortization of intangibles | — | — | 19,230 | 22,860 | — | — | 42,090 | ||||||
Adjusted EBITDA | $266,325 | $51,426 | $41,568 | $17,840 | $(34,619) | $— | $342,540 | ||||||
Revenue | $516,778 | $145,425 | $161,181 | $72,282 | $— | $(182) | $895,484 | ||||||
Net Income Margin | 15% | ||||||||||||
Operating Income (Loss) Margin(b) | 45% | 29% | 2% | (26)% | NA | NA | 24% | ||||||
Adjusted EBITDA Margin | 52% | 35% | 26% | 25% | NA | NA | 38% | ||||||
______________________
(a) These items are not allocated to a segment.
(b) At a segment level, the closest GAAP measure is operating income as items outside operating
income are not allocated to segments.
Reconciliation of Operating Cash Flow to Free Cash Flow
Nine Months Ended September 30, 2025 | |
(In thousands) | |
Net cash provided by operating activities | $757,600 |
Capital expenditures | (42,100) |
Free Cash Flow | $715,500 |
| 15 |
Reconciliation of Forecasted Operating Cash Flow to Free Cash Flow
Year Ended December 31, 2025 | |
(In millions) | |
Net cash provided by operating activities | $1,175 to $1,195 |
Capital expenditures | (55 to 65) |
Free Cash Flow | $1,110 to $1140 |
Reconciliation of Net Income to Adjusted EBITDA used in Leverage Ratios
Twelve months ended September 30, 2025 | |
(In thousands) | |
Net income attributable to Match Group, Inc. shareholders | $562,093 |
Add back: | |
Net loss attributable to noncontrolling interests | (10) |
Income tax provision | 126,757 |
Other income, net | (21,604) |
Interest expense | 144,000 |
Stock-based compensation expense | 263,373 |
Depreciation | 75,219 |
Amortization of intangibles | 40,663 |
Adjusted EBITDA | $1,190,491 |
Reconciliation of Forecasted Net Income to Forecasted Adjusted EBITDA
Three Months Ended December 31, 2025 | |
(In millions) | |
Net income attributable to Match Group, Inc. shareholders | $159 to $164 |
Add back: | |
Net income attributable to noncontrolling interests | 7 |
Income tax provision | 46 |
Other income, net | 7 |
Interest expense | 43 |
Stock-based compensation expense | 66 |
Depreciation and amortization of intangibles | 22 |
Adjusted EBITDA | $350 to $355 |
Revenue | $865 to $875 |
Net Income Margin (at the mid-point of the ranges) | 19% |
Adjusted EBITDA Margin (at the mid-point of the ranges) | 41% |
| 16 |
Reconciliation of GAAP Revenue to Non-GAAP Revenue, Excluding
Foreign Exchange Effects
Three Months Ended September 30, | |||||||
2025 | $ Change | % Change | 2024 | ||||
(Dollars in millions, rounding differences may occur) | |||||||
Total Revenue, as reported | $914.3 | $18.8 | 2% | $895.5 | |||
Foreign exchange effects | (12.2) | ||||||
Total Revenue, excluding foreign exchange effects | $902.1 | $6.6 | 1% | $895.5 | |||
Direct Revenue, as reported | $896.7 | $17.5 | 2% | $879.2 | |||
Foreign exchange effects | (12.0) | ||||||
Direct Revenue, excluding foreign exchange effects | $884.6 | $5.4 | 1% | $879.2 | |||
Tinder Direct Revenue, as reported | $490.6 | $(12.6) | (3)% | $503.2 | |||
Foreign exchange effects | (8.2) | ||||||
Tinder Direct Revenue, excluding foreign exchange effects | $482.4 | $(20.8) | (4)% | $503.2 | |||
Hinge Direct Revenue, as reported | $184.7 | $39.2 | 27% | $145.4 | |||
Foreign exchange effects | (1.6) | ||||||
Hinge Direct Revenue, excluding foreign exchange effects | $183.0 | $37.6 | 26% | $145.4 | |||
E&E Direct Revenue, as reported | $152.2 | $(6.1) | (4)% | $158.4 | |||
Foreign exchange effects | (2.5) | ||||||
E&E Direct Revenue, excluding foreign exchange effects | $149.8 | $(8.6) | (5)% | $158.4 | |||
MG Asia Direct Revenue, as reported | $69.1 | $(3.0) | (4)% | $72.2 | |||
Foreign exchange effects | 0.3 | ||||||
MG Asia Direct Revenue, excluding foreign exchange effects | $69.4 | $(2.7) | (4)% | $72.2 | |||
MG Asia Direct Revenue excluding Hakuna, as reported | $69.1 | $(0.2) | —% | $69.3 | |||
Foreign exchange effects | 0.3 | ||||||
MG Asia Direct Revenue excluding Hakuna, excluding foreign exchange effects | $69.4 | $0.1 | —% | $69.3 | |||
Azar Direct Revenue | $40.1 | $0.1 | —% | $40.0 | |||
Foreign exchange effects | 0.6 | ||||||
Azar Direct Revenue, excluding foreign exchange effects | $40.7 | $0.7 | 2% | $40.0 | |||
Pairs Direct Revenue, as reported | $29.0 | $(0.3) | (1)% | $29.3 | |||
Foreign exchange effects | (0.3) | ||||||
Pairs Direct Revenue, excluding foreign exchange effects | $28.7 | $(0.6) | (2)% | $29.3 | |||
| 17 |
Non-GAAP Financial Measures
Match Group reports Adjusted EBITDA, Adjusted EBITDA Margin, Free Cash Flow, and Revenue
Excluding Foreign Exchange Effects, all of which are supplemental measures to U.S. generally accepted
accounting principles (“GAAP”). The Adjusted EBITDA, Adjusted EBITDA Margin, and Free Cash Flow
measures are among the primary metrics by which we evaluate the performance of our business, on
which our internal budget is based and by which management is compensated. Revenue Excluding
Foreign Exchange Effects provides a comparable framework for assessing the performance of our
business without the effect of exchange rate differences when compared to prior periods. We believe
that investors should have access to the same set of tools that we use in analyzing our results. These
non-GAAP measures should be considered in addition to results prepared in accordance with GAAP but
should not be considered a substitute for or superior to GAAP results. Match Group endeavors to
compensate for the limitations of the non-GAAP measures presented by providing the comparable
GAAP measures and descriptions of the reconciling items, including quantifying such items, to derive
the non-GAAP measures. We encourage investors to examine the reconciling adjustments between the
GAAP and non-GAAP measures, which we describe below. Interim results are not necessarily indicative
of the results that may be expected for a full year.
Definitions of Non-GAAP Measures
Adjusted EBITDA is defined as net income attributable to Match Group, Inc. shareholders excluding: (1)
net income attributable to noncontrolling interests; (2) income tax provision or benefit; (3) other income
(expense), net; (4) interest expense; (5) depreciation; (6) acquisition-related items consisting of
amortization of intangible assets and impairments of goodwill and intangible assets, if applicable; and
(7) stock-based compensation expense. We believe Adjusted EBITDA is useful to analysts and investors
as this measure allows a more meaningful comparison between our performance and that of our
competitors. Adjusted EBITDA has certain limitations because it excludes certain expenses. At a
segment level, the closest GAAP measure is operating income as items outside operating income are
not allocated to segments.
Adjusted EBITDA Margin is defined as Adjusted EBITDA divided by revenues. We believe Adjusted
EBITDA Margin is useful for analysts and investors as this measure allows a more meaningful
comparison between our performance and that of our competitors. Adjusted EBITDA Margin has
certain limitations in that it does not take into account the impact to our consolidated statement of
operations of certain expenses.
Free Cash Flow is defined as net cash provided by operating activities, less capital expenditures. We
believe Free Cash Flow is useful to investors because it represents the cash that our operating
businesses generate, before taking into account non-operational cash movements. Free Cash Flow has
certain limitations in that it does not represent the total increase or decrease in the cash balance for the
period, nor does it represent the residual cash flow for discretionary expenditures. Therefore, we think it
is important to evaluate Free Cash Flow along with our consolidated statement of cash flows.
We look at Free Cash Flow as a measure of the strength and performance of our businesses, not for
valuation purposes. In our view, applying “multiples” to Free Cash Flow is inappropriate because it is
subject to timing, seasonality and one-time events. We manage our business for cash, and we think it is
of utmost importance to maximize cash – but our primary valuation metric is Adjusted EBITDA.
Revenue Excluding Foreign Exchange Effects is calculated by translating current period revenues
using prior period exchange rates. The percentage change in Revenue Excluding Foreign Exchange
Effects is calculated by determining the change in current period revenues over prior period revenues
where current period revenues are translated using prior period exchange rates. We believe the impact
of foreign exchange rates on Match Group, due to its global reach, may be an important factor in
| 18 |
understanding period over period comparisons if movement in rates is significant. Since our results are
reported in U.S. dollars, international revenues are favorably impacted as the U.S. dollar weakens relative
to other currencies, and unfavorably impacted as the U.S. dollar strengthens relative to other currencies.
We believe the presentation of revenue excluding foreign exchange effects in addition to reported
revenue helps improve the ability to understand Match Group’s performance because it excludes the
impact of foreign currency volatility that is not indicative of Match Group’s core operating results.
Non-Cash Expenses That Are Excluded From Our Non-GAAP Measures
Stock-based compensation expense consists principally of expense associated with the grants of
RSUs, performance-based RSUs, and market-based awards. These expenses are not paid in cash, and
we include the related shares in our fully diluted shares outstanding using the treasury stock method;
however, performance-based RSUs and market-based awards are included only to the extent the
applicable performance or market condition(s) have been met (assuming the end of the reporting
period is the end of the contingency period). To the extent stock-based awards are settled on a net
basis, we remit the required tax-withholding amounts from our current funds.
Depreciation is a non-cash expense relating to our property and equipment and is computed using the
straight-line method to allocate the cost of depreciable assets to operations over their estimated useful
lives, or, in the case of leasehold improvements, the lease term, if shorter.
Amortization of intangible assets and impairments of goodwill and intangible assets are non-cash
expenses related primarily to acquisitions. At the time of an acquisition, the identifiable definite-lived
intangible assets of the acquired company, such as customer lists, trade names and technology, are
valued and amortized over their estimated lives. Value is also assigned to (i) acquired indefinite-lived
intangible assets, which consist of trade names and trademarks, and (ii) goodwill, which are not subject
to amortization. An impairment is recorded when the carrying value of an intangible asset or goodwill
exceeds its fair value. We believe that intangible assets represent costs incurred by the acquired
company to build value prior to acquisition and the related amortization and impairment charges of
intangible assets or goodwill, if applicable, are not ongoing costs of doing business.
Additional Definitions
Tinder consists of the world-wide activity of the brand Tinder®.
Hinge consists of the world-wide activity of the brand Hinge®.
Evergreen & Emerging (“E&E”) consists of the world-wide activity of our Evergreen brands, including
Match®, Meetic®, OkCupid®, Plenty Of Fish®, and a number of demographically focused brands and our
Emerging brands including, BLK®, ChispaTM, The League®, Archer®, Upward®, YuzuTM, Salams®, HERTM, and
other smaller brands.
Match Group Asia (“MG Asia”) consists of the world-wide activity of the brands Pairs® and Azar®.
Direct Revenue is revenue that is received directly from end users of our services and includes both
subscription and à la carte revenue.
Indirect Revenue is revenue that is not received directly from end users of our services, a majority of
which is advertising revenue.
Payers are unique users at a brand level in a given month from whom we earned Direct Revenue.
When presented as a quarter-to-date or year-to-date value, Payers represents the average of the
monthly values for the respective period presented. At a consolidated level and a business unit level to
the extent a business unit consists of multiple brands, duplicate Payers may exist when we earn
| 19 |
revenue from the same individual at multiple brands in a given month, as we are unable to identify
unique individuals across brands in the Match Group portfolio.
Revenue Per Payer (“RPP”) is the average monthly revenue earned from a Payer and is Direct Revenue
for a period divided by the Payers in the period, further divided by the number of months in the period.
Monthly Active User (“MAU”) is a unique registered user at a brand level who has visited the brand’s
app or, if applicable, their website in the given month. For measurement periods that span multiple
months, the average of each month is used. At a consolidated level and a business unit level to the
extent a business unit consists of multiple brands, duplicate users will exist within MAU when the same
individual visits multiple brands in a given month.
Leverage on a gross basis is calculated as principal debt balance divided by Adjusted EBITDA for the
period referenced.
Leverage on a net basis is calculated as principal debt balance less cash and cash equivalents and
short-term investments divided by Adjusted EBITDA for the period referenced.
Safe Harbor Statement Under the Private Securities Litigation Reform Act
of 1995
These prepared remarks and our conference call, which will be held at 5:00 p.m. Eastern Time on
November 4, 2025, may contain “forward-looking statements” within the meaning of the Private
Securities Litigation Reform Act of 1995. All statements that are not historical facts are “forward looking
statements.” The use of words such as “anticipates,” “estimates,” “expects,” “plans,” “believes,” “will,” and
“would,” among others, generally identify forward-looking statements. These forward-looking
statements include, among others, statements relating to: Match Group’s future financial performance,
Match Group’s business prospects and strategy, anticipated trends, and other similar matters. These
forward-looking statements are based on management’s current expectations and assumptions about
future events, which are inherently subject to uncertainties, risks and changes in circumstances that
are difficult to predict. Actual results could differ materially from those contained in these forward-
looking statements for a variety of reasons, including, among others: our ability to maintain or grow the
size of our user base and convert users to paying users, the success of our product strategies,
competition, our ability to realize reductions in in-app purchase fees, the limited operating history of
some of our brands, our ability to attract users to our services through cost-effective marketing and
related efforts, our ability to distribute our services through third parties and offset related fees, risks
relating to our use of artificial intelligence, foreign currency exchange rate fluctuations (including
anticipated gains from fluctuations), the integrity and scalability of our systems and infrastructure (and
those of third parties) and our ability to adapt ours to changes in a timely and cost-effective manner,
our ability to protect our systems from cyberattacks and to protect personal and confidential user
information, impacts to our offices and employees from more frequent extreme weather events, risks
relating to certain of our international operations and acquisitions, damage to our brands' reputations
as a result of inappropriate actions by users of our services, and macroeconomic conditions. Certain of
these and other risks and uncertainties are discussed in Match Group’s filings with the Securities and
Exchange Commission. Other unknown or unpredictable factors that could also adversely affect Match
Group’s business, financial condition and results of operations may arise from time to time. In light of
these risks and uncertainties, these forward-looking statements may not prove to be accurate.
Accordingly, you should not place undue reliance on these forward-looking statements, which only
reflect the views of Match Group management as of the date of this press release. Match Group does
not undertake to update these forward-looking statements.