 | 1 |
.2
Q4 2025 Prepared Remarks
One Year In
Good afternoon, and
thanks for joining us.
Just one year ago, I
became CEO of Match
Group.
From day one, my focus
was clear: prioritize user
outcomes to rebuild trust
and position Match Group
to lead the next chapter
of human connection.
Given Tinder®’s scale and
importance, I also took
direct ownership of its
turnaround.
To guide this work, I laid
out a simple three-phase transformation. Reset the company. Revitalize the products.
And drive a Resurgence with our audiences and, over time, our financials.
We completed the Reset phase by putting user outcomes at the center of everything we
do, rationalizing costs, and shifting from a siloed organization to a more collaborative
“One MG” approach. With that foundation in place, we are now firmly in the Revitalize
phase, focused on delivering clear value to users and building experiences that lead to
real human connection.
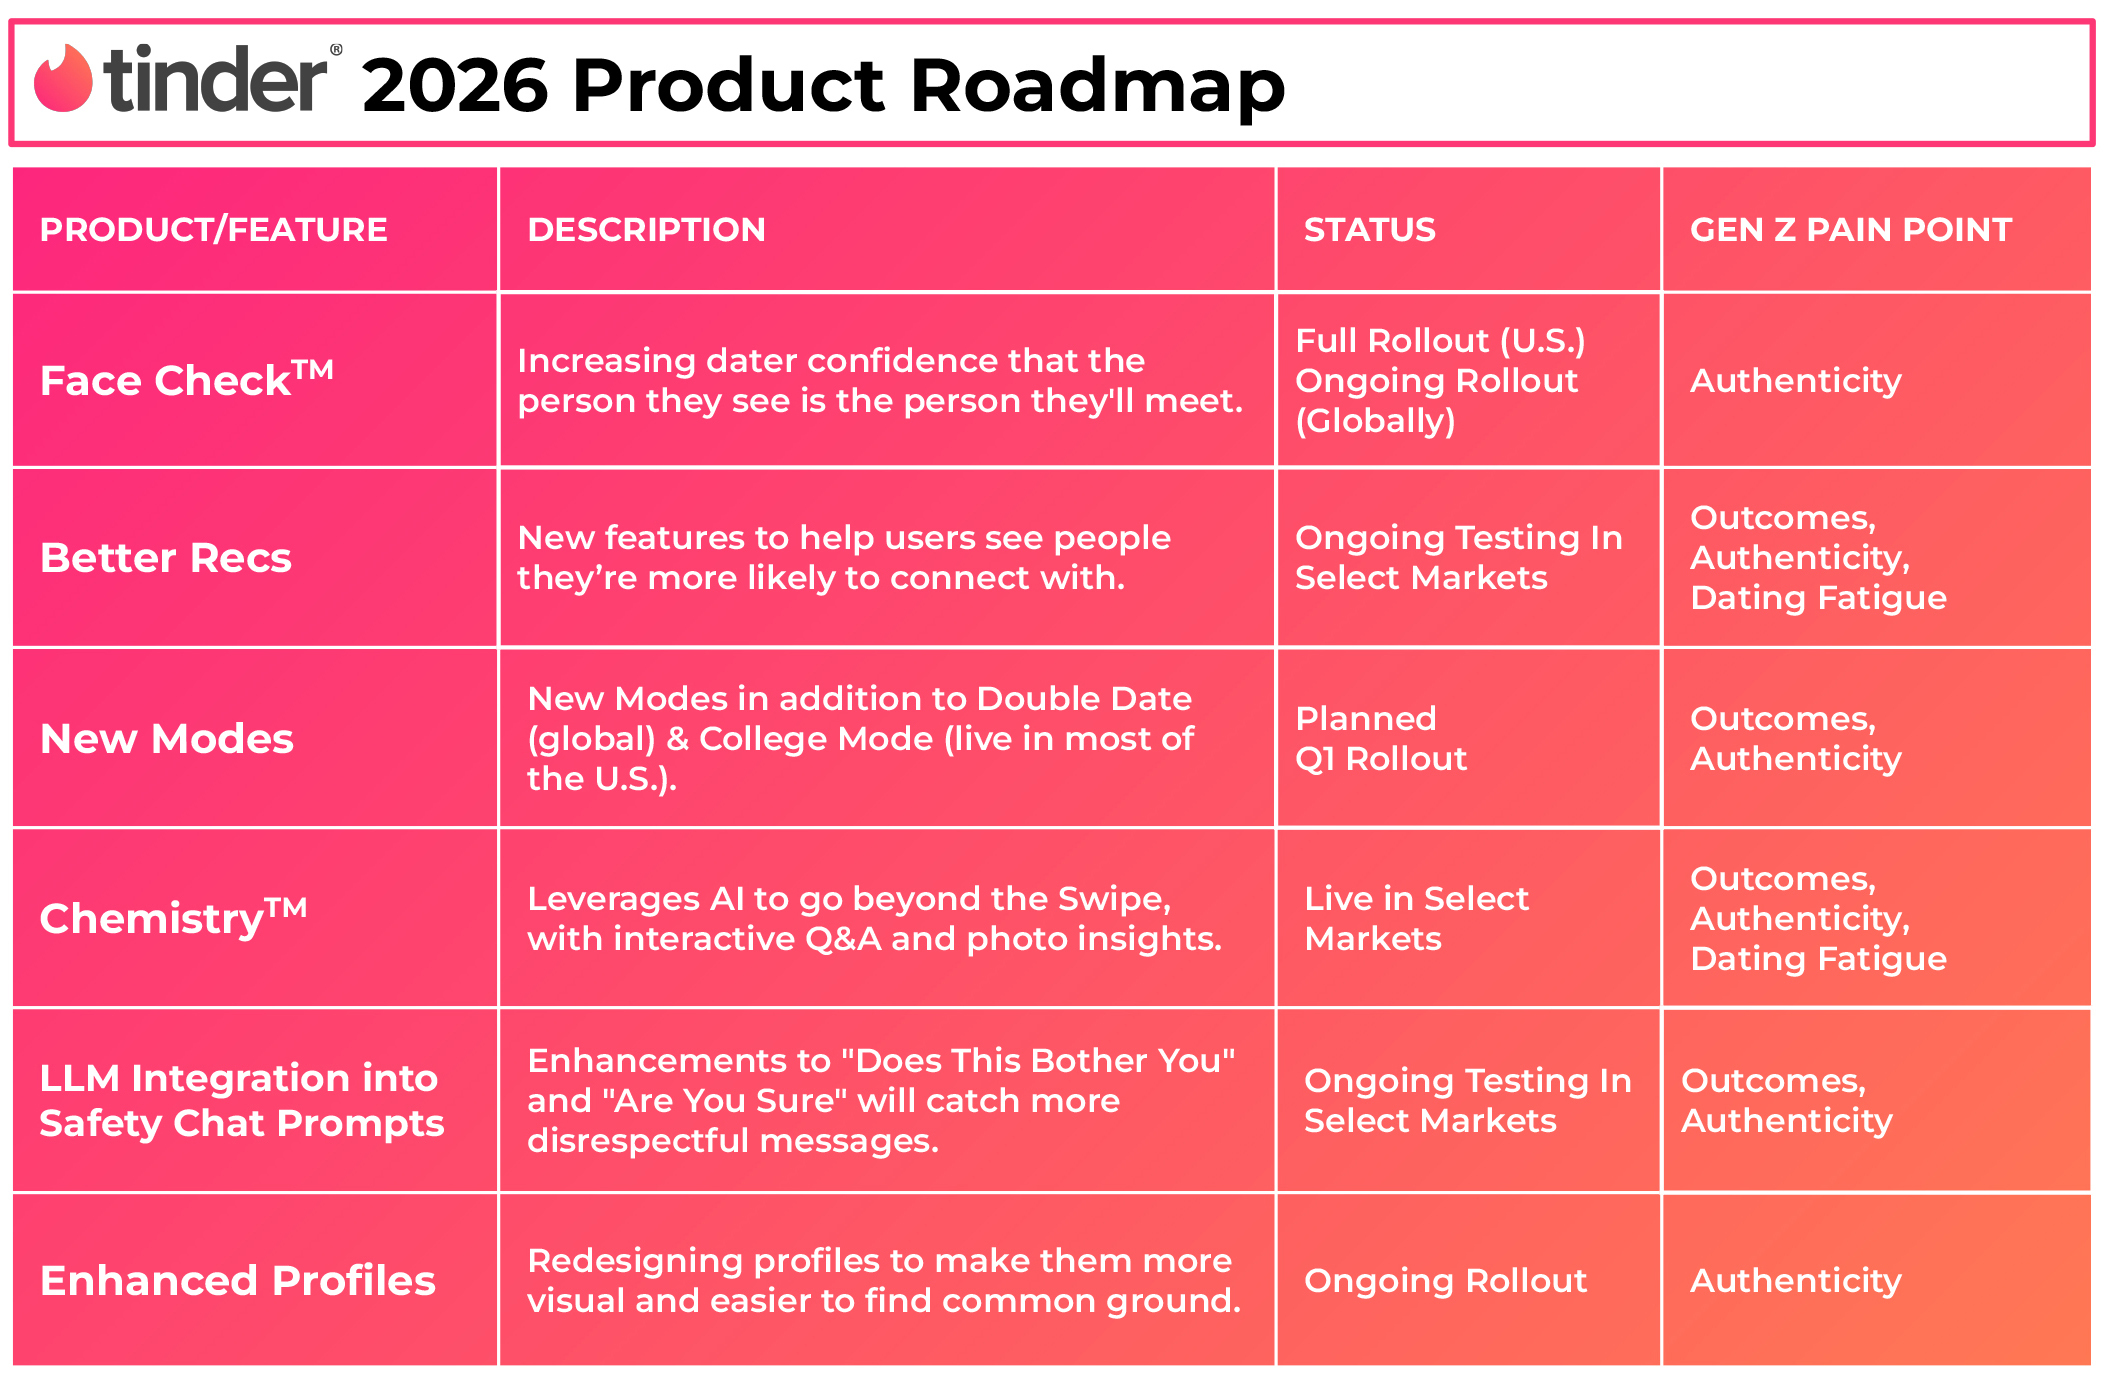
We have compelling 2026 product roadmaps across the company, and, at Tinder, I’m
confident that by the end of this year the product will feel meaningfully different.
Before focusing on Tinder, I first want to highlight our financial performance in 2025 and
our expectations for 2026, which Steve will then cover in more detail.
1 2025 Adjusted EBITDA includes $75 million of legal settlement costs, $22 million of restructuring and related costs, and an
$8 million gain on the sale of one of our two buildings in L.A.
2 As defined on page 17.
| 2 |
Q4 and Full Year 2025 Performance + 2026 Priorities
In 2025, we achieved our Match Group revenue and margin goals, excluding the discrete
items1 we’ve called out in prior quarters and generated over $1 billion of Free Cash Flow
(“FCF”), which we returned to shareholders through nearly $800 million of share buybacks
and nearly $200 million in dividends, reducing our diluted shares outstanding2 by 7% year-
over-year (“Y/Y”). And we did this while making meaningful progress on the Tinder
turnaround and continuing to invest in Hinge®.
In 2026, we expect Tinder Y/Y Direct Revenue declines to be similar to 2025 as we
continue to make product changes to improve user outcomes and drive long-term
sustainable growth, but with short-term revenue trade-offs. Across the rest of the
portfolio, we expect continued strong Direct Revenue growth at Hinge, while Evergreen &
Emerging (“E&E”) and MG Asia continue to face headwinds.
We are reinvesting savings from last year’s workforce reductions and alternative
payments initiative into Tinder and Hinge product and marketing to drive long-term
growth and shareholder value.
Together, we expect this to result in relatively flat Match Group Total Revenue Y/Y in 2026
and Adjusted EBITDA margins broadly in-line with last year, excluding the discrete items1
we’ve discussed.
The Tinder Turnaround is Progressing
Now, let me go a level deeper on Tinder.
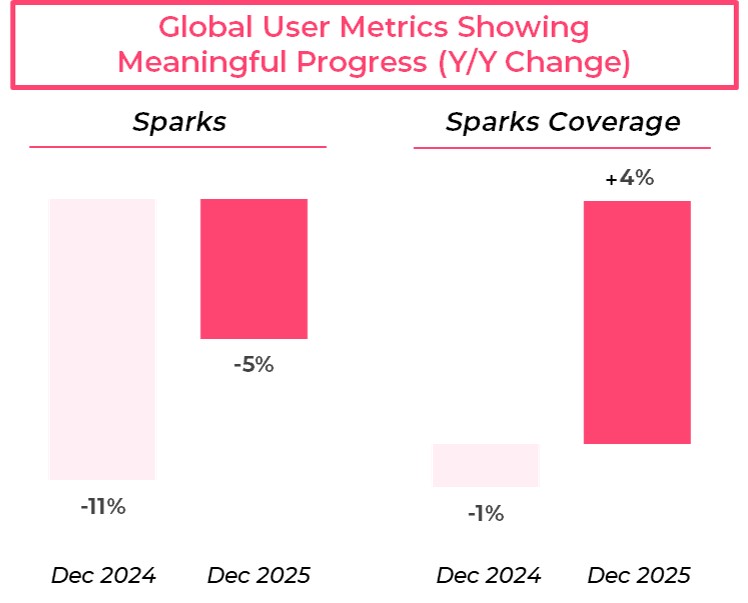
The most important leading indicators
we track for product efficacy are Sparks
and Sparks Coverage. Sparks reflect the
number of users engaging in a six-way
conversation, which we believe is a
strong proxy for real connection. Sparks
Coverage measures what percent of our
users get a Spark in that period. Both
metrics are improving, including among
Gen Z users in the U.S. Globally, total
Sparks were down 11% Y/Y in December
2024 compared to down 5% Y/Y in
December 2025. Similarly, global Sparks
Coverage improved from down 1% to up
4% Y/Y over that same time period. Our product work is paying off.
| 3 |
Our data indicates that Sparks drive retention, retention helps stabilize monthly active
users (“MAU”), and stabilized MAU supports revenue recovery over time. It is the earliest
measurable signal that the ecosystem is healing, and I’m very encouraged by the trends.
We also closely track new registrations as a leading indicator
of future MAU growth. Globally, new registration trends have
improved significantly, down 5% Y/Y in Q4 compared to down
12% in Q2, also a positive signal.
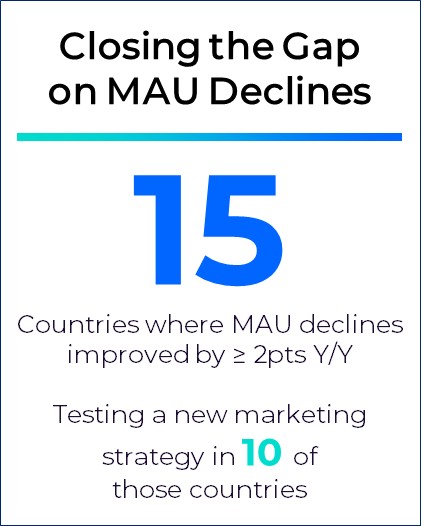
MAU naturally lags, but we’re starting to see some progress
here as well. MAU was down 9% Y/Y in Q4 compared to down
10% Y/Y in Q3. In fact, Y/Y MAU declines in December
improved by at least two points across 15 countries (together
representing approximately one-third of Tinder’s global MAU)
and in 10 of those markets we are actively testing new
marketing strategies. This momentum has continued into
early 2026, driven by better retention of existing users.
Much of this progress is a result of our increased focus on improving the experience for
women (and in turn for all users), through greater relevance and stronger safety. For
example, we’ve been testing new AI-driven recommendation algorithms which affect the
order of profiles shown to women.
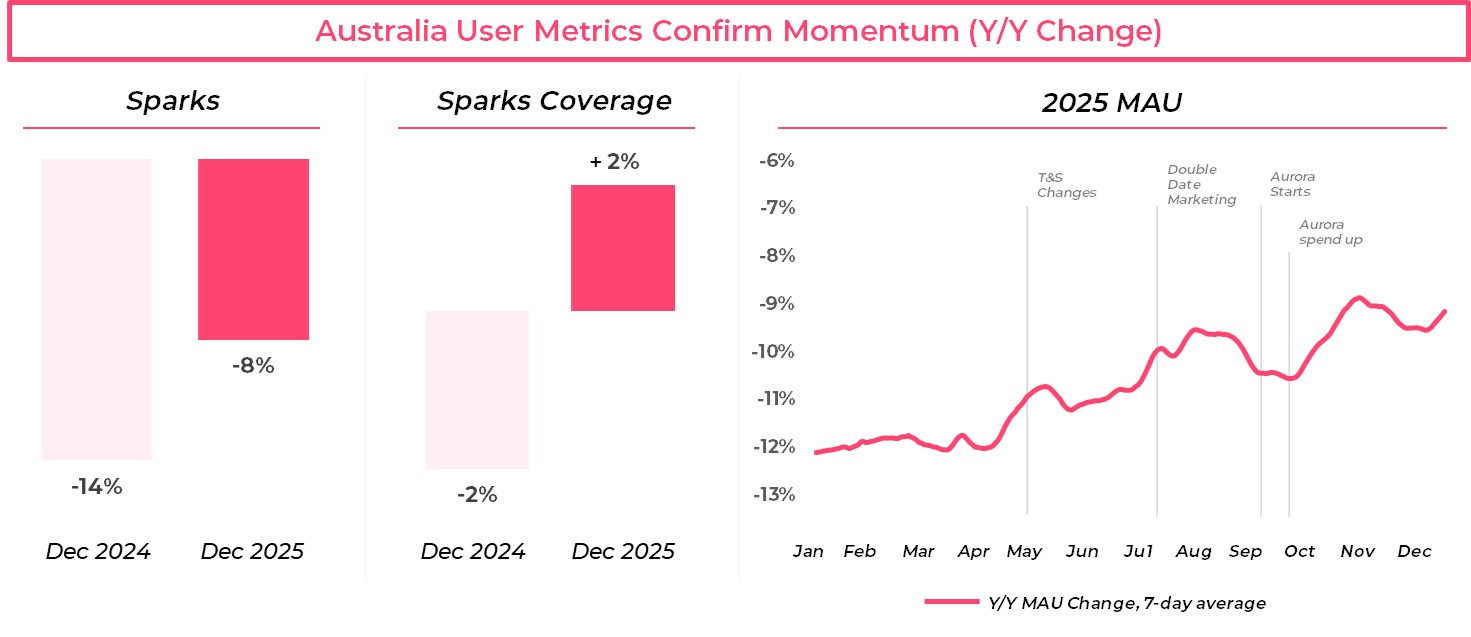
Project Aurora has been an important learning engine, allowing us to test multiple high-
conviction product changes together in a single market, Australia. In tests, Sparks went
from down 14% in December 2024 to down around 8% Y/Y in December 2025, and Sparks
Coverage reversed declines from down 2% to up 2% Y/Y over that same time period. MAU
trends have also improved in Australia, from down 12% in January 2025 to down 9% Y/Y in
December 2025 and improvement was even more pronounced among women over the
same period. Importantly, the negative revenue impact from these product changes
continues to be less than we expected. This gives us a lot of confidence that the
turnaround is working.
| 4 |
Our 2026 product roadmap directly addresses the most common Gen Z pain points. They
want better outcomes, so we’re focusing on relevance and match quality. They want
authenticity and trust, so we’re further strengthening verification and safety. And they are
feeling dating fatigue, so we’re redesigning discovery to be more expressive and less
repetitive.
The early indicators give us confidence in our strategy and I expect more lagging
indicators like Y/Y MAU trends to improve throughout the year as we execute on the
product roadmap. Our objective is to re-establish Tinder as a sustainable growth business
in 2027 and beyond by restoring durable user engagement and relevance at scale. While
this approach involves making some near-term revenue trade offs, we believe it ultimately
strengthens Tinder’s long-term monetization engine, and will provide opportunities to
increase both Payer Penetration and RPP, as user outcomes and the overall ecosystem
improves.
On March 12, Tinder will host our first ever product event in Los Angeles to showcase
upcoming feature updates, AI-driven innovations, and a deeper look into our roadmap.
The event will be webcast and available via our IR website.
3 Source: Match Group survey of 2,500 U.S. adult singles conducted in late September 2025 to early October 2025.
4 Based on a random weighted sample of in-app profile views. Bad actors include accounts that engage in deceptive or
harmful behaviors, including spam, scam attempts, or operating automated fake profiles (bots).
| 5 |
Hinge: Continued Momentum
Our latest research with Harris Poll3 shows that roughly 80% of Gen Z singles want
meaningful relationships, much higher rates than older generations, and we believe our
platforms will increasingly be where those connections begin. Hinge continues to be the
leading app in this intentional dating space, with strong user growth and revenue
momentum. Their exceptional performance reflects clear positioning, disciplined
execution, and a simple north star of getting users on more great dates.
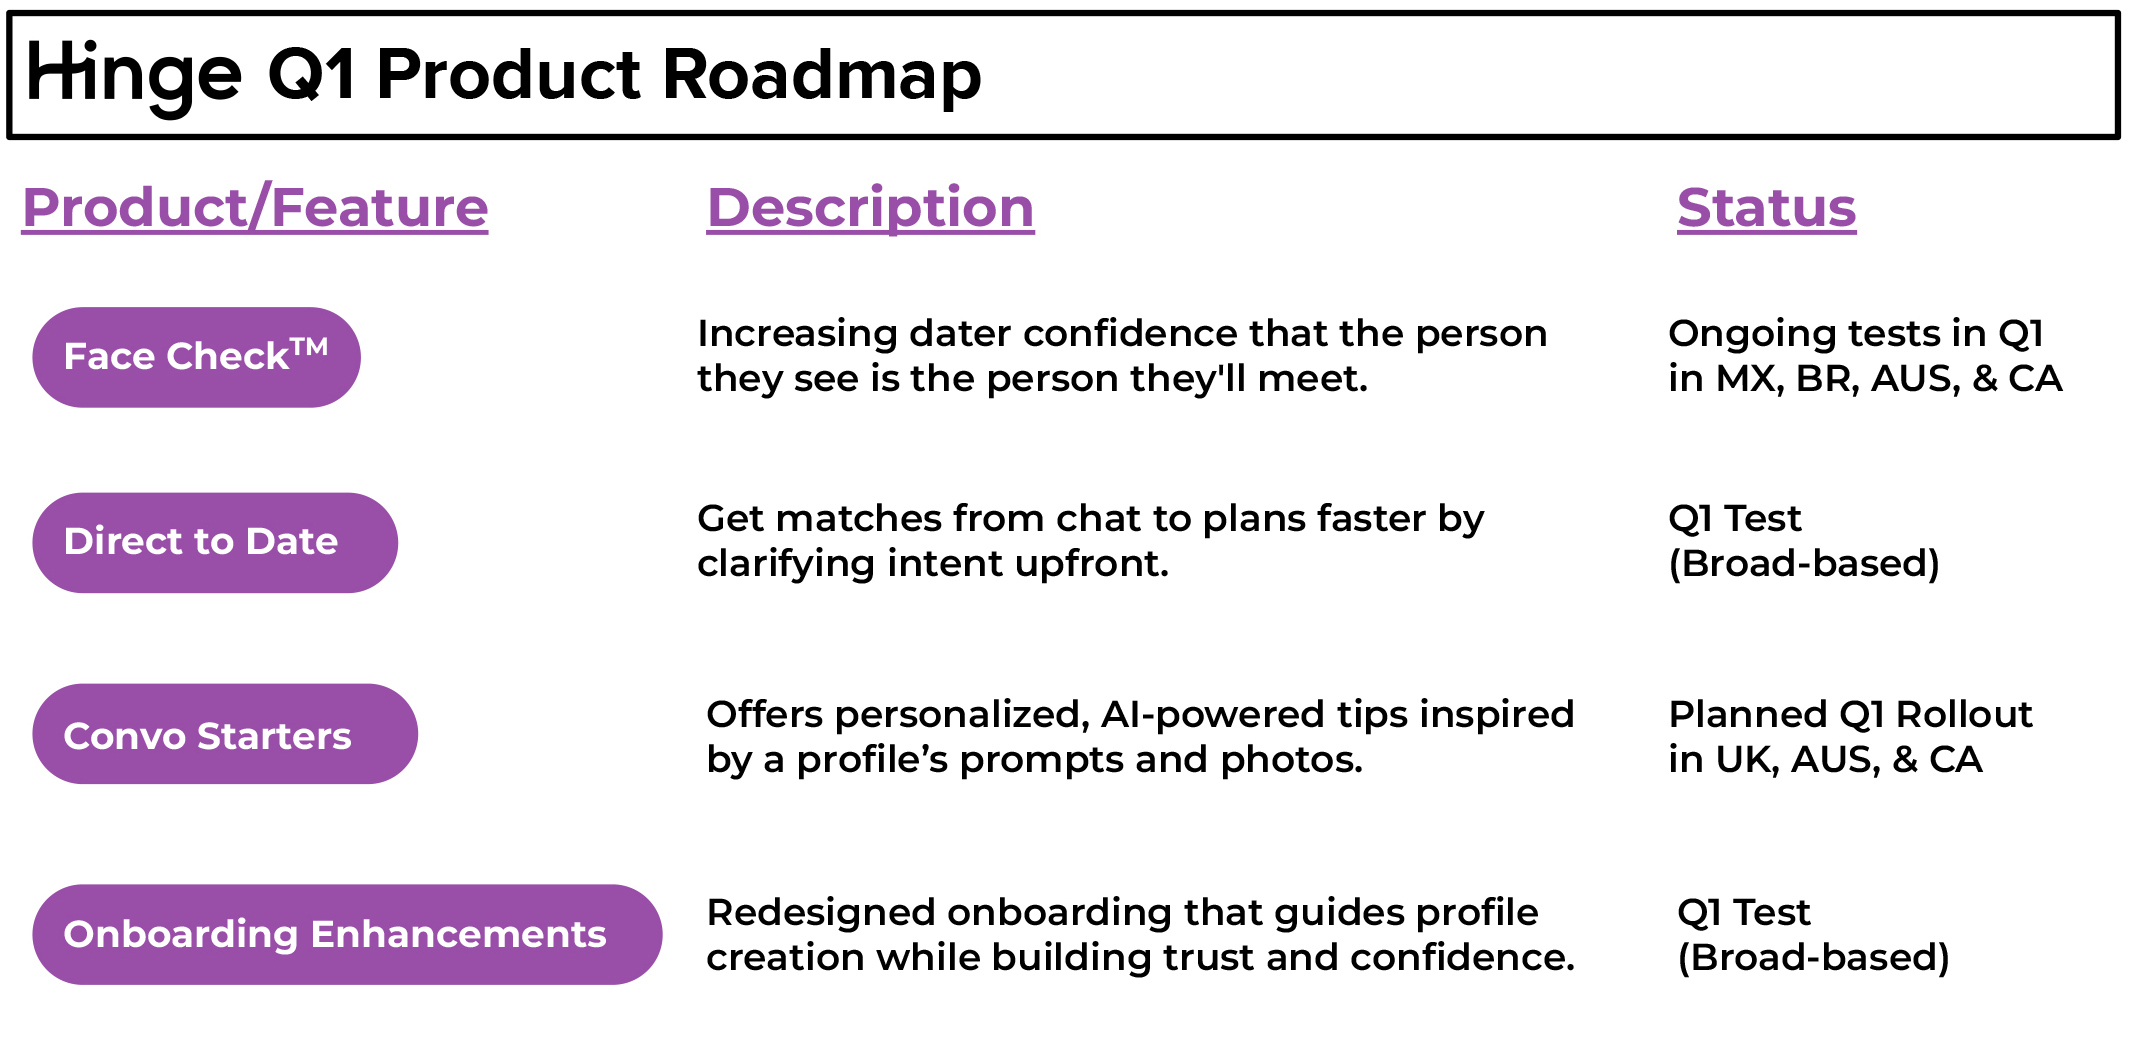
Trust and safety is foundational to the Hinge experience. Built upon Tinder’s successful
rollout of Face Check™, Hinge is also rapidly testing the feature across key markets. By
the end of Q1, we expect Tinder to launch Face Check globally in the majority of markets,
and Hinge to have rolled out in some of its major markets. On Tinder, Face Check has led
to a more than 50% reduction in interactions with bad actors4 in markets where it’s been
rolled out (with only a minimal impact on revenue), and we expect it to meaningfully
improve Hinge’s user experience as well.
In Q1, Hinge is also testing features that help users get out on great dates faster, including
Direct to Date, which clarifies intent to accelerate IRL plans, and a redesigned
onboarding experience to build confidence in profile creation. Hinge also plans to roll out
an AI-driven feature, Convo Starters, to more countries following its successful rollout in
the U.S. in December.
Hinge is poised to stay at the forefront of product innovation in the category, and it
continues to show broad appeal not only in the U.S., but across every international market
it has entered. Hinge officially entered its first non-English-speaking market in Q2’22,
supported by already strong organic traction.
5 European expansion markets where Hinge is actively marketing include: France, Germany, Austria, Switzerland, Denmark,
Finland, Sweden, Norway, Spain, Italy, Netherlands, and Belgium.
6 Source: Sensor Tower. Combined downloads and rank across Apple App Store and Google Play Store.
| 6 |
Since then, Hinge has actively marketed in 12
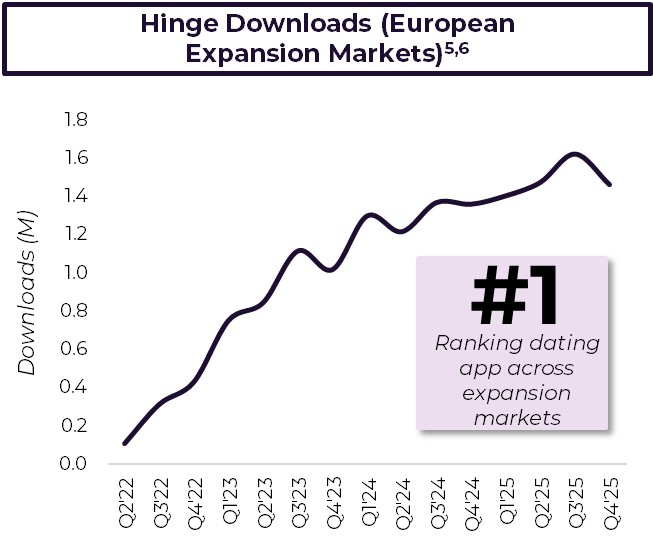
European countries, its European expansion
markets5, where it is the top downloaded
dating app as of December 20256. In these
markets, Hinge ended 2025 with over 3.3
million MAU, up from approximately 200
thousand at launch. User growth continues to
scale rapidly, with MAU growing nearly 50%
Y/Y in 2025. We expect Hinge to deliver over
$100 million of Direct Revenue in 2026 in its
European expansion markets, with significant
runway ahead.
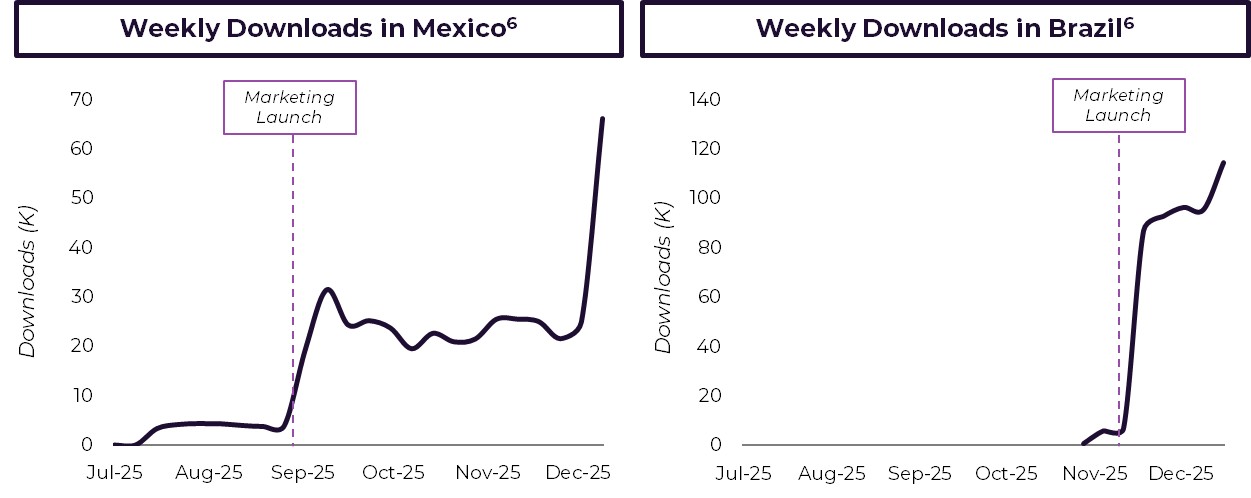
In H2’25, Hinge successfully launched in both
Mexico and Brazil, where very early results have far outpaced our expectations. Hinge was
already the second most downloaded dating app in Mexico and Brazil as of December
2025, and is clearly resonating with intentioned daters.
Building on this momentum, Hinge plans to expand to three additional Latin America
markets in 2026 – Argentina, Chile and Peru – and into its first APAC market: India. Hinge
has already built a meaningful organic presence in India with over one million MAU in
2025, growing 40% Y/Y without marketing spend.
Overall, Hinge is on track with the targets we have shared previously and demonstrates
how a strong focus on product-market fit and user outcomes can drive durable growth
and long-term shareholder value.
| 7 |
Portfolio Strategy: The Power of a Multibrand Portfolio
Taken together, the work at Tinder and Hinge
gives us greater clarity on how the portfolio fits
together and how we can unlock new value with
focus and investment. Our robust multi-brand
portfolio provides scale, rich data from multiple
apps (in a multi-app usage category), and the
ability to serve different user intents, while
preserving strong and distinct brand identities.
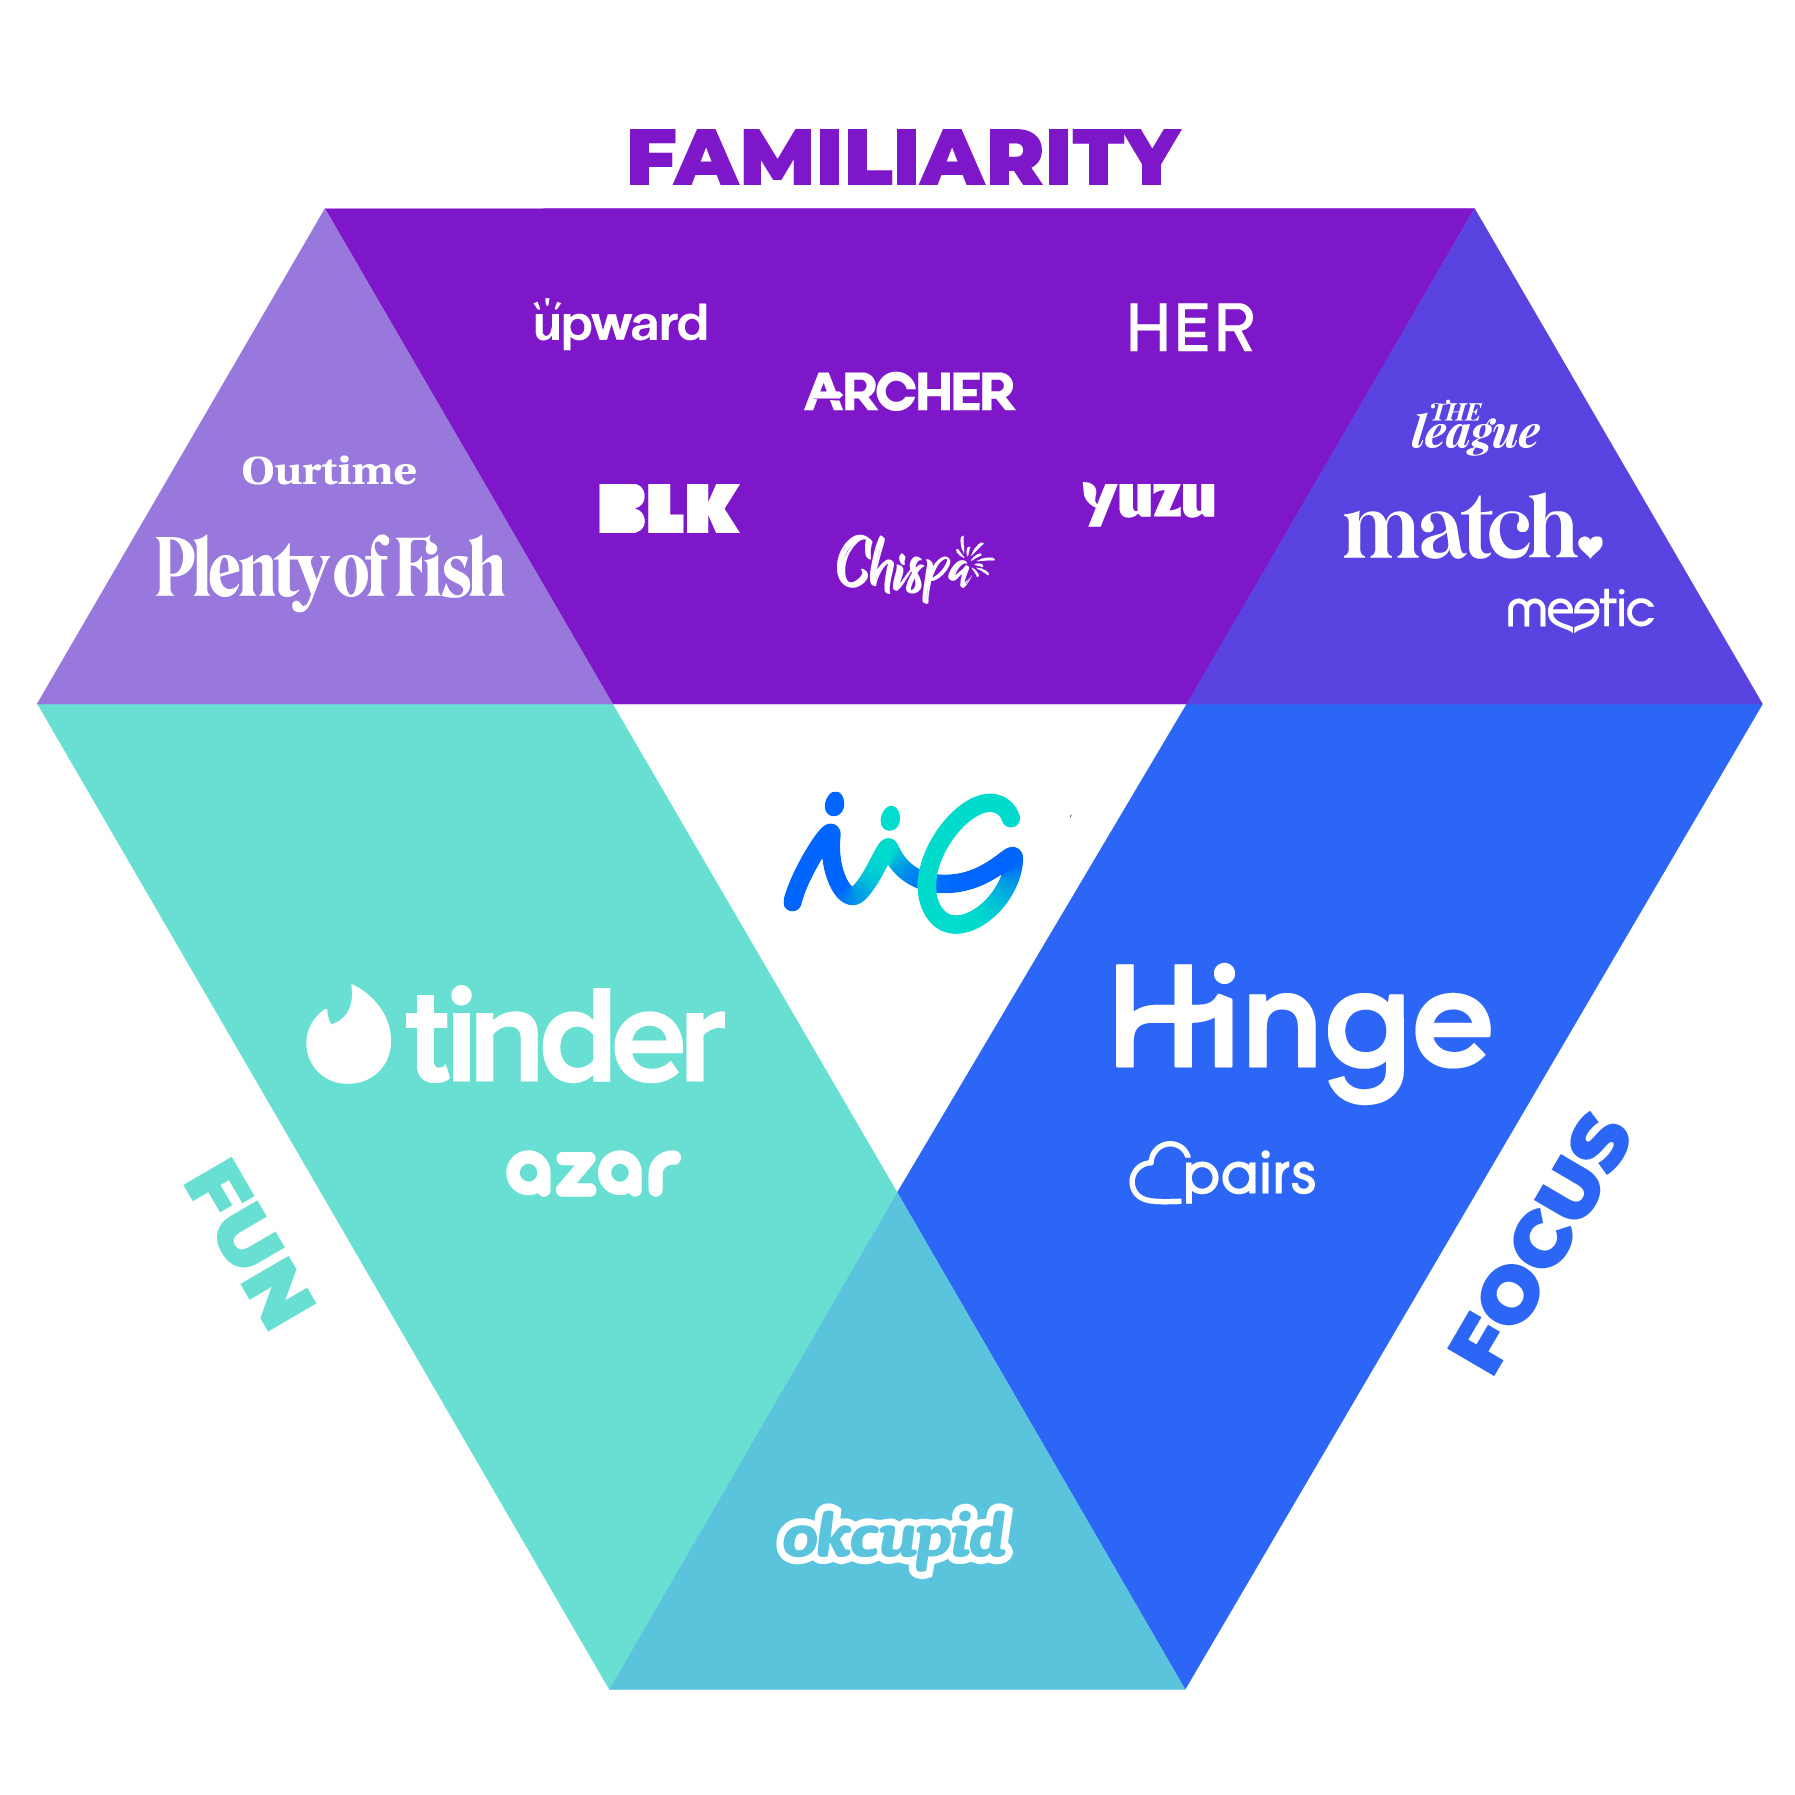
We’ve introduced a simple internal framework
to articulate how we position our brands based
on how they solve users’ needs.
At one end of the portfolio is Fun, where Tinder
leads with social, low-pressure connection. At
another is Focus, where Hinge leads with
intention and depth. And across Familiarity, our
Affinity brands serve communities with shared identity and purpose. Some of our apps sit
at the intersection of these user needs – for example, The League® (our app for intentional
dating among highly ambitious people) sits at the intersection of Focus and Familiarity.
This rubric shapes how we think about future growth, including M&A and incubations. It
helps us identify white and gray space where unmet user needs exist, and where we can
build or acquire products that meaningfully expand how people connect.
Closing Thoughts
I’ll close with this.
At the core of our vision for Match Group is a simple truth: humans need humans. In a
world facing a growing loneliness and mental health crisis, we believe Match Group is
uniquely positioned to make a positive impact by helping people form real connections.
We believe Match Group plays a fundamentally different role in people’s lives than most
digital platforms. Our goal is clear: help users get off their phones and into the real world,
where meaningful relationships actually form.
Long-term value creation depends on delivering successful outcomes for our users.
People will only use our products if they work. We believe AI is a core enabler of how we
improve relevance and matching, strengthen trust and safety at scale, and increase the
speed at which we learn and iterate.
The early progress we’re seeing in our technology, product quality, and user outcomes
reinforce our decision to double down on these initiatives, all while maintaining a
commitment to returning meaningful capital to shareholders through buybacks and the
dividend, and boosts our confidence in the turnaround already underway at Match Group.
7 2025 Adjusted EBITDA includes $75 million of legal settlement costs, $22 million of restructuring and related costs, and an
$8 million gain on the sale of one of our two buildings in L.A.
| 8 |
Q4 and Full Year 2025 Financial Performance
Today, I’ll share more details on our latest performance and discuss our guidance for Q1
and full year 2026. Unless otherwise noted, all amounts are on an as reported basis and
comparisons will be discussed on a year-over-year (“Y/Y”) basis. More details can be found
in the financial table below.
We finished 2025 with another quarter of strong execution. Total Revenue and Adjusted
EBITDA both exceeded the high-end of our Q4 guidance. Total Revenue benefited from a
smaller-than-expected impact from Tinder’s user experience tests. These tests had a $6
million negative impact to Tinder Direct Revenue in Q4, which was $8 million less than we
expected at the time of our last call, and Adjusted EBITDA benefited from our ongoing
cost efficiency efforts.
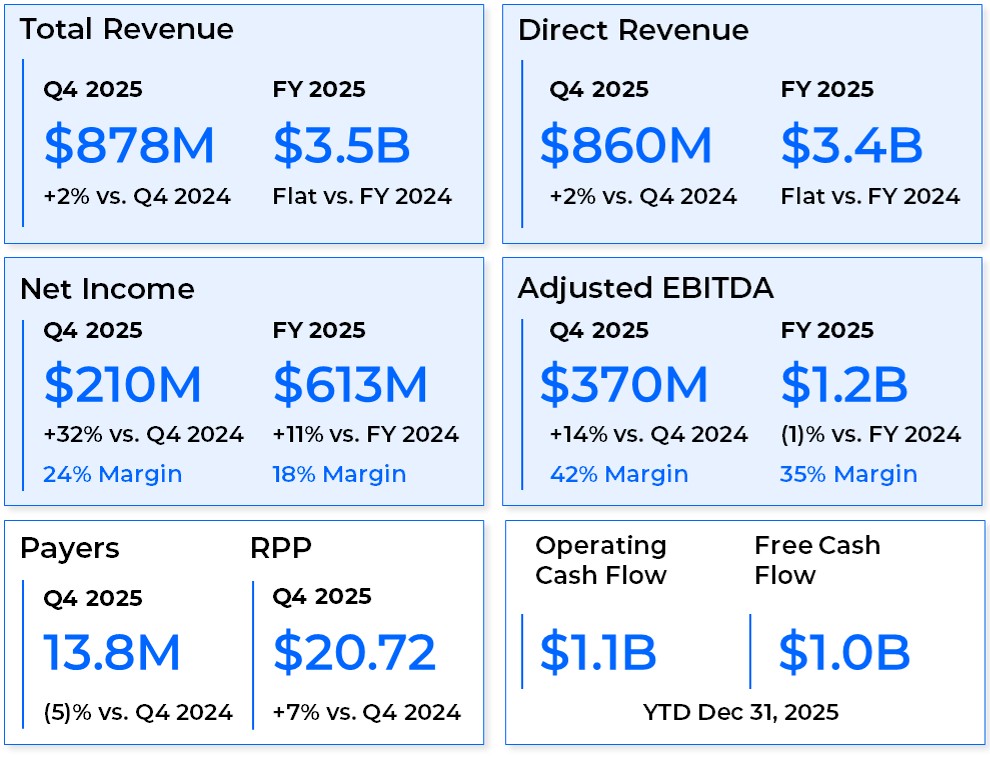
Diving deeper into Q4, Match Group delivered Total Revenue of $878 million, up 2%, and
flat on a foreign exchange (“FX”) neutral (“FXN”) basis. Payers declined 5% to 13.8 million,
while RPP increased 7% to $20.72. Adjusted EBITDA was $370 million, up 14%,
representing an Adjusted EBITDA margin of 42%. Excluding an $8 million gain on the sale
of an L.A. office building and $2 million of restructuring costs, Adjusted EBITDA margin
would have been 41%.
For the full year 2025, Match Group delivered Total Revenue of $3.5 billion, flat both as
reported and FXN. Adjusted EBITDA for the full year was $1.2 billion, down 1%, representing
an Adjusted EBITDA Margin of 35%. Excluding the legal settlements, restructuring costs,
and the sale of an L.A. office building7, each of which we’ve discussed in prior quarters,
Adjusted EBITDA margin would have been 38%, which meaningfully exceeded our 36.5%
margin target provided at the beginning of 2025, primarily due to our restructuring efforts
and alternative payments initiative.
| 9 |
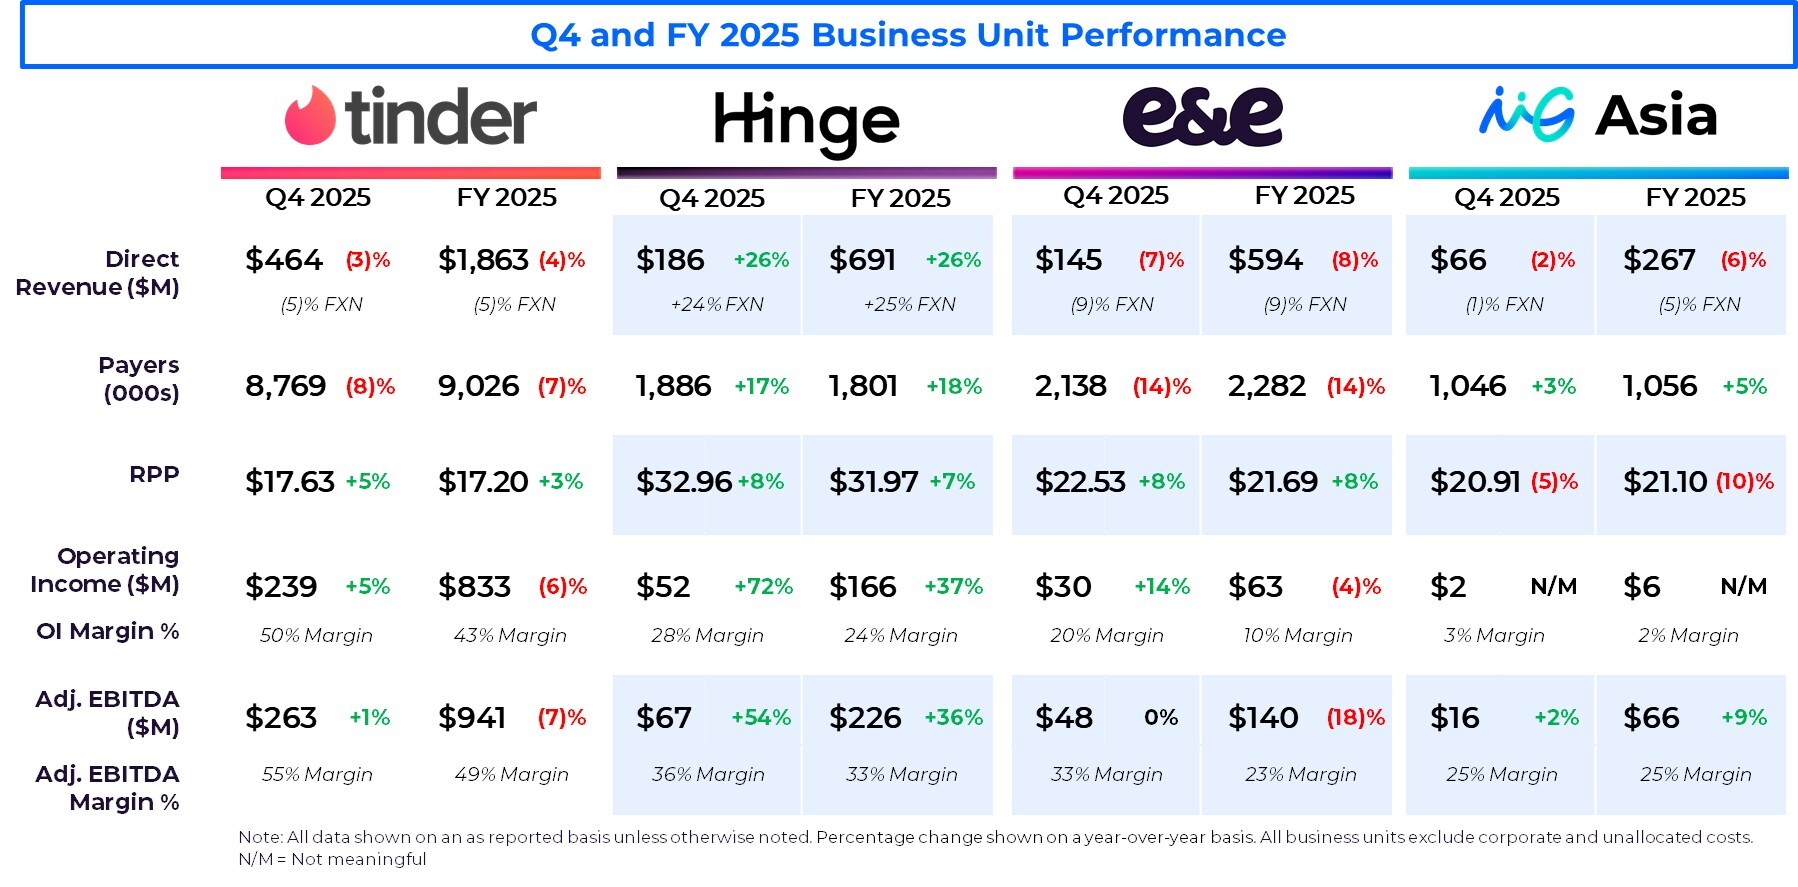
•Tinder Q4 Direct Revenue was $464 million, down 3%, down 5% FXN. Tinder Payers
declined 8% to 8.8 million and RPP grew 5% to $17.63. Adjusted EBITDA in the
quarter was $263 million, up 1%, representing an Adjusted EBITDA margin of 55%.
For the full year, Tinder delivered Direct Revenue of $1.9 billion, down 4%, down 5%
FXN. Adjusted EBITDA was $941 million, down 7%, representing an Adjusted
EBITDA margin of 49%. Excluding the $61 million Candelore legal settlement
charge and $5 million of restructuring costs, Adjusted EBITDA margin would have
been 52%.
•Hinge Q4 Direct Revenue was $186 million, up 26%, up 24% FXN. Payers were up
17% to 1.9 million, and RPP grew 8% to $32.96. Adjusted EBITDA was $67 million in
Q4, up 54%, representing an Adjusted EBITDA Margin of 36%.
For the full year, Hinge delivered Direct Revenue of $691 million, up 26%, up 25%
FXN. Adjusted EBITDA was $226 million, up 36%, for an Adjusted EBITDA margin of
33%.
•E&E Q4 Direct Revenue was $145 million, down 7%, down 9% FXN. Payers were
down 14% to 2.1 million, and RPP grew 8% to $22.53. Adjusted EBITDA was $48
million, flat Y/Y, representing an Adjusted EBITDA Margin of 33%.
For the full year, E&E delivered Direct Revenue of $594 million, down 8%, down 9%
FXN. Adjusted EBITDA was $140 million, down 18%, for an Adjusted EBITDA margin
of 23%. Excluding the $14 million Federal Trade Commission legal settlement
charge and $6 million of restructuring costs, Adjusted EBITDA margin would have
been 26%.
•MG Asia Direct Revenue in Q4 was $66 million, down 2%, down 1% FXN. Azar® Direct
Revenue was up 1% both as reported and FXN. Pairs™ Direct Revenue was down
5%, down 4% FXN. Across MG Asia, Payers increased 3% to 1.0 million, while RPP
declined 5% to $20.91. Adjusted EBITDA was $16 million, up 2%, representing an
Adjusted EBITDA Margin of 25%.
For the full year, MG Asia Direct Revenue was $267 million, down 6%, down 5% FXN.
Excluding the exit of our live streaming businesses, MG Asia Direct Revenue would
have been flat Y/Y, up 1% FXN. Adjusted EBITDA was $66 million, up 9%, for an
Adjusted EBITDA Margin of 25%.
8 Leverage is calculated utilizing the non-GAAP measure Adjusted EBITDA as the denominator. For a reconciliation of the
non-GAAP measure for each period presented, see page 15.
9 As defined on page 17.
| 10 |
Q4 2025 Consolidated Operating Costs and Expenses
Including stock-based compensation (“SBC”) expense, total expenses in Q4 were down
7%. Cost of revenue decreased 6% and represented 25% of Total Revenue, down two
points as a percentage of Total Revenue, driven by alternative payment savings. Selling
and marketing costs increased $6 million, or 4%, but was flat at 17% of Total Revenue,
primarily due to higher marketing spend at Hinge. General and administrative costs
decreased 22%, down three points as a percentage of Total Revenue to 10%, driven by the
gain on sale of an L.A. office building and lower legal fees. Product development costs
remained flat at 12% of Total Revenue. Depreciation and amortization decreased by $10
million to $21 million due to lower internally developed capitalized software costs,
primarily at Tinder.
Capital Allocation & Liquidity
Our trailing twelve-month gross leverage was 3.2x and net leverage8 was 2.4x at the end
of Q4. We ended the quarter with $1.0 billion of cash, cash equivalents, and short-term
investments on hand, and plan to use $424 million of cash to pay off the 2026 convertible
notes on, or before, their maturity in June. In Q4, we repurchased 7.3 million shares at an
average price of $33 per share on a trade date basis, for a total of $239 million and paid
$45 million in dividends.
For the full year 2025, we delivered Operating Cash Flow of $1.1 billion and FCF of $1.0
billion. FCF was negatively impacted by the timing of the final Apple payment of the year,
which we expected in December but did not receive until early January. For the full year
2025, we repurchased 24.7 million shares at an average price of $32 per share on a trade
date basis for a total of $789 million, paid $186 million in dividends, and deployed $129
million of cash toward net share settlement of employee equity awards to reduce share
dilution, equating to 108% of Free Cash Flow in total. As of January 31, 2026, we’ve reduced
diluted shares outstanding9 by 7% Y/Y, a meaningful accomplishment.
Our Board of Directors declared a cash dividend of $0.20 per share, representing a 5%
increase from our prior quarterly dividend. The dividend is payable on April 21, 2026 to
shareholders of record as of April 7, 2026. The increased dividend reflects our commitment
to providing shareholders with a predictable and consistent form of capital return. The
dividend is expected to be paid on a quarterly basis going forward, subject to approval by
our Board of Directors.
| 11 |
Financial Guidance
Q1 2026
We expect Q1 Total Revenue for Match Group of $850 million to $860 million, up 2% to 3%
Y/Y. This range assumes a three and a half-point tailwind from FX. FXN, we expect Total
Revenue to be down 1% to flat. We expect Match Group Adjusted EBITDA of $315 million to
$320 million, representing a 15% Y/Y increase, and an Adjusted EBITDA margin of 37% at
the mid-points of the ranges. Q1 Total Revenue guidance assumes a $6 million negative
impact to Tinder Direct Revenue from user experience tests.
Total Revenue | Adjusted EBITDA | |||
Q1 2026 | $850 to $860 million | $315 to $320 million |
Full Year 2026
For the full year 2026, we expect Match Group to deliver Total Revenue of $3.410 to $3.535
billion, approximately flat Y/Y at the mid-point of the range. This Y/Y range assumes a one-
point tailwind from FX, a nearly one and a half-point headwind from Tinder user
experience tests, and a one-point headwind from the planned rollout of Face Check
across the portfolio. We expect full year 2026 Indirect Revenue to decline in the mid-teens
percent.
We expect Total Match Group Adjusted EBITDA of $1.280 to $1.325 billion and Adjusted
EBITDA Margin of 37.5% at the mid-point of the ranges, as we reinvest savings into Tinder
and Hinge to drive the Revitalize phase of our transformation.
Our guidance assumes approximately $110 million of Adjusted EBITDA savings in 2026
from alternative payments, based on current app store policies. The app store fees we pay
could change based on evolving litigation and regulatory changes both in the U.S. and in
other jurisdictions, including the Epic Games v. Apple case which was recently sent back
to the lower court. We continue to monitor these events closely and will determine the
appropriate course of action if and when there are future changes to app store policies.
At Tinder, we expect Direct Revenue to decline at approximately the same rate as 2025.
Our guidance includes a three-point headwind from user experience tests and a one-
point headwind from the full rollout of Face Check. It also includes a $50 million increase
in Tinder marketing spend, for a total budget of approximately $230 million, as we test
into marketing to support our product turnaround and user growth efforts. We expect
Adjusted EBITDA margins of approximately 50% with alternative payments savings
helping to offset higher marketing spend.
At Hinge, we expect continued strong Direct Revenue growth in the low-to-mid 20%s and
Adjusted EBITDA margins in the mid-to-high 30%s, with robust margin expansion driven
by our plan to reinvest only about 1/3rd of Hinge’s expected savings from alternative
payments. Hinge remains on track to achieve $1 billion in revenue in 2027 with continued
margin expansion.
10 As defined on page 17.
| 12 |
At E&E, we expect Direct Revenue to decline in the low-double-digits, as we work to
reinvigorate Emerging brands growth by improving user outcomes. We expect Adjusted
EBITDA margins to expand to the high 20%s, with the completion of our platform
consolidation efforts and from alternative payment savings.
And at MG Asia, we expect Direct Revenue to decline in the high-single-digits, reflecting
Azar’s ongoing block in Turkey and its global rollout of a new user verification technology,
which builds upon Face Check. We also expect a three-point FX headwind to MG Asia
Direct Revenue. We expect Adjusted EBITDA margins to be in the low-to-mid 20%s.
We expect FCF of $1.085 billion to $1.135 billion in 2026, an 8% Y/Y increase, and
representing 85% FCF conversion at the mid-point, due in part to the Apple payment we
originally expected in December, but received in January. We expect SBC expense of $250
to $260 million and capital expenditures of $55 to $65 million. Our effective tax rate is
expected to be approximately 19%.
Total Revenue | Adjusted EBITDA | Free Cash Flow | ||||
FY 2026 | $3,410 to $3,535 million | $1,280 to $1,325 million | $1,085 to $1,135 million |
Our capital allocation strategy remains unchanged, prioritizing organic investment in our
business, capital return to shareholders through buybacks and the dividend, and selective
M&A. We plan to continue net settling employee equity awards in 2026 to reduce dilution.
We expect to use 100% of FCF for buybacks, dividends, and net settling employee equity
awards over time; however, the percent of FCF used in any particular quarter or calendar
year could vary due to a number of factors, including market conditions. While execution
in our existing businesses remains our top priority, we may use FCF for selective M&A,
evaluated on a case-by-case basis. We will continue to target net leverage of 2.0x to 3.0x.
Taking a step back, we’ve reduced our diluted shares outstanding10 by 7% over the last
year and our plan calls for a similar reduction in 2026. While we’re hard at work turning
around Tinder’s MAU trends, we’re also aggressively reducing shares outstanding, which
we expect will leave us in a very attractive spot on the other side of this.
| 13 |
Appendix
Reconciliations of GAAP to Non-GAAP Measures
Reconciliation of Net Income to Adjusted EBITDA
Three Months Ended December 31, 2025 | |||||||||||||
Tinder | Hinge | E&E | MG Asia | Corporate & unallocated costs | Eliminations | Total Match Group | |||||||
(Dollars in thousands) | |||||||||||||
Net income attributable to Match Group, Inc. shareholders | $209,649 | ||||||||||||
Add back: | |||||||||||||
Net income attributable to noncontrolling interests(a) | 7 | ||||||||||||
Income tax provision(a) | 45,051 | ||||||||||||
Other income, net(a) | (13,137) | ||||||||||||
Interest expense(a) | 43,111 | ||||||||||||
Operating income (loss)(b) | $238,579 | $52,421 | $29,538 | $2,272 | $(38,129) | $— | $284,681 | ||||||
Stock-based compensation expense | 22,925 | 13,765 | 9,956 | 5,234 | 12,155 | — | 64,035 | ||||||
Depreciation | 1,347 | 1,280 | 5,167 | 3,652 | 1,031 | — | 12,477 | ||||||
Amortization of intangibles | — | — | 3,656 | 4,995 | — | — | 8,651 | ||||||
Adjusted EBITDA | $262,851 | $67,466 | $48,317 | $16,153 | $(24,943) | $— | $369,844 | ||||||
Revenue | $479,250 | $186,453 | $148,063 | $65,824 | $— | $(1,584) | $878,006 | ||||||
Net Income Margin | 24% | ||||||||||||
Operating Income Margin(b) | 50% | 28% | 20% | 3% | NA | NA | 32% | ||||||
Adjusted EBITDA Margin | 55% | 36% | 33% | 25% | NA | NA | 42% | ||||||
Three Months Ended December 31, 2024 | |||||||||||||
Tinder | Hinge | E&E | MG Asia | Corporate & unallocated costs | Eliminations | Total Match Group | |||||||
(Dollars in thousands) | |||||||||||||
Net income attributable to Match Group, Inc. shareholders | $158,296 | ||||||||||||
Add back: | |||||||||||||
Net loss attributable to redeemable noncontrolling interestsa | (18) | ||||||||||||
Income tax provisiona | 39,266 | ||||||||||||
Other income, neta | (13,716) | ||||||||||||
Interest expensea | 39,560 | ||||||||||||
Operating income (loss)(b) | $226,346 | $30,556 | $26,021 | $(418) | $(59,117) | $— | $223,388 | ||||||
Stock-based compensation expense | 23,584 | 12,695 | 12,944 | 5,135 | 14,848 | — | 69,206 | ||||||
Depreciation | 9,235 | 621 | 5,822 | 3,877 | 1,029 | — | 20,584 | ||||||
Impairments and amortization of intangibles | — | — | 3,471 | 7,295 | — | — | 10,766 | ||||||
Adjusted EBITDA | $259,165 | $43,872 | $48,258 | $15,889 | $(43,240) | $— | $323,944 | ||||||
Revenue | $488,341 | $147,688 | $158,094 | $66,754 | $— | $(701) | $860,176 | ||||||
Net Income Margin | 18% | ||||||||||||
Operating Income (Loss) Margin(b) | 46% | 21% | 16% | (1)% | NA | NA | 26% | ||||||
Adjusted EBITDA Margin | 53% | 30% | 31% | 24% | NA | NA | 38% | ||||||
| 14 |
Reconciliation of Net Income to Adjusted EBITDA (continued)
Year Ended December 31, 2025 | |||||||||||||
Tinder | Hinge | E&E | MG Asia | Corporate & unallocated costs | Eliminations | Total Match Group | |||||||
(Dollars in thousands) | |||||||||||||
Net income attributable to Match Group, Inc. shareholders | $613,446 | ||||||||||||
Add back: | |||||||||||||
Net income attributable to noncontrolling interests(a) | 15 | ||||||||||||
Income tax provision(a) | 132,542 | ||||||||||||
Other income, net(a) | (21,025) | ||||||||||||
Interest expense(a) | 147,551 | ||||||||||||
Operating income (loss)(b) | $832,638 | $166,286 | $63,266 | $6,258 | $(195,919) | $— | $872,529 | ||||||
Stock-based compensation expense | 89,586 | 56,279 | 38,548 | 21,052 | 52,737 | — | 258,202 | ||||||
Depreciation | 19,127 | 3,934 | 24,252 | 14,887 | 4,912 | — | 67,112 | ||||||
Amortization of intangibles | — | — | 14,370 | 24,178 | — | — | 38,548 | ||||||
Adjusted EBITDA | $941,351 | $226,499 | $140,436 | $66,375 | $(138,270) | $— | $1,236,391 | ||||||
Revenue | $1,924,711 | $690,872 | $608,093 | $268,166 | $— | $(4,645) | $3,487,197 | ||||||
Net Income Margin | 18% | ||||||||||||
Operating Income Margin(b) | 43% | 24% | 10% | 2% | NA | NA | 25% | ||||||
Adjusted EBITDA Margin | 49% | 33% | 23% | 25% | NA | NA | 35% | ||||||
Year Ended December 31, 2024 | |||||||||||||
Tinder | Hinge | E&E | MG Asia | Corporate & unallocated costs | Eliminations | Total Match Group | |||||||
(Dollars in thousands) | |||||||||||||
Net income attributable to Match Group, Inc. shareholders | $551,276 | ||||||||||||
Add back: | |||||||||||||
Net income attributable to noncontrolling interests(a) | 37 | ||||||||||||
Income tax provisiona | 152,743 | ||||||||||||
Other income, neta | (40,815) | ||||||||||||
Interest expensea | 160,071 | ||||||||||||
Operating income (loss)(b) | $889,222 | $121,482 | $66,088 | $(32,345) | $(221,135) | $— | $823,312 | ||||||
Stock-based compensation expense | 90,141 | 42,673 | 54,922 | 25,818 | 53,827 | — | 267,381 | ||||||
Depreciation | 37,660 | 2,323 | 21,732 | 20,834 | 4,950 | — | 87,499 | ||||||
Impairments and amortization of intangibles | — | — | 27,676 | 46,499 | — | — | 74,175 | ||||||
Adjusted EBITDA | $1,017,023 | $166,478 | $170,418 | $60,806 | $(162,358) | $— | $1,252,367 | ||||||
Revenue | $1,991,137 | $550,435 | $654,168 | $284,522 | $— | $(889) | $3,479,373 | ||||||
Net Income Margin | 16% | ||||||||||||
Operating Income (Loss) Margin(b) | 45% | 22% | 10% | (11)% | NA | NA | 24% | ||||||
Adjusted EBITDA Margin | 51% | 30% | 26% | 21% | NA | NA | 36% | ||||||
______________________
(a) These items are not allocated to a segment.
(b) At a segment level, the closest GAAP measure is operating income as items outside operating income are not allocated
to segments.
| 15 |
Reconciliation of Operating Cash Flow to Free Cash Flow
Year Ended December 31, 2025 | |
(In thousands) | |
Net cash provided by operating activities | $1,080,380 |
Capital expenditures | (56,765) |
Free Cash Flow | $1,023,615 |
Reconciliation of Net Income to Adjusted EBITDA used in Leverage Ratios
Twelve months ended December 31, 2025 | |
(In thousands) | |
Net income attributable to Match Group, Inc. shareholders | $613,446 |
Add back: | |
Net loss attributable to noncontrolling interests | 15 |
Income tax provision | 132,542 |
Other income, net | (21,025) |
Interest expense | 147,551 |
Stock-based compensation expense | 258,202 |
Depreciation | 67,112 |
Amortization of intangibles | 38,548 |
Adjusted EBITDA | $1,236,391 |
Reconciliation of Forecasted Net Income to Forecasted Adjusted EBITDA
Three Months Ended March 31, 2026 | Year Ended December 31, 2026 | ||
(In millions) | |||
Net income attributable to Match Group, Inc. shareholders | $160 to $165 | $650 to $670 | |
Add back: | |||
Net income attributable to noncontrolling interests | 0 | 0 | |
Income tax provision | 38 | 150 to 160 | |
Other income, net | (7) | (14) to (17) | |
Interest expense | 43 | 168 to 172 | |
Stock-based compensation expense | 61 | 250 to 260 | |
Depreciation and amortization of intangibles | 20 | 76 to 80 | |
Adjusted EBITDA | $315 to $320 | $1,280 to $1,325 | |
Revenue | $850 to $860 | $3,410 to $3,535 | |
Net Income Margin (at the mid-point of the ranges) | 19% | 19% | |
Adjusted EBITDA Margin (at the mid-point of the ranges) | 37% | 38% | |
Reconciliation of Forecasted Operating Cash Flow to Free Cash Flow
Year Ended December 31, 2026 | |
(In millions) | |
Net cash provided by operating activities | $1,150 to $1,190 |
Capital expenditures | (55 to 65) |
Free Cash Flow | $1,085 to $1,135 |
| 16 |
Reconciliation of GAAP Revenue to Non-GAAP Revenue, Excluding Foreign
Exchange Effects
Three Months Ended December 31, | Years Ended December 31, | ||||||||||||||
2025 | $ Change | % Change | 2024 | 2025 | $ Change | % Change | 2024 | ||||||||
(Dollars in millions, rounding differences may occur) | |||||||||||||||
Total Revenue, as reported | $878.0 | $17.8 | 2% | $860.2 | $3,487.2 | $7.8 | —% | $3,479.4 | |||||||
Foreign exchange effects | (19.8) | (23.8) | |||||||||||||
Total Revenue, excluding foreign exchange effects | $858.2 | $(2.0) | —% | $860.2 | $3,463.4 | $(16.0) | —% | $3,479.4 | |||||||
Direct Revenue, as reported | $860.3 | $15.0 | 2% | $845.4 | $3,414.9 | $(3.1) | —% | $3,418.0 | |||||||
Foreign exchange effects | (19.5) | (23.6) | |||||||||||||
Direct Revenue, excluding foreign exchange effects | $840.8 | $(4.5) | (1)% | $845.4 | $3,391.3 | $(26.7) | (1)% | $3,418.0 | |||||||
Tinder Direct Revenue, as reported | $463.8 | $(12.2) | (3)% | $476.0 | $1,862.9 | $(77.7) | (4)% | $1,940.6 | |||||||
Foreign exchange effects | (13.3) | (14.8) | |||||||||||||
Tinder Direct Revenue, excluding foreign exchange effects | $450.4 | $(25.6) | (5)% | $476.0 | $1,848.1 | $(92.5) | (5)% | $1,940.6 | |||||||
Hinge Direct Revenue, as reported | $186.5 | $38.8 | 26% | $147.7 | $690.9 | $140.4 | 26% | $550.4 | |||||||
Foreign exchange effects | (2.9) | (4.6) | |||||||||||||
Hinge Direct Revenue, excluding foreign exchange effects | $183.5 | $35.8 | 24% | $147.7 | $686.2 | $135.8 | 25% | $550.4 | |||||||
E&E Direct Revenue, as reported | $144.5 | $(10.6) | (7)% | $155.1 | $593.8 | $(49.2) | (8)% | $643.0 | |||||||
Foreign exchange effects | (3.4) | (6.7) | |||||||||||||
E&E Direct Revenue, excluding foreign exchange effects | $141.1 | $(14.0) | (9)% | $155.1 | $587.1 | $(55.9) | (9)% | $643.0 | |||||||
MG Asia Direct Revenue, as reported | $65.6 | $(1.0) | (2)% | $66.6 | $267.3 | $(16.6) | (6)% | $283.9 | |||||||
Foreign exchange effects | 0.2 | 2.5 | |||||||||||||
MG Asia Direct Revenue, excluding foreign exchange effects | $65.8 | $(0.8) | (1)% | $66.6 | $269.8 | $(14.1) | (5)% | $283.9 | |||||||
MG Asia Direct Revenue excluding Hakuna, as reported | $65.6 | $(1.0) | (2)% | $66.6 | $267.3 | $(0.3) | —% | $267.6 | |||||||
Foreign exchange effects | 0.2 | 2.5 | |||||||||||||
MG Asia Direct Revenue excluding Hakuna, excluding foreign exchange effects | $65.8 | $(0.8) | (1)% | $66.6 | $269.8 | $2.2 | 1% | $267.6 | |||||||
Azar Direct Revenue | $38.8 | $0.3 | 1% | $38.6 | $155.8 | $1.3 | 1% | $154.5 | |||||||
Foreign exchange effects | (0.1) | 3.9 | |||||||||||||
Azar Direct Revenue, excluding foreign exchange effects | $38.8 | $0.2 | 1% | $38.6 | $159.6 | $5.1 | 3% | $154.5 | |||||||
Pairs Direct Revenue, as reported | $26.7 | $(1.3) | (5)% | $28.1 | $111.6 | $(1.6) | (1)% | $113.1 | |||||||
Foreign exchange effects | 0.3 | (1.3) | |||||||||||||
Pairs Direct Revenue, excluding foreign exchange effects | $27.0 | $(1.0) | (4)% | $28.1 | $110.2 | $(2.9) | (3)% | $113.1 | |||||||
| 17 |
Dilutive Securities
Match Group has various tranches of dilutive securities. The table below details these securities and their
potentially dilutive impact (shares in millions; rounding differences may occur).
Average Exercise Price | 1/31/2026 | ||
Share Price | $31.15 | ||
Absolute Shares | 232.6 | ||
Equity Awards | |||
Options | $17.81 | 0.1 | |
RSUs and subsidiary denominated equity awards | 8.3 | ||
Total Dilution - Equity Awards | 8.4 | ||
Outstanding Warrants | |||
Warrants expiring on September 15, 2026 (5.0 million outstanding) | $130.90 | — | |
Warrants expiring on April 15, 2030 (7.0 million outstanding) | $130.95 | — | |
Total Dilution - Outstanding Warrants | — | ||
Total Dilution | 8.4 | ||
% Dilution | 3.5% | ||
Total Diluted Shares Outstanding | 241.0 |
______________________
The dilutive securities presentation above is calculated using the methods and assumptions described below;
these are different from GAAP dilution, which is calculated based on the treasury stock method.
Options — The table above assumes the options are settled net of the option exercise price and employee
withholding taxes, as is our practice, and the dilutive effect is presented as the net shares that would be issued
upon exercise. Withholding taxes paid by the Company on behalf of the employees upon exercise is
estimated to be $4.0 million, assuming the stock price in the table above and a 50% estimated employee
withholding tax rate.
RSUs and subsidiary denominated equity awards — The table above assumes RSUs are settled net of
employee withholding taxes, as is our practice, and the dilutive effect is presented as the net number of
shares that would be issued upon vesting. Withholding taxes paid by the Company on behalf of the
employees upon vesting is estimated to be $258.1 million, assuming the stock price in the table above and a
50% withholding rate.
All performance-based and market-based awards reflect the expected shares that will vest based on current
performance or market estimates. The table assumes no change in the fair value estimate of the subsidiary
denominated equity awards from the values used for GAAP purposes at December 31, 2025.
Exchangeable Senior Notes — The Company has two series of Exchangeable Senior Notes outstanding. In
the event of an exchange, each series of Exchangeable Senior Notes can be settled in cash, shares, or a
combination of cash and shares. At the time of each Exchangeable Senior Notes issuance, the Company
purchased call options with a strike price equal to the exchange price of each series of Exchangeable Senior
Notes (“Note Hedge”), which can be used to offset the dilution of each series of the Exchangeable Senior
Notes. No dilution is reflected in the table above for any of the Exchangeable Senior Notes because it is the
Company’s intention to settle the Exchangeable Senior Notes with cash equal to the face amount of the
notes; any shares issued would be offset by shares received upon exercise of the Note Hedge.
Warrants — At the time of the issuance of each series of Exchangeable Senior Notes, the Company also sold
warrants for the number of shares with the strike prices reflected in the table above. The cash generated from
the exercise of the warrants is assumed to be used to repurchase Match Group shares and the resulting net
dilution, if any, is reflected in the table above.
| 18 |
Non-GAAP Financial Measures
Match Group reports Adjusted EBITDA, Adjusted EBITDA Margin, Free Cash Flow, and Revenue Excluding
Foreign Exchange Effects, all of which are supplemental measures to U.S. generally accepted accounting
principles (“GAAP”). The Adjusted EBITDA, Adjusted EBITDA Margin, and Free Cash Flow measures are among
the primary metrics by which we evaluate the performance of our business, on which our internal budget is
based and by which management is compensated. Revenue Excluding Foreign Exchange Effects provides a
comparable framework for assessing the performance of our business without the effect of exchange rate
differences when compared to prior periods. We believe that investors should have access to the same set of
tools that we use in analyzing our results. These non-GAAP measures should be considered in addition to
results prepared in accordance with GAAP but should not be considered a substitute for or superior to GAAP
results. Match Group endeavors to compensate for the limitations of the non-GAAP measures presented by
providing the comparable GAAP measures and descriptions of the reconciling items, including quantifying
such items, to derive the non-GAAP measures. We encourage investors to examine the reconciling
adjustments between the GAAP and non-GAAP measures, which we describe below. Interim results are not
necessarily indicative of the results that may be expected for a full year.
Definitions of Non-GAAP Measures
Adjusted EBITDA is defined as net income attributable to Match Group, Inc. shareholders excluding: (1) net
income attributable to noncontrolling interests; (2) income tax provision or benefit; (3) other income (expense),
net; (4) interest expense; (5) depreciation; (6) acquisition-related items consisting of amortization of intangible
assets and impairments of goodwill and intangible assets, if applicable and (ii) gains and losses recognized on
changes in fair value of contingent consideration arrangements, as applicable; and (7) stock-based
compensation expense. We believe Adjusted EBITDA is useful to analysts and investors as this measure allows
a more meaningful comparison between our performance and that of our competitors. Adjusted EBITDA has
certain limitations because it excludes certain expenses. At a segment level, the closest GAAP measure is
operating income as items outside operating income are not allocated to segments.
Adjusted EBITDA Margin is defined as Adjusted EBITDA divided by revenues. We believe Adjusted EBITDA
Margin is useful for analysts and investors as this measure allows a more meaningful comparison between our
performance and that of our competitors. Adjusted EBITDA Margin has certain limitations in that it does not
take into account the impact to our consolidated statement of operations of certain expenses.
Free Cash Flow is defined as net cash provided by operating activities, less capital expenditures. We believe
Free Cash Flow is useful to investors because it represents the cash that our operating businesses generate,
before taking into account non-operational cash movements. Free Cash Flow has certain limitations in that it
does not represent the total increase or decrease in the cash balance for the period, nor does it represent the
residual cash flow for discretionary expenditures. Therefore, we think it is important to evaluate Free Cash
Flow along with our consolidated statement of cash flows.
We look at Free Cash Flow as a measure of the strength and performance of our businesses, not for valuation
purposes. In our view, applying “multiples” to Free Cash Flow is inappropriate because it is subject to timing,
seasonality and one-time events. We manage our business for cash, and we think it is of utmost importance
to maximize cash – but our primary valuation metric is Adjusted EBITDA.
Revenue Excluding Foreign Exchange Effects is calculated by translating current period revenues using
prior period exchange rates. The percentage change in Revenue Excluding Foreign Exchange Effects is
calculated by determining the change in current period revenues over prior period revenues where current
period revenues are translated using prior period exchange rates. We believe the impact of foreign exchange
rates on Match Group, due to its global reach, may be an important factor in understanding period over
period comparisons if movement in rates is significant. Since our results are reported in U.S. dollars,
international revenues are favorably impacted as the U.S. dollar weakens relative to other currencies, and
unfavorably impacted as the U.S. dollar strengthens relative to other currencies. We believe the presentation
of revenue excluding foreign exchange effects in addition to reported revenue helps improve the ability to
understand Match Group’s performance because it excludes the impact of foreign currency volatility that is
not indicative of Match Group’s core operating results.
| 19 |
Non-Cash Expenses That Are Excluded From Our Non-GAAP Measures
Stock-based compensation expense consists principally of expense associated with the grants of RSUs,
performance-based RSUs, and market-based awards. These expenses are not paid in cash, and we include the
related shares in our fully diluted shares outstanding using the treasury stock method; however, performance-
based RSUs and market-based awards are included only to the extent the applicable performance or market
condition(s) have been met (assuming the end of the reporting period is the end of the contingency period).
To the extent stock-based awards are settled on a net basis, we remit the required tax-withholding amounts
from our current funds.
Depreciation is a non-cash expense relating to our property and equipment and is computed using the
straight-line method to allocate the cost of depreciable assets to operations over their estimated useful lives,
or, in the case of leasehold improvements, the lease term, if shorter.
Amortization of intangible assets and impairments of goodwill and intangible assets are non-cash
expenses related primarily to acquisitions. At the time of an acquisition, the identifiable definite-lived
intangible assets of the acquired company, such as customer lists, trade names and technology, are valued
and amortized over their estimated lives. Value is also assigned to (i) acquired indefinite-lived intangible
assets, which consist of trade names and trademarks, and (ii) goodwill, which are not subject to amortization.
An impairment is recorded when the carrying value of an intangible asset or goodwill exceeds its fair value.
We believe that intangible assets represent costs incurred by the acquired company to build value prior to
acquisition and the related amortization and impairment charges of intangible assets or goodwill, if
applicable, are not ongoing costs of doing business.
Additional Definitions
Tinder consists of the world-wide activity of the brand Tinder®.
Hinge consists of the world-wide activity of the brand Hinge®.
Evergreen & Emerging (“E&E”) consists of the world-wide activity of our Evergreen brands, including Match®,
Meetic®, OkCupid®, Plenty Of Fish®, and a number of demographically focused brands and our Emerging
brands including, BLK®, ChispaTM, The League®, Archer®, Upward®, YuzuTM, Salams®, HERTM, and other smaller
brands.
Match Group Asia (“MG Asia”) consists of the world-wide activity of the brands Pairs® and Azar®.
Direct Revenue is revenue that is received directly from end users of our services and includes both
subscription and à la carte revenue.
Indirect Revenue is revenue that is not received directly from end users of our services, a majority of which is
advertising revenue.
Payers are unique users at a brand level in a given month from whom we earned Direct Revenue. When
presented as a quarter-to-date or year-to-date value, Payers represents the average of the monthly values for
the respective period presented. At a consolidated level and a business unit level to the extent a business unit
consists of multiple brands, duplicate Payers may exist when we earn revenue from the same individual at
multiple brands in a given month, as we are unable to identify unique individuals across brands in the Match
Group portfolio.
Revenue Per Payer (“RPP”) is the average monthly revenue earned from a Payer and is Direct Revenue for a
period divided by the Payers in the period, further divided by the number of months in the period.
Monthly Active User (“MAU”) is a unique registered user at a brand level who has visited the brand’s app or, if
applicable, their website in the given month. For measurement periods that span multiple months, the
average of each month is used. At a consolidated level and a business unit level to the extent a business unit
consists of multiple brands, duplicate users will exist within MAU when the same individual visits multiple
brands in a given month.
| 20 |
Leverage on a gross basis is calculated as principal debt balance divided by Adjusted EBITDA for the period
referenced.
Leverage on a net basis is calculated as principal debt balance less cash and cash equivalents and short-term
investments divided by Adjusted EBITDA for the period referenced.
Safe Harbor Statement Under the Private Securities Litigation Reform Act of
1995
These prepared remarks and our conference call, which will be held at 5:00 p.m. Eastern Time on February 3,
2026, may contain “forward-looking statements” within the meaning of the Private Securities Litigation
Reform Act of 1995. All statements that are not historical facts are “forward looking statements.” The use of
words such as “anticipates,” “estimates,” “expects,” “plans,” “believes,” “will,” and “would,” among others,
generally identify forward-looking statements. These forward-looking statements include, among others,
statements relating to: Match Group’s future financial performance, Match Group’s business prospects and
strategy, anticipated trends, and other similar matters. These forward-looking statements are based on
management’s current expectations and assumptions about future events, which are inherently subject to
uncertainties, risks and changes in circumstances that are difficult to predict. Actual results could differ
materially from those contained in these forward-looking statements for a variety of reasons, including,
among others: failure to retain existing users or add new users, or if users do not convert to paying users;
competition; risks related to our restructuring and reorganization activities; our ability to attract and retain
users through cost-effective marketing efforts; our reliance on a variety of third-party platforms, in particular,
mobile app stores; our ability to realize reductions in in-app purchase fees; inappropriate actions by certain of
our users could be attributed to us or may not be adequately prevented by us; dependence on our key
personnel; volatile global economic conditions; operational and financial risks in connection with acquisitions;
impairment charges related to our intangible assets; operations in various international markets, including
certain markets in which we have limited experience; foreign currency exchange rate fluctuations; challenges
in measuring our user metrics and other estimates; the limited operating history of our newer brands and
services makes it difficult to evaluate our current business and future prospects; impacts of climate change;
the integrity of our and third parties’ systems and infrastructure; cyberattacks on our systems and
infrastructure and cyberattacks experienced by third parties; our ability to access, collect, and use personal
data about our users; breaches or unauthorized access of personal and confidential or sensitive user
information that we maintain and store; challenges with properly managing the use of artificial intelligence;
risks related to credit card payments; risks related to our use of “open source” software; complex and evolving
U.S., foreign, and international laws and regulations; our ability to protect our intellectual property rights or
accusations that we infringe upon the intellectual property rights of others; adverse outcomes in litigation;
risks related to our taxation in multiple jurisdictions; risks related to our indebtedness; and risks relating to
ownership of our common stock. Certain of these and other risks and uncertainties are discussed in Match
Group’s filings with the Securities and Exchange Commission. Other unknown or unpredictable factors that
could also adversely affect Match Group’s business, financial condition and results of operations may arise
from time to time. In light of these risks and uncertainties, these forward-looking statements may not prove to
be accurate. Accordingly, you should not place undue reliance on these forward-looking statements, which
only reflect the views of Match Group management as of the date of this press release. Match Group does not
undertake to update these forward-looking statements.