Proxy Statement Pursuant to Section 14(a) of |
the Securities Exchange Act of 1934 (Amendment No. ) |


Proposal | Voting Options and Board Recommendation | Voting Standard | Effect of Abstentions | Effect of Broker Non-Votes | ||||
Proposal 1: Election of Directors | FOR, AGAINST or ABSTAIN (for each nominee for director) The Board recommends a vote “FOR” each of the four Match Group nominees for director | For each director nominee, majority of the votes cast | No effect | No effect – broker discretionary voting is not permitted | ||||
Proposal 2: Advisory Vote to Approve Executive Compensation | FOR, AGAINST or ABSTAIN The Board recommends a vote “FOR” the advisory vote to approve executive compensation | Majority of the voting power of the shares present or represented by proxy and entitled to vote on the matter | Same effect as a vote AGAINST the proposal | No effect – broker discretionary voting is not permitted | ||||
Proposal 3: Approval of the Second Amended and Restated 2024 Stock and Annual Incentive Plan | FOR, AGAINST or ABSTAIN The Board recommends a vote “FOR” the approval of the Second Amended and Restated 2024 Stock and Annual Incentive Plan | Majority of the voting power of the shares present or represented by proxy and entitled to vote on the matter | Same effect as a vote AGAINST the proposal | No effect – broker discretionary voting is not permitted |
Proposal | Voting Options and Board Recommendation | Voting Standard | Effect of Abstentions | Effect of Broker Non-Votes | ||||
Proposal 4: Ratification of the Appointment of Ernst & Young | FOR, AGAINST or ABSTAIN The Board recommends a vote “FOR” the ratification | Majority of the voting power of the shares present or represented by proxy and entitled to vote on the matter | Same effect as a vote AGAINST the proposal | No broker non-votes are expected - broker discretionary voting is permitted |


Female | Male | |
Gender Identity: | ||
Directors | 5 | 6 |
Demographic Background: | ||
African American or Black | 0 | 1 |
Hispanic or Latinx | 0 | 1 |
White | 5 | 4 |

Share Allocation and Potential Dilution | |
2024 Plan additional share request | 6,250,000 |
Shares currently available for future awards(1) | 9,312,930 |
Shares subject to currently outstanding full value awards(1) | 18,707,442 |
Shares subject to currently outstanding stock options(2) | 644,849 |
Total potential equity awards | 34,915,221 |
Shares outstanding | 233,884,942 |
Potential dilution from equity awards | 14.93% |
2023 | 2024 | 2025 | |
Burn rate (annual)(1) | 1.93% | 2.58% | 3.21% |
Name | RSUs and PSUs Granted Since Adoption of Plan(1) |
Spencer Rascoff | 2,409,833 |
Steven Bailey | 434,672 |
Sean Edgett | 346,529 |
Hesam Hosseini | 326,712 |
Bernard Kim | — |
Gary Swidler | — |
Name | RSUs and PSUs Granted Since Adoption of Plan(1) |
All current executive officers as a group (4 persons) | 3,517,746 |
All non-employee directors as a group (10 persons) | 83,980 |
Manuel Bronstein (director nominee) | — |
Laura Rachel Jones (director nominee) | 8,398 |
Ann L. McDaniel (director nominee) | 8,398 |
Thomas J. McInerney (director nominee) | 8,398 |
All employees, including all current officers who are not executive officers, as a group (1,598 persons) | 14,369,475 |
2025 | 2024 | ||||
Audit Fees | $4,904,434 | (1) | $4,721,702 | (2) | |
Audit-Related Fees | $— | $— | |||
Total Audit and Audit-Related Fees | $4,904,434 | $4,721,702 | |||
Tax Fees | $185,073 | (3) | $45,980 | (4) | |
Total Fees | $5,089,507 | $4,767,682 | |||
Named Executive Officer | Position |
Spencer Rascoff | Chief Executive Officer (since February 4, 2025) |
Steven Bailey | Chief Financial Officer (since March 1, 2025) |
Sean Edgett | Chief Legal Officer and Secretary |
Hesam Hosseini | Chief Operating Officer (since April 1, 2025) & Former CEO, Evergreen & Emerging Brands (until March 31, 2026) |
Bernard Kim | Former Chief Executive Officer (until February 4, 2025) |
Gary Swidler | Former President (until April 1, 2025) and Former Chief Financial Officer (until March 1, 2025) |
Spencer Rascoff CEO 2025 New-Hire Compensation | ||
Pay Element | Target Value(1) | Key Features |
Annual Base Salary | $800,000 | |
Annual Cash Bonus | 200% of annual base salary | •Payout determined based on financial and individual performance consistent with our 2025 program design |
Initial PSUs | $10,800,000 | •Three-year performance period tied to Match Group’s total shareholder return (“TSR”) relative to the other companies in the Nasdaq Composite index •Vests, if earned, on the third anniversary of grant |
Initial RSUs | $7,200,000 | •Three-year vesting: 1/3 of the award vests on the first anniversary of grant, with the remainder vesting ratably 1/12 or 8.33% over following quarters, subject to continued service |
New-Hire Value Creation Award (the "VCA") | $30,000,000 | •Three-year performance period; eligible to vest in three equal tranches subject to achievement of stock price hurdles of $40, $50 and $60(2) ◦For each tranche, 50% vests upon achievement of the stock price hurdle, and 50% vests at the end of the three-year performance period, subject to continued service through each vesting date |
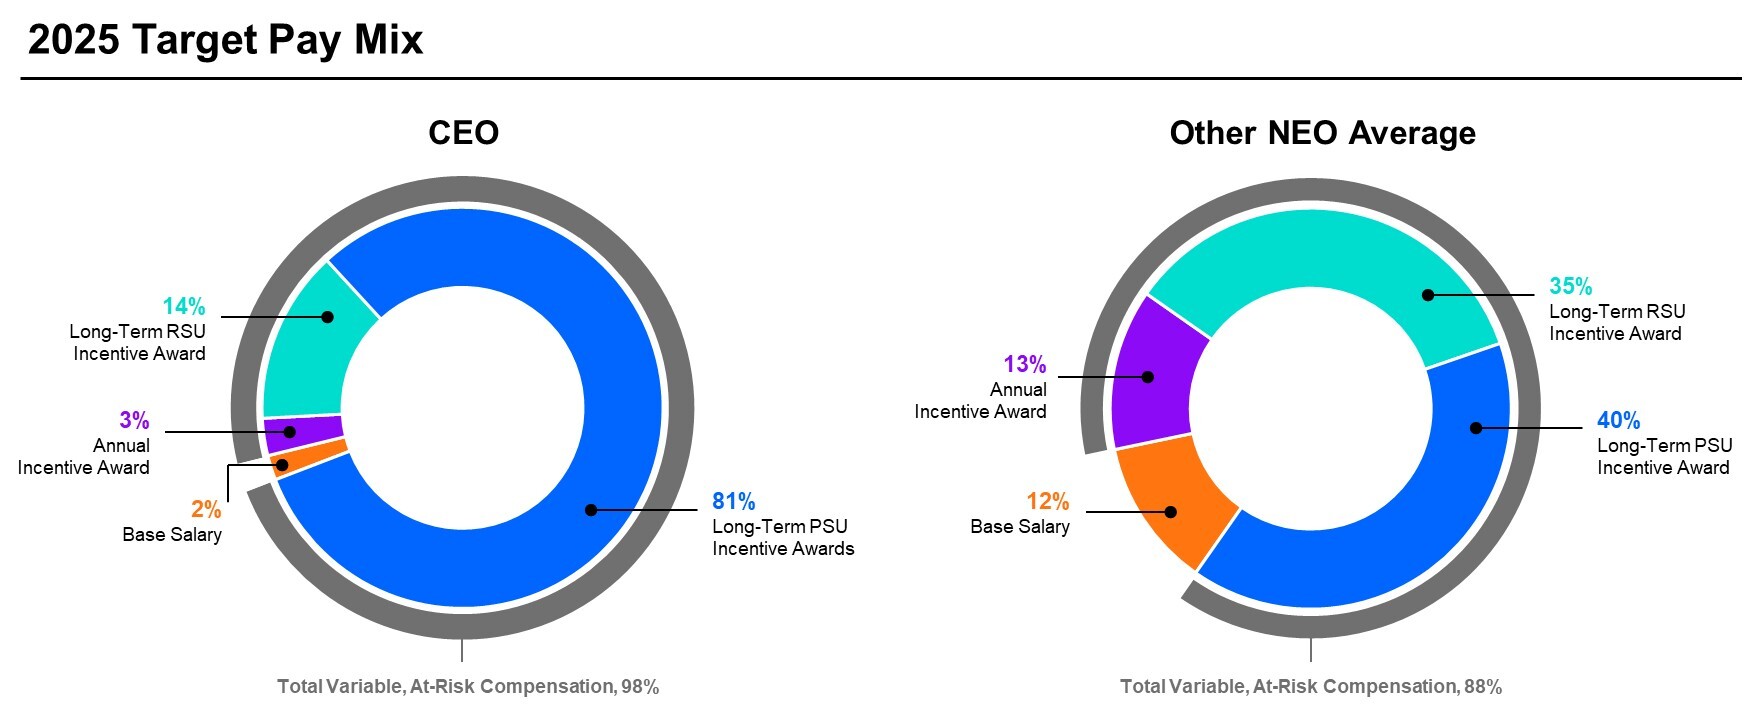
Pays for performance: | We take a rigorous performance-based approach to executive compensation. A significant portion of NEO pay is not guaranteed but rather is at risk and/or based on attaining various Company and individual performance objectives. |
Instills an ownership culture: | Our ownership culture guides our decision to make equity awards the most significant component of our NEOs’ annual pay opportunities. 2025 long-term incentives were granted in the form of RSUs and PSUs, as discussed further in "Compensation Elements – Long-Term Incentives" below, to motivate and reward absolute and relative long-term value creation for our stockholders, strongly linking the interests of each of our NEOs with those of our stockholders. |
Pays competitively: | We set compensation levels that are competitive with those of individuals holding comparable positions at companies with which we compete for talent and that are of similar size, market valuation and business complexity. |
Values stockholder input: | We consider feedback from our stockholders relevant to our compensation practices. |


What We Do | What We Don’t Do | |
✓ Pay for performance - structure a substantial portion of pay to be “at risk” and based on Company and individual performance ✓ Use objective performance-based Company goals that are designed to be rigorous in our incentive programs ✓ Annually review the composition of our executive compensation peer group to evaluate whether the peer group remains appropriate considering our size and industry ✓ Conduct an annual advisory say-on-pay vote on our NEO compensation ✓ Formally assess risk within the executive compensation program ✓ Ensure the independence of the members of the Committee and the advisors who report to them ✓ Maintain stock ownership guidelines that reinforce the alignment of NEO and stockholder interests ✓ Prohibit hedging and pledging transactions with respect to our securities ✓ Maintain a clawback policy regarding recovery of erroneously awarded compensation in the event of an accounting restatement and can require forfeiture or reimbursement of RSUs and PSUs in certain other circumstances | x No guaranteed base salary increases x No excise tax gross ups for NEOs x No excessive perquisites x No “single-trigger” change in control payments x No repricing of underwater options without stockholder approval |


Target Compensation Opportunities: | ▪No NEO salaries were increased, other than for Mr. Bailey upon his promotion to Chief Financial Officer and Mr. Hosseini upon his promotion to Chief Operating Officer. ▪No NEO annual target bonus opportunities were increased, except for Mr. Hosseini upon his promotion to Chief Operating Officer. Mr. Rascoff’s target bonus of 200% was set upon his appointment as Chief Executive Officer. ▪Equity award opportunities for NEOs hired or promoted during the year were informed by those actions. As Mr. Edgett joined Match Group near the end of 2024, the size of his 2025 equity awards was limited in accordance with the Company’s standard practice of limiting or not granting annual refresher awards to employees joining towards the end of the previous year. ▪Mr. Kim and Mr. Swidler did not receive 2025 equity awards due to the timing of their respective departures. |
Annual Program Design: | ▪Consistent with our 2024 design, the 2025 annual bonus program measured Company revenue and profitability performance to determine the majority of bonus payouts for each of our current NEOs, as discussed further in "Compensation Elements – Annual Bonuses" below. ▪Excluding Mr. Rascoff's New-Hire Value Creation Award, 60% of the target value of his and Mr. Hosseini's 2025 equity awards were in the form of PSUs and 40% were in the form of RSUs. Annual equity awards for all other NEOs were delivered in an equal mix of RSUs and PSUs. Mr. Rascoff's New-Hire Value Creation Award requires significant stock price appreciation to vest and brings the aggregate performance-based portion of the target value of Mr. Rascoff's new hire equity awards to 85%. Our emphasis on equity opportunities incentivizes long-term value creation and ensures that NEOs’ pay is primarily at-risk based on our stock price performance, creating strong alignment with our stockholders. In addition, the three-year vesting periods reduce the risk that our NEOs will place too much focus on short-term achievements to the detriment of the long- term goals of the Company. For additional information on the equity awards granted to our NEOs during 2025, including a description of how target values are converted into a number of PSUs and RSUs, see “Compensation Elements – Long-Term Incentives.” ▪PSUs granted in 2025, other than Mr. Rascoff's New-Hire Value Creation Award, continue to have their payout solely based on Match Group’s 3-year relative TSR (“rTSR”) percentile rank among Nasdaq Composite index companies. The payout range for our PSUs was widened for 2025. See “Compensation Elements – Long-Term Incentives”. |
Pay Outcomes: | ▪2025 NEO annual bonus payouts averaged 93% of target. ▪Mr. Hosseini received the second $500,000 installment of a one-time retention bonus that was awarded in 2023. ▪All the PSUs awarded in 2021 and 2022 to NEOs that were scheduled to vest in 2025 were earned at 0% of target with no payout based on the Company's relative stock growth performance over the four-year and three-year periods ending in 2025, respectively. |
Criteria for Peer Group | General Characteristics |
Revenue | •Approximately 0.5x to 2.0x Match Group’s last 12-month revenue of $3.5B (~$1.7B to ~$6.9B as of August 22, 2024). •Select companies outside this guideline may be retained if they are particularly relevant. |
Market Capitalization | •Approximately 0.33x to 3.0x Match Group’s then current 30-day average market capitalization of ~$9.0B (~$3.0B to ~$27.0B as of August 22, 2024). •Given market volatility, some peers may be slightly outside this range. |
Qualitative Factors | •In addition, the Committee considers other characteristics such as growth rate, profitability, a company’s proximity to its IPO, whether a company has a relevant business model or is a competitor, peers identified by proxy advisory firms, and whether a company has named Match Group as a peer. |
Akamai Technologies Inc. (AKAM) | eBay Inc. (EBAY) | Maplebear Inc. (dba Instacart) (CART) | Roku, Inc. (ROKU) |
Bumble Inc. (BMBL) | Etsy Inc. (ETSY) | Light & Wonder, Inc. (LNW.AX) | Snap Inc. (SNAP) |
DocuSign, Inc. (DOCU) | Expedia Group, Inc. (EXPE) | Lyft, Inc. (LYFT) | Take-Two Interactive Software Inc. (TTWO) |
DraftKings Inc. (DKNG) | GoDaddy Inc. (GDDY) | Pinterest, Inc. (PINS) | Zillow Group, Inc. (ZG) |
Dropbox, Inc. (DBX) | IAC Inc. (IAC) | Roblox Corp. (RBLX) | Zoom Communications, Inc. (ZM) |
NEO | Annualized Base Salary for 2025 |
Spencer Rascoff | $800,000 |
Steven Bailey* | $475,000 |
Sean Edgett | $500,000 |
Hesam Hosseini* | $635,000 |
Bernard Kim | $1,000,000 |
Gary Swidler | $675,000 |
Metric | Threshold (25% Payout) | Target (100% Payout) | Maximum (200% Payout) | Reported Results | Adjusted Results(1) | Payout % |
Revenue (35% weighting) | $3,360M | $3,445M | $3,665M | $3,487M | $3,383M | 45.8% |
Adjusted EBITDA Margin (35% weighting) | 36.0% | 36.5% | 39.5% | 35.5% | 37.3% | 125.2% |
NEO | Key Individual Achievements | Payout % of Target |
Spencer Rascoff, Chief Executive Officer | •Development of the strategic agenda for the Company •Launch of the three-phase turnaround, and completion of the Reset phase early in the year •Realignment of the Company around user outcomes and product execution •Simplification of the organization and rationalization of costs •Efforts as Chief Executive Officer of Tinder in addition to Match Group | 113% |
Steven Bailey, Chief Financial Officer | •Strong management of our finance, tax, investor relations, treasury, real estate and facilities, business technology, and corporate social responsibility functions •Successful transition to the role of Chief Financial Officer during the year •Leadership and efforts to rationalize costs and execute with greater financial discipline across the Company | 123% |
NEO | Key Individual Achievements | Payout % of Target |
Sean Edgett, Chief Legal Officer | •Strong management of our legal, compliance, privacy, cybersecurity, corporate affairs and communications functions, including the immediate value he quickly added to the Company shortly after joining and willingness to take on additional responsibilities •Leadership in reducing legal costs and settling outstanding lawsuits that were distractions to management focus | 117% |
Hesam Hosseini, Chief Operating Officer and Chief Executive Officer, Evergreen and Emerging Brands | •Leadership in rationalizing costs across the Company and implementing alternative payment solutions to reduce in-app payment fees •Effective oversight of the Evergreen & Emerging segment’s consolidation of technology platforms across various Evergreen and Emerging brands to enable faster new feature releases and to reduce the cost to maintain those platforms | 93% |
NEO(1) | Target Bonus % | Target Bonus ($) | Weighted Revenue Performance Payout | Weighted Adjusted EBITDA Margin Performance Payout | Weighted Individual Performance Payout | Total Payout % | Total Bonus Payout |
Spencer Rascoff | 200% | $1,600,000 | $256,480 | $701,120 | $542,400 | 94% | $1,500,000 |
Steven Bailey(2) | 100% | $433,619 | $69,509 | $190,012 | $160,479 | 97% | $420,000 |
Sean Edgett | 100% | $500,000 | $80,150 | $219,100 | $175,750 | 95% | $475,000 |
Hesam Hosseini(2) | 150% | $853,253 | $136,776 | $373,895 | $239,328 | 88% | $750,000 |
NEO | RSUs | PSUs (at target) |
Spencer Rascoff | $7,200,000 | $10,800,000 |
Steven Bailey | $1,875,000 | $1,875,000 |
Sean Edgett | $750,000 | $750,000 |
Hesam Hosseini | $3,600,000 | $5,400,000 |
rTSR Percentile Ranking Among Nasdaq Composite Companies | rTSR Multiplier(1) |
Below 30th (Below Threshold) | 0% |
30th (Threshold) | 30% |
55th (Target) | 100% |
90th and above (Maximum) | 200% |
rTSR Percentile Ranking Among Nasdaq Composite Companies | rTSR Multiplier(1) |
Below 25th (Below Threshold) | 0% |
25th (Threshold) | 25% |
55th (Target) | 100% |
90th and above (Maximum) | 200% |
Match Group Stock Growth | Median Nasdaq-100 Company Stock Growth | Relative Stock Growth | Payout % |
-77.49% | 37.97% | -115.47% | 0% |
rTSR Percentile Ranking Among Nasdaq-100 Companies | rTSR Multiplier(1) |
Below 30th (Below Threshold) | 0% |
30th (Threshold) | 30% |
55th (Target) | 100% |
85th and above (Maximum) | 225% |
Match Group TSR | Percentile Ranking Among Nasdaq-100 | Payout % |
-69.99% | 0% | 0% |
Match Group TSR | Percentile Ranking Among Nasdaq-100 | Payout % |
-61.43% | 0% | 0% |
Position | Multiple of Base Salary |
Chief Executive Officer | 6x |
Chief Financial Officer | 3x |
Chief Legal Officer | 3x |
All Other NEOs | 2x |
Name and Principal Position(1) | Year | Salary ($)(2) | Bonus ($)(3) | Stock Awards ($)(4) | Non-Equity Incentive Plan Compensation ($)(5) | All Other Compensation ($)(6) | Total | |||||||
Spencer Rascoff | 2025 | $689,231 | $290,640 | $44,790,300 | $1,209,360 | $34,722 | $47,014,253 | |||||||
Chief Executive Officer | ||||||||||||||
Steven Bailey | 2025 | $451,731 | $78,767 | $4,600,803 | $341,233 | $10,000 | $5,482,534 | |||||||
Chief Financial Officer | ||||||||||||||
Sean Edgett | 2025 | $500,000 | $90,825 | $1,840,304 | $384,175 | $10,000 | $2,825,304 | |||||||
Chief Legal Officer | 2024 | $115,385 | — | $5,866,844 | $63,182 | $4,808 | $6,050,219 | |||||||
Hesam Hosseini | 2025 | $610,154 | $654,993 | $11,450,456 | $595,007 | $25,000 | $13,335,610 | |||||||
Chief Operating Officer | ||||||||||||||
Bernard Kim | 2025 | $240,385 | — | — | — | $10,390,107 | $10,630,492 | |||||||
Former Chief Executive | 2024 | $1,000,000 | — | $14,321,295 | $415,000 | $10,000 | $15,746,295 | |||||||
Officer | 2023 | $1,000,000 | $1,860,000 | $13,210,272 | — | $10,000 | $16,080,272 | |||||||
Gary Swidler | 2025 | $454,327 | — | — | — | $10,000 | $464,327 | |||||||
Former President and CFO | 2024 | $675,000 | — | $6,609,799 | $523,125 | $10,000 | $7,817,924 | |||||||
2023 | $675,000 | $1,255,500 | $11,053,195 | — | $10,000 | $12,993,695 |
Name | Grant Date | Maximum Grant Date Fair Value of PSUs Granted in 2025 | ||
Spencer Rascoff | 3/1/25 | $20,384,964 | ||
Steven Bailey | 3/1/25 | $3,510,804 | ||
Sean Edgett | 3/1/25 | $1,404,309 | ||
Hesam Hosseini | 3/1/25 | $10,111,241 |
Name | Grant Date(1) | Approval Date | Estimated Possible Payouts Under Non-Equity Incentive Plan Awards(2) | Estimated Future Payouts Under Equity Incentive Plan Awards | All Other Stock Awards: Number of Shares of Stock or Units (#) | Grant Date Fair Value of Stock Awards ($) | ||||||||||||||
Threshold ($) | Target ($) | Maximum ($) | Threshold (#) | Target (#) | Maximum (#) | |||||||||||||||
Spencer Rascoff | 2/4/25(3) | 2/2/25 | – | – | – | – | – | – | 214,285 | $7,814,974 | ||||||||||
2/4/25(4) | 2/2/25 | – | – | – | – | 892,857 | – | – | $21,196,425 | |||||||||||
3/1/25(5) | 2/2/25 | – | – | – | 80,357 | 321,428 | 642,856 | – | $15,778,901 | |||||||||||
– | – | $280,000 | $1,600,000 | $2,840,000 | – | – | – | – | – | |||||||||||
Steven Bailey | 2/20/25(3) | 2/20/25 | – | – | – | – | – | – | 55,358 | $1,874,975 | ||||||||||
3/1/25(5) | 2/20/25 | – | – | – | 13,840 | 55,358 | 110,716 | – | $2,725,828 | |||||||||||
– | – | $75,883 | $433,619 | $769,674 | – | – | – | – | – | |||||||||||
Sean Edgett | 2/20/25(3) | 2/20/25 | – | – | – | – | – | – | 22,143 | $749,983 | ||||||||||
3/1/25(5) | 2/20/25 | – | – | – | 5,536 | 22,143 | 44,286 | – | $1,090,321 | |||||||||||
– | – | $87,500 | $500,000 | $887,500 | – | – | – | – | – | |||||||||||
Hesam Hosseini | 2/20/25(3) | 2/20/25 | – | – | – | – | – | – | 106,288 | $3,599,975 | ||||||||||
3/1/25(5) | 2/20/25 | – | – | – | 39,858 | 159,433 | 318,866 | – | $7,850,481 | |||||||||||
– | – | $149,319 | $853,253 | $1,514,524 | – | – | – | – | – | |||||||||||
Gary Swidler | – | – | $236,250 | $1,350,000 | $2,396,250 | – | – | – | – | – | ||||||||||
Option Awards | Stock Awards | |||||||||||||||
Name | Grant Date(1) | Number of Securities Underlying Unexercised Options (#) Exercisable | Option Exercise Price ($) | Option Expiration Date | Number of Shares or Units of Stock That Have Not Vested (#) | Market Value of Shares or Units of Stock That Have Not Vested ($) | Equity Incentive Plan Awards: Number of Unearned Shares, Units or Other Rights That Have Not Vested (#) | Equity Incentive Plan Awards: Market or Payout Value of Unearned Shares, Units or Other Rights That Have Not Vested ($) | ||||||||
Spencer Rascoff | 3/1/25 | — | — | — | 218,221(2) | $7,046,356 | 327,333(3) | $10,569,583 | ||||||||
3/1/25 | — | — | — | — | — | 909,260(4) | $29,360,005 | |||||||||
Steven Bailey | 3/1/22 | — | — | — | 384(5) | $12,399 | — | — | ||||||||
3/1/23 | — | — | — | 1,373(6) | $44,334 | — | — | |||||||||
3/1/24 | — | — | — | 9,174(7) | $296,228 | — | — | |||||||||
3/1/25 | — | — | — | 56,375(2) | $1,820,349 | 56,375(3) | $1,820,349 | |||||||||
Sean Edgett | 10/1/24 | — | — | — | 46,721(8) | $1,508,621 | 70,079(9) | $2,262,851 | ||||||||
3/1/25 | — | — | — | 22,549(2) | $728,107 | 22,549(3) | $728,107 | |||||||||
Hesam Hosseini | 11/7/17 | 42,458 | $24.7678 | 11/7/27 | — | — | — | — | ||||||||
3/1/23 | — | — | — | 27,468(6) | $886,942 | — | — | |||||||||
5/1/23 | — | — | — | — | — | 82,406(10) | $2,660,890 | |||||||||
3/1/24 | — | — | — | 51,382(8) | $1,659,125 | 115,612(9) | $3,733,111 | |||||||||
3/1/25 | — | — | — | 108,240(2) | $3,495,070 | 162,362(3) | $5,242,669 | |||||||||
Bernard Kim | 3/1/23 | — | — | — | — | — | 43,263(11) | $1,396,962 | ||||||||
Option Awards | Stock Awards | |||||||
Name | Number of Shares Acquired on Exercise (#) | Value Realized on Exercise ($) | Number of Shares Acquired on Vesting (#) | Value Realized on Vesting ($)(1) | ||||
Spencer Rascoff | — | — | 7,033 | $214,436 | ||||
Steven Bailey | — | — | 20,452 | $670,741 | ||||
Sean Edgett | — | — | 23,222 | $820,201 | ||||
Hesam Hosseini | — | — | 69,142 | $2,192,493 | ||||
Bernard Kim | — | — | 207,077 | $7,330,526 | ||||
Gary Swidler | 144,208 | $2,771,063 | 100,807 | $3,162,631 | ||||
Standard FMV(1) | Portion of Shares that Vest |
$40, $50, or $60 Standard FMV achieved or exceeded prior to his Qualifying Termination | In each case, 1/6 vest upon Qualifying Termination date |
$40 Standard FMV not achieved or exceeded prior to his Qualifying Termination | 1/3 remain outstanding and eligible to vest through the first anniversary of his Qualifying Termination (or if earlier, May 4, 2028) and will vest upon satisfaction of a $40 Post-Termination FMV(2) |
$50 Standard FMV not achieved or exceeded prior to his Qualifying Termination | 1/3 remain outstanding and eligible to vest through the first anniversary of his Qualifying Termination (or if earlier, May 4, 2028) and will vest upon satisfaction of a $50 Post-Termination FMV |
$60 Standard FMV not achieved or exceeded prior to his Qualifying Termination | 1/3 remain outstanding and eligible to vest through the first anniversary of his Qualifying Termination (or if earlier, May 4, 2028) and will vest upon satisfaction of a $60 Post-Termination FMV |
Standard FMV(1) | Portion of Shares that Vest |
$40, $50, or $60 Standard FMV achieved or exceeded prior to his death | In each case, 1/6 vest upon termination date |
$40 Standard FMV not achieved or exceeded prior to his death | 1/3 remain outstanding and eligible to vest through the first anniversary of his death (or if earlier, May 4, 2028) and will vest upon satisfaction of a $40 Post-Termination FMV(2) |
$50 Standard FMV not achieved or exceeded prior to his death | 1/3 remain outstanding and eligible to vest through the first anniversary of his death (or if earlier, May 4, 2028) and will vest upon satisfaction of a $50 Post-Termination FMV |
$60 Standard FMV not achieved or exceeded prior to his death | 1/3 remain outstanding and eligible to vest through the first anniversary of his death (or if earlier, May 4, 2028) and will vest upon satisfaction of a $60 Post-Termination FMV |
Name and Benefit | Qualifying Termination | Qualifying Termination During the One Year Period Following a Change in Control of Match Group | Qualifying Termination During the Two Year Period Following a Change in Control of Match Group(1) | Change in Control without Assumption or Substitution of Awards | Death | |||||
Spencer Rascoff | ||||||||||
Continued salary | $800,000 | $1,200,000 | $800,000 | — | — | |||||
Bonus payment | $1,600,000 | $2,400,000 | $1,600,000 | — | — | |||||
Continued health coverage(2) | $52,934 | $78,841 | $52,934 | — | — | |||||
Market value of Match Group RSUs that would vest(3) | $4,111,486 | $7,046,356 | $7,046,356 | $7,046,356 | $4,111,486 | |||||
Market value of Match Group PSUs that would vest(4) | $2,948,914 | $39,929,588 | $39,929,588 | $39,929,588 | $2,948,914 | |||||
Total estimated incremental value | $9,513,334 | $50,654,785 | $49,428,878 | $46,975,944 | $7,060,400 | |||||
Steven Bailey | ||||||||||
Continued salary | $475,000 | $475,000 | $475,000 | — | — | |||||
Continued health coverage(2) | $41,129 | $41,129 | $41,129 | — | — | |||||
Market value of Match Group RSUs that would vest(3) | $1,355,793 | $2,173,311 | $2,173,311 | — | $1,355,793 | |||||
Market value of Match Group PSUs that would vest(4) | — | $1,820,349 | $1,820,349 | — | — | |||||
Total estimated incremental value | $1,871,922 | $4,509,789 | $4,509,789 | — | $1,355,793 | |||||
Sean Edgett | ||||||||||
Continued salary | $500,000 | $500,000 | $500,000 | — | — | |||||
Continued health coverage(2) | $52,934 | $52,934 | $52,934 | — | — | |||||
Market value of Match Group RSUs that would vest(3) | $1,179,037 | $2,236,728 | $2,236,728 | — | $1,179,037 | |||||
Market value of Match Group PSUs that would vest(4) | — | $2,990,958 | $2,990,958 | — | — | |||||
Total estimated incremental value | $1,731,971 | $5,780,620 | $5,780,620 | — | $1,179,037 | |||||
Hesam Hosseini | ||||||||||
Continued salary | $635,000 | $635,000 | $635,000 | — | — | |||||
Bonus payment | $952,500 | $952,500 | $952,500 | — | — | |||||
Continued health coverage(2) | $45,237 | $45,237 | $45,237 | — | — | |||||
Market value of Match Group RSUs that would vest(3) | $3,755,876 | $6,041,136 | $6,041,136 | — | $3,755,876 | |||||
Market value of Match Group PSUs that would vest(4) | — | $11,636,670 | $11,636,670 | — | — | |||||
Total estimated incremental value | $5,388,613 | $19,310,543 | $19,310,543 | — | $3,755,876 |
Plan Category | Number of Securities to be Issued upon Exercise of Outstanding Options, Warrants and Rights (A) | Weighted- Average Exercise Price of Outstanding Options, Warrants and Rights (B) | Number of Securities Remaining Available for Future Issuance Under Equity Compensation Plans (Excluding Securities Reflected in Column (A)) (C) | ||||||
Equity compensation plans approved by security holders(1) | 13,602,527 | (2) | $24.82 | (3) | 20,584,069 | (4) | |||
Equity compensation plans not approved by security holders | — | — | — | ||||||
Total | 13,602,527 | (2) | $24.82 | (3) | 20,584,069 | (4) | |||
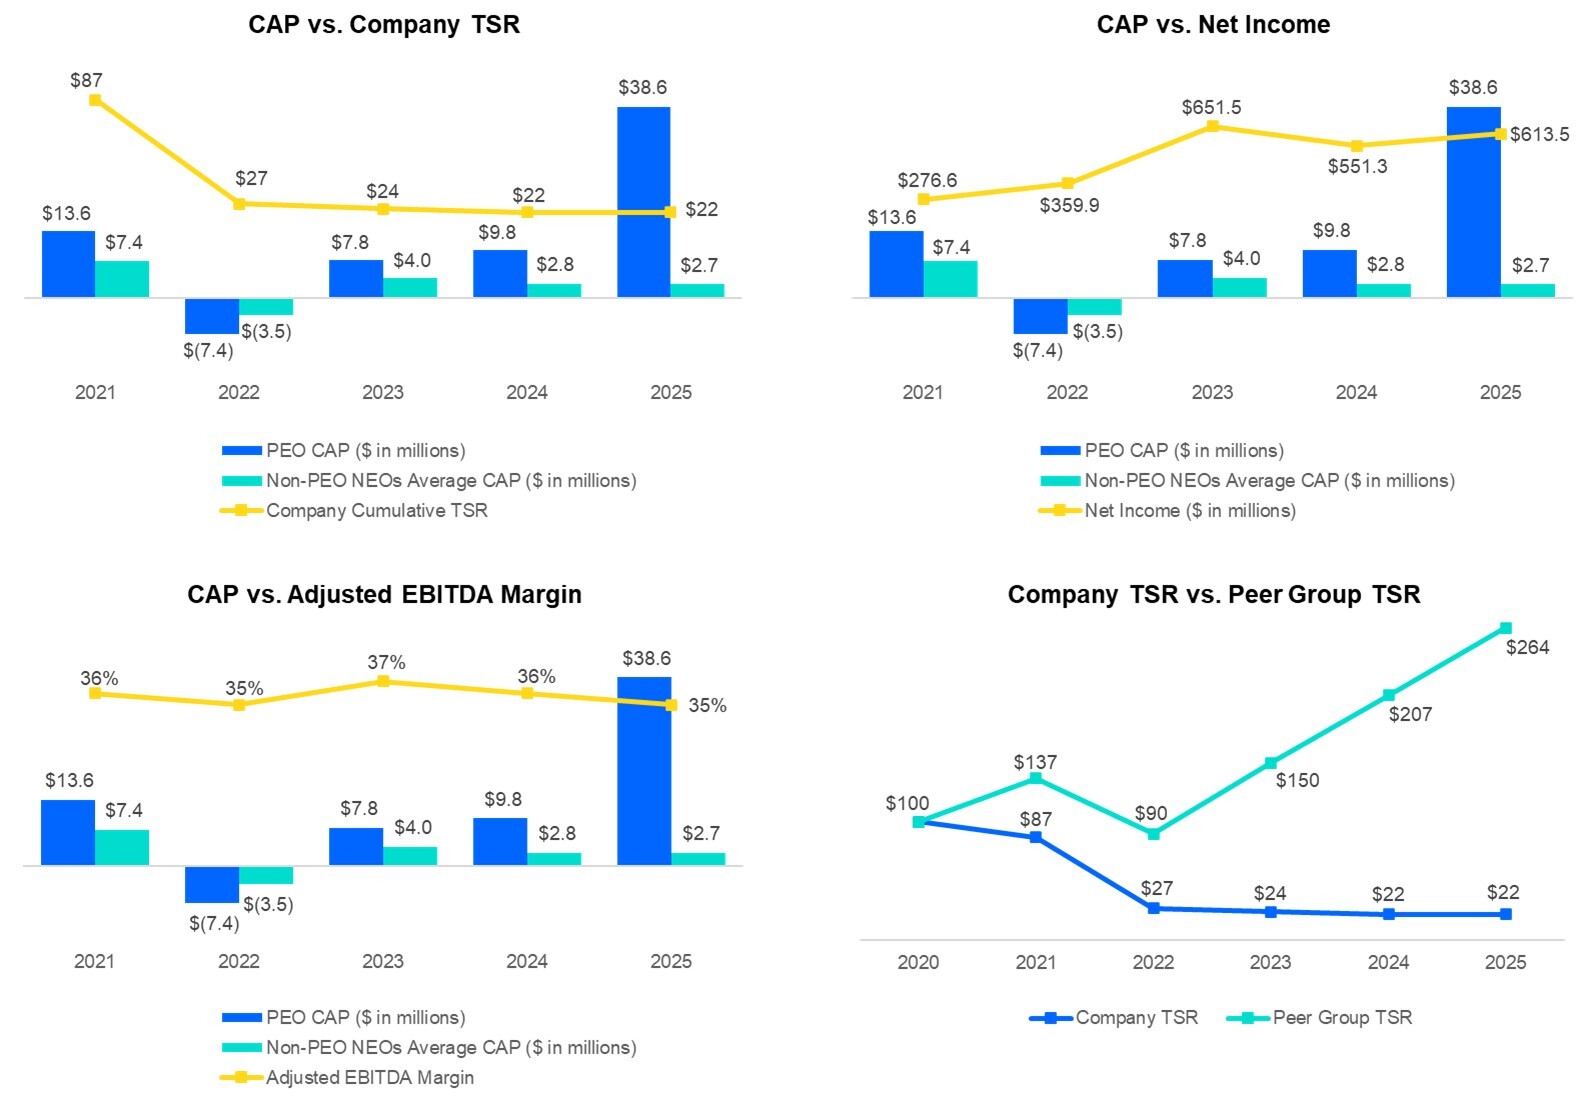
Year | Summary Compen- sation Table ("SCT") Total for PEO 1(1) | SCT Total for PEO 2(1) | SCT Total for PEO 3(1) | Compen- sation Actually Paid to PEO 1(2)(3) | Compen- sation Actually Paid to PEO 2(3)(4) | Compen- sation Actually Paid to PEO 3(3)(5) | Average SCT Total for Non- PEO NEOs(6) | Average Compen- sation Actually Paid to Non-PEO NEOs(3)(7) | Value of Initial Fixed $100 Investment Based On: | Net Income (in thou- sands) | Adjusted EBITDA Margin(9) | |||||||||||||
Total Share- holder Return ("TSR") | Peer Group TSR(8) | |||||||||||||||||||||||
(a) | (b) | (c) | (d) | (e) | (f) | (g) | (h) | (i) | (j) | (k) | (l) | (m) | ||||||||||||
2025 | — | $ | $ | — | $ | $ | $ | $ | $ | $ | $ | |||||||||||||
2024 | — | $ | — | — | $ | $ | $ | $ | $ | $ | ||||||||||||||
2023 | — | $ | — | — | $ | $ | $ | $ | $ | $ | ||||||||||||||
2022 | $ | $ | — | $( | $ | — | $ | $( | $ | $ | $ | |||||||||||||
2021 | $ | — | — | $ | — | $ | $ | $ | $ | $ | ||||||||||||||
Reported SCT Total | Reported Value of Equity Awards(a) | Equity Award Adjustments(b) | Compensation Actually Paid | |||
$ | $( | $ |
Year End Fair Value of Equity Awards Granted During the Year | Year over Year Change in Fair Value of Outstanding and Unvested Equity Awards | Fair Value as of Vesting Date of Equity Awards Granted and Vested in the Same Year | Year over Year Change in Fair Value of Equity Awards Granted in Prior Years that Vested in the Year | Fair Value at the End of the Prior Year of Equity Awards that Failed to Meet Vesting Conditions in the Year | Value of Dividends or other Earnings Paid on Stock or Option Awards not Otherwise Reflected in Fair Value or Total Compensation | Total Equity Award Adjustments | ||||||
$( | $ | $( | $( |
Reported SCT Total | Reported Value of Equity Awards(a) | Equity Award Adjustments(b) | Compensation Actually Paid | |||
$ | $( | $ | $ |
Year End Fair Value of Equity Awards Granted During the Year | Year over Year Change in Fair Value of Outstanding and Unvested Equity Awards | Fair Value as of Vesting Date of Equity Awards Granted and Vested in the Same Year | Year over Year Change in Fair Value of Equity Awards Granted in Prior Years that Vested in the Year | Fair Value at the End of the Prior Year of Equity Awards that Failed to Meet Vesting Conditions in the Year | Value of Dividends or other Earnings Paid on Stock or Option Awards not Otherwise Reflected in Fair Value or Total Compensation | Total Equity Award Adjustments | ||||||
$ | $( | $ |
Average Reported SCT Total for Non- PEO NEOs | Average Reported Value of Equity Awards(a) | Average Equity Award Adjustments(b) | Average Compensation Actually Paid to Non-PEO NEOs* | |||
$ | $( | $ | $ |
Average Year End Fair Value of Equity Awards Granted During the Year | Average Year over Year Change in Fair Value of Outstanding and Unvested Equity Awards | Average Fair Value as of Vesting Date of Equity Awards Granted and Vested in the Same Year | Average Year over Year Change in Fair Value of Equity Awards Granted in Prior Years that Vested in the Year | Average Fair Value at the End of the Prior Year of Equity Awards that Failed to Meet Vesting Conditions in the Year | Average Value of Dividends or other Earnings Paid on Stock or Option Awards not Otherwise Reflected in Fair Value or Total Compensation | Average Total Equity Award Adjustments* | ||||||
$ | $( | $( | $( | $ |
Fees Earned | ||||||||
Name | Fees Paid in Cash | Fees Deferred(1) | Stock Awards(2) | Total | ||||
Stephen Bailey | $60,000 | — | $249,975 | $309,975 | ||||
Melissa Brenner | $55,000 | — | $249,975 | $304,975 | ||||
Kelly Campbell(3) | $29,464 | — | $249,975 | $279,439 | ||||
Darrell Cavens(3) | $1,319 | $41,538 | $249,975 | $292,832 | ||||
Sharmistha Dubey | $50,000 | — | $249,975 | $299,975 | ||||
Laura Rachel Jones | — | $54,125 | $249,975 | $304,100 | ||||
Ann L. McDaniel | $77,335 | — | $249,975 | $327,310 | ||||
Thomas J. McInerney | $150,000 | — | $249,975 | $399,975 | ||||
Glenn H. Schiffman | — | $60,000 | $249,975 | $309,975 | ||||
Pamela S. Seymon | $55,000 | — | $249,975 | $304,975 | ||||
Alan G. Spoon(4) | $39,698 | — | — | $39,698 | ||||
Name | Outstanding RSUs (#) | |
Stephen Bailey | 8,346 | |
Melissa Brenner | 8,346 | |
Kelly Campbell | 8,346 | |
Darrell Cavens | 8,346 | |
Sharmistha Dubey | 8,346 | |
Laura Rachel Jones | 8,346 | |
Ann L. McDaniel | 8,346 | |
Thomas J. McInerney | 8,346 | |
Glenn H. Schiffman | 8,346 | |
Pamela S. Seymon | 8,346 |
Name and Address of Beneficial Owner | Number of Shares | Percent of Outstanding Shares | |||
The Vanguard Group | 31,942,223 | (1) | 13.7% | ||
100 Vanguard Blvd. | |||||
Malvern, PA 19355 | |||||
BlackRock, Inc. | 27,660,359 | (2) | 11.9% | ||
50 Hudson Yards | |||||
New York, NY 10001 | |||||
Starboard Value LP | 17,641,850 | (3) | 7.6% | ||
777 Third Avenue, 18th Floor | |||||
New York, NY 10017 | |||||
State Street Corporation | 16,188,353 | (4) | 6.9% | ||
One Congress Street, Suite 1 | |||||
Boston, MA 02114 | |||||
Stephen Bailey | 16,456 | (5) | * | ||
Steven Bailey | 34,734 | (6) | * | ||
Melissa Brenner | 29,757 | (5) | * | ||
Manuel Bronstein | 1,875 | * | |||
Kelly Campbell | 8,398 | (7) | * | ||
Darrell Cavens | 8,398 | (7) | * | ||
Sharmistha Dubey | 412,910 | (8) | * | ||
Sean Edgett | 20,361 | (9) | * | ||
Hesam Hosseini | 113,229 | (10) | * | ||
Laura Rachel Jones | 15,431 | (5) | * | ||
Bernard Kim | 140,171 | (11) | * | ||
Ann L. McDaniel | 30,324 | (5) | * | ||
Thomas J. McInerney | 360,600 | (5) | * | ||
Raina Moskowitz | — | — | |||
Spencer Rascoff | 221,301 | (12) | * | ||
Glenn H. Schiffman | 292,763 | (13) | * | ||
Pamela S. Seymon | 98,729 | (5) | * | ||
Gary Swidler | — | — | |||
All current executive officers and directors as a group (14 persons) | 1,663,391 | (14) | * | ||
Years Ended December 31, | |||
2025 | 2024 | ||
(In thousands) | |||
Net income attributable to Match Group, Inc. shareholders | $613,446 | $551,276 | |
Add back: | |||
Net income (loss) attributable to noncontrolling interests | 15 | 37 | |
Income tax provision | 132,542 | 152,743 | |
Other income, net | (21,025) | (40,815) | |
Interest expense | 147,551 | 160,071 | |
Stock-based compensation expense | 258,202 | 267,381 | |
Depreciation | 67,112 | 87,499 | |
Impairments and amortization of intangibles | 38,548 | 74,175 | |
Adjusted EBITDA | $1,236,391 | $1,252,367 | |
Revenue | $3,487,197 | $3,479,373 | |
Adjusted EBITDA Margin | 35% | 36% | |
Year Ended December 31, 2025 | |
(In thousands) | |
Net cash provided by operating activities | $1,080,380 |
Capital expenditures | (56,765) |
Free Cash Flow | $1,023,615 |