Please wait
0000891478false12-312025-12-312025FY11oneP3Y5 years, 6 months10 years, 3 months5 years, 3 monthsP3YP4YP3YP3YP4YP3Yfive years, six monthsiso4217:EURiso4217:EURxbrli:sharessan:subsidiarysan:companiesxbrli:pureiso4217:USDiso4217:USDxbrli:sharesxbrli:sharessan:stagesan:Argentian_pesoiso4217:EURiso4217:PLNxbrli:sharesiso4217:PLNiso4217:GBPiso4217:MXNxbrli:sharessan:branchsan:employeesan:jurisdictionsan:programsan:remuneration_componentsan:annuitysan:variable_remunerationsan:credit_institutionsan:metricsan:Paymentsan:trading_sessionsan:paymentssan:peopleiso4217:BRLiso4217:CLPsan:casesan:childsan:judgementiso4217:GBPiso4217:EURiso4217:GBPiso4217:USDiso4217:GBPiso4217:JPYiso4217:GBPiso4217:CHFiso4217:GBPiso4217:CADiso4217:CNYiso4217:EURiso4217:MXNiso4217:EURiso4217:AUDiso4217:EURiso4217:NZDiso4217:EURiso4217:CZKiso4217:EURiso4217:EURiso4217:COPiso4217:EURiso4217:USDiso4217:HKDiso4217:EURiso4217:JPYiso4217:EURiso4217:NOKiso4217:EURiso4217:RONiso4217:EURiso4217:CHFiso4217:EURiso4217:USDiso4217:COPiso4217:USDiso4217:MXNiso4217:BRLiso4217:EURiso4217:CLPiso4217:EURiso4217:COPiso4217:EURiso4217:USDiso4217:EURiso4217:PLNiso4217:EURiso4217:CADiso4217:EURiso4217:UYUiso4217:EURiso4217:EURiso4217:GBPiso4217:PENiso4217:USDiso4217:COPiso4217:USDiso4217:MADiso4217:EURiso4217:PENiso4217:EURiso4217:USDiso4217:CLPsan:marketsan:countrysan:geographiessan:salesProgramsan:customersan:blockiso4217:GBPxbrli:sharessan:contractsan:independent_divisionsan:segmentsan:operatingAreassan:linesOfDefensesan:tranchessan:scenariosan:line_of_businesssan:transactionssan:bankssan:indicator00008914782025-01-012025-12-3100008914782025-12-3100008914782024-12-3100008914782023-12-310000891478ifrs-full:DerivativesMember2025-12-310000891478ifrs-full:DerivativesMember2024-12-310000891478ifrs-full:DerivativesMember2023-12-310000891478ifrs-full:EquityInvestmentsMember2025-12-310000891478ifrs-full:EquityInvestmentsMember2024-12-310000891478ifrs-full:EquityInvestmentsMember2023-12-310000891478ifrs-full:DebtSecuritiesMember2025-12-310000891478ifrs-full:DebtSecuritiesMember2024-12-310000891478ifrs-full:DebtSecuritiesMember2023-12-310000891478san:LoansAndAdvancesMember2025-12-310000891478san:LoansAndAdvancesMember2024-12-310000891478san:LoansAndAdvancesMember2023-12-310000891478san:LoansAndAdvancesCentralBanksMember2025-12-310000891478san:LoansAndAdvancesCentralBanksMember2024-12-310000891478san:LoansAndAdvancesCentralBanksMember2023-12-310000891478san:LoansAndAdvancesCreditInstitutionsMember2025-12-310000891478san:LoansAndAdvancesCreditInstitutionsMember2024-12-310000891478san:LoansAndAdvancesCreditInstitutionsMember2023-12-310000891478san:LoansAndAdvancesCustomersMember2025-12-310000891478san:LoansAndAdvancesCustomersMember2024-12-310000891478san:LoansAndAdvancesCustomersMember2023-12-310000891478ifrs-full:PropertyPlantAndEquipmentNotSubjectToOperatingLeasesMember2025-12-310000891478ifrs-full:PropertyPlantAndEquipmentNotSubjectToOperatingLeasesMember2024-12-310000891478ifrs-full:PropertyPlantAndEquipmentNotSubjectToOperatingLeasesMember2023-12-310000891478ifrs-full:PropertyPlantAndEquipmentSubjectToOperatingLeasesMember2025-12-310000891478ifrs-full:PropertyPlantAndEquipmentSubjectToOperatingLeasesMember2024-12-310000891478ifrs-full:PropertyPlantAndEquipmentSubjectToOperatingLeasesMember2023-12-310000891478ifrs-full:DerivativesMember2025-12-310000891478ifrs-full:DerivativesMember2024-12-310000891478ifrs-full:DerivativesMember2023-12-310000891478san:ShortPositionsMember2025-12-310000891478san:ShortPositionsMember2024-12-310000891478san:ShortPositionsMember2023-12-310000891478san:DepositMember2025-12-310000891478san:DepositMember2024-12-310000891478san:DepositMember2023-12-310000891478san:DepositsCentralBanksMember2025-12-310000891478san:DepositsCentralBanksMember2024-12-310000891478san:DepositsCentralBanksMember2023-12-310000891478san:DepositsCreditInstitutionsMember2025-12-310000891478san:DepositsCreditInstitutionsMember2024-12-310000891478san:DepositsCreditInstitutionsMember2023-12-310000891478san:DepositsCustomersMember2025-12-310000891478san:DepositsCustomersMember2024-12-310000891478san:DepositsCustomersMember2023-12-310000891478san:DebtInstrumentsMember2025-12-310000891478san:DebtInstrumentsMember2024-12-310000891478san:DebtInstrumentsMember2023-12-310000891478san:OtherFinancialLiabilitiesMember2025-12-310000891478san:OtherFinancialLiabilitiesMember2024-12-310000891478san:OtherFinancialLiabilitiesMember2023-12-310000891478ifrs-full:FinancialLiabilitiesAtFairValueThroughProfitOrLossDesignatedUponInitialRecognitionCategoryMember2025-12-310000891478ifrs-full:FinancialLiabilitiesAtFairValueThroughProfitOrLossDesignatedUponInitialRecognitionCategoryMember2024-12-310000891478ifrs-full:FinancialLiabilitiesAtFairValueThroughProfitOrLossDesignatedUponInitialRecognitionCategoryMember2023-12-310000891478ifrs-full:FinancialLiabilitiesAtAmortisedCostCategoryMember2025-12-310000891478ifrs-full:FinancialLiabilitiesAtAmortisedCostCategoryMember2024-12-310000891478ifrs-full:FinancialLiabilitiesAtAmortisedCostCategoryMember2023-12-310000891478san:PensionsAndOtherEmploymentDefinedBenefitObligationsProvisionMember2025-12-310000891478san:PensionsAndOtherEmploymentDefinedBenefitObligationsProvisionMember2024-12-310000891478san:PensionsAndOtherEmploymentDefinedBenefitObligationsProvisionMember2023-12-310000891478san:OtherLongTermEmployeeBenefitsProvisionMember2025-12-310000891478san:OtherLongTermEmployeeBenefitsProvisionMember2024-12-310000891478san:OtherLongTermEmployeeBenefitsProvisionMember2023-12-310000891478san:TaxesAndOtherLegalContingenciesProvisionMember2025-12-310000891478san:TaxesAndOtherLegalContingenciesProvisionMember2024-12-310000891478san:TaxesAndOtherLegalContingenciesProvisionMember2023-12-310000891478san:CommitmentsAndGuaranteesGivenProvisionMember2025-12-310000891478san:CommitmentsAndGuaranteesGivenProvisionMember2024-12-310000891478san:CommitmentsAndGuaranteesGivenProvisionMember2023-12-310000891478ifrs-full:MiscellaneousOtherProvisionsMember2025-12-310000891478ifrs-full:MiscellaneousOtherProvisionsMember2024-12-310000891478ifrs-full:MiscellaneousOtherProvisionsMember2023-12-310000891478ifrs-full:LoanCommitmentsMember2025-12-310000891478ifrs-full:LoanCommitmentsMember2024-12-310000891478ifrs-full:LoanCommitmentsMember2023-12-310000891478ifrs-full:FinancialGuaranteeContractsMember2025-12-310000891478ifrs-full:FinancialGuaranteeContractsMember2024-12-310000891478ifrs-full:FinancialGuaranteeContractsMember2023-12-310000891478san:OtherCommitmentsMember2025-12-310000891478san:OtherCommitmentsMember2024-12-310000891478san:OtherCommitmentsMember2023-12-3100008914782024-01-012024-12-3100008914782023-01-012023-12-310000891478ifrs-full:FinancialAssetsAtFairValueThroughOtherComprehensiveIncomeCategoryMember2025-01-012025-12-310000891478ifrs-full:FinancialAssetsAtFairValueThroughOtherComprehensiveIncomeCategoryMember2024-01-012024-12-310000891478ifrs-full:FinancialAssetsAtFairValueThroughOtherComprehensiveIncomeCategoryMember2023-01-012023-12-310000891478ifrs-full:FinancialAssetsAtAmortisedCostCategoryMember2025-01-012025-12-310000891478ifrs-full:FinancialAssetsAtAmortisedCostCategoryMember2024-01-012024-12-310000891478ifrs-full:FinancialAssetsAtAmortisedCostCategoryMember2023-01-012023-12-310000891478san:InterestIncomeFromOtherFinancialAssetsMember2025-01-012025-12-310000891478san:InterestIncomeFromOtherFinancialAssetsMember2024-01-012024-12-310000891478san:InterestIncomeFromOtherFinancialAssetsMember2023-01-012023-12-310000891478san:OtherFinancialAssetsAndLiabilitiesMember2025-01-012025-12-310000891478san:OtherFinancialAssetsAndLiabilitiesMember2024-01-012024-12-310000891478san:OtherFinancialAssetsAndLiabilitiesMember2023-01-012023-12-310000891478san:FinancialAssetsReclassifiedFromFairValueWithChangesInOtherComprehensiveIncomeMember2025-01-012025-12-310000891478san:FinancialAssetsReclassifiedFromFairValueWithChangesInOtherComprehensiveIncomeMember2024-01-012024-12-310000891478san:FinancialAssetsReclassifiedFromFairValueWithChangesInOtherComprehensiveIncomeMember2023-01-012023-12-310000891478san:ReclassifiedFinancialAssetsFromAmortizedCostMember2025-01-012025-12-310000891478san:ReclassifiedFinancialAssetsFromAmortizedCostMember2024-01-012024-12-310000891478san:ReclassifiedFinancialAssetsFromAmortizedCostMember2023-01-012023-12-310000891478san:OtherGainsOrLossesMember2025-01-012025-12-310000891478san:OtherGainsOrLossesMember2024-01-012024-12-310000891478san:OtherGainsOrLossesMember2023-01-012023-12-310000891478country:AR2025-01-012025-12-310000891478country:AR2024-01-012024-12-310000891478country:AR2023-01-012023-12-310000891478ifrs-full:IssuedCapitalMemberifrs-full:PreviouslyStatedMember2024-12-310000891478ifrs-full:SharePremiumMemberifrs-full:PreviouslyStatedMember2024-12-310000891478san:OtherEquityInstrumentsIssuedMemberifrs-full:PreviouslyStatedMember2024-12-310000891478ifrs-full:OtherEquityInterestMemberifrs-full:PreviouslyStatedMember2024-12-310000891478ifrs-full:RetainedEarningsExcludingProfitLossForReportingPeriodMemberifrs-full:PreviouslyStatedMember2024-12-310000891478ifrs-full:IssuedCapitalMember2024-12-310000891478ifrs-full:SharePremiumMember2024-12-310000891478san:OtherEquityInstrumentsIssuedMember2024-12-310000891478ifrs-full:OtherEquityInterestMember2024-12-310000891478ifrs-full:RetainedEarningsExcludingProfitLossForReportingPeriodMember2024-12-310000891478ifrs-full:IssuedCapitalMember2025-01-012025-12-310000891478ifrs-full:SharePremiumMember2025-01-012025-12-310000891478san:OtherEquityInstrumentsIssuedMember2025-01-012025-12-310000891478ifrs-full:OtherEquityInterestMember2025-01-012025-12-310000891478ifrs-full:RetainedEarningsExcludingProfitLossForReportingPeriodMember2025-01-012025-12-310000891478ifrs-full:IssuedCapitalMember2025-12-310000891478ifrs-full:SharePremiumMember2025-12-310000891478san:OtherEquityInstrumentsIssuedMember2025-12-310000891478ifrs-full:OtherEquityInterestMember2025-12-310000891478ifrs-full:RetainedEarningsExcludingProfitLossForReportingPeriodMember2025-12-310000891478ifrs-full:RevaluationSurplusMemberifrs-full:PreviouslyStatedMember2024-12-310000891478ifrs-full:OtherReservesMemberifrs-full:PreviouslyStatedMember2024-12-310000891478ifrs-full:TreasurySharesMemberifrs-full:PreviouslyStatedMember2024-12-310000891478san:ProfitLossAttributableToShareholdersOfParentMemberifrs-full:PreviouslyStatedMember2024-12-310000891478san:InterimDividendsMemberifrs-full:PreviouslyStatedMember2024-12-310000891478ifrs-full:AccumulatedOtherComprehensiveIncomeMemberifrs-full:PreviouslyStatedMember2024-12-310000891478san:AccumulatedOtherComprehensiveIncomeAttributableToNonControllingInterestsMemberifrs-full:PreviouslyStatedMember2024-12-310000891478san:NonControllingInterestExcludingAccumulatedOtherComprehensiveIncomeMemberifrs-full:PreviouslyStatedMember2024-12-310000891478ifrs-full:PreviouslyStatedMember2024-12-310000891478ifrs-full:FinancialEffectOfCorrectionsOfAccountingErrorsMember2024-12-310000891478ifrs-full:FinancialEffectOfChangesInAccountingPolicyMember2024-12-310000891478ifrs-full:RevaluationSurplusMember2024-12-310000891478ifrs-full:OtherReservesMember2024-12-310000891478ifrs-full:TreasurySharesMember2024-12-310000891478san:ProfitLossAttributableToShareholdersOfParentMember2024-12-310000891478san:InterimDividendsMember2024-12-310000891478ifrs-full:AccumulatedOtherComprehensiveIncomeMember2024-12-310000891478san:AccumulatedOtherComprehensiveIncomeAttributableToNonControllingInterestsMember2024-12-310000891478san:NonControllingInterestExcludingAccumulatedOtherComprehensiveIncomeMember2024-12-310000891478san:ProfitLossAttributableToShareholdersOfParentMember2025-01-012025-12-310000891478ifrs-full:AccumulatedOtherComprehensiveIncomeMember2025-01-012025-12-310000891478san:AccumulatedOtherComprehensiveIncomeAttributableToNonControllingInterestsMember2025-01-012025-12-310000891478san:NonControllingInterestExcludingAccumulatedOtherComprehensiveIncomeMember2025-01-012025-12-310000891478ifrs-full:OtherReservesMember2025-01-012025-12-310000891478ifrs-full:TreasurySharesMember2025-01-012025-12-310000891478san:InterimDividendsMember2025-01-012025-12-310000891478ifrs-full:RevaluationSurplusMember2025-12-310000891478ifrs-full:OtherReservesMember2025-12-310000891478ifrs-full:TreasurySharesMember2025-12-310000891478san:ProfitLossAttributableToShareholdersOfParentMember2025-12-310000891478san:InterimDividendsMember2025-12-310000891478ifrs-full:AccumulatedOtherComprehensiveIncomeMember2025-12-310000891478san:AccumulatedOtherComprehensiveIncomeAttributableToNonControllingInterestsMember2025-12-310000891478san:NonControllingInterestExcludingAccumulatedOtherComprehensiveIncomeMember2025-12-310000891478ifrs-full:IssuedCapitalMemberifrs-full:PreviouslyStatedMember2023-12-310000891478ifrs-full:SharePremiumMemberifrs-full:PreviouslyStatedMember2023-12-310000891478san:OtherEquityInstrumentsIssuedMemberifrs-full:PreviouslyStatedMember2023-12-310000891478ifrs-full:OtherEquityInterestMemberifrs-full:PreviouslyStatedMember2023-12-310000891478ifrs-full:RetainedEarningsExcludingProfitLossForReportingPeriodMemberifrs-full:PreviouslyStatedMember2023-12-310000891478ifrs-full:IssuedCapitalMember2023-12-310000891478ifrs-full:SharePremiumMember2023-12-310000891478san:OtherEquityInstrumentsIssuedMember2023-12-310000891478ifrs-full:OtherEquityInterestMember2023-12-310000891478ifrs-full:RetainedEarningsExcludingProfitLossForReportingPeriodMember2023-12-310000891478ifrs-full:IssuedCapitalMember2024-01-012024-12-310000891478ifrs-full:SharePremiumMember2024-01-012024-12-310000891478san:OtherEquityInstrumentsIssuedMember2024-01-012024-12-310000891478ifrs-full:OtherEquityInterestMember2024-01-012024-12-310000891478ifrs-full:RetainedEarningsExcludingProfitLossForReportingPeriodMember2024-01-012024-12-310000891478ifrs-full:RevaluationSurplusMemberifrs-full:PreviouslyStatedMember2023-12-310000891478ifrs-full:OtherReservesMemberifrs-full:PreviouslyStatedMember2023-12-310000891478ifrs-full:TreasurySharesMemberifrs-full:PreviouslyStatedMember2023-12-310000891478san:ProfitLossAttributableToShareholdersOfParentMemberifrs-full:PreviouslyStatedMember2023-12-310000891478san:InterimDividendsMemberifrs-full:PreviouslyStatedMember2023-12-310000891478ifrs-full:AccumulatedOtherComprehensiveIncomeMemberifrs-full:PreviouslyStatedMember2023-12-310000891478san:AccumulatedOtherComprehensiveIncomeAttributableToNonControllingInterestsMemberifrs-full:PreviouslyStatedMember2023-12-310000891478san:NonControllingInterestExcludingAccumulatedOtherComprehensiveIncomeMemberifrs-full:PreviouslyStatedMember2023-12-310000891478ifrs-full:PreviouslyStatedMember2023-12-310000891478ifrs-full:FinancialEffectOfCorrectionsOfAccountingErrorsMember2023-12-310000891478ifrs-full:FinancialEffectOfChangesInAccountingPolicyMember2023-12-310000891478ifrs-full:RevaluationSurplusMember2023-12-310000891478ifrs-full:OtherReservesMember2023-12-310000891478ifrs-full:TreasurySharesMember2023-12-310000891478san:ProfitLossAttributableToShareholdersOfParentMember2023-12-310000891478san:InterimDividendsMember2023-12-310000891478ifrs-full:AccumulatedOtherComprehensiveIncomeMember2023-12-310000891478san:AccumulatedOtherComprehensiveIncomeAttributableToNonControllingInterestsMember2023-12-310000891478san:NonControllingInterestExcludingAccumulatedOtherComprehensiveIncomeMember2023-12-310000891478san:ProfitLossAttributableToShareholdersOfParentMember2024-01-012024-12-310000891478ifrs-full:AccumulatedOtherComprehensiveIncomeMember2024-01-012024-12-310000891478san:AccumulatedOtherComprehensiveIncomeAttributableToNonControllingInterestsMember2024-01-012024-12-310000891478san:NonControllingInterestExcludingAccumulatedOtherComprehensiveIncomeMember2024-01-012024-12-310000891478ifrs-full:OtherReservesMember2024-01-012024-12-310000891478ifrs-full:TreasurySharesMember2024-01-012024-12-310000891478san:InterimDividendsMember2024-01-012024-12-310000891478ifrs-full:IssuedCapitalMemberifrs-full:PreviouslyStatedMember2022-12-310000891478ifrs-full:SharePremiumMemberifrs-full:PreviouslyStatedMember2022-12-310000891478san:OtherEquityInstrumentsIssuedMemberifrs-full:PreviouslyStatedMember2022-12-310000891478ifrs-full:OtherEquityInterestMemberifrs-full:PreviouslyStatedMember2022-12-310000891478ifrs-full:RetainedEarningsExcludingProfitLossForReportingPeriodMemberifrs-full:PreviouslyStatedMember2022-12-310000891478ifrs-full:IssuedCapitalMember2022-12-310000891478ifrs-full:SharePremiumMember2022-12-310000891478san:OtherEquityInstrumentsIssuedMember2022-12-310000891478ifrs-full:OtherEquityInterestMember2022-12-310000891478ifrs-full:RetainedEarningsExcludingProfitLossForReportingPeriodMember2022-12-310000891478ifrs-full:IssuedCapitalMember2023-01-012023-12-310000891478ifrs-full:SharePremiumMember2023-01-012023-12-310000891478san:OtherEquityInstrumentsIssuedMember2023-01-012023-12-310000891478ifrs-full:OtherEquityInterestMember2023-01-012023-12-310000891478ifrs-full:RetainedEarningsExcludingProfitLossForReportingPeriodMember2023-01-012023-12-310000891478ifrs-full:RevaluationSurplusMemberifrs-full:PreviouslyStatedMember2022-12-310000891478ifrs-full:OtherReservesMemberifrs-full:PreviouslyStatedMember2022-12-310000891478ifrs-full:TreasurySharesMemberifrs-full:PreviouslyStatedMember2022-12-310000891478san:ProfitLossAttributableToShareholdersOfParentMemberifrs-full:PreviouslyStatedMember2022-12-310000891478san:InterimDividendsMemberifrs-full:PreviouslyStatedMember2022-12-310000891478ifrs-full:AccumulatedOtherComprehensiveIncomeMemberifrs-full:PreviouslyStatedMember2022-12-310000891478san:AccumulatedOtherComprehensiveIncomeAttributableToNonControllingInterestsMemberifrs-full:PreviouslyStatedMember2022-12-310000891478san:NonControllingInterestExcludingAccumulatedOtherComprehensiveIncomeMemberifrs-full:PreviouslyStatedMember2022-12-310000891478ifrs-full:PreviouslyStatedMember2022-12-310000891478ifrs-full:FinancialEffectOfCorrectionsOfAccountingErrorsMember2022-12-310000891478ifrs-full:FinancialEffectOfChangesInAccountingPolicyMember2022-12-310000891478ifrs-full:RevaluationSurplusMember2022-12-310000891478ifrs-full:OtherReservesMember2022-12-310000891478ifrs-full:TreasurySharesMember2022-12-310000891478san:ProfitLossAttributableToShareholdersOfParentMember2022-12-310000891478san:InterimDividendsMember2022-12-310000891478ifrs-full:AccumulatedOtherComprehensiveIncomeMember2022-12-310000891478san:AccumulatedOtherComprehensiveIncomeAttributableToNonControllingInterestsMember2022-12-310000891478san:NonControllingInterestExcludingAccumulatedOtherComprehensiveIncomeMember2022-12-3100008914782022-12-310000891478san:ProfitLossAttributableToShareholdersOfParentMember2023-01-012023-12-310000891478ifrs-full:AccumulatedOtherComprehensiveIncomeMember2023-01-012023-12-310000891478san:AccumulatedOtherComprehensiveIncomeAttributableToNonControllingInterestsMember2023-01-012023-12-310000891478san:NonControllingInterestExcludingAccumulatedOtherComprehensiveIncomeMember2023-01-012023-12-310000891478ifrs-full:OtherReservesMember2023-01-012023-12-310000891478ifrs-full:TreasurySharesMember2023-01-012023-12-310000891478san:InterimDividendsMember2023-01-012023-12-310000891478san:IncreaseDecreaseDueToChangesInPresentationMember2025-12-312025-12-310000891478san:IncreaseDecreaseDueToChangesInPresentationMemberifrs-full:MiscellaneousOtherProvisionsMember2025-12-310000891478san:IncreaseDecreaseDueToChangesInPresentationMember2024-01-012024-12-310000891478san:IncreaseDecreaseDueToChangesInPresentationMember2023-01-012023-12-310000891478currency:MXN2025-01-012025-12-310000891478currency:USD2025-01-012025-12-310000891478currency:BRL2025-01-012025-12-310000891478currency:ARS2025-01-012025-12-310000891478currency:GBP2025-01-012025-12-310000891478currency:CLP2025-01-012025-12-310000891478currency:PLN2025-01-012025-12-310000891478ifrs-full:DisposalOfMajorSubsidiaryMembersan:SantanderBankPolskaSAMembersan:AgreementForTheSaleOfSantanderBankPolskaS.A.Member2026-01-092026-01-090000891478ifrs-full:DisposalOfMajorSubsidiaryMembersan:SantanderTowarzystwoFunduszyInwestycyjnychS.A.Membersan:AgreementForTheSaleOfSantanderBankPolskaS.A.Member2026-01-092026-01-090000891478ifrs-full:DisposalOfMajorSubsidiaryMembersan:SantanderTowarzystwoFunduszyInwestycyjnychS.A.AndSantanderBankPolskaS.A.Membersan:AgreementForTheSaleOfSantanderBankPolskaS.A.Member2026-01-092026-01-090000891478ifrs-full:DisposalOfMajorSubsidiaryMembersan:SantanderBankPolskaSAMember2026-01-092026-01-090000891478ifrs-full:MajorBusinessCombinationMembersan:WebsterFinancialCorporationMember2026-02-032026-02-030000891478ifrs-full:MajorBusinessCombinationMembersan:WebsterFinancialCorporationMember2026-02-0300008914782018-01-012018-12-3100008914782016-01-012018-12-310000891478country:AR2025-12-310000891478country:AR2024-12-310000891478currency:USD2025-12-310000891478currency:USD2024-12-310000891478currency:USD2023-12-310000891478currency:CLP2025-12-310000891478currency:CLP2024-12-310000891478currency:CLP2023-12-310000891478currency:GBP2025-12-310000891478currency:GBP2024-12-310000891478currency:GBP2023-12-310000891478currency:MXN2025-12-310000891478currency:MXN2024-12-310000891478currency:MXN2023-12-310000891478currency:BRL2025-12-310000891478currency:BRL2024-12-310000891478currency:BRL2023-12-310000891478currency:PLN2025-12-310000891478currency:PLN2024-12-310000891478currency:PLN2023-12-310000891478currency:ARS2025-12-310000891478currency:ARS2024-12-310000891478currency:ARS2023-12-310000891478currency:USD2024-01-012024-12-310000891478currency:USD2023-01-012023-12-310000891478currency:CLP2024-01-012024-12-310000891478currency:CLP2023-01-012023-12-310000891478currency:GBP2024-01-012024-12-310000891478currency:GBP2023-01-012023-12-310000891478currency:MXN2024-01-012024-12-310000891478currency:MXN2023-01-012023-12-310000891478currency:BRL2024-01-012024-12-310000891478currency:BRL2023-01-012023-12-310000891478currency:PLN2024-01-012024-12-310000891478currency:PLN2023-01-012023-12-310000891478currency:ARS2024-01-012024-12-310000891478currency:ARS2023-01-012023-12-310000891478san:ProjectQuasarInvestments2017SlMember2024-01-012024-12-310000891478san:ProjectQuasarInvestments2017SlMember2023-01-012023-12-310000891478ifrs-full:CountryOfDomicileMember2025-12-310000891478ifrs-full:BuildingsMember2025-01-012025-12-310000891478san:FurnitureMember2025-01-012025-12-310000891478ifrs-full:FixturesAndFittingsMember2025-01-012025-12-310000891478san:OfficeAndComputerEquipmentMember2025-01-012025-12-310000891478san:SantanderBankPolskaSAMember2025-05-050000891478san:SantanderBankPolskaSAMembersan:AgreementForTheSaleOfSantanderBankPolskaS.A.Member2025-05-050000891478san:SantanderTowarzystwoFunduszyInwestycyjnychS.A.Membersan:AgreementForTheSaleOfSantanderBankPolskaS.A.Member2025-05-050000891478san:SantanderTowarzystwoFunduszyInwestycyjnychS.A.AndSantanderBankPolskaS.A.Membersan:AgreementForTheSaleOfSantanderBankPolskaS.A.Member2025-05-052025-05-050000891478san:SantanderBankPolskaSAMember2025-12-022025-12-020000891478san:SantanderBankPolskaSAMember2025-12-020000891478san:SantanderBankPolskaSAMember2025-12-312025-12-310000891478san:AgreementForTheSaleOfSantanderBankPolskaS.A.Membersan:SantanderConsumerS.A.Membersan:SantanderConsumerBankPolskaMember2025-12-230000891478san:AgreementForTheSaleOfSantanderBankPolskaS.A.Membersan:SantanderConsumerS.A.Membersan:SantanderConsumerBankPolskaMember2025-12-232025-12-230000891478san:TSBBankingGroupPlcTSBMember2025-07-012025-07-010000891478san:CaceisMember2024-12-190000891478san:CaceisMember2025-01-012025-12-310000891478san:CreditAgricoleS.A.Membersan:CaceisMember2024-12-192024-12-190000891478san:SantanderBankPolskaSAMember2024-09-102024-09-100000891478san:SantanderBankPolskaSAMember2024-09-100000891478ifrs-full:OrdinarySharesMembersan:SantanderBankPolskaSAMember2024-09-100000891478san:SantanderBankPolskaSAMember2024-09-132024-09-130000891478san:SantanderBankPolskaSAMember2024-09-092024-09-090000891478ifrs-full:OtherReservesMembersan:SantanderBankPolskaSAMember2024-09-132024-09-130000891478ifrs-full:AccumulatedOtherComprehensiveIncomeMembersan:SantanderBankPolskaSAMember2024-09-132024-09-130000891478san:NonControllingInterestExcludingAccumulatedOtherComprehensiveIncomeMembersan:SantanderBankPolskaSAMember2024-09-132024-09-130000891478san:BancoSantanderMexicoSAInstitucionDeBancaMultipleGrupoFinancieroSantanderMexicoMember2022-10-210000891478san:BancoSantanderMexicoSAInstitucionDeBancaMultipleGrupoFinancieroSantanderMexicoMember2023-04-100000891478san:BancoSantanderMexicoSAInstitucionDeBancaMultipleGrupoFinancieroSantanderMexicoMember2023-04-092023-04-090000891478san:BancoSantanderMexicoSAInstitucionDeBancaMultipleGrupoFinancieroSantanderMexicoMember2023-04-102023-04-100000891478san:BancoSantanderMexicoSAInstitucionDeBancaMultipleGrupoFinancieroSantanderMexicoMember2023-02-072023-04-100000891478san:BancoSantanderMexicoSAInstitucionDeBancaMultipleGrupoFinancieroSantanderMexicoMember2022-11-300000891478san:BancoSantanderMexicoSAInstitucionDeBancaMultipleGrupoFinancieroSantanderMexicoMember2023-05-122023-12-310000891478san:OffShoreEntitiesMembersan:SpanishLegislationMember2025-12-310000891478san:OffShoreEntitiesBranchesMembersan:SpanishLegislationMember2025-12-310000891478san:OffShoreEntitiesMembersan:CouncilOfTheEUBlacklistMember2025-12-310000891478san:OffShoreEntitiesMembersan:OECDMember2025-12-310000891478san:OffShoreEntitiesMember2025-12-310000891478san:OffShoreEntitiesMember2024-12-310000891478country:GG2025-01-012025-12-310000891478san:OffShoreEntitiesMembersan:JerseyTheIsleOfManAndTheCaymanIslandsMembersan:SpanishLegislationMember2025-12-310000891478country:BM2025-01-012025-12-310000891478srt:ParentCompanyMember2025-01-012025-12-310000891478san:InterimDividendMembersrt:ParentCompanyMember2025-01-012025-12-310000891478san:ComplementaryDividendMembersrt:ParentCompanyMember2025-01-012025-12-310000891478san:InterimDividendMember2025-11-012025-11-300000891478san:ComplementaryDividendMember2026-02-242026-02-240000891478san:A2025ProgramFirstMember2025-08-012025-12-310000891478san:A2025And2026ProgramMember2025-01-012025-12-310000891478san:A2025ProgramSecondMember2026-02-042026-12-310000891478san:A2025ProgramSecondGroupUnderlyingProfitMember2026-02-042026-12-3100008914782026-02-042026-12-310000891478san:A2025ProgramSecondCapitalReleasedOfPolandSaleMember2026-02-042026-12-310000891478san:SantanderBankPolskaSAMembersan:AgreementForTheSaleOfSantanderBankPolskaS.A.Member2026-01-092026-01-0900008914782025-01-012025-08-3100008914782025-08-310000891478san:ComplementaryDividendMember2025-05-022025-05-020000891478san:A2024ProgramFirstMember2025-04-042025-04-040000891478san:A2024ProgramSecondMember2025-04-042025-04-040000891478srt:DirectorMemberifrs-full:TopOfRangeMember2025-01-012025-12-310000891478srt:DirectorMemberifrs-full:TopOfRangeMember2024-01-012024-12-310000891478srt:DirectorMember2025-01-012025-12-310000891478srt:DirectorMember2024-01-012024-12-310000891478san:ExecutiveCommittee1Member2025-01-012025-12-310000891478san:ExecutiveCommittee1Member2024-01-012024-12-310000891478san:AuditCommitteeMember2025-01-012025-12-310000891478san:AuditCommitteeMember2024-01-012024-12-310000891478san:AppointmentsCommitteeMember2025-01-012025-12-310000891478san:AppointmentsCommitteeMember2024-01-012024-12-310000891478san:RemunerationCommitteeMember2025-01-012025-12-310000891478san:RemunerationCommitteeMember2024-01-012024-12-310000891478san:RiskSupervisionRegulationAndComplianceOversightCommitteeMember2025-01-012025-12-310000891478san:RiskSupervisionRegulationAndComplianceOversightCommitteeMember2024-01-012024-12-310000891478san:ResponsibleBankingSustainabilityAndCultureCommitteeMember2025-01-012025-12-310000891478san:ResponsibleBankingSustainabilityAndCultureCommitteeMember2024-01-012024-12-310000891478san:InnovationAndTechnologyCommitteeMember2025-01-012025-12-310000891478san:InnovationAndTechnologyCommitteeMember2024-01-012024-12-310000891478san:AuditCommitteeChairmanMember2025-01-012025-12-310000891478san:AuditCommitteeChairmanMember2024-01-012024-12-310000891478san:AppointmentsCommitteeChairmanMember2025-01-012025-12-310000891478san:AppointmentsCommitteeChairmanMember2024-01-012024-12-310000891478san:RemunerationCommitteeChairmanMember2025-01-012025-12-310000891478san:RemunerationCommitteeChairmanMember2024-01-012024-12-310000891478san:RiskSupervisionRegulationAndComplianceOversightCommitteeChairmanMember2025-01-012025-12-310000891478san:RiskSupervisionRegulationAndComplianceOversightCommitteeChairmanMember2024-01-012024-12-310000891478san:ResponsibleBankingSustainabilityAndCultureCommitteeChairmanMember2025-01-012025-12-310000891478san:ResponsibleBankingSustainabilityAndCultureCommitteeChairmanMember2024-01-012024-12-310000891478san:TheInnovationAndTechnologyCommitteeChairmanMember2025-01-012025-12-310000891478san:TheInnovationAndTechnologyCommitteeChairmanMember2024-01-012024-12-310000891478san:LeadDirectorMember2025-01-012025-12-310000891478san:LeadDirectorMember2024-01-012024-12-310000891478san:NonExecutiveViceChairmanMember2025-01-012025-12-310000891478san:NonExecutiveViceChairmanMember2024-01-012024-12-310000891478san:GlennHutchinsMemberifrs-full:BottomOfRangeMember2025-01-012025-12-3100008914782024-03-222024-03-220000891478san:AuditCommitteeAndRiskSupervisionRegulationAndComplianceOversightCommitteeMember2025-01-012025-12-310000891478san:AuditCommitteeAndRiskSupervisionRegulationAndComplianceOversightCommitteeMember2024-01-012024-12-310000891478san:OtherCommitteesMember2025-01-012025-12-310000891478san:OtherCommitteesMember2024-01-012024-12-310000891478san:DeferredVariableCompensationFirstAndSecondPortionMember2025-01-012025-12-310000891478san:DeferredVariableCompensationThirdFourthAndFifthPortionMember2025-01-012025-12-310000891478san:DeferredVariableCompensationPlanMultiannualObjectivesMember2025-01-012025-12-310000891478san:AnaBotinSanzDeSautuolaYOSheaAndJoseAntonioAlvarezMembersan:BoardOfDirectorsChairmanAndChiefExecutiveOfficerMember2025-01-012025-12-310000891478san:AnaBotinSanzDeSautuolaYOSheaMembersrt:DirectorMember2025-01-012025-12-310000891478san:AnaBotinSanzDeSautuolaYOSheaMembersan:ExecutiveCommittee1Member2025-01-012025-12-310000891478san:AnaBotinSanzDeSautuolaYOSheaMembersan:AuditCommitteeMember2025-01-012025-12-310000891478san:AnaBotinSanzDeSautuolaYOSheaMembersan:AppointmentsCommitteeMember2025-01-012025-12-310000891478san:AnaBotinSanzDeSautuolaYOSheaMembersan:RemunerationCommitteeMember2025-01-012025-12-310000891478san:AnaBotinSanzDeSautuolaYOSheaMembersan:RiskSupervisionRegulationAndComplianceOversightCommitteeMember2025-01-012025-12-310000891478san:AnaBotinSanzDeSautuolaYOSheaMembersan:ResponsibleBankingSustainabilityAndCultureCommitteeMember2025-01-012025-12-310000891478san:AnaBotinSanzDeSautuolaYOSheaMembersan:InnovationAndTechnologyCommitteeMember2025-01-012025-12-310000891478san:AttendanceFeesAndCommissionsMembersan:AnaBotinSanzDeSautuolaYOSheaMember2025-01-012025-12-310000891478san:HectorGrisiMembersrt:DirectorMember2025-01-012025-12-310000891478san:HectorGrisiMembersan:ExecutiveCommittee1Member2025-01-012025-12-310000891478san:HectorGrisiMembersan:AuditCommitteeMember2025-01-012025-12-310000891478san:HectorGrisiMembersan:AppointmentsCommitteeMember2025-01-012025-12-310000891478san:HectorGrisiMembersan:RemunerationCommitteeMember2025-01-012025-12-310000891478san:HectorGrisiMembersan:RiskSupervisionRegulationAndComplianceOversightCommitteeMember2025-01-012025-12-310000891478san:HectorGrisiMembersan:ResponsibleBankingSustainabilityAndCultureCommitteeMember2025-01-012025-12-310000891478san:HectorGrisiMembersan:InnovationAndTechnologyCommitteeMember2025-01-012025-12-310000891478san:AttendanceFeesAndCommissionsMembersan:HectorGrisiMember2025-01-012025-12-310000891478san:JoseAntonioAlvarezMembersrt:DirectorMember2025-01-012025-12-310000891478san:JoseAntonioAlvarezMembersan:ExecutiveCommittee1Member2025-01-012025-12-310000891478san:JoseAntonioAlvarezMembersan:AuditCommitteeMember2025-01-012025-12-310000891478san:JoseAntonioAlvarezMembersan:AppointmentsCommitteeMember2025-01-012025-12-310000891478san:JoseAntonioAlvarezMembersan:RemunerationCommitteeMember2025-01-012025-12-310000891478san:JoseAntonioAlvarezMembersan:RiskSupervisionRegulationAndComplianceOversightCommitteeMember2025-01-012025-12-310000891478san:JoseAntonioAlvarezMembersan:ResponsibleBankingSustainabilityAndCultureCommitteeMember2025-01-012025-12-310000891478san:JoseAntonioAlvarezMembersan:InnovationAndTechnologyCommitteeMember2025-01-012025-12-310000891478san:AttendanceFeesAndCommissionsMembersan:JoseAntonioAlvarezMember2025-01-012025-12-310000891478san:GlennHutchinsMembersrt:DirectorMember2025-01-012025-12-310000891478san:GlennHutchinsMembersan:ExecutiveCommittee1Member2025-01-012025-12-310000891478san:GlennHutchinsMembersan:AuditCommitteeMember2025-01-012025-12-310000891478san:GlennHutchinsMembersan:AppointmentsCommitteeMember2025-01-012025-12-310000891478san:GlennHutchinsMembersan:RemunerationCommitteeMember2025-01-012025-12-310000891478san:GlennHutchinsMembersan:RiskSupervisionRegulationAndComplianceOversightCommitteeMember2025-01-012025-12-310000891478san:GlennHutchinsMembersan:ResponsibleBankingSustainabilityAndCultureCommitteeMember2025-01-012025-12-310000891478san:GlennHutchinsMembersan:InnovationAndTechnologyCommitteeMember2025-01-012025-12-310000891478san:AttendanceFeesAndCommissionsMembersan:GlennHutchinsMember2025-01-012025-12-310000891478san:HomairaAkbariMembersrt:DirectorMember2025-01-012025-12-310000891478san:HomairaAkbariMembersan:ExecutiveCommittee1Member2025-01-012025-12-310000891478san:HomairaAkbariMembersan:AuditCommitteeMember2025-01-012025-12-310000891478san:HomairaAkbariMembersan:AppointmentsCommitteeMember2025-01-012025-12-310000891478san:HomairaAkbariMembersan:RemunerationCommitteeMember2025-01-012025-12-310000891478san:HomairaAkbariMembersan:RiskSupervisionRegulationAndComplianceOversightCommitteeMember2025-01-012025-12-310000891478san:HomairaAkbariMembersan:ResponsibleBankingSustainabilityAndCultureCommitteeMember2025-01-012025-12-310000891478san:HomairaAkbariMembersan:InnovationAndTechnologyCommitteeMember2025-01-012025-12-310000891478san:AttendanceFeesAndCommissionsMembersan:HomairaAkbariMember2025-01-012025-12-310000891478san:JavierBotinSaenzDeSautuolaMembersrt:DirectorMember2025-01-012025-12-310000891478san:JavierBotinSaenzDeSautuolaMembersan:ExecutiveCommittee1Member2025-01-012025-12-310000891478san:JavierBotinSaenzDeSautuolaMembersan:AuditCommitteeMember2025-01-012025-12-310000891478san:JavierBotinSaenzDeSautuolaMembersan:AppointmentsCommitteeMember2025-01-012025-12-310000891478san:JavierBotinSaenzDeSautuolaMembersan:RemunerationCommitteeMember2025-01-012025-12-310000891478san:JavierBotinSaenzDeSautuolaMembersan:RiskSupervisionRegulationAndComplianceOversightCommitteeMember2025-01-012025-12-310000891478san:JavierBotinSaenzDeSautuolaMembersan:ResponsibleBankingSustainabilityAndCultureCommitteeMember2025-01-012025-12-310000891478san:JavierBotinSaenzDeSautuolaMembersan:InnovationAndTechnologyCommitteeMember2025-01-012025-12-310000891478san:AttendanceFeesAndCommissionsMembersan:JavierBotinSaenzDeSautuolaMember2025-01-012025-12-310000891478san:SolDaurellaComadranMembersrt:DirectorMember2025-01-012025-12-310000891478san:SolDaurellaComadranMembersan:ExecutiveCommittee1Member2025-01-012025-12-310000891478san:SolDaurellaComadranMembersan:AuditCommitteeMember2025-01-012025-12-310000891478san:SolDaurellaComadranMembersan:AppointmentsCommitteeMember2025-01-012025-12-310000891478san:SolDaurellaComadranMembersan:RemunerationCommitteeMember2025-01-012025-12-310000891478san:SolDaurellaComadranMembersan:RiskSupervisionRegulationAndComplianceOversightCommitteeMember2025-01-012025-12-310000891478san:SolDaurellaComadranMembersan:ResponsibleBankingSustainabilityAndCultureCommitteeMember2025-01-012025-12-310000891478san:SolDaurellaComadranMembersan:InnovationAndTechnologyCommitteeMember2025-01-012025-12-310000891478san:AttendanceFeesAndCommissionsMembersan:SolDaurellaComadranMember2025-01-012025-12-310000891478san:HenriqueManuelDrummondBorgesCirneDeCastroMembersrt:DirectorMember2025-01-012025-12-310000891478san:HenriqueManuelDrummondBorgesCirneDeCastroMembersan:ExecutiveCommittee1Member2025-01-012025-12-310000891478san:HenriqueManuelDrummondBorgesCirneDeCastroMembersan:AuditCommitteeMember2025-01-012025-12-310000891478san:HenriqueManuelDrummondBorgesCirneDeCastroMembersan:AppointmentsCommitteeMember2025-01-012025-12-310000891478san:HenriqueManuelDrummondBorgesCirneDeCastroMembersan:RemunerationCommitteeMember2025-01-012025-12-310000891478san:HenriqueManuelDrummondBorgesCirneDeCastroMembersan:RiskSupervisionRegulationAndComplianceOversightCommitteeMember2025-01-012025-12-310000891478san:HenriqueManuelDrummondBorgesCirneDeCastroMembersan:ResponsibleBankingSustainabilityAndCultureCommitteeMember2025-01-012025-12-310000891478san:HenriqueManuelDrummondBorgesCirneDeCastroMembersan:InnovationAndTechnologyCommitteeMember2025-01-012025-12-310000891478san:AttendanceFeesAndCommissionsMembersan:HenriqueManuelDrummondBorgesCirneDeCastroMember2025-01-012025-12-310000891478san:GinaLorenzaDiezBarrosoAracarragaMembersrt:DirectorMember2025-01-012025-12-310000891478san:GinaLorenzaDiezBarrosoAracarragaMembersan:ExecutiveCommittee1Member2025-01-012025-12-310000891478san:GinaLorenzaDiezBarrosoAracarragaMembersan:AuditCommitteeMember2025-01-012025-12-310000891478san:GinaLorenzaDiezBarrosoAracarragaMembersan:AppointmentsCommitteeMember2025-01-012025-12-310000891478san:GinaLorenzaDiezBarrosoAracarragaMembersan:RemunerationCommitteeMember2025-01-012025-12-310000891478san:GinaLorenzaDiezBarrosoAracarragaMembersan:RiskSupervisionRegulationAndComplianceOversightCommitteeMember2025-01-012025-12-310000891478san:GinaLorenzaDiezBarrosoAracarragaMembersan:ResponsibleBankingSustainabilityAndCultureCommitteeMember2025-01-012025-12-310000891478san:GinaLorenzaDiezBarrosoAracarragaMembersan:InnovationAndTechnologyCommitteeMember2025-01-012025-12-310000891478san:AttendanceFeesAndCommissionsMembersan:GinaLorenzaDiezBarrosoAracarragaMember2025-01-012025-12-310000891478san:LuisIsasiFernandezDeBobadillaMembersrt:DirectorMember2025-01-012025-12-310000891478san:LuisIsasiFernandezDeBobadillaMembersan:ExecutiveCommittee1Member2025-01-012025-12-310000891478san:LuisIsasiFernandezDeBobadillaMembersan:AuditCommitteeMember2025-01-012025-12-310000891478san:LuisIsasiFernandezDeBobadillaMembersan:AppointmentsCommitteeMember2025-01-012025-12-310000891478san:LuisIsasiFernandezDeBobadillaMembersan:RemunerationCommitteeMember2025-01-012025-12-310000891478san:LuisIsasiFernandezDeBobadillaMembersan:RiskSupervisionRegulationAndComplianceOversightCommitteeMember2025-01-012025-12-310000891478san:LuisIsasiFernandezDeBobadillaMembersan:ResponsibleBankingSustainabilityAndCultureCommitteeMember2025-01-012025-12-310000891478san:LuisIsasiFernandezDeBobadillaMembersan:InnovationAndTechnologyCommitteeMember2025-01-012025-12-310000891478san:AttendanceFeesAndCommissionsMembersan:LuisIsasiFernandezDeBobadillaMember2025-01-012025-12-310000891478san:BelenRomanaGarciaMembersrt:DirectorMember2025-01-012025-12-310000891478san:BelenRomanaGarciaMembersan:ExecutiveCommittee1Member2025-01-012025-12-310000891478san:BelenRomanaGarciaMembersan:AuditCommitteeMember2025-01-012025-12-310000891478san:BelenRomanaGarciaMembersan:AppointmentsCommitteeMember2025-01-012025-12-310000891478san:BelenRomanaGarciaMembersan:RemunerationCommitteeMember2025-01-012025-12-310000891478san:BelenRomanaGarciaMembersan:RiskSupervisionRegulationAndComplianceOversightCommitteeMember2025-01-012025-12-310000891478san:BelenRomanaGarciaMembersan:ResponsibleBankingSustainabilityAndCultureCommitteeMember2025-01-012025-12-310000891478san:BelenRomanaGarciaMembersan:InnovationAndTechnologyCommitteeMember2025-01-012025-12-310000891478san:AttendanceFeesAndCommissionsMembersan:BelenRomanaGarciaMember2025-01-012025-12-310000891478san:PamelaAnnWalkdenMembersrt:DirectorMember2025-01-012025-12-310000891478san:PamelaAnnWalkdenMembersan:ExecutiveCommittee1Member2025-01-012025-12-310000891478san:PamelaAnnWalkdenMembersan:AuditCommitteeMember2025-01-012025-12-310000891478san:PamelaAnnWalkdenMembersan:AppointmentsCommitteeMember2025-01-012025-12-310000891478san:PamelaAnnWalkdenMembersan:RemunerationCommitteeMember2025-01-012025-12-310000891478san:PamelaAnnWalkdenMembersan:RiskSupervisionRegulationAndComplianceOversightCommitteeMember2025-01-012025-12-310000891478san:PamelaAnnWalkdenMembersan:ResponsibleBankingSustainabilityAndCultureCommitteeMember2025-01-012025-12-310000891478san:PamelaAnnWalkdenMembersan:InnovationAndTechnologyCommitteeMember2025-01-012025-12-310000891478san:AttendanceFeesAndCommissionsMembersan:PamelaAnnWalkdenMember2025-01-012025-12-310000891478san:GermanDeLaFuenteEscamillaMembersrt:DirectorMember2025-01-012025-12-310000891478san:GermanDeLaFuenteEscamillaMembersan:ExecutiveCommittee1Member2025-01-012025-12-310000891478san:GermanDeLaFuenteEscamillaMembersan:AuditCommitteeMember2025-01-012025-12-310000891478san:GermanDeLaFuenteEscamillaMembersan:AppointmentsCommitteeMember2025-01-012025-12-310000891478san:GermanDeLaFuenteEscamillaMembersan:RemunerationCommitteeMember2025-01-012025-12-310000891478san:GermanDeLaFuenteEscamillaMembersan:RiskSupervisionRegulationAndComplianceOversightCommitteeMember2025-01-012025-12-310000891478san:GermanDeLaFuenteEscamillaMembersan:ResponsibleBankingSustainabilityAndCultureCommitteeMember2025-01-012025-12-310000891478san:GermanDeLaFuenteEscamillaMembersan:InnovationAndTechnologyCommitteeMember2025-01-012025-12-310000891478san:AttendanceFeesAndCommissionsMembersan:GermanDeLaFuenteEscamillaMember2025-01-012025-12-310000891478san:JuanCarlosBarrabesConsulMembersrt:DirectorMember2025-01-012025-12-310000891478san:JuanCarlosBarrabesConsulMembersan:ExecutiveCommittee1Member2025-01-012025-12-310000891478san:JuanCarlosBarrabesConsulMembersan:AuditCommitteeMember2025-01-012025-12-310000891478san:JuanCarlosBarrabesConsulMembersan:AppointmentsCommitteeMember2025-01-012025-12-310000891478san:JuanCarlosBarrabesConsulMembersan:RemunerationCommitteeMember2025-01-012025-12-310000891478san:JuanCarlosBarrabesConsulMembersan:RiskSupervisionRegulationAndComplianceOversightCommitteeMember2025-01-012025-12-310000891478san:JuanCarlosBarrabesConsulMembersan:ResponsibleBankingSustainabilityAndCultureCommitteeMember2025-01-012025-12-310000891478san:JuanCarlosBarrabesConsulMembersan:InnovationAndTechnologyCommitteeMember2025-01-012025-12-310000891478san:AttendanceFeesAndCommissionsMembersan:JuanCarlosBarrabesConsulMember2025-01-012025-12-310000891478san:AntonioFrancescoWeissMembersrt:DirectorMember2025-01-012025-12-310000891478san:AntonioFrancescoWeissMembersan:ExecutiveCommittee1Member2025-01-012025-12-310000891478san:AntonioFrancescoWeissMembersan:AuditCommitteeMember2025-01-012025-12-310000891478san:AntonioFrancescoWeissMembersan:AppointmentsCommitteeMember2025-01-012025-12-310000891478san:AntonioFrancescoWeissMembersan:RemunerationCommitteeMember2025-01-012025-12-310000891478san:AntonioFrancescoWeissMembersan:RiskSupervisionRegulationAndComplianceOversightCommitteeMember2025-01-012025-12-310000891478san:AntonioFrancescoWeissMembersan:ResponsibleBankingSustainabilityAndCultureCommitteeMember2025-01-012025-12-310000891478san:AntonioFrancescoWeissMembersan:InnovationAndTechnologyCommitteeMember2025-01-012025-12-310000891478san:AttendanceFeesAndCommissionsMembersan:AntonioFrancescoWeissMember2025-01-012025-12-310000891478san:BruceCarnegieBrownMembersrt:DirectorMember2025-01-012025-12-310000891478san:BruceCarnegieBrownMembersan:ExecutiveCommittee1Member2025-01-012025-12-310000891478san:BruceCarnegieBrownMembersan:AuditCommitteeMember2025-01-012025-12-310000891478san:BruceCarnegieBrownMembersan:AppointmentsCommitteeMember2025-01-012025-12-310000891478san:BruceCarnegieBrownMembersan:RemunerationCommitteeMember2025-01-012025-12-310000891478san:BruceCarnegieBrownMembersan:RiskSupervisionRegulationAndComplianceOversightCommitteeMember2025-01-012025-12-310000891478san:BruceCarnegieBrownMembersan:ResponsibleBankingSustainabilityAndCultureCommitteeMember2025-01-012025-12-310000891478san:BruceCarnegieBrownMembersan:InnovationAndTechnologyCommitteeMember2025-01-012025-12-310000891478san:AttendanceFeesAndCommissionsMembersan:BruceCarnegieBrownMember2025-01-012025-12-310000891478san:RamiroMatoGarcaAnsorenaMembersrt:DirectorMember2025-01-012025-12-310000891478san:RamiroMatoGarcaAnsorenaMembersan:ExecutiveCommittee1Member2025-01-012025-12-310000891478san:RamiroMatoGarcaAnsorenaMembersan:AuditCommitteeMember2025-01-012025-12-310000891478san:RamiroMatoGarcaAnsorenaMembersan:AppointmentsCommitteeMember2025-01-012025-12-310000891478san:RamiroMatoGarcaAnsorenaMembersan:RemunerationCommitteeMember2025-01-012025-12-310000891478san:RamiroMatoGarcaAnsorenaMembersan:RiskSupervisionRegulationAndComplianceOversightCommitteeMember2025-01-012025-12-310000891478san:RamiroMatoGarcaAnsorenaMembersan:ResponsibleBankingSustainabilityAndCultureCommitteeMember2025-01-012025-12-310000891478san:RamiroMatoGarcaAnsorenaMembersan:InnovationAndTechnologyCommitteeMember2025-01-012025-12-310000891478san:AttendanceFeesAndCommissionsMembersan:RamiroMatoGarcaAnsorenaMember2025-01-012025-12-310000891478san:AttendanceFeesAndCommissionsMember2025-01-012025-12-310000891478san:AttendanceFeesAndCommissionsMember2024-01-012024-12-310000891478srt:DirectorMembersan:SantanderSpainMembersan:LuisIsasiFernandezDeBobadillaMember2025-01-012025-12-310000891478san:AnaBotinSanzDeSautuolaYOSheaMember2025-01-012025-12-310000891478san:AnaBotinSanzDeSautuolaYOSheaMember2024-01-012024-12-310000891478san:HectorGrisiMember2025-01-012025-12-310000891478san:HectorGrisiMember2024-01-012024-12-310000891478san:JoseAntonioAlvarezMember2025-01-012025-12-310000891478san:JoseAntonioAlvarezMember2024-01-012024-12-310000891478san:GlennHutchinsMember2025-01-012025-12-310000891478san:GlennHutchinsMember2024-01-012024-12-310000891478san:HomairaAkbariMember2025-01-012025-12-310000891478san:HomairaAkbariMember2024-01-012024-12-310000891478san:JavierBotinSaenzDeSautuolaMember2025-01-012025-12-310000891478san:JavierBotinSaenzDeSautuolaMember2024-01-012024-12-310000891478san:SolDaurellaComadranMember2025-01-012025-12-310000891478san:SolDaurellaComadranMember2024-01-012024-12-310000891478san:HenriqueManuelDrummondBorgesCirneDeCastroMember2025-01-012025-12-310000891478san:HenriqueManuelDrummondBorgesCirneDeCastroMember2024-01-012024-12-310000891478san:GinaLorenzaDiezBarrosoAracarragaMember2025-01-012025-12-310000891478san:GinaLorenzaDiezBarrosoAracarragaMember2024-01-012024-12-310000891478san:LuisIsasiFernandezDeBobadillaMember2025-01-012025-12-310000891478san:LuisIsasiFernandezDeBobadillaMember2024-01-012024-12-310000891478san:BelenRomanaGarciaMember2025-01-012025-12-310000891478san:BelenRomanaGarciaMember2024-01-012024-12-310000891478san:PamelaAnnWalkdenMember2025-01-012025-12-310000891478san:PamelaAnnWalkdenMember2024-01-012024-12-310000891478san:GermanDeLaFuenteEscamillaMember2025-01-012025-12-310000891478san:GermanDeLaFuenteEscamillaMember2024-01-012024-12-310000891478san:JuanCarlosBarrabesConsulMember2025-01-012025-12-310000891478san:JuanCarlosBarrabesConsulMember2024-01-012024-12-310000891478san:AntonioFrancescoWeissMember2025-01-012025-12-310000891478san:AntonioFrancescoWeissMember2024-01-012024-12-310000891478san:BruceCarnegieBrownMember2025-01-012025-12-310000891478san:BruceCarnegieBrownMember2024-01-012024-12-310000891478san:RamiroMatoGarcaAnsorenaMember2025-01-012025-12-310000891478san:RamiroMatoGarcaAnsorenaMember2024-01-012024-12-310000891478san:BoardOfDirectorsChairmanAndChiefExecutiveOfficerMembersan:DeferredVariableCompensationPlanMultiannualObjectivesMembersan:AnaBotinSanzDeSautuolaYOSheaMember2025-01-012025-12-310000891478san:BoardOfDirectorsChairmanAndChiefExecutiveOfficerMembersan:DeferredVariableCompensationPlanMultiannualObjectivesMembersan:AnaBotinSanzDeSautuolaYOSheaMember2024-01-012024-12-310000891478san:BoardOfDirectorsChairmanAndChiefExecutiveOfficerMembersan:DeferredVariableCompensationPlanMultiannualObjectivesMembersan:HectorGrisiMember2025-01-012025-12-310000891478san:BoardOfDirectorsChairmanAndChiefExecutiveOfficerMembersan:DeferredVariableCompensationPlanMultiannualObjectivesMembersan:HectorGrisiMember2024-01-012024-12-310000891478san:DeferredVariableCompensationPlanMultiannualObjectivesMembersan:BoardOfDirectorsChairmanAndChiefExecutiveOfficerMember2025-01-012025-12-310000891478san:DeferredVariableCompensationPlanMultiannualObjectivesMembersan:BoardOfDirectorsChairmanAndChiefExecutiveOfficerMember2024-01-012024-12-310000891478san:DeferredVariableCompensationPlanMultiannualObjectivesMembersan:BoardOfDirectorsChairmanAndChiefExecutiveOfficerMember2025-12-310000891478san:DeferredVariableCompensationPlanMultiannualObjectivesMember2025-12-310000891478san:HomairaAkbariMembersan:SantanderConsumerUSAHoldingsIncMember2025-01-012025-12-310000891478san:HomairaAkbariMembersan:PagoNxtMember2025-01-012025-12-310000891478san:HenriqueManuelDrummondBorgesCirneDeCastroMembersan:PagoNxtMember2025-01-012025-12-310000891478san:JoseAntonioAlvarezMembersan:PagoNxtMember2025-01-012025-12-310000891478san:HenriqueManuelDrummondBorgesCirneDeCastroMembersan:PagoNxtNominationCommitteeMember2025-01-012025-12-310000891478san:PamelaAnnWalkdenMembersan:SantanderUKPLCAndSantanderUKGroupHoldingsMember2025-01-012025-12-310000891478san:BelenRomanaGarciaMembersan:SantanderInsuranceS.L.Member2025-01-012025-12-310000891478san:LuisIsasiFernandezDeBobadillaMembersan:SantanderSpainAndBancoSantanderMember2025-01-012025-12-310000891478san:AnaBotinSanzDeSautuolaYOSheaMembersrt:DirectorMember2025-12-310000891478san:AnaBotinSanzDeSautuolaYOSheaMembersrt:DirectorMember2024-12-310000891478san:HectorGrisiMembersrt:DirectorMember2025-12-310000891478san:HectorGrisiMembersrt:DirectorMember2024-12-310000891478srt:DirectorMember2025-12-310000891478srt:DirectorMember2024-12-310000891478san:AnaBotinSanzDeSautuolaYOSheaMembersrt:DirectorMember2024-01-012024-12-310000891478san:HectorGrisiMembersrt:DirectorMember2024-01-012024-12-310000891478san:JoseAntonioAlvarezMembersrt:DirectorMember2024-01-012024-12-310000891478srt:DirectorMembersan:LifeInsuranceMembersan:AnaBotinSanzDeSautuolaYOSheaMember2025-01-012025-12-310000891478srt:DirectorMembersan:LifeInsuranceMembersan:AnaBotinSanzDeSautuolaYOSheaMember2024-01-012024-12-310000891478srt:DirectorMembersan:LifeInsuranceMembersan:HectorGrisiMember2025-01-012025-12-310000891478srt:DirectorMembersan:LifeInsuranceMembersan:HectorGrisiMember2024-01-012024-12-310000891478srt:DirectorMembersan:LifeInsuranceMembersan:JoseAntonioAlvarezMember2025-01-012025-12-310000891478srt:DirectorMembersan:LifeInsuranceMembersan:JoseAntonioAlvarezMember2024-01-012024-12-310000891478srt:DirectorMembersan:LifeInsuranceMember2025-01-012025-12-310000891478srt:DirectorMembersan:LifeInsuranceMember2024-01-012024-12-310000891478san:OtherDirectorsMembersan:LifeInsuranceMember2025-01-012025-12-310000891478san:OtherDirectorsMembersan:LifeInsuranceMember2024-01-012024-12-310000891478san:DeferredVariableCompensationPlanMultiannualObjectivesMembersrt:DirectorMember2025-11-252025-11-250000891478san:DeferredVariableCompensationPlanMultiannualObjectivesMembersrt:DirectorMember2025-11-242025-11-240000891478san:DeferredVariableCompensationPlanMultiannualObjectivesMembersrt:DirectorMember2025-02-032025-02-030000891478san:DeferredVariableCompensationPlanMultiannualObjectivesMembersrt:DirectorMember2025-12-310000891478srt:DirectorMembersan:PagoNxtMembersan:DeferredVariableCompensationPlanMultiannualObjectivesMember2025-12-310000891478srt:DirectorMembersan:ShareBasedVariableRemunerationAward2019Membersan:AnaBotinSanzDeSautuolaYOSheaMemberifrs-full:TopOfRangeMember2023-12-310000891478srt:DirectorMembersan:ShareBasedVariableRemunerationAward2019Membersan:AnaBotinSanzDeSautuolaYOSheaMember2024-01-012024-12-310000891478srt:DirectorMembersan:ShareBasedVariableRemunerationAward2019Membersan:JoseAntonioAlvarezMemberifrs-full:TopOfRangeMember2023-12-310000891478srt:DirectorMembersan:ShareBasedVariableRemunerationAward2019Membersan:JoseAntonioAlvarezMember2024-01-012024-12-310000891478srt:DirectorMembersan:ShareBasedVariableRemunerationAward2019Memberifrs-full:TopOfRangeMember2023-12-310000891478san:ShareBasedVariableRemunerationAward2019Membersrt:DirectorMember2024-01-012024-12-310000891478srt:DirectorMembersan:ShareBasedVariableRemunerationAward2020Membersan:AnaBotinSanzDeSautuolaYOSheaMemberifrs-full:TopOfRangeMember2023-12-310000891478srt:DirectorMembersan:ShareBasedVariableRemunerationAward2020Membersan:AnaBotinSanzDeSautuolaYOSheaMember2024-01-012024-12-310000891478srt:DirectorMembersan:ShareBasedVariableRemunerationAward2020Membersan:JoseAntonioAlvarezMemberifrs-full:TopOfRangeMember2023-12-310000891478srt:DirectorMembersan:ShareBasedVariableRemunerationAward2020Membersan:JoseAntonioAlvarezMember2024-01-012024-12-310000891478srt:DirectorMembersan:ShareBasedVariableRemunerationAward2020Memberifrs-full:TopOfRangeMember2023-12-310000891478san:ShareBasedVariableRemunerationAward2020Membersrt:DirectorMember2024-01-012024-12-310000891478srt:DirectorMembersan:ShareBasedVariableRemunerationAward2021Membersan:AnaBotinSanzDeSautuolaYOSheaMemberifrs-full:TopOfRangeMember2023-12-310000891478srt:DirectorMembersan:ShareBasedVariableRemunerationAward2021Membersan:AnaBotinSanzDeSautuolaYOSheaMember2024-01-012024-12-310000891478srt:DirectorMembersan:ShareBasedVariableRemunerationAward2021Membersan:JoseAntonioAlvarezMemberifrs-full:TopOfRangeMember2023-12-310000891478srt:DirectorMembersan:ShareBasedVariableRemunerationAward2021Membersan:JoseAntonioAlvarezMember2024-01-012024-12-310000891478srt:DirectorMembersan:ShareBasedVariableRemunerationAward2021Memberifrs-full:TopOfRangeMember2023-12-310000891478san:ShareBasedVariableRemunerationAward2021Membersrt:DirectorMember2024-01-012024-12-310000891478srt:DirectorMembersan:ShareBasedVariableRemunerationAward2022Membersan:AnaBotinSanzDeSautuolaYOSheaMemberifrs-full:TopOfRangeMember2023-12-310000891478srt:DirectorMembersan:ShareBasedVariableRemunerationAward2022Membersan:AnaBotinSanzDeSautuolaYOSheaMember2024-01-012024-12-310000891478srt:DirectorMembersan:ShareBasedVariableRemunerationAward2022Membersan:JoseAntonioAlvarezMemberifrs-full:TopOfRangeMember2023-12-310000891478srt:DirectorMembersan:ShareBasedVariableRemunerationAward2022Membersan:JoseAntonioAlvarezMember2024-01-012024-12-310000891478srt:DirectorMembersan:ShareBasedVariableRemunerationAward2022Memberifrs-full:TopOfRangeMember2023-12-310000891478san:ShareBasedVariableRemunerationAward2022Membersrt:DirectorMember2024-01-012024-12-310000891478srt:DirectorMembersan:ShareBasedVariableRemunerationAward2023Membersan:AnaBotinSanzDeSautuolaYOSheaMemberifrs-full:TopOfRangeMember2023-12-310000891478srt:DirectorMembersan:ShareBasedVariableRemunerationAward2023Membersan:AnaBotinSanzDeSautuolaYOSheaMember2024-01-012024-12-310000891478srt:DirectorMembersan:ShareBasedVariableRemunerationAward2023Membersan:HectorGrisiMemberifrs-full:TopOfRangeMember2023-12-310000891478srt:DirectorMembersan:ShareBasedVariableRemunerationAward2023Membersan:HectorGrisiMember2024-01-012024-12-310000891478srt:DirectorMembersan:ShareBasedVariableRemunerationAward2023Memberifrs-full:TopOfRangeMember2023-12-310000891478san:ShareBasedVariableRemunerationAward2023Membersrt:DirectorMember2024-01-012024-12-310000891478srt:DirectorMembersan:ShareBasedVariableRemunerationAward2024Membersan:AnaBotinSanzDeSautuolaYOSheaMemberifrs-full:TopOfRangeMember2024-12-310000891478srt:DirectorMembersan:ShareBasedVariableRemunerationAward2024Membersan:HectorGrisiMemberifrs-full:TopOfRangeMember2024-12-310000891478srt:DirectorMembersan:ShareBasedVariableRemunerationAward2024Memberifrs-full:TopOfRangeMember2024-12-310000891478san:DeferredVariableCompensationPlanMultiannualObjectivesMembersrt:DirectorMember2025-01-012025-12-310000891478srt:DirectorMembersan:ShareBasedVariableRemunerationAward2019Membersan:AnaBotinSanzDeSautuolaYOSheaMemberifrs-full:TopOfRangeMember2024-12-310000891478srt:DirectorMembersan:ShareBasedVariableRemunerationAward2019Membersan:AnaBotinSanzDeSautuolaYOSheaMember2025-01-012025-12-310000891478srt:DirectorMembersan:ShareBasedVariableRemunerationAward2019Membersan:JoseAntonioAlvarezMemberifrs-full:TopOfRangeMember2024-12-310000891478srt:DirectorMembersan:ShareBasedVariableRemunerationAward2019Membersan:JoseAntonioAlvarezMember2025-01-012025-12-310000891478srt:DirectorMembersan:ShareBasedVariableRemunerationAward2019Memberifrs-full:TopOfRangeMember2024-12-310000891478san:ShareBasedVariableRemunerationAward2019Membersrt:DirectorMember2025-01-012025-12-310000891478srt:DirectorMembersan:ShareBasedVariableRemunerationAward2020Membersan:AnaBotinSanzDeSautuolaYOSheaMemberifrs-full:TopOfRangeMember2024-12-310000891478srt:DirectorMembersan:ShareBasedVariableRemunerationAward2020Membersan:AnaBotinSanzDeSautuolaYOSheaMember2025-01-012025-12-310000891478srt:DirectorMembersan:ShareBasedVariableRemunerationAward2020Membersan:AnaBotinSanzDeSautuolaYOSheaMemberifrs-full:TopOfRangeMember2025-12-310000891478srt:DirectorMembersan:ShareBasedVariableRemunerationAward2020Membersan:JoseAntonioAlvarezMemberifrs-full:TopOfRangeMember2024-12-310000891478srt:DirectorMembersan:ShareBasedVariableRemunerationAward2020Membersan:JoseAntonioAlvarezMember2025-01-012025-12-310000891478srt:DirectorMembersan:ShareBasedVariableRemunerationAward2020Membersan:JoseAntonioAlvarezMemberifrs-full:TopOfRangeMember2025-12-310000891478srt:DirectorMembersan:ShareBasedVariableRemunerationAward2020Memberifrs-full:TopOfRangeMember2024-12-310000891478san:ShareBasedVariableRemunerationAward2020Membersrt:DirectorMember2025-01-012025-12-310000891478srt:DirectorMembersan:ShareBasedVariableRemunerationAward2020Memberifrs-full:TopOfRangeMember2025-12-310000891478srt:DirectorMembersan:ShareBasedVariableRemunerationAward2021Membersan:AnaBotinSanzDeSautuolaYOSheaMemberifrs-full:TopOfRangeMember2024-12-310000891478srt:DirectorMembersan:ShareBasedVariableRemunerationAward2021Membersan:AnaBotinSanzDeSautuolaYOSheaMember2024-12-310000891478srt:DirectorMembersan:ShareBasedVariableRemunerationAward2021Membersan:AnaBotinSanzDeSautuolaYOSheaMember2025-01-012025-12-310000891478srt:DirectorMembersan:ShareBasedVariableRemunerationAward2021Membersan:AnaBotinSanzDeSautuolaYOSheaMemberifrs-full:TopOfRangeMember2025-12-310000891478srt:DirectorMembersan:ShareBasedVariableRemunerationAward2021Membersan:JoseAntonioAlvarezMemberifrs-full:TopOfRangeMember2024-12-310000891478srt:DirectorMembersan:ShareBasedVariableRemunerationAward2021Membersan:JoseAntonioAlvarezMember2024-12-310000891478srt:DirectorMembersan:ShareBasedVariableRemunerationAward2021Membersan:JoseAntonioAlvarezMember2025-01-012025-12-310000891478srt:DirectorMembersan:ShareBasedVariableRemunerationAward2021Membersan:JoseAntonioAlvarezMemberifrs-full:TopOfRangeMember2025-12-310000891478srt:DirectorMembersan:ShareBasedVariableRemunerationAward2021Memberifrs-full:TopOfRangeMember2024-12-310000891478san:ShareBasedVariableRemunerationAward2021Membersrt:DirectorMember2024-12-310000891478san:ShareBasedVariableRemunerationAward2021Membersrt:DirectorMember2025-01-012025-12-310000891478srt:DirectorMembersan:ShareBasedVariableRemunerationAward2021Memberifrs-full:TopOfRangeMember2025-12-310000891478srt:DirectorMembersan:ShareBasedVariableRemunerationAward2022Membersan:AnaBotinSanzDeSautuolaYOSheaMemberifrs-full:TopOfRangeMember2024-12-310000891478srt:DirectorMembersan:ShareBasedVariableRemunerationAward2022Membersan:AnaBotinSanzDeSautuolaYOSheaMember2025-01-012025-12-310000891478srt:DirectorMembersan:ShareBasedVariableRemunerationAward2022Membersan:AnaBotinSanzDeSautuolaYOSheaMemberifrs-full:TopOfRangeMember2025-12-310000891478srt:DirectorMembersan:ShareBasedVariableRemunerationAward2022Membersan:JoseAntonioAlvarezMemberifrs-full:TopOfRangeMember2024-12-310000891478srt:DirectorMembersan:ShareBasedVariableRemunerationAward2022Membersan:JoseAntonioAlvarezMember2025-01-012025-12-310000891478srt:DirectorMembersan:ShareBasedVariableRemunerationAward2022Membersan:JoseAntonioAlvarezMemberifrs-full:TopOfRangeMember2025-12-310000891478srt:DirectorMembersan:ShareBasedVariableRemunerationAward2022Memberifrs-full:TopOfRangeMember2024-12-310000891478san:ShareBasedVariableRemunerationAward2022Membersrt:DirectorMember2025-01-012025-12-310000891478srt:DirectorMembersan:ShareBasedVariableRemunerationAward2022Memberifrs-full:TopOfRangeMember2025-12-310000891478srt:DirectorMembersan:ShareBasedVariableRemunerationAward2023Membersan:AnaBotinSanzDeSautuolaYOSheaMemberifrs-full:TopOfRangeMember2024-12-310000891478srt:DirectorMembersan:ShareBasedVariableRemunerationAward2023Membersan:AnaBotinSanzDeSautuolaYOSheaMember2025-01-012025-12-310000891478srt:DirectorMembersan:ShareBasedVariableRemunerationAward2023Membersan:AnaBotinSanzDeSautuolaYOSheaMemberifrs-full:TopOfRangeMember2025-12-310000891478srt:DirectorMembersan:ShareBasedVariableRemunerationAward2023Membersan:HectorGrisiMemberifrs-full:TopOfRangeMember2024-12-310000891478srt:DirectorMembersan:ShareBasedVariableRemunerationAward2023Membersan:HectorGrisiMember2025-01-012025-12-310000891478srt:DirectorMembersan:ShareBasedVariableRemunerationAward2023Membersan:HectorGrisiMemberifrs-full:TopOfRangeMember2025-12-310000891478srt:DirectorMembersan:ShareBasedVariableRemunerationAward2023Memberifrs-full:TopOfRangeMember2024-12-310000891478san:ShareBasedVariableRemunerationAward2023Membersrt:DirectorMember2025-01-012025-12-310000891478srt:DirectorMembersan:ShareBasedVariableRemunerationAward2023Memberifrs-full:TopOfRangeMember2025-12-310000891478srt:DirectorMembersan:ShareBasedVariableRemunerationAward2024Membersan:AnaBotinSanzDeSautuolaYOSheaMember2025-01-012025-12-310000891478srt:DirectorMembersan:ShareBasedVariableRemunerationAward2024Membersan:AnaBotinSanzDeSautuolaYOSheaMemberifrs-full:TopOfRangeMember2025-12-310000891478srt:DirectorMembersan:ShareBasedVariableRemunerationAward2024Membersan:HectorGrisiMember2025-01-012025-12-310000891478srt:DirectorMembersan:ShareBasedVariableRemunerationAward2024Membersan:HectorGrisiMemberifrs-full:TopOfRangeMember2025-12-310000891478san:ShareBasedVariableRemunerationAward2024Membersrt:DirectorMember2025-01-012025-12-310000891478srt:DirectorMembersan:ShareBasedVariableRemunerationAward2024Memberifrs-full:TopOfRangeMember2025-12-310000891478srt:DirectorMembersan:ShareBasedVariableRemunerationAward2025Membersan:AnaBotinSanzDeSautuolaYOSheaMemberifrs-full:TopOfRangeMember2025-12-310000891478srt:DirectorMembersan:ShareBasedVariableRemunerationAward2025Membersan:HectorGrisiMemberifrs-full:TopOfRangeMember2025-12-310000891478srt:DirectorMembersan:ShareBasedVariableRemunerationAward2025Memberifrs-full:TopOfRangeMember2025-12-310000891478san:ShareBasedVariableRemunerationAward2022Member2025-01-012025-12-310000891478san:ShareBasedVariableRemunerationAward2021Member2025-01-012025-12-310000891478san:ShareBasedVariableRemunerationAward2020Member2025-01-012025-12-310000891478san:PagoNxtMembersan:ShareBasedVariableRemunerationAward2022Membersan:AnaBotinSanzDeSautuolaYOSheaMembersrt:DirectorMemberifrs-full:TopOfRangeMember2025-01-012025-12-310000891478san:PagoNxtMembersan:ShareBasedVariableRemunerationAward2022Membersan:HectorGrisiMembersrt:DirectorMemberifrs-full:TopOfRangeMember2025-01-012025-12-310000891478san:DirectorsRetiredMembersan:DeferredConditionalVariableRemunerationPlanAndLinkedToObjectives2019Memberifrs-full:TopOfRangeMember2025-01-012025-12-310000891478san:DirectorsRetiredMembersan:DeferredConditionalVariableRemunerationPlanAndLinkedToObjectives2019Memberifrs-full:TopOfRangeMember2024-01-012024-12-310000891478san:DirectorsRetiredMembersan:DeferredConditionalVariableRemunerationPlanAndLinkedToObjectives2020Memberifrs-full:TopOfRangeMember2025-01-012025-12-310000891478san:DirectorsRetiredMembersan:DeferredConditionalVariableRemunerationPlanAndLinkedToObjectives2020Memberifrs-full:TopOfRangeMember2024-01-012024-12-310000891478san:DirectorsRetiredMembersan:DeferredConditionalVariableRemunerationPlanAndLinkedToObjectives2021Memberifrs-full:TopOfRangeMember2025-01-012025-12-310000891478san:DirectorsRetiredMembersan:DeferredConditionalVariableRemunerationPlanAndLinkedToObjectives2021Memberifrs-full:TopOfRangeMember2024-01-012024-12-310000891478san:DeferredConditionalVariableRemunerationPlanAndLinkedToObjectives2018Membersan:DirectorsRetiredMember2025-01-012025-12-310000891478san:DeferredConditionalVariableRemunerationPlanAndLinkedToObjectives2018Membersan:DirectorsRetiredMember2024-01-012024-12-310000891478san:DeferredConditionalVariableRemunerationPlanAndLinkedToObjectives2019Membersan:DirectorsRetiredMember2025-01-012025-12-310000891478san:DeferredConditionalVariableRemunerationPlanAndLinkedToObjectives2019Membersan:DirectorsRetiredMember2024-01-012024-12-310000891478san:DeferredConditionalVariableRemunerationPlanAndLinkedToObjectives2020Membersan:DirectorsRetiredMember2025-01-012025-12-310000891478san:DeferredConditionalVariableRemunerationPlanAndLinkedToObjectives2020Membersan:DirectorsRetiredMember2024-01-012024-12-310000891478san:DeferredConditionalVariableRemunerationPlanAndLinkedToObjectives2021Membersan:DirectorsRetiredMember2025-01-012025-12-310000891478san:DeferredConditionalVariableRemunerationPlanAndLinkedToObjectives2021Membersan:DirectorsRetiredMember2024-01-012024-12-310000891478san:DirectorsRetiredMember2025-01-012025-12-310000891478san:DirectorsRetiredMember2024-01-012024-12-310000891478srt:DirectorMemberifrs-full:LoanCommitmentsMembersan:AnaBotinSanzDeSautuolaYOSheaMember2025-12-310000891478srt:DirectorMemberifrs-full:FinancialGuaranteeContractsMembersan:AnaBotinSanzDeSautuolaYOSheaMember2025-12-310000891478srt:DirectorMemberifrs-full:LoanCommitmentsMembersan:AnaBotinSanzDeSautuolaYOSheaMember2024-12-310000891478srt:DirectorMemberifrs-full:FinancialGuaranteeContractsMembersan:AnaBotinSanzDeSautuolaYOSheaMember2024-12-310000891478srt:DirectorMemberifrs-full:LoanCommitmentsMembersan:HectorGrisiMember2025-12-310000891478srt:DirectorMemberifrs-full:FinancialGuaranteeContractsMembersan:HectorGrisiMember2025-12-310000891478srt:DirectorMemberifrs-full:LoanCommitmentsMembersan:HectorGrisiMember2024-12-310000891478srt:DirectorMemberifrs-full:FinancialGuaranteeContractsMembersan:HectorGrisiMember2024-12-310000891478srt:DirectorMemberifrs-full:LoanCommitmentsMembersan:JoseAntonioAlvarezMember2025-12-310000891478srt:DirectorMemberifrs-full:FinancialGuaranteeContractsMembersan:JoseAntonioAlvarezMember2025-12-310000891478san:JoseAntonioAlvarezMembersrt:DirectorMember2025-12-310000891478srt:DirectorMemberifrs-full:LoanCommitmentsMembersan:JoseAntonioAlvarezMember2024-12-310000891478srt:DirectorMemberifrs-full:FinancialGuaranteeContractsMembersan:JoseAntonioAlvarezMember2024-12-310000891478san:JoseAntonioAlvarezMembersrt:DirectorMember2024-12-310000891478srt:DirectorMemberifrs-full:LoanCommitmentsMembersan:GlennHutchinsMember2025-12-310000891478srt:DirectorMemberifrs-full:FinancialGuaranteeContractsMembersan:GlennHutchinsMember2025-12-310000891478san:GlennHutchinsMembersrt:DirectorMember2025-12-310000891478srt:DirectorMemberifrs-full:LoanCommitmentsMembersan:GlennHutchinsMember2024-12-310000891478srt:DirectorMemberifrs-full:FinancialGuaranteeContractsMembersan:GlennHutchinsMember2024-12-310000891478san:GlennHutchinsMembersrt:DirectorMember2024-12-310000891478srt:DirectorMemberifrs-full:LoanCommitmentsMembersan:AntonioFrancescoWeissMember2025-12-310000891478srt:DirectorMemberifrs-full:FinancialGuaranteeContractsMembersan:AntonioFrancescoWeissMember2025-12-310000891478san:AntonioFrancescoWeissMembersrt:DirectorMember2025-12-310000891478srt:DirectorMemberifrs-full:LoanCommitmentsMembersan:AntonioFrancescoWeissMember2024-12-310000891478srt:DirectorMemberifrs-full:FinancialGuaranteeContractsMembersan:AntonioFrancescoWeissMember2024-12-310000891478san:AntonioFrancescoWeissMembersrt:DirectorMember2024-12-310000891478srt:DirectorMemberifrs-full:LoanCommitmentsMembersan:BelenRomanaGarciaMember2025-12-310000891478srt:DirectorMemberifrs-full:FinancialGuaranteeContractsMembersan:BelenRomanaGarciaMember2025-12-310000891478san:BelenRomanaGarciaMembersrt:DirectorMember2025-12-310000891478srt:DirectorMemberifrs-full:LoanCommitmentsMembersan:BelenRomanaGarciaMember2024-12-310000891478srt:DirectorMemberifrs-full:FinancialGuaranteeContractsMembersan:BelenRomanaGarciaMember2024-12-310000891478san:BelenRomanaGarciaMembersrt:DirectorMember2024-12-310000891478srt:DirectorMemberifrs-full:LoanCommitmentsMembersan:BruceCarnegieBrownMember2025-12-310000891478srt:DirectorMemberifrs-full:FinancialGuaranteeContractsMembersan:BruceCarnegieBrownMember2025-12-310000891478san:BruceCarnegieBrownMembersrt:DirectorMember2025-12-310000891478srt:DirectorMemberifrs-full:LoanCommitmentsMembersan:BruceCarnegieBrownMember2024-12-310000891478srt:DirectorMemberifrs-full:FinancialGuaranteeContractsMembersan:BruceCarnegieBrownMember2024-12-310000891478san:BruceCarnegieBrownMembersrt:DirectorMember2024-12-310000891478srt:DirectorMemberifrs-full:LoanCommitmentsMembersan:GermanDeLaFuenteEscamillaMember2025-12-310000891478srt:DirectorMemberifrs-full:FinancialGuaranteeContractsMembersan:GermanDeLaFuenteEscamillaMember2025-12-310000891478san:GermanDeLaFuenteEscamillaMembersrt:DirectorMember2025-12-310000891478srt:DirectorMemberifrs-full:LoanCommitmentsMembersan:GermanDeLaFuenteEscamillaMember2024-12-310000891478srt:DirectorMemberifrs-full:FinancialGuaranteeContractsMembersan:GermanDeLaFuenteEscamillaMember2024-12-310000891478san:GermanDeLaFuenteEscamillaMembersrt:DirectorMember2024-12-310000891478srt:DirectorMemberifrs-full:LoanCommitmentsMembersan:GinaLorenzaDiezBarrosoAracarragaMember2025-12-310000891478srt:DirectorMemberifrs-full:FinancialGuaranteeContractsMembersan:GinaLorenzaDiezBarrosoAracarragaMember2025-12-310000891478san:GinaLorenzaDiezBarrosoAracarragaMembersrt:DirectorMember2025-12-310000891478srt:DirectorMemberifrs-full:LoanCommitmentsMembersan:GinaLorenzaDiezBarrosoAracarragaMember2024-12-310000891478srt:DirectorMemberifrs-full:FinancialGuaranteeContractsMembersan:GinaLorenzaDiezBarrosoAracarragaMember2024-12-310000891478san:GinaLorenzaDiezBarrosoAracarragaMembersrt:DirectorMember2024-12-310000891478srt:DirectorMemberifrs-full:LoanCommitmentsMembersan:HenriqueManuelDrummondBorgesCirneDeCastroMember2025-12-310000891478srt:DirectorMemberifrs-full:FinancialGuaranteeContractsMembersan:HenriqueManuelDrummondBorgesCirneDeCastroMember2025-12-310000891478san:HenriqueManuelDrummondBorgesCirneDeCastroMembersrt:DirectorMember2025-12-310000891478srt:DirectorMemberifrs-full:LoanCommitmentsMembersan:HenriqueManuelDrummondBorgesCirneDeCastroMember2024-12-310000891478srt:DirectorMemberifrs-full:FinancialGuaranteeContractsMembersan:HenriqueManuelDrummondBorgesCirneDeCastroMember2024-12-310000891478san:HenriqueManuelDrummondBorgesCirneDeCastroMembersrt:DirectorMember2024-12-310000891478srt:DirectorMemberifrs-full:LoanCommitmentsMembersan:HomairaAkbariMember2025-12-310000891478srt:DirectorMemberifrs-full:FinancialGuaranteeContractsMembersan:HomairaAkbariMember2025-12-310000891478san:HomairaAkbariMembersrt:DirectorMember2025-12-310000891478srt:DirectorMemberifrs-full:LoanCommitmentsMembersan:HomairaAkbariMember2024-12-310000891478srt:DirectorMemberifrs-full:FinancialGuaranteeContractsMembersan:HomairaAkbariMember2024-12-310000891478san:HomairaAkbariMembersrt:DirectorMember2024-12-310000891478srt:DirectorMemberifrs-full:LoanCommitmentsMembersan:JavierBotinSaenzDeSautuolaMember2025-12-310000891478srt:DirectorMemberifrs-full:FinancialGuaranteeContractsMembersan:JavierBotinSaenzDeSautuolaMember2025-12-310000891478san:JavierBotinSaenzDeSautuolaMembersrt:DirectorMember2025-12-310000891478srt:DirectorMemberifrs-full:LoanCommitmentsMembersan:JavierBotinSaenzDeSautuolaMember2024-12-310000891478srt:DirectorMemberifrs-full:FinancialGuaranteeContractsMembersan:JavierBotinSaenzDeSautuolaMember2024-12-310000891478san:JavierBotinSaenzDeSautuolaMembersrt:DirectorMember2024-12-310000891478srt:DirectorMemberifrs-full:LoanCommitmentsMembersan:JuanCarlosBarrabesConsulMember2025-12-310000891478srt:DirectorMemberifrs-full:FinancialGuaranteeContractsMembersan:JuanCarlosBarrabesConsulMember2025-12-310000891478san:JuanCarlosBarrabesConsulMembersrt:DirectorMember2025-12-310000891478srt:DirectorMemberifrs-full:LoanCommitmentsMembersan:JuanCarlosBarrabesConsulMember2024-12-310000891478srt:DirectorMemberifrs-full:FinancialGuaranteeContractsMembersan:JuanCarlosBarrabesConsulMember2024-12-310000891478san:JuanCarlosBarrabesConsulMembersrt:DirectorMember2024-12-310000891478srt:DirectorMemberifrs-full:LoanCommitmentsMembersan:LuisIsasiFernandezDeBobadillaMember2025-12-310000891478srt:DirectorMemberifrs-full:FinancialGuaranteeContractsMembersan:LuisIsasiFernandezDeBobadillaMember2025-12-310000891478san:LuisIsasiFernandezDeBobadillaMembersrt:DirectorMember2025-12-310000891478srt:DirectorMemberifrs-full:LoanCommitmentsMembersan:LuisIsasiFernandezDeBobadillaMember2024-12-310000891478srt:DirectorMemberifrs-full:FinancialGuaranteeContractsMembersan:LuisIsasiFernandezDeBobadillaMember2024-12-310000891478san:LuisIsasiFernandezDeBobadillaMembersrt:DirectorMember2024-12-310000891478srt:DirectorMemberifrs-full:LoanCommitmentsMembersan:PamelaAnnWalkdenMember2025-12-310000891478srt:DirectorMemberifrs-full:FinancialGuaranteeContractsMembersan:PamelaAnnWalkdenMember2025-12-310000891478san:PamelaAnnWalkdenMembersrt:DirectorMember2025-12-310000891478srt:DirectorMemberifrs-full:LoanCommitmentsMembersan:PamelaAnnWalkdenMember2024-12-310000891478srt:DirectorMemberifrs-full:FinancialGuaranteeContractsMembersan:PamelaAnnWalkdenMember2024-12-310000891478san:PamelaAnnWalkdenMembersrt:DirectorMember2024-12-310000891478srt:DirectorMemberifrs-full:LoanCommitmentsMembersan:RamiroMatoGarcaAnsorenaMember2025-12-310000891478srt:DirectorMemberifrs-full:FinancialGuaranteeContractsMembersan:RamiroMatoGarcaAnsorenaMember2025-12-310000891478san:RamiroMatoGarcaAnsorenaMembersrt:DirectorMember2025-12-310000891478srt:DirectorMemberifrs-full:LoanCommitmentsMembersan:RamiroMatoGarcaAnsorenaMember2024-12-310000891478srt:DirectorMemberifrs-full:FinancialGuaranteeContractsMembersan:RamiroMatoGarcaAnsorenaMember2024-12-310000891478san:RamiroMatoGarcaAnsorenaMembersrt:DirectorMember2024-12-310000891478srt:DirectorMemberifrs-full:LoanCommitmentsMembersan:SolDaurellaComadranMember2025-12-310000891478srt:DirectorMemberifrs-full:FinancialGuaranteeContractsMembersan:SolDaurellaComadranMember2025-12-310000891478san:SolDaurellaComadranMembersrt:DirectorMember2025-12-310000891478srt:DirectorMemberifrs-full:LoanCommitmentsMembersan:SolDaurellaComadranMember2024-12-310000891478srt:DirectorMemberifrs-full:FinancialGuaranteeContractsMembersan:SolDaurellaComadranMember2024-12-310000891478san:SolDaurellaComadranMembersrt:DirectorMember2024-12-310000891478ifrs-full:LoanCommitmentsMembersrt:DirectorMember2025-12-310000891478ifrs-full:FinancialGuaranteeContractsMembersrt:DirectorMember2025-12-310000891478ifrs-full:LoanCommitmentsMembersrt:DirectorMember2024-12-310000891478ifrs-full:FinancialGuaranteeContractsMembersrt:DirectorMember2024-12-310000891478san:SeniorManagementMember2025-12-310000891478san:SeniorManagementMember2025-01-012025-12-310000891478san:LongTermIncentivePlanMembersan:SeniorManagementMember2025-01-012025-12-310000891478san:DeferredConditionalVariableRemunerationPlanMembersan:SeniorManagementMember2025-01-012025-12-310000891478san:SeniorManagementMember2024-12-310000891478san:SeniorManagementMember2024-01-012024-12-310000891478san:LongTermIncentivePlanMembersan:SeniorManagementMember2024-01-012024-12-310000891478san:DeferredConditionalVariableRemunerationPlanMembersan:SeniorManagementMember2024-01-012024-12-310000891478san:SeniorManagementMemberifrs-full:TopOfRangeMember2025-01-012025-12-310000891478san:DeferredVariableCompensationPlanMultiannualObjectivesMembersan:SeniorManagementMember2025-12-310000891478san:DeferredVariableCompensationPlanMultiannualObjectivesMembersan:SeniorManagementMember2025-01-012025-12-310000891478san:DeferredVariableCompensationPlanMultiannualObjectivesMembersan:SeniorManagementMember2024-12-310000891478san:DeferredVariableCompensationPlanMultiannualObjectivesMembersan:SeniorManagementMember2024-01-012024-12-310000891478san:SeniorManagementRetiredMember2025-01-012025-12-310000891478san:SeniorManagementRetiredMember2024-01-012024-12-310000891478san:DeferredConditionalVariableRemunerationPlanAndLinkedToObjectives2019Membersan:SeniorManagementMember2025-01-012025-12-310000891478san:DeferredConditionalVariableRemunerationPlanAndLinkedToObjectives2019Membersan:SeniorManagementMember2024-01-012024-12-310000891478san:DeferredConditionalVariableRemunerationPlanAndLinkedToObjectives2020Membersan:SeniorManagementMember2025-01-012025-12-310000891478san:DeferredConditionalVariableRemunerationPlanAndLinkedToObjectives2020Membersan:SeniorManagementMember2024-01-012024-12-310000891478san:DeferredConditionalVariableRemunerationPlanAndLinkedToObjectives2021Membersan:SeniorManagementMember2025-01-012025-12-310000891478san:DeferredConditionalVariableRemunerationPlanAndLinkedToObjectives2021Membersan:SeniorManagementMember2024-01-012024-12-310000891478san:DeferredConditionalVariableRemunerationPlanAndLinkedToObjectives2022Membersan:SeniorManagementMember2025-01-012025-12-310000891478san:DeferredConditionalVariableRemunerationPlanAndLinkedToObjectives2022Membersan:SeniorManagementMember2024-01-012024-12-310000891478san:DeferredConditionalVariableRemunerationPlanAndLinkedToObjectives2023Membersan:SeniorManagementMember2025-01-012025-12-310000891478san:DeferredConditionalVariableRemunerationPlanAndLinkedToObjectives2023Membersan:SeniorManagementMember2024-01-012024-12-310000891478san:DeferredConditionalVariableRemunerationPlanAndLinkedToObjectives2024Membersan:SeniorManagementMember2025-01-012025-12-310000891478san:DeferredConditionalVariableRemunerationPlanAndLinkedToObjectives2024Membersan:SeniorManagementMember2024-01-012024-12-310000891478san:DeferredConditionalVariableRemunerationPlanAndLinkedToObjectives2018Membersan:SeniorManagementMember2025-01-012025-12-310000891478san:DeferredConditionalVariableRemunerationPlanAndLinkedToObjectives2018Membersan:SeniorManagementMember2024-01-012024-12-310000891478san:SeniorManagementMemberifrs-full:BottomOfRangeMember2025-01-012025-12-310000891478san:FormerDirectorsOfTheBankMember2025-01-012025-12-310000891478san:FormerDirectorsOfTheBankMember2024-01-012024-12-310000891478san:FormerExecutiveVicePresidentsMember2025-01-012025-12-310000891478san:FormerExecutiveVicePresidentsMember2024-01-012024-12-310000891478san:FormerSeniorManagingDirectorsMember2025-01-012025-12-310000891478san:FormerSeniorManagingDirectorsMember2024-01-012024-12-310000891478san:ProvisionForPostEmploymentDefinedBenefitObligationsMembersan:FormerDirectorsOfTheBankMember2025-12-310000891478san:ProvisionForPostEmploymentDefinedBenefitObligationsMembersan:FormerDirectorsOfTheBankMember2024-12-310000891478san:ProvisionForPostEmploymentDefinedBenefitObligationsMembersan:FormerSeniorManagingDirectorsMember2025-12-310000891478san:ProvisionForPostEmploymentDefinedBenefitObligationsMembersan:FormerSeniorManagingDirectorsMember2024-12-310000891478srt:BoardOfDirectorsChairmanMembersan:AnaBotinSanzDeSautuolaYOSheaMember2025-01-012025-12-310000891478ifrs-full:GrossCarryingAmountMembersan:LoansAndAdvancesCentralBanksMembersan:TimeDepositsMember2025-12-310000891478ifrs-full:GrossCarryingAmountMembersan:LoansAndAdvancesCentralBanksMembersan:TimeDepositsMember2024-12-310000891478ifrs-full:GrossCarryingAmountMembersan:LoansAndAdvancesCentralBanksMembersan:TimeDepositsMember2023-12-310000891478ifrs-full:GrossCarryingAmountMembersan:LoansAndAdvancesCentralBanksMembersan:ReverseRepurchaseAgreementsMember2025-12-310000891478ifrs-full:GrossCarryingAmountMembersan:LoansAndAdvancesCentralBanksMembersan:ReverseRepurchaseAgreementsMember2024-12-310000891478ifrs-full:GrossCarryingAmountMembersan:LoansAndAdvancesCentralBanksMembersan:ReverseRepurchaseAgreementsMember2023-12-310000891478ifrs-full:GrossCarryingAmountMembersan:LoansAndAdvancesCentralBanksMembersan:ImpairedAssetsFinancialInstrumentTypeMember2025-12-310000891478ifrs-full:GrossCarryingAmountMembersan:LoansAndAdvancesCentralBanksMembersan:ImpairedAssetsFinancialInstrumentTypeMember2024-12-310000891478ifrs-full:GrossCarryingAmountMembersan:LoansAndAdvancesCentralBanksMembersan:ImpairedAssetsFinancialInstrumentTypeMember2023-12-310000891478ifrs-full:GrossCarryingAmountMembersan:LoansAndAdvancesCentralBanksMembersan:ValuationAdjustmentForImpairmentFinancialInstrumentTypeMember2025-12-310000891478ifrs-full:GrossCarryingAmountMembersan:LoansAndAdvancesCentralBanksMembersan:ValuationAdjustmentForImpairmentFinancialInstrumentTypeMember2024-12-310000891478ifrs-full:GrossCarryingAmountMembersan:LoansAndAdvancesCentralBanksMembersan:ValuationAdjustmentForImpairmentFinancialInstrumentTypeMember2023-12-310000891478ifrs-full:GrossCarryingAmountMembersan:LoansAndAdvancesCreditInstitutionsMembersan:TimeDepositsMember2025-12-310000891478ifrs-full:GrossCarryingAmountMembersan:LoansAndAdvancesCreditInstitutionsMembersan:TimeDepositsMember2024-12-310000891478ifrs-full:GrossCarryingAmountMembersan:LoansAndAdvancesCreditInstitutionsMembersan:TimeDepositsMember2023-12-310000891478ifrs-full:GrossCarryingAmountMembersan:LoansAndAdvancesCreditInstitutionsMembersan:ReverseRepurchaseAgreementsMember2025-12-310000891478ifrs-full:GrossCarryingAmountMembersan:LoansAndAdvancesCreditInstitutionsMembersan:ReverseRepurchaseAgreementsMember2024-12-310000891478ifrs-full:GrossCarryingAmountMembersan:LoansAndAdvancesCreditInstitutionsMembersan:ReverseRepurchaseAgreementsMember2023-12-310000891478ifrs-full:GrossCarryingAmountMembersan:LoansAndAdvancesCreditInstitutionsMembersan:NonLoanAdvancesMember2025-12-310000891478ifrs-full:GrossCarryingAmountMembersan:LoansAndAdvancesCreditInstitutionsMembersan:NonLoanAdvancesMember2024-12-310000891478ifrs-full:GrossCarryingAmountMembersan:LoansAndAdvancesCreditInstitutionsMembersan:NonLoanAdvancesMember2023-12-310000891478ifrs-full:GrossCarryingAmountMembersan:LoansAndAdvancesCreditInstitutionsMembersan:ImpairedAssetsFinancialInstrumentTypeMember2025-12-310000891478ifrs-full:GrossCarryingAmountMembersan:LoansAndAdvancesCreditInstitutionsMembersan:ImpairedAssetsFinancialInstrumentTypeMember2024-12-310000891478ifrs-full:GrossCarryingAmountMembersan:LoansAndAdvancesCreditInstitutionsMembersan:ImpairedAssetsFinancialInstrumentTypeMember2023-12-310000891478ifrs-full:AccumulatedImpairmentMembersan:LoansAndAdvancesCreditInstitutionsMembersan:ValuationAdjustmentForImpairmentFinancialInstrumentTypeMember2025-12-310000891478ifrs-full:AccumulatedImpairmentMembersan:LoansAndAdvancesCreditInstitutionsMembersan:ValuationAdjustmentForImpairmentFinancialInstrumentTypeMember2024-12-310000891478ifrs-full:AccumulatedImpairmentMembersan:LoansAndAdvancesCreditInstitutionsMembersan:ValuationAdjustmentForImpairmentFinancialInstrumentTypeMember2023-12-310000891478currency:EURsan:LoansAndAdvancesCentralBanksAndCreditInstitutionsMember2025-12-310000891478currency:EURsan:LoansAndAdvancesCentralBanksAndCreditInstitutionsMember2024-12-310000891478currency:EURsan:LoansAndAdvancesCentralBanksAndCreditInstitutionsMember2023-12-310000891478currency:GBPsan:LoansAndAdvancesCentralBanksAndCreditInstitutionsMember2025-12-310000891478currency:GBPsan:LoansAndAdvancesCentralBanksAndCreditInstitutionsMember2024-12-310000891478currency:GBPsan:LoansAndAdvancesCentralBanksAndCreditInstitutionsMember2023-12-310000891478currency:USDsan:LoansAndAdvancesCentralBanksAndCreditInstitutionsMember2025-12-310000891478currency:USDsan:LoansAndAdvancesCentralBanksAndCreditInstitutionsMember2024-12-310000891478currency:USDsan:LoansAndAdvancesCentralBanksAndCreditInstitutionsMember2023-12-310000891478currency:BRLsan:LoansAndAdvancesCentralBanksAndCreditInstitutionsMember2025-12-310000891478currency:BRLsan:LoansAndAdvancesCentralBanksAndCreditInstitutionsMember2024-12-310000891478currency:BRLsan:LoansAndAdvancesCentralBanksAndCreditInstitutionsMember2023-12-310000891478san:OtherCurrenciesMembersan:LoansAndAdvancesCentralBanksAndCreditInstitutionsMember2025-12-310000891478san:OtherCurrenciesMembersan:LoansAndAdvancesCentralBanksAndCreditInstitutionsMember2024-12-310000891478san:OtherCurrenciesMembersan:LoansAndAdvancesCentralBanksAndCreditInstitutionsMember2023-12-310000891478san:LoansAndAdvancesCentralBanksAndCreditInstitutionsMember2025-12-310000891478san:LoansAndAdvancesCentralBanksAndCreditInstitutionsMember2024-12-310000891478san:LoansAndAdvancesCentralBanksAndCreditInstitutionsMember2023-12-310000891478ifrs-full:GrossCarryingAmountMemberifrs-full:TwelvemonthExpectedCreditLossesMembersan:LoansAndAdvancesCentralBanksAndCreditInstitutionsMemberifrs-full:FinancialInstrumentsNotCreditimpairedMember2025-12-310000891478ifrs-full:GrossCarryingAmountMemberifrs-full:LifetimeExpectedCreditLossesMembersan:LoansAndAdvancesCentralBanksAndCreditInstitutionsMemberifrs-full:FinancialInstrumentsNotCreditimpairedMember2025-12-310000891478ifrs-full:GrossCarryingAmountMemberifrs-full:LifetimeExpectedCreditLossesMembersan:LoansAndAdvancesCentralBanksAndCreditInstitutionsMemberifrs-full:FinancialInstrumentsCreditimpairedMember2025-12-310000891478ifrs-full:GrossCarryingAmountMemberifrs-full:TwelvemonthExpectedCreditLossesMembersan:LoansAndAdvancesCentralBanksAndCreditInstitutionsMemberifrs-full:FinancialInstrumentsNotCreditimpairedMember2024-12-310000891478ifrs-full:GrossCarryingAmountMemberifrs-full:LifetimeExpectedCreditLossesMembersan:LoansAndAdvancesCentralBanksAndCreditInstitutionsMemberifrs-full:FinancialInstrumentsNotCreditimpairedMember2024-12-310000891478ifrs-full:GrossCarryingAmountMemberifrs-full:LifetimeExpectedCreditLossesMembersan:LoansAndAdvancesCentralBanksAndCreditInstitutionsMemberifrs-full:FinancialInstrumentsCreditimpairedMember2024-12-310000891478ifrs-full:GrossCarryingAmountMemberifrs-full:TwelvemonthExpectedCreditLossesMembersan:LoansAndAdvancesCentralBanksAndCreditInstitutionsMemberifrs-full:FinancialInstrumentsNotCreditimpairedMember2023-12-310000891478ifrs-full:GrossCarryingAmountMemberifrs-full:LifetimeExpectedCreditLossesMembersan:LoansAndAdvancesCentralBanksAndCreditInstitutionsMemberifrs-full:FinancialInstrumentsNotCreditimpairedMember2023-12-310000891478ifrs-full:GrossCarryingAmountMemberifrs-full:LifetimeExpectedCreditLossesMembersan:LoansAndAdvancesCentralBanksAndCreditInstitutionsMemberifrs-full:FinancialInstrumentsCreditimpairedMember2023-12-310000891478ifrs-full:AccumulatedImpairmentMemberifrs-full:TwelvemonthExpectedCreditLossesMembersan:LoansAndAdvancesCentralBanksAndCreditInstitutionsMemberifrs-full:FinancialInstrumentsNotCreditimpairedMember2025-12-310000891478ifrs-full:AccumulatedImpairmentMemberifrs-full:LifetimeExpectedCreditLossesMembersan:LoansAndAdvancesCentralBanksAndCreditInstitutionsMemberifrs-full:FinancialInstrumentsNotCreditimpairedMember2025-12-310000891478ifrs-full:AccumulatedImpairmentMemberifrs-full:LifetimeExpectedCreditLossesMembersan:LoansAndAdvancesCentralBanksAndCreditInstitutionsMemberifrs-full:FinancialInstrumentsCreditimpairedMember2025-12-310000891478ifrs-full:AccumulatedImpairmentMemberifrs-full:TwelvemonthExpectedCreditLossesMembersan:LoansAndAdvancesCentralBanksAndCreditInstitutionsMemberifrs-full:FinancialInstrumentsNotCreditimpairedMember2024-12-310000891478ifrs-full:AccumulatedImpairmentMemberifrs-full:LifetimeExpectedCreditLossesMembersan:LoansAndAdvancesCentralBanksAndCreditInstitutionsMemberifrs-full:FinancialInstrumentsNotCreditimpairedMember2024-12-310000891478ifrs-full:AccumulatedImpairmentMemberifrs-full:LifetimeExpectedCreditLossesMembersan:LoansAndAdvancesCentralBanksAndCreditInstitutionsMemberifrs-full:FinancialInstrumentsCreditimpairedMember2024-12-310000891478ifrs-full:AccumulatedImpairmentMemberifrs-full:TwelvemonthExpectedCreditLossesMembersan:LoansAndAdvancesCentralBanksAndCreditInstitutionsMemberifrs-full:FinancialInstrumentsNotCreditimpairedMember2023-12-310000891478ifrs-full:AccumulatedImpairmentMemberifrs-full:LifetimeExpectedCreditLossesMembersan:LoansAndAdvancesCentralBanksAndCreditInstitutionsMemberifrs-full:FinancialInstrumentsNotCreditimpairedMember2023-12-310000891478ifrs-full:AccumulatedImpairmentMemberifrs-full:LifetimeExpectedCreditLossesMembersan:LoansAndAdvancesCentralBanksAndCreditInstitutionsMemberifrs-full:FinancialInstrumentsCreditimpairedMember2023-12-310000891478ifrs-full:GrossCarryingAmountMembersan:SpanishGovernmentDebtSecuritiesMember2025-12-310000891478ifrs-full:GrossCarryingAmountMembersan:SpanishGovernmentDebtSecuritiesMember2024-12-310000891478ifrs-full:GrossCarryingAmountMembersan:SpanishGovernmentDebtSecuritiesMember2023-12-310000891478ifrs-full:GrossCarryingAmountMembersan:IFRSForeignGovernmentDebtSecuritiesMember2025-12-310000891478ifrs-full:GrossCarryingAmountMembersan:IFRSForeignGovernmentDebtSecuritiesMember2024-12-310000891478ifrs-full:GrossCarryingAmountMembersan:IFRSForeignGovernmentDebtSecuritiesMember2023-12-310000891478ifrs-full:GrossCarryingAmountMembersan:DebtSecuritiesIssuedByFinancialInstitutionsMember2025-12-310000891478ifrs-full:GrossCarryingAmountMembersan:DebtSecuritiesIssuedByFinancialInstitutionsMember2024-12-310000891478ifrs-full:GrossCarryingAmountMembersan:DebtSecuritiesIssuedByFinancialInstitutionsMember2023-12-310000891478ifrs-full:GrossCarryingAmountMembersan:OtherFixedIncomeDebtSecuritiesMember2025-12-310000891478ifrs-full:GrossCarryingAmountMembersan:OtherFixedIncomeDebtSecuritiesMember2024-12-310000891478ifrs-full:GrossCarryingAmountMembersan:OtherFixedIncomeDebtSecuritiesMember2023-12-310000891478ifrs-full:GrossCarryingAmountMemberifrs-full:DebtSecuritiesMemberifrs-full:FinancialInstrumentsCreditimpairedMember2025-12-310000891478ifrs-full:GrossCarryingAmountMemberifrs-full:DebtSecuritiesMemberifrs-full:FinancialInstrumentsCreditimpairedMember2024-12-310000891478ifrs-full:GrossCarryingAmountMemberifrs-full:DebtSecuritiesMemberifrs-full:FinancialInstrumentsCreditimpairedMember2023-12-310000891478ifrs-full:AccumulatedImpairmentMember2025-12-310000891478ifrs-full:AccumulatedImpairmentMember2024-12-310000891478ifrs-full:AccumulatedImpairmentMember2023-12-310000891478ifrs-full:GrossCarryingAmountMembercurrency:EURifrs-full:DebtSecuritiesMember2025-12-310000891478ifrs-full:GrossCarryingAmountMembercurrency:EURifrs-full:DebtSecuritiesMember2024-12-310000891478ifrs-full:GrossCarryingAmountMembercurrency:EURifrs-full:DebtSecuritiesMember2023-12-310000891478ifrs-full:GrossCarryingAmountMembercurrency:GBPifrs-full:DebtSecuritiesMember2025-12-310000891478ifrs-full:GrossCarryingAmountMembercurrency:GBPifrs-full:DebtSecuritiesMember2024-12-310000891478ifrs-full:GrossCarryingAmountMembercurrency:GBPifrs-full:DebtSecuritiesMember2023-12-310000891478ifrs-full:GrossCarryingAmountMembercurrency:USDifrs-full:DebtSecuritiesMember2025-12-310000891478ifrs-full:GrossCarryingAmountMembercurrency:USDifrs-full:DebtSecuritiesMember2024-12-310000891478ifrs-full:GrossCarryingAmountMembercurrency:USDifrs-full:DebtSecuritiesMember2023-12-310000891478ifrs-full:GrossCarryingAmountMembercurrency:BRLifrs-full:DebtSecuritiesMember2025-12-310000891478ifrs-full:GrossCarryingAmountMembercurrency:BRLifrs-full:DebtSecuritiesMember2024-12-310000891478ifrs-full:GrossCarryingAmountMembercurrency:BRLifrs-full:DebtSecuritiesMember2023-12-310000891478ifrs-full:GrossCarryingAmountMembersan:OtherCurrenciesMemberifrs-full:DebtSecuritiesMember2025-12-310000891478ifrs-full:GrossCarryingAmountMembersan:OtherCurrenciesMemberifrs-full:DebtSecuritiesMember2024-12-310000891478ifrs-full:GrossCarryingAmountMembersan:OtherCurrenciesMemberifrs-full:DebtSecuritiesMember2023-12-310000891478ifrs-full:GrossCarryingAmountMemberifrs-full:DebtSecuritiesMember2025-12-310000891478ifrs-full:GrossCarryingAmountMemberifrs-full:DebtSecuritiesMember2024-12-310000891478ifrs-full:GrossCarryingAmountMemberifrs-full:DebtSecuritiesMember2023-12-310000891478ifrs-full:GrossCarryingAmountMemberifrs-full:TwelvemonthExpectedCreditLossesMemberifrs-full:FinancialInstrumentsNotCreditimpairedMember2025-12-310000891478ifrs-full:GrossCarryingAmountMemberifrs-full:TwelvemonthExpectedCreditLossesMemberifrs-full:FinancialInstrumentsNotCreditimpairedMember2024-12-310000891478ifrs-full:GrossCarryingAmountMemberifrs-full:TwelvemonthExpectedCreditLossesMemberifrs-full:FinancialInstrumentsNotCreditimpairedMember2023-12-310000891478ifrs-full:GrossCarryingAmountMemberifrs-full:LifetimeExpectedCreditLossesMemberifrs-full:FinancialInstrumentsNotCreditimpairedMember2025-12-310000891478ifrs-full:GrossCarryingAmountMemberifrs-full:LifetimeExpectedCreditLossesMemberifrs-full:FinancialInstrumentsNotCreditimpairedMember2024-12-310000891478ifrs-full:GrossCarryingAmountMemberifrs-full:LifetimeExpectedCreditLossesMemberifrs-full:FinancialInstrumentsNotCreditimpairedMember2023-12-310000891478ifrs-full:GrossCarryingAmountMemberifrs-full:LifetimeExpectedCreditLossesMemberifrs-full:FinancialInstrumentsCreditimpairedMember2025-12-310000891478ifrs-full:GrossCarryingAmountMemberifrs-full:LifetimeExpectedCreditLossesMemberifrs-full:FinancialInstrumentsCreditimpairedMember2024-12-310000891478ifrs-full:GrossCarryingAmountMemberifrs-full:LifetimeExpectedCreditLossesMemberifrs-full:FinancialInstrumentsCreditimpairedMember2023-12-310000891478san:FixedIncomeAssetsMemberifrs-full:FinancialInstrumentsPurchasedOrOriginatedCreditimpairedMember2025-12-310000891478san:FixedIncomeAssetsMemberifrs-full:FinancialInstrumentsPurchasedOrOriginatedCreditimpairedMember2024-12-310000891478san:PrivateFixedIncomeDebtSecuritiesMemberifrs-full:CountryOfDomicileMember2025-12-310000891478san:PublicFixedIncomeDebtSecuritiesMemberifrs-full:CountryOfDomicileMember2025-12-310000891478ifrs-full:DebtSecuritiesMemberifrs-full:CountryOfDomicileMember2025-12-310000891478san:PrivateFixedIncomeDebtSecuritiesMemberifrs-full:CountryOfDomicileMember2024-12-310000891478san:PublicFixedIncomeDebtSecuritiesMemberifrs-full:CountryOfDomicileMember2024-12-310000891478ifrs-full:DebtSecuritiesMemberifrs-full:CountryOfDomicileMember2024-12-310000891478san:PrivateFixedIncomeDebtSecuritiesMemberifrs-full:CountryOfDomicileMember2023-12-310000891478san:PublicFixedIncomeDebtSecuritiesMemberifrs-full:CountryOfDomicileMember2023-12-310000891478ifrs-full:DebtSecuritiesMemberifrs-full:CountryOfDomicileMember2023-12-310000891478san:PrivateFixedIncomeDebtSecuritiesMembercountry:GB2025-12-310000891478san:PublicFixedIncomeDebtSecuritiesMembercountry:GB2025-12-310000891478ifrs-full:DebtSecuritiesMembercountry:GB2025-12-310000891478san:PrivateFixedIncomeDebtSecuritiesMembercountry:GB2024-12-310000891478san:PublicFixedIncomeDebtSecuritiesMembercountry:GB2024-12-310000891478ifrs-full:DebtSecuritiesMembercountry:GB2024-12-310000891478san:PrivateFixedIncomeDebtSecuritiesMembercountry:GB2023-12-310000891478san:PublicFixedIncomeDebtSecuritiesMembercountry:GB2023-12-310000891478ifrs-full:DebtSecuritiesMembercountry:GB2023-12-310000891478san:PrivateFixedIncomeDebtSecuritiesMembercountry:PT2025-12-310000891478san:PublicFixedIncomeDebtSecuritiesMembercountry:PT2025-12-310000891478ifrs-full:DebtSecuritiesMembercountry:PT2025-12-310000891478san:PrivateFixedIncomeDebtSecuritiesMembercountry:PT2024-12-310000891478san:PublicFixedIncomeDebtSecuritiesMembercountry:PT2024-12-310000891478ifrs-full:DebtSecuritiesMembercountry:PT2024-12-310000891478san:PrivateFixedIncomeDebtSecuritiesMembercountry:PT2023-12-310000891478san:PublicFixedIncomeDebtSecuritiesMembercountry:PT2023-12-310000891478ifrs-full:DebtSecuritiesMembercountry:PT2023-12-310000891478san:PrivateFixedIncomeDebtSecuritiesMembercountry:IT2025-12-310000891478san:PublicFixedIncomeDebtSecuritiesMembercountry:IT2025-12-310000891478ifrs-full:DebtSecuritiesMembercountry:IT2025-12-310000891478san:PrivateFixedIncomeDebtSecuritiesMembercountry:IT2024-12-310000891478san:PublicFixedIncomeDebtSecuritiesMembercountry:IT2024-12-310000891478ifrs-full:DebtSecuritiesMembercountry:IT2024-12-310000891478san:PrivateFixedIncomeDebtSecuritiesMembercountry:IT2023-12-310000891478san:PublicFixedIncomeDebtSecuritiesMembercountry:IT2023-12-310000891478ifrs-full:DebtSecuritiesMembercountry:IT2023-12-310000891478san:PrivateFixedIncomeDebtSecuritiesMembercountry:IE2025-12-310000891478san:PublicFixedIncomeDebtSecuritiesMembercountry:IE2025-12-310000891478ifrs-full:DebtSecuritiesMembercountry:IE2025-12-310000891478san:PrivateFixedIncomeDebtSecuritiesMembercountry:IE2024-12-310000891478san:PublicFixedIncomeDebtSecuritiesMembercountry:IE2024-12-310000891478ifrs-full:DebtSecuritiesMembercountry:IE2024-12-310000891478san:PrivateFixedIncomeDebtSecuritiesMembercountry:IE2023-12-310000891478san:PublicFixedIncomeDebtSecuritiesMembercountry:IE2023-12-310000891478ifrs-full:DebtSecuritiesMembercountry:IE2023-12-310000891478san:PrivateFixedIncomeDebtSecuritiesMembercountry:PL2025-12-310000891478san:PublicFixedIncomeDebtSecuritiesMembercountry:PL2025-12-310000891478ifrs-full:DebtSecuritiesMembercountry:PL2025-12-310000891478san:PrivateFixedIncomeDebtSecuritiesMembercountry:PL2024-12-310000891478san:PublicFixedIncomeDebtSecuritiesMembercountry:PL2024-12-310000891478ifrs-full:DebtSecuritiesMembercountry:PL2024-12-310000891478san:PrivateFixedIncomeDebtSecuritiesMembercountry:PL2023-12-310000891478san:PublicFixedIncomeDebtSecuritiesMembercountry:PL2023-12-310000891478ifrs-full:DebtSecuritiesMembercountry:PL2023-12-310000891478san:PrivateFixedIncomeDebtSecuritiesMembersan:OtherEuropeanCountriesMember2025-12-310000891478san:PublicFixedIncomeDebtSecuritiesMembersan:OtherEuropeanCountriesMember2025-12-310000891478ifrs-full:DebtSecuritiesMembersan:OtherEuropeanCountriesMember2025-12-310000891478san:PrivateFixedIncomeDebtSecuritiesMembersan:OtherEuropeanCountriesMember2024-12-310000891478san:PublicFixedIncomeDebtSecuritiesMembersan:OtherEuropeanCountriesMember2024-12-310000891478ifrs-full:DebtSecuritiesMembersan:OtherEuropeanCountriesMember2024-12-310000891478san:PrivateFixedIncomeDebtSecuritiesMembersan:OtherEuropeanCountriesMember2023-12-310000891478san:PublicFixedIncomeDebtSecuritiesMembersan:OtherEuropeanCountriesMember2023-12-310000891478ifrs-full:DebtSecuritiesMembersan:OtherEuropeanCountriesMember2023-12-310000891478san:PrivateFixedIncomeDebtSecuritiesMembercountry:US2025-12-310000891478san:PublicFixedIncomeDebtSecuritiesMembercountry:US2025-12-310000891478ifrs-full:DebtSecuritiesMembercountry:US2025-12-310000891478san:PrivateFixedIncomeDebtSecuritiesMembercountry:US2024-12-310000891478san:PublicFixedIncomeDebtSecuritiesMembercountry:US2024-12-310000891478ifrs-full:DebtSecuritiesMembercountry:US2024-12-310000891478san:PrivateFixedIncomeDebtSecuritiesMembercountry:US2023-12-310000891478san:PublicFixedIncomeDebtSecuritiesMembercountry:US2023-12-310000891478ifrs-full:DebtSecuritiesMembercountry:US2023-12-310000891478san:PrivateFixedIncomeDebtSecuritiesMembercountry:BR2025-12-310000891478san:PublicFixedIncomeDebtSecuritiesMembercountry:BR2025-12-310000891478ifrs-full:DebtSecuritiesMembercountry:BR2025-12-310000891478san:PrivateFixedIncomeDebtSecuritiesMembercountry:BR2024-12-310000891478san:PublicFixedIncomeDebtSecuritiesMembercountry:BR2024-12-310000891478ifrs-full:DebtSecuritiesMembercountry:BR2024-12-310000891478san:PrivateFixedIncomeDebtSecuritiesMembercountry:BR2023-12-310000891478san:PublicFixedIncomeDebtSecuritiesMembercountry:BR2023-12-310000891478ifrs-full:DebtSecuritiesMembercountry:BR2023-12-310000891478san:PrivateFixedIncomeDebtSecuritiesMembercountry:MX2025-12-310000891478san:PublicFixedIncomeDebtSecuritiesMembercountry:MX2025-12-310000891478ifrs-full:DebtSecuritiesMembercountry:MX2025-12-310000891478san:PrivateFixedIncomeDebtSecuritiesMembercountry:MX2024-12-310000891478san:PublicFixedIncomeDebtSecuritiesMembercountry:MX2024-12-310000891478ifrs-full:DebtSecuritiesMembercountry:MX2024-12-310000891478san:PrivateFixedIncomeDebtSecuritiesMembercountry:MX2023-12-310000891478san:PublicFixedIncomeDebtSecuritiesMembercountry:MX2023-12-310000891478ifrs-full:DebtSecuritiesMembercountry:MX2023-12-310000891478san:PrivateFixedIncomeDebtSecuritiesMembercountry:CL2025-12-310000891478san:PublicFixedIncomeDebtSecuritiesMembercountry:CL2025-12-310000891478ifrs-full:DebtSecuritiesMembercountry:CL2025-12-310000891478san:PrivateFixedIncomeDebtSecuritiesMembercountry:CL2024-12-310000891478san:PublicFixedIncomeDebtSecuritiesMembercountry:CL2024-12-310000891478ifrs-full:DebtSecuritiesMembercountry:CL2024-12-310000891478san:PrivateFixedIncomeDebtSecuritiesMembercountry:CL2023-12-310000891478san:PublicFixedIncomeDebtSecuritiesMembercountry:CL2023-12-310000891478ifrs-full:DebtSecuritiesMembercountry:CL2023-12-310000891478san:PrivateFixedIncomeDebtSecuritiesMembersan:OtherAmericanCountriesMember2025-12-310000891478san:PublicFixedIncomeDebtSecuritiesMembersan:OtherAmericanCountriesMember2025-12-310000891478ifrs-full:DebtSecuritiesMembersan:OtherAmericanCountriesMember2025-12-310000891478san:PrivateFixedIncomeDebtSecuritiesMembersan:OtherAmericanCountriesMember2024-12-310000891478san:PublicFixedIncomeDebtSecuritiesMembersan:OtherAmericanCountriesMember2024-12-310000891478ifrs-full:DebtSecuritiesMembersan:OtherAmericanCountriesMember2024-12-310000891478san:PrivateFixedIncomeDebtSecuritiesMembersan:OtherAmericanCountriesMember2023-12-310000891478san:PublicFixedIncomeDebtSecuritiesMembersan:OtherAmericanCountriesMember2023-12-310000891478ifrs-full:DebtSecuritiesMembersan:OtherAmericanCountriesMember2023-12-310000891478san:PrivateFixedIncomeDebtSecuritiesMembersan:RestOfWorldMember2025-12-310000891478san:PublicFixedIncomeDebtSecuritiesMembersan:RestOfWorldMember2025-12-310000891478ifrs-full:DebtSecuritiesMembersan:RestOfWorldMember2025-12-310000891478san:PrivateFixedIncomeDebtSecuritiesMembersan:RestOfWorldMember2024-12-310000891478san:PublicFixedIncomeDebtSecuritiesMembersan:RestOfWorldMember2024-12-310000891478ifrs-full:DebtSecuritiesMembersan:RestOfWorldMember2024-12-310000891478san:PrivateFixedIncomeDebtSecuritiesMembersan:RestOfWorldMember2023-12-310000891478san:PublicFixedIncomeDebtSecuritiesMembersan:RestOfWorldMember2023-12-310000891478ifrs-full:DebtSecuritiesMembersan:RestOfWorldMember2023-12-310000891478san:PrivateFixedIncomeDebtSecuritiesMember2025-12-310000891478san:PublicFixedIncomeDebtSecuritiesMember2025-12-310000891478san:PrivateFixedIncomeDebtSecuritiesMember2024-12-310000891478san:PublicFixedIncomeDebtSecuritiesMember2024-12-310000891478san:PrivateFixedIncomeDebtSecuritiesMember2023-12-310000891478san:PublicFixedIncomeDebtSecuritiesMember2023-12-310000891478san:IFRSStandardPoorsAAARatingMembersan:PrivateFixedIncomeDebtSecuritiesMember2025-12-310000891478san:IFRSStandardPoorsAAARatingMembersan:PublicFixedIncomeDebtSecuritiesMember2025-12-310000891478san:IFRSStandardPoorsAAARatingMemberifrs-full:DebtSecuritiesMember2025-12-310000891478san:IFRSStandardPoorsAAARatingMembersan:PrivateFixedIncomeDebtSecuritiesMember2024-12-310000891478san:IFRSStandardPoorsAAARatingMembersan:PublicFixedIncomeDebtSecuritiesMember2024-12-310000891478san:IFRSStandardPoorsAAARatingMemberifrs-full:DebtSecuritiesMember2024-12-310000891478san:IFRSStandardPoorsAAARatingMembersan:PrivateFixedIncomeDebtSecuritiesMember2023-12-310000891478san:IFRSStandardPoorsAAARatingMembersan:PublicFixedIncomeDebtSecuritiesMember2023-12-310000891478san:IFRSStandardPoorsAAARatingMemberifrs-full:DebtSecuritiesMember2023-12-310000891478san:IFRSStandardPoorsAARatingMembersan:PrivateFixedIncomeDebtSecuritiesMember2025-12-310000891478san:IFRSStandardPoorsAARatingMembersan:PublicFixedIncomeDebtSecuritiesMember2025-12-310000891478san:IFRSStandardPoorsAARatingMemberifrs-full:DebtSecuritiesMember2025-12-310000891478san:IFRSStandardPoorsAARatingMembersan:PrivateFixedIncomeDebtSecuritiesMember2024-12-310000891478san:IFRSStandardPoorsAARatingMembersan:PublicFixedIncomeDebtSecuritiesMember2024-12-310000891478san:IFRSStandardPoorsAARatingMemberifrs-full:DebtSecuritiesMember2024-12-310000891478san:IFRSStandardPoorsAARatingMembersan:PrivateFixedIncomeDebtSecuritiesMember2023-12-310000891478san:IFRSStandardPoorsAARatingMembersan:PublicFixedIncomeDebtSecuritiesMember2023-12-310000891478san:IFRSStandardPoorsAARatingMemberifrs-full:DebtSecuritiesMember2023-12-310000891478san:IFRSStandardPoorsARatingMembersan:PrivateFixedIncomeDebtSecuritiesMember2025-12-310000891478san:IFRSStandardPoorsARatingMembersan:PublicFixedIncomeDebtSecuritiesMember2025-12-310000891478san:IFRSStandardPoorsARatingMemberifrs-full:DebtSecuritiesMember2025-12-310000891478san:IFRSStandardPoorsARatingMembersan:PrivateFixedIncomeDebtSecuritiesMember2024-12-310000891478san:IFRSStandardPoorsARatingMembersan:PublicFixedIncomeDebtSecuritiesMember2024-12-310000891478san:IFRSStandardPoorsARatingMemberifrs-full:DebtSecuritiesMember2024-12-310000891478san:IFRSStandardPoorsARatingMembersan:PrivateFixedIncomeDebtSecuritiesMember2023-12-310000891478san:IFRSStandardPoorsARatingMembersan:PublicFixedIncomeDebtSecuritiesMember2023-12-310000891478san:IFRSStandardPoorsARatingMemberifrs-full:DebtSecuritiesMember2023-12-310000891478san:IFRSStandardPoorsBBBRatingMembersan:PrivateFixedIncomeDebtSecuritiesMember2025-12-310000891478san:IFRSStandardPoorsBBBRatingMembersan:PublicFixedIncomeDebtSecuritiesMember2025-12-310000891478san:IFRSStandardPoorsBBBRatingMemberifrs-full:DebtSecuritiesMember2025-12-310000891478san:IFRSStandardPoorsBBBRatingMembersan:PrivateFixedIncomeDebtSecuritiesMember2024-12-310000891478san:IFRSStandardPoorsBBBRatingMembersan:PublicFixedIncomeDebtSecuritiesMember2024-12-310000891478san:IFRSStandardPoorsBBBRatingMemberifrs-full:DebtSecuritiesMember2024-12-310000891478san:IFRSStandardPoorsBBBRatingMembersan:PrivateFixedIncomeDebtSecuritiesMember2023-12-310000891478san:IFRSStandardPoorsBBBRatingMembersan:PublicFixedIncomeDebtSecuritiesMember2023-12-310000891478san:IFRSStandardPoorsBBBRatingMemberifrs-full:DebtSecuritiesMember2023-12-310000891478san:IFRSStandardPoorsBelowBBBRatingMembersan:PrivateFixedIncomeDebtSecuritiesMember2025-12-310000891478san:IFRSStandardPoorsBelowBBBRatingMembersan:PublicFixedIncomeDebtSecuritiesMember2025-12-310000891478san:IFRSStandardPoorsBelowBBBRatingMemberifrs-full:DebtSecuritiesMember2025-12-310000891478san:IFRSStandardPoorsBelowBBBRatingMembersan:PrivateFixedIncomeDebtSecuritiesMember2024-12-310000891478san:IFRSStandardPoorsBelowBBBRatingMembersan:PublicFixedIncomeDebtSecuritiesMember2024-12-310000891478san:IFRSStandardPoorsBelowBBBRatingMemberifrs-full:DebtSecuritiesMember2024-12-310000891478san:IFRSStandardPoorsBelowBBBRatingMembersan:PrivateFixedIncomeDebtSecuritiesMember2023-12-310000891478san:IFRSStandardPoorsBelowBBBRatingMembersan:PublicFixedIncomeDebtSecuritiesMember2023-12-310000891478san:IFRSStandardPoorsBelowBBBRatingMemberifrs-full:DebtSecuritiesMember2023-12-310000891478san:UnratedMembersan:PrivateFixedIncomeDebtSecuritiesMember2025-12-310000891478san:UnratedMembersan:PublicFixedIncomeDebtSecuritiesMember2025-12-310000891478san:UnratedMemberifrs-full:DebtSecuritiesMember2025-12-310000891478san:UnratedMembersan:PrivateFixedIncomeDebtSecuritiesMember2024-12-310000891478san:UnratedMembersan:PublicFixedIncomeDebtSecuritiesMember2024-12-310000891478san:UnratedMemberifrs-full:DebtSecuritiesMember2024-12-310000891478san:UnratedMembersan:PrivateFixedIncomeDebtSecuritiesMember2023-12-310000891478san:UnratedMembersan:PublicFixedIncomeDebtSecuritiesMember2023-12-310000891478san:UnratedMemberifrs-full:DebtSecuritiesMember2023-12-310000891478san:SecuritizedMortgageBondsMembersan:PrivateFixedIncomeDebtSecuritiesMember2025-12-310000891478san:SecuritizedMortgageBondsMembersan:PrivateFixedIncomeDebtSecuritiesMember2024-12-310000891478san:SecuritizedMortgageBondsMembersan:PrivateFixedIncomeDebtSecuritiesMember2023-12-310000891478san:OtherAssetBackBondsMembersan:PrivateFixedIncomeDebtSecuritiesMember2025-12-310000891478san:OtherAssetBackBondsMembersan:PrivateFixedIncomeDebtSecuritiesMember2024-12-310000891478san:OtherAssetBackBondsMembersan:PrivateFixedIncomeDebtSecuritiesMember2023-12-310000891478ifrs-full:FloatingInterestRateMembersan:PrivateFixedIncomeDebtSecuritiesMember2025-12-310000891478ifrs-full:FloatingInterestRateMembersan:PrivateFixedIncomeDebtSecuritiesMember2024-12-310000891478ifrs-full:FloatingInterestRateMembersan:PrivateFixedIncomeDebtSecuritiesMember2023-12-310000891478ifrs-full:FixedInterestRateMembersan:PrivateFixedIncomeDebtSecuritiesMember2025-12-310000891478ifrs-full:FixedInterestRateMembersan:PrivateFixedIncomeDebtSecuritiesMember2024-12-310000891478ifrs-full:FixedInterestRateMembersan:PrivateFixedIncomeDebtSecuritiesMember2023-12-310000891478ifrs-full:AccumulatedImpairmentMemberifrs-full:DebtSecuritiesMember2024-12-310000891478ifrs-full:AccumulatedImpairmentMemberifrs-full:DebtSecuritiesMember2023-12-310000891478ifrs-full:AccumulatedImpairmentMemberifrs-full:DebtSecuritiesMember2022-12-310000891478ifrs-full:AccumulatedImpairmentMemberifrs-full:DebtSecuritiesMember2025-01-012025-12-310000891478ifrs-full:AccumulatedImpairmentMemberifrs-full:DebtSecuritiesMember2024-01-012024-12-310000891478ifrs-full:AccumulatedImpairmentMemberifrs-full:DebtSecuritiesMember2023-01-012023-12-310000891478ifrs-full:AccumulatedImpairmentMemberifrs-full:DebtSecuritiesMember2025-12-310000891478ifrs-full:AccumulatedImpairmentMemberifrs-full:DebtSecuritiesMembersan:IFRSEuropeanUnionMember2025-12-310000891478ifrs-full:AccumulatedImpairmentMemberifrs-full:DebtSecuritiesMembersan:IFRSEuropeanUnionMember2024-12-310000891478ifrs-full:AccumulatedImpairmentMemberifrs-full:DebtSecuritiesMembersan:IFRSEuropeanUnionMember2023-12-310000891478ifrs-full:AccumulatedImpairmentMemberifrs-full:DebtSecuritiesMembersan:IFRSAmericaMember2025-12-310000891478ifrs-full:AccumulatedImpairmentMemberifrs-full:DebtSecuritiesMembersan:IFRSAmericaMember2024-12-310000891478ifrs-full:AccumulatedImpairmentMemberifrs-full:DebtSecuritiesMembersan:IFRSAmericaMember2023-12-310000891478ifrs-full:AccumulatedImpairmentMemberifrs-full:FinancialAssetsAtAmortisedCostCategoryMemberifrs-full:DebtSecuritiesMember2025-01-012025-12-310000891478ifrs-full:AccumulatedImpairmentMemberifrs-full:FinancialAssetsAtAmortisedCostCategoryMemberifrs-full:DebtSecuritiesMember2024-01-012024-12-310000891478ifrs-full:AccumulatedImpairmentMemberifrs-full:FinancialAssetsAtAmortisedCostCategoryMemberifrs-full:DebtSecuritiesMember2023-01-012023-12-310000891478ifrs-full:AccumulatedImpairmentMemberifrs-full:FinancialAssetsAtFairValueThroughOtherComprehensiveIncomeCategoryMemberifrs-full:DebtSecuritiesMember2025-01-012025-12-310000891478ifrs-full:AccumulatedImpairmentMemberifrs-full:FinancialAssetsAtFairValueThroughOtherComprehensiveIncomeCategoryMemberifrs-full:DebtSecuritiesMember2024-01-012024-12-310000891478ifrs-full:AccumulatedImpairmentMemberifrs-full:FinancialAssetsAtFairValueThroughOtherComprehensiveIncomeCategoryMemberifrs-full:DebtSecuritiesMember2023-01-012023-12-310000891478ifrs-full:AccumulatedImpairmentMemberifrs-full:TwelvemonthExpectedCreditLossesMemberifrs-full:DebtSecuritiesMemberifrs-full:FinancialInstrumentsNotCreditimpairedMember2025-12-310000891478ifrs-full:AccumulatedImpairmentMemberifrs-full:TwelvemonthExpectedCreditLossesMemberifrs-full:DebtSecuritiesMemberifrs-full:FinancialInstrumentsNotCreditimpairedMember2024-12-310000891478ifrs-full:AccumulatedImpairmentMemberifrs-full:TwelvemonthExpectedCreditLossesMemberifrs-full:DebtSecuritiesMemberifrs-full:FinancialInstrumentsNotCreditimpairedMember2023-12-310000891478ifrs-full:AccumulatedImpairmentMemberifrs-full:LifetimeExpectedCreditLossesMemberifrs-full:DebtSecuritiesMemberifrs-full:FinancialInstrumentsNotCreditimpairedMember2025-12-310000891478ifrs-full:AccumulatedImpairmentMemberifrs-full:LifetimeExpectedCreditLossesMemberifrs-full:DebtSecuritiesMemberifrs-full:FinancialInstrumentsNotCreditimpairedMember2024-12-310000891478ifrs-full:AccumulatedImpairmentMemberifrs-full:LifetimeExpectedCreditLossesMemberifrs-full:DebtSecuritiesMemberifrs-full:FinancialInstrumentsNotCreditimpairedMember2023-12-310000891478ifrs-full:AccumulatedImpairmentMemberifrs-full:LifetimeExpectedCreditLossesMemberifrs-full:DebtSecuritiesMemberifrs-full:FinancialInstrumentsCreditimpairedMember2025-12-310000891478ifrs-full:AccumulatedImpairmentMemberifrs-full:LifetimeExpectedCreditLossesMemberifrs-full:DebtSecuritiesMemberifrs-full:FinancialInstrumentsCreditimpairedMember2024-12-310000891478ifrs-full:AccumulatedImpairmentMemberifrs-full:LifetimeExpectedCreditLossesMemberifrs-full:DebtSecuritiesMemberifrs-full:FinancialInstrumentsCreditimpairedMember2023-12-310000891478san:FinancialAssetsSharesOfDomesticCompaniesMember2025-12-310000891478san:FinancialAssetsSharesOfDomesticCompaniesMember2024-12-310000891478san:FinancialAssetsSharesOfDomesticCompaniesMember2023-12-310000891478san:FinancialAssetsSharesOfForeignCompaniesMember2025-12-310000891478san:FinancialAssetsSharesOfForeignCompaniesMember2024-12-310000891478san:FinancialAssetsSharesOfForeignCompaniesMember2023-12-310000891478ifrs-full:InvestmentFundsMember2025-12-310000891478ifrs-full:InvestmentFundsMember2024-12-310000891478ifrs-full:InvestmentFundsMember2023-12-310000891478ifrs-full:EquityInvestmentsMember2022-12-310000891478ifrs-full:EquityInvestmentsMember2025-01-012025-12-310000891478ifrs-full:EquityInvestmentsMember2024-01-012024-12-310000891478ifrs-full:EquityInvestmentsMember2023-01-012023-12-310000891478ifrs-full:InterestRateRiskMemberifrs-full:DerivativesMember2025-12-310000891478ifrs-full:InterestRateRiskMemberifrs-full:DerivativesMember2025-12-310000891478ifrs-full:InterestRateRiskMemberifrs-full:DerivativesMember2024-12-310000891478ifrs-full:InterestRateRiskMemberifrs-full:DerivativesMember2024-12-310000891478ifrs-full:InterestRateRiskMemberifrs-full:DerivativesMember2023-12-310000891478ifrs-full:InterestRateRiskMemberifrs-full:DerivativesMember2023-12-310000891478ifrs-full:CurrencyRiskMemberifrs-full:DerivativesMember2025-12-310000891478ifrs-full:CurrencyRiskMemberifrs-full:DerivativesMember2025-12-310000891478ifrs-full:CurrencyRiskMemberifrs-full:DerivativesMember2024-12-310000891478ifrs-full:CurrencyRiskMemberifrs-full:DerivativesMember2024-12-310000891478ifrs-full:CurrencyRiskMemberifrs-full:DerivativesMember2023-12-310000891478ifrs-full:CurrencyRiskMemberifrs-full:DerivativesMember2023-12-310000891478ifrs-full:OtherPriceRiskMemberifrs-full:DerivativesMember2025-12-310000891478ifrs-full:OtherPriceRiskMemberifrs-full:DerivativesMember2025-12-310000891478ifrs-full:OtherPriceRiskMemberifrs-full:DerivativesMember2024-12-310000891478ifrs-full:OtherPriceRiskMemberifrs-full:DerivativesMember2024-12-310000891478ifrs-full:OtherPriceRiskMemberifrs-full:DerivativesMember2023-12-310000891478ifrs-full:OtherPriceRiskMemberifrs-full:DerivativesMember2023-12-310000891478san:OtherRisksMemberifrs-full:DerivativesMember2025-12-310000891478san:OtherRisksMemberifrs-full:DerivativesMember2025-12-310000891478san:OtherRisksMemberifrs-full:DerivativesMember2024-12-310000891478san:OtherRisksMemberifrs-full:DerivativesMember2024-12-310000891478san:OtherRisksMemberifrs-full:DerivativesMember2023-12-310000891478san:OtherRisksMemberifrs-full:DerivativesMember2023-12-310000891478ifrs-full:DebtSecuritiesMembersan:ShortPositionsMember2025-12-310000891478ifrs-full:DebtSecuritiesMembersan:ShortPositionsMember2024-12-310000891478ifrs-full:DebtSecuritiesMembersan:ShortPositionsMember2023-12-310000891478ifrs-full:DebtSecuritiesMembersrt:ParentCompanyMembersan:ShortPositionsMember2025-12-310000891478ifrs-full:DebtSecuritiesMembersrt:ParentCompanyMembersan:ShortPositionsMember2024-12-310000891478ifrs-full:DebtSecuritiesMembersrt:ParentCompanyMembersan:ShortPositionsMember2023-12-310000891478san:BancoSantanderMexicoSAInstitucionDeBancaMultipleGrupoFinancieroSantanderMexicoMemberifrs-full:DebtSecuritiesMembersan:ShortPositionsMember2025-12-310000891478san:BancoSantanderMexicoSAInstitucionDeBancaMultipleGrupoFinancieroSantanderMexicoMemberifrs-full:DebtSecuritiesMembersan:ShortPositionsMember2024-12-310000891478san:BancoSantanderMexicoSAInstitucionDeBancaMultipleGrupoFinancieroSantanderMexicoMemberifrs-full:DebtSecuritiesMembersan:ShortPositionsMember2023-12-310000891478ifrs-full:EquityInvestmentsMembersan:ShortPositionsMember2025-12-310000891478ifrs-full:EquityInvestmentsMembersan:ShortPositionsMember2024-12-310000891478ifrs-full:EquityInvestmentsMembersan:ShortPositionsMember2023-12-310000891478ifrs-full:EquityInvestmentsMembersrt:ParentCompanyMembersan:ShortPositionsMember2025-12-310000891478ifrs-full:EquityInvestmentsMembersrt:ParentCompanyMembersan:ShortPositionsMember2024-12-310000891478ifrs-full:EquityInvestmentsMembersrt:ParentCompanyMembersan:ShortPositionsMember2023-12-310000891478san:BancoSantanderBrasilSAMemberifrs-full:DebtSecuritiesMembersan:ShortPositionsMember2025-12-310000891478san:BancoSantanderBrasilSAMemberifrs-full:DebtSecuritiesMembersan:ShortPositionsMember2024-12-310000891478san:BancoSantanderBrasilSAMemberifrs-full:DebtSecuritiesMembersan:ShortPositionsMember2023-12-310000891478san:SantanderUSCapitalMarketsLLCMemberifrs-full:DebtSecuritiesMembersan:ShortPositionsMember2025-12-310000891478san:SantanderUSCapitalMarketsLLCMemberifrs-full:DebtSecuritiesMembersan:ShortPositionsMember2024-12-310000891478san:SantanderUSCapitalMarketsLLCMemberifrs-full:DebtSecuritiesMembersan:ShortPositionsMember2023-12-310000891478ifrs-full:AccumulatedImpairmentMembersan:LoansAndAdvancesCustomersMember2025-12-310000891478ifrs-full:AccumulatedImpairmentMembersan:LoansAndAdvancesCustomersMember2024-12-310000891478ifrs-full:AccumulatedImpairmentMembersan:LoansAndAdvancesCustomersMember2023-12-310000891478ifrs-full:GrossCarryingAmountMembersan:LoansAndAdvancesCustomersMember2025-12-310000891478ifrs-full:GrossCarryingAmountMembersan:LoansAndAdvancesCustomersMember2024-12-310000891478ifrs-full:GrossCarryingAmountMembersan:LoansAndAdvancesCustomersMember2023-12-310000891478san:CommercialCreditMemberifrs-full:GrossCarryingAmountMember2025-12-310000891478san:CommercialCreditMemberifrs-full:GrossCarryingAmountMember2024-12-310000891478san:CommercialCreditMemberifrs-full:GrossCarryingAmountMember2023-12-310000891478san:SecuredLoansReceivableMemberifrs-full:GrossCarryingAmountMember2025-12-310000891478san:SecuredLoansReceivableMemberifrs-full:GrossCarryingAmountMember2024-12-310000891478san:SecuredLoansReceivableMemberifrs-full:GrossCarryingAmountMember2023-12-310000891478san:ReverseRepurchaseAgreementsMemberifrs-full:GrossCarryingAmountMember2025-12-310000891478san:ReverseRepurchaseAgreementsMemberifrs-full:GrossCarryingAmountMember2024-12-310000891478san:ReverseRepurchaseAgreementsMemberifrs-full:GrossCarryingAmountMember2023-12-310000891478san:OtherTermLoansReceivablesMemberifrs-full:GrossCarryingAmountMember2025-12-310000891478san:OtherTermLoansReceivablesMemberifrs-full:GrossCarryingAmountMember2024-12-310000891478san:OtherTermLoansReceivablesMemberifrs-full:GrossCarryingAmountMember2023-12-310000891478san:FinanceLeaseLoansMemberifrs-full:GrossCarryingAmountMember2025-12-310000891478san:FinanceLeaseLoansMemberifrs-full:GrossCarryingAmountMember2024-12-310000891478san:FinanceLeaseLoansMemberifrs-full:GrossCarryingAmountMember2023-12-310000891478san:ReceivableOnDemandMemberifrs-full:GrossCarryingAmountMember2025-12-310000891478san:ReceivableOnDemandMemberifrs-full:GrossCarryingAmountMember2024-12-310000891478san:ReceivableOnDemandMemberifrs-full:GrossCarryingAmountMember2023-12-310000891478san:CreditCardsReceivablesMemberifrs-full:GrossCarryingAmountMember2025-12-310000891478san:CreditCardsReceivablesMemberifrs-full:GrossCarryingAmountMember2024-12-310000891478san:CreditCardsReceivablesMemberifrs-full:GrossCarryingAmountMember2023-12-310000891478san:ImpairedAssetsFinancialInstrumentTypeMemberifrs-full:GrossCarryingAmountMember2025-12-310000891478san:ImpairedAssetsFinancialInstrumentTypeMemberifrs-full:GrossCarryingAmountMember2024-12-310000891478san:ImpairedAssetsFinancialInstrumentTypeMemberifrs-full:GrossCarryingAmountMember2023-12-310000891478san:LoansAndAdvancesCustomersMemberifrs-full:GrossCarryingAmountMember2025-12-310000891478san:LoansAndAdvancesCustomersMemberifrs-full:GrossCarryingAmountMember2024-12-310000891478san:LoansAndAdvancesCustomersMemberifrs-full:GrossCarryingAmountMember2023-12-310000891478ifrs-full:GrossCarryingAmountMemberifrs-full:CountryOfDomicileMembersan:LoansAndAdvancesCustomersMember2025-12-310000891478ifrs-full:GrossCarryingAmountMemberifrs-full:CountryOfDomicileMembersan:LoansAndAdvancesCustomersMember2024-12-310000891478ifrs-full:GrossCarryingAmountMemberifrs-full:CountryOfDomicileMembersan:LoansAndAdvancesCustomersMember2023-12-310000891478ifrs-full:GrossCarryingAmountMembersan:RestOfEuropeMembersan:LoansAndAdvancesCustomersMember2025-12-310000891478ifrs-full:GrossCarryingAmountMembersan:RestOfEuropeMembersan:LoansAndAdvancesCustomersMember2024-12-310000891478ifrs-full:GrossCarryingAmountMembersan:RestOfEuropeMembersan:LoansAndAdvancesCustomersMember2023-12-310000891478ifrs-full:GrossCarryingAmountMembercountry:GBsan:LoansAndAdvancesCustomersMember2025-12-310000891478ifrs-full:GrossCarryingAmountMembercountry:GBsan:LoansAndAdvancesCustomersMember2024-12-310000891478ifrs-full:GrossCarryingAmountMembercountry:GBsan:LoansAndAdvancesCustomersMember2023-12-310000891478ifrs-full:GrossCarryingAmountMembersrt:AmericasMembersan:LoansAndAdvancesCustomersMember2025-12-310000891478ifrs-full:GrossCarryingAmountMembersrt:AmericasMembersan:LoansAndAdvancesCustomersMember2024-12-310000891478ifrs-full:GrossCarryingAmountMembersrt:AmericasMembersan:LoansAndAdvancesCustomersMember2023-12-310000891478ifrs-full:GrossCarryingAmountMembercountry:USsan:LoansAndAdvancesCustomersMember2025-12-310000891478ifrs-full:GrossCarryingAmountMembercountry:USsan:LoansAndAdvancesCustomersMember2024-12-310000891478ifrs-full:GrossCarryingAmountMembercountry:USsan:LoansAndAdvancesCustomersMember2023-12-310000891478ifrs-full:GrossCarryingAmountMembercountry:BRsan:LoansAndAdvancesCustomersMember2025-12-310000891478ifrs-full:GrossCarryingAmountMembercountry:BRsan:LoansAndAdvancesCustomersMember2024-12-310000891478ifrs-full:GrossCarryingAmountMembercountry:BRsan:LoansAndAdvancesCustomersMember2023-12-310000891478ifrs-full:GrossCarryingAmountMembersan:RestOfWorldMembersan:LoansAndAdvancesCustomersMember2025-12-310000891478ifrs-full:GrossCarryingAmountMembersan:RestOfWorldMembersan:LoansAndAdvancesCustomersMember2024-12-310000891478ifrs-full:GrossCarryingAmountMembersan:RestOfWorldMembersan:LoansAndAdvancesCustomersMember2023-12-310000891478ifrs-full:GrossCarryingAmountMembersan:LoansAndAdvancesCustomersMemberifrs-full:FixedInterestRateMember2025-12-310000891478ifrs-full:GrossCarryingAmountMembersan:LoansAndAdvancesCustomersMemberifrs-full:FixedInterestRateMember2024-12-310000891478ifrs-full:GrossCarryingAmountMembersan:LoansAndAdvancesCustomersMemberifrs-full:FixedInterestRateMember2023-12-310000891478ifrs-full:GrossCarryingAmountMembersan:LoansAndAdvancesCustomersMemberifrs-full:FloatingInterestRateMember2025-12-310000891478ifrs-full:GrossCarryingAmountMembersan:LoansAndAdvancesCustomersMemberifrs-full:FloatingInterestRateMember2024-12-310000891478ifrs-full:GrossCarryingAmountMembersan:LoansAndAdvancesCustomersMemberifrs-full:FloatingInterestRateMember2023-12-310000891478ifrs-full:GrossCarryingAmountMembersan:IFRSStandardPoorsARatingMemberifrs-full:CountryOfDomicileMembersan:PublicSectorMember2025-12-310000891478ifrs-full:GrossCarryingAmountMembersan:IFRSStandardPoorsARatingMemberifrs-full:CountryOfDomicileMembersan:PublicSectorMember2024-12-310000891478ifrs-full:GrossCarryingAmountMembersan:IFRSStandardPoorsARatingMemberifrs-full:CountryOfDomicileMembersan:PublicSectorMember2023-12-310000891478ifrs-full:GrossCarryingAmountMembersan:RestOfWorldMembersan:PublicSectorMember2025-12-310000891478ifrs-full:GrossCarryingAmountMembersan:RestOfWorldMembersan:PublicSectorMember2024-12-310000891478ifrs-full:GrossCarryingAmountMembersan:RestOfWorldMembersan:PublicSectorMember2023-12-310000891478san:IFRSStandardPoorsAAARatingMembersan:RestOfWorldMembersan:PublicSectorMember2025-12-310000891478san:IFRSStandardPoorsAARatingMembersan:RestOfWorldMembersan:PublicSectorMember2025-12-310000891478san:IFRSStandardPoorsARatingMembersan:RestOfWorldMembersan:PublicSectorMember2025-12-310000891478san:IFRSStandardPoorsBBBRatingMembersan:RestOfWorldMembersan:PublicSectorMember2025-12-310000891478san:IFRSStandardPoorsBelowBBBRatingMembersan:RestOfWorldMembersan:PublicSectorMember2025-12-310000891478san:NoRatingMembersan:RestOfWorldMembersan:PublicSectorMember2025-12-310000891478san:LoansAndReceivablesWithoutConsideringPublicAdministrationMember2025-12-310000891478san:LoansAndReceivablesWithoutConsideringPublicAdministrationMember2024-12-310000891478san:LoansAndReceivablesWithoutConsideringPublicAdministrationMember2023-12-310000891478ifrs-full:FinancialInstrumentsNotCreditimpairedMembersan:LoansAndReceivablesWithoutConsideringPublicAdministrationMember2025-12-310000891478ifrs-full:FinancialInstrumentsNotCreditimpairedMembersan:LoansAndReceivablesWithoutConsideringPublicAdministrationMember2024-12-310000891478ifrs-full:FinancialInstrumentsNotCreditimpairedMembersan:LoansAndReceivablesWithoutConsideringPublicAdministrationMember2023-12-310000891478san:PublicSectorMember2025-12-310000891478san:IFRSUncollateralizedMembersan:PublicSectorMember2025-12-310000891478san:IFRSCollateralPledgedMembersan:PublicSectorMember2025-12-310000891478san:OtherThanPropertyCollateralPledgedMembersan:PublicSectorMember2025-12-310000891478san:LTBLessThanOrEqualTo40PercentMembersan:PublicSectorMember2025-12-310000891478san:LTV40To60PercentMembersan:PublicSectorMember2025-12-310000891478san:LTV60To80PercentMembersan:PublicSectorMember2025-12-310000891478san:IFRSLTV80To100PercentMembersan:PublicSectorMember2025-12-310000891478san:LTVMoreThan100PercentMembersan:PublicSectorMember2025-12-310000891478san:OtherFinancialInstitutionsMember2025-12-310000891478san:IFRSUncollateralizedMembersan:OtherFinancialInstitutionsMember2025-12-310000891478san:IFRSCollateralPledgedMembersan:OtherFinancialInstitutionsMember2025-12-310000891478san:OtherThanPropertyCollateralPledgedMembersan:OtherFinancialInstitutionsMember2025-12-310000891478san:LTBLessThanOrEqualTo40PercentMembersan:OtherFinancialInstitutionsMember2025-12-310000891478san:LTV40To60PercentMembersan:OtherFinancialInstitutionsMember2025-12-310000891478san:LTV60To80PercentMembersan:OtherFinancialInstitutionsMember2025-12-310000891478san:IFRSLTV80To100PercentMembersan:OtherFinancialInstitutionsMember2025-12-310000891478san:LTVMoreThan100PercentMembersan:OtherFinancialInstitutionsMember2025-12-310000891478san:NonFinancialCorporationsAndIndividualEntrepreneursMember2025-12-310000891478san:IFRSUncollateralizedMembersan:NonFinancialCorporationsAndIndividualEntrepreneursMember2025-12-310000891478san:IFRSCollateralPledgedMembersan:NonFinancialCorporationsAndIndividualEntrepreneursMember2025-12-310000891478san:OtherThanPropertyCollateralPledgedMembersan:NonFinancialCorporationsAndIndividualEntrepreneursMember2025-12-310000891478san:LTBLessThanOrEqualTo40PercentMembersan:NonFinancialCorporationsAndIndividualEntrepreneursMember2025-12-310000891478san:LTV40To60PercentMembersan:NonFinancialCorporationsAndIndividualEntrepreneursMember2025-12-310000891478san:LTV60To80PercentMembersan:NonFinancialCorporationsAndIndividualEntrepreneursMember2025-12-310000891478san:IFRSLTV80To100PercentMembersan:NonFinancialCorporationsAndIndividualEntrepreneursMember2025-12-310000891478san:LTVMoreThan100PercentMembersan:NonFinancialCorporationsAndIndividualEntrepreneursMember2025-12-310000891478san:ConstructionAndPropertyDevelopmentLoansMembersan:NonFinancialCorporationsAndIndividualEntrepreneursMember2025-12-310000891478san:ConstructionAndPropertyDevelopmentLoansMembersan:IFRSUncollateralizedMembersan:NonFinancialCorporationsAndIndividualEntrepreneursMember2025-12-310000891478san:ConstructionAndPropertyDevelopmentLoansMembersan:IFRSCollateralPledgedMembersan:NonFinancialCorporationsAndIndividualEntrepreneursMember2025-12-310000891478san:ConstructionAndPropertyDevelopmentLoansMembersan:OtherThanPropertyCollateralPledgedMembersan:NonFinancialCorporationsAndIndividualEntrepreneursMember2025-12-310000891478san:LTBLessThanOrEqualTo40PercentMembersan:ConstructionAndPropertyDevelopmentLoansMembersan:NonFinancialCorporationsAndIndividualEntrepreneursMember2025-12-310000891478san:LTV40To60PercentMembersan:ConstructionAndPropertyDevelopmentLoansMembersan:NonFinancialCorporationsAndIndividualEntrepreneursMember2025-12-310000891478san:LTV60To80PercentMembersan:ConstructionAndPropertyDevelopmentLoansMembersan:NonFinancialCorporationsAndIndividualEntrepreneursMember2025-12-310000891478san:IFRSLTV80To100PercentMembersan:ConstructionAndPropertyDevelopmentLoansMembersan:NonFinancialCorporationsAndIndividualEntrepreneursMember2025-12-310000891478san:LTVMoreThan100PercentMembersan:ConstructionAndPropertyDevelopmentLoansMembersan:NonFinancialCorporationsAndIndividualEntrepreneursMember2025-12-310000891478san:CivilEngineeringConstructionLoansMembersan:NonFinancialCorporationsAndIndividualEntrepreneursMember2025-12-310000891478san:CivilEngineeringConstructionLoansMembersan:IFRSUncollateralizedMembersan:NonFinancialCorporationsAndIndividualEntrepreneursMember2025-12-310000891478san:CivilEngineeringConstructionLoansMembersan:IFRSCollateralPledgedMembersan:NonFinancialCorporationsAndIndividualEntrepreneursMember2025-12-310000891478san:CivilEngineeringConstructionLoansMembersan:OtherThanPropertyCollateralPledgedMembersan:NonFinancialCorporationsAndIndividualEntrepreneursMember2025-12-310000891478san:LTBLessThanOrEqualTo40PercentMembersan:CivilEngineeringConstructionLoansMembersan:NonFinancialCorporationsAndIndividualEntrepreneursMember2025-12-310000891478san:LTV40To60PercentMembersan:CivilEngineeringConstructionLoansMembersan:NonFinancialCorporationsAndIndividualEntrepreneursMember2025-12-310000891478san:LTV60To80PercentMembersan:CivilEngineeringConstructionLoansMembersan:NonFinancialCorporationsAndIndividualEntrepreneursMember2025-12-310000891478san:IFRSLTV80To100PercentMembersan:CivilEngineeringConstructionLoansMembersan:NonFinancialCorporationsAndIndividualEntrepreneursMember2025-12-310000891478san:LTVMoreThan100PercentMembersan:CivilEngineeringConstructionLoansMembersan:NonFinancialCorporationsAndIndividualEntrepreneursMember2025-12-310000891478san:CorporateLoansToLargeCompaniesMembersan:NonFinancialCorporationsAndIndividualEntrepreneursMember2025-12-310000891478san:CorporateLoansToLargeCompaniesMembersan:IFRSUncollateralizedMembersan:NonFinancialCorporationsAndIndividualEntrepreneursMember2025-12-310000891478san:CorporateLoansToLargeCompaniesMembersan:IFRSCollateralPledgedMembersan:NonFinancialCorporationsAndIndividualEntrepreneursMember2025-12-310000891478san:CorporateLoansToLargeCompaniesMembersan:OtherThanPropertyCollateralPledgedMembersan:NonFinancialCorporationsAndIndividualEntrepreneursMember2025-12-310000891478san:LTBLessThanOrEqualTo40PercentMembersan:CorporateLoansToLargeCompaniesMembersan:NonFinancialCorporationsAndIndividualEntrepreneursMember2025-12-310000891478san:LTV40To60PercentMembersan:CorporateLoansToLargeCompaniesMembersan:NonFinancialCorporationsAndIndividualEntrepreneursMember2025-12-310000891478san:LTV60To80PercentMembersan:CorporateLoansToLargeCompaniesMembersan:NonFinancialCorporationsAndIndividualEntrepreneursMember2025-12-310000891478san:IFRSLTV80To100PercentMembersan:CorporateLoansToLargeCompaniesMembersan:NonFinancialCorporationsAndIndividualEntrepreneursMember2025-12-310000891478san:LTVMoreThan100PercentMembersan:CorporateLoansToLargeCompaniesMembersan:NonFinancialCorporationsAndIndividualEntrepreneursMember2025-12-310000891478san:CorporateLoansToSMEsAndIndividualEntrepreneursMembersan:NonFinancialCorporationsAndIndividualEntrepreneursMember2025-12-310000891478san:CorporateLoansToSMEsAndIndividualEntrepreneursMembersan:IFRSUncollateralizedMembersan:NonFinancialCorporationsAndIndividualEntrepreneursMember2025-12-310000891478san:CorporateLoansToSMEsAndIndividualEntrepreneursMembersan:IFRSCollateralPledgedMembersan:NonFinancialCorporationsAndIndividualEntrepreneursMember2025-12-310000891478san:CorporateLoansToSMEsAndIndividualEntrepreneursMembersan:OtherThanPropertyCollateralPledgedMembersan:NonFinancialCorporationsAndIndividualEntrepreneursMember2025-12-310000891478san:LTBLessThanOrEqualTo40PercentMembersan:CorporateLoansToSMEsAndIndividualEntrepreneursMembersan:NonFinancialCorporationsAndIndividualEntrepreneursMember2025-12-310000891478san:LTV40To60PercentMembersan:CorporateLoansToSMEsAndIndividualEntrepreneursMembersan:NonFinancialCorporationsAndIndividualEntrepreneursMember2025-12-310000891478san:LTV60To80PercentMembersan:CorporateLoansToSMEsAndIndividualEntrepreneursMembersan:NonFinancialCorporationsAndIndividualEntrepreneursMember2025-12-310000891478san:IFRSLTV80To100PercentMembersan:CorporateLoansToSMEsAndIndividualEntrepreneursMembersan:NonFinancialCorporationsAndIndividualEntrepreneursMember2025-12-310000891478san:LTVMoreThan100PercentMembersan:CorporateLoansToSMEsAndIndividualEntrepreneursMembersan:NonFinancialCorporationsAndIndividualEntrepreneursMember2025-12-310000891478san:HouseholdsOtherMember2025-12-310000891478san:IFRSUncollateralizedMembersan:HouseholdsOtherMember2025-12-310000891478san:IFRSCollateralPledgedMembersan:HouseholdsOtherMember2025-12-310000891478san:OtherThanPropertyCollateralPledgedMembersan:HouseholdsOtherMember2025-12-310000891478san:LTBLessThanOrEqualTo40PercentMembersan:HouseholdsOtherMember2025-12-310000891478san:LTV40To60PercentMembersan:HouseholdsOtherMember2025-12-310000891478san:LTV60To80PercentMembersan:HouseholdsOtherMember2025-12-310000891478san:IFRSLTV80To100PercentMembersan:HouseholdsOtherMember2025-12-310000891478san:LTVMoreThan100PercentMembersan:HouseholdsOtherMember2025-12-310000891478san:ResidentialLoansMembersan:HouseholdsOtherMember2025-12-310000891478san:ResidentialLoansMembersan:IFRSUncollateralizedMembersan:HouseholdsOtherMember2025-12-310000891478san:ResidentialLoansMembersan:IFRSCollateralPledgedMembersan:HouseholdsOtherMember2025-12-310000891478san:ResidentialLoansMembersan:OtherThanPropertyCollateralPledgedMembersan:HouseholdsOtherMember2025-12-310000891478san:LTBLessThanOrEqualTo40PercentMembersan:ResidentialLoansMembersan:HouseholdsOtherMember2025-12-310000891478san:LTV40To60PercentMembersan:ResidentialLoansMembersan:HouseholdsOtherMember2025-12-310000891478san:LTV60To80PercentMembersan:ResidentialLoansMembersan:HouseholdsOtherMember2025-12-310000891478san:IFRSLTV80To100PercentMembersan:ResidentialLoansMembersan:HouseholdsOtherMember2025-12-310000891478san:LTVMoreThan100PercentMembersan:ResidentialLoansMembersan:HouseholdsOtherMember2025-12-310000891478ifrs-full:ConsumerLoansMembersan:HouseholdsOtherMember2025-12-310000891478ifrs-full:ConsumerLoansMembersan:IFRSUncollateralizedMembersan:HouseholdsOtherMember2025-12-310000891478ifrs-full:ConsumerLoansMembersan:IFRSCollateralPledgedMembersan:HouseholdsOtherMember2025-12-310000891478ifrs-full:ConsumerLoansMembersan:OtherThanPropertyCollateralPledgedMembersan:HouseholdsOtherMember2025-12-310000891478san:LTBLessThanOrEqualTo40PercentMemberifrs-full:ConsumerLoansMembersan:HouseholdsOtherMember2025-12-310000891478san:LTV40To60PercentMemberifrs-full:ConsumerLoansMembersan:HouseholdsOtherMember2025-12-310000891478san:LTV60To80PercentMemberifrs-full:ConsumerLoansMembersan:HouseholdsOtherMember2025-12-310000891478san:IFRSLTV80To100PercentMemberifrs-full:ConsumerLoansMembersan:HouseholdsOtherMember2025-12-310000891478san:LTVMoreThan100PercentMemberifrs-full:ConsumerLoansMembersan:HouseholdsOtherMember2025-12-310000891478san:OtherPurposesLoansMembersan:HouseholdsOtherMember2025-12-310000891478san:OtherPurposesLoansMembersan:IFRSUncollateralizedMembersan:HouseholdsOtherMember2025-12-310000891478san:OtherPurposesLoansMembersan:IFRSCollateralPledgedMembersan:HouseholdsOtherMember2025-12-310000891478san:OtherPurposesLoansMembersan:OtherThanPropertyCollateralPledgedMembersan:HouseholdsOtherMember2025-12-310000891478san:LTBLessThanOrEqualTo40PercentMembersan:OtherPurposesLoansMembersan:HouseholdsOtherMember2025-12-310000891478san:LTV40To60PercentMembersan:OtherPurposesLoansMembersan:HouseholdsOtherMember2025-12-310000891478san:LTV60To80PercentMembersan:OtherPurposesLoansMembersan:HouseholdsOtherMember2025-12-310000891478san:IFRSLTV80To100PercentMembersan:OtherPurposesLoansMembersan:HouseholdsOtherMember2025-12-310000891478san:LTVMoreThan100PercentMembersan:OtherPurposesLoansMembersan:HouseholdsOtherMember2025-12-310000891478san:IFRSUncollateralizedMember2025-12-310000891478san:IFRSCollateralPledgedMember2025-12-310000891478san:OtherThanPropertyCollateralPledgedMember2025-12-310000891478san:LTBLessThanOrEqualTo40PercentMember2025-12-310000891478san:LTV40To60PercentMember2025-12-310000891478san:LTV60To80PercentMember2025-12-310000891478san:IFRSLTV80To100PercentMember2025-12-310000891478san:LTVMoreThan100PercentMember2025-12-310000891478ifrs-full:AccumulatedImpairmentMemberifrs-full:TwelvemonthExpectedCreditLossesMembersan:FinancialAssetsAtFairValueThroughOtherComprehensiveIncomeAndFinancialAssetsAtAmortisedCostMembersan:LoansAndAdvancesCustomersMemberifrs-full:FinancialInstrumentsNotCreditimpairedMember2024-12-310000891478ifrs-full:AccumulatedImpairmentMemberifrs-full:LifetimeExpectedCreditLossesMembersan:FinancialAssetsAtFairValueThroughOtherComprehensiveIncomeAndFinancialAssetsAtAmortisedCostMembersan:LoansAndAdvancesCustomersMemberifrs-full:FinancialInstrumentsNotCreditimpairedMember2024-12-310000891478ifrs-full:AccumulatedImpairmentMemberifrs-full:LifetimeExpectedCreditLossesMembersan:FinancialAssetsAtFairValueThroughOtherComprehensiveIncomeAndFinancialAssetsAtAmortisedCostMembersan:LoansAndAdvancesCustomersMemberifrs-full:FinancialInstrumentsCreditimpairedMember2024-12-310000891478ifrs-full:AccumulatedImpairmentMembersan:FinancialAssetsAtFairValueThroughOtherComprehensiveIncomeAndFinancialAssetsAtAmortisedCostMembersan:LoansAndAdvancesCustomersMember2024-12-310000891478ifrs-full:AccumulatedImpairmentMemberifrs-full:TwelvemonthExpectedCreditLossesMembersan:FinancialAssetsAtFairValueThroughOtherComprehensiveIncomeAndFinancialAssetsAtAmortisedCostMembersan:LoansAndAdvancesCustomersMemberifrs-full:FinancialInstrumentsNotCreditimpairedMember2025-01-012025-12-310000891478ifrs-full:AccumulatedImpairmentMemberifrs-full:LifetimeExpectedCreditLossesMembersan:FinancialAssetsAtFairValueThroughOtherComprehensiveIncomeAndFinancialAssetsAtAmortisedCostMembersan:LoansAndAdvancesCustomersMemberifrs-full:FinancialInstrumentsNotCreditimpairedMember2025-01-012025-12-310000891478ifrs-full:AccumulatedImpairmentMemberifrs-full:LifetimeExpectedCreditLossesMembersan:FinancialAssetsAtFairValueThroughOtherComprehensiveIncomeAndFinancialAssetsAtAmortisedCostMembersan:LoansAndAdvancesCustomersMemberifrs-full:FinancialInstrumentsCreditimpairedMember2025-01-012025-12-310000891478ifrs-full:AccumulatedImpairmentMembersan:FinancialAssetsAtFairValueThroughOtherComprehensiveIncomeAndFinancialAssetsAtAmortisedCostMembersan:LoansAndAdvancesCustomersMember2025-01-012025-12-310000891478ifrs-full:AccumulatedImpairmentMemberifrs-full:TwelvemonthExpectedCreditLossesMembersan:FinancialAssetsAtFairValueThroughOtherComprehensiveIncomeAndFinancialAssetsAtAmortisedCostMembersan:LoansAndAdvancesCustomersMemberifrs-full:FinancialInstrumentsNotCreditimpairedMember2025-12-310000891478ifrs-full:AccumulatedImpairmentMemberifrs-full:LifetimeExpectedCreditLossesMembersan:FinancialAssetsAtFairValueThroughOtherComprehensiveIncomeAndFinancialAssetsAtAmortisedCostMembersan:LoansAndAdvancesCustomersMemberifrs-full:FinancialInstrumentsNotCreditimpairedMember2025-12-310000891478ifrs-full:AccumulatedImpairmentMemberifrs-full:LifetimeExpectedCreditLossesMembersan:FinancialAssetsAtFairValueThroughOtherComprehensiveIncomeAndFinancialAssetsAtAmortisedCostMembersan:LoansAndAdvancesCustomersMemberifrs-full:FinancialInstrumentsCreditimpairedMember2025-12-310000891478ifrs-full:AccumulatedImpairmentMembersan:FinancialAssetsAtFairValueThroughOtherComprehensiveIncomeAndFinancialAssetsAtAmortisedCostMembersan:LoansAndAdvancesCustomersMember2025-12-310000891478ifrs-full:AccumulatedImpairmentMemberifrs-full:TwelvemonthExpectedCreditLossesMembersan:FinancialAssetsAtFairValueThroughOtherComprehensiveIncomeAndFinancialAssetsAtAmortisedCostMembersan:LoansAndAdvancesCustomersMemberifrs-full:FinancialInstrumentsNotCreditimpairedMember2023-12-310000891478ifrs-full:AccumulatedImpairmentMemberifrs-full:LifetimeExpectedCreditLossesMembersan:FinancialAssetsAtFairValueThroughOtherComprehensiveIncomeAndFinancialAssetsAtAmortisedCostMembersan:LoansAndAdvancesCustomersMemberifrs-full:FinancialInstrumentsNotCreditimpairedMember2023-12-310000891478ifrs-full:AccumulatedImpairmentMemberifrs-full:LifetimeExpectedCreditLossesMembersan:FinancialAssetsAtFairValueThroughOtherComprehensiveIncomeAndFinancialAssetsAtAmortisedCostMembersan:LoansAndAdvancesCustomersMemberifrs-full:FinancialInstrumentsCreditimpairedMember2023-12-310000891478ifrs-full:AccumulatedImpairmentMembersan:FinancialAssetsAtFairValueThroughOtherComprehensiveIncomeAndFinancialAssetsAtAmortisedCostMembersan:LoansAndAdvancesCustomersMember2023-12-310000891478ifrs-full:AccumulatedImpairmentMemberifrs-full:TwelvemonthExpectedCreditLossesMembersan:FinancialAssetsAtFairValueThroughOtherComprehensiveIncomeAndFinancialAssetsAtAmortisedCostMembersan:LoansAndAdvancesCustomersMemberifrs-full:FinancialInstrumentsNotCreditimpairedMember2024-01-012024-12-310000891478ifrs-full:AccumulatedImpairmentMemberifrs-full:LifetimeExpectedCreditLossesMembersan:FinancialAssetsAtFairValueThroughOtherComprehensiveIncomeAndFinancialAssetsAtAmortisedCostMembersan:LoansAndAdvancesCustomersMemberifrs-full:FinancialInstrumentsNotCreditimpairedMember2024-01-012024-12-310000891478ifrs-full:AccumulatedImpairmentMemberifrs-full:LifetimeExpectedCreditLossesMembersan:FinancialAssetsAtFairValueThroughOtherComprehensiveIncomeAndFinancialAssetsAtAmortisedCostMembersan:LoansAndAdvancesCustomersMemberifrs-full:FinancialInstrumentsCreditimpairedMember2024-01-012024-12-310000891478ifrs-full:AccumulatedImpairmentMembersan:FinancialAssetsAtFairValueThroughOtherComprehensiveIncomeAndFinancialAssetsAtAmortisedCostMembersan:LoansAndAdvancesCustomersMember2024-01-012024-12-310000891478ifrs-full:AccumulatedImpairmentMemberifrs-full:TwelvemonthExpectedCreditLossesMembersan:FinancialAssetsAtFairValueThroughOtherComprehensiveIncomeAndFinancialAssetsAtAmortisedCostMembersan:LoansAndAdvancesCustomersMemberifrs-full:FinancialInstrumentsNotCreditimpairedMember2022-12-310000891478ifrs-full:AccumulatedImpairmentMemberifrs-full:LifetimeExpectedCreditLossesMembersan:FinancialAssetsAtFairValueThroughOtherComprehensiveIncomeAndFinancialAssetsAtAmortisedCostMembersan:LoansAndAdvancesCustomersMemberifrs-full:FinancialInstrumentsNotCreditimpairedMember2022-12-310000891478ifrs-full:AccumulatedImpairmentMemberifrs-full:LifetimeExpectedCreditLossesMembersan:FinancialAssetsAtFairValueThroughOtherComprehensiveIncomeAndFinancialAssetsAtAmortisedCostMembersan:LoansAndAdvancesCustomersMemberifrs-full:FinancialInstrumentsCreditimpairedMember2022-12-310000891478ifrs-full:AccumulatedImpairmentMembersan:FinancialAssetsAtFairValueThroughOtherComprehensiveIncomeAndFinancialAssetsAtAmortisedCostMembersan:LoansAndAdvancesCustomersMember2022-12-310000891478ifrs-full:AccumulatedImpairmentMemberifrs-full:TwelvemonthExpectedCreditLossesMembersan:FinancialAssetsAtFairValueThroughOtherComprehensiveIncomeAndFinancialAssetsAtAmortisedCostMembersan:LoansAndAdvancesCustomersMemberifrs-full:FinancialInstrumentsNotCreditimpairedMember2023-01-012023-12-310000891478ifrs-full:AccumulatedImpairmentMemberifrs-full:LifetimeExpectedCreditLossesMembersan:FinancialAssetsAtFairValueThroughOtherComprehensiveIncomeAndFinancialAssetsAtAmortisedCostMembersan:LoansAndAdvancesCustomersMemberifrs-full:FinancialInstrumentsNotCreditimpairedMember2023-01-012023-12-310000891478ifrs-full:AccumulatedImpairmentMemberifrs-full:LifetimeExpectedCreditLossesMembersan:FinancialAssetsAtFairValueThroughOtherComprehensiveIncomeAndFinancialAssetsAtAmortisedCostMembersan:LoansAndAdvancesCustomersMemberifrs-full:FinancialInstrumentsCreditimpairedMember2023-01-012023-12-310000891478ifrs-full:AccumulatedImpairmentMembersan:FinancialAssetsAtFairValueThroughOtherComprehensiveIncomeAndFinancialAssetsAtAmortisedCostMembersan:LoansAndAdvancesCustomersMember2023-01-012023-12-310000891478san:LoansAndAdvancesCustomersMemberifrs-full:FinancialInstrumentsPurchasedOrOriginatedCreditimpairedMember2025-12-310000891478san:LoansAndAdvancesCustomersMemberifrs-full:FinancialInstrumentsPurchasedOrOriginatedCreditimpairedMember2024-12-310000891478san:LoansAndAdvancesCustomersMemberifrs-full:FinancialInstrumentsPurchasedOrOriginatedCreditimpairedMember2023-12-310000891478san:LoansAndAdvancesCustomersMemberifrs-full:FinancialInstrumentsPurchasedOrOriginatedCreditimpairedMembersan:BusinessCombinationsCarriedOutMember2025-12-310000891478ifrs-full:AccumulatedImpairmentMembersan:FinancialAssetsAtAmortisedCostAndFinancialAssetsAtFairValueThroughOtherComprehensiveIncomeCategoryMember2024-12-310000891478ifrs-full:AccumulatedImpairmentMembersan:FinancialAssetsAtAmortisedCostAndFinancialAssetsAtFairValueThroughOtherComprehensiveIncomeCategoryMember2023-12-310000891478ifrs-full:AccumulatedImpairmentMembersan:FinancialAssetsAtAmortisedCostAndFinancialAssetsAtFairValueThroughOtherComprehensiveIncomeCategoryMember2022-12-310000891478ifrs-full:AccumulatedImpairmentMembersan:FinancialAssetsAtAmortisedCostAndFinancialAssetsAtFairValueThroughOtherComprehensiveIncomeCategoryMember2025-01-012025-12-310000891478ifrs-full:AccumulatedImpairmentMembersan:FinancialAssetsAtAmortisedCostAndFinancialAssetsAtFairValueThroughOtherComprehensiveIncomeCategoryMember2024-01-012024-12-310000891478ifrs-full:AccumulatedImpairmentMembersan:FinancialAssetsAtAmortisedCostAndFinancialAssetsAtFairValueThroughOtherComprehensiveIncomeCategoryMember2023-01-012023-12-310000891478ifrs-full:AccumulatedImpairmentMembersan:FinancialAssetsAtAmortisedCostAndFinancialAssetsAtFairValueThroughOtherComprehensiveIncomeCategoryMember2025-12-310000891478ifrs-full:AccumulatedImpairmentMembersan:FinancialAssetsAtAmortisedCostAndFinancialAssetsAtFairValueThroughOtherComprehensiveIncomeCategoryMemberifrs-full:FinancialInstrumentsCreditimpairedMember2025-12-310000891478ifrs-full:AccumulatedImpairmentMembersan:FinancialAssetsAtAmortisedCostAndFinancialAssetsAtFairValueThroughOtherComprehensiveIncomeCategoryMemberifrs-full:FinancialInstrumentsCreditimpairedMember2024-12-310000891478ifrs-full:AccumulatedImpairmentMembersan:FinancialAssetsAtAmortisedCostAndFinancialAssetsAtFairValueThroughOtherComprehensiveIncomeCategoryMemberifrs-full:FinancialInstrumentsCreditimpairedMember2023-12-310000891478ifrs-full:AccumulatedImpairmentMembersan:FinancialAssetsAtAmortisedCostAndFinancialAssetsAtFairValueThroughOtherComprehensiveIncomeCategoryMemberifrs-full:FinancialInstrumentsNotCreditimpairedMember2025-12-310000891478ifrs-full:AccumulatedImpairmentMembersan:FinancialAssetsAtAmortisedCostAndFinancialAssetsAtFairValueThroughOtherComprehensiveIncomeCategoryMemberifrs-full:FinancialInstrumentsNotCreditimpairedMember2024-12-310000891478ifrs-full:AccumulatedImpairmentMembersan:FinancialAssetsAtAmortisedCostAndFinancialAssetsAtFairValueThroughOtherComprehensiveIncomeCategoryMemberifrs-full:FinancialInstrumentsNotCreditimpairedMember2023-12-310000891478ifrs-full:ExpectedCreditLossesIndividuallyAssessedMemberifrs-full:AccumulatedImpairmentMembersan:FinancialAssetsAtAmortisedCostAndFinancialAssetsAtFairValueThroughOtherComprehensiveIncomeCategoryMember2025-12-310000891478ifrs-full:ExpectedCreditLossesIndividuallyAssessedMemberifrs-full:AccumulatedImpairmentMembersan:FinancialAssetsAtAmortisedCostAndFinancialAssetsAtFairValueThroughOtherComprehensiveIncomeCategoryMember2024-12-310000891478ifrs-full:ExpectedCreditLossesIndividuallyAssessedMemberifrs-full:AccumulatedImpairmentMembersan:FinancialAssetsAtAmortisedCostAndFinancialAssetsAtFairValueThroughOtherComprehensiveIncomeCategoryMember2023-12-310000891478ifrs-full:ExpectedCreditLossesCollectivelyAssessedMemberifrs-full:AccumulatedImpairmentMembersan:FinancialAssetsAtAmortisedCostAndFinancialAssetsAtFairValueThroughOtherComprehensiveIncomeCategoryMember2025-12-310000891478ifrs-full:ExpectedCreditLossesCollectivelyAssessedMemberifrs-full:AccumulatedImpairmentMembersan:FinancialAssetsAtAmortisedCostAndFinancialAssetsAtFairValueThroughOtherComprehensiveIncomeCategoryMember2024-12-310000891478ifrs-full:ExpectedCreditLossesCollectivelyAssessedMemberifrs-full:AccumulatedImpairmentMembersan:FinancialAssetsAtAmortisedCostAndFinancialAssetsAtFairValueThroughOtherComprehensiveIncomeCategoryMember2023-12-310000891478ifrs-full:LoansAndReceivablesCategoryMember2025-01-012025-12-310000891478ifrs-full:LoansAndReceivablesCategoryMember2024-01-012024-12-310000891478ifrs-full:LoansAndReceivablesCategoryMember2023-01-012023-12-310000891478ifrs-full:AccumulatedImpairmentMemberifrs-full:TwelvemonthExpectedCreditLossesMembersan:FinancialAssetsAtAmortisedCostAndFinancialAssetsAtFairValueThroughOtherComprehensiveIncomeCategoryMembersan:LoansAndAdvancesCustomersMemberifrs-full:FinancialInstrumentsNotCreditimpairedMember2024-12-310000891478ifrs-full:AccumulatedImpairmentMemberifrs-full:LifetimeExpectedCreditLossesMembersan:FinancialAssetsAtAmortisedCostAndFinancialAssetsAtFairValueThroughOtherComprehensiveIncomeCategoryMembersan:LoansAndAdvancesCustomersMemberifrs-full:FinancialInstrumentsNotCreditimpairedMember2024-12-310000891478ifrs-full:AccumulatedImpairmentMemberifrs-full:LifetimeExpectedCreditLossesMembersan:FinancialAssetsAtAmortisedCostAndFinancialAssetsAtFairValueThroughOtherComprehensiveIncomeCategoryMembersan:LoansAndAdvancesCustomersMemberifrs-full:FinancialInstrumentsCreditimpairedMember2024-12-310000891478ifrs-full:AccumulatedImpairmentMembersan:FinancialAssetsAtAmortisedCostAndFinancialAssetsAtFairValueThroughOtherComprehensiveIncomeCategoryMembersan:LoansAndAdvancesCustomersMember2024-12-310000891478ifrs-full:AccumulatedImpairmentMemberifrs-full:TwelvemonthExpectedCreditLossesMembersan:FinancialAssetsAtAmortisedCostAndFinancialAssetsAtFairValueThroughOtherComprehensiveIncomeCategoryMembersan:LoansAndAdvancesCustomersMemberifrs-full:FinancialInstrumentsNotCreditimpairedMember2025-01-012025-12-310000891478ifrs-full:AccumulatedImpairmentMemberifrs-full:LifetimeExpectedCreditLossesMembersan:FinancialAssetsAtAmortisedCostAndFinancialAssetsAtFairValueThroughOtherComprehensiveIncomeCategoryMembersan:LoansAndAdvancesCustomersMemberifrs-full:FinancialInstrumentsNotCreditimpairedMember2025-01-012025-12-310000891478ifrs-full:AccumulatedImpairmentMembersan:FinancialAssetsAtAmortisedCostAndFinancialAssetsAtFairValueThroughOtherComprehensiveIncomeCategoryMembersan:LoansAndAdvancesCustomersMember2025-01-012025-12-310000891478ifrs-full:AccumulatedImpairmentMemberifrs-full:LifetimeExpectedCreditLossesMembersan:FinancialAssetsAtAmortisedCostAndFinancialAssetsAtFairValueThroughOtherComprehensiveIncomeCategoryMembersan:LoansAndAdvancesCustomersMemberifrs-full:FinancialInstrumentsCreditimpairedMember2025-01-012025-12-310000891478ifrs-full:AccumulatedImpairmentMemberifrs-full:TwelvemonthExpectedCreditLossesMembersan:FinancialAssetsAtAmortisedCostAndFinancialAssetsAtFairValueThroughOtherComprehensiveIncomeCategoryMembersan:LoansAndAdvancesCustomersMemberifrs-full:FinancialInstrumentsNotCreditimpairedMember2025-12-310000891478ifrs-full:AccumulatedImpairmentMemberifrs-full:LifetimeExpectedCreditLossesMembersan:FinancialAssetsAtAmortisedCostAndFinancialAssetsAtFairValueThroughOtherComprehensiveIncomeCategoryMembersan:LoansAndAdvancesCustomersMemberifrs-full:FinancialInstrumentsNotCreditimpairedMember2025-12-310000891478ifrs-full:AccumulatedImpairmentMemberifrs-full:LifetimeExpectedCreditLossesMembersan:FinancialAssetsAtAmortisedCostAndFinancialAssetsAtFairValueThroughOtherComprehensiveIncomeCategoryMembersan:LoansAndAdvancesCustomersMemberifrs-full:FinancialInstrumentsCreditimpairedMember2025-12-310000891478ifrs-full:AccumulatedImpairmentMembersan:FinancialAssetsAtAmortisedCostAndFinancialAssetsAtFairValueThroughOtherComprehensiveIncomeCategoryMembersan:LoansAndAdvancesCustomersMember2025-12-310000891478ifrs-full:AccumulatedImpairmentMemberifrs-full:TwelvemonthExpectedCreditLossesMembersan:FinancialAssetsAtAmortisedCostAndFinancialAssetsAtFairValueThroughOtherComprehensiveIncomeCategoryMembersan:LoansAndAdvancesCustomersMemberifrs-full:FinancialInstrumentsNotCreditimpairedMember2023-12-310000891478ifrs-full:AccumulatedImpairmentMemberifrs-full:LifetimeExpectedCreditLossesMembersan:FinancialAssetsAtAmortisedCostAndFinancialAssetsAtFairValueThroughOtherComprehensiveIncomeCategoryMembersan:LoansAndAdvancesCustomersMemberifrs-full:FinancialInstrumentsNotCreditimpairedMember2023-12-310000891478ifrs-full:AccumulatedImpairmentMemberifrs-full:LifetimeExpectedCreditLossesMembersan:FinancialAssetsAtAmortisedCostAndFinancialAssetsAtFairValueThroughOtherComprehensiveIncomeCategoryMembersan:LoansAndAdvancesCustomersMemberifrs-full:FinancialInstrumentsCreditimpairedMember2023-12-310000891478ifrs-full:AccumulatedImpairmentMembersan:FinancialAssetsAtAmortisedCostAndFinancialAssetsAtFairValueThroughOtherComprehensiveIncomeCategoryMembersan:LoansAndAdvancesCustomersMember2023-12-310000891478ifrs-full:AccumulatedImpairmentMemberifrs-full:TwelvemonthExpectedCreditLossesMembersan:FinancialAssetsAtAmortisedCostAndFinancialAssetsAtFairValueThroughOtherComprehensiveIncomeCategoryMembersan:LoansAndAdvancesCustomersMemberifrs-full:FinancialInstrumentsNotCreditimpairedMember2024-01-012024-12-310000891478ifrs-full:AccumulatedImpairmentMemberifrs-full:LifetimeExpectedCreditLossesMembersan:FinancialAssetsAtAmortisedCostAndFinancialAssetsAtFairValueThroughOtherComprehensiveIncomeCategoryMembersan:LoansAndAdvancesCustomersMemberifrs-full:FinancialInstrumentsNotCreditimpairedMember2024-01-012024-12-310000891478ifrs-full:AccumulatedImpairmentMembersan:FinancialAssetsAtAmortisedCostAndFinancialAssetsAtFairValueThroughOtherComprehensiveIncomeCategoryMembersan:LoansAndAdvancesCustomersMember2024-01-012024-12-310000891478ifrs-full:AccumulatedImpairmentMemberifrs-full:LifetimeExpectedCreditLossesMembersan:FinancialAssetsAtAmortisedCostAndFinancialAssetsAtFairValueThroughOtherComprehensiveIncomeCategoryMembersan:LoansAndAdvancesCustomersMemberifrs-full:FinancialInstrumentsCreditimpairedMember2024-01-012024-12-310000891478ifrs-full:AccumulatedImpairmentMemberifrs-full:TwelvemonthExpectedCreditLossesMembersan:FinancialAssetsAtAmortisedCostAndFinancialAssetsAtFairValueThroughOtherComprehensiveIncomeCategoryMembersan:LoansAndAdvancesCustomersMemberifrs-full:FinancialInstrumentsNotCreditimpairedMember2022-12-310000891478ifrs-full:AccumulatedImpairmentMemberifrs-full:LifetimeExpectedCreditLossesMembersan:FinancialAssetsAtAmortisedCostAndFinancialAssetsAtFairValueThroughOtherComprehensiveIncomeCategoryMembersan:LoansAndAdvancesCustomersMemberifrs-full:FinancialInstrumentsNotCreditimpairedMember2022-12-310000891478ifrs-full:AccumulatedImpairmentMemberifrs-full:LifetimeExpectedCreditLossesMembersan:FinancialAssetsAtAmortisedCostAndFinancialAssetsAtFairValueThroughOtherComprehensiveIncomeCategoryMembersan:LoansAndAdvancesCustomersMemberifrs-full:FinancialInstrumentsCreditimpairedMember2022-12-310000891478ifrs-full:AccumulatedImpairmentMembersan:FinancialAssetsAtAmortisedCostAndFinancialAssetsAtFairValueThroughOtherComprehensiveIncomeCategoryMembersan:LoansAndAdvancesCustomersMember2022-12-310000891478ifrs-full:AccumulatedImpairmentMemberifrs-full:TwelvemonthExpectedCreditLossesMembersan:FinancialAssetsAtAmortisedCostAndFinancialAssetsAtFairValueThroughOtherComprehensiveIncomeCategoryMembersan:LoansAndAdvancesCustomersMemberifrs-full:FinancialInstrumentsNotCreditimpairedMember2023-01-012023-12-310000891478ifrs-full:AccumulatedImpairmentMemberifrs-full:LifetimeExpectedCreditLossesMembersan:FinancialAssetsAtAmortisedCostAndFinancialAssetsAtFairValueThroughOtherComprehensiveIncomeCategoryMembersan:LoansAndAdvancesCustomersMemberifrs-full:FinancialInstrumentsNotCreditimpairedMember2023-01-012023-12-310000891478ifrs-full:AccumulatedImpairmentMembersan:FinancialAssetsAtAmortisedCostAndFinancialAssetsAtFairValueThroughOtherComprehensiveIncomeCategoryMembersan:LoansAndAdvancesCustomersMember2023-01-012023-12-310000891478ifrs-full:AccumulatedImpairmentMemberifrs-full:LifetimeExpectedCreditLossesMembersan:FinancialAssetsAtAmortisedCostAndFinancialAssetsAtFairValueThroughOtherComprehensiveIncomeCategoryMembersan:LoansAndAdvancesCustomersMemberifrs-full:FinancialInstrumentsCreditimpairedMember2023-01-012023-12-310000891478ifrs-full:GrossCarryingAmountMembersan:LoansAndAdvancesCustomersMemberifrs-full:FinancialInstrumentsCreditimpairedMember2024-12-310000891478ifrs-full:GrossCarryingAmountMembersan:LoansAndAdvancesCustomersMemberifrs-full:FinancialInstrumentsCreditimpairedMember2023-12-310000891478ifrs-full:GrossCarryingAmountMembersan:LoansAndAdvancesCustomersMemberifrs-full:FinancialInstrumentsCreditimpairedMember2022-12-310000891478san:LoansAndAdvancesCustomersMemberifrs-full:FinancialInstrumentsCreditimpairedMember2025-01-012025-12-310000891478san:LoansAndAdvancesCustomersMemberifrs-full:FinancialInstrumentsCreditimpairedMember2024-01-012024-12-310000891478san:LoansAndAdvancesCustomersMemberifrs-full:FinancialInstrumentsCreditimpairedMember2023-01-012023-12-310000891478ifrs-full:GrossCarryingAmountMembersan:LoansAndAdvancesCustomersMemberifrs-full:FinancialInstrumentsCreditimpairedMember2025-12-310000891478ifrs-full:LoansAndReceivablesCategoryMemberifrs-full:FinancialInstrumentsCreditimpairedMember2025-12-310000891478ifrs-full:LoansAndReceivablesCategoryMemberifrs-full:FinancialInstrumentsCreditimpairedMember2024-12-310000891478ifrs-full:LoansAndReceivablesCategoryMemberifrs-full:FinancialInstrumentsCreditimpairedMember2023-12-310000891478ifrs-full:GrossCarryingAmountMemberifrs-full:FinancialInstrumentsCreditimpairedMembersan:IFRSUncollateralizedMember2025-12-310000891478ifrs-full:AccumulatedImpairmentMemberifrs-full:FinancialInstrumentsCreditimpairedMembersan:IFRSUncollateralizedMember2025-12-310000891478san:IFRSUncollateralizedMemberifrs-full:FinancialInstrumentsCreditimpairedMember2025-01-012025-12-310000891478ifrs-full:GrossCarryingAmountMemberifrs-full:FinancialInstrumentsCreditimpairedMembersan:IFRSCollateralPledgedMember2025-12-310000891478ifrs-full:AccumulatedImpairmentMemberifrs-full:FinancialInstrumentsCreditimpairedMembersan:IFRSCollateralPledgedMember2025-12-310000891478san:IFRSCollateralPledgedMemberifrs-full:FinancialInstrumentsCreditimpairedMember2025-01-012025-12-310000891478ifrs-full:GrossCarryingAmountMemberifrs-full:FinancialInstrumentsCreditimpairedMembersan:OtherThanPropertyCollateralPledgedMember2025-12-310000891478ifrs-full:AccumulatedImpairmentMemberifrs-full:FinancialInstrumentsCreditimpairedMembersan:OtherThanPropertyCollateralPledgedMember2025-12-310000891478san:OtherThanPropertyCollateralPledgedMemberifrs-full:FinancialInstrumentsCreditimpairedMember2025-01-012025-12-310000891478ifrs-full:GrossCarryingAmountMemberifrs-full:FinancialInstrumentsCreditimpairedMember2025-12-310000891478ifrs-full:AccumulatedImpairmentMemberifrs-full:FinancialInstrumentsCreditimpairedMember2025-12-310000891478ifrs-full:FinancialInstrumentsCreditimpairedMember2025-01-012025-12-310000891478san:SecuritizedLoansLoansAndAdvancesToCustomersMember2025-12-310000891478san:SecuritizedLoansLoansAndAdvancesToCustomersMember2024-12-310000891478san:SecuritizedLoansLoansAndAdvancesToCustomersMember2023-12-310000891478ifrs-full:MortgagesMembersan:SecuritizedLoansLoansAndAdvancesToCustomersMember2025-12-310000891478ifrs-full:MortgagesMembersan:SecuritizedLoansLoansAndAdvancesToCustomersMember2024-12-310000891478ifrs-full:MortgagesMembersan:SecuritizedLoansLoansAndAdvancesToCustomersMember2023-12-310000891478san:SecuritizedLoansLoansAndAdvancesToCustomersMembercountry:GBifrs-full:MortgagesMember2025-12-310000891478san:SecuritizedLoansLoansAndAdvancesToCustomersMembercountry:GBifrs-full:MortgagesMember2024-12-310000891478san:SecuritizedLoansLoansAndAdvancesToCustomersMembercountry:GBifrs-full:MortgagesMember2023-12-310000891478san:LoansBackedByAssetsRatherThanMortgagesMembersan:SecuritizedLoansLoansAndAdvancesToCustomersMember2025-12-310000891478san:LoansBackedByAssetsRatherThanMortgagesMembersan:SecuritizedLoansLoansAndAdvancesToCustomersMember2024-12-310000891478san:LoansBackedByAssetsRatherThanMortgagesMembersan:SecuritizedLoansLoansAndAdvancesToCustomersMember2023-12-310000891478ifrs-full:ForwardContractMembersan:TradingDerivativesMember2025-12-310000891478ifrs-full:ForwardContractMembersan:TradingDerivativesMember2024-12-310000891478ifrs-full:ForwardContractMembersan:TradingDerivativesMember2023-12-310000891478ifrs-full:InterestRateSwapContractMembersan:TradingDerivativesMember2025-12-310000891478ifrs-full:InterestRateSwapContractMembersan:TradingDerivativesMember2024-12-310000891478ifrs-full:InterestRateSwapContractMembersan:TradingDerivativesMember2023-12-310000891478san:OptionContractAndFuturesContractAndOtherDerivativesMembersan:TradingDerivativesMember2025-12-310000891478san:OptionContractAndFuturesContractAndOtherDerivativesMembersan:TradingDerivativesMember2024-12-310000891478san:OptionContractAndFuturesContractAndOtherDerivativesMembersan:TradingDerivativesMember2023-12-310000891478san:CreditDefaultSwap1Membersan:TradingDerivativesMember2025-12-310000891478san:CreditDefaultSwap1Membersan:TradingDerivativesMember2024-12-310000891478san:CreditDefaultSwap1Membersan:TradingDerivativesMember2023-12-310000891478san:ForeignCurrencyPurchasesAndSalesMembersan:TradingDerivativesMember2025-12-310000891478san:ForeignCurrencyPurchasesAndSalesMembersan:TradingDerivativesMember2024-12-310000891478san:ForeignCurrencyPurchasesAndSalesMembersan:TradingDerivativesMember2023-12-310000891478san:ForeignCurrencyOptionsMembersan:TradingDerivativesMember2025-12-310000891478san:ForeignCurrencyOptionsMembersan:TradingDerivativesMember2024-12-310000891478san:ForeignCurrencyOptionsMembersan:TradingDerivativesMember2023-12-310000891478ifrs-full:CurrencySwapContractMembersan:TradingDerivativesMember2025-12-310000891478ifrs-full:CurrencySwapContractMembersan:TradingDerivativesMember2024-12-310000891478ifrs-full:CurrencySwapContractMembersan:TradingDerivativesMember2023-12-310000891478san:SecuritiesAndCommoditiesDerivativesAndOtherMembersan:TradingDerivativesMember2025-12-310000891478san:SecuritiesAndCommoditiesDerivativesAndOtherMembersan:TradingDerivativesMember2024-12-310000891478san:SecuritiesAndCommoditiesDerivativesAndOtherMembersan:TradingDerivativesMember2023-12-310000891478san:TradingDerivativesMember2025-12-310000891478san:TradingDerivativesMember2024-12-310000891478san:TradingDerivativesMember2023-12-310000891478ifrs-full:AssetsAndLiabilitiesClassifiedAsHeldForSaleMember2025-12-310000891478ifrs-full:AssetsAndLiabilitiesClassifiedAsHeldForSaleMember2024-12-310000891478ifrs-full:AssetsAndLiabilitiesClassifiedAsHeldForSaleMember2023-12-310000891478ifrs-full:AssetsAndLiabilitiesClassifiedAsHeldForSaleMembersan:ForeclosedAssetsMember2025-12-310000891478ifrs-full:AssetsAndLiabilitiesClassifiedAsHeldForSaleMembersan:ForeclosedAssetsMember2024-12-310000891478ifrs-full:AssetsAndLiabilitiesClassifiedAsHeldForSaleMembersan:ForeclosedAssetsMember2023-12-310000891478ifrs-full:AssetsAndLiabilitiesClassifiedAsHeldForSaleMemberifrs-full:CountryOfDomicileMembersan:ForeclosedAssetsMember2025-12-310000891478ifrs-full:AssetsAndLiabilitiesClassifiedAsHeldForSaleMemberifrs-full:CountryOfDomicileMembersan:ForeclosedAssetsMember2024-12-310000891478ifrs-full:AssetsAndLiabilitiesClassifiedAsHeldForSaleMemberifrs-full:CountryOfDomicileMembersan:ForeclosedAssetsMember2023-12-310000891478ifrs-full:AssetsAndLiabilitiesClassifiedAsHeldForSaleMembersan:OtherTangibleAssetsMember2025-12-310000891478ifrs-full:AssetsAndLiabilitiesClassifiedAsHeldForSaleMembersan:OtherTangibleAssetsMember2024-12-310000891478ifrs-full:AssetsAndLiabilitiesClassifiedAsHeldForSaleMembersan:OtherTangibleAssetsMember2023-12-310000891478ifrs-full:AssetsAndLiabilitiesClassifiedAsHeldForSaleMemberifrs-full:AssociatesMemberifrs-full:SubsidiariesMember2025-12-310000891478ifrs-full:AssetsAndLiabilitiesClassifiedAsHeldForSaleMemberifrs-full:AssociatesMemberifrs-full:SubsidiariesMember2024-12-310000891478ifrs-full:AssetsAndLiabilitiesClassifiedAsHeldForSaleMemberifrs-full:AssociatesMemberifrs-full:SubsidiariesMember2023-12-310000891478ifrs-full:AssetsAndLiabilitiesClassifiedAsHeldForSaleMembersan:CaceisMember2025-12-310000891478ifrs-full:AssetsAndLiabilitiesClassifiedAsHeldForSaleMembersan:CaceisMember2024-12-310000891478ifrs-full:AssetsAndLiabilitiesClassifiedAsHeldForSaleMembersan:CaceisMember2023-12-310000891478ifrs-full:AssetsAndLiabilitiesClassifiedAsHeldForSaleMembersan:SantanderBankPolskaSAMember2025-12-310000891478ifrs-full:AssetsAndLiabilitiesClassifiedAsHeldForSaleMembersan:SantanderBankPolskaSAMember2024-12-310000891478ifrs-full:AssetsAndLiabilitiesClassifiedAsHeldForSaleMembersan:SantanderBankPolskaSAMember2023-12-310000891478ifrs-full:AssetsAndLiabilitiesClassifiedAsHeldForSaleMember2025-01-012025-12-310000891478ifrs-full:AssetsAndLiabilitiesClassifiedAsHeldForSaleMember2024-01-012024-12-310000891478ifrs-full:AssetsAndLiabilitiesClassifiedAsHeldForSaleMember2023-01-012023-12-310000891478san:SantanderBankPolskaSAMemberifrs-full:DiscontinuedOperationsMember2025-12-310000891478san:SantanderBankPolskaSAMember2025-01-012025-12-310000891478san:SantanderBankPolskaSAMember2024-01-012024-12-310000891478san:SantanderBankPolskaSAMember2023-01-012023-12-310000891478san:SantanderBankPolskaSAMemberifrs-full:DiscontinuedOperationsMember2025-01-012025-12-310000891478san:SantanderBankPolskaSAMemberifrs-full:DiscontinuedOperationsMember2024-01-012024-12-310000891478san:SantanderBankPolskaSAMemberifrs-full:DiscontinuedOperationsMember2023-01-012023-12-310000891478ifrs-full:AssetsAndLiabilitiesClassifiedAsHeldForSaleMembersan:SantanderBankPolskaSAMember2025-01-012025-12-310000891478san:MerlinPropertiesSocimiSAMember2025-12-310000891478san:MerlinPropertiesSocimiSAMember2024-12-310000891478san:MerlinPropertiesSocimiSAMember2023-12-310000891478san:ZurichSantanderInsuranceAmericaSLMember2025-12-310000891478san:ZurichSantanderInsuranceAmericaSLMember2024-12-310000891478san:ZurichSantanderInsuranceAmericaSLMember2023-12-310000891478san:MetrovacesaSAMember2025-12-310000891478san:MetrovacesaSAMember2024-12-310000891478san:MetrovacesaSAMember2023-12-310000891478san:CNPSantanderMember2025-12-310000891478san:CNPSantanderMember2024-12-310000891478san:CNPSantanderMember2023-12-310000891478san:PluxeeBeneficiosBrasilS.A.Member2025-12-310000891478san:PluxeeBeneficiosBrasilS.A.Member2024-12-310000891478san:PluxeeBeneficiosBrasilS.A.Member2023-12-310000891478san:CaceisMember2025-12-310000891478san:CaceisMember2024-12-310000891478san:CaceisMember2023-12-310000891478ifrs-full:AggregatedIndividuallyImmaterialAssociatesMember2025-12-310000891478ifrs-full:AggregatedIndividuallyImmaterialAssociatesMember2024-12-310000891478ifrs-full:AggregatedIndividuallyImmaterialAssociatesMember2023-12-310000891478san:SantanderCACEISLatamHolding1SLMember2025-12-310000891478san:SantanderCACEISLatamHolding1SLMember2024-12-310000891478san:SantanderCACEISLatamHolding1SLMember2023-12-310000891478san:SantanderVidaSegurosYReasegurosMember2025-12-310000891478san:SantanderVidaSegurosYReasegurosMember2024-12-310000891478san:SantanderVidaSegurosYReasegurosMember2023-12-310000891478san:UnionDeCreditosInmobiliariosSAEFCMember2025-12-310000891478san:UnionDeCreditosInmobiliariosSAEFCMember2024-12-310000891478san:UnionDeCreditosInmobiliariosSAEFCMember2023-12-310000891478san:FortuneAutoFinanceCoLtdMember2025-12-310000891478san:FortuneAutoFinanceCoLtdMember2024-12-310000891478san:FortuneAutoFinanceCoLtdMember2023-12-310000891478san:HyundaiCapitalUKLimitedMember2025-12-310000891478san:HyundaiCapitalUKLimitedMember2024-12-310000891478san:HyundaiCapitalUKLimitedMember2023-12-310000891478san:VolvoCarFinancialServicesUKLtd.Member2025-12-310000891478san:VolvoCarFinancialServicesUKLtd.Member2024-12-310000891478san:VolvoCarFinancialServicesUKLtd.Member2023-12-310000891478san:BancoRCIBrasilSAMember2025-12-310000891478san:BancoRCIBrasilSAMember2024-12-310000891478san:BancoRCIBrasilSAMember2023-12-310000891478ifrs-full:AggregatedIndividuallyImmaterialJointVenturesMember2025-12-310000891478ifrs-full:AggregatedIndividuallyImmaterialJointVenturesMember2024-12-310000891478ifrs-full:AggregatedIndividuallyImmaterialJointVenturesMember2023-12-310000891478san:AssociatesAndJointVenturesMember2025-12-310000891478san:AssociatesAndJointVenturesMember2024-12-310000891478san:AssociatesAndJointVenturesMember2023-12-310000891478san:ZurichSantanderInsuranceAmericaSLMember2025-01-012025-12-310000891478san:ZurichSantanderInsuranceAmericaSLMember2024-01-012024-12-310000891478san:ZurichSantanderInsuranceAmericaSLMember2023-01-012023-12-310000891478san:MetrovacesaSAMember2025-01-012025-12-310000891478san:MetrovacesaSAMember2024-01-012024-12-310000891478san:MetrovacesaSAMember2023-01-012023-12-310000891478san:SantanderVidaSegurosYReasegurosMember2025-01-012025-12-310000891478san:SantanderVidaSegurosYReasegurosMember2024-01-012024-12-310000891478san:SantanderVidaSegurosYReasegurosMember2023-01-012023-12-310000891478san:MerlinPropertiesSocimiSAMember2025-01-012025-12-310000891478san:MerlinPropertiesSocimiSAMember2024-01-012024-12-310000891478san:MerlinPropertiesSocimiSAMember2023-01-012023-12-310000891478san:CNPSantanderMember2025-01-012025-12-310000891478san:CNPSantanderMember2024-01-012024-12-310000891478san:CNPSantanderMember2023-01-012023-12-310000891478san:CIPS.A.Member2025-01-012025-12-310000891478san:CIPS.A.Member2024-01-012024-12-310000891478san:CIPS.A.Member2023-01-012023-12-310000891478san:CaceisMember2024-01-012024-12-310000891478san:CaceisMember2023-01-012023-12-310000891478san:HyundaiCapitalUKLimitedMember2025-01-012025-12-310000891478san:HyundaiCapitalUKLimitedMember2024-01-012024-12-310000891478san:HyundaiCapitalUKLimitedMember2023-01-012023-12-310000891478san:AggregateAmountsForEntitiesAccountedForUsingEquityMethodMembersan:MerlinPropertiesSocimiSAMember2025-12-310000891478san:AggregateAmountsForEntitiesAccountedForUsingEquityMethodMembersan:MetrovacesaSAMember2025-12-310000891478san:AggregateAmountsForEntitiesAccountedForUsingEquityMethodMembersan:PluxeeBeneficiosBrasilS.A.Member2025-12-310000891478san:AggregateAmountsForEntitiesAccountedForUsingEquityMethodMembersan:ZurichSantanderInsuranceAmericaSLMember2025-12-310000891478san:AggregateAmountsForEntitiesAccountedForUsingEquityMethodMembersan:CNPSantanderMember2025-12-310000891478san:AggregateAmountsForEntitiesAccountedForUsingEquityMethodMembersan:SantanderCACEISLatamHolding1SLMember2025-12-310000891478san:AggregateAmountsForEntitiesAccountedForUsingEquityMethodMembersan:UnionDeCreditosInmobiliariosSAEFCMember2025-12-310000891478san:AggregateAmountsForEntitiesAccountedForUsingEquityMethodMembersan:HyundaiCapitalUKLimitedMember2025-12-310000891478san:AggregateAmountsForEntitiesAccountedForUsingEquityMethodMembersan:FortuneAutoFinanceCoLtdMember2025-12-310000891478san:AggregateAmountsForEntitiesAccountedForUsingEquityMethodMembersan:SantanderSegurosYReasegurosCompaniaAseguradoraSAMember2025-12-310000891478san:AggregateAmountsForEntitiesAccountedForUsingEquityMethodMembersan:BancoRCIBrasilSAMember2025-12-310000891478san:AggregateAmountsForEntitiesAccountedForUsingEquityMethodMembersan:MerlinPropertiesSocimiSAMember2025-01-012025-12-310000891478san:AggregateAmountsForEntitiesAccountedForUsingEquityMethodMembersan:MetrovacesaSAMember2025-01-012025-12-310000891478san:AggregateAmountsForEntitiesAccountedForUsingEquityMethodMembersan:PluxeeBeneficiosBrasilS.A.Member2025-01-012025-12-310000891478san:AggregateAmountsForEntitiesAccountedForUsingEquityMethodMembersan:ZurichSantanderInsuranceAmericaSLMember2025-01-012025-12-310000891478san:AggregateAmountsForEntitiesAccountedForUsingEquityMethodMembersan:CNPSantanderMember2025-01-012025-12-310000891478san:AggregateAmountsForEntitiesAccountedForUsingEquityMethodMembersan:SantanderCACEISLatamHolding1SLMember2025-01-012025-12-310000891478san:AggregateAmountsForEntitiesAccountedForUsingEquityMethodMembersan:UnionDeCreditosInmobiliariosSAEFCMember2025-01-012025-12-310000891478san:AggregateAmountsForEntitiesAccountedForUsingEquityMethodMembersan:HyundaiCapitalUKLimitedMember2025-01-012025-12-310000891478san:AggregateAmountsForEntitiesAccountedForUsingEquityMethodMembersan:FortuneAutoFinanceCoLtdMember2025-01-012025-12-310000891478san:AggregateAmountsForEntitiesAccountedForUsingEquityMethodMembersan:SantanderSegurosYReasegurosCompaniaAseguradoraSAMember2025-01-012025-12-310000891478san:AggregateAmountsForEntitiesAccountedForUsingEquityMethodMembersan:BancoRCIBrasilSAMember2025-01-012025-12-310000891478srt:ParentCompanyMember2025-12-310000891478srt:ParentCompanyMember2024-12-310000891478srt:ParentCompanyMember2023-12-310000891478san:NetLiabilitiesOrAssetsForRemainingCoverageMember2025-12-310000891478san:NetLiabilitiesOrAssetsForRemainingCoverageMember2024-12-310000891478san:NetLiabilitiesOrAssetsForRemainingCoverageMember2023-12-310000891478ifrs-full:LossComponentMember2025-12-310000891478ifrs-full:LossComponentMember2024-12-310000891478ifrs-full:LossComponentMember2023-12-310000891478ifrs-full:EstimatesOfPresentValueOfFutureCashFlowsMemberifrs-full:LossComponentMember2025-12-310000891478ifrs-full:EstimatesOfPresentValueOfFutureCashFlowsMemberifrs-full:LossComponentMember2024-12-310000891478ifrs-full:EstimatesOfPresentValueOfFutureCashFlowsMemberifrs-full:LossComponentMember2023-12-310000891478ifrs-full:RiskAdjustmentForNonfinancialRiskMemberifrs-full:LossComponentMember2025-12-310000891478ifrs-full:RiskAdjustmentForNonfinancialRiskMemberifrs-full:LossComponentMember2024-12-310000891478ifrs-full:RiskAdjustmentForNonfinancialRiskMemberifrs-full:LossComponentMember2023-12-310000891478ifrs-full:ContractualServiceMarginMemberifrs-full:LossComponentMember2025-12-310000891478ifrs-full:ContractualServiceMarginMemberifrs-full:LossComponentMember2024-12-310000891478ifrs-full:ContractualServiceMarginMemberifrs-full:LossComponentMember2023-12-310000891478ifrs-full:NetLiabilitiesOrAssetsForRemainingCoverageExcludingLossComponentMember2025-12-310000891478ifrs-full:NetLiabilitiesOrAssetsForRemainingCoverageExcludingLossComponentMember2024-12-310000891478ifrs-full:NetLiabilitiesOrAssetsForRemainingCoverageExcludingLossComponentMember2023-12-310000891478ifrs-full:LiabilitiesForIncurredClaimsMember2025-12-310000891478ifrs-full:LiabilitiesForIncurredClaimsMember2024-12-310000891478ifrs-full:LiabilitiesForIncurredClaimsMember2023-12-310000891478srt:MaximumMember2025-01-012025-12-310000891478srt:MinimumMember2025-01-012025-12-310000891478san:PropertyPlantAndEquipmentPurchasedForOwnUseMemberifrs-full:GrossCarryingAmountMember2022-12-310000891478ifrs-full:PropertyPlantAndEquipmentSubjectToOperatingLeasesMemberifrs-full:GrossCarryingAmountMember2022-12-310000891478ifrs-full:InvestmentPropertyMemberifrs-full:GrossCarryingAmountMember2022-12-310000891478ifrs-full:GrossCarryingAmountMember2022-12-310000891478ifrs-full:GrossCarryingAmountMemberifrs-full:RightofuseAssetsMembersan:PropertyPlantAndEquipmentPurchasedForOwnUseMember2022-12-310000891478ifrs-full:GrossCarryingAmountMemberifrs-full:RightofuseAssetsMemberifrs-full:PropertyPlantAndEquipmentSubjectToOperatingLeasesMember2022-12-310000891478ifrs-full:GrossCarryingAmountMemberifrs-full:RightofuseAssetsMemberifrs-full:InvestmentPropertyMember2022-12-310000891478ifrs-full:GrossCarryingAmountMemberifrs-full:RightofuseAssetsMember2022-12-310000891478san:PropertyPlantAndEquipmentPurchasedForOwnUseMemberifrs-full:GrossCarryingAmountMember2023-01-012023-12-310000891478ifrs-full:PropertyPlantAndEquipmentSubjectToOperatingLeasesMemberifrs-full:GrossCarryingAmountMember2023-01-012023-12-310000891478ifrs-full:InvestmentPropertyMemberifrs-full:GrossCarryingAmountMember2023-01-012023-12-310000891478ifrs-full:GrossCarryingAmountMember2023-01-012023-12-310000891478ifrs-full:GrossCarryingAmountMemberifrs-full:RightofuseAssetsMembersan:PropertyPlantAndEquipmentPurchasedForOwnUseMember2023-01-012023-12-310000891478ifrs-full:GrossCarryingAmountMemberifrs-full:RightofuseAssetsMemberifrs-full:PropertyPlantAndEquipmentSubjectToOperatingLeasesMember2023-01-012023-12-310000891478ifrs-full:GrossCarryingAmountMemberifrs-full:RightofuseAssetsMemberifrs-full:InvestmentPropertyMember2023-01-012023-12-310000891478ifrs-full:GrossCarryingAmountMemberifrs-full:RightofuseAssetsMember2023-01-012023-12-310000891478san:PropertyPlantAndEquipmentPurchasedForOwnUseMemberifrs-full:GrossCarryingAmountMember2023-12-310000891478ifrs-full:PropertyPlantAndEquipmentSubjectToOperatingLeasesMemberifrs-full:GrossCarryingAmountMember2023-12-310000891478ifrs-full:InvestmentPropertyMemberifrs-full:GrossCarryingAmountMember2023-12-310000891478ifrs-full:GrossCarryingAmountMember2023-12-310000891478ifrs-full:GrossCarryingAmountMemberifrs-full:RightofuseAssetsMembersan:PropertyPlantAndEquipmentPurchasedForOwnUseMember2023-12-310000891478ifrs-full:GrossCarryingAmountMemberifrs-full:RightofuseAssetsMemberifrs-full:PropertyPlantAndEquipmentSubjectToOperatingLeasesMember2023-12-310000891478ifrs-full:GrossCarryingAmountMemberifrs-full:RightofuseAssetsMemberifrs-full:InvestmentPropertyMember2023-12-310000891478ifrs-full:GrossCarryingAmountMemberifrs-full:RightofuseAssetsMember2023-12-310000891478san:PropertyPlantAndEquipmentPurchasedForOwnUseMemberifrs-full:GrossCarryingAmountMember2024-01-012024-12-310000891478ifrs-full:PropertyPlantAndEquipmentSubjectToOperatingLeasesMemberifrs-full:GrossCarryingAmountMember2024-01-012024-12-310000891478ifrs-full:InvestmentPropertyMemberifrs-full:GrossCarryingAmountMember2024-01-012024-12-310000891478ifrs-full:GrossCarryingAmountMember2024-01-012024-12-310000891478ifrs-full:GrossCarryingAmountMemberifrs-full:RightofuseAssetsMembersan:PropertyPlantAndEquipmentPurchasedForOwnUseMember2024-01-012024-12-310000891478ifrs-full:GrossCarryingAmountMemberifrs-full:RightofuseAssetsMemberifrs-full:PropertyPlantAndEquipmentSubjectToOperatingLeasesMember2024-01-012024-12-310000891478ifrs-full:GrossCarryingAmountMemberifrs-full:RightofuseAssetsMemberifrs-full:InvestmentPropertyMember2024-01-012024-12-310000891478ifrs-full:GrossCarryingAmountMemberifrs-full:RightofuseAssetsMember2024-01-012024-12-310000891478san:PropertyPlantAndEquipmentPurchasedForOwnUseMemberifrs-full:GrossCarryingAmountMember2024-12-310000891478ifrs-full:PropertyPlantAndEquipmentSubjectToOperatingLeasesMemberifrs-full:GrossCarryingAmountMember2024-12-310000891478ifrs-full:InvestmentPropertyMemberifrs-full:GrossCarryingAmountMember2024-12-310000891478ifrs-full:GrossCarryingAmountMember2024-12-310000891478ifrs-full:GrossCarryingAmountMemberifrs-full:RightofuseAssetsMembersan:PropertyPlantAndEquipmentPurchasedForOwnUseMember2024-12-310000891478ifrs-full:GrossCarryingAmountMemberifrs-full:RightofuseAssetsMemberifrs-full:PropertyPlantAndEquipmentSubjectToOperatingLeasesMember2024-12-310000891478ifrs-full:GrossCarryingAmountMemberifrs-full:RightofuseAssetsMemberifrs-full:InvestmentPropertyMember2024-12-310000891478ifrs-full:GrossCarryingAmountMemberifrs-full:RightofuseAssetsMember2024-12-310000891478san:PropertyPlantAndEquipmentPurchasedForOwnUseMemberifrs-full:GrossCarryingAmountMember2025-01-012025-12-310000891478ifrs-full:PropertyPlantAndEquipmentSubjectToOperatingLeasesMemberifrs-full:GrossCarryingAmountMember2025-01-012025-12-310000891478ifrs-full:InvestmentPropertyMemberifrs-full:GrossCarryingAmountMember2025-01-012025-12-310000891478ifrs-full:GrossCarryingAmountMember2025-01-012025-12-310000891478ifrs-full:GrossCarryingAmountMemberifrs-full:RightofuseAssetsMembersan:PropertyPlantAndEquipmentPurchasedForOwnUseMember2025-01-012025-12-310000891478ifrs-full:GrossCarryingAmountMemberifrs-full:RightofuseAssetsMemberifrs-full:PropertyPlantAndEquipmentSubjectToOperatingLeasesMember2025-01-012025-12-310000891478ifrs-full:GrossCarryingAmountMemberifrs-full:RightofuseAssetsMemberifrs-full:InvestmentPropertyMember2025-01-012025-12-310000891478ifrs-full:GrossCarryingAmountMemberifrs-full:RightofuseAssetsMember2025-01-012025-12-310000891478san:PropertyPlantAndEquipmentPurchasedForOwnUseMemberifrs-full:GrossCarryingAmountMember2025-12-310000891478ifrs-full:PropertyPlantAndEquipmentSubjectToOperatingLeasesMemberifrs-full:GrossCarryingAmountMember2025-12-310000891478ifrs-full:InvestmentPropertyMemberifrs-full:GrossCarryingAmountMember2025-12-310000891478ifrs-full:GrossCarryingAmountMember2025-12-310000891478ifrs-full:GrossCarryingAmountMemberifrs-full:RightofuseAssetsMembersan:PropertyPlantAndEquipmentPurchasedForOwnUseMember2025-12-310000891478ifrs-full:GrossCarryingAmountMemberifrs-full:RightofuseAssetsMemberifrs-full:PropertyPlantAndEquipmentSubjectToOperatingLeasesMember2025-12-310000891478ifrs-full:GrossCarryingAmountMemberifrs-full:RightofuseAssetsMemberifrs-full:InvestmentPropertyMember2025-12-310000891478ifrs-full:GrossCarryingAmountMemberifrs-full:RightofuseAssetsMember2025-12-310000891478san:PropertyPlantAndEquipmentPurchasedForOwnUseMemberifrs-full:AccumulatedDepreciationAndAmortisationMember2022-12-310000891478ifrs-full:PropertyPlantAndEquipmentSubjectToOperatingLeasesMemberifrs-full:AccumulatedDepreciationAndAmortisationMember2022-12-310000891478ifrs-full:InvestmentPropertyMemberifrs-full:AccumulatedDepreciationAndAmortisationMember2022-12-310000891478ifrs-full:AccumulatedDepreciationAndAmortisationMember2022-12-310000891478ifrs-full:AccumulatedDepreciationAndAmortisationMemberifrs-full:RightofuseAssetsMembersan:PropertyPlantAndEquipmentPurchasedForOwnUseMember2022-12-310000891478ifrs-full:AccumulatedDepreciationAndAmortisationMemberifrs-full:RightofuseAssetsMemberifrs-full:PropertyPlantAndEquipmentSubjectToOperatingLeasesMember2022-12-310000891478ifrs-full:AccumulatedDepreciationAndAmortisationMemberifrs-full:RightofuseAssetsMemberifrs-full:InvestmentPropertyMember2022-12-310000891478ifrs-full:AccumulatedDepreciationAndAmortisationMemberifrs-full:RightofuseAssetsMember2022-12-310000891478san:PropertyPlantAndEquipmentPurchasedForOwnUseMemberifrs-full:AccumulatedDepreciationAndAmortisationMember2023-01-012023-12-310000891478ifrs-full:PropertyPlantAndEquipmentSubjectToOperatingLeasesMemberifrs-full:AccumulatedDepreciationAndAmortisationMember2023-01-012023-12-310000891478ifrs-full:InvestmentPropertyMemberifrs-full:AccumulatedDepreciationAndAmortisationMember2023-01-012023-12-310000891478ifrs-full:AccumulatedDepreciationAndAmortisationMember2023-01-012023-12-310000891478ifrs-full:AccumulatedDepreciationAndAmortisationMemberifrs-full:RightofuseAssetsMembersan:PropertyPlantAndEquipmentPurchasedForOwnUseMember2023-01-012023-12-310000891478ifrs-full:AccumulatedDepreciationAndAmortisationMemberifrs-full:RightofuseAssetsMemberifrs-full:PropertyPlantAndEquipmentSubjectToOperatingLeasesMember2023-01-012023-12-310000891478ifrs-full:AccumulatedDepreciationAndAmortisationMemberifrs-full:RightofuseAssetsMemberifrs-full:InvestmentPropertyMember2023-01-012023-12-310000891478ifrs-full:AccumulatedDepreciationAndAmortisationMemberifrs-full:RightofuseAssetsMember2023-01-012023-12-310000891478san:PropertyPlantAndEquipmentPurchasedForOwnUseMemberifrs-full:AccumulatedDepreciationAndAmortisationMember2023-12-310000891478ifrs-full:PropertyPlantAndEquipmentSubjectToOperatingLeasesMemberifrs-full:AccumulatedDepreciationAndAmortisationMember2023-12-310000891478ifrs-full:InvestmentPropertyMemberifrs-full:AccumulatedDepreciationAndAmortisationMember2023-12-310000891478ifrs-full:AccumulatedDepreciationAndAmortisationMember2023-12-310000891478ifrs-full:AccumulatedDepreciationAndAmortisationMemberifrs-full:RightofuseAssetsMembersan:PropertyPlantAndEquipmentPurchasedForOwnUseMember2023-12-310000891478ifrs-full:AccumulatedDepreciationAndAmortisationMemberifrs-full:RightofuseAssetsMemberifrs-full:PropertyPlantAndEquipmentSubjectToOperatingLeasesMember2023-12-310000891478ifrs-full:AccumulatedDepreciationAndAmortisationMemberifrs-full:RightofuseAssetsMemberifrs-full:InvestmentPropertyMember2023-12-310000891478ifrs-full:AccumulatedDepreciationAndAmortisationMemberifrs-full:RightofuseAssetsMember2023-12-310000891478san:PropertyPlantAndEquipmentPurchasedForOwnUseMemberifrs-full:AccumulatedDepreciationAndAmortisationMember2024-01-012024-12-310000891478ifrs-full:PropertyPlantAndEquipmentSubjectToOperatingLeasesMemberifrs-full:AccumulatedDepreciationAndAmortisationMember2024-01-012024-12-310000891478ifrs-full:InvestmentPropertyMemberifrs-full:AccumulatedDepreciationAndAmortisationMember2024-01-012024-12-310000891478ifrs-full:AccumulatedDepreciationAndAmortisationMember2024-01-012024-12-310000891478ifrs-full:AccumulatedDepreciationAndAmortisationMemberifrs-full:RightofuseAssetsMembersan:PropertyPlantAndEquipmentPurchasedForOwnUseMember2024-01-012024-12-310000891478ifrs-full:AccumulatedDepreciationAndAmortisationMemberifrs-full:RightofuseAssetsMemberifrs-full:PropertyPlantAndEquipmentSubjectToOperatingLeasesMember2024-01-012024-12-310000891478ifrs-full:AccumulatedDepreciationAndAmortisationMemberifrs-full:RightofuseAssetsMemberifrs-full:InvestmentPropertyMember2024-01-012024-12-310000891478ifrs-full:AccumulatedDepreciationAndAmortisationMemberifrs-full:RightofuseAssetsMember2024-01-012024-12-310000891478san:PropertyPlantAndEquipmentPurchasedForOwnUseMemberifrs-full:AccumulatedDepreciationAndAmortisationMember2024-12-310000891478ifrs-full:PropertyPlantAndEquipmentSubjectToOperatingLeasesMemberifrs-full:AccumulatedDepreciationAndAmortisationMember2024-12-310000891478ifrs-full:InvestmentPropertyMemberifrs-full:AccumulatedDepreciationAndAmortisationMember2024-12-310000891478ifrs-full:AccumulatedDepreciationAndAmortisationMember2024-12-310000891478ifrs-full:AccumulatedDepreciationAndAmortisationMemberifrs-full:RightofuseAssetsMembersan:PropertyPlantAndEquipmentPurchasedForOwnUseMember2024-12-310000891478ifrs-full:AccumulatedDepreciationAndAmortisationMemberifrs-full:RightofuseAssetsMemberifrs-full:PropertyPlantAndEquipmentSubjectToOperatingLeasesMember2024-12-310000891478ifrs-full:AccumulatedDepreciationAndAmortisationMemberifrs-full:RightofuseAssetsMemberifrs-full:InvestmentPropertyMember2024-12-310000891478ifrs-full:AccumulatedDepreciationAndAmortisationMemberifrs-full:RightofuseAssetsMember2024-12-310000891478san:PropertyPlantAndEquipmentPurchasedForOwnUseMemberifrs-full:AccumulatedDepreciationAndAmortisationMember2025-01-012025-12-310000891478ifrs-full:PropertyPlantAndEquipmentSubjectToOperatingLeasesMemberifrs-full:AccumulatedDepreciationAndAmortisationMember2025-01-012025-12-310000891478ifrs-full:InvestmentPropertyMemberifrs-full:AccumulatedDepreciationAndAmortisationMember2025-01-012025-12-310000891478ifrs-full:AccumulatedDepreciationAndAmortisationMember2025-01-012025-12-310000891478ifrs-full:AccumulatedDepreciationAndAmortisationMemberifrs-full:RightofuseAssetsMembersan:PropertyPlantAndEquipmentPurchasedForOwnUseMember2025-01-012025-12-310000891478ifrs-full:AccumulatedDepreciationAndAmortisationMemberifrs-full:RightofuseAssetsMemberifrs-full:PropertyPlantAndEquipmentSubjectToOperatingLeasesMember2025-01-012025-12-310000891478ifrs-full:AccumulatedDepreciationAndAmortisationMemberifrs-full:RightofuseAssetsMemberifrs-full:InvestmentPropertyMember2025-01-012025-12-310000891478ifrs-full:AccumulatedDepreciationAndAmortisationMemberifrs-full:RightofuseAssetsMember2025-01-012025-12-310000891478san:PropertyPlantAndEquipmentPurchasedForOwnUseMemberifrs-full:AccumulatedDepreciationAndAmortisationMember2025-12-310000891478ifrs-full:PropertyPlantAndEquipmentSubjectToOperatingLeasesMemberifrs-full:AccumulatedDepreciationAndAmortisationMember2025-12-310000891478ifrs-full:InvestmentPropertyMemberifrs-full:AccumulatedDepreciationAndAmortisationMember2025-12-310000891478ifrs-full:AccumulatedDepreciationAndAmortisationMember2025-12-310000891478ifrs-full:AccumulatedDepreciationAndAmortisationMemberifrs-full:RightofuseAssetsMembersan:PropertyPlantAndEquipmentPurchasedForOwnUseMember2025-12-310000891478ifrs-full:AccumulatedDepreciationAndAmortisationMemberifrs-full:RightofuseAssetsMemberifrs-full:PropertyPlantAndEquipmentSubjectToOperatingLeasesMember2025-12-310000891478ifrs-full:AccumulatedDepreciationAndAmortisationMemberifrs-full:RightofuseAssetsMemberifrs-full:InvestmentPropertyMember2025-12-310000891478ifrs-full:AccumulatedDepreciationAndAmortisationMemberifrs-full:RightofuseAssetsMember2025-12-310000891478san:PropertyPlantAndEquipmentPurchasedForOwnUseMemberifrs-full:AccumulatedImpairmentMember2022-12-310000891478ifrs-full:PropertyPlantAndEquipmentSubjectToOperatingLeasesMemberifrs-full:AccumulatedImpairmentMember2022-12-310000891478ifrs-full:InvestmentPropertyMemberifrs-full:AccumulatedImpairmentMember2022-12-310000891478ifrs-full:AccumulatedImpairmentMember2022-12-310000891478ifrs-full:AccumulatedImpairmentMemberifrs-full:RightofuseAssetsMembersan:PropertyPlantAndEquipmentPurchasedForOwnUseMember2022-12-310000891478ifrs-full:AccumulatedImpairmentMemberifrs-full:RightofuseAssetsMemberifrs-full:PropertyPlantAndEquipmentSubjectToOperatingLeasesMember2022-12-310000891478ifrs-full:AccumulatedImpairmentMemberifrs-full:RightofuseAssetsMemberifrs-full:InvestmentPropertyMember2022-12-310000891478ifrs-full:AccumulatedImpairmentMemberifrs-full:RightofuseAssetsMember2022-12-310000891478san:PropertyPlantAndEquipmentPurchasedForOwnUseMemberifrs-full:AccumulatedImpairmentMember2023-01-012023-12-310000891478ifrs-full:PropertyPlantAndEquipmentSubjectToOperatingLeasesMemberifrs-full:AccumulatedImpairmentMember2023-01-012023-12-310000891478ifrs-full:InvestmentPropertyMemberifrs-full:AccumulatedImpairmentMember2023-01-012023-12-310000891478ifrs-full:AccumulatedImpairmentMember2023-01-012023-12-310000891478ifrs-full:AccumulatedImpairmentMemberifrs-full:RightofuseAssetsMembersan:PropertyPlantAndEquipmentPurchasedForOwnUseMember2023-01-012023-12-310000891478ifrs-full:AccumulatedImpairmentMemberifrs-full:RightofuseAssetsMemberifrs-full:PropertyPlantAndEquipmentSubjectToOperatingLeasesMember2023-01-012023-12-310000891478ifrs-full:AccumulatedImpairmentMemberifrs-full:RightofuseAssetsMemberifrs-full:InvestmentPropertyMember2023-01-012023-12-310000891478ifrs-full:AccumulatedImpairmentMemberifrs-full:RightofuseAssetsMember2023-01-012023-12-310000891478san:PropertyPlantAndEquipmentPurchasedForOwnUseMemberifrs-full:AccumulatedImpairmentMember2023-12-310000891478ifrs-full:PropertyPlantAndEquipmentSubjectToOperatingLeasesMemberifrs-full:AccumulatedImpairmentMember2023-12-310000891478ifrs-full:InvestmentPropertyMemberifrs-full:AccumulatedImpairmentMember2023-12-310000891478ifrs-full:AccumulatedImpairmentMemberifrs-full:RightofuseAssetsMembersan:PropertyPlantAndEquipmentPurchasedForOwnUseMember2023-12-310000891478ifrs-full:AccumulatedImpairmentMemberifrs-full:RightofuseAssetsMemberifrs-full:PropertyPlantAndEquipmentSubjectToOperatingLeasesMember2023-12-310000891478ifrs-full:AccumulatedImpairmentMemberifrs-full:RightofuseAssetsMemberifrs-full:InvestmentPropertyMember2023-12-310000891478ifrs-full:AccumulatedImpairmentMemberifrs-full:RightofuseAssetsMember2023-12-310000891478san:PropertyPlantAndEquipmentPurchasedForOwnUseMemberifrs-full:AccumulatedImpairmentMember2024-01-012024-12-310000891478ifrs-full:PropertyPlantAndEquipmentSubjectToOperatingLeasesMemberifrs-full:AccumulatedImpairmentMember2024-01-012024-12-310000891478ifrs-full:InvestmentPropertyMemberifrs-full:AccumulatedImpairmentMember2024-01-012024-12-310000891478ifrs-full:AccumulatedImpairmentMember2024-01-012024-12-310000891478ifrs-full:AccumulatedImpairmentMemberifrs-full:RightofuseAssetsMembersan:PropertyPlantAndEquipmentPurchasedForOwnUseMember2024-01-012024-12-310000891478ifrs-full:AccumulatedImpairmentMemberifrs-full:RightofuseAssetsMemberifrs-full:PropertyPlantAndEquipmentSubjectToOperatingLeasesMember2024-01-012024-12-310000891478ifrs-full:AccumulatedImpairmentMemberifrs-full:RightofuseAssetsMemberifrs-full:InvestmentPropertyMember2024-01-012024-12-310000891478ifrs-full:AccumulatedImpairmentMemberifrs-full:RightofuseAssetsMember2024-01-012024-12-310000891478san:PropertyPlantAndEquipmentPurchasedForOwnUseMemberifrs-full:AccumulatedImpairmentMember2024-12-310000891478ifrs-full:PropertyPlantAndEquipmentSubjectToOperatingLeasesMemberifrs-full:AccumulatedImpairmentMember2024-12-310000891478ifrs-full:InvestmentPropertyMemberifrs-full:AccumulatedImpairmentMember2024-12-310000891478ifrs-full:AccumulatedImpairmentMemberifrs-full:RightofuseAssetsMembersan:PropertyPlantAndEquipmentPurchasedForOwnUseMember2024-12-310000891478ifrs-full:AccumulatedImpairmentMemberifrs-full:RightofuseAssetsMemberifrs-full:PropertyPlantAndEquipmentSubjectToOperatingLeasesMember2024-12-310000891478ifrs-full:AccumulatedImpairmentMemberifrs-full:RightofuseAssetsMemberifrs-full:InvestmentPropertyMember2024-12-310000891478ifrs-full:AccumulatedImpairmentMemberifrs-full:RightofuseAssetsMember2024-12-310000891478san:PropertyPlantAndEquipmentPurchasedForOwnUseMemberifrs-full:AccumulatedImpairmentMember2025-01-012025-12-310000891478ifrs-full:PropertyPlantAndEquipmentSubjectToOperatingLeasesMemberifrs-full:AccumulatedImpairmentMember2025-01-012025-12-310000891478ifrs-full:InvestmentPropertyMemberifrs-full:AccumulatedImpairmentMember2025-01-012025-12-310000891478ifrs-full:AccumulatedImpairmentMember2025-01-012025-12-310000891478ifrs-full:AccumulatedImpairmentMemberifrs-full:RightofuseAssetsMembersan:PropertyPlantAndEquipmentPurchasedForOwnUseMember2025-01-012025-12-310000891478ifrs-full:AccumulatedImpairmentMemberifrs-full:RightofuseAssetsMemberifrs-full:PropertyPlantAndEquipmentSubjectToOperatingLeasesMember2025-01-012025-12-310000891478ifrs-full:AccumulatedImpairmentMemberifrs-full:RightofuseAssetsMemberifrs-full:InvestmentPropertyMember2025-01-012025-12-310000891478ifrs-full:AccumulatedImpairmentMemberifrs-full:RightofuseAssetsMember2025-01-012025-12-310000891478san:PropertyPlantAndEquipmentPurchasedForOwnUseMemberifrs-full:AccumulatedImpairmentMember2025-12-310000891478ifrs-full:PropertyPlantAndEquipmentSubjectToOperatingLeasesMemberifrs-full:AccumulatedImpairmentMember2025-12-310000891478ifrs-full:InvestmentPropertyMemberifrs-full:AccumulatedImpairmentMember2025-12-310000891478ifrs-full:AccumulatedImpairmentMemberifrs-full:RightofuseAssetsMembersan:PropertyPlantAndEquipmentPurchasedForOwnUseMember2025-12-310000891478ifrs-full:AccumulatedImpairmentMemberifrs-full:RightofuseAssetsMemberifrs-full:PropertyPlantAndEquipmentSubjectToOperatingLeasesMember2025-12-310000891478ifrs-full:AccumulatedImpairmentMemberifrs-full:RightofuseAssetsMemberifrs-full:InvestmentPropertyMember2025-12-310000891478ifrs-full:AccumulatedImpairmentMemberifrs-full:RightofuseAssetsMember2025-12-310000891478san:PropertyPlantAndEquipmentPurchasedForOwnUseMember2023-12-310000891478ifrs-full:PropertyPlantAndEquipmentSubjectToOperatingLeasesMember2023-12-310000891478ifrs-full:InvestmentPropertyMember2023-12-310000891478san:PropertyPlantAndEquipmentPurchasedForOwnUseMemberifrs-full:RightofuseAssetsMember2023-12-310000891478ifrs-full:PropertyPlantAndEquipmentSubjectToOperatingLeasesMemberifrs-full:RightofuseAssetsMember2023-12-310000891478ifrs-full:InvestmentPropertyMemberifrs-full:RightofuseAssetsMember2023-12-310000891478ifrs-full:RightofuseAssetsMember2023-12-310000891478san:PropertyPlantAndEquipmentPurchasedForOwnUseMember2024-12-310000891478ifrs-full:PropertyPlantAndEquipmentSubjectToOperatingLeasesMember2024-12-310000891478ifrs-full:InvestmentPropertyMember2024-12-310000891478san:PropertyPlantAndEquipmentPurchasedForOwnUseMemberifrs-full:RightofuseAssetsMember2024-12-310000891478ifrs-full:PropertyPlantAndEquipmentSubjectToOperatingLeasesMemberifrs-full:RightofuseAssetsMember2024-12-310000891478ifrs-full:InvestmentPropertyMemberifrs-full:RightofuseAssetsMember2024-12-310000891478ifrs-full:RightofuseAssetsMember2024-12-310000891478san:PropertyPlantAndEquipmentPurchasedForOwnUseMember2025-12-310000891478ifrs-full:PropertyPlantAndEquipmentSubjectToOperatingLeasesMember2025-12-310000891478ifrs-full:InvestmentPropertyMember2025-12-310000891478san:PropertyPlantAndEquipmentPurchasedForOwnUseMemberifrs-full:RightofuseAssetsMember2025-12-310000891478ifrs-full:PropertyPlantAndEquipmentSubjectToOperatingLeasesMemberifrs-full:RightofuseAssetsMember2025-12-310000891478ifrs-full:InvestmentPropertyMemberifrs-full:RightofuseAssetsMember2025-12-310000891478ifrs-full:RightofuseAssetsMember2025-12-310000891478ifrs-full:GrossCarryingAmountMemberifrs-full:PropertyPlantAndEquipmentMemberifrs-full:LandAndBuildingsMember2023-12-310000891478ifrs-full:AccumulatedDepreciationAndAmortisationMemberifrs-full:PropertyPlantAndEquipmentMemberifrs-full:LandAndBuildingsMember2023-12-310000891478ifrs-full:AccumulatedImpairmentMemberifrs-full:PropertyPlantAndEquipmentMemberifrs-full:LandAndBuildingsMember2023-12-310000891478ifrs-full:LandAndBuildingsMemberifrs-full:PropertyPlantAndEquipmentMember2023-12-310000891478ifrs-full:GrossCarryingAmountMemberifrs-full:RightofuseAssetsMemberifrs-full:LandAndBuildingsMember2023-12-310000891478ifrs-full:GrossCarryingAmountMemberifrs-full:PropertyPlantAndEquipmentMemberifrs-full:ComputerEquipmentMember2023-12-310000891478ifrs-full:AccumulatedDepreciationAndAmortisationMemberifrs-full:PropertyPlantAndEquipmentMemberifrs-full:ComputerEquipmentMember2023-12-310000891478ifrs-full:AccumulatedImpairmentMemberifrs-full:PropertyPlantAndEquipmentMemberifrs-full:ComputerEquipmentMember2023-12-310000891478ifrs-full:ComputerEquipmentMemberifrs-full:PropertyPlantAndEquipmentMember2023-12-310000891478ifrs-full:GrossCarryingAmountMemberifrs-full:RightofuseAssetsMemberifrs-full:ComputerEquipmentMember2023-12-310000891478ifrs-full:GrossCarryingAmountMemberifrs-full:PropertyPlantAndEquipmentMembersan:FurnitureAndVehiclesMember2023-12-310000891478ifrs-full:AccumulatedDepreciationAndAmortisationMemberifrs-full:PropertyPlantAndEquipmentMembersan:FurnitureAndVehiclesMember2023-12-310000891478ifrs-full:AccumulatedImpairmentMemberifrs-full:PropertyPlantAndEquipmentMembersan:FurnitureAndVehiclesMember2023-12-310000891478san:FurnitureAndVehiclesMemberifrs-full:PropertyPlantAndEquipmentMember2023-12-310000891478ifrs-full:GrossCarryingAmountMemberifrs-full:RightofuseAssetsMembersan:FurnitureAndVehiclesMember2023-12-310000891478ifrs-full:GrossCarryingAmountMemberifrs-full:PropertyPlantAndEquipmentMemberifrs-full:ConstructionInProgressMember2023-12-310000891478ifrs-full:AccumulatedDepreciationAndAmortisationMemberifrs-full:PropertyPlantAndEquipmentMemberifrs-full:ConstructionInProgressMember2023-12-310000891478ifrs-full:AccumulatedImpairmentMemberifrs-full:PropertyPlantAndEquipmentMemberifrs-full:ConstructionInProgressMember2023-12-310000891478ifrs-full:ConstructionInProgressMemberifrs-full:PropertyPlantAndEquipmentMember2023-12-310000891478ifrs-full:GrossCarryingAmountMemberifrs-full:RightofuseAssetsMemberifrs-full:ConstructionInProgressMember2023-12-310000891478ifrs-full:GrossCarryingAmountMemberifrs-full:PropertyPlantAndEquipmentMembersan:PropertyPlantAndEquipmentPurchasedForOwnUseMember2023-12-310000891478ifrs-full:AccumulatedDepreciationAndAmortisationMemberifrs-full:PropertyPlantAndEquipmentMembersan:PropertyPlantAndEquipmentPurchasedForOwnUseMember2023-12-310000891478ifrs-full:AccumulatedImpairmentMemberifrs-full:PropertyPlantAndEquipmentMembersan:PropertyPlantAndEquipmentPurchasedForOwnUseMember2023-12-310000891478san:PropertyPlantAndEquipmentPurchasedForOwnUseMemberifrs-full:PropertyPlantAndEquipmentMember2023-12-310000891478ifrs-full:GrossCarryingAmountMemberifrs-full:RightofuseAssetsMembersan:PropertyPlantAndEquipmentPurchasedForOwnUseMember2023-12-310000891478ifrs-full:GrossCarryingAmountMemberifrs-full:PropertyPlantAndEquipmentMemberifrs-full:LandAndBuildingsMember2024-12-310000891478ifrs-full:AccumulatedDepreciationAndAmortisationMemberifrs-full:PropertyPlantAndEquipmentMemberifrs-full:LandAndBuildingsMember2024-12-310000891478ifrs-full:AccumulatedImpairmentMemberifrs-full:PropertyPlantAndEquipmentMemberifrs-full:LandAndBuildingsMember2024-12-310000891478ifrs-full:LandAndBuildingsMemberifrs-full:PropertyPlantAndEquipmentMember2024-12-310000891478ifrs-full:GrossCarryingAmountMemberifrs-full:RightofuseAssetsMemberifrs-full:LandAndBuildingsMember2024-12-310000891478ifrs-full:GrossCarryingAmountMemberifrs-full:PropertyPlantAndEquipmentMemberifrs-full:ComputerEquipmentMember2024-12-310000891478ifrs-full:AccumulatedDepreciationAndAmortisationMemberifrs-full:PropertyPlantAndEquipmentMemberifrs-full:ComputerEquipmentMember2024-12-310000891478ifrs-full:AccumulatedImpairmentMemberifrs-full:PropertyPlantAndEquipmentMemberifrs-full:ComputerEquipmentMember2024-12-310000891478ifrs-full:ComputerEquipmentMemberifrs-full:PropertyPlantAndEquipmentMember2024-12-310000891478ifrs-full:GrossCarryingAmountMemberifrs-full:RightofuseAssetsMemberifrs-full:ComputerEquipmentMember2024-12-310000891478ifrs-full:GrossCarryingAmountMemberifrs-full:PropertyPlantAndEquipmentMembersan:FurnitureAndVehiclesMember2024-12-310000891478ifrs-full:AccumulatedDepreciationAndAmortisationMemberifrs-full:PropertyPlantAndEquipmentMembersan:FurnitureAndVehiclesMember2024-12-310000891478ifrs-full:AccumulatedImpairmentMemberifrs-full:PropertyPlantAndEquipmentMembersan:FurnitureAndVehiclesMember2024-12-310000891478san:FurnitureAndVehiclesMemberifrs-full:PropertyPlantAndEquipmentMember2024-12-310000891478ifrs-full:GrossCarryingAmountMemberifrs-full:RightofuseAssetsMembersan:FurnitureAndVehiclesMember2024-12-310000891478ifrs-full:GrossCarryingAmountMemberifrs-full:PropertyPlantAndEquipmentMemberifrs-full:ConstructionInProgressMember2024-12-310000891478ifrs-full:AccumulatedDepreciationAndAmortisationMemberifrs-full:PropertyPlantAndEquipmentMemberifrs-full:ConstructionInProgressMember2024-12-310000891478ifrs-full:AccumulatedImpairmentMemberifrs-full:PropertyPlantAndEquipmentMemberifrs-full:ConstructionInProgressMember2024-12-310000891478ifrs-full:ConstructionInProgressMemberifrs-full:PropertyPlantAndEquipmentMember2024-12-310000891478ifrs-full:GrossCarryingAmountMemberifrs-full:RightofuseAssetsMemberifrs-full:ConstructionInProgressMember2024-12-310000891478ifrs-full:GrossCarryingAmountMemberifrs-full:PropertyPlantAndEquipmentMembersan:PropertyPlantAndEquipmentPurchasedForOwnUseMember2024-12-310000891478ifrs-full:AccumulatedDepreciationAndAmortisationMemberifrs-full:PropertyPlantAndEquipmentMembersan:PropertyPlantAndEquipmentPurchasedForOwnUseMember2024-12-310000891478ifrs-full:AccumulatedImpairmentMemberifrs-full:PropertyPlantAndEquipmentMembersan:PropertyPlantAndEquipmentPurchasedForOwnUseMember2024-12-310000891478san:PropertyPlantAndEquipmentPurchasedForOwnUseMemberifrs-full:PropertyPlantAndEquipmentMember2024-12-310000891478ifrs-full:GrossCarryingAmountMemberifrs-full:RightofuseAssetsMembersan:PropertyPlantAndEquipmentPurchasedForOwnUseMember2024-12-310000891478ifrs-full:GrossCarryingAmountMemberifrs-full:PropertyPlantAndEquipmentMemberifrs-full:LandAndBuildingsMember2025-12-310000891478ifrs-full:AccumulatedDepreciationAndAmortisationMemberifrs-full:PropertyPlantAndEquipmentMemberifrs-full:LandAndBuildingsMember2025-12-310000891478ifrs-full:AccumulatedImpairmentMemberifrs-full:PropertyPlantAndEquipmentMemberifrs-full:LandAndBuildingsMember2025-12-310000891478ifrs-full:LandAndBuildingsMemberifrs-full:PropertyPlantAndEquipmentMember2025-12-310000891478ifrs-full:GrossCarryingAmountMemberifrs-full:RightofuseAssetsMemberifrs-full:LandAndBuildingsMember2025-12-310000891478ifrs-full:GrossCarryingAmountMemberifrs-full:PropertyPlantAndEquipmentMemberifrs-full:ComputerEquipmentMember2025-12-310000891478ifrs-full:AccumulatedDepreciationAndAmortisationMemberifrs-full:PropertyPlantAndEquipmentMemberifrs-full:ComputerEquipmentMember2025-12-310000891478ifrs-full:AccumulatedImpairmentMemberifrs-full:PropertyPlantAndEquipmentMemberifrs-full:ComputerEquipmentMember2025-12-310000891478ifrs-full:ComputerEquipmentMemberifrs-full:PropertyPlantAndEquipmentMember2025-12-310000891478ifrs-full:GrossCarryingAmountMemberifrs-full:RightofuseAssetsMemberifrs-full:ComputerEquipmentMember2025-12-310000891478ifrs-full:GrossCarryingAmountMemberifrs-full:PropertyPlantAndEquipmentMembersan:FurnitureAndVehiclesMember2025-12-310000891478ifrs-full:AccumulatedDepreciationAndAmortisationMemberifrs-full:PropertyPlantAndEquipmentMembersan:FurnitureAndVehiclesMember2025-12-310000891478ifrs-full:AccumulatedImpairmentMemberifrs-full:PropertyPlantAndEquipmentMembersan:FurnitureAndVehiclesMember2025-12-310000891478san:FurnitureAndVehiclesMemberifrs-full:PropertyPlantAndEquipmentMember2025-12-310000891478ifrs-full:GrossCarryingAmountMemberifrs-full:RightofuseAssetsMembersan:FurnitureAndVehiclesMember2025-12-310000891478ifrs-full:GrossCarryingAmountMemberifrs-full:PropertyPlantAndEquipmentMemberifrs-full:ConstructionInProgressMember2025-12-310000891478ifrs-full:AccumulatedDepreciationAndAmortisationMemberifrs-full:PropertyPlantAndEquipmentMemberifrs-full:ConstructionInProgressMember2025-12-310000891478ifrs-full:AccumulatedImpairmentMemberifrs-full:PropertyPlantAndEquipmentMemberifrs-full:ConstructionInProgressMember2025-12-310000891478ifrs-full:ConstructionInProgressMemberifrs-full:PropertyPlantAndEquipmentMember2025-12-310000891478ifrs-full:GrossCarryingAmountMemberifrs-full:RightofuseAssetsMemberifrs-full:ConstructionInProgressMember2025-12-310000891478ifrs-full:GrossCarryingAmountMemberifrs-full:PropertyPlantAndEquipmentMembersan:PropertyPlantAndEquipmentPurchasedForOwnUseMember2025-12-310000891478ifrs-full:AccumulatedDepreciationAndAmortisationMemberifrs-full:PropertyPlantAndEquipmentMembersan:PropertyPlantAndEquipmentPurchasedForOwnUseMember2025-12-310000891478ifrs-full:AccumulatedImpairmentMemberifrs-full:PropertyPlantAndEquipmentMembersan:PropertyPlantAndEquipmentPurchasedForOwnUseMember2025-12-310000891478san:PropertyPlantAndEquipmentPurchasedForOwnUseMemberifrs-full:PropertyPlantAndEquipmentMember2025-12-310000891478ifrs-full:GrossCarryingAmountMemberifrs-full:RightofuseAssetsMembersan:PropertyPlantAndEquipmentPurchasedForOwnUseMember2025-12-310000891478san:PropertyPlantAndEquipmentPurchasedForOwnUseMemberifrs-full:ForeignCountriesMember2025-12-310000891478san:PropertyPlantAndEquipmentPurchasedForOwnUseMemberifrs-full:ForeignCountriesMember2024-12-310000891478san:PropertyPlantAndEquipmentPurchasedForOwnUseMemberifrs-full:ForeignCountriesMember2023-12-310000891478san:SantanderUSAutoMemberifrs-full:PropertyPlantAndEquipmentSubjectToOperatingLeasesMemberifrs-full:VehiclesMember2025-12-310000891478san:SantanderUSAutoMemberifrs-full:PropertyPlantAndEquipmentSubjectToOperatingLeasesMemberifrs-full:VehiclesMember2024-12-310000891478san:SantanderUSAutoMemberifrs-full:PropertyPlantAndEquipmentSubjectToOperatingLeasesMemberifrs-full:VehiclesMember2023-12-310000891478san:SantanderUSAutoMemberifrs-full:NotLaterThanOneYearMember2025-12-310000891478san:SantanderUSAutoMemberifrs-full:LaterThanOneYearAndNotLaterThanTwoYearsMember2025-12-310000891478san:SantanderUSAutoMemberifrs-full:LaterThanTwoYearsAndNotLaterThanThreeYearsMember2025-12-310000891478san:SantanderUSAutoMemberifrs-full:LaterThanThreeYearsAndNotLaterThanFourYearsMember2025-12-310000891478ifrs-full:InvestmentPropertyMember2025-01-012025-12-310000891478ifrs-full:InvestmentPropertyMember2024-01-012024-12-310000891478ifrs-full:InvestmentPropertyMember2023-01-012023-12-310000891478san:BancoSantanderBrasilSAMember2025-12-310000891478san:BancoSantanderBrasilSAMember2024-12-310000891478san:BancoSantanderBrasilSAMember2023-12-310000891478san:SAMInvestmentHoldingsLimitedMember2025-12-310000891478san:SAMInvestmentHoldingsLimitedMember2024-12-310000891478san:SAMInvestmentHoldingsLimitedMember2023-12-310000891478san:SantanderConsumerGermanyMember2025-12-310000891478san:SantanderConsumerGermanyMember2024-12-310000891478san:SantanderConsumerGermanyMember2023-12-310000891478san:SantanderPortugalMember2025-12-310000891478san:SantanderPortugalMember2024-12-310000891478san:SantanderPortugalMember2023-12-310000891478san:SantanderEspanaMember2025-12-310000891478san:SantanderEspanaMember2024-12-310000891478san:SantanderEspanaMember2023-12-310000891478san:SantanderUSAutoMember2025-12-310000891478san:SantanderUSAutoMember2024-12-310000891478san:SantanderUSAutoMember2023-12-310000891478san:SantanderHoldingUSAIncMember2025-12-310000891478san:SantanderHoldingUSAIncMember2024-12-310000891478san:SantanderHoldingUSAIncMember2023-12-310000891478san:SantanderUKGroupMember2025-12-310000891478san:SantanderUKGroupMember2024-12-310000891478san:SantanderUKGroupMember2023-12-310000891478san:BancoSantanderChileMember2025-12-310000891478san:BancoSantanderChileMember2024-12-310000891478san:BancoSantanderChileMember2023-12-310000891478san:BancoSantanderMexicoSAInstitucionDeBancaMultipleGrupoFinancieroSantanderMexicoMember2025-12-310000891478san:BancoSantanderMexicoSAInstitucionDeBancaMultipleGrupoFinancieroSantanderMexicoMember2024-12-310000891478san:BancoSantanderMexicoSAInstitucionDeBancaMultipleGrupoFinancieroSantanderMexicoMember2023-12-310000891478san:EburyPartnersLtdMember2025-12-310000891478san:EburyPartnersLtdMember2024-12-310000891478san:EburyPartnersLtdMember2023-12-310000891478san:SantanderConsumerNordicsMember2025-12-310000891478san:SantanderConsumerNordicsMember2024-12-310000891478san:SantanderConsumerNordicsMember2023-12-310000891478san:SantanderBankPolskaSAMember2025-12-310000891478san:SantanderBankPolskaSAMember2024-12-310000891478san:SantanderBankPolskaSAMember2023-12-310000891478ifrs-full:AggregateNotSignificantIndividualAssetsOrCashgeneratingUnitsMember2025-12-310000891478ifrs-full:AggregateNotSignificantIndividualAssetsOrCashgeneratingUnitsMember2024-12-310000891478ifrs-full:AggregateNotSignificantIndividualAssetsOrCashgeneratingUnitsMember2023-12-310000891478san:EburyPartnersLtdMember2025-01-012025-12-310000891478san:EburyPartnersLtdMember2024-01-012024-12-310000891478san:EburyPartnersLtdMember2023-01-012023-12-310000891478ifrs-full:BottomOfRangeMember2025-01-012025-12-310000891478ifrs-full:TopOfRangeMember2025-01-012025-12-310000891478san:SantanderUKGroupMember2025-01-012025-12-310000891478san:SantanderUSAutoMember2025-01-012025-12-310000891478san:SantanderHoldingUSAIncMember2025-01-012025-12-310000891478san:SantanderConsumerGermanyMember2025-01-012025-12-310000891478san:SAMInvestmentHoldingsLimitedMember2025-01-012025-12-310000891478san:SantanderPortugalMember2025-01-012025-12-310000891478ifrs-full:GrossCarryingAmountMemberifrs-full:BrandNamesMember2024-12-310000891478ifrs-full:GrossCarryingAmountMemberifrs-full:BrandNamesMember2025-01-012025-12-310000891478ifrs-full:GrossCarryingAmountMemberifrs-full:BrandNamesMember2025-12-310000891478ifrs-full:TechnologybasedIntangibleAssetsMemberifrs-full:BottomOfRangeMember2025-01-012025-12-310000891478ifrs-full:TechnologybasedIntangibleAssetsMemberifrs-full:TopOfRangeMember2025-01-012025-12-310000891478ifrs-full:GrossCarryingAmountMemberifrs-full:TechnologybasedIntangibleAssetsMember2024-12-310000891478ifrs-full:GrossCarryingAmountMemberifrs-full:TechnologybasedIntangibleAssetsMember2025-01-012025-12-310000891478ifrs-full:GrossCarryingAmountMemberifrs-full:TechnologybasedIntangibleAssetsMember2025-12-310000891478ifrs-full:GrossCarryingAmountMemberifrs-full:OtherIntangibleAssetsMember2024-12-310000891478ifrs-full:GrossCarryingAmountMemberifrs-full:OtherIntangibleAssetsMember2025-01-012025-12-310000891478ifrs-full:GrossCarryingAmountMemberifrs-full:OtherIntangibleAssetsMember2025-12-310000891478ifrs-full:AccumulatedDepreciationAndAmortisationMemberifrs-full:TechnologybasedIntangibleAssetsMember2024-12-310000891478ifrs-full:AccumulatedDepreciationAndAmortisationMemberifrs-full:TechnologybasedIntangibleAssetsMember2025-01-012025-12-310000891478ifrs-full:AccumulatedDepreciationAndAmortisationMemberifrs-full:TechnologybasedIntangibleAssetsMember2025-12-310000891478ifrs-full:AccumulatedDepreciationAndAmortisationMemberifrs-full:OtherIntangibleAssetsMember2024-12-310000891478ifrs-full:AccumulatedDepreciationAndAmortisationMemberifrs-full:OtherIntangibleAssetsMember2025-01-012025-12-310000891478ifrs-full:AccumulatedDepreciationAndAmortisationMemberifrs-full:OtherIntangibleAssetsMember2025-12-310000891478ifrs-full:GrossCarryingAmountMemberifrs-full:BrandNamesMember2023-12-310000891478ifrs-full:GrossCarryingAmountMemberifrs-full:BrandNamesMember2024-01-012024-12-310000891478ifrs-full:TechnologybasedIntangibleAssetsMemberifrs-full:BottomOfRangeMember2024-01-012024-12-310000891478ifrs-full:TechnologybasedIntangibleAssetsMemberifrs-full:TopOfRangeMember2024-01-012024-12-310000891478ifrs-full:GrossCarryingAmountMemberifrs-full:TechnologybasedIntangibleAssetsMember2023-12-310000891478ifrs-full:GrossCarryingAmountMemberifrs-full:TechnologybasedIntangibleAssetsMember2024-01-012024-12-310000891478ifrs-full:GrossCarryingAmountMemberifrs-full:OtherIntangibleAssetsMember2023-12-310000891478ifrs-full:GrossCarryingAmountMemberifrs-full:OtherIntangibleAssetsMember2024-01-012024-12-310000891478ifrs-full:AccumulatedDepreciationAndAmortisationMemberifrs-full:TechnologybasedIntangibleAssetsMember2023-12-310000891478ifrs-full:AccumulatedDepreciationAndAmortisationMemberifrs-full:TechnologybasedIntangibleAssetsMember2024-01-012024-12-310000891478ifrs-full:AccumulatedDepreciationAndAmortisationMemberifrs-full:OtherIntangibleAssetsMember2023-12-310000891478ifrs-full:AccumulatedDepreciationAndAmortisationMemberifrs-full:OtherIntangibleAssetsMember2024-01-012024-12-310000891478ifrs-full:GrossCarryingAmountMemberifrs-full:BrandNamesMember2022-12-310000891478ifrs-full:GrossCarryingAmountMemberifrs-full:BrandNamesMember2023-01-012023-12-310000891478ifrs-full:TechnologybasedIntangibleAssetsMemberifrs-full:BottomOfRangeMember2023-01-012023-12-310000891478ifrs-full:TechnologybasedIntangibleAssetsMemberifrs-full:TopOfRangeMember2023-01-012023-12-310000891478ifrs-full:GrossCarryingAmountMemberifrs-full:TechnologybasedIntangibleAssetsMember2022-12-310000891478ifrs-full:GrossCarryingAmountMemberifrs-full:TechnologybasedIntangibleAssetsMember2023-01-012023-12-310000891478ifrs-full:GrossCarryingAmountMemberifrs-full:OtherIntangibleAssetsMember2022-12-310000891478ifrs-full:GrossCarryingAmountMemberifrs-full:OtherIntangibleAssetsMember2023-01-012023-12-310000891478ifrs-full:AccumulatedDepreciationAndAmortisationMemberifrs-full:TechnologybasedIntangibleAssetsMember2022-12-310000891478ifrs-full:AccumulatedDepreciationAndAmortisationMemberifrs-full:TechnologybasedIntangibleAssetsMember2023-01-012023-12-310000891478ifrs-full:AccumulatedDepreciationAndAmortisationMemberifrs-full:OtherIntangibleAssetsMember2022-12-310000891478ifrs-full:AccumulatedDepreciationAndAmortisationMemberifrs-full:OtherIntangibleAssetsMember2023-01-012023-12-310000891478san:DemandDepositMembersan:DepositsCentralBanksMember2025-12-310000891478san:DemandDepositMembersan:DepositsCentralBanksMember2024-12-310000891478san:DemandDepositMembersan:DepositsCentralBanksMember2023-12-310000891478san:TimeDepositsMembersan:DepositsCentralBanksMember2025-12-310000891478san:TimeDepositsMembersan:DepositsCentralBanksMember2024-12-310000891478san:TimeDepositsMembersan:DepositsCentralBanksMember2023-12-310000891478san:ReverseRepurchaseAgreementsMembersan:DepositsCentralBanksMember2025-12-310000891478san:ReverseRepurchaseAgreementsMembersan:DepositsCentralBanksMember2024-12-310000891478san:ReverseRepurchaseAgreementsMembersan:DepositsCentralBanksMember2023-12-310000891478san:DemandDepositMembersan:DepositsCreditInstitutionsMember2025-12-310000891478san:DemandDepositMembersan:DepositsCreditInstitutionsMember2024-12-310000891478san:DemandDepositMembersan:DepositsCreditInstitutionsMember2023-12-310000891478san:TimeDepositsMembersan:DepositsCreditInstitutionsMember2025-12-310000891478san:TimeDepositsMembersan:DepositsCreditInstitutionsMember2024-12-310000891478san:TimeDepositsMembersan:DepositsCreditInstitutionsMember2023-12-310000891478san:ReverseRepurchaseAgreementsMembersan:DepositsCreditInstitutionsMember2025-12-310000891478san:ReverseRepurchaseAgreementsMembersan:DepositsCreditInstitutionsMember2024-12-310000891478san:ReverseRepurchaseAgreementsMembersan:DepositsCreditInstitutionsMember2023-12-310000891478san:SubordinatedLiabilitiesMembersan:DepositsCreditInstitutionsMember2025-12-310000891478san:SubordinatedLiabilitiesMembersan:DepositsCreditInstitutionsMember2024-12-310000891478san:SubordinatedLiabilitiesMembersan:DepositsCreditInstitutionsMember2023-12-310000891478currency:EUR2025-12-310000891478currency:EUR2024-12-310000891478currency:EUR2023-12-310000891478san:OtherCurrenciesMember2025-12-310000891478san:OtherCurrenciesMember2024-12-310000891478san:OtherCurrenciesMember2023-12-310000891478san:CentralBanksAndCreditInstitutionsMember2025-12-310000891478san:CentralBanksAndCreditInstitutionsMember2024-12-310000891478san:CentralBanksAndCreditInstitutionsMember2023-12-310000891478san:TargetedLongTermRefinancingOperationIIIMember2025-12-310000891478san:TargetedLongTermRefinancingOperationIIIMember2024-12-310000891478san:TargetedLongTermRefinancingOperationIIIMember2023-12-310000891478san:TargetedLongTermRefinancingOperationIIIMember2025-01-012025-12-310000891478san:TargetedLongTermRefinancingOperationIIIMember2024-01-012024-12-310000891478san:TargetedLongTermRefinancingOperationIIIMember2023-01-012023-12-310000891478ifrs-full:CountryOfDomicileMembersan:DepositsCustomersMember2025-12-310000891478ifrs-full:CountryOfDomicileMembersan:DepositsCustomersMember2024-12-310000891478ifrs-full:CountryOfDomicileMembersan:DepositsCustomersMember2023-12-310000891478san:RestOfEuropeMembersan:DepositsCustomersMember2025-12-310000891478san:RestOfEuropeMembersan:DepositsCustomersMember2024-12-310000891478san:RestOfEuropeMembersan:DepositsCustomersMember2023-12-310000891478country:GBsan:DepositsCustomersMember2025-12-310000891478country:GBsan:DepositsCustomersMember2024-12-310000891478country:GBsan:DepositsCustomersMember2023-12-310000891478san:RestOfAmericaMembersan:DepositsCustomersMember2025-12-310000891478san:RestOfAmericaMembersan:DepositsCustomersMember2024-12-310000891478san:RestOfAmericaMembersan:DepositsCustomersMember2023-12-310000891478country:USsan:DepositsCustomersMember2025-12-310000891478country:USsan:DepositsCustomersMember2024-12-310000891478country:USsan:DepositsCustomersMember2023-12-310000891478san:RestOfWorldMembersan:DepositsCustomersMember2025-12-310000891478san:RestOfWorldMembersan:DepositsCustomersMember2024-12-310000891478san:RestOfWorldMembersan:DepositsCustomersMember2023-12-310000891478san:DemandDepositMembersan:DepositsCustomersMember2025-12-310000891478san:DemandDepositMembersan:DepositsCustomersMember2024-12-310000891478san:DemandDepositMembersan:DepositsCustomersMember2023-12-310000891478san:TimeDepositsMembersan:DepositsCustomersMember2025-12-310000891478san:TimeDepositsMembersan:DepositsCustomersMember2024-12-310000891478san:TimeDepositsMembersan:DepositsCustomersMember2023-12-310000891478san:DepositsRedeemableAtNoticeMembersan:DepositsCustomersMember2025-12-310000891478san:DepositsRedeemableAtNoticeMembersan:DepositsCustomersMember2024-12-310000891478san:DepositsRedeemableAtNoticeMembersan:DepositsCustomersMember2023-12-310000891478san:RepurchaseAgreementMembersan:DepositsCustomersMember2025-12-310000891478san:RepurchaseAgreementMembersan:DepositsCustomersMember2024-12-310000891478san:RepurchaseAgreementMembersan:DepositsCustomersMember2023-12-310000891478san:DebtInstrumentsMembersan:BondsAndDebenturesOutstandingMember2025-12-310000891478san:DebtInstrumentsMembersan:BondsAndDebenturesOutstandingMember2024-12-310000891478san:DebtInstrumentsMembersan:BondsAndDebenturesOutstandingMember2023-12-310000891478san:DebtInstrumentsMembersan:SubordinatedLiabilitiesMember2025-12-310000891478san:DebtInstrumentsMembersan:SubordinatedLiabilitiesMember2024-12-310000891478san:DebtInstrumentsMembersan:SubordinatedLiabilitiesMember2023-12-310000891478san:DebtInstrumentsMembersan:NotesAndOtherSecuritiesMember2025-12-310000891478san:DebtInstrumentsMembersan:NotesAndOtherSecuritiesMember2024-12-310000891478san:DebtInstrumentsMembersan:NotesAndOtherSecuritiesMember2023-12-310000891478san:SubordinatedLiabilitiesMemberifrs-full:NotLaterThanThreeMonthsMembersan:DebtInstrumentsMember2025-12-310000891478san:SubordinatedLiabilitiesMemberifrs-full:LaterThanThreeMonthsAndNotLaterThanOneYearMembersan:DebtInstrumentsMember2025-12-310000891478san:SubordinatedLiabilitiesMemberifrs-full:LaterThanOneYearAndNotLaterThanThreeYearsMembersan:DebtInstrumentsMember2025-12-310000891478san:SubordinatedLiabilitiesMemberifrs-full:LaterThanThreeYearsAndNotLaterThanFiveYearsMembersan:DebtInstrumentsMember2025-12-310000891478san:SubordinatedLiabilitiesMemberifrs-full:LaterThanFiveYearsMembersan:DebtInstrumentsMember2025-12-310000891478san:SeniorUnsecuredDebtMemberifrs-full:NotLaterThanThreeMonthsMembersan:DebtInstrumentsMember2025-12-310000891478san:SeniorUnsecuredDebtMemberifrs-full:LaterThanThreeMonthsAndNotLaterThanOneYearMembersan:DebtInstrumentsMember2025-12-310000891478san:SeniorUnsecuredDebtMemberifrs-full:LaterThanOneYearAndNotLaterThanThreeYearsMembersan:DebtInstrumentsMember2025-12-310000891478san:SeniorUnsecuredDebtMemberifrs-full:LaterThanThreeYearsAndNotLaterThanFiveYearsMembersan:DebtInstrumentsMember2025-12-310000891478san:SeniorUnsecuredDebtMemberifrs-full:LaterThanFiveYearsMembersan:DebtInstrumentsMember2025-12-310000891478san:DebtInstrumentsMembersan:SeniorUnsecuredDebtMember2025-12-310000891478san:SeniorSecuredDebtMemberifrs-full:NotLaterThanThreeMonthsMembersan:DebtInstrumentsMember2025-12-310000891478san:SeniorSecuredDebtMemberifrs-full:LaterThanThreeMonthsAndNotLaterThanOneYearMembersan:DebtInstrumentsMember2025-12-310000891478san:SeniorSecuredDebtMemberifrs-full:LaterThanOneYearAndNotLaterThanThreeYearsMembersan:DebtInstrumentsMember2025-12-310000891478san:SeniorSecuredDebtMemberifrs-full:LaterThanThreeYearsAndNotLaterThanFiveYearsMembersan:DebtInstrumentsMember2025-12-310000891478san:SeniorSecuredDebtMemberifrs-full:LaterThanFiveYearsMembersan:DebtInstrumentsMember2025-12-310000891478san:DebtInstrumentsMembersan:SeniorSecuredDebtMember2025-12-310000891478san:NotesAndOtherSecuritiesMemberifrs-full:NotLaterThanThreeMonthsMembersan:DebtInstrumentsMember2025-12-310000891478san:NotesAndOtherSecuritiesMemberifrs-full:LaterThanThreeMonthsAndNotLaterThanOneYearMembersan:DebtInstrumentsMember2025-12-310000891478san:NotesAndOtherSecuritiesMemberifrs-full:LaterThanOneYearAndNotLaterThanThreeYearsMembersan:DebtInstrumentsMember2025-12-310000891478san:NotesAndOtherSecuritiesMemberifrs-full:LaterThanThreeYearsAndNotLaterThanFiveYearsMembersan:DebtInstrumentsMember2025-12-310000891478san:NotesAndOtherSecuritiesMemberifrs-full:LaterThanFiveYearsMembersan:DebtInstrumentsMember2025-12-310000891478san:BondsAndDebenturesOutstandingAndSubordinatedLiabilitiesMemberifrs-full:NotLaterThanThreeMonthsMembersan:DebtInstrumentsMember2025-12-310000891478san:BondsAndDebenturesOutstandingAndSubordinatedLiabilitiesMemberifrs-full:LaterThanThreeMonthsAndNotLaterThanOneYearMembersan:DebtInstrumentsMember2025-12-310000891478san:BondsAndDebenturesOutstandingAndSubordinatedLiabilitiesMemberifrs-full:LaterThanOneYearAndNotLaterThanThreeYearsMembersan:DebtInstrumentsMember2025-12-310000891478san:BondsAndDebenturesOutstandingAndSubordinatedLiabilitiesMemberifrs-full:LaterThanThreeYearsAndNotLaterThanFiveYearsMembersan:DebtInstrumentsMember2025-12-310000891478san:BondsAndDebenturesOutstandingAndSubordinatedLiabilitiesMemberifrs-full:LaterThanFiveYearsMembersan:DebtInstrumentsMember2025-12-310000891478san:DebtInstrumentsMembersan:BondsAndDebenturesOutstandingAndSubordinatedLiabilitiesMember2025-12-310000891478currency:EURsan:BondsAndDebenturesOutstandingMembersan:DebtInstrumentsMember2025-12-310000891478currency:EURsan:BondsAndDebenturesOutstandingMembersan:DebtInstrumentsMember2024-12-310000891478currency:EURsan:BondsAndDebenturesOutstandingMembersan:DebtInstrumentsMember2023-12-310000891478currency:USDsan:BondsAndDebenturesOutstandingMembersan:DebtInstrumentsMember2025-12-310000891478currency:USDsan:BondsAndDebenturesOutstandingMembersan:DebtInstrumentsMember2024-12-310000891478currency:USDsan:BondsAndDebenturesOutstandingMembersan:DebtInstrumentsMember2023-12-310000891478currency:GBPsan:BondsAndDebenturesOutstandingMembersan:DebtInstrumentsMember2025-12-310000891478currency:GBPsan:BondsAndDebenturesOutstandingMembersan:DebtInstrumentsMember2024-12-310000891478currency:GBPsan:BondsAndDebenturesOutstandingMembersan:DebtInstrumentsMember2023-12-310000891478currency:BRLsan:BondsAndDebenturesOutstandingMembersan:DebtInstrumentsMember2025-12-310000891478currency:BRLsan:BondsAndDebenturesOutstandingMembersan:DebtInstrumentsMember2024-12-310000891478currency:BRLsan:BondsAndDebenturesOutstandingMembersan:DebtInstrumentsMember2023-12-310000891478currency:CLPsan:BondsAndDebenturesOutstandingMembersan:DebtInstrumentsMember2025-12-310000891478currency:CLPsan:BondsAndDebenturesOutstandingMembersan:DebtInstrumentsMember2024-12-310000891478currency:CLPsan:BondsAndDebenturesOutstandingMembersan:DebtInstrumentsMember2023-12-310000891478san:OtherCurrenciesMembersan:BondsAndDebenturesOutstandingMembersan:DebtInstrumentsMember2025-12-310000891478san:OtherCurrenciesMembersan:BondsAndDebenturesOutstandingMembersan:DebtInstrumentsMember2024-12-310000891478san:OtherCurrenciesMembersan:BondsAndDebenturesOutstandingMembersan:DebtInstrumentsMember2023-12-310000891478san:DebtInstrumentsMembersan:BondsAndDebenturesOutstandingMember2022-12-310000891478san:DebtInstrumentsMembersan:BondsAndDebenturesOutstandingMember2025-01-012025-12-310000891478san:DebtInstrumentsMembersan:BondsAndDebenturesOutstandingMember2024-01-012024-12-310000891478san:DebtInstrumentsMembersan:BondsAndDebenturesOutstandingMember2023-01-012023-12-310000891478san:SPIRESACompartment2023374Membersan:BondsAndDebenturesOutstandingMembersan:DebtInstrumentsMember2025-01-012025-12-310000891478san:SPIRESACompartment2023374Membersan:BondsAndDebenturesOutstandingMembersan:DebtInstrumentsMember2024-01-012024-12-310000891478san:SPIRESACompartment2023374Membersan:BondsAndDebenturesOutstandingMembersan:DebtInstrumentsMember2023-01-012023-12-310000891478san:AutoABSUKLoansPLCMembersan:BondsAndDebenturesOutstandingMembersan:DebtInstrumentsMember2025-01-012025-12-310000891478san:AutoABSUKLoansPLCMembersan:BondsAndDebenturesOutstandingMembersan:DebtInstrumentsMember2024-01-012024-12-310000891478san:AutoABSUKLoansPLCMembersan:BondsAndDebenturesOutstandingMembersan:DebtInstrumentsMember2023-01-012023-12-310000891478san:PSABankDeutschlandGmbHMembersan:BondsAndDebenturesOutstandingMembersan:DebtInstrumentsMember2025-01-012025-12-310000891478san:PSABankDeutschlandGmbHMembersan:BondsAndDebenturesOutstandingMembersan:DebtInstrumentsMember2024-01-012024-12-310000891478san:PSABankDeutschlandGmbHMembersan:BondsAndDebenturesOutstandingMembersan:DebtInstrumentsMember2023-01-012023-12-310000891478srt:ParentCompanyMembersan:BondsAndDebenturesOutstandingMembersan:DebtInstrumentsMember2025-01-012025-12-310000891478srt:ParentCompanyMembersan:BondsAndDebenturesOutstandingMembersan:DebtInstrumentsMember2024-01-012024-12-310000891478srt:ParentCompanyMembersan:BondsAndDebenturesOutstandingMembersan:DebtInstrumentsMember2023-01-012023-12-310000891478san:BancoSantanderBrasilSAMembersan:BondsAndDebenturesOutstandingMembersan:DebtInstrumentsMember2025-01-012025-12-310000891478san:BancoSantanderBrasilSAMembersan:BondsAndDebenturesOutstandingMembersan:DebtInstrumentsMember2024-01-012024-12-310000891478san:BancoSantanderBrasilSAMembersan:BondsAndDebenturesOutstandingMembersan:DebtInstrumentsMember2023-01-012023-12-310000891478san:SantanderGroupUKMembersan:BondsAndDebenturesOutstandingMembersan:DebtInstrumentsMember2025-01-012025-12-310000891478san:SantanderGroupUKMembersan:BondsAndDebenturesOutstandingMembersan:DebtInstrumentsMember2024-01-012024-12-310000891478san:SantanderGroupUKMembersan:BondsAndDebenturesOutstandingMembersan:DebtInstrumentsMember2023-01-012023-12-310000891478san:SantanderConsumerUSAHoldingsIncMembersan:BondsAndDebenturesOutstandingMembersan:DebtInstrumentsMember2025-01-012025-12-310000891478san:SantanderConsumerUSAHoldingsIncMembersan:BondsAndDebenturesOutstandingMembersan:DebtInstrumentsMember2024-01-012024-12-310000891478san:SantanderConsumerUSAHoldingsIncMembersan:BondsAndDebenturesOutstandingMembersan:DebtInstrumentsMember2023-01-012023-12-310000891478san:SantanderInternationalProductsPLCMembersan:BondsAndDebenturesOutstandingMembersan:DebtInstrumentsMember2025-01-012025-12-310000891478san:SantanderInternationalProductsPLCMembersan:BondsAndDebenturesOutstandingMembersan:DebtInstrumentsMember2024-01-012024-12-310000891478san:SantanderInternationalProductsPLCMembersan:BondsAndDebenturesOutstandingMembersan:DebtInstrumentsMember2023-01-012023-12-310000891478san:StellantisFinancialServicesItaliaSpAMembersan:BondsAndDebenturesOutstandingMembersan:DebtInstrumentsMember2025-01-012025-12-310000891478san:StellantisFinancialServicesItaliaSpAMembersan:BondsAndDebenturesOutstandingMembersan:DebtInstrumentsMember2024-01-012024-12-310000891478san:StellantisFinancialServicesItaliaSpAMembersan:BondsAndDebenturesOutstandingMembersan:DebtInstrumentsMember2023-01-012023-12-310000891478san:SantanderConsumerBankSpAMembersan:BondsAndDebenturesOutstandingMembersan:DebtInstrumentsMember2025-01-012025-12-310000891478san:SantanderConsumerBankSpAMembersan:BondsAndDebenturesOutstandingMembersan:DebtInstrumentsMember2024-01-012024-12-310000891478san:SantanderConsumerBankSpAMembersan:BondsAndDebenturesOutstandingMembersan:DebtInstrumentsMember2023-01-012023-12-310000891478san:SantanderHoldingsUSAIncMembersan:BondsAndDebenturesOutstandingMembersan:DebtInstrumentsMember2025-01-012025-12-310000891478san:SantanderHoldingsUSAIncMembersan:BondsAndDebenturesOutstandingMembersan:DebtInstrumentsMember2024-01-012024-12-310000891478san:SantanderHoldingsUSAIncMembersan:BondsAndDebenturesOutstandingMembersan:DebtInstrumentsMember2023-01-012023-12-310000891478san:SantanderConsumo8F.T.Membersan:BondsAndDebenturesOutstandingMembersan:DebtInstrumentsMember2025-01-012025-12-310000891478san:SantanderConsumo8F.T.Membersan:BondsAndDebenturesOutstandingMembersan:DebtInstrumentsMember2024-01-012024-12-310000891478san:SantanderConsumo8F.T.Membersan:BondsAndDebenturesOutstandingMembersan:DebtInstrumentsMember2023-01-012023-12-310000891478san:SantanderConsumo9F.T.Membersan:BondsAndDebenturesOutstandingMembersan:DebtInstrumentsMember2025-01-012025-12-310000891478san:SantanderConsumo9F.T.Membersan:BondsAndDebenturesOutstandingMembersan:DebtInstrumentsMember2024-01-012024-12-310000891478san:SantanderConsumo9F.T.Membersan:BondsAndDebenturesOutstandingMembersan:DebtInstrumentsMember2023-01-012023-12-310000891478san:BancoSantanderChileMembersan:BondsAndDebenturesOutstandingMembersan:DebtInstrumentsMember2025-01-012025-12-310000891478san:BancoSantanderChileMembersan:BondsAndDebenturesOutstandingMembersan:DebtInstrumentsMember2024-01-012024-12-310000891478san:BancoSantanderChileMembersan:BondsAndDebenturesOutstandingMembersan:DebtInstrumentsMember2023-01-012023-12-310000891478san:SantanderConsumerFinanceSAMembersan:BondsAndDebenturesOutstandingMembersan:DebtInstrumentsMember2025-01-012025-12-310000891478san:SantanderConsumerFinanceSAMembersan:BondsAndDebenturesOutstandingMembersan:DebtInstrumentsMember2024-01-012024-12-310000891478san:SantanderConsumerFinanceSAMembersan:BondsAndDebenturesOutstandingMembersan:DebtInstrumentsMember2023-01-012023-12-310000891478san:BancoSantanderTottaSAMembersan:BondsAndDebenturesOutstandingMembersan:DebtInstrumentsMember2025-01-012025-12-310000891478san:BancoSantanderTottaSAMembersan:BondsAndDebenturesOutstandingMembersan:DebtInstrumentsMember2024-01-012024-12-310000891478san:BancoSantanderTottaSAMembersan:BondsAndDebenturesOutstandingMembersan:DebtInstrumentsMember2023-01-012023-12-310000891478san:SantanderBankNationalAssociationMembersan:BondsAndDebenturesOutstandingMembersan:DebtInstrumentsMember2025-01-012025-12-310000891478san:SantanderBankNationalAssociationMembersan:BondsAndDebenturesOutstandingMembersan:DebtInstrumentsMember2024-01-012024-12-310000891478san:SantanderBankNationalAssociationMembersan:BondsAndDebenturesOutstandingMembersan:DebtInstrumentsMember2023-01-012023-12-310000891478san:SCGermanyS.A.CompartmentConsumer20252Membersan:BondsAndDebenturesOutstandingMembersan:DebtInstrumentsMember2025-01-012025-12-310000891478san:SCGermanyS.A.CompartmentConsumer20252Membersan:BondsAndDebenturesOutstandingMembersan:DebtInstrumentsMember2024-01-012024-12-310000891478san:SCGermanyS.A.CompartmentConsumer20252Membersan:BondsAndDebenturesOutstandingMembersan:DebtInstrumentsMember2023-01-012023-12-310000891478san:SCGermanyS.A.CompartmentConsumer20251Membersan:BondsAndDebenturesOutstandingMembersan:DebtInstrumentsMember2025-01-012025-12-310000891478san:SCGermanyS.A.CompartmentConsumer20251Membersan:BondsAndDebenturesOutstandingMembersan:DebtInstrumentsMember2024-01-012024-12-310000891478san:SCGermanyS.A.CompartmentConsumer20251Membersan:BondsAndDebenturesOutstandingMembersan:DebtInstrumentsMember2023-01-012023-12-310000891478san:SecucorFinance20251DesignatedActivityCompanyMembersan:BondsAndDebenturesOutstandingMembersan:DebtInstrumentsMember2025-01-012025-12-310000891478san:SecucorFinance20251DesignatedActivityCompanyMembersan:BondsAndDebenturesOutstandingMembersan:DebtInstrumentsMember2024-01-012024-12-310000891478san:SecucorFinance20251DesignatedActivityCompanyMembersan:BondsAndDebenturesOutstandingMembersan:DebtInstrumentsMember2023-01-012023-12-310000891478san:BancoSantanderMexicoSAInstitucionDeBancaMultipleGrupoFinancieroSantanderMexicoMembersan:BondsAndDebenturesOutstandingMembersan:DebtInstrumentsMember2025-01-012025-12-310000891478san:BancoSantanderMexicoSAInstitucionDeBancaMultipleGrupoFinancieroSantanderMexicoMembersan:BondsAndDebenturesOutstandingMembersan:DebtInstrumentsMember2024-01-012024-12-310000891478san:BancoSantanderMexicoSAInstitucionDeBancaMultipleGrupoFinancieroSantanderMexicoMembersan:BondsAndDebenturesOutstandingMembersan:DebtInstrumentsMember2023-01-012023-12-310000891478san:HyundaiCapitalBankEuropeGmbHItalyMembersan:BondsAndDebenturesOutstandingMembersan:DebtInstrumentsMember2025-01-012025-12-310000891478san:HyundaiCapitalBankEuropeGmbHItalyMembersan:BondsAndDebenturesOutstandingMembersan:DebtInstrumentsMember2024-01-012024-12-310000891478san:HyundaiCapitalBankEuropeGmbHItalyMembersan:BondsAndDebenturesOutstandingMembersan:DebtInstrumentsMember2023-01-012023-12-310000891478san:BanqueStellantisFranceMembersan:BondsAndDebenturesOutstandingMembersan:DebtInstrumentsMember2025-01-012025-12-310000891478san:BanqueStellantisFranceMembersan:BondsAndDebenturesOutstandingMembersan:DebtInstrumentsMember2024-01-012024-12-310000891478san:BanqueStellantisFranceMembersan:BondsAndDebenturesOutstandingMembersan:DebtInstrumentsMember2023-01-012023-12-310000891478san:SantanderConsumerBankAGMembersan:BondsAndDebenturesOutstandingMembersan:DebtInstrumentsMember2025-01-012025-12-310000891478san:SantanderConsumerBankAGMembersan:BondsAndDebenturesOutstandingMembersan:DebtInstrumentsMember2024-01-012024-12-310000891478san:SantanderConsumerBankAGMembersan:BondsAndDebenturesOutstandingMembersan:DebtInstrumentsMember2023-01-012023-12-310000891478san:SCGermanyS.A.CompartmentConsumer20241Membersan:BondsAndDebenturesOutstandingMembersan:DebtInstrumentsMember2025-01-012025-12-310000891478san:SCGermanyS.A.CompartmentConsumer20241Membersan:BondsAndDebenturesOutstandingMembersan:DebtInstrumentsMember2024-01-012024-12-310000891478san:SCGermanyS.A.CompartmentConsumer20241Membersan:BondsAndDebenturesOutstandingMembersan:DebtInstrumentsMember2023-01-012023-12-310000891478san:SantanderConsumo6F.T.Membersan:BondsAndDebenturesOutstandingMembersan:DebtInstrumentsMember2025-01-012025-12-310000891478san:SantanderConsumo6F.T.Membersan:BondsAndDebenturesOutstandingMembersan:DebtInstrumentsMember2024-01-012024-12-310000891478san:SantanderConsumo6F.T.Membersan:BondsAndDebenturesOutstandingMembersan:DebtInstrumentsMember2023-01-012023-12-310000891478san:SantanderConsumo7F.T.Membersan:BondsAndDebenturesOutstandingMembersan:DebtInstrumentsMember2025-01-012025-12-310000891478san:SantanderConsumo7F.T.Membersan:BondsAndDebenturesOutstandingMembersan:DebtInstrumentsMember2024-01-012024-12-310000891478san:SantanderConsumo7F.T.Membersan:BondsAndDebenturesOutstandingMembersan:DebtInstrumentsMember2023-01-012023-12-310000891478san:SantanderBankPolskaSAMembersan:BondsAndDebenturesOutstandingMembersan:DebtInstrumentsMember2025-01-012025-12-310000891478san:SantanderBankPolskaSAMembersan:BondsAndDebenturesOutstandingMembersan:DebtInstrumentsMember2024-01-012024-12-310000891478san:SantanderBankPolskaSAMembersan:BondsAndDebenturesOutstandingMembersan:DebtInstrumentsMember2023-01-012023-12-310000891478san:SCGermanyS.A.CompartmentConsumer20242Membersan:BondsAndDebenturesOutstandingMembersan:DebtInstrumentsMember2025-01-012025-12-310000891478san:SCGermanyS.A.CompartmentConsumer20242Membersan:BondsAndDebenturesOutstandingMembersan:DebtInstrumentsMember2024-01-012024-12-310000891478san:SCGermanyS.A.CompartmentConsumer20242Membersan:BondsAndDebenturesOutstandingMembersan:DebtInstrumentsMember2023-01-012023-12-310000891478san:SantanderConsumerBankASMembersan:BondsAndDebenturesOutstandingMembersan:DebtInstrumentsMember2025-01-012025-12-310000891478san:SantanderConsumerBankASMembersan:BondsAndDebenturesOutstandingMembersan:DebtInstrumentsMember2024-01-012024-12-310000891478san:SantanderConsumerBankASMembersan:BondsAndDebenturesOutstandingMembersan:DebtInstrumentsMember2023-01-012023-12-310000891478san:DebtInstrumentsMemberifrs-full:BottomOfRangeMember2025-01-012025-12-310000891478san:DebtInstrumentsMemberifrs-full:TopOfRangeMember2025-12-310000891478san:DebtInstrumentsMember2025-01-012025-12-310000891478ifrs-full:FinancialLiabilitiesAtAmortisedCostCategoryMembercurrency:EUR2025-12-310000891478ifrs-full:FinancialLiabilitiesAtAmortisedCostCategoryMembercurrency:EUR2024-12-310000891478ifrs-full:FinancialLiabilitiesAtAmortisedCostCategoryMembercurrency:EUR2023-12-310000891478ifrs-full:FinancialLiabilitiesAtAmortisedCostCategoryMembercurrency:EUR2025-01-012025-12-310000891478ifrs-full:FinancialLiabilitiesAtAmortisedCostCategoryMembercurrency:USD2025-12-310000891478ifrs-full:FinancialLiabilitiesAtAmortisedCostCategoryMembercurrency:USD2024-12-310000891478ifrs-full:FinancialLiabilitiesAtAmortisedCostCategoryMembercurrency:USD2023-12-310000891478ifrs-full:FinancialLiabilitiesAtAmortisedCostCategoryMembercurrency:USD2025-01-012025-12-310000891478ifrs-full:FinancialLiabilitiesAtAmortisedCostCategoryMembercurrency:BRL2025-12-310000891478ifrs-full:FinancialLiabilitiesAtAmortisedCostCategoryMembercurrency:BRL2024-12-310000891478ifrs-full:FinancialLiabilitiesAtAmortisedCostCategoryMembercurrency:BRL2023-12-310000891478ifrs-full:FinancialLiabilitiesAtAmortisedCostCategoryMembercurrency:BRL2025-01-012025-12-310000891478ifrs-full:FinancialLiabilitiesAtAmortisedCostCategoryMembercurrency:GBP2025-12-310000891478ifrs-full:FinancialLiabilitiesAtAmortisedCostCategoryMembercurrency:GBP2024-12-310000891478ifrs-full:FinancialLiabilitiesAtAmortisedCostCategoryMembercurrency:GBP2023-12-310000891478ifrs-full:FinancialLiabilitiesAtAmortisedCostCategoryMembercurrency:GBP2025-01-012025-12-310000891478ifrs-full:FinancialLiabilitiesAtAmortisedCostCategoryMembersan:OtherCurrenciesMember2025-12-310000891478ifrs-full:FinancialLiabilitiesAtAmortisedCostCategoryMembersan:OtherCurrenciesMember2024-12-310000891478ifrs-full:FinancialLiabilitiesAtAmortisedCostCategoryMembersan:OtherCurrenciesMember2023-12-310000891478ifrs-full:FinancialLiabilitiesAtAmortisedCostCategoryMember2022-12-310000891478ifrs-full:FinancialLiabilitiesAtAmortisedCostCategoryMember2025-01-012025-12-310000891478ifrs-full:FinancialLiabilitiesAtAmortisedCostCategoryMember2024-01-012024-12-310000891478ifrs-full:FinancialLiabilitiesAtAmortisedCostCategoryMember2023-01-012023-12-310000891478ifrs-full:FinancialLiabilitiesAtAmortisedCostCategoryMembersrt:ParentCompanyMember2025-01-012025-12-310000891478ifrs-full:FinancialLiabilitiesAtAmortisedCostCategoryMembersrt:ParentCompanyMember2024-01-012024-12-310000891478ifrs-full:FinancialLiabilitiesAtAmortisedCostCategoryMembersrt:ParentCompanyMember2023-01-012023-12-310000891478ifrs-full:FinancialLiabilitiesAtAmortisedCostCategoryMembersan:BancoSantanderBrasilSAMember2025-01-012025-12-310000891478ifrs-full:FinancialLiabilitiesAtAmortisedCostCategoryMembersan:BancoSantanderBrasilSAMember2024-01-012024-12-310000891478ifrs-full:FinancialLiabilitiesAtAmortisedCostCategoryMembersan:BancoSantanderBrasilSAMember2023-01-012023-12-310000891478ifrs-full:FinancialLiabilitiesAtAmortisedCostCategoryMembersan:BanqueStellantisFranceMember2025-01-012025-12-310000891478ifrs-full:FinancialLiabilitiesAtAmortisedCostCategoryMembersan:BanqueStellantisFranceMember2024-01-012024-12-310000891478ifrs-full:FinancialLiabilitiesAtAmortisedCostCategoryMembersan:BanqueStellantisFranceMember2023-01-012023-12-310000891478ifrs-full:FinancialLiabilitiesAtAmortisedCostCategoryMembersan:SantanderUKGroupHoldingsPLCMember2025-01-012025-12-310000891478ifrs-full:FinancialLiabilitiesAtAmortisedCostCategoryMembersan:SantanderUKGroupHoldingsPLCMember2024-01-012024-12-310000891478ifrs-full:FinancialLiabilitiesAtAmortisedCostCategoryMembersan:SantanderUKGroupHoldingsPLCMember2023-01-012023-12-310000891478ifrs-full:FinancialLiabilitiesAtAmortisedCostCategoryMembersan:SantanderBankPolskaSAMember2025-01-012025-12-310000891478ifrs-full:FinancialLiabilitiesAtAmortisedCostCategoryMembersan:SantanderBankPolskaSAMember2024-01-012024-12-310000891478ifrs-full:FinancialLiabilitiesAtAmortisedCostCategoryMembersan:SantanderBankPolskaSAMember2023-01-012023-12-310000891478ifrs-full:FinancialLiabilitiesAtAmortisedCostCategoryMembersan:SantanderUKPLCMember2025-01-012025-12-310000891478ifrs-full:FinancialLiabilitiesAtAmortisedCostCategoryMembersan:SantanderUKPLCMember2024-01-012024-12-310000891478ifrs-full:FinancialLiabilitiesAtAmortisedCostCategoryMembersan:SantanderUKPLCMember2023-01-012023-12-310000891478san:RepaidByBancoSantanderS.A.InDecember2025Membersan:SubordinatedLiabilitiesMember2025-12-010000891478san:IssuanceByBancoSantanderS.A.InNovember2025Membersan:SubordinatedLiabilitiesMember2025-11-190000891478san:RepaidByBancoSantanderS.A.InSeptember2025Membersan:SubordinatedLiabilitiesMember2025-09-240000891478san:RepaidByBancoSantanderS.A.InAugust2025ISINXS1384064587Membersan:SubordinatedLiabilitiesMember2025-08-050000891478san:RepaidByBancoSantanderS.A.InAugust2025ISINXS1548444816Membersan:SubordinatedLiabilitiesMember2025-08-050000891478san:RepaidByBancoSantanderS.A.InJuly2025Membersan:SubordinatedLiabilitiesPreferenceSharesMember2025-07-020000891478san:IssuanceByBancoSantanderS.A.InJuly2025Membersan:SubordinatedLiabilitiesPreferenceSharesMember2025-07-020000891478san:IssuanceByBancoSantanderS.A.InJuly2025Membersan:SubordinatedLiabilitiesPreferenceSharesMember2025-07-022025-07-020000891478san:IssuanceByBancoSantanderS.A.InJuly2025Membersan:SubordinatedLiabilitiesPreferenceSharesMembersan:MidSwapRateFiveYearEuroMember2025-07-020000891478san:IssuanceByBancoSantanderS.A.InMarch2025Membersan:SubordinatedLiabilitiesMember2025-03-180000891478san:IssuanceByBancoSantanderS.A.InApril2016Membersan:SubordinatedLiabilitiesMember2025-02-172025-02-170000891478san:IssuanceByBancoSantanderS.A.InApril2016Membersan:SubordinatedLiabilitiesMember2025-02-060000891478san:IssuanceByBancoSantanderS.A.InJanuary2017Membersan:SubordinatedLiabilitiesMember2025-02-172025-02-170000891478san:IssuanceByBancoSantanderS.A.InJanuary2017Membersan:SubordinatedLiabilitiesMember2025-02-060000891478san:IssuanceByBancoSantanderS.A.InAugust2024Membersan:SubordinatedLiabilitiesPreferenceSharesMember2024-08-010000891478san:IssuanceByBancoSantanderS.A.InAugust2024Membersan:SubordinatedLiabilitiesPreferenceSharesMember2024-08-012024-08-010000891478san:IssuanceByBancoSantanderS.A.InAugust2024Membersan:SubordinatedLiabilitiesPreferenceSharesMembersan:MidSwapRateFiveYearEuroMember2024-08-010000891478san:RepaidByBancoSantanderS.A.InMay2024Membersan:SubordinatedLiabilitiesPreferenceSharesMember2024-05-200000891478san:IssuanceByBancoSantanderS.A.InMay2024Membersan:SubordinatedLiabilitiesPreferenceSharesMember2024-05-200000891478san:IssuanceByBancoSantanderS.A.InMay2024Membersan:SubordinatedLiabilitiesPreferenceSharesMember2024-05-202024-05-200000891478san:IssuanceByBancoSantanderS.A.InMay2024Membersan:SubordinatedLiabilitiesPreferenceSharesMembersan:MidSwapRateFiveYearEuroMember2024-05-200000891478san:IssuanceByBancoSantanderS.A.InMarch2024Membersan:SubordinatedLiabilitiesMember2024-03-140000891478san:IssuanceByBancoSantanderS.A.InMarch2024Membersan:SubordinatedLiabilitiesMember2024-03-142024-03-140000891478san:RepaidByBancoSantanderS.A.InFebruary2024Membersan:TierOneContingentlyConvertiblePreferredSecuritiesMember2024-02-080000891478san:IssuanceByBancoSantanderSAInJanuary2024Membersan:SubordinatedLiabilitiesMember2024-01-220000891478san:IssuanceByBancoSantanderSAInJanuary2024Membersan:SubordinatedLiabilitiesMember2024-01-222024-01-220000891478san:IssuanceByBancoSantanderSAInSeptember2017Membersan:TierOneContingentlyConvertiblePreferredSecuritiesMember2023-12-2900008914782023-11-210000891478san:IssuanceByBancoSantanderSAInNovember2023Membersan:SubordinatedLiabilitiesPreferenceSharesFirstSeriesMember2023-11-210000891478san:IssuanceByBancoSantanderSAInNovember2023Membersan:SubordinatedLiabilitiesPreferenceSharesSecondSeriesMember2023-11-210000891478san:IssuanceByBancoSantanderSAInNovember2023Membersan:SubordinatedLiabilitiesPreferenceSharesFirstSeriesMember2023-11-212023-11-210000891478san:IssuanceByBancoSantanderSAInNovember2023Membersan:SubordinatedLiabilitiesPreferenceSharesSecondSeriesMember2023-11-212023-11-210000891478san:IssuanceByBancoSantanderSAInAugust2023Membersan:SubordinatedLiabilitiesMember2023-08-080000891478san:IssuanceByBancoSantanderSAInAugust2023Membersan:SubordinatedLiabilitiesMember2023-08-082023-08-080000891478san:IssuanceByBancoSantanderSAInMay2023Membersan:SubordinatedLiabilitiesMember2023-05-230000891478san:IssuanceByBancoSantanderSAInMay2023Membersan:SubordinatedLiabilitiesMember2023-05-232023-05-230000891478san:TierOneContingentlyConvertiblePreferredSecuritiesMember2022-04-250000891478san:IssuanceByBancoSantanderSAInNovember2021Membersan:SubordinatedDebenturesMember2021-11-222021-11-220000891478san:IssuanceByBancoSantanderSAInNovember2021Membersan:SubordinatedDebenturesMember2021-11-220000891478san:IssuanceByBancoSantanderSAInOctober2021Membersan:SubordinatedDebenturesMember2021-10-042021-10-040000891478san:IssuanceByBancoSantanderSAInOctober2021Membersan:SubordinatedDebenturesMember2021-10-040000891478san:IssuanceByBancoSantanderSAInSeptember2021Membersan:SubordinatedLiabilitiesPreferenceSharesMember2021-09-210000891478san:IssuanceByBancoSantanderSAInSeptember2021Membersan:SubordinatedLiabilitiesPreferenceSharesMember2021-09-212021-09-210000891478san:IssuanceByBancoSantanderSAInMay2021Membersan:SubordinatedLiabilitiesPreferenceSharesMember2021-05-120000891478san:IssuanceByBancoSantanderSAInMay2021SeriesInDollarsMembersan:SubordinatedLiabilitiesPreferenceSharesMember2021-05-120000891478san:IssuanceByBancoSantanderSAInMay2021SeriesInEurosMembersan:SubordinatedLiabilitiesPreferenceSharesMember2021-05-120000891478san:IssuanceByBancoSantanderSAInMay2021SeriesInDollarsMembersan:SubordinatedLiabilitiesPreferenceSharesMember2021-05-122021-05-120000891478san:IssuanceByBancoSantanderSAInMay2021SeriesInEurosMembersan:SubordinatedLiabilitiesPreferenceSharesMember2021-05-122021-05-120000891478san:IssuanceByBancoSantanderSAInDecember2020Membersan:SubordinatedDebenturesMember2020-12-032020-12-030000891478san:IssuanceByBancoSantanderSAInDecember2020Membersan:SubordinatedDebenturesMember2020-12-030000891478san:IssuanceByBancoSantanderSAInOctober2020Membersan:SubordinatedDebenturesMember2020-10-222020-10-220000891478san:IssuanceByBancoSantanderSAInOctober2020Membersan:SubordinatedDebenturesMember2020-10-220000891478san:IssuanceByBancoSantanderSAInJanuary2020Membersan:SubordinatedLiabilitiesPreferredSecuritiesMember2020-01-140000891478san:IssuanceByBancoSantanderSAInJanuary2020Membersan:SubordinatedLiabilitiesPreferredSecuritiesMember2020-01-142020-01-140000891478san:IssuanceByBancoSantanderSAInFebruary2018Membersan:SubordinatedDebenturesMember2018-02-082018-02-080000891478san:IssuanceByBancoSantanderSAInFebruary2018Membersan:SubordinatedDebenturesMember2018-02-080000891478san:BancoSantanderBrasilSAMembersan:IssuanceByBancoSantanderBrasilInDecember2025Membersan:Tier2SubordinatedDebtMember2025-12-012025-12-010000891478san:BancoSantanderBrasilSAMembersan:IssuanceByBancoSantanderBrasilInDecember2025Membersan:Tier2SubordinatedDebtMember2025-12-010000891478san:BancoSantanderBrasilSAMembersan:IssuanceByBancoSantanderBrasilInSeptember2024Membersan:AdditionalTier1FinancialNotesMember2024-09-300000891478san:BancoSantanderBrasilSAMembersan:IssuanceByBancoSantanderBrasilInOctober2023Membersan:SubordinatedFinancialBillsTIERIIMember2023-10-012023-10-010000891478san:BancoSantanderBrasilSAMembersan:IssuanceByBancoSantanderBrasilInOctober2023Membersan:SubordinatedFinancialBillsTIERIIMember2023-10-010000891478san:BancoSantanderBrasilSAMembersan:IssuanceByBancoSantanderBrasilInNovember2021Membersan:SubordinatedFinancialBillsTIERIIMember2021-11-012021-11-300000891478san:BancoSantanderBrasilSAMembersan:IssuanceByBancoSantanderBrasilInNovember2021Membersan:SubordinatedFinancialBillsTIERIIMember2021-11-300000891478san:IssuanceBySantanderBankPolskaS.A.InAugust2010Membersan:SantanderBankPolskaSAMembersan:SubordinatedLiabilitiesMember2024-11-280000891478san:SubordinatedLiabilitiesMember2025-12-310000891478san:SubordinatedLiabilitiesMember2024-12-310000891478san:SubordinatedLiabilitiesMember2023-12-310000891478san:SubordinatedLiabilitiesMember2025-01-012025-12-310000891478san:SubordinatedLiabilitiesMember2024-01-012024-12-310000891478san:SubordinatedLiabilitiesMember2023-01-012023-12-310000891478san:IssuanceByBancoSantanderSAInNovember2023Membersan:SubordinatedLiabilitiesPreferenceSharesFirstSeriesMember2023-11-162023-11-160000891478ifrs-full:NotLaterThanOneYearMember2025-12-310000891478ifrs-full:NotLaterThanOneYearMember2024-12-310000891478ifrs-full:NotLaterThanOneYearMember2023-12-310000891478ifrs-full:LaterThanOneYearAndNotLaterThanThreeYearsMember2025-12-310000891478ifrs-full:LaterThanOneYearAndNotLaterThanThreeYearsMember2024-12-310000891478ifrs-full:LaterThanOneYearAndNotLaterThanThreeYearsMember2023-12-310000891478ifrs-full:LaterThanThreeYearsAndNotLaterThanFiveYearsMember2025-12-310000891478ifrs-full:LaterThanThreeYearsAndNotLaterThanFiveYearsMember2024-12-310000891478ifrs-full:LaterThanThreeYearsAndNotLaterThanFiveYearsMember2023-12-310000891478ifrs-full:LaterThanFiveYearsMember2025-12-310000891478ifrs-full:LaterThanFiveYearsMember2024-12-310000891478ifrs-full:LaterThanFiveYearsMember2023-12-310000891478san:ProvisionsForTaxesAndOtherLegalContingenciesAndOtherProvisionsMember2024-12-310000891478san:PensionsAndOtherEmploymentDefinedBenefitObligationsProvisionMember2025-01-012025-12-310000891478san:OtherLongTermEmployeeBenefitsProvisionMember2025-01-012025-12-310000891478san:CommitmentsAndGuaranteesGivenProvisionMember2025-01-012025-12-310000891478san:ProvisionsForTaxesAndOtherLegalContingenciesAndOtherProvisionsMember2025-01-012025-12-310000891478san:ProvisionsForTaxesAndOtherLegalContingenciesAndOtherProvisionsMember2025-12-310000891478san:ProvisionsForTaxesAndOtherLegalContingenciesAndOtherProvisionsMember2023-12-310000891478san:PensionsAndOtherEmploymentDefinedBenefitObligationsProvisionMember2022-12-310000891478san:OtherLongTermEmployeeBenefitsProvisionMember2022-12-310000891478san:CommitmentsAndGuaranteesGivenProvisionMember2022-12-310000891478san:ProvisionsForTaxesAndOtherLegalContingenciesAndOtherProvisionsMember2022-12-310000891478san:PensionsAndOtherEmploymentDefinedBenefitObligationsProvisionMember2024-01-012024-12-310000891478san:OtherLongTermEmployeeBenefitsProvisionMember2024-01-012024-12-310000891478san:CommitmentsAndGuaranteesGivenProvisionMember2024-01-012024-12-310000891478san:ProvisionsForTaxesAndOtherLegalContingenciesAndOtherProvisionsMember2024-01-012024-12-310000891478san:PensionsAndOtherEmploymentDefinedBenefitObligationsProvisionMember2023-01-012023-12-310000891478san:OtherLongTermEmployeeBenefitsProvisionMember2023-01-012023-12-310000891478san:CommitmentsAndGuaranteesGivenProvisionMember2023-01-012023-12-310000891478san:ProvisionsForTaxesAndOtherLegalContingenciesAndOtherProvisionsMember2023-01-012023-12-310000891478ifrs-full:CountryOfDomicileMembersan:PensionsAndOtherEmploymentDefinedBenefitObligationsProvisionMember2025-12-310000891478ifrs-full:CountryOfDomicileMembersan:PensionsAndOtherEmploymentDefinedBenefitObligationsProvisionMember2024-12-310000891478ifrs-full:CountryOfDomicileMembersan:PensionsAndOtherEmploymentDefinedBenefitObligationsProvisionMember2023-12-310000891478ifrs-full:CountryOfDomicileMembersan:OtherLongTermEmployeeBenefitsProvisionMember2025-12-310000891478ifrs-full:CountryOfDomicileMembersan:OtherLongTermEmployeeBenefitsProvisionMember2024-12-310000891478ifrs-full:CountryOfDomicileMembersan:OtherLongTermEmployeeBenefitsProvisionMember2023-12-310000891478ifrs-full:CountryOfDomicileMember2024-12-310000891478ifrs-full:CountryOfDomicileMember2023-12-310000891478country:GBsan:PensionsAndOtherEmploymentDefinedBenefitObligationsProvisionMember2025-12-310000891478country:GBsan:PensionsAndOtherEmploymentDefinedBenefitObligationsProvisionMember2024-12-310000891478country:GBsan:PensionsAndOtherEmploymentDefinedBenefitObligationsProvisionMember2023-12-310000891478san:OtherForeignCountriesNotIncludingUKMembersan:PensionsAndOtherEmploymentDefinedBenefitObligationsProvisionMember2025-12-310000891478san:OtherForeignCountriesNotIncludingUKMembersan:PensionsAndOtherEmploymentDefinedBenefitObligationsProvisionMember2024-12-310000891478san:OtherForeignCountriesNotIncludingUKMembersan:PensionsAndOtherEmploymentDefinedBenefitObligationsProvisionMember2023-12-310000891478san:OtherForeignCountriesNotIncludingUKMembersan:OtherLongTermEmployeeBenefitsProvisionMember2025-12-310000891478san:OtherForeignCountriesNotIncludingUKMembersan:OtherLongTermEmployeeBenefitsProvisionMember2024-12-310000891478san:OtherForeignCountriesNotIncludingUKMembersan:OtherLongTermEmployeeBenefitsProvisionMember2023-12-310000891478san:ProvisionsForPensionsAndSimilarObligationsMember2025-12-310000891478san:ProvisionsForPensionsAndSimilarObligationsMember2024-12-310000891478san:ProvisionsForPensionsAndSimilarObligationsMember2023-12-310000891478ifrs-full:CountryOfDomicileMember2025-01-012025-12-310000891478ifrs-full:CountryOfDomicileMember2024-01-012024-12-310000891478ifrs-full:CountryOfDomicileMember2023-01-012023-12-310000891478ifrs-full:ActuarialAssumptionOfDiscountRatesMemberifrs-full:CountryOfDomicileMember2025-12-310000891478ifrs-full:ActuarialAssumptionOfDiscountRatesMemberifrs-full:CountryOfDomicileMembersan:PensionsAndOtherEmploymentDefinedBenefitObligationsProvisionMember2025-12-310000891478ifrs-full:ActuarialAssumptionOfDiscountRatesMemberifrs-full:CountryOfDomicileMembersan:OtherLongTermEmployeeBenefitsProvisionMember2025-12-310000891478san:PensionsAndOtherEmploymentDefinedBenefitObligationsProvisionMemberifrs-full:CountryOfDomicileMember2025-12-310000891478san:PensionsAndOtherEmploymentDefinedBenefitObligationsProvisionMemberifrs-full:CountryOfDomicileMember2024-12-310000891478san:PensionsAndOtherEmploymentDefinedBenefitObligationsProvisionMemberifrs-full:CountryOfDomicileMember2023-12-310000891478san:OtherLongTermEmployeeBenefitsProvisionMemberifrs-full:CountryOfDomicileMember2025-12-310000891478san:OtherLongTermEmployeeBenefitsProvisionMemberifrs-full:CountryOfDomicileMember2024-12-310000891478san:OtherLongTermEmployeeBenefitsProvisionMemberifrs-full:CountryOfDomicileMember2023-12-310000891478san:PostEmploymentPlansMemberifrs-full:CountryOfDomicileMember2025-12-310000891478san:PostEmploymentPlansMemberifrs-full:CountryOfDomicileMember2024-12-310000891478san:PostEmploymentPlansMemberifrs-full:CountryOfDomicileMember2023-12-310000891478san:OtherSimilarBenefitsPlansMemberifrs-full:CountryOfDomicileMember2025-12-310000891478san:OtherSimilarBenefitsPlansMemberifrs-full:CountryOfDomicileMember2024-12-310000891478san:OtherSimilarBenefitsPlansMemberifrs-full:CountryOfDomicileMember2023-12-310000891478san:PostEmploymentPlansMemberifrs-full:CountryOfDomicileMember2025-01-012025-12-310000891478san:PostEmploymentPlansMemberifrs-full:CountryOfDomicileMember2024-01-012024-12-310000891478san:PostEmploymentPlansMemberifrs-full:CountryOfDomicileMember2023-01-012023-12-310000891478san:OtherSimilarBenefitsPlansMemberifrs-full:CountryOfDomicileMember2025-01-012025-12-310000891478san:OtherSimilarBenefitsPlansMemberifrs-full:CountryOfDomicileMember2024-01-012024-12-310000891478san:OtherSimilarBenefitsPlansMemberifrs-full:CountryOfDomicileMember2023-01-012023-12-310000891478san:PostEmploymentPlansMemberifrs-full:CountryOfDomicileMemberifrs-full:PresentValueOfDefinedBenefitObligationMember2024-12-310000891478san:PostEmploymentPlansMemberifrs-full:CountryOfDomicileMemberifrs-full:PresentValueOfDefinedBenefitObligationMember2023-12-310000891478san:PostEmploymentPlansMemberifrs-full:CountryOfDomicileMemberifrs-full:PresentValueOfDefinedBenefitObligationMember2022-12-310000891478san:OtherSimilarBenefitsPlansMemberifrs-full:CountryOfDomicileMemberifrs-full:PresentValueOfDefinedBenefitObligationMember2024-12-310000891478san:OtherSimilarBenefitsPlansMemberifrs-full:CountryOfDomicileMemberifrs-full:PresentValueOfDefinedBenefitObligationMember2023-12-310000891478san:OtherSimilarBenefitsPlansMemberifrs-full:CountryOfDomicileMemberifrs-full:PresentValueOfDefinedBenefitObligationMember2022-12-310000891478san:PostEmploymentPlansMemberifrs-full:CountryOfDomicileMemberifrs-full:PresentValueOfDefinedBenefitObligationMember2025-01-012025-12-310000891478san:PostEmploymentPlansMemberifrs-full:CountryOfDomicileMemberifrs-full:PresentValueOfDefinedBenefitObligationMember2024-01-012024-12-310000891478san:PostEmploymentPlansMemberifrs-full:CountryOfDomicileMemberifrs-full:PresentValueOfDefinedBenefitObligationMember2023-01-012023-12-310000891478san:OtherSimilarBenefitsPlansMemberifrs-full:CountryOfDomicileMemberifrs-full:PresentValueOfDefinedBenefitObligationMember2025-01-012025-12-310000891478san:OtherSimilarBenefitsPlansMemberifrs-full:CountryOfDomicileMemberifrs-full:PresentValueOfDefinedBenefitObligationMember2024-01-012024-12-310000891478san:OtherSimilarBenefitsPlansMemberifrs-full:CountryOfDomicileMemberifrs-full:PresentValueOfDefinedBenefitObligationMember2023-01-012023-12-310000891478san:PostEmploymentPlansMemberifrs-full:CountryOfDomicileMemberifrs-full:PresentValueOfDefinedBenefitObligationMember2025-12-310000891478san:OtherSimilarBenefitsPlansMemberifrs-full:CountryOfDomicileMemberifrs-full:PresentValueOfDefinedBenefitObligationMember2025-12-310000891478san:PostEmploymentPlansMemberifrs-full:CountryOfDomicileMemberifrs-full:PlanAssetsMember2024-12-310000891478san:PostEmploymentPlansMemberifrs-full:CountryOfDomicileMemberifrs-full:PlanAssetsMember2023-12-310000891478san:PostEmploymentPlansMemberifrs-full:CountryOfDomicileMemberifrs-full:PlanAssetsMember2022-12-310000891478san:OtherSimilarBenefitsPlansMemberifrs-full:CountryOfDomicileMemberifrs-full:PlanAssetsMember2024-12-310000891478san:OtherSimilarBenefitsPlansMemberifrs-full:CountryOfDomicileMemberifrs-full:PlanAssetsMember2023-12-310000891478san:OtherSimilarBenefitsPlansMemberifrs-full:CountryOfDomicileMemberifrs-full:PlanAssetsMember2022-12-310000891478san:PostEmploymentPlansMemberifrs-full:CountryOfDomicileMemberifrs-full:PlanAssetsMember2025-01-012025-12-310000891478san:PostEmploymentPlansMemberifrs-full:CountryOfDomicileMemberifrs-full:PlanAssetsMember2024-01-012024-12-310000891478san:PostEmploymentPlansMemberifrs-full:CountryOfDomicileMemberifrs-full:PlanAssetsMember2023-01-012023-12-310000891478san:OtherSimilarBenefitsPlansMemberifrs-full:CountryOfDomicileMemberifrs-full:PlanAssetsMember2025-01-012025-12-310000891478san:OtherSimilarBenefitsPlansMemberifrs-full:CountryOfDomicileMemberifrs-full:PlanAssetsMember2024-01-012024-12-310000891478san:OtherSimilarBenefitsPlansMemberifrs-full:CountryOfDomicileMemberifrs-full:PlanAssetsMember2023-01-012023-12-310000891478san:PostEmploymentPlansMemberifrs-full:CountryOfDomicileMemberifrs-full:PlanAssetsMember2025-12-310000891478san:OtherSimilarBenefitsPlansMemberifrs-full:CountryOfDomicileMemberifrs-full:PlanAssetsMember2025-12-310000891478san:PostEmploymentPlansMemberifrs-full:CountryOfDomicileMember2022-12-310000891478san:OtherSimilarBenefitsPlansMemberifrs-full:CountryOfDomicileMember2022-12-310000891478ifrs-full:CountryOfDomicileMemberifrs-full:NotLaterThanOneYearMember2025-12-310000891478ifrs-full:CountryOfDomicileMemberifrs-full:LaterThanOneYearAndNotLaterThanTwoYearsMember2025-12-310000891478ifrs-full:CountryOfDomicileMemberifrs-full:LaterThanTwoYearsAndNotLaterThanThreeYearsMember2025-12-310000891478ifrs-full:CountryOfDomicileMemberifrs-full:LaterThanThreeYearsAndNotLaterThanFourYearsMember2025-12-310000891478ifrs-full:CountryOfDomicileMemberifrs-full:LaterThanFourYearsAndNotLaterThanFiveYearsMember2025-12-310000891478ifrs-full:CountryOfDomicileMemberifrs-full:LaterThanFiveYearsAndNotLaterThanTenYearsMember2025-12-310000891478country:GB2025-01-012025-12-310000891478country:GB2024-01-012024-12-310000891478country:GB2023-01-012023-12-310000891478country:GB2025-12-310000891478country:GB2024-12-310000891478country:GB2023-12-310000891478ifrs-full:ActuarialAssumptionOfDiscountRatesMembercountry:GB2025-12-310000891478ifrs-full:ActuarialAssumptionOfExpectedRatesOfInflationMembercountry:GB2025-12-310000891478country:GBifrs-full:PresentValueOfDefinedBenefitObligationMember2024-12-310000891478country:GBifrs-full:PresentValueOfDefinedBenefitObligationMember2023-12-310000891478country:GBifrs-full:PresentValueOfDefinedBenefitObligationMember2022-12-310000891478country:GBifrs-full:PresentValueOfDefinedBenefitObligationMember2025-01-012025-12-310000891478country:GBifrs-full:PresentValueOfDefinedBenefitObligationMember2024-01-012024-12-310000891478country:GBifrs-full:PresentValueOfDefinedBenefitObligationMember2023-01-012023-12-310000891478country:GBifrs-full:PresentValueOfDefinedBenefitObligationMember2025-12-310000891478country:GBifrs-full:PlanAssetsMember2024-12-310000891478country:GBifrs-full:PlanAssetsMember2023-12-310000891478country:GBifrs-full:PlanAssetsMember2022-12-310000891478country:GBifrs-full:PlanAssetsMember2025-01-012025-12-310000891478country:GBifrs-full:PlanAssetsMember2024-01-012024-12-310000891478country:GBifrs-full:PlanAssetsMember2023-01-012023-12-310000891478country:GBifrs-full:PlanAssetsMember2025-12-310000891478country:GBifrs-full:EquityInvestmentsMember2025-01-012025-12-310000891478country:GBifrs-full:EquityInvestmentsMember2024-01-012024-12-310000891478country:GBifrs-full:EquityInvestmentsMember2023-01-012023-12-310000891478country:GBifrs-full:DebtSecuritiesMember2025-01-012025-12-310000891478country:GBifrs-full:DebtSecuritiesMember2024-01-012024-12-310000891478country:GBifrs-full:DebtSecuritiesMember2023-01-012023-12-310000891478country:GBifrs-full:InvestmentPropertyMember2025-01-012025-12-310000891478country:GBifrs-full:InvestmentPropertyMember2024-01-012024-12-310000891478country:GBifrs-full:InvestmentPropertyMember2023-01-012023-12-310000891478country:GBifrs-full:OtherAssetsMember2025-01-012025-12-310000891478country:GBifrs-full:OtherAssetsMember2024-01-012024-12-310000891478country:GBifrs-full:OtherAssetsMember2023-01-012023-12-310000891478country:GBifrs-full:NotLaterThanOneYearMember2025-12-310000891478country:GBifrs-full:LaterThanOneYearAndNotLaterThanTwoYearsMember2025-12-310000891478country:GBifrs-full:LaterThanTwoYearsAndNotLaterThanThreeYearsMember2025-12-310000891478country:GBifrs-full:LaterThanThreeYearsAndNotLaterThanFourYearsMember2025-12-310000891478country:GBifrs-full:LaterThanFourYearsAndNotLaterThanFiveYearsMember2025-12-310000891478country:GBifrs-full:LaterThanFiveYearsAndNotLaterThanTenYearsMember2025-12-310000891478san:OtherForeignCountriesNotIncludingUKMember2025-01-012025-12-310000891478san:OtherForeignCountriesNotIncludingUKMember2024-01-012024-12-310000891478san:OtherForeignCountriesNotIncludingUKMember2023-01-012023-12-310000891478country:BRifrs-full:BottomOfRangeMember2025-12-310000891478country:BRifrs-full:TopOfRangeMember2025-12-310000891478country:BR2025-12-310000891478ifrs-full:ActuarialAssumptionOfDiscountRatesMembersan:OtherForeignCountriesNotIncludingUKMember2025-12-310000891478san:OtherForeignCountriesNotIncludingUKMember2025-12-310000891478san:OtherForeignCountriesNotIncludingUKMember2024-12-310000891478san:OtherForeignCountriesNotIncludingUKMember2023-12-310000891478san:OtherForeignCountriesNotIncludingUKMemberifrs-full:PresentValueOfDefinedBenefitObligationMember2024-12-310000891478san:OtherForeignCountriesNotIncludingUKMemberifrs-full:PresentValueOfDefinedBenefitObligationMember2023-12-310000891478san:OtherForeignCountriesNotIncludingUKMemberifrs-full:PresentValueOfDefinedBenefitObligationMember2022-12-310000891478san:OtherForeignCountriesNotIncludingUKMemberifrs-full:PresentValueOfDefinedBenefitObligationMember2025-01-012025-12-310000891478san:OtherForeignCountriesNotIncludingUKMemberifrs-full:PresentValueOfDefinedBenefitObligationMember2024-01-012024-12-310000891478san:OtherForeignCountriesNotIncludingUKMemberifrs-full:PresentValueOfDefinedBenefitObligationMember2023-01-012023-12-310000891478san:OtherForeignCountriesNotIncludingUKMemberifrs-full:PresentValueOfDefinedBenefitObligationMember2025-12-310000891478san:OtherForeignCountriesNotIncludingUKMemberifrs-full:PlanAssetsMember2024-12-310000891478san:OtherForeignCountriesNotIncludingUKMemberifrs-full:PlanAssetsMember2023-12-310000891478san:OtherForeignCountriesNotIncludingUKMemberifrs-full:PlanAssetsMember2022-12-310000891478san:OtherForeignCountriesNotIncludingUKMemberifrs-full:PlanAssetsMember2025-01-012025-12-310000891478san:OtherForeignCountriesNotIncludingUKMemberifrs-full:PlanAssetsMember2024-01-012024-12-310000891478san:OtherForeignCountriesNotIncludingUKMemberifrs-full:PlanAssetsMember2023-01-012023-12-310000891478san:OtherForeignCountriesNotIncludingUKMemberifrs-full:PlanAssetsMember2025-12-310000891478san:OtherForeignCountriesNotIncludingUKMemberifrs-full:EquityInvestmentsMember2025-01-012025-12-310000891478san:OtherForeignCountriesNotIncludingUKMemberifrs-full:EquityInvestmentsMember2024-01-012024-12-310000891478san:OtherForeignCountriesNotIncludingUKMemberifrs-full:EquityInvestmentsMember2023-01-012023-12-310000891478san:OtherForeignCountriesNotIncludingUKMemberifrs-full:DebtSecuritiesMember2025-01-012025-12-310000891478san:OtherForeignCountriesNotIncludingUKMemberifrs-full:DebtSecuritiesMember2024-01-012024-12-310000891478san:OtherForeignCountriesNotIncludingUKMemberifrs-full:DebtSecuritiesMember2023-01-012023-12-310000891478san:OtherForeignCountriesNotIncludingUKMemberifrs-full:InvestmentPropertyMember2025-01-012025-12-310000891478san:OtherForeignCountriesNotIncludingUKMemberifrs-full:InvestmentPropertyMember2024-01-012024-12-310000891478san:OtherForeignCountriesNotIncludingUKMemberifrs-full:InvestmentPropertyMember2023-01-012023-12-310000891478san:OtherForeignCountriesNotIncludingUKMemberifrs-full:OtherAssetsMember2025-01-012025-12-310000891478san:OtherForeignCountriesNotIncludingUKMemberifrs-full:OtherAssetsMember2024-01-012024-12-310000891478san:OtherForeignCountriesNotIncludingUKMemberifrs-full:OtherAssetsMember2023-01-012023-12-310000891478san:OtherForeignCountriesNotIncludingUKMemberifrs-full:NotLaterThanOneYearMember2025-12-310000891478san:OtherForeignCountriesNotIncludingUKMemberifrs-full:LaterThanOneYearAndNotLaterThanTwoYearsMember2025-12-310000891478san:OtherForeignCountriesNotIncludingUKMemberifrs-full:LaterThanTwoYearsAndNotLaterThanThreeYearsMember2025-12-310000891478san:OtherForeignCountriesNotIncludingUKMemberifrs-full:LaterThanThreeYearsAndNotLaterThanFourYearsMember2025-12-310000891478san:OtherForeignCountriesNotIncludingUKMemberifrs-full:LaterThanFourYearsAndNotLaterThanFiveYearsMember2025-12-310000891478san:OtherForeignCountriesNotIncludingUKMemberifrs-full:LaterThanFiveYearsAndNotLaterThanTenYearsMember2025-12-310000891478ifrs-full:CountryOfDomicileMembersan:ProvisionsForTaxesAndOtherLegalContingenciesAndOtherProvisionsMember2025-12-310000891478ifrs-full:CountryOfDomicileMembersan:ProvisionsForTaxesAndOtherLegalContingenciesAndOtherProvisionsMember2024-12-310000891478ifrs-full:CountryOfDomicileMembersan:ProvisionsForTaxesAndOtherLegalContingenciesAndOtherProvisionsMember2023-12-310000891478san:EuropeanUnionExcludingSpainMembersan:ProvisionsForTaxesAndOtherLegalContingenciesAndOtherProvisionsMember2025-12-310000891478san:EuropeanUnionExcludingSpainMembersan:ProvisionsForTaxesAndOtherLegalContingenciesAndOtherProvisionsMember2024-12-310000891478san:EuropeanUnionExcludingSpainMembersan:ProvisionsForTaxesAndOtherLegalContingenciesAndOtherProvisionsMember2023-12-310000891478san:OtherForeignCountriesNotIncludingCountriesInEUMembersan:ProvisionsForTaxesAndOtherLegalContingenciesAndOtherProvisionsMember2025-12-310000891478san:OtherForeignCountriesNotIncludingCountriesInEUMembersan:ProvisionsForTaxesAndOtherLegalContingenciesAndOtherProvisionsMember2024-12-310000891478san:OtherForeignCountriesNotIncludingCountriesInEUMembersan:ProvisionsForTaxesAndOtherLegalContingenciesAndOtherProvisionsMember2023-12-310000891478country:BRsan:ProvisionsForTaxesAndOtherLegalContingenciesAndOtherProvisionsMember2025-12-310000891478country:BRsan:ProvisionsForTaxesAndOtherLegalContingenciesAndOtherProvisionsMember2024-12-310000891478country:BRsan:ProvisionsForTaxesAndOtherLegalContingenciesAndOtherProvisionsMember2023-12-310000891478country:GBsan:ProvisionsForTaxesAndOtherLegalContingenciesAndOtherProvisionsMember2025-12-310000891478country:GBsan:ProvisionsForTaxesAndOtherLegalContingenciesAndOtherProvisionsMember2024-12-310000891478country:GBsan:ProvisionsForTaxesAndOtherLegalContingenciesAndOtherProvisionsMember2023-12-310000891478san:FinancialConductAuthorityFCAReviewOfTheVehicleFinanceMarketMembercountry:GBsan:ProvisionsForTaxesAndOtherLegalContingenciesAndOtherProvisionsMember2025-12-310000891478san:ProvisionsForTaxesMember2025-12-310000891478san:ProvisionsForTaxesMember2024-12-310000891478san:ProvisionsForTaxesMember2023-12-310000891478country:BRsan:ProvisionsForLabourProceedingsMember2025-12-310000891478country:BRsan:ProvisionsForLabourProceedingsMember2024-12-310000891478country:BRsan:ProvisionsForLabourProceedingsMember2023-12-310000891478ifrs-full:LegalProceedingsProvisionMember2025-12-310000891478ifrs-full:LegalProceedingsProvisionMember2024-12-310000891478ifrs-full:LegalProceedingsProvisionMember2023-12-310000891478san:ProvisionForCustomerRemediationMember2025-12-310000891478san:ProvisionForCustomerRemediationMember2024-12-310000891478san:ProvisionForCustomerRemediationMember2023-12-310000891478ifrs-full:RestructuringProvisionMember2025-12-310000891478ifrs-full:RestructuringProvisionMember2024-12-310000891478ifrs-full:RestructuringProvisionMember2023-12-310000891478san:OtherProvisionMember2025-12-310000891478san:OtherProvisionMember2024-12-310000891478san:OtherProvisionMember2023-12-310000891478country:BRsan:ProvisionsForLabourProceedingsMember2025-01-012025-12-310000891478country:BRifrs-full:LegalProceedingsProvisionMember2025-01-012025-12-310000891478san:LegalCaseRelatingToProgramaDeIntegracaoSocialAndContribuicaoParaFinanciamentoDaSeguridadeSocialMember2023-06-130000891478san:BancoSantanderBrazilSASubsidiaryMembersan:LegalCaseRelatingToQuestionableDeductionOfLoanLossesInIncomeTaxReturnsMember2025-12-310000891478san:BancoSantanderBrazilSASubsidiaryMembersan:LegalCaseRelatingToTaxDeductibilityOfSaleOfSharesMember2025-12-310000891478san:BancoSantanderBrasilSAMembersan:LegalCaseRelatingToDeductionOfExpensesInIncomeTaxMember2025-12-310000891478san:BancoSantanderBrazilSASubsidiaryMembersan:LegalCaseRelatingToTaxDeductibilityOfAmortizationOfGoodwillArisingOnAcquisitionMembersan:BancoComercialEDeInvestimentoSudamerisSAMember2025-12-310000891478san:BancoSantanderBrazilSASubsidiaryMembersan:LegalCaseRelatedToTaxCompensationWithCreditsMember2025-12-310000891478san:BancoSantanderBrazilSASubsidiaryMembersan:LegalCaseRelatedToInfringementNoticesInitiatedByTaxAuthoritiesRegardingOffsettingTaxLossesMember2025-12-310000891478san:BancoSantanderBrasilSAMembersan:LegalCaseRelatedToWithholdingIncomeTaxOnPaymentsDerivedFromTechnologyServicesMember2025-12-310000891478san:BancoSantanderBrazilSASubsidiaryMembersan:LegalCaseRelatingToTaxDeductibilityOfAmortizationOfGoodwillArisingOnAcquisitionMembersan:GetnetTecnologiaProcesSAMember2025-12-310000891478san:BancoSantanderBrasilSAMember2025-12-310000891478san:BancoSantanderBrasilSaSubsidiaryMember2025-12-310000891478san:SantanderInsuranceServicesUKLimitedMembersan:ProvisionForCompensationAndAssociatedCostInRespectOfPPIPoliciesMember2025-12-310000891478san:SantanderInsuranceServicesUKLimitedMembersan:ProvisionForCompensationAndAssociatedCostInRespectOfPPIPoliciesInterestMember2025-12-310000891478san:FinancialConductAuthorityFCAReviewOfTheVehicleFinanceMarketMembercountry:GBsan:ProvisionsForTaxesAndOtherLegalContingenciesAndOtherProvisionsMember2024-12-310000891478san:FinancialConductAuthorityFCAReviewOfTheVehicleFinanceMarketMembercountry:GBsan:ProvisionsForTaxesAndOtherLegalContingenciesAndOtherProvisionsMember2025-01-012025-12-310000891478san:LegalCaseToRequestCourtJudgmentOnValidityOfSwapsMember2025-01-012025-12-310000891478san:LegalCaseToRequestCourtJudgmentOnValidityOfSwapsMember2021-09-162021-09-160000891478san:PlanosEconomicosMember2020-05-292020-05-290000891478san:BancoSantanderBrasilSAMembersan:PlanosEconomicosMember2025-12-310000891478san:BancoPopularsCompensationRequestMember2024-11-220000891478san:BancoPopularEspanolSAMember2017-12-310000891478san:TaxDividendCumExTransactionsMember2025-12-310000891478san:IndividualPlaintiffCEOFunctionsMember2021-01-012021-05-160000891478san:IndividualPlaintiffCEOFunctionsMember2021-05-172022-12-310000891478san:IndividualPlaintiffCEOFunctionsMember2021-12-092021-12-090000891478san:IndividualPlaintiffCEOFunctionsMember2022-01-132022-01-130000891478san:ShareBasedVariableRemunerationAward2018Membersan:IndividualPlaintiffCEOFunctionsMember2022-12-312022-12-310000891478san:IndividualPlaintiffCEOFunctionsMember2025-12-310000891478san:IndividualPlaintiffCEOFunctionsMember2023-02-062023-02-060000891478san:IndividualPlaintiffCEOFunctionsMember2023-07-112023-07-110000891478san:SantanderBankPolskaAndSantanderConsumerBankPolandMembersan:ConversionOfActiveLoansFromSwissFrancsToPLNLoansMember2025-12-310000891478san:SantanderBankPolskaAndSantanderConsumerBankPolandMembersan:ConversionOfActiveLoansFromSwissFrancsToPLNLoansMembersan:ActiveLoansUnderIAS37Member2025-12-310000891478san:SantanderBankPolskaAndSantanderConsumerBankPolandMembersan:ConversionOfActiveLoansFromSwissFrancsToPLNLoansMember2025-01-012025-12-310000891478san:SantanderBankPolskaAndSantanderConsumerBankPolandMembersan:ConversionOfActiveLoansFromSwissFrancsToPLNLoansMembersan:ActiveLoansUnderIAS37Member2025-01-012025-12-310000891478san:SantanderBankPolskaSAMember2025-12-310000891478san:SantanderBankPolskaSAMembersan:ConversionOfActiveLoansFromSwissFrancsToPLNLoansMember2025-12-310000891478san:SantanderConsumerBankPolskaMember2025-12-310000891478san:SantanderConsumerBankPolskaMembersan:ConversionOfActiveLoansFromSwissFrancsToPLNLoansMember2025-12-310000891478san:BancoSantanderMexicoSAInstitucionDeBancaMultipleGrupoFinancieroSantanderMexicoMembersan:InheritanceTrustMember1994-01-011994-12-310000891478san:BancoSantanderMexicoSAInstitucionDeBancaMultipleGrupoFinancieroSantanderMexicoMembersan:InheritanceTrustMember1999-01-011999-12-310000891478san:SpanishSupremeCourtMortgageExpensesMember2019-01-230000891478san:SpanishSupremeCourtMortgageExpensesMember2024-04-250000891478san:SpanishSupremeCourtMortgageExpensesMember2024-12-310000891478country:ES2023-01-012023-12-310000891478country:ES2025-01-012025-12-310000891478country:ES2024-01-012024-12-310000891478country:BR2025-01-012025-12-310000891478country:BR2024-01-012024-12-310000891478country:BR2023-01-012023-12-310000891478country:US2025-01-012025-12-310000891478country:US2024-01-012024-12-310000891478country:US2023-01-012023-12-310000891478country:CL2025-01-012025-12-310000891478country:CL2024-01-012024-12-310000891478country:CL2023-01-012023-12-310000891478country:PL2025-01-012025-12-310000891478country:PL2024-01-012024-12-310000891478country:PL2023-01-012023-12-310000891478san:MonetizableTaxAssetsMember2025-12-310000891478san:NonMonetizableTaxAssetsMember2025-12-310000891478san:MonetizableTaxAssetsMember2024-12-310000891478san:NonMonetizableTaxAssetsMember2024-12-310000891478san:MonetizableTaxAssetsMember2023-12-310000891478san:NonMonetizableTaxAssetsMember2023-12-310000891478san:NonMonetizableTaxAssetsMembersan:UnusedTaxLossesAndTaxCreditsMember2025-12-310000891478san:NonMonetizableTaxAssetsMembersan:UnusedTaxLossesAndTaxCreditsMember2024-12-310000891478san:NonMonetizableTaxAssetsMembersan:UnusedTaxLossesAndTaxCreditsMember2023-12-310000891478san:MonetizableTaxAssetsMemberifrs-full:TemporaryDifferenceMember2025-12-310000891478san:NonMonetizableTaxAssetsMemberifrs-full:TemporaryDifferenceMember2025-12-310000891478san:MonetizableTaxAssetsMemberifrs-full:TemporaryDifferenceMember2024-12-310000891478san:NonMonetizableTaxAssetsMemberifrs-full:TemporaryDifferenceMember2024-12-310000891478san:MonetizableTaxAssetsMemberifrs-full:TemporaryDifferenceMember2023-12-310000891478san:NonMonetizableTaxAssetsMemberifrs-full:TemporaryDifferenceMember2023-12-310000891478san:NonMonetizableTaxAssetsMembersan:NonDeductibleProvisionsMember2025-12-310000891478san:NonMonetizableTaxAssetsMembersan:NonDeductibleProvisionsMember2024-12-310000891478san:NonMonetizableTaxAssetsMembersan:NonDeductibleProvisionsMember2023-12-310000891478san:NonMonetizableTaxAssetsMembersan:ValuationOfFinancialInstrumentsMember2025-12-310000891478san:NonMonetizableTaxAssetsMembersan:ValuationOfFinancialInstrumentsMember2024-12-310000891478san:NonMonetizableTaxAssetsMembersan:ValuationOfFinancialInstrumentsMember2023-12-310000891478san:MonetizableTaxAssetsMembersan:LoanLossesMember2025-12-310000891478san:NonMonetizableTaxAssetsMembersan:LoanLossesMember2025-12-310000891478san:MonetizableTaxAssetsMembersan:LoanLossesMember2024-12-310000891478san:NonMonetizableTaxAssetsMembersan:LoanLossesMember2024-12-310000891478san:MonetizableTaxAssetsMembersan:LoanLossesMember2023-12-310000891478san:NonMonetizableTaxAssetsMembersan:LoanLossesMember2023-12-310000891478san:MonetizableTaxAssetsMembersan:PensionsMember2025-12-310000891478san:NonMonetizableTaxAssetsMembersan:PensionsMember2025-12-310000891478san:MonetizableTaxAssetsMembersan:PensionsMember2024-12-310000891478san:NonMonetizableTaxAssetsMembersan:PensionsMember2024-12-310000891478san:MonetizableTaxAssetsMembersan:PensionsMember2023-12-310000891478san:NonMonetizableTaxAssetsMembersan:PensionsMember2023-12-310000891478san:NonMonetizableTaxAssetsMembersan:ValuationOfTangibleAndIntangibleAssetsMember2025-12-310000891478san:NonMonetizableTaxAssetsMembersan:ValuationOfTangibleAndIntangibleAssetsMember2024-12-310000891478san:NonMonetizableTaxAssetsMembersan:ValuationOfTangibleAndIntangibleAssetsMember2023-12-310000891478ifrs-full:TemporaryDifferenceMember2025-12-310000891478ifrs-full:TemporaryDifferenceMember2024-12-310000891478ifrs-full:TemporaryDifferenceMember2023-12-310000891478san:ValuationOfFinancialInstrumentsMember2025-12-310000891478san:ValuationOfFinancialInstrumentsMember2024-12-310000891478san:ValuationOfFinancialInstrumentsMember2023-12-310000891478san:ValuationOfTangibleAndIntangibleAssetsMember2025-12-310000891478san:ValuationOfTangibleAndIntangibleAssetsMember2024-12-310000891478san:ValuationOfTangibleAndIntangibleAssetsMember2023-12-310000891478san:InvestmentsInGroupCompaniesMember2025-12-310000891478san:InvestmentsInGroupCompaniesMember2024-12-310000891478san:InvestmentsInGroupCompaniesMember2023-12-310000891478san:BancoPopularEspanolSAMember2017-12-310000891478san:ActuarialAssumptionOfGrowthMemberifrs-full:CountryOfDomicileMember2025-01-012025-12-310000891478ifrs-full:ActuarialAssumptionOfExpectedRatesOfInflationMemberifrs-full:CountryOfDomicileMember2025-01-012025-12-310000891478ifrs-full:CountryOfDomicileMembersan:MonetizableTaxAssetsMemberifrs-full:TemporaryDifferenceMember2025-12-310000891478ifrs-full:CountryOfDomicileMembersan:NonMonetizableTaxAssetsMemberifrs-full:TemporaryDifferenceMember2025-12-310000891478san:UnusedTaxLossesAndTaxCreditsMemberifrs-full:CountryOfDomicileMember2025-12-310000891478country:BRsan:MonetizableTaxAssetsMemberifrs-full:TemporaryDifferenceMember2025-12-310000891478country:BRsan:NonMonetizableTaxAssetsMemberifrs-full:TemporaryDifferenceMember2025-12-310000891478san:UnusedTaxLossesAndTaxCreditsMembercountry:BR2025-12-310000891478country:MX2025-12-310000891478ifrs-full:TemporaryDifferenceMembercountry:MX2025-12-310000891478san:UnusedTaxLossesAndTaxCreditsMembercountry:MX2025-12-310000891478country:US2025-12-310000891478ifrs-full:TemporaryDifferenceMembercountry:US2025-12-310000891478san:UnusedTaxLossesAndTaxCreditsMembercountry:US2025-12-310000891478ifrs-full:TemporaryDifferenceMember2025-01-012025-12-310000891478san:UnusedTaxLossesAndTaxCreditsMember2024-12-310000891478san:UnusedTaxLossesAndTaxCreditsMember2025-01-012025-12-310000891478san:UnusedTaxLossesAndTaxCreditsMember2025-12-310000891478san:MonetizableTaxAssetsMemberifrs-full:TemporaryDifferenceMember2025-01-012025-12-310000891478san:UnusedTaxLossesAndTaxCreditsMember2023-12-310000891478san:UnusedTaxLossesAndTaxCreditsMember2024-01-012024-12-310000891478ifrs-full:TemporaryDifferenceMember2024-01-012024-12-310000891478san:MonetizableTaxAssetsMemberifrs-full:TemporaryDifferenceMember2024-01-012024-12-310000891478san:UnusedTaxLossesAndTaxCreditsMember2022-12-310000891478san:UnusedTaxLossesAndTaxCreditsMember2023-01-012023-12-310000891478ifrs-full:TemporaryDifferenceMember2022-12-310000891478ifrs-full:TemporaryDifferenceMember2023-01-012023-12-310000891478san:MonetizableTaxAssetsMemberifrs-full:TemporaryDifferenceMember2022-12-310000891478san:MonetizableTaxAssetsMemberifrs-full:TemporaryDifferenceMember2023-01-012023-12-310000891478san:Law382022TaxReformMember2023-01-012023-12-310000891478san:Law382022TaxReformMember2024-01-012024-12-310000891478san:DecreeLaw92024Member2025-01-012025-12-310000891478san:Law72024TaxReformMember2025-01-012025-12-310000891478san:SantanderBankPolskaSAMember2024-12-310000891478san:SantanderBankPolskaSAMember2023-12-310000891478san:GrupoPSAMember2025-12-310000891478san:GrupoPSAMember2024-12-310000891478san:GrupoPSAMember2023-12-310000891478san:BancoSantanderChileMember2025-12-310000891478san:BancoSantanderChileMember2024-12-310000891478san:BancoSantanderChileMember2023-12-310000891478san:BancoSantanderBrasilSAMember2024-12-310000891478san:BancoSantanderBrasilSAMember2023-12-310000891478san:OtherCompaniesMember2025-12-310000891478san:OtherCompaniesMember2024-12-310000891478san:OtherCompaniesMember2023-12-310000891478san:GrupoPSAMember2025-01-012025-12-310000891478san:GrupoPSAMember2024-01-012024-12-310000891478san:GrupoPSAMember2023-01-012023-12-310000891478san:BancoSantanderChileMember2025-01-012025-12-310000891478san:BancoSantanderChileMember2024-01-012024-12-310000891478san:BancoSantanderChileMember2023-01-012023-12-310000891478san:BancoSantanderBrasilSAMember2025-01-012025-12-310000891478san:BancoSantanderBrasilSAMember2024-01-012024-12-310000891478san:BancoSantanderBrasilSAMember2023-01-012023-12-310000891478san:OtherCompaniesMember2025-01-012025-12-310000891478san:OtherCompaniesMember2024-01-012024-12-310000891478san:OtherCompaniesMember2023-01-012023-12-310000891478san:FixedRateResetPerpetualATOneCapitalSecuritiesMembersan:SantanderUKPLCMember2023-12-310000891478san:FixedRateResetPerpetualATOneCapitalSecuritiesMembersan:SantanderUKPLCMember2024-12-310000891478ifrs-full:NoncontrollingInterestsMember2024-12-310000891478ifrs-full:NoncontrollingInterestsMember2023-12-310000891478ifrs-full:NoncontrollingInterestsMember2022-12-310000891478san:NonControllingInterestsOtherComprehensiveIncomeMember2025-01-012025-12-310000891478san:NonControllingInterestsOtherComprehensiveIncomeMember2024-01-012024-12-310000891478san:NonControllingInterestsOtherComprehensiveIncomeMember2023-01-012023-12-310000891478san:NonControllingInterestsOtherElementsMember2025-01-012025-12-310000891478san:NonControllingInterestsOtherElementsMember2024-01-012024-12-310000891478san:NonControllingInterestsOtherElementsMember2023-01-012023-12-310000891478ifrs-full:NoncontrollingInterestsMember2025-12-310000891478san:FixedRateResetPerpetualATOneCapitalSecuritiesMember2024-01-012024-12-310000891478san:SantanderBankPolskaSAMember2025-12-310000891478san:BancoSantanderBrasilSAMember2025-12-310000891478san:BancoSantanderChileMember2025-12-310000891478san:GrupoPSAMember2025-12-310000891478san:SantanderBankPolskaSAMember2025-01-012025-12-310000891478san:BancoSantanderBrasilSAMember2025-01-012025-12-310000891478san:BancoSantanderChileMember2025-01-012025-12-310000891478san:GrupoPSAMember2025-01-012025-12-310000891478country:BR2024-12-310000891478san:OtherRegionsMember2025-01-012025-12-310000891478san:EquityInstrumentsDomesticMemberifrs-full:CountryOfDomicileMember2025-12-310000891478san:EquityInstrumentsInternationalMembersan:EuropeExcludingSpainMember2025-12-310000891478san:EquityInstrumentsInternationalMembercountry:US2025-12-310000891478san:EquityInstrumentsInternationalMembersan:LatinAmericaAndRestOfTheWorldMember2025-12-310000891478san:ListedMember2025-12-310000891478san:UnlistedMember2025-12-310000891478san:EquityInstrumentsDomesticMemberifrs-full:CountryOfDomicileMember2024-12-310000891478san:EquityInstrumentsInternationalMembersan:EuropeExcludingSpainMember2024-12-310000891478san:EquityInstrumentsInternationalMembercountry:US2024-12-310000891478san:EquityInstrumentsInternationalMembersan:LatinAmericaAndRestOfTheWorldMember2024-12-310000891478san:ListedMember2024-12-310000891478san:UnlistedMember2024-12-310000891478san:EquityInstrumentsDomesticMemberifrs-full:CountryOfDomicileMember2023-12-310000891478san:EquityInstrumentsInternationalMembersan:EuropeExcludingSpainMember2023-12-310000891478san:EquityInstrumentsInternationalMembercountry:US2023-12-310000891478san:EquityInstrumentsInternationalMembersan:LatinAmericaAndRestOfTheWorldMember2023-12-310000891478san:ListedMember2023-12-310000891478san:UnlistedMember2023-12-310000891478ifrs-full:GoodwillMember2025-01-012025-12-310000891478ifrs-full:GoodwillMember2024-01-012024-12-310000891478ifrs-full:GoodwillMember2023-01-012023-12-310000891478san:GrupoSantanderMembercurrency:BRL2024-12-310000891478san:GrupoSantanderMembercurrency:BRL2025-12-310000891478san:GrupoSantanderMembercurrency:BRL2025-01-012025-12-310000891478san:GrupoSantanderMembercurrency:GBP2024-12-310000891478san:GrupoSantanderMembercurrency:GBP2025-12-310000891478san:GrupoSantanderMembercurrency:GBP2025-01-012025-12-310000891478san:GrupoSantanderMembercurrency:MXN2024-12-310000891478san:GrupoSantanderMembercurrency:MXN2025-12-310000891478san:GrupoSantanderMembercurrency:MXN2025-01-012025-12-310000891478san:GrupoSantanderMembercurrency:ARS2024-12-310000891478san:GrupoSantanderMembercurrency:ARS2025-12-310000891478san:GrupoSantanderMembercurrency:ARS2025-01-012025-12-310000891478san:GrupoSantanderMembercurrency:CLP2024-12-310000891478san:GrupoSantanderMembercurrency:CLP2025-12-310000891478san:GrupoSantanderMembercurrency:CLP2025-01-012025-12-310000891478san:GrupoSantanderMembercurrency:USD2024-12-310000891478san:GrupoSantanderMembercurrency:USD2025-12-310000891478san:GrupoSantanderMembercurrency:USD2025-01-012025-12-310000891478san:GrupoSantanderMembercurrency:PLN2024-12-310000891478san:GrupoSantanderMembercurrency:PLN2025-12-310000891478san:GrupoSantanderMembercurrency:PLN2025-01-012025-12-310000891478san:GrupoSantanderMembersan:OtherCurrenciesMember2024-12-310000891478san:GrupoSantanderMembersan:OtherCurrenciesMember2025-12-310000891478san:GrupoSantanderMembersan:OtherCurrenciesMember2025-01-012025-12-310000891478san:GrupoSantanderMember2024-12-310000891478san:GrupoSantanderMember2025-12-310000891478san:GrupoSantanderMember2025-01-012025-12-310000891478san:GrupoSantanderMembercurrency:BRL2023-12-310000891478san:GrupoSantanderMembercurrency:BRL2024-01-012024-12-310000891478san:GrupoSantanderMembercurrency:GBP2023-12-310000891478san:GrupoSantanderMembercurrency:GBP2024-01-012024-12-310000891478san:GrupoSantanderMembercurrency:MXN2023-12-310000891478san:GrupoSantanderMembercurrency:MXN2024-01-012024-12-310000891478san:GrupoSantanderMembercurrency:ARS2023-12-310000891478san:GrupoSantanderMembercurrency:ARS2024-01-012024-12-310000891478san:GrupoSantanderMembercurrency:CLP2023-12-310000891478san:GrupoSantanderMembercurrency:CLP2024-01-012024-12-310000891478san:GrupoSantanderMembercurrency:USD2023-12-310000891478san:GrupoSantanderMembercurrency:USD2024-01-012024-12-310000891478san:GrupoSantanderMembercurrency:PLN2023-12-310000891478san:GrupoSantanderMembercurrency:PLN2024-01-012024-12-310000891478san:GrupoSantanderMembersan:OtherCurrenciesMember2023-12-310000891478san:GrupoSantanderMembersan:OtherCurrenciesMember2024-01-012024-12-310000891478san:GrupoSantanderMember2023-12-310000891478san:GrupoSantanderMember2024-01-012024-12-310000891478san:GrupoSantanderMembercurrency:BRL2022-12-310000891478san:GrupoSantanderMembercurrency:BRL2023-01-012023-12-310000891478san:GrupoSantanderMembercurrency:GBP2022-12-310000891478san:GrupoSantanderMembercurrency:GBP2023-01-012023-12-310000891478san:GrupoSantanderMembercurrency:MXN2022-12-310000891478san:GrupoSantanderMembercurrency:MXN2023-01-012023-12-310000891478san:GrupoSantanderMembercurrency:ARS2022-12-310000891478san:GrupoSantanderMembercurrency:ARS2023-01-012023-12-310000891478san:GrupoSantanderMembercurrency:CLP2022-12-310000891478san:GrupoSantanderMembercurrency:CLP2023-01-012023-12-310000891478san:GrupoSantanderMembercurrency:USD2022-12-310000891478san:GrupoSantanderMembercurrency:USD2023-01-012023-12-310000891478san:GrupoSantanderMembercurrency:PLN2022-12-310000891478san:GrupoSantanderMembercurrency:PLN2023-01-012023-12-310000891478san:GrupoSantanderMembersan:OtherCurrenciesMember2022-12-310000891478san:GrupoSantanderMembersan:OtherCurrenciesMember2023-01-012023-12-310000891478san:GrupoSantanderMember2022-12-310000891478san:GrupoSantanderMember2023-01-012023-12-310000891478san:DebtInstrumentsIssuedByPublicSectorMemberifrs-full:CountryOfDomicileMember2025-12-310000891478san:DebtInstrumentsIssuedByPublicSectorMembersan:EuropeExcludingSpainMember2025-12-310000891478san:DebtInstrumentsIssuedByPublicSectorMembersan:AmericaAndRestOfTheWorldMember2025-12-310000891478san:DebtInstrumentsIssuedByPrivateSectorMemberifrs-full:CountryOfDomicileMember2025-12-310000891478san:DebtInstrumentsIssuedByPrivateSectorMembersan:EuropeExcludingSpainMember2025-12-310000891478san:DebtInstrumentsIssuedByPrivateSectorMembersan:AmericaAndRestOfTheWorldMember2025-12-310000891478san:DebtSecuritiesAndLoanAndAdvancesMember2025-12-310000891478san:DebtInstrumentsIssuedByPublicSectorMemberifrs-full:CountryOfDomicileMember2024-12-310000891478san:DebtInstrumentsIssuedByPublicSectorMembersan:EuropeExcludingSpainMember2024-12-310000891478san:DebtInstrumentsIssuedByPublicSectorMembersan:AmericaAndRestOfTheWorldMember2024-12-310000891478san:DebtInstrumentsIssuedByPrivateSectorMemberifrs-full:CountryOfDomicileMember2024-12-310000891478san:DebtInstrumentsIssuedByPrivateSectorMembersan:EuropeExcludingSpainMember2024-12-310000891478san:DebtInstrumentsIssuedByPrivateSectorMembersan:AmericaAndRestOfTheWorldMember2024-12-310000891478san:DebtSecuritiesAndLoanAndAdvancesMember2024-12-310000891478san:DebtInstrumentsIssuedByPublicSectorMemberifrs-full:CountryOfDomicileMember2023-12-310000891478san:DebtInstrumentsIssuedByPublicSectorMembersan:EuropeExcludingSpainMember2023-12-310000891478san:DebtInstrumentsIssuedByPublicSectorMembersan:AmericaAndRestOfTheWorldMember2023-12-310000891478san:DebtInstrumentsIssuedByPrivateSectorMemberifrs-full:CountryOfDomicileMember2023-12-310000891478san:DebtInstrumentsIssuedByPrivateSectorMembersan:EuropeExcludingSpainMember2023-12-310000891478san:DebtInstrumentsIssuedByPrivateSectorMembersan:AmericaAndRestOfTheWorldMember2023-12-310000891478san:DebtSecuritiesAndLoanAndAdvancesMember2023-12-310000891478ifrs-full:InvestmentsAccountedForUsingEquityMethodMember2025-12-310000891478ifrs-full:InvestmentsAccountedForUsingEquityMethodMember2024-12-310000891478ifrs-full:InvestmentsAccountedForUsingEquityMethodMember2023-12-310000891478ifrs-full:InvestmentsAccountedForUsingEquityMethodMember2025-01-012025-12-310000891478ifrs-full:InvestmentsAccountedForUsingEquityMethodMember2024-01-012024-12-310000891478ifrs-full:InvestmentsAccountedForUsingEquityMethodMember2023-01-012023-12-310000891478ifrs-full:TreasurySharesMember2023-03-212023-03-210000891478ifrs-full:TreasurySharesMember2023-06-302023-06-300000891478san:A2023ProgramMember2023-01-012023-12-310000891478ifrs-full:TreasurySharesMember2024-02-052024-02-050000891478ifrs-full:TreasurySharesMember2024-07-012024-07-010000891478ifrs-full:TreasurySharesMember2024-12-202024-12-200000891478ifrs-full:TreasurySharesMember2025-06-032025-06-030000891478ifrs-full:TreasurySharesMember2025-12-232025-12-230000891478san:StateStreetBankMember2025-12-310000891478san:ChaseNomineesLtdMember2025-12-310000891478san:BankOfNewYorkMellonCorporationMember2025-12-310000891478san:CitibankMember2025-12-310000891478san:BNPParibasMember2025-12-310000891478san:CaceisBankMember2025-12-310000891478san:TheNorthernTrustMember2025-12-310000891478san:SantanderUKGroupMember2025-12-310000891478san:SantanderUKGroupMember2024-12-310000891478san:SantanderUKGroupMember2023-12-310000891478san:BancoSantanderMexicoSAInstitucionDeBancaMultipleGrupoFinancieroSantanderMexicoMember2025-12-310000891478san:BancoSantanderMexicoSAInstitucionDeBancaMultipleGrupoFinancieroSantanderMexicoMember2024-12-310000891478san:BancoSantanderMexicoSAInstitucionDeBancaMultipleGrupoFinancieroSantanderMexicoMember2023-12-310000891478san:SantanderConsumerFinanceGroupMember2025-12-310000891478san:SantanderConsumerFinanceGroupMember2024-12-310000891478san:SantanderConsumerFinanceGroupMember2023-12-310000891478san:BancoSantanderArgentinaSAMember2025-12-310000891478san:BancoSantanderArgentinaSAMember2024-12-310000891478san:BancoSantanderArgentinaSAMember2023-12-310000891478san:BancoSantanderTottaSAMember2025-12-310000891478san:BancoSantanderTottaSAMember2024-12-310000891478san:BancoSantanderTottaSAMember2023-12-310000891478san:SantanderHoldingsUSAIncMember2025-12-310000891478san:SantanderHoldingsUSAIncMember2024-12-310000891478san:SantanderHoldingsUSAIncMember2023-12-310000891478san:SantanderInvestmentSAMember2025-12-310000891478san:SantanderInvestmentSAMember2024-12-310000891478san:SantanderInvestmentSAMember2023-12-310000891478san:SantanderSegurosYReasegurosCompaniaAseguradoraSAMember2025-12-310000891478san:SantanderSegurosYReasegurosCompaniaAseguradoraSAMember2024-12-310000891478san:SantanderSegurosYReasegurosCompaniaAseguradoraSAMember2023-12-310000891478san:BancoSantanderInternationalSAMember2025-12-310000891478san:BancoSantanderInternationalSAMember2024-12-310000891478san:BancoSantanderInternationalSAMember2023-12-310000891478san:OtherCompaniesExchangeDifferencesAndConsolidationAdjustmentsMember2025-12-310000891478san:OtherCompaniesExchangeDifferencesAndConsolidationAdjustmentsMember2024-12-310000891478san:OtherCompaniesExchangeDifferencesAndConsolidationAdjustmentsMember2023-12-3100008914782017-09-080000891478san:A2023ProgramSecondMember2024-01-012024-12-310000891478san:A2024ProgramMember2024-01-012024-12-310000891478san:A2024ProgramSecondMember2025-01-012025-12-310000891478san:A2025ProgramMember2025-01-012025-12-310000891478ifrs-full:LoanCommitmentsMemberifrs-full:FinancialInstrumentsCreditimpairedMember2025-12-310000891478ifrs-full:LoanCommitmentsMemberifrs-full:FinancialInstrumentsCreditimpairedMember2024-12-310000891478ifrs-full:LoanCommitmentsMemberifrs-full:FinancialInstrumentsCreditimpairedMember2023-12-310000891478ifrs-full:FinancialGuaranteeContractsMemberifrs-full:FinancialInstrumentsCreditimpairedMember2025-12-310000891478ifrs-full:FinancialGuaranteeContractsMemberifrs-full:FinancialInstrumentsCreditimpairedMember2024-12-310000891478ifrs-full:FinancialGuaranteeContractsMemberifrs-full:FinancialInstrumentsCreditimpairedMember2023-12-310000891478san:BankSuretiesGrantedMember2025-12-310000891478san:BankSuretiesGrantedMember2024-12-310000891478san:BankSuretiesGrantedMember2023-12-310000891478san:SoldCreditDerivativesMember2025-12-310000891478san:SoldCreditDerivativesMember2024-12-310000891478san:SoldCreditDerivativesMember2023-12-310000891478san:OtherCommitmentsMemberifrs-full:FinancialInstrumentsCreditimpairedMember2025-12-310000891478san:OtherCommitmentsMemberifrs-full:FinancialInstrumentsCreditimpairedMember2024-12-310000891478san:OtherCommitmentsMemberifrs-full:FinancialInstrumentsCreditimpairedMember2023-12-310000891478san:OtherGrantedGuaranteesMember2025-12-310000891478san:OtherGrantedGuaranteesMember2024-12-310000891478san:OtherGrantedGuaranteesMember2023-12-310000891478san:OtherContingentCommitmentsMember2025-12-310000891478san:OtherContingentCommitmentsMember2024-12-310000891478san:OtherContingentCommitmentsMember2023-12-310000891478ifrs-full:TwelvemonthExpectedCreditLossesMemberifrs-full:FinancialInstrumentsNotCreditimpairedMember2025-12-310000891478ifrs-full:TwelvemonthExpectedCreditLossesMemberifrs-full:FinancialInstrumentsNotCreditimpairedMembersan:CommitmentsAndGuaranteesGivenProvisionMember2025-12-310000891478ifrs-full:TwelvemonthExpectedCreditLossesMemberifrs-full:FinancialInstrumentsNotCreditimpairedMember2024-12-310000891478ifrs-full:TwelvemonthExpectedCreditLossesMemberifrs-full:FinancialInstrumentsNotCreditimpairedMembersan:CommitmentsAndGuaranteesGivenProvisionMember2024-12-310000891478ifrs-full:TwelvemonthExpectedCreditLossesMemberifrs-full:FinancialInstrumentsNotCreditimpairedMember2023-12-310000891478ifrs-full:TwelvemonthExpectedCreditLossesMemberifrs-full:FinancialInstrumentsNotCreditimpairedMembersan:CommitmentsAndGuaranteesGivenProvisionMember2023-12-310000891478ifrs-full:LifetimeExpectedCreditLossesMemberifrs-full:FinancialInstrumentsNotCreditimpairedMember2025-12-310000891478ifrs-full:LifetimeExpectedCreditLossesMemberifrs-full:FinancialInstrumentsNotCreditimpairedMembersan:CommitmentsAndGuaranteesGivenProvisionMember2025-12-310000891478ifrs-full:LifetimeExpectedCreditLossesMemberifrs-full:FinancialInstrumentsNotCreditimpairedMember2024-12-310000891478ifrs-full:LifetimeExpectedCreditLossesMemberifrs-full:FinancialInstrumentsNotCreditimpairedMembersan:CommitmentsAndGuaranteesGivenProvisionMember2024-12-310000891478ifrs-full:LifetimeExpectedCreditLossesMemberifrs-full:FinancialInstrumentsNotCreditimpairedMember2023-12-310000891478ifrs-full:LifetimeExpectedCreditLossesMemberifrs-full:FinancialInstrumentsNotCreditimpairedMembersan:CommitmentsAndGuaranteesGivenProvisionMember2023-12-310000891478ifrs-full:LifetimeExpectedCreditLossesMemberifrs-full:FinancialInstrumentsCreditimpairedMember2025-12-310000891478ifrs-full:LifetimeExpectedCreditLossesMemberifrs-full:FinancialInstrumentsCreditimpairedMembersan:CommitmentsAndGuaranteesGivenProvisionMember2025-12-310000891478ifrs-full:LifetimeExpectedCreditLossesMemberifrs-full:FinancialInstrumentsCreditimpairedMember2024-12-310000891478ifrs-full:LifetimeExpectedCreditLossesMemberifrs-full:FinancialInstrumentsCreditimpairedMembersan:CommitmentsAndGuaranteesGivenProvisionMember2024-12-310000891478ifrs-full:LifetimeExpectedCreditLossesMemberifrs-full:FinancialInstrumentsCreditimpairedMember2023-12-310000891478ifrs-full:LifetimeExpectedCreditLossesMemberifrs-full:FinancialInstrumentsCreditimpairedMembersan:CommitmentsAndGuaranteesGivenProvisionMember2023-12-310000891478ifrs-full:InvestmentFundsMember2025-12-310000891478ifrs-full:InvestmentFundsMember2024-12-310000891478ifrs-full:InvestmentFundsMember2023-12-310000891478san:PensionFundsMember2025-12-310000891478san:PensionFundsMember2024-12-310000891478san:PensionFundsMember2023-12-310000891478san:AssetsUnderManagementMember2025-12-310000891478san:AssetsUnderManagementMember2024-12-310000891478san:AssetsUnderManagementMember2023-12-310000891478ifrs-full:FairValueHedgesMember2025-12-310000891478ifrs-full:FairValueHedgesMember2025-01-012025-12-310000891478ifrs-full:InterestRateRiskMemberifrs-full:FairValueHedgesMember2025-12-310000891478ifrs-full:InterestRateRiskMemberifrs-full:FairValueHedgesMember2025-01-012025-12-310000891478ifrs-full:InterestRateSwapContractMemberifrs-full:InterestRateRiskMemberifrs-full:FairValueHedgesMember2025-12-310000891478ifrs-full:InterestRateSwapContractMemberifrs-full:InterestRateRiskMemberifrs-full:FairValueHedgesMember2025-01-012025-12-310000891478ifrs-full:FuturesContractMemberifrs-full:InterestRateRiskMemberifrs-full:FairValueHedgesMember2025-12-310000891478ifrs-full:FuturesContractMemberifrs-full:InterestRateRiskMemberifrs-full:FairValueHedgesMember2025-01-012025-12-310000891478san:CapsFloorsMemberifrs-full:InterestRateRiskMemberifrs-full:FairValueHedgesMember2025-12-310000891478san:CapsFloorsMemberifrs-full:InterestRateRiskMemberifrs-full:FairValueHedgesMember2025-01-012025-12-310000891478ifrs-full:CurrencyRiskMemberifrs-full:FairValueHedgesMember2025-12-310000891478ifrs-full:CurrencyRiskMemberifrs-full:FairValueHedgesMember2025-01-012025-12-310000891478san:ForeignExchangeForwardContractMemberifrs-full:CurrencyRiskMemberifrs-full:FairValueHedgesMember2025-12-310000891478san:ForeignExchangeForwardContractMemberifrs-full:CurrencyRiskMemberifrs-full:FairValueHedgesMember2025-01-012025-12-310000891478san:ForeignExchangeSwapMemberifrs-full:CurrencyRiskMemberifrs-full:FairValueHedgesMember2025-12-310000891478san:ForeignExchangeSwapMemberifrs-full:CurrencyRiskMemberifrs-full:FairValueHedgesMember2025-01-012025-12-310000891478ifrs-full:FuturesContractMemberifrs-full:CurrencyRiskMemberifrs-full:FairValueHedgesMember2025-12-310000891478ifrs-full:FuturesContractMemberifrs-full:CurrencyRiskMemberifrs-full:FairValueHedgesMember2025-01-012025-12-310000891478san:InterestRateAndExchangeRateRiskMemberifrs-full:FairValueHedgesMember2025-12-310000891478san:InterestRateAndExchangeRateRiskMemberifrs-full:FairValueHedgesMember2025-01-012025-12-310000891478ifrs-full:InterestRateSwapContractMembersan:InterestRateAndExchangeRateRiskMemberifrs-full:FairValueHedgesMember2025-12-310000891478ifrs-full:InterestRateSwapContractMembersan:InterestRateAndExchangeRateRiskMemberifrs-full:FairValueHedgesMember2025-01-012025-12-310000891478ifrs-full:CurrencySwapContractMembersan:InterestRateAndExchangeRateRiskMemberifrs-full:FairValueHedgesMember2025-12-310000891478ifrs-full:CurrencySwapContractMembersan:InterestRateAndExchangeRateRiskMemberifrs-full:FairValueHedgesMember2025-01-012025-12-310000891478san:BaseRiskMemberifrs-full:FairValueHedgesMember2025-12-310000891478san:BaseRiskMemberifrs-full:FairValueHedgesMember2025-01-012025-12-310000891478ifrs-full:InterestRateSwapContractMembersan:BaseRiskMemberifrs-full:FairValueHedgesMember2025-12-310000891478ifrs-full:InterestRateSwapContractMembersan:BaseRiskMemberifrs-full:FairValueHedgesMember2025-01-012025-12-310000891478san:InflationRiskMemberifrs-full:FairValueHedgesMember2025-12-310000891478san:InflationRiskMemberifrs-full:FairValueHedgesMember2025-01-012025-12-310000891478san:InflationSwapContractMembersan:InflationRiskMemberifrs-full:FairValueHedgesMember2025-12-310000891478san:InflationSwapContractMembersan:InflationRiskMemberifrs-full:FairValueHedgesMember2025-01-012025-12-310000891478ifrs-full:CashFlowHedgesMember2025-12-310000891478ifrs-full:CashFlowHedgesMember2025-01-012025-12-310000891478ifrs-full:InterestRateRiskMemberifrs-full:CashFlowHedgesMember2025-12-310000891478ifrs-full:InterestRateRiskMemberifrs-full:CashFlowHedgesMember2025-01-012025-12-310000891478ifrs-full:FuturesContractMemberifrs-full:InterestRateRiskMemberifrs-full:CashFlowHedgesMember2025-12-310000891478ifrs-full:FuturesContractMemberifrs-full:InterestRateRiskMemberifrs-full:CashFlowHedgesMember2025-01-012025-12-310000891478ifrs-full:InterestRateSwapContractMemberifrs-full:InterestRateRiskMemberifrs-full:CashFlowHedgesMember2025-12-310000891478ifrs-full:InterestRateSwapContractMemberifrs-full:InterestRateRiskMemberifrs-full:CashFlowHedgesMember2025-01-012025-12-310000891478san:CapsFloorsMemberifrs-full:InterestRateRiskMemberifrs-full:CashFlowHedgesMember2025-12-310000891478san:CapsFloorsMemberifrs-full:InterestRateRiskMemberifrs-full:CashFlowHedgesMember2025-01-012025-12-310000891478ifrs-full:CurrencyRiskMemberifrs-full:CashFlowHedgesMember2025-12-310000891478ifrs-full:CurrencyRiskMemberifrs-full:CashFlowHedgesMember2025-01-012025-12-310000891478san:ForeignExchangeForwardContractMemberifrs-full:CurrencyRiskMemberifrs-full:CashFlowHedgesMember2025-12-310000891478san:ForeignExchangeForwardContractMemberifrs-full:CurrencyRiskMemberifrs-full:CashFlowHedgesMember2025-01-012025-12-310000891478san:ForeignExchangeSwapMemberifrs-full:CurrencyRiskMemberifrs-full:CashFlowHedgesMember2025-12-310000891478san:ForeignExchangeSwapMemberifrs-full:CurrencyRiskMemberifrs-full:CashFlowHedgesMember2025-01-012025-12-310000891478ifrs-full:CurrencySwapContractMemberifrs-full:CurrencyRiskMemberifrs-full:CashFlowHedgesMember2025-12-310000891478ifrs-full:CurrencySwapContractMemberifrs-full:CurrencyRiskMemberifrs-full:CashFlowHedgesMember2025-01-012025-12-310000891478san:InterestRateAndExchangeRateRiskMemberifrs-full:CashFlowHedgesMember2025-12-310000891478san:InterestRateAndExchangeRateRiskMemberifrs-full:CashFlowHedgesMember2025-01-012025-12-310000891478ifrs-full:InterestRateSwapContractMembersan:InterestRateAndExchangeRateRiskMemberifrs-full:CashFlowHedgesMember2025-12-310000891478ifrs-full:InterestRateSwapContractMembersan:InterestRateAndExchangeRateRiskMemberifrs-full:CashFlowHedgesMember2025-01-012025-12-310000891478ifrs-full:CurrencySwapContractMembersan:InterestRateAndExchangeRateRiskMemberifrs-full:CashFlowHedgesMember2025-12-310000891478ifrs-full:CurrencySwapContractMembersan:InterestRateAndExchangeRateRiskMemberifrs-full:CashFlowHedgesMember2025-01-012025-12-310000891478san:InflationRiskMemberifrs-full:CashFlowHedgesMember2025-12-310000891478san:InflationRiskMemberifrs-full:CashFlowHedgesMember2025-01-012025-12-310000891478san:InflationSwapContractMembersan:InflationRiskMemberifrs-full:CashFlowHedgesMember2025-12-310000891478san:InflationSwapContractMembersan:InflationRiskMemberifrs-full:CashFlowHedgesMember2025-01-012025-12-310000891478san:MarketValueOfEquityMemberifrs-full:CashFlowHedgesMember2025-12-310000891478san:MarketValueOfEquityMemberifrs-full:CashFlowHedgesMember2025-01-012025-12-310000891478ifrs-full:OptionContractMembersan:MarketValueOfEquityMemberifrs-full:CashFlowHedgesMember2025-12-310000891478ifrs-full:OptionContractMembersan:MarketValueOfEquityMemberifrs-full:CashFlowHedgesMember2025-01-012025-12-310000891478ifrs-full:HedgesOfNetInvestmentInForeignOperationsMember2025-12-310000891478ifrs-full:HedgesOfNetInvestmentInForeignOperationsMember2025-01-012025-12-310000891478ifrs-full:CurrencyRiskMemberifrs-full:HedgesOfNetInvestmentInForeignOperationsMember2025-12-310000891478ifrs-full:CurrencyRiskMemberifrs-full:HedgesOfNetInvestmentInForeignOperationsMember2025-01-012025-12-310000891478san:ForeignExchangeForwardContractMemberifrs-full:CurrencyRiskMemberifrs-full:HedgesOfNetInvestmentInForeignOperationsMember2025-12-310000891478san:ForeignExchangeForwardContractMemberifrs-full:CurrencyRiskMemberifrs-full:HedgesOfNetInvestmentInForeignOperationsMember2025-01-012025-12-310000891478san:ForeignExchangeSwapMemberifrs-full:CurrencyRiskMemberifrs-full:HedgesOfNetInvestmentInForeignOperationsMember2025-12-310000891478san:ForeignExchangeSwapMemberifrs-full:CurrencyRiskMemberifrs-full:HedgesOfNetInvestmentInForeignOperationsMember2025-01-012025-12-310000891478ifrs-full:FairValueHedgesMember2024-12-310000891478ifrs-full:FairValueHedgesMember2024-01-012024-12-310000891478ifrs-full:InterestRateRiskMemberifrs-full:FairValueHedgesMember2024-12-310000891478ifrs-full:InterestRateRiskMemberifrs-full:FairValueHedgesMember2024-01-012024-12-310000891478ifrs-full:InterestRateSwapContractMemberifrs-full:InterestRateRiskMemberifrs-full:FairValueHedgesMember2024-12-310000891478ifrs-full:InterestRateSwapContractMemberifrs-full:InterestRateRiskMemberifrs-full:FairValueHedgesMember2024-01-012024-12-310000891478ifrs-full:CurrencyRiskMemberifrs-full:FairValueHedgesMember2024-12-310000891478ifrs-full:CurrencyRiskMemberifrs-full:FairValueHedgesMember2024-01-012024-12-310000891478san:ForeignExchangeForwardContractMemberifrs-full:CurrencyRiskMemberifrs-full:FairValueHedgesMember2024-12-310000891478san:ForeignExchangeForwardContractMemberifrs-full:CurrencyRiskMemberifrs-full:FairValueHedgesMember2024-01-012024-12-310000891478ifrs-full:FuturesContractMemberifrs-full:CurrencyRiskMemberifrs-full:FairValueHedgesMember2024-12-310000891478ifrs-full:FuturesContractMemberifrs-full:CurrencyRiskMemberifrs-full:FairValueHedgesMember2024-01-012024-12-310000891478san:InterestRateAndExchangeRateRiskMemberifrs-full:FairValueHedgesMember2024-12-310000891478san:InterestRateAndExchangeRateRiskMemberifrs-full:FairValueHedgesMember2024-01-012024-12-310000891478ifrs-full:InterestRateSwapContractMembersan:InterestRateAndExchangeRateRiskMemberifrs-full:FairValueHedgesMember2024-12-310000891478ifrs-full:InterestRateSwapContractMembersan:InterestRateAndExchangeRateRiskMemberifrs-full:FairValueHedgesMember2024-01-012024-12-310000891478ifrs-full:CurrencySwapContractMembersan:InterestRateAndExchangeRateRiskMemberifrs-full:FairValueHedgesMember2024-12-310000891478ifrs-full:CurrencySwapContractMembersan:InterestRateAndExchangeRateRiskMemberifrs-full:FairValueHedgesMember2024-01-012024-12-310000891478san:BaseRiskMemberifrs-full:FairValueHedgesMember2024-12-310000891478san:BaseRiskMemberifrs-full:FairValueHedgesMember2024-01-012024-12-310000891478ifrs-full:InterestRateSwapContractMembersan:BaseRiskMemberifrs-full:FairValueHedgesMember2024-12-310000891478ifrs-full:InterestRateSwapContractMembersan:BaseRiskMemberifrs-full:FairValueHedgesMember2024-01-012024-12-310000891478san:MarketValueOfEquityMemberifrs-full:FairValueHedgesMember2024-12-310000891478san:MarketValueOfEquityMemberifrs-full:FairValueHedgesMember2024-01-012024-12-310000891478san:EquitySwapContractMembersan:MarketValueOfEquityMemberifrs-full:FairValueHedgesMember2024-12-310000891478san:EquitySwapContractMembersan:MarketValueOfEquityMemberifrs-full:FairValueHedgesMember2024-01-012024-12-310000891478ifrs-full:CashFlowHedgesMember2024-12-310000891478ifrs-full:CashFlowHedgesMember2024-01-012024-12-310000891478ifrs-full:InterestRateRiskMemberifrs-full:CashFlowHedgesMember2024-12-310000891478ifrs-full:InterestRateRiskMemberifrs-full:CashFlowHedgesMember2024-01-012024-12-310000891478ifrs-full:FuturesContractMemberifrs-full:InterestRateRiskMemberifrs-full:CashFlowHedgesMember2024-12-310000891478ifrs-full:FuturesContractMemberifrs-full:InterestRateRiskMemberifrs-full:CashFlowHedgesMember2024-01-012024-12-310000891478ifrs-full:InterestRateSwapContractMemberifrs-full:InterestRateRiskMemberifrs-full:CashFlowHedgesMember2024-12-310000891478ifrs-full:InterestRateSwapContractMemberifrs-full:InterestRateRiskMemberifrs-full:CashFlowHedgesMember2024-01-012024-12-310000891478ifrs-full:CurrencyRiskMemberifrs-full:CashFlowHedgesMember2024-12-310000891478ifrs-full:CurrencyRiskMemberifrs-full:CashFlowHedgesMember2024-01-012024-12-310000891478san:ForeignExchangeForwardContractMemberifrs-full:CurrencyRiskMemberifrs-full:CashFlowHedgesMember2024-12-310000891478san:ForeignExchangeForwardContractMemberifrs-full:CurrencyRiskMemberifrs-full:CashFlowHedgesMember2024-01-012024-12-310000891478ifrs-full:CurrencySwapContractMemberifrs-full:CurrencyRiskMemberifrs-full:CashFlowHedgesMember2024-12-310000891478ifrs-full:CurrencySwapContractMemberifrs-full:CurrencyRiskMemberifrs-full:CashFlowHedgesMember2024-01-012024-12-310000891478san:InterestRateAndExchangeRateRiskMemberifrs-full:CashFlowHedgesMember2024-12-310000891478san:InterestRateAndExchangeRateRiskMemberifrs-full:CashFlowHedgesMember2024-01-012024-12-310000891478ifrs-full:InterestRateSwapContractMembersan:InterestRateAndExchangeRateRiskMemberifrs-full:CashFlowHedgesMember2024-12-310000891478ifrs-full:InterestRateSwapContractMembersan:InterestRateAndExchangeRateRiskMemberifrs-full:CashFlowHedgesMember2024-01-012024-12-310000891478ifrs-full:CurrencySwapContractMembersan:InterestRateAndExchangeRateRiskMemberifrs-full:CashFlowHedgesMember2024-12-310000891478ifrs-full:CurrencySwapContractMembersan:InterestRateAndExchangeRateRiskMemberifrs-full:CashFlowHedgesMember2024-01-012024-12-310000891478san:InflationRiskMemberifrs-full:CashFlowHedgesMember2024-12-310000891478san:InflationRiskMemberifrs-full:CashFlowHedgesMember2024-01-012024-12-310000891478san:InflationSwapContractMembersan:InflationRiskMemberifrs-full:CashFlowHedgesMember2024-12-310000891478san:InflationSwapContractMembersan:InflationRiskMemberifrs-full:CashFlowHedgesMember2024-01-012024-12-310000891478san:MarketValueOfEquityMemberifrs-full:CashFlowHedgesMember2024-12-310000891478san:MarketValueOfEquityMemberifrs-full:CashFlowHedgesMember2024-01-012024-12-310000891478san:EquitySwapContractMembersan:MarketValueOfEquityMemberifrs-full:CashFlowHedgesMember2024-12-310000891478san:EquitySwapContractMembersan:MarketValueOfEquityMemberifrs-full:CashFlowHedgesMember2024-01-012024-12-310000891478ifrs-full:HedgesOfNetInvestmentInForeignOperationsMember2024-12-310000891478ifrs-full:HedgesOfNetInvestmentInForeignOperationsMember2024-01-012024-12-310000891478ifrs-full:CurrencyRiskMemberifrs-full:HedgesOfNetInvestmentInForeignOperationsMember2024-12-310000891478ifrs-full:CurrencyRiskMemberifrs-full:HedgesOfNetInvestmentInForeignOperationsMember2024-01-012024-12-310000891478san:ForeignExchangeForwardContractMemberifrs-full:CurrencyRiskMemberifrs-full:HedgesOfNetInvestmentInForeignOperationsMember2024-12-310000891478san:ForeignExchangeForwardContractMemberifrs-full:CurrencyRiskMemberifrs-full:HedgesOfNetInvestmentInForeignOperationsMember2024-01-012024-12-310000891478ifrs-full:FairValueHedgesMember2023-12-310000891478ifrs-full:FairValueHedgesMember2023-01-012023-12-310000891478ifrs-full:InterestRateRiskMemberifrs-full:FairValueHedgesMember2023-12-310000891478ifrs-full:InterestRateRiskMemberifrs-full:FairValueHedgesMember2023-01-012023-12-310000891478ifrs-full:InterestRateSwapContractMemberifrs-full:InterestRateRiskMemberifrs-full:FairValueHedgesMember2023-12-310000891478ifrs-full:InterestRateSwapContractMemberifrs-full:InterestRateRiskMemberifrs-full:FairValueHedgesMember2023-01-012023-12-310000891478ifrs-full:CurrencyRiskMemberifrs-full:FairValueHedgesMember2023-12-310000891478ifrs-full:CurrencyRiskMemberifrs-full:FairValueHedgesMember2023-01-012023-12-310000891478san:ForeignExchangeForwardContractMemberifrs-full:CurrencyRiskMemberifrs-full:FairValueHedgesMember2023-12-310000891478san:ForeignExchangeForwardContractMemberifrs-full:CurrencyRiskMemberifrs-full:FairValueHedgesMember2023-01-012023-12-310000891478ifrs-full:FuturesContractMemberifrs-full:CurrencyRiskMemberifrs-full:FairValueHedgesMember2023-12-310000891478ifrs-full:FuturesContractMemberifrs-full:CurrencyRiskMemberifrs-full:FairValueHedgesMember2023-01-012023-12-310000891478san:InterestRateAndExchangeRateRiskMemberifrs-full:FairValueHedgesMember2023-12-310000891478san:InterestRateAndExchangeRateRiskMemberifrs-full:FairValueHedgesMember2023-01-012023-12-310000891478ifrs-full:InterestRateSwapContractMembersan:InterestRateAndExchangeRateRiskMemberifrs-full:FairValueHedgesMember2023-12-310000891478ifrs-full:InterestRateSwapContractMembersan:InterestRateAndExchangeRateRiskMemberifrs-full:FairValueHedgesMember2023-01-012023-12-310000891478ifrs-full:CurrencySwapContractMembersan:InterestRateAndExchangeRateRiskMemberifrs-full:FairValueHedgesMember2023-12-310000891478ifrs-full:CurrencySwapContractMembersan:InterestRateAndExchangeRateRiskMemberifrs-full:FairValueHedgesMember2023-01-012023-12-310000891478ifrs-full:CashFlowHedgesMember2023-12-310000891478ifrs-full:CashFlowHedgesMember2023-01-012023-12-310000891478ifrs-full:InterestRateRiskMemberifrs-full:CashFlowHedgesMember2023-12-310000891478ifrs-full:InterestRateRiskMemberifrs-full:CashFlowHedgesMember2023-01-012023-12-310000891478ifrs-full:FuturesContractMemberifrs-full:InterestRateRiskMemberifrs-full:CashFlowHedgesMember2023-12-310000891478ifrs-full:FuturesContractMemberifrs-full:InterestRateRiskMemberifrs-full:CashFlowHedgesMember2023-01-012023-12-310000891478ifrs-full:InterestRateSwapContractMemberifrs-full:InterestRateRiskMemberifrs-full:CashFlowHedgesMember2023-12-310000891478ifrs-full:InterestRateSwapContractMemberifrs-full:InterestRateRiskMemberifrs-full:CashFlowHedgesMember2023-01-012023-12-310000891478ifrs-full:CurrencyRiskMemberifrs-full:CashFlowHedgesMember2023-12-310000891478ifrs-full:CurrencyRiskMemberifrs-full:CashFlowHedgesMember2023-01-012023-12-310000891478san:ForeignExchangeForwardContractMemberifrs-full:CurrencyRiskMemberifrs-full:CashFlowHedgesMember2023-12-310000891478san:ForeignExchangeForwardContractMemberifrs-full:CurrencyRiskMemberifrs-full:CashFlowHedgesMember2023-01-012023-12-310000891478ifrs-full:CurrencySwapContractMemberifrs-full:CurrencyRiskMemberifrs-full:CashFlowHedgesMember2023-12-310000891478ifrs-full:CurrencySwapContractMemberifrs-full:CurrencyRiskMemberifrs-full:CashFlowHedgesMember2023-01-012023-12-310000891478san:InterestRateAndExchangeRateRiskMemberifrs-full:CashFlowHedgesMember2023-12-310000891478san:InterestRateAndExchangeRateRiskMemberifrs-full:CashFlowHedgesMember2023-01-012023-12-310000891478ifrs-full:InterestRateSwapContractMembersan:InterestRateAndExchangeRateRiskMemberifrs-full:CashFlowHedgesMember2023-12-310000891478ifrs-full:InterestRateSwapContractMembersan:InterestRateAndExchangeRateRiskMemberifrs-full:CashFlowHedgesMember2023-01-012023-12-310000891478ifrs-full:CurrencySwapContractMembersan:InterestRateAndExchangeRateRiskMemberifrs-full:CashFlowHedgesMember2023-12-310000891478ifrs-full:CurrencySwapContractMembersan:InterestRateAndExchangeRateRiskMemberifrs-full:CashFlowHedgesMember2023-01-012023-12-310000891478san:InflationRiskMemberifrs-full:CashFlowHedgesMember2023-12-310000891478san:InflationRiskMemberifrs-full:CashFlowHedgesMember2023-01-012023-12-310000891478ifrs-full:CurrencySwapContractMembersan:InflationRiskMemberifrs-full:CashFlowHedgesMember2023-12-310000891478ifrs-full:CurrencySwapContractMembersan:InflationRiskMemberifrs-full:CashFlowHedgesMember2023-01-012023-12-310000891478san:MarketValueOfEquityMemberifrs-full:CashFlowHedgesMember2023-12-310000891478san:MarketValueOfEquityMemberifrs-full:CashFlowHedgesMember2023-01-012023-12-310000891478ifrs-full:OptionContractMembersan:MarketValueOfEquityMemberifrs-full:CashFlowHedgesMember2023-12-310000891478ifrs-full:OptionContractMembersan:MarketValueOfEquityMemberifrs-full:CashFlowHedgesMember2023-01-012023-12-310000891478ifrs-full:HedgesOfNetInvestmentInForeignOperationsMember2023-12-310000891478ifrs-full:HedgesOfNetInvestmentInForeignOperationsMember2023-01-012023-12-310000891478ifrs-full:CurrencyRiskMemberifrs-full:HedgesOfNetInvestmentInForeignOperationsMember2023-12-310000891478ifrs-full:CurrencyRiskMemberifrs-full:HedgesOfNetInvestmentInForeignOperationsMember2023-01-012023-12-310000891478san:ForeignExchangeForwardContractMemberifrs-full:CurrencyRiskMemberifrs-full:HedgesOfNetInvestmentInForeignOperationsMember2023-12-310000891478san:ForeignExchangeForwardContractMemberifrs-full:CurrencyRiskMemberifrs-full:HedgesOfNetInvestmentInForeignOperationsMember2023-01-012023-12-310000891478ifrs-full:NotLaterThanOneMonthMemberifrs-full:FairValueHedgesMember2025-12-310000891478ifrs-full:LaterThanOneMonthAndNotLaterThanThreeMonthsMemberifrs-full:FairValueHedgesMember2025-12-310000891478ifrs-full:LaterThanThreeMonthsAndNotLaterThanOneYearMemberifrs-full:FairValueHedgesMember2025-12-310000891478ifrs-full:LaterThanOneYearAndNotLaterThanFiveYearsMemberifrs-full:FairValueHedgesMember2025-12-310000891478ifrs-full:LaterThanFiveYearsMemberifrs-full:FairValueHedgesMember2025-12-310000891478ifrs-full:InterestRateRiskMemberifrs-full:NotLaterThanOneMonthMemberifrs-full:FairValueHedgesMember2025-12-310000891478ifrs-full:InterestRateRiskMemberifrs-full:LaterThanOneMonthAndNotLaterThanThreeMonthsMemberifrs-full:FairValueHedgesMember2025-12-310000891478ifrs-full:InterestRateRiskMemberifrs-full:LaterThanThreeMonthsAndNotLaterThanOneYearMemberifrs-full:FairValueHedgesMember2025-12-310000891478ifrs-full:InterestRateRiskMemberifrs-full:LaterThanOneYearAndNotLaterThanFiveYearsMemberifrs-full:FairValueHedgesMember2025-12-310000891478ifrs-full:InterestRateRiskMemberifrs-full:LaterThanFiveYearsMemberifrs-full:FairValueHedgesMember2025-12-310000891478ifrs-full:InterestRateSwapContractMemberifrs-full:InterestRateRiskMemberifrs-full:NotLaterThanOneMonthMemberifrs-full:FairValueHedgesMember2025-12-310000891478ifrs-full:InterestRateSwapContractMemberifrs-full:InterestRateRiskMemberifrs-full:LaterThanOneMonthAndNotLaterThanThreeMonthsMemberifrs-full:FairValueHedgesMember2025-12-310000891478ifrs-full:InterestRateSwapContractMemberifrs-full:InterestRateRiskMemberifrs-full:LaterThanThreeMonthsAndNotLaterThanOneYearMemberifrs-full:FairValueHedgesMember2025-12-310000891478ifrs-full:InterestRateSwapContractMemberifrs-full:InterestRateRiskMemberifrs-full:LaterThanOneYearAndNotLaterThanFiveYearsMemberifrs-full:FairValueHedgesMember2025-12-310000891478ifrs-full:InterestRateSwapContractMemberifrs-full:InterestRateRiskMemberifrs-full:LaterThanFiveYearsMemberifrs-full:FairValueHedgesMember2025-12-310000891478ifrs-full:FuturesContractMemberifrs-full:InterestRateRiskMemberifrs-full:NotLaterThanOneMonthMemberifrs-full:FairValueHedgesMember2025-12-310000891478ifrs-full:FuturesContractMemberifrs-full:InterestRateRiskMemberifrs-full:LaterThanOneMonthAndNotLaterThanThreeMonthsMemberifrs-full:FairValueHedgesMember2025-12-310000891478ifrs-full:FuturesContractMemberifrs-full:InterestRateRiskMemberifrs-full:LaterThanThreeMonthsAndNotLaterThanOneYearMemberifrs-full:FairValueHedgesMember2025-12-310000891478ifrs-full:FuturesContractMemberifrs-full:InterestRateRiskMemberifrs-full:LaterThanOneYearAndNotLaterThanFiveYearsMemberifrs-full:FairValueHedgesMember2025-12-310000891478ifrs-full:FuturesContractMemberifrs-full:InterestRateRiskMemberifrs-full:LaterThanFiveYearsMemberifrs-full:FairValueHedgesMember2025-12-310000891478ifrs-full:CurrencyRiskMemberifrs-full:NotLaterThanOneMonthMemberifrs-full:FairValueHedgesMember2025-12-310000891478ifrs-full:CurrencyRiskMemberifrs-full:LaterThanOneMonthAndNotLaterThanThreeMonthsMemberifrs-full:FairValueHedgesMember2025-12-310000891478ifrs-full:CurrencyRiskMemberifrs-full:LaterThanThreeMonthsAndNotLaterThanOneYearMemberifrs-full:FairValueHedgesMember2025-12-310000891478ifrs-full:CurrencyRiskMemberifrs-full:LaterThanOneYearAndNotLaterThanFiveYearsMemberifrs-full:FairValueHedgesMember2025-12-310000891478ifrs-full:CurrencyRiskMemberifrs-full:LaterThanFiveYearsMemberifrs-full:FairValueHedgesMember2025-12-310000891478san:ForeignExchangeForwardContractMemberifrs-full:CurrencyRiskMemberifrs-full:NotLaterThanOneMonthMemberifrs-full:FairValueHedgesMember2025-12-310000891478san:ForeignExchangeForwardContractMemberifrs-full:CurrencyRiskMemberifrs-full:LaterThanOneMonthAndNotLaterThanThreeMonthsMemberifrs-full:FairValueHedgesMember2025-12-310000891478san:ForeignExchangeForwardContractMemberifrs-full:CurrencyRiskMemberifrs-full:LaterThanThreeMonthsAndNotLaterThanOneYearMemberifrs-full:FairValueHedgesMember2025-12-310000891478san:ForeignExchangeForwardContractMemberifrs-full:CurrencyRiskMemberifrs-full:LaterThanOneYearAndNotLaterThanFiveYearsMemberifrs-full:FairValueHedgesMember2025-12-310000891478san:ForeignExchangeForwardContractMemberifrs-full:CurrencyRiskMemberifrs-full:LaterThanFiveYearsMemberifrs-full:FairValueHedgesMember2025-12-310000891478ifrs-full:FuturesContractMemberifrs-full:CurrencyRiskMemberifrs-full:NotLaterThanOneMonthMemberifrs-full:FairValueHedgesMember2025-12-310000891478ifrs-full:FuturesContractMemberifrs-full:CurrencyRiskMemberifrs-full:LaterThanOneMonthAndNotLaterThanThreeMonthsMemberifrs-full:FairValueHedgesMember2025-12-310000891478ifrs-full:FuturesContractMemberifrs-full:CurrencyRiskMemberifrs-full:LaterThanThreeMonthsAndNotLaterThanOneYearMemberifrs-full:FairValueHedgesMember2025-12-310000891478ifrs-full:FuturesContractMemberifrs-full:CurrencyRiskMemberifrs-full:LaterThanOneYearAndNotLaterThanFiveYearsMemberifrs-full:FairValueHedgesMember2025-12-310000891478ifrs-full:FuturesContractMemberifrs-full:CurrencyRiskMemberifrs-full:LaterThanFiveYearsMemberifrs-full:FairValueHedgesMember2025-12-310000891478san:InterestRateAndExchangeRateRiskMemberifrs-full:NotLaterThanOneMonthMemberifrs-full:FairValueHedgesMember2025-12-310000891478san:InterestRateAndExchangeRateRiskMemberifrs-full:LaterThanOneMonthAndNotLaterThanThreeMonthsMemberifrs-full:FairValueHedgesMember2025-12-310000891478san:InterestRateAndExchangeRateRiskMemberifrs-full:LaterThanThreeMonthsAndNotLaterThanOneYearMemberifrs-full:FairValueHedgesMember2025-12-310000891478san:InterestRateAndExchangeRateRiskMemberifrs-full:LaterThanOneYearAndNotLaterThanFiveYearsMemberifrs-full:FairValueHedgesMember2025-12-310000891478san:InterestRateAndExchangeRateRiskMemberifrs-full:LaterThanFiveYearsMemberifrs-full:FairValueHedgesMember2025-12-310000891478ifrs-full:InterestRateSwapContractMembersan:InterestRateAndExchangeRateRiskMemberifrs-full:NotLaterThanOneMonthMemberifrs-full:FairValueHedgesMember2025-12-310000891478ifrs-full:InterestRateSwapContractMembersan:InterestRateAndExchangeRateRiskMemberifrs-full:LaterThanOneMonthAndNotLaterThanThreeMonthsMemberifrs-full:FairValueHedgesMember2025-12-310000891478ifrs-full:InterestRateSwapContractMembersan:InterestRateAndExchangeRateRiskMemberifrs-full:LaterThanThreeMonthsAndNotLaterThanOneYearMemberifrs-full:FairValueHedgesMember2025-12-310000891478ifrs-full:InterestRateSwapContractMembersan:InterestRateAndExchangeRateRiskMemberifrs-full:LaterThanOneYearAndNotLaterThanFiveYearsMemberifrs-full:FairValueHedgesMember2025-12-310000891478ifrs-full:InterestRateSwapContractMembersan:InterestRateAndExchangeRateRiskMemberifrs-full:LaterThanFiveYearsMemberifrs-full:FairValueHedgesMember2025-12-310000891478ifrs-full:CurrencySwapContractMembersan:InterestRateAndExchangeRateRiskMemberifrs-full:NotLaterThanOneMonthMemberifrs-full:FairValueHedgesMember2025-12-310000891478ifrs-full:CurrencySwapContractMembersan:InterestRateAndExchangeRateRiskMemberifrs-full:LaterThanOneMonthAndNotLaterThanThreeMonthsMemberifrs-full:FairValueHedgesMember2025-12-310000891478ifrs-full:CurrencySwapContractMembersan:InterestRateAndExchangeRateRiskMemberifrs-full:LaterThanThreeMonthsAndNotLaterThanOneYearMemberifrs-full:FairValueHedgesMember2025-12-310000891478ifrs-full:CurrencySwapContractMembersan:InterestRateAndExchangeRateRiskMemberifrs-full:LaterThanOneYearAndNotLaterThanFiveYearsMemberifrs-full:FairValueHedgesMember2025-12-310000891478ifrs-full:CurrencySwapContractMembersan:InterestRateAndExchangeRateRiskMemberifrs-full:LaterThanFiveYearsMemberifrs-full:FairValueHedgesMember2025-12-310000891478san:BaseRiskMemberifrs-full:NotLaterThanOneMonthMemberifrs-full:FairValueHedgesMember2025-12-310000891478san:BaseRiskMemberifrs-full:LaterThanOneMonthAndNotLaterThanThreeMonthsMemberifrs-full:FairValueHedgesMember2025-12-310000891478san:BaseRiskMemberifrs-full:LaterThanThreeMonthsAndNotLaterThanOneYearMemberifrs-full:FairValueHedgesMember2025-12-310000891478san:BaseRiskMemberifrs-full:LaterThanOneYearAndNotLaterThanFiveYearsMemberifrs-full:FairValueHedgesMember2025-12-310000891478san:BaseRiskMemberifrs-full:LaterThanFiveYearsMemberifrs-full:FairValueHedgesMember2025-12-310000891478ifrs-full:InterestRateSwapContractMembersan:BaseRiskMemberifrs-full:NotLaterThanOneMonthMemberifrs-full:FairValueHedgesMember2025-12-310000891478ifrs-full:InterestRateSwapContractMembersan:BaseRiskMemberifrs-full:LaterThanOneMonthAndNotLaterThanThreeMonthsMemberifrs-full:FairValueHedgesMember2025-12-310000891478ifrs-full:InterestRateSwapContractMembersan:BaseRiskMemberifrs-full:LaterThanThreeMonthsAndNotLaterThanOneYearMemberifrs-full:FairValueHedgesMember2025-12-310000891478ifrs-full:InterestRateSwapContractMembersan:BaseRiskMemberifrs-full:LaterThanOneYearAndNotLaterThanFiveYearsMemberifrs-full:FairValueHedgesMember2025-12-310000891478ifrs-full:InterestRateSwapContractMembersan:BaseRiskMemberifrs-full:LaterThanFiveYearsMemberifrs-full:FairValueHedgesMember2025-12-310000891478san:InflationRiskMemberifrs-full:NotLaterThanOneMonthMemberifrs-full:FairValueHedgesMember2025-12-310000891478san:InflationRiskMemberifrs-full:LaterThanOneMonthAndNotLaterThanThreeMonthsMemberifrs-full:FairValueHedgesMember2025-12-310000891478san:InflationRiskMemberifrs-full:LaterThanThreeMonthsAndNotLaterThanOneYearMemberifrs-full:FairValueHedgesMember2025-12-310000891478san:InflationRiskMemberifrs-full:LaterThanOneYearAndNotLaterThanFiveYearsMemberifrs-full:FairValueHedgesMember2025-12-310000891478san:InflationRiskMemberifrs-full:LaterThanFiveYearsMemberifrs-full:FairValueHedgesMember2025-12-310000891478san:InflationSwapContractMembersan:InflationRiskMemberifrs-full:NotLaterThanOneMonthMemberifrs-full:FairValueHedgesMember2025-12-310000891478san:InflationSwapContractMembersan:InflationRiskMemberifrs-full:LaterThanOneMonthAndNotLaterThanThreeMonthsMemberifrs-full:FairValueHedgesMember2025-12-310000891478san:InflationSwapContractMembersan:InflationRiskMemberifrs-full:LaterThanThreeMonthsAndNotLaterThanOneYearMemberifrs-full:FairValueHedgesMember2025-12-310000891478san:InflationSwapContractMembersan:InflationRiskMemberifrs-full:LaterThanOneYearAndNotLaterThanFiveYearsMemberifrs-full:FairValueHedgesMember2025-12-310000891478san:InflationSwapContractMembersan:InflationRiskMemberifrs-full:LaterThanFiveYearsMemberifrs-full:FairValueHedgesMember2025-12-310000891478ifrs-full:NotLaterThanOneMonthMemberifrs-full:CashFlowHedgesMember2025-12-310000891478ifrs-full:LaterThanOneMonthAndNotLaterThanThreeMonthsMemberifrs-full:CashFlowHedgesMember2025-12-310000891478ifrs-full:LaterThanThreeMonthsAndNotLaterThanOneYearMemberifrs-full:CashFlowHedgesMember2025-12-310000891478ifrs-full:LaterThanOneYearAndNotLaterThanFiveYearsMemberifrs-full:CashFlowHedgesMember2025-12-310000891478ifrs-full:LaterThanFiveYearsMemberifrs-full:CashFlowHedgesMember2025-12-310000891478ifrs-full:InterestRateRiskMemberifrs-full:NotLaterThanOneMonthMemberifrs-full:CashFlowHedgesMember2025-12-310000891478ifrs-full:InterestRateRiskMemberifrs-full:LaterThanOneMonthAndNotLaterThanThreeMonthsMemberifrs-full:CashFlowHedgesMember2025-12-310000891478ifrs-full:InterestRateRiskMemberifrs-full:LaterThanThreeMonthsAndNotLaterThanOneYearMemberifrs-full:CashFlowHedgesMember2025-12-310000891478ifrs-full:InterestRateRiskMemberifrs-full:LaterThanOneYearAndNotLaterThanFiveYearsMemberifrs-full:CashFlowHedgesMember2025-12-310000891478ifrs-full:InterestRateRiskMemberifrs-full:LaterThanFiveYearsMemberifrs-full:CashFlowHedgesMember2025-12-310000891478ifrs-full:FuturesContractMemberifrs-full:InterestRateRiskMemberifrs-full:NotLaterThanOneMonthMemberifrs-full:CashFlowHedgesMember2025-12-310000891478ifrs-full:FuturesContractMemberifrs-full:InterestRateRiskMemberifrs-full:LaterThanOneMonthAndNotLaterThanThreeMonthsMemberifrs-full:CashFlowHedgesMember2025-12-310000891478ifrs-full:FuturesContractMemberifrs-full:InterestRateRiskMemberifrs-full:LaterThanThreeMonthsAndNotLaterThanOneYearMemberifrs-full:CashFlowHedgesMember2025-12-310000891478ifrs-full:FuturesContractMemberifrs-full:InterestRateRiskMemberifrs-full:LaterThanOneYearAndNotLaterThanFiveYearsMemberifrs-full:CashFlowHedgesMember2025-12-310000891478ifrs-full:FuturesContractMemberifrs-full:InterestRateRiskMemberifrs-full:LaterThanFiveYearsMemberifrs-full:CashFlowHedgesMember2025-12-310000891478ifrs-full:InterestRateSwapContractMemberifrs-full:InterestRateRiskMemberifrs-full:NotLaterThanOneMonthMemberifrs-full:CashFlowHedgesMember2025-12-310000891478ifrs-full:InterestRateSwapContractMemberifrs-full:InterestRateRiskMemberifrs-full:LaterThanOneMonthAndNotLaterThanThreeMonthsMemberifrs-full:CashFlowHedgesMember2025-12-310000891478ifrs-full:InterestRateSwapContractMemberifrs-full:InterestRateRiskMemberifrs-full:LaterThanThreeMonthsAndNotLaterThanOneYearMemberifrs-full:CashFlowHedgesMember2025-12-310000891478ifrs-full:InterestRateSwapContractMemberifrs-full:InterestRateRiskMemberifrs-full:LaterThanOneYearAndNotLaterThanFiveYearsMemberifrs-full:CashFlowHedgesMember2025-12-310000891478ifrs-full:InterestRateSwapContractMemberifrs-full:InterestRateRiskMemberifrs-full:LaterThanFiveYearsMemberifrs-full:CashFlowHedgesMember2025-12-310000891478san:CapsFloorsMemberifrs-full:InterestRateRiskMemberifrs-full:NotLaterThanOneMonthMemberifrs-full:CashFlowHedgesMember2025-12-310000891478san:CapsFloorsMemberifrs-full:InterestRateRiskMemberifrs-full:LaterThanOneMonthAndNotLaterThanThreeMonthsMemberifrs-full:CashFlowHedgesMember2025-12-310000891478san:CapsFloorsMemberifrs-full:InterestRateRiskMemberifrs-full:LaterThanThreeMonthsAndNotLaterThanOneYearMemberifrs-full:CashFlowHedgesMember2025-12-310000891478san:CapsFloorsMemberifrs-full:InterestRateRiskMemberifrs-full:LaterThanOneYearAndNotLaterThanFiveYearsMemberifrs-full:CashFlowHedgesMember2025-12-310000891478san:CapsFloorsMemberifrs-full:InterestRateRiskMemberifrs-full:LaterThanFiveYearsMemberifrs-full:CashFlowHedgesMember2025-12-310000891478ifrs-full:CurrencyRiskMemberifrs-full:NotLaterThanOneMonthMemberifrs-full:CashFlowHedgesMember2025-12-310000891478ifrs-full:CurrencyRiskMemberifrs-full:LaterThanOneMonthAndNotLaterThanThreeMonthsMemberifrs-full:CashFlowHedgesMember2025-12-310000891478ifrs-full:CurrencyRiskMemberifrs-full:LaterThanThreeMonthsAndNotLaterThanOneYearMemberifrs-full:CashFlowHedgesMember2025-12-310000891478ifrs-full:CurrencyRiskMemberifrs-full:LaterThanOneYearAndNotLaterThanFiveYearsMemberifrs-full:CashFlowHedgesMember2025-12-310000891478ifrs-full:CurrencyRiskMemberifrs-full:LaterThanFiveYearsMemberifrs-full:CashFlowHedgesMember2025-12-310000891478san:ForeignExchangeForwardContractMemberifrs-full:CurrencyRiskMemberifrs-full:NotLaterThanOneMonthMemberifrs-full:CashFlowHedgesMember2025-12-310000891478san:ForeignExchangeForwardContractMemberifrs-full:CurrencyRiskMemberifrs-full:LaterThanOneMonthAndNotLaterThanThreeMonthsMemberifrs-full:CashFlowHedgesMember2025-12-310000891478san:ForeignExchangeForwardContractMemberifrs-full:CurrencyRiskMemberifrs-full:LaterThanThreeMonthsAndNotLaterThanOneYearMemberifrs-full:CashFlowHedgesMember2025-12-310000891478san:ForeignExchangeForwardContractMemberifrs-full:CurrencyRiskMemberifrs-full:LaterThanOneYearAndNotLaterThanFiveYearsMemberifrs-full:CashFlowHedgesMember2025-12-310000891478san:ForeignExchangeForwardContractMemberifrs-full:CurrencyRiskMemberifrs-full:LaterThanFiveYearsMemberifrs-full:CashFlowHedgesMember2025-12-310000891478san:ForeignExchangeSwapMemberifrs-full:CurrencyRiskMemberifrs-full:NotLaterThanOneMonthMemberifrs-full:CashFlowHedgesMember2025-12-310000891478san:ForeignExchangeSwapMemberifrs-full:CurrencyRiskMemberifrs-full:LaterThanOneMonthAndNotLaterThanThreeMonthsMemberifrs-full:CashFlowHedgesMember2025-12-310000891478san:ForeignExchangeSwapMemberifrs-full:CurrencyRiskMemberifrs-full:LaterThanThreeMonthsAndNotLaterThanOneYearMemberifrs-full:CashFlowHedgesMember2025-12-310000891478san:ForeignExchangeSwapMemberifrs-full:CurrencyRiskMemberifrs-full:LaterThanOneYearAndNotLaterThanFiveYearsMemberifrs-full:CashFlowHedgesMember2025-12-310000891478san:ForeignExchangeSwapMemberifrs-full:CurrencyRiskMemberifrs-full:LaterThanFiveYearsMemberifrs-full:CashFlowHedgesMember2025-12-310000891478ifrs-full:CurrencySwapContractMemberifrs-full:CurrencyRiskMemberifrs-full:NotLaterThanOneMonthMemberifrs-full:CashFlowHedgesMember2025-12-310000891478ifrs-full:CurrencySwapContractMemberifrs-full:CurrencyRiskMemberifrs-full:LaterThanOneMonthAndNotLaterThanThreeMonthsMemberifrs-full:CashFlowHedgesMember2025-12-310000891478ifrs-full:CurrencySwapContractMemberifrs-full:CurrencyRiskMemberifrs-full:LaterThanThreeMonthsAndNotLaterThanOneYearMemberifrs-full:CashFlowHedgesMember2025-12-310000891478ifrs-full:CurrencySwapContractMemberifrs-full:CurrencyRiskMemberifrs-full:LaterThanOneYearAndNotLaterThanFiveYearsMemberifrs-full:CashFlowHedgesMember2025-12-310000891478ifrs-full:CurrencySwapContractMemberifrs-full:CurrencyRiskMemberifrs-full:LaterThanFiveYearsMemberifrs-full:CashFlowHedgesMember2025-12-310000891478san:InterestRateAndExchangeRateRiskMemberifrs-full:NotLaterThanOneMonthMemberifrs-full:CashFlowHedgesMember2025-12-310000891478san:InterestRateAndExchangeRateRiskMemberifrs-full:LaterThanOneMonthAndNotLaterThanThreeMonthsMemberifrs-full:CashFlowHedgesMember2025-12-310000891478san:InterestRateAndExchangeRateRiskMemberifrs-full:LaterThanThreeMonthsAndNotLaterThanOneYearMemberifrs-full:CashFlowHedgesMember2025-12-310000891478san:InterestRateAndExchangeRateRiskMemberifrs-full:LaterThanOneYearAndNotLaterThanFiveYearsMemberifrs-full:CashFlowHedgesMember2025-12-310000891478san:InterestRateAndExchangeRateRiskMemberifrs-full:LaterThanFiveYearsMemberifrs-full:CashFlowHedgesMember2025-12-310000891478ifrs-full:InterestRateSwapContractMembersan:InterestRateAndExchangeRateRiskMemberifrs-full:NotLaterThanOneMonthMemberifrs-full:CashFlowHedgesMember2025-12-310000891478ifrs-full:InterestRateSwapContractMembersan:InterestRateAndExchangeRateRiskMemberifrs-full:LaterThanOneMonthAndNotLaterThanThreeMonthsMemberifrs-full:CashFlowHedgesMember2025-12-310000891478ifrs-full:InterestRateSwapContractMembersan:InterestRateAndExchangeRateRiskMemberifrs-full:LaterThanThreeMonthsAndNotLaterThanOneYearMemberifrs-full:CashFlowHedgesMember2025-12-310000891478ifrs-full:InterestRateSwapContractMembersan:InterestRateAndExchangeRateRiskMemberifrs-full:LaterThanOneYearAndNotLaterThanFiveYearsMemberifrs-full:CashFlowHedgesMember2025-12-310000891478ifrs-full:InterestRateSwapContractMembersan:InterestRateAndExchangeRateRiskMemberifrs-full:LaterThanFiveYearsMemberifrs-full:CashFlowHedgesMember2025-12-310000891478ifrs-full:CurrencySwapContractMembersan:InterestRateAndExchangeRateRiskMemberifrs-full:NotLaterThanOneMonthMemberifrs-full:CashFlowHedgesMember2025-12-310000891478ifrs-full:CurrencySwapContractMembersan:InterestRateAndExchangeRateRiskMemberifrs-full:LaterThanOneMonthAndNotLaterThanThreeMonthsMemberifrs-full:CashFlowHedgesMember2025-12-310000891478ifrs-full:CurrencySwapContractMembersan:InterestRateAndExchangeRateRiskMemberifrs-full:LaterThanThreeMonthsAndNotLaterThanOneYearMemberifrs-full:CashFlowHedgesMember2025-12-310000891478ifrs-full:CurrencySwapContractMembersan:InterestRateAndExchangeRateRiskMemberifrs-full:LaterThanOneYearAndNotLaterThanFiveYearsMemberifrs-full:CashFlowHedgesMember2025-12-310000891478ifrs-full:CurrencySwapContractMembersan:InterestRateAndExchangeRateRiskMemberifrs-full:LaterThanFiveYearsMemberifrs-full:CashFlowHedgesMember2025-12-310000891478san:MarketValueOfEquityMemberifrs-full:NotLaterThanOneMonthMemberifrs-full:CashFlowHedgesMember2025-12-310000891478san:MarketValueOfEquityMemberifrs-full:LaterThanOneMonthAndNotLaterThanThreeMonthsMemberifrs-full:CashFlowHedgesMember2025-12-310000891478san:MarketValueOfEquityMemberifrs-full:LaterThanThreeMonthsAndNotLaterThanOneYearMemberifrs-full:CashFlowHedgesMember2025-12-310000891478san:MarketValueOfEquityMemberifrs-full:LaterThanOneYearAndNotLaterThanFiveYearsMemberifrs-full:CashFlowHedgesMember2025-12-310000891478san:MarketValueOfEquityMemberifrs-full:LaterThanFiveYearsMemberifrs-full:CashFlowHedgesMember2025-12-310000891478ifrs-full:OptionContractMembersan:MarketValueOfEquityMemberifrs-full:NotLaterThanOneMonthMemberifrs-full:CashFlowHedgesMember2025-12-310000891478ifrs-full:OptionContractMembersan:MarketValueOfEquityMemberifrs-full:LaterThanOneMonthAndNotLaterThanThreeMonthsMemberifrs-full:CashFlowHedgesMember2025-12-310000891478ifrs-full:OptionContractMembersan:MarketValueOfEquityMemberifrs-full:LaterThanThreeMonthsAndNotLaterThanOneYearMemberifrs-full:CashFlowHedgesMember2025-12-310000891478ifrs-full:OptionContractMembersan:MarketValueOfEquityMemberifrs-full:LaterThanOneYearAndNotLaterThanFiveYearsMemberifrs-full:CashFlowHedgesMember2025-12-310000891478ifrs-full:OptionContractMembersan:MarketValueOfEquityMemberifrs-full:LaterThanFiveYearsMemberifrs-full:CashFlowHedgesMember2025-12-310000891478ifrs-full:NotLaterThanOneMonthMemberifrs-full:HedgesOfNetInvestmentInForeignOperationsMember2025-12-310000891478ifrs-full:LaterThanOneMonthAndNotLaterThanThreeMonthsMemberifrs-full:HedgesOfNetInvestmentInForeignOperationsMember2025-12-310000891478ifrs-full:LaterThanThreeMonthsAndNotLaterThanOneYearMemberifrs-full:HedgesOfNetInvestmentInForeignOperationsMember2025-12-310000891478ifrs-full:LaterThanOneYearAndNotLaterThanFiveYearsMemberifrs-full:HedgesOfNetInvestmentInForeignOperationsMember2025-12-310000891478ifrs-full:LaterThanFiveYearsMemberifrs-full:HedgesOfNetInvestmentInForeignOperationsMember2025-12-310000891478ifrs-full:CurrencyRiskMemberifrs-full:NotLaterThanOneMonthMemberifrs-full:HedgesOfNetInvestmentInForeignOperationsMember2025-12-310000891478ifrs-full:CurrencyRiskMemberifrs-full:LaterThanOneMonthAndNotLaterThanThreeMonthsMemberifrs-full:HedgesOfNetInvestmentInForeignOperationsMember2025-12-310000891478ifrs-full:CurrencyRiskMemberifrs-full:LaterThanThreeMonthsAndNotLaterThanOneYearMemberifrs-full:HedgesOfNetInvestmentInForeignOperationsMember2025-12-310000891478ifrs-full:CurrencyRiskMemberifrs-full:LaterThanOneYearAndNotLaterThanFiveYearsMemberifrs-full:HedgesOfNetInvestmentInForeignOperationsMember2025-12-310000891478ifrs-full:CurrencyRiskMemberifrs-full:LaterThanFiveYearsMemberifrs-full:HedgesOfNetInvestmentInForeignOperationsMember2025-12-310000891478san:ForeignExchangeForwardContractMemberifrs-full:CurrencyRiskMemberifrs-full:NotLaterThanOneMonthMemberifrs-full:HedgesOfNetInvestmentInForeignOperationsMember2025-12-310000891478san:ForeignExchangeForwardContractMemberifrs-full:CurrencyRiskMemberifrs-full:LaterThanOneMonthAndNotLaterThanThreeMonthsMemberifrs-full:HedgesOfNetInvestmentInForeignOperationsMember2025-12-310000891478san:ForeignExchangeForwardContractMemberifrs-full:CurrencyRiskMemberifrs-full:LaterThanThreeMonthsAndNotLaterThanOneYearMemberifrs-full:HedgesOfNetInvestmentInForeignOperationsMember2025-12-310000891478san:ForeignExchangeForwardContractMemberifrs-full:CurrencyRiskMemberifrs-full:LaterThanOneYearAndNotLaterThanFiveYearsMemberifrs-full:HedgesOfNetInvestmentInForeignOperationsMember2025-12-310000891478san:ForeignExchangeForwardContractMemberifrs-full:CurrencyRiskMemberifrs-full:LaterThanFiveYearsMemberifrs-full:HedgesOfNetInvestmentInForeignOperationsMember2025-12-310000891478san:ForeignExchangeSwapMemberifrs-full:CurrencyRiskMemberifrs-full:NotLaterThanOneMonthMemberifrs-full:HedgesOfNetInvestmentInForeignOperationsMember2025-12-310000891478san:ForeignExchangeSwapMemberifrs-full:CurrencyRiskMemberifrs-full:LaterThanOneMonthAndNotLaterThanThreeMonthsMemberifrs-full:HedgesOfNetInvestmentInForeignOperationsMember2025-12-310000891478san:ForeignExchangeSwapMemberifrs-full:CurrencyRiskMemberifrs-full:LaterThanThreeMonthsAndNotLaterThanOneYearMemberifrs-full:HedgesOfNetInvestmentInForeignOperationsMember2025-12-310000891478san:ForeignExchangeSwapMemberifrs-full:CurrencyRiskMemberifrs-full:LaterThanOneYearAndNotLaterThanFiveYearsMemberifrs-full:HedgesOfNetInvestmentInForeignOperationsMember2025-12-310000891478san:ForeignExchangeSwapMemberifrs-full:CurrencyRiskMemberifrs-full:LaterThanFiveYearsMemberifrs-full:HedgesOfNetInvestmentInForeignOperationsMember2025-12-310000891478ifrs-full:NotLaterThanOneMonthMember2025-12-310000891478ifrs-full:LaterThanOneMonthAndNotLaterThanThreeMonthsMember2025-12-310000891478ifrs-full:LaterThanThreeMonthsAndNotLaterThanOneYearMember2025-12-310000891478ifrs-full:LaterThanOneYearAndNotLaterThanFiveYearsMember2025-12-310000891478ifrs-full:NotLaterThanOneMonthMemberifrs-full:FairValueHedgesMember2024-12-310000891478ifrs-full:LaterThanOneMonthAndNotLaterThanThreeMonthsMemberifrs-full:FairValueHedgesMember2024-12-310000891478ifrs-full:LaterThanThreeMonthsAndNotLaterThanOneYearMemberifrs-full:FairValueHedgesMember2024-12-310000891478ifrs-full:LaterThanOneYearAndNotLaterThanFiveYearsMemberifrs-full:FairValueHedgesMember2024-12-310000891478ifrs-full:LaterThanFiveYearsMemberifrs-full:FairValueHedgesMember2024-12-310000891478ifrs-full:InterestRateRiskMemberifrs-full:NotLaterThanOneMonthMemberifrs-full:FairValueHedgesMember2024-12-310000891478ifrs-full:InterestRateRiskMemberifrs-full:LaterThanOneMonthAndNotLaterThanThreeMonthsMemberifrs-full:FairValueHedgesMember2024-12-310000891478ifrs-full:InterestRateRiskMemberifrs-full:LaterThanThreeMonthsAndNotLaterThanOneYearMemberifrs-full:FairValueHedgesMember2024-12-310000891478ifrs-full:InterestRateRiskMemberifrs-full:LaterThanOneYearAndNotLaterThanFiveYearsMemberifrs-full:FairValueHedgesMember2024-12-310000891478ifrs-full:InterestRateRiskMemberifrs-full:LaterThanFiveYearsMemberifrs-full:FairValueHedgesMember2024-12-310000891478ifrs-full:InterestRateSwapContractMemberifrs-full:InterestRateRiskMemberifrs-full:NotLaterThanOneMonthMemberifrs-full:FairValueHedgesMember2024-12-310000891478ifrs-full:InterestRateSwapContractMemberifrs-full:InterestRateRiskMemberifrs-full:LaterThanOneMonthAndNotLaterThanThreeMonthsMemberifrs-full:FairValueHedgesMember2024-12-310000891478ifrs-full:InterestRateSwapContractMemberifrs-full:InterestRateRiskMemberifrs-full:LaterThanThreeMonthsAndNotLaterThanOneYearMemberifrs-full:FairValueHedgesMember2024-12-310000891478ifrs-full:InterestRateSwapContractMemberifrs-full:InterestRateRiskMemberifrs-full:LaterThanOneYearAndNotLaterThanFiveYearsMemberifrs-full:FairValueHedgesMember2024-12-310000891478ifrs-full:InterestRateSwapContractMemberifrs-full:InterestRateRiskMemberifrs-full:LaterThanFiveYearsMemberifrs-full:FairValueHedgesMember2024-12-310000891478ifrs-full:CurrencyRiskMemberifrs-full:NotLaterThanOneMonthMemberifrs-full:FairValueHedgesMember2024-12-310000891478ifrs-full:CurrencyRiskMemberifrs-full:LaterThanOneMonthAndNotLaterThanThreeMonthsMemberifrs-full:FairValueHedgesMember2024-12-310000891478ifrs-full:CurrencyRiskMemberifrs-full:LaterThanThreeMonthsAndNotLaterThanOneYearMemberifrs-full:FairValueHedgesMember2024-12-310000891478ifrs-full:CurrencyRiskMemberifrs-full:LaterThanOneYearAndNotLaterThanFiveYearsMemberifrs-full:FairValueHedgesMember2024-12-310000891478ifrs-full:CurrencyRiskMemberifrs-full:LaterThanFiveYearsMemberifrs-full:FairValueHedgesMember2024-12-310000891478san:ForeignExchangeForwardContractMemberifrs-full:CurrencyRiskMemberifrs-full:NotLaterThanOneMonthMemberifrs-full:FairValueHedgesMember2024-12-310000891478san:ForeignExchangeForwardContractMemberifrs-full:CurrencyRiskMemberifrs-full:LaterThanOneMonthAndNotLaterThanThreeMonthsMemberifrs-full:FairValueHedgesMember2024-12-310000891478san:ForeignExchangeForwardContractMemberifrs-full:CurrencyRiskMemberifrs-full:LaterThanThreeMonthsAndNotLaterThanOneYearMemberifrs-full:FairValueHedgesMember2024-12-310000891478san:ForeignExchangeForwardContractMemberifrs-full:CurrencyRiskMemberifrs-full:LaterThanOneYearAndNotLaterThanFiveYearsMemberifrs-full:FairValueHedgesMember2024-12-310000891478san:ForeignExchangeForwardContractMemberifrs-full:CurrencyRiskMemberifrs-full:LaterThanFiveYearsMemberifrs-full:FairValueHedgesMember2024-12-310000891478ifrs-full:FuturesContractMemberifrs-full:CurrencyRiskMemberifrs-full:NotLaterThanOneMonthMemberifrs-full:FairValueHedgesMember2024-12-310000891478ifrs-full:FuturesContractMemberifrs-full:CurrencyRiskMemberifrs-full:LaterThanOneMonthAndNotLaterThanThreeMonthsMemberifrs-full:FairValueHedgesMember2024-12-310000891478ifrs-full:FuturesContractMemberifrs-full:CurrencyRiskMemberifrs-full:LaterThanThreeMonthsAndNotLaterThanOneYearMemberifrs-full:FairValueHedgesMember2024-12-310000891478ifrs-full:FuturesContractMemberifrs-full:CurrencyRiskMemberifrs-full:LaterThanOneYearAndNotLaterThanFiveYearsMemberifrs-full:FairValueHedgesMember2024-12-310000891478ifrs-full:FuturesContractMemberifrs-full:CurrencyRiskMemberifrs-full:LaterThanFiveYearsMemberifrs-full:FairValueHedgesMember2024-12-310000891478san:InterestRateAndExchangeRateRiskMemberifrs-full:NotLaterThanOneMonthMemberifrs-full:FairValueHedgesMember2024-12-310000891478san:InterestRateAndExchangeRateRiskMemberifrs-full:LaterThanOneMonthAndNotLaterThanThreeMonthsMemberifrs-full:FairValueHedgesMember2024-12-310000891478san:InterestRateAndExchangeRateRiskMemberifrs-full:LaterThanThreeMonthsAndNotLaterThanOneYearMemberifrs-full:FairValueHedgesMember2024-12-310000891478san:InterestRateAndExchangeRateRiskMemberifrs-full:LaterThanOneYearAndNotLaterThanFiveYearsMemberifrs-full:FairValueHedgesMember2024-12-310000891478san:InterestRateAndExchangeRateRiskMemberifrs-full:LaterThanFiveYearsMemberifrs-full:FairValueHedgesMember2024-12-310000891478ifrs-full:InterestRateSwapContractMembersan:InterestRateAndExchangeRateRiskMemberifrs-full:NotLaterThanOneMonthMemberifrs-full:FairValueHedgesMember2024-12-310000891478ifrs-full:InterestRateSwapContractMembersan:InterestRateAndExchangeRateRiskMemberifrs-full:LaterThanOneMonthAndNotLaterThanThreeMonthsMemberifrs-full:FairValueHedgesMember2024-12-310000891478ifrs-full:InterestRateSwapContractMembersan:InterestRateAndExchangeRateRiskMemberifrs-full:LaterThanThreeMonthsAndNotLaterThanOneYearMemberifrs-full:FairValueHedgesMember2024-12-310000891478ifrs-full:InterestRateSwapContractMembersan:InterestRateAndExchangeRateRiskMemberifrs-full:LaterThanOneYearAndNotLaterThanFiveYearsMemberifrs-full:FairValueHedgesMember2024-12-310000891478ifrs-full:InterestRateSwapContractMembersan:InterestRateAndExchangeRateRiskMemberifrs-full:LaterThanFiveYearsMemberifrs-full:FairValueHedgesMember2024-12-310000891478ifrs-full:CurrencySwapContractMembersan:InterestRateAndExchangeRateRiskMemberifrs-full:NotLaterThanOneMonthMemberifrs-full:FairValueHedgesMember2024-12-310000891478ifrs-full:CurrencySwapContractMembersan:InterestRateAndExchangeRateRiskMemberifrs-full:LaterThanOneMonthAndNotLaterThanThreeMonthsMemberifrs-full:FairValueHedgesMember2024-12-310000891478ifrs-full:CurrencySwapContractMembersan:InterestRateAndExchangeRateRiskMemberifrs-full:LaterThanThreeMonthsAndNotLaterThanOneYearMemberifrs-full:FairValueHedgesMember2024-12-310000891478ifrs-full:CurrencySwapContractMembersan:InterestRateAndExchangeRateRiskMemberifrs-full:LaterThanOneYearAndNotLaterThanFiveYearsMemberifrs-full:FairValueHedgesMember2024-12-310000891478ifrs-full:CurrencySwapContractMembersan:InterestRateAndExchangeRateRiskMemberifrs-full:LaterThanFiveYearsMemberifrs-full:FairValueHedgesMember2024-12-310000891478san:BaseRiskMemberifrs-full:NotLaterThanOneMonthMemberifrs-full:FairValueHedgesMember2024-12-310000891478san:BaseRiskMemberifrs-full:LaterThanOneMonthAndNotLaterThanThreeMonthsMemberifrs-full:FairValueHedgesMember2024-12-310000891478san:BaseRiskMemberifrs-full:LaterThanThreeMonthsAndNotLaterThanOneYearMemberifrs-full:FairValueHedgesMember2024-12-310000891478san:BaseRiskMemberifrs-full:LaterThanOneYearAndNotLaterThanFiveYearsMemberifrs-full:FairValueHedgesMember2024-12-310000891478san:BaseRiskMemberifrs-full:LaterThanFiveYearsMemberifrs-full:FairValueHedgesMember2024-12-310000891478ifrs-full:InterestRateSwapContractMembersan:BaseRiskMemberifrs-full:NotLaterThanOneMonthMemberifrs-full:FairValueHedgesMember2024-12-310000891478ifrs-full:InterestRateSwapContractMembersan:BaseRiskMemberifrs-full:LaterThanOneMonthAndNotLaterThanThreeMonthsMemberifrs-full:FairValueHedgesMember2024-12-310000891478ifrs-full:InterestRateSwapContractMembersan:BaseRiskMemberifrs-full:LaterThanThreeMonthsAndNotLaterThanOneYearMemberifrs-full:FairValueHedgesMember2024-12-310000891478ifrs-full:InterestRateSwapContractMembersan:BaseRiskMemberifrs-full:LaterThanOneYearAndNotLaterThanFiveYearsMemberifrs-full:FairValueHedgesMember2024-12-310000891478ifrs-full:InterestRateSwapContractMembersan:BaseRiskMemberifrs-full:LaterThanFiveYearsMemberifrs-full:FairValueHedgesMember2024-12-310000891478san:MarketValueOfEquityMemberifrs-full:NotLaterThanOneMonthMemberifrs-full:FairValueHedgesMember2024-12-310000891478san:MarketValueOfEquityMemberifrs-full:LaterThanOneMonthAndNotLaterThanThreeMonthsMemberifrs-full:FairValueHedgesMember2024-12-310000891478san:MarketValueOfEquityMemberifrs-full:LaterThanThreeMonthsAndNotLaterThanOneYearMemberifrs-full:FairValueHedgesMember2024-12-310000891478san:MarketValueOfEquityMemberifrs-full:LaterThanOneYearAndNotLaterThanFiveYearsMemberifrs-full:FairValueHedgesMember2024-12-310000891478san:MarketValueOfEquityMemberifrs-full:LaterThanFiveYearsMemberifrs-full:FairValueHedgesMember2024-12-310000891478san:EquitySwapContractMembersan:MarketValueOfEquityMemberifrs-full:NotLaterThanOneMonthMemberifrs-full:FairValueHedgesMember2024-12-310000891478san:EquitySwapContractMembersan:MarketValueOfEquityMemberifrs-full:LaterThanOneMonthAndNotLaterThanThreeMonthsMemberifrs-full:FairValueHedgesMember2024-12-310000891478san:EquitySwapContractMembersan:MarketValueOfEquityMemberifrs-full:LaterThanThreeMonthsAndNotLaterThanOneYearMemberifrs-full:FairValueHedgesMember2024-12-310000891478san:EquitySwapContractMembersan:MarketValueOfEquityMemberifrs-full:LaterThanOneYearAndNotLaterThanFiveYearsMemberifrs-full:FairValueHedgesMember2024-12-310000891478san:EquitySwapContractMembersan:MarketValueOfEquityMemberifrs-full:LaterThanFiveYearsMemberifrs-full:FairValueHedgesMember2024-12-310000891478ifrs-full:NotLaterThanOneMonthMemberifrs-full:CashFlowHedgesMember2024-12-310000891478ifrs-full:LaterThanOneMonthAndNotLaterThanThreeMonthsMemberifrs-full:CashFlowHedgesMember2024-12-310000891478ifrs-full:LaterThanThreeMonthsAndNotLaterThanOneYearMemberifrs-full:CashFlowHedgesMember2024-12-310000891478ifrs-full:LaterThanOneYearAndNotLaterThanFiveYearsMemberifrs-full:CashFlowHedgesMember2024-12-310000891478ifrs-full:LaterThanFiveYearsMemberifrs-full:CashFlowHedgesMember2024-12-310000891478ifrs-full:InterestRateRiskMemberifrs-full:NotLaterThanOneMonthMemberifrs-full:CashFlowHedgesMember2024-12-310000891478ifrs-full:InterestRateRiskMemberifrs-full:LaterThanOneMonthAndNotLaterThanThreeMonthsMemberifrs-full:CashFlowHedgesMember2024-12-310000891478ifrs-full:InterestRateRiskMemberifrs-full:LaterThanThreeMonthsAndNotLaterThanOneYearMemberifrs-full:CashFlowHedgesMember2024-12-310000891478ifrs-full:InterestRateRiskMemberifrs-full:LaterThanOneYearAndNotLaterThanFiveYearsMemberifrs-full:CashFlowHedgesMember2024-12-310000891478ifrs-full:InterestRateRiskMemberifrs-full:LaterThanFiveYearsMemberifrs-full:CashFlowHedgesMember2024-12-310000891478ifrs-full:FuturesContractMemberifrs-full:InterestRateRiskMemberifrs-full:NotLaterThanOneMonthMemberifrs-full:CashFlowHedgesMember2024-12-310000891478ifrs-full:FuturesContractMemberifrs-full:InterestRateRiskMemberifrs-full:LaterThanOneMonthAndNotLaterThanThreeMonthsMemberifrs-full:CashFlowHedgesMember2024-12-310000891478ifrs-full:FuturesContractMemberifrs-full:InterestRateRiskMemberifrs-full:LaterThanThreeMonthsAndNotLaterThanOneYearMemberifrs-full:CashFlowHedgesMember2024-12-310000891478ifrs-full:FuturesContractMemberifrs-full:InterestRateRiskMemberifrs-full:LaterThanOneYearAndNotLaterThanFiveYearsMemberifrs-full:CashFlowHedgesMember2024-12-310000891478ifrs-full:FuturesContractMemberifrs-full:InterestRateRiskMemberifrs-full:LaterThanFiveYearsMemberifrs-full:CashFlowHedgesMember2024-12-310000891478ifrs-full:InterestRateSwapContractMemberifrs-full:InterestRateRiskMemberifrs-full:NotLaterThanOneMonthMemberifrs-full:CashFlowHedgesMember2024-12-310000891478ifrs-full:InterestRateSwapContractMemberifrs-full:InterestRateRiskMemberifrs-full:LaterThanOneMonthAndNotLaterThanThreeMonthsMemberifrs-full:CashFlowHedgesMember2024-12-310000891478ifrs-full:InterestRateSwapContractMemberifrs-full:InterestRateRiskMemberifrs-full:LaterThanThreeMonthsAndNotLaterThanOneYearMemberifrs-full:CashFlowHedgesMember2024-12-310000891478ifrs-full:InterestRateSwapContractMemberifrs-full:InterestRateRiskMemberifrs-full:LaterThanOneYearAndNotLaterThanFiveYearsMemberifrs-full:CashFlowHedgesMember2024-12-310000891478ifrs-full:InterestRateSwapContractMemberifrs-full:InterestRateRiskMemberifrs-full:LaterThanFiveYearsMemberifrs-full:CashFlowHedgesMember2024-12-310000891478ifrs-full:CurrencyRiskMemberifrs-full:NotLaterThanOneMonthMemberifrs-full:CashFlowHedgesMember2024-12-310000891478ifrs-full:CurrencyRiskMemberifrs-full:LaterThanOneMonthAndNotLaterThanThreeMonthsMemberifrs-full:CashFlowHedgesMember2024-12-310000891478ifrs-full:CurrencyRiskMemberifrs-full:LaterThanThreeMonthsAndNotLaterThanOneYearMemberifrs-full:CashFlowHedgesMember2024-12-310000891478ifrs-full:CurrencyRiskMemberifrs-full:LaterThanOneYearAndNotLaterThanFiveYearsMemberifrs-full:CashFlowHedgesMember2024-12-310000891478ifrs-full:CurrencyRiskMemberifrs-full:LaterThanFiveYearsMemberifrs-full:CashFlowHedgesMember2024-12-310000891478san:ForeignExchangeForwardContractMemberifrs-full:CurrencyRiskMemberifrs-full:NotLaterThanOneMonthMemberifrs-full:CashFlowHedgesMember2024-12-310000891478san:ForeignExchangeForwardContractMemberifrs-full:CurrencyRiskMemberifrs-full:LaterThanOneMonthAndNotLaterThanThreeMonthsMemberifrs-full:CashFlowHedgesMember2024-12-310000891478san:ForeignExchangeForwardContractMemberifrs-full:CurrencyRiskMemberifrs-full:LaterThanThreeMonthsAndNotLaterThanOneYearMemberifrs-full:CashFlowHedgesMember2024-12-310000891478san:ForeignExchangeForwardContractMemberifrs-full:CurrencyRiskMemberifrs-full:LaterThanOneYearAndNotLaterThanFiveYearsMemberifrs-full:CashFlowHedgesMember2024-12-310000891478san:ForeignExchangeForwardContractMemberifrs-full:CurrencyRiskMemberifrs-full:LaterThanFiveYearsMemberifrs-full:CashFlowHedgesMember2024-12-310000891478ifrs-full:CurrencySwapContractMemberifrs-full:CurrencyRiskMemberifrs-full:NotLaterThanOneMonthMemberifrs-full:CashFlowHedgesMember2024-12-310000891478ifrs-full:CurrencySwapContractMemberifrs-full:CurrencyRiskMemberifrs-full:LaterThanOneMonthAndNotLaterThanThreeMonthsMemberifrs-full:CashFlowHedgesMember2024-12-310000891478ifrs-full:CurrencySwapContractMemberifrs-full:CurrencyRiskMemberifrs-full:LaterThanThreeMonthsAndNotLaterThanOneYearMemberifrs-full:CashFlowHedgesMember2024-12-310000891478ifrs-full:CurrencySwapContractMemberifrs-full:CurrencyRiskMemberifrs-full:LaterThanOneYearAndNotLaterThanFiveYearsMemberifrs-full:CashFlowHedgesMember2024-12-310000891478ifrs-full:CurrencySwapContractMemberifrs-full:CurrencyRiskMemberifrs-full:LaterThanFiveYearsMemberifrs-full:CashFlowHedgesMember2024-12-310000891478san:InterestRateAndExchangeRateRiskMemberifrs-full:NotLaterThanOneMonthMemberifrs-full:CashFlowHedgesMember2024-12-310000891478san:InterestRateAndExchangeRateRiskMemberifrs-full:LaterThanOneMonthAndNotLaterThanThreeMonthsMemberifrs-full:CashFlowHedgesMember2024-12-310000891478san:InterestRateAndExchangeRateRiskMemberifrs-full:LaterThanThreeMonthsAndNotLaterThanOneYearMemberifrs-full:CashFlowHedgesMember2024-12-310000891478san:InterestRateAndExchangeRateRiskMemberifrs-full:LaterThanOneYearAndNotLaterThanFiveYearsMemberifrs-full:CashFlowHedgesMember2024-12-310000891478san:InterestRateAndExchangeRateRiskMemberifrs-full:LaterThanFiveYearsMemberifrs-full:CashFlowHedgesMember2024-12-310000891478ifrs-full:InterestRateSwapContractMembersan:InterestRateAndExchangeRateRiskMemberifrs-full:NotLaterThanOneMonthMemberifrs-full:CashFlowHedgesMember2024-12-310000891478ifrs-full:InterestRateSwapContractMembersan:InterestRateAndExchangeRateRiskMemberifrs-full:LaterThanOneMonthAndNotLaterThanThreeMonthsMemberifrs-full:CashFlowHedgesMember2024-12-310000891478ifrs-full:InterestRateSwapContractMembersan:InterestRateAndExchangeRateRiskMemberifrs-full:LaterThanThreeMonthsAndNotLaterThanOneYearMemberifrs-full:CashFlowHedgesMember2024-12-310000891478ifrs-full:InterestRateSwapContractMembersan:InterestRateAndExchangeRateRiskMemberifrs-full:LaterThanOneYearAndNotLaterThanFiveYearsMemberifrs-full:CashFlowHedgesMember2024-12-310000891478ifrs-full:InterestRateSwapContractMembersan:InterestRateAndExchangeRateRiskMemberifrs-full:LaterThanFiveYearsMemberifrs-full:CashFlowHedgesMember2024-12-310000891478ifrs-full:CurrencySwapContractMembersan:InterestRateAndExchangeRateRiskMemberifrs-full:NotLaterThanOneMonthMemberifrs-full:CashFlowHedgesMember2024-12-310000891478ifrs-full:CurrencySwapContractMembersan:InterestRateAndExchangeRateRiskMemberifrs-full:LaterThanOneMonthAndNotLaterThanThreeMonthsMemberifrs-full:CashFlowHedgesMember2024-12-310000891478ifrs-full:CurrencySwapContractMembersan:InterestRateAndExchangeRateRiskMemberifrs-full:LaterThanThreeMonthsAndNotLaterThanOneYearMemberifrs-full:CashFlowHedgesMember2024-12-310000891478ifrs-full:CurrencySwapContractMembersan:InterestRateAndExchangeRateRiskMemberifrs-full:LaterThanOneYearAndNotLaterThanFiveYearsMemberifrs-full:CashFlowHedgesMember2024-12-310000891478ifrs-full:CurrencySwapContractMembersan:InterestRateAndExchangeRateRiskMemberifrs-full:LaterThanFiveYearsMemberifrs-full:CashFlowHedgesMember2024-12-310000891478san:InflationRiskMemberifrs-full:NotLaterThanOneMonthMemberifrs-full:CashFlowHedgesMember2024-12-310000891478san:InflationRiskMemberifrs-full:LaterThanOneMonthAndNotLaterThanThreeMonthsMemberifrs-full:CashFlowHedgesMember2024-12-310000891478san:InflationRiskMemberifrs-full:LaterThanThreeMonthsAndNotLaterThanOneYearMemberifrs-full:CashFlowHedgesMember2024-12-310000891478san:InflationRiskMemberifrs-full:LaterThanOneYearAndNotLaterThanFiveYearsMemberifrs-full:CashFlowHedgesMember2024-12-310000891478san:InflationRiskMemberifrs-full:LaterThanFiveYearsMemberifrs-full:CashFlowHedgesMember2024-12-310000891478san:InflationSwapContractMembersan:InflationRiskMemberifrs-full:NotLaterThanOneMonthMemberifrs-full:CashFlowHedgesMember2024-12-310000891478san:InflationSwapContractMembersan:InflationRiskMemberifrs-full:LaterThanOneMonthAndNotLaterThanThreeMonthsMemberifrs-full:CashFlowHedgesMember2024-12-310000891478san:InflationSwapContractMembersan:InflationRiskMemberifrs-full:LaterThanThreeMonthsAndNotLaterThanOneYearMemberifrs-full:CashFlowHedgesMember2024-12-310000891478san:InflationSwapContractMembersan:InflationRiskMemberifrs-full:LaterThanOneYearAndNotLaterThanFiveYearsMemberifrs-full:CashFlowHedgesMember2024-12-310000891478san:InflationSwapContractMembersan:InflationRiskMemberifrs-full:LaterThanFiveYearsMemberifrs-full:CashFlowHedgesMember2024-12-310000891478san:MarketValueOfEquityMemberifrs-full:NotLaterThanOneMonthMemberifrs-full:CashFlowHedgesMember2024-12-310000891478san:MarketValueOfEquityMemberifrs-full:LaterThanOneMonthAndNotLaterThanThreeMonthsMemberifrs-full:CashFlowHedgesMember2024-12-310000891478san:MarketValueOfEquityMemberifrs-full:LaterThanThreeMonthsAndNotLaterThanOneYearMemberifrs-full:CashFlowHedgesMember2024-12-310000891478san:MarketValueOfEquityMemberifrs-full:LaterThanOneYearAndNotLaterThanFiveYearsMemberifrs-full:CashFlowHedgesMember2024-12-310000891478san:MarketValueOfEquityMemberifrs-full:LaterThanFiveYearsMemberifrs-full:CashFlowHedgesMember2024-12-310000891478ifrs-full:OptionContractMembersan:MarketValueOfEquityMemberifrs-full:NotLaterThanOneMonthMemberifrs-full:CashFlowHedgesMember2024-12-310000891478ifrs-full:OptionContractMembersan:MarketValueOfEquityMemberifrs-full:LaterThanOneMonthAndNotLaterThanThreeMonthsMemberifrs-full:CashFlowHedgesMember2024-12-310000891478ifrs-full:OptionContractMembersan:MarketValueOfEquityMemberifrs-full:LaterThanThreeMonthsAndNotLaterThanOneYearMemberifrs-full:CashFlowHedgesMember2024-12-310000891478ifrs-full:OptionContractMembersan:MarketValueOfEquityMemberifrs-full:LaterThanOneYearAndNotLaterThanFiveYearsMemberifrs-full:CashFlowHedgesMember2024-12-310000891478ifrs-full:OptionContractMembersan:MarketValueOfEquityMemberifrs-full:LaterThanFiveYearsMemberifrs-full:CashFlowHedgesMember2024-12-310000891478ifrs-full:OptionContractMembersan:MarketValueOfEquityMemberifrs-full:CashFlowHedgesMember2024-12-310000891478ifrs-full:NotLaterThanOneMonthMemberifrs-full:HedgesOfNetInvestmentInForeignOperationsMember2024-12-310000891478ifrs-full:LaterThanOneMonthAndNotLaterThanThreeMonthsMemberifrs-full:HedgesOfNetInvestmentInForeignOperationsMember2024-12-310000891478ifrs-full:LaterThanThreeMonthsAndNotLaterThanOneYearMemberifrs-full:HedgesOfNetInvestmentInForeignOperationsMember2024-12-310000891478ifrs-full:LaterThanOneYearAndNotLaterThanFiveYearsMemberifrs-full:HedgesOfNetInvestmentInForeignOperationsMember2024-12-310000891478ifrs-full:LaterThanFiveYearsMemberifrs-full:HedgesOfNetInvestmentInForeignOperationsMember2024-12-310000891478ifrs-full:CurrencyRiskMemberifrs-full:NotLaterThanOneMonthMemberifrs-full:HedgesOfNetInvestmentInForeignOperationsMember2024-12-310000891478ifrs-full:CurrencyRiskMemberifrs-full:LaterThanOneMonthAndNotLaterThanThreeMonthsMemberifrs-full:HedgesOfNetInvestmentInForeignOperationsMember2024-12-310000891478ifrs-full:CurrencyRiskMemberifrs-full:LaterThanThreeMonthsAndNotLaterThanOneYearMemberifrs-full:HedgesOfNetInvestmentInForeignOperationsMember2024-12-310000891478ifrs-full:CurrencyRiskMemberifrs-full:LaterThanOneYearAndNotLaterThanFiveYearsMemberifrs-full:HedgesOfNetInvestmentInForeignOperationsMember2024-12-310000891478ifrs-full:CurrencyRiskMemberifrs-full:LaterThanFiveYearsMemberifrs-full:HedgesOfNetInvestmentInForeignOperationsMember2024-12-310000891478san:ForeignExchangeForwardContractMemberifrs-full:CurrencyRiskMemberifrs-full:NotLaterThanOneMonthMemberifrs-full:HedgesOfNetInvestmentInForeignOperationsMember2024-12-310000891478san:ForeignExchangeForwardContractMemberifrs-full:CurrencyRiskMemberifrs-full:LaterThanOneMonthAndNotLaterThanThreeMonthsMemberifrs-full:HedgesOfNetInvestmentInForeignOperationsMember2024-12-310000891478san:ForeignExchangeForwardContractMemberifrs-full:CurrencyRiskMemberifrs-full:LaterThanThreeMonthsAndNotLaterThanOneYearMemberifrs-full:HedgesOfNetInvestmentInForeignOperationsMember2024-12-310000891478san:ForeignExchangeForwardContractMemberifrs-full:CurrencyRiskMemberifrs-full:LaterThanOneYearAndNotLaterThanFiveYearsMemberifrs-full:HedgesOfNetInvestmentInForeignOperationsMember2024-12-310000891478san:ForeignExchangeForwardContractMemberifrs-full:CurrencyRiskMemberifrs-full:LaterThanFiveYearsMemberifrs-full:HedgesOfNetInvestmentInForeignOperationsMember2024-12-310000891478ifrs-full:NotLaterThanOneMonthMember2024-12-310000891478ifrs-full:LaterThanOneMonthAndNotLaterThanThreeMonthsMember2024-12-310000891478ifrs-full:LaterThanThreeMonthsAndNotLaterThanOneYearMember2024-12-310000891478ifrs-full:LaterThanOneYearAndNotLaterThanFiveYearsMember2024-12-310000891478ifrs-full:NotLaterThanOneMonthMemberifrs-full:FairValueHedgesMember2023-12-310000891478ifrs-full:LaterThanOneMonthAndNotLaterThanThreeMonthsMemberifrs-full:FairValueHedgesMember2023-12-310000891478ifrs-full:LaterThanThreeMonthsAndNotLaterThanOneYearMemberifrs-full:FairValueHedgesMember2023-12-310000891478ifrs-full:LaterThanOneYearAndNotLaterThanFiveYearsMemberifrs-full:FairValueHedgesMember2023-12-310000891478ifrs-full:LaterThanFiveYearsMemberifrs-full:FairValueHedgesMember2023-12-310000891478ifrs-full:InterestRateRiskMemberifrs-full:NotLaterThanOneMonthMemberifrs-full:FairValueHedgesMember2023-12-310000891478ifrs-full:InterestRateRiskMemberifrs-full:LaterThanOneMonthAndNotLaterThanThreeMonthsMemberifrs-full:FairValueHedgesMember2023-12-310000891478ifrs-full:InterestRateRiskMemberifrs-full:LaterThanThreeMonthsAndNotLaterThanOneYearMemberifrs-full:FairValueHedgesMember2023-12-310000891478ifrs-full:InterestRateRiskMemberifrs-full:LaterThanOneYearAndNotLaterThanFiveYearsMemberifrs-full:FairValueHedgesMember2023-12-310000891478ifrs-full:InterestRateRiskMemberifrs-full:LaterThanFiveYearsMemberifrs-full:FairValueHedgesMember2023-12-310000891478ifrs-full:InterestRateSwapContractMemberifrs-full:InterestRateRiskMemberifrs-full:NotLaterThanOneMonthMemberifrs-full:FairValueHedgesMember2023-12-310000891478ifrs-full:InterestRateSwapContractMemberifrs-full:InterestRateRiskMemberifrs-full:LaterThanOneMonthAndNotLaterThanThreeMonthsMemberifrs-full:FairValueHedgesMember2023-12-310000891478ifrs-full:InterestRateSwapContractMemberifrs-full:InterestRateRiskMemberifrs-full:LaterThanThreeMonthsAndNotLaterThanOneYearMemberifrs-full:FairValueHedgesMember2023-12-310000891478ifrs-full:InterestRateSwapContractMemberifrs-full:InterestRateRiskMemberifrs-full:LaterThanOneYearAndNotLaterThanFiveYearsMemberifrs-full:FairValueHedgesMember2023-12-310000891478ifrs-full:InterestRateSwapContractMemberifrs-full:InterestRateRiskMemberifrs-full:LaterThanFiveYearsMemberifrs-full:FairValueHedgesMember2023-12-310000891478ifrs-full:CurrencyRiskMemberifrs-full:NotLaterThanOneMonthMemberifrs-full:FairValueHedgesMember2023-12-310000891478ifrs-full:CurrencyRiskMemberifrs-full:LaterThanOneMonthAndNotLaterThanThreeMonthsMemberifrs-full:FairValueHedgesMember2023-12-310000891478ifrs-full:CurrencyRiskMemberifrs-full:LaterThanThreeMonthsAndNotLaterThanOneYearMemberifrs-full:FairValueHedgesMember2023-12-310000891478ifrs-full:CurrencyRiskMemberifrs-full:LaterThanOneYearAndNotLaterThanFiveYearsMemberifrs-full:FairValueHedgesMember2023-12-310000891478ifrs-full:CurrencyRiskMemberifrs-full:LaterThanFiveYearsMemberifrs-full:FairValueHedgesMember2023-12-310000891478san:ForeignExchangeForwardContractMemberifrs-full:CurrencyRiskMemberifrs-full:NotLaterThanOneMonthMemberifrs-full:FairValueHedgesMember2023-12-310000891478san:ForeignExchangeForwardContractMemberifrs-full:CurrencyRiskMemberifrs-full:LaterThanOneMonthAndNotLaterThanThreeMonthsMemberifrs-full:FairValueHedgesMember2023-12-310000891478san:ForeignExchangeForwardContractMemberifrs-full:CurrencyRiskMemberifrs-full:LaterThanThreeMonthsAndNotLaterThanOneYearMemberifrs-full:FairValueHedgesMember2023-12-310000891478san:ForeignExchangeForwardContractMemberifrs-full:CurrencyRiskMemberifrs-full:LaterThanOneYearAndNotLaterThanFiveYearsMemberifrs-full:FairValueHedgesMember2023-12-310000891478san:ForeignExchangeForwardContractMemberifrs-full:CurrencyRiskMemberifrs-full:LaterThanFiveYearsMemberifrs-full:FairValueHedgesMember2023-12-310000891478ifrs-full:FuturesContractMemberifrs-full:CurrencyRiskMemberifrs-full:NotLaterThanOneMonthMemberifrs-full:FairValueHedgesMember2023-12-310000891478ifrs-full:FuturesContractMemberifrs-full:CurrencyRiskMemberifrs-full:LaterThanOneMonthAndNotLaterThanThreeMonthsMemberifrs-full:FairValueHedgesMember2023-12-310000891478ifrs-full:FuturesContractMemberifrs-full:CurrencyRiskMemberifrs-full:LaterThanThreeMonthsAndNotLaterThanOneYearMemberifrs-full:FairValueHedgesMember2023-12-310000891478ifrs-full:FuturesContractMemberifrs-full:CurrencyRiskMemberifrs-full:LaterThanOneYearAndNotLaterThanFiveYearsMemberifrs-full:FairValueHedgesMember2023-12-310000891478ifrs-full:FuturesContractMemberifrs-full:CurrencyRiskMemberifrs-full:LaterThanFiveYearsMemberifrs-full:FairValueHedgesMember2023-12-310000891478san:InterestRateAndExchangeRateRiskMemberifrs-full:NotLaterThanOneMonthMemberifrs-full:FairValueHedgesMember2023-12-310000891478san:InterestRateAndExchangeRateRiskMemberifrs-full:LaterThanOneMonthAndNotLaterThanThreeMonthsMemberifrs-full:FairValueHedgesMember2023-12-310000891478san:InterestRateAndExchangeRateRiskMemberifrs-full:LaterThanThreeMonthsAndNotLaterThanOneYearMemberifrs-full:FairValueHedgesMember2023-12-310000891478san:InterestRateAndExchangeRateRiskMemberifrs-full:LaterThanOneYearAndNotLaterThanFiveYearsMemberifrs-full:FairValueHedgesMember2023-12-310000891478san:InterestRateAndExchangeRateRiskMemberifrs-full:LaterThanFiveYearsMemberifrs-full:FairValueHedgesMember2023-12-310000891478ifrs-full:CurrencySwapContractMembersan:InterestRateAndExchangeRateRiskMemberifrs-full:NotLaterThanOneMonthMemberifrs-full:FairValueHedgesMember2023-12-310000891478ifrs-full:CurrencySwapContractMembersan:InterestRateAndExchangeRateRiskMemberifrs-full:LaterThanOneMonthAndNotLaterThanThreeMonthsMemberifrs-full:FairValueHedgesMember2023-12-310000891478ifrs-full:CurrencySwapContractMembersan:InterestRateAndExchangeRateRiskMemberifrs-full:LaterThanThreeMonthsAndNotLaterThanOneYearMemberifrs-full:FairValueHedgesMember2023-12-310000891478ifrs-full:CurrencySwapContractMembersan:InterestRateAndExchangeRateRiskMemberifrs-full:LaterThanOneYearAndNotLaterThanFiveYearsMemberifrs-full:FairValueHedgesMember2023-12-310000891478ifrs-full:CurrencySwapContractMembersan:InterestRateAndExchangeRateRiskMemberifrs-full:LaterThanFiveYearsMemberifrs-full:FairValueHedgesMember2023-12-310000891478ifrs-full:InterestRateSwapContractMembersan:InterestRateAndExchangeRateRiskMemberifrs-full:NotLaterThanOneMonthMemberifrs-full:FairValueHedgesMember2023-12-310000891478ifrs-full:InterestRateSwapContractMembersan:InterestRateAndExchangeRateRiskMemberifrs-full:LaterThanOneMonthAndNotLaterThanThreeMonthsMemberifrs-full:FairValueHedgesMember2023-12-310000891478ifrs-full:InterestRateSwapContractMembersan:InterestRateAndExchangeRateRiskMemberifrs-full:LaterThanThreeMonthsAndNotLaterThanOneYearMemberifrs-full:FairValueHedgesMember2023-12-310000891478ifrs-full:InterestRateSwapContractMembersan:InterestRateAndExchangeRateRiskMemberifrs-full:LaterThanOneYearAndNotLaterThanFiveYearsMemberifrs-full:FairValueHedgesMember2023-12-310000891478ifrs-full:InterestRateSwapContractMembersan:InterestRateAndExchangeRateRiskMemberifrs-full:LaterThanFiveYearsMemberifrs-full:FairValueHedgesMember2023-12-310000891478ifrs-full:NotLaterThanOneMonthMemberifrs-full:CashFlowHedgesMember2023-12-310000891478ifrs-full:LaterThanOneMonthAndNotLaterThanThreeMonthsMemberifrs-full:CashFlowHedgesMember2023-12-310000891478ifrs-full:LaterThanThreeMonthsAndNotLaterThanOneYearMemberifrs-full:CashFlowHedgesMember2023-12-310000891478ifrs-full:LaterThanOneYearAndNotLaterThanFiveYearsMemberifrs-full:CashFlowHedgesMember2023-12-310000891478ifrs-full:LaterThanFiveYearsMemberifrs-full:CashFlowHedgesMember2023-12-310000891478ifrs-full:InterestRateRiskMemberifrs-full:NotLaterThanOneMonthMemberifrs-full:CashFlowHedgesMember2023-12-310000891478ifrs-full:InterestRateRiskMemberifrs-full:LaterThanOneMonthAndNotLaterThanThreeMonthsMemberifrs-full:CashFlowHedgesMember2023-12-310000891478ifrs-full:InterestRateRiskMemberifrs-full:LaterThanThreeMonthsAndNotLaterThanOneYearMemberifrs-full:CashFlowHedgesMember2023-12-310000891478ifrs-full:InterestRateRiskMemberifrs-full:LaterThanOneYearAndNotLaterThanFiveYearsMemberifrs-full:CashFlowHedgesMember2023-12-310000891478ifrs-full:InterestRateRiskMemberifrs-full:LaterThanFiveYearsMemberifrs-full:CashFlowHedgesMember2023-12-310000891478ifrs-full:FuturesContractMemberifrs-full:InterestRateRiskMemberifrs-full:NotLaterThanOneMonthMemberifrs-full:CashFlowHedgesMember2023-12-310000891478ifrs-full:FuturesContractMemberifrs-full:InterestRateRiskMemberifrs-full:LaterThanOneMonthAndNotLaterThanThreeMonthsMemberifrs-full:CashFlowHedgesMember2023-12-310000891478ifrs-full:FuturesContractMemberifrs-full:InterestRateRiskMemberifrs-full:LaterThanThreeMonthsAndNotLaterThanOneYearMemberifrs-full:CashFlowHedgesMember2023-12-310000891478ifrs-full:FuturesContractMemberifrs-full:InterestRateRiskMemberifrs-full:LaterThanOneYearAndNotLaterThanFiveYearsMemberifrs-full:CashFlowHedgesMember2023-12-310000891478ifrs-full:FuturesContractMemberifrs-full:InterestRateRiskMemberifrs-full:LaterThanFiveYearsMemberifrs-full:CashFlowHedgesMember2023-12-310000891478ifrs-full:InterestRateSwapContractMemberifrs-full:InterestRateRiskMemberifrs-full:NotLaterThanOneMonthMemberifrs-full:CashFlowHedgesMember2023-12-310000891478ifrs-full:InterestRateSwapContractMemberifrs-full:InterestRateRiskMemberifrs-full:LaterThanOneMonthAndNotLaterThanThreeMonthsMemberifrs-full:CashFlowHedgesMember2023-12-310000891478ifrs-full:InterestRateSwapContractMemberifrs-full:InterestRateRiskMemberifrs-full:LaterThanThreeMonthsAndNotLaterThanOneYearMemberifrs-full:CashFlowHedgesMember2023-12-310000891478ifrs-full:InterestRateSwapContractMemberifrs-full:InterestRateRiskMemberifrs-full:LaterThanOneYearAndNotLaterThanFiveYearsMemberifrs-full:CashFlowHedgesMember2023-12-310000891478ifrs-full:InterestRateSwapContractMemberifrs-full:InterestRateRiskMemberifrs-full:LaterThanFiveYearsMemberifrs-full:CashFlowHedgesMember2023-12-310000891478ifrs-full:CurrencyRiskMemberifrs-full:NotLaterThanOneMonthMemberifrs-full:CashFlowHedgesMember2023-12-310000891478ifrs-full:CurrencyRiskMemberifrs-full:LaterThanOneMonthAndNotLaterThanThreeMonthsMemberifrs-full:CashFlowHedgesMember2023-12-310000891478ifrs-full:CurrencyRiskMemberifrs-full:LaterThanThreeMonthsAndNotLaterThanOneYearMemberifrs-full:CashFlowHedgesMember2023-12-310000891478ifrs-full:CurrencyRiskMemberifrs-full:LaterThanOneYearAndNotLaterThanFiveYearsMemberifrs-full:CashFlowHedgesMember2023-12-310000891478ifrs-full:CurrencyRiskMemberifrs-full:LaterThanFiveYearsMemberifrs-full:CashFlowHedgesMember2023-12-310000891478san:ForeignExchangeForwardContractMemberifrs-full:CurrencyRiskMemberifrs-full:NotLaterThanOneMonthMemberifrs-full:CashFlowHedgesMember2023-12-310000891478san:ForeignExchangeForwardContractMemberifrs-full:CurrencyRiskMemberifrs-full:LaterThanOneMonthAndNotLaterThanThreeMonthsMemberifrs-full:CashFlowHedgesMember2023-12-310000891478san:ForeignExchangeForwardContractMemberifrs-full:CurrencyRiskMemberifrs-full:LaterThanThreeMonthsAndNotLaterThanOneYearMemberifrs-full:CashFlowHedgesMember2023-12-310000891478san:ForeignExchangeForwardContractMemberifrs-full:CurrencyRiskMemberifrs-full:LaterThanOneYearAndNotLaterThanFiveYearsMemberifrs-full:CashFlowHedgesMember2023-12-310000891478san:ForeignExchangeForwardContractMemberifrs-full:CurrencyRiskMemberifrs-full:LaterThanFiveYearsMemberifrs-full:CashFlowHedgesMember2023-12-310000891478ifrs-full:CurrencySwapContractMemberifrs-full:CurrencyRiskMemberifrs-full:NotLaterThanOneMonthMemberifrs-full:CashFlowHedgesMember2023-12-310000891478ifrs-full:CurrencySwapContractMemberifrs-full:CurrencyRiskMemberifrs-full:LaterThanOneMonthAndNotLaterThanThreeMonthsMemberifrs-full:CashFlowHedgesMember2023-12-310000891478ifrs-full:CurrencySwapContractMemberifrs-full:CurrencyRiskMemberifrs-full:LaterThanThreeMonthsAndNotLaterThanOneYearMemberifrs-full:CashFlowHedgesMember2023-12-310000891478ifrs-full:CurrencySwapContractMemberifrs-full:CurrencyRiskMemberifrs-full:LaterThanOneYearAndNotLaterThanFiveYearsMemberifrs-full:CashFlowHedgesMember2023-12-310000891478ifrs-full:CurrencySwapContractMemberifrs-full:CurrencyRiskMemberifrs-full:LaterThanFiveYearsMemberifrs-full:CashFlowHedgesMember2023-12-310000891478san:InterestRateAndExchangeRateRiskMemberifrs-full:NotLaterThanOneMonthMemberifrs-full:CashFlowHedgesMember2023-12-310000891478san:InterestRateAndExchangeRateRiskMemberifrs-full:LaterThanOneMonthAndNotLaterThanThreeMonthsMemberifrs-full:CashFlowHedgesMember2023-12-310000891478san:InterestRateAndExchangeRateRiskMemberifrs-full:LaterThanThreeMonthsAndNotLaterThanOneYearMemberifrs-full:CashFlowHedgesMember2023-12-310000891478san:InterestRateAndExchangeRateRiskMemberifrs-full:LaterThanOneYearAndNotLaterThanFiveYearsMemberifrs-full:CashFlowHedgesMember2023-12-310000891478san:InterestRateAndExchangeRateRiskMemberifrs-full:LaterThanFiveYearsMemberifrs-full:CashFlowHedgesMember2023-12-310000891478ifrs-full:InterestRateSwapContractMembersan:InterestRateAndExchangeRateRiskMemberifrs-full:NotLaterThanOneMonthMemberifrs-full:CashFlowHedgesMember2023-12-310000891478ifrs-full:InterestRateSwapContractMembersan:InterestRateAndExchangeRateRiskMemberifrs-full:LaterThanOneMonthAndNotLaterThanThreeMonthsMemberifrs-full:CashFlowHedgesMember2023-12-310000891478ifrs-full:InterestRateSwapContractMembersan:InterestRateAndExchangeRateRiskMemberifrs-full:LaterThanThreeMonthsAndNotLaterThanOneYearMemberifrs-full:CashFlowHedgesMember2023-12-310000891478ifrs-full:InterestRateSwapContractMembersan:InterestRateAndExchangeRateRiskMemberifrs-full:LaterThanOneYearAndNotLaterThanFiveYearsMemberifrs-full:CashFlowHedgesMember2023-12-310000891478ifrs-full:InterestRateSwapContractMembersan:InterestRateAndExchangeRateRiskMemberifrs-full:LaterThanFiveYearsMemberifrs-full:CashFlowHedgesMember2023-12-310000891478ifrs-full:CurrencySwapContractMembersan:InterestRateAndExchangeRateRiskMemberifrs-full:NotLaterThanOneMonthMemberifrs-full:CashFlowHedgesMember2023-12-310000891478ifrs-full:CurrencySwapContractMembersan:InterestRateAndExchangeRateRiskMemberifrs-full:LaterThanOneMonthAndNotLaterThanThreeMonthsMemberifrs-full:CashFlowHedgesMember2023-12-310000891478ifrs-full:CurrencySwapContractMembersan:InterestRateAndExchangeRateRiskMemberifrs-full:LaterThanThreeMonthsAndNotLaterThanOneYearMemberifrs-full:CashFlowHedgesMember2023-12-310000891478ifrs-full:CurrencySwapContractMembersan:InterestRateAndExchangeRateRiskMemberifrs-full:LaterThanOneYearAndNotLaterThanFiveYearsMemberifrs-full:CashFlowHedgesMember2023-12-310000891478ifrs-full:CurrencySwapContractMembersan:InterestRateAndExchangeRateRiskMemberifrs-full:LaterThanFiveYearsMemberifrs-full:CashFlowHedgesMember2023-12-310000891478san:InflationRiskMemberifrs-full:NotLaterThanOneMonthMemberifrs-full:CashFlowHedgesMember2023-12-310000891478san:InflationRiskMemberifrs-full:LaterThanOneMonthAndNotLaterThanThreeMonthsMemberifrs-full:CashFlowHedgesMember2023-12-310000891478san:InflationRiskMemberifrs-full:LaterThanThreeMonthsAndNotLaterThanOneYearMemberifrs-full:CashFlowHedgesMember2023-12-310000891478san:InflationRiskMemberifrs-full:LaterThanOneYearAndNotLaterThanFiveYearsMemberifrs-full:CashFlowHedgesMember2023-12-310000891478san:InflationRiskMemberifrs-full:LaterThanFiveYearsMemberifrs-full:CashFlowHedgesMember2023-12-310000891478ifrs-full:CurrencySwapContractMembersan:InflationRiskMemberifrs-full:NotLaterThanOneMonthMemberifrs-full:CashFlowHedgesMember2023-12-310000891478ifrs-full:CurrencySwapContractMembersan:InflationRiskMemberifrs-full:LaterThanOneMonthAndNotLaterThanThreeMonthsMemberifrs-full:CashFlowHedgesMember2023-12-310000891478ifrs-full:CurrencySwapContractMembersan:InflationRiskMemberifrs-full:LaterThanThreeMonthsAndNotLaterThanOneYearMemberifrs-full:CashFlowHedgesMember2023-12-310000891478ifrs-full:CurrencySwapContractMembersan:InflationRiskMemberifrs-full:LaterThanOneYearAndNotLaterThanFiveYearsMemberifrs-full:CashFlowHedgesMember2023-12-310000891478ifrs-full:CurrencySwapContractMembersan:InflationRiskMemberifrs-full:LaterThanFiveYearsMemberifrs-full:CashFlowHedgesMember2023-12-310000891478san:MarketValueOfEquityMemberifrs-full:NotLaterThanOneMonthMemberifrs-full:CashFlowHedgesMember2023-12-310000891478san:MarketValueOfEquityMemberifrs-full:LaterThanOneMonthAndNotLaterThanThreeMonthsMemberifrs-full:CashFlowHedgesMember2023-12-310000891478san:MarketValueOfEquityMemberifrs-full:LaterThanThreeMonthsAndNotLaterThanOneYearMemberifrs-full:CashFlowHedgesMember2023-12-310000891478san:MarketValueOfEquityMemberifrs-full:LaterThanOneYearAndNotLaterThanFiveYearsMemberifrs-full:CashFlowHedgesMember2023-12-310000891478san:MarketValueOfEquityMemberifrs-full:LaterThanFiveYearsMemberifrs-full:CashFlowHedgesMember2023-12-310000891478ifrs-full:OptionContractMembersan:MarketValueOfEquityMemberifrs-full:NotLaterThanOneMonthMemberifrs-full:CashFlowHedgesMember2023-12-310000891478ifrs-full:OptionContractMembersan:MarketValueOfEquityMemberifrs-full:LaterThanOneMonthAndNotLaterThanThreeMonthsMemberifrs-full:CashFlowHedgesMember2023-12-310000891478ifrs-full:OptionContractMembersan:MarketValueOfEquityMemberifrs-full:LaterThanThreeMonthsAndNotLaterThanOneYearMemberifrs-full:CashFlowHedgesMember2023-12-310000891478ifrs-full:OptionContractMembersan:MarketValueOfEquityMemberifrs-full:LaterThanOneYearAndNotLaterThanFiveYearsMemberifrs-full:CashFlowHedgesMember2023-12-310000891478ifrs-full:OptionContractMembersan:MarketValueOfEquityMemberifrs-full:LaterThanFiveYearsMemberifrs-full:CashFlowHedgesMember2023-12-310000891478ifrs-full:NotLaterThanOneMonthMemberifrs-full:HedgesOfNetInvestmentInForeignOperationsMember2023-12-310000891478ifrs-full:LaterThanOneMonthAndNotLaterThanThreeMonthsMemberifrs-full:HedgesOfNetInvestmentInForeignOperationsMember2023-12-310000891478ifrs-full:LaterThanThreeMonthsAndNotLaterThanOneYearMemberifrs-full:HedgesOfNetInvestmentInForeignOperationsMember2023-12-310000891478ifrs-full:LaterThanOneYearAndNotLaterThanFiveYearsMemberifrs-full:HedgesOfNetInvestmentInForeignOperationsMember2023-12-310000891478ifrs-full:LaterThanFiveYearsMemberifrs-full:HedgesOfNetInvestmentInForeignOperationsMember2023-12-310000891478ifrs-full:CurrencyRiskMemberifrs-full:NotLaterThanOneMonthMemberifrs-full:HedgesOfNetInvestmentInForeignOperationsMember2023-12-310000891478ifrs-full:CurrencyRiskMemberifrs-full:LaterThanOneMonthAndNotLaterThanThreeMonthsMemberifrs-full:HedgesOfNetInvestmentInForeignOperationsMember2023-12-310000891478ifrs-full:CurrencyRiskMemberifrs-full:LaterThanThreeMonthsAndNotLaterThanOneYearMemberifrs-full:HedgesOfNetInvestmentInForeignOperationsMember2023-12-310000891478ifrs-full:CurrencyRiskMemberifrs-full:LaterThanOneYearAndNotLaterThanFiveYearsMemberifrs-full:HedgesOfNetInvestmentInForeignOperationsMember2023-12-310000891478ifrs-full:CurrencyRiskMemberifrs-full:LaterThanFiveYearsMemberifrs-full:HedgesOfNetInvestmentInForeignOperationsMember2023-12-310000891478san:ForeignExchangeForwardContractMemberifrs-full:CurrencyRiskMemberifrs-full:NotLaterThanOneMonthMemberifrs-full:HedgesOfNetInvestmentInForeignOperationsMember2023-12-310000891478san:ForeignExchangeForwardContractMemberifrs-full:CurrencyRiskMemberifrs-full:LaterThanOneMonthAndNotLaterThanThreeMonthsMemberifrs-full:HedgesOfNetInvestmentInForeignOperationsMember2023-12-310000891478san:ForeignExchangeForwardContractMemberifrs-full:CurrencyRiskMemberifrs-full:LaterThanThreeMonthsAndNotLaterThanOneYearMemberifrs-full:HedgesOfNetInvestmentInForeignOperationsMember2023-12-310000891478san:ForeignExchangeForwardContractMemberifrs-full:CurrencyRiskMemberifrs-full:LaterThanOneYearAndNotLaterThanFiveYearsMemberifrs-full:HedgesOfNetInvestmentInForeignOperationsMember2023-12-310000891478san:ForeignExchangeForwardContractMemberifrs-full:CurrencyRiskMemberifrs-full:LaterThanFiveYearsMemberifrs-full:HedgesOfNetInvestmentInForeignOperationsMember2023-12-310000891478ifrs-full:NotLaterThanOneMonthMember2023-12-310000891478ifrs-full:LaterThanOneMonthAndNotLaterThanThreeMonthsMember2023-12-310000891478ifrs-full:LaterThanThreeMonthsAndNotLaterThanOneYearMember2023-12-310000891478ifrs-full:LaterThanOneYearAndNotLaterThanFiveYearsMember2023-12-310000891478san:SantanderUKGroupMemberifrs-full:InterestRateRiskMemberifrs-full:NotLaterThanOneMonthMemberifrs-full:FairValueHedgesMember2025-12-310000891478san:SantanderUKGroupMemberifrs-full:InterestRateRiskMemberifrs-full:LaterThanOneMonthAndNotLaterThanThreeMonthsMemberifrs-full:FairValueHedgesMember2025-12-310000891478san:SantanderUKGroupMemberifrs-full:InterestRateRiskMemberifrs-full:LaterThanThreeMonthsAndNotLaterThanOneYearMemberifrs-full:FairValueHedgesMember2025-12-310000891478san:SantanderUKGroupMemberifrs-full:InterestRateRiskMemberifrs-full:LaterThanOneYearAndNotLaterThanFiveYearsMemberifrs-full:FairValueHedgesMember2025-12-310000891478san:SantanderUKGroupMemberifrs-full:InterestRateRiskMemberifrs-full:LaterThanFiveYearsMemberifrs-full:FairValueHedgesMember2025-12-310000891478san:SantanderUKGroupMemberifrs-full:InterestRateRiskMemberifrs-full:FairValueHedgesMember2025-12-310000891478san:SantanderUKGroupMemberifrs-full:InterestRateRiskMemberifrs-full:FairValueHedgesMembercurrency:GBPifrs-full:NotLaterThanOneMonthMember2025-12-310000891478san:SantanderUKGroupMemberifrs-full:InterestRateRiskMemberifrs-full:FairValueHedgesMembercurrency:GBPifrs-full:LaterThanOneMonthAndNotLaterThanThreeMonthsMember2025-12-310000891478san:SantanderUKGroupMemberifrs-full:InterestRateRiskMemberifrs-full:FairValueHedgesMembercurrency:GBPifrs-full:LaterThanThreeMonthsAndNotLaterThanOneYearMember2025-12-310000891478san:SantanderUKGroupMemberifrs-full:InterestRateRiskMemberifrs-full:FairValueHedgesMembercurrency:GBPifrs-full:LaterThanOneYearAndNotLaterThanFiveYearsMember2025-12-310000891478san:SantanderUKGroupMemberifrs-full:InterestRateRiskMemberifrs-full:FairValueHedgesMembercurrency:GBPifrs-full:LaterThanFiveYearsMember2025-12-310000891478san:SantanderUKGroupMemberifrs-full:InterestRateRiskMemberifrs-full:FairValueHedgesMembercurrency:EURifrs-full:NotLaterThanOneMonthMember2025-12-310000891478san:SantanderUKGroupMemberifrs-full:InterestRateRiskMemberifrs-full:FairValueHedgesMembercurrency:EURifrs-full:LaterThanOneMonthAndNotLaterThanThreeMonthsMember2025-12-310000891478san:SantanderUKGroupMemberifrs-full:InterestRateRiskMemberifrs-full:FairValueHedgesMembercurrency:EURifrs-full:LaterThanThreeMonthsAndNotLaterThanOneYearMember2025-12-310000891478san:SantanderUKGroupMemberifrs-full:InterestRateRiskMemberifrs-full:FairValueHedgesMembercurrency:EURifrs-full:LaterThanOneYearAndNotLaterThanFiveYearsMember2025-12-310000891478san:SantanderUKGroupMemberifrs-full:InterestRateRiskMemberifrs-full:FairValueHedgesMembercurrency:EURifrs-full:LaterThanFiveYearsMember2025-12-310000891478san:SantanderUKGroupMemberifrs-full:InterestRateRiskMemberifrs-full:FairValueHedgesMembercurrency:USDifrs-full:NotLaterThanOneMonthMember2025-12-310000891478san:SantanderUKGroupMemberifrs-full:InterestRateRiskMemberifrs-full:FairValueHedgesMembercurrency:USDifrs-full:LaterThanOneMonthAndNotLaterThanThreeMonthsMember2025-12-310000891478san:SantanderUKGroupMemberifrs-full:InterestRateRiskMemberifrs-full:FairValueHedgesMembercurrency:USDifrs-full:LaterThanThreeMonthsAndNotLaterThanOneYearMember2025-12-310000891478san:SantanderUKGroupMemberifrs-full:InterestRateRiskMemberifrs-full:FairValueHedgesMembercurrency:USDifrs-full:LaterThanOneYearAndNotLaterThanFiveYearsMember2025-12-310000891478san:SantanderUKGroupMemberifrs-full:InterestRateRiskMemberifrs-full:FairValueHedgesMembercurrency:USDifrs-full:LaterThanFiveYearsMember2025-12-310000891478san:SantanderUKGroupMembersan:InterestRateAndExchangeRateRiskMemberifrs-full:NotLaterThanOneMonthMemberifrs-full:FairValueHedgesMember2025-12-310000891478san:SantanderUKGroupMembersan:InterestRateAndExchangeRateRiskMemberifrs-full:LaterThanOneMonthAndNotLaterThanThreeMonthsMemberifrs-full:FairValueHedgesMember2025-12-310000891478san:SantanderUKGroupMembersan:InterestRateAndExchangeRateRiskMemberifrs-full:LaterThanThreeMonthsAndNotLaterThanOneYearMemberifrs-full:FairValueHedgesMember2025-12-310000891478san:SantanderUKGroupMembersan:InterestRateAndExchangeRateRiskMemberifrs-full:LaterThanOneYearAndNotLaterThanFiveYearsMemberifrs-full:FairValueHedgesMember2025-12-310000891478san:SantanderUKGroupMembersan:InterestRateAndExchangeRateRiskMemberifrs-full:LaterThanFiveYearsMemberifrs-full:FairValueHedgesMember2025-12-310000891478san:SantanderUKGroupMembersan:InterestRateAndExchangeRateRiskMemberifrs-full:FairValueHedgesMember2025-12-310000891478san:SantanderUKGroupMembersan:InterestRateAndExchangeRateRiskMemberifrs-full:NotLaterThanOneMonthMemberifrs-full:FairValueHedgesMember2025-01-012025-12-310000891478san:SantanderUKGroupMembersan:InterestRateAndExchangeRateRiskMemberifrs-full:LaterThanOneMonthAndNotLaterThanThreeMonthsMemberifrs-full:FairValueHedgesMember2025-01-012025-12-310000891478san:SantanderUKGroupMembersan:InterestRateAndExchangeRateRiskMemberifrs-full:LaterThanThreeMonthsAndNotLaterThanOneYearMemberifrs-full:FairValueHedgesMember2025-01-012025-12-310000891478san:SantanderUKGroupMembersan:InterestRateAndExchangeRateRiskMemberifrs-full:LaterThanOneYearAndNotLaterThanFiveYearsMemberifrs-full:FairValueHedgesMember2025-01-012025-12-310000891478san:SantanderUKGroupMembersan:InterestRateAndExchangeRateRiskMemberifrs-full:LaterThanFiveYearsMemberifrs-full:FairValueHedgesMember2025-01-012025-12-310000891478san:SantanderUKGroupMembersan:InterestRateAndExchangeRateRiskMemberifrs-full:FairValueHedgesMembercurrency:EURifrs-full:NotLaterThanOneMonthMember2025-12-310000891478san:SantanderUKGroupMembersan:InterestRateAndExchangeRateRiskMemberifrs-full:FairValueHedgesMembercurrency:EURifrs-full:LaterThanOneMonthAndNotLaterThanThreeMonthsMember2025-12-310000891478san:SantanderUKGroupMembersan:InterestRateAndExchangeRateRiskMemberifrs-full:FairValueHedgesMembercurrency:EURifrs-full:LaterThanThreeMonthsAndNotLaterThanOneYearMember2025-12-310000891478san:SantanderUKGroupMembersan:InterestRateAndExchangeRateRiskMemberifrs-full:FairValueHedgesMembercurrency:EURifrs-full:LaterThanOneYearAndNotLaterThanFiveYearsMember2025-12-310000891478san:SantanderUKGroupMembersan:InterestRateAndExchangeRateRiskMemberifrs-full:FairValueHedgesMembercurrency:EURifrs-full:LaterThanFiveYearsMember2025-12-310000891478san:SantanderUKGroupMembersan:InterestRateAndExchangeRateRiskMemberifrs-full:FairValueHedgesMembercurrency:USDifrs-full:NotLaterThanOneMonthMember2025-12-310000891478san:SantanderUKGroupMembersan:InterestRateAndExchangeRateRiskMemberifrs-full:FairValueHedgesMembercurrency:USDifrs-full:LaterThanOneMonthAndNotLaterThanThreeMonthsMember2025-12-310000891478san:SantanderUKGroupMembersan:InterestRateAndExchangeRateRiskMemberifrs-full:FairValueHedgesMembercurrency:USDifrs-full:LaterThanThreeMonthsAndNotLaterThanOneYearMember2025-12-310000891478san:SantanderUKGroupMembersan:InterestRateAndExchangeRateRiskMemberifrs-full:FairValueHedgesMembercurrency:USDifrs-full:LaterThanOneYearAndNotLaterThanFiveYearsMember2025-12-310000891478san:SantanderUKGroupMembersan:InterestRateAndExchangeRateRiskMemberifrs-full:FairValueHedgesMembercurrency:USDifrs-full:LaterThanFiveYearsMember2025-12-310000891478san:SantanderUKGroupMembersan:InflationRiskMemberifrs-full:NotLaterThanOneMonthMemberifrs-full:FairValueHedgesMember2025-12-310000891478san:SantanderUKGroupMembersan:InflationRiskMemberifrs-full:LaterThanOneMonthAndNotLaterThanThreeMonthsMemberifrs-full:FairValueHedgesMember2025-12-310000891478san:SantanderUKGroupMembersan:InflationRiskMemberifrs-full:LaterThanThreeMonthsAndNotLaterThanOneYearMemberifrs-full:FairValueHedgesMember2025-12-310000891478san:SantanderUKGroupMembersan:InflationRiskMemberifrs-full:LaterThanOneYearAndNotLaterThanFiveYearsMemberifrs-full:FairValueHedgesMember2025-12-310000891478san:SantanderUKGroupMembersan:InflationRiskMemberifrs-full:LaterThanFiveYearsMemberifrs-full:FairValueHedgesMember2025-12-310000891478san:SantanderUKGroupMembersan:InflationRiskMemberifrs-full:FairValueHedgesMember2025-12-310000891478san:SantanderUKGroupMembersan:InflationRiskMemberifrs-full:FairValueHedgesMembercurrency:GBPifrs-full:NotLaterThanOneMonthMember2025-12-310000891478san:SantanderUKGroupMembersan:InflationRiskMemberifrs-full:FairValueHedgesMembercurrency:GBPifrs-full:LaterThanOneMonthAndNotLaterThanThreeMonthsMember2025-12-310000891478san:SantanderUKGroupMembersan:InflationRiskMemberifrs-full:FairValueHedgesMembercurrency:GBPifrs-full:LaterThanThreeMonthsAndNotLaterThanOneYearMember2025-12-310000891478san:SantanderUKGroupMembersan:InflationRiskMemberifrs-full:FairValueHedgesMembercurrency:GBPifrs-full:LaterThanOneYearAndNotLaterThanFiveYearsMember2025-12-310000891478san:SantanderUKGroupMembersan:InflationRiskMemberifrs-full:FairValueHedgesMembercurrency:GBPifrs-full:LaterThanFiveYearsMember2025-12-310000891478san:SantanderUKGroupMemberifrs-full:InterestRateRiskMemberifrs-full:NotLaterThanOneMonthMemberifrs-full:CashFlowHedgesMember2025-12-310000891478san:SantanderUKGroupMemberifrs-full:InterestRateRiskMemberifrs-full:LaterThanOneMonthAndNotLaterThanThreeMonthsMemberifrs-full:CashFlowHedgesMember2025-12-310000891478san:SantanderUKGroupMemberifrs-full:InterestRateRiskMemberifrs-full:LaterThanThreeMonthsAndNotLaterThanOneYearMemberifrs-full:CashFlowHedgesMember2025-12-310000891478san:SantanderUKGroupMemberifrs-full:InterestRateRiskMemberifrs-full:LaterThanOneYearAndNotLaterThanFiveYearsMemberifrs-full:CashFlowHedgesMember2025-12-310000891478san:SantanderUKGroupMemberifrs-full:InterestRateRiskMemberifrs-full:LaterThanFiveYearsMemberifrs-full:CashFlowHedgesMember2025-12-310000891478san:SantanderUKGroupMemberifrs-full:InterestRateRiskMemberifrs-full:CashFlowHedgesMember2025-12-310000891478san:SantanderUKGroupMemberifrs-full:InterestRateRiskMemberifrs-full:CashFlowHedgesMembercurrency:GBPifrs-full:NotLaterThanOneMonthMember2025-12-310000891478san:SantanderUKGroupMemberifrs-full:InterestRateRiskMemberifrs-full:CashFlowHedgesMembercurrency:GBPifrs-full:LaterThanOneMonthAndNotLaterThanThreeMonthsMember2025-12-310000891478san:SantanderUKGroupMemberifrs-full:InterestRateRiskMemberifrs-full:CashFlowHedgesMembercurrency:GBPifrs-full:LaterThanThreeMonthsAndNotLaterThanOneYearMember2025-12-310000891478san:SantanderUKGroupMemberifrs-full:InterestRateRiskMemberifrs-full:CashFlowHedgesMembercurrency:GBPifrs-full:LaterThanOneYearAndNotLaterThanFiveYearsMember2025-12-310000891478san:SantanderUKGroupMemberifrs-full:InterestRateRiskMemberifrs-full:CashFlowHedgesMembercurrency:GBPifrs-full:LaterThanFiveYearsMember2025-12-310000891478san:SantanderUKGroupMemberifrs-full:CurrencyRiskMemberifrs-full:NotLaterThanOneMonthMemberifrs-full:CashFlowHedgesMember2025-12-310000891478san:SantanderUKGroupMemberifrs-full:CurrencyRiskMemberifrs-full:LaterThanOneMonthAndNotLaterThanThreeMonthsMemberifrs-full:CashFlowHedgesMember2025-12-310000891478san:SantanderUKGroupMemberifrs-full:CurrencyRiskMemberifrs-full:LaterThanThreeMonthsAndNotLaterThanOneYearMemberifrs-full:CashFlowHedgesMember2025-12-310000891478san:SantanderUKGroupMemberifrs-full:CurrencyRiskMemberifrs-full:LaterThanOneYearAndNotLaterThanFiveYearsMemberifrs-full:CashFlowHedgesMember2025-12-310000891478san:SantanderUKGroupMemberifrs-full:CurrencyRiskMemberifrs-full:LaterThanFiveYearsMemberifrs-full:CashFlowHedgesMember2025-12-310000891478san:SantanderUKGroupMemberifrs-full:CurrencyRiskMemberifrs-full:CashFlowHedgesMember2025-12-310000891478san:SantanderUKGroupMemberifrs-full:CurrencyRiskMemberifrs-full:NotLaterThanOneMonthMemberifrs-full:CashFlowHedgesMember2025-01-012025-12-310000891478san:SantanderUKGroupMemberifrs-full:CurrencyRiskMemberifrs-full:LaterThanOneMonthAndNotLaterThanThreeMonthsMemberifrs-full:CashFlowHedgesMember2025-01-012025-12-310000891478san:SantanderUKGroupMemberifrs-full:CurrencyRiskMemberifrs-full:LaterThanThreeMonthsAndNotLaterThanOneYearMemberifrs-full:CashFlowHedgesMember2025-01-012025-12-310000891478san:SantanderUKGroupMemberifrs-full:CurrencyRiskMemberifrs-full:LaterThanOneYearAndNotLaterThanFiveYearsMemberifrs-full:CashFlowHedgesMember2025-01-012025-12-310000891478san:SantanderUKGroupMemberifrs-full:CurrencyRiskMemberifrs-full:LaterThanFiveYearsMemberifrs-full:CashFlowHedgesMember2025-01-012025-12-310000891478san:SantanderUKGroupMembersan:MarketValueOfEquityMemberifrs-full:NotLaterThanOneMonthMemberifrs-full:CashFlowHedgesMember2025-12-310000891478san:SantanderUKGroupMembersan:MarketValueOfEquityMemberifrs-full:LaterThanOneMonthAndNotLaterThanThreeMonthsMemberifrs-full:CashFlowHedgesMember2025-12-310000891478san:SantanderUKGroupMembersan:MarketValueOfEquityMemberifrs-full:LaterThanThreeMonthsAndNotLaterThanOneYearMemberifrs-full:CashFlowHedgesMember2025-12-310000891478san:SantanderUKGroupMembersan:MarketValueOfEquityMemberifrs-full:LaterThanOneYearAndNotLaterThanFiveYearsMemberifrs-full:CashFlowHedgesMember2025-12-310000891478san:SantanderUKGroupMembersan:MarketValueOfEquityMemberifrs-full:LaterThanFiveYearsMemberifrs-full:CashFlowHedgesMember2025-12-310000891478san:SantanderUKGroupMembersan:MarketValueOfEquityMemberifrs-full:CashFlowHedgesMember2025-12-310000891478san:SantanderUKGroupMembersan:InterestRateAndExchangeRateRiskMemberifrs-full:NotLaterThanOneMonthMemberifrs-full:CashFlowHedgesMember2025-12-310000891478san:SantanderUKGroupMembersan:InterestRateAndExchangeRateRiskMemberifrs-full:LaterThanOneMonthAndNotLaterThanThreeMonthsMemberifrs-full:CashFlowHedgesMember2025-12-310000891478san:SantanderUKGroupMembersan:InterestRateAndExchangeRateRiskMemberifrs-full:LaterThanThreeMonthsAndNotLaterThanOneYearMemberifrs-full:CashFlowHedgesMember2025-12-310000891478san:SantanderUKGroupMembersan:InterestRateAndExchangeRateRiskMemberifrs-full:LaterThanOneYearAndNotLaterThanFiveYearsMemberifrs-full:CashFlowHedgesMember2025-12-310000891478san:SantanderUKGroupMembersan:InterestRateAndExchangeRateRiskMemberifrs-full:LaterThanFiveYearsMemberifrs-full:CashFlowHedgesMember2025-12-310000891478san:SantanderUKGroupMembersan:InterestRateAndExchangeRateRiskMemberifrs-full:CashFlowHedgesMember2025-12-310000891478san:SantanderUKGroupMembersan:InterestRateAndExchangeRateRiskMemberifrs-full:NotLaterThanOneMonthMemberifrs-full:CashFlowHedgesMember2025-01-012025-12-310000891478san:SantanderUKGroupMembersan:InterestRateAndExchangeRateRiskMemberifrs-full:LaterThanOneMonthAndNotLaterThanThreeMonthsMemberifrs-full:CashFlowHedgesMember2025-01-012025-12-310000891478san:SantanderUKGroupMembersan:InterestRateAndExchangeRateRiskMemberifrs-full:LaterThanThreeMonthsAndNotLaterThanOneYearMemberifrs-full:CashFlowHedgesMember2025-01-012025-12-310000891478san:SantanderUKGroupMembersan:InterestRateAndExchangeRateRiskMemberifrs-full:LaterThanOneYearAndNotLaterThanFiveYearsMemberifrs-full:CashFlowHedgesMember2025-01-012025-12-310000891478san:SantanderUKGroupMembersan:InterestRateAndExchangeRateRiskMemberifrs-full:LaterThanFiveYearsMemberifrs-full:CashFlowHedgesMember2025-01-012025-12-310000891478san:SantanderUKGroupMembersan:InterestRateAndExchangeRateRiskMemberifrs-full:CashFlowHedgesMembercurrency:GBPifrs-full:NotLaterThanOneMonthMember2025-12-310000891478san:SantanderUKGroupMembersan:InterestRateAndExchangeRateRiskMemberifrs-full:CashFlowHedgesMembercurrency:GBPifrs-full:LaterThanOneMonthAndNotLaterThanThreeMonthsMember2025-12-310000891478san:SantanderUKGroupMembersan:InterestRateAndExchangeRateRiskMemberifrs-full:CashFlowHedgesMembercurrency:GBPifrs-full:LaterThanThreeMonthsAndNotLaterThanOneYearMember2025-12-310000891478san:SantanderUKGroupMembersan:InterestRateAndExchangeRateRiskMemberifrs-full:CashFlowHedgesMembercurrency:GBPifrs-full:LaterThanOneYearAndNotLaterThanFiveYearsMember2025-12-310000891478san:SantanderUKGroupMembersan:InterestRateAndExchangeRateRiskMemberifrs-full:CashFlowHedgesMembercurrency:GBPifrs-full:LaterThanFiveYearsMember2025-12-310000891478san:SantanderUKGroupMemberifrs-full:InterestRateRiskMemberifrs-full:NotLaterThanOneMonthMemberifrs-full:FairValueHedgesMember2024-12-310000891478san:SantanderUKGroupMemberifrs-full:InterestRateRiskMemberifrs-full:LaterThanOneMonthAndNotLaterThanThreeMonthsMemberifrs-full:FairValueHedgesMember2024-12-310000891478san:SantanderUKGroupMemberifrs-full:InterestRateRiskMemberifrs-full:LaterThanThreeMonthsAndNotLaterThanOneYearMemberifrs-full:FairValueHedgesMember2024-12-310000891478san:SantanderUKGroupMemberifrs-full:InterestRateRiskMemberifrs-full:LaterThanOneYearAndNotLaterThanFiveYearsMemberifrs-full:FairValueHedgesMember2024-12-310000891478san:SantanderUKGroupMemberifrs-full:InterestRateRiskMemberifrs-full:LaterThanFiveYearsMemberifrs-full:FairValueHedgesMember2024-12-310000891478san:SantanderUKGroupMemberifrs-full:InterestRateRiskMemberifrs-full:FairValueHedgesMember2024-12-310000891478san:SantanderUKGroupMemberifrs-full:InterestRateRiskMemberifrs-full:FairValueHedgesMembercurrency:GBPifrs-full:NotLaterThanOneMonthMember2024-12-310000891478san:SantanderUKGroupMemberifrs-full:InterestRateRiskMemberifrs-full:FairValueHedgesMembercurrency:GBPifrs-full:LaterThanOneMonthAndNotLaterThanThreeMonthsMember2024-12-310000891478san:SantanderUKGroupMemberifrs-full:InterestRateRiskMemberifrs-full:FairValueHedgesMembercurrency:GBPifrs-full:LaterThanThreeMonthsAndNotLaterThanOneYearMember2024-12-310000891478san:SantanderUKGroupMemberifrs-full:InterestRateRiskMemberifrs-full:FairValueHedgesMembercurrency:GBPifrs-full:LaterThanOneYearAndNotLaterThanFiveYearsMember2024-12-310000891478san:SantanderUKGroupMemberifrs-full:InterestRateRiskMemberifrs-full:FairValueHedgesMembercurrency:GBPifrs-full:LaterThanFiveYearsMember2024-12-310000891478san:SantanderUKGroupMemberifrs-full:InterestRateRiskMemberifrs-full:FairValueHedgesMembercurrency:EURifrs-full:NotLaterThanOneMonthMember2024-12-310000891478san:SantanderUKGroupMemberifrs-full:InterestRateRiskMemberifrs-full:FairValueHedgesMembercurrency:EURifrs-full:LaterThanOneMonthAndNotLaterThanThreeMonthsMember2024-12-310000891478san:SantanderUKGroupMemberifrs-full:InterestRateRiskMemberifrs-full:FairValueHedgesMembercurrency:EURifrs-full:LaterThanThreeMonthsAndNotLaterThanOneYearMember2024-12-310000891478san:SantanderUKGroupMemberifrs-full:InterestRateRiskMemberifrs-full:FairValueHedgesMembercurrency:EURifrs-full:LaterThanOneYearAndNotLaterThanFiveYearsMember2024-12-310000891478san:SantanderUKGroupMemberifrs-full:InterestRateRiskMemberifrs-full:FairValueHedgesMembercurrency:EURifrs-full:LaterThanFiveYearsMember2024-12-310000891478san:SantanderUKGroupMemberifrs-full:InterestRateRiskMemberifrs-full:FairValueHedgesMembercurrency:USDifrs-full:NotLaterThanOneMonthMember2024-12-310000891478san:SantanderUKGroupMemberifrs-full:InterestRateRiskMemberifrs-full:FairValueHedgesMembercurrency:USDifrs-full:LaterThanOneMonthAndNotLaterThanThreeMonthsMember2024-12-310000891478san:SantanderUKGroupMemberifrs-full:InterestRateRiskMemberifrs-full:FairValueHedgesMembercurrency:USDifrs-full:LaterThanThreeMonthsAndNotLaterThanOneYearMember2024-12-310000891478san:SantanderUKGroupMemberifrs-full:InterestRateRiskMemberifrs-full:FairValueHedgesMembercurrency:USDifrs-full:LaterThanOneYearAndNotLaterThanFiveYearsMember2024-12-310000891478san:SantanderUKGroupMemberifrs-full:InterestRateRiskMemberifrs-full:FairValueHedgesMembercurrency:USDifrs-full:LaterThanFiveYearsMember2024-12-310000891478san:SantanderUKGroupMembersan:InterestRateAndExchangeRateRiskMemberifrs-full:NotLaterThanOneMonthMemberifrs-full:FairValueHedgesMember2024-12-310000891478san:SantanderUKGroupMembersan:InterestRateAndExchangeRateRiskMemberifrs-full:LaterThanOneMonthAndNotLaterThanThreeMonthsMemberifrs-full:FairValueHedgesMember2024-12-310000891478san:SantanderUKGroupMembersan:InterestRateAndExchangeRateRiskMemberifrs-full:LaterThanThreeMonthsAndNotLaterThanOneYearMemberifrs-full:FairValueHedgesMember2024-12-310000891478san:SantanderUKGroupMembersan:InterestRateAndExchangeRateRiskMemberifrs-full:LaterThanOneYearAndNotLaterThanFiveYearsMemberifrs-full:FairValueHedgesMember2024-12-310000891478san:SantanderUKGroupMembersan:InterestRateAndExchangeRateRiskMemberifrs-full:LaterThanFiveYearsMemberifrs-full:FairValueHedgesMember2024-12-310000891478san:SantanderUKGroupMembersan:InterestRateAndExchangeRateRiskMemberifrs-full:FairValueHedgesMember2024-12-310000891478san:SantanderUKGroupMembersan:InterestRateAndExchangeRateRiskMemberifrs-full:NotLaterThanOneMonthMemberifrs-full:FairValueHedgesMember2024-01-012024-12-310000891478san:SantanderUKGroupMembersan:InterestRateAndExchangeRateRiskMemberifrs-full:LaterThanOneMonthAndNotLaterThanThreeMonthsMemberifrs-full:FairValueHedgesMember2024-01-012024-12-310000891478san:SantanderUKGroupMembersan:InterestRateAndExchangeRateRiskMemberifrs-full:LaterThanThreeMonthsAndNotLaterThanOneYearMemberifrs-full:FairValueHedgesMember2024-01-012024-12-310000891478san:SantanderUKGroupMembersan:InterestRateAndExchangeRateRiskMemberifrs-full:LaterThanOneYearAndNotLaterThanFiveYearsMemberifrs-full:FairValueHedgesMember2024-01-012024-12-310000891478san:SantanderUKGroupMembersan:InterestRateAndExchangeRateRiskMemberifrs-full:LaterThanFiveYearsMemberifrs-full:FairValueHedgesMember2024-01-012024-12-310000891478san:SantanderUKGroupMembersan:InterestRateAndExchangeRateRiskMemberifrs-full:FairValueHedgesMembercurrency:EURifrs-full:NotLaterThanOneMonthMember2024-12-310000891478san:SantanderUKGroupMembersan:InterestRateAndExchangeRateRiskMemberifrs-full:FairValueHedgesMembercurrency:EURifrs-full:LaterThanOneMonthAndNotLaterThanThreeMonthsMember2024-12-310000891478san:SantanderUKGroupMembersan:InterestRateAndExchangeRateRiskMemberifrs-full:FairValueHedgesMembercurrency:EURifrs-full:LaterThanThreeMonthsAndNotLaterThanOneYearMember2024-12-310000891478san:SantanderUKGroupMembersan:InterestRateAndExchangeRateRiskMemberifrs-full:FairValueHedgesMembercurrency:EURifrs-full:LaterThanOneYearAndNotLaterThanFiveYearsMember2024-12-310000891478san:SantanderUKGroupMembersan:InterestRateAndExchangeRateRiskMemberifrs-full:FairValueHedgesMembercurrency:EURifrs-full:LaterThanFiveYearsMember2024-12-310000891478san:SantanderUKGroupMembersan:InterestRateAndExchangeRateRiskMemberifrs-full:FairValueHedgesMembercurrency:USDifrs-full:NotLaterThanOneMonthMember2024-12-310000891478san:SantanderUKGroupMembersan:InterestRateAndExchangeRateRiskMemberifrs-full:FairValueHedgesMembercurrency:USDifrs-full:LaterThanOneMonthAndNotLaterThanThreeMonthsMember2024-12-310000891478san:SantanderUKGroupMembersan:InterestRateAndExchangeRateRiskMemberifrs-full:FairValueHedgesMembercurrency:USDifrs-full:LaterThanThreeMonthsAndNotLaterThanOneYearMember2024-12-310000891478san:SantanderUKGroupMembersan:InterestRateAndExchangeRateRiskMemberifrs-full:FairValueHedgesMembercurrency:USDifrs-full:LaterThanOneYearAndNotLaterThanFiveYearsMember2024-12-310000891478san:SantanderUKGroupMembersan:InterestRateAndExchangeRateRiskMemberifrs-full:FairValueHedgesMembercurrency:USDifrs-full:LaterThanFiveYearsMember2024-12-310000891478san:SantanderUKGroupMemberifrs-full:InterestRateRiskMemberifrs-full:NotLaterThanOneMonthMemberifrs-full:CashFlowHedgesMember2024-12-310000891478san:SantanderUKGroupMemberifrs-full:InterestRateRiskMemberifrs-full:LaterThanOneMonthAndNotLaterThanThreeMonthsMemberifrs-full:CashFlowHedgesMember2024-12-310000891478san:SantanderUKGroupMemberifrs-full:InterestRateRiskMemberifrs-full:LaterThanThreeMonthsAndNotLaterThanOneYearMemberifrs-full:CashFlowHedgesMember2024-12-310000891478san:SantanderUKGroupMemberifrs-full:InterestRateRiskMemberifrs-full:LaterThanOneYearAndNotLaterThanFiveYearsMemberifrs-full:CashFlowHedgesMember2024-12-310000891478san:SantanderUKGroupMemberifrs-full:InterestRateRiskMemberifrs-full:LaterThanFiveYearsMemberifrs-full:CashFlowHedgesMember2024-12-310000891478san:SantanderUKGroupMemberifrs-full:InterestRateRiskMemberifrs-full:CashFlowHedgesMember2024-12-310000891478san:SantanderUKGroupMemberifrs-full:InterestRateRiskMemberifrs-full:CashFlowHedgesMembercurrency:GBPifrs-full:NotLaterThanOneMonthMember2024-12-310000891478san:SantanderUKGroupMemberifrs-full:InterestRateRiskMemberifrs-full:CashFlowHedgesMembercurrency:GBPifrs-full:LaterThanOneMonthAndNotLaterThanThreeMonthsMember2024-12-310000891478san:SantanderUKGroupMemberifrs-full:InterestRateRiskMemberifrs-full:CashFlowHedgesMembercurrency:GBPifrs-full:LaterThanThreeMonthsAndNotLaterThanOneYearMember2024-12-310000891478san:SantanderUKGroupMemberifrs-full:InterestRateRiskMemberifrs-full:CashFlowHedgesMembercurrency:GBPifrs-full:LaterThanOneYearAndNotLaterThanFiveYearsMember2024-12-310000891478san:SantanderUKGroupMemberifrs-full:InterestRateRiskMemberifrs-full:CashFlowHedgesMembercurrency:GBPifrs-full:LaterThanFiveYearsMember2024-12-310000891478san:SantanderUKGroupMemberifrs-full:CurrencyRiskMemberifrs-full:NotLaterThanOneMonthMemberifrs-full:CashFlowHedgesMember2024-12-310000891478san:SantanderUKGroupMemberifrs-full:CurrencyRiskMemberifrs-full:LaterThanOneMonthAndNotLaterThanThreeMonthsMemberifrs-full:CashFlowHedgesMember2024-12-310000891478san:SantanderUKGroupMemberifrs-full:CurrencyRiskMemberifrs-full:LaterThanThreeMonthsAndNotLaterThanOneYearMemberifrs-full:CashFlowHedgesMember2024-12-310000891478san:SantanderUKGroupMemberifrs-full:CurrencyRiskMemberifrs-full:LaterThanOneYearAndNotLaterThanFiveYearsMemberifrs-full:CashFlowHedgesMember2024-12-310000891478san:SantanderUKGroupMemberifrs-full:CurrencyRiskMemberifrs-full:LaterThanFiveYearsMemberifrs-full:CashFlowHedgesMember2024-12-310000891478san:SantanderUKGroupMemberifrs-full:CurrencyRiskMemberifrs-full:CashFlowHedgesMember2024-12-310000891478san:SantanderUKGroupMemberifrs-full:CurrencyRiskMemberifrs-full:NotLaterThanOneMonthMemberifrs-full:CashFlowHedgesMember2024-01-012024-12-310000891478san:SantanderUKGroupMemberifrs-full:CurrencyRiskMemberifrs-full:LaterThanOneMonthAndNotLaterThanThreeMonthsMemberifrs-full:CashFlowHedgesMember2024-01-012024-12-310000891478san:SantanderUKGroupMemberifrs-full:CurrencyRiskMemberifrs-full:LaterThanThreeMonthsAndNotLaterThanOneYearMemberifrs-full:CashFlowHedgesMember2024-01-012024-12-310000891478san:SantanderUKGroupMemberifrs-full:CurrencyRiskMemberifrs-full:LaterThanOneYearAndNotLaterThanFiveYearsMemberifrs-full:CashFlowHedgesMember2024-01-012024-12-310000891478san:SantanderUKGroupMemberifrs-full:CurrencyRiskMemberifrs-full:LaterThanFiveYearsMemberifrs-full:CashFlowHedgesMember2024-01-012024-12-310000891478san:SantanderUKGroupMembersan:MarketValueOfEquityMemberifrs-full:NotLaterThanOneMonthMemberifrs-full:CashFlowHedgesMember2024-12-310000891478san:SantanderUKGroupMembersan:MarketValueOfEquityMemberifrs-full:LaterThanOneMonthAndNotLaterThanThreeMonthsMemberifrs-full:CashFlowHedgesMember2024-12-310000891478san:SantanderUKGroupMembersan:MarketValueOfEquityMemberifrs-full:LaterThanThreeMonthsAndNotLaterThanOneYearMemberifrs-full:CashFlowHedgesMember2024-12-310000891478san:SantanderUKGroupMembersan:MarketValueOfEquityMemberifrs-full:LaterThanOneYearAndNotLaterThanFiveYearsMemberifrs-full:CashFlowHedgesMember2024-12-310000891478san:SantanderUKGroupMembersan:MarketValueOfEquityMemberifrs-full:LaterThanFiveYearsMemberifrs-full:CashFlowHedgesMember2024-12-310000891478san:SantanderUKGroupMembersan:MarketValueOfEquityMemberifrs-full:CashFlowHedgesMember2024-12-310000891478san:SantanderUKGroupMembersan:InterestRateAndExchangeRateRiskMemberifrs-full:NotLaterThanOneMonthMemberifrs-full:CashFlowHedgesMember2024-12-310000891478san:SantanderUKGroupMembersan:InterestRateAndExchangeRateRiskMemberifrs-full:LaterThanOneMonthAndNotLaterThanThreeMonthsMemberifrs-full:CashFlowHedgesMember2024-12-310000891478san:SantanderUKGroupMembersan:InterestRateAndExchangeRateRiskMemberifrs-full:LaterThanThreeMonthsAndNotLaterThanOneYearMemberifrs-full:CashFlowHedgesMember2024-12-310000891478san:SantanderUKGroupMembersan:InterestRateAndExchangeRateRiskMemberifrs-full:LaterThanOneYearAndNotLaterThanFiveYearsMemberifrs-full:CashFlowHedgesMember2024-12-310000891478san:SantanderUKGroupMembersan:InterestRateAndExchangeRateRiskMemberifrs-full:LaterThanFiveYearsMemberifrs-full:CashFlowHedgesMember2024-12-310000891478san:SantanderUKGroupMembersan:InterestRateAndExchangeRateRiskMemberifrs-full:CashFlowHedgesMember2024-12-310000891478san:SantanderUKGroupMembersan:InterestRateAndExchangeRateRiskMemberifrs-full:NotLaterThanOneMonthMemberifrs-full:CashFlowHedgesMember2024-01-012024-12-310000891478san:SantanderUKGroupMembersan:InterestRateAndExchangeRateRiskMemberifrs-full:LaterThanOneMonthAndNotLaterThanThreeMonthsMemberifrs-full:CashFlowHedgesMember2024-01-012024-12-310000891478san:SantanderUKGroupMembersan:InterestRateAndExchangeRateRiskMemberifrs-full:LaterThanThreeMonthsAndNotLaterThanOneYearMemberifrs-full:CashFlowHedgesMember2024-01-012024-12-310000891478san:SantanderUKGroupMembersan:InterestRateAndExchangeRateRiskMemberifrs-full:LaterThanOneYearAndNotLaterThanFiveYearsMemberifrs-full:CashFlowHedgesMember2024-01-012024-12-310000891478san:SantanderUKGroupMembersan:InterestRateAndExchangeRateRiskMemberifrs-full:LaterThanFiveYearsMemberifrs-full:CashFlowHedgesMember2024-01-012024-12-310000891478san:SantanderUKGroupMembersan:InterestRateAndExchangeRateRiskMemberifrs-full:CashFlowHedgesMembercurrency:GBPifrs-full:NotLaterThanOneMonthMember2024-12-310000891478san:SantanderUKGroupMembersan:InterestRateAndExchangeRateRiskMemberifrs-full:CashFlowHedgesMembercurrency:GBPifrs-full:LaterThanOneMonthAndNotLaterThanThreeMonthsMember2024-12-310000891478san:SantanderUKGroupMembersan:InterestRateAndExchangeRateRiskMemberifrs-full:CashFlowHedgesMembercurrency:GBPifrs-full:LaterThanThreeMonthsAndNotLaterThanOneYearMember2024-12-310000891478san:SantanderUKGroupMembersan:InterestRateAndExchangeRateRiskMemberifrs-full:CashFlowHedgesMembercurrency:GBPifrs-full:LaterThanOneYearAndNotLaterThanFiveYearsMember2024-12-310000891478san:SantanderUKGroupMembersan:InterestRateAndExchangeRateRiskMemberifrs-full:CashFlowHedgesMembercurrency:GBPifrs-full:LaterThanFiveYearsMember2024-12-310000891478san:SantanderUKGroupMembersan:InflationRiskMemberifrs-full:NotLaterThanOneMonthMemberifrs-full:CashFlowHedgesMember2024-12-310000891478san:SantanderUKGroupMembersan:InflationRiskMemberifrs-full:LaterThanOneMonthAndNotLaterThanThreeMonthsMemberifrs-full:CashFlowHedgesMember2024-12-310000891478san:SantanderUKGroupMembersan:InflationRiskMemberifrs-full:LaterThanThreeMonthsAndNotLaterThanOneYearMemberifrs-full:CashFlowHedgesMember2024-12-310000891478san:SantanderUKGroupMembersan:InflationRiskMemberifrs-full:LaterThanOneYearAndNotLaterThanFiveYearsMemberifrs-full:CashFlowHedgesMember2024-12-310000891478san:SantanderUKGroupMembersan:InflationRiskMemberifrs-full:LaterThanFiveYearsMemberifrs-full:CashFlowHedgesMember2024-12-310000891478san:SantanderUKGroupMembersan:InflationRiskMemberifrs-full:CashFlowHedgesMember2024-12-310000891478san:SantanderUKGroupMembersan:InflationRiskMemberifrs-full:CashFlowHedgesMembercurrency:GBPifrs-full:NotLaterThanOneMonthMember2024-12-310000891478san:SantanderUKGroupMembersan:InflationRiskMemberifrs-full:CashFlowHedgesMembercurrency:GBPifrs-full:LaterThanOneMonthAndNotLaterThanThreeMonthsMember2024-12-310000891478san:SantanderUKGroupMembersan:InflationRiskMemberifrs-full:CashFlowHedgesMembercurrency:GBPifrs-full:LaterThanThreeMonthsAndNotLaterThanOneYearMember2024-12-310000891478san:SantanderUKGroupMembersan:InflationRiskMemberifrs-full:CashFlowHedgesMembercurrency:GBPifrs-full:LaterThanOneYearAndNotLaterThanFiveYearsMember2024-12-310000891478san:SantanderUKGroupMembersan:InflationRiskMemberifrs-full:CashFlowHedgesMembercurrency:GBPifrs-full:LaterThanFiveYearsMember2024-12-310000891478san:SantanderUKGroupMemberifrs-full:InterestRateRiskMemberifrs-full:NotLaterThanOneMonthMemberifrs-full:FairValueHedgesMember2023-12-310000891478san:SantanderUKGroupMemberifrs-full:InterestRateRiskMemberifrs-full:LaterThanOneMonthAndNotLaterThanThreeMonthsMemberifrs-full:FairValueHedgesMember2023-12-310000891478san:SantanderUKGroupMemberifrs-full:InterestRateRiskMemberifrs-full:LaterThanThreeMonthsAndNotLaterThanOneYearMemberifrs-full:FairValueHedgesMember2023-12-310000891478san:SantanderUKGroupMemberifrs-full:InterestRateRiskMemberifrs-full:LaterThanOneYearAndNotLaterThanFiveYearsMemberifrs-full:FairValueHedgesMember2023-12-310000891478san:SantanderUKGroupMemberifrs-full:InterestRateRiskMemberifrs-full:LaterThanFiveYearsMemberifrs-full:FairValueHedgesMember2023-12-310000891478san:SantanderUKGroupMemberifrs-full:InterestRateRiskMemberifrs-full:FairValueHedgesMember2023-12-310000891478san:SantanderUKGroupMemberifrs-full:InterestRateRiskMemberifrs-full:FairValueHedgesMembercurrency:GBPifrs-full:NotLaterThanOneMonthMember2023-12-310000891478san:SantanderUKGroupMemberifrs-full:InterestRateRiskMemberifrs-full:FairValueHedgesMembercurrency:GBPifrs-full:LaterThanOneMonthAndNotLaterThanThreeMonthsMember2023-12-310000891478san:SantanderUKGroupMemberifrs-full:InterestRateRiskMemberifrs-full:FairValueHedgesMembercurrency:GBPifrs-full:LaterThanThreeMonthsAndNotLaterThanOneYearMember2023-12-310000891478san:SantanderUKGroupMemberifrs-full:InterestRateRiskMemberifrs-full:FairValueHedgesMembercurrency:GBPifrs-full:LaterThanOneYearAndNotLaterThanFiveYearsMember2023-12-310000891478san:SantanderUKGroupMemberifrs-full:InterestRateRiskMemberifrs-full:FairValueHedgesMembercurrency:GBPifrs-full:LaterThanFiveYearsMember2023-12-310000891478san:SantanderUKGroupMemberifrs-full:InterestRateRiskMemberifrs-full:FairValueHedgesMembercurrency:EURifrs-full:NotLaterThanOneMonthMember2023-12-310000891478san:SantanderUKGroupMemberifrs-full:InterestRateRiskMemberifrs-full:FairValueHedgesMembercurrency:EURifrs-full:LaterThanOneMonthAndNotLaterThanThreeMonthsMember2023-12-310000891478san:SantanderUKGroupMemberifrs-full:InterestRateRiskMemberifrs-full:FairValueHedgesMembercurrency:EURifrs-full:LaterThanThreeMonthsAndNotLaterThanOneYearMember2023-12-310000891478san:SantanderUKGroupMemberifrs-full:InterestRateRiskMemberifrs-full:FairValueHedgesMembercurrency:EURifrs-full:LaterThanOneYearAndNotLaterThanFiveYearsMember2023-12-310000891478san:SantanderUKGroupMemberifrs-full:InterestRateRiskMemberifrs-full:FairValueHedgesMembercurrency:EURifrs-full:LaterThanFiveYearsMember2023-12-310000891478san:SantanderUKGroupMemberifrs-full:InterestRateRiskMemberifrs-full:FairValueHedgesMembercurrency:USDifrs-full:NotLaterThanOneMonthMember2023-12-310000891478san:SantanderUKGroupMemberifrs-full:InterestRateRiskMemberifrs-full:FairValueHedgesMembercurrency:USDifrs-full:LaterThanOneMonthAndNotLaterThanThreeMonthsMember2023-12-310000891478san:SantanderUKGroupMemberifrs-full:InterestRateRiskMemberifrs-full:FairValueHedgesMembercurrency:USDifrs-full:LaterThanThreeMonthsAndNotLaterThanOneYearMember2023-12-310000891478san:SantanderUKGroupMemberifrs-full:InterestRateRiskMemberifrs-full:FairValueHedgesMembercurrency:USDifrs-full:LaterThanOneYearAndNotLaterThanFiveYearsMember2023-12-310000891478san:SantanderUKGroupMemberifrs-full:InterestRateRiskMemberifrs-full:FairValueHedgesMembercurrency:USDifrs-full:LaterThanFiveYearsMember2023-12-310000891478san:SantanderUKGroupMembersan:InterestRateAndExchangeRateRiskMemberifrs-full:NotLaterThanOneMonthMemberifrs-full:FairValueHedgesMember2023-12-310000891478san:SantanderUKGroupMembersan:InterestRateAndExchangeRateRiskMemberifrs-full:LaterThanOneMonthAndNotLaterThanThreeMonthsMemberifrs-full:FairValueHedgesMember2023-12-310000891478san:SantanderUKGroupMembersan:InterestRateAndExchangeRateRiskMemberifrs-full:LaterThanThreeMonthsAndNotLaterThanOneYearMemberifrs-full:FairValueHedgesMember2023-12-310000891478san:SantanderUKGroupMembersan:InterestRateAndExchangeRateRiskMemberifrs-full:LaterThanOneYearAndNotLaterThanFiveYearsMemberifrs-full:FairValueHedgesMember2023-12-310000891478san:SantanderUKGroupMembersan:InterestRateAndExchangeRateRiskMemberifrs-full:LaterThanFiveYearsMemberifrs-full:FairValueHedgesMember2023-12-310000891478san:SantanderUKGroupMembersan:InterestRateAndExchangeRateRiskMemberifrs-full:FairValueHedgesMember2023-12-310000891478san:SantanderUKGroupMembersan:InterestRateAndExchangeRateRiskMemberifrs-full:NotLaterThanOneMonthMemberifrs-full:FairValueHedgesMember2023-01-012023-12-310000891478san:SantanderUKGroupMembersan:InterestRateAndExchangeRateRiskMemberifrs-full:LaterThanOneMonthAndNotLaterThanThreeMonthsMemberifrs-full:FairValueHedgesMember2023-01-012023-12-310000891478san:SantanderUKGroupMembersan:InterestRateAndExchangeRateRiskMemberifrs-full:LaterThanThreeMonthsAndNotLaterThanOneYearMemberifrs-full:FairValueHedgesMember2023-01-012023-12-310000891478san:SantanderUKGroupMembersan:InterestRateAndExchangeRateRiskMemberifrs-full:LaterThanOneYearAndNotLaterThanFiveYearsMemberifrs-full:FairValueHedgesMember2023-01-012023-12-310000891478san:SantanderUKGroupMembersan:InterestRateAndExchangeRateRiskMemberifrs-full:LaterThanFiveYearsMemberifrs-full:FairValueHedgesMember2023-01-012023-12-310000891478san:SantanderUKGroupMembersan:InterestRateAndExchangeRateRiskMemberifrs-full:FairValueHedgesMembercurrency:EURifrs-full:NotLaterThanOneMonthMember2023-12-310000891478san:SantanderUKGroupMembersan:InterestRateAndExchangeRateRiskMemberifrs-full:FairValueHedgesMembercurrency:EURifrs-full:LaterThanOneMonthAndNotLaterThanThreeMonthsMember2023-12-310000891478san:SantanderUKGroupMembersan:InterestRateAndExchangeRateRiskMemberifrs-full:FairValueHedgesMembercurrency:EURifrs-full:LaterThanThreeMonthsAndNotLaterThanOneYearMember2023-12-310000891478san:SantanderUKGroupMembersan:InterestRateAndExchangeRateRiskMemberifrs-full:FairValueHedgesMembercurrency:EURifrs-full:LaterThanOneYearAndNotLaterThanFiveYearsMember2023-12-310000891478san:SantanderUKGroupMembersan:InterestRateAndExchangeRateRiskMemberifrs-full:FairValueHedgesMembercurrency:EURifrs-full:LaterThanFiveYearsMember2023-12-310000891478san:SantanderUKGroupMembersan:InterestRateAndExchangeRateRiskMemberifrs-full:FairValueHedgesMembercurrency:USDifrs-full:NotLaterThanOneMonthMember2023-12-310000891478san:SantanderUKGroupMembersan:InterestRateAndExchangeRateRiskMemberifrs-full:FairValueHedgesMembercurrency:USDifrs-full:LaterThanOneMonthAndNotLaterThanThreeMonthsMember2023-12-310000891478san:SantanderUKGroupMembersan:InterestRateAndExchangeRateRiskMemberifrs-full:FairValueHedgesMembercurrency:USDifrs-full:LaterThanThreeMonthsAndNotLaterThanOneYearMember2023-12-310000891478san:SantanderUKGroupMembersan:InterestRateAndExchangeRateRiskMemberifrs-full:FairValueHedgesMembercurrency:USDifrs-full:LaterThanOneYearAndNotLaterThanFiveYearsMember2023-12-310000891478san:SantanderUKGroupMembersan:InterestRateAndExchangeRateRiskMemberifrs-full:FairValueHedgesMembercurrency:USDifrs-full:LaterThanFiveYearsMember2023-12-310000891478san:SantanderUKGroupMemberifrs-full:InterestRateRiskMemberifrs-full:NotLaterThanOneMonthMemberifrs-full:CashFlowHedgesMember2023-12-310000891478san:SantanderUKGroupMemberifrs-full:InterestRateRiskMemberifrs-full:LaterThanOneMonthAndNotLaterThanThreeMonthsMemberifrs-full:CashFlowHedgesMember2023-12-310000891478san:SantanderUKGroupMemberifrs-full:InterestRateRiskMemberifrs-full:LaterThanThreeMonthsAndNotLaterThanOneYearMemberifrs-full:CashFlowHedgesMember2023-12-310000891478san:SantanderUKGroupMemberifrs-full:InterestRateRiskMemberifrs-full:LaterThanOneYearAndNotLaterThanFiveYearsMemberifrs-full:CashFlowHedgesMember2023-12-310000891478san:SantanderUKGroupMemberifrs-full:InterestRateRiskMemberifrs-full:LaterThanFiveYearsMemberifrs-full:CashFlowHedgesMember2023-12-310000891478san:SantanderUKGroupMemberifrs-full:InterestRateRiskMemberifrs-full:CashFlowHedgesMember2023-12-310000891478san:SantanderUKGroupMemberifrs-full:InterestRateRiskMemberifrs-full:CashFlowHedgesMembercurrency:GBPifrs-full:NotLaterThanOneMonthMember2023-12-310000891478san:SantanderUKGroupMemberifrs-full:InterestRateRiskMemberifrs-full:CashFlowHedgesMembercurrency:GBPifrs-full:LaterThanOneMonthAndNotLaterThanThreeMonthsMember2023-12-310000891478san:SantanderUKGroupMemberifrs-full:InterestRateRiskMemberifrs-full:CashFlowHedgesMembercurrency:GBPifrs-full:LaterThanThreeMonthsAndNotLaterThanOneYearMember2023-12-310000891478san:SantanderUKGroupMemberifrs-full:InterestRateRiskMemberifrs-full:CashFlowHedgesMembercurrency:GBPifrs-full:LaterThanOneYearAndNotLaterThanFiveYearsMember2023-12-310000891478san:SantanderUKGroupMemberifrs-full:InterestRateRiskMemberifrs-full:CashFlowHedgesMembercurrency:GBPifrs-full:LaterThanFiveYearsMember2023-12-310000891478san:SantanderUKGroupMemberifrs-full:CurrencyRiskMemberifrs-full:NotLaterThanOneMonthMemberifrs-full:CashFlowHedgesMember2023-12-310000891478san:SantanderUKGroupMemberifrs-full:CurrencyRiskMemberifrs-full:LaterThanOneMonthAndNotLaterThanThreeMonthsMemberifrs-full:CashFlowHedgesMember2023-12-310000891478san:SantanderUKGroupMemberifrs-full:CurrencyRiskMemberifrs-full:LaterThanThreeMonthsAndNotLaterThanOneYearMemberifrs-full:CashFlowHedgesMember2023-12-310000891478san:SantanderUKGroupMemberifrs-full:CurrencyRiskMemberifrs-full:LaterThanOneYearAndNotLaterThanFiveYearsMemberifrs-full:CashFlowHedgesMember2023-12-310000891478san:SantanderUKGroupMemberifrs-full:CurrencyRiskMemberifrs-full:LaterThanFiveYearsMemberifrs-full:CashFlowHedgesMember2023-12-310000891478san:SantanderUKGroupMemberifrs-full:CurrencyRiskMemberifrs-full:CashFlowHedgesMember2023-12-310000891478san:SantanderUKGroupMemberifrs-full:CurrencyRiskMemberifrs-full:NotLaterThanOneMonthMemberifrs-full:CashFlowHedgesMember2023-01-012023-12-310000891478san:SantanderUKGroupMemberifrs-full:CurrencyRiskMemberifrs-full:LaterThanOneMonthAndNotLaterThanThreeMonthsMemberifrs-full:CashFlowHedgesMember2023-01-012023-12-310000891478san:SantanderUKGroupMemberifrs-full:CurrencyRiskMemberifrs-full:LaterThanThreeMonthsAndNotLaterThanOneYearMemberifrs-full:CashFlowHedgesMember2023-01-012023-12-310000891478san:SantanderUKGroupMemberifrs-full:CurrencyRiskMemberifrs-full:LaterThanOneYearAndNotLaterThanFiveYearsMemberifrs-full:CashFlowHedgesMember2023-01-012023-12-310000891478san:SantanderUKGroupMemberifrs-full:CurrencyRiskMemberifrs-full:LaterThanFiveYearsMemberifrs-full:CashFlowHedgesMember2023-01-012023-12-310000891478san:SantanderUKGroupMembersan:MarketValueOfEquityMemberifrs-full:NotLaterThanOneMonthMemberifrs-full:CashFlowHedgesMember2023-12-310000891478san:SantanderUKGroupMembersan:MarketValueOfEquityMemberifrs-full:LaterThanOneMonthAndNotLaterThanThreeMonthsMemberifrs-full:CashFlowHedgesMember2023-12-310000891478san:SantanderUKGroupMembersan:MarketValueOfEquityMemberifrs-full:LaterThanThreeMonthsAndNotLaterThanOneYearMemberifrs-full:CashFlowHedgesMember2023-12-310000891478san:SantanderUKGroupMembersan:MarketValueOfEquityMemberifrs-full:LaterThanOneYearAndNotLaterThanFiveYearsMemberifrs-full:CashFlowHedgesMember2023-12-310000891478san:SantanderUKGroupMembersan:MarketValueOfEquityMemberifrs-full:LaterThanFiveYearsMemberifrs-full:CashFlowHedgesMember2023-12-310000891478san:SantanderUKGroupMembersan:MarketValueOfEquityMemberifrs-full:CashFlowHedgesMember2023-12-310000891478san:SantanderUKGroupMembersan:InterestRateAndExchangeRateRiskMemberifrs-full:NotLaterThanOneMonthMemberifrs-full:CashFlowHedgesMember2023-12-310000891478san:SantanderUKGroupMembersan:InterestRateAndExchangeRateRiskMemberifrs-full:LaterThanOneMonthAndNotLaterThanThreeMonthsMemberifrs-full:CashFlowHedgesMember2023-12-310000891478san:SantanderUKGroupMembersan:InterestRateAndExchangeRateRiskMemberifrs-full:LaterThanThreeMonthsAndNotLaterThanOneYearMemberifrs-full:CashFlowHedgesMember2023-12-310000891478san:SantanderUKGroupMembersan:InterestRateAndExchangeRateRiskMemberifrs-full:LaterThanOneYearAndNotLaterThanFiveYearsMemberifrs-full:CashFlowHedgesMember2023-12-310000891478san:SantanderUKGroupMembersan:InterestRateAndExchangeRateRiskMemberifrs-full:LaterThanFiveYearsMemberifrs-full:CashFlowHedgesMember2023-12-310000891478san:SantanderUKGroupMembersan:InterestRateAndExchangeRateRiskMemberifrs-full:CashFlowHedgesMember2023-12-310000891478san:SantanderUKGroupMembersan:InterestRateAndExchangeRateRiskMemberifrs-full:NotLaterThanOneMonthMemberifrs-full:CashFlowHedgesMember2023-01-012023-12-310000891478san:SantanderUKGroupMembersan:InterestRateAndExchangeRateRiskMemberifrs-full:LaterThanOneMonthAndNotLaterThanThreeMonthsMemberifrs-full:CashFlowHedgesMember2023-01-012023-12-310000891478san:SantanderUKGroupMembersan:InterestRateAndExchangeRateRiskMemberifrs-full:LaterThanThreeMonthsAndNotLaterThanOneYearMemberifrs-full:CashFlowHedgesMember2023-01-012023-12-310000891478san:SantanderUKGroupMembersan:InterestRateAndExchangeRateRiskMemberifrs-full:LaterThanOneYearAndNotLaterThanFiveYearsMemberifrs-full:CashFlowHedgesMember2023-01-012023-12-310000891478san:SantanderUKGroupMembersan:InterestRateAndExchangeRateRiskMemberifrs-full:LaterThanFiveYearsMemberifrs-full:CashFlowHedgesMember2023-01-012023-12-310000891478san:SantanderUKGroupMembersan:InterestRateAndExchangeRateRiskMemberifrs-full:CashFlowHedgesMembercurrency:GBPifrs-full:NotLaterThanOneMonthMember2023-12-310000891478san:SantanderUKGroupMembersan:InterestRateAndExchangeRateRiskMemberifrs-full:CashFlowHedgesMembercurrency:GBPifrs-full:LaterThanOneMonthAndNotLaterThanThreeMonthsMember2023-12-310000891478san:SantanderUKGroupMembersan:InterestRateAndExchangeRateRiskMemberifrs-full:CashFlowHedgesMembercurrency:GBPifrs-full:LaterThanThreeMonthsAndNotLaterThanOneYearMember2023-12-310000891478san:SantanderUKGroupMembersan:InterestRateAndExchangeRateRiskMemberifrs-full:CashFlowHedgesMembercurrency:GBPifrs-full:LaterThanOneYearAndNotLaterThanFiveYearsMember2023-12-310000891478san:SantanderUKGroupMembersan:InterestRateAndExchangeRateRiskMemberifrs-full:CashFlowHedgesMembercurrency:GBPifrs-full:LaterThanFiveYearsMember2023-12-310000891478srt:ParentCompanyMemberifrs-full:InterestRateRiskMemberifrs-full:NotLaterThanOneMonthMemberifrs-full:FairValueHedgesMember2025-12-310000891478srt:ParentCompanyMemberifrs-full:InterestRateRiskMemberifrs-full:LaterThanOneMonthAndNotLaterThanThreeMonthsMemberifrs-full:FairValueHedgesMember2025-12-310000891478srt:ParentCompanyMemberifrs-full:InterestRateRiskMemberifrs-full:LaterThanThreeMonthsAndNotLaterThanOneYearMemberifrs-full:FairValueHedgesMember2025-12-310000891478srt:ParentCompanyMemberifrs-full:InterestRateRiskMemberifrs-full:LaterThanOneYearAndNotLaterThanFiveYearsMemberifrs-full:FairValueHedgesMember2025-12-310000891478srt:ParentCompanyMemberifrs-full:InterestRateRiskMemberifrs-full:LaterThanFiveYearsMemberifrs-full:FairValueHedgesMember2025-12-310000891478srt:ParentCompanyMemberifrs-full:InterestRateRiskMemberifrs-full:FairValueHedgesMember2025-12-310000891478srt:ParentCompanyMemberifrs-full:InterestRateRiskMemberifrs-full:FairValueHedgesMembercurrency:GBPifrs-full:NotLaterThanOneMonthMember2025-12-310000891478srt:ParentCompanyMemberifrs-full:InterestRateRiskMemberifrs-full:FairValueHedgesMembercurrency:GBPifrs-full:LaterThanOneMonthAndNotLaterThanThreeMonthsMember2025-12-310000891478srt:ParentCompanyMemberifrs-full:InterestRateRiskMemberifrs-full:FairValueHedgesMembercurrency:GBPifrs-full:LaterThanThreeMonthsAndNotLaterThanOneYearMember2025-12-310000891478srt:ParentCompanyMemberifrs-full:InterestRateRiskMemberifrs-full:FairValueHedgesMembercurrency:GBPifrs-full:LaterThanOneYearAndNotLaterThanFiveYearsMember2025-12-310000891478srt:ParentCompanyMemberifrs-full:InterestRateRiskMemberifrs-full:FairValueHedgesMembercurrency:GBPifrs-full:LaterThanFiveYearsMember2025-12-310000891478srt:ParentCompanyMemberifrs-full:InterestRateRiskMemberifrs-full:FairValueHedgesMembercurrency:EURifrs-full:NotLaterThanOneMonthMember2025-12-310000891478srt:ParentCompanyMemberifrs-full:InterestRateRiskMemberifrs-full:FairValueHedgesMembercurrency:EURifrs-full:LaterThanOneMonthAndNotLaterThanThreeMonthsMember2025-12-310000891478srt:ParentCompanyMemberifrs-full:InterestRateRiskMemberifrs-full:FairValueHedgesMembercurrency:EURifrs-full:LaterThanThreeMonthsAndNotLaterThanOneYearMember2025-12-310000891478srt:ParentCompanyMemberifrs-full:InterestRateRiskMemberifrs-full:FairValueHedgesMembercurrency:EURifrs-full:LaterThanOneYearAndNotLaterThanFiveYearsMember2025-12-310000891478srt:ParentCompanyMemberifrs-full:InterestRateRiskMemberifrs-full:FairValueHedgesMembercurrency:EURifrs-full:LaterThanFiveYearsMember2025-12-310000891478srt:ParentCompanyMemberifrs-full:InterestRateRiskMemberifrs-full:FairValueHedgesMembercurrency:CHFifrs-full:NotLaterThanOneMonthMember2025-12-310000891478srt:ParentCompanyMemberifrs-full:InterestRateRiskMemberifrs-full:FairValueHedgesMembercurrency:CHFifrs-full:LaterThanOneMonthAndNotLaterThanThreeMonthsMember2025-12-310000891478srt:ParentCompanyMemberifrs-full:InterestRateRiskMemberifrs-full:FairValueHedgesMembercurrency:CHFifrs-full:LaterThanThreeMonthsAndNotLaterThanOneYearMember2025-12-310000891478srt:ParentCompanyMemberifrs-full:InterestRateRiskMemberifrs-full:FairValueHedgesMembercurrency:CHFifrs-full:LaterThanOneYearAndNotLaterThanFiveYearsMember2025-12-310000891478srt:ParentCompanyMemberifrs-full:InterestRateRiskMemberifrs-full:FairValueHedgesMembercurrency:CHFifrs-full:LaterThanFiveYearsMember2025-12-310000891478srt:ParentCompanyMemberifrs-full:InterestRateRiskMemberifrs-full:FairValueHedgesMembercurrency:USDifrs-full:NotLaterThanOneMonthMember2025-12-310000891478srt:ParentCompanyMemberifrs-full:InterestRateRiskMemberifrs-full:FairValueHedgesMembercurrency:USDifrs-full:LaterThanOneMonthAndNotLaterThanThreeMonthsMember2025-12-310000891478srt:ParentCompanyMemberifrs-full:InterestRateRiskMemberifrs-full:FairValueHedgesMembercurrency:USDifrs-full:LaterThanThreeMonthsAndNotLaterThanOneYearMember2025-12-310000891478srt:ParentCompanyMemberifrs-full:InterestRateRiskMemberifrs-full:FairValueHedgesMembercurrency:USDifrs-full:LaterThanOneYearAndNotLaterThanFiveYearsMember2025-12-310000891478srt:ParentCompanyMemberifrs-full:InterestRateRiskMemberifrs-full:FairValueHedgesMembercurrency:USDifrs-full:LaterThanFiveYearsMember2025-12-310000891478srt:ParentCompanyMemberifrs-full:InterestRateRiskMemberifrs-full:FairValueHedgesMembercurrency:CZKifrs-full:NotLaterThanOneMonthMember2025-12-310000891478srt:ParentCompanyMemberifrs-full:InterestRateRiskMemberifrs-full:FairValueHedgesMembercurrency:CZKifrs-full:LaterThanOneMonthAndNotLaterThanThreeMonthsMember2025-12-310000891478srt:ParentCompanyMemberifrs-full:InterestRateRiskMemberifrs-full:FairValueHedgesMembercurrency:CZKifrs-full:LaterThanThreeMonthsAndNotLaterThanOneYearMember2025-12-310000891478srt:ParentCompanyMemberifrs-full:InterestRateRiskMemberifrs-full:FairValueHedgesMembercurrency:CZKifrs-full:LaterThanOneYearAndNotLaterThanFiveYearsMember2025-12-310000891478srt:ParentCompanyMemberifrs-full:InterestRateRiskMemberifrs-full:FairValueHedgesMembercurrency:CZKifrs-full:LaterThanFiveYearsMember2025-12-310000891478srt:ParentCompanyMemberifrs-full:InterestRateRiskMemberifrs-full:FairValueHedgesMembercurrency:NOKifrs-full:NotLaterThanOneMonthMember2025-12-310000891478srt:ParentCompanyMemberifrs-full:InterestRateRiskMemberifrs-full:FairValueHedgesMembercurrency:NOKifrs-full:LaterThanOneMonthAndNotLaterThanThreeMonthsMember2025-12-310000891478srt:ParentCompanyMemberifrs-full:InterestRateRiskMemberifrs-full:FairValueHedgesMembercurrency:NOKifrs-full:LaterThanThreeMonthsAndNotLaterThanOneYearMember2025-12-310000891478srt:ParentCompanyMemberifrs-full:InterestRateRiskMemberifrs-full:FairValueHedgesMembercurrency:NOKifrs-full:LaterThanOneYearAndNotLaterThanFiveYearsMember2025-12-310000891478srt:ParentCompanyMemberifrs-full:InterestRateRiskMemberifrs-full:FairValueHedgesMembercurrency:NOKifrs-full:LaterThanFiveYearsMember2025-12-310000891478srt:ParentCompanyMemberifrs-full:InterestRateRiskMemberifrs-full:FairValueHedgesMembercurrency:AUDifrs-full:NotLaterThanOneMonthMember2025-12-310000891478srt:ParentCompanyMemberifrs-full:InterestRateRiskMemberifrs-full:FairValueHedgesMembercurrency:AUDifrs-full:LaterThanOneMonthAndNotLaterThanThreeMonthsMember2025-12-310000891478srt:ParentCompanyMemberifrs-full:InterestRateRiskMemberifrs-full:FairValueHedgesMembercurrency:AUDifrs-full:LaterThanThreeMonthsAndNotLaterThanOneYearMember2025-12-310000891478srt:ParentCompanyMemberifrs-full:InterestRateRiskMemberifrs-full:FairValueHedgesMembercurrency:AUDifrs-full:LaterThanOneYearAndNotLaterThanFiveYearsMember2025-12-310000891478srt:ParentCompanyMemberifrs-full:InterestRateRiskMemberifrs-full:FairValueHedgesMembercurrency:AUDifrs-full:LaterThanFiveYearsMember2025-12-310000891478srt:ParentCompanyMemberifrs-full:InterestRateRiskMemberifrs-full:FairValueHedgesMembercurrency:RONifrs-full:NotLaterThanOneMonthMember2025-12-310000891478srt:ParentCompanyMemberifrs-full:InterestRateRiskMemberifrs-full:FairValueHedgesMembercurrency:RONifrs-full:LaterThanOneMonthAndNotLaterThanThreeMonthsMember2025-12-310000891478srt:ParentCompanyMemberifrs-full:InterestRateRiskMemberifrs-full:FairValueHedgesMembercurrency:RONifrs-full:LaterThanThreeMonthsAndNotLaterThanOneYearMember2025-12-310000891478srt:ParentCompanyMemberifrs-full:InterestRateRiskMemberifrs-full:FairValueHedgesMembercurrency:RONifrs-full:LaterThanOneYearAndNotLaterThanFiveYearsMember2025-12-310000891478srt:ParentCompanyMemberifrs-full:InterestRateRiskMemberifrs-full:FairValueHedgesMembercurrency:RONifrs-full:LaterThanFiveYearsMember2025-12-310000891478srt:ParentCompanyMemberifrs-full:InterestRateRiskMemberifrs-full:FairValueHedgesMembercurrency:HKDifrs-full:NotLaterThanOneMonthMember2025-12-310000891478srt:ParentCompanyMemberifrs-full:InterestRateRiskMemberifrs-full:FairValueHedgesMembercurrency:HKDifrs-full:LaterThanOneMonthAndNotLaterThanThreeMonthsMember2025-12-310000891478srt:ParentCompanyMemberifrs-full:InterestRateRiskMemberifrs-full:FairValueHedgesMembercurrency:HKDifrs-full:LaterThanThreeMonthsAndNotLaterThanOneYearMember2025-12-310000891478srt:ParentCompanyMemberifrs-full:InterestRateRiskMemberifrs-full:FairValueHedgesMembercurrency:HKDifrs-full:LaterThanOneYearAndNotLaterThanFiveYearsMember2025-12-310000891478srt:ParentCompanyMemberifrs-full:InterestRateRiskMemberifrs-full:FairValueHedgesMembercurrency:HKDifrs-full:LaterThanFiveYearsMember2025-12-310000891478srt:ParentCompanyMemberifrs-full:InterestRateRiskMemberifrs-full:FairValueHedgesMembercurrency:NZDifrs-full:NotLaterThanOneMonthMember2025-12-310000891478srt:ParentCompanyMemberifrs-full:InterestRateRiskMemberifrs-full:FairValueHedgesMembercurrency:NZDifrs-full:LaterThanOneMonthAndNotLaterThanThreeMonthsMember2025-12-310000891478srt:ParentCompanyMemberifrs-full:InterestRateRiskMemberifrs-full:FairValueHedgesMembercurrency:NZDifrs-full:LaterThanThreeMonthsAndNotLaterThanOneYearMember2025-12-310000891478srt:ParentCompanyMemberifrs-full:InterestRateRiskMemberifrs-full:FairValueHedgesMembercurrency:NZDifrs-full:LaterThanOneYearAndNotLaterThanFiveYearsMember2025-12-310000891478srt:ParentCompanyMemberifrs-full:InterestRateRiskMemberifrs-full:FairValueHedgesMembercurrency:NZDifrs-full:LaterThanFiveYearsMember2025-12-310000891478srt:ParentCompanyMemberifrs-full:CurrencyRiskMemberifrs-full:NotLaterThanOneMonthMemberifrs-full:FairValueHedgesMember2025-12-310000891478srt:ParentCompanyMemberifrs-full:CurrencyRiskMemberifrs-full:LaterThanOneMonthAndNotLaterThanThreeMonthsMemberifrs-full:FairValueHedgesMember2025-12-310000891478srt:ParentCompanyMemberifrs-full:CurrencyRiskMemberifrs-full:LaterThanThreeMonthsAndNotLaterThanOneYearMemberifrs-full:FairValueHedgesMember2025-12-310000891478srt:ParentCompanyMemberifrs-full:CurrencyRiskMemberifrs-full:LaterThanOneYearAndNotLaterThanFiveYearsMemberifrs-full:FairValueHedgesMember2025-12-310000891478srt:ParentCompanyMemberifrs-full:CurrencyRiskMemberifrs-full:LaterThanFiveYearsMemberifrs-full:FairValueHedgesMember2025-12-310000891478srt:ParentCompanyMemberifrs-full:CurrencyRiskMemberifrs-full:FairValueHedgesMember2025-12-310000891478srt:ParentCompanyMemberifrs-full:CurrencyRiskMemberifrs-full:NotLaterThanOneMonthMemberifrs-full:FairValueHedgesMember2025-01-012025-12-310000891478srt:ParentCompanyMemberifrs-full:CurrencyRiskMemberifrs-full:LaterThanOneMonthAndNotLaterThanThreeMonthsMemberifrs-full:FairValueHedgesMember2025-01-012025-12-310000891478srt:ParentCompanyMemberifrs-full:CurrencyRiskMemberifrs-full:LaterThanThreeMonthsAndNotLaterThanOneYearMemberifrs-full:FairValueHedgesMember2025-01-012025-12-310000891478srt:ParentCompanyMemberifrs-full:CurrencyRiskMemberifrs-full:LaterThanOneYearAndNotLaterThanFiveYearsMemberifrs-full:FairValueHedgesMember2025-01-012025-12-310000891478srt:ParentCompanyMemberifrs-full:CurrencyRiskMemberifrs-full:LaterThanFiveYearsMemberifrs-full:FairValueHedgesMember2025-01-012025-12-310000891478srt:ParentCompanyMembersan:InterestRateAndExchangeRateRiskMemberifrs-full:NotLaterThanOneMonthMemberifrs-full:FairValueHedgesMember2025-12-310000891478srt:ParentCompanyMembersan:InterestRateAndExchangeRateRiskMemberifrs-full:LaterThanOneMonthAndNotLaterThanThreeMonthsMemberifrs-full:FairValueHedgesMember2025-12-310000891478srt:ParentCompanyMembersan:InterestRateAndExchangeRateRiskMemberifrs-full:LaterThanThreeMonthsAndNotLaterThanOneYearMemberifrs-full:FairValueHedgesMember2025-12-310000891478srt:ParentCompanyMembersan:InterestRateAndExchangeRateRiskMemberifrs-full:LaterThanOneYearAndNotLaterThanFiveYearsMemberifrs-full:FairValueHedgesMember2025-12-310000891478srt:ParentCompanyMembersan:InterestRateAndExchangeRateRiskMemberifrs-full:LaterThanFiveYearsMemberifrs-full:FairValueHedgesMember2025-12-310000891478srt:ParentCompanyMembersan:InterestRateAndExchangeRateRiskMemberifrs-full:FairValueHedgesMember2025-12-310000891478srt:ParentCompanyMembersan:InterestRateAndExchangeRateRiskMemberifrs-full:FairValueHedgesMembersan:AustraliaDollarAndEuroMemberifrs-full:NotLaterThanOneMonthMember2025-12-310000891478srt:ParentCompanyMembersan:InterestRateAndExchangeRateRiskMemberifrs-full:FairValueHedgesMembersan:AustraliaDollarAndEuroMemberifrs-full:LaterThanOneMonthAndNotLaterThanThreeMonthsMember2025-12-310000891478srt:ParentCompanyMembersan:InterestRateAndExchangeRateRiskMemberifrs-full:FairValueHedgesMembersan:AustraliaDollarAndEuroMemberifrs-full:LaterThanThreeMonthsAndNotLaterThanOneYearMember2025-12-310000891478srt:ParentCompanyMembersan:InterestRateAndExchangeRateRiskMemberifrs-full:FairValueHedgesMembersan:AustraliaDollarAndEuroMemberifrs-full:LaterThanOneYearAndNotLaterThanFiveYearsMember2025-12-310000891478srt:ParentCompanyMembersan:InterestRateAndExchangeRateRiskMemberifrs-full:FairValueHedgesMembersan:AustraliaDollarAndEuroMemberifrs-full:LaterThanFiveYearsMember2025-12-310000891478srt:ParentCompanyMembersan:InterestRateAndExchangeRateRiskMemberifrs-full:FairValueHedgesMembersan:CzechRepublicKorunyAndEuroMemberifrs-full:NotLaterThanOneMonthMember2025-12-310000891478srt:ParentCompanyMembersan:InterestRateAndExchangeRateRiskMemberifrs-full:FairValueHedgesMembersan:CzechRepublicKorunyAndEuroMemberifrs-full:LaterThanOneMonthAndNotLaterThanThreeMonthsMember2025-12-310000891478srt:ParentCompanyMembersan:InterestRateAndExchangeRateRiskMemberifrs-full:FairValueHedgesMembersan:CzechRepublicKorunyAndEuroMemberifrs-full:LaterThanThreeMonthsAndNotLaterThanOneYearMember2025-12-310000891478srt:ParentCompanyMembersan:InterestRateAndExchangeRateRiskMemberifrs-full:FairValueHedgesMembersan:CzechRepublicKorunyAndEuroMemberifrs-full:LaterThanOneYearAndNotLaterThanFiveYearsMember2025-12-310000891478srt:ParentCompanyMembersan:InterestRateAndExchangeRateRiskMemberifrs-full:FairValueHedgesMembersan:CzechRepublicKorunyAndEuroMemberifrs-full:LaterThanFiveYearsMember2025-12-310000891478srt:ParentCompanyMembersan:InterestRateAndExchangeRateRiskMemberifrs-full:FairValueHedgesMembersan:RomaniaNewLeiAndEuroMemberifrs-full:NotLaterThanOneMonthMember2025-12-310000891478srt:ParentCompanyMembersan:InterestRateAndExchangeRateRiskMemberifrs-full:FairValueHedgesMembersan:RomaniaNewLeiAndEuroMemberifrs-full:LaterThanOneMonthAndNotLaterThanThreeMonthsMember2025-12-310000891478srt:ParentCompanyMembersan:InterestRateAndExchangeRateRiskMemberifrs-full:FairValueHedgesMembersan:RomaniaNewLeiAndEuroMemberifrs-full:LaterThanThreeMonthsAndNotLaterThanOneYearMember2025-12-310000891478srt:ParentCompanyMembersan:InterestRateAndExchangeRateRiskMemberifrs-full:FairValueHedgesMembersan:RomaniaNewLeiAndEuroMemberifrs-full:LaterThanOneYearAndNotLaterThanFiveYearsMember2025-12-310000891478srt:ParentCompanyMembersan:InterestRateAndExchangeRateRiskMemberifrs-full:FairValueHedgesMembersan:RomaniaNewLeiAndEuroMemberifrs-full:LaterThanFiveYearsMember2025-12-310000891478srt:ParentCompanyMembersan:InterestRateAndExchangeRateRiskMemberifrs-full:FairValueHedgesMembersan:HongKongDollarsAndEuroMemberifrs-full:NotLaterThanOneMonthMember2025-12-310000891478srt:ParentCompanyMembersan:InterestRateAndExchangeRateRiskMemberifrs-full:FairValueHedgesMembersan:HongKongDollarsAndEuroMemberifrs-full:LaterThanOneMonthAndNotLaterThanThreeMonthsMember2025-12-310000891478srt:ParentCompanyMembersan:InterestRateAndExchangeRateRiskMemberifrs-full:FairValueHedgesMembersan:HongKongDollarsAndEuroMemberifrs-full:LaterThanThreeMonthsAndNotLaterThanOneYearMember2025-12-310000891478srt:ParentCompanyMembersan:InterestRateAndExchangeRateRiskMemberifrs-full:FairValueHedgesMembersan:HongKongDollarsAndEuroMemberifrs-full:LaterThanOneYearAndNotLaterThanFiveYearsMember2025-12-310000891478srt:ParentCompanyMembersan:InterestRateAndExchangeRateRiskMemberifrs-full:FairValueHedgesMembersan:HongKongDollarsAndEuroMemberifrs-full:LaterThanFiveYearsMember2025-12-310000891478srt:ParentCompanyMembersan:InterestRateAndExchangeRateRiskMemberifrs-full:FairValueHedgesMembersan:JapanYenAndEuroMemberifrs-full:NotLaterThanOneMonthMember2025-12-310000891478srt:ParentCompanyMembersan:InterestRateAndExchangeRateRiskMemberifrs-full:FairValueHedgesMembersan:JapanYenAndEuroMemberifrs-full:LaterThanOneMonthAndNotLaterThanThreeMonthsMember2025-12-310000891478srt:ParentCompanyMembersan:InterestRateAndExchangeRateRiskMemberifrs-full:FairValueHedgesMembersan:JapanYenAndEuroMemberifrs-full:LaterThanThreeMonthsAndNotLaterThanOneYearMember2025-12-310000891478srt:ParentCompanyMembersan:InterestRateAndExchangeRateRiskMemberifrs-full:FairValueHedgesMembersan:JapanYenAndEuroMemberifrs-full:LaterThanOneYearAndNotLaterThanFiveYearsMember2025-12-310000891478srt:ParentCompanyMembersan:InterestRateAndExchangeRateRiskMemberifrs-full:FairValueHedgesMembersan:JapanYenAndEuroMemberifrs-full:LaterThanFiveYearsMember2025-12-310000891478srt:ParentCompanyMembersan:InterestRateAndExchangeRateRiskMemberifrs-full:FairValueHedgesMembersan:NorwayKroneAndEuroMemberifrs-full:NotLaterThanOneMonthMember2025-12-310000891478srt:ParentCompanyMembersan:InterestRateAndExchangeRateRiskMemberifrs-full:FairValueHedgesMembersan:NorwayKroneAndEuroMemberifrs-full:LaterThanOneMonthAndNotLaterThanThreeMonthsMember2025-12-310000891478srt:ParentCompanyMembersan:InterestRateAndExchangeRateRiskMemberifrs-full:FairValueHedgesMembersan:NorwayKroneAndEuroMemberifrs-full:LaterThanThreeMonthsAndNotLaterThanOneYearMember2025-12-310000891478srt:ParentCompanyMembersan:InterestRateAndExchangeRateRiskMemberifrs-full:FairValueHedgesMembersan:NorwayKroneAndEuroMemberifrs-full:LaterThanOneYearAndNotLaterThanFiveYearsMember2025-12-310000891478srt:ParentCompanyMembersan:InterestRateAndExchangeRateRiskMemberifrs-full:FairValueHedgesMembersan:NorwayKroneAndEuroMemberifrs-full:LaterThanFiveYearsMember2025-12-310000891478srt:ParentCompanyMembersan:InterestRateAndExchangeRateRiskMemberifrs-full:FairValueHedgesMembersan:SwitzerlandFrancsAndEuroMemberifrs-full:NotLaterThanOneMonthMember2025-12-310000891478srt:ParentCompanyMembersan:InterestRateAndExchangeRateRiskMemberifrs-full:FairValueHedgesMembersan:SwitzerlandFrancsAndEuroMemberifrs-full:LaterThanOneMonthAndNotLaterThanThreeMonthsMember2025-12-310000891478srt:ParentCompanyMembersan:InterestRateAndExchangeRateRiskMemberifrs-full:FairValueHedgesMembersan:SwitzerlandFrancsAndEuroMemberifrs-full:LaterThanThreeMonthsAndNotLaterThanOneYearMember2025-12-310000891478srt:ParentCompanyMembersan:InterestRateAndExchangeRateRiskMemberifrs-full:FairValueHedgesMembersan:SwitzerlandFrancsAndEuroMemberifrs-full:LaterThanOneYearAndNotLaterThanFiveYearsMember2025-12-310000891478srt:ParentCompanyMembersan:InterestRateAndExchangeRateRiskMemberifrs-full:FairValueHedgesMembersan:SwitzerlandFrancsAndEuroMemberifrs-full:LaterThanFiveYearsMember2025-12-310000891478srt:ParentCompanyMembersan:InterestRateAndExchangeRateRiskMemberifrs-full:FairValueHedgesMembersan:UnitedStatesDollarAndChilePesoMemberifrs-full:NotLaterThanOneMonthMember2025-12-310000891478srt:ParentCompanyMembersan:InterestRateAndExchangeRateRiskMemberifrs-full:FairValueHedgesMembersan:UnitedStatesDollarAndChilePesoMemberifrs-full:LaterThanOneMonthAndNotLaterThanThreeMonthsMember2025-12-310000891478srt:ParentCompanyMembersan:InterestRateAndExchangeRateRiskMemberifrs-full:FairValueHedgesMembersan:UnitedStatesDollarAndChilePesoMemberifrs-full:LaterThanThreeMonthsAndNotLaterThanOneYearMember2025-12-310000891478srt:ParentCompanyMembersan:InterestRateAndExchangeRateRiskMemberifrs-full:FairValueHedgesMembersan:UnitedStatesDollarAndChilePesoMemberifrs-full:LaterThanOneYearAndNotLaterThanFiveYearsMember2025-12-310000891478srt:ParentCompanyMembersan:InterestRateAndExchangeRateRiskMemberifrs-full:FairValueHedgesMembersan:UnitedStatesDollarAndChilePesoMemberifrs-full:LaterThanFiveYearsMember2025-12-310000891478srt:ParentCompanyMembersan:InterestRateAndExchangeRateRiskMemberifrs-full:FairValueHedgesMembersan:UnitedStatesDollarAndColombiaPesoMemberifrs-full:NotLaterThanOneMonthMember2025-12-310000891478srt:ParentCompanyMembersan:InterestRateAndExchangeRateRiskMemberifrs-full:FairValueHedgesMembersan:UnitedStatesDollarAndColombiaPesoMemberifrs-full:LaterThanOneMonthAndNotLaterThanThreeMonthsMember2025-12-310000891478srt:ParentCompanyMembersan:InterestRateAndExchangeRateRiskMemberifrs-full:FairValueHedgesMembersan:UnitedStatesDollarAndColombiaPesoMemberifrs-full:LaterThanThreeMonthsAndNotLaterThanOneYearMember2025-12-310000891478srt:ParentCompanyMembersan:InterestRateAndExchangeRateRiskMemberifrs-full:FairValueHedgesMembersan:UnitedStatesDollarAndColombiaPesoMemberifrs-full:LaterThanOneYearAndNotLaterThanFiveYearsMember2025-12-310000891478srt:ParentCompanyMembersan:InterestRateAndExchangeRateRiskMemberifrs-full:FairValueHedgesMembersan:UnitedStatesDollarAndColombiaPesoMemberifrs-full:LaterThanFiveYearsMember2025-12-310000891478srt:ParentCompanyMembersan:InterestRateAndExchangeRateRiskMemberifrs-full:FairValueHedgesMembersan:UnitedStatesDollarAndMexicanPesoMemberifrs-full:NotLaterThanOneMonthMember2025-12-310000891478srt:ParentCompanyMembersan:InterestRateAndExchangeRateRiskMemberifrs-full:FairValueHedgesMembersan:UnitedStatesDollarAndMexicanPesoMemberifrs-full:LaterThanOneMonthAndNotLaterThanThreeMonthsMember2025-12-310000891478srt:ParentCompanyMembersan:InterestRateAndExchangeRateRiskMemberifrs-full:FairValueHedgesMembersan:UnitedStatesDollarAndMexicanPesoMemberifrs-full:LaterThanThreeMonthsAndNotLaterThanOneYearMember2025-12-310000891478srt:ParentCompanyMembersan:InterestRateAndExchangeRateRiskMemberifrs-full:FairValueHedgesMembersan:UnitedStatesDollarAndMexicanPesoMemberifrs-full:LaterThanOneYearAndNotLaterThanFiveYearsMember2025-12-310000891478srt:ParentCompanyMembersan:InterestRateAndExchangeRateRiskMemberifrs-full:FairValueHedgesMembersan:UnitedStatesDollarAndMexicanPesoMemberifrs-full:LaterThanFiveYearsMember2025-12-310000891478srt:ParentCompanyMembersan:InterestRateAndExchangeRateRiskMemberifrs-full:NotLaterThanOneMonthMemberifrs-full:FairValueHedgesMember2025-01-012025-12-310000891478srt:ParentCompanyMembersan:InterestRateAndExchangeRateRiskMemberifrs-full:LaterThanOneMonthAndNotLaterThanThreeMonthsMemberifrs-full:FairValueHedgesMember2025-01-012025-12-310000891478srt:ParentCompanyMembersan:InterestRateAndExchangeRateRiskMemberifrs-full:LaterThanThreeMonthsAndNotLaterThanOneYearMemberifrs-full:FairValueHedgesMember2025-01-012025-12-310000891478srt:ParentCompanyMembersan:InterestRateAndExchangeRateRiskMemberifrs-full:LaterThanOneYearAndNotLaterThanFiveYearsMemberifrs-full:FairValueHedgesMember2025-01-012025-12-310000891478srt:ParentCompanyMembersan:InterestRateAndExchangeRateRiskMemberifrs-full:LaterThanFiveYearsMemberifrs-full:FairValueHedgesMember2025-01-012025-12-310000891478srt:ParentCompanyMembersan:BasisRiskMemberifrs-full:NotLaterThanOneMonthMemberifrs-full:FairValueHedgesMember2025-12-310000891478srt:ParentCompanyMembersan:BasisRiskMemberifrs-full:LaterThanOneMonthAndNotLaterThanThreeMonthsMemberifrs-full:FairValueHedgesMember2025-12-310000891478srt:ParentCompanyMembersan:BasisRiskMemberifrs-full:LaterThanThreeMonthsAndNotLaterThanOneYearMemberifrs-full:FairValueHedgesMember2025-12-310000891478srt:ParentCompanyMembersan:BasisRiskMemberifrs-full:LaterThanOneYearAndNotLaterThanFiveYearsMemberifrs-full:FairValueHedgesMember2025-12-310000891478srt:ParentCompanyMembersan:BasisRiskMemberifrs-full:LaterThanFiveYearsMemberifrs-full:FairValueHedgesMember2025-12-310000891478srt:ParentCompanyMembersan:BasisRiskMemberifrs-full:FairValueHedgesMember2025-12-310000891478srt:ParentCompanyMembersan:InterestRateAndExchangeRateRiskMemberifrs-full:NotLaterThanOneMonthMemberifrs-full:CashFlowHedgesMember2025-12-310000891478srt:ParentCompanyMembersan:InterestRateAndExchangeRateRiskMemberifrs-full:LaterThanOneMonthAndNotLaterThanThreeMonthsMemberifrs-full:CashFlowHedgesMember2025-12-310000891478srt:ParentCompanyMembersan:InterestRateAndExchangeRateRiskMemberifrs-full:LaterThanThreeMonthsAndNotLaterThanOneYearMemberifrs-full:CashFlowHedgesMember2025-12-310000891478srt:ParentCompanyMembersan:InterestRateAndExchangeRateRiskMemberifrs-full:LaterThanOneYearAndNotLaterThanFiveYearsMemberifrs-full:CashFlowHedgesMember2025-12-310000891478srt:ParentCompanyMembersan:InterestRateAndExchangeRateRiskMemberifrs-full:LaterThanFiveYearsMemberifrs-full:CashFlowHedgesMember2025-12-310000891478srt:ParentCompanyMembersan:InterestRateAndExchangeRateRiskMemberifrs-full:CashFlowHedgesMember2025-12-310000891478srt:ParentCompanyMembersan:InterestRateAndExchangeRateRiskMemberifrs-full:CashFlowHedgesMembersan:AustralianDollarAndEuroMemberifrs-full:NotLaterThanOneMonthMember2025-12-310000891478srt:ParentCompanyMembersan:InterestRateAndExchangeRateRiskMemberifrs-full:CashFlowHedgesMembersan:AustralianDollarAndEuroMemberifrs-full:LaterThanOneMonthAndNotLaterThanThreeMonthsMember2025-12-310000891478srt:ParentCompanyMembersan:InterestRateAndExchangeRateRiskMemberifrs-full:CashFlowHedgesMembersan:AustralianDollarAndEuroMemberifrs-full:LaterThanThreeMonthsAndNotLaterThanOneYearMember2025-12-310000891478srt:ParentCompanyMembersan:InterestRateAndExchangeRateRiskMemberifrs-full:CashFlowHedgesMembersan:AustralianDollarAndEuroMemberifrs-full:LaterThanOneYearAndNotLaterThanFiveYearsMember2025-12-310000891478srt:ParentCompanyMembersan:InterestRateAndExchangeRateRiskMemberifrs-full:CashFlowHedgesMembersan:AustralianDollarAndEuroMemberifrs-full:LaterThanFiveYearsMember2025-12-310000891478srt:ParentCompanyMembersan:InterestRateAndExchangeRateRiskMemberifrs-full:CashFlowHedgesMembersan:SwitzerlandFrancsAndEuroMemberifrs-full:NotLaterThanOneMonthMember2025-12-310000891478srt:ParentCompanyMembersan:InterestRateAndExchangeRateRiskMemberifrs-full:CashFlowHedgesMembersan:SwitzerlandFrancsAndEuroMemberifrs-full:LaterThanOneMonthAndNotLaterThanThreeMonthsMember2025-12-310000891478srt:ParentCompanyMembersan:InterestRateAndExchangeRateRiskMemberifrs-full:CashFlowHedgesMembersan:SwitzerlandFrancsAndEuroMemberifrs-full:LaterThanThreeMonthsAndNotLaterThanOneYearMember2025-12-310000891478srt:ParentCompanyMembersan:InterestRateAndExchangeRateRiskMemberifrs-full:CashFlowHedgesMembersan:SwitzerlandFrancsAndEuroMemberifrs-full:LaterThanOneYearAndNotLaterThanFiveYearsMember2025-12-310000891478srt:ParentCompanyMembersan:InterestRateAndExchangeRateRiskMemberifrs-full:CashFlowHedgesMembersan:SwitzerlandFrancsAndEuroMemberifrs-full:LaterThanFiveYearsMember2025-12-310000891478srt:ParentCompanyMembersan:InterestRateAndExchangeRateRiskMemberifrs-full:NotLaterThanOneMonthMemberifrs-full:CashFlowHedgesMember2025-01-012025-12-310000891478srt:ParentCompanyMembersan:InterestRateAndExchangeRateRiskMemberifrs-full:LaterThanOneMonthAndNotLaterThanThreeMonthsMemberifrs-full:CashFlowHedgesMember2025-01-012025-12-310000891478srt:ParentCompanyMembersan:InterestRateAndExchangeRateRiskMemberifrs-full:LaterThanThreeMonthsAndNotLaterThanOneYearMemberifrs-full:CashFlowHedgesMember2025-01-012025-12-310000891478srt:ParentCompanyMembersan:InterestRateAndExchangeRateRiskMemberifrs-full:LaterThanOneYearAndNotLaterThanFiveYearsMemberifrs-full:CashFlowHedgesMember2025-01-012025-12-310000891478srt:ParentCompanyMembersan:InterestRateAndExchangeRateRiskMemberifrs-full:LaterThanFiveYearsMemberifrs-full:CashFlowHedgesMember2025-01-012025-12-310000891478srt:ParentCompanyMemberifrs-full:InterestRateRiskMemberifrs-full:NotLaterThanOneMonthMemberifrs-full:CashFlowHedgesMember2025-12-310000891478srt:ParentCompanyMemberifrs-full:InterestRateRiskMemberifrs-full:LaterThanOneMonthAndNotLaterThanThreeMonthsMemberifrs-full:CashFlowHedgesMember2025-12-310000891478srt:ParentCompanyMemberifrs-full:InterestRateRiskMemberifrs-full:LaterThanThreeMonthsAndNotLaterThanOneYearMemberifrs-full:CashFlowHedgesMember2025-12-310000891478srt:ParentCompanyMemberifrs-full:InterestRateRiskMemberifrs-full:LaterThanOneYearAndNotLaterThanFiveYearsMemberifrs-full:CashFlowHedgesMember2025-12-310000891478srt:ParentCompanyMemberifrs-full:InterestRateRiskMemberifrs-full:LaterThanFiveYearsMemberifrs-full:CashFlowHedgesMember2025-12-310000891478srt:ParentCompanyMemberifrs-full:InterestRateRiskMemberifrs-full:CashFlowHedgesMember2025-12-310000891478srt:ParentCompanyMemberifrs-full:InterestRateRiskMemberifrs-full:CashFlowHedgesMembercurrency:EURifrs-full:NotLaterThanOneMonthMember2025-12-310000891478srt:ParentCompanyMemberifrs-full:InterestRateRiskMemberifrs-full:CashFlowHedgesMembercurrency:EURifrs-full:LaterThanOneMonthAndNotLaterThanThreeMonthsMember2025-12-310000891478srt:ParentCompanyMemberifrs-full:InterestRateRiskMemberifrs-full:CashFlowHedgesMembercurrency:EURifrs-full:LaterThanThreeMonthsAndNotLaterThanOneYearMember2025-12-310000891478srt:ParentCompanyMemberifrs-full:InterestRateRiskMemberifrs-full:CashFlowHedgesMembercurrency:EURifrs-full:LaterThanOneYearAndNotLaterThanFiveYearsMember2025-12-310000891478srt:ParentCompanyMemberifrs-full:InterestRateRiskMemberifrs-full:CashFlowHedgesMembercurrency:EURifrs-full:LaterThanFiveYearsMember2025-12-310000891478srt:ParentCompanyMemberifrs-full:InterestRateRiskMemberifrs-full:CashFlowHedgesMembercurrency:AUDifrs-full:NotLaterThanOneMonthMember2025-12-310000891478srt:ParentCompanyMemberifrs-full:InterestRateRiskMemberifrs-full:CashFlowHedgesMembercurrency:AUDifrs-full:LaterThanOneMonthAndNotLaterThanThreeMonthsMember2025-12-310000891478srt:ParentCompanyMemberifrs-full:InterestRateRiskMemberifrs-full:CashFlowHedgesMembercurrency:AUDifrs-full:LaterThanThreeMonthsAndNotLaterThanOneYearMember2025-12-310000891478srt:ParentCompanyMemberifrs-full:InterestRateRiskMemberifrs-full:CashFlowHedgesMembercurrency:AUDifrs-full:LaterThanOneYearAndNotLaterThanFiveYearsMember2025-12-310000891478srt:ParentCompanyMemberifrs-full:InterestRateRiskMemberifrs-full:CashFlowHedgesMembercurrency:AUDifrs-full:LaterThanFiveYearsMember2025-12-310000891478srt:ParentCompanyMemberifrs-full:CurrencyRiskMemberifrs-full:NotLaterThanOneMonthMemberifrs-full:CashFlowHedgesMember2025-12-310000891478srt:ParentCompanyMemberifrs-full:CurrencyRiskMemberifrs-full:LaterThanOneMonthAndNotLaterThanThreeMonthsMemberifrs-full:CashFlowHedgesMember2025-12-310000891478srt:ParentCompanyMemberifrs-full:CurrencyRiskMemberifrs-full:LaterThanThreeMonthsAndNotLaterThanOneYearMemberifrs-full:CashFlowHedgesMember2025-12-310000891478srt:ParentCompanyMemberifrs-full:CurrencyRiskMemberifrs-full:LaterThanOneYearAndNotLaterThanFiveYearsMemberifrs-full:CashFlowHedgesMember2025-12-310000891478srt:ParentCompanyMemberifrs-full:CurrencyRiskMemberifrs-full:LaterThanFiveYearsMemberifrs-full:CashFlowHedgesMember2025-12-310000891478srt:ParentCompanyMemberifrs-full:CurrencyRiskMemberifrs-full:CashFlowHedgesMember2025-12-310000891478srt:ParentCompanyMemberifrs-full:CurrencyRiskMemberifrs-full:NotLaterThanOneMonthMemberifrs-full:CashFlowHedgesMember2025-01-012025-12-310000891478srt:ParentCompanyMemberifrs-full:CurrencyRiskMemberifrs-full:LaterThanOneMonthAndNotLaterThanThreeMonthsMemberifrs-full:CashFlowHedgesMember2025-01-012025-12-310000891478srt:ParentCompanyMemberifrs-full:CurrencyRiskMemberifrs-full:LaterThanThreeMonthsAndNotLaterThanOneYearMemberifrs-full:CashFlowHedgesMember2025-01-012025-12-310000891478srt:ParentCompanyMemberifrs-full:CurrencyRiskMemberifrs-full:LaterThanOneYearAndNotLaterThanFiveYearsMemberifrs-full:CashFlowHedgesMember2025-01-012025-12-310000891478srt:ParentCompanyMemberifrs-full:CurrencyRiskMemberifrs-full:LaterThanFiveYearsMemberifrs-full:CashFlowHedgesMember2025-01-012025-12-310000891478srt:ParentCompanyMemberifrs-full:CurrencyRiskMemberifrs-full:NotLaterThanOneMonthMemberifrs-full:HedgesOfNetInvestmentInForeignOperationsMember2025-12-310000891478srt:ParentCompanyMemberifrs-full:CurrencyRiskMemberifrs-full:LaterThanOneMonthAndNotLaterThanThreeMonthsMemberifrs-full:HedgesOfNetInvestmentInForeignOperationsMember2025-12-310000891478srt:ParentCompanyMemberifrs-full:CurrencyRiskMemberifrs-full:LaterThanThreeMonthsAndNotLaterThanOneYearMemberifrs-full:HedgesOfNetInvestmentInForeignOperationsMember2025-12-310000891478srt:ParentCompanyMemberifrs-full:CurrencyRiskMemberifrs-full:LaterThanOneYearAndNotLaterThanFiveYearsMemberifrs-full:HedgesOfNetInvestmentInForeignOperationsMember2025-12-310000891478srt:ParentCompanyMemberifrs-full:CurrencyRiskMemberifrs-full:LaterThanFiveYearsMemberifrs-full:HedgesOfNetInvestmentInForeignOperationsMember2025-12-310000891478srt:ParentCompanyMemberifrs-full:CurrencyRiskMemberifrs-full:HedgesOfNetInvestmentInForeignOperationsMember2025-12-310000891478srt:ParentCompanyMemberifrs-full:CurrencyRiskMemberifrs-full:NotLaterThanOneMonthMemberifrs-full:HedgesOfNetInvestmentInForeignOperationsMember2025-01-012025-12-310000891478srt:ParentCompanyMemberifrs-full:CurrencyRiskMemberifrs-full:LaterThanOneMonthAndNotLaterThanThreeMonthsMemberifrs-full:HedgesOfNetInvestmentInForeignOperationsMember2025-01-012025-12-310000891478srt:ParentCompanyMemberifrs-full:CurrencyRiskMemberifrs-full:LaterThanThreeMonthsAndNotLaterThanOneYearMemberifrs-full:HedgesOfNetInvestmentInForeignOperationsMember2025-01-012025-12-310000891478srt:ParentCompanyMemberifrs-full:CurrencyRiskMemberifrs-full:LaterThanOneYearAndNotLaterThanFiveYearsMemberifrs-full:HedgesOfNetInvestmentInForeignOperationsMember2025-01-012025-12-310000891478srt:ParentCompanyMemberifrs-full:CurrencyRiskMemberifrs-full:LaterThanFiveYearsMemberifrs-full:HedgesOfNetInvestmentInForeignOperationsMember2025-01-012025-12-310000891478srt:ParentCompanyMemberifrs-full:InterestRateRiskMemberifrs-full:NotLaterThanOneMonthMemberifrs-full:FairValueHedgesMember2024-12-310000891478srt:ParentCompanyMemberifrs-full:InterestRateRiskMemberifrs-full:LaterThanOneMonthAndNotLaterThanThreeMonthsMemberifrs-full:FairValueHedgesMember2024-12-310000891478srt:ParentCompanyMemberifrs-full:InterestRateRiskMemberifrs-full:LaterThanThreeMonthsAndNotLaterThanOneYearMemberifrs-full:FairValueHedgesMember2024-12-310000891478srt:ParentCompanyMemberifrs-full:InterestRateRiskMemberifrs-full:LaterThanOneYearAndNotLaterThanFiveYearsMemberifrs-full:FairValueHedgesMember2024-12-310000891478srt:ParentCompanyMemberifrs-full:InterestRateRiskMemberifrs-full:LaterThanFiveYearsMemberifrs-full:FairValueHedgesMember2024-12-310000891478srt:ParentCompanyMemberifrs-full:InterestRateRiskMemberifrs-full:FairValueHedgesMember2024-12-310000891478srt:ParentCompanyMemberifrs-full:InterestRateRiskMemberifrs-full:FairValueHedgesMembercurrency:GBPifrs-full:NotLaterThanOneMonthMember2024-12-310000891478srt:ParentCompanyMemberifrs-full:InterestRateRiskMemberifrs-full:FairValueHedgesMembercurrency:GBPifrs-full:LaterThanOneMonthAndNotLaterThanThreeMonthsMember2024-12-310000891478srt:ParentCompanyMemberifrs-full:InterestRateRiskMemberifrs-full:FairValueHedgesMembercurrency:GBPifrs-full:LaterThanThreeMonthsAndNotLaterThanOneYearMember2024-12-310000891478srt:ParentCompanyMemberifrs-full:InterestRateRiskMemberifrs-full:FairValueHedgesMembercurrency:GBPifrs-full:LaterThanOneYearAndNotLaterThanFiveYearsMember2024-12-310000891478srt:ParentCompanyMemberifrs-full:InterestRateRiskMemberifrs-full:FairValueHedgesMembercurrency:GBPifrs-full:LaterThanFiveYearsMember2024-12-310000891478srt:ParentCompanyMemberifrs-full:InterestRateRiskMemberifrs-full:FairValueHedgesMembercurrency:EURifrs-full:NotLaterThanOneMonthMember2024-12-310000891478srt:ParentCompanyMemberifrs-full:InterestRateRiskMemberifrs-full:FairValueHedgesMembercurrency:EURifrs-full:LaterThanOneMonthAndNotLaterThanThreeMonthsMember2024-12-310000891478srt:ParentCompanyMemberifrs-full:InterestRateRiskMemberifrs-full:FairValueHedgesMembercurrency:EURifrs-full:LaterThanThreeMonthsAndNotLaterThanOneYearMember2024-12-310000891478srt:ParentCompanyMemberifrs-full:InterestRateRiskMemberifrs-full:FairValueHedgesMembercurrency:EURifrs-full:LaterThanOneYearAndNotLaterThanFiveYearsMember2024-12-310000891478srt:ParentCompanyMemberifrs-full:InterestRateRiskMemberifrs-full:FairValueHedgesMembercurrency:EURifrs-full:LaterThanFiveYearsMember2024-12-310000891478srt:ParentCompanyMemberifrs-full:InterestRateRiskMemberifrs-full:FairValueHedgesMembercurrency:USDifrs-full:NotLaterThanOneMonthMember2024-12-310000891478srt:ParentCompanyMemberifrs-full:InterestRateRiskMemberifrs-full:FairValueHedgesMembercurrency:USDifrs-full:LaterThanOneMonthAndNotLaterThanThreeMonthsMember2024-12-310000891478srt:ParentCompanyMemberifrs-full:InterestRateRiskMemberifrs-full:FairValueHedgesMembercurrency:USDifrs-full:LaterThanThreeMonthsAndNotLaterThanOneYearMember2024-12-310000891478srt:ParentCompanyMemberifrs-full:InterestRateRiskMemberifrs-full:FairValueHedgesMembercurrency:USDifrs-full:LaterThanOneYearAndNotLaterThanFiveYearsMember2024-12-310000891478srt:ParentCompanyMemberifrs-full:InterestRateRiskMemberifrs-full:FairValueHedgesMembercurrency:USDifrs-full:LaterThanFiveYearsMember2024-12-310000891478srt:ParentCompanyMemberifrs-full:InterestRateRiskMemberifrs-full:FairValueHedgesMembercurrency:CZKifrs-full:NotLaterThanOneMonthMember2024-12-310000891478srt:ParentCompanyMemberifrs-full:InterestRateRiskMemberifrs-full:FairValueHedgesMembercurrency:CZKifrs-full:LaterThanOneMonthAndNotLaterThanThreeMonthsMember2024-12-310000891478srt:ParentCompanyMemberifrs-full:InterestRateRiskMemberifrs-full:FairValueHedgesMembercurrency:CZKifrs-full:LaterThanThreeMonthsAndNotLaterThanOneYearMember2024-12-310000891478srt:ParentCompanyMemberifrs-full:InterestRateRiskMemberifrs-full:FairValueHedgesMembercurrency:CZKifrs-full:LaterThanOneYearAndNotLaterThanFiveYearsMember2024-12-310000891478srt:ParentCompanyMemberifrs-full:InterestRateRiskMemberifrs-full:FairValueHedgesMembercurrency:CZKifrs-full:LaterThanFiveYearsMember2024-12-310000891478srt:ParentCompanyMemberifrs-full:InterestRateRiskMemberifrs-full:FairValueHedgesMembercurrency:NOKifrs-full:NotLaterThanOneMonthMember2024-12-310000891478srt:ParentCompanyMemberifrs-full:InterestRateRiskMemberifrs-full:FairValueHedgesMembercurrency:NOKifrs-full:LaterThanOneMonthAndNotLaterThanThreeMonthsMember2024-12-310000891478srt:ParentCompanyMemberifrs-full:InterestRateRiskMemberifrs-full:FairValueHedgesMembercurrency:NOKifrs-full:LaterThanThreeMonthsAndNotLaterThanOneYearMember2024-12-310000891478srt:ParentCompanyMemberifrs-full:InterestRateRiskMemberifrs-full:FairValueHedgesMembercurrency:NOKifrs-full:LaterThanOneYearAndNotLaterThanFiveYearsMember2024-12-310000891478srt:ParentCompanyMemberifrs-full:InterestRateRiskMemberifrs-full:FairValueHedgesMembercurrency:NOKifrs-full:LaterThanFiveYearsMember2024-12-310000891478srt:ParentCompanyMemberifrs-full:InterestRateRiskMemberifrs-full:FairValueHedgesMembercurrency:AUDifrs-full:NotLaterThanOneMonthMember2024-12-310000891478srt:ParentCompanyMemberifrs-full:InterestRateRiskMemberifrs-full:FairValueHedgesMembercurrency:AUDifrs-full:LaterThanOneMonthAndNotLaterThanThreeMonthsMember2024-12-310000891478srt:ParentCompanyMemberifrs-full:InterestRateRiskMemberifrs-full:FairValueHedgesMembercurrency:AUDifrs-full:LaterThanThreeMonthsAndNotLaterThanOneYearMember2024-12-310000891478srt:ParentCompanyMemberifrs-full:InterestRateRiskMemberifrs-full:FairValueHedgesMembercurrency:AUDifrs-full:LaterThanOneYearAndNotLaterThanFiveYearsMember2024-12-310000891478srt:ParentCompanyMemberifrs-full:InterestRateRiskMemberifrs-full:FairValueHedgesMembercurrency:AUDifrs-full:LaterThanFiveYearsMember2024-12-310000891478srt:ParentCompanyMemberifrs-full:InterestRateRiskMemberifrs-full:FairValueHedgesMembercurrency:RONifrs-full:NotLaterThanOneMonthMember2024-12-310000891478srt:ParentCompanyMemberifrs-full:InterestRateRiskMemberifrs-full:FairValueHedgesMembercurrency:RONifrs-full:LaterThanOneMonthAndNotLaterThanThreeMonthsMember2024-12-310000891478srt:ParentCompanyMemberifrs-full:InterestRateRiskMemberifrs-full:FairValueHedgesMembercurrency:RONifrs-full:LaterThanThreeMonthsAndNotLaterThanOneYearMember2024-12-310000891478srt:ParentCompanyMemberifrs-full:InterestRateRiskMemberifrs-full:FairValueHedgesMembercurrency:RONifrs-full:LaterThanOneYearAndNotLaterThanFiveYearsMember2024-12-310000891478srt:ParentCompanyMemberifrs-full:InterestRateRiskMemberifrs-full:FairValueHedgesMembercurrency:RONifrs-full:LaterThanFiveYearsMember2024-12-310000891478srt:ParentCompanyMemberifrs-full:InterestRateRiskMemberifrs-full:FairValueHedgesMembercurrency:HKDifrs-full:NotLaterThanOneMonthMember2024-12-310000891478srt:ParentCompanyMemberifrs-full:InterestRateRiskMemberifrs-full:FairValueHedgesMembercurrency:HKDifrs-full:LaterThanOneMonthAndNotLaterThanThreeMonthsMember2024-12-310000891478srt:ParentCompanyMemberifrs-full:InterestRateRiskMemberifrs-full:FairValueHedgesMembercurrency:HKDifrs-full:LaterThanThreeMonthsAndNotLaterThanOneYearMember2024-12-310000891478srt:ParentCompanyMemberifrs-full:InterestRateRiskMemberifrs-full:FairValueHedgesMembercurrency:HKDifrs-full:LaterThanOneYearAndNotLaterThanFiveYearsMember2024-12-310000891478srt:ParentCompanyMemberifrs-full:InterestRateRiskMemberifrs-full:FairValueHedgesMembercurrency:HKDifrs-full:LaterThanFiveYearsMember2024-12-310000891478srt:ParentCompanyMemberifrs-full:InterestRateRiskMemberifrs-full:FairValueHedgesMembercurrency:NZDifrs-full:NotLaterThanOneMonthMember2024-12-310000891478srt:ParentCompanyMemberifrs-full:InterestRateRiskMemberifrs-full:FairValueHedgesMembercurrency:NZDifrs-full:LaterThanOneMonthAndNotLaterThanThreeMonthsMember2024-12-310000891478srt:ParentCompanyMemberifrs-full:InterestRateRiskMemberifrs-full:FairValueHedgesMembercurrency:NZDifrs-full:LaterThanThreeMonthsAndNotLaterThanOneYearMember2024-12-310000891478srt:ParentCompanyMemberifrs-full:InterestRateRiskMemberifrs-full:FairValueHedgesMembercurrency:NZDifrs-full:LaterThanOneYearAndNotLaterThanFiveYearsMember2024-12-310000891478srt:ParentCompanyMemberifrs-full:InterestRateRiskMemberifrs-full:FairValueHedgesMembercurrency:NZDifrs-full:LaterThanFiveYearsMember2024-12-310000891478srt:ParentCompanyMemberifrs-full:CurrencyRiskMemberifrs-full:NotLaterThanOneMonthMemberifrs-full:FairValueHedgesMember2024-12-310000891478srt:ParentCompanyMemberifrs-full:CurrencyRiskMemberifrs-full:LaterThanOneMonthAndNotLaterThanThreeMonthsMemberifrs-full:FairValueHedgesMember2024-12-310000891478srt:ParentCompanyMemberifrs-full:CurrencyRiskMemberifrs-full:LaterThanThreeMonthsAndNotLaterThanOneYearMemberifrs-full:FairValueHedgesMember2024-12-310000891478srt:ParentCompanyMemberifrs-full:CurrencyRiskMemberifrs-full:LaterThanOneYearAndNotLaterThanFiveYearsMemberifrs-full:FairValueHedgesMember2024-12-310000891478srt:ParentCompanyMemberifrs-full:CurrencyRiskMemberifrs-full:LaterThanFiveYearsMemberifrs-full:FairValueHedgesMember2024-12-310000891478srt:ParentCompanyMemberifrs-full:CurrencyRiskMemberifrs-full:FairValueHedgesMember2024-12-310000891478srt:ParentCompanyMemberifrs-full:CurrencyRiskMemberifrs-full:NotLaterThanOneMonthMemberifrs-full:FairValueHedgesMember2024-01-012024-12-310000891478srt:ParentCompanyMemberifrs-full:CurrencyRiskMemberifrs-full:LaterThanOneMonthAndNotLaterThanThreeMonthsMemberifrs-full:FairValueHedgesMember2024-01-012024-12-310000891478srt:ParentCompanyMemberifrs-full:CurrencyRiskMemberifrs-full:LaterThanThreeMonthsAndNotLaterThanOneYearMemberifrs-full:FairValueHedgesMember2024-01-012024-12-310000891478srt:ParentCompanyMemberifrs-full:CurrencyRiskMemberifrs-full:LaterThanOneYearAndNotLaterThanFiveYearsMemberifrs-full:FairValueHedgesMember2024-01-012024-12-310000891478srt:ParentCompanyMemberifrs-full:CurrencyRiskMemberifrs-full:LaterThanFiveYearsMemberifrs-full:FairValueHedgesMember2024-01-012024-12-310000891478srt:ParentCompanyMembersan:InterestRateAndExchangeRateRiskMemberifrs-full:NotLaterThanOneMonthMemberifrs-full:FairValueHedgesMember2024-12-310000891478srt:ParentCompanyMembersan:InterestRateAndExchangeRateRiskMemberifrs-full:LaterThanOneMonthAndNotLaterThanThreeMonthsMemberifrs-full:FairValueHedgesMember2024-12-310000891478srt:ParentCompanyMembersan:InterestRateAndExchangeRateRiskMemberifrs-full:LaterThanThreeMonthsAndNotLaterThanOneYearMemberifrs-full:FairValueHedgesMember2024-12-310000891478srt:ParentCompanyMembersan:InterestRateAndExchangeRateRiskMemberifrs-full:LaterThanOneYearAndNotLaterThanFiveYearsMemberifrs-full:FairValueHedgesMember2024-12-310000891478srt:ParentCompanyMembersan:InterestRateAndExchangeRateRiskMemberifrs-full:LaterThanFiveYearsMemberifrs-full:FairValueHedgesMember2024-12-310000891478srt:ParentCompanyMembersan:InterestRateAndExchangeRateRiskMemberifrs-full:FairValueHedgesMember2024-12-310000891478srt:ParentCompanyMembersan:InterestRateAndExchangeRateRiskMemberifrs-full:FairValueHedgesMembersan:AustraliaDollarAndEuroMemberifrs-full:NotLaterThanOneMonthMember2024-12-310000891478srt:ParentCompanyMembersan:InterestRateAndExchangeRateRiskMemberifrs-full:FairValueHedgesMembersan:AustraliaDollarAndEuroMemberifrs-full:LaterThanOneMonthAndNotLaterThanThreeMonthsMember2024-12-310000891478srt:ParentCompanyMembersan:InterestRateAndExchangeRateRiskMemberifrs-full:FairValueHedgesMembersan:AustraliaDollarAndEuroMemberifrs-full:LaterThanThreeMonthsAndNotLaterThanOneYearMember2024-12-310000891478srt:ParentCompanyMembersan:InterestRateAndExchangeRateRiskMemberifrs-full:FairValueHedgesMembersan:AustraliaDollarAndEuroMemberifrs-full:LaterThanOneYearAndNotLaterThanFiveYearsMember2024-12-310000891478srt:ParentCompanyMembersan:InterestRateAndExchangeRateRiskMemberifrs-full:FairValueHedgesMembersan:AustraliaDollarAndEuroMemberifrs-full:LaterThanFiveYearsMember2024-12-310000891478srt:ParentCompanyMembersan:InterestRateAndExchangeRateRiskMemberifrs-full:FairValueHedgesMembersan:CzechRepublicKorunyAndEuroMemberifrs-full:NotLaterThanOneMonthMember2024-12-310000891478srt:ParentCompanyMembersan:InterestRateAndExchangeRateRiskMemberifrs-full:FairValueHedgesMembersan:CzechRepublicKorunyAndEuroMemberifrs-full:LaterThanOneMonthAndNotLaterThanThreeMonthsMember2024-12-310000891478srt:ParentCompanyMembersan:InterestRateAndExchangeRateRiskMemberifrs-full:FairValueHedgesMembersan:CzechRepublicKorunyAndEuroMemberifrs-full:LaterThanThreeMonthsAndNotLaterThanOneYearMember2024-12-310000891478srt:ParentCompanyMembersan:InterestRateAndExchangeRateRiskMemberifrs-full:FairValueHedgesMembersan:CzechRepublicKorunyAndEuroMemberifrs-full:LaterThanOneYearAndNotLaterThanFiveYearsMember2024-12-310000891478srt:ParentCompanyMembersan:InterestRateAndExchangeRateRiskMemberifrs-full:FairValueHedgesMembersan:CzechRepublicKorunyAndEuroMemberifrs-full:LaterThanFiveYearsMember2024-12-310000891478srt:ParentCompanyMembersan:InterestRateAndExchangeRateRiskMemberifrs-full:FairValueHedgesMembersan:RomaniaNewLeiAndEuroMemberifrs-full:NotLaterThanOneMonthMember2024-12-310000891478srt:ParentCompanyMembersan:InterestRateAndExchangeRateRiskMemberifrs-full:FairValueHedgesMembersan:RomaniaNewLeiAndEuroMemberifrs-full:LaterThanOneMonthAndNotLaterThanThreeMonthsMember2024-12-310000891478srt:ParentCompanyMembersan:InterestRateAndExchangeRateRiskMemberifrs-full:FairValueHedgesMembersan:RomaniaNewLeiAndEuroMemberifrs-full:LaterThanThreeMonthsAndNotLaterThanOneYearMember2024-12-310000891478srt:ParentCompanyMembersan:InterestRateAndExchangeRateRiskMemberifrs-full:FairValueHedgesMembersan:RomaniaNewLeiAndEuroMemberifrs-full:LaterThanOneYearAndNotLaterThanFiveYearsMember2024-12-310000891478srt:ParentCompanyMembersan:InterestRateAndExchangeRateRiskMemberifrs-full:FairValueHedgesMembersan:RomaniaNewLeiAndEuroMemberifrs-full:LaterThanFiveYearsMember2024-12-310000891478srt:ParentCompanyMembersan:InterestRateAndExchangeRateRiskMemberifrs-full:FairValueHedgesMembersan:HongKongDollarsAndEuroMemberifrs-full:NotLaterThanOneMonthMember2024-12-310000891478srt:ParentCompanyMembersan:InterestRateAndExchangeRateRiskMemberifrs-full:FairValueHedgesMembersan:HongKongDollarsAndEuroMemberifrs-full:LaterThanOneMonthAndNotLaterThanThreeMonthsMember2024-12-310000891478srt:ParentCompanyMembersan:InterestRateAndExchangeRateRiskMemberifrs-full:FairValueHedgesMembersan:HongKongDollarsAndEuroMemberifrs-full:LaterThanThreeMonthsAndNotLaterThanOneYearMember2024-12-310000891478srt:ParentCompanyMembersan:InterestRateAndExchangeRateRiskMemberifrs-full:FairValueHedgesMembersan:HongKongDollarsAndEuroMemberifrs-full:LaterThanOneYearAndNotLaterThanFiveYearsMember2024-12-310000891478srt:ParentCompanyMembersan:InterestRateAndExchangeRateRiskMemberifrs-full:FairValueHedgesMembersan:HongKongDollarsAndEuroMemberifrs-full:LaterThanFiveYearsMember2024-12-310000891478srt:ParentCompanyMembersan:InterestRateAndExchangeRateRiskMemberifrs-full:FairValueHedgesMembersan:JapanYenAndEuroMemberifrs-full:NotLaterThanOneMonthMember2024-12-310000891478srt:ParentCompanyMembersan:InterestRateAndExchangeRateRiskMemberifrs-full:FairValueHedgesMembersan:JapanYenAndEuroMemberifrs-full:LaterThanOneMonthAndNotLaterThanThreeMonthsMember2024-12-310000891478srt:ParentCompanyMembersan:InterestRateAndExchangeRateRiskMemberifrs-full:FairValueHedgesMembersan:JapanYenAndEuroMemberifrs-full:LaterThanThreeMonthsAndNotLaterThanOneYearMember2024-12-310000891478srt:ParentCompanyMembersan:InterestRateAndExchangeRateRiskMemberifrs-full:FairValueHedgesMembersan:JapanYenAndEuroMemberifrs-full:LaterThanOneYearAndNotLaterThanFiveYearsMember2024-12-310000891478srt:ParentCompanyMembersan:InterestRateAndExchangeRateRiskMemberifrs-full:FairValueHedgesMembersan:JapanYenAndEuroMemberifrs-full:LaterThanFiveYearsMember2024-12-310000891478srt:ParentCompanyMembersan:InterestRateAndExchangeRateRiskMemberifrs-full:FairValueHedgesMembersan:NorwayKroneAndEuroMemberifrs-full:NotLaterThanOneMonthMember2024-12-310000891478srt:ParentCompanyMembersan:InterestRateAndExchangeRateRiskMemberifrs-full:FairValueHedgesMembersan:NorwayKroneAndEuroMemberifrs-full:LaterThanOneMonthAndNotLaterThanThreeMonthsMember2024-12-310000891478srt:ParentCompanyMembersan:InterestRateAndExchangeRateRiskMemberifrs-full:FairValueHedgesMembersan:NorwayKroneAndEuroMemberifrs-full:LaterThanThreeMonthsAndNotLaterThanOneYearMember2024-12-310000891478srt:ParentCompanyMembersan:InterestRateAndExchangeRateRiskMemberifrs-full:FairValueHedgesMembersan:NorwayKroneAndEuroMemberifrs-full:LaterThanOneYearAndNotLaterThanFiveYearsMember2024-12-310000891478srt:ParentCompanyMembersan:InterestRateAndExchangeRateRiskMemberifrs-full:FairValueHedgesMembersan:NorwayKroneAndEuroMemberifrs-full:LaterThanFiveYearsMember2024-12-310000891478srt:ParentCompanyMembersan:InterestRateAndExchangeRateRiskMemberifrs-full:FairValueHedgesMembersan:SwitzerlandFrancsAndEuroMemberifrs-full:NotLaterThanOneMonthMember2024-12-310000891478srt:ParentCompanyMembersan:InterestRateAndExchangeRateRiskMemberifrs-full:FairValueHedgesMembersan:SwitzerlandFrancsAndEuroMemberifrs-full:LaterThanOneMonthAndNotLaterThanThreeMonthsMember2024-12-310000891478srt:ParentCompanyMembersan:InterestRateAndExchangeRateRiskMemberifrs-full:FairValueHedgesMembersan:SwitzerlandFrancsAndEuroMemberifrs-full:LaterThanThreeMonthsAndNotLaterThanOneYearMember2024-12-310000891478srt:ParentCompanyMembersan:InterestRateAndExchangeRateRiskMemberifrs-full:FairValueHedgesMembersan:SwitzerlandFrancsAndEuroMemberifrs-full:LaterThanOneYearAndNotLaterThanFiveYearsMember2024-12-310000891478srt:ParentCompanyMembersan:InterestRateAndExchangeRateRiskMemberifrs-full:FairValueHedgesMembersan:SwitzerlandFrancsAndEuroMemberifrs-full:LaterThanFiveYearsMember2024-12-310000891478srt:ParentCompanyMembersan:InterestRateAndExchangeRateRiskMemberifrs-full:FairValueHedgesMembersan:UnitedStatesDollarAndColombiaPesoMemberifrs-full:NotLaterThanOneMonthMember2024-12-310000891478srt:ParentCompanyMembersan:InterestRateAndExchangeRateRiskMemberifrs-full:FairValueHedgesMembersan:UnitedStatesDollarAndColombiaPesoMemberifrs-full:LaterThanOneMonthAndNotLaterThanThreeMonthsMember2024-12-310000891478srt:ParentCompanyMembersan:InterestRateAndExchangeRateRiskMemberifrs-full:FairValueHedgesMembersan:UnitedStatesDollarAndColombiaPesoMemberifrs-full:LaterThanThreeMonthsAndNotLaterThanOneYearMember2024-12-310000891478srt:ParentCompanyMembersan:InterestRateAndExchangeRateRiskMemberifrs-full:FairValueHedgesMembersan:UnitedStatesDollarAndColombiaPesoMemberifrs-full:LaterThanOneYearAndNotLaterThanFiveYearsMember2024-12-310000891478srt:ParentCompanyMembersan:InterestRateAndExchangeRateRiskMemberifrs-full:FairValueHedgesMembersan:UnitedStatesDollarAndColombiaPesoMemberifrs-full:LaterThanFiveYearsMember2024-12-310000891478srt:ParentCompanyMembersan:InterestRateAndExchangeRateRiskMemberifrs-full:FairValueHedgesMembersan:EuroAndPoundSterlingMemberifrs-full:NotLaterThanOneMonthMember2024-12-310000891478srt:ParentCompanyMembersan:InterestRateAndExchangeRateRiskMemberifrs-full:FairValueHedgesMembersan:EuroAndPoundSterlingMemberifrs-full:LaterThanOneMonthAndNotLaterThanThreeMonthsMember2024-12-310000891478srt:ParentCompanyMembersan:InterestRateAndExchangeRateRiskMemberifrs-full:FairValueHedgesMembersan:EuroAndPoundSterlingMemberifrs-full:LaterThanThreeMonthsAndNotLaterThanOneYearMember2024-12-310000891478srt:ParentCompanyMembersan:InterestRateAndExchangeRateRiskMemberifrs-full:FairValueHedgesMembersan:EuroAndPoundSterlingMemberifrs-full:LaterThanOneYearAndNotLaterThanFiveYearsMember2024-12-310000891478srt:ParentCompanyMembersan:InterestRateAndExchangeRateRiskMemberifrs-full:FairValueHedgesMembersan:EuroAndPoundSterlingMemberifrs-full:LaterThanFiveYearsMember2024-12-310000891478srt:ParentCompanyMembersan:InterestRateAndExchangeRateRiskMemberifrs-full:FairValueHedgesMembersan:UnitedStatesDollarAndMexicanPesoMemberifrs-full:NotLaterThanOneMonthMember2024-12-310000891478srt:ParentCompanyMembersan:InterestRateAndExchangeRateRiskMemberifrs-full:FairValueHedgesMembersan:UnitedStatesDollarAndMexicanPesoMemberifrs-full:LaterThanOneMonthAndNotLaterThanThreeMonthsMember2024-12-310000891478srt:ParentCompanyMembersan:InterestRateAndExchangeRateRiskMemberifrs-full:FairValueHedgesMembersan:UnitedStatesDollarAndMexicanPesoMemberifrs-full:LaterThanThreeMonthsAndNotLaterThanOneYearMember2024-12-310000891478srt:ParentCompanyMembersan:InterestRateAndExchangeRateRiskMemberifrs-full:FairValueHedgesMembersan:UnitedStatesDollarAndMexicanPesoMemberifrs-full:LaterThanOneYearAndNotLaterThanFiveYearsMember2024-12-310000891478srt:ParentCompanyMembersan:InterestRateAndExchangeRateRiskMemberifrs-full:FairValueHedgesMembersan:UnitedStatesDollarAndMexicanPesoMemberifrs-full:LaterThanFiveYearsMember2024-12-310000891478srt:ParentCompanyMembersan:InterestRateAndExchangeRateRiskMemberifrs-full:NotLaterThanOneMonthMemberifrs-full:FairValueHedgesMember2024-01-012024-12-310000891478srt:ParentCompanyMembersan:InterestRateAndExchangeRateRiskMemberifrs-full:LaterThanOneMonthAndNotLaterThanThreeMonthsMemberifrs-full:FairValueHedgesMember2024-01-012024-12-310000891478srt:ParentCompanyMembersan:InterestRateAndExchangeRateRiskMemberifrs-full:LaterThanThreeMonthsAndNotLaterThanOneYearMemberifrs-full:FairValueHedgesMember2024-01-012024-12-310000891478srt:ParentCompanyMembersan:InterestRateAndExchangeRateRiskMemberifrs-full:LaterThanOneYearAndNotLaterThanFiveYearsMemberifrs-full:FairValueHedgesMember2024-01-012024-12-310000891478srt:ParentCompanyMembersan:InterestRateAndExchangeRateRiskMemberifrs-full:LaterThanFiveYearsMemberifrs-full:FairValueHedgesMember2024-01-012024-12-310000891478srt:ParentCompanyMembersan:BasisRiskMemberifrs-full:NotLaterThanOneMonthMemberifrs-full:FairValueHedgesMember2024-12-310000891478srt:ParentCompanyMembersan:BasisRiskMemberifrs-full:LaterThanOneMonthAndNotLaterThanThreeMonthsMemberifrs-full:FairValueHedgesMember2024-12-310000891478srt:ParentCompanyMembersan:BasisRiskMemberifrs-full:LaterThanThreeMonthsAndNotLaterThanOneYearMemberifrs-full:FairValueHedgesMember2024-12-310000891478srt:ParentCompanyMembersan:BasisRiskMemberifrs-full:LaterThanOneYearAndNotLaterThanFiveYearsMemberifrs-full:FairValueHedgesMember2024-12-310000891478srt:ParentCompanyMembersan:BasisRiskMemberifrs-full:LaterThanFiveYearsMemberifrs-full:FairValueHedgesMember2024-12-310000891478srt:ParentCompanyMembersan:BasisRiskMemberifrs-full:FairValueHedgesMember2024-12-310000891478srt:ParentCompanyMembersan:InterestRateAndExchangeRateRiskMemberifrs-full:NotLaterThanOneMonthMemberifrs-full:CashFlowHedgesMember2024-12-310000891478srt:ParentCompanyMembersan:InterestRateAndExchangeRateRiskMemberifrs-full:LaterThanOneMonthAndNotLaterThanThreeMonthsMemberifrs-full:CashFlowHedgesMember2024-12-310000891478srt:ParentCompanyMembersan:InterestRateAndExchangeRateRiskMemberifrs-full:LaterThanThreeMonthsAndNotLaterThanOneYearMemberifrs-full:CashFlowHedgesMember2024-12-310000891478srt:ParentCompanyMembersan:InterestRateAndExchangeRateRiskMemberifrs-full:LaterThanOneYearAndNotLaterThanFiveYearsMemberifrs-full:CashFlowHedgesMember2024-12-310000891478srt:ParentCompanyMembersan:InterestRateAndExchangeRateRiskMemberifrs-full:LaterThanFiveYearsMemberifrs-full:CashFlowHedgesMember2024-12-310000891478srt:ParentCompanyMembersan:InterestRateAndExchangeRateRiskMemberifrs-full:CashFlowHedgesMember2024-12-310000891478srt:ParentCompanyMembersan:InterestRateAndExchangeRateRiskMemberifrs-full:CashFlowHedgesMembersan:AustralianDollarAndEuroMemberifrs-full:NotLaterThanOneMonthMember2024-12-310000891478srt:ParentCompanyMembersan:InterestRateAndExchangeRateRiskMemberifrs-full:CashFlowHedgesMembersan:AustralianDollarAndEuroMemberifrs-full:LaterThanOneMonthAndNotLaterThanThreeMonthsMember2024-12-310000891478srt:ParentCompanyMembersan:InterestRateAndExchangeRateRiskMemberifrs-full:CashFlowHedgesMembersan:AustralianDollarAndEuroMemberifrs-full:LaterThanThreeMonthsAndNotLaterThanOneYearMember2024-12-310000891478srt:ParentCompanyMembersan:InterestRateAndExchangeRateRiskMemberifrs-full:CashFlowHedgesMembersan:AustralianDollarAndEuroMemberifrs-full:LaterThanOneYearAndNotLaterThanFiveYearsMember2024-12-310000891478srt:ParentCompanyMembersan:InterestRateAndExchangeRateRiskMemberifrs-full:CashFlowHedgesMembersan:AustralianDollarAndEuroMemberifrs-full:LaterThanFiveYearsMember2024-12-310000891478srt:ParentCompanyMembersan:InterestRateAndExchangeRateRiskMemberifrs-full:CashFlowHedgesMembersan:SwitzerlandFrancsAndEuroMemberifrs-full:NotLaterThanOneMonthMember2024-12-310000891478srt:ParentCompanyMembersan:InterestRateAndExchangeRateRiskMemberifrs-full:CashFlowHedgesMembersan:SwitzerlandFrancsAndEuroMemberifrs-full:LaterThanOneMonthAndNotLaterThanThreeMonthsMember2024-12-310000891478srt:ParentCompanyMembersan:InterestRateAndExchangeRateRiskMemberifrs-full:CashFlowHedgesMembersan:SwitzerlandFrancsAndEuroMemberifrs-full:LaterThanThreeMonthsAndNotLaterThanOneYearMember2024-12-310000891478srt:ParentCompanyMembersan:InterestRateAndExchangeRateRiskMemberifrs-full:CashFlowHedgesMembersan:SwitzerlandFrancsAndEuroMemberifrs-full:LaterThanOneYearAndNotLaterThanFiveYearsMember2024-12-310000891478srt:ParentCompanyMembersan:InterestRateAndExchangeRateRiskMemberifrs-full:CashFlowHedgesMembersan:SwitzerlandFrancsAndEuroMemberifrs-full:LaterThanFiveYearsMember2024-12-310000891478srt:ParentCompanyMembersan:InterestRateAndExchangeRateRiskMemberifrs-full:NotLaterThanOneMonthMemberifrs-full:CashFlowHedgesMember2024-01-012024-12-310000891478srt:ParentCompanyMembersan:InterestRateAndExchangeRateRiskMemberifrs-full:LaterThanOneMonthAndNotLaterThanThreeMonthsMemberifrs-full:CashFlowHedgesMember2024-01-012024-12-310000891478srt:ParentCompanyMembersan:InterestRateAndExchangeRateRiskMemberifrs-full:LaterThanThreeMonthsAndNotLaterThanOneYearMemberifrs-full:CashFlowHedgesMember2024-01-012024-12-310000891478srt:ParentCompanyMembersan:InterestRateAndExchangeRateRiskMemberifrs-full:LaterThanOneYearAndNotLaterThanFiveYearsMemberifrs-full:CashFlowHedgesMember2024-01-012024-12-310000891478srt:ParentCompanyMembersan:InterestRateAndExchangeRateRiskMemberifrs-full:LaterThanFiveYearsMemberifrs-full:CashFlowHedgesMember2024-01-012024-12-310000891478srt:ParentCompanyMemberifrs-full:InterestRateRiskMemberifrs-full:NotLaterThanOneMonthMemberifrs-full:CashFlowHedgesMember2024-12-310000891478srt:ParentCompanyMemberifrs-full:InterestRateRiskMemberifrs-full:LaterThanOneMonthAndNotLaterThanThreeMonthsMemberifrs-full:CashFlowHedgesMember2024-12-310000891478srt:ParentCompanyMemberifrs-full:InterestRateRiskMemberifrs-full:LaterThanThreeMonthsAndNotLaterThanOneYearMemberifrs-full:CashFlowHedgesMember2024-12-310000891478srt:ParentCompanyMemberifrs-full:InterestRateRiskMemberifrs-full:LaterThanOneYearAndNotLaterThanFiveYearsMemberifrs-full:CashFlowHedgesMember2024-12-310000891478srt:ParentCompanyMemberifrs-full:InterestRateRiskMemberifrs-full:LaterThanFiveYearsMemberifrs-full:CashFlowHedgesMember2024-12-310000891478srt:ParentCompanyMemberifrs-full:InterestRateRiskMemberifrs-full:CashFlowHedgesMember2024-12-310000891478srt:ParentCompanyMemberifrs-full:InterestRateRiskMemberifrs-full:CashFlowHedgesMembercurrency:EURifrs-full:NotLaterThanOneMonthMember2024-12-310000891478srt:ParentCompanyMemberifrs-full:InterestRateRiskMemberifrs-full:CashFlowHedgesMembercurrency:EURifrs-full:LaterThanOneMonthAndNotLaterThanThreeMonthsMember2024-12-310000891478srt:ParentCompanyMemberifrs-full:InterestRateRiskMemberifrs-full:CashFlowHedgesMembercurrency:EURifrs-full:LaterThanThreeMonthsAndNotLaterThanOneYearMember2024-12-310000891478srt:ParentCompanyMemberifrs-full:InterestRateRiskMemberifrs-full:CashFlowHedgesMembercurrency:EURifrs-full:LaterThanOneYearAndNotLaterThanFiveYearsMember2024-12-310000891478srt:ParentCompanyMemberifrs-full:InterestRateRiskMemberifrs-full:CashFlowHedgesMembercurrency:EURifrs-full:LaterThanFiveYearsMember2024-12-310000891478srt:ParentCompanyMemberifrs-full:CurrencyRiskMemberifrs-full:NotLaterThanOneMonthMemberifrs-full:CashFlowHedgesMember2024-12-310000891478srt:ParentCompanyMemberifrs-full:CurrencyRiskMemberifrs-full:LaterThanOneMonthAndNotLaterThanThreeMonthsMemberifrs-full:CashFlowHedgesMember2024-12-310000891478srt:ParentCompanyMemberifrs-full:CurrencyRiskMemberifrs-full:LaterThanThreeMonthsAndNotLaterThanOneYearMemberifrs-full:CashFlowHedgesMember2024-12-310000891478srt:ParentCompanyMemberifrs-full:CurrencyRiskMemberifrs-full:LaterThanOneYearAndNotLaterThanFiveYearsMemberifrs-full:CashFlowHedgesMember2024-12-310000891478srt:ParentCompanyMemberifrs-full:CurrencyRiskMemberifrs-full:LaterThanFiveYearsMemberifrs-full:CashFlowHedgesMember2024-12-310000891478srt:ParentCompanyMemberifrs-full:CurrencyRiskMemberifrs-full:CashFlowHedgesMember2024-12-310000891478srt:ParentCompanyMemberifrs-full:CurrencyRiskMemberifrs-full:NotLaterThanOneMonthMemberifrs-full:CashFlowHedgesMember2024-01-012024-12-310000891478srt:ParentCompanyMemberifrs-full:CurrencyRiskMemberifrs-full:LaterThanOneMonthAndNotLaterThanThreeMonthsMemberifrs-full:CashFlowHedgesMember2024-01-012024-12-310000891478srt:ParentCompanyMemberifrs-full:CurrencyRiskMemberifrs-full:LaterThanThreeMonthsAndNotLaterThanOneYearMemberifrs-full:CashFlowHedgesMember2024-01-012024-12-310000891478srt:ParentCompanyMemberifrs-full:CurrencyRiskMemberifrs-full:LaterThanOneYearAndNotLaterThanFiveYearsMemberifrs-full:CashFlowHedgesMember2024-01-012024-12-310000891478srt:ParentCompanyMemberifrs-full:CurrencyRiskMemberifrs-full:LaterThanFiveYearsMemberifrs-full:CashFlowHedgesMember2024-01-012024-12-310000891478srt:ParentCompanyMemberifrs-full:CurrencyRiskMemberifrs-full:NotLaterThanOneMonthMemberifrs-full:HedgesOfNetInvestmentInForeignOperationsMember2024-12-310000891478srt:ParentCompanyMemberifrs-full:CurrencyRiskMemberifrs-full:LaterThanOneMonthAndNotLaterThanThreeMonthsMemberifrs-full:HedgesOfNetInvestmentInForeignOperationsMember2024-12-310000891478srt:ParentCompanyMemberifrs-full:CurrencyRiskMemberifrs-full:LaterThanThreeMonthsAndNotLaterThanOneYearMemberifrs-full:HedgesOfNetInvestmentInForeignOperationsMember2024-12-310000891478srt:ParentCompanyMemberifrs-full:CurrencyRiskMemberifrs-full:LaterThanOneYearAndNotLaterThanFiveYearsMemberifrs-full:HedgesOfNetInvestmentInForeignOperationsMember2024-12-310000891478srt:ParentCompanyMemberifrs-full:CurrencyRiskMemberifrs-full:LaterThanFiveYearsMemberifrs-full:HedgesOfNetInvestmentInForeignOperationsMember2024-12-310000891478srt:ParentCompanyMemberifrs-full:CurrencyRiskMemberifrs-full:HedgesOfNetInvestmentInForeignOperationsMember2024-12-310000891478srt:ParentCompanyMemberifrs-full:CurrencyRiskMemberifrs-full:NotLaterThanOneMonthMemberifrs-full:HedgesOfNetInvestmentInForeignOperationsMember2024-01-012024-12-310000891478srt:ParentCompanyMemberifrs-full:CurrencyRiskMemberifrs-full:LaterThanOneMonthAndNotLaterThanThreeMonthsMemberifrs-full:HedgesOfNetInvestmentInForeignOperationsMember2024-01-012024-12-310000891478srt:ParentCompanyMemberifrs-full:CurrencyRiskMemberifrs-full:LaterThanThreeMonthsAndNotLaterThanOneYearMemberifrs-full:HedgesOfNetInvestmentInForeignOperationsMember2024-01-012024-12-310000891478srt:ParentCompanyMemberifrs-full:CurrencyRiskMemberifrs-full:LaterThanOneYearAndNotLaterThanFiveYearsMemberifrs-full:HedgesOfNetInvestmentInForeignOperationsMember2024-01-012024-12-310000891478srt:ParentCompanyMemberifrs-full:CurrencyRiskMemberifrs-full:LaterThanFiveYearsMemberifrs-full:HedgesOfNetInvestmentInForeignOperationsMember2024-01-012024-12-310000891478srt:ParentCompanyMemberifrs-full:InterestRateRiskMemberifrs-full:NotLaterThanOneMonthMemberifrs-full:FairValueHedgesMember2023-12-310000891478srt:ParentCompanyMemberifrs-full:InterestRateRiskMemberifrs-full:LaterThanOneMonthAndNotLaterThanThreeMonthsMemberifrs-full:FairValueHedgesMember2023-12-310000891478srt:ParentCompanyMemberifrs-full:InterestRateRiskMemberifrs-full:LaterThanThreeMonthsAndNotLaterThanOneYearMemberifrs-full:FairValueHedgesMember2023-12-310000891478srt:ParentCompanyMemberifrs-full:InterestRateRiskMemberifrs-full:LaterThanOneYearAndNotLaterThanFiveYearsMemberifrs-full:FairValueHedgesMember2023-12-310000891478srt:ParentCompanyMemberifrs-full:InterestRateRiskMemberifrs-full:LaterThanFiveYearsMemberifrs-full:FairValueHedgesMember2023-12-310000891478srt:ParentCompanyMemberifrs-full:InterestRateRiskMemberifrs-full:FairValueHedgesMember2023-12-310000891478srt:ParentCompanyMemberifrs-full:InterestRateRiskMemberifrs-full:FairValueHedgesMembercurrency:GBPifrs-full:NotLaterThanOneMonthMember2023-12-310000891478srt:ParentCompanyMemberifrs-full:InterestRateRiskMemberifrs-full:FairValueHedgesMembercurrency:GBPifrs-full:LaterThanOneMonthAndNotLaterThanThreeMonthsMember2023-12-310000891478srt:ParentCompanyMemberifrs-full:InterestRateRiskMemberifrs-full:FairValueHedgesMembercurrency:GBPifrs-full:LaterThanThreeMonthsAndNotLaterThanOneYearMember2023-12-310000891478srt:ParentCompanyMemberifrs-full:InterestRateRiskMemberifrs-full:FairValueHedgesMembercurrency:GBPifrs-full:LaterThanOneYearAndNotLaterThanFiveYearsMember2023-12-310000891478srt:ParentCompanyMemberifrs-full:InterestRateRiskMemberifrs-full:FairValueHedgesMembercurrency:GBPifrs-full:LaterThanFiveYearsMember2023-12-310000891478srt:ParentCompanyMemberifrs-full:InterestRateRiskMemberifrs-full:FairValueHedgesMembercurrency:EURifrs-full:NotLaterThanOneMonthMember2023-12-310000891478srt:ParentCompanyMemberifrs-full:InterestRateRiskMemberifrs-full:FairValueHedgesMembercurrency:EURifrs-full:LaterThanOneMonthAndNotLaterThanThreeMonthsMember2023-12-310000891478srt:ParentCompanyMemberifrs-full:InterestRateRiskMemberifrs-full:FairValueHedgesMembercurrency:EURifrs-full:LaterThanThreeMonthsAndNotLaterThanOneYearMember2023-12-310000891478srt:ParentCompanyMemberifrs-full:InterestRateRiskMemberifrs-full:FairValueHedgesMembercurrency:EURifrs-full:LaterThanOneYearAndNotLaterThanFiveYearsMember2023-12-310000891478srt:ParentCompanyMemberifrs-full:InterestRateRiskMemberifrs-full:FairValueHedgesMembercurrency:EURifrs-full:LaterThanFiveYearsMember2023-12-310000891478srt:ParentCompanyMemberifrs-full:InterestRateRiskMemberifrs-full:FairValueHedgesMembercurrency:CHFifrs-full:NotLaterThanOneMonthMember2023-12-310000891478srt:ParentCompanyMemberifrs-full:InterestRateRiskMemberifrs-full:FairValueHedgesMembercurrency:CHFifrs-full:LaterThanOneMonthAndNotLaterThanThreeMonthsMember2023-12-310000891478srt:ParentCompanyMemberifrs-full:InterestRateRiskMemberifrs-full:FairValueHedgesMembercurrency:CHFifrs-full:LaterThanThreeMonthsAndNotLaterThanOneYearMember2023-12-310000891478srt:ParentCompanyMemberifrs-full:InterestRateRiskMemberifrs-full:FairValueHedgesMembercurrency:CHFifrs-full:LaterThanOneYearAndNotLaterThanFiveYearsMember2023-12-310000891478srt:ParentCompanyMemberifrs-full:InterestRateRiskMemberifrs-full:FairValueHedgesMembercurrency:CHFifrs-full:LaterThanFiveYearsMember2023-12-310000891478srt:ParentCompanyMemberifrs-full:InterestRateRiskMemberifrs-full:FairValueHedgesMembercurrency:USDifrs-full:NotLaterThanOneMonthMember2023-12-310000891478srt:ParentCompanyMemberifrs-full:InterestRateRiskMemberifrs-full:FairValueHedgesMembercurrency:USDifrs-full:LaterThanOneMonthAndNotLaterThanThreeMonthsMember2023-12-310000891478srt:ParentCompanyMemberifrs-full:InterestRateRiskMemberifrs-full:FairValueHedgesMembercurrency:USDifrs-full:LaterThanThreeMonthsAndNotLaterThanOneYearMember2023-12-310000891478srt:ParentCompanyMemberifrs-full:InterestRateRiskMemberifrs-full:FairValueHedgesMembercurrency:USDifrs-full:LaterThanOneYearAndNotLaterThanFiveYearsMember2023-12-310000891478srt:ParentCompanyMemberifrs-full:InterestRateRiskMemberifrs-full:FairValueHedgesMembercurrency:USDifrs-full:LaterThanFiveYearsMember2023-12-310000891478srt:ParentCompanyMemberifrs-full:CurrencyRiskMemberifrs-full:NotLaterThanOneMonthMemberifrs-full:FairValueHedgesMember2023-12-310000891478srt:ParentCompanyMemberifrs-full:CurrencyRiskMemberifrs-full:LaterThanOneMonthAndNotLaterThanThreeMonthsMemberifrs-full:FairValueHedgesMember2023-12-310000891478srt:ParentCompanyMemberifrs-full:CurrencyRiskMemberifrs-full:LaterThanThreeMonthsAndNotLaterThanOneYearMemberifrs-full:FairValueHedgesMember2023-12-310000891478srt:ParentCompanyMemberifrs-full:CurrencyRiskMemberifrs-full:LaterThanOneYearAndNotLaterThanFiveYearsMemberifrs-full:FairValueHedgesMember2023-12-310000891478srt:ParentCompanyMemberifrs-full:CurrencyRiskMemberifrs-full:LaterThanFiveYearsMemberifrs-full:FairValueHedgesMember2023-12-310000891478srt:ParentCompanyMemberifrs-full:CurrencyRiskMemberifrs-full:FairValueHedgesMember2023-12-310000891478srt:ParentCompanyMemberifrs-full:CurrencyRiskMemberifrs-full:NotLaterThanOneMonthMemberifrs-full:FairValueHedgesMember2023-01-012023-12-310000891478srt:ParentCompanyMemberifrs-full:CurrencyRiskMemberifrs-full:LaterThanOneMonthAndNotLaterThanThreeMonthsMemberifrs-full:FairValueHedgesMember2023-01-012023-12-310000891478srt:ParentCompanyMemberifrs-full:CurrencyRiskMemberifrs-full:LaterThanThreeMonthsAndNotLaterThanOneYearMemberifrs-full:FairValueHedgesMember2023-01-012023-12-310000891478srt:ParentCompanyMemberifrs-full:CurrencyRiskMemberifrs-full:LaterThanOneYearAndNotLaterThanFiveYearsMemberifrs-full:FairValueHedgesMember2023-01-012023-12-310000891478srt:ParentCompanyMemberifrs-full:CurrencyRiskMemberifrs-full:LaterThanFiveYearsMemberifrs-full:FairValueHedgesMember2023-01-012023-12-310000891478srt:ParentCompanyMembersan:InterestRateAndExchangeRateRiskMemberifrs-full:NotLaterThanOneMonthMemberifrs-full:FairValueHedgesMember2023-12-310000891478srt:ParentCompanyMembersan:InterestRateAndExchangeRateRiskMemberifrs-full:LaterThanOneMonthAndNotLaterThanThreeMonthsMemberifrs-full:FairValueHedgesMember2023-12-310000891478srt:ParentCompanyMembersan:InterestRateAndExchangeRateRiskMemberifrs-full:LaterThanThreeMonthsAndNotLaterThanOneYearMemberifrs-full:FairValueHedgesMember2023-12-310000891478srt:ParentCompanyMembersan:InterestRateAndExchangeRateRiskMemberifrs-full:LaterThanOneYearAndNotLaterThanFiveYearsMemberifrs-full:FairValueHedgesMember2023-12-310000891478srt:ParentCompanyMembersan:InterestRateAndExchangeRateRiskMemberifrs-full:LaterThanFiveYearsMemberifrs-full:FairValueHedgesMember2023-12-310000891478srt:ParentCompanyMembersan:InterestRateAndExchangeRateRiskMemberifrs-full:FairValueHedgesMember2023-12-310000891478srt:ParentCompanyMembersan:InterestRateAndExchangeRateRiskMemberifrs-full:FairValueHedgesMembersan:AustraliaDollarAndEuroMemberifrs-full:NotLaterThanOneMonthMember2023-12-310000891478srt:ParentCompanyMembersan:InterestRateAndExchangeRateRiskMemberifrs-full:FairValueHedgesMembersan:AustraliaDollarAndEuroMemberifrs-full:LaterThanOneMonthAndNotLaterThanThreeMonthsMember2023-12-310000891478srt:ParentCompanyMembersan:InterestRateAndExchangeRateRiskMemberifrs-full:FairValueHedgesMembersan:AustraliaDollarAndEuroMemberifrs-full:LaterThanThreeMonthsAndNotLaterThanOneYearMember2023-12-310000891478srt:ParentCompanyMembersan:InterestRateAndExchangeRateRiskMemberifrs-full:FairValueHedgesMembersan:AustraliaDollarAndEuroMemberifrs-full:LaterThanOneYearAndNotLaterThanFiveYearsMember2023-12-310000891478srt:ParentCompanyMembersan:InterestRateAndExchangeRateRiskMemberifrs-full:FairValueHedgesMembersan:AustraliaDollarAndEuroMemberifrs-full:LaterThanFiveYearsMember2023-12-310000891478srt:ParentCompanyMembersan:InterestRateAndExchangeRateRiskMemberifrs-full:FairValueHedgesMembersan:CzechRepublicKorunyAndEuroMemberifrs-full:NotLaterThanOneMonthMember2023-12-310000891478srt:ParentCompanyMembersan:InterestRateAndExchangeRateRiskMemberifrs-full:FairValueHedgesMembersan:CzechRepublicKorunyAndEuroMemberifrs-full:LaterThanOneMonthAndNotLaterThanThreeMonthsMember2023-12-310000891478srt:ParentCompanyMembersan:InterestRateAndExchangeRateRiskMemberifrs-full:FairValueHedgesMembersan:CzechRepublicKorunyAndEuroMemberifrs-full:LaterThanThreeMonthsAndNotLaterThanOneYearMember2023-12-310000891478srt:ParentCompanyMembersan:InterestRateAndExchangeRateRiskMemberifrs-full:FairValueHedgesMembersan:CzechRepublicKorunyAndEuroMemberifrs-full:LaterThanOneYearAndNotLaterThanFiveYearsMember2023-12-310000891478srt:ParentCompanyMembersan:InterestRateAndExchangeRateRiskMemberifrs-full:FairValueHedgesMembersan:CzechRepublicKorunyAndEuroMemberifrs-full:LaterThanFiveYearsMember2023-12-310000891478srt:ParentCompanyMembersan:InterestRateAndExchangeRateRiskMemberifrs-full:FairValueHedgesMembersan:RomaniaNewLeiAndEuroMemberifrs-full:NotLaterThanOneMonthMember2023-12-310000891478srt:ParentCompanyMembersan:InterestRateAndExchangeRateRiskMemberifrs-full:FairValueHedgesMembersan:RomaniaNewLeiAndEuroMemberifrs-full:LaterThanOneMonthAndNotLaterThanThreeMonthsMember2023-12-310000891478srt:ParentCompanyMembersan:InterestRateAndExchangeRateRiskMemberifrs-full:FairValueHedgesMembersan:RomaniaNewLeiAndEuroMemberifrs-full:LaterThanThreeMonthsAndNotLaterThanOneYearMember2023-12-310000891478srt:ParentCompanyMembersan:InterestRateAndExchangeRateRiskMemberifrs-full:FairValueHedgesMembersan:RomaniaNewLeiAndEuroMemberifrs-full:LaterThanOneYearAndNotLaterThanFiveYearsMember2023-12-310000891478srt:ParentCompanyMembersan:InterestRateAndExchangeRateRiskMemberifrs-full:FairValueHedgesMembersan:RomaniaNewLeiAndEuroMemberifrs-full:LaterThanFiveYearsMember2023-12-310000891478srt:ParentCompanyMembersan:InterestRateAndExchangeRateRiskMemberifrs-full:FairValueHedgesMembersan:HongKongDollarsAndEuroMemberifrs-full:NotLaterThanOneMonthMember2023-12-310000891478srt:ParentCompanyMembersan:InterestRateAndExchangeRateRiskMemberifrs-full:FairValueHedgesMembersan:HongKongDollarsAndEuroMemberifrs-full:LaterThanOneMonthAndNotLaterThanThreeMonthsMember2023-12-310000891478srt:ParentCompanyMembersan:InterestRateAndExchangeRateRiskMemberifrs-full:FairValueHedgesMembersan:HongKongDollarsAndEuroMemberifrs-full:LaterThanThreeMonthsAndNotLaterThanOneYearMember2023-12-310000891478srt:ParentCompanyMembersan:InterestRateAndExchangeRateRiskMemberifrs-full:FairValueHedgesMembersan:HongKongDollarsAndEuroMemberifrs-full:LaterThanOneYearAndNotLaterThanFiveYearsMember2023-12-310000891478srt:ParentCompanyMembersan:InterestRateAndExchangeRateRiskMemberifrs-full:FairValueHedgesMembersan:HongKongDollarsAndEuroMemberifrs-full:LaterThanFiveYearsMember2023-12-310000891478srt:ParentCompanyMembersan:InterestRateAndExchangeRateRiskMemberifrs-full:FairValueHedgesMembersan:JapanYenAndEuroMemberifrs-full:NotLaterThanOneMonthMember2023-12-310000891478srt:ParentCompanyMembersan:InterestRateAndExchangeRateRiskMemberifrs-full:FairValueHedgesMembersan:JapanYenAndEuroMemberifrs-full:LaterThanOneMonthAndNotLaterThanThreeMonthsMember2023-12-310000891478srt:ParentCompanyMembersan:InterestRateAndExchangeRateRiskMemberifrs-full:FairValueHedgesMembersan:JapanYenAndEuroMemberifrs-full:LaterThanThreeMonthsAndNotLaterThanOneYearMember2023-12-310000891478srt:ParentCompanyMembersan:InterestRateAndExchangeRateRiskMemberifrs-full:FairValueHedgesMembersan:JapanYenAndEuroMemberifrs-full:LaterThanOneYearAndNotLaterThanFiveYearsMember2023-12-310000891478srt:ParentCompanyMembersan:InterestRateAndExchangeRateRiskMemberifrs-full:FairValueHedgesMembersan:JapanYenAndEuroMemberifrs-full:LaterThanFiveYearsMember2023-12-310000891478srt:ParentCompanyMembersan:InterestRateAndExchangeRateRiskMemberifrs-full:FairValueHedgesMembersan:NorwayKroneAndEuroMemberifrs-full:NotLaterThanOneMonthMember2023-12-310000891478srt:ParentCompanyMembersan:InterestRateAndExchangeRateRiskMemberifrs-full:FairValueHedgesMembersan:NorwayKroneAndEuroMemberifrs-full:LaterThanOneMonthAndNotLaterThanThreeMonthsMember2023-12-310000891478srt:ParentCompanyMembersan:InterestRateAndExchangeRateRiskMemberifrs-full:FairValueHedgesMembersan:NorwayKroneAndEuroMemberifrs-full:LaterThanThreeMonthsAndNotLaterThanOneYearMember2023-12-310000891478srt:ParentCompanyMembersan:InterestRateAndExchangeRateRiskMemberifrs-full:FairValueHedgesMembersan:NorwayKroneAndEuroMemberifrs-full:LaterThanOneYearAndNotLaterThanFiveYearsMember2023-12-310000891478srt:ParentCompanyMembersan:InterestRateAndExchangeRateRiskMemberifrs-full:FairValueHedgesMembersan:NorwayKroneAndEuroMemberifrs-full:LaterThanFiveYearsMember2023-12-310000891478srt:ParentCompanyMembersan:InterestRateAndExchangeRateRiskMemberifrs-full:FairValueHedgesMembersan:SwitzerlandFrancsAndEuroMemberifrs-full:NotLaterThanOneMonthMember2023-12-310000891478srt:ParentCompanyMembersan:InterestRateAndExchangeRateRiskMemberifrs-full:FairValueHedgesMembersan:SwitzerlandFrancsAndEuroMemberifrs-full:LaterThanOneMonthAndNotLaterThanThreeMonthsMember2023-12-310000891478srt:ParentCompanyMembersan:InterestRateAndExchangeRateRiskMemberifrs-full:FairValueHedgesMembersan:SwitzerlandFrancsAndEuroMemberifrs-full:LaterThanThreeMonthsAndNotLaterThanOneYearMember2023-12-310000891478srt:ParentCompanyMembersan:InterestRateAndExchangeRateRiskMemberifrs-full:FairValueHedgesMembersan:SwitzerlandFrancsAndEuroMemberifrs-full:LaterThanOneYearAndNotLaterThanFiveYearsMember2023-12-310000891478srt:ParentCompanyMembersan:InterestRateAndExchangeRateRiskMemberifrs-full:FairValueHedgesMembersan:SwitzerlandFrancsAndEuroMemberifrs-full:LaterThanFiveYearsMember2023-12-310000891478srt:ParentCompanyMembersan:InterestRateAndExchangeRateRiskMemberifrs-full:FairValueHedgesMembersan:UnitedStatesDollarAndMexicanPesoMemberifrs-full:NotLaterThanOneMonthMember2023-12-310000891478srt:ParentCompanyMembersan:InterestRateAndExchangeRateRiskMemberifrs-full:FairValueHedgesMembersan:UnitedStatesDollarAndMexicanPesoMemberifrs-full:LaterThanOneMonthAndNotLaterThanThreeMonthsMember2023-12-310000891478srt:ParentCompanyMembersan:InterestRateAndExchangeRateRiskMemberifrs-full:FairValueHedgesMembersan:UnitedStatesDollarAndMexicanPesoMemberifrs-full:LaterThanThreeMonthsAndNotLaterThanOneYearMember2023-12-310000891478srt:ParentCompanyMembersan:InterestRateAndExchangeRateRiskMemberifrs-full:FairValueHedgesMembersan:UnitedStatesDollarAndMexicanPesoMemberifrs-full:LaterThanOneYearAndNotLaterThanFiveYearsMember2023-12-310000891478srt:ParentCompanyMembersan:InterestRateAndExchangeRateRiskMemberifrs-full:FairValueHedgesMembersan:UnitedStatesDollarAndMexicanPesoMemberifrs-full:LaterThanFiveYearsMember2023-12-310000891478srt:ParentCompanyMembersan:InterestRateAndExchangeRateRiskMemberifrs-full:FairValueHedgesMembersan:UnitedStatesDollarAndColombiaPesoMemberifrs-full:NotLaterThanOneMonthMember2023-12-310000891478srt:ParentCompanyMembersan:InterestRateAndExchangeRateRiskMemberifrs-full:FairValueHedgesMembersan:UnitedStatesDollarAndColombiaPesoMemberifrs-full:LaterThanOneMonthAndNotLaterThanThreeMonthsMember2023-12-310000891478srt:ParentCompanyMembersan:InterestRateAndExchangeRateRiskMemberifrs-full:FairValueHedgesMembersan:UnitedStatesDollarAndColombiaPesoMemberifrs-full:LaterThanThreeMonthsAndNotLaterThanOneYearMember2023-12-310000891478srt:ParentCompanyMembersan:InterestRateAndExchangeRateRiskMemberifrs-full:FairValueHedgesMembersan:UnitedStatesDollarAndColombiaPesoMemberifrs-full:LaterThanOneYearAndNotLaterThanFiveYearsMember2023-12-310000891478srt:ParentCompanyMembersan:InterestRateAndExchangeRateRiskMemberifrs-full:FairValueHedgesMembersan:UnitedStatesDollarAndColombiaPesoMemberifrs-full:LaterThanFiveYearsMember2023-12-310000891478srt:ParentCompanyMembersan:InterestRateAndExchangeRateRiskMemberifrs-full:FairValueHedgesMembersan:EuroAndUnitedStatesDollarMemberifrs-full:NotLaterThanOneMonthMember2023-12-310000891478srt:ParentCompanyMembersan:InterestRateAndExchangeRateRiskMemberifrs-full:FairValueHedgesMembersan:EuroAndUnitedStatesDollarMemberifrs-full:LaterThanOneMonthAndNotLaterThanThreeMonthsMember2023-12-310000891478srt:ParentCompanyMembersan:InterestRateAndExchangeRateRiskMemberifrs-full:FairValueHedgesMembersan:EuroAndUnitedStatesDollarMemberifrs-full:LaterThanThreeMonthsAndNotLaterThanOneYearMember2023-12-310000891478srt:ParentCompanyMembersan:InterestRateAndExchangeRateRiskMemberifrs-full:FairValueHedgesMembersan:EuroAndUnitedStatesDollarMemberifrs-full:LaterThanOneYearAndNotLaterThanFiveYearsMember2023-12-310000891478srt:ParentCompanyMembersan:InterestRateAndExchangeRateRiskMemberifrs-full:FairValueHedgesMembersan:EuroAndUnitedStatesDollarMemberifrs-full:LaterThanFiveYearsMember2023-12-310000891478srt:ParentCompanyMembersan:InterestRateAndExchangeRateRiskMemberifrs-full:FairValueHedgesMembersan:UnitedStatesDollarAndChilePesoMemberifrs-full:NotLaterThanOneMonthMember2023-12-310000891478srt:ParentCompanyMembersan:InterestRateAndExchangeRateRiskMemberifrs-full:FairValueHedgesMembersan:UnitedStatesDollarAndChilePesoMemberifrs-full:LaterThanOneMonthAndNotLaterThanThreeMonthsMember2023-12-310000891478srt:ParentCompanyMembersan:InterestRateAndExchangeRateRiskMemberifrs-full:FairValueHedgesMembersan:UnitedStatesDollarAndChilePesoMemberifrs-full:LaterThanThreeMonthsAndNotLaterThanOneYearMember2023-12-310000891478srt:ParentCompanyMembersan:InterestRateAndExchangeRateRiskMemberifrs-full:FairValueHedgesMembersan:UnitedStatesDollarAndChilePesoMemberifrs-full:LaterThanOneYearAndNotLaterThanFiveYearsMember2023-12-310000891478srt:ParentCompanyMembersan:InterestRateAndExchangeRateRiskMemberifrs-full:FairValueHedgesMembersan:UnitedStatesDollarAndChilePesoMemberifrs-full:LaterThanFiveYearsMember2023-12-310000891478srt:ParentCompanyMembersan:InterestRateAndExchangeRateRiskMemberifrs-full:NotLaterThanOneMonthMemberifrs-full:FairValueHedgesMember2023-01-012023-12-310000891478srt:ParentCompanyMembersan:InterestRateAndExchangeRateRiskMemberifrs-full:LaterThanOneMonthAndNotLaterThanThreeMonthsMemberifrs-full:FairValueHedgesMember2023-01-012023-12-310000891478srt:ParentCompanyMembersan:InterestRateAndExchangeRateRiskMemberifrs-full:LaterThanThreeMonthsAndNotLaterThanOneYearMemberifrs-full:FairValueHedgesMember2023-01-012023-12-310000891478srt:ParentCompanyMembersan:InterestRateAndExchangeRateRiskMemberifrs-full:LaterThanOneYearAndNotLaterThanFiveYearsMemberifrs-full:FairValueHedgesMember2023-01-012023-12-310000891478srt:ParentCompanyMembersan:InterestRateAndExchangeRateRiskMemberifrs-full:LaterThanFiveYearsMemberifrs-full:FairValueHedgesMember2023-01-012023-12-310000891478srt:ParentCompanyMembersan:InterestRateAndExchangeRateRiskMemberifrs-full:NotLaterThanOneMonthMemberifrs-full:CashFlowHedgesMember2023-12-310000891478srt:ParentCompanyMembersan:InterestRateAndExchangeRateRiskMemberifrs-full:LaterThanOneMonthAndNotLaterThanThreeMonthsMemberifrs-full:CashFlowHedgesMember2023-12-310000891478srt:ParentCompanyMembersan:InterestRateAndExchangeRateRiskMemberifrs-full:LaterThanThreeMonthsAndNotLaterThanOneYearMemberifrs-full:CashFlowHedgesMember2023-12-310000891478srt:ParentCompanyMembersan:InterestRateAndExchangeRateRiskMemberifrs-full:LaterThanOneYearAndNotLaterThanFiveYearsMemberifrs-full:CashFlowHedgesMember2023-12-310000891478srt:ParentCompanyMembersan:InterestRateAndExchangeRateRiskMemberifrs-full:LaterThanFiveYearsMemberifrs-full:CashFlowHedgesMember2023-12-310000891478srt:ParentCompanyMembersan:InterestRateAndExchangeRateRiskMemberifrs-full:CashFlowHedgesMember2023-12-310000891478srt:ParentCompanyMembersan:InterestRateAndExchangeRateRiskMemberifrs-full:CashFlowHedgesMembersan:SwitzerlandFrancsAndEuroMemberifrs-full:NotLaterThanOneMonthMember2023-12-310000891478srt:ParentCompanyMembersan:InterestRateAndExchangeRateRiskMemberifrs-full:CashFlowHedgesMembersan:SwitzerlandFrancsAndEuroMemberifrs-full:LaterThanOneMonthAndNotLaterThanThreeMonthsMember2023-12-310000891478srt:ParentCompanyMembersan:InterestRateAndExchangeRateRiskMemberifrs-full:CashFlowHedgesMembersan:SwitzerlandFrancsAndEuroMemberifrs-full:LaterThanThreeMonthsAndNotLaterThanOneYearMember2023-12-310000891478srt:ParentCompanyMembersan:InterestRateAndExchangeRateRiskMemberifrs-full:CashFlowHedgesMembersan:SwitzerlandFrancsAndEuroMemberifrs-full:LaterThanOneYearAndNotLaterThanFiveYearsMember2023-12-310000891478srt:ParentCompanyMembersan:InterestRateAndExchangeRateRiskMemberifrs-full:CashFlowHedgesMembersan:SwitzerlandFrancsAndEuroMemberifrs-full:LaterThanFiveYearsMember2023-12-310000891478srt:ParentCompanyMembersan:InterestRateAndExchangeRateRiskMemberifrs-full:CashFlowHedgesMembersan:AustralianDollarAndEuroMemberifrs-full:NotLaterThanOneMonthMember2023-12-310000891478srt:ParentCompanyMembersan:InterestRateAndExchangeRateRiskMemberifrs-full:CashFlowHedgesMembersan:AustralianDollarAndEuroMemberifrs-full:LaterThanOneMonthAndNotLaterThanThreeMonthsMember2023-12-310000891478srt:ParentCompanyMembersan:InterestRateAndExchangeRateRiskMemberifrs-full:CashFlowHedgesMembersan:AustralianDollarAndEuroMemberifrs-full:LaterThanThreeMonthsAndNotLaterThanOneYearMember2023-12-310000891478srt:ParentCompanyMembersan:InterestRateAndExchangeRateRiskMemberifrs-full:CashFlowHedgesMembersan:AustralianDollarAndEuroMemberifrs-full:LaterThanOneYearAndNotLaterThanFiveYearsMember2023-12-310000891478srt:ParentCompanyMembersan:InterestRateAndExchangeRateRiskMemberifrs-full:CashFlowHedgesMembersan:AustralianDollarAndEuroMemberifrs-full:LaterThanFiveYearsMember2023-12-310000891478srt:ParentCompanyMembersan:InterestRateAndExchangeRateRiskMemberifrs-full:NotLaterThanOneMonthMemberifrs-full:CashFlowHedgesMember2023-01-012023-12-310000891478srt:ParentCompanyMembersan:InterestRateAndExchangeRateRiskMemberifrs-full:LaterThanOneMonthAndNotLaterThanThreeMonthsMemberifrs-full:CashFlowHedgesMember2023-01-012023-12-310000891478srt:ParentCompanyMembersan:InterestRateAndExchangeRateRiskMemberifrs-full:LaterThanThreeMonthsAndNotLaterThanOneYearMemberifrs-full:CashFlowHedgesMember2023-01-012023-12-310000891478srt:ParentCompanyMembersan:InterestRateAndExchangeRateRiskMemberifrs-full:LaterThanOneYearAndNotLaterThanFiveYearsMemberifrs-full:CashFlowHedgesMember2023-01-012023-12-310000891478srt:ParentCompanyMembersan:InterestRateAndExchangeRateRiskMemberifrs-full:LaterThanFiveYearsMemberifrs-full:CashFlowHedgesMember2023-01-012023-12-310000891478srt:ParentCompanyMemberifrs-full:InterestRateRiskMemberifrs-full:NotLaterThanOneMonthMemberifrs-full:CashFlowHedgesMember2023-12-310000891478srt:ParentCompanyMemberifrs-full:InterestRateRiskMemberifrs-full:LaterThanOneMonthAndNotLaterThanThreeMonthsMemberifrs-full:CashFlowHedgesMember2023-12-310000891478srt:ParentCompanyMemberifrs-full:InterestRateRiskMemberifrs-full:LaterThanThreeMonthsAndNotLaterThanOneYearMemberifrs-full:CashFlowHedgesMember2023-12-310000891478srt:ParentCompanyMemberifrs-full:InterestRateRiskMemberifrs-full:LaterThanOneYearAndNotLaterThanFiveYearsMemberifrs-full:CashFlowHedgesMember2023-12-310000891478srt:ParentCompanyMemberifrs-full:InterestRateRiskMemberifrs-full:LaterThanFiveYearsMemberifrs-full:CashFlowHedgesMember2023-12-310000891478srt:ParentCompanyMemberifrs-full:InterestRateRiskMemberifrs-full:CashFlowHedgesMember2023-12-310000891478srt:ParentCompanyMemberifrs-full:InterestRateRiskMemberifrs-full:CashFlowHedgesMembercurrency:EURifrs-full:NotLaterThanOneMonthMember2023-12-310000891478srt:ParentCompanyMemberifrs-full:InterestRateRiskMemberifrs-full:CashFlowHedgesMembercurrency:EURifrs-full:LaterThanOneMonthAndNotLaterThanThreeMonthsMember2023-12-310000891478srt:ParentCompanyMemberifrs-full:InterestRateRiskMemberifrs-full:CashFlowHedgesMembercurrency:EURifrs-full:LaterThanThreeMonthsAndNotLaterThanOneYearMember2023-12-310000891478srt:ParentCompanyMemberifrs-full:InterestRateRiskMemberifrs-full:CashFlowHedgesMembercurrency:EURifrs-full:LaterThanOneYearAndNotLaterThanFiveYearsMember2023-12-310000891478srt:ParentCompanyMemberifrs-full:InterestRateRiskMemberifrs-full:CashFlowHedgesMembercurrency:EURifrs-full:LaterThanFiveYearsMember2023-12-310000891478srt:ParentCompanyMemberifrs-full:CurrencyRiskMemberifrs-full:NotLaterThanOneMonthMemberifrs-full:CashFlowHedgesMember2023-12-310000891478srt:ParentCompanyMemberifrs-full:CurrencyRiskMemberifrs-full:LaterThanOneMonthAndNotLaterThanThreeMonthsMemberifrs-full:CashFlowHedgesMember2023-12-310000891478srt:ParentCompanyMemberifrs-full:CurrencyRiskMemberifrs-full:LaterThanThreeMonthsAndNotLaterThanOneYearMemberifrs-full:CashFlowHedgesMember2023-12-310000891478srt:ParentCompanyMemberifrs-full:CurrencyRiskMemberifrs-full:LaterThanOneYearAndNotLaterThanFiveYearsMemberifrs-full:CashFlowHedgesMember2023-12-310000891478srt:ParentCompanyMemberifrs-full:CurrencyRiskMemberifrs-full:LaterThanFiveYearsMemberifrs-full:CashFlowHedgesMember2023-12-310000891478srt:ParentCompanyMemberifrs-full:CurrencyRiskMemberifrs-full:CashFlowHedgesMember2023-12-310000891478srt:ParentCompanyMemberifrs-full:CurrencyRiskMemberifrs-full:NotLaterThanOneMonthMemberifrs-full:CashFlowHedgesMember2023-01-012023-12-310000891478srt:ParentCompanyMemberifrs-full:CurrencyRiskMemberifrs-full:LaterThanOneMonthAndNotLaterThanThreeMonthsMemberifrs-full:CashFlowHedgesMember2023-01-012023-12-310000891478srt:ParentCompanyMemberifrs-full:CurrencyRiskMemberifrs-full:LaterThanThreeMonthsAndNotLaterThanOneYearMemberifrs-full:CashFlowHedgesMember2023-01-012023-12-310000891478srt:ParentCompanyMemberifrs-full:CurrencyRiskMemberifrs-full:LaterThanOneYearAndNotLaterThanFiveYearsMemberifrs-full:CashFlowHedgesMember2023-01-012023-12-310000891478srt:ParentCompanyMemberifrs-full:CurrencyRiskMemberifrs-full:LaterThanFiveYearsMemberifrs-full:CashFlowHedgesMember2023-01-012023-12-310000891478srt:ParentCompanyMemberifrs-full:CurrencyRiskMemberifrs-full:NotLaterThanOneMonthMemberifrs-full:HedgesOfNetInvestmentInForeignOperationsMember2023-12-310000891478srt:ParentCompanyMemberifrs-full:CurrencyRiskMemberifrs-full:LaterThanOneMonthAndNotLaterThanThreeMonthsMemberifrs-full:HedgesOfNetInvestmentInForeignOperationsMember2023-12-310000891478srt:ParentCompanyMemberifrs-full:CurrencyRiskMemberifrs-full:LaterThanThreeMonthsAndNotLaterThanOneYearMemberifrs-full:HedgesOfNetInvestmentInForeignOperationsMember2023-12-310000891478srt:ParentCompanyMemberifrs-full:CurrencyRiskMemberifrs-full:LaterThanOneYearAndNotLaterThanFiveYearsMemberifrs-full:HedgesOfNetInvestmentInForeignOperationsMember2023-12-310000891478srt:ParentCompanyMemberifrs-full:CurrencyRiskMemberifrs-full:LaterThanFiveYearsMemberifrs-full:HedgesOfNetInvestmentInForeignOperationsMember2023-12-310000891478srt:ParentCompanyMemberifrs-full:CurrencyRiskMemberifrs-full:HedgesOfNetInvestmentInForeignOperationsMember2023-12-310000891478srt:ParentCompanyMemberifrs-full:CurrencyRiskMemberifrs-full:NotLaterThanOneMonthMemberifrs-full:HedgesOfNetInvestmentInForeignOperationsMember2023-01-012023-12-310000891478srt:ParentCompanyMemberifrs-full:CurrencyRiskMemberifrs-full:LaterThanOneMonthAndNotLaterThanThreeMonthsMemberifrs-full:HedgesOfNetInvestmentInForeignOperationsMember2023-01-012023-12-310000891478srt:ParentCompanyMemberifrs-full:CurrencyRiskMemberifrs-full:LaterThanThreeMonthsAndNotLaterThanOneYearMemberifrs-full:HedgesOfNetInvestmentInForeignOperationsMember2023-01-012023-12-310000891478srt:ParentCompanyMemberifrs-full:CurrencyRiskMemberifrs-full:LaterThanOneYearAndNotLaterThanFiveYearsMemberifrs-full:HedgesOfNetInvestmentInForeignOperationsMember2023-01-012023-12-310000891478srt:ParentCompanyMemberifrs-full:CurrencyRiskMemberifrs-full:LaterThanFiveYearsMemberifrs-full:HedgesOfNetInvestmentInForeignOperationsMember2023-01-012023-12-310000891478ifrs-full:CreditRiskMemberifrs-full:FairValueHedgesMember2025-12-310000891478ifrs-full:CreditRiskMemberifrs-full:FairValueHedgesMember2025-01-012025-12-310000891478ifrs-full:EquityPriceRiskMemberifrs-full:FairValueHedgesMember2025-12-310000891478ifrs-full:EquityPriceRiskMemberifrs-full:FairValueHedgesMember2025-01-012025-12-310000891478san:OtherRisksMemberifrs-full:CashFlowHedgesMember2025-01-012025-12-310000891478san:OtherRisksMemberifrs-full:CashFlowHedgesMember2025-12-310000891478san:InflationRiskMemberifrs-full:FairValueHedgesMember2024-12-310000891478san:InflationRiskMemberifrs-full:FairValueHedgesMember2024-01-012024-12-310000891478ifrs-full:CreditRiskMemberifrs-full:FairValueHedgesMember2024-12-310000891478ifrs-full:CreditRiskMemberifrs-full:FairValueHedgesMember2024-01-012024-12-310000891478ifrs-full:EquityPriceRiskMemberifrs-full:FairValueHedgesMember2024-12-310000891478ifrs-full:EquityPriceRiskMemberifrs-full:FairValueHedgesMember2024-01-012024-12-310000891478san:InflationRiskMemberifrs-full:FairValueHedgesMember2023-12-310000891478san:InflationRiskMemberifrs-full:FairValueHedgesMember2023-01-012023-12-310000891478ifrs-full:CreditRiskMemberifrs-full:FairValueHedgesMember2023-12-310000891478ifrs-full:CreditRiskMemberifrs-full:FairValueHedgesMember2023-01-012023-12-310000891478san:DesignatedItemsMemberifrs-full:CashFlowHedgesMember2025-01-012025-12-310000891478ifrs-full:InterestRateRiskMembersan:DesignatedItemsMemberifrs-full:CashFlowHedgesMember2025-01-012025-12-310000891478ifrs-full:CurrencyRiskMembersan:DesignatedItemsMemberifrs-full:CashFlowHedgesMember2025-01-012025-12-310000891478san:InterestRateAndExchangeRateRiskMembersan:DesignatedItemsMemberifrs-full:CashFlowHedgesMember2025-01-012025-12-310000891478san:InflationRiskMembersan:DesignatedItemsMemberifrs-full:CashFlowHedgesMember2025-01-012025-12-310000891478san:MarketValueOfEquityMembersan:DesignatedItemsMemberifrs-full:CashFlowHedgesMember2025-01-012025-12-310000891478san:DesignatedItemsMemberifrs-full:HedgesOfNetInvestmentInForeignOperationsMember2025-01-012025-12-310000891478ifrs-full:CurrencyRiskMembersan:DesignatedItemsMemberifrs-full:HedgesOfNetInvestmentInForeignOperationsMember2025-01-012025-12-310000891478san:DesignatedItemsMember2025-01-012025-12-310000891478san:DesignatedItemsMemberifrs-full:CashFlowHedgesMember2024-01-012024-12-310000891478ifrs-full:InterestRateRiskMembersan:DesignatedItemsMemberifrs-full:CashFlowHedgesMember2024-01-012024-12-310000891478ifrs-full:CurrencyRiskMembersan:DesignatedItemsMemberifrs-full:CashFlowHedgesMember2024-01-012024-12-310000891478san:InterestRateAndExchangeRateRiskMembersan:DesignatedItemsMemberifrs-full:CashFlowHedgesMember2024-01-012024-12-310000891478san:InflationRiskMembersan:DesignatedItemsMemberifrs-full:CashFlowHedgesMember2024-01-012024-12-310000891478san:MarketValueOfEquityMembersan:DesignatedItemsMemberifrs-full:CashFlowHedgesMember2024-01-012024-12-310000891478san:DesignatedItemsMemberifrs-full:HedgesOfNetInvestmentInForeignOperationsMember2024-01-012024-12-310000891478ifrs-full:CurrencyRiskMembersan:DesignatedItemsMemberifrs-full:HedgesOfNetInvestmentInForeignOperationsMember2024-01-012024-12-310000891478san:DesignatedItemsMember2024-01-012024-12-310000891478san:DesignatedItemsMemberifrs-full:CashFlowHedgesMember2023-01-012023-12-310000891478ifrs-full:InterestRateRiskMembersan:DesignatedItemsMemberifrs-full:CashFlowHedgesMember2023-01-012023-12-310000891478ifrs-full:CurrencyRiskMembersan:DesignatedItemsMemberifrs-full:CashFlowHedgesMember2023-01-012023-12-310000891478san:InterestRateAndExchangeRateRiskMembersan:DesignatedItemsMemberifrs-full:CashFlowHedgesMember2023-01-012023-12-310000891478san:InflationRiskMembersan:DesignatedItemsMemberifrs-full:CashFlowHedgesMember2023-01-012023-12-310000891478san:MarketValueOfEquityMembersan:DesignatedItemsMemberifrs-full:CashFlowHedgesMember2023-01-012023-12-310000891478san:DesignatedItemsMemberifrs-full:HedgesOfNetInvestmentInForeignOperationsMember2023-01-012023-12-310000891478ifrs-full:CurrencyRiskMembersan:DesignatedItemsMemberifrs-full:HedgesOfNetInvestmentInForeignOperationsMember2023-01-012023-12-310000891478san:DesignatedItemsMember2023-01-012023-12-310000891478ifrs-full:InterestRateRiskMembersan:NotDesignatedItemsByTimePeriodMemberifrs-full:CashFlowHedgesMember2025-01-012025-12-310000891478ifrs-full:InterestRateRiskMembersan:NotDesignatedItemsByTimePeriodMemberifrs-full:CashFlowHedgesMember2024-01-012024-12-310000891478ifrs-full:InterestRateRiskMembersan:NotDesignatedItemsByTimePeriodMemberifrs-full:CashFlowHedgesMember2023-01-012023-12-310000891478ifrs-full:InterestRateRiskMembersan:NotDesignatedItemsByTransactionMemberifrs-full:CashFlowHedgesMember2025-01-012025-12-310000891478ifrs-full:InterestRateRiskMembersan:NotDesignatedItemsByTransactionMemberifrs-full:CashFlowHedgesMember2024-01-012024-12-310000891478ifrs-full:InterestRateRiskMembersan:NotDesignatedItemsByTransactionMemberifrs-full:CashFlowHedgesMember2023-01-012023-12-310000891478ifrs-full:CurrencyRiskMembersan:NotDesignatedItemsByTimePeriodMemberifrs-full:CashFlowHedgesMember2025-01-012025-12-310000891478ifrs-full:CurrencyRiskMembersan:NotDesignatedItemsByTimePeriodMemberifrs-full:CashFlowHedgesMember2024-01-012024-12-310000891478ifrs-full:CurrencyRiskMembersan:NotDesignatedItemsByTimePeriodMemberifrs-full:CashFlowHedgesMember2023-01-012023-12-310000891478ifrs-full:CurrencyRiskMembersan:NotDesignatedItemsByTransactionMemberifrs-full:CashFlowHedgesMember2025-01-012025-12-310000891478ifrs-full:CurrencyRiskMembersan:NotDesignatedItemsByTransactionMemberifrs-full:CashFlowHedgesMember2024-01-012024-12-310000891478ifrs-full:CurrencyRiskMembersan:NotDesignatedItemsByTransactionMemberifrs-full:CashFlowHedgesMember2023-01-012023-12-310000891478san:InterestRateAndExchangeRateRiskMembersan:NotDesignatedItemsByTimePeriodMemberifrs-full:CashFlowHedgesMember2025-01-012025-12-310000891478san:InterestRateAndExchangeRateRiskMembersan:NotDesignatedItemsByTimePeriodMemberifrs-full:CashFlowHedgesMember2024-01-012024-12-310000891478san:InterestRateAndExchangeRateRiskMembersan:NotDesignatedItemsByTimePeriodMemberifrs-full:CashFlowHedgesMember2023-01-012023-12-310000891478san:InterestRateAndExchangeRateRiskMembersan:NotDesignatedItemsByTransactionMemberifrs-full:CashFlowHedgesMember2025-01-012025-12-310000891478san:InterestRateAndExchangeRateRiskMembersan:NotDesignatedItemsByTransactionMemberifrs-full:CashFlowHedgesMember2024-01-012024-12-310000891478san:InterestRateAndExchangeRateRiskMembersan:NotDesignatedItemsByTransactionMemberifrs-full:CashFlowHedgesMember2023-01-012023-12-310000891478san:MarketValueOfEquityMembersan:NotDesignatedItemsByTimePeriodMemberifrs-full:CashFlowHedgesMember2025-01-012025-12-310000891478san:MarketValueOfEquityMembersan:NotDesignatedItemsByTimePeriodMemberifrs-full:CashFlowHedgesMember2024-01-012024-12-310000891478san:MarketValueOfEquityMembersan:NotDesignatedItemsByTimePeriodMemberifrs-full:CashFlowHedgesMember2023-01-012023-12-310000891478san:MarketValueOfEquityMembersan:NotDesignatedItemsByTransactionMemberifrs-full:CashFlowHedgesMember2025-01-012025-12-310000891478san:MarketValueOfEquityMembersan:NotDesignatedItemsByTransactionMemberifrs-full:CashFlowHedgesMember2024-01-012024-12-310000891478san:MarketValueOfEquityMembersan:NotDesignatedItemsByTransactionMemberifrs-full:CashFlowHedgesMember2023-01-012023-12-310000891478ifrs-full:CurrencyRiskMembersan:NotDesignatedItemsByTimePeriodMemberifrs-full:HedgesOfNetInvestmentInForeignOperationsMember2025-01-012025-12-310000891478ifrs-full:CurrencyRiskMembersan:NotDesignatedItemsByTimePeriodMemberifrs-full:HedgesOfNetInvestmentInForeignOperationsMember2024-01-012024-12-310000891478ifrs-full:CurrencyRiskMembersan:NotDesignatedItemsByTimePeriodMemberifrs-full:HedgesOfNetInvestmentInForeignOperationsMember2023-01-012023-12-310000891478ifrs-full:CurrencyRiskMembersan:NotDesignatedItemsByTransactionMemberifrs-full:HedgesOfNetInvestmentInForeignOperationsMember2025-01-012025-12-310000891478ifrs-full:CurrencyRiskMembersan:NotDesignatedItemsByTransactionMemberifrs-full:HedgesOfNetInvestmentInForeignOperationsMember2024-01-012024-12-310000891478ifrs-full:CurrencyRiskMembersan:NotDesignatedItemsByTransactionMemberifrs-full:HedgesOfNetInvestmentInForeignOperationsMember2023-01-012023-12-310000891478ifrs-full:InterestRateRiskMembersan:NotDesignatedItemsByTimePeriodMemberifrs-full:FairValueHedgesMember2025-01-012025-12-310000891478ifrs-full:InterestRateRiskMembersan:NotDesignatedItemsByTimePeriodMemberifrs-full:FairValueHedgesMember2024-01-012024-12-310000891478ifrs-full:InterestRateRiskMembersan:NotDesignatedItemsByTimePeriodMemberifrs-full:FairValueHedgesMember2023-01-012023-12-310000891478ifrs-full:InterestRateRiskMembersan:NotDesignatedItemsByTransactionMemberifrs-full:FairValueHedgesMember2025-01-012025-12-310000891478ifrs-full:InterestRateRiskMembersan:NotDesignatedItemsByTransactionMemberifrs-full:FairValueHedgesMember2024-01-012024-12-310000891478ifrs-full:InterestRateRiskMembersan:NotDesignatedItemsByTransactionMemberifrs-full:FairValueHedgesMember2023-01-012023-12-310000891478ifrs-full:CurrencyRiskMembersan:NotDesignatedItemsByTimePeriodMemberifrs-full:FairValueHedgesMember2025-01-012025-12-310000891478ifrs-full:CurrencyRiskMembersan:NotDesignatedItemsByTimePeriodMemberifrs-full:FairValueHedgesMember2024-01-012024-12-310000891478ifrs-full:CurrencyRiskMembersan:NotDesignatedItemsByTimePeriodMemberifrs-full:FairValueHedgesMember2023-01-012023-12-310000891478ifrs-full:CurrencyRiskMembersan:NotDesignatedItemsByTransactionMemberifrs-full:FairValueHedgesMember2025-01-012025-12-310000891478ifrs-full:CurrencyRiskMembersan:NotDesignatedItemsByTransactionMemberifrs-full:FairValueHedgesMember2024-01-012024-12-310000891478ifrs-full:CurrencyRiskMembersan:NotDesignatedItemsByTransactionMemberifrs-full:FairValueHedgesMember2023-01-012023-12-310000891478san:InterestRateAndExchangeRateRiskMembersan:NotDesignatedItemsByTimePeriodMemberifrs-full:FairValueHedgesMember2025-01-012025-12-310000891478san:InterestRateAndExchangeRateRiskMembersan:NotDesignatedItemsByTimePeriodMemberifrs-full:FairValueHedgesMember2024-01-012024-12-310000891478san:InterestRateAndExchangeRateRiskMembersan:NotDesignatedItemsByTimePeriodMemberifrs-full:FairValueHedgesMember2023-01-012023-12-310000891478san:InterestRateAndExchangeRateRiskMembersan:NotDesignatedItemsByTransactionMemberifrs-full:FairValueHedgesMember2025-01-012025-12-310000891478san:InterestRateAndExchangeRateRiskMembersan:NotDesignatedItemsByTransactionMemberifrs-full:FairValueHedgesMember2024-01-012024-12-310000891478san:InterestRateAndExchangeRateRiskMembersan:NotDesignatedItemsByTransactionMemberifrs-full:FairValueHedgesMember2023-01-012023-12-310000891478san:SantanderBankPolskaSAMemberifrs-full:DiscontinuedOperationsMembersan:RenegotiationAndContractualModificationsMember2025-01-012025-12-310000891478san:SantanderBankPolskaSAMemberifrs-full:DiscontinuedOperationsMembersan:RenegotiationAndContractualModificationsMember2024-01-012024-12-310000891478san:SantanderBankPolskaSAMemberifrs-full:DiscontinuedOperationsMembersan:RenegotiationAndContractualModificationsMember2023-01-012023-12-310000891478ifrs-full:FinancialAssetsAtFairValueThroughProfitOrLossClassifiedAsHeldForTradingCategoryMember2025-01-012025-12-310000891478ifrs-full:FinancialAssetsAtFairValueThroughProfitOrLossClassifiedAsHeldForTradingCategoryMember2024-01-012024-12-310000891478ifrs-full:FinancialAssetsAtFairValueThroughProfitOrLossClassifiedAsHeldForTradingCategoryMember2023-01-012023-12-310000891478ifrs-full:FinancialAssetsAtFairValueThroughProfitOrLossMandatorilyMeasuredAtFairValueCategoryMember2025-01-012025-12-310000891478ifrs-full:FinancialAssetsAtFairValueThroughProfitOrLossMandatorilyMeasuredAtFairValueCategoryMember2024-01-012024-12-310000891478ifrs-full:FinancialAssetsAtFairValueThroughProfitOrLossMandatorilyMeasuredAtFairValueCategoryMember2023-01-012023-12-310000891478ifrs-full:DebtSecuritiesMember2025-01-012025-12-310000891478ifrs-full:DebtSecuritiesMember2024-01-012024-12-310000891478ifrs-full:DebtSecuritiesMember2023-01-012023-12-310000891478san:LoansAndAdvancesCreditInstitutionsAndCustomersMember2025-12-310000891478san:SpanishAndForeignGovernmentSecuritiesMember2025-12-310000891478san:DepositMember2025-01-012025-12-310000891478srt:ParentCompanyMember2025-01-012025-12-310000891478srt:ParentCompanyMember2024-01-012024-12-310000891478srt:ParentCompanyMember2023-01-012023-12-310000891478san:ExecutiveDirectorsAndSeniorManagementMember2025-01-012025-12-310000891478san:ExecutiveDirectorsAndSeniorManagementMember2024-01-012024-12-310000891478san:ExecutiveDirectorsAndSeniorManagementMember2023-01-012023-12-310000891478san:SeniorExecutivesMembersrt:EuropeMember2025-12-310000891478san:SeniorExecutivesMembersrt:EuropeMember2025-01-012025-12-310000891478san:OtherExecutivePersonnelMembersrt:EuropeMember2025-12-310000891478san:OtherExecutivePersonnelMembersrt:EuropeMember2025-01-012025-12-310000891478san:OtherEmployeesMembersrt:EuropeMember2025-12-310000891478san:OtherEmployeesMembersrt:EuropeMember2025-01-012025-12-310000891478san:SeniorExecutivesMembersrt:NorthAmericaMember2025-12-310000891478san:SeniorExecutivesMembersrt:NorthAmericaMember2025-01-012025-12-310000891478san:OtherExecutivePersonnelMembersrt:NorthAmericaMember2025-12-310000891478san:OtherExecutivePersonnelMembersrt:NorthAmericaMember2025-01-012025-12-310000891478san:OtherEmployeesMembersrt:NorthAmericaMember2025-12-310000891478san:OtherEmployeesMembersrt:NorthAmericaMember2025-01-012025-12-310000891478san:SeniorExecutivesMembersrt:SouthAmericaMember2025-12-310000891478san:SeniorExecutivesMembersrt:SouthAmericaMember2025-01-012025-12-310000891478san:OtherExecutivePersonnelMembersrt:SouthAmericaMember2025-12-310000891478san:OtherExecutivePersonnelMembersrt:SouthAmericaMember2025-01-012025-12-310000891478san:OtherEmployeesMembersrt:SouthAmericaMember2025-12-310000891478san:OtherEmployeesMembersrt:SouthAmericaMember2025-01-012025-12-310000891478san:SeniorExecutivesMember2025-12-310000891478san:SeniorExecutivesMember2025-01-012025-12-310000891478san:OtherExecutivePersonnelMember2025-12-310000891478san:OtherExecutivePersonnelMember2025-01-012025-12-310000891478san:OtherEmployeesMember2025-12-310000891478san:OtherEmployeesMember2025-01-012025-12-310000891478srt:ParentCompanyMember2025-01-012025-12-310000891478srt:ParentCompanyMember2024-01-012024-12-310000891478srt:ParentCompanyMember2023-01-012023-12-310000891478san:DeferredConditionalVariableRemunerationPlanSixthCycle2016Member2025-01-012025-12-310000891478san:DeferredConditionalVariableRemunerationPlanFifthSeventhEighthNinthTenthAndEleventhCycles20152017201820192020And2021Memberifrs-full:BottomOfRangeMember2025-01-012025-12-310000891478san:DeferredConditionalVariableRemunerationPlanFifthSeventhEighthNinthTenthAndEleventhCycles20152017201820192020And2021Memberifrs-full:TopOfRangeMember2025-01-012025-12-310000891478san:DeferredConditionalVariableRemunerationPlanTwelfthCycle2022Memberifrs-full:BottomOfRangeMember2025-01-012025-12-310000891478san:DeferredConditionalVariableRemunerationPlanTwelfthCycle2022Memberifrs-full:TopOfRangeMember2025-01-012025-12-310000891478san:DeferredConditionalVariableRemunerationPlanFifthCycle2015Membersan:ExecutiveDirectorsAndMembersOfIdentifiedStaffWithTotalVariableRemunerationSpecifiedAmountMember2025-01-012025-12-310000891478san:DeferredConditionalVariableRemunerationPlanFourthAndFifthCycles2014And2015Membersan:ExecutiveDirectorsAndMembersOfIdentifiedStaffWithTotalVariableRemunerationSpecifiedAmountMember2025-01-012025-12-310000891478san:DivisionManagersCountryHeadsOtherExecutivesAndIdentifiedStaffWithTotalVariableRemunerationSpecifiedAmountMembersan:DeferredConditionalVariableRemunerationPlanFourthAndFifthCycles2014And2015Memberifrs-full:BottomOfRangeMember2025-01-012025-12-310000891478san:DivisionManagersCountryHeadsOtherExecutivesAndIdentifiedStaffWithTotalVariableRemunerationSpecifiedAmountMembersan:DeferredConditionalVariableRemunerationPlanFourthCycle2014Memberifrs-full:BottomOfRangeMember2025-01-012025-12-310000891478san:DivisionManagersCountryHeadsOtherExecutivesAndIdentifiedStaffWithTotalVariableRemunerationSpecifiedAmountMembersan:DeferredConditionalVariableRemunerationPlanFifthCycle2015Memberifrs-full:TopOfRangeMember2025-01-012025-12-310000891478san:DeferredConditionalVariableRemunerationPlanFourthAndFifthCycles2014And2015Membersan:DivisionManagersCountryHeadsOtherExecutivesAndIdentifiedStaffWithTotalVariableRemunerationSpecifiedAmountMember2025-01-012025-12-310000891478san:DeferredConditionalVariableRemunerationPlanFifthCycle2015Membersan:DivisionManagersCountryHeadsOtherExecutivesAndIdentifiedStaffWithTotalVariableRemunerationSpecifiedAmountMember2025-01-012025-12-310000891478san:DeferredConditionalVariableRemunerationPlanFourthAndFifthCycles2014And2015Membersan:OtherBeneficiariesMember2025-01-012025-12-310000891478san:DeferredConditionalVariableRemunerationPlanSeventhEighthNinthTenthAndEleventhCycles2017201820192020And2021Membersan:BeneficiariesWithTargetTotalVariableRemunerationHigherOrEqualTo27MillionEurosMember2025-01-012025-12-310000891478san:BeneficiariesWithTargetTotalVariableRemunerationBetween17And27MillionEurosMembersan:DeferredConditionalVariableRemunerationPlanSeventhEighthNinthTenthAndEleventhCycles2017201820192020And2021Memberifrs-full:BottomOfRangeMember2025-01-012025-12-310000891478san:BeneficiariesWithTargetTotalVariableRemunerationBetween17And27MillionEurosMembersan:DeferredConditionalVariableRemunerationPlanSeventhEighthNinthTenthAndEleventhCycles2017201820192020And2021Memberifrs-full:TopOfRangeMember2025-01-012025-12-310000891478san:DeferredConditionalVariableRemunerationPlanSeventhEighthNinthTenthAndEleventhCycles2017201820192020And2021Membersan:BeneficiariesWithTargetTotalVariableRemunerationBetween17And27MillionEurosMember2025-01-012025-12-310000891478san:DeferredConditionalVariableRemunerationPlanSeventhEighthNinthTenthAndEleventhCycles2017201820192020And2021Membersan:OtherBeneficiariesMember2025-01-012025-12-310000891478san:DeferredConditionalVariableRemunerationPlanThirteenthCycle2023Membersan:BeneficiariesWithTargetTotalVariableRemunerationHigherOrEqualTo27MillionEurosMember2025-01-012025-12-310000891478san:DeferredConditionalVariableRemunerationPlanFourteenthCycle2024Membersan:BeneficiariesWithTargetTotalVariableRemunerationHigherOrEqualTo27MillionEurosMember2025-01-012025-12-310000891478san:DeferredConditionalVariableRemunerationPlanTwelfthCycle2022Membersan:BeneficiariesWithTargetTotalVariableRemunerationHigherOrEqualTo27MillionEurosMember2025-01-012025-12-310000891478san:BeneficiariesWithTargetTotalVariableRemunerationBetween17And27MillionEurosMembersan:DeferredConditionalVariableRemunerationPlanTwelfthCycle2022Memberifrs-full:BottomOfRangeMember2025-01-012025-12-310000891478san:BeneficiariesWithTargetTotalVariableRemunerationBetween17And27MillionEurosMembersan:DeferredConditionalVariableRemunerationPlanThirteenthCycle2023Memberifrs-full:BottomOfRangeMember2025-01-012025-12-310000891478san:BeneficiariesWithTargetTotalVariableRemunerationBetween17And27MillionEurosMembersan:DeferredConditionalVariableRemunerationPlanFourteenthCycle2024Memberifrs-full:BottomOfRangeMember2025-01-012025-12-310000891478san:BeneficiariesWithTargetTotalVariableRemunerationBetween17And27MillionEurosMembersan:DeferredConditionalVariableRemunerationPlanFourteenthCycle2024Memberifrs-full:TopOfRangeMember2025-01-012025-12-310000891478san:BeneficiariesWithTargetTotalVariableRemunerationBetween17And27MillionEurosMembersan:DeferredConditionalVariableRemunerationPlanTwelfthCycle2022Memberifrs-full:TopOfRangeMember2025-01-012025-12-310000891478san:BeneficiariesWithTargetTotalVariableRemunerationBetween17And27MillionEurosMembersan:DeferredConditionalVariableRemunerationPlanThirteenthCycle2023Memberifrs-full:TopOfRangeMember2025-01-012025-12-310000891478san:DeferredConditionalVariableRemunerationPlanTwelfthCycle2022Membersan:BeneficiariesWithTargetTotalVariableRemunerationBetween17And27MillionEurosMember2025-01-012025-12-310000891478san:DeferredConditionalVariableRemunerationPlanThirteenthCycle2023Membersan:BeneficiariesWithTargetTotalVariableRemunerationBetween17And27MillionEurosMember2025-01-012025-12-310000891478san:DeferredConditionalVariableRemunerationPlanFourteenthCycle2024Membersan:BeneficiariesWithTargetTotalVariableRemunerationBetween17And27MillionEurosMember2025-01-012025-12-310000891478san:DeferredConditionalVariableRemunerationPlanFourteenthCycle2024Membersan:OtherBeneficiariesMember2025-01-012025-12-310000891478san:DeferredConditionalVariableRemunerationPlanThirteenthCycle2023Membersan:OtherBeneficiariesMember2025-01-012025-12-310000891478san:DeferredConditionalVariableRemunerationPlanTwelfthCycle2022Membersan:OtherBeneficiariesMember2025-01-012025-12-310000891478san:DeferredVariableCompensationPlanMultiannualObjectivesMemberifrs-full:BottomOfRangeMember2025-01-012025-12-310000891478san:DeferredVariableCompensationPlanMultiannualObjectivesMemberifrs-full:TopOfRangeMember2025-01-012025-12-310000891478san:DeferredMultiyearObjectivesVariableRemunerationPlanSeventhCycleMemberifrs-full:BottomOfRangeMember2025-01-012025-12-310000891478san:DeferredMultiyearObjectivesVariableRemunerationPlanSeventhCycleMemberifrs-full:TopOfRangeMember2025-01-012025-12-310000891478san:DeferredVariableCompensationPlanMultiannualObjectivesThreeYearPlanMemberifrs-full:BottomOfRangeMember2025-01-012025-12-310000891478san:DeferredVariableCompensationPlanMultiannualObjectivesFourYearPlanMember2025-01-012025-12-310000891478san:DeferredVariableCompensationPlanMultiannualObjectivesFiveYearPlanMemberifrs-full:TopOfRangeMember2025-01-012025-12-310000891478san:DeferredMultiyearObjectivesVariableRemunerationPlanSeventhCycleMembersan:ExecutiveDirectorsMember2025-01-012025-12-310000891478san:DeferredMultiyearObjectivesVariableRemunerationPlanEighthCycleMembersan:ExecutiveDirectorsMember2025-01-012025-12-310000891478san:DeferredMultiyearObjectivesVariableRemunerationPlanFirstCycle2016Membersan:ExecutiveDirectorsAndMembersOfIdentifiedStaffWithTotalVariableRemunerationSpecifiedAmountMember2025-01-012025-12-310000891478san:DeferredMultiyearObjectivesVariableRemunerationPlanFirstCycle2016Membersan:DivisionManagersCountryHeadsOtherExecutivesAndIdentifiedStaffWithTotalVariableRemunerationSpecifiedAmountMember2025-01-012025-12-310000891478san:DivisionManagersCountryHeadsOtherExecutivesAndIdentifiedStaffWithTotalVariableRemunerationSpecifiedAmountMembersan:DeferredMultiyearObjectivesVariableRemunerationPlanFirstCycle2016Memberifrs-full:BottomOfRangeMember2025-01-012025-12-310000891478san:DivisionManagersCountryHeadsOtherExecutivesAndIdentifiedStaffWithTotalVariableRemunerationSpecifiedAmountMembersan:DeferredMultiyearObjectivesVariableRemunerationPlanFirstCycle2016Memberifrs-full:TopOfRangeMember2025-01-012025-12-310000891478san:DeferredMultiyearObjectivesVariableRemunerationPlanFirstCycle2016Membersan:OtherBeneficiariesMember2025-01-012025-12-310000891478san:DeferredMultiyearObjectivesVariableRemunerationPlanSecondAndThirdCyclesMember2025-01-012025-12-310000891478san:DeferredMultiyearObjectivesVariableRemunerationPlanFourthFifthAndSixthCycleMember2025-01-012025-12-310000891478san:DeferredMultiyearObjectivesVariableRemunerationPlanTenthCycleMemberifrs-full:BottomOfRangeMember2025-01-012025-12-310000891478san:DeferredMultiyearObjectivesVariableRemunerationPlanEighthCycleMemberifrs-full:BottomOfRangeMember2025-01-012025-12-310000891478san:DeferredMultiyearObjectivesVariableRemunerationPlanNinthCycleMemberifrs-full:BottomOfRangeMember2025-01-012025-12-310000891478san:DeferredMultiyearObjectivesVariableRemunerationPlanTenthCycleMemberifrs-full:TopOfRangeMember2025-01-012025-12-310000891478san:DeferredMultiyearObjectivesVariableRemunerationPlanNinthCycleMemberifrs-full:TopOfRangeMember2025-01-012025-12-310000891478san:DeferredMultiyearObjectivesVariableRemunerationPlanEighthCycleMemberifrs-full:TopOfRangeMember2025-01-012025-12-310000891478san:DeferredMultiyearObjectivesVariableRemunerationPlanNinthCycleMember2025-01-012025-12-310000891478san:DeferredMultiyearObjectivesVariableRemunerationPlanSeventhCycleMember2025-01-012025-12-310000891478san:DeferredMultiyearObjectivesVariableRemunerationPlanEighthCycleMember2025-01-012025-12-310000891478san:DigitalTransformationAwardMember2025-01-012025-12-310000891478san:DigitalTransformationAward2020Member2025-01-012025-12-310000891478san:DigitalTransformationAward2021Member2025-01-012025-12-310000891478san:DigitalTransformationAwardMemberifrs-full:TopOfRangeMember2025-01-012025-12-310000891478san:DigitalTransformationAwardMemberifrs-full:BottomOfRangeMember2025-01-012025-12-310000891478san:DigitalTransformationAward20202021Member2025-01-012025-12-310000891478san:DigitalTransformationAwardMemberifrs-full:BottomOfRangeMember2021-01-012021-12-310000891478san:DigitalTransformationAwardMember2020-01-012020-12-3100008914782019-01-012019-12-310000891478san:DigitalTransformationAward2022Member2022-01-012022-12-310000891478san:DigitalTransformationAward2022FirstBlockMember2022-01-012022-12-310000891478san:DigitalTransformationAward2022FirstBlockMemberifrs-full:TopOfRangeMember2022-01-012022-12-310000891478san:DigitalTransformationAward2022FirstBlockMemberifrs-full:BottomOfRangeMember2022-01-012022-12-310000891478san:DigitalTransformationAward2022SecondBlockMember2022-01-012022-12-310000891478san:DigitalTransformationAward2023Member2024-01-012024-12-310000891478san:DigitalTransformationAward2023Member2023-01-012023-12-310000891478san:DigitalTransformationAward2025Memberifrs-full:BottomOfRangeMember2025-01-012025-12-310000891478san:DigitalTransformationAward2024Memberifrs-full:BottomOfRangeMember2025-01-012025-12-310000891478san:DigitalTransformationAward2025Memberifrs-full:TopOfRangeMember2025-01-012025-12-310000891478san:DigitalTransformationAward2024Memberifrs-full:TopOfRangeMember2025-01-012025-12-310000891478san:DigitalTransformationAward2024Member2025-01-012025-12-310000891478san:DigitalTransformationAward2025Member2025-01-012025-12-310000891478san:SharesavePlanMembersan:SantanderUKPLCMember2022-12-310000891478san:SharesavePlanMembersan:SantanderUKPLCMember2023-01-012023-12-310000891478san:SharesavePlanMembersan:SantanderUKPLCMember2023-12-310000891478san:SharesavePlanMembersan:SantanderUKPLCMember2024-01-012024-12-310000891478san:SharesavePlanMembersan:SantanderUKPLCMember2024-12-310000891478san:SharesavePlanMembersan:SantanderUKPLCMember2025-01-012025-12-310000891478san:SharesavePlanMembersan:SantanderUKPLCMember2025-12-310000891478san:SantanderUKPLCMember2025-12-310000891478san:SantanderUKPLCMember2024-12-310000891478san:SantanderUKPLCMember2023-12-310000891478san:SantanderUKPLCMembersan:SharesavePlanMemberifrs-full:BottomOfRangeMember2008-01-012008-12-310000891478san:SantanderUKPLCMembersan:SharesavePlanMemberifrs-full:TopOfRangeMember2008-01-012008-12-310000891478san:SharesavePlanMembersan:SantanderUKPLCMember2008-01-012008-12-310000891478san:BDOMember2025-01-012025-12-310000891478ifrs-full:ForeignCountriesMember2025-01-012025-12-310000891478ifrs-full:ForeignCountriesMember2024-01-012024-12-310000891478ifrs-full:ForeignCountriesMember2023-01-012023-12-310000891478ifrs-full:NoncurrentAssetsHeldForSaleMember2025-01-012025-12-310000891478ifrs-full:NoncurrentAssetsHeldForSaleMember2024-01-012024-12-310000891478ifrs-full:NoncurrentAssetsHeldForSaleMember2023-01-012023-12-310000891478ifrs-full:NoncurrentAssetsHeldForSaleMembersan:CaceisMember2025-01-012025-12-310000891478ifrs-full:NoncurrentAssetsHeldForSaleMembersan:CaceisMember2024-01-012024-12-310000891478ifrs-full:NoncurrentAssetsHeldForSaleMembersan:CaceisMember2023-01-012023-12-310000891478ifrs-full:Level1OfFairValueHierarchyMember2025-12-310000891478ifrs-full:Level2And3OfFairValueHierarchyMember2025-12-310000891478ifrs-full:Level1OfFairValueHierarchyMember2024-12-310000891478ifrs-full:Level2And3OfFairValueHierarchyMember2024-12-310000891478ifrs-full:Level1OfFairValueHierarchyMember2023-12-310000891478ifrs-full:Level2And3OfFairValueHierarchyMember2023-12-310000891478ifrs-full:Level2OfFairValueHierarchyMember2025-12-310000891478ifrs-full:Level3OfFairValueHierarchyMember2025-12-310000891478san:FinancialAssetsAndLiabilitiesCategoryMemberifrs-full:FinancialAssetsAtFairValueThroughProfitOrLossClassifiedAsHeldForTradingCategoryMemberifrs-full:Level2OfFairValueHierarchyMember2025-12-310000891478san:FinancialAssetsAndLiabilitiesCategoryMemberifrs-full:FinancialAssetsAtFairValueThroughProfitOrLossClassifiedAsHeldForTradingCategoryMemberifrs-full:Level3OfFairValueHierarchyMember2025-12-310000891478san:FinancialAssetsAndLiabilitiesCategoryMemberifrs-full:FinancialAssetsAtFairValueThroughProfitOrLossClassifiedAsHeldForTradingCategoryMembersan:LoansAndAdvancesCentralBanksMemberifrs-full:Level2OfFairValueHierarchyMember2025-12-310000891478san:FinancialAssetsAndLiabilitiesCategoryMemberifrs-full:FinancialAssetsAtFairValueThroughProfitOrLossClassifiedAsHeldForTradingCategoryMembersan:LoansAndAdvancesCentralBanksMemberifrs-full:Level3OfFairValueHierarchyMember2025-12-310000891478san:FinancialAssetsAndLiabilitiesCategoryMemberifrs-full:FinancialAssetsAtFairValueThroughProfitOrLossClassifiedAsHeldForTradingCategoryMembersan:LoansAndAdvancesCreditInstitutionsMemberifrs-full:Level2OfFairValueHierarchyMember2025-12-310000891478san:FinancialAssetsAndLiabilitiesCategoryMemberifrs-full:FinancialAssetsAtFairValueThroughProfitOrLossClassifiedAsHeldForTradingCategoryMembersan:LoansAndAdvancesCreditInstitutionsMemberifrs-full:Level3OfFairValueHierarchyMember2025-12-310000891478san:FinancialAssetsAndLiabilitiesCategoryMemberifrs-full:FinancialAssetsAtFairValueThroughProfitOrLossClassifiedAsHeldForTradingCategoryMembersan:LoansAndAdvancesCustomersMemberifrs-full:Level2OfFairValueHierarchyMember2025-12-310000891478san:FinancialAssetsAndLiabilitiesCategoryMemberifrs-full:FinancialAssetsAtFairValueThroughProfitOrLossClassifiedAsHeldForTradingCategoryMembersan:LoansAndAdvancesCustomersMemberifrs-full:Level3OfFairValueHierarchyMember2025-12-310000891478san:FinancialAssetsAndLiabilitiesCategoryMemberifrs-full:FinancialAssetsAtFairValueThroughProfitOrLossClassifiedAsHeldForTradingCategoryMembersan:DebtAndEquityInstrumentsMemberifrs-full:Level2OfFairValueHierarchyMember2025-12-310000891478san:FinancialAssetsAndLiabilitiesCategoryMemberifrs-full:FinancialAssetsAtFairValueThroughProfitOrLossClassifiedAsHeldForTradingCategoryMembersan:DebtAndEquityInstrumentsMemberifrs-full:Level3OfFairValueHierarchyMember2025-12-310000891478san:FinancialAssetsAndLiabilitiesCategoryMemberifrs-full:FinancialAssetsAtFairValueThroughProfitOrLossClassifiedAsHeldForTradingCategoryMemberifrs-full:DerivativesMemberifrs-full:Level2OfFairValueHierarchyMember2025-12-310000891478san:FinancialAssetsAndLiabilitiesCategoryMemberifrs-full:FinancialAssetsAtFairValueThroughProfitOrLossClassifiedAsHeldForTradingCategoryMemberifrs-full:DerivativesMemberifrs-full:Level3OfFairValueHierarchyMember2025-12-310000891478san:FinancialAssetsAndLiabilitiesCategoryMemberifrs-full:FinancialAssetsAtFairValueThroughProfitOrLossClassifiedAsHeldForTradingCategoryMemberifrs-full:SwapContractMemberifrs-full:Level2OfFairValueHierarchyMember2025-12-310000891478san:FinancialAssetsAndLiabilitiesCategoryMemberifrs-full:FinancialAssetsAtFairValueThroughProfitOrLossClassifiedAsHeldForTradingCategoryMemberifrs-full:SwapContractMemberifrs-full:Level3OfFairValueHierarchyMember2025-12-310000891478san:FinancialAssetsAndLiabilitiesCategoryMemberifrs-full:FinancialAssetsAtFairValueThroughProfitOrLossClassifiedAsHeldForTradingCategoryMembersan:ExchangeRateOptionMemberifrs-full:Level2OfFairValueHierarchyMember2025-12-310000891478san:FinancialAssetsAndLiabilitiesCategoryMemberifrs-full:FinancialAssetsAtFairValueThroughProfitOrLossClassifiedAsHeldForTradingCategoryMembersan:ExchangeRateOptionMemberifrs-full:Level3OfFairValueHierarchyMember2025-12-310000891478san:FinancialAssetsAndLiabilitiesCategoryMemberifrs-full:FinancialAssetsAtFairValueThroughProfitOrLossClassifiedAsHeldForTradingCategoryMembersan:InterestRateOptionMemberifrs-full:Level2OfFairValueHierarchyMember2025-12-310000891478san:FinancialAssetsAndLiabilitiesCategoryMemberifrs-full:FinancialAssetsAtFairValueThroughProfitOrLossClassifiedAsHeldForTradingCategoryMembersan:InterestRateOptionMemberifrs-full:Level3OfFairValueHierarchyMember2025-12-310000891478san:FinancialAssetsAndLiabilitiesCategoryMemberifrs-full:FinancialAssetsAtFairValueThroughProfitOrLossClassifiedAsHeldForTradingCategoryMembersan:InterestRateForwardsMemberifrs-full:Level2OfFairValueHierarchyMember2025-12-310000891478san:FinancialAssetsAndLiabilitiesCategoryMemberifrs-full:FinancialAssetsAtFairValueThroughProfitOrLossClassifiedAsHeldForTradingCategoryMembersan:InterestRateForwardsMemberifrs-full:Level3OfFairValueHierarchyMember2025-12-310000891478san:FinancialAssetsAndLiabilitiesCategoryMemberifrs-full:FinancialAssetsAtFairValueThroughProfitOrLossClassifiedAsHeldForTradingCategoryMembersan:IndexAndSecuritiesOptionsMemberifrs-full:Level2OfFairValueHierarchyMember2025-12-310000891478san:FinancialAssetsAndLiabilitiesCategoryMemberifrs-full:FinancialAssetsAtFairValueThroughProfitOrLossClassifiedAsHeldForTradingCategoryMembersan:IndexAndSecuritiesOptionsMemberifrs-full:Level3OfFairValueHierarchyMember2025-12-310000891478san:FinancialAssetsAndLiabilitiesCategoryMemberifrs-full:FinancialAssetsAtFairValueThroughProfitOrLossClassifiedAsHeldForTradingCategoryMembersan:OtherDerivativesMemberifrs-full:Level2OfFairValueHierarchyMember2025-12-310000891478san:FinancialAssetsAndLiabilitiesCategoryMemberifrs-full:FinancialAssetsAtFairValueThroughProfitOrLossClassifiedAsHeldForTradingCategoryMembersan:OtherDerivativesMemberifrs-full:Level3OfFairValueHierarchyMember2025-12-310000891478san:FinancialAssetsAndLiabilitiesCategoryMembersan:DerivativesDesignatedAsHedgingInstrumentsCategoryMemberifrs-full:Level2OfFairValueHierarchyMember2025-12-310000891478san:FinancialAssetsAndLiabilitiesCategoryMembersan:DerivativesDesignatedAsHedgingInstrumentsCategoryMemberifrs-full:Level3OfFairValueHierarchyMember2025-12-310000891478san:FinancialAssetsAndLiabilitiesCategoryMembersan:DerivativesDesignatedAsHedgingInstrumentsCategoryMemberifrs-full:SwapContractMemberifrs-full:Level2OfFairValueHierarchyMember2025-12-310000891478san:FinancialAssetsAndLiabilitiesCategoryMembersan:DerivativesDesignatedAsHedgingInstrumentsCategoryMemberifrs-full:SwapContractMemberifrs-full:Level3OfFairValueHierarchyMember2025-12-310000891478san:FinancialAssetsAndLiabilitiesCategoryMembersan:DerivativesDesignatedAsHedgingInstrumentsCategoryMembersan:InterestRateOptionMemberifrs-full:Level2OfFairValueHierarchyMember2025-12-310000891478san:FinancialAssetsAndLiabilitiesCategoryMembersan:DerivativesDesignatedAsHedgingInstrumentsCategoryMembersan:InterestRateOptionMemberifrs-full:Level3OfFairValueHierarchyMember2025-12-310000891478san:FinancialAssetsAndLiabilitiesCategoryMembersan:DerivativesDesignatedAsHedgingInstrumentsCategoryMembersan:OtherDerivativesMemberifrs-full:Level2OfFairValueHierarchyMember2025-12-310000891478san:FinancialAssetsAndLiabilitiesCategoryMembersan:DerivativesDesignatedAsHedgingInstrumentsCategoryMembersan:OtherDerivativesMemberifrs-full:Level3OfFairValueHierarchyMember2025-12-310000891478san:FinancialAssetsAndLiabilitiesCategoryMemberifrs-full:FinancialAssetsAtFairValueThroughProfitOrLossMandatorilyMeasuredAtFairValueCategoryMemberifrs-full:Level2OfFairValueHierarchyMember2025-12-310000891478san:FinancialAssetsAndLiabilitiesCategoryMemberifrs-full:FinancialAssetsAtFairValueThroughProfitOrLossMandatorilyMeasuredAtFairValueCategoryMemberifrs-full:Level3OfFairValueHierarchyMember2025-12-310000891478san:FinancialAssetsAndLiabilitiesCategoryMemberifrs-full:FinancialAssetsAtFairValueThroughProfitOrLossMandatorilyMeasuredAtFairValueCategoryMemberifrs-full:EquityInvestmentsMemberifrs-full:Level2OfFairValueHierarchyMember2025-12-310000891478san:FinancialAssetsAndLiabilitiesCategoryMemberifrs-full:FinancialAssetsAtFairValueThroughProfitOrLossMandatorilyMeasuredAtFairValueCategoryMemberifrs-full:EquityInvestmentsMemberifrs-full:Level3OfFairValueHierarchyMember2025-12-310000891478san:FinancialAssetsAndLiabilitiesCategoryMemberifrs-full:FinancialAssetsAtFairValueThroughProfitOrLossMandatorilyMeasuredAtFairValueCategoryMemberifrs-full:DebtSecuritiesMemberifrs-full:Level2OfFairValueHierarchyMember2025-12-310000891478san:FinancialAssetsAndLiabilitiesCategoryMemberifrs-full:FinancialAssetsAtFairValueThroughProfitOrLossMandatorilyMeasuredAtFairValueCategoryMemberifrs-full:DebtSecuritiesMemberifrs-full:Level3OfFairValueHierarchyMember2025-12-310000891478san:FinancialAssetsAndLiabilitiesCategoryMemberifrs-full:FinancialAssetsAtFairValueThroughProfitOrLossMandatorilyMeasuredAtFairValueCategoryMembersan:LoansAndAdvancesMemberifrs-full:Level2OfFairValueHierarchyMember2025-12-310000891478san:FinancialAssetsAndLiabilitiesCategoryMemberifrs-full:FinancialAssetsAtFairValueThroughProfitOrLossMandatorilyMeasuredAtFairValueCategoryMembersan:LoansAndAdvancesMemberifrs-full:Level3OfFairValueHierarchyMember2025-12-310000891478san:FinancialAssetsAndLiabilitiesCategoryMemberifrs-full:FinancialAssetsAtFairValueThroughProfitOrLossDesignatedUponInitialRecognitionCategoryMemberifrs-full:Level2OfFairValueHierarchyMember2025-12-310000891478san:FinancialAssetsAndLiabilitiesCategoryMemberifrs-full:FinancialAssetsAtFairValueThroughProfitOrLossDesignatedUponInitialRecognitionCategoryMemberifrs-full:Level3OfFairValueHierarchyMember2025-12-310000891478san:FinancialAssetsAndLiabilitiesCategoryMemberifrs-full:FinancialAssetsAtFairValueThroughProfitOrLossDesignatedUponInitialRecognitionCategoryMembersan:LoansAndAdvancesCentralBanksMemberifrs-full:Level2OfFairValueHierarchyMember2025-12-310000891478san:FinancialAssetsAndLiabilitiesCategoryMemberifrs-full:FinancialAssetsAtFairValueThroughProfitOrLossDesignatedUponInitialRecognitionCategoryMembersan:LoansAndAdvancesCentralBanksMemberifrs-full:Level3OfFairValueHierarchyMember2025-12-310000891478san:FinancialAssetsAndLiabilitiesCategoryMemberifrs-full:FinancialAssetsAtFairValueThroughProfitOrLossDesignatedUponInitialRecognitionCategoryMembersan:LoansAndAdvancesCreditInstitutionsMemberifrs-full:Level2OfFairValueHierarchyMember2025-12-310000891478san:FinancialAssetsAndLiabilitiesCategoryMemberifrs-full:FinancialAssetsAtFairValueThroughProfitOrLossDesignatedUponInitialRecognitionCategoryMembersan:LoansAndAdvancesCreditInstitutionsMemberifrs-full:Level3OfFairValueHierarchyMember2025-12-310000891478san:FinancialAssetsAndLiabilitiesCategoryMemberifrs-full:FinancialAssetsAtFairValueThroughProfitOrLossDesignatedUponInitialRecognitionCategoryMembersan:LoansAndAdvancesCustomersMemberifrs-full:Level2OfFairValueHierarchyMember2025-12-310000891478san:FinancialAssetsAndLiabilitiesCategoryMemberifrs-full:FinancialAssetsAtFairValueThroughProfitOrLossDesignatedUponInitialRecognitionCategoryMembersan:LoansAndAdvancesCustomersMemberifrs-full:Level3OfFairValueHierarchyMember2025-12-310000891478san:FinancialAssetsAndLiabilitiesCategoryMemberifrs-full:FinancialAssetsAtFairValueThroughProfitOrLossDesignatedUponInitialRecognitionCategoryMemberifrs-full:DebtSecuritiesMemberifrs-full:Level2OfFairValueHierarchyMember2025-12-310000891478san:FinancialAssetsAndLiabilitiesCategoryMemberifrs-full:FinancialAssetsAtFairValueThroughProfitOrLossDesignatedUponInitialRecognitionCategoryMemberifrs-full:DebtSecuritiesMemberifrs-full:Level3OfFairValueHierarchyMember2025-12-310000891478san:FinancialAssetsAndLiabilitiesCategoryMemberifrs-full:FinancialAssetsAtFairValueThroughOtherComprehensiveIncomeCategoryMemberifrs-full:Level2OfFairValueHierarchyMember2025-12-310000891478san:FinancialAssetsAndLiabilitiesCategoryMemberifrs-full:FinancialAssetsAtFairValueThroughOtherComprehensiveIncomeCategoryMemberifrs-full:Level3OfFairValueHierarchyMember2025-12-310000891478san:FinancialAssetsAndLiabilitiesCategoryMemberifrs-full:FinancialAssetsAtFairValueThroughOtherComprehensiveIncomeCategoryMemberifrs-full:EquityInvestmentsMemberifrs-full:Level2OfFairValueHierarchyMember2025-12-310000891478san:FinancialAssetsAndLiabilitiesCategoryMemberifrs-full:FinancialAssetsAtFairValueThroughOtherComprehensiveIncomeCategoryMemberifrs-full:EquityInvestmentsMemberifrs-full:Level3OfFairValueHierarchyMember2025-12-310000891478san:FinancialAssetsAndLiabilitiesCategoryMemberifrs-full:FinancialAssetsAtFairValueThroughOtherComprehensiveIncomeCategoryMemberifrs-full:DebtSecuritiesMemberifrs-full:Level2OfFairValueHierarchyMember2025-12-310000891478san:FinancialAssetsAndLiabilitiesCategoryMemberifrs-full:FinancialAssetsAtFairValueThroughOtherComprehensiveIncomeCategoryMemberifrs-full:DebtSecuritiesMemberifrs-full:Level3OfFairValueHierarchyMember2025-12-310000891478san:FinancialAssetsAndLiabilitiesCategoryMemberifrs-full:FinancialAssetsAtFairValueThroughOtherComprehensiveIncomeCategoryMembersan:LoansAndAdvancesMemberifrs-full:Level2OfFairValueHierarchyMember2025-12-310000891478san:FinancialAssetsAndLiabilitiesCategoryMemberifrs-full:FinancialAssetsAtFairValueThroughOtherComprehensiveIncomeCategoryMembersan:LoansAndAdvancesMemberifrs-full:Level3OfFairValueHierarchyMember2025-12-310000891478san:FinancialAssetsAndLiabilitiesCategoryMemberifrs-full:FinancialLiabilitiesAtFairValueThroughProfitOrLossThatMeetDefinitionOfHeldForTradingCategoryMemberifrs-full:Level2OfFairValueHierarchyMember2025-12-310000891478san:FinancialAssetsAndLiabilitiesCategoryMemberifrs-full:FinancialLiabilitiesAtFairValueThroughProfitOrLossThatMeetDefinitionOfHeldForTradingCategoryMemberifrs-full:Level3OfFairValueHierarchyMember2025-12-310000891478san:FinancialAssetsAndLiabilitiesCategoryMemberifrs-full:FinancialLiabilitiesAtFairValueThroughProfitOrLossThatMeetDefinitionOfHeldForTradingCategoryMemberifrs-full:Level2OfFairValueHierarchyMembersan:LoansAndAdvancesCentralBanksMember2025-12-310000891478san:FinancialAssetsAndLiabilitiesCategoryMemberifrs-full:FinancialLiabilitiesAtFairValueThroughProfitOrLossThatMeetDefinitionOfHeldForTradingCategoryMemberifrs-full:Level3OfFairValueHierarchyMembersan:LoansAndAdvancesCentralBanksMember2025-12-310000891478san:FinancialAssetsAndLiabilitiesCategoryMemberifrs-full:FinancialLiabilitiesAtFairValueThroughProfitOrLossThatMeetDefinitionOfHeldForTradingCategoryMemberifrs-full:Level2OfFairValueHierarchyMembersan:LoansAndAdvancesCreditInstitutionsMember2025-12-310000891478san:FinancialAssetsAndLiabilitiesCategoryMemberifrs-full:FinancialLiabilitiesAtFairValueThroughProfitOrLossThatMeetDefinitionOfHeldForTradingCategoryMemberifrs-full:Level3OfFairValueHierarchyMembersan:LoansAndAdvancesCreditInstitutionsMember2025-12-310000891478san:FinancialAssetsAndLiabilitiesCategoryMemberifrs-full:FinancialLiabilitiesAtFairValueThroughProfitOrLossThatMeetDefinitionOfHeldForTradingCategoryMemberifrs-full:Level2OfFairValueHierarchyMembersan:LoansAndAdvancesCustomersMember2025-12-310000891478san:FinancialAssetsAndLiabilitiesCategoryMemberifrs-full:FinancialLiabilitiesAtFairValueThroughProfitOrLossThatMeetDefinitionOfHeldForTradingCategoryMemberifrs-full:Level3OfFairValueHierarchyMembersan:LoansAndAdvancesCustomersMember2025-12-310000891478san:FinancialAssetsAndLiabilitiesCategoryMemberifrs-full:FinancialLiabilitiesAtFairValueThroughProfitOrLossThatMeetDefinitionOfHeldForTradingCategoryMemberifrs-full:Level2OfFairValueHierarchyMemberifrs-full:DerivativesMember2025-12-310000891478san:FinancialAssetsAndLiabilitiesCategoryMemberifrs-full:FinancialLiabilitiesAtFairValueThroughProfitOrLossThatMeetDefinitionOfHeldForTradingCategoryMemberifrs-full:Level3OfFairValueHierarchyMemberifrs-full:DerivativesMember2025-12-310000891478san:FinancialAssetsAndLiabilitiesCategoryMemberifrs-full:FinancialLiabilitiesAtFairValueThroughProfitOrLossThatMeetDefinitionOfHeldForTradingCategoryMemberifrs-full:Level2OfFairValueHierarchyMemberifrs-full:SwapContractMember2025-12-310000891478san:FinancialAssetsAndLiabilitiesCategoryMemberifrs-full:FinancialLiabilitiesAtFairValueThroughProfitOrLossThatMeetDefinitionOfHeldForTradingCategoryMemberifrs-full:Level3OfFairValueHierarchyMemberifrs-full:SwapContractMember2025-12-310000891478san:FinancialAssetsAndLiabilitiesCategoryMemberifrs-full:FinancialLiabilitiesAtFairValueThroughProfitOrLossThatMeetDefinitionOfHeldForTradingCategoryMemberifrs-full:Level2OfFairValueHierarchyMembersan:ExchangeRateOptionMember2025-12-310000891478san:FinancialAssetsAndLiabilitiesCategoryMemberifrs-full:FinancialLiabilitiesAtFairValueThroughProfitOrLossThatMeetDefinitionOfHeldForTradingCategoryMemberifrs-full:Level3OfFairValueHierarchyMembersan:ExchangeRateOptionMember2025-12-310000891478san:FinancialAssetsAndLiabilitiesCategoryMemberifrs-full:FinancialLiabilitiesAtFairValueThroughProfitOrLossThatMeetDefinitionOfHeldForTradingCategoryMemberifrs-full:Level2OfFairValueHierarchyMembersan:ForwardsOnInterestRateAndVariableIncomeMember2025-12-310000891478san:FinancialAssetsAndLiabilitiesCategoryMemberifrs-full:FinancialLiabilitiesAtFairValueThroughProfitOrLossThatMeetDefinitionOfHeldForTradingCategoryMemberifrs-full:Level3OfFairValueHierarchyMembersan:ForwardsOnInterestRateAndVariableIncomeMember2025-12-310000891478san:FinancialAssetsAndLiabilitiesCategoryMemberifrs-full:FinancialLiabilitiesAtFairValueThroughProfitOrLossThatMeetDefinitionOfHeldForTradingCategoryMemberifrs-full:Level2OfFairValueHierarchyMembersan:IndexAndSecuritiesOptionsMember2025-12-310000891478san:FinancialAssetsAndLiabilitiesCategoryMemberifrs-full:FinancialLiabilitiesAtFairValueThroughProfitOrLossThatMeetDefinitionOfHeldForTradingCategoryMemberifrs-full:Level3OfFairValueHierarchyMembersan:IndexAndSecuritiesOptionsMember2025-12-310000891478san:FinancialAssetsAndLiabilitiesCategoryMemberifrs-full:FinancialLiabilitiesAtFairValueThroughProfitOrLossThatMeetDefinitionOfHeldForTradingCategoryMemberifrs-full:Level2OfFairValueHierarchyMembersan:InterestRateOptionMember2025-12-310000891478san:FinancialAssetsAndLiabilitiesCategoryMemberifrs-full:FinancialLiabilitiesAtFairValueThroughProfitOrLossThatMeetDefinitionOfHeldForTradingCategoryMemberifrs-full:Level3OfFairValueHierarchyMembersan:InterestRateOptionMember2025-12-310000891478san:FinancialAssetsAndLiabilitiesCategoryMemberifrs-full:FinancialLiabilitiesAtFairValueThroughProfitOrLossThatMeetDefinitionOfHeldForTradingCategoryMemberifrs-full:Level2OfFairValueHierarchyMembersan:OtherDerivativesMember2025-12-310000891478san:FinancialAssetsAndLiabilitiesCategoryMemberifrs-full:FinancialLiabilitiesAtFairValueThroughProfitOrLossThatMeetDefinitionOfHeldForTradingCategoryMemberifrs-full:Level3OfFairValueHierarchyMembersan:OtherDerivativesMember2025-12-310000891478san:FinancialAssetsAndLiabilitiesCategoryMemberifrs-full:FinancialLiabilitiesAtFairValueThroughProfitOrLossThatMeetDefinitionOfHeldForTradingCategoryMemberifrs-full:Level2OfFairValueHierarchyMembersan:ShortPositionsMember2025-12-310000891478san:FinancialAssetsAndLiabilitiesCategoryMemberifrs-full:FinancialLiabilitiesAtFairValueThroughProfitOrLossThatMeetDefinitionOfHeldForTradingCategoryMemberifrs-full:Level3OfFairValueHierarchyMembersan:ShortPositionsMember2025-12-310000891478san:FinancialAssetsAndLiabilitiesCategoryMembersan:DerivativesDesignatedAsHedgingInstrumentsCategoryMemberifrs-full:Level2OfFairValueHierarchyMember2025-12-310000891478san:FinancialAssetsAndLiabilitiesCategoryMembersan:DerivativesDesignatedAsHedgingInstrumentsCategoryMemberifrs-full:Level3OfFairValueHierarchyMember2025-12-310000891478san:FinancialAssetsAndLiabilitiesCategoryMembersan:DerivativesDesignatedAsHedgingInstrumentsCategoryMemberifrs-full:Level2OfFairValueHierarchyMemberifrs-full:SwapContractMember2025-12-310000891478san:FinancialAssetsAndLiabilitiesCategoryMembersan:DerivativesDesignatedAsHedgingInstrumentsCategoryMemberifrs-full:Level3OfFairValueHierarchyMemberifrs-full:SwapContractMember2025-12-310000891478san:FinancialAssetsAndLiabilitiesCategoryMembersan:DerivativesDesignatedAsHedgingInstrumentsCategoryMemberifrs-full:Level2OfFairValueHierarchyMembersan:InterestRateOptionMember2025-12-310000891478san:FinancialAssetsAndLiabilitiesCategoryMembersan:DerivativesDesignatedAsHedgingInstrumentsCategoryMemberifrs-full:Level3OfFairValueHierarchyMembersan:InterestRateOptionMember2025-12-310000891478san:FinancialAssetsAndLiabilitiesCategoryMembersan:DerivativesDesignatedAsHedgingInstrumentsCategoryMemberifrs-full:Level2OfFairValueHierarchyMembersan:OtherDerivativesMember2025-12-310000891478san:FinancialAssetsAndLiabilitiesCategoryMembersan:DerivativesDesignatedAsHedgingInstrumentsCategoryMemberifrs-full:Level3OfFairValueHierarchyMembersan:OtherDerivativesMember2025-12-310000891478san:FinancialAssetsAndLiabilitiesCategoryMemberifrs-full:FinancialLiabilitiesAtFairValueThroughProfitOrLossDesignatedUponInitialRecognitionCategoryMemberifrs-full:Level2OfFairValueHierarchyMember2025-12-310000891478san:FinancialAssetsAndLiabilitiesCategoryMemberifrs-full:FinancialLiabilitiesAtFairValueThroughProfitOrLossDesignatedUponInitialRecognitionCategoryMemberifrs-full:Level3OfFairValueHierarchyMember2025-12-310000891478san:LiabilitiesUnderInsuranceContractsMemberifrs-full:Level2OfFairValueHierarchyMember2025-12-310000891478san:LiabilitiesUnderInsuranceContractsMemberifrs-full:Level3OfFairValueHierarchyMember2025-12-310000891478ifrs-full:Level2OfFairValueHierarchyMember2024-12-310000891478ifrs-full:Level3OfFairValueHierarchyMember2024-12-310000891478ifrs-full:Level2OfFairValueHierarchyMember2023-12-310000891478ifrs-full:Level3OfFairValueHierarchyMember2023-12-310000891478san:FinancialAssetsAndLiabilitiesCategoryMemberifrs-full:FinancialAssetsAtFairValueThroughProfitOrLossClassifiedAsHeldForTradingCategoryMemberifrs-full:Level2OfFairValueHierarchyMember2024-12-310000891478san:FinancialAssetsAndLiabilitiesCategoryMemberifrs-full:FinancialAssetsAtFairValueThroughProfitOrLossClassifiedAsHeldForTradingCategoryMemberifrs-full:Level3OfFairValueHierarchyMember2024-12-310000891478san:FinancialAssetsAndLiabilitiesCategoryMemberifrs-full:FinancialAssetsAtFairValueThroughProfitOrLossClassifiedAsHeldForTradingCategoryMemberifrs-full:Level2OfFairValueHierarchyMember2023-12-310000891478san:FinancialAssetsAndLiabilitiesCategoryMemberifrs-full:FinancialAssetsAtFairValueThroughProfitOrLossClassifiedAsHeldForTradingCategoryMemberifrs-full:Level3OfFairValueHierarchyMember2023-12-310000891478san:FinancialAssetsAndLiabilitiesCategoryMemberifrs-full:FinancialAssetsAtFairValueThroughProfitOrLossClassifiedAsHeldForTradingCategoryMembersan:LoansAndAdvancesCentralBanksMemberifrs-full:Level2OfFairValueHierarchyMember2024-12-310000891478san:FinancialAssetsAndLiabilitiesCategoryMemberifrs-full:FinancialAssetsAtFairValueThroughProfitOrLossClassifiedAsHeldForTradingCategoryMembersan:LoansAndAdvancesCentralBanksMemberifrs-full:Level3OfFairValueHierarchyMember2024-12-310000891478san:FinancialAssetsAndLiabilitiesCategoryMemberifrs-full:FinancialAssetsAtFairValueThroughProfitOrLossClassifiedAsHeldForTradingCategoryMembersan:LoansAndAdvancesCentralBanksMemberifrs-full:Level2OfFairValueHierarchyMember2023-12-310000891478san:FinancialAssetsAndLiabilitiesCategoryMemberifrs-full:FinancialAssetsAtFairValueThroughProfitOrLossClassifiedAsHeldForTradingCategoryMembersan:LoansAndAdvancesCentralBanksMemberifrs-full:Level3OfFairValueHierarchyMember2023-12-310000891478san:FinancialAssetsAndLiabilitiesCategoryMemberifrs-full:FinancialAssetsAtFairValueThroughProfitOrLossClassifiedAsHeldForTradingCategoryMembersan:LoansAndAdvancesCreditInstitutionsMemberifrs-full:Level2OfFairValueHierarchyMember2024-12-310000891478san:FinancialAssetsAndLiabilitiesCategoryMemberifrs-full:FinancialAssetsAtFairValueThroughProfitOrLossClassifiedAsHeldForTradingCategoryMembersan:LoansAndAdvancesCreditInstitutionsMemberifrs-full:Level3OfFairValueHierarchyMember2024-12-310000891478san:FinancialAssetsAndLiabilitiesCategoryMemberifrs-full:FinancialAssetsAtFairValueThroughProfitOrLossClassifiedAsHeldForTradingCategoryMembersan:LoansAndAdvancesCreditInstitutionsMemberifrs-full:Level2OfFairValueHierarchyMember2023-12-310000891478san:FinancialAssetsAndLiabilitiesCategoryMemberifrs-full:FinancialAssetsAtFairValueThroughProfitOrLossClassifiedAsHeldForTradingCategoryMembersan:LoansAndAdvancesCreditInstitutionsMemberifrs-full:Level3OfFairValueHierarchyMember2023-12-310000891478san:FinancialAssetsAndLiabilitiesCategoryMemberifrs-full:FinancialAssetsAtFairValueThroughProfitOrLossClassifiedAsHeldForTradingCategoryMembersan:LoansAndAdvancesCustomersMemberifrs-full:Level2OfFairValueHierarchyMember2024-12-310000891478san:FinancialAssetsAndLiabilitiesCategoryMemberifrs-full:FinancialAssetsAtFairValueThroughProfitOrLossClassifiedAsHeldForTradingCategoryMembersan:LoansAndAdvancesCustomersMemberifrs-full:Level3OfFairValueHierarchyMember2024-12-310000891478san:FinancialAssetsAndLiabilitiesCategoryMemberifrs-full:FinancialAssetsAtFairValueThroughProfitOrLossClassifiedAsHeldForTradingCategoryMembersan:LoansAndAdvancesCustomersMemberifrs-full:Level2OfFairValueHierarchyMember2023-12-310000891478san:FinancialAssetsAndLiabilitiesCategoryMemberifrs-full:FinancialAssetsAtFairValueThroughProfitOrLossClassifiedAsHeldForTradingCategoryMembersan:LoansAndAdvancesCustomersMemberifrs-full:Level3OfFairValueHierarchyMember2023-12-310000891478san:FinancialAssetsAndLiabilitiesCategoryMemberifrs-full:FinancialAssetsAtFairValueThroughProfitOrLossClassifiedAsHeldForTradingCategoryMembersan:DebtAndEquityInstrumentsMemberifrs-full:Level2OfFairValueHierarchyMember2024-12-310000891478san:FinancialAssetsAndLiabilitiesCategoryMemberifrs-full:FinancialAssetsAtFairValueThroughProfitOrLossClassifiedAsHeldForTradingCategoryMembersan:DebtAndEquityInstrumentsMemberifrs-full:Level3OfFairValueHierarchyMember2024-12-310000891478san:FinancialAssetsAndLiabilitiesCategoryMemberifrs-full:FinancialAssetsAtFairValueThroughProfitOrLossClassifiedAsHeldForTradingCategoryMembersan:DebtAndEquityInstrumentsMemberifrs-full:Level2OfFairValueHierarchyMember2023-12-310000891478san:FinancialAssetsAndLiabilitiesCategoryMemberifrs-full:FinancialAssetsAtFairValueThroughProfitOrLossClassifiedAsHeldForTradingCategoryMembersan:DebtAndEquityInstrumentsMemberifrs-full:Level3OfFairValueHierarchyMember2023-12-310000891478san:FinancialAssetsAndLiabilitiesCategoryMemberifrs-full:FinancialAssetsAtFairValueThroughProfitOrLossClassifiedAsHeldForTradingCategoryMemberifrs-full:DerivativesMemberifrs-full:Level2OfFairValueHierarchyMember2024-12-310000891478san:FinancialAssetsAndLiabilitiesCategoryMemberifrs-full:FinancialAssetsAtFairValueThroughProfitOrLossClassifiedAsHeldForTradingCategoryMemberifrs-full:DerivativesMemberifrs-full:Level3OfFairValueHierarchyMember2024-12-310000891478san:FinancialAssetsAndLiabilitiesCategoryMemberifrs-full:FinancialAssetsAtFairValueThroughProfitOrLossClassifiedAsHeldForTradingCategoryMemberifrs-full:DerivativesMemberifrs-full:Level2OfFairValueHierarchyMember2023-12-310000891478san:FinancialAssetsAndLiabilitiesCategoryMemberifrs-full:FinancialAssetsAtFairValueThroughProfitOrLossClassifiedAsHeldForTradingCategoryMemberifrs-full:DerivativesMemberifrs-full:Level3OfFairValueHierarchyMember2023-12-310000891478san:FinancialAssetsAndLiabilitiesCategoryMemberifrs-full:FinancialAssetsAtFairValueThroughProfitOrLossClassifiedAsHeldForTradingCategoryMemberifrs-full:SwapContractMemberifrs-full:Level2OfFairValueHierarchyMember2024-12-310000891478san:FinancialAssetsAndLiabilitiesCategoryMemberifrs-full:FinancialAssetsAtFairValueThroughProfitOrLossClassifiedAsHeldForTradingCategoryMemberifrs-full:SwapContractMemberifrs-full:Level3OfFairValueHierarchyMember2024-12-310000891478san:FinancialAssetsAndLiabilitiesCategoryMemberifrs-full:FinancialAssetsAtFairValueThroughProfitOrLossClassifiedAsHeldForTradingCategoryMemberifrs-full:SwapContractMemberifrs-full:Level2OfFairValueHierarchyMember2023-12-310000891478san:FinancialAssetsAndLiabilitiesCategoryMemberifrs-full:FinancialAssetsAtFairValueThroughProfitOrLossClassifiedAsHeldForTradingCategoryMemberifrs-full:SwapContractMemberifrs-full:Level3OfFairValueHierarchyMember2023-12-310000891478san:FinancialAssetsAndLiabilitiesCategoryMemberifrs-full:FinancialAssetsAtFairValueThroughProfitOrLossClassifiedAsHeldForTradingCategoryMembersan:ExchangeRateOptionMemberifrs-full:Level2OfFairValueHierarchyMember2024-12-310000891478san:FinancialAssetsAndLiabilitiesCategoryMemberifrs-full:FinancialAssetsAtFairValueThroughProfitOrLossClassifiedAsHeldForTradingCategoryMembersan:ExchangeRateOptionMemberifrs-full:Level3OfFairValueHierarchyMember2024-12-310000891478san:FinancialAssetsAndLiabilitiesCategoryMemberifrs-full:FinancialAssetsAtFairValueThroughProfitOrLossClassifiedAsHeldForTradingCategoryMembersan:ExchangeRateOptionMemberifrs-full:Level2OfFairValueHierarchyMember2023-12-310000891478san:FinancialAssetsAndLiabilitiesCategoryMemberifrs-full:FinancialAssetsAtFairValueThroughProfitOrLossClassifiedAsHeldForTradingCategoryMembersan:ExchangeRateOptionMemberifrs-full:Level3OfFairValueHierarchyMember2023-12-310000891478san:FinancialAssetsAndLiabilitiesCategoryMemberifrs-full:FinancialAssetsAtFairValueThroughProfitOrLossClassifiedAsHeldForTradingCategoryMembersan:InterestRateOptionMemberifrs-full:Level2OfFairValueHierarchyMember2024-12-310000891478san:FinancialAssetsAndLiabilitiesCategoryMemberifrs-full:FinancialAssetsAtFairValueThroughProfitOrLossClassifiedAsHeldForTradingCategoryMembersan:InterestRateOptionMemberifrs-full:Level3OfFairValueHierarchyMember2024-12-310000891478san:FinancialAssetsAndLiabilitiesCategoryMemberifrs-full:FinancialAssetsAtFairValueThroughProfitOrLossClassifiedAsHeldForTradingCategoryMembersan:InterestRateOptionMemberifrs-full:Level2OfFairValueHierarchyMember2023-12-310000891478san:FinancialAssetsAndLiabilitiesCategoryMemberifrs-full:FinancialAssetsAtFairValueThroughProfitOrLossClassifiedAsHeldForTradingCategoryMembersan:InterestRateOptionMemberifrs-full:Level3OfFairValueHierarchyMember2023-12-310000891478san:FinancialAssetsAndLiabilitiesCategoryMemberifrs-full:FinancialAssetsAtFairValueThroughProfitOrLossClassifiedAsHeldForTradingCategoryMembersan:InterestRateForwardsMemberifrs-full:Level2OfFairValueHierarchyMember2024-12-310000891478san:FinancialAssetsAndLiabilitiesCategoryMemberifrs-full:FinancialAssetsAtFairValueThroughProfitOrLossClassifiedAsHeldForTradingCategoryMembersan:InterestRateForwardsMemberifrs-full:Level3OfFairValueHierarchyMember2024-12-310000891478san:FinancialAssetsAndLiabilitiesCategoryMemberifrs-full:FinancialAssetsAtFairValueThroughProfitOrLossClassifiedAsHeldForTradingCategoryMembersan:InterestRateForwardsMemberifrs-full:Level2OfFairValueHierarchyMember2023-12-310000891478san:FinancialAssetsAndLiabilitiesCategoryMemberifrs-full:FinancialAssetsAtFairValueThroughProfitOrLossClassifiedAsHeldForTradingCategoryMembersan:InterestRateForwardsMemberifrs-full:Level3OfFairValueHierarchyMember2023-12-310000891478san:FinancialAssetsAndLiabilitiesCategoryMemberifrs-full:FinancialAssetsAtFairValueThroughProfitOrLossClassifiedAsHeldForTradingCategoryMembersan:IndexAndSecuritiesOptionsMemberifrs-full:Level2OfFairValueHierarchyMember2024-12-310000891478san:FinancialAssetsAndLiabilitiesCategoryMemberifrs-full:FinancialAssetsAtFairValueThroughProfitOrLossClassifiedAsHeldForTradingCategoryMembersan:IndexAndSecuritiesOptionsMemberifrs-full:Level3OfFairValueHierarchyMember2024-12-310000891478san:FinancialAssetsAndLiabilitiesCategoryMemberifrs-full:FinancialAssetsAtFairValueThroughProfitOrLossClassifiedAsHeldForTradingCategoryMembersan:IndexAndSecuritiesOptionsMemberifrs-full:Level2OfFairValueHierarchyMember2023-12-310000891478san:FinancialAssetsAndLiabilitiesCategoryMemberifrs-full:FinancialAssetsAtFairValueThroughProfitOrLossClassifiedAsHeldForTradingCategoryMembersan:IndexAndSecuritiesOptionsMemberifrs-full:Level3OfFairValueHierarchyMember2023-12-310000891478san:FinancialAssetsAndLiabilitiesCategoryMemberifrs-full:FinancialAssetsAtFairValueThroughProfitOrLossClassifiedAsHeldForTradingCategoryMembersan:OtherDerivativesMemberifrs-full:Level2OfFairValueHierarchyMember2024-12-310000891478san:FinancialAssetsAndLiabilitiesCategoryMemberifrs-full:FinancialAssetsAtFairValueThroughProfitOrLossClassifiedAsHeldForTradingCategoryMembersan:OtherDerivativesMemberifrs-full:Level3OfFairValueHierarchyMember2024-12-310000891478san:FinancialAssetsAndLiabilitiesCategoryMemberifrs-full:FinancialAssetsAtFairValueThroughProfitOrLossClassifiedAsHeldForTradingCategoryMembersan:OtherDerivativesMemberifrs-full:Level2OfFairValueHierarchyMember2023-12-310000891478san:FinancialAssetsAndLiabilitiesCategoryMemberifrs-full:FinancialAssetsAtFairValueThroughProfitOrLossClassifiedAsHeldForTradingCategoryMembersan:OtherDerivativesMemberifrs-full:Level3OfFairValueHierarchyMember2023-12-310000891478san:FinancialAssetsAndLiabilitiesCategoryMembersan:DerivativesDesignatedAsHedgingInstrumentsCategoryMemberifrs-full:Level2OfFairValueHierarchyMember2024-12-310000891478san:FinancialAssetsAndLiabilitiesCategoryMembersan:DerivativesDesignatedAsHedgingInstrumentsCategoryMemberifrs-full:Level3OfFairValueHierarchyMember2024-12-310000891478san:FinancialAssetsAndLiabilitiesCategoryMembersan:DerivativesDesignatedAsHedgingInstrumentsCategoryMemberifrs-full:Level2OfFairValueHierarchyMember2023-12-310000891478san:FinancialAssetsAndLiabilitiesCategoryMembersan:DerivativesDesignatedAsHedgingInstrumentsCategoryMemberifrs-full:Level3OfFairValueHierarchyMember2023-12-310000891478san:FinancialAssetsAndLiabilitiesCategoryMembersan:DerivativesDesignatedAsHedgingInstrumentsCategoryMemberifrs-full:SwapContractMemberifrs-full:Level2OfFairValueHierarchyMember2024-12-310000891478san:FinancialAssetsAndLiabilitiesCategoryMembersan:DerivativesDesignatedAsHedgingInstrumentsCategoryMemberifrs-full:SwapContractMemberifrs-full:Level3OfFairValueHierarchyMember2024-12-310000891478san:FinancialAssetsAndLiabilitiesCategoryMembersan:DerivativesDesignatedAsHedgingInstrumentsCategoryMemberifrs-full:SwapContractMemberifrs-full:Level2OfFairValueHierarchyMember2023-12-310000891478san:FinancialAssetsAndLiabilitiesCategoryMembersan:DerivativesDesignatedAsHedgingInstrumentsCategoryMemberifrs-full:SwapContractMemberifrs-full:Level3OfFairValueHierarchyMember2023-12-310000891478san:FinancialAssetsAndLiabilitiesCategoryMembersan:DerivativesDesignatedAsHedgingInstrumentsCategoryMembersan:InterestRateOptionMemberifrs-full:Level2OfFairValueHierarchyMember2024-12-310000891478san:FinancialAssetsAndLiabilitiesCategoryMembersan:DerivativesDesignatedAsHedgingInstrumentsCategoryMembersan:InterestRateOptionMemberifrs-full:Level3OfFairValueHierarchyMember2024-12-310000891478san:FinancialAssetsAndLiabilitiesCategoryMembersan:DerivativesDesignatedAsHedgingInstrumentsCategoryMembersan:InterestRateOptionMemberifrs-full:Level2OfFairValueHierarchyMember2023-12-310000891478san:FinancialAssetsAndLiabilitiesCategoryMembersan:DerivativesDesignatedAsHedgingInstrumentsCategoryMembersan:InterestRateOptionMemberifrs-full:Level3OfFairValueHierarchyMember2023-12-310000891478san:FinancialAssetsAndLiabilitiesCategoryMembersan:DerivativesDesignatedAsHedgingInstrumentsCategoryMembersan:OtherDerivativesMemberifrs-full:Level2OfFairValueHierarchyMember2024-12-310000891478san:FinancialAssetsAndLiabilitiesCategoryMembersan:DerivativesDesignatedAsHedgingInstrumentsCategoryMembersan:OtherDerivativesMemberifrs-full:Level3OfFairValueHierarchyMember2024-12-310000891478san:FinancialAssetsAndLiabilitiesCategoryMembersan:DerivativesDesignatedAsHedgingInstrumentsCategoryMembersan:OtherDerivativesMemberifrs-full:Level2OfFairValueHierarchyMember2023-12-310000891478san:FinancialAssetsAndLiabilitiesCategoryMembersan:DerivativesDesignatedAsHedgingInstrumentsCategoryMembersan:OtherDerivativesMemberifrs-full:Level3OfFairValueHierarchyMember2023-12-310000891478san:FinancialAssetsAndLiabilitiesCategoryMemberifrs-full:FinancialAssetsAtFairValueThroughProfitOrLossMandatorilyMeasuredAtFairValueCategoryMemberifrs-full:Level2OfFairValueHierarchyMember2024-12-310000891478san:FinancialAssetsAndLiabilitiesCategoryMemberifrs-full:FinancialAssetsAtFairValueThroughProfitOrLossMandatorilyMeasuredAtFairValueCategoryMemberifrs-full:Level3OfFairValueHierarchyMember2024-12-310000891478san:FinancialAssetsAndLiabilitiesCategoryMemberifrs-full:FinancialAssetsAtFairValueThroughProfitOrLossMandatorilyMeasuredAtFairValueCategoryMemberifrs-full:Level2OfFairValueHierarchyMember2023-12-310000891478san:FinancialAssetsAndLiabilitiesCategoryMemberifrs-full:FinancialAssetsAtFairValueThroughProfitOrLossMandatorilyMeasuredAtFairValueCategoryMemberifrs-full:Level3OfFairValueHierarchyMember2023-12-310000891478san:FinancialAssetsAndLiabilitiesCategoryMemberifrs-full:FinancialAssetsAtFairValueThroughProfitOrLossMandatorilyMeasuredAtFairValueCategoryMemberifrs-full:EquityInvestmentsMemberifrs-full:Level2OfFairValueHierarchyMember2024-12-310000891478san:FinancialAssetsAndLiabilitiesCategoryMemberifrs-full:FinancialAssetsAtFairValueThroughProfitOrLossMandatorilyMeasuredAtFairValueCategoryMemberifrs-full:EquityInvestmentsMemberifrs-full:Level3OfFairValueHierarchyMember2024-12-310000891478san:FinancialAssetsAndLiabilitiesCategoryMemberifrs-full:FinancialAssetsAtFairValueThroughProfitOrLossMandatorilyMeasuredAtFairValueCategoryMemberifrs-full:EquityInvestmentsMemberifrs-full:Level2OfFairValueHierarchyMember2023-12-310000891478san:FinancialAssetsAndLiabilitiesCategoryMemberifrs-full:FinancialAssetsAtFairValueThroughProfitOrLossMandatorilyMeasuredAtFairValueCategoryMemberifrs-full:EquityInvestmentsMemberifrs-full:Level3OfFairValueHierarchyMember2023-12-310000891478san:FinancialAssetsAndLiabilitiesCategoryMemberifrs-full:FinancialAssetsAtFairValueThroughProfitOrLossMandatorilyMeasuredAtFairValueCategoryMemberifrs-full:DebtSecuritiesMemberifrs-full:Level2OfFairValueHierarchyMember2024-12-310000891478san:FinancialAssetsAndLiabilitiesCategoryMemberifrs-full:FinancialAssetsAtFairValueThroughProfitOrLossMandatorilyMeasuredAtFairValueCategoryMemberifrs-full:DebtSecuritiesMemberifrs-full:Level3OfFairValueHierarchyMember2024-12-310000891478san:FinancialAssetsAndLiabilitiesCategoryMemberifrs-full:FinancialAssetsAtFairValueThroughProfitOrLossMandatorilyMeasuredAtFairValueCategoryMemberifrs-full:DebtSecuritiesMemberifrs-full:Level2OfFairValueHierarchyMember2023-12-310000891478san:FinancialAssetsAndLiabilitiesCategoryMemberifrs-full:FinancialAssetsAtFairValueThroughProfitOrLossMandatorilyMeasuredAtFairValueCategoryMemberifrs-full:DebtSecuritiesMemberifrs-full:Level3OfFairValueHierarchyMember2023-12-310000891478san:FinancialAssetsAndLiabilitiesCategoryMemberifrs-full:FinancialAssetsAtFairValueThroughProfitOrLossMandatorilyMeasuredAtFairValueCategoryMembersan:LoansAndAdvancesMemberifrs-full:Level2OfFairValueHierarchyMember2024-12-310000891478san:FinancialAssetsAndLiabilitiesCategoryMemberifrs-full:FinancialAssetsAtFairValueThroughProfitOrLossMandatorilyMeasuredAtFairValueCategoryMembersan:LoansAndAdvancesMemberifrs-full:Level3OfFairValueHierarchyMember2024-12-310000891478san:FinancialAssetsAndLiabilitiesCategoryMemberifrs-full:FinancialAssetsAtFairValueThroughProfitOrLossMandatorilyMeasuredAtFairValueCategoryMembersan:LoansAndAdvancesMemberifrs-full:Level2OfFairValueHierarchyMember2023-12-310000891478san:FinancialAssetsAndLiabilitiesCategoryMemberifrs-full:FinancialAssetsAtFairValueThroughProfitOrLossMandatorilyMeasuredAtFairValueCategoryMembersan:LoansAndAdvancesMemberifrs-full:Level3OfFairValueHierarchyMember2023-12-310000891478san:FinancialAssetsAndLiabilitiesCategoryMemberifrs-full:FinancialAssetsAtFairValueThroughProfitOrLossDesignatedUponInitialRecognitionCategoryMemberifrs-full:Level2OfFairValueHierarchyMember2024-12-310000891478san:FinancialAssetsAndLiabilitiesCategoryMemberifrs-full:FinancialAssetsAtFairValueThroughProfitOrLossDesignatedUponInitialRecognitionCategoryMemberifrs-full:Level3OfFairValueHierarchyMember2024-12-310000891478san:FinancialAssetsAndLiabilitiesCategoryMemberifrs-full:FinancialAssetsAtFairValueThroughProfitOrLossDesignatedUponInitialRecognitionCategoryMemberifrs-full:Level2OfFairValueHierarchyMember2023-12-310000891478san:FinancialAssetsAndLiabilitiesCategoryMemberifrs-full:FinancialAssetsAtFairValueThroughProfitOrLossDesignatedUponInitialRecognitionCategoryMemberifrs-full:Level3OfFairValueHierarchyMember2023-12-310000891478san:FinancialAssetsAndLiabilitiesCategoryMemberifrs-full:FinancialAssetsAtFairValueThroughProfitOrLossDesignatedUponInitialRecognitionCategoryMembersan:LoansAndAdvancesCreditInstitutionsMemberifrs-full:Level2OfFairValueHierarchyMember2024-12-310000891478san:FinancialAssetsAndLiabilitiesCategoryMemberifrs-full:FinancialAssetsAtFairValueThroughProfitOrLossDesignatedUponInitialRecognitionCategoryMembersan:LoansAndAdvancesCreditInstitutionsMemberifrs-full:Level3OfFairValueHierarchyMember2024-12-310000891478san:FinancialAssetsAndLiabilitiesCategoryMemberifrs-full:FinancialAssetsAtFairValueThroughProfitOrLossDesignatedUponInitialRecognitionCategoryMembersan:LoansAndAdvancesCreditInstitutionsMemberifrs-full:Level2OfFairValueHierarchyMember2023-12-310000891478san:FinancialAssetsAndLiabilitiesCategoryMemberifrs-full:FinancialAssetsAtFairValueThroughProfitOrLossDesignatedUponInitialRecognitionCategoryMembersan:LoansAndAdvancesCreditInstitutionsMemberifrs-full:Level3OfFairValueHierarchyMember2023-12-310000891478san:FinancialAssetsAndLiabilitiesCategoryMemberifrs-full:FinancialAssetsAtFairValueThroughProfitOrLossDesignatedUponInitialRecognitionCategoryMembersan:LoansAndAdvancesCustomersMemberifrs-full:Level2OfFairValueHierarchyMember2024-12-310000891478san:FinancialAssetsAndLiabilitiesCategoryMemberifrs-full:FinancialAssetsAtFairValueThroughProfitOrLossDesignatedUponInitialRecognitionCategoryMembersan:LoansAndAdvancesCustomersMemberifrs-full:Level3OfFairValueHierarchyMember2024-12-310000891478san:FinancialAssetsAndLiabilitiesCategoryMemberifrs-full:FinancialAssetsAtFairValueThroughProfitOrLossDesignatedUponInitialRecognitionCategoryMembersan:LoansAndAdvancesCustomersMemberifrs-full:Level2OfFairValueHierarchyMember2023-12-310000891478san:FinancialAssetsAndLiabilitiesCategoryMemberifrs-full:FinancialAssetsAtFairValueThroughProfitOrLossDesignatedUponInitialRecognitionCategoryMembersan:LoansAndAdvancesCustomersMemberifrs-full:Level3OfFairValueHierarchyMember2023-12-310000891478san:FinancialAssetsAndLiabilitiesCategoryMemberifrs-full:FinancialAssetsAtFairValueThroughProfitOrLossDesignatedUponInitialRecognitionCategoryMemberifrs-full:DebtSecuritiesMemberifrs-full:Level2OfFairValueHierarchyMember2024-12-310000891478san:FinancialAssetsAndLiabilitiesCategoryMemberifrs-full:FinancialAssetsAtFairValueThroughProfitOrLossDesignatedUponInitialRecognitionCategoryMemberifrs-full:DebtSecuritiesMemberifrs-full:Level3OfFairValueHierarchyMember2024-12-310000891478san:FinancialAssetsAndLiabilitiesCategoryMemberifrs-full:FinancialAssetsAtFairValueThroughProfitOrLossDesignatedUponInitialRecognitionCategoryMemberifrs-full:DebtSecuritiesMemberifrs-full:Level2OfFairValueHierarchyMember2023-12-310000891478san:FinancialAssetsAndLiabilitiesCategoryMemberifrs-full:FinancialAssetsAtFairValueThroughProfitOrLossDesignatedUponInitialRecognitionCategoryMemberifrs-full:DebtSecuritiesMemberifrs-full:Level3OfFairValueHierarchyMember2023-12-310000891478san:FinancialAssetsAndLiabilitiesCategoryMemberifrs-full:FinancialAssetsAtFairValueThroughOtherComprehensiveIncomeCategoryMemberifrs-full:Level2OfFairValueHierarchyMember2024-12-310000891478san:FinancialAssetsAndLiabilitiesCategoryMemberifrs-full:FinancialAssetsAtFairValueThroughOtherComprehensiveIncomeCategoryMemberifrs-full:Level3OfFairValueHierarchyMember2024-12-310000891478san:FinancialAssetsAndLiabilitiesCategoryMemberifrs-full:FinancialAssetsAtFairValueThroughOtherComprehensiveIncomeCategoryMemberifrs-full:Level2OfFairValueHierarchyMember2023-12-310000891478san:FinancialAssetsAndLiabilitiesCategoryMemberifrs-full:FinancialAssetsAtFairValueThroughOtherComprehensiveIncomeCategoryMemberifrs-full:Level3OfFairValueHierarchyMember2023-12-310000891478san:FinancialAssetsAndLiabilitiesCategoryMemberifrs-full:FinancialAssetsAtFairValueThroughOtherComprehensiveIncomeCategoryMemberifrs-full:EquityInvestmentsMemberifrs-full:Level2OfFairValueHierarchyMember2024-12-310000891478san:FinancialAssetsAndLiabilitiesCategoryMemberifrs-full:FinancialAssetsAtFairValueThroughOtherComprehensiveIncomeCategoryMemberifrs-full:EquityInvestmentsMemberifrs-full:Level3OfFairValueHierarchyMember2024-12-310000891478san:FinancialAssetsAndLiabilitiesCategoryMemberifrs-full:FinancialAssetsAtFairValueThroughOtherComprehensiveIncomeCategoryMemberifrs-full:EquityInvestmentsMemberifrs-full:Level2OfFairValueHierarchyMember2023-12-310000891478san:FinancialAssetsAndLiabilitiesCategoryMemberifrs-full:FinancialAssetsAtFairValueThroughOtherComprehensiveIncomeCategoryMemberifrs-full:EquityInvestmentsMemberifrs-full:Level3OfFairValueHierarchyMember2023-12-310000891478san:FinancialAssetsAndLiabilitiesCategoryMemberifrs-full:FinancialAssetsAtFairValueThroughOtherComprehensiveIncomeCategoryMemberifrs-full:DebtSecuritiesMemberifrs-full:Level2OfFairValueHierarchyMember2024-12-310000891478san:FinancialAssetsAndLiabilitiesCategoryMemberifrs-full:FinancialAssetsAtFairValueThroughOtherComprehensiveIncomeCategoryMemberifrs-full:DebtSecuritiesMemberifrs-full:Level3OfFairValueHierarchyMember2024-12-310000891478san:FinancialAssetsAndLiabilitiesCategoryMemberifrs-full:FinancialAssetsAtFairValueThroughOtherComprehensiveIncomeCategoryMemberifrs-full:DebtSecuritiesMemberifrs-full:Level2OfFairValueHierarchyMember2023-12-310000891478san:FinancialAssetsAndLiabilitiesCategoryMemberifrs-full:FinancialAssetsAtFairValueThroughOtherComprehensiveIncomeCategoryMemberifrs-full:DebtSecuritiesMemberifrs-full:Level3OfFairValueHierarchyMember2023-12-310000891478san:FinancialAssetsAndLiabilitiesCategoryMemberifrs-full:FinancialAssetsAtFairValueThroughOtherComprehensiveIncomeCategoryMembersan:LoansAndAdvancesMemberifrs-full:Level2OfFairValueHierarchyMember2024-12-310000891478san:FinancialAssetsAndLiabilitiesCategoryMemberifrs-full:FinancialAssetsAtFairValueThroughOtherComprehensiveIncomeCategoryMembersan:LoansAndAdvancesMemberifrs-full:Level3OfFairValueHierarchyMember2024-12-310000891478san:FinancialAssetsAndLiabilitiesCategoryMemberifrs-full:FinancialAssetsAtFairValueThroughOtherComprehensiveIncomeCategoryMembersan:LoansAndAdvancesMemberifrs-full:Level2OfFairValueHierarchyMember2023-12-310000891478san:FinancialAssetsAndLiabilitiesCategoryMemberifrs-full:FinancialAssetsAtFairValueThroughOtherComprehensiveIncomeCategoryMembersan:LoansAndAdvancesMemberifrs-full:Level3OfFairValueHierarchyMember2023-12-310000891478san:FinancialAssetsAndLiabilitiesCategoryMemberifrs-full:FinancialLiabilitiesAtFairValueThroughProfitOrLossThatMeetDefinitionOfHeldForTradingCategoryMemberifrs-full:Level2OfFairValueHierarchyMember2024-12-310000891478san:FinancialAssetsAndLiabilitiesCategoryMemberifrs-full:FinancialLiabilitiesAtFairValueThroughProfitOrLossThatMeetDefinitionOfHeldForTradingCategoryMemberifrs-full:Level3OfFairValueHierarchyMember2024-12-310000891478san:FinancialAssetsAndLiabilitiesCategoryMemberifrs-full:FinancialLiabilitiesAtFairValueThroughProfitOrLossThatMeetDefinitionOfHeldForTradingCategoryMemberifrs-full:Level2OfFairValueHierarchyMember2023-12-310000891478san:FinancialAssetsAndLiabilitiesCategoryMemberifrs-full:FinancialLiabilitiesAtFairValueThroughProfitOrLossThatMeetDefinitionOfHeldForTradingCategoryMemberifrs-full:Level3OfFairValueHierarchyMember2023-12-310000891478san:FinancialAssetsAndLiabilitiesCategoryMemberifrs-full:FinancialLiabilitiesAtFairValueThroughProfitOrLossThatMeetDefinitionOfHeldForTradingCategoryMemberifrs-full:Level2OfFairValueHierarchyMembersan:LoansAndAdvancesCentralBanksMember2024-12-310000891478san:FinancialAssetsAndLiabilitiesCategoryMemberifrs-full:FinancialLiabilitiesAtFairValueThroughProfitOrLossThatMeetDefinitionOfHeldForTradingCategoryMemberifrs-full:Level3OfFairValueHierarchyMembersan:LoansAndAdvancesCentralBanksMember2024-12-310000891478san:FinancialAssetsAndLiabilitiesCategoryMemberifrs-full:FinancialLiabilitiesAtFairValueThroughProfitOrLossThatMeetDefinitionOfHeldForTradingCategoryMemberifrs-full:Level2OfFairValueHierarchyMembersan:LoansAndAdvancesCentralBanksMember2023-12-310000891478san:FinancialAssetsAndLiabilitiesCategoryMemberifrs-full:FinancialLiabilitiesAtFairValueThroughProfitOrLossThatMeetDefinitionOfHeldForTradingCategoryMemberifrs-full:Level3OfFairValueHierarchyMembersan:LoansAndAdvancesCentralBanksMember2023-12-310000891478san:FinancialAssetsAndLiabilitiesCategoryMemberifrs-full:FinancialLiabilitiesAtFairValueThroughProfitOrLossThatMeetDefinitionOfHeldForTradingCategoryMemberifrs-full:Level2OfFairValueHierarchyMembersan:LoansAndAdvancesCreditInstitutionsMember2024-12-310000891478san:FinancialAssetsAndLiabilitiesCategoryMemberifrs-full:FinancialLiabilitiesAtFairValueThroughProfitOrLossThatMeetDefinitionOfHeldForTradingCategoryMemberifrs-full:Level3OfFairValueHierarchyMembersan:LoansAndAdvancesCreditInstitutionsMember2024-12-310000891478san:FinancialAssetsAndLiabilitiesCategoryMemberifrs-full:FinancialLiabilitiesAtFairValueThroughProfitOrLossThatMeetDefinitionOfHeldForTradingCategoryMemberifrs-full:Level2OfFairValueHierarchyMembersan:LoansAndAdvancesCreditInstitutionsMember2023-12-310000891478san:FinancialAssetsAndLiabilitiesCategoryMemberifrs-full:FinancialLiabilitiesAtFairValueThroughProfitOrLossThatMeetDefinitionOfHeldForTradingCategoryMemberifrs-full:Level3OfFairValueHierarchyMembersan:LoansAndAdvancesCreditInstitutionsMember2023-12-310000891478san:FinancialAssetsAndLiabilitiesCategoryMemberifrs-full:FinancialLiabilitiesAtFairValueThroughProfitOrLossThatMeetDefinitionOfHeldForTradingCategoryMemberifrs-full:Level2OfFairValueHierarchyMembersan:LoansAndAdvancesCustomersMember2024-12-310000891478san:FinancialAssetsAndLiabilitiesCategoryMemberifrs-full:FinancialLiabilitiesAtFairValueThroughProfitOrLossThatMeetDefinitionOfHeldForTradingCategoryMemberifrs-full:Level3OfFairValueHierarchyMembersan:LoansAndAdvancesCustomersMember2024-12-310000891478san:FinancialAssetsAndLiabilitiesCategoryMemberifrs-full:FinancialLiabilitiesAtFairValueThroughProfitOrLossThatMeetDefinitionOfHeldForTradingCategoryMemberifrs-full:Level2OfFairValueHierarchyMembersan:LoansAndAdvancesCustomersMember2023-12-310000891478san:FinancialAssetsAndLiabilitiesCategoryMemberifrs-full:FinancialLiabilitiesAtFairValueThroughProfitOrLossThatMeetDefinitionOfHeldForTradingCategoryMemberifrs-full:Level3OfFairValueHierarchyMembersan:LoansAndAdvancesCustomersMember2023-12-310000891478san:FinancialAssetsAndLiabilitiesCategoryMemberifrs-full:FinancialLiabilitiesAtFairValueThroughProfitOrLossThatMeetDefinitionOfHeldForTradingCategoryMemberifrs-full:Level2OfFairValueHierarchyMemberifrs-full:DerivativesMember2024-12-310000891478san:FinancialAssetsAndLiabilitiesCategoryMemberifrs-full:FinancialLiabilitiesAtFairValueThroughProfitOrLossThatMeetDefinitionOfHeldForTradingCategoryMemberifrs-full:Level3OfFairValueHierarchyMemberifrs-full:DerivativesMember2024-12-310000891478san:FinancialAssetsAndLiabilitiesCategoryMemberifrs-full:FinancialLiabilitiesAtFairValueThroughProfitOrLossThatMeetDefinitionOfHeldForTradingCategoryMemberifrs-full:Level2OfFairValueHierarchyMemberifrs-full:DerivativesMember2023-12-310000891478san:FinancialAssetsAndLiabilitiesCategoryMemberifrs-full:FinancialLiabilitiesAtFairValueThroughProfitOrLossThatMeetDefinitionOfHeldForTradingCategoryMemberifrs-full:Level3OfFairValueHierarchyMemberifrs-full:DerivativesMember2023-12-310000891478san:FinancialAssetsAndLiabilitiesCategoryMemberifrs-full:FinancialLiabilitiesAtFairValueThroughProfitOrLossThatMeetDefinitionOfHeldForTradingCategoryMemberifrs-full:Level2OfFairValueHierarchyMemberifrs-full:SwapContractMember2024-12-310000891478san:FinancialAssetsAndLiabilitiesCategoryMemberifrs-full:FinancialLiabilitiesAtFairValueThroughProfitOrLossThatMeetDefinitionOfHeldForTradingCategoryMemberifrs-full:Level3OfFairValueHierarchyMemberifrs-full:SwapContractMember2024-12-310000891478san:FinancialAssetsAndLiabilitiesCategoryMemberifrs-full:FinancialLiabilitiesAtFairValueThroughProfitOrLossThatMeetDefinitionOfHeldForTradingCategoryMemberifrs-full:Level2OfFairValueHierarchyMemberifrs-full:SwapContractMember2023-12-310000891478san:FinancialAssetsAndLiabilitiesCategoryMemberifrs-full:FinancialLiabilitiesAtFairValueThroughProfitOrLossThatMeetDefinitionOfHeldForTradingCategoryMemberifrs-full:Level3OfFairValueHierarchyMemberifrs-full:SwapContractMember2023-12-310000891478san:FinancialAssetsAndLiabilitiesCategoryMemberifrs-full:FinancialLiabilitiesAtFairValueThroughProfitOrLossThatMeetDefinitionOfHeldForTradingCategoryMemberifrs-full:Level2OfFairValueHierarchyMembersan:InterestRateOptionMember2024-12-310000891478san:FinancialAssetsAndLiabilitiesCategoryMemberifrs-full:FinancialLiabilitiesAtFairValueThroughProfitOrLossThatMeetDefinitionOfHeldForTradingCategoryMemberifrs-full:Level3OfFairValueHierarchyMembersan:InterestRateOptionMember2024-12-310000891478san:FinancialAssetsAndLiabilitiesCategoryMemberifrs-full:FinancialLiabilitiesAtFairValueThroughProfitOrLossThatMeetDefinitionOfHeldForTradingCategoryMemberifrs-full:Level2OfFairValueHierarchyMembersan:InterestRateOptionMember2023-12-310000891478san:FinancialAssetsAndLiabilitiesCategoryMemberifrs-full:FinancialLiabilitiesAtFairValueThroughProfitOrLossThatMeetDefinitionOfHeldForTradingCategoryMemberifrs-full:Level3OfFairValueHierarchyMembersan:InterestRateOptionMember2023-12-310000891478san:FinancialAssetsAndLiabilitiesCategoryMemberifrs-full:FinancialLiabilitiesAtFairValueThroughProfitOrLossThatMeetDefinitionOfHeldForTradingCategoryMemberifrs-full:Level2OfFairValueHierarchyMembersan:ExchangeRateOptionMember2024-12-310000891478san:FinancialAssetsAndLiabilitiesCategoryMemberifrs-full:FinancialLiabilitiesAtFairValueThroughProfitOrLossThatMeetDefinitionOfHeldForTradingCategoryMemberifrs-full:Level3OfFairValueHierarchyMembersan:ExchangeRateOptionMember2024-12-310000891478san:FinancialAssetsAndLiabilitiesCategoryMemberifrs-full:FinancialLiabilitiesAtFairValueThroughProfitOrLossThatMeetDefinitionOfHeldForTradingCategoryMemberifrs-full:Level2OfFairValueHierarchyMembersan:ExchangeRateOptionMember2023-12-310000891478san:FinancialAssetsAndLiabilitiesCategoryMemberifrs-full:FinancialLiabilitiesAtFairValueThroughProfitOrLossThatMeetDefinitionOfHeldForTradingCategoryMemberifrs-full:Level3OfFairValueHierarchyMembersan:ExchangeRateOptionMember2023-12-310000891478san:FinancialAssetsAndLiabilitiesCategoryMemberifrs-full:FinancialLiabilitiesAtFairValueThroughProfitOrLossThatMeetDefinitionOfHeldForTradingCategoryMemberifrs-full:Level2OfFairValueHierarchyMembersan:IndexAndSecuritiesOptionsMember2024-12-310000891478san:FinancialAssetsAndLiabilitiesCategoryMemberifrs-full:FinancialLiabilitiesAtFairValueThroughProfitOrLossThatMeetDefinitionOfHeldForTradingCategoryMemberifrs-full:Level3OfFairValueHierarchyMembersan:IndexAndSecuritiesOptionsMember2024-12-310000891478san:FinancialAssetsAndLiabilitiesCategoryMemberifrs-full:FinancialLiabilitiesAtFairValueThroughProfitOrLossThatMeetDefinitionOfHeldForTradingCategoryMemberifrs-full:Level2OfFairValueHierarchyMembersan:IndexAndSecuritiesOptionsMember2023-12-310000891478san:FinancialAssetsAndLiabilitiesCategoryMemberifrs-full:FinancialLiabilitiesAtFairValueThroughProfitOrLossThatMeetDefinitionOfHeldForTradingCategoryMemberifrs-full:Level3OfFairValueHierarchyMembersan:IndexAndSecuritiesOptionsMember2023-12-310000891478san:FinancialAssetsAndLiabilitiesCategoryMemberifrs-full:FinancialLiabilitiesAtFairValueThroughProfitOrLossThatMeetDefinitionOfHeldForTradingCategoryMemberifrs-full:Level2OfFairValueHierarchyMembersan:ForwardsOnInterestRateAndVariableIncomeMember2024-12-310000891478san:FinancialAssetsAndLiabilitiesCategoryMemberifrs-full:FinancialLiabilitiesAtFairValueThroughProfitOrLossThatMeetDefinitionOfHeldForTradingCategoryMemberifrs-full:Level3OfFairValueHierarchyMembersan:ForwardsOnInterestRateAndVariableIncomeMember2024-12-310000891478san:FinancialAssetsAndLiabilitiesCategoryMemberifrs-full:FinancialLiabilitiesAtFairValueThroughProfitOrLossThatMeetDefinitionOfHeldForTradingCategoryMemberifrs-full:Level2OfFairValueHierarchyMembersan:ForwardsOnInterestRateAndVariableIncomeMember2023-12-310000891478san:FinancialAssetsAndLiabilitiesCategoryMemberifrs-full:FinancialLiabilitiesAtFairValueThroughProfitOrLossThatMeetDefinitionOfHeldForTradingCategoryMemberifrs-full:Level3OfFairValueHierarchyMembersan:ForwardsOnInterestRateAndVariableIncomeMember2023-12-310000891478san:FinancialAssetsAndLiabilitiesCategoryMemberifrs-full:FinancialLiabilitiesAtFairValueThroughProfitOrLossThatMeetDefinitionOfHeldForTradingCategoryMemberifrs-full:Level2OfFairValueHierarchyMembersan:OtherDerivativesMember2024-12-310000891478san:FinancialAssetsAndLiabilitiesCategoryMemberifrs-full:FinancialLiabilitiesAtFairValueThroughProfitOrLossThatMeetDefinitionOfHeldForTradingCategoryMemberifrs-full:Level3OfFairValueHierarchyMembersan:OtherDerivativesMember2024-12-310000891478san:FinancialAssetsAndLiabilitiesCategoryMemberifrs-full:FinancialLiabilitiesAtFairValueThroughProfitOrLossThatMeetDefinitionOfHeldForTradingCategoryMemberifrs-full:Level2OfFairValueHierarchyMembersan:OtherDerivativesMember2023-12-310000891478san:FinancialAssetsAndLiabilitiesCategoryMemberifrs-full:FinancialLiabilitiesAtFairValueThroughProfitOrLossThatMeetDefinitionOfHeldForTradingCategoryMemberifrs-full:Level3OfFairValueHierarchyMembersan:OtherDerivativesMember2023-12-310000891478san:FinancialAssetsAndLiabilitiesCategoryMemberifrs-full:FinancialLiabilitiesAtFairValueThroughProfitOrLossThatMeetDefinitionOfHeldForTradingCategoryMemberifrs-full:Level2OfFairValueHierarchyMembersan:ShortPositionsMember2024-12-310000891478san:FinancialAssetsAndLiabilitiesCategoryMemberifrs-full:FinancialLiabilitiesAtFairValueThroughProfitOrLossThatMeetDefinitionOfHeldForTradingCategoryMemberifrs-full:Level3OfFairValueHierarchyMembersan:ShortPositionsMember2024-12-310000891478san:FinancialAssetsAndLiabilitiesCategoryMemberifrs-full:FinancialLiabilitiesAtFairValueThroughProfitOrLossThatMeetDefinitionOfHeldForTradingCategoryMemberifrs-full:Level2OfFairValueHierarchyMembersan:ShortPositionsMember2023-12-310000891478san:FinancialAssetsAndLiabilitiesCategoryMemberifrs-full:FinancialLiabilitiesAtFairValueThroughProfitOrLossThatMeetDefinitionOfHeldForTradingCategoryMemberifrs-full:Level3OfFairValueHierarchyMembersan:ShortPositionsMember2023-12-310000891478san:FinancialAssetsAndLiabilitiesCategoryMembersan:DerivativesDesignatedAsHedgingInstrumentsCategoryMemberifrs-full:Level2OfFairValueHierarchyMember2024-12-310000891478san:FinancialAssetsAndLiabilitiesCategoryMembersan:DerivativesDesignatedAsHedgingInstrumentsCategoryMemberifrs-full:Level3OfFairValueHierarchyMember2024-12-310000891478san:FinancialAssetsAndLiabilitiesCategoryMembersan:DerivativesDesignatedAsHedgingInstrumentsCategoryMemberifrs-full:Level2OfFairValueHierarchyMember2023-12-310000891478san:FinancialAssetsAndLiabilitiesCategoryMembersan:DerivativesDesignatedAsHedgingInstrumentsCategoryMemberifrs-full:Level3OfFairValueHierarchyMember2023-12-310000891478san:FinancialAssetsAndLiabilitiesCategoryMembersan:DerivativesDesignatedAsHedgingInstrumentsCategoryMemberifrs-full:Level2OfFairValueHierarchyMemberifrs-full:SwapContractMember2024-12-310000891478san:FinancialAssetsAndLiabilitiesCategoryMembersan:DerivativesDesignatedAsHedgingInstrumentsCategoryMemberifrs-full:Level3OfFairValueHierarchyMemberifrs-full:SwapContractMember2024-12-310000891478san:FinancialAssetsAndLiabilitiesCategoryMembersan:DerivativesDesignatedAsHedgingInstrumentsCategoryMemberifrs-full:Level2OfFairValueHierarchyMemberifrs-full:SwapContractMember2023-12-310000891478san:FinancialAssetsAndLiabilitiesCategoryMembersan:DerivativesDesignatedAsHedgingInstrumentsCategoryMemberifrs-full:Level3OfFairValueHierarchyMemberifrs-full:SwapContractMember2023-12-310000891478san:FinancialAssetsAndLiabilitiesCategoryMembersan:DerivativesDesignatedAsHedgingInstrumentsCategoryMemberifrs-full:Level2OfFairValueHierarchyMembersan:InterestRateOptionMember2024-12-310000891478san:FinancialAssetsAndLiabilitiesCategoryMembersan:DerivativesDesignatedAsHedgingInstrumentsCategoryMemberifrs-full:Level3OfFairValueHierarchyMembersan:InterestRateOptionMember2024-12-310000891478san:FinancialAssetsAndLiabilitiesCategoryMembersan:DerivativesDesignatedAsHedgingInstrumentsCategoryMemberifrs-full:Level2OfFairValueHierarchyMembersan:InterestRateOptionMember2023-12-310000891478san:FinancialAssetsAndLiabilitiesCategoryMembersan:DerivativesDesignatedAsHedgingInstrumentsCategoryMemberifrs-full:Level3OfFairValueHierarchyMembersan:InterestRateOptionMember2023-12-310000891478san:FinancialAssetsAndLiabilitiesCategoryMembersan:DerivativesDesignatedAsHedgingInstrumentsCategoryMemberifrs-full:Level2OfFairValueHierarchyMembersan:OtherDerivativesMember2024-12-310000891478san:FinancialAssetsAndLiabilitiesCategoryMembersan:DerivativesDesignatedAsHedgingInstrumentsCategoryMemberifrs-full:Level3OfFairValueHierarchyMembersan:OtherDerivativesMember2024-12-310000891478san:FinancialAssetsAndLiabilitiesCategoryMembersan:DerivativesDesignatedAsHedgingInstrumentsCategoryMemberifrs-full:Level2OfFairValueHierarchyMembersan:OtherDerivativesMember2023-12-310000891478san:FinancialAssetsAndLiabilitiesCategoryMembersan:DerivativesDesignatedAsHedgingInstrumentsCategoryMemberifrs-full:Level3OfFairValueHierarchyMembersan:OtherDerivativesMember2023-12-310000891478san:FinancialAssetsAndLiabilitiesCategoryMemberifrs-full:FinancialLiabilitiesAtFairValueThroughProfitOrLossDesignatedUponInitialRecognitionCategoryMemberifrs-full:Level2OfFairValueHierarchyMember2024-12-310000891478san:FinancialAssetsAndLiabilitiesCategoryMemberifrs-full:FinancialLiabilitiesAtFairValueThroughProfitOrLossDesignatedUponInitialRecognitionCategoryMemberifrs-full:Level3OfFairValueHierarchyMember2024-12-310000891478san:FinancialAssetsAndLiabilitiesCategoryMemberifrs-full:FinancialLiabilitiesAtFairValueThroughProfitOrLossDesignatedUponInitialRecognitionCategoryMemberifrs-full:Level2OfFairValueHierarchyMember2023-12-310000891478san:FinancialAssetsAndLiabilitiesCategoryMemberifrs-full:FinancialLiabilitiesAtFairValueThroughProfitOrLossDesignatedUponInitialRecognitionCategoryMemberifrs-full:Level3OfFairValueHierarchyMember2023-12-310000891478san:LiabilitiesUnderInsuranceContractsMemberifrs-full:Level2OfFairValueHierarchyMember2024-12-310000891478san:LiabilitiesUnderInsuranceContractsMemberifrs-full:Level3OfFairValueHierarchyMember2024-12-310000891478san:LiabilitiesUnderInsuranceContractsMemberifrs-full:Level2OfFairValueHierarchyMember2023-12-310000891478san:LiabilitiesUnderInsuranceContractsMemberifrs-full:Level3OfFairValueHierarchyMember2023-12-310000891478ifrs-full:FinancialAssetsAtFairValueThroughProfitOrLossClassifiedAsHeldForTradingCategoryMembersan:ReposReverseReposMembersan:OtherValuationTechniqueMember2025-01-012025-12-310000891478ifrs-full:FinancialAssetsAtFairValueThroughProfitOrLossClassifiedAsHeldForTradingCategoryMembersan:CorporateDebtMemberifrs-full:DiscountedCashFlowMemberifrs-full:CreditSpreadMeasurementInputMemberifrs-full:BottomOfRangeMember2025-12-310000891478ifrs-full:FinancialAssetsAtFairValueThroughProfitOrLossClassifiedAsHeldForTradingCategoryMembersan:CorporateDebtMemberifrs-full:DiscountedCashFlowMemberifrs-full:CreditSpreadMeasurementInputMemberifrs-full:TopOfRangeMember2025-12-310000891478ifrs-full:FinancialAssetsAtFairValueThroughProfitOrLossClassifiedAsHeldForTradingCategoryMembersan:CorporateDebtMemberifrs-full:DiscountedCashFlowMemberifrs-full:CreditSpreadMeasurementInputMemberifrs-full:WeightedAverageMember2025-12-310000891478ifrs-full:FinancialAssetsAtFairValueThroughProfitOrLossClassifiedAsHeldForTradingCategoryMembersan:CorporateDebtMemberifrs-full:DiscountedCashFlowMember2025-01-012025-12-310000891478ifrs-full:FinancialAssetsAtFairValueThroughProfitOrLossClassifiedAsHeldForTradingCategoryMembersan:GovernmentDebtMemberifrs-full:DiscountedCashFlowMembersan:DiscountCurveMeasurementInputMemberifrs-full:BottomOfRangeMember2025-12-310000891478ifrs-full:FinancialAssetsAtFairValueThroughProfitOrLossClassifiedAsHeldForTradingCategoryMembersan:GovernmentDebtMemberifrs-full:DiscountedCashFlowMembersan:DiscountCurveMeasurementInputMemberifrs-full:TopOfRangeMember2025-12-310000891478ifrs-full:FinancialAssetsAtFairValueThroughProfitOrLossClassifiedAsHeldForTradingCategoryMembersan:GovernmentDebtMemberifrs-full:DiscountedCashFlowMembersan:DiscountCurveMeasurementInputMemberifrs-full:WeightedAverageMember2025-12-310000891478ifrs-full:FinancialAssetsAtFairValueThroughProfitOrLossClassifiedAsHeldForTradingCategoryMembersan:GovernmentDebtMemberifrs-full:DiscountedCashFlowMember2025-01-012025-12-310000891478ifrs-full:FinancialAssetsAtFairValueThroughProfitOrLossClassifiedAsHeldForTradingCategoryMembersan:DebtSecuritiesOtherMemberifrs-full:DiscountedCashFlowMemberifrs-full:CreditSpreadMeasurementInputMemberifrs-full:BottomOfRangeMember2025-12-310000891478ifrs-full:FinancialAssetsAtFairValueThroughProfitOrLossClassifiedAsHeldForTradingCategoryMembersan:DebtSecuritiesOtherMemberifrs-full:DiscountedCashFlowMemberifrs-full:CreditSpreadMeasurementInputMemberifrs-full:TopOfRangeMember2025-12-310000891478ifrs-full:FinancialAssetsAtFairValueThroughProfitOrLossClassifiedAsHeldForTradingCategoryMembersan:DebtSecuritiesOtherMemberifrs-full:DiscountedCashFlowMemberifrs-full:CreditSpreadMeasurementInputMemberifrs-full:WeightedAverageMember2025-12-310000891478ifrs-full:FinancialAssetsAtFairValueThroughProfitOrLossClassifiedAsHeldForTradingCategoryMembersan:DebtSecuritiesOtherMemberifrs-full:DiscountedCashFlowMember2025-01-012025-12-310000891478ifrs-full:FinancialAssetsAtFairValueThroughProfitOrLossClassifiedAsHeldForTradingCategoryMembersan:CapsFloorsMembersan:BlackScholesModelMemberifrs-full:HistoricalVolatilityForSharesMeasurementInputMemberifrs-full:BottomOfRangeMember2025-12-310000891478ifrs-full:FinancialAssetsAtFairValueThroughProfitOrLossClassifiedAsHeldForTradingCategoryMembersan:CapsFloorsMembersan:BlackScholesModelMemberifrs-full:HistoricalVolatilityForSharesMeasurementInputMemberifrs-full:TopOfRangeMember2025-12-310000891478ifrs-full:FinancialAssetsAtFairValueThroughProfitOrLossClassifiedAsHeldForTradingCategoryMembersan:CapsFloorsMembersan:BlackScholesModelMemberifrs-full:HistoricalVolatilityForSharesMeasurementInputMemberifrs-full:WeightedAverageMember2025-12-310000891478ifrs-full:FinancialAssetsAtFairValueThroughProfitOrLossClassifiedAsHeldForTradingCategoryMembersan:CapsFloorsMembersan:BlackScholesModelMember2025-01-012025-12-310000891478ifrs-full:FinancialAssetsAtFairValueThroughProfitOrLossClassifiedAsHeldForTradingCategoryMemberifrs-full:CurrencySwapContractMemberifrs-full:DiscountedCashFlowMemberifrs-full:CreditSpreadMeasurementInputMemberifrs-full:BottomOfRangeMember2025-12-310000891478ifrs-full:FinancialAssetsAtFairValueThroughProfitOrLossClassifiedAsHeldForTradingCategoryMemberifrs-full:CurrencySwapContractMemberifrs-full:DiscountedCashFlowMemberifrs-full:CreditSpreadMeasurementInputMemberifrs-full:TopOfRangeMember2025-12-310000891478ifrs-full:FinancialAssetsAtFairValueThroughProfitOrLossClassifiedAsHeldForTradingCategoryMemberifrs-full:CurrencySwapContractMemberifrs-full:DiscountedCashFlowMemberifrs-full:CreditSpreadMeasurementInputMemberifrs-full:WeightedAverageMember2025-12-310000891478ifrs-full:FinancialAssetsAtFairValueThroughProfitOrLossClassifiedAsHeldForTradingCategoryMemberifrs-full:CurrencySwapContractMemberifrs-full:DiscountedCashFlowMember2025-01-012025-12-310000891478ifrs-full:FinancialAssetsAtFairValueThroughProfitOrLossClassifiedAsHeldForTradingCategoryMembersan:EQOptionsMembersan:EQOptionPricingModelValuationTechniqueMemberifrs-full:HistoricalVolatilityForSharesMeasurementInputMemberifrs-full:BottomOfRangeMember2025-12-310000891478ifrs-full:FinancialAssetsAtFairValueThroughProfitOrLossClassifiedAsHeldForTradingCategoryMembersan:EQOptionsMembersan:EQOptionPricingModelValuationTechniqueMemberifrs-full:HistoricalVolatilityForSharesMeasurementInputMemberifrs-full:TopOfRangeMember2025-12-310000891478ifrs-full:FinancialAssetsAtFairValueThroughProfitOrLossClassifiedAsHeldForTradingCategoryMembersan:EQOptionsMembersan:EQOptionPricingModelValuationTechniqueMemberifrs-full:HistoricalVolatilityForSharesMeasurementInputMemberifrs-full:WeightedAverageMember2025-12-310000891478ifrs-full:FinancialAssetsAtFairValueThroughProfitOrLossClassifiedAsHeldForTradingCategoryMembersan:EQOptionsMembersan:EQOptionPricingModelValuationTechniqueMember2025-01-012025-12-310000891478ifrs-full:FinancialAssetsAtFairValueThroughProfitOrLossClassifiedAsHeldForTradingCategoryMembersan:EQOptionsMembersan:LocalVolatilityOptionTechniqueMemberifrs-full:HistoricalVolatilityForSharesMeasurementInputMemberifrs-full:BottomOfRangeMember2025-12-310000891478ifrs-full:FinancialAssetsAtFairValueThroughProfitOrLossClassifiedAsHeldForTradingCategoryMembersan:EQOptionsMembersan:LocalVolatilityOptionTechniqueMemberifrs-full:HistoricalVolatilityForSharesMeasurementInputMemberifrs-full:TopOfRangeMember2025-12-310000891478ifrs-full:FinancialAssetsAtFairValueThroughProfitOrLossClassifiedAsHeldForTradingCategoryMembersan:EQOptionsMembersan:LocalVolatilityOptionTechniqueMemberifrs-full:HistoricalVolatilityForSharesMeasurementInputMemberifrs-full:WeightedAverageMember2025-12-310000891478ifrs-full:FinancialAssetsAtFairValueThroughProfitOrLossClassifiedAsHeldForTradingCategoryMembersan:EQOptionsMembersan:LocalVolatilityOptionTechniqueMember2025-01-012025-12-310000891478ifrs-full:FinancialAssetsAtFairValueThroughProfitOrLossClassifiedAsHeldForTradingCategoryMembersan:ForeignExchangeOptionsMembersan:FXOptionPricingModelMemberifrs-full:HistoricalVolatilityForSharesMeasurementInputMemberifrs-full:BottomOfRangeMember2025-12-310000891478ifrs-full:FinancialAssetsAtFairValueThroughProfitOrLossClassifiedAsHeldForTradingCategoryMembersan:ForeignExchangeOptionsMembersan:FXOptionPricingModelMemberifrs-full:HistoricalVolatilityForSharesMeasurementInputMemberifrs-full:TopOfRangeMember2025-12-310000891478ifrs-full:FinancialAssetsAtFairValueThroughProfitOrLossClassifiedAsHeldForTradingCategoryMembersan:ForeignExchangeOptionsMembersan:FXOptionPricingModelMemberifrs-full:HistoricalVolatilityForSharesMeasurementInputMemberifrs-full:WeightedAverageMember2025-12-310000891478ifrs-full:FinancialAssetsAtFairValueThroughProfitOrLossClassifiedAsHeldForTradingCategoryMembersan:ForeignExchangeOptionsMembersan:FXOptionPricingModelMember2025-01-012025-12-310000891478ifrs-full:FinancialAssetsAtFairValueThroughProfitOrLossClassifiedAsHeldForTradingCategoryMembersan:ForeignExchangeForwardContractMembersan:ForwardEstimationValuationTechniqueMembersan:SwapRateMeasurementInputMemberifrs-full:BottomOfRangeMember2025-12-310000891478ifrs-full:FinancialAssetsAtFairValueThroughProfitOrLossClassifiedAsHeldForTradingCategoryMembersan:ForeignExchangeForwardContractMembersan:ForwardEstimationValuationTechniqueMembersan:SwapRateMeasurementInputMemberifrs-full:TopOfRangeMember2025-12-310000891478ifrs-full:FinancialAssetsAtFairValueThroughProfitOrLossClassifiedAsHeldForTradingCategoryMembersan:ForeignExchangeForwardContractMembersan:ForwardEstimationValuationTechniqueMembersan:SwapRateMeasurementInputMemberifrs-full:WeightedAverageMember2025-12-310000891478ifrs-full:FinancialAssetsAtFairValueThroughProfitOrLossClassifiedAsHeldForTradingCategoryMembersan:ForeignExchangeForwardContractMembersan:ForwardEstimationValuationTechniqueMember2025-01-012025-12-310000891478ifrs-full:FinancialAssetsAtFairValueThroughProfitOrLossClassifiedAsHeldForTradingCategoryMembersan:InflationDerivativesMembersan:AssetSwapModelValuationTechniqueMembersan:InflationSwapRateMeasurementInputMemberifrs-full:BottomOfRangeMember2025-12-310000891478ifrs-full:FinancialAssetsAtFairValueThroughProfitOrLossClassifiedAsHeldForTradingCategoryMembersan:InflationDerivativesMembersan:AssetSwapModelValuationTechniqueMembersan:InflationSwapRateMeasurementInputMemberifrs-full:TopOfRangeMember2025-12-310000891478ifrs-full:FinancialAssetsAtFairValueThroughProfitOrLossClassifiedAsHeldForTradingCategoryMembersan:InflationDerivativesMembersan:AssetSwapModelValuationTechniqueMembersan:InflationSwapRateMeasurementInputMemberifrs-full:WeightedAverageMember2025-12-310000891478ifrs-full:FinancialAssetsAtFairValueThroughProfitOrLossClassifiedAsHeldForTradingCategoryMembersan:InflationDerivativesMembersan:AssetSwapModelValuationTechniqueMember2025-01-012025-12-310000891478ifrs-full:FinancialAssetsAtFairValueThroughProfitOrLossClassifiedAsHeldForTradingCategoryMembersan:IROptionsMembersan:InterestRateOptionPricingModelMemberifrs-full:HistoricalVolatilityForSharesMeasurementInputMemberifrs-full:BottomOfRangeMember2025-12-310000891478ifrs-full:FinancialAssetsAtFairValueThroughProfitOrLossClassifiedAsHeldForTradingCategoryMembersan:IROptionsMembersan:InterestRateOptionPricingModelMemberifrs-full:HistoricalVolatilityForSharesMeasurementInputMemberifrs-full:TopOfRangeMember2025-12-310000891478ifrs-full:FinancialAssetsAtFairValueThroughProfitOrLossClassifiedAsHeldForTradingCategoryMembersan:IROptionsMembersan:InterestRateOptionPricingModelMemberifrs-full:HistoricalVolatilityForSharesMeasurementInputMemberifrs-full:WeightedAverageMember2025-12-310000891478ifrs-full:FinancialAssetsAtFairValueThroughProfitOrLossClassifiedAsHeldForTradingCategoryMembersan:IROptionsMembersan:InterestRateOptionPricingModelMember2025-01-012025-12-310000891478ifrs-full:FinancialAssetsAtFairValueThroughProfitOrLossClassifiedAsHeldForTradingCategoryMembersan:IROptionsMembersan:InflationOptionPricingModelMemberifrs-full:HistoricalVolatilityForSharesMeasurementInputMemberifrs-full:BottomOfRangeMember2025-12-310000891478ifrs-full:FinancialAssetsAtFairValueThroughProfitOrLossClassifiedAsHeldForTradingCategoryMembersan:IROptionsMembersan:InflationOptionPricingModelMemberifrs-full:HistoricalVolatilityForSharesMeasurementInputMemberifrs-full:TopOfRangeMember2025-12-310000891478ifrs-full:FinancialAssetsAtFairValueThroughProfitOrLossClassifiedAsHeldForTradingCategoryMembersan:IROptionsMembersan:InflationOptionPricingModelMemberifrs-full:HistoricalVolatilityForSharesMeasurementInputMemberifrs-full:WeightedAverageMember2025-12-310000891478ifrs-full:FinancialAssetsAtFairValueThroughProfitOrLossClassifiedAsHeldForTradingCategoryMembersan:IROptionsMembersan:InflationOptionPricingModelMember2025-01-012025-12-310000891478ifrs-full:FinancialAssetsAtFairValueThroughProfitOrLossClassifiedAsHeldForTradingCategoryMemberifrs-full:InterestRateSwapContractMembersan:OtherValuationTechniqueMembersan:OtherMeasurementInputMemberifrs-full:BottomOfRangeMember2025-12-310000891478ifrs-full:FinancialAssetsAtFairValueThroughProfitOrLossClassifiedAsHeldForTradingCategoryMemberifrs-full:InterestRateSwapContractMembersan:OtherValuationTechniqueMember2025-01-012025-12-310000891478ifrs-full:FinancialAssetsAtFairValueThroughProfitOrLossClassifiedAsHeldForTradingCategoryMemberifrs-full:InterestRateSwapContractMembersan:FlowDiscountingMethodOnCreditSpreadMemberifrs-full:CreditSpreadMeasurementInputMemberifrs-full:BottomOfRangeMember2025-12-310000891478ifrs-full:FinancialAssetsAtFairValueThroughProfitOrLossClassifiedAsHeldForTradingCategoryMemberifrs-full:InterestRateSwapContractMembersan:FlowDiscountingMethodOnCreditSpreadMemberifrs-full:CreditSpreadMeasurementInputMemberifrs-full:TopOfRangeMember2025-12-310000891478ifrs-full:FinancialAssetsAtFairValueThroughProfitOrLossClassifiedAsHeldForTradingCategoryMemberifrs-full:InterestRateSwapContractMembersan:FlowDiscountingMethodOnCreditSpreadMemberifrs-full:CreditSpreadMeasurementInputMemberifrs-full:WeightedAverageMember2025-12-310000891478ifrs-full:FinancialAssetsAtFairValueThroughProfitOrLossClassifiedAsHeldForTradingCategoryMemberifrs-full:InterestRateSwapContractMembersan:FlowDiscountingMethodOnCreditSpreadMember2025-01-012025-12-310000891478ifrs-full:FinancialAssetsAtFairValueThroughProfitOrLossClassifiedAsHeldForTradingCategoryMemberifrs-full:InterestRateSwapContractMembersan:FlowDiscountingMethodOnInflationSwapRateMembersan:InflationSwapRateMeasurementInputMemberifrs-full:BottomOfRangeMember2025-12-310000891478ifrs-full:FinancialAssetsAtFairValueThroughProfitOrLossClassifiedAsHeldForTradingCategoryMemberifrs-full:InterestRateSwapContractMembersan:FlowDiscountingMethodOnInflationSwapRateMembersan:InflationSwapRateMeasurementInputMemberifrs-full:TopOfRangeMember2025-12-310000891478ifrs-full:FinancialAssetsAtFairValueThroughProfitOrLossClassifiedAsHeldForTradingCategoryMemberifrs-full:InterestRateSwapContractMembersan:FlowDiscountingMethodOnInflationSwapRateMembersan:InflationSwapRateMeasurementInputMemberifrs-full:WeightedAverageMember2025-12-310000891478ifrs-full:FinancialAssetsAtFairValueThroughProfitOrLossClassifiedAsHeldForTradingCategoryMemberifrs-full:InterestRateSwapContractMembersan:FlowDiscountingMethodOnInflationSwapRateMember2025-01-012025-12-310000891478ifrs-full:FinancialAssetsAtFairValueThroughProfitOrLossClassifiedAsHeldForTradingCategoryMembersan:OtherDerivativesMembersan:ForwardEstimationValuationTechniqueMembersan:PriceMeasurementInputMemberifrs-full:BottomOfRangeMember2025-12-310000891478ifrs-full:FinancialAssetsAtFairValueThroughProfitOrLossClassifiedAsHeldForTradingCategoryMembersan:OtherDerivativesMembersan:ForwardEstimationValuationTechniqueMembersan:PriceMeasurementInputMemberifrs-full:TopOfRangeMember2025-12-310000891478ifrs-full:FinancialAssetsAtFairValueThroughProfitOrLossClassifiedAsHeldForTradingCategoryMembersan:OtherDerivativesMembersan:ForwardEstimationValuationTechniqueMembersan:PriceMeasurementInputMemberifrs-full:WeightedAverageMember2025-12-310000891478ifrs-full:FinancialAssetsAtFairValueThroughProfitOrLossClassifiedAsHeldForTradingCategoryMembersan:OtherDerivativesMembersan:ForwardEstimationValuationTechniqueMember2025-01-012025-12-310000891478ifrs-full:FinancialAssetsAtFairValueThroughProfitOrLossClassifiedAsHeldForTradingCategoryMembersan:PropertyDerivativesMemberifrs-full:OptionPricingModelMembersan:GrowthRateMeasurementInputMemberifrs-full:BottomOfRangeMember2025-12-310000891478ifrs-full:FinancialAssetsAtFairValueThroughProfitOrLossClassifiedAsHeldForTradingCategoryMembersan:PropertyDerivativesMemberifrs-full:OptionPricingModelMembersan:GrowthRateMeasurementInputMemberifrs-full:TopOfRangeMember2025-12-310000891478ifrs-full:FinancialAssetsAtFairValueThroughProfitOrLossClassifiedAsHeldForTradingCategoryMembersan:PropertyDerivativesMemberifrs-full:OptionPricingModelMembersan:GrowthRateMeasurementInputMemberifrs-full:WeightedAverageMember2025-12-310000891478ifrs-full:FinancialAssetsAtFairValueThroughProfitOrLossClassifiedAsHeldForTradingCategoryMembersan:PropertyDerivativesMemberifrs-full:OptionPricingModelMember2025-01-012025-12-310000891478ifrs-full:FinancialAssetsAtFairValueThroughProfitOrLossClassifiedAsHeldForTradingCategoryMembersan:SecuritisationSwapMemberifrs-full:DiscountedCashFlowMemberifrs-full:ConstantPrepaymentRateMeasurementInputMemberifrs-full:BottomOfRangeMember2025-12-310000891478ifrs-full:FinancialAssetsAtFairValueThroughProfitOrLossClassifiedAsHeldForTradingCategoryMembersan:SecuritisationSwapMemberifrs-full:DiscountedCashFlowMemberifrs-full:ConstantPrepaymentRateMeasurementInputMemberifrs-full:TopOfRangeMember2025-12-310000891478ifrs-full:FinancialAssetsAtFairValueThroughProfitOrLossClassifiedAsHeldForTradingCategoryMembersan:SecuritisationSwapMemberifrs-full:DiscountedCashFlowMemberifrs-full:ConstantPrepaymentRateMeasurementInputMemberifrs-full:WeightedAverageMember2025-12-310000891478ifrs-full:FinancialAssetsAtFairValueThroughProfitOrLossClassifiedAsHeldForTradingCategoryMembersan:SecuritisationSwapMemberifrs-full:DiscountedCashFlowMember2025-01-012025-12-310000891478ifrs-full:FinancialAssetsAtFairValueThroughProfitOrLossDesignatedUponInitialRecognitionCategoryMembersan:LoanMemberifrs-full:DiscountedCashFlowMemberifrs-full:CreditSpreadMeasurementInputMemberifrs-full:BottomOfRangeMember2025-12-310000891478ifrs-full:FinancialAssetsAtFairValueThroughProfitOrLossDesignatedUponInitialRecognitionCategoryMembersan:LoanMemberifrs-full:DiscountedCashFlowMemberifrs-full:CreditSpreadMeasurementInputMemberifrs-full:TopOfRangeMember2025-12-310000891478ifrs-full:FinancialAssetsAtFairValueThroughProfitOrLossDesignatedUponInitialRecognitionCategoryMembersan:LoanMemberifrs-full:DiscountedCashFlowMemberifrs-full:CreditSpreadMeasurementInputMemberifrs-full:WeightedAverageMember2025-12-310000891478ifrs-full:FinancialAssetsAtFairValueThroughProfitOrLossDesignatedUponInitialRecognitionCategoryMembersan:LoanMemberifrs-full:DiscountedCashFlowMember2025-01-012025-12-310000891478ifrs-full:FinancialAssetsAtFairValueThroughProfitOrLossDesignatedUponInitialRecognitionCategoryMembersan:MortgagePortfolioMembersan:BlackScholesModelMembersan:GrowthRateMeasurementInputMemberifrs-full:BottomOfRangeMember2025-12-310000891478ifrs-full:FinancialAssetsAtFairValueThroughProfitOrLossDesignatedUponInitialRecognitionCategoryMembersan:MortgagePortfolioMembersan:BlackScholesModelMembersan:GrowthRateMeasurementInputMemberifrs-full:TopOfRangeMember2025-12-310000891478ifrs-full:FinancialAssetsAtFairValueThroughProfitOrLossDesignatedUponInitialRecognitionCategoryMembersan:MortgagePortfolioMembersan:BlackScholesModelMembersan:GrowthRateMeasurementInputMemberifrs-full:WeightedAverageMember2025-12-310000891478ifrs-full:FinancialAssetsAtFairValueThroughProfitOrLossDesignatedUponInitialRecognitionCategoryMembersan:MortgagePortfolioMembersan:BlackScholesModelMember2025-01-012025-12-310000891478ifrs-full:FinancialAssetsAtFairValueThroughProfitOrLossDesignatedUponInitialRecognitionCategoryMembersan:DebtSecuritiesOtherMembersan:OtherValuationTechniqueMembersan:InflationSwapRateMeasurementInputMemberifrs-full:BottomOfRangeMember2025-12-310000891478ifrs-full:FinancialAssetsAtFairValueThroughProfitOrLossDesignatedUponInitialRecognitionCategoryMembersan:DebtSecuritiesOtherMembersan:OtherValuationTechniqueMembersan:InflationSwapRateMeasurementInputMemberifrs-full:TopOfRangeMember2025-12-310000891478ifrs-full:FinancialAssetsAtFairValueThroughProfitOrLossDesignatedUponInitialRecognitionCategoryMembersan:DebtSecuritiesOtherMembersan:OtherValuationTechniqueMembersan:InflationSwapRateMeasurementInputMemberifrs-full:WeightedAverageMember2025-12-310000891478ifrs-full:FinancialAssetsAtFairValueThroughProfitOrLossDesignatedUponInitialRecognitionCategoryMembersan:DebtSecuritiesOtherMembersan:OtherValuationTechniqueMember2025-01-012025-12-310000891478ifrs-full:FinancialAssetsAtFairValueThroughProfitOrLossMandatorilyMeasuredAtFairValueCategoryMembersan:PropertySecuritiesMembersan:ProbabilityWeightingValuationTechniqueMembersan:GrowthRateMeasurementInputMemberifrs-full:BottomOfRangeMember2025-12-310000891478ifrs-full:FinancialAssetsAtFairValueThroughProfitOrLossMandatorilyMeasuredAtFairValueCategoryMembersan:PropertySecuritiesMembersan:ProbabilityWeightingValuationTechniqueMembersan:GrowthRateMeasurementInputMemberifrs-full:TopOfRangeMember2025-12-310000891478ifrs-full:FinancialAssetsAtFairValueThroughProfitOrLossMandatorilyMeasuredAtFairValueCategoryMembersan:PropertySecuritiesMembersan:ProbabilityWeightingValuationTechniqueMembersan:GrowthRateMeasurementInputMemberifrs-full:WeightedAverageMember2025-12-310000891478ifrs-full:FinancialAssetsAtFairValueThroughProfitOrLossMandatorilyMeasuredAtFairValueCategoryMembersan:PropertySecuritiesMembersan:ProbabilityWeightingValuationTechniqueMember2025-01-012025-12-310000891478ifrs-full:FinancialAssetsAtFairValueThroughProfitOrLossMandatorilyMeasuredAtFairValueCategoryMemberifrs-full:EquityInvestmentsMembersan:PriceBasedValuationTechniqueMembersan:PriceMeasurementInputMemberifrs-full:BottomOfRangeMember2025-12-310000891478ifrs-full:FinancialAssetsAtFairValueThroughProfitOrLossMandatorilyMeasuredAtFairValueCategoryMemberifrs-full:EquityInvestmentsMembersan:PriceBasedValuationTechniqueMembersan:PriceMeasurementInputMemberifrs-full:TopOfRangeMember2025-12-310000891478ifrs-full:FinancialAssetsAtFairValueThroughProfitOrLossMandatorilyMeasuredAtFairValueCategoryMemberifrs-full:EquityInvestmentsMembersan:PriceBasedValuationTechniqueMembersan:PriceMeasurementInputMemberifrs-full:WeightedAverageMember2025-12-310000891478ifrs-full:FinancialAssetsAtFairValueThroughProfitOrLossMandatorilyMeasuredAtFairValueCategoryMemberifrs-full:EquityInvestmentsMembersan:PriceBasedValuationTechniqueMember2025-01-012025-12-310000891478ifrs-full:FinancialAssetsAtFairValueThroughOtherComprehensiveIncomeCategoryMembersan:LoanMembersan:FlowDiscountingMethodOnCreditSpreadMember2025-01-012025-12-310000891478ifrs-full:FinancialAssetsAtFairValueThroughOtherComprehensiveIncomeCategoryMembersan:LoanMembersan:DiscountedCashFlowsOnInterestRateCurveMemberifrs-full:InterestRateMeasurementInputMemberifrs-full:BottomOfRangeMember2025-12-310000891478ifrs-full:FinancialAssetsAtFairValueThroughOtherComprehensiveIncomeCategoryMembersan:LoanMembersan:DiscountedCashFlowsOnInterestRateCurveMemberifrs-full:InterestRateMeasurementInputMemberifrs-full:TopOfRangeMember2025-12-310000891478ifrs-full:FinancialAssetsAtFairValueThroughOtherComprehensiveIncomeCategoryMembersan:LoanMembersan:DiscountedCashFlowsOnInterestRateCurveMemberifrs-full:InterestRateMeasurementInputMemberifrs-full:WeightedAverageMember2025-12-310000891478ifrs-full:FinancialAssetsAtFairValueThroughOtherComprehensiveIncomeCategoryMembersan:LoanMembersan:DiscountedCashFlowsOnInterestRateCurveMember2025-01-012025-12-310000891478ifrs-full:FinancialAssetsAtFairValueThroughOtherComprehensiveIncomeCategoryMembersan:LoanMembersan:DiscountedCashFlowsOnMarginOfAReferencePortfolioMembersan:MarginOfAPreferencePortfolioMeasurementInputMemberifrs-full:BottomOfRangeMember2025-12-310000891478ifrs-full:FinancialAssetsAtFairValueThroughOtherComprehensiveIncomeCategoryMembersan:LoanMembersan:DiscountedCashFlowsOnMarginOfAReferencePortfolioMembersan:MarginOfAPreferencePortfolioMeasurementInputMemberifrs-full:TopOfRangeMember2025-12-310000891478ifrs-full:FinancialAssetsAtFairValueThroughOtherComprehensiveIncomeCategoryMembersan:LoanMembersan:DiscountedCashFlowsOnMarginOfAReferencePortfolioMembersan:MarginOfAPreferencePortfolioMeasurementInputMemberifrs-full:WeightedAverageMember2025-12-310000891478ifrs-full:FinancialAssetsAtFairValueThroughOtherComprehensiveIncomeCategoryMembersan:LoanMembersan:DiscountedCashFlowsOnMarginOfAReferencePortfolioMember2025-01-012025-12-310000891478ifrs-full:FinancialAssetsAtFairValueThroughOtherComprehensiveIncomeCategoryMembersan:LoanMembersan:PresentValueMethodMemberifrs-full:CreditSpreadMeasurementInputMemberifrs-full:BottomOfRangeMember2025-12-310000891478ifrs-full:FinancialAssetsAtFairValueThroughOtherComprehensiveIncomeCategoryMembersan:LoanMembersan:PresentValueMethodMemberifrs-full:CreditSpreadMeasurementInputMemberifrs-full:TopOfRangeMember2025-12-310000891478ifrs-full:FinancialAssetsAtFairValueThroughOtherComprehensiveIncomeCategoryMembersan:LoanMembersan:PresentValueMethodMemberifrs-full:CreditSpreadMeasurementInputMemberifrs-full:WeightedAverageMember2025-12-310000891478ifrs-full:FinancialAssetsAtFairValueThroughOtherComprehensiveIncomeCategoryMembersan:LoanMembersan:PresentValueMethodMember2025-01-012025-12-310000891478ifrs-full:FinancialAssetsAtFairValueThroughOtherComprehensiveIncomeCategoryMembersan:LoanMemberifrs-full:MarketComparablePricesMembersan:MarketPriceMeasurementInputMemberifrs-full:BottomOfRangeMember2025-12-310000891478ifrs-full:FinancialAssetsAtFairValueThroughOtherComprehensiveIncomeCategoryMembersan:LoanMemberifrs-full:MarketComparablePricesMembersan:MarketPriceMeasurementInputMemberifrs-full:TopOfRangeMember2025-12-310000891478ifrs-full:FinancialAssetsAtFairValueThroughOtherComprehensiveIncomeCategoryMembersan:LoanMemberifrs-full:MarketComparablePricesMembersan:MarketPriceMeasurementInputMemberifrs-full:WeightedAverageMember2025-12-310000891478ifrs-full:FinancialAssetsAtFairValueThroughOtherComprehensiveIncomeCategoryMembersan:LoanMemberifrs-full:MarketComparablePricesMember2025-01-012025-12-310000891478ifrs-full:FinancialAssetsAtFairValueThroughOtherComprehensiveIncomeCategoryMembersan:MortgageLettersDebtSecuritiesMemberifrs-full:DiscountedCashFlowMembersan:MortgageLettersMeasurementInputMemberifrs-full:BottomOfRangeMember2025-12-310000891478ifrs-full:FinancialAssetsAtFairValueThroughOtherComprehensiveIncomeCategoryMembersan:MortgageLettersDebtSecuritiesMemberifrs-full:DiscountedCashFlowMembersan:MortgageLettersMeasurementInputMemberifrs-full:TopOfRangeMember2025-12-310000891478ifrs-full:FinancialAssetsAtFairValueThroughOtherComprehensiveIncomeCategoryMembersan:MortgageLettersDebtSecuritiesMemberifrs-full:DiscountedCashFlowMembersan:MortgageLettersMeasurementInputMemberifrs-full:WeightedAverageMember2025-12-310000891478ifrs-full:FinancialAssetsAtFairValueThroughOtherComprehensiveIncomeCategoryMembersan:MortgageLettersDebtSecuritiesMemberifrs-full:DiscountedCashFlowMember2025-01-012025-12-310000891478ifrs-full:FinancialAssetsAtFairValueThroughOtherComprehensiveIncomeCategoryMemberifrs-full:EquityInvestmentsMembersan:PriceBasedValuationTechniqueMembersan:PriceMeasurementInputMemberifrs-full:BottomOfRangeMember2025-12-310000891478ifrs-full:FinancialAssetsAtFairValueThroughOtherComprehensiveIncomeCategoryMemberifrs-full:EquityInvestmentsMembersan:PriceBasedValuationTechniqueMembersan:PriceMeasurementInputMemberifrs-full:TopOfRangeMember2025-12-310000891478ifrs-full:FinancialAssetsAtFairValueThroughOtherComprehensiveIncomeCategoryMemberifrs-full:EquityInvestmentsMembersan:PriceBasedValuationTechniqueMembersan:PriceMeasurementInputMemberifrs-full:WeightedAverageMember2025-12-310000891478ifrs-full:FinancialAssetsAtFairValueThroughOtherComprehensiveIncomeCategoryMemberifrs-full:EquityInvestmentsMembersan:PriceBasedValuationTechniqueMember2025-01-012025-12-310000891478san:VolatilityOptionModelValuationTechniqueMemberifrs-full:FinancialLiabilitiesAtFairValueThroughProfitOrLossThatMeetDefinitionOfHeldForTradingCategoryMembersan:CapsFloorsMemberifrs-full:HistoricalVolatilityForSharesMeasurementInputMemberifrs-full:BottomOfRangeMember2025-12-310000891478san:VolatilityOptionModelValuationTechniqueMemberifrs-full:FinancialLiabilitiesAtFairValueThroughProfitOrLossThatMeetDefinitionOfHeldForTradingCategoryMembersan:CapsFloorsMemberifrs-full:HistoricalVolatilityForSharesMeasurementInputMemberifrs-full:TopOfRangeMember2025-12-310000891478san:VolatilityOptionModelValuationTechniqueMemberifrs-full:FinancialLiabilitiesAtFairValueThroughProfitOrLossThatMeetDefinitionOfHeldForTradingCategoryMembersan:CapsFloorsMemberifrs-full:HistoricalVolatilityForSharesMeasurementInputMemberifrs-full:WeightedAverageMember2025-12-310000891478san:VolatilityOptionModelValuationTechniqueMemberifrs-full:FinancialLiabilitiesAtFairValueThroughProfitOrLossThatMeetDefinitionOfHeldForTradingCategoryMembersan:CapsFloorsMember2025-01-012025-12-310000891478san:VolatilityOptionModelValuationTechniqueMemberifrs-full:FinancialLiabilitiesAtFairValueThroughProfitOrLossThatMeetDefinitionOfHeldForTradingCategoryMembersan:ForeignExchangeOptionsMemberifrs-full:HistoricalVolatilityForSharesMeasurementInputMemberifrs-full:BottomOfRangeMember2025-12-310000891478san:VolatilityOptionModelValuationTechniqueMemberifrs-full:FinancialLiabilitiesAtFairValueThroughProfitOrLossThatMeetDefinitionOfHeldForTradingCategoryMembersan:ForeignExchangeOptionsMemberifrs-full:HistoricalVolatilityForSharesMeasurementInputMemberifrs-full:TopOfRangeMember2025-12-310000891478san:VolatilityOptionModelValuationTechniqueMemberifrs-full:FinancialLiabilitiesAtFairValueThroughProfitOrLossThatMeetDefinitionOfHeldForTradingCategoryMembersan:ForeignExchangeOptionsMemberifrs-full:HistoricalVolatilityForSharesMeasurementInputMemberifrs-full:WeightedAverageMember2025-12-310000891478san:VolatilityOptionModelValuationTechniqueMemberifrs-full:FinancialLiabilitiesAtFairValueThroughProfitOrLossThatMeetDefinitionOfHeldForTradingCategoryMembersan:ForeignExchangeOptionsMember2025-01-012025-12-310000891478san:DiscountedCashFlowsOnInflationSwapRateMemberifrs-full:FinancialLiabilitiesAtFairValueThroughProfitOrLossThatMeetDefinitionOfHeldForTradingCategoryMemberifrs-full:InterestRateSwapContractMembersan:InflationSwapRateMeasurementInputMemberifrs-full:BottomOfRangeMember2025-12-310000891478san:DiscountedCashFlowsOnInflationSwapRateMemberifrs-full:FinancialLiabilitiesAtFairValueThroughProfitOrLossThatMeetDefinitionOfHeldForTradingCategoryMemberifrs-full:InterestRateSwapContractMembersan:InflationSwapRateMeasurementInputMemberifrs-full:TopOfRangeMember2025-12-310000891478san:DiscountedCashFlowsOnInflationSwapRateMemberifrs-full:FinancialLiabilitiesAtFairValueThroughProfitOrLossThatMeetDefinitionOfHeldForTradingCategoryMemberifrs-full:InterestRateSwapContractMembersan:InflationSwapRateMeasurementInputMemberifrs-full:WeightedAverageMember2025-12-310000891478san:DiscountedCashFlowsOnInflationSwapRateMemberifrs-full:FinancialLiabilitiesAtFairValueThroughProfitOrLossThatMeetDefinitionOfHeldForTradingCategoryMemberifrs-full:InterestRateSwapContractMember2025-01-012025-12-310000891478ifrs-full:DiscountedCashFlowMemberifrs-full:FinancialLiabilitiesAtFairValueThroughProfitOrLossThatMeetDefinitionOfHeldForTradingCategoryMemberifrs-full:InterestRateSwapContractMemberifrs-full:CreditSpreadMeasurementInputMemberifrs-full:BottomOfRangeMember2025-12-310000891478ifrs-full:DiscountedCashFlowMemberifrs-full:FinancialLiabilitiesAtFairValueThroughProfitOrLossThatMeetDefinitionOfHeldForTradingCategoryMemberifrs-full:InterestRateSwapContractMemberifrs-full:CreditSpreadMeasurementInputMemberifrs-full:TopOfRangeMember2025-12-310000891478ifrs-full:DiscountedCashFlowMemberifrs-full:FinancialLiabilitiesAtFairValueThroughProfitOrLossThatMeetDefinitionOfHeldForTradingCategoryMemberifrs-full:InterestRateSwapContractMemberifrs-full:CreditSpreadMeasurementInputMemberifrs-full:WeightedAverageMember2025-12-310000891478ifrs-full:DiscountedCashFlowMemberifrs-full:FinancialLiabilitiesAtFairValueThroughProfitOrLossThatMeetDefinitionOfHeldForTradingCategoryMemberifrs-full:InterestRateSwapContractMember2025-01-012025-12-310000891478ifrs-full:FinancialAssetsAtFairValueThroughProfitOrLossClassifiedAsHeldForTradingCategoryMembersan:ReposReverseReposMembersan:OtherValuationTechniqueMember2024-01-012024-12-310000891478ifrs-full:FinancialAssetsAtFairValueThroughProfitOrLossClassifiedAsHeldForTradingCategoryMembersan:CorporateDebtMemberifrs-full:DiscountedCashFlowMemberifrs-full:CreditSpreadMeasurementInputMemberifrs-full:BottomOfRangeMember2024-12-310000891478ifrs-full:FinancialAssetsAtFairValueThroughProfitOrLossClassifiedAsHeldForTradingCategoryMembersan:CorporateDebtMemberifrs-full:DiscountedCashFlowMemberifrs-full:CreditSpreadMeasurementInputMemberifrs-full:TopOfRangeMember2024-12-310000891478ifrs-full:FinancialAssetsAtFairValueThroughProfitOrLossClassifiedAsHeldForTradingCategoryMembersan:CorporateDebtMemberifrs-full:DiscountedCashFlowMemberifrs-full:CreditSpreadMeasurementInputMemberifrs-full:WeightedAverageMember2024-12-310000891478ifrs-full:FinancialAssetsAtFairValueThroughProfitOrLossClassifiedAsHeldForTradingCategoryMembersan:CorporateDebtMemberifrs-full:DiscountedCashFlowMember2024-01-012024-12-310000891478ifrs-full:FinancialAssetsAtFairValueThroughProfitOrLossClassifiedAsHeldForTradingCategoryMembersan:GovernmentDebtMemberifrs-full:DiscountedCashFlowMembersan:DiscountCurveMeasurementInputMemberifrs-full:BottomOfRangeMember2024-12-310000891478ifrs-full:FinancialAssetsAtFairValueThroughProfitOrLossClassifiedAsHeldForTradingCategoryMembersan:GovernmentDebtMemberifrs-full:DiscountedCashFlowMembersan:DiscountCurveMeasurementInputMemberifrs-full:TopOfRangeMember2024-12-310000891478ifrs-full:FinancialAssetsAtFairValueThroughProfitOrLossClassifiedAsHeldForTradingCategoryMembersan:GovernmentDebtMemberifrs-full:DiscountedCashFlowMembersan:DiscountCurveMeasurementInputMemberifrs-full:WeightedAverageMember2024-12-310000891478ifrs-full:FinancialAssetsAtFairValueThroughProfitOrLossClassifiedAsHeldForTradingCategoryMembersan:GovernmentDebtMemberifrs-full:DiscountedCashFlowMember2024-01-012024-12-310000891478ifrs-full:FinancialAssetsAtFairValueThroughProfitOrLossClassifiedAsHeldForTradingCategoryMembersan:DebtSecuritiesOtherMemberifrs-full:DiscountedCashFlowMemberifrs-full:CreditSpreadMeasurementInputMemberifrs-full:BottomOfRangeMember2024-12-310000891478ifrs-full:FinancialAssetsAtFairValueThroughProfitOrLossClassifiedAsHeldForTradingCategoryMembersan:DebtSecuritiesOtherMemberifrs-full:DiscountedCashFlowMemberifrs-full:CreditSpreadMeasurementInputMemberifrs-full:TopOfRangeMember2024-12-310000891478ifrs-full:FinancialAssetsAtFairValueThroughProfitOrLossClassifiedAsHeldForTradingCategoryMembersan:DebtSecuritiesOtherMemberifrs-full:DiscountedCashFlowMemberifrs-full:CreditSpreadMeasurementInputMemberifrs-full:WeightedAverageMember2024-12-310000891478ifrs-full:FinancialAssetsAtFairValueThroughProfitOrLossClassifiedAsHeldForTradingCategoryMembersan:DebtSecuritiesOtherMemberifrs-full:DiscountedCashFlowMember2024-01-012024-12-310000891478ifrs-full:FinancialAssetsAtFairValueThroughProfitOrLossClassifiedAsHeldForTradingCategoryMembersan:CapsFloorsMembersan:ForwardEstimationValuationTechniqueMemberifrs-full:InterestRateMeasurementInputMemberifrs-full:BottomOfRangeMember2024-12-310000891478ifrs-full:FinancialAssetsAtFairValueThroughProfitOrLossClassifiedAsHeldForTradingCategoryMembersan:CapsFloorsMembersan:ForwardEstimationValuationTechniqueMemberifrs-full:InterestRateMeasurementInputMemberifrs-full:TopOfRangeMember2024-12-310000891478ifrs-full:FinancialAssetsAtFairValueThroughProfitOrLossClassifiedAsHeldForTradingCategoryMembersan:CapsFloorsMembersan:ForwardEstimationValuationTechniqueMemberifrs-full:InterestRateMeasurementInputMemberifrs-full:WeightedAverageMember2024-12-310000891478ifrs-full:FinancialAssetsAtFairValueThroughProfitOrLossClassifiedAsHeldForTradingCategoryMembersan:CapsFloorsMembersan:ForwardEstimationValuationTechniqueMember2024-01-012024-12-310000891478ifrs-full:FinancialAssetsAtFairValueThroughProfitOrLossClassifiedAsHeldForTradingCategoryMemberifrs-full:CurrencySwapContractMemberifrs-full:DiscountedCashFlowMemberifrs-full:CreditSpreadMeasurementInputMemberifrs-full:BottomOfRangeMember2024-12-310000891478ifrs-full:FinancialAssetsAtFairValueThroughProfitOrLossClassifiedAsHeldForTradingCategoryMemberifrs-full:CurrencySwapContractMemberifrs-full:DiscountedCashFlowMemberifrs-full:CreditSpreadMeasurementInputMemberifrs-full:TopOfRangeMember2024-12-310000891478ifrs-full:FinancialAssetsAtFairValueThroughProfitOrLossClassifiedAsHeldForTradingCategoryMemberifrs-full:CurrencySwapContractMemberifrs-full:DiscountedCashFlowMemberifrs-full:CreditSpreadMeasurementInputMemberifrs-full:WeightedAverageMember2024-12-310000891478ifrs-full:FinancialAssetsAtFairValueThroughProfitOrLossClassifiedAsHeldForTradingCategoryMemberifrs-full:CurrencySwapContractMemberifrs-full:DiscountedCashFlowMember2024-01-012024-12-310000891478ifrs-full:FinancialAssetsAtFairValueThroughProfitOrLossClassifiedAsHeldForTradingCategoryMembersan:CreditDefaultSwap1Membersan:PriceBasedValuationTechniqueMemberifrs-full:CreditSpreadMeasurementInputMemberifrs-full:BottomOfRangeMember2024-12-310000891478ifrs-full:FinancialAssetsAtFairValueThroughProfitOrLossClassifiedAsHeldForTradingCategoryMembersan:CreditDefaultSwap1Membersan:PriceBasedValuationTechniqueMemberifrs-full:CreditSpreadMeasurementInputMemberifrs-full:TopOfRangeMember2024-12-310000891478ifrs-full:FinancialAssetsAtFairValueThroughProfitOrLossClassifiedAsHeldForTradingCategoryMembersan:CreditDefaultSwap1Membersan:PriceBasedValuationTechniqueMemberifrs-full:CreditSpreadMeasurementInputMemberifrs-full:WeightedAverageMember2024-12-310000891478ifrs-full:FinancialAssetsAtFairValueThroughProfitOrLossClassifiedAsHeldForTradingCategoryMembersan:CreditDefaultSwap1Membersan:PriceBasedValuationTechniqueMember2024-01-012024-12-310000891478ifrs-full:FinancialAssetsAtFairValueThroughProfitOrLossClassifiedAsHeldForTradingCategoryMembersan:EQOptionsMembersan:EQOptionPricingModelValuationTechniqueMemberifrs-full:HistoricalVolatilityForSharesMeasurementInputMemberifrs-full:BottomOfRangeMember2024-12-310000891478ifrs-full:FinancialAssetsAtFairValueThroughProfitOrLossClassifiedAsHeldForTradingCategoryMembersan:EQOptionsMembersan:EQOptionPricingModelValuationTechniqueMemberifrs-full:HistoricalVolatilityForSharesMeasurementInputMemberifrs-full:TopOfRangeMember2024-12-310000891478ifrs-full:FinancialAssetsAtFairValueThroughProfitOrLossClassifiedAsHeldForTradingCategoryMembersan:EQOptionsMembersan:EQOptionPricingModelValuationTechniqueMemberifrs-full:HistoricalVolatilityForSharesMeasurementInputMemberifrs-full:WeightedAverageMember2024-12-310000891478ifrs-full:FinancialAssetsAtFairValueThroughProfitOrLossClassifiedAsHeldForTradingCategoryMembersan:EQOptionsMembersan:EQOptionPricingModelValuationTechniqueMember2024-01-012024-12-310000891478ifrs-full:FinancialAssetsAtFairValueThroughProfitOrLossClassifiedAsHeldForTradingCategoryMembersan:EQOptionsMembersan:LocalVolatilityOptionTechniqueMemberifrs-full:HistoricalVolatilityForSharesMeasurementInputMemberifrs-full:BottomOfRangeMember2024-12-310000891478ifrs-full:FinancialAssetsAtFairValueThroughProfitOrLossClassifiedAsHeldForTradingCategoryMembersan:EQOptionsMembersan:LocalVolatilityOptionTechniqueMemberifrs-full:HistoricalVolatilityForSharesMeasurementInputMemberifrs-full:TopOfRangeMember2024-12-310000891478ifrs-full:FinancialAssetsAtFairValueThroughProfitOrLossClassifiedAsHeldForTradingCategoryMembersan:EQOptionsMembersan:LocalVolatilityOptionTechniqueMemberifrs-full:HistoricalVolatilityForSharesMeasurementInputMemberifrs-full:WeightedAverageMember2024-12-310000891478ifrs-full:FinancialAssetsAtFairValueThroughProfitOrLossClassifiedAsHeldForTradingCategoryMembersan:EQOptionsMembersan:LocalVolatilityOptionTechniqueMember2024-01-012024-12-310000891478ifrs-full:FinancialAssetsAtFairValueThroughProfitOrLossClassifiedAsHeldForTradingCategoryMembersan:ForeignExchangeForwardContractMembersan:ForwardEstimationValuationTechniqueMembersan:SwapRateMeasurementInputMemberifrs-full:BottomOfRangeMember2024-12-310000891478ifrs-full:FinancialAssetsAtFairValueThroughProfitOrLossClassifiedAsHeldForTradingCategoryMembersan:ForeignExchangeForwardContractMembersan:ForwardEstimationValuationTechniqueMembersan:SwapRateMeasurementInputMemberifrs-full:TopOfRangeMember2024-12-310000891478ifrs-full:FinancialAssetsAtFairValueThroughProfitOrLossClassifiedAsHeldForTradingCategoryMembersan:ForeignExchangeForwardContractMembersan:ForwardEstimationValuationTechniqueMembersan:SwapRateMeasurementInputMemberifrs-full:WeightedAverageMember2024-12-310000891478ifrs-full:FinancialAssetsAtFairValueThroughProfitOrLossClassifiedAsHeldForTradingCategoryMembersan:ForeignExchangeForwardContractMembersan:ForwardEstimationValuationTechniqueMember2024-01-012024-12-310000891478ifrs-full:FinancialAssetsAtFairValueThroughProfitOrLossClassifiedAsHeldForTradingCategoryMembersan:ForeignExchangeOptionsMembersan:FXOptionPricingModelMemberifrs-full:HistoricalVolatilityForSharesMeasurementInputMemberifrs-full:BottomOfRangeMember2024-12-310000891478ifrs-full:FinancialAssetsAtFairValueThroughProfitOrLossClassifiedAsHeldForTradingCategoryMembersan:ForeignExchangeOptionsMembersan:FXOptionPricingModelMemberifrs-full:HistoricalVolatilityForSharesMeasurementInputMemberifrs-full:TopOfRangeMember2024-12-310000891478ifrs-full:FinancialAssetsAtFairValueThroughProfitOrLossClassifiedAsHeldForTradingCategoryMembersan:ForeignExchangeOptionsMembersan:FXOptionPricingModelMemberifrs-full:HistoricalVolatilityForSharesMeasurementInputMemberifrs-full:WeightedAverageMember2024-12-310000891478ifrs-full:FinancialAssetsAtFairValueThroughProfitOrLossClassifiedAsHeldForTradingCategoryMembersan:ForeignExchangeOptionsMembersan:FXOptionPricingModelMember2024-01-012024-12-310000891478ifrs-full:FinancialAssetsAtFairValueThroughProfitOrLossClassifiedAsHeldForTradingCategoryMembersan:InflationDerivativesMembersan:AssetSwapModelValuationTechniqueMembersan:InflationSwapRateMeasurementInputMemberifrs-full:BottomOfRangeMember2024-12-310000891478ifrs-full:FinancialAssetsAtFairValueThroughProfitOrLossClassifiedAsHeldForTradingCategoryMembersan:InflationDerivativesMembersan:AssetSwapModelValuationTechniqueMembersan:InflationSwapRateMeasurementInputMemberifrs-full:TopOfRangeMember2024-12-310000891478ifrs-full:FinancialAssetsAtFairValueThroughProfitOrLossClassifiedAsHeldForTradingCategoryMembersan:InflationDerivativesMembersan:AssetSwapModelValuationTechniqueMembersan:InflationSwapRateMeasurementInputMemberifrs-full:WeightedAverageMember2024-12-310000891478ifrs-full:FinancialAssetsAtFairValueThroughProfitOrLossClassifiedAsHeldForTradingCategoryMembersan:InflationDerivativesMembersan:AssetSwapModelValuationTechniqueMember2024-01-012024-12-310000891478ifrs-full:FinancialAssetsAtFairValueThroughProfitOrLossClassifiedAsHeldForTradingCategoryMembersan:IROptionsMembersan:InterestRateOptionPricingModelMemberifrs-full:HistoricalVolatilityForSharesMeasurementInputMemberifrs-full:BottomOfRangeMember2024-12-310000891478ifrs-full:FinancialAssetsAtFairValueThroughProfitOrLossClassifiedAsHeldForTradingCategoryMembersan:IROptionsMembersan:InterestRateOptionPricingModelMemberifrs-full:HistoricalVolatilityForSharesMeasurementInputMemberifrs-full:TopOfRangeMember2024-12-310000891478ifrs-full:FinancialAssetsAtFairValueThroughProfitOrLossClassifiedAsHeldForTradingCategoryMembersan:IROptionsMembersan:InterestRateOptionPricingModelMemberifrs-full:HistoricalVolatilityForSharesMeasurementInputMemberifrs-full:WeightedAverageMember2024-12-310000891478ifrs-full:FinancialAssetsAtFairValueThroughProfitOrLossClassifiedAsHeldForTradingCategoryMembersan:IROptionsMembersan:InterestRateOptionPricingModelMember2024-01-012024-12-310000891478ifrs-full:FinancialAssetsAtFairValueThroughProfitOrLossClassifiedAsHeldForTradingCategoryMemberifrs-full:InterestRateSwapContractMembersan:OtherValuationTechniqueMembersan:OtherMeasurementInputMemberifrs-full:BottomOfRangeMember2024-12-310000891478ifrs-full:FinancialAssetsAtFairValueThroughProfitOrLossClassifiedAsHeldForTradingCategoryMemberifrs-full:InterestRateSwapContractMembersan:OtherValuationTechniqueMember2024-01-012024-12-310000891478ifrs-full:FinancialAssetsAtFairValueThroughProfitOrLossClassifiedAsHeldForTradingCategoryMemberifrs-full:InterestRateSwapContractMembersan:FlowDiscountingMethodOnCreditSpreadMemberifrs-full:CreditSpreadMeasurementInputMemberifrs-full:BottomOfRangeMember2024-12-310000891478ifrs-full:FinancialAssetsAtFairValueThroughProfitOrLossClassifiedAsHeldForTradingCategoryMemberifrs-full:InterestRateSwapContractMembersan:FlowDiscountingMethodOnCreditSpreadMemberifrs-full:CreditSpreadMeasurementInputMemberifrs-full:TopOfRangeMember2024-12-310000891478ifrs-full:FinancialAssetsAtFairValueThroughProfitOrLossClassifiedAsHeldForTradingCategoryMemberifrs-full:InterestRateSwapContractMembersan:FlowDiscountingMethodOnCreditSpreadMemberifrs-full:CreditSpreadMeasurementInputMemberifrs-full:WeightedAverageMember2024-12-310000891478ifrs-full:FinancialAssetsAtFairValueThroughProfitOrLossClassifiedAsHeldForTradingCategoryMemberifrs-full:InterestRateSwapContractMembersan:FlowDiscountingMethodOnCreditSpreadMember2024-01-012024-12-310000891478ifrs-full:FinancialAssetsAtFairValueThroughProfitOrLossClassifiedAsHeldForTradingCategoryMemberifrs-full:InterestRateSwapContractMembersan:FlowDiscountingMethodOnSwapRateMembersan:SwapRateMeasurementInputMemberifrs-full:BottomOfRangeMember2024-12-310000891478ifrs-full:FinancialAssetsAtFairValueThroughProfitOrLossClassifiedAsHeldForTradingCategoryMemberifrs-full:InterestRateSwapContractMembersan:FlowDiscountingMethodOnSwapRateMembersan:SwapRateMeasurementInputMemberifrs-full:TopOfRangeMember2024-12-310000891478ifrs-full:FinancialAssetsAtFairValueThroughProfitOrLossClassifiedAsHeldForTradingCategoryMemberifrs-full:InterestRateSwapContractMembersan:FlowDiscountingMethodOnSwapRateMembersan:SwapRateMeasurementInputMemberifrs-full:WeightedAverageMember2024-12-310000891478ifrs-full:FinancialAssetsAtFairValueThroughProfitOrLossClassifiedAsHeldForTradingCategoryMemberifrs-full:InterestRateSwapContractMembersan:FlowDiscountingMethodOnSwapRateMember2024-01-012024-12-310000891478ifrs-full:FinancialAssetsAtFairValueThroughProfitOrLossClassifiedAsHeldForTradingCategoryMembersan:OtherDerivativesMembersan:ForwardEstimationValuationTechniqueMembersan:PriceMeasurementInputMemberifrs-full:BottomOfRangeMember2024-12-310000891478ifrs-full:FinancialAssetsAtFairValueThroughProfitOrLossClassifiedAsHeldForTradingCategoryMembersan:OtherDerivativesMembersan:ForwardEstimationValuationTechniqueMembersan:PriceMeasurementInputMemberifrs-full:TopOfRangeMember2024-12-310000891478ifrs-full:FinancialAssetsAtFairValueThroughProfitOrLossClassifiedAsHeldForTradingCategoryMembersan:OtherDerivativesMembersan:ForwardEstimationValuationTechniqueMembersan:PriceMeasurementInputMemberifrs-full:WeightedAverageMember2024-12-310000891478ifrs-full:FinancialAssetsAtFairValueThroughProfitOrLossClassifiedAsHeldForTradingCategoryMembersan:OtherDerivativesMembersan:ForwardEstimationValuationTechniqueMember2024-01-012024-12-310000891478ifrs-full:FinancialAssetsAtFairValueThroughProfitOrLossClassifiedAsHeldForTradingCategoryMembersan:PropertyDerivativesMemberifrs-full:OptionPricingModelMembersan:GrowthRateMeasurementInputMemberifrs-full:BottomOfRangeMember2024-12-310000891478ifrs-full:FinancialAssetsAtFairValueThroughProfitOrLossClassifiedAsHeldForTradingCategoryMembersan:PropertyDerivativesMemberifrs-full:OptionPricingModelMembersan:GrowthRateMeasurementInputMemberifrs-full:TopOfRangeMember2024-12-310000891478ifrs-full:FinancialAssetsAtFairValueThroughProfitOrLossClassifiedAsHeldForTradingCategoryMembersan:PropertyDerivativesMemberifrs-full:OptionPricingModelMembersan:GrowthRateMeasurementInputMemberifrs-full:WeightedAverageMember2024-12-310000891478ifrs-full:FinancialAssetsAtFairValueThroughProfitOrLossClassifiedAsHeldForTradingCategoryMembersan:PropertyDerivativesMemberifrs-full:OptionPricingModelMember2024-01-012024-12-310000891478ifrs-full:FinancialAssetsAtFairValueThroughProfitOrLossClassifiedAsHeldForTradingCategoryMembersan:SecuritisationSwapMemberifrs-full:DiscountedCashFlowMemberifrs-full:ConstantPrepaymentRateMeasurementInputMemberifrs-full:BottomOfRangeMember2024-12-310000891478ifrs-full:FinancialAssetsAtFairValueThroughProfitOrLossClassifiedAsHeldForTradingCategoryMembersan:SecuritisationSwapMemberifrs-full:DiscountedCashFlowMemberifrs-full:ConstantPrepaymentRateMeasurementInputMemberifrs-full:TopOfRangeMember2024-12-310000891478ifrs-full:FinancialAssetsAtFairValueThroughProfitOrLossClassifiedAsHeldForTradingCategoryMembersan:SecuritisationSwapMemberifrs-full:DiscountedCashFlowMemberifrs-full:ConstantPrepaymentRateMeasurementInputMemberifrs-full:WeightedAverageMember2024-12-310000891478ifrs-full:FinancialAssetsAtFairValueThroughProfitOrLossClassifiedAsHeldForTradingCategoryMembersan:SecuritisationSwapMemberifrs-full:DiscountedCashFlowMember2024-01-012024-12-310000891478ifrs-full:FinancialAssetsAtFairValueThroughProfitOrLossDesignatedUponInitialRecognitionCategoryMembersan:LoanMemberifrs-full:DiscountedCashFlowMemberifrs-full:CreditSpreadMeasurementInputMemberifrs-full:BottomOfRangeMember2024-12-310000891478ifrs-full:FinancialAssetsAtFairValueThroughProfitOrLossDesignatedUponInitialRecognitionCategoryMembersan:LoanMemberifrs-full:DiscountedCashFlowMemberifrs-full:CreditSpreadMeasurementInputMemberifrs-full:TopOfRangeMember2024-12-310000891478ifrs-full:FinancialAssetsAtFairValueThroughProfitOrLossDesignatedUponInitialRecognitionCategoryMembersan:LoanMemberifrs-full:DiscountedCashFlowMemberifrs-full:CreditSpreadMeasurementInputMemberifrs-full:WeightedAverageMember2024-12-310000891478ifrs-full:FinancialAssetsAtFairValueThroughProfitOrLossDesignatedUponInitialRecognitionCategoryMembersan:LoanMemberifrs-full:DiscountedCashFlowMember2024-01-012024-12-310000891478ifrs-full:FinancialAssetsAtFairValueThroughProfitOrLossDesignatedUponInitialRecognitionCategoryMembersan:MortgagePortfolioMembersan:BlackScholesModelMembersan:GrowthRateMeasurementInputMemberifrs-full:BottomOfRangeMember2024-12-310000891478ifrs-full:FinancialAssetsAtFairValueThroughProfitOrLossDesignatedUponInitialRecognitionCategoryMembersan:MortgagePortfolioMembersan:BlackScholesModelMembersan:GrowthRateMeasurementInputMemberifrs-full:TopOfRangeMember2024-12-310000891478ifrs-full:FinancialAssetsAtFairValueThroughProfitOrLossDesignatedUponInitialRecognitionCategoryMembersan:MortgagePortfolioMembersan:BlackScholesModelMembersan:GrowthRateMeasurementInputMemberifrs-full:WeightedAverageMember2024-12-310000891478ifrs-full:FinancialAssetsAtFairValueThroughProfitOrLossDesignatedUponInitialRecognitionCategoryMembersan:MortgagePortfolioMembersan:BlackScholesModelMember2024-01-012024-12-310000891478ifrs-full:FinancialAssetsAtFairValueThroughProfitOrLossDesignatedUponInitialRecognitionCategoryMembersan:DebtSecuritiesOtherMembersan:OtherValuationTechniqueMembersan:InflationSwapRateMeasurementInputMemberifrs-full:BottomOfRangeMember2024-12-310000891478ifrs-full:FinancialAssetsAtFairValueThroughProfitOrLossDesignatedUponInitialRecognitionCategoryMembersan:DebtSecuritiesOtherMembersan:OtherValuationTechniqueMembersan:InflationSwapRateMeasurementInputMemberifrs-full:TopOfRangeMember2024-12-310000891478ifrs-full:FinancialAssetsAtFairValueThroughProfitOrLossDesignatedUponInitialRecognitionCategoryMembersan:DebtSecuritiesOtherMembersan:OtherValuationTechniqueMembersan:InflationSwapRateMeasurementInputMemberifrs-full:WeightedAverageMember2024-12-310000891478ifrs-full:FinancialAssetsAtFairValueThroughProfitOrLossDesignatedUponInitialRecognitionCategoryMembersan:DebtSecuritiesOtherMembersan:OtherValuationTechniqueMember2024-01-012024-12-310000891478ifrs-full:FinancialAssetsAtFairValueThroughProfitOrLossMandatorilyMeasuredAtFairValueCategoryMembersan:PropertySecuritiesMembersan:ProbabilityWeightingValuationTechniqueMembersan:GrowthRateMeasurementInputMemberifrs-full:BottomOfRangeMember2024-12-310000891478ifrs-full:FinancialAssetsAtFairValueThroughProfitOrLossMandatorilyMeasuredAtFairValueCategoryMembersan:PropertySecuritiesMembersan:ProbabilityWeightingValuationTechniqueMembersan:GrowthRateMeasurementInputMemberifrs-full:TopOfRangeMember2024-12-310000891478ifrs-full:FinancialAssetsAtFairValueThroughProfitOrLossMandatorilyMeasuredAtFairValueCategoryMembersan:PropertySecuritiesMembersan:ProbabilityWeightingValuationTechniqueMembersan:GrowthRateMeasurementInputMemberifrs-full:WeightedAverageMember2024-12-310000891478ifrs-full:FinancialAssetsAtFairValueThroughProfitOrLossMandatorilyMeasuredAtFairValueCategoryMembersan:PropertySecuritiesMembersan:ProbabilityWeightingValuationTechniqueMember2024-01-012024-12-310000891478ifrs-full:FinancialAssetsAtFairValueThroughProfitOrLossMandatorilyMeasuredAtFairValueCategoryMemberifrs-full:EquityInvestmentsMembersan:PriceBasedValuationTechniqueMembersan:PriceMeasurementInputMemberifrs-full:BottomOfRangeMember2024-12-310000891478ifrs-full:FinancialAssetsAtFairValueThroughProfitOrLossMandatorilyMeasuredAtFairValueCategoryMemberifrs-full:EquityInvestmentsMembersan:PriceBasedValuationTechniqueMembersan:PriceMeasurementInputMemberifrs-full:TopOfRangeMember2024-12-310000891478ifrs-full:FinancialAssetsAtFairValueThroughProfitOrLossMandatorilyMeasuredAtFairValueCategoryMemberifrs-full:EquityInvestmentsMembersan:PriceBasedValuationTechniqueMembersan:PriceMeasurementInputMemberifrs-full:WeightedAverageMember2024-12-310000891478ifrs-full:FinancialAssetsAtFairValueThroughProfitOrLossMandatorilyMeasuredAtFairValueCategoryMemberifrs-full:EquityInvestmentsMembersan:PriceBasedValuationTechniqueMember2024-01-012024-12-310000891478ifrs-full:FinancialAssetsAtFairValueThroughOtherComprehensiveIncomeCategoryMembersan:LoanMembersan:FlowDiscountingMethodOnCreditSpreadMember2024-01-012024-12-310000891478ifrs-full:FinancialAssetsAtFairValueThroughOtherComprehensiveIncomeCategoryMembersan:LoanMembersan:DiscountedCashFlowsOnInterestRateCurveMemberifrs-full:InterestRateMeasurementInputMemberifrs-full:BottomOfRangeMember2024-12-310000891478ifrs-full:FinancialAssetsAtFairValueThroughOtherComprehensiveIncomeCategoryMembersan:LoanMembersan:DiscountedCashFlowsOnInterestRateCurveMemberifrs-full:InterestRateMeasurementInputMemberifrs-full:TopOfRangeMember2024-12-310000891478ifrs-full:FinancialAssetsAtFairValueThroughOtherComprehensiveIncomeCategoryMembersan:LoanMembersan:DiscountedCashFlowsOnInterestRateCurveMemberifrs-full:InterestRateMeasurementInputMemberifrs-full:WeightedAverageMember2024-12-310000891478ifrs-full:FinancialAssetsAtFairValueThroughOtherComprehensiveIncomeCategoryMembersan:LoanMembersan:DiscountedCashFlowsOnInterestRateCurveMember2024-01-012024-12-310000891478ifrs-full:FinancialAssetsAtFairValueThroughOtherComprehensiveIncomeCategoryMembersan:LoanMembersan:DiscountedCashFlowsOnMarginOfAReferencePortfolioMembersan:MarginOfAPreferencePortfolioMeasurementInputMemberifrs-full:BottomOfRangeMember2024-12-310000891478ifrs-full:FinancialAssetsAtFairValueThroughOtherComprehensiveIncomeCategoryMembersan:LoanMembersan:DiscountedCashFlowsOnMarginOfAReferencePortfolioMembersan:MarginOfAPreferencePortfolioMeasurementInputMemberifrs-full:TopOfRangeMember2024-12-310000891478ifrs-full:FinancialAssetsAtFairValueThroughOtherComprehensiveIncomeCategoryMembersan:LoanMembersan:DiscountedCashFlowsOnMarginOfAReferencePortfolioMembersan:MarginOfAPreferencePortfolioMeasurementInputMemberifrs-full:WeightedAverageMember2024-12-310000891478ifrs-full:FinancialAssetsAtFairValueThroughOtherComprehensiveIncomeCategoryMembersan:LoanMembersan:DiscountedCashFlowsOnMarginOfAReferencePortfolioMember2024-01-012024-12-310000891478ifrs-full:FinancialAssetsAtFairValueThroughOtherComprehensiveIncomeCategoryMembersan:LoanMembersan:ForwardEstimationValuationTechniqueMemberifrs-full:CreditSpreadMeasurementInputMemberifrs-full:BottomOfRangeMember2024-12-310000891478ifrs-full:FinancialAssetsAtFairValueThroughOtherComprehensiveIncomeCategoryMembersan:LoanMembersan:ForwardEstimationValuationTechniqueMemberifrs-full:CreditSpreadMeasurementInputMemberifrs-full:TopOfRangeMember2024-12-310000891478ifrs-full:FinancialAssetsAtFairValueThroughOtherComprehensiveIncomeCategoryMembersan:LoanMembersan:ForwardEstimationValuationTechniqueMemberifrs-full:CreditSpreadMeasurementInputMemberifrs-full:WeightedAverageMember2024-12-310000891478ifrs-full:FinancialAssetsAtFairValueThroughOtherComprehensiveIncomeCategoryMembersan:LoanMembersan:ForwardEstimationValuationTechniqueMember2024-01-012024-12-310000891478ifrs-full:FinancialAssetsAtFairValueThroughOtherComprehensiveIncomeCategoryMembersan:LoanMemberifrs-full:MarketComparablePricesMembersan:MarketPriceMeasurementInputMemberifrs-full:BottomOfRangeMember2024-12-310000891478ifrs-full:FinancialAssetsAtFairValueThroughOtherComprehensiveIncomeCategoryMembersan:LoanMemberifrs-full:MarketComparablePricesMembersan:MarketPriceMeasurementInputMemberifrs-full:TopOfRangeMember2024-12-310000891478ifrs-full:FinancialAssetsAtFairValueThroughOtherComprehensiveIncomeCategoryMembersan:LoanMemberifrs-full:MarketComparablePricesMembersan:MarketPriceMeasurementInputMemberifrs-full:WeightedAverageMember2024-12-310000891478ifrs-full:FinancialAssetsAtFairValueThroughOtherComprehensiveIncomeCategoryMembersan:LoanMemberifrs-full:MarketComparablePricesMember2024-01-012024-12-310000891478ifrs-full:FinancialAssetsAtFairValueThroughOtherComprehensiveIncomeCategoryMembersan:CorporateDebtMemberifrs-full:DiscountedCashFlowMembersan:MarginOfAReferencePortfolioMemberifrs-full:BottomOfRangeMember2024-12-310000891478ifrs-full:FinancialAssetsAtFairValueThroughOtherComprehensiveIncomeCategoryMembersan:CorporateDebtMemberifrs-full:DiscountedCashFlowMembersan:MarginOfAReferencePortfolioMemberifrs-full:TopOfRangeMember2024-12-310000891478ifrs-full:FinancialAssetsAtFairValueThroughOtherComprehensiveIncomeCategoryMembersan:CorporateDebtMemberifrs-full:DiscountedCashFlowMembersan:MarginOfAReferencePortfolioMemberifrs-full:WeightedAverageMember2024-12-310000891478ifrs-full:FinancialAssetsAtFairValueThroughOtherComprehensiveIncomeCategoryMembersan:CorporateDebtMemberifrs-full:DiscountedCashFlowMember2024-01-012024-12-310000891478ifrs-full:FinancialAssetsAtFairValueThroughOtherComprehensiveIncomeCategoryMembersan:MortgageLettersDebtSecuritiesMemberifrs-full:DiscountedCashFlowMembersan:MortgageLettersMeasurementInputMemberifrs-full:BottomOfRangeMember2024-12-310000891478ifrs-full:FinancialAssetsAtFairValueThroughOtherComprehensiveIncomeCategoryMembersan:MortgageLettersDebtSecuritiesMemberifrs-full:DiscountedCashFlowMembersan:MortgageLettersMeasurementInputMemberifrs-full:TopOfRangeMember2024-12-310000891478ifrs-full:FinancialAssetsAtFairValueThroughOtherComprehensiveIncomeCategoryMembersan:MortgageLettersDebtSecuritiesMemberifrs-full:DiscountedCashFlowMembersan:MortgageLettersMeasurementInputMemberifrs-full:WeightedAverageMember2024-12-310000891478ifrs-full:FinancialAssetsAtFairValueThroughOtherComprehensiveIncomeCategoryMembersan:MortgageLettersDebtSecuritiesMemberifrs-full:DiscountedCashFlowMember2024-01-012024-12-310000891478ifrs-full:FinancialAssetsAtFairValueThroughOtherComprehensiveIncomeCategoryMemberifrs-full:EquityInvestmentsMembersan:PriceBasedValuationTechniqueMembersan:PriceMeasurementInputMemberifrs-full:BottomOfRangeMember2024-12-310000891478ifrs-full:FinancialAssetsAtFairValueThroughOtherComprehensiveIncomeCategoryMemberifrs-full:EquityInvestmentsMembersan:PriceBasedValuationTechniqueMembersan:PriceMeasurementInputMemberifrs-full:TopOfRangeMember2024-12-310000891478ifrs-full:FinancialAssetsAtFairValueThroughOtherComprehensiveIncomeCategoryMemberifrs-full:EquityInvestmentsMembersan:PriceBasedValuationTechniqueMembersan:PriceMeasurementInputMemberifrs-full:WeightedAverageMember2024-12-310000891478ifrs-full:FinancialAssetsAtFairValueThroughOtherComprehensiveIncomeCategoryMemberifrs-full:EquityInvestmentsMembersan:PriceBasedValuationTechniqueMember2024-01-012024-12-310000891478san:VolatilityOptionModelValuationTechniqueMemberifrs-full:FinancialLiabilitiesAtFairValueThroughProfitOrLossThatMeetDefinitionOfHeldForTradingCategoryMembersan:CapsFloorsMemberifrs-full:HistoricalVolatilityForSharesMeasurementInputMemberifrs-full:BottomOfRangeMember2024-12-310000891478san:VolatilityOptionModelValuationTechniqueMemberifrs-full:FinancialLiabilitiesAtFairValueThroughProfitOrLossThatMeetDefinitionOfHeldForTradingCategoryMembersan:CapsFloorsMemberifrs-full:HistoricalVolatilityForSharesMeasurementInputMemberifrs-full:TopOfRangeMember2024-12-310000891478san:VolatilityOptionModelValuationTechniqueMemberifrs-full:FinancialLiabilitiesAtFairValueThroughProfitOrLossThatMeetDefinitionOfHeldForTradingCategoryMembersan:CapsFloorsMemberifrs-full:HistoricalVolatilityForSharesMeasurementInputMemberifrs-full:WeightedAverageMember2024-12-310000891478san:VolatilityOptionModelValuationTechniqueMemberifrs-full:FinancialLiabilitiesAtFairValueThroughProfitOrLossThatMeetDefinitionOfHeldForTradingCategoryMembersan:CapsFloorsMember2024-01-012024-12-310000891478san:VolatilityOptionModelValuationTechniqueMemberifrs-full:FinancialLiabilitiesAtFairValueThroughProfitOrLossThatMeetDefinitionOfHeldForTradingCategoryMembersan:ForeignExchangeOptionsMemberifrs-full:HistoricalVolatilityForSharesMeasurementInputMemberifrs-full:BottomOfRangeMember2024-12-310000891478san:VolatilityOptionModelValuationTechniqueMemberifrs-full:FinancialLiabilitiesAtFairValueThroughProfitOrLossThatMeetDefinitionOfHeldForTradingCategoryMembersan:ForeignExchangeOptionsMemberifrs-full:HistoricalVolatilityForSharesMeasurementInputMemberifrs-full:TopOfRangeMember2024-12-310000891478san:VolatilityOptionModelValuationTechniqueMemberifrs-full:FinancialLiabilitiesAtFairValueThroughProfitOrLossThatMeetDefinitionOfHeldForTradingCategoryMembersan:ForeignExchangeOptionsMemberifrs-full:HistoricalVolatilityForSharesMeasurementInputMemberifrs-full:WeightedAverageMember2024-12-310000891478san:VolatilityOptionModelValuationTechniqueMemberifrs-full:FinancialLiabilitiesAtFairValueThroughProfitOrLossThatMeetDefinitionOfHeldForTradingCategoryMembersan:ForeignExchangeOptionsMember2024-01-012024-12-310000891478san:DiscountedCashFlowsOnInflationSwapRateMemberifrs-full:FinancialLiabilitiesAtFairValueThroughProfitOrLossThatMeetDefinitionOfHeldForTradingCategoryMemberifrs-full:InterestRateSwapContractMembersan:InflationSwapRateMeasurementInputMemberifrs-full:BottomOfRangeMember2024-12-310000891478san:DiscountedCashFlowsOnInflationSwapRateMemberifrs-full:FinancialLiabilitiesAtFairValueThroughProfitOrLossThatMeetDefinitionOfHeldForTradingCategoryMemberifrs-full:InterestRateSwapContractMembersan:InflationSwapRateMeasurementInputMemberifrs-full:TopOfRangeMember2024-12-310000891478san:DiscountedCashFlowsOnInflationSwapRateMemberifrs-full:FinancialLiabilitiesAtFairValueThroughProfitOrLossThatMeetDefinitionOfHeldForTradingCategoryMemberifrs-full:InterestRateSwapContractMembersan:InflationSwapRateMeasurementInputMemberifrs-full:WeightedAverageMember2024-12-310000891478san:DiscountedCashFlowsOnInflationSwapRateMemberifrs-full:FinancialLiabilitiesAtFairValueThroughProfitOrLossThatMeetDefinitionOfHeldForTradingCategoryMemberifrs-full:InterestRateSwapContractMember2024-01-012024-12-310000891478ifrs-full:DiscountedCashFlowMemberifrs-full:FinancialLiabilitiesAtFairValueThroughProfitOrLossThatMeetDefinitionOfHeldForTradingCategoryMemberifrs-full:InterestRateSwapContractMemberifrs-full:CreditSpreadMeasurementInputMemberifrs-full:BottomOfRangeMember2024-12-310000891478ifrs-full:DiscountedCashFlowMemberifrs-full:FinancialLiabilitiesAtFairValueThroughProfitOrLossThatMeetDefinitionOfHeldForTradingCategoryMemberifrs-full:InterestRateSwapContractMemberifrs-full:CreditSpreadMeasurementInputMemberifrs-full:TopOfRangeMember2024-12-310000891478ifrs-full:DiscountedCashFlowMemberifrs-full:FinancialLiabilitiesAtFairValueThroughProfitOrLossThatMeetDefinitionOfHeldForTradingCategoryMemberifrs-full:InterestRateSwapContractMemberifrs-full:CreditSpreadMeasurementInputMemberifrs-full:WeightedAverageMember2024-12-310000891478ifrs-full:DiscountedCashFlowMemberifrs-full:FinancialLiabilitiesAtFairValueThroughProfitOrLossThatMeetDefinitionOfHeldForTradingCategoryMemberifrs-full:InterestRateSwapContractMember2024-01-012024-12-310000891478ifrs-full:FinancialAssetsAtFairValueThroughProfitOrLossClassifiedAsHeldForTradingCategoryMembersan:ReposReverseReposMembersan:OtherValuationTechniqueMember2023-01-012023-12-310000891478ifrs-full:FinancialAssetsAtFairValueThroughProfitOrLossClassifiedAsHeldForTradingCategoryMembersan:CorporateDebtMemberifrs-full:DiscountedCashFlowMemberifrs-full:CreditSpreadMeasurementInputMemberifrs-full:BottomOfRangeMember2023-12-310000891478ifrs-full:FinancialAssetsAtFairValueThroughProfitOrLossClassifiedAsHeldForTradingCategoryMembersan:CorporateDebtMemberifrs-full:DiscountedCashFlowMemberifrs-full:CreditSpreadMeasurementInputMemberifrs-full:TopOfRangeMember2023-12-310000891478ifrs-full:FinancialAssetsAtFairValueThroughProfitOrLossClassifiedAsHeldForTradingCategoryMembersan:CorporateDebtMemberifrs-full:DiscountedCashFlowMemberifrs-full:CreditSpreadMeasurementInputMemberifrs-full:WeightedAverageMember2023-12-310000891478ifrs-full:FinancialAssetsAtFairValueThroughProfitOrLossClassifiedAsHeldForTradingCategoryMembersan:CorporateDebtMemberifrs-full:DiscountedCashFlowMember2023-01-012023-12-310000891478ifrs-full:FinancialAssetsAtFairValueThroughProfitOrLossClassifiedAsHeldForTradingCategoryMembersan:GovernmentDebtMemberifrs-full:DiscountedCashFlowMembersan:DiscountCurveMeasurementInputMemberifrs-full:BottomOfRangeMember2023-12-310000891478ifrs-full:FinancialAssetsAtFairValueThroughProfitOrLossClassifiedAsHeldForTradingCategoryMembersan:GovernmentDebtMemberifrs-full:DiscountedCashFlowMembersan:DiscountCurveMeasurementInputMemberifrs-full:TopOfRangeMember2023-12-310000891478ifrs-full:FinancialAssetsAtFairValueThroughProfitOrLossClassifiedAsHeldForTradingCategoryMembersan:GovernmentDebtMemberifrs-full:DiscountedCashFlowMembersan:DiscountCurveMeasurementInputMemberifrs-full:WeightedAverageMember2023-12-310000891478ifrs-full:FinancialAssetsAtFairValueThroughProfitOrLossClassifiedAsHeldForTradingCategoryMembersan:GovernmentDebtMemberifrs-full:DiscountedCashFlowMember2023-01-012023-12-310000891478ifrs-full:FinancialAssetsAtFairValueThroughProfitOrLossClassifiedAsHeldForTradingCategoryMemberifrs-full:CurrencySwapContractMembersan:ForwardEstimationValuationTechniqueMemberifrs-full:InterestRateMeasurementInputMemberifrs-full:BottomOfRangeMember2023-12-310000891478ifrs-full:FinancialAssetsAtFairValueThroughProfitOrLossClassifiedAsHeldForTradingCategoryMemberifrs-full:CurrencySwapContractMembersan:ForwardEstimationValuationTechniqueMemberifrs-full:InterestRateMeasurementInputMemberifrs-full:TopOfRangeMember2023-12-310000891478ifrs-full:FinancialAssetsAtFairValueThroughProfitOrLossClassifiedAsHeldForTradingCategoryMemberifrs-full:CurrencySwapContractMembersan:ForwardEstimationValuationTechniqueMemberifrs-full:InterestRateMeasurementInputMemberifrs-full:WeightedAverageMember2023-12-310000891478ifrs-full:FinancialAssetsAtFairValueThroughProfitOrLossClassifiedAsHeldForTradingCategoryMemberifrs-full:CurrencySwapContractMembersan:ForwardEstimationValuationTechniqueMember2023-01-012023-12-310000891478ifrs-full:FinancialAssetsAtFairValueThroughProfitOrLossClassifiedAsHeldForTradingCategoryMembersan:CreditDefaultSwap1Membersan:CreditDefaultModelsMembersan:IlliquidCreditDefaultSpreadCurvesMemberifrs-full:BottomOfRangeMember2023-12-310000891478ifrs-full:FinancialAssetsAtFairValueThroughProfitOrLossClassifiedAsHeldForTradingCategoryMembersan:CreditDefaultSwap1Membersan:CreditDefaultModelsMembersan:IlliquidCreditDefaultSpreadCurvesMemberifrs-full:TopOfRangeMember2023-12-310000891478ifrs-full:FinancialAssetsAtFairValueThroughProfitOrLossClassifiedAsHeldForTradingCategoryMembersan:CreditDefaultSwap1Membersan:CreditDefaultModelsMembersan:IlliquidCreditDefaultSpreadCurvesMemberifrs-full:WeightedAverageMember2023-12-310000891478ifrs-full:FinancialAssetsAtFairValueThroughProfitOrLossClassifiedAsHeldForTradingCategoryMembersan:CreditDefaultSwap1Membersan:CreditDefaultModelsMember2023-01-012023-12-310000891478ifrs-full:FinancialAssetsAtFairValueThroughProfitOrLossClassifiedAsHeldForTradingCategoryMembersan:EQOptionsMembersan:EQOptionPricingModelValuationTechniqueMemberifrs-full:HistoricalVolatilityForSharesMeasurementInputMemberifrs-full:BottomOfRangeMember2023-12-310000891478ifrs-full:FinancialAssetsAtFairValueThroughProfitOrLossClassifiedAsHeldForTradingCategoryMembersan:EQOptionsMembersan:EQOptionPricingModelValuationTechniqueMemberifrs-full:HistoricalVolatilityForSharesMeasurementInputMemberifrs-full:TopOfRangeMember2023-12-310000891478ifrs-full:FinancialAssetsAtFairValueThroughProfitOrLossClassifiedAsHeldForTradingCategoryMembersan:EQOptionsMembersan:EQOptionPricingModelValuationTechniqueMemberifrs-full:HistoricalVolatilityForSharesMeasurementInputMemberifrs-full:WeightedAverageMember2023-12-310000891478ifrs-full:FinancialAssetsAtFairValueThroughProfitOrLossClassifiedAsHeldForTradingCategoryMembersan:EQOptionsMembersan:EQOptionPricingModelValuationTechniqueMember2023-01-012023-12-310000891478ifrs-full:FinancialAssetsAtFairValueThroughProfitOrLossClassifiedAsHeldForTradingCategoryMembersan:EQOptionsMembersan:LocalVolatilityOptionTechniqueMemberifrs-full:HistoricalVolatilityForSharesMeasurementInputMemberifrs-full:BottomOfRangeMember2023-12-310000891478ifrs-full:FinancialAssetsAtFairValueThroughProfitOrLossClassifiedAsHeldForTradingCategoryMembersan:EQOptionsMembersan:LocalVolatilityOptionTechniqueMemberifrs-full:HistoricalVolatilityForSharesMeasurementInputMemberifrs-full:TopOfRangeMember2023-12-310000891478ifrs-full:FinancialAssetsAtFairValueThroughProfitOrLossClassifiedAsHeldForTradingCategoryMembersan:EQOptionsMembersan:LocalVolatilityOptionTechniqueMemberifrs-full:HistoricalVolatilityForSharesMeasurementInputMemberifrs-full:WeightedAverageMember2023-12-310000891478ifrs-full:FinancialAssetsAtFairValueThroughProfitOrLossClassifiedAsHeldForTradingCategoryMembersan:EQOptionsMembersan:LocalVolatilityOptionTechniqueMember2023-01-012023-12-310000891478ifrs-full:FinancialAssetsAtFairValueThroughProfitOrLossClassifiedAsHeldForTradingCategoryMembersan:ForeignExchangeOptionsMembersan:FXOptionPricingModelMemberifrs-full:HistoricalVolatilityForSharesMeasurementInputMemberifrs-full:BottomOfRangeMember2023-12-310000891478ifrs-full:FinancialAssetsAtFairValueThroughProfitOrLossClassifiedAsHeldForTradingCategoryMembersan:ForeignExchangeOptionsMembersan:FXOptionPricingModelMemberifrs-full:HistoricalVolatilityForSharesMeasurementInputMemberifrs-full:TopOfRangeMember2023-12-310000891478ifrs-full:FinancialAssetsAtFairValueThroughProfitOrLossClassifiedAsHeldForTradingCategoryMembersan:ForeignExchangeOptionsMembersan:FXOptionPricingModelMemberifrs-full:HistoricalVolatilityForSharesMeasurementInputMemberifrs-full:WeightedAverageMember2023-12-310000891478ifrs-full:FinancialAssetsAtFairValueThroughProfitOrLossClassifiedAsHeldForTradingCategoryMembersan:ForeignExchangeOptionsMembersan:FXOptionPricingModelMember2023-01-012023-12-310000891478ifrs-full:FinancialAssetsAtFairValueThroughProfitOrLossClassifiedAsHeldForTradingCategoryMembersan:InflationDerivativesMembersan:AssetSwapModelValuationTechniqueMembersan:InflationSwapRateMeasurementInputMemberifrs-full:BottomOfRangeMember2023-12-310000891478ifrs-full:FinancialAssetsAtFairValueThroughProfitOrLossClassifiedAsHeldForTradingCategoryMembersan:InflationDerivativesMembersan:AssetSwapModelValuationTechniqueMembersan:InflationSwapRateMeasurementInputMemberifrs-full:TopOfRangeMember2023-12-310000891478ifrs-full:FinancialAssetsAtFairValueThroughProfitOrLossClassifiedAsHeldForTradingCategoryMembersan:InflationDerivativesMembersan:AssetSwapModelValuationTechniqueMembersan:InflationSwapRateMeasurementInputMemberifrs-full:WeightedAverageMember2023-12-310000891478ifrs-full:FinancialAssetsAtFairValueThroughProfitOrLossClassifiedAsHeldForTradingCategoryMembersan:InflationDerivativesMembersan:AssetSwapModelValuationTechniqueMember2023-01-012023-12-310000891478ifrs-full:FinancialAssetsAtFairValueThroughProfitOrLossClassifiedAsHeldForTradingCategoryMembersan:IROptionsMembersan:InterestRateOptionPricingModelMemberifrs-full:HistoricalVolatilityForSharesMeasurementInputMemberifrs-full:BottomOfRangeMember2023-12-310000891478ifrs-full:FinancialAssetsAtFairValueThroughProfitOrLossClassifiedAsHeldForTradingCategoryMembersan:IROptionsMembersan:InterestRateOptionPricingModelMemberifrs-full:HistoricalVolatilityForSharesMeasurementInputMemberifrs-full:TopOfRangeMember2023-12-310000891478ifrs-full:FinancialAssetsAtFairValueThroughProfitOrLossClassifiedAsHeldForTradingCategoryMembersan:IROptionsMembersan:InterestRateOptionPricingModelMemberifrs-full:HistoricalVolatilityForSharesMeasurementInputMemberifrs-full:WeightedAverageMember2023-12-310000891478ifrs-full:FinancialAssetsAtFairValueThroughProfitOrLossClassifiedAsHeldForTradingCategoryMembersan:IROptionsMembersan:InterestRateOptionPricingModelMember2023-01-012023-12-310000891478ifrs-full:FinancialAssetsAtFairValueThroughProfitOrLossClassifiedAsHeldForTradingCategoryMemberifrs-full:InterestRateSwapContractMembersan:OtherValuationTechniqueMembersan:OtherMeasurementInputMemberifrs-full:BottomOfRangeMember2023-12-310000891478ifrs-full:FinancialAssetsAtFairValueThroughProfitOrLossClassifiedAsHeldForTradingCategoryMemberifrs-full:InterestRateSwapContractMembersan:OtherValuationTechniqueMember2023-01-012023-12-310000891478ifrs-full:FinancialAssetsAtFairValueThroughProfitOrLossClassifiedAsHeldForTradingCategoryMemberifrs-full:InterestRateSwapContractMembersan:FlowDiscountingMethodOnCreditSpreadMemberifrs-full:CreditSpreadMeasurementInputMemberifrs-full:BottomOfRangeMember2023-12-310000891478ifrs-full:FinancialAssetsAtFairValueThroughProfitOrLossClassifiedAsHeldForTradingCategoryMemberifrs-full:InterestRateSwapContractMembersan:FlowDiscountingMethodOnCreditSpreadMemberifrs-full:CreditSpreadMeasurementInputMemberifrs-full:TopOfRangeMember2023-12-310000891478ifrs-full:FinancialAssetsAtFairValueThroughProfitOrLossClassifiedAsHeldForTradingCategoryMemberifrs-full:InterestRateSwapContractMembersan:FlowDiscountingMethodOnCreditSpreadMemberifrs-full:CreditSpreadMeasurementInputMemberifrs-full:WeightedAverageMember2023-12-310000891478ifrs-full:FinancialAssetsAtFairValueThroughProfitOrLossClassifiedAsHeldForTradingCategoryMemberifrs-full:InterestRateSwapContractMembersan:FlowDiscountingMethodOnCreditSpreadMember2023-01-012023-12-310000891478ifrs-full:FinancialAssetsAtFairValueThroughProfitOrLossClassifiedAsHeldForTradingCategoryMemberifrs-full:InterestRateSwapContractMembersan:FlowDiscountingMethodOnSwapRateMembersan:SwapRateMeasurementInputMemberifrs-full:BottomOfRangeMember2023-12-310000891478ifrs-full:FinancialAssetsAtFairValueThroughProfitOrLossClassifiedAsHeldForTradingCategoryMemberifrs-full:InterestRateSwapContractMembersan:FlowDiscountingMethodOnSwapRateMembersan:SwapRateMeasurementInputMemberifrs-full:TopOfRangeMember2023-12-310000891478ifrs-full:FinancialAssetsAtFairValueThroughProfitOrLossClassifiedAsHeldForTradingCategoryMemberifrs-full:InterestRateSwapContractMembersan:FlowDiscountingMethodOnSwapRateMembersan:SwapRateMeasurementInputMemberifrs-full:WeightedAverageMember2023-12-310000891478ifrs-full:FinancialAssetsAtFairValueThroughProfitOrLossClassifiedAsHeldForTradingCategoryMemberifrs-full:InterestRateSwapContractMembersan:FlowDiscountingMethodOnSwapRateMember2023-01-012023-12-310000891478ifrs-full:FinancialAssetsAtFairValueThroughProfitOrLossClassifiedAsHeldForTradingCategoryMemberifrs-full:InterestRateSwapContractMembersan:ForwardEstimationValuationTechniqueMemberifrs-full:InterestRateMeasurementInputMemberifrs-full:BottomOfRangeMember2023-12-310000891478ifrs-full:FinancialAssetsAtFairValueThroughProfitOrLossClassifiedAsHeldForTradingCategoryMemberifrs-full:InterestRateSwapContractMembersan:ForwardEstimationValuationTechniqueMemberifrs-full:InterestRateMeasurementInputMemberifrs-full:TopOfRangeMember2023-12-310000891478ifrs-full:FinancialAssetsAtFairValueThroughProfitOrLossClassifiedAsHeldForTradingCategoryMemberifrs-full:InterestRateSwapContractMembersan:ForwardEstimationValuationTechniqueMemberifrs-full:InterestRateMeasurementInputMemberifrs-full:WeightedAverageMember2023-12-310000891478ifrs-full:FinancialAssetsAtFairValueThroughProfitOrLossClassifiedAsHeldForTradingCategoryMemberifrs-full:InterestRateSwapContractMembersan:ForwardEstimationValuationTechniqueMember2023-01-012023-12-310000891478ifrs-full:FinancialAssetsAtFairValueThroughProfitOrLossClassifiedAsHeldForTradingCategoryMemberifrs-full:InterestRateSwapContractMembersan:PrepaymentModelingValuationTechniqueMemberifrs-full:ConstantPrepaymentRateMeasurementInputMemberifrs-full:BottomOfRangeMember2023-12-310000891478ifrs-full:FinancialAssetsAtFairValueThroughProfitOrLossClassifiedAsHeldForTradingCategoryMemberifrs-full:InterestRateSwapContractMembersan:PrepaymentModelingValuationTechniqueMemberifrs-full:ConstantPrepaymentRateMeasurementInputMemberifrs-full:TopOfRangeMember2023-12-310000891478ifrs-full:FinancialAssetsAtFairValueThroughProfitOrLossClassifiedAsHeldForTradingCategoryMemberifrs-full:InterestRateSwapContractMembersan:PrepaymentModelingValuationTechniqueMemberifrs-full:ConstantPrepaymentRateMeasurementInputMemberifrs-full:WeightedAverageMember2023-12-310000891478ifrs-full:FinancialAssetsAtFairValueThroughProfitOrLossClassifiedAsHeldForTradingCategoryMemberifrs-full:InterestRateSwapContractMembersan:PrepaymentModelingValuationTechniqueMember2023-01-012023-12-310000891478ifrs-full:FinancialAssetsAtFairValueThroughProfitOrLossClassifiedAsHeldForTradingCategoryMembersan:PropertyDerivativesMemberifrs-full:OptionPricingModelMembersan:GrowthRateMeasurementInputMemberifrs-full:BottomOfRangeMember2023-12-310000891478ifrs-full:FinancialAssetsAtFairValueThroughProfitOrLossClassifiedAsHeldForTradingCategoryMembersan:PropertyDerivativesMemberifrs-full:OptionPricingModelMembersan:GrowthRateMeasurementInputMemberifrs-full:TopOfRangeMember2023-12-310000891478ifrs-full:FinancialAssetsAtFairValueThroughProfitOrLossClassifiedAsHeldForTradingCategoryMembersan:PropertyDerivativesMemberifrs-full:OptionPricingModelMembersan:GrowthRateMeasurementInputMemberifrs-full:WeightedAverageMember2023-12-310000891478ifrs-full:FinancialAssetsAtFairValueThroughProfitOrLossClassifiedAsHeldForTradingCategoryMembersan:PropertyDerivativesMemberifrs-full:OptionPricingModelMember2023-01-012023-12-310000891478ifrs-full:FinancialAssetsAtFairValueThroughProfitOrLossClassifiedAsHeldForTradingCategoryMembersan:SecuritisationSwapMemberifrs-full:DiscountedCashFlowMemberifrs-full:ConstantPrepaymentRateMeasurementInputMemberifrs-full:BottomOfRangeMember2023-12-310000891478ifrs-full:FinancialAssetsAtFairValueThroughProfitOrLossClassifiedAsHeldForTradingCategoryMembersan:SecuritisationSwapMemberifrs-full:DiscountedCashFlowMemberifrs-full:ConstantPrepaymentRateMeasurementInputMemberifrs-full:TopOfRangeMember2023-12-310000891478ifrs-full:FinancialAssetsAtFairValueThroughProfitOrLossClassifiedAsHeldForTradingCategoryMembersan:SecuritisationSwapMemberifrs-full:DiscountedCashFlowMemberifrs-full:ConstantPrepaymentRateMeasurementInputMemberifrs-full:WeightedAverageMember2023-12-310000891478ifrs-full:FinancialAssetsAtFairValueThroughProfitOrLossClassifiedAsHeldForTradingCategoryMembersan:SecuritisationSwapMemberifrs-full:DiscountedCashFlowMember2023-01-012023-12-310000891478ifrs-full:FinancialAssetsAtFairValueThroughProfitOrLossClassifiedAsHeldForTradingCategoryMembersan:StructuredNotesMembersan:PriceBasedValuationTechniqueMembersan:PriceMeasurementInputMemberifrs-full:BottomOfRangeMember2023-12-310000891478ifrs-full:FinancialAssetsAtFairValueThroughProfitOrLossClassifiedAsHeldForTradingCategoryMembersan:StructuredNotesMembersan:PriceBasedValuationTechniqueMembersan:PriceMeasurementInputMemberifrs-full:TopOfRangeMember2023-12-310000891478ifrs-full:FinancialAssetsAtFairValueThroughProfitOrLossClassifiedAsHeldForTradingCategoryMembersan:StructuredNotesMembersan:PriceBasedValuationTechniqueMembersan:PriceMeasurementInputMemberifrs-full:WeightedAverageMember2023-12-310000891478ifrs-full:FinancialAssetsAtFairValueThroughProfitOrLossClassifiedAsHeldForTradingCategoryMembersan:StructuredNotesMembersan:PriceBasedValuationTechniqueMember2023-01-012023-12-310000891478ifrs-full:FinancialAssetsAtFairValueThroughProfitOrLossDesignatedUponInitialRecognitionCategoryMembersan:LoanMemberifrs-full:DiscountedCashFlowMemberifrs-full:CreditSpreadMeasurementInputMemberifrs-full:BottomOfRangeMember2023-12-310000891478ifrs-full:FinancialAssetsAtFairValueThroughProfitOrLossDesignatedUponInitialRecognitionCategoryMembersan:LoanMemberifrs-full:DiscountedCashFlowMemberifrs-full:CreditSpreadMeasurementInputMemberifrs-full:TopOfRangeMember2023-12-310000891478ifrs-full:FinancialAssetsAtFairValueThroughProfitOrLossDesignatedUponInitialRecognitionCategoryMembersan:LoanMemberifrs-full:DiscountedCashFlowMemberifrs-full:CreditSpreadMeasurementInputMemberifrs-full:WeightedAverageMember2023-12-310000891478ifrs-full:FinancialAssetsAtFairValueThroughProfitOrLossDesignatedUponInitialRecognitionCategoryMembersan:LoanMemberifrs-full:DiscountedCashFlowMember2023-01-012023-12-310000891478ifrs-full:FinancialAssetsAtFairValueThroughProfitOrLossDesignatedUponInitialRecognitionCategoryMembersan:MortgagePortfolioMembersan:BlackScholesModelMembersan:GrowthRateMeasurementInputMemberifrs-full:BottomOfRangeMember2023-12-310000891478ifrs-full:FinancialAssetsAtFairValueThroughProfitOrLossDesignatedUponInitialRecognitionCategoryMembersan:MortgagePortfolioMembersan:BlackScholesModelMembersan:GrowthRateMeasurementInputMemberifrs-full:TopOfRangeMember2023-12-310000891478ifrs-full:FinancialAssetsAtFairValueThroughProfitOrLossDesignatedUponInitialRecognitionCategoryMembersan:MortgagePortfolioMembersan:BlackScholesModelMembersan:GrowthRateMeasurementInputMemberifrs-full:WeightedAverageMember2023-12-310000891478ifrs-full:FinancialAssetsAtFairValueThroughProfitOrLossDesignatedUponInitialRecognitionCategoryMembersan:MortgagePortfolioMembersan:BlackScholesModelMember2023-01-012023-12-310000891478ifrs-full:FinancialAssetsAtFairValueThroughProfitOrLossDesignatedUponInitialRecognitionCategoryMembersan:DebtSecuritiesOtherMembersan:OtherValuationTechniqueMembersan:InflationSwapRateMeasurementInputMemberifrs-full:BottomOfRangeMember2023-12-310000891478ifrs-full:FinancialAssetsAtFairValueThroughProfitOrLossDesignatedUponInitialRecognitionCategoryMembersan:DebtSecuritiesOtherMembersan:OtherValuationTechniqueMembersan:InflationSwapRateMeasurementInputMemberifrs-full:TopOfRangeMember2023-12-310000891478ifrs-full:FinancialAssetsAtFairValueThroughProfitOrLossDesignatedUponInitialRecognitionCategoryMembersan:DebtSecuritiesOtherMembersan:OtherValuationTechniqueMembersan:InflationSwapRateMeasurementInputMemberifrs-full:WeightedAverageMember2023-12-310000891478ifrs-full:FinancialAssetsAtFairValueThroughProfitOrLossDesignatedUponInitialRecognitionCategoryMembersan:DebtSecuritiesOtherMembersan:OtherValuationTechniqueMember2023-01-012023-12-310000891478ifrs-full:FinancialAssetsAtFairValueThroughProfitOrLossMandatorilyMeasuredAtFairValueCategoryMembersan:PropertySecuritiesMembersan:ProbabilityWeightingValuationTechniqueMembersan:GrowthRateMeasurementInputMemberifrs-full:BottomOfRangeMember2023-12-310000891478ifrs-full:FinancialAssetsAtFairValueThroughProfitOrLossMandatorilyMeasuredAtFairValueCategoryMembersan:PropertySecuritiesMembersan:ProbabilityWeightingValuationTechniqueMembersan:GrowthRateMeasurementInputMemberifrs-full:TopOfRangeMember2023-12-310000891478ifrs-full:FinancialAssetsAtFairValueThroughProfitOrLossMandatorilyMeasuredAtFairValueCategoryMembersan:PropertySecuritiesMembersan:ProbabilityWeightingValuationTechniqueMembersan:GrowthRateMeasurementInputMemberifrs-full:WeightedAverageMember2023-12-310000891478ifrs-full:FinancialAssetsAtFairValueThroughProfitOrLossMandatorilyMeasuredAtFairValueCategoryMembersan:PropertySecuritiesMembersan:ProbabilityWeightingValuationTechniqueMember2023-01-012023-12-310000891478ifrs-full:FinancialAssetsAtFairValueThroughProfitOrLossMandatorilyMeasuredAtFairValueCategoryMemberifrs-full:EquityInvestmentsMembersan:PriceBasedValuationTechniqueMembersan:PriceMeasurementInputMemberifrs-full:BottomOfRangeMember2023-12-310000891478ifrs-full:FinancialAssetsAtFairValueThroughProfitOrLossMandatorilyMeasuredAtFairValueCategoryMemberifrs-full:EquityInvestmentsMembersan:PriceBasedValuationTechniqueMembersan:PriceMeasurementInputMemberifrs-full:TopOfRangeMember2023-12-310000891478ifrs-full:FinancialAssetsAtFairValueThroughProfitOrLossMandatorilyMeasuredAtFairValueCategoryMemberifrs-full:EquityInvestmentsMembersan:PriceBasedValuationTechniqueMembersan:PriceMeasurementInputMemberifrs-full:WeightedAverageMember2023-12-310000891478ifrs-full:FinancialAssetsAtFairValueThroughProfitOrLossMandatorilyMeasuredAtFairValueCategoryMemberifrs-full:EquityInvestmentsMembersan:PriceBasedValuationTechniqueMember2023-01-012023-12-310000891478ifrs-full:FinancialAssetsAtFairValueThroughOtherComprehensiveIncomeCategoryMembersan:LoanMembersan:FlowDiscountingMethodOnCreditSpreadMember2023-01-012023-12-310000891478ifrs-full:FinancialAssetsAtFairValueThroughOtherComprehensiveIncomeCategoryMembersan:LoanMembersan:DiscountedCashFlowsOnInterestRateCurveMemberifrs-full:InterestRateMeasurementInputMemberifrs-full:BottomOfRangeMember2023-12-310000891478ifrs-full:FinancialAssetsAtFairValueThroughOtherComprehensiveIncomeCategoryMembersan:LoanMembersan:DiscountedCashFlowsOnInterestRateCurveMemberifrs-full:InterestRateMeasurementInputMemberifrs-full:TopOfRangeMember2023-12-310000891478ifrs-full:FinancialAssetsAtFairValueThroughOtherComprehensiveIncomeCategoryMembersan:LoanMembersan:DiscountedCashFlowsOnInterestRateCurveMemberifrs-full:InterestRateMeasurementInputMemberifrs-full:WeightedAverageMember2023-12-310000891478ifrs-full:FinancialAssetsAtFairValueThroughOtherComprehensiveIncomeCategoryMembersan:LoanMembersan:DiscountedCashFlowsOnInterestRateCurveMember2023-01-012023-12-310000891478ifrs-full:FinancialAssetsAtFairValueThroughOtherComprehensiveIncomeCategoryMembersan:LoanMembersan:DiscountedCashFlowsOnMarginOfAReferencePortfolioMembersan:MarginOfAPreferencePortfolioMeasurementInputMemberifrs-full:BottomOfRangeMember2023-12-310000891478ifrs-full:FinancialAssetsAtFairValueThroughOtherComprehensiveIncomeCategoryMembersan:LoanMembersan:DiscountedCashFlowsOnMarginOfAReferencePortfolioMembersan:MarginOfAPreferencePortfolioMeasurementInputMemberifrs-full:TopOfRangeMember2023-12-310000891478ifrs-full:FinancialAssetsAtFairValueThroughOtherComprehensiveIncomeCategoryMembersan:LoanMembersan:DiscountedCashFlowsOnMarginOfAReferencePortfolioMembersan:MarginOfAPreferencePortfolioMeasurementInputMemberifrs-full:WeightedAverageMember2023-12-310000891478ifrs-full:FinancialAssetsAtFairValueThroughOtherComprehensiveIncomeCategoryMembersan:LoanMembersan:DiscountedCashFlowsOnMarginOfAReferencePortfolioMember2023-01-012023-12-310000891478ifrs-full:FinancialAssetsAtFairValueThroughOtherComprehensiveIncomeCategoryMembersan:LoanMembersan:ForwardEstimationValuationTechniqueMemberifrs-full:CreditSpreadMeasurementInputMemberifrs-full:BottomOfRangeMember2023-12-310000891478ifrs-full:FinancialAssetsAtFairValueThroughOtherComprehensiveIncomeCategoryMembersan:LoanMembersan:ForwardEstimationValuationTechniqueMemberifrs-full:CreditSpreadMeasurementInputMemberifrs-full:TopOfRangeMember2023-12-310000891478ifrs-full:FinancialAssetsAtFairValueThroughOtherComprehensiveIncomeCategoryMembersan:LoanMembersan:ForwardEstimationValuationTechniqueMemberifrs-full:CreditSpreadMeasurementInputMemberifrs-full:WeightedAverageMember2023-12-310000891478ifrs-full:FinancialAssetsAtFairValueThroughOtherComprehensiveIncomeCategoryMembersan:LoanMembersan:ForwardEstimationValuationTechniqueMember2023-01-012023-12-310000891478ifrs-full:FinancialAssetsAtFairValueThroughOtherComprehensiveIncomeCategoryMembersan:LoanMemberifrs-full:MarketComparablePricesMembersan:MarketPriceMeasurementInputMemberifrs-full:BottomOfRangeMember2023-12-310000891478ifrs-full:FinancialAssetsAtFairValueThroughOtherComprehensiveIncomeCategoryMembersan:LoanMemberifrs-full:MarketComparablePricesMembersan:MarketPriceMeasurementInputMemberifrs-full:TopOfRangeMember2023-12-310000891478ifrs-full:FinancialAssetsAtFairValueThroughOtherComprehensiveIncomeCategoryMembersan:LoanMemberifrs-full:MarketComparablePricesMembersan:MarketPriceMeasurementInputMemberifrs-full:WeightedAverageMember2023-12-310000891478ifrs-full:FinancialAssetsAtFairValueThroughOtherComprehensiveIncomeCategoryMembersan:LoanMemberifrs-full:MarketComparablePricesMember2023-01-012023-12-310000891478ifrs-full:FinancialAssetsAtFairValueThroughOtherComprehensiveIncomeCategoryMembersan:CorporateDebtMemberifrs-full:DiscountedCashFlowMembersan:MarginOfAReferencePortfolioMemberifrs-full:BottomOfRangeMember2023-12-310000891478ifrs-full:FinancialAssetsAtFairValueThroughOtherComprehensiveIncomeCategoryMembersan:CorporateDebtMemberifrs-full:DiscountedCashFlowMembersan:MarginOfAReferencePortfolioMemberifrs-full:TopOfRangeMember2023-12-310000891478ifrs-full:FinancialAssetsAtFairValueThroughOtherComprehensiveIncomeCategoryMembersan:CorporateDebtMemberifrs-full:DiscountedCashFlowMembersan:MarginOfAReferencePortfolioMemberifrs-full:WeightedAverageMember2023-12-310000891478ifrs-full:FinancialAssetsAtFairValueThroughOtherComprehensiveIncomeCategoryMembersan:CorporateDebtMemberifrs-full:DiscountedCashFlowMember2023-01-012023-12-310000891478ifrs-full:FinancialAssetsAtFairValueThroughOtherComprehensiveIncomeCategoryMembersan:GovernmentDebtMemberifrs-full:DiscountedCashFlowMemberifrs-full:InterestRateMeasurementInputMemberifrs-full:BottomOfRangeMember2023-12-310000891478ifrs-full:FinancialAssetsAtFairValueThroughOtherComprehensiveIncomeCategoryMembersan:GovernmentDebtMemberifrs-full:DiscountedCashFlowMemberifrs-full:InterestRateMeasurementInputMemberifrs-full:TopOfRangeMember2023-12-310000891478ifrs-full:FinancialAssetsAtFairValueThroughOtherComprehensiveIncomeCategoryMembersan:GovernmentDebtMemberifrs-full:DiscountedCashFlowMemberifrs-full:InterestRateMeasurementInputMemberifrs-full:WeightedAverageMember2023-12-310000891478ifrs-full:FinancialAssetsAtFairValueThroughOtherComprehensiveIncomeCategoryMembersan:GovernmentDebtMemberifrs-full:DiscountedCashFlowMember2023-01-012023-12-310000891478ifrs-full:FinancialAssetsAtFairValueThroughOtherComprehensiveIncomeCategoryMemberifrs-full:EquityInvestmentsMembersan:PriceBasedValuationTechniqueMembersan:PriceMeasurementInputMemberifrs-full:BottomOfRangeMember2023-12-310000891478ifrs-full:FinancialAssetsAtFairValueThroughOtherComprehensiveIncomeCategoryMemberifrs-full:EquityInvestmentsMembersan:PriceBasedValuationTechniqueMembersan:PriceMeasurementInputMemberifrs-full:TopOfRangeMember2023-12-310000891478ifrs-full:FinancialAssetsAtFairValueThroughOtherComprehensiveIncomeCategoryMemberifrs-full:EquityInvestmentsMembersan:PriceBasedValuationTechniqueMembersan:PriceMeasurementInputMemberifrs-full:WeightedAverageMember2023-12-310000891478ifrs-full:FinancialAssetsAtFairValueThroughOtherComprehensiveIncomeCategoryMemberifrs-full:EquityInvestmentsMembersan:PriceBasedValuationTechniqueMember2023-01-012023-12-310000891478san:VolatilityOptionModelValuationTechniqueMemberifrs-full:FinancialLiabilitiesAtFairValueThroughProfitOrLossThatMeetDefinitionOfHeldForTradingCategoryMembersan:CapsFloorsMemberifrs-full:HistoricalVolatilityForSharesMeasurementInputMemberifrs-full:BottomOfRangeMember2023-12-310000891478san:VolatilityOptionModelValuationTechniqueMemberifrs-full:FinancialLiabilitiesAtFairValueThroughProfitOrLossThatMeetDefinitionOfHeldForTradingCategoryMembersan:CapsFloorsMemberifrs-full:HistoricalVolatilityForSharesMeasurementInputMemberifrs-full:TopOfRangeMember2023-12-310000891478san:VolatilityOptionModelValuationTechniqueMemberifrs-full:FinancialLiabilitiesAtFairValueThroughProfitOrLossThatMeetDefinitionOfHeldForTradingCategoryMembersan:CapsFloorsMemberifrs-full:HistoricalVolatilityForSharesMeasurementInputMemberifrs-full:WeightedAverageMember2023-12-310000891478san:VolatilityOptionModelValuationTechniqueMemberifrs-full:FinancialLiabilitiesAtFairValueThroughProfitOrLossThatMeetDefinitionOfHeldForTradingCategoryMembersan:CapsFloorsMember2023-01-012023-12-310000891478ifrs-full:DiscountedCashFlowMemberifrs-full:FinancialLiabilitiesAtFairValueThroughProfitOrLossThatMeetDefinitionOfHeldForTradingCategoryMembersan:ConstantMaturitySwapCMSMemberifrs-full:HistoricalVolatilityForSharesMeasurementInputMemberifrs-full:BottomOfRangeMember2023-12-310000891478ifrs-full:DiscountedCashFlowMemberifrs-full:FinancialLiabilitiesAtFairValueThroughProfitOrLossThatMeetDefinitionOfHeldForTradingCategoryMembersan:ConstantMaturitySwapCMSMemberifrs-full:HistoricalVolatilityForSharesMeasurementInputMemberifrs-full:TopOfRangeMember2023-12-310000891478ifrs-full:DiscountedCashFlowMemberifrs-full:FinancialLiabilitiesAtFairValueThroughProfitOrLossThatMeetDefinitionOfHeldForTradingCategoryMembersan:ConstantMaturitySwapCMSMemberifrs-full:HistoricalVolatilityForSharesMeasurementInputMemberifrs-full:WeightedAverageMember2023-12-310000891478ifrs-full:DiscountedCashFlowMemberifrs-full:FinancialLiabilitiesAtFairValueThroughProfitOrLossThatMeetDefinitionOfHeldForTradingCategoryMembersan:ConstantMaturitySwapCMSMember2023-01-012023-12-310000891478san:VolatilityOptionModelValuationTechniqueMemberifrs-full:FinancialLiabilitiesAtFairValueThroughProfitOrLossThatMeetDefinitionOfHeldForTradingCategoryMembersan:ForeignExchangeOptionsMemberifrs-full:HistoricalVolatilityForSharesMeasurementInputMemberifrs-full:BottomOfRangeMember2023-12-310000891478san:VolatilityOptionModelValuationTechniqueMemberifrs-full:FinancialLiabilitiesAtFairValueThroughProfitOrLossThatMeetDefinitionOfHeldForTradingCategoryMembersan:ForeignExchangeOptionsMemberifrs-full:HistoricalVolatilityForSharesMeasurementInputMemberifrs-full:TopOfRangeMember2023-12-310000891478san:VolatilityOptionModelValuationTechniqueMemberifrs-full:FinancialLiabilitiesAtFairValueThroughProfitOrLossThatMeetDefinitionOfHeldForTradingCategoryMembersan:ForeignExchangeOptionsMemberifrs-full:HistoricalVolatilityForSharesMeasurementInputMemberifrs-full:WeightedAverageMember2023-12-310000891478san:VolatilityOptionModelValuationTechniqueMemberifrs-full:FinancialLiabilitiesAtFairValueThroughProfitOrLossThatMeetDefinitionOfHeldForTradingCategoryMembersan:ForeignExchangeOptionsMember2023-01-012023-12-310000891478ifrs-full:DiscountedCashFlowMemberifrs-full:FinancialLiabilitiesAtFairValueThroughProfitOrLossThatMeetDefinitionOfHeldForTradingCategoryMemberifrs-full:InterestRateSwapContractMembersan:InflationSwapRateMeasurementInputMemberifrs-full:BottomOfRangeMember2023-12-310000891478ifrs-full:DiscountedCashFlowMemberifrs-full:FinancialLiabilitiesAtFairValueThroughProfitOrLossThatMeetDefinitionOfHeldForTradingCategoryMemberifrs-full:InterestRateSwapContractMembersan:InflationSwapRateMeasurementInputMemberifrs-full:TopOfRangeMember2023-12-310000891478ifrs-full:DiscountedCashFlowMemberifrs-full:FinancialLiabilitiesAtFairValueThroughProfitOrLossThatMeetDefinitionOfHeldForTradingCategoryMemberifrs-full:InterestRateSwapContractMembersan:InflationSwapRateMeasurementInputMemberifrs-full:WeightedAverageMember2023-12-310000891478ifrs-full:DiscountedCashFlowMemberifrs-full:FinancialLiabilitiesAtFairValueThroughProfitOrLossThatMeetDefinitionOfHeldForTradingCategoryMemberifrs-full:InterestRateSwapContractMember2023-01-012023-12-310000891478san:VolatilityOptionModelValuationTechniqueMemberifrs-full:FinancialLiabilitiesAtFairValueThroughProfitOrLossThatMeetDefinitionOfHeldForTradingCategoryMembersan:SwaptionsMemberifrs-full:HistoricalVolatilityForSharesMeasurementInputMemberifrs-full:BottomOfRangeMember2023-12-310000891478san:VolatilityOptionModelValuationTechniqueMemberifrs-full:FinancialLiabilitiesAtFairValueThroughProfitOrLossThatMeetDefinitionOfHeldForTradingCategoryMembersan:SwaptionsMemberifrs-full:HistoricalVolatilityForSharesMeasurementInputMemberifrs-full:TopOfRangeMember2023-12-310000891478san:VolatilityOptionModelValuationTechniqueMemberifrs-full:FinancialLiabilitiesAtFairValueThroughProfitOrLossThatMeetDefinitionOfHeldForTradingCategoryMembersan:SwaptionsMemberifrs-full:HistoricalVolatilityForSharesMeasurementInputMemberifrs-full:WeightedAverageMember2023-12-310000891478san:VolatilityOptionModelValuationTechniqueMemberifrs-full:FinancialLiabilitiesAtFairValueThroughProfitOrLossThatMeetDefinitionOfHeldForTradingCategoryMembersan:SwaptionsMember2023-01-012023-12-310000891478ifrs-full:Level3OfFairValueHierarchyMemberifrs-full:FinancialAssetsAtFairValueThroughProfitOrLossClassifiedAsHeldForTradingCategoryMember2024-12-310000891478ifrs-full:Level3OfFairValueHierarchyMemberifrs-full:FinancialAssetsAtFairValueThroughProfitOrLossClassifiedAsHeldForTradingCategoryMember2025-01-012025-12-310000891478ifrs-full:Level3OfFairValueHierarchyMemberifrs-full:FinancialAssetsAtFairValueThroughProfitOrLossClassifiedAsHeldForTradingCategoryMember2025-12-310000891478ifrs-full:FinancialAssetsAtFairValueThroughProfitOrLossClassifiedAsHeldForTradingCategoryMembersan:LoansAndAdvancesCentralBanksMemberifrs-full:Level3OfFairValueHierarchyMember2024-12-310000891478ifrs-full:FinancialAssetsAtFairValueThroughProfitOrLossClassifiedAsHeldForTradingCategoryMembersan:LoansAndAdvancesCentralBanksMemberifrs-full:Level3OfFairValueHierarchyMember2025-01-012025-12-310000891478ifrs-full:FinancialAssetsAtFairValueThroughProfitOrLossClassifiedAsHeldForTradingCategoryMembersan:LoansAndAdvancesCentralBanksMemberifrs-full:Level3OfFairValueHierarchyMember2025-12-310000891478ifrs-full:FinancialAssetsAtFairValueThroughProfitOrLossClassifiedAsHeldForTradingCategoryMembersan:LoansAndAdvancesCreditInstitutionsMemberifrs-full:Level3OfFairValueHierarchyMember2024-12-310000891478ifrs-full:FinancialAssetsAtFairValueThroughProfitOrLossClassifiedAsHeldForTradingCategoryMembersan:LoansAndAdvancesCreditInstitutionsMemberifrs-full:Level3OfFairValueHierarchyMember2025-01-012025-12-310000891478ifrs-full:FinancialAssetsAtFairValueThroughProfitOrLossClassifiedAsHeldForTradingCategoryMembersan:LoansAndAdvancesCreditInstitutionsMemberifrs-full:Level3OfFairValueHierarchyMember2025-12-310000891478ifrs-full:FinancialAssetsAtFairValueThroughProfitOrLossClassifiedAsHeldForTradingCategoryMembersan:LoansAndAdvancesCustomersMemberifrs-full:Level3OfFairValueHierarchyMember2024-12-310000891478ifrs-full:FinancialAssetsAtFairValueThroughProfitOrLossClassifiedAsHeldForTradingCategoryMembersan:LoansAndAdvancesCustomersMemberifrs-full:Level3OfFairValueHierarchyMember2025-01-012025-12-310000891478ifrs-full:FinancialAssetsAtFairValueThroughProfitOrLossClassifiedAsHeldForTradingCategoryMembersan:LoansAndAdvancesCustomersMemberifrs-full:Level3OfFairValueHierarchyMember2025-12-310000891478ifrs-full:FinancialAssetsAtFairValueThroughProfitOrLossClassifiedAsHeldForTradingCategoryMemberifrs-full:DebtSecuritiesMemberifrs-full:Level3OfFairValueHierarchyMember2024-12-310000891478ifrs-full:FinancialAssetsAtFairValueThroughProfitOrLossClassifiedAsHeldForTradingCategoryMemberifrs-full:DebtSecuritiesMemberifrs-full:Level3OfFairValueHierarchyMember2025-01-012025-12-310000891478ifrs-full:FinancialAssetsAtFairValueThroughProfitOrLossClassifiedAsHeldForTradingCategoryMemberifrs-full:DebtSecuritiesMemberifrs-full:Level3OfFairValueHierarchyMember2025-12-310000891478ifrs-full:FinancialAssetsAtFairValueThroughProfitOrLossClassifiedAsHeldForTradingCategoryMemberifrs-full:DerivativesMemberifrs-full:Level3OfFairValueHierarchyMember2024-12-310000891478ifrs-full:FinancialAssetsAtFairValueThroughProfitOrLossClassifiedAsHeldForTradingCategoryMemberifrs-full:DerivativesMemberifrs-full:Level3OfFairValueHierarchyMember2025-01-012025-12-310000891478ifrs-full:FinancialAssetsAtFairValueThroughProfitOrLossClassifiedAsHeldForTradingCategoryMemberifrs-full:DerivativesMemberifrs-full:Level3OfFairValueHierarchyMember2025-12-310000891478ifrs-full:FinancialAssetsAtFairValueThroughProfitOrLossClassifiedAsHeldForTradingCategoryMemberifrs-full:SwapContractMemberifrs-full:Level3OfFairValueHierarchyMember2024-12-310000891478ifrs-full:FinancialAssetsAtFairValueThroughProfitOrLossClassifiedAsHeldForTradingCategoryMemberifrs-full:SwapContractMemberifrs-full:Level3OfFairValueHierarchyMember2025-01-012025-12-310000891478ifrs-full:FinancialAssetsAtFairValueThroughProfitOrLossClassifiedAsHeldForTradingCategoryMemberifrs-full:SwapContractMemberifrs-full:Level3OfFairValueHierarchyMember2025-12-310000891478ifrs-full:FinancialAssetsAtFairValueThroughProfitOrLossClassifiedAsHeldForTradingCategoryMembersan:ExchangeRateOptionMemberifrs-full:Level3OfFairValueHierarchyMember2024-12-310000891478ifrs-full:FinancialAssetsAtFairValueThroughProfitOrLossClassifiedAsHeldForTradingCategoryMembersan:ExchangeRateOptionMemberifrs-full:Level3OfFairValueHierarchyMember2025-01-012025-12-310000891478ifrs-full:FinancialAssetsAtFairValueThroughProfitOrLossClassifiedAsHeldForTradingCategoryMembersan:ExchangeRateOptionMemberifrs-full:Level3OfFairValueHierarchyMember2025-12-310000891478ifrs-full:FinancialAssetsAtFairValueThroughProfitOrLossClassifiedAsHeldForTradingCategoryMembersan:InterestRateOptionMemberifrs-full:Level3OfFairValueHierarchyMember2024-12-310000891478ifrs-full:FinancialAssetsAtFairValueThroughProfitOrLossClassifiedAsHeldForTradingCategoryMembersan:InterestRateOptionMemberifrs-full:Level3OfFairValueHierarchyMember2025-01-012025-12-310000891478ifrs-full:FinancialAssetsAtFairValueThroughProfitOrLossClassifiedAsHeldForTradingCategoryMembersan:InterestRateOptionMemberifrs-full:Level3OfFairValueHierarchyMember2025-12-310000891478ifrs-full:FinancialAssetsAtFairValueThroughProfitOrLossClassifiedAsHeldForTradingCategoryMembersan:IndexAndSecuritiesOptionsMemberifrs-full:Level3OfFairValueHierarchyMember2024-12-310000891478ifrs-full:FinancialAssetsAtFairValueThroughProfitOrLossClassifiedAsHeldForTradingCategoryMembersan:IndexAndSecuritiesOptionsMemberifrs-full:Level3OfFairValueHierarchyMember2025-01-012025-12-310000891478ifrs-full:FinancialAssetsAtFairValueThroughProfitOrLossClassifiedAsHeldForTradingCategoryMembersan:IndexAndSecuritiesOptionsMemberifrs-full:Level3OfFairValueHierarchyMember2025-12-310000891478ifrs-full:FinancialAssetsAtFairValueThroughProfitOrLossClassifiedAsHeldForTradingCategoryMembersan:InterestRateFuturesMemberifrs-full:Level3OfFairValueHierarchyMember2024-12-310000891478ifrs-full:FinancialAssetsAtFairValueThroughProfitOrLossClassifiedAsHeldForTradingCategoryMembersan:InterestRateFuturesMemberifrs-full:Level3OfFairValueHierarchyMember2025-01-012025-12-310000891478ifrs-full:FinancialAssetsAtFairValueThroughProfitOrLossClassifiedAsHeldForTradingCategoryMembersan:InterestRateFuturesMemberifrs-full:Level3OfFairValueHierarchyMember2025-12-310000891478ifrs-full:FinancialAssetsAtFairValueThroughProfitOrLossClassifiedAsHeldForTradingCategoryMembersan:OtherDerivativesMemberifrs-full:Level3OfFairValueHierarchyMember2024-12-310000891478ifrs-full:FinancialAssetsAtFairValueThroughProfitOrLossClassifiedAsHeldForTradingCategoryMembersan:OtherDerivativesMemberifrs-full:Level3OfFairValueHierarchyMember2025-01-012025-12-310000891478ifrs-full:FinancialAssetsAtFairValueThroughProfitOrLossClassifiedAsHeldForTradingCategoryMembersan:OtherDerivativesMemberifrs-full:Level3OfFairValueHierarchyMember2025-12-310000891478ifrs-full:Level3OfFairValueHierarchyMembersan:HedgingDerivativesMember2024-12-310000891478ifrs-full:Level3OfFairValueHierarchyMembersan:HedgingDerivativesMember2025-01-012025-12-310000891478ifrs-full:Level3OfFairValueHierarchyMembersan:HedgingDerivativesMember2025-12-310000891478san:HedgingDerivativesMemberifrs-full:SwapContractMemberifrs-full:Level3OfFairValueHierarchyMember2024-12-310000891478san:HedgingDerivativesMemberifrs-full:SwapContractMemberifrs-full:Level3OfFairValueHierarchyMember2025-01-012025-12-310000891478san:HedgingDerivativesMemberifrs-full:SwapContractMemberifrs-full:Level3OfFairValueHierarchyMember2025-12-310000891478ifrs-full:Level3OfFairValueHierarchyMemberifrs-full:FinancialAssetsAtFairValueThroughProfitOrLossDesignatedUponInitialRecognitionCategoryMember2024-12-310000891478ifrs-full:Level3OfFairValueHierarchyMemberifrs-full:FinancialAssetsAtFairValueThroughProfitOrLossDesignatedUponInitialRecognitionCategoryMember2025-01-012025-12-310000891478ifrs-full:Level3OfFairValueHierarchyMemberifrs-full:FinancialAssetsAtFairValueThroughProfitOrLossDesignatedUponInitialRecognitionCategoryMember2025-12-310000891478ifrs-full:FinancialAssetsAtFairValueThroughProfitOrLossDesignatedUponInitialRecognitionCategoryMembersan:LoansAndAdvancesCustomersMemberifrs-full:Level3OfFairValueHierarchyMember2024-12-310000891478ifrs-full:FinancialAssetsAtFairValueThroughProfitOrLossDesignatedUponInitialRecognitionCategoryMembersan:LoansAndAdvancesCustomersMemberifrs-full:Level3OfFairValueHierarchyMember2025-01-012025-12-310000891478ifrs-full:FinancialAssetsAtFairValueThroughProfitOrLossDesignatedUponInitialRecognitionCategoryMembersan:LoansAndAdvancesCustomersMemberifrs-full:Level3OfFairValueHierarchyMember2025-12-310000891478ifrs-full:FinancialAssetsAtFairValueThroughProfitOrLossDesignatedUponInitialRecognitionCategoryMemberifrs-full:DebtSecuritiesMemberifrs-full:Level3OfFairValueHierarchyMember2024-12-310000891478ifrs-full:FinancialAssetsAtFairValueThroughProfitOrLossDesignatedUponInitialRecognitionCategoryMemberifrs-full:DebtSecuritiesMemberifrs-full:Level3OfFairValueHierarchyMember2025-01-012025-12-310000891478ifrs-full:FinancialAssetsAtFairValueThroughProfitOrLossDesignatedUponInitialRecognitionCategoryMemberifrs-full:DebtSecuritiesMemberifrs-full:Level3OfFairValueHierarchyMember2025-12-310000891478ifrs-full:Level3OfFairValueHierarchyMemberifrs-full:FinancialAssetsAtFairValueThroughProfitOrLossMandatorilyMeasuredAtFairValueCategoryMember2024-12-310000891478ifrs-full:Level3OfFairValueHierarchyMemberifrs-full:FinancialAssetsAtFairValueThroughProfitOrLossMandatorilyMeasuredAtFairValueCategoryMember2025-01-012025-12-310000891478ifrs-full:Level3OfFairValueHierarchyMemberifrs-full:FinancialAssetsAtFairValueThroughProfitOrLossMandatorilyMeasuredAtFairValueCategoryMember2025-12-310000891478ifrs-full:FinancialAssetsAtFairValueThroughProfitOrLossMandatorilyMeasuredAtFairValueCategoryMembersan:LoansAndAdvancesCustomersMemberifrs-full:Level3OfFairValueHierarchyMember2024-12-310000891478ifrs-full:FinancialAssetsAtFairValueThroughProfitOrLossMandatorilyMeasuredAtFairValueCategoryMembersan:LoansAndAdvancesCustomersMemberifrs-full:Level3OfFairValueHierarchyMember2025-01-012025-12-310000891478ifrs-full:FinancialAssetsAtFairValueThroughProfitOrLossMandatorilyMeasuredAtFairValueCategoryMembersan:LoansAndAdvancesCustomersMemberifrs-full:Level3OfFairValueHierarchyMember2025-12-310000891478ifrs-full:FinancialAssetsAtFairValueThroughProfitOrLossMandatorilyMeasuredAtFairValueCategoryMemberifrs-full:DebtSecuritiesMemberifrs-full:Level3OfFairValueHierarchyMember2024-12-310000891478ifrs-full:FinancialAssetsAtFairValueThroughProfitOrLossMandatorilyMeasuredAtFairValueCategoryMemberifrs-full:DebtSecuritiesMemberifrs-full:Level3OfFairValueHierarchyMember2025-01-012025-12-310000891478ifrs-full:FinancialAssetsAtFairValueThroughProfitOrLossMandatorilyMeasuredAtFairValueCategoryMemberifrs-full:DebtSecuritiesMemberifrs-full:Level3OfFairValueHierarchyMember2025-12-310000891478ifrs-full:FinancialAssetsAtFairValueThroughProfitOrLossMandatorilyMeasuredAtFairValueCategoryMemberifrs-full:EquityInvestmentsMemberifrs-full:Level3OfFairValueHierarchyMember2024-12-310000891478ifrs-full:FinancialAssetsAtFairValueThroughProfitOrLossMandatorilyMeasuredAtFairValueCategoryMemberifrs-full:EquityInvestmentsMemberifrs-full:Level3OfFairValueHierarchyMember2025-01-012025-12-310000891478ifrs-full:FinancialAssetsAtFairValueThroughProfitOrLossMandatorilyMeasuredAtFairValueCategoryMemberifrs-full:EquityInvestmentsMemberifrs-full:Level3OfFairValueHierarchyMember2025-12-310000891478ifrs-full:Level3OfFairValueHierarchyMemberifrs-full:FinancialAssetsAtFairValueThroughOtherComprehensiveIncomeCategoryMember2024-12-310000891478ifrs-full:Level3OfFairValueHierarchyMemberifrs-full:FinancialAssetsAtFairValueThroughOtherComprehensiveIncomeCategoryMember2025-01-012025-12-310000891478ifrs-full:Level3OfFairValueHierarchyMemberifrs-full:FinancialAssetsAtFairValueThroughOtherComprehensiveIncomeCategoryMember2025-12-310000891478ifrs-full:FinancialAssetsAtFairValueThroughOtherComprehensiveIncomeCategoryMembersan:LoansAndAdvancesMemberifrs-full:Level3OfFairValueHierarchyMember2024-12-310000891478ifrs-full:FinancialAssetsAtFairValueThroughOtherComprehensiveIncomeCategoryMembersan:LoansAndAdvancesMemberifrs-full:Level3OfFairValueHierarchyMember2025-01-012025-12-310000891478ifrs-full:FinancialAssetsAtFairValueThroughOtherComprehensiveIncomeCategoryMembersan:LoansAndAdvancesMemberifrs-full:Level3OfFairValueHierarchyMember2025-12-310000891478ifrs-full:FinancialAssetsAtFairValueThroughOtherComprehensiveIncomeCategoryMemberifrs-full:DebtSecuritiesMemberifrs-full:Level3OfFairValueHierarchyMember2024-12-310000891478ifrs-full:FinancialAssetsAtFairValueThroughOtherComprehensiveIncomeCategoryMemberifrs-full:DebtSecuritiesMemberifrs-full:Level3OfFairValueHierarchyMember2025-01-012025-12-310000891478ifrs-full:FinancialAssetsAtFairValueThroughOtherComprehensiveIncomeCategoryMemberifrs-full:DebtSecuritiesMemberifrs-full:Level3OfFairValueHierarchyMember2025-12-310000891478ifrs-full:FinancialAssetsAtFairValueThroughOtherComprehensiveIncomeCategoryMemberifrs-full:EquityInvestmentsMemberifrs-full:Level3OfFairValueHierarchyMember2024-12-310000891478ifrs-full:FinancialAssetsAtFairValueThroughOtherComprehensiveIncomeCategoryMemberifrs-full:EquityInvestmentsMemberifrs-full:Level3OfFairValueHierarchyMember2025-01-012025-12-310000891478ifrs-full:FinancialAssetsAtFairValueThroughOtherComprehensiveIncomeCategoryMemberifrs-full:EquityInvestmentsMemberifrs-full:Level3OfFairValueHierarchyMember2025-12-310000891478ifrs-full:Level3OfFairValueHierarchyMember2025-01-012025-12-310000891478ifrs-full:FinancialLiabilitiesAtFairValueThroughProfitOrLossThatMeetDefinitionOfHeldForTradingCategoryMemberifrs-full:Level3OfFairValueHierarchyMember2024-12-310000891478ifrs-full:FinancialLiabilitiesAtFairValueThroughProfitOrLossThatMeetDefinitionOfHeldForTradingCategoryMemberifrs-full:Level3OfFairValueHierarchyMember2025-01-012025-12-310000891478ifrs-full:FinancialLiabilitiesAtFairValueThroughProfitOrLossThatMeetDefinitionOfHeldForTradingCategoryMemberifrs-full:Level3OfFairValueHierarchyMember2025-12-310000891478ifrs-full:FinancialLiabilitiesAtFairValueThroughProfitOrLossThatMeetDefinitionOfHeldForTradingCategoryMemberifrs-full:Level3OfFairValueHierarchyMemberifrs-full:DerivativesMember2024-12-310000891478ifrs-full:FinancialLiabilitiesAtFairValueThroughProfitOrLossThatMeetDefinitionOfHeldForTradingCategoryMemberifrs-full:Level3OfFairValueHierarchyMemberifrs-full:DerivativesMember2025-01-012025-12-310000891478ifrs-full:FinancialLiabilitiesAtFairValueThroughProfitOrLossThatMeetDefinitionOfHeldForTradingCategoryMemberifrs-full:Level3OfFairValueHierarchyMemberifrs-full:DerivativesMember2025-12-310000891478ifrs-full:FinancialLiabilitiesAtFairValueThroughProfitOrLossThatMeetDefinitionOfHeldForTradingCategoryMemberifrs-full:Level3OfFairValueHierarchyMemberifrs-full:SwapContractMember2024-12-310000891478ifrs-full:FinancialLiabilitiesAtFairValueThroughProfitOrLossThatMeetDefinitionOfHeldForTradingCategoryMemberifrs-full:Level3OfFairValueHierarchyMemberifrs-full:SwapContractMember2025-01-012025-12-310000891478ifrs-full:FinancialLiabilitiesAtFairValueThroughProfitOrLossThatMeetDefinitionOfHeldForTradingCategoryMemberifrs-full:Level3OfFairValueHierarchyMemberifrs-full:SwapContractMember2025-12-310000891478ifrs-full:FinancialLiabilitiesAtFairValueThroughProfitOrLossThatMeetDefinitionOfHeldForTradingCategoryMemberifrs-full:Level3OfFairValueHierarchyMembersan:ExchangeRateOptionMember2024-12-310000891478ifrs-full:FinancialLiabilitiesAtFairValueThroughProfitOrLossThatMeetDefinitionOfHeldForTradingCategoryMemberifrs-full:Level3OfFairValueHierarchyMembersan:ExchangeRateOptionMember2025-01-012025-12-310000891478ifrs-full:FinancialLiabilitiesAtFairValueThroughProfitOrLossThatMeetDefinitionOfHeldForTradingCategoryMemberifrs-full:Level3OfFairValueHierarchyMembersan:ExchangeRateOptionMember2025-12-310000891478ifrs-full:FinancialLiabilitiesAtFairValueThroughProfitOrLossThatMeetDefinitionOfHeldForTradingCategoryMemberifrs-full:Level3OfFairValueHierarchyMembersan:InterestRateOptionMember2024-12-310000891478ifrs-full:FinancialLiabilitiesAtFairValueThroughProfitOrLossThatMeetDefinitionOfHeldForTradingCategoryMemberifrs-full:Level3OfFairValueHierarchyMembersan:InterestRateOptionMember2025-01-012025-12-310000891478ifrs-full:FinancialLiabilitiesAtFairValueThroughProfitOrLossThatMeetDefinitionOfHeldForTradingCategoryMemberifrs-full:Level3OfFairValueHierarchyMembersan:InterestRateOptionMember2025-12-310000891478ifrs-full:FinancialLiabilitiesAtFairValueThroughProfitOrLossThatMeetDefinitionOfHeldForTradingCategoryMemberifrs-full:Level3OfFairValueHierarchyMembersan:IndexAndSecuritiesOptionsMember2024-12-310000891478ifrs-full:FinancialLiabilitiesAtFairValueThroughProfitOrLossThatMeetDefinitionOfHeldForTradingCategoryMemberifrs-full:Level3OfFairValueHierarchyMembersan:IndexAndSecuritiesOptionsMember2025-01-012025-12-310000891478ifrs-full:FinancialLiabilitiesAtFairValueThroughProfitOrLossThatMeetDefinitionOfHeldForTradingCategoryMemberifrs-full:Level3OfFairValueHierarchyMembersan:IndexAndSecuritiesOptionsMember2025-12-310000891478ifrs-full:FinancialLiabilitiesAtFairValueThroughProfitOrLossThatMeetDefinitionOfHeldForTradingCategoryMemberifrs-full:Level3OfFairValueHierarchyMembersan:SecuritiesAndInterestRateFuturesMember2024-12-310000891478ifrs-full:FinancialLiabilitiesAtFairValueThroughProfitOrLossThatMeetDefinitionOfHeldForTradingCategoryMemberifrs-full:Level3OfFairValueHierarchyMembersan:SecuritiesAndInterestRateFuturesMember2025-01-012025-12-310000891478ifrs-full:FinancialLiabilitiesAtFairValueThroughProfitOrLossThatMeetDefinitionOfHeldForTradingCategoryMemberifrs-full:Level3OfFairValueHierarchyMembersan:SecuritiesAndInterestRateFuturesMember2025-12-310000891478ifrs-full:FinancialLiabilitiesAtFairValueThroughProfitOrLossThatMeetDefinitionOfHeldForTradingCategoryMemberifrs-full:Level3OfFairValueHierarchyMembersan:OtherDerivativesMember2024-12-310000891478ifrs-full:FinancialLiabilitiesAtFairValueThroughProfitOrLossThatMeetDefinitionOfHeldForTradingCategoryMemberifrs-full:Level3OfFairValueHierarchyMembersan:OtherDerivativesMember2025-01-012025-12-310000891478ifrs-full:FinancialLiabilitiesAtFairValueThroughProfitOrLossThatMeetDefinitionOfHeldForTradingCategoryMemberifrs-full:Level3OfFairValueHierarchyMembersan:OtherDerivativesMember2025-12-310000891478san:HedgingDerivativesMemberifrs-full:Level3OfFairValueHierarchyMember2024-12-310000891478san:HedgingDerivativesMemberifrs-full:Level3OfFairValueHierarchyMember2025-01-012025-12-310000891478san:HedgingDerivativesMemberifrs-full:Level3OfFairValueHierarchyMember2025-12-310000891478san:HedgingDerivativesMemberifrs-full:Level3OfFairValueHierarchyMemberifrs-full:SwapContractMember2024-12-310000891478san:HedgingDerivativesMemberifrs-full:Level3OfFairValueHierarchyMemberifrs-full:SwapContractMember2025-01-012025-12-310000891478san:HedgingDerivativesMemberifrs-full:Level3OfFairValueHierarchyMemberifrs-full:SwapContractMember2025-12-310000891478san:HedgingDerivativesMemberifrs-full:Level3OfFairValueHierarchyMembersan:InterestRateOptionMember2024-12-310000891478san:HedgingDerivativesMemberifrs-full:Level3OfFairValueHierarchyMembersan:InterestRateOptionMember2025-01-012025-12-310000891478san:HedgingDerivativesMemberifrs-full:Level3OfFairValueHierarchyMembersan:InterestRateOptionMember2025-12-310000891478ifrs-full:FinancialLiabilitiesAtFairValueThroughProfitOrLossDesignatedUponInitialRecognitionCategoryMemberifrs-full:Level3OfFairValueHierarchyMember2024-12-310000891478ifrs-full:FinancialLiabilitiesAtFairValueThroughProfitOrLossDesignatedUponInitialRecognitionCategoryMemberifrs-full:Level3OfFairValueHierarchyMember2025-01-012025-12-310000891478ifrs-full:FinancialLiabilitiesAtFairValueThroughProfitOrLossDesignatedUponInitialRecognitionCategoryMemberifrs-full:Level3OfFairValueHierarchyMember2025-12-310000891478san:LiabilitiesUnderInsuranceContractsMemberifrs-full:Level3OfFairValueHierarchyMember2024-12-310000891478san:LiabilitiesUnderInsuranceContractsMemberifrs-full:Level3OfFairValueHierarchyMember2025-01-012025-12-310000891478san:LiabilitiesUnderInsuranceContractsMemberifrs-full:Level3OfFairValueHierarchyMember2025-12-310000891478ifrs-full:Level3OfFairValueHierarchyMemberifrs-full:FinancialAssetsAtFairValueThroughProfitOrLossClassifiedAsHeldForTradingCategoryMember2023-12-310000891478ifrs-full:Level3OfFairValueHierarchyMemberifrs-full:FinancialAssetsAtFairValueThroughProfitOrLossClassifiedAsHeldForTradingCategoryMember2024-01-012024-12-310000891478ifrs-full:FinancialAssetsAtFairValueThroughProfitOrLossClassifiedAsHeldForTradingCategoryMembersan:LoansAndAdvancesCreditInstitutionsMemberifrs-full:Level3OfFairValueHierarchyMember2023-12-310000891478ifrs-full:FinancialAssetsAtFairValueThroughProfitOrLossClassifiedAsHeldForTradingCategoryMembersan:LoansAndAdvancesCreditInstitutionsMemberifrs-full:Level3OfFairValueHierarchyMember2024-01-012024-12-310000891478ifrs-full:FinancialAssetsAtFairValueThroughProfitOrLossClassifiedAsHeldForTradingCategoryMembersan:LoansAndAdvancesCustomersMemberifrs-full:Level3OfFairValueHierarchyMember2023-12-310000891478ifrs-full:FinancialAssetsAtFairValueThroughProfitOrLossClassifiedAsHeldForTradingCategoryMembersan:LoansAndAdvancesCustomersMemberifrs-full:Level3OfFairValueHierarchyMember2024-01-012024-12-310000891478ifrs-full:FinancialAssetsAtFairValueThroughProfitOrLossClassifiedAsHeldForTradingCategoryMemberifrs-full:DebtSecuritiesMemberifrs-full:Level3OfFairValueHierarchyMember2023-12-310000891478ifrs-full:FinancialAssetsAtFairValueThroughProfitOrLossClassifiedAsHeldForTradingCategoryMemberifrs-full:DebtSecuritiesMemberifrs-full:Level3OfFairValueHierarchyMember2024-01-012024-12-310000891478ifrs-full:FinancialAssetsAtFairValueThroughProfitOrLossClassifiedAsHeldForTradingCategoryMemberifrs-full:EquityInvestmentsMemberifrs-full:Level3OfFairValueHierarchyMember2023-12-310000891478ifrs-full:FinancialAssetsAtFairValueThroughProfitOrLossClassifiedAsHeldForTradingCategoryMemberifrs-full:EquityInvestmentsMemberifrs-full:Level3OfFairValueHierarchyMember2024-01-012024-12-310000891478ifrs-full:FinancialAssetsAtFairValueThroughProfitOrLossClassifiedAsHeldForTradingCategoryMemberifrs-full:EquityInvestmentsMemberifrs-full:Level3OfFairValueHierarchyMember2024-12-310000891478ifrs-full:FinancialAssetsAtFairValueThroughProfitOrLossClassifiedAsHeldForTradingCategoryMemberifrs-full:DerivativesMemberifrs-full:Level3OfFairValueHierarchyMember2023-12-310000891478ifrs-full:FinancialAssetsAtFairValueThroughProfitOrLossClassifiedAsHeldForTradingCategoryMemberifrs-full:DerivativesMemberifrs-full:Level3OfFairValueHierarchyMember2024-01-012024-12-310000891478ifrs-full:FinancialAssetsAtFairValueThroughProfitOrLossClassifiedAsHeldForTradingCategoryMemberifrs-full:SwapContractMemberifrs-full:Level3OfFairValueHierarchyMember2023-12-310000891478ifrs-full:FinancialAssetsAtFairValueThroughProfitOrLossClassifiedAsHeldForTradingCategoryMemberifrs-full:SwapContractMemberifrs-full:Level3OfFairValueHierarchyMember2024-01-012024-12-310000891478ifrs-full:FinancialAssetsAtFairValueThroughProfitOrLossClassifiedAsHeldForTradingCategoryMembersan:ExchangeRateOptionMemberifrs-full:Level3OfFairValueHierarchyMember2023-12-310000891478ifrs-full:FinancialAssetsAtFairValueThroughProfitOrLossClassifiedAsHeldForTradingCategoryMembersan:ExchangeRateOptionMemberifrs-full:Level3OfFairValueHierarchyMember2024-01-012024-12-310000891478ifrs-full:FinancialAssetsAtFairValueThroughProfitOrLossClassifiedAsHeldForTradingCategoryMembersan:InterestRateOptionMemberifrs-full:Level3OfFairValueHierarchyMember2023-12-310000891478ifrs-full:FinancialAssetsAtFairValueThroughProfitOrLossClassifiedAsHeldForTradingCategoryMembersan:InterestRateOptionMemberifrs-full:Level3OfFairValueHierarchyMember2024-01-012024-12-310000891478ifrs-full:FinancialAssetsAtFairValueThroughProfitOrLossClassifiedAsHeldForTradingCategoryMembersan:IndexAndSecuritiesOptionsMemberifrs-full:Level3OfFairValueHierarchyMember2023-12-310000891478ifrs-full:FinancialAssetsAtFairValueThroughProfitOrLossClassifiedAsHeldForTradingCategoryMembersan:IndexAndSecuritiesOptionsMemberifrs-full:Level3OfFairValueHierarchyMember2024-01-012024-12-310000891478ifrs-full:FinancialAssetsAtFairValueThroughProfitOrLossClassifiedAsHeldForTradingCategoryMembersan:OtherDerivativesMemberifrs-full:Level3OfFairValueHierarchyMember2023-12-310000891478ifrs-full:FinancialAssetsAtFairValueThroughProfitOrLossClassifiedAsHeldForTradingCategoryMembersan:OtherDerivativesMemberifrs-full:Level3OfFairValueHierarchyMember2024-01-012024-12-310000891478ifrs-full:Level3OfFairValueHierarchyMembersan:HedgingDerivativesMember2023-12-310000891478ifrs-full:Level3OfFairValueHierarchyMembersan:HedgingDerivativesMember2024-01-012024-12-310000891478san:HedgingDerivativesMemberifrs-full:SwapContractMemberifrs-full:Level3OfFairValueHierarchyMember2023-12-310000891478san:HedgingDerivativesMemberifrs-full:SwapContractMemberifrs-full:Level3OfFairValueHierarchyMember2024-01-012024-12-310000891478ifrs-full:Level3OfFairValueHierarchyMemberifrs-full:FinancialAssetsAtFairValueThroughProfitOrLossDesignatedUponInitialRecognitionCategoryMember2023-12-310000891478ifrs-full:Level3OfFairValueHierarchyMemberifrs-full:FinancialAssetsAtFairValueThroughProfitOrLossDesignatedUponInitialRecognitionCategoryMember2024-01-012024-12-310000891478ifrs-full:FinancialAssetsAtFairValueThroughProfitOrLossDesignatedUponInitialRecognitionCategoryMembersan:LoansAndAdvancesCustomersMemberifrs-full:Level3OfFairValueHierarchyMember2023-12-310000891478ifrs-full:FinancialAssetsAtFairValueThroughProfitOrLossDesignatedUponInitialRecognitionCategoryMembersan:LoansAndAdvancesCustomersMemberifrs-full:Level3OfFairValueHierarchyMember2024-01-012024-12-310000891478ifrs-full:FinancialAssetsAtFairValueThroughProfitOrLossDesignatedUponInitialRecognitionCategoryMemberifrs-full:DebtSecuritiesMemberifrs-full:Level3OfFairValueHierarchyMember2023-12-310000891478ifrs-full:FinancialAssetsAtFairValueThroughProfitOrLossDesignatedUponInitialRecognitionCategoryMemberifrs-full:DebtSecuritiesMemberifrs-full:Level3OfFairValueHierarchyMember2024-01-012024-12-310000891478ifrs-full:Level3OfFairValueHierarchyMemberifrs-full:FinancialAssetsAtFairValueThroughProfitOrLossMandatorilyMeasuredAtFairValueCategoryMember2023-12-310000891478ifrs-full:Level3OfFairValueHierarchyMemberifrs-full:FinancialAssetsAtFairValueThroughProfitOrLossMandatorilyMeasuredAtFairValueCategoryMember2024-01-012024-12-310000891478ifrs-full:FinancialAssetsAtFairValueThroughProfitOrLossMandatorilyMeasuredAtFairValueCategoryMembersan:LoansAndAdvancesCustomersMemberifrs-full:Level3OfFairValueHierarchyMember2023-12-310000891478ifrs-full:FinancialAssetsAtFairValueThroughProfitOrLossMandatorilyMeasuredAtFairValueCategoryMembersan:LoansAndAdvancesCustomersMemberifrs-full:Level3OfFairValueHierarchyMember2024-01-012024-12-310000891478ifrs-full:FinancialAssetsAtFairValueThroughProfitOrLossMandatorilyMeasuredAtFairValueCategoryMemberifrs-full:DebtSecuritiesMemberifrs-full:Level3OfFairValueHierarchyMember2023-12-310000891478ifrs-full:FinancialAssetsAtFairValueThroughProfitOrLossMandatorilyMeasuredAtFairValueCategoryMemberifrs-full:DebtSecuritiesMemberifrs-full:Level3OfFairValueHierarchyMember2024-01-012024-12-310000891478ifrs-full:FinancialAssetsAtFairValueThroughProfitOrLossMandatorilyMeasuredAtFairValueCategoryMemberifrs-full:EquityInvestmentsMemberifrs-full:Level3OfFairValueHierarchyMember2023-12-310000891478ifrs-full:FinancialAssetsAtFairValueThroughProfitOrLossMandatorilyMeasuredAtFairValueCategoryMemberifrs-full:EquityInvestmentsMemberifrs-full:Level3OfFairValueHierarchyMember2024-01-012024-12-310000891478ifrs-full:Level3OfFairValueHierarchyMemberifrs-full:FinancialAssetsAtFairValueThroughOtherComprehensiveIncomeCategoryMember2023-12-310000891478ifrs-full:Level3OfFairValueHierarchyMemberifrs-full:FinancialAssetsAtFairValueThroughOtherComprehensiveIncomeCategoryMember2024-01-012024-12-310000891478ifrs-full:FinancialAssetsAtFairValueThroughOtherComprehensiveIncomeCategoryMembersan:LoansAndAdvancesMemberifrs-full:Level3OfFairValueHierarchyMember2023-12-310000891478ifrs-full:FinancialAssetsAtFairValueThroughOtherComprehensiveIncomeCategoryMembersan:LoansAndAdvancesMemberifrs-full:Level3OfFairValueHierarchyMember2024-01-012024-12-310000891478ifrs-full:FinancialAssetsAtFairValueThroughOtherComprehensiveIncomeCategoryMemberifrs-full:DebtSecuritiesMemberifrs-full:Level3OfFairValueHierarchyMember2023-12-310000891478ifrs-full:FinancialAssetsAtFairValueThroughOtherComprehensiveIncomeCategoryMemberifrs-full:DebtSecuritiesMemberifrs-full:Level3OfFairValueHierarchyMember2024-01-012024-12-310000891478ifrs-full:FinancialAssetsAtFairValueThroughOtherComprehensiveIncomeCategoryMemberifrs-full:EquityInvestmentsMemberifrs-full:Level3OfFairValueHierarchyMember2023-12-310000891478ifrs-full:FinancialAssetsAtFairValueThroughOtherComprehensiveIncomeCategoryMemberifrs-full:EquityInvestmentsMemberifrs-full:Level3OfFairValueHierarchyMember2024-01-012024-12-310000891478ifrs-full:Level3OfFairValueHierarchyMember2024-01-012024-12-310000891478ifrs-full:FinancialLiabilitiesAtFairValueThroughProfitOrLossThatMeetDefinitionOfHeldForTradingCategoryMemberifrs-full:Level3OfFairValueHierarchyMember2023-12-310000891478ifrs-full:FinancialLiabilitiesAtFairValueThroughProfitOrLossThatMeetDefinitionOfHeldForTradingCategoryMemberifrs-full:Level3OfFairValueHierarchyMember2024-01-012024-12-310000891478ifrs-full:FinancialLiabilitiesAtFairValueThroughProfitOrLossThatMeetDefinitionOfHeldForTradingCategoryMemberifrs-full:Level3OfFairValueHierarchyMemberifrs-full:DerivativesMember2023-12-310000891478ifrs-full:FinancialLiabilitiesAtFairValueThroughProfitOrLossThatMeetDefinitionOfHeldForTradingCategoryMemberifrs-full:Level3OfFairValueHierarchyMemberifrs-full:DerivativesMember2024-01-012024-12-310000891478ifrs-full:FinancialLiabilitiesAtFairValueThroughProfitOrLossThatMeetDefinitionOfHeldForTradingCategoryMemberifrs-full:Level3OfFairValueHierarchyMemberifrs-full:SwapContractMember2023-12-310000891478ifrs-full:FinancialLiabilitiesAtFairValueThroughProfitOrLossThatMeetDefinitionOfHeldForTradingCategoryMemberifrs-full:Level3OfFairValueHierarchyMemberifrs-full:SwapContractMember2024-01-012024-12-310000891478ifrs-full:FinancialLiabilitiesAtFairValueThroughProfitOrLossThatMeetDefinitionOfHeldForTradingCategoryMemberifrs-full:Level3OfFairValueHierarchyMembersan:ExchangeRateOptionMember2023-12-310000891478ifrs-full:FinancialLiabilitiesAtFairValueThroughProfitOrLossThatMeetDefinitionOfHeldForTradingCategoryMemberifrs-full:Level3OfFairValueHierarchyMembersan:ExchangeRateOptionMember2024-01-012024-12-310000891478ifrs-full:FinancialLiabilitiesAtFairValueThroughProfitOrLossThatMeetDefinitionOfHeldForTradingCategoryMemberifrs-full:Level3OfFairValueHierarchyMembersan:InterestRateOptionMember2023-12-310000891478ifrs-full:FinancialLiabilitiesAtFairValueThroughProfitOrLossThatMeetDefinitionOfHeldForTradingCategoryMemberifrs-full:Level3OfFairValueHierarchyMembersan:InterestRateOptionMember2024-01-012024-12-310000891478ifrs-full:FinancialLiabilitiesAtFairValueThroughProfitOrLossThatMeetDefinitionOfHeldForTradingCategoryMemberifrs-full:Level3OfFairValueHierarchyMembersan:IndexAndSecuritiesOptionsMember2023-12-310000891478ifrs-full:FinancialLiabilitiesAtFairValueThroughProfitOrLossThatMeetDefinitionOfHeldForTradingCategoryMemberifrs-full:Level3OfFairValueHierarchyMembersan:IndexAndSecuritiesOptionsMember2024-01-012024-12-310000891478ifrs-full:FinancialLiabilitiesAtFairValueThroughProfitOrLossThatMeetDefinitionOfHeldForTradingCategoryMemberifrs-full:Level3OfFairValueHierarchyMembersan:OtherDerivativesMember2023-12-310000891478ifrs-full:FinancialLiabilitiesAtFairValueThroughProfitOrLossThatMeetDefinitionOfHeldForTradingCategoryMemberifrs-full:Level3OfFairValueHierarchyMembersan:OtherDerivativesMember2024-01-012024-12-310000891478san:HedgingDerivativesMemberifrs-full:Level3OfFairValueHierarchyMember2023-12-310000891478san:HedgingDerivativesMemberifrs-full:Level3OfFairValueHierarchyMember2024-01-012024-12-310000891478san:HedgingDerivativesMemberifrs-full:Level3OfFairValueHierarchyMemberifrs-full:SwapContractMember2023-12-310000891478san:HedgingDerivativesMemberifrs-full:Level3OfFairValueHierarchyMemberifrs-full:SwapContractMember2024-01-012024-12-310000891478ifrs-full:FinancialLiabilitiesAtFairValueThroughProfitOrLossDesignatedUponInitialRecognitionCategoryMemberifrs-full:Level3OfFairValueHierarchyMember2023-12-310000891478ifrs-full:FinancialLiabilitiesAtFairValueThroughProfitOrLossDesignatedUponInitialRecognitionCategoryMemberifrs-full:Level3OfFairValueHierarchyMember2024-01-012024-12-310000891478san:LiabilitiesUnderInsuranceContractsMemberifrs-full:Level3OfFairValueHierarchyMember2023-12-310000891478san:LiabilitiesUnderInsuranceContractsMemberifrs-full:Level3OfFairValueHierarchyMember2024-01-012024-12-310000891478ifrs-full:Level3OfFairValueHierarchyMemberifrs-full:FinancialAssetsAtFairValueThroughProfitOrLossClassifiedAsHeldForTradingCategoryMember2022-12-310000891478ifrs-full:Level3OfFairValueHierarchyMemberifrs-full:FinancialAssetsAtFairValueThroughProfitOrLossClassifiedAsHeldForTradingCategoryMember2023-01-012023-12-310000891478ifrs-full:FinancialAssetsAtFairValueThroughProfitOrLossClassifiedAsHeldForTradingCategoryMembersan:LoansAndAdvancesCustomersMemberifrs-full:Level3OfFairValueHierarchyMember2022-12-310000891478ifrs-full:FinancialAssetsAtFairValueThroughProfitOrLossClassifiedAsHeldForTradingCategoryMembersan:LoansAndAdvancesCustomersMemberifrs-full:Level3OfFairValueHierarchyMember2023-01-012023-12-310000891478ifrs-full:FinancialAssetsAtFairValueThroughProfitOrLossClassifiedAsHeldForTradingCategoryMemberifrs-full:DebtSecuritiesMemberifrs-full:Level3OfFairValueHierarchyMember2022-12-310000891478ifrs-full:FinancialAssetsAtFairValueThroughProfitOrLossClassifiedAsHeldForTradingCategoryMemberifrs-full:DebtSecuritiesMemberifrs-full:Level3OfFairValueHierarchyMember2023-01-012023-12-310000891478ifrs-full:FinancialAssetsAtFairValueThroughProfitOrLossClassifiedAsHeldForTradingCategoryMemberifrs-full:EquityInvestmentsMemberifrs-full:Level3OfFairValueHierarchyMember2022-12-310000891478ifrs-full:FinancialAssetsAtFairValueThroughProfitOrLossClassifiedAsHeldForTradingCategoryMemberifrs-full:EquityInvestmentsMemberifrs-full:Level3OfFairValueHierarchyMember2023-01-012023-12-310000891478ifrs-full:FinancialAssetsAtFairValueThroughProfitOrLossClassifiedAsHeldForTradingCategoryMemberifrs-full:DerivativesMemberifrs-full:Level3OfFairValueHierarchyMember2022-12-310000891478ifrs-full:FinancialAssetsAtFairValueThroughProfitOrLossClassifiedAsHeldForTradingCategoryMemberifrs-full:DerivativesMemberifrs-full:Level3OfFairValueHierarchyMember2023-01-012023-12-310000891478ifrs-full:FinancialAssetsAtFairValueThroughProfitOrLossClassifiedAsHeldForTradingCategoryMemberifrs-full:SwapContractMemberifrs-full:Level3OfFairValueHierarchyMember2022-12-310000891478ifrs-full:FinancialAssetsAtFairValueThroughProfitOrLossClassifiedAsHeldForTradingCategoryMemberifrs-full:SwapContractMemberifrs-full:Level3OfFairValueHierarchyMember2023-01-012023-12-310000891478ifrs-full:FinancialAssetsAtFairValueThroughProfitOrLossClassifiedAsHeldForTradingCategoryMembersan:ExchangeRateOptionMemberifrs-full:Level3OfFairValueHierarchyMember2022-12-310000891478ifrs-full:FinancialAssetsAtFairValueThroughProfitOrLossClassifiedAsHeldForTradingCategoryMembersan:ExchangeRateOptionMemberifrs-full:Level3OfFairValueHierarchyMember2023-01-012023-12-310000891478ifrs-full:FinancialAssetsAtFairValueThroughProfitOrLossClassifiedAsHeldForTradingCategoryMembersan:InterestRateOptionMemberifrs-full:Level3OfFairValueHierarchyMember2022-12-310000891478ifrs-full:FinancialAssetsAtFairValueThroughProfitOrLossClassifiedAsHeldForTradingCategoryMembersan:InterestRateOptionMemberifrs-full:Level3OfFairValueHierarchyMember2023-01-012023-12-310000891478ifrs-full:FinancialAssetsAtFairValueThroughProfitOrLossClassifiedAsHeldForTradingCategoryMembersan:IndexAndSecuritiesOptionsMemberifrs-full:Level3OfFairValueHierarchyMember2022-12-310000891478ifrs-full:FinancialAssetsAtFairValueThroughProfitOrLossClassifiedAsHeldForTradingCategoryMembersan:IndexAndSecuritiesOptionsMemberifrs-full:Level3OfFairValueHierarchyMember2023-01-012023-12-310000891478ifrs-full:FinancialAssetsAtFairValueThroughProfitOrLossClassifiedAsHeldForTradingCategoryMembersan:OtherDerivativesMemberifrs-full:Level3OfFairValueHierarchyMember2022-12-310000891478ifrs-full:FinancialAssetsAtFairValueThroughProfitOrLossClassifiedAsHeldForTradingCategoryMembersan:OtherDerivativesMemberifrs-full:Level3OfFairValueHierarchyMember2023-01-012023-12-310000891478ifrs-full:Level3OfFairValueHierarchyMemberifrs-full:FinancialAssetsAtFairValueThroughProfitOrLossDesignatedUponInitialRecognitionCategoryMember2022-12-310000891478ifrs-full:Level3OfFairValueHierarchyMemberifrs-full:FinancialAssetsAtFairValueThroughProfitOrLossDesignatedUponInitialRecognitionCategoryMember2023-01-012023-12-310000891478ifrs-full:FinancialAssetsAtFairValueThroughProfitOrLossDesignatedUponInitialRecognitionCategoryMembersan:LoansAndAdvancesCustomersMemberifrs-full:Level3OfFairValueHierarchyMember2022-12-310000891478ifrs-full:FinancialAssetsAtFairValueThroughProfitOrLossDesignatedUponInitialRecognitionCategoryMembersan:LoansAndAdvancesCustomersMemberifrs-full:Level3OfFairValueHierarchyMember2023-01-012023-12-310000891478ifrs-full:FinancialAssetsAtFairValueThroughProfitOrLossDesignatedUponInitialRecognitionCategoryMemberifrs-full:DebtSecuritiesMemberifrs-full:Level3OfFairValueHierarchyMember2022-12-310000891478ifrs-full:FinancialAssetsAtFairValueThroughProfitOrLossDesignatedUponInitialRecognitionCategoryMemberifrs-full:DebtSecuritiesMemberifrs-full:Level3OfFairValueHierarchyMember2023-01-012023-12-310000891478ifrs-full:Level3OfFairValueHierarchyMemberifrs-full:FinancialAssetsAtFairValueThroughProfitOrLossMandatorilyMeasuredAtFairValueCategoryMember2022-12-310000891478ifrs-full:Level3OfFairValueHierarchyMemberifrs-full:FinancialAssetsAtFairValueThroughProfitOrLossMandatorilyMeasuredAtFairValueCategoryMember2023-01-012023-12-310000891478ifrs-full:FinancialAssetsAtFairValueThroughProfitOrLossMandatorilyMeasuredAtFairValueCategoryMembersan:LoansAndAdvancesCustomersMemberifrs-full:Level3OfFairValueHierarchyMember2022-12-310000891478ifrs-full:FinancialAssetsAtFairValueThroughProfitOrLossMandatorilyMeasuredAtFairValueCategoryMembersan:LoansAndAdvancesCustomersMemberifrs-full:Level3OfFairValueHierarchyMember2023-01-012023-12-310000891478ifrs-full:FinancialAssetsAtFairValueThroughProfitOrLossMandatorilyMeasuredAtFairValueCategoryMemberifrs-full:DebtSecuritiesMemberifrs-full:Level3OfFairValueHierarchyMember2022-12-310000891478ifrs-full:FinancialAssetsAtFairValueThroughProfitOrLossMandatorilyMeasuredAtFairValueCategoryMemberifrs-full:DebtSecuritiesMemberifrs-full:Level3OfFairValueHierarchyMember2023-01-012023-12-310000891478ifrs-full:FinancialAssetsAtFairValueThroughProfitOrLossMandatorilyMeasuredAtFairValueCategoryMemberifrs-full:EquityInvestmentsMemberifrs-full:Level3OfFairValueHierarchyMember2022-12-310000891478ifrs-full:FinancialAssetsAtFairValueThroughProfitOrLossMandatorilyMeasuredAtFairValueCategoryMemberifrs-full:EquityInvestmentsMemberifrs-full:Level3OfFairValueHierarchyMember2023-01-012023-12-310000891478ifrs-full:Level3OfFairValueHierarchyMemberifrs-full:FinancialAssetsAtFairValueThroughOtherComprehensiveIncomeCategoryMember2022-12-310000891478ifrs-full:Level3OfFairValueHierarchyMemberifrs-full:FinancialAssetsAtFairValueThroughOtherComprehensiveIncomeCategoryMember2023-01-012023-12-310000891478ifrs-full:FinancialAssetsAtFairValueThroughOtherComprehensiveIncomeCategoryMembersan:LoansAndAdvancesMemberifrs-full:Level3OfFairValueHierarchyMember2022-12-310000891478ifrs-full:FinancialAssetsAtFairValueThroughOtherComprehensiveIncomeCategoryMembersan:LoansAndAdvancesMemberifrs-full:Level3OfFairValueHierarchyMember2023-01-012023-12-310000891478ifrs-full:FinancialAssetsAtFairValueThroughOtherComprehensiveIncomeCategoryMemberifrs-full:DebtSecuritiesMemberifrs-full:Level3OfFairValueHierarchyMember2022-12-310000891478ifrs-full:FinancialAssetsAtFairValueThroughOtherComprehensiveIncomeCategoryMemberifrs-full:DebtSecuritiesMemberifrs-full:Level3OfFairValueHierarchyMember2023-01-012023-12-310000891478ifrs-full:FinancialAssetsAtFairValueThroughOtherComprehensiveIncomeCategoryMemberifrs-full:EquityInvestmentsMemberifrs-full:Level3OfFairValueHierarchyMember2022-12-310000891478ifrs-full:FinancialAssetsAtFairValueThroughOtherComprehensiveIncomeCategoryMemberifrs-full:EquityInvestmentsMemberifrs-full:Level3OfFairValueHierarchyMember2023-01-012023-12-310000891478ifrs-full:Level3OfFairValueHierarchyMember2022-12-310000891478ifrs-full:Level3OfFairValueHierarchyMember2023-01-012023-12-310000891478ifrs-full:FinancialLiabilitiesAtFairValueThroughProfitOrLossThatMeetDefinitionOfHeldForTradingCategoryMemberifrs-full:Level3OfFairValueHierarchyMember2022-12-310000891478ifrs-full:FinancialLiabilitiesAtFairValueThroughProfitOrLossThatMeetDefinitionOfHeldForTradingCategoryMemberifrs-full:Level3OfFairValueHierarchyMember2023-01-012023-12-310000891478ifrs-full:FinancialLiabilitiesAtFairValueThroughProfitOrLossThatMeetDefinitionOfHeldForTradingCategoryMemberifrs-full:Level3OfFairValueHierarchyMemberifrs-full:DerivativesMember2022-12-310000891478ifrs-full:FinancialLiabilitiesAtFairValueThroughProfitOrLossThatMeetDefinitionOfHeldForTradingCategoryMemberifrs-full:Level3OfFairValueHierarchyMemberifrs-full:DerivativesMember2023-01-012023-12-310000891478ifrs-full:FinancialLiabilitiesAtFairValueThroughProfitOrLossThatMeetDefinitionOfHeldForTradingCategoryMemberifrs-full:Level3OfFairValueHierarchyMemberifrs-full:SwapContractMember2022-12-310000891478ifrs-full:FinancialLiabilitiesAtFairValueThroughProfitOrLossThatMeetDefinitionOfHeldForTradingCategoryMemberifrs-full:Level3OfFairValueHierarchyMemberifrs-full:SwapContractMember2023-01-012023-12-310000891478ifrs-full:FinancialLiabilitiesAtFairValueThroughProfitOrLossThatMeetDefinitionOfHeldForTradingCategoryMemberifrs-full:Level3OfFairValueHierarchyMembersan:ExchangeRateOptionMember2022-12-310000891478ifrs-full:FinancialLiabilitiesAtFairValueThroughProfitOrLossThatMeetDefinitionOfHeldForTradingCategoryMemberifrs-full:Level3OfFairValueHierarchyMembersan:ExchangeRateOptionMember2023-01-012023-12-310000891478ifrs-full:FinancialLiabilitiesAtFairValueThroughProfitOrLossThatMeetDefinitionOfHeldForTradingCategoryMemberifrs-full:Level3OfFairValueHierarchyMembersan:InterestRateOptionMember2022-12-310000891478ifrs-full:FinancialLiabilitiesAtFairValueThroughProfitOrLossThatMeetDefinitionOfHeldForTradingCategoryMemberifrs-full:Level3OfFairValueHierarchyMembersan:InterestRateOptionMember2023-01-012023-12-310000891478ifrs-full:FinancialLiabilitiesAtFairValueThroughProfitOrLossThatMeetDefinitionOfHeldForTradingCategoryMemberifrs-full:Level3OfFairValueHierarchyMembersan:IndexAndSecuritiesOptionsMember2022-12-310000891478ifrs-full:FinancialLiabilitiesAtFairValueThroughProfitOrLossThatMeetDefinitionOfHeldForTradingCategoryMemberifrs-full:Level3OfFairValueHierarchyMembersan:IndexAndSecuritiesOptionsMember2023-01-012023-12-310000891478ifrs-full:FinancialLiabilitiesAtFairValueThroughProfitOrLossThatMeetDefinitionOfHeldForTradingCategoryMemberifrs-full:Level3OfFairValueHierarchyMembersan:OtherDerivativesMember2022-12-310000891478ifrs-full:FinancialLiabilitiesAtFairValueThroughProfitOrLossThatMeetDefinitionOfHeldForTradingCategoryMemberifrs-full:Level3OfFairValueHierarchyMembersan:OtherDerivativesMember2023-01-012023-12-310000891478san:HedgingDerivativesMemberifrs-full:Level3OfFairValueHierarchyMember2022-12-310000891478san:HedgingDerivativesMemberifrs-full:Level3OfFairValueHierarchyMember2023-01-012023-12-310000891478san:HedgingDerivativesMemberifrs-full:Level3OfFairValueHierarchyMemberifrs-full:SwapContractMember2022-12-310000891478san:HedgingDerivativesMemberifrs-full:Level3OfFairValueHierarchyMemberifrs-full:SwapContractMember2023-01-012023-12-310000891478ifrs-full:FinancialLiabilitiesAtFairValueThroughProfitOrLossDesignatedUponInitialRecognitionCategoryMemberifrs-full:Level3OfFairValueHierarchyMember2022-12-310000891478ifrs-full:FinancialLiabilitiesAtFairValueThroughProfitOrLossDesignatedUponInitialRecognitionCategoryMemberifrs-full:Level3OfFairValueHierarchyMember2023-01-012023-12-310000891478san:LiabilitiesUnderInsuranceContractsMemberifrs-full:Level3OfFairValueHierarchyMember2022-12-310000891478san:LiabilitiesUnderInsuranceContractsMemberifrs-full:Level3OfFairValueHierarchyMember2023-01-012023-12-310000891478ifrs-full:OnDemandMember2025-12-310000891478ifrs-full:NotLaterThanThreeMonthsMember2025-12-310000891478ifrs-full:DebtSecuritiesMemberifrs-full:OnDemandMember2025-12-310000891478ifrs-full:DebtSecuritiesMemberifrs-full:NotLaterThanThreeMonthsMember2025-12-310000891478ifrs-full:DebtSecuritiesMemberifrs-full:LaterThanThreeMonthsAndNotLaterThanOneYearMember2025-12-310000891478ifrs-full:DebtSecuritiesMemberifrs-full:LaterThanOneYearAndNotLaterThanThreeYearsMember2025-12-310000891478ifrs-full:DebtSecuritiesMemberifrs-full:LaterThanThreeYearsAndNotLaterThanFiveYearsMember2025-12-310000891478ifrs-full:DebtSecuritiesMemberifrs-full:LaterThanFiveYearsMember2025-12-310000891478san:LoansAndAdvancesMemberifrs-full:OnDemandMember2025-12-310000891478san:LoansAndAdvancesMemberifrs-full:NotLaterThanThreeMonthsMember2025-12-310000891478san:LoansAndAdvancesMemberifrs-full:LaterThanThreeMonthsAndNotLaterThanOneYearMember2025-12-310000891478san:LoansAndAdvancesMemberifrs-full:LaterThanOneYearAndNotLaterThanThreeYearsMember2025-12-310000891478san:LoansAndAdvancesMemberifrs-full:LaterThanThreeYearsAndNotLaterThanFiveYearsMember2025-12-310000891478san:LoansAndAdvancesMemberifrs-full:LaterThanFiveYearsMember2025-12-310000891478san:LoansAndAdvancesCreditInstitutionsMemberifrs-full:OnDemandMember2025-12-310000891478san:LoansAndAdvancesCreditInstitutionsMemberifrs-full:NotLaterThanThreeMonthsMember2025-12-310000891478san:LoansAndAdvancesCreditInstitutionsMemberifrs-full:LaterThanThreeMonthsAndNotLaterThanOneYearMember2025-12-310000891478san:LoansAndAdvancesCreditInstitutionsMemberifrs-full:LaterThanOneYearAndNotLaterThanThreeYearsMember2025-12-310000891478san:LoansAndAdvancesCreditInstitutionsMemberifrs-full:LaterThanThreeYearsAndNotLaterThanFiveYearsMember2025-12-310000891478san:LoansAndAdvancesCreditInstitutionsMemberifrs-full:LaterThanFiveYearsMember2025-12-310000891478san:LoansAndAdvancesCustomersMemberifrs-full:OnDemandMember2025-12-310000891478san:LoansAndAdvancesCustomersMemberifrs-full:NotLaterThanThreeMonthsMember2025-12-310000891478san:LoansAndAdvancesCustomersMemberifrs-full:LaterThanThreeMonthsAndNotLaterThanOneYearMember2025-12-310000891478san:LoansAndAdvancesCustomersMemberifrs-full:LaterThanOneYearAndNotLaterThanThreeYearsMember2025-12-310000891478san:LoansAndAdvancesCustomersMemberifrs-full:LaterThanThreeYearsAndNotLaterThanFiveYearsMember2025-12-310000891478san:LoansAndAdvancesCustomersMemberifrs-full:LaterThanFiveYearsMember2025-12-310000891478san:LoansAndAdvancesCentralBanksMemberifrs-full:OnDemandMember2025-12-310000891478san:LoansAndAdvancesCentralBanksMemberifrs-full:NotLaterThanThreeMonthsMember2025-12-310000891478san:LoansAndAdvancesCentralBanksMemberifrs-full:LaterThanThreeMonthsAndNotLaterThanOneYearMember2025-12-310000891478san:LoansAndAdvancesCentralBanksMemberifrs-full:LaterThanOneYearAndNotLaterThanThreeYearsMember2025-12-310000891478san:LoansAndAdvancesCentralBanksMemberifrs-full:LaterThanThreeYearsAndNotLaterThanFiveYearsMember2025-12-310000891478san:LoansAndAdvancesCentralBanksMemberifrs-full:LaterThanFiveYearsMember2025-12-310000891478ifrs-full:OnDemandMembersan:DepositMember2025-12-310000891478ifrs-full:NotLaterThanThreeMonthsMembersan:DepositMember2025-12-310000891478ifrs-full:LaterThanThreeMonthsAndNotLaterThanOneYearMembersan:DepositMember2025-12-310000891478ifrs-full:LaterThanOneYearAndNotLaterThanThreeYearsMembersan:DepositMember2025-12-310000891478ifrs-full:LaterThanThreeYearsAndNotLaterThanFiveYearsMembersan:DepositMember2025-12-310000891478ifrs-full:LaterThanFiveYearsMembersan:DepositMember2025-12-310000891478ifrs-full:OnDemandMembersan:DepositsCentralBanksMember2025-12-310000891478ifrs-full:NotLaterThanThreeMonthsMembersan:DepositsCentralBanksMember2025-12-310000891478ifrs-full:LaterThanThreeMonthsAndNotLaterThanOneYearMembersan:DepositsCentralBanksMember2025-12-310000891478ifrs-full:LaterThanOneYearAndNotLaterThanThreeYearsMembersan:DepositsCentralBanksMember2025-12-310000891478ifrs-full:LaterThanThreeYearsAndNotLaterThanFiveYearsMembersan:DepositsCentralBanksMember2025-12-310000891478ifrs-full:LaterThanFiveYearsMembersan:DepositsCentralBanksMember2025-12-310000891478ifrs-full:OnDemandMembersan:DepositsCreditInstitutionsMember2025-12-310000891478ifrs-full:NotLaterThanThreeMonthsMembersan:DepositsCreditInstitutionsMember2025-12-310000891478ifrs-full:LaterThanThreeMonthsAndNotLaterThanOneYearMembersan:DepositsCreditInstitutionsMember2025-12-310000891478ifrs-full:LaterThanOneYearAndNotLaterThanThreeYearsMembersan:DepositsCreditInstitutionsMember2025-12-310000891478ifrs-full:LaterThanThreeYearsAndNotLaterThanFiveYearsMembersan:DepositsCreditInstitutionsMember2025-12-310000891478ifrs-full:LaterThanFiveYearsMembersan:DepositsCreditInstitutionsMember2025-12-310000891478ifrs-full:OnDemandMembersan:DepositsCustomersMember2025-12-310000891478ifrs-full:NotLaterThanThreeMonthsMembersan:DepositsCustomersMember2025-12-310000891478ifrs-full:LaterThanThreeMonthsAndNotLaterThanOneYearMembersan:DepositsCustomersMember2025-12-310000891478ifrs-full:LaterThanOneYearAndNotLaterThanThreeYearsMembersan:DepositsCustomersMember2025-12-310000891478ifrs-full:LaterThanThreeYearsAndNotLaterThanFiveYearsMembersan:DepositsCustomersMember2025-12-310000891478ifrs-full:LaterThanFiveYearsMembersan:DepositsCustomersMember2025-12-310000891478ifrs-full:OnDemandMembersan:DebtInstrumentsMember2025-12-310000891478ifrs-full:NotLaterThanThreeMonthsMembersan:DebtInstrumentsMember2025-12-310000891478ifrs-full:LaterThanThreeMonthsAndNotLaterThanOneYearMembersan:DebtInstrumentsMember2025-12-310000891478ifrs-full:LaterThanOneYearAndNotLaterThanThreeYearsMembersan:DebtInstrumentsMember2025-12-310000891478ifrs-full:LaterThanThreeYearsAndNotLaterThanFiveYearsMembersan:DebtInstrumentsMember2025-12-310000891478ifrs-full:LaterThanFiveYearsMembersan:DebtInstrumentsMember2025-12-310000891478ifrs-full:OnDemandMembersan:OtherFinancialLiabilitiesMember2025-12-310000891478ifrs-full:NotLaterThanThreeMonthsMembersan:OtherFinancialLiabilitiesMember2025-12-310000891478ifrs-full:LaterThanThreeMonthsAndNotLaterThanOneYearMembersan:OtherFinancialLiabilitiesMember2025-12-310000891478ifrs-full:LaterThanOneYearAndNotLaterThanThreeYearsMembersan:OtherFinancialLiabilitiesMember2025-12-310000891478ifrs-full:LaterThanThreeYearsAndNotLaterThanFiveYearsMembersan:OtherFinancialLiabilitiesMember2025-12-310000891478ifrs-full:LaterThanFiveYearsMembersan:OtherFinancialLiabilitiesMember2025-12-310000891478ifrs-full:OnDemandMember2024-12-310000891478ifrs-full:NotLaterThanThreeMonthsMember2024-12-310000891478ifrs-full:DebtSecuritiesMemberifrs-full:OnDemandMember2024-12-310000891478ifrs-full:DebtSecuritiesMemberifrs-full:NotLaterThanThreeMonthsMember2024-12-310000891478ifrs-full:DebtSecuritiesMemberifrs-full:LaterThanThreeMonthsAndNotLaterThanOneYearMember2024-12-310000891478ifrs-full:DebtSecuritiesMemberifrs-full:LaterThanOneYearAndNotLaterThanThreeYearsMember2024-12-310000891478ifrs-full:DebtSecuritiesMemberifrs-full:LaterThanThreeYearsAndNotLaterThanFiveYearsMember2024-12-310000891478ifrs-full:DebtSecuritiesMemberifrs-full:LaterThanFiveYearsMember2024-12-310000891478san:LoansAndAdvancesMemberifrs-full:OnDemandMember2024-12-310000891478san:LoansAndAdvancesMemberifrs-full:NotLaterThanThreeMonthsMember2024-12-310000891478san:LoansAndAdvancesMemberifrs-full:LaterThanThreeMonthsAndNotLaterThanOneYearMember2024-12-310000891478san:LoansAndAdvancesMemberifrs-full:LaterThanOneYearAndNotLaterThanThreeYearsMember2024-12-310000891478san:LoansAndAdvancesMemberifrs-full:LaterThanThreeYearsAndNotLaterThanFiveYearsMember2024-12-310000891478san:LoansAndAdvancesMemberifrs-full:LaterThanFiveYearsMember2024-12-310000891478san:LoansAndAdvancesCreditInstitutionsMemberifrs-full:OnDemandMember2024-12-310000891478san:LoansAndAdvancesCreditInstitutionsMemberifrs-full:NotLaterThanThreeMonthsMember2024-12-310000891478san:LoansAndAdvancesCreditInstitutionsMemberifrs-full:LaterThanThreeMonthsAndNotLaterThanOneYearMember2024-12-310000891478san:LoansAndAdvancesCreditInstitutionsMemberifrs-full:LaterThanOneYearAndNotLaterThanThreeYearsMember2024-12-310000891478san:LoansAndAdvancesCreditInstitutionsMemberifrs-full:LaterThanThreeYearsAndNotLaterThanFiveYearsMember2024-12-310000891478san:LoansAndAdvancesCreditInstitutionsMemberifrs-full:LaterThanFiveYearsMember2024-12-310000891478san:LoansAndAdvancesCustomersMemberifrs-full:OnDemandMember2024-12-310000891478san:LoansAndAdvancesCustomersMemberifrs-full:NotLaterThanThreeMonthsMember2024-12-310000891478san:LoansAndAdvancesCustomersMemberifrs-full:LaterThanThreeMonthsAndNotLaterThanOneYearMember2024-12-310000891478san:LoansAndAdvancesCustomersMemberifrs-full:LaterThanOneYearAndNotLaterThanThreeYearsMember2024-12-310000891478san:LoansAndAdvancesCustomersMemberifrs-full:LaterThanThreeYearsAndNotLaterThanFiveYearsMember2024-12-310000891478san:LoansAndAdvancesCustomersMemberifrs-full:LaterThanFiveYearsMember2024-12-310000891478san:LoansAndAdvancesCentralBanksMemberifrs-full:OnDemandMember2024-12-310000891478san:LoansAndAdvancesCentralBanksMemberifrs-full:NotLaterThanThreeMonthsMember2024-12-310000891478san:LoansAndAdvancesCentralBanksMemberifrs-full:LaterThanThreeMonthsAndNotLaterThanOneYearMember2024-12-310000891478san:LoansAndAdvancesCentralBanksMemberifrs-full:LaterThanOneYearAndNotLaterThanThreeYearsMember2024-12-310000891478san:LoansAndAdvancesCentralBanksMemberifrs-full:LaterThanThreeYearsAndNotLaterThanFiveYearsMember2024-12-310000891478san:LoansAndAdvancesCentralBanksMemberifrs-full:LaterThanFiveYearsMember2024-12-310000891478ifrs-full:OnDemandMembersan:DepositMember2024-12-310000891478ifrs-full:NotLaterThanThreeMonthsMembersan:DepositMember2024-12-310000891478ifrs-full:LaterThanThreeMonthsAndNotLaterThanOneYearMembersan:DepositMember2024-12-310000891478ifrs-full:LaterThanOneYearAndNotLaterThanThreeYearsMembersan:DepositMember2024-12-310000891478ifrs-full:LaterThanThreeYearsAndNotLaterThanFiveYearsMembersan:DepositMember2024-12-310000891478ifrs-full:LaterThanFiveYearsMembersan:DepositMember2024-12-310000891478ifrs-full:OnDemandMembersan:DepositsCentralBanksMember2024-12-310000891478ifrs-full:NotLaterThanThreeMonthsMembersan:DepositsCentralBanksMember2024-12-310000891478ifrs-full:LaterThanThreeMonthsAndNotLaterThanOneYearMembersan:DepositsCentralBanksMember2024-12-310000891478ifrs-full:LaterThanOneYearAndNotLaterThanThreeYearsMembersan:DepositsCentralBanksMember2024-12-310000891478ifrs-full:LaterThanThreeYearsAndNotLaterThanFiveYearsMembersan:DepositsCentralBanksMember2024-12-310000891478ifrs-full:LaterThanFiveYearsMembersan:DepositsCentralBanksMember2024-12-310000891478ifrs-full:OnDemandMembersan:DepositsCreditInstitutionsMember2024-12-310000891478ifrs-full:NotLaterThanThreeMonthsMembersan:DepositsCreditInstitutionsMember2024-12-310000891478ifrs-full:LaterThanThreeMonthsAndNotLaterThanOneYearMembersan:DepositsCreditInstitutionsMember2024-12-310000891478ifrs-full:LaterThanOneYearAndNotLaterThanThreeYearsMembersan:DepositsCreditInstitutionsMember2024-12-310000891478ifrs-full:LaterThanThreeYearsAndNotLaterThanFiveYearsMembersan:DepositsCreditInstitutionsMember2024-12-310000891478ifrs-full:LaterThanFiveYearsMembersan:DepositsCreditInstitutionsMember2024-12-310000891478ifrs-full:OnDemandMembersan:DepositsCustomersMember2024-12-310000891478ifrs-full:NotLaterThanThreeMonthsMembersan:DepositsCustomersMember2024-12-310000891478ifrs-full:LaterThanThreeMonthsAndNotLaterThanOneYearMembersan:DepositsCustomersMember2024-12-310000891478ifrs-full:LaterThanOneYearAndNotLaterThanThreeYearsMembersan:DepositsCustomersMember2024-12-310000891478ifrs-full:LaterThanThreeYearsAndNotLaterThanFiveYearsMembersan:DepositsCustomersMember2024-12-310000891478ifrs-full:LaterThanFiveYearsMembersan:DepositsCustomersMember2024-12-310000891478ifrs-full:OnDemandMembersan:DebtInstrumentsMember2024-12-310000891478ifrs-full:NotLaterThanThreeMonthsMembersan:DebtInstrumentsMember2024-12-310000891478ifrs-full:LaterThanThreeMonthsAndNotLaterThanOneYearMembersan:DebtInstrumentsMember2024-12-310000891478ifrs-full:LaterThanOneYearAndNotLaterThanThreeYearsMembersan:DebtInstrumentsMember2024-12-310000891478ifrs-full:LaterThanThreeYearsAndNotLaterThanFiveYearsMembersan:DebtInstrumentsMember2024-12-310000891478ifrs-full:LaterThanFiveYearsMembersan:DebtInstrumentsMember2024-12-310000891478ifrs-full:OnDemandMembersan:OtherFinancialLiabilitiesMember2024-12-310000891478ifrs-full:NotLaterThanThreeMonthsMembersan:OtherFinancialLiabilitiesMember2024-12-310000891478ifrs-full:LaterThanThreeMonthsAndNotLaterThanOneYearMembersan:OtherFinancialLiabilitiesMember2024-12-310000891478ifrs-full:LaterThanOneYearAndNotLaterThanThreeYearsMembersan:OtherFinancialLiabilitiesMember2024-12-310000891478ifrs-full:LaterThanThreeYearsAndNotLaterThanFiveYearsMembersan:OtherFinancialLiabilitiesMember2024-12-310000891478ifrs-full:LaterThanFiveYearsMembersan:OtherFinancialLiabilitiesMember2024-12-310000891478ifrs-full:OnDemandMember2023-12-310000891478ifrs-full:NotLaterThanThreeMonthsMember2023-12-310000891478ifrs-full:DebtSecuritiesMemberifrs-full:OnDemandMember2023-12-310000891478ifrs-full:DebtSecuritiesMemberifrs-full:NotLaterThanThreeMonthsMember2023-12-310000891478ifrs-full:DebtSecuritiesMemberifrs-full:LaterThanThreeMonthsAndNotLaterThanOneYearMember2023-12-310000891478ifrs-full:DebtSecuritiesMemberifrs-full:LaterThanOneYearAndNotLaterThanThreeYearsMember2023-12-310000891478ifrs-full:DebtSecuritiesMemberifrs-full:LaterThanThreeYearsAndNotLaterThanFiveYearsMember2023-12-310000891478ifrs-full:DebtSecuritiesMemberifrs-full:LaterThanFiveYearsMember2023-12-310000891478san:LoansAndAdvancesMemberifrs-full:OnDemandMember2023-12-310000891478san:LoansAndAdvancesMemberifrs-full:NotLaterThanThreeMonthsMember2023-12-310000891478san:LoansAndAdvancesMemberifrs-full:LaterThanThreeMonthsAndNotLaterThanOneYearMember2023-12-310000891478san:LoansAndAdvancesMemberifrs-full:LaterThanOneYearAndNotLaterThanThreeYearsMember2023-12-310000891478san:LoansAndAdvancesMemberifrs-full:LaterThanThreeYearsAndNotLaterThanFiveYearsMember2023-12-310000891478san:LoansAndAdvancesMemberifrs-full:LaterThanFiveYearsMember2023-12-310000891478san:LoansAndAdvancesCustomersMemberifrs-full:OnDemandMember2023-12-310000891478san:LoansAndAdvancesCustomersMemberifrs-full:NotLaterThanThreeMonthsMember2023-12-310000891478san:LoansAndAdvancesCustomersMemberifrs-full:LaterThanThreeMonthsAndNotLaterThanOneYearMember2023-12-310000891478san:LoansAndAdvancesCustomersMemberifrs-full:LaterThanOneYearAndNotLaterThanThreeYearsMember2023-12-310000891478san:LoansAndAdvancesCustomersMemberifrs-full:LaterThanThreeYearsAndNotLaterThanFiveYearsMember2023-12-310000891478san:LoansAndAdvancesCustomersMemberifrs-full:LaterThanFiveYearsMember2023-12-310000891478san:LoansAndAdvancesCentralBanksMemberifrs-full:OnDemandMember2023-12-310000891478san:LoansAndAdvancesCentralBanksMemberifrs-full:NotLaterThanThreeMonthsMember2023-12-310000891478san:LoansAndAdvancesCentralBanksMemberifrs-full:LaterThanThreeMonthsAndNotLaterThanOneYearMember2023-12-310000891478san:LoansAndAdvancesCentralBanksMemberifrs-full:LaterThanOneYearAndNotLaterThanThreeYearsMember2023-12-310000891478san:LoansAndAdvancesCentralBanksMemberifrs-full:LaterThanThreeYearsAndNotLaterThanFiveYearsMember2023-12-310000891478san:LoansAndAdvancesCentralBanksMemberifrs-full:LaterThanFiveYearsMember2023-12-310000891478san:LoansAndAdvancesCreditInstitutionsMemberifrs-full:OnDemandMember2023-12-310000891478san:LoansAndAdvancesCreditInstitutionsMemberifrs-full:NotLaterThanThreeMonthsMember2023-12-310000891478san:LoansAndAdvancesCreditInstitutionsMemberifrs-full:LaterThanThreeMonthsAndNotLaterThanOneYearMember2023-12-310000891478san:LoansAndAdvancesCreditInstitutionsMemberifrs-full:LaterThanOneYearAndNotLaterThanThreeYearsMember2023-12-310000891478san:LoansAndAdvancesCreditInstitutionsMemberifrs-full:LaterThanThreeYearsAndNotLaterThanFiveYearsMember2023-12-310000891478san:LoansAndAdvancesCreditInstitutionsMemberifrs-full:LaterThanFiveYearsMember2023-12-310000891478ifrs-full:OnDemandMembersan:DepositMember2023-12-310000891478ifrs-full:NotLaterThanThreeMonthsMembersan:DepositMember2023-12-310000891478ifrs-full:LaterThanThreeMonthsAndNotLaterThanOneYearMembersan:DepositMember2023-12-310000891478ifrs-full:LaterThanOneYearAndNotLaterThanThreeYearsMembersan:DepositMember2023-12-310000891478ifrs-full:LaterThanThreeYearsAndNotLaterThanFiveYearsMembersan:DepositMember2023-12-310000891478ifrs-full:LaterThanFiveYearsMembersan:DepositMember2023-12-310000891478ifrs-full:OnDemandMembersan:DepositsCentralBanksMember2023-12-310000891478ifrs-full:NotLaterThanThreeMonthsMembersan:DepositsCentralBanksMember2023-12-310000891478ifrs-full:LaterThanThreeMonthsAndNotLaterThanOneYearMembersan:DepositsCentralBanksMember2023-12-310000891478ifrs-full:LaterThanOneYearAndNotLaterThanThreeYearsMembersan:DepositsCentralBanksMember2023-12-310000891478ifrs-full:LaterThanThreeYearsAndNotLaterThanFiveYearsMembersan:DepositsCentralBanksMember2023-12-310000891478ifrs-full:LaterThanFiveYearsMembersan:DepositsCentralBanksMember2023-12-310000891478ifrs-full:OnDemandMembersan:DepositsCreditInstitutionsMember2023-12-310000891478ifrs-full:NotLaterThanThreeMonthsMembersan:DepositsCreditInstitutionsMember2023-12-310000891478ifrs-full:LaterThanThreeMonthsAndNotLaterThanOneYearMembersan:DepositsCreditInstitutionsMember2023-12-310000891478ifrs-full:LaterThanOneYearAndNotLaterThanThreeYearsMembersan:DepositsCreditInstitutionsMember2023-12-310000891478ifrs-full:LaterThanThreeYearsAndNotLaterThanFiveYearsMembersan:DepositsCreditInstitutionsMember2023-12-310000891478ifrs-full:LaterThanFiveYearsMembersan:DepositsCreditInstitutionsMember2023-12-310000891478ifrs-full:OnDemandMembersan:DepositsCustomersMember2023-12-310000891478ifrs-full:NotLaterThanThreeMonthsMembersan:DepositsCustomersMember2023-12-310000891478ifrs-full:LaterThanThreeMonthsAndNotLaterThanOneYearMembersan:DepositsCustomersMember2023-12-310000891478ifrs-full:LaterThanOneYearAndNotLaterThanThreeYearsMembersan:DepositsCustomersMember2023-12-310000891478ifrs-full:LaterThanThreeYearsAndNotLaterThanFiveYearsMembersan:DepositsCustomersMember2023-12-310000891478ifrs-full:LaterThanFiveYearsMembersan:DepositsCustomersMember2023-12-310000891478ifrs-full:OnDemandMembersan:DebtInstrumentsMember2023-12-310000891478ifrs-full:NotLaterThanThreeMonthsMembersan:DebtInstrumentsMember2023-12-310000891478ifrs-full:LaterThanThreeMonthsAndNotLaterThanOneYearMembersan:DebtInstrumentsMember2023-12-310000891478ifrs-full:LaterThanOneYearAndNotLaterThanThreeYearsMembersan:DebtInstrumentsMember2023-12-310000891478ifrs-full:LaterThanThreeYearsAndNotLaterThanFiveYearsMembersan:DebtInstrumentsMember2023-12-310000891478ifrs-full:LaterThanFiveYearsMembersan:DebtInstrumentsMember2023-12-310000891478ifrs-full:OnDemandMembersan:OtherFinancialLiabilitiesMember2023-12-310000891478ifrs-full:NotLaterThanThreeMonthsMembersan:OtherFinancialLiabilitiesMember2023-12-310000891478ifrs-full:LaterThanThreeMonthsAndNotLaterThanOneYearMembersan:OtherFinancialLiabilitiesMember2023-12-310000891478ifrs-full:LaterThanOneYearAndNotLaterThanThreeYearsMembersan:OtherFinancialLiabilitiesMember2023-12-310000891478ifrs-full:LaterThanThreeYearsAndNotLaterThanFiveYearsMembersan:OtherFinancialLiabilitiesMember2023-12-310000891478ifrs-full:LaterThanFiveYearsMembersan:OtherFinancialLiabilitiesMember2023-12-310000891478ifrs-full:DerivativesMemberifrs-full:NotLaterThanThreeMonthsMember2025-12-310000891478ifrs-full:DerivativesMemberifrs-full:LaterThanThreeMonthsAndNotLaterThanOneYearMember2025-12-310000891478ifrs-full:DerivativesMemberifrs-full:LaterThanOneYearAndNotLaterThanThreeYearsMember2025-12-310000891478ifrs-full:DerivativesMemberifrs-full:LaterThanThreeYearsAndNotLaterThanFiveYearsMember2025-12-310000891478ifrs-full:DerivativesMemberifrs-full:LaterThanFiveYearsMember2025-12-310000891478ifrs-full:EquityInvestmentsMemberifrs-full:NotLaterThanThreeMonthsMember2025-12-310000891478ifrs-full:EquityInvestmentsMemberifrs-full:LaterThanThreeMonthsAndNotLaterThanOneYearMember2025-12-310000891478ifrs-full:EquityInvestmentsMemberifrs-full:LaterThanOneYearAndNotLaterThanThreeYearsMember2025-12-310000891478ifrs-full:EquityInvestmentsMemberifrs-full:LaterThanThreeYearsAndNotLaterThanFiveYearsMember2025-12-310000891478ifrs-full:EquityInvestmentsMemberifrs-full:LaterThanFiveYearsMember2025-12-310000891478ifrs-full:NotLaterThanThreeMonthsMemberifrs-full:DerivativesMember2025-12-310000891478ifrs-full:LaterThanThreeMonthsAndNotLaterThanOneYearMemberifrs-full:DerivativesMember2025-12-310000891478ifrs-full:LaterThanOneYearAndNotLaterThanThreeYearsMemberifrs-full:DerivativesMember2025-12-310000891478ifrs-full:LaterThanThreeYearsAndNotLaterThanFiveYearsMemberifrs-full:DerivativesMember2025-12-310000891478ifrs-full:LaterThanFiveYearsMemberifrs-full:DerivativesMember2025-12-310000891478ifrs-full:NotLaterThanThreeMonthsMembersan:ShortPositionsMember2025-12-310000891478ifrs-full:LaterThanThreeMonthsAndNotLaterThanOneYearMembersan:ShortPositionsMember2025-12-310000891478ifrs-full:LaterThanOneYearAndNotLaterThanThreeYearsMembersan:ShortPositionsMember2025-12-310000891478ifrs-full:LaterThanThreeYearsAndNotLaterThanFiveYearsMembersan:ShortPositionsMember2025-12-310000891478ifrs-full:LaterThanFiveYearsMembersan:ShortPositionsMember2025-12-310000891478ifrs-full:LoanCommitmentsMemberifrs-full:NotLaterThanThreeMonthsMember2025-12-310000891478ifrs-full:LoanCommitmentsMemberifrs-full:LaterThanThreeMonthsAndNotLaterThanOneYearMember2025-12-310000891478ifrs-full:LoanCommitmentsMemberifrs-full:LaterThanOneYearAndNotLaterThanThreeYearsMember2025-12-310000891478ifrs-full:LoanCommitmentsMemberifrs-full:LaterThanThreeYearsAndNotLaterThanFiveYearsMember2025-12-310000891478ifrs-full:LoanCommitmentsMemberifrs-full:LaterThanFiveYearsMember2025-12-310000891478ifrs-full:FinancialGuaranteeContractsMemberifrs-full:NotLaterThanThreeMonthsMember2025-12-310000891478ifrs-full:FinancialGuaranteeContractsMemberifrs-full:LaterThanThreeMonthsAndNotLaterThanOneYearMember2025-12-310000891478ifrs-full:FinancialGuaranteeContractsMemberifrs-full:LaterThanOneYearAndNotLaterThanThreeYearsMember2025-12-310000891478ifrs-full:FinancialGuaranteeContractsMemberifrs-full:LaterThanThreeYearsAndNotLaterThanFiveYearsMember2025-12-310000891478ifrs-full:FinancialGuaranteeContractsMemberifrs-full:LaterThanFiveYearsMember2025-12-310000891478san:OtherCommitmentsMemberifrs-full:NotLaterThanThreeMonthsMember2025-12-310000891478san:OtherCommitmentsMemberifrs-full:LaterThanThreeMonthsAndNotLaterThanOneYearMember2025-12-310000891478san:OtherCommitmentsMemberifrs-full:LaterThanOneYearAndNotLaterThanThreeYearsMember2025-12-310000891478san:OtherCommitmentsMemberifrs-full:LaterThanThreeYearsAndNotLaterThanFiveYearsMember2025-12-310000891478san:OtherCommitmentsMemberifrs-full:LaterThanFiveYearsMember2025-12-310000891478san:ContingentLiabilitiesAndContingentCommitmentsMemberifrs-full:NotLaterThanThreeMonthsMember2025-12-310000891478san:ContingentLiabilitiesAndContingentCommitmentsMemberifrs-full:LaterThanThreeMonthsAndNotLaterThanOneYearMember2025-12-310000891478san:ContingentLiabilitiesAndContingentCommitmentsMemberifrs-full:LaterThanOneYearAndNotLaterThanThreeYearsMember2025-12-310000891478san:ContingentLiabilitiesAndContingentCommitmentsMemberifrs-full:LaterThanThreeYearsAndNotLaterThanFiveYearsMember2025-12-310000891478san:ContingentLiabilitiesAndContingentCommitmentsMemberifrs-full:LaterThanFiveYearsMember2025-12-310000891478san:ContingentLiabilitiesAndContingentCommitmentsMember2025-12-310000891478ifrs-full:DerivativesMemberifrs-full:NotLaterThanThreeMonthsMember2024-12-310000891478ifrs-full:DerivativesMemberifrs-full:LaterThanThreeMonthsAndNotLaterThanOneYearMember2024-12-310000891478ifrs-full:DerivativesMemberifrs-full:LaterThanOneYearAndNotLaterThanThreeYearsMember2024-12-310000891478ifrs-full:DerivativesMemberifrs-full:LaterThanThreeYearsAndNotLaterThanFiveYearsMember2024-12-310000891478ifrs-full:DerivativesMemberifrs-full:LaterThanFiveYearsMember2024-12-310000891478ifrs-full:EquityInvestmentsMemberifrs-full:NotLaterThanThreeMonthsMember2024-12-310000891478ifrs-full:EquityInvestmentsMemberifrs-full:LaterThanThreeMonthsAndNotLaterThanOneYearMember2024-12-310000891478ifrs-full:EquityInvestmentsMemberifrs-full:LaterThanOneYearAndNotLaterThanThreeYearsMember2024-12-310000891478ifrs-full:EquityInvestmentsMemberifrs-full:LaterThanThreeYearsAndNotLaterThanFiveYearsMember2024-12-310000891478ifrs-full:EquityInvestmentsMemberifrs-full:LaterThanFiveYearsMember2024-12-310000891478ifrs-full:NotLaterThanThreeMonthsMemberifrs-full:DerivativesMember2024-12-310000891478ifrs-full:LaterThanThreeMonthsAndNotLaterThanOneYearMemberifrs-full:DerivativesMember2024-12-310000891478ifrs-full:LaterThanOneYearAndNotLaterThanThreeYearsMemberifrs-full:DerivativesMember2024-12-310000891478ifrs-full:LaterThanThreeYearsAndNotLaterThanFiveYearsMemberifrs-full:DerivativesMember2024-12-310000891478ifrs-full:LaterThanFiveYearsMemberifrs-full:DerivativesMember2024-12-310000891478ifrs-full:NotLaterThanThreeMonthsMembersan:ShortPositionsMember2024-12-310000891478ifrs-full:LaterThanThreeMonthsAndNotLaterThanOneYearMembersan:ShortPositionsMember2024-12-310000891478ifrs-full:LaterThanOneYearAndNotLaterThanThreeYearsMembersan:ShortPositionsMember2024-12-310000891478ifrs-full:LaterThanThreeYearsAndNotLaterThanFiveYearsMembersan:ShortPositionsMember2024-12-310000891478ifrs-full:LaterThanFiveYearsMembersan:ShortPositionsMember2024-12-310000891478ifrs-full:LoanCommitmentsMemberifrs-full:NotLaterThanThreeMonthsMember2024-12-310000891478ifrs-full:LoanCommitmentsMemberifrs-full:LaterThanThreeMonthsAndNotLaterThanOneYearMember2024-12-310000891478ifrs-full:LoanCommitmentsMemberifrs-full:LaterThanOneYearAndNotLaterThanThreeYearsMember2024-12-310000891478ifrs-full:LoanCommitmentsMemberifrs-full:LaterThanThreeYearsAndNotLaterThanFiveYearsMember2024-12-310000891478ifrs-full:LoanCommitmentsMemberifrs-full:LaterThanFiveYearsMember2024-12-310000891478ifrs-full:FinancialGuaranteeContractsMemberifrs-full:NotLaterThanThreeMonthsMember2024-12-310000891478ifrs-full:FinancialGuaranteeContractsMemberifrs-full:LaterThanThreeMonthsAndNotLaterThanOneYearMember2024-12-310000891478ifrs-full:FinancialGuaranteeContractsMemberifrs-full:LaterThanOneYearAndNotLaterThanThreeYearsMember2024-12-310000891478ifrs-full:FinancialGuaranteeContractsMemberifrs-full:LaterThanThreeYearsAndNotLaterThanFiveYearsMember2024-12-310000891478ifrs-full:FinancialGuaranteeContractsMemberifrs-full:LaterThanFiveYearsMember2024-12-310000891478san:OtherCommitmentsMemberifrs-full:NotLaterThanThreeMonthsMember2024-12-310000891478san:OtherCommitmentsMemberifrs-full:LaterThanThreeMonthsAndNotLaterThanOneYearMember2024-12-310000891478san:OtherCommitmentsMemberifrs-full:LaterThanOneYearAndNotLaterThanThreeYearsMember2024-12-310000891478san:OtherCommitmentsMemberifrs-full:LaterThanThreeYearsAndNotLaterThanFiveYearsMember2024-12-310000891478san:OtherCommitmentsMemberifrs-full:LaterThanFiveYearsMember2024-12-310000891478san:ContingentLiabilitiesAndContingentCommitmentsMemberifrs-full:NotLaterThanThreeMonthsMember2024-12-310000891478san:ContingentLiabilitiesAndContingentCommitmentsMemberifrs-full:LaterThanThreeMonthsAndNotLaterThanOneYearMember2024-12-310000891478san:ContingentLiabilitiesAndContingentCommitmentsMemberifrs-full:LaterThanOneYearAndNotLaterThanThreeYearsMember2024-12-310000891478san:ContingentLiabilitiesAndContingentCommitmentsMemberifrs-full:LaterThanThreeYearsAndNotLaterThanFiveYearsMember2024-12-310000891478san:ContingentLiabilitiesAndContingentCommitmentsMemberifrs-full:LaterThanFiveYearsMember2024-12-310000891478san:ContingentLiabilitiesAndContingentCommitmentsMember2024-12-310000891478ifrs-full:DerivativesMemberifrs-full:NotLaterThanThreeMonthsMember2023-12-310000891478ifrs-full:DerivativesMemberifrs-full:LaterThanThreeMonthsAndNotLaterThanOneYearMember2023-12-310000891478ifrs-full:DerivativesMemberifrs-full:LaterThanOneYearAndNotLaterThanThreeYearsMember2023-12-310000891478ifrs-full:DerivativesMemberifrs-full:LaterThanThreeYearsAndNotLaterThanFiveYearsMember2023-12-310000891478ifrs-full:DerivativesMemberifrs-full:LaterThanFiveYearsMember2023-12-310000891478ifrs-full:EquityInvestmentsMemberifrs-full:NotLaterThanThreeMonthsMember2023-12-310000891478ifrs-full:EquityInvestmentsMemberifrs-full:LaterThanThreeMonthsAndNotLaterThanOneYearMember2023-12-310000891478ifrs-full:EquityInvestmentsMemberifrs-full:LaterThanOneYearAndNotLaterThanThreeYearsMember2023-12-310000891478ifrs-full:EquityInvestmentsMemberifrs-full:LaterThanThreeYearsAndNotLaterThanFiveYearsMember2023-12-310000891478ifrs-full:EquityInvestmentsMemberifrs-full:LaterThanFiveYearsMember2023-12-310000891478ifrs-full:NotLaterThanThreeMonthsMemberifrs-full:DerivativesMember2023-12-310000891478ifrs-full:LaterThanThreeMonthsAndNotLaterThanOneYearMemberifrs-full:DerivativesMember2023-12-310000891478ifrs-full:LaterThanOneYearAndNotLaterThanThreeYearsMemberifrs-full:DerivativesMember2023-12-310000891478ifrs-full:LaterThanThreeYearsAndNotLaterThanFiveYearsMemberifrs-full:DerivativesMember2023-12-310000891478ifrs-full:LaterThanFiveYearsMemberifrs-full:DerivativesMember2023-12-310000891478ifrs-full:NotLaterThanThreeMonthsMembersan:ShortPositionsMember2023-12-310000891478ifrs-full:LaterThanThreeMonthsAndNotLaterThanOneYearMembersan:ShortPositionsMember2023-12-310000891478ifrs-full:LaterThanOneYearAndNotLaterThanThreeYearsMembersan:ShortPositionsMember2023-12-310000891478ifrs-full:LaterThanThreeYearsAndNotLaterThanFiveYearsMembersan:ShortPositionsMember2023-12-310000891478ifrs-full:LaterThanFiveYearsMembersan:ShortPositionsMember2023-12-310000891478ifrs-full:LoanCommitmentsMemberifrs-full:NotLaterThanThreeMonthsMember2023-12-310000891478ifrs-full:LoanCommitmentsMemberifrs-full:LaterThanThreeMonthsAndNotLaterThanOneYearMember2023-12-310000891478ifrs-full:LoanCommitmentsMemberifrs-full:LaterThanOneYearAndNotLaterThanThreeYearsMember2023-12-310000891478ifrs-full:LoanCommitmentsMemberifrs-full:LaterThanThreeYearsAndNotLaterThanFiveYearsMember2023-12-310000891478ifrs-full:LoanCommitmentsMemberifrs-full:LaterThanFiveYearsMember2023-12-310000891478ifrs-full:FinancialGuaranteeContractsMemberifrs-full:NotLaterThanThreeMonthsMember2023-12-310000891478ifrs-full:FinancialGuaranteeContractsMemberifrs-full:LaterThanThreeMonthsAndNotLaterThanOneYearMember2023-12-310000891478ifrs-full:FinancialGuaranteeContractsMemberifrs-full:LaterThanOneYearAndNotLaterThanThreeYearsMember2023-12-310000891478ifrs-full:FinancialGuaranteeContractsMemberifrs-full:LaterThanThreeYearsAndNotLaterThanFiveYearsMember2023-12-310000891478ifrs-full:FinancialGuaranteeContractsMemberifrs-full:LaterThanFiveYearsMember2023-12-310000891478san:OtherCommitmentsMemberifrs-full:NotLaterThanThreeMonthsMember2023-12-310000891478san:OtherCommitmentsMemberifrs-full:LaterThanThreeMonthsAndNotLaterThanOneYearMember2023-12-310000891478san:OtherCommitmentsMemberifrs-full:LaterThanOneYearAndNotLaterThanThreeYearsMember2023-12-310000891478san:OtherCommitmentsMemberifrs-full:LaterThanThreeYearsAndNotLaterThanFiveYearsMember2023-12-310000891478san:OtherCommitmentsMemberifrs-full:LaterThanFiveYearsMember2023-12-310000891478san:ContingentLiabilitiesAndContingentCommitmentsMemberifrs-full:NotLaterThanThreeMonthsMember2023-12-310000891478san:ContingentLiabilitiesAndContingentCommitmentsMemberifrs-full:LaterThanThreeMonthsAndNotLaterThanOneYearMember2023-12-310000891478san:ContingentLiabilitiesAndContingentCommitmentsMemberifrs-full:LaterThanOneYearAndNotLaterThanThreeYearsMember2023-12-310000891478san:ContingentLiabilitiesAndContingentCommitmentsMemberifrs-full:LaterThanThreeYearsAndNotLaterThanFiveYearsMember2023-12-310000891478san:ContingentLiabilitiesAndContingentCommitmentsMemberifrs-full:LaterThanFiveYearsMember2023-12-310000891478san:ContingentLiabilitiesAndContingentCommitmentsMember2023-12-310000891478san:NonEuroMember2025-12-310000891478san:NonEuroMember2024-12-310000891478san:NonEuroMember2023-12-310000891478san:LoansAndAdvancesMembersan:NotAtFairValueMember2025-12-310000891478san:LoansAndAdvancesMemberifrs-full:NotMeasuredAtFairValueInStatementOfFinancialPositionButForWhichFairValueIsDisclosedMember2025-12-310000891478san:LoansAndAdvancesMemberifrs-full:Level1OfFairValueHierarchyMemberifrs-full:NotMeasuredAtFairValueInStatementOfFinancialPositionButForWhichFairValueIsDisclosedMember2025-12-310000891478san:LoansAndAdvancesMemberifrs-full:Level2OfFairValueHierarchyMemberifrs-full:NotMeasuredAtFairValueInStatementOfFinancialPositionButForWhichFairValueIsDisclosedMember2025-12-310000891478san:LoansAndAdvancesMemberifrs-full:Level3OfFairValueHierarchyMemberifrs-full:NotMeasuredAtFairValueInStatementOfFinancialPositionButForWhichFairValueIsDisclosedMember2025-12-310000891478san:LoansAndAdvancesMembersan:NotAtFairValueMember2024-12-310000891478san:LoansAndAdvancesMemberifrs-full:NotMeasuredAtFairValueInStatementOfFinancialPositionButForWhichFairValueIsDisclosedMember2024-12-310000891478san:LoansAndAdvancesMemberifrs-full:Level1OfFairValueHierarchyMemberifrs-full:NotMeasuredAtFairValueInStatementOfFinancialPositionButForWhichFairValueIsDisclosedMember2024-12-310000891478san:LoansAndAdvancesMemberifrs-full:Level2OfFairValueHierarchyMemberifrs-full:NotMeasuredAtFairValueInStatementOfFinancialPositionButForWhichFairValueIsDisclosedMember2024-12-310000891478san:LoansAndAdvancesMemberifrs-full:Level3OfFairValueHierarchyMemberifrs-full:NotMeasuredAtFairValueInStatementOfFinancialPositionButForWhichFairValueIsDisclosedMember2024-12-310000891478san:LoansAndAdvancesMembersan:NotAtFairValueMember2023-12-310000891478san:LoansAndAdvancesMemberifrs-full:NotMeasuredAtFairValueInStatementOfFinancialPositionButForWhichFairValueIsDisclosedMember2023-12-310000891478san:LoansAndAdvancesMemberifrs-full:Level1OfFairValueHierarchyMemberifrs-full:NotMeasuredAtFairValueInStatementOfFinancialPositionButForWhichFairValueIsDisclosedMember2023-12-310000891478san:LoansAndAdvancesMemberifrs-full:Level2OfFairValueHierarchyMemberifrs-full:NotMeasuredAtFairValueInStatementOfFinancialPositionButForWhichFairValueIsDisclosedMember2023-12-310000891478san:LoansAndAdvancesMemberifrs-full:Level3OfFairValueHierarchyMemberifrs-full:NotMeasuredAtFairValueInStatementOfFinancialPositionButForWhichFairValueIsDisclosedMember2023-12-310000891478ifrs-full:DebtSecuritiesMembersan:NotAtFairValueMember2025-12-310000891478ifrs-full:DebtSecuritiesMemberifrs-full:NotMeasuredAtFairValueInStatementOfFinancialPositionButForWhichFairValueIsDisclosedMember2025-12-310000891478ifrs-full:DebtSecuritiesMemberifrs-full:Level1OfFairValueHierarchyMemberifrs-full:NotMeasuredAtFairValueInStatementOfFinancialPositionButForWhichFairValueIsDisclosedMember2025-12-310000891478ifrs-full:DebtSecuritiesMemberifrs-full:Level2OfFairValueHierarchyMemberifrs-full:NotMeasuredAtFairValueInStatementOfFinancialPositionButForWhichFairValueIsDisclosedMember2025-12-310000891478ifrs-full:DebtSecuritiesMemberifrs-full:Level3OfFairValueHierarchyMemberifrs-full:NotMeasuredAtFairValueInStatementOfFinancialPositionButForWhichFairValueIsDisclosedMember2025-12-310000891478ifrs-full:DebtSecuritiesMembersan:NotAtFairValueMember2024-12-310000891478ifrs-full:DebtSecuritiesMemberifrs-full:NotMeasuredAtFairValueInStatementOfFinancialPositionButForWhichFairValueIsDisclosedMember2024-12-310000891478ifrs-full:DebtSecuritiesMemberifrs-full:Level1OfFairValueHierarchyMemberifrs-full:NotMeasuredAtFairValueInStatementOfFinancialPositionButForWhichFairValueIsDisclosedMember2024-12-310000891478ifrs-full:DebtSecuritiesMemberifrs-full:Level2OfFairValueHierarchyMemberifrs-full:NotMeasuredAtFairValueInStatementOfFinancialPositionButForWhichFairValueIsDisclosedMember2024-12-310000891478ifrs-full:DebtSecuritiesMemberifrs-full:Level3OfFairValueHierarchyMemberifrs-full:NotMeasuredAtFairValueInStatementOfFinancialPositionButForWhichFairValueIsDisclosedMember2024-12-310000891478ifrs-full:DebtSecuritiesMembersan:NotAtFairValueMember2023-12-310000891478ifrs-full:DebtSecuritiesMemberifrs-full:NotMeasuredAtFairValueInStatementOfFinancialPositionButForWhichFairValueIsDisclosedMember2023-12-310000891478ifrs-full:DebtSecuritiesMemberifrs-full:Level1OfFairValueHierarchyMemberifrs-full:NotMeasuredAtFairValueInStatementOfFinancialPositionButForWhichFairValueIsDisclosedMember2023-12-310000891478ifrs-full:DebtSecuritiesMemberifrs-full:Level2OfFairValueHierarchyMemberifrs-full:NotMeasuredAtFairValueInStatementOfFinancialPositionButForWhichFairValueIsDisclosedMember2023-12-310000891478ifrs-full:DebtSecuritiesMemberifrs-full:Level3OfFairValueHierarchyMemberifrs-full:NotMeasuredAtFairValueInStatementOfFinancialPositionButForWhichFairValueIsDisclosedMember2023-12-310000891478san:NotAtFairValueMember2025-12-310000891478ifrs-full:NotMeasuredAtFairValueInStatementOfFinancialPositionButForWhichFairValueIsDisclosedMember2025-12-310000891478ifrs-full:Level1OfFairValueHierarchyMemberifrs-full:NotMeasuredAtFairValueInStatementOfFinancialPositionButForWhichFairValueIsDisclosedMember2025-12-310000891478ifrs-full:Level2OfFairValueHierarchyMemberifrs-full:NotMeasuredAtFairValueInStatementOfFinancialPositionButForWhichFairValueIsDisclosedMember2025-12-310000891478ifrs-full:Level3OfFairValueHierarchyMemberifrs-full:NotMeasuredAtFairValueInStatementOfFinancialPositionButForWhichFairValueIsDisclosedMember2025-12-310000891478san:NotAtFairValueMember2024-12-310000891478ifrs-full:NotMeasuredAtFairValueInStatementOfFinancialPositionButForWhichFairValueIsDisclosedMember2024-12-310000891478ifrs-full:Level1OfFairValueHierarchyMemberifrs-full:NotMeasuredAtFairValueInStatementOfFinancialPositionButForWhichFairValueIsDisclosedMember2024-12-310000891478ifrs-full:Level2OfFairValueHierarchyMemberifrs-full:NotMeasuredAtFairValueInStatementOfFinancialPositionButForWhichFairValueIsDisclosedMember2024-12-310000891478ifrs-full:Level3OfFairValueHierarchyMemberifrs-full:NotMeasuredAtFairValueInStatementOfFinancialPositionButForWhichFairValueIsDisclosedMember2024-12-310000891478san:NotAtFairValueMember2023-12-310000891478ifrs-full:NotMeasuredAtFairValueInStatementOfFinancialPositionButForWhichFairValueIsDisclosedMember2023-12-310000891478ifrs-full:Level1OfFairValueHierarchyMemberifrs-full:NotMeasuredAtFairValueInStatementOfFinancialPositionButForWhichFairValueIsDisclosedMember2023-12-310000891478ifrs-full:Level2OfFairValueHierarchyMemberifrs-full:NotMeasuredAtFairValueInStatementOfFinancialPositionButForWhichFairValueIsDisclosedMember2023-12-310000891478ifrs-full:Level3OfFairValueHierarchyMemberifrs-full:NotMeasuredAtFairValueInStatementOfFinancialPositionButForWhichFairValueIsDisclosedMember2023-12-310000891478san:NotAtFairValueMembersan:DepositMember2025-12-310000891478ifrs-full:NotMeasuredAtFairValueInStatementOfFinancialPositionButForWhichFairValueIsDisclosedMembersan:DepositMember2025-12-310000891478ifrs-full:Level1OfFairValueHierarchyMemberifrs-full:NotMeasuredAtFairValueInStatementOfFinancialPositionButForWhichFairValueIsDisclosedMembersan:DepositMember2025-12-310000891478ifrs-full:Level2OfFairValueHierarchyMemberifrs-full:NotMeasuredAtFairValueInStatementOfFinancialPositionButForWhichFairValueIsDisclosedMembersan:DepositMember2025-12-310000891478ifrs-full:Level3OfFairValueHierarchyMemberifrs-full:NotMeasuredAtFairValueInStatementOfFinancialPositionButForWhichFairValueIsDisclosedMembersan:DepositMember2025-12-310000891478san:NotAtFairValueMembersan:DepositMember2024-12-310000891478ifrs-full:NotMeasuredAtFairValueInStatementOfFinancialPositionButForWhichFairValueIsDisclosedMembersan:DepositMember2024-12-310000891478ifrs-full:Level1OfFairValueHierarchyMemberifrs-full:NotMeasuredAtFairValueInStatementOfFinancialPositionButForWhichFairValueIsDisclosedMembersan:DepositMember2024-12-310000891478ifrs-full:Level2OfFairValueHierarchyMemberifrs-full:NotMeasuredAtFairValueInStatementOfFinancialPositionButForWhichFairValueIsDisclosedMembersan:DepositMember2024-12-310000891478ifrs-full:Level3OfFairValueHierarchyMemberifrs-full:NotMeasuredAtFairValueInStatementOfFinancialPositionButForWhichFairValueIsDisclosedMembersan:DepositMember2024-12-310000891478san:NotAtFairValueMembersan:DepositMember2023-12-310000891478ifrs-full:NotMeasuredAtFairValueInStatementOfFinancialPositionButForWhichFairValueIsDisclosedMembersan:DepositMember2023-12-310000891478ifrs-full:Level1OfFairValueHierarchyMemberifrs-full:NotMeasuredAtFairValueInStatementOfFinancialPositionButForWhichFairValueIsDisclosedMembersan:DepositMember2023-12-310000891478ifrs-full:Level2OfFairValueHierarchyMemberifrs-full:NotMeasuredAtFairValueInStatementOfFinancialPositionButForWhichFairValueIsDisclosedMembersan:DepositMember2023-12-310000891478ifrs-full:Level3OfFairValueHierarchyMemberifrs-full:NotMeasuredAtFairValueInStatementOfFinancialPositionButForWhichFairValueIsDisclosedMembersan:DepositMember2023-12-310000891478san:NotAtFairValueMemberifrs-full:DebtSecuritiesMember2025-12-310000891478ifrs-full:NotMeasuredAtFairValueInStatementOfFinancialPositionButForWhichFairValueIsDisclosedMemberifrs-full:DebtSecuritiesMember2025-12-310000891478ifrs-full:Level1OfFairValueHierarchyMemberifrs-full:NotMeasuredAtFairValueInStatementOfFinancialPositionButForWhichFairValueIsDisclosedMemberifrs-full:DebtSecuritiesMember2025-12-310000891478ifrs-full:Level2OfFairValueHierarchyMemberifrs-full:NotMeasuredAtFairValueInStatementOfFinancialPositionButForWhichFairValueIsDisclosedMemberifrs-full:DebtSecuritiesMember2025-12-310000891478ifrs-full:Level3OfFairValueHierarchyMemberifrs-full:NotMeasuredAtFairValueInStatementOfFinancialPositionButForWhichFairValueIsDisclosedMemberifrs-full:DebtSecuritiesMember2025-12-310000891478san:NotAtFairValueMemberifrs-full:DebtSecuritiesMember2024-12-310000891478ifrs-full:NotMeasuredAtFairValueInStatementOfFinancialPositionButForWhichFairValueIsDisclosedMemberifrs-full:DebtSecuritiesMember2024-12-310000891478ifrs-full:Level1OfFairValueHierarchyMemberifrs-full:NotMeasuredAtFairValueInStatementOfFinancialPositionButForWhichFairValueIsDisclosedMemberifrs-full:DebtSecuritiesMember2024-12-310000891478ifrs-full:Level2OfFairValueHierarchyMemberifrs-full:NotMeasuredAtFairValueInStatementOfFinancialPositionButForWhichFairValueIsDisclosedMemberifrs-full:DebtSecuritiesMember2024-12-310000891478ifrs-full:Level3OfFairValueHierarchyMemberifrs-full:NotMeasuredAtFairValueInStatementOfFinancialPositionButForWhichFairValueIsDisclosedMemberifrs-full:DebtSecuritiesMember2024-12-310000891478san:NotAtFairValueMemberifrs-full:DebtSecuritiesMember2023-12-310000891478ifrs-full:NotMeasuredAtFairValueInStatementOfFinancialPositionButForWhichFairValueIsDisclosedMemberifrs-full:DebtSecuritiesMember2023-12-310000891478ifrs-full:Level1OfFairValueHierarchyMemberifrs-full:NotMeasuredAtFairValueInStatementOfFinancialPositionButForWhichFairValueIsDisclosedMemberifrs-full:DebtSecuritiesMember2023-12-310000891478ifrs-full:Level2OfFairValueHierarchyMemberifrs-full:NotMeasuredAtFairValueInStatementOfFinancialPositionButForWhichFairValueIsDisclosedMemberifrs-full:DebtSecuritiesMember2023-12-310000891478ifrs-full:Level3OfFairValueHierarchyMemberifrs-full:NotMeasuredAtFairValueInStatementOfFinancialPositionButForWhichFairValueIsDisclosedMemberifrs-full:DebtSecuritiesMember2023-12-310000891478san:RepurchaseAgreementsAssetsMember2025-12-310000891478san:RepurchaseAgreementsAssetsMember2024-12-310000891478san:RepurchaseAgreementsAssetsMember2023-12-310000891478san:RepurchaseAgreementsLiabilitiesMember2025-12-310000891478san:RepurchaseAgreementsLiabilitiesMember2024-12-310000891478san:RepurchaseAgreementsLiabilitiesMember2023-12-310000891478ifrs-full:OperatingSegmentsMembersan:LoansAndAdvancesCustomersMembersan:RetailAndCommercialBankingMember2025-12-310000891478ifrs-full:OperatingSegmentsMembersan:LoansAndAdvancesCustomersMembersan:OpenbankSegmentMember2025-12-310000891478ifrs-full:OperatingSegmentsMembersan:LoansAndAdvancesCustomersMembersan:CorporateAndInvestmentBankingSegmentMember2025-12-310000891478ifrs-full:OperatingSegmentsMembersan:LoansAndAdvancesCustomersMembersan:WealthManagementAndInsuranceSegmentMember2025-12-310000891478ifrs-full:OperatingSegmentsMembersan:LoansAndAdvancesCustomersMembersan:PaymentSolutionsSegmentMember2025-12-310000891478san:CorporateCenterMembersan:LoansAndAdvancesCustomersMember2025-12-310000891478ifrs-full:OperatingSegmentsMembersan:RetailAndCommercialBankingMembersan:DepositsCustomersMember2025-12-310000891478ifrs-full:OperatingSegmentsMembersan:OpenbankSegmentMembersan:DepositsCustomersMember2025-12-310000891478ifrs-full:OperatingSegmentsMembersan:CorporateAndInvestmentBankingSegmentMembersan:DepositsCustomersMember2025-12-310000891478ifrs-full:OperatingSegmentsMembersan:WealthManagementAndInsuranceSegmentMembersan:DepositsCustomersMember2025-12-310000891478ifrs-full:OperatingSegmentsMembersan:PaymentSolutionsSegmentMembersan:DepositsCustomersMember2025-12-310000891478san:CorporateCenterMembersan:DepositsCustomersMember2025-12-310000891478ifrs-full:OperatingSegmentsMembersan:GrossLoansAndAdvancesToCustomersMembersan:RetailAndCommercialBankingMember2025-12-310000891478ifrs-full:OperatingSegmentsMembersan:GrossLoansAndAdvancesToCustomersMembersan:OpenbankSegmentMember2025-12-310000891478ifrs-full:OperatingSegmentsMembersan:GrossLoansAndAdvancesToCustomersMembersan:CorporateAndInvestmentBankingSegmentMember2025-12-310000891478ifrs-full:OperatingSegmentsMembersan:GrossLoansAndAdvancesToCustomersMembersan:WealthManagementAndInsuranceSegmentMember2025-12-310000891478ifrs-full:OperatingSegmentsMembersan:GrossLoansAndAdvancesToCustomersMembersan:PaymentSolutionsSegmentMember2025-12-310000891478san:CorporateCenterMembersan:GrossLoansAndAdvancesToCustomersMember2025-12-310000891478san:GrossLoansAndAdvancesToCustomersMember2025-12-310000891478ifrs-full:OperatingSegmentsMembersan:CustomerFundsMembersan:RetailAndCommercialBankingMember2025-12-310000891478ifrs-full:OperatingSegmentsMembersan:CustomerFundsMembersan:OpenbankSegmentMember2025-12-310000891478ifrs-full:OperatingSegmentsMembersan:CustomerFundsMembersan:CorporateAndInvestmentBankingSegmentMember2025-12-310000891478ifrs-full:OperatingSegmentsMembersan:CustomerFundsMembersan:WealthManagementAndInsuranceSegmentMember2025-12-310000891478ifrs-full:OperatingSegmentsMembersan:CustomerFundsMembersan:PaymentSolutionsSegmentMember2025-12-310000891478san:CorporateCenterMembersan:CustomerFundsMember2025-12-310000891478san:CustomerFundsMember2025-12-310000891478ifrs-full:OperatingSegmentsMembersan:DepositsCustomersMembersan:RetailAndCommercialBankingMember2025-12-310000891478ifrs-full:OperatingSegmentsMembersan:DepositsCustomersMembersan:OpenbankSegmentMember2025-12-310000891478ifrs-full:OperatingSegmentsMembersan:DepositsCustomersMembersan:CorporateAndInvestmentBankingSegmentMember2025-12-310000891478ifrs-full:OperatingSegmentsMembersan:DepositsCustomersMembersan:WealthManagementAndInsuranceSegmentMember2025-12-310000891478ifrs-full:OperatingSegmentsMembersan:DepositsCustomersMembersan:PaymentSolutionsSegmentMember2025-12-310000891478san:CorporateCenterMembersan:DepositsCustomersMember2025-12-310000891478san:DepositsCustomersMember2025-12-310000891478ifrs-full:OperatingSegmentsMemberifrs-full:InvestmentFundsMembersan:RetailAndCommercialBankingMember2025-12-310000891478ifrs-full:OperatingSegmentsMemberifrs-full:InvestmentFundsMembersan:OpenbankSegmentMember2025-12-310000891478ifrs-full:OperatingSegmentsMemberifrs-full:InvestmentFundsMembersan:CorporateAndInvestmentBankingSegmentMember2025-12-310000891478ifrs-full:OperatingSegmentsMemberifrs-full:InvestmentFundsMembersan:WealthManagementAndInsuranceSegmentMember2025-12-310000891478ifrs-full:OperatingSegmentsMemberifrs-full:InvestmentFundsMembersan:PaymentSolutionsSegmentMember2025-12-310000891478san:CorporateCenterMemberifrs-full:InvestmentFundsMember2025-12-310000891478ifrs-full:InvestmentFundsMember2025-12-310000891478ifrs-full:OperatingSegmentsMembersan:LoansAndAdvancesCustomersExcludingPolandDisposalMembersan:RetailAndCommercialBankingMember2024-12-310000891478ifrs-full:OperatingSegmentsMembersan:LoansAndAdvancesCustomersExcludingPolandDisposalMembersan:OpenbankSegmentMember2024-12-310000891478ifrs-full:OperatingSegmentsMembersan:LoansAndAdvancesCustomersExcludingPolandDisposalMembersan:CorporateAndInvestmentBankingSegmentMember2024-12-310000891478ifrs-full:OperatingSegmentsMembersan:LoansAndAdvancesCustomersExcludingPolandDisposalMembersan:WealthManagementAndInsuranceSegmentMember2024-12-310000891478ifrs-full:OperatingSegmentsMembersan:LoansAndAdvancesCustomersExcludingPolandDisposalMembersan:PaymentSolutionsSegmentMember2024-12-310000891478san:CorporateCenterMembersan:LoansAndAdvancesCustomersExcludingPolandDisposalMember2024-12-310000891478san:LoansAndAdvancesCustomersExcludingPolandDisposalMember2024-12-310000891478ifrs-full:OperatingSegmentsMembersan:RetailAndCommercialBankingMembersan:DepositsCustomersExcludingPolandDisposalMember2024-12-310000891478ifrs-full:OperatingSegmentsMembersan:OpenbankSegmentMembersan:DepositsCustomersExcludingPolandDisposalMember2024-12-310000891478ifrs-full:OperatingSegmentsMembersan:CorporateAndInvestmentBankingSegmentMembersan:DepositsCustomersExcludingPolandDisposalMember2024-12-310000891478ifrs-full:OperatingSegmentsMembersan:WealthManagementAndInsuranceSegmentMembersan:DepositsCustomersExcludingPolandDisposalMember2024-12-310000891478ifrs-full:OperatingSegmentsMembersan:PaymentSolutionsSegmentMembersan:DepositsCustomersExcludingPolandDisposalMember2024-12-310000891478san:CorporateCenterMembersan:DepositsCustomersExcludingPolandDisposalMember2024-12-310000891478san:DepositsCustomersExcludingPolandDisposalMember2024-12-310000891478ifrs-full:OperatingSegmentsMembersan:GrossLoansAndAdvancesToCustomersMembersan:RetailAndCommercialBankingMember2024-12-310000891478ifrs-full:OperatingSegmentsMembersan:GrossLoansAndAdvancesToCustomersMembersan:OpenbankSegmentMember2024-12-310000891478ifrs-full:OperatingSegmentsMembersan:GrossLoansAndAdvancesToCustomersMembersan:CorporateAndInvestmentBankingSegmentMember2024-12-310000891478ifrs-full:OperatingSegmentsMembersan:GrossLoansAndAdvancesToCustomersMembersan:WealthManagementAndInsuranceSegmentMember2024-12-310000891478ifrs-full:OperatingSegmentsMembersan:GrossLoansAndAdvancesToCustomersMembersan:PaymentSolutionsSegmentMember2024-12-310000891478san:CorporateCenterMembersan:GrossLoansAndAdvancesToCustomersMember2024-12-310000891478san:GrossLoansAndAdvancesToCustomersMember2024-12-310000891478ifrs-full:OperatingSegmentsMembersan:CustomerFundsMembersan:RetailAndCommercialBankingMember2024-12-310000891478ifrs-full:OperatingSegmentsMembersan:CustomerFundsMembersan:OpenbankSegmentMember2024-12-310000891478ifrs-full:OperatingSegmentsMembersan:CustomerFundsMembersan:CorporateAndInvestmentBankingSegmentMember2024-12-310000891478ifrs-full:OperatingSegmentsMembersan:CustomerFundsMembersan:WealthManagementAndInsuranceSegmentMember2024-12-310000891478ifrs-full:OperatingSegmentsMembersan:CustomerFundsMembersan:PaymentSolutionsSegmentMember2024-12-310000891478san:CorporateCenterMembersan:CustomerFundsMember2024-12-310000891478san:CustomerFundsMember2024-12-310000891478ifrs-full:OperatingSegmentsMembersan:DepositsCustomersMembersan:RetailAndCommercialBankingMember2024-12-310000891478ifrs-full:OperatingSegmentsMembersan:DepositsCustomersMembersan:OpenbankSegmentMember2024-12-310000891478ifrs-full:OperatingSegmentsMembersan:DepositsCustomersMembersan:CorporateAndInvestmentBankingSegmentMember2024-12-310000891478ifrs-full:OperatingSegmentsMembersan:DepositsCustomersMembersan:WealthManagementAndInsuranceSegmentMember2024-12-310000891478ifrs-full:OperatingSegmentsMembersan:DepositsCustomersMembersan:PaymentSolutionsSegmentMember2024-12-310000891478san:CorporateCenterMembersan:DepositsCustomersMember2024-12-310000891478san:DepositsCustomersMember2024-12-310000891478ifrs-full:OperatingSegmentsMemberifrs-full:InvestmentFundsMembersan:RetailAndCommercialBankingMember2024-12-310000891478ifrs-full:OperatingSegmentsMemberifrs-full:InvestmentFundsMembersan:OpenbankSegmentMember2024-12-310000891478ifrs-full:OperatingSegmentsMemberifrs-full:InvestmentFundsMembersan:CorporateAndInvestmentBankingSegmentMember2024-12-310000891478ifrs-full:OperatingSegmentsMemberifrs-full:InvestmentFundsMembersan:WealthManagementAndInsuranceSegmentMember2024-12-310000891478ifrs-full:OperatingSegmentsMemberifrs-full:InvestmentFundsMembersan:PaymentSolutionsSegmentMember2024-12-310000891478san:CorporateCenterMemberifrs-full:InvestmentFundsMember2024-12-310000891478ifrs-full:InvestmentFundsMember2024-12-310000891478ifrs-full:OperatingSegmentsMembersan:LoansAndAdvancesCustomersExcludingPolandDisposalMembersan:RetailAndCommercialBankingMember2023-12-310000891478ifrs-full:OperatingSegmentsMembersan:LoansAndAdvancesCustomersExcludingPolandDisposalMembersan:OpenbankSegmentMember2023-12-310000891478ifrs-full:OperatingSegmentsMembersan:LoansAndAdvancesCustomersExcludingPolandDisposalMembersan:CorporateAndInvestmentBankingSegmentMember2023-12-310000891478ifrs-full:OperatingSegmentsMembersan:LoansAndAdvancesCustomersExcludingPolandDisposalMembersan:WealthManagementAndInsuranceSegmentMember2023-12-310000891478ifrs-full:OperatingSegmentsMembersan:LoansAndAdvancesCustomersExcludingPolandDisposalMembersan:PaymentSolutionsSegmentMember2023-12-310000891478san:CorporateCenterMembersan:LoansAndAdvancesCustomersExcludingPolandDisposalMember2023-12-310000891478san:LoansAndAdvancesCustomersExcludingPolandDisposalMember2023-12-310000891478ifrs-full:OperatingSegmentsMembersan:RetailAndCommercialBankingMembersan:DepositsCustomersExcludingPolandDisposalMember2023-12-310000891478ifrs-full:OperatingSegmentsMembersan:OpenbankSegmentMembersan:DepositsCustomersExcludingPolandDisposalMember2023-12-310000891478ifrs-full:OperatingSegmentsMembersan:CorporateAndInvestmentBankingSegmentMembersan:DepositsCustomersExcludingPolandDisposalMember2023-12-310000891478ifrs-full:OperatingSegmentsMembersan:WealthManagementAndInsuranceSegmentMembersan:DepositsCustomersExcludingPolandDisposalMember2023-12-310000891478ifrs-full:OperatingSegmentsMembersan:PaymentSolutionsSegmentMembersan:DepositsCustomersExcludingPolandDisposalMember2023-12-310000891478san:CorporateCenterMembersan:DepositsCustomersExcludingPolandDisposalMember2023-12-310000891478san:DepositsCustomersExcludingPolandDisposalMember2023-12-310000891478ifrs-full:OperatingSegmentsMembersan:GrossLoansAndAdvancesToCustomersMembersan:RetailAndCommercialBankingMember2023-12-310000891478ifrs-full:OperatingSegmentsMembersan:GrossLoansAndAdvancesToCustomersMembersan:OpenbankSegmentMember2023-12-310000891478ifrs-full:OperatingSegmentsMembersan:GrossLoansAndAdvancesToCustomersMembersan:CorporateAndInvestmentBankingSegmentMember2023-12-310000891478ifrs-full:OperatingSegmentsMembersan:GrossLoansAndAdvancesToCustomersMembersan:WealthManagementAndInsuranceSegmentMember2023-12-310000891478ifrs-full:OperatingSegmentsMembersan:GrossLoansAndAdvancesToCustomersMembersan:PaymentSolutionsSegmentMember2023-12-310000891478san:CorporateCenterMembersan:GrossLoansAndAdvancesToCustomersMember2023-12-310000891478san:GrossLoansAndAdvancesToCustomersMember2023-12-310000891478ifrs-full:OperatingSegmentsMembersan:CustomerFundsMembersan:RetailAndCommercialBankingMember2023-12-310000891478ifrs-full:OperatingSegmentsMembersan:CustomerFundsMembersan:OpenbankSegmentMember2023-12-310000891478ifrs-full:OperatingSegmentsMembersan:CustomerFundsMembersan:CorporateAndInvestmentBankingSegmentMember2023-12-310000891478ifrs-full:OperatingSegmentsMembersan:CustomerFundsMembersan:WealthManagementAndInsuranceSegmentMember2023-12-310000891478ifrs-full:OperatingSegmentsMembersan:CustomerFundsMembersan:PaymentSolutionsSegmentMember2023-12-310000891478san:CorporateCenterMembersan:CustomerFundsMember2023-12-310000891478san:CustomerFundsMember2023-12-310000891478ifrs-full:OperatingSegmentsMembersan:DepositsCustomersMembersan:RetailAndCommercialBankingMember2023-12-310000891478ifrs-full:OperatingSegmentsMembersan:DepositsCustomersMembersan:OpenbankSegmentMember2023-12-310000891478ifrs-full:OperatingSegmentsMembersan:DepositsCustomersMembersan:CorporateAndInvestmentBankingSegmentMember2023-12-310000891478ifrs-full:OperatingSegmentsMembersan:DepositsCustomersMembersan:WealthManagementAndInsuranceSegmentMember2023-12-310000891478ifrs-full:OperatingSegmentsMembersan:DepositsCustomersMembersan:PaymentSolutionsSegmentMember2023-12-310000891478san:CorporateCenterMembersan:DepositsCustomersMember2023-12-310000891478san:DepositsCustomersMember2023-12-310000891478ifrs-full:OperatingSegmentsMemberifrs-full:InvestmentFundsMembersan:RetailAndCommercialBankingMember2023-12-310000891478ifrs-full:OperatingSegmentsMemberifrs-full:InvestmentFundsMembersan:OpenbankSegmentMember2023-12-310000891478ifrs-full:OperatingSegmentsMemberifrs-full:InvestmentFundsMembersan:CorporateAndInvestmentBankingSegmentMember2023-12-310000891478ifrs-full:OperatingSegmentsMemberifrs-full:InvestmentFundsMembersan:WealthManagementAndInsuranceSegmentMember2023-12-310000891478ifrs-full:OperatingSegmentsMemberifrs-full:InvestmentFundsMembersan:PaymentSolutionsSegmentMember2023-12-310000891478san:CorporateCenterMemberifrs-full:InvestmentFundsMember2023-12-310000891478ifrs-full:InvestmentFundsMember2023-12-310000891478san:RetailAndCommercialBankingMembersan:UnderlyingProfitItemsMember2025-01-012025-12-310000891478san:OpenbankSegmentMembersan:UnderlyingProfitItemsMember2025-01-012025-12-310000891478san:CorporateAndInvestmentBankingSegmentMembersan:UnderlyingProfitItemsMember2025-01-012025-12-310000891478san:WealthManagementAndInsuranceSegmentMembersan:UnderlyingProfitItemsMember2025-01-012025-12-310000891478san:PaymentSolutionsSegmentMembersan:UnderlyingProfitItemsMember2025-01-012025-12-310000891478san:CorporateCenterMembersan:UnderlyingProfitItemsMember2025-01-012025-12-310000891478san:UnderlyingProfitItemsMember2025-01-012025-12-310000891478san:RetailAndCommercialBankingMembersan:UnderlyingProfitItemsMember2024-01-012024-12-310000891478san:OpenbankSegmentMembersan:UnderlyingProfitItemsMember2024-01-012024-12-310000891478san:CorporateAndInvestmentBankingSegmentMembersan:UnderlyingProfitItemsMember2024-01-012024-12-310000891478san:WealthManagementAndInsuranceSegmentMembersan:UnderlyingProfitItemsMember2024-01-012024-12-310000891478san:PaymentSolutionsSegmentMembersan:UnderlyingProfitItemsMember2024-01-012024-12-310000891478san:CorporateCenterMembersan:UnderlyingProfitItemsMember2024-01-012024-12-310000891478san:UnderlyingProfitItemsMember2024-01-012024-12-310000891478san:RetailAndCommercialBankingMembersan:UnderlyingProfitItemsMember2023-01-012023-12-310000891478san:OpenbankSegmentMembersan:UnderlyingProfitItemsMember2023-01-012023-12-310000891478san:CorporateAndInvestmentBankingSegmentMembersan:UnderlyingProfitItemsMember2023-01-012023-12-310000891478san:WealthManagementAndInsuranceSegmentMembersan:UnderlyingProfitItemsMember2023-01-012023-12-310000891478san:PaymentSolutionsSegmentMembersan:UnderlyingProfitItemsMember2023-01-012023-12-310000891478san:CorporateCenterMembersan:UnderlyingProfitItemsMember2023-01-012023-12-310000891478san:UnderlyingProfitItemsMember2023-01-012023-12-310000891478country:ESsan:LoansAndAdvancesCustomersMember2025-12-310000891478country:GBsan:LoansAndAdvancesCustomersMember2025-12-310000891478country:PTsan:LoansAndAdvancesCustomersMember2025-12-310000891478san:OpenbankEuropeMembersan:LoansAndAdvancesCustomersMember2025-12-310000891478country:USsan:LoansAndAdvancesCustomersMember2025-12-310000891478country:MXsan:LoansAndAdvancesCustomersMember2025-12-310000891478country:ESsan:DepositsCustomersMember2025-12-310000891478country:GBsan:DepositsCustomersMember2025-12-310000891478country:PTsan:DepositsCustomersMember2025-12-310000891478san:OpenbankEuropeMembersan:DepositsCustomersMember2025-12-310000891478country:USsan:DepositsCustomersMember2025-12-310000891478country:MXsan:DepositsCustomersMember2025-12-310000891478country:ESsan:GrossLoansAndAdvancesToCustomersMember2025-12-310000891478country:GBsan:GrossLoansAndAdvancesToCustomersMember2025-12-310000891478country:PTsan:GrossLoansAndAdvancesToCustomersMember2025-12-310000891478san:OpenbankEuropeMembersan:GrossLoansAndAdvancesToCustomersMember2025-12-310000891478country:USsan:GrossLoansAndAdvancesToCustomersMember2025-12-310000891478country:MXsan:GrossLoansAndAdvancesToCustomersMember2025-12-310000891478country:ESsan:CustomerFundsMember2025-12-310000891478country:GBsan:CustomerFundsMember2025-12-310000891478country:PTsan:CustomerFundsMember2025-12-310000891478san:OpenbankEuropeMembersan:CustomerFundsMember2025-12-310000891478country:USsan:CustomerFundsMember2025-12-310000891478country:MXsan:CustomerFundsMember2025-12-310000891478country:ESsan:DepositsCustomersMember2025-12-310000891478country:GBsan:DepositsCustomersMember2025-12-310000891478country:PTsan:DepositsCustomersMember2025-12-310000891478san:OpenbankEuropeMembersan:DepositsCustomersMember2025-12-310000891478country:USsan:DepositsCustomersMember2025-12-310000891478country:MXsan:DepositsCustomersMember2025-12-310000891478country:ESifrs-full:InvestmentFundsMember2025-12-310000891478country:GBifrs-full:InvestmentFundsMember2025-12-310000891478country:PTifrs-full:InvestmentFundsMember2025-12-310000891478san:OpenbankEuropeMemberifrs-full:InvestmentFundsMember2025-12-310000891478country:USifrs-full:InvestmentFundsMember2025-12-310000891478country:MXifrs-full:InvestmentFundsMember2025-12-310000891478country:BRsan:LoansAndAdvancesCustomersMember2025-12-310000891478country:CLsan:LoansAndAdvancesCustomersMember2025-12-310000891478country:ARsan:LoansAndAdvancesCustomersMember2025-12-310000891478san:RestOfTheGroupMembersan:LoansAndAdvancesCustomersMember2025-12-310000891478country:BRsan:DepositsCustomersMember2025-12-310000891478country:CLsan:DepositsCustomersMember2025-12-310000891478country:ARsan:DepositsCustomersMember2025-12-310000891478san:RestOfTheGroupMembersan:DepositsCustomersMember2025-12-310000891478country:BRsan:GrossLoansAndAdvancesToCustomersMember2025-12-310000891478country:CLsan:GrossLoansAndAdvancesToCustomersMember2025-12-310000891478country:ARsan:GrossLoansAndAdvancesToCustomersMember2025-12-310000891478san:RestOfTheGroupMembersan:GrossLoansAndAdvancesToCustomersMember2025-12-310000891478country:BRsan:CustomerFundsMember2025-12-310000891478country:CLsan:CustomerFundsMember2025-12-310000891478country:ARsan:CustomerFundsMember2025-12-310000891478san:RestOfTheGroupMembersan:CustomerFundsMember2025-12-310000891478country:BRsan:DepositsCustomersMember2025-12-310000891478country:CLsan:DepositsCustomersMember2025-12-310000891478country:ARsan:DepositsCustomersMember2025-12-310000891478san:RestOfTheGroupMembersan:DepositsCustomersMember2025-12-310000891478country:BRifrs-full:InvestmentFundsMember2025-12-310000891478country:CLifrs-full:InvestmentFundsMember2025-12-310000891478country:ARifrs-full:InvestmentFundsMember2025-12-310000891478san:RestOfTheGroupMemberifrs-full:InvestmentFundsMember2025-12-310000891478country:ESsan:LoansAndAdvancesCustomersExcludingPolandDisposalMember2024-12-310000891478country:GBsan:LoansAndAdvancesCustomersExcludingPolandDisposalMember2024-12-310000891478country:PTsan:LoansAndAdvancesCustomersExcludingPolandDisposalMember2024-12-310000891478san:OpenbankEuropeMembersan:LoansAndAdvancesCustomersExcludingPolandDisposalMember2024-12-310000891478country:USsan:LoansAndAdvancesCustomersExcludingPolandDisposalMember2024-12-310000891478country:MXsan:LoansAndAdvancesCustomersExcludingPolandDisposalMember2024-12-310000891478country:ESsan:DepositsCustomersExcludingPolandDisposalMember2024-12-310000891478country:GBsan:DepositsCustomersExcludingPolandDisposalMember2024-12-310000891478country:PTsan:DepositsCustomersExcludingPolandDisposalMember2024-12-310000891478san:OpenbankEuropeMembersan:DepositsCustomersExcludingPolandDisposalMember2024-12-310000891478country:USsan:DepositsCustomersExcludingPolandDisposalMember2024-12-310000891478country:MXsan:DepositsCustomersExcludingPolandDisposalMember2024-12-310000891478country:ESsan:GrossLoansAndAdvancesToCustomersMember2024-12-310000891478country:GBsan:GrossLoansAndAdvancesToCustomersMember2024-12-310000891478country:PTsan:GrossLoansAndAdvancesToCustomersMember2024-12-310000891478san:OpenbankEuropeMembersan:GrossLoansAndAdvancesToCustomersMember2024-12-310000891478country:USsan:GrossLoansAndAdvancesToCustomersMember2024-12-310000891478country:MXsan:GrossLoansAndAdvancesToCustomersMember2024-12-310000891478country:ESsan:CustomerFundsMember2024-12-310000891478country:GBsan:CustomerFundsMember2024-12-310000891478country:PTsan:CustomerFundsMember2024-12-310000891478san:OpenbankEuropeMembersan:CustomerFundsMember2024-12-310000891478country:USsan:CustomerFundsMember2024-12-310000891478country:MXsan:CustomerFundsMember2024-12-310000891478country:ESsan:DepositsCustomersMember2024-12-310000891478country:GBsan:DepositsCustomersMember2024-12-310000891478country:PTsan:DepositsCustomersMember2024-12-310000891478san:OpenbankEuropeMembersan:DepositsCustomersMember2024-12-310000891478country:USsan:DepositsCustomersMember2024-12-310000891478country:MXsan:DepositsCustomersMember2024-12-310000891478country:ESifrs-full:InvestmentFundsMember2024-12-310000891478country:GBifrs-full:InvestmentFundsMember2024-12-310000891478country:PTifrs-full:InvestmentFundsMember2024-12-310000891478san:OpenbankEuropeMemberifrs-full:InvestmentFundsMember2024-12-310000891478country:USifrs-full:InvestmentFundsMember2024-12-310000891478country:MXifrs-full:InvestmentFundsMember2024-12-310000891478country:BRsan:LoansAndAdvancesCustomersExcludingPolandDisposalMember2024-12-310000891478country:CLsan:LoansAndAdvancesCustomersExcludingPolandDisposalMember2024-12-310000891478country:ARsan:LoansAndAdvancesCustomersExcludingPolandDisposalMember2024-12-310000891478san:RestOfTheGroupMembersan:LoansAndAdvancesCustomersExcludingPolandDisposalMember2024-12-310000891478country:BRsan:DepositsCustomersExcludingPolandDisposalMember2024-12-310000891478country:CLsan:DepositsCustomersExcludingPolandDisposalMember2024-12-310000891478country:ARsan:DepositsCustomersExcludingPolandDisposalMember2024-12-310000891478san:RestOfTheGroupMembersan:DepositsCustomersExcludingPolandDisposalMember2024-12-310000891478country:BRsan:GrossLoansAndAdvancesToCustomersMember2024-12-310000891478country:CLsan:GrossLoansAndAdvancesToCustomersMember2024-12-310000891478country:ARsan:GrossLoansAndAdvancesToCustomersMember2024-12-310000891478san:RestOfTheGroupMembersan:GrossLoansAndAdvancesToCustomersMember2024-12-310000891478country:BRsan:CustomerFundsMember2024-12-310000891478country:CLsan:CustomerFundsMember2024-12-310000891478country:ARsan:CustomerFundsMember2024-12-310000891478san:RestOfTheGroupMembersan:CustomerFundsMember2024-12-310000891478country:BRsan:DepositsCustomersMember2024-12-310000891478country:CLsan:DepositsCustomersMember2024-12-310000891478country:ARsan:DepositsCustomersMember2024-12-310000891478san:RestOfTheGroupMembersan:DepositsCustomersMember2024-12-310000891478country:BRifrs-full:InvestmentFundsMember2024-12-310000891478country:CLifrs-full:InvestmentFundsMember2024-12-310000891478country:ARifrs-full:InvestmentFundsMember2024-12-310000891478san:RestOfTheGroupMemberifrs-full:InvestmentFundsMember2024-12-310000891478country:ESsan:LoansAndAdvancesCustomersExcludingPolandDisposalMember2023-12-310000891478country:GBsan:LoansAndAdvancesCustomersExcludingPolandDisposalMember2023-12-310000891478country:PTsan:LoansAndAdvancesCustomersExcludingPolandDisposalMember2023-12-310000891478san:OpenbankEuropeMembersan:LoansAndAdvancesCustomersExcludingPolandDisposalMember2023-12-310000891478country:USsan:LoansAndAdvancesCustomersExcludingPolandDisposalMember2023-12-310000891478country:MXsan:LoansAndAdvancesCustomersExcludingPolandDisposalMember2023-12-310000891478country:ESsan:DepositsCustomersExcludingPolandDisposalMember2023-12-310000891478country:GBsan:DepositsCustomersExcludingPolandDisposalMember2023-12-310000891478country:PTsan:DepositsCustomersExcludingPolandDisposalMember2023-12-310000891478san:OpenbankEuropeMembersan:DepositsCustomersExcludingPolandDisposalMember2023-12-310000891478country:USsan:DepositsCustomersExcludingPolandDisposalMember2023-12-310000891478country:MXsan:DepositsCustomersExcludingPolandDisposalMember2023-12-310000891478country:ESsan:GrossLoansAndAdvancesToCustomersMember2023-12-310000891478country:GBsan:GrossLoansAndAdvancesToCustomersMember2023-12-310000891478country:PTsan:GrossLoansAndAdvancesToCustomersMember2023-12-310000891478san:OpenbankEuropeMembersan:GrossLoansAndAdvancesToCustomersMember2023-12-310000891478country:USsan:GrossLoansAndAdvancesToCustomersMember2023-12-310000891478country:MXsan:GrossLoansAndAdvancesToCustomersMember2023-12-310000891478country:ESsan:CustomerFundsMember2023-12-310000891478country:GBsan:CustomerFundsMember2023-12-310000891478country:PTsan:CustomerFundsMember2023-12-310000891478san:OpenbankEuropeMembersan:CustomerFundsMember2023-12-310000891478country:USsan:CustomerFundsMember2023-12-310000891478country:MXsan:CustomerFundsMember2023-12-310000891478country:ESsan:DepositsCustomersMember2023-12-310000891478country:GBsan:DepositsCustomersMember2023-12-310000891478country:PTsan:DepositsCustomersMember2023-12-310000891478san:OpenbankEuropeMembersan:DepositsCustomersMember2023-12-310000891478country:USsan:DepositsCustomersMember2023-12-310000891478country:MXsan:DepositsCustomersMember2023-12-310000891478country:ESifrs-full:InvestmentFundsMember2023-12-310000891478country:GBifrs-full:InvestmentFundsMember2023-12-310000891478country:PTifrs-full:InvestmentFundsMember2023-12-310000891478san:OpenbankEuropeMemberifrs-full:InvestmentFundsMember2023-12-310000891478country:USifrs-full:InvestmentFundsMember2023-12-310000891478country:MXifrs-full:InvestmentFundsMember2023-12-310000891478country:BRsan:LoansAndAdvancesCustomersExcludingPolandDisposalMember2023-12-310000891478country:CLsan:LoansAndAdvancesCustomersExcludingPolandDisposalMember2023-12-310000891478country:ARsan:LoansAndAdvancesCustomersExcludingPolandDisposalMember2023-12-310000891478san:RestOfTheGroupMembersan:LoansAndAdvancesCustomersExcludingPolandDisposalMember2023-12-310000891478country:BRsan:DepositsCustomersExcludingPolandDisposalMember2023-12-310000891478country:CLsan:DepositsCustomersExcludingPolandDisposalMember2023-12-310000891478country:ARsan:DepositsCustomersExcludingPolandDisposalMember2023-12-310000891478san:RestOfTheGroupMembersan:DepositsCustomersExcludingPolandDisposalMember2023-12-310000891478country:BRsan:GrossLoansAndAdvancesToCustomersMember2023-12-310000891478country:CLsan:GrossLoansAndAdvancesToCustomersMember2023-12-310000891478country:ARsan:GrossLoansAndAdvancesToCustomersMember2023-12-310000891478san:RestOfTheGroupMembersan:GrossLoansAndAdvancesToCustomersMember2023-12-310000891478country:BRsan:CustomerFundsMember2023-12-310000891478country:CLsan:CustomerFundsMember2023-12-310000891478country:ARsan:CustomerFundsMember2023-12-310000891478san:RestOfTheGroupMembersan:CustomerFundsMember2023-12-310000891478country:BRsan:DepositsCustomersMember2023-12-310000891478country:CLsan:DepositsCustomersMember2023-12-310000891478country:ARsan:DepositsCustomersMember2023-12-310000891478san:RestOfTheGroupMembersan:DepositsCustomersMember2023-12-310000891478country:BRifrs-full:InvestmentFundsMember2023-12-310000891478country:CLifrs-full:InvestmentFundsMember2023-12-310000891478country:ARifrs-full:InvestmentFundsMember2023-12-310000891478san:RestOfTheGroupMemberifrs-full:InvestmentFundsMember2023-12-310000891478country:ESsan:UnderlyingProfitItemsMember2025-01-012025-12-310000891478country:GBsan:UnderlyingProfitItemsMember2025-01-012025-12-310000891478country:PTsan:UnderlyingProfitItemsMember2025-01-012025-12-310000891478san:OpenbankEuropeMembersan:UnderlyingProfitItemsMember2025-01-012025-12-310000891478country:USsan:UnderlyingProfitItemsMember2025-01-012025-12-310000891478country:MXsan:UnderlyingProfitItemsMember2025-01-012025-12-310000891478country:BRsan:UnderlyingProfitItemsMember2025-01-012025-12-310000891478country:CLsan:UnderlyingProfitItemsMember2025-01-012025-12-310000891478country:ARsan:UnderlyingProfitItemsMember2025-01-012025-12-310000891478san:RestOfTheGroupMembersan:UnderlyingProfitItemsMember2025-01-012025-12-310000891478country:ESsan:UnderlyingProfitItemsMember2024-01-012024-12-310000891478country:GBsan:UnderlyingProfitItemsMember2024-01-012024-12-310000891478country:PTsan:UnderlyingProfitItemsMember2024-01-012024-12-310000891478san:OpenbankEuropeMembersan:UnderlyingProfitItemsMember2024-01-012024-12-310000891478country:USsan:UnderlyingProfitItemsMember2024-01-012024-12-310000891478country:MXsan:UnderlyingProfitItemsMember2024-01-012024-12-310000891478country:BRsan:UnderlyingProfitItemsMember2024-01-012024-12-310000891478country:CLsan:UnderlyingProfitItemsMember2024-01-012024-12-310000891478country:ARsan:UnderlyingProfitItemsMember2024-01-012024-12-310000891478san:RestOfTheGroupMembersan:UnderlyingProfitItemsMember2024-01-012024-12-310000891478country:ESsan:UnderlyingProfitItemsMember2023-01-012023-12-310000891478country:GBsan:UnderlyingProfitItemsMember2023-01-012023-12-310000891478country:PTsan:UnderlyingProfitItemsMember2023-01-012023-12-310000891478san:OpenbankEuropeMembersan:UnderlyingProfitItemsMember2023-01-012023-12-310000891478country:USsan:UnderlyingProfitItemsMember2023-01-012023-12-310000891478country:MXsan:UnderlyingProfitItemsMember2023-01-012023-12-310000891478country:BRsan:UnderlyingProfitItemsMember2023-01-012023-12-310000891478country:CLsan:UnderlyingProfitItemsMember2023-01-012023-12-310000891478country:ARsan:UnderlyingProfitItemsMember2023-01-012023-12-310000891478san:RestOfTheGroupMembersan:UnderlyingProfitItemsMember2023-01-012023-12-310000891478san:AdjustmentDueToPolandDisposalMember2025-01-012025-12-310000891478ifrs-full:MaterialReconcilingItemsMember2025-01-012025-12-310000891478ifrs-full:MaterialReconcilingItemsMembercountry:BR2025-01-012025-12-310000891478ifrs-full:MaterialReconcilingItemsMembercountry:BR2025-12-310000891478san:AdjustmentDueToPolandDisposalMember2024-01-012024-12-310000891478ifrs-full:MaterialReconcilingItemsMember2024-01-012024-12-310000891478san:FinancialConductAuthorityFCAReviewOfTheVehicleFinanceMarketMembercountry:GBsan:ProvisionsForTaxesAndOtherLegalContingenciesAndOtherProvisionsMember2024-01-012024-12-310000891478san:MerchantPlatformInGermanyAndSuperdigitalInLatinAmericaMember2024-01-012024-12-310000891478ifrs-full:MaterialReconcilingItemsMembercountry:BR2024-01-012024-12-310000891478ifrs-full:MaterialReconcilingItemsMembercountry:BR2024-12-310000891478san:AdjustmentDueToPolandDisposalMember2023-01-012023-12-310000891478ifrs-full:MaterialReconcilingItemsMember2023-01-012023-12-310000891478ifrs-full:MaterialReconcilingItemsMembercountry:BR2023-12-310000891478ifrs-full:MaterialReconcilingItemsMembercountry:BR2023-01-012023-12-310000891478san:BrazilAndOpenbankSegmentMember2023-01-012023-12-310000891478san:AssociatesAndJointVenturesMember2025-12-310000891478ifrs-full:OtherRelatedPartiesMember2025-12-310000891478san:AssociatesAndJointVenturesMembersan:CashCashBalanceAtCentralBanksAndOtherDepositsOnDemandMember2025-12-310000891478srt:DirectorMembersan:CashCashBalanceAtCentralBanksAndOtherDepositsOnDemandMember2025-12-310000891478san:SeniorManagementMembersan:CashCashBalanceAtCentralBanksAndOtherDepositsOnDemandMember2025-12-310000891478ifrs-full:OtherRelatedPartiesMembersan:CashCashBalanceAtCentralBanksAndOtherDepositsOnDemandMember2025-12-310000891478san:AssociatesAndJointVenturesMembersan:LoansAndAdvancesCreditInstitutionsMember2025-12-310000891478srt:DirectorMembersan:LoansAndAdvancesCreditInstitutionsMember2025-12-310000891478san:SeniorManagementMembersan:LoansAndAdvancesCreditInstitutionsMember2025-12-310000891478ifrs-full:OtherRelatedPartiesMembersan:LoansAndAdvancesCreditInstitutionsMember2025-12-310000891478san:AssociatesAndJointVenturesMembersan:LoansAndAdvancesCustomersMember2025-12-310000891478srt:DirectorMembersan:LoansAndAdvancesCustomersMember2025-12-310000891478san:SeniorManagementMembersan:LoansAndAdvancesCustomersMember2025-12-310000891478ifrs-full:OtherRelatedPartiesMembersan:LoansAndAdvancesCustomersMember2025-12-310000891478san:AssociatesAndJointVenturesMemberifrs-full:DebtSecuritiesMember2025-12-310000891478srt:DirectorMemberifrs-full:DebtSecuritiesMember2025-12-310000891478san:SeniorManagementMemberifrs-full:DebtSecuritiesMember2025-12-310000891478ifrs-full:OtherRelatedPartiesMemberifrs-full:DebtSecuritiesMember2025-12-310000891478san:AssociatesAndJointVenturesMembersan:OtherFinancialAssetsMember2025-12-310000891478srt:DirectorMembersan:OtherFinancialAssetsMember2025-12-310000891478san:SeniorManagementMembersan:OtherFinancialAssetsMember2025-12-310000891478ifrs-full:OtherRelatedPartiesMembersan:OtherFinancialAssetsMember2025-12-310000891478san:AssociatesAndJointVenturesMembersan:DepositsCreditInstitutionsMember2025-12-310000891478srt:DirectorMembersan:DepositsCreditInstitutionsMember2025-12-310000891478san:SeniorManagementMembersan:DepositsCreditInstitutionsMember2025-12-310000891478ifrs-full:OtherRelatedPartiesMembersan:DepositsCreditInstitutionsMember2025-12-310000891478san:AssociatesAndJointVenturesMembersan:DepositsCustomersMember2025-12-310000891478srt:DirectorMembersan:DepositsCustomersMember2025-12-310000891478san:SeniorManagementMembersan:DepositsCustomersMember2025-12-310000891478ifrs-full:OtherRelatedPartiesMembersan:DepositsCustomersMember2025-12-310000891478san:AssociatesAndJointVenturesMembersan:DebtInstrumentsMember2025-12-310000891478srt:DirectorMembersan:DebtInstrumentsMember2025-12-310000891478san:SeniorManagementMembersan:DebtInstrumentsMember2025-12-310000891478ifrs-full:OtherRelatedPartiesMembersan:DebtInstrumentsMember2025-12-310000891478san:AssociatesAndJointVenturesMembersan:OtherFinancialLiabilitiesMember2025-12-310000891478srt:DirectorMembersan:OtherFinancialLiabilitiesMember2025-12-310000891478san:SeniorManagementMembersan:OtherFinancialLiabilitiesMember2025-12-310000891478ifrs-full:OtherRelatedPartiesMembersan:OtherFinancialLiabilitiesMember2025-12-310000891478san:AssociatesAndJointVenturesMember2025-01-012025-12-310000891478ifrs-full:OtherRelatedPartiesMember2025-01-012025-12-310000891478san:AssociatesAndJointVenturesMember2024-12-310000891478ifrs-full:OtherRelatedPartiesMember2024-12-310000891478san:AssociatesAndJointVenturesMembersan:CashCashBalanceAtCentralBanksAndOtherDepositsOnDemandMember2024-12-310000891478srt:DirectorMembersan:CashCashBalanceAtCentralBanksAndOtherDepositsOnDemandMember2024-12-310000891478san:SeniorManagementMembersan:CashCashBalanceAtCentralBanksAndOtherDepositsOnDemandMember2024-12-310000891478ifrs-full:OtherRelatedPartiesMembersan:CashCashBalanceAtCentralBanksAndOtherDepositsOnDemandMember2024-12-310000891478san:AssociatesAndJointVenturesMembersan:LoansAndAdvancesCreditInstitutionsMember2024-12-310000891478srt:DirectorMembersan:LoansAndAdvancesCreditInstitutionsMember2024-12-310000891478san:SeniorManagementMembersan:LoansAndAdvancesCreditInstitutionsMember2024-12-310000891478ifrs-full:OtherRelatedPartiesMembersan:LoansAndAdvancesCreditInstitutionsMember2024-12-310000891478san:AssociatesAndJointVenturesMembersan:LoansAndAdvancesCustomersMember2024-12-310000891478srt:DirectorMembersan:LoansAndAdvancesCustomersMember2024-12-310000891478san:SeniorManagementMembersan:LoansAndAdvancesCustomersMember2024-12-310000891478ifrs-full:OtherRelatedPartiesMembersan:LoansAndAdvancesCustomersMember2024-12-310000891478san:AssociatesAndJointVenturesMemberifrs-full:DebtSecuritiesMember2024-12-310000891478srt:DirectorMemberifrs-full:DebtSecuritiesMember2024-12-310000891478san:SeniorManagementMemberifrs-full:DebtSecuritiesMember2024-12-310000891478ifrs-full:OtherRelatedPartiesMemberifrs-full:DebtSecuritiesMember2024-12-310000891478san:AssociatesAndJointVenturesMembersan:OtherFinancialAssetsMember2024-12-310000891478srt:DirectorMembersan:OtherFinancialAssetsMember2024-12-310000891478san:SeniorManagementMembersan:OtherFinancialAssetsMember2024-12-310000891478ifrs-full:OtherRelatedPartiesMembersan:OtherFinancialAssetsMember2024-12-310000891478san:AssociatesAndJointVenturesMembersan:DepositsCreditInstitutionsMember2024-12-310000891478srt:DirectorMembersan:DepositsCreditInstitutionsMember2024-12-310000891478san:SeniorManagementMembersan:DepositsCreditInstitutionsMember2024-12-310000891478ifrs-full:OtherRelatedPartiesMembersan:DepositsCreditInstitutionsMember2024-12-310000891478san:AssociatesAndJointVenturesMembersan:DepositsCustomersMember2024-12-310000891478srt:DirectorMembersan:DepositsCustomersMember2024-12-310000891478san:SeniorManagementMembersan:DepositsCustomersMember2024-12-310000891478ifrs-full:OtherRelatedPartiesMembersan:DepositsCustomersMember2024-12-310000891478san:AssociatesAndJointVenturesMembersan:DebtInstrumentsMember2024-12-310000891478srt:DirectorMembersan:DebtInstrumentsMember2024-12-310000891478san:SeniorManagementMembersan:DebtInstrumentsMember2024-12-310000891478ifrs-full:OtherRelatedPartiesMembersan:DebtInstrumentsMember2024-12-310000891478san:AssociatesAndJointVenturesMembersan:OtherFinancialLiabilitiesMember2024-12-310000891478srt:DirectorMembersan:OtherFinancialLiabilitiesMember2024-12-310000891478san:SeniorManagementMembersan:OtherFinancialLiabilitiesMember2024-12-310000891478ifrs-full:OtherRelatedPartiesMembersan:OtherFinancialLiabilitiesMember2024-12-310000891478san:AssociatesAndJointVenturesMember2024-01-012024-12-310000891478ifrs-full:OtherRelatedPartiesMember2024-01-012024-12-310000891478san:AssociatesAndJointVenturesMember2023-12-310000891478srt:DirectorMember2023-12-310000891478san:SeniorManagementMember2023-12-310000891478ifrs-full:OtherRelatedPartiesMember2023-12-310000891478san:AssociatesAndJointVenturesMembersan:CashCashBalanceAtCentralBanksAndOtherDepositsOnDemandMember2023-12-310000891478srt:DirectorMembersan:CashCashBalanceAtCentralBanksAndOtherDepositsOnDemandMember2023-12-310000891478san:SeniorManagementMembersan:CashCashBalanceAtCentralBanksAndOtherDepositsOnDemandMember2023-12-310000891478ifrs-full:OtherRelatedPartiesMembersan:CashCashBalanceAtCentralBanksAndOtherDepositsOnDemandMember2023-12-310000891478san:AssociatesAndJointVenturesMembersan:LoansAndAdvancesCreditInstitutionsMember2023-12-310000891478srt:DirectorMembersan:LoansAndAdvancesCreditInstitutionsMember2023-12-310000891478san:SeniorManagementMembersan:LoansAndAdvancesCreditInstitutionsMember2023-12-310000891478ifrs-full:OtherRelatedPartiesMembersan:LoansAndAdvancesCreditInstitutionsMember2023-12-310000891478san:AssociatesAndJointVenturesMembersan:LoansAndAdvancesCustomersMember2023-12-310000891478srt:DirectorMembersan:LoansAndAdvancesCustomersMember2023-12-310000891478san:SeniorManagementMembersan:LoansAndAdvancesCustomersMember2023-12-310000891478ifrs-full:OtherRelatedPartiesMembersan:LoansAndAdvancesCustomersMember2023-12-310000891478san:AssociatesAndJointVenturesMemberifrs-full:DebtSecuritiesMember2023-12-310000891478srt:DirectorMemberifrs-full:DebtSecuritiesMember2023-12-310000891478san:SeniorManagementMemberifrs-full:DebtSecuritiesMember2023-12-310000891478ifrs-full:OtherRelatedPartiesMemberifrs-full:DebtSecuritiesMember2023-12-310000891478san:AssociatesAndJointVenturesMembersan:OtherFinancialAssetsMember2023-12-310000891478srt:DirectorMembersan:OtherFinancialAssetsMember2023-12-310000891478san:SeniorManagementMembersan:OtherFinancialAssetsMember2023-12-310000891478ifrs-full:OtherRelatedPartiesMembersan:OtherFinancialAssetsMember2023-12-310000891478san:AssociatesAndJointVenturesMembersan:DepositsCreditInstitutionsMember2023-12-310000891478srt:DirectorMembersan:DepositsCreditInstitutionsMember2023-12-310000891478san:SeniorManagementMembersan:DepositsCreditInstitutionsMember2023-12-310000891478ifrs-full:OtherRelatedPartiesMembersan:DepositsCreditInstitutionsMember2023-12-310000891478san:AssociatesAndJointVenturesMembersan:DepositsCustomersMember2023-12-310000891478srt:DirectorMembersan:DepositsCustomersMember2023-12-310000891478san:SeniorManagementMembersan:DepositsCustomersMember2023-12-310000891478ifrs-full:OtherRelatedPartiesMembersan:DepositsCustomersMember2023-12-310000891478san:AssociatesAndJointVenturesMembersan:DebtInstrumentsMember2023-12-310000891478srt:DirectorMembersan:DebtInstrumentsMember2023-12-310000891478san:SeniorManagementMembersan:DebtInstrumentsMember2023-12-310000891478ifrs-full:OtherRelatedPartiesMembersan:DebtInstrumentsMember2023-12-310000891478san:AssociatesAndJointVenturesMembersan:OtherFinancialLiabilitiesMember2023-12-310000891478srt:DirectorMembersan:OtherFinancialLiabilitiesMember2023-12-310000891478san:SeniorManagementMembersan:OtherFinancialLiabilitiesMember2023-12-310000891478ifrs-full:OtherRelatedPartiesMembersan:OtherFinancialLiabilitiesMember2023-12-310000891478san:AssociatesAndJointVenturesMember2023-01-012023-12-310000891478srt:DirectorMember2023-01-012023-12-310000891478san:SeniorManagementMember2023-01-012023-12-310000891478ifrs-full:OtherRelatedPartiesMember2023-01-012023-12-310000891478ifrs-full:CountryOfDomicileMembersan:LoansAndAdvancesCustomersMemberifrs-full:CreditRiskMember2025-12-310000891478ifrs-full:CountryOfDomicileMembersan:LoansAndAdvancesCustomersMemberifrs-full:CreditRiskMember2024-12-310000891478ifrs-full:CountryOfDomicileMembersan:LoansAndAdvancesCustomersMemberifrs-full:CreditRiskMember2023-12-310000891478ifrs-full:AccumulatedImpairmentMemberifrs-full:FinancialInstrumentsCreditimpairedMemberifrs-full:CountryOfDomicileMembersan:LoansAndAdvancesCustomersMemberifrs-full:CreditRiskMember2025-12-310000891478ifrs-full:AccumulatedImpairmentMemberifrs-full:FinancialInstrumentsCreditimpairedMemberifrs-full:CountryOfDomicileMembersan:LoansAndAdvancesCustomersMemberifrs-full:CreditRiskMember2024-12-310000891478ifrs-full:AccumulatedImpairmentMemberifrs-full:FinancialInstrumentsCreditimpairedMemberifrs-full:CountryOfDomicileMembersan:LoansAndAdvancesCustomersMemberifrs-full:CreditRiskMember2023-12-310000891478ifrs-full:CreditRiskMemberifrs-full:CountryOfDomicileMember2025-12-310000891478ifrs-full:CreditRiskMemberifrs-full:CountryOfDomicileMember2024-12-310000891478ifrs-full:CreditRiskMemberifrs-full:CountryOfDomicileMember2023-12-310000891478country:GBsan:LoansAndAdvancesCustomersMemberifrs-full:CreditRiskMember2025-12-310000891478country:GBsan:LoansAndAdvancesCustomersMemberifrs-full:CreditRiskMember2024-12-310000891478country:GBsan:LoansAndAdvancesCustomersMemberifrs-full:CreditRiskMember2023-12-310000891478ifrs-full:AccumulatedImpairmentMemberifrs-full:FinancialInstrumentsCreditimpairedMembercountry:GBsan:LoansAndAdvancesCustomersMemberifrs-full:CreditRiskMember2025-12-310000891478ifrs-full:AccumulatedImpairmentMemberifrs-full:FinancialInstrumentsCreditimpairedMembercountry:GBsan:LoansAndAdvancesCustomersMemberifrs-full:CreditRiskMember2024-12-310000891478ifrs-full:AccumulatedImpairmentMemberifrs-full:FinancialInstrumentsCreditimpairedMembercountry:GBsan:LoansAndAdvancesCustomersMemberifrs-full:CreditRiskMember2023-12-310000891478ifrs-full:CreditRiskMembercountry:GB2025-12-310000891478ifrs-full:CreditRiskMembercountry:GB2024-12-310000891478ifrs-full:CreditRiskMembercountry:GB2023-12-310000891478country:PTsan:LoansAndAdvancesCustomersMemberifrs-full:CreditRiskMember2025-12-310000891478country:PTsan:LoansAndAdvancesCustomersMemberifrs-full:CreditRiskMember2024-12-310000891478country:PTsan:LoansAndAdvancesCustomersMemberifrs-full:CreditRiskMember2023-12-310000891478ifrs-full:AccumulatedImpairmentMemberifrs-full:FinancialInstrumentsCreditimpairedMembercountry:PTsan:LoansAndAdvancesCustomersMemberifrs-full:CreditRiskMember2025-12-310000891478ifrs-full:AccumulatedImpairmentMemberifrs-full:FinancialInstrumentsCreditimpairedMembercountry:PTsan:LoansAndAdvancesCustomersMemberifrs-full:CreditRiskMember2024-12-310000891478ifrs-full:AccumulatedImpairmentMemberifrs-full:FinancialInstrumentsCreditimpairedMembercountry:PTsan:LoansAndAdvancesCustomersMemberifrs-full:CreditRiskMember2023-12-310000891478ifrs-full:CreditRiskMembercountry:PT2025-12-310000891478ifrs-full:CreditRiskMembercountry:PT2024-12-310000891478ifrs-full:CreditRiskMembercountry:PT2023-12-310000891478san:LoansAndAdvancesCustomersMembersan:OpenbankEuropeMemberifrs-full:CreditRiskMember2025-12-310000891478san:LoansAndAdvancesCustomersMembersan:OpenbankEuropeMemberifrs-full:CreditRiskMember2024-12-310000891478san:LoansAndAdvancesCustomersMembersan:OpenbankEuropeMemberifrs-full:CreditRiskMember2023-12-310000891478ifrs-full:AccumulatedImpairmentMemberifrs-full:FinancialInstrumentsCreditimpairedMembersan:LoansAndAdvancesCustomersMembersan:OpenbankEuropeMemberifrs-full:CreditRiskMember2025-12-310000891478ifrs-full:AccumulatedImpairmentMemberifrs-full:FinancialInstrumentsCreditimpairedMembersan:LoansAndAdvancesCustomersMembersan:OpenbankEuropeMemberifrs-full:CreditRiskMember2024-12-310000891478ifrs-full:AccumulatedImpairmentMemberifrs-full:FinancialInstrumentsCreditimpairedMembersan:LoansAndAdvancesCustomersMembersan:OpenbankEuropeMemberifrs-full:CreditRiskMember2023-12-310000891478san:OpenbankEuropeMemberifrs-full:CreditRiskMember2025-12-310000891478san:OpenbankEuropeMemberifrs-full:CreditRiskMember2024-12-310000891478san:OpenbankEuropeMemberifrs-full:CreditRiskMember2023-12-310000891478country:USsan:LoansAndAdvancesCustomersMemberifrs-full:CreditRiskMember2025-12-310000891478country:USsan:LoansAndAdvancesCustomersMemberifrs-full:CreditRiskMember2024-12-310000891478country:USsan:LoansAndAdvancesCustomersMemberifrs-full:CreditRiskMember2023-12-310000891478ifrs-full:AccumulatedImpairmentMemberifrs-full:FinancialInstrumentsCreditimpairedMembercountry:USsan:LoansAndAdvancesCustomersMemberifrs-full:CreditRiskMember2025-12-310000891478ifrs-full:AccumulatedImpairmentMemberifrs-full:FinancialInstrumentsCreditimpairedMembercountry:USsan:LoansAndAdvancesCustomersMemberifrs-full:CreditRiskMember2024-12-310000891478ifrs-full:AccumulatedImpairmentMemberifrs-full:FinancialInstrumentsCreditimpairedMembercountry:USsan:LoansAndAdvancesCustomersMemberifrs-full:CreditRiskMember2023-12-310000891478ifrs-full:CreditRiskMembercountry:US2025-12-310000891478ifrs-full:CreditRiskMembercountry:US2024-12-310000891478ifrs-full:CreditRiskMembercountry:US2023-12-310000891478country:MXsan:LoansAndAdvancesCustomersMemberifrs-full:CreditRiskMember2025-12-310000891478country:MXsan:LoansAndAdvancesCustomersMemberifrs-full:CreditRiskMember2024-12-310000891478country:MXsan:LoansAndAdvancesCustomersMemberifrs-full:CreditRiskMember2023-12-310000891478ifrs-full:AccumulatedImpairmentMemberifrs-full:FinancialInstrumentsCreditimpairedMembercountry:MXsan:LoansAndAdvancesCustomersMemberifrs-full:CreditRiskMember2025-12-310000891478ifrs-full:AccumulatedImpairmentMemberifrs-full:FinancialInstrumentsCreditimpairedMembercountry:MXsan:LoansAndAdvancesCustomersMemberifrs-full:CreditRiskMember2024-12-310000891478ifrs-full:AccumulatedImpairmentMemberifrs-full:FinancialInstrumentsCreditimpairedMembercountry:MXsan:LoansAndAdvancesCustomersMemberifrs-full:CreditRiskMember2023-12-310000891478ifrs-full:CreditRiskMembercountry:MX2025-12-310000891478ifrs-full:CreditRiskMembercountry:MX2024-12-310000891478ifrs-full:CreditRiskMembercountry:MX2023-12-310000891478country:BRsan:LoansAndAdvancesCustomersMemberifrs-full:CreditRiskMember2025-12-310000891478country:BRsan:LoansAndAdvancesCustomersMemberifrs-full:CreditRiskMember2024-12-310000891478country:BRsan:LoansAndAdvancesCustomersMemberifrs-full:CreditRiskMember2023-12-310000891478ifrs-full:AccumulatedImpairmentMemberifrs-full:FinancialInstrumentsCreditimpairedMembercountry:BRsan:LoansAndAdvancesCustomersMemberifrs-full:CreditRiskMember2025-12-310000891478ifrs-full:AccumulatedImpairmentMemberifrs-full:FinancialInstrumentsCreditimpairedMembercountry:BRsan:LoansAndAdvancesCustomersMemberifrs-full:CreditRiskMember2024-12-310000891478ifrs-full:AccumulatedImpairmentMemberifrs-full:FinancialInstrumentsCreditimpairedMembercountry:BRsan:LoansAndAdvancesCustomersMemberifrs-full:CreditRiskMember2023-12-310000891478ifrs-full:CreditRiskMembercountry:BR2025-12-310000891478ifrs-full:CreditRiskMembercountry:BR2024-12-310000891478ifrs-full:CreditRiskMembercountry:BR2023-12-310000891478country:CLsan:LoansAndAdvancesCustomersMemberifrs-full:CreditRiskMember2025-12-310000891478country:CLsan:LoansAndAdvancesCustomersMemberifrs-full:CreditRiskMember2024-12-310000891478country:CLsan:LoansAndAdvancesCustomersMemberifrs-full:CreditRiskMember2023-12-310000891478ifrs-full:AccumulatedImpairmentMemberifrs-full:FinancialInstrumentsCreditimpairedMembercountry:CLsan:LoansAndAdvancesCustomersMemberifrs-full:CreditRiskMember2025-12-310000891478ifrs-full:AccumulatedImpairmentMemberifrs-full:FinancialInstrumentsCreditimpairedMembercountry:CLsan:LoansAndAdvancesCustomersMemberifrs-full:CreditRiskMember2024-12-310000891478ifrs-full:AccumulatedImpairmentMemberifrs-full:FinancialInstrumentsCreditimpairedMembercountry:CLsan:LoansAndAdvancesCustomersMemberifrs-full:CreditRiskMember2023-12-310000891478ifrs-full:CreditRiskMembercountry:CL2025-12-310000891478ifrs-full:CreditRiskMembercountry:CL2024-12-310000891478ifrs-full:CreditRiskMembercountry:CL2023-12-310000891478country:ARsan:LoansAndAdvancesCustomersMemberifrs-full:CreditRiskMember2025-12-310000891478country:ARsan:LoansAndAdvancesCustomersMemberifrs-full:CreditRiskMember2024-12-310000891478country:ARsan:LoansAndAdvancesCustomersMemberifrs-full:CreditRiskMember2023-12-310000891478ifrs-full:AccumulatedImpairmentMemberifrs-full:FinancialInstrumentsCreditimpairedMembercountry:ARsan:LoansAndAdvancesCustomersMemberifrs-full:CreditRiskMember2025-12-310000891478ifrs-full:AccumulatedImpairmentMemberifrs-full:FinancialInstrumentsCreditimpairedMembercountry:ARsan:LoansAndAdvancesCustomersMemberifrs-full:CreditRiskMember2024-12-310000891478ifrs-full:AccumulatedImpairmentMemberifrs-full:FinancialInstrumentsCreditimpairedMembercountry:ARsan:LoansAndAdvancesCustomersMemberifrs-full:CreditRiskMember2023-12-310000891478ifrs-full:CreditRiskMembercountry:AR2025-12-310000891478ifrs-full:CreditRiskMembercountry:AR2024-12-310000891478ifrs-full:CreditRiskMembercountry:AR2023-12-310000891478san:LoansAndAdvancesCustomersMembersan:CorporateCenterMemberifrs-full:CreditRiskMember2025-12-310000891478san:LoansAndAdvancesCustomersMembersan:CorporateCenterMemberifrs-full:CreditRiskMember2024-12-310000891478san:LoansAndAdvancesCustomersMembersan:CorporateCenterMemberifrs-full:CreditRiskMember2023-12-310000891478ifrs-full:AccumulatedImpairmentMemberifrs-full:FinancialInstrumentsCreditimpairedMembersan:LoansAndAdvancesCustomersMembersan:CorporateCenterMemberifrs-full:CreditRiskMember2025-12-310000891478ifrs-full:AccumulatedImpairmentMemberifrs-full:FinancialInstrumentsCreditimpairedMembersan:LoansAndAdvancesCustomersMembersan:CorporateCenterMemberifrs-full:CreditRiskMember2024-12-310000891478ifrs-full:AccumulatedImpairmentMemberifrs-full:FinancialInstrumentsCreditimpairedMembersan:LoansAndAdvancesCustomersMembersan:CorporateCenterMemberifrs-full:CreditRiskMember2023-12-310000891478san:CorporateCenterMemberifrs-full:CreditRiskMember2025-12-310000891478san:CorporateCenterMemberifrs-full:CreditRiskMember2024-12-310000891478san:CorporateCenterMemberifrs-full:CreditRiskMember2023-12-310000891478san:LoansAndAdvancesCustomersMemberifrs-full:CreditRiskMember2025-12-310000891478san:LoansAndAdvancesCustomersMemberifrs-full:CreditRiskMember2024-12-310000891478san:LoansAndAdvancesCustomersMemberifrs-full:CreditRiskMember2023-12-310000891478ifrs-full:AccumulatedImpairmentMemberifrs-full:FinancialInstrumentsCreditimpairedMembersan:LoansAndAdvancesCustomersMemberifrs-full:CreditRiskMember2025-12-310000891478ifrs-full:AccumulatedImpairmentMemberifrs-full:FinancialInstrumentsCreditimpairedMembersan:LoansAndAdvancesCustomersMemberifrs-full:CreditRiskMember2024-12-310000891478ifrs-full:AccumulatedImpairmentMemberifrs-full:FinancialInstrumentsCreditimpairedMembersan:LoansAndAdvancesCustomersMemberifrs-full:CreditRiskMember2023-12-310000891478ifrs-full:CreditRiskMember2025-12-310000891478ifrs-full:CreditRiskMember2024-12-310000891478ifrs-full:CreditRiskMember2023-12-310000891478ifrs-full:CreditRiskMember2025-01-012025-12-310000891478ifrs-full:TwelvemonthExpectedCreditLossesMemberifrs-full:FinancialInstrumentsNotCreditimpairedMembersan:FromAAAToAAMember2025-12-310000891478ifrs-full:LifetimeExpectedCreditLossesMemberifrs-full:FinancialInstrumentsNotCreditimpairedMembersan:FromAAAToAAMember2025-12-310000891478ifrs-full:LifetimeExpectedCreditLossesMemberifrs-full:FinancialInstrumentsCreditimpairedMembersan:FromAAAToAAMember2025-12-310000891478san:FromAAAToAAMember2025-12-310000891478ifrs-full:TwelvemonthExpectedCreditLossesMemberifrs-full:FinancialInstrumentsNotCreditimpairedMembersan:FromAToBBMember2025-12-310000891478ifrs-full:LifetimeExpectedCreditLossesMemberifrs-full:FinancialInstrumentsNotCreditimpairedMembersan:FromAToBBMember2025-12-310000891478ifrs-full:LifetimeExpectedCreditLossesMemberifrs-full:FinancialInstrumentsCreditimpairedMembersan:FromAToBBMember2025-12-310000891478san:FromAToBBMember2025-12-310000891478ifrs-full:TwelvemonthExpectedCreditLossesMemberifrs-full:FinancialInstrumentsNotCreditimpairedMembersan:FromBBToBMember2025-12-310000891478ifrs-full:LifetimeExpectedCreditLossesMemberifrs-full:FinancialInstrumentsNotCreditimpairedMembersan:FromBBToBMember2025-12-310000891478ifrs-full:LifetimeExpectedCreditLossesMemberifrs-full:FinancialInstrumentsCreditimpairedMembersan:FromBBToBMember2025-12-310000891478san:FromBBToBMember2025-12-310000891478ifrs-full:TwelvemonthExpectedCreditLossesMemberifrs-full:FinancialInstrumentsNotCreditimpairedMembersan:CCCAndBelowMember2025-12-310000891478ifrs-full:LifetimeExpectedCreditLossesMemberifrs-full:FinancialInstrumentsNotCreditimpairedMembersan:CCCAndBelowMember2025-12-310000891478ifrs-full:LifetimeExpectedCreditLossesMemberifrs-full:FinancialInstrumentsCreditimpairedMembersan:CCCAndBelowMember2025-12-310000891478san:CCCAndBelowMember2025-12-310000891478ifrs-full:AccumulatedImpairmentMemberifrs-full:TwelvemonthExpectedCreditLossesMembersan:FinancialAssetsAtAmortisedCostAndFinancialAssetsAtFairValueThroughOtherComprehensiveIncomeCategoryMembersan:LoansAndAdvancesCustomersIncludingProvisionsForUndrawnAuthorizedMemberifrs-full:FinancialInstrumentsNotCreditimpairedMember2025-12-310000891478ifrs-full:AccumulatedImpairmentMemberifrs-full:LifetimeExpectedCreditLossesMembersan:FinancialAssetsAtAmortisedCostAndFinancialAssetsAtFairValueThroughOtherComprehensiveIncomeCategoryMembersan:LoansAndAdvancesCustomersIncludingProvisionsForUndrawnAuthorizedMemberifrs-full:FinancialInstrumentsNotCreditimpairedMember2025-12-310000891478ifrs-full:AccumulatedImpairmentMemberifrs-full:LifetimeExpectedCreditLossesMembersan:FinancialAssetsAtAmortisedCostAndFinancialAssetsAtFairValueThroughOtherComprehensiveIncomeCategoryMembersan:LoansAndAdvancesCustomersIncludingProvisionsForUndrawnAuthorizedMemberifrs-full:FinancialInstrumentsCreditimpairedMember2025-12-310000891478ifrs-full:AccumulatedImpairmentMembersan:FinancialAssetsAtAmortisedCostAndFinancialAssetsAtFairValueThroughOtherComprehensiveIncomeCategoryMembersan:LoansAndAdvancesCustomersIncludingProvisionsForUndrawnAuthorizedMember2025-12-310000891478ifrs-full:TwelvemonthExpectedCreditLossesMemberifrs-full:FinancialInstrumentsNotCreditimpairedMembersan:FromAAAToAAMember2024-12-310000891478ifrs-full:LifetimeExpectedCreditLossesMemberifrs-full:FinancialInstrumentsNotCreditimpairedMembersan:FromAAAToAAMember2024-12-310000891478ifrs-full:LifetimeExpectedCreditLossesMemberifrs-full:FinancialInstrumentsCreditimpairedMembersan:FromAAAToAAMember2024-12-310000891478san:FromAAAToAAMember2024-12-310000891478ifrs-full:TwelvemonthExpectedCreditLossesMemberifrs-full:FinancialInstrumentsNotCreditimpairedMembersan:FromAToBBMember2024-12-310000891478ifrs-full:LifetimeExpectedCreditLossesMemberifrs-full:FinancialInstrumentsNotCreditimpairedMembersan:FromAToBBMember2024-12-310000891478ifrs-full:LifetimeExpectedCreditLossesMemberifrs-full:FinancialInstrumentsCreditimpairedMembersan:FromAToBBMember2024-12-310000891478san:FromAToBBMember2024-12-310000891478ifrs-full:TwelvemonthExpectedCreditLossesMemberifrs-full:FinancialInstrumentsNotCreditimpairedMembersan:FromBBToBMember2024-12-310000891478ifrs-full:LifetimeExpectedCreditLossesMemberifrs-full:FinancialInstrumentsNotCreditimpairedMembersan:FromBBToBMember2024-12-310000891478ifrs-full:LifetimeExpectedCreditLossesMemberifrs-full:FinancialInstrumentsCreditimpairedMembersan:FromBBToBMember2024-12-310000891478san:FromBBToBMember2024-12-310000891478ifrs-full:TwelvemonthExpectedCreditLossesMemberifrs-full:FinancialInstrumentsNotCreditimpairedMembersan:CCCAndBelowMember2024-12-310000891478ifrs-full:LifetimeExpectedCreditLossesMemberifrs-full:FinancialInstrumentsNotCreditimpairedMembersan:CCCAndBelowMember2024-12-310000891478ifrs-full:LifetimeExpectedCreditLossesMemberifrs-full:FinancialInstrumentsCreditimpairedMembersan:CCCAndBelowMember2024-12-310000891478san:CCCAndBelowMember2024-12-310000891478ifrs-full:AccumulatedImpairmentMemberifrs-full:TwelvemonthExpectedCreditLossesMembersan:FinancialAssetsAtAmortisedCostAndFinancialAssetsAtFairValueThroughOtherComprehensiveIncomeCategoryMembersan:LoansAndAdvancesCustomersIncludingProvisionsForUndrawnAuthorizedMemberifrs-full:FinancialInstrumentsNotCreditimpairedMember2024-12-310000891478ifrs-full:AccumulatedImpairmentMemberifrs-full:LifetimeExpectedCreditLossesMembersan:FinancialAssetsAtAmortisedCostAndFinancialAssetsAtFairValueThroughOtherComprehensiveIncomeCategoryMembersan:LoansAndAdvancesCustomersIncludingProvisionsForUndrawnAuthorizedMemberifrs-full:FinancialInstrumentsNotCreditimpairedMember2024-12-310000891478ifrs-full:AccumulatedImpairmentMemberifrs-full:LifetimeExpectedCreditLossesMembersan:FinancialAssetsAtAmortisedCostAndFinancialAssetsAtFairValueThroughOtherComprehensiveIncomeCategoryMembersan:LoansAndAdvancesCustomersIncludingProvisionsForUndrawnAuthorizedMemberifrs-full:FinancialInstrumentsCreditimpairedMember2024-12-310000891478ifrs-full:AccumulatedImpairmentMembersan:FinancialAssetsAtAmortisedCostAndFinancialAssetsAtFairValueThroughOtherComprehensiveIncomeCategoryMembersan:LoansAndAdvancesCustomersIncludingProvisionsForUndrawnAuthorizedMember2024-12-310000891478ifrs-full:TwelvemonthExpectedCreditLossesMemberifrs-full:FinancialInstrumentsNotCreditimpairedMembersan:FromAAAToAAMember2023-12-310000891478ifrs-full:LifetimeExpectedCreditLossesMemberifrs-full:FinancialInstrumentsNotCreditimpairedMembersan:FromAAAToAAMember2023-12-310000891478ifrs-full:LifetimeExpectedCreditLossesMemberifrs-full:FinancialInstrumentsCreditimpairedMembersan:FromAAAToAAMember2023-12-310000891478san:FromAAAToAAMember2023-12-310000891478ifrs-full:TwelvemonthExpectedCreditLossesMemberifrs-full:FinancialInstrumentsNotCreditimpairedMembersan:FromAToBBMember2023-12-310000891478ifrs-full:LifetimeExpectedCreditLossesMemberifrs-full:FinancialInstrumentsNotCreditimpairedMembersan:FromAToBBMember2023-12-310000891478ifrs-full:LifetimeExpectedCreditLossesMemberifrs-full:FinancialInstrumentsCreditimpairedMembersan:FromAToBBMember2023-12-310000891478san:FromAToBBMember2023-12-310000891478ifrs-full:TwelvemonthExpectedCreditLossesMemberifrs-full:FinancialInstrumentsNotCreditimpairedMembersan:FromBBToBMember2023-12-310000891478ifrs-full:LifetimeExpectedCreditLossesMemberifrs-full:FinancialInstrumentsNotCreditimpairedMembersan:FromBBToBMember2023-12-310000891478ifrs-full:LifetimeExpectedCreditLossesMemberifrs-full:FinancialInstrumentsCreditimpairedMembersan:FromBBToBMember2023-12-310000891478san:FromBBToBMember2023-12-310000891478ifrs-full:TwelvemonthExpectedCreditLossesMemberifrs-full:FinancialInstrumentsNotCreditimpairedMembersan:CCCAndBelowMember2023-12-310000891478ifrs-full:LifetimeExpectedCreditLossesMemberifrs-full:FinancialInstrumentsNotCreditimpairedMembersan:CCCAndBelowMember2023-12-310000891478ifrs-full:LifetimeExpectedCreditLossesMemberifrs-full:FinancialInstrumentsCreditimpairedMembersan:CCCAndBelowMember2023-12-310000891478san:CCCAndBelowMember2023-12-310000891478ifrs-full:AccumulatedImpairmentMemberifrs-full:TwelvemonthExpectedCreditLossesMembersan:FinancialAssetsAtAmortisedCostAndFinancialAssetsAtFairValueThroughOtherComprehensiveIncomeCategoryMembersan:LoansAndAdvancesCustomersIncludingProvisionsForUndrawnAuthorizedMemberifrs-full:FinancialInstrumentsNotCreditimpairedMember2023-12-310000891478ifrs-full:AccumulatedImpairmentMemberifrs-full:LifetimeExpectedCreditLossesMembersan:FinancialAssetsAtAmortisedCostAndFinancialAssetsAtFairValueThroughOtherComprehensiveIncomeCategoryMembersan:LoansAndAdvancesCustomersIncludingProvisionsForUndrawnAuthorizedMemberifrs-full:FinancialInstrumentsNotCreditimpairedMember2023-12-310000891478ifrs-full:AccumulatedImpairmentMemberifrs-full:LifetimeExpectedCreditLossesMembersan:FinancialAssetsAtAmortisedCostAndFinancialAssetsAtFairValueThroughOtherComprehensiveIncomeCategoryMembersan:LoansAndAdvancesCustomersIncludingProvisionsForUndrawnAuthorizedMemberifrs-full:FinancialInstrumentsCreditimpairedMember2023-12-310000891478ifrs-full:AccumulatedImpairmentMembersan:FinancialAssetsAtAmortisedCostAndFinancialAssetsAtFairValueThroughOtherComprehensiveIncomeCategoryMembersan:LoansAndAdvancesCustomersIncludingProvisionsForUndrawnAuthorizedMember2023-12-310000891478san:OtherGeographicalUnitsMember2025-12-310000891478ifrs-full:TwelvemonthExpectedCreditLossesMemberifrs-full:FinancialInstrumentsNotCreditimpairedMembersan:OtherGeographicalUnitsMember2025-12-310000891478ifrs-full:LifetimeExpectedCreditLossesMemberifrs-full:FinancialInstrumentsNotCreditimpairedMembersan:OtherGeographicalUnitsMember2025-12-310000891478ifrs-full:LifetimeExpectedCreditLossesMemberifrs-full:FinancialInstrumentsCreditimpairedMembersan:OtherGeographicalUnitsMember2025-12-310000891478ifrs-full:TwelvemonthExpectedCreditLossesMemberifrs-full:FinancialInstrumentsNotCreditimpairedMembersan:OtherGeographicalUnitsMember2024-12-310000891478ifrs-full:LifetimeExpectedCreditLossesMemberifrs-full:FinancialInstrumentsNotCreditimpairedMembersan:OtherGeographicalUnitsMember2024-12-310000891478ifrs-full:LifetimeExpectedCreditLossesMemberifrs-full:FinancialInstrumentsCreditimpairedMembersan:OtherGeographicalUnitsMember2024-12-310000891478ifrs-full:TwelvemonthExpectedCreditLossesMemberifrs-full:FinancialInstrumentsNotCreditimpairedMembersan:OtherGeographicalUnitsMember2023-12-310000891478ifrs-full:LifetimeExpectedCreditLossesMemberifrs-full:FinancialInstrumentsNotCreditimpairedMembersan:OtherGeographicalUnitsMember2023-12-310000891478ifrs-full:LifetimeExpectedCreditLossesMemberifrs-full:FinancialInstrumentsCreditimpairedMembersan:OtherGeographicalUnitsMember2023-12-310000891478ifrs-full:AccumulatedImpairmentMembersan:OtherGeographicalUnitsMember2025-12-310000891478ifrs-full:AccumulatedImpairmentMemberifrs-full:TwelvemonthExpectedCreditLossesMemberifrs-full:FinancialInstrumentsNotCreditimpairedMembersan:OtherGeographicalUnitsMember2025-12-310000891478ifrs-full:AccumulatedImpairmentMemberifrs-full:LifetimeExpectedCreditLossesMemberifrs-full:FinancialInstrumentsNotCreditimpairedMembersan:OtherGeographicalUnitsMember2025-12-310000891478ifrs-full:AccumulatedImpairmentMemberifrs-full:LifetimeExpectedCreditLossesMemberifrs-full:FinancialInstrumentsCreditimpairedMembersan:OtherGeographicalUnitsMember2025-12-310000891478ifrs-full:AccumulatedImpairmentMemberifrs-full:TwelvemonthExpectedCreditLossesMemberifrs-full:FinancialInstrumentsNotCreditimpairedMembersan:OtherGeographicalUnitsMember2024-12-310000891478ifrs-full:AccumulatedImpairmentMemberifrs-full:LifetimeExpectedCreditLossesMemberifrs-full:FinancialInstrumentsNotCreditimpairedMembersan:OtherGeographicalUnitsMember2024-12-310000891478ifrs-full:AccumulatedImpairmentMemberifrs-full:LifetimeExpectedCreditLossesMemberifrs-full:FinancialInstrumentsCreditimpairedMembersan:OtherGeographicalUnitsMember2024-12-310000891478ifrs-full:AccumulatedImpairmentMemberifrs-full:TwelvemonthExpectedCreditLossesMemberifrs-full:FinancialInstrumentsNotCreditimpairedMembersan:OtherGeographicalUnitsMember2023-12-310000891478ifrs-full:AccumulatedImpairmentMemberifrs-full:LifetimeExpectedCreditLossesMemberifrs-full:FinancialInstrumentsNotCreditimpairedMembersan:OtherGeographicalUnitsMember2023-12-310000891478ifrs-full:AccumulatedImpairmentMemberifrs-full:LifetimeExpectedCreditLossesMemberifrs-full:FinancialInstrumentsCreditimpairedMembersan:OtherGeographicalUnitsMember2023-12-310000891478ifrs-full:FinancialInstrumentsPurchasedOrOriginatedCreditimpairedMember2025-12-310000891478ifrs-full:FinancialInstrumentsPurchasedOrOriginatedCreditimpairedMember2024-12-310000891478ifrs-full:FinancialInstrumentsPurchasedOrOriginatedCreditimpairedMember2023-12-310000891478country:GB2025-12-310000891478country:GB2025-01-012025-12-310000891478ifrs-full:GrossCarryingAmountMembersan:SantanderUKPLCMemberifrs-full:MortgagesMembercountry:GB2025-12-310000891478san:SantanderUKPLCMemberifrs-full:MortgagesMembercountry:GB2025-12-310000891478san:SantanderUKPLCMemberifrs-full:MortgagesMembercountry:GB2025-01-012025-12-310000891478country:GBsan:SantanderUKPLCMember2025-12-310000891478country:GBsan:SantanderUKPLCMember2025-01-012025-12-310000891478san:SantanderUKPLCMembersan:LTVLessThan70PercentMemberifrs-full:MortgagesMembercountry:GBifrs-full:TopOfRangeMember2025-01-012025-12-310000891478san:SantanderUKPLCMemberifrs-full:TwelvemonthExpectedCreditLossesMemberifrs-full:FinancialInstrumentsNotCreditimpairedMembersan:FromAAAToAAMember2025-12-310000891478san:SantanderUKPLCMemberifrs-full:LifetimeExpectedCreditLossesMemberifrs-full:FinancialInstrumentsNotCreditimpairedMembersan:FromAAAToAAMember2025-12-310000891478san:SantanderUKPLCMemberifrs-full:LifetimeExpectedCreditLossesMemberifrs-full:FinancialInstrumentsCreditimpairedMembersan:FromAAAToAAMember2025-12-310000891478san:FromAAAToAAMembersan:SantanderUKPLCMember2025-12-310000891478san:SantanderUKPLCMemberifrs-full:TwelvemonthExpectedCreditLossesMemberifrs-full:FinancialInstrumentsNotCreditimpairedMembersan:FromAToBBMember2025-12-310000891478san:SantanderUKPLCMemberifrs-full:LifetimeExpectedCreditLossesMemberifrs-full:FinancialInstrumentsNotCreditimpairedMembersan:FromAToBBMember2025-12-310000891478san:SantanderUKPLCMemberifrs-full:LifetimeExpectedCreditLossesMemberifrs-full:FinancialInstrumentsCreditimpairedMembersan:FromAToBBMember2025-12-310000891478san:FromAToBBMembersan:SantanderUKPLCMember2025-12-310000891478san:SantanderUKPLCMemberifrs-full:TwelvemonthExpectedCreditLossesMemberifrs-full:FinancialInstrumentsNotCreditimpairedMembersan:FromBBToBMember2025-12-310000891478san:SantanderUKPLCMemberifrs-full:LifetimeExpectedCreditLossesMemberifrs-full:FinancialInstrumentsNotCreditimpairedMembersan:FromBBToBMember2025-12-310000891478san:SantanderUKPLCMemberifrs-full:LifetimeExpectedCreditLossesMemberifrs-full:FinancialInstrumentsCreditimpairedMembersan:FromBBToBMember2025-12-310000891478san:FromBBToBMembersan:SantanderUKPLCMember2025-12-310000891478san:SantanderUKPLCMemberifrs-full:TwelvemonthExpectedCreditLossesMemberifrs-full:FinancialInstrumentsNotCreditimpairedMembersan:CCCAndBelowMember2025-12-310000891478san:SantanderUKPLCMemberifrs-full:LifetimeExpectedCreditLossesMemberifrs-full:FinancialInstrumentsNotCreditimpairedMembersan:CCCAndBelowMember2025-12-310000891478san:SantanderUKPLCMemberifrs-full:LifetimeExpectedCreditLossesMemberifrs-full:FinancialInstrumentsCreditimpairedMembersan:CCCAndBelowMember2025-12-310000891478san:CCCAndBelowMembersan:SantanderUKPLCMember2025-12-310000891478san:SantanderUKPLCMemberifrs-full:TwelvemonthExpectedCreditLossesMemberifrs-full:FinancialInstrumentsNotCreditimpairedMember2025-12-310000891478san:SantanderUKPLCMemberifrs-full:LifetimeExpectedCreditLossesMemberifrs-full:FinancialInstrumentsNotCreditimpairedMember2025-12-310000891478san:SantanderUKPLCMemberifrs-full:LifetimeExpectedCreditLossesMemberifrs-full:FinancialInstrumentsCreditimpairedMember2025-12-310000891478ifrs-full:AccumulatedImpairmentMembersan:SantanderUKPLCMemberifrs-full:TwelvemonthExpectedCreditLossesMembersan:FinancialAssetsAtAmortisedCostAndFinancialAssetsAtFairValueThroughOtherComprehensiveIncomeCategoryMembersan:LoansAndAdvancesCustomersMemberifrs-full:FinancialInstrumentsNotCreditimpairedMember2025-12-310000891478ifrs-full:AccumulatedImpairmentMembersan:SantanderUKPLCMemberifrs-full:LifetimeExpectedCreditLossesMembersan:FinancialAssetsAtAmortisedCostAndFinancialAssetsAtFairValueThroughOtherComprehensiveIncomeCategoryMembersan:LoansAndAdvancesCustomersMemberifrs-full:FinancialInstrumentsNotCreditimpairedMember2025-12-310000891478ifrs-full:AccumulatedImpairmentMembersan:SantanderUKPLCMemberifrs-full:LifetimeExpectedCreditLossesMembersan:FinancialAssetsAtAmortisedCostAndFinancialAssetsAtFairValueThroughOtherComprehensiveIncomeCategoryMembersan:LoansAndAdvancesCustomersMemberifrs-full:FinancialInstrumentsCreditimpairedMember2025-12-310000891478ifrs-full:AccumulatedImpairmentMembersan:SantanderUKPLCMembersan:FinancialAssetsAtAmortisedCostAndFinancialAssetsAtFairValueThroughOtherComprehensiveIncomeCategoryMembersan:LoansAndAdvancesCustomersMember2025-12-310000891478san:SantanderUKPLCMemberifrs-full:TwelvemonthExpectedCreditLossesMemberifrs-full:FinancialInstrumentsNotCreditimpairedMembersan:FromAAAToAAMember2024-12-310000891478san:SantanderUKPLCMemberifrs-full:LifetimeExpectedCreditLossesMemberifrs-full:FinancialInstrumentsNotCreditimpairedMembersan:FromAAAToAAMember2024-12-310000891478san:SantanderUKPLCMemberifrs-full:LifetimeExpectedCreditLossesMemberifrs-full:FinancialInstrumentsCreditimpairedMembersan:FromAAAToAAMember2024-12-310000891478san:FromAAAToAAMembersan:SantanderUKPLCMember2024-12-310000891478san:SantanderUKPLCMemberifrs-full:TwelvemonthExpectedCreditLossesMemberifrs-full:FinancialInstrumentsNotCreditimpairedMembersan:FromAToBBMember2024-12-310000891478san:SantanderUKPLCMemberifrs-full:LifetimeExpectedCreditLossesMemberifrs-full:FinancialInstrumentsNotCreditimpairedMembersan:FromAToBBMember2024-12-310000891478san:SantanderUKPLCMemberifrs-full:LifetimeExpectedCreditLossesMemberifrs-full:FinancialInstrumentsCreditimpairedMembersan:FromAToBBMember2024-12-310000891478san:FromAToBBMembersan:SantanderUKPLCMember2024-12-310000891478san:SantanderUKPLCMemberifrs-full:TwelvemonthExpectedCreditLossesMemberifrs-full:FinancialInstrumentsNotCreditimpairedMembersan:FromBBToBMember2024-12-310000891478san:SantanderUKPLCMemberifrs-full:LifetimeExpectedCreditLossesMemberifrs-full:FinancialInstrumentsNotCreditimpairedMembersan:FromBBToBMember2024-12-310000891478san:SantanderUKPLCMemberifrs-full:LifetimeExpectedCreditLossesMemberifrs-full:FinancialInstrumentsCreditimpairedMembersan:FromBBToBMember2024-12-310000891478san:FromBBToBMembersan:SantanderUKPLCMember2024-12-310000891478san:SantanderUKPLCMemberifrs-full:TwelvemonthExpectedCreditLossesMemberifrs-full:FinancialInstrumentsNotCreditimpairedMembersan:CCCAndBelowMember2024-12-310000891478san:SantanderUKPLCMemberifrs-full:LifetimeExpectedCreditLossesMemberifrs-full:FinancialInstrumentsNotCreditimpairedMembersan:CCCAndBelowMember2024-12-310000891478san:SantanderUKPLCMemberifrs-full:LifetimeExpectedCreditLossesMemberifrs-full:FinancialInstrumentsCreditimpairedMembersan:CCCAndBelowMember2024-12-310000891478san:CCCAndBelowMembersan:SantanderUKPLCMember2024-12-310000891478san:SantanderUKPLCMemberifrs-full:TwelvemonthExpectedCreditLossesMemberifrs-full:FinancialInstrumentsNotCreditimpairedMember2024-12-310000891478san:SantanderUKPLCMemberifrs-full:LifetimeExpectedCreditLossesMemberifrs-full:FinancialInstrumentsNotCreditimpairedMember2024-12-310000891478san:SantanderUKPLCMemberifrs-full:LifetimeExpectedCreditLossesMemberifrs-full:FinancialInstrumentsCreditimpairedMember2024-12-310000891478ifrs-full:AccumulatedImpairmentMembersan:SantanderUKPLCMemberifrs-full:TwelvemonthExpectedCreditLossesMembersan:FinancialAssetsAtAmortisedCostAndFinancialAssetsAtFairValueThroughOtherComprehensiveIncomeCategoryMembersan:LoansAndAdvancesCustomersMemberifrs-full:FinancialInstrumentsNotCreditimpairedMember2024-12-310000891478ifrs-full:AccumulatedImpairmentMembersan:SantanderUKPLCMemberifrs-full:LifetimeExpectedCreditLossesMembersan:FinancialAssetsAtAmortisedCostAndFinancialAssetsAtFairValueThroughOtherComprehensiveIncomeCategoryMembersan:LoansAndAdvancesCustomersMemberifrs-full:FinancialInstrumentsNotCreditimpairedMember2024-12-310000891478ifrs-full:AccumulatedImpairmentMembersan:SantanderUKPLCMemberifrs-full:LifetimeExpectedCreditLossesMembersan:FinancialAssetsAtAmortisedCostAndFinancialAssetsAtFairValueThroughOtherComprehensiveIncomeCategoryMembersan:LoansAndAdvancesCustomersMemberifrs-full:FinancialInstrumentsCreditimpairedMember2024-12-310000891478ifrs-full:AccumulatedImpairmentMembersan:SantanderUKPLCMembersan:FinancialAssetsAtAmortisedCostAndFinancialAssetsAtFairValueThroughOtherComprehensiveIncomeCategoryMembersan:LoansAndAdvancesCustomersMember2024-12-310000891478san:SantanderUKPLCMemberifrs-full:TwelvemonthExpectedCreditLossesMemberifrs-full:FinancialInstrumentsNotCreditimpairedMembersan:FromAAAToAAMember2023-12-310000891478san:SantanderUKPLCMemberifrs-full:LifetimeExpectedCreditLossesMemberifrs-full:FinancialInstrumentsNotCreditimpairedMembersan:FromAAAToAAMember2023-12-310000891478san:SantanderUKPLCMemberifrs-full:LifetimeExpectedCreditLossesMemberifrs-full:FinancialInstrumentsCreditimpairedMembersan:FromAAAToAAMember2023-12-310000891478san:FromAAAToAAMembersan:SantanderUKPLCMember2023-12-310000891478san:SantanderUKPLCMemberifrs-full:TwelvemonthExpectedCreditLossesMemberifrs-full:FinancialInstrumentsNotCreditimpairedMembersan:FromAToBBMember2023-12-310000891478san:SantanderUKPLCMemberifrs-full:LifetimeExpectedCreditLossesMemberifrs-full:FinancialInstrumentsNotCreditimpairedMembersan:FromAToBBMember2023-12-310000891478san:SantanderUKPLCMemberifrs-full:LifetimeExpectedCreditLossesMemberifrs-full:FinancialInstrumentsCreditimpairedMembersan:FromAToBBMember2023-12-310000891478san:FromAToBBMembersan:SantanderUKPLCMember2023-12-310000891478san:SantanderUKPLCMemberifrs-full:TwelvemonthExpectedCreditLossesMemberifrs-full:FinancialInstrumentsNotCreditimpairedMembersan:FromBBToBMember2023-12-310000891478san:SantanderUKPLCMemberifrs-full:LifetimeExpectedCreditLossesMemberifrs-full:FinancialInstrumentsNotCreditimpairedMembersan:FromBBToBMember2023-12-310000891478san:SantanderUKPLCMemberifrs-full:LifetimeExpectedCreditLossesMemberifrs-full:FinancialInstrumentsCreditimpairedMembersan:FromBBToBMember2023-12-310000891478san:FromBBToBMembersan:SantanderUKPLCMember2023-12-310000891478san:SantanderUKPLCMemberifrs-full:TwelvemonthExpectedCreditLossesMemberifrs-full:FinancialInstrumentsNotCreditimpairedMembersan:CCCAndBelowMember2023-12-310000891478san:SantanderUKPLCMemberifrs-full:LifetimeExpectedCreditLossesMemberifrs-full:FinancialInstrumentsNotCreditimpairedMembersan:CCCAndBelowMember2023-12-310000891478san:SantanderUKPLCMemberifrs-full:LifetimeExpectedCreditLossesMemberifrs-full:FinancialInstrumentsCreditimpairedMembersan:CCCAndBelowMember2023-12-310000891478san:CCCAndBelowMembersan:SantanderUKPLCMember2023-12-310000891478san:SantanderUKPLCMemberifrs-full:TwelvemonthExpectedCreditLossesMemberifrs-full:FinancialInstrumentsNotCreditimpairedMember2023-12-310000891478san:SantanderUKPLCMemberifrs-full:LifetimeExpectedCreditLossesMemberifrs-full:FinancialInstrumentsNotCreditimpairedMember2023-12-310000891478san:SantanderUKPLCMemberifrs-full:LifetimeExpectedCreditLossesMemberifrs-full:FinancialInstrumentsCreditimpairedMember2023-12-310000891478ifrs-full:AccumulatedImpairmentMembersan:SantanderUKPLCMemberifrs-full:TwelvemonthExpectedCreditLossesMembersan:FinancialAssetsAtAmortisedCostAndFinancialAssetsAtFairValueThroughOtherComprehensiveIncomeCategoryMembersan:LoansAndAdvancesCustomersMemberifrs-full:FinancialInstrumentsNotCreditimpairedMember2023-12-310000891478ifrs-full:AccumulatedImpairmentMembersan:SantanderUKPLCMemberifrs-full:LifetimeExpectedCreditLossesMembersan:FinancialAssetsAtAmortisedCostAndFinancialAssetsAtFairValueThroughOtherComprehensiveIncomeCategoryMembersan:LoansAndAdvancesCustomersMemberifrs-full:FinancialInstrumentsNotCreditimpairedMember2023-12-310000891478ifrs-full:AccumulatedImpairmentMembersan:SantanderUKPLCMemberifrs-full:LifetimeExpectedCreditLossesMembersan:FinancialAssetsAtAmortisedCostAndFinancialAssetsAtFairValueThroughOtherComprehensiveIncomeCategoryMembersan:LoansAndAdvancesCustomersMemberifrs-full:FinancialInstrumentsCreditimpairedMember2023-12-310000891478ifrs-full:AccumulatedImpairmentMembersan:SantanderUKPLCMembersan:FinancialAssetsAtAmortisedCostAndFinancialAssetsAtFairValueThroughOtherComprehensiveIncomeCategoryMembersan:LoansAndAdvancesCustomersMember2023-12-310000891478san:SantanderUKPLCMember2025-01-012025-12-310000891478san:PessimisticScenarioTwoMembersan:SantanderUKPLCMember2025-01-012025-12-310000891478san:PessimisticScenarioOneMembersan:SantanderUKPLCMember2025-01-012025-12-310000891478san:BaseScenarioMembersan:SantanderUKPLCMember2025-01-012025-12-310000891478san:OptimisticScenarioMembersan:SantanderUKPLCMember2025-01-012025-12-310000891478san:PessimisticScenarioThreeMembersan:SantanderUKPLCMember2025-01-012025-12-310000891478san:PessimisticScenarioThreeMembersan:SantanderUKPLCMember2024-01-012024-12-310000891478san:PessimisticScenarioThreeMembersan:SantanderUKPLCMember2023-01-012023-12-310000891478san:PessimisticScenarioTwoMembersan:SantanderUKPLCMember2024-01-012024-12-310000891478san:PessimisticScenarioTwoMembersan:SantanderUKPLCMember2023-01-012023-12-310000891478san:PessimisticScenarioOneMembersan:SantanderUKPLCMember2024-01-012024-12-310000891478san:PessimisticScenarioOneMembersan:SantanderUKPLCMember2023-01-012023-12-310000891478san:BaseScenarioMembersan:SantanderUKPLCMember2024-01-012024-12-310000891478san:BaseScenarioMembersan:SantanderUKPLCMember2023-01-012023-12-310000891478san:OptimisticScenarioMembersan:SantanderUKPLCMember2024-01-012024-12-310000891478san:OptimisticScenarioMembersan:SantanderUKPLCMember2023-01-012023-12-310000891478san:SantanderUKPLCMembersan:HomePurchaseLoansMember2025-12-310000891478san:SantanderUKPLCMemberifrs-full:CorporateLoansMember2025-12-310000891478ifrs-full:GrossCarryingAmountMemberifrs-full:CountryOfDomicileMembersan:HomePurchaseLoansMember2025-12-310000891478ifrs-full:GrossCarryingAmountMemberifrs-full:CountryOfDomicileMembersan:HomePurchaseLoansMember2024-12-310000891478ifrs-full:GrossCarryingAmountMemberifrs-full:CountryOfDomicileMembersan:HomePurchaseLoansMember2023-12-310000891478ifrs-full:CountryOfDomicileMembersan:HomePurchaseLoansMembersan:IFRSCollateralPledgedMember2025-01-012025-12-310000891478ifrs-full:CountryOfDomicileMembersan:HomePurchaseLoansMembersan:IFRSCollateralPledgedMember2024-01-012024-12-310000891478ifrs-full:CountryOfDomicileMembersan:HomePurchaseLoansMembersan:IFRSCollateralPledgedMember2023-01-012023-12-310000891478ifrs-full:GrossCarryingAmountMemberifrs-full:CountryOfDomicileMembersan:HomePurchaseLoansMembersan:CreditImpairedMember2025-12-310000891478ifrs-full:GrossCarryingAmountMemberifrs-full:CountryOfDomicileMembersan:HomePurchaseLoansMembersan:IFRSUncollateralizedMember2025-12-310000891478ifrs-full:GrossCarryingAmountMemberifrs-full:CountryOfDomicileMembersan:HomePurchaseLoansMembersan:IFRSUncollateralizedMembersan:CreditImpairedMember2025-12-310000891478ifrs-full:GrossCarryingAmountMemberifrs-full:CountryOfDomicileMembersan:HomePurchaseLoansMembersan:IFRSCollateralPledgedMember2025-12-310000891478ifrs-full:GrossCarryingAmountMemberifrs-full:CountryOfDomicileMembersan:HomePurchaseLoansMembersan:IFRSCollateralPledgedMembersan:CreditImpairedMember2025-12-310000891478ifrs-full:GrossCarryingAmountMemberifrs-full:CountryOfDomicileMembersan:HomePurchaseLoansMembersan:CreditImpairedMember2024-12-310000891478ifrs-full:GrossCarryingAmountMemberifrs-full:CountryOfDomicileMembersan:HomePurchaseLoansMembersan:IFRSUncollateralizedMember2024-12-310000891478ifrs-full:GrossCarryingAmountMemberifrs-full:CountryOfDomicileMembersan:HomePurchaseLoansMembersan:IFRSUncollateralizedMembersan:CreditImpairedMember2024-12-310000891478ifrs-full:GrossCarryingAmountMemberifrs-full:CountryOfDomicileMembersan:HomePurchaseLoansMembersan:IFRSCollateralPledgedMember2024-12-310000891478ifrs-full:GrossCarryingAmountMemberifrs-full:CountryOfDomicileMembersan:HomePurchaseLoansMembersan:IFRSCollateralPledgedMembersan:CreditImpairedMember2024-12-310000891478ifrs-full:GrossCarryingAmountMemberifrs-full:CountryOfDomicileMembersan:HomePurchaseLoansMembersan:CreditImpairedMember2023-12-310000891478ifrs-full:GrossCarryingAmountMemberifrs-full:CountryOfDomicileMembersan:HomePurchaseLoansMembersan:IFRSUncollateralizedMember2023-12-310000891478ifrs-full:GrossCarryingAmountMemberifrs-full:CountryOfDomicileMembersan:HomePurchaseLoansMembersan:IFRSUncollateralizedMembersan:CreditImpairedMember2023-12-310000891478ifrs-full:GrossCarryingAmountMemberifrs-full:CountryOfDomicileMembersan:HomePurchaseLoansMembersan:IFRSCollateralPledgedMember2023-12-310000891478ifrs-full:GrossCarryingAmountMemberifrs-full:CountryOfDomicileMembersan:HomePurchaseLoansMembersan:IFRSCollateralPledgedMembersan:CreditImpairedMember2023-12-310000891478san:HomePurchaseLoansMemberifrs-full:CountryOfDomicileMember2025-12-310000891478san:HomePurchaseLoansMemberifrs-full:CountryOfDomicileMember2025-01-012025-12-310000891478san:HomePurchaseLoansMemberifrs-full:CountryOfDomicileMember2024-01-012024-12-310000891478san:HomePurchaseLoansMemberifrs-full:CountryOfDomicileMember2023-01-012023-12-310000891478ifrs-full:CountryOfDomicileMembersan:HomePurchaseLoansMembersan:RetailAndCommercialBankingMember2025-01-012025-12-310000891478ifrs-full:CountryOfDomicileMembersan:IFRSLTVLessThan80PercentMembersan:HomePurchaseLoansMemberifrs-full:TopOfRangeMember2025-01-012025-12-310000891478ifrs-full:GrossCarryingAmountMemberifrs-full:CountryOfDomicileMembersan:LTBLessThanOrEqualTo40PercentMembersan:HomePurchaseLoansMembersan:IFRSCollateralPledgedMember2025-12-310000891478ifrs-full:GrossCarryingAmountMemberifrs-full:CountryOfDomicileMembersan:LTV40To60PercentMembersan:HomePurchaseLoansMembersan:IFRSCollateralPledgedMember2025-12-310000891478ifrs-full:GrossCarryingAmountMemberifrs-full:CountryOfDomicileMembersan:LTV60To80PercentMembersan:HomePurchaseLoansMembersan:IFRSCollateralPledgedMember2025-12-310000891478ifrs-full:GrossCarryingAmountMemberifrs-full:CountryOfDomicileMembersan:IFRSLTV80To100PercentMembersan:HomePurchaseLoansMembersan:IFRSCollateralPledgedMember2025-12-310000891478ifrs-full:GrossCarryingAmountMemberifrs-full:CountryOfDomicileMembersan:LTVMoreThan100PercentMembersan:HomePurchaseLoansMembersan:IFRSCollateralPledgedMember2025-12-310000891478ifrs-full:GrossCarryingAmountMemberifrs-full:CountryOfDomicileMembersan:LTBLessThanOrEqualTo40PercentMembersan:HomePurchaseLoansMembersan:IFRSCollateralPledgedMembersan:CreditImpairedMember2025-12-310000891478ifrs-full:GrossCarryingAmountMemberifrs-full:CountryOfDomicileMembersan:LTV40To60PercentMembersan:HomePurchaseLoansMembersan:IFRSCollateralPledgedMembersan:CreditImpairedMember2025-12-310000891478ifrs-full:GrossCarryingAmountMemberifrs-full:CountryOfDomicileMembersan:LTV60To80PercentMembersan:HomePurchaseLoansMembersan:IFRSCollateralPledgedMembersan:CreditImpairedMember2025-12-310000891478ifrs-full:GrossCarryingAmountMemberifrs-full:CountryOfDomicileMembersan:IFRSLTV80To100PercentMembersan:HomePurchaseLoansMembersan:IFRSCollateralPledgedMembersan:CreditImpairedMember2025-12-310000891478ifrs-full:GrossCarryingAmountMemberifrs-full:CountryOfDomicileMembersan:LTVMoreThan100PercentMembersan:HomePurchaseLoansMembersan:IFRSCollateralPledgedMembersan:CreditImpairedMember2025-12-310000891478ifrs-full:CountryOfDomicileMembersan:SmallAndMediumEntitiesAndCorporatesMember2025-12-310000891478ifrs-full:CountryOfDomicileMembersan:SmallAndMediumEntitiesAndCorporatesMember2025-01-012025-12-310000891478ifrs-full:CountryOfDomicileMembersan:SmallAndMediumEntitiesAndCorporatesMember2024-12-310000891478ifrs-full:CountryOfDomicileMembersan:ConstructionAndPropertyDevelopmentLoansMembersan:RealEstateOperationsInSpainSegmentMember2024-12-310000891478ifrs-full:CountryOfDomicileMembersan:ConstructionAndPropertyDevelopmentLoansMembersan:RealEstateOperationsInSpainSegmentMember2023-12-310000891478ifrs-full:CountryOfDomicileMembersan:ConstructionAndPropertyDevelopmentLoansMembersan:RealEstateOperationsInSpainSegmentMember2022-12-310000891478ifrs-full:CountryOfDomicileMembersan:ConstructionAndPropertyDevelopmentLoansMembersan:RealEstateOperationsInSpainSegmentMember2025-01-012025-12-310000891478ifrs-full:CountryOfDomicileMembersan:ConstructionAndPropertyDevelopmentLoansMembersan:RealEstateOperationsInSpainSegmentMember2024-01-012024-12-310000891478ifrs-full:CountryOfDomicileMembersan:ConstructionAndPropertyDevelopmentLoansMembersan:RealEstateOperationsInSpainSegmentMember2023-01-012023-12-310000891478ifrs-full:CountryOfDomicileMembersan:ConstructionAndPropertyDevelopmentLoansMembersan:RealEstateOperationsInSpainSegmentMember2025-12-310000891478ifrs-full:CountryOfDomicileMembersan:ConstructionAndPropertyDevelopmentLoansMembersan:CreditImpairedMembersan:RealEstateOperationsInSpainSegmentMember2025-12-310000891478ifrs-full:CountryOfDomicileMembersan:ConstructionAndPropertyDevelopmentLoansMembersan:CreditImpairedMembersan:RealEstateOperationsInSpainSegmentMember2024-12-310000891478ifrs-full:CountryOfDomicileMembersan:ConstructionAndPropertyDevelopmentLoansMembersan:CreditImpairedMembersan:RealEstateOperationsInSpainSegmentMember2023-12-310000891478ifrs-full:GrossCarryingAmountMemberifrs-full:CountryOfDomicileMembersan:ConstructionAndPropertyDevelopmentLoansMembersan:RealEstateOperationsInSpainSegmentMember2025-12-310000891478ifrs-full:AccumulatedImpairmentMemberifrs-full:CountryOfDomicileMembersan:ConstructionAndPropertyDevelopmentLoansMemberifrs-full:ExpectedCreditLossesIndividuallyAssessedMembersan:RealEstateOperationsInSpainSegmentMember2025-12-310000891478ifrs-full:GrossCarryingAmountMemberifrs-full:CountryOfDomicileMembersan:ConstructionAndPropertyDevelopmentLoansMembersan:CreditImpairedMembersan:RealEstateOperationsInSpainSegmentMember2025-12-310000891478ifrs-full:AccumulatedImpairmentMemberifrs-full:CountryOfDomicileMembersan:ConstructionAndPropertyDevelopmentLoansMemberifrs-full:ExpectedCreditLossesIndividuallyAssessedMembersan:CreditImpairedMembersan:RealEstateOperationsInSpainSegmentMember2025-12-310000891478ifrs-full:CountryOfDomicileMembersan:PrivateSectorMember2025-12-310000891478ifrs-full:AccumulatedImpairmentMemberifrs-full:CountryOfDomicileMember2025-12-310000891478ifrs-full:GrossCarryingAmountMemberifrs-full:CountryOfDomicileMembersan:IFRSUncollateralizedMembersan:RealEstateOperationsInSpainSegmentMember2025-12-310000891478ifrs-full:GrossCarryingAmountMemberifrs-full:CountryOfDomicileMembersan:IFRSCollateralPledgedMembersan:RealEstateOperationsInSpainSegmentMember2025-12-310000891478ifrs-full:GrossCarryingAmountMemberifrs-full:CountryOfDomicileMemberifrs-full:BuildingsMembersan:IFRSCollateralPledgedMembersan:RealEstateOperationsInSpainSegmentMember2025-12-310000891478ifrs-full:GrossCarryingAmountMemberifrs-full:CountryOfDomicileMemberifrs-full:BuildingsMembersan:ResidentialPropertyCollateralMembersan:RealEstateOperationsInSpainSegmentMember2025-12-310000891478ifrs-full:GrossCarryingAmountMemberifrs-full:CountryOfDomicileMemberifrs-full:BuildingsMembersan:NonResidentialPropertyCollateralMembersan:RealEstateOperationsInSpainSegmentMember2025-12-310000891478ifrs-full:GrossCarryingAmountMemberifrs-full:CountryOfDomicileMemberifrs-full:ConstructionInProgressMembersan:IFRSCollateralPledgedMembersan:RealEstateOperationsInSpainSegmentMember2025-12-310000891478ifrs-full:GrossCarryingAmountMemberifrs-full:CountryOfDomicileMemberifrs-full:ConstructionInProgressMembersan:ResidentialPropertyCollateralMembersan:RealEstateOperationsInSpainSegmentMember2025-12-310000891478ifrs-full:GrossCarryingAmountMemberifrs-full:CountryOfDomicileMemberifrs-full:ConstructionInProgressMembersan:NonResidentialPropertyCollateralMembersan:RealEstateOperationsInSpainSegmentMember2025-12-310000891478ifrs-full:GrossCarryingAmountMemberifrs-full:CountryOfDomicileMemberifrs-full:LandMembersan:IFRSCollateralPledgedMembersan:RealEstateOperationsInSpainSegmentMember2025-12-310000891478ifrs-full:GrossCarryingAmountMemberifrs-full:CountryOfDomicileMemberifrs-full:LandMembersan:DevelopedLandCollateralMembersan:RealEstateOperationsInSpainSegmentMember2025-12-310000891478ifrs-full:GrossCarryingAmountMemberifrs-full:CountryOfDomicileMemberifrs-full:LandMembersan:UndevelopedLandCollateralMembersan:RealEstateOperationsInSpainSegmentMember2025-12-310000891478ifrs-full:GrossCarryingAmountMemberifrs-full:CountryOfDomicileMembersan:RealEstateOperationsInSpainSegmentMember2025-12-310000891478ifrs-full:CountryOfDomicileMembersan:ForeclosedPropertiesMember2025-12-310000891478ifrs-full:CountryOfDomicileMembersan:ForeclosedPropertiesMember2024-12-310000891478ifrs-full:CountryOfDomicileMembersan:ForeclosedPropertiesMember2023-12-310000891478ifrs-full:GrossCarryingAmountMemberifrs-full:CountryOfDomicileMembersan:ForeclosedPropertiesMember2025-12-310000891478ifrs-full:GrossCarryingAmountMemberifrs-full:CountryOfDomicileMembersan:ForeclosedPropertiesMember2024-12-310000891478ifrs-full:GrossCarryingAmountMemberifrs-full:CountryOfDomicileMembersan:ForeclosedPropertiesMember2023-12-310000891478ifrs-full:AccumulatedImpairmentMemberifrs-full:CountryOfDomicileMembersan:ForeclosedPropertiesMember2025-12-310000891478ifrs-full:AccumulatedImpairmentMemberifrs-full:CountryOfDomicileMembersan:ForeclosedPropertiesMember2024-12-310000891478ifrs-full:AccumulatedImpairmentMemberifrs-full:CountryOfDomicileMembersan:ForeclosedPropertiesMember2023-12-310000891478ifrs-full:GrossCarryingAmountMemberifrs-full:CountryOfDomicileMembersan:ForeclosedPropertiesMembersan:ConstructionAndPropertyDevelopmentLoansMember2025-12-310000891478ifrs-full:AccumulatedImpairmentMemberifrs-full:CountryOfDomicileMembersan:ForeclosedPropertiesMembersan:ConstructionAndPropertyDevelopmentLoansMember2025-12-310000891478san:AccumulatedImpairmentSinceInitialImpairmentMemberifrs-full:CountryOfDomicileMembersan:ForeclosedPropertiesMembersan:ConstructionAndPropertyDevelopmentLoansMember2025-12-310000891478ifrs-full:CountryOfDomicileMembersan:ForeclosedPropertiesMembersan:ConstructionAndPropertyDevelopmentLoansMember2025-12-310000891478ifrs-full:GrossCarryingAmountMemberifrs-full:CountryOfDomicileMembersan:ForeclosedPropertiesMembersan:CompletedBuildingsMember2025-12-310000891478ifrs-full:AccumulatedImpairmentMemberifrs-full:CountryOfDomicileMembersan:ForeclosedPropertiesMembersan:CompletedBuildingsMember2025-12-310000891478san:AccumulatedImpairmentSinceInitialImpairmentMemberifrs-full:CountryOfDomicileMembersan:ForeclosedPropertiesMembersan:CompletedBuildingsMember2025-12-310000891478ifrs-full:CountryOfDomicileMembersan:ForeclosedPropertiesMembersan:CompletedBuildingsMember2025-12-310000891478ifrs-full:GrossCarryingAmountMembersan:ResidentialLoansMemberifrs-full:CountryOfDomicileMembersan:ForeclosedPropertiesMembersan:CompletedBuildingsMember2025-12-310000891478ifrs-full:AccumulatedImpairmentMembersan:ResidentialLoansMemberifrs-full:CountryOfDomicileMembersan:ForeclosedPropertiesMembersan:CompletedBuildingsMember2025-12-310000891478san:AccumulatedImpairmentSinceInitialImpairmentMembersan:ResidentialLoansMemberifrs-full:CountryOfDomicileMembersan:ForeclosedPropertiesMembersan:CompletedBuildingsMember2025-12-310000891478san:ResidentialLoansMemberifrs-full:CountryOfDomicileMembersan:ForeclosedPropertiesMembersan:CompletedBuildingsMember2025-12-310000891478ifrs-full:GrossCarryingAmountMembersan:OtherPurposesLoansMemberifrs-full:CountryOfDomicileMembersan:ForeclosedPropertiesMembersan:CompletedBuildingsMember2025-12-310000891478ifrs-full:AccumulatedImpairmentMembersan:OtherPurposesLoansMemberifrs-full:CountryOfDomicileMembersan:ForeclosedPropertiesMembersan:CompletedBuildingsMember2025-12-310000891478san:AccumulatedImpairmentSinceInitialImpairmentMembersan:OtherPurposesLoansMemberifrs-full:CountryOfDomicileMembersan:ForeclosedPropertiesMembersan:CompletedBuildingsMember2025-12-310000891478san:OtherPurposesLoansMemberifrs-full:CountryOfDomicileMembersan:ForeclosedPropertiesMembersan:CompletedBuildingsMember2025-12-310000891478ifrs-full:GrossCarryingAmountMemberifrs-full:CountryOfDomicileMembersan:ForeclosedPropertiesMembersan:BuildingsAndOtherConstructionsUnderConstructionMember2025-12-310000891478ifrs-full:AccumulatedImpairmentMemberifrs-full:CountryOfDomicileMembersan:ForeclosedPropertiesMembersan:BuildingsAndOtherConstructionsUnderConstructionMember2025-12-310000891478san:AccumulatedImpairmentSinceInitialImpairmentMemberifrs-full:CountryOfDomicileMembersan:ForeclosedPropertiesMembersan:BuildingsAndOtherConstructionsUnderConstructionMember2025-12-310000891478ifrs-full:CountryOfDomicileMembersan:ForeclosedPropertiesMembersan:BuildingsAndOtherConstructionsUnderConstructionMember2025-12-310000891478ifrs-full:GrossCarryingAmountMembersan:ResidentialLoansMemberifrs-full:CountryOfDomicileMembersan:ForeclosedPropertiesMembersan:BuildingsAndOtherConstructionsUnderConstructionMember2025-12-310000891478ifrs-full:AccumulatedImpairmentMembersan:ResidentialLoansMemberifrs-full:CountryOfDomicileMembersan:ForeclosedPropertiesMembersan:BuildingsAndOtherConstructionsUnderConstructionMember2025-12-310000891478san:AccumulatedImpairmentSinceInitialImpairmentMembersan:ResidentialLoansMemberifrs-full:CountryOfDomicileMembersan:ForeclosedPropertiesMembersan:BuildingsAndOtherConstructionsUnderConstructionMember2025-12-310000891478san:ResidentialLoansMemberifrs-full:CountryOfDomicileMembersan:ForeclosedPropertiesMembersan:BuildingsAndOtherConstructionsUnderConstructionMember2025-12-310000891478ifrs-full:GrossCarryingAmountMembersan:OtherPurposesLoansMemberifrs-full:CountryOfDomicileMembersan:ForeclosedPropertiesMembersan:BuildingsAndOtherConstructionsUnderConstructionMember2025-12-310000891478ifrs-full:AccumulatedImpairmentMembersan:OtherPurposesLoansMemberifrs-full:CountryOfDomicileMembersan:ForeclosedPropertiesMembersan:BuildingsAndOtherConstructionsUnderConstructionMember2025-12-310000891478san:AccumulatedImpairmentSinceInitialImpairmentMembersan:OtherPurposesLoansMemberifrs-full:CountryOfDomicileMembersan:ForeclosedPropertiesMembersan:BuildingsAndOtherConstructionsUnderConstructionMember2025-12-310000891478san:OtherPurposesLoansMemberifrs-full:CountryOfDomicileMembersan:ForeclosedPropertiesMembersan:BuildingsAndOtherConstructionsUnderConstructionMember2025-12-310000891478ifrs-full:GrossCarryingAmountMemberifrs-full:CountryOfDomicileMembersan:ForeclosedPropertiesMembersan:LandLoansMember2025-12-310000891478ifrs-full:AccumulatedImpairmentMemberifrs-full:CountryOfDomicileMembersan:ForeclosedPropertiesMembersan:LandLoansMember2025-12-310000891478san:AccumulatedImpairmentSinceInitialImpairmentMemberifrs-full:CountryOfDomicileMembersan:ForeclosedPropertiesMembersan:LandLoansMember2025-12-310000891478ifrs-full:CountryOfDomicileMembersan:ForeclosedPropertiesMembersan:LandLoansMember2025-12-310000891478ifrs-full:GrossCarryingAmountMembersan:DevelopedConsolidatedLandMemberifrs-full:CountryOfDomicileMembersan:ForeclosedPropertiesMembersan:LandLoansMember2025-12-310000891478ifrs-full:AccumulatedImpairmentMembersan:DevelopedConsolidatedLandMemberifrs-full:CountryOfDomicileMembersan:ForeclosedPropertiesMembersan:LandLoansMember2025-12-310000891478san:AccumulatedImpairmentSinceInitialImpairmentMembersan:DevelopedConsolidatedLandMemberifrs-full:CountryOfDomicileMembersan:ForeclosedPropertiesMembersan:LandLoansMember2025-12-310000891478san:DevelopedConsolidatedLandMemberifrs-full:CountryOfDomicileMembersan:ForeclosedPropertiesMembersan:LandLoansMember2025-12-310000891478ifrs-full:GrossCarryingAmountMembersan:LandLoansOtherMemberifrs-full:CountryOfDomicileMembersan:ForeclosedPropertiesMembersan:LandLoansMember2025-12-310000891478ifrs-full:AccumulatedImpairmentMembersan:LandLoansOtherMemberifrs-full:CountryOfDomicileMembersan:ForeclosedPropertiesMembersan:LandLoansMember2025-12-310000891478san:AccumulatedImpairmentSinceInitialImpairmentMembersan:LandLoansOtherMemberifrs-full:CountryOfDomicileMembersan:ForeclosedPropertiesMembersan:LandLoansMember2025-12-310000891478san:LandLoansOtherMemberifrs-full:CountryOfDomicileMembersan:ForeclosedPropertiesMembersan:LandLoansMember2025-12-310000891478ifrs-full:GrossCarryingAmountMemberifrs-full:CountryOfDomicileMembersan:ForeclosedPropertiesMembersan:HomePurchaseLoansMember2025-12-310000891478ifrs-full:AccumulatedImpairmentMemberifrs-full:CountryOfDomicileMembersan:ForeclosedPropertiesMembersan:HomePurchaseLoansMember2025-12-310000891478san:AccumulatedImpairmentSinceInitialImpairmentMemberifrs-full:CountryOfDomicileMembersan:ForeclosedPropertiesMembersan:HomePurchaseLoansMember2025-12-310000891478ifrs-full:CountryOfDomicileMembersan:ForeclosedPropertiesMembersan:HomePurchaseLoansMember2025-12-310000891478ifrs-full:GrossCarryingAmountMemberifrs-full:CountryOfDomicileMembersan:ForeclosedPropertiesMembersan:OtherLoansMember2025-12-310000891478ifrs-full:AccumulatedImpairmentMemberifrs-full:CountryOfDomicileMembersan:ForeclosedPropertiesMembersan:OtherLoansMember2025-12-310000891478san:AccumulatedImpairmentSinceInitialImpairmentMemberifrs-full:CountryOfDomicileMembersan:ForeclosedPropertiesMembersan:OtherLoansMember2025-12-310000891478ifrs-full:CountryOfDomicileMembersan:ForeclosedPropertiesMembersan:OtherLoansMember2025-12-310000891478san:AccumulatedImpairmentSinceInitialImpairmentMemberifrs-full:CountryOfDomicileMembersan:ForeclosedPropertiesMember2025-12-310000891478ifrs-full:CountryOfDomicileMembersan:ForeclosedEquityInstrumentsMember2025-12-310000891478ifrs-full:CountryOfDomicileMembersan:ForeclosedPropertiesMember2025-01-012025-12-310000891478ifrs-full:CountryOfDomicileMembersan:ForeclosedPropertiesMember2024-01-012024-12-310000891478ifrs-full:CountryOfDomicileMembersan:ForeclosedPropertiesMember2023-01-012023-12-310000891478ifrs-full:TwelvemonthExpectedCreditLossesMemberifrs-full:FinancialInstrumentsNotCreditimpairedMemberifrs-full:CountryOfDomicileMembersan:FromAAAToAAMember2025-12-310000891478ifrs-full:LifetimeExpectedCreditLossesMemberifrs-full:FinancialInstrumentsNotCreditimpairedMemberifrs-full:CountryOfDomicileMembersan:FromAAAToAAMember2025-12-310000891478ifrs-full:LifetimeExpectedCreditLossesMemberifrs-full:FinancialInstrumentsCreditimpairedMemberifrs-full:CountryOfDomicileMembersan:FromAAAToAAMember2025-12-310000891478san:FromAAAToAAMemberifrs-full:CountryOfDomicileMember2025-12-310000891478ifrs-full:TwelvemonthExpectedCreditLossesMemberifrs-full:FinancialInstrumentsNotCreditimpairedMemberifrs-full:CountryOfDomicileMembersan:FromAToBBMember2025-12-310000891478ifrs-full:LifetimeExpectedCreditLossesMemberifrs-full:FinancialInstrumentsNotCreditimpairedMemberifrs-full:CountryOfDomicileMembersan:FromAToBBMember2025-12-310000891478ifrs-full:LifetimeExpectedCreditLossesMemberifrs-full:FinancialInstrumentsCreditimpairedMemberifrs-full:CountryOfDomicileMembersan:FromAToBBMember2025-12-310000891478san:FromAToBBMemberifrs-full:CountryOfDomicileMember2025-12-310000891478ifrs-full:TwelvemonthExpectedCreditLossesMemberifrs-full:FinancialInstrumentsNotCreditimpairedMemberifrs-full:CountryOfDomicileMembersan:FromBBToBMember2025-12-310000891478ifrs-full:LifetimeExpectedCreditLossesMemberifrs-full:FinancialInstrumentsNotCreditimpairedMemberifrs-full:CountryOfDomicileMembersan:FromBBToBMember2025-12-310000891478ifrs-full:LifetimeExpectedCreditLossesMemberifrs-full:FinancialInstrumentsCreditimpairedMemberifrs-full:CountryOfDomicileMembersan:FromBBToBMember2025-12-310000891478san:FromBBToBMemberifrs-full:CountryOfDomicileMember2025-12-310000891478ifrs-full:TwelvemonthExpectedCreditLossesMemberifrs-full:FinancialInstrumentsNotCreditimpairedMemberifrs-full:CountryOfDomicileMembersan:CCCAndBelowMember2025-12-310000891478ifrs-full:LifetimeExpectedCreditLossesMemberifrs-full:FinancialInstrumentsNotCreditimpairedMemberifrs-full:CountryOfDomicileMembersan:CCCAndBelowMember2025-12-310000891478ifrs-full:LifetimeExpectedCreditLossesMemberifrs-full:FinancialInstrumentsCreditimpairedMemberifrs-full:CountryOfDomicileMembersan:CCCAndBelowMember2025-12-310000891478san:CCCAndBelowMemberifrs-full:CountryOfDomicileMember2025-12-310000891478ifrs-full:TwelvemonthExpectedCreditLossesMemberifrs-full:FinancialInstrumentsNotCreditimpairedMemberifrs-full:CountryOfDomicileMember2025-12-310000891478ifrs-full:LifetimeExpectedCreditLossesMemberifrs-full:FinancialInstrumentsNotCreditimpairedMemberifrs-full:CountryOfDomicileMember2025-12-310000891478ifrs-full:LifetimeExpectedCreditLossesMemberifrs-full:FinancialInstrumentsCreditimpairedMemberifrs-full:CountryOfDomicileMember2025-12-310000891478ifrs-full:AccumulatedImpairmentMemberifrs-full:TwelvemonthExpectedCreditLossesMembersan:FinancialAssetsAtAmortisedCostAndFinancialAssetsAtFairValueThroughOtherComprehensiveIncomeCategoryMembersan:LoansAndAdvancesCustomersMemberifrs-full:FinancialInstrumentsNotCreditimpairedMemberifrs-full:CountryOfDomicileMember2025-12-310000891478ifrs-full:AccumulatedImpairmentMemberifrs-full:LifetimeExpectedCreditLossesMembersan:FinancialAssetsAtAmortisedCostAndFinancialAssetsAtFairValueThroughOtherComprehensiveIncomeCategoryMembersan:LoansAndAdvancesCustomersMemberifrs-full:FinancialInstrumentsNotCreditimpairedMemberifrs-full:CountryOfDomicileMember2025-12-310000891478ifrs-full:AccumulatedImpairmentMemberifrs-full:LifetimeExpectedCreditLossesMembersan:FinancialAssetsAtAmortisedCostAndFinancialAssetsAtFairValueThroughOtherComprehensiveIncomeCategoryMembersan:LoansAndAdvancesCustomersMemberifrs-full:FinancialInstrumentsCreditimpairedMemberifrs-full:CountryOfDomicileMember2025-12-310000891478ifrs-full:AccumulatedImpairmentMembersan:FinancialAssetsAtAmortisedCostAndFinancialAssetsAtFairValueThroughOtherComprehensiveIncomeCategoryMembersan:LoansAndAdvancesCustomersMemberifrs-full:CountryOfDomicileMember2025-12-310000891478ifrs-full:TwelvemonthExpectedCreditLossesMemberifrs-full:FinancialInstrumentsNotCreditimpairedMemberifrs-full:CountryOfDomicileMembersan:FromAAAToAAMember2024-12-310000891478ifrs-full:LifetimeExpectedCreditLossesMemberifrs-full:FinancialInstrumentsNotCreditimpairedMemberifrs-full:CountryOfDomicileMembersan:FromAAAToAAMember2024-12-310000891478ifrs-full:LifetimeExpectedCreditLossesMemberifrs-full:FinancialInstrumentsCreditimpairedMemberifrs-full:CountryOfDomicileMembersan:FromAAAToAAMember2024-12-310000891478san:FromAAAToAAMemberifrs-full:CountryOfDomicileMember2024-12-310000891478ifrs-full:TwelvemonthExpectedCreditLossesMemberifrs-full:FinancialInstrumentsNotCreditimpairedMemberifrs-full:CountryOfDomicileMembersan:FromAToBBMember2024-12-310000891478ifrs-full:LifetimeExpectedCreditLossesMemberifrs-full:FinancialInstrumentsNotCreditimpairedMemberifrs-full:CountryOfDomicileMembersan:FromAToBBMember2024-12-310000891478ifrs-full:LifetimeExpectedCreditLossesMemberifrs-full:FinancialInstrumentsCreditimpairedMemberifrs-full:CountryOfDomicileMembersan:FromAToBBMember2024-12-310000891478san:FromAToBBMemberifrs-full:CountryOfDomicileMember2024-12-310000891478ifrs-full:TwelvemonthExpectedCreditLossesMemberifrs-full:FinancialInstrumentsNotCreditimpairedMemberifrs-full:CountryOfDomicileMembersan:FromBBToBMember2024-12-310000891478ifrs-full:LifetimeExpectedCreditLossesMemberifrs-full:FinancialInstrumentsNotCreditimpairedMemberifrs-full:CountryOfDomicileMembersan:FromBBToBMember2024-12-310000891478ifrs-full:LifetimeExpectedCreditLossesMemberifrs-full:FinancialInstrumentsCreditimpairedMemberifrs-full:CountryOfDomicileMembersan:FromBBToBMember2024-12-310000891478san:FromBBToBMemberifrs-full:CountryOfDomicileMember2024-12-310000891478ifrs-full:TwelvemonthExpectedCreditLossesMemberifrs-full:FinancialInstrumentsNotCreditimpairedMemberifrs-full:CountryOfDomicileMembersan:CCCAndBelowMember2024-12-310000891478ifrs-full:LifetimeExpectedCreditLossesMemberifrs-full:FinancialInstrumentsNotCreditimpairedMemberifrs-full:CountryOfDomicileMembersan:CCCAndBelowMember2024-12-310000891478ifrs-full:LifetimeExpectedCreditLossesMemberifrs-full:FinancialInstrumentsCreditimpairedMemberifrs-full:CountryOfDomicileMembersan:CCCAndBelowMember2024-12-310000891478san:CCCAndBelowMemberifrs-full:CountryOfDomicileMember2024-12-310000891478ifrs-full:TwelvemonthExpectedCreditLossesMemberifrs-full:FinancialInstrumentsNotCreditimpairedMemberifrs-full:CountryOfDomicileMember2024-12-310000891478ifrs-full:LifetimeExpectedCreditLossesMemberifrs-full:FinancialInstrumentsNotCreditimpairedMemberifrs-full:CountryOfDomicileMember2024-12-310000891478ifrs-full:LifetimeExpectedCreditLossesMemberifrs-full:FinancialInstrumentsCreditimpairedMemberifrs-full:CountryOfDomicileMember2024-12-310000891478ifrs-full:AccumulatedImpairmentMemberifrs-full:TwelvemonthExpectedCreditLossesMembersan:FinancialAssetsAtAmortisedCostAndFinancialAssetsAtFairValueThroughOtherComprehensiveIncomeCategoryMembersan:LoansAndAdvancesCustomersMemberifrs-full:FinancialInstrumentsNotCreditimpairedMemberifrs-full:CountryOfDomicileMember2024-12-310000891478ifrs-full:AccumulatedImpairmentMemberifrs-full:LifetimeExpectedCreditLossesMembersan:FinancialAssetsAtAmortisedCostAndFinancialAssetsAtFairValueThroughOtherComprehensiveIncomeCategoryMembersan:LoansAndAdvancesCustomersMemberifrs-full:FinancialInstrumentsNotCreditimpairedMemberifrs-full:CountryOfDomicileMember2024-12-310000891478ifrs-full:AccumulatedImpairmentMemberifrs-full:LifetimeExpectedCreditLossesMembersan:FinancialAssetsAtAmortisedCostAndFinancialAssetsAtFairValueThroughOtherComprehensiveIncomeCategoryMembersan:LoansAndAdvancesCustomersMemberifrs-full:FinancialInstrumentsCreditimpairedMemberifrs-full:CountryOfDomicileMember2024-12-310000891478ifrs-full:AccumulatedImpairmentMembersan:FinancialAssetsAtAmortisedCostAndFinancialAssetsAtFairValueThroughOtherComprehensiveIncomeCategoryMembersan:LoansAndAdvancesCustomersMemberifrs-full:CountryOfDomicileMember2024-12-310000891478ifrs-full:TwelvemonthExpectedCreditLossesMemberifrs-full:FinancialInstrumentsNotCreditimpairedMemberifrs-full:CountryOfDomicileMembersan:FromAAAToAAMember2023-12-310000891478ifrs-full:LifetimeExpectedCreditLossesMemberifrs-full:FinancialInstrumentsNotCreditimpairedMemberifrs-full:CountryOfDomicileMembersan:FromAAAToAAMember2023-12-310000891478ifrs-full:LifetimeExpectedCreditLossesMemberifrs-full:FinancialInstrumentsCreditimpairedMemberifrs-full:CountryOfDomicileMembersan:FromAAAToAAMember2023-12-310000891478san:FromAAAToAAMemberifrs-full:CountryOfDomicileMember2023-12-310000891478ifrs-full:TwelvemonthExpectedCreditLossesMemberifrs-full:FinancialInstrumentsNotCreditimpairedMemberifrs-full:CountryOfDomicileMembersan:FromAToBBMember2023-12-310000891478ifrs-full:LifetimeExpectedCreditLossesMemberifrs-full:FinancialInstrumentsNotCreditimpairedMemberifrs-full:CountryOfDomicileMembersan:FromAToBBMember2023-12-310000891478ifrs-full:LifetimeExpectedCreditLossesMemberifrs-full:FinancialInstrumentsCreditimpairedMemberifrs-full:CountryOfDomicileMembersan:FromAToBBMember2023-12-310000891478san:FromAToBBMemberifrs-full:CountryOfDomicileMember2023-12-310000891478ifrs-full:TwelvemonthExpectedCreditLossesMemberifrs-full:FinancialInstrumentsNotCreditimpairedMemberifrs-full:CountryOfDomicileMembersan:FromBBToBMember2023-12-310000891478ifrs-full:LifetimeExpectedCreditLossesMemberifrs-full:FinancialInstrumentsNotCreditimpairedMemberifrs-full:CountryOfDomicileMembersan:FromBBToBMember2023-12-310000891478ifrs-full:LifetimeExpectedCreditLossesMemberifrs-full:FinancialInstrumentsCreditimpairedMemberifrs-full:CountryOfDomicileMembersan:FromBBToBMember2023-12-310000891478san:FromBBToBMemberifrs-full:CountryOfDomicileMember2023-12-310000891478ifrs-full:TwelvemonthExpectedCreditLossesMemberifrs-full:FinancialInstrumentsNotCreditimpairedMemberifrs-full:CountryOfDomicileMembersan:CCCAndBelowMember2023-12-310000891478ifrs-full:LifetimeExpectedCreditLossesMemberifrs-full:FinancialInstrumentsNotCreditimpairedMemberifrs-full:CountryOfDomicileMembersan:CCCAndBelowMember2023-12-310000891478ifrs-full:LifetimeExpectedCreditLossesMemberifrs-full:FinancialInstrumentsCreditimpairedMemberifrs-full:CountryOfDomicileMembersan:CCCAndBelowMember2023-12-310000891478san:CCCAndBelowMemberifrs-full:CountryOfDomicileMember2023-12-310000891478ifrs-full:TwelvemonthExpectedCreditLossesMemberifrs-full:FinancialInstrumentsNotCreditimpairedMemberifrs-full:CountryOfDomicileMember2023-12-310000891478ifrs-full:LifetimeExpectedCreditLossesMemberifrs-full:FinancialInstrumentsNotCreditimpairedMemberifrs-full:CountryOfDomicileMember2023-12-310000891478ifrs-full:LifetimeExpectedCreditLossesMemberifrs-full:FinancialInstrumentsCreditimpairedMemberifrs-full:CountryOfDomicileMember2023-12-310000891478ifrs-full:AccumulatedImpairmentMemberifrs-full:TwelvemonthExpectedCreditLossesMembersan:FinancialAssetsAtAmortisedCostAndFinancialAssetsAtFairValueThroughOtherComprehensiveIncomeCategoryMembersan:LoansAndAdvancesCustomersMemberifrs-full:FinancialInstrumentsNotCreditimpairedMemberifrs-full:CountryOfDomicileMember2023-12-310000891478ifrs-full:AccumulatedImpairmentMemberifrs-full:LifetimeExpectedCreditLossesMembersan:FinancialAssetsAtAmortisedCostAndFinancialAssetsAtFairValueThroughOtherComprehensiveIncomeCategoryMembersan:LoansAndAdvancesCustomersMemberifrs-full:FinancialInstrumentsNotCreditimpairedMemberifrs-full:CountryOfDomicileMember2023-12-310000891478ifrs-full:AccumulatedImpairmentMemberifrs-full:LifetimeExpectedCreditLossesMembersan:FinancialAssetsAtAmortisedCostAndFinancialAssetsAtFairValueThroughOtherComprehensiveIncomeCategoryMembersan:LoansAndAdvancesCustomersMemberifrs-full:FinancialInstrumentsCreditimpairedMemberifrs-full:CountryOfDomicileMember2023-12-310000891478ifrs-full:AccumulatedImpairmentMembersan:FinancialAssetsAtAmortisedCostAndFinancialAssetsAtFairValueThroughOtherComprehensiveIncomeCategoryMembersan:LoansAndAdvancesCustomersMemberifrs-full:CountryOfDomicileMember2023-12-310000891478san:PessimisticScenarioMemberifrs-full:CountryOfDomicileMember2025-01-012025-12-310000891478san:BaseScenarioMemberifrs-full:CountryOfDomicileMember2025-01-012025-12-310000891478san:OptimisticScenarioMemberifrs-full:CountryOfDomicileMember2025-01-012025-12-310000891478san:PessimisticScenarioMemberifrs-full:CountryOfDomicileMember2024-01-012024-12-310000891478san:PessimisticScenarioMemberifrs-full:CountryOfDomicileMember2023-01-012023-12-310000891478san:BaseScenarioMemberifrs-full:CountryOfDomicileMember2024-01-012024-12-310000891478san:BaseScenarioMemberifrs-full:CountryOfDomicileMember2023-01-012023-12-310000891478san:OptimisticScenarioOneMemberifrs-full:CountryOfDomicileMember2025-01-012025-12-310000891478san:OptimisticScenarioOneMemberifrs-full:CountryOfDomicileMember2024-01-012024-12-310000891478san:OptimisticScenarioOneMemberifrs-full:CountryOfDomicileMember2023-01-012023-12-310000891478san:HomePurchaseLoansMemberifrs-full:CountryOfDomicileMember2025-12-310000891478ifrs-full:CorporateLoansMemberifrs-full:CountryOfDomicileMember2025-12-310000891478srt:NorthAmericaMembercountry:US2025-12-310000891478srt:NorthAmericaMember2025-12-310000891478srt:NorthAmericaMembercountry:US2025-01-012025-12-310000891478san:SantanderBankNationalAssociationMembercountry:USsrt:NorthAmericaMember2025-12-310000891478san:SantanderBankNationalAssociationMembercountry:USsrt:NorthAmericaMember2025-01-012025-12-310000891478san:SantanderBankNationalAssociationMembercountry:US2025-12-310000891478san:SantanderBankNationalAssociationMemberifrs-full:TwelvemonthExpectedCreditLossesMemberifrs-full:FinancialInstrumentsNotCreditimpairedMembercountry:USsrt:NorthAmericaMembersan:FromAAAToAAMember2025-12-310000891478san:SantanderBankNationalAssociationMemberifrs-full:LifetimeExpectedCreditLossesMemberifrs-full:FinancialInstrumentsNotCreditimpairedMembercountry:USsrt:NorthAmericaMembersan:FromAAAToAAMember2025-12-310000891478san:SantanderBankNationalAssociationMemberifrs-full:LifetimeExpectedCreditLossesMemberifrs-full:FinancialInstrumentsCreditimpairedMembercountry:USsrt:NorthAmericaMembersan:FromAAAToAAMember2025-12-310000891478san:SantanderBankNationalAssociationMembercountry:USsan:FromAAAToAAMembersrt:NorthAmericaMember2025-12-310000891478san:SantanderBankNationalAssociationMemberifrs-full:TwelvemonthExpectedCreditLossesMemberifrs-full:FinancialInstrumentsNotCreditimpairedMembercountry:USsrt:NorthAmericaMembersan:FromAToBBMember2025-12-310000891478san:SantanderBankNationalAssociationMemberifrs-full:LifetimeExpectedCreditLossesMemberifrs-full:FinancialInstrumentsNotCreditimpairedMembercountry:USsrt:NorthAmericaMembersan:FromAToBBMember2025-12-310000891478san:SantanderBankNationalAssociationMemberifrs-full:LifetimeExpectedCreditLossesMemberifrs-full:FinancialInstrumentsCreditimpairedMembercountry:USsrt:NorthAmericaMembersan:FromAToBBMember2025-12-310000891478san:SantanderBankNationalAssociationMembercountry:USsan:FromAToBBMembersrt:NorthAmericaMember2025-12-310000891478san:SantanderBankNationalAssociationMemberifrs-full:TwelvemonthExpectedCreditLossesMemberifrs-full:FinancialInstrumentsNotCreditimpairedMembercountry:USsrt:NorthAmericaMembersan:FromBBToBMember2025-12-310000891478san:SantanderBankNationalAssociationMemberifrs-full:LifetimeExpectedCreditLossesMemberifrs-full:FinancialInstrumentsNotCreditimpairedMembercountry:USsrt:NorthAmericaMembersan:FromBBToBMember2025-12-310000891478san:SantanderBankNationalAssociationMemberifrs-full:LifetimeExpectedCreditLossesMemberifrs-full:FinancialInstrumentsCreditimpairedMembercountry:USsrt:NorthAmericaMembersan:FromBBToBMember2025-12-310000891478san:SantanderBankNationalAssociationMembercountry:USsan:FromBBToBMembersrt:NorthAmericaMember2025-12-310000891478san:SantanderBankNationalAssociationMemberifrs-full:TwelvemonthExpectedCreditLossesMemberifrs-full:FinancialInstrumentsNotCreditimpairedMembercountry:USsrt:NorthAmericaMembersan:CCCAndBelowMember2025-12-310000891478san:SantanderBankNationalAssociationMemberifrs-full:LifetimeExpectedCreditLossesMemberifrs-full:FinancialInstrumentsNotCreditimpairedMembercountry:USsrt:NorthAmericaMembersan:CCCAndBelowMember2025-12-310000891478san:SantanderBankNationalAssociationMemberifrs-full:LifetimeExpectedCreditLossesMemberifrs-full:FinancialInstrumentsCreditimpairedMembercountry:USsrt:NorthAmericaMembersan:CCCAndBelowMember2025-12-310000891478san:SantanderBankNationalAssociationMembercountry:USsan:CCCAndBelowMembersrt:NorthAmericaMember2025-12-310000891478san:SantanderBankNationalAssociationMemberifrs-full:TwelvemonthExpectedCreditLossesMemberifrs-full:FinancialInstrumentsNotCreditimpairedMembercountry:USsrt:NorthAmericaMember2025-12-310000891478san:SantanderBankNationalAssociationMemberifrs-full:LifetimeExpectedCreditLossesMemberifrs-full:FinancialInstrumentsNotCreditimpairedMembercountry:USsrt:NorthAmericaMember2025-12-310000891478san:SantanderBankNationalAssociationMemberifrs-full:LifetimeExpectedCreditLossesMemberifrs-full:FinancialInstrumentsCreditimpairedMembercountry:USsrt:NorthAmericaMember2025-12-310000891478ifrs-full:AccumulatedImpairmentMembersan:SantanderBankNationalAssociationMemberifrs-full:TwelvemonthExpectedCreditLossesMembersan:FinancialAssetsAtAmortisedCostAndFinancialAssetsAtFairValueThroughOtherComprehensiveIncomeCategoryMemberifrs-full:FinancialInstrumentsNotCreditimpairedMembercountry:USsrt:NorthAmericaMember2025-12-310000891478ifrs-full:AccumulatedImpairmentMembersan:SantanderBankNationalAssociationMemberifrs-full:LifetimeExpectedCreditLossesMembersan:FinancialAssetsAtAmortisedCostAndFinancialAssetsAtFairValueThroughOtherComprehensiveIncomeCategoryMemberifrs-full:FinancialInstrumentsNotCreditimpairedMembercountry:USsrt:NorthAmericaMember2025-12-310000891478ifrs-full:AccumulatedImpairmentMembersan:SantanderBankNationalAssociationMemberifrs-full:LifetimeExpectedCreditLossesMembersan:FinancialAssetsAtAmortisedCostAndFinancialAssetsAtFairValueThroughOtherComprehensiveIncomeCategoryMemberifrs-full:FinancialInstrumentsCreditimpairedMembercountry:USsrt:NorthAmericaMember2025-12-310000891478ifrs-full:AccumulatedImpairmentMembersan:SantanderBankNationalAssociationMembersan:FinancialAssetsAtAmortisedCostAndFinancialAssetsAtFairValueThroughOtherComprehensiveIncomeCategoryMembercountry:USsrt:NorthAmericaMember2025-12-310000891478san:SantanderBankNationalAssociationMemberifrs-full:TwelvemonthExpectedCreditLossesMemberifrs-full:FinancialInstrumentsNotCreditimpairedMembercountry:USsrt:NorthAmericaMembersan:FromAAAToAAMember2024-12-310000891478san:SantanderBankNationalAssociationMemberifrs-full:LifetimeExpectedCreditLossesMemberifrs-full:FinancialInstrumentsNotCreditimpairedMembercountry:USsrt:NorthAmericaMembersan:FromAAAToAAMember2024-12-310000891478san:SantanderBankNationalAssociationMemberifrs-full:LifetimeExpectedCreditLossesMemberifrs-full:FinancialInstrumentsCreditimpairedMembercountry:USsrt:NorthAmericaMembersan:FromAAAToAAMember2024-12-310000891478san:SantanderBankNationalAssociationMembercountry:USsan:FromAAAToAAMembersrt:NorthAmericaMember2024-12-310000891478san:SantanderBankNationalAssociationMemberifrs-full:TwelvemonthExpectedCreditLossesMemberifrs-full:FinancialInstrumentsNotCreditimpairedMembercountry:USsrt:NorthAmericaMembersan:FromAToBBMember2024-12-310000891478san:SantanderBankNationalAssociationMemberifrs-full:LifetimeExpectedCreditLossesMemberifrs-full:FinancialInstrumentsNotCreditimpairedMembercountry:USsrt:NorthAmericaMembersan:FromAToBBMember2024-12-310000891478san:SantanderBankNationalAssociationMemberifrs-full:LifetimeExpectedCreditLossesMemberifrs-full:FinancialInstrumentsCreditimpairedMembercountry:USsrt:NorthAmericaMembersan:FromAToBBMember2024-12-310000891478san:SantanderBankNationalAssociationMembercountry:USsan:FromAToBBMembersrt:NorthAmericaMember2024-12-310000891478san:SantanderBankNationalAssociationMemberifrs-full:TwelvemonthExpectedCreditLossesMemberifrs-full:FinancialInstrumentsNotCreditimpairedMembercountry:USsrt:NorthAmericaMembersan:FromBBToBMember2024-12-310000891478san:SantanderBankNationalAssociationMemberifrs-full:LifetimeExpectedCreditLossesMemberifrs-full:FinancialInstrumentsNotCreditimpairedMembercountry:USsrt:NorthAmericaMembersan:FromBBToBMember2024-12-310000891478san:SantanderBankNationalAssociationMemberifrs-full:LifetimeExpectedCreditLossesMemberifrs-full:FinancialInstrumentsCreditimpairedMembercountry:USsrt:NorthAmericaMembersan:FromBBToBMember2024-12-310000891478san:SantanderBankNationalAssociationMembercountry:USsan:FromBBToBMembersrt:NorthAmericaMember2024-12-310000891478san:SantanderBankNationalAssociationMemberifrs-full:TwelvemonthExpectedCreditLossesMemberifrs-full:FinancialInstrumentsNotCreditimpairedMembercountry:USsrt:NorthAmericaMembersan:CCCAndBelowMember2024-12-310000891478san:SantanderBankNationalAssociationMemberifrs-full:LifetimeExpectedCreditLossesMemberifrs-full:FinancialInstrumentsNotCreditimpairedMembercountry:USsrt:NorthAmericaMembersan:CCCAndBelowMember2024-12-310000891478san:SantanderBankNationalAssociationMemberifrs-full:LifetimeExpectedCreditLossesMemberifrs-full:FinancialInstrumentsCreditimpairedMembercountry:USsrt:NorthAmericaMembersan:CCCAndBelowMember2024-12-310000891478san:SantanderBankNationalAssociationMembercountry:USsan:CCCAndBelowMembersrt:NorthAmericaMember2024-12-310000891478san:SantanderBankNationalAssociationMemberifrs-full:TwelvemonthExpectedCreditLossesMemberifrs-full:FinancialInstrumentsNotCreditimpairedMembercountry:USsrt:NorthAmericaMember2024-12-310000891478san:SantanderBankNationalAssociationMemberifrs-full:LifetimeExpectedCreditLossesMemberifrs-full:FinancialInstrumentsNotCreditimpairedMembercountry:USsrt:NorthAmericaMember2024-12-310000891478san:SantanderBankNationalAssociationMemberifrs-full:LifetimeExpectedCreditLossesMemberifrs-full:FinancialInstrumentsCreditimpairedMembercountry:USsrt:NorthAmericaMember2024-12-310000891478san:SantanderBankNationalAssociationMembercountry:USsrt:NorthAmericaMember2024-12-310000891478ifrs-full:AccumulatedImpairmentMembersan:SantanderBankNationalAssociationMemberifrs-full:TwelvemonthExpectedCreditLossesMembersan:FinancialAssetsAtAmortisedCostAndFinancialAssetsAtFairValueThroughOtherComprehensiveIncomeCategoryMemberifrs-full:FinancialInstrumentsNotCreditimpairedMembercountry:USsrt:NorthAmericaMember2024-12-310000891478ifrs-full:AccumulatedImpairmentMembersan:SantanderBankNationalAssociationMemberifrs-full:LifetimeExpectedCreditLossesMembersan:FinancialAssetsAtAmortisedCostAndFinancialAssetsAtFairValueThroughOtherComprehensiveIncomeCategoryMemberifrs-full:FinancialInstrumentsNotCreditimpairedMembercountry:USsrt:NorthAmericaMember2024-12-310000891478ifrs-full:AccumulatedImpairmentMembersan:SantanderBankNationalAssociationMemberifrs-full:LifetimeExpectedCreditLossesMembersan:FinancialAssetsAtAmortisedCostAndFinancialAssetsAtFairValueThroughOtherComprehensiveIncomeCategoryMemberifrs-full:FinancialInstrumentsCreditimpairedMembercountry:USsrt:NorthAmericaMember2024-12-310000891478ifrs-full:AccumulatedImpairmentMembersan:SantanderBankNationalAssociationMembersan:FinancialAssetsAtAmortisedCostAndFinancialAssetsAtFairValueThroughOtherComprehensiveIncomeCategoryMembercountry:USsrt:NorthAmericaMember2024-12-310000891478san:SantanderBankNationalAssociationMemberifrs-full:TwelvemonthExpectedCreditLossesMemberifrs-full:FinancialInstrumentsNotCreditimpairedMembercountry:USsrt:NorthAmericaMembersan:FromAAAToAAMember2023-12-310000891478san:SantanderBankNationalAssociationMemberifrs-full:LifetimeExpectedCreditLossesMemberifrs-full:FinancialInstrumentsNotCreditimpairedMembercountry:USsrt:NorthAmericaMembersan:FromAAAToAAMember2023-12-310000891478san:SantanderBankNationalAssociationMemberifrs-full:LifetimeExpectedCreditLossesMemberifrs-full:FinancialInstrumentsCreditimpairedMembercountry:USsrt:NorthAmericaMembersan:FromAAAToAAMember2023-12-310000891478san:SantanderBankNationalAssociationMembercountry:USsan:FromAAAToAAMembersrt:NorthAmericaMember2023-12-310000891478san:SantanderBankNationalAssociationMemberifrs-full:TwelvemonthExpectedCreditLossesMemberifrs-full:FinancialInstrumentsNotCreditimpairedMembercountry:USsrt:NorthAmericaMembersan:FromAToBBMember2023-12-310000891478san:SantanderBankNationalAssociationMemberifrs-full:LifetimeExpectedCreditLossesMemberifrs-full:FinancialInstrumentsNotCreditimpairedMembercountry:USsrt:NorthAmericaMembersan:FromAToBBMember2023-12-310000891478san:SantanderBankNationalAssociationMemberifrs-full:LifetimeExpectedCreditLossesMemberifrs-full:FinancialInstrumentsCreditimpairedMembercountry:USsrt:NorthAmericaMembersan:FromAToBBMember2023-12-310000891478san:SantanderBankNationalAssociationMembercountry:USsan:FromAToBBMembersrt:NorthAmericaMember2023-12-310000891478san:SantanderBankNationalAssociationMemberifrs-full:TwelvemonthExpectedCreditLossesMemberifrs-full:FinancialInstrumentsNotCreditimpairedMembercountry:USsrt:NorthAmericaMembersan:FromBBToBMember2023-12-310000891478san:SantanderBankNationalAssociationMemberifrs-full:LifetimeExpectedCreditLossesMemberifrs-full:FinancialInstrumentsNotCreditimpairedMembercountry:USsrt:NorthAmericaMembersan:FromBBToBMember2023-12-310000891478san:SantanderBankNationalAssociationMemberifrs-full:LifetimeExpectedCreditLossesMemberifrs-full:FinancialInstrumentsCreditimpairedMembercountry:USsrt:NorthAmericaMembersan:FromBBToBMember2023-12-310000891478san:SantanderBankNationalAssociationMembercountry:USsan:FromBBToBMembersrt:NorthAmericaMember2023-12-310000891478san:SantanderBankNationalAssociationMemberifrs-full:TwelvemonthExpectedCreditLossesMemberifrs-full:FinancialInstrumentsNotCreditimpairedMembercountry:USsrt:NorthAmericaMembersan:CCCAndBelowMember2023-12-310000891478san:SantanderBankNationalAssociationMemberifrs-full:LifetimeExpectedCreditLossesMemberifrs-full:FinancialInstrumentsNotCreditimpairedMembercountry:USsrt:NorthAmericaMembersan:CCCAndBelowMember2023-12-310000891478san:SantanderBankNationalAssociationMemberifrs-full:LifetimeExpectedCreditLossesMemberifrs-full:FinancialInstrumentsCreditimpairedMembercountry:USsrt:NorthAmericaMembersan:CCCAndBelowMember2023-12-310000891478san:SantanderBankNationalAssociationMembercountry:USsan:CCCAndBelowMembersrt:NorthAmericaMember2023-12-310000891478san:SantanderBankNationalAssociationMemberifrs-full:TwelvemonthExpectedCreditLossesMemberifrs-full:FinancialInstrumentsNotCreditimpairedMembercountry:USsrt:NorthAmericaMember2023-12-310000891478san:SantanderBankNationalAssociationMemberifrs-full:LifetimeExpectedCreditLossesMemberifrs-full:FinancialInstrumentsNotCreditimpairedMembercountry:USsrt:NorthAmericaMember2023-12-310000891478san:SantanderBankNationalAssociationMemberifrs-full:LifetimeExpectedCreditLossesMemberifrs-full:FinancialInstrumentsCreditimpairedMembercountry:USsrt:NorthAmericaMember2023-12-310000891478san:SantanderBankNationalAssociationMembercountry:USsrt:NorthAmericaMember2023-12-310000891478ifrs-full:AccumulatedImpairmentMembersan:SantanderBankNationalAssociationMemberifrs-full:TwelvemonthExpectedCreditLossesMembersan:FinancialAssetsAtAmortisedCostAndFinancialAssetsAtFairValueThroughOtherComprehensiveIncomeCategoryMemberifrs-full:FinancialInstrumentsNotCreditimpairedMembercountry:USsrt:NorthAmericaMember2023-12-310000891478ifrs-full:AccumulatedImpairmentMembersan:SantanderBankNationalAssociationMemberifrs-full:LifetimeExpectedCreditLossesMembersan:FinancialAssetsAtAmortisedCostAndFinancialAssetsAtFairValueThroughOtherComprehensiveIncomeCategoryMemberifrs-full:FinancialInstrumentsNotCreditimpairedMembercountry:USsrt:NorthAmericaMember2023-12-310000891478ifrs-full:AccumulatedImpairmentMembersan:SantanderBankNationalAssociationMemberifrs-full:LifetimeExpectedCreditLossesMembersan:FinancialAssetsAtAmortisedCostAndFinancialAssetsAtFairValueThroughOtherComprehensiveIncomeCategoryMemberifrs-full:FinancialInstrumentsCreditimpairedMembercountry:USsrt:NorthAmericaMember2023-12-310000891478ifrs-full:AccumulatedImpairmentMembersan:SantanderBankNationalAssociationMembersan:FinancialAssetsAtAmortisedCostAndFinancialAssetsAtFairValueThroughOtherComprehensiveIncomeCategoryMembercountry:USsrt:NorthAmericaMember2023-12-310000891478san:SantanderBankNationalAssociationMembercountry:USsrt:NorthAmericaMembersan:PessimisticScenarioTwoMember2025-01-012025-12-310000891478san:SantanderBankNationalAssociationMembercountry:USsrt:NorthAmericaMembersan:PessimisticScenarioOneMember2025-01-012025-12-310000891478san:SantanderBankNationalAssociationMembercountry:USsrt:NorthAmericaMembersan:BaseScenarioMember2025-01-012025-12-310000891478san:SantanderBankNationalAssociationMembercountry:USsrt:NorthAmericaMembersan:OptimisticScenarioMember2025-01-012025-12-310000891478san:SantanderBankNationalAssociationMembercountry:USsrt:NorthAmericaMembersan:PessimisticScenarioTwoMember2024-01-012024-12-310000891478san:SantanderBankNationalAssociationMembercountry:USsrt:NorthAmericaMembersan:PessimisticScenarioTwoMember2023-01-012023-12-310000891478san:SantanderBankNationalAssociationMembercountry:USsrt:NorthAmericaMembersan:PessimisticScenarioOneMember2024-01-012024-12-310000891478san:SantanderBankNationalAssociationMembercountry:USsrt:NorthAmericaMembersan:PessimisticScenarioOneMember2023-01-012023-12-310000891478san:SantanderBankNationalAssociationMembercountry:USsrt:NorthAmericaMembersan:BaseScenarioMember2024-01-012024-12-310000891478san:SantanderBankNationalAssociationMembercountry:USsrt:NorthAmericaMembersan:BaseScenarioMember2023-01-012023-12-310000891478san:SantanderBankNationalAssociationMembercountry:USsrt:NorthAmericaMembersan:OptimisticScenarioMember2024-01-012024-12-310000891478san:SantanderBankNationalAssociationMembercountry:USsrt:NorthAmericaMembersan:OptimisticScenarioMember2023-01-012023-12-310000891478san:SantanderBankNationalAssociationMembersan:HomePurchaseLoansMembercountry:USsrt:NorthAmericaMember2025-12-310000891478san:SantanderBankNationalAssociationMemberifrs-full:CorporateLoansMembercountry:USsrt:NorthAmericaMember2025-12-310000891478san:SantanderBankNationalAssociationMembersan:AutoMembercountry:USsrt:NorthAmericaMember2025-12-310000891478san:SantanderBankNationalAssociationMembercountry:USsrt:NorthAmericaMemberifrs-full:TopOfRangeMember2025-01-012025-12-310000891478san:SantanderBankNationalAssociationMembercountry:USsrt:NorthAmericaMemberifrs-full:BottomOfRangeMember2025-01-012025-12-310000891478san:SantanderConsumerUSAHoldingsIncMembercountry:USsrt:NorthAmericaMember2025-12-310000891478san:SantanderConsumerUSAHoldingsIncMembercountry:USsrt:NorthAmericaMember2025-01-012025-12-310000891478san:SantanderConsumerUSAHoldingsIncMemberifrs-full:TwelvemonthExpectedCreditLossesMemberifrs-full:FinancialInstrumentsNotCreditimpairedMembercountry:USsrt:NorthAmericaMembersan:FromAAAToAAMember2025-12-310000891478san:SantanderConsumerUSAHoldingsIncMemberifrs-full:LifetimeExpectedCreditLossesMemberifrs-full:FinancialInstrumentsNotCreditimpairedMembercountry:USsrt:NorthAmericaMembersan:FromAAAToAAMember2025-12-310000891478san:SantanderConsumerUSAHoldingsIncMemberifrs-full:LifetimeExpectedCreditLossesMemberifrs-full:FinancialInstrumentsCreditimpairedMembercountry:USsrt:NorthAmericaMembersan:FromAAAToAAMember2025-12-310000891478san:SantanderConsumerUSAHoldingsIncMembercountry:USsan:FromAAAToAAMembersrt:NorthAmericaMember2025-12-310000891478san:SantanderConsumerUSAHoldingsIncMemberifrs-full:TwelvemonthExpectedCreditLossesMemberifrs-full:FinancialInstrumentsNotCreditimpairedMembercountry:USsrt:NorthAmericaMembersan:FromAToBBMember2025-12-310000891478san:SantanderConsumerUSAHoldingsIncMemberifrs-full:LifetimeExpectedCreditLossesMemberifrs-full:FinancialInstrumentsNotCreditimpairedMembercountry:USsrt:NorthAmericaMembersan:FromAToBBMember2025-12-310000891478san:SantanderConsumerUSAHoldingsIncMemberifrs-full:LifetimeExpectedCreditLossesMemberifrs-full:FinancialInstrumentsCreditimpairedMembercountry:USsrt:NorthAmericaMembersan:FromAToBBMember2025-12-310000891478san:SantanderConsumerUSAHoldingsIncMembercountry:USsan:FromAToBBMembersrt:NorthAmericaMember2025-12-310000891478san:SantanderConsumerUSAHoldingsIncMemberifrs-full:TwelvemonthExpectedCreditLossesMemberifrs-full:FinancialInstrumentsNotCreditimpairedMembercountry:USsrt:NorthAmericaMembersan:FromBBToBMember2025-12-310000891478san:SantanderConsumerUSAHoldingsIncMemberifrs-full:LifetimeExpectedCreditLossesMemberifrs-full:FinancialInstrumentsNotCreditimpairedMembercountry:USsrt:NorthAmericaMembersan:FromBBToBMember2025-12-310000891478san:SantanderConsumerUSAHoldingsIncMemberifrs-full:LifetimeExpectedCreditLossesMemberifrs-full:FinancialInstrumentsCreditimpairedMembercountry:USsrt:NorthAmericaMembersan:FromBBToBMember2025-12-310000891478san:SantanderConsumerUSAHoldingsIncMembercountry:USsan:FromBBToBMembersrt:NorthAmericaMember2025-12-310000891478san:SantanderConsumerUSAHoldingsIncMemberifrs-full:TwelvemonthExpectedCreditLossesMemberifrs-full:FinancialInstrumentsNotCreditimpairedMembercountry:USsrt:NorthAmericaMembersan:CCCAndBelowMember2025-12-310000891478san:SantanderConsumerUSAHoldingsIncMemberifrs-full:LifetimeExpectedCreditLossesMemberifrs-full:FinancialInstrumentsNotCreditimpairedMembercountry:USsrt:NorthAmericaMembersan:CCCAndBelowMember2025-12-310000891478san:SantanderConsumerUSAHoldingsIncMemberifrs-full:LifetimeExpectedCreditLossesMemberifrs-full:FinancialInstrumentsCreditimpairedMembercountry:USsrt:NorthAmericaMembersan:CCCAndBelowMember2025-12-310000891478san:SantanderConsumerUSAHoldingsIncMembercountry:USsan:CCCAndBelowMembersrt:NorthAmericaMember2025-12-310000891478san:SantanderConsumerUSAHoldingsIncMemberifrs-full:TwelvemonthExpectedCreditLossesMemberifrs-full:FinancialInstrumentsNotCreditimpairedMembercountry:USsrt:NorthAmericaMember2025-12-310000891478san:SantanderConsumerUSAHoldingsIncMemberifrs-full:LifetimeExpectedCreditLossesMemberifrs-full:FinancialInstrumentsNotCreditimpairedMembercountry:USsrt:NorthAmericaMember2025-12-310000891478san:SantanderConsumerUSAHoldingsIncMemberifrs-full:LifetimeExpectedCreditLossesMemberifrs-full:FinancialInstrumentsCreditimpairedMembercountry:USsrt:NorthAmericaMember2025-12-310000891478ifrs-full:AccumulatedImpairmentMembersan:SantanderConsumerUSAHoldingsIncMemberifrs-full:TwelvemonthExpectedCreditLossesMembersan:FinancialAssetsAtAmortisedCostAndFinancialAssetsAtFairValueThroughOtherComprehensiveIncomeCategoryMembersan:LoansAndAdvancesCustomersMemberifrs-full:FinancialInstrumentsNotCreditimpairedMembercountry:USsrt:NorthAmericaMember2025-12-310000891478ifrs-full:AccumulatedImpairmentMembersan:SantanderConsumerUSAHoldingsIncMemberifrs-full:LifetimeExpectedCreditLossesMembersan:FinancialAssetsAtAmortisedCostAndFinancialAssetsAtFairValueThroughOtherComprehensiveIncomeCategoryMembersan:LoansAndAdvancesCustomersMemberifrs-full:FinancialInstrumentsNotCreditimpairedMembercountry:USsrt:NorthAmericaMember2025-12-310000891478ifrs-full:AccumulatedImpairmentMembersan:SantanderConsumerUSAHoldingsIncMemberifrs-full:LifetimeExpectedCreditLossesMembersan:FinancialAssetsAtAmortisedCostAndFinancialAssetsAtFairValueThroughOtherComprehensiveIncomeCategoryMembersan:LoansAndAdvancesCustomersMemberifrs-full:FinancialInstrumentsCreditimpairedMembercountry:USsrt:NorthAmericaMember2025-12-310000891478ifrs-full:AccumulatedImpairmentMembersan:SantanderConsumerUSAHoldingsIncMembersan:FinancialAssetsAtAmortisedCostAndFinancialAssetsAtFairValueThroughOtherComprehensiveIncomeCategoryMembersan:LoansAndAdvancesCustomersMembercountry:USsrt:NorthAmericaMember2025-12-310000891478san:SantanderConsumerUSAHoldingsIncMemberifrs-full:TwelvemonthExpectedCreditLossesMemberifrs-full:FinancialInstrumentsNotCreditimpairedMembercountry:USsrt:NorthAmericaMembersan:FromAAAToAAMember2024-12-310000891478san:SantanderConsumerUSAHoldingsIncMemberifrs-full:LifetimeExpectedCreditLossesMemberifrs-full:FinancialInstrumentsNotCreditimpairedMembercountry:USsrt:NorthAmericaMembersan:FromAAAToAAMember2024-12-310000891478san:SantanderConsumerUSAHoldingsIncMemberifrs-full:LifetimeExpectedCreditLossesMemberifrs-full:FinancialInstrumentsCreditimpairedMembercountry:USsrt:NorthAmericaMembersan:FromAAAToAAMember2024-12-310000891478san:SantanderConsumerUSAHoldingsIncMembercountry:USsan:FromAAAToAAMembersrt:NorthAmericaMember2024-12-310000891478san:SantanderConsumerUSAHoldingsIncMemberifrs-full:TwelvemonthExpectedCreditLossesMemberifrs-full:FinancialInstrumentsNotCreditimpairedMembercountry:USsrt:NorthAmericaMembersan:FromAToBBMember2024-12-310000891478san:SantanderConsumerUSAHoldingsIncMemberifrs-full:LifetimeExpectedCreditLossesMemberifrs-full:FinancialInstrumentsNotCreditimpairedMembercountry:USsrt:NorthAmericaMembersan:FromAToBBMember2024-12-310000891478san:SantanderConsumerUSAHoldingsIncMemberifrs-full:LifetimeExpectedCreditLossesMemberifrs-full:FinancialInstrumentsCreditimpairedMembercountry:USsrt:NorthAmericaMembersan:FromAToBBMember2024-12-310000891478san:SantanderConsumerUSAHoldingsIncMembercountry:USsan:FromAToBBMembersrt:NorthAmericaMember2024-12-310000891478san:SantanderConsumerUSAHoldingsIncMemberifrs-full:TwelvemonthExpectedCreditLossesMemberifrs-full:FinancialInstrumentsNotCreditimpairedMembercountry:USsrt:NorthAmericaMembersan:FromBBToBMember2024-12-310000891478san:SantanderConsumerUSAHoldingsIncMemberifrs-full:LifetimeExpectedCreditLossesMemberifrs-full:FinancialInstrumentsNotCreditimpairedMembercountry:USsrt:NorthAmericaMembersan:FromBBToBMember2024-12-310000891478san:SantanderConsumerUSAHoldingsIncMemberifrs-full:LifetimeExpectedCreditLossesMemberifrs-full:FinancialInstrumentsCreditimpairedMembercountry:USsrt:NorthAmericaMembersan:FromBBToBMember2024-12-310000891478san:SantanderConsumerUSAHoldingsIncMembercountry:USsan:FromBBToBMembersrt:NorthAmericaMember2024-12-310000891478san:SantanderConsumerUSAHoldingsIncMemberifrs-full:TwelvemonthExpectedCreditLossesMemberifrs-full:FinancialInstrumentsNotCreditimpairedMembercountry:USsrt:NorthAmericaMembersan:CCCAndBelowMember2024-12-310000891478san:SantanderConsumerUSAHoldingsIncMemberifrs-full:LifetimeExpectedCreditLossesMemberifrs-full:FinancialInstrumentsNotCreditimpairedMembercountry:USsrt:NorthAmericaMembersan:CCCAndBelowMember2024-12-310000891478san:SantanderConsumerUSAHoldingsIncMemberifrs-full:LifetimeExpectedCreditLossesMemberifrs-full:FinancialInstrumentsCreditimpairedMembercountry:USsrt:NorthAmericaMembersan:CCCAndBelowMember2024-12-310000891478san:SantanderConsumerUSAHoldingsIncMembercountry:USsan:CCCAndBelowMembersrt:NorthAmericaMember2024-12-310000891478san:SantanderConsumerUSAHoldingsIncMemberifrs-full:TwelvemonthExpectedCreditLossesMemberifrs-full:FinancialInstrumentsNotCreditimpairedMembercountry:USsrt:NorthAmericaMember2024-12-310000891478san:SantanderConsumerUSAHoldingsIncMemberifrs-full:LifetimeExpectedCreditLossesMemberifrs-full:FinancialInstrumentsNotCreditimpairedMembercountry:USsrt:NorthAmericaMember2024-12-310000891478san:SantanderConsumerUSAHoldingsIncMemberifrs-full:LifetimeExpectedCreditLossesMemberifrs-full:FinancialInstrumentsCreditimpairedMembercountry:USsrt:NorthAmericaMember2024-12-310000891478san:SantanderConsumerUSAHoldingsIncMembercountry:USsrt:NorthAmericaMember2024-12-310000891478ifrs-full:AccumulatedImpairmentMembersan:SantanderConsumerUSAHoldingsIncMemberifrs-full:TwelvemonthExpectedCreditLossesMembersan:FinancialAssetsAtAmortisedCostAndFinancialAssetsAtFairValueThroughOtherComprehensiveIncomeCategoryMembersan:LoansAndAdvancesCustomersMemberifrs-full:FinancialInstrumentsNotCreditimpairedMembercountry:USsrt:NorthAmericaMember2024-12-310000891478ifrs-full:AccumulatedImpairmentMembersan:SantanderConsumerUSAHoldingsIncMemberifrs-full:LifetimeExpectedCreditLossesMembersan:FinancialAssetsAtAmortisedCostAndFinancialAssetsAtFairValueThroughOtherComprehensiveIncomeCategoryMembersan:LoansAndAdvancesCustomersMemberifrs-full:FinancialInstrumentsNotCreditimpairedMembercountry:USsrt:NorthAmericaMember2024-12-310000891478ifrs-full:AccumulatedImpairmentMembersan:SantanderConsumerUSAHoldingsIncMemberifrs-full:LifetimeExpectedCreditLossesMembersan:FinancialAssetsAtAmortisedCostAndFinancialAssetsAtFairValueThroughOtherComprehensiveIncomeCategoryMembersan:LoansAndAdvancesCustomersMemberifrs-full:FinancialInstrumentsCreditimpairedMembercountry:USsrt:NorthAmericaMember2024-12-310000891478ifrs-full:AccumulatedImpairmentMembersan:SantanderConsumerUSAHoldingsIncMembersan:FinancialAssetsAtAmortisedCostAndFinancialAssetsAtFairValueThroughOtherComprehensiveIncomeCategoryMembersan:LoansAndAdvancesCustomersMembercountry:USsrt:NorthAmericaMember2024-12-310000891478san:SantanderConsumerUSAHoldingsIncMemberifrs-full:TwelvemonthExpectedCreditLossesMemberifrs-full:FinancialInstrumentsNotCreditimpairedMembercountry:USsrt:NorthAmericaMembersan:FromAAAToAAMember2023-12-310000891478san:SantanderConsumerUSAHoldingsIncMemberifrs-full:LifetimeExpectedCreditLossesMemberifrs-full:FinancialInstrumentsNotCreditimpairedMembercountry:USsrt:NorthAmericaMembersan:FromAAAToAAMember2023-12-310000891478san:SantanderConsumerUSAHoldingsIncMemberifrs-full:LifetimeExpectedCreditLossesMemberifrs-full:FinancialInstrumentsCreditimpairedMembercountry:USsrt:NorthAmericaMembersan:FromAAAToAAMember2023-12-310000891478san:SantanderConsumerUSAHoldingsIncMembercountry:USsan:FromAAAToAAMembersrt:NorthAmericaMember2023-12-310000891478san:SantanderConsumerUSAHoldingsIncMemberifrs-full:TwelvemonthExpectedCreditLossesMemberifrs-full:FinancialInstrumentsNotCreditimpairedMembercountry:USsrt:NorthAmericaMembersan:FromAToBBMember2023-12-310000891478san:SantanderConsumerUSAHoldingsIncMemberifrs-full:LifetimeExpectedCreditLossesMemberifrs-full:FinancialInstrumentsNotCreditimpairedMembercountry:USsrt:NorthAmericaMembersan:FromAToBBMember2023-12-310000891478san:SantanderConsumerUSAHoldingsIncMemberifrs-full:LifetimeExpectedCreditLossesMemberifrs-full:FinancialInstrumentsCreditimpairedMembercountry:USsrt:NorthAmericaMembersan:FromAToBBMember2023-12-310000891478san:SantanderConsumerUSAHoldingsIncMembercountry:USsan:FromAToBBMembersrt:NorthAmericaMember2023-12-310000891478san:SantanderConsumerUSAHoldingsIncMemberifrs-full:TwelvemonthExpectedCreditLossesMemberifrs-full:FinancialInstrumentsNotCreditimpairedMembercountry:USsrt:NorthAmericaMembersan:FromBBToBMember2023-12-310000891478san:SantanderConsumerUSAHoldingsIncMemberifrs-full:LifetimeExpectedCreditLossesMemberifrs-full:FinancialInstrumentsNotCreditimpairedMembercountry:USsrt:NorthAmericaMembersan:FromBBToBMember2023-12-310000891478san:SantanderConsumerUSAHoldingsIncMemberifrs-full:LifetimeExpectedCreditLossesMemberifrs-full:FinancialInstrumentsCreditimpairedMembercountry:USsrt:NorthAmericaMembersan:FromBBToBMember2023-12-310000891478san:SantanderConsumerUSAHoldingsIncMembercountry:USsan:FromBBToBMembersrt:NorthAmericaMember2023-12-310000891478san:SantanderConsumerUSAHoldingsIncMemberifrs-full:TwelvemonthExpectedCreditLossesMemberifrs-full:FinancialInstrumentsNotCreditimpairedMembercountry:USsrt:NorthAmericaMembersan:CCCAndBelowMember2023-12-310000891478san:SantanderConsumerUSAHoldingsIncMemberifrs-full:LifetimeExpectedCreditLossesMemberifrs-full:FinancialInstrumentsNotCreditimpairedMembercountry:USsrt:NorthAmericaMembersan:CCCAndBelowMember2023-12-310000891478san:SantanderConsumerUSAHoldingsIncMemberifrs-full:LifetimeExpectedCreditLossesMemberifrs-full:FinancialInstrumentsCreditimpairedMembercountry:USsrt:NorthAmericaMembersan:CCCAndBelowMember2023-12-310000891478san:SantanderConsumerUSAHoldingsIncMembercountry:USsan:CCCAndBelowMembersrt:NorthAmericaMember2023-12-310000891478san:SantanderConsumerUSAHoldingsIncMemberifrs-full:TwelvemonthExpectedCreditLossesMemberifrs-full:FinancialInstrumentsNotCreditimpairedMembercountry:USsrt:NorthAmericaMember2023-12-310000891478san:SantanderConsumerUSAHoldingsIncMemberifrs-full:LifetimeExpectedCreditLossesMemberifrs-full:FinancialInstrumentsNotCreditimpairedMembercountry:USsrt:NorthAmericaMember2023-12-310000891478san:SantanderConsumerUSAHoldingsIncMemberifrs-full:LifetimeExpectedCreditLossesMemberifrs-full:FinancialInstrumentsCreditimpairedMembercountry:USsrt:NorthAmericaMember2023-12-310000891478san:SantanderConsumerUSAHoldingsIncMembercountry:USsrt:NorthAmericaMember2023-12-310000891478ifrs-full:AccumulatedImpairmentMembersan:SantanderConsumerUSAHoldingsIncMemberifrs-full:TwelvemonthExpectedCreditLossesMembersan:FinancialAssetsAtAmortisedCostAndFinancialAssetsAtFairValueThroughOtherComprehensiveIncomeCategoryMembersan:LoansAndAdvancesCustomersMemberifrs-full:FinancialInstrumentsNotCreditimpairedMembercountry:USsrt:NorthAmericaMember2023-12-310000891478ifrs-full:AccumulatedImpairmentMembersan:SantanderConsumerUSAHoldingsIncMemberifrs-full:LifetimeExpectedCreditLossesMembersan:FinancialAssetsAtAmortisedCostAndFinancialAssetsAtFairValueThroughOtherComprehensiveIncomeCategoryMembersan:LoansAndAdvancesCustomersMemberifrs-full:FinancialInstrumentsNotCreditimpairedMembercountry:USsrt:NorthAmericaMember2023-12-310000891478ifrs-full:AccumulatedImpairmentMembersan:SantanderConsumerUSAHoldingsIncMemberifrs-full:LifetimeExpectedCreditLossesMembersan:FinancialAssetsAtAmortisedCostAndFinancialAssetsAtFairValueThroughOtherComprehensiveIncomeCategoryMembersan:LoansAndAdvancesCustomersMemberifrs-full:FinancialInstrumentsCreditimpairedMembercountry:USsrt:NorthAmericaMember2023-12-310000891478ifrs-full:AccumulatedImpairmentMembersan:SantanderConsumerUSAHoldingsIncMembersan:FinancialAssetsAtAmortisedCostAndFinancialAssetsAtFairValueThroughOtherComprehensiveIncomeCategoryMembersan:LoansAndAdvancesCustomersMembercountry:USsrt:NorthAmericaMember2023-12-310000891478san:SantanderConsumerUSAHoldingsIncMembercountry:USsrt:NorthAmericaMembersan:PessimisticScenarioTwoMember2025-01-012025-12-310000891478san:SantanderConsumerUSAHoldingsIncMembercountry:USsrt:NorthAmericaMembersan:PessimisticScenarioOneMember2025-01-012025-12-310000891478san:SantanderConsumerUSAHoldingsIncMembercountry:USsrt:NorthAmericaMembersan:BaseScenarioMember2025-01-012025-12-310000891478san:SantanderConsumerUSAHoldingsIncMembercountry:USsrt:NorthAmericaMembersan:OptimisticScenarioMember2025-01-012025-12-310000891478san:SantanderConsumerUSAHoldingsIncMembercountry:USsrt:NorthAmericaMembersan:PessimisticScenarioTwoMember2024-01-012024-12-310000891478san:SantanderConsumerUSAHoldingsIncMembercountry:USsrt:NorthAmericaMembersan:PessimisticScenarioTwoMember2023-01-012023-12-310000891478san:SantanderConsumerUSAHoldingsIncMembercountry:USsrt:NorthAmericaMembersan:PessimisticScenarioOneMember2024-01-012024-12-310000891478san:SantanderConsumerUSAHoldingsIncMembercountry:USsrt:NorthAmericaMembersan:PessimisticScenarioOneMember2023-01-012023-12-310000891478san:SantanderConsumerUSAHoldingsIncMembercountry:USsrt:NorthAmericaMembersan:BaseScenarioMember2024-01-012024-12-310000891478san:SantanderConsumerUSAHoldingsIncMembercountry:USsrt:NorthAmericaMembersan:BaseScenarioMember2023-01-012023-12-310000891478san:SantanderConsumerUSAHoldingsIncMembercountry:USsrt:NorthAmericaMembersan:OptimisticScenarioMember2024-01-012024-12-310000891478san:SantanderConsumerUSAHoldingsIncMembercountry:USsrt:NorthAmericaMembersan:OptimisticScenarioMember2023-01-012023-12-310000891478san:SantanderConsumerUSAHoldingsIncMembersan:SCAutoMembercountry:USsrt:NorthAmericaMember2025-12-310000891478srt:SouthAmericaMembercountry:BR2025-12-310000891478srt:SouthAmericaMembercountry:BR2025-01-012025-12-310000891478srt:SouthAmericaMembercountry:BR2024-12-310000891478san:RetailBankingSegmentMembercountry:BR2025-12-310000891478country:BRifrs-full:MortgagesMembersan:RetailBankingSegmentMember2025-12-310000891478country:BRsan:CreditCardsMembersan:RetailBankingSegmentMember2025-12-310000891478san:BancoSantanderBrasilSAMembercountry:BRsrt:SouthAmericaMember2025-12-310000891478san:BancoSantanderBrasilSAMemberifrs-full:TwelvemonthExpectedCreditLossesMemberifrs-full:FinancialInstrumentsNotCreditimpairedMembercountry:BRsrt:SouthAmericaMembersan:FromAAAToAAMember2025-12-310000891478san:BancoSantanderBrasilSAMemberifrs-full:LifetimeExpectedCreditLossesMemberifrs-full:FinancialInstrumentsNotCreditimpairedMembercountry:BRsrt:SouthAmericaMembersan:FromAAAToAAMember2025-12-310000891478san:BancoSantanderBrasilSAMemberifrs-full:LifetimeExpectedCreditLossesMemberifrs-full:FinancialInstrumentsCreditimpairedMembercountry:BRsrt:SouthAmericaMembersan:FromAAAToAAMember2025-12-310000891478san:BancoSantanderBrasilSAMembercountry:BRsan:FromAAAToAAMembersrt:SouthAmericaMember2025-12-310000891478san:BancoSantanderBrasilSAMemberifrs-full:TwelvemonthExpectedCreditLossesMemberifrs-full:FinancialInstrumentsNotCreditimpairedMembercountry:BRsrt:SouthAmericaMembersan:FromAToBBMember2025-12-310000891478san:BancoSantanderBrasilSAMemberifrs-full:LifetimeExpectedCreditLossesMemberifrs-full:FinancialInstrumentsNotCreditimpairedMembercountry:BRsrt:SouthAmericaMembersan:FromAToBBMember2025-12-310000891478san:BancoSantanderBrasilSAMemberifrs-full:LifetimeExpectedCreditLossesMemberifrs-full:FinancialInstrumentsCreditimpairedMembercountry:BRsrt:SouthAmericaMembersan:FromAToBBMember2025-12-310000891478san:BancoSantanderBrasilSAMembercountry:BRsan:FromAToBBMembersrt:SouthAmericaMember2025-12-310000891478san:BancoSantanderBrasilSAMemberifrs-full:TwelvemonthExpectedCreditLossesMemberifrs-full:FinancialInstrumentsNotCreditimpairedMembercountry:BRsrt:SouthAmericaMembersan:FromBBToBMember2025-12-310000891478san:BancoSantanderBrasilSAMemberifrs-full:LifetimeExpectedCreditLossesMemberifrs-full:FinancialInstrumentsNotCreditimpairedMembercountry:BRsrt:SouthAmericaMembersan:FromBBToBMember2025-12-310000891478san:BancoSantanderBrasilSAMemberifrs-full:LifetimeExpectedCreditLossesMemberifrs-full:FinancialInstrumentsCreditimpairedMembercountry:BRsrt:SouthAmericaMembersan:FromBBToBMember2025-12-310000891478san:BancoSantanderBrasilSAMembercountry:BRsan:FromBBToBMembersrt:SouthAmericaMember2025-12-310000891478san:BancoSantanderBrasilSAMemberifrs-full:TwelvemonthExpectedCreditLossesMemberifrs-full:FinancialInstrumentsNotCreditimpairedMembercountry:BRsrt:SouthAmericaMembersan:CCCAndBelowMember2025-12-310000891478san:BancoSantanderBrasilSAMemberifrs-full:LifetimeExpectedCreditLossesMemberifrs-full:FinancialInstrumentsNotCreditimpairedMembercountry:BRsrt:SouthAmericaMembersan:CCCAndBelowMember2025-12-310000891478san:BancoSantanderBrasilSAMemberifrs-full:LifetimeExpectedCreditLossesMemberifrs-full:FinancialInstrumentsCreditimpairedMembercountry:BRsrt:SouthAmericaMembersan:CCCAndBelowMember2025-12-310000891478san:BancoSantanderBrasilSAMembercountry:BRsan:CCCAndBelowMembersrt:SouthAmericaMember2025-12-310000891478san:BancoSantanderBrasilSAMemberifrs-full:TwelvemonthExpectedCreditLossesMemberifrs-full:FinancialInstrumentsNotCreditimpairedMembercountry:BRsrt:SouthAmericaMember2025-12-310000891478san:BancoSantanderBrasilSAMemberifrs-full:LifetimeExpectedCreditLossesMemberifrs-full:FinancialInstrumentsNotCreditimpairedMembercountry:BRsrt:SouthAmericaMember2025-12-310000891478san:BancoSantanderBrasilSAMemberifrs-full:LifetimeExpectedCreditLossesMemberifrs-full:FinancialInstrumentsCreditimpairedMembercountry:BRsrt:SouthAmericaMember2025-12-310000891478ifrs-full:AccumulatedImpairmentMembersan:BancoSantanderBrasilSAMemberifrs-full:TwelvemonthExpectedCreditLossesMembersan:FinancialAssetsAtAmortisedCostAndFinancialAssetsAtFairValueThroughOtherComprehensiveIncomeCategoryMembersan:LoansAndAdvancesCustomersMemberifrs-full:FinancialInstrumentsNotCreditimpairedMembercountry:BRsrt:SouthAmericaMember2025-12-310000891478ifrs-full:AccumulatedImpairmentMembersan:BancoSantanderBrasilSAMemberifrs-full:LifetimeExpectedCreditLossesMembersan:FinancialAssetsAtAmortisedCostAndFinancialAssetsAtFairValueThroughOtherComprehensiveIncomeCategoryMembersan:LoansAndAdvancesCustomersMemberifrs-full:FinancialInstrumentsNotCreditimpairedMembercountry:BRsrt:SouthAmericaMember2025-12-310000891478ifrs-full:AccumulatedImpairmentMembersan:BancoSantanderBrasilSAMemberifrs-full:LifetimeExpectedCreditLossesMembersan:FinancialAssetsAtAmortisedCostAndFinancialAssetsAtFairValueThroughOtherComprehensiveIncomeCategoryMembersan:LoansAndAdvancesCustomersMemberifrs-full:FinancialInstrumentsCreditimpairedMembercountry:BRsrt:SouthAmericaMember2025-12-310000891478ifrs-full:AccumulatedImpairmentMembersan:BancoSantanderBrasilSAMembersan:FinancialAssetsAtAmortisedCostAndFinancialAssetsAtFairValueThroughOtherComprehensiveIncomeCategoryMembersan:LoansAndAdvancesCustomersMembercountry:BRsrt:SouthAmericaMember2025-12-310000891478san:BancoSantanderBrasilSAMemberifrs-full:TwelvemonthExpectedCreditLossesMemberifrs-full:FinancialInstrumentsNotCreditimpairedMembercountry:BRsrt:SouthAmericaMembersan:FromAAAToAAMember2024-12-310000891478san:BancoSantanderBrasilSAMemberifrs-full:LifetimeExpectedCreditLossesMemberifrs-full:FinancialInstrumentsNotCreditimpairedMembercountry:BRsrt:SouthAmericaMembersan:FromAAAToAAMember2024-12-310000891478san:BancoSantanderBrasilSAMemberifrs-full:LifetimeExpectedCreditLossesMemberifrs-full:FinancialInstrumentsCreditimpairedMembercountry:BRsrt:SouthAmericaMembersan:FromAAAToAAMember2024-12-310000891478san:BancoSantanderBrasilSAMembercountry:BRsan:FromAAAToAAMembersrt:SouthAmericaMember2024-12-310000891478san:BancoSantanderBrasilSAMemberifrs-full:TwelvemonthExpectedCreditLossesMemberifrs-full:FinancialInstrumentsNotCreditimpairedMembercountry:BRsrt:SouthAmericaMembersan:FromAToBBMember2024-12-310000891478san:BancoSantanderBrasilSAMemberifrs-full:LifetimeExpectedCreditLossesMemberifrs-full:FinancialInstrumentsNotCreditimpairedMembercountry:BRsrt:SouthAmericaMembersan:FromAToBBMember2024-12-310000891478san:BancoSantanderBrasilSAMemberifrs-full:LifetimeExpectedCreditLossesMemberifrs-full:FinancialInstrumentsCreditimpairedMembercountry:BRsrt:SouthAmericaMembersan:FromAToBBMember2024-12-310000891478san:BancoSantanderBrasilSAMembercountry:BRsan:FromAToBBMembersrt:SouthAmericaMember2024-12-310000891478san:BancoSantanderBrasilSAMemberifrs-full:TwelvemonthExpectedCreditLossesMemberifrs-full:FinancialInstrumentsNotCreditimpairedMembercountry:BRsrt:SouthAmericaMembersan:FromBBToBMember2024-12-310000891478san:BancoSantanderBrasilSAMemberifrs-full:LifetimeExpectedCreditLossesMemberifrs-full:FinancialInstrumentsNotCreditimpairedMembercountry:BRsrt:SouthAmericaMembersan:FromBBToBMember2024-12-310000891478san:BancoSantanderBrasilSAMemberifrs-full:LifetimeExpectedCreditLossesMemberifrs-full:FinancialInstrumentsCreditimpairedMembercountry:BRsrt:SouthAmericaMembersan:FromBBToBMember2024-12-310000891478san:BancoSantanderBrasilSAMembercountry:BRsan:FromBBToBMembersrt:SouthAmericaMember2024-12-310000891478san:BancoSantanderBrasilSAMemberifrs-full:TwelvemonthExpectedCreditLossesMemberifrs-full:FinancialInstrumentsNotCreditimpairedMembercountry:BRsrt:SouthAmericaMembersan:CCCAndBelowMember2024-12-310000891478san:BancoSantanderBrasilSAMemberifrs-full:LifetimeExpectedCreditLossesMemberifrs-full:FinancialInstrumentsNotCreditimpairedMembercountry:BRsrt:SouthAmericaMembersan:CCCAndBelowMember2024-12-310000891478san:BancoSantanderBrasilSAMemberifrs-full:LifetimeExpectedCreditLossesMemberifrs-full:FinancialInstrumentsCreditimpairedMembercountry:BRsrt:SouthAmericaMembersan:CCCAndBelowMember2024-12-310000891478san:BancoSantanderBrasilSAMembercountry:BRsan:CCCAndBelowMembersrt:SouthAmericaMember2024-12-310000891478san:BancoSantanderBrasilSAMemberifrs-full:TwelvemonthExpectedCreditLossesMemberifrs-full:FinancialInstrumentsNotCreditimpairedMembercountry:BRsrt:SouthAmericaMember2024-12-310000891478san:BancoSantanderBrasilSAMemberifrs-full:LifetimeExpectedCreditLossesMemberifrs-full:FinancialInstrumentsNotCreditimpairedMembercountry:BRsrt:SouthAmericaMember2024-12-310000891478san:BancoSantanderBrasilSAMemberifrs-full:LifetimeExpectedCreditLossesMemberifrs-full:FinancialInstrumentsCreditimpairedMembercountry:BRsrt:SouthAmericaMember2024-12-310000891478san:BancoSantanderBrasilSAMembercountry:BRsrt:SouthAmericaMember2024-12-310000891478ifrs-full:AccumulatedImpairmentMembersan:BancoSantanderBrasilSAMemberifrs-full:TwelvemonthExpectedCreditLossesMembersan:FinancialAssetsAtAmortisedCostAndFinancialAssetsAtFairValueThroughOtherComprehensiveIncomeCategoryMembersan:LoansAndAdvancesCustomersMemberifrs-full:FinancialInstrumentsNotCreditimpairedMembercountry:BRsrt:SouthAmericaMember2024-12-310000891478ifrs-full:AccumulatedImpairmentMembersan:BancoSantanderBrasilSAMemberifrs-full:LifetimeExpectedCreditLossesMembersan:FinancialAssetsAtAmortisedCostAndFinancialAssetsAtFairValueThroughOtherComprehensiveIncomeCategoryMembersan:LoansAndAdvancesCustomersMemberifrs-full:FinancialInstrumentsNotCreditimpairedMembercountry:BRsrt:SouthAmericaMember2024-12-310000891478ifrs-full:AccumulatedImpairmentMembersan:BancoSantanderBrasilSAMemberifrs-full:LifetimeExpectedCreditLossesMembersan:FinancialAssetsAtAmortisedCostAndFinancialAssetsAtFairValueThroughOtherComprehensiveIncomeCategoryMembersan:LoansAndAdvancesCustomersMemberifrs-full:FinancialInstrumentsCreditimpairedMembercountry:BRsrt:SouthAmericaMember2024-12-310000891478ifrs-full:AccumulatedImpairmentMembersan:BancoSantanderBrasilSAMembersan:FinancialAssetsAtAmortisedCostAndFinancialAssetsAtFairValueThroughOtherComprehensiveIncomeCategoryMembersan:LoansAndAdvancesCustomersMembercountry:BRsrt:SouthAmericaMember2024-12-310000891478san:BancoSantanderBrasilSAMemberifrs-full:TwelvemonthExpectedCreditLossesMemberifrs-full:FinancialInstrumentsNotCreditimpairedMembercountry:BRsrt:SouthAmericaMembersan:FromAAAToAAMember2023-12-310000891478san:BancoSantanderBrasilSAMemberifrs-full:LifetimeExpectedCreditLossesMemberifrs-full:FinancialInstrumentsNotCreditimpairedMembercountry:BRsrt:SouthAmericaMembersan:FromAAAToAAMember2023-12-310000891478san:BancoSantanderBrasilSAMemberifrs-full:LifetimeExpectedCreditLossesMemberifrs-full:FinancialInstrumentsCreditimpairedMembercountry:BRsrt:SouthAmericaMembersan:FromAAAToAAMember2023-12-310000891478san:BancoSantanderBrasilSAMembercountry:BRsan:FromAAAToAAMembersrt:SouthAmericaMember2023-12-310000891478san:BancoSantanderBrasilSAMemberifrs-full:TwelvemonthExpectedCreditLossesMemberifrs-full:FinancialInstrumentsNotCreditimpairedMembercountry:BRsrt:SouthAmericaMembersan:FromAToBBMember2023-12-310000891478san:BancoSantanderBrasilSAMemberifrs-full:LifetimeExpectedCreditLossesMemberifrs-full:FinancialInstrumentsNotCreditimpairedMembercountry:BRsrt:SouthAmericaMembersan:FromAToBBMember2023-12-310000891478san:BancoSantanderBrasilSAMemberifrs-full:LifetimeExpectedCreditLossesMemberifrs-full:FinancialInstrumentsCreditimpairedMembercountry:BRsrt:SouthAmericaMembersan:FromAToBBMember2023-12-310000891478san:BancoSantanderBrasilSAMembercountry:BRsan:FromAToBBMembersrt:SouthAmericaMember2023-12-310000891478san:BancoSantanderBrasilSAMemberifrs-full:TwelvemonthExpectedCreditLossesMemberifrs-full:FinancialInstrumentsNotCreditimpairedMembercountry:BRsrt:SouthAmericaMembersan:FromBBToBMember2023-12-310000891478san:BancoSantanderBrasilSAMemberifrs-full:LifetimeExpectedCreditLossesMemberifrs-full:FinancialInstrumentsNotCreditimpairedMembercountry:BRsrt:SouthAmericaMembersan:FromBBToBMember2023-12-310000891478san:BancoSantanderBrasilSAMemberifrs-full:LifetimeExpectedCreditLossesMemberifrs-full:FinancialInstrumentsCreditimpairedMembercountry:BRsrt:SouthAmericaMembersan:FromBBToBMember2023-12-310000891478san:BancoSantanderBrasilSAMembercountry:BRsan:FromBBToBMembersrt:SouthAmericaMember2023-12-310000891478san:BancoSantanderBrasilSAMemberifrs-full:TwelvemonthExpectedCreditLossesMemberifrs-full:FinancialInstrumentsNotCreditimpairedMembercountry:BRsrt:SouthAmericaMembersan:CCCAndBelowMember2023-12-310000891478san:BancoSantanderBrasilSAMemberifrs-full:LifetimeExpectedCreditLossesMemberifrs-full:FinancialInstrumentsNotCreditimpairedMembercountry:BRsrt:SouthAmericaMembersan:CCCAndBelowMember2023-12-310000891478san:BancoSantanderBrasilSAMemberifrs-full:LifetimeExpectedCreditLossesMemberifrs-full:FinancialInstrumentsCreditimpairedMembercountry:BRsrt:SouthAmericaMembersan:CCCAndBelowMember2023-12-310000891478san:BancoSantanderBrasilSAMembercountry:BRsan:CCCAndBelowMembersrt:SouthAmericaMember2023-12-310000891478san:BancoSantanderBrasilSAMemberifrs-full:TwelvemonthExpectedCreditLossesMemberifrs-full:FinancialInstrumentsNotCreditimpairedMembercountry:BRsrt:SouthAmericaMember2023-12-310000891478san:BancoSantanderBrasilSAMemberifrs-full:LifetimeExpectedCreditLossesMemberifrs-full:FinancialInstrumentsNotCreditimpairedMembercountry:BRsrt:SouthAmericaMember2023-12-310000891478san:BancoSantanderBrasilSAMemberifrs-full:LifetimeExpectedCreditLossesMemberifrs-full:FinancialInstrumentsCreditimpairedMembercountry:BRsrt:SouthAmericaMember2023-12-310000891478san:BancoSantanderBrasilSAMembercountry:BRsrt:SouthAmericaMember2023-12-310000891478ifrs-full:AccumulatedImpairmentMembersan:BancoSantanderBrasilSAMemberifrs-full:TwelvemonthExpectedCreditLossesMembersan:FinancialAssetsAtAmortisedCostAndFinancialAssetsAtFairValueThroughOtherComprehensiveIncomeCategoryMembersan:LoansAndAdvancesCustomersMemberifrs-full:FinancialInstrumentsNotCreditimpairedMembercountry:BRsrt:SouthAmericaMember2023-12-310000891478ifrs-full:AccumulatedImpairmentMembersan:BancoSantanderBrasilSAMemberifrs-full:LifetimeExpectedCreditLossesMembersan:FinancialAssetsAtAmortisedCostAndFinancialAssetsAtFairValueThroughOtherComprehensiveIncomeCategoryMembersan:LoansAndAdvancesCustomersMemberifrs-full:FinancialInstrumentsNotCreditimpairedMembercountry:BRsrt:SouthAmericaMember2023-12-310000891478ifrs-full:AccumulatedImpairmentMembersan:BancoSantanderBrasilSAMemberifrs-full:LifetimeExpectedCreditLossesMembersan:FinancialAssetsAtAmortisedCostAndFinancialAssetsAtFairValueThroughOtherComprehensiveIncomeCategoryMembersan:LoansAndAdvancesCustomersMemberifrs-full:FinancialInstrumentsCreditimpairedMembercountry:BRsrt:SouthAmericaMember2023-12-310000891478ifrs-full:AccumulatedImpairmentMembersan:BancoSantanderBrasilSAMembersan:FinancialAssetsAtAmortisedCostAndFinancialAssetsAtFairValueThroughOtherComprehensiveIncomeCategoryMembersan:LoansAndAdvancesCustomersMembercountry:BRsrt:SouthAmericaMember2023-12-310000891478san:BancoSantanderBrasilSAMembercountry:BRsrt:SouthAmericaMembersan:PessimisticScenarioMember2025-01-012025-12-310000891478san:BancoSantanderBrasilSAMembercountry:BRsrt:SouthAmericaMembersan:BaseScenarioMember2025-01-012025-12-310000891478san:BancoSantanderBrasilSAMembercountry:BRsrt:SouthAmericaMembersan:OptimisticScenarioMember2025-01-012025-12-310000891478san:BancoSantanderBrasilSAMembercountry:BRsrt:SouthAmericaMembersan:PessimisticScenarioMember2024-01-012024-12-310000891478san:BancoSantanderBrasilSAMembercountry:BRsrt:SouthAmericaMembersan:PessimisticScenarioMember2023-01-012023-12-310000891478san:BancoSantanderBrasilSAMembercountry:BRsrt:SouthAmericaMembersan:BaseScenarioMember2024-01-012024-12-310000891478san:BancoSantanderBrasilSAMembercountry:BRsrt:SouthAmericaMembersan:BaseScenarioMember2023-01-012023-12-310000891478san:BancoSantanderBrasilSAMembercountry:BRsrt:SouthAmericaMembersan:OptimisticScenarioMember2024-01-012024-12-310000891478san:BancoSantanderBrasilSAMembercountry:BRsrt:SouthAmericaMembersan:OptimisticScenarioMember2023-01-012023-12-310000891478san:BancoSantanderBrasilSAMemberifrs-full:ConsumerLoansMembercountry:BRsrt:SouthAmericaMember2025-12-310000891478san:BancoSantanderBrasilSAMembersan:LoansToSmallAndMediumSizedEnterprisesMembercountry:BRsrt:SouthAmericaMember2025-12-310000891478san:BancoSantanderBrasilSAMembersan:LoansToOtherEntitiesMembercountry:BRsrt:SouthAmericaMember2025-12-310000891478san:LargeExposureCustomersMemberifrs-full:CreditRiskMember2025-01-012025-12-310000891478san:LargeExposureCustomersMember2025-01-012025-12-310000891478san:LargeExposureCustomersMemberifrs-full:CreditRiskMember2025-12-310000891478san:LargeExposureCustomersTopFortyMember2025-01-012025-12-310000891478san:LargeExposureCustomersTopFortyMemberifrs-full:CreditRiskMember2025-12-310000891478ifrs-full:CreditRiskMembersan:CentralBanksAndCreditInstitutionsMember2025-12-310000891478ifrs-full:CountryOfDomicileMemberifrs-full:CreditRiskMembersan:CentralBanksAndCreditInstitutionsMember2025-12-310000891478san:OtherEuropeanCountriesMemberifrs-full:CreditRiskMembersan:CentralBanksAndCreditInstitutionsMember2025-12-310000891478srt:AmericasMemberifrs-full:CreditRiskMembersan:CentralBanksAndCreditInstitutionsMember2025-12-310000891478san:RestOfWorldMemberifrs-full:CreditRiskMembersan:CentralBanksAndCreditInstitutionsMember2025-12-310000891478ifrs-full:CreditRiskMembersan:PublicSectorMember2025-12-310000891478ifrs-full:CountryOfDomicileMemberifrs-full:CreditRiskMembersan:PublicSectorMember2025-12-310000891478san:OtherEuropeanCountriesMemberifrs-full:CreditRiskMembersan:PublicSectorMember2025-12-310000891478srt:AmericasMemberifrs-full:CreditRiskMembersan:PublicSectorMember2025-12-310000891478san:RestOfWorldMemberifrs-full:CreditRiskMembersan:PublicSectorMember2025-12-310000891478ifrs-full:CreditRiskMembersan:CentralGovernmentMember2025-12-310000891478ifrs-full:CountryOfDomicileMemberifrs-full:CreditRiskMembersan:CentralGovernmentMember2025-12-310000891478san:OtherEuropeanCountriesMemberifrs-full:CreditRiskMembersan:CentralGovernmentMember2025-12-310000891478srt:AmericasMemberifrs-full:CreditRiskMembersan:CentralGovernmentMember2025-12-310000891478san:RestOfWorldMemberifrs-full:CreditRiskMembersan:CentralGovernmentMember2025-12-310000891478ifrs-full:CreditRiskMembersan:OtherCentralGovernmentMember2025-12-310000891478ifrs-full:CountryOfDomicileMemberifrs-full:CreditRiskMembersan:OtherCentralGovernmentMember2025-12-310000891478san:OtherEuropeanCountriesMemberifrs-full:CreditRiskMembersan:OtherCentralGovernmentMember2025-12-310000891478srt:AmericasMemberifrs-full:CreditRiskMembersan:OtherCentralGovernmentMember2025-12-310000891478san:RestOfWorldMemberifrs-full:CreditRiskMembersan:OtherCentralGovernmentMember2025-12-310000891478ifrs-full:CreditRiskMembersan:OtherFinancialInstitutionsMember2025-12-310000891478ifrs-full:CountryOfDomicileMemberifrs-full:CreditRiskMembersan:OtherFinancialInstitutionsMember2025-12-310000891478san:OtherEuropeanCountriesMemberifrs-full:CreditRiskMembersan:OtherFinancialInstitutionsMember2025-12-310000891478srt:AmericasMemberifrs-full:CreditRiskMembersan:OtherFinancialInstitutionsMember2025-12-310000891478san:RestOfWorldMemberifrs-full:CreditRiskMembersan:OtherFinancialInstitutionsMember2025-12-310000891478ifrs-full:CreditRiskMembersan:NonFinancialCorporationsAndIndividualEntrepreneursMember2025-12-310000891478ifrs-full:CountryOfDomicileMemberifrs-full:CreditRiskMembersan:NonFinancialCorporationsAndIndividualEntrepreneursMember2025-12-310000891478san:OtherEuropeanCountriesMemberifrs-full:CreditRiskMembersan:NonFinancialCorporationsAndIndividualEntrepreneursMember2025-12-310000891478srt:AmericasMemberifrs-full:CreditRiskMembersan:NonFinancialCorporationsAndIndividualEntrepreneursMember2025-12-310000891478san:RestOfWorldMemberifrs-full:CreditRiskMembersan:NonFinancialCorporationsAndIndividualEntrepreneursMember2025-12-310000891478ifrs-full:CreditRiskMembersan:ConstructionAndPropertyDevelopmentLoansMember2025-12-310000891478ifrs-full:CountryOfDomicileMemberifrs-full:CreditRiskMembersan:ConstructionAndPropertyDevelopmentLoansMember2025-12-310000891478san:OtherEuropeanCountriesMemberifrs-full:CreditRiskMembersan:ConstructionAndPropertyDevelopmentLoansMember2025-12-310000891478srt:AmericasMemberifrs-full:CreditRiskMembersan:ConstructionAndPropertyDevelopmentLoansMember2025-12-310000891478san:RestOfWorldMemberifrs-full:CreditRiskMembersan:ConstructionAndPropertyDevelopmentLoansMember2025-12-310000891478ifrs-full:CreditRiskMembersan:CivilEngineeringConstructionLoansMember2025-12-310000891478ifrs-full:CountryOfDomicileMemberifrs-full:CreditRiskMembersan:CivilEngineeringConstructionLoansMember2025-12-310000891478san:OtherEuropeanCountriesMemberifrs-full:CreditRiskMembersan:CivilEngineeringConstructionLoansMember2025-12-310000891478srt:AmericasMemberifrs-full:CreditRiskMembersan:CivilEngineeringConstructionLoansMember2025-12-310000891478san:RestOfWorldMemberifrs-full:CreditRiskMembersan:CivilEngineeringConstructionLoansMember2025-12-310000891478ifrs-full:CreditRiskMembersan:CorporateLoansToLargeCompaniesMember2025-12-310000891478ifrs-full:CountryOfDomicileMemberifrs-full:CreditRiskMembersan:CorporateLoansToLargeCompaniesMember2025-12-310000891478san:OtherEuropeanCountriesMemberifrs-full:CreditRiskMembersan:CorporateLoansToLargeCompaniesMember2025-12-310000891478srt:AmericasMemberifrs-full:CreditRiskMembersan:CorporateLoansToLargeCompaniesMember2025-12-310000891478san:RestOfWorldMemberifrs-full:CreditRiskMembersan:CorporateLoansToLargeCompaniesMember2025-12-310000891478ifrs-full:CreditRiskMembersan:CorporateLoansToSMEsAndIndividualEntrepreneursMember2025-12-310000891478ifrs-full:CountryOfDomicileMemberifrs-full:CreditRiskMembersan:CorporateLoansToSMEsAndIndividualEntrepreneursMember2025-12-310000891478san:OtherEuropeanCountriesMemberifrs-full:CreditRiskMembersan:CorporateLoansToSMEsAndIndividualEntrepreneursMember2025-12-310000891478srt:AmericasMemberifrs-full:CreditRiskMembersan:CorporateLoansToSMEsAndIndividualEntrepreneursMember2025-12-310000891478san:RestOfWorldMemberifrs-full:CreditRiskMembersan:CorporateLoansToSMEsAndIndividualEntrepreneursMember2025-12-310000891478ifrs-full:CreditRiskMembersan:HouseholdsOtherMember2025-12-310000891478ifrs-full:CountryOfDomicileMemberifrs-full:CreditRiskMembersan:HouseholdsOtherMember2025-12-310000891478san:OtherEuropeanCountriesMemberifrs-full:CreditRiskMembersan:HouseholdsOtherMember2025-12-310000891478srt:AmericasMemberifrs-full:CreditRiskMembersan:HouseholdsOtherMember2025-12-310000891478san:RestOfWorldMemberifrs-full:CreditRiskMembersan:HouseholdsOtherMember2025-12-310000891478ifrs-full:CreditRiskMembersan:ResidentialLoansMember2025-12-310000891478ifrs-full:CountryOfDomicileMemberifrs-full:CreditRiskMembersan:ResidentialLoansMember2025-12-310000891478san:OtherEuropeanCountriesMemberifrs-full:CreditRiskMembersan:ResidentialLoansMember2025-12-310000891478srt:AmericasMemberifrs-full:CreditRiskMembersan:ResidentialLoansMember2025-12-310000891478san:RestOfWorldMemberifrs-full:CreditRiskMembersan:ResidentialLoansMember2025-12-310000891478ifrs-full:CreditRiskMemberifrs-full:ConsumerLoansMember2025-12-310000891478ifrs-full:CountryOfDomicileMemberifrs-full:CreditRiskMemberifrs-full:ConsumerLoansMember2025-12-310000891478san:OtherEuropeanCountriesMemberifrs-full:CreditRiskMemberifrs-full:ConsumerLoansMember2025-12-310000891478srt:AmericasMemberifrs-full:CreditRiskMemberifrs-full:ConsumerLoansMember2025-12-310000891478san:RestOfWorldMemberifrs-full:CreditRiskMemberifrs-full:ConsumerLoansMember2025-12-310000891478ifrs-full:CreditRiskMembersan:OtherPurposesLoansMember2025-12-310000891478ifrs-full:CountryOfDomicileMemberifrs-full:CreditRiskMembersan:OtherPurposesLoansMember2025-12-310000891478san:OtherEuropeanCountriesMemberifrs-full:CreditRiskMembersan:OtherPurposesLoansMember2025-12-310000891478srt:AmericasMemberifrs-full:CreditRiskMembersan:OtherPurposesLoansMember2025-12-310000891478san:RestOfWorldMemberifrs-full:CreditRiskMembersan:OtherPurposesLoansMember2025-12-310000891478ifrs-full:CreditRiskMembersan:OtherEuropeanCountriesMember2025-12-310000891478ifrs-full:CreditRiskMembersrt:AmericasMember2025-12-310000891478ifrs-full:CreditRiskMembersan:RestOfWorldMember2025-12-310000891478san:LocalSovereignOtherThanOfficialCurrencyRiskMember2025-12-310000891478san:LocalSovereignOtherThanOfficialCurrencyRiskMember2025-01-012025-12-310000891478san:NonLocalSovereignCrossBorderRiskMember2025-12-310000891478san:NonLocalSovereignCrossBorderRiskMember2025-01-012025-12-310000891478san:SovereignRiskMembersan:IFRSStandardPoorsAAARatingMember2025-12-310000891478san:SovereignRiskMembersan:IFRSStandardPoorsAAARatingMember2024-12-310000891478san:SovereignRiskMembersan:IFRSStandardPoorsAAARatingMember2023-12-310000891478san:SovereignRiskMembersan:IFRSStandardPoorsAARatingMember2025-12-310000891478san:SovereignRiskMembersan:IFRSStandardPoorsAARatingMember2024-12-310000891478san:SovereignRiskMembersan:IFRSStandardPoorsAARatingMember2023-12-310000891478san:SovereignRiskMembersan:IFRSStandardPoorsARatingMember2025-12-310000891478san:SovereignRiskMembersan:IFRSStandardPoorsARatingMember2024-12-310000891478san:SovereignRiskMembersan:IFRSStandardPoorsARatingMember2023-12-310000891478san:SovereignRiskMembersan:IFRSStandardPoorsBBBRatingMember2025-12-310000891478san:SovereignRiskMembersan:IFRSStandardPoorsBBBRatingMember2024-12-310000891478san:SovereignRiskMembersan:IFRSStandardPoorsBBBRatingMember2023-12-310000891478san:SovereignRiskMembersan:LessThanBBBRatingMember2025-12-310000891478san:SovereignRiskMembersan:LessThanBBBRatingMember2024-12-310000891478san:SovereignRiskMembersan:LessThanBBBRatingMember2023-12-310000891478san:FinancialAssetsHeldForTradingAndFinancialAssetsDesignatedAtFairValueThroughProfitOrLossMemberifrs-full:CountryOfDomicileMembersan:SovereignRiskMember2025-12-310000891478ifrs-full:FinancialAssetsAtFairValueThroughOtherComprehensiveIncomeCategoryMemberifrs-full:CountryOfDomicileMembersan:SovereignRiskMember2025-12-310000891478ifrs-full:FinancialAssetsAtAmortisedCostCategoryMemberifrs-full:CountryOfDomicileMembersan:SovereignRiskMember2025-12-310000891478san:NonTradingFinancialAssetsAtFairValueThroughProfitOrLossMandatorilyMeasuredAtFairValueCategoryMemberifrs-full:CountryOfDomicileMembersan:SovereignRiskMember2025-12-310000891478san:SovereignRiskMemberifrs-full:CountryOfDomicileMember2025-12-310000891478san:SovereignRiskMemberifrs-full:CountryOfDomicileMember2024-12-310000891478san:FinancialAssetsHeldForTradingAndFinancialAssetsDesignatedAtFairValueThroughProfitOrLossMembercountry:PTsan:SovereignRiskMember2025-12-310000891478ifrs-full:FinancialAssetsAtFairValueThroughOtherComprehensiveIncomeCategoryMembercountry:PTsan:SovereignRiskMember2025-12-310000891478ifrs-full:FinancialAssetsAtAmortisedCostCategoryMembercountry:PTsan:SovereignRiskMember2025-12-310000891478san:NonTradingFinancialAssetsAtFairValueThroughProfitOrLossMandatorilyMeasuredAtFairValueCategoryMembercountry:PTsan:SovereignRiskMember2025-12-310000891478san:SovereignRiskMembercountry:PT2025-12-310000891478san:SovereignRiskMembercountry:PT2024-12-310000891478san:FinancialAssetsHeldForTradingAndFinancialAssetsDesignatedAtFairValueThroughProfitOrLossMembercountry:ITsan:SovereignRiskMember2025-12-310000891478ifrs-full:FinancialAssetsAtFairValueThroughOtherComprehensiveIncomeCategoryMembercountry:ITsan:SovereignRiskMember2025-12-310000891478ifrs-full:FinancialAssetsAtAmortisedCostCategoryMembercountry:ITsan:SovereignRiskMember2025-12-310000891478san:NonTradingFinancialAssetsAtFairValueThroughProfitOrLossMandatorilyMeasuredAtFairValueCategoryMembercountry:ITsan:SovereignRiskMember2025-12-310000891478san:SovereignRiskMembercountry:IT2025-12-310000891478san:SovereignRiskMembercountry:IT2024-12-310000891478san:FinancialAssetsHeldForTradingAndFinancialAssetsDesignatedAtFairValueThroughProfitOrLossMembercountry:GRsan:SovereignRiskMember2025-12-310000891478ifrs-full:FinancialAssetsAtFairValueThroughOtherComprehensiveIncomeCategoryMembercountry:GRsan:SovereignRiskMember2025-12-310000891478ifrs-full:FinancialAssetsAtAmortisedCostCategoryMembercountry:GRsan:SovereignRiskMember2025-12-310000891478san:NonTradingFinancialAssetsAtFairValueThroughProfitOrLossMandatorilyMeasuredAtFairValueCategoryMembercountry:GRsan:SovereignRiskMember2025-12-310000891478san:SovereignRiskMembercountry:GR2025-12-310000891478san:SovereignRiskMembercountry:GR2024-12-310000891478san:FinancialAssetsHeldForTradingAndFinancialAssetsDesignatedAtFairValueThroughProfitOrLossMembercountry:IEsan:SovereignRiskMember2025-12-310000891478ifrs-full:FinancialAssetsAtFairValueThroughOtherComprehensiveIncomeCategoryMembercountry:IEsan:SovereignRiskMember2025-12-310000891478ifrs-full:FinancialAssetsAtAmortisedCostCategoryMembercountry:IEsan:SovereignRiskMember2025-12-310000891478san:NonTradingFinancialAssetsAtFairValueThroughProfitOrLossMandatorilyMeasuredAtFairValueCategoryMembercountry:IEsan:SovereignRiskMember2025-12-310000891478san:SovereignRiskMembercountry:IE2025-12-310000891478san:SovereignRiskMembercountry:IE2024-12-310000891478san:FinancialAssetsHeldForTradingAndFinancialAssetsDesignatedAtFairValueThroughProfitOrLossMembersan:RestOfEurozoneMembersan:SovereignRiskMember2025-12-310000891478ifrs-full:FinancialAssetsAtFairValueThroughOtherComprehensiveIncomeCategoryMembersan:RestOfEurozoneMembersan:SovereignRiskMember2025-12-310000891478ifrs-full:FinancialAssetsAtAmortisedCostCategoryMembersan:RestOfEurozoneMembersan:SovereignRiskMember2025-12-310000891478san:NonTradingFinancialAssetsAtFairValueThroughProfitOrLossMandatorilyMeasuredAtFairValueCategoryMembersan:RestOfEurozoneMembersan:SovereignRiskMember2025-12-310000891478san:SovereignRiskMembersan:RestOfEurozoneMember2025-12-310000891478san:SovereignRiskMembersan:RestOfEurozoneMember2024-12-310000891478san:FinancialAssetsHeldForTradingAndFinancialAssetsDesignatedAtFairValueThroughProfitOrLossMembercountry:GBsan:SovereignRiskMember2025-12-310000891478ifrs-full:FinancialAssetsAtFairValueThroughOtherComprehensiveIncomeCategoryMembercountry:GBsan:SovereignRiskMember2025-12-310000891478ifrs-full:FinancialAssetsAtAmortisedCostCategoryMembercountry:GBsan:SovereignRiskMember2025-12-310000891478san:NonTradingFinancialAssetsAtFairValueThroughProfitOrLossMandatorilyMeasuredAtFairValueCategoryMembercountry:GBsan:SovereignRiskMember2025-12-310000891478san:SovereignRiskMembercountry:GB2025-12-310000891478san:SovereignRiskMembercountry:GB2024-12-310000891478san:FinancialAssetsHeldForTradingAndFinancialAssetsDesignatedAtFairValueThroughProfitOrLossMembercountry:PLsan:SovereignRiskMember2025-12-310000891478ifrs-full:FinancialAssetsAtFairValueThroughOtherComprehensiveIncomeCategoryMembercountry:PLsan:SovereignRiskMember2025-12-310000891478ifrs-full:FinancialAssetsAtAmortisedCostCategoryMembercountry:PLsan:SovereignRiskMember2025-12-310000891478san:NonTradingFinancialAssetsAtFairValueThroughProfitOrLossMandatorilyMeasuredAtFairValueCategoryMembercountry:PLsan:SovereignRiskMember2025-12-310000891478san:SovereignRiskMembercountry:PL2025-12-310000891478san:SovereignRiskMembercountry:PL2024-12-310000891478san:FinancialAssetsHeldForTradingAndFinancialAssetsDesignatedAtFairValueThroughProfitOrLossMembersan:RestOfEuropeMembersan:SovereignRiskMember2025-12-310000891478ifrs-full:FinancialAssetsAtFairValueThroughOtherComprehensiveIncomeCategoryMembersan:RestOfEuropeMembersan:SovereignRiskMember2025-12-310000891478ifrs-full:FinancialAssetsAtAmortisedCostCategoryMembersan:RestOfEuropeMembersan:SovereignRiskMember2025-12-310000891478san:NonTradingFinancialAssetsAtFairValueThroughProfitOrLossMandatorilyMeasuredAtFairValueCategoryMembersan:RestOfEuropeMembersan:SovereignRiskMember2025-12-310000891478san:SovereignRiskMembersan:RestOfEuropeMember2025-12-310000891478san:SovereignRiskMembersan:RestOfEuropeMember2024-12-310000891478san:FinancialAssetsHeldForTradingAndFinancialAssetsDesignatedAtFairValueThroughProfitOrLossMembercountry:USsan:SovereignRiskMember2025-12-310000891478ifrs-full:FinancialAssetsAtFairValueThroughOtherComprehensiveIncomeCategoryMembercountry:USsan:SovereignRiskMember2025-12-310000891478ifrs-full:FinancialAssetsAtAmortisedCostCategoryMembercountry:USsan:SovereignRiskMember2025-12-310000891478san:NonTradingFinancialAssetsAtFairValueThroughProfitOrLossMandatorilyMeasuredAtFairValueCategoryMembercountry:USsan:SovereignRiskMember2025-12-310000891478san:SovereignRiskMembercountry:US2025-12-310000891478san:SovereignRiskMembercountry:US2024-12-310000891478san:FinancialAssetsHeldForTradingAndFinancialAssetsDesignatedAtFairValueThroughProfitOrLossMembercountry:BRsan:SovereignRiskMember2025-12-310000891478ifrs-full:FinancialAssetsAtFairValueThroughOtherComprehensiveIncomeCategoryMembercountry:BRsan:SovereignRiskMember2025-12-310000891478ifrs-full:FinancialAssetsAtAmortisedCostCategoryMembercountry:BRsan:SovereignRiskMember2025-12-310000891478san:NonTradingFinancialAssetsAtFairValueThroughProfitOrLossMandatorilyMeasuredAtFairValueCategoryMembercountry:BRsan:SovereignRiskMember2025-12-310000891478san:SovereignRiskMembercountry:BR2025-12-310000891478san:SovereignRiskMembercountry:BR2024-12-310000891478san:FinancialAssetsHeldForTradingAndFinancialAssetsDesignatedAtFairValueThroughProfitOrLossMembercountry:MXsan:SovereignRiskMember2025-12-310000891478ifrs-full:FinancialAssetsAtFairValueThroughOtherComprehensiveIncomeCategoryMembercountry:MXsan:SovereignRiskMember2025-12-310000891478ifrs-full:FinancialAssetsAtAmortisedCostCategoryMembercountry:MXsan:SovereignRiskMember2025-12-310000891478san:NonTradingFinancialAssetsAtFairValueThroughProfitOrLossMandatorilyMeasuredAtFairValueCategoryMembercountry:MXsan:SovereignRiskMember2025-12-310000891478san:SovereignRiskMembercountry:MX2025-12-310000891478san:SovereignRiskMembercountry:MX2024-12-310000891478san:FinancialAssetsHeldForTradingAndFinancialAssetsDesignatedAtFairValueThroughProfitOrLossMembercountry:CLsan:SovereignRiskMember2025-12-310000891478ifrs-full:FinancialAssetsAtFairValueThroughOtherComprehensiveIncomeCategoryMembercountry:CLsan:SovereignRiskMember2025-12-310000891478ifrs-full:FinancialAssetsAtAmortisedCostCategoryMembercountry:CLsan:SovereignRiskMember2025-12-310000891478san:NonTradingFinancialAssetsAtFairValueThroughProfitOrLossMandatorilyMeasuredAtFairValueCategoryMembercountry:CLsan:SovereignRiskMember2025-12-310000891478san:SovereignRiskMembercountry:CL2025-12-310000891478san:SovereignRiskMembercountry:CL2024-12-310000891478san:FinancialAssetsHeldForTradingAndFinancialAssetsDesignatedAtFairValueThroughProfitOrLossMembersan:OtherAmericanCountriesMembersan:SovereignRiskMember2025-12-310000891478ifrs-full:FinancialAssetsAtFairValueThroughOtherComprehensiveIncomeCategoryMembersan:OtherAmericanCountriesMembersan:SovereignRiskMember2025-12-310000891478ifrs-full:FinancialAssetsAtAmortisedCostCategoryMembersan:OtherAmericanCountriesMembersan:SovereignRiskMember2025-12-310000891478san:NonTradingFinancialAssetsAtFairValueThroughProfitOrLossMandatorilyMeasuredAtFairValueCategoryMembersan:OtherAmericanCountriesMembersan:SovereignRiskMember2025-12-310000891478san:SovereignRiskMembersan:OtherAmericanCountriesMember2025-12-310000891478san:SovereignRiskMembersan:OtherAmericanCountriesMember2024-12-310000891478san:FinancialAssetsHeldForTradingAndFinancialAssetsDesignatedAtFairValueThroughProfitOrLossMembersan:RestOfWorldMembersan:SovereignRiskMember2025-12-310000891478ifrs-full:FinancialAssetsAtFairValueThroughOtherComprehensiveIncomeCategoryMembersan:RestOfWorldMembersan:SovereignRiskMember2025-12-310000891478ifrs-full:FinancialAssetsAtAmortisedCostCategoryMembersan:RestOfWorldMembersan:SovereignRiskMember2025-12-310000891478san:NonTradingFinancialAssetsAtFairValueThroughProfitOrLossMandatorilyMeasuredAtFairValueCategoryMembersan:RestOfWorldMembersan:SovereignRiskMember2025-12-310000891478san:SovereignRiskMembersan:RestOfWorldMember2025-12-310000891478san:SovereignRiskMembersan:RestOfWorldMember2024-12-310000891478san:SovereignRiskMembersan:FinancialAssetsHeldForTradingAndFinancialAssetsDesignatedAtFairValueThroughProfitOrLossMember2025-12-310000891478san:SovereignRiskMemberifrs-full:FinancialAssetsAtFairValueThroughOtherComprehensiveIncomeCategoryMember2025-12-310000891478san:SovereignRiskMemberifrs-full:FinancialAssetsAtAmortisedCostCategoryMember2025-12-310000891478san:SovereignRiskMembersan:NonTradingFinancialAssetsAtFairValueThroughProfitOrLossMandatorilyMeasuredAtFairValueCategoryMember2025-12-310000891478san:SovereignRiskMember2025-12-310000891478san:SovereignRiskMember2024-12-310000891478san:ForborneLoanPortfolioMembersan:CreditImpairedMemberifrs-full:CreditRiskMember2025-12-310000891478san:ForborneLoanPortfolioMembersan:PerformingMemberifrs-full:CreditRiskMember2025-12-310000891478san:ForborneLoanPortfolioMemberifrs-full:CreditRiskMembersan:IFRSUncollateralizedMembersan:CreditEntitiesMember2025-01-012025-12-310000891478ifrs-full:GrossCarryingAmountMembersan:ForborneLoanPortfolioMemberifrs-full:CreditRiskMembersan:IFRSUncollateralizedMembersan:CreditEntitiesMember2025-12-310000891478san:ForborneLoanPortfolioMemberifrs-full:CreditRiskMembersan:IFRSCollateralPledgedMembersan:CreditEntitiesMember2025-01-012025-12-310000891478ifrs-full:GrossCarryingAmountMembersan:ForborneLoanPortfolioMemberifrs-full:CreditRiskMembersan:IFRSCollateralPledgedMembersan:CreditEntitiesMember2025-12-310000891478san:ForborneLoanPortfolioMemberifrs-full:CreditRiskMembersan:RealEstateGuaranteeMembersan:CreditEntitiesMember2025-01-012025-12-310000891478san:ForborneLoanPortfolioMemberifrs-full:CreditRiskMembersan:RestOfRealGuaranteesMembersan:CreditEntitiesMember2025-01-012025-12-310000891478ifrs-full:AccumulatedImpairmentMembersan:ForborneLoanPortfolioMemberifrs-full:CreditRiskMembersan:CreditEntitiesMember2025-12-310000891478san:ForborneLoanPortfolioMemberifrs-full:CreditRiskMembersan:IFRSUncollateralizedMembersan:PublicSectorMember2025-01-012025-12-310000891478ifrs-full:GrossCarryingAmountMembersan:ForborneLoanPortfolioMemberifrs-full:CreditRiskMembersan:IFRSUncollateralizedMembersan:PublicSectorMember2025-12-310000891478san:ForborneLoanPortfolioMemberifrs-full:CreditRiskMembersan:IFRSCollateralPledgedMembersan:PublicSectorMember2025-01-012025-12-310000891478ifrs-full:GrossCarryingAmountMembersan:ForborneLoanPortfolioMemberifrs-full:CreditRiskMembersan:IFRSCollateralPledgedMembersan:PublicSectorMember2025-12-310000891478san:ForborneLoanPortfolioMemberifrs-full:CreditRiskMembersan:RealEstateGuaranteeMembersan:PublicSectorMember2025-01-012025-12-310000891478san:ForborneLoanPortfolioMemberifrs-full:CreditRiskMembersan:RestOfRealGuaranteesMembersan:PublicSectorMember2025-01-012025-12-310000891478ifrs-full:AccumulatedImpairmentMembersan:ForborneLoanPortfolioMemberifrs-full:CreditRiskMembersan:PublicSectorMember2025-12-310000891478san:ForborneLoanPortfolioMemberifrs-full:CreditRiskMembersan:IFRSUncollateralizedMembersan:OtherFinancialInstitutionsMember2025-01-012025-12-310000891478ifrs-full:GrossCarryingAmountMembersan:ForborneLoanPortfolioMemberifrs-full:CreditRiskMembersan:IFRSUncollateralizedMembersan:OtherFinancialInstitutionsMember2025-12-310000891478san:ForborneLoanPortfolioMemberifrs-full:CreditRiskMembersan:IFRSCollateralPledgedMembersan:OtherFinancialInstitutionsMember2025-01-012025-12-310000891478ifrs-full:GrossCarryingAmountMembersan:ForborneLoanPortfolioMemberifrs-full:CreditRiskMembersan:IFRSCollateralPledgedMembersan:OtherFinancialInstitutionsMember2025-12-310000891478san:ForborneLoanPortfolioMemberifrs-full:CreditRiskMembersan:RealEstateGuaranteeMembersan:OtherFinancialInstitutionsMember2025-01-012025-12-310000891478san:ForborneLoanPortfolioMemberifrs-full:CreditRiskMembersan:RestOfRealGuaranteesMembersan:OtherFinancialInstitutionsMember2025-01-012025-12-310000891478ifrs-full:AccumulatedImpairmentMembersan:ForborneLoanPortfolioMemberifrs-full:CreditRiskMembersan:OtherFinancialInstitutionsMember2025-12-310000891478san:ForborneLoanPortfolioMemberifrs-full:CreditRiskMembersan:IFRSUncollateralizedMembersan:NonFinancialCorporationsAndIndividualEntrepreneursMember2025-01-012025-12-310000891478ifrs-full:GrossCarryingAmountMembersan:ForborneLoanPortfolioMemberifrs-full:CreditRiskMembersan:IFRSUncollateralizedMembersan:NonFinancialCorporationsAndIndividualEntrepreneursMember2025-12-310000891478san:ForborneLoanPortfolioMemberifrs-full:CreditRiskMembersan:IFRSCollateralPledgedMembersan:NonFinancialCorporationsAndIndividualEntrepreneursMember2025-01-012025-12-310000891478ifrs-full:GrossCarryingAmountMembersan:ForborneLoanPortfolioMemberifrs-full:CreditRiskMembersan:IFRSCollateralPledgedMembersan:NonFinancialCorporationsAndIndividualEntrepreneursMember2025-12-310000891478san:ForborneLoanPortfolioMemberifrs-full:CreditRiskMembersan:RealEstateGuaranteeMembersan:NonFinancialCorporationsAndIndividualEntrepreneursMember2025-01-012025-12-310000891478san:ForborneLoanPortfolioMemberifrs-full:CreditRiskMembersan:RestOfRealGuaranteesMembersan:NonFinancialCorporationsAndIndividualEntrepreneursMember2025-01-012025-12-310000891478ifrs-full:AccumulatedImpairmentMembersan:ForborneLoanPortfolioMemberifrs-full:CreditRiskMembersan:NonFinancialCorporationsAndIndividualEntrepreneursMember2025-12-310000891478san:ForborneLoanPortfolioMemberifrs-full:CreditRiskMembersan:IFRSUncollateralizedMembersan:ConstructionAndPropertyDevelopmentLoansMember2025-01-012025-12-310000891478ifrs-full:GrossCarryingAmountMembersan:ForborneLoanPortfolioMemberifrs-full:CreditRiskMembersan:IFRSUncollateralizedMembersan:ConstructionAndPropertyDevelopmentLoansMember2025-12-310000891478san:ForborneLoanPortfolioMemberifrs-full:CreditRiskMembersan:IFRSCollateralPledgedMembersan:ConstructionAndPropertyDevelopmentLoansMember2025-01-012025-12-310000891478ifrs-full:GrossCarryingAmountMembersan:ForborneLoanPortfolioMemberifrs-full:CreditRiskMembersan:IFRSCollateralPledgedMembersan:ConstructionAndPropertyDevelopmentLoansMember2025-12-310000891478san:ForborneLoanPortfolioMemberifrs-full:CreditRiskMembersan:RealEstateGuaranteeMembersan:ConstructionAndPropertyDevelopmentLoansMember2025-01-012025-12-310000891478san:ForborneLoanPortfolioMemberifrs-full:CreditRiskMembersan:RestOfRealGuaranteesMembersan:ConstructionAndPropertyDevelopmentLoansMember2025-01-012025-12-310000891478ifrs-full:AccumulatedImpairmentMembersan:ForborneLoanPortfolioMemberifrs-full:CreditRiskMembersan:ConstructionAndPropertyDevelopmentLoansMember2025-12-310000891478san:ForborneLoanPortfolioMemberifrs-full:CreditRiskMembersan:IFRSUncollateralizedMembersan:OtherWarehousesMember2025-01-012025-12-310000891478ifrs-full:GrossCarryingAmountMembersan:ForborneLoanPortfolioMemberifrs-full:CreditRiskMembersan:IFRSUncollateralizedMembersan:OtherWarehousesMember2025-12-310000891478san:ForborneLoanPortfolioMemberifrs-full:CreditRiskMembersan:IFRSCollateralPledgedMembersan:OtherWarehousesMember2025-01-012025-12-310000891478ifrs-full:GrossCarryingAmountMembersan:ForborneLoanPortfolioMemberifrs-full:CreditRiskMembersan:IFRSCollateralPledgedMembersan:OtherWarehousesMember2025-12-310000891478san:ForborneLoanPortfolioMemberifrs-full:CreditRiskMembersan:RealEstateGuaranteeMembersan:OtherWarehousesMember2025-01-012025-12-310000891478san:ForborneLoanPortfolioMemberifrs-full:CreditRiskMembersan:RestOfRealGuaranteesMembersan:OtherWarehousesMember2025-01-012025-12-310000891478ifrs-full:AccumulatedImpairmentMembersan:ForborneLoanPortfolioMemberifrs-full:CreditRiskMembersan:OtherWarehousesMember2025-12-310000891478san:ForborneLoanPortfolioMemberifrs-full:CreditRiskMembersan:IFRSUncollateralizedMember2025-01-012025-12-310000891478ifrs-full:GrossCarryingAmountMembersan:ForborneLoanPortfolioMemberifrs-full:CreditRiskMembersan:IFRSUncollateralizedMember2025-12-310000891478san:ForborneLoanPortfolioMemberifrs-full:CreditRiskMembersan:IFRSCollateralPledgedMember2025-01-012025-12-310000891478ifrs-full:GrossCarryingAmountMembersan:ForborneLoanPortfolioMemberifrs-full:CreditRiskMembersan:IFRSCollateralPledgedMember2025-12-310000891478san:ForborneLoanPortfolioMemberifrs-full:CreditRiskMembersan:RealEstateGuaranteeMember2025-01-012025-12-310000891478san:ForborneLoanPortfolioMemberifrs-full:CreditRiskMembersan:RestOfRealGuaranteesMember2025-01-012025-12-310000891478ifrs-full:AccumulatedImpairmentMembersan:ForborneLoanPortfolioMemberifrs-full:CreditRiskMember2025-12-310000891478ifrs-full:NoncurrentAssetsOrDisposalGroupsClassifiedAsHeldForSaleMemberifrs-full:CreditRiskMembersan:IFRSUncollateralizedMember2025-01-012025-12-310000891478ifrs-full:GrossCarryingAmountMemberifrs-full:NoncurrentAssetsOrDisposalGroupsClassifiedAsHeldForSaleMemberifrs-full:CreditRiskMembersan:IFRSUncollateralizedMember2025-12-310000891478ifrs-full:NoncurrentAssetsOrDisposalGroupsClassifiedAsHeldForSaleMemberifrs-full:CreditRiskMembersan:IFRSCollateralPledgedMember2025-01-012025-12-310000891478ifrs-full:GrossCarryingAmountMemberifrs-full:NoncurrentAssetsOrDisposalGroupsClassifiedAsHeldForSaleMemberifrs-full:CreditRiskMembersan:IFRSCollateralPledgedMember2025-12-310000891478ifrs-full:NoncurrentAssetsOrDisposalGroupsClassifiedAsHeldForSaleMemberifrs-full:CreditRiskMembersan:RealEstateGuaranteeMember2025-01-012025-12-310000891478ifrs-full:NoncurrentAssetsOrDisposalGroupsClassifiedAsHeldForSaleMemberifrs-full:CreditRiskMembersan:RestOfRealGuaranteesMember2025-01-012025-12-310000891478ifrs-full:AccumulatedImpairmentMemberifrs-full:NoncurrentAssetsOrDisposalGroupsClassifiedAsHeldForSaleMemberifrs-full:CreditRiskMember2025-12-310000891478san:ForborneLoanPortfolioMemberifrs-full:CreditRiskMembersan:IFRSUncollateralizedMembersan:CreditEntitiesMembersan:CreditImpairedMember2025-01-012025-12-310000891478ifrs-full:GrossCarryingAmountMembersan:ForborneLoanPortfolioMemberifrs-full:CreditRiskMembersan:IFRSUncollateralizedMembersan:CreditEntitiesMembersan:CreditImpairedMember2025-12-310000891478san:ForborneLoanPortfolioMemberifrs-full:CreditRiskMembersan:IFRSCollateralPledgedMembersan:CreditEntitiesMembersan:CreditImpairedMember2025-01-012025-12-310000891478ifrs-full:GrossCarryingAmountMembersan:ForborneLoanPortfolioMemberifrs-full:CreditRiskMembersan:IFRSCollateralPledgedMembersan:CreditEntitiesMembersan:CreditImpairedMember2025-12-310000891478san:ForborneLoanPortfolioMemberifrs-full:CreditRiskMembersan:RealEstateGuaranteeMembersan:CreditEntitiesMembersan:CreditImpairedMember2025-01-012025-12-310000891478san:ForborneLoanPortfolioMemberifrs-full:CreditRiskMembersan:RestOfRealGuaranteesMembersan:CreditEntitiesMembersan:CreditImpairedMember2025-01-012025-12-310000891478ifrs-full:AccumulatedImpairmentMembersan:ForborneLoanPortfolioMemberifrs-full:CreditRiskMembersan:CreditEntitiesMembersan:CreditImpairedMember2025-12-310000891478san:ForborneLoanPortfolioMemberifrs-full:CreditRiskMembersan:IFRSUncollateralizedMembersan:PublicSectorMembersan:CreditImpairedMember2025-01-012025-12-310000891478ifrs-full:GrossCarryingAmountMembersan:ForborneLoanPortfolioMemberifrs-full:CreditRiskMembersan:IFRSUncollateralizedMembersan:PublicSectorMembersan:CreditImpairedMember2025-12-310000891478san:ForborneLoanPortfolioMemberifrs-full:CreditRiskMembersan:IFRSCollateralPledgedMembersan:PublicSectorMembersan:CreditImpairedMember2025-01-012025-12-310000891478ifrs-full:GrossCarryingAmountMembersan:ForborneLoanPortfolioMemberifrs-full:CreditRiskMembersan:IFRSCollateralPledgedMembersan:PublicSectorMembersan:CreditImpairedMember2025-12-310000891478san:ForborneLoanPortfolioMemberifrs-full:CreditRiskMembersan:RealEstateGuaranteeMembersan:PublicSectorMembersan:CreditImpairedMember2025-01-012025-12-310000891478san:ForborneLoanPortfolioMemberifrs-full:CreditRiskMembersan:RestOfRealGuaranteesMembersan:PublicSectorMembersan:CreditImpairedMember2025-01-012025-12-310000891478ifrs-full:AccumulatedImpairmentMembersan:ForborneLoanPortfolioMemberifrs-full:CreditRiskMembersan:PublicSectorMembersan:CreditImpairedMember2025-12-310000891478san:ForborneLoanPortfolioMemberifrs-full:CreditRiskMembersan:IFRSUncollateralizedMembersan:OtherFinancialInstitutionsMembersan:CreditImpairedMember2025-01-012025-12-310000891478ifrs-full:GrossCarryingAmountMembersan:ForborneLoanPortfolioMemberifrs-full:CreditRiskMembersan:IFRSUncollateralizedMembersan:OtherFinancialInstitutionsMembersan:CreditImpairedMember2025-12-310000891478san:ForborneLoanPortfolioMemberifrs-full:CreditRiskMembersan:IFRSCollateralPledgedMembersan:OtherFinancialInstitutionsMembersan:CreditImpairedMember2025-01-012025-12-310000891478ifrs-full:GrossCarryingAmountMembersan:ForborneLoanPortfolioMemberifrs-full:CreditRiskMembersan:IFRSCollateralPledgedMembersan:OtherFinancialInstitutionsMembersan:CreditImpairedMember2025-12-310000891478san:ForborneLoanPortfolioMemberifrs-full:CreditRiskMembersan:RealEstateGuaranteeMembersan:OtherFinancialInstitutionsMembersan:CreditImpairedMember2025-01-012025-12-310000891478san:ForborneLoanPortfolioMemberifrs-full:CreditRiskMembersan:RestOfRealGuaranteesMembersan:OtherFinancialInstitutionsMembersan:CreditImpairedMember2025-01-012025-12-310000891478ifrs-full:AccumulatedImpairmentMembersan:ForborneLoanPortfolioMemberifrs-full:CreditRiskMembersan:OtherFinancialInstitutionsMembersan:CreditImpairedMember2025-12-310000891478san:ForborneLoanPortfolioMemberifrs-full:CreditRiskMembersan:IFRSUncollateralizedMembersan:NonFinancialCorporationsAndIndividualEntrepreneursMembersan:CreditImpairedMember2025-01-012025-12-310000891478ifrs-full:GrossCarryingAmountMembersan:ForborneLoanPortfolioMemberifrs-full:CreditRiskMembersan:IFRSUncollateralizedMembersan:NonFinancialCorporationsAndIndividualEntrepreneursMembersan:CreditImpairedMember2025-12-310000891478san:ForborneLoanPortfolioMemberifrs-full:CreditRiskMembersan:IFRSCollateralPledgedMembersan:NonFinancialCorporationsAndIndividualEntrepreneursMembersan:CreditImpairedMember2025-01-012025-12-310000891478ifrs-full:GrossCarryingAmountMembersan:ForborneLoanPortfolioMemberifrs-full:CreditRiskMembersan:IFRSCollateralPledgedMembersan:NonFinancialCorporationsAndIndividualEntrepreneursMembersan:CreditImpairedMember2025-12-310000891478san:ForborneLoanPortfolioMemberifrs-full:CreditRiskMembersan:RealEstateGuaranteeMembersan:NonFinancialCorporationsAndIndividualEntrepreneursMembersan:CreditImpairedMember2025-01-012025-12-310000891478san:ForborneLoanPortfolioMemberifrs-full:CreditRiskMembersan:RestOfRealGuaranteesMembersan:NonFinancialCorporationsAndIndividualEntrepreneursMembersan:CreditImpairedMember2025-01-012025-12-310000891478ifrs-full:AccumulatedImpairmentMembersan:ForborneLoanPortfolioMemberifrs-full:CreditRiskMembersan:NonFinancialCorporationsAndIndividualEntrepreneursMembersan:CreditImpairedMember2025-12-310000891478san:ForborneLoanPortfolioMemberifrs-full:CreditRiskMembersan:IFRSUncollateralizedMembersan:ConstructionAndPropertyDevelopmentLoansMembersan:CreditImpairedMember2025-01-012025-12-310000891478ifrs-full:GrossCarryingAmountMembersan:ForborneLoanPortfolioMemberifrs-full:CreditRiskMembersan:IFRSUncollateralizedMembersan:ConstructionAndPropertyDevelopmentLoansMembersan:CreditImpairedMember2025-12-310000891478san:ForborneLoanPortfolioMemberifrs-full:CreditRiskMembersan:IFRSCollateralPledgedMembersan:ConstructionAndPropertyDevelopmentLoansMembersan:CreditImpairedMember2025-01-012025-12-310000891478ifrs-full:GrossCarryingAmountMembersan:ForborneLoanPortfolioMemberifrs-full:CreditRiskMembersan:IFRSCollateralPledgedMembersan:ConstructionAndPropertyDevelopmentLoansMembersan:CreditImpairedMember2025-12-310000891478san:ForborneLoanPortfolioMemberifrs-full:CreditRiskMembersan:RealEstateGuaranteeMembersan:ConstructionAndPropertyDevelopmentLoansMembersan:CreditImpairedMember2025-01-012025-12-310000891478san:ForborneLoanPortfolioMemberifrs-full:CreditRiskMembersan:RestOfRealGuaranteesMembersan:ConstructionAndPropertyDevelopmentLoansMembersan:CreditImpairedMember2025-01-012025-12-310000891478ifrs-full:AccumulatedImpairmentMembersan:ForborneLoanPortfolioMemberifrs-full:CreditRiskMembersan:ConstructionAndPropertyDevelopmentLoansMembersan:CreditImpairedMember2025-12-310000891478san:ForborneLoanPortfolioMemberifrs-full:CreditRiskMembersan:IFRSUncollateralizedMembersan:OtherWarehousesMembersan:CreditImpairedMember2025-01-012025-12-310000891478ifrs-full:GrossCarryingAmountMembersan:ForborneLoanPortfolioMemberifrs-full:CreditRiskMembersan:IFRSUncollateralizedMembersan:OtherWarehousesMembersan:CreditImpairedMember2025-12-310000891478san:ForborneLoanPortfolioMemberifrs-full:CreditRiskMembersan:IFRSCollateralPledgedMembersan:OtherWarehousesMembersan:CreditImpairedMember2025-01-012025-12-310000891478ifrs-full:GrossCarryingAmountMembersan:ForborneLoanPortfolioMemberifrs-full:CreditRiskMembersan:IFRSCollateralPledgedMembersan:OtherWarehousesMembersan:CreditImpairedMember2025-12-310000891478san:ForborneLoanPortfolioMemberifrs-full:CreditRiskMembersan:RealEstateGuaranteeMembersan:OtherWarehousesMembersan:CreditImpairedMember2025-01-012025-12-310000891478san:ForborneLoanPortfolioMemberifrs-full:CreditRiskMembersan:RestOfRealGuaranteesMembersan:OtherWarehousesMembersan:CreditImpairedMember2025-01-012025-12-310000891478ifrs-full:AccumulatedImpairmentMembersan:ForborneLoanPortfolioMemberifrs-full:CreditRiskMembersan:OtherWarehousesMembersan:CreditImpairedMember2025-12-310000891478san:ForborneLoanPortfolioMembersan:CreditImpairedMemberifrs-full:CreditRiskMembersan:IFRSUncollateralizedMember2025-01-012025-12-310000891478ifrs-full:GrossCarryingAmountMembersan:ForborneLoanPortfolioMemberifrs-full:CreditRiskMembersan:IFRSUncollateralizedMembersan:CreditImpairedMember2025-12-310000891478san:ForborneLoanPortfolioMembersan:CreditImpairedMemberifrs-full:CreditRiskMembersan:IFRSCollateralPledgedMember2025-01-012025-12-310000891478ifrs-full:GrossCarryingAmountMembersan:ForborneLoanPortfolioMemberifrs-full:CreditRiskMembersan:IFRSCollateralPledgedMembersan:CreditImpairedMember2025-12-310000891478san:ForborneLoanPortfolioMembersan:CreditImpairedMemberifrs-full:CreditRiskMembersan:RealEstateGuaranteeMember2025-01-012025-12-310000891478san:ForborneLoanPortfolioMembersan:CreditImpairedMemberifrs-full:CreditRiskMembersan:RestOfRealGuaranteesMember2025-01-012025-12-310000891478ifrs-full:AccumulatedImpairmentMembersan:ForborneLoanPortfolioMembersan:CreditImpairedMemberifrs-full:CreditRiskMember2025-12-310000891478ifrs-full:NoncurrentAssetsOrDisposalGroupsClassifiedAsHeldForSaleMembersan:CreditImpairedMemberifrs-full:CreditRiskMembersan:IFRSUncollateralizedMember2025-01-012025-12-310000891478ifrs-full:GrossCarryingAmountMemberifrs-full:NoncurrentAssetsOrDisposalGroupsClassifiedAsHeldForSaleMemberifrs-full:CreditRiskMembersan:IFRSUncollateralizedMembersan:CreditImpairedMember2025-12-310000891478ifrs-full:NoncurrentAssetsOrDisposalGroupsClassifiedAsHeldForSaleMembersan:CreditImpairedMemberifrs-full:CreditRiskMembersan:IFRSCollateralPledgedMember2025-01-012025-12-310000891478ifrs-full:GrossCarryingAmountMemberifrs-full:NoncurrentAssetsOrDisposalGroupsClassifiedAsHeldForSaleMemberifrs-full:CreditRiskMembersan:IFRSCollateralPledgedMembersan:CreditImpairedMember2025-12-310000891478ifrs-full:NoncurrentAssetsOrDisposalGroupsClassifiedAsHeldForSaleMembersan:CreditImpairedMemberifrs-full:CreditRiskMembersan:RealEstateGuaranteeMember2025-01-012025-12-310000891478ifrs-full:NoncurrentAssetsOrDisposalGroupsClassifiedAsHeldForSaleMembersan:CreditImpairedMemberifrs-full:CreditRiskMembersan:RestOfRealGuaranteesMember2025-01-012025-12-310000891478ifrs-full:AccumulatedImpairmentMemberifrs-full:NoncurrentAssetsOrDisposalGroupsClassifiedAsHeldForSaleMembersan:CreditImpairedMemberifrs-full:CreditRiskMember2025-12-310000891478san:ForborneLoanPortfolioMember2025-01-012025-12-310000891478san:ForborneLoanPortfolioMember2024-01-012024-12-310000891478san:ForborneLoanPortfolioMember2025-12-310000891478san:ForborneLoanPortfolioMember2024-12-310000891478san:ForborneLoanPortfolioMemberifrs-full:CreditRiskMembersan:IFRSCollateralPledgedMember2025-12-310000891478ifrs-full:CreditRiskMembersan:ForborneLoanPortfolioMember2025-12-310000891478ifrs-full:MarketRiskMember2025-01-012025-12-310000891478srt:MinimumMemberifrs-full:MarketRiskMember2025-01-012025-12-310000891478ifrs-full:MarketRiskMember2025-12-310000891478ifrs-full:InterestRateRiskMember2025-12-310000891478san:MarketRiskEvaluatedUsingValueAtRiskMetricMember2025-12-310000891478san:InterestRateAndCreditSpreadRiskMember2025-12-310000891478san:CurrencyAndInterestRateRiskMember2025-12-310000891478ifrs-full:MarketRiskMemberifrs-full:BottomOfRangeMember2025-12-310000891478ifrs-full:MarketRiskMemberifrs-full:WeightedAverageMember2025-12-310000891478ifrs-full:MarketRiskMemberifrs-full:TopOfRangeMember2025-12-310000891478ifrs-full:MarketRiskMemberifrs-full:WeightedAverageMember2024-12-310000891478ifrs-full:MarketRiskMember2024-12-310000891478ifrs-full:MarketRiskMemberifrs-full:WeightedAverageMember2023-12-310000891478ifrs-full:MarketRiskMember2023-12-310000891478ifrs-full:RiskDiversificationEffectMemberifrs-full:BottomOfRangeMember2025-12-310000891478ifrs-full:RiskDiversificationEffectMemberifrs-full:WeightedAverageMember2025-12-310000891478ifrs-full:RiskDiversificationEffectMemberifrs-full:TopOfRangeMember2025-12-310000891478ifrs-full:RiskDiversificationEffectMember2025-12-310000891478ifrs-full:RiskDiversificationEffectMemberifrs-full:WeightedAverageMember2024-12-310000891478ifrs-full:RiskDiversificationEffectMember2024-12-310000891478ifrs-full:RiskDiversificationEffectMemberifrs-full:WeightedAverageMember2023-12-310000891478ifrs-full:RiskDiversificationEffectMember2023-12-310000891478ifrs-full:InterestRateRiskMemberifrs-full:BottomOfRangeMember2025-12-310000891478ifrs-full:InterestRateRiskMemberifrs-full:WeightedAverageMember2025-12-310000891478ifrs-full:InterestRateRiskMemberifrs-full:TopOfRangeMember2025-12-310000891478ifrs-full:InterestRateRiskMemberifrs-full:WeightedAverageMember2024-12-310000891478ifrs-full:InterestRateRiskMember2024-12-310000891478ifrs-full:InterestRateRiskMemberifrs-full:WeightedAverageMember2023-12-310000891478ifrs-full:InterestRateRiskMember2023-12-310000891478ifrs-full:EquityPriceRiskMemberifrs-full:BottomOfRangeMember2025-12-310000891478ifrs-full:EquityPriceRiskMemberifrs-full:WeightedAverageMember2025-12-310000891478ifrs-full:EquityPriceRiskMemberifrs-full:TopOfRangeMember2025-12-310000891478ifrs-full:EquityPriceRiskMember2025-12-310000891478ifrs-full:EquityPriceRiskMemberifrs-full:WeightedAverageMember2024-12-310000891478ifrs-full:EquityPriceRiskMember2024-12-310000891478ifrs-full:EquityPriceRiskMemberifrs-full:WeightedAverageMember2023-12-310000891478ifrs-full:EquityPriceRiskMember2023-12-310000891478ifrs-full:CurrencyRiskMemberifrs-full:BottomOfRangeMember2025-12-310000891478ifrs-full:CurrencyRiskMemberifrs-full:WeightedAverageMember2025-12-310000891478ifrs-full:CurrencyRiskMemberifrs-full:TopOfRangeMember2025-12-310000891478ifrs-full:CurrencyRiskMember2025-12-310000891478ifrs-full:CurrencyRiskMemberifrs-full:WeightedAverageMember2024-12-310000891478ifrs-full:CurrencyRiskMember2024-12-310000891478ifrs-full:CurrencyRiskMemberifrs-full:WeightedAverageMember2023-12-310000891478ifrs-full:CurrencyRiskMember2023-12-310000891478san:CreditSpreadRiskMemberifrs-full:BottomOfRangeMember2025-12-310000891478san:CreditSpreadRiskMemberifrs-full:WeightedAverageMember2025-12-310000891478san:CreditSpreadRiskMemberifrs-full:TopOfRangeMember2025-12-310000891478san:CreditSpreadRiskMember2025-12-310000891478san:CreditSpreadRiskMemberifrs-full:WeightedAverageMember2024-12-310000891478san:CreditSpreadRiskMember2024-12-310000891478san:CreditSpreadRiskMemberifrs-full:WeightedAverageMember2023-12-310000891478san:CreditSpreadRiskMember2023-12-310000891478ifrs-full:CommodityPriceRiskMemberifrs-full:BottomOfRangeMember2025-12-310000891478ifrs-full:CommodityPriceRiskMemberifrs-full:WeightedAverageMember2025-12-310000891478ifrs-full:CommodityPriceRiskMemberifrs-full:TopOfRangeMember2025-12-310000891478ifrs-full:CommodityPriceRiskMember2025-12-310000891478ifrs-full:CommodityPriceRiskMemberifrs-full:WeightedAverageMember2024-12-310000891478ifrs-full:CommodityPriceRiskMember2024-12-310000891478ifrs-full:CommodityPriceRiskMemberifrs-full:WeightedAverageMember2023-12-310000891478ifrs-full:CommodityPriceRiskMember2023-12-310000891478srt:EuropeMemberifrs-full:MarketRiskMemberifrs-full:BottomOfRangeMember2025-12-310000891478srt:EuropeMemberifrs-full:MarketRiskMemberifrs-full:WeightedAverageMember2025-12-310000891478srt:EuropeMemberifrs-full:MarketRiskMemberifrs-full:TopOfRangeMember2025-12-310000891478srt:EuropeMemberifrs-full:MarketRiskMember2025-12-310000891478srt:EuropeMemberifrs-full:MarketRiskMemberifrs-full:WeightedAverageMember2024-12-310000891478srt:EuropeMemberifrs-full:MarketRiskMember2024-12-310000891478srt:EuropeMemberifrs-full:MarketRiskMemberifrs-full:WeightedAverageMember2023-12-310000891478srt:EuropeMemberifrs-full:MarketRiskMember2023-12-310000891478srt:EuropeMemberifrs-full:RiskDiversificationEffectMemberifrs-full:BottomOfRangeMember2025-12-310000891478srt:EuropeMemberifrs-full:RiskDiversificationEffectMemberifrs-full:WeightedAverageMember2025-12-310000891478srt:EuropeMemberifrs-full:RiskDiversificationEffectMemberifrs-full:TopOfRangeMember2025-12-310000891478srt:EuropeMemberifrs-full:RiskDiversificationEffectMember2025-12-310000891478srt:EuropeMemberifrs-full:RiskDiversificationEffectMemberifrs-full:WeightedAverageMember2024-12-310000891478srt:EuropeMemberifrs-full:RiskDiversificationEffectMember2024-12-310000891478srt:EuropeMemberifrs-full:RiskDiversificationEffectMemberifrs-full:WeightedAverageMember2023-12-310000891478srt:EuropeMemberifrs-full:RiskDiversificationEffectMember2023-12-310000891478srt:EuropeMemberifrs-full:InterestRateRiskMemberifrs-full:BottomOfRangeMember2025-12-310000891478srt:EuropeMemberifrs-full:InterestRateRiskMemberifrs-full:WeightedAverageMember2025-12-310000891478srt:EuropeMemberifrs-full:InterestRateRiskMemberifrs-full:TopOfRangeMember2025-12-310000891478srt:EuropeMemberifrs-full:InterestRateRiskMember2025-12-310000891478srt:EuropeMemberifrs-full:InterestRateRiskMemberifrs-full:WeightedAverageMember2024-12-310000891478srt:EuropeMemberifrs-full:InterestRateRiskMember2024-12-310000891478srt:EuropeMemberifrs-full:InterestRateRiskMemberifrs-full:WeightedAverageMember2023-12-310000891478srt:EuropeMemberifrs-full:InterestRateRiskMember2023-12-310000891478srt:EuropeMemberifrs-full:EquityPriceRiskMemberifrs-full:BottomOfRangeMember2025-12-310000891478srt:EuropeMemberifrs-full:EquityPriceRiskMemberifrs-full:WeightedAverageMember2025-12-310000891478srt:EuropeMemberifrs-full:EquityPriceRiskMemberifrs-full:TopOfRangeMember2025-12-310000891478srt:EuropeMemberifrs-full:EquityPriceRiskMember2025-12-310000891478srt:EuropeMemberifrs-full:EquityPriceRiskMemberifrs-full:WeightedAverageMember2024-12-310000891478srt:EuropeMemberifrs-full:EquityPriceRiskMember2024-12-310000891478srt:EuropeMemberifrs-full:EquityPriceRiskMemberifrs-full:WeightedAverageMember2023-12-310000891478srt:EuropeMemberifrs-full:EquityPriceRiskMember2023-12-310000891478srt:EuropeMemberifrs-full:CurrencyRiskMemberifrs-full:BottomOfRangeMember2025-12-310000891478srt:EuropeMemberifrs-full:CurrencyRiskMemberifrs-full:WeightedAverageMember2025-12-310000891478srt:EuropeMemberifrs-full:CurrencyRiskMemberifrs-full:TopOfRangeMember2025-12-310000891478srt:EuropeMemberifrs-full:CurrencyRiskMember2025-12-310000891478srt:EuropeMemberifrs-full:CurrencyRiskMemberifrs-full:WeightedAverageMember2024-12-310000891478srt:EuropeMemberifrs-full:CurrencyRiskMember2024-12-310000891478srt:EuropeMemberifrs-full:CurrencyRiskMemberifrs-full:WeightedAverageMember2023-12-310000891478srt:EuropeMemberifrs-full:CurrencyRiskMember2023-12-310000891478srt:EuropeMembersan:CreditSpreadRiskMemberifrs-full:BottomOfRangeMember2025-12-310000891478srt:EuropeMembersan:CreditSpreadRiskMemberifrs-full:WeightedAverageMember2025-12-310000891478srt:EuropeMembersan:CreditSpreadRiskMemberifrs-full:TopOfRangeMember2025-12-310000891478srt:EuropeMembersan:CreditSpreadRiskMember2025-12-310000891478srt:EuropeMembersan:CreditSpreadRiskMemberifrs-full:WeightedAverageMember2024-12-310000891478srt:EuropeMembersan:CreditSpreadRiskMember2024-12-310000891478srt:EuropeMembersan:CreditSpreadRiskMemberifrs-full:WeightedAverageMember2023-12-310000891478srt:EuropeMembersan:CreditSpreadRiskMember2023-12-310000891478srt:EuropeMemberifrs-full:CommodityPriceRiskMemberifrs-full:BottomOfRangeMember2025-12-310000891478srt:EuropeMemberifrs-full:CommodityPriceRiskMemberifrs-full:WeightedAverageMember2025-12-310000891478srt:EuropeMemberifrs-full:CommodityPriceRiskMemberifrs-full:TopOfRangeMember2025-12-310000891478srt:EuropeMemberifrs-full:CommodityPriceRiskMember2025-12-310000891478srt:EuropeMemberifrs-full:CommodityPriceRiskMemberifrs-full:WeightedAverageMember2024-12-310000891478srt:EuropeMemberifrs-full:CommodityPriceRiskMember2024-12-310000891478srt:EuropeMemberifrs-full:CommodityPriceRiskMemberifrs-full:WeightedAverageMember2023-12-310000891478srt:EuropeMemberifrs-full:CommodityPriceRiskMember2023-12-310000891478srt:NorthAmericaMemberifrs-full:MarketRiskMemberifrs-full:BottomOfRangeMember2025-12-310000891478srt:NorthAmericaMemberifrs-full:MarketRiskMemberifrs-full:WeightedAverageMember2025-12-310000891478srt:NorthAmericaMemberifrs-full:MarketRiskMemberifrs-full:TopOfRangeMember2025-12-310000891478srt:NorthAmericaMemberifrs-full:MarketRiskMember2025-12-310000891478srt:NorthAmericaMemberifrs-full:MarketRiskMemberifrs-full:WeightedAverageMember2024-12-310000891478srt:NorthAmericaMemberifrs-full:MarketRiskMember2024-12-310000891478srt:NorthAmericaMemberifrs-full:MarketRiskMemberifrs-full:WeightedAverageMember2023-12-310000891478srt:NorthAmericaMemberifrs-full:MarketRiskMember2023-12-310000891478srt:NorthAmericaMemberifrs-full:RiskDiversificationEffectMemberifrs-full:BottomOfRangeMember2025-12-310000891478srt:NorthAmericaMemberifrs-full:RiskDiversificationEffectMemberifrs-full:WeightedAverageMember2025-12-310000891478srt:NorthAmericaMemberifrs-full:RiskDiversificationEffectMemberifrs-full:TopOfRangeMember2025-12-310000891478srt:NorthAmericaMemberifrs-full:RiskDiversificationEffectMember2025-12-310000891478srt:NorthAmericaMemberifrs-full:RiskDiversificationEffectMemberifrs-full:WeightedAverageMember2024-12-310000891478srt:NorthAmericaMemberifrs-full:RiskDiversificationEffectMember2024-12-310000891478srt:NorthAmericaMemberifrs-full:RiskDiversificationEffectMemberifrs-full:WeightedAverageMember2023-12-310000891478srt:NorthAmericaMemberifrs-full:RiskDiversificationEffectMember2023-12-310000891478srt:NorthAmericaMemberifrs-full:InterestRateRiskMemberifrs-full:BottomOfRangeMember2025-12-310000891478srt:NorthAmericaMemberifrs-full:InterestRateRiskMemberifrs-full:WeightedAverageMember2025-12-310000891478srt:NorthAmericaMemberifrs-full:InterestRateRiskMemberifrs-full:TopOfRangeMember2025-12-310000891478srt:NorthAmericaMemberifrs-full:InterestRateRiskMember2025-12-310000891478srt:NorthAmericaMemberifrs-full:InterestRateRiskMemberifrs-full:WeightedAverageMember2024-12-310000891478srt:NorthAmericaMemberifrs-full:InterestRateRiskMember2024-12-310000891478srt:NorthAmericaMemberifrs-full:InterestRateRiskMemberifrs-full:WeightedAverageMember2023-12-310000891478srt:NorthAmericaMemberifrs-full:InterestRateRiskMember2023-12-310000891478srt:NorthAmericaMemberifrs-full:EquityPriceRiskMemberifrs-full:BottomOfRangeMember2025-12-310000891478srt:NorthAmericaMemberifrs-full:EquityPriceRiskMemberifrs-full:WeightedAverageMember2025-12-310000891478srt:NorthAmericaMemberifrs-full:EquityPriceRiskMemberifrs-full:TopOfRangeMember2025-12-310000891478srt:NorthAmericaMemberifrs-full:EquityPriceRiskMember2025-12-310000891478srt:NorthAmericaMemberifrs-full:EquityPriceRiskMemberifrs-full:WeightedAverageMember2024-12-310000891478srt:NorthAmericaMemberifrs-full:EquityPriceRiskMember2024-12-310000891478srt:NorthAmericaMemberifrs-full:EquityPriceRiskMemberifrs-full:WeightedAverageMember2023-12-310000891478srt:NorthAmericaMemberifrs-full:EquityPriceRiskMember2023-12-310000891478srt:NorthAmericaMemberifrs-full:CurrencyRiskMemberifrs-full:BottomOfRangeMember2025-12-310000891478srt:NorthAmericaMemberifrs-full:CurrencyRiskMemberifrs-full:WeightedAverageMember2025-12-310000891478srt:NorthAmericaMemberifrs-full:CurrencyRiskMemberifrs-full:TopOfRangeMember2025-12-310000891478srt:NorthAmericaMemberifrs-full:CurrencyRiskMember2025-12-310000891478srt:NorthAmericaMemberifrs-full:CurrencyRiskMemberifrs-full:WeightedAverageMember2024-12-310000891478srt:NorthAmericaMemberifrs-full:CurrencyRiskMember2024-12-310000891478srt:NorthAmericaMemberifrs-full:CurrencyRiskMemberifrs-full:WeightedAverageMember2023-12-310000891478srt:NorthAmericaMemberifrs-full:CurrencyRiskMember2023-12-310000891478srt:SouthAmericaMemberifrs-full:MarketRiskMemberifrs-full:BottomOfRangeMember2025-12-310000891478srt:SouthAmericaMemberifrs-full:MarketRiskMemberifrs-full:WeightedAverageMember2025-12-310000891478srt:SouthAmericaMemberifrs-full:MarketRiskMemberifrs-full:TopOfRangeMember2025-12-310000891478srt:SouthAmericaMemberifrs-full:MarketRiskMember2025-12-310000891478srt:SouthAmericaMemberifrs-full:MarketRiskMemberifrs-full:WeightedAverageMember2024-12-310000891478srt:SouthAmericaMemberifrs-full:MarketRiskMember2024-12-310000891478srt:SouthAmericaMemberifrs-full:MarketRiskMemberifrs-full:WeightedAverageMember2023-12-310000891478srt:SouthAmericaMemberifrs-full:MarketRiskMember2023-12-310000891478srt:SouthAmericaMemberifrs-full:RiskDiversificationEffectMemberifrs-full:BottomOfRangeMember2025-12-310000891478srt:SouthAmericaMemberifrs-full:RiskDiversificationEffectMemberifrs-full:WeightedAverageMember2025-12-310000891478srt:SouthAmericaMemberifrs-full:RiskDiversificationEffectMemberifrs-full:TopOfRangeMember2025-12-310000891478srt:SouthAmericaMemberifrs-full:RiskDiversificationEffectMember2025-12-310000891478srt:SouthAmericaMemberifrs-full:RiskDiversificationEffectMemberifrs-full:WeightedAverageMember2024-12-310000891478srt:SouthAmericaMemberifrs-full:RiskDiversificationEffectMember2024-12-310000891478srt:SouthAmericaMemberifrs-full:RiskDiversificationEffectMemberifrs-full:WeightedAverageMember2023-12-310000891478srt:SouthAmericaMemberifrs-full:RiskDiversificationEffectMember2023-12-310000891478srt:SouthAmericaMemberifrs-full:InterestRateRiskMemberifrs-full:BottomOfRangeMember2025-12-310000891478srt:SouthAmericaMemberifrs-full:InterestRateRiskMemberifrs-full:WeightedAverageMember2025-12-310000891478srt:SouthAmericaMemberifrs-full:InterestRateRiskMemberifrs-full:TopOfRangeMember2025-12-310000891478srt:SouthAmericaMemberifrs-full:InterestRateRiskMember2025-12-310000891478srt:SouthAmericaMemberifrs-full:InterestRateRiskMemberifrs-full:WeightedAverageMember2024-12-310000891478srt:SouthAmericaMemberifrs-full:InterestRateRiskMember2024-12-310000891478srt:SouthAmericaMemberifrs-full:InterestRateRiskMemberifrs-full:WeightedAverageMember2023-12-310000891478srt:SouthAmericaMemberifrs-full:InterestRateRiskMember2023-12-310000891478srt:SouthAmericaMemberifrs-full:EquityPriceRiskMemberifrs-full:BottomOfRangeMember2025-12-310000891478srt:SouthAmericaMemberifrs-full:EquityPriceRiskMemberifrs-full:WeightedAverageMember2025-12-310000891478srt:SouthAmericaMemberifrs-full:EquityPriceRiskMemberifrs-full:TopOfRangeMember2025-12-310000891478srt:SouthAmericaMemberifrs-full:EquityPriceRiskMember2025-12-310000891478srt:SouthAmericaMemberifrs-full:EquityPriceRiskMemberifrs-full:WeightedAverageMember2024-12-310000891478srt:SouthAmericaMemberifrs-full:EquityPriceRiskMember2024-12-310000891478srt:SouthAmericaMemberifrs-full:EquityPriceRiskMemberifrs-full:WeightedAverageMember2023-12-310000891478srt:SouthAmericaMemberifrs-full:EquityPriceRiskMember2023-12-310000891478srt:SouthAmericaMemberifrs-full:CurrencyRiskMemberifrs-full:BottomOfRangeMember2025-12-310000891478srt:SouthAmericaMemberifrs-full:CurrencyRiskMemberifrs-full:WeightedAverageMember2025-12-310000891478srt:SouthAmericaMemberifrs-full:CurrencyRiskMemberifrs-full:TopOfRangeMember2025-12-310000891478srt:SouthAmericaMemberifrs-full:CurrencyRiskMember2025-12-310000891478srt:SouthAmericaMemberifrs-full:CurrencyRiskMemberifrs-full:WeightedAverageMember2024-12-310000891478srt:SouthAmericaMemberifrs-full:CurrencyRiskMember2024-12-310000891478srt:SouthAmericaMemberifrs-full:CurrencyRiskMemberifrs-full:WeightedAverageMember2023-12-310000891478srt:SouthAmericaMemberifrs-full:CurrencyRiskMember2023-12-310000891478srt:SouthAmericaMemberifrs-full:CommodityPriceRiskMemberifrs-full:BottomOfRangeMember2025-12-310000891478srt:SouthAmericaMemberifrs-full:CommodityPriceRiskMemberifrs-full:WeightedAverageMember2025-12-310000891478srt:SouthAmericaMemberifrs-full:CommodityPriceRiskMemberifrs-full:TopOfRangeMember2025-12-310000891478srt:SouthAmericaMemberifrs-full:CommodityPriceRiskMember2025-12-310000891478srt:SouthAmericaMemberifrs-full:CommodityPriceRiskMemberifrs-full:WeightedAverageMember2024-12-310000891478srt:SouthAmericaMemberifrs-full:CommodityPriceRiskMember2024-12-310000891478srt:SouthAmericaMemberifrs-full:CommodityPriceRiskMemberifrs-full:WeightedAverageMember2023-12-310000891478srt:SouthAmericaMemberifrs-full:CommodityPriceRiskMember2023-12-310000891478san:StructuralRisksMember2025-01-012025-12-310000891478san:BankingBookMembersan:StructuralRisksMemberifrs-full:BottomOfRangeMember2025-12-310000891478san:BankingBookMembersan:StructuralRisksMemberifrs-full:WeightedAverageMember2025-12-310000891478san:BankingBookMembersan:StructuralRisksMemberifrs-full:TopOfRangeMember2025-12-310000891478san:BankingBookMembersan:StructuralRisksMember2025-12-310000891478san:BankingBookMembersan:StructuralRisksMemberifrs-full:WeightedAverageMember2024-12-310000891478san:BankingBookMembersan:StructuralRisksMember2024-12-310000891478san:BankingBookMembersan:StructuralRisksMemberifrs-full:WeightedAverageMember2023-12-310000891478san:BankingBookMembersan:StructuralRisksMember2023-12-310000891478san:BankingBookMemberifrs-full:RiskDiversificationEffectMemberifrs-full:BottomOfRangeMember2025-12-310000891478san:BankingBookMemberifrs-full:RiskDiversificationEffectMemberifrs-full:WeightedAverageMember2025-12-310000891478san:BankingBookMemberifrs-full:RiskDiversificationEffectMemberifrs-full:TopOfRangeMember2025-12-310000891478san:BankingBookMemberifrs-full:RiskDiversificationEffectMember2025-12-310000891478san:BankingBookMemberifrs-full:RiskDiversificationEffectMemberifrs-full:WeightedAverageMember2024-12-310000891478san:BankingBookMemberifrs-full:RiskDiversificationEffectMember2024-12-310000891478san:BankingBookMemberifrs-full:RiskDiversificationEffectMemberifrs-full:WeightedAverageMember2023-12-310000891478san:BankingBookMemberifrs-full:RiskDiversificationEffectMember2023-12-310000891478san:BankingBookMembersan:InterestRateAndCreditSpreadRiskMemberifrs-full:BottomOfRangeMember2025-12-310000891478san:BankingBookMembersan:InterestRateAndCreditSpreadRiskMemberifrs-full:WeightedAverageMember2025-12-310000891478san:BankingBookMembersan:InterestRateAndCreditSpreadRiskMemberifrs-full:TopOfRangeMember2025-12-310000891478san:BankingBookMembersan:InterestRateAndCreditSpreadRiskMember2025-12-310000891478san:BankingBookMembersan:InterestRateAndCreditSpreadRiskMemberifrs-full:WeightedAverageMember2024-12-310000891478san:BankingBookMembersan:InterestRateAndCreditSpreadRiskMember2024-12-310000891478san:BankingBookMembersan:InterestRateAndCreditSpreadRiskMemberifrs-full:WeightedAverageMember2023-12-310000891478san:BankingBookMembersan:InterestRateAndCreditSpreadRiskMember2023-12-310000891478san:BankingBookMemberifrs-full:CurrencyRiskMemberifrs-full:BottomOfRangeMember2025-12-310000891478san:BankingBookMemberifrs-full:CurrencyRiskMemberifrs-full:WeightedAverageMember2025-12-310000891478san:BankingBookMemberifrs-full:CurrencyRiskMemberifrs-full:TopOfRangeMember2025-12-310000891478san:BankingBookMemberifrs-full:CurrencyRiskMember2025-12-310000891478san:BankingBookMemberifrs-full:CurrencyRiskMemberifrs-full:WeightedAverageMember2024-12-310000891478san:BankingBookMemberifrs-full:CurrencyRiskMember2024-12-310000891478san:BankingBookMemberifrs-full:CurrencyRiskMemberifrs-full:WeightedAverageMember2023-12-310000891478san:BankingBookMemberifrs-full:CurrencyRiskMember2023-12-310000891478san:BankingBookMemberifrs-full:EquityPriceRiskMemberifrs-full:BottomOfRangeMember2025-12-310000891478san:BankingBookMemberifrs-full:EquityPriceRiskMemberifrs-full:WeightedAverageMember2025-12-310000891478san:BankingBookMemberifrs-full:EquityPriceRiskMemberifrs-full:TopOfRangeMember2025-12-310000891478san:BankingBookMemberifrs-full:EquityPriceRiskMember2025-12-310000891478san:BankingBookMemberifrs-full:EquityPriceRiskMemberifrs-full:WeightedAverageMember2024-12-310000891478san:BankingBookMemberifrs-full:EquityPriceRiskMember2024-12-310000891478san:BankingBookMemberifrs-full:EquityPriceRiskMemberifrs-full:WeightedAverageMember2023-12-310000891478san:BankingBookMemberifrs-full:EquityPriceRiskMember2023-12-310000891478san:NIIRiskConcentrationMembercurrency:EURsrt:EuropeMemberifrs-full:InterestRateRiskMember2025-12-310000891478san:NIIRiskConcentrationMembercurrency:GBPsrt:EuropeMemberifrs-full:InterestRateRiskMember2025-12-310000891478san:NIIRiskConcentrationMembercurrency:USDsrt:EuropeMemberifrs-full:InterestRateRiskMember2025-12-310000891478san:EVERiskConcentrationMembercurrency:GBPsrt:EuropeMemberifrs-full:InterestRateRiskMember2025-12-310000891478san:EVERiskConcentrationMembercurrency:PLNsrt:EuropeMemberifrs-full:InterestRateRiskMember2025-12-310000891478san:EVERiskConcentrationMembercurrency:USDsrt:EuropeMemberifrs-full:InterestRateRiskMember2025-12-310000891478san:NIIRiskConcentrationMembercountry:USifrs-full:InterestRateRiskMember2025-12-310000891478san:EVERiskConcentrationMembercountry:USifrs-full:InterestRateRiskMember2025-12-310000891478san:NIIRiskConcentrationMembercountry:BRifrs-full:InterestRateRiskMember2025-12-310000891478san:EVERiskConcentrationMembercountry:BRifrs-full:InterestRateRiskMember2025-12-310000891478san:EVERiskConcentrationMembercountry:CLifrs-full:InterestRateRiskMember2025-12-310000891478ifrs-full:CurrencyRiskMember2025-01-012025-12-310000891478ifrs-full:EquityPriceRiskMemberifrs-full:EquityInvestmentsMember2025-01-012025-12-310000891478ifrs-full:EquityPriceRiskMemberifrs-full:EquityInvestmentsMember2025-12-310000891478ifrs-full:EquityPriceRiskMemberifrs-full:EquityInvestmentsMember2024-12-310000891478ifrs-full:EquityPriceRiskMemberifrs-full:EquityInvestmentsMember2023-12-310000891478ifrs-full:LiquidityRiskMember2025-01-012025-12-310000891478ifrs-full:LiquidityRiskMembersan:CashCashBalanceAtCentralBanksAndOtherDepositsOnDemandMember2025-12-310000891478ifrs-full:LiquidityRiskMembersan:CashCashBalanceAtCentralBanksAndOtherDepositsOnDemandMember2024-12-310000891478ifrs-full:LiquidityRiskMembersan:CashCashBalanceAtCentralBanksAndOtherDepositsOnDemandMember2023-12-310000891478ifrs-full:LiquidityRiskMembersan:MarketableAssetsLevel1Member2025-12-310000891478ifrs-full:LiquidityRiskMembersan:MarketableAssetsLevel1Member2024-12-310000891478ifrs-full:LiquidityRiskMembersan:MarketableAssetsLevel1Member2023-12-310000891478ifrs-full:LiquidityRiskMembersan:MarketableAssetsLevel2AMember2025-12-310000891478ifrs-full:LiquidityRiskMembersan:MarketableAssetsLevel2AMember2024-12-310000891478ifrs-full:LiquidityRiskMembersan:MarketableAssetsLevel2AMember2023-12-310000891478ifrs-full:LiquidityRiskMembersan:MarketableAssetsLevel2BMember2025-12-310000891478ifrs-full:LiquidityRiskMembersan:MarketableAssetsLevel2BMember2024-12-310000891478ifrs-full:LiquidityRiskMembersan:MarketableAssetsLevel2BMember2023-12-310000891478ifrs-full:LiquidityRiskMember2025-12-310000891478ifrs-full:LiquidityRiskMember2024-12-310000891478ifrs-full:LiquidityRiskMember2023-12-310000891478ifrs-full:LiquidityRiskMember2024-01-012024-12-310000891478ifrs-full:LiquidityRiskMember2023-01-012023-12-310000891478san:OnBalanceSheetAssetsMemberifrs-full:LiquidityRiskMembersan:IFRSCollateralPledgedMembersan:UnmaturedMember2025-12-310000891478san:OnBalanceSheetAssetsMemberifrs-full:LiquidityRiskMembersan:IFRSCollateralPledgedMemberifrs-full:NotLaterThanOneMonthMember2025-12-310000891478san:OnBalanceSheetAssetsMemberifrs-full:LiquidityRiskMembersan:IFRSCollateralPledgedMemberifrs-full:LaterThanOneMonthAndNotLaterThanThreeMonthsMember2025-12-310000891478san:OnBalanceSheetAssetsMemberifrs-full:LiquidityRiskMembersan:IFRSCollateralPledgedMemberifrs-full:LaterThanThreeMonthsAndNotLaterThanOneYearMember2025-12-310000891478san:OnBalanceSheetAssetsMemberifrs-full:LiquidityRiskMembersan:IFRSCollateralPledgedMemberifrs-full:LaterThanOneYearAndNotLaterThanTwoYearsMember2025-12-310000891478san:OnBalanceSheetAssetsMemberifrs-full:LiquidityRiskMembersan:IFRSCollateralPledgedMemberifrs-full:LaterThanTwoYearsAndNotLaterThanThreeYearsMember2025-12-310000891478san:OnBalanceSheetAssetsMemberifrs-full:LiquidityRiskMembersan:IFRSCollateralPledgedMemberifrs-full:LaterThanThreeYearsAndNotLaterThanFiveYearsMember2025-12-310000891478san:OnBalanceSheetAssetsMemberifrs-full:LiquidityRiskMembersan:IFRSCollateralPledgedMemberifrs-full:LaterThanFiveYearsAndNotLaterThanTenYearsMember2025-12-310000891478san:OnBalanceSheetAssetsMemberifrs-full:LiquidityRiskMembersan:IFRSCollateralPledgedMemberifrs-full:LaterThanTenYearsMember2025-12-310000891478san:OnBalanceSheetAssetsMemberifrs-full:LiquidityRiskMembersan:IFRSCollateralPledgedMember2025-12-310000891478san:OffBalanceSheetAssetsMemberifrs-full:LiquidityRiskMembersan:IFRSCollateralPledgedMembersan:UnmaturedMember2025-12-310000891478san:OffBalanceSheetAssetsMemberifrs-full:LiquidityRiskMembersan:IFRSCollateralPledgedMemberifrs-full:NotLaterThanOneMonthMember2025-12-310000891478san:OffBalanceSheetAssetsMemberifrs-full:LiquidityRiskMembersan:IFRSCollateralPledgedMemberifrs-full:LaterThanOneMonthAndNotLaterThanThreeMonthsMember2025-12-310000891478san:OffBalanceSheetAssetsMemberifrs-full:LiquidityRiskMembersan:IFRSCollateralPledgedMemberifrs-full:LaterThanThreeMonthsAndNotLaterThanOneYearMember2025-12-310000891478san:OffBalanceSheetAssetsMemberifrs-full:LiquidityRiskMembersan:IFRSCollateralPledgedMemberifrs-full:LaterThanOneYearAndNotLaterThanTwoYearsMember2025-12-310000891478san:OffBalanceSheetAssetsMemberifrs-full:LiquidityRiskMembersan:IFRSCollateralPledgedMemberifrs-full:LaterThanTwoYearsAndNotLaterThanThreeYearsMember2025-12-310000891478san:OffBalanceSheetAssetsMemberifrs-full:LiquidityRiskMembersan:IFRSCollateralPledgedMemberifrs-full:LaterThanThreeYearsAndNotLaterThanFiveYearsMember2025-12-310000891478san:OffBalanceSheetAssetsMemberifrs-full:LiquidityRiskMembersan:IFRSCollateralPledgedMemberifrs-full:LaterThanFiveYearsAndNotLaterThanTenYearsMember2025-12-310000891478san:OffBalanceSheetAssetsMemberifrs-full:LiquidityRiskMembersan:IFRSCollateralPledgedMemberifrs-full:LaterThanTenYearsMember2025-12-310000891478san:OffBalanceSheetAssetsMemberifrs-full:LiquidityRiskMembersan:IFRSCollateralPledgedMember2025-12-310000891478san:OnBalanceSheetAssetsMembersan:LoansAndAdvancesMemberifrs-full:LiquidityRiskMembersan:IFRSCollateralPledgedMember2025-12-310000891478san:OnBalanceSheetAssetsMembersan:LoansAndAdvancesMemberifrs-full:LiquidityRiskMembersan:IFRSUncollateralizedMember2025-12-310000891478san:OnBalanceSheetAssetsMemberifrs-full:EquityInvestmentsMemberifrs-full:LiquidityRiskMembersan:IFRSCollateralPledgedMember2025-12-310000891478san:OnBalanceSheetAssetsMemberifrs-full:EquityInvestmentsMemberifrs-full:LiquidityRiskMembersan:IFRSUncollateralizedMember2025-12-310000891478san:OnBalanceSheetAssetsMemberifrs-full:DebtSecuritiesMemberifrs-full:LiquidityRiskMembersan:IFRSCollateralPledgedMember2025-12-310000891478san:OnBalanceSheetAssetsMemberifrs-full:DebtSecuritiesMemberifrs-full:LiquidityRiskMembersan:IFRSUncollateralizedMember2025-12-310000891478san:OnBalanceSheetAssetsMemberifrs-full:OtherAssetsMemberifrs-full:LiquidityRiskMembersan:IFRSCollateralPledgedMember2025-12-310000891478san:OnBalanceSheetAssetsMemberifrs-full:OtherAssetsMemberifrs-full:LiquidityRiskMembersan:IFRSUncollateralizedMember2025-12-310000891478san:OnBalanceSheetAssetsMemberifrs-full:LiquidityRiskMembersan:IFRSUncollateralizedMember2025-12-310000891478san:OffBalanceSheetAssetsMembersan:LoansAndAdvancesMemberifrs-full:LiquidityRiskMembersan:IFRSCollateralPledgedMember2025-12-310000891478san:OffBalanceSheetAssetsMemberifrs-full:EquityInvestmentsMemberifrs-full:LiquidityRiskMembersan:IFRSCollateralPledgedMember2025-12-310000891478san:OffBalanceSheetAssetsMemberifrs-full:DebtSecuritiesMemberifrs-full:LiquidityRiskMembersan:IFRSCollateralPledgedMember2025-12-310000891478san:OffBalanceSheetAssetsMembersan:OtherCollateralAssetsMemberifrs-full:LiquidityRiskMembersan:IFRSCollateralPledgedMember2025-12-310000891478san:OffBalanceSheetAssetsMembersan:EntityOwnEquityInstrumentsOtherThanCoveredBondsAndAssetBackedSecuritiesMemberifrs-full:LiquidityRiskMembersan:IFRSCollateralPledgedMember2025-12-310000891478ifrs-full:LiquidityRiskMembersan:IFRSCollateralPledgedMember2025-12-310000891478san:OnBalanceSheetAssetsMemberifrs-full:LiquidityRiskMembersan:IFRSCollateralPledgedMember2025-01-012025-12-310000891478ifrs-full:LiquidityRiskMembersan:IFRSCollateralPledgedMember2025-01-012025-12-310000891478ifrs-full:BottomOfRangeMember2025-12-310000891478srt:ReportableLegalEntitiesMembersrt:ParentCompanyMember2025-12-310000891478srt:ReportableLegalEntitiesMembersrt:ParentCompanyMember2024-12-310000891478srt:ReportableLegalEntitiesMembersrt:ParentCompanyMember2023-12-310000891478srt:ReportableLegalEntitiesMembersan:BankSubsidiariesMembersrt:ParentCompanyMember2025-12-310000891478srt:ReportableLegalEntitiesMembersan:BankSubsidiariesMembersrt:ParentCompanyMember2024-12-310000891478srt:ReportableLegalEntitiesMembersan:BankSubsidiariesMembersrt:ParentCompanyMember2023-12-310000891478srt:ReportableLegalEntitiesMembersan:NonBankSubsidiariesMembersrt:ParentCompanyMember2025-12-310000891478srt:ReportableLegalEntitiesMembersan:NonBankSubsidiariesMembersrt:ParentCompanyMember2024-12-310000891478srt:ReportableLegalEntitiesMembersan:NonBankSubsidiariesMembersrt:ParentCompanyMember2023-12-310000891478srt:ReportableLegalEntitiesMembersrt:ParentCompanyMember2025-01-012025-12-310000891478srt:ReportableLegalEntitiesMembersrt:ParentCompanyMember2024-01-012024-12-310000891478srt:ReportableLegalEntitiesMembersrt:ParentCompanyMember2023-01-012023-12-310000891478srt:ReportableLegalEntitiesMembersan:EarningAssetsMembersrt:ParentCompanyMember2025-01-012025-12-310000891478srt:ReportableLegalEntitiesMembersan:EarningAssetsMembersrt:ParentCompanyMember2024-01-012024-12-310000891478srt:ReportableLegalEntitiesMembersan:EarningAssetsMembersrt:ParentCompanyMember2023-01-012023-12-310000891478srt:ReportableLegalEntitiesMembersan:BankSubsidiariesMembersrt:ParentCompanyMember2025-01-012025-12-310000891478srt:ReportableLegalEntitiesMembersan:BankSubsidiariesMembersrt:ParentCompanyMember2024-01-012024-12-310000891478srt:ReportableLegalEntitiesMembersan:BankSubsidiariesMembersrt:ParentCompanyMember2023-01-012023-12-310000891478srt:ReportableLegalEntitiesMembersan:NonBankSubsidiariesMembersrt:ParentCompanyMember2025-01-012025-12-310000891478srt:ReportableLegalEntitiesMembersan:NonBankSubsidiariesMembersrt:ParentCompanyMember2024-01-012024-12-310000891478srt:ReportableLegalEntitiesMembersan:NonBankSubsidiariesMembersrt:ParentCompanyMember2023-01-012023-12-310000891478srt:ReportableLegalEntitiesMembersrt:ParentCompanyMember2022-12-310000891478ifrs-full:FinancialLiabilitiesAtAmortisedCostCategoryMembersan:SubordinatedLiabilitiesPreferenceSharesMember2025-12-310000891478ifrs-full:FinancialLiabilitiesAtAmortisedCostCategoryMembersan:SubordinatedLiabilitiesPreferenceSharesMember2024-12-310000891478ifrs-full:FinancialLiabilitiesAtAmortisedCostCategoryMembersan:SubordinatedLiabilitiesPreferenceSharesMember2023-12-310000891478ifrs-full:FinancialLiabilitiesAtAmortisedCostCategoryMembersan:SubordinatedLiabilitiesPreferredSecuritiesMember2025-12-310000891478ifrs-full:FinancialLiabilitiesAtAmortisedCostCategoryMembersan:SubordinatedLiabilitiesPreferredSecuritiesMember2024-12-310000891478ifrs-full:FinancialLiabilitiesAtAmortisedCostCategoryMembersan:SubordinatedLiabilitiesPreferredSecuritiesMember2023-12-310000891478ifrs-full:FinancialLiabilitiesAtAmortisedCostCategoryMembersan:SubordinatedLiabilitiesMember2025-12-310000891478ifrs-full:FinancialLiabilitiesAtAmortisedCostCategoryMembersan:SubordinatedLiabilitiesMember2024-12-310000891478ifrs-full:FinancialLiabilitiesAtAmortisedCostCategoryMembersan:SubordinatedLiabilitiesMember2023-12-310000891478san:IssuanceBySantanderUKPLCInOctober1995Membersan:SubordinatedLiabilitiesPreferenceSharesMemberifrs-full:FixedInterestRateMember2025-12-310000891478san:IssuanceBySantanderUKPLCInFebruary1996Membersan:SubordinatedLiabilitiesPreferenceSharesMemberifrs-full:FixedInterestRateMember2025-12-310000891478san:IssuanceByBancoSantanderSAInJanuary2020Membersan:SubordinatedLiabilitiesPreferredSecuritiesMemberifrs-full:FixedInterestRateMember2025-12-310000891478san:IssuanceByBancoSantanderSAInMay2021SeriesInDollarsMembersan:SubordinatedLiabilitiesPreferredSecuritiesMemberifrs-full:FixedInterestRateMember2025-12-310000891478san:IssuanceByBancoSantanderSAInMay2021SeriesInEurosMembersan:SubordinatedLiabilitiesPreferredSecuritiesMemberifrs-full:FixedInterestRateMember2025-12-310000891478san:IssuanceByBancoSantanderSAInSeptember2021Membersan:SubordinatedLiabilitiesPreferredSecuritiesMemberifrs-full:FixedInterestRateMember2025-12-310000891478san:IssuanceByBancoSantanderSAInNovember2023FirstSeriesMembersan:SubordinatedLiabilitiesPreferredSecuritiesMemberifrs-full:FixedInterestRateMember2025-12-310000891478san:IssuanceByBancoSantanderSAInNovember2023SecondSeriesMembersan:SubordinatedLiabilitiesPreferredSecuritiesMemberifrs-full:FixedInterestRateMember2025-12-310000891478san:IssuanceByBancoSantanderS.A.InMay2024Membersan:SubordinatedLiabilitiesPreferredSecuritiesMemberifrs-full:FixedInterestRateMember2025-12-310000891478san:IssuanceByBancoSantanderS.A.InAugust2024Membersan:SubordinatedLiabilitiesPreferredSecuritiesMemberifrs-full:FixedInterestRateMember2025-12-310000891478san:IssuanceByBancoSantanderS.A.InJuly2025Membersan:SubordinatedLiabilitiesPreferredSecuritiesMemberifrs-full:FixedInterestRateMember2025-12-310000891478san:IssuanceBySantanderFinancePreferredSAInSeptember2004Membersan:SubordinatedLiabilitiesPreferredSecuritiesMembersan:CMS10InterestRateMember2025-12-310000891478san:IssuanceByBancoSantanderSAInJanuary2020Membersan:SubordinatedLiabilitiesPreferredSecuritiesMember2025-12-310000891478san:IssuanceByBancoSantanderSAInJanuary2020Membersan:SubordinatedLiabilitiesPreferredSecuritiesMember2025-01-012025-12-310000891478san:IssuanceByBancoSantanderSAInJanuary2020Membersan:SubordinatedLiabilitiesPreferredSecuritiesMembersan:MidSwapRateFiveYearEuroMember2025-12-310000891478san:IssuanceByBancoSantanderSAInMay2021SeriesInDollarsMembersan:SubordinatedLiabilitiesPreferredSecuritiesMember2025-12-310000891478san:IssuanceByBancoSantanderSAInMay2021SeriesInDollarsMembersan:SubordinatedLiabilitiesPreferredSecuritiesMember2025-01-012025-12-310000891478san:IssuanceByBancoSantanderSAInMay2021SeriesInDollarsMembersan:SubordinatedLiabilitiesPreferredSecuritiesMembersan:USTRateFiveYearUSDollarMember2025-12-310000891478san:IssuanceByBancoSantanderSAInMay2021SeriesInEurosMembersan:SubordinatedLiabilitiesPreferredSecuritiesMember2025-12-310000891478san:IssuanceByBancoSantanderSAInMay2021SeriesInEurosMembersan:SubordinatedLiabilitiesPreferredSecuritiesMember2025-01-012025-12-310000891478san:IssuanceByBancoSantanderSAInMay2021SeriesInEurosMembersan:SubordinatedLiabilitiesPreferredSecuritiesMembersan:MidSwapRateFiveYearEuroMember2025-12-310000891478san:IssuanceByBancoSantanderSAInSeptember2021Membersan:SubordinatedLiabilitiesPreferredSecuritiesMember2025-12-310000891478san:IssuanceByBancoSantanderSAInSeptember2021Membersan:SubordinatedLiabilitiesPreferredSecuritiesMember2025-01-012025-12-310000891478san:IssuanceByBancoSantanderSAInSeptember2021Membersan:SubordinatedLiabilitiesPreferredSecuritiesMembersan:MidSwapRateFiveYearEuroMember2025-12-310000891478san:IssuanceByBancoSantanderSAInNovember2023FirstSeriesMembersan:SubordinatedLiabilitiesPreferredSecuritiesMember2025-12-310000891478san:IssuanceByBancoSantanderSAInNovember2023FirstSeriesMembersan:SubordinatedLiabilitiesPreferredSecuritiesMember2025-01-012025-12-310000891478san:IssuanceByBancoSantanderSAInNovember2023FirstSeriesMembersan:SubordinatedLiabilitiesPreferredSecuritiesMembersan:USTRateFiveYearUSDollarMember2025-12-310000891478san:IssuanceByBancoSantanderSAInNovember2023SecondSeriesMembersan:SubordinatedLiabilitiesPreferredSecuritiesMember2025-12-310000891478san:IssuanceByBancoSantanderSAInNovember2023SecondSeriesMembersan:SubordinatedLiabilitiesPreferredSecuritiesMember2025-01-012025-12-310000891478san:IssuanceByBancoSantanderSAInNovember2023SecondSeriesMembersan:SubordinatedLiabilitiesPreferredSecuritiesMembersan:USTRateFiveYearUSDollarMember2025-12-310000891478san:IssuanceByBancoSantanderS.A.InMay2024Membersan:SubordinatedLiabilitiesPreferredSecuritiesMember2025-12-310000891478san:IssuanceByBancoSantanderS.A.InMay2024Membersan:SubordinatedLiabilitiesPreferredSecuritiesMember2025-01-012025-12-310000891478san:IssuanceByBancoSantanderS.A.InMay2024Membersan:SubordinatedLiabilitiesPreferredSecuritiesMembersan:USTRateFiveYearUSDollarMember2025-12-310000891478san:IssuanceByBancoSantanderS.A.InAugust2024Membersan:SubordinatedLiabilitiesPreferredSecuritiesMember2025-12-310000891478san:IssuanceByBancoSantanderS.A.InAugust2024Membersan:SubordinatedLiabilitiesPreferredSecuritiesMember2025-01-012025-12-310000891478san:IssuanceByBancoSantanderS.A.InAugust2024Membersan:SubordinatedLiabilitiesPreferredSecuritiesMembersan:USTRateFiveYearUSDollarMember2025-12-310000891478san:IssuanceByBancoSantanderS.A.InJuly2025Membersan:SubordinatedLiabilitiesPreferredSecuritiesMember2025-12-310000891478san:IssuanceByBancoSantanderS.A.InJuly2025Membersan:SubordinatedLiabilitiesPreferredSecuritiesMember2025-01-012025-12-310000891478san:IssuanceByBancoSantanderS.A.InJuly2025Membersan:SubordinatedLiabilitiesPreferredSecuritiesMembersan:USTRateFiveYearUSDollarMember2025-12-31
FORM 6-K
SECURITIES AND EXCHANGE COMMISSION
Washington, D.C. 20549
Report of Foreign Issuer
Pursuant to Rule 13a-16 or 15d-16
of the Securities Exchange Act of 1934
For the year ended December 31, 2025
Commission File Number: 001-12518
Banco Santander, S.A.
(Exact name of registrant as specified in its charter)
Ciudad Grupo Santander
28660 Boadilla del Monte (Madrid) Spain
(Address of principal executive office)
Indicate by check mark whether the registrant files or will file annual reports under cover of Form 20-F or Form 40-F:
Form 20-F ☒ Form 40-F ☐
The information contained in this Form 6-K and any exhibits hereto shall be deemed filed with the Securities and Exchange Commission (“SEC”) solely for purposes of incorporation by reference into and as part of Banco Santander, S.A.’s Registration Statement No. 333-294235 on Form F-4, Registration Statement No. 333-293987 on Form F-3, and Registration Statements Nos. 333-293144, 333-285208, 333-278095, 333-269251, 333-262484, 333-256936, 333-238260, 333-231568 and 333-227289 on Form S-8 filed with the SEC, including any prospectuses forming a part of such registration statements, and to be a part thereof from the date on which this report is filed, to the extent not superseded by documents or reports subsequently filed or furnished.
BANCO SANTANDER, S.A.
________________________
TABLE OF CONTENTS
A Under these titles we include information that updates 'Part 2. Supplemental information - 6. Supplement to the operating and financial review disclosure in the directors’ report. Consolidated income statement. Variations 2024 compared to 2023 for the Group and by primary and secondary segments' in our 2025 Form 20-F which incorporated by reference 'Part 1. Consolidated Directors´ Report-Economic and Financial review. Section 3.2 and Section 4' in our 2024 Form 20-F.
| | | | | | | | | | | | | | | | | | | | | | | | | | | | | | | | | | | | | | | | | | | | | | | | | | | | | |
| | | | | | | | | | | | | | | | | |
| Contents | | | | Section1. Certain recast financial information | | | Section 2. Consolidated recast financial statements | | Exhibits | | |
| | | | | | | | | | | | | | | | |
| | | | | | | | | | | | | | | | | |
Section 1
Certain financial information included in Banco Santander, S.A.’s 2025 Form 20-F retrospectively recast as a result of certain changes to the presentation of the Group's financial information.
1. Cross reference to Form 20-F
| | | | | | | | | | | |
Form 20-F item number and caption | Location | Page |
Presentation of financial and other information | | |
Cautionary statement regarding forward-looking statements | | |
PART I | | | |
ITEM 1. | IDENTITY OF DIRECTORS, SENIOR MANAGEMENT AND ADVISERS | | |
| A. Directors and senior management | Not required for annual report on Form 20-F | - |
| B. Advisers | Not required for annual report on Form 20-F | - |
| C. Auditors | Not required for annual report on Form 20-F | - |
ITEM 2. | OFFER STATISTICS AND EXPECTED TIMETABLE | | |
| A. Offer statistics | Not required for annual report on Form 20-F | - |
| B. Method and expected timetable | Not required for annual report on Form 20-F | - |
ITEM 3. | KEY INFORMATION | | |
| Selected financial data | | |
| A. [Reserved] | | |
| B. Capitalization and indebtedness | Not required for annual report on Form 20-F | - |
| C. Reasons for the offer and use of proceeds | Not required for annual report on Form 20-F | - |
| D. Risk factors | No material changes derived from the recast | - |
ITEM 4. | INFORMATION ON THE COMPANY | | |
| A. History and development of the company | No material changes derived from the recast | - |
| Acquisitions, dispositions, reorganizations | No material changes derived from the recast | - |
| Capital increases | No material changes derived from the recast | - |
| Recent events | No material changes derived from the recast | - |
| B. Business overview | | |
| | | |
| | | |
| | | |
| Selected statistical information | No material changes derived from the recast | - |
| Competition in Spain | No material changes derived from the recast | - |
| Supervision and regulation | No material changes derived from the recast | - |
| C. Organizational structure | No material changes derived from the recast | - |
| D. Property, plants and equipment | No material changes derived from the recast | - |
ITEM 4A. | UNRESOLVED STAFF COMMENTS | No material changes derived from the recast | - |
ITEM 5. | OPERATING AND FINANCIAL REVIEW AND PROSPECTS | | |
| A. Operating results | | |
| | | |
| | | |
| | | |
| B. Liquidity and capital resources | No material changes derived from the recast | - |
| C. Research and development, patents and licenses, etc. | No material changes derived from the recast | - |
| D. Trend information | No material changes derived from the recast | - |
| E. Critical accounting estimates | No material changes derived from the recast | - |
ITEM 6. | DIRECTORS, SENIOR MANAGEMENT AND EMPLOYEES | | |
| A. Directors and senior management | No material changes derived from the recast | - |
| B. Compensation | No material changes derived from the recast | - |
| C. Board practices | No material changes derived from the recast | - |
| D. Employees | No material changes derived from the recast | - |
| E. Share ownership | No material changes derived from the recast | - |
| F. Disclosure of a registrant's action to recover erroneously awarded compensation | No material changes derived from the recast | |
| | | | | | | | | | | |
Form 20-F item number and caption | Location | Page |
ITEM 7. | MAJOR SHAREHOLDERS AND RELATED PARTY TRANSACTIONS | | |
| A. Major shareholders | No material changes derived from the recast | - |
| B. Related party transactions | No material changes derived from the recast | - |
| C. Interests of experts and counsel | Not required for annual report on Form 20-F | - |
ITEM 8. | FINANCIAL INFORMATION | | |
| A. Consolidated statements and other financial information | | |
| Financial statements | | |
| Legal proceedings | No material changes derived from the recast | - |
| Shareholders remuneration | No material changes derived from the recast | - |
| B. Significant changes | Not applicable | - |
ITEM 9. | THE OFFER AND LISTING | | |
| A. Offer and listing details | No material changes derived from the recast | - |
| B. Plan of distribution | Not required for annual report on Form 20-F | - |
| C. Markets | No material changes derived from the recast | - |
| D. Selling shareholders | Not required for annual report on Form 20-F | - |
| E. Dilution | Not required for annual report on Form 20-F | - |
| F. Expenses of the issue | Not required for annual report on Form 20-F | - |
ITEM 10. | ADDITIONAL INFORMATION | | |
| A. Share capital | Not required for annual report on Form 20-F | - |
| B. Memorandum and articles of association | No material changes derived from the recast | - |
| C. Material contracts | No material changes derived from the recast | - |
| D. Exchange controls | No material changes derived from the recast | - |
| E. Taxation | No material changes derived from the recast | - |
| F. Dividends and paying agents | Not required for annual report on Form 20-F | - |
| G. Statement by experts | Not required for annual report on Form 20-F | - |
| H. Documents on display | No material changes derived from the recast | - |
| I. Subsidiary information | Not required for annual report on Form 20-F | - |
| J. Annual report to security holders | Not required for annual report on Form 20-F | - |
ITEM 11. | QUANTITATIVE AND QUALITATIVE DISCLOSURES ABOUT MARKET RISK | | |
ITEM 12. | DESCRIPTION OF SECURITIES OTHER THAN EQUITY SECURITIES | | |
| A. Debt securities | Not required for annual report on Form 20-F | - |
| B. Warrants and rights | Not required for annual report on Form 20-F | - |
| C. Other securities | Not required for annual report on Form 20-F | - |
| D. American Depositary Shares | No material changes derived from the recast | - |
PART II | | | |
ITEM 13. | DEFAULTS, DIVIDEND ARREARAGES AND DELINQUENCIES | Not applicable | - |
ITEM 14. | MATERIAL MODIFICATIONS TO THE RIGHTS OF SECURITY HOLDERS AND USE OF PROCEEDS | Not applicable | - |
ITEM 15. | CONTROLS AND PROCEDURES | No material changes derived from the recast | - |
ITEM 16 | [Reserved] | | |
| A. Audit committee financial expert | No material changes derived from the recast | - |
| B. Code of ethics | No material changes derived from the recast | - |
| C. Principal accountant fees and services | No material changes derived from the recast | - |
| D. Exemptions from the listing standards for audit committees | Not applicable | - |
| E. Purchases of equity securities by the issuer and affiliated purchasers | No material changes derived from the recast | - |
| F. Change in registrant’s certifying accountant | Not applicable | - |
| G. Corporate governance | No material changes derived from the recast | - |
| H. Mine safety disclosure | Not applicable | - |
| I. Disclosure regarding foreign jurisdictions that prevent inspections | Not applicable | - |
| J. Insider trading policies | No material changes derived from the recast | - |
| K. Cybersecurity | No material changes derived from the recast | - |
PART III | | | |
| | | | | | | | | | | |
Form 20-F item number and caption | Location | Page |
ITEM 17. | FINANCIAL STATEMENTS | | |
ITEM 18. | FINANCIAL STATEMENTS | | |
ITEM 19 | EXHIBITS | | |
| | | |
2. Presentation of financial and other information
Explanatory Note
We are filing this report on Form 6-K to recast certain financial information and related disclosure for the three years ended 31 December 2025 that were included in our annual report on Form 20-F for the fiscal year ended 31 December 2025 filed with the Securities and Exchange Commission (SEC) on 27 February 2026 (the '2025 Form 20-F'), in order to reflect our new reporting structure.
On 10 February 2026, the Group announced the implementation of a series of changes to its reporting structure. These changes do not affect the Group’s attributable profit nor the Group's targets announced in the Q4 2025 results presentation but rather are intended to improve the transparency and comparability of the metrics and financial statements, as well as to align the reporting with the way the bank has been managed since the beginning of 2026.
These changes, which affect the statutory and underlying income statements, the segment reporting and certain management metrics, have been applied to the periods presented herein and will apply to the information reported from the first quarter of 2026. These changes do not affect the Group’s consolidated balance sheet.
The main changes are as follows:
a. Poland disposal
In the underlying income statement, the results associated with the business subject to the Poland disposal are recorded in a single line item under 'non-recurring items'. Consequently, the global businesses, which, in accordance with IFRS 8, are reported only on an underlying basis, also exclude Poland.
Likewise, the underlying ratios, management metrics and business volumes exclude the activity affected by the Poland disposal.
b. Classification of certain costs
Certain charges that, until 31 December 2025, were recorded under the 'other provisions' line item are now presented in different lines of the income statement. In particular, charges mainly relating to bank levies and other taxes applicable to the banking sector are reclassified to 'other operating costs' to ensure uniformity across the Group.
In addition, certain recurring operating charges, primarily related to labour (mainly in Brazil) and legal processes, are presented in 'total costs' (comprising 'administrative expenses and amortizations' and 'other operating costs').
c. Reporting of the Cards business within Retail & Commercial Banking (Retail)
Given that our payments platform strategy is now largely established, we are positioning Payments, renamed Payment Solutions, as the Group’s payments platform business.
In this context, from 1 January 2026, the income statement and balance sheet items relating to the Cards business have been reclassified to Retail (previously recorded in Payments), to better align reporting with the management structure in these businesses in 2026.
Plard, the Group’s card processing platform, remains in Payment Solutions and charges market-based fees to the global businesses for card processing.
d. Cost of risk, NPL ratio and NPL coverage ratio
The definitions of the cost of risk, the non-performing loan (NPL) ratio and the NPL coverage ratio have been enhanced to include corporate exposures originated through debt securities issued by non-financial institutions. This adjustment provides a more accurate view of our credit exposure and quality.
e. RoTE Spain
The Santander Spain secondary segment does not have its own accounting tangible equity since it is booked under Banco Santander, S.A., together with other units such as the Corporate Centre. For this reason, a theoretical tangible equity is allocated to the segment.
The methodology for allocating such tangible equity to Spain has been updated to increase accuracy, taking into account: i) the amount required to reach a 13% CET1 ratio; and ii) the allocation of deductions and other capital adjustments (add-ons).
f. Other changes within the primary segments
In addition to the change in the Payments business described in section c, two minor adjustments have been introduced to the primary segments: i) the Digital Consumer Bank (Consumer) business has been renamed Openbank; and ii) Wealth Management & Insurance has been reorganized into two business lines: Private Banking, which comprises the corporate private banking unit and International Private Banking in the US, Switzerland and the UAE; and Insurance & Asset Management Solutions, which brings together the insurance business and liquid and illiquid asset management activities, and includes the investment platforms and holdings that complement the traditional Wealth business. These changes do not impact figures at the Group or primary segment levels.
The Group has recast the corresponding information of earlier periods to reflect these changes in the structure of its internal organization.
In this report, we have included only such disclosure as is impacted by the revisions described above and have only revised such disclosure to reflect such revisions, therefore this report does not recast the information in any other part of the 2025 Form 20-F. Accordingly, this report does not, and does not purport to, update any information in such Form 20-F to reflect any events that have occurred after its filing.
References in this report to our consolidated financial statements shall be deemed to refer to our recast consolidated
financial statements and related notes that are also included in this Form 6-K. This Form 6-K should be read in conjunction with the above-mentioned 2025 Form 20-F and our other filings with the SEC.
Accounting principles
Under Regulation (EC) No. 1606/2002 of the European Parliament and of the Council of 19 July 2002, all companies governed by the law of an EU Member State (a Member State) and whose securities are admitted to trading on a regulated market of any Member State must prepare their consolidated financial statements in conformity with the International Financial Reporting Standards as previously adopted by the European Union (EU-IFRS). The Bank of Spain Circular 4/2004 of 22 December 2004 on Public and Confidential Financial Reporting Rules and Formats (Circular 4/2004) required Spanish credit institutions to adapt their accounting systems to the principles derived from the adoption by the European Union of International Financial Reporting Standards. Circular 4/2004 was repealed on 1 January 2018 by Bank of Spain Circular 4/2017, of 27 November 2017 on Public and Confidential Financial Reporting Rules and Formats (Circular 4/2017). Therefore, Grupo Santander (the 'Group' or 'Santander') is required to prepare its consolidated financial statements for the years ended 31 December 2025, 31 December 2024 and 31 December 2023 in conformity with EU-IFRS and Circular 4/2017. Differences between EU-IFRS, Bank of Spain’s Circulars and International Financial Reporting Standards as issued by the International Accounting Standards Board (IFRS-IASB) are not material. Therefore, we assert that the financial information contained in this report on Form 6-K complies with IFRS-IASB.
Our auditors, PricewaterhouseCoopers Auditores, S.L., an independent registered public accounting firm, have audited our consolidated financial statements as of, and for the years ended, 31 December 2025, 2024 and 2023, which were prepared in accordance with IFRS-IASB. See the audit report issued by PricewaterhouseCoopers Auditores, S.L., in Section 2 of this report on Form 6-K. We have presented our financial information according to the classification format for banks used in Spain. We have not reclassified the line items to comply with Article 9 of Regulation S-X, as permitted by the rules and regulations of the SEC. Article 9 is a regulation of the US Securities and Exchange Commission that contains presentation requirements for bank holding company financial statements.
General information
Our consolidated financial statements included in Section 2 of this report on Form 6-K are in Euros, which are denoted 'euro', 'euros', 'EUR' or '€' throughout this report on Form 6-K. Also, throughout this report on Form 6-K, when we refer to:
•'we', 'us', 'our', the 'Group', 'Grupo Santander' or 'Santander', we mean Banco Santander, S.A. and its subsidiaries, unless the context otherwise requires;
•'dollars', 'USD', 'US$' or '$', we mean United States dollars; and
•'pounds', 'GBP' or '£', we mean United Kingdom pounds.
When we refer to 'net interest income', we mean 'interest income/(charges)'.
When we refer to 'staff costs', we mean 'personnel expenses'.
When we refer to 'profit before tax', we mean 'operating profit/(loss) before tax'.
When we refer to 'average balances' for a particular period, we mean the average of the month-end balances for that period, unless otherwise noted. We do not believe that monthly averages present trends that are materially different from trends that daily averages would show. In calculating our interest income, we include any interest payments we received on non-accruing loans if they were received in the period when due.
When we refer to 'loans', we mean loans, leases, discounted bills and accounts receivable, unless otherwise noted. The loan to value ('LTV') ratios disclosed in this report on Form 6-K are calculated as the ratio of the outstanding amount of the loan to the most recent available appraisal value of the mortgaged asset. Additionally, if a loan shows signs of impairment, we update the appraisals which are then used to estimate allowances for loan losses.
When we refer to the 'non-performing loans ratio' ('NPL ratio'), we mean credit impaired loans and advances to customers, debt securities issued by non-financial institutions, customer guarantees and customer commitments granted divided by total risk (which comprises total loans and advances to customers, customer guarantees and customer commitments granted, including those that are credit impaired).
When we refer to 'credit impaired balances', unless otherwise noted, we mean credit impaired loans and advances to customers, debt securities issued by non-financial institutions, customer guarantees and customer commitments granted.
When we refer to 'allowances for credit losses', unless otherwise noted, we mean allowances for inherent losses of impaired assets. Allowances reflect expected credit losses.
When we refer to 'perimeter effect', we mean growth or reduction derived from changes in the companies that we consolidate resulting from acquisitions, dispositions or other reasons.
Where a translation of foreign exchange is given for any financial data, unless otherwise noted, we use the exchange rates of the relevant period (as of the end of such period for balance sheet data and the average exchange rate of such period for income statement data) as published by the European Central Bank (ECB).
Management makes use of certain financial measures in local currency to help in the assessment of ongoing operating performance. These non-GAAP financial measures include the results of operations of our subsidiary banks located outside the eurozone, excluding the impact of foreign exchange. We analyse these banks’ performance on a local currency basis to better measure the comparability of results between periods. Because changes in foreign currency exchange rates have a non-operating impact on the results of operations, we believe that evaluating their performance on a local currency basis provides an additional and meaningful assessment of performance to both management and the company’s investors. Variances in financial metrics, excluding the exchange rate impact, are calculated by translating the components of the financial metrics to our euro presentation currency using the same foreign currency exchange rate for both periods presented. For a discussion of the accounting principles used in translation of foreign currency-denominated assets and liabilities to euros, see note 2(a) to our consolidated financial statements included in Section 2 of this report on Form 6-K. In addition, throughout this report on Form 6-K we make use of other alternative performance measures. See more information in '4.6. 'Alternative performance measures (APMs): 2025, 2024 and 2023' and in section 6 'Alternative performance measures (APMs)' in the 'Economic and financial review' chapter of the consolidated directors’ report and note SN 9 'Alternative performance measures (APMs) in the 'Sustainability statement' chapter in the consolidated directors’ report in Part 1 of the 2025 Form 20-F.
3. Cautionary statement regarding forward-looking statements
Banco Santander advises that this report on Form 6-K contains statements that constitute 'forward-looking statements' within the meaning of the US Private Securities Litigation Reform Act of 1995. Forward-looking statements include, but are not limited to, information regarding:
•future business development;
•shareholders' remuneration policy;
•exposure to various types of market risks;
•management strategy;
•capital expenditures;
•earnings and other targets;
•asset portfolios; and
•non-financial information.
Forward-looking statements may be identified by words such as 'may', 'will', 'expect', 'project', 'anticipate', 'should', 'intend', 'probability', 'risk', 'VaR', 'RoRAC', 'RoRWA', 'TNAV', 'target', 'goal', 'objective', 'estimate', 'future', 'commitment', 'commit', 'focus', 'pledge' and similar expressions found throughout this report on Form 6-K. We include forward-looking statements throughout this report on Form 6-K, including but not limited to, the 'Operating and financial review and prospects' and 'Quantitative analysis about market risk' sections as well as climate and ESG related metrics, data, targets and other non-financial disclosures. Forward-looking statements are not guarantees of future performance and involve risks and uncertainties, and actual results may differ materially from those in the forward-looking statements.
Written and/or oral forward-looking statements may also be made in the periodic reports to the US Securities and Exchange Commission ('SEC'), shareholders' and investors' reports, offering circulars, prospectuses, press releases and other written materials, and in oral statements made by our directors, officers or employees to third parties, including financial analysts.
You should understand that the following important factors, in addition to those discussed in section 4. 'Risk factors', section 5.'Information on the Company' and section 6.'Supplement to the operating and financial review disclosure in the directors’ report' in Part 2 of the 2025 Form 20-F, 'Consolidated directors’ report-Economic and financial review' in Part 1 of the 2025 Form 20-F, and elsewhere in the 2025 Form 20-F and in this Form 6-K, could affect our future results and could cause those results or
other outcomes to differ materially from those anticipated in any forward-looking statement:
Economic and industry conditions
•general economic or industry conditions in Spain, the UK, other European countries, the US, Brazil, other Latin American countries and other areas where we have significant operations or investments, including a worsening of the economic environment in these areas and an increase in capital markets volatility;
•climate-related conditions, regulations, targets and weather events;
•uncertainty over the scope of actions that may be required by us, governments and others to achieve goals relating to climate, environmental and social matters, as well as the evolving nature of underlying science and industry and potential conflicts and inconsistencies among governmental standards and regulations;
•exposure to various market risks, principally including interest rate risk, foreign exchange rate risk, equity price risk, inflation, deflation and risks associated with new or modified benchmark indices;
•the effects of a decline in real estate prices, particularly in Spain and the UK;
•the effects of political developments in the UK, including the UK’s exit from the European Union;
•monetary and interest rate policies of the ECB and various central banks;
•the effects of market behaviour not captured by our statistical models, such as the VaR model we use;
•the inability to hedge some risks economically;
•changes in demographics (including due to an ageing population or migration flows), consumer spending, investment or saving habits;
•changes in energy prices;
•potential losses from early repayments on our loan and investment portfolio, declines in value of collateral securing our loan portfolio, and counterparty risk; and
•changes in competition and pricing environments, including as a result of the progressive adoption of the internet for conducting financial services and/or other factors.
Political, geopolitical and governmental factors
•political instability in Spain, the UK, other European countries, the US, Brazil, other Latin American countries and other areas where we have significant operations or investments;
•changes in monetary, fiscal and immigration policies and trade tensions, including the imposition of tariffs and retaliatory responses;
•effects of wars and conflicts (including the armed conflicts in Ukraine and the Middle East or other hostilities) or the outbreak of public health emergencies on the global economy;
•changes in Spanish, UK, EU, US, Latin American, or other jurisdictions’ legislation, regulations or taxes, including changes in regulatory capital and liquidity requirements; and
•increased regulation in response to financial crises.
Transaction and commercial factors
•acquisitions, dispositions or restructurings of businesses that may not be completed in a timely manner or at all and may not perform in accordance with our expectations; and our ability to successfully integrate our acquisitions and related challenges that may result from the diversion of management’s focus and resources from other strategic opportunities and operational matters;
•reputational risk and potential adverse reactions of customers, employees, vendors or other business partners, including adverse effects on the market price of our securities; and
•the outcome of our negotiations with business partners and governments.
Operating factors
•the adequacy of loss reserves;
•potential losses associated with an increase in the level of impairment by counterparties to other types of financial instruments;
•the adequacy of provisions for tax, legal and other contingencies;
•technical difficulties and/or failure to adequately improve or upgrade our information technology;
•changes in our access to liquidity and funding on acceptable terms, including as a result of credit spread shifts or downgrades in our credit ratings or those of our more significant subsidiaries;
•our exposure to operational risks (e.g., failed internal or external processes, people and systems, liabilities derived from utilizing artificial intelligence or potential losses associated with cyberattacks, data breaches, data losses and other security incidents);
•limitations in our disclosure controls and procedures over financial and non-financial reporting;
•changes in our ability to recruit, retain and develop appropriate senior management and skilled personnel;
•the occurrence of force majeure events, such as natural disasters, epidemics and pandemics, that impact our operations or impair the asset quality of our loan portfolio;
•the impact of changes in the composition of our balance sheet on future interest income / (charges); and
•our own decisions and actions including those affecting or changing our practices, operations, priorities, strategies, policies or procedures.
The forward-looking statements contained in this report on Form 6-K speak only as of the date of this report. We do not undertake to update any forward-looking statement to reflect events or circumstances after the date of this report on Form 6-K or to reflect the occurrence of unanticipated events.
4. Financial information
4.1 Group selected data: 2025, 2024 and 2023
| | | | | | | | | | | | | | |
BALANCE SHEET (EUR million) A | Dec-25 | Dec-24 | % Dec-25 vs. Dec-24 | Dec-23 |
| Total assets | 1,867,515 | | 1,837,081 | | 1.7 | | 1,797,062 | |
| Loans and advances to customers | 1,037,288 | | 1,054,069 | | (1.6) | | 1,036,349 | |
| Customer deposits | 1,041,200 | | 1,055,936 | | (1.4) | | 1,047,169 | |
Total funds B | 1,363,160 | | 1,348,422 | | 1.1 | | 1,306,942 | |
| Total equity | 112,748 | | 107,327 | | 5.1 | | 104,241 | |
Note: if we exclude loans, deposits and funds associated with the Poland disposal, as at 31 December 2024 loans and advances to customers would have been EUR 1,017,160 million; customer deposits EUR 1,005,605 million and total funds EUR 1,291,446 million; and as at 31 December 2023 loans and advances to customers would have been EUR 1,003,465 million; customer deposits EUR 1,002,669 million and total funds EUR 1,257,351 million. | | | | | | | | | | | | | | |
| INCOME STATEMENT (EUR million) | 2025 | 2024 | % 2025 vs. 2024 | 2023 |
| Net interest income | 42,348 | | 43,787 | | (3.3) | | 40,650 | |
| Total income | 58,311 | | 58,043 | | 0.5 | | 53,951 | |
| Net operating income | 33,532 | | 32,828 | | 2.1 | | 29,267 | |
| Profit before tax | 18,681 | | 17,347 | | 7.7 | | 15,005 | |
| Profit attributable to the parent | 14,101 | | 12,574 | | 12.1 | | 11,076 | |
Note: net operating income is total income minus total costs.
| | | | | | | | | | | | | | |
EPS AND PROFITABILITY (%) C | 2025 | 2024 | % 2025 vs. 2024 | 2023 |
| Earnings per share (euro) | 0.91 | | 0.77 | | 17.3 | | 0.65 | |
RoE | 13.9 | | 13.0 | | | 11.9 | |
| | | | |
RoTE (post-AT1) | 16.3 | | 15.5 | | | 14.4 | |
RoA | 0.84 | | 0.76 | | | 0.69 | |
RoRWA | 2.44 | | 2.18 | | | 1.95 | |
| | | | |
| | | | | | | | | | | | | | |
UNDERLYING INCOME STATEMENT D (EUR million) | 2025 | 2024 | % 2025 vs. 2024 | 2023 |
| Net interest income | 42,401 | | 43,824 | | (3.2) | | 40,718 | |
| Total income | 58,308 | | 57,984 | | 0.6 | | 53,940 | |
| Net operating income | 31,898 | | 30,630 | | 4.1 | | 27,439 | |
| Profit before tax | 18,936 | | 17,377 | | 9.0 | | 15,305 | |
| Profit attributable to the parent | 13,152 | | 11,774 | | 11.7 | | 10,402 | |
| Note: net operating income is total income minus total costs. | | | | |
| % changes in constant euros (2025 vs. 2024 at 2025 exchange rates): | | | | |
| NII: +0.5%; Total income: +4.5%; Net operating income: +8.6%; Profit before tax: +13.2%; Attributable profit: +16.1%. |
| % changes in constant euros (2024 vs. 2023 at 2024 exchange rates): | | | | |
| NII: +9.8%; Total income: +10.0%; Net operating income: +14.6%; Profit before tax: +15.9%; Underlying attributable profit: +15.5%. |
| | | | | | | | | | | | | | |
UNDERLYING EPS, PROFITABILITY AND EFFICIENCY C D (%) | 2025 | 2024 | % 2025 vs. 2024 | 2023 |
| Underlying earnings per share (euro) | 0.84 | | 0.72 | | 16.9 | | 0.61 | |
| Underlying RoE | 13.0 | | 12.2 | | | 11.2 | |
| Underlying RoTE (post-AT1) | 15.2 | | 14.4 | | | 13.5 | |
| Underlying RoA | 0.79 | | 0.72 | | | 0.65 | |
| Underlying RoRWA | 2.31 | | 2.07 | | | 1.86 | |
| Efficiency ratio | 45.3 | | 47.2 | | | 49.1 | |
| | | | | | | | | | | | | | |
SOLVENCY (%) | Dec-25 | Dec-24 | | Dec-23 |
Phased-in CET1 capital ratio | 13.5 | | 12.8 | | | 12.3 | |
Phased-in total capital ratio | 17.8 | | 17.4 | | | 16.4 | |
| | | | | | | | | | | | | | |
CREDIT QUALITY (%) C | Dec-25 | Dec-24 | | Dec-23 |
Cost of risk D E | 1.14 | | 1.12 | | | 1.13 | |
| NPL ratio | 2.91 | | 3.03 | | | 3.11 | |
| NPL coverage ratio | 66 | | 64 | | | 66 | |
| | | | | | | | | | | | | | |
THE SHARE AND MARKET CAPITALIZATION | Dec-25 | Dec-24 | % Dec-25 vs. Dec-24 | Dec-23 |
| Number of shareholders | 3,518,729 | | 3,485,134 | | 1.0 | | 3,662,377 | |
| Number of shares (millions) | 14,689 | | 15,152 | | (3.1) | | 16,184 | |
| Share price (euro) | 10.070 | | 4.465 | | 125.6 | | 3.780 | |
| Market capitalization (EUR million) | 147,921 | | 67,648 | | 118.7 | | 61,168 | |
| | | | |
| Tangible book value per share (euro) | 5.76 | | 5.24 | | | 4.76 | |
| Price / Tangible book value per share (X) | 1.75 | | 0.85 | | | 0.79 | |
| | | | | | | | | | | | | | |
CUSTOMERS (thousands) | Dec-25 | Dec-24 | % Dec-25 vs. Dec-24 | Dec-23 |
| Total customers | 174,197 | | 166,559 | | 4.6 | | 158,665 | |
Active customers F | 101,651 | | 98,631 | | 3.1 | | 95,038 | |
| | | | |
| | | | |
Digital customers G | 59,040 | | 55,553 | | 6.3 | | 50,665 | |
| | | | |
Note: data excluding Poland. Including Poland:
In 2025: Total customers 180,221; Active customers 106,410; Digital customers 62,982.
In 2024: Total customers 172,537; Active customers 103,262; Digital customers 59,317.
In 2023: Total customers 164,542; Active customers 99,503; Digital customers 54,161.
| | | | | | | | | | | | | | |
| OTHER DATA | Dec-25 | Dec-24 | % Dec-25 vs. Dec-24 | Dec-23 |
| Number of employees | 187,539 | | 196,088 | | (4.4) | | 201,942 | |
Number of branches H | 6,765 | | 7,718 | | (12.3) | | 8,137 | |
Note: data excluding Poland. Including Poland:
In 2025: Number of employees 198,403; Number of branches 7,124.
In 2024: Number of employees 206,753; Number of branches 8,086.
In 2023: Number of employees 212,764; Number of branches 8,518.
| | | | | | | | |
| | |
| Note: for Argentina and any grouping which includes it, the variations in constant euros have been calculated considering the Argentine peso exchange rate on the last working day for each of the periods presented. For further information, see 4.6. 'Alternative performance measures: 2025, 2024 and 2023'. Certain figures contained in this chapter, have been subject to rounding to enhance their presentation. Accordingly, in certain instances, the sum of the numbers in a column or a row in tables contained in this report may not conform exactly to the total figure given for that column or row. | |
| | |
| | |
A.In the consolidated balance sheet, the assets associated with the businesses subject to the Poland disposal are classified under the 'non-current assets held for sale' line item and the related liabilities under 'liabilities associated with non-current assets held for sale' solely for the year ended 31 December 2025. Therefore, this classification does not affect the balance sheet for the years ended 31 December 2024 and 31 December 2023. |
B.Includes customer deposits, mutual funds, pension funds and managed portfolios. |
|
D.In addition to IFRS measures, we present non-IFRS measures including some which we refer to as underlying measures. These non-IFRS measures exclude items outside the ordinary course of business and reclassify certain items under some headings of the underlying income statement as described at the end of 5.1 'Results' and in 4.6. 'Alternative performance measures: 2025, 2024 and 2023'. In our view, this provides a better year-on-year comparison. |
|
|
E.Allowances for loan-loss provisions over the last 12 months / Average loans and advances to customers over the last 12 months and debt securities issued by non-financial institutions over the last 12 months. |
|
|
F.Those customers who comply with the minimum balance and/or transactionality requirements as defined according to the business area. |
G.Every physical or legal person, that, being part of a commercial bank, has logged in to its personal area of internet banking or mobile phone or both in the last 30 days. |
H.For 2025 and 2024 data, we have included the CartaSur points of sale and the banking service points in Argentina, while we have excluded operational locations that do not provide customer service in Colombia. |
4.2 Financial performance: 2025 vs 2024
Santander follows IFRS to report its results (see note 1.b to the consolidated financial statements), which generally inform reporting of our financial situation in this report. However, we also use non-IFRS measures and Alternative Performance Measures (APMs) to assess our performance (see 4.6. 'Alternative performance measures: 2025, 2024 and 2023'). Thus, the main adjustments to our IFRS results consist of: •Underlying results measures: we present what we call underlying results measures which exclude items outside the ordinary course of business and reclassify certain items under some headings of the underlying income statement as described at the end of 4.2.1 ‘Results’ and in note 52.c to the consolidated financial statements. In our view, this provides a better year-on-year comparison. •Local currency measures: we use certain non-IFRS financial indicators in local currency to assess our ongoing operating performance. They include the results from our subsidiary banks outside the eurozone excluding the exchange rate impact (i.e., in constant euros) except for Argentina and any grouping which includes it. For further information, see 4.6. 'Alternative performance measures: 2025, 2024 and 2023' which explains how we exclude the exchange rate impact from financial measures in local currency. Because changes in exchange rates have a non-operating impact on results, we believe assessing performance in local currency provides management and investors a more meaningful assessment of performance. We have rounded certain figures in this report to present them more clearly. Thus, the amounts given in the totals columns and rows of tables in certain instances may not match the sum of that column or row.
4.2.1 Group results
Group statutory income statement
| | | | | | | | | | | | | | | | |
| Condensed income statement |
| EUR million |
| | | Change | |
| 2025 | 2024 | Absolute | % | | |
| Net interest income (interest income minus interest expense) | 42,348 | | 43,787 | | (1,439) | | (3.3) | | | |
| Net fee income (commission income minus commission expense) | 12,976 | | 12,376 | | 600 | | 4.8 | | | |
Gains or losses on financial assets and liabilities and exchange differences (net)A | 2,362 | | 2,211 | | 151 | | 6.8 | | | |
| Dividend income | 715 | | 710 | | 5 | | 0.7 | | | |
| Income from companies accounted for using the equity method | 665 | | 687 | | (22) | | (3.2) | | | |
Other operating income/expensesB | (755) | | (1,728) | | 973 | | (56.3) | | | |
| Total income | 58,311 | | 58,043 | | 268 | | 0.5 | | | |
| Operating expenses | (24,779) | | (25,215) | | 436 | | (1.7) | | | |
| Administrative expenses | (21,601) | | (22,036) | | 435 | | (2.0) | | | |
| Staff costs | (13,656) | | (13,851) | | 195 | | (1.4) | | | |
| Other general administrative expenses | (7,945) | | (8,185) | | 240 | | (2.9) | | | |
| Depreciation and amortization | (3,178) | | (3,179) | | 1 | | 0.0 | | | |
| Provisions or reversal of provisions | (2,302) | | (3,062) | | 760 | | (24.8) | | | |
| Impairment or reversal of impairment of financial assets not measured at fair value through profit or loss (net) | (12,546) | | (12,136) | | (410) | | 3.4 | | | |
| | | | | | |
| Impairment of other assets (net) | (251) | | (624) | | 373 | | (59.8) | | | |
| Gains or losses on non-financial assets and investments (net) | — | | 368 | | (368) | | (100.0) | | | |
| Negative goodwill recognized in results | 22 | | — | | 22 | | — | | | |
| Gains or losses on non-current assets held for sale not classified as discontinued operations | 226 | | (27) | | 253 | | — | | | |
| Profit or loss before tax from continuing operations | 18,681 | | 17,347 | | 1,334 | | 7.7 | | | |
| Tax expense or income from continuing operations | (4,723) | | (4,844) | | 121 | | (2.5) | | | |
| Profit from the period from continuing operations | 13,958 | | 12,503 | | 1,455 | | 11.6 | | | |
| Profit or loss after tax from discontinued operations | 1,542 | | 1,241 | | 301 | | 24.3 | | | |
| Profit for the period | 15,500 | | 13,744 | | 1,756 | | 12.8 | | | |
| Profit attributable to non-controlling interests | (1,399) | | (1,170) | | (229) | | 19.6 | | | |
| Profit attributable to the parent | 14,101 | | 12,574 | | 1,527 | | 12.1 | | | |
A.‘Gain or losses on financial assets and liabilities not measured at fair value through profit or loss, net’; ‘Gain or losses on financial assets and liabilities held for trading, net’; ‘Gains or losses on non-trading financial assets and liabilities mandatorily at fair value through profit or loss’; ‘Gain or losses on financial assets and liabilities measured at fair value through profit or loss, net’; ‘Gain or losses from hedge accounting, net’; and ‘Exchange differences, net’.
B.'Other operating income’; ‘Other operating expenses’; ’Income from insurance and reinsurance contracts’; and ‘Expenses from insurance and reinsurance contracts’.
Main income statement items
In accordance with IFRS 5 requirements, results associated with the business subject to the Poland disposal are reported under a single line item in the consolidated income statement — 'profit/(loss) after tax from discontinued operations' — for the years 2025, 2024 and 2023.
In the consolidated balance sheet, the assets associated with the businesses subject to the Poland disposal are classified under the 'non-current assets held for sale' line item and the related liabilities under 'liabilities associated with non-current assets held for sale' solely for the year ended 31 December 2025.
Therefore, this classification does not affect the balance sheet for the year ended 31 December 2024.
However, to facilitate analysis and ensure comparability of the information in the following tables 'average balance sheet - assets and interest income', 'average balance sheet - liabilities and interest expense', 'volume and profitability analysis', 'volume and cost analysis' and 'net interest income. Volume, profitability and cost analysis summary' were calculated classifying assets and liabilities associated with the businesses subject to the Poland disposal under 'assets/liabilities from discontinued operations' in both periods presented.
In 2025, profit attributable to the parent reached a new record of EUR 14,101 million, representing a year-on-year increase of 12%, compared to the EUR 12,574 million recorded in 2024. This increase was backed by the good performance of our global businesses which grew strongly.
Total income
Total income amounted to EUR 58,311 million in 2025, compared to EUR 58,043 million in 2024, a slight increase year-on-year (+0.5%). Net interest income and net fee income accounted for around 95% of total income. By line item:
Net interest income
Net interest income amounted to EUR 42,348 million, 3% lower than 2024, due to the impact from the sharp fall in interest rates in Argentina compared to 2024, especially in Retail, as well as a decline in Wealth.
This decrease was partially offset by the good performance in Openbank, due to active margin management and higher volumes, and, to a lesser extent, in CIB and Payments.
The following tables show the average balances of each year
calculated as the monthly average over the period, which we believe should not differ materially from using daily balances, and the interest generated.
The tables on the following pages also include average balances and interest rates in 2025 and 2024, based on the domicile of the entities at which the relevant assets or liabilities are recorded. Domestic balances relate to our entities domiciled in Spain. International balances relate to entities domiciled outside of Spain (reflecting our foreign activity), and are divided into mature markets (the US and Europe, except Spain) and developing markets (South America and Mexico).
The average balance of interest-earning assets in 2025 was 2% higher than in 2024. The activity of our entities in the domestic market increased 7% year-on-year and 1% in international mature markets, while in international developing markets they decreased 1%.
The average balance of interest-bearing liabilities in 2025 was 1% higher year-on-year, with growth in the domestic market (+5% year-on-year) whereas international developing markets were 1% lower year-on-year and international mature markets were flat.
The average return on interest-earning assets decreased from 7.03% in 2024 to 6.42% in 2025, due to the lower interest rate environment. By market, it fell 68 bps year-on-year in the domestic market, -53 bps year-on-year in our international mature markets, and -36 bps year-on-year in our international developing markets.
The average cost of interest-bearing liabilities decreased 45 bps in 2025 to 3.97%. By market, domestic and international mature markets performed in line with the average yield on assets, decreasing 53 bps and 61 bps, respectively. However, in international developing markets it rose 22 bps.
We calculated the change in interest income/(expense) shown in the tables below by:
•Applying the interest rate of the previous period to the difference between the average balances from the current and previous periods to obtain the change in volumes.
•Applying the difference between the rates from the current and previous periods to the average balance from the previous year to obtain the change in interest rate.
Both interest income and expense decreased in 2025, mainly due to lower interest rates across most of our footprint.
| | | | | | | | | | | | | | | | | | | | | | | |
| Average balance sheet - assets and interest income |
| EUR million | | | | | | | |
| 2025 | | 2024 |
| Assets | Average balance | Interest | Average rate | | Average balance | Interest | Average rate |
| Cash balances at central banks and other deposits on demand, and loans and advances to central banks and credit institutions | 282,529 | | 13,663 | | 4.84 | % | | 285,813 | | 16,140 | | 5.65 | % |
| Domestic | 115,906 | | 3,577 | | 3.09 | % | | 108,705 | | 4,701 | | 4.32 | % |
| International - Mature markets | 104,584 | | 4,411 | | 4.22 | % | | 114,350 | | 5,700 | | 4.98 | % |
| International - Developing markets | 62,039 | | 5,675 | | 9.15 | % | | 62,758 | | 5,739 | | 9.14 | % |
| | | | | | | |
| of which: | | | | | | | |
| Reverse repurchase agreements | 63,091 | | 4,954 | | 7.85 | % | | 63,820 | | 5,533 | | 8.67 | % |
| Domestic | 34,605 | | 1,646 | | 4.76 | % | | 32,739 | | 1,901 | | 5.81 | % |
| International - Mature markets | 6,902 | | 415 | | 6.01 | % | | 8,085 | | 492 | | 6.09 | % |
| International - Developing markets | 21,584 | | 2,893 | | 13.40 | % | | 22,996 | | 3,140 | | 13.65 | % |
| | | | | | | |
| Loans and advances to customers | 1,022,507 | | 70,830 | | 6.93 | % | | 1,018,241 | | 74,900 | | 7.36 | % |
| Domestic | 265,675 | | 10,861 | | 4.09 | % | | 265,043 | | 12,272 | | 4.63 | % |
| International - Mature markets | 569,580 | | 32,180 | | 5.65 | % | | 562,488 | | 33,884 | | 6.02 | % |
| International - Developing markets | 187,252 | | 27,789 | | 14.84 | % | | 190,710 | | 28,744 | | 15.07 | % |
| | | | | | | |
| of which: | | | | | | | |
| Reverse repurchase agreements | 71,826 | | 5,234 | | 7.29 | % | | 61,528 | | 5,884 | | 9.56 | % |
| Domestic | 10,837 | | 380 | | 3.51 | % | | 12,410 | | 468 | | 3.77 | % |
| International - Mature markets | 59,968 | | 4,725 | | 7.88 | % | | 48,161 | | 5,310 | | 11.03 | % |
| International - Developing markets | 1,021 | | 129 | | 12.63 | % | | 957 | | 106 | | 11.08 | % |
| | | | | | | |
| Debt securities | 280,413 | | 15,890 | | 5.67 | % | | 246,539 | | 15,431 | | 6.26 | % |
| Domestic | 119,990 | | 3,975 | | 3.31 | % | | 94,607 | | 3,478 | | 3.68 | % |
| International - Mature markets | 71,725 | | 2,539 | | 3.54 | % | | 64,140 | | 2,174 | | 3.39 | % |
| International - Developing markets | 88,698 | | 9,376 | | 10.57 | % | | 87,792 | | 9,779 | | 11.14 | % |
| | | | | | | |
| Income from hedging operations | | 1,420 | | | | | 2,470 | | |
| Domestic | | 396 | | | | | 152 | | |
| International - Mature markets | | 974 | | | | | 2,001 | | |
| International - Developing markets | | 50 | | | | | 317 | | |
| | | | | | | |
| Other interest | | (93) | | | | | 71 | | |
| Domestic | | (256) | | | | | (71) | | |
| International - Mature markets | | 35 | | | | | 42 | | |
| International - Developing markets | | 128 | | | | | 100 | | |
| | | | | | | |
| Total interest-earning assets | 1,585,449 | | 101,710 | | 6.42 | % | | 1,550,593 | | 109,012 | | 7.03 | % |
| Domestic | 501,571 | | 18,553 | | 3.70 | % | | 468,355 | | 20,532 | | 4.38 | % |
| International - Mature markets | 745,889 | | 40,139 | | 5.38 | % | | 740,978 | | 43,801 | | 5.91 | % |
| International - Developing markets | 337,989 | | 43,018 | | 12.73 | % | | 341,260 | | 44,679 | | 13.09 | % |
| | | | | | | |
| Other non-interest earning assets | 190,583 | | | | | 193,101 | | | |
| Assets from discontinued operations | 67,080 | | | | | 59,578 | | | |
| Average total assets | 1,843,112 | | 101,710 | | | | 1,803,272 | | 109,012 | | |
| | | | | | | | | | | | | | | | | | | | | | | |
| Average balance sheet - liabilities and interest expense |
| EUR million |
| 2025 | | 2024 |
| Liabilities and stockholders’ equity | Average
balance | Interest | Average
rate | | Average
balance | Interest | Average
rate |
| Deposits from central banks and credit institutions | 141,619 | | 8,151 | | 5.76 | % | | 151,986 | | 9,381 | | 6.17 | % |
| Domestic | 63,551 | | 2,594 | | 4.08 | % | | 60,256 | | 2,960 | | 4.91 | % |
| International - Mature markets | 31,824 | | 1,537 | | 4.83 | % | | 44,633 | | 2,447 | | 5.48 | % |
| International - Developing markets | 46,244 | | 4,020 | | 8.69 | % | | 47,097 | | 3,974 | | 8.44 | % |
| | | | | | | |
| of which: | | | | | | | |
| Repurchase agreements | 69,047 | | 4,696 | | 6.80 | % | | 63,556 | | 4,539 | | 7.14 | % |
| Domestic | 43,163 | | 1,910 | | 4.43 | % | | 37,663 | | 1,973 | | 5.24 | % |
| International - Mature markets | 8,195 | | 478 | | 5.83 | % | | 8,773 | | 579 | | 6.60 | % |
| International - Developing markets | 17,689 | | 2,308 | | 13.05 | % | | 17,120 | | 1,987 | | 11.61 | % |
| | | | | | | |
| Customer deposits | 1,024,250 | | 31,735 | | 3.10 | % | | 994,107 | | 35,714 | | 3.59 | % |
| Domestic | 354,809 | | 3,884 | | 1.09 | % | | 321,519 | | 4,944 | | 1.54 | % |
| International - Mature markets | 471,883 | | 13,336 | | 2.83 | % | | 472,750 | | 16,283 | | 3.44 | % |
| International - Developing markets | 197,558 | | 14,515 | | 7.35 | % | | 199,838 | | 14,487 | | 7.25 | % |
| | | | | | | |
| of which: | | | | | | | |
| Repurchase agreements | 101,424 | | 7,405 | | 7.30 | % | | 85,139 | | 8,207 | | 9.64 | % |
| Domestic | 33,963 | | 798 | | 2.35 | % | | 14,124 | | 586 | | 4.15 | % |
| International - Mature markets | 46,316 | | 4,230 | | 9.13 | % | | 48,115 | | 5,278 | | 10.97 | % |
| International - Developing markets | 21,145 | | 2,377 | | 11.24 | % | | 22,900 | | 2,343 | | 10.23 | % |
| | | | | | | |
Marketable debt securities A | 308,272 | | 15,066 | | 4.89 | % | | 307,931 | | 14,612 | | 4.75 | % |
| Domestic | 136,229 | | 4,890 | | 3.59 | % | | 147,606 | | 5,330 | | 3.61 | % |
| International - Mature markets | 127,870 | | 5,360 | | 4.19 | % | | 117,291 | | 5,323 | | 4.54 | % |
| International - Developing markets | 44,173 | | 4,816 | | 10.90 | % | | 43,034 | | 3,959 | | 9.20 | % |
| | | | | | | |
| of which: | | | | | | | |
| Commercial paper | 20,386 | | 759 | | 3.72 | % | | 25,809 | | 1,244 | | 4.82 | % |
| Domestic | 11,707 | | 347 | | 2.96 | % | | 17,046 | | 727 | | 4.26 | % |
| International - Mature markets | 6,962 | | 265 | | 3.81 | % | | 7,143 | | 339 | | 4.75 | % |
| International - Developing markets | 1,717 | | 147 | | 8.56 | % | | 1,620 | | 178 | | 10.99 | % |
| | | | | | | |
| Other interest-bearing liabilities | 22,841 | | 679 | | 2.97 | % | | 22,762 | | 672 | | 2.95 | % |
| Domestic | 17,741 | | 504 | | 2.84 | % | | 17,151 | | 490 | | 2.86 | % |
| International - Mature markets | 3,658 | | 36 | | 0.98 | % | | 3,707 | | 17 | | 0.46 | % |
| International - Developing markets | 1,442 | | 139 | | 9.64 | % | | 1,904 | | 165 | | 8.67 | % |
| | | | | | | |
| Expenses from hedging operations | | 1,762 | | | | | 3,066 | | |
| Domestic | | 620 | | | | | 1,159 | | |
| International - Mature markets | | 1,009 | | | | | 1,325 | | |
| International - Developing markets | | 133 | | | | | 582 | | |
| | | | | | | |
| Other interest | | 1,969 | | | | | 1,780 | | |
| Domestic | | 843 | | | | | 741 | | |
| International - Mature markets | | 388 | | | | | 282 | | |
| International - Developing markets | | 738 | | | | | 757 | | |
| | | | | | | |
| Total interest-bearing liabilities | 1,496,982 | | 59,362 | | 3.97 | % | | 1,476,786 | | 65,225 | | 4.42 | % |
| Domestic | 572,330 | | 13,335 | | 2.33 | % | | 546,532 | | 15,624 | | 2.86 | % |
| International - Mature markets | 635,235 | | 21,666 | | 3.41 | % | | 638,381 | | 25,677 | | 4.02 | % |
| International - Developing markets | 289,417 | | 24,361 | | 8.42 | % | | 291,873 | | 23,924 | | 8.20 | % |
| | | | | | | |
| Other non-interest bearing liabilities | 176,158 | | | | | 168,212 | | | |
| Non-controlling interests | 8,871 | | | | | 8,398 | | | |
| Total stockholders´ equity | 101,497 | | | | | 96,744 | | | |
| Liabilities from discontinued operations | 59,604 | | | | | 53,132 | | | |
| Average total liabilities and stockholders´ equity | 1,843,112 | | 59,362 | | | | 1,803,272 | | 65,225 | | |
A.Does not include contingently convertible preference shares and perpetual subordinated notes because they do not accrue interest. We include them under 'Other non-interest-bearing liabilities'.
| | | | | | | | | | | | | | |
| Volume and profitability analysis |
| EUR million |
| 2025 vs. 2024 |
| Increase (decrease) due to changes in | | |
| Interest income | Volume | Rate | | Total change |
| Cash and deposits on demand and loans and advances to central banks and credit institutions | (231) | | (2,246) | | | (2,477) | |
| Domestic | 295 | | (1,419) | | | (1,124) | |
| International - Mature markets | (460) | | (829) | | | (1,289) | |
| International - Developing markets | (66) | | 2 | | | (64) | |
| | | | |
| of which: | | | | |
| Reverse repurchase agreements | (157) | | (422) | | | (579) | |
| Domestic | 104 | | (359) | | | (255) | |
| International - Mature markets | (71) | | (6) | | | (77) | |
| International - Developing markets | (190) | | (57) | | | (247) | |
| | | | |
| Loans and advances to customers | (65) | | (4,005) | | | (4,070) | |
| Domestic | 29 | | (1,440) | | | (1,411) | |
| International - Mature markets | 423 | | (2,127) | | | (1,704) | |
| International - Developing markets | (517) | | (438) | | | (955) | |
| | | | |
| of which: | | | | |
| Reverse repurchase agreements | 1,080 | | (1,730) | | | (650) | |
| Domestic | (57) | | (31) | | | (88) | |
| International - Mature markets | 1,130 | | (1,715) | | | (585) | |
| International - Developing markets | 7 | | 16 | | | 23 | |
| | | | |
| Debt securities | 1,231 | | (772) | | | 459 | |
| Domestic | 866 | | (369) | | | 497 | |
| International - Mature markets | 265 | | 100 | | | 365 | |
| International - Developing markets | 100 | | (503) | | | (403) | |
| | | | |
| Income from hedging income | (1,050) | | — | | | (1,050) | |
| Domestic | 244 | | — | | | 244 | |
| International - Mature markets | (1,027) | | — | | | (1,027) | |
| International - Developing markets | (267) | | — | | | (267) | |
| | | | |
| Other interest | (164) | | — | | | (164) | |
| Domestic | (185) | | — | | | (185) | |
| International - Mature markets | (7) | | — | | | (7) | |
| International - Developing markets | 28 | | — | | | 28 | |
| | | | |
| Total interest-earning assets | (279) | | (7,023) | | | (7,302) | |
| Domestic | 1,249 | | (3,228) | | | (1,979) | |
| International - Mature markets | (806) | | (2,856) | | | (3,662) | |
| International - Developing markets | (722) | | (939) | | | (1,661) | |
| | | | | | | | | | | | | | |
Volume and cost analysis | | | | |
| EUR million | | | | |
| 2025 vs. 2024 |
| Increase (decrease) due to changes in | | |
| Interest expense | Volume | Rate | | Total change |
| Deposits from central banks and credit institutions | (561) | | (669) | | | (1,230) | |
| Domestic | 155 | | (521) | | | (366) | |
| International - Mature markets | (643) | | (267) | | | (910) | |
| International - Developing markets | (73) | | 119 | | | 46 | |
| | | | |
| of which: | | | | |
| Repurchase agreements | 297 | | (140) | | | 157 | |
| Domestic | 266 | | (329) | | | (63) | |
| International - Mature markets | (37) | | (64) | | | (101) | |
| International - Developing markets | 68 | | 253 | | | 321 | |
| | | | |
| Customer deposits | 277 | | (4,256) | | | (3,979) | |
| Domestic | 473 | | (1,533) | | | (1,060) | |
| International - Mature markets | (30) | | (2,917) | | | (2,947) | |
| International - Developing markets | (166) | | 194 | | | 28 | |
| | | | |
| of which: | | | | |
| Repurchase agreements | 172 | | (974) | | | (802) | |
| Domestic | 550 | | (338) | | | 212 | |
| International - Mature markets | (191) | | (857) | | | (1,048) | |
| International - Developing markets | (187) | | 221 | | | 34 | |
| | | | |
| Marketable debt securities | 158 | | 296 | | | 454 | |
| Domestic | (409) | | (31) | | | (440) | |
| International - Mature markets | 460 | | (423) | | | 37 | |
| International - Developing markets | 107 | | 750 | | | 857 | |
| | | | |
| of which: | | | | |
| Commercial paper | (191) | | (294) | | | (485) | |
| Domestic | (193) | | (187) | | | (380) | |
| International - Mature markets | (8) | | (66) | | | (74) | |
| International - Developing markets | 10 | | (41) | | | (31) | |
| | | | |
| Other interest-bearing liabilities | (26) | | 33 | | | 7 | |
| Domestic | 17 | | (3) | | | 14 | |
| International - Mature markets | 0 | | 19 | | | 19 | |
| International - Developing markets | (43) | | 17 | | | (26) | |
| | | | |
| Expenses from hedging expenses | (1,304) | | — | | | (1,304) | |
| Domestic | (539) | | — | | | (539) | |
| International - Mature markets | (316) | | — | | | (316) | |
| International - Developing markets | (449) | | — | | | (449) | |
| | | | |
| Other interest | 189 | | — | | | 189 | |
| Domestic | 102 | | — | | | 102 | |
| International - Mature markets | 106 | | — | | | 106 | |
| International - Developing markets | (19) | | — | | | (19) | |
| | | | |
| Total interest-bearing liabilities | (1,267) | | (4,596) | | | (5,863) | |
| Domestic | (201) | | (2,088) | | | (2,289) | |
| International - Mature markets | (423) | | (3,588) | | | (4,011) | |
| International - Developing markets | (643) | | 1,080 | | | 437 | |
| | | | | | | | | | | | | | |
| Net interest income. Volume, profitability and cost analysis summary | | | | |
| EUR million | | | | |
| 2025 vs. 2024 |
| Increase (decrease) due to changes in | | |
| Volume | Rate | | Total change |
| Interest income | (279) | | (7,023) | | | (7,302) | |
| Domestic | 1,249 | | (3,228) | | | (1,979) | |
| International - Mature markets | (806) | | (2,856) | | | (3,662) | |
| International - Developing markets | (722) | | (939) | | | (1,661) | |
| | | | |
| Interest expense | (1,267) | | (4,596) | | | (5,863) | |
| Domestic | (201) | | (2,088) | | | (2,289) | |
| International - Mature markets | (423) | | (3,588) | | | (4,011) | |
| International - Developing markets | (643) | | 1,080 | | | 437 | |
| | | | |
| Net interest income | 988 | | (2,427) | | | (1,439) | |
| Domestic | 1,450 | | (1,140) | | | 310 | |
| International - Mature markets | (383) | | 732 | | | 349 | |
| International - Developing markets | (79) | | (2,019) | | | (2,098) | |
| | |
Net interest income |
| EUR million |
| | |
Net fee income |
| EUR million |
Net fee income
Net fee income totalled EUR 12,976 million in 2025 and grew 5% compared to 2024, with good performances across most businesses, especially in Retail, Wealth and CIB.
For more details, see note 41 and note 42 to the consolidated financial statements. Gains or losses on financial assets and liabilities and exchange differences (net)
Gains on financial assets and liabilities and exchange differences (net) stood at EUR 2,362 million (EUR 2,211 million in 2024), mainly due to lower impacts from foreign exchange hedges in Corporate Centre and results in Wealth.
Gains or losses on financial assets and liabilities stem from mark-to-market valuations of the trading portfolio and derivative instruments, which include spot market foreign exchange transactions, sales of investment securities and liquidation of our hedging and other derivative positions.
For more details, see note 43 to the consolidated financial statements. Exchange rate differences primarily show gains and losses from foreign exchange and the differences that arise from converting monetary items in foreign currencies to the functional currency, and from selling non-monetary assets denominated in foreign currency at the time of their disposal. Given that Santander manages currency exposures with derivative instruments, the changes in this line should be analysed together with gains or losses on financial assets and liabilities.
For more details, see note 44 to the consolidated financial statements.
Dividend income
Dividend income was EUR 715 million in 2025 (EUR 710 million in 2024).
Income from companies accounted for using the equity method
Income from companies accounted for using the equity method reached EUR 665 million in 2025 compared to EUR 687 million in 2024.
Other operating income/expenses
Other operating income recorded a loss of EUR 755 million in 2025. This compares to a EUR 1,728 million loss in 2024 affected by a larger hyperinflation adjustment in Argentina and the charge relating to the temporary levy on revenue earned in Spain (EUR 335 million), whereas in 2025 the tax on expected revenue earned in Spain for the year was recorded under the ‘tax expense or income from continuing operations' line.
For more details, see note 45 to the consolidated financial statement. Operating expenses
Operating expenses amounted to EUR 24,779 million in 2025, 2% lower than 2024, reflecting our progress in transformation.
Our costs management continued to focus on improving our efficiency ratio and, as a result, we remained among the most efficient global banks.
Our business transformation plan, ONE Transformation, continued to progress across our footprint, reflected in increased operational leverage and better business dynamics.
For more details, see note 46 and note 47 to the consolidated financial statements. Provisions or reversal of provisions
Provisions (net of provisions reversals) amounted to EUR 2,302 million in 2025 compared to EUR 3,062 million in 2024 which included the charges after discontinuing our Superdigital platform in Latin America in Q2 2024.
Additionally, both in Q4 2025 and Q4 2024 provisions included charges for potential complaints related to motor finance dealer
commissions in the UK (EUR 214 million and EUR 353 million, respectively).
For more details, see note 25 to the consolidated financial statements. Impairment or reversal of impairment of financial assets not measured at fair value through profit or loss (net)
Net impairments totalled EUR 12,546 million in 2025 (impairment of EUR 12,136 million in 2024).
Impairment on other assets (net)
Impairment on other assets (net) was EUR 251 million in 2025. In 2024, the impairment amounted to EUR 624 million and included the charge registered in Q2 2024 in PagoNxt after discontinuing our merchant platform in Germany.
Gains or losses on non-financial assets and investments (net)
No amount was recorded in gains or losses on non-financial assets and investments (net) in 2025. In 2024, it stood at EUR 368 million and included the gain recorded in Q2 2024 from an agreement with Sodexo in Brazil (EUR 352 million).
For more details, see note 48 to the consolidated financial statements. Negative goodwill recognized in results
In 2025, negative goodwill recognized in results was EUR 22 million relating to the acquisition of CrediScotia Financiera from Scotiabank in Q1 2025 which expands Openbank's presence in Peru. No negative goodwill was recorded in 2024.
Gains or losses on non-current assets held for sale not classified as discontinued operations
This item, which mainly includes impairment of foreclosed assets recorded and the sale of properties acquired upon foreclosure, recorded a EUR 226 million gain in 2025 which included a capital gain of EUR 231 million in Q2 2025 from the sale of Santander’s remaining 30.5% stake in CACEIS. In 2024, this line recorded a loss of EUR 27 million.
For more details, see note 49 to the consolidated financial statements.
| | | | | | | | | |
Impairment or reversal of impairment of financial assets not measured at fair value through profit or loss (net) |
| EUR million | | | |
| 2025 | 2024 | |
| Financial assets at fair value through other comprehensive income | 29 | | (1) | | |
| Financial assets at amortized cost | 12,517 | | 12,137 | | |
| Impairment or reversal of impairment of financial assets not measured at fair value through profit or loss and net gains and losses from changes | 12,546 | | 12,136 | | |
| | | | | | | | | |
Impairment on other assets (net) |
| EUR million | | | |
| 2025 | 2024 | |
| Impairment of investments in subsidiaries, joint ventures and associates, net | — | | — | | |
| Impairment on non-financial assets, net | 251 | | 624 | | |
| Tangible assets | 129 | | 382 | | |
| Intangible assets | 112 | | 231 | | |
| Others | 10 | | 11 | | |
| Impairment on other assets (net) | 251 | | 624 | | |
| | | |
Profit or loss before tax from continuing operations
Profit before tax was EUR 18,681 million in 2025, +8% year-on-year, supported by the good performance of net fee income and cost discipline.
Tax expense or income from continuing operations
Total tax expense from continuing operations was EUR 4,723 million in 2025 (compared to EUR 4,844 million in 2024) which includes EUR 353 million corresponding to the expected tax on income obtained in Spain for the year.
Profit or loss after tax from discontinued operations
Profit or loss after tax from discontinued operations totalled EUR 1,542 million in 2025 compared to EUR 1,241 million in 2024. This line records the results associated with the Poland disposal, which increased year-on-year driven by a good revenue performance and lower provisions.
| | |
| Profit attributable to the parent |
| EUR million |
Profit attributable to non-controlling interests
Profit attributable to non-controlling interests stood at EUR 1,399 million in 2025 (EUR 1,170 million in 2024).
For more details, see note 28 to the consolidated financial statements. Profit attributable to the parent
Profit attributable to the parent amounted to EUR 14,101 million in 2025, 12% higher than the EUR 12,574 million in 2024.
Group underlying income statement
| | | | | | | | | | | | | | | | | | | | | | | | | | | | | | | | | | | | | | | | |
| | | | |
Attributable | | Underlying | | |
Profit | | RoTE (post-AT1) | | Profit | | RoTE (post-AT1) | | |
EUR 14,101 million | +12% in euros | | 16.3% | | EUR 13,152 million | +12% in euros | | 15.2% | | |
+16% in constant euros | | +0.8 pp | | +16% in constant euros | | +0.8 pp | | |
Note: changes vs. 2024. | | | | | | |
Below is the condensed income statement adjusted for items beyond the ordinary course of business and reclassification of certain items under some headings of the underlying income statement, as described in note 52.c to the consolidated financial statements, where our segments' aggregate underlying consolidated results are reconciled to the statutory consolidated results. In the underlying income statement, results obtained in Poland are reported in the 'non-recurring items' line item for 2025 and 2024, so that it is excluded from underlying profit at both the Group and global business levels.
Therefore, all underlying ratios and management metrics included in this underlying income statement section have been calculated excluding Poland.
The Group presents, both at the total Group level and for each of the business units, the changes in euros registered in the income statement, as well as variations excluding the exchange rate effect (i.e. in constant euros, except for Argentina and any grouping which includes it), understanding that the latter provide a better analysis of the Group’s management. For further information, see 4.6. 'Alternative performance measures (APMs): 2025, 2024 and 2023'. At the Group level, exchange rates had an unfavourable year-on-year impact of 4.0 pp on total income and a favourable impact of 3.5 pp on total costs, mainly due to the depreciation of the Brazilian real and the Mexican peso.
To better understand the business trends, we reclassified certain items under some headings of the underlying income statement. These reclassifications between the statutory and underlying income statements include:
| | | | | | | | | | | | | | | | | | |
Condensed underlying income statement |
| EUR million | | | | | | |
| | | Change | |
| 2025 | | 2024 | | Absolute | % | % excl. FX | |
| Net interest income | 42,401 | | 43,824 | | (1,423) | | (3.2) | 0.5 | |
| Net fee income | 12,928 | | 12,335 | | 593 | | 4.8 | 9.1 | |
| Gains (losses) on financial transactions and exchange differences | 2,354 | | 2,216 | | 138 | | 6.2 | 9.7 | |
| Other operating income | 625 | | (391) | | 1,016 | | — | — | |
| Total income | 58,308 | | 57,984 | | 324 | | 0.6 | 4.5 | |
| Total costs | (26,410) | | (27,354) | | 944 | | (3.5) | 0.0 | |
| Net operating income | 31,898 | | 30,630 | | 1,268 | | 4.1 | 8.6 | |
| Net loan-loss provisions | (12,128) | | (11,822) | | (306) | | 2.6 | 8.1 | |
| Other gains (losses) and provisions | (834) | | (1,431) | | 597 | | (41.7) | (41.3) | |
| Profit before tax | 18,936 | | 17,377 | | 1,559 | | 9.0 | 13.2 | |
| Tax on profit | (4,939) | | (4,853) | | (86) | | 1.8 | 5.3 | |
| Profit from continuing operations | 13,997 | | 12,524 | | 1,473 | | 11.8 | 16.2 | |
| Net profit from discontinued operations | — | | — | | — | | — | | — | | |
| Consolidated profit | 13,997 | | 12,524 | | 1,473 | | 11.8 | 16.2 | |
| Non-controlling interests | (845) | | (750) | | (95) | | 12.7 | | 17.7 | | |
Underlying profit attributable to the parent A | 13,152 | | 11,774 | | 1,378 | | 11.7 | 16.1 | |
| Non-recurring items | 949 | | 800 | | 149 | | 18.6 | 18.6 | |
| Profit attributable to the parent | 14,101 | | 12,574 | | 1,527 | | 12.1 | 16.3 | |
A.Excluding non-recurring items.
•In 2025:
•As previously explained, in the statutory income statement, results associated with the business subject to the Poland disposal are reported in the 'profit/(loss) after tax from discontinued operations' line item.
However, in the underlying income statement, the results related to the business subject to the Poland disposal are excluded line-by-line from the underlying income statement and recorded in the 'non-recurring items' line.
•As explained in note 52.c, certain charges recorded in the statutory account under the line items that comprise 'other
gains (losses) and provisions' are presented in the underlying income statement under the 'total costs' line item. These are mainly recurring operating charges, primarily related to labour and legal processes, and exclude EUR 620 million of restructuring charges and EUR 214 million of provisions for potential complaints related to motor finance dealer commissions.
•A capital gain, that falls outside the ordinary course of our business, in Q2 2025 of EUR 231 million from the sale of Santander’s remaining 30.5% stake in CACEIS.
•A one-off charge of EUR 467 million in Q2 2025 (EUR 231 million net of tax and minority interests), which strengthens the balance sheet after having updated macroeconomic parameters in Brazil’s credit provisioning models.
•In 2024:
•As previously explained, in the statutory income statement, results associated with the business subject to the Poland disposal are reported in the 'profit/(loss) after tax from discontinued operations' line item.
However, in the underlying income statement, the results related to the business subject to the Poland disposal are excluded line-by-line from the underlying income statement and recorded in the 'non-recurring items' line.
•As explained in note 52.c, certain charges recorded in the statutory account under the line items that comprise 'other gains (losses) and provisions' are presented in the underlying income statement under the 'total costs' line item. These are mainly recurring operating charges, primarily related to labour and legal processes, and exclude EUR 835 million of restructuring charges, EUR 353 million of provisions for potential complaints related to motor finance dealer commissions and EUR 243 million from charges related to the discontinuation of our merchant platform in Germany and Superdigital in Latin America. •Provisions which strengthen the balance sheet in Brazil of EUR 352 million gross in Q2 2024 (EUR 174 million net of tax and minority interests) which were compensated by gains on the sale of our stake in Pluxee in Brazil.
Additionally, regarding results that fall outside the ordinary course of our business and are therefore excluded from the underlying income statement and recorded in the 'non-recurring items' line:
•In 2025:
•As previously explained, results obtained in Poland are reported in the 'non-recurring items' line.
•Additionally, it includes the following two events of the same value but opposite signs:
-A capital gain in Q2 2025 of EUR 231 million from the sale of Santander’s remaining 30.5% stake in CACEIS.
-A one-off charge of EUR 467 million in Q2 2025 (EUR 231 million, net of tax and minority interests), which strengthens the balance sheet after having updated macroeconomic
parameters in Brazil’s credit provisioning models, in accordance with IFRS 9 regulations.
•In 2024:
•As previously explained, results obtained in Poland are reported in the 'non-recurring items' line.
For more details, see note 52.c to the consolidated financial statements. As a result, profit attributable to the parent was EUR 14,101 million, increasing 12% in euros and 16% in constant euros compared to 2024, while underlying profit was EUR 13,152 million in 2025 which also represented a rise of 12% in euros and 16% in constant euros compared to 2024.
The year-on-year comparisons of both attributable profit and underlying profit were favoured mainly by the charges in Q2 2024 related to the discontinuation of our merchant platform in Germany and Superdigital in Latin America (EUR 243 million, net of tax and minority interests) and the charge in Q4 2025 related to the provisions recorded for complaints related to motor finance dealer commissions in the UK that was less than the provision in Q4 2024.
Total income amounted to EUR 58,308 million in 2025, a 1% increase year-on-year. In constant euros, total income rose by 5% year-on-year, as follows:
•Net interest income (NII) totalled EUR 42,401 million and increased by 1% year-on-year, even after the impact from the sharp fall in interest rates in Argentina. Excluding Argentina, NII increased 4%. By business:
•In Retail, which represented 62% of the NII of the total operating areas, NII decreased by 1%. Excluding Argentina, it improved 2%, with positive performances across most countries. Of note were Mexico, due to volumes and a lower cost of deposits, Chile supported by a lower cost of deposits and the UK, driven by higher mortgage profitability and a lower cost of deposits.
•NII grew strongly (+5%) in Openbank (26% of the NII of the total operating areas), with positive trends across almost all of our footprint, boosted by active margin management and higher volumes in Openbank Europe and Latin America and additionally favoured by CrediScotia's integration in Peru.
•In CIB, NII increased by 6%, boosted by Global Markets in Europe and the US.
•In Wealth, NII decreased by 14%, affected by some deposit cost inelasticity to interest rate declines in Private Banking and by the lower yield on assets in a lower interest rate environment.
•In Payments, NII grew strongly, +36%, due to higher activity.
•Net fee income reached EUR 12,928 million, increased by 9% year-on-year, achieving a new record, with growth across all businesses. This excellent net fee income performance was underpinned by higher customer activity, network benefits and greater collaboration between our global businesses. By business:
•In Retail, net fee income increased by 9%, supported by higher commercial activity and a larger customer base.
•In Openbank, net fee income was relatively stable, as double-digit growth in the US and Latin America was offset by lower net fee income in Openbank Europe which was impacted by new insurance regulation in Germany.
•In CIB, net fee income increased by 9%, reaching record levels with growth in all business lines.
•In Wealth, net fee income rose by 17%, with the largest contribution coming from Private Banking and the asset management business.
•In Payments, net fee income increased by 16%, boosted by higher activity.
| | | | | | | | | | | | |
| Net fee income | | | | | | |
| EUR million | | | | | | |
| | | | |
| 2025 | 2024 | | | | |
| Asset management business, funds and insurance | 4,377 | | 4,244 | | | | | |
| Credit and debit cards | 2,296 | | 2,250 | | | | | |
| Securities and custody services | 1,412 | | 1,251 | | | | | |
| Account management and availability fees | 1,913 | | 1,953 | | | | | |
| Cheques and payment orders | 747 | | 795 | | | | | |
| Foreign exchange | 761 | | 632 | | | | | |
| Charges for past-due/unpaid balances and guarantees | 475 | | 313 | | | | | |
| Bill discounting | 129 | | 139 | | | | | |
| Other | 818 | | 758 | | | | | |
| Net fee income | 12,928 | | 12,335 | | | | | |
•Gains on financial transactions and exchange differences increased by 10%, mainly due to lower impacts from foreign exchange hedges in the Corporate Centre and results in Wealth.
•Other operating income improved in 2025 compared to 2024, primarily due to a less negative impact from the hyperinflation adjustment in Argentina and the temporary levy on revenue earned in Spain, which is recorded in this line in 2024, whereas in 2025 the expected tax on revenue earned in Spain for the year was recorded under the ‘tax on profit' line.
A. In constant euros: +5%.
We continued to progress with our business transformation plan, ONE Transformation, reflected in greater operational leverage, better business dynamics and more streamlined and agile structures. By business and in constant euros:
•In Retail, total costs declined 1%. In real terms they fell 5%, driven by the transformation efforts through organizational and process simplification and the implementation of our global platform and lower charges in the 'other operating costs' line. The efficiency ratio improved to 42.9%.
•In Openbank, total costs increased by 4% year-on-year. In real terms, they grew 2%, driven by our investments in platforms and our digital bank, as well as the CrediScotia integration, which were partially offset by savings from our efficiency and transformation efforts. The efficiency ratio stood at 43.6%.
•In CIB, total costs decreased by 1% (-4% in real terms), as our investments in new products and capabilities to support growth were more than offset by lower charges in the 'other operating costs' line. The efficiency ratio stood at 46.8%.
•In Wealth, total costs rose 6% (+3% in real terms), reflecting investments made to strengthen PB teams and to develop new capabilities to address the increase in commercial activity. The efficiency ratio improved to 35.7%.
•In Payments, total costs grew by 2%, but improved 1% in real terms, even with our investments in platforms.
| | | | | | | | | | | | |
| Total costs | | | | | | |
| EUR million | | | | | | |
| | | | |
| 2025 | 2024 | | | | |
| Staff costs | 13,656 | | 13,827 | | | | | |
| Other administrative expenses | 7,923 | | 8,129 | | | | | |
| Information technology | 2,344 | | 2,579 | | | | | |
| Communications | 367 | | 387 | | | | | |
| Advertising | 517 | | 512 | | | | | |
| Buildings and premises | 702 | | 711 | | | | | |
| Printed and office material | 101 | | 86 | | | | | |
| Taxes (other than tax on profits) | 543 | | 554 | | | | | |
| Other expenses | 3,349 | | 3,300 | | | | | |
| Administrative expenses | 21,579 | | 21,956 | | | | | |
| Depreciation and amortization | 3,178 | | 3,179 | | | | | |
| Operating expenses | 24,757 | | 25,135 | | | | | |
| Other operating costs | 1,653 | | 2,219 | | | | | |
| Total costs | 26,410 | | 27,354 | | | | | |
Our cost management continued to focus on structurally improving our efficiency. As a result, we improved our efficiency ratio by 1.9 pp to 45.3%.
All in all, net operating income reached EUR 31,898 million, up 4% year-on-year. In constant euros, it rose by 9%, mainly driven by the good revenue performance (particularly in net fee income), while total costs were stable.
Net loan-loss provisions in 2025 amounted to EUR 12,128 million, a 3% increase year-on-year.
In constant euros, they rose 8%, mainly due to: i) higher LLPs in Retail, as an increase in card provisions driven by strong loan growth and a less favourable macro environment in some of our countries more than offset a positive performance in the other Retail portfolios; and ii) the increase in the Corporate Centre due to provisions in H1 2025 related to our plan to accelerate NPL ratio reductions, improving the Group's credit quality.
| | |
Net loan-loss provisions |
| EUR million |

A. In constant euros: +8%.
Other gains (losses) and provisions recorded a loss of EUR 834 million in 2025, compared to a EUR 1,431 million loss in 2024.
This year-on-year improvement was favoured by the aforementioned charges in 2024: i) the discontinuation of our merchant platforms in Germany and Superdigital in Latin America; and ii) the charge in Q4 2025 due to the provisions recorded for complaints related to motor finance dealer commissions in the UK that was less than the provision in Q4 2024.
Tax on profit amounted to EUR 4,939 million, 2% higher than in 2024. In constant euros, it rose 5%, as a lower tax burden in some countries, mainly in Brazil, did not fully offset lower benefits from fiscal incentives for electric vehicles in the US and a EUR 353 million charge in 2025 corresponding to the aforementioned tax on revenue expected in Spain for the year.
Underlying profit attributable to the parent in 2025 was EUR 13,152 million, 12% more than in 2024. In constant euros, it rose by 16%, supported by solid total income growth, while total costs were stable and with a controlled cost of risk.
As a result, underlying RoTE post-AT1 was 15.2%, up from 14.4% in 2024, underlying RoRWA was 2.31% (compared to 2.07% in 2024) and underlying earnings per share reached EUR 0.84 (from EUR 0.72 in 2024).
| | |
Underlying profit attributable to the parent |
| EUR million |
A. In constant euros: +16%.
| | |
Underlying RoTE post-AT1 |
| % |
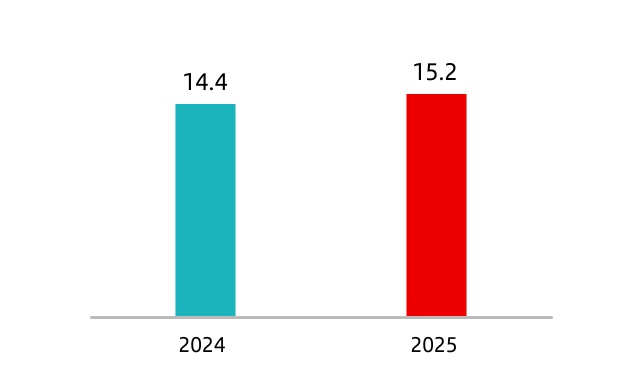
As previously explained, results related to the Poland disposal are recorded in non-recurring items, totalling EUR 949 million in 2025 compared to EUR 800 million in 2024.
Including these non-recurring items, profit attributable to the parent in 2025 was EUR 14,101 million, 12% more than in 2024. In constant euros, it rose by 16%.
RoTE post-AT1 stood at 16.3% (15.5% in 2024), in line with our full-year target of reaching a ratio close to 16.5%. RoRWA stood at 2.44% (2.18% in 2024) and earnings per share stood at EUR 0.91 (EUR 0.77 in 2024).
4.2.2 Group balance sheet
Since Q2 2025, the assets associated with the Poland disposal have been classified under the 'non-current assets held for sale' line item in the Group’s consolidated balance sheet, in accordance with IFRS 5 requirements and as a result of the announcement of the Poland disposal. The related liabilities have been classified under 'liabilities associated with non-current assets held for sale'. This classification applies solely to balance sheets from 30 June 2025 onwards and does not affect prior periods, which therefore limits the comparability of the balance sheets presented below.
| | | | | | | | | | | | | | | |
| Balance sheet |
| EUR million |
| | | Change | |
Assets | Dec-25 | Dec-24 | Absolute | % | |
| Cash, cash balances at central banks and other deposits on demand | 152,281 | | 192,208 | | (39,927) | | (20.8) | | |
| Financial assets held for trading | 252,318 | | 230,253 | | 22,065 | | 9.6 | | |
| Non-trading financial assets mandatorily at fair value through profit or loss | 7,761 | | 6,130 | | 1,631 | | 26.6 | | |
Financial assets designated at fair value through profit or loss | 8,046 | | 7,915 | | 131 | | 1.7 | | |
| Financial assets at fair value through other comprehensive income | 74,612 | | 89,898 | | (15,286) | | (17.0) | | |
| Financial assets at amortized cost | 1,202,689 | | 1,203,707 | | (1,018) | | (0.1) | | |
| Hedging derivatives | 3,931 | | 5,672 | | (1,741) | | (30.7) | | |
| Changes in the fair value of hedged items in portfolio hedges of interest risk | 50 | | (704) | | 754 | | — | | |
| Investments | 7,052 | | 7,277 | | (225) | | (3.1) | | |
| Assets under reinsurance contracts | 223 | | 222 | | 1 | | 0.5 | | |
| Tangible assets | 27,438 | | 32,087 | | (4,649) | | (14.5) | | |
| Intangible assets | 17,308 | | 19,259 | | (1,951) | | (10.1) | | |
| Tax assets | 30,076 | | 30,596 | | (520) | | (1.7) | | |
Other assets | 8,719 | | 8,559 | | 160 | | 1.9 | | |
| Non-current assets held for sale | 75,011 | | 4,002 | | 71,009 | | — | | |
| Total assets | 1,867,515 | | 1,837,081 | | 30,434 | | 1.7 | | |
| | | | | |
| Liabilities and equity | | | | | |
| Financial liabilities held for trading | 171,546 | | 152,151 | | 19,395 | | 12.7 | | |
| Financial liabilities designated at fair value through profit or loss | 42,148 | | 36,360 | | 5,788 | | 15.9 | | |
| Financial liabilities at amortized cost | 1,421,184 | | 1,484,322 | | (63,138) | | (4.3) | | |
| Hedging derivatives | 4,248 | | 4,752 | | (504) | | (10.6) | | |
| Changes in the fair value of hedged items in portfolio hedges of interest rate risk | 49 | | (9) | | 58 | | (644.4) | | |
| Liabilities under insurance contracts | 18,737 | | 17,829 | | 908 | | 5.1 | | |
| Provisions | 8,355 | | 8,407 | | (52) | | (0.6) | | |
| Tax liabilities | 9,568 | | 9,598 | | (30) | | (0.3) | | |
Other liabilities | 15,937 | | 16,344 | | (407) | | (2.5) | | |
| Liabilities associated with non-current assets held for sale | 62,995 | | — | | 62,995 | | — | | |
| Total liabilities | 1,754,767 | | 1,729,754 | | 25,013 | | 1.4 | | |
| Shareholders' equity | 141,144 | | 135,196 | | 5,948 | | 4.4 | | |
| Other comprehensive income | (37,974) | | (36,595) | | (1,379) | | 3.8 | | |
| Non-controlling interest | 9,578 | | 8,726 | | 852 | | 9.8 | | |
| Total equity | 112,748 | | 107,327 | | 5,421 | | 5.1 | | |
| Total liabilities and equity | 1,867,515 | | 1,837,081 | | 30,434 | | 1.7 | | |
Note: this is a summarized balance sheet. For further information, see 'consolidated balance sheet' section in the consolidated financial statements.
| | | | | | | | | | | | | | | | | | | | | | | | | | | | | | | | | | | | | | | | | | | | | | | | | | | | | | | | | | | |
| | | | | Executive summary A | | | | | | | | | | | |
| | | | | | | | | | | | | | | |
| | | | | Gross loans and advances to customers (excluding reverse repos) | | | | | Customer funds (deposits excluding repos + mutual funds) | | |
| | | | | | | | | | |
| | | | | | | | | | |
| | | | | | | |
| | | | | EUR 984 billion | +4% | | | | | EUR 1,200 billion | +6% | | |
| | | | | | | | | | |
| | | | | | | | | | | | | | | | | | | |
| | | | | è By segment: | | | | | | è By product: | | | | |
| | | | | | | | | | | | | |
| | | | | | | | | | | | | |
| | | | | | | | | | | | | |
| | | | | Growth across main businesses, led by double-digit performance in CIB and Wealth. | | Growth in all products, rising double digits in mutual funds and with a pickup in demand deposits at the end of the year. | | |
| | | | | | | | | | | | | | | | | | |
| | | | | Retail | Openbank | CIB | Wealth | | Demand | Time | Mutual funds | | |
| | | | | +1% | +2% | +16% | +13% | | +3% | +7% | +14% | | |
| | | | |
| | | | | | | | | | | | | | | | | | | |
Loans and advances to customers
Loans and advances to customers totalled EUR 1,037,288 million in December 2025, a 2% decrease year-on-year. The year-on-year comparison was affected by the Poland disposal as, in accordance with IFRS 5 requirements and only from 30 June 2025 onwards, the assets related to the Poland disposal are aggregated under the 'non-current assets held for sale' line, without affecting assets in previous periods.
For the purpose of analysing traditional commercial banking loans, the Group uses gross loans and advances to customers excluding reverse repurchase agreements (repos). To enable like-for-like comparisons, we analyse gross loans and advances to customers excluding reverse repos and, for 2024 data, excluding Poland, i.e. aligning the perimeter with the accounting treatment from June 2025. As at end December 2025, gross loans and advances to customers excluding reverse repos, totalled EUR 984,466 million in December 2025, a 1% increase year-on-year.
Gross loans and advances to customers excluding Poland and reverse repos and in constant euros, grew by 4% year-on-year, as follows:
•In Retail, which represented 60% of the Group's loan portfolio, gross loans and advances to customers grew by 1%, as growth in the mortgage and card portfolios in most countries and higher corporate loans in Europe offset the decrease in SMEs, mainly in Spain, the UK and Portugal.
•In Openbank, which represented 22% of the Group's loan portfolio, they grew by 2% driven by good performances in auto markets in Europe and Latin America.
•In CIB, which represented 15% of the Group's loan portfolio, lending volumes increased by 16%, with double-digit growth in the three business lines.
•In Wealth, gross loans and advances to customers rose by 13% driven by strong growth in Private Banking.
•Payments had a loan portfolio of just EUR 1 billion (-8% year-on-year).
| | | | | | | | | | | | | | | |
| Loans and advances to customers |
| EUR million. Excluding Poland |
| | | Change | |
| Dec-25 | Dec-24 | Absolute | % | |
| Commercial bills | 51,110 | | 51,429 | | (319) | | (0.6) | | |
| Secured loans | 530,749 | | 538,218 | | (7,469) | | (1.4) | | |
| Other term loans | 295,998 | | 284,136 | | 11,862 | | 4.2 | | |
| Finance leases | 38,540 | | 37,643 | | 897 | | 2.4 | | |
| Receivable on demand | 10,313 | | 10,737 | | (424) | | (3.9) | | |
| Credit cards receivable | 26,179 | | 24,563 | | 1,616 | | 6.6 | | |
| Impaired assets | 31,577 | | 32,235 | | (658) | | (2.0) | | |
| Gross loans and advances to customers (excluding reverse repos) | 984,466 | | 978,961 | | 5,505 | | 0.6 | | |
Reverse repurchase agreements | 73,980 | | 59,344 | | 14,636 | | 24.7 | | |
| Gross loans and advances to customers | 1,058,446 | | 1,038,305 | | 20,141 | | 1.9 | | |
| Loan-loss allowances | 21,158 | | 21,145 | | 13 | | 0.1 | | |
| Net loans and advances to customers | 1,037,288 | | 1,017,160 | | 20,128 | | 2.0 | | |
| | |
Gross loans and advances to customers
(excluding reverse repos) |
| EUR billion. Excluding Poland |
A. In constant euros: +4%.
As of December 2025, gross loans and advances to customers excluding reverse repos maintained a diversified structure between the markets in which the Group operates.
With respect to gross loans and advances to customers (including reverse repos) maturing in more than one year, at the end of 2025, 66% had a fixed interest rate, while the remaining 34% had a floating interest rate:
| | |
Gross loans and advances to customers
(excluding reverse repos) |
| % of operating areas. December 2025. Excluding Poland |
•In Spain, 53% of loans and advances to customers were fixed rate and 47% were floating rate.
•Outside of Spain, 69% of loans and advances to customers were fixed rate and 31% were floating rate.
For more details on the distribution of loans and advances to customers by business line, see note 10.b to the consolidated financial statements.
| | | | | | | | | | | | | | | | | | | | | | | | | | |
| Gross loans and advances to customers (including reverse repos) with maturities exceeding one year as at 31 December 2025 |
| EUR million. Excluding Poland |
| Domestic | | International | | TOTAL |
| Amount | Weight as % of the total | | Amount | Weight as % of the total | | Amount | Weight as % of the total |
| Fixed | 74,310 | 53 | % | | 361,576 | 69 | % | | 435,886 | 66 | % |
| Floating | 66,108 | 47 | % | | 158,758 | 31 | % | | 224,866 | 34 | % |
| TOTAL | 140,418 | 100 | % | | 520,334 | 100 | % | | 660,752 | 100 | % |
| | | | | | | | | | | | | | | |
| Total customer funds |
| EUR million. Excluding Poland |
| | | Change | |
| Dec-25 | Dec-24 | Absolute | % | |
| Demand deposits | 646,125 | | 641,237 | | 4,888 | | 0.8 | |
| Time deposits | 298,284 | | 286,296 | | 11,988 | | 4.2 | |
Mutual funds A | 255,389 | | 227,226 | | 28,163 | | 12.4 | |
| Customer funds | 1,199,798 | | 1,154,759 | | 45,039 | | 3.9 | |
Pension funds A | 16,112 | | 15,646 | | 466 | | 3.0 | |
Managed portfolios A | 50,459 | | 42,969 | | 7,490 | | 17.4 | |
| Repurchase agreements | 96,791 | | 78,072 | | 18,719 | | 24.0 | |
| Total funds | 1,363,160 | | 1,291,446 | | 71,714 | | 5.6 | |
A. Including managed and marketed funds.
Customer deposits fell 1% year-on-year to EUR 1,041,200 million as at 31 December 2025. This year-on-year comparison was also affected by the Poland disposal as, in accordance with IFRS 5 requirements and only from 30 June 2025 onwards, the liabilities related to the Poland disposal are aggregated under the 'liabilities associated with non-current assets held for sale' line, without affecting liabilities in previous periods.
The Group uses customer funds (customer deposits, excluding repos, plus mutual funds) to analyse traditional retail banking funds. To enable like-for-like comparisons, we analyse customer funds excluding Poland in 2024, i.e. aligning the perimeter with the accounting treatment from June 2025. As at 31 December 2025, they amounted to EUR 1,199,798 million and grew 4% year-on-year.
| | |
| Customer funds (excluding repos) |
| EUR billion. Excluding Poland |
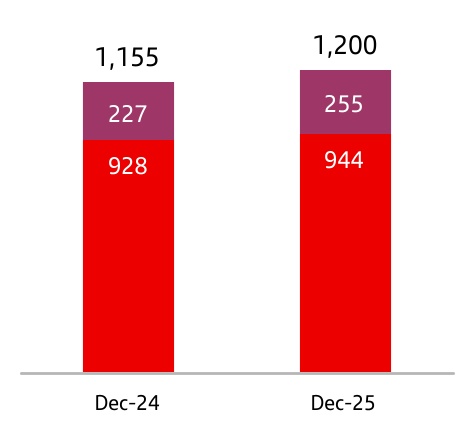
| | | | | |
Dec-25 vs. Dec-24 |
+4 | % | A |
| |
+12 | % | |
| |
+2 | % | |
| |
Total |
Mutual fundsB |
Deposits excluding repos |
| |
|
| |
A. In constant euros: +6%.
B. Including managed and marketed funds.
Compared to December 2024, customer funds excluding Poland rose 6% in constant euros, as follows:
•By product, customer deposits excluding repos rose 4%, with an increase in both demand (+3%) and time deposits (+7%). Mutual funds rose 14%, with widespread increases across most businesses and countries.
•By business, customer funds increased 5% in Retail, mainly driven by time deposits in Europe and South America. In Openbank, customer funds rose 6%, in line with our deposit gathering strategy. In CIB, customer funds grew 4%, due to deposits in Cash Management. In Wealth, they were up 15%, driven mainly by mutual funds.
Customer funds maintained a diversified structure across the markets in which the Group operates. The weight of demand deposits was 54% of total customer funds, while time deposits accounted for 25% and mutual funds 21%.
In addition to capturing customer deposits, for strategic reasons the Group has a selective policy on issuing securities in international fixed income markets and strives to adapt the frequency and volume of its market operations to the structural liquidity needs of each unit, as well as to the receptiveness of each market.
| | |
| Customer funds (excluding repos) |
| % of operating areas. December 2025. Excluding Poland |
4.3 Financial information by segment: 2025 vs 2024
4.3.1 Description of segments
We base segment reporting on financial information presented to the chief operating decision maker, which excludes certain statutory results items that distort year-on-year comparisons and are not considered for management reporting. This financial information (underlying basis) is computed by adjusting reported results for the effects of certain gains and losses (e.g. capital gains, write-downs, impairment of goodwill, etc.). These gains and losses are items that management and investors ordinarily identify and consider separately to better understand the underlying trends in the business. For more details, see note 52.c to the consolidated financial statements. Santander has aligned the information in this section with the underlying information used internally for management reporting and with that presented in the Group's other public documents.
The executive committee of Santander's board of directors has been selected to be its chief operating decision maker. The Group's operating segments reflect its organizational and managerial structures. The executive committee reviews internal reporting based on these segments to assess performance and allocate resources.
The segments are split by global business and by country in which profits are earned. We prepare the financial information by aggregating the figures for Group’s global businesses and countries, relating it to both the accounting data of the business units integrated in each segment and that provided by management information systems. The same general principles as those used in the Group are applied.
Primary segments
This primary level of segmentation comprises six reportable segments: five global businesses plus the Corporate Centre.
Retail & Commercial Banking (Retail): area that integrates the retail banking and commercial banking businesses (individuals, SMEs and corporates), except private banking clients and business originated in the consumer finance businesses. Detailed financial information is provided on Spain (Retail Spain), the UK (Retail UK), Mexico (Retail Mexico) and Brazil (Retail Brazil), which represent most of the total Retail business.
Openbank, formerly Digital Consumer Bank (Consumer): comprises all business originated by consumer finance companies, plus our digital bank (formerly Openbank), Open Digital Services (ODS) and SBNA Consumer. Detailed financial information is provided on Europe (Openbank Europe) and the US (Openbank US).
Corporate & Investment Banking (CIB): this business, which includes Global Transaction Banking, Global Banking (Global Debt Financing and Corporate Finance) and Global Markets, offers products and services on a global scale to corporate and institutional customers, and collaborates with other global businesses to better serve our broad customer base.
Wealth Management & Insurance (Wealth): comprises two business lines: i) Private Banking, which includes the corporate private banking unit and International Private Banking in the US, Switzerland and the UAE; and ii) Insurance & Asset Management Solutions, which brings together the insurance business and liquid and illiquid asset management activities and includes the investment platforms and holdings that complement the traditional Wealth business.
Payment Solutions (Payments): brings together the Group’s digital payment solutions, providing global technological solutions to Group entities and new customers in the open market. It comprises Getnet, Getnet Platforms and Ebury.
Corporate Centre: includes the centralized activities relating to equity stakes in financial companies, financial management of the structural exchange rate position, assumed within the sphere of the Group’s asset and liability committee, as well as management of liquidity and of shareholders’ equity via issuances.
As the Group’s holding entity, this area manages all capital and reserves and allocations of capital and liquidity with the other businesses. It also incorporates goodwill impairments but not the costs related to the Group’s central services (charged to the areas), except for corporate and institutional expenses related to the Group’s functioning.
Secondary segments
This secondary level includes our main geographical units and the Corporate Centre, as described in the primary segments.
Detailed financial information is provided on Spain, the UK, Portugal, Openbank Europe (previously referred to as DCB Europe), which includes all consumer business, our digital bank in Europe and ODS, the US, Mexico, Brazil, Chile and Argentina.
Information is also provided for the 'Rest of the Group', the grouping which brings together everything that is not included in the aforementioned geographical units or the Corporate Centre.
| | | | | | | | |
| | |
| The information included on each of the segments in this report and the accounting principles under which their results are presented here may differ from the accounting principles applied and the financial information separately prepared and disclosed by our subsidiaries (some of which are publicly listed) which in name or geographical description may seem to correspond to the segments covered in this report. Accordingly, the results of operations and trends shown for our segments in this document may differ materially from those of such subsidiaries. As described in 4.2 'Group financial performance: 2025 vs 2024', the results of our segments presented below are only provided on the basis of underlying results in accordance with IFRS 8. Therefore, the information included in this section, at the Group and primary segment levels, excludes Poland's results line by line as they are recorded in full in the 'non-recurring items' line item. This reporting approach is consistent with the information used internally in management reporting as well as with other public Group disclosures from 2026. For the same reason, all underlying ratios and management metrics included in this section have been calculated excluding Poland. For further information, see 4.6 'Alternative performance measures (APMs): 2025, 2024 and 2023'. The results of our segments presented below are provided on the basis of underlying results only and include the impact of foreign exchange rate fluctuations. However, for a better understanding of the changes in the performance of our business areas, we also provide and discuss the year-on-year changes to our results excluding such exchange rate impacts (i.e. in constant euros), except for Argentina, and any grouping which includes it, where the variations in constant euros have been calculated considering the Argentine peso exchange rate on the last working day for each of the periods presented. For further information, see 4.6 'Alternative performance measures (APMs): 2025, 2024 and 2023'. The statements included in this section regarding Santander's competitiveness and that of its subsidiaries have been produced by the Group based on public information (corporate websites of competing entities and information published by national banking institutions). Certain figures contained in this chapter have been subject to rounding to enhance their presentation. Accordingly, in certain instances, the sum of the numbers in a column or a row in tables contained in this report may not conform exactly to the total figure given for that column or row. | |
| | |
4.3.2 Summary of the Group's main business areas' income statements
| | | | | | | | | | | | | | | | | | | | | |
| 2025 | | | | | | |
| Main items of the underlying income statement | | | | | | |
| EUR million | | | | | | |
| Primary segments | Net interest income | Net fee
income | Total
income | Net operating income | Profit before tax | Underlying profit attributable to the parent |
| Retail & Commercial Banking | 26,528 | | 6,222 | | 32,447 | | 18,534 | | 10,998 | | 7,710 | |
| Openbank | 11,036 | | 1,479 | | 13,015 | | 7,335 | | 2,566 | | 1,741 | |
| Corporate & Investment Banking | 3,824 | | 2,552 | | 8,016 | | 4,264 | | 3,949 | | 2,708 | |
| Wealth Management & Insurance | 1,335 | | 1,642 | | 4,042 | | 2,598 | | 2,564 | | 1,983 | |
| Payment Solutions | 167 | | 1,059 | | 1,373 | | 170 | | 134 | | 96 | |
| | | | | | | |
| | | | | | | |
| Corporate Centre | (490) | | (27) | | (585) | | (1,003) | | (1,275) | | (1,085) | |
| TOTAL GROUP | 42,401 | | 12,928 | | 58,308 | | 31,898 | | 18,936 | | 13,152 | |
| | | | | | | |
| | | | | | | |
| Secondary segments | | | | | | |
| | | | | | | |
| Spain | 7,305 | | 3,022 | | 11,887 | | 7,423 | | 6,083 | | 4,272 | |
| UK | 5,008 | | 369 | | 5,032 | | 2,095 | | 1,794 | | 1,307 | |
| Portugal | 1,346 | | 506 | | 1,956 | | 1,412 | | 1,417 | | 1,010 | |
| | | | | | | |
| Openbank Europe | 4,685 | | 804 | | 5,925 | | 3,026 | | 1,398 | | 772 | |
| | | | | | | |
| | | | | | | |
| US | 5,888 | | 1,328 | | 7,929 | | 4,039 | | 1,748 | | 1,541 | |
| Mexico | 4,554 | | 1,454 | | 6,305 | | 3,575 | | 2,336 | | 1,705 | |
| | | | | | | |
| | | | | | | |
| Brazil | 9,380 | | 3,193 | | 12,602 | | 7,645 | | 3,224 | | 2,168 | |
| Chile | 1,917 | | 582 | | 2,714 | | 1,795 | | 1,232 | | 729 | |
| Argentina | 1,727 | | 788 | | 2,235 | | 1,257 | | 650 | | 433 | |
| Corporate Centre | (490) | | (27) | | (585) | | (1,003) | | (1,275) | | (1,085) | |
| Rest of the Group | 1,080 | | 908 | | 2,309 | | 634 | | 328 | | 300 | |
| TOTAL GROUP | 42,401 | | 12,928 | | 58,308 | | 31,898 | | 18,936 | | 13,152 | |
| | |
| Underlying profit attributable to the parent. 2025 distribution |
Distribution A by primary segment |
A. As a % of operating areas. Excluding the Corporate Centre.
| | |
Underlying profit attributable to the parent. 2025 |
| EUR million. % change YoY |
| | | | | | | | |
| | | | |
| | | | |
| | | | |
| Retail | | | |
| | | | |
| Openbank | | | |
| | | | |
| CIB | | | |
| | | | |
| Wealth | | | |
| | | | |
| Payments | | | |
| | | | |
| | | | |
| | | | |
| | | | |
| | | | |
| | | | |
| | | | |
| | | | |
| | | | |
| | | | |
| | | | |
| | | | |
| | | |
| | | |
| | | |
| | | |
| | | |
| | | |
| | | |
| | | |
| | | |
| | | |
| | | |
| | | |
| | | |
| | | |
| | | |
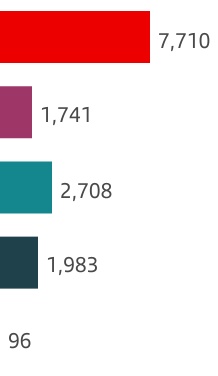
| | | | | |
| Var | Var B |
+5 | % | +9 | % |
+5 | % | +8 | % |
+3 | % | +7 | % |
+25 | % | +29 | % |
— | — |
| |
| |
| |
| |
| |
| |
| |
| |
B. Changes in constant euros.
| | | | | | | | | | | | | | | | | | | | |
2024 |
| Main items of the underlying income statement |
| EUR million | | | | | | |
| Primary segments | Net interest income | Net fee
income | Total
income | Net operating income | Profit before tax | Underlying profit attributable to the parent |
| | | | | | |
| Retail & Commercial Banking | 27,854 | | 6,022 | | 33,064 | | 18,359 | | 10,750 | | 7,345 | |
Openbank | 10,777 | | 1,508 | | 12,877 | | 7,302 | | 2,228 | | 1,659 | |
| Corporate & Investment Banking | 3,779 | | 2,415 | | 7,897 | | 3,975 | | 3,815 | | 2,639 | |
| Wealth Management & Insurance | 1,591 | | 1,442 | | 3,587 | | 2,183 | | 2,134 | | 1,584 | |
| Payment Solutions | 132 | | 958 | | 1,240 | | 31 | | (233) | | (299) | |
| | | | | | |
| | | | | | |
| Corporate Centre | (308) | | (11) | | (680) | | (1,220) | | (1,317) | | (1,154) | |
| TOTAL GROUP | 43,824 | | 12,335 | | 57,984 | | 30,630 | | 17,377 | | 11,774 | |
| | | | | | |
| Secondary segments | | | | | | |
| | | | | | |
| | | | | | |
| Spain | 7,256 | | 2,867 | | 11,580 | | 7,071 | | 5,440 | | 3,762 | |
| UK | 4,950 | | 283 | | 5,011 | | 1,962 | | 1,794 | | 1,306 | |
| Portugal | 1,548 | | 467 | | 2,065 | | 1,492 | | 1,481 | | 1,001 | |
| | | | | | |
| Openbank Europe | 4,361 | | 902 | | 5,644 | | 2,796 | | 1,131 | | 642 | |
| | | | | | |
| | | | | | |
| US | 5,693 | | 1,152 | | 7,580 | | 3,615 | | 1,053 | | 1,109 | |
| Mexico | 4,631 | | 1,385 | | 6,278 | | 3,551 | | 2,274 | | 1,671 | |
| | | | | | |
| | | | | | |
| Brazil | 10,121 | | 3,414 | | 13,536 | | 8,318 | | 3,830 | | 2,422 | |
| Chile | 1,822 | | 551 | | 2,592 | | 1,650 | | 1,111 | | 629 | |
| Argentina | 2,919 | | 602 | | 2,487 | | 1,150 | | 827 | | 665 | |
| Corporate Centre | (308) | | (11) | | (680) | | (1,220) | | (1,317) | | (1,154) | |
| Rest of the Group | 832 | | 722 | | 1,889 | | 246 | | (248) | | (280) | |
| TOTAL GROUP | 43,824 | | 12,335 | | 57,984 | | 30,630 | | 17,377 | | 11,774 | |
| | | | | | | | | | | | | | | |
| | | |
| | | | | |
| | | Retail & Commercial Banking | Underlying attributable profit | EUR 7,710 mn |
| | | |
| | | |
| | | |
Business performance
Gross loans and advances to customers, excluding reverse repos and in constant euros rose 1% year-on-year, mainly due to the increase in mortgages and cards, which amply offset the decrease in SMEs.
The mortgage portfolio increased across most countries. However, personal loans decreased driven by Brazil, partially offset by growth in Spain, Chile and Argentina.
Corporate loans rose, mainly due to generalized growth across Europe, while SME loans were affected by lower volumes in Spain, the UK and Portugal.
Customer deposits, excluding repos and in constant euros, rose 4%, driven by broad-based growth across countries in Europe, particularly in Spain, the UK and Brazil, especially in time deposits. Mutual funds rose 11% in constant euros, with positive performances across most countries. As a result, customer funds increased 5% in constant euros.
| | |
Retail. 2025 business performance |
| EUR billion and YoY % change in constant euros |
| | | | | | | | | | | | | | | | | | | | | | | | | | | | | | | | | | | | | | |
| Gross loans and advances to customer excl. reverse repos | | Customer deposits excl. repos + mutual funds |
Results
Underlying attributable profit in 2025 was EUR 7,710 million (54% of the Group's total operating areas), up 5% compared to 2024. In constant euros, it rose 9% year-on-year, as follows:
•Total income increased 3%, as the decrease in net interest income was amply offset by improvements in net fee income and other income, the latter favoured by the temporary levy on revenue earned in Spain, which was recorded in this line in 2024, whereas in 2025 the expected tax on revenue earned in Spain for the year was recorded under the ‘tax on profit' line.
Net interest income decreased 1% year-on-year, heavily impacted by Argentina, where interest rates declined significantly over the year. However, if we exclude Argentina, net interest income increased 2%, even in a less favourable interest rate environment, with positive performances in most countries. Of note, Mexico due to volumes and a lower cost of deposits, Chile supported by a lower cost of deposits and the UK driven by higher mortgage profitability and a lower cost of deposits.
Greater commercial activity and a larger loyal customer base contributed to net fee income growth (+9%). The most significant increases were in Argentina, Mexico and the UK and by product in transactional, insurance and mutual fund fees.
| | |
| Retail. Total income |
| EUR million and YoY % change in constant euros |
•Total costs decreased 1%. In real terms, expenses declined 5% reflecting our transformation efforts through organizational simplification, process automation and the deployment of the global platform as well as lower charges in the 'other operating costs' line. As a result, net operating income increased 6% and efficiency improved to 42.9%.
•Net loan-loss provisions increased 8% year-on-year, as declines in Spain and the US partially offset the increases in Argentina due normalization and Brazil driven by loan growth and a less favourable macro environment.
•Other gains (losses) and provisions line recorded a 29% lower loss than in 2024, due to lower charges related to transformation.
Overall, underlying RoTE (post-AT1) in 2025 was 17.1%.
| | | | | | | | | | | | | | | |
| Retail. Underlying income statement |
| EUR million and % change |
| | | | / | 2024 |
| | 2025 | 2024 | | % | % excl. FX |
| | | | | |
| | | | | |
| | | | | |
| Revenue | | 32,447 | 33,064 | | (2) | +3 |
| Total costs | | (13,913) | (14,704) | (5) | (1) |
| Net operating income | | 18,534 | | 18,359 | | +1 | +6 |
| LLPs | | (7,150) | (7,064) | +1 | +8 |
| PBT | | 10,998 | 10,750 | | +2 | +6 |
| Underlying attr. profit | | 7,710 | | 7,345 | | +5 | +9 |
| | | | | | | | |
| Retail Spain | Profit before tax |
EUR 3,316 | mn |
Business performance
Gross loans and advances to customers, excluding reverse repos, were flat year-on-year as the increase in personal loans, consistent with our customer engagement strategy, and higher corporate loans offset a decrease in SMEs, affected by the ICO maturities and the impact of our focus on active risk management and balance sheet optimization.
Customer deposits excluding repos, increased 4% year-on-year, driven by our new value proposition for Select customers, supporting customer acquisition and improving our funding mix. Mutual funds increased 15% year-on-year. As a result, customer funds increased 6% year-on-year.
Results
Profit before tax in 2025 reached EUR 3,316 million, 17% higher than in 2024. By line item:
•Total income increased 3% mainly due to the rise of net fee income, driven by transactional, insurance and mutual funds fees, and other income favoured by the temporary levy on revenue earned in Spain, which was recorded in this line in 2024, whereas in 2025 the expected tax on revenue earned in Spain for the year was recorded under the ‘tax on profit' line.
•Total costs were flat, reflecting the progress achieved in product simplification and process automation, as well as by the savings obtained from the rollout of global platforms such as Gravity. As a result, the efficiency ratio improved to 36.5%.
•Net loan-loss provisions decreased 8%, which resulted in an improvement in the cost of risk and NPL ratio to 0.71% and 2.39%, respectively.
•The other gains (losses) and provisions line recorded a 49% lower loss year-on-year, benefited by less charges related to transformation.
| | | | | | | | | | | | | |
| Retail Spain. Underlying income statement |
| EUR million and % change |
| | | | / 2024 | |
| | | | | |
| | 2025 | 2024 | | % | |
| | | | | |
| Revenue | | 7,143 | 6,915 | | +3 | |
| Total costs | | (2,605) | (2,606) | 0 | |
| Net operating income | | 4,538 | 4,309 | | +5 | |
| LLPs | | (1,036) | (1,121) | (8) | |
| PBT | | 3,316 | | 2,824 | | +17 | |
| | | | | |
| | | | | | | | |
| Retail UK | Profit before tax |
EUR 1,658 | mn |
Business performance
Gross loans and advances to customers, excluding reverse repos and in constant euros, increased 2% year-on-year, driven by an increase in mortgages and corporates. The trend in mortgages was positive throughout the year, with a progressive recovery in new business volumes.
Customer deposits, excluding repos and in constant euros, increased 4% mainly driven by time deposits. Mutual funds increased 5% year-on-year in constant euros. As a result, customer funds increased 4% in constant euros.
Results
Profit before tax was EUR 1,658 million, up 2% year-on-year. In constant euros, it increased 3%, by line item:
•Total income increased 2%, driven by a positive performance in net interest income, supported both by higher loan yields and a lower cost of deposits, and higher net fee income, driven by transactional and FX fees.
•Total costs decreased 3% reflecting our efforts in process simplification and automation. Net operating income increased 10% and the efficiency ratio improved by 2.9 pp to 59.3%.
•Net loan-loss provisions continued to normalize, though they remained at low levels, with a cost of risk of only 7 bps.
•The other gains (losses) and provisions line recorded losses of EUR 124 million, a 21% greater loss year-on-year, impacted by charges related to transformation.
| | | | | | | | | | | | | | | |
| Retail UK. Underlying income statement |
| EUR million and % change |
| | | | / | 2024 |
| | 2025 | 2024 | | % | % excl. FX |
| | | | | |
| | | | | |
| | | | | |
| Revenue | | 4,812 | 4,766 | | +1 | +2 |
| Total costs | | (2,853) | (2,965) | (4) | (3) |
| Net operating income | | 1,959 | 1,801 | | +9 | +10 |
| LLPs | | (177) | (64) | +177 | +181 |
| PBT | | 1,658 | | 1,633 | | +2 | +3 |
| | | | | |
Detailed financial information in 4.3.4 'Appendix'.
| | | | | | | | |
| Retail Mexico | Profit before tax |
EUR 1,628 | mn |
Business performance
Gross loans and advances to customers, excluding reverse repos and in constant euros, grew 2% year-on-year, mainly due to growth in mortgages, supported by our enhanced commercial offering.
Customer deposits, excluding repos and in constant euros, increased 8% year-on-year, with growth in both demand and time deposits. This reflects increased transactional activity as a result of our focus on customer primacy. In addition, during the year mutual funds rose 16% in constant euros. As a result, customer funds grew 10% in constant euros.
Results
Profit before tax reached EUR 1,628 million in 2025 up 7% year-on-year. In constant euros, it increased 17%, as follows:
•Total income rose 9%, mainly driven by a good net interest income performance, supported by higher activity and a lower cost of deposits, and by an increase in net fee income, particularly from transactional fees and higher volumes in mutual funds.
•Total costs rose 7% affected by inflation and our investments in transformation. As a result, net operating income increased 11% and the efficiency ratio improved by 0.9 pp to 42.6%.
•Net loan-loss provisions increased 2%, partially due to loan growth, with a cost of risk of 5.03% and an NPL ratio of 5.00%.
•No other gains (losses) and provisions were recorded in 2025 or 2024.
| | | | | | | | | | | | | | | |
Retail Mexico. Underlying income statement |
| EUR million and % change |
| | | | / | 2024 |
| | 2025 | 2024 | | % | % excl. FX |
| | | | | |
| | | | | |
| | | | | |
| Revenue | | 4,820 | 4,861 | | (1) | +9 |
| Total costs | | (2,055) | | (2,114) | | (3) | +7 |
| Net operating income | | 2,765 | 2,746 | | +1 | +11 |
| LLPs | | (1,136) | | (1,222) | | (7) | +2 |
| PBT | | 1,628 | | 1,524 | | +7 | +17 |
| | | | | |
| | | | | | | | |
| Retail Brazil | Profit before tax |
EUR 1,464 | mn |
Business performance
Gross loans and advances to customers, excluding reverse repos and in constant euros, declined 1%, as growth in cards and mortgages did not fully offset declines in personal loans, in line with our strategy to focus on more profitable growth and capital optimization.
Customer deposits increased 9%, excluding repos and in constant euros, driven by time deposits, which rose double-digits, particularly individuals. Mutual funds increased 18% in constant euros. As a result, customer funds grew 11% in constant euros.
Results
Profit before tax was EUR 1,464 million in 2025, a 26% decrease year-on-year. In constant euros, it declined 20%, as follows:
•Total income was flat, as higher fees driven by cards offset the negative sensitivity of the balance sheet to higher interest rates and lower gains on financial transactions, in an environment with lower activity.
•Total costs increased 3%, driven by higher T&O costs and higher charges in the 'other operating costs' line However, this growth is below inflation, reflecting our transformation efforts in simplification, automation and digitalization.
•Net loan-loss provisions increased 6%, affected by higher provisions in cards (volumes and macroeconomic environment) as well as in the corporate and agribusiness segments, which were impacted by the macroeconomic and regulatory environment.
•The other gains (losses) and provisions line recorded losses of EUR 11 million, a greater loss year-on-year.
| | | | | | | | | | | | | | | |
Retail Brazil. Underlying income statement |
| EUR million and % change |
| | | | / | 2024 |
| | 2025 | 2024 | | % | % excl. FX |
| | | | | |
| | | | | |
| | | | | |
| Revenue | | 9,172 | 9,992 | | (8) | 0 |
| Total costs | | (3,936) | | (4,159) | | (5) | +3 |
| Net operating income | | 5,237 | 5,833 | | (10) | (3) |
| LLPs | | (3,762) | | (3,857) | | (2) | +6 |
| PBT | | 1,464 | | 1,975 | | (26) | (20) |
| | | | | |
Detailed financial information in 4.3.4 'Appendix'.
| | | | | | | | | | | | | | | |
| | | |
| | | | | |
| | | Openbank | Underlying attributable profit | EUR 1,741 mn |
| | | |
| | | |
| | | |
Business performance
Gross loans and advances to customers, excluding reverse repos and in constant euros, rose 2% year-on-year. This was driven by auto (+4%), which saw continuous growth in Europe, in a market that picked up from a weak start at the beginning of 2025, and double-digit increases across most of Latin America.
The new lending performance (-8% year-on-year in constant euros) continued to reflect our focus on prioritizing profitability over volumes as we remained prudent in terms of originations in an environment marked by volatility and geopolitical uncertainty.
Our EUR 13.3 billion leasing portfolio decreased 15% year-on-year in constant euros, as growth in Europe was more than offset by a decline in the US, due to the wind down of business through our relationship with Stellantis, lower demand for electric vehicles and our strategy to prioritize profitability over growth.
In terms of liabilities, our access to wholesale funding markets remained strong and diversified. Customer deposits accounted for 61% of Openbank's total funding. Excluding repos and in constant euros, deposits were up 5% year-on-year (+11% in the US and +1% in Europe), as a result of our focus on deposit gathering, supported by our digital bank. Including mutual funds (which rose 17%, albeit from low levels), customer funds grew 6% year-on-year in constant euros.
| | | | | | | | | | | | | | | | | | | | | | | | | | | | | | | | |
| Openbank. 2025 business performance |
| EUR billion and YoY % change in constant euros |
| | | | | |
| Openbank Europe | |
| Openbank US | |
| |
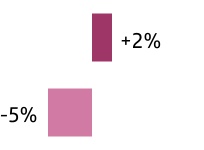
| | | | | |
| Openbank Europe | |
| Openbank US | |
| |
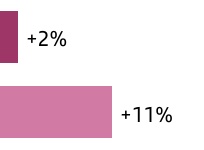
| | | | | | | | | | | | | | | | | | | | | | | | | | | | | | | | | | | | | | |
| Gross loans and advances to customer excl. reverse repos | | Customer deposits excl. repos + mutual funds |
| | | | | | | | | | | | | | | | | | | | | | | | | | | | | | | | |
| Openbank. Leasing portfolio |
| EUR billion and YoY % change in constant euros |
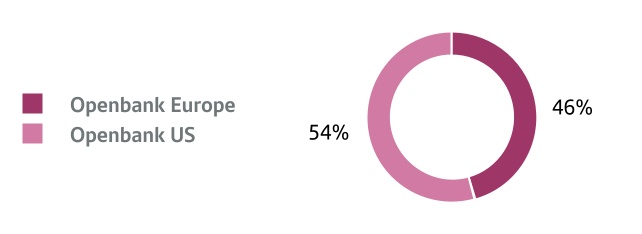 Results
Underlying attributable profit in 2025 was EUR 1,741 million, up 5% year-on-year, representing 12% of the Group's total operating areas. In constant euros, profit increased 8%, as follows:
•Total income rose 4%, mainly driven by net interest income, which grew 5%, with positive trends across almost all of our footprint, underpinned by our active margin management and higher volumes, as well as the CrediScotia integration in Peru.
Net fee income was flat, as double-digit growth in the US and Latin America was offset by Openbank Europe, which was impacted by new insurance regulation in Germany and weaker car registration trends, especially in H1 2025.
Other income declined, mainly due to lower leasing results in the US, driven by reduced volumes and lower residual values.
| | | | | | | | | | | | | | | | | | | | | | | | | | | | | | | | |
| Openbank. 2025 total income |
| EUR million and YoY % change in constant euros |
| | | | | | | |
| | | |
| Openbank Europe | | | |
| Openbank US | | |
| Other | | |
| | |
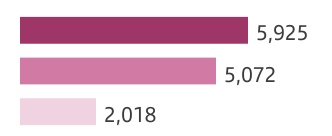
•Total costs rose 4% year-on-year (+2% in real terms), mainly driven by our investments in platforms, our digital bank and the CrediScotia integration, which were partially offset by savings from our efficiency and transformation efforts.
•Net loan-loss provisions grew 1%, as an excellent performance in auto in the US nearly offset increases in other units, mainly in Openbank Europe, and the impact of the CrediScotia integration. Credit quality remained controlled with the cost of risk improving 7 bps to 2.10%, while the NPL ratio stood at 5.32%.
•Other gains (losses) and provisions registered a loss of EUR 312 million in 2025 compared to a EUR 512 million loss in 2024, mainly due to lower provisions for potential complaints related to motor finance dealer commissions in the UK.
•The effective tax rate normalized as the benefit from fiscal incentives for electric vehicles decreased, following a decline in leasing volumes for these vehicles in the US during 2025.
As a result, underlying RoTE (post-AT1) stood at 8.5% in 2025.
| | | | | | | | | | | | | | | |
| Openbank. Underlying income statement |
| EUR million and % change |
| | | | / | 2024 |
| | 2025 | 2024 | | % | % excl. FX |
| | | | | |
| | | | | |
| | | | | |
| Revenue | | 13,015 | 12,877 | | +1 | +4 |
| Total costs | | (5,680) | (5,576) | +2 | +4 |
| Net operating income | | 7,335 | | 7,302 | | 0 | +4 |
| LLPs | | (4,457) | (4,562) | (2) | +1 |
| PBT | | 2,566 | 2,228 | | +15 | +18 |
| Underlying attr. profit | | 1,741 | | 1,659 | | +5 | +8 |
Detailed financial information in 4.3.4 'Appendix'.
| | | | | | | | |
OB | Openbank Europe | Profit before tax |
EUR 1,398 | mn |
Business performance
New car registrations saw weaker trends at the beginning of the year, with declines in normally strong months, but they picked up towards the end of the year. This performance and our focus on prioritizing profitability over growth were reflected in a 3% year-on-year drop in new business volumes in constant euros.
However, gross loans and advances to customers, excluding reverse repos and in constant euros, grew 2% year-on-year, driven by auto balances.
Customer deposits, excluding repos and in constant euros, rose 1% year-on-year, supported by demand deposits, in line with our strategy to increase the weight of retail funding. Mutual funds grew 16% in constant euros.
Results
In 2025, profit before tax reached EUR 1,398 million, 24% higher than in 2024. In constant euros, it rose 23%, as follows:
•Total income grew 5%, mainly driven by strong net interest income (+8%), underpinned by our margin management and volumes growth, which more than offset the impact on net fee income from new insurance regulation in Germany and weaker car registration trends, particularly in the first half of the year.
•Total costs were up 2%. In real terms costs were flat as our strategic investments in platforms and business growth and higher charges in the 'other operating costs' line were offset by savings from the transformation of our operating model. As a result, net operating income increased 8% and the efficiency ratio improved to 48.9%.
•Net loan-loss provisions grew 13%, especially in Germany, impacted by the macro environment and worse credit quality in corporates (which is in run-off). However, cost of risk remained below 1%.
•Other gains (losses) and provisions posted a loss of EUR 266 million, compared to a EUR 456 million loss in 2024, mainly due to a decline in provisions for potential complaints related to motor finance dealer commissions in the UK.
| | | | | | | | | | | | | | | |
| Openbank Europe. Underlying income statement |
| EUR million and % change |
| | | | / | 2024 |
| | 2025 | 2024 | | % | % excl. FX |
| | | | | |
| | | | | |
| | | | | |
| Revenue | | 5,925 | 5,644 | | +5 | +5 |
| Total costs | | (2,899) | (2,848) | +2 | +2 |
| Net operating income | | 3,026 | 2,796 | | +8 | +8 |
| LLPs | | (1,363) | (1,209) | +13 | +13 |
| PBT | | 1,398 | 1,131 | | +24 | +23 |
| | | | | |
| | | | | | | | |
| Openbank US | Profit before tax |
EUR 699 | mn |
Business performance
The stock of gross loans and advances to customers, excluding reverse repos and in constant euros, declined 5% year-on-year, mainly due to asset rotation initiatives (in line with our capital light strategy) and reduced new business activity, as we maintained our focus on profitability over growth. The leasing portfolio fell 28% in constant euros, impacted by the wind down of business through our relationship with Stellantis and a lower demand for electric vehicles.
Customer deposits, excluding repos and in constant euros, rose 11% year-on-year, driven by demand deposits, reflecting strong momentum in our digital bank. Mutual funds also grew in constant euros, contributing to an 11% increase in customer funds in constant euros.
Results
In 2025, profit before tax was 27% higher year-on-year, reaching EUR 699 million. In constant euros, it increased 32%, as follows:
•Total income was flat, as stronger net interest income (higher auto loan margins) and net fee income (higher activity in auto servicing for third parties), offset a decline in leasing income, primarily due to lower volumes and lower residual values.
•Total costs increased 3%, driven by strategic investment in our digital bank, which was partially offset by savings from our transformation initiatives.
•Net loan-loss provisions improved 9%, underpinned by resilient consumer behaviour, used car prices stable at high levels, and capital relief measures. As a result, cost of risk improved 26 bps, reaching 4.17%.
•The other gains (losses) and provisions line recorded a loss of EUR 45 million compared to a EUR 55 million loss in 2024.
| | | | | | | | | | | | | | | |
| Openbank US. Underlying income statement |
| EUR million and % change |
| | | | / | 2024 |
| | 2025 | 2024 | | % | % excl. FX |
| | | | | |
| | | | | |
| | | | | |
| Revenue | | 5,072 | 5,297 | | (4) | 0 |
| Total costs | | (2,188) | (2,225) | (2) | +3 |
| Net operating income | | 2,884 | 3,072 | | (6) | (2) |
| LLPs | | (2,140) | (2,466) | (13) | (9) |
| PBT | | 699 | 551 | | +27 | +32 |
| | | | | |
| | | | | | | | | | | | | | | |
| | | |
| | | | | |
| | | Corporate & Investment Banking | Underlying attributable profit | EUR 2,708 mn |
| | | |
| | | |
| | | |
Business performance
Gross loans and advances to customers, excluding reverse repos and in constant euros, increased 16% year-on-year, boosted by double-digit growth in GTB, GB and GM. Customer deposits, excluding repos and in constant euros, rose 6% year-on-year, driven by Cash Management.
Global Transaction Banking (GTB) recorded good activity levels year-on-year in a challenging environment:
•In Trade & Working Capital Solutions (T&WCS), activity grew year-on-year, supported by the expansion into new segments and partnerships, such as Invensa, a new global inventory finance platform, in alliance with Pemberton, and the implementation of innovative, tailored solutions to address new client demands.
•Export Finance activity, which increased in our main markets, was adversely impacted by Argentina. We achieved a fourth consecutive year as a global leader and strengthened our leadership in Sustainability through transactions carried out together with the Structured Finance team.
•Cash Management activity was affected by interest rates easing across most of our markets. Nevertheless, we expanded real-time payment solutions and strengthened treasury connectivity, in line with our ambition to build a stronger European franchise while preserving our leadership in Spain, Portugal and Latin America.
In Global Banking (GB), activity rose in the year, especially on the back of our US BBO initiative.
•In Corporate Finance (CF), strong growth was driven by M&A in the US and Europe, reflected in transactions such as with Orange, where we acted as financial advisor on the acquisition of its remaining stake in MasOrange. ECM activity recovered during the second half of the year. Leveraged Finance activity increased, especially in the US, with key mandates such as Advent’s leveraged buyout of Reckitt Essential Homes and with more important roles such as our lead arranger role in Partners Group’s acquisition of Middle River Power.
•In Debt Finance, DCM performed well, supported by strong investor demand and refinancing-driven issuances in the US, Europe and Latin America. However, Syndicated Loans activity softened, though we maintained leading bookrunner roles in Latin American sovereign and corporate deals, with prominent clients such as the Republic of Colombia and Metro de Rio de Janeiro.
•Structured Finance activity was broadly flat year-on-year despite challenging conditions during the first half of the year. We achieved notable growth in the US, reinforcing our leadership in Liquefied Natural Gas and Renewables sectors and gaining traction in Digital and Data Centres infrastructure. We are also expanding our business in the UK and Asia and maintaining a top global position in Project Finance advisory.
In Global Markets (GM), we recorded strong institutional client activity, particularly in the US, with disciplined risk management supported growth. Fixed income and FX products performed particularly well, offsetting weaker activity in Cash Equity.
Results
Underlying attributable profit in 2025 was EUR 2,708 million (19% of the Group's total operating areas), up 3% year-on-year. In constant euros, profit grew 7%, as follows:
•Total income rose 5% year-on-year, on the back of net interest income growth (+6%), mainly due to GM in Europe and the US, and strong net fee income (+9%) which grew across business lines. Other income was fairly stable year-on-year.
By country, there was double-digit revenue growth in the US, Mexico and our branch in the UK.
By business line, revenue rose 11% and 8% in GM and in GB, respectively, and there was double-digit growth in CF, mainly in the US. GTB revenue decreased slightly, as growth in Trade & Working Capital Solutions was offset by lower results in Cash Management and Export Finance.
| | |
| CIB. Total income by business |
| Both EUR million and % change in constant euros |
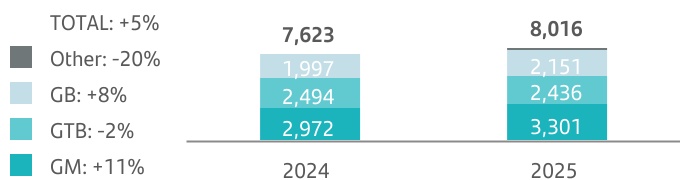 Note: total income includes revenue from other activities which are less material (EUR 160 million in 2024 and EUR 128 million in 2025).
•Total costs decreased 1%, as our investments in new products and capabilities to support growth were more than offset by lower charges in the 'other operating costs' line. As a result, net operating income increased 12% and the efficiency ratio was 46.8%.
•Net loan-loss provisions have a limited impact on results due to the nature of CIB business. They increased year-on-year, though the cost of risk remained low at just 0.14%.
•Other gains (losses) and provisions recorded a EUR 37 million loss compared to a EUR 19 million loss in 2024.
Underlying RoTE (post-AT1) was 17.8%.
| | | | | | | | | | | | | | | |
| CIB. Underlying income statement |
| EUR million and % change |
| | | | / | 2024 |
| | 2025 | 2024 | | % | % excl. FX |
| | | | | |
| | | | | |
| | | | | |
| Revenue | | 8,016 | 7,897 | | +2 | +5 |
| Total costs | | (3,752) | (3,922) | (4) | (1) |
| Net operating income | | 4,264 | 3,975 | 7 | 12 |
| LLPs | | (278) | (141) | +96 | +98 |
| PBT | | 3,949 | 3,815 | | +4 | +8 |
| Underlying attr. profit | | 2,708 | 2,639 | 3 | 7 |
| | | | | | | | | | | | | | | |
| | | |
| | | | | |
| | | Wealth Management & Insurance | Underlying attributable profit | EUR 1,983 mn |
| | | | | |
| | | |
| | | |
| | | |
Business performance
During 2025, solid commercial activity and a positive market performance enabled us to reach a total volume of assets under management (AuMs) of EUR 541 billion, +14% year-on-year in constant euros. By business and in constant euros, volumes performed as follows:
•In Private Banking (PB), customer assets and liabilities reached EUR 363 billion (+17% year-on-year), with all products growing, as we focus on offering products with greater added value, such as alternatives and discretionary portfolio management.
Our focus on offering our customers the benefits of our scale and international presence helped us expand our Private Banking customer base by 5% year-on-year to nearly 297,000.
•In Insurance & Asset Management Solutions: i) total Santander Asset Management (SAM) AuMs increased year-on-year, on the back of the solid commercial activity, confirming strong client engagement and the attractive product offering; and ii) Insurance gross written premiums reached EUR 10.6 billion in 2025, +5% year-on-year, mainly driven by life savings business.
| | | | | |
Wealth. 2025 business performance |
EUR billion and % change in constant euros. December 2025 |
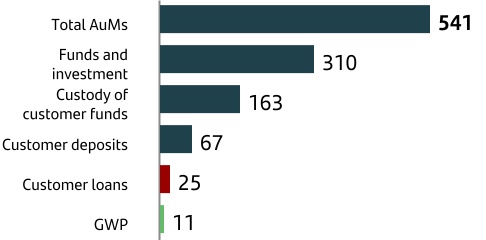
| | |
| / 2024 |
| +14 | % |
| +10 | % |
|
|
| +24 | % |
| +6 | % |
| +13 | % |
| +5 | % |
|
Note: total products marketed, advised, under custody and/or managed.
Results
Underlying attributable profit was EUR 1,983 million (14% of the Group's total operating areas), up 25% compared to 2024. In constant euros, it was 29% higher, by line item:
•Total income increased 16% year-on-year, as a result of our focus on value-added solutions to expand our fee business and improve revenue recurrency and predictability.
Net interest income decreased 14% year-on-year affected by Private Banking deposit cost inelasticity to interest rate cuts and a decline in the yield on assets in a lower interest rate environment in most of our markets.
Net fee income rose 17% year-on-year, with notable performances in Private Banking and our asset management business, driven by solid commercial activity, a positive market performance and our focus on promoting fee-generating activities and products.
Other income improved year-on-year, boosted by the good performances of our insurance joint ventures and the investment platform units, both in the Insurance & Asset Management Solutions business line.
Including the fees ceded to our commercial network, total revenue reached EUR 6,488 million, up 14%, on the back of higher customer activity in PB and higher volumes and good performance of our asset management business.
•Total costs were 6% higher year-on-year, growing less than total income, reflecting investments made to strengthen PB teams and develop new capabilities to address the increase in commercial activity.
•Net loan-loss provisions recorded a EUR 20 million loss compared to a EUR 42 million loss in 2024.
•The other gains (losses) and provisions recorded a EUR 14 million loss compared to a EUR 8 million loss in 2024.
When considering ceded fees along with our PAT, the total contribution to Group profit (PAT+Fees) reached EUR 3,612 million, up 20% year-on-year.
Underlying RoTE (post-AT1) in 2025 was 61.5%.
| | | | | | | | | | | | | | | |
| Wealth. Underlying income statement |
| EUR million and % change |
| | | | / | 2024 |
| | 2025 | 2024 | | % | % excl. FX |
| | | | | |
| | | | | |
| | | | | |
| Revenue | | 4,042 | 3,587 | | +13 | +16 |
| Total costs | | (1,444) | | (1,403) | | +3 | +6 |
| Net operating income | | 2,598 | 2,183 | | +19 | +22 |
| LLPs | | (20) | (42) | | (51) | (51) |
| PBT | | 2,564 | 2,134 | | +20 | +24 |
| Underlying attr. profit | | 1,983 | | 1,584 | | +25 | +29 |
| | | | | | | | | | | | | | | |
| | | |
| | | | | |
| | | Payment Solutions | Underlying attributable profit | EUR 96 mn |
| | | |
| | | |
| | | |
Business performance
In 2025, activity increased sharply. The total number of transactions in Getnet reached 10.5 billion, 7% higher year-on-year, for a total payments volume (TPV) of EUR 238 billion, 14% more than in 2024 in constant euros. This was driven by the good performances across countries, especially in Latin America.
In our A2A payments platform, the significant increase in the volume of payments processed enabled us to operate with greater efficiency, achieving a very competitive cost per transaction.
Payments' loan and deposit portfolios are not material, making up just 0.1% of the Group's total portfolios.
| | | | |
| Getnet. TPV |
EUR billion and % change year-on-year in constant euros | | |
Results
Underlying attributable profit was EUR 96 million in 2025, compared to a EUR 299 million loss in 2024 (EUR 56 million loss excluding the charges related to the discontinuation of platforms in 2024). In constant euros:
•Total income increased 16% year-on-year, driven mainly by the increase in net fee income, boosted by higher activity.
•Total costs rose 2%, but improved 1% in real terms, even with our investments in platforms.
•Net loan-loss provisions increased, mainly due to Getnet in Brazil.
•Other gains (losses) and provisions recorded a loss of EUR 12 million, a significantly lower loss than a year ago due to the aforementioned charges related to the discontinuation of our platforms in 2024.
EBITDA margin was 34.5%, 7.0 pp higher than in 2024.
| | | | | | | | | | | | | | | |
| Payment Solutions. Underlying income statement |
| EUR million and % change |
| | | | | |
| | | | | |
| | | | / | 2024 |
| | 2025 | 2024 | | % | % excl. FX |
| | | | | |
| Revenue | | 1,373 | 1,240 | | +11 | +16 |
| Total costs | | (1,203) | (1,208) | 0 | +2 |
| Net operating income | | 170 | 31 | | +447 | 0 |
| LLPs | | (24) | (16) | | +49 | +55 |
| PBT | | 134 | (233) | | 0 | 0 |
| Underlying attr. profit | | 96 | | (299) | | 0 | 0 |
Detailed financial information in 4.3.4 'Appendix'.
| | | | | | | | | | | | | | | |
| | | |
| | | | | |
| | | Corporate Centre | Underlying attributable profit | -EUR 1,085 mn |
| | | |
| | | |
Results
The underlying attributable loss in 2025 was EUR 1,085 million, a 6% lower loss than in 2024 (loss of EUR 1,154 million), with the following breakdown by line item:
•Net interest income declined EUR 182 million as lower interest rates impacted the balance sheet which has positive sensitivity to rate rises.
•Losses on financial transactions decreased by EUR 325 million, due to a lower impact from foreign currency hedges.
•Total costs were 23% lower year-on-year, as higher IT costs were more than offset by lower charges in the 'other operating costs' line.
•Net loan-loss provisions increased by EUR 200 million due to LLPs recorded in the first half of the year related to our plan to accelerate NPL ratio reductions, improving the Group's credit quality.
•Other gains (losses) and provisions showed an improvement of EUR 25 million compared to 2024.
| | | | | | | | | | | | | | | |
| Corporate Centre. Underlying income statement |
| EUR million | | | | | |
| | | | | |
| | | 2025 | 2024 | % |
| Net interest income | | | (490) | | (308) | | 59.1 | |
| Net fee income | | | (27) | | (11) | | 156.5 | |
Gains (losses) on financial transactions A | | | (82) | | (408) | | (79.8) | |
| Other operating income | | | 14 | | 47 | | (68.9) | |
| Total income | | | (585) | | (680) | | (13.9) | |
| Total costs | | | (417) | | (540) | | (22.8) | |
| Net operating income | | | (1,003) | | (1,220) | | (17.8) | |
| Net loan-loss provisions | | | (198) | | 3 | | — | |
| Other gains (losses) and provisions | | | (75) | | (99) | | (24.9) | |
| Profit before tax | | | (1,275) | | (1,317) | | (3.2) | |
| Tax on profit | | | 190 | | 162 | | 16.9 | |
| Profit from continuing operations | | | (1,085) | | (1,155) | | (6.0) | |
| Net profit from discontinued operations | | | — | | — | | — | |
| Consolidated profit | | | (1,085) | | (1,155) | | (6.0) | |
| Non-controlling interests | | | 0 | | 1 | | (99.7) | |
| Underlying profit attributable to the parent | | | (1,085) | | (1,154) | | (6.0) | |
| | | | | |
| | | | | |
| | | | | |
| | | | | |
| | | | | |
| | | | | |
| | | | | |
| | | | | |
| | | | | |
| | | | | |
| | | | | |
| | | | | |
| | | | | |
| | | | | |
| | | | | |
| | | | | |
| | | | | |
| | | | | |
| | | | | |
| | | | | |
| | | | | |
| | | | | |
| | | | | |
| | | | | |
| | | | | |
| | |
| | |
| | |
| | | | | | | | | | | | | | | |
| Corporate Centre. Balance sheet and operating means |
| EUR million |
| | | | | |
| | | Dec-25 | Dec-24 | % |
| | | | | |
| | | | | |
| | | | | |
| | | | | |
| | | | | |
| | | | | |
| | | | | |
| | | | | |
| | | | | |
| | | | | |
| | | | | |
| | | | | |
| | | | | |
| | | | | |
| | | | | |
| | | | | |
| | | | | |
| | | | | |
| Loans and advances to customers | | 7,465 | | 6,911 | | 8.0 | |
| Cash, central banks and credit institutions | | 109,001 | | 110,984 | | (1.8) | |
| Debt instruments | | 11,075 | | 10,922 | | 1.4 | |
| Other financial assets | | 1,613 | | 1,444 | | 11.7 | |
| Other asset accounts | | 179,896 | | 175,693 | | 2.4 | |
| Total assets | | 309,050 | | 305,954 | | 1.0 | |
| Customer deposits | | 1,387 | | 1,430 | | (3.0) | |
| Central banks and credit institutions | | 29,024 | | 26,103 | | 11.2 | |
| Marketable debt securities | | 112,520 | | 121,122 | | (7.1) | |
| Other financial liabilities | | 772 | | 48 | | — | |
| Other liabilities accounts | | 69,659 | | 64,321 | | 8.3 | |
| Total liabilities | | 213,363 | | 213,024 | | 0.2 | |
| Total equity | | 95,687 | | 92,930 | | 3.0 | |
| | | | | |
| Memorandum items: | | | | |
| Gross loans and advances to customers B | | 7,537 | | 6,997 | | 7.7 | |
| Customer funds | | 1,387 | | 1,299 | | 6.7 | |
| Customer deposits C | | 1,387 | | 1,299 | | 6.7 | |
| Mutual funds | | — | | — | | — | |
| | | | | |
| Operating means | | | | |
| Number of employees | | 1,901 | | 1,825 | | 4.2 | |
| | | | | |
| |
| |
| |
| | |
| A. Includes exchange differences. |
| B. Excluding reverse repos. |
| C. Excluding repos. |
4.3.4 Appendix
Primary segments
| | | | | | | | | | | | | | | |
| RETAIL & COMMERCIAL BANKING | | | | |
| EUR million | | | | |
| Underlying income statement | 2025 | 2024 | % | % excl. FX |
| | | | | |
| Net interest income | 26,528 | | 27,854 | | (4.8) | | (0.7) | |
| Net fee income | 6,222 | | 6,022 | | 3.3 | | 8.6 | |
| Gains (losses) on financial transactions ᴬ | 680 | | 805 | | (15.5) | | (13.7) | |
| Other operating income | (983) | | (1,617) | | (39.2) | | (38.1) | |
| Total income | 32,447 | | 33,064 | | (1.9) | | 2.5 | |
| Total costs | (13,913) | | (14,704) | | (5.4) | | (1.3) | |
| Net operating income | 18,534 | | 18,359 | | 1.0 | | 5.5 | |
| Net loan-loss provisions | (7,150) | | (7,064) | | 1.2 | | 8.0 | |
| Other gains (losses) and provisions | (385) | | (545) | | (29.3) | | (28.8) | |
| Profit before tax | 10,998 | | 10,750 | | 2.3 | | 5.8 | |
| Tax on profit | (2,974) | | (3,132) | | (5.0) | | (2.0) | |
| Profit from continuing operations | 8,024 | | 7,619 | | 5.3 | | 9.0 | |
| Net profit from discontinued operations | — | | — | | — | | — | |
| Consolidated profit | 8,024 | | 7,619 | | 5.3 | | 9.0 | |
| Non-controlling interests | (314) | | (273) | | 14.9 | | 22.4 | |
| Underlying profit attributable to the parent | 7,710 | | 7,345 | | 5.0 | | 8.5 | |
| | | | | |
| Business volumes | | | | |
| | | | | |
| | | | | |
| | | | | |
| | | | | |
| Gross loans and advances to customers ᴮ | 591,287 | | 600,230 | | (1.5) | | 1.1 | |
| Customer funds | 726,779 | | 706,505 | | 2.9 | | 4.8 | |
| Customer deposits C | 616,402 | | 607,094 | | 1.5 | | 3.7 | |
| Mutual funds | 110,377 | | 99,411 | | 11.0 | | 11.5 | |
| Risk-weighted assets | 290,080 | | 285,525 | | 1.6 | | |
| | | | | |
| Ratios (%), operating means and customers | | | | |
| | | | | |
| RoTE (post-AT1) | 17.1 | | 17.6 | | (0.6) | | |
| Efficiency ratio | 42.9 | | 44.5 | | (1.6) | | |
| NPL ratio | 3.09 | | 3.21 | | (0.12) | | |
| NPL coverage ratio | 66 | | 63 | | 3 | | |
| Number of employees | 126,299 | | 135,901 | | (7.1) | | |
| | | | | |
| Number of total customers (thousands) | 147,129 | | 141,179 | | 4.2 | | |
| Number of active customers (thousands) | 76,305 | | 74,465 | | 2.5 | | |
| | | | | |
| A. Includes exchange differences. | | | | |
| B. Excluding reverse repos. | | | | |
| C. Excluding repos. | | | | |
| | | | | |
| | | | | | | | | | | | | |
| Retail Spain | | | | |
| EUR million | | | | |
| Underlying income statement | 2025 | 2024 | % | |
| | | | | |
| Net interest income | 5,877 | | 5,930 | | (0.9) | | |
| Net fee income | 1,223 | | 1,199 | | 2.0 | | |
| | | | | |
| | | | | |
| Total income | 7,143 | | 6,915 | | 3.3 | | |
| Total costs | (2,605) | | (2,606) | | (0.1) | | |
| Net operating income | 4,538 | | 4,309 | | 5.3 | | |
| Net loan-loss provisions | (1,036) | | (1,121) | | (7.6) | | |
| | | | | |
| Profit before tax | 3,316 | | 2,824 | | 17.4 | | |
| | | | | |
| | | | | |
| | | | | |
| | | | | |
| | | | | |
| | | | | |
| | | | | |
| Business volumes | | | | |
| | | | | |
| | | | | |
| | | | | |
| | | | | |
| Gross loans and advances to customers ᴬ | 156,497 | | 156,118 | | 0.2 | | |
| Customer funds | 281,486 | | 266,230 | | 5.7 | | |
| Customer deposits ᴮ | 230,850 | | 222,089 | | 3.9 | | |
| Mutual funds | 50,636 | | 44,141 | | 14.7 | | |
| | | | | |
| | | | | |
| | | | | |
| | | | | |
| | | | | |
| | | | | |
| | | | | |
| | | | | |
| | | | | |
| | | | | |
| | | | | |
| | | | | |
| | | | | |
| A. Excluding reverse repos. | | | | |
| B. Excluding repos. | | | | |
| | | | | |
| | | | | | | | | | | | | | | |
| Retail UK | | | | |
| EUR million | | | | |
| Underlying income statement | 2025 | 2024 | % | % excl. FX |
| | | | | |
| Net interest income | 4,846 | | 4,760 | | 1.8 | | 3.0 | |
| Net fee income | 313 | | 233 | | 34.4 | | 36.1 | |
| | | | | |
| | | | | |
| Total income | 4,812 | | 4,766 | | 1.0 | | 2.2 | |
| Total costs | (2,853) | | (2,965) | | (3.8) | | (2.6) | |
| Net operating income | 1,959 | | 1,801 | | 8.8 | | 10.1 | |
| Net loan-loss provisions | (177) | | (64) | | 177.3 | | 180.7 | |
| | | | | |
| Profit before tax | 1,658 | | 1,633 | | 1.5 | | 2.7 | |
| | | | | |
| | | | | |
| | | | | |
| | | | | |
| | | | | |
| | | | | |
| | | | | |
| Business volumes | | | | |
| | | | | |
| | | | | |
| | | | | |
| | | | | |
| Gross loans and advances to customers ᴬ | 225,043 | | 233,033 | | (3.4) | | 1.6 | |
| Customer funds | 215,472 | | 217,765 | | (1.1) | | 4.1 | |
| Customer deposits ᴮ | 209,427 | | 211,720 | | (1.1) | | 4.1 | |
| Mutual funds | 6,046 | | 6,045 | | 0.0 | | 5.3 | |
| | | | | |
| | | | | |
| | | | | |
| | | | | |
| | | | | |
| | | | | |
| | | | | |
| | | | | |
| | | | | |
| | | | | |
| | | | | |
| | | | | |
| | | | | |
| A. Excluding reverse repos. | | | | |
| B. Excluding repos. | | | | |
| | | | | |
| | | | | | | | | | | | | | | |
| Retail Mexico | | | | |
| EUR million | | | | |
| Underlying income statement | 2025 | 2024 | % | % excl. FX |
| | | | | |
| Net interest income | 3,901 | | 3,974 | | (1.8) | | 7.8 | |
| Net fee income | 929 | | 910 | | 2.1 | | 12.1 | |
| | | | | |
| | | | | |
| Total income | 4,820 | | 4,861 | | (0.8) | | 8.9 | |
| Total costs | (2,055) | | (2,114) | | (2.8) | | 6.8 | |
| Net operating income | 2,765 | | 2,746 | | 0.7 | | 10.6 | |
| Net loan-loss provisions | (1,136) | | (1,222) | | (7.0) | | 2.1 | |
| | | | | |
| Profit before tax | 1,628 | | 1,524 | | 6.9 | | 17.4 | |
| | | | | |
| | | | | |
| | | | | |
| | | | | |
| | | | | |
| | | | | |
| | | | | |
| Business volumes | | | | |
| | | | | |
| | | | | |
| | | | | |
| | | | | |
| Gross loans and advances to customers ᴬ | 37,284 | | 35,721 | | 4.4 | | 2.3 | |
| Customer funds | 54,278 | | 48,220 | | 12.6 | | 10.3 | |
| Customer deposits ᴮ | 38,864 | | 35,245 | | 10.3 | | 8.1 | |
| Mutual funds | 15,414 | | 12,975 | | 18.8 | | 16.4 | |
| | | | | |
| | | | | |
| | | | | |
| | | | | |
| | | | | |
| | | | | |
| | | | | |
| | | | | |
| | | | | |
| | | | | |
| | | | | |
| | | | | |
| | | | | |
| A. Excluding reverse repos. | | | | |
| B. Excluding repos. | | | | |
| | | | | |
| | | | | | | | | | | | | | | |
| Retail Brazil | | | | |
| EUR million | | | | |
| Underlying income statement | 2025 | 2024 | % | % excl. FX |
| | | | | |
| Net interest income | 7,190 | | 7,811 | | (7.9) | | (0.1) | |
| Net fee income | 2,188 | | 2,327 | | (6.0) | | 2.0 | |
| | | | | |
| | | | | |
| Total income | 9,172 | | 9,992 | | (8.2) | | (0.4) | |
| Total costs | (3,936) | | (4,159) | | (5.4) | | 2.7 | |
| Net operating income | 5,237 | | 5,833 | | (10.2) | | (2.6) | |
| Net loan-loss provisions | (3,762) | | (3,857) | | (2.5) | | 5.8 | |
| | | | | |
| Profit before tax | 1,464 | | 1,975 | | (25.9) | | (19.6) | |
| | | | | |
| | | | | |
| | | | | |
| | | | | |
| | | | | |
| | | | | |
| | | | | |
| Business volumes | | | | |
| | | | | |
| | | | | |
| | | | | |
| | | | | |
| Gross loans and advances to customers ᴬ | 65,589 | | 66,406 | | (1.2) | | (0.8) | |
| Customer funds | 80,749 | | 72,993 | | 10.6 | | 11.1 | |
| Customer deposits ᴮ | 58,241 | | 53,865 | | 8.1 | | 8.6 | |
| Mutual funds | 22,508 | | 19,128 | | 17.7 | | 18.2 | |
| | | | | |
| | | | | |
| | | | | |
| | | | | |
| | | | | |
| | | | | |
| | | | | |
| | | | | |
| | | | | |
| | | | | |
| | | | | |
| | | | | |
| | | | | |
| A. Excluding reverse repos. | | | | |
| B. Excluding repos. | | | | |
| | | | | |
| | | | | | | | | | | | | | | |
| OPENBANK | | | | |
| EUR million | | | | |
| | | | | |
| Underlying income statement | 2025 | 2024 | % | % excl. FX |
| Net interest income | 11,036 | | 10,777 | | 2.4 | | 5.4 | |
| Net fee income | 1,479 | | 1,508 | | (2.0) | | 0.4 | |
| Gains (losses) on financial transactions ᴬ | (11) | | (4) | | 168.4 | | 126.4 | |
| Other operating income | 511 | | 596 | | (14.2) | | (12.0) | |
| Total income | 13,015 | | 12,877 | | 1.1 | | 3.9 | |
| Total costs | (5,680) | | (5,576) | | 1.9 | | 4.2 | |
| Net operating income | 7,335 | | 7,302 | | 0.5 | | 3.7 | |
| Net loan-loss provisions | (4,457) | | (4,562) | | (2.3) | | 1.4 | |
| Other gains (losses) and provisions | (312) | | (512) | | (39.0) | | (38.2) | |
| Profit before tax | 2,566 | | 2,228 | | 15.2 | | 18.2 | |
| Tax on profit | (489) | | (294) | | 66.2 | | 69.4 | |
| Profit from continuing operations | 2,077 | | 1,934 | | 7.4 | | 10.4 | |
| Net profit from discontinued operations | — | | — | | — | | — | |
| Consolidated profit | 2,077 | | 1,934 | | 7.4 | | 10.4 | |
| Non-controlling interests | (336) | | (275) | | 22.1 | | 23.5 | |
| Underlying profit attributable to the parent | 1,741 | | 1,659 | | 4.9 | | 8.2 | |
| | | | | |
| Business volumes | | | | |
| | | | | |
| | | | | |
| | | | | |
| | | | | |
| Gross loans and advances to customers ᴮ | 211,894 | | 215,164 | | (1.5) | | 1.9 | |
| Customer funds | 138,999 | | 137,122 | | 1.4 | | 6.0 | |
| Customer deposits C | 129,909 | | 128,933 | | 0.8 | | 5.3 | |
| Mutual funds | 9,089 | | 8,189 | | 11.0 | | 17.1 | |
| Risk-weighted assets | 155,664 | | 151,102 | | 3.0 | | |
| | | | | |
| Ratios (%), operating means and customers | | | | |
| | | | | |
| RoTE (post-AT1) | 8.5 | | 8.8 | | (0.3) | | |
| Efficiency ratio | 43.6 | | 43.3 | | 0.3 | | |
| NPL ratio | 5.32 | | 5.07 | | 0.24 | | |
| NPL coverage ratio | 71 | | 74 | | (2) | | |
| Number of employees | 30,751 | | 29,903 | | 2.8 | | |
| Number of total customers (thousands) | 26,709 | | 25,041 | | 6.7 | | |
| | | | | |
| A. Includes exchange differences. | | | | |
| B. Excluding reverse repos. | | | | |
| C. Excluding repos. | | | | |
| | | | | |
| | | | | | | | | | | | | | | |
| Openbank Europe | | | | |
| EUR million | | | | |
| Underlying income statement | 2025 | 2024 | % | % excl. FX |
| | | | | |
| Net interest income | 4,685 | | 4,361 | | 7.4 | | 7.5 | |
| Net fee income | 804 | | 902 | | (10.9) | | (10.8) | |
| | | | | |
| | | | | |
| Total income | 5,925 | | 5,644 | | 5.0 | | 5.1 | |
| Total costs | (2,899) | | (2,848) | | 1.8 | | 1.8 | |
| Net operating income | 3,026 | | 2,796 | | 8.2 | | 8.4 | |
| Net loan-loss provisions | (1,363) | | (1,209) | | 12.7 | | 12.9 | |
| | | | | |
| Profit before tax | 1,398 | | 1,131 | | 23.6 | | 23.4 | |
| | | | | |
| | | | | |
| | | | | |
| | | | | |
| | | | | |
| | | | | |
| | | | | |
| Business volumes | | | | |
| | | | | |
| | | | | |
| | | | | |
| | | | | |
| Gross loans and advances to customers ᴬ | 142,477 | | 139,927 | | 1.8 | | 2.3 | |
| Customer funds | 87,559 | | 85,876 | | 2.0 | | 2.0 | |
| Customer deposits ᴮ | 82,359 | | 81,376 | | 1.2 | | 1.3 | |
| Mutual funds | 5,200 | | 4,500 | | 15.6 | | 15.6 | |
| | | | | |
| | | | | |
| | | | | |
| | | | | |
| | | | | |
| | | | | |
| | | | | |
| | | | | |
| | | | | |
| | | | | |
| | | | | |
| | | | | |
| | | | | |
| A. Excluding reverse repos. | | | | |
| B. Excluding repos. | | | | |
| | | | | |
| | | | | | | | | | | | | | | |
| Openbank US | | | | |
| EUR million | | | | |
| Underlying income statement | 2025 | 2024 | % | % excl. FX |
| | | | | |
| Net interest income | 4,581 | | 4,651 | | (1.5) | | 2.8 | |
| Net fee income | 339 | | 303 | | 11.8 | | 16.6 | |
| | | | | |
| | | | | |
| Total income | 5,072 | | 5,297 | | (4.2) | | (0.1) | |
| Total costs | (2,188) | | (2,225) | | (1.7) | | 2.6 | |
| Net operating income | 2,884 | | 3,072 | | (6.1) | | (2.0) | |
| Net loan-loss provisions | (2,140) | | (2,466) | | (13.2) | | (9.5) | |
| | | | | |
| Profit before tax | 699 | | 551 | | 26.9 | | 32.4 | |
| | | | | |
| | | | | |
| | | | | |
| | | | | |
| | | | | |
| | | | | |
| | | | | |
| Business volumes | | | | |
| | | | | |
| | | | | |
| | | | | |
| | | | | |
| Gross loans and advances to customers ᴬ | 47,402 | | 56,266 | | (15.8) | | (4.7) | |
| Customer funds | 50,333 | | 51,230 | | (1.8) | | 11.2 | |
| Customer deposits ᴮ | 46,444 | | 47,541 | | (2.3) | | 10.5 | |
| Mutual funds | 3,889 | | 3,689 | | 5.4 | | 19.3 | |
| | | | | |
| | | | | |
| | | | | |
| | | | | |
| | | | | |
| | | | | |
| | | | | |
| | | | | |
| | | | | |
| | | | | |
| | | | | |
| | | | | |
| | | | | |
| A. Excluding reverse repos. | | | | |
| B. Excluding repos. | | | | |
| | | | | |
| | | | | | | | | | | | | | | |
| CORPORATE & INVESTMENT BANKING | | | | |
| EUR million | | | | |
| Underlying income statement | 2025 | 2024 | % | % excl. FX |
| | | | | |
| Net interest income | 3,824 | | 3,779 | | 1.2 | | 5.7 | |
| Net fee income | 2,552 | | 2,415 | | 5.7 | | 8.8 | |
| Gains (losses) on financial transactions ᴬ | 1,281 | | 1,568 | | (18.3) | | (15.9) | |
| Other operating income | 359 | | 136 | | 164.5 | | 159.1 | |
| Total income | 8,016 | | 7,897 | | 1.5 | | 5.2 | |
| Total costs | (3,752) | | (3,922) | | (4.3) | | (1.3) | |
| Net operating income | 4,264 | | 3,975 | | 7.3 | | 11.5 | |
| Net loan-loss provisions | (278) | | (141) | | 96.5 | | 97.9 | |
| Other gains (losses) and provisions | (37) | | (19) | | 98.1 | | 99.3 | |
| Profit before tax | 3,949 | | 3,815 | | 3.5 | | 7.8 | |
| Tax on profit | (1,114) | | (1,023) | | 8.9 | | 13.6 | |
| Profit from continuing operations | 2,835 | | 2,792 | | 1.5 | | 5.6 | |
| Net profit from discontinued operations | — | | — | | — | | — | |
| Consolidated profit | 2,835 | | 2,792 | | 1.5 | | 5.6 | |
| Non-controlling interests | (127) | | (153) | | (17.2) | | (11.6) | |
| Underlying profit attributable to the parent | 2,708 | | 2,639 | | 2.6 | | 6.6 | |
| | | | | |
| Business volumes | | | | |
| | | | | |
| | | | | |
| | | | | |
| | | | | |
| Gross loans and advances to customers ᴮ | 146,065 | | 130,840 | | 11.6 | | 15.8 | |
| Customer funds | 149,731 | | 147,492 | | 1.5 | | 4.0 | |
| Customer deposits C | 137,267 | | 133,433 | | 2.9 | | 5.6 | |
| Mutual funds | 12,464 | | 14,059 | | (11.3) | | (10.8) | |
| Risk-weighted assets | 103,485 | | 117,010 | | (11.6) | | |
| | | | | |
| Ratios (%) and operating means | | | | |
| | | | | |
| RoTE (post-AT1) | 17.8 | | 16.3 | | 1.5 | | |
| Efficiency ratio | 46.8 | | 49.7 | | (2.9) | | |
| NPL ratio | 0.72 | | 0.86 | | (0.14) | | |
| NPL coverage ratio | 47 | | 39 | | 8 | | |
| Number of employees | 13,266 | | 12,652 | | 4.9 | | |
| | | | | |
| A. Includes exchange differences. | | | | |
| B. Excluding reverse repos. | | | | |
| C. Excluding repos. | | | | |
| | | | | |
| | | | | | | | | | | | | | | |
| WEALTH MANAGEMENT & INSURANCE | | | | |
| EUR million | | | | |
| Underlying income statement | 2025 | 2024 | % | % excl. FX |
| | | | | |
| Net interest income | 1,335 | | 1,591 | | (16.0) | | (14.2) | |
| Net fee income | 1,642 | | 1,442 | | 13.8 | | 17.0 | |
| Gains (losses) on financial transactions ᴬ | 512 | | 256 | | 100.2 | | 105.2 | |
| Other operating income | 552 | | 298 | | 85.4 | | 98.7 | |
| Total income | 4,042 | | 3,587 | | 12.7 | | 15.9 | |
| Total costs | (1,444) | | (1,403) | | 2.9 | | 6.0 | |
| Net operating income | 2,598 | | 2,183 | | 19.0 | | 22.2 | |
| Net loan-loss provisions | (20) | | (42) | | (51.4) | | (51.2) | |
| Other gains (losses) and provisions | (14) | | (8) | | 66.6 | | 67.9 | |
| Profit before tax | 2,564 | | 2,134 | | 20.2 | | 23.5 | |
| Tax on profit | (532) | | (509) | | 4.4 | | 6.5 | |
| Profit from continuing operations | 2,032 | | 1,624 | | 25.1 | | 28.9 | |
| Net profit from discontinued operations | — | | — | | — | | — | |
| Consolidated profit | 2,032 | | 1,624 | | 25.1 | | 28.9 | |
| Non-controlling interests | (50) | | (40) | | 23.5 | | 31.5 | |
| Underlying profit attributable to the parent | 1,983 | | 1,584 | | 25.2 | | 28.9 | |
| | | | | |
| Business volumes | | | | |
| | | | | |
| | | | | |
| | | | | |
| | | | | |
| Gross loans and advances to customers ᴮ | 26,680 | | 24,643 | | 8.3 | | 13.2 | |
| Customer funds | 181,509 | | 161,304 | | 12.5 | | 15.0 | |
| Customer deposits C | 58,051 | | 55,736 | | 4.2 | | 7.1 | |
| Mutual funds | 123,458 | | 105,568 | | 16.9 | | 19.1 | |
| Risk-weighted assets | 18,447 | | 11,709 | | 57.6 | | |
| Assets under management | 540,585 | | 483,695 | | 11.8 | | 13.6 | |
| Gross written premiums | 10,632 | | 10,752 | | (1.1) | | 4.5 | |
| | | | | |
| Ratios (%), operating means and customers | | | | |
| | | | | |
| RoTE (post-AT1) | 61.5 | | 68.2 | | (6.7) | | |
| Efficiency ratio | 35.7 | | 39.1 | | (3.4) | | |
| NPL ratio | 0.86 | | 0.98 | | (0.12) | | |
| NPL coverage ratio | 71 | | 68 | | 4 | | |
| Number of employees | 7,263 | | 7,425 | | (2.2) | | |
| Number of Private Banking customers (thousands) | 297 | | 283 | | 5.0 | | |
| | | | | |
| A. Includes exchange differences. | | | | |
| B. Excluding reverse repos. | | | | |
| C. Excluding repos. | | | | |
| | | | | |
| | | | | | | | | | | | | | | |
| PAYMENT SOLUTIONS | | | | |
| EUR million | | | | |
| Underlying income statement | 2025 | 2024 | % | % excl. FX |
| | | | | |
| Net interest income | 167 | | 132 | | 27.0 | | 35.7 | |
| Net fee income | 1,059 | | 958 | | 10.5 | | 16.4 | |
| Gains (losses) on financial transactions ᴬ | (24) | | — | | — | | — | |
| Other operating income | 171 | | 150 | | 14.3 | | 14.9 | |
| Total income | 1,373 | | 1,240 | | 10.8 | | 16.2 | |
| Total costs | (1,203) | | (1,209) | | (0.5) | | 2.4 | |
| Net operating income | 170 | | 31 | | 451.7 | | — | |
| Net loan-loss provisions | (24) | | (16) | | 48.5 | | 55.1 | |
| Other gains (losses) and provisions | (12) | | (247) | | (95.2) | | (95.2) | |
| Profit before tax | 134 | | (233) | | — | | — | |
| Tax on profit | (19) | | (57) | | (65.9) | | (60.1) | |
| Profit from continuing operations | 115 | | (290) | | — | | — | |
| Net profit from discontinued operations | — | | — | | — | | — | |
| Consolidated profit | 115 | | (290) | | — | | — | |
| Non-controlling interests | (19) | | (9) | | 101.1 | | 120.7 | |
| Underlying profit attributable to the parent | 96 | | (299) | | — | | — | |
| | | | | |
| Business volumes | | | | |
| | | | | |
| | | | | |
| | | | | |
| | | | | |
| Gross loans and advances to customers ᴮ | 1,002 | | 1,087 | | (7.8) | | (7.9) | |
| Customer funds | 1,392 | | 1,038 | | 34.2 | | 34.2 | |
| Customer deposits C | 1,392 | | 1,038 | | 34.2 | | 34.2 | |
| Mutual funds | — | | — | | — | | — | |
| Risk-weighted assets | 4,421 | | 4,898 | | (9.7) | | |
| | | | | |
| Ratios (%) and operating means | | | | |
| | | | | |
| | | | | |
| EBITDA margin | 34.5 | | 27.5 | | 7.0 | | |
| Efficiency ratio | 87.6 | | 97.5 | | (9.9) | | |
| | | | | |
| Number of employees | 8,059 | | 8,382 | | (3.9) | | |
| | | | | |
| A. Includes exchange differences. | | | | |
| B. Excluding reverse repos. | | | | |
| C. Excluding repos. | | | | |
| | | | | |
Secondary segments
| | | | | | | | | | | | | | | | | | | | | | | | | | | | | | | | | | |
| | | | | | | | | | | | |
| EUR million | | | | | | | | | | | | |
| | | Spain | | | | UK |
| Underlying income statement | | | 2025 | 2024 | % | | | | 2025 | 2024 | % | % excl. FX |
| | | | | | | |
| | | | | | | | | | | | |
| Net interest income | | | 7,305 | | 7,256 | | 0.7 | | | | | 5,008 | | 4,950 | | 1.2 | | 2.4 | |
| Net fee income | | | 3,022 | | 2,867 | | 5.4 | | | | | 369 | | 283 | | 30.3 | | 31.8 | |
Gains (losses) on financial transactions A | | | 841 | | 1,100 | | (23.6) | | | | | (100) | | (18) | | 445.8 | | 452.4 | |
| Other operating income | | | 720 | | 358 | | 101.4 | | | | | (245) | | (203) | | 20.8 | | 22.2 | |
| Total income | | | 11,887 | | 11,580 | | 2.6 | | | | | 5,032 | | 5,011 | | 0.4 | | 1.6 | |
| Total costs | | | (4,465) | | (4,509) | | (1.0) | | | | | (2,937) | | (3,050) | | (3.7) | | (2.5) | |
| Net operating income | | | 7,423 | | 7,071 | | 5.0 | | | | | 2,095 | | 1,962 | | 6.8 | | 8.1 | |
| Net loan-loss provisions | | | (1,142) | | (1,259) | | (9.3) | | | | | (177) | | (64) | | 177.4 | | 180.7 | |
| Other gains (losses) and provisions | | | (198) | | (372) | | (46.8) | | | | | (124) | | (104) | | 19.4 | | 20.8 | |
| Profit before tax | | | 6,083 | | 5,440 | | 11.8 | | | | | 1,794 | | 1,794 | | 0.0 | | 1.2 | |
| Tax on profit | | | (1,811) | | (1,678) | | 7.9 | | | | | (486) | | (488) | | (0.3) | | 0.9 | |
| Profit from continuing operations | | | 4,272 | | 3,763 | | 13.5 | | | | | 1,307 | | 1,306 | | 0.1 | | 1.3 | |
| Net profit from discontinued operations | | | — | | — | | — | | | | | — | | — | | — | | — | |
| Consolidated profit | | | 4,272 | | 3,763 | | 13.5 | | | | | 1,307 | | 1,306 | | 0.1 | | 1.3 | |
| Non-controlling interests | | | 0 | | 0 | | (2.5) | | | | | — | | — | | — | | — | |
| Underlying profit attributable to the parent | | | 4,272 | | 3,762 | | 13.5 | | | | | 1,307 | | 1,306 | | 0.1 | | 1.3 | |
| | | | | | | | | | | | |
| Balance sheet | | | | | | | | | | | | |
| Loans and advances to customers | | | 264,950 | | 246,897 | | 7.3 | | | | | 242,624 | | 246,453 | | (1.6) | | 3.6 | |
| Cash, central banks and credit institutions | | | 88,904 | | 97,838 | | (9.1) | | | | | 55,335 | | 54,787 | | 1.0 | | 6.3 | |
| Debt instruments | | | 120,671 | | 94,519 | | 27.7 | | | | | 10,570 | | 15,120 | | (30.1) | | (26.4) | |
| Other financial assets | | | 51,675 | | 48,132 | | 7.4 | | | | | 270 | | 390 | | (30.8) | | (27.2) | |
| Other asset accounts | | | 19,361 | | 22,341 | | (13.3) | | | | | 4,048 | | 3,382 | | 19.7 | | 26.0 | |
| Total assets | | | 545,561 | | 509,726 | | 7.0 | | | | | 312,846 | | 320,132 | | (2.3) | | 2.9 | |
| Customer deposits | | | 354,943 | | 323,425 | | 9.7 | | | | | 225,708 | | 230,408 | | (2.0) | | 3.1 | |
| Central banks and credit institutions | | | 54,996 | | 57,218 | | (3.9) | | | | | 18,326 | | 25,665 | | (28.6) | | (24.8) | |
| Marketable debt securities | | | 29,957 | | 27,385 | | 9.4 | | | | | 51,231 | | 47,933 | | 6.9 | | 12.5 | |
| Other financial liabilities | | | 63,188 | | 59,976 | | 5.4 | | | | | 2,441 | | 2,500 | | (2.4) | | 2.8 | |
| Other liabilities accounts | | | 22,268 | | 21,163 | | 5.2 | | | | | 2,277 | | 1,733 | | 31.4 | | 38.3 | |
| Total liabilities | | | 525,352 | | 489,168 | | 7.4 | | | | | 299,984 | | 308,239 | | (2.7) | | 2.4 | |
| Total equity | | | 20,209 | | 20,558 | | (1.7) | | | | | 12,863 | | 11,893 | | 8.2 | | 13.8 | |
| | | | | | | | | | | | |
| Memorandum items: | | | | | | | | | | | | |
Gross loans and advances to customers B | | | 237,385 | | 225,759 | | 5.1 | | | | | 228,273 | | 236,496 | | (3.5) | | 1.6 | |
| Customer funds | | | 429,464 | | 399,999 | | 7.4 | | | | | 227,160 | | 230,479 | | (1.4) | | 3.7 | |
Customer deposits C | | | 322,070 | | 306,389 | | 5.1 | | | | | 219,440 | | 222,835 | | (1.5) | | 3.7 | |
| Mutual funds | | | 107,394 | | 93,609 | | 14.7 | | | | | 7,719 | | 7,643 | | 1.0 | | 6.3 | |
| | | | | | | | | | | | |
| Ratios (%), operating means and customers | | | | | | | | | | | | |
| | | | | | | | | | | | |
RoTE (post-AT1) | | | 20.4 | | 18.3 | | 2.2 | | | | | 10.2 | | 10.6 | | (0.4) | | |
| Efficiency ratio | | | 37.6 | | 38.9 | | (1.4) | | | | | 58.4 | | 60.9 | | (2.5) | | |
| NPL ratio | | | 1.94 | | 2.66 | | (0.73) | | | | | 1.08 | | 1.33 | | (0.25) | | |
| NPL coverage ratio | | | 55 | | 53 | | 2 | | | | | 33 | | 29 | | 3 | | |
| | | | | | | | | | | | |
| Number of branches | | | 1,630 | | 1,827 | | (10.8) | | | | | 363 | | 444 | | (18.2) | | |
| Number of total customers (thousands) | | | 15,362 | | 15,307 | | 0.4 | | | | | 22,720 | | 22,541 | | 0.8 | | |
| Number of active customers (thousands) | | | 9,242 | | 8,842 | | 4.5 | | | | | 13,547 | | 13,646 | | (0.7) | | |
| | | | | | | | | | | | |
| A. Includes exchange differences. | | | | | | | | | | | | |
| B. Excluding reverse repos. | | | | | | | | | | | | |
| C. Excluding repos. | | | | | | | | | | | | |
| |
| | | | | | | | | | | | | | | | | | | | | | | | | | | | | | | | | | | |
| | | | | | | | | | | | | |
| EUR million | | | | | | | | | | | | | |
| | | Portugal | | | | Openbank Europe | |
| Underlying income statement | | | 2025 | 2024 | % | | | | 2025 | 2024 | % | % excl. FX | |
| | | | | | | |
| | | | | | | | | | | | | |
| Net interest income | | | 1,346 | | 1,548 | | (13.0) | | | | | 4,685 | | 4,361 | | 7.4 | | 7.5 | | |
| Net fee income | | | 506 | | 467 | | 8.2 | | | | | 804 | | 902 | | (10.9) | | (10.8) | | |
Gains (losses) on financial transactions A | | | 70 | | 45 | | 56.9 | | | | | (39) | | (24) | | 60.8 | | 61.9 | | |
| Other operating income | | | 33 | | 5 | | 569.5 | | | | | 474 | | 405 | | 17.1 | | 17.5 | | |
| Total income | | | 1,956 | | 2,065 | | (5.3) | | | | | 5,925 | | 5,644 | | 5.0 | | 5.1 | | |
| Total costs | | | (544) | | (574) | | (5.2) | | | | | (2,899) | | (2,848) | | 1.8 | | 1.8 | | |
| Net operating income | | | 1,412 | | 1,492 | | (5.4) | | | | | 3,026 | | 2,796 | | 8.2 | | 8.4 | | |
| Net loan-loss provisions | | | 8 | | (11) | | — | | | | | (1,363) | | (1,209) | | 12.7 | | 12.9 | | |
| Other gains (losses) and provisions | | | (3) | | — | | — | | | | | (266) | | (456) | | (41.7) | | (41.1) | | |
| Profit before tax | | | 1,417 | | 1,481 | | (4.3) | | | | | 1,398 | | 1,131 | | 23.6 | | 23.4 | | |
| Tax on profit | | | (405) | | (478) | | (15.2) | | | | | (322) | | (255) | | 25.9 | | 25.2 | | |
| Profit from continuing operations | | | 1,011 | | 1,003 | | 0.8 | | | | | 1,076 | | 876 | | 22.9 | | 22.9 | | |
| Net profit from discontinued operations | | | — | | — | | — | | | | | — | | — | | — | | — | | |
| Consolidated profit | | | 1,011 | | 1,003 | | 0.8 | | | | | 1,076 | | 876 | | 22.9 | | 22.9 | | |
| Non-controlling interests | | | (2) | | (2) | | (18.9) | | | | | (304) | | (234) | | 30.3 | | 30.3 | | |
| Underlying profit attributable to the parent | | | 1,010 | | 1,001 | | 0.9 | | | | | 772 | | 642 | | 20.2 | | 20.2 | | |
| | | | | | | | | | | | | |
| Balance sheet | | | | | | | | | | | | | |
| Loans and advances to customers | | | 41,260 | | 38,410 | | 7.4 | | | | | 139,322 | | 137,038 | | 1.7 | | 2.1 | | |
| Cash, central banks and credit institutions | | | 2,744 | | 3,873 | | (29.2) | | | | | 16,078 | | 19,185 | | (16.2) | | (15.6) | | |
| Debt instruments | | | 15,998 | | 15,010 | | 6.6 | | | | | 8,510 | | 6,310 | | 34.9 | | 34.6 | | |
| Other financial assets | | | 1,243 | | 1,129 | | 10.1 | | | | | 126 | | 128 | | (1.3) | | (1.3) | | |
| Other asset accounts | | | 1,090 | | 1,109 | | (1.7) | | | | | 12,088 | | 11,115 | | 8.8 | | 9.6 | | |
| Total assets | | | 62,334 | | 59,530 | | 4.7 | | | | | 176,125 | | 173,775 | | 1.4 | | 1.8 | | |
| Customer deposits | | | 40,576 | | 38,304 | | 5.9 | | | | | 82,359 | | 81,376 | | 1.2 | | 1.3 | | |
| Central banks and credit institutions | | | 9,357 | | 8,813 | | 6.2 | | | | | 26,820 | | 28,120 | | (4.6) | | (2.5) | | |
| Marketable debt securities | | | 5,809 | | 4,973 | | 16.8 | | | | | 45,494 | | 43,137 | | 5.5 | | 5.6 | | |
| Other financial liabilities | | | 304 | | 339 | | (10.3) | | | | | 2,014 | | 1,918 | | 5.0 | | 5.2 | | |
| Other liabilities accounts | | | 2,916 | | 3,056 | | (4.6) | | | | | 6,208 | | 5,714 | | 8.7 | | 9.0 | | |
| Total liabilities | | | 58,961 | | 55,485 | | 6.3 | | | | | 162,896 | | 160,264 | | 1.6 | | 2.1 | | |
| Total equity | | | 3,373 | | 4,046 | | (16.6) | | | | | 13,229 | | 13,512 | | (2.1) | | (1.6) | | |
| | | | | | | | | | | | | |
| Memorandum items: | | | | | | | | | | | | | |
Gross loans and advances to customers B | | | 41,980 | | 39,143 | | 7.2 | | | | | 142,477 | | 139,927 | | 1.8 | | 2.3 | | |
| Customer funds | | | 46,201 | | 43,186 | | 7.0 | | | | | 87,559 | | 85,876 | | 2.0 | | 2.0 | | |
Customer deposits C | | | 40,576 | | 38,304 | | 5.9 | | | | | 82,359 | | 81,376 | | 1.2 | | 1.3 | | |
| Mutual funds | | | 5,625 | | 4,882 | | 15.2 | | | | | 5,200 | | 4,500 | | 15.6 | | 15.6 | | |
| | | | | | | | | | | | | |
| Ratios (%), operating means and customers | | | | | | | | | | | | | |
| | | | | | | | | | | | | |
| RoTE (post-AT1) | | | 30.3 | | 25.0 | | 5.3 | | | | | 6.7 | | 5.5 | | 1.2 | | | |
| Efficiency ratio | | | 27.8 | | 27.8 | | 0.0 | | | | | 48.9 | | 50.5 | | (1.5) | | | |
| NPL ratio | | | 1.99 | | 2.27 | | (0.29) | | | | | 2.53 | | 2.50 | | 0.03 | | | |
| NPL coverage ratio | | | 81 | | 78 | | 3 | | | | | 87 | | 83 | | 5 | | | |
| | | | | | | | | | | | | |
| Number of branches | | | 308 | | 374 | | (17.6) | | | | | 298 | | 326 | | (8.6) | | | |
| Number of total customers (thousands) | | | 2,971 | | 2,989 | | (0.6) | | | | | 19,893 | | 19,550 | | 1.8 | | | |
| Number of active customers (thousands) | | | 1,945 | | 1,905 | | 2.1 | | | | | | | | | |
| | | | | | | | | | | | | |
| A. Includes exchange differences. | | | | | | | | | | | | | |
| B. Excluding reverse repos. | | | | | | | | | | | | | |
| C. Excluding repos. | | | | | | | | | | | | | |
| |
| | | | | | | | | | | | | | | | | | | | | | | | | | | | | | | | | | | | |
| | | | | | | | | | | | |
| EUR million | | | | | | | | | | | | |
| | | US | | | Mexico |
| Underlying income statement | | | 2025 | 2024 | % | % excl. FX | | | 2025 | 2024 | % | % excl. FX |
| | | | | | |
| | | | | | | | | | | | |
| Net interest income | | | 5,888 | | 5,693 | | 3.4 | | 7.9 | | | | 4,554 | | 4,631 | | (1.7) | | 8.0 | |
| Net fee income | | | 1,328 | | 1,152 | | 15.3 | | 20.3 | | | | 1,454 | | 1,385 | | 5.0 | | 15.3 | |
Gains (losses) on financial transactions A | | | 547 | | 371 | | 47.7 | | 54.1 | | | | 427 | | 396 | | 7.7 | | 18.3 | |
| Other operating income | | | 165 | | 365 | | (54.7) | | (52.7) | | | | (130) | | (133) | | (2.5) | | 7.1 | |
| Total income | | | 7,929 | | 7,580 | | 4.6 | | 9.1 | | | | 6,305 | | 6,278 | | 0.4 | | 10.3 | |
| Total costs | | | (3,890) | | (3,965) | | (1.9) | | 2.4 | | | | (2,730) | | (2,727) | | 0.1 | | 9.9 | |
| Net operating income | | | 4,039 | | 3,615 | | 11.7 | | 16.6 | | | | 3,575 | | 3,551 | | 0.7 | | 10.6 | |
| Net loan-loss provisions | | | (2,244) | | (2,507) | | (10.5) | | (6.6) | | | | (1,239) | | (1,277) | | (3.0) | | 6.5 | |
| Other gains (losses) and provisions | | | (47) | | (55) | | (14.5) | | (10.8) | | | | — | | — | | — | | — | |
| Profit before tax | | | 1,748 | | 1,053 | | 66.0 | | 73.2 | | | | 2,336 | | 2,274 | | 2.7 | | 12.8 | |
| Tax on profit | | | (207) | | 56 | | — | | — | | | | (627) | | (598) | | 4.9 | | 15.2 | |
| Profit from continuing operations | | | 1,541 | | 1,109 | | 39.0 | | 45.0 | | | | 1,709 | | 1,676 | | 2.0 | | 12.0 | |
| Net profit from discontinued operations | | | — | | — | | — | | — | | | | — | | — | | — | | — | |
| Consolidated profit | | | 1,541 | | 1,109 | | 39.0 | | 45.0 | | | | 1,709 | | 1,676 | | 2.0 | | 12.0 | |
| Non-controlling interests | | | — | | — | | — | | — | | | | (4) | | (5) | | (9.0) | | (0.1) | |
| Underlying profit attributable to the parent | | | 1,541 | | 1,109 | | 39.0 | | 45.0 | | | | 1,705 | | 1,671 | | 2.0 | | 12.0 | |
| | | | | | | | | | | | |
| Balance sheet | | | | | | | | | | | | |
| Loans and advances to customers | | | 132,659 | | 134,856 | | (1.6) | | 11.3 | | | | 48,083 | | 45,054 | | 6.7 | | 4.6 | |
| Cash, central banks and credit institutions | | | 21,318 | | 28,200 | | (24.4) | | (14.5) | | | | 11,569 | | 10,945 | | 5.7 | | 3.6 | |
| Debt instruments | | | 38,411 | | 27,042 | | 42.0 | | 60.7 | | | | 32,066 | | 30,092 | | 6.6 | | 4.4 | |
| Other financial assets | | | 3,159 | | 2,821 | | 12.0 | | 26.7 | | | | 4,731 | | 5,785 | | (18.2) | | (19.9) | |
| Other asset accounts | | | 11,171 | | 16,058 | | (30.4) | | (21.3) | | | | 5,778 | | 5,745 | | 0.6 | | (1.5) | |
| Total assets | | | 206,718 | | 208,978 | | (1.1) | | 11.9 | | | | 102,227 | | 97,621 | | 4.7 | | 2.6 | |
| Customer deposits | | | 122,000 | | 125,403 | | (2.7) | | 10.1 | | | | 55,595 | | 49,836 | | 11.6 | | 9.3 | |
| Central banks and credit institutions | | | 34,934 | | 26,794 | | 30.4 | | 47.5 | | | | 17,984 | | 17,260 | | 4.2 | | 2.1 | |
| Marketable debt securities | | | 26,433 | | 31,783 | | (16.8) | | (5.9) | | | | 9,316 | | 9,632 | | (3.3) | | (5.2) | |
| Other financial liabilities | | | 6,255 | | 5,223 | | 19.8 | | 35.5 | | | | 7,586 | | 9,640 | | (21.3) | | (22.9) | |
| Other liabilities accounts | | | 3,085 | | 3,683 | | (16.2) | | (5.2) | | | | 3,258 | | 3,115 | | 4.6 | | 2.5 | |
| Total liabilities | | | 192,707 | | 192,886 | | (0.1) | | 13.0 | | | | 93,740 | | 89,483 | | 4.8 | | 2.7 | |
| Total equity | | | 14,011 | | 16,091 | | (12.9) | | (1.5) | | | | 8,487 | | 8,138 | | 4.3 | | 2.2 | |
| | | | | | | | | | | | |
| Memorandum items: | | | | | | | | | | | | |
Gross loans and advances to customers B | | | 108,950 | | 117,511 | | (7.3) | | 4.9 | | | | 49,442 | | 44,715 | | 10.6 | | 8.4 | |
| Customer funds | | | 103,178 | | 108,246 | | (4.7) | | 7.9 | | | | 68,201 | | 61,160 | | 11.5 | | 9.3 | |
Customer deposits C | | | 87,686 | | 93,545 | | (6.3) | | 6.1 | | | | 45,498 | | 41,528 | | 9.6 | | 7.4 | |
| Mutual funds | | | 15,492 | | 14,702 | | 5.4 | | 19.2 | | | | 22,703 | | 19,632 | | 15.6 | | 13.3 | |
| | | | | | | | | | | | |
| Ratios (%), operating means and customers | | | | | | | | | | | | |
| | | | | | | | | | | | |
RoTE (post-AT1) | | | 10.2 | | 6.9 | | 3.2 | | | | | 22.0 | | 19.6 | | 2.3 | | |
| Efficiency ratio | | | 49.1 | | 52.3 | | (3.2) | | | | | 43.3 | | 43.4 | | (0.1) | | |
| NPL ratio | | | 4.82 | | 4.68 | | 0.14 | | | | | 2.65 | | 2.71 | | (0.05) | | |
| NPL coverage ratio | | | 55 | | 64 | | (9) | | | | | 105 | | 100 | | 4 | | |
| | | | | | | | | | | | |
| Number of branches | | | 376 | | 405 | | (7.2) | | | | | 1,314 | | 1,356 | | (3.1) | | |
| Number of total customers (thousands) | | | 4,369 | | 4,474 | | (2.4) | | | | | 22,577 | | 21,289 | | 6.1 | | |
| Number of active customers (thousands) | | | 4,169 | | 4,308 | | (3.2) | | | | | 11,976 | | 10,871 | | 10.2 | | |
| | | | | | | | | | | | |
| A. Includes exchange differences. | | | | | | | | | | | | |
| B. Excluding reverse repos. | | | | | | | | | | | | |
| C. Excluding repos. | | | | | | | | | | | | |
|
| | | | | | | | | | | | | | | | | | | | | | | | | | | | | | | | | | | | |
| | | | | | | | | | | | |
| EUR million | | | | | | | | | | | | |
| | | Brazil | | | Chile |
| Underlying income statement | | | 2025 | 2024 | % | % excl. FX | | | 2025 | 2024 | % | % excl. FX |
| | | | | | |
| | | | | | | | | | | | |
| Net interest income | | | 9,380 | | 10,121 | | (7.3) | | 0.6 | | | | 1,917 | | 1,822 | | 5.2 | | 10.7 | |
| Net fee income | | | 3,193 | | 3,414 | | (6.5) | | 1.5 | | | | 582 | | 551 | | 5.8 | | 11.2 | |
Gains (losses) on financial transactions A | | | (64) | | (37) | | 71.7 | | 86.3 | | | | 230 | | 238 | | (3.4) | | 1.6 | |
| Other operating income | | | 93 | | 39 | | 139.5 | | 160.0 | | | | (15) | | (18) | | (16.4) | | (12.1) | |
| Total income | | | 12,602 | | 13,536 | | (6.9) | | 1.0 | | | | 2,714 | | 2,592 | | 4.7 | | 10.1 | |
| Total costs | | | (4,957) | | (5,219) | | (5.0) | | 3.1 | | | | (919) | | (942) | | (2.5) | | 2.6 | |
| Net operating income | | | 7,645 | | 8,318 | | (8.1) | | (0.2) | | | | 1,795 | | 1,650 | | 8.8 | | 14.4 | |
| Net loan-loss provisions | | | (4,409) | | (4,487) | | (1.7) | | 6.6 | | | | (531) | | (497) | | 6.9 | | 12.4 | |
| Other gains (losses) and provisions | | | (11) | | 0 | | — | | — | | | | (32) | | (42) | | (24.7) | | (20.8) | |
| Profit before tax | | | 3,224 | | 3,830 | | (15.8) | | (8.6) | | | | 1,232 | | 1,111 | | 11.0 | | 16.7 | |
| Tax on profit | | | (836) | | (1,165) | | (28.2) | | (22.1) | | | | (189) | | (211) | | (10.5) | | (5.9) | |
| Profit from continuing operations | | | 2,388 | | 2,665 | | (10.4) | | (2.8) | | | | 1,043 | | 899 | | 16.0 | | 22.0 | |
| Net profit from discontinued operations | | | — | | — | | — | | — | | | | — | | — | | — | | — | |
| Consolidated profit | | | 2,388 | | 2,665 | | (10.4) | | (2.8) | | | | 1,043 | | 899 | | 16.0 | | 22.0 | |
| Non-controlling interests | | | (220) | | (243) | | (9.3) | | (1.6) | | | | (314) | | (271) | | 16.0 | | 22.0 | |
| Underlying profit attributable to the parent | | | 2,168 | | 2,422 | | (10.5) | | (2.9) | | | | 729 | | 629 | | 16.0 | | 22.0 | |
| | | | | | | | | | | | |
| Balance sheet | | | | | | | | | | | | |
| Loans and advances to customers | | | 87,653 | | 88,620 | | (1.1) | | (0.6) | | | | 39,924 | | 40,332 | | (1.0) | | 1.6 | |
| Cash, central banks and credit institutions | | | 49,450 | | 46,745 | | 5.8 | | 6.3 | | | | 5,218 | | 5,759 | | (9.4) | | (7.0) | |
| Debt instruments | | | 46,658 | | 45,670 | | 2.2 | | 2.6 | | | | 9,385 | | 7,993 | | 17.4 | | 20.5 | |
| Other financial assets | | | 11,772 | | 10,632 | | 10.7 | | 11.2 | | | | 11,489 | | 13,554 | | (15.2) | | (13.0) | |
| Other asset accounts | | | 13,919 | | 13,844 | | 0.5 | | 1.0 | | | | 2,189 | | 2,796 | | (21.7) | | (19.7) | |
| Total assets | | | 209,453 | | 205,510 | | 1.9 | | 2.4 | | | | 68,205 | | 70,434 | | (3.2) | | (0.6) | |
| Customer deposits | | | 92,256 | | 93,994 | | (1.8) | | (1.4) | | | | 29,503 | | 30,181 | | (2.2) | | 0.3 | |
| Central banks and credit institutions | | | 32,377 | | 30,878 | | 4.9 | | 5.3 | | | | 8,778 | | 8,133 | | 7.9 | | 10.8 | |
| Marketable debt securities | | | 29,161 | | 25,351 | | 15.0 | | 15.6 | | | | 9,703 | | 10,403 | | (6.7) | | (4.3) | |
| Other financial liabilities | | | 33,757 | | 34,215 | | (1.3) | | (0.9) | | | | 12,322 | | 14,323 | | (14.0) | | (11.7) | |
| Other liabilities accounts | | | 5,829 | | 5,582 | | 4.4 | | 4.9 | | | | 2,299 | | 1,942 | | 18.4 | | 21.5 | |
| Total liabilities | | | 193,380 | | 190,020 | | 1.8 | | 2.2 | | | | 62,604 | | 64,983 | | (3.7) | | (1.1) | |
| Total equity | | | 16,073 | | 15,490 | | 3.8 | | 4.2 | | | | 5,601 | | 5,451 | | 2.8 | | 5.5 | |
| | | | | | | | | | | | |
| Memorandum items: | | | | | | | | | | | | |
Gross loans and advances to customers B | | | 93,030 | | 93,785 | | (0.8) | | (0.3) | | | | 40,986 | | 41,405 | | (1.0) | | 1.6 | |
| Customer funds | | | 132,580 | | 129,881 | | 2.1 | | 2.6 | | | | 42,256 | | 43,383 | | (2.6) | | 0.0 | |
Customer deposits C | | | 80,449 | | 81,378 | | (1.1) | | (0.7) | | | | 28,293 | | 30,060 | | (5.9) | | (3.4) | |
| Mutual funds | | | 52,132 | | 48,503 | | 7.5 | | 8.0 | | | | 13,963 | | 13,324 | | 4.8 | | 7.6 | |
| | | | | | | | | | | | |
| Ratios (%), operating means and customers | | | | | | | | | | | | |
| | | | | | | | | | | | |
RoTE (post-AT1) | | | 15.3 | | 16.8 | | (1.5) | | | | | 19.7 | | 16.3 | | 3.4 | | |
| Efficiency ratio | | | 39.3 | | 38.6 | | 0.8 | | | | | 33.9 | | 36.4 | | (2.5) | | |
| NPL ratio | | | 6.76 | | 6.10 | | 0.66 | | | | | 5.73 | | 5.37 | | 0.36 | | |
| NPL coverage ratio | | | 81 | | 79 | | 2 | | | | | 48 | | 50 | | (2) | | |
| | | | | | | | | | | | |
| Number of branches | | | 1,618 | | 2,202 | | (26.5) | | | | | 228 | | 237 | | (3.8) | | |
| Number of total customers (thousands) | | | 73,948 | | 69,455 | | 6.5 | | | | | 4,608 | | 4,311 | | 6.9 | | |
| Number of active customers (thousands) | | | 33,966 | | 33,123 | | 2.5 | | | | | 2,693 | | 2,556 | | 5.4 | | |
| | | | | | | | | | | | |
| A. Includes exchange differences. | | | | | | | | | | | | |
| B. Excluding reverse repos. | | | | | | | | | | | | |
| C. Excluding repos. | | | | | | | | | | | | |
|
| | | | | | | | | | | | | | | | | | | | | | | | | | | | | | | | | | |
| | | | | | | | | | | | |
| EUR million | | | | | | | | | | | | |
| | | Argentina | | | | Rest of the Group |
| Underlying income statement | | | 2025 | 2024 | % | | | | 2025 | 2024 | % | % excl. FX |
| | | | | | |
| | | | | | | | | | | | |
| Net interest income | | | 1,727 | | 2,919 | | (40.8) | | | | | 1,080 | | 832 | | 29.8 | | 36.1 | |
| Net fee income | | | 788 | | 602 | | 30.9 | | | | | 908 | | 722 | | 25.8 | | 28.8 | |
Gains (losses) on financial transactions A | | | 229 | | 229 | | 0.1 | | | | | 296 | | 326 | | (9.1) | | (6.2) | |
| Other operating income | | | (510) | | (1,263) | | (59.6) | | | | | 25 | | 9 | | 187.7 | | 175.7 | |
| Total income | | | 2,235 | | 2,487 | | (10.2) | | | | | 2,309 | | 1,889 | | 22.3 | | 26.7 | |
| Total costs | | | (978) | | (1,337) | | (26.9) | | | | | (1,676) | | (1,643) | | 2.0 | | 4.1 | |
| Net operating income | | | 1,257 | | 1,150 | | 9.3 | | | | | 634 | | 246 | | 158.1 | | 197.3 | |
| Net loan-loss provisions | | | (574) | | (284) | | 101.8 | | | | | (260) | | (230) | | 13.1 | | 17.9 | |
| Other gains (losses) and provisions | | | (33) | | (39) | | (14.7) | | | | | (45) | | (263) | | (82.7) | | (82.7) | |
| Profit before tax | | | 650 | | 827 | | (21.4) | | | | | 328 | | (248) | | — | | — | |
| Tax on profit | | | (216) | | (161) | | 34.6 | | | | | (29) | | (37) | | (22.6) | | (9.1) | |
| Profit from continuing operations | | | 434 | | 666 | | (34.9) | | | | | 300 | | (285) | | — | | — | |
| Net profit from discontinued operations | | | — | | — | | — | | | | | — | | — | | — | | — | |
| Consolidated profit | | | 434 | | 666 | | (34.9) | | | | | 300 | | (285) | | — | | — | |
| Non-controlling interests | | | (1) | | (1) | | (39.8) | | | | | 1 | | 5 | | (89.3) | | (87.5) | |
| Underlying profit attributable to the parent | | | 433 | | 665 | | (34.9) | | | | | 300 | | (280) | | — | | — | |
| | | | | | | | | | | | |
| Balance sheet | | | | | | | | | | | | |
| Loans and advances to customers | | | 8,032 | | 7,684 | | 4.5 | | | | | 25,315 | | 24,905 | | 1.6 | | 8.2 | |
| Cash, central banks and credit institutions | | | 3,724 | | 4,901 | | (24.0) | | | | | 12,912 | | 8,178 | | 57.9 | | 64.7 | |
| Debt instruments | | | 2,230 | | 2,654 | | (16.0) | | | | | 4,452 | | 10,677 | | (58.3) | | (57.8) | |
| Other financial assets | | | 16 | | 23 | | (28.5) | | | | | 2,387 | | 3,041 | | (21.5) | | (16.9) | |
| Other asset accounts | | | 1,078 | | 978 | | 10.2 | | | | | 3,157 | | 2,930 | | 7.7 | | 8.1 | |
| Total assets | | | 15,080 | | 16,240 | | (7.1) | | | | | 48,222 | | 49,732 | | (3.0) | | 1.3 | |
| Customer deposits | | | 9,959 | | 11,293 | | (11.8) | | | | | 26,913 | | 19,955 | | 34.9 | | 42.5 | |
| Central banks and credit institutions | | | 685 | | 852 | | (19.5) | | | | | 8,249 | | 19,309 | | (57.3) | | (55.8) | |
| Marketable debt securities | | | 258 | | 158 | | 63.4 | | | | | 4,508 | | 898 | | 401.8 | | 408.3 | |
| Other financial liabilities | | | 1,060 | | 968 | | 9.5 | | | | | 2,402 | | 2,694 | | (10.9) | | (4.5) | |
| Other liabilities accounts | | | 547 | | 476 | | 14.9 | | | | | 1,543 | | 1,514 | | 1.9 | | 2.3 | |
| Total liabilities | | | 12,510 | | 13,746 | | (9.0) | | | | | 43,614 | | 44,371 | | (1.7) | | 2.7 | |
| Total equity | | | 2,570 | | 2,494 | | 3.1 | | | | | 4,608 | | 5,360 | | (14.0) | | (10.3) | |
| | | | | | | | | | | | |
| Memorandum items: | | | | | | | | | | | | |
Gross loans and advances to customers B | | | 8,611 | | 7,938 | | 8.5 | | | | | 25,796 | | 25,285 | | 2.0 | | 8.5 | |
| Customer funds | | | 15,894 | | 17,047 | | (6.8) | | | | | 45,916 | | 34,204 | | 34.2 | | 40.8 | |
Customer deposits C | | | 9,959 | | 11,293 | | (11.8) | | | | | 26,691 | | 19,527 | | 36.7 | | 44.6 | |
| Mutual funds | | | 5,934 | | 5,754 | | 3.1 | | | | | 19,225 | | 14,677 | | 31.0 | | 35.9 | |
| | | | | | | | | | | | |
| Ratios (%), operating means and customers | | | | | | | | | | | | |
| | | | | | | | | | | | |
RoTE (post-AT1) | | | 20.2 | | 34.5 | | (14.3) | | | | | | | | |
| Efficiency ratio | | | 43.8 | | 53.8 | | (10.0) | | | | | | | | |
| NPL ratio | | | 7.68 | | 2.06 | | 5.62 | | | | | | | | |
| NPL coverage ratio | | | 90 | | 177 | | (87) | | | | | | | | |
| | | | | | | | | | | | |
Number of branches D | | | 391 | | 409 | | (4.4) | | | | | | | | |
| Number of total customers (thousands) | | | 5,412 | | 5,117 | | 5.8 | | | | | | | | |
| Number of active customers (thousands) | | | 3,772 | | 3,674 | | 2.7 | | | | | | | | |
| | | | | | | | | | | | |
| A. Includes exchange differences. | | | | | | | | | | | | |
| B. Excluding reverse repos. | | | | | | | | | | | | |
| C. Excluding repos. | | | | | | | | | | | | |
|
| D. In Argentina, we have included the CartaSur points of sale and the banking service points in 2025 and 2024 figures and all previous periods. |
4.4 Financial performance: 2024 vs 2023
Santander follows IFRS to report its results (see note 1.b to the consolidated financial statements), which generally inform reporting of our financial situation in this consolidated directors’ report. However, we also use non-IFRS measures and Alternative Performance Measures (APMs) to assess our performance (see 4.6. 'Alternative performance measures: 2025, 2024 and 2023'). Thus, the main adjustments to our IFRS results consist of: •Underlying results measures: we present what we call underlying results measures which exclude items outside the ordinary course of business and reclassify certain items under some headings of the underlying income statement as described at the end of 4.4.1 ‘Results’ and in note 52.c to the consolidated financial statements. In our view, this provides a better year-on-year comparison. •Local currency measures: we use certain non-IFRS financial indicators in local currency to assess our ongoing operating performance. They include the results from our subsidiary banks outside the eurozone excluding the exchange rate impact (i.e., in constant euros) except for Argentina and any grouping which includes it. For further information, see 4.6. 'Alternative performance measures: 2025, 2024 and 2023', which explains how we exclude the exchange rate impact from financial measures in local currency. Because changes in exchange rates have a non-operating impact on results, we believe assessing performance in local currency provides management and investors a more meaningful assessment of performance. We have rounded certain figures in this consolidated directors' report to present them more clearly. Thus, the amounts given in the totals columns and rows of tables in certain instances may not match the sum of that column or row.
4.4.1 Group results
Group statutory income statement
| | | | | | | | | | | | | | | | |
| Condensed income statement |
| EUR million |
| | | Change | |
| 2024 | 2023 | Absolute | % | | |
Net interest income (interest income minus interest expense) | 43,787 | | 40,650 | | 3,137 | | 7.7 | | | |
| Net fee income (commission income minus commission expense) | 12,376 | | 11,495 | | 881 | | 7.7 | | | |
Gains or losses on financial assets and liabilities and exchange differences (net)A | 2,211 | | 2,565 | | (354) | | (13.8) | | | |
| Dividend income | 710 | | 568 | | 142 | | 25.0 | | | |
| Income from companies accounted for using the equity method | 687 | | 591 | | 96 | | 16.2 | | | |
Other operating income/expensesB | (1,728) | | (1,918) | | 190 | | (9.9) | | | |
| Total income | 58,043 | | 53,951 | | 4,092 | | 7.6 | | | |
| Operating expenses | (25,215) | | (24,684) | | (531) | | 2.2 | | | |
| Administrative expenses | (22,036) | | (21,598) | | (438) | | 2.0 | | | |
| Staff costs | (13,851) | | (13,299) | | (552) | | 4.2 | | | |
| Other general administrative expenses | (8,185) | | (8,299) | | 114 | | (1.4) | | | |
| Depreciation and amortization | (3,179) | | (3,086) | | (93) | | 3.0 | | | |
| Provisions or reversal of provisions | (3,062) | | (2,058) | | (1,004) | | 48.8 | | | |
| Impairment or reversal of impairment of financial assets not measured at fair value through profit or loss (net) | (12,136) | | (12,298) | | 162 | | (1.3) | | | |
| | | | | | |
| Impairment of other assets (net) | (624) | | (237) | | (387) | | 163.3 | | | |
| Gains or losses on non-financial assets and investments (net) | 368 | | 312 | | 56 | | 17.9 | | | |
| Negative goodwill recognized in results | — | | 39 | | (39) | | (100.0) | | | |
| Gains or losses on non-current assets held for sale not classified as discontinued operations | (27) | | (20) | | (7) | | 35.0 | | | |
| Profit or loss before tax from continuing operations | 17,347 | | 15,005 | | 2,342 | | 15.6 | | | |
| Tax expense or income from continuing operations | (4,844) | | (3,880) | | (964) | | 24.8 | | | |
| Profit from the period from continuing operations | 12,503 | | 11,125 | | 1,378 | | 12.4 | | | |
| Profit or loss after tax from discontinued operations | 1,241 | | 1,058 | | 183 | | 17.3 | | | |
| Profit for the period | 13,744 | | 12,183 | | 1,561 | | 12.8 | | | |
| Profit attributable to non-controlling interests | (1,170) | | (1,107) | | (63) | | 5.7 | | | |
| Profit attributable to the parent | 12,574 | | 11,076 | | 1,498 | | 13.5 | | | |
A.‘Gain or losses on financial assets and liabilities not measured at fair value through profit or loss, net’; ‘Gain or losses on financial assets and liabilities held for trading, net’; ‘Gains or losses on non-trading financial assets and liabilities mandatorily at fair value through profit or loss’; ‘Gain or losses on financial assets and liabilities measured at fair value through profit or loss, net’; ‘Gain or losses from hedge accounting, net’; and ‘Exchange differences, net’.
B.Other operating income’; ‘Other operating expenses’; ’Income from insurance and reinsurance contracts’; and ‘Expenses from insurance and reinsurance contracts’.
Main income statement items
In accordance with IFRS 5 requirements, results associated with the business subject to the Poland disposal are reported under a single line item in the consolidated income statement — 'profit/(loss) after tax from discontinued operations' — for the years 2025, 2024 and 2023.
In the consolidated balance sheet, the assets associated with the businesses subject to the Poland disposal are classified under the 'non-current assets held for sale' line item and the related liabilities under 'liabilities associated with non-current assets held for sale' solely for the year ended 31 December 2025.
Therefore, this classification does not affect the balance sheet for the year ended 31 December 2024 or for the year ended 31 December 2023.
However, to facilitate analysis and ensure comparability of the information in the following tables 'average balance sheet - assets and interest income', 'average balance sheet - liabilities and interest expense', 'volume and profitability analysis', 'volume and cost analysis' and 'net interest income. Volume, profitability and cost analysis summary' were calculated classifying assets and liabilities associated with the businesses subject to the Poland disposal under 'assets/liabilities from discontinued operations' in both periods presented.
In 2024, profit attributable to the parent reached a new record of EUR 12,574 million, representing a year-on-year increase of 14%, compared to the EUR 11,076 million recorded in 2023. This increase was backed by the good performance in total income, which grew at a much higher pace than operating expenses.
This year-on-year comparison is impacted by a higher charge relating to the temporary levy on revenue earned in Spain (EUR 335 million in 2024), charges in Q2 2024 related to the discontinuation of our merchant platform in Germany and Superdigital in Latin America (EUR 243 million, net of tax and minority interests) and the provision in Q4 2024 for potential complaints related to motor finance dealer commissions in the UK (EUR 260 million, net of tax). Additionally, there was a lower contribution to the Deposit Guarantee Fund (DGF) in Spain in 2024 and there was no contribution to the Single Resolution Fund (SRF) as contributions ended in 2023.
Total income
Total income amounted to EUR 58,043 million in 2024, compared to EUR 53,951 million in 2023, an 8% increase year-on-year. Net interest income and net fee income accounted for around 97% of total income. By line item:
Net interest income
Net interest income amounted to EUR 43,787 million, 8% higher than in 2023.
The following tables show the average balances of each year
calculated as the monthly average over the period, which we believe should not differ materially from using daily balances, and the interest generated.
The tables on the following pages also include average balances and interest rates in 2024 and 2023, based on the domicile of the entities at which the relevant assets or liabilities are recorded. Domestic balances relate to our entities domiciled in Spain. International balances relate to entities domiciled outside of Spain (reflecting our foreign activity), and are divided into mature markets (the US and Europe, except Spain) and developing markets (South America and Mexico).
The average balance of interest-earning assets in 2024 was 2% higher than in 2023. The activity of our entities in both the domestic market and in the international mature markets grew by 3% year-on-year, while in international developing markets they decreased 2%.
The average balance of interest-bearing liabilities in 2024 was 2% higher year-on-year, with growth in the domestic market (+6% year-on-year) whereas both the international mature markets and international developing markets were 1% lower year-on-year.
The average return on interest-earning assets increased from 6.68% in 2023 to 7.03% in 2024, following a strong rise in 2023. By market, it grew 49 bps year-on-year in the domestic market, +53 bps year-on-year in our international mature markets, and +6 bps year-on-year in our international developing markets.
The average cost of interest-bearing liabilities increased 22 bps in 2024 to 4.42%. By market, domestic and international mature markets increased 48 bps and 67 bps, respectively. However, in international developing markets it decreased 106 bps.
We calculated the change in interest income/(expense) shown in the tables below by:
•Applying the interest rate of the previous period to the difference between the average balances from the current and previous periods to obtain the change in volumes.
•Applying the difference between the rates from the current and previous periods to the average balance from the previous year to obtain the change in interest rate.
Both interest income and expense increased in 2024, mainly due to higher average interest rates.
| | | | | | | | | | | | | | | | | | | | | | | |
Average balance sheet - assets and interest income |
| EUR million | | | | | | | |
| 2024 | | 2023 |
| Assets | Average balance | Interest | Average rate | | Average balance | Interest | Average rate |
| Cash balances at central banks and other deposits on demand, and loans and advances to central banks and credit institutions | 285,813 | | 16,140 | | 5.65 | % | | 306,622 | | 16,272 | | 5.31 | % |
| Domestic | 108,705 | | 4,701 | | 4.32 | % | | 117,332 | | 4,694 | | 4.00 | % |
| International - Mature markets | 114,350 | | 5,700 | | 4.98 | % | | 124,570 | | 5,611 | | 4.50 | % |
| International - Developing markets | 62,758 | | 5,739 | | 9.14 | % | | 64,720 | | 5,967 | | 9.22 | % |
| | | | | | | |
| of which: | | | | | | | |
| Reverse repurchase agreements | 63,820 | | 5,533 | | 8.67 | % | | 53,760 | | 4,670 | | 8.69 | % |
| Domestic | 32,739 | | 1,901 | | 5.81 | % | | 24,292 | | 1,336 | | 5.50 | % |
| International - Mature markets | 8,085 | | 492 | | 6.09 | % | | 4,845 | | 278 | | 5.74 | % |
| International - Developing markets | 22,996 | | 3,140 | | 13.65 | % | | 24,623 | | 3,056 | | 12.41 | % |
| | | | | | | |
| Loans and advances to customers | 1,018,241 | | 74,900 | | 7.36 | % | | 1,005,713 | | 67,879 | | 6.75 | % |
| Domestic | 265,043 | | 12,272 | | 4.63 | % | | 265,322 | | 10,581 | | 3.99 | % |
| International - Mature markets | 562,488 | | 33,884 | | 6.02 | % | | 546,641 | | 28,771 | | 5.26 | % |
| International - Developing markets | 190,710 | | 28,744 | | 15.07 | % | | 193,750 | | 28,527 | | 14.72 | % |
| | | | | | | |
| of which: | | | | | | | |
| Reverse repurchase agreements | 61,528 | | 5,884 | | 9.56 | % | | 46,238 | | 4,163 | | 9.00 | % |
| Domestic | 12,410 | | 468 | | 3.77 | % | | 8,725 | | 261 | | 2.99 | % |
| International - Mature markets | 48,161 | | 5,310 | | 11.03 | % | | 36,546 | | 3,809 | | 10.42 | % |
| International - Developing markets | 957 | | 106 | | 11.08 | % | | 967 | | 93 | | 9.62 | % |
| | | | | | | |
| Debt securities | 246,539 | | 15,431 | | 6.26 | % | | 211,269 | | 13,955 | | 6.61 | % |
| Domestic | 94,607 | | 3,478 | | 3.68 | % | | 71,507 | | 2,503 | | 3.50 | % |
| International - Mature markets | 64,140 | | 2,174 | | 3.39 | % | | 51,327 | | 1,444 | | 2.81 | % |
| International - Developing markets | 87,792 | | 9,779 | | 11.14 | % | | 88,435 | | 10,008 | | 11.32 | % |
| | | | | | | |
| Income from hedging operations | | 2,470 | | | | | 3,510 | | |
| Domestic | | 152 | | | | | (45) | | |
| International - Mature markets | | 2,001 | | | | | 2,955 | | |
| International - Developing markets | | 317 | | | | | 600 | | |
| | | | | | | |
| Other interest | | 71 | | | | | 126 | | |
| Domestic | | (71) | | | | | (47) | | |
| International - Mature markets | | 42 | | | | | 63 | | |
| International - Developing markets | | 100 | | | | | 110 | | |
| | | | | | | |
| Total interest-earning assets | 1,550,593 | | 109,012 | | 7.03 | % | | 1,523,604 | | 101,742 | | 6.68 | % |
| Domestic | 468,355 | | 20,532 | | 4.38 | % | | 454,161 | | 17,686 | | 3.89 | % |
| International - Mature markets | 740,978 | | 43,801 | | 5.91 | % | | 722,538 | | 38,844 | | 5.38 | % |
| International - Developing markets | 341,260 | | 44,679 | | 13.09 | % | | 346,905 | | 45,212 | | 13.03 | % |
| | | | | | | |
| Other non-interest earning assets | 193,101 | | | | | 197,273 | | | |
| Assets from discontinued operations | 59,578 | | | | | 52,226 | | | |
| Average total assets | 1,803,272 | | 109,012 | | | | 1,773,103 | | 101,742 | | |
| | | | | | | | | | | | | | | | | | | | | | | |
Average balance sheet - liabilities and interest expense |
| EUR million |
| 2024 | | 2023 |
| Liabilities and stockholders’ equity | Average
balance | Interest | Average
rate | | Average
balance | Interest | Average
rate |
| Deposits from central banks and credit institutions | 151,986 | | 9,381 | | 6.17 | % | | 174,294 | | 9,360 | | 5.37 | % |
| Domestic | 60,256 | | 2,960 | | 4.91 | % | | 62,366 | | 2,723 | | 4.37 | % |
| International - Mature markets | 44,633 | | 2,447 | | 5.48 | % | | 63,456 | | 2,989 | | 4.71 | % |
| International - Developing markets | 47,097 | | 3,974 | | 8.44 | % | | 48,472 | | 3,648 | | 7.53 | % |
| | | | | | | |
| of which: | | | | | | | |
| Repurchase agreements | 63,556 | | 4,539 | | 7.14 | % | | 55,594 | | 3,711 | | 6.68 | % |
| Domestic | 37,663 | | 1,973 | | 5.24 | % | | 34,123 | | 1,686 | | 4.94 | % |
| International - Mature markets | 8,773 | | 579 | | 6.60 | % | | 6,542 | | 388 | | 5.93 | % |
| International - Developing markets | 17,120 | | 1,987 | | 11.61 | % | | 14,929 | | 1,637 | | 10.97 | % |
| | | | | | | |
| Customer deposits | 994,107 | | 35,714 | | 3.59 | % | | 969,831 | | 32,457 | | 3.35 | % |
| Domestic | 321,519 | | 4,944 | | 1.54 | % | | 302,379 | | 3,269 | | 1.08 | % |
| International - Mature markets | 472,750 | | 16,283 | | 3.44 | % | | 468,602 | | 12,386 | | 2.64 | % |
| International - Developing markets | 199,838 | | 14,487 | | 7.25 | % | | 198,850 | | 16,802 | | 8.45 | % |
| | | | | | | |
| of which: | | | | | | | |
| Repurchase agreements | 85,139 | | 8,207 | | 9.64 | % | | 73,158 | | 7,059 | | 9.65 | % |
| Domestic | 14,124 | | 586 | | 4.15 | % | | 4,602 | | 263 | | 5.71 | % |
| International - Mature markets | 48,115 | | 5,278 | | 10.97 | % | | 46,992 | | 4,125 | | 8.78 | % |
| International - Developing markets | 22,900 | | 2,343 | | 10.23 | % | | 21,564 | | 2,671 | | 12.39 | % |
| | | | | | | |
Marketable debt securities A | 307,931 | | 14,612 | | 4.75 | % | | 287,148 | | 12,671 | | 4.41 | % |
| Domestic | 147,606 | | 5,330 | | 3.61 | % | | 134,045 | | 4,184 | | 3.12 | % |
| International - Mature markets | 117,291 | | 5,323 | | 4.54 | % | | 108,912 | | 4,219 | | 3.87 | % |
| International - Developing markets | 43,034 | | 3,959 | | 9.20 | % | | 44,191 | | 4,268 | | 9.66 | % |
| | | | | | | |
| of which: | | | | | | | |
| Commercial paper | 25,809 | | 1,244 | | 4.82 | % | | 29,195 | | 1,329 | | 4.55 | % |
| Domestic | 17,046 | | 727 | | 4.26 | % | | 21,509 | | 888 | | 4.13 | % |
| International - Mature markets | 7,143 | | 339 | | 4.75 | % | | 5,641 | | 243 | | 4.31 | % |
| International - Developing markets | 1,620 | | 178 | | 10.99 | % | | 2,045 | | 198 | | 9.68 | % |
| | | | | | | |
| Other interest-bearing liabilities | 22,762 | | 672 | | 2.95 | % | | 23,020 | | 634 | | 2.75 | % |
| Domestic | 17,151 | | 490 | | 2.86 | % | | 16,109 | | 469 | | 2.91 | % |
| International - Mature markets | 3,707 | | 17 | | 0.46 | % | | 4,830 | | 1 | | 0.02 | % |
| International - Developing markets | 1,904 | | 165 | | 8.67 | % | | 2,081 | | 164 | | 7.88 | % |
| | | | | | | |
| Expenses from hedging operations | | 3,066 | | | | | 4,374 | | |
| Domestic | | 1,159 | | | | | 1,045 | | |
| International - Mature markets | | 1,325 | | | | | 1,756 | | |
| International - Developing markets | | 582 | | | | | 1,573 | | |
| | | | | | | |
| Other interest | | 1,780 | | | | | 1,596 | | |
| Domestic | | 741 | | | | | 567 | | |
| International - Mature markets | | 282 | | | | | 304 | | |
| International - Developing markets | | 757 | | | | | 725 | | |
| | | | | | | |
| Total interest-bearing liabilities | 1,476,786 | | 65,225 | | 4.42 | % | | 1,454,293 | | 61,092 | | 4.20 | % |
| Domestic | 546,532 | | 15,624 | | 2.86 | % | | 514,899 | | 12,257 | | 2.38 | % |
| International - Mature markets | 638,381 | | 25,677 | | 4.02 | % | | 645,800 | | 21,655 | | 3.35 | % |
| International - Developing markets | 291,873 | | 23,924 | | 8.20 | % | | 293,594 | | 27,180 | | 9.26 | % |
| | | | | | | |
| Other non-interest bearing liabilities | 168,212 | | | | | 170,566 | | | |
| Non-controlling interests | 8,398 | | | | | 8,650 | | | |
| Total stockholders´ equity | 96,744 | | | | | 93,035 | | | |
| Liabilities from discontinued operations | 53,132 | | | | | 46,559 | | | |
| Average total liabilities and stockholders´ equity | 1,803,272 | | 65,225 | | | | 1,773,103 | | 61,092 | | |
A.Does not include contingently convertible preference shares and perpetual subordinated notes because they do not accrue interest. We include them under 'Other non-interest-bearing liabilities'.
| | | | | | | | | | | | | | |
Volume and profitability analysis |
| EUR million |
| 2024 vs. 2023 |
| Increase (decrease) due to changes in | | |
| Interest income | Volume | Rate | | Total change |
| Cash and deposits on demand and loans and advances to central banks and credit institutions | (1,020) | | 888 | | | (132) | |
| Domestic | (358) | | 365 | | | 7 | |
| International - Mature markets | (482) | | 571 | | | 89 | |
| International - Developing markets | (180) | | (48) | | | (228) | |
| | | | |
| of which: | | | | |
| Reverse repurchase agreements | 473 | | 390 | | | 863 | |
| Domestic | 487 | | 78 | | | 565 | |
| International - Mature markets | 196 | | 18 | | | 214 | |
| International - Developing markets | (210) | | 294 | | | 84 | |
| | | | |
| Loans and advances to customers | 391 | | 6,630 | | | 7,021 | |
| Domestic | (11) | | 1,702 | | | 1,691 | |
| International - Mature markets | 854 | | 4,259 | | | 5,113 | |
| International - Developing markets | (452) | | 669 | | | 217 | |
| | | | |
| of which: | | | | |
| Reverse repurchase agreements | 1,397 | | 324 | | | 1,721 | |
| Domestic | 128 | | 79 | | | 207 | |
| International - Mature markets | 1,270 | | 231 | | | 1,501 | |
| International - Developing markets | (1) | | 14 | | | 13 | |
| | | | |
| Debt securities | 1,173 | | 303 | | | 1,476 | |
| Domestic | 844 | | 131 | | | 975 | |
| International - Mature markets | 401 | | 329 | | | 730 | |
| International - Developing markets | (72) | | (157) | | | (229) | |
| | | | |
| Income from hedging income | (1,040) | | — | | | (1,040) | |
| Domestic | 197 | | — | | | 197 | |
| International - Mature markets | (954) | | — | | | (954) | |
| International - Developing markets | (283) | | — | | | (283) | |
| | | | |
| Other interest | (55) | | — | | | (55) | |
| Domestic | (24) | | — | | | (24) | |
| International - Mature markets | (21) | | — | | | (21) | |
| International - Developing markets | (10) | | — | | | (10) | |
| | | | |
| Total interest-earning assets | (551) | | 7,821 | | | 7,270 | |
| Domestic | 648 | | 2,198 | | | 2,846 | |
| International - Mature markets | (202) | | 5,159 | | | 4,957 | |
| International - Developing markets | (997) | | 464 | | | (533) | |
| | | | | | | | | | | | | | |
Volume and cost analysis | | | | |
| EUR million | | | | |
| 2024 vs. 2023 |
| Increase (decrease) due to changes in | | |
| Interest expense | Volume | Rate | | Total change |
| Deposits from central banks and credit institutions | (1,181) | | 1,202 | | | 21 | |
| Domestic | (95) | | 332 | | | 237 | |
| International - Mature markets | (980) | | 438 | | | (542) | |
| International - Developing markets | (106) | | 432 | | | 326 | |
| | | | |
| of which: | | | | |
| Repurchase agreements | 576 | | 252 | | | 828 | |
| Domestic | 182 | | 105 | | | 287 | |
| International - Mature markets | 144 | | 47 | | | 191 | |
| International - Developing markets | 250 | | 100 | | | 350 | |
| | | | |
| Customer deposits | 412 | | 2,845 | | | 3,257 | |
| Domestic | 218 | | 1,457 | | | 1,675 | |
| International - Mature markets | 111 | | 3,786 | | | 3,897 | |
| International - Developing markets | 83 | | (2,398) | | | (2,315) | |
| | | | |
| of which: | | | | |
| Repurchase agreements | 672 | | 476 | | | 1,148 | |
| Domestic | 413 | | (90) | | | 323 | |
| International - Mature markets | 101 | | 1,052 | | | 1,153 | |
| International - Developing markets | 158 | | (486) | | | (328) | |
| | | | |
| Marketable debt securities | 681 | | 1,260 | | | 1,941 | |
| Domestic | 449 | | 697 | | | 1,146 | |
| International - Mature markets | 342 | | 762 | | | 1,104 | |
| International - Developing markets | (110) | | (199) | | | (309) | |
| | | | |
| of which: | | | | |
| Commercial paper | (166) | | 81 | | | (85) | |
| Domestic | (190) | | 29 | | | (161) | |
| International - Mature markets | 69 | | 27 | | | 96 | |
| International - Developing markets | (45) | | 25 | | | (20) | |
| | | | |
| Other interest-bearing liabilities | 15 | | 23 | | | 38 | |
| Domestic | 30 | | (9) | | | 21 | |
| International - Mature markets | — | | 16 | | | 16 | |
| International - Developing markets | (15) | | 16 | | | 1 | |
| | | | |
| Expenses from hedging expenses | (1,308) | | — | | | (1,308) | |
| Domestic | 114 | | — | | | 114 | |
| International - Mature markets | (431) | | — | | | (431) | |
| International - Developing markets | (991) | | — | | | (991) | |
| | | | |
| Other interest | 184 | | — | | | 184 | |
| Domestic | 174 | | — | | | 174 | |
| International - Mature markets | (22) | | — | | | (22) | |
| International - Developing markets | 32 | | — | | | 32 | |
| | | | |
| Total interest-bearing liabilities | (1,197) | | 5,330 | | | 4,133 | |
| Domestic | 890 | | 2,477 | | | 3,367 | |
| International - Mature markets | (980) | | 5,002 | | | 4,022 | |
| International - Developing markets | (1,107) | | (2,149) | | | (3,256) | |
| | | | | | | | | | | | | | |
Net interest income. Volume, profitability and cost analysis summary | | | | |
| EUR million | | | | |
| 2024 vs. 2023 |
| Increase (decrease) due to changes in | | |
| Volume | Rate | | Total change |
| Interest income | (551) | | 7,821 | | | 7,270 | |
| Domestic | 648 | | 2,198 | | | 2,846 | |
| International - Mature markets | (202) | | 5,159 | | | 4,957 | |
| International - Developing markets | (997) | | 464 | | | (533) | |
| | | | |
| Interest expense | (1,197) | | 5,330 | | | 4,133 | |
| Domestic | 890 | | 2,477 | | | 3,367 | |
| International - Mature markets | (980) | | 5,002 | | | 4,022 | |
| International - Developing markets | (1,107) | | (2,149) | | | (3,256) | |
| | | | |
| Net interest income | 646 | | 2,491 | | | 3,137 | |
| Domestic | (242) | | (279) | | | (521) | |
| International - Mature markets | 778 | | 157 | | | 935 | |
| International - Developing markets | 110 | | 2,613 | | | 2,723 | |
| | |
Net interest income |
| EUR million |
| | |
Net fee income |
| EUR million |
Net fee income
Net fee income totalled EUR 12,376 million in 2024, 8% higher than in 2023, with good performances in CIB, Openbank and Wealth.
For more details, see note 41 and note 42 to the consolidated financial statements. Gains or losses on financial assets and liabilities and exchange differences (net)
Gains on financial transactions and liabilities and exchange differences (net) stood at EUR 2,211 million (EUR 2,565 million in 2023), affected by lower market activity in South America, especially in Brazil, lower results in Openbank Europe and lower results in the Corporate Centre from foreign currency hedges and risk transfer initiatives.
Gains or losses on financial assets and liabilities stem from mark-to-market valuations of the trading portfolio and derivative instruments, which include spot market foreign exchange
transactions, sales of investment securities and liquidation of our hedging and other derivative positions.
For more details, see note 43 to the consolidated financial statements. Exchange rate differences primarily show gains and losses from foreign exchange and the differences that arise from converting monetary items in foreign currencies to the functional currency, and from selling non-monetary assets denominated in foreign currency at the time of their disposal. Given Santander manages currency exposures with derivative instruments, the changes in this line should be analysed together with gains or losses on financial assets and liabilities.
For more details, see note 44 to the consolidated financial statements.
Dividend income
Dividend income was EUR 710 million in 2024 (EUR 568 million in 2023).
Income from companies accounted for using the equity method
The income from companies accounted for using the equity method reached EUR 687 million in 2024 compared to EUR 591 million in 2023.
Other operating income/expenses
Other operating income/expenses recorded a loss of EUR 1,728 million in 2024 (compared to a EUR 1,918 million loss in 2023). These results include the hyperinflation adjustment in Argentina and a charge relating to the temporary levy on revenue earned in Spain, which was 50% higher than in 2023 (EUR 335 million in 2024 versus EUR 224 million in 2023). There was no contribution to the SRF in 2024 and there was a lower contribution to the DGF in Spain (EUR 11 million, net of tax and minority interests in 2024).
For more details, see note 45 to the consolidated financial statement. Operating expenses
Operating expenses amounted to EUR 25,215 million in 2024, 2% higher than 2023, increasing below inflation, reflecting our progress in transformation.
Our cost management continued to focus on improving our efficiency and, as a result, we remained among the most efficient global banks in the world.
Our business transformation plan, ONE Transformation, continued to progress across our footprint, reflected in an enhanced operating performance and better business dynamics.
For more details, see note 46 and note 47 to the consolidated financial statements. Provisions or reversal of provisions
Provisions (net of provisions reversals) amounted to EUR 3,062 million in 2024 compared to EUR 2,058 million in 2023. In 2024 they included the charges after discontinuing our Superdigital platform in Latin America in Q2 2024 and a charge in Q4 2024 from provisions for potential complaints related to motor finance dealer commissions in the UK (EUR 353 million).
For more details, see note 25 to the consolidated financial statements.
Impairment or reversal of impairment of financial assets not measured at fair value through profit or loss (net)
Net impairments totalled EUR 12,136 million in 2024 (EUR 12,298 million in 2023).
Impairment on other assets (net)
Impairment on other assets (net) was EUR 624 million in 2024 (compared to EUR 237 million in 2023). In 2024, it included the charge registered in Q2 2024 in PagoNxt after discontinuing our merchant platform in Germany.
Gains or losses on non-financial assets and investments (net)
In 2024, gains or losses on non-financial assets and investments (net) stood at EUR 368 million, which included the gain recorded in Q2 2024 from an agreement with Sodexo in Brazil (EUR 352 million). In 2023, gains or losses on non-financial assets and investments (net) stood at EUR 312 million.
For more details, see note 48 to the consolidated financial statements. Negative goodwill recognized in results
No negative goodwill was recorded in 2024. Negative goodwill of EUR 39 million was recorded in 2023.
Gains or losses on non-current assets held for sale not classified as discontinued operations
This item, which mainly includes impairment of foreclosed assets recorded and the sale of properties acquired upon foreclosure, recorded a EUR 27 million loss in 2024 (EUR 20 million loss in 2023).
For more details, see note 49 to the consolidated financial statements.
| | | | | | | | | |
Impairment or reversal of impairment of financial assets not measured at fair value through profit or loss (net) |
| EUR million | | | |
| 2024 | 2023 | |
| Financial assets at fair value through other comprehensive income | (1) | | 24 | | |
| Financial assets at amortized cost | 12,137 | | 12,274 | | |
| Impairment or reversal of impairment of financial assets not measured at fair value through profit or loss and net gains and losses from changes | 12,136 | | 12,298 | | |
| | | | | | | | | |
Impairment on other assets (net) |
| EUR million | | | |
| 2024 | 2023 | |
| Impairment of investments in subsidiaries, joint ventures and associates, net | — | | — | | |
| Impairment on non-financial assets, net | 624 | | 237 | | |
| Tangible assets | 382 | | 135 | | |
| Intangible assets | 231 | | 73 | | |
| Others | 11 | | 29 | | |
| Impairment on other assets (net) | 624 | | 237 | | |
| | | |
Profit or loss before tax from continuing operations
Profit before tax was EUR 17,347 million in 2024, +16% year-on-year, supported by the good performances in net interest income and net fee income.
Tax expense or income from continuing operations
Total tax expense from continuing operations was EUR 4,844 million in 2024 (compared to EUR 3,880 million in 2023).
Profit or loss after tax from discontinued operations
Profit or loss after tax from discontinued operations totalled EUR 1,241 million in 2024 compared to EUR 1,058 million in 2023. This line records the results associated with the Poland disposal, which increased year-on-year driven by a good revenue performance.
| | |
| Profit attributable to the parent |
| EUR million |
Profit attributable to non-controlling interests
Profit attributable to non-controlling interests stood at EUR 1,170 million in 2024 (EUR 1,107 million in 2023), in part due to the accelerated placement of ordinary shares of Santander Bank Polska S.A. in the year.
For more details, see note 28 to the consolidated financial statements. Profit attributable to the parent
Profit attributable to the parent amounted to EUR 12,574 million in 2024, 14% higher than the EUR 11,076 million in 2023.
Group underlying income statement
| | | | | | | | | | | | | | | | | | | | | | | | | | | | | | | | | | | | | | | | |
| | | | |
Attributable | | Underlying | | |
Profit | | RoTE (post-AT1) | | Profit | | RoTE (post-AT1) | | |
EUR 12,574 million | +14% in euros | | 15.5% | | EUR 11,774 million | +13% in euros | | 14.4% | | |
+16% in constant euros | | +1.1 pp | | +15% in constant euros | | +1.0 pp | | |
| Note: changes vs. 2023. | | | | | | |
Below is the condensed income statement adjusted for items beyond the ordinary course of business and reclassification of certain items under some headings of the underlying income statement, as described in note 52.c to the consolidated financial statements, where our segments' aggregate underlying consolidated results are reconciled to the statutory consolidated results. In the underlying income statement, results obtained in Poland are reported in the 'non-recurring items' line item for 2024 and 2023, so that it is excluded from underlying profit at both the Group and global business levels.
Therefore, all underlying ratios and management metrics included in this underlying income statement section have been calculated excluding Poland.
The Group presents, both at the total Group level and for each of the business units, the changes in euros registered in the income statement, as well as variations excluding the exchange rate effect (i.e. in constant euros, except for Argentina and any grouping which includes it), understanding that the latter provide a better analysis of the Group’s management. For further information, see 4.6. 'Alternative performance measures (APMs): 2025, 2024 and 2023'. At the Group level, exchange rates had an unfavourable year-on-year impact of 2.5 pp on total income and a favourable impact of 1.9 pp on total costs, mainly due to the depreciation of the Brazilian real and the Mexican peso.
To better understand the business trends, we reclassified certain items under some headings of the underlying income statement. These reclassifications between the statutory and underlying income statements include:
•In 2024:
•As previously explained, in the statutory income statement, results associated with the business subject to the Poland disposal are reported in the 'profit/(loss) after tax from discontinued operations' line item.
However, in the underlying income statement, the results related to the business subject to the Poland disposal are excluded line-by-line from the underlying income statement and recorded in the 'non-recurring items' line.
| | | | | | | | | | | | | | | | | | |
Condensed underlying income statement |
| EUR million | | | | | | |
| | | Change | |
| 2024 | | 2023 | | Absolute | % | % excl. FX | |
| Net interest income | 43,824 | | 40,718 | | 3,106 | | 7.6 | 9.8 | |
| Net fee income | 12,335 | | 11,468 | | 867 | | 7.6 | 10.8 | |
| Gains (losses) on financial transactions and exchange differences | 2,216 | | 2,566 | | (350) | | (13.6) | (11.1) | |
| Other operating income | (391) | | (812) | | 421 | | (51.8) | (52.0) | |
| Total income | 57,984 | | 53,940 | | 4,044 | | 7.5 | 10.0 | |
| Total costs | (27,354) | | (26,501) | | (853) | | 3.2 | 5.1 | |
| Net operating income | 30,630 | | 27,439 | | 3,191 | | 11.6 | 14.6 | |
| Net loan-loss provisions | (11,822) | | (11,784) | | (38) | | 0.3 | 3.8 | |
| Other gains (losses) and provisions | (1,431) | | (350) | | (1,081) | | 308.9 | 313.8 | |
| Profit before tax | 17,377 | | 15,305 | | 2,072 | | 13.5 | 15.9 | |
| Tax on profit | (4,853) | | (4,112) | | (741) | | 18.0 | 20.1 | |
| Profit from continuing operations | 12,524 | | 11,193 | | 1,331 | | 11.9 | 14.4 | |
| Net profit from discontinued operations | — | | — | | — | | — | | — | | |
| Consolidated profit | 12,524 | | 11,193 | | 1,331 | | 11.9 | 14.4 | |
| Non-controlling interests | (750) | | (791) | | 41 | | (5.2) | | (0.1) | | |
Underlying profit attributable to the parent A | 11,774 | | 10,402 | | 1,372 | | 13.2 | 15.5 | |
| Non-recurring items | 800 | | 674 | | 126 | | 18.7 | 18.8 | |
| Profit attributable to the parent | 12,574 | | 11,076 | | 1,498 | | 13.5 | 15.7 | |
A.Excluding non-recurring items.
•As explained in note 52.c to the consolidated financial statements, certain charges recorded in the statutory income statements under the line items that comprise 'other gains (losses) and provisions' are presented in the underlying income statement under the 'total costs' line item. These are mainly recurring operating charges, primarily related to labour and legal processes, and exclude EUR 835 million of restructuring charges, EUR 353 million of provisions for potential complaints related to motor finance dealer commissions and EUR 243 million from charges related to the discontinuation of our merchant platform in Germany and Superdigital in Latin America. •Provisions which strengthen the balance sheet in Brazil of EUR 352 million gross in Q2 2024 (EUR 174 million net of tax and minority interests) which were compensated by gains on the sale of our stake in Pluxee in Brazil.
•In 2023:
•As previously explained, in the statutory income statement, results associated with the business subject to the Poland disposal are reported in the 'profit/(loss) after tax from discontinued operations' line item.
However, in the underlying income statement, the results related to the business subject to the Poland disposal are excluded line-by-line from the underlying income statement and recorded in the 'non-recurring items' line.
•As explained in note 52.c, certain charges recorded in the statutory account under the line items that comprise 'other gains (losses) and provisions' are presented in the underlying income statement under the 'total costs' line item. These are mainly recurring operating charges, primarily related to labour and legal processes, and exclude EUR 385 million of restructuring charges. •Provisions to strengthen the balance sheet in Brazil in Q1 2023, totalling EUR 235 million, net of tax and non-controlling interests (EUR 474 million recorded in net loan-loss provisions, EUR 213 million positive impact in tax and EUR 26 million in non-controlling interests) which were more than offset by gains of EUR 270 million resulting primarily from the divestments of stakes in Brazil and Openbank in the 'other gains (losses) and provisions' line item.
Additionally, regarding results that fall outside the ordinary course of our business and are therefore excluded from the underlying income statement and recorded in the 'non-recurring items' line:
•As previously explained, in both 2024 and 2023, results obtained in Poland are reported in the 'non-recurring items' line.
For more details, see note 52.c to the consolidated financial statements. As a result, the profit attributable to the parent was EUR 12,574 million, increasing 14% in euros and 16% in constant euros compared to 2023, while the underlying profit was EUR 11,774 million in 2024 which also represented a rise of 13% in euros and 15% in constant euros compared to 2023.
This year-on-year comparison is impacted by a higher charge relating to the temporary levy on revenue earned in Spain, charges
in Q2 2024 related to the discontinuation of our merchant platform in Germany and Superdigital in Latin America (EUR 243 million, net of tax and minority interests) and by the provision in Q4 2024 for potential complaints related to motor finance dealer commissions in the UK (EUR 260 million, net of tax and minority interests).
Additionally, in 2024, there was a lower DGF contribution in Spain and there was no contribution to the SRF as contributions ended in 2023.
Total income amounted to EUR 57,984 million in 2024, a 7% increase year-on-year. In constant euros, total income increased by 10% year-on-year, as follows:
•Net interest income (NII) totalled EUR 43,824 million and increased by 10% year-on-year, with growth across all businesses:
•In Retail, which represented 63% of the NII of the total operating areas, NII increased by 11%, with rises in most countries, but especially in South America, driven by higher volumes, and in Spain and Portugal, due to good margin management.
•NII grew strongly (+6%) in Openbank (24% of the NII of the total operating areas), on the back of active loan repricing and volumes growth in Openbank Europe, and higher volumes and lower interest rates in Brazil.
•In CIB, NII increased by 16%, boosted by our three main business lines.
•In Wealth, NII increased by 7%, driven by good margin management in a favourable macroeconomic environment and strong commercial activity in Private Banking.
•In Payments, NII increased strongly (+50%), due to higher activity.
•Net fee income reached EUR 12,335 million, increasing by 11% year-on-year, with growth across all businesses. We recorded this excellent net fee income performance as a result of executing our strategy to capture network effects across the Group. By business:
•In Retail, net fee income increased by 3%, supported by the good performances in Brazil, Argentina and the US.
•In Openbank, net fee income increased by 24%, driven mainly by growth in Openbank Europe due to increased insurance penetration, volumes growth in Brazil and auto fee income in the US.
•In CIB, net fee income increased by 22%, especially boosted by the US Banking Build-Out (US BBO) initiative.
•In Wealth, net fee income increased by 21%, with growth across businesses, boosted especially by higher volumes on the back of positive commercial activity and a favourable market performance.
•In Payments, net fee income increased by 5%, boosted by higher activity.
| | | | | | | | | | | | |
| Net fee income | | | | | | |
| EUR million | | | | | | |
| | | | |
| 2024 | 2023 | | | | |
| Asset management business, funds and insurance | 4,244 | | 3,890 | | | | | |
| Credit and debit cards | 2,250 | | 2,286 | | | | | |
| Securities and custody services | 1,251 | | 1,059 | | | | | |
| Account management and availability fees | 1,953 | | 1,866 | | | | | |
| Cheques and payment orders | 795 | | 784 | | | | | |
| Foreign exchange | 632 | | 629 | | | | | |
| Charges for past-due/unpaid balances and guarantees | 313 | | 304 | | | | | |
| Bill discounting | 139 | | 208 | | | | | |
| Other | 758 | | 441 | | | | | |
| Net fee income | 12,335 | | 11,468 | | | | | |
•Gains on financial transactions and exchange differences decreased 11%, mainly due to lower results in CIB, mainly in Brazil, affected by weaker market activity (though there was some recovery in the second half of the year), lower results in Openbank Europe and in the Corporate Centre due to impacts from foreign currency hedges and risk transfer initiatives.
•Other operating income registered a lower negative result in 2024 than in 2023. These results include the hyperinflation adjustment in Argentina and the charge relating to the temporary levy on revenue earned in Spain, which was 50% higher than in 2023 (EUR 335 million in 2024 versus EUR 224 million in 2023). There was no contribution to the SRF in 2024 and there was a lower contribution to the DGF in Spain (EUR 11 million, net of tax and minority interests in 2024).
A. In constant euros: +10%.
Total costs in 2024 reached EUR 27,354 million, up 3% year-on-year (+5% in constant euros). In real terms, excluding the impact of average inflation and in constant euros, they increased 2% year-on-year, well below total income growth. For further information about costs in real terms, see 4.6. 'Alternative performance measures (APMs): 2025, 2024 and 2023'. We continued to progress with our business transformation plan, ONE Transformation, reflected in greater operational leverage, better business dynamics and more streamlined and agile structures. By business and in constant euros:
•In Retail, total costs decreased by 1%. In real terms they also fell 1%, reflecting our transformation efforts through organizational simplification, process automation and the deployment of the global platform, as well as lower charges in the 'other operating costs' line. The efficiency ratio improved strongly to 44.5%.
•In Openbank, total costs increased by 1% year-on-year. In real terms, they declined 1%, driven by our efficiency and transformation efforts in the US and Europe. The efficiency ratio was 49.7%.
•In CIB, total costs increased by 18% (+15% in real terms), due to our investments in new products and capabilities to support growth and higher impacts in the 'other operating costs' line. The efficiency ratio stood at 49.7%.
•In Wealth, total costs rose 12% (+9% in real terms), reflecting investments made to strengthen PB teams and develop new capabilities to address the increase in commercial activity. The efficiency ratio improved to 39.1%.
•In Payments, total costs grew 11% (+7% in real terms), reflecting continued investment in global payments platforms.
| | | | | | | | | | | | |
Total costs | | | | | | |
| EUR million | | | | | | |
| | | | |
| 2024 | 2023 | | | | |
| Staff costs | 13,827 | | 13,279 | | | | | |
| Other administrative expenses | 8,129 | | 8,250 | | | | | |
| Information technology | 2,579 | | 2,387 | | | | | |
| Communications | 387 | | 399 | | | | | |
| Advertising | 512 | | 575 | | | | | |
| Buildings and premises | 711 | | 681 | | | | | |
| Printed and office material | 86 | | 93 | | | | | |
| Taxes (other than tax on profits) | 554 | | 570 | | | | | |
| Other expenses | 3,300 | | 3,545 | | | | | |
| Administrative expenses | 21,956 | | 21,529 | | | | | |
| Depreciation and amortization | 3,179 | | 3,086 | | | | | |
| Operating expenses | 25,135 | | 24,615 | | | | | |
| Other operating costs | 2,219 | | 1,886 | | | | | |
| Total costs | 27,354 | | 26,501 | | | | | |
Our cost management continued to focus on structurally improving our efficiency. As a result, we improved our efficiency ratio to 47.2%.
All in all, net operating income reached EUR 30,630 million, up 12% year-on-year. In constant euros, it rose 15%, mainly driven by the good revenue performance (particularly in net interest income and net fee income).
Net loan-loss provisions in 2024 amounted to EUR 11,822 million, broadly in line with 2023.
In constant euros, they increased by 4%. The good performance in Retail due to lower provisions in Europe, especially in Spain and the UK partially offset the expected increases in Openbank, as a result of the normalization in Europe, higher volumes, lower portfolio sales compared to 2023 and some regulatory charges.
| | |
Net loan-loss provisions |
| EUR million |
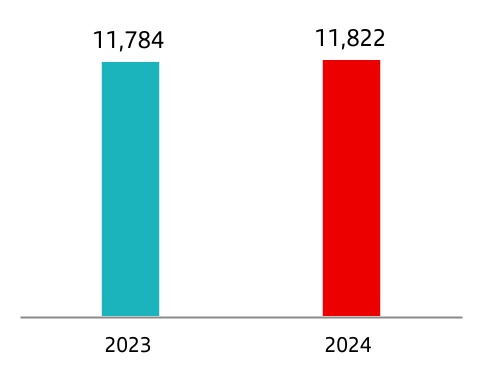
A. In constant euros: +4%.
Other gains (losses) and provisions recorded a loss of EUR 1,431 million in 2024, compared to a EUR 350 million loss in 2023.
This year-on-year comparison was impacted by the aforementioned charges in 2024: i) the discontinuation of our merchant platforms in Germany and Superdigital in Latin America; and ii) the charge in Q4 2024 due to the provisions recorded for complaints related to motor finance dealer commissions in the UK.
Tax on profit amounted to EUR 4,853 million, 18% higher than in 2023. In constant euros, it rose 20%, due to higher tax burden in some countries, mainly in Spain and Brazil.
Underlying profit attributable to the parent in 2024 was EUR 11,774 million, 13% more than in 2023. In constant euros, it rose 15%, supported by solid total income growth.
As a result, underlying RoTE post-AT1 was 14.4%, up from 13.5% in 2023, underlying RoRWA was 2.07% (compared to 1.86% in 2023) and underlying earnings per share reached EUR 0.72 (from EUR 0.61 in 2023).
| | |
Underlying profit attributable to the parent |
| EUR million |
A. In constant euros: +15%.
| | |
Underlying RoTE post-AT1 |
| % |
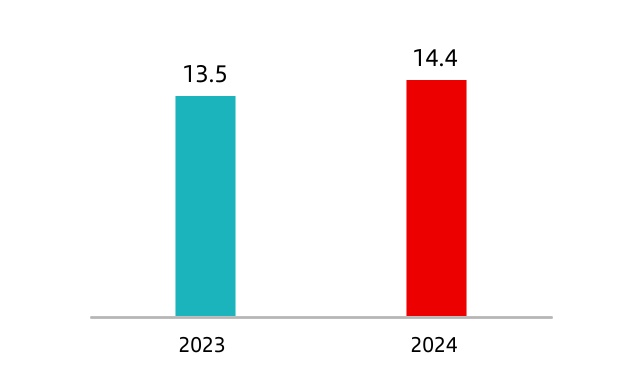
As previously explained, results related to the Poland disposal are recorded in non-recurring items, totalling EUR 800 million in 2024 compared to EUR 674 million in 2023.
Including these non-recurring items, profit attributable to the parent in 2024 was EUR 12,574 million, 14% more than in 2023. In constant euros, it rose 16%.
RoTE post-AT1 stood at 15.5% (14.4% in 2023). RoRWA stood at 2.18% (1.95% in 2023) and earnings per share stood at EUR 0.77 (EUR 0.65 in 2023).
4.4.2 Group balance sheet
| | | | | | | | | | | | | | | |
| Balance sheet |
| EUR million |
| | | Change | |
Assets | Dec-24 | Dec-23 | Absolute | % | |
| Cash, cash balances at central banks and other deposits on demand | 192,208 | | 220,342 | | (28,134) | | (12.8) | | |
| Financial assets held for trading | 230,253 | | 176,921 | | 53,332 | | 30.1 | | |
| Non-trading financial assets mandatorily at fair value through profit or loss | 6,130 | | 5,910 | | 220 | | 3.7 | | |
Financial assets designated at fair value through profit or loss | 7,915 | | 9,773 | | (1,858) | | (19.0) | | |
| Financial assets at fair value through other comprehensive income | 89,898 | | 83,308 | | 6,590 | | 7.9 | | |
| Financial assets at amortized cost | 1,203,707 | | 1,191,403 | | 12,304 | | 1.0 | | |
| Hedging derivatives | 5,672 | | 5,297 | | 375 | | 7.1 | | |
| Changes in the fair value of hedged items in portfolio hedges of interest risk | (704) | | (788) | | 84 | | (10.7) | | |
| Investments | 7,277 | | 7,646 | | (369) | | (4.8) | | |
| Assets under reinsurance contracts | 222 | | 237 | | (15) | | (6.3) | | |
| Tangible assets | 32,087 | | 33,882 | | (1,795) | | (5.3) | | |
| Intangible assets | 19,259 | | 19,871 | | (612) | | (3.1) | | |
| Tax assets | 30,596 | | 31,390 | | (794) | | (2.5) | | |
Other assets | 8,559 | | 8,856 | | (297) | | (3.4) | | |
| Non-current assets held for sale | 4,002 | | 3,014 | | 988 | | 32.8 | | |
| Total assets | 1,837,081 | | 1,797,062 | | 40,019 | | 2.2 | | |
| | | | | |
| Liabilities and equity | | | | | |
| Financial liabilities held for trading | 152,151 | | 122,270 | | 29,881 | | 24.4 | | |
| Financial liabilities designated at fair value through profit or loss | 36,360 | | 40,367 | | (4,007) | | (9.9) | | |
| Financial liabilities at amortized cost | 1,484,322 | | 1,468,703 | | 15,619 | | 1.1 | | |
| Hedging derivatives | 4,752 | | 7,656 | | (2,904) | | (37.9) | | |
| Changes in the fair value of hedged items in portfolio hedges of interest rate risk | (9) | | 55 | | (64) | | (116.4) | | |
| Liabilities under insurance contracts | 17,829 | | 17,799 | | 30 | | 0.2 | | |
| Provisions | 8,407 | | 8,441 | | (34) | | (0.4) | | |
| Tax liabilities | 9,598 | | 9,932 | | (334) | | (3.4) | | |
Other liabilities | 16,344 | | 17,598 | | (1,254) | | (7.1) | | |
| Liabilities associated with non-current assets held for sale | — | | — | | — | | — | | |
| Total liabilities | 1,729,754 | | 1,692,821 | | 36,933 | | 2.2 | | |
| Shareholders' equity | 135,196 | | 130,443 | | 4,753 | | 3.6 | | |
| Other comprehensive income | (36,595) | | (35,020) | | (1,575) | | 4.5 | | |
| Non-controlling interest | 8,726 | | 8,818 | | (92) | | (1.0) | | |
| Total equity | 107,327 | | 104,241 | | 3,086 | | 3.0 | | |
| Total liabilities and equity | 1,837,081 | | 1,797,062 | | 40,019 | | 2.2 | | |
Note: this is a summarized balance sheet. For further information, see the 'consolidated balance sheet' in the consolidated financial statements.
| | | | | | | | | | | | | | | | | | | | | | | | | | | | | | | | | | | | | | | | | | | | | | | | | | | | | | | | | | | | | | | | | | | | |
| | | | | Executive summary A | | | | | | | | | | | | | | |
| | | | | | | | | | | | | | | | | | |
| | | | | Gross loans and advances to customers (excluding reverse repos and Poland) | | | | | Customer funds (deposits excluding repos + mutual funds, excluding Poland) | | |
| | | | | | | | | | |
| | | | | | | | | | |
| | | | | | | |
| | | | | EUR 979 billion | +1% | +1% | | | | | EUR 1,155 billion | +4% | | |
| | | | | | | | | | |
| | | | | | | | | | | | | | | | | | | | | | |
| | | | | è By segment: | | | | | | è By product: | | | | | | | |
| | | | | | | | | | | | | | | | |
| | | | | | | | | | | | | | | | |
| | | | | | | | | | | | | | | | |
| | | | | Growth in the year was mainly driven by Openbank and Wealth | | Growth in all products, rising double digits in mutual funds | | |
| | | | | | | | | | | | | | | | | | | | | | |
| | | | | Retail | Openbank | CIB | Wealth | | | Demand | Time | Mutual funds | | |
| | | | | -1% | +4% | 0% | +8% | | | +1% | +1% | +18% | | |
| | | | |
| | | | | | | | | | | | | | | | | | | | | | |
Loans and advances to customers
Loans and advances to customers totalled EUR 1,054,069 million in December 2024, a 2% increase year-on-year.
For the purpose of analysing traditional commercial banking loans, the Group uses gross loans and advances to customers excluding reverse repurchase agreements (repos). Additionally, in line with the criteria used in 4.2.2.'Balance sheet', we analysed loans and advances to customers excluding Poland in both 2024 and 2023 balance sheets. As at end December 2024, gross loans and advances to customers excluding reverse repos and Poland, totalled EUR 978,961 million in December 2024, flat compared to December 2023. Gross loans and advances to customers excluding Poland and reverse repos and in constant euros, grew by 1% year-on-year, as follows:
•In Retail, which represented 62% of the Group's loan portfolio, gross loans and advances to customers decreased 1%, mainly due to declines in the UK (in line with our profitability strategy) and Spain, still impacted by pre-payments despite a pickup in new business volumes.
•In Openbank, which represented 22% of the Group's loan portfolio, they grew 4% driven by good performances in the auto markets in Openbank Europe and Latin America.
•In CIB, which represented 13% of the Group's loan portfolio, lending volumes were stable, as growth in North and South America compensated the lower volumes in Europe.
•In Wealth, gross loans and advances to customers increased by 8% driven by growth in Private Banking.
•Payments had a loan portfolio of just EUR 1 billion (+5% year-on-year).
| | | | | | | | | | | | | | | |
| Loans and advances to customers |
EUR million. Excluding Poland |
| | | Change | |
| Dec-24 | Dec-23 | Absolute | % | |
| Commercial bills | 51,429 | | 53,970 | | (2,541) | | (4.7) | | |
| Secured loans | 538,218 | | 535,118 | | 3,100 | | 0.6 | | |
| Other term loans | 284,136 | | 286,585 | | (2,449) | | (0.9) | | |
| Finance leases | 37,643 | | 36,518 | | 1,125 | | 3.1 | | |
| Receivable on demand | 10,737 | | 12,255 | | (1,518) | | (12.4) | | |
| Credit cards receivable | 24,563 | | 24,016 | | 547 | | 2.3 | | |
| Impaired assets | 32,235 | | 32,730 | | (495) | | (1.5) | | |
| Gross loans and advances to customers (excluding reverse repos) | 978,961 | | 981,192 | | (2,231) | | (0.2) | | |
Reverse repurchase agreements | 59,344 | | 44,067 | | 15,277 | | 34.7 | | |
| Gross loans and advances to customers | 1,038,305 | | 1,025,259 | | 13,046 | | 1.3 | | |
| Loan-loss allowances | 21,145 | | 21,794 | | (649) | | (3.0) | | |
| Net loans and advances to customers | 1,017,160 | | 1,003,465 | | 13,695 | | 1.4 | | |
| | |
Gross loans and advances to customers
(excluding reverse repos) |
EUR billion. Excluding Poland |
A. In constant euros: +1%.
As of December 2024, gross loans and advances to customers excluding reverse repos maintained a diversified structure between the markets in which the Group operates.
With respect to gross loans and advances to customers (including reverse repos) maturing in more than one year, at the end of 2024, 67% had a fixed interest rate, while the remaining 33% had a floating interest rate:
| | |
Gross loans and advances to customers
(excluding reverse repos) |
| % of operating areas. December 2024. Excluding Poland |
•In Spain, 51% of loans and advances to customers were fixed rate and 49% were floating rate.
•Outside of Spain, 71% of loans and advances to customers were fixed rate and 29% were floating rate.
For more details on the distribution of loans and advances to customers by business line, see note 10.b to the consolidated financial statements.
| | | | | | | | | | | | | | | | | | | | | | | | | | |
| Gross loans and advances to customers (including reverse repos) with maturities exceeding one year as at 31 December 2024 |
EUR million. Excluding Poland |
| Domestic | | International | | TOTAL |
| Amount | Weight as % of the total | | Amount | Weight as % of the total | | Amount | Weight as % of the total |
| Fixed | 70,166 | 51 | % | | 368,330 | 71 | % | | 438,496 | 67 | % |
| Floating | 67,440 | 49 | % | | 148,521 | 29 | % | | 215,961 | 33 | % |
| TOTAL | 137,606 | 100 | % | | 516,851 | 100 | % | | 654,456 | 100 | % |
| | | | | | | | | | | | | | | |
| Total customer funds |
EUR million. Excluding Poland |
| | | Change | |
| Dec-24 | Dec-23 | Absolute | % | |
| Demand deposits | 641,237 | | 628,451 | | 12,786 | | 2.0 | |
| Time deposits | 286,296 | | 295,434 | | (9,138) | | (3.1) | |
Mutual funds A | 227,226 | | 203,618 | | 23,608 | | 11.6 | |
| Customer funds | 1,154,759 | | 1,127,503 | | 27,256 | | 2.4 | |
Pension funds A | 15,646 | | 14,831 | | 815 | | 5.5 | |
Managed portfolios A | 42,969 | | 36,233 | | 6,736 | | 18.6 | |
| Repurchase agreements | 78,072 | | 78,784 | | (712) | | (0.9) | |
| Total funds | 1,291,446 | | 1,257,351 | | 34,095 | | 2.7 | |
A. Including managed and marketed funds.
Customer deposits grew 1% year-on-year to EUR 1,055,936 million at 31 of December 2024.
The Group uses customer funds (customer deposits, excluding repos, plus mutual funds) to analyse traditional retail banking funds. Additionally, in line with the criteria used in 4.2.2 'Balance sheet', we analysed customer funds excluding Poland in both 2024 and 2023 balance sheets. As at 31 December 2024, they amounted to EUR 1,154,759 million and grew 2% year-on-year. Compared to December 2023, customer funds excluding Poland rose 4% in constant euros, as follows:
| | |
| Customer funds (excluding repos) |
EUR billion. Excluding Poland |
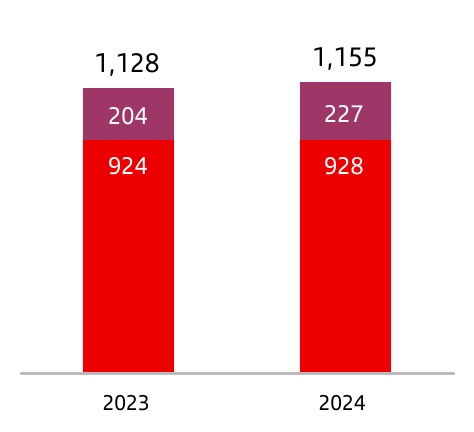
| | | | | |
Dec-24 vs. Dec-23 |
+2 | % | A |
| |
+12 | % | |
| |
0 | % | |
| |
Total |
Mutual fundsB |
Deposits excluding repos |
| |
|
| |
A. In constant euros: +4%.
B. Including managed and marketed funds.
•By product, customer deposits excluding repos rose 1%, with a 1% increase in both demand and time deposits. Mutual funds rose 18%, with widespread increases across all businesses and countries.
•By business, customer funds increased 4% in Retail, mainly driven by time deposits and mutual funds. In Openbank, customer funds rose 11%, in line with our retail deposit gathering strategy. In CIB, customer funds fell 8%, as a result of our strategy to reduce excess corporate deposits while in Wealth they were up 11%, mainly driven by mutual funds.
Customer funds maintained a diversified structure across the markets in which the Group operates. The weight of demand deposits was 55% of total customer funds, while time deposits accounted for 25% and mutual funds 20%.
In addition to capturing customer deposits, for strategic reasons the Group has a selective policy on issuing securities in international fixed income markets and strives to adapt the frequency and volume of its market operations to the structural liquidity needs of each unit, as well as to the receptiveness of each market.
| | |
| Customer funds (excluding repos) |
| % of operating areas. December 2024. Excluding Poland |
4.5 Financial information by segment: 2024 vs 2023
4.5.1 Summary of the Group's main business areas' income statements
| | | | | | | | | | | | | | | | | | | | | |
| 2024 | | | | | | |
| Main items of the underlying income statement | | | | | | |
| EUR million | | | | | | |
| Primary segments | Net interest income | Net fee
income | Total
income | Net operating income | Profit before tax | Underlying profit attributable to the parent |
| Retail & Commercial Banking | 27,854 | | 6,022 | | 33,064 | | 18,359 | | 10,750 | | 7,345 | |
| Openbank | 10,777 | | 1,508 | | 12,877 | | 7,302 | | 2,228 | | 1,659 | |
| Corporate & Investment Banking | 3,779 | | 2,415 | | 7,897 | | 3,975 | | 3,815 | | 2,639 | |
| Wealth Management & Insurance | 1,591 | | 1,442 | | 3,587 | | 2,183 | | 2,134 | | 1,584 | |
| Payment Solutions | 132 | | 958 | | 1,240 | | 31 | | (233) | | (299) | |
| | | | | | | |
| | | | | | | |
| Corporate Centre | (308) | | (11) | | (680) | | (1,220) | | (1,317) | | (1,154) | |
| TOTAL GROUP | 43,824 | | 12,335 | | 57,984 | | 30,630 | | 17,377 | | 11,774 | |
| | | | | | | |
| | | | | | | |
| Secondary segments | | | | | | |
| | | | | | | |
| Spain | 7,256 | | 2,867 | | 11,580 | | 7,071 | | 5,440 | | 3,762 | |
| UK | 4,950 | | 283 | | 5,011 | | 1,962 | | 1,794 | | 1,306 | |
| Portugal | 1,548 | | 467 | | 2,065 | | 1,492 | | 1,481 | | 1,001 | |
| | | | | | | |
| Openbank Europe | 4,361 | | 902 | | 5,644 | | 2,796 | | 1,131 | | 642 | |
| | | | | | | |
| | | | | | | |
| US | 5,693 | | 1,152 | | 7,580 | | 3,615 | | 1,053 | | 1,109 | |
| Mexico | 4,631 | | 1,385 | | 6,278 | | 3,551 | | 2,274 | | 1,671 | |
| | | | | | | |
| | | | | | | |
| Brazil | 10,121 | | 3,414 | | 13,536 | | 8,318 | | 3,830 | | 2,422 | |
| Chile | 1,822 | | 551 | | 2,592 | | 1,650 | | 1,111 | | 629 | |
| Argentina | 2,919 | | 602 | | 2,487 | | 1,150 | | 827 | | 665 | |
| Corporate Centre | (308) | | (11) | | (680) | | (1,220) | | (1,317) | | (1,154) | |
| Rest of the Group | 832 | | 722 | | 1,889 | | 246 | | (248) | | (280) | |
| TOTAL GROUP | 43,824 | | 12,335 | | 57,984 | | 30,630 | | 17,377 | | 11,774 | |
| | |
| Underlying profit attributable to the parent. 2024 distribution |
Distribution A by primary segment |
A. As a % of operating areas. Excluding the Corporate Centre and negative contribution from Payments.
| | |
| Underlying profit attributable to the parent. 2024 |
| EUR million. % change YoY |
| | | | | | | | |
| | | | |
| | | | |
| | | | |
| Retail | | | |
| | | | |
| Openbank | | | |
| | | | |
| CIB | | | |
| | | | |
| Wealth | | | |
| | | | |
| Payments | | | |
| | | | |
| | | | |
| | | | |
| | | | |
| | | | |
| | | | |
| | | | |
| | | | |
| | | | |
| | | | |
| | | | |
| | | | |
| | | |
| | | |
| | | |
| | | |
| | | |
| | | |
| | | |
| | | |
| | | |
| | | |
| | | |
| | | |
| | | |
| | | |
| | | |
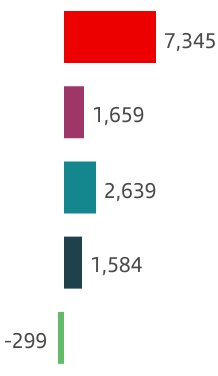
| | | | | |
| Var | Var B |
+25 | % | +27 | % |
-13 | % | -12 | % |
+13 | % | +17 | % |
+17 | % | +18 | % |
+291 | % | +231 | % |
| |
| |
| |
| |
| |
| |
| |
| |
B. Changes in constant euros.
| | | | | | | | | | | | | | | | | | | | |
| 2023 |
| Main items of the underlying income statement |
| EUR million | | | | | | |
| Primary segments | Net interest income | Net fee
income | Total
income | Net operating income | Profit before tax | Underlying profit attributable to the parent |
| | | | | | |
| Retail & Commercial Banking | 25,586 | | 6,077 | | 30,792 | | 16,036 | | 8,195 | | 5,887 | |
| Openbank | 10,221 | | 1,229 | | 12,274 | | 6,748 | | 2,677 | | 1,901 | |
| Corporate & Investment Banking | 3,361 | | 2,013 | | 7,100 | | 3,719 | | 3,578 | | 2,328 | |
| Wealth Management & Insurance | 1,499 | | 1,209 | | 3,082 | | 1,816 | | 1,834 | | 1,360 | |
| Payment Solutions | 92 | | 954 | | 1,134 | | 23 | | (17) | | (77) | |
| | | | | | |
| | | | | | |
| Corporate Centre | (41) | | (13) | | (442) | | (901) | | (961) | | (998) | |
| TOTAL GROUP | 40,718 | | 11,468 | | 53,940 | | 27,439 | | 15,305 | | 10,402 | |
| | | | | | |
| Secondary segments | | | | | | |
| | | | | | |
| | | | | | |
Spain | 6,641 | | 2,699 | | 9,837 | | 5,022 | | 3,399 | | 2,371 | |
UK | 5,152 | | 338 | | 5,358 | | 2,430 | | 2,107 | | 1,545 | |
Portugal | 1,465 | | 464 | | 1,944 | | 1,378 | | 1,314 | | 896 | |
| | | | | | |
Openbank Europe | 4,193 | | 796 | | 5,481 | | 2,730 | | 2,019 | | 1,199 | |
| | | | | | |
| | | | | | |
US | 5,742 | | 766 | | 7,209 | | 3,502 | | 863 | | 932 | |
Mexico | 4,408 | | 1,374 | | 5,899 | | 3,254 | | 2,119 | | 1,560 | |
| | | | | | |
| | | | | | |
Brazil | 9,116 | | 3,462 | | 13,104 | | 7,674 | | 2,911 | | 1,921 | |
Chile | 1,383 | | 572 | | 2,285 | | 1,332 | | 951 | | 582 | |
Argentina | 1,879 | | 396 | | 1,544 | | 713 | | 505 | | 386 | |
| Corporate Centre | (41) | | (13) | | (442) | | (901) | | (961) | | (998) | |
| Rest of the Group | 780 | | 615 | | 1,721 | | 306 | | 77 | | 9 | |
| TOTAL GROUP | 40,718 | | 11,468 | | 53,940 | | 27,439 | | 15,305 | | 10,402 | |
| | | | | | | | | | | | | | | |
| | | |
| | | | | |
| | | Retail & Commercial Banking | Underlying attributable profit | EUR 7,345 mn |
| | | |
| | | |
| | | |
Business performance
Gross loans and advances to customers, excluding reverse repos and in constant euros, decreased 1% year-on-year. Balances fell mainly in the UK (in line with our profitability strategy) and in Spain, still impacted by pre-payments despite a pickup in new business volumes. This was partially offset by increases in Brazil, Mexico and Portugal.
Customer deposits, excluding repos and in constant euros, rose 2%, driven by Spain and Brazil, especially in time deposits. Mutual funds rose 21% in constant euros, with positive performances across most countries. As a result, customer funds increased 4% in constant euros.
| | |
| Retail. 2024 business performance |
| EUR billion and YoY % change in constant euros |
| | | | | | | | | | | | | | | | | | | | | | | | | | | | | | | | | | | | | | |
| Gross loans and advances to customer excl. reverse repos | | Customer deposits excl. repos + mutual funds |
Results
Underlying attributable profit in 2024 was EUR 7,345 million, up 25% compared to 2023. In constant euros, it rose 27% year-on-year, as follows:
•Total income increased 10%, driven by both net interest income and net fee income.
Net interest income increased 11% year-on-year, with rises in most countries, but especially in South America, driven by higher volumes, and in Spain and Portugal due to good margin management. The exceptions were the UK and the US, affected by lower volumes.
Greater commercial activity and a larger loyal customer base contributed to net fee income growth (+3%). The most significant increases were in Brazil, Argentina and the US.
| | |
| Retail. Total income |
| EUR million and YoY % change in constant euros |
•Total costs increased 2%. In real terms, expenses declined 1% reflecting our transformation efforts through organizational simplification, process automation and the deployment of the global platform, as well as lower charges in the 'other operating costs' line. As a result, net operating income increased 18% and efficiency improved to 44.5%.
•Net loan-loss provisions improved 2% year-on-year, due to positive performances across Europe, especially in Spain and the UK (macro outlook improvement in the country), which more than offset greater provisions in Brazil due to higher activity and cost of risk normalization in Mexico and Chile.
•The other gains (losses) and provisions line had an 85% greater loss than in 2023.
Underlying RoTE (post-AT1) in 2024 was 17.6%.
| | | | | | | | | | | | | | | |
| Retail. Underlying income statement |
| EUR million and % change |
| | | | / | 2023 |
| | 2024 | 2023 | | % | % excl. FX |
| | | | | |
| | | | | |
| | | | | |
| Revenue | | 33,064 | 30,792 | | +7 | +10 |
| Total costs | | (14,704) | (14,757) | 0 | +2 |
| Net operating income | | 18,359 | | 16,036 | | +14 | +18 |
| LLPs | | (7,064) | (7,542) | (6) | (2) |
| PBT | | 10,750 | 8,195 | | +31 | +33 |
| Underlying attr. profit | | 7,345 | | 5,887 | | +25 | +27 |
| | | | | | | | |
| Retail Spain | Profit before tax |
EUR 2,824 | mn |
Business performance
Gross loans and advances to customers, excluding reverse repos, decreased 3% year-on-year still impacted by pre-payments despite higher new business volumes.
Customer deposits excluding repos, increased 4% year-on-year, driven by both demand and time deposits. Mutual funds increased 15% year-on-year. As a result, customer funds increased 6% year-on-year.
Results
Profit before tax in 2024 reached EUR 2,824 million, more than double that of 2023. By line item:
•Total income increased 15% mainly due to the pick up in net interest income, driven by good margin management.
•Total costs declined 14%, reflecting the progress achieved in product simplification and process automation and a strong decrease in the 'other operating costs' line. As a result, the efficiency ratio improved to 37.7%.
•Net loan-loss provisions decreased 23%, which resulted in an improvement in the cost of risk and NPL ratio to 0.84% and 3.47%, respectively.
•The other gains (losses) and provisions line recorded losses of EUR 363 million in 2024 and EUR 100 million in 2023.
| | | | | | | | | | | | | |
| Retail Spain. Underlying income statement |
| EUR million and % change |
| | | | / 2023 | |
| | | | | |
| | 2024 | 2023 | | % | |
| | | | | |
| Revenue | | 6,915 | 6,012 | | +15 | |
| Total costs | | (2,606) | (3,048) | (14) | |
| Net operating income | | 4,309 | 2,964 | | +45 | |
| LLPs | | (1,121) | (1,464) | (23) | |
| PBT | | 2,824 | | 1,400 | | +102 | |
| | | | | |
| | | | | | | | |
| Retail UK | Profit before tax |
EUR 1,633 | mn |
Business performance
Gross loans and advances to customers, excluding reverse repos and in constant euros, decreased 4% year-on-year (in line with our profitability strategy). However, the trend in mortgages was positive throughout the year, with a progressive recovery in new business volumes.
Customer deposits, excluding repos and in constant euros, decreased 5% mainly driven by demand deposits. Mutual funds fell 1% year-on-year in constant euros. As a result, customer funds declined 5% in constant euros.
Results
Profit before tax in 2024 was EUR 1,633 million, down 17% year-on-year. In constant euros, it decreased 19%, by line item:
•Total income fell 10% with net interest income down affected by lower volumes.
•Total costs increased 1% in a competitive labour market. Net operating income declined 23% and the efficiency ratio stood at 62.2%.
•Net loan-loss provisions improved 75% driven by positive macro outlook, with a cost of risk of only 3 bps.
•The other gains (losses) and provisions line recorded losses of EUR 104 million, a 35% greater loss year-on-year.
| | | | | | | | | | | | | | | |
Retail UK. Underlying income statement |
| EUR million and % change |
| | | | / | 2023 |
| | 2024 | 2023 | | % | % excl. FX |
| | | | | |
| | | | | |
| | | | | |
| Revenue | | 4,766 | 5,140 | | (7) | (10) |
| Total costs | | (2,965) | (2,858) | +4 | +1 |
| Net operating income | | 1,801 | 2,283 | | (21) | (23) |
| LLPs | | (64) | (247) | (74) | (75) |
| PBT | | 1,633 | | 1,960 | | (17) | (19) |
| | | | | |
Detailed financial information in 4.5.3 'Appendix'.
| | | | | | | | |
| Retail Mexico | Profit before tax |
EUR 1,524 | mn |
Business performance
Gross loans and advances to customers, excluding reverse repos and in constant euros, grew 6% year-on-year, supported by our enhanced commercial offering.
Customer deposits, excluding repos and in constant euros, increased 2% year-on-year, mainly driven by demand deposits. Additionally, mutual funds rose 42% in constant euros. As a result, customer funds grew 11% in constant euros.
Results
Profit before tax reached EUR 1,524 million in 2024 up 6% year-on-year. In constant euros, it increased 9%, as follows:
•Total income rose 7%, mainly driven by a good net interest income performance, supported by higher activity.
•Total costs rose 3%. In real terms, expenses declined 2% even after our investments in transformation. As a result, net operating income increased 11% and the efficiency ratio improved by 1.8 pp to 43.5%.
•Net loan-loss provisions increased 13%, partially driven by loan growth, with a cost of risk of 5.03% and an NPL ratio of 5.25%.
•No other gains (losses) and provisions were recorded in 2024 or 2023.
| | | | | | | | | | | | | | | |
Retail Mexico. Underlying income statement |
| EUR million and % change |
| | | | / | 2023 |
| | 2024 | 2023 | | % | % excl. FX |
| | | | | |
| | | | | |
| | | | | |
| Revenue | | 4,861 | 4,670 | | +4 | +7 |
| Total costs | | (2,114) | | (2,114) | | 0 | +3 |
| Net operating income | | 2,746 | 2,556 | | +7 | +11 |
| LLPs | | (1,222) | | (1,117) | | +9 | +13 |
| PBT | | 1,524 | | 1,439 | | +6 | +9 |
| | | | | |
| | | | | | | | |
| Retail Brazil | Profit before tax |
EUR 1,975 | mn |
Business performance
Gross loans and advances to customers, excluding reverse repos and in constant euros, increased 7%.
Customer deposits increased 10%, excluding repos and in constant euros, driven by time deposits, which rose double digits. Mutual funds increased 2% in constant euros. As a result, customer funds grew 8% in constant euros.
Results
Profit before tax was EUR 1,975 million in 2024, a 73% increase year-on-year. In constant euros, it rose 86%, as follows:
•Total income grew 14% driven by net interest income and higher net fee income, mainly due to volumes in an environment of higher activity.
•Total costs increased 5%, affected by the impact of higher labour costs and greater charges in the 'other operating costs' line. As a result, net operating income increased 21% and the efficiency ratio improved by 3.6 pp to 41.6%.
•Net loan-loss provisions increased 5%, below volume growth.
•No other gains (losses) and provisions were recorded in 2024 and a EUR 62 million loss was recorded in 2023.
| | | | | | | | | | | | | | | |
Retail Brazil. Underlying income statement |
| EUR million and % change |
| | | | / | 2023 |
| | 2024 | 2023 | | % | % excl. FX |
| | | | | |
| | | | | |
| | | | | |
| Revenue | | 9,992 | 9,454 | | +6 | +14 |
| Total costs | | (4,159) | | (4,278) | | (3) | +5 |
| Net operating income | | 5,833 | 5,176 | | +13 | +21 |
| LLPs | | (3,857) | | (3,970) | | (3) | +5 |
| PBT | | 1,975 | | 1,144 | | +73 | +86 |
| | | | | |
Detailed financial information in 4.5.3 'Appendix'.
| | | | | | | | | | | | | | | |
| | | |
| | | | | |
| | | Openbank | Underlying attributable profit | EUR 1,659 mn |
| | | |
| | | |
| | | |
Business performance
New lending increased 4% year-on-year, with notable growth in Brazil. Gross loans and advances to customers, excluding reverse repos and in constant euros, also rose 4% year-on-year, mainly driven by auto in Openbank Europe and Brazil.
Our EUR 16.9 billion leasing portfolio decreased 5% year-on-year in constant euros, as growth in Europe was more than offset by a decline in the US.
Our access to wholesale funding markets remained strong and diversified. Customer deposits accounted for 60% of Openbank's total funding. Excluding repos and in constant euros, deposits were up 10% year-on-year, underpinned by our strategy to lower funding costs and reduce net interest income volatility across the cycle. Mutual funds rose 19% in constant euros, albeit from very low levels. As a result, customer funds increased 11% year-on-year in constant euros.
| | | | | | | | | | | | | | | | | | | | | | | | | | | | | | | | |
| Openbank. 2024 business performance |
| EUR billion and YoY % change in constant euros |
| | | | | |
Openbank Europe | |
Openbank US | |
| |
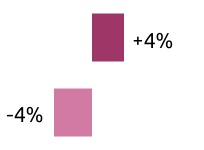
| | | | | |
Openbank Europe | |
Openbank US | |
| |
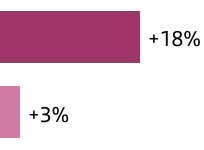
| | | | | | | | | | | | | | | | | | | | | | | | | | | | | | | | | | | | | | |
| Gross loans and advances to customers excl. reverse repos | | Customer deposits excl. repos + mutual funds |
| | | | | | | | | | | | | | | | | | | | | | | | | | | | | | | | |
Openbank. Leasing portfolio |
| EUR billion and YoY % change in constant euros |
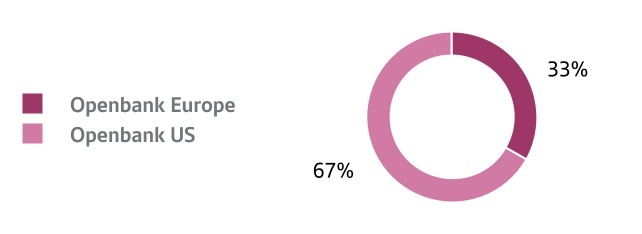 Results
In 2024, underlying attributable profit stood at EUR 1,659 million, 13% lower year-on-year. In constant euros, profit fell 12%, as follows:
•Total income rose 6%, with net interest income up 6%, mainly driven by volumes growth in Brazil and Argentina and repricing actions and higher volumes in Europe.
Net fee income increased strongly (+24%), with double-digit growth across our main units, underpinned by increased insurance penetration in Europe, volumes growth in Brazil and auto servicing fees in the US.
Other income fell, as gains on financial transactions declined, mainly in Europe, and leasing income decreased in the US, primarily due to lower volumes, reduced residual values and the pass-on of fiscal benefits (recorded in the tax line) from electric vehicle (EV) leases to pricing.
| | | | | | | | | | | | | | | | | | | | | | | | | | | | | | | | |
| Openbank. 2024 total income |
| EUR million and YoY % change in constant euros |
| | | | | | | |
| | | |
| Openbank Europe | | | |
| Openbank US* | | |
| Other | | |
| | |
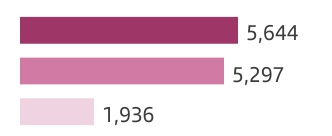
* Year-on-year growth in revenue in the US would have been flat if we included the impact from the EV incentives recorded in the tax line.
•Total costs performed well, increasing slightly year-on-year and declining 1% in real terms, supported by efficiency and transformation efforts in the US and Europe, which partially offset investments in platforms and business growth, as well as higher other operating costs. Consequently, net operating income grew 9% and the efficiency ratio improved 1.7 pp to 43.3%.
•Net loan-loss provisions were up 12%, reflecting continued normalization in Europe, higher volumes, increased CHF mortgage portfolio coverage, some regulatory charges and lower portfolio sales than in 2023. Credit quality remained controlled, with the cost of risk at 2.16% and the NPL ratio at 5.07%.
•Other gains (losses) and provisions registered a loss of EUR 512 million in 2024 (compared to a EUR 35 million gain in 2023), mainly due to the provision for potential complaints related to motor finance dealer commissions in the UK.
As a result, underlying RoTE (post-AT1) stood at 8.8% in 2024.
| | | | | | | | | | | | | | | |
Openbank. Underlying income statement |
| EUR million and % change |
| | | | / | 2023 |
| | 2024 | 2023 | | % | % excl. FX |
| | | | | |
| | | | | |
| | | | | |
| Revenue | | 12,877 | 12,274 | | +5 | +6 |
| Total costs | | (5,576) | (5,526) | +1 | +1 |
| Net operating income | | 7,302 | | 6,748 | | +8 | +9 |
| LLPs | | (4,562) | (4,106) | +11 | +12 |
| PBT | | 2,228 | 2,677 | | (17) | (17) |
| Underlying attr. profit | | 1,659 | | 1,901 | | (13) | (12) |
Detailed financial information in 4.5.3 'Appendix'.
| | | | | | | | |
OB | Openbank Europe | Profit before tax |
EUR 1,131 | mn |
Business performance
New business volumes increased 1% year-on-year in constant euros, mainly underpinned by new auto loans. In turn, gross loans and advances to customers, excluding reverse repos and in constant euros, rose 4% year-on-year, primarily driven by auto balances.
Customer deposits, excluding repos and in constant euros, grew strongly year-on-year (+18%), in line with our strategy to increase retail funding. Mutual funds rose 24% year-on-year in constant euros, albeit from very low levels.
Results
Profit before tax stood at EUR 1,131 million in 2024, 44% lower than in 2023. In constant euros, it also fell 44%, as follows:
•Total income grew 3%, mainly supported by higher net interest income (+4%), on the back of repricing actions and volumes growth, and net fee income (+13%), backed by greater insurance penetration, especially in Germany, and higher fees from our agreements.
•Total costs rose 3%, broadly in line with inflation, mainly due to our investments in platforms and business growth and higher charges linked to the CHF mortgage portfolio, partially offset by savings resulting from our efficiency and transformation efforts.
•Net loan-loss provisions increased 52%, reflecting normalization, volumes growth, higher provisions linked to our CHF mortgage portfolio in Poland, some regulatory impacts and lower portfolio sales compared to the previous year. Cost of risk remained at low levels (0.88%), having normalized in line with expectations.
•Other gains (losses) and provisions recorded a EUR 456 million loss in 2024 (compared to a EUR 82 million gain in 2023), mainly due to the provision for potential complaints related to motor finance dealer commissions in the UK.
| | | | | | | | | | | | | | | |
Openbank Europe. Underlying income statement |
| EUR million and % change |
| | | | / | 2023 |
| | 2024 | 2023 | | % | % excl. FX |
| | | | | |
| | | | | |
| | | | | |
| Revenue | | 5,644 | 5,481 | | +3 | +3 |
| Total costs | | (2,848) | (2,751) | +4 | +3 |
| Net operating income | | 2,796 | 2,730 | | +2 | +2 |
| LLPs | | (1,209) | (792) | +53 | +52 |
| PBT | | 1,131 | 2,019 | | (44) | (44) |
| | | | | |
| | | | | | | | |
| Openbank US | Profit before tax |
EUR 551 | mn |
Business performance
Gross loans and advances to customers, excluding reverse repos and in constant euros, declined 4% year-on-year, in line with our focus on capital optimization and efficient allocation and value creation. The leasing portfolio fell 15% in constant euros, impacted by the wind down of business through our relationship with Stellantis and reduced EV new business volumes.
Customer deposits, excluding repos and in constant euros, rose 2% year-on-year, supported by the launch of our digital bank in Q4 2024. Mutual funds recorded double-digit growth in constant euros, contributing to a 3% increase in customer funds in constant euros.
Results
Profit before tax was 5% higher year-on-year, reaching EUR 551 million. In constant euros, it also grew 5%, as follows:
•Total income decreased slightly, as weaker other income, mainly due to lower leasing results (lower volumes, reduced residual values and pass-on of EV fiscal benefits to pricing) was partially offset by solid net interest income and double-digit growth in net fee income (auto servicing fees).
•Total costs improved 3%, even with investments related to the launch of our digital bank, supported by savings from our transformation initiatives.
•Net loan-loss provisions decreased 1%, on the back of lower provisions in our auto portfolio. Cost of risk stood at 4.44%.
•The other gains (losses) and provisions line posted a loss of EUR 55 million compared to a EUR 46 million loss in 2023.
| | | | | | | | | | | | | | | |
Openbank US. Underlying income statement |
| EUR million and % change |
| | | | / | 2023 |
| | 2024 | 2023 | | % | % excl. FX |
| | | | | |
| | | | | |
| | | | | |
| Revenue | | 5,297 | 5,367 | | (1) | (1) |
| Total costs | | (2,225) | (2,305) | (3) | (3) |
| Net operating income | | 3,072 | 3,062 | | 0 | 0 |
| LLPs | | (2,466) | (2,490) | (1) | (1) |
| PBT | | 551 | 525 | | +5 | +5 |
| | | | | |
| | | | | | | | | | | | | | | |
| | | |
| | | | | |
| | | Corporate & Investment Banking | Underlying attributable profit | EUR 2,639 mn |
| | | |
| | | |
| | | |
Business performance
Gross loans and advances to customers, excluding reverse repos and in constant euros, remained flat year-on-year, as higher activity in Global Markets was offset by lower volumes in Global Transaction Banking and in Global Banking. Customer deposits, excluding repos and in constant euros, fell 10% year-on-year, in line with our strategy to reduce excess corporate deposits.
In Global Transaction Banking (GTB) strong activity in Export Finance and Trade & Working Capital Solutions more than compensated weaker activity in Cash Management, impacted by lower interest rates:
•Export Finance maintained a strong market position driven by our coordinator and underwriter roles in some of the most important transactions.
•Trade & Working Capital Solutions continued to increase collaboration with Financial Sponsors, Leveraged Finance and M&A teams and we outperformed the market backed by our leading innovative solutions.
Global Banking (GB) performed well on the back of growth in Corporate Finance and Global Debt Financing (GDF).
•In Corporate finance, we gained market share in a complex environment, with leading advisory and capital raising roles across our focused industry sectors and higher activity levels in Europe and the US, as a result of our upgraded capabilities and the expansion of our US franchise.
•GDF had the best-ever year in terms of DCM activity and wallet share growth. Structured Finance increased significantly at the end of the year driven by Energy advisory mandates and Fund Finance. Securitized Products in Europe had the most active year in over a decade, being the leading bookrunner in primary cash issuances and as synthetic securitization arranger with fund investments, with increasing activity in Latin America.
Global Markets (GM) saw good activity levels throughout the year in Europe, Asia and the US, while Latin America recovered in the second half of the year. Our investments led to increased client activity, highlighting institutional flows, while our US BBO initiative continued to gain momentum, with most key products implemented and volumes ramping up. There was strong activity in Rates, Securitized Products and Cash Equities.
Results
Underlying attributable profit in 2024 was EUR 2,639 million, up 13% year-on-year. In constant euros, profit grew 17%, as follows:
•Total income rose 14% year-on-year, backed by double-digit growth in net interest income and net fee income. Net interest income grew 16%, boosted by GM. Net fee income increased 22%, driven particularly by GB on the back of the US BBO initiative. Gains on financial transactions decreased 7%, worsening in all business lines except in GTB.
By country, there was double-digit revenue growth in Spain, the US, Mexico and Argentina.
By business, total income rose 24% in GM, on the back of strong activity across European and North American units, mainly with institutional clients. In GB it grew 18% (CF in Europe and the US and GDF across markets). In GTB, total income grew 4% supported by good performance in Export Finance and Trade & Working Capital Solutions.
| | |
| CIB. Total income by business |
| Both EUR million and % change in constant euros |
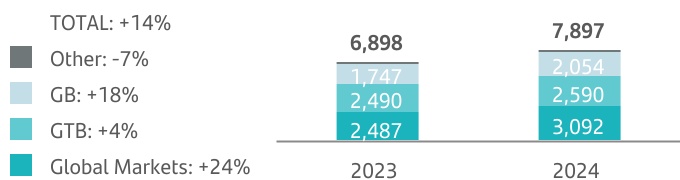 Note: total income includes revenue from other activities which are less material (EUR 174 million in 2023 and EUR 161 million in 2024).
•Total costs increased 18% mainly driven by our investments in new products and capabilities to support growth and the increase in the 'other operating costs' line. As a result, net operating income increased 11% and the efficiency ratio was 49.7%.
•Net loan-loss provisions have a limited impact on results due to the nature of CIB business. They increased year-on-year, though the cost of risk remained low at just 0.08%.
•Other gains (losses) and provisions recorded a EUR 19 million loss compared to a EUR 9 million loss in 2023.
Underlying RoTE (post-AT1) was 16.3%.
| | | | | | | | | | | | | | | |
| CIB. Underlying income statement |
| EUR million and % change |
| | | | / | 2023 |
| | 2024 | 2023 | | % | % excl. FX |
| | | | | |
| | | | | |
| | | | | |
| Revenue | | 7,897 | 7,100 | | +11 | +14 |
| Total costs | | (3,922) | (3,381) | +16 | +18 |
| Net operating income | | 3,975 | 3,719 | +7 | +11 |
| LLPs | | (141) | (132) | +7 | +10 |
| PBT | | 3,815 | 3,578 | | +7 | +11 |
| Underlying attr. profit | | 2,639 | 2,328 | +13 | +17 |
| | | | | | | | | | | | | | | |
| | | |
| | | | | |
| | | Wealth Management & Insurance | Underlying attributable profit | EUR 1,584 mn |
| | | | | |
| | | |
| | | |
| | | |
Business performance
Total assets under management (AuMs) reached EUR 484 billion, +12% year-on-year in constant euros, driven by excellent commercial activity and positive market performance. By business and in constant euros, volumes performed as follows:
•In Private Banking (PB), customer assets and liabilities reached EUR 318 billion, growing 11% year-on-year especially funds and investments.
We offer our customers the benefits of our scale and international presence which is reflected in 14% growth year-on-year in total clients to 283 thousand.
•In Insurance & Asset Management Solutions: total SAM AuMs increased year-on-year on the back of the record commercial activity across countries. Insurance gross written premiums reached EUR 10.8 billion in 2024, -14% year-on-year, impacted particularly by lower activity in savings business.
| | | | | |
| Wealth. 2024 business performance |
| EUR billion and % change in constant euros. December 2024 |
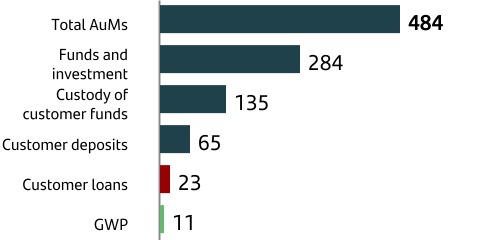
| | |
| / 2023 |
| +12 | % |
| +15 | % |
|
|
| +10 | % |
| +4 | % |
| +6 | % |
| -14 | % |
|
Note: total products marketed, advised, under custody and/or managed.
Results
Underlying attributable profit was EUR 1,584 million, up 17% compared to 2023. In constant euros, it was 18% higher, by line:
•Total income increased 18% year-on-year, supported by solid growth in net fee income and net interest income.
Net interest income increased 7% in a favourable macro environment driven by solid margin management and strong commercial activity in Private Banking.
Net fee income rose 21% year-on-year, with growth across businesses, boosted especially by higher volumes on the back of positive commercial activity and favourable market performance.
Other income improved year-on-year, mainly due to higher activity in PB, as well as to our insurance joint ventures and our investment platform units, both of them under the Insurance & Asset Management Solutions business line.
Including the fees ceded to our commercial network, total revenue reached EUR 5,913 million, up 16%, on the back of higher customer activity in PB as well as higher volumes and good performance of our asset management business.
•Total costs were 12% higher year-on-year, reflecting our investments made to strengthen PB teams and develop new capabilities to address the increase in commercial activity.
•Net loan-loss provisions recorded a EUR 42 million loss compared to net releases of EUR 19 million in 2023.
•The other gains (losses) and provisions recorded an EUR 8 million loss compared to a EUR 1 million loss in 2023.
When considering ceded fees along with our PAT, the total contribution to Group profit (PAT+Fees) reached EUR 3,127 million, up 16% year-on-year.
Underlying RoTE (post-AT1) in 2024 was 68.2%.
| | | | | | | | | | | | | | | |
| Wealth. Underlying income statement |
| EUR million and % change |
| | | | / | 2023 |
| | 2024 | 2023 | | % | % excl. FX |
| | | | | |
| | | | | |
| | | | | |
| Revenue | | 3,587 | 3,082 | | +16 | +18 |
| Total costs | | (1,403) | | (1,266) | | +11 | +12 |
| Net operating income | | 2,183 | 1,816 | | +20 | +22 |
| LLPs | | (42) | 19 | | — | — |
| PBT | | 2,134 | 1,834 | | +16 | +18 |
| Underlying attr. profit | | 1,584 | | 1,360 | | +17 | +18 |
| | | | | | | | | | | | | | | |
| | | |
| | | | | |
| | | Payment Solutions | Underlying attributable profit | -EUR 299 mn |
| | | |
| | | |
| | | |
Business performance
In 2024, activity increased as the total number of transactions in Getnet reached 9.8 billion, 5% higher year-on-year, and total payments volume (TPV) was EUR 222 billion, 13% more than in 2023 in constant euros.
In our A2A payments platform, the number of transactions processed in 2024 increased strongly, reaching 1.2 billion compared to 303 million in 2023.
Payments' loan and deposit portfolios are not material, making up just 0.1% of the Group's total portfolio.
| | | | |
| Getnet. TPV |
| EUR billion and % change in constant euros | | |
Results
In 2024, Payments recorded an underlying attributable loss of EUR 299 million in 2024. If we exclude the charges after discontinuing our merchant platform in Germany and Superdigital in Latin America in Q2 2024, the underlying attributable loss is EUR 56 million, compared to a EUR 77 million loss in 2023. In constant euros:
•Total income rose 14% year-on-year, driven by the increase in both NII and net fee income.
•Total costs grew 11% year-on-year, reflecting continued investment in global payments platforms.
•Net loan-loss provisions have a limited impact on results due to the nature of Payments business. They improved 31% year-on-year.
•Other gains (losses) and provisions recorded a loss of EUR 247 million, impacted by the aforementioned charges related to the discontinuation of our platforms (EUR 243 mn).
EBITDA margin was 27.5%, 2.7 pp higher than in 2023.
| | | | | | | | | | | | | | | |
Payment Solutions. Underlying income statement |
| EUR million and % change |
| | | | | |
| | | | | |
| | | | / | 2023 |
| | 2024 | 2023 | | % | % excl. FX |
| | | | | |
| Revenue | | 1,240 | | 1,134 | | +9 | +14 |
| Total costs | | (1,209) | (1,111) | +9 | +11 |
| Net operating income | | 31 | | 23 | | +37 | 0 |
| LLPs | | (16) | | (24) | | (32) | (31) |
| PBT | | (233) | | (17) | | 0 | +514 |
| Underlying attr. profit | | (299) | | (77) | | +291 | +231 |
Detailed financial information in 4.5.3 'Appendix'.
| | | | | | | | | | | | | | | |
| | | |
| | | | | |
| | | Corporate Centre | Underlying attributable profit | -EUR 1,154 mn |
| | | |
| | | |
Results
The underlying attributable loss in 2024 was EUR 1,154 million, a 16% greater loss than in 2023 (loss of EUR 998 million), with the following breakdown by line item:
•Net interest income worsened by EUR 268 million, as increased liquidity buffer remuneration was offset by greater interest expense related to higher volumes of TLAC/MREL.
•Losses on financial transactions worsened by EUR 106 million, due to the impact from foreign currency hedges and risk transfer initiatives.
•Total costs increased 18% year-on-year, driven by higher expenses in the 'other operating costs' line, partially offset by savings from ongoing simplification measures.
•Net loan-loss provisions recorded a EUR 3 million net release in 2024, after having registered a net release of EUR 2 million in 2023.
•The net negative impact of other gains (losses) and provisions, increased from a EUR 62 million loss in 2023 to a EUR 99 million loss in 2024.
| | | | | | | | | | | | | | | |
| Corporate Centre. Underlying income statement |
| EUR million | | | | | |
| | | | | |
| | | 2024 | 2023 | % |
| Net interest income | | | (308) | | (41) | | 660.3 | |
| Net fee income | | | (11) | | (13) | | (20.6) | |
Gains (losses) on financial transactions A | | | (408) | | (302) | | 35.2 | |
| Other operating income | | | 47 | | (86) | | — | |
| Total income | | | (680) | | (442) | | 53.9 | |
| Total costs | | | (540) | | (460) | | 17.5 | |
| Net operating income | | | (1,220) | | (901) | | 35.4 | |
| Net loan-loss provisions | | | 3 | | 2 | | 25.6 | |
| Other gains (losses) and provisions | | | (99) | | (62) | | 60.0 | |
| Profit before tax | | | (1,317) | | (961) | | 37.0 | |
| Tax on profit | | | 162 | | (36) | | — | |
| Profit from continuing operations | | | (1,155) | | (998) | | 15.7 | |
| Net profit from discontinued operations | | | — | | — | | — | |
| Consolidated profit | | | (1,155) | | (998) | | 15.7 | |
| Non-controlling interests | | | 1 | | 0 | | — | |
| Underlying profit attributable to the parent | | | (1,154) | | (998) | | 15.7 | |
| | | | | |
| | | | | |
| | | | | |
| | | | | |
| | | | | |
| | | | | |
| | | | | |
| | | | | |
| | | | | |
| | | | | |
| | | | | |
| | | | | |
| | | | | |
| | | | | |
| | | | | |
| | | | | |
| | | | | |
| | | | | |
| | | | | |
| | | | | |
| | | | | |
| | | | | |
| | | | | |
| | | | | |
| | | | | |
| | |
| | |
| | |
| | | | | | | | | | | | | | | |
| Corporate Centre. Balance sheet and operating means |
| EUR million |
| | | | | |
| | | Dec-24 | Dec-23 | % |
| | | | | |
| | | | | |
| | | | | |
| | | | | |
| | | | | |
| | | | | |
| | | | | |
| | | | | |
| | | | | |
| | | | | |
| | | | | |
| | | | | |
| | | | | |
| | | | | |
| | | | | |
| | | | | |
| | | | | |
| | | | | |
| Loans and advances to customers | | 6,911 | | 6,531 | | 5.8 | |
| Cash, central banks and credit institutions | | 110,984 | | 126,919 | | (12.6) | |
| Debt instruments | | 10,922 | | 7,727 | | 41.4 | |
| Other financial assets | | 1,444 | | 807 | | 78.9 | |
| Other asset accounts | | 175,693 | | 170,193 | | 3.2 | |
| Total assets | | 305,954 | | 312,177 | | (2.0) | |
| Customer deposits | | 1,430 | | 1,508 | | (5.2) | |
| Central banks and credit institutions | | 26,103 | | 51,332 | | (49.1) | |
| Marketable debt securities | | 121,122 | | 110,144 | | 10.0 | |
| Other financial liabilities | | 48 | | 326 | | (85.4) | |
| Other liabilities accounts | | 64,321 | | 57,961 | | 11.0 | |
| Total liabilities | | 213,024 | | 221,271 | | (3.7) | |
| Total equity | | 92,930 | | 90,906 | | 2.2 | |
| | | | | |
| Memorandum items: | | | | |
| Gross loans and advances to customers B | | 6,997 | | 6,608 | | 5.9 | |
| Customer funds | | 1,299 | | 1,507 | | (13.8) | |
| Customer deposits C | | 1,299 | | 1,508 | | (13.8) | |
| Mutual funds | | — | | — | | — | |
| | | | | |
| Operating means | | | | |
| Number of employees | | 1,825 | | — | | — | |
| | | | | |
| |
| |
| |
| | |
| A. Includes exchange differences. |
| B. Excluding reverse repos. |
| C. Excluding repos. |
4.5.3 Appendix
Primary segments
| | | | | | | | | | | | | | | |
| RETAIL & COMMERCIAL BANKING | | | | |
| EUR million | | | | |
| Underlying income statement | 2024 | 2023 | % | % excl. FX |
| | | | | |
| Net interest income | 27,854 | | 25,586 | | 8.9 | | 11.5 | |
| Net fee income | 6,022 | | 6,077 | | (0.9) | | 3.0 | |
| Gains (losses) on financial transactions ᴬ | 805 | | 837 | | (3.9) | | (2.7) | |
| Other operating income | (1,617) | | (1,707) | | (5.3) | | (4.7) | |
| Total income | 33,064 | | 30,792 | | 7.4 | | 10.4 | |
| Total costs | (14,704) | | (14,757) | | (0.4) | | 2.2 | |
| Net operating income | 18,359 | | 16,036 | | 14.5 | | 17.9 | |
| Net loan-loss provisions | (7,064) | | (7,542) | | (6.3) | | (1.8) | |
| Other gains (losses) and provisions | (545) | | (298) | | 82.8 | | 85.5 | |
| Profit before tax | 10,750 | | 8,195 | | 31.2 | | 33.0 | |
| Tax on profit | (3,132) | | (2,076) | | 50.9 | | 51.4 | |
| Profit from continuing operations | 7,619 | | 6,120 | | 24.5 | | 26.7 | |
| Net profit from discontinued operations | — | | — | | — | | — | |
| Consolidated profit | 7,619 | | 6,120 | | 24.5 | | 26.7 | |
| Non-controlling interests | (273) | | (232) | | 17.7 | | 29.2 | |
| Underlying profit attributable to the parent | 7,345 | | 5,887 | | 24.8 | | 26.6 | |
| | | | | |
| Business volumes | | | | |
| | | | | |
| | | | | |
| | | | | |
| | | | | |
| Gross loans and advances to customers ᴮ | 600,230 | | 611,882 | | (1.9) | | (0.6) | |
| Customer funds | 706,505 | | 688,569 | | 2.6 | | 4.2 | |
| Customer deposits C | 607,094 | | 600,871 | | 1.0 | | 2.0 | |
| Mutual funds | 99,411 | | 87,698 | | 13.4 | | 20.7 | |
| Risk-weighted assets | 285,525 | | 289,187 | | (1.3) | | |
| | | | | |
| Ratios (%), operating means and customers | | | | |
| | | | | |
| RoTE (post-AT1) | 17.6 | | 14.5 | | 3.1 | | |
| Efficiency ratio | 44.5 | | 47.9 | | (3.4) | | |
| NPL ratio | 3.21 | | 3.21 | | 0.00 | | |
| NPL coverage ratio | 63 | | 65 | | (3) | | |
| Number of employees | 135,901 | | — | | — | | |
| | | | | |
| Number of total customers (thousands) | 141,179 | | 132,961 | | 6.2 | | |
| Number of active customers (thousands) | 74,465 | | 70,682 | | 5.4 | | |
| | | | | |
| A. Includes exchange differences. | | | | |
| B. Excluding reverse repos. | | | | |
| C. Excluding repos. | | | | |
| | | | | |
| | | | | | | | | | | | | |
| Retail Spain | | | | |
| EUR million | | | | |
| Underlying income statement | 2024 | 2023 | % | |
| | | | | |
| Net interest income | 5,930 | | 5,160 | | 14.9 | | |
| Net fee income | 1,199 | | 1,219 | | (1.7) | | |
| | | | | |
| | | | | |
| Total income | 6,915 | | 6,012 | | 15.0 | | |
| Total costs | (2,606) | | (3,048) | | (14.5) | | |
| Net operating income | 4,309 | | 2,964 | | 45.3 | | |
| Net loan-loss provisions | (1,121) | | (1,464) | | (23.4) | | |
| | | | | |
| Profit before tax | 2,824 | | 1,400 | | 101.7 | | |
| | | | | |
| | | | | |
| | | | | |
| | | | | |
| | | | | |
| | | | | |
| | | | | |
| Business volumes | | | | |
| | | | | |
| | | | | |
| | | | | |
| | | | | |
| Gross loans and advances to customers ᴬ | 156,118 | | 161,512 | | (3.3) | | |
| Customer funds | 266,230 | | 251,301 | | 5.9 | | |
| Customer deposits ᴮ | 222,089 | | 212,952 | | 4.3 | | |
| Mutual funds | 44,141 | | 38,349 | | 15.1 | | |
| | | | | |
| | | | | |
| | | | | |
| | | | | |
| | | | | |
| | | | | |
| | | | | |
| | | | | |
| | | | | |
| | | | | |
| | | | | |
| | | | | |
| | | | | |
| A. Excluding reverse repos. | | | | |
| B. Excluding repos. | | | | |
| | | | | |
| | | | | | | | | | | | | | | |
| Retail UK | | | | |
| EUR million | | | | |
| Underlying income statement | 2024 | 2023 | % | % excl. FX |
| | | | | |
| Net interest income | 4,760 | | 4,973 | | (4.3) | | (6.8) | |
| Net fee income | 233 | | 302 | | (22.9) | | (25.0) | |
| | | | | |
| | | | | |
| Total income | 4,766 | | 5,140 | | (7.3) | | (9.8) | |
| Total costs | (2,965) | | (2,858) | | 3.7 | | 1.0 | |
| Net operating income | 1,801 | | 2,283 | | (21.1) | | (23.2) | |
| Net loan-loss provisions | (64) | | (247) | | (74.2) | | (74.9) | |
| | | | | |
| Profit before tax | 1,633 | | 1,960 | | (16.7) | | (18.9) | |
| | | | | |
| | | | | |
| | | | | |
| | | | | |
| | | | | |
| | | | | |
| | | | | |
| Business volumes | | | | |
| | | | | |
| | | | | |
| | | | | |
| | | | | |
| Gross loans and advances to customers ᴬ | 233,033 | | 231,856 | | 0.5 | | (3.9) | |
| Customer funds | 217,765 | | 219,820 | | (0.9) | | (5.3) | |
| Customer deposits ᴮ | 211,720 | | 213,965 | | (1.0) | | (5.4) | |
| Mutual funds | 6,045 | | 5,855 | | 3.3 | | (1.3) | |
| | | | | |
| | | | | |
| | | | | |
| | | | | |
| | | | | |
| | | | | |
| | | | | |
| | | | | |
| | | | | |
| | | | | |
| | | | | |
| | | | | |
| | | | | |
| A. Excluding reverse repos. | | | | |
| B. Excluding repos. | | | | |
| | | | | |
| | | | | | | | | | | | | | | |
| Retail Mexico | | | | |
| EUR million | | | | |
| Underlying income statement | 2024 | 2023 | % | % excl. FX |
| | | | | |
| Net interest income | 3,974 | | 3,848 | | 3.3 | | 6.3 | |
| Net fee income | 910 | | 961 | | (5.4) | | (2.6) | |
| | | | | |
| | | | | |
| Total income | 4,861 | | 4,670 | | 4.1 | | 7.2 | |
| Total costs | (2,114) | | (2,114) | | 0.0 | | 3.0 | |
| Net operating income | 2,746 | | 2,556 | | 7.4 | | 10.6 | |
| Net loan-loss provisions | (1,222) | | (1,117) | | 9.4 | | 12.6 | |
| | | | | |
| Profit before tax | 1,524 | | 1,439 | | 5.9 | | 9.1 | |
| | | | | |
| | | | | |
| | | | | |
| | | | | |
| | | | | |
| | | | | |
| | | | | |
| Business volumes | | | | |
| | | | | |
| | | | | |
| | | | | |
| | | | | |
| Gross loans and advances to customers ᴬ | 35,721 | | 38,724 | | (7.8) | | 6.4 | |
| Customer funds | 48,220 | | 50,315 | | (4.2) | | 10.5 | |
| Customer deposits ᴮ | 35,245 | | 39,761 | | (11.4) | | 2.2 | |
| Mutual funds | 12,975 | | 10,554 | | 22.9 | | 41.8 | |
| | | | | |
| | | | | |
| | | | | |
| | | | | |
| | | | | |
| | | | | |
| | | | | |
| | | | | |
| | | | | |
| | | | | |
| | | | | |
| | | | | |
| | | | | |
| A. Excluding reverse repos. | | | | |
| B. Excluding repos. | | | | |
| | | | | |
| | | | | | | | | | | | | | | |
| Retail Brazil | | | | |
| EUR million | | | | |
| Underlying income statement | 2024 | 2023 | % | % excl. FX |
| | | | | |
| Net interest income | 7,811 | | 7,278 | | 7.3 | | 15.5 | |
| Net fee income | 2,327 | | 2,338 | | (0.5) | | 7.1 | |
| | | | | |
| | | | | |
| Total income | 9,992 | | 9,454 | | 5.7 | | 13.8 | |
| Total costs | (4,159) | | (4,278) | | (2.8) | | 4.7 | |
| Net operating income | 5,833 | | 5,176 | | 12.7 | | 21.3 | |
| Net loan-loss provisions | (3,857) | | (3,970) | | (2.8) | | 4.6 | |
| | | | | |
| Profit before tax | 1,975 | | 1,144 | | 72.6 | | 85.8 | |
| | | | | |
| | | | | |
| | | | | |
| | | | | |
| | | | | |
| | | | | |
| | | | | |
| Business volumes | | | | |
| | | | | |
| | | | | |
| | | | | |
| | | | | |
| Gross loans and advances to customers ᴬ | 66,406 | | 74,526 | | (10.9) | | 6.8 | |
| Customer funds | 72,993 | | 81,119 | | (10.0) | | 7.8 | |
| Customer deposits ᴮ | 53,865 | | 58,753 | | (8.3) | | 9.8 | |
| Mutual funds | 19,128 | | 22,366 | | (14.5) | | 2.5 | |
| | | | | |
| | | | | |
| | | | | |
| | | | | |
| | | | | |
| | | | | |
| | | | | |
| | | | | |
| | | | | |
| | | | | |
| | | | | |
| | | | | |
| | | | | |
| A. Excluding reverse repos. | | | | |
| B. Excluding repos. | | | | |
| | | | | |
| | | | | | | | | | | | | | | |
| OPENBANK | | | | |
| EUR million | | | | |
| | | | | |
| Underlying income statement | 2024 | 2023 | % | % excl. FX |
| Net interest income | 10,777 | | 10,221 | | 5.4 | | 6.1 | |
| Net fee income | 1,508 | | 1,229 | | 22.7 | | 23.8 | |
| Gains (losses) on financial transactions ᴬ | (4) | | 116 | | — | | — | |
| Other operating income | 596 | | 709 | | (15.9) | | (16.2) | |
| Total income | 12,877 | | 12,274 | | 4.9 | | 5.6 | |
| Total costs | (5,576) | | (5,526) | | 0.9 | | 1.3 | |
| Net operating income | 7,302 | | 6,748 | | 8.2 | | 9.1 | |
| Net loan-loss provisions | (4,562) | | (4,106) | | 11.1 | | 12.4 | |
| Other gains (losses) and provisions | (512) | | 35 | | 0.0 | | 0.0 | |
| Profit before tax | 2,228 | | 2,677 | | (16.8) | | (16.5) | |
| Tax on profit | (294) | | (426) | | (31.0) | | (30.9) | |
| Profit from continuing operations | 1,934 | | 2,251 | | (14.1) | | (13.8) | |
| Net profit from discontinued operations | — | | — | | — | | — | |
| Consolidated profit | 1,934 | | 2,251 | | (14.1) | | (13.8) | |
| Non-controlling interests | (275) | | (350) | | (21.4) | | (21.2) | |
| Underlying profit attributable to the parent | 1,659 | | 1,901 | | (12.7) | | (12.5) | |
| | | | | |
| Business volumes | | | | |
| | | | | |
| | | | | |
| | | | | |
| | | | | |
| Gross loans and advances to customers ᴮ | 215,164 | | 206,649 | | 4.1 | | 3.6 | |
| Customer funds | 137,122 | | 120,996 | | 13.3 | | 10.8 | |
| Customer deposits C | 128,933 | | 114,334 | | 12.8 | | 10.3 | |
| Mutual funds | 8,189 | | 6,662 | | 22.9 | | 19.4 | |
| Risk-weighted assets | 151,102 | | 154,396 | | (2.1) | | |
| | | | | |
| Ratios (%), operating means and customers | | | | |
| | | | | |
| RoTE (post-AT1) | 8.8 | | 10.6 | | (1.9) | | |
| Efficiency ratio | 43.3 | | 45.0 | | (1.7) | | |
| NPL ratio | 5.07 | | 4.75 | | 0.33 | | |
| NPL coverage ratio | 74 | | 77 | | (3) | | |
| Number of employees | 29,903 | | — | | — | | |
| Number of total customers (thousands) | 25,041 | | 25,413 | | (1.5) | | |
| | | | | |
| A. Includes exchange differences. | | | | |
| B. Excluding reverse repos. | | | | |
| C. Excluding repos. | | | | |
| | | | | |
| | | | | | | | | | | | | | | |
| Openbank Europe | | | | |
| EUR million | | | | |
| Underlying income statement | 2024 | 2023 | % | % excl. FX |
| | | | | |
| Net interest income | 4,361 | | 4,193 | | 4.0 | | 3.8 | |
| Net fee income | 902 | | 796 | | 13.4 | | 13.1 | |
| | | | | |
| | | | | |
| Total income | 5,644 | | 5,481 | | 3.0 | | 2.7 | |
| Total costs | (2,848) | | (2,751) | | 3.5 | | 3.2 | |
| Net operating income | 2,796 | | 2,730 | | 2.4 | | 2.2 | |
| Net loan-loss provisions | (1,209) | | (792) | | 52.6 | | 51.9 | |
| | | | | |
| Profit before tax | 1,131 | | 2,019 | | (44.0) | | (44.1) | |
| | | | | |
| | | | | |
| | | | | |
| | | | | |
| | | | | |
| | | | | |
| | | | | |
| Business volumes | | | | |
| | | | | |
| | | | | |
| | | | | |
| | | | | |
| Gross loans and advances to customers ᴬ | 139,927 | | 135,202 | | 3.5 | | 3.6 | |
| Customer funds | 85,876 | | 72,963 | | 17.7 | | 18.2 | |
| Customer deposits ᴮ | 81,376 | | 69,334 | | 17.4 | | 17.9 | |
| Mutual funds | 4,500 | | 3,629 | | 24.0 | | 24.0 | |
| | | | | |
| | | | | |
| | | | | |
| | | | | |
| | | | | |
| | | | | |
| | | | | |
| | | | | |
| | | | | |
| | | | | |
| | | | | |
| | | | | |
| | | | | |
| A. Excluding reverse repos. | | | | |
| B. Excluding repos. | | | | |
| | | | | |
| | | | | | | | | | | | | | | |
| Openbank US | | | | |
| EUR million | | | | |
| Underlying income statement | 2024 | 2023 | % | % excl. FX |
| | | | | |
| Net interest income | 4,651 | | 4,599 | | 1.1 | | 1.2 | |
| Net fee income | 303 | | 237 | | 28.1 | | 28.2 | |
| | | | | |
| | | | | |
| Total income | 5,297 | | 5,367 | | (1.3) | | (1.2) | |
| Total costs | (2,225) | | (2,305) | | (3.5) | | (3.4) | |
| Net operating income | 3,072 | | 3,062 | | 0.3 | | 0.4 | |
| Net loan-loss provisions | (2,466) | | (2,490) | | (1.0) | | (0.9) | |
| | | | | |
| Profit before tax | 551 | | 525 | | 4.9 | | 5.0 | |
| | | | | |
| | | | | |
| | | | | |
| | | | | |
| | | | | |
| | | | | |
| | | | | |
| Business volumes | | | | |
| | | | | |
| | | | | |
| | | | | |
| | | | | |
| Gross loans and advances to customers ᴬ | 56,266 | | 55,013 | | 2.3 | | (3.9) | |
| Customer funds | 51,230 | | 46,895 | | 9.2 | | 2.7 | |
| Customer deposits ᴮ | 47,541 | | 43,862 | | 8.4 | | 1.9 | |
| Mutual funds | 3,689 | | 3,033 | | 21.6 | | 14.3 | |
| | | | | |
| | | | | |
| | | | | |
| | | | | |
| | | | | |
| | | | | |
| | | | | |
| | | | | |
| | | | | |
| | | | | |
| | | | | |
| | | | | |
| | | | | |
| A. Excluding reverse repos. | | | | |
| B. Excluding repos. | | | | |
| | | | | |
| | | | | | | | | | | | | | | |
| CORPORATE & INVESTMENT BANKING | | | | |
| EUR million | | | | |
| Underlying income statement | 2024 | 2023 | % | % excl. FX |
| | | | | |
| Net interest income | 3,779 | | 3,361 | | 12.4 | | 16.0 | |
| Net fee income | 2,415 | | 2,013 | | 20.0 | | 22.3 | |
| Gains (losses) on financial transactions ᴬ | 1,568 | | 1,748 | | (10.3) | | (7.0) | |
| Other operating income | 136 | | (22) | | — | | — | |
| Total income | 7,897 | | 7,100 | | 11.2 | | 14.5 | |
| Total costs | (3,922) | | (3,381) | | 16.0 | | 17.8 | |
| Net operating income | 3,975 | | 3,719 | | 6.9 | | 11.3 | |
| Net loan-loss provisions | (141) | | (132) | | 6.8 | | 10.3 | |
| Other gains (losses) and provisions | (19) | | (9) | | 113.9 | | 116.2 | |
| Profit before tax | 3,815 | | 3,578 | | 6.6 | | 11.1 | |
| Tax on profit | (1,023) | | (1,086) | | (5.8) | | (1.3) | |
| Profit from continuing operations | 2,792 | | 2,491 | | 12.1 | | 16.5 | |
| Net profit from discontinued operations | — | | — | | — | | — | |
| Consolidated profit | 2,792 | | 2,491 | | 12.1 | | 16.5 | |
| Non-controlling interests | (153) | | (163) | | (5.9) | | 3.7 | |
| Underlying profit attributable to the parent | 2,639 | | 2,328 | | 13.3 | | 17.3 | |
| | | | | |
| Business volumes | | | | |
| | | | | |
| | | | | |
| | | | | |
| | | | | |
| Gross loans and advances to customers ᴮ | 130,840 | | 132,308 | | (1.1) | | (0.2) | |
| Customer funds | 147,492 | | 166,721 | | (11.5) | | (8.3) | |
| Customer deposits C | 133,433 | | 152,156 | | (12.3) | | (10.0) | |
| Mutual funds | 14,059 | | 14,565 | | (3.5) | | 12.5 | |
| Risk-weighted assets | 117,010 | | 109,397 | | 7.0 | | |
| | | | | |
| Ratios (%) and operating means | | | | |
| | | | | |
| RoTE (post-AT1) | 16.3 | | 15.9 | | 0.4 | | |
| Efficiency ratio | 49.7 | | 47.6 | | 2.0 | | |
| NPL ratio | 0.86 | | 1.43 | | (0.56) | | |
| NPL coverage ratio | 39 | | 39 | | 0 | | |
| Number of employees | 12,652 | | — | | — | | |
| | | | | |
| A. Includes exchange differences. | | | | |
| B. Excluding reverse repos. | | | | |
| C. Excluding repos. | | | | |
| | | | | |
| | | | | | | | | | | | | | | |
| WEALTH MANAGEMENT & INSURANCE | | | | |
| EUR million | | | | |
| Underlying income statement | 2024 | 2023 | % | % excl. FX |
| | | | | |
| Net interest income | 1,591 | | 1,499 | | 6.1 | | 7.1 | |
| Net fee income | 1,442 | | 1,209 | | 19.3 | | 20.9 | |
| Gains (losses) on financial transactions ᴬ | 256 | | 178 | | 44.0 | | 45.7 | |
| Other operating income | 298 | | 197 | | 51.0 | | 63.5 | |
| Total income | 3,587 | | 3,082 | | 16.4 | | 18.2 | |
| Total costs | (1,403) | | (1,266) | | 10.8 | | 12.2 | |
| Net operating income | 2,183 | | 1,816 | | 20.2 | | 22.3 | |
| Net loan-loss provisions | (42) | | 19 | | — | | — | |
| Other gains (losses) and provisions | (8) | | (1) | | 548.9 | | 577.6 | |
| Profit before tax | 2,134 | | 1,834 | | 16.3 | | 18.4 | |
| Tax on profit | (509) | | (429) | | 18.7 | | 20.2 | |
| Profit from continuing operations | 1,624 | | 1,405 | | 15.6 | | 17.8 | |
| Net profit from discontinued operations | — | | — | | — | | — | |
| Consolidated profit | 1,624 | | 1,405 | | 15.6 | | 17.8 | |
| Non-controlling interests | (40) | | (45) | | (11.4) | | (3.1) | |
| Underlying profit attributable to the parent | 1,584 | | 1,360 | | 16.5 | | 18.5 | |
| | | | | |
| Business volumes | | | | |
| | | | | |
| | | | | |
| | | | | |
| | | | | |
| Gross loans and advances to customers ᴮ | 24,643 | | 22,550 | | 9.3 | | 8.3 | |
| Customer funds | 161,304 | | 148,292 | | 8.8 | | 11.2 | |
| Customer deposits C | 55,736 | | 53,599 | | 4.0 | | 3.6 | |
| Mutual funds | 105,568 | | 94,693 | | 11.5 | | 15.7 | |
| Risk-weighted assets | 11,709 | | 18,066 | | (35.2) | | |
| Assets under management | 483,695 | | 448,297 | | 7.9 | | 12.3 | |
| Gross written premiums | 10,752 | | 12,937 | | (16.9) | | (13.7) | |
| | | | | |
| Ratios (%), operating means and customers | | | | |
| | | | | |
| RoTE (post-AT1) | 68.2 | | 61.8 | | 6.4 | | |
| Efficiency ratio | 39.1 | | 41.1 | | (2.0) | | |
| NPL ratio | 0.98 | | 1.39 | | (0.41) | | |
| NPL coverage ratio | 68 | | 29 | | 38 | | |
| Number of employees | 7,425 | | — | | — | | |
| Number of Private Banking customers (thousands) | 283 | | 247 | | 14.4 | | |
| | | | | |
| A. Includes exchange differences. | | | | |
| B. Excluding reverse repos. | | | | |
| C. Excluding repos. | | | | |
| | | | | |
| | | | | | | | | | | | | | | |
| PAYMENT SOLUTIONS | | | | |
| EUR million | | | | |
| Underlying income statement | 2024 | 2023 | % | % excl. FX |
| | | | | |
| Net interest income | 132 | | 92 | | 42.6 | | 50.2 | |
| Net fee income | 958 | | 954 | | 0.5 | | 5.2 | |
| Gains (losses) on financial transactions ᴬ | 0 | | (10) | | (97.5) | | (97.4) | |
| Other operating income | 150 | | 97 | | 54.2 | | 56.1 | |
| Total income | 1,240 | | 1,134 | | 9.3 | | 14.2 | |
| Total costs | (1,209) | | (1,111) | | 8.8 | | 11.5 | |
| Net operating income | 31 | | 23 | | 36.7 | | — | |
| Net loan-loss provisions | (16) | | (24) | | (32.5) | | (30.9) | |
| Other gains (losses) and provisions | (247) | | (15) | | — | | — | |
| Profit before tax | (233) | | (17) | | — | | 514.3 | |
| Tax on profit | (57) | | (59) | | (3.0) | | 10.2 | |
| Profit from continuing operations | (290) | | (75) | | 285.5 | | 223.9 | |
| Net profit from discontinued operations | — | | — | | — | | — | |
| Consolidated profit | (290) | | (75) | | 285.5 | | 223.9 | |
| Non-controlling interests | (9) | | (1) | | 571.7 | | — | |
| Underlying profit attributable to the parent | (299) | | (77) | | 290.7 | | 231.4 | |
| | | | | |
| Business volumes | | | | |
| | | | | |
| | | | | |
| | | | | |
| | | | | |
| Gross loans and advances to customers ᴮ | 1,087 | | 1,194 | | (8.9) | | 5.5 | |
| Customer funds | 1,038 | | 1,418 | | (26.8) | | (26.8) | |
| Customer deposits C | 1,038 | | 1,418 | | (26.8) | | (26.8) | |
| Mutual funds | — | | — | | — | | — | |
| Risk-weighted assets | 4,898 | | 5,428 | | (9.8) | | |
| | | | | |
| Ratios (%) and operating means | | | | |
| | | | | |
| | | | | |
| EBITDA margin | 27.5 | | 24.8 | | 2.7 | | |
| Efficiency ratio | 97.5 | | 98.0 | | (0.5) | | |
| | | | | |
| Number of employees | 8,382 | | — | | — | | |
| | | | | |
| A. Includes exchange differences. | | | | |
| B. Excluding reverse repos. | | | | |
| C. Excluding repos. | | | | |
| | | | | |
Secondary segments
| | | | | | | | | | | | | | | | | | | | | | | | | | | | | | | | | | |
| | | | | | | | | | | | |
| EUR million | | | | | | | | | | | | |
| | | Spain | | | | UK |
| Underlying income statement | | | 2024 | 2023 | % | | | | 2024 | 2023 | % | % excl. FX |
| | | | | | | |
| | | | | | | | | | | | |
| Net interest income | | | 7,256 | | 6,641 | | 9.3 | | | | | 4,950 | | 5,152 | | (3.9) | | (6.5) | |
| Net fee income | | | 2,867 | | 2,699 | | 6.2 | | | | | 283 | | 338 | | (16.2) | | (18.4) | |
Gains (losses) on financial transactions A | | | 1,100 | | 688 | | 59.9 | | | | | (18) | | 29 | | — | | — | |
| Other operating income | | | 358 | | (190) | | — | | | | | (203) | | (162) | | 25.7 | | 22.4 | |
| Total income | | | 11,580 | | 9,837 | | 17.7 | | | | | 5,011 | | 5,358 | | (6.5) | | (9.0) | |
| Total costs | | | (4,509) | | (4,815) | | (6.4) | | | | | (3,050) | | (2,928) | | 4.2 | | 1.4 | |
| Net operating income | | | 7,071 | | 5,022 | | 40.8 | | | | | 1,962 | | 2,430 | | (19.3) | | (21.4) | |
| Net loan-loss provisions | | | (1,259) | | (1,522) | | (17.3) | | | | | (64) | | (247) | | (74.2) | | (74.9) | |
| Other gains (losses) and provisions | | | (372) | | (100) | | 270.3 | | | | | (104) | | (75) | | 38.2 | | 34.5 | |
| Profit before tax | | | 5,440 | | 3,399 | | 60.1 | | | | | 1,794 | | 2,107 | | (14.9) | | (17.1) | |
| Tax on profit | | | (1,678) | | (1,029) | | 63.1 | | | | | (488) | | (563) | | (13.3) | | (15.6) | |
| Profit from continuing operations | | | 3,763 | | 2,371 | | 58.7 | | | | | 1,306 | | 1,545 | | (15.4) | | (17.7) | |
| Net profit from discontinued operations | | | — | | — | | — | | | | | — | | — | | — | | — | |
| Consolidated profit | | | 3,763 | | 2,371 | | 58.7 | | | | | 1,306 | | 1,545 | | (15.4) | | (17.7) | |
| Non-controlling interests | | | 0 | | 0 | | 106.8 | | | | | — | | — | | — | | — | |
| Underlying profit attributable to the parent | | | 3,762 | | 2,371 | | 58.7 | | | | | 1,306 | | 1,545 | | (15.4) | | (17.7) | |
| | | | | | | | | | | | |
| Balance sheet | | | | | | | | | | | | |
| Loans and advances to customers | | | 246,897 | | 239,214 | | 3.2 | | | | | 246,453 | | 245,743 | | 0.3 | | (4.1) | |
| Cash, central banks and credit institutions | | | 97,838 | | 113,091 | | (13.5) | | | | | 54,787 | | 62,387 | | (12.2) | | (16.1) | |
| Debt instruments | | | 94,519 | | 70,072 | | 34.9 | | | | | 15,120 | | 10,234 | | 47.7 | | 41.2 | |
| Other financial assets | | | 48,132 | | 40,926 | | 17.6 | | | | | 390 | | 289 | | 35.0 | | 29.1 | |
| Other asset accounts | | | 22,341 | | 22,497 | | (0.7) | | | | | 3,382 | | 4,363 | | (22.5) | | (25.9) | |
| Total assets | | | 509,726 | | 485,799 | | 4.9 | | | | | 320,132 | | 323,016 | | (0.9) | | (5.3) | |
| Customer deposits | | | 323,425 | | 324,099 | | (0.2) | | | | | 230,408 | | 233,453 | | (1.3) | | (5.7) | |
| Central banks and credit institutions | | | 57,218 | | 44,802 | | 27.7 | | | | | 25,665 | | 28,202 | | (9.0) | | (13.0) | |
| Marketable debt securities | | | 27,385 | | 28,486 | | (3.9) | | | | | 47,933 | | 43,850 | | 9.3 | | 4.5 | |
| Other financial liabilities | | | 59,976 | | 46,532 | | 28.9 | | | | | 2,500 | | 3,434 | | (27.2) | | (30.4) | |
| Other liabilities accounts | | | 21,163 | | 22,264 | | (4.9) | | | | | 1,733 | | 1,704 | | 1.7 | | (2.8) | |
| Total liabilities | | | 489,168 | | 466,184 | | 4.9 | | | | | 308,239 | | 310,642 | | (0.8) | | (5.2) | |
| Total equity | | | 20,558 | | 19,615 | | 4.8 | | | | | 11,893 | | 12,373 | | (3.9) | | (8.1) | |
| | | | | | | | | | | | |
| Memorandum items: | | | | | | | | | | | | |
Gross loans and advances to customers B | | | 225,759 | | 229,803 | | (1.8) | | | | | 236,496 | | 235,111 | | 0.6 | | (3.9) | |
| Customer funds | | | 399,999 | | 386,810 | | 3.4 | | | | | 230,479 | | 231,667 | | (0.5) | | (4.9) | |
Customer deposits C | | | 306,389 | | 308,745 | | (0.8) | | | | | 222,835 | | 224,396 | | (0.7) | | (5.1) | |
| Mutual funds | | | 93,609 | | 78,065 | | 19.9 | | | | | 7,643 | | 7,272 | | 5.1 | | 0.5 | |
| | | | | | | | | | | | |
| Ratios (%), operating means and customers | | | | | | | | | | | | |
| | | | | | | | | | | | |
RoTE (post-AT1) | | | 18.3 | | 11.8 | | 6.4 | | | | | 10.6 | | 12.5 | | (2.0) | | |
| Efficiency ratio | | | 38.9 | | 48.9 | | (10.0) | | | | | 60.9 | | 54.6 | | 6.2 | | |
| NPL ratio | | | 2.66 | | 3.04 | | (0.38) | | | | | 1.33 | | 1.42 | | (0.09) | | |
| NPL coverage ratio | | | 53 | | 49 | | 4 | | | | | 29 | | 30 | | (1) | | |
| | | | | | | | | | | | |
| Number of branches | | | 1,827 | | 1,874 | | (2.5) | | | | | 444 | | 444 | | — | | |
| Number of total customers (thousands) | | | 15,307 | | 15,023 | | 1.9 | | | | | 22,541 | | 22,481 | | 0.3 | | |
| Number of active customers (thousands) | | | 8,842 | | 8,367 | | 5.7 | | | | | 13,646 | | 13,864 | | (1.6) | | |
| | | | | | | | | | | | |
| A. Includes exchange differences. | | | | | | | | | | | | |
| B. Excluding reverse repos. | | | | | | | | | | | | |
| C. Excluding repos. | | | | | | | | | | | | |
| |
| | | | | | | | | | | | | | | | | | | | | | | | | | | | | | | | | | | |
| | | | | | | | | | | | | |
| EUR million | | | | | | | | | | | | | |
| | | Portugal | | | | Openbank Europe | |
| Underlying income statement | | | 2024 | 2023 | % | | | | 2024 | 2023 | % | % excl. FX | |
| | | | | | | |
| | | | | | | | | | | | | |
| Net interest income | | | 1,548 | | 1,465 | | 5.7 | | | | | 4,361 | | 4,193 | | 4.0 | | 3.8 | | |
| Net fee income | | | 467 | | 464 | | 0.8 | | | | | 902 | | 796 | | 13.4 | | 13.1 | | |
Gains (losses) on financial transactions A | | | 45 | | 33 | | 35.3 | | | | | (24) | | 117 | | — | | — | | |
| Other operating income | | | 5 | | (17) | | — | | | | | 405 | | 375 | | 8.0 | | 7.2 | | |
| Total income | | | 2,065 | | 1,944 | | 6.2 | | | | | 5,644 | | 5,481 | | 3.0 | | 2.7 | | |
| Total costs | | | (574) | | (567) | | 1.2 | | | | | (2,848) | | (2,751) | | 3.5 | | 3.2 | | |
| Net operating income | | | 1,492 | | 1,378 | | 8.3 | | | | | 2,796 | | 2,730 | | 2.4 | | 2.2 | | |
| Net loan-loss provisions | | | (11) | | (77) | | (85.7) | | | | | (1,209) | | (792) | | 52.6 | | 51.9 | | |
| Other gains (losses) and provisions | | | — | | 14 | | (100.0) | | | | | (456) | | 82 | | — | | — | | |
| Profit before tax | | | 1,481 | | 1,314 | | 12.7 | | | | | 1,131 | | 2,019 | | (44.0) | | (44.1) | | |
| Tax on profit | | | (478) | | (416) | | 14.9 | | | | | (255) | | (493) | | (48.2) | | (48.3) | | |
| Profit from continuing operations | | | 1,003 | | 898 | | 11.6 | | | | | 876 | | 1,526 | | (42.6) | | (42.7) | | |
| Net profit from discontinued operations | | | — | | — | | — | | | | | — | | — | | — | | — | | |
| Consolidated profit | | | 1,003 | | 898 | | 11.6 | | | | | 876 | | 1,526 | | (42.6) | | (42.7) | | |
| Non-controlling interests | | | (2) | | (2) | | 4.6 | | | | | (234) | | (327) | | (28.7) | | (28.8) | | |
| Underlying profit attributable to the parent | | | 1,001 | | 896 | | 11.7 | | | | | 642 | | 1,199 | | (46.5) | | (46.5) | | |
| | | | | | | | | | | | | |
| Balance sheet | | | | | | | | | | | | | |
| Loans and advances to customers | | | 38,410 | | 36,864 | | 4.2 | | | | | 137,038 | | 132,692 | | 3.3 | | 3.4 | | |
| Cash, central banks and credit institutions | | | 3,873 | | 8,084 | | (52.1) | | | | | 19,185 | | 18,636 | | 2.9 | | 3.1 | | |
| Debt instruments | | | 15,010 | | 10,991 | | 36.6 | | | | | 6,310 | | 5,387 | | 17.1 | | 17.8 | | |
| Other financial assets | | | 1,129 | | 1,078 | | 4.7 | | | | | 128 | | 135 | | (5.3) | | (5.4) | | |
| Other asset accounts | | | 1,109 | | 1,279 | | (13.3) | | | | | 11,115 | | 9,945 | | 11.8 | | 11.3 | | |
| Total assets | | | 59,530 | | 58,297 | | 2.1 | | | | | 173,775 | | 166,796 | | 4.2 | | 4.3 | | |
| Customer deposits | | | 38,304 | | 36,366 | | 5.3 | | | | | 81,376 | | 69,334 | | 17.4 | | 17.9 | | |
| Central banks and credit institutions | | | 8,813 | | 9,237 | | (4.6) | | | | | 28,120 | | 31,965 | | (12.0) | | (12.9) | | |
| Marketable debt securities | | | 4,973 | | 4,813 | | 3.3 | | | | | 43,137 | | 44,605 | | (3.3) | | (3.1) | | |
| Other financial liabilities | | | 339 | | 319 | | 6.3 | | | | | 1,918 | | 2,218 | | (13.5) | | (13.7) | | |
| Other liabilities accounts | | | 3,056 | | 3,725 | | (18.0) | | | | | 5,714 | | 5,233 | | 9.2 | | 9.5 | | |
| Total liabilities | | | 55,485 | | 54,460 | | 1.9 | | | | | 160,264 | | 153,355 | | 4.5 | | 4.6 | | |
| Total equity | | | 4,046 | | 3,837 | | 5.4 | | | | | 13,512 | | 13,441 | | 0.5 | | 0.8 | | |
| | | | | | | | | | | | | |
| Memorandum items: | | | | | | | | | | | | | |
Gross loans and advances to customers B | | | 39,143 | | 37,658 | | 3.9 | | | | | 139,927 | | 135,202 | | 3.5 | | 3.6 | | |
| Customer funds | | | 43,186 | | 40,618 | | 6.3 | | | | | 85,876 | | 72,963 | | 17.7 | | 18.2 | | |
Customer deposits C | | | 38,304 | | 36,366 | | 5.3 | | | | | 81,376 | | 69,334 | | 17.4 | | 17.9 | | |
| Mutual funds | | | 4,882 | | 4,252 | | 14.8 | | | | | 4,500 | | 3,629 | | 24.0 | | 24.0 | | |
| | | | | | | | | | | | | |
| Ratios (%), operating means and customers | | | | | | | | | | | | | |
| | | | | | | | | | | | | |
| RoTE (post-AT1) | | | 25.0 | | 25.6 | | (0.6) | | | | | 5.5 | | 11.6 | | (6.1) | | | |
| Efficiency ratio | | | 27.8 | | 29.1 | | (1.4) | | | | | 50.5 | | 50.2 | | 0.3 | | | |
| NPL ratio | | | 2.27 | | 2.41 | | (0.14) | | | | | 2.50 | | 2.12 | | 0.37 | | | |
| NPL coverage ratio | | | 78 | | 83 | | (5) | | | | | 83 | | 88 | | (5) | | | |
| | | | | | | | | | | | | |
| Number of branches | | | 374 | | 376 | | (0.5) | | | | | 326 | | 342 | | (4.7) | | | |
| Number of total customers (thousands) | | | 2,989 | | 2,908 | | 2.8 | | | | | 19,550 | | 20,193 | | (3.2) | | | |
| Number of active customers (thousands) | | | 1,905 | | 1,838 | | 3.6 | | | | | | | | | |
| | | | | | | | | | | | | |
| A. Includes exchange differences. | | | | | | | | | | | | | |
| B. Excluding reverse repos. | | | | | | | | | | | | | |
| C. Excluding repos. | | | | | | | | | | | | | |
| |
| | | | | | | | | | | | | | | | | | | | | | | | | | | | | | | | | | | | |
| | | | | | | | | | | | |
| EUR million | | | | | | | | | | | | |
| | | US | | | Mexico |
| Underlying income statement | | | 2024 | 2023 | % | % excl. FX | | | 2024 | 2023 | % | % excl. FX |
| | | | | | |
| | | | | | | | | | | | |
| Net interest income | | | 5,693 | | 5,742 | | (0.9) | | (0.8) | | | | 4,631 | | 4,408 | | 5.0 | | 8.1 | |
| Net fee income | | | 1,152 | | 766 | | 50.3 | | 50.4 | | | | 1,385 | | 1,374 | | 0.8 | | 3.8 | |
Gains (losses) on financial transactions A | | | 371 | | 294 | | 25.8 | | 25.9 | | | | 396 | | 211 | | 88.0 | | 93.5 | |
| Other operating income | | | 365 | | 406 | | (10.1) | | (10.1) | | | | (133) | | (94) | | 41.7 | | 45.9 | |
| Total income | | | 7,580 | | 7,209 | | 5.1 | | 5.2 | | | | 6,278 | | 5,899 | | 6.4 | | 9.6 | |
| Total costs | | | (3,965) | | (3,707) | | 7.0 | | 7.0 | | | | (2,727) | | (2,645) | | 3.1 | | 6.1 | |
| Net operating income | | | 3,615 | | 3,502 | | 3.2 | | 3.3 | | | | 3,551 | | 3,254 | | 9.1 | | 12.4 | |
| Net loan-loss provisions | | | (2,507) | | (2,593) | | (3.3) | | (3.3) | | | | (1,277) | | (1,135) | | 12.5 | | 15.8 | |
| Other gains (losses) and provisions | | | (55) | | (46) | | 19.0 | | 19.1 | | | | — | | — | | — | | — | |
| Profit before tax | | | 1,053 | | 863 | | 22.0 | | 22.1 | | | | 2,274 | | 2,119 | | 7.3 | | 10.5 | |
| Tax on profit | | | 56 | | 69 | | (19.1) | | (19.1) | | | | (598) | | (541) | | 10.5 | | 13.7 | |
| Profit from continuing operations | | | 1,109 | | 932 | | 19.0 | | 19.0 | | | | 1,676 | | 1,577 | | 6.3 | | 9.4 | |
| Net profit from discontinued operations | | | — | | — | | — | | — | | | | — | | — | | — | | — | |
| Consolidated profit | | | 1,109 | | 932 | | 19.0 | | 19.0 | | | | 1,676 | | 1,577 | | 6.3 | | 9.4 | |
| Non-controlling interests | | | — | | — | | — | | — | | | | (5) | | (17) | | (73.0) | | (72.2) | |
| Underlying profit attributable to the parent | | | 1,109 | | 932 | | 19.0 | | 19.0 | | | | 1,671 | | 1,560 | | 7.2 | | 10.3 | |
| | | | | | | | | | | | |
| Balance sheet | | | | | | | | | | | | |
| Loans and advances to customers | | | 134,856 | | 126,843 | | 6.3 | | (0.1) | | | | 45,054 | | 47,905 | | (6.0) | | 8.5 | |
| Cash, central banks and credit institutions | | | 28,200 | | 21,215 | | 32.9 | | 24.9 | | | | 10,945 | | 14,088 | | (22.3) | | (10.4) | |
| Debt instruments | | | 27,042 | | 22,686 | | 19.2 | | 12.0 | | | | 30,092 | | 27,624 | | 8.9 | | 25.6 | |
| Other financial assets | | | 2,821 | | 4,075 | | (30.8) | | (34.9) | | | | 5,785 | | 6,723 | | (14.0) | | (0.8) | |
| Other asset accounts | | | 16,058 | | 16,307 | | (1.5) | | (7.4) | | | | 5,745 | | 6,156 | | (6.7) | | 7.6 | |
| Total assets | | | 208,978 | | 191,126 | | 9.3 | | 2.8 | | | | 97,621 | | 102,496 | | (4.8) | | 9.8 | |
| Customer deposits | | | 125,403 | | 121,782 | | 3.0 | | (3.2) | | | | 49,836 | | 53,703 | | (7.2) | | 7.0 | |
| Central banks and credit institutions | | | 26,794 | | 17,411 | | 53.9 | | 44.7 | | | | 17,260 | | 17,047 | | 1.3 | | 16.8 | |
| Marketable debt securities | | | 31,783 | | 27,059 | | 17.5 | | 10.4 | | | | 9,632 | | 8,074 | | 19.3 | | 37.6 | |
| Other financial liabilities | | | 5,223 | | 7,276 | | (28.2) | | (32.5) | | | | 9,640 | | 11,189 | | (13.8) | | (0.6) | |
| Other liabilities accounts | | | 3,683 | | 3,119 | | 18.1 | | 11.0 | | | | 3,115 | | 3,579 | | (13.0) | | 0.3 | |
| Total liabilities | | | 192,886 | | 176,646 | | 9.2 | | 2.6 | | | | 89,483 | | 93,592 | | (4.4) | | 10.3 | |
| Total equity | | | 16,091 | | 14,480 | | 11.1 | | 4.5 | | | | 8,138 | | 8,904 | | (8.6) | | 5.4 | |
| | | | | | | | | | | | |
| Memorandum items: | | | | | | | | | | | | |
Gross loans and advances to customers B | | | 117,511 | | 112,671 | | 4.3 | | (2.0) | | | | 44,715 | | 48,688 | | (8.2) | | 5.9 | |
| Customer funds | | | 108,246 | | 108,062 | | 0.2 | | (5.8) | | | | 61,160 | | 62,775 | | (2.6) | | 12.4 | |
Customer deposits C | | | 93,545 | | 95,697 | | (2.2) | | (8.1) | | | | 41,528 | | 45,693 | | (9.1) | | 4.8 | |
| Mutual funds | | | 14,702 | | 12,364 | | 18.9 | | 11.8 | | | | 19,632 | | 17,082 | | 14.9 | | 32.5 | |
| | | | | | | | | | | | |
| Ratios (%), operating means and customers | | | | | | | | | | | | |
| | | | | | | | | | | | |
RoTE (post-AT1) | | | 6.9 | | 5.6 | | 1.3 | | | | | 19.6 | | 17.4 | | 2.2 | | |
| Efficiency ratio | | | 52.3 | | 51.4 | | 0.9 | | | | | 43.4 | | 44.8 | | (1.4) | | |
| NPL ratio | | | 4.68 | | 4.57 | | 0.11 | | | | | 2.71 | | 2.82 | | (0.11) | | |
| NPL coverage ratio | | | 64 | | 68 | | (4) | | | | | 100 | | 100 | | 0 | | |
| | | | | | | | | | | | |
| Number of branches | | | 405 | | 415 | | (2.4) | | | | | 1,356 | | 1,369 | | (0.9) | | |
| Number of total customers (thousands) | | | 4,474 | | 4,510 | | (0.8) | | | | | 21,289 | | 20,517 | | 3.8 | | |
| Number of active customers (thousands) | | | 4,308 | | 4,223 | | 2.0 | | | | | 10,871 | | 10,263 | | 5.9 | | |
| | | | | | | | | | | | |
| A. Includes exchange differences. | | | | | | | | | | | | |
| B. Excluding reverse repos. | | | | | | | | | | | | |
| C. Excluding repos. | | | | | | | | | | | | |
|
| | | | | | | | | | | | | | | | | | | | | | | | | | | | | | | | | | | | |
| | | | | | | | | | | | |
| EUR million | | | | | | | | | | | | |
| | | Brazil | | | Chile |
| Underlying income statement | | | 2024 | 2023 | % | % excl. FX | | | 2024 | 2023 | % | % excl. FX |
| | | | | | |
| | | | | | | | | | | | |
| Net interest income | | | 10,121 | | 9,116 | | 11.0 | | 19.5 | | | | 1,822 | | 1,383 | | 31.8 | | 48.3 | |
| Net fee income | | | 3,414 | | 3,462 | | (1.4) | | 6.1 | | | | 551 | | 572 | | (3.7) | | 8.4 | |
Gains (losses) on financial transactions A | | | (37) | | 483 | | — | | — | | | | 238 | | 320 | | (25.7) | | (16.3) | |
| Other operating income | | | 39 | | 43 | | (10.3) | | (3.4) | | | | (18) | | 11 | | — | | — | |
| Total income | | | 13,536 | | 13,104 | | 3.3 | | 11.2 | | | | 2,592 | | 2,285 | | 13.4 | | 27.7 | |
| Total costs | | | (5,219) | | (5,430) | | (3.9) | | 3.4 | | | | (942) | | (953) | | (1.1) | | 11.3 | |
| Net operating income | | | 8,318 | | 7,674 | | 8.4 | | 16.7 | | | | 1,650 | | 1,332 | | 23.8 | | 39.4 | |
| Net loan-loss provisions | | | (4,487) | | (4,701) | | (4.5) | | 2.7 | | | | (497) | | (365) | | 36.1 | | 53.2 | |
| Other gains (losses) and provisions | | | 0 | | (62) | | (99.4) | | (99.4) | | | | (42) | | (16) | | 169.3 | | 203.2 | |
| Profit before tax | | | 3,830 | | 2,911 | | 31.6 | | 41.6 | | | | 1,111 | | 951 | | 16.7 | | 31.4 | |
| Tax on profit | | | (1,165) | | (776) | | 50.1 | | 61.6 | | | | (211) | | (135) | | 56.1 | | 75.7 | |
| Profit from continuing operations | | | 2,665 | | 2,135 | | 24.8 | | 34.4 | | | | 899 | | 816 | | 10.2 | | 24.1 | |
| Net profit from discontinued operations | | | — | | — | | — | | — | | | | — | | — | | — | | — | |
| Consolidated profit | | | 2,665 | | 2,135 | | 24.8 | | 34.4 | | | | 899 | | 816 | | 10.2 | | 24.1 | |
| Non-controlling interests | | | (243) | | (215) | | 13.2 | | 21.9 | | | | (271) | | (234) | | 15.5 | | 30.0 | |
| Underlying profit attributable to the parent | | | 2,422 | | 1,921 | | 26.1 | | 35.8 | | | | 629 | | 582 | | 8.1 | | 21.7 | |
| | | | | | | | | | | | |
| Balance sheet | | | | | | | | | | | | |
| Loans and advances to customers | | | 88,620 | | 96,399 | | (8.1) | | 10.1 | | | | 40,332 | | 42,616 | | (5.4) | | 1.2 | |
| Cash, central banks and credit institutions | | | 46,745 | | 53,618 | | (12.8) | | 4.4 | | | | 5,759 | | 6,373 | | (9.6) | | (3.3) | |
| Debt instruments | | | 45,670 | | 47,325 | | (3.5) | | 15.6 | | | | 7,993 | | 13,273 | | (39.8) | | (35.6) | |
| Other financial assets | | | 10,632 | | 8,161 | | 30.3 | | 56.1 | | | | 13,554 | | 12,159 | | 11.5 | | 19.3 | |
| Other asset accounts | | | 13,844 | | 14,590 | | (5.1) | | 13.7 | | | | 2,796 | | 2,746 | | 1.8 | | 8.9 | |
| Total assets | | | 205,510 | | 220,093 | | (6.6) | | 11.9 | | | | 70,434 | | 77,167 | | (8.7) | | (2.4) | |
| Customer deposits | | | 93,994 | | 110,162 | | (14.7) | | 2.2 | | | | 30,181 | | 29,578 | | 2.0 | | 9.2 | |
| Central banks and credit institutions | | | 30,878 | | 28,333 | | 9.0 | | 30.6 | | | | 8,133 | | 14,808 | | (45.1) | | (41.2) | |
| Marketable debt securities | | | 25,351 | | 27,976 | | (9.4) | | 8.6 | | | | 10,403 | | 10,775 | | (3.5) | | 3.3 | |
| Other financial liabilities | | | 34,215 | | 28,625 | | 19.5 | | 43.2 | | | | 14,323 | | 12,624 | | 13.5 | | 21.4 | |
| Other liabilities accounts | | | 5,582 | | 7,938 | | (29.7) | | (15.7) | | | | 1,942 | | 3,733 | | (48.0) | | (44.3) | |
| Total liabilities | | | 190,020 | | 203,035 | | (6.4) | | 12.1 | | | | 64,983 | | 71,518 | | (9.1) | | (2.8) | |
| Total equity | | | 15,490 | | 17,058 | | (9.2) | | 8.8 | | | | 5,451 | | 5,648 | | (3.5) | | 3.2 | |
| | | | | | | | | | | | |
| Memorandum items: | | | | | | | | | | | | |
Gross loans and advances to customers B | | | 93,785 | | 102,583 | | (8.6) | | 9.5 | | | | 41,405 | | 43,823 | | (5.5) | | 1.1 | |
| Customer funds | | | 129,881 | | 145,044 | | (10.5) | | 7.3 | | | | 43,383 | | 40,098 | | 8.2 | | 15.7 | |
Customer deposits C | | | 81,378 | | 90,297 | | (9.9) | | 8.0 | | | | 30,060 | | 29,337 | | 2.5 | | 9.6 | |
| Mutual funds | | | 48,503 | | 54,747 | | (11.4) | | 6.1 | | | | 13,324 | | 10,761 | | 23.8 | | 32.5 | |
| | | | | | | | | | | | |
| Ratios (%), operating means and customers | | | | | | | | | | | | |
| | | | | | | | | | | | |
RoTE (post-AT1) | | | 16.8 | | 13.1 | | 3.6 | | | | | 16.3 | | 14.2 | | 2.1 | | |
| Efficiency ratio | | | 38.6 | | 41.4 | | (2.9) | | | | | 36.4 | | 41.7 | | (5.4) | | |
| NPL ratio | | | 6.10 | | 6.25 | | (0.15) | | | | | 5.37 | | 5.01 | | 0.36 | | |
| NPL coverage ratio | | | 79 | | 83 | | (4) | | | | | 50 | | 53 | | (3) | | |
| | | | | | | | | | | | |
| Number of branches | | | 2,202 | | 2,580 | | (14.7) | | | | | 237 | | 248 | | (4.4) | | |
| Number of total customers (thousands) | | | 69,455 | | 62,804 | | 10.6 | | | | | 4,311 | | 4,052 | | 6.4 | | |
| Number of active customers (thousands) | | | 33,123 | | 30,460 | | 8.7 | | | | | 2,556 | | 2,399 | | 6.6 | | |
| | | | | | | | | | | | |
| A. Includes exchange differences. | | | | | | | | | | | | |
| B. Excluding reverse repos. | | | | | | | | | | | | |
| C. Excluding repos. | | | | | | | | | | | | |
|
| | | | | | | | | | | | | | | | | | | | | | | | | | | | | | | | | | |
| | | | | | | | | | | | |
| EUR million | | | | | | | | | | | | |
| | | Argentina | | | | Rest of the Group |
| Underlying income statement | | | 2024 | 2023 | % | | | | 2024 | 2023 | % | % excl. FX |
| | | | | | |
| | | | | | | | | | | | |
| Net interest income | | | 2,919 | | 1,879 | | 55.3 | | | | | 832 | | 780 | | 6.7 | | 8.4 | |
| Net fee income | | | 602 | | 396 | | 52.2 | | | | | 722 | | 615 | | 17.5 | | 17.9 | |
Gains (losses) on financial transactions A | | | 229 | | 341 | | (32.8) | | | | | 326 | | 353 | | (7.6) | | (8.1) | |
| Other operating income | | | (1,263) | | (1,071) | | 17.9 | | | | | 9 | | (26) | | 0.0 | | 0.0 | |
| Total income | | | 2,487 | | 1,544 | | 61.1 | | | | | 1,889 | | 1,721 | | 9.8 | | 10.5 | |
| Total costs | | | (1,337) | | (831) | | 60.9 | | | | | (1,643) | | (1,415) | | 16.1 | | 16.4 | |
| Net operating income | | | 1,150 | | 713 | | 61.2 | | | | | 246 | | 306 | | (19.6) | | (17.5) | |
| Net loan-loss provisions | | | (284) | | (150) | | 89.5 | | | | | (230) | | (203) | | 13.4 | | 14.7 | |
| Other gains (losses) and provisions | | | (39) | | (58) | | (34.0) | | | | | (263) | | (25) | | 938.7 | | 942.3 | |
| Profit before tax | | | 827 | | 505 | | 63.8 | | | | | (248) | | 77 | | — | | — | |
| Tax on profit | | | (161) | | (117) | | 38.0 | | | | | (37) | | (75) | | (50.8) | | (49.9) | |
| Profit from continuing operations | | | 666 | | 388 | | 71.6 | | | | | (285) | | 2 | | — | | — | |
| Net profit from discontinued operations | | | — | | — | | — | | | | | — | | — | | — | | — | |
| Consolidated profit | | | 666 | | 388 | | 71.6 | | | | | (285) | | 2 | | — | | — | |
| Non-controlling interests | | | (1) | | (2) | | (43.9) | | | | | 5 | | 7 | | (30.3) | | (22.8) | |
| Underlying profit attributable to the parent | | | 665 | | 386 | | 72.2 | | | | | (280) | | 9 | | — | | — | |
| | | | | | | | | | | | |
| Balance sheet | | | | | | | | | | | | |
| Loans and advances to customers | | | 7,684 | | 3,767 | | 104.0 | | | | | 24,905 | | 24,892 | | 0.1 | | (2.5) | |
| Cash, central banks and credit institutions | | | 4,901 | | 4,548 | | 7.8 | | | | | 8,178 | | 5,911 | | 38.4 | | 99.2 | |
| Debt instruments | | | 2,654 | | 1,368 | | 94.0 | | | | | 10,677 | | 11,447 | | (6.7) | | (6.6) | |
| Other financial assets | | | 23 | | 11 | | 112.9 | | | | | 3,041 | | 2,116 | | 43.7 | | 58.0 | |
| Other asset accounts | | | 978 | | 776 | | 26.1 | | | | | 2,930 | | 3,671 | | (20.2) | | (29.2) | |
| Total assets | | | 16,240 | | 10,470 | | 55.1 | | | | | 49,732 | | 48,037 | | 3.5 | | 2.2 | |
| Customer deposits | | | 11,293 | | 6,478 | | 74.3 | | | | | 19,955 | | 16,207 | | 23.1 | | 32.3 | |
| Central banks and credit institutions | | | 852 | | 1,271 | | (33.0) | | | | | 19,309 | | 22,050 | | (12.4) | | (15.5) | |
| Marketable debt securities | | | 158 | | 148 | | 6.4 | | | | | 898 | | 703 | | 27.7 | | 32.0 | |
| Other financial liabilities | | | 968 | | 638 | | 51.6 | | | | | 2,694 | | 2,061 | | 30.7 | | 48.0 | |
| Other liabilities accounts | | | 476 | | 455 | | 4.6 | | | | | 1,514 | | 960 | | 57.8 | | 93.8 | |
| Total liabilities | | | 13,746 | | 8,990 | | 52.9 | | | | | 44,371 | | 41,981 | | 5.7 | | 6.3 | |
| Total equity | | | 2,494 | | 1,479 | | 68.6 | | | | | 5,360 | | 6,056 | | (11.5) | | (36.9) | |
| | | | | | | | | | | | |
| Memorandum items: | | | | | | | | | | | | |
Gross loans and advances to customers B | | | 7,938 | | 3,878 | | 104.7 | | | | | 25,285 | | 25,164 | | 0.5 | | (2.0) | |
| Customer funds | | | 17,047 | | 10,288 | | 65.7 | | | | | 34,204 | | 27,670 | | 23.6 | | 27.8 | |
Customer deposits C | | | 11,293 | | 6,478 | | 74.3 | | | | | 19,527 | | 16,034 | | 21.8 | | 30.8 | |
| Mutual funds | | | 5,754 | | 3,810 | | 51.0 | | | | | 14,677 | | 11,636 | | 26.1 | | 24.3 | |
| | | | | | | | | | | | |
| Ratios (%), operating means and customers | | | | | | | | | | | | |
| | | | | | | | | | | | |
RoTE (post-AT1) | | | 34.5 | | 54.7 | | (20.2) | | | | | | | | |
| Efficiency ratio | | | 53.8 | | 53.8 | | — | | | | | | | | |
| NPL ratio | | | 2.06 | | 1.99 | | 0.07 | | | | | | | | |
| NPL coverage ratio | | | 177 | | 166 | | 11 | | | | | | | | |
| | | | | | | | | | | | |
Number of branches D | | | 409 | | 322 | | 27.0 | | | | | | | | |
| Number of total customers (thousands) | | | 5,117 | | 4,771 | | 7.2 | | | | | | | | |
| Number of active customers (thousands) | | | 3,674 | | 3,562 | | 3.1 | | | | | | | | |
| | | | | | | | | | | | |
| A. Includes exchange differences. | | | | | | | | | | | | |
| B. Excluding reverse repos. | | | | | | | | | | | | |
| C. Excluding repos. | | | | | | | | | | | | |
|
| D. In Argentina, we have included the CartaSur points of sale and the banking service points in 2024 figures. |
4.6 Alternative performance measures (APMs): 2025, 2024 and 2023
Profitability and efficiency ratios
The purpose of the profitability ratios is to measure the ratio of profit to equity, to tangible equity, to assets and to risk-weighted assets. The efficiency ratio measures the amount of costs needed to generate revenue.
The results related to activity in Poland affected by the Poland disposal are recorded in the 'non-recurring items' line within the underlying income statement. Profitability ratios are therefore also presented on an underlying basis. Additionally, the definition of efficiency has been adjusted to use the new total costs line.
| | | | | | | | | | | | | | |
| Ratio | | Formula | | Relevance of the metric |
| RoE | | Profit attributable to the parent | | This ratio measures the return that shareholders obtain on the funds invested in the bank and as such measures the bank’s ability to pay shareholders. |
| (Return on Equity) | | Average stockholders’ equity A (excl. minority interests) | |
| Underlying RoE | | Underlying profit attributable to the parent | | This ratio measures the return that shareholders obtain on the funds invested in the bank excluding results from operations outside the ordinary course of business. |
| Average stockholders’ equity A (excl. minority interests) | |
| | | | |
| | | |
| RoTE (post-AT1) | | Profit attributable to the parent minus AT1 costsB | | This indicator is used to assess the profitability of a company as a percentage of its tangible equity, deducting AT1 issuance costs from the numerator. It is measured as the return that shareholders receive as a percentage of the funds invested in the bank less intangible assets. |
(Return on Tangible Equity) | | Average stockholders' equity A (excl. minority interests) - intangible assets | |
| | | | |
| | |
Underlying RoTE (post-AT1) | | Underlying profit attributable to the parent minus AT1 costs B | | As with RoTE (post-AT1), this indicator is used to assess the profitability of the tangible equity of a company of a company, deducting AT1 issuance costs from the numerator, but excluding results from operations outside the ordinary course of business (i.e. arising from underlying activities). |
| | Average stockholders' equity A (excl. minority interests) - intangible assets | |
| RoA | | Consolidated profit | | This metric measures the profitability of a company as a percentage of its total assets. It is an indicator that reflects the efficiency of the bank’s total assets in generating profit over a given period. |
| (Return on Assets) | | Average total assets | |
| Underlying RoA | | Underlying consolidated profit | | This metric measures the profitability of a company as a percentage of its total assets excluding results from operations outside the ordinary course of business. It is an indicator that reflects the efficiency of the bank’s total assets in generating underlying profit over a given period. |
| | Average total assets | |
| RoRWA | | Consolidated profit | | The return adjusted for risk is a derivative of the RoA metric. The difference is that RoRWA measures profit in relation to the bank’s risk-weighted assets. |
| (Return on Risk-Weighted Assets) | | Average risk-weighted assets | |
| Underlying RoRWA | | Underlying consolidated profit | | This relates the underlying consolidated profit (excluding results from operations outside the ordinary course of business) to the Group’s risk-weighted assets. |
| Average risk-weighted assets | |
| | | | |
| | | |
| | | | |
| Efficiency | | Total costs C | | One of the most commonly used indicators when comparing productivity of different financial entities. It measures the amount of resources used to generate the bank’s total income. |
| (Cost-to-income) | | Total income | |
A.Stockholders’ equity = Capital and Reserves + Accumulated other comprehensive income + Profit attributable to the parent + Dividends.
B.Excluding the adjustment to the valuation of goodwill, since they are not considered in the denominator, we believe this calculation is more correct.
C.Total costs = Administrative expenses + amortizations + other operating costs.
| | | | | | | | | | | | |
Profitability and efficiency A (EUR million and %) | | | | |
| 2025 | 2024 | 2023 | |
| RoE | 13.9 | % | 13.0 | % | 11.9 | % | |
| Profit attributable to the parent | 14,101 | 12,574 | 11,076 | |
| Average stockholders' equity (excluding minority interests) | 101,497 | 96,744 | 93,035 | |
| | | | |
| Underlying RoE | 13.0 | % | 12.2 | % | 11.2 | % | |
| Profit attributable to the parent | 14,101 | 12,574 | 11,076 | |
| (-) Non-recurring items | 949 | 800 | 674 | |
| Underlying profit attributable to the parent | 13,152 | 11,774 | 10,402 | |
| Average stockholders' equity (excluding minority interests) | 101,497 | 96,744 | 93,035 | |
| | | | |
| RoTE post-AT1 | 16.3 | % | 15.5 | % | 14.4 | % | |
| Profit attributable to the parent | 14,101 | 12,574 | 11,076 | |
| (-) AT1 costs | 622 | 620 | 492 | |
| | | | |
| (-) Goodwill impairment | (4) | (4) | (20) | |
| Profit attributable to the parent minus AT1 costs (excluding goodwill impairment) | 13,483 | 11,958 | 10,604 | |
| Average stockholders' equity (excluding minority interests) | 101,497 | 96,744 | 93,035 | |
| (-) Average intangible assets | 18,865 | 19,428 | 19,361 | |
| Average stockholders' equity (excl. minority interests) - intangible assets | 82,631 | 77,316 | 73,675 | |
| | | | |
| | | | |
| | | | |
| | | | |
| | | | |
| | | | |
| | | | |
| | | | |
| | | | |
| | | | |
| Underlying RoTE (post-AT1) | 15.2 | % | 14.4 | % | 13.5 | % | |
| Profit attributable to the parent | 14,101 | 12,574 | 11,076 | |
| (-) AT1 costs | 622 | 620 | 492 | |
| (-) Goodwill impairment | (4) | (4) | (20) | |
| Profit attributable to the parent minus AT1 costs (excluding goodwill impairment) | 13,483 | 11,958 | 10,604 | |
| (-) Non-recurring items | 949 | 800 | 674 | |
| Underlying profit attributable to the parent minus AT1 costs (excluding goodwill impairment) | 12,534 | 11,158 | 9,930 | |
| Average stockholders' equity (excluding minority interests) | 101,497 | 96,744 | 93,035 | |
| (-) Average intangible assets | 18,865 | 19,428 | 19,361 | |
| Average stockholders' equity (excl. minority interests) - intangible assets | 82,631 | 77,316 | 73,675 | |
| | | | |
| RoA | 0.84 | % | 0.76 | % | 0.69 | % | |
| Consolidated profit | 15,500 | 13,744 | 12,183 | |
| Average total assets | 1,843,112 | 1,803,272 | 1,773,103 | |
| | | | |
| Underlying RoA | 0.79 | % | 0.72 | % | 0.65 | % | |
| Consolidated profit | 15,500 | 13,744 | 12,183 | |
| (-) Adjustments to consolidated profit for activity outside the ordinary course of business | 1,503 | 1,220 | 990 | |
| Underlying consolidated profit | 13,997 | 12,524 | 11,193 | |
Average total assets C | 1,771,298 | 1,739,915 | 1,716,997 | |
| | | | |
| RoRWA | 2.44 | % | 2.18 | % | 1.95 | % | |
| Consolidated profit | 15,500 | 13,744 | 12,183 | |
Average risk-weighted assets B | 634,020 | 630,494 | 624,031 | |
| | | | |
| Underlying RoRWA | 2.31 | % | 2.07 | % | 1.86 | % | |
| Consolidated profit | 15,500 | 13,744 | 12,183 | |
| (-) Adjustments to consolidated profit for activity outside the ordinary course of business | 1,503 | 1,220 | 989 | |
| Underlying consolidated profit | 13,997 | 12,524 | 11,194 | |
Average risk-weighted assets B C | 605,556 | 604,137 | 602,132 | |
| | | | |
| | | | |
| | | | |
| | | | |
| | | | |
| | | | |
| | | | |
| | | | |
| | | | |
| | | | |
| | | | |
| | | | |
| | | | |
| Efficiency ratio | 45.3 | % | 47.2 | % | 49.1 | % | |
| Operating expenses | 24,779 | 25,215 | 24,684 | |
Adjustments to operating expenses in the underlying income statement | 1,631 | 2,139 | 1,817 | |
Underlying total costs | 26,410 | 27,354 | 26,501 | |
| Total income | 58,311 | 58,043 | 53,951 | |
Adjustments to total income in the underlying income statement | (3) | (59) | (11) | |
| Underlying total income | 58,308 | 57,984 | 53,940 | |
| | | | |
A.Averages included in the RoE, RoTE, RoTE (post-AT1), RoA and RoRWA denominators are calculated using the monthly average over the period, which we believe should not differ materially from using daily balances.
B.The risk-weighted assets included in the denominator of the RoRWA metric are calculated in line with the criteria laid out in the CRR (Capital Requirements Regulation).
C.Excludes balances related to the Poland disposal.
| | | | | | | | | | | | | | |
| Ratio | | Formula | | Relevance of the metric |
| | | | |
| | |
Global business and country underlying RoTE (post-AT1) | | Underlying profit attributable to the parent minus AT1 costsA (excluding goodwill impairment) | | This indicator is used to assess the profitability of the tangible equity of a company arising from underlying activities, i.e. excluding results from operations outside the ordinary course of business, deducting AT1 issuance costs from the numerator. |
| Average stockholders' equity (excl. minority interests) - intangible assetsB | |
A.For both global businesses and countries, AT1 costs are allocated according to RWA consumption.
B.For global businesses, tangible equity is allocated according to RWA consumption.
| | | | | | | | | | | | | | | | | | | | | | | | | | | | | | | | | | | |
RoTE (post-AT1) (EUR million and %) | | | | |
| 2025 | | 2024 | | 2023 |
| % | Numerator | Denominator | | % | Numerator | Denominator | | % | Numerator | Denominator |
| Retail | 17.1 | | 7,411 | | 43,382 | | | 17.6 | | 7,051 | | 39,997 | | | 14.5 | | 5,639 | | 38,855 | |
| Openbank | 8.5 | | 1,578 | | 18,546 | | | 8.8 | | 1,500 | | 17,090 | | | 10.6 | | 1,774 | | 16,686 | |
| CIB | 17.8 | | 2,602 | | 14,603 | | | 16.3 | | 2,519 | | 15,483 | | | 15.9 | | 2,240 | | 14,105 | |
| Wealth | 61.5 | | 1,961 | | 3,189 | | | 68.2 | | 1,567 | | 2,296 | | | 61.8 | | 1,346 | | 2,178 | |
| Payments | | | | | | | | | | | |
| | | | | | | | | | | |
| | | | | | | | | | | |
| | | | | | | | | | | |
| | | | | | | | | | | |
| Spain | 20.4 | | 4,133 | | 20,230 | | | 18.3 | | 3,620 | | 19,822 | | | 11.8 | | 2,261 | | 19,104 | |
| UK | 10.2 | | 1,248 | | 12,200 | | | 10.6 | | 1,247 | | 11,781 | | | 12.5 | | 1,489 | | 11,874 | |
| Portugal | 30.3 | | 994 | | 3,282 | | | 25.0 | | 985 | | 3,948 | | | 25.6 | | 884 | | 3,458 | |
| | | | | | | | | | | |
| Openbank Europe | 6.7 | | 685 | | 10,212 | | | 5.5 | | 556 | | 10,055 | | | 11.6 | | 1,131 | | 9,721 | |
| | | | | | | | | | | |
| US | 10.2 | | 1,454 | | 14,311 | | | 6.9 | | 1,024 | | 14,742 | | | 5.6 | | 865 | | 15,355 | |
| Mexico | 22.0 | | 1,674 | | 7,616 | | | 19.6 | | 1,638 | | 8,343 | | | 17.4 | | 1,533 | | 8,814 | |
| | | | | | | | | | | |
| Brazil | 15.3 | | 2,074 | | 13,545 | | | 16.8 | | 2,323 | | 13,853 | | | 13.1 | | 1,839 | | 13,987 | |
| Chile | 19.7 | | 703 | | 3,567 | | | 16.3 | | 602 | | 3,693 | | | 14.2 | | 559 | | 3,925 | |
| Argentina | 20.2 | | 419 | | 2,072 | | | 34.5 | | 658 | | 1,909 | | | 54.7 | | 1,201 | | 2,195 | |
| | | | | | | | | | | |
Numerator: underlying profit attributable to the parent excluding goodwill impairment minus AT1 costs (excluding goodwill impairment).
Denominator: average stockholders' equity (excluding minority interests) - tangible assets.
Payment Solutions' RoTE (post-AT1) is not provided as we do not consider it a relevant metric to measure performance in this type of business.
| | | | | | | | | | | | | | | | | | | | | | | | | | | | | | | | | | | |
Efficiency ratio (EUR million and %) | | | | |
| 2025 | | 2024 | | 2023 |
| % | Numerator | Denominator | | % | Numerator | Denominator | | % | Numerator | Denominator |
Retail | 42.9 | | 13,913 | | 32,447 | | | 44.5 | | 14,704 | | 33,064 | | | 47.9 | | 14,757 | | 30,792 | |
| Openbank | 43.6 | | 5,680 | | 13,015 | | | 43.3 | | 5,576 | | 12,877 | | | 45.0 | | 5,526 | | 12,274 | |
CIB | 46.8 | | 3,752 | | 8,016 | | | 49.7 | | 3,922 | | 7,897 | | | 47.6 | | 3,381 | | 7,100 | |
Wealth | 35.7 | | 1,444 | | 4,042 | | | 39.1 | | 1,403 | | 3,587 | | | 41.1 | | 1,266 | | 3,082 | |
Payments | 87.6 | | 1,203 | | 1,373 | | | 97.5 | | 1,209 | | 1,240 | | | 98.0 | | 1,111 | | 1,134 | |
| | | | | | | | | | | |
| | | | | | | | | | | |
| | | | | | | | | | | |
| | | | | | | | | | | |
| Spain | 37.6 | | 4,465 | | 11,887 | | | 38.9 | | 4,509 | | 11,580 | | | 48.9 | | 4,815 | | 9,837 | |
| UK | 58.4 | | 2,937 | | 5,032 | | | 60.9 | | 3,050 | | 5,011 | | | 54.6 | | 2,928 | | 5,358 | |
| Portugal | 27.8 | | 544 | | 1,956 | | | 27.8 | | 574 | | 2,065 | | | 29.1 | | 567 | | 1,944 | |
| | | | | | | | | | | |
| Openbank Europe | 48.9 | | 2,899 | | 5,925 | | | 50.5 | | 2,848 | | 5,644 | | | 50.2 | | 2,751 | | 5,481 | |
| | | | | | | | | | | |
| US | 49.1 | | 3,890 | | 7,929 | | | 52.3 | | 3,965 | | 7,580 | | | 51.4 | | 3,707 | | 7,209 | |
| Mexico | 43.3 | | 2,730 | | 6,305 | | | 43.4 | | 2,727 | | 6,278 | | | 44.8 | | 2,645 | | 5,899 | |
| | | | | | | | | | | |
| Brazil | 39.3 | | 4,957 | | 12,602 | | | 38.6 | | 5,219 | | 13,536 | | | 41.4 | | 5,430 | | 13,104 | |
| Chile | 33.9 | | 919 | | 2,714 | | | 36.4 | | 942 | | 2,592 | | | 41.7 | | 953 | | 2,285 | |
| Argentina | 43.8 | | 978 | | 2,235 | | | 53.8 | | 1,337 | | 2,487 | | | 53.8 | | 831 | | 1,544 | |
Numerator: underlying total costs.
Denominator: underlying total income.
Credit risk indicators
The credit risk indicators measure the quality of the credit portfolio and the percentage of non-performing loans covered by provisions.
As explained in 2. 'Presentation of financial and other information', the credit risk metrics have been enhanced to include corporate exposures originated through private fixed income products. Additionally, these measures exclude Poland from all periods presented. | | | | | | | | | | | | | | |
| Ratio | | Formula | | Relevance of the metric |
NPL ratio
(Non-performing loans ratio) | | Credit impaired customer loans and advances, guarantees and undrawn balances and debt securities issued by non-financial institutions | | The NPL ratio is an important variable regarding financial institutions' activity since it gives an indication of the level of credit risk the entities are exposed to. It calculates risks that are, in accounting terms, declared to be credit impaired as a percentage of the total outstanding amount of customer credit and contingent liabilities and debt securities issued by non-financial institutions. |
| Total risk A | |
| NPL coverage ratio | | Total allowances to cover impairment losses on customer loans and advances, guarantees and undrawn balances and debt securities issued by non-financial institutions | | The NPL coverage ratio is a fundamental metric in the financial sector. It reflects the level of provisions as a percentage of the credit impaired assets. Therefore, it is a good indicator of the entity's solvency against customer defaults both present and future. |
| Credit impaired customer loans and advances, guarantees and undrawn balances and debt securities issued by non-financial institutions | |
| Cost of risk | | Allowances for loan-loss provisions over the last 12 months | | This ratio quantifies loan-loss provisions arising from credit risk over a defined period of time for a given loan and debt securities issued by non-financial institutions portfolio. As such, it acts as an indicator of credit quality. |
| Average loans and advances to customers and debt securities issued by non-financial institutions over the last 12 months | |
A.Total risk = non-impaired and impaired customer loans and advances and guarantees + impaired undrawn customer balances + debt securities issued by non-financial institutions.
| | | | | | | | | | | |
Credit risk (I) (EUR million and %) | | | |
| Dec-25 | Dec-24 | Dec-23 |
| NPL ratio | 2.91 | % | 3.03 | % | 3.11 | % |
| Credit impaired balances | 33,739 | 34,383 | 34,671 |
| Gross loans and advances to customers registered under the headings 'financial assets measured at amortized cost' and 'financial assets designated at fair value through other comprehensive income' classified in stage 3, excluding POCI (Purchased or Originated Credit Impaired) | 31,531 | 32,144 | 32,565 |
| Customer guarantees and undrawn balances classified in stage 3 | 1,306 | 1,438 | 1,485 |
| Gross debt securities issued by non-financial institutions registered under the headings 'financial assets measured at amortized cost' and 'financial assets designated at fair value through other comprehensive income' classified in stage 3 | 839 | 697 | 447 |
| POCI exposure (Purchased or Originated Credit Impaired) that is additionally impaired | 46 | 91 | 165 |
| Doubtful exposure of portfolios at fair value through profit or loss | 17 | 13 | 9 |
| Total risk | 1,159,180 | 1,134,418 | 1,115,288 |
| Impaired and non-impaired gross loans and advances to customers | 1,058,447 | 1,038,306 | 1,025,256 |
| Impaired and non-impaired customer guarantees and impaired undrawn customer balances | 80,056 | 77,560 | 72,026 |
| Impaired and non-impaired gross debt securities issued by non-financial institutions | 20,677 | 18,552 | 18,006 |
| | | | | | | | | | | |
Credit risk (II) (EUR million and %) | | | |
| Dec-25 | Dec-24 | Dec-23 |
| NPL coverage ratio | 66 | % | 64 | % | 66 | % |
| Total allowances to cover impairment losses | 22,358 | 22,155 | 22,734 |
| Total allowances to cover impairment losses on loans and advances to customers measured at amortized cost and designated at fair value through other comprehensive income | 21,158 | 21,145 | 21,794 |
| Total allowances to cover impairment losses on customer guarantees and undrawn balances | 712 | 688 | 674 |
| Total allowances to cover impairment losses on debt securities issued by non-financial institutions measured at amortized cost and designated at fair value through other comprehensive income | 488 | 322 | 266 |
| Credit impaired balances | 33,739 | 34,383 | 34,671 |
| Gross loans and advances to customers registered under the headings 'financial assets measured at amortized cost' and 'financial assets designated at fair value through other comprehensive income' classified in stage 3, excluding POCI (Purchased or Originated Credit Impaired) | 31,531 | 32,144 | 32,565 |
| Customer guarantees and undrawn balances classified in stage 3 | 1,306 | 1,438 | 1,485 |
| Gross debt securities issued by non-financial institutions registered under the headings 'financial assets measured at amortized cost' and 'financial assets designated at fair value through other comprehensive income' classified in stage 3 | 839 | 697 | 447 |
| POCI exposure (Purchased or Originated Credit Impaired) that is additionally impaired | 46 | 91 | 165 |
| Doubtful exposure of portfolios at fair value through profit or loss | 17 | 13 | 9 |
| | | |
| Cost of risk | 1.14 | % | 1.12 | % | 1.13 | % |
| Underlying allowances for loan-loss provisions over the last 12 months | 12,128 | 11,822 | 11,784 |
| Allowances for loan-loss provisions over the last 12 months | 12,596 | 12,183 | 12,260 |
Adjustments to allowances for loan-loss provisions for activity outside the ordinary course of business | (468) | (361) | (476) |
| Average loans and advances to customers and debt securities issued by non-financial institutions over the last 12 months | 1,063,783 | 1,057,100 | 1,043,881 |
| | | |
| | | |
| | | | | | | | | | | | | | | | | | | | | | | | | | | | | | | | | | | |
NPL ratio (EUR million and %) | | | | | | |
| Dec-25 | | Dec-24 | | Dec-23 |
| % | Numerator | Denominator | | % | Numerator | Denominator | | % | Numerator | Denominator |
| Retail | 3.09 | | 19,855 | | 641,820 | | | 3.21 | | 20,689 | | 643,578 | | | 3.21 | | 21,025 | | 654,436 | |
| Openbank | 5.32 | | 11,351 | | 213,525 | | | 5.07 | | 10,993 | | 216,616 | | | 4.75 | | 9,831 | | 207,107 | |
| CIB | 0.72 | | 1,928 | | 266,108 | | | 0.86 | | 2,058 | | 238,187 | | | 1.43 | | 3,145 | | 220,656 | |
| Wealth | 0.86 | | 235 | | 27,384 | | | 0.98 | | 252 | | 25,692 | | | 1.39 | | 330 | | 23,688 | |
| Payments | | | | | | | | | | | |
| | | | | | | | | | | |
| | | | | | | | | | | |
| | | | | | | | | | | |
| | | | | | | | | | | |
| Spain | 1.94 | | 5,915 | | 305,156 | | | 2.66 | | 7,677 | | 288,162 | | | 3.04 | | 8,531 | | 280,629 | |
| UK | 1.08 | | 2,645 | | 244,303 | | | 1.33 | | 3,299 | | 248,061 | | | 1.42 | | 3,518 | | 247,360 | |
| Portugal | 1.99 | | 948 | | 47,760 | | | 2.27 | | 1,014 | | 44,573 | | | 2.41 | | 1,024 | | 42,455 | |
| | | | | | | | | | | |
| Openbank Europe | 2.53 | | 3,642 | | 144,039 | | | 2.50 | | 3,527 | | 141,312 | | | 2.12 | | 2,877 | | 135,608 | |
| | | | | | | | | | | |
| US | 4.82 | | 7,150 | | 148,488 | | | 4.68 | | 7,012 | | 149,907 | | | 4.57 | | 6,303 | | 137,894 | |
| Mexico | 2.65 | | 1,420 | | 53,476 | | | 2.71 | | 1,352 | | 49,927 | | | 2.82 | | 1,489 | | 52,785 | |
| | | | | | | | | | | |
| Brazil | 6.76 | | 8,010 | | 118,546 | | | 6.10 | | 7,090 | | 116,247 | | | 6.25 | | 7,923 | | 126,722 | |
| Chile | 5.73 | | 2,528 | | 44,146 | | | 5.37 | | 2,394 | | 44,590 | | | 5.01 | | 2,332 | | 46,565 | |
| Argentina | 7.68 | | 677 | | 8,813 | | | 2.06 | | 173 | | 8,411 | | | 1.99 | | 78 | | 3,903 | |
Numerator: credit impaired customer loans and advances, guarantees and undrawn balances + debt securities issued by non-financial institutions.
Denominator: total risk.
Payment Solutions' NPL ratio is not provided as we do not consider it a relevant metric for this type of business.
| | | | | | | | | | | | | | | | | | | | | | | | | | | | | | | | | | | |
NPL coverage ratio (EUR million and %) |
| | |
|
| | | | |
| Dec-25 | | Dec-24 | | Dec-23 |
| % | Numerator | Denominator | | % | Numerator | Denominator | | % | Numerator | Denominator |
| Retail | 66 | | 13,104 | | 19,855 | | | 63 | | 12,984 | | 20,689 | | | 65 | | 13,744 | | 21,025 | |
| Openbank | 71 | | 8,075 | | 11,351 | | | 74 | | 8,088 | | 10,993 | | | 77 | | 7,521 | | 9,831 | |
| CIB | 47 | | 908 | | 1,928 | | | 39 | | 803 | | 2,058 | | | 39 | | 1,241 | | 3,145 | |
| Wealth | 71 | | 168 | | 235 | | | 68 | | 170 | | 252 | | | 29 | | 97 | | 330 | |
| Payments | | | | | | | | | | | |
| | | | | | | | | | | |
| | | | | | | | | | | |
| | | | | | | | | | | |
| | | | | | | | | | | |
| Spain | 55 | | 3,254 | | 5,915 | | | 53 | | 4,041 | | 7,677 | | | 49 | | 4,188 | | 8,531 | |
| UK | 33 | | 860 | | 2,645 | | | 29 | | 967 | | 3,299 | | | 30 | | 1,066 | | 3,518 | |
| Portugal | 81 | | 770 | | 948 | | | 78 | | 792 | | 1,014 | | | 83 | | 849 | | 1,024 | |
| | | | | | | | | | | |
| Openbank Europe | 87 | | 3,181 | | 3,642 | | | 83 | | 2,910 | | 3,527 | | | 88 | | 2,532 | | 2,877 | |
| | | | | | | | | | | |
| US | 55 | | 3,934 | | 7,150 | | | 64 | | 4,471 | | 7,012 | | | 68 | | 4,265 | | 6,303 | |
| Mexico | 105 | | 1,488 | | 1,420 | | | 100 | | 1,358 | | 1,352 | | | 100 | | 1,489 | | 1,489 | |
| | | | | | | | | | | |
| Brazil | 81 | | 6,478 | | 8,010 | | | 79 | | 5,627 | | 7,090 | | | 83 | | 6,597 | | 7,923 | |
| Chile | 48 | | 1,211 | | 2,528 | | | 50 | | 1,196 | | 2,394 | | | 53 | | 1,230 | | 2,332 | |
| Argentina | 90 | | 607 | | 677 | | | 177 | | 307 | | 173 | | | 166 | | 128 | | 78 | |
Numerator: total allowances to cover impairment losses on customer loans and advances, guarantees and undrawn balances + debt securities issued by non-financial institutions.
Denominator: credit impaired customer loans and advances, guarantees and undrawn balances + debt securities issued by non-financial institutions.
Payment Solutions' coverage ratio is not provided as we do not consider it a relevant metric for this type of business.
| | | | | | | | | | | | | | | | | | | | | | | | | | | | | | | | | | | |
Cost of risk (EUR million and %) | | |
|
| | | | |
| Dec-25 | | Dec-24 | | Dec-23 |
| % | Numerator | Denominator | | % | Numerator | Denominator | | % | Numerator | Denominator |
| Retail | 1.15 | | 7,150 | | 621,246 | | | 1.11 | | 7,064 | | 634,438 | | | 1.17 | | 7,542 | | 642,839 | |
| Openbank | 2.10 | | 4,457 | | 212,551 | | | 2.16 | | 4,562 | | 210,748 | | | 2.04 | | 4,106 | | 201,376 | |
| CIB | 0.14 | | 278 | | 196,144 | | | 0.08 | | 141 | | 180,547 | | | 0.08 | | 132 | | 170,175 | |
| Wealth | 0.08 | | 20 | | 25,509 | | | 0.18 | | 42 | | 23,686 | | | (0.08) | | (19) | | 22,442 | |
| Payments | | | | | | | | | | | |
| | | | | | | | | | | |
| | | | | | | | | | | |
| | | | | | | | | | | |
| | | | | | | | | | | |
| Spain | 0.43 | | 1,142 | | 263,717 | | | 0.50 | | 1,259 | | 251,826 | | | 0.61 | | 1,522 | | 248,723 | |
| UK | 0.07 | | 177 | | 244,442 | | | 0.03 | | 64 | | 251,348 | | | 0.10 | | 247 | | 251,531 | |
| Portugal | (0.02) | | (8) | | 43,578 | | | 0.03 | | 11 | | 41,676 | | | 0.19 | | 77 | | 41,364 | |
| | | | | | | | | | | |
| Openbank Europe | 0.97 | | 1,363 | | 140,504 | | | 0.88 | | 1,209 | | 137,165 | | | 0.62 | | 792 | | 128,583 | |
| | | | | | | | | | | |
| US | 1.62 | | 2,244 | | 138,832 | | | 1.82 | | 2,507 | | 137,926 | | | 1.92 | | 2,593 | | 135,191 | |
| Mexico | 2.69 | | 1,239 | | 46,067 | | | 2.64 | | 1,277 | | 48,439 | | | 2.43 | | 1,135 | | 46,729 | |
| | | | | | | | | | | |
| Brazil | 4.17 | | 4,409 | | 105,666 | | | 4.03 | | 4,487 | | 111,362 | | | 4.27 | | 4,701 | | 110,102 | |
| Chile | 1.32 | | 531 | | 40,181 | | | 1.19 | | 497 | | 41,582 | | | 0.80 | | 365 | | 45,637 | |
| Argentina | 7.34 | | 574 | | 7,820 | | | 4.59 | | 284 | | 6,190 | | | 6.64 | | 150 | | 2,262 | |
Numerator: underlying allowances for loan-loss provisions over the last 12 months.
Denominator: average loans and advances to customers + debt securities issued by non-financial institutions over the last 12 months.
Payment Solutions' cost of risk is not provided as we do not consider it a relevant metric for this type of business.
Other indicators
The Group has a series of additional financial metrics which facilitate analysis of the underlying business trends and performance.
| | | | | | | | | | | | | | |
Ratio | | Formula | | Relevance of the metric |
TNAV per share
(Tangible net asset value per share) | | Tangible book value A | | This is a very commonly used ratio used to measure the company’s accounting value per share having deducted the intangible assets. It is useful in evaluating the amount each shareholder would receive if the company were to enter into liquidation and had to sell all the company’s tangible assets. |
| Number of shares excluding treasury stock | |
Price to tangible book
value per share (X) | | Share price | | This is one of the most commonly used ratios by market participants for the valuation of listed companies both in absolute terms and relative to other entities. This ratio measures the relationship between the price paid for a company and its accounting equity value. |
| TNAV per share | |
LTD ratio
(Loan-to-deposit) | | Net loans and advances to customers | | This is an indicator of the bank's liquidity. It measures the
total loans and advances to customers net of loan-loss provisions as a percentage of customer deposits. |
| Customer deposits | |
Loans and advances (excl. reverse repos) | | Gross loans and advances to customers excluding reverse repos | | In order to aid analysis of the commercial banking activity, reverse repos are excluded as they are highly volatile treasury products. |
Deposits (excl. repos) | | Customer deposits excluding repos | | In order to aid analysis of the commercial banking activity, repos are excluded as they are highly volatile treasury products. |
PAT + After tax fees (in Wealth Management & Insurance) | | Net profit + fees ceded by Santander Insurances and Asset Management Solutions to the branch network, net of taxes, excluding Private Banking customers | | Metric to assess Wealth Management & Insurance’s total contribution to the Group’s profit. |
| | | | |
A.Tangible book value = Stockholders' equity (excl. minority interests) - intangible assets. | | |
| | | | | | | | | | | |
Others (EUR million and %) | | | |
| Dec-25 | Dec-24 | Dec-23 |
| TNAV (tangible book value) per share | 5.76 | 5.24 | 4.76 |
| Tangible book value | 84,527 | 79,342 | 75,552 |
| Number of shares excl. treasury stock (million) | 14,678 | 15,137 | 15,886 |
| | | |
| Price to tangible book value per share (X) | 1.75 | 0.85 | 0.79 |
| Share price (euros) | 10.070 | 4.465 | 3.780 |
| TNAV (tangible book value) per share | 5.76 | 5.24 | 4.76 |
| | | |
| Loan-to-deposit ratio | 100 | % | 101 | % | 100 | % |
| Net loans and advances to customers | 1,037,288 | 1,017,160 | 1,003,465 |
| Customer deposits | 1,041,200 | 1,005,605 | 1,002,669 |
| | | |
| Dec-25 | Dec-24 | |
| PAT + After tax fees (in Wealth) (Constant EUR million at average 2025 exchange) | 3,612 | 3,007 | |
| Profit after tax | 2,032 | 1,576 | |
| Net fee income net of tax | 1,580 | 1,431 | |
| | | |
| | Dec-24 | Dec-23 |
| PAT + After tax fees (in Wealth) (Constant EUR million at average 2024 exchange) | | 3,127 | 2,703 |
| Profit after tax | | 1,624 | 1,379 |
| Net fee income net of tax | | 1,503 | 1,324 |
| | | |
| | | |
| | | |
| | | |
| | | |
| | | |
| | | |
| | | |
Local currency measures
We make use of certain financial measures in local currency to help in the assessment of our ongoing operating performance. These non-IFRS financial measures include the results of operations of our subsidiary banks located outside the eurozone, excluding the impact of foreign exchange. Because changes in foreign currency exchange rates do not have an operating impact on the results, we believe that evaluating their performance on a local currency basis provides an additional and meaningful assessment of performance to both management and the company’s investors.
The Group presents, at both the Group and business unit levels, the real changes in euros in the income statement as well as the changes excluding the exchange rate effect (i.e., 'excluding FX' or 'constant euros'), as it considers the latter facilitates analysis, since it enables business movements to be identified without taking into account the impact of converting each local currency into euros.
Said variations, excluding the impact of exchange rate movements, are calculated by converting income statement lines for the different business units comprising the Group into our presentation currency, the euro, applying the average exchange rate for 2025 to all periods contemplated in sections 4.2 and 4.3 and the average exchange rate for 2024 to all periods contemplated in sections 4.4 and 4.5. We use this method for all countries with the exception of Argentina, where we use the exchange rate on the last working day of each period presented, given it is a hyperinflationary economy, to mitigate the distortions caused by the hyperinflation.
The Group presents, at both the Group level as well as the business unit level, the changes in euros as well as the changes excluding the exchange rate effect ('excluding FX' or 'constant euros') for loans and advances to customers excluding reverse repurchase agreements (repos) and customer funds (which comprise deposits and mutual funds) excluding repos. Additionally, we present changes in the main balance sheet lines of the Group's countries both in euros as well as the changes excluding the exchange rate effect. As with the income statement, the reason is to facilitate analysis by isolating the changes in the balance sheet that are not caused by converting each local currency into euros.
These changes excluding the impact of exchange rate movements are calculated by converting the balances, into our presentation currency, the euro, applying the closing exchange rate on the last working day of December 2025 to all periods contemplated in sections 4.2 and 4.3 and the closing exchange rate on the last working day of December 2024 to all periods contemplated in sections 4.4 and 4.5. We use this method to calculate the variations for all countries with the exception of Argentina, where we use the exchange rate on the last working day of each period presented, given it is a hyperinflationary economy, to mitigate the distortions caused by the hyperinflation.
In 2023, we applied the official exchange rate for the Argentine peso. However, during 2024, due to the significant divergence between the official Argentine peso exchange rate and other macroeconomic magnitudes, mainly inflation, we applied an alternative exchange rate to 2024 results which reflected the exchange rate observed in transactions ordered between market participants under the prevailing economic conditions, such as the repatriation of dividends from businesses in Argentina. This alternative exchange rate took the dollar contado con liquidación rate (CCL) as a reference, which is the exchange rate resulting from the sale of local bonds denominated in Argentine pesos in US dollars (dual denomination peso/dollar bonds). At the end of 2024, the value of this exchange rate did not significantly differ from other market rates or the official exchange rate.
In 2025, we once again began to apply the official exchange rate given that the value of the dollar CCL exchange rate did not significantly differ from other market rates or the official exchange rate following the lifting of currency controls and the removal of restrictions on the purchase of foreign currency for individuals in Argentina.
The average and period-end exchange rates for the main currencies in which the Group operates are set out in the table below.
| | | | | | | | | | | | | | | | | | | | | | | |
| Exchange rates: 1 euro/currency parity |
| | | | | | | |
| Average (income statement) | | Period-end (balance sheet) |
| 2025 | 2024 | 2023 | | 2025 | 2024 | 2023 |
| US dollar | 1.129 | | 1.082 | | 1.081 | | | 1.176 | | 1.039 | | 1.105 | |
| Pound sterling | 0.857 | | 0.846 | | 0.870 | | | 0.873 | | 0.829 | | 0.868 | |
| Brazilian real | 6.304 | | 5.809 | | 5.397 | | | 6.458 | | 6.427 | | 5.365 | |
| Mexican peso | 21.662 | | 19.723 | | 19.158 | | | 21.122 | | 21.554 | | 18.691 | |
| Chilean peso | 1,073.108 | | 1,020.473 | | 906.417 | | | 1,059.750 | | 1,032.560 | | 965.192 | |
Argentine peso A | | | | | 1,706.383 | | 1,232.389 | | 893.635 | |
| | | | | | | |
A.Average exchange rates for the Argentine peso are not included since we use the exchange rate on the last working day of each period presented given it is a hyperinflationary economy. For 2024 data, we applied an alternative exchange rate for the Argentine peso that better reflects the evolution of inflation. We apply the official ARS exchange rate to all other periods.
Impact of inflation on total costs
Santander presents, for both the Group and the business units included in the primary and secondary segments: i) the changes in total costs in euros; ii) the changes excluding the exchange rate effect with the exception of Argentina which is calculated as described above; and iii) the changes excluding the exchange rate effect minus the effect of average inflation (i.e. 'in real terms') over the year except for Argentina as Argentina's cost growth in euros should already largely reflect the effect of hyperinflation on exchange rates. The reason is that the two latter facilitate analysis for management purposes.
Inflation is calculated as the arithmetic average of the last 12 months for each country and, for the global businesses, as the weighted average of the inflation rate of each country comprising the global business, weighted by each country's total costs in the global business. For the Group and the global businesses, we exclude the impact of inflation in Argentina from the calculation as Argentina's cost growth in euros should already largely reflect the effect of hyperinflation on exchange rates.
The table below shows the average inflation rates calculated as indicated.
| | | | | | | | | | | |
12 month average inflation (%) | | | | | |
| | | 2025 | 2024 | |
| | | | | |
Retail A | | | 3.5 | 3.4 | |
Openbank A | | | 2.6 | 2.8 | |
CIB A | | | 2.9 | 3.2 | |
Wealth A | | | 2.9 | 3.1 | |
Payments A | | | 3.0 | 4.0 | |
| | | | | |
| | | | | |
| Spain | | | 2.7 | 2.8 | |
| UK | | | 3.4 | 2.5 | |
| Portugal | | | 2.3 | 2.4 | |
| | | | | |
| Openbank Europe | | | 2.1 | 2.4 | |
| | | | | |
| US | | | 2.7 | 3.0 | |
| Mexico | | | 3.8 | 4.7 | |
| | | | | |
| Brazil | | | 5.0 | 4.4 | |
| Chile | | | 4.2 | 4.3 | |
| | | | | |
Total Group A | | | 3.2 | 3.3 | |
A.Excluding the impact of inflation in Argentina.
5. Risk management information
5.1 Key credit risk metrics1
In 2025, developments in the credit market were shaped by successive interest rate cuts in mature markets and some emerging economies and the start of a new cycle of credit growth. Against this backdrop, demand gradually recovered, with positive growth in the main geographies where we operate.
In retail banking, mortgage lending balances began to recover, supported by more favourable financial conditions and lower early repayments. Consumer lending maintained a positive performance during the year, as it is less sensitive to interest rate trends and benefitted from a resilient labour market. In the eurozone, the ECB’s neutral-to-expansionary monetary policy stance has already fed through to mortgage and consumer portfolios. In the United Kingdom, rate cuts, stable house prices and support measures from the Bank of England drove greater credit activity.
In corporate lending, credit volumes grew in the first part of the year, in line with the expansion phase of the investment cycle. However, developments in US trade policy and geopolitical tensions, together with some weaker activity and external demand indicators, led to some slowdown in the second half of the year, especially in Latin America, where, after a strong first half, signs of moderation started to appear. In the United States, weaker labour market data and greater caution on the economic outlook prompted the Federal Reserve to cut interest rates. This helped sustain credit activity, although in a more prudent lending environment focused on lower-risk segments.
Our credit risk remained well diversified, with an appropriate balance between mature and emerging markets: Spain (26%), the United Kingdom (21%), the United States (13%) and Brazil (10%).
The distribution of credit risk by global businesses (including gross customer loans, guarantees and documentary credits) is shown below:
| | | | | | | | | | | | | | | | | | | | | | | | | | | | | | | | | | | |
| Main credit risk performance metrics from our activity with customers |
| Credit risk with customersA
(EUR million) | | Impaired loans (EUR million) | | NPL ratio (%) |
| 2025 | 2024 | 2023 | | 2025 | 2024 | 2023 | | 2025 | 2024 | 2023 |
| Retail & Commercial Banking | 641,820 | | 643,578 | | 654,436 | | | 19,855 | | 20,689 | | 21,025 | | | 3.09 | 3.21 | 3.21 |
| Openbank | 213,525 | | 216,616 | | 207,107 | | | 11,351 | | 10,993 | | 9,831 | | | 5.32 | 5.07 | 4.75 |
| Corporate & Investment Banking | 266,108 | | 238,187 | | 220,656 | | | 1,928 | | 2,058 | | 3,145 | | | 0.72 | 0.86 | 1.43 |
| Wealth Management & Insurance | 27,384 | | 25,692 | | 23,688 | | | 235 | | 252 | | 330 | | | 0.86 | 0.98 | 1.39 |
| Total Group | 1,159,180 | | 1,134,418 | | 1,115,288 | | | 33,739 | | 34,383 | | 34,671 | | | 2.91 | 3.03 | 3.11 |
| | | | | | | | | | | | | | | | | | | | | | | | | | | | | | | | | | | |
| NPL Coverage Ratio
(%) | | Net loan-loss provisionsB
(EUR million) | | Cost of riskC (%) |
| 2025 | 2024 | 2023 | | 2025 | 2024 | 2023 | | 2025 | 2024 | 2023 |
| Retail & Commercial Banking | 66 | 63 | 65 | | 7,150 | | 7,064 | | 7,542 | | | 1.15 | 1.11 | 1.17 |
| Openbank | 71 | 74 | 77 | | 4,457 | | 4,562 | | 4,106 | | | 2.10 | 2.16 | 2.04 |
| Corporate & Investment Banking | 47 | 39 | 39 | | 278 | | 141 | | 132 | | | 0.14 | 0.08 | 0.08 |
| Wealth Management & Insurance | 71 | 68 | 29 | | 20 | | 42 | | (19) | | | 0.08 | 0.18 | (0.08) |
| Total Group | 66 | 64 | 66 | | 12,128 | | 11,822 | | 11,784 | | | 1.14 | 1.12 | 1.13 |
Data for 2025, 2024 and 2023 reflects the new reporting structure. Total Group includes the Corporate Centre.
Due to the Cards portfolio integration in the Retail & Commercial business, Payments Solutions represents less than 1% of the total credit risk with customers. In view of the immateriality of the portfolio no further disclosures are considered necessary.
A.Includes credit impaired customer loans and advances, guarantees, impaired undrawn balances and debt securities issued by non-financial institutions.
B.Loan-loss provisions net of post write-off recoveries (EUR 1,791 million in 2025).
C.Cost of risk calculated as allowances for loan-loss provisions over the past 12 months / average loans and advances to customers and debt securities issued by non-financial institutions over the last 12 months.
1 Certain figures contained in this section have been subject to rounding to enhance their presentation. Accordingly, in certain instances, the sum of the numbers in a column or a row in tables contained in this report may not conform exactly to the total given for that column or row.
Credit quality during 2025 was as follows:
The NPL ratio stood at 2.91% (-12 bps vs. year-end 2024), mainly due to the Group's efforts to reduce its non-performing portfolio, which fell 2% to EUR 33,739 million. Declines in Europe led the improvement, supported by the strong performance of the portfolios and the execution of the NPL reduction plan. Gross customer exposure (total risk) grew 2.2% in the year to EUR 1,159 billion, driven mainly by the positive performance of the CIB business.
Under IFRS 9 requirements, Group net loan-loss provisions (LLPs) in December 2025 totalled EUR 12,128 million, increasing 3% compared to the previous year. The higher LLPs in Corporate & Investment Banking (CIB), Retail & Commercial Banking (mainly driven by normalization in Argentina and the UK) and the Corporate Centre (provisions related to our plan to accelerate NPL ratio reductions) were partially offset by Openbank, where, despite a less favourable performance in Germany, the US and Brazil performed better during the year.
The cost of risk stood at 1.14%, 2 bps above 2024, mainly driven by the aforementioned LLP increase. Nevertheless, it remained in line with our target for the year.
The total NPL coverage ratio increased to 66%, with impairment allowances of EUR 22,358 million. Coverage remained at comfortable levels, considering that more than 65% of the Group’s portfolio is secured by collateral.
Our credit risk management performance within the global businesses at December 2025 was as follows:
| | | | | |
| Retail & Commercial Banking |
The retail portfolio mainly comprises high credit quality mortgage loans, around 90% of which have a loan-to-value (relationship between the loan amount and the appraised value of the collateral) below 80%, and a corporate portfolio where roughly 50% has real estate or other tangible collateral.
| | |
Portfolio distribution by geography and by performing loans and credit impaired |
| 31 December 2025 data |
At December 2025, gross customer credit exposure in Retail was distributed among mortgages (52%), corporates and institutions (25%), SMEs (12%) and other individuals (11%).
The NPL ratio fell by 12 bps during the year to 3.09%, supported by the reduction in impaired loans, driven by declines in Europe. Gross customer credit exposure (total risk) remained practically stable during the year.
The cost of risk increased 4 bps year-on-year to 1.15%, with LLPs slightly up, mainly driven by normalization in Argentina and the UK, partially offset by declines in Spain (good mortgage portfolio performance, supported by lower interest rates and a resilient labour market), Mexico and Brazil (both reflecting currency depreciation).
The total NPL coverage ratio rose to 66%. Given that Retail includes the mortgage portfolios in Spain and the United Kingdom, which are backed by high-quality collateral, we consider coverage levels appropriate for the portfolio’s risk profile.
This business comprises all business originated by consumer finance companies, plus our digital bank (formerly Openbank), Open Digital Services (ODS) and SBNA Consumer. The portfolio mainly consists of vehicle finance loans, which account for close to 80% of the portfolio and are originated through strategic partnerships with car manufacturers, as well as leasing and personal loans.
| | |
Portfolio distribution by geography and by performing loans and credit impaired |
31 December 2025 data |
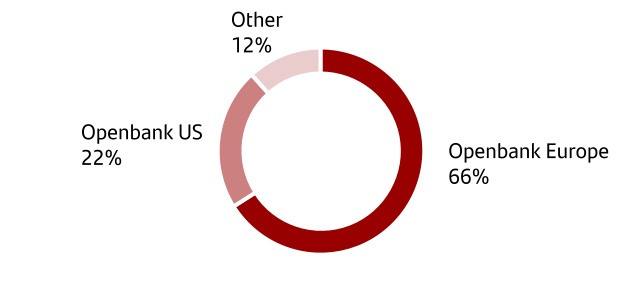
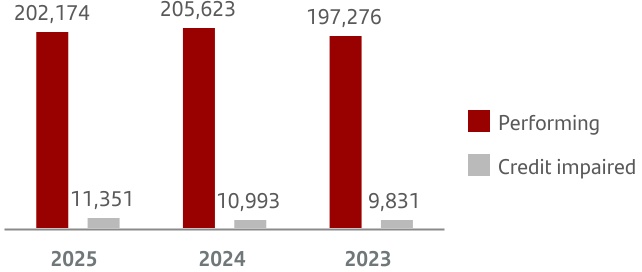
The NPL ratio at year-end 2025 stood at 5.32%, 24 bps higher than in the same period in 2024, due to: (i) higher impaired loans, mainly in Germany (due to the macroeconomic environment and the credit quality deterioration of the corporates portfolio), Brazil and Argentina; (ii) decrease in gross customer exposure (total risk), linked to lower auto lending and to asset rotation initiatives in the US.
Net loan-loss provisions declined 2.3% year-on-year, mainly driven by better performance in the US and Brazil, with both benefiting from FX movements.
The cost of risk fell by 7 bps versus December 2024, to 2.10%, mainly due to a decline in provisions in the US (-13%), driven by resilient consumer behaviour, used car prices stable at high levels, capital relief measures.
The total NPL coverage ratio at year-end 2025 stood at 71%, which we consider comfortable, given the positive impact of vehicle price trends and the higher share of secured loans in the portfolio, mainly in the US.
| | | | | |
| Corporate & Investment Banking |
Corporate & Investment Banking is a wholesale business in which over 83% of our customers have a credit rating higher than 'investment grade'. It’s a business with a strong component of advisory services and high value added solutions.
| | |
Portfolio distribution by geography and by performing loans and credit impaired |
31 December 2025 data |
During the year, CIB showed a strong ability to deliver profitable growth and maintain solid credit quality in a complex environment, while keeping its strategic focus on geographic and client diversification and on offering higher value-added products. By business line, growth was recorded across all lines (Global Markets, Global Banking and Global Transaction Banking).
The NPL ratio improved by 14 bps in the year, to 0.72%, backed by a reduction in impaired loans of c. -EUR 130 million year-on-year across a range of clients and geographies, mainly in Europe and South America. In addition, gross customer credit exposure (total risk) increased by 12% year-on-year, mainly in the US and Spain, and to a lesser extent Mexico.
Net loan-loss provisions rose to EUR 278 million, reflecting the performance of the business in Brazil in a more challenging macroeconomic environment, higher coverage for already impaired customers and portfolio growth in the US.
The cost of risk increased by 6 bps versus December 2024 to 0.14% as portfolio growth did not offset the increase in provisions.
The total NPL coverage ratio reached 47%, up 8 pp versus December 2024 with higher provisions in a more challenging economic and geopolitical environment.
In 2025, CIB continued to strengthen the control environment amid portfolio growth and heightened regulatory and supervisory scrutiny, leveraging new technologies. Key initiatives included reinforcing the risk infrastructure —including organisation and governance, with a particular focus on the United States—upgrading credit risk systems and models, defining more robust frameworks in specific areas, and strengthening preventive risk management capabilities.
| | | | | |
| Wealth Management & Insurance |
Wealth comprises two business lines: i) Private Banking, which includes the corporate private banking unit and International Private Banking in the US, Switzerland and the UAE; and ii) Insurance & Asset Management Solutions, which brings together the insurance business and liquid and illiquid asset management activities and also includes the investment platforms and holdings that complement the traditional Wealth business.
| | |
Portfolio distribution by geography and by performing loans and credit impaired |
31 December 2025 data |
The NPL ratio closed at 0.86%, down 12 bps in the year, supported by an increase in gross customer exposure during the period (+7%), with a particular focus on the Middle East portfolio and the roll-out of secured lending in all core geographies, while impaired loans fell 7% year-on-year.
Net loan-loss provisions in 2025 totalled EUR 20 million, compared with EUR 42 million at year-end 2024.
The cost of risk decreased by 10 bps in the year to 0.08%, driven by lower provisions and by portfolio growth, with a focus on collateral-backed loans.
The total NPL coverage ratio rose to 71%, remaining at a comfortable level given the high share of the collateral-backed loan portfolio.
Reconciliation of key figures
Santander’s 2025 consolidated financial statements disclose loans and advances to customers before and after loan-loss reserves. Credit risk with customers also includes off-balance sheet risk or contingent liabilities. This table shows the relationship between those concepts:
| | | | | | | | | | | | | | | | | | | | | | | | | | | | | | | | | | |
| | Gross credit risk with customersA | | |
| | 1,159,180 | | |
| | | | | | | | | | | | |
| Gross credit risk with customers | = | Gross loans and advances to customers & others | | | + | Contingent liabilities | + | Debt securities |
| 1,159,180 | 1,058,447 | | | 80,056 | 20,677 |
| | | | | | | | | | | | |
| | | | | | | | |
| | | | | | | | |
Loans and advances to customers (Gross) | = | Financial assets measured at amortized cost (Gross)B | + | Financial assets held for tradingB | + | Financial assets at fair value (Gross)B | | | | | | |
| 1,058,447 | 1,006,253 | 32,766 | 19,428 | | | | | | |
| | | | | | | | | | | | |
Loan-loss reserves | = | Loan-loss reserves | | + | | Loan-loss reserves | | | | | | |
| (21,158) | (21,077) | | | (81) | | | | | | |
| | | | | | | | | | | | |
Net loans and advances to customers | = | Net financial assets measured at amortized cost | + | Financial assets held for trading | + | Net financial assets at fair value | | | | | | |
| 1,037,288 | 985,176 | 32,766 | 19,346 | | | | | | |
| | | | | | | | | | | | |
| | Net loans and advances to customers | | | | | | |
| | 1,037,288 | | | | | | |
5.1. Credit risk Balance sheet item from consolidated financial statement A. Includes gross loans and advances to customers, guarantees, impaired undrawn customer balances and dept securities issued by non-financial institutions.
B. Before loan-loss allowances.
Financial asset impairment
IFRS 9 introduced a substantial change in the approach to calculating impairment provisions for credit risk exposures, moving from an incurred loss model to an expected loss model. Under this new approach, provisions are recognised from the moment a transaction is originated, since credit risk exists from that moment and not only when defaults occur.
This change required a review of the models and methodologies used to estimate expected loss for customers and portfolios, incorporating the expected evolution of the economy and the residual life of different transactions.
The methodology to quantify expected credit losses – and therefore impairment provisions – is based on an unbiased, probability-weighted estimate of up to five future macroeconomic scenarios that could affect the ability to collect contractual cash flows. These scenarios take into account the time value of money, relevant information about past events, current conditions and projections of significant macroeconomic factors, such as GDP, house prices, unemployment rate and interest rates, among others.
The parameters used by the Group to calculate impairment provisions (mainly EAD2, PD3, LGD4 and discount rate) build on our internal model infrastructure and the experience gained in regulatory and management environments. However, rather than simply adapting existing models, these parameters are specifically designed, updated and validated to comply with IFRS 9 requirements.
| | | | | |
| For more details on financial asset impairment and the calculation of provisions under IFRS 9, see '2. Main aggregates and variations' in Note 54 to the consolidated financial statements. |
IFRS 9 classifies transactions based on how credit risk has evolved since origination to the analysis date, so we can determine both their accounting treatment and pricing. Transactions with different probabilities of default must carry different interest rates or margins that cover their expected loss.
2 Exposure at Default.
3 Probability of Default.
4 Loss Given Default.
If a transaction has undergone a significant increase in credit risk since origination, the interest rate initially applied no longer covers its potential risk, so it requires a higher level of provisions. Under the standard, transactions fall into three groups or stages:
•Stage 1 includes assets whose current credit risk has not increased relative to origination or initial recognition. Provisions are calculated to cover expected credit losses from possible defaults over the next 12 months.
•Stage 2 includes assets that have not yet incurred credit losses but have shown a significant increase in credit risk since origination or initial recognition. Impairment provisions must cover potential loss over the lifetime of the exposure, during which losses may materialise.
•Stage 3 includes assets where there is evidence of credit deterioration that will eventually materialise as credit losses. Provisions must cover potential loss over the lifetime of the exposure.
IFRS 9: Classification of exposures by credit quality and expected credit loss horizons
| | | | | | | | | | | | | | | | | | | | | | | | | | | | | | | | |
.+. Credit quality | | | Stage 1 | | Stage 2 | | Stage 3 | | | .-. Credit quality |
| | | | | | | } |
| | | |
| | | |
| | | | | |
| | | | | | | | | | |
| | | Performing credit assets with no significant credit risk increase since initial recognition | | Credit assets that have experienced a significant credit risk increase since initial recognition | | Impaired credit assets | | | |
| | | Ä | | Ä | | Ä | | | |
| | | | | | | | | | |
| | | Expected losses 12 months | | Expected losses over residual life (Lifetime) | | | |
In addition, impairment provisions include expected credit losses over the expected remaining lifetime of those financial instruments originated or purchased credit-impaired (POCI).
The following table shows credit risk exposure by stage and geography:
| | | | | | | | | | | | | | |
Exposure by stage and geographyA, B |
| EUR million. 31 December 2025 data |
| Stage 1 | Stage 2 | Stage 3 | Total |
| Spain | 283,825 | 15,416 | 5,915 | 305,156 |
| UK | 221,869 | 19,789 | 2,645 | 244,303 |
| Portugal | 43,931 | 2,881 | 948 | 47,760 |
| Openbank Europe | 131,724 | 8,673 | 3,642 | 144,039 |
| US | 127,680 | 13,658 | 7,150 | 148,488 |
| Mexico | 47,936 | 4,120 | 1,420 | 53,476 |
| Brazil | 95,882 | 14,654 | 8,010 | 118,546 |
| Chile | 37,560 | 4,058 | 2,528 | 44,146 |
| Argentina | 6,711 | 1,425 | 677 | 8,813 |
| Total Group | 1,038,698 | 86,743 | 33,739 | 1,159,180 |
Data for 2025 reflects the new reporting structure.
A. Includes credit impaired customer loans and advances, guarantees, impaired undrawn balances and debt securities issued by non-financial institutions, temporary purchases of stage 1 assets and risk not subject to impairment.
B. Total Group includes the Corporate Centre.
Stage 3 financial assets (showing impairment) performed as follows:
| | | | | | | | | | | |
2023 - 2025 Impaired credit assets |
EUR million |
| 2025 | 2024 | 2023 |
| Start of period | 34,383 | 34,671 | 33,788 |
| | | |
| | | |
| Net entries | 13,697 | 13,918 | 14,442 |
| Perimeter | — | 17 | (59) |
| FX and others | (1,075) | (1,073) | 126 |
| Write-off | (13,266) | (13,150) | (13,626) |
| End of period | 33,739 | 34,383 | 34,671 |
| | | |
| | | |
Data for 2025, 2024 and 2023 reflects the new reporting structure.
The following table shows the calculation of IFRS 9 loan loss reserves for assets subject to credit risk:
| | | | | | | | | | | |
2023 - 2025 loan-loss reserves |
EUR million |
| 2025 | 2024 | 2023 |
Start of period | 22,155 | 22,734 | 22,692 |
| Stage 1 and 2 | 8,536 | 8,754 | 9,055 |
| Stage 3 | 13,619 | 13,980 | 13,637 |
| Gross provision for impaired assets and write-downs | 13,919 | 13,341 | 13,316 |
| Provision for other assets | — | 82 | 55 |
| FX and other | (450) | (852) | 297 |
| Write-off | (13,266) | (13,150) | (13,626) |
End of period | 22,358 | 22,155 | 22,734 |
| Stage 1 and 2 | 8,271 | 8,536 | 8,754 |
| Stage 3 | 14,087 | 13,619 | 13,980 |
Data for 2025, 2024 and 2023 reflects the new reporting structure.
A. Includes off-balance.
Forbearance
Our forbearance policy incorporates the regulatory requirements set out in the EBA Guidelines on the management of non-performing exposures and forbearance. The policy serves as a reference for implementation in our subsidiaries and reflects applicable supervisory expectations.
It sets the criteria to identify, classify and monitor these transactions, with the aim of applying maximum diligence in their granting and control. Forbearance solutions must aim to recover the amounts due, aligning payment obligations with the customer’s current situation.
Forborne transactions must remain in the appropriate classification for a suitable period in order to capture the associated risk and confirm a reasonable recovery of repayment capacity. Under no circumstances should forbearance be used to delay the immediate recognition of losses or to mask non-payment risk.
The stock of forborne exposures continued to decline from EUR 26,223 million to EUR 25,235 million as of 31 December 2025, supported by good repayment performance in our main geographies, which offset higher activity in other regions. In credit quality terms, 53% of the portfolio is classified as non-performing, with a coverage ratio of 41%.
| | | | | | | | | | | |
| Key forbearance figures |
| EUR million |
| 2025 | 2024 | 2023 |
| Performing | 11,901 | 11,955 | 16,455 |
Credit impaired | 13,334 | 14,268 | 14,695 |
| Total forborne | 25,235 | 26,223 | 31,150 |
% Total coverageA | 26 | % | 27 | % | 25 | % |
Data for 2025, 2024 and 2023 reflects the new reporting structure.
A. Total forbearance portfolio loan-loss allowances/total forborne portfolio.
Section 2
Consolidated financial statements for the three years ended 31 December 2025, recast as a result of certain changes to the presentation of the Group’s financial information.
Auditor's report and consolidated financial statements
Auditor's report
REPORT OF INDEPENDENT REGISTERED PUBLIC ACCOUNTING FIRM
To the Board of Directors and Shareholders of Banco Santander, S.A.
Opinions on the Financial Statements and Internal Control over Financial Reporting
We have audited the accompanying consolidated balance sheets of Banco Santander, S.A. and its subsidiaries (the “Company”) as of December 31, 2025, 2024 and 2023, and the related consolidated income statements, statements of recognised income and expense, statements of changes in total equity and statements of cash flows for each of the three years in the period ended December 31, 2025, including the related notes (collectively referred to as the “consolidated financial statements”). We also have audited the Company’s internal control over financial reporting as of December 31, 2025, based on criteria established in Internal Control - Integrated Framework (2013) issued by the Committee of Sponsoring Organizations of the Treadway Commission (COSO).
In our opinion, the consolidated financial statements referred to above present fairly, in all material respects, the financial position of the Company as of December 31, 2025, 2024 and 2023, and the results of its operations and its cash flows for each of the three years in the period ended December 31, 2025 in conformity with International Financial Reporting Standards as issued by the International Accounting Standards Board. Also in our opinion, the Company maintained, in all material respects, effective internal control over financial reporting as of December 31, 2025, based on criteria established in Internal Control - Integrated Framework (2013) issued by the COSO.
Basis for Opinions
The Company’s management is responsible for these consolidated financial statements, for maintaining effective internal control over financial reporting, and for its assessment of the effectiveness of internal control over financial reporting, included in Management’s Report on Internal Control over Financial Reporting (not presented herein) appearing under Item 15 of the Company’s 2025 Annual Report on Form 20-F. Our responsibility is to express opinions on the Company’s consolidated financial statements and on the Company’s internal control over financial reporting based on our audits. We are a public accounting firm registered with the Public Company Accounting Oversight Board (United States) (PCAOB) and are required to be independent with respect to the Company in accordance with the U.S. federal securities laws and the applicable rules and regulations of the Securities and Exchange Commission and the PCAOB.
We conducted our audits in accordance with the standards of the PCAOB. Those standards require that we plan and perform the audits to obtain reasonable assurance about whether the consolidated financial statements are free of material misstatement, whether due to error or fraud, and whether effective internal control over financial reporting was maintained in all material respects.
Our audits of the consolidated financial statements included performing procedures to assess the risks of material misstatement of the consolidated financial statements, whether due to error or fraud, and performing procedures that respond to those risks. Such procedures included examining, on a test basis, evidence regarding the amounts and disclosures in the consolidated financial statements. Our audits also included evaluating the accounting principles used and significant estimates made by management, as well as evaluating the overall presentation of the consolidated financial statements. Our audit of internal control over financial reporting included obtaining an understanding of internal control over financial reporting, assessing the risk that a material weakness exists, and testing and
evaluating the design and operating effectiveness of internal control based on the assessed risk. Our audits also included performing such other procedures as we considered necessary in the circumstances. We believe that our audits provide a reasonable basis for our opinions.
Definition and Limitations of Internal Control over Financial Reporting
A company’s internal control over financial reporting is a process designed to provide reasonable assurance regarding the reliability of financial reporting and the preparation of financial statements for external purposes in accordance with generally accepted accounting principles. A company’s internal control over financial reporting includes those policies and procedures that (i) pertain to the maintenance of records that, in reasonable detail, accurately and fairly reflect the transactions and dispositions of the assets of the company; (ii) provide reasonable assurance that transactions are recorded as necessary to permit preparation of financial statements in accordance with generally accepted accounting principles, and that receipts and expenditures of the company are being made only in accordance with authorizations of management and directors of the company; and (iii) provide reasonable assurance regarding prevention or timely detection of unauthorized acquisition, use, or disposition of the company’s assets that could have a material effect on the financial statements.
Because of its inherent limitations, internal control over financial reporting may not prevent or detect misstatements. Also, projections of any evaluation of effectiveness to future periods are subject to the risk that controls may become inadequate because of changes in conditions, or that the degree of compliance with the policies or procedures may deteriorate.
Critical Audit Matters
The critical audit matters communicated below are matters arising from the current period audit of the consolidated financial statements that were communicated or required to be communicated to the audit committee and that (i) relate to accounts or disclosures that are material to the consolidated financial statements and (ii) involved our especially challenging, subjective, or complex judgments. The communication of critical audit matters does not alter in any way our opinion on the consolidated financial statements, taken as a whole, and we are not, by communicating the critical audit matters below, providing separate opinions on the critical audit matters or on the accounts or disclosures to which they relate.
Estimation of impairment of financial assets at amortized cost– loans and advances to customers
As described in Notes 2,10 and 54 to the consolidated financial statements, the Company’s financial assets at amortized cost – loans and advances to customers - were EUR 985,176 million as of December 31, 2025, and its estimation of impairment of financial assets at amortized cost – loans and advances to customers – was EUR 12,517 million for the year ended December 31, 2025. The Company assesses impairment by estimating the expected credit losses based on the stage in which each financial asset is classified. Management’s assessment of expected credit losses considers instruments with similar credit risk characteristics that are indicative of debtors’ capacity to pay. The methodology required to estimate the expected credit losses due to credit events is based on the estimation of credit risk parameters (probability of default and loss given default) with an unbiased and weighted consideration by the probability of occurrence of a series of scenarios. The estimation of expected credit losses requires expert judgment and the support of historical, current and future information, including considering management overlays, if applicable. The probability of
loss is measured considering past events, the present situation and future trends of macroeconomic scenarios.
The principal considerations for our determination that performing procedures relating to the estimation of the impairment of financial assets at amortized cost – loans and advances to customers is a critical audit matter are (i) the significant judgment by management in determining the assessment of the expected credit losses; (ii) a high degree of auditor judgment, subjectivity and effort in performing procedures relating to the models and assumptions used to determine the expected credit losses; and (iii) the audit effort involved the use of professionals with specialized skill and knowledge.
Addressing the matter involved performing procedures and evaluating audit evidence in connection with forming our overall opinion on the consolidated financial statements. These procedures included testing the effectiveness of controls relating to management’s expected credit loss estimation process, which included controls over the data, models and assumptions used in the estimation process, including management overlays to the models, if applicable. These procedures also included, among others, (i) evaluating, on a test basis, expected credit loss models parameters with respect to the estimation criteria and calculation, the appropriateness of the methodology used for the generation of the macroeconomic scenarios, the reliability of the data sources and the completeness and accuracy of data provided by management, and the reasonableness of management’s criteria for significant increase in credit risk and loan classification by stages; (ii) testing the mathematical accuracy of the impairment calculation for the credit portfolios; (iii) evaluating the reasonableness of the management overlays to the models, if applicable; (iv) evaluating a sample of individual credit files to determine the reasonableness of management’s classification, expected loss estimation methodologies and, where appropriate, corresponding impairment, and (v) evaluating the loan collateral assignment and valuation process, including collateral recovery process. Professionals with specialized skill and knowledge were used to assist in evaluating the appropriateness of the models used by management and evaluating the reasonableness of assumptions used in the impairment estimation for the credit portfolios.
Goodwill Impairment Assessment of Certain Cash Generating Unit (CGU)
As described in Notes 2 and 17 to the consolidated financial statements, the Company’s consolidated goodwill balance was EUR 11,958 million as of December 31, 2025, which includes the goodwill balance of the Santander US Auto CGU of EUR 943 million. Management assesses goodwill for impairment at the end of each annual reporting period or whenever there is any indication of impairment. Potential impairment is identified by management by comparing the value in use of a CGU to its carrying value. Value in use is estimated by management using discounted cash flow projections. Management’s cash flow projections for the CGU include assumptions relating to earnings projections, discount rates determined as the cost of capital taking into account the risk-free rate of return plus a risk premium and constant growth rates used in order to extrapolate earnings in perpetuity.
The principal considerations for our determination that performing procedures relating to the goodwill impairment assessment of the aforementioned CGU is a critical audit matter are (i) the significant judgment by management when developing the value in use of the CGU; (ii) a high degree of auditor judgment, subjectivity, and effort in performing procedures and evaluating management’s significant assumptions related to earnings projections, discount rates and constant growth rates; and (iii) the audit effort involved the use of professionals with specialized skill and knowledge.
Addressing the matter involved performing procedures and evaluating audit evidence in connection with forming our overall
opinion on the consolidated financial statements. These procedures included testing the effectiveness of controls relating to management’s goodwill impairment assessment, including controls over the valuation of the aforementioned CGU. These procedures also included, among others, (i) testing management’s process for developing the value in use estimate; (ii) evaluating the appropriateness of the discounted cash flow model; (iii) evaluating the reasonableness of the earnings projections, the discount rate and the constant growth rates assumptions used by management; and (iv) testing the mathematical accuracy of the discounted cash flow projections. Evaluating the reasonableness of management’s key assumptions involved (i) performing a retrospective comparison of forecasted earnings to actual past performance and previous forecasts; and (ii) evaluating the consistency of the discount rate and constant growth rate with external market and industry data. Professionals with specialized skill and knowledge were used to assist in the evaluation of the appropriateness of management’s discounted cash flow model and reasonableness of the earnings projections, discount rate and constant growth rates assumptions.
Litigation provisions and contingencies
As described in Notes 2 and 25 to the consolidated financial statements, the Company’s consolidated litigation provisions and contingencies balance as of December 31, 2025 were EUR 4,714 million. The Company records provisions for tax, civil and legal proceedings in which management assesses the chances of loss to be probable. Management determines the amounts to be provided for as the best estimate of the expenditure required to settle the corresponding claim based, among other factors, on a case-by-case analysis of the facts and the legal opinion of internal and external counsel or by considering the historical average amount of the loss incurred in claims of the same nature.
The principal considerations for our determination that performing procedures relating to litigation provisions and contingencies is a critical audit matter are the significant judgment by management to assess the intrinsic uncertainty of the obligations for which management recognizes a provision for these proceedings based on estimates, which in turn led to a high degree of auditor judgment and effort in performing procedures and evaluating management’s process for estimating the litigation provisions and contingencies.
Addressing the matter involved performing procedures and evaluating audit evidence in connection with forming our overall opinion on the consolidated financial statements. These procedures included testing the effectiveness of controls relating to the assessment of litigation provisions and contingencies. These procedures also included, among others, (i) obtaining and evaluating letters of audit inquiry with internal and external lawyers and external tax advisors, (ii) evaluating the reasonableness of management’s assessment regarding whether an outflow of resources is probable and the contingency is estimable, (iii) evaluating management’s assessment of possible contingencies relating to compliance with the tax obligations for all the years open to inspection and (iv) evaluating the sufficiency of the Company’s contingency disclosures.
/s/ PricewaterhouseCoopers Auditores, S.L.
Madrid, Spain
February 27, 2026, except with respect to our opinion on the consolidated financial statements insofar as it relates to the change in reportable segments discussed in Note 52, and the change in the manner in which the company presents certain items in the consolidated income statements discussed in Note 1, as to which the date is April 1, 2026
We have served as the Company’s auditor since 2016.
Consolidated financial statements
| | | | | | | | | | | | | | |
| CONSOLIDATED BALANCE SHEETS AS OF 31 DECEMBER 2025, 2024 AND 2023 |
| EUR million | | | | |
| | | | |
| ASSETS | Note | 2025 | 2024 | 2023 |
| CASH, CASH BALANCES AT CENTRAL BANKS AND OTHER DEPOSITS ON DEMAND | | 152,281 | | 192,208 | | 220,342 | |
| FINANCIAL ASSETS HELD FOR TRADING | | 252,318 | | 230,253 | | 176,921 | |
| Derivatives | 9 and 11 | 58,355 | | 64,100 | | 56,328 | |
| Equity instruments | 8 | 22,030 | | 16,636 | | 15,057 | |
| Debt securities | 7 | 98,568 | | 82,646 | | 62,124 | |
| Loans and advances | | 73,365 | | 66,871 | | 43,412 | |
| Central banks | 6 | 14,632 | | 12,966 | | 17,717 | |
| Credit institutions | 6 | 25,967 | | 27,314 | | 14,061 | |
| Customers | 10 | 32,766 | | 26,591 | | 11,634 | |
NON-TRADING FINANCIAL ASSETS MANDATORILY AT
FAIR VALUE THROUGH PROFIT OR LOSS | | 7,761 | | 6,130 | | 5,910 | |
| Equity instruments | 8 | 5,815 | | 4,641 | | 4,068 | |
| Debt securities | 7 | 245 | | 447 | | 860 | |
| Loans and advances | | 1,701 | | 1,042 | | 982 | |
| Central banks | 6 | — | | — | | — | |
| Credit institutions | 6 | — | | — | | — | |
| Customers | 10 | 1,701 | | 1,042 | | 982 | |
| FINANCIAL ASSETS DESIGNATED AT FAIR VALUE THROUGH PROFIT OR LOSS | | 8,046 | | 7,915 | | 9,773 | |
| Debt securities | 7 | 2,894 | | 2,897 | | 3,095 | |
| Loans and advances | | 5,152 | | 5,018 | | 6,678 | |
| Central banks | 6 | — | | — | | — | |
| Credit institutions | 6 | 413 | | 408 | | 459 | |
| Customers | 10 | 4,739 | | 4,610 | | 6,219 | |
| FINANCIAL ASSETS AT FAIR VALUE THROUGH OTHER COMPREHENSIVE INCOME | | 74,612 | | 89,898 | | 83,308 | |
| Equity instruments | 8 | 2,281 | | 2,193 | | 1,761 | |
| Debt securities | 7 | 58,305 | | 76,558 | | 73,565 | |
| Loans and advances | | 14,026 | | 11,147 | | 7,982 | |
| Central banks | 6 | — | | — | | — | |
| Credit institutions | 6 | 1,120 | | 363 | | 313 | |
| Customers | 10 | 12,906 | | 10,784 | | 7,669 | |
| FINANCIAL ASSETS AT AMORTIZED COST | | 1,202,689 | | 1,203,707 | | 1,191,403 | |
| Debt securities | 7 | 140,014 | | 120,949 | | 103,559 | |
| Loans and advances | | 1,062,675 | | 1,082,758 | | 1,087,844 | |
| Central banks | 6 | 15,986 | | 16,179 | | 20,082 | |
| Credit institutions | 6 | 61,513 | | 55,537 | | 57,917 | |
| Customers | 10 | 985,176 | | 1,011,042 | | 1,009,845 | |
| HEDGING DERIVATIVES | 36 | 3,931 | | 5,672 | | 5,297 | |
CHANGES IN THE FAIR VALUE OF HEDGED ITEMS IN
PORTFOLIO HEDGES OF INTEREST RATE RISK | 54 | 50 | | (704) | | (788) | |
| | | | |
| | | | |
| | | | | | | | | | | | | | |
| CONSOLIDATED BALANCE SHEETS AS OF 31 DECEMBER 2025, 2024 AND 2023 |
| EUR million | | | | |
| | | | |
| ASSETS | Note | 2025 | 2024 | 2023 |
| INVESTMENTS | 13 | 7,052 | | 7,277 | | 7,646 | |
| Joint venture entities | | 1,956 | | 2,061 | | 1,964 | |
| Associated entities | | 5,096 | | 5,216 | | 5,682 | |
| ASSETS UNDER REINSURANCE CONTRACTS | | 223 | | 222 | | 237 | |
| TANGIBLE ASSETS | | 27,438 | | 32,087 | | 33,882 | |
| Property, plant and equipment | 16 | 26,416 | | 31,212 | | 32,926 | |
| For own-use | | 11,663 | | 12,636 | | 13,408 | |
| Leased out under an operating lease | | 14,753 | | 18,576 | | 19,518 | |
| Investment properties | 16 | 1,022 | | 875 | | 956 | |
| Of which leased out under an operating lease | | 860 | | 749 | | 851 | |
| INTANGIBLE ASSETS | | 17,308 | | 19,259 | | 19,871 | |
| Goodwill | 17 | 11,958 | | 13,438 | | 14,017 | |
| Other intangible assets | 18 | 5,350 | | 5,821 | | 5,854 | |
| TAX ASSETS | | 30,076 | | 30,596 | | 31,390 | |
| Current tax assets | | 11,132 | | 11,426 | | 10,623 | |
| Deferred tax assets | 27 | 18,944 | | 19,170 | | 20,767 | |
| OTHER ASSETS | | 8,719 | | 8,559 | | 8,856 | |
| Insurance contracts linked to pensions | 14 | 67 | | 81 | | 93 | |
| Inventories | | 7 | | 6 | | 7 | |
| Other | 19 | 8,645 | | 8,472 | | 8,756 | |
| NON-CURRENT ASSETS HELD FOR SALE | 12 | 75,011 | | 4,002 | | 3,014 | |
| TOTAL ASSETS | | 1,867,515 | | 1,837,081 | | 1,797,062 | |
The accompanying notes 1 to 55 and appendices are an integral part of the consolidated balance sheet as of 31 December 2025.
| | | | | | | | | | | | | | |
| CONSOLIDATED BALANCE SHEETS AS OF 31 DECEMBER 2025, 2024 AND 2023 |
| EUR million |
| | | | | | | | | | | | | | |
| LIABILITIES | Note | 2025 | 2024 | 2023 |
| FINANCIAL LIABILITIES HELD FOR TRADING | | 171,546 | | 152,151 | | 122,270 | |
| Derivatives | 9 and 11 | 51,968 | | 57,753 | | 50,589 | |
| Short positions | 9 | | 44,015 | | 35,830 | | 26,174 | |
| Deposits | | 75,563 | | 58,568 | | 45,507 | |
| Central banks | 20 | | 12,385 | | 13,300 | | 7,808 | |
| Credit institutions | 20 | | 27,058 | | 26,284 | | 17,862 | |
| Customers | 21 | | 36,120 | | 18,984 | | 19,837 | |
| Marketable debt securities | 22 | | — | | — | | — | |
| Other financial liabilities | 24 | | — | | — | | — | |
| FINANCIAL LIABILITIES DESIGNATED AT FAIR VALUE THROUGH PROFIT OR LOSS | | 42,148 | | 36,360 | | 40,367 | |
| Deposits | | 30,440 | | 28,806 | | 34,996 | |
| Central banks | 20 | | 3,086 | | 1,774 | | 1,209 | |
| Credit institutions | 20 | | 1,424 | | 1,625 | | 1,735 | |
| Customers | 21 | | 25,930 | | 25,407 | | 32,052 | |
| Marketable debt securities | 22 | | 11,686 | | 7,554 | | 5,371 | |
| Other financial liabilities | 24 | | 22 | | — | | — | |
| Memorandum items: subordinated liabilities | 23 | | — | | — | | — | |
| FINANCIAL LIABILITIES AT AMORTIZED COST | | 1,421,184 | | 1,484,322 | | 1,468,703 | |
| Deposits | | 1,072,384 | | 1,126,439 | | 1,125,308 | |
| Central banks | 20 | | 18,542 | | 24,882 | | 48,782 | |
| Credit institutions | 20 | | 74,692 | | 90,012 | | 81,246 | |
| Customers | 21 | | 979,150 | | 1,011,545 | | 995,280 | |
| Marketable debt securities | 22 | | 312,704 | | 317,967 | | 303,208 | |
| Other financial liabilities | 24 | | 36,096 | | 39,916 | | 40,187 | |
| Memorandum items: subordinated liabilities | 23 | | 29,287 | | 35,813 | | 30,912 | |
| HEDGING DERIVATIVES | 36 | 4,248 | | 4,752 | | 7,656 | |
CHANGES IN THE FAIR VALUE OF HEDGED ITEMS IN
PORTFOLIO HEDGES OF INTEREST RATE RISK | 54 | 49 | | (9) | | 55 | |
| LIABILITIES UNDER INSURANCE CONTRACTS | 15 | 18,737 | | 17,829 | | 17,799 | |
| PROVISIONS | 25 | 8,355 | | 8,407 | | 8,441 | |
| Pensions and other post-retirement obligations | | 1,656 | | 1,731 | | 2,225 | |
| Other long term employee benefits | | 993 | | 915 | | 880 | |
| Taxes and other legal contingencies | | 2,989 | | 2,717 | | 2,715 | |
| Contingent liabilities and commitments | | 713 | | 710 | | 702 | |
| Other provisions | | 2,004 | | 2,334 | | 1,919 | |
| TAX LIABILITIES | | 9,568 | | 9,598 | | 9,932 | |
| Current tax liabilities | | 3,664 | | 3,322 | | 3,846 | |
| Deferred tax liabilities | 27 | | 5,904 | | 6,276 | | 6,086 | |
| OTHER LIABILITIES | 26 | 15,937 | | 16,344 | | 17,598 | |
| LIABILITIES ASSOCIATED WITH NON-CURRENT ASSETS HELD FOR SALE | | 62,995 | | — | | — | |
| TOTAL LIABILITIES | | 1,754,767 | | 1,729,754 | | 1,692,821 | |
| | | | | | | | | | | | | | |
| CONSOLIDATED BALANCE SHEETS AS OF 31 DECEMBER 2025, 2024 AND 2023 |
| EUR million |
| | | | | | | | | | | | | | |
| EQUITY | Note | 2025 | 2024 | 2023 |
| SHAREHOLDERS´ EQUITY | 30 | | 141,144 | | 135,196 | | 130,443 | |
| CAPITAL | 31 | | 7,345 | | 7,576 | | 8,092 | |
| Called up paid capital | | 7,345 | | 7,576 | | 8,092 | |
| Unpaid capital which has been called up | | — | | — | | — | |
| SHARE PREMIUM | 32 | | 36,792 | | 40,079 | | 44,373 | |
| EQUITY INSTRUMENTS ISSUED OTHER THAN CAPITAL | 34 | — | | — | | 720 | |
| Equity component of the compound financial instrument | | — | | — | | — | |
| Other equity instruments issued | | — | | — | | 720 | |
| OTHER EQUITY | 34 | | 273 | | 217 | | 195 | |
| ACCUMULATED RETAINED EARNINGS | 33 | | 91,959 | | 82,326 | | 74,114 | |
| REVALUATION RESERVES | 33 | | — | | — | | — | |
| OTHER RESERVES | 33 | | (7,532) | | (5,976) | | (5,751) | |
| Reserves or accumulated losses in joint venture investments | | 1,643 | | 1,831 | | 1,762 | |
| Others | | (9,175) | | (7,807) | | (7,513) | |
| (-) OWN SHARES | 34 | | (96) | | (68) | | (1,078) | |
| PROFIT OR LOSS ATTRIBUTABLE TO SHAREHOLDERS OF THE PARENT | | 14,101 | | 12,574 | | 11,076 | |
| (-) INTERIM DIVIDENDS | 4 | | (1,698) | | (1,532) | | (1,298) | |
| OTHER COMPREHENSIVE INCOME OR LOSS | 29 | (37,974) | | (36,595) | | (35,020) | |
Items that will not be reclassified to profit or loss | | (4,121) | | (4,757) | | (5,212) | |
| Items that may be reclassified to profit or loss | | (33,853) | | (31,838) | | (29,808) | |
| NON-CONTROLLING INTEREST | 28 | | 9,578 | | 8,726 | | 8,818 | |
| Other comprehensive income or loss | | (1,947) | | (2,020) | | (1,559) | |
| Other items | | 11,525 | | 10,746 | | 10,377 | |
| TOTAL EQUITY | | 112,748 | | 107,327 | | 104,241 | |
| TOTAL LIABILITIES AND EQUITY | | 1,867,515 | | 1,837,081 | | 1,797,062 | |
| MEMORANDUM ITEMS: OFF BALANCE SHEET AMOUNTS | 35 | | | | |
| Loan commitments granted | | 321,234 | | 302,861 | | 279,589 | |
| Financial guarantees granted | | 17,449 | | 16,901 | | 15,435 | |
| Other commitments granted | | 148,118 | | 134,493 | | 113,273 | |
The accompanying notes 1 to 55 and appendices are an integral part of the consolidated balance sheet as of 31 December 2025.
| | | | | | | | | | | | | | |
| CONSOLIDATED INCOME STATEMENTS FOR THE YEARS ENDED 31 DECEMBER 2025, 2024 AND 2023 |
| EUR million |
| | | | |
| (Debit) Credit |
| Note | 2025 | 2024 | 2023 |
| Interest income | 38 | | 101,710 | | 109,012 | | 101,742 | |
| Financial assets at fair value through other comprehensive income | | 5,713 | | 6,931 | | 5,533 | |
| Financial assets at amortized cost | | 76,248 | | 80,992 | | 74,799 | |
| Other interest income | | 19,749 | | 21,089 | | 21,410 | |
| Interest expense | 39 | | (59,362) | | (65,225) | | (61,092) | |
| Interest income/(charges) | | 42,348 | | 43,787 | | 40,650 | |
| Dividend income | 40 | | 715 | | 710 | | 568 | |
| Income from companies accounted for using the equity method | 13 | | 665 | | 687 | | 591 | |
| Commission income | 41 | | 17,387 | | 16,834 | | 15,644 | |
| Commission expense | 42 | | (4,411) | | (4,458) | | (4,149) | |
Gain or losses on financial assets and liabilities not measured
at fair value through profit or loss, net | 43 | | 127 | | (117) | | 96 | |
| Financial assets at amortized cost | | (89) | | (190) | | (3) | |
| Other financial assets and liabilities | | 216 | | 73 | | 99 | |
| Gain or losses on financial assets and liabilities held for trading, net | 43 | | 1,017 | | 1,344 | | 2,316 | |
| Reclassification of financial assets at fair value through other comprehensive income | | — | | — | | — | |
| Reclassification of financial assets at amortized cost | | — | | — | | — | |
| Other gains (losses) | | 1,017 | | 1,344 | | 2,316 | |
Gains or losses on non-trading financial assets and liabilities mandatorily
at fair value through profit or loss | 43 | | 1,106 | | 495 | | 198 | |
| Reclassification of financial assets at fair value through other comprehensive income | | — | | — | | — | |
| Reclassification of financial assets at amortized cost | | — | | — | | — | |
| Other gains (losses) | | 1,106 | | 495 | | 198 | |
Gain or losses on financial assets and liabilities measured
at fair value through profit or loss, net | 43 | | (307) | | 691 | | (92) | |
| Gain or losses from hedge accounting, net | 43 | | 12 | | 14 | | 69 | |
| Exchange differences, net | 44 | | 407 | | (216) | | (22) | |
Other operating incomeA | 45 | | 1,583 | | 846 | | 1,137 | |
| Other operating expenses | 45 | | (2,429) | | (2,595) | | (3,066) | |
| Income from insurance and reinsurance contracts | | 476 | | 470 | | 460 | |
| Expenses from insurance and reinsurance contracts | | (385) | | (449) | | (449) | |
| | | | | | | | | | | | | | |
| CONSOLIDATED INCOME STATEMENTS FOR THE YEARS ENDED 31 DECEMBER 2025, 2024 AND 2023 |
| EUR million |
| | | | |
| (Debit) Credit |
| Note | 2025 | 2024 | 2023 |
| Total income | | 58,311 | | 58,043 | | 53,951 | |
| Administrative expenses | | (21,601) | | (22,036) | | (21,598) | |
| Staff costs | 46 | | (13,656) | | (13,851) | | (13,299) | |
| Other general administrative expenses | 47 | | (7,945) | | (8,185) | | (8,299) | |
| Depreciation and amortisation cost | 16 and 18 | (3,178) | | (3,179) | | (3,086) | |
| Provisions or reversal of provisions, net | 25 | | (2,302) | | (3,062) | | (2,058) | |
Impairment or reversal of impairment at financial assets not measured
at fair value through profit or loss and net gains and losses from changes | | (12,546) | | (12,136) | | (12,298) | |
| Financial assets at fair value through other comprehensive income | | (29) | | 1 | | (24) | |
| Financial assets at amortized cost | 10 | | (12,517) | | (12,137) | | (12,274) | |
Impairment or reversal of impairment of investments in
subsidiaries, joint ventures and associates, net | 17 and 18 | — | | — | | — | |
| Impairment or reversal of impairment on non-financial assets, net | | (251) | | (624) | | (237) | |
| Tangible assets | 16 | | (129) | | (382) | | (135) | |
| Intangible assets | 17 and 18 | (112) | | (231) | | (73) | |
| Others | | (10) | | (11) | | (29) | |
| Gain or losses on non-financial assets and investments, net | 48 | | — | | 368 | | 312 | |
| Negative goodwill recognized in results | | 22 | | — | | 39 | |
Gains or losses on non-current assets held for sale
not classified as discontinued operations | 49 | | 226 | | (27) | | (20) | |
| Operating profit/(loss) before tax | | 18,681 | | 17,347 | | 15,005 | |
| Tax expense or income from continuing operations | 27 | | (4,723) | | (4,844) | | (3,880) | |
| Profit/(loss) from continuing operations | | 13,958 | | 12,503 | | 11,125 | |
| Profit/(loss) after tax from discontinued operations | 37 | | 1,542 | | 1,241 | | 1,058 | |
| Profit/(loss) for the year | | 15,500 | | 13,744 | | 12,183 | |
| Profit/(loss) attributable to non-controlling interests | 28 | | 1,399 | | 1,170 | | 1,107 | |
| Profit/(loss) attributable to the parent | | 14,101 | | 12,574 | | 11,076 | |
| Earnings/(losses) per share | | | | |
| Basic | 4 | | 0.905 | | 0.771 | | 0.654 | |
| Diluted | 4 | | 0.900 | | 0.768 | | 0.651 | |
A. Includes EUR -486 million at 31 December 2025 (EUR -1,225 and EUR -1,016 at 31 December 2024 and 2023, respectively) derived from the net loss generated in Argentina as a result of the application of IAS 29 Financial reporting in hyperinflationary economies.
The accompanying notes 1 to 55 and appendices are an integral part of the consolidated income statement for the year ended 31 December 2025.
| | | | | | | | | | | | | | |
CONSOLIDATED STATEMENTS OF RECOGNISED INCOME AND EXPENSE
FOR THE YEARS ENDED 31 DECEMBER 2025, 2024 AND 2023 |
| EUR million |
| Note | 2025 | 2024 | 2023 |
| CONSOLIDATED PROFIT/(LOSS) FOR THE YEAR | | 15,500 | | 13,744 | | 12,183 | |
| OTHER RECOGNISED INCOME AND EXPENSE | | (1,858) | | (2,339) | | 614 | |
| Items that will not be reclassified to profit or loss | 29 | 100 | | 219 | | (964) | |
| Actuarial gains and losses on defined benefit pension plans | | (73) | | (584) | | (1,038) | |
| Non-current assets held for sale | | 10 | | — | | — | |
Other recognised income and expense of investments in
subsidiaries, joint ventures and associates | | 1 | | (3) | | (5) | |
| Changes in the fair value of equity instruments measured at fair value through other comprehensive income | | 245 | | 447 | | (162) | |
| Gains or losses resulting from the accounting for hedges of equity instruments measured at fair value through other comprehensive income, net | 36 | | — | | — | | — | |
| Changes in the fair value of equity instruments measured at fair value through other comprehensive income (hedged item) | | (76) | | 20 | | (29) | |
| Changes in the fair value of equity instruments measured at fair value through other comprehensive income (hedging instrument) | | 76 | | (20) | | 29 | |
| Changes in the fair value of financial liabilities at fair value through profit or loss attributable to changes in credit risk | | (160) | | 277 | | (120) | |
| Income tax relating to items that will not be reclassified | | 77 | | 82 | | 361 | |
| Items that may be reclassified to profit or loss | 29 | | (1,958) | | (2,558) | | 1,578 | |
| Hedges of net investments in foreign operations (effective portion) | 36 | | 195 | | 420 | | (1,888) | |
| Revaluation gains (losses) | | 195 | | 420 | | (1,888) | |
| Amounts transferred to income statement | | — | | — | | — | |
| Other reclassifications | | — | | — | | — | |
| Exchanges differences | | (3,399) | | (3,047) | | 1,017 | |
| Revaluation gains (losses) | | (3,399) | | (3,047) | | 1,009 | |
| Amounts transferred to income statement | | — | | — | | 8 | |
| Other reclassifications | | — | | — | | — | |
| Cash flow hedges (effective portion) | 36 | | 867 | | 558 | | 2,592 | |
| Revaluation gains (losses) | | 158 | | (698) | | (30) | |
| Amounts transferred to income statement | | 709 | | 1,256 | | 2,622 | |
| Transferred to initial carrying amount of hedged items | | — | | — | | — | |
| Other reclassifications | | — | | — | | — | |
| Hedging instruments (items not designated) | 36 | | (14) | | — | | — | |
| Revaluation gains (losses) | | (1) | | — | | — | |
| Amounts transferred to income statement | | (13) | | — | | — | |
| Other reclassifications | | — | | — | | — | |
| Debt instruments at fair value with changes in other comprehensive income | | 613 | | (493) | | 858 | |
| Revaluation gains (losses) | 29 | | 715 | | (447) | | 852 | |
| Amounts transferred to income statement | | (102) | | (46) | | 6 | |
| Other reclassifications | | — | | — | | — | |
| Non-current assets held for sale | | 274 | | — | | — | |
| Revaluation gains (losses) | | 267 | | — | | — | |
| Amounts transferred to income statement | | 7 | | — | | — | |
| Other reclassifications | | — | | — | | — | |
| Share of other recognised income and expense of investments | | 20 | | (108) | | 19 | |
| Income tax relating to items that may be reclassified to profit or loss | | (514) | | 112 | | (1,020) | |
| Total recognised income and expenses for the year | | 13,642 | | 11,405 | | 12,797 | |
| Attributable to non-controlling interests | | 1,452 | | 709 | | 1,401 | |
| Attributable to the parent | | 12,190 | | 10,696 | | 11,396 | |
The accompanying notes 1 to 55 and appendices are an integral part of the consolidated statement of recognised income and expense for the year ended 31 December 2025.
| | | | | | | | | | | | | | | | | |
| CONSOLIDATED STATEMENTS OF CHANGES IN TOTAL EQUITY FOR THE YEARS ENDED 31 DECEMBER 2025, 2024 AND 2023 |
| EUR million | | | | | |
| | | | | |
| Capital | Share premium | Equity instruments issued (not capital) | Other equity instruments | Accumulated retained earnings |
Balance at 31 December 2024 | 7,576 | | 40,079 | | 0 | | 217 | | 82,326 | |
| Adjustments due to errors | — | | — | | — | | — | | — | |
| Adjustments due to changes in accounting policies | — | | — | | — | | — | | — | |
Opening balance at 1 January 2025 | 7,576 | | 40,079 | | — | | 217 | | 82,326 | |
| Total recognised income and expense | — | | — | | — | | — | | — | |
| Other changes in equity | (231) | | (3,287) | | — | | 56 | | 9,633 | |
| Issuance of ordinary shares | — | | — | | — | | — | | — | |
| Issuance of preferred shares | — | | — | | — | | — | | — | |
| Issuance of other financial instruments | — | | — | | — | | — | | — | |
| Maturity of other financial instruments | — | | — | | — | | — | | — | |
| Conversion of financial liabilities into equity | — | | — | | — | | — | | — | |
| Capital reduction | (231) | | (3,287) | | — | | — | | — | |
Dividends | — | | — | | — | | — | | (1,643) | |
| Purchase of equity instruments | — | | — | | — | | — | | — | |
| Disposal of equity instruments | — | | — | | — | | — | | — | |
| Transfer from equity to liabilities | — | | — | | — | | — | | — | |
| Transfer from liabilities to equity | — | | — | | — | | — | | — | |
| Transfers between equity items | — | | — | | — | | — | | 11,276 | |
| Increases (decreases) due to business combinations | — | | — | | — | | — | | — | |
| Share-based payment | — | | — | | — | | (67) | | — | |
| Others increases or (-) decreases in equity | — | | — | | — | | 123 | | — | |
| Balance at 31 December 2025 | 7,345 | | 36,792 | | — | | 273 | | 91,959 | |
The accompanying notes 1 to 55 and appendices are an integral part of the consolidated statement of changes in total equity for the year ended 31 December 2025.
| | | | | | | | | | | | | | | | | | | | | | | | | | |
|
| | | | | | | |
| | | | | | Non-controlling interest | |
| Revaluation reserves | Other reserves | (-) Own shares | Profit attributable to shareholders of the parent | (-) Interim dividends | Other comprehensive income | Other comprehensive income | Other items | Total |
| — | | (5,976) | | (68) | | 12,574 | | (1,532) | | (36,595) | | (2,020) | | 10,746 | | 107,327 | |
| — | | — | | — | | — | | — | | — | | — | | — | | — | |
| — | | — | | — | | — | | — | | — | | — | | — | | — | |
| — | | (5,976) | | (68) | | 12,574 | | (1,532) | | (36,595) | | (2,020) | | 10,746 | | 107,327 | |
| — | | — | | — | | 14,101 | | — | | (1,911) | | 53 | | 1,399 | | 13,642 | |
| — | | (1,556) | | (28) | | (12,574) | | (166) | | 532 | | 20 | | (620) | | (8,221) | |
| — | | — | | — | | — | | — | | — | | — | | — | | — | |
| — | | — | | — | | — | | — | | — | | — | | — | | — | |
| — | | — | | — | | — | | — | | — | | — | | — | | — | |
| — | | — | | — | | — | | — | | — | | — | | — | | — | |
| — | | — | | — | | — | | — | | — | | — | | — | | — | |
| — | | 231 | | 3,287 | | — | | — | | — | | — | | (8) | | (8) | |
| — | | — | | — | | — | | (1,698) | | — | | — | | (896) | | (4,237) | |
| — | | — | | (4,081) | | — | | — | | — | | — | | — | | (4,081) | |
| — | | 34 | | 766 | | — | | — | | — | | — | | — | | 800 | |
| — | | — | | — | | — | | — | | — | | — | | — | | — | |
| — | | — | | — | | — | | — | | — | | — | | — | | — | |
| — | | (766) | | — | | (12,574) | | 1,532 | | 532 | | 20 | | (20) | | — | |
| — | | — | | — | | — | | — | | — | | — | | (5) | | (5) | |
| — | | — | | — | | — | | — | | — | | — | | — | | (67) | |
| — | | (1,055) | | — | | — | | — | | — | | — | | 309 | | (623) | |
| — | | (7,532) | | (96) | | 14,101 | | (1,698) | | (37,974) | | (1,947) | | 11,525 | | 112,748 | |
| | | | | | | | | | | | | | | | | |
| CONSOLIDATED STATEMENTS OF CHANGES IN TOTAL EQUITY FOR THE YEARS ENDED 31 DECEMBER 2025, 2024 AND 2023 |
| EUR million | | | | | |
| | | | | |
| Capital | Share premium | Equity instruments issued (not capital) | Other equity instruments | Accumulated retained earnings |
Balance at 31 December 2023 | 8,092 | | 44,373 | | 720 | | 195 | | 74,114 | |
| Adjustments due to errors | — | | — | | — | | — | | — | |
| Adjustments due to changes in accounting policies | — | | — | | — | | — | | — | |
Opening balance at 1 January 2024 | 8,092 | | 44,373 | | 720 | | 195 | | 74,114 | |
| Total recognised income and expense | — | | — | | — | | — | | — | |
| Other changes in equity | (516) | | (4,294) | | (720) | | 22 | | 8,212 | |
| Issuance of ordinary shares | — | | — | | — | | — | | — | |
| Issuance of preferred shares | — | | — | | — | | — | | — | |
| Issuance of other financial instruments | — | | — | | — | | — | | — | |
| Maturity of other financial instruments | — | | — | | (751) | | — | | — | |
| Conversion of financial liabilities into equity | — | | — | | — | | — | | — | |
| Capital reduction | (516) | | (4,294) | | — | | — | | — | |
| Dividends | — | | — | | — | | — | | (1,485) | |
| Purchase of equity instruments | — | | — | | — | | — | | — | |
| Disposal of equity instruments | — | | — | | — | | — | | — | |
| Transfer from equity to liabilities | — | | — | | — | | — | | — | |
| Transfer from liabilities to equity | — | | — | | — | | — | | — | |
| Transfers between equity items | — | | — | | — | | — | | 9,697 | |
| Increases (decreases) due to business combinations | — | | — | | — | | — | | — | |
| Share-based payment | — | | — | | — | | (62) | | — | |
| Others increases or (-) decreases in equity | — | | — | | 31 | | 84 | | — | |
Balance at 31 December 2024 | 7,576 | | 40,079 | | — | | 217 | | 82,326 | |
The accompanying notes 1 to 55 and appendices are an integral part of the consolidated statement of changes in total equity for the year ended 31 December 2025.
| | | | | | | | | | | | | | | | | | | | | | | | | | |
|
| | | | | | | |
| | | | | | Non-controlling interest | |
| Revaluation reserves | Other reserves | (-) Own shares | Profit attributable to shareholders of the parent | (-) Interim dividends | Other comprehensive income | Other comprehensive income | Other items | Total |
| — | | (5,751) | | (1,078) | | 11,076 | | (1,298) | | (35,020) | | (1,559) | | 10,377 | | 104,241 | |
| — | | — | | — | | — | | — | | — | | — | | — | | — | |
| — | | — | | — | | — | | — | | — | | — | | — | | — | |
| — | | (5,751) | | (1,078) | | 11,076 | | (1,298) | | (35,020) | | (1,559) | | 10,377 | | 104,241 | |
| — | | — | | — | | 12,574 | | — | | (1,878) | | (461) | | 1,170 | | 11,405 | |
| — | | (225) | | 1,010 | | (11,076) | | (234) | | 303 | | — | | (801) | | (8,319) | |
| — | | — | | — | | — | | — | | — | | — | | — | | — | |
| — | | — | | — | | — | | — | | — | | — | | — | | — | |
| — | | — | | — | | — | | — | | — | | — | | — | | — | |
| — | | — | | — | | — | | — | | — | | — | | (590) | | (1,341) | |
| — | | — | | — | | — | | — | | — | | — | | — | | — | |
| — | | 516 | | 4,294 | | — | | — | | — | | — | | (93) | | (93) | |
| — | | — | | — | | — | | (1,532) | | — | | — | | (660) | | (3,677) | |
| — | | — | | (4,038) | | — | | — | | — | | — | | — | | (4,038) | |
| — | | 8 | | 754 | | — | | — | | — | | — | | — | | 762 | |
| — | | — | | — | | — | | — | | — | | — | | — | | — | |
| — | | — | | — | | — | | — | | — | | — | | — | | — | |
| — | | (215) | | — | | (11,076) | | 1,298 | | 303 | | — | | (7) | | — | |
| — | | — | | — | | — | | — | | — | | — | | (8) | | (8) | |
| — | | — | | — | | — | | — | | — | | — | | — | | (62) | |
| — | | (534) | | — | | — | | — | | — | | — | | 557 | | 138 | |
| — | | (5,976) | | (68) | | 12,574 | | (1,532) | | (36,595) | | (2,020) | | 10,746 | | 107,327 | |
| | | | | | | | | | | | | | | | | |
CONSOLIDATED STATEMENTS OF CHANGES IN TOTAL EQUITY FOR THE YEARS ENDED 31 DECEMBER 2025, 2024 AND 2023 |
| EUR million | | | | | |
| | | | | |
| Capital | Share premium | Equity instruments issued (not capital) | Other equity instruments | Accumulated retained earnings |
Balance at 31 December 2022 | 8,397 | | 46,273 | | 688 | | 175 | | 66,702 | |
| Adjustments due to errors | — | | — | | — | | — | | — | |
| Adjustments due to changes in accounting policies | — | | — | | — | | — | | — | |
Opening balance at 1 January 2023 | 8,397 | | 46,273 | | 688 | | 175 | | 66,702 | |
| Total recognised income and expense | — | | — | | — | | — | | — | |
| Other changes in equity | (305) | | (1,900) | | 32 | | 20 | | 7,412 | |
| Issuance of ordinary shares | — | | — | | — | | — | | — | |
| Issuance of preferred shares | — | | — | | — | | — | | — | |
| Issuance of other financial instruments | — | | — | | — | | — | | — | |
| Maturity of other financial instruments | — | | — | | — | | — | | — | |
| Conversion of financial liabilities into equity | — | | — | | — | | — | | — | |
| Capital reduction | (305) | | (1,900) | | — | | — | | — | |
| Dividends | — | | — | | — | | — | | (963) | |
| Purchase of equity instruments | — | | — | | — | | — | | — | |
| Disposal of equity instruments | — | | — | | — | | — | | — | |
| Transfer from equity to liabilities | — | | — | | — | | — | | — | |
| Transfer from liabilities to equity | — | | — | | — | | — | | — | |
| Transfers between equity items | — | | — | | — | | — | | 8,375 | |
| Increases (decreases) due to business combinations | — | | — | | — | | — | | — | |
| Share-based payment | — | | — | | — | | (60) | | — | |
| Others increases or (-) decreases in equity | — | | — | | 32 | | 80 | | — | |
Balance at 31 December 2023 | 8,092 | | 44,373 | | 720 | | 195 | | 74,114 | |
The accompanying notes 1 to 55 and appendices are an integral part of the consolidated statement of changes in total equity for the year ended 31 December 2025.
| | | | | | | | | | | | | | | | | | | | | | | | | | |
|
| | | | | | | |
| | | | | | Non-controlling interest | |
| Revaluation reserves | Other reserves | (-) Own shares | Profit attributable to shareholders of the parent | (-) Interim dividends | Other comprehensive income | Other comprehensive income | Other items | Total |
| — | | (5,454) | | (675) | | 9,605 | | (979) | | (35,628) | | (1,856) | | 10,337 | | 97,585 | |
| — | | — | | — | | — | | — | | — | | — | | — | | — | |
| — | | — | | — | | — | | — | | — | | — | | — | | — | |
| — | | (5,454) | | (675) | | 9,605 | | (979) | | (35,628) | | (1,856) | | 10,337 | | 97,585 | |
| — | | — | | — | | 11,076 | | — | | 320 | | 294 | | 1,107 | | 12,797 | |
| — | | (297) | | (403) | | (9,605) | | (319) | | 288 | | 3 | | (1,067) | | (6,141) | |
| — | | — | | — | | — | | — | | — | | — | | 1 | | 1 | |
| — | | — | | — | | — | | — | | — | | — | | — | | — | |
| — | | — | | — | | — | | — | | — | | — | | — | | — | |
| — | | — | | — | | — | | — | | — | | — | | — | | — | |
| — | | — | | — | | — | | — | | — | | — | | — | | — | |
| — | | 305 | | 1,900 | | — | | — | | — | | — | | — | | — | |
| — | | — | | — | | — | | (1,298) | | — | | — | | (748) | | (3,009) | |
| — | | — | | (3,109) | | — | | — | | — | | — | | — | | (3,109) | |
| — | | 13 | | 806 | | — | | — | | — | | — | | — | | 819 | |
| — | | — | | — | | — | | — | | — | | — | | — | | — | |
| — | | — | | — | | — | | — | | — | | — | | — | | — | |
| — | | (37) | | — | | (9,605) | | 979 | | 288 | | 3 | | (3) | | — | |
| — | | — | | — | | — | | — | | — | | — | | (364) | | (364) | |
| — | | — | | — | | — | | — | | — | | — | | — | | (60) | |
| — | | (578) | | — | | — | | — | | — | | — | | 47 | | (419) | |
| — | | (5,751) | | (1,078) | | 11,076 | | (1,298) | | (35,020) | | (1,559) | | 10,377 | | 104,241 | |
| | | | | | | | | | | | | | |
| CONSOLIDATED STATEMENTS OF CASH FLOWS FOR THE YEARS ENDED 2025, 2024 AND 2023 |
| EUR million |
| Note | 2025 | 2024 | 2023 |
| A. CASH FLOWS FROM OPERATING ACTIVITIES | | (14,835) | | (24,155) | | 5,015 | |
| Profit or loss for the year | | 15,500 | | 13,744 | | 12,183 | |
| Adjustments made to obtain the cash flows from operating activities | | 31,347 | | 28,361 | | 26,948 | |
| Depreciation and amortisation cost | | 3,178 | | 3,179 | | 3,086 | |
| Other adjustments | | 28,169 | | 25,182 | | 23,862 | |
| Net increase/(decrease) in operating assets | | 119,257 | | 117,996 | | 74,982 | |
| Financial assets held-for-trading | | 25,776 | | 62,460 | | 18,332 | |
| Non-trading financial assets mandatorily at fair value through profit or loss | | 1,867 | | 31 | | 286 | |
| Financial assets at fair value through profit or loss | | 146 | | (1,850) | | 874 | |
| Financial assets at fair value through other comprehensive income | | (6,733) | | 10,225 | | (4,470) | |
| Financial assets at amortized cost | | 97,964 | | 45,995 | | 60,525 | |
| Other operating assets | | 237 | | 1,135 | | (565) | |
| Net increase/(decrease) in operating liabilities | | 62,529 | | 57,616 | | 46,080 | |
| Financial liabilities held-for-trading | | 20,654 | | 34,256 | | 5,450 | |
| Financial liabilities designated at fair value through profit or loss | | 5,858 | | (3,854) | | (11) | |
| Financial liabilities at amortized cost | | 35,719 | | 34,164 | | 40,138 | |
| Other operating liabilities | | 298 | | (6,950) | | 503 | |
| Income tax recovered/(paid) | | (4,954) | | (5,880) | | (5,214) | |
| B. CASH FLOWS FROM INVESTING ACTIVITIES | | 534 | | (3,712) | | (5,366) | |
| Payments | | 7,925 | | 11,355 | | 15,056 | |
| Tangible assets | 16 | | 5,854 | | 8,494 | | 11,446 | |
| Intangible assets | 18 | | 1,805 | | 2,104 | | 2,197 | |
| Investments | 13 | | 79 | | 686 | | 139 | |
| Subsidiaries and other business units | | 187 | | 71 | | 1,274 | |
| Non-current assets held for sale and associated liabilities | | — | | — | | — | |
| Other payments related to investing activities | | — | | — | | — | |
| Proceeds | | 8,459 | | 7,643 | | 9,690 | |
| Tangible assets | 16 | | 5,206 | | 5,966 | | 7,074 | |
| Intangible assets | 18 | | — | | — | | — | |
| Investments | 13 | | 749 | | 681 | | 814 | |
| Subsidiaries and other business units | | 54 | | 8 | | 885 | |
| Non-current assets held for sale and associated liabilities | 12 | | 2,450 | | 988 | | 917 | |
| Other proceeds related to investing activities | | — | | — | | — | |
| C. CASH FLOW FROM FINANCING ACTIVITIES | | (14,203) | | (5,510) | | (2,058) | |
| Payments | | 17,743 | | 14,045 | | 10,187 | |
| Dividends | 4 | | 3,341 | | 3,017 | | 2,261 | |
| Subordinated liabilities | 23 | | 8,822 | | 4,096 | | 2,931 | |
| Redemption of own equity instruments | | — | | 751 | | — | |
| Acquisition of own equity instruments | | 4,081 | | 4,038 | | 3,109 | |
| Other payments related to financing activities | | 1,499 | | 2,143 | | 1,886 | |
| Proceeds | | 3,540 | | 8,535 | | 8,129 | |
| Subordinated liabilities | 23 | | 2,287 | | 7,001 | | 7,007 | |
| Issuance of own equity instruments | | — | | — | | — | |
| Disposal of own equity instruments | | 815 | | 765 | | 825 | |
| Other proceeds related to financing activities | | 438 | | 769 | | 297 | |
| | | | | | | | | | | | | | |
| CONSOLIDATED STATEMENTS OF CASH FLOWS FOR THE YEARS ENDED 2025, 2024 AND 2023 |
| EUR million |
| Note | 2025 | 2024 | 2023 |
| D. EFFECT OF FOREIGN EXCHANGE RATE DIFFERENCES | | (8,908) | | 5,243 | | (322) | |
E. NET INCREASE/(DECREASE) IN CASH AND CASH EQUIVALENTS | | (37,412) | | (28,134) | | (2,731) | |
| F. CASH AND CASH EQUIVALENTS AT BEGINNING OF THE YEAR | | 192,208 | | 220,342 | | 223,073 | |
| G. CASH AND CASH EQUIVALENTS AT END OF THE YEAR | | 154,796 | | 192,208 | | 220,342 | |
| COMPONENTS OF CASH AND CASH EQUIVALENTS AT END OF THE YEAR | | | | |
| Cash | | 7,357 | | 9,253 | | 8,621 | |
| Cash equivalents at central banks | | 135,330 | | 170,914 | | 199,932 | |
| Other financial assets | | 9,594 | | 12,041 | | 11,789 | |
| Less, bank overdrafts refundable on demand | | — | | — | | — | |
| TOTAL CASH AND CASH EQUIVALENTS AT END OF THE YEAR | | 152,281 | | 192,208 | | 220,342 | |
| In which, restricted cash | | — | | — | | — | |
| TOTAL CASH AND CASH EQUIVALENTS AT END OF PERIOD ASSOCIATED WITH NON-CURRENT ASSETS HELD FOR SALE | 12 | 2,515 | | — | | — | |
The accompanying notes 1 to 55 and appendices are an integral part of the consolidated statement of cash flows for the year ended 31 December 2025.
Notes to the consolidated financial statements
Banco Santander, S.A., and Companies composing Grupo Santander
Notes to the consolidated financial statements (consolidated annual accounts) for the year ended 31 December 2025.
1. Introduction, basis of presentation of the consolidated financial statements (consolidated annual accounts) and other information
a) Introduction
Banco Santander, S.A. ('the parent' or 'Banco Santander'), is a private-law entity subject to the rules and regulations applicable to banks operating in Spain, where it was constituted and currently maintains its legal domicile, which is paseo de Pereda, numbers 9 to 12, 39004, Santander, Spain.
The principal headquarters of Banco Santander are located in Ciudad Grupo Santander, Avenida Cantabria s/n, 28660, Boadilla del Monte, Madrid, Spain.
The corporate purpose of Banco Santander, S.A. mainly entails carrying out all kinds of activities, operations and services inherent to the banking business in general and permitted by current legislation, and the acquisition, holding, enjoyment and disposal of all kinds of securities.
In addition to the operations carried on directly by it, Banco Santander is the head of a group of subsidiaries that engage in various business activities and which compose, together with it, Grupo Santander ('Santander' or 'the Group'). Therefore, Banco Santander is obliged to prepare, in addition to its own separate financial statements, the Group's consolidated financial statements, which also include the interests in joint ventures and investments in associates.
At 31 December 2025, Grupo Santander consisted of 755 subsidiaries of Banco Santander, S.A. In addition, other 191 companies are associates of the Group, joint ventures or companies of which the Group holds more than 5% (excluding the Group companies of negligible interest with respect to the fair presentation that the annual accounts must express).
Grupo Santander consolidated financial statements for 2023 were approved by the shareholders at the group´s annual general meeting on 22 March 2024. Grupo Santander consolidated financial statements for 2024 were approved by the shareholders at the group´s annual general meeting on 4 April 2025. The Group's 2025 consolidated financial statements, the financial statements of the parent and of substantially all the Group companies have not been approved yet by their shareholders at the respective annual general meetings. However, Banco Santander board of directors considers that the aforementioned financial statements will be approved without any significant changes.
b) Basis of presentation of the consolidated financial statements
Under Regulation (EC) n.º 1606/2002 of the European Parliament and of the Council of 19 July 2002 all companies governed by the law of an EU Member State and whose securities are admitted to trading on a regulated market of any Member State must prepare their consolidated financial statements for the years beginning on or after 1 January 2005 in conformity with the International Financial Reporting Standards ('IFRS') previously adopted by the European Union ('EU-IFRS').
In order to adapt the accounting system of Spanish credit institutions with the principles and criteria established by the IFRS adopted by the European Union ('EU-IFRS'), the Bank of Spain published circular 4/2017, dated 27 November 2017, on Public and Confidential Financial Reporting Standards and Financial Statement Formats and the following regulations.
Particularly, during 2025 and 2023, the Bank of Spain published Circulars 1/2025 of 19 December of 2025, and 1/2023 of 24 February of 2023, amending Circular 4/2017 of 27 November to credit institutions on Public and Confidential Financial Reporting Standards and Financial Statement Formats.
Grupo Santander consolidated financial statements for 2025 were authorised by the Bank's directors (at the board meeting on 24 February 2026) in accordance with International Financial Reporting Standards as adopted by the European Union and with Bank of Spain circular 4/2017 and subsequent modifications, and Spanish corporate and commercial law applicable to the Group, using the basis of consolidation, accounting policies and measurement bases set forth in note 2, accordingly, they present fairly the Group's equity and financial position at 31 December 2025, 2024 and 2023 and the consolidated results of its operations and the consolidated cash flows in 2025, 2024 and 2023. These consolidated annual accounts have been prepared on the basis of the accounting records held by Banco Santander and by each of the other companies of the Group, and include the adjustments and reclassifications required to standardise the accounting policies and valuation criteria applied by Grupo Santander. The consolidated financial statements are also in compliance with IFRS as issued by the International Accounting Standards Board ('IFRS – IASB' and together with IFRS adopted by the European Union, 'IFRS').
The notes to the consolidated financial statements contain additional information to that presented in the consolidated balance sheet, consolidated income statement, consolidated statement of recognised income and expense, consolidated statement of changes in total equity and consolidated statement of cash flows. The notes provide, in a clear, relevant, reliable and comparable manner, narrative descriptions and breakdowns of these statements.
The information contained in the consolidated income statement has been reclassified as a result of the change in the presentation for certain charges at 31 December 2025 in the amount of EUR 427 million, mainly levies and other expenses, of which EUR 359 million have been reclassified from the line item 'Other provisions' to the line item 'Other operating expenses'.
The figures of the consolidated annual accounts are presented in millions of euros unless another alternative monetary unit is indicated, rounded to the nearest million unit.
Adoption of new standards and interpretations issued
The following modifications came into force and were adopted by the European Union in 2025:
•IAS 21 Effects of changes in foreign currency exchange rates: IAS 21 established the requirements to apply when there is a temporary lack of interchangeability between two currencies, but did not give indications when this situation was not temporary. Given this scenario, IAS 21 has been modified establishing the criteria to identify these situations, specifying how entities should estimate the spot exchange rate, the methodologies and data to be considered, as well as the associated disclosure requirements. This modification was applied in advance by the Group on 31 December 2024. For more information, see Note 2.a.iv.
The application of the aforementioned amendment to accounting standards and interpretations did not have any material effects on Grupo Santander consolidated financial statements.
Likewise, at the date of approval of these consolidated annual accounts, the following standards which effectively came into force have effective dates after 31 December 2025:
•Amendments to IFRS 9 Financial Instruments and IFRS 7 Financial Instruments: Disclosures: (i) amendments to classification and measurement requirements related to the assessment of contractual cash flows of certain financial assets (with ESG characteristics, non-recourse or contractually linked); (ii) an accounting policy option for the derecognition of financial liabilities settled through an electronic payment system is included; (iii) the disclosure requirements related to equity instruments designated at fair value through other comprehensive income are amended; (iv) disclosure requirements are included for financial instruments with contingent characteristics that may modify their contractual cash flows. These amendments will be applicable from 1 January 2026.
•Amendments to IFRS 9 and IFRS 7 - Nature-dependent electricity contracts for electricity contracts dependent on energy sources and susceptible to variations due to uncontrollable factors, such as weather conditions, this modification: (i) clarifies the application of the 'own use' requirements; (ii) allows hedge accounting if these contracts were used as hedging instruments; and, (iii) adds new filing requirements for greater clarity on the impact of these contracts. These modifications will be applicable form 1 January 2026.
•IFRS 18 Presentation and Disclosure in Financial Statements, which replaces IAS 1 Presentation of Financial Statements, (i) improves the comparability of the income statement by defining its structure into three categories (operating, investing, and financing) and presenting defined subtotals, including operating profit; (ii) breaks down in the financial statements certain management-defined performance measures related to the income statement; and (iii) improves the aggregation of information for disclosure in the financial statements or notes. The new standard will be applicable from 1 January 2027.
•Amendments to IFRS Improvement Cycle: introduces minor amendments, effective from 1 January 2026, to the following standards:
•IFRS 1 First-time Adoption of International Financial Reporting Standards, for hedge accounting in first adoption.
•IFRS 7 Financial Instruments: Disclosures: updated references and alignment with IFRS 13, as well as clarifications in the Implementation Guidance.
•IFRS 9 Financial Instruments: amendment to apply derecognition criteria to lease liabilities recorded by the lessee and replacement of the term 'transaction price' with 'the amount determined in accordance with IFRS 15'.
•IFRS10 Consolidated Financial Statements: Determining a 'de facto agent'.
•IAS 7 Statement of Cashflows: replacing the term 'cost method' with 'cost'.
Finally, at the date of approval of these consolidated annual accounts, the following standards which effectively come into force after 31 December 2025 had not yet been adopted by the European Union:
•IFRS 19 Subsidiaries without Public Accountability: Disclosures: this new standard works alongside other IFRS Accounting Standards. An eligible subsidiary applies the requirements in other IFRS Accounting Standards except for the disclosure requirements and instead applies the reduced disclosure requirements in IFRS 19. A subsidiary is eligible if: (i) it does not have public accountability; and (ii) it has an ultimate or intermediate parent that produces consolidated financial statements available for public use that comply with IFRS Accounting Standards. Applicable from 1 January 2027.
•IFRS 19 Subsidiaries without Public Accountability: Disclosures: these new amendments help eligible subsidiaries reduce disclosures related to IFRS standards and amendments issued between February 2021 and May 2024. With these amendments, IFRS 19 reflects the IFRS changes that will take effect up to 1 January 2027, when IFRS 19 will become applicable.
•Amendments to IAS 21 The effects of Changes in Foreign Exchange Rates: Translation to a Hyperinflationary Presentation Currency: establishes how to translate financial statements when the presentation currency is subject to hyperinflation. Requires converting all amounts, including comparatives, at the closing exchange rates and restating them in accordance with IAS 29. Furthermore, introduces additional disclosures to enhance comparability and reduce diversity in practice. Applicable from 1 January 2027, with early application permitted.
Grupo Santander is currently analyzing the possible effects of these new standards and interpretations, and unless expressly indicated otherwise, no significant impacts are expected from their application.
During 2025, the Group completed the project to adapt its accounting policies relating to hedging transactions to the hedge accounting requirements set out in IFRS 9 (see Note 2.d.v). The main impacts of this change on the accounting for hedging relationships are primarily due to: (i) the mandatory separation of the time value of options (when the hedged risk is the intrinsic value); (ii) and the optional separation of the forward element of foreign exchange forward contracts for all hedges, as well as (iii) the separation of the foreign currency basis spread of a foreign exchange derivative for each hedging relationship. The application of these options to hedges designated before 31 December 2024 did not have a material impact on the Group's consolidated statement of financial position or consolidated profit or loss.
All accounting policies and measurement bases with a material effect on the consolidated financial statements for 2025 were applied in the preparation of these consolidated annual accounts.
c) Use of accounting estimates
The consolidated results and the determination of consolidated equity are sensitive to the accounting policies, measurement bases and estimates used by Banco Santander in preparing the consolidated financial statements.
The main accounting policies and measurement bases are set forth in note 2.
In the consolidated financial statements estimates were occasionally made by the senior management of Grupo Santander in order to quantify certain of the assets, liabilities, income, expenses and obligations reported herein. These estimates, which were made on the basis of the best information available, relate basically to the following:
•The impairment losses on certain assets: it applies to financial assets at fair value through other comprehensive income, financial assets at amortised cost, non-current assets held for sale, investments, tangible assets and intangible assets (see Notes 6, 7, 10, 12, 13, 16, 17, 18 and 54).
•The assumptions used in the actuarial calculation of the post-employment benefit liabilities and commitments and other obligations (see Note 25).
•The useful life of the tangible and intangible assets (see Notes 16 and 18).
•The measurement of the impairment in goodwill arising on consolidation (see Note 17).
•The calculation of provisions and the consideration of contingent liabilities (see Note 25).
•The fair value of certain unquoted assets and liabilities (see Notes 6, 7, 8, 9, 10, 11, 20, 21 and 22).
•The recoverability of deferred tax assets (see Note 27).
•The fair value of the identifiable assets acquired and the liabilities assumed in business combinations in accordance with IFRS 3 (see Note 17).
•The measurement of assets under reinsurance contracts and liabilities under insurance contracts (see Note 15).
To update the previous estimates, the Group's management has taken into account the current macroeconomic scenario, characterized by persistent geopolitical tensions and changing financial conditions, as well as the evolution of monetary and fiscal policies in major economies. The analysis also considers developments in interest rates, credit spreads, and currency movements, along with labor market trends in the geographies where the Group operates.
The Group's management has evaluated in particular the uncertainties caused by the current environment in relation to credit risk, maintaining active oversight of clients in geographies and sectors more exposed to international trade tensions, global geopolitical uncertainty and the impact of public debt containment policies or fiscal stimulus measures, liquidity and market risks, taking into account the best available information, to estimate the impact on the credit portfolio's impairment provision, and in the debt instruments' interest rates and valuation, developing in the notes the main estimates made during the period ended December 31, 2025 (see notes 10, 17, 50 and 54).
Although these estimates have been made on the basis of the best information available at the end of the year 2025, and considering information updated at the date of preparation of these consolidated annual accounts, it is possible that events that may take place in the future may make it necessary to modify them (upwards or downwards) in the coming years, which would be done, if appropriate, in a prospective manner, recognising the effects of the change in estimate in the corresponding consolidated income statement.
d) Information relating to 2024 and 2023
The information in the consolidated income statement from 2024 and 2023 has been restated, as a result of the agreement for the sale of Santander Bank Polska S.A. by Grupo Santander, as required by IFRS 5 (see, mainly, Notes 3 and 37, as well as the rest of the notes of the profit and loss account).
Additionally, the segment information corresponding to the years ended 31 December 2024 and 2023 has been restated, in accordance with the changes in the segments' composition of Grupo Santander, as required by IFRS 8 (see note 52).
The information contained in the consolidated income statements relating to the periods 2024 and 2023 has been modified as a result of the retrospective application of the change in the presentation for certain charges in the amounts of EUR 403 million and EUR 352 million, respectively (see Note 1.b).
In order to interpret the changes in the balances with respect to 31 December 2025, it is necessary to take into consideration the exchange rate effect arising from the volume of foreign currency balances held by Grupo Santander in view of its geographic diversity (see note 52.b) and the impact of the appreciation/depreciation of the various currencies against the euro in 2025, based on the exchange rates at the end of 2025: Mexican peso (2.05%), US dollar (-11.62%), Brazilian real (-0.47%), Argentinian peso (-37.23%), Sterling pound (-4.99%), Chilean peso (-2.57%), and Polish zloty (1.30%); as well as the evolution of the comparable average rates: Mexican peso (-8.95%), US dollar (-4.15%), Brazilian real (-7.86%), Sterling pound (-1.20%), Chilean peso (-4.90%) and Polish zloty (1.56%).
e) Capital management
i. Regulatory and economic capital
Credit institutions must comply with a set of minimum capital and liquidity requirements. These minimum requirements are regulated by the European Capital Requirements Regulation (CRR), which is directly applicable within the Spanish legal framework, and by the Capital Requirements Directive (CRD).
On 19 June 2024, the final texts of the update to the banking package were published in the Official Journal of the European Union: Regulation (EU) 2024/1623 (hereinafter, CRR 3), which amends the CRR with regard to requirements for credit risk, credit valuation adjustment risk, operational risk, market risk and the floor on risk-weighted assets (known as the output floor), as well as Directive (EU) 2024/1619 (hereinafter, CRD VI), which amends the CRD as regards supervisory powers, sanctions, third-country branches, and environmental, social and governance risks.
The update to the banking package aims, on the one hand, to implement the final Basel III reforms and, on the other, to strengthen the harmonisation of banking supervision within the European Union (EU).
CRR 3, applicable since 1 January 2025, introduce greater risk sensitivity into standardised approaches, reduce the variability of risk-weighted assets among banks using internal models to calculate capital requirements, and enhance comparability across banks.
Under CRD VI, the ambition to achieve more robust supervision and to safeguard financial stability is reflected in a set of rules affecting fit-and-proper requirements, an extended scope resulting from the revision of certain definitions, and new provisions regarding the establishment of third-country branches in the EU, with the aim of achieving greater regulatory harmonisation and improved supervision of this type of entity.
Although most CRR 3 provisions apply since 1 January 2025, for certain provisions the regulator has established a gradual implementation (phase-in) period until 2030 in order to give the industry sufficient time to build up the capital required to meet the requirements on a fully loaded basis.
Regarding Market Risk, the European Commission and the European Parliament have approved an additional 12-month delay to the entry into force of the new market risk capital framework, or FRTB, until 1 January 2027. Beyond this date, the CRR 3 does not allow for any further delay, as postponements are limited to two years. This delay also covers other provisions, such as the separation between the trading book and the banking book, the internal risk transfer regime, etc.
The CRR 3/CRD VI package contains 140 mandates for the EBA to develop Level 2 or Level 3 legislation (regulatory technical standards, implementing technical standards and guidelines—RTS, ITS and GL, for their acronyms) and to issue opinions and reports to further specify certain aspects of the regulation. In this context, the EBA published its roadmap (EBA Roadmap) at the end of 2023, structuring the implementation of the banking package around four sequential phases, under which the authority will address the various mandates in an orderly manner based on their latest legal application dates (up to four years after the entry into force of CRR 3 and CRD VI). In addition, at the end of 2024, the EBA published its 2025 work programme, setting out the guidelines for addressing these mandates during the year. This has resulted in the publication of various consultations throughout the year on RTS, ITS and Guidelines, such as, for example:
–Regulatory Technical Standards (RTS) on off-balance-sheet exposures and unconditionally cancellable commitments
–Regulatory Technical Standards (RTS) on material changes to IRB models and model extensions
–Revision of the Guidelines on the revised definition of default
–Regulatory Technical Standards (RTS) and Implementing Technical Standards (ITS) on operational risk
In its 2025 Work Programme, the EBA undertook, among other initiatives, the revision of the SREP Guidelines, the consultation for which was published on 24 October, with the aim of updating them based on three pillars: legislative changes (CRR 3 and CRD VI, IRRBB/CSRBB, DORA, etc.), lessons learned, and structural changes intended to improve the usability of the Guidelines. The consultation period was set to run until early February 2026, and following the conclusion of the consultation process, the Guidelines are expected to enter into force on 1 January 2027.
On 28 July 2025, the ECB published a revised version of its Guide to Internal Models, with the objective of reflecting the regulatory changes introduced by CRR 3 in relation to internal models for credit, counterparty credit and market risk; clarifying supervisory expectations for internal models that make use of machine learning; and enhancing transparency and supervisory harmonisation. This revision builds on the experience accumulated by the ECB since the first publication of the Guide in 2019.
On 25 July 2025, the ECB also published the final Guide on Options and Discretions, following a consultation process launched in November 2024. The Guide introduces clarifications and adjustments to the treatment of market risk and operational risk, as well as to the conditions under which minority interests may be included in group capital, among other aspects.
Regarding resolution regulation, institutions are required to maintain an adequate funding structure to ensure that, in the event of financial distress, they hold sufficient liabilities to absorb losses and either restore viability or be resolved while safeguarding depositor protection and financial stability. To this end, global systemically important institutions are subject to minimum loss-absorbing capacity requirements, namely Total Loss-Absorbing Capacity (TLAC) and the Minimum Requirement for own funds and Eligible Liabilities (MREL), as regulated under CRR 3 and the Bank Recovery and Resolution Directive (BRRD).
On 25 October 2022, a regulation on the prudential treatment of global systemically important institutions was published, amending both the CRR and the BRRD with respect to the prudential treatment of G-SIBs with a multiple point of entry (MPE) resolution strategy, as well as the methods for the indirect subscription of eligible instruments (daisy chains) for the purpose of meeting MREL requirements. This regulation, known as the Resolution 'Quick Fix', pursues two main objectives:
•The inclusion in the BRRD and CRR 3 of references to third-country subsidiaries allowing for adjustments to the deduction for holdings of TLAC instruments issued by such subsidiaries, based on excess TLAC/MREL at subsidiary level, as well as adjustments in cases where the aggregate own funds and eligible liabilities requirements of a G-SIB under an MPE strategy exceed the theoretical requirements of the same group under a single point of entry (SPE) strategy. This adjustment is therefore based on a comparison between the two possible resolution strategies.
•The introduction of a deduction regime for holdings of MREL instruments through entities within the same resolution group other than the resolution entity. The Regulation establishes a deduction at the level of the intermediate entity within the daisy chain that repurchases the instruments. As a result, the intermediate entity is required to issue an equivalent amount, thereby transferring internal MREL needs to the resolution entity, which will cover them with external MREL.
In this context, in 2025 the EBA published the Final Report on the draft Implementing Technical Standards (ITS) on resolution planning, aimed at further harmonising reporting requirements.
Regarding Deposit Guarantee Schemes (DGS), these are regulated under the Deposit Guarantee Schemes Directive (DGSD), which has not undergone substantial amendments since its publication in 2014. The Directive aims to harmonise DGS across Member States to ensure stability and consistency across countries. It establishes an appropriate framework to improve depositor access to DGS through a clear scope of coverage, short repayment periods, enhanced information, and robust funding requirements. The Directive has been transposed into Spanish law through Royal Decree 2606/1996, as amended by Royal Decree 1041/2021.
To ensure the protection of depositors, DGS collect financial resources through contributions from their members, which must be paid at least annually. These annual contributions are determined based on the number of covered deposits and the risk profile of the institutions affiliated with the DGS. The methodology for calculating contributions is set out in the EBA Guidelines (EBA/GL/2023/02).
In June 2025, the Council and the European Parliament reached a political agreement, which still needs to be finalized at a technical level as a prerequisite for its final formal approval.
Within the sustainability field from a prudential perspective, the implementation of the CRR 3/CRD VI package has progressed, introducing specific requirements to integrate environmental, social and governance (ESG) risks into the prudential framework. With the aim of assessing whether a specific prudential treatment is warranted, the CRR establishes three mandates: to assess the availability of ESG risk data; to evaluate the effective risk profile of exposures affected by environmental or social factors; and to analyse the potential effects on financial stability of differentiated prudential treatment, with a view to possible legislative proposals by 31 December 2026.
In addition, the CRR 3/CRD VI package introduces disclosure requirements on ESG risks, reporting of ESG risk exposures to competent authorities, and an obligation for institutions to develop specific plans for managing financial risks arising from ESG factors, including those related to transition trends.
In this context, the EBA published in January 2025 the Guidelines on the Management of ESG Risks, fulfilling the CRD VI mandate to structurally integrate ESG risks into the European prudential framework. These Guidelines set out minimum standards and reference methodologies for the identification, measurement, management and monitoring of ESG risks, as well as their proper integration into internal governance processes, risk appetite frameworks and strategic planning. The Guidelines also specify minimum requirements for the development of transition plans, which must include metrics, quantifiable targets and time-bound milestones aligned with institutions’ sustainability strategies and prudential requirements. Their application will be mandatory from 11 January 2026, consolidating a prudential framework that strengthens the systematic consideration of ESG risks in supervisory and risk management processes.
At the international level, the Basel Committee on Banking Supervision (BCBS) has continued to advance work on ESG-related standards. In June 2025, the Committee published a voluntary framework for the disclosure of climate-related financial risks, aimed at guiding internationally active banks in the provision of qualitative and quantitative information on their exposures to physical and transition risks. The framework acknowledges the still nascent state of climate data availability, consistency and quality, and therefore adopts a flexible approach that allows for the use of different metrics and methodologies. While its adoption will depend on jurisdictional decisions, the Committee considers this framework an important step towards enhancing transparency and international comparability of climate risk disclosures and intends to monitor its implementation with a view to potential future revisions.
In the digital field, due to the increase in international crypto assets activities, the EU is moving forward with the integration of Basel standards on crypto-assets through the mandate set out in CRR 3, which will enable the establishment of a harmonised prudential treatment once the legislative process is completed. In fulfilment of the CRR 3 mandate, the EBA has finalised and published the draft Regulatory Technical Standards (RTS) applicable to the calculation of own funds requirements for crypto-asset exposures.
At 31 December 2025 Grupo Santander met the minimum capital requirements established by current legislation (see note 54.d). Additionally, it should be noted that the Group has filed an appeal with the Court of Justice of the European Union (CJEU) requesting the annulment of a decision by the European Central Bank (ECB) related to the treatment of deferred tax assets generated at Banco Santander Brasil, which, if resolved favourably, would have a positive impact of approximately 20 basis points on the Group's CET1, using the amounts at the end of the year.
f) Environmental impact
In view of the business activities carried on by the Group entities, the Group does not have any environmental liability, expenses, assets, provisions or contingencies that might be material with respect to its consolidated equity, financial position or results (see note 54.a).
g) Events after the reporting period
On 9 January 2026, after obtaining the necessary regulatory approvals and fulfilling the conditions for closing, the Group completed the sale of 49% of the share capital of Santander Bank Polska S.A. and 50% of the share capital of Santander Towarzystwo Funduszy Inwestycyjnych S.A. (TFI, the asset management business in Poland) to Erste Group Bank AG for a total cash amount of approximately EUR 7,000 million. The transaction generated a net capital gain of approximately EUR 1,900 million, which will be recognized in the consolidated income statement for the 2026 financial year. Santander holds the 9.7% of Santander Polska's share capital.
The transaction resulted in the loss of effective control over the entity, and therefore, effective as of 9 January 2026, Santander Bank Polska S.A. will cease to be consolidated using the global integration method in the Group's consolidated financial statements from that date forward.
Additionally, on 3 February 2026, Banco Santander, S.A. ('Santander') announced that it had reached an agreement to acquire Webster Financial Corporation ('Webster'), the parent company of Webster Bank, N.A., for approximately USD 12,200 million (around EUR 10,300 million). Webster shareholders will receive USD 48.75 in cash and 2.0548 Santander shares for each Webster share, resulting in a total consideration of USD 75 per Webster share. Completion of the transaction is expected to take place in the second half of 2026 subject to the customary conditions for this type of operations, including obtaining the relevant regulatory approvals and the approvals of both Webster's and Santander's shareholders.
2. Accounting policies
The accounting policies applied in preparing the consolidated financial statements were as follows:
a) Foreign currency transactions
i. Presentation currency
Banco Santander’s functional and presentation currency is the euro. Also, the presentation currency of the Group is the euro.
ii. Translation of foreign currency balances
Foreign currency balances are translated to euros in two consecutive stages:
•Translation of foreign currency to the functional currency (currency of the main economic environment in which the entity operates).
•Translation to euros of the balances held in the functional currencies of entities whose functional currency is not the euro.
Translation of foreign currency to the functional currency
Foreign currency transactions performed by consolidated entities (or entities accounted for using the equity method) not located in European Monetary Union ('EMU') countries are initially recognised in their respective currencies. Monetary items in foreign currency are subsequently translated to their functional currencies using the closing rate.
Furthermore:
•Non-monetary items measured at historical cost are translated to the functional currency at the exchange rate at the date of acquisition.
•Non-monetary items measured at fair value are translated at the exchange rate at the date when the fair value was determined.
•Income and expenses are translated at the average exchange rates for the year for all the transactions performed during the year. When applying this criterion, the Group considers whether there have been significant changes in the exchange rates in the year which, in view of their materiality with respect to the consolidated financial statements taken as a whole, would make it necessary to use the exchange rates at the transaction date rather than the aforementioned average exchange rates.
•The balances arising from non-hedging forward foreign currency/foreign currency and foreign currency/euro purchase and sale transactions are translated at the closing rates prevailing in the forward foreign currency market for the related maturity.
Translation of functional currencies to euros
The balances in the financial statements of consolidated entities (or entities accounted for using the equity method) whose functional currency is not the euro are translated to euros as follows:
-Assets and liabilities, at the closing rates.
-Income and expenses, at the average exchange rates for the year.
-Equity items, at the historical exchange rates.
iii. Recognition of exchange differences
The exchange differences arising on the translation of foreign currency balances to the functional currency are generally recognised at their net amount under 'Exchange differences, net' in the consolidated income statement, except for exchange differences arising on financial instruments at fair value through profit or loss, which are recognised in the consolidated income statement without distinguishing them from other changes in fair value, and for exchange differences arising on non-monetary items measured at fair value through equity, which are recognised under 'Other comprehensive income–Items that may be reclassified to profit or loss–Exchange differences' except for exchange differences on equity instruments, where the option to irrevocably elect to be measured at fair value through changes in accumulated other comprehensive income, which are recognised in accumulated 'Other Comprehensive Income - Items not to be reclassified to profit or loss - Changes in fair value of equity instruments measured at fair value' through other comprehensive income (see note 29).
The exchange differences arising on the translation to euros of the financial statements denominated in functional currencies other than the euro are recognised in 'Other comprehensive income–Items that may be reclassified to profit or loss–Exchange differences' in the consolidated balance sheet, whereas those arising on the translation to euros of the financial statements of entities accounted for using the equity method are recognised in equity under 'Other comprehensive income–Items that may be reclassified to profit or loss and Items not reclassified to profit or loss–Other recognised income and expense' of investments in subsidiaries, joint ventures and associates (see note 29), until the related item is derecognised, at which time they are recognised in profit or loss.
Exchange differences arising on actuarial gains or losses when converting to euros the financial statements denominated in the functional currencies of entities whose functional currency is different from the euro are recognised under equity 'Other comprehensive income–Items not reclassified to profit or loss–Actuarial gains or (-) losses' on defined benefit pension plans (see note 29).
iv. Entities located in hyperinflationary economies
When a subsidiary operates in a country with hyperinflationary economy, IAS 29 Financial Information in Hyperinflationary Economies is applied, which means that:
–Historical cost of non-monetary assets and liabilities and of the various items of equity have to be adjusted to reflect the changes in the purchasing power of the currency due to inflation from their date of acquisition or incorporation into the consolidated balance sheet.
–The different items of the income statement are adjusted by the inflationary index since their generation, with a balancing entry in 'Other comprehensive income'.
–The loss on the net monetary position is recorded in the income for the year against 'Accumulated Other comprehensive income'.
–All components of the financial statements of the subsidiary are translated at the closing exchange rate.
The deterioration of the economic situation in Argentina over the last years caused, among other impacts, a significant increase in inflation, which by the end of 2018 had reached 48% per year (147% accumulated in three years). This led the Group to conclude that it was necessary to apply IAS 29 Financial Information in Hyperinflationary Economies to its activities in the country in question in its consolidated financial statements from that year on.
In 2024, Grupo Santander decided to apply an alternative exchange rate for the conversion of its Argentine business in the preparation of its consolidated annual accounts. This decision stemmed from the divergence observed between the official exchange rate and certain macroeconomic variables, primarily inflation, coupled with the fact that for certain transactions, such as the repatriation of dividends, the exchange rate implied in orderly transactions between market participants did not correspond to the official exchange rate. As of 31 December 2024, the alternative exchange rate used was based on the CCL dollar ('contado con liquidación'), which is the exchange rate resulting from the sale in US dollars of local bonds denominated in Argentine pesos (bonds with dual peso dollar/denomination). At that date, this rate did not differ significantly from other market rates.
From the second quarter of 2025, and considering the liberalization of the foreign exchange market and the elimination of restrictions on the purchase of foreign currency by individuals, and the value of this CCL dollar exchange rate did not differ significantly from other market rates and the official exchange rate, Grupo Santander started using the official exchange rate as a reference once again.
Inflation during 2025, according to the national consumer price index published by the National Statistics and Census Institute, was 31.5% for the year (117.8% at 31 December 2024). The official exchange rate as 31 December 2025 was 1,706.38 Argentine pesos per euro (1,071.16 Argentine pesos per euro at 31 December 2024). The exchange rate applied by the Group as at 31 December 2024 was 1,232.39 Argentine pesos per euro.
At 31 December 2025, no other country in which the consolidated and associated entities of Grupo Santander are located is considered to have a hyperinflationary economy in accordance with the criteria established in this regard by the International Financial Reporting Standards adopted by the European Union.
v. Exposure to foreign currency risk
Grupo Santander hedges a portion of its long-term foreign currency positions using foreign exchange derivative financial instruments (see note 36). Also, the Group manages foreign exchange risk dynamically by hedging its short-term position (with a potential impact on profit or loss) in order to limit the impact of currency depreciations while optimising the cost of financing the hedges.
The following tables show the sensitivity of the consolidated income statement and consolidated equity to percentage changes of ± 1% in the foreign exchange rate positions arising from investments in Grupo Santander companies with currencies other than the euro (with its hedges) and in their results (with its hedges), in which the Group maintains significant balances.
The estimated effect on the consolidated equity attributable to Grupo Santander and on consolidated profit and loss account of a 1% appreciation of the euro against the corresponding currency is as follows:
| | | | | | | | | | | | | | | | | | | | | | | |
| EUR million |
| Effect on
consolidated equity | | Effect on
consolidated profit |
| Currency | 2025 | 2024 | 2023 | | 2025 | 2024 | 2023 |
| US dollar | (135.0) | | (168.4) | | (136.9) | | | (2.5) | | (3.9) | | (3.4) | |
| Chilean peso | (8.8) | | (15.3) | | (35.3) | | | (4.3) | | (2.1) | | (2.3) | |
| Pound sterling | (88.1) | | (96.5) | | (79.1) | | | (7.6) | | (4.4) | | (3.1) | |
| Mexican peso | (32.5) | | (33.9) | | (36.4) | | | (0.5) | | (0.5) | | (0.1) | |
| Brazilian real | (141.2) | | (144.1) | | (175.7) | | | (0.8) | | (4.3) | | (6.5) | |
| Polish zloty | (12.8) | | (25.1) | | (48.8) | | | — | | (0.4) | | — | |
| Argentine peso | (21.3) | | (18.3) | | (7.5) | | | (3.7) | | (6.6) | | (4.2) | |
Similarly, the estimated effect on the Group’s consolidated equity and on consolidated profit and loss account of a 1% depreciation of the euro against the corresponding currency is as follows:
| | | | | | | | | | | | | | | | | | | | | | | |
| EUR million |
| Effect on
consolidated equity | | Effect on
consolidated profit |
| Currency | 2025 | 2024 | 2023 | | 2025 | 2024 | 2023 |
| US dollar | 137.8 | | 171.8 | | 139.7 | | | 2.5 | | 4.0 | | 3.4 | |
| Chilean peso | 9.0 | | 15.6 | | 36.0 | | | 4.4 | | 2.2 | | 2.3 | |
| Pound sterling | 89.9 | | 98.4 | | 80.7 | | | 7.7 | | 4.5 | | 3.1 | |
| Mexican peso | 33.1 | | 34.6 | | 37.1 | | | 0.5 | | 0.5 | | 0.1 | |
| Brazilian real | 144.0 | | 147.0 | | 179.3 | | | 0.9 | | 4.3 | | 6.6 | |
Polish zloty | 13.0 | | 25.6 | | 49.8 | | | — | | 0.4 | | — | |
| Argentine peso | 21.7 | | 18.7 | | 7.7 | | | 3.8 | | 6.7 | | 4.2 | |
The above data were obtained as follows:
a) Effect on consolidated equity: in accordance with the accounting policy detailed in note 2.a.iii, foreign exchange rate impact arising on the translation to euros of the financial statements in the functional currencies of the Group entities whose functional currency is not the euro are recognised in consolidated equity. The potential effect that a change in the exchange rates of the related currency would have on the Group’s consolidated equity was therefore determined by applying the aforementioned change to the net value of each unit’s assets and liabilities -including, where appropriate, the related goodwill- and by taking into consideration the offsetting effect of the hedges of net investments in foreign operations.
b) Effect on consolidated profit: the effect was determined by applying the up and down movements in the average exchange rates of the year, as indicated in note 2.a.ii (except in the case of Argentina, which is a hyperinflationary economy and has applied the closing exchange rate), to translate to euros the income and expenses of the consolidated entities whose functional currency is not the euro, taking into consideration, where appropriate, the offsetting effect of the various hedging transactions in place.
The estimates used to obtain the foregoing data were performed considering the effects of the changes in the exchange rate in standalone basis not considering the effect of the performance of other variables whose changes would affect equity and profit or loss, such as variations in the interest rates of the reference currencies or other market factors. Accordingly, all variables other than the exchange rate variations were kept constant with respect to their positions at 31 December 2025, 2024 and 2023.
b) Basis of consolidation
i. Subsidiaries
Subsidiaries are defined as entities over which the Bank has the capacity to exercise control. The Bank controls an entity when it is exposed, or has rights, to variable returns from its involvement with the investee and has the ability to affect those returns through its power over the investee.
The financial statements of the subsidiaries are fully consolidated with those of the Bank. Accordingly, all balances and effects of the transactions between consolidated companies are eliminated on consolidation.
On acquisition of control of a subsidiary, its assets, liabilities and contingent liabilities are recognised at their acquisition-date fair values. Any positive differences between the acquisition cost and the fair values of the identifiable net assets acquired are recognised as goodwill (see note 17). Negative differences are recognised in profit or loss on the date of acquisition.
Additionally, the share of third parties of Grupo Santander equity is presented under 'Non-controlling interests' in the consolidated balance sheet (see note 28). Their share of the profit for the year is presented under 'Profit attributable to non-controlling interests' in the consolidated income statement.
The results of subsidiaries acquired during the year are included in the consolidated income statement from the date of acquisition to year-end. Similarly, the results of subsidiaries for which control is lost during the year are included in the consolidated income statement from the beginning of the year to the date of disposal.
At 31 December 2025, apart from the structured consolidated entities, Grupo Santander does not control any company in which it maintains a percentage of direct participation in its share capital of less than 50% and in where other elements exist which, considered together, would grant give it decision-making power over its relevant activities.
The appendices contain significant information on the subsidiaries.
ii. Interests in joint ventures
Joint ventures are deemed to be entities that are not subsidiaries but which are jointly controlled by two or more unrelated entities. This is evidenced by contractual arrangements whereby two or more parties have interests in entities so that decisions about the relevant activities require the unanimous consent of all the parties sharing control.
In the consolidated financial statements, investments in joint ventures are accounted for using the equity method, i.e. at the Group’s share of net assets of the investee, after taking into account the dividends received therefrom and other equity eliminations. The profits and losses resulting from transactions with a joint venture are eliminated to the extent of the Group’s interest therein.
The appendices contain relevant information on the joint ventures.
iii. Associates
Associates are entities over which Banco Santander is in a position to exercise significant influence, but not control or joint control. It is presumed that Banco Santander exercises significant influence if it holds 20% or more of the voting power of the investee.
In the consolidated financial statements, investments in associates are accounted for using the equity method, with the same criteria applicable to shares in joint ventures.
There are certain investments in entities which, although Grupo Santander owns 20% or more of their voting power, are not considered to be associates because the Group is not in a position to exercise significant influence over them. As of 31 December 2024 and 2023, the investment in Project Quasar Investments 2017, S.L. was in this situation, despite maintaining a 49% stake in the share capital. The rest of the investments are not significant for the Group.
There are also certain investments in associates where the Group owns less than 20% of the voting rights, as it is determined that it has the capacity to exercise significant influence over them. The impact of these companies is immaterial in the Group's consolidated financial statements.
The appendices contain significant information on the associates.
iv. Structured entities
In some cases, Grupo Santander incorporates entities, or holds ownership interests therein, to enable its customers to access certain investments, or for the transfer of risks or other purposes. Those entities are called 'structured entities' and they are characterized by the fact that since the voting, or similar power is not a key factor in deciding who controls the entity. The control is determined by using internal criteria and procedures and taking into consideration the applicable legislation, as described above. Specifically, for those entities to which this policy applies (mainly investment funds and pension funds), the Group analyses the following factors:
•Percentage of ownership held by Grupo Santander; 20% is established as the general threshold.
•Identification of the fund manager, and verification as to whether it is a company controlled by the Group since this could affect Grupo Santander ability to direct the relevant activities.
•Existence of agreements between investors that might require decisions to be taken jointly by the investors, rather than by the fund manager.
•Existence of currently exercisable removal rights (possibility of removing the manager from his position), since the existence of such rights might limit the manager’s power over the fund, and it may be concluded that the manager is acting as an agent of the investors.
•Analysis of the fund manager’s remuneration regime, taking into consideration that a remuneration regime that is proportionate to the service rendered does not, generally, create exposure of such importance as to indicate that the manager is acting as the principal. Conversely, if the remuneration regime is not proportionate to the service rendered, this might give rise to an exposure that would lead the Group to a different conclusion.
These structured entities also include the securitisation special purpose vehicles, which are consolidated in the case of the Special Purpose Vehicles (SPVs) over which, being exposed to variable yield, it is considered that the Group continues to exercise control.
The exposure associated with unconsolidated structured entities, additional to investments in the equity of investment funds (note 8), are not material with respect to the Group’s consolidated financial statements.
v. Business combinations
A business combination is the bringing together of two or more separate entities or economic units into one single entity or group of entities.
Business combinations whereby Grupo Santander obtains control over an entity or a business are recognised for accounting purposes as follows:
•Grupo Santander measures the cost of the business combination, which is normally the consideration transferred, defined as the acquisition-date fair values of the assets transferred, the liabilities incurred to the former owners of the acquiree and the equity instruments issued, if any, by the acquirer. In cases where the amount of the consideration to be transferred has not been definitively established at the acquisition date, but rather depends on future events, any contingent consideration is recognised as part of the consideration transferred and measured at its acquisition-date fair value. Moreover, acquisition-related costs do not for these purposes form part of the cost of the business combination.
•The fair values of the assets, liabilities and contingent liabilities of the acquired entity or business, including any intangible assets identified in the business combination which might not have been recognised by the acquiree, are estimated and recognised in the consolidated balance sheet; the Group also estimates the amount of any non-controlling interests and the fair value of the previously held equity interest in the acquiree.
•Any positive difference between the aforementioned items is recognised as discussed in note 2.m. Any negative difference is recognised under 'Negative Goodwill' recognised in the consolidated income statement.
Goodwill is only calculated and recognised once, when control of a business or an entity is obtained.
vi. Changes in the levels of ownership interests in subsidiaries
Acquisitions and disposals not giving rise to a change in control are recognised as equity transactions, and no gain or loss is recognised in the income statement and the initially recognised goodwill is not remeasured. The difference between the consideration transferred or received and the decrease or increase in non-controlling interests, respectively, is recognised in reserves.
Similarly, when control over a subsidiary is lost, the assets, liabilities and non-controlling interests and any other items recognised in 'Other Comprehensive income' of that company are derecognised from the consolidated balance sheet, and the fair value of the consideration received and of any remaining equity interest is recognised. The difference between these amounts is recognised in profit or loss.
c) Classification of financial instruments
A financial instrument is any contract that gives rise to a financial asset of one entity and a financial liability or an equity instrument of another entity.
The following transactions are not treated for accounting purposes as financial instruments:
•Investments in associates and joint venture when accounted for using the equity method in accordance with IAS 28 (see note 13).
•Rights and obligations under employee benefit plans recognized in accordance with IAS 19 (see note 25).
•Insurance contracts and the rights and obligations directly arising from them, within the scope of IFRS 17 (see note 15).
•Contracts and obligations relating to employee remuneration based on own equity instruments accounted for in accordance with IFRS 2 (see note 34).
i. Classification of financial assets for measurement purposes
Financial assets are classified into the various categories used for management and measurement purposes, unless they have to be presented as 'Non-current assets held for sale' or they relate to 'Cash, cash balances at central banks and other deposits on demand', 'Changes in the fair value of hedged items in portfolio hedges of interest rate risk (asset side)', 'Hedging derivatives and Investments', which are reported separately.
Classification of financial instruments: the classification criteria for financial assets depends on the business model for their management and the characteristics of their contractual flows.
Grupo Santander business models refer to the way in which it manages its financial assets to generate cash flows. In defining these models, the Group takes into account the following factors:
•How key entity staff are assessed and reported on the performance of the business model and the financial assets held in the business model.
•The risks that affect the performance of the business model (and the financial assets held in the business model) and, specifically, the way in which these risks are managed.
•The way in which business managers are remunerated.
•The frequency, the calendar and volume of sales in previous years, as well as expectations of future sales and the reasons of the sales.
The analysis of the characteristics of the contractual cash flows of financial assets requires an assessment of the congruence of these flows with a basic loan agreement. The Group determines if the contractual cash flows of its financial assets that are only principal and interest payments on the outstanding principal amount at the beginning of the transaction. This analysis takes into consideration four factors (performance, contractual clauses, contractually linked products and currencies). Furthermore, among the most significant judgements used by the Group in carrying out this analysis, the following ones are included:
•The return on the financial asset, in particular in cases of periodic interest rate adjustments where the term of the reference rate does not coincide with the frequency of the adjustment. In these cases, an assessment is made to determine whether or not the contractual cash flows differ significantly from the flows without this change in the time value of money, establishing a tolerance level of 5%.
•When contractual clauses that may modify the cash flows of the financial asset exist, the structure of the cash flows before and after the activation of such clauses is analysed, regardless of the probability of occurrence of the contingent event. The evaluation of contractual flows of financial assets with characteristics associated with ESG (Environmental, Social and Governance) is included in this analysis.
•Financial assets whose cash flows have different priority for payment due to a contractual link to underlying assets (e.g. securitization instruments or similar structures) require a look-through analysis by the Group so as to review that both the financial asset and the underlying assets are only principal and interest payments and that the exposure to credit risk of analyzed segment does not exceed the average exposure of the underlying assets of the instrument.
Depending on these factors, the financial assets classify for measurement as: (i) at amortised cost, (ii) at fair value with changes in other comprehensive income or (iii) at fair value with changes through profit and loss. IFRS 9 also establishes an option to irrevocably designate an instrument at fair value with changes in profit or loss, when doing so eliminates or significantly reduces a measurement or recognition inconsistency (sometimes referred to as 'accounting asymmetry') that would otherwise arise from measuring assets or liabilities or recognising gains and losses on different bases.
Grupo Santander uses the following criteria for the classification of the financial debt instruments:
•Amortised cost: financial instruments managed under a business model whose objective is to hold the financial assets to collect contractual principal and interest flows. This category includes instruments for which there are no frequent or significant unjustified sales and fair value is not a key element in the management of these assets and contractual conditions they give rise to cash flows on specific dates, which are only payments of principal and interest on the outstanding principal amount. In this sense, justified sales are considered to be those related to an (i) increase in the credit risk of the asset, (ii) unanticipated funding needs (stress case scenarios) and (iii) those close to maturity . Additionally, the characteristics of its contractual flows represent substantially a 'basic financing agreement'.
•Fair value with changes in other comprehensive income: financial instruments held in a business model whose objective is to collect principal and interest cash flows and the sale of these assets, where fair value is a relevant factor in their management. Additionally, the contractual cash flow characteristics substantially represent a 'basic financing agreement'.
•Fair value with changes in profit or loss: financial instruments included in a business model different from the above, where fair value is a key element in the management of these assets, and the contractual flows of the financial instruments do not substantially represent a 'basic financing agreement'. In this section it can be enclosed the portfolios classified under 'Financial assets held for trading', 'Non-trading financial assets mandatorily at fair value through profit or loss' and 'Financial assets at fair value through profit or loss'. In this regard, most of the financial assets presented in the category of 'Financial assets designated at value reasonable with change in results' are instruments financial services that, not being part of the portfolio of negotiation, are contracted jointly with other financial instruments that are recorded in the category of 'held for trading', and that by both are recorded at fair value with changes in results, so your record in any other category would produce accounting asymmetries.
Equity instruments will be classified at fair value under IFRS 9, with changes in profit or loss, unless the Group decides, for non-trading assets, to classify them at fair value with changes in other comprehensive income (irrevocably) at initial recognition.
ii. Classification of financial assets for presentation purposes
Financial assets are classified by nature into the following items in the consolidated balance sheet:
•Cash, cash balances at Central Banks and other deposits on demand: cash balances and balances receivable on demand relating to deposits with central banks and other credit institutions.
•Loans and advances: includes the debit balances of all credit and loans granted by the Group, other than those represented by securities or securitized, as well as the finance lease receivables and other debit balances of a financial nature in favour of the Group such as cheques drawn on credit institutions, balances receivable from clearing houses and settlement agencies for transactions on the stock exchange and organised markets, bonds given in cash, capital calls, fees and commissions receivable for financial guarantees and debit balances arising from transactions not originating in banking transactions and services, such as the collection of rentals and similar items. They are classified, on the basis of the institutional sector to which the debtor belongs, into:
–Central banks: credit of any nature, including deposits and money market transactions received from the Bank of Spain or other central banks.
–Credit institutions: credit of any nature, including deposits and money market transactions, in the name of credit institutions.
–Customers: includes the remaining credit, including money market transactions through central counterparties.
•Debt securities: bonds and other securities that represent a debt for their issuer, that that accrue interest or equivalent returns implemented in securities or in book entries.
•Equity instruments: financial instruments issued by other entities, such as shares, which have the nature of equity instruments for the issuer, other than investments in subsidiaries, joint ventures or associates. Investment fund units are included in this item.
•Derivatives: includes the fair value in favour of the Group of derivatives which do not form part of hedge accounting, including embedded derivatives separated from hybrid financial instruments.
•Repurchase agreements and reverse repurchase agreements: Purchases of financial instruments under a non-optional resale (repurchase) agreement at a fixed price (repos) are recognised in the consolidated balance sheet as financing granted, based on the nature of the debtor, under 'Loans and advances with central banks', 'Loans and advances to credit institutions' or 'Loans and advances to customers. Differences between the purchase and sale prices are recognised as interest over the contract term.
•Changes in the fair value of hedged items in portfolio hedges of interest rate risk: this item is the balancing entry for the amounts credited to the consolidated income statement in respect of the measurement of the portfolios of financial instruments which are effectively hedged against interest rate risk through fair value hedging derivatives.
•Hedging derivatives: Includes the fair value in favour of the Group of derivatives, including embedded derivatives separated from hybrid financial instruments, designated as hedging instruments in hedge accounting.
iii. Classification of financial liabilities for measurement purposes
Financial liabilities are initially classified into the various categories used for management and measurement purposes, unless they have to be presented as 'Liabilities associated with non-current assets held for sale' or they relate to 'Hedging derivatives' or the changes in the fair value of hedged items in portfolio hedges of interest rate risk (liability side), which are reported separately.
In most cases, changes in the fair value of financial liabilities designated at fair value through profit or loss, caused by the entity's credit risk, are recognized in other comprehensive income, unless this treatment results in an accounting asymmetry, in which case the full effect is recognized in the profit or loss for the period.
Financial liabilities are included for measurement purposes in one of the following categories:
•Financial liabilities held for trading (at fair value through profit or loss): this category includes financial liabilities incurred for the purpose of generating a profit in the near term from fluctuations in their prices, financial derivatives not designated in accounting hedging relationships, and financial liabilities arising from the outright sale of financial assets temporarily acquired or received on loan (short positions).
•Financial liabilities designated at fair value through profit or loss: financial liabilities are included in this category when they provide more relevant information, either because this eliminates or significantly reduces recognition or measurement inconsistencies (accounting mismatches) that would otherwise arise from measuring assets or liabilities or recognising the gains or losses on them on different bases, or because a group of financial liabilities or financial assets and liabilities is managed and its performance is evaluated on a fair value basis, in accordance with a documented risk management or investment strategy, and information about the group is provided on that basis to the Group’s key management personnel.
Liabilities may only be included in this category on the date when they are incurred or originated.
•Financial liabilities at amortised cost: financial liabilities, irrespective of their instrumentation and maturity, not included in any of the above-mentioned categories which arise from the ordinary borrowing activities carried on by financial institutions.
iv. Classification of financial liabilities for presentation purposes
Financial liabilities are classified by nature into the following items in the consolidated balance sheet:
•Deposits: includes all repayable balances received in cash by Grupo Santander, other than those instrumented as marketable securities and those having the substance of subordinated liabilities (amount of the loans received, which for credit priority purposes are after common creditors), except for the debt instruments issued. This item also includes cash bonds and cash consignments received the amount of which may be invested without restriction. Deposits are classified on the basis of the creditor’s institutional sector into:
–Central banks: deposits of any nature, including credit received and money market transactions received from the Bank of Spain or other central banks.
–Credit institutions: deposits of any nature, including credit received and money market transactions in the name of credit institutions.
–Customer: includes the remaining deposits, including money market transactions through central counterparties.
•Marketable debt securities: includes the amount of bonds, debentures and other debt represented by marketable securities, other than those having the substance of subordinated liabilities (amount of the loans received, which for credit priority purposes are after common creditors, and includes the amount of the financial instruments issued by the Group which, having the legal nature of capital, do not meet the requirements to qualify as equity, such as certain preferred shares issued). This item includes the component that has the consideration of financial liability of the securities issued that are compound financial instruments.
•Derivatives: includes the fair value, with a negative balance for the Group, of derivatives, including embedded derivatives separated from the host contract, which do not form part of hedge accounting.
•Short positions: includes the amount of financial liabilities arising from the outright sale of financial assets acquired under reverse repurchase agreements or borrowed.
•Other financial liabilities: includes the amount of payment obligations having the nature of financial liabilities not included in other items (includes, among others, the balance of lease liabilities recognized in accordance with IFRS 16), and liabilities under financial guarantee contracts, unless they have been classified as non-performing.
•Repurchase agreements and reverse repurchase agreements: Sales of financial instruments under a non-optional resale (repurchase) agreement at a fixed price (repos) are recognised in the consolidated balance sheet as financing received, based on the nature of the creditor, under 'Deposits from central banks', 'Deposits from credit institutions' or 'Customer deposits'. Differences between the purchase and sale prices is recorded as interest accrued over the life of the contract, using the effective interest rate method.
•Changes in the fair value of hedged items in portfolio hedges of interest rate risk: this item is the balancing entry for the amounts charged to the consolidated income statement in respect of the measurement of the portfolios of financial instruments which are effectively hedged against interest rate risk through fair value hedging derivatives.
•Hedging derivatives: includes the fair value of the Group’s liability in respect of derivatives, including embedded derivatives separated from hybrid financial instruments, designated as hedging instruments in hedge accounting.
•The preference shares contingently convertible into ordinary shares eligible as Additional Tier 1 capital (PPCC) -perpetual shares, which may be repurchased by the issuer in certain circumstances, the interest on which is discretionary, and would convert into variable number of newly issued ordinary shares if the capital ratio of the Bank or its consolidated group falls below a given percentage (trigger event), as those two terms are defined in the related issue prospectuses are recognised for accounting purposes by the Group as compound instruments in accordance with IAS 32. The liability component reflects the issuer’s obligation to deliver a variable number of shares and the equity component reflects the issuer’s discretion in relation to the payment of the related coupons. In order to effect the initial allocation, the Group estimates the fair value of the liability as the amount that would have to be delivered if the trigger event were to occur immediately and, accordingly, the equity component, calculated as the residual amount, is zero. In view of the aforementioned discretionary nature of the payment of the coupons, they are deducted directly from equity.
•Capital perpetual preference shares (PPCA), with the possibility of purchase by the issuer in certain circumstances, whose remuneration is discretionary, and which will be amortised permanently, totally or partially, in the event that the bank or its consolidated group submits a capital ratio lesser than a certain percentage (trigger event), as defined in the corresponding prospectuses, are accounted for by the Group as equity instruments.
•Derivatives embedded in other financial instruments or in other host contracts are accounted for separately as derivatives if their risks and characteristics are not closely related to those of the host contracts, provided that the host contracts are not classified as financial assets/liabilities designated at fair value through profit or loss or as 'Financial assets/liabilities held for trading'.
d) Measurement of financial assets and liabilities and recognition of fair value changes
In general, financial assets and liabilities are initially recognised at fair value which, in the absence of evidence to the contrary, is deemed to be the transaction price.
In this regard, IFRS 9 states that regular way purchases or sales of financial assets shall be recognised and derecognised on the trade date or on the settlement date. Grupo Santander has opted to make such recognition on the trading date or settlement date, depending on the convention of each of the markets in which the transactions are carried out. For example, in relation to the purchase or sale of debt securities or equity instruments traded in the Spanish market, securities market regulations stipulate their effective transfer at the time of settlement and, therefore, the same time has been established for the accounting record to be made.
The fair value of instruments not measured at fair value through profit and loss is adjusted by transaction costs. Subsequently, and on the occasion of each accounting close, they are valued in accordance with the following criteria:
i. Measurement of financial assets
Financial assets are measured at fair value are valued mainly at their fair value without deducting any transaction cost for their sale.
The fair value of a financial instrument on a given date is taken to be the price that would be received to sell an asset or paid to transfer a liability in an orderly transaction between market participants. The most objective and common reference for the fair value of a financial instrument is the price that would be paid for it on an active, transparent and deep market (quoted price or market price). At 31 December 2025, there were no significant investments in quoted financial instruments that had ceased to be recognised at their quoted price because their market could not be deemed to be active.
If there is no market price for a given financial instrument, its fair value is estimated on the basis of the price established in recent transactions involving similar instruments and, in the absence thereof, of valuation techniques commonly used by the international financial community, taking into account the specific features of the instrument to be measured and, particularly, the various types of risk associated with it.
All derivatives are recognised in the balance sheet at fair value from the trade date. If the fair value is positive, they are recognised as an asset and if the fair value is negative, they are recognised as a liability. The fair value on the trade date is deemed, in the absence of evidence to the contrary, to be the transaction price. The changes in the fair value of derivatives from the trade date are recorded in the consolidated income statement. Specifically, the fair value of financial derivatives traded in organised markets included in the portfolios of financial assets or liabilities held for trading is deemed to be their daily quoted price and if, for exceptional reasons, the quoted price cannot be determined on a given date, these financial derivatives are measured using methods similar to those used to measure derivatives.
The fair value of derivatives is taken to be the sum of the future cash flows arising from the instrument, discounted to present value at the date of measurement (present value or theoretical close) using valuation techniques commonly used by the financial markets: net present value, option pricing models and other methods.
The amount of debt securities and loans and advances under a business model whose objective is to collect the principal and interest flows are valued at their amortised cost, as long as they comply with the 'SPPI' (Solely Payments of Principal and Interest) test, using the effective interest rate method in their determination. Amortised cost refers to the acquisition cost of a corrected financial asset or liability (more or less, as the case may be) for repayments of principal and the part systematically charged to the consolidated income statement of the difference between the initial cost and the corresponding reimbursement value at expiration. In the case of financial assets, the amortised cost includes, in addition, the corrections to their value due to the impairment. In the loans and advances covered in fair value hedging transactions, the changes that occur in their fair value related to the risk or the risks covered in these hedging transactions are recorded.
The effective interest rate is the discount rate that exactly matches the carrying amount of a financial instrument to all its estimated cash flows of all kinds over its remaining life.
For fixed rate financial instruments, the effective interest rate coincides with the contractual interest rate established on the acquisition date plus, where applicable, the fees and transaction costs that, because of their nature, form part of their financial return. In the case of floating rate financial instruments, the effective interest rate coincides with the rate of return prevailing in all connections until the next benchmark interest reset date.
Equity instruments and contracts related with these instruments are measured at fair value. However, in certain circumstances the Group estimates cost value as a suitable estimate of the fair value. This can happen if the recent event available information is not enough to measure the fair value or if there is a broad range of possible measures and the cost value represents the best estimates of fair value within this range.
The amounts at which the financial assets are recognised represent, in all material respects, the Group’s maximum exposure to credit risk at each reporting date. Also, Grupo Santander has received collateral and other credit enhancements to mitigate its exposure to credit risk, which consist mainly of mortgage guarantees, cash collateral, equity instruments and personal security, assets leased out under finance lease and full-service lease agreements, assets acquired under repurchase agreements, securities loans and credit derivatives.
ii. Measurement of financial liabilities
In general, financial liabilities are measured at amortised cost, as defined above, except for those included under 'Financial liabilities held for trading' and 'Financial liabilities designated at fair value through profit or loss' and financial liabilities designated as hedged items (or hedging instruments) in fair value hedges, which are measured at fair value. The changes in credit risk arising from financial liabilities designated at fair value through profit or loss are recognised in accumulated other comprehensive income, unless they generate or increase an accounting mismatch, in which case changes in the fair value of the financial liability in all respects are recognised in the income statement.
iii. Valuation techniques
The financial instruments at fair value determined on the basis of published price quotations in active markets (level 1) include government debt securities, private-sector debt securities, derivatives traded in organised markets, securitised assets, shares, short positions and fixed-income securities issued.
In cases where price quotations cannot be observed, management makes its best estimate of the price that the market would set, using its own internal models, described in note 50. In most cases, these internal models use data based on observable market parameters as significant inputs (level 2) and, in cases, they use significant inputs not observable in market data (level 3). In order to make these estimates, various techniques are employed, including the extrapolation of observable market data. The best evidence of the fair value of a financial instrument on initial recognition is the transaction price, unless the fair value of the instrument can be obtained from other market transactions performed with the same or similar instruments or can be measured by using a valuation technique in which the variables used include only observable market data, mainly interest rates.
iv. Recognition of fair value changes
As a general rule, changes in the carrying amount of financial assets and liabilities are recognised in the consolidated income statement. A distinction is made between the changes resulting from the accrual of interest and similar items, (which are recognised under Interest income or Interest expense, as appropriate), and those arising for other reasons, which are recognised at their net amount under 'Gains/losses on financial assets and liabilities'.
Adjustments due to changes in fair value arising from:
•'Financial assets at fair value with changes in other comprehensive income' are recorded temporarily, in the case of debt instruments in 'Other comprehensive income - Elements that can be reclassified to profit or loss - Financial assets at fair value with changes in other comprehensive income', while in the case of equity instruments are recorded in 'other comprehensive income - Elements that will not be reclassified to line item - Changes in the fair value of equity instruments valued at fair value with changes in other comprehensive income'.
Exchange differences on debt instruments measured at fair value with changes in other comprehensive income are recognised under 'Exchange Differences, net' of the consolidated income statement. Exchange differences on equity instruments, in which the irrevocable option of being measured at fair value with changes in other comprehensive income has been chosen, are recognised in 'Other comprehensive income - Items that will not be reclassified to profit or loss - Changes in the fair value of equity instruments measured at fair value with changes in other comprehensive income'.
•Items charged or credited to 'Items that may be reclassified to profit or loss – Financial assets at fair value through other comprehensive income' and 'Other comprehensive income – Items that may be reclassified to profit or loss – Exchange differences in equity' remain in the Group's consolidated equity until the asset giving rise to them is impaired or derecognised, at which time they are recognised in the consolidated income statement.
•Unrealized capital gains on financial assets at fair value through other comprehensive income classified as 'Non-current assets held for sale' because they form part of a disposal group or a discontinued operation that are recorded in the equity balancing entry 'Other accumulated comprehensive income - Items that can be reclassified in income - Non-current assets as held for sale.
v. Hedging transactions
The objective of hedge accounting is to represent in the financial statements the effect of an entity's risk management activities when it uses financial instruments to manage exposures arising from specific risks that could affect profit or loss or other comprehensive income (in the case of investments in equity instruments for which the entity has opted to represent changes in the fair value of other comprehensive income).
As described in Note 1.b, the Group has adopted IFRS 9 for hedge accounting prospectively, while continuing to apply IAS 39 for fair value hedges in portfolios where the hedged risk is interest rate risk. This change has not resulted in any modifications to the accounting treatment of hedges designated under IAS 39, which remain unchanged in both their designation and accounting treatment.
For a hedging relationship to meet the requirements set out in IFRS 9, it must meet the following conditions:
1. Instruments that can be designated as hedging instruments include all derivative financial instruments or non-derivative financial instruments measured at fair value through profit or loss, or a combination thereof. In the case of foreign exchange risk hedges, any type of non-derivative financial instrument can also be designated, regardless of its measurement method.
2. Items that can be designated as covered items are all those that are recognized assets or liabilities, firm commitments, highly probable anticipated transactions, and net investments abroad.
3. At the start of coverage, a formal designation and documentation of the hedging relationship must be made, which will include the entity's risk management strategy and objective, identification of the hedging instrument and the covered item, the nature of the covered risk, the methodology for measuring effectiveness, which includes an analysis of the sources of ineffectiveness, and the coverage ratio.
The main sources of ineffectiveness based on the risk covered are:
a. Interest rate risk: mismatches in time horizons, principal, repricing and payment dates, time value of options, modifications in the hedged item or the hedging instrument.
b. Exchange rate risk: in addition to the above, the difference between the interest rates of the two currencies that represents the net cost or benefit of switching cash flows between two currencies with different interest rates.
4. The hedging relationship must be effective, for which there must be an economic relationship between the hedged item and the hedging instrument, credit risk must not have a dominant effect on changes in the value of the economic relationship between the hedging instrument and the hedged item, and the hedging ratio must coincide with that used by the entity in its management.
The Group assesses these effectiveness requirements, at the time of designation and on each submission date, through:
•The economic relationship between the hedged item and the hedging instrument is demonstrated through a qualitative test, and in the event of non-compliance, through quantitative tests that compare the market value of the hedged items—corresponding to the hedged risk—and the hedging instruments. Likewise, a quantitative analysis of variations in the market values of the hedging instrument and the hedged item is performed prospectively.
•The hedge ratio is determined based on the proportion between the amount of the hedged item and the amount of the instrument actually designated by the Group in each hedging relationship.
• The credit risk domain assessment is performed through an analysis of the credit exposure of the hedged items and the hedging instruments.
Accounting hedges are classified and recorded according to the type of risk they cover, based on the following criteria:
•Fair value hedges: These are hedges against exposure to changes in the fair value of the hedged item, attributable to a specific risk.
The differences arising from both the hedging instruments and the hedged items (due to the hedged risk) are recognized directly in the consolidated profit and loss account.
When the fair value hedge is discontinued, the adjustments previously recorded in the hedged item are charged to profit or loss using the effective interest rate method recalculated at the date the hedge ceases to be covered, and must be fully amortized at maturity.
In fair value hedges of interest rate risk of a portfolio of financial instruments (macro hedges), regulated by IAS 39, the gains or losses arising from the valuation of the hedging instruments are recognized directly in the consolidated profit and loss account, while the gains or losses due to changes in the fair value of the hedged amount (attributable to the hedged risk) are recognized in the consolidated profit and loss account using as a counterpart the headings 'Changes in the fair value of hedged items' of a portfolio with interest rate risk hedge (asset or liability), as appropriate.
•Cash flow hedges: These are hedges against exposure to changes in cash flows attributable to a specific risk associated with the hedged item.
The effective portion of the change in the value of the hedging instrument is temporarily recorded in the equity account 'Other accumulated comprehensive income - Items that may be reclassified in profit or loss - Hedging derivatives. Cash flow hedges (effective portion)' until the hedged item affects profit or loss. From that point onward, it will be recorded in the consolidated profit or loss account for the same period as the hedged item, except in cases where it is required to be included in the cost of the non-financial asset or liability, or the anticipated transactions are ultimately recognized as non-financial assets or liabilities.
When cash flow hedges are discontinued, the accumulated result of the hedging instrument recognized in the equity heading 'Other accumulated global result' (while the hedge was effective) will continue to be recognized in that heading until the hedged transaction occurs, at which time it will be recorded in profit or loss, unless it is expected that the transaction will not take place, in which case it is recorded immediately in profit or loss.
•Net investment hedges of a foreign operation: This is a hedge of the amount corresponding to the reporting entity's share of the net assets of said operation.
The effective portion of the hedging instrument is temporarily recorded in the equity account 'Other accumulated comprehensive income - Items that may be reclassified in profit or loss - Net investment hedges' in foreign operations until the gains or losses on the hedged item are recognized in profit or loss.
To measure ineffectiveness, the Group compares the valuation of the hedging instrument with the valuation of the hedged item based on the hedged risk, using different methodologies such as the proxy method or the hypothetical derivative method. The ineffective portion of the cash flow and net investment hedge relationships in foreign operations is recorded directly in the consolidated profit and loss account, under the heading 'Net gains or losses from hedge accounting'.
The Group discontinues accounting for hedging relationships when the hedging instrument expires, is sold, or when the hedging relationship becomes ineffective because it is no longer aligned with the risk management objective. In that case, the derivative is then treated as a trading derivative.
If a hedging relationship ceases to meet the effectiveness requirements, but the risk management objective remains, the Group will assess whether to rebalance or adjust the hedging ratio to meet the effectiveness requirements again without discontinuing the hedging relationship.
A hedging instrument is generally designated in its entirety, as the factors contributing to its fair value are interdependent. However, IFRS 9 allows certain parts of a hedging instrument to be excluded from its fair value:
a.Separating the intrinsic value and the time value of an option and designating only the intrinsic element as the hedging instrument, which is mandatory if the intrinsic value is designated;
b.Separating the forward and spot elements of a forward contract and designating only the spot element as the hedging instrument, which will be determined for each hedging relationship. and
c.Separate the foreign currency basis spread of a currency derivative and exclude it from the designation of the hedging instrument, as determined for each hedging relationship.
Separating these components will improve the effectiveness of the hedge and allows for alternative accounting treatment for the excluded component. This treatment consists of recording the changes in value under the heading 'Other accumulated comprehensive income – Undesignated items' and recording this component in the consolidated profit or loss statement, depending on the nature of the hedged item, either over a period of time or at the time the hedged transaction occurs.
Additionally, if the entity manages the credit risk of all or part of a financial instrument through the use of credit derivatives, there is the option of designating a fair value credit exposure through profit or loss, provided that the derivative matches the name and priority of the financial instrument being hedged. This designation may be made at the initial recognition of the designated financial instrument or subsequently, with the designation being documented. From its designation, fair value variations (for all its risks, not exclusively credit risk) will be recorded in the consolidated profit and loss account.
e) Derecognition of financial assets and liabilities
The accounting treatment of transfers of financial assets depends on the extent to which the risks and rewards associated with the transferred assets are transferred to third parties:
1. If the Group transfers substantially all the risks and rewards to third parties unconditional -sale of financial assets, sale of financial assets under an agreement to repurchase them at their fair value at the date of repurchase, sale of financial assets with a purchased call option or written put option that is deeply out of the money, securitisation of assets in which the transferor does not retain a subordinated debt or grant any credit enhancement to the new holders, and other similar cases-, the transferred financial asset is derecognised and any rights or obligations retained or created in the transfer are recognised simultaneously.
2. If the Group retains substantially all the risks and rewards associated with the transferred financial asset -sale of financial assets under an agreement to repurchase them at a fixed price or at the sale price plus interest, a securities lending agreement in which the borrower undertakes to return the same or similar assets, and other similar cases-, the transferred financial asset is not derecognised and continues to be measured by the same criteria as those used before the transfer. In this case, the following items are recognised:
a.An associated financial liability, which is recognised for an amount equal to the consideration received and is subsequently measured at amortised cost, unless it meets the requirements for classification under 'Financial liabilities designated at fair value through profit or loss'.
b.The income from the transferred financial asset not derecognised and any expense incurred on the new financial liability, without offsetting.
3. If the Group neither transfers nor retains substantially all the risks and rewards associated with the transferred financial asset -sale of financial assets with a purchased call option or written put option that is not deeply in or out of the money, securitisation of assets in which the transferor retains a subordinated debt or other type of credit enhancement for a portion of the transferred asset, and other similar cases- the following distinction is made:
a.If the transferor does not retain control of the transferred financial asset, the asset is derecognised and any rights or obligations retained or created in the transfer are recognised.
b.If the transferor retains control of the transferred financial asset, it continues to recognise it for an amount equal to its exposure to changes in value and recognises a financial liability associated with the transferred financial asset. The net carrying amount of the transferred asset and the associated liability is the amortised cost of the rights and obligations retained, if the transferred asset is measured at amortised cost, or the fair value of the rights and obligations retained, if the transferred asset is measured at fair value.
Accordingly, financial assets are only derecognised when the rights to the cash flows they generate have expired or when substantially all the inherent risks and rewards have been transferred to third parties. Similarly, financial liabilities are only derecognised when the obligations they generate have been extinguished or when they are acquired with the intention either to cancel them or to resell them.
Regarding contractual modifications of financial assets, Grupo Santander distinguishes two main categories depending on whether the new conditions result in the disposal of the asset (and recognition of a new one) or imply the continuation of the original instrument with the new modified terms:
•Contractual modifications for commercial or market reasons, which are generally carried out at the request of the debtor to apply current market conditions to the debt. The new contract is considered a new transaction and, consequently, it is necessary to derecognize the original financial asset and recognize a new financial asset subject to the classification and measurement requirements established by IFRS 9. The new financial asset will be recorded at fair value and, if applicable, the difference between the carrying amount of the asset derecognized and the fair value of the new asset will be recognized in profit or loss.
•Modifications due to refinancing or restructuring, in which the payment conditions are modified to allow a customer that is experiencing financial difficulties (current or foreseeable) to meet its payment obligations and that, if such modification had not been made, it would be reasonably certain that it would not be able to meet such payment obligations. In this case, the modification does not result in the derecognition of the financial asset, but rather the original financial asset is maintained and does not require a new assessment of its classification and measurement. When assessing credit impairment, the current credit risk (considering the modified cash flows) should be compared with the credit risk at initial recognition. The gross carrying amount of the financial asset (the present value of the renegotiated or modified contractual cash flows that are discounted at the original effective interest rate of the financial asset) should be recalculated, with a gain or loss recognized in profit or loss for the difference.
f) Offsetting of financial instruments
Financial asset and liability balances are offset, i.e. reported in the consolidated balance sheet at their net amount, only if the Group entities currently have a legally enforceable right to set off the recognised amounts and intend either to settle on a net basis, or to realise the asset and settle the liability simultaneously.
g) Impairment of financial assets
i. Definition
Grupo Santander associates an impairment in the value to financial assets measured at amortised cost, debt instruments measured at fair value with changes in other comprehensive income, lease receivables, assets from contracts and loan commitments and the financial guarantees issued that are not measured at fair value through profit or loss.
The impairment for expected credit losses is recorded with a charge to the consolidated income statement for the period in which the impairment arises. In the event of occurrence, the recoveries of previously recognised impairment losses are recorded in the consolidated income statement for the period in which the impairment no longer exists or is reduced.
In the case of purchased or originated credit-impaired assets, the Group only recognizes at the reporting date the changes in the expected credit losses during the life of the asset since the initial recognition as a credit loss. In the case of assets measured at fair value with changes in other comprehensive income, the changes in the fair value due to expected credit losses are charged in the consolidated income statement of the year where the change happened, reflecting the rest of the valuation in other comprehensive income.
As a rule, the expected credit loss is estimated as the difference between the contractual cash flows to be recovered and the expected cash flows discounted using the original effective interest rate. In the case of purchased or originated credit-impaired assets, this difference is discounted using the effective interest rate adjusted by credit rating.
Depending on the classification of financial instruments, which is mentioned in the following sections, the expected credit losses may be along 12 months or during the life of the financial instrument:
•12-month expected credit losses: arising from the potential default events, as defined in the following sections that are estimated to be likely to occur within the 12 months following the reporting date. These losses will be associated with financial assets classified as 'normal risk' as defined in the following sections.
•Expected credit losses over the life of the financial instrument: arising from the potential default events that are estimated to be likely to occur throughout the life of the financial instruments. These losses are associated with financial assets classified as 'normal risk under watchlist' or 'doubtful risk'.
With the purpose of estimating the expected life of the financial instrument all the contractual terms have been taken into account (e.g. prepayments, duration, purchase options, etc.), being the contractual period (including extension options) the maximum period considered to measure the expected credit losses. In the case of financial instruments with an uncertain maturity period and a component of undrawn commitment (e.g.: credit cards), the expected life is estimated through quantitative analyses to determine the period during which the entity is exposed to credit risk, also considering the effectiveness of management procedures that mitigate such exposure (e.g. the ability to unilaterally cancel such financial instruments, etc.).
The following constitute effective guarantees:
a) Mortgage guarantees on housing as long as they are first duly constituted and registered in favour of the entity. The properties include:
i.Buildings and building elements, distinguishing among:
–Houses.
–Offices, stores and multi-purpose premises.
–Rest of buildings such as non-multi-purpose premises and hotels.
ii.Urban and developable ordered land.
iii. Rest of properties that classify as: buildings and building elements under construction, such as property development in progress and halted development, and the rest of land types, such as rustic lands.
b) Collateral guarantees on financial instruments in the form of cash deposits, debt securities or equity instruments issued by creditworthy issuers.
c) Other types of real guarantees, including properties received in guarantee and second and subsequent mortgages on properties, as long as the entity demonstrates its effectiveness. When assessing the effectiveness of the second and subsequent mortgages on properties the entity will implement particularly restrictive criteria. It will take into account, among others, whether the previous charges are in favour of the entity itself or not and the relationship between the risk guaranteed by them and the property value.
d) Personal guarantees, as well as the incorporation of new owners, covering the entire amount of the financial instruments and implying direct and joint liability to the entity of persons or other entities whose solvency is sufficiently proven to ensure the repayment of the loan on the agreed terms.
The different aspects that the Group considers for the evaluation of effective guarantees are set out below in relation to the individual analysis.
ii. Financial instruments presentation
For the purposes of estimating the impairment amount, and in accordance with its internal policies, the Group classifies its financial instruments (financial assets, commitments and guarantees) measured at amortised cost or fair value through other comprehensive income in one of the following categories:
•Normal Risk ('stage 1'): includes all instruments that do not meet the requirements to be classified in the rest of the categories.
•Normal risk under watchlist ('stage 2'): includes all instruments that, without meeting the criteria for classification as doubtful or default risk, have experienced significant increases in credit risk since initial recognition.
In order to determine whether a financial instrument has increased its credit risk since initial recognition and is to be classified in stage 2, the Group considers the following criteria:
| | | | | |
| Quantitative criteria | Changes in the risk of a default occurring through the expected life of the financial instrument are analysed and quantified with respect to its credit level in its initial recognition.
With the purpose of determining if such changes are considered as significant, with the consequent classification into stage 2, each Group unit has defined the quantitative thresholds to consider in each of its portfolios taking into account corporate guidelines ensuring a consistent interpretation in all units.
Within the quantitative thresholds, two types are considered: A relative threshold is those that compare current credit quality with credit quality at the time of origination in percentage terms of change. In addition, an absolute threshold compares both references in total terms, calculating the difference between the two. These absolute/relative concepts are used homogeneously (with different values) in all geographies. The use of one type of threshold or another (or both) is determined in accordance with the process described in note 54, below, and is marked by the type of portfolio and characteristics such as the starting point of the average credit quality of the portfolio. |
| Qualitative criteria | In addition to the quantitative criteria indicated, various indicators are used that are aligned with those used by the Group in the normal management of credit risk. Irregular positions of more than 30 days and renewals are common criteria in all Group units. In addition, each unit can define other qualitative indicators, for each of its portfolios, according to the particularities and normal management practices in line with the policies currently in force (i.e. use of management alerts, etc.).
The use of these qualitative criteria is complemented with the use of an expert judgement, under the corresponding governance. |
In the case of forbearances, instruments classified as 'normal risk under watchlist' may be generally reclassified to 'normal risk' in the following circumstances: at least two years have elapsed from the date of reclassification to that category or from its forbearance date, the client has paid the accrued principal and interest balance, and the client has no other instruments with more than 30 days past due balances.
•Doubtful Risk ('stage 3'): includes financial instruments, overdue or not, in which, without meeting the circumstances to classify them in the category of default risk, there are reasonable doubts about their total repayment (principal and interests) by the client in the terms contractually agreed. Likewise, off-balance-sheet exposures whose payment is probable and their recovery doubtful are considered in stage 3. Within this category, two situations are differentiated:
–Doubtful risk for non-performing loans: financial instruments, irrespective of the client and guarantee, with balances more than 90 consecutive days on material arrears for principal, interest or expenses contractually agreed.
This category also includes all loan balances for a client when the operations with more than 90 consecutive days on material arrears are greater than 20% of the amounts pending collection.
These instruments may be reclassified to other categories if, as a result of the collection of part of the past due balances, the reasons for their classification in this category do not remain and the client does not have balances more than 90 consecutive days on material arrears in other loans.
–Doubtful risk for reasons other than non-performing loans: this category includes doubtful recovery financial instruments that are not more than 90 consecutive days on material arrears.
Grupo Santander considers that a financial instrument to be doubtful for reasons other than delinquency when one or more combined events have occurred with a negative impact on the estimated future cash flows of the financial instrument. To this end, the following indicators, among others, are considered:
a)Negative net equity or decrease because of losses of the client's net equity by at least 50% during the last financial year.
b)Continued losses or significant decrease in revenue or, in general, in the client's recurring cash flows.
c)Generalised delay in payments or insufficient cash flows to service debts.
d)Significantly inadequate economic or financial structure or inability to obtain additional financing by the client.
e)Existence of an internal or external credit rating showing that the client is in default.
f)Existence of overdue customer commitments with a significant amount to public institutions or employees.
These financial instruments may be reclassified to other categories if, as a result of an individualised study, reasonable doubts do not remain about the total repayment under the contractually agreed terms and the client does not have balances of 90 days on material arrears.
In the case of forbearances, instruments classified as doubtful risk may be reclassified to the category of 'normal risk under watchlist' when the following circumstances are present: a minimum period of one year has elapsed from the forbearance date, the client has paid the accrued principal and interest amounts, and the client has no other loan balances of 90 days on material arrears.
•Default Risk: includes all financial assets, or part of them, for which, after an individualised analysis, their recovery is considered remote due to a notorious and irrecoverable deterioration of their solvency.
In any event, except in the case of financial instruments with effective collateral covering a substantial portion of the transaction amount, the Group generally consider as remote the following:
- Those operations that, after an individualized analysis, are categorized as unsustainable debt, assuming an irrecoverability of such debt.
- Transactions classified as doubtful due to non-performing loans with recovery costs that exceed the amounts receivable.
- The operations on which the award is executed. The queue of these operations shall be included under default risk, as the recovery of the flows, provided that no further guarantees associated with the operation remain after the award of the property.
- Those operations on which a deduction is made, the portion of the operation corresponding to that deduction, will be given as a balance at the time of signature.
A financial asset amount is maintained in the balance sheet until they are considered as a 'default risk', either all or a part of it, and the write-off is registered against the balance sheet.
In the case of operations that have only been partially derecognised, for forgiveness reasons or because part of the total balance is considered unrecoverable, the remaining amount shall be fully classified in the category of 'doubtful risk', except where duly justified.
The classification of a financial asset, or part of it, as a 'default risk' does not involve the disruption of negotiations and legal proceedings to recover the amount.
iii. Impairment valuation assessment
Grupo Santander has policies, methods and procedures in place to hedge its credit risk, both due to the insolvency attributable to counterparties and its residence in a specific country.
These policies, methods and procedures are applied in the concession, study and documentation of financial assets, commitments and guarantees, as well as in the identification of their impairment and in the calculation of the amounts needed to cover their credit risk.
The impairment represents the best estimation of the financial assets expected credit losses at the balance sheet date, assessed both individually and collectively.
•Individually: for the purposes of estimating the provisions for credit risk arising from the insolvency of a financial instrument, the Group individually assesses impairment by estimating the expected credit losses on those financial instruments that are considered to be significant and with sufficient information to make such an estimate.
Therefore, this classification mostly includes wholesale banking customers —Corporations, specialised financing— as well as some of the largest companies —Chartered and real estate developers— from retail banking. The determination of the perimeter in which the individualised estimate is applied is detailed in a later section.
The individually assessed impairment estimate is equal to the difference between the gross carrying amount of the financial instrument and the estimated value of the expected cash flows receivable discounted using the original effective interest rate of the transaction. The estimate of these cash flows takes into account all available information on the financial asset and the effective guarantees associated with that asset. This estimation process is detailed below.
•Collectively: the Group also assesses impairment by estimating the expected credit losses collectively in cases where they are not assessed on an individual basis. This includes, for example, loans with individuals, sole proprietors or businesses in retail banking subject to a standardised risk management.
For the purposes of the collective assessment of expected credit losses, the Group has consistent and reliable internal models. For the development of these models, instruments with similar credit risk characteristics that are indicative of the debtors' capacity to pay are considered.
The credit risk characteristics used to group the instruments are, among others: type of instrument, debtor's sector of activity, geographical area of activity, type of guarantee, aging of past due balances and any other factor relevant to estimating the future cash flows.
Grupo Santander performs retrospective and monitoring tests to evaluate the reasonableness of the collective estimate.
On the other hand, the methodology required to estimate the expected credit loss due to credit events is based on an unbiased and weighted consideration by the probability of occurrence of a series of scenarios, considering a range of three to five possible future scenarios, depending on the characteristics of each unit, which could have an impact on the collection of contractual cash flows, always taking into account the time value of money, as well as all available, reasonable and sustainable information on past events, current conditions and forecasts of the evolution of macroeconomic scenarios that are shown to be relevant for the estimation of this amount (for example: GDP (Gross Domestic Product), housing price, unemployment rate, etc.).
The estimation of expected losses requires expert judgment and the support of historical, current and future information. The probability of loss is measured considering past events, the present situation and future trends of macroeconomic scenarios.
Grupo Santander uses forward-looking information in both internal risk management and prudential regulation processes, so that for the calculation of the impairment loss allowance, various scenarios are incorporated that take advantage of the experience with such information, thus ensuring consistency in obtaining the expected loss.
The complexity of the estimation in this exercise has been derived from the current macroeconomic scenario as a consequence of the complex geopolitical situation, as well changes in inflations levels and interest rates, which has generated uncertainty in economic evolution.
Grupo Santander has internally ensured the criteria to be followed for guarantees received from government bodies, both through credit lines and other public guarantees, so that when they are adequately reflected in each of the contracts, they are recognised as mitigating factors of the potential expected losses, and therefore of the provisions to be recognised, based on the provisions of the applicable standard (IFRS 9 Par. B5.5.55). Furthermore, where applicable, these guarantees are appropriately reflected in the mitigation of the significant increase in risk, considering their nature as personal guarantees.
For the estimation of the parameters used in the estimation of impairment provisions -EAD (exposure at default), PD (probability of default), LGD (loss given default)-, the Group based its experience in developing internal models for the estimation of parameters both in the regulatory area and for management purposes, adapting the development of the impairment provision models under IFRS 9.
•Exposure at default: is the amount of estimated risk incurred at the time of the counterparty's analysis.
•Probability of default: is the estimated probability that the counterparty will default on its principal and/or interest payment obligations.
•Loss given default: is the estimate of the severity of the loss incurred in the event of non-compliance. It depends mainly on the updating of the guarantees associated with the operation and the future cash flows that are expected to be recovered.
In any case, when estimating the flows expected to be recovered, portfolio sales are included. It should be noted that due to the Group's recovery policy and the experience observed in relation to the prices of past sales of assets classified as stage 3 and/or default risk, there is no substantial divergence between the flows obtained from recoveries after performing recovery management of the assets with those obtained from the sale of portfolios of assets discounting structural expenses and other costs incurred.
The definition of default implemented by the Group for the purpose of calculating the impairment provision models is based on the definition in Article 178 of Regulation 575/2013 of the European Union (CRR), which is fully aligned with the requirements of IFRS 9, which considers that a 'default' exists in relation to a specific customer/contract when at least one of the following circumstances exists: the entity considers that there are reasonable doubts about the payment of all its credit obligations or that the customer/contract is in an irregular situation for more than 90 consecutive days past due material balances with respect to any significant credit obligation.
Grupo Santander aligned partially and voluntarily during 2022 the accounting definition of Stage 3, as well as the calculation of impairment provision models, to the New Definition of Default, incorporating the criteria defined by the EBA in its implementation guide of the definition of default, capturing the economic deterioration of the operations (days in default - on a daily basis - and materiality thresholds - minimum amount in arrears). The alignment of criteria was done taking into account the criteria of IFRS 9 as well as the accounting principles of unbiased presentation of financial information. Grupo Santander registered an increase in the default rate at around 19 basis points, with no material impact on the provision figures for credit risk.
In addition, the Group considers the risk generated in all cross-border transactions due to circumstances other than the usual commercial risk of insolvency (sovereign risk, transfer risk or risks arising from international financial activity, such as wars, natural catastrophes, balance of payments crisis, etc.).
IFRS 9 includes a series of practical solutions that can be implemented by entities, with the aim of facilitating its implementation. In order to achieve a complete and high-level implementation of the standard, and following the best practices of the industry, the Group applies these practical solutions adapting them to their own characteristics and circumstances:
–Rebuttable presumption that the credit risk has increased significantly, when payments are more than 30 days past due: this threshold is used as an additional, but not primary, indicator of significant risk increase.
–Assets with low credit risk at the reporting date: the Group adopts this practice prioritizing its reduced and punctual use and its systematic and periodic justification through quantitative evidence.
This information is provided in more detail in note 54.b.
iv. Detail of individual estimate of impairment
For the individual estimate of the assessment for impairment of the financial asset, the Group has a specific methodology to estimate the value of the cash flows expected to be collected:
•Recovery through the debtor's ordinary activities (going approach).
•Recovery through the execution and sale of the collateral guaranteeing the operations (gone approach).
Gone approach:
a. Evaluation of the effectiveness of guarantees
Grupo Santander assesses the effectiveness of all the guarantees associated considering the following:
•The time required to execute these guarantees.
•Grupo Santander's ability to enforce or assert these guarantees in its favour.
•The existence of limitations imposed by each local unit´s regulation on the foreclosure of collateral.
Under no circumstances the Group considers that a guarantee is effective if its effectiveness depends substantially on the solvency of the debtor, as could be the case:
•Promises of shares or other securities of the debtor himself when their valuation may be significantly affected by a debtor's default.
•Personal cross-collateralisation: when the guarantor of a transaction is, at the same time, guaranteed by the holder of that transaction.
The different types of effective guarantees have been detailed in section i. Definition
b. Valuation of guarantees
Grupo Santander assesses the guarantees on the basis of their nature in accordance with the following:
•Mortgage guarantees on properties associated with financial instruments, using complete individual valuations carried out by independent valuation experts and under generally accepted valuation standards. If this is not possible, alternative valuations are used with duly documented and approved internal valuation models.
•Personal guarantees are valued individually on the basis of the guarantor´s updated information.
•The rest of the guarantees are valued based on current market values.
c. Adjustments to the value of guarantees and estimation of future cash flow inflows and outflows
Grupo Santander applies a series of adjustments to the value of the guarantees in order to improve the reference values:
•Adjustments based on the historical sales experience of local units for certain types of assets.
•Individual expert adjustments based on additional management information.
Likewise, to adjust the value of the guarantees, the time value of money is taken into account based on the historical experience of each of the units, estimating:
•Period of adjudication.
•Estimated time of sale of the asset.
In addition, the Group takes into account all those cash inflows and outflows linked to that guarantee until it is sold:
•Possible future income commitments in favour of the borrower which will available after the asset is awarded.
•Estimated foreclosure costs.
•Asset maintenance costs, taxes and community costs.
•Estimated marketing or sales costs.
Finally, since it is considered that the guarantee will be sold in the future, the Group applies an additional adjustment ('index forward') in order to adjust the value of the guarantees to future valuation expectations.
v. Impairment individual assessment scope
Grupo Santander determines the perimeter over which it makes an estimate of the assessment for impairment on an individual basis based on a relevance threshold set by each of the geographical areas and the stage in which the operations are located. In general, the Group applies the individualised calculation of expected losses to the significant exposures classified in stage 3, although Banco Santander, S.A. has also extended its analyses to some of the exposures classified in stage 2.
It should be noted that, in any case and irrespective of the stage in which their transactions are carried out, for customers who do not receive standardised treatment, a relational risk management model is applied, with individualised treatment and monitoring by the assigned risk analyst. In addition to wholesale customers (Santander Corporate & Investment Banking or SCIB) and large companies, this relational management model also includes other segments of smaller companies for which there is information and capacity for more personalised and expert analysis and monitoring. As indicated in the Group's wholesale credit model, the individual treatment of the client facilitates the continuous updating of information. The risk assumed must be followed and monitored throughout its life cycle, enabling anticipation and action to be taken in the event of possible impairments. In this way, the customer's credit quality is analysed individually, taking into account specific aspects such as his competitive position, financial performance, management, etc. In the wholesale risk management model, every customer with a credit risk position is assigned a rating, which has an associated probability of customer default.
Thus, individual analysis of the debtor triggers a specific rating for each customer, which determines the appropriate parameters for calculating the expected loss, so that it is the rating itself that initially modulates the necessary coverage, adjusting the severity of the possible loss to the guarantees and other mitigating factors that the customer may have available. In addition, if as a result of this individualised monitoring of the customer, the analyst finally considers that his coverage is not sufficient, he has the necessary mechanisms to adjust it under his expert judgement, always under the appropriate governance.
h) 'Non-current assets' and 'liabilities associated with non-current assets held for sale'
Non-current assets held for sale' includes the carrying amount of individual items, disposal groups or items forming part of a business unit earmarked for disposal (discontinued operations), whose sale in their present condition is highly likely to be completed within one year from the reporting date. Therefore, the recovery of the carrying amount of these items -which can be of a financial nature or otherwise- will foreseeably be effected through the proceeds from their disposal.
Specifically, property or other non-current assets received by the consolidated entities as total or partial settlement of their debtors’ payment obligations to them are deemed to be 'Non-current assets held for sale', unless the consolidated entities have decided to make continuing use of these assets.
'Liabilities associated with non-current assets held for sale' includes the balances payable arising from the assets held for sale or disposal groups and from discontinued operations.
'Non-current assets and disposal groups of items that have been classified as held for sale' are generally recognised at the date of their allocation to this category and are subsequently valued at the lower of their fair value less costs to sell or its book value. 'Non-current assets and disposal groups of items that are classified as held for sale' are not amortised as long as they remain in this category.
The valuation of the portfolio of non-current assets held for sale has been made in compliance with the requirements of International Financial Reporting Standards in relation to the estimate of the fair value of tangible assets and the value-in-use of financial assets.
The value of the portfolio is determined as the sum of the values of the individual elements that compose the portfolio, without considering any total or batch grouping in order to correct the individual values.
For the purposes of its consideration in initial recognition, the Group obtains, at the time of award, the fair value of the corresponding asset by requesting an appraisal from external valuation agencies.
Grupo Santander has in place a corporate policy that ensures the professional competence and the independence and objectivity of the external appraisal agencies, in accordance with the regulations, which require appraisal agencies to meet independence, neutrality and credibility requirements, so that the use of their estimates does not reduce the reliability of its valuations.
This policy establishes that all the appraisal companies and agencies with which the Group works in Spain should be registered in the Official Register of the Bank of Spain and that the appraisals performed by them should follow the methodology established in Order ECO/805/2003, of 27 March. The main appraisal companies and agencies with which the Group worked in Spain in 2025 are as follows: Tinsa Tasaciones Inmobiliarias, S.A.U., Sociedad de Tasación, S.A., Global Valuation, S.A.U., Instituto de Valoraciones, S.A., Euroevaluaciones, S.A. and Valoraciones Mediterráneo, S.A.
Also, this policy establishes that the various subsidiaries abroad work with appraisal companies that have recent experience in the area and the type of asset under appraisal and meet the independence requirements established in the corporate policy. They should verify, inter alia, that the appraisal company is not a party related to the Group and that its billings to the Group in the last twelve months do not exceed 15% of the appraisal company’s total billings.
At 31 December 2025 the fair value less costs to sell of non-current assets held for sale exceeded their carrying amount by EUR 551 million (EUR 553 million at 31 December 2024); however, in accordance with the accounting standards, this unrealised gain could not be recognised.
Banco Santander, in compliance with Bank of Spain Circular 4/2017, and subsequent amendments, on public and private financial reporting standards and financial statement models, has developed a methodology that enables it to estimate the fair value and costs of sale of assets foreclosed or received in payment of debts. This methodology is based on the classification of the portfolio of foreclosed assets into different segments. Segmentation enables the intrinsic characteristics of Banco Santander's portfolio of foreclosed assets to be differentiated, so that assets with homogeneous characteristics are grouped by segment.
Thus, the portfolio is segmented into (i) finished assets of a residential and tertiary nature, (ii) developments in progress and (iii) land.1
In determining the critical segments in the overall portfolio, assets are classified on the basis of the nature of the asset and its stage of development. This segmentation is made in order to seek the liquidation of the asset (which should be carried out in the shortest possible time).
When making decisions, the situation and/or characteristics of the asset are fundamentally taken into account, as well as the evaluation of all the determining factors that favour the recovery of the debt. For them, the following aspects are analyzed, among others:
•The time that has elapsed since the adjudication.
•The transferability and contingencies of the foreclosed asset.
•The economic viability from the real estate point of view with the necessary investment estimate.
•The expenses that may arise from the marketing process.
•The offers received, as well as the difficulties in finding buyers.
In the case of real estate assets foreclosed in Spain, which represent 76% of the Group’s total non-current assets held for sale, the valuation of the portfolio is carried out by applying the following models:
•Market Value Model used in the valuation of finished properties of a residential nature (mainly homes and car parks) and properties of a tertiary nature (offices, commercial premises and multipurpose buildings). For the valuation of finished assets whose availability for sale is immediate, a market sale value provided by a third party external to Banco Santander is considered, calculated under the AVM methodology by the comparable properties method adjusted by our experience in selling similar assets, given the term, price, volume, trend in the value of these assets and the time elapsing until their sale and discounting the estimated costs of sale.
The market value is determined on the basis of the definition established by the International Valuation Standards drawn up by the IVSC (International Valuation Standards Council), understood as the estimated amount for which an asset or a liability should be exchanged on the measurement date between a willing buyer and a willing seller, in an arm's length transaction, after appropriate marketing, and in which the parties have acted with sufficient information, prudently and without coercion.
The current market value of the properties is estimated on the basis of automated valuations obtained by taking comparable properties as a reference; simulating the procedure carried out by an appraiser in a physical valuation according to Order ECO 805/2003: selection of properties and obtaining the unit value by applying homogenisation adjustments. The selection of the properties is carried out by location within the same real estate cluster and according to the characteristics of the properties, filtering by type2, surface area range and age. The model enables a distinction to be made within the municipality under study as to which areas are similar and comparable and therefore have a similar value in the property market, discriminating between which properties are good comparators and which are not.
Adjustments to homogenize the properties are made according to: (i) the age of the property according to the age of the property to be valued, (ii) the deviation of the built area from the common area with respect to the property to be valued and (iii) by age of the date of capture of the property according to the price evolution index of the real estate market.
In addition, for individually significant assets, complete individual valuations are carried out, including a visit to the asset, market analysis (data relating to supply, demand, current sale or rental price ranges and supply-demand and revaluation expectations) and an estimate of expected income and costs.
1. The assets in a situation of 'stopped development' are included under 'land
2. Assets qualified as protected housing are taken into account. The maximum legal value of these assets is determined by the VPO module, obtained from the result of multiplying the State Basic Module (MBE) by a zone coefficient determined by each autonomous community. To carry out the valuation of a protected property, the useful surface area is used in accordance with current regulations.
For this segmentation of assets, when they are completed, the real costs are known and the actual expenses for the marketing and sale of the asset must be taken into account. Therefore, Banco Santander uses the actual costs in its calculation engine or, failing that, those estimated on the basis of its observed experience.
•Market Value Model according to Evolution of Market Values used to update the valuation of developments in progress. The valuation model estimates the current market value of the properties based on complete individual valuations by third parties, calculated from the values of the feasibility studies and development costs of the promotion, as well as the selling costs, distinguishing by location, size and type of property. The inputs used in the valuation model for residential assets under construction are actual revenues and costs.
For this purpose, in order to calculate the investment flows, Banco Santander considers, on the basis of the feasibility studies, the expenditure required for construction, the professional fees relating to the project and to project management, the premiums for mandatory building insurance, the developer's administrative expenses, licenses, taxes on new construction and fees, and urban development charges.
With respect to the calculation of income flows, Banco Santander takes into account the square metres built, the number of homes under construction and the estimated selling price over 1.5 years.
The market value will be the result of the difference between the income flows and the investment flows estimated at each moment.
•Land Valuation model. The methodology followed by the Group regarding land valuation consists of updating the individual reference valuation of each of the land on an annual basis, through updated valuation valuations carried out by independent professionals and following the methodology established in the Order ECO/805/2003, of 27 March, whose main verifications in the case of land valuation, regardless of the degree of urbanisation of the land, correspond to:
–Visual verification of the assessed property.
–Registry description.
–Urban planning.
–Visible easements.
–Visible state of occupation, possession, use and exploitation.
–Protection regime.
–Apparent state of preservation.
–Correspondence with cadastral property.
–Existence of expropriation procedure, expropriation plan or project, administrative resolution or file that may lead to expropriation.
–Expiry of the urbanization or building deadlines.
–Existence of a procedure for failure to comply with obligations.
–Verification of surfaces.
For the purposes of valuation, the land will be classified in the following levels:
–Level I: It will include all the lands that do not belong to level II.
–Level II: It shall include land classified as undeveloped where building is not allowed for uses other than agriculture, forestry, livestock or linked to an economic exploitation permitted by the regulations in force. Also included are lands classified as developable that are not included in a development area of urban planning or that, in such an area, the conditions for its development have not been defined.
In those cases where the Group does not have an updated reference value through an ECO valuation for the current year, we use as a reference value the latest available ECO valuation reduced or corrected by the average annual coverage ratio of the land on which we have obtained an updated reference value, through an ECO valuation.
Grupo Santander applies a discount to the aforementioned reference values that takes into account both the discount on the reference value in the sales process and the estimated costs of marketing or selling the land; discount on reference value = % discount on sales + % marketing costs being:
–% discount on Sales: = 100 - (sales price / updated appraisal value).
–marketing costs: calculated on the basis of our historical experience in sales and in accordance with the marketing management fees negotiated with our suppliers of this type of service.
In this way the Group obtains the corrected market value, an amount that we compare with the net cost of each piece of land to determine its correct valuation and conclude with our valuation process.
In addition, in relation to the previously mentioned valuations, less costs to sell, are contrasted with the sales experience of each type of asset in order to confirm that there is no significant difference between the sale price and the valuation.
Impairment losses on an asset or disposal group arising from a reduction in its carrying amount to its fair value (less costs to sell) are recognised under 'Gains or (losses) on non-current assets held for sale not classified as discontinued operations' in the consolidated income statement.
The gains on a non-current asset held for sale resulting from subsequent increases in fair value (less costs to sell) increase its carrying amount and are recognised in the consolidated income statement up to an amount equal to the impairment losses previously recognised.
i) Assets under reinsurance contracts and Liabilities under insurance contracts
The Group has prepared the accounting policy that establishes the criteria for recording insurance contracts, in accordance with IFRS 17. This standard defines insurance contracts as contracts under which one party accepts a significant insurance risk from another party by agreeing to compensate the policyholder if a specific uncertain future event negatively affects the policyholder.
IFRS 17 requires a level of aggregation of contracts that the Group identifies in portfolios of contracts with similar risks and that are managed jointly. The Group then divides each portfolio into a minimum of three groups: (i) contracts that are onerous on initial recognition; (ii) contracts that, upon initial recognition, have no significant possibility of subsequently becoming onerous; and (iii) any remaining contract.
For contracts that are considered not to be onerous, a profit margin is recognized in the profit and loss account (referred to as 'Contractual Service Margin' or 'CSM') throughout the period in which the entity performs the service. However, if at the time of initial recognition, or during the period in which the entity performs the service, the contract is onerous, the entity recognizes the loss in the income statement.
Contract limits define the term up to which compliance cash flows must be considered in order to measure an insurance contract. Fulfilment cash flows comprise an unbiased, probability-weighted estimate of future cash flows, a discount adjustment to the present value to reflect the time value of money for monetary and financial risks, and a risk adjustment for non-fulfilment risks. financial. The identification of the contractual limit under IFRS 17 is essential not only for measuring the fulfilment cash flows of a group of contracts, but also for determining the applicable measurement model, in case the contractual limits are identified in a year or more.
Cash flows are within the contractual limit of an insurance contract if they arise from substantial rights and obligations that exist during the reporting period, in which the entity can obligate the insurance policyholder to pay premiums or in which the entity has a substantive obligation to provide services to the insured.
The Group has carried out an analysis of the limits of insurance and reinsurance contracts under IFRS 17, separately, generally applying the General Model (Building Block Approach) to all contracts, except those eligible to be valued by the Simplified Model (Premium Allocation Approach), or the Variable Commission Approach ('VCA' or Variable Fee Approach).
The general model measures a group of contracts as the sum of the fulfilment cash flows and the Contractual Service Margin. The CSM represents benefits not yet recorded that the entity will recognize as providing services under the insurance contract.
Insurance contracts with direct participation apply the VCA as a modified version of the General Model. This should reduce the volatility of results due to the asymmetry between the accounting treatment of the profit and losses of the underlying items attributable to the policyholders and the accounting treatment of the liability owed to those policyholders.
Another aspect considered in measuring the present value of the future cash flows of a group of insurance contracts is the discount
rate applied to reflect the time value of money and the financial risks related to those cash flows. The Group has established a generally chosen methodology and guarantees that the calculation components have a homogeneous basis, previously approved by the Group, establishing the base curves provided by the Group and allowing adjustments to these curves based on the expert criteria of each local address.
Likewise, measuring compliance cash flows requires a risk adjustment for non-financial risk. Risk adjustment for non-financial risk is the compensation necessary to withstand uncertainty about the amount and timing of cash flows arising from non-financial risks. If a change in the assumptions occurs, it could affect the income statement or the Other comprehensive income, depending on its nature. The risks covered by the risk adjustment for non-financial risk are insurance risk and other non-financial risks, such as interruption risk and expense risk.
j) Tangible assets
Tangible assets includes the amount of buildings, land, furniture, vehicles, computer hardware and other fixtures owned by the consolidated entities or acquired under finance leases. Tangible assets are classified by use as follows:
i. Property, plant and equipment for own use
Property, plant and equipment for own use – including tangible assets received by the consolidated entities in full or partial satisfaction of financial assets representing receivables from third parties which are intended to be held for continuing use and tangible assets acquired under finance leases– are presented at acquisition cost, less the related accumulated depreciation and any estimated impairment losses (carrying amount higher than recoverable amount).
Depreciation is calculated, using the straight-line method, on the basis of the acquisition cost of the assets less their residual value. The land on which the buildings and other structures stand has an indefinite life and, therefore, is not depreciated.
The annual tangible asset depreciation charge is recognised in the consolidated income statement and are essentially equivalent to the following amortization percentages (determined based on the years of estimated useful life, on average, of the different elements):
| | | | | |
| Average
annual rate |
| Buildings for own use | 2.4 | % |
| Furniture | 9.5 | % |
| Fixtures | 9.5 | % |
| Office and IT equipment | 23.6 | % |
| Lease use rights | Less than the lease
term or the useful life
of the underlying asset |
At the end of each reporting period, consolidated entities assess whether there is any indication that the carrying amount of an asset exceeds its recoverable amount, in which case they write down the carrying amount of the asset to its recoverable amount and adjust future depreciation charges in proportion to its adjusted carrying amount and to its new remaining useful life, if the useful life needs to be re-estimated.
Similarly, if there is an indication of a recovery in the value of a tangible asset, the consolidated entities recognise the reversal of the impairment loss recognised in prior periods and adjust the future depreciation charges accordingly. In no circumstances may the reversal of an impairment loss on an asset raise its carrying amount above that which it would have if no impairment losses had been recognised in prior years.
The estimated useful lives of the items of property, plant and equipment for own use are reviewed at least at the end of the reporting period with a view to detecting significant changes therein. If changes are detected, the useful lives of the assets are adjusted by correcting the depreciation charge to be recognised in the consolidated income statement in future years on the basis of the new useful lives.
Upkeep and maintenance expenses relating to property, plant and equipment for own use are recognised as an expense in the period in which they are incurred, since they do not increase the useful lives of the assets.
ii. Investment property
'Investment property' reflects the net values of the land, buildings and other structures held either to earn rentals or for obtaining profits by sales due to future increase in market prices.
The criteria used to recognise the acquisition cost of investment property, to calculate its depreciation and its estimated useful life and to recognise any impairment losses thereon are consistent with those described in relation to property, plant and equipment for own use.
In the case of investment properties that support obligations to pay a return directly linked to fair value, or to the returns of certain assets including the investment property itself, such properties are measured using the fair value model.
In order to evaluate the possible impairment Grupo Santander determines periodically the fair value of its investment property so that, at the end of the reporting period, the fair value reflects the market conditions of the investment property at that date. This fair value is determined annually, taking as benchmarks the valuations performed by independent experts. The methodology used to determine the fair value of investment property is selected based on the status of the asset in question; thus, for properties earmarked for lease, the valuations are performed using the sales comparison approach, whereas for leased properties the valuations are made primarily using the income capitalisation approach and, exceptionally, the sales comparison approach.
In the sales comparison approach, the property market segment for comparable properties is analysed, inter alia, and, based on specific information on actual transactions and firm offers, current prices are obtained for cash sales of those properties. The valuations performed using this approach are considered as Level 2 valuations.
In the income capitalisation approach, the cash flows estimated to be obtained over the useful life of the property are discounted taking into account factors that may influence the amount and actual obtainment thereof, such as: (i) the payments that are normally received on comparable properties; (ii) current and probable future occupancy; (iii) the current or foreseeable default rate on payments. The valuations performed using this approach
are considered as Level 3 valuations, since significant unobservable inputs are used, such as current and probable future occupancy and/or the current or foreseeable default rate on payments.
iii. Assets leased out under an operating lease
'Property, plant and equipment' - Leased out under an operating lease reflects the amount of the tangible assets, other than land and buildings, leased out by the Group under an operating lease.
The criteria used to recognise the acquisition cost of assets leased out under operating leases, to calculate their depreciation and their respective estimated useful lives and to recognise the impairment losses thereon are consistent with those described in relation to property, plant and equipment for own use.
k) Accounting for leases
The main aspects contained in the regulation (IFRS 16) adopted by the Group are included below:
When the Group acts as lessee, it recognises a right-of-use asset representing its right to use the underlying leased asset with a corresponding lease liability on the date on which the leased asset is available for use by the Group.
Each lease payment is allocated between liability and finance charge. The finance charge is allocated to the income statement during the term of the lease in such a way as to produce a constant periodic interest rate on the remaining balance of the liability for each year.
The right-of-use asset is depreciated over the useful life of the asset or the lease term, whichever is shorter, on a straight-line basis. If the Group is reasonably certain to exercise a purchase option, the right-of-use asset is amortized over the useful life of the underlying asset.
Assets and liabilities arising from a lease are initially measured at present value. Lease liabilities include the net present value of the following lease payments:
–Fixed payments (including inflation-linked payments), less any lease incentive receivable.
–Variable lease payments that depend on an index or rate.
–The amounts expected to be paid by the lessee under residual value guarantees.
–The exercise price of a purchase option if the lessee is reasonably certain that it will exercise that option.
–Lease termination penalty payments, if the term of the lease reflects the lessee's exercise of that option.
Lease payments are discounted using the interest rate implicit in the lease. When this interest rate cannot be obtained, the interest rate used in these cases, is the lessee's incremental borrowing rate at the related date. For this purpose, the entity has calculated this incremental borrowing rate taking as reference the listed debt instruments issued by the Group; in this regard, the Group has estimated different interest rate curves depending on the currency and economic environment in which the contracts are located.
In order to construct the incremental borrowing rate, a methodology has been developed at the corporate level. This
methodology is based on the need for each entity to consider its economic and financial situation, for which the following factors must be considered:
–Economic and political situation (country risk).
–Credit risk of the company.
–Monetary policy.
–Volume and seniority of the company’s debt instrument issues.
The incremental borrowing rate is defined as the interest rate that a lessee would have to pay for borrowing, given a similar period to the duration of the lease and with similar security, the funds necessary to obtain an asset of similar value to the right-of-use asset in a similar economic environment. The Group entities have a wide stock and variety of financing instruments issued in different currencies to that of the euro (pound, dollar, etc.) that provide sufficient information to be able to determine an 'all in rate' (reference rate plus adjustment for credit spread at different terms and in different currencies). In circumstances, where the leasing company has its own financing, this has been used as the starting point for determining the incremental borrowing rate. On the other hand, for those Grupo Santander entities that do not have their own financing, the information from the financing of the consolidated subgroup to which they belong was used as the starting point for estimating the entity's curve, analysing other factors to assess whether it is necessary to make any type of negative or positive adjustment to the initially estimated credit spread.
Right-of-use assets are valued at cost which includes the following:
–The amount of the initial measurement of the lease liability.
–Any lease payment made at or before the commencement date less any lease incentive received.
–Any initial direct costs.
–Restoration costs.
The Group recognises the payments associated with short-term leases and leases of low-value assets on a straight-line basis as an expense in the income statement. Short-term leases are leases with a lease term less than or equal to 12 months (a lease that contains a purchase option is not a short term lease).
l) Intangible assets
Intangible assets are identifiable non-monetary assets (separable from other assets) without physical substance which arise as a result of a legal transaction or which are developed internally by the consolidated entities.
Only assets whose cost can be measured reliably and it is likely that the consolidated entities obtain future economic benefits are recognised.
Intangible assets are recognised initially at acquisition or production cost and are subsequently measured at cost less any accumulated amortisation and any accumulated impairment losses.
i. Goodwill
Any excess of the cost of the investments in the consolidated entities and entities accounted for using the equity method over the corresponding underlying carrying amounts acquired, adjusted at the date of first-time consolidation, is allocated as follows:
a.If it is attributable to specific assets and liabilities of the companies acquired, by increasing the value of the assets (or reducing the value of the liabilities) whose fair values were higher (lower) than the carrying amounts at which they had been recognised in the acquired entities’ balance sheets.
b.If it is attributable to specific intangible assets, by recognising it explicitly in the consolidated balance sheet provided that the fair value of these assets within twelve months following the date of acquisition can be measured reliably.
c.The remaining amount is recognised as goodwill, which is allocated to one or more cash-generating units (CGU) (a cash-generating unit is the smallest identifiable group of assets that, as a result of continuing operation, generates cash inflows that are largely independent of the cash inflows from other assets or groups of assets). The cash-generating units represent the Group’s geographical and/or business segments.
Goodwill (only recognised when it has been acquired by consideration) represents, therefore, a payment made by the acquirer in anticipation of future economic benefits from assets of the acquired entity that are not capable of being individually identified and separately recognised.
At the end of each annual reporting period or whenever there is any indication of impairment goodwill is reviewed for impairment (i.e. a reduction in its recoverable amount to below its carrying amount) and, if there is any impairment, the goodwill is written down with a charge to 'Impairment or reversal of impairment on non-financial assets, net - Intangible assets' in the consolidated income statement.
An impairment loss recognised for goodwill is not reversed in a subsequent period.
In the event of sale or departure of an activity that is part of a CGU, the part of the goodwill that can be assigned to said activity would be written-off, taking as a reference the relative value of the same over the total of the CGU at the time of sale or abandonment. If applicable, the distribution by currency of the remaining goodwill will be performed based on the relative values of the remaining activities.
ii. Other intangible assets
Other intangible assets includes the amount of identifiable intangible assets, such as purchased customer lists and computer software.
Other intangible assets can have an indefinite useful life -when, based on an analysis of all the relevant factors, it is concluded that there is no foreseeable limit to the period over which the asset is expected to generate net cash inflows for the consolidated entities- or a finite useful life, in all other cases.
Intangible assets with indefinite useful lives are not amortised, but rather at the end of each reporting period or whenever there is any indication of impairment the consolidated entities review the remaining useful lives of the assets in order to determine whether they continue to be indefinite and, if this is not the case, to take the appropriate steps.
Intangible assets with finite useful lives are amortised over those useful lives using methods similar to those used to depreciate tangible assets.
The intangible asset amortisation charge is recognised under 'Depreciation and amortisation' in the consolidated income statement.
In both cases the consolidated entities recognise any impairment loss on the carrying amount of these assets with a charge to 'Impairment or reversal of impairment on non-financial assets, net - Intangible assets in the consolidated' income statement.
The criteria used to recognise the impairment losses on these assets and, where applicable, the reversal of impairment losses recognised in prior years are similar to those used for tangible assets (see note 2.k).
Internally developed computer software
Internally developed computer software is recognised as an intangible asset if, among other requisites (basically the Group’s ability to use or sell it), it can be identified and its ability to generate future economic benefits can be demonstrated.
Expenditure on research activities is recognised as an expense in the year in which it is incurred and cannot be subsequently capitalised into the carrying amount of the intangible asset.
m) Other assets
Other assets' in the consolidated balance sheet includes the amount of assets not recorded in other items, the breakdown being as follows:
•Inventories: this item includes the amount of assets, other than financial instruments, that are held for sale in the ordinary course of business, that are in the process of production, construction or development for such purpose, or that are to be consumed in the production process or in the provision of services. Inventories include land and other property held for sale in the property development business.
Inventories are measured at the lower of cost and net realisable value, which is the estimated selling price of the inventories in the ordinary course of business, less the estimated costs of completion and the estimated costs required to make the sale.
Any write-downs of inventories -such as those due to damage, obsolescence or reduction of selling price- to net realisable value and other impairment losses are recognised as expenses for the year in which the impairment or loss occurs. Subsequent reversals are recognised in the consolidated income statement for the year in which they occur.
The carrying amount of inventories is derecognised and recognised as an expense in the period in which the revenue from their sale is recognised.
▪Other: this item includes the balance of all prepayments and accrued income (excluding accrued interest, fees and commissions), the net amount of the difference between pension plan obligations and the value of the plan assets with a balance in the entity’s favour, when this net amount is to be reported in the consolidated balance sheet, and the amount of any other assets not included in other items.
n) Other liabilities
'Other liabilities' includes the balance of all accrued expenses and deferred income, excluding those related to interests and fees on financial instruments, as well as the amount of any other liabilities not included in other categories.
o) Provisions and contingent liabilities (assets)
When preparing the financial statements of the consolidated entities, Banco Santander makes a distinction between:
•Provisions: credit balances covering present obligations at the reporting date arising from past events which could give rise to a loss for the consolidated entities, which is considered to be likely to occur and certain as to its nature but uncertain as to its amount and/or timing.
•Contingent liabilities: possible obligations that arise from past events and whose existence will be confirmed only by the occurrence or non-occurrence of one or more future events not wholly within the control of the consolidated entities. They include the present obligations of the consolidated entities when it is not probable that an outflow of resources embodying economic benefits will be required to settle them. The Group does not recognise the contingent liability. The Group will disclose a contingent liability, unless the possibility of an outflow of resources embodying economic benefits is remote.
Irrevocable contingent payments (ICPs), corresponding to payment facilities allowed under the annual contributions of certain levies, are recorded in accordance with the definitions mentioned above. In this regard, on 14 November 2025, the Group learned that the CJEU had definitively resolved the dispute concerning the CPI contributions made by a financial institution to the Single Resolution Fund, upholding the judgment of the General Court of 25 October 2023, which ruled against said financial institution regarding its request for the return of guarantees linked to irrevocable payment commitments for a Group entity whose license had been withdrawn. In light of this ruling, it was concluded that it was not necessary to modify the accounting entries that the Santander Group has made when using these facilities to make contributions corresponding to this levy or to other similar levies that also allow for such contributions.
•Contingent assets: possible assets that arise from past events and whose existence is conditional on, and will be confirmed only by, the occurrence or non-occurrence of one or more uncertain future events not wholly within the control of the Group. Contingent assets are not recognised in the consolidated balance sheet or in the consolidated income statement, but rather are disclosed in the notes, provided that it is probable that these assets will give rise to an increase in resources embodying economic benefits.
Grupo Santander’s consolidated financial statements include all the material provisions with respect to which it is considered that it is more likely than not the obligation will have to be settled. In accordance with accounting standards, contingent liabilities must not be recognised in the consolidated financial statements, but must rather be disclosed in the Notes.
Provisions (which are quantified on the basis of the best information available on the consequences of the event giving rise to them and are reviewed and adjusted at the end of each year) are used to cater for the specific obligations for which they were originally recognised. Provisions are fully or partially reversed when such obligations cease to exist or are reduced.
Provisions are classified according to the obligations covered as follows (see note 25):
▪Provision for pensions and similar obligations: includes the amount of all the provisions made to cover post-employment benefits, including obligations to pre-retirees and similar obligations.
▪Provisions for contingent liabilities and commitments: include the amount of the provisions made to cover contingent liabilities -defined as those transactions in which the Group guarantees the obligations of a third party, arising as a result of financial guarantees granted or contracts of another kind- and contingent commitments -defined as irrevocable commitments that may give rise to the recognition of financial assets.
▪Provisions for taxes and other legal contingencies and Other provisions: include the amount of the provisions recognised to cover tax and legal contingencies and litigation and the other provisions recognised by the consolidated entities. Other provisions includes, inter alia, any provisions for restructuring costs and environmental measures.
p) Own equity instruments
Own equity instruments are those meeting both of the following conditions:
▪The instruments do not include any contractual obligation for the issuer (i) to deliver cash or another financial asset to a third party; or (ii) to exchange financial assets or financial liabilities with a third party under conditions that are potentially unfavourable to the issuer.
▪The instruments will or may be settled in the issuer’s own equity instruments and are: (i) a non-derivative that includes no contractual obligation for the issuer to deliver a variable number of its own equity instruments; or (ii) a derivative that will be settled by the issuer through the exchange of a fixed amount of cash or another financial asset for a fixed number of its own equity instruments.
Transactions involving own equity instruments, including their issuance and cancellation, are charged directly to equity.
Changes in the value of instruments classified as own equity instruments are not recognised in the consolidated financial statements. Consideration received or paid in exchange for such instruments, including the coupons on preference shares contingently convertible into ordinary shares and the coupons associated with CCPP, is directly added to or deducted from equity.
q) Equity-instrument-based employee remuneration
Own equity instruments delivered to employees in consideration for their services, if the instruments are delivered once the specific period of service has ended, are recognised as an expense for services (with the corresponding increase in equity) as the services are rendered by employees during the service period. At the grant date the services received (and the related increase in equity) are measured at the fair value of the equity instruments granted. If the equity instruments granted are vested immediately, Grupo Santander recognises in full, at the grant date, the expense for the services received.
When the requirements stipulated in the remuneration agreement include external market conditions (such as equity instruments reaching a certain quoted price), the amount ultimately to be recognised in equity will depend on the other conditions being met by the employees (normally length of service requirements), irrespective of whether the market conditions are satisfied.
If the conditions of the agreement are met but the external market conditions are not satisfied, the amounts previously recognised in equity are not reversed, even if the employees do not exercise their right to receive the equity instruments.
r) Recognition of income and expenses
The most significant criteria used by Grupo Santander to recognise its income and expenses are summarised as follows:
i. Interest income, interest expenses and similar items
Interest income, interest expenses and similar items are generally recognised on an accrual basis using the effective interest method. Dividends received from other companies are recognised as income when the consolidated entities’ right to receive them arises.
ii. Commissions, fees and similar items
Fee and commission income and expenses are recognised in the consolidated income statement using criteria that vary according to their nature. The main criteria are as follows:
▪Fee and commission income and expenses relating to financial assets and financial liabilities measured at fair value through profit or loss are recognised when paid.
▪Those arising from transactions or services that are performed over a period of time are recognised over the life of these transactions or services.
▪Those relating to services provided in a single act are recognised when the single act is carried out.
iii. Non-finance income and expenses
They are recognised for accounting purposes when the good is delivered or the non-financial service is rendered. To determine the amount and timing of recognition, a five-step model is followed: identification of the contract with the customer, identification of the separate obligations of the contract, determination of the transaction price, distribution of the transaction price among the identified obligations and finally recording of income as the obligations are satisfied.
iv. Deferred collections and payments
These are recognised for accounting purposes at the amount resulting from discounting the expected cash flows at market rates.
v. Loan arrangement fees
Loan arrangement fees, mainly loan origination, application and information fees, are accrued and recognised in income over the term of the loan.
s) Financial guarantees
Financial guarantees are considered contracts that require the issuer to make specific payments to reimburse the creditor for the loss it incurs when a specific debtor defaults on its due date payment obligation in accordance with the original or modified conditions of debt instrument, regardless of its legal form, which may be, among others, a deposit, financial guarantee, insurance contract or credit derivative.
Grupo Santander initially recognises the financial guarantees provided on the liability side of the consolidated balance sheet at fair value, which is generally the present value of the fees, commissions and interest receivable from these contracts over the term thereof, and simultaneously the Group recognises the amount of the fees, commissions and similar interest received at the inception of the transactions and a credit on the asset side of the consolidated balance sheet for the present value of the fees, commissions and interest outstanding.
Financial guarantees, regardless of the guarantor, instrumentation or other circumstances, are reviewed periodically so as to determine the credit risk to which they are exposed and, if appropriate, to consider whether a provision is required. The credit risk is determined by application of criteria similar to those established for quantifying impairment losses on debt instruments carried at amortised cost (described in note 2.g above).
The provisions made for these transactions are recognised under 'Provisions - Provisions for commitments and guarantees given in the consolidated balance sheet' (see note 25). These provisions are recognised and reversed with a charge or credit, respectively, to 'Provisions or reversal of provisions', net, in the consolidated income statement.
t) Assets under management and investment and pension funds managed by the Group
Assets owned by third parties and managed by the consolidated entities are not presented on the face of the consolidated balance sheet. The investment funds and pension funds managed by the consolidated companies are also not presented in the Group's consolidated balance sheet, as they are owned by third parties.
The commissions generated by these activities are included in the balance of the 'Commission income' chapter of the consolidated profit and loss account.
Note 2.b.iv describes the internal criteria and procedures used to determine whether control exists over the structured entities, which include, inter alia, investment funds and pension funds.
u) Post-employment benefits
Under the collective agreements currently in force and other arrangements, the Spanish banks included in the Group and certain other Spanish and foreign consolidated entities have undertaken to supplement the public social security system benefits accruing to certain employees, and to their beneficiary right holders, for retirement, permanent disability or death, and the post-employment welfare benefits.
Grupo Santander's post-employment obligations to its employees are deemed to be defined contribution plans when the Group makes pre-determined contributions (recognised under Personnel expenses in the consolidated income statement) to a separate entity and will have no legal or effective obligation to make further contributions if the separate entity cannot pay the employee benefits relating to the service rendered in the current and prior periods. Post-employment obligations that do not meet the aforementioned conditions are classified as defined benefit plans (see note 25).
Defined contribution plans
The contributions made in this connection in each year are recognised under 'Personnel expenses' in the consolidated income statement.
The amounts not yet contributed at each year-end are recognised, at their present value, under 'Provisions - Provision for pensions' and similar obligations on the liability side of the consolidated balance sheet.
Defined benefit plans
Grupo Santander recognises under 'Provisions - Provision for pensions and similar obligations on the liability side of the consolidated balance sheet' (or under 'Other assets' on the asset side, as appropriate) the present value of its defined benefit post-employment obligations, net of the fair value of the plan assets.
Plan assets are defined as those that will be directly used to settle obligations and that meet the following conditions:
▪They are not owned by the consolidated entities, but by a legally separate third party that is not a party related to the Group.
▪They are only available to pay or fund post-employment benefits and they cannot be returned to the consolidated entities unless the assets remaining in the plan are sufficient to meet all the benefit obligations of the plan and of the entity to current and former employees, or they are returned to reimburse employee benefits already paid by Grupo Santander.
If Grupo Santander can look to an insurer to pay part or all of the expenditure required to settle a defined benefit obligation, and it is practically certain that said insurer will reimburse some or all of the expenditure required to settle that obligation, but the insurance policy does not qualify as a plan asset, the Group recognises its right to reimbursement -which, in all other respects, is treated as a plan asset- under 'Insurance contracts linked to pensions' on the asset side of the consolidated balance sheet.
Grupo Santander will recognise the following items in the income statement:
•Current service cost, (the increase in the present value of the obligations resulting from employee service in the current period), is recognised under 'Staff costs'.
•The past service cost, which arises from changes to existing post-employment benefits or from the introduction of new benefits and includes the cost of reductions, is recognised under 'Provisions or reversal of provisions'.
•Any gain or loss arising from a liquidation of the plan is included in the 'Provisions or reversion of provisions'.
•Net interest on the net defined benefit liability (asset), i.e. the change during the period in the net defined benefit liability (asset) that arises from the passage of time, is recognised under 'Interest expense' and similar charges ('Interest and similar income' if it constitutes income) in the consolidated income statement.
The remeasurement of the net defined benefit liability (asset) is recognised in 'Other comprehensive income' under Items not reclassified to profit or loss and includes:
▪Actuarial gains and losses generated in the year, arising from the differences between the previous actuarial assumptions and what has actually occurred and from the effects of changes in actuarial assumptions.
▪The return on plan assets, excluding amounts included in net interest on the net defined benefit liability (asset).
▪Any change in the effect of the asset ceiling, excluding amounts included in net interest on the net defined benefit liability (asset).
v) Other long-term employee benefits
Other long-term employee benefits, defined as obligations to pre-retirees -taken to be those who have ceased to render services at the entity but who, without being legally retired, continue to have economic rights vis-à-vis the entity until they acquire the legal status of retiree-, long-service bonuses, obligations for death of spouse or disability before retirement that depend on the employee’s length of service at the entity and other similar items, are treated for accounting purposes, where applicable, as established above for defined benefit post-employment plans, except that actuarial gains and losses are recognised under 'Provisions or reversal of provisions', net, in the consolidated income statement (see note 25).
w) Termination benefits
Termination benefits are recognised when there is a detailed formal plan identifying the basic changes to be made, provided that implementation of the plan has begun, its main features have been publicly announced or objective facts concerning its implementation have been disclosed.
x) Income tax
The expense for Spanish income tax and other similar taxes applicable to the foreign consolidated entities is recognised in the consolidated income statement, except when they arise from a transaction whose results are recognised directly in equity, in which case the related tax effect is recognised in equity.
The current income tax expense is calculated as the sum of the current tax resulting from application of the appropriate tax rate to the taxable profit for the year (net of any deductions allowable for tax purposes), and of the changes in deferred tax assets and liabilities recognised in the consolidated income statement.
'Deferred tax assets' and liabilities include temporary differences, which are identified as the amounts expected to be payable or recoverable on differences between the carrying amounts of assets and liabilities and their related tax bases, and tax loss and tax credit carryforwards. These amounts are measured at the tax rates that are expected to apply in the period when the asset is realised or the liability is settled.
'Tax assets' include the amount of all tax assets, which are broken down into current -amounts of tax to be recovered within the next twelve months- and deferred -amounts of tax to be recovered in future years, including those arising from tax loss or tax credit carryforwards.
Tax liabilities' includes the amount of all tax liabilities (except provisions for taxes), which are broken down into current -the amount payable in respect of the income tax on the taxable profit for the year and other taxes in the next twelve months- and deferred -the amount of income tax payable in future years.
Deferred tax liabilities are recognised in respect of taxable temporary differences associated with investments in subsidiaries, associates or joint ventures, except when the Group is able to control the timing of the reversal of the temporary difference and, in addition, it is probable that the temporary difference will not reverse in the foreseeable future. In this regard, no deferred tax liabilities of EUR 321.9 million were recognised in relation to the taxation that would arise from the undistributed earnings of certain Group holding companies, in accordance with the legislation applicable in those jurisdictions.
Deferred tax assets are only recognised for temporary differences to the extent that it is considered probable that the consolidated entities will have sufficient future taxable profits against which the deferred tax assets can be utilised, and the deferred tax assets do not arise from, in its initial recognition of (i)a business combination, (ii) an operation that does not affect either the tax result or the accounting result or (iii) on the date of the transaction, does not generate deductible and taxable temporary differences for the same amount (in which case assets and deferred tax liabilities). Other deferred tax assets (tax loss and tax credit carryforwards) are only recognised if it is considered probable that the consolidated entities will have sufficient future taxable profits against which they can be utilised.
Differences generated by the different accounting and tax treatment of any of the income and expenses recorded directly in equity to be paid or recovered in the future are accounted for as temporary differences.
The deferred tax assets and liabilities are reassessed at the reporting date in order to ascertain whether any adjustments need to be made on the basis of the findings of the analyses performed.
Regarding taxes on profits arising from the application of tax laws for the implementation of the Pillar Two model rules, including those related to national minimum complementary taxes, the Group applies the mandatory and temporary exception to the recognition of deferred tax assets and liabilities derived from said tax laws (see note 27.f).
y) Residual maturity periods
In note 51 it is provided an analysis of the maturities of the balances of certain items in the consolidated balance sheet.
Santander Group has recorded as 'time liabilities' those recognised financial liabilities in which the counterparty may require payments.
Likewise, when Grupo Santander has committed to having amounts available at different maturity periods, these amounts have been recorded in the first year in which they may be required.
Additionally, for the financial guarantee contracts issued, the Group has recorded the maximum amount of the financial guarantee issued in the first year in which the guarantee can be executed.
z) Consolidated statement of recognised income and expense
This statement presents the income and expenses generated by the Group as a result of its business activity in the year, and a distinction is made between the income and expenses recognised in the consolidated income statement for the year and the other income and expenses recognised directly in consolidated equity.
Accordingly, this statement presents:
a. Consolidated profit for the year.
b. The net amount of the income and expenses recognised in 'Other comprehensive income' under items that will not be reclassified to profit or loss.
c. The net amount of the income and expenses recognised in Other comprehensive income under items that may be reclassified subsequently to profit or loss.
d. The income tax incurred in respect of the items indicated in b and c above, except for the valuation adjustments arising from investments in associates or joint ventures accounted for using the equity method, which are presented net.
e. Total consolidated recognised income and expense, calculated as the sum of a) to d) above, presenting separately the amount attributable to the parent company and the amount relating to non-controlling interests.
The statement presents the items separately by nature, grouping together items that, in accordance with the applicable accounting standards, will not be reclassified subsequently to profit and loss since the requirements established by the corresponding accounting standards are met.
aa) Statement of changes in total equity
This statement presents all the changes in equity, including those arising from changes in accounting policies and from the correction of errors. Accordingly, this statement presents a reconciliation of the carrying amount at the beginning and end of the year of all the consolidated equity items, and the changes are grouped together on the basis of their nature into the following items:
a. Adjustments due to changes in accounting policies and to errors: include the changes in consolidated equity arising as a result of the retrospective restatement of the balances in the consolidated financial statements, distinguishing between those resulting from changes in accounting policies and those relating to the correction of errors.
b. Income and expense recognised in the year: includes, in aggregate form, the total of the aforementioned items recognised in the consolidated statement of recognised 'Income and expense'.
c. Other changes in equity: includes the remaining items recognised in equity, including, inter alia, increases and decreases in capital, distribution of profit, transactions involving own equity instruments, equity-instrument-based payments, transfers between equity items and any other increases or decreases in consolidated equity.
ab) Consolidated statement of cash flows
The following terms are used in the consolidated statements of cash flows with the meanings specified:
•Cash flows: inflows and outflows of cash and cash equivalents, which are short-term, highly liquid investments that are subject to an insignificant risk of changes in value, irrespective of the portfolio in which they are classified.
Grupo Santander classifies as cash and cash equivalents the balances recognised under 'Cash, cash balances at central banks' and 'Other deposits on demand' in the consolidated balance sheet.
•Operating activities: the principal revenue-producing activities of credit institutions and other activities that are not investing or financing activities.
•Investing activities: the acquisition or disposal of long-term assets and other investments not included in cash and cash equivalents.
•Financing activities: activities that result in changes in the size and composition of the equity and liabilities that are not operating activities.
During 2025 Grupo Santander received interest amounting to EUR 109,840 million (EUR 117,046 and EUR 101,029 in 2024 and 2023, respectively) and paid interest amounting to EUR 57,737 million (EUR 61,091 and EUR 50,954 in 2024 and 2023, respectively).
Also, dividends received and paid by the Group are detailed in notes 4, 28 and 40, including dividends paid to minority interests (non-controlling interests)
3. Grupo Santander
a) Banco Santander, S.A., and international Group structure
The growth of Grupo Santander in the last decades has led Banco Santander to also act, in practice, as a holding entity of the shares of the various companies in its Group, and its results are becoming progressively less representative of the performance and earnings of the Group. Therefore, each year the bank determines the amount of the dividends to be distributed to its shareholders on the basis of the consolidated net profit, while maintaining the Group’s objectives of capitalisation and taking into account that the transactions of the Bank and of the rest of the Group are managed on a consolidated basis (notwithstanding the allocation to each company of the related net worth effect).
At the international level, the various banks and other subsidiaries, joint ventures and associates of the Group are integrated in a corporate structure comprising various holding companies which are the ultimate shareholders of the banks and subsidiaries abroad.
The purpose of this structure, all of which is controlled Banco Santander, is to optimise the international organisation from the strategic, economic, financial and tax standpoints, since it makes it possible to define the most appropriate units to be entrusted with acquiring, selling or holding stakes in other international entities, the most appropriate financing method for these transactions and the most appropriate means of remitting the profits obtained by the group’s various operating units to Spain.
The Appendices provide relevant data on the consolidated group companies and on the companies accounted for using the equity method.
b) Acquisitions and disposals
Following is a summary of the main acquisitions and disposals of ownership interests in the share capital of other entities and other significant corporate transactions performed in the last three years or pending to be completed:
i. Agreement for the sale of 49% of Santander Bank Polska S.A. and accelerated placement of ordinary shares
On 5 May 2025, Banco Santander announced an agreement to sell approximately 49% of the share capital of Santander Bank Polska S.A. (Santander Polska) to Erste Group Bank AG at a price of 584 zlotys per share, as well as the 50% of Santander Towarzystwo Funduszy Inwestycyjnych S.A. (TFI, the asset management business in Poland) owned directly by Banco Santander, S.A., for a total amount of approximately EUR 7,000 million. Following the transaction and the accelerated placement of ordinary shares announced on 2 December 2025, of 3,576,626 ordinary shares of Santander Polska, representing approximately 3.5% of its share capital, for a total import of EUR 407 million, Santander will hold 9.7% of Santander Polska's share capital (58.7% as of 31 December 2025). The transaction was completed on 9 January 2026 (see Note 1.g. Introduction, basis of presentation of the consolidated annual accounts, and other information, subsequent events).
As a result of the agreement, the Group has reclassified the assets of Santander Polska and TFI in the consolidated balance sheet as of 31 December 2025, to the heading 'Non-current assets held for sale', and their liabilities to the heading 'Liabilities associated with non-current assets held for sale'. Furthermore, the effect of these businesses on the profit and loss account for the 2025 financial year has been classified under the heading 'Profit/(loss) after tax from discontinued operations' (see Note 12), with the same classification being applied for comparative purposes in the profit and loss accounts for the 2024 and 2023 financial years.
As part of this transaction, on 23 December 2025, Santander Consumer, S.A. acquired 60% of Santander Consumer Bank Polska, which was owned by Santander Polska, for PLN 3,105 million (EUR 726 million). This transaction had no significant impact on the Group's consolidated financial statements.
ii. Agreement for the acquisition of TSB Banking Group plc
On 1 July 2025, Banco Santander announced an agreement with Banco de Sabadell, S.A. for the acquisition of TSB Banking Group plc for approximately GBP 2,650 million (EUR 3,100 million) plus the results generated by this business between 31 March 2025, and the closing of the transaction.
The completion of the transaction is subject to the usual conditions for this type of deal, including obtaining the relevant regulatory authorizations.
iii. Agreement for the sale of the stake in Caceis
On 19 December 2024, Grupo Santander signed an agreement with Crédit Agricole S.A. for the sale of its 30.5% stake in the share capital of CACEIS. As a result of the above, as of 31 December 2024, this participation was reclassified, at its carrying value, from the line item 'investments' to the line item 'Non-current assets held for sale' in the balance sheet (see Note 6). The transaction was formalized in 2025 after obtaining the relevant regulatory approvals, generating a profit before taxes of EUR 231 million registered in the line item 'Gains or losses on non-current assets held for sale not classified as discontinued operations' of the income statement. Following the completion of the planned transaction, Crédit Agricole S.A. holds the 100% of CACEIS’s share capital.
The joint depositary, custody and related asset servicing services of Santander and CACEIS in Latin America is not included in the scope of the transaction and continues to be jointly controlled by Santander and CACEIS.
iv. Accelerated placement of ordinary shares of Santander Bank Polska
On 10 September 2024, Banco Santander, S.A. announced an accelerated placement of 5,320,000 ordinary shares of its subsidiary Santander Bank Polska S.A., representing approximately 5.2% of its share capital, at a price of PLN 463 (EUR 108) per ordinary share. The transaction was settled on September 13, with the total transaction amounting to PLN 2,463 million (EUR 575 million). Banco Santander will continue to hold a majority stake in Santander Bank Polska S.A. of 62.2% of the share capital (prior to this transaction, the percentage of participation was 67.4%).
This sale has resulted in an increase in reserves and valuation adjustments of EUR 158 million and EUR 57 million, respectively, and an increase in minority equity of EUR 360 million.
v. Tender offers for shares of Banco Santander México, S.A., Institución de Banca Múltiple, Grupo Financiero Santander México
On 21 October 2022, Banco Santander, S.A. ('Banco Santander') announced that it intends to make concurrent cash tender offers to acquire all of the shares of Banco Santander México, S.A., Institución de Banca Múltiple, Grupo Financiero Santander México ('Santander Mexico') in Mexico (Shares) and United States (American Depositary Shares ('ADSs')) which were not owned by Grupo Santander, which amount to approximately 3.76% of Santander Mexico’s share capital.
The offers were launched on 7 February 2023 and were originally scheduled to close on 8 March 2023. On 1 March 2023, Banco Santander announced its decision to extend the expiration date of the offers so that they could be concluded on 10 April 2023. Finally, after the offers' closing, 3.6% of the capital accepted the offer, which raised the Group's stake in Santander México from 96.2% to 99.8%.will be settled on 13 March 2023.
Shareholders who participated in the offerings received 24.52 Mexican pesos (approximately EUR 1.20) per Share and USD 6.6876 in cash for each ADS (i.e., the equivalent in United States dollars of 122.6 Mexican pesos in cash for each ADS at the US dollar/Mexican peso exchange rate on the expiration date of 10 April 2023),which corresponded to the book value of the Santander México share according to the quarterly report of Santander México corresponding to the fourth quarter of the year 2022 in accordance with applicable legislation, with a total disbursement by Banco Santander of approximately EUR 300 million.
The operation led to an increase of EUR 13 million in Reserves and a decrease of EUR 313 million in minority interests.
Once the offers were concluded and settled, Banco Santander proceeded to: (i) withdraw the ADSs from the listing on the New York Stock Exchange ('NYSE') and the Shares from the registry before the Securities and Exchange Commission ('SEC') in the United States and; (ii) cancel the registration of the Shares in the National Securities Registry of the National Banking and Securities Commission ('CNBV') and withdraw the listing of the Shares in the Mexican Stock Exchange, S.A.B. de C.V. ('BMV'). Said cancellation was approved by the extraordinary general shareholders' meeting of Santander México held on 30 November 2022, with the favourable vote of the holders of the shares that represent more than 95% of the shares of Santander Mexico, as required by the Mexican Securities Market Law.
Pursuant to Mexican law, on 12 May 2023, Banco Santander and Santander México established a trust (the 'Repurchase Trust'), to which the holders of the Shares that remain outstanding after the conclusion of the offers, to sell said Shares to the repurchase trust, at the same cash price that would have been paid to them in the Mexican offer with respect to the same. At the end of the year, said trust was liquidated and the Group's effective participation amounts to 99.98%.
c) Offshore entities
Spanish regulation
According to current Spanish regulation (Law 11/2021, of 9 July; Royal Decree 1080/1991, of 5 July; and Order HFP/115/2023, of 9 February), at year-end 2025 Grupo Santander has three branches in the non-cooperative jurisdictions of Jersey, the Isle of Man and the Cayman Islands (offshore entities). The Group also has a subsidiary in Guernsey, which is in the process of being wound up and is tax resident in the United Kingdom, and is therefore subject to its tax regime.
i. Offshore branches
As previously mentioned, Grupo Santander has three offshore branches in the non-cooperative jurisdictions of the Cayman Islands, the Isle of Man and Jersey. They report to, and consolidate balance sheets and income statements with, their respective foreign headquarters. They are taxed either with their headquarters (the Cayman Islands branch in Brazil) or in the territories they are located (Jersey and the Isle of Man, pertain to the UK).
These three offshore branches have a total of 147 employees as of December 2025.
ii. Subsidiaries in non-cooperative jurisdictions that are tax resident in the United Kingdom (UK)
Grupo Santander also has a subsidiary incorporated in the non-cooperative jurisdiction of Guernsey, which is not deemed an offshore entity because it operated exclusively from the UK and is tax resident there, and is therefore subject to UK tax law. This subsidiary is in the process of being liquidated as of December 31, 2025.
Additionally, during 2025 a subsidiary incorporated in Bermuda and tax resident in the United Kingdom, was liquidated.
iii. Other offshore holdings
From Brazil, Grupo Santander manages Santander Brazil Global Investment Fund SPC, a segregated portfolio company located in the Cayman Islands. The Group also holds minority, non-controlling financial interests in entities located in non-cooperative jurisdictions, including, among others, Klar Holdings Limited in the Cayman Islands.
The European Union (EU)
Santander has no presence in any of the 11 jurisdictions included on the EU Council’s blacklist of non-cooperative jurisdictions for tax purposes as of 31 December 2025. Additionally, the EU grey list comprises another 11 jurisdictions which have sufficiently committed to fully adapting their legislation to international tax standards, subject to monitoring by the EU. Within these grey-list jurisdictions, Santander operates only in Morocco through one subsidiary and holds a minority interest in a financial institution tax resident in that jurisdiction.
Organization for Economic Cooperation and Development (OECD)
Grupo Santander has no presence in any jurisdictions non-compliant with both OECD standards on transparency and exchange of information for tax purposes (the automatic exchange of information AEOI standard and the exchange of information on request EOIR standard), according to the last annual reports of the OECD Global Forum on Transparency and Exchange of Information for Tax Purposes, released on 2 December 2025.
However, Vietnam —a jurisdiction where Santander has a subsidiary— does not comply with the EOIR standard. Meanwhile, The Bahamas and Chile —jurisdictions where Santander is also present—, although they have complete legal and regulatory frameworks in place for the implementation of the AEOI standard, they still need to improve the effectiveness of this standard.
Santander presence in offshore territories at the end of 2025 is as follows:
Group presence in non-cooperative jurisdictions
| | | | | | | | |
Regulatory framework | Group presence in non-cooperative jurisdictions |
Subsidiaries | Branches |
Spanish legislationa | — | 3b |
Council of the EU blacklist | — | — |
OECDc | — | — |
| 2025 | — | 3 |
| 2024 | — | 3 |
aAdditionally, there is one subsidiary constituted in Guernsey (in the process of winding up), but resident for tax purposes in the UK.
bThe Group has three branches in Jersey, the Isle of Man and the Cayman Islands. These jurisdictions are not included in the European Union’s October 2025 blacklist and fully comply with both OECD international standards on transparency and exchange of information for tax purposes (AEOI and EOIR).
cJurisdictions non-compliant with both OECD standards (AEOI and EOIR).
Grupo Santander has the right mechanisms (risk management, supervision, verification and review plans, and regular reporting) to prevent reputational, tax and legal risks in entities resident in non-cooperative jurisdictions. Grupo Santander also maintains its policy of limiting and reducing its presence in non-cooperative jurisdictions when possible.
PwC member firms audited the financial statements of Grupo Santander’s offshore entities in 2025, 2024 and 2023.
4. Distribution of Banco Santander's profit, shareholder remuneration scheme and earnings per share
a) Distribution of Banco Santander's profit and shareholder remuneration scheme
The distribution of the Bank's current annual results that the board of directors will propose for approval by the shareholders at the annual general meeting is as follows:
| | | | | |
| EUR million | |
| To dividends | 3,520 | |
Dividend paid at 31 DecemberA | 1,699 | |
Complementary dividendB | 1,821 | |
To voluntary reservesC | 7,593 | |
| Net profit for the year | 11,113 | |
A.Total amount paid as interim dividend, at the rate of EUR 11.5 fixed cents per eligible share (recorded in 'Shareholders' equity - Interim dividends').
B.Fixed complementary dividend of EUR 12.5 gross cents per eligible share, payable in cash as from 5 May 2026. The total amount has been estimated on the assumption that, as a result of the partial implementation of the buyback program announced on February 3, 2026, the number of the Bank's outstanding shares eligible for the dividend will be 14,568,470,446 and that, as envisaged, the capital increase submitted to the 2026 general meeting under item 6.C of the agenda will not be executed before 5 May 2026. Therefore, the total amount of the complementary dividend may be lower if more shares than initially envisaged are acquired under the buy-back programme, or higher if fewer shares are acquired under the buy-back programme or if the capital increase submitted to this general meeting under item 6.C of the agenda is executed before 5 May 2026.
C.Estimated amount corresponding to a complementary dividend of EUR 1,821,058,805.75. To be increased or reduced by the same amount by which the total amount of the final dividend is lower or higher, respectively, than its estimated amount.
The transcribed proposal comprises the part of the 2025 shareholder remuneration policy that is implemented through cash dividends (the interim dividend paid in November 2025 of EUR 11.5 cents per share with dividend entitlement, approved by the board of directors on September 30, 2025, and the complementary dividend expected to be paid as of 5 May 2026, of EUR 12.5 cents per share with the dividend entitlement, proposed by the board of directors on 24 February 2026, and therefore subject to approval by the general meeting).
The remuneration policy also provides for shareholder remuneration through the implementation of share buyback programmes, to which an amount equivalent to 25% of the Group’s underlying profit will be allocated. The first programme charged to 2025 results, amounting to approximately amount of EUR 1,700 million, was completed between August 2025 and December 2025. In addition, in 2025 Banco Santander announced its objective of allocating at least EUR 10,000 million to share buybacks in respect of 2025 and 2026 results and expected excess capital. As part of this objective, on 4 February 2026 a second buyback programme was launched for a maximum total amount of EUR 5,030 million, of which EUR 1,830 million corresponds to an amount equivalent to c.25% of the Group’s underlying profit in the second half of 2025, and the remaining EUR 3,200 million corresponds to c.50% of the capital released following completion of the sale of the 49% stake in Santander Bank Polska. A capital reduction resolution is also being submitted to the general meeting to enable the cancellation of the treasury shares acquired under this second buyback programme.
The accounting statement, prepared by the Bank pursuant to legal requirements, evidencing the existence of sufficient liquidity for the payment of the interim dividend on the date and for the amount mentioned above, was as follows:
| | | | | |
| EUR million |
| 31 August 2025 |
| Profit before taxes | 6,193 | |
| Tax expense | 635 | |
| Dividends paid in cash | — | |
| Distributable maximum amount | 5,558 | |
| Available liquidity | 96,923 | |
Finally, and although it does not form part of the remuneration charged to the 2025 financial year, it is hereby stated that, in execution of the resolution of the general meeting held on 4 April 2025, on 2 May 2025 the Bank paid a final cash dividend of EUR 11 cents per share charged to the results of the 2024 financial year. Finally, also charged to the results of 2024, the Bank implemented two repurchase programs. The first of them for a maximum amount of EUR 1,525 million, was completed in December 2024, and the second, for a maximum amount of EUR 1,587 million, was completed in June 2025.
b) Earnings/loss per share from continuing and discontinued operations
i. Basic earnings / loss per share
Basic earnings/loss per share are calculated by dividing the net profit attributable to the Group, adjusted by the after-tax amount of the remuneration of contingently convertible preference shares (PPCC) recognised in equity and the capital perpetual preference shares (PPCA) (see note 23), if applicable, by the weighted average number of ordinary shares outstanding during that period, excluding the average number of own shares held through that period.
Accordingly:
| | | | | | | | | | | |
| 2025 | 2024 | 2023 |
| Profit (Loss) attributable to the Parent (EUR million) | 14,101 | | 12,574 | 11,076 | |
| Remuneration of PPCC and PPCA (EUR million) (note 23) | (622) | | (620) | | (492) | |
| 13,479 | | 11,954 | | 10,584 | |
| Of which: | | | |
| Profit (Loss) from discontinued operations (non controlling interest net) (EUR million) | 962 | | 822 | | 717 | |
Profit (Loss) from continuing operations (non-controlling interest and PPCC and PPCA net)
(EUR million) | 12,517 | | 11,132 | | 9,867 | |
| Weighted average number of shares outstanding | 14,890,304,840 | | 15,497,607,269 | | 16,172,084,714 | |
| Basic earnings (Loss) per share (euros) | 0.905 | | 0.771 | | 0.654 | |
| Of which, from discounted operations (euros) | 0.065 | | 0.053 | | 0.044 | |
| Basic earnings (Loss) per share from continuing operations (euros) | 0.840 | | 0.718 | | 0.610 | |
ii. Diluted earnings / loss per share
Diluted earnings/loss per share are calculated by dividing the net profit attributable to the Group, adjusted by the after-tax amount of the remuneration of contingently convertible preference shares recognised in equity (PPCC) recognised in equity and the capital perpetual preference shares (PPCA) (see note 23), by the weighted average number of ordinary shares outstanding during the year, excluding the average number of treasury shares and adjusted for all the dilutive effects inherent to potential ordinary shares (share options, and convertible debt securities).
Accordingly, diluted earnings/loss per share were determined as follows:
| | | | | | | | | | | |
| 2025 | 2024 | 2023 |
| Profit (Loss) attributable to the Parent (EUR million) | 14,101 | | 12,574 | | 11,076 | |
| Remuneration of PPCC and PPCA (EUR million) (Note 23) | (622) | | (620) | | (492) | |
| Dilutive effect of changes in profit for the period arising from potential conversion of ordinary shares | — | | — | | — | |
| 13,479 | | 11,954 | | 10,584 | |
| Of which: | | | |
| Profit (Loss) from discontinued operations (net of non-controlling interests) (EUR million) | 962 | | 822 | | 717 | |
| Profit (Loss) from continuing operations (net of non-controlling interests and PPCC and PPCA) (EUR million) | 12,517 | | 11,132 | | 9,867 | |
| Weighted average number of shares outstanding | 14,890,304,840 | | 15,497,607,269 | | 16,172,084,714 | |
| Dilutive effect of options/rights on shares | 85,269,647 | | 70,110,570 | | 75,180,407 | |
| Adjusted number of shares | 14,975,574,487 | | 15,567,717,839 | | 16,247,265,121 | |
| Diluted earnings (Loss) per share (euros) | 0.900 | | 0.768 | | 0.651 | |
| Of which, from discounted operations (euros) | 0.064 | | 0.053 | | 0.044 | |
| Diluted earnings (Loss) per share from continuing operations (euros) | 0.836 | | 0.715 | | 0.607 | |
5. Remuneration and other benefits paid to the Bank’s directors and senior managers
The following section contains qualitative and quantitative disclosures on the remuneration paid to the members of the board of directors —both executive and non-executive directors— and senior managers for 2025 and 2024.
a) Remuneration of Directors
i. Bylaw-stipulated emoluments
The annual general meeting held on 22 March 2013 approved an amendment to the Bylaws, whereby the remuneration of directors in their capacity as board members became an annual fixed amount determined by the annual general meeting. This amount shall remain in effect unless the shareholders resolve to change it at a general meeting. However, the board of directors may elect to reduce the amount in any years in which it deems such action justified.
The maximum remuneration established by the annual general meeting was EUR 6 million in 2025 (EUR 6 million in 2024), with two components: (a) an annual emolument and (b) attendance fees.
The specific amount payable for the above-mentioned items to each of the directors is determined by the board of directors. For such purpose, it takes into consideration the positions held by each director on the board, their membership of the board and the board committees and their attendance to the meetings thereof, and any other objective circumstances considered by the board.
The total Bylaw-stipulated emoluments earned by the directors in 2025 amounted to EUR 5.3 million (EUR 5.4 million in 2024).
Annual allotment
For 2025, the board of directors, upon recommendation of the remuneration committee, approved a 3% increase in the annual
allotments payable to the chair and members of the board and its committees (including the executive committee), as well as to the lead independent director and the non-executive Vice Chair . Accordingly, each director received, in respect of 2024 and 2025, the amounts corresponding to their service on the board and its committees, with such amounts determined by the specific position held, as detailed in the table below.
| | | | | | | | |
| Amount per director in euros | 2025 | 2024 |
| Members of the board of directors | 100,940 | | 98,000 | |
| Members of the executive committee | 175,100 | 170,000 |
| Members of the audit committee | 44,290 | 43,000 |
| Members of the appointments committee | 28,840 | 28,000 |
| Members of the remuneration committee | 28,840 | 28,000 |
| Members of the risk supervision, regulation and compliance committee | 44,290 | 43,000 |
| Members of the responsible banking, sustainability and culture committee | 28,840 | 28,000 |
| Members of the innovation and technology committee | 28,840 | 28,000 | |
| Chair of the audit committee | 72,100 | 70,000 |
| Chair of the appointments committee | 51,500 | 50,000 |
| Chair of the remuneration committee | 51,500 | 50,000 |
| Chair of the risk supervision, regulation and compliance committee | 72,100 | 70,000 |
| Chair of the responsible banking, sustainability and culture committee | 51,500 | 50,000 |
| Chair of the innovation and technology committee | 72,100 | 70,000 | |
Lead independent directorA | 113,300 | 110,000 |
| Non-executive Vice Chair | 30,900 | 30,000 |
A.Glenn Hutchins has been allocated EUR 700,000 (including annual allowances and attendance fees) in minimum total annual pay set for the required time and dedication to perform his roles.
Attendance fees
The directors receive fees for attending board and committee meetings, excluding executive committee meetings, where no attendance fees are received.
In line with the adjustment to the annual allotments, the board of directors approved a 3% increase for 2025 in attendance fees compared with 2024.
Accordingly, attendance fees for meetings of the board and its committees (with the exception of the Executive Committee, for which no attendance fees are payable) amounted, for the last two years, to the totals set out in the table below:
| | | | | | | | |
| Attendance fees per director per meeting in euros | 2025 | 2024 |
| Board of directors | 2,785 | | 2,704 | |
| Audit committee and risk supervision, regulation and compliance committee | 1,821 | | 1,768 | |
| Other committees (excluding executive committee) | 1,606 | | 1,560 | |
ii. Salaries
The executive directors receive salaries. In accordance with the policy approved by the annual general meeting, salaries are composed of a fixed annual remuneration and a variable one, which consists in a unique incentive, which is a deferred variable remuneration plan linked to multi-year objectives, which establishes the following payment scheme:
•40% of the variable remuneration amount, determined at year-end on the basis of the achievement of the established objectives, is paid immediately.
•The remaining 60% is deferred over five years, provided that the conditions of permanence in the Group and non-concurrence of the malus clauses are met, and subject to long term metrics, taking into account the following accrual scheme:
–The accrual of the first and second portion (20% of total variable compensation, paid in 2027 and 2028) will be conditional on none of the malus clauses being triggered.
–The accrual of the third, fourth and fifth portion (40% of total variable compensation and paid in 2029, 2030 and 2031), is linked to objectives related to the period 2025—2027 and the metrics and scales associated with these objectives. The fulfilment of the objectives determines the percentage to be paid of the deferred amount in these three annuities, and these targets can reduce these amounts and the number of deferred instruments, or increase them up to a maximum achievement ratio of 125%, so executives have the incentive to exceed their targets.
In accordance with current remuneration policies, the amounts already paid will be subject to a possible recovery (clawback) by the Bank during the period set out in the policy in force at each moment.
Payment of the approved incentive is paid 40% in cash and the remaining 60% in instruments, consisting of Banco Santander shares and restricted stock units (RSUs) of PagoNxt, split as:
◦ the amount of PagoNxt RSUs set for each year; and
◦ the rest, all in shares of Banco Santander.
Comparative of executive remuneration (Chair and CEO)
The target bonus of the Executive Chair and the CEO for 2025 remains unchanged compared to 2024.
Variable contributions to pensions were not modified in 2025, so the amounts are the 22% of the 30% of the last three assigned bonus' average.
In assessing individual performance, the Board considered the Grupo Santander’s strong results for 2025, reflecting continued delivery of our strategic plan. Attributable profit reached EUR 14,101 million in 2025, up 12% year-on-year (or +16% in constant euros), with a TSR during the year of 132% (+60% in relative terms vs. our peer group).
The Board also evaluated the leadership of the Executive Chair and the Chief Executive Officer in delivering these results and advancing the Group’s strategic priorities. Taking these factors into account, it determined that both executives achieved an 'Exceptional' level of performance and approved the corresponding variable remuneration.
Moreover, the ratio of executive directors’ total remuneration to underlying attributable profit fell to 0.17% from 0.18% in 2024.
The detail, by bank director, of the short-term (immediate) and deferred (not subject to long-term goals) remuneration for 2025 and 2024 is provided below:
| | | | | | | | | | | | | | | | | | | | | | | | | | | | | |
| EUR thousand |
| 2025 |
| Bylaw-stipulated emoluments |
| Annual emolument |
BoardF | Executive committee | Audit committee | Nomination committee | Remuneration committee1 | Risk supervision, regulation and compliance oversight committee2 | Responsible banking, sustainability and culture committee | Innovation and technology committee | Attendance fees and commissions |
|
|
| Ana Botín | 101 | | 175 | | — | | — | | — | | — | | — | | 29 | | 44 | |
| Héctor Grisi | 101 | | 175 | | — | | — | | — | | — | | — | | 29 | | 44 | |
| José Antonio Álvarez | 132 | | 175 | | — | | — | | — | | 44 | | — | | 29 | | 67 | |
| Glenn Hutchins | 412 | | — | | — | | 29 | | 80 | | — | | — | | 101 | | 78 | |
| Homaira Akbari | 101 | | — | | 44 | | — | | — | | — | | 29 | | 29 | | 81 | |
Javier BotínA | 101 | | — | | — | | — | | — | | — | | — | | — | | 36 | |
| Sol Daurella | 101 | | — | | — | | 29 | | 29 | | — | | 80 | | — | | 75 | |
| Henrique de Castro | 101 | | — | | 44 | | — | | 29 | | — | | — | | 29 | | 80 | |
| Gina Díez | 101 | | — | | — | | 29 | | — | | — | | 29 | | — | | 63 | |
| Luis Isasi | 101 | | 175 | | — | | — | | 29 | | 44 | | — | | — | | 74 | |
| Belén Romana | 101 | | 175 | | 44 | | 80 | | — | | 44 | | — | | 29 | | 107 | |
| Pamela Walkden | 101 | | — | | 44 | | — | | — | | 116 | | 29 | | — | | 93 | |
| Germán de la Fuente | 101 | | — | | 116 | | — | | — | | 44 | | — | | — | | 83 | |
Carlos BarrabésB | 101 | | — | | — | | 29 | | — | | — | | 29 | | 29 | | 71 | |
Antonio WeissC | 101 | | — | | — | | — | | 29 | | — | | — | | — | | 50 | |
Bruce Carnegie-BrownD | — | | — | | — | | — | | — | | — | | — | | — | | — | |
Ramiro MatoE | — | | — | | — | | — | | — | | — | | — | | — | | — | |
Total 2025 | 1,857 | | 875 | | 292 | | 196 | | 196 | | 292 | | 196 | | 304 | | 1,047 | |
Total 2024 | 1,791 | | 933 | | 306 | | 183 | | 168 | | 263 | | 190 | | 280 | | 1,240 | |
A. All amounts received were reimbursed to Fundación Botín.
B. Director and member of the nomination committee, responsible banking, sustainability and culture committee and innovation and technology committee since 27 June 2024.
C. Director since 27 June 2024.
D. Stepped down as director on 22 March 2024.
E. Stepped down as director on 27 June 2024.
F. Also includes emoluments for other roles in the board.
Changes in the chairship or membership of the committees:
1.Antonio Weiss was appointed member of the remuneration committee on 1 January 2025.
2.José Antonio Álvarez was appointed member of the risk supervision, regulation and compliance oversight committee on 1 January 2025.
Other remuneration includes EUR 1,000 thousand for the role as non-executive Chair of the Santander España business unit and for attending its board and committee meetings for Luis Isasi. For José Antonio Álvarez, this amount includes remuneration as strategic advisor of Grupo Santander, life and health insurance contributions (EUR 678 thousand) and part of the former supplement for having waived the death and disability policy (EUR 12 thousand).
| | | | | | | | | | | | | | | | | | | | | | | | | | | | | | | | | | | |
| 2025 | | 2024 |
| | | | | | | | | | | |
| Short-term and deferred (not subject to long-term goals) salaries of executive directors | | | | | |
| | | | | |
| Fixed | Variable - immediate payment | Deferred variable | | | | | | |
| In cash | In instruments | In cash | In instruments | Total | Pension contribution | Other remuneration | Total | | Total |
| Ana Botín | 3,435 | | 2,003 | | 2,003 | | 1,001 | | 1,002 | | 9,444 | | 1,341 | | 843 | | 11,977 | | | 12,127 | |
| Héctor Grisi | 3,150 | | 1,384 | | 1,384 | | 692 | | 692 | | 7,302 | | 1,120 | | 718 | | 9,489 | | | 9,137 | |
| José Antonio Álvarez | — | | — | | — | | — | | — | | — | | — | | 2,440 | | 2,887 | | | 3,698 | |
| Glenn Hutchins | — | | — | | — | | — | | — | | — | | — | | — | | 700 | | | 700 | |
| Homaira Akbari | — | | — | | — | | — | | — | | — | | — | | — | | 284 | | | 285 | |
Javier BotínA | — | | — | | — | | — | | — | | — | | — | | — | | 137 | | | 144 | |
| Sol Daurella | — | | — | | — | | — | | — | | — | | — | | — | | 314 | | | 292 | |
| Henrique de Castro | — | | — | | — | | — | | — | | — | | — | | — | | 283 | | | 300 | |
| Gina Díez | — | | — | | — | | — | | — | | — | | — | | — | | 222 | | | 225 | |
| Luis Isasi | — | | — | | — | | — | | — | | — | | — | | 1,000 | | 1,423 | | | 1,440 | |
| Belén Romana | — | | — | | — | | — | | — | | — | | — | | — | | 581 | | | 599 | |
| Pamela Walkden | — | | — | | — | | — | | — | | — | | — | | — | | 383 | | | 381 | |
| Germán de la Fuente | — | | — | | — | | — | | — | | — | | — | | — | | 344 | | | 338 | |
Carlos BarrabésB | — | | — | | — | | — | | — | | — | | — | | — | | 259 | | | 128 | |
Antonio WeissC | — | | — | | — | | — | | — | | — | | — | | — | | 180 | | | 72 | |
Bruce Carnegie-BrownD | — | | — | | — | | — | | — | | — | | — | | — | | — | | | 78 | |
Ramiro MatoE | — | | — | | — | | — | | — | | — | | — | | — | | — | | | 271 | |
| Total 2025 | 6,585 | | 3,387 | | 3,387 | | 1,693 | | 1,694 | | 16,746 | | 2,461 | | 5,001 | | 29,462 | | | — | |
| Total 2024 | 6,585 | | 3,130 | | 3,130 | | 1,877 | | 1,879 | | 16,601 | | 2,444 | | 5,815 | | — | | | 30,214 | |
Footnotes in previous table.
Following is the detail by executive director of the salaries linked to multi-year objectives at their fair Value, which will only be received if the conditions of permanence in the Group, non-applicability of malus clauses and achievement of the established objectives are met (or, as the case may be, of the minimum thresholds thereof, with the consequent reduction of amount agreed-upon at the end of the year) in the terms described in Note 46.
| | | | | | | | | | | | | | | | | |
| EUR thousand |
| 2025 | 2024 |
| Variable subject to long-term
objectives1 | | |
| In cash | In shares | In RSUs | Total | Total |
| Ana Botín | 701 | | 1,893 | | 210 | | 2,804 | | 2,332 | |
| Héctor Grisi | 484 | | 1,277 | | 176 | | 1,938 | | 1,611 | |
| Total | 1,185 | | 3,170 | | 386 | | 4,742 | | 3,943 | |
1. Corresponds with the fair value of the maximum amount they are entitled to in a total of 3 years: 2029, 2030 and 2031, subject to conditions of continued service, with the exceptions provided, and to the non-applicability of malus clauses and achievement of the objectives established. The face value of the three aforementioned deferred amounts is EUR 6,774 thousand for 2025 (EUR 4,006 thousand for Ana Botín and EUR 2,768 thousand for Héctor Grisi).
The fair value has been determined at the grant date based on the valuation report of an independent expert, Willis Towers Watson. Based on the design of the plan for 2025 and the levels of achievement of similar plans in comparable entities, the fair value considered is 70% of the variable remuneration subject to long-term objectives. (see note 46).
Note 5.e below includes disclosures on the shares delivered from the deferred remuneration schemes in place in previous years and for which delivery conditions were met, as well as on the maximum number of shares that may be received in future years in connection with the aforementioned 2025 and 2024 variable remuneration plans.
b) Remuneration of the board members as representatives of the Bank
By resolution of the executive committee, all the remuneration received by the Bank’s directors who represent the Bank on the boards of directors of listed companies in which the Bank has a stake, paid by those companies and relating to appointments made on or after 18 March 2002, accrues to the Group. In 2025 the Bank’s directors did not receive any remuneration in respect of these representative duties.
On the other hand, in their personal capacity, in 2025 Homaira Akbari was paid USD 100 thousand (EUR 85 thousand) as member of the board of Santander Consumer USA Holdings, Inc. and EUR 200 thousand as member of the board of PagoNxt S.L., and José Antonio Álvarez and Henrique de Castro were each paid the same EUR 200 thousand as members of the board of PagoNxt S.L. (Henrique de Castro also received EUR 15 thousand as member of the nomination committee of PagoNxt, S.L.). Likewise, Pamela Walkden was paid GBP 100 thousand (EUR 115 thousand) as member of Santander UK plc and Santander UK Group Holdings; and Belén Romana EUR 157 thousand as member of the Board of Santander Insurance, S.L.
Likewise, Luis Isasi was paid EUR 1,000 thousand as non-executive Chair of the Santander España business unit and for attending its board and committee meetings (amounts paid by Banco Santander, S.A.).
And finally, José Antonio Álvarez, as strategic adviser of Grupo Santander, received fixed remuneration of EUR 1,750 thousand. In addition, he received the life and health insurance contributions, and the part of the former supplement for having waived the death and disability policy.
c) Post-employment and other long-term benefits
In 2012, the contracts of Ana Botín and other members of the Bank's senior management with defined benefit pension commitments were modified to transform these commitments into a defined contribution system, which covers the contingencies of retirement, disability and death. From that moment on, the Bank makes annual contributions to their pension system for their benefit.
This system gives them the right to receive benefits upon retirement, regardless of whether or not they are active at the Bank at such time, based on contributions to the system, and replaced their previous right to receive a pension supplement in the event of retirement.
The initial balance for Ana Botín in the new defined benefits system corresponded to the market value of the assets from which the provisions corresponding to the respective accrued obligations had materialised on the date on which the old pension commitments were transferred into the new benefits system.
Since 2013, the Bank has made annual contributions to the benefits system for executive directors and other members of executive team, in proportion to their respective pensionable bases, until they leave Grupo Santander or until their retirement within the Group, death, or disability.
The benefit plan system is outsourced to Santander Seguros y Reaseguros, Compañía Aseguradora, S.A., and the economic rights of the foregoing directors under this plan belong to them regardless of whether or not they are active at the Bank at the time of their retirement, death or disability.
In accordance with the provisions of the remuneration regulations, contributions made calculated on variable remuneration are subject to the discretionary pension benefits regime. Under this regime, contributions are subject to malus clauses and clawback according to the policy in force at any given time and during the same period in which the variable remuneration is deferred.
Furthermore, they must be invested in bank shares for a period of five years from the date when the executive director leaves the Group, regardless of whether or not they leave to retire. Once that period has elapsed, the amount invested in shares will be reinvested, along with the remainder of the cumulative balance corresponding to the executive director, or it will be paid to the executive director or to their beneficiaries in the event of a contingency covered by the benefits system.
As per the director´s remuneration policy approved at the 23 March 2018 general shareholder´s meeting, the system was changed with a focus on:
•Aligning the annual contributions with practices of comparable institutions.
•Reducing future liabilities by eliminating the supplementary benefits scheme in the event of death (death of spouse or parent) and permanent disability of serving directors.
•Not increasing total costs for the Bank.
The changes to the system were the following:
•Fixed and variable pension contributions were reduced to 22% of the respective pensionable bases. The gross annual salaries and the benchmark variable remuneration were increased in the corresponding amount with no increase in total costs for the Bank. The pensionable base for the purposes of the annual contributions for the executive directors is the sum of fixed remuneration plus 30% of the average of their last three variable remuneration amounts. This means complying with Circular 2/2016 of the Bank of Spain, standard 41, on pension benefits, by which a part of not less than 15% of the total contribution must be based on variable components.
•The death and disability supplementary benefits were eliminated since 1 April 2018. A fixed remuneration supplement (included in other remuneration in section a.iii in this note) was implemented the same date. During 2025, this fixed remuneration supplement has expired both for Ana Botín and José Antonio Álvarez, in line with the age of 65 initially set at the time this remuneration component was approved.
•The total amount insured for life and accident insurance was increased.
The provisions recognised in 2025 and 2024 for retirement pensions were as follows:
| | | | | | | | |
| EUR thousand |
| 2025 | 2024 |
| Ana Botín | 1,341 | | 1,339 | |
| Héctor Grisi | 1,120 | | 1,105 | |
| Total | 2,461 | | 2,445 | |
Following is a detail of the balances relating to each of the directors under the welfare system as of 31 December 2025 and 2024:
| | | | | | | | |
| EUR thousand |
| 2025 | 2024 |
| Ana Botín | 65,027 | | 54,731 | |
| Héctor Grisi | 2,033 | | 1,299 | |
| José Antonio Álvarez | 23,178 | | 20,326 | |
| Total | 90,238 | | 76,356 | |
d) Insurance
The Group pays for life insurance policies for the Bank’s directors, who will be entitled to receive benefits if they are declared disabled. In the event of death, the benefits will be payable to their heirs. The premiums paid by the Group are included in the 'Other remuneration' column of the table shown in Note 5.a.iii above. Also, the following table provides information on the sums insured for the Bank’s directors:
| | | | | | | | |
| Insured capital |
| EUR thousand | |
| 2025 | 2024 |
| Ana Botín | 20,659 | | 21,525 | |
| Héctor Grisi | 12,600 | | 12,600 | |
| José Antonio Álvarez | 10,500 | | 11,215 | |
| Total | 43,759 | | 45,340 | |
The insured capital has been modified in 2018 for Ana Botín as part of the pension systems transformation set out in note 5.c) above, which has encompassed the elimination of the supplementary benefits systems (death of spouse and death of parent) and the increase of the life and accident insurance annuities.
During 2025 and 2024, the Group has disbursed a total amount of EUR 8.3 million and EUR 13.5 million, respectively, for the payment of civil-liability insurance premiums. These premiums correspond to several civil-liability insurance policies that hedge, among others, directors, senior management and other managers and employees of the Group and the Bank itself, as well as its subsidiaries, in light of certain types of potential claims of third parties. For this reason, it is not possible to disaggregate or individualize the amount that correspond to the directors and executives.
As of 31 December 2025 and 2024, no life insurance commitments exist for the Group in respect of any other directors.
e) Deferred variable remuneration systems
The following information relates to the maximum number of shares to which the executive directors are entitled at the beginning and end of 2025 and 2024 due to their participation in the deferred variable remuneration systems, which instrumented a portion of their variable remuneration relating to 2025 and prior years, as well as on the deliveries, in shares or in cash, made to them in 2025 and 2024 once the conditions for the receipt thereof had been met (see Note 46):
i) Deferred variable compensation plan linked to multiannual objectives
In the annual shareholders meeting of 18 March 2016, with the aim of simplifying the remuneration structure, improving the ex-ante risk adjustment and increasing the incidence of long-term objectives, the bonus plan (deferred and conditioned variable compensation plan) and ILP were replaced by one single plan.
The variable remuneration of executive directors and certain executives (including senior management) corresponding to 2025 has been approved by the board of directors and implemented through the tenth cycle of the deferred variable remuneration plan linked to multi-year objectives. The application of the plan was authorised by the annual general meeting of shareholders, as it entails the delivery of shares to the beneficiaries.
As indicated in section a.ii of this note, 60% of the variable remuneration amount is deferred over five years for executive directors, to be paid, where appropriate, provided that the conditions of permanence in the Group, according to the following accrual scheme:
•The accrual of the first and second parts (instalments in 2027 and 2028) is conditional on none of the malus clauses being triggered.
•The accrual of the third, fourth and fifth parts (instalments in 2029, 2030 and 2031) is linked to non-concurrence of malus clauses and the fulfilment of certain objectives related to the 2025‑ 2027 period. These objectives and their respective weights are:
–Banco Santander’s consolidated Return on tangible equity (RoTE) target in 2027 (weight of 30%).
–Relative performance of Banco Santander's total shareholder return (TSR) in 2025-2027 in respect of the weighted TSR of a peer group comprising 9 credit institutions, with the appropriate TSR ratio based on the group’s TSR among its peers (weight of 50%).
–Four sustainability metrics, which have different weighting (with a total weight of 20%).
The degree of compliance with the above objectives determines the percentage to be applied to the deferred amount in these three annuities, with a maximum achievement ratio of 125%, so executives have the incentive to exceed their targets.
Both the immediate payment and the two first deferrals (short-term part) are paid 50% in cash and the remaining 50% in instruments. The last three deferrals (conditioned to long-term metrics) are paid 25% in cash and 75% in instruments.
The accrual of deferred amounts (whether or not subject to performance measures) is conditioned, in addition to the permanence of the beneficiary in the Group, to non-occurrence, during the period prior to each of the deliveries, of any the circumstances giving rise to the application of malus as set out in the Group’s remuneration policy in its chapter related to malus and clawback. Likewise, the amounts already paid of the incentive will be subject to clawback by the Bank in the cases and during the term foreseen in said policy, and in accordance with the terms and conditions foreseen in it.
Malus and clawback clauses are triggered by poor financial performance of Banco Santander, a division or area, or exposures from staff as a result of an executive(s)’s management of, at least, one of these factors:
i.Significant failures in risk management committed by the entity, or by a business unit or risk control.
ii.The increase suffered by the entity or by a business unit of its capital needs, not foreseen at the time of generation of the exposures.
iii.Regulatory sanctions or judicial sentences from events that could be attributable to the unit or the personnel responsible for those. Also, the breach of internal codes of conduct of the entity.
iv.Irregular conduct, whether individual or collective. In this regard, the negative effects derived from the marketing of inappropriate products and the responsibilities of the people or bodies that made those decisions will be specially considered.
In addition to the existing policy on malus and clawback clauses of our remuneration policy, the addendum to our remuneration policy entitled 'Financial Statement Restatement Compensation' regulates the recoupment of compensation received by the executive directors of Banco Santander, S.A., and senior management, in the event of a financial restatement (according to the regulation) resulting from material noncompliance with financial reporting requirements under US federal securities laws.
The maximum amount of shares to be delivered under the plan is within the maximum amount of the award to be delivered in shares (EUR 11.5 million) approved at the 2025 AGM for executive directors. At its meeting on 25 November 2025 and pursuant to the powers granted by shareholders at the 2025 AGM, the board agreed to amend the calculation period used to determine the number of shares to be delivered from 50 to 30 trading sessions (under no circumstances may the number of shares exceed the maximum approved at the AGM), as the board considered that this better reflects market practice and enables us to offset share price volatility. Thus, the number of shares to be delivered under the 2025 policy has been calculated with the weighted average daily volume of weighted average listing prices of Banco Santander shares in the 30 trading sessions prior to the Friday (not inclusive) before 4 February 2025 (the date on which the board approved the 2025 bonus for executive directors), which was EUR 10.261 per share. According to an independent experts' valuation, the price per PagoNxt, S.L. RSU equals EUR 61.07.
ii) Shares assigned by deferred variable remuneration plans
The following table shows the number of Santander shares assigned to each director already in service and pending delivery as of 1 January 2024, 31 December 2024 and 31 December 2025, as well as the gross shares that were delivered to them in 2024 and 2025, either in the form of an immediate payment or a deferred payment. In this case after having been appraised by the board, at the proposal of the remuneration committee, that the corresponding one-fifth of each plan had accrued. They come from the deferred conditional and linked to multi-year objectives in 2019, 2020, 2021, 2022, 2023, 2024 and 2025 were formalized.
| | | | | | | | | | | | | | | | | | | | | | | |
| Share-based variable remuneration | | | | | | | |
| Maximum number of shares to be delivered at January 1,2024 | Shares delivered in 2024 (immediate payment 2023 variable remuneration) | Shares delivered in 2024 (deferred payment 2022 variable remuneration) | Shares delivered in 2024 (deferred payment 2021 variable remuneration) | Shares delivered in 2024 (deferred payment 2020 variable remuneration) | Shares delivered in 2024 (deferred payment 2019 variable remuneration) | Variable remuneration 2024 (Maximum number of shares to be delivered) |
| 2019 variable remuneration | | | | | | | |
| Ana Botín | 70,905 | | — | | — | | — | | — | | (35,452) | | — | |
| José Antonio Álvarez | 47,386 | | — | | — | | — | | — | | (23,693) | | — | |
| 118,290 | | — | | — | | — | | — | | (59,145) | | — | |
2020 variable remuneration | | | | | | | |
| Ana Botín | 93,146 | | — | | — | | — | | (31,049) | | — | | — | |
| José Antonio Álvarez | 50,594 | | — | | — | | — | | (16,865) | | — | | — | |
| 143,740 | | — | | — | | — | | (47,914) | | — | | — | |
2021 variable remuneration | | | | | | | |
| Ana Botín | 710,698 | | — | | — | | (177,675) | | — | | — | | — | |
| José Antonio Álvarez | 479,644 | | — | | — | | (119,911) | | — | | — | | — | |
| 1,190,342 | | — | | — | | (297,586) | | — | | — | | — | |
2022 variable remuneration | | | | | | | |
| Ana Botín | 358,419 | | — | | (62,334) | | — | | — | | — | | — | |
| José Antonio Álvarez | 241,954 | | — | | (42,079) | | — | | — | | — | | — | |
| 600,374 | | — | | (104,413) | | — | | — | | — | | — | |
2023 variable remuneration | | | | | | | |
| Ana Botín | 1,127,209 | | (469,286) | | — | | — | | — | | — | | — | |
Héctor Grisi | 749,143 | | (321,645) | | — | | — | | — | | — | | — | |
| 1,876,352 | | (790,931) | | — | | — | | — | | — | | — | |
2024 variable remuneration | | | | | | | |
| Ana Botín | — | | — | | — | | — | | — | | — | | 976,463 | |
Héctor Grisi | — | | — | | — | | — | | — | | — | | 656,033 | |
| — | | — | | — | | — | | — | | — | | 1,632,496 | |
2025 variable remuneration1 | | | | | | | |
| Ana Botín | — | | — | | — | | — | | — | | — | | — | |
| Héctor Grisi | — | | — | | — | | — | | — | | — | | — | |
| — | | — | | — | | — | | — | | — | | — | |
1.For each director, 40% of the shares indicated correspond to the short-term variable (or immediate payment). The remaining 60% is deferred for delivery, where appropriate, in the next five years, the last three being subject to the fulfilment of multiannual objectives. Maximum opportunity subject to regulatory ratio compliance.
| | | | | | | | | | | | | | | | | | | | | | | | | | | | | |
| | | | | | | | | |
| Maximum number of shares to be delivered at December 31, 2024 | Instruments matured but not consolidated at January 1, 20252 | Shares delivered in 2025 (immediate payment 2024 variable remuneration) | Shares delivered in 2025 (deferred payment 2023 variable remuneration) | Shares delivered in 2025 (deferred payment 2022 variable remuneration) | Shares delivered in 2025 (deferred payment 2021 variable remuneration) | Shares delivered in 2025 (deferred payment 2020 variable remuneration) | Shares delivered in 2025 (deferred payment 2019 variable remuneration) | Variable remuneration 2025 (Maximum number of shares to be delivered) | Maximum number of shares to be delivered at December 31, 2025 |
| | | | | | | | | |
| 35,452 | | — | | — | | — | | — | | — | | — | | (35,452) | | — | | — | |
| 23,693 | | — | | — | | — | | — | | — | | — | | (23,693) | | — | | — | |
| 59,145 | | — | | — | | — | | — | | — | | — | | (59,145) | | — | | — | |
| | | | | | | | | |
| 62,097 | | — | | — | | — | | — | | — | | (31,049) | | — | | — | | 31,048 | |
| 33,729 | | — | | — | | — | | — | | — | | (16,865) | | — | | — | | 16,864 | |
| 95,826 | | — | | — | | — | | — | | — | | (47,914) | | — | | — | | 47,912 | |
| | | | | | | | | |
| 533,023 | | (44,774) | | — | | — | | — | | (162,750) | | — | | — | | — | | 325,499 | |
| 359,733 | | (30,218) | | — | | — | | — | | (109,838) | | — | | — | | — | | 219,677 | |
| 892,756 | | (74,992) | | — | | — | | — | | (272,588) | | — | | — | | — | | 545,176 | |
| | | | | | | | | |
| 296,085 | | — | | — | | — | | (62,334) | | — | | — | | — | | — | | 233,751 | |
| 199,875 | | — | | — | | — | | (42,079) | | — | | — | | — | | — | | 157,796 | |
| 495,961 | | — | | — | | — | | (104,413) | | — | | — | | — | | — | | 391,548 | |
| | | | | | | | | |
| 657,923 | | — | | — | | (114,421) | | — | | — | | — | | — | | — | | 543,502 | |
| 427,498 | | — | | — | | (74,347) | | — | | — | | — | | — | | — | | 353,151 | |
| 1,085,421 | | — | | — | | (188,768) | | — | | — | | — | | — | | — | | 896,653 | |
| | | | | | | | | |
| 976,463 | | — | | (404,447) | | — | | — | | — | | — | | — | | — | | 572,016 | |
| 656,033 | | — | | (279,480) | | — | | — | | — | | — | | — | | — | | 376,553 | |
| 1,632,496 | | — | | (683,927) | | — | | — | | — | | — | | — | | — | | 948,569 | |
| | | | | | | | | |
| — | | — | | — | | — | | — | | — | | — | | — | | 602,746 | | 602,746 | |
| — | | — | | — | | — | | — | | — | | — | | — | | 408,159 | | 408,159 | |
| — | | — | | — | | — | | — | | — | | — | | — | | 1,010,904 | | 1,010,904 | |
2.The levels of achievement of the multi-year metrics of the long-term variable remuneration plans:
1) Seventh cycle of the deferred multi-year objectives variable remuneration plan (2022): 115.2% of achievement for the period 2022-2024.
a. RoTE metric for 2024 year-end period at 150%. Weight of 40.0%.
b. Relative TSR metric in 2022-2024 period at 83% of achievement. Weight of 40.0%.
c. Sustainability metrics at 25% of achievement. Weight of 20.0%.
2) Sixth cycle of the deferred multi-year objectives variable remuneration plan (2021): 91.6% of achievement for the period 2021-2023.
a. CET1 metric at 100% of achievement for 2023 year-end period (target 12.00%). Weight of 33.3%.
b. Underlying BPA growth at 150% of achievement (target growth of 100%). Weight of 33.3%.
c. TSR metric at 25% of achievement (target of 33 to 66 percentile). Weight of 33.3%.
3) Fifth cycle of the deferred multi-year objectives variable remuneration plan (2020): 83.0% of achievement for the period 2020-2022.
a. CET1 metric at 100% of achievement for 2022 year-end period (target 12.00%). Weight of 33.3%.
b. Underlying BPA growth at 150% of achievement (target growth of 10%). Weight of 33.3%.
c. TSR metric at 0% of achievement (minimum target of 33% not reached). Weight of 33.3%
Furthermore, the maximum number of RSUs of PagoNxt, S.L. to be delivered under the current plan (and subject to regulatory ratio compliance) is 9,415 and 7,909 units for Ana Botín and Héctor Grisi, respectively.
In addition, the table below shows the cash delivered in 2025 and 2024, by way of either immediate payment or deferred payment, in the latter case once the Board had determined, at the proposal of the remuneration committee, that one deferral relating to each plan had accrued:
| | | | | | | | | | | | | | | | | |
| EUR thousand | |
| 2025 | | 2024 |
| Cash paid (immediate payment 2024 variable remuneration) | Cash paid (deferred payments from 2023, 2022, 2021 and 2020 variable remuneration) | | Cash paid (immediate payment 2023 variable remuneration) | Cash paid (deferred payments from 2022, 2021, 2020 and 2019 variable remuneration) |
| Ana Botín | 1,851 | 1,759 | | 1,780 | 1,419 |
| Héctor Grisi | 1,279 | 366 | | 1,220 | 863 |
| José Antonio Álvarez | — | 815 | | — | 945 |
| Total | 3,130 | 2,940 | | 3,000 | 3,228 |
iii) Information on former members of the board of directors
The chart below includes information on the maximum number of shares to which former members of the board of directors, are entitled for their participation in the various deferred variable remuneration systems, which instrumented a portion of their variable remuneration relating to the years in which they were executive directors. Also set forth below is information on the deliveries, whether in shares or in cash, made in 2025 and 2024 to former board members, upon achievement of the conditions for the receipt thereof (see note 46):
| | | | | | | | |
| Maximum number of shares to be delivered | | |
| 2025 | | 2024 | |
| Deferred conditional variable remuneration plan and linked to objectives (2019) | — | 24,490 |
| Deferred conditional variable remuneration plan and linked to objectives (2020) | 35,511 | 71,024 |
| Deferred conditional variable remuneration plan and linked to objectives (2021) | 137,400 | 206,100 |
| | | | | | | | |
| Number of shares delivered | | |
| 2025 | | 2024 | |
| Deferred conditional variable remuneration plan and linked to objectives (2018) | — | 29,860 |
| Deferred conditional variable remuneration plan and linked to objectives (2019) | 24,490 | 24,490 |
| Deferred conditional variable remuneration plan and linked to objectives (2020) | 35,512 | 35,512 |
| Deferred conditional variable remuneration plan and linked to objectives (2021) | 68,700 | 12,911 |
In addition, EUR 724 thousand and EUR 650 thousand relating to the deferred portion payable in cash of the aforementioned plans were paid each in 2025 and 2024.
f) Loans
Grupo Santander’s direct risk exposure to the bank’s directors and the guarantees provided for them are detailed below. These transactions were made on terms equivalent to those that prevail in arm’s-length transactions or the related compensation in kind was recognized:
| | | | | | | | | | | | | | | | | | | | | | | |
| EUR thousand |
| 2025 | | 2024 |
| Loans and credits | Guarantees | Total | | Loans and credits | Guarantees | Total |
| Ana Botín | 3 | | — | | 3 | | | — | | — | | — | |
| Héctor Grisi | — | | — | | — | | | — | | — | | — | |
| José Antonio Álvarez | — | | — | | — | | | — | | — | | — | |
| Glenn Hutchins | — | | — | | — | | | — | | — | | — | |
Antonio Francesco Weiss B | — | | — | | — | | | — | | — | | — | |
| Belén Romana | — | | — | | — | | | — | | — | | — | |
Bruce Carnegie-Brown A | — | | — | | — | | | — | | — | | — | |
| Germán de la Fuente | — | | — | | — | | | — | | — | | — | |
| Gina Díez Barroso | — | | — | | — | | | 5 | | — | | 5 | |
| Henrique de Castro | — | | — | | — | | | — | | — | | — | |
| Homaira Akbari | — | | — | | — | | | — | | — | | — | |
| Javier Botín | — | | — | | — | | | — | | — | | — | |
Juan Carlos Barrabés C | 137 | | — | | 137 | | | 138 | | — | | 138 | |
| Luis Isasi | — | | — | | — | | | — | | — | | — | |
| Pamela Walkden | — | | — | | — | | | — | | — | | — | |
Ramiro Mato D | — | | — | | — | | | — | | — | | — | |
| Sol Daurella | — | | — | | — | | | — | | — | | — | |
| 140 | | — | | 140 | | | 143 | | — | | 143 | |
A.Ceased as director of Banco Santander, S.A. on 22 March 2024.
B.Director since 27 June 2024.
C.Director since 27 June 2024.
D.Ceased as director of Banco Santander, S.A. on 27 June 2024 .
g) Senior management
The table below includes the amounts relating to the short-term remuneration of the members of senior management at 31 December 2025 and those at 31 December 2024, excluding the remuneration of the executive directors, which is detailed above.
| | | | | | | | | | | | | | | | | | | | | | | | | | | | | | | | |
| EUR thousand |
| | Short-term salaries and deferred remuneration | | | |
| | | Variable remuneration (bonus) - Immediate payment | | Deferred variable remuneration | | | |
| Year | Number of
persons | Fixed | In cash | In instruments2 | | In cash | In instruments3 | Pensions | Other
remuneration1 | Total |
| 2025 | 15 | 19,255 | 9,179 | 9,180 | | 4,306 | 4,306 | 4,910 | 6,456 | 57,592 |
| 2024 | 14 | 16,466 | 7,376 | 7,377 | | 3,319 | 3,320 | 4,520 | 7,153 | 49,531 |
1.Includes other remuneration items such as life and medical insurance premiums and localization aids and lastly RSUs from PagoNxt S.L., for the work of one director in said entity.2. The amount of immediate payment for 2024 is 894,587 shares (1,611,965 Santander shares in 2024).
3. The deferred amount in instruments not linked to long-term objectives for 2024 is 416,410 shares ( 725,399 Santander shares in 2024).
In addition to the amounts reflected in the table, salary remunerations amounting to EUR 4,118 thousand were granted in the form of buyouts and sign-on awards, related to the recruitment of new members who joined this employee group during the year.
In 2025, the ratio of variable to fixed pay components was 134% of the total for senior managers, well within the maximum limit of 200% set by 2024 AGM.
Also, the detail of the breakdown of the remuneration linked to long-term objectives of the members of senior management at 31 December 2025 and 31 December 2024 is provided below. These remuneration payments shall be received, as the case may be, in the corresponding deferral periods, upon achievement of the conditions stipulated for each payment (see note 46):
| | | | | | | | | | | | | | |
| EUR thousand |
| | Variable remuneration subject to long-term objectives1 | |
| Year | Number of people | Cash
payment | Instrument payment | Total |
| 2025 | 15 | 4,521 | | 4,522 | | 9,043 | |
| 2024 | 14 | 3,485 | | 3,486 | | 6,971 | |
1. Relates to the fair value of the maximum annual amounts for years 2029, 2030 and 2031 of the tenth cycle of the deferred conditional variable remuneration plan (2028, 2029 and 2030 for the ninth cycle of the deferred variable compensation plan linked to annual objectives for the year 2024). The face value of the three aforementioned deferred amounts is EUR 12,919 thousand for 2025.
Additionally, members of senior management who stepped down from their roles in 2025 consolidated salary remuneration and other remuneration for a total amount of EUR 2,905 thousand (EUR 12,303 thousand in 2024). In 2025 rights regarding variable
pay subject to long-term objectives amounted to EUR 342 thousand (EUR 633 thousand were generated in 2024 for this collective).
The maximum number of Santander shares that the members of senior management at each plan grant date (excluding executive directors) were entitled to receive as of 31 December 2025 and 31 December 2024 relating to the deferred portion under the various plans then in force is the following (see note 46):
| | | | | | | | |
| Maximum number of shares to be delivered |
| 2025 | 2024 |
| Deferred conditional variable remuneration plan and linked to objectives (2019) | — | | 71,294 | |
| Deferred conditional variable remuneration plan and linked to objectives (2020) | 145,704 | | 370,522 | |
| Deferred conditional variable remuneration plan and linked to objectives (2021) | 486,863 | | 966,680 | |
| Deferred conditional variable remuneration plan and linked to objectives (2022) | 891,305 | | 1,430,464 | |
| Deferred conditional variable remuneration plan and linked to objectives (2023) | 934,609 | | 1,395,815 | |
| Deferred conditional variable remuneration plan and linked to objectives (2024) | 1,601,213 | | — | |
Since the conditions established in the corresponding deferred share-based remuneration schemes for prior years had been met, the following number of Santander shares was delivered in 2025 and 2024 to the senior management, in addition to the payment of the related cash amounts:
| | | | | | | | |
| Number of shares delivered |
| 2025 | 2024 |
| Deferred conditional variable remuneration plan and linked to objectives (2018) | — | | 57,730 | |
| Deferred conditional variable remuneration plan and linked to objectives (2019) | 54,249 | | 71,294 | |
| Deferred conditional variable remuneration plan and linked to objectives (2020) | 145,704 | | 185,261 | |
| Deferred conditional variable remuneration plan and linked to objectives (2021) | 243,433 | | 351,777 | |
| Deferred conditional variable remuneration plan and linked to objectives (2022) | 266,390 | | 357,615 | |
| Deferred conditional variable remuneration plan and linked to objectives (2023) | 233,652 | | 1,212,984 | |
| Deferred conditional variable remuneration plan and linked to objectives (2024) | 1,399,679 | | — | |
As indicated in note 5.c above, senior management participate in the benefit system created in 2012, which covers the contingencies of retirement, disability and death. Banco Santander makes annual contributions to the benefit plans of its senior managers. In 2012, the contracts of the senior managers with benefit pension commitments were amended to transform them into a contribution system. The system, which is outsourced to Santander Seguros y Reaseguros, Compañía Aseguradora, S.A., gives senior managers the right to receive benefits upon retirement, regardless of whether or not they are active at Banco Santander at such time, based on contributions to the system. This new system replaced their previous right to receive a pension supplement in the event of retirement. In the event of pre-retirement, and up to the retirement date, senior managers appointed prior to September 2015 are entitled to receive an annual allowance.
In addition, further to applicable remuneration regulations, from 2016 (inclusive), a discretionary pension benefit component of at least 15% of total remuneration in contributions to the pension system has been included. Under the regime corresponding to these discretionary benefits, the contributions that are calculated on variable remunerations are subject to malus and clawback clauses, subject to policies applicable at each time, and during the same period in which the variable remuneration is deferred.
Likewise, the annual contributions calculated on variable remunerations must be invested in Bank shares for a period of five years from the date that the senior manager leaves the Group, regardless of whether or not they leave to retire. Once that period has elapsed, the amount invested in shares will be reinvested, along with the remainder of the cumulative balance corresponding to the senior manager, or it will be paid to the senior manager or to their beneficiaries in the event of a contingency covered by the benefits system.
The contracts of some members of senior management were modified at the beginning of 2018 with the same objective and changes indicated in section c of this note for Ana Botín. The modifications, which are aimed at aligning the annual contributions with the practices of comparable institutions and reducing the risk of future obligations by eliminating the supplementary scheme for death (widowhood and orphanhood) and permanent disability in service without increasing the costs to the bank, are as follows:
•Contributions to the pensionable bases were reduced. Gross annual salaries were increased in the corresponding amount.
•The death and disability supplementary benefits were eliminated since 1 January 2018 for some members of senior management and since 1 April 2018 for executive directors. A fixed remuneration supplement reflected in other remuneration in the table above was implemented on the same date.
•The amounts insured for life and accident insurance were increased.
All of the above was done without an increase in total cost for the Bank.
The balance as of 31 December 2025 in the pension system for those who were part of senior management at year end amounted to EUR 51 million (EUR 51 million at 31 December 2024).
The net charge to income corresponding to pension amounted to EUR 4.9 million in 2025 (EUR 4.5 million in 31 December 2024).
In 2025 and 2024 there have been no payments in the form of a single payment of the annual voluntary pre-retirement allowance.
Additionally, the capital insured by life and accident insurance at 31 December 2025 of this group amounts to EUR 78 million (EUR 83 million at 31 December 2024).
h) Post-employment benefits to former directors and former senior executive vice presidents
The post-employment benefits and settlements paid in 2025 to former directors of the Bank, other than those detailed in note 5.c amounted to EUR 5.6 million and EUR 5.6 million in 2024, respectively. Also, the post-employment benefits and settlements paid in 2025 to former executive vice presidents amounted to EUR 16 million and EUR 12.7 million in 2024, respectively.
Contributions to insurance policies that hedge pensions to previous members of the Bank’s board of directors, amounted to EUR 0.17 million in 2025 (EUR 0.17 million in 2024). Likewise, contributions to insurance policies that hedge pensions for previous senior managers amounted to EUR 1.3 million in 2025 (EUR 2.3 million in 2024).
No releases or charges were recorded in the consolidated income statement for pension commitments and similar obligations held by the Group with previous former members of the bank's board of directors or former members of senior management in 2025 and 2024.
In addition, 'Provisions - Pension Fund and similar obligations' in the consolidated balance sheet as at 31 December 2025 included EUR 43 million in respect of the post-employment benefit obligations to former Directors of the Bank (EUR 46 million at 31 December 2024) and EUR 108 million corresponding to former members of senior management (EUR 96 million at 31 December 2024).
i) Pre-retirement and retirement
The board of directors approved an amendment to the contracts of executive directors whereby they ceased to have the right to pre-retire in case of termination of his contract.
j) Contract termination
The executive directors and members of senior management have indefinite-term employment contracts. Executive directors or senior managers whose contracts are terminated voluntarily or due to breach of duties are not entitled to receive any economic compensation. If Banco Santander terminates the contract for any other reason, they will be entitled to the corresponding legally-stipulated termination benefit, without prejudice to any compensation that may for non-competition obligations, as detailed in the directors' remuneration policy.
If Banco Santander were to terminate her contract, Ana Botín would have to remain at Banco Santander’s disposal for a period of 4 months in order to ensure an adequate transition, and would receive her fixed salary during that period.
k) Information on investments held by the directors in other companies and conflicts of interest
None of the members of the board of directors have declared that they or persons related to them may have a direct or indirect conflict of interest with the interests of Banco Santander, S.A., as set forth in article 229 of the Corporate Enterprises Act.
6. Loans and advances to central banks and credit institutions
The detail, by classification, type and currency, of Loans and advances to central banks and credit institutions in the consolidated balance sheets is as follows:
| | | | | | | | | | | |
| EUR million |
| CENTRAL BANKS | 2025 | 2024 | 2023 |
| Classification | | | |
| Financial assets held for trading | 14,632 | 12,966 | 17,717 |
Non-trading financial assets mandatorily at
fair value through profit or loss | — | — | — |
| Financial assets designated at fair value through profit or loss | — | — | — |
Financial assets designated at fair value
through other comprehensive income | — | — | — |
| Financial assets at amortised cost | 15,986 | 16,179 | 20,082 |
| 30,618 | 29,145 | 37,799 |
| Type | | | |
| Time deposits | 15,986 | 16,179 | 17,747 |
| Reverse repurchase agreements | 14,632 | 12,966 | 20,052 |
| Impaired assets | — | — | — |
| Valuation adjustments for impairment | — | — | — |
| 30,618 | 29,145 | 37,799 |
| CREDIT INSTITUTIONS | | | |
| Classification | | | |
| Financial assets held for trading | 25,967 | 27,314 | 14,061 |
Non-trading financial assets mandatorily at
fair value through profit or loss | — | — | — |
| Financial assets designated at fair value through profit or loss | 413 | 408 | 459 |
Financial assets designated at fair value
through other comprehensive income | 1,120 | 363 | 313 |
| Financial assets at amortised cost | 61,513 | 55,537 | 57,917 |
| 89,013 | 83,622 | 72,750 |
| Type | | | |
| Time deposits | 10,665 | 9,036 | 8,560 |
| Reverse repurchase agreements | 52,365 | 48,932 | 35,846 |
| Non- loans advances | 25,987 | 25,659 | 28,353 |
| Impaired assets | — | — | — |
| Valuation adjustments for impairment | (4) | (5) | (9) |
| 89,013 | 83,622 | 72,750 |
| CURRENCY | | | |
| Euro | 43,697 | 43,347 | 34,229 |
| Pound sterling | 5,147 | 2,424 | 3,539 |
| US dollar | 23,320 | 22,539 | 17,602 |
| Brazilian real | 43,577 | 39,379 | 47,151 |
| Other currencies | 3,890 | 5,078 | 8,028 |
| TOTAL | 119,631 | 112,767 | 110,549 |
The loans and advances to credit institutions classified under 'Financial assets at amortised' cost are mainly time accounts and deposits.
Note 51 contains a detail of their residual maturity periods.
This line item also includes irrevocable payment commitments to the Single Resolution Fund made in accordance with article 70.3 of Regulation 806/2014, which establishes uniform rules and a uniform procedure for the resolution of credit institutions and certain security service companies. investment within the framework of a Single Resolution Mechanism and a Single Resolution Fund, for which, in accordance with the standard, no provision has been recorded, these commitments have not been significant regarding the consolidated annual accounts.
At 31 December 2025 the gross exposure by impairment stage of the assets accounted subject to impairment for amounts to EUR 78,623 million, EUR 0 million and EUR 0 million (EUR 72,084, EUR 0 million and EUR 0 million in 2024 and EUR 78,321 million, EUR 0 million and EUR 0 million in 2023), and the loan loss provision by impairment stage amounts to EUR 4 million, EUR 0 million and EUR 0 million (EUR 5 million, EUR 0 million and EUR 0 million in 2024 and EUR 9 million, EUR 0 million and EUR 0 million in 2023) in stage 1, stage 2 and stage 3, respectively.
7. Debt securities
a) Detail
The detail, by classification, type and currency, of Debt securities in the consolidated balance sheets is as follows:
| | | | | | | | | | | |
| EUR million | |
| 2025 | 2024 | 2023 |
| Classification | | | |
| Financial assets held for trading | 98,568 | | 82,646 | | 62,124 | |
| Non-trading financial assets mandatorily at fair value through profit or loss | 245 | | 447 | | 860 | |
| Financial assets designated at fair value through profit or loss | 2,894 | | 2,897 | | 3,095 | |
| Financial assets designated at fair value through other comprehensive income | 58,305 | | 76,558 | | 73,565 | |
| Financial assets at amortised cost | 140,014 | | 120,949 | | 103,559 | |
| 300,026 | | 283,497 | | 243,203 | |
| Type | | | |
| Spanish government debt securities | 63,742 | | 56,919 | | 40,321 | |
| Foreign government debt securities | 172,468 | | 164,747 | | 145,732 | |
| Issued by financial institutions | 17,465 | | 16,776 | | 14,681 | |
| Other fixed-income securities | 46,029 | | 44,703 | | 42,294 | |
| Impaired financial assets | 842 | | 701 | | 461 | |
| Impairment losses | (520) | | (349) | | (286) | |
| 300,026 | | 283,497 | | 243,203 | |
| Currency | | | |
| Euro | 142,969 | | 118,456 | | 90,857 | |
| Pound sterling | 14,114 | | 15,630 | | 9,284 | |
| US dollar | 50,671 | | 48,189 | | 38,161 | |
| Brazilian real | 48,231 | | 44,432 | | 46,190 | |
| Other currencies | 44,561 | | 57,139 | | 58,997 | |
| Debt securities excluding impairment adjustments | 300,546 | | 283,846 | | 243,489 | |
| Impairment losses | (520) | | (349) | | (286) | |
| 300,026 | | 283,497 | | 243,203 | |
The increase in the year of the debt securities portfolio under the heading 'Financial assets at fair value with changes in other comprehensive income' is mainly due to the increase in exposure to sovereign debt, as a result of greater activity in the markets business, both its own and for distribution to clients.
Likewise, the increase in the debt securities portfolio under the heading 'Financial assets at amortized cost' is due to the continuation of the strategy started in year 2022 in which two new business models were created for the optimization of excess liquidity and the management of the maturity of the balance sheet credit and deposit portfolios.
At 31 December 2025, 2024 and 2023 the gross exposure by impairment stage of the book assets amounted to EUR 196,509 million, EUR 196,514 million and EUR 176,697 million in stage 1; EUR 1,480 million, EUR 597 million and EUR 203 million in stage 2, and EUR 842 million, EUR 701 million and EUR 461 million in stage 3, respectively.
In addition, at 31 December 2025, the Group had EUR 8 million (EUR 44 million at 31 December 2024) of exposure in assets purchased with impairments, which correspond mainly to the business combinations carried out by the Group with any additional impairment signs.
b) Breakdown
The breakdown, by origin of the issuer, of debt securities at 31 December 2025, 2024 and 2023, net of impairment losses, is as follows:
| | | | | | | | | | | | | | | | | | | | | | | | | | | | | | | | | | | | | | | | | | | | |
| EUR million |
| 2025 | | 2024 | | 2023 |
| Private fixed-income | Public fixed-income | Total | % | | Private fixed-income | Public fixed-income | Total | % | | Private fixed-income | Public fixed-income | Total | % |
| Spain | 2,528 | | 63,742 | | 66,270 | | 22.09 | % | | 1,901 | | 56,919 | | 58,820 | | 20.75 | % | | 2,525 | | 40,321 | | 42,846 | | 17.62 | % |
| United Kingdom | 2,336 | | 9,227 | | 11,563 | | 3.85 | % | | 3,077 | | 9,903 | | 12,980 | | 4.58 | % | | 2,816 | | 4,748 | | 7,564 | | 3.11 | % |
| Portugal | 3,212 | | 5,627 | | 8,839 | | 2.95 | % | | 3,224 | | 5,138 | | 8,362 | | 2.95 | % | | 2,826 | | 4,815 | | 7,641 | | 3.14 | % |
| Italy | 2,821 | | 24,215 | | 27,036 | | 9.01 | % | | 3,072 | | 22,954 | | 26,026 | | 9.18 | % | | 2,968 | | 12,945 | | 15,913 | | 6.54 | % |
| Ireland | 4,239 | | 42 | | 4,281 | | 1.43 | % | | 4,557 | | 14 | | 4,571 | | 1.61 | % | | 5,632 | | 11 | | 5,643 | | 2.32 | % |
| Poland | 22 | | 1,465 | | 1,487 | | 0.50 | % | | 2,472 | | 15,224 | | 17,696 | | 6.24 | % | | 2,937 | | 12,482 | | 15,419 | | 6.34 | % |
| Other European countries | 12,682 | | 25,894 | | 38,576 | | 12.86 | % | | 11,593 | | 12,702 | | 24,295 | | 8.57 | % | | 9,797 | | 15,495 | | 25,292 | | 10.40 | % |
| United States | 14,941 | | 29,199 | | 44,140 | | 14.71 | % | | 12,475 | | 27,811 | | 40,286 | | 14.21 | % | | 8,959 | | 22,992 | | 31,951 | | 13.14 | % |
| Brazil | 13,518 | | 33,908 | | 47,426 | | 15.81 | % | | 12,738 | | 32,645 | | 45,383 | | 16.01 | % | | 13,551 | | 32,342 | | 45,893 | | 18.87 | % |
| Mexico | 3,001 | | 25,113 | | 28,114 | | 9.37 | % | | 2,190 | | 20,822 | | 23,012 | | 8.12 | % | | 1,969 | | 20,738 | | 22,707 | | 9.34 | % |
| Chile | 137 | | 8,567 | | 8,704 | | 2.90 | % | | 96 | | 6,982 | | 7,078 | | 2.50 | % | | 49 | | 11,995 | | 12,044 | | 4.95 | % |
| Other American countries | 3,254 | | 5,954 | | 9,208 | | 3.07 | % | | 3,336 | | 4,502 | | 7,838 | | 2.76 | % | | 2,315 | | 2,546 | | 4,861 | | 2.00 | % |
| Rest of the world | 1,125 | | 3,257 | | 4,382 | | 1.45 | % | | 1,100 | | 6,050 | | 7,150 | | 2.52 | % | | 806 | | 4,623 | | 5,429 | | 2.23 | % |
| 63,816 | | 236,210 | | 300,026 | | 100 | % | | 61,831 | | 221,666 | | 283,497 | | 100 | % | | 57,150 | | 186,053 | | 243,203 | | 100 | % |
The detail, by issuer rating, of Debt securities at 31 December 2025, 2024 and 2023 is as follows:
| | | | | | | | | | | | | | | | | | | | | | | | | | | | | | | | | | | | | | | | | | | | |
| EUR million |
| 2025 | | 2024 | | 2023 |
| Private fixed-income | Public fixed-income | Total | % | | Private fixed-income | Public fixed-income | Total | % | | Private fixed-income | Public fixed-income | Total | % |
| AAA | 15,952 | | 9,320 | | 25,272 | | 8.42 | % | | 16,889 | | 6,440 | | 23,329 | | 8.23 | % | | 15,152 | | 7,887 | | 23,039 | | 9.47 | % |
| AA | 19,598 | | 42,451 | | 62,049 | | 20.68 | % | | 16,972 | | 47,254 | | 64,226 | | 22.65 | % | | 15,142 | | 36,704 | | 51,846 | | 21.32 | % |
| A | 13,206 | | 95,537 | | 108,743 | | 36.24 | % | | 10,056 | | 87,814 | | 97,870 | | 34.53 | % | | 11,175 | | 68,112 | | 79,287 | | 32.60 | % |
| BBB | 6,872 | | 50,066 | | 56,938 | | 18.98 | % | | 8,900 | | 44,483 | | 53,383 | | 18.83 | % | | 7,749 | | 39,173 | | 46,922 | | 19.29 | % |
| Below BBB | 5,052 | | 38,836 | | 43,888 | | 14.63 | % | | 5,543 | | 35,675 | | 41,218 | | 14.54 | % | | 4,654 | | 34,177 | | 38,831 | | 15.97 | % |
| Unrated | 3,136 | | — | | 3,136 | | 1.05 | % | | 3,471 | | — | | 3,471 | | 1.22 | % | | 3,278 | | — | | 3,278 | | 1.35 | % |
| 63,816 | | 236,210 | | 300,026 | | 100 | % | | 61,831 | | 221,666 | | 283,497 | | 100 | % | | 57,150 | | 186,053 | | 243,203 | | 100 | % |
During 2025, France's rating for sovereign issuances has been modified from AA- to A+. During 2024, Portugal's rating for sovereign issuances was modified from BBB+ to A-. For the year 2023, the distribution of the exposure by rating level of the previous table was not affected by ratings reviews of the sovereign issuers.
The detail, by type of financial instrument, of private fixed-income securities at 31 December 2025, 2024 and 2023, net of impairment losses, is as follows:
| | | | | | | | | | | |
| EUR million |
| 2025 | 2024 | 2023 |
| Securitised mortgage bonds | 10,514 | | 10,709 | | 9,310 | |
| Other asset-backed bonds | 14,073 | | 11,624 | | 10,243 | |
| Floating rate debt | 18,721 | | 17,323 | | 15,376 | |
| Fixed rate debt | 20,508 | | 22,175 | | 22,221 | |
| Total | 63,816 | | 61,831 | | 57,150 | |
c) Impairment losses
The changes in the impairment losses on debt securities are summarised below:
| | | | | | | | | | | |
| EUR million |
| 2025 | 2024 | 2023 |
| Balance at beginning of year | 349 | | 286 | | 226 | |
Net impairment losses for the yearA | 182 | | 226 | | 24 | |
| Of which: | | | |
| Impairment losses charged to income | 238 | | 234 | | 36 | |
| Impairment losses reversed with a credit to income | (56) | | (8) | | (12) | |
| Assets written off | — | | (131) | | 0 | |
| Exchange differences and other items | (11) | | (32) | | 36 | |
| Balance at end of year | 520 | | 349 | | 286 | |
| Of which: | | | |
| By geographical location of risk: | | | |
| European Union | 26 | | 23 | | 22 | |
| America | 494 | | 326 | | 264 | |
A.Of the EUR 182 million corresponding to net provisions for the year ended 31 December 2025 (EUR 226 million and EUR 24 million at 31 December 2024 and 2023, respectively), EUR 182 million relates to financial assets at amortized cost (EUR 227 million and EUR 23 million at 31 December 2024 and 2023, respectively) and EUR 0 million relates to financial assets designated at fair value through other comprehensive income (EUR -1 million and EUR 1 million at 31 December 2024 and 2023, respectively).
At 31 December 2025, 2024 and 2023 the loan loss provision by impairment stage of the assets accounted for under IFRS9 amounted to EUR 62 million, EUR 39 million and EUR 30 million in stage 1, EUR 66 million, EUR 9 million and EUR 8 million in stage 2, and EUR 392 million, EUR 301 million and EUR 248 million in stage 3, respectively.
8. Equity instruments
a) Breakdown
The detail, by classification and type, of Equity instruments in the consolidated balance sheets is as follows:
| | | | | | | | | | | |
| EUR million | |
| 2025 | 2024 | 2023 |
| Classification | | | |
| Financial assets held for trading | 22,030 | | 16,636 | | 15,057 | |
| Non-trading financial assets mandatorily at fair value through profit or loss | 5,815 | | 4,641 | | 4,068 | |
| Financial assets designated at fair value through other comprehensive income | 2,281 | | 2,193 | | 1,761 | |
| 30,126 | | 23,470 | | 20,886 | |
| Type | | | |
| Shares of Spanish companies | 5,083 | | 3,730 | | 3,540 | |
| Shares of foreign companies | 21,633 | | 17,153 | | 15,185 | |
| Shares of investment funds | 3,410 | | 2,587 | | 2,161 | |
| 30,126 | | 23,470 | | 20,886 | |
Note 29 contains a detail of the 'Other comprehensive income', recognised in equity, on 'Financial assets designated at fair value through other comprehensive income'.
b) Changes
The changes in 'Financial assets at fair value through other comprehensive income' were as follows:
| | | | | | | | | | | |
| EUR million | |
| 2025 | 2024 | 2023 |
| Balance at beginning of the year | 2,193 | | 1,761 | | 1,941 | |
| Net additions (disposals) | (81) | | (35) | | 11 | |
Changes in the fair value of equity instruments measured at fair value through other comprehensive income (EIGR)A | 245 | | 447 | | (162) | |
| Changes in the RV hedged with micro-hedging transactions | (76) | | 20 | | (29) | |
| Balance at end of year | 2,281 | | 2,193 | | 1,761 | |
A.They do not include fair value movements for currency risk hedged with hedging instruments.
c) Notifications of acquisitions of investments
The notifications of the acquisitions and disposals of holdings in investees made by the Bank in 2025, in compliance with Article 155 of the Spanish Limited Liability Companies Law and Article 105 of Spanish Securities Market Law 24/1998, are listed in appendix IV.
9. Trading derivatives (assets and liabilities) and short positions
a) Trading Derivatives
The detail, by type of inherent risk, of the fair value of the trading derivatives arranged by the Group is as follows (see note 11):
| | | | | | | | | | | | | | | | | | | | |
| EUR million |
| 2025 | 2024 | 2023 |
| Debit balance | Credit balance | Debit balance | Credit balance | Debit balance | Credit balance |
| Interest rate risk | 29,550 | | 23,728 | | 30,834 | | 24,754 | | 31,480 | | 26,014 | |
| Currency risk | 24,755 | | 20,508 | | 29,395 | | 29,110 | | 22,834 | | 23,094 | |
| Price risk | 1,858 | | 2,279 | | 1,765 | | 1,632 | | 1,279 | | 904 | |
| Other risks | 2,192 | | 5,453 | | 2,106 | | 2,257 | | 735 | | 577 | |
| 58,355 | | 51,968 | | 64,100 | | 57,753 | | 56,328 | | 50,589 | |
b) Short positions
Following is a breakdown of the short positions (liabilities):
| | | | | | | | | | | |
| EUR million |
| 2025 | 2024 | 2023 |
| Borrowed securities | | | |
| Debt instruments | 2,938 | | 2,566 | 3,263 | |
| Of which: | | | |
| Banco Santander, S.A. | 1,555 | | 1,347 | 1,383 | |
| Banco Santander México, S.A., Institución de Banca Múltiple, Grupo Financiero Santander México | 1,358 | | 1,199 | | 1,881 | |
| Equity instruments | 690 | | 538 | | 546 | |
| Of which: | | | |
| Banco Santander, S.A. | 429 | | 358 | | 312 | |
| Short sales | | | |
| Debt instruments | 40,387 | | 32,726 | | 22,365 | |
| Of which: | | | |
| Banco Santander, S.A. | 28,710 | | 23,813 | | 16,143 | |
| Banco Santander (Brasil) S.A. | 7,417 | | 5,950 | | 3,462 | |
| Santander US Capital Markets LLC | 3,396 | | 2,382 | | 2,442 | |
| 44,015 | | 35,830 | | 26,174 | |
10. Loans and advances to customers
a) Detail
The detail, by classification, of Loans and advances to customers in the consolidated balance sheets is as follows:
| | | | | | | | | | | |
| EUR million |
| 2025 | 2024 | 2023 |
| Financial assets held for trading | 32,766 | | 26,591 | | 11,634 | |
Non-trading financial assets mandatorily at fair value through
profit or loss | 1,701 | | 1,042 | | 982 | |
| Financial assets designated at fair value through profit or loss | 4,739 | | 4,610 | | 6,219 | |
| Financial assets at fair value through other comprehensive income | 12,906 | | 10,784 | | 7,669 | |
| Financial assets at amortized cost | 985,176 | | 1,011,042 | | 1,009,845 | |
| Of which: | | | |
| Impairment losses | (21,158) | | (22,125) | | (22,788) | |
| 1,037,288 | | 1,054,069 | | 1,036,349 | |
| Loans and advances to customers disregarding impairment losses | 1,058,446 | | 1,076,194 | | 1,059,137 | |
Note 51 contains a detail of the residual maturity periods of 'Financial assets at amortized cost'.
Note 54 shows the Group’s total exposure, by geographical origin of the issuer.
There are no loans and advances to customers for material amounts without fixed maturity dates.
b) Breakdown
Following is a breakdown of the loans and advances granted to the Group's customers, which reflect the Group's exposure to credit risk in its main activity, without considering the balance of value adjustments for impairment, taking into account the type and situation of the transactions, the geographical area of their residence and the type of interest rate on the transactions:
| | | | | | | | | | | |
| EUR million |
| 2025 | 2024 | 2023 |
| Loan type and status | | | |
| Commercial credit | 51,110 | | 53,209 | | 55,628 | |
| Secured loans | 530,749 | | 557,463 | | 554,375 | |
| Reverse repurchase agreements | 73,980 | | 59,648 | | 44,184 | |
| Other term loans | 295,998 | | 296,339 | | 295,485 | |
| Finance leases | 38,540 | | 40,120 | | 38,723 | |
| Receivable on demand | 10,313 | | 10,756 | | 12,277 | |
| Credit cards receivables | 26,179 | | 24,928 | | 24,371 | |
| Impaired assets | 31,577 | | 33,731 | | 34,094 | |
| 1,058,446 | | 1,076,194 | | 1,059,137 | |
| Geographical area | | | |
| Spain | 198,894 | | 198,164 | | 203,680 | |
| Rest of Europe | 467,697 | | 502,664 | | 489,706 | |
| of which United Kingdom | 258,739 | | 266,934 | | 263,808 | |
| The Americas | 374,739 | | 359,264 | | 350,873 | |
of which USA | 135,088 | | 136,054 | | 126,529 | |
| of which Brazil | 90,951 | | 91,066 | | 100,758 | |
| Rest of the world | 17,116 | | 16,102 | | 14,878 | |
| 1,058,446 | | 1,076,194 | | 1,059,137 | |
| Interest rate formula | | | |
| Fixed rate | 694,332 | | 678,994 | | 647,349 | |
| Floating rate | 364,114 | | 397,200 | | 411,788 | |
| 1,058,446 | | 1,076,194 | | 1,059,137 | |
At 31 December 2025, 2024 and 2023 the Group had granted loans amounting to EUR 18,127 million, EUR 16,562 million and EUR 15,544 million to Spanish public sector agencies which had a rating at 31 December 2025 of A (ratings of A at 31 December 2024 and 31 December 2023), and EUR 16,248 million, EUR 13,593 million, and EUR 11,530 million to the public sector in other countries (at 31 December 2025, the breakdown of this amount by issuer rating was as follows: 3.6% AAA, 26.4% AA, 25.6% A, 27.5% BBB, 16.4% below BBB and 0.5% without rating).
Without considering the public administrations, the amount of the loans and advances at 31 December 2025, 2024 and 2023 amounts to EUR 1,024,071 million, EUR 1,046,039 million and EUR 1,032,063 million, of which, EUR 954,533 million, EUR 1,012,389 million and EUR 998,010 million are classified as performing, respectively.
Following is a detail, by activity, of the loans to customers at 31 December 2025, net of impairment losses:
| | | | | | | | | | | | | | | | | | | | | | | | | | | | | | | | |
| EUR million |
| | | Secured loans |
| | | Net exposure | | Loan to value ratioC |
| Total | Without
collateral | Of which
property
collateral | Of which
other
collateral | | Less than or equal to 40% | More
than 40% and less than or equal
to 60% | More
than 60% and less than or equal
to 80% | More
than 80% and less than or equal
to 100% | More than 100% |
| Public sector | 29,607 | | 28,423 | | 153 | | 1,031 | | | 157 | | 168 | | 251 | | 334 | | 274 | |
| Other financial institutions (financial business activity) | 124,684 | | 42,687 | | 1,959 | | 80,038 | | | 2,045 | | 995 | | 424 | | 77,935 | | 598 | |
| Non-financial corporations and individual entrepreneurs (non-financial business activity) (broken down by purpose) | 318,284 | | 179,529 | | 63,124 | | 75,631 | | | 23,917 | | 26,942 | | 19,168 | | 45,306 | | 23,422 | |
| Of which: | | | | | | | | | | |
| Construction and property development | 17,118 | | 1,294 | | 15,594 | | 230 | | | 4,963 | | 6,921 | | 1,890 | | 1,164 | | 886 | |
| Civil engineering construction | 2,522 | | 1,732 | | 19 | | 771 | | | 93 | | 84 | | 39 | | 470 | | 104 | |
| Large companies | 181,870 | | 128,502 | | 17,718 | | 35,650 | | | 7,177 | | 6,666 | | 6,157 | | 25,459 | | 7,909 | |
| SMEs and individual entrepreneurs | 116,774 | | 48,001 | | 29,793 | | 38,980 | | | 11,684 | | 13,271 | | 11,082 | | 18,213 | | 14,523 | |
| Households – other (broken down by purpose) | 542,623 | | 108,903 | | 338,778 | | 94,942 | | | 100,584 | | 126,917 | | 113,075 | | 55,214 | | 37,930 | |
| Of which: | | | | | | | | | | |
| Residential | 332,931 | | 1,149 | | 331,655 | | 127 | | | 90,170 | | 116,264 | | 97,858 | | 25,944 | | 1,546 | |
| Consumer loans | 192,576 | | 104,388 | | 1,667 | | 86,521 | | | 5,909 | | 8,063 | | 13,297 | | 24,977 | | 35,942 | |
| Other purposes | 17,116 | | 3,366 | | 5,456 | | 8,294 | | | 4,505 | | 2,590 | | 1,920 | | 4,293 | | 442 | |
TotalA | 1,015,198 | | 359,542 | | 404,014 | | 251,642 | | | 126,703 | | 155,022 | | 132,918 | | 178,789 | | 62,224 | |
| Memorandum item | | | | | | | | | | |
Refinanced and restructured transactionsB | 18,151 | | 5,546 | | 6,896 | | 5,709 | | | 2,347 | | 2,381 | | 2,037 | | 2,457 | | 3,383 | |
A.In addition, the Group has granted advances to customers amounting to EUR 22,090 million, bringing the total of loans and advances to EUR 1,037,288 million.
B.Includes the net balance of the impairment of the accumulated value or accumulated losses in the fair value due to credit risk.
C.The ratio is the carrying amount of the transactions at 31 December 2025 provided by the latest available appraisal value of the collateral.
Note 54 contains information relating to the forborne loan portfolio.
Following is the movement of the gross exposure broken down by impairment stage of loans and advances to customers recognised under 'Financial assets at amortised cost' and 'Financial assets at fair value through other comprehensive income' during 2025, 2024 and 2023:
| | | | | | | | | | | | | | |
| 2025 |
| EUR million |
| Stage 1 | Stage 2 | Stage 3 | Total |
| Balance at the beginning of year | 925,413 | | 84,455 | | 33,568 | | 1,043,436 | |
| Movements | | | | |
| Transfers | | | | |
| To stage 2 from stage 1 | (39,015) | | 39,015 | | | — | |
To stage 3 from stage 1 | (12,097) | | | 12,097 | | — | |
| To stage 3 from stage 2 | | (8,266) | | 8,266 | | — | |
| To stage 1 from stage 2 | 16,079 | | (16,079) | | | — | |
| To stage 2 from stage 3 | | 1,764 | | (1,764) | | — | |
| To stage 1 from stage 3 | 441 | | | (441) | | — | |
| Net changes on financial assets | 69,819 | | (12,940) | | (4,436) | | 52,443 | |
| Write-offs | — | | — | | (13,266) | | (13,266) | |
| Exchange differences and others | (54,818) | | (6,369) | | (2,493) | | (63,680) | |
| Balance at the end of the year | 905,822 | | 81,580 | | 31,531 | | 1,018,933 | |
| | | | | | | | | | | | | | |
| 2024 |
| EUR million |
| Stage 1 | Stage 2 | Stage 3 | Total |
| Balance at the beginning of year | 929,133 | | 76,654 | | 33,821 | | 1,039,608 | |
| Movements | | | | |
| Transfers | | | | |
| To stage 2 from stage 1 | (49,316) | | 49,316 | | | — | |
To stage 3 from stage 1 | (11,517) | | | 11,517 | | — | |
| To stage 3 from stage 2 | | (10,083) | | 10,083 | | — | |
| To stage 1 from stage 2 | 21,475 | | (21,475) | | | — | |
| To stage 2 from stage 3 | | 2,358 | | (2,358) | | — | |
| To stage 1 from stage 3 | 447 | | | (447) | | — | |
| Net changes on financial assets | 43,281 | | (11,616) | | (4,889) | | 26,776 | |
| Write-offs | — | | — | | (13,212) | | (13,212) | |
| Exchange differences and others | (8,090) | | (699) | | (947) | | (9,736) | |
| Balance at the end of the year | 925,413 | | 84,455 | | 33,568 | | 1,043,436 | |
| | | | | | | | | | | | | | |
| 2023 |
| EUR million |
| Stage 1 | Stage 2 | Stage 3 | Total |
| Balance at the beginning of year | 942,861 | | 66,696 | | 32,617 | | 1,042,174 | |
| Movements | | | | |
| Transfers | | | | |
| To stage 2 from stage 1 | (43,278) | | 43,278 | | | — | |
| To stage 3 from stage 1 | (12,636) | | | 12,636 | | — | |
| To stage 3 from stage 2 | | (9,915) | | 9,915 | | — | |
| To stage 1 from stage 2 | 15,180 | | (15,180) | | | — | |
| To stage 2 from stage 3 | | 2,899 | | (2,899) | | — | |
| To stage 1 from stage 3 | 488 | | | (488) | | — | |
| Net changes on financial assets | 29,696 | | (10,673) | | (4,218) | | 14,805 | |
| Write-offs | — | | — | | (13,847) | | (13,847) | |
| Exchange differences and others | (3,178) | | (451) | | 105 | | (3,524) | |
| Balance at the end of the year | 929,133 | | 76,654 | | 33,821 | | 1,039,608 | |
In addition, at 31 December 2025, the Group had EUR 307 million (EUR 515 million at 31 December 2024 and EUR 694 million at 31 December 2023) of exposure in assets purchased with impairment of which EUR 46 million still show signs of additional impairment, which correspond mainly to the business combinations carried out by the Group.
c) Impairment losses on loans and advances to customers at amortised cost and at fair value through other comprehensive income
The changes in the impairment losses on the assets making up the balances of financial assets at amortised cost and at fair value through other comprehensive income - Loans and advances - Customers:
| | | | | | | | | | | |
| EUR million |
| 2025 | 2024 | 2023 |
| Amount at beginning of the year | 22,125 | | 22,788 | | 22,684 | |
| Impairment losses charged to income for the year | 14,144 | | 13,428 | | 13,805 | |
| Of which: | | | |
| Impairment losses charged to profit or loss | 24,935 | | 22,761 | | 20,608 | |
| Impairment losses reversed with a credit to profit or loss | (10,791) | | (9,333) | | (6,803) | |
| Change of perimeter | — | | — | | (48) | |
| Write-off of impaired balances against recorded impairment allowance | (13,266) | | (13,212) | | (13,847) | |
| Exchange differences and other changes | (1,845) | | (879) | | 194 | |
| Amount at end of the year | 21,158 | | 22,125 | | 22,788 | |
| Which correspond to: | | | |
| Impaired assets | 13,527 | | 14,088 | | 14,238 | |
| Other assets | 7,631 | | 8,037 | | 8,550 | |
| Of which: | | | |
| Individually calculated | 2,359 | | 2,258 | | 2,951 | |
| Collective calculated | 18,799 | | 19,867 | | 19,837 | |
In addition, provisions for debt securities amounting to EUR 182 million were recorded at 31 December 2025 (provisions amounting to EUR 226 million and EUR 24 million as of 31 December 2024 and 2023, respectively), written-off assets recoveries have been recorded in the year amounting to EUR 1,791 million at 31 December 2025 (EUR 1,600 million and EUR 1,587 million at 31 December 2024 and 2023, respectively).
With this, the impairment recorded in Impairment or reversal of impairment at financial assets not measured at fair value through profit or loss and net gains and losses from changes: 'Financial assets at fair value through other comprehensive income' and 'Financial assets at amortised cost (IFRS 9) and, Loans and receivables (IAS 39)'; amounts EUR 12,535 million at 31 December 2025 (EUR 12,136 million and EUR 12,298 million at 31 December 2024 and 2023, respectively).
Following is the movement of the loan loss provision broken down by impairment stage of loans and advances to customers during 2025, 2024 and 2023:
| | | | | | | | | | | | | | |
| 2025 |
| EUR million |
| Stage 1 | Stage 2 | Stage 3 | Total |
| Loss allowance at the beginning of the year | 3,293 | | 4,744 | | 14,088 | | 22,125 | |
| Transfers | | | | |
| To stage 2 from stage 1 | (847) | | 2,734 | | | 1,887 | |
| To stage 3 from stage 1 | (701) | | | 4,931 | | 4,230 | |
| To stage 3 from stage 2 | | (1,189) | | 2,760 | | 1,571 | |
| To stage 1 from stage 2 | 82 | | (466) | | | (384) | |
| To stage 2 from stage 3 | | 177 | | (344) | | (167) | |
| To stage 1 from stage 3 | 16 | | | (59) | | (43) | |
| Net changes of the exposure and modifications in the credit risk | 1,269 | | (800) | | 6,581 | | 7,050 | |
| Write-offs | — | | — | | (13,266) | | (13,266) | |
| FX and other movements | (112) | | (569) | | (1,164) | | (1,845) | |
| Loss allowance at the end of the year | 3,000 | | 4,631 | | 13,527 | | 21,158 | |
| | | | | | | | | | | | | | |
| 2024 |
| EUR million |
| Stage 1 | Stage 2 | Stage 3 | Total |
| Loss allowance at the beginning of the year | 3,596 | | 4,954 | | 14,238 | | 22,788 | |
| Transfers | | | | |
| To stage 2 from stage 1 | (626) | | 2,676 | | | 2,050 | |
| To stage 3 from stage 1 | (385) | | | 4,548 | | 4,163 | |
| To stage 3 from stage 2 | | (1,591) | | 3,444 | | 1,853 | |
| To stage 1 from stage 2 | 109 | | (725) | | | (616) | |
| To stage 2 from stage 3 | | 278 | | (693) | | (415) | |
| To stage 1 from stage 3 | 23 | | | (156) | | (133) | |
| Net changes of the exposure and modifications in the credit risk | 755 | | (704) | | 6,655 | | 6,706 | |
| Write-offs | — | | — | | (13,212) | | (13,212) | |
| FX and other movements | (179) | | (144) | | (736) | | (1,059) | |
| Loss allowance at the end of the year | 3,293 | | 4,744 | | 14,088 | | 22,125 | |
| | | | | | | | | | | | | | |
| 2023 |
| EUR million |
| Stage 1 | Stage 2 | Stage 3 | Total |
| Loss allowance at the beginning of the year | 3,626 | | 5,127 | | 13,931 | | 22,684 | |
| Transfers | | | | |
| To stage 2 from stage 1 | (696) | | 2,954 | | | 2,258 | |
| To stage 3 from stage 1 | (405) | | | 4,278 | | 3,873 | |
| To stage 3 from stage 2 | | (1,820) | | 3,721 | | 1,901 | |
| To stage 1 from stage 2 | 149 | | (905) | | | (756) | |
| To stage 2 from stage 3 | | 282 | | (920) | | (638) | |
| To stage 1 from stage 3 | 27 | | | (184) | | (157) | |
| Net changes of the exposure and modifications in the credit risk | 875 | | (557) | | 7,212 | | 7,530 | |
| Write-offs | — | | — | | (13,847) | | (13,847) | |
| FX and other movements | 20 | | (127) | | 47 | | (60) | |
| Loss allowance at the end of the year | 3,596 | | 4,954 | | 14,238 | | 22,788 | |
d) Impaired assets and assets with unpaid past-due amounts
The detail of the changes in the balance of the financial assets classified as 'Financial assets Loans to customers' considered to be impaired due to credit risk is as follows:
| | | | | | | | | | | |
| EUR million |
| 2025 | 2024 | 2023 |
| Balance at beginning of year | 33,731 | | 34,094 | | 32,888 | |
| Net additions | 13,648 | | 13,779 | | 14,944 | |
| Written-off assets | (13,266) | | (13,212) | | (13,847) | |
| Changes in the scope of consolidation | — | | 17 | | (59) | |
| Exchange differences and other | (2,536) | | (947) | | 168 | |
| Balance at end of year | 31,577 | | 33,731 | | 34,094 | |
This amount, after deducting the related allowances, represents the Group’s best estimate of the discounted value of the flows that are expected to be recovered from the impaired assets.
At 31 December 2025, the Group’s written-off assets totalled EUR 51,435 million (EUR 49,939 million and EUR 48,138 million at 31 December 2024 and 2023, respectively).
Set forth below for each class of impaired asset are the gross amount, associated allowances and information relating to the collateral and/or other credit enhancements obtained at 31 December 2025:
| | | | | | | | | | | |
| EUR million |
| Gross
amount | Allowance recognised | Estimated collateral
valueA |
| Without associated real collateral | 13,846 | | 8,133 | | — | |
| With real estate collateral | 7,777 | | 1,759 | | 5,657 | |
| With other collateral | 9,954 | | 3,635 | | 5,424 | |
| Total | 31,577 | | 13,527 | | 11,081 | |
A.Including the estimated value of the collateral associated with each loan. Accordingly, any other cash flows that may be obtained, such as those arising from borrowers’ personal guarantees, are not included.
When classifying assets in the previous table, the main factors considered by the Group to determine whether an asset has become impaired are the existence of amounts past due —assets impaired due to arrears— or other circumstances that may arise which will not result in all contractual cash flows being recovered, such as a deterioration of the borrower’s financial situation, the worsening of its capacity to generate funds or difficulties experienced by it in accessing credit.
e) Transferred credits
'Loans and advances to customers' includes, inter alia, the securitised loans transferred to third parties on which the Group has retained the risks and rewards, albeit partially, and which therefore, in accordance with the applicable accounting standards, cannot be derecognised. This is mainly due to mortgage loans, loans to companies and consumer loans in which the group retains subordinate financing and/or grants some kind of credit enhancement to new holders.
Securitisation is used as a tool for the management of regulatory capital and as a means of diversifying the Group's liquidity sources.
The breakdown of securitized loans held on the balance sheet, according to the nature of the financial instrument in which they are originated, is shown below:
| | | | | | | | | | | |
| EUR million |
| 2025 | 2024 | 2023 |
| Retained on the balance sheet | 80,072 | 80,824 | 75,738 |
| Of which | | | |
| Securitised mortgage assets | 19,640 | 17,782 | 16,994 |
| Of which: UK assets | 10,236 | 9,034 | 6,096 |
| Other securitised assets | 60,432 | 63,042 | 58,744 |
TotalA | 80,072 | | 80,824 | | 75,738 | |
A.Note 22 details the liabilities associated with these securitisation transactions.
At 31 December 2025, Grupo Santander had loans that had been fully derecognised and for which it retained servicing amounting to EUR 12,174 million (EUR 14,919 million and EUR 13,923 million at 31 December 2024 and 2023, respectively).
11. Trading derivatives
The detail of the notional amounts and the market values of the trading derivatives held by the Group in 2025, 2024 and 2023 is as follows:
| | | | | | | | | | | | | | | | | | | | | | | | | | |
| EUR million |
| 2025 | | 2024 | | 2023 |
| Notional amount | Market
value | | Notional amount | Market
value | | Notional amount | Market
value |
| Trading derivatives | | | | | | | | |
| Interest rate risk | | | | | | | | |
| Forward rate agreements | 1,995,070 | | (32) | | | 1,992,413 | | 13 | | | 829,913 | | 3 | |
| Interest rate swaps | 6,166,278 | | 6,324 | | | 6,127,812 | | 6,364 | | | 5,381,966 | | 5,514 | |
| Options, futures and other derivatives | 470,659 | | (472) | | | 377,285 | | (297) | | | 398,519 | | (51) | |
| Credit risk | | | | | | | | |
| Credit default swaps | 64,924 | | (3,135) | | | 41,111 | | (572) | | | 22,462 | | (86) | |
| Foreign currency risk | | | | | | | | |
| Foreign currency purchases and sales | 611,850 | | 1,282 | | | 514,268 | | 595 | | | 471,955 | | 33 | |
| Foreign currency options | 160,421 | | 441 | | | 221,159 | | 528 | | | 77,934 | | 288 | |
| Currency swaps | 682,350 | | 2,526 | | | 625,765 | | (838) | | | 586,405 | | (581) | |
| Securities and commodities derivatives and other | 98,588 | | (547) | | | 78,328 | | 554 | | | 68,664 | | 619 | |
| Total | 10,250,140 | | 6,387 | | | 9,978,141 | | 6,347 | | | 7,837,818 | | 5,739 | |
12. Non-current assets held for sale and liabilities associated with non-current assets held for sale
a) Breakdown
The detail of Non-current assets held for sale in the consolidated balance sheets is as follows: | | | | | | | | | | | |
EUR million | 2025 | 2024 | 2023 |
| Tangible assets | 2,850 | | 2,851 | | 2,991 | |
| Foreclosed assets | 2,487 | | 2,621 | | 2,773 | |
| Of which property assets in Spain | 1,705 | | 1,896 | | 2,138 | |
| Other tangible assets held for sale | 363 | | 230 | | 218 | |
| | | |
| Entities held for sale | 72,148 | | 1,137 | | — | |
| Caceis (Note 3) | — | | 1,137 | | — | |
| Santander Bank Polska S.A. (Note 3) | 72,148 | | — | | — | |
| | | |
| Other assets | 13 | | 14 | | 23 | |
Total non-current assets held for sale | 75,011 | | 4,002 | | 3,014 | |
| | | | | | | | | | | |
EUR million | 2025 | 2024 | 2023 |
| Entities held for sale | | | |
| Santander Bank Polska S.A. (Note 2) | 62,995 | | — | | — | |
| Total Liabilities associated with non-current assets held for sale | 62,995 | | — | | — | |
At 31 December 2025, the provisions recognised for the total non current assets held for sale totalled EUR 2,357 million (EUR 2,606 million and EUR 2,956 million at 31 December 2024 and 2023, respectively). The charges recorded in those years amounted to EUR 131 million, EUR 163 million and EUR 139 million, respectively, and the recoveries during these exercises are amounted to EUR 59 million, EUR 71 million and EUR 88 million, respectively.
b) Assets and liabilities from entities held for sale
The following is the consolidated balance sheet and consolidated summary cash flow statements for the Polish business held for sale:
| | | | | |
EUR million |
| Condensed consolidated balance sheet | 2025 |
| Cash, cash balances at central banks and other deposits on demand | 2,515 |
| Financial assets held for trading | 1,956 |
| Financial assets designated at fair value through other comprehensive income | 8,173 |
| Financial assets at amortised cost | 55,642 |
| Intangible assets | 1,335 |
| Tax assets | 1,224 |
| Other assets | 1,303 |
| Total assets | 72,148 |
| | | | | |
EUR million |
| Condensed consolidated balance sheet | 2025 |
| Financial liabilities held for trading | 842 | |
| Financial liabilities at amortised cost | 59,704 | |
| Provisions | 603 | |
| Tax liabilities | 1,335 | |
| Other liabilities | 511 | |
| Total liabilities | 62,995 | |
| | | | | |
EUR million |
| Other comprehensive income | 2025 |
| Items that will not be reclassified to profit or loss | 56 | |
| Actuarial gains or losses on defined benefit pension plans | — | |
| Changes in the fair value of equity instruments measured at fair value through other comprehensive income | 56 | |
| Items that may be reclassified to profit or loss | (590) | |
| Hedges of net investments in foreign operations (effective portion) | (522) | |
| Exchange differences | (164) | |
| Cash flow hedges (effective portion) | 98 | |
| Debt instruments at fair value with changes in other comprehensive income | 8 | |
| Share in other income and expenses recognised in investments, joint ventures and associates | (10) | |
| | | | | | | | | | | |
| EUR million |
| Condensed consolidated statements of cash flows | 2025 | 2024 | 2023 |
| A) Cash flows from operating activities | 1,405 | 1,705 | 352 |
| B) Cash flows from investing activities | (98) | (96) | (91) |
| C) Cash flows from financing activities | (1,301) | (1,194) | (591) |
| D) Effect of foreign exchange rate differences | 20 | 27 | 143 |
| E) Net increase/(decrease) in cash and cash equivalents | 26 | 442 | (187) |
At 31 December 2025, the written-off assets totalled EUR 2,339 million from the Polish business held for sale.
Consistent with the Group´s management model, the amounts related to the business held for sale in Poland are primarily reported within the Retail & Commercial Banking segment for primary segment information purposes. Additionally, a separate breakdown for the Poland geography is presented as a secondary segment.
In addition, see the consolidated summary profit and loss accounts for the business for sale in Poland in Note 37.
13. Investments
a) Breakdown
The detail, by company, of Investments is as follows:
| | | | | | | | | | | |
| EUR million |
| 2025 | 2024 | 2023 |
| Associated entities | 5,096 | | 5,216 | | 5,682 | |
Merlin Properties, SOCIMI, S.A.A | 1,830 | | 1,803 | | 1,621 | |
Zurich Santander Insurance
America, S.L. - Consolidated | 940 | | 884 | | 936 | |
| Metrovacesa, S.A. | 748 | | 841 | | 899 | |
| CNP Santander | 399 | | 397 | | 423 | |
Pluxee Beneficios Brasil S.A. A | 295 | | 309 | | — | |
Caceis (Notes 3 and 12) | — | | — | | 1,139 | |
| Other companies | 884 | | 982 | | 664 | |
| | | |
| Joint Ventures entities | 1,956 | | 2,061 | | 1,964 | |
| Santander Caceis Latam Holding 1, S.L. - Consolidated (previously Santander Securities Services Latam Holding, S.L) | 404 | | 381 | | 389 | |
| Santander Vida Seguros y Reaseguros, S.A. | 329 | | 356 | | 362 | |
| U.C.I., S.A. - Consolidated | 293 | | 325 | | 349 | |
| Fortune Auto Finance Co., Ltd | 232 | | 261 | | 254 | |
| Hyundai Capital UK Limited | 270 | | 249 | | 205 | |
Volvo Car Financial Services UK Limited | 116 | | 99 | | 76 | |
| Banco RCI Brasil S.A. | 77 | | 94 | | 92 | |
| Other companies | 235 | | 296 | | 237 | |
| | | |
| Total Associated entities and Joint ventures | 7,052 | | 7,277 | | 7,646 | |
A.Acquisition of 20% of Pluxee Beneficios Brasil S.A. and capital increase of Merlin Properties, SOCIMI, S.A., both carried out in 2024.
Of the entities included above, at 31 December 2025, the entities Merlin Properties, SOCIMI, S.A, and Metrovacesa, S.A. and Compañía Española de Viviendas en Alquiler, S.A., are the only listed companies.
Below is a breakdown of the Goodwill of the main investments in joint ventures and associates included in the balance of this heading:
| | | | | | | | | | | |
| EUR million |
| 2025 | 2024 | 2023 |
| Goodwill | 1,096 | | 1,238 | | 1,460 | |
| Of which: | | | |
| Zurich Santander Insurance America, S.L. - Consolidated | 526 | | 526 | | 526 | |
Pluxee Beneficios Brasil S.A.A | 71 | | 122 | | — | |
| Caceis (Notes 3 and 12) | — | | — | | 337 | |
A.Acquisition of 20% of Pluxee Beneficios Brasil S.A. in 2024.
b) Changes
The changes in the investments were as follows:
| | | | | | | | | | | |
| EUR million |
| 2025 | 2024 | 2023 |
| Balance at beginning of year | 7,277 | | 7,646 | | 7,615 | |
Acquisitions (disposals) of companies and capital increases (reductions)A | (17) | | 1,011 | | 52 | |
Changes in the consolidation method (Note 3) | 15 | | (13) | | (43) | |
Entities for sale (Notes 3 y 12)B | (168) | | (1,137) | | — | |
| Effect of equity accounting | 665 | | 687 | | 591 | |
| Dividends distributed and reimbursements of share premium | (694) | | (745) | | (565) | |
| Of which: | | | |
| Zurich Santander Insurance América, S.L. - Consolidado | (206) | | (202) | | (202) | |
| Metrovacesa, S.A. | (118) | | (52) | | (50) | |
| Santander Vida Seguros y Reaseguros, S.A.- Consolidated | (87) | | (82) | | (52) | |
| Merlin Properties, SOCIMI, S.A. | (57) | | (53) | | (51) | |
| CNP Santander | (54) | | (88) | | (51) | |
| CIP S.A. | (16) | | (56) | | — | |
| Caceis | — | | (114) | | — | |
| Hyundai Capital UK Limited | — | | — | | (58) | |
| Other global result | 28 | | (32) | | (24) | |
| Exchange differences and other changes | (54) | | (140) | | 20 | |
Balance at end of year | 7,052 | | 7,277 | | 7,646 | |
A.Includes the acquisition of 20% of Pluxee Beneficios Brasil S.A. and the capital increase of Merlin Properties, SOCIMI, S.A carried out in 2024.
B.Stakes of Santander Bank Polska S.A. and Caceis (Notes 3 and 12).
c) Impairment adjustments
During the years 2025, 2024 and 2023 there was no evidence of significant impairment in the Group's associated interests.
d) Other information
A summary of the financial information at the end of December 2025 of the main associates and joint ventures (obtained from the information available at the date of preparation of the consolidated financial statements) is shown below:
| | | | | | | | | | | | | | | | | | | | | | | | | | | | | | | | | | | | | | |
| EUR million | |
| Associates | | Joint ventures |
| Merlin Properties, SOCIMI, S.A.A | Metrovacesa, S.A.A | Pluxee Beneficios Brasil S.A. | Zurich Santander Insurance América, S.L. - Consolidated | CNP Santander | | Santander Caceis Latam Holding, S.L. - Consolidated | U.C.I., S.A. - Consolidated | Hyundai Capital UK Limited | Fortune Auto Finance Co., LTD | Santander Vida Seguros y Reaseguros, S.A.- Consolidated (note 3) | Banco RCI Brasil S.A. |
| Current assets | 1,701 | | 2,025 | | 689 | | 2,434 | | 165 | | | 201 | | 397 | | 2,022 | | 167 | | 157 | | 10 | |
| Non current assets | 11,758 | | 389 | | 652 | | 20,190 | | 2,139 | | | 579 | | 8,876 | | 3,665 | | 1,933 | | 1,710 | | 2,221 | |
| Total assets | 13,459 | | 2,414 | | 1,341 | | 22,624 | | 2,304 | | | 780 | | 9,273 | | 5,687 | | 2,100 | | 1,867 | | 2,231 | |
| Current liabilities | 840 | | 507 | | 254 | | 657 | | 186 | | | 315 | | 6,930 | | 3,685 | | 10 | | 140 | | 112 | |
| Non current liabilities | 5,118 | | 310 | | 578 | | 21,021 | | 1,726 | | | 35 | | 1,715 | | 1,480 | | 1,627 | | 1,243 | | 1,924 | |
| Total liabilities | 5,958 | | 817 | | 832 | | 21,678 | | 1,912 | | | 350 | | 8,645 | | 5,165 | | 1,637 | | 1,383 | | 2,036 | |
| Attributable profit for the period | 284 | | 16 | | 87 | | 534 | | 101 | | | 97 | | (75) | | 77 | | 20 | | 145 | | 54 | |
| Other accumulated comprehensive income | (11) | | — | | — | | (33) | | (9) | | | — | | 114 | | (1) | | — | | (21) | | 4 | |
| Rest of equity | 7,228 | | 1,581 | | 422 | | 445 | | 300 | | | 333 | | 589 | | 446 | | 443 | | 360 | | 137 | |
| Total Equity | 7,501 | | 1,597 | | 509 | | 946 | | 392 | | | 430 | | 628 | | 522 | | 463 | | 484 | | 195 | |
| Total liabilities and equity | 13,459 | | 2,414 | | 1,341 | | 22,624 | | 2,304 | | | 780 | | 9,273 | | 5,687 | | 2,100 | | 1,867 | | 2,231 | |
| | | | | | | | | | | | |
| Ordinary activities income | 544 | | 658 | | 457 | | 4,559 | | 568 | | | 163 | | 499 | | 426 | | 159 | | 907 | | 312 | |
| Profit (loss) from continuing operations | 284 | | 16 | | 87 | | 534 | | 101 | | | 97 | | (75) | | 77 | | 20 | | 145 | | 54 | |
| Profit (loss) for the year from discontinuing operations | — | | — | | — | | — | | — | | | — | | — | | — | | — | | — | | — | |
A.Data as of 31 December 2024, latest accounts available.
14. Insurance contracts linked to pensions
The detail of Insurance contracts linked to pensions in the consolidated balance sheets is as follows:
| | | | | | | | | | | |
| EUR million |
| 2025 | 2024 | 2023 |
| Assets relating to insurance contracts covering post-employment benefit plan obligations: | | | |
| Banco Santander, S.A. | 67 | | 81 | | 93 | |
| 67 | | 81 | | 93 | |
15. Liabilities under insurance contracts
The detail of Liabilities under insurance contracts and reinsurance assets in the consolidated balance sheets (see note 2.i) is as follows:
| | | | | | | | | | | |
| EUR million |
| 2025 | 2024 | 2023 |
| Liabilities under insurance contracts | 18,737 | | 17,829 | | 17,799 | |
Liability for Remaining Coverage (LRC) | 18,291 | | 17,377 | | 17,333 | |
| Liabilities relating to insurance contracts measured under BBA/VFA | 18,194 | | 17,292 | | 17,262 | |
| Current value of future cashflows (PVFCF) | 17,461 | | 16,614 | | 16,627 | |
| Risk adjustment for non-financial risk (RA) | 186 | | 199 | | 211 | |
| Contractual service margin (CSM) | 547 | | 479 | | 424 | |
| Liabilities relating to insurance contracts measured under PAA | 97 | | 85 | | 71 | |
| Liability for incurred claims (LIC) | 446 | | 452 | | 466 | |
The balance of liabilities under insurance contracts reflected in the consolidated balance sheet includes the following elements:
•Liability for Remaining Coverage (LRC): amount of obligations provisioned to meet the fulfilment of future services assigned to the group on a date for a specific coverage period.
•Liabilities relating to insurance contracts measured under BBA/VFA, formed from the sum of the following elements:
-Current value of future cashflows (PVFCF): present value of future inflow and outflow cash flows weighted by their probability of occurrence.
-Risk adjustment for non-financial risk (RA): reflects compensation for the uncertainty of cash flows by quantifying the amount necessary to compensate for unexpected losses in liability flows.
-Contractual service margin (CSM): future benefit to be recognized during the coverage period.
•Liabilities relating to insurance contracts measured under PAA, valued using the premium allocation method, represent the portion of premiums written for the remaining hedge net of acquisition expenses.
•Liability for Incurred Claims (LIC): amount of obligations provisioned to meet the fulfilment of past services assigned to the group on a date.
The insurance activity is carried out mainly in the life insurance sector in its life-savings modality. Within the amount of liabilities for insurance contracts, Individual Life Annuities are the product that has the greatest weight in the consolidated balance sheet. This product consists of life annuities where the client contributes a single premium and receives a constant and periodic insured income (monthly, quarterly, semi-annual or annual) until his death where, at that time, the beneficiaries will receive the insured capital of 102% or 101% of the premium contributed.
The income and expenses recorded in the profit and loss account for the insurance activity, including reinsurance income and expenses, are not material in the Group's consolidated annual accounts.
16. Tangible assets
a) Changes
The changes in Tangible assets in the consolidated balance sheets were as follows:
| | | | | | | | | | | | | | | | | | | | | | | | | | | | | |
| EUR million |
| Tangible assets | | Of which:
For leasing |
| For own use | Leased out under
an operating
lease | Investment
property | Total | | For own use | Leased out under
an operating
lease | Investment
property | Total |
| Cost | | | | | | | | | |
| Balance at 1 January 2023 | 26,570 | | 25,166 | | 1,580 | | 53,316 | | | 4,692 | | — | | — | | 4,692 | |
| Additions / disposals (net) due to change in the scope of consolidation | 11 | | 37 | | — | | 48 | | | (13) | | — | | — | | (13) | |
| Additions / disposals (net) | 1,122 | | 742 | | (34) | | 1,830 | | | 125A | — | | — | | 125 | |
| Transfers, exchange differences and other items | (1,460) | | (641) | | 30 | | (2,071) | | | 33 | | — | | — | | 33 | |
| Balance at 31 December 2023 | 26,243 | | 25,304 | | 1,576 | | 53,123 | | | 4,837 | | — | | — | | 4,837 | |
| Additions / disposals (net) due to change in the scope of consolidation | 28 | | (1,192) | | — | | (1,164) | | | — | | — | | — | | — | |
| Additions / disposals (net) | 730 | | (1,716) | | (17) | | (1,003) | | | 179A | — | | — | | 179 | |
| Transfers, exchange differences and other items | (1,345) | | 1,003 | | (104) | | (446) | | | (235) | | — | | — | | (235) | |
| Balance at 31 December 2024 | 25,656 | | 23,399 | | 1,455 | | 50,510 | | | 4,781 | | — | | — | | 4,781 | |
| Additions / disposals (net) due to change in the scope of consolidation | 4 | | — | | 7 | | 11 | | | — | | — | | — | | — | |
| Additions / disposals (net) | 326 | | (2,603) | | (58) | | (2,335) | | | (40)A | — | | — | | (40) | |
| Transfers, exchange differences and other items | (1,845) | | (1,743) | | 188 | | (3,400) | | | (450) | | — | | — | | (450) | |
| Balance at 31 December 2025 | 24,141 | | 19,053 | | 1,592 | | 44,786 | | | 4,291 | | — | | — | | 4,291 | |
| | | | | | | | | |
| Accumulated depreciation | | | | | | | | | |
Balances at 1 January 2023 | (12,892) | | (5,578) | | (172) | | (18,642) | | | (2,265) | | — | | — | | (2,265) | |
| Disposals due to change in the scope of consolidation | 7 | | — | | — | | 7 | | | 7 | | — | | — | | 7 | |
| Disposals | 284 | | 2,540 | | — | | 2,824 | | | 160 | | — | | — | | 160 | |
| Charge for the year | (1,689) | | — | | (11) | | (1,700) | | | (580) | | — | | — | | (580) | |
| Transfers, exchange differences and other items | 1,653 | | (2,744) | | (16) | | (1,107) | | | 69 | | — | | — | | 69 | |
Balance at 31 December 2023 | (12,637) | | (5,782) | | (199) | | (18,618) | | | (2,609) | | — | | — | | (2,609) | |
| Disposals due to change in the scope of consolidation | — | | 686 | | — | | 686 | | | — | | — | | — | | — | |
| Disposals | 672 | | 3,214 | | — | | 3,886 | | | 196 | | — | | — | | 196 | |
| Charge for the year | (1,544) | | — | | (9) | | (1,553) | | | (460) | | — | | — | | (460) | |
| Transfers, exchange differences and other items | 890 | | (2,902) | | 46 | | (1,966) | | | 59 | | — | | — | | 59 | |
Balance at 31 December 2024 | (12,619) | | (4,784) | | (162) | | (17,565) | | | (2,814) | | — | | — | | (2,814) | |
| Disposals due to change in the scope of consolidation | — | | — | | — | | — | | | — | | — | | — | | — | |
| Disposals | 663 | | 2,428 | | — | | 3,091 | | | 177 | | — | | — | | 177 | |
| Charge for the year | (1,323) | | — | | (8) | | (1,331) | | | (405) | | | — | | (405) | |
| Transfers, exchange differences and other items | 1,150 | | (1,917) | | (32) | | (799) | | | 381 | | — | | — | | 381 | |
Balance at 31 December 2025 | (12,129) | | (4,273) | | (202) | | (16,604) | | | (2,661) | | — | | — | | (2,661) | |
A. Includes contract extensions on operating leases and repurchases.
| | | | | | | | | | | | | | | | | | | | | | | | | | | | | |
| EUR million |
| Tangible assets | | Of which:
For leasing |
| For own use | Leased out under
an operating
lease | Investment
property | Total | | For own use | Leased out under
an operating
lease | Investment
property | Total |
| Impairment losses | | | | | | | | | |
Balance at 1 January 2023 | (189) | | (33) | | (379) | | (601) | | | (14) | | — | | — | | (14) | |
| Impairment charge for the year | (113) | | (29) | | (12) | | (154) | | | (38) | | — | | — | | (38) | |
| Releases | 4 | | 11 | | 4 | | 19 | | | 3 | | — | | — | | 3 | |
| Disposals due to change in the scope of consolidation | — | | — | | — | | — | | | — | | — | | — | | — | |
| Disposals | 36 | | — | 4 | | 40 | | | 5 | | | | 5 | |
| Exchange differences and other | 64 | | 47 | | (38) | | 73 | | | (1) | | — | | — | | (1) | |
Balance at 31 December 2023 | (198) | | (4) | | (421) | | (623) | | | (45) | | — | | — | | (45) | |
| Impairment charge for the year | (276) | | (70) | | (81) | | (427) | | | (31) | | — | | — | | (31) | |
| Releases | 34 | | 3 | | 8 | | 45 | | | 10 | | — | | — | | 10 | |
| Disposals due to change in the scope of consolidation | — | | — | | — | | — | | | — | | — | | — | | — | |
| Disposals | 53 | | — | | — | | 53 | | | 19 | | — | | — | | 19 | |
| Exchange differences and other | (14) | | 32 | | 76 | | 94 | | | (2) | | — | | — | | (2) | |
Balance at 31 December 2024 | (401) | | (39) | | (418) | | (858) | | | (49) | | — | | — | | (49) | |
| Impairment charge for the year | (172) | | (79) | | (15) | | (266) | | | (41) | | — | | — | | (41) | |
| Releases | 41 | | 71 | | 25 | | 137 | | | 1 | | — | | — | | 1 | |
| Disposals due to change in the scope of consolidation | — | | — | | — | | — | | | — | | — | | — | | — | |
| Disposals | 17 | | 17 | | — | | 34 | | | 6 | | — | | — | | 6 | |
| Exchange differences and other | 166 | | 3 | | 40 | | 209 | | | 9 | | — | | — | | 9 | |
Balance at 31 December 2025 | (349) | | (27) | | (368) | | (744) | | | (74) | | — | | — | | (74) | |
| | | | | | | | | |
| Tangible assets, net | | | | | | | | | |
Balances at 31 December 2023 | 13,408 | | 19,518 | | 956 | | 33,882 | | | 2,183 | | — | | — | | 2,183 | |
Balances at 31 December 2024 | 12,636 | | 18,576 | | 875 | | 32,087 | | | 1,918 | | — | | — | | 1,918 | |
Balances at 31 December 2025 | 11,663 | | 14,753 | | 1,022 | | 27,438 | | | 1,556 | | — | | — | | 1,556 | |
b) Tangible assets - For own use
The detail, by class of asset, of 'Property, plant and equipment' which is owned by the Group in the consolidated balance sheets is as follows:
| | | | | | | | | | | | | | | | | |
| EUR million | |
| Tangible assets for own use | Of which:
for leasing |
| Cost | Accumulated
depreciation | Impairment
losses | Carrying
amount |
| Land and buildings | 14,973 | | (5,010) | | (154) | | 9,809 | | 2,104 | |
| IT equipment and fixtures | 5,614 | | (4,154) | | — | | 1,460 | | 60 | |
| Furniture and vehicles | 5,412 | | (3,424) | | — | | 1,988 | | 19 | |
| Construction in progress and other items | 244 | | (49) | | (44) | | 151 | | — | |
| Balance at 31 December 2023 | 26,243 | | (12,637) | | (198) | | 13,408 | | 2,183 | |
| | | | | |
| Land and buildings | 15,113 | | (5,516) | | (353) | | 9,244 | | 1,882 | |
| IT equipment and fixtures | 5,283 | | (3,926) | | — | | 1,357 | | 23 | |
| Furniture and vehicles | 4,963 | | (3,130) | | — | | 1,833 | | 13 | |
| Construction in progress and other items | 297 | | (47) | | (48) | | 202 | | — | |
| Balance at 31 December 2024 | 25,656 | | (12,619) | | (401) | | 12,636 | | 1,918 | |
| | | | | |
| Land and buildings | 14,067 | | (5,359) | | (304) | | 8,404 | | 1,536 | |
| IT equipment and fixtures | 4,204 | | (3,003) | | (10) | | 1,191 | | 13 | |
| Furniture and vehicles | 5,548 | | (3,746) | | (1) | | 1,801 | | 7 | |
| Construction in progress and other items | 322 | | (21) | | (34) | | 267 | | — | |
| Balance at 31 December 2025 | 24,141 | | (12,129) | | (349) | | 11,663 | | 1,556 | |
The carrying amount at 31 December 2025 in the foregoing table includes the following approximate amounts EUR 6,545 million (EUR 6,531 million at 31 December 2024 and EUR 7,119 million at 31 December 2023) relating to property, plant and equipment owned by group entities and branches located abroad.
c) Tangible assets - Leased out under an operating lease
Grupo Santander has assets leased out under operating leases where the company is the lessor and do not meet the accounting requirements to be classified as finance leases. The net cost of these leases is recorded as an asset and depreciated on a straight-line basis over the contractual term of the lease to the expected residual value.
The expected residual value and, consequently, the monthly depreciation expense may change during the term of the lease. The Group estimates expected residual values using independent data sources and internal statistical models. It also assesses the estimate of the residual value of these leases and adjusts the depreciation rate in line with the change in the expected value of the asset at the end of the lease.
Grupo Santander periodically assesses its investment in operating leases for impairment in certain circumstances, such as a systemic and material decrease in the values of used vehicles. If assets leased out under operating leases are deemed to be impaired, impairment is measured as the amount by which the carrying amount of the assets exceeds the fair value as estimated by discounted cash flows.
Of the 14,753 EUR million that the Group had assigned to operating leases at 31 December 2025 (18,576 EUR and 19,518 EUR at 31 December 2024 and 2023, respectively), EUR 7,227 million (EUR 11,336 and EUR 12,525 at 31 December 2024 and 2023, respectively) relate to vehicles of Santander US Auto's business. The variable lease payments of various items of this business are not significant.
In addition, the maturity analysis of the assets leased out under operating leases from Santander US Auto, is as follows:
| | | | | |
| EUR million |
| |
| Maturity Analysis | 2025 |
| 2025 | 3,988 | |
| 2026 | 4,228 | |
| 2027 | 1,332 | |
| 2028 | 330 | |
d) Tangible assets - Investment property
The fair value of investment property at 31 December 2025, 2024, 2023 amounted to EUR 1,194, 1,041 and 1,163 million, respectively. A comparison of the fair value of investment property at 31 December 2025, 2024 and 2023 with the net book value shows gross unrealised gains of EUR 172, 166 and 207 million, respectively, attributed completely to the group.
The rental income earned from investment property and the direct costs related both to investment properties that generated rental income in 2025, 2024 and 2023 and to investment properties that did not generate rental income in those years are not material in the context of the consolidated financial statements.
17. Intangible assets – Goodwill
The detail of goodwill, based on the cash-generating units giving rise thereto, is as follows:
| | | | | | | | | | | |
| EUR million |
| 2025 | 2024 | 2023 |
| Banco Santander (Brasil) | 3,031 | | 3,079 | | 3,679 | |
| SAM Investment Holdings Limited | 1,444 | | 1,444 | | 1,444 | |
| Santander Consumer Germany | 1,304 | | 1,304 | | 1,304 | |
| Santander Portugal | 1,040 | | 1,040 | | 1,040 | |
| Santander España | 998 | | 998 | | 998 | |
| Santander US Auto | 943 | | 1,068 | | 1,003 | |
| Santander Holding USA (ex. Auto) | 765 | | 865 | | 814 | |
| Santander UK | 609 | | 641 | | 612 | |
| Banco Santander - Chile | 470 | | 482 | | 516 | |
| Grupo Financiero Santander (México) | 463 | | 453 | | 523 | |
| Ebury Partners | 326 | | 340 | | 350 | |
| Santander Consumer Nordics | 211 | | 211 | | 206 | |
| Santander Bank Polska | — | | 1,178 | | 1,159 | |
| Other companies | 354 | | 335 | | 369 | |
| Total Goodwill | 11,958 | | 13,438 | | 14,017 | |
The changes in goodwill were as follows:
| | | | | | | | | | | |
| EUR million |
| 2025 | 2024 | 2023 |
| Balance at beginning of year | 13,438 | | 14,017 | | 13,741 | |
Additions | 19 | | 30 | | 56 | |
| Of which: | | | |
| Ebury Partners | — | | — | | 45 | |
| Impairment losses | (4) | | (4) | | (20) | |
| Transfer to Assets held for sale (Notes 3 y 12) | (1,176) | | — | | — | |
| Exchange differences and other items | (291) | | (605) | | 240 | |
| Balance at end of year | 11,958 | | 13,438 | | 14,017 | |
Grupo Santander has goodwill generated by cash-generating units located in non-euro currency countries (mainly Brazil, Poland, the United States, the United Kingdom, Chile, Mexico, Norway and Sweden) and, therefore, this gives rise to exchange differences on the translation to euros, at closing rates, of the amounts of goodwill denominated in foreign currencies. Accordingly, in 2025 there was a decrease of EUR 291 million (a decrease of EUR 605 million in 2024 and an increase of EUR 240 million in 2023), due to exchange differences and other items which, pursuant to current standards, were recognised with a change to 'Other comprehensive income - Items that may be reclassified to profit or loss - Exchange differences in other comprehensive income in the consolidated statement of recognised income and expense' (see note 29.d).
At least once per year (or whenever there is any indication of impairment), Grupo Santander performs an analysis of the potential impairment of its recorded goodwill with respect to its recoverable amount. The first step that must be taken in order to perform this analysis is the identification of the cash-generating units, which are the Group's smallest identifiable groups of assets that generate cash inflows that are largely independent of the cash flows of other assets or groups of assets.
The amount to be recovered of each cash-generating unit is determined taking into consideration the carrying amount (including any fair value adjustment arising on the business combination) of all the assets and liabilities of all the independent legal entities composing the cash-generating unit, together with the related goodwill.
The amount to be recovered of the cash-generating unit is compared with its recoverable amount in order to determine whether there is any impairment.
Grupo Santander assesses the existence of any indication that might be considered to be evidence of impairment of the cash-generating unit by reviewing information including the following (i) certain macroeconomic variables that might affect its investments (population data, political situation, economic situation —including banking concentration level—, among others) and (ii) various microeconomic variables comparing the investments of the Group with the financial services industry of the country in which the cash-generating unit carries on most of its business activities (balance sheet composition, total funds under management, results, efficiency ratio, capital adequacy ratio, return on equity, among others).
Regardless of whether there is any indication of impairment, every year the Group calculates the recoverable amount of each cash-generating unit to which goodwill, has been allocated and, to this end, it uses price quotations, market references (multiples), internal estimates and valuations performed by internal and external experts.
Firstly, the Group determines the recoverable amount by calculating the fair value of each cash-generating unit on the basis of the quoted price of the cash-generating units, if available.
In addition, the Group performs estimates of the recoverable amounts of certain cash-generating units by calculating their value in use using discounted cash flow projections. The main assumptions used in this calculation are (i) earnings projections based on the financial budgets approved by the Group’s directors which cover between three and five year periods (unless a longer time horizon can be justified), (ii) discount rates determined as the cost of capital taking into account the risk-free rate of return plus a risk premium in line with the market and the business in which the units operate and (iii) constant growth rates used in order to extrapolate earnings in perpetuity which do not exceed the long-term average growth rate for the market in which the cash-generating unit in question operates.
The cash flow projections used by Group management to obtain the values in use are based on the financial budgets approved by both local management of the related local units and the Group’s directors. The Group’s budgetary estimation process is common for all the cash-generating units. The local management teams prepare their budgets using the following key assumptions:
a) Microeconomic variables of the cash-generating unit: management takes into consideration the current balance sheet structure, the product mix and the business decisions taken by local management in this regard.
b) Macroeconomic variables: growth is estimated on the basis of the changing environment, taking into consideration expected GDP growth in the unit’s geographical location and forecast trends in interest and exchange rates. These data, which are based on external information sources, are provided by the Group’s economic research service.
c) Past performance variables: in addition, management takes into consideration in the projection the difference (both positive and negative) between the cash-generating unit’s past performance and budgets.
During 2025, the Group has recognised impairment losses of EUR 4 million of immaterial goodwill that has been recorded under the heading 'Impairment or reversal of the impairment of non-financial assets - Intangible assets' (EUR 4 million and EUR 20 million in 2024 and 2023, respectively). Goodwill is deducted from CET1 for regulatory purposes, so an impairment of goodwill has no impact on the Group's capital ratios.
Following is a detail of the main assumptions taken into account in determining the recoverable amount, at 2025 year-end, of the most significant cash-generating units which were valued using the discounted cash flow method:
| | | | | | | | | | | |
| 2025 |
| Projected period | Discount rateA | Nominal
perpetual
growth rate |
| Santander UK | 5 years | 12.4 | % | 2.5% |
| Santander US Auto | 3 years | 11.5 | % | 3.0% |
Santander Holding USA (ex. Auto)B | 5 years | 13.6 | % | 3.5% |
| Santander Consumer Germany | 5 years | 9.5 | % | 2.5% |
| SAM Investment Holdings, Limited | 5 years | 11.5 | % | 2.5% |
| Santander Portugal | 5 years | 10.6 | % | 2.5% |
A.Post-tax discount rate.
B.Weighted information of the main assumptions of the segments to which goodwill has been allocated.
The discount and nominal perpetual growth rates taken into account in 2024 and 2023 are presented below for comparison purposes:
| | | | | | | | | | | | | | |
| Discount rateA | Nominal
perpetual
growth rate |
| 2024 | 2023 | 2024 | 2023 |
| Santander UK | 11.8 | % | 11.9 | % | 2.5 | % | 2.5 | % |
| Santander Bank Polska | 12.9 | % | 13.2 | % | 5.0 | % | 5.0 | % |
| Santander US Auto | 12.2 | % | 12.8 | % | 3.0 | % | 3.0 | % |
Santander Holding USA (ex. Auto)B | 13.4 | % | 13.4 | % | 3.5 | % | 3.5 | % |
| Santander Consumer Germany | 9.1 | % | 9.7 | % | 2.0 | % | 2.3 | % |
| SAM Investment Holdings, Limited | 11.6 | % | 11.6 | % | 2.5 | % | 2.5 | % |
| Santander Portugal | 10.2 | % | 11.2 | % | 2.5 | % | 2.5 | % |
A.Post-tax discount rate.
B.Weighted information of the main assumptions of the segments to which goodwill has been allocated.
The variations reflected in the assumptions used in 2025 are mainly a consequence of the current macroeconomic scenario, as well as the level of inflation.
Given the degree of uncertainty of the above key assumptions on which the recoverable amount of the cash-generating units is based, the Group performs a sensitivity analysis which consisted of adjusting +/- 50 basis points the discount rate, adjusting +/- 50 basis points the growth rate in perpetuity and reducing the cash flow projections by 5%. These changes in the key assumptions in isolation mean that the recoverable amount of all the cash-generating units continues to exceed their amount to be recovered and have been considered by the Group as reasonably possible changes in the business operations of the cash-generating units are not contemplated.
The recoverable amount of Banco Santander - Chile and Banco Santander (Brasil) was calculated as the fair values of the aforementioned cash-generating units obtained from the quoted market prices of their shares at year-end. This value exceeded the amount to be recovered. A significant reduction in the quoted market prices of these cash generating unit could result in an indication of impairment which in turn may lead to a goodwill impairment charge in the future.
18. Intangible assets - Other intangible assets
The detail of Intangible assets - Other intangible assets in the consolidated balance sheets and of the changes therein in 2025, 2024, and 2023 is as follows:
| | | | | | | | | | | | | | | | | | | | | | | | | | |
| EUR million |
| Estimated
useful life | 1 January 2025 | Net
additions
and
disposals | Change in
scope of
consolidation | Amortization
and
impairment | Application of
amortization
and
impairment | Exchange
differences
and other | 31 December 2025 |
| Cost | | 15,261 | | 1,714 | | (20) | | | (1,286) | | (1,179) | | 14,490 | |
| Brand names | | 32 | | — | | — | | | — | | — | | 32 | |
| IT developments | 3-10 years | 13,322 | | 1,713 | | (7) | | | (1,286) | | (1,084) | | 12,658 | |
| Other | | 1,907 | | 1 | | (13) | | | — | | (95) | | 1,800 | |
| Accumulated amortisation | | (9,235) | | — | | 12 | | (1,847) | | 1,228 | | 795 | | (9,047) | |
| Development | | (8,312) | | — | | 6 | | (1,715) | | 1,228 | | 723 | | (8,070) | |
| Other | | (923) | | — | | 6 | | (132) | | — | | 72 | | (977) | |
| Impairment losses | | (205) | | — | | — | | (108) | | 58 | | 162 | | (93) | |
| Of which addition | | | | | (108) | | | | |
| Of which Liberation | | | | | | | | |
| | 5,821 | | 1,714 | | (8) | | (1,955) | | — | | (222) | | 5,350 | |
| | | | | | | | | | | | | | | | | | | | | | | | | | |
| EUR million |
| Estimated
useful life | 1 January 2024 | Net
additions
and
disposals | Change in
scope of
consolidation | Amortization
and
impairment | Application of
amortization
and
impairment | Exchange
differences
and other | 31 December 2024 |
| Cost | | 14,773 | | 2,104 | | (8) | | | (1,169) | | (439) | | 15,261 | |
| Brand names | | 40 | | — | | — | | | — | | (8) | | 32 | |
| IT developments | 3-10 years | 12,867 | | 2,104 | | (8) | | | (1,169) | | (472) | | 13,322 | |
| Other | | 1,866 | | — | | — | | | — | | 41 | | 1,907 | |
| Accumulated amortisation | | (8,851) | | — | | 6 | | (1,626) | | 1,062 | | 174 | | (9,235) | |
| Development | | (8,078) | | — | | 6 | | (1,546) | | 1,062 | | 244 | | (8,312) | |
| Other | | (773) | | — | | — | | (80) | | — | | (70) | | (923) | |
| Impairment losses | | (68) | | — | | — | | (227) | | 107 | | (17) | | (205) | |
| Of which addition | | | | | (227) | | | | |
| Of which Liberation | | | | | — | | | | |
| | 5,854 | | 2,104 | | (2) | | (1,853) | | — | | (282) | | 5,821 | |
| | | | | | | | | | | | | | | | | | | | | | | | | | |
| EUR million |
| Estimated
useful life | 1 January 2023 | Net
additions
and
disposals | Change in
scope of
consolidation | Amortization
and
impairment | Application of
amortization
and
impairment | Exchange
differences
and other | 31 December 2023 |
| Cost | | 12,502 | | 2,197 | | 176 | | | (230) | | 128 | | 14,773 | |
| Brand names | | 33 | | — | | 8 | | | (2) | | 1 | | 40 | |
| IT developments | 3-10 years | 10,721 | | 2,197 | | 18 | | | (196) | | 127 | | 12,867 | |
| Other | | 1,748 | | — | | 150 | | | (32) | | — | | 1,866 | |
| Accumulated amortisation | | (7,554) | | — | | 5 | | (1,386) | | 209 | | (125) | | (8,851) | |
| Development | | (6,866) | | — | | — | | (1,294) | | 177 | | (95) | | (8,078) | |
| Other | | (688) | | — | | 5 | | (92) | | 32 | | (30) | | (773) | |
| Impairment losses | | (44) | | — | | — | | (53) | | 21 | | 8 | | (68) | |
| Of which addition | | | | | (53) | | | | |
| Of which Liberation | | | | | — | | | | |
| | 4,904 | | 2,197 | | 181 | | (1,439) | | — | | 11 | | 5,854 | |
In 2025, 2024 and 2023, impairment losses of EUR 108 million, EUR 227 million and EUR 53 million, respectively, were recognised under Impairment or reversal of impairment on non-financial assets, net – intangible assets. This impairment losses are related mainly to the decline in or loss of the recoverable value of certain computer systems and applications as a result of the processes initiated by the Group to transform or integrate businesses and to adapt to the various regulatory changes.
19. Other assets
The detail of 'Other' of 'Other assets' is as follows:
| | | | | | | | | | | |
| EUR million |
| 2025 | 2024 | 2023 |
| Transactions in transit | 364 | | 469 | | 246 | |
| Net pension plan assets (note 25) | 784 | | 677 | | 1,001 | |
| Prepayments and accrued income | 3,121 | | 3,016 | | 2,911 | |
| Other | 4,376 | | 4,310 | | 4,598 | |
| 8,645 | | 8,472 | | 8,756 | |
20. Deposits from central banks and credit institutions
The detail, by classification, counterparty, type and currency, of 'Deposits from central banks' and 'Deposits from credit institutions' in the consolidated balance sheets is as follows:
| | | | | | | | | | | |
| EUR million |
| 2025 | 2024 | 2023 |
| CENTRAL BANKS | | | |
| Classification | | | |
| Financial liabilities held for trading | 12,385 | | 13,300 | | 7,808 | |
| Financial liabilities designated at fair value through profit or loss | 3,086 | | 1,774 | | 1,209 | |
| Financial liabilities at amortized cost | 18,542 | | 24,882 | | 48,782 | |
| 34,013 | | 39,956 | | 57,799 | |
| Type | | | |
| Deposits on demand | 856 | | 405 | | 117 | |
| Time deposits | 14,709 | | 18,488 | | 43,853 | |
| Reverse repurchase agreements | 18,448 | | 21,063 | | 13,829 | |
| 34,013 | | 39,956 | | 57,799 | |
| CREDIT INSTITUTIONS | | | |
| Classification | | | |
| Financial liabilities held for trading | 27,058 | | 26,284 | | 17,862 | |
| Financial liabilities designated at fair value through profit or loss | 1,424 | | 1,625 | | 1,735 | |
| Financial liabilities at amortized cost | 74,692 | | 90,012 | | 81,246 | |
| 103,174 | | 117,921 | | 100,843 | |
| Type | | | |
| Deposits on demand | 5,005 | | 6,657 | | 5,468 | |
| Time deposits | 42,718 | | 54,716 | | 54,402 | |
| Reverse repurchase agreements | 55,186 | | 56,273 | | 40,689 | |
| Subordinated deposits | 265 | | 275 | | 284 | |
| 103,174 | | 117,921 | | 100,843 | |
| Currency | | | |
| Euro | 54,588 | | 53,779 | | 53,921 | |
| Pound sterling | 13,625 | | 21,853 | | 27,697 | |
| US dollar | 43,466 | | 57,992 | | 49,447 | |
| Brazilian real | 6,783 | | 7,459 | | 7,997 | |
| Other currencies | 18,725 | | 16,794 | | 19,580 | |
| TOTAL | 137,187 | | 157,877 | | 158,642 | |
At 31 December 2025 and 2024, no conditional long-term financing of the European Central Bank (TLTRO- Targeted Long-Term Refinancing Operation-) was outstanding. As of 2023, the balance of such financing amounted to EUR 11,583 million, all corresponding to the TLTRO III financing program.
At 31 December 2025, no expense has been recognized in the consolidated income statement corresponding to TLTRO III (expenses of EUR 158 million and EUR 659 million at 31 December 2024 and 2023, respectively, as a result of the conditions of the financing programme).
Note 51 contains a detail of the residual maturity periods of financial liabilities at amortised cost.
21. Customer deposits
The detail, by classification, geographical area and type, of Customer deposits is as follows:
| | | | | | | | | | | |
| EUR million |
| 2025 | 2024 | 2023 |
| Classification | | | |
| Financial liabilities held for trading | 36,120 | | 18,984 | | 19,837 | |
| Financial liabilities designated at fair value through profit or loss | 25,930 | | 25,407 | | 32,052 | |
Financial liabilities
at amortized cost | 979,150 | | 1,011,545 | | 995,280 | |
| 1,041,200 | | 1,055,936 | | 1,047,169 | |
Geographical areaA | | | |
| Spain | 437,855 | | 395,479 | | 388,736 | |
| Rest of Europe | 323,854 | | 377,057 | | 366,165 | |
| of which: United Kingdom | 228,810 | | 233,192 | | 235,698 | |
| Rest of America | 279,491 | | 283,400 | | 292,268 | |
| of which: United States | 82,321 | | 88,712 | | 83,555 | |
| Rest of the world | — | | — | | — | |
| 1,041,200 | | 1,055,936 | | 1,047,169 | |
| Type | | | |
| Demand deposits- | 646,125 | | 677,818 | | 661,262 | |
| Time deposits- | 296,797 | | 298,276 | | 305,296 | |
| Deposits redeemable at notice | 1,487 | | 1,525 | | 1,789 | |
| Repurchase agreements | 96,791 | | 78,317 | | 78,822 | |
| 1,041,200 | | 1,055,936 | | 1,047,169 | |
A.According to the geography of the legal entity.
Note 51 contains a detail of the residual maturity periods of financial liabilities at amortised cost.
22. Marketable debt securities
a) Breakdown
The detail, by classification and type, of Marketable debt securities is as follows:
| | | | | | | | | | | |
| EUR million |
| 2025 | 2024 | 2023 |
| Classification | | | |
Financial liabilities
held for trading | — | | — | | — | |
Financial liabilities designated
at fair value through profit or loss | 11,686 | | 7,554 | | 5,371 | |
Financial liabilities
at amortized cost | 312,704 | | 317,967 | | 303,208 | |
| 324,390 | | 325,521 | | 308,579 | |
| Type | | | |
| Bonds and debentures outstanding | 253,893 | | 252,765 | | 231,880 | |
| Subordinated | 28,859 | | 35,461 | | 30,529 | |
| Notes and other securities | 41,638 | | 37,295 | | 46,170 | |
| 324,390 | | 325,521 | | 308,579 | |
The distribution of the book value of debt securities issued by contractual maturity at 31 December 2025 is shown below:
| | | | | | | | | | | | | | | | | | | | |
| EUR million | | |
| Within 3 months | 3 to 12
months | 1 to 3
years | 3 to 5
years | More than 5
years | Total |
| Subordinated debt | — | 798 | 1,760 | 2,277 | 24,024 | 28,859 |
| Senior unsecured debt | 10,509 | 13,643 | 51,461 | 34,465 | 35,618 | 145,696 |
| Senior secured debt | 11,529 | 12,308 | 43,661 | 28,106 | 12,593 | 108,197 |
| Promissory notes and other securities | 17,747 | 23,060 | 335 | 170 | 326 | 41,638 |
| Debt securities issued | 39,785 | | 49,809 | | 97,217 | | 65,018 | | 72,561 | | 324,390 | |
The distribution by contractual maturity of the notional amounts of these debt securities issued at 31 December 2025 is as follows:
| | | | | | | | | | | | | | | | | | | | |
| EUR million | | |
| Within 3 months | 3 to 12
months | 1 to 3
years | 3 to 5
years | More than 5
years | Total |
| Subordinated debt | — | 790 | 1,744 | 2,255 | 22,926 | 27,715 |
| Senior unsecured debt | 10,056 | 12,654 | 50,189 | 34,089 | 36,469 | 143,457 |
| Senior secured debt | 11,038 | 12,110 | 43,467 | 28,116 | 12,513 | 107,244 |
| Promissory notes and other securities | 17,709 | 23,042 | 299 | 154 | 312 | 41,516 |
| Debt securities issued | 38,803 | | 48,596 | | 95,699 | | 64,614 | | 72,220 | | 319,932 | |
b) Bonds and debentures outstanding
The detail, by currency of issue, of 'Bonds and debentures outstanding' is as follows:
| | | | | | | | | | | | | | | | | |
| EUR million | 2025 |
| Currency of issue | 2025 | 2024 | 2023 | Outstanding issue amount in foreign currency (Million) | Annual
interest rate (%) |
| Euro | 117,350 | 110,973 | 101,657 | 117,350 | 2.72% |
| US dollar | 71,140 | 79,740 | 70,229 | 83,632 | 4.73% |
| Pound sterling | 25,548 | 23,961 | 20,520 | 22,301 | 5.14% |
| Brazilian real | 21,848 | 18,683 | 21,861 | 141,089 | 14.21% |
| Chilean peso | 4,697 | 4,579 | 4,921 | 4,977,648 | 3.61% |
| Other currencies | 13,310 | 14,829 | 12,692 | | |
| Balance at end of year | 253,893 | | 252,765 | | 231,880 | | | |
The changes in 'Bonds and debentures outstanding' were as follows:
| | | | | | | | | | | |
| EUR million |
| 2025 | 2024 | 2023 |
| Balance at beginning of year | 252,765 | | 231,880 | | 211,597 | |
| Net inclusion of entities in the Group | — | | (1,224) | | (1,467) | |
| Of which: | | | |
| SPIRE SA Compartment 2023-374 | — | | (1,224) | | — | |
| Auto ABS UK Loans PLC | — | | — | | (841) | |
| PSA Bank Deutschland GmbH | — | | — | | (626) | |
| Issues | 72,014 | | 77,921 | | 68,568 | |
| Of which: | | | |
| Banco Santander, S.A. | 12,682 | | 20,559 | | 19,706 | |
| Banco Santander (Brasil) S.A. | 11,827 | | 8,039 | | 12,781 | |
| Santander Group UK | 11,450 | | 9,884 | | 6,002 | |
| Santander Consumer USA Holdings Inc. | 8,705 | | 8,949 | | 7,309 | |
| Santander International Products, Plc. | 5,071 | | 2,752 | | 1,054 | |
| Stellantis Financial Services Italia S.p.A. | 2,020 | | 2,021 | | 761 | |
| Santander Consumer Bank S.p.A. | 1,799 | | 1,001 | | 1,460 | |
| Santander Holdings USA, Inc. | 1,772 | | 3,004 | | 1,850 | |
| Fondo de Titulización, Santander Consumo 8 | 1,523 | | — | | — | |
| Fondo de Titulización, Santander Consumo 9 | 1,421 | | — | | — | |
| Banco Santander - Chile | 1,204 | | 1,171 | | 814 | |
| Santander Consumer Finance, S.A. | 1,181 | | 2,271 | | 2,557 | |
| Banco Santander Totta, S.A. | 1,069 | | 1,129 | | 1,734 | |
| Santander Bank, National Association | 853 | | 4,133 | | 1,346 | |
| SC Germany S.A., Compartment Consumer 2025-2 | 850 | | — | | — | |
| SC Austria S.à r.l., Compartment Consumer 2025-1 | 803 | | — | | — | |
| Secucor Finance 2025-1 Designated Activity Company | 801 | | — | | — | |
| Banco Santander México, S.A., Institución de Banca Múltiple, Grupo Financiero Santander México | 787 | | 875 | | 634 | |
| Hyundai Capital Bank Europe GmbH Italy | 749 | | — | | — | |
| Banque Stellantis France | 728 | | 897 | | 1,145 | |
| Santander Consumer Bank AG | — | | 180 | | 1,256 | |
| SC Germany S.A., Compartment Consumer 2024-1 | — | | 1,500 | | — | |
| Santander Consumo 6, F.T. | — | | 1,230 | | — | |
| Santander Consumo 7, F.T. | — | | 1,218 | | — | |
| Santander Bank Polska S.A. | — | | 1,002 | | 1,102 | |
| SC Germany S.A., Compartment Consumer 2024-2 | — | | 1,000 | | — | |
| Redemptions and repurchases | (60,335) | | (57,676) | | (48,825) | |
| Of which: | | | |
| Banco Santander, S.A. | (14,854) | | (15,888) | | (7,889) | |
| Banco Santander (Brasil) S.A. | (9,430) | | (6,919) | | (10,542) | |
| Santander Consumer USA Holdings Inc. | (7,905) | | (10,806) | | (14,466) | |
| Santander Group UK | (4,936) | | (7,764) | | (6,185) | |
| Santander Consumer Finance, S.A. | (2,743) | | (2,900) | | (1,800) | |
| Santander Holdings USA, Inc. | (2,693) | | (1,387) | | — | |
| Santander Bank, National Association | (2,648) | | (1,440) | | (567) | |
| Banco Santander México, S.A., Institución de Banca Múltiple, Grupo Financiero Santander México | (2,084) | | (122) | | (140) | |
| Banco Santander - Chile | (1,930) | | (1,486) | | (575) | |
| Santander International Products, Plc. | (1,327) | | (584) | | (728) | |
| Santander Consumer Bank S.p.A. | (1,327) | | (233) | | (266) | |
| Santander Consumer Bank AS | (1,174) | | (839) | | (681) | |
| Banque Stellantis France | (746) | | (565) | | (813) | |
| Stellantis Financial Services Italia S.p.A. | (698) | | (22) | | — | |
| Banco Santander Totta, S.A. | (223) | | (1,055) | | (108) | |
| Exchange differences and other movements | (10,551) | | 1,864 | | 2,007 | |
| Balance at year-end | 253,893 | | 252,765 | | 231,880 | |
c) Notes and other securities
The notes of the Group (see Note 22.a) were issued basically by Santander Consumer Finance, S.A., Santander UK plc, Banco Santander (México), S.A. Institución de Banca Múltiple, Grupo Financiero Santander México, Banco Santander, S.A., Santander Consumer Bank AG, Banque Stellantis France, Banco Santander -Chile and Banco Santander S.A. - Uruguay.
d) Guarantees
Set forth below is information on the liabilities secured by assets:
| | | | | | | | | | | |
| EUR million |
| 2025 | 2024 | 2023 |
| Asset-backed securities | 55,031 | | 49,723 | | 37,717 | |
| Of which, mortgage-backed securities | 5,961 | | 4,377 | | 3,019 | |
| Other mortgage securities | 51,438 | | 50,141 | | 49,478 | |
| Of which: mortgage-backed bonds | 22,624 | | 22,631 | | 24,619 | |
| Covered bonds (non mortgage and export financing) | 1,728 | | 995 | | 764 | |
| 108,197 | | 100,859 | | 87,959 | |
The main characteristics of the assets securing the aforementioned financial liabilities are as follows:
1.Asset-backed securities
a.Mortgage-backed securities- these securities are secured by mortgage assets (see Note 10.e) with average maturities of more than ten years that must: be a first mortgage for acquisition of principal or second residence, be current in payments, have a loan-to-value ratio below 80% and have a liability insurance policy in force covering at least the appraisal value. The value of the financial liabilities broken down in the foregoing table is lower than the balance of the assets securing them —securitised assets retained on the balance sheet— mainly because the Group repurchases a portion of the bonds issued, and in such cases they are not recognised on the liability side of the consolidated balance sheet.
b.Other asset - backed securities: includes asset-backed securities, notes issued by securitization funds collateralized mainly by mortgage loans that do not meet the above requirements and other loans (mainly personal loans with an average maturity of five years and loans to SMEs with average maturities of seven years) and private issues of Santander Consumer USA Holdings Inc. collateralized by vehicles assigned under operating leases.
2.Other mortgage securities include mainly:
a.Mortgage-backed bonds with average maturities of more than ten years that are secured by a portfolio of mortgage loans and credits (included in secured loans —see note 10.b—) which must: not be classified as of procedural stage; have available appraisals performed by specialised entities; have a loan-to-value (LTV) ratio below 80% in the case of home loans and below 60% for loans for other assets and have sufficient liability insurance.
b.Other debt securities issued as part of the Group’s liquidity strategy in the UK, mainly covered bonds in the UK secured by mortgage loans and other assets.
Grupo Santander has a balance corresponding to mortgage bonds at 31 December 2025 of EUR 22,624 million (all of them issued in euros), which correspond to issues of Banco Santander, S.A. (with an outstanding face value of EUR 22,360 million).
The issuing entity may repay the mortgage bonds early, if this has been expressly established in the final conditions of the issue in question and in the conditions established there.
None of the mortgage bonds issued by Banco Santander have replacement assets involved.
During 2023, the Bank of Spain has published Circular 1/2023 of 4 February , which modifies Circular 4/2017, repealing the breakdown in the annual accounts and the information related to internal accounting development and management control.
Additionally, Banco Santander, S.A. issues internationalization certificates, which are securities whose capital and interest are guaranteed by loans and credits that are linked to the financing of export contracts or the internationalization of companies.
The fair value of the guarantees received by the Group (financial and non-financial assets) which the Group is authorised to sell or pledge even if the owner of the guarantee has not defaulted is scantly material taking into account the Consolidated financial statements as a whole.
23. Subordinated liabilities
a) Breakdown
The detail, by currency of issue, of Subordinated liabilities, deposits and marketable debt securities, in the consolidated balance sheets is as follows:
| | | | | | | | | | | | | | | | | |
| EUR million | 2025 |
| 2025 | 2024 | 2023 | Outstanding issue amount in foreign currency (million) | Annual interest rate (%) |
| Currency of issue |
| Euro | 11,402 | 14,999 | 13,684 | 11,402 | 4.55% |
| US dollar | 9,750 | 13,425 | 11,300 | 11,462 | 6.53% |
| Brazilian real | 4,354 | 3,600 | 2,518 | 28,117 | 16.30% |
| Pound sterling | 1,347 | 1,409 | 1,353 | 1,176 | 4.28% |
| Other currencies | 2,434 | 2,380 | 2,057 | | |
| Balance at end of year | 29,287 | | 35,813 | | 30,912 | | | |
Note 51 contains a detail of the residual maturity periods of subordinated liabilities at each year-end.
b) Changes
The movement in the balance of subordinated liabilities in the last three years were as follows:
| | | | | | | | | | | |
| EUR million |
| 2025 | 2024 | 2023 |
| Balance at beginning of year | 35,813 | | 30,912 | | 25,926 | |
| Net inclusion of entities in the Group | — | | — | | (40) | |
IssuancesA | 2,287 | | 7,001 | | 7,007 | |
| Of which: | | | |
| Banco Santander, S.A. | 1,862 | | 5,625 | | 5,610 | |
| Banco Santander (Brasil) S.A. | 375 | | 1,338 | | 1,112 | |
| Banque Stellantis France | — | | 25 | | 150 | |
Redemptions and repurchasesA | (7,110) | | (2,572) | | (1,781) | |
| Of which: | | | |
| Banco Santander, S.A. | (6,754) | | (2,433) | | (1,000) | |
| Santander UK Group Holdings plc | (352) | | — | | — | |
| Santander Bank Polska S.A. | — | | (100) | | — | |
| Santander UK plc | — | | — | | (702) | |
| Banque Stellantis France | — | | — | | (78) | |
| Exchange differences and other movements | (1,703) | | 472 | | (200) | |
| Balance at end of year | 29,287 | | 35,813 | | 30,912 | |
A.The balance relating to issuances, redemptions and repurchases (EUR 4,823 million), together with the interest paid in remuneration of these issuances including PPCC (EUR 1,560 million), is included in the cash flow from financing activities.
c) Other disclosures
This caption includes contingent convertible or redeemable preferred participations, as well as other subordinated financial instruments issued by consolidated companies, which do not qualify as equity (preferred shares).
Preferred shares do not have voting rights and are non-cumulative. They have been subscribed by third parties outside the Group, and except for the issuances of Santander UK plc, the rest are redeemable by decision of the issuer, according to the terms of each issue.
Banco Santander's contingently convertible preferred participations are subordinated debentures and rank after common creditors and any other subordinated credit that by law and/or by their terms, to the extent permitted by Spanish law, ranks higher than the contingently convertible preferred participations. Their remuneration is conditioned to the obtainment of sufficient distributable profits, and to the limitations imposed by the regulations on shareholders' equity, and they have no voting rights. The other issues of Banco Santander, S.A. mentioned in this caption are also subordinated debentures and, for credit ranking purposes, they rank behind all the common creditors of the issuing entities and ahead of any other subordinated credit that ranks pari passu with the Bank's contingently convertible preferred participations.
The main issuances of subordinated debt securities, broken down by company, are detailed below:
Issuances by Banco Santander, S.A.
On 1 December 2025, Banco Santander, S.A. has proceeded to redeem in advance all the issued subordinated obligations: 'EUR 60,000,000', with original maturity date on December 2026 and with ISIN code XS1492669509.
On 19 November 2025, Banco Santander, S.A. carried out an issuance for an amount of USD 1,500 million with ISIN code US05971KAA79.
On 24 September 2025, Banco Santander, S.A. proceeded to redeem in advance all the issued subordinated obligations: 'EUR 50,000,000 Fixed/Floating', with original maturity date on March 2029 and with ISIN code XS1585005314.
On 5 August 2025, Banco Santander, S.A. proceeded to redeem in advance the subordinated debt issuances with ISIN code XS1384064587, for a nominal amount of EUR 1,500 million, with a coupon of 3.250% and original maturity date on April 2026 and with ISIN code XS1548444816, for a nominal amount of EUR 1,000 million, with a coupon of 3.125% and original maturity date on January 2027.
On 2 July 2025, Banco Santander, S.A. proceeded to repurchase for their subsequent redeem in advance the contingently convertible preferred shares with ISIN code XS2102912966, for a total nominal amount of EUR 466.6 million and which are traded on the market of the Irish Stock Exchange 'Global Exchange Market', leaving the amount in circulation at EUR 1,033.4 million.
On 2 July 2025, Banco Santander, S.A. carried out a placement of preference shares contingently convertible into newly issued ordinary shares of the Bank (PPCC), for a nominal amount of EUR 1,500 million with ISIN code XS3100756637 . The Issuance has been made at par and the remuneration of the PPCC, whose payment is subject to certain conditions and is also discretionary, has been set at 6% quarterly for the first six years, being reviewed every five years thereafter by applying a margin of 381.9 basis points over the five-year mid-swap rate.
On 18 March 2025, Banco Santander, S.A. carried out an issuance for an amount of EUR 1,500 million with ISIN code XS1201001572.
On 17 February 2025, Banco Santander, S.A. prepaid EUR 600.8 million out of a total of EUR 1,500 million of the transaction with ISIN XS138406464587 following the tender announcement launched on 6 February 2025.
On 17 February 2025, Banco Santander, S.A. prepaid EUR 563.6 million euros out of a total of EUR 1,000 million of the transaction with ISIN XS1548444816 following the tender announcement launched on 6 February 2025.
On 1 August 2024, Banco Santander, S.A. carried out a placement of preference shares contingently convertible into newly issued ordinary shares of the Bank (PPCC), for a nominal amount of USD 1,500 million (valued at EUR 1,356 million). The issuance has been made at par and the remuneration of the PPCC, whose payment is subject to certain conditions and is also discretionary, has been set at 8% annually for the first ten years, being reviewed every five years thereafter by applying a margin of 391.1 basis points over the 5-year mid-swap rate.
On 20 May 2024, Banco Santander, S.A., proceeded to partially redeem in advance the contingently convertible preferred shares with ISIN code XS1793250041, for a total nominal amount of EUR 1,312 million and which are traded on the market of the Irish Stock Exchange 'Global Exchange Market' (the 'PPCC'), leaving the amount in circulation at EUR 187.6 million.
On 20 May 2024, Banco Santander, S.A. carried out a placement of preference shares contingently convertible into newly issued ordinary shares of the Bank (PPCC), for a nominal amount of EUR 1,500 million. The Issuance has been made at par and the remuneration of the PPCC, whose payment is subject to certain conditions and is also discretionary, has been set at 7% annually for the first six years, being reviewed every five years thereafter by applying a margin of 443.2 basis points over the 5-year mid-swap rate.
On 14 March 2024, Banco Santander, S.A. issued subordinated obligations for an amount of USD 1,250 million (valued at EUR 1,158 million) for a term of 10 years. The issuance was made at par and the issue coupon was set at 6.35% per year, payable bi-annually.
On 8 February 2024, Banco Santander, S.A., proceeded to prepay all of the contingently convertible Tier 1 preferred shares with ISIN code XS1951093894, for a total nominal amount of USD 1,200 million (valued at EUR 1,110 million) and that were traded on the Irish Stock Exchange 'Global Exchange Market' (the 'PPCC').
On 22 January 2024, Banco Santander, S.A. issued subordinated bonds for an amount of EUR 1,250 million for a term of 10 years and 3 months. The issue was carried out at 99.74% and the issue coupon was set at 5% per year for the first 5 years and 3 months, with an amortization option in April 2029, reviewing the coupon, in case of non-amortization, at a fixed rate equivalent to a margin of 250 points plus the 5-year Euro swap rate.
On 29 December 2023, Banco Santander, S.A., proceeded to prepay all the Tier 1 Contingently Convertible Preferred Securities with ISIN code XS1692931121 for a total nominal amount of EUR 1,000 million and which were traded on the Irish Stock Market 'Global Exchange Market' (the 'PPCC').
On 21 November 2023, Banco Santander, S.A., carried out a placement of two series of contingently convertible preferred shares into newly issued ordinary shares of the Bank, for a total nominal amount of USD 1,150 million (EUR 1,054 million at the exchange rate on the day of issue) and USD 1,350 million (EUR 1,235 million at the exchange rate on the day of issue), respectively.
The issue was carried out at par and the remuneration of the PPCC, whose payment is subject to certain conditions and is also discretionary, was set (i) for the first Series at 9.625% annually for the first five years and six months, being reviewed every five years thereafter by applying a margin of 530.6 basis points on the five-year UST rate (5-year UST), and (ii) for the second Series at 9.625% annually for the first ten years, being reviewed thereafter every five years, applying a margin of 529.8 basis points on the five-year UST rate.
On 8 August 2023, Banco Santander, S.A. carried out an issuance of subordinated obligations for an amount of 2,000 million dollars (1,821 million euros at the exchange rate on the day of issuance). The issue was carried out at par coupon was set at 6.921% per year, payable semiannually during the 10-year life of the operation.
On 23 May 2023, Banco Santander, S.A. issued subordinated bonds for an amount of 1,500 million euros for a term of 10 years and 3 months. The issue was carried at 99.739% and the coupon of the issue was set at 5.75% annually for the first 5 years and 3 months, with the option of amortization in August 2028, revising the coupon, in case of non-amortization, at a margin of 285 points plus the Euro Swap type 5 years.
On 25 April 2022, Banco Santander, S.A. proceeded to prepay all the Tier 1 Contingently Convertible Preferred Securities with ISIN code XS1602466424 and common code 160246642 in circulation, for a total nominal amount of EUR 750 million and which were traded on the Irish Stock Market 'Global Exchange Market' (the 'PPCC').
On 22 November 2021, Banco Santander, S.A. issued subordinated debentures for a term of eleven years, with a redemption option on the tenth anniversary of the issue date, in the amount of USD 1,000 million (EUR 1,007 million at the exchange rate on the day of issue). The issue bears interest at an annual rate of 3.225%, payable semi-annually, for the first ten years. This issue has an early redemption option in the tenth year from the issue date and if the redemption is not executed in the tenth year, the coupon is repriced at a margin of 160 points over the one-year US government bond.
On 4 October 2021, Banco Santander, S.A. issued subordinated debentures for a term of eleven years, with a redemption option on the sixth anniversary of the issue date, amounting to GBP 850 million (EUR 887 million at the exchange rate on the day of issue). The issue bears interest at an annual rate of 2.25%, payable annually for the first six years (then repricing at a margin of 165 points over the 5-year UK government bond).
On 21 September 2021, Banco Santander, S.A. carried out a placement of preferential shares contingently convertible into newly issued ordinary shares of the Bank ('PPCC') for a nominal amount of EUR 1,000 million (issue placed on the market EUR 997 million). The issuance was carried out at par and the remuneration of the PPCC, whose payment is subject to certain conditions and is also discretionary, was set at 3.625% per year for the first eight years, being reviewed every five years applying a margin of 376 basis points over the 5-year Mid-Swap Rate.
On 12 May 2021, Banco Santander, S.A. placed the issue of preference shares contingently convertible into newly issued ordinary shares of the Bank, previously announced, for a total nominal amount of EUR 1,578 million, issued in a Series in Dollars of USD 1,000 million (EUR 828 million at the exchange rate on the day of issue) and a Series in Euros for an amount of EUR 750 million. The issuance was carried out at par and the remuneration of the PPCC, whose payment is subject to certain conditions and is also discretionary, was set (i) for the Series in Dollars at 4.750% per annum for the first six years, being revised every five years applying a margin of 375.3 basis points over the 5-year UST rate and (ii) for the Series in Euros by 4.125% per annum for the first seven years, being revised every five years applying a margin of 431.1 basis points over the applicable 5-year euro mid-swap.
On 3 December 2020, Banco Santander, S.A. issued subordinated debentures with a ten-year term of USD 1,500 million (EUR 1,222 million at the date of issue). The issue bears interest at an annual rate of 2.749%, payable semiannually.
On 22 October 2020, it carried out a ten-year subordinated debenture issue for an amount of EUR 1,000 million. The issue bears interest at an annual rate of 1.625%, payable annually.
On 14 January 2020, it carried out a placement of contingently convertible preferred participations into newly issued ordinary shares of the Bank (the 'PPCCs'), excluding the pre-emptive subscription rights of its shareholders and for a nominal amount of EUR 1,500 million (the 'Issuance' and the 'PPCCs'). The Issuance was made at par and the remuneration of the PPCCs, the payment of which is subject to certain conditions and is also discretionary, was set at 4.375% per annum for the first six years, revised every five years thereafter by applying a margin of 453.4 basis points over the 5-year mid-Swap Rate (5-year mid-Swap Rate).
On 8 February 2018, a ten-year subordinated debenture issuance of EUR 1,250 million was carried out. The issue accrues annual interest of 2.125% payable annually.
Issuances by Banco Santander (Brasil) S.A.
In early December 2025, Brazil closed a Tier 2 subordinated debt issuance in its local market with a 10-year term and the first call date at 5 years, for an amount of BRL 2.4 billion. The issuance price was 10y CDI + 65 bps.
At September 2024, Brazil issued AT1 Financial Notes (PerpNC5) in its local market for an amount of BRL 7,600 million at CDI + 140% (equivalent to UST +222 bps).
At the beginning of October 2023, Banco Santander (Brasil) S.A. carried out an issuance of Subordinated Financial Bills (TIER II) in its local market for a 10-year term, with a repurchase option as of the fifth anniversary of the issuance date, in the amount of BRL 6,000 million. The issuance price was CDI +1.6% per annum, payable at maturity.
At the end of November 2021, Banco Santander (Brasil) S.A. carried out an issuance of Subordinated Financial Bills (TIER II) in its local market for a 10-year term, with a repurchase option as of the fifth anniversary of the issue date, in the amount of BRL 5,500 million. The issue price was CDI 2% per annum, payable at maturity.
Issuance by Santander Bank Polska S.A.
At 28 November 2024, Santander Bank Polska S.A proceeded to repay subordinated debt ISIN XS0531310182 for EUR 100 million. The debt was originally fully subscribed by the EBRD at 5 August 2010.
The accrued interests from the subordinated liabilities during 2025 amounted to EUR 1,486 million (EUR 1,357 million and EUR 1,010 million during 2024 and 2023, respectively).
In addition, interests from the PPCC and PPCA during 2025 amounted to EUR 622 million (EUR 620 million and EUR 492 million in 2024 and 2023, respectively).
24. Other financial liabilities
The detail of Other financial liabilities in the consolidated balance sheets is as follows:
| | | | | | | | | | | |
| EUR million |
| 2025 | 2024 | 2023 |
| Trade payables | 1,452 | | 1,452 | | 1,783 | |
| Clearing houses | 794 | | 776 | | 1,269 | |
| Tax collection accounts: | | | |
| Public Institutions | 6,271 | | 6,156 | | 4,986 | |
| Factoring accounts payable | 274 | | 226 | | 272 | |
| Unsettled financial transactions | 3,860 | | 7,421 | | 6,412 | |
| Lease liabilities (note 2.k) | 1,822 | | 2,202 | | 2,400 | |
| Other financial liabilities | 21,645 | | 21,683 | | 23,065 | |
| 36,118 | | 39,916 | | 40,187 | |
Note 51 contains a detail of the residual maturity periods of other financial liabilities at each year-end.
Lease liabilities
The cash outflow of leases in 2025 was EUR 510 million (EUR 684 million and EUR 738 in 2024 and 2023, respectively).
The analysis of the maturities of lease liabilities at 31 December 2025, 2024 and 2023 is shown below:
| | | | | | | | | | | |
| EUR million | | |
| 2025 | 2024 | 2023 |
Maturity Analysis - Discounted payments | | | |
| Within 1 year | 466 | | 526 | | 586 | |
| Between 1 and 3 years | 619 | | 868 | | 918 | |
| Between 3 and 5 years | 315 | | 405 | | 480 | |
| Later than 5 years | 422 | | 403 | | 416 | |
| Total discounted payments at the end of the year | 1,822 | | 2,202 | | 2,400 | |
During 2025, 2024 and 2023 there were no significant variable lease payments not included in the valuation of lease liabilities.
25. Provisions
a) Breakdown
The detail of Provisions in the consolidated balance sheets is as follows:
| | | | | | | | | | | |
| EUR million |
| 2025 | 2024 | 2023 |
| Provision for pensions and other obligations post-employments | 1,656 | | 1,731 | | 2,225 | |
| Other long term employee benefits | 993 | | 915 | | 880 | |
| Provisions for taxes and other legal contingencies | 2,989 | | 2,717 | | 2,715 | |
| Contingent liabilities and commitments (note 2.o) | 713 | | 710 | | 702 | |
| Other provisions | 2,004 | | 2,334 | | 1,919 | |
| Provisions | 8,355 | | 8,407 | | 8,441 | |
b) Changes
The changes in 'Provisions' in the last three years were as follows:
| | | | | | | | | | | | | | | | | |
| EUR million |
| 2025 |
| Post employment plans | Long term employee benefits | Contingent liabilities and commitments | Other provisions | Total |
| Balances at beginning of year | 1,731 | | 915 | | 710 | | 5,051 | | 8,407 | |
| Incorporation of Group companies, net | (13) | | — | | — | | — | | (13) | |
| Additions charged to income | 75 | | 437 | | 50 | | 1,872 | | 2,434 | |
| Interest expense (note 39) | 59 | | 32 | | — | | — | | 91 | |
Staff costs (note 46) | 32 | | 9 | | — | | — | | 41 | |
| Provisions or reversion of provisions | (16) | | 396 | | 50 | | 1,872 | | 2,302 | |
| Addition | 6 | | 424 | | 591 | | 4,036 | | 5,057 | |
| Release | (22) | | (28) | | (541) | | (2,164) | | (2,755) | |
| Other additions arising from insurance contracts linked to pensions | (5) | | — | | — | | — | | (5) | |
| Changes in value recognised in equity | 220 | | — | | — | | — | | 220 | |
| Payments to pensioners and pre-retirees with a charge to internal provisions | (107) | | (358) | | — | | — | | (465) | |
| Benefits paid due to settlements | (31) | | — | | — | | — | | (31) | |
| Insurance premiums paid | — | | — | | — | | — | | — | |
| Payments to external funds | (329) | | — | | — | | — | | (329) | |
| Amounts used | — | | — | | — | | (1,914) | | (1,914) | |
| Transfer, exchange differences and other changes | 115 | | (1) | | (47) | | (16) | | 51 | |
| Balances at end of year | 1,656 | | 993 | | 713 | | 4,993 | | 8,355 | |
| | | | | | | | | | | | | | | | | | | | | | | | | | | | | | | | | | | |
| EUR million |
| 2024 | | 2023 |
| Post employment plans | Long term employee benefits | Contingent liabilities and commitments | Other provisions | Total | | Post employment plans | Long term employee benefits | Contingent liabilities and commitments | Other provisions | Total |
| Balances at beginning of year | 2,225 | | 880 | | 702 | | 4,634 | | 8,441 | | | 2,392 | | 950 | | 734 | | 4,073 | | 8,149 | |
| Incorporation of Group companies, net | — | | — | | — | | — | | — | | | (4) | | — | | — | | — | | (4) | |
| Additions charged to income | 94 | | 368 | | 47 | | 2,703 | | 3,212 | | | 92 | | 244 | | (38) | | 1,895 | | 2,193 | |
| Interest expense (note 39) | 76 | | 29 | | — | | — | | 105 | | | 59 | | 34 | | — | | — | | 93 | |
Staff costs (note 46) | 34 | | 11 | | — | | — | | 45 | | | 33 | | 9 | | — | | — | | 42 | |
| Provisions or reversion of provisions | (16) | | 328 | | 47 | | 2,703 | | 3,062 | | | — | | 201 | | (38) | | 1,895 | | 2,058 | |
| Addition | 5 | | 335 | | 430 | | 4,026 | | 4,796 | | | 3 | | 204 | | 378 | | 3,407 | | 3,992 | |
| Release | (21) | | (7) | | (383) | | (1,323) | | (1,734) | | | (3) | | (3) | | (416) | | (1,512) | | (1,934) | |
| Other additions arising from insurance contracts linked to pensions | (2) | | — | | — | | — | | (2) | | | — | | — | | — | | — | | — | |
| Changes in value recognised in equity | 643 | | — | | — | | — | | 643 | | | 944 | | — | | — | | — | | 944 | |
| Payments to pensioners and pre-retirees with a charge to internal provisions | (153) | | (331) | | — | | — | | (484) | | | (182) | | (316) | | — | | — | | (498) | |
| Insurance premiums paid | — | | — | | — | | — | | — | | | — | | — | | — | | — | | — | |
| Payments to external funds | (708) | | — | | — | | — | | (708) | | | (750) | | — | | — | | — | | (750) | |
| Amounts used | — | | — | | — | | (2,178) | | (2,178) | | | — | | — | | (1) | | (1,825) | | (1,826) | |
| Transfer, exchange differences and other changes | (368) | | (2) | | (39) | | (108) | | (517) | | | (267) | | 2 | | 7 | | 491 | | 233 | |
| Balances at end of year | 1,731 | | 915 | | 710 | | 5,051 | | 8,407 | | | 2,225 | | 880 | | 702 | | 4,634 | | 8,441 | |
c) Provision for pensions and other obligations post –employments and Other long term employee benefits
The detail of Provisions for pensions and similar obligations is as follows:
| | | | | | | | | | | |
| EUR million |
| 2025 | 2024 | 2023 |
| Provisions for post-employment plans - Spanish entities | 602 | 674 | 770 |
| Provisions for other similar obligations - Spanish entities | 927 | 852 | 817 |
| Of which pre-retirements | 916 | 839 | 805 |
| Provisions for post-employment plans - United Kingdom | 26 | 28 | 76 |
| Provisions for post-employment plans - Other subsidiaries | 1,028 | 1,029 | 1,379 |
| Provisions for other similar obligations - Other subsidiaries | 66 | 63 | 63 |
| Provision for pensions and other obligations post -employments and Other long term employee benefits | 2,649 | | 2,646 | | 3,105 | |
| Of which defined benefits | 2,637 | 2,638 | 3,097 |
i. Spanish entities - Post-employment plans and other similar obligations
At 31 December 2025, 2024 and 2023, the Spanish entities had post-employment benefit obligations under defined contribution and defined benefit plans. In addition, in various years some of the consolidated entities offered certain of their employees the possibility of taking pre-retirement and, therefore, provisions are recognised each year for the obligations to employees taking pre-retirement -in terms of salaries and other employee benefit costs- from the date of their pre-retirement to the agreed end date.
In 2023, the provisions made to cover the commitments with 502 employees covered by early retirement and incentivized dismissals plan amounted to EUR 160 million.
In 2024, the provisions made to cover the commitments with 826 employees covered by early retirements and incentivized dismissals amounted to EUR 303 million.
In 2025, the provisions made to cover the commitments with 1,238 employees covered by early retirements and incentivized dismissals amounted to EUR 389 million.
The expenses incurred by the Spanish companies in 2025, 2024 and 2023 in respect of contributions to defined contribution plans amounted to EUR 130 million, EUR 126 million and EUR 116 million, respectively.
The amount of the defined benefit obligations was determined on the basis of the work performed by independent actuaries using the following actuarial techniques:
1. Valuation method: projected unit credit method, which sees each period of service as giving rise to an additional unit of benefit entitlement and measures each unit separately.
2. Actuarial assumptions used: unbiased and mutually compatible. Specifically, the most significant actuarial assumptions used in the calculations were as follows:
| | | | | | | | | | | | | | | | | | | | | | | |
| Post-employment plans | | Other similar obligations |
| 2025 | 2024 | 2023 | | 2025 | 2024 | 2023 |
| Annual discount rate | 3.75 | % | 3.00 | % | 3.35 | % | | 3.75 | % | 3.00 | % | 3.35 | % |
| Mortality tables | PER2020 M/F Col. Orden 1 | PER2020 M/F Col. Orden 1 | PER2020 M/F Col. Orden 1 | | PER2020 M/F Col. Orden 1 | PER2020 M/F Col. Orden 1 | PER2020 M/F Col. Orden 1 |
| Cumulative annual CPI growth | 2.00 | % | 2.00 | % | 2.00 | % | | 2.00 | % | 2.00 | % | 2.00 | % |
| Annual salary increase rate | 1.25%A | 1.25%A | 1.25%A | | N/A | N/A | N/A |
| Annual social security pension increase rate | 2.12 | % | 2.12 | % | 2.12 | % | | N/A | N/A | N/A |
| Annual benefit increase rate | N/A | N/A | N/A | | 0 | % | 0 | % | 0 | % |
A.Corresponds to the group’s defined-benefit obligations.
The discount rate used for the flows was determined by reference to high-quality corporate bonds (at least AA in euros) matching the durations of the commitments. From the bond portfolio considered, callable, putable and sinkable bonds, which could distort the rates, are excluded.
Any changes in the main assumptions could affect the calculation of the obligations. At 31 December 2025, if the discount rate used had been decreased or increased by 50 basis points (bp), there would have been an increase or decrease in the present value of the post-employment obligations of 4.02% (-50 bp) to -3.75% (+50 bp),respectively, and an increase or decrease in the present value of the long-term obligations of 1.15% (-50 bp) to -1.15% (+50 bp), respectively.
These changes would be offset in part by increases or decreases in the fair value of the assets and insurance contracts linked to pensions.
3. The estimated retirement age of each employee is the first at which the employee is entitled to retire or the agreed-upon age, as appropriate.
The fair value of insurance contracts was determined as the present value of the related payment obligations, taking into account the following assumptions:
| | | | | | | | | | | | | | | | | | | | | | | |
| Post-employment plans | | Other similar obligations |
| 2025 | 2024 | 2023 | | 2025 | 2024 | 2023 |
| Expected rate of return on plan assets | 3.75 | % | 3.00 | % | 3.35 | % | | 3.75 | % | 3.00 | % | 3.35 | % |
| Expected rate of return on reimbursement rights | 3.75 | % | 3.00 | % | 3.35 | % | | N/A | N/A | N/A |
The funding status of the defined benefit obligations in 2025 and the two preceding years is as follows:
| | | | | | | | | | | | | | | | | | | | | | | |
| EUR million |
| Post-employment plans | | Other similar obligations |
| 2025 | 2024 | 2023 | | 2025 | 2024 | 2023 |
| Present value of the obligations | | | | | | | |
| To current employees | 34 | | 49 | | 51 | | | — | | — | | — | |
| Vested obligations to retired employees | 1,610 | | 1,850 | | 1,936 | | | — | | — | | — | |
| To pre-retirees employees | | — | | — | | | 919 | | 844 | | 812 | |
| Long-service bonuses and other benefits | | — | | — | | | 11 | | 13 | | 12 | |
| 1,644 | | 1,899 | | 1,987 | | | 930 | | 857 | | 824 | |
| Less - Fair value of plan assets | 1,058 | | 1,234 | | 1,235 | | | 3 | | 5 | | 7 | |
| Provisions - Provisions for pensions | 586 | | 665 | | 752 | | | 927 | | 852 | | 817 | |
| Of which: | | | | | | | |
| Internal provisions for pensions | 535 | | 593 | | 677 | | | 927 | | 852 | | 817 | |
| Net pension assets | (13) | | (6) | | (14) | | | — | | — | | — | |
| Insurance contracts linked to pensions (note 14) | 67 | | 81 | | 93 | | | — | | — | | — | |
| Unrecognised net assets for pensions | (3) | | (3) | | (4) | | | — | | — | | — | |
The amounts recognised in the consolidated income statements in relation to the aforementioned defined benefit obligations are as follows:
| | | | | | | | | | | | | | | | | | | | | | | |
| EUR million |
| Post-employment plans | | Other similar obligations |
| 2025 | 2024 | 2023 | | 2025 | 2024 | 2023 |
| Current service cost | 5 | | 3 | | 2 | | | 1 | | 1 | | 1 | |
| Interest cost (net) | 27 | | 28 | | 42 | | | 27 | | 25 | | 30 | |
| Expected return on insurance contracts linked to pensions | (3) | | (3) | | (4) | | | — | | — | | — | |
| Provisions or reversion of provisions | | | | | | | |
| Actuarial (gains)/losses recognised in the year | — | | — | | — | | | (19) | | — | | 7 | |
| Past service cost | — | | 3 | | 2 | | | — | | — | | 13 | |
| Pre-retirement cost | — | | — | | — | | | 389 | | 303 | | 160 | |
OtherA | (16) | | (10) | | (1) | | | — | | (4) | | (1) | |
| 13 | | 21 | | 41 | | | 398 | | 325 | | 210 | |
A.Including reduction/settlement effect
In addition, in 2025 'Other comprehensive income – Items not reclassified to profit or loss – Actuarial gains or (-) losses on defined benefit pension plans' has decreased by EUR 33 million with respect to defined benefit obligations (increase of EUR 21 and increase of EUR 10 million in 2024 and 2023, respectively).
The changes in the present value of the accrued defined benefit obligations were as follows:
| | | | | | | | | | | | | | | | | | | | | | | |
| EUR million |
| Post-employment plans | | Other similar obligations |
| 2025 | 2024 | 2023 | | 2025 | 2024 | 2023 |
| Present value of the obligations at beginning of year | 1,899 | | 1,987 | | 2,076 | | | 857 | | 824 | | 903 | |
| Incorporation of Group companies, net | — | | — | | — | | | — | | — | | — | |
| Current service cost | 5 | | 3 | | 2 | | | 1 | | 1 | | 1 | |
| Interest cost | 67 | | 71 | | 82 | | | 27 | | 25 | | 30 | |
| Pre-retirement cost | — | | — | | — | | | 389 | | 303 | | 160 | |
| Effect of curtailment/settlement | (9) | | (10) | | (1) | | | — | | (4) | | (1) | |
| Benefits paid | (179) | | (203) | | (210) | | | (325) | | (292) | | (290) | |
| Benefits paid due to settlements | (31) | | (2) | | — | | | — | | — | | — | |
| Past service cost | — | | 3 | | 2 | | | — | | — | | 13 | |
| Actuarial (gains)/losses | (102) | | 45 | | 37 | | | (19) | | — | | 7 | |
| Demographic actuarial (gains)/losses | (14) | | — | | (2) | | | (8) | | (1) | | — | |
| Financial actuarial (gains)/losses | (88) | | 45 | | 39 | | | (11) | | 1 | | 7 | |
| Exchange differences and other items | (6) | | 5 | | (1) | | | — | | — | | 1 | |
| Present value of the obligations at end of year | 1,644 | | 1,899 | | 1,987 | | | 930 | | 857 | | 824 | |
The changes in the fair value of plan assets and of insurance contracts linked to pensions were as follows:
| | | | | | | | | | | | | | | | | | | | | | | |
| Plan Assets |
| EUR million | |
| Post-employment plans | | Other similar obligations |
| 2025 | 2024 | 2023 | | 2025 | 2024 | 2023 |
| Fair value of plan assets at beginning of year | 1,234 | | 1,235 | | 861 | | | 5 | | 7 | | 8 | |
| Incorporation of Group companies, net | — | | — | | — | | | — | | — | | — | |
| Expected return on plan assets | 40 | | 43 | | 40 | | | — | | — | | — | |
| Gains/(losses) on settlements | 7 | | — | | — | | | — | | — | | — | |
| Benefits paid | (144) | | (124) | | (89) | | | (2) | | (2) | | (2) | |
| Contributions/(surrenders) | (7) | | 58 | | 409 | | | — | | — | | — | |
| Actuarial gains/(losses) | (64) | | 27 | | 25 | | | — | | — | | — | |
| Exchange differences and other items | (8) | | (5) | | (11) | | | — | | — | | 1 | |
| Fair value of plan assets at end of year | 1,058 | | 1,234 | | 1,235 | | | 3 | | 5 | | 7 | |
| | | | | | | | | | | | | | | | | | | | | | | |
| Insurance Contracts linked to pensions |
| EUR million |
| Post-employment plans | | Other similar obligations |
| 2025 | 2024 | 2023 | | 2025 | 2024 | 2023 |
| Fair value of insurance contracts linked to pensions at beginning of year | 81 | | 93 | | 104 | | | — | | — | | — | |
| Incorporation of Group companies, net | — | | — | | — | | | — | | — | | — | |
| Expected return on insurance contracts linked to pensions | 3 | | 3 | | 4 | | | — | | — | | — | |
| Benefits paid | (12) | | (13) | | (15) | | | — | | — | | — | |
| Paid premiums | — | | — | | — | | | — | | — | | — | |
| Actuarial gains/(losses) | (5) | | (2) | | — | | | — | | — | | — | |
| Fair value of insurance contracts linked to pensions at end of year | 67 | | 81 | | 93 | | | — | | — | | — | |
In view of the conversion of the defined-benefit obligations to defined-contribution obligations, the Group will not make material current contributions in Spain in 2026 to fund its defined-benefit pension obligations.
The plan assets and the insurance contracts linked to pensions are instrumented mainly through insurance policies.
The following table shows the estimated benefits payable at 31 December 2025 for the next ten years:
| | | | | |
| EUR million |
| 2026 | 461 |
| 2027 | 391 |
| 2028 | 331 |
| 2029 | 274 |
| 2030 | 223 |
| 2031 to 2035 | 672 |
ii. United Kingdom
At the end of each of the last three years, the businesses in the United Kingdom had post-employment benefit obligations under defined contribution and defined benefit plans. The expenses incurred in respect of contributions to defined contribution plans amounted to EUR 92 million in 2025 (EUR 98 million in 2024 and EUR 87 million in 2023).
The amount of the defined benefit obligations was determined on the basis of the work performed by independent actuaries using the following actuarial techniques:
1. Valuation method: projected unit credit method, which sees each period of service as giving rise to an additional unit of benefit entitlement and measures each unit separately.
2. Actuarial assumptions used: unbiased and mutually compatible. Specifically, the most significant actuarial assumptions used in the calculations were as follows:
| | | | | | | | | | | |
| 2025 | 2024 | 2023 |
| Annual discount rate | 5.58% | 5.54% | 4.63% |
| Mortality tables | ''S4 Light' tables weighted 105% males/101% females and CMI_2024 projection [LTR=1.25%, A=0.25%, H=1] with both Age-Period and Cohort convergence periods equal to core values except increased to 20 years for ages 80 to 100 and then tapering down to nil by age 120 | The S3 Middle tables weighted at 84% of the CMI_2023 projection with an initial addition of 0.25%, smoothing parameter 7 and improving 1.25%. | The S3 Middle tables weighted at 84% of the CMI_2022 projection with an initial addition of 0.25%, smoothing parameter 7 and improving 1.25%. |
| Cumulative annual CPI growth | 2.9% | 3.11% | 3.02% |
| Annual salary increase rate | 1.00% | 1.00% | 1.00% |
| Annual pension increase rate | 2.78% | 3.04% | 2.96% |
The discount rate used for the flows was determined by reference to high-quality corporate bonds (at least AA in pounds sterling) that coincide with the terms of the obligations.
Any changes in the main assumptions could affect the calculation of the obligations. At 31 December 2025, if the discount rate used had been decreased or increased by 50 basis points, there would have been an increase or decrease in the present value of the obligations of 5.82% (-50 bp) and -5.28% (+50 bp), respectively. If the inflation assumption had been increased or decreased by 50 basis points, there would have been an increase or decrease in the present value of the obligations of 4.23% (+50 bp) and -4.14% (-50 bp), respectively. These changes would be offset in part by increases or decreases in the fair value of the assets.
The funding status of the defined benefit obligations in 2025 and the two preceding years is as follows:
| | | | | | | | | | | |
| EUR million |
| 2025 | 2024 | 2023 |
| Present value of the obligations | 8,164 | | 8,898 | | 9,451 | |
| Less- | | | |
| Fair value of plan assets | 8,740 | | 9,400 | | 10,208 | |
| Provisions - Provisions for pensions | (576) | | (502) | | (757) | |
| Of which: | | | |
| Internal provisions for pensions | 25 | | 28 | | 76 | |
| Net assets for pensions | (601) | | (530) | | (833) | |
The amounts recognised in the consolidated income statements in relation to the aforementioned defined benefit obligations are as follows:
| | | | | | | | | | | |
| EUR million |
| 2025 | 2024 | 2023 |
| Current service cost | 9 | | 13 | | 14 | |
| Interest cost (net) | (31) | | (40) | | (62) | |
| Provisions or reversal of provisions, net | | | |
| Cost of services provided | — | | — | | — | |
| Others | — | | — | | — | |
| (22) | | (27) | | (48) | |
In addition, in 2025 'Other comprehensive income – Items not reclassified to profit or loss – Actuarial gains or (-) losses on defined benefit pension plans has increased by EUR 117 million with respect to defined benefit obligations ( increase of EUR 475 and of EUR 687 million in 2024 and 2023, respectively).
The changes in the present value of the accrued defined benefit obligations were as follows:
| | | | | | | | | | | |
| EUR million |
| 2025 | 2024 | 2023 |
| Present value of the obligations at beginning of year | 8,898 | | 9,451 | | 8,982 | |
| Net incorporation of companies into the Group | — | | — | | (28) | |
| Current service cost | 9 | | 13 | | 14 | |
| Interest cost | 465 | | 438 | | 436 | |
| Benefits paid | (469) | | (465) | | (428) | |
| Benefits paid by settlements | — | | — | | (9) | |
| Contributions made by employees | 3 | | 7 | | 6 | |
| Past service cost | — | | — | | — | |
| Actuarial (gains)/losses | (304) | | (965) | | 281 | |
| Demographic actuarial (gains)/losses | (91) | | (133) | | (59) | |
| Financial actuarial (gains)/losses | (213) | | (832) | | 340 | |
| Exchange differences and other items | (438) | | 419 | | 197 | |
| Present value of the obligations at end of year | 8,164 | | 8,898 | | 9,451 | |
The changes in the fair value of the plan assets were as follows:
| | | | | | | | | | | |
| EUR million |
| 2025 | 2024 | 2023 |
| Fair value of plan assets at beginning of year | 9,400 | | 10,208 | | 10,152 | |
| Net incorporation of companies into the Group | — | | — | | (41) | |
| Expected return on plan assets | 496 | | 478 | | 498 | |
| Benefits paid | (469) | | (465) | | (434) | |
| Contributions | 203 | | 182 | | 225 | |
| Actuarial gains/(losses) | (421) | | (1,440) | | (406) | |
| Exchange differences and other items | (469) | | 437 | | 214 | |
| Fair value of plan assets at end of year | 8,740 | | 9,400 | | 10,208 | |
In 2026 the Group expects to make current contributions to fund these obligations for amounts similar to those made in 2025.
The main categories of plan assets as a percentage of total plan assets are as follows:
| | | | | | | | | | | |
| 2025 | 2024 | 2023 |
| Equity instruments | — | | — | — |
| Debt instruments | 67 | % | 66 | % | 62 | % |
| Properties | 11 | % | 14 | % | 12 | % |
| Other | 22 | % | 20 | % | 26 | % |
The following table shows the estimated benefits payable at 31 December 2025 for the next ten years:
| | | | | |
| EUR million |
| 2026 | 576 | |
| 2027 | 485 | |
| 2028 | 503 | |
| 2029 | 527 | |
| 2030 | 545 | |
| 2031 to 2035 | 2,801 | |
iii. Other foreign subsidiaries
Certain of the consolidated foreign entities have acquired commitments to their employees similar to post-employment benefits.
At 31 December 2025, 2024 and 2023, these entities had defined-contribution and defined-benefit post-employment benefit obligations. The expenses incurred in respect of contributions to defined contribution plans amounted to EUR 110 million in 2025 (EUR 133 million at 31 December 2024 and EUR 107 million at 31 December 2023).
The actuarial assumptions used by these entities (discount rates, mortality tables and cumulative annual CPI growth) are consistent with the economic and social conditions prevailing in the countries in which they are located.
Specifically, the discount rate used for the flows was determined by reference to high-quality corporate bonds, except in the case of Brazil where there is no extensive corporate bond market and, accordingly the discount rate was determined by reference to the series B bonds issued by the Brazilian National Treasury Secretariat for a term coinciding with that of the obligations. In Brazil the discount rate used was between 10.52% and 10.65%, the CPI 3.00% and the mortality table the AT-2000, AT-2000 Basic y AT-2000 S10.
Any changes in the main assumptions could affect the calculation of the obligations. At 31 December 2025, if the discount rate used had been decreased or increased by 50 basis points, there would have been an increase or decrease in the present value of the obligations of 3.92% (-50 bp) and -3.53% (+50 bp), respectively. These changes would be offset in part by increases or decreases in the fair value of the assets.
The funding status of the obligations similar to post-employment benefits and other long-term benefits in 2025 and the two preceding years is as follows:
| | | | | | | | | | | | | | |
| EUR million |
| 2025 | Of which business in Brazil | 2024 | 2023 |
| Present value of the obligations | 6,886 | | 4,569 | | 6,903 | | 8,485 | |
| Less- | | | | |
| Of which: with a charge to the participants | 152 | | 152 | | 157 | | 114 | |
| Fair value of plan assets | 6,284 | | 4,730 | | 6,502 | | 7,787 | |
| Provisions - Provisions for pensions | 450 | | (313) | | 244 | | 584 | |
| Of which: | | | | |
| Internal provisions for pensions | 1,083 | | 210 | | 1,084 | | 1,434 | |
| Net assets for pensions | (170) | | (60) | | (141) | | (154) | |
| Unrecognised net assets for pensions | (463) | | (463) | | (699) | | (696) | |
The amounts recognised in the consolidated income statements in relation to these obligations are as follows:
| | | | | | | | | | | |
| EUR million | |
| 2025 | 2024 | 2023 |
| Current service cost | 26 | | 28 | | 25 | |
| Interest cost (net) | 68 | | 92 | | 83 | |
| Provisions or reversion of provisions | | | |
| (Actuarial gains)/losses recognised in the year | 25 | | 28 | | 23 | |
| Past service cost | — | | 2 | | 1 | |
| Pre-retirement cost | 3 | | — | | — | |
| Other | (2) | | (10) | | (3) | |
| 120 | | 140 | | 129 | |
In addition, in 2025 'Other comprehensive income – Items not reclassified to profit or loss – Actuarial gains or (-) losses on defined benefit pension plans' has increased by EUR 136 million with respect to defined benefit obligations (increase of EUR 147 million and EUR 247 million in 2024 and 2023, respectively).
The changes in the present value of the accrued obligations were as follows:
| | | | | | | | | | | |
| EUR million |
| 2025 | 2024 | 2023 |
| Present value of the obligations at beginning of year | 6,903 | | 8,485 | | 7,578 | |
| Incorporation of Group companies, net | (6) | | — | | (20) | |
| Current service cost | 26 | | 28 | | 25 | |
| Interest cost | 552 | | 578 | | 599 | |
| Pre-retirement cost | 3 | | — | | — | |
| Effect of curtailment/settlement | (2) | | (10) | | (2) | |
| Benefits paid | (726) | | (1,113) | | (730) | |
| Benefits paid due to settlements | (133) | | (20) | | (2) | |
| Contributions made by employees | 4 | | 4 | | 3 | |
| Past service cost | — | | 2 | | 1 | |
| Actuarial (gains)/losses | 270 | | (191) | | 697 | |
| Demographic actuarial (gains)/losses | 300 | | (1) | | 40 | |
| Financial actuarial (gains)/losses | (30) | | (190) | | 657 | |
| Exchange differences and other items | (5) | | (860) | | 336 | |
Present value of the obligations
at end of year | 6,886 | | 6,903 | | 8,485 | |
The changes in the fair value of the plan assets were as follows:
| | | | | | | | | | | |
| EUR million |
| 2025 | 2024 | 2023 |
| Fair value of plan assets at beginning of year | 6,502 | | 7,787 | | 7,321 | |
| Incorporation of Group companies, net | — | | — | | (16) | |
| Expected return on plan assets | 556 | | 551 | | 588 | |
| Benefits paid | (752) | | (1,022) | | (644) | |
| Contributions | 134 | | 477 | | 124 | |
| Actuarial gains/(losses) | (201) | | (304) | | 110 | |
| Settlements gains/(losses) | (1) | | — | | — | |
| Exchange differences and other items | 46 | | (987) | | 304 | |
| Fair value of plan assets at end of year | 6,284 | | 6,502 | | 7,787 | |
In 2026 the Group expects to make contributions to fund these obligations for amounts similar to those made in 2025.
The main categories of plan assets as a percentage of total plan assets are as follows:
| | | | | | | | | | | |
| 2025 | 2024 | 2023 |
| Equity instruments | 14 | % | 13% | 11% |
| Debt instruments | 79 | % | 79% | 83% |
| Properties | 1 | % | 1% | 1% |
| Other | 6 | % | 7% | 5% |
The following table shows the estimated benefits payable at 31 December 2025 for the next ten years:
| | | | | |
| EUR million |
| 2026 | 746 | |
| 2027 | 736 | |
| 2028 | 740 | |
| 2029 | 744 | |
| 2030 | 747 | |
| 2031 to 2035 | 3,790 | |
d) Provisions for taxes and other legal contingencies and Other provisions
'Provisions - Provisions for taxes and other legal contingencies' and 'Provisions - Other provisions', which include, inter alia, provisions for restructuring costs and tax-related and non-tax-related proceedings, were estimated using prudent calculation procedures in keeping with the uncertainty inherent to the obligations covered. The definitive date of the outflow of resources embodying economic benefits for the Group depends on each obligation. In certain cases, these obligations have no fixed settlement period and, in other cases, depend on the legal proceedings in progress.
The detail, by geographical area, of Provisions for taxes and other legal contingencies and Other provisions is as follows:
| | | | | | | | | | | |
| EUR million |
| 2025 | 2024 | 2023 |
| Recognised by Spanish companies | 2,033 | | 1,924 | | 1,921 | |
| Recognised by other EU companies | 310 | | 694 | | 433 | |
| Recognised by other companies | 2,650 | | 2,433 | | 2,280 | |
| Of which: | | | |
| Brazil | 1,530 | | 1,445 | | 1,618 | |
United Kingdom A | 736 | 654 | | 373 | |
| 4,993 | | 5,051 | | 4,634 | |
A.Of which GBP 461 million (EUR 528.1 million) correspond to the Financial Conduct Authority (FCA) review of the Vehicle Finance Market as detailed in note 25.e.ii.
Set forth below is the detail, by type of provision, of the balance at 31 December 2025, 2024 and 2023 of Provisions for taxes and other legal contingencies and Other provisions.
The types of provision were determined by grouping together items of a similar nature:
| | | | | | | | | | | |
| EUR million |
| 2025 | 2024 | 2023 |
| Provisions for taxes | 720 | | 727 | | 745 | |
| Provisions for employment-related proceedings (Brazil) | 594 | | 458 | | 611 | |
| Provisions for other legal proceedings | 1,675 | | 1,532 | | 1,359 | |
| Provision for customer remediation | 826 | | 1,001 | | 454 | |
| Provision for restructuring | 279 | | 589 | | 596 | |
| Other | 899 | | 744 | | 869 | |
| 4,993 | | 5,051 | | 4,634 | |
Relevant information is set forth below in relation to each type of provision shown in the preceding table.
The provisions for taxes include provisions for tax-related proceedings.
The provisions for employment-related proceedings (Brazil) relate to claims filed by trade unions, associations, the prosecutor’s office and ex-employees claiming employment rights to which, in their view, they are entitled, particularly the payment of overtime and other employment rights, including litigation concerning retirement benefits. The number and nature of these proceedings, which are common for banks in Brazil, justify the classification of these provisions in a separate category or as a separate type from the rest. The Group calculates the provisions associated with these claims in accordance with past experience of payments made in relation to claims for similar items. When claims do not fall within these categories, a case-by-case assessment is performed and the amount of the provision is calculated in accordance with the status of each proceeding and the risk assessment carried out by the legal advisers.
The provisions for other legal proceedings include provisions for court, arbitration or administrative proceedings (other than those included in other categories or types of provisions disclosed separately) brought against Grupo Santander companies.
The provisions for customer remediation include mainly the estimated cost of payments to remedy errors relating to the sale of certain products in the UK, the CHF mortgage portfolio of Poland, as well as the estimated amount related to the floor clauses of Banco Popular Español, S.A.U in Spain. To calculate the provision for customer remediation, the best estimate of the provision made by management is used, which is based on the estimated number of claims to be received and, of these, the number that will be accepted, as well as the estimated average payment per case.
The provisions for restructuring include only the costs arising from restructuring processes carried out by the various Group companies.
Lastly, the Other heading contains very atomized and individually insignificant provisions, such as the provisions to cover the operational risk of the different offices of the Group.
Qualitative information on the main litigation is provided in Note 25 e to the consolidated financial statements.
The Group's general policy is to record provisions for tax and legal proceedings in which the Group assesses the chances of loss to be probable and the Group does not record provisions when the chances of loss are possible or remote. Grupo Santander determines the amounts to be provided for as its best estimate of the expenditure required to settle the corresponding claim based, among other factors, on a case-by-case analysis of the facts and the legal opinion of internal and external counsel or by considering the historical average amount of the loss incurred in claims of the same nature. The definitive date of the outflow of resources embodying economic benefits for the Group depends on each obligation. In certain cases, the obligations do not have a fixed settlement term and, in others, they depend on legal proceedings in progress.
Regarding their variations in fiscal year 2025, in provisions for labour processes and others of a legal nature, EUR 524 million and EUR 185 million were recorded in Brazil in 2025, making payments of EUR 384 million and EUR 159 million, respectively.
e) Litigation and other matters
i. Tax-related litigation
At 31 December 2025 the main tax-related proceedings concerning the Group were as follows:
•Legal actions filed by Banco Santander (Brasil) S.A. and other Group entities to avoid the application of Law 9.718/98, which modifies the basis to calculate Programa de Integraçao Social (PIS) and Contribuição para Financiamento da Seguridade Social (COFINS), extending it to all the entities income, and not only to the income from the provision of services. In relation of Banco Santander (Brasil) S.A. process, in 2015 the Federal Supreme Court (FSC) admitted the extraordinary appeal filed by the Federal Union regarding PIS, and dismissed the extraordinary appeal lodged by the Brazilian Public Prosecutor's Office regarding COFINS contribution, confirming the decision of Federal Regional Court favourable to Banco Santander (Brasil) S.A. of August 2007. The Federal Supreme Court also admitted the appeals related to the other Group entities both for PIS and COFINS. On June 13, 2023, the Federal Supreme Court ruled unfavorably 2 cases through General Repercussion (Theme 372), including Banco Santander (Brasil) S.A. case. The Bank has filed a new appeal, considering the possible loss as a contingent liability. The cases of the other Group entities are no longer susceptible of appeal and a provision has been recognized for the amount of the estimated loss.
•Banco Santander (Brasil) S.A. and other Group companies in Brazil have appealed against the assessments issued by the Brazilian tax authorities questioning the deduction of loan losses in their income tax returns (Imposto sobre a Renda das Pessoas Jurídicas - IRPJ - and Contribuçao Social sobre o Lucro Liquido -CSLL-) in relation to different administrative processes of various years on the ground that the requirements under the applicable legislation were not met. The appeals, which involves several cases, are pending decision in different administrative and judicial instances. No provision was recognised in connection with the amount considered to be a contingent liability.
•Banco Santander (Brasil) S.A. and other Group companies in Brazil are involved in administrative and legal proceedings against several municipalities that demand payment of the Service Tax on certain items of income from transactions not classified as provisions of services. There are several cases in different judicial instances. A provision was recognised in connection with the amount of the estimated loss.
•Banco Santander (Brasil) S.A. and other Group companies in Brazil are involved in administrative and legal proceedings against the tax authorities in connection with the taxation for social security purposes of certain items which are not considered to be employee remuneration. There are several cases in different judicial instances. A provision was recognised in connection with the amount of the estimated loss.
•In May 2003 the Brazilian tax authorities issued separate infringement notices against Santander Distribuidora de Títulos e Valores Mobiliarios, Ltda. (DTVM, actually Santander Brasil Tecnología S.A.) and Banco Santander (Brasil) S.A. in relation to the Provisional Tax on Financial Movements (Contribuição Provisória sobre Movimentação Financeira) of the years 2000 to 2002. The administrative discussion ended unfavourably for both companies, and on July 3, 2015, filed a lawsuit requesting the cancellation of both tax assessments. The lawsuit was judged unfavourably in first instance. Therefore, both plaintiffs appealed to the court of second instance. In December 2020, the appeal was decided unfavourably and the judgement was appealed before the higher courts. This case fell within the scope of the Comprehensive Transaction Programme (Programa de Transaçao Integral) established by the Ministry of Finance, and in 2025 a final settlement was reached. The amounts paid under the terms of the Transaction were fully provisioned.
•In December 2010 the Brazilian tax authorities issued an infringement notice against Santander Seguros S.A. (Brasil), (currently Zurich Santander Brasil Seguros e Previdência S.A.), as the successor by merger to ABN AMRO Brasil dois Participações S.A., in relation to income tax (IRPJ and CSLL) for 2005, questioning the tax treatment applied to a sale of shares of Real Seguros, S.A. The administrative discussion ended unfavourably, and the CARF decision has been appealed at the Federal Justice. As the former parent of Santander Seguros S.A. (Brasil) (currently Zurich Santander Brasil Seguros e Previdência S.A.), Banco Santander (Brasil) S.A. is liable in the event of any adverse outcome of this proceeding. No provision was recognised in connection with this proceeding as it is considered to be a contingent liability.
•In November 2014 the Brazilian tax authorities issued an infringement notice against Banco Santander (Brasil) S.A. in relation to corporate income tax (IRPJ and CSLL) for 2009 questioning the tax-deductibility of the amortisation of the goodwill of Banco ABN AMRO Real S.A. performed prior to the absorption of this bank by Banco Santander (Brasil) S.A., but accepting the amortisation performed after the merger. The Bank appealed before the Higher Chamber of CARF, and a final favourable decision was obtained in April 2024. No provision was recognised in connection with this proceeding as it was considered to be a contingent liability.
•Banco Santander (Brasil) S.A. has also appealed against infringement notices issued by the tax authorities questioning the tax deductibility of the amortisation of the goodwill arising on the acquisition of Banco Comercial e de Investimento Sudameris S.A from years 2007 to 2012. In May and October 2024, the appeal related to period 2009 to 2012 was finally rejected by the CARF and the resolution was appealed at the Federal Justice. No provision was recognised in connection with this matter as it was considered to be a contingent liability.
•Banco Santander (Brasil) S.A. and other companies of the Group in Brazil are undergoing administrative and judicial procedures against Brazilian tax authorities for not admitting tax compensation with credits derived from other tax concepts, not having registered a provision for the amount considered to be a contingent liability.
•Banco Santander (Brasil) S.A. is involved in appeals in relation to infringement notices initiated by tax authorities regarding the offsetting of tax losses in the CSLL of year 2009 and 2019. The appeals are pending decision at the administrative level. No provision was recognised in connection with this matter as it is considered to be a contingent liability.
•Banco Santander (Brasil) S.A. filed a suspensive judicial measure aiming to avoid the withholding income tax (Imposto sobre a Renda Retido na Fonte - IRRF), on payments derived from technology services provided by Group foreign entities. A favorable decision was handed down and an appeal was filed by the tax authority at the Federal Regional Court, where it awaits judgment. No provision was recognized as it is considered to be a contingent liability.
•Brazilian tax authorities have issued infringement notices against Getnet Adquirência e Serviços para Meios de Pagamento S.A and Banco Santander (Brasil) S.A. as jointly liable in relation to corporate income tax (IRPJ and CSLL) for 2014 to 2018 questioning the tax-deductibility of the amortization of the goodwill from the acquisition of Getnet Tecnologia Proces S.A., considering that the company would not have complied with the legal requirements for such amortization. The tax assessment notices were appealed to the CARF. In 2024, the CARF issued a favourable partial decision on both infraction notices. In December 2024, the tax authorities issued a new infringement notice for 2019 and 2020. No provision was recognized as it is considered to be a contingent liability.
The total amount for the aforementioned Brazil lawsuits that are fully provisioned is EUR 553 million, and for lawsuits that qualify as contingent liabilities is EUR 5,040 million.
At the date of approval of these consolidated annual accounts, there are other less significant tax disputes.
ii. Non-tax-related proceedings
At 31 December 2025 the main non-tax-related proceedings concerning the Group were as follows:
•Payment Protection Insurance (PPI): AXA France IARD and AXA France Vie (former GE Capital Corporation Group entities, known as Financial Insurance Company Ltd (FICL) and Financial Assurance Company Ltd (FACL), acquired by AXA SA in 2015) (together, AXA France) brought a claim against (i) Santander Cards UK Limited (formerly known as GE Capital Bank Limited (GECB), which was acquired by Banco Santander, S.A. in 2008 and subsequently transferred to Santander UK plc); and (ii) Santander Insurance Services UK Limited (a Banco Santander, S.A. subsidiary) (SISUK and together with GECB the Santander Entities). The claim relates to the allocation of liability for compensation and associated costs in respect of a large number of PPI policies distributed by GECB pre-2005, which were underwritten by FICL and FACL.
On 25 July 2025, the Commercial Court of England and Wales handed down its judgment in relation to the claim brought by AXA France (the Judgment). It found against SISUK in relation to AXA France’s claim pursuant to an indemnity in an agency agreement entered into between GECB, FICL and FACL in 2000 and novated by GECB to SISUK in 2010. It also found GECB negligent in the sale of PPI policies, but this element of the claim was time barred to PPI policies sold in the period between 2002 and 2005 and overlaps with the indemnity claim. The Judgment required the Santander Entities to pay GBP 515 million plus interest of GBP 162 million.
In October 2025 the Santander Entities obtained permission to appeal the findings in the Judgment relating to the application of the indemnity arising from PPI sales occurring before the indemnity had been agreed in December 2000 (Santander Appeal). In January 2026, AXA France obtained permission to cross-appeal the Commercial Court’s rejection of AXA France’s contribution claim made under the Civil Liability (Contribution) Act 1978 (the AXA France’s cross appeal). A decision on the Santander Appeal and AXA France’s cross appeal is expected in the second half of 2026.
With respect to the Santander Appeal and AXA France’s cross-appeal, there are points of legal interpretation to be resolved and, in the case of the cross-appeal, factual points to be determined. The significant uncertainties make it difficult to predict the timing or the final impact of the resolution of the appeals for the Group.
No customers have suffered loss as a consequence of the claim brought by AXA France or the Judgment, nor does it impact upon past redress paid to customers for PPI complaints.
•Motor Finance Broker Commissions: following the Financial Conduct Authority’s (FCA) Motor Market review in 2019 which resulted in a change in rules in January 2021, Santander Consumer (UK) plc (SCUK) has received several of county court claims and complaints in respect of its historical use of discretionary commission arrangements (DCAs) prior to the 2021 rule changes. In January 2024, the FCA commenced a review of the use of DCAs between lenders and credit brokers (the FCA Review). Pending the conclusion of its review, the FCA paused the handling of motor finance commission related complaints. The pause is currently in place until 31 May 2026, reflecting the extended timeline of the FCA's Review and subsequent Consultation (see below).
After the Court of Appeal's decision rendered on 25 October 2024 within the judicial proceedings followed against DCAs of other financial entities, as of 31 December 2024, the Santander UK group Holdings recognised a provision of GBP 293.0 million (EUR 353.3 million). This provision was determined based upon the information then available. It included estimates for operational and legal costs and potential awards based on various scenarios and used a range of assumptions, including the possible outcome of the appeal to the Supreme Court in 2025 of the Court of Appeal's decision. On 1 August 2025, the Supreme Court handed down its judgment stating that motor dealers acting as credit brokers do not owe fiduciary or disinterested duties to their customers and, as a consequence, commission payments by lenders to motor dealers would not be unlawful on that basis. In addition, the Supreme Court held that an unfair relationship under s.140A of the Consumer Credit Act 1974 had arisen in one of the cases on its facts and awarded the amount of the commission paid by the lender plus interest at a commercial rate as the remedy. It also confirmed that the test for unfairness of the relationship with borrower was highly fact sensitive and it outlined a series of non-exhaustive factors to consider in assessing unfair relationships in this context (indicating that no or partial disclosure was not necessarily enough on its own to constitute an unfair relationship).
Following the Supreme Court’s judgment, on 3 August 2025, the FCA announced that it aimed to publish a consultation on an industry wide redress scheme in early October (the Consultation). Further to the publication of the FCA’s Consultation on 7 October 2025, the Santander UK group submitted its comments on 12 December 2025 and continues to engage constructively with the FCA. The FCA has stated that its intention is to publish the industry wide redress scheme no later than in March 2026.
In light of the proposed sectoral scheme and taking into account the objections raised and the uncertainty surrounding both the final decision to be adopted by the FCA and the outcome of any potential legal challenges, the Santander UK group has reviewed the potential impact on SCUK in relation to the vehicle finance market. The range of scenarios has been updated, which has resulted in an additional estimated charge of GBP 183 million (EUR 213.6 million). As of 31 December 2025, the total provision amounts to GBP 461 million (EUR 528.1 million). This continues to include estimates for operational and legal costs and potential awards reflecting an increased likelihood of a higher number of cases than had previously been predicted as eligible for redress as well as an increased possibility that a remedy is sought to be imposed which extends beyond reversing any damaging financial consequences caused by any unfair relationships. The provision is based on various scenarios using a range of assumptions, including potential changes to the proposed scheme following responses to the Consultation or publication of the FCA’s final scheme rules.
There continue to be significant uncertainties as to the nature, extent and timing of redress payments. Therefore, while the ultimate financial impact of this matter could materially differ from the amount of the provision as of this date, such impact is not expected to be material for the Group as of the date of these financial statements.
•Delforca: dispute arising from equity swaps entered into by Gaesco (now Delforca 2008, S.A. (Delforca)) on shares of Inmobiliaria Colonial, S.A. Banco Santander, S.A. is claiming to Delforca before the Court of Barcelona in charge of the bankruptcy proceedings, a total of EUR 66 million from the liquidation resulting from the early termination of financial transactions due to Delforca's non-payment of the equity swaps. In the same bankruptcy proceedings, Delforca and Mobiliaria Monesa, S.A., parent of Delforca (Monesa) have in turn claimed the Bank to repay EUR 57 million, which the Bank received for the enforcement of the agreed guarantee, as a result of the aforementioned liquidation. On 16 September 2021 the Commercial Court Number 10 of Barcelona has ordered Delforca to pay the Bank EUR 66 million plus EUR 11 million in interest and has dismissed the claims filed by Delforca. This decision was appealed by Delforca, Monesa and the bankruptcy administrator. On 15 November 2023 the Provincial Court of Barcelona rendered a judgment dismissing the appeals filed by Delforca, Monesa and the bankruptcy administrator. Delforca and Monesa (not the bankruptcy administrator) filed an appeal in cassation, that was rejected in November 2025 by the First Chamber of Supreme Court and, as a result, the appeal and first instance judgments in favor of the Bank have been confirmed.
Separately, Monesa, filed in 2009 a civil procedure with the Courts of Santander against the Bank claiming damages that have not been specified to date. The procedure is suspended.
•'Planos Económicos': like the rest of the banking system in Brazil, Santander Brazil has been the target of customer complaints and collective civil suits stemming mainly from legislative changes and its application to the retribution of bank deposits (economic plans). At the end of 2017, an agreement was reached between regulatory entities and the Brazilian Federation of Banks (Febraban) with the purpose of closing the lawsuits and was approved by the Supremo Tribunal Federal (the STF and the Collective Agreement). Discussions focused on specifying the amount to be paid to each affected client according to the balance in their notebook at the time of the application of the plan. Finally, the total value of the payments will depend on the number of adhesions there may be and the number of savers who have proved the existence of the account and its balance on the date the indexes were changed. In November 2018, the STF ordered the suspension of all economic plan proceedings for two years from May 2018. On 29 May 2020, STF approved the extension of the Collective Agreement for 5 additional years starting from 3 June 2020. Condition for this extension was to include in the Collective Agreement actions related to the 'Collor I Plan'. On May 2025, the STF issued the judgment recognizing the constitutionality of the Bresser, Verão, Collor I and II plans, guaranteeing savers the receipt of the amounts established in the Collective Agreement and setting a deadline of 24 months for new adhesions. As of 31 December 2025, the provision recorded for the economic plan proceedings amounts to EUR 155.3 million.
•Banco Popular´s acquisition: after the declaration of the resolution of Banco Popular, some investors filed claims against the EU’s Single Resolution Board decision, and the FROB's resolution executed in accordance with the aforementioned decision. Likewise, numerous civil lawsuits were filed against Banco Santander, S.A. alleging that the information provided by Banco Popular was erroneous and requesting from Banco Santander, S.A. the restitution of the price paid for the acquisition of the investment instruments or, where appropriate, the corresponding compensation.
In relation to the direct appeals filed before the General Court of the European Union (EGC) and the Court of Justice of the European Union (CJEU), all appeals were either dismissed or discontinued. Currently there are no ongoing appeals. On 4 February 2026, the National Court issued its first rulings dismissing the actions brought against the FROB’s decision, in application of the judgments of the EGC and the CJEU.
In the civil proceedings, several Spanish judges referred to the CJEU a number of preliminary questions that have already been resolved. In particular, in the judgments of 5 May 2022 (C-410/20) and 5 September 2024 (C-775/22, C-779/22, C-794/22), the CJEU stated that Directive 2014/59/EU on bank resolution prevents shareholders, subordinated debt holders, and holders of equity instruments converted into shares bringing actions against a financial institution subject to a resolution proceeding or against its successor after the resolution, claiming liability for the information contained in the prospectus, under Directive 2003/71/EC, or actions seeking the nullity of the contract of subscription of capital instruments, which, given its retroactive effects, would result in the refund of the value of such securities, plus the interest accrued as of the date of execution of the contract. In its 11 September 2025 resolution (C-687/23), the CJEU declared that the above referred TJUE resolutions do not apply to actions pursued prior to the entity’s resolution. There are currently no other preliminary questions under consideration.
On 4 March 2024, in the context of preliminary proceedings 42/2017, the Central Court of Instruction No. 4 issued a ruling transforming the proceedings into Summary Proceedings and terminating the investigation phase. This ruling considers that the circumstantial evidence resulting from the investigation which could constitute a crime is basically the following: (i) an alleged misrepresentation in the prospectus of the 2016 capital increase of Banco Popular; (ii) an alleged misrepresentation in the annual accounts of Banco Popular for 2015, the interim financial statements for 2016 and the annual accounts for 2016; and (iii) the offer to the market of a distorted amount of regulatory capital, after the capital increase of 2016 (for allegedly having been granted by Banco Popular financing to clients for the subscription of shares in the aforementioned capital increase, without discounting it from the regulatory capital). According to the aforementioned ruling, these facts could constitute the crimes of fraud of investors (art. 282 of the Criminal Code) and accounting falsehood (art. 290 of the Criminal Code). All appeals filed against the ruling have been dismissed.
The accusing parties, including the Public Prosecutor's Office, filed their indictment briefs on 28 October 2024, which included requests for compensation for civil liability and the request that not only the defendants but also several entities are held liable for such compensation, including Banco Santander, S.A., the auditing firm and several insurance companies. Following the filing of the indictment briefs, on 22 November 2024, the Court (Investigating Judge) issued an order for the opening of the oral trial against the defendants and civil liability parties, including Banco Santander, S.A. as a possible civil liable party. However, in line with what was determined by the Spanish National Court and confirmed by the Supreme Court concerning the hypothetical succession of Banco Popular by Banco Santander, S.A., the oral trial has not been opened against the Bank as possible direct civil liable party.
The order to open the oral trial states that the plaintiffs have requested compensation for civil liability for a total amount of EUR 2,277.65. Additionally, the order rejects the imposition of the guarantee requested by several of the accusing parties, considering that it is unnecessary to secure the outcome of the trial. The defendants and potential civil liable parties submitted their defense writs on 4 February 2025. After that, the proceedings will be forwarded to the Criminal Chamber of the National Court for the oral trial.
Regarding civil liability, the Bank considers that it has no subsidiary civil liability in light of the CJEU’s judgments of 5 May 2022 (C-410/20), 5 September 2024 (C-775/22, C-779/22, C-794/22) and 11 September 2025 (C-687/23 and C-447/23). Notwithstanding the foregoing, the Spanish National Court has stated that this issue shall be resolved within the ongoing proceedings.
The estimated cost of any compensation to shareholders and bondholders of Banco Popular recognized in the 2017 accounts amounted to EUR 680 million, of which EUR 535 million were applied to the commercial loyalty program. On 15 December 2024, Banco Santander, S.A., proceeded to redeem in advance voluntarily all bonds in circulation regarding such commercial action. The CJEU judgements of 5 May 2022 (C-410/20), 5 September 2024 (C-775/22, C-779/22, C-794/22) and 11 September 2025 (C-687/23 and C-447/23) referred above, represented a very significant reduction in the risk associated with these claims.
•German shares investigation: the Cologne Public Prosecution Office is conducting an investigation against the Bank and other group entities based in the UK - Santander UK plc, Santander Financial Services Plc and Cater Allen International Limited -, in relation to a particular type of tax dividend linked transactions known as cum-ex transactions.
The Group is cooperating with the German authorities. According to the state of the investigations, the result, and the effects for the Group, which may potentially include the imposition of material financial consequences (penalties, and/or disgorgement of proceeds) cannot be anticipated. For this reason, the Bank has not recognized any provisions in relation to the potential imposition of financial liabilities.
•Banco Santander, S.A. was sued in a legal proceeding in which the plaintiff alleges that the Bank breached his contract as CEO of the institution: in the lawsuit, the claimant mainly requested a declaratory ruling upholding the existence, validity and effectiveness of such contract and its enforcement together with the payment of certain amounts. For the case that the main request is not granted, the claimant sought a compensation for a total amount of approximately EUR 112 million or, an alternative relief for other minor amounts. Banco Santander, S.A. answered to the legal action stating that the conditions to which the appointment of that position was subject to were not met; that the executive services contract required by law was not concluded; and that in any case, the parties could terminate the contract without any justified cause. On 17 May 2021, the plaintiff reduced his claims for compensation to EUR 61.9 million.
On 9 December 2021, the Court upheld the claim and ordered the Bank to compensate the claimant in the amount of EUR 67.8 million. By court order of 13 January 2022, the Court corrected and supplemented its judgment, reducing the total amount to be paid by the Bank to EUR 51.4 million and clarifying that part of this amount (buy out) was to be paid under the terms of the offer letter, i.e., entirely in Banco Santander shares, within the deferral period for this type of remuneration at the plaintiff's former employer and subject to the performance metrics or parameters of the plan in force at the Bank, which was that of 2018. As explained in note 5 of the report of the consolidated annual accounts of the year 2022, the degree of performance of these objectives was 33.3%.
The Bank filed an appeal against the judgment before the Madrid Court of Appeal, which was opposed by the plaintiff. At the same time, the plaintiff filed an application for provisional enforcement of the judgment in the First Instance Court. A court order was issued ordering enforcement of the judgment, and the Bank deposited in the court bank account the full amount provisionally awarded to the claimant, including interest, for an approximate sum of EUR 35.5 million, within the voluntary compliance period.
On 6 February 2023, Banco Santander was notified with the judgment of 20 January 2023 by which the Madrid Court of Appeal partially upheld the appeal filed by the Bank. The judgment has reduced the amount to be paid by EUR 8 million, which, to the extent that this amount was already paid in the provisional partial enforcement of the judgement of First Instance Court, must be returned to the Bank together with other amounts for interest, which the appeal judgement also rejects. The plaintiff deposited circa EUR 9.6 million. This amount was received by the Bank on 11 July 2023.
On 11 April 2023, the Bank filed an extraordinary appeal for procedural infringement and an appeal in cassation against the Madrid Court of Appeal’s judgment before Spanish Supreme Court. The extraordinary and cassation appeals submitted by the Bank were accepted on 26 March 2025 and are pending to be resolved. Existing provisions cover the estimated risk of loss.
•CHF Polish Mortgage Loans: In October 2019, the CJEU rendered its decision in relation to the effects of the potential unfairness of certain contractual clauses in CHF-Indexed loan agreements. The CJEU established that it for the national courts to determine the invalidity of a contract where it cannot be maintained without the clause declared unfair and where no supplementary provisions exist that would allow the contract to be maintained. Subsequently, in June 2023, the CJEU confirmed that the effects of such invalidity must be determined in accordance with national law, interpreted in the light of Directive 93/13/EEC, and that claims by financial institutions exceeding the reimbursement of the loan principal and, where applicable, default interest, are contrary to the objectives of that Directive.
In April 2024, the Civil Chamber of the Polish Supreme Court issued a judgment confirming that clauses relating to the mechanism for determining the exchange rate declared abusive cannot be replaced by alternative provisions and that, in the absence of a binding exchange rate, the contract is not enforceable for the parties. With regard to the effects of invalidity, the Supreme Court confirmed the existence of independent restitution claims for each party and ruled out the possibility of claiming interest or other amounts for the use of the funds. Nevertheless, certain aspects of this judgment have been subject to internal debate within the Supreme Court itself, reflecting the complexity and evolving nature of the jurisprudential framework
In this context, Santander Bank Polska S.A. and Santander Consumer Bank S.A. estimate legal risk using a model that considers different possible outcomes and regularly review court rulings on this matter in order to assess changes in case law, including the impact of the aforementioned Supreme Court judgment. Settlements are being reached both with customers who have already initiated legal proceedings and with customers who have not yet filed a claim. The model used to calculate provisions for legal risks considers the evolution and expected development of such settlements.
As of 31 December 2025, the total amount adjusted against the gross carrying amount of loans in accordance with IFRS 9, together with the provisions recognised under IAS 37, amounts to PLN 5,874.3 million (EUR 1,391.9 million), of which PLN3,191.7 million (EUR 756.3 million) corresponds to adjustments to the gross carrying amount under IFRS 9 and PLN 2,682.6 million (EUR 635.6 million) to provisions recognised under IAS 37. The adjustment to gross carrying amount in accordance with IFRS9 during 2025 amounted to PLN 99.7 million (EUR 23.6 million), and the additional provisions recognised under IAS 37 amounted to PLN 1245.3 million (EUR 293.8 million). Other costs related to the dispute amounted to PLN 730.5 million (EUR 172.4 million). IAS 37.
As of the same date, Santander Bank Polska S.A. held a portfolio of mortgages denominated in or indexed to CHF amounting to approximately PLN 2,642.0 million (EUR 626.0 million) and recognised provisions of PLN 4,766.4 million (EUR 1,129.4 million) to cover the CHF mortgage portfolio. Santander Consumer Bank S.A. (Poland), in turn, held a portfolio of mortgages denominated in or indexed to CHF amounting to approximately PLN 735.9 million (EUR 174.4 million) and recognised provisions of PLN 1,107.9 million (EUR 262.5 million) to cover this portfolio.
Notwithstanding the above, as detailed in Note 3 b), in January 2026 the Group sold a 49% stake in Santander Bank Polska S.A., which ceased to be consolidated within the Group’s perimeter as of that date.
The Group continues to monitor the evolution of legal proceedings and to periodically review the adequacy of the provisions recognised, which represent the best estimate of the risk existing as of the reporting date.
•Banco Santander Mexico: dispute regarding a testamentary trust constituted in 1994 by Mr. Roberto Garza Sada in Banca Serfin (currently Santander Mexico) in favor of his four sons in which he affected shares of Alfa, S.A.B. de C.V. (respectively, Alfa and the Trust). During 1999, Mr. Roberto Garza Sada instructed Santander México in its capacity as trustee to transfer 36,700,000 shares from the Trust's assets to his sons and daughters and himself. These instructions were ratified in 2004 by Mr. Roberto Garza Sada before a Notary Public.
Mr. Roberto Garza Sada passed away on 14 August 2010 and subsequently, in 2012, his daughters filed a complaint against Santander Mexico alleging it had been negligent in its trustee role. The lawsuit was dismissed at first instance in April 2017 and on appeal in 2018. In May 2018, the plaintiffs filed an appeal (recurso de amparo) before the First Collegiate Court of the Fourth Circuit based in Nuevo León, which ruled in favor of the plaintiffs on 7 May 2021, annulling the 2018 appeal judgment and condemning Santander Mexico to the petitions claimed, consisting of the recovery of the amount of 36,700,000 Alfa shares, together with dividends, interest and damages.
Since 2021, Santander Mexico has filed before the Supreme Court of Justice of the Nation a constitutional review challenge (recurso de revisión constitucional) against the referred decision which was initially rejected by the Supreme Court; and several appeals (recursos de reclamación) against such rejection. On 25 June 2025, one of the appeals filed by the Bank was accepted, and this decision was extended to a remaining one, which will now be resolved. In case that these appeals are resolved favorably to the Bank, the Supreme Court will decide on the merits of the constitutional review against the judgment which condemned the Bank.
In parallel to the foregoing, the Bank also filed an amparo against the judgment favorable to the plaintiffs rendered by the First District Court in the State of Nuevo León before the Collegiate Courts if such State, and in 2024, the Bank requested the Supreme Court of Justice of the Nation to take up and resolve the matter through the faculty of attraction, what is pending.
The challenges and appeals filed by the Bank imply that the judgment rendered in favour of the plaintiffs is not final, and Santander México believes that the actions taken should prevail and reverse the decision against it. The impact of a potential unfavorable resolution for Santander México will be determined in a subsequent proceeding and will also depend on the additional actions that Santander México may take in its defense, so it is not possible to determine it at this time. At the current stage of the proceedings, the provisions recorded are considered sufficient to cover the risks deriving from this claim.
•Mortgage Expenses: in December 2015 the Spanish Supreme Court ruled that mortgage clauses relating to the payment of fees associated to formalizing the mortgage were abusive. On 27 November 2018, the Supreme Court agreed that the taxpayer of the documented legal acts stamp duty tax (IAJD) on the mortgage loans should be the borrower. On 9 November 2018, RDL 17/2018 came into force and modified the Law of the IAJD, establishing that the taxpayer is the Bank. On 23 January 2019, the Supreme Court ruled the distribution of the same must be 50% between the Bank and the borrower in public notary expenses and agency expenses. The Supreme Court also ruled that the Bank must pay 100% of the Registry. On 26 October 2020, the Supreme Court ruled that the Bank is fully responsible for the management expenses; and on 27 January 2021, the Supreme Court ruled that the Bank is also responsible for the valuation expenses.
In relation to the statute of limitations, on 25 April 2024, two judgments were rendered (cases C-561/21 and C-484/21) in which the Court of Justice of the European Union (CJEU) stated that the commencement of the statute of limitations for the reimbursement action of the mortgage expenses derived from the annulment of the clause, shall be fixed on the moment when the consumer has an effective knowledge of the abusive nature of the clause and its effects and that this date must not be fixed (a) on the date of payment of such expense nor of the execution of the agreement; (b) when the Supreme Court has handed down judgments stating the abusive nature of a clause similar to the one included in the consumer contract; nor (c) when the CJEU has handed down judgments confirming that the statute of limitations for the reimbursement action of the amounts derived from the annulment of contractual provisions is valid subject to its compliance with the principles of equivalence and effectiveness.
The Supreme Court has confirmed this criterion in its 14 June 2024 judgment, establishing that the public dissemination of case-law declaring the abusive nature of a clause does not necessarily give rise to the limitation period of the reimbursement action derived from similar clauses. However, the 4 July 2024 judgment, rendered in the case C-450/22, the CJEU has established that it cannot be excluded a priori that, as a consequence of the occurrence of an objective event or of a notorious event, such as the amendment of the applicable legislation or a widely disseminated and debated development of jurisprudence, the court considers that the average consumer's overall perception of the floor clause has changed during the reference period and has enabled him to become aware of the potentially significant economic consequences arising from such clause. A further preliminary question concerning the statute of limitations of the reimbursement action derived from the annulment of mortgage expenses has been raised before the CJEU by the First Instance Court No 8 of La Coruña.
In December in 2024, the Supreme Court handed down two additional judgments regarding statute of limitations, in which it determines that the date to be considered for the purposes of the application of Directive 93/1994 and, consequently, the statute of limitations detailed in its previous judgments, is 31 December 1994 (i.e. the date when the deadline for its transposition ended). This is based on the principle of interpretation in accordance with directives not transposed (applicable once their transposition period has expired). The recorded provision includes the best estimate of Group’s liability for this matter.
Banco Santander and the other Group companies are subject to claims and, therefore, are party to certain judicial and administrative proceedings incidental to the normal course of their business including those in connection with lending activities, relationships with employees and other commercial or tax matters additional to those referred to here.
With the information available to it, the Group considers that, at 31 December 2025, it had reliably estimated the obligations associated with each proceeding and had recognized, where necessary, sufficient provisions to cover reasonably any liabilities that may arise as a result of these tax and legal risks. Disputes in which risk and/or provisions have been registered but are not disclosed is justified on the basis that it would be prejudicial to the proper defense of the Group. Subject to the qualifications made, it also believes that any liability arising from such claims and proceedings will not have, overall, a material adverse effect on the Group’s business, financial position, or results of operations.
26. Other liabilities
The detail of Other liabilities in the consolidated balance sheets is as follows:
| | | | | | | | | | | |
| EUR million |
| 2025 | 2024 | 2023 |
| Transactions in transit | 707 | | 910 | | 767 | |
| Accrued expenses and deferred income | 9,018 | | 9,003 | | 9,136 | |
| Other | 6,212 | | 6,431 | | 7,695 | |
| 15,937 | | 16,344 | | 17,598 | |
27. Tax matters
a) Consolidated Tax Group
According to current Spanish regulation, the Tax Consolidated Group includes Banco Santander, S.A. as the parent company and, as subsidiaries, those Spanish subsidiaries that meet the requirements established by the regulations on the taxation of consolidated groups.
The other Group companies file income tax returns in accordance with the tax regulations applicable to them.
b) Years open for review by the tax authorities
In relation to the partial scope tax audit of Corporate Income Tax for fiscal year 2020 and Value Added Tax for fiscal years 2020 to 2022, initiated in April 2024, in December 2025 the Spanish tax authorities issued a Corporate Income Tax assessment, which has been appealed before the Central Economic-Administrative Court, and the VAT assessments were still pending at the close of the financial year.
The main appeals filed against assessments issued in prior audits remain pending before the Central Economic-Administrative Court (Corporate Income Tax and Value Added Tax for fiscal years 2017 to 2019) and before the National Appellate Court (Corporate Income Tax for fiscal years 2003 to 2015). Banco Santander, S.A., as the parent company of the Tax Consolidated Group, considers, based on the advice of its external legal counsel, that the adjustments made should not have a significant impact on the consolidated annual accounts, as there are strong arguments for defense in the appeals filed against these assessments. Consequently, no provision has been recognized in this respect. Furthermore, it should be noted that, in those cases where it was considered appropriate, the available mechanisms have been used to avoid international double taxation.
At the date of approval of these consolidated annual accounts, subsequent years up to and including 2025, are subject to review.
The other entities have the corresponding years open for review, pursuant to their respective tax regulations.
Due to possible different interpretations which can be made of the tax regulations, the outcome of the tax audits of the rest of years subject to review might give rise to contingent tax liabilities which cannot be objectively quantified. However, the Group’s tax advisers consider that it is unlikely that such tax liabilities will materialize, and that in any event the tax charge arising therefrom would not materially affect the Group’s consolidated financial statements.
c) Reconciliation
The reconciliation of the income tax expense calculated at the tax rate applicable in Spain (30%) to the income tax expense recognised and the detail of the effective tax rate are as follows:
| | | | | | | | | | | |
| EUR million |
| 2025 | 2024 | 2023 |
| Consolidated profit (loss) before tax: | | | |
| From continuing operations | 18,681 | 17,347 | | 15,005 | |
| From discontinued operations | 1,950 | 1,680 | | 1,454 | |
| 20,631 | 19,027 | | 16,459 | |
Income tax at tax rate applicable in Spain (30%) | 6,189 | 5,708 | | 4,938 | |
By the effect of application of the various tax rates applicable in each countryA | (103) | 115 | | (100) | |
| Of which: | | | |
| Brazil | 264 | 413 | | 198 | |
| United Kingdom | (42) | (53) | | (51) | |
| United States | (60) | (25) | | (28) | |
| Chile | (36) | (33) | | (28) | |
| Poland | (224) | (183) | | (164) | |
| Effect of profit or loss of associates and joint ventures | (207) | (213) | | (184) | |
| USA electric vehicle leasing incentives | (203) | (258) | | (259) | |
| Global minimum tax Pillar Two | 6 | 14 | | — | |
| Effect of reassessment of deferred taxes | (101) | 68 | | — | |
Permanent differences
and other | (450) | (151) | | (119) | |
| Income tax | 5,131 | 5,283 | | 4,276 | |
| Effective tax rate | 24.87% | 27.77 | % | 25.98 | % |
| Of which: | | | |
| Continuing operations | 4,723 | 4,844 | | 3,880 | |
Discontinued operations (Note 37) | 408 | 439 | | 396 | |
| Of which: | | | |
| Current taxes | 5,666 | 4,855 | | 5,568 | |
| Deferred taxes | (535) | 428 | | (1,292) | |
| Income tax (receipts)/payments | 4,954 | 5,880 | | 5,214 | |
A.Calculated by applying the difference between the tax rate applicable in Spain and the tax rate applicable in each jurisdiction to the profit or loss contributed to the Group by the entities which operate in each jurisdiction.
d) Tax recognised in equity
In addition to the income tax recognised in the consolidated income statement, the Group recognised the following amounts in consolidated equity in 2025, 2024 and 2023:
| | | | | | | | | | | |
| EUR million |
| 2025 | 2024 | 2023 |
| Other comprehensive income | | | |
| Items not reclassified to profit or loss | 115 | | 85 | | 358 | |
| Actuarial gains or (-) losses on defined benefit pension plans | 63 | | 172 | | 302 | |
| Changes in the fair value of equity instruments measured at fair value through other comprehensive income | 4 | | (4) | | 20 | |
| Financial liabilities at fair value with changes in results attributable to changes in credit risk | 48 | | (83) | | 36 | |
| | | |
| Items that may be reclassified to profit or loss | (440) | | 54 | | (919) | |
| Cash flow hedges | (207) | | (205) | | (732) | |
| Changes in the fair value of debt instruments through other comprehensive income | (204) | | 261 | | (214) | |
| Hedging instruments (items not designated) | 3 | | — | | — | |
| Non-current assets held for sale | (32) | | — | | — | |
| Other recognised income and expense of investments in subsidiaries, joint ventures and associates | — | | (2) | | 27 | |
| Total | (325) | | 139 | | (561) | |
e) Deferred taxes
'Tax assets' in the consolidated balance sheets includes debit balances with the Public Treasury relating to deferred tax assets. 'Tax liabilities' includes the liability for the Group’s various deferred tax liabilities.
In accordance with EU Regulation 575/2013 on prudential requirements for credit institutions and investment firms (CRR), and subsequently amended by EU Regulation 2019/876 of the European Parliament and of the Council, those deferred tax assets that do not rely on future profitability arising from temporary differences (referred to hereinafter as 'monetizable deferred tax assets’), meeting certain conditions, should not be deducted from regulatory capital and should not be risk-weighted at 250% according to the thresholds set out in Article 48 of the said Regulation, but shall apply a risk weight of 100% under Article 39.
The detail of deferred tax assets, by classification as monetizable or non-monetizable assets, and of deferred tax liabilities at 31 December 2025, 2024 and 2023 is as follows:
| | | | | | | | | | | | | | | | | | | | | | | | | | |
| EUR million |
| 2025 | | 2024 | | 2023 |
| MonetizableA | Other | | MonetizableA | Other | | MonetizableA | Other |
| Tax assets | 10,725 | | 8,219 | | | 10,309 | | 8,861 | | | 11,099 | | 9,668 | |
| Tax losses and tax credits | — | | 2,354 | | | — | | 2,367 | | | — | | 2,393 | |
| Temporary differences | 10,725 | | 5,865 | | | 10,309 | | 6,494 | | | 11,099 | | 7,275 | |
| Of which: | | | | | | | | |
| Non-deductible provisions | — | | 1,970 | | | — | | 1,784 | | | — | | 1,965 | |
| Valuation of financial instruments | — | | 810 | | | — | | 1,486 | | | — | | 1,543 | |
| Loan losses | 8,471 | | 1,341 | | | 7,880 | | 1,103 | | | 8,248 | | 1,577 | |
| Pensions | 2,254 | | 426 | | | 2,429 | | 423 | | | 2,851 | | 665 | |
| Valuation of tangible and intangible assets | — | | 832 | | | — | | 885 | | | — | | 1,060 | |
| | | | | | | | |
| Tax liabilities | — | | 5,904 | | | — | | 6,276 | | | — | | 6,086 | |
| Temporary differences | — | | 5,904 | | | — | | 6,276 | | | — | | 6,086 | |
| Of which: | | | | | | | | |
| Valuation of financial instruments | — | | 1,980 | | | — | | 2,412 | | | — | | 2,059 | |
| Valuation of tangible and intangible assets | — | | 2,714 | | | — | | 2,797 | | | — | | 2,594 | |
| Investments in Group companies | — | | 427 | | | — | | 403 | | | — | | 378 | |
A.In 2023, the Spanish Economic Administrative Court ruled that in 2017 the requirements for the conversion of part of the monetizable assets of Popular Group into a credit against the Tax Administration were met, allowing the conversion to EUR 995 million. Banco Santander was refunded without impact on results. The favourable Economic Administrative Court decision was declared harmful to the public interests and challenged at the National Appellate Court by the Tax Administration. The estimation of this appeal, which is pending at the National Appellate Court, would imply that Grupo Santander should repay the amount refunded and would, once again, credit these monetizable assets with no impact on results except for late payment interests. However, it is considered that there are strong defense arguments in relation to this appeal.
Grupo Santander only recognises deferred tax assets for temporary differences or tax loss and tax credit carryforwards where it is considered probable that consolidated entities that generated them will have sufficient future taxable profits against which they can be utilised.
The deferred tax assets and liabilities are reassessed at the reporting date in order to ascertain whether any adjustments need to be made on the basis of the findings of the analyses performed.
These analyses take into consideration all evidence, both positive and negative, of the recoverability of such deferred tax assets, among which we can find, (i) the results generated by the different entities in previous years, (ii) the projections of results of each entity or fiscal group, (iii) the estimation of the reversal of the different temporary differences according to their nature and (iv) the period and limits established under the applicable legislation of each country for the recovery of the different deferred tax assets, thus concluding on the ability of each entity or fiscal group to recover the deferred tax assets registered.
The projections of results used in this analysis are based on the financial planning approved by both the local directions of the corresponding units and by the Group's directors. The Group's budget estimation process is common for all units. The Group's management prepares its financial planning based on the following key assumptions:
a)Microeconomic variables of the entities that make up the fiscal group in each location: the existing balance structure, the mix of products offered and the commercial strategy at each moment defined by local directions are taken into account, based on the competition, regulatory and market environment.
b)Macroeconomic variables: estimated growths are based on the evolution of the economic environment considering the expected evolution in the gross domestic product of each location, and the forecasts of interest rates, inflation and exchange rates fluctuations. These data are provided by the Group’s Studies Service.
Additionally, the Group performs retrospective contrasts (backtesting) on the variables projected in the past. The differential behaviour of these variables with respect to the real market data is considered in the projections estimated in each fiscal year. Thus, and in relation to Spain, the deviations identified by the Directors in recent past years are due to a combination of exogenous factors, mainly the changing impact of the macroeconomic environment and competition, and management actions, such as the acceleration of restructuring plans, investment in digitalisation, and the optimisation of capital and shareholder returns.
Finally, and given the degree of uncertainty of these assumptions on the referred variables, the Group conducts a sensitivity analysis of the most significant assumptions considered in the deferred tax assets’ recoverability analysis, considering any reasonable change in the key assumptions on which the projections of results of each entity or fiscal group and the estimation of the reversal of the different temporary differences are based.
In relation to Spain, the sensitivity analysis has consisted of making reasonable changes to the key assumptions, including adjusting 50 basis points for growth (gross domestic product) and adjusting 50 basis points for inflation.
Relevant information is set forth below for the main countries which have recognised deferred tax assets:
Spain
The deferred tax assets recognised at the Consolidated Tax Group total EUR 7,183 million, of which EUR 5,069 million were for monetizable temporary differences with the right to conversion into a credit against the tax administration as explained before, EUR 1,433 million for other temporary differences and EUR 681 million for tax losses and credits.
Brazil
The deferred tax assets recognised in Brazil total EUR 7,465, of which EUR 5,606 million were for monetizable temporary differences, EUR 1,150 for other temporary differences and EUR 709 for tax losses and credits.
Mexico
The deferred tax assets recognized in Mexico total EUR 1,542, of which EUR 1,511 were for temporary differences and EUR 31 for tax losses and credits.
United States
The deferred tax assets recognised in the United States total EUR 1,026, of which EUR 253 were for temporary differences and EUR 773 for tax losses and credits.
The Group estimates that the recognised deferred tax assets for temporary differences, tax losses and credits in the different jurisdictions could be recovered in a maximum period of 15 years.
The changes in Tax assets - Deferred and Tax liabilities - Deferred in the last three years were as follows:
| | | | | | | | | | | | | | | | | | | | | | | |
| EUR million | | | | | | | |
| Balance at 1 January 2025 | (Charge)/Credit to income | Foreign currency balance translation differences and other items | (Charge)/Credit to asset and liability valuation adjustments | Reclassification no-current asset held for sale | Acquisition for the year (net) | Balance at 31 December 2025 |
| Deferred tax assets | 19,170 | | 1,107 | | (102) | | (132) | | (1,130) | | 31 | | 18,944 | |
| Tax losses and tax credits | 2,367 | | 82 | | (107) | | — | | — | | 12 | | 2,354 | |
| Temporary differences | 16,803 | | 1,025 | | 5 | | (132) | | (1,130) | | 19 | | 16,590 | |
| Of which monetizable | 10,309 | | 455 | | (39) | | — | | | — | | 10,725 | |
| Deferred tax liabilities | (6,276) | | (572) | | 108 | | (232) | | 1,064 | | — | | (5,904) | |
| Temporary differences | (6,276) | | (572) | | 108 | | (232) | | 1,064 | | 4 | | (5,904) | |
| 12,894 | | 535 | | 6 | | (364) | | (66) | | 31 | | 13,040 | |
| | | | | | | | | | | | | | | | | | | | |
| EUR million |
| Balance at 1 January 2024 | (Charge)/Credit to income | Foreign currency balance translation differences and other items | (Charge)/Credit to asset and liability valuation adjustments | Acquisition for the year (net) | Balance at 31 December 2024 |
| Deferred tax assets | 20,767 | | 119 | | (1,670) | | (41) | | (5) | | 19,170 | |
| Tax losses and tax credits | 2,393 | | 114 | | (139) | | — | | (1) | | 2,367 | |
| Temporary differences | 18,374 | | 5 | | (1,531) | | (41) | | (4) | | 16,803 | |
| Of which monetizable | 11,099 | | 147 | | (937) | | — | | — | | 10,309 | |
| Deferred tax liabilities | (6,086) | | (547) | | 142 | | 215 | | — | | (6,276) | |
| Temporary differences | (6,086) | | (547) | | 142 | | 215 | | — | | (6,276) | |
| 14,681 | | (428) | | (1,528) | | 174 | | (5) | | 12,894 | |
| | | | | | | | | | | | | | | | | | | | |
| EUR million |
| Balance at 1 January 2023 | (Charge)/Credit to income | Foreign currency balance translation differences and other items | (Charge)/Credit to asset and liability valuation adjustments | Acquisition for the year (net) | Balance at 31 December 2023 |
| Deferred tax assets | 20,787 | | 629 | | (130) | | (422) | | (97) | | 20,767 | |
| Tax losses and tax credits | 1,778 | | 392 | | 224 | | — | | (1) | | 2,393 | |
| Temporary differences | 19,009 | | 237 | | (354) | | (422) | | (96) | | 18,374 | |
| Of which monetizable | 10,660 | | 1,232 | | (787) | | — | | (6) | | 11,099 | |
| Deferred tax liabilities | (6,428) | | 663 | | 3 | | (338) | | 14 | | (6,086) | |
| Temporary differences | (6,428) | | 663 | | 3 | | (338) | | 14 | | (6,086) | |
| 14,359 | | 1,292 | | (127) | | (760) | | (83) | | 14,681 | |
Also, the Group did not recognise deferred tax assets amounting to approximately EUR 11,240 million of which EUR 6,420 million relate to tax losses, EUR 3,430 million to tax credits, and EUR 1,390 million to other concepts.
f) Global Minimum Tax Pillar Two
The Global Minimum Tax Model Rules, known as Pillar Two and approved in 2021 by the OECD Inclusive Framework, require multinational groups with revenues exceeding EUR 750 million to be subject to a minimum tax rate of 15% on adjusted accounting profit, calculated on a jurisdiction-by-jurisdiction basis. The OECD has complemented these rules through the approval of administrative guidance and a document on transitional safe harbours applicable to fiscal years 2024 to 2026. In January 2026, the application of the transitional safe harbours was extended for an additional year, and new permanent safe harbours were approved with the aim of simplifying the application of the Model Rules and implementing the 'side-by-side agreement' reached in June 2025 within the G7, which will apply from 2026 to multinational groups with a U.S. parent company.
In the European Union, in December 2022, the Council approved Directive (EU) 2022/2523 on ensuring a global minimum level of taxation for multinational enterprise groups and large scale domestic groups in the Union, setting 1 January 2024 as the entry-into-force date of the new minimum taxation. The Directive implements the OECD Inclusive Framework Pillar Two rules within the European Union, while also extending their application to large domestic groups.
In Spain, on 20 December 2024, Law 7/2024 was approved, establishing a Supplementary Tax to ensure a global minimum level of taxation for multinational groups and large domestic groups, effective as from 1 January 2024. This Law transposes Directive (EU) 2022/2523 and also establishes a domestic supplementary tax aligned with the Pillar Two rules. In April 2025, Royal Decree 252/2025 was published, approving the implementing regulations of the Law.
With regard to other jurisdictions, the rules on the new global minimum tax are already in force in most of the main geographies in which the Group operates, with the exception of Mexico, Chile, and Argentina.
The Pillar Two rules require calculating, in each jurisdiction in which the Group operates, the effective tax rate resulting from comparing income tax expense with accounting profit, both subject to certain adjustments. If, in a given jurisdiction, this rate is below 15%, Banco Santander, as the ultimate parent entity, must pay the difference to the Spanish tax authorities as a supplementary tax, unless a domestic supplementary tax aligned with the Pillar Two rules (a qualified domestic tax) has been approved in that jurisdiction, in which case the amount will be paid to the local tax authorities.
Both Banco Santander, S.A., as the ultimate parent entity, and the subsidiaries resident in jurisdictions where a qualified domestic tax has been approved, have estimated the supplementary taxes accrued, taking into account the application of the transitional safe harbours in fiscal years 2024 and 2025.
These safe harbours mean that the supplementary tax, whether at the level of the parent entity or in jurisdictions that have adopted a qualified domestic tax, is not payable provided that any of the following conditions are met: (i) the effective tax rate calculated based on country-by-country reporting data exceeds 15% in 2024 and 16% in 2025; (ii) the Group’s presence in a jurisdiction is not significant if below EUR 10 million and profit before tax is below EUR 1 million; or (iii) profit before tax is lower than the amount resulting from the sum of tangible fixed assets and employee expenses adjusted by a certain percentage that varies annually.
This supplementary tax expense recognized by the Group has not been significant, as the effective tax rates calculated in accordance with the Pillar Two rules in most of the jurisdictions in which the Group operates are above 15%. Nevertheless, the new regulations require the provision of a large amount of information to the tax authorities in the jurisdictions where the Group is present, broken down on an entity-by-entity basis, which involves a significant administrative burden.
g) Tax reforms
In 2025 and prior years, the following significant tax reforms were approved:
In Spain, in 2022, Law 38/2022 was approved, establishing a temporary levy payable by credit institutions and financial credit institutions in fiscal years 2023 and 2024. The levy amounted to 4.8% of the sum of net interest income and net fees and commissions from the activity carried out in Spain in the previous year. The payment obligation arose on the first day of each fiscal year. The expense recognized for this temporary levy amounted to EUR 224 million in 2023 and EUR 334 million in 2024. However, the tax authorities have audited both years and consider that an additional amount is payable due to differences in the criteria applied in determining the taxable base, which are currently being discussed by the Bank. Furthermore, the Law established, for 2023, a 50% limitation on the inclusion of individual tax losses in the taxable base of the Tax Consolidated Group, setting a 10-year period for the reversal of this positive adjustment.
On 20 December 2024, Law 7/2024 was approved, which, among other tax measures, introduced a tax on the net interest margin and commissions earned in Spanish territory by certain financial institutions, with accrual on 1 January of fiscal years 2025, 2026 and 2027. The taxable base, with certain changes compared to that of the temporary levy, is now calculated on an individual basis for each financial institution, and the tax liability is determined in accordance with a progressive rate scale ranging from 1% to 7%, after applying certain deductions. On 24 December 2024, Royal Decree-Law 9/2024 was published in the Official State Gazette, amending certain technical aspects of the tax and postponing its accrual to 31 January of those fiscal years. This Royal Decree-Law was abolished on 22 January 2025 and, therefore, no expense was recognized for the new tax in respect of 2024 income in accordance with the legislation in force at that time (EUR 392 million were paid during the year). In 2025, the expense corresponding to income accrued during the financial year, recognised as income tax, amounts to €353 million and will be paid in 2026. The Group considers that both the temporary levy and the tax on net interest margin and fees and commissions are contrary to the Spanish and European Union constitutional and legal principles and has therefore disputed the corresponding self-assessments, requesting a refund of the amounts paid.
Additionally, the aforementioned Law 7/2024 once again establishes, for fiscal years 2024 and 2025, a 50% limitation on the inclusion of individual tax losses in the taxable base of the Tax Consolidated Group, setting a 10-year period for the reversal of this positive adjustment. Likewise, this Law reintroduces the limits provided for in Royal Decree-Law 3/2016—which was declared unconstitutional by the Constitutional Court ruling of 18 January 2024—on the utilization of monetizable deferred tax assets and the offsetting of tax losses (with the limit reduced from 70% to 25%), as well as on the application of deductions to avoid double taxation (50%), and also reinstates the mandatory reversal of impairments on shareholdings that were deductible in prior years by third parties, regardless of any recovery in the value of the investees.
In Brazil, Law 14,467 enacted in 2022 with effect from 2025, amends the rules on the tax deductibility of credit provisions in financial institutions, bringing those rules closer to the accounting recognition criterion. In 2024, Law 15,078 was published, allowing the recovery of the accumulated balance of provisions of nondeductible loans at the end of 2024 within a seven-year period (with the option to extend to ten years) from January 2026.
In 2025, several Legislative Decrees and decisions of the Federal Supreme Court were published concerning the Financial Transactions Tax (IOF), amending the applicable rules and setting new rates for its various categories: (i) IOF Credit (local loans to legal entities increased from 1.88% to a maximum of 3.37% per annum); (ii) IOF Insurance (a 5% rate was introduced on the excess of certain contributions to life insurance policies); and (iii) IOF Foreign Exchange (payments for the import of services and royalties paid abroad rose from 0.38% to 3.5%).
In December 2023, Congress approved Constitutional Amendment 132/2023 on indirect taxation reform, initiating the legislative development process, which culminated in the enactment of Supplementary Laws 214/2025 in January 2025 and 227/2026 in January 2026. This reform replaces the various existing indirect taxes in Brazil, -applicable at the federal, regional and municipal levels-, with two taxes administered at federal level (contribution on goods and services and selective tax) and other administered at regional and municipal levels (tax on goods and services). The new system will be gradually implemented over a transitional period of 8 years (from 2026 to 2033).
In 2024, Law No. 14.973/2024 partially extended, until 31 December 2027, an optional social contribution regime for employees applicable to certain sectors of activity, allowing such contributions to be calculated as a percentage of gross income (ranging from 1% to 4.5%, depending on the sector), rather than under the general regime, which applies a 20% rate to employee payroll.
In November 2025, Law No. 15.270 was published which, among other measures, introduced a 10% withholding tax on ordinary dividends paid abroad as from 1 January 2026.
In December 2025, Supplementary Law No. 224 was enacted, which, among other measures: (i) increased the withholding tax on Interest on equity (juros sobre o capital próprio) from 15% to 17.5%; (ii) raised the CSLL rate applicable to non-bank financial institutions as from 1 April 2026 on a gradual basis: payment institutions to 12% in 2026 and 2027, and 15% as from 2028; and credit, financing and capitalisation companies to 17.5% in 2026 and 2027, and 20% as from 2028 (the rate for banks remains at 20% and for other financial institutions at 15%), and (iii) introduced an automatic 10% reduction in the amount of certain federal tax incentives as from 2026.
In Argentina, as from 23 December 2024, Tax for an Inclusive and Solidarity Argentina (PAIS), which imposed certain foreign currency purchasing operations in order to make payments abroad, has been eliminated. Likewise, General Resolution (AFIP) No. 5,554 repeals, with effect from 1 September 2024, the obligation to withhold VAT and income tax on electronic payments.
In Chile, Law 27,713 on Tax Compliance Obligations was published in October 2024, amending, among other instruments, the Tax Code, the Income Tax Law and the Value Added Tax Law. Additionally, in July 2024, Law No. 21,681 was published, which, among other measures, introduced a new Substitute Tax of Final Tax, allowing the distribution of taxable profits at a fixed rate of 12% until 31 January 2025, thereby reducing the fiscal cost of such distributions.
In Mexico, the Federal Revenue Law for Fiscal Year 2026 was published in November 2025, limiting the deductibility of contributions paid to the Institute for the Protection of Bank Savings (IPAB) to 25% of their amount and amending the tax treatment of loan loss provisions, bringing them into line with the regime applicable to other entities.
In the United States, Law 119-21 ('One, Big, Beautiful Bill Act') was passed in July 2025, introducing significant regulatory changes. Notable among these are the repeal of tax credits linked to electric vehicles as from 1 October 2025 (while preserving those already generated), the elimination of the obligation to capitalise and amortise the costs of in-house software development (which will now be deductible), and the reintroduction of accelerated tax depreciation for investments in certain tangible assets.
In Portugal, a gradual reduction of the corporate income tax rate has been approved, falling from 20% in 2025 to 19% in 2026, 18% in 2027 and 17% in 2028 and subsequent years. Including the municipal surtax of up to 1.5% and the state surtax of up to 9%, this results in an aggregate combined rate of 30.50%, 29.50%, 28.50% and 27.50%, respectively.
In Poland, one of the most significant changes to the tax framework is the increase in the corporate income tax rate for banks, from 19% to 30% in 2026, followed by a reduction to 26% in 2027 and 23% in 2028 and subsequent years.
In Germany, the Tax Investment Programme to Strengthen Germany’s Economic Base was passed in July. It provides for a gradual annual one-percentage-point reduction in the corporate income tax rate from 2028, falling from the current 15% to 10% by 2032. In Germany, the combined corporate income tax and municipal trade tax rate—which also applies to business profits—is currently 32.45% and will decrease to 27.18% by 2032.
h) Other information
In compliance with the disclosure requirement established in the listing rules instrument 2005 published by the UK Financial Conduct Authority, it is hereby stated that shareholders of the Bank resident in the United Kingdom will be entitled to a tax credit for taxes paid abroad in respect of withholdings that the Bank has to pay on the dividends to be paid to such shareholders if the total income of the dividend exceeds the amount of exempt dividends of GBP 500 for the year 2025/26 (GBP 500 for the year 2024/25). The shareholders of the Bank resident in the United Kingdom who hold their ownership interest in the Bank through Santander Nominee Service will be informed directly of the amount thus withheld and of any other data they may require to complete their tax returns in the United Kingdom. The other shareholders of the Bank resident in the United Kingdom should contact their bank or securities broker.
Banco Santander, S.A., is part of the Large Business Forum and has adhered since 2010 to the Code of Good Tax Practices in Spain. Also Santander UK is a member of the HMRC’s (His Majesty's Revenue and Customs) Code of Practice on Taxation in the United Kingdom and Santander Portugal has adhered to the Code of Good Tax Practices in Portugal, actively participating in the cooperative compliance programs being developed by these Tax Administrations.
28. Non-controlling interests
Non-controlling interests include the net amount of the equity of subsidiaries attributable to equity instruments that do not belong, directly or indirectly, to the Bank, including the portion attributed to them of profit for the year.
a) Breakdown
The detail, by Group company, of 'Equity - Non-controlling interests' is as follows:
| | | | | | | | | | | |
| EUR million |
| | 2025 | 2024 | 2023 |
| Santander Bank Polska S.A. | 2,670 | | 2,320 | | 1,934 | |
| Grupo PSA | 1,815 | | 1,725 | | 1,590 | |
| Banco Santander - Chile | 1,422 | | 1,364 | | 1,379 | |
| Banco Santander (Brasil) S.A. | 1,397 | | 1,257 | | 1,493 | |
Other companiesA | 875 | | 890 | | 1,315 | |
| 8,179 | | 7,556 | | 7,711 | |
| | | |
| Profit/(Loss) for the year attributable to non-controlling interests | 1,399 | | 1,170 | | 1,107 | |
| Of which: | | | |
| Grupo PSA | 230 | | 217 | | 285 | |
| Banco Santander - Chile | 313 | | 271 | | 235 | |
| Banco Santander (Brasil) S.A. | 184 | | 233 | | 182 | |
| Santander Bank Polska S.A. | 604 | | 413 | | 347 | |
| Other companies | 68 | | 36 | | 58 | |
| TOTAL | 9,578 | | 8,726 | | 8,818 | |
A.It included, as of 31 December 2023, perpetual Santander UK plc equity instruments convertible at the option of Santander UK plc into preferred shares of the entity itself amounting EUR 576 million. During 2024, the last outstanding issuance held by third parties for GBP 500 million (EUR 590 million) was redeemed.
b) Changes
The changes in Non-controlling interests are summarised as follows:
| | | | | | | | | | | |
| EUR million |
| 2025 | 2024 | 2023 |
| Balance at beginning of year | 8,726 | | 8,818 | | 8,481 | |
| Other comprehensive income | 73 | | (461) | | 297 | |
| Other | 779 | | 369 | | 40 | |
| Profit attributable to non-controlling interests | 1,399 | | 1,170 | | 1,107 | |
Modification of participation ratesA | 339 | | 395 | | (258) | |
| Change of perimeter | (5) | | (8) | | (364) | |
| Dividends paid to minority shareholders | (896) | | (660) | | (748) | |
Changes in capital and other conceptsB | (58) | | (528) | | 303 | |
| Balance at end of year | 9,578 | | 8,726 | | 8,818 | |
A.Include the effects of the accelerated placements of 3.5% and 5.2% of the share capital of Santander Bank Polska S.A. in 2025 and 2024, respectively, and the public offer for the acquisition of shares of Banco Santander México, S.A., Institución de Banca Múltiple, Grupo Financiero Santander México that occurred in 2023 (see note 3.b).
B.Includes the effects of the amortization of AT1 UK by EUR 590 million at closing of fiscal year 2024.
The foregoing changes are shown in the consolidated statement of changes in total equity.
c) Other information
The financial information on the subsidiaries with significant non-controlling interests at 31 December 2025 is summarised below:
| | | | | | | | | | | | | | |
EUR millionA |
| Santander Bank Polska S.A. | Banco Santander (Brasil) S.A. | Banco Santander - Chile | Grupo PSA |
| Total assets | 78,186 | | 209,453 | | 68,205 | | 47,826 | |
| Total liabilities | 70,380 | | 193,380 | | 62,604 | | 43,717 | |
| Net assets | 7,806 | | 16,073 | | 5,601 | | 4,109 | |
| Total income | 3,724 | | 12,602 | | 2,714 | | 1,305 | |
| Total profit | 1,528 | | 2,388 | | 1,043 | | 460 | |
A.Information prepared using corporate management criteria, which may not coincide with those published individually by each entity.
29. Other comprehensive income
The balances of 'Other comprehensive income' include the amounts, net of the related tax effect, of the adjustments to assets and liabilities recognised in equity through the consolidated statement of recognised income and expense. The amounts arising from subsidiaries are presented, on a line by line basis, in the appropriate items according to their nature.
Respect to items that may be reclassified to profit or loss, the consolidated statement of recognised income and expense includes changes in other comprehensive income as follows:
•Revaluation gains (losses): includes the amount of the income, net of the expenses incurred in the year, recognised directly in equity. The amounts recognised in equity in the year remain under this item, even if in the same year they are transferred to the income statement or to the initial carrying amount of the assets or liabilities or are reclassified to another line item.
•Amounts transferred to income statement: includes the amount of the revaluation gains and losses previously recognised in equity, even in the same year, which are recognised in the income statement.
•Amounts transferred to initial carrying amount of hedged items: includes the amount of the revaluation gains and losses previously recognised in equity, even in the same year, which are recognised in the initial carrying amount of assets or liabilities as a result of cash flow hedges.
•Other reclassifications: includes the amount of the transfers made in the year between the different 'Other comprehensive income' items.
a) Breakdown of Other comprehensive income - Items that will not be reclassified in results and Items that can be classified in results
| | | | | | | | | | | |
EUR millionA |
| 2025 | | 2024 | | 2023 | |
Other comprehensive income | (37,974) | | (36,595) | | (35,020) | |
Items that will not be reclassified to profit or loss | (4,121) | | (4,757) | | (5,212) | |
| Actuarial gains and losses on defined benefit pension plans | (3,896) | | (4,404) | | (4,324) | |
| Non-current assets held for sale | 56 | | — | | — | |
| Share in other income and expenses recognised in investments, joint ventures and associates | 1 | | (1) | | 1 | |
| Other valuation adjustments | — | | — | | — | |
| Changes in the fair value of equity instruments measured at fair value with changes in other comprehensive income | (250) | | (432) | | (776) | |
| Inefficiency of fair value hedges of equity instruments measured at fair value with changes in other comprehensive income | — | | — | | — | |
| Changes in the fair value of equity instruments measured at fair value with changes in other comprehensive income (hedged item) | 208 | | 284 | | 264 | |
| Changes in the fair value of equity instruments measured at fair value with changes in other comprehensive income (hedging instrument) | (208) | | (284) | | (264) | |
| Changes in the fair value of financial liabilities measured at fair value through profit or loss attributable to changes in credit risk | (32) | | 80 | | (113) | |
Items that may be reclassified to profit or loss | (33,853) | | (31,838) | | (29,808) | |
| Hedges of net investments in foreign operations (Effective portion) | (7,343) | | (8,002) | | (8,684) | |
| Exchange differences | (25,475) | | (22,375) | | (19,510) | |
| Hedging derivatives. Cash flow hedges (Effective portion) | 333 | | (298) | | (740) | |
| Changes in the fair value of debt instruments measured at fair value with changes in other comprehensive income | (372) | | (736) | | (555) | |
| Hedging instruments (items not designated) | (11) | | — | | — | |
| Non-current assets classified as held for sale | (590) | | — | | — | |
| Share in other income and expenses recognised in investments, joint ventures and associates | (395) | | (427) | | (319) | |
A.Net amount of taxes and minorities
b) Other comprehensive income- Items not reclassified to profit or loss – Actuarial gains or (-) losses on defined benefit pension plans
'Other comprehensive income —Items not reclassified to profit or loss— Actuarial gains or (-) losses on defined benefit pension plans' include the actuarial gains and losses and the return on plan assets, less the administrative expenses and taxes inherent to the plan, and any change in the effect of the asset ceiling, excluding amounts included in net interest on the net defined benefit liability (asset), attributed to the group net of taxes.
In 2025, the amount of actuarial losses (net of actuarial gains) recognized in the consolidated statement of recognised income was EUR 73 million, which corresponds to:
•In first place, due to the addition against equity of 2025 amounting to EUR 220 million - see note 25.b -, with the following breakdown:
•Increase of EUR 117 million in the cumulative actuarial losses relating to the Group´s businesses in the UK, mainly due to the evolution of the asset portfolio. These losses have been partially offset by the evolution experienced in the discount rate-increase from 5.54% to 5.58%- in long-term inflation -decrease from 3.11% to 2.90%- and in other demographic hypotheses.
•Increase of EUR 116 million in accumulated actuarial losses corresponding to the Group’s business in Brazil, mainly due to the collective experience and the evolution of the asset portfolio. These losses have been partially offset by the evolution experienced by the discount rate -increase from 10.58% to 10.65% in the main pension benefits and 10.50% to 10.52% in medical benefits-.
•Decrease of EUR 33 million in the accumulates actuarial losses relating to the Group´s entities in Spain, mainly due to the evolution experienced by the discount rate -increase from 3.00% to 3.75%-.
•Increase of EUR 20 million in the accumulated actuarial losses corresponding to the Group's businesses in other geographical areas.
•In second place, due to the evolution of exchange rates, a EUR 147 million decrease.
c) Other comprehensive income - Items that will not be reclassified in results - Changes in the fair value of equity instruments measured at fair value with changes in other comprehensive income
Since the entry into force of IFRS 9, no impairment analysis is performed of equity instruments recognised under 'Other comprehensive income'. IFRS 9 eliminates the need to carry out the impairment estimate on this class of equity instruments and the reclassification to profit and loss on the disposal of these assets, being recognised at fair value with changes in equity.
The following is a breakdown of the composition of the balance as of 31 December 2025, 2024 and 2023 under 'Other comprehensive income - Items that will not be reclassified to profit or loss - Changes in the fair value of equity instruments measured at fair value with changes in other global result' depending on the geographical origin of the issuer:
| | | | | | | | | | | | | | |
| EUR million |
| 2025 |
| Capital gains by valuation | Capital losses by valuation | Net gains/losses by valuation | Fair Value |
| Equity instruments | | | | |
| Domestic | | | | |
| Spain | 47 | | (1326) | | (1,279) | | 133 | |
| International | | | | |
| Rest of Europe | 75 | | (81) | | (6) | | 186 | |
| United States | 23 | | (1) | | 22 | | 36 | |
| Latin America and rest | 1,013 | | — | | 1,013 | | 1,926 | |
| 1,158 | | (1,408) | | (250) | | 2,281 | |
| Of which: | | | | |
| Publicly listed | 1,033 | | (49) | | 985 | | 1,993 | |
| Non publicly listed | 125 | | (1,359) | | (1,235) | | 288 | |
| | | | | | | | | | | | | | |
| EUR million |
| 2024 |
| Capital gains by valuation | Capital losses by valuation | Net gains/losses by valuation | Fair Value |
| Equity instruments | | | | |
| Domestic | | | | |
| Spain | 39 | | (1,328) | | (1,289) | | 117 | |
| International | | | | |
| Rest of Europe | 131 | | (71) | | 60 | | 299 | |
| United States | 22 | | — | | 22 | | 24 | |
| Latin America and rest | 775 | | — | | 775 | | 1,753 | |
| 967 | | (1,399) | | (432) | | 2,193 | |
| Of which: | | | | |
| Publicly listed | 779 | | (51) | | 728 | | 1,780 | |
| Non publicly listed | 188 | | (1,348) | | (1,160) | | 413 | |
| | | | | | | | | | | | | | |
| EUR million |
| 2023 |
| Capital gains by valuation | Capital losses by valuation | Net gains/losses by valuation | Fair Value |
| Equity instruments | | | | |
| Domestic | | | | |
| Spain | 32 | | (1,173) | | (1,141) | | 252 | |
| International | | | | |
| Rest of Europe | 117 | | (71) | | 46 | | 267 | |
| United States | 16 | | — | | 16 | | 19 | |
| Latin America and rest | 370 | | (67) | | 303 | | 1,223 | |
| 535 | | (1,311) | | (776) | | 1,761 | |
| Of which: | | | | |
| Publicly listed | 316 | | (118) | | 198 | | 1,225 | |
| Non publicly listed | 219 | | (1,193) | (974) | | 536 | |
d) Other comprehensive income - Items that may be reclassified to profit or loss - Hedge of net investments in foreign operations (effective portion) and exchange differences
The change in 2025 reflects the depreciation of the US dollar, pound sterling, Argentine peso, Chilean peso and Brazilian real and the positive effect of the appreciation of the Mexican peso, whereas the change in 2024 reflected the positive effect of the appreciation of pound sterling, the US dollar and Polish zloty and the negative effect of the depreciation of the Brazilian real, Argentine peso, Mexican peso and Chilean peso. The change in 2023 reflected the positive effect of the appreciation of the Brazilian real, pound sterling, Polish zloty and the Mexican peso and the negative effect of the depreciation of the US dollar, Argentine peso and Chilean peso.
Of the change in the balance in these years, a loss of EUR 287 million, a loss of EUR 568 million and a profit of EUR 249 million in 2025, 2024 and 2023, respectively relate to the measurement of goodwill.
The detail, by country is as follows:
| | | | | | | | | | | |
| EUR million |
| 2025 | 2024 | 2023 |
| Net balance at end of year | (32,818) | | (30,377) | | (28,194) | |
| Of which: | | | |
| Brazilian real | (19,412) | | (19,293) | | (16,340) | |
| Mexican peso | (4,137) | | (3,995) | | (2,942) | |
| Pound sterling | (4,125) | | (3,444) | | (3,964) | |
| Chilean peso | (2,926) | | (2,857) | | (2,531) | |
| Argentine peso | (2,217) | | (2,090) | | (2,655) | |
| Polish zloty | (43) | | (709) | | (786) | |
| US dollar | 1,047 | | 2,923 | | 1,819 | |
| Other | (1,005) | | (912) | | (795) | |
The breakdown of translation differences by currency is as follows:
| | | | | | | | | | | | | | | | | | | | | | | |
| EUR million | | | | | | | |
| 2025 | | | | Of which: |
| Currency | Balance at the beginning of the year | Balance at the end of the year | Movement | From goodwill | From resultsA | From net assets | From transfersB |
| Brazilian real | (16,664) | | (16,755) | | (91) | | (13) | | (41) | | (37) | | — | |
| Pound sterling | (3,300) | | (4,126) | | (826) | | (48) | | (18) | | (760) | | — | |
| Mexican peso | (1,437) | | (1,222) | | 215 | | 11 | | 40 | | 164 | | — | |
| Argentine peso | (2,090) | | (2,216) | | (126) | | — | | — | | (126) | | — | |
| Chilean peso | (2,180) | | (2,249) | | (69) | | (12) | | 9 | | (66) | | — | |
| US dollar | 4,462 | | 2,340 | | (2,122) | | (225) | | (48) | | (1,849) | | — | |
| Polish zloty | (202) | | 18 | | 220 | | 1 | | — | | 4 | | 215 | |
| Other | (964) | | (1,265) | | (301) | | (1) | | 6 | | (306) | | — | |
| Total Group | (22,375) | | (25,475) | | (3,100) | | (287) | | (52) | | (2,976) | | 215 | |
A.Profit and loss items are translated into euros at the average exchange rate for the year as described in note 2 a) ii.
B.It includes the accumulated exchange differences of Santander Polska transferred to the heading 'Other comprehensive income - Items that may be reclassified to profit or loss - Non-current assets held for sale' (see Note 12).
| | | | | | | | | | | | | | | | | | | | |
| EUR million | | | | | | |
| 2024 | | | | Of which: |
| Currency | Balance at the beginning of the year | Balance at the end of the year | Movement | From goodwill | From resultsA | From net assets |
| Brazilian real | (13,287) | | (16,664) | | (3,377) | | (631) | | (206) | | (2,540) | |
| Pound sterling | (4,064) | | (3,300) | | 764 | | 39 | | 22 | | 703 | |
| Mexican peso | (64) | | (1,437) | | (1,373) | | (82) | | (136) | | (1,155) | |
| Argentine peso | (2,658) | | (2,090) | | 568 | | — | | — | | 568 | |
| Chilean peso | (1,890) | | (2,180) | | (290) | | (34) | | (7) | | (249) | |
| US dollar | 3,433 | | 4,462 | | 1,029 | | 116 | | 35 | | 878 | |
| Polish zloty | (325) | | (202) | | 123 | | 34 | | 5 | | 84 | |
| Other | (655) | | (964) | | (309) | | (10) | | (8) | | (291) | |
| Total Group | (19,510) | | (22,375) | | (2,865) | | (568) | | (295) | | (2,002) | |
A.Profit and loss items are translated into euros at the average exchange rate for the year as described in note 2 a) ii.
| | | | | | | | | | | | | | | | | | | | |
| EUR million | | | | | | |
| 2023 | | | | Of which: |
| Currency | Balance at the beginning of the year | Balance at the end of the year | Movement | From goodwill | From resultsA | From net assets |
| Brazilian real | (14,199) | | (13,287) | | 912 | | 191 | | 11 | | 710 | |
| Pound sterling | (4,446) | | (4,064) | | 382 | | 20 | | 4 | | 358 | |
| Mexican peso | (1,132) | | (64) | | 1,068 | | 62 | | 41 | | 965 | |
| Argentine peso | (1,754) | | (2,658) | | (904) | | (4) | | — | | (900) | |
| Chilean peso | (1,605) | | (1,890) | | (285) | | (32) | | (34) | | (219) | |
| US dollar | 4,062 | | 3,433 | | (629) | | (64) | | (16) | | (549) | |
| Polish zloty | (776) | | (325) | | 451 | | 87 | | 32 | | 332 | |
| Other | (570) | | (655) | | (85) | | (11) | | (1) | | (73) | |
| Total Group | (20,420) | | (19,510) | | 910 | | 249 | | 37 | | 624 | |
A.Profit and loss items are translated into euros at the average exchange rate for the year as described in note 2 a) ii.
e) Other comprehensive income -Items that may be reclassified to profit or loss - Hedging derivatives – Cash flow hedges (Effective portion)
Other comprehensive income – Items that may be reclassified to profit or loss - Cash flow hedges includes the gains or losses attributable to hedging instruments that qualify as effective hedges. These amounts will remain under this heading until they are recognised in the consolidated income statement in the periods in which the hedged items affect it.
f) Other comprehensive income - Items that may be reclassified to profit or loss – Changes in the fair value of debt instruments measured at fair value with changes in other comprehensive income
Includes the net amount of unrealised changes in the fair value of assets classified as Changes in the fair value of debt instruments measured at fair value with changes in other comprehensive income (see note 7).
The breakdown, by type of instrument and geographical origin of the issuer, of 'Other comprehensive income – Items that may be reclassified to profit or loss - Changes in the fair value of debt instruments measured at fair value with changes in other comprehensive income' at 31 December 2025, 2024 and 2023 is as follows:
| | | | | | | | | | | | | | |
| EUR million |
| 31 December 2025 |
| Revaluation gains | Revaluation losses | Net revaluation gains/ (losses) | Fair value |
| Debt instruments | | | | |
| Issued by Public-sector | | | | |
| Spain | 118 | | — | | 118 | | 10,142 | |
| Rest of Europe | 209 | | (36) | | 173 | | 8,856 | |
| America and rest of the world | 109 | | (528) | | (419) | | 31,685 | |
| Issued by Private-sector | | | | |
| Spain | 29 | | (53) | | (24) | | 9,745 | |
| Rest of Europe | 28 | | (15) | | 13 | | 6,445 | |
| America and rest of the world | 40 | | (273) | | (233) | | 5,458 | |
| 533 | | (905) | | (372) | | 72,331 | |
| | | | | | | | | | | | | | |
| EUR million |
| 31 December 2024 |
| Revaluation gains | Revaluation losses | Net revaluation gains/ (losses) | Fair value |
| Debt instruments | | | | |
| Issued by Public-sector | | | | |
| Spain | 103 | | — | | 103 | | 13,764 | |
| Rest of Europe | 268 | | (70) | | 198 | | 15,413 | |
| America and rest of the world | 76 | | (944) | | (868) | | 38,784 | |
| Issued by Private-sector | | | | |
| Spain | 96 | | (23) | | 73 | | 6,019 | |
| Rest of Europe | 25 | | (18) | | 7 | | 7,478 | |
| America and rest of the world | 16 | | (265) | | (249) | | 6,247 | |
| 584 | | (1,320) | | (736) | | 87,705 | |
| | | | | | | | | | | | | | |
| EUR million |
| 31 December 2023 |
| Revaluation gains | Revaluation losses | Net revaluation gains/ (losses) | Fair value |
| Debt instruments | | | | |
| Issued by Public-sector | | | | |
| Spain | 17 | | — | | 17 | | 9,867 | |
| Rest of Europe | 333 | | (96) | | 237 | | 18,258 | |
| America and rest of the world | 194 | | (820) | | (626) | | 38,169 | |
| Issued by Private-sector | | | | |
| Spain | 98 | | (9) | | 89 | | 5,129 | |
| Rest of Europe | 19 | | (30) | | (11) | | 5,018 | |
| America and rest of the world | 6 | | (267) | | (261) | | 5,106 | |
| 667 | | (1,222) | | (555) | | 81,547 | |
The Group estimates the expected losses on debt instruments measured at fair value with changes in other comprehensive income. These losses are recorded with a charge to the consolidated income statement for the period.
At the end of the year 2025, the Group recorded a provision of EUR 29 million under the heading 'Impairment or reversal of impairment on financial assets not measured at fair value through profit or loss'. In 2024, the Group did not record any provision in this regard and at the end of the year 2023, the Group recorded EUR 24 million.
g) Other comprehensive income - Items that may be reclassified to profit or loss and Items not reclassified to profit or loss - Other recognised income and expense of investments in subsidiaries, joint ventures and associates
At 31 December 2025, the heading includes a negative amount of EUR 394 million (EUR 428 million and EUR 318 million in 2024 and 2023, respectively). Of the variation in the balance of said years, a gain of EUR 17 million, EUR 45 million EUR 44 million and has been transferred to results in the years 2025, 2024 and 2023, respectively.
30. Shareholders' equity
The changes in Shareholders' equity are presented in the consolidated statement of changes in total equity. Significant information on certain items of Shareholders' equity and the changes during the year are set forth below.
31. Issued capital
a) Changes
At 31 December 2022, Banco Santander's share capital consisted of EUR 8,397 million, represented by 16,794,401,584 shares of EUR 0.50 of nominal value each and all of them of a unique class and series.
On 21 March 2023, there was a capital reduction amounting EUR 170,203,286 through the redemption of 340,406,572 shares, corresponding to the share buyback programme carried out in 2022 and ended in January 2023.
Likewise, on 30 June 2023, there was a capital reduction of EUR 134,924,476.50 through the redemption of 269,848,953 shares, corresponding to the share buyback programme during the first half of 2023.
Therefore, Banco Santander's share capital at 31 December 2023 consisted of EUR 8,092 million, represented by 16,184,146,059 shares of EUR 0.50 of nominal value each and all of them of a unique class and series; including 286,842,316 shares corresponding to the first buyback programme of 2023 (see note 1.g.).
On 5 February 2024, a capital reduction of EUR179,283,743.50 took place through the redemption of 358,567,487 shares, corresponding to the share buyback programme carried out in 2023 and ended in January 2024.
On 1 July 2024, a capital reduction of EUR 165,652,500 took place through the redemption of 331,305,000 shares, corresponding to he share buyback programme carried out between February and June 2024.
On 20 December 2024, a capital reduction of EUR 170,890,625 took place through the redemption of 341,781,250 shares, corresponding to he share buyback programme carried out during the second semester of 2024.
Therefore, Banco Santander's share capital at 31 December 2024 consisted of EUR 7,576 million, represented by 15,152,492,322 shares of EUR 0.50 of nominal value each and all of them of a unique class and series.
On 3 June 2025, there was a capital reduction amounting to EUR 133,583,475 through the redemption of 267,166,950 shares, corresponding to the share buyback programme carried out between February and June 2025.
On 23 December 2025, a capital reduction of EUR 98,002,935 took place through the redemption of 196,005,870 shares, corresponding to the share buyback programme carried out during the second semester of 2025.
Aforementioned operations have not entailed the return of contributions to the shareholders as Banco Santander was the owner of the redeemed shares.
Therefore, Banco Santander's share capital at 31 December 2025 consisted of EUR 7,345 million, represented by 14,689,319,502 shares of EUR 0.50 of nominal value each and all of them of a unique class and series.
Banco Santander’s shares are listed on the Spanish Stock Market Interconnection System and on the New York, London, Mexico and Warsaw Stock Exchanges, and all of them have the same features and rights. Santander shares are listed on the London Stock Exchange under Crest Depository Interest (CDI), each CDI representing one Bank’s share. They are also listed on the New York Stock Exchange under American Depositary Shares (ADS), each ADS representing one share. Additionally, Banco Santander's shares were listed on the traditional listing of the Mexican Stock Exchange (BMV) and since 29 December 2023, they were listed only in the International Quotation System of said stock exchange.
As of 31 December 2025, no Banco Santander shareholder individually held more than 3% of its total share capital (which is the threshold generally provided for in Spanish regulations for mandatory notification of a significant participation in a listed company). Even though at 31 December 2025, certain custodians appeared in our shareholder registry as holding more than 3% of our share capital, we understand that those shares were held in custody on behalf of other investors, none of whom exceeded that threshold individually. These custodians were State Street Bank (13.90%), Chase Nominees Limited (7.50%), The Bank of New York Mellon Corporation (7.18%),Citibank (6.40%), BNP Paribas (3.74%), Caceis Bank (3.57%) y The Northern Trust (3.06%).
At 31 December 2025, neither Banco Santander's shareholder registry nor the CNMV's registry showed any shareholder residing in a non-cooperative jurisdiction with a shareholding equal to, or greater than, 1% of our share capital (which is the other threshold applicable under Spanish regulations).
b) Other considerations
Under Spanish law, only shareholders at the general meeting have the authority to increase share capital. However, they may delegate the authority to approve or execute capital increases to the board of directors. Banco Santander´s Bylaws are fully aligned with Spanish law and do not establish any different conditions for share capital increases.
At 31 December 2025 the shares of the following companies were listed on official stock markets: Banco Santander - Chile; Banco Santander (Brasil) S.A. and Santander Bank Polska S.A.
At 31 December 2025 the number of Banco Santander shares owned by third parties and managed by Group management companies (mainly portfolio, collective investment undertaking and pension fund managers) or jointly managed was 33 million shares, which represented 0.22% of Banco Santander’s share capital (40 and 36 million shares, representing 0.26% and 0.22% of the share capital in 2024 and 2023, respectively). In addition, the number of Banco Santander shares owned by third parties and received as security was 28 million shares (equal to 0.19% of the Bank’s share capital).
At 31 December 2025 the capital increases in progress at Group companies and the additional capital authorised by their shareholders at the respective general meetings were not material at Group level (see appendix V)
32. Share premium
Share premium includes the amount paid up by the Bank’s shareholders in capital issues in excess of the par value.
The Corporate Enterprises Act expressly permits the use of the share premium account balance to increase capital at the entities at which it is recognised and does not establish any specific restrictions as to its use.
The change in the balance of share premium corresponds to the capital reductions detailed in note 31.a).
The decreased produced in 2023 by an amount of EUR 1,595 million was the consequence of the difference between the purchase value of the redeemed shares (EUR 1,900 million) and the par value of said shares (EUR 305 million) (see note 4.a and consolidated statements of changes in total equity) as a consequence of the capital decreases described in note 31.a.
The decrease produced in 2024 by an amount of EUR 3,778 million was the consequence of the difference between the purchase value of the redeemed shares (EUR 4,294 million) and the par value of said shares (EUR 516 million) (see note 4.a and consolidated statements of changes in total equity) as a consequence of the capital decreases described in note 31.a.
The decrease produced in 2025 by an amount of EUR 3,055 million has been the consequence of the difference between the purchase value of the redeemed shares (EUR 3,287 million) and the par value of said shares (EUR 231 million) (see note 4.a and consolidated statements of changes in total equity) as a consequence of the capital decreases described in note 31.a.
Likewise, in accordance with the applicable legislation, a reserve has been provided in 2024 for amortized capital charged to the issue premium for an amount equal to the nominal value of said amortized shares ascending to EUR 231 million (EUR 516 million and EUR 305 million euros in 2024 and 2023 respectively).
33. Accumulated retained earnings
a) Definitions
The balance of 'Equity - Accumulated gains and Other reserves' includes the net amount of the accumulated results (profits or losses) recognised in previous years through the consolidated income statement which in the profit distribution were allocated in equity, the expenses of own equity instrument issues, the differences between the amount for which the treasury shares are sold and their acquisition price, as well as the net amount of the results accumulated in previous years, generated by the result of non-current assets held for sale, recognised through the consolidated income statement.
b) Breakdown
The detail of Accumulated retained earnings and Reserves of entities accounted for using the equity method is as follows:
| | | | | | | | | | | |
| EUR million |
| 2025 | 2024 | 2023 |
| Restricted reserves | 3,328 | | 3,084 | | 2,899 | |
Legal reserveA | 1,469 | | 1,515 | | 1,618 | |
| Own shares | 480 | | 421 | | 649 | |
| Revaluation reserve Royal Decree-Law 7/1996 | 43 | | 43 | | 43 | |
| Reserve for retired capital | 1,336 | | 1,105 | | 589 | |
| Unrestricted reserves | 31,519 | | 24,186 | | 16,033 | |
Voluntary reservesB | 26,357 | | 20,362 | | 14,284 | |
| Consolidation reserves attributable to the Bank | 5,162 | | 3,824 | | 1,749 | |
| Reserves of subsidiaries | 47,937 | | 47,249 | | 47,669 | |
| Reserves of entities accounted for using the equity method | 1,643 | | 1,831 | | 1,762 | |
| 84,427 | | 76,350 | | 68,363 | |
A.The board of directors has proposed to the general shareholders' meeting the reclassification of the excess that the amount of the balance of the legal reserve account shows over the figure that is equivalent to 20% of the resulting share capital after the executed capital reductions, to be included in the voluntary reserves account.
B.In accordance with the commercial regulations in force in Spain.
i. Legal reserve
Under the Consolidated Spanish Corporate Enterprises Act, 10% of net profit for each year must be transferred to the legal reserve. These transfers must be made until the balance of this reserve reaches 20% of the share capital. The legal reserve can be used to increase capital provided that the remaining reserve balance does not fall below 10% of the increased share capital amount.
Consequently, once again, after the capital reductions described in note 31 had been carried out, the balance of the legal reserve met the percentage of 20% of the share capital, and at 31 December 2025 the Legal reserve was at the stipulated level.
ii. Reserve for treasury shares
According to the Corporate Enterprises Act, an unavailable reserve equivalent to the amount for which Banco Santander's shares owned by subsidiaries are recorded. This reservation shall be freely available when the circumstances which have obliged its constitution disappear. In addition, this reserve covers the outstanding balance of loans granted by the Group with Banco Santander's share guarantee and the amount equivalent to the credits granted by the Group companies to third parties for the acquisition of own shares.
iii. Revaluation reserve Royal Decree Law 7/1996, of 7 June
The balance of Revaluation reserve Royal Decree-Law 7/1996 can be used, free of tax, to increase share capital. From 1 January 2007, the balance of this account can be taken to unrestricted reserves, provided that the monetary surplus has been realised. The surplus will be deemed to have been realised in respect of the portion on which depreciation has been taken for accounting purposes or when the revalued assets have been transferred or derecognised.
If the balance of this reserve were used in a manner other than that provided for in Royal Decree law 7/1996, of 7 June, it would be subject to taxation.
iv. Reserves of subsidiaries
The detail, by company, of Reserves of subsidiaries, based on the companies’ contribution to the Group (considering the effect of consolidation adjustments) is as follows:
| | | | | | | | | | | |
| EUR million |
| 2025 | 2024 | 2023 |
| Banco Santander (Brasil) S.A. (Consolidated Group) | 16,085 | | 15,107 | | 14,512 | |
| Santander UK Group | 7,973 | | 8,576 | | 8,700 | |
| Banco Santander México, S.A., Institución de Banca Múltiple, Grupo Financiero Santander México | 4,977 | | 5,248 | | 5,684 | |
| Santander Consumer Finance Group | 4,804 | | 4,729 | | 4,344 | |
| Banco Santander - Chile | 4,560 | | 4,250 | | 4,112 | |
| Banco Santander Argentina S.A. | 3,217 | | 2,892 | | 2,813 | |
| Banco Santander Totta, S.A. (Consolidated Group) | 2,726 | | 2,766 | | 2,626 | |
| Santander Bank Polska S.A. | 2,875 | | 2,890 | | 2,535 | |
| Grupo Santander Holdings USA | 63 | | 187 | | 1,893 | |
| Santander Investment, S.A. | 1,424 | | 1,217 | | 1,215 | |
| Santander Seguros y Reaseguros, Compañía Aseguradora, S.A. | 845 | | 836 | | 1,044 | |
| Banco Santander International SA (former Banco Santander (Suisse) S.A) | 450 | | 397 | | 346 | |
| Other companies and consolidation adjustments | (2,062) | | (1,846) | | (2,155) | |
| 47,937 | | 47,249 | | 47,669 | |
| Of which, restricted | 4,722 | | 4,175 | | 3,870 | |
34. Other equity instruments and own shares
a) Equity instruments issued not capital and other equity instruments
Other equity instruments includes the equity component of compound financial instruments, the increase in equity due to personnel remuneration, and other items not recognised in other 'Shareholders’ equity' items.
On 8 September 2017, Banco Santander, S.A. issued contingent redeemable perpetual bonds (the fidelity bonds) amounting to EUR 981 million nominal value EUR - 686 million fair value -.
On 15 December 2024, Banco Santander, S.A., proceeded to redeem in advance voluntarily all of said bonds in circulation.
Additionally, at 31 December 2025 the Group had other equity instruments amounting to EUR 273 million.
b) Own shares
'Shareholders’ equity - Own shares' includes the amount of own equity instruments held by all the Group entities.
Transactions involving own equity instruments, including their issuance and cancellation, are recognised directly in equity, and no profit or loss may be recognised on these transactions. The costs of any transaction involving own equity instruments are deducted directly from equity, net of any related tax effect.
At 31 December 2023, the number of treasury shares held by the Group was 297,815,673 (1.84% of the issued share capital).
During 2024, 930,610,636 shares of the Bank were acquired at an average price of EUR 4.34 per share, of which 403,030,171 relate to the Share Buyback Programme carried out during the first half of 2025, and 341,781,250 relate to the Share Buyback Programme started in September. Likewise, 1,031,653,737 shares were amortised (note 31) and 181,243,113 shares at an average price of EUR 4.22 per share were transferred, of which 22,167,105 shares correspond to the donation made by Banco Santander to Fundación Banco Santander with extraordinary character.
At 31 December 2024, the number of treasury shares held by the Group was 15,529,459 (0.102% of the issued share capital).
During 2025, 584,363,745 shares of the Bank have been acquired at an average price of EUR 6.98 per share, of which 267,166,950 relate to the Share Buyback Programme carried out during the first half of 2025, and 196,005,870 relate to the new Share Buyback Programme started in August. Likewise, 463,172,820 shares have been amortised (note 31) and 125,643,093 shares at an average price of EUR 6.48 per share have been transferred.
At 31 December 2025, the Group holds 11,077,291 shares of the Bank's issued share capital (0.075%).
The effect on equity, net of tax, arising from the purchase and sale of Bank shares is of EUR 34 million profit in 2025 (EUR 8 million and EUR 13 million profit in 2024 and 2023, respectively).
35. Memorandum items
Memorandum items relates to balances representing rights, obligations and other legal situations that in the future may have an impact on net assets, as well as any other balances needed to reflect all transactions performed by the consolidated entities although they may not impinge on their net assets.
a) Guarantees and contingent commitments granted
Contingent liabilities includes all transactions under which an entity guarantees the obligations of a third party and which result from financial guarantees granted by the entity or from other types of contracts. The detail is as follows:
| | | | | | | | | | | |
|
| 2025 | 2024 | 2023 |
| Loans commitment granted | 321,234 | | 302,861 | | 279,589 | |
| Of which impaired | 345 | | 511 | | 406 | |
| Financial guarantees granted | 17,449 | | 16,901 | | 15,435 | |
| Of which impaired | 332 | | 217 | | 578 | |
| Financial guarantees | 17,437 | | 16,887 | | 15,400 | |
| Credit derivatives sold | 12 | | 14 | | 35 | |
| Other commitments granted | 148,118 | | 134,493 | | 113,273 | |
| Of which impaired | 668 | | 793 | | 542 | |
| Technical guarantees | 62,161 | | 61,551 | | 57,363 | |
| Other | 85,957 | | 72,942 | | 55,910 | |
The breakdown as at 31 December 2025 of the exposures and the provision fund out of balance sheet by impairment stage is EUR 464,215 million and EUR 338 million (EUR 435,147 million and EUR 305 million in 2024 and EUR 398,243 million and EUR 302 million in 2023) in stage 1, EUR 21,241 million and EUR 206 million (EUR 17,587 million and EUR 192 million in 2024 and EUR 8,528 million and EUR 174 million in 2023) in stage 2 and EUR 1,345 million and EUR 169 million (EUR 1,521 million and EUR 213 million in 2024 and EUR 1,526 million and EUR 226 million in 2023) in stage 3, respectively.
Income from guarantee instruments is recognised under 'Fee and commission income' in the consolidated income statements and is calculated by applying the rate established in the related contract to the nominal amount of the guarantee.
i. Loan commitments granted
Loan commitments granted: firm commitments of grating of credit under predefined terms and conditions, except for those that comply with the definition of derivatives as these can be settled in cash or through the delivery of issuance of another financial instrument. They include stand-by credit lines and long-term deposits.
ii. Financial guarantees granted
Financial guarantees includes, inter alia, financial guarantee contracts such as financial bank guarantees, credit derivatives sold, and risks arising from derivatives arranged for the account of third parties.
iii. Other commitments granted
Other contingent liabilities include all commitments that could give rise to the recognition of financial assets not included in the above items, such as technical guarantees and guarantees for the import and export of goods and services.
b) Memorandum items
i. Off-balance-sheet funds under management
The detail of off-balance-sheet funds managed by the Group and by joint ventures is as follows:
| | | | | | | | | | | |
| EUR million |
| 2025 | 2024 | 2023 |
| Investment funds | 197,346 | | 178,840 | | 165,174 | |
| Pension funds | 16,112 | | 15,646 | | 14,831 | |
| Assets under management | 43,974 | | 35,999 | | 29,732 | |
| 257,432 | | 230,485 | | 209,737 | |
ii. Non-managed marketed funds
Additionally, at 31 December 2025 there are non-managed marketed funds totalling EUR 73,173 million (EUR 62,002 million and EUR 50,036 million at 31 December 2024 and 2023, respectively).
c) Third-party securities held in custody
At 31 December 2025 the Group held in custody debt securities and equity instruments totalling EUR 306,723 million (EUR 292,216 million and EUR 268,338 million at 31 December 2024 and 2023, respectively) entrusted to it by third parties.
36. Hedging derivatives
Grupo Santander, within its financial risk management strategy, and in order to reduce asymmetries in the accounting treatment of its operations, enters into hedging derivatives on interest, exchange rate, credit risk or variation of stock prices, depending on the nature of the risk covered.
Based on its objective, Grupo Santander classifies its hedges in the following categories:
•Cash flow hedges: cover the exposure to the variation of the cash flows associated with an asset, liability or a highly probable forecast transaction. This cover the variable-rate issues in foreign currencies, fixed-rate issues in non-local currency, variable-rate interbank financing and variable-rate assets (bonds, commercial loans, mortgages, etc.).
•Fair value hedges: cover the exposure to the variation in the fair value of assets or liabilities, attributable to an identified and hedged risk. This covers the interest risk of assets or liabilities (bonds, loans, bills, issues, deposits, etc.) with coupons or fixed interest rates, interests in entities, issues in foreign currencies and deposits or other fixed rate liabilities.
•Hedging of net investments abroad: cover the exchange rate risk of the investments in subsidiaries domiciled in a country with a different currency from the functional one of the Group.
The following tables contains the detail of the hedging derivatives according to the type of hedging, the hedge risk and the main products used as of 31 December 2025, 2024 and 2023:
| | | | | | | | | | | | | | | | | |
| EUR million | |
| 2025 | |
| | Carrying amount | | |
| Nominal value | Assets | Liabilities | Changes in fair value used for calculating hedge ineffectiveness | Balance sheet line items |
| Fair value hedges | 338,057 | | 2,387 | | 2,588 | | (454) | | |
| Interest rate risk | 305,348 | | 1,501 | | 1,532 | | (433) | | Hedging derivatives |
| Interest rate swap | 285,983 | | 1,326 | | 1,485 | | (188) | | |
| Future interest rate | 19,365 | | 175 | | 47 | | (247) | | |
Cap&Floor | — | | — | | — | | 2 | | |
| Exchange rate risk | 2,656 | | 6 | | 20 | | 46 | | Hedging derivatives |
| Fx forward | 2,414 | | 6 | | 20 | | 5 | | |
Fx Swap | — | | — | | — | | 46 | | |
| Future interest rate | 242 | | — | | — | | (5) | | |
| Interest rate and exchange rate risk | 27,433 | | 735 | | 1,035 | | (76) | | Hedging derivatives |
| Interest rate swap | 5,452 | | 38 | | 80 | | (8) | | |
| Currency swap | 21,981 | | 697 | | 955 | | (68) | | |
| Base risk | 500 | | — | | 1 | | — | | Hedging derivatives |
| Interest rate swap | 500 | | — | | 1 | | — | | |
| Inflation risk | 2,120 | | 145 | | — | | 9 | | Hedging derivatives |
| Inflation swap | 2,120 | | 145 | | — | | 9 | | |
| | | | | |
| Cash flow hedges | 148,269 | | 1,954 | | 1,231 | | 1,067 | | |
| Interest rate risk | 99,969 | | 960 | | 41 | | 1,171 | | Hedging derivatives |
| Future interest rate | 12,357 | | 22 | | 7 | | (293) | | |
| Interest rate swap | 87,412 | | 937 | | 34 | | 1,464 | | |
Cap&Floor | 200 | | 1 | | — | | — | | |
| Exchange rate risk | 24,791 | | 605 | | 473 | | (233) | | Hedging derivatives |
| FX forward | 3,445 | | 62 | | 20 | | (18) | | |
FX swap | 1,606 | | 38 | | 43 | | (3) | | |
| Currency swap | 19,740 | | 505 | | 410 | | (212) | | |
| Interest rate and exchange rate risk | 23,445 | | 298 | | 718 | | (3) | | Hedging derivatives |
| Interest rate swap | 3,253 | | 17 | | 85 | | 51 | | |
| Currency swap | 20,192 | | 281 | | 633 | | (54) | | |
| Inflation risk | — | | — | | — | | 131 | | Hedging derivatives |
| Inflation swap | — | | — | | — | | 131 | | |
| Equity risk | 64 | | 91 | | | 1 | | Hedging derivatives |
Equity Option | 64 | | 91 | | | 1 | | |
| | | | | |
| Hedges of net investments in foreign operations | 19,666 | | 86 | | 475 | | 136 | | |
| Exchange rate risk | 19,666 | | 86 | | 475 | | 136 | | Hedging derivatives |
| FX forward | 19,614 | | 86 | | 474 | | 134 | | |
FX swap | 52 | | | 1 | | 2 | | |
| | | | | |
| 505,992 | | 4,427 | | 4,294 | | 749 | | |
| | | | | | | | | | | | | | | | | |
| EUR million | |
| 2024 | |
| | Carrying amount | | |
| Nominal value | Assets | Liabilities | Changes in fair value used for calculating hedge ineffectiveness | Balance sheet line items |
| Fair value hedges | 308,897 | | 2,584 | | 2,964 | | 483 | | |
| Interest rate risk | 290,152 | | 2,070 | | 2,319 | | 373 | | Hedging derivatives |
| Of which: | | | | | |
| Interest rate swap | 276,715 | | 1,578 | | 2,082 | | 156 | | |
| Exchange rate risk | 4,411 | | 13 | | 59 | | 101 | | Hedging derivatives |
Of which: | | | | | |
| Fx forward | 2,240 | | 8 | | 39 | | (2) | | |
| Future interest rate | 2,059 | | — | | — | | 91 | | |
| Interest rate and exchange rate risk | 13,739 | | 501 | | 586 | | 8 | | Hedging derivatives |
| Interest rate swap | 2,720 | | 15 | | 65 | | 46 | | |
| Currency swap | 11,019 | | 486 | | 520 | | (38) | | |
| Base risk | 500 | | — | | — | | — | | Hedging derivatives |
| Interest rate swap | 500 | | — | | — | | — | | |
| Equity risk | 95 | | — | | — | | 1 | | Hedging derivatives |
| Equity swap | 95 | | — | | — | | 1 | | |
| | | | | |
| Cash flow hedges | 179,271 | | 2,415 | | 1,519 | | 558 | | |
| Interest rate risk | 134,503 | | 1,060 | | 1,089 | | 144 | | |
| Of which: | | | | | |
| Future interest rate | 6,621 | | — | | — | | 225 | | |
| Interest rate swap | 106,663 | | 788 | | 478 | | (130) | | |
| Exchange rate risk | 30,653 | | 738 | | 258 | | 459 | | Hedging derivatives |
| Of which: | | | | | |
| FX forward | 9,286 | | 362 | | 51 | | 408 | | |
| Currency swap | 19,957 | | 323 | | 189 | | 114 | | |
| Interest rate and exchange rate risk | 11,724 | | 539 | | 172 | | 26 | | Hedging derivatives |
| Interest rate swap | 3,092 | | (6) | | 46 | | 75 | | |
| Currency swap | 8,632 | | 545 | | 126 | | (49) | | |
| Inflation risk | 2,316 | | 58 | | — | | (69) | | Hedging derivatives |
| Of which: | | | | | |
| Inflation swap | 2,163 | | 57 | | — | | 82 | | |
| Equity risk | 75 | | 20 | | — | | (2) | | Hedging derivatives |
| Equity swap | 75 | | 20 | | — | | (2) | | |
| | | | | |
| Hedges of net investments in foreign operations | 23,559 | | 673 | | 269 | | 420 | | |
| Exchange rate risk | 23,559 | | 673 | | 269 | | 420 | | Hedging derivatives |
| FX forward | 23,559 | | 673 | | 269 | | 420 | | |
| | | | | |
| 511,727 | | 5,672 | | 4,752 | | 1,461 | | |
| | | | | | | | | | | | | | | | | |
| EUR million | |
| 2023 | |
| | Carrying amount | | |
| Nominal value | Assets | Liabilities | Changes in fair value used for calculating hedge ineffectiveness | Balance sheet line items |
| Fair value hedges | 241,792 | | 2,661 | | 4,231 | | (1,869) | | |
| Interest rate risk | 225,377 | | 2,280 | | 3,644 | | (1,684) | | Hedging derivatives |
| Of which: | | | | | |
| Interest rate swap | 215,382 | | 2,015 | | 3,462 | | (1,871) | | |
| Exchange rate risk | 4,331 | | 15 | | 24 | | (98) | | Hedging derivatives |
| FX forward | 1,913 | | 15 | | 24 | | (11) | | |
| Future interest rate | 2,418 | | — | | — | | (87) | | |
| Interest rate and exchange rate risk | 12,084 | | 366 | | 563 | | (87) | | Hedging derivatives |
| Interest rate swap | 2,311 | | 9 | | 179 | | 20 | | |
| Currency swap | 9,773 | | 357 | | 384 | | (107) | | |
| | | | | |
| Cash flow hedges | 157,796 | | 2,575 | | 2,889 | | 1,828 | | |
| Interest rate risk | 97,780 | | 913 | | 1,246 | | 2,181 | | Hedging derivatives |
| Of which: | | | | | |
| Future interest rate | 3,020 | | — | | — | | 6 | | |
| Interest rate swap | 91,569 | | 872 | | 1,214 | | 2,188 | | |
| Exchange rate risk | 34,823 | | 1,001 | | 663 | | (498) | | Hedging derivatives |
| Of which: | | | | | |
| FX forward | 11,160 | | 502 | | 241 | | 43 | | |
| Currency swap | 20,043 | | 446 | | 397 | | (537) | | |
| Interest rate and exchange rate risk | 12,217 | | 484 | | 74 | | (98) | | Hedging derivatives |
| Interest rate swap | 2,847 | | — | | (45) | | 227 | | |
| Currency swap | 9,370 | | 484 | | 119 | | (325) | | |
| Inflation risk | 12,908 | | 155 | | 906 | | 234 | | Hedging derivatives |
| Of which: | | | | | |
| Currency swap | 12,495 | | 153 | | 906 | | 240 | | |
| Equity risk | 68 | | 22 | | — | | 9 | | Hedging derivatives |
| Option | 68 | | 22 | | — | | 9 | | |
| | | | | |
| Hedges of net investments in foreign operations | 18,706 | | 61 | | 536 | | (1,888) | | |
| Exchange rate risk | 18,706 | | 61 | | 536 | | (1,888) | | Hedging derivatives |
| FX forward | 18,706 | | 61 | | 536 | | (1,888) | | |
| | | | | |
| 418,294 | | 5,297 | | 7,656 | | (1,929) | | |
Considering the main entities or groups within the Group by the weight of their hedging, the main types of hedging that are being carried out in Santander UK Group Holdings plc group and Banco Santander, S.A.
Santander UK Group Holdings plc group enters into fair value and cash flow hedging derivatives depending on the exposure of the underlying. Only designated risks are hedged and therefore other risks, such as credit risk, are managed but not hedged. When contracting derivatives, Santander UK applies the same credit risk management procedures that it uses for ordinary lending activity.
Within fair value hedges, Santander UK Group Holdings plc group has portfolios of assets and liabilities at fixed rate that are exposed to changes in fair value due to changes in market interest rates. These positions are managed by contracting mainly interest rate swaps. Effectiveness is assessed by comparing the changes in the fair value of these portfolios generated by the hedged risk with the changes in the fair value of the derivatives contracted.
Santander UK Group Holdings plc group also has access to international markets to obtain financing by issuing fixed-rate debt or investing in fixed rate debt of other issuers, in its functional currency and other currencies. As such, they are exposed to changes in interest rates and exchange rates, mainly in EUR and USD. This risk is mitigated with cross currency swaps e interest rate swaps in which they pay a fixed rate and receive a variable rate. Effectiveness is evaluated using linear regression techniques to compare changes in the fair value of the debt at interest and exchange rates with changes in the fair value of interest rate swaps or cross currency swaps.
Within the cash flow hedges, Santander UK Group Holdings plc group has portfolios of assets and liabilities at variable rates, normally at SONIA or BoE base rate. To mitigate this market rate variability risk, it contracts interest rate swaps.
As Santander UK Group Holdings plc group obtains financing in the international markets, it assumes a significant exposure to currency risk mainly USD and EUR. In addition, it also holds debt securities for liquidity purposes which assume exposure mainly in JPY, CAD and CHF. To manage this exchange rate risk, Spot, Forward y Cross Currency Swap are contracted to match the cash flow profile and the maturity of the estimated interest and principal repayments of the hedged item.
Effectiveness is assessed by comparing changes in the fair value of the derivatives with changes in the fair value of the hedged item attributable to the hedged risk by applying a hypothetical derivative method using linear regression techniques.
It also has inflation risk hedges, which arise from UK bonds linked to UK inflation and are hedged using inflation swaps.
Effectiveness is assessed by comparing changes in the fair value of the inflation swap with the changes in the fair value of the hedged item attributable to the hedged risk, applying the hypothetical derivative method using linear regression techniques.
In addition, within the hedges that cover equity risk, Santander UK Group Holdings plc group offers employees the opportunity to purchase shares of the Bank at a discount under the Sharesave Scheme, exposing the Bank to share price risk. As such, options are purchased allowing them to purchase shares at a pre-set price.
Banco Santander, S.A. covers the risks of its balance sheet in a variety of ways. On the one hand, documented as fair value hedges, it covers the interest rate and foreign exchange risk of fixed-income portfolios at a fixed rate (REPOs are included in this category). Resulting, in an exposure to changes in their fair value due to variations in market conditions based on the various risks hedged, which has an impact on Banco Santander's income statement.
To mitigate these risks, Banco Santander contracts derivatives, mainly Interest Rate Swaps, Cross Currency Swaps, Cap&floors and Forex Forward.
On the other hand, the interest and exchange rate risk of loans granted to corporate clients at a fixed rate or variable rate is covered. These hedges, are carried out through interest rate swaps, cross currency swaps and exchange rate derivatives (forex swaps and forex forward).
In addition, Banco Santander, S.A. manages the interest and exchange risk of debt issues in its various categories (issuing covered bonds, perpetual, subordinated and senior bond) and in different currencies, denominated at fixed rates, and therefore subject to changes in their fair value. These issues are covered through interest rate swaps and cross currency swaps.
The methodology used by Banco Santander, S.A. to measure the effectiveness of fair value hedges is based on comparing the market values of the hedged items (based on the objective risk of the hedge) and of the hedging instruments in order to analyse whether the changes in the market value of the hedged items are offset by the market value of the hedging instruments, thereby mitigating the hedged risk and minimizing volatility in the income statement.
Prospectively, the same analysis is performed, measuring the theoretical market values in the event of parallel variations in the market curves of a positive basis point.
There is a macro hedge of structured loans in which the interest rate risk of fixed-rate loans (mortgage, personal or with other guarantees) granted to legal entities in commercial or corporate banking and wealth clients in the medium-long term is hedged. This hedge is instrumented as a macro hedge of fair value, the main hedging instruments being Interest Rate Swap and Cap&floors. In case of total or partial cancellation or early repayment, the customer is obliged to pay/receive the cost/income of the cancellation of the interest rate risk hedge managed by the Bank.
Regarding cash flow hedges, the objective is to hedge the cash flow exposure to changes in interest rates and exchange rates.
For retrospective purposes, the hypothetical derivative methodology is used to measure effectiveness. By means of this methodology, the hedged risk is modelled as a derivative instrument -not real-, created exclusively for the purpose of measuring the effectiveness of the hedge, and which must comply with the fact that its main characteristics coincide with the critical terms of the hedged item throughout the period for which the hedging relationship is designated. This hypothetical derivative does not incorporate characteristics that are exclusive to the hedging instrument. Additionally, it is worth mentioning that any risk component not associated with the hedged objective risk and effectively documented at the beginning of the hedge is excluded for the purpose of calculating the effectiveness. The market value of the hypothetical derivative that replicates the hedged item is compared with the market value of the hedging instrument, verifying that the hedged risk is effectively mitigated and that the impact on the income statement due to potential ineffectiveness is residual.
Prospectively, the variations in the market values of the hedging instrument and the hedged item (represented by the hypothetical derivative) are measured in the event of parallel shifts of a positive basis point in the affected market curves.
There is another macro-hedge, this time of cash flows, the purpose of which is to actively manage the risk-free interest rate risk (excluding credit risk) of a portion of the floating rate assets of Banco Santander, S.A., through the arrangement of interest rate derivatives whereby the bank exchanges floating rate interest flows for others at a fixed rate agreed at the time the transactions are arranged. The items affected by the Macro-hedging have been designated as those in which their cash flows are exposed to interest rate risk, specifically the floating rate mortgages of the Banco Santander, S.A. network referenced to Euribor 12 Months or Euribor Mortgage, with annual renewal of rates, classified as sound risk and which do not have a contractual floor (or, if not, this floor is not activated). The hedged position affecting the Macro Cash Flow Hedge at the present time is near to EUR 5,000 million.
Regarding net foreign investments hedges, basically, they are allocated in Banco Santander, S.A. and Santander Consumer Finance Group. Grupo Santander assumes as a priority risk management objective to minimize -to the limit determined by the Group's Financial Management- the impact on the calculation of the capital ratio of its permanent investments included within the Group's consolidation perimeter, and whose shares or equity interests are legally denominated in a currency other than that of the Group's parent company. For this purpose, financial instruments (generally derivatives) are contracted to hedge the impact on the capital ratio of changes in forward exchange rates. Grupo Santander mainly hedges the risk for the following currencies: BRL, CLP, MXN, CAD, COP, CNY, GBP, CHF, NOK, USD, PLN, UYU and PEN. The instruments used to hedge the risk of these investments are forex swaps, forex forward and spot currency purchases/sales.
For this type of hedges, ineffectiveness scenarios are considered to be of low probability, given that the hedging instrument is designated considering the position determined and the spot rate at which the position is located.
The following table sets out the maturity profile of the hedging instruments used in Grupo Santander non-dynamic hedging strategies:
| | | | | | | | | | | | | | | | | | | | |
| EUR million |
| 31 December 2025 |
| Up to one month | One to three months | Three months to one year | One year to five years | More than five years | Total |
| Fair value hedges | 17,263 | | 20,353 | | 87,830 | | 176,040 | | 36,571 | | 338,057 | |
| Interest rate risk | 15,778 | | 19,042 | | 82,060 | | 160,461 | | 28,007 | | 305,348 | |
| Interest rate swap | 15,588 | | 18,565 | | 78,893 | | 146,294 | | 26,643 | | 285,983 | |
| Future interest rate | 190 | | 477 | | 3,167 | | 14,167 | | 1,364 | | 19,365 | |
| Exchange rate risk | 963 | | 365 | | 1,086 | | — | | 242 | | 2,656 | |
| Fx forward | 963 | | 365 | | 1,086 | | — | | — | | 2,414 | |
| Future interest rate | — | | — | | — | | — | | 242 | | 242 | |
| Interest rate and exchange rate risk | 522 | | 946 | | 4,684 | | 15,079 | | 6,202 | | 27,433 | |
| Interest rate swap | 15 | | 54 | | 218 | | 3,898 | | 1,267 | | 5,452 | |
| Currency swap | 507 | | 892 | | 4,466 | | 11,181 | | 4,935 | | 21,981 | |
| Base risk | — | | — | | — | | 500 | | — | | 500 | |
| Interest rate swap | — | | — | | — | | 500 | | — | | 500 | |
| Inflation risk | — | | — | | — | | — | | 2,120 | | 2,120 | |
| Inflation swap | — | | — | | — | | — | | 2,120 | | 2,120 | |
| | | | | | |
| Cash flow hedges | 6,499 | | 4,405 | | 21,536 | | 103,955 | | 11,874 | | 148,269 | |
| Interest rate risk | 3,497 | | 1,347 | | 12,090 | | 76,749 | | 6,286 | | 99,969 | |
| Future interest rate | — | | — | | 13 | | 11,837 | | 507 | | 12,357 | |
| Interest rate swap | 3,497 | | 1,347 | | 12,077 | | 64,712 | | 5,779 | | 87,412 | |
Cap&Floor | — | | — | | — | | 200 | | — | | 200 | |
| Exchange rate risk | 981 | | 1,169 | | 4,062 | | 15,467 | | 3,112 | | 24,791 | |
| FX forward | 874 | | 1,025 | | 1,546 | | — | | — | | 3,445 | |
FX swap | 66 | | 92 | | 492 | | 956 | | — | | 1,606 | |
| Currency swap | 41 | | 52 | | 2,024 | | 14,511 | | 3,112 | | 19,740 | |
| Interest rate and exchange rate risk | 2,021 | | 1,887 | | 5,371 | | 11,690 | | 2,476 | | 23,445 | |
| Interest rate swap | 761 | | — | | 227 | | 2,085 | | 180 | | 3,253 | |
| Currency swap | 1,260 | | 1,887 | | 5,144 | | 9,605 | | 2,296 | | 20,192 | |
| Equity risk | — | | 2 | | 13 | | 49 | | — | | 64 | |
Equity option | — | | 2 | | 13 | | 49 | | — | | 64 | |
| | | | | | |
| Hedges of net investments in foreign operations: | 2,945 | | 5,218 | | 11,296 | | 207 | | — | | 19,666 | |
| Exchange rate risk | 2,945 | | 5,218 | | 11,296 | | 207 | | — | | 19,666 | |
| FX forward | 2,893 | | 5,218 | | 11,296 | | 207 | | — | | 19,614 | |
FX swap | 52 | | — | | — | | — | | — | | 52 | |
| 26,707 | | 29,976 | | 120,662 | | 280,202 | | 48,445 | | 505,992 | |
| | | | | | | | | | | | | | | | | | | | |
| EUR million |
| 31 December 2024 |
| Up to one month | One to three months | Three months to one year | One year to five years | More than five years | Total |
| Fair value hedges | 9,791 | | 15,953 | | 88,519 | | 163,086 | | 31,548 | | 308,897 | |
| Interest rate risk | 8,725 | | 14,680 | | 85,981 | | 154,440 | | 26,326 | | 290,152 | |
| Of which: | | | | | | |
| Interest rate swap | 7,910 | | 11,913 | | 83,890 | | 148,913 | | 24,089 | | 276,715 | |
| Exchange rate risk | 1,054 | | 717 | | 469 | | 112 | | 2,059 | | 4,411 | |
| Of which: | | | | | | |
| Fx forward | 1,054 | | 717 | | 469 | | — | | — | | 2,240 | |
| Future interest rate | — | | — | | — | | — | | 2,059 | | 2,059 | |
| Interest rate and exchange rate risk | 12 | | 511 | | 2,019 | | 8,034 | | 3,163 | | 13,739 | |
| Of which: | | | | | | |
| Interest rate swap | — | | 149 | | 104 | | 1,543 | | 924 | | 2,720 | |
| Currency swap | 12 | | 361 | | 1,915 | | 6,491 | | 2,240 | | 11,019 | |
| Base risk | — | | — | | — | | 500 | | — | | 500 | |
| Interest rate swap | — | | — | | — | | 500 | | — | | 500 | |
| Equity risk | — | | 45 | | 50 | | — | | — | | 95 | |
| Equity swap | — | | 45 | | 50 | | — | | — | | 95 | |
| | | | | | |
| Cash flow hedges | 19,696 | | 10,088 | | 43,111 | | 94,030 | | 12,346 | | 179,271 | |
| Interest rate risk | 14,628 | | 7,932 | | 30,390 | | 75,459 | | 6,094 | | 134,503 | |
| Of which: | | | | | | |
| Future interest rate | 6,621 | | — | | — | | — | | — | | 6,621 | |
| Interest rate swap | 7,146 | | 5,856 | | 20,846 | | 67,495 | | 5,320 | | 106,663 | |
| Exchange rate risk | 2,982 | | 1,377 | | 8,765 | | 14,703 | | 2,826 | | 30,653 | |
| Of which: | | | | | | |
| FX forward | 2,594 | | 1,310 | | 5,382 | | — | | — | | 9,286 | |
| Currency swap | 133 | | 66 | | 3,383 | | 14,704 | | 1,671 | | 19,957 | |
| Interest rate and exchange rate risk | 2,086 | | 778 | | 3,785 | | 3,813 | | 1,262 | | 11,724 | |
| Of which: | | | | | | |
| Interest rate swap | 997 | | — | | 395 | | 1,260 | | 440 | | 3,092 | |
| Currency swap | 1,090 | | 778 | | 3,389 | | 2,553 | | 822 | | 8,632 | |
| Inflation risk | — | | — | | 153 | | — | | 2,163 | | 2,316 | |
| Of which: | | | | | | |
| Inflation swap | — | | — | | — | | — | | 2,163 | | 2,163 | |
| Equity risk | — | | 1 | | 18 | | 55 | | 1 | | 75 | |
| Option | — | | 1 | | 18 | | 55 | | 1 | | 75 | |
| | | | | | |
| Hedges of net investments in foreign operations: | 3,918 | | 5,644 | | 13,997 | | — | | — | | 23,559 | |
| Exchange rate risk | 3,918 | | 5,644 | | 13,997 | | — | | — | | 23,559 | |
| FX forward | 3,918 | | 5,644 | | 13,997 | | — | | — | | 23,559 | |
| 33,405 | | 31,685 | | 145,627 | | 257,116 | | 43,894 | | 511,727 | |
| | | | | | | | | | | | | | | | | | | | |
| EUR million |
| 31 December 2023 |
| Up to one month | One to three months | Three months to one year | One year to five years | More than five years | Total |
| Fair value hedges | 6,862 | | 14,535 | | 59,170 | | 139,486 | | 21,739 | | 241,792 | |
| Interest rate risk | 6,266 | | 13,749 | | 56,860 | | 131,323 | | 17,179 | | 225,377 | |
| Of which: | | | | | | |
| Interest rate swap | 6,176 | | 13,525 | | 55,918 | | 125,405 | | 14,358 | | 215,382 | |
| Exchange rate risk | 566 | | 678 | | 619 | | 50 | | 2,418 | | 4,331 | |
| Fx forward | 566 | | 678 | | 619 | | 50 | | — | | 1,913 | |
| Future interest rate | — | | — | | — | | — | | 2,418 | | 2,418 | |
| Interest rate and exchange rate risk | 30 | | 108 | | 1,691 | | 8,113 | | 2,142 | | 12,084 | |
| Currency swap | 30 | | 87 | | 1,370 | | 6,605 | | 1,681 | | 9,773 | |
| Interest rate swap | — | | 21 | | 321 | | 1,508 | | 461 | | 2,311 | |
| | | | | | |
| Cash flow hedges | 7,873 | | 16,149 | | 43,913 | | 83,291 | | 6,570 | | 157,796 | |
| Interest rate risk | 4,467 | | 6,859 | | 30,846 | | 53,038 | | 2,570 | | 97,780 | |
| Of which: | | | | | | |
| Future interest rate | — | | — | | — | | 3,020 | | — | | 3,020 | |
| Interest rate swap | 4,241 | | 6,429 | | 29,863 | | 48,735 | | 2,301 | | 91,569 | |
| Exchange rate risk | 2,655 | | 7,087 | | 6,607 | | 16,711 | | 1,763 | | 34,823 | |
| Of which: | | | | | | |
| FX forward | 2,013 | | 2,344 | | 4,617 | | 2,186 | | — | | 11,160 | |
| Currency swap | 642 | | 2,209 | | 1,990 | | 14,525 | | 677 | | 20,043 | |
| Interest rate and exchange rate risk | 407 | | 1,547 | | 2,270 | | 7,187 | | 806 | | 12,217 | |
| Of which: | | | | | | |
| Interest rate swap | — | | 80 | | — | | 2,575 | | 192 | | 2,847 | |
| Currency swap | 407 | | 1,467 | | 2,270 | | 4,612 | | 614 | | 9,370 | |
| Inflation risk | 344 | | 656 | | 4,182 | | 6,296 | | 1,430 | | 12,908 | |
| Of which: | | | | | | |
| Currency swap | 318 | | 618 | | 3,833 | | 6,296 | | 1,430 | | 12,495 | |
| Equity risk | — | | — | | 8 | | 59 | | 1 | | 68 | |
| Option | — | | — | | 8 | | 59 | | 1 | | 68 | |
| | | | | | |
| Hedges of net investments in foreign operations: | 4,303 | | 4,940 | | 9,463 | | — | | — | | 18,706 | |
| Exchange rate risk | 4,303 | | 4,940 | | 9,463 | | — | | — | | 18,706 | |
| FX forward | 4,303 | | 4,940 | | 9,463 | | — | | — | | 18,706 | |
| 19,038 | | 35,624 | | 112,546 | | 222,777 | | 28,309 | | 418,294 | |
Additionally, for Santander UK Group Holdings plc and Banco Santander, S.A., both the maturity profile, the average interest and exchange rate of hedging instruments by maturity buckets are shown:
Santander UK Group Holdings plc group
| | | | | | | | | | | | | | | | | | | | |
| 31 December 2025 |
| EUR million |
| Up to one month | One to three months | Three months
to one year | One year
to five years | More than five
years | Total |
| Fair value hedges | | | | | | |
| Interest rate risk | | | | | | |
| Interest rate instruments | | | | | | |
| Nominal | 14,490 | | 12,469 | | 69,366 | | 86,738 | | 6,222 | | 189,285 | |
| Average fixed interest rate (%) GBP | 4.150 | | 4.703 | | 4.021 | | 3.508 | | 4.181 | | |
| Average fixed interest rate (%) EUR | — | | 0.216 | | — | | 0.621 | | 0.437 | | |
| Average fixed interest rate (%) USD | — | | — | | — | | 4.091 | | 1.325 | | |
| Interest rate and foreign exchange rate risk | | | | | | |
| Exchange and interest rate instruments | | | | | | |
| Nominal | 27.000 | 30 | 357 | | 6,936 | | 1,808 | | 9,158 | |
| Average GBP/EUR exchange rate | 1.176 | 1.138 | 1.158 | 1.177 | 1.182 | |
| Average GBP/USD exchange rate | — | — | 1.249 | 1.346 | 1.293 | |
| Average fixed interest rate (%) EUR | 2 | | 3 | | 4.080 | | 2.812 | | 2.822 | | |
| Average fixed interest rate (%) USD | — | | — | | 4.991 | | 4.385 | | 4.364 | | |
| Inflation risk | | | | | | |
| Interest rate instruments | | | | | | |
| Nominal | — | — | — | | — | | 2,120 | | 2,120 | |
| Average fixed interest rate (%) GBP | — | | — | | — | | — | | 4.997 | | |
| Cash flow hedges | | | | | | |
| Interest rate risk | | | | | | |
| Interest rate instruments | | | | | | |
| Nominal | 360 | | 111 | | 3,472 | | 35,087 | | 4,067 | | 43,097 | |
| Average fixed interest rate (%) GBP | 4.373 | | 4.235 | | 3.344 | | 3.881 | | 4.481 | | |
| Foreign exchange risk | | | | | | |
| Exchange and interest rate instruments | | | | | | |
| Nominal | — | | — | | 1,982 | | 14,238 | | 3,112 | | 19,332 | |
| Average GBP/JPY exchange rate | — | — | — | — | — | |
| Average GBP/CHF exchange rate | — | — | 1.121 | 1.111 | — | |
| Average GBP/EUR exchange rate | — | — | — | 1.180 | 1.172 | |
| Average GBP/USD exchange rate | — | — | 1.334 | 1.275 | 1.373 | |
| Average GBP/CAD exchange rate | — | — | — | — | — | |
| Equity risk | | | | | | |
| Equity instruments | | | | | | |
| Nominal | — | 2 | 13 | 49 | — | 64 |
| Interest rate and foreign exchange rate risk | | | | | | |
| Exchange and interest rate instruments | | | | | | |
| Nominal | — | | — | | 87 | | 2,206 | | 420 | | 2,713 | |
| Average GBP/EUR exchange rate | — | — | 1.166 | 1.181 | 1.172 | |
| Average GBP/USD exchange rate | — | — | 1.334 | 1.281 | 1.397 | |
| Average fixed interest rate (%) GBP | — | | — | | 2.609 | | 3.973 | | 4.475 | | |
| | | | | | | | | | | | | | | | | | | | |
| 31 December 2024 |
| EUR million |
| Up to one month | One to three months | Three months
to one year | One year
to five years | More than five
years | Total |
| Fair value hedges | | | | | | |
| Interest rate risk | | | | | | |
| Interest rate instruments | | | | | | |
| Nominal | 5,033 | | 7,598 | | 64,755 | | 93,176 | | 4,110 | | 174,672 | |
| Average fixed interest rate (%) GBP | 3.749 | | 4.293 | | 4.496 | | 3.868 | | 3.653 | | |
| Average fixed interest rate (%) EUR | 0.200 | | (0.346) | | (0.446) | | 0.585 | | 4.370 | | |
| Average fixed interest rate (%) USD | 1.677 | | 1.534 | | 1.531 | | 5.756 | | 0.449 | | |
| Interest rate and foreign exchange rate risk | | | | | | |
| Exchange and interest rate instruments | | | | | | |
| Nominal | — | 212 | 258 | | 2,280 | | 1,152 | | 3,902 | |
| Average GBP/EUR exchange rate | — | 1.136 | 1.158 | 1.162 | 1.176 | |
| Average GBP/USD exchange rate | — | — | — | 1.318 | 1.281 | |
| Average fixed interest rate (%) EUR | — | | — | | 1.350 | | 3.304 | | 2.940 | | |
| Average fixed interest rate (%) USD | — | | — | | — | | 4.831 | | 4.375 | | |
| Cash flow hedges | | | | | | |
| Interest rate risk | | | | | | |
| Interest rate instruments | | | | | | |
| Nominal | 5,330 | | 4,190 | | 14,896 | | 34,841 | | 4,325 | | 63,582 | |
| Average fixed interest rate (%) GBP | 4.592 | | 4.075 | | 4.761 | | 3.707 | | 4.352 | | |
| Foreign exchange risk | | | | | | |
| Exchange and interest rate instruments | | | | | | |
| Nominal | 311 | | 954 | | 5,941 | | 13,235 | | 2,730 | | 23,171 | |
| Average GBP/JPY exchange rate | 178.368 | 179.995 | 187.640 | — | — | |
| Average GBP/CHF exchange rate | — | — | 1.086 | 1.115 | — | |
| Average GBP/EUR exchange rate | — | 1.203 | 1.188 | 1.177 | 1.162 | |
| Average GBP/USD exchange rate | — | — | 1.238 | 1.297 | 1.388 | |
| Average GBP/CAD exchange rate | — | — | 1.758 | — | — | |
| Equity risk | | | | | | |
| Equity instruments | | | | | | |
| Nominal | — | — | 19 | 55 | 1 | 75 |
| Interest rate and foreign exchange rate risk | | | | | | |
| Exchange and interest rate instruments | | | | | | |
| Nominal | 1,993 | | 476 | | 1,039 | | 2,294 | | 707 | | 6,509 | |
| Average GBP/EUR exchange rate | 1.124 | 1.370 | 1.161 | 1.213 | 1.179 | |
| Average GBP/USD exchange rate | — | — | 1.538 | 1.319 | 1.537 | |
| Average fixed interest rate (%) GBP | 1.480 | | 2.760 | | 3.203 | | 2.771 | | 4.885 | | |
| Inflation risk | | | | | | |
| Interest rate instruments | | | | | | |
| Nominal | — | | — | | — | | — | | 2,163 | | 2,163 | |
| Average fixed interest rate (%) GBP | — | | — | | — | | — | | 4.983 | | |
| | | | | | | | | | | | | | | | | | | | |
| 31 December 2023 |
| EUR million |
| Up to one month | One to three months | Three months to one year | One year to five years | More than five
years | Total |
| Fair value hedges | | | | | | |
| Interest rate risk | | | | | | |
| Interest rate instruments | | | | | | |
| Nominal | 4,163 | | 8,230 | | 37,158 | | 70,075 | | 3,467 | | 123,093 | |
| Average fixed interest rate (%) GBP | 2.380 | | 3.190 | | 3.420 | | 3.890 | | 3.990 | | |
| Average fixed interest rate (%) EUR | 1.140 | | 0.180 | | 0.450 | | 0.210 | | 3.920 | | |
| Average fixed interest rate (%) USD | 2.600 | | 2.460 | | 4.230 | | 1.360 | | 4.910 | | |
| Interest rate and foreign exchange rate risk | | | | | | |
| Exchange and interest rate instruments | | | | | | |
| Nominal | — | | 41 | | — | | 2,172 | | 198 | | 2,411 | |
| Average GBP/EUR exchange rate | — | | 1.113 | — | 1.156 | 1.148 | |
| Average GBP/USD exchange rate | — | — | — | 1.318 | — | |
| Average fixed interest rate (%) EUR | — | | — | | — | | 2.770 | | 3.480 | | |
| Average fixed interest rate (%) USD | — | | — | | — | | 4.830 | | — | | |
| Cash flow hedges | | | | | | |
| Interest rate risk | | | | | | |
| Interest rate instruments | | | | | | |
| Nominal | 1,050 | | 3,553 | | 15,756 | | 31,941 | | 1,405 | | 53,705 | |
| Average fixed interest rate (%) GBP | 5.060 | | 3.050 | | 5.380 | | 3.840 | | 3.450 | | |
| Foreign exchange risk | | | | | | |
| Exchange and interest rate instruments | | | | | | |
| Nominal | 1,068 | | 6,266 | | 3,104 | | 10,888 | | 1,763 | | 23,089 | |
| Average GBP/JPY exchange rate | 154.135 | 153.954 | 167.846 | — | | — | | |
| Average GBP/CHF exchange rate | 1.092 | 1.093 | 1.089 | 1.121 | 1.121 | |
| Average GBP/EUR exchange rate | — | | 1.197 | 1.167 | 1.179 | — | |
| Average GBP/USD exchange rate | — | 1.392 | — | 1.277 | 1.388 | |
| Equity risk | | | | | | |
| Equity instruments | | | | | | |
| Nominal | — | | — | | 8 | | 58 | | 2 | | 68 | |
| Interest rate and foreign exchange rate risk | | | | | | |
| Exchange and interest rate instruments | | | | | | |
| Nominal | 100 | | 905 | | 576 | | 5,614 | | 719 | | 7,914 | |
| Average GBP/EUR exchange rate | 1,183 | | — | | 1.254 | 1.198 | 1.189 | |
| Average GBP/USD exchange rate | — | | 1,663 | — | 1.383 | 1.537 | |
| Average fixed interest rate (%) GBP | 2.570 | | 2.540 | | 2.960 | | 2.420 | | 4.810 | | |
Banco Santander, S.A. | | | | | | | | | | | | | | | | | | | | |
| 31 December 2025 |
| EUR million |
| Up to one month | One to three months | Three months to one year | One year to five years | More than five
years | Total |
| Fair value hedges | | | | | | |
| Interest rate risk | | | | | | |
| Interest rate instruments | | | | | | |
| Nominal | 746 | 2,790 | 6,849 | 34,331 | 17,003 | 61,719 |
| Average fixed interest rate (%) GBP | — | 2.155 | 1.500 | 5.725 | 5.371 | |
| Average fixed interest rate (%) EUR | 3.303 | 2.809 | 2.101 | 3.139 | 0.330 | |
| Average fixed interest rate (%) CHF | — | — | — | 0.403 | — | |
| Average fixed interest rate (%) USD | 5.075 | 4.422 | 1.983 | 3.653 | 4.991 | |
| Average fixed interest rate (%) CZK | — | 1.650 | 2.350 | — | — | |
| Average fixed interest rate (%) NOK | — | — | — | — | 2.403 | |
| Average fixed interest rate (%) AUD | — | — | — | — | 3.824 | |
| Average fixed interest rate (%) RON | — | — | 4.880 | 3.200 | — | |
| Average fixed interest rate (%) HKD | — | — | — | 1.960 | — | |
| Average fixed interest rate (%) NZD | — | — | — | — | 3.252 | |
| Foreign exchange risk | | | | | | |
| Exchange and interest rate instruments | | | | | | |
| Nominal | 329 | | 250 | | 697 | | — | | — | | 1,276 | |
| Average CNY/EUR exchange rate | — | 8,273 | 8,284 | — | — | |
| Average MXN/EUR exchange rate | 2,173 | — | — | — | — | |
| Interest rate and foreign exchange rate risk | | | | | | |
| Exchange and interest rate instruments | | | | | | |
| Nominal | 46 | | 99 | | 956 | | 3,750 | | 1,608 | | 6,459 | |
| Average fixed interest rate (%) AUD/EUR | — | | — | | — | | 5.710 | | 6.101 | | |
| Average fixed interest rate (%) CZK/EUR | — | | — | | — | | 4.264 | | — | | |
| Average fixed interest rate (%) RON/EUR | — | | — | | — | | — | | 0.697 | | |
| Average fixed interest rate (%) HKD/EUR | — | | — | | — | | 4.618 | | — | | |
| Average fixed interest rate (%) JPY/EUR | — | | — | | — | | 0.975 | | 1.407 | | |
| Average fixed interest rate (%) NOK/EUR | — | | — | | — | | 3.441 | | 4.155 | | |
| Average fixed interest rate (%) CHF/EUR | — | | — | | — | | 2.021 | | 1.919 | | |
| Average fixed interest rate (%) USD/CLP | — | | — | | — | | — | | — | | |
| Average fixed interest rate (%) USD/COP | 11.669 | | 11.703 | | 9.869 | | 9.356 | | — | | |
| Average fixed interest rate (%) USD/MXN | — | — | 8.800 | — | — | |
| Average AUD/EUR exchange rate | — | — | — | 1.617 | 1.584 | |
| Average NZD/EUR exchange rate | — | — | — | — | 1.666 | |
| Average CZK/EUR exchange rate | — | 26.131 | 25.365 | 24.832 | — | |
| Average EUR/COP exchange rate | — | — | — | — | — | |
| Average EUR/USD exchange rate | — | — | 0.940 | 0.948 | — | |
| Average HKD/EUR exchange rate | — | — | — | 8.488 | — | |
| Average JPY/EUR exchange rate | — | — | — | 137.802 | 129.229 | |
| Average MXN/EUR exchange rate | — | — | — | 19.083 | — | |
| Average NOK/EUR exchange rate | — | — | — | 9.519 | 10.651 | |
| Average RON/EUR exchange rate | — | — | 4.948 | 4.927 | 4.980 | |
| Average CHF/EUR exchange rate | — | — | — | 1.019 | 0.935 | |
| Average USD/COP exchange rate | — | — | — | — | — | |
| Average USD/MXN exchange rate | — | — | 0.055 | — | — | |
| Basis Risk | | | | | | |
| Basis risk instruments | | | | | | |
| Nominal | — | | — | | — | | 500 | | — | | 500 | |
| | | | | | | | | | | | | | | | | | | | |
| 31 December 2025 |
| EUR million |
| Up to one month | One to three months | Three months to one year | One year to five years | More than five
years | Total |
| Cash flow hedges | | | | | | |
| Interest rate and foreign exchange rate risk | | | | | | |
| Interest rate and foreign exchange rate instruments | | | | | | |
| Nominal | 236 | | — | | 288 | | 213 | | 80 | | 817 | |
| Average fixed interest rate (%) AUD/EUR | — | | — | | — | | 5.678 | | — | | |
| Average fixed interest rate (%) CHF/EUR | 2.258 | | — | | — | | — | | — | | |
| Average AUD/EUR exchange rate | — | — | 1.590 | 1.577 | 1.562 | |
| Average RON/EUR exchange rate | — | — | 4.940 | — | — | |
| Average CHF/EUR exchange rate | 1.002 | — | — | — | — | |
| Interest rate risk | | | | | | |
| Bond Forward instruments | | | | | | |
| Nominal | — | | — | | 2,120 | | 9,003 | | 507 | | 11,630 | |
| Average fixed interest rate (%) EUR | — | | — | | 2.964 | | 2.695 | | 3.016 | | |
| Average fixed interest rate (%) AUD | — | | — | | 1.650 | | — | | — | | |
| Exchange rate risk | | | | | | |
| Exchange instruments | | | | | | |
| Nominal | 9 | | — | | 9 | | — | | — | | 18 | |
| Average exchange rate GBP/EUR | 1.129 | — | | 1.119 | — | | — | | |
| Hedges of net investments in foreign operations | | | | | | |
| Exchange rate risk | | | | | | |
| Exchange and interest rate instruments | | | | | | |
| Nominal | 2,574 | | 4,530 | | 9,866 | | 207 | | — | | 17,177 | |
| Average BRL/EUR exchange rate | 6.892 | 6.979 | 6.652 | — | — | |
| Average CLP/EUR exchange rate | 1,054.241 | 1,018.994 | 1,108.027 | 1,099.571 | — | |
| Average COP/EUR exchange rate | — | 4,566 | — | — | — | |
| Average GBP/EUR exchange rate | 0.860 | 0.867 | 0.884 | — | — | |
| Average MXN/EUR exchange rate | 22.187 | 23.465 | 22.823 | — | — | |
| Average USD/EUR exchange rate | — | 1.078 | 1.175 | — | — | |
| Average PLN/EUR exchange rate | 4.321 | 4.307 | 4.309 | — | — | |
| Average CAD/EUR exchange rate | 1.611 | — | — | — | — | |
| Average UYU/EUR exchange rate | 48.093 | 48.729 | 49.916 | 53.350 | — | |
| | | | | | | | | | | | | | | | | | | | |
| 31 December 2024 |
| EUR million |
| Up to one month | One to three months | Three months to one year | One year to five years | More than five
years | Total |
| Fair value hedges | | | | | | |
| Interest rate risk | | | | | | |
| Interest rate instruments | | | | | | |
| Nominal | 1,431 | 4,446 | 6,878 | 33,324 | 15,991 | 62,070 |
| Average fixed interest rate (%) GBP | — | 0.020 | 3.120 | 2.640 | 5.370 | |
| Average fixed interest rate (%) EUR | 1.340 | 0.010 | 2.000 | 3.460 | 3.170 | |
| Average fixed interest rate (%) USD | 0.010 | 3.500 | 2.740 | 4.460 | 4.720 | |
| Average fixed interest rate (%) CZK | — | — | — | 2.000 | — | |
| Average fixed interest rate (%) NOK | — | — | — | — | 2.400 | |
| Average fixed interest rate (%) AUD | — | — | — | — | 3.820 | |
| Average fixed interest rate (%) RON | — | 3.610 | — | 4.200 | — | |
| Average fixed interest rate (%) HKD | — | — | — | 1.960 | — | |
| Average fixed interest rate (%) NZD | — | — | — | — | 3.250 | |
| Foreign exchange risk | | | | | | |
| Exchange and interest rate instruments | | | | | | |
| Nominal | 473 | | 405 | | 287 | | — | | — | | 1,165 | |
| Average CNY/EUR exchange rate | 7,710 | 7,710 | 7,710 | — | — | |
| Average MXN/EUR exchange rate | 2,178 | — | — | — | — | |
| Interest rate and foreign exchange rate risk | | | | | | |
| Exchange and interest rate instruments | | | | | | |
| Nominal | 12 | | 148 | | 1,355 | | 4,859 | | 1,669 | | 8,043 | |
| Average fixed interest rate (%) AUD/EUR | — | | — | | — | | 5.690 | | 6.100 | | |
| Average fixed interest rate (%) CZK/EUR | — | | — | | — | | 4.190 | | — | | |
| Average fixed interest rate (%) RON/EUR | — | | — | | — | | — | | 6.970 | | |
| Average fixed interest rate (%) HKD/EUR | — | | — | | — | | 4.620 | | — | | |
| Average fixed interest rate (%) JPY/EUR | — | | — | | — | | 1.300 | | 1.410 | | |
| Average fixed interest rate (%) NOK/EUR | — | | — | | — | | 3.440 | | 4.500 | | |
| Average fixed interest rate (%) CHF/EUR | — | | — | | — | | 2.030 | | 2.250 | | |
| Average fixed interest rate (%) USD/COP | — | | 12.750 | | 10.580 | | 10.540 | | 7.760 | | |
| Average fixed interest rate (%) EUR/GBP | 6.690 | | — | | — | | — | | — | | |
| Average fixed interest rate (%) USD/MXN | — | — | 11.300 | — | — | |
| Average AUD/EUR exchange rate | — | — | — | 1.599 | 1.584 | |
| Average NZD/EUR exchange rate | — | — | — | — | 1.666 | |
| Average CZK/EUR exchange rate | — | — | 26.030 | 25.634 | — | |
| Average EUR/GBP exchange rate | 1.189 | — | — | — | — | |
| Average EUR/USD exchange rate | — | — | 0.982 | 0.943 | — | |
| Average HKD/EUR exchange rate | — | — | — | 8.488 | — | |
| Average JPY/EUR exchange rate | — | — | — | 134.151 | 129.229 | |
| Average MXN/EUR exchange rate | — | — | — | 19.083 | — | |
| Average NOK/EUR exchange rate | — | — | — | 9.519 | 10.429 | |
| Average RON/EUR exchange rate | — | 4.810 | — | 4.940 | 4.980 | |
| Average CHF/EUR exchange rate | — | — | — | 1.019 | 0.932 | |
| Average USD/COP exchange rate | — | — | — | — | — | |
| Average USD/MXN exchange rate | — | — | 0.052 | — | — | |
| Basis Risk | | | | | | |
| Basis risk instruments | | | | | | |
| Nominal | — | | — | | — | | 500 | | — | | 500 | |
| | | | | | | | | | | | | | | | | | | | |
| 31 December 2024 |
| EUR million |
| Up to one month | One to three months | Three months to one year | One year to five years | More than five
years | Total |
| Cash flow hedges | | | | | | |
| Interest rate and foreign exchange rate risk | | | | | | |
| Interest rate and foreign exchange rate instruments | | | | | | |
| Nominal | — | | — | | — | | 1,055 | | 84 | | 1,139 | |
| Average fixed interest rate (%) AUD/EUR | — | | — | | — | | 3.520 | | — | | |
| Average fixed interest rate (%) CHF/EUR | — | | — | | — | | 3.110 | | — | | |
| Average AUD/EUR exchange rate | — | — | — | 1.580 | 1.560 | |
| Average RON/EUR exchange rate | — | — | — | 4.940 | — | |
| Average CHF/EUR exchange rate | — | — | — | 1.000 | — | |
| Interest rate risk | | | | | | |
| Bond Forward instruments | | | | | | |
| Nominal | — | | — | | 6,200 | | 5,820 | | — | | 12,020 | |
| Average fixed interest rate (%) EUR | — | | — | | — | | 2.910 | | — | | |
| Exchange rate risk | | | | | | |
| Exchange instruments | | | | | | |
| Nominal | 14 | | 83 | | 125 | | — | | — | | 222 | |
| Average exchange rate GBP/EUR | 1.200 | 1.170 | 1.190 | — | | — | | |
| Hedges of net investments in foreign operations | | | | | | |
| Exchange rate risk | | | | | | |
| Exchange and interest rate instruments | | | | | | |
| Nominal | 3,240 | | 5,070 | | 12,821 | | — | | — | | 21,131 | |
| Average BRL/EUR exchange rate | 5.990 | 6.120 | 6.270 | — | — | |
| Average CLP/EUR exchange rate | 1,052.780 | 1,066.580 | 1,045.090 | — | — | |
| Average COP/EUR exchange rate | — | 4,703 | — | — | — | |
| Average GBP/EUR exchange rate | 0.860 | 0.850 | 0.850 | — | — | |
| Average MXN/EUR exchange rate | 20.280 | 19.830 | 21.970 | — | — | |
| Average USD/EUR exchange rate | 1.090 | 1.080 | 1.090 | — | — | |
| Average PLN/EUR exchange rate | 4.370 | 4.410 | 4.410 | — | — | |
| Average CAD/EUR exchange rate | — | 1.500 | — | — | — | |
| Average CHF/EUR exchange rate | — | 0.940 | — | — | — | |
| Average UYU/EUR exchange rate | 45.820 | 45.160 | 48.290 | — | — | |
| | | | | | | | | | | | | | | | | | | | |
| 31 December 2023 |
| EUR million |
| Up to one month | One to three months | Three months to one year | One year to five years | More than five
years | Total |
| Fair value hedges | | | | | | |
| Interest rate risk | | | | | | |
| Interest rate instruments | | | | | | |
| Nominal | 1,532 | | 194 | | 7,880 | | 22,714 | | 8,775 | | 41,095 | |
| Average fixed interest rate (%) GBP | — | | — | | 1.375 | | 4.479 | | 2.036 | | |
| Average fixed interest rate (%) EUR | 0.096 | | 0.014 | | 2.085 | | 2.422 | | 3.421 | | |
| Average fixed interest rate (%) CHF | — | | — | | 1.010 | | — | | — | | |
| Average fixed interest rate (%) USD | 0.015 | | 3.688 | | 2.603 | | 3.801 | | 4.446 | | |
| Foreign exchange risk | | | | | | |
| Exchange and interest rate instruments | | | | | | |
| Nominal | 278 | 634 | 524 | 50 | — | 1,486 |
| Average PEN/USD exchange rate | 3.784 | 3.751 | — | — | — | |
| Average CNY/EUR exchange rate | — | 7.323 | 7.732 | 7.716 | — | |
| Average AUD/EUR exchange rate | 1.648 | 1.665 | — | — | — | |
| Average MXN/EUR exchange rate | — | 19.363 | — | — | — | |
| Average COP/USD exchange rate | 4,159.190 | 3,998.060 | — | — | — | |
| Average MAD/EUR exchange rate | 10.929 | 11.057 | — | — | — | |
| Average PEN/EUR exchange rate | 4.095 | 4.110 | — | — | — | |
| Interest rate and foreign exchange rate risk | | | | | | |
| Exchange and interest rate instruments | | | | | | |
| Nominal | 30 | 66 | 1,450 | 4,321 | 1,150 | 7,017 |
| Average fixed interest rate (%) AUD/EUR | — | | — | | — | | 4.800 | | 3.615 | | |
| Average fixed interest rate (%) CZK/EUR | — | | — | | — | | 2.000 | | — | | |
| Average fixed interest rate (%) RON/EUR | 5.130 | | — | | — | | 3.967 | | — | | |
| Average fixed interest rate (%) HKD/EUR | — | | — | | 2.580 | | 5.270 | | — | | |
| Average fixed interest rate (%) JPY/EUR | — | | — | | 0.465 | | 1.298 | | 1.407 | | |
| Average fixed interest rate (%) NOK/EUR | — | | — | | — | | 3.441 | | 4.501 | | |
| Average fixed interest rate (%) CHF/EUR | — | | — | | — | | 1.243 | | — | | |
| Average fixed interest rate (%) USD/MXN | — | | — | | 14.250 | | — | | — | | |
| Average fixed interest rate (%) USD/COP | — | | 17.980 | | 6.152 | | 13.207 | | 7.149 | | |
| Average fixed interest rate (%) EUR/USD | — | | — | | (0.140) | | — | | — | | |
| Average fixed interest rate (%) USD/CLP | — | | — | | 3.450 | | — | | — | | |
| Average AUD/EUR exchange rate | — | — | — | 1.499 | 1.545 | |
| Average CZK/EUR exchange rate | — | — | — | 25.831 | — | |
| Average EUR/USD exchange rate | — | — | 0.891 | 0.961 | — | |
| Average HKD/EUR exchange rate | — | — | 8.782 | 8.666 | — | |
| Average JPY/EUR exchange rate | — | — | 120.568 | 134.151 | 129.229 | |
| Average NOK/EUR exchange rate | — | — | — | 9.519 | 10.429 | |
| Average RON/EUR exchange rate | 4.711 | — | — | 4.887 | — | |
| Average CHF/EUR exchange rate | — | — | — | 1.104 | — | |
| Average MXN/EUR exchange rate | — | — | — | — | 19.083 | |
| Average USD/CLP exchange rate | — | — | 0.001 | — | — | |
| Average NZD/EUR exchange rate | — | | — | | — | | — | | 1.666 | | |
| Average USD/MXN exchange rate | — | | — | | 0.058 | | — | | — | | |
| | | | | | | | | | | | | | | | | | | | |
| 31 December 2023 |
| EUR million |
| Up to one month | One to three months | Three months to one year | One year to five years | More than five
years | Total |
| Cash flow hedges | | | | | | |
| Interest rate and foreign exchange rate risk | | | | | | |
| Interest rate and foreign exchange rate instruments | | | | | | |
| Nominal | — | | — | | 414 | | 1,075 | | 86 | | 1,575 | |
| Average fixed interest rate (%) CHF/EUR | — | | — | | — | | 3.106 | | — | | |
| Average fixed interest rate (%) AUD/EUR | — | | — | | — | | 3.521 | | — | | |
| Average EUR/GBP exchange rate | — | | — | | 1.173 | | — | | — | | |
| Average AUD/EUR exchange rate | — | | — | | 1.625 | | 1.584 | | 1.562 | | |
| Average RON/EUR exchange rate | — | | — | | — | | 4.940 | | — | | |
| Average CHF/EUR exchange rate | — | | — | | — | | 1.002 | | — | | |
| Interest rate risk | | | | | | |
| Bond Forward instruments | | | | | | |
| Nominal | 750 | 1,500 | 7,750 | 0 | 0 | 10,000 |
| Average fixed interest rate (%) EUR | (0.124) | | (0.889) | | 0.016 | | — | | — | | |
| Exchange rate risk | | | | | | |
| Exchange instruments | | | | | | |
| Nominal | 13 | | 25 | | 111 | | — | | — | | |
| Average exchange rate GBP/EUR | 1.148 | | 1.146 | | 1.138 | | — | | — | | |
| Hedges of net investments in foreign operations | | | | | | |
| Exchange rate risk | | | | | | |
| Exchange and interest rate instruments | | | | | | |
| Nominal | 3,593 | | 4,870 | | 8,034 | | — | | — | | 16,497 | |
| Average BRL/EUR exchange rate | 5.569 | | 5.505 | | 5.481 | | — | | — | | |
| Average CLP/EUR exchange rate | 916.724 | | 936.166 | | 987.202 | | — | | — | | |
| Average COP/EUR exchange rate | — | | 4,525.656 | | — | | — | | — | | |
| Average GBP/EUR exchange rate | 0.866 | | 0.867 | | 0.876 | | — | | — | | |
| Average MXN/EUR exchange rate | 20.078 | | 20.589 | | 20.210 | | — | | — | | |
| Average USD/EUR exchange rate | — | | 1.129 | | 1.081 | | — | | — | | |
| Average PLN/EUR exchange rate | 4.664 | | 4.752 | | 4.580 | | — | | — | | |
| Average CAD/EUR exchange rate | — | | 1.461 | | — | | — | | — | | |
| Average CHF/EUR exchange rate | — | | 0.940 | | — | | — | | — | | |
| Average UYU/EUR exchange rate | 43.235 | | 43.521 | | 44.400 | | — | | — | | |
Other geographies
Consumer Group entities mainly have loans portfolios at fixed interest rates and are therefore, exposed to changes in fair value due to movements in market interest rates. The entities manage this risk by contracting interest rate swaps in which they pay a fixed rate and receive a variable rate. Interest rate risk is the only one hedged and, therefore, other risks, such as credit risk, are managed but not hedged by the entities. The interest rate risk component is determined as the change in fair value of fixed rate loans arising solely from changes in a reference rate. This strategy is designated as a fair value hedge and its effectiveness is assessed by comparing changes in the fair value of loans attributable to changes in reference interest rates with changes in the fair value of interest rate swaps.
In addition, in order to access international markets with the aim of obtaining sources of financing, some Consumer Group´s entities issue fixed rate debt in their own currency and in other currencies that differ from their functional currency. Therefore, they are exposed to changes in both interest rates and exchange rates, which they mitigate with derivatives (interest rate swaps, fx forward and cross currency swaps) in which they receive a fixed interest rate and pay a variable interest rate, implemented with a fair value hedge.
The cash flow hedges of the Grupo Santander´s entities hedge the foreign currency risk of loans and financing.
Finally, it has hedges of net investments abroad to hedge the foreign exchange risk of the shareholding in NOK, CNY, PLN, CAD and CHF currencies.
Banco Santander México, S.A., Institución de Banca Múltiple, Grupo Financiero Santander México, applies accounting hedges for both fair value and cash flows through micro-hedging structures to mitigate risks arising from fluctuations in interest rates and exchange rates.
In its cash flow hedges, the Bank is primarily exposed to exchange rate risk stemming from portfolios of Mexican government bonds issued in a currency other than its functional currency, Brazilian government bonds denominated in reais, US Treasury bonds in dollars, and fixed-rate debt issuances in USD. These exposures are mitigated through fixed-rate cross-currency swaps and FX forward contracts, using different currency combinations (MXN, USD, and BRL) depending on the nature of each portfolio.
The Bank also maintains exposures to interest rate risk associated with bank loans and commercial loans, both fixed-rate and floating-rate. To manage this risk, interest rate swaps are used, whereby the Bank exchanges fixed-rate cash flows for variable-rate cash flows or vice versa, in order to stabilize future cash flows.
In its fair value hedges, Banco Santander México, S.A., Institución de Banca Múltiple, Grupo Financiero Santander México holds portfolios of long-term, fixed-rate commercial loans and Mexican government bonds, denominated in both local and non-functional currencies. These portfolios are exposed to changes in fair value resulting from fluctuations in market interest rates and, where applicable, exchange rates. These exposures are mitigated through interest rate swaps and cross-currency swaps, designated as hedging instruments.
Only interest rate and exchange rate risks are hedged, while other risks, such as credit risk, are managed by the entity but are not designated as hedged risks within the hedging relationships. The effectiveness of the hedges is assessed by comparing the changes in the fair value of the hedged items attributable to the hedged risk with the changes in the fair value of the derivative instruments.
Banco Santander (Brasil) S.A. has fair value and cash flow hedges to mitigate risks arising from market interest rate fluctuations.
In market risk hedging, the Bank protects recognized assets and liabilities against changes in interest rates, exchange rates, and inflation. The risk management methodology segments exposures by risk factor (BRL/USD exchange rate risk, BRL fixed interest rate risk, USD foreign exchange coupon risk, inflation risk, among others). To mitigate these risks, the Bank primarily uses interest rate swaps, currency swaps, and futures contracts, designated as hedging instruments within hedge accounting structures. The results derived from hedging instruments and hedged items are recognized directly in the income statement.
In cash flow hedging, Banco Santander (Brasil) S.A. hedges its exposure to cash flow variability, primarily associated with interest payments and exchange rate movements, arising from assets and liabilities denominated in foreign currency or at variable rates. To this end, futures contracts and interest rate swaps are used to provide predictability to future cash flows. The effective portion of the change in the value of the hedging instruments is temporarily recognized in equity and reclassified to profit or loss when the anticipated transaction occurs, while the ineffective portion is recognized directly in profit or loss. As of December 31, 2025, no amounts corresponding to the ineffective portion have been recorded.
Additionally, Banco Santander - Chile uses fair value hedges with cross currency swaps, interest rate swaps and call money swaps to hedge its exposure to changes in the fair value of the hedged item attributable to interest rates. The aforementioned hedging instruments modify the effective cost of long-term issues, from a fixed interest rate to a variable interest rate.
In addition, it also makes cash flow hedges in which it uses cross currency swaps to cover the risk of variability of flows attributable to changes in the interest rate of bonds and interbank loans issued at variable rates, as well as to cover the variation of foreign currency, mainly in United States dollars. To hedge the inflation risk present in certain items, it uses both forwards and cross currency swaps.
At Santander Bank, National Association, Interest Rate Swaps are used to leave commercial loans at a fixed rate at a variable rate in USD indexed to 1-month Libor or SOFR, under cash flow hedges.
Regarding the hedged items, the following table shows the detail of the type of hedging, the risk that is hedged and which products are being hedged at 31 December 2025, 2024 and 2023. The products that are being hedged are mainly borrowed deposits, financial deposits, loans, government bonds as assets and financial bonds as liabilities:
| | | | | | | | | | | | | | | | | | | | | | | | | | | | | |
| EUR million |
| 31 December 2025 |
| Carrying amount of hedged items | | Accumulated amount of fair value adjustments on the hedged item | Balance sheet line item | Change in fair value of hedged item for ineffectiveness assessment | Cash flow reserves or conversion reserves |
| Assets | Liabilities | | Assets | Liabilities | Continuing hedges | Discontinued hedges |
| Fair value hedges | 166,907 | | 107,124 | | | (191) | | 490 | | Loans and advances / Deposits and Debt securities / Debt securities issued | 461 | | — | | — | |
| Interest rate risk | 152,380 | | 93,395 | | | (201) | | 364 | | | 400 | | — | | — | |
| Exchange rate risk | 2,154 | | 242 | | | (6) | | — | | | (43) | | — | | — | |
| Interest and Exchange rate risk | 9,619 | | 13,487 | | | 3 | | 126 | | | 66 | | — | | — | |
| Inflation risk | 2,253 | | — | | | 13 | | — | | | 38 | | — | | — | |
| Credit risk | — | | — | | | — | | — | | | — | | — | | — | |
| Base risk | 501 | | — | | | — | | — | | | — | | — | | — | |
| Equity risk | — | | — | | | — | | — | | | — | | — | | — | |
| | | | | | | | | |
| Cash flow hedges | | | | | | | (1,063) | | 401 | | 235 | |
| Interest rate risk | | | | | | | (1,174) | | 381 | | 86 | |
| Exchange rate risk | | | | | | | 240 | | (8) | | — | |
| Interest and Exchange rate risk | | | | | | | (8) | | 28 | | (13) | |
| Inflation risk | | | | | | | (131) | | — | | 162 | |
| Equity risk | | | | | | | 10 | | | — | |
| Other risk | | | | | | | — | | — | | — | |
| | | | | | | | | |
| Net foreign investments hedges | 19,666 | — | | | | | (136) | | (7,867) | | 2 | |
| Exchange rate risk | 19,666 | — | | | | | (136) | | (7,867) | | 2 | |
| 186,573 | | 107,124 | | | (191) | | 490 | | | (738) | | (7,466) | | 237 | |
| | | | | | | | | | | | | | | | | | | | | | | | | | | | | |
| EUR million |
| 31 December 2024 |
| Carrying amount of hedged items | | Accumulated amount of fair value adjustments on the hedged item | Balance sheet line item | Change in fair value of hedged item for ineffectiveness assessment | Cash flow reserves or conversion reserves |
| Assets | Liabilities | | Assets | Liabilities | Continuing hedges | Discontinued hedges |
| Fair value hedges | 138,906 | | 32,642 | | | (1,412) | | (1,200) | | Loans and advances / Deposits and Debt securities / Debt securities issued | (461) | | — | | — | |
| Interest rate risk | 133,149 | | 23,780 | | | (1,345) | | (1,176) | | | (343) | | — | | — | |
| Exchange rate risk | 2,017 | | 1,562 | | | 1 | | 3 | | | (118) | | — | | — | |
| Interest and Exchange rate risk | 3,238 | | 7,205 | | | (68) | | (27) | | | 1 | | — | | — | |
| Inflation risk | — | | — | | | — | | — | | | — | | — | | — | |
| Credit risk | — | | — | | | — | | — | | | — | | — | | — | |
| Base risk | 502 | | — | | | — | | — | | | — | | — | | — | |
| Equity risk | — | | 95 | | | — | | — | | | (1) | | — | | — | |
| | | | | | | | | |
| Cash flow hedges | | | | | | | (564) | | (478) | | 50 | |
| Interest rate risk | | | | | | | (156) | | (794) | | 83 | |
| Exchange rate risk | | | | | | | (439) | | 213 | | 19 | |
| Interest and Exchange rate risk | | | | | | | (40) | | 11 | | — | |
| Inflation risk | | | | | | | 69 | | 82 | | (52) | |
| Equity risk | | | | | | | 2 | | 10 | | — | |
| | | | | | | | | |
| Net foreign investments hedges | 23,559 | — | | | | | (420) | | (8,002) | | — | |
| Exchange rate risk | 23,559 | — | | | | | (420) | | (8,002) | | — | |
| 162,465 | | 32,642 | | | (1,412) | | (1,200) | | | (1,445) | | (8,480) | | 50 | |
| | | | | | | | | | | | | | | | | | | | | | | | | | | | | |
| EUR million |
| 31 December 2023 |
| Carrying amount of hedged items | | Accumulated amount of fair value adjustments on the hedged item | Balance sheet line item | Change in fair value of hedged item for ineffectiveness assessment | Cash flow reserves or conversion reserves |
| Assets | Liabilities | | Assets | Liabilities | Continuing hedges | Discontinued hedges |
| Fair value hedges | 134,095 | | 26,946 | | | (1,798) | | (1,652) | | Loans and advances / Deposits and Debt securities / Debt securities issued | 1,928 | | | — | |
| Interest rate risk | 130,672 | | 19,176 | | | (1,682) | | (1,546) | | | 1,757 | | — | | — | |
| Exchange rate risk | 637 | | 1,365 | | | (1) | | (3) | | | 60 | | — | | — | |
| Interest and Exchange rate risk | 2,786 | | 6,405 | | | (115) | | (103) | | | 111 | | — | | — | |
| Inflation risk | — | | — | | | — | | — | | | — | | — | | — | |
| Credit risk | — | | — | | | — | | — | | | — | | — | | — | |
| | | | | | | | | |
| Cash flow hedges | | | | | | | (1,824) | | (813) | | (173) | |
| Interest rate risk | | | | | | | (2,182) | | (797) | | (77) | |
| Exchange rate risk | | | | | | | 500 | | (80) | | — | |
| Interest and Exchange rate risk | | | | | | | 100 | | (144) | | — | |
| Inflation risk | | | | | | | (233) | | 196 | | (96) | |
| Equity risk | | | | | | | (9) | | 12 | | — | |
| | | | | | | | | |
| Net foreign investments hedges | 18,706 | | — | | | | | | 1,888 | | (8,684) | | — | |
| Exchange rate risk | 18,706 | | — | | | | | | 1,888 | | (8,684) | | — | |
| 152,801 | | 26,946 | | | (1,798) | | (1,652) | | | 1,992 | | (9,497) | | (173) | |
The cumulative amount of adjustments of the fair value hedging instruments that remain in the balance for hedges items that are no longer adjusted by profit and loss of coverage as at 31 December 2025 is EUR 227 losses (EUR 775 million and EUR 1,006 million losses in 2024 and 2023, respectively).
The net impact of the hedges are shown in the following table:
| | | | | | | | | | | | | | | | | |
| EUR million |
| 31 December 2025 |
| Earnings/(losses) recognised in another cumulative overall result | Ineffective recognised in the income statement | Line of the income statement that includes the ineffectiveness of cash flows | Reclassified amount of reserves to the income statement due to: |
| Cover transaction affecting the income statement | Line of the income statement that includes reclassified items |
| Fair value hedges | | 7 | | Gains or losses financial assets/liabilities | | |
Interest rate risk | | (33) | | | | |
| Exchange rate risk | | 3 | | | | |
| Interest rate and exchange rate risk | | (9) | | | | |
Inflation risk | | 46 | | | | |
| | | | | |
| Cash flow hedges | 1,063 | | 4 | | | (706) | | Interest margin/Gains or losses financial assets/liabilities |
Interest rate risk | 1,174 | | (3) | | | (638) | | |
| Exchange rate risk | (240) | | 7 | | | 85 | | |
| Interest rate and exchange rate risk | 8 | | (10) | | | (233) | | |
| Inflation risk | 131 | | | | 80 | | |
| Equity risk | (10) | | 10 | | — | 0 | | |
| | | | | |
| Net foreign investments hedges | 136 | | — | | | — | | |
| Exchange rate risk | 136 | | — | | | — | | |
| 1,199 | | 11 | | | (706) | | |
| | | | | | | | | | | | | | | | | |
| EUR million |
| 31 December 2024 |
| Earnings/(losses) recognised in another cumulative overall result | Ineffective recognised in the income statement | Line of the income statement that includes the ineffectiveness of cash flows | Reclassified amount of reserves to the income statement due to: |
| Cover transaction affecting the income statement | Line of the income statement that includes reclassified items |
| Fair value hedges | | 22 | | Gains or losses financial assets/liabilities | | |
| Interest rate risk | | 30 | | — | | |
| Exchange rate risk | | (17) | | — | | |
| Interest rate and exchange rate risk | | 9 | | — | | |
| | | | | |
| Cash flow hedges | 558 | | (6) | | — | | (1,256) | | Interest margin/Gains or losses financial assets/liabilities |
| Interest rate risk | 163 | | (12) | | — | (1,166) | | |
| Exchange rate risk | 312 | | 20 | | — | 319 | | |
| Interest rate and exchange rate risk | 155 | | (14) | | — | (340) | | |
| Inflation risk | (70) | | — | | — | (69) | | |
| Equity risk | (2) | | — | | — | 0 | | |
| | | | | |
| Net foreign investments hedges | 420 | | — | | — | | — | | |
| Exchange rate risk | 420 | | — | | | — | | |
| 978 | | 16 | | | (1,256) | | |
| | | | | | | | | | | | | | | | | |
| EUR million |
| 31 December 2023 |
| Earnings/(losses) recognised in another cumulative overall result | Ineffective coverage recognised in the income statement | Line of the income statement that includes the ineffectiveness of cash flows | Reclassified amount of reserves to the income statement due to: |
| Cover transaction affecting the income statement | Line of the income statement that includes reclassified items |
| Fair value hedges | | 59 | | Gains or losses financial assets/liabilities | | |
| Interest rate risk | | 72 | | | | |
| Exchange rate risk | | (38) | | | | |
| Interest rate and exchange rate risk | | 25 | | | | |
| | | | | |
| Cash flow hedges | 2,592 | | 4 | | Gains or losses financial assets/liabilities | (2,622) | | Interest margin/Gains or losses financial assets/liabilities |
| Interest rate risk | 2,179 | | 2 | | | (1,647) | | |
| Exchange rate risk | 7 | | (1) | | | (416) | | |
| Interest rate and exchange rate risk | 164 | | 2 | | | (431) | | |
| Inflation risk | 233 | | 1 | | | (128) | | |
| Equity risk | 9 | | — | | | 0 | | |
| | | | | |
Net foreign investments hedges
hedges | (1,888) | | — | | | — | | |
| Exchange rate risk | (1,888) | | — | | | — | | |
| 704 | | 63 | | | (2,622) | | |
The following table shows the movement in the impact of equity for the year:
| | | | | | | | | | | |
| EUR million | | |
| 2025 | 2024 | 2023 |
| Balance at beginning of year | (8,300) | | (9,424) | | (9,187) | |
| Cash flow hedges | 1,049 | | 558 | 2,592 | |
| Interest rate risk | 1,155 | | 163 | | 2,179 | |
A) Not designated elements - linked to a time period | (19) | | — | | — | |
Gain or loss in value - recognized in equity | (19) | | — | | — | |
| Amounts transferred to income statements | — | | — | | — | |
Other reclassifications | — | | — | | — | |
B) Not designated elements - linked to a transaction | — | | — | | — | |
C) Designated elements | 1,174 | | 163 | | 2,179 | |
| Amounts transferred to income statements | 638 | | 1,166 | | 1,647 | |
| Gain or loss in value CFE - recognized in equity | 536 | | (1,003) | | 532 | |
| Exchange rate risk | (229) | | 312 | | 7 | |
A) Not designated elements - linked to a time period | 11 | | — | | — | |
Gain or loss in value - recognized in equity | 26 | | — | | — | |
| Amounts transferred to income statements | (15) | | — | | — | |
Other reclassifications | — | | — | | — | |
B) Not designated elements - linked to a transaction | — | | — | | — | |
C) Designated elements | (240) | | 312 | | 7 | |
| Amounts transferred to income statements | (85) | | (319) | | 416 | |
| Gain or loss in value CFE - recognized in equity | (155) | | 631 | | (409) | |
| Interest rate and exchange rate risk | 8 | | 155 | | 164 | |
A) Not designated elements - linked to a time period | — | | — | | — | |
B) Not designated elements - linked to a transaction | — | | — | | — | |
| C) Designated elements | 8 | | 155 | | 164 | |
| Amounts transferred to income statements | 233 | | 340 | | 431 | |
| Gain or loss in value CFE - recognized in equity | (225) | | (185) | | 267 | |
| Inflation risk | 131 | | (70) | | 233 | |
| Amounts transferred to income statements | (80) | | 69 | | 128 | |
| Gain or loss in value CFE - recognized in equity | 211 | | (139) | | 105 | |
| Equity risk | (16) | | (2) | | 9 | |
A) Not designated elements - linked to a time period | (6) | | — | | — | |
Gain or loss in value - recognized in equity | (8) | | — | | — | |
| Amounts transferred to income statements | 2 | | — | | — | |
Other reclassifications | — | | — | | — | |
B) Not designated elements - linked to a transaction | — | | — | | — | |
| C) Designated elements | (10) | | (2) | | 9 | |
| | | | | | | | | | | |
| Amounts transferred to income statements | — | | — | | — | |
| Gain or loss in value CFE - recognized in equity | (10) | | (2) | | 9 | |
| Net foreign investments hedges | 136 | | 420 | (1,888) |
| Exchange rate risk | 136 | | 420 | (1,888) |
A) Not designated elements - linked to a time period | — | | — | — |
B) Not designated elements - linked to a transaction | — | | — | — |
| C) Designated elements | 136 | | 420 | (1,888) |
| Amounts transferred to income statements | — | | — | — |
| Gain or loss in value CFE - recognized in equity | 136 | | 420 | (1,888) |
Fair Value hedges | — | | — | — |
Interest rate risk | — | | — | — |
A) Not designated elements - linked to a time period | — | | — | — |
B) Not designated elements - linked to a transaction | — | | — | — |
| Exchange rate risk | — | | — | — |
A) Not designated elements - linked to a time period | — | | — | — |
B) Not designated elements - linked to a transaction | — | | — | | — | |
| Interest rate and exchange rate risk | — | | — | | — | |
A) Not designated elements - linked to a time period | — | | — | | — | |
B) Not designated elements - linked to a transaction | — | | — | | — | |
| Minorities, taxes and others | (330) | | 146 | | (941) | |
| | | |
| Balance at end of year | (7,445) | | (8,300) | | (9,424) | |
37. Discontinued operations
As a result of the agreement for the sale of part of the Polish business, the effect of these businesses on the consolidated income statement of 2025 has been classified under the line item 'Profit/(loss) after tax from discontinued operations', with the same classification applied for comparative purposes in the consolidated income statement of years 2024 and 2023 (see Note 3).
a) Breakdown
The following is a breakdown of the heading 'Profit/loss after tax from discontinued operations' at 31 December of 2025, 2024 and 2023:
| | | | | | | | | | | |
| EUR million | 2025 | 2024 | 2023 |
| Entities held for sale | | | |
Santander Bank Polska (Note 3) | 1,542 | 1,241 | 1,058 |
| Profit/loss after tax from discontinued operations | 1,542 | 1,241 | 1,058 |
b) Gains or losses from entities held for sale
The following are the consolidated summary profit and loss accounts for the business held for sale in Poland:
| | | | | | | | | | | |
| EUR million |
| Condensed consolidated income statements | 2025 | 2024 | 2023 |
| Interest margin | 3,006 | | 2,881 | | 2,611 | |
| Dividend income | 4 | | 4 | | 3 | |
| Investments accounted for using the equity method | 28 | | 24 | | 22 | |
| Net commissions | 685 | | 634 | | 562 | |
| Net trading income | 74 | | 62 | | 68 | |
| Other operating results | (77) | | (109) | | (94) | |
| Total income | 3,720 | | 3,496 | | 3,172 | |
| Administrative expenses, depreciation and amortisation cost | (1,014) | | (885) | | (793) | |
Impairment of financial assets A | (285) | | (508) | | (658) | |
| Other results and provisions | (471) | | (423) | | (267) | |
| Profit before taxes | 1,950 | | 1,680 | | 1,454 | |
| Tax expense | (408) | | (439) | (396) |
| Profit of the year | 1,542 | | 1,241 | | 1,058 | |
A.Of which EUR 144 million correspond to renegotiations or contractual modifications at 31 December 2025 (EUR 334 and 457 million at 31 December 2024 and 2023, respectively).
38. Interest income
Interest and similar income in the consolidated income statement comprises the interest accruing in the year on all financial assets with an implicit or explicit return, calculated by applying the effective interest method, irrespective of measurement at fair value; and the rectifications of income as a result of hedge accounting. Interest is recognised gross, without deducting any tax withheld at source.
The detail of the main interest and similar income items earned in 2025, 2024 and 2023 is as follows:
| | | | | | | | | | | |
| EUR million |
| 2025 | 2024 | 2023 |
| Loans and advances, customers | 70,830 | | 74,900 | | 67,879 | |
| Debt instruments | 15,890 | | 15,431 | | 13,955 | |
Loans and advances, central banks and credit institutions | 7,599 | | 8,195 | | 7,229 | |
Other interestA | 7,391 | | 10,486 | | 12,679 | |
| 101,710 | | 109,012 | | 101,742 | |
A.Mainly include the rectification of income originating from accounting hedges as well as interest on balances in central banks and on demand credit institutions.
Most of the interest and similar income was generated by the Group’s financial assets that are measured either at amortised cost or at fair value through other comprehensive income.
39. Interest expense
Interest expense and similar charges in the consolidated income statement includes the interest accruing in the year on all financial liabilities with an implicit or explicit return, including remuneration in kind, calculated by applying the effective interest method, irrespective of measurement at fair value; the rectifications of cost as a result of hedge accounting; and the interest cost attributable to provisions recorded for pensions.
The detail of the main items of interest expense and similar charges accrued in 2025, 2024 and 2023 is as follows:
| | | | | | | | | | | |
| EUR million |
| 2025 | 2024 | 2023 |
| Customer deposits | 31,735 | | 35,714 | | 32,457 | |
| Debt securities issued and subordinated liabilities | 15,066 | | 14,612 | | 12,671 | |
| Marketable debt securities | 13,580 | | 13,255 | | 11,661 | |
| Subordinated liabilities (note 23) | 1,486 | | 1,357 | | 1,010 | |
Central banks and credit institution deposits | 8,151 | | 9,381 | | 9,360 | |
| Lease Liabilities | 107 | | 122 | | 127 | |
| Provisions for pensions (note 25) | 91 | | 105 | | 93 | |
| Other interest expense | 4,212 | | 5,291 | | 6,384 | |
| 59,362 | | 65,225 | | 61,092 | |
Most of the interest expense and similar charges was generated by the Group’s financial liabilities that are measured at amortised cost.
40. Dividend income
Dividend income includes the dividends and payments on equity instruments out of profits generated by investees after the acquisition of the equity interest.
The detail of income from dividends as follows:
| | | | | | | | | | | |
| EUR million |
| 2025 | 2024 | 2023 |
| Dividend income classified as: | | | |
| Financial assets held for trading | 556 | | 521 | | 414 | |
| Non-trading financial assets mandatorily at fair value through profit or loss | 57 | | 71 | | 68 | |
| Financial assets at fair value through other comprehensive income | 102 | | 118 | | 86 | |
| 715 | | 710 | | 568 | |
41. Commission income
Commission income comprises the amount of all fees and commissions accruing in favour of the Group in the year, except those that form an integral part of the effective interest rate on financial instruments.
The detail of fee and commission income is as follows:
| | | | | | | | | | | |
| EUR million |
| 2025 | 2024 | 2023 |
| Coming from collection and payment services | | | |
| Bills | 209 | | 220 | | 232 | |
| Demand accounts | 1,359 | | 1,411 | | 1,372 | |
| Cards | 4,039 | | 4,067 | | 4,146 | |
| Orders | 607 | | 657 | | 656 | |
| Cheques and other | 140 | | 138 | | 128 | |
| 6,354 | | 6,493 | | 6,534 | |
| Coming from non-banking financial products | | | |
| Investment funds | 1,428 | | 1,389 | | 1,037 | |
| Pension funds | 238 | | 194 | | 178 | |
| Insurance | 2,782 | | 2,865 | | 2,669 | |
| 4,448 | | 4,448 | | 3,884 | |
| Coming from Securities services | | | |
| Securities underwriting and placement | 602 | | 586 | | 502 | |
| Securities trading | 654 | | 452 | | 331 | |
| Administration and custody | 402 | | 370 | | 354 | |
| Asset management | 385 | | 254 | | 341 | |
| 2,043 | | 1,662 | | 1,528 | |
| Other | | | |
| Foreign exchange | 848 | | 705 | | 678 | |
| Commitments and financial guarantees | 718 | | 713 | | 621 | |
| Commitment fees | 504 | | 491 | | 497 | |
| Structure Finance | 902 | | 709 | | 551 | |
| Corporate Finance | 243 | | 213 | | 136 | |
| Loans granted | 259 | | 318 | | 259 | |
| Loan Servicing activities | 118 | | 130 | | 45 | |
| Other fees and commissions | 950 | | 952 | | 911 | |
| 4,542 | | 4,231 | | 3,698 | |
| 17,387 | | 16,834 | | 15,644 | |
42. Commission expense
Commission expense shows the amount of all fees and commissions paid or payable by the Group in the year, except those that form an integral part of the effective interest rate on financial instruments.
The detail of commission expense is as follows:
| | | | | | | | | | | |
| EUR million |
| 2025 | 2024 | 2023 |
| Cards | 1,744 | | 1,816 | | 1,858 | |
| By collection and return of effects | 30 | | 30 | | 24 | |
| Financial guarantees and other commitments | 359 | | 323 | | 282 | |
| Brokerages and intermediaries | 130 | | 181 | | 204 | |
| Sales of insurance and funds | 456 | | 453 | | 352 | |
| Other fees and commissions | 1,692 | | 1,655 | | 1,429 | |
| 4,411 | | 4,458 | | 4,149 | |
43. Gains or losses on financial assets and liabilities
The following information is presented below regarding the gains or losses recorded for financial assets or liabilities:
a) Breakdown
The detail, by origin, of Gains/losses on financial assets and liabilities:
| | | | | | | | | | | |
| EUR million |
| 2025 | 2024 | 2023 |
| Gains or losses on financial assets and liabilities not measured at fair value through profit or loss, net | 127 | | (117) | | 96 | |
| Financial assets at amortized cost | (89) | | (190) | | (3) | |
| Other financial assets and liabilities | 216 | | 73 | | 99 | |
| Of which debt instruments | 133 | | 50 | | 51 | |
Gains or losses on financial assets and liabilities held for trading, netA | 1,017 | | 1,344 | | 2,316 | |
| Gains or losses on non-trading financial assets and liabilities mandatory at fair value through profit or loss | 1,106 | | 495 | | 198 | |
Gains or losses on financial assets and liabilities measured at fair value through profit or loss, netA | (307) | | 691 | | (92) | |
| Gains or losses from hedge accounting, net | 12 | | 14 | | 69 | |
| 1,955 | | 2,427 | | 2,587 | |
A.Includes the net result obtained by transactions with debt securities, equity instruments, derivatives and short positions included in this portfolio when the Group jointly manages its risk in these instruments.
As explained in note 44, the above breakdown should be analysed in conjunction with the 'Exchange differences, net': | | | | | | | | | | | |
| EUR million |
| 2025 | 2024 | 2023 |
| Exchange differences, net | 407 | | (216) | | (22) | |
b) Financial assets and liabilities at fair value through profit or loss
The detail of the amount of the asset balances is as follows:
| | | | | | | | | | | |
| EUR million |
| 2025 | 2024 | 2023 |
| Loans and receivables: | 80,218 | | 72,931 | | 51,072 | |
| Central banks | 14,632 | | 12,966 | | 17,717 | |
| Credit institutions | 26,380 | | 27,722 | | 14,520 | |
| Customers | 39,206 | | 32,243 | | 18,835 | |
| Debt instruments | 101,707 | | 85,990 | | 66,079 | |
| Equity instruments | 27,845 | | 21,277 | | 19,125 | |
| Derivatives | 58,355 | | 64,100 | | 56,328 | |
| 268,125 | | 244,298 | | 192,604 | |
Grupo Santander mitigates and reduces this exposure as follows:
•With respect to derivatives, the Group has entered into framework agreements with a large number of credit institutions and customers for the netting-off of asset positions and the provision of collateral for non-payment.
At 31 December 2025 the exposure to credit risk of the derivatives presented in the balance sheet is not significant because they are subject to netting and collateral agreements (see note 51.d).
•Loans and advances to credit institutions and Loans and advances includes reverse repos amounting to EUR 71,129 million at 31 December 2025.
Also, mortgage-backed assets totalled EUR 1,597 million.
•Debt instruments include EUR 80,908 million of Spanish and foreign government securities.
At 31 December 2025 the amount of the change in the year in the fair value of financial assets at fair value through profit or loss attributable to variations in their credit risk (spread) was not material.
The detail of the amount of the liability balances is as follows:
| | | | | | | | | | | |
| EUR million |
| 2025 | 2024 | 2023 |
| Deposits | 106,003 | | 87,374 | | 80,503 | |
| Central banks | 15,471 | | 15,074 | | 9,017 | |
| Credit institutions | 28,482 | | 27,909 | | 19,597 | |
| Customer | 62,050 | | 44,391 | | 51,889 | |
| Marketable debt securities | 11,686 | | 7,554 | | 5,371 | |
| Short positions | 44,015 | | 35,830 | | 26,174 | |
| Derivatives | 51,968 | | 57,753 | | 50,589 | |
| Other financial liabilities | 22 | | — | | — | |
| 213,694 | | 188,511 | | 162,637 | |
At 31 December 2025, the amount of the change in the fair value of financial liabilities at fair value through profit or loss attributable to changes in their credit risk during the year is not material.
In relation to liabilities designated at fair value through profit or loss where it has been determined at initial recognition that the credit risk is recorded in accumulated 'Other comprehensive income' (see 'Statement of recognised income and expense') the amount that the Group would be contractually obliged to pay on maturity of these liabilities at 31 December 2025 is EUR 1,281 million higher than their carrying amount (EUR 1,851 million higher at 31 December 2024 and EUR 866 million higher at 31 December 2023, no significant impact on results as its fair value is covered by hedging operations.
Within Deposits, there are repurchase agreements amounting to EUR 75,562 million at 31 December 2025.
44. Exchange differences, net
Exchange differences shows basically the gains or losses on currency dealings, the differences that arise on translations of monetary items in foreign currencies to the functional currency.
Grupo Santander manages the currencies to which it is exposed together with the arrangement of derivative instruments and, accordingly, the changes in this line item should be analysed together with those recognised under 'Gains/losses on financial assets and liabilities' (see note 43).
45. Other operating income and expenses
Other operating income and Other operating expenses in the consolidated income statements include:
| | | | | | | | | | | |
| EUR million |
| 2025 | 2024 | 2023 |
| Other operating income | 1,583 | | 846 | | 1,137 | |
| Non- financial services | 738 | | 654 | | 752 | |
| Other operating income | 845 | | 192 | | 385 | |
| Other operating expense | (2,429) | | (2,595) | | (3,066) | |
| Non-financial services | (650) | | (498) | | (674) | |
| Other operating expense: | (1,779) | | (2,097) | | (2,392) | |
| Of which, credit institutions deposit guarantee fund and single resolution fund | (478) | | (481) | | (1,083) | |
| (846) | | (1,749) | | (1,929) | |
In the 2025 and 2024 financial years, it was decided that there will not be contribution in Spain to the Single Resolution Fund, as well as a decrease in the contribution to the Deposit Guarantee Fund, by the Single Resolution Board (SRB) and the Deposit Guarantee Fund Management Committee, respectively.
The amount of the Group recognises in relation to income from sub-leases of rights of use is not material.
46. Staff costs
a) Breakdown
The detail of Staff costs is as follows:
| | | | | | | | | | | |
| EUR million |
| 2025 | 2024 | 2023 |
| Wages and salaries | 10,351 | | 10,567 | | 10,042 | |
| Social Security costs | 1,680 | | 1,644 | | 1,576 | |
| Additions to provisions for defined benefit pension plans (note 25) | 41 | | 45 | | 42 | |
| Contributions to defined contribution pension funds | 332 | | 354 | | 307 | |
| Other Staff costs | 1,252 | | 1,241 | | 1,332 | |
| 13,656 | | 13,851 | | 13,299 | |
b) Headcount
The number of employees of Grupo Santander at 31 December 2025, 2024 and 2023 is 198,403, 206,753 and 212,764, respectively. For the years 2025, 2024 and 2023 the average number of employees of the Group is 203,572, 209,371 and 211,135 , respectively, being the average number of employees of Banco Santander, S.A. 23,207, 23,839 and 24,061, of which 17, 15 and 16 are executive directors and Senior management, respectively.
The functional breakdown (final employment), by gender, at 31 December 2025 is as follows:
| | | | | | | | | | | | | | | | | | | | | | | | | | | | | | | | | | | | | | | | | | | | |
| Functional breakdown by gender | | |
| Senior executivesA | Other executivesB | | Other employees |
| Men | Women | Others | Not declared | | Men | Women | Others | Not declared | | Men | Women | Others | Not declared |
| Europe | 918 | | 426 | | — | | — | | | 8,778 | | 5,052 | | — | | 10 | | | 31,404 | | 37,094 | | 3 | | 39 | |
| North America | 181 | | 64 | | — | | — | | | 3,859 | | 2,630 | | — | | 4 | | | 14,555 | | 18,517 | | 2 | | 1 | |
| South America | 284 | | 142 | | — | | — | | | 4,678 | | 3,398 | | — | | 1 | | | 30,472 | | 35,890 | | — | | 1 | |
| 1,383 | 632 | | — | | — | | | 17,315 | 11,080 | | — | | 15 | | | 76,431 | | 91,501 | | 5 | | 41 | |
A.Senior Executives includes employees with job profiles under the following harmonized management levels: Senior Executive VP. Executive VP and VP.
B.Other Executives includes Directors, Mangers, Experts and Branch Managers.
Note: This includes employees related to the Group's business held for sale in Poland.
The labour relations between employees and the various Group companies are governed by the related collective agreements or similar regulations.
The number of Group employees with disabilities at 31 December 2025, 2024 and 2023, was 4,854, 4,828 and 4,701, respectively.
Likewise, the average number of employees of Banco Santander, S.A. with disabilities, equal to or greater than 33%, during 2025 was 419 (435 and 428 employees during 2024 and 2023). At the end of fiscal year 2025, there were 413 employees (432 and 436 employees at 31 December, 2024 and 2023, respectively).
An employee with disabilities is considered to be a person who is recognised by the State or the company in each jurisdiction where the Group operates and that entitles them to receive direct monetary assistance, or other types of aid such as, for example, reduction of their taxes. In the case of Spain, employees with disabilities have been considered to be those with a degree of disabilities greater than or equal to 33%.
c) Share-based payments
The main share-based payments granted by the Group in force at 31 December, 2025, 2024 and 2023 are described below.
i. Bank
The variable remuneration policy for the Bank’s executive directors and certain executive personnel of the Bank and of other Group companies includes Bank share-based payments, the implementation of which requires, in conformity with the law and the Bank’s Bylaws, specific resolutions to be adopted by the general meeting.
Were it necessary or advisable for legal, regulatory or other similar reasons, the delivery mechanisms described below may be adapted in specific cases without altering the maximum number of shares linked to the plan or the essential conditions to which the delivery thereof is subject.
These adaptations may involve replacing the delivery of shares with the delivery of cash amounts of an equal value.
The plans that include share-based payments are as follows: (i) Deferred and Conditional Variable Remuneration Plan; (ii) Deferred Multiyear Objectives Variable Remuneration Plan; (iii) Digital Transformation Award, (iv) Digital Transformation Award 2022, Digital Transformation Award 2023 and (vi) PagoNxt incentive Plan 2024 and 2025 for Santander executives. The characteristics of the plans are set forth below:
| | | | | | | | | | | |
Deferred variable remuneration systems | Description and plan beneficiaries | Conditions | Calculation Base |
(i) Deferred and conditional variable remuneration plan (2015, 2016, 2017, 2018, 2019, 2020, 2021, 2022, 2023, 2024 and 2025) | The purpose of these cycles is to defer a portion of the variable remuneration of the beneficiaries over a period of three years for the sixth cycles, over three or five years for the fifth, seventh, eighth, ninth, tenth and eleventh cycles, and over four or five years for the twelfth cycle, for it to be paid, where appropriate, in cash and in Santander shares. The other portion of the variable remuneration is also to be paid in cash and Santander shares, upon commencement of the cycles, in accordance with the rules set forth below.
Beneficiaries: •Executive directors and certain executives (including senior management) and employees who assume risk, who perform control functions or receive an overall remuneration which puts them on the same remuneration level as executives and employees who assume risks (fifth cycle).
•In the case of the sixth, seventh, eighth, ninth, tenth, eleventh twelfth, thirteenth, fourteenth and fifteenth cycle the beneficiaries are Material Risk Takers (Identified staff) that are not beneficiaries of the Deferred Multiyear Objectives Variable Remuneration Plan.
| For the fifth and sixth cycles (2015 to 2016), the accrual of the deferred compensation is conditioned, in addition to the requirement that the beneficiary remains in the Group's employ, with the exceptions included in the plan regulations on none of the following circumstances existing during the period prior to each delivery, pursuant to the provisions set forth in each case in the plan regulations: •Poor financial performance of the Group. •Breach by the beneficiary of internal regulations, including, in particular, those relating to risks. •Material restatement of the Group's consolidated financial statements, except when it is required pursuant to a change in accounting standards. •Significant changes in the Group’s economic capital or risk profile In the case of the seventh, eighth, ninth, tenth, eleventh, twelfth, thirteenth, fourteenth and fifteenth cycles, the accrual of deferred compensation is conditioned, in addition to the permanence of the beneficiary in the Group, with the exceptions contained in the plan's regulations, to non-occurrence of a poor performance of the entity as a whole or of a specific division or area of the entity or of the exposures generated by the personnel: i.significant failures in risk management by the entity , or by a business unit or risk control unit. ii.the increase suffered by the entity or by a business unit of its capital needs, not foreseen at the time of generation of the exposures. iii.Regulatory sanctions or judicial sentences for events that could be attributable to the unit or the personnel responsible for those. Also, the breach of internal codes of conduct of the entity. iv.Irregular behaviours, whether individual or collective, considering in particular the negative effects derived from the marketing of inappropriate products and the responsibilities of the persons or bodies that made those decisions. | Fifth cycle (2015): •Executive directors and members of the Identified Staff with total variable remuneration higher than 2.6 million euros: 40% paid immediately and 60% deferred over 5 years deferral period. •Division managers, country heads (of countries which represent at least 1% of Group's economic capital), other executives of the Group with a similar profile and members of the Identified Staff with total variable remuneration between 1.7 million euros (1.8 million in fourth cycle) and 2.6 million euros: 50% paid immediately and 50% deferred over 5 years (fifth cycle) •Other beneficiaries: 60% paid immediately and 40% deferred over 3 years.
Sixth cycle (2016): •60% of bonus will be paid immediately and 40% deferred over a three year period.
Seventh, eighth, ninth, tenth and eleventh cycle (2017, 2018, 2019, 2020 and 2021): •Beneficiaries of these plans with target total variable remuneration higher or equal to 2.7 million euros: 40% paid immediately and 60% deferred over 5 years •Beneficiaries of these plans with target total variable remuneration between 1.7 million euros and 2.7 million euros: 50% paid immediately and 50%paid over 5 years •Other beneficiaries of these plans: 60% paid immediately and 40% deferred over 3 years.
Twelfth (2022), thirteenth (2023),fourteenth (2024) and fifteenth (2025) cycle: •Beneficiaries of these plans with target total variable remuneration higher or equal to 2.7 million euros: 40% paid immediately and 60% deferred over 5 years •Beneficiaries of these plans with target total variable remuneration between 1.7 million euros and 2.7 million euros: 50% paid immediately and 50% paid over 5 years •Other beneficiaries of these plans: 60% paid immediately and 40% deferred over 4 years.
T
|
| | | | | | | | | | | |
Deferred variable remuneration systems | Description and plan beneficiaries | Conditions | Calculation Base |
(ii)Deferred Multiyear Objectives Variable Remuneration Plan (2016, 2017, 2018, 2019, 2020, 2021, 2022, 2023, 2024 and 2025) | The aim is simplifying the remuneration structure, improving the ex ante risk adjustment and increasing the impact of the long-term objectives on the Group’s most relevant roles. The purpose of these cycles is to defer a portion of the variable remuneration of the beneficiaries over a period of three or five years (four or five years for the seventh cycle) for it to be paid, where appropriate, in cash and in Santander shares; the other portion of the variable remuneration is also to be paid in cash and Santander shares (regarding the instruments part, executive directors in the seventh cycle have the opportunity to choose all in share options or half in share options and half in shares), upon commencement of the cycles, in accordance with the rules set forth below. The accrual of the last third of the deferral (in the case of 3 years deferral), the last 2 fourths (in the case of 4 years deferral) and the last three fifths (in the case of 5 years deferral) is also subject to long-term objectives.
Beneficiaries Executive directors, senior management and certain executives of the Group’s first lines of responsibility.
| In 2016 the accrual is conditioned, in addition to the permanence of the beneficiary in the Group, with the exceptions contained in the plan’s regulations, to non-occurrence of the following circumstances during the period prior to each of the deliveries in the terms set forth in each case in the plan’s regulations: i.Poor performance of the Group. ii.Breach by the beneficiary of the internal regulations, including in particular that relating to risks. iii.Material restatement of the Group’s consolidated financial statements, except when appropriate under a change in accounting regulations. iv.Significant changes in the Group’s economic capital or risk profile. In 2017, 2018, 2019, 2020 and 2021 the accrual is conditioned, in addition to the beneficiary' permanence in the Group, with the exceptions contained in the plan’s regulations, to the non-occurrence of poor financial performance from the entity as a whole or of a specific division or area thereof or of the exposures generated by the personnel, taking into account the following factors: v.Significant failures in risk management committed by the entity, or by a business unit or risk control unit. vi.the increase suffered by the entity or by a business unit of its capital needs, not foreseen at the time of generation of the exposures. vii.Regulatory sanctions or court rulings for events that could be attributable to the unit or the personnel responsible for those. Also, the breach of internal codes of conduct of the entity. viii.Irregular behaviours, whether individual or collective, considering in particular negative effects derived from the marketing of inappropriate products and responsibilities of persons or bodies that made those decisions. Paid half in cash and half in shares. In the seventh cycle, and only for executive directors: half in cash and 25% in share options and 25% in shares (unless the director chooses to receive options only). The maximum number of shares to be delivered is calculated by taking into account the weighted average daily volume of weighted average prices for the fifteen trading sessions prior to the previous Friday (excluding) on the date on which the board decides the bonus for the Executive directors of the Bank. In the eighth cycle, and for all Identified Staff: half in cash and 25% in shares and 25% in share options, or half in cash and half in shares, according to each executive´s choice.
In the ninth and tenth cycle, half in cash and half in shares.
| First cycle (2016): •Executive directors and members of the Identified Staff with total variable remuneration higher than or equal to 2.7 million euros: 40% paid immediately and 60% deferred over a 5 year period. •Senior managers, country heads of countries representing at least 1% of the Group´s capital and other members of the identified staff whose total variable remuneration is between 1.7 million and 2.7 million euros: 50% paid immediately and 50% deferred over a 5 year period. •Other beneficiaries: 60% paid immediately and 40% deferred over a 3 year period.
The second, third, fourth, fifth and sixth cycles (2017, 2018, 2019,2020 and 2021 respectively) are under the aforementioned deferral rules, except that the variable remuneration considered is the target for each executive and not the actual award.
In 2016 the metrics for the deferred portion subject to long-term objectives (last third or last three fifths, respectively, for the cases of three years and five years deferrals) are: •Earnings per share (EPS) growth in 2018 over 2015. •Relative Total Shareholder Return (TSR) in the 2016-2018 period measured against a group of credit institutions. •Compliance with the fully-loaded common equity tier 1 ('CET1') ratio target for financial year 2018. •Compliance with Grupo Santander’s underlying return on risk-weighted assets ('RoRWA') growth target for financial year 2018 compared to financial year 2015.
In the second, third, fourth, fifth and sixth cycle (2017, 2018, 2019, 2020 and 2021) the metrics for the deferred portion subject to long-term objectives (last third or last three fifths, respectively, for the cases of three years and five years deferrals) are: •EPS growth in 2019, 2020, 2021, 2022 and 2023 (over 2016, 2017, 2018, 2019 and 2020, for each respective cycle) •Relative Total Shareholder Return (TSR) measured against a group of 17 credit institutions (second and third cycles) in the periods 2017-2019 and 2018-2019, respectively, and against a group of 9 entities (fourth, fifth and sixth cycle) for the 2019-2021, 2020-2022 and 2010-2023 period. •Compliance with the fully-loaded common equity tier 1 ('CET1') ratio target for financial years 2019, 2020, 2021,2022 and 2023, respectively.
In the seventh (2022), eighth cycle (2023), ninth (2025) and tenth cycle (2025), the metrics for the deferred portion subject to long-term objectives (two last fourths and last three fifths, for the cases of four years and five years deferrals) are: •Banco Santander's consolidated Return on tangible equity (RoTE) target in 2024 (7th cycle), 2025 (8th cycle), 2026 (9th cycle) and 2027 (10th cycle). •Relative Total Shareholder Return (TSR) measured against a group of 9 credit institutions for the period 2022-2024 (7th cycle), 2023-2025 (8th cycle), 2024-2026 (9th cycle) and 2025-2027 (10th cycle). •Progress level in the public targets of our Sustainability agenda. |
| | | | | | | | | | | |
Deferred variable remuneration systems | Description and plan beneficiaries | Conditions | Calculation Base |
| (iii) Digital Transformation Award (2019, 2020 and 2021) | The 2019, 2020 and 2021 Digital Transformation Incentive (the 'Digital Incentive') is a variable remuneration system that includes the delivery of Santander shares and share options.
The aim of the Digital Incentive is to attract and retain the critical skill sets to support and accelerate the digital transformation of the Group. By means of this program, the Group offers a remuneration element which is competitive with the remuneration systems offered by other market operators who also compete for digital talent.
The number of beneficiaries is limited to a maximum of 250 employees and the total amount of the incentive is limited to 30 million euros. | The funding of this incentive is subject to meeting important milestones that are aligned with the Group´s digital roadmap and have been approved by the board of directors, taking into account the digitalization strategy of the Group, with the aim of becoming the best open, responsible global financial services platform.
Performance of 2019 incentive was measured based on achievement of the following milestones: (i) Launch of a Global Trade Services (GTS) platform; (ii) launch of a Global Merchant Services (GMS) platform; (iii) migration of our fully digital bank, OpenBank, to a 'next generation' platform and launch in 3 markets; (iv) extension of SuperDigital in Brazil to at least one other country; (v) and launch of our international payments app based on blockchain Pago FX to non-Santander customers.
The milestones for the 2020 Digital Transformation Award were: (i) rolling out the global merchant services (GMS) platform in 3 new geographies, enhancing the platform functionality and achieving volume targets for transactions and participating merchants; (ii) doing the commercial rollout of the global trade services (GTS) platform in 8 new geographies, enhancing platform functionality, and achieving volume targets for on-boarded clients and monthly active users; (iii) launching OpenBank in a new market and migrating the retail banking infrastructure to 'new-mode' bank; (iv) launch the global platform SuperDigital in at least 4 countries, driving target active user growth; (v) deploying machine learning across pre-defined markets for 4 priority use cases, rolling out Conversion Rate Optimization (Digital marketing) for at least 40 sales programs, delivering profit targets, and driving reduction of agent handled calls in contact centers; (vi) successfully implementing initiatives related to on-board and identity services, common API (application programming interface) layer, payment hubs, mobile app for SMEs and virtual assistant services; and (vii) launching the PagoFX global platform in at least 4 countries.
The milestones for 2021 were: (i)in relation to Pago Nxt Consumer payment platform: implementation of Superdigital platform in seven countries, acquisition of over 1.5 million active customer base and accelerating growth through B2B (business to business) and B2B2C (business to business to customer) partnerships, acquiring more than 50% of the new customers through these channels, which are more cost-effective; (ii)in relation to Digital Consumer Bank: launching online API for checkout lending in the European Union and completion of controllable items for Openbank launch in USA; (iii)in relation to One Santander strategy: implementation in Europe of One Common Mobile Experience and, specifically, implementation of Europe ONE app for individual customers in at least three of the four countries by December 2021; and be among the three-top rated entities in terms of Mobile NetPromoter Score (Mobile NPS) in at least two of the four countries by December 2021; (iv) In relation to cloud adoption: host 75% of migratable virtual machines on cloud technology (either public cloud or OHE) by December 2021. For these purposes, mainframes, physical servers and servers with non-x86 operating systems will be considered non-migratable.
| The Digital Incentive is structured 50% in Santander shares and 50% in options over Santander shares, taking into account the fair value of the option at the moment in which they are granted. For Material Risk Takers subject to five years deferrals, the Digital Incentive (shares and options over shares) shall be delivered in thirds, on the third, fourth and fifth anniversary from their granting. For Material Risk Takers subject to three years deferrals and employees not subject to deferrals, delivery shall be done on the third anniversary from their granting.
Any delivery of shares, either directly or via exercise of options overs shares, will be subject generally to the Group’s general malus & clawback provisions as described in the Group’s remuneration policy and to the continuity of the beneficiary within the Grupo Santander. In this regard, the board may define specific rules for non-Identified Staff.
Vested share options can be exercised until maturity, with all options lapsing after ten years (for granting the 2019 incentive) and eight years (for granting the 2020 and 2021 incentive).
The total achievement for 2021 Digital Incentive was 77.5% (85% en 2020 and 83% en 2019). |
| | | | | | | | | | | |
| Deferred variable remuneration systems | Description and plan beneficiaries | Conditions | Calculation base |
| (iv) Digital Transformation Award (2022) | The board of directors approved the 2022 Digital Transformation Incentive. It is a variable remuneration scheme splits in two different blocks:
• The first one, with the same mechanism than previous years, that delivers Santander shares and share options if the group hits major milestones on its digital roadmap. This is aimed at a group of up to 250 (is limited to 30 million euros)employees whose functions are deemed essential to Santander’s growth.
• And the second one, which delivers PagoNxt, S.L. RSUs and premium prices options (PPOs), and is aimed at up to 50 employees (and limited to 15 million euros) whose roles are considered key to PagoNxt’s success.
The aim of the Digital Incentive is to attract and retain the critical skill sets to support and accelerate the digital transformation of the Group. By means of this program, the Group offers a remuneration element which is competitive with the remuneration systems offered by other market operators who also compete for digital talent. | Performance of the first block of the incentive shall be measured based on achievement of the following milestones:
i. Edelweiss: Our Santander future retail architecture EDELWEISS will mean moving from our current Core centric banking architecture towards a Customer and Data-Centric Core supported by lean Record Processing engines.
ii. Simplification: Speed up the simplification of our technology platform and business model by Reducing the total number of applications in production and reducing number of products in the regions.
iii. Agile: Agile ways of working enable a better and faster reaction to customers’ needs and is based on a value-driven delivery that increases efficiency by reducing time-to-market and development costs, and increasing quality. People working in Agile are more collaborative, engaged, empowered and creative.
iv. In Digital Consumer Bank: a) To create the BNPL platform connected to at least one merchant in Netherlands and Germany, and to make sure the platform is ready to connect in Spain. b) To support the definition of Openbank US’s IT digital strategy and achieve 2022 milestones in it. c) To have the new leasing platform connected to dealers in Italy. d) To expand the Wabi B2B online business to Germany. To execute the first B2B deal with an Original Equipment Manufacturer or mobility player in at least one country. To expand coches.com business and platform to Portugal.
And in regard to the second block of digital incentive: the consolidation of PagoNxt Core Perimeter.
| The first block of thee Digital Incentive is structured 50% in Santander shares and 50% in options over Santander shares, taking into account the fair value of the option at the moment in which they are granted. For Material Risk Takers subject to five years deferrals, the Digital Incentive (shares and options over shares) shall be delivered in thirds, on the third, fourth and fifth anniversary from their granting. For Material Risk Takers subject to three years deferrals and employees not subject to deferrals, delivery shall be done on the third anniversary from their granting.
Any delivery of shares, either directly or via exercise of options overs shares, will be subject generally to the Group’s general malus & clawback provisions as described in the Group’s remuneration policy and to the continuity of the beneficiary within the Grupo Santander. In this regard, the board may define specific rules for non-Identified Staff.
Vested share options can be exercised until maturity, with all options lapsing after ten years.
The total achievement for 2022 Digital Incentive was 96.5%.
The second block of Digital Incentive is structures in restricted stock units (RSUs) and premium priced Options (PPOs) of PagoNxt S.L. in a percentage determined by the internal category of the beneficiary. The total achievement for 2022 was 100%. |
| | | | | | | | | | | |
| Deferred variable remuneration systems | Description and plan beneficiaries | Conditions | Calculation base |
(v) Digital Transformation Award (2023) | The board of directors approved the 2023 Digital Transformation Incentive. It is a variable remuneration scheme which delivers PagoNxt, S.L. RSUs and premium prices options (PPOs), and is aimed at up to 50 employees (and limited to 15 million euros) whose roles are considered key to PagoNxt’s success.
With this program, the Group offers a remuneration element which is competitive with the remuneration systems offered by other market operators who also compete for digital talent. | And the performance conditions were focus on key digital projects related with PagoNxt's main businesses (Trade, Merchant and Payments) in its core geographies.
| This incentive is structures in restricted stock units (RSUs) and premium priced Options (PPOs) of PagoNxt S.L. in a percentage determined by the internal category of the beneficiary. The average achievement for 2023 was 88%. |
| | | | | | | | | | | |
| Deferred variable remuneration systems | Description and plan beneficiaries | Conditions | Calculation base |
(vi) PagoNxt incentive Plan 2024 and 2025 for Santander executives) | The board of directors approved the PagoNxt incentive Plan 2024 and 2025 Incentive. It is a variable remuneration scheme which delivers PagoNxt, S.L. RSUs, and is aimed at approximately to 50 - 60 employees whose roles are considered key to PagoNxt’s success.
With this program, the Group offers a remuneration element which is competitive with the remuneration systems offered by other market operators who also compete for digital talent. | And the performance conditions were focus on key digital projects related with PagoNxt's main businesses (Trade, Merchant and Payments) in its core geographies.
| This incentive is structures in restricted stock units (RSUs) of PagoNxt S.L. in a percentage determined by the internal category of the beneficiary. The average achievement for 2024 was 77% and 85% in 2025. |
ii. Santander UK plc
The long-term incentive plans on shares of the Bank granted by management of Santander UK plc to its employees are as follows:
| | | | | | | | | | | | | | | | | | | | | | | |
| Number of shares (in thousand) | Exercise price in pounds sterlingA | Year granted | Employee group | Number of personsB | Date of commencement of exercise period | Date of expiry of exercise period |
| Plans outstanding at 01/01/2023 | 29,988 | | | | | | | |
| Options granted (sharesave) | 7,175 | | 2.78 | | 2023 | Employees | 4,752 | | 01/11/23 | 01/11/26 |
| | | | | | 01/11/23 | 01/11/28 |
| Options exercised | (5,980) | | 1.7 | | | | | | |
| Options cancelled (net) or not exercised | (4,044) | | 2.53 | | | | | | |
| Plans outstanding at 31/12/2023 | 27,139 | | | | | | | |
| Options granted (sharesave) | 4,991 | | 3.36 | | 2024 | Employees | 4,107 | | 01/11/24 | 01/11/27 |
| | | | | | 01/11/24 | 01/11/29 |
| Options exercised | (4,004) | | 2.29 | | | | | | |
| Options cancelled (net) or not exercised | (2,437) | | 2.37 | | | | | | |
| Plans outstanding at 31/12/2024 | 25,689 | | | | | | | |
| Options granted (sharesave) | 3,324 | | 6.35 | | 2025 | Employees | 4,637 | | 01/11/25 | 01/11/28 |
| | | | | | | |
| Options exercised | (9,966) | | 1.9 | | | | | | |
| Options cancelled (net) or not exercised | (1,554) | | 2.88 | | | | | | |
| Plans outstanding at 31/12/2025 | 17,493 | | | | | | | |
A.At 31 December, 2025, 2024 and 2023, the euro/pound sterling exchange rate was 1.15, 1.21 and 1.15 , respectively.
B.Number of accounts/contracts. A single employee may have more than one account/contract.
In 2008 the Group launched a voluntary savings scheme for Santander UK employees (Sharesave Scheme) whereby employees who join the scheme see deducted between GBP 5 and GBP 500 from their net monthly pay over a period of three or five years. At the end of the chosen period, the employee may choose between collecting the amount contributed, the interest accrued and a bonus (tax-exempt in the United Kingdom) or exercising options on shares of the Bank in an amount equal to the sum of such three amounts at a fixed price. The exercise price will be the result of reducing by up to 20% the average purchase and sale prices of the Bank shares in the three trading sessions prior to the approval of the scheme by the UK tax authorities (HMRC). This approval must be received within 21 to 41 days following the publication of the Group’s results for the first half of the year. This scheme was approved by the board of directors, at the proposal of the appointments and remuneration committee, and, since it involved the delivery of Bank shares, its application was authorized by the Annual General Meeting held on June 21, 2008. Also, the scheme was authorized by the UK tax authorities (HMRC) and commenced in September 2008. In subsequent years, at the Annual General Meetings held on June 19, 2009, June 11, 2010, June 17, 2011, March 30, 2012, March 22, 2013, March 28, 2014, March 27, 2015, March 18, 2016, April 7, 2017, March 23, 2018, April 12, 2019, April 3, 2020 and March 26, 2021, respectively, the shareholders approved the application of schemes previously approved by the board and with similar features to the scheme approved in 2008.
iii. Fair value
The fair value of the performance share plans was calculated as follows:
a) Deferred variable compensation plan linked to multi-year objectives 2023, 2024 and 2025:
The Group calculates at the grant date the fair value of the plan based on the valuation report of an independent expert, Willis Towers Watson. According to the design of the plan for 2023, 2024 and 2025 and the levels of achievement of similar plans in comparable entities, it has been considered that the fair value is 70%.
b) Santander UK sharesave plans:
The fair value of each option at the date of grant is estimated using an analytical model that also reflects the correlation between EUR and GBP. This model uses assumptions on the share price, the EUR/GBP FX rate, the EUR/GBP risk-free interest rate, dividend yields, the expected volatilities of both the underlying shares and EUR/GBP for the expected lives of options granted. The weighted average grant-date fair value of options granted during the year was GBP 0.44 (GBP 0.23 and GBP 0.33 reported in 2024 and 2023, respectively).
47. Other general administrative expenses
a) Breakdown
The detail of Other general administrative expenses is as follows:
| | | | | | | | | | | |
| EUR million |
| 2025 | 2024 | 2023 |
| Technology and systems | 2,298 | | 2,539 | | 2,389 | |
Property, fixtures and supplies
(note 2.k) | 803 | | 797 | | 774 | |
| Technical reports | 712 | | 724 | | 796 | |
| Advertising | 517 | | 512 | | 574 | |
| Taxes other than income tax | 543 | | 554 | | 568 | |
| Communications | 367 | | 387 | | 400 | |
| Surveillance and cash courier services | 314 | | 337 | | 325 | |
| Per diems and travel expenses | 250 | | 232 | | 213 | |
| Insurance premiums | 86 | | 95 | | 88 | |
| Other administrative expenses | 2,055 | | 2,008 | | 2,172 | |
| 7,945 | | 8,185 | | 8,299 | |
The payments associated with short-term leases (leases less than or equal to 12 months) and leases of low-value assets, that the Group recognises as an expense in the income statement is not material.
b) Technical reports and other
Technical reports include the fees from the various Group companies (detailed in the accompanying appendices) for the services provided by their respective auditors, with the following detail:
| | | | | | | | | | | |
| EUR million |
| 2025 | 2024 | 2023 |
| Audit | 118.5 | | 122.3 | | 117.5 | |
| Audit-related services | 15.0 | | 13.6 | | 8.6 | |
| Tax services | 0.1 | | 0.9 | | 1.6 | |
| All other | 7.1 | | 7.4 | | 5.9 | |
| Total | 140.7 | | 144.2 | | 133.6 | |
Additionally, the firm BDO has performed audit and audit-related services totalling EUR 1.9 million.
The audit services and main non-audit services included for each item in the above breakdown are detailed as follows:
•Audit services: audit of the individual and consolidated financial statements of Banco Santander and its subsidiaries (of which PwC or another network firm is the external auditor); audit of the interim consolidated financial statements of Banco Santander; integrated audits prepared in order to file the Form 20-F with the SEC and the internal control audits (SOx) for required Group's entities; limited reviews of financial statements; and regulatory reports required to the external auditors regarding several Grupo Santander entities.
•Audit-related services: issuance of comfort letters, verification services of financial and non-financial information required by regulators, and other reviews of documentation to be submitted to domestic or foreign authorities that, due to their nature, the external auditor typically provides.
•Tax services: tax compliance and advisory services provided to Group companies outside Spain, which have no direct effect on the audited financial statements and are permitted in accordance with the applicable independence regulations.
•Other services: agreed-upon procedure reports, assurance reports and special reports performed under the accepted profession's standards; as well as other reports required by the regulators.
The 'Audit' heading includes the fees for the year's audit, regardless of the date the audit was completed. Any subsequent adjustments, which are not significant, are shown in this note for each year for comparison purposes. The fees corresponding to the rest of the services are shown by reference to when the audit committee approved them.
The services commissioned from the Group's auditors meet the independence requirements under applicable European and Spanish law, the SEC rules and the Public Company Accounting Oversight Board (PCAOB), applicable to the Group, and did not involve in any case the performance of any work that is incompatible with the auditor's role.
Lastly, the Group commissioned services from audit firms other than PwC amounting to EUR 155.9 million in 2025 (EUR 206.2 million and EUR 174.1 million in 2024 and 2023, respectively).
c) Number of branches
The number of offices according to their geographical location at 31 December 2025, 2024 and 2023 is as follows:
| | | | | | | | | | | |
| Number of branches | |
| Group |
| 2025 | 2024 | 2023 |
Spain A | 1,674 | | 1,877 | | 1,924 | |
| Group | 5,450 | | 6,209 | | 6,594 | |
| 7,124 | | 8,086 | | 8,518 | |
A. Includes branches in Spain of the Digital Consumer Bank business.Note: Branches corresponding to the Group's business held for sale in Poland are included.
Note: The figures for 2025 and 2024 include CartaSur points of sale and banking service points (PAB) in Argentina and exclude operational points that do not provide customer service in Colombia.
48. Gains or losses on non financial assets, net
The detail of Gains/ (losses) on disposal of assets not classified as non-current assets held for sale is as follows:
| | | | | | | | | | | |
| EUR million |
| 2025 | 2024 | 2023 |
| Gains | | | |
| Tangible and intangible assets | 65 | | 48 | | 53 | |
| Investments | 17 | | 360 | | 285 | |
| 82 | | 408 | | 338 | |
| Losses | | | |
| Tangible and intangible assets | (41) | | (36) | | (26) | |
| Investments | (41) | | (4) | | — | |
| (82) | | (40) | | (26) | |
| — | | 368 | | 312 | |
49. Gains or losses on non-current assets held for sale not classified as discontinued operations
The detail of Gains/(losses) on non-current assets held for sale not classified as discontinued operations is as follows:
| | | | | | | | | | | |
| EUR million |
| Net balance | 2025 | 2024 | 2023 |
| Tangible assets | (6) | | (24) | | (20) | |
Impairment (Note 12) | (72) | | (92) | | (51) | |
Gain (loss) on sale (Note 12) | 66 | | 68 | | 31 | |
| Other gains and other losses | 232 | | (3) | | — | |
Caceis (Note 3) | 231 | | — | | — | |
| 226 | (27) | (20) |
50. Fair value of financial instruments
a) Details
The following table summarises the fair values, at the end of each of the years indicated, of the financial assets and liabilities listed below, classified according to the different valuation methodologies used by the Group to determine their fair value:
| | | | | | | | | | | | | | | | | | | | | | | | | | | | | |
| EUR million |
| 2025 | 2024 | 2023 |
| Published
price
quotations
in active
markets
(level 1) | Internal
Models
(level 2
and 3) | Total | Published
price
quotations
in active
markets
(level 1) | Internal
Models
(level 2
and 3) | Total | Published
price
quotations
in active
markets
(level 1) | Internal
Models
(level 2
and 3) | Total |
| Financial assets held for trading | 106,560 | | 145,758 | | 252,318 | | 88,147 | | 142,106 | | 230,253 | | 67,842 | | 109,079 | | 176,921 | |
| Non-trading financial assets mandatorily at fair value through profit or loss | 2,407 | | 5,354 | | 7,761 | | 2,037 | | 4,093 | | 6,130 | | 1,765 | | 4,145 | | 5,910 | |
| Financial assets designated at fair value through profit or loss | 2,860 | | 5,186 | | 8,046 | | 2,744 | | 5,171 | | 7,915 | | 2,746 | | 7,027 | | 9,773 | |
| Financial assets at fair value through other comprehensive income | 52,589 | | 22,023 | | 74,612 | | 67,680 | | 22,218 | | 89,898 | | 64,631 | | 18,677 | | 83,308 | |
| Hedging derivatives (assets) | — | | 3,931 | | 3,931 | | — | | 5,672 | | 5,672 | | — | | 5,297 | | 5,297 | |
| Financial liabilities held for trading | 37,192 | | 134,354 | | 171,546 | | 29,974 | | 122,177 | | 152,151 | | 20,298 | | 101,972 | | 122,270 | |
Financial liabilities designated at fair value through profit or loss | — | | 42,148 | | 42,148 | | — | | 36,360 | | 36,360 | | 25 | | 40,342 | | 40,367 | |
| Hedging derivatives (liabilities) | — | | 4,248 | | 4,248 | | — | | 4,752 | | 4,752 | | — | | 7,656 | | 7,656 | |
Liabilities under insurance contracts | — | | 18,737 | | 18,737 | | — | | 17,829 | | 17,829 | | — | | 17,799 | | 17,799 | |
Grupo Santander has developed a formal process for the systematic valuation and management of financial instruments, which has been implemented worldwide across all the Group’s units. The governance scheme for this process distributes responsibilities between two independent divisions: Treasury (development, marketing and daily management of financial products) and Risk (on a periodic basis, validation of pricing models and daily risk certification of market data, computation of risk metrics, new transaction approval policies, management control of market risk and implementation of fair value adjustment policies).
The approval of new products follows a sequence of steps (request, development, validation, integration in corporate systems and quality assurance) before the product is brought into production. This process ensures that pricing systems have been properly reviewed and are stable before they are used.
The following subsections set forth the most important products and families of derivatives, and the related valuation techniques and inputs, by asset class:
Interest rate and inflation
The fixed income asset class includes basic instruments such as interest rate forwards, interest rate swaps and cross currency swaps, which are valued using the net present value of the estimated future cash flows discounted taking into account basis (swap and cross currency spreads) determined on the basis of the payment frequency and currency of each leg of the derivative. Vanilla options, including caps, floors and swaptions, are priced using the Black-Scholes model, which is one of the benchmark industry models. More exotic derivatives are priced using more complex models which are generally accepted as standard across institutions.
These pricing models are fed with observable market data such as deposit interest rates, futures rates, cross currency swap and constant maturity swap rates, and basis spreads, on the basis of which different yield curves, depending on the payment frequency, and discounting curves are calculated for each currency. In the case of options, implied volatilities are also used as model inputs. These volatilities are observable in the market for cap and floor options and swaptions, and interpolation and extrapolation of volatilities from the quoted ranges are carried out using generally accepted industry models. The pricing of more exotic derivatives may require the use of non-observable data or parameters, such as correlation (among interest rates and cross-asset), mean reversion rates and prepayment rates, which are usually defined from historical data or through calibration.
Inflation-related assets include zero-coupon or year-on-year inflation-linked bonds and swaps, valued with the present value method using forward estimation and discounting. Derivatives on inflation indices are priced using standard or more complex internal models. Valuation inputs of these models consider inflation-linked swap spreads observable in the market and estimations of inflation seasonality, on the basis of which a forward inflation curve is calculated. Also, implied volatilities taken from zero-coupon and year-on-year inflation options are also inputs for the pricing of more complex derivatives.
Equity and foreign exchange
The most important products in these asset classes are forward and futures contracts; they also include vanilla, listed and OTC (Over-The-Counter) derivatives on single underlying assets and baskets of assets. Vanilla options are priced using the standard Black-Scholes model and more exotic derivatives involving forward returns, average performance, or digital, barrier or callable features are priced using generally accepted industry models or internal models, as appropriate. For derivatives on illiquid stocks, hedging takes into account the liquidity constraints in models.
The inputs of equity models consider yield curves, spot prices, dividends, asset funding costs (repo margin spreads), implied volatilities, correlation among equity stocks and indices, and cross-asset correlation. Implied volatilities are obtained from market quotes of European and American-style vanilla call and put options. Various interpolation and extrapolation techniques are used to obtain continuous volatility for illiquid stocks. Dividends are usually estimated for the mid and long term. Correlations are implied, when possible, from market quotes of correlation-dependent products. In all other cases, proxies are used for correlations between benchmark underlyings or correlations are obtained from historical data.
The inputs of foreign exchange models include the yield curve for each currency, the spot foreign exchange rate, the implied volatilities and the correlation among assets of this class. Volatilities are obtained from European call and put options which are quoted in markets as of-the-money, risk reversal or butterfly options. Illiquid currency pairs are usually handled by using the data of the liquid pairs from which the illiquid currency can be derived. For more exotic products, unobservable model parameters may be estimated by fitting to reference prices provided by other non-quoted market sources.
Credit
The most common instrument in this asset class is the credit default swap (CDS), which is used to hedge credit exposure to third parties. In addition, models for first-to-default (FTD), n-to-default (NTD) and single-tranche collateralised debt obligation (CDO) products are also available. These products are valued with standard industry models, which estimate the probability of default of a single issuer (for CDS) or the joint probability of default of more than one issuer for FTD, NTD and CDO.
Valuation inputs are the yield curve, the CDS spread curve and the recovery rate. For indices and important individual issuers, the CDS spread curve is obtained in the market. For less liquid issuers, this spread curve is estimated using proxies or other credit-dependent instruments. Recovery rates are usually set to standard values. For listed single-tranche CDO, the correlation of joint default of several issuers is implied from the market. For FTD, NTD and internal CDO, the correlation is estimated from proxies or historical data when no other option is available.
Valuation adjustment for counterparty risk or default risk
The Credit valuation adjustment (CVA) is a valuation adjustment to over-the-counter (OTC) derivatives as a result of the risk associated with the credit exposure assumed to each counterparty.
The CVA is calculated taking into account potential exposure to each counterparty in each future period. The CVA for a specific counterparty is equal to the sum of the CVA for all the periods. The following inputs are used to calculate the CVA:
•Expected exposure: including for each transaction the mark-to-market (MtM) value plus an add-on for the potential future exposure for each period. Mitigating factors such as collateral and netting agreements are taken into account, as well as a temporary impairment factor for derivatives with interim payments.
•Severity: percentage of final loss assumed in a counterparty credit event/default.
•Probability of default: for cases where there is no market information (the CDS quoted spread curve, etc.), proxies based on companies holding exchange-listed CDS, in the same industry and with the same external rating as the counterparty, are used.
•Discount factor curve.
The Debit Valuation Adjustment (DVA) is a valuation adjustment similar to the CVA but, in this case, it arises as a result of the Group’s own risk assumed by its counterparties in OTC derivatives.
The CVA at 31 December 2025 amounted to EUR 224 million (resulting in a decrease of 17.6% compared to 31 December 2024) and DVA amounted to EUR 285 million (resulting in a decrease of 10.1% compared to 31 December 2024). These decreases are primarily due to the performance of credit markets, with lower spreads compared to December 2024, and secondarily to changes in the composition of certain derivatives portfolios. Furthermore, the observed reduction in CVA is influenced by changes in the calculation models applicable to certain clients.
The CVA at 31 December 2024 amounted to EUR 272 million (resulting in a decrease of 7.2% compared to 31 December 2023) and DVA amounted to EUR 317 million (resulting in a decrease of 3.9% compared to 31 December 2023). These decreases are mainly due to the declines in the EUR and USD interest rate markets, lower inflation and the movements in credit markets whose spread levels have reduced moderately compared to those of December 2023.
The CVA at 31 December 2023 amounted to EUR 293 million (decrease of 16.5% compared to 31 December 2022) and DVA amounted EUR 330 million (decrease of 9.3% compared to 31 December 2022). These decreases are mainly due to movements in credit markets whose spread levels have reduced moderately compared to those of December 2022, partially offset by the upward movement in interest rates.
In addition, the Group amounts the funding fair value adjustment (FFVA) is calculated by applying future market funding spreads to the expected future funding exposure of any uncollateralised component of the OTC derivative portfolio. This includes the uncollateralised component of collateralised derivatives in addition to derivatives that are fully uncollateralised. The expected future funding exposure is calculated by a simulation methodology, where available. The FFVA impact is not material for the consolidated annual accounts as of 31 December 2025, 2024 and 2023.
During 2025, the Group has continued to apply the criteria for classifying financial instruments within the levels of the fair value hierarchy established to comply with regulatory expectations. These criteria, based on information from the price contributors and real market transactions, represent a significant reduction in the use of expert judgement to determine observability and allow the measurement of the significance of non-observable valuation inputs based on objective criteria.
There has been an increase in instruments classified as Level 3, especially during the last quarter of the year. This increase is due to higher holding volumes of some of these instruments in the portfolio due to new trading activity. No significant reclassifications were detected due to changes in the market observability of the valuation inputs for the remaining positions. The main increases include long-term repo/reverse repo transactions, illiquid equities in non-trading portfolios, and syndicated loans with an HTC&S business model for which there is no observable market price based on the criteria used.
Valuation adjustments due to model risk
The valuation models described above do not involve a significant level of subjectivity, since they can be adjusted and recalibrated, where appropriate, through internal calculation of the fair value and subsequent comparison with the related actively traded price. However, valuation adjustments may be necessary when market quoted prices are not available for comparison purposes.
The sources of risk are associated with uncertain model parameters, illiquid underlying issuers, and poor quality market data or missing risk factors (sometimes the best available option is to use limited models with controllable risk). In these situations, the Group calculates and applies valuation adjustments in accordance with common industry practice. The main sources of model risk are described below:
•In the interest rate markets, the sources of model risk include interest rate indexes correlations, basis spread modelling, the risk of calibrating model parameters and the treatment of near-zero or negative interest rates. Other sources of risk arise from the estimation of market data, such as volatilities or yield curves, whether used for estimation or cash flow discounting purposes.
•In the stock markets, the sources of model risk include forward skew modelling, the impact of stochastic interest rates, correlation and multi-curve modelling. Other sources of risk arise from managing hedges of digital callable and barrier option payments. Also worthy of consideration as sources of risk are the estimation of market data such as dividends and correlation for quanto and composite basket options.
•For specific financial instruments relating to home mortgage loans secured by financial institutions in the UK (which are regulated and partially financed by the Government) and property asset derivatives, the main input is the Halifax House Price Index (HPI). In these cases, risk assumptions include estimations of the future growth and the volatility of the HPI, the mortality rate and the implied credit spreads.
•Inflation markets are exposed to model risk resulting from uncertainty around modelling the correlation structure among various Consumer Price Index (CPI) rates. Another source of risk may arise from the bid-offer spread of inflation-linked swaps.
•The currency markets are exposed to model risk resulting from forward skew modelling and the impact of stochastic interest rate and correlation modelling for multi-asset instruments. Risk may also arise from market data, due to the existence of specific illiquid foreign exchange pairs.
•The most important source of model risk for credit derivatives relates to the estimation of the correlation between the probabilities of default of different underlying issuers. For illiquid underlying issuers, the CDS spread may not be well defined.
Set forth below are the financial instruments at fair value whose measurement was based on internal models (levels 2 and 3) at 31 December 2025, 2024 and 2023:
| | | | | | | | | | | | | | | | | |
| EUR million |
| Fair values calculated
using internal models at | | | |
| 2025A | | | |
| Level 2 | Level 3 | | Valuation techniques | Main assumptions |
| ASSETS | 163,796 | | 18,487 | | | | |
| Financial assets held for trading | 139,293 | | 6,496 | | | | |
Central banksB | 14,191 | | 441 | | | Present value method | Yield curves, FX market prices |
Credit institutionsB | 25,815 | | 152 | | | Present value method | Yield curves, FX market prices |
CustomersB | 27,986 | | 4,592 | | | Present value method | Yield curves, FX market prices |
| Debt and equity instruments | 14,470 | | 340 | | | Present value method | Yield curves, FX market prices |
| Derivatives | 56,831 | | 971 | | | | |
| Swaps | 39,716 | | 551 | | | Present value method, Gaussian CopulaC | Yield curves, FX market prices, HPI, Basis, Liquidity |
| Exchange rate options | 1,332 | | 39 | | | Black-Scholes Model | Yield curves, Volatility surfaces, FX market prices, Liquidity |
| Interest rate options | 1,490 | | 39 | | | Black's Model, multifactorial advanced models interest rate | Yield curves, Volatility surfaces, FX market prices, Liquidity |
Interest rate forwards | 177 | | — | | | Present value method | Yield curves, FX market prices |
| Index and securities options | 439 | | 120 | | | Black's Model, multifactorial advanced models interest rate | Yield curves, Volatility surfaces, FX & EQ market prices, Dividends, Liquidity |
| Other | 13,677 | | 222 | | | Present value method, Advanced stochastic volatility models and other | Yield curves, Volatility surfaces, FX and EQ market prices, Dividends, Correlation, HPI, Credit, Others |
| Hedging derivatives | 3,924 | | 7 | | | | |
| Swaps | 3,690 | | 7 | | | Present value method | Yield curves, FX market prices, Basis |
| Interest rate options | 91 | | — | | | Black's Model | Yield curves, FX market prices, Volatility surfaces |
| Other | 143 | | — | | | Present value method, Advanced stochastic volatility models and other | Yield curves, Volatility surfaces, FX market prices, Credit, Liquidity, Others |
| Non-trading financial assets mandatorily at fair value through profit or loss | 2,465 | | 2,889 | | | | |
| Equity instruments | 899 | | 2,543 | | | Present value method | Market price, Interest rates curves, Dividends and Others |
| Debt securities | 54 | | 175 | | | Present value method | Yield curves |
| Loans and receivables | 1,512 | | 171 | | | Present value method, swap asset model & CDS | Yield curves and Credit curves |
| Financial assets designated at fair value through profit or loss | 5,152 | | 34 | | | | |
| Central banks | — | | — | | | Present value method | Yield curves, FX market prices |
Credit institutions | 413 | | — | | | Present value method | Yield curves, FX market prices, HPI |
| Customers | 4,725 | | 14 | | | Present value method | Yield curves, FX market prices |
| Debt securities | 14 | | 20 | | | Present value method | Yield curves, FX market prices |
| Financial assets at fair value through other comprehensive income | 12,962 | | 9,061 | | | | |
Equity instrumentsC | 19 | | 272 | | | Present value method | Yield curves, Market price, Dividends and Others |
| Debt securities | 6,819 | | 887 | | | Present value method | Yield curves, FX market prices |
Loans and receivablesC | 6,124 | | 7,902 | | | Present value method | Yield curves, FX market prices and Credit curves |
| | | | | | | | | | | | | | | | | |
| EUR million |
| Fair values calculated
using internal models at | | | |
| 2025A | | | |
| Level 2 | Level 3 | | Valuation techniques | Main assumptions |
LIABILITIES | 198,377 | | 1,110 | | | | |
Financial liabilities held for trading | 133,490 | | 864 | | | | |
Central banksB | 12,385 | | — | | | Present value method | FX market prices, Yield curves |
Credit institutionsB | 27,058 | | — | | | Present value method | FX market prices, Yield curves |
| Customers | 36,120 | | — | | | Present value methodC | FX market prices, Yield curves |
| Derivatives | 50,248 | | 864 | | | | |
| Swaps | 33,597 | | 418 | | | Present value method, Gaussian Copula | Yield curves, FX market prices, Basis, Liquidity, HPI |
| Exchange rate options | 903 | | 34 | | | Black's Model, multifactorial advanced models interest rate | Yield curves, Volatility surfaces, FX & EQ market prices, Dividends, Liquidity |
| Forwards on interest rate and variable income | 1,951 | | 95 | | | Black-Scholes Model | Yield curves, Volatility surfaces, FX market prices |
| Index and securities options | 1,094 | | 151 | | | Black-Scholes Model | Yield curves, FX market prices, Liquidity |
| Interest rate and equity futures | 121 | | — | | | Present value method | Yield curves, Volatility surfaces, FX & EQ market prices, Dividends, Correlation, Liquidity, HPI |
| Other | 12,582 | | 166 | | | Present value method, Advanced stochastic volatility models and others | Yield curves, Volatility surfaces, FX & EQ market prices, Dividends, Correlation, HPI, Credit, Others |
| Short positions | 7,679 | | — | | | Present value method | Yield curves ,FX market prices, Equity |
| Hedging derivatives | 4,229 | | 19 | | | | |
SwapsD | 4,191 | | 19 | | | Present value method | Yield curves, FX market prices |
Interest rate options | — | | — | | | Black's Model | Yield curves , Volatility surfaces, FX market prices and Liquidity |
| Other | 38 | | — | | | Present value method, Advanced stochastic volatility models and other | Yield curves , Volatility surfaces, FX market prices, Credit, Liquidity, Other |
| Financial liabilities designated at fair value through profit or loss | 42,148 | | — | | | Present value method | Yield curves, FX market prices |
| Liabilities under insurance contracts | 18,510 | | 227 | | | Present Value Method with actuarial techniques | Mortality tables and interest rate curves |
A.Level 2 internal models use data based on observable market parameters, while level 3 internal models use significant non-observable inputs in market data.
B.Includes mainly temporary acquisitions/disposals of assets with corporate clients and, to a lesser extent, with central banks.
C.Includes mainly syndicated loans under the HTC&S business model.
D.It mainly includes short-term deposits that are managed based on their fair value.
| | | | | | | | | | | | | | | | | | | | | | | |
| EUR million |
| Fair values calculated
using internal models at | | Fair values calculated
using internal models at | | |
| 2024A | | 2023A | | |
| Level 2 | Level 3 | | Level 2 | Level 3 | | Valuation techniques |
| ASSETS | 163,941 | | 15,319 | | | 133,874 | | 10,351 | | | |
| Financial assets held for trading | 138,176 | | 3,930 | | | 106,993 | | 2,086 | | | |
Central banksB | 12,966 | | — | | 17,717 | | — | | | Present value method |
Credit institutionsB | 26,546 | | 769 | | 14,061 | | — | | Present Value method |
CustomersB | 24,602 | | 1,801 | | 11,418 | | 24 | | Present Value method |
| Debt and equity instruments | 11,115 | | 413 | | 8,683 | | 915 | | Present Value method |
| Derivatives | 62,947 | | 947 | | 55,114 | | 1,147 | | |
| Swaps | 47,519 | | 556 | | 44,987 | | 577 | | Present Value method, Gaussian Copula |
| Exchange rate options | 1,583 | | 2 | | 836 | | 9 | | Black-Scholes Model |
| Interest rate options | 1,879 | | 30 | | 2,210 | | 153 | | Black's Model, advanced multifactor interest rate models |
Interest rate forwards | 1,445 | | — | | 33 | | — | | Present Value method |
| Index and securities options | 465 | | 241 | | 126 | | 235 | | Black's Model, advanced multifactor interest rate models |
| Other | 10,056 | | 118 | | 6,922 | | 173 | | Present Value method, Advanced stochastic volatility models and other |
| Hedging derivatives | 5,652 | | 20 | | | 5,297 | | — | | | |
| Swaps | 5,390 | | 20 | | | 4,665 | | — | | | Present Value method |
| Interest rate options | 2 | | — | | 2 | | — | | Black’s Model |
| Other | 260 | | — | | 630 | | — | | Present Value method, Advanced stochastic volatility models and other |
| Non-trading financial assets mandatorily at fair value through profit or loss | 1,505 | | 2,588 | | | 2,050 | | 2,095 | | | |
| Equity instruments | 763 | | 1,841 | | | 815 | | 1,495 | | | Present Value method |
| Debt securities issued | 205 | | 242 | | | 539 | | 313 | | | Present Value method |
| Loans and receivables | 537 | | 505 | | | 696 | | 287 | | | Present Value method, swap asset model & CDS |
| Financial assets designated at fair value through profit or loss | 5,065 | | 106 | | | 6,846 | | 181 | | | |
| Credit institutions | 408 | | — | | | 459 | | — | | | Present Value method |
Customers | 4,590 | | 20 | | | 6,189 | | 31 | | | Present Value method |
| Debt securities | 67 | | 86 | | | 198 | | 150 | | | Present Value method |
| Financial assets at fair value through other comprehensive income | 13,543 | | 8,675 | | | 12,688 | | 5,989 | | | |
| Equity instruments | 5 | | 375 | | | 5 | | 492 | | | Present Value method |
| Debt securities | 9,644 | | 1,047 | | | 9,638 | | 559 | | | Present Value method |
Loans and receivablesC | 3,894 | | 7,253 | | | 3,045 | | 4,938 | | | Present Value method |
| | | | | | | | | | | | | | | | | | | | | | | |
| EUR million |
| Fair values calculated
using internal models at | | Fair values calculated
using internal models at | | |
| 2024A | | 2023A | | |
| Level 2 | Level 3 | | Level 2 | Level 3 | | Valuation techniques |
| LIABILITIES | 179,766 | | 1,352 | | | 166,542 | | 1,227 | | | |
| Financial liabilities held for trading | 121,243 | | 934 | | | 101,103 | | 869 | | | |
Central banksB | 13,300 | | — | | 7,808 | | — | | | Present Value method |
Credit institutionsB | 26,284 | | — | | 17,862 | | — | | | Present Value method |
| Customers | 18,984 | | — | | 19,837 | | — | | | Present Value method |
| Derivatives | 56,205 | | 934 | | 49,380 | | 869 | | | |
| Swaps | 41,283 | | 479 | | 39,395 | | 388 | | | Present Value method, Gaussian Copula |
| Interest rate options | 2,295 | | 79 | | 2,207 | | 139 | | | Black's Model, advanced multifactor interest rate models |
| Exchange rate options | 1,057 | | — | | 549 | | 8 | | | Black-Scholes Model |
| Index and securities options | 1,160 | | 294 | | 466 | | 187 | | | Black's Model, advanced multifactor interest rate models |
Forwards on interest rate and variable income | 1,276 | | — | | 101 | | — | | | Present Value method |
| Other | 9,134 | | 82 | | 6,662 | | 147 | | | Present Value method, Advanced stochastic volatility models and other |
| Short positions | 6,470 | | — | | 6,216 | | — | | | Present Value method |
| Hedging derivatives | 4,740 | | 12 | | | 7,650 | | 6 | | | |
| Swaps | 4,618 | | 12 | | 6,866 | | 6 | | | Present Value method |
| Interest rate options | 3 | | — | | 1 | | — | | | Black’s Model |
| Other | 119 | | — | | 783 | | — | | | Present Value method, Advanced stochastic volatility models and other |
Financial liabilities designated at fair value through profit or lossD | 36,200 | | 160 | | 40,313 | | 29 | | | Present Value method |
Liabilities under insurance contracts | 17,583 | | 246 | | 17,476 | | 323 | | | Present Value method with actuarial techniques |
A.Level 2 internal models use data based on observable market parameters, while level 3 internal models use significant non-observable inputs in market data.
B.Includes mainly temporary acquisitions/disposals of assets with corporate clients and, to a lesser extent, with central banks.
C.Includes mainly syndicated loans under the HTC&S business model.
D.Includes, mainly, short-term deposits that are managed based on their fair value.
b) Financial Instruments (level 3)
Set forth below are the Group’s main financial instruments measured using unobservable market data as significant inputs of the internal models (level 3):
•HTC&S (Held to collect and sale) syndicated loans classified in the fair value category with changes in other comprehensive income, where the cost of liquidity is not directly observable in the market, as well as the prepayment option in favour of the borrower.
•Repos and reverse repos classified as financial assets held for trading, whose valuation uses significant unobservable inputs, mainly associated with credit adjustments, liquidity and certain specific characteristics of the counterparty and the collateral.
•Illiquid equity in non-trading portfolios, classified at fair value through profit or loss and at fair value through equity.
•Instruments in Santander UK’s portfolio (loans, debt securities and derivatives) linked to the House Price Index (HPI). Even if the valuation techniques used for these instruments may be the same as those used to value similar products (present value in the case of loans and debt securities, and the Black-Scholes model for derivatives), the main factors used in the valuation of these instruments are the HPI spot rate, the growth and volatility
thereof, and the mortality rates, which are not always observable in the market and, accordingly, these instruments are considered illiquid.
•Callable interest rate derivatives (Bermudan-style options) where the main unobservable input is mean reversion of interest rates.
•Trading derivatives on interest rates, taking as an underlying asset titling and with the amortization rate (CPR, Conditional prepayment rate) as unobservable main entry.
• Derivatives from trading on inflation in Spain, where volatility is not observable in the market.
•Equity volatility derivatives, specifically indices and equities, where volatility is not observable in the long term.
•Derivatives on long-term interest rate and FX in some units (mainly South America) where for certain underlyings it is not possible to demonstrate observability to these terms.
•Debt instruments referenced to certain illiquid interest rates, for which there is no reasonable market observability.
The measurements obtained using the internal models might have been different if other methods or assumptions had been used with respect to interest rate risk, to credit risk, market risk and foreign currency risk spreads, or to their related correlations and volatilities. Nevertheless, the Bank considers that the fair value of the financial assets and liabilities recognised in the consolidated balance sheet and the gains and losses arising from these financial instruments are reasonable.
The net amount recognised in profit and loss in 2025 arising from models whose significant inputs are unobservable market data (level 3) amounted to EUR 469 profit (EUR 523 million and EUR 404 million profit in 2024 and 2023, respectively).
1.Valuation techniques
The table below shows the effect, at 31 December 2025, 2024 and 2023 on the fair value of the main financial instruments classified as level 3 of a reasonable change in the assumptions used in the valuation. This effect was determined by applying the probable valuation ranges of the main unobservable inputs detailed in the following table:
| | | | | | | | | | | | | | | | | | | | |
| 2025 | | | | | | |
| Portfolio/Instrument | Valuation technique | Main unobservable inputs | Range | Weighted average | Impacts (EUR million) |
| (Level 3) | Unfavourable scenario | Favourable scenario |
Financial assets held for trading | | | | | | |
Loans and advances to customers | | | | | | |
| Repos/Reverse repos | Market proxy | Price / Credit spread | n.a. | n.a. | (10.50) | | 10.50 | |
Debt securities | | | | | | |
| Corporate debt | Discounted Cash Flows | Credit spread | 0% - 10% | 5.10% | (2.24) | | 2.29 | |
| Government debt | Discounted Cash Flows | Discount curve | 0% - 8% | 4.00% | (9.21) | | 9.24 | |
| Others | Discounted Cash Flows | Credit spread | 10% - 90% | 35.50% | (1.32) | | 0.62 | |
Derivatives | | | | | | |
| Cap&Floor | Modelo de Black Scholes | Volatility | (6.50)bps - 6.50bps | 1.00 | bps | (0.38) | | 0.52 | |
| CCS | Discounted Cash Flows | Credit spread | 146.3% - 148.3% | 147.30 | % | (0.01) | | 0.01 | |
| EQ Options | EQ option pricing model | Volatility | 0% - 70% | 40.50 | % | (0.17) | | 0.24 | |
| EQ Options | Local volatility | Volatility | 10% - 90% | 50.00 | % | (18.86) | | 18.86 | |
| Fx Options | Fx option pricing model | Volatility | 0% - 40% | 19.80 | % | (0.5) | | 0.49 | |
| FX Forward | Forward estimation | Swap Rate | 0% - 15% | 8.10 | % | (0.01) | | 0.02 | |
| Inflation Derivatives | Asset Swap model | Inflation Swap Rate | 2% - 8% | 4.90 | % | (0.18) | | 0.17 | |
| IR Options | IR option pricing model | Volatility | 0% - 30% | 14.80 | % | (0.19) | | 0.19 | |
| IR Options | INF option pricing model | Volatility | 0% - 30% | 14.90 | % | (0.63) | | 0.63 | |
| IRS | Others | Others | 5% - n.a. | n.a. | (11.24) | | 8.23 | |
| IRS | Discounted Cash Flows | Credit spread | 19.6% - 127.5% | 50.50 | % | (2.1) | | 0.84 | |
| IRS | Discounted Cash Flows | Inflation Swap Rate | 1.0% - 99.0% | 99.00 | % | — | | 1.41 | |
| Others | Forward estimation | Price | 60bps - 300bps | 179.80bps | (3.48) | | 3.47 | |
| Property derivatives | Option pricing model | Growth rate | (5)% - 5% | 0.00 | % | (2.64) | | 2.64 | |
| Securitisation Swap | Discounted Cash Flows | Constant prepayment rates | 10% - 90% | 50.00 | % | — | | — | |
Financial assets designated at fair value through profit or loss | | | | | | |
Loans and advances to customers | | | | | | |
| Loans | Discounted Cash Flows | Credit spreads | 0.1% - 3% | 1.60 | % | (0.12) | | 0.12 | |
| Mortgage portfolio | Black Scholes model | Growth rate | (5)% - 5% | 0.00 | % | (0.23) | | 0.23 | |
Debt securities | | | | | | |
| Other debt securities | Others | Inflation Swap Rate | 0% - 8% | 4.10 | % | — | | — | |
| | | | | | | | | | | | | | | | | | | | |
| 2025 | | | | | | |
| Portfolio/Instrument | Valuation technique | Main unobservable inputs | Range | Weighted average | Impacts (EUR million) |
| (Level 3) | Unfavourable scenario | Favourable scenario |
Non-trading financial assets mandatorily at fair value through profit or loss | | | | | | |
Debt securities | | | | | | |
| Property securities | Probability weighting | Growth rate | (5)% - 5% | 0.00 | % | (0.11) | | 0.11 | |
Equity instruments | | | | | | |
| Equities | Price Based | Price | 90% - 110% | 100.00 | % | (254.29) | | 254.29 | |
Financial assets at fair value through other comprehensive income | | | | | | |
Loans and advances to customers | | | | | | |
| Loans | Discounted Cash Flows | Credit spread | n.a. | n.a. | (2.33) | | 2.33 | |
| Loans | Discounted Cash Flows | Interest rate curve | 6.1% - 7.2% | 6.60 | % | — | | — | |
| Loans | Discounted Cash Flows | Margin of a reference portfolio | 3% - 7% | 5 | % | (0.25) | | 0.25 | |
| Loans | Present value method | Credit spread | 121.9bps - 174.7 bps | 121.9bps | (1.6) | | — | |
| Loans | Market price | Market price | (0.3)% - 0.1% | (0.30 | %) | (2.70) | | 0.54 | |
Debt securities | | | | | | |
| Mortgage Letters | Discounted Cash Flows | Mortgage Letters | 3.4% - 5.5% | 4.50 | % | — | | — | |
Equity instruments | | | | | | |
| Equities | Price Based | Price | 90% - 110% | 100.00 | % | (27.16) | | 27.16 | |
Financial liabilities held for trading | | | | | | |
Derivatives | | | | | | |
| Cap&Floor | Volatility option model | Volatility | 10% - 90% | 43.80 | % | (0.09) | | 0.07 | |
| FX Options | Volatility option model | Volatility | 10% - 90% | 42.30 | % | (0.33) | | 0.22 | |
| IRS | Discounted Cash Flows | Inflation Swap Rate | 1% - 99% | 50.40 | % | (1.38) | | 1.40 | |
| IRS | Discounted Cash Flows | Credit Spread | 8.4bps - 19.2bps | 10.70bps | (2.42) | | 0.66 | |
| | | | | | | | | | | | | | | | | | | | |
| 2024 | | | | | | |
| Portfolio/Instrument | Valuation technique | Main unobservable inputs | Range | Weighted average | Impacts (EUR million) |
| (Level 3) | Unfavourable scenario | Favourable scenario |
Financial assets held for trading | | | | | | |
Loans and advances to customers | | | | | | |
| Repos/Reverse repos | Other | Long-term repo spread | n.a. | n.a. | (0.05) | | — | |
Debt securities | | | | | | |
| Corporate debt | Discounted Cash Flows | Credit spread | 0% - 10% | 5.10% | (2.24) | | 2.29 | |
| Government debt | Discounted Cash Flows | Discount curve | 0% - 8% | 4.00% | (9.21) | | 9.24 | |
| Others | Discounted Cash Flows | Credit spread | 10% - 90% | 35.50% | (1.32) | | 0.62 | |
Derivatives | | | | | | |
| Cap&Floor | Forward estimation | Interest rate | (2)bps - 2bps | 0.00 | bps | — | | — | |
| CCS | Discounted Cash Flows | Credit spread | 158% - 165% | 161.50 | % | (0.01) | | 0.01 | |
| CDS | Price | Credit spread | 100% - 250% | 178.83 | % | (0.09) | | 0.10 | |
| EQ Options | EQ option pricing model | Volatility | 0% - 70% | 41.25 | % | (0.48) | | 0.69 | |
| EQ Options | Local volatility | Volatility | 10% - 90% | 50.00 | % | (21.54) | | 21.54 | |
| FX Forward | Forward estimation | Swap Rate | 0% - 15% | 8.08 | % | (0.06) | | 0.07 | |
| FX Options | FX option pricing model | Volatility | 0% - 40% | 20.10 | % | (0.65) | | 0.66 | |
| Inflation Derivatives | Asset Swap model | Inflation Swap Rate | 2% - 8% | 4.78 | % | (0.21) | | 0.18 | |
| IR Options | IR option pricing model | Volatility | 0% - 30% | 17.34 | % | (0.16) | | 0.22 | |
| IRS | Others | Others | 5% - n.a. | n.a. | (4.09) | | — | |
| IRS | Discounted Cash Flows | Credit spread | 47.8% - 273.4% | 155.36 | % | (1.91) | | 1.74 | |
| IRS | Discounted Cash Flows | Swap rate | 1% - 99% | 49.58 | % | (2.45) | | 2.41 | |
| Others | Forward estimation | Price | 60bps - 300bps | 181.50bps | (3.00) | | 3.08 | |
| Property derivatives | Option pricing model | Growth rate | (5)% - 5% | 0.00 | % | (3.39) | | 3.39 | |
| Securitisation Swap | Discounted Cash Flows | Constant prepayment rates | 10% - 90% | 50.00 | % | (0.63) | | 0.63 | |
Financial assets designated at fair value through profit or loss | | | | | | |
Loans and advances to customers | | | | | | |
| Loans | Discounted Cash Flows | Credit spreads | 0.1% - 2.0% | 1.05 | % | (0.15) | | 0.15 | |
| Mortgage portfolio | Black Scholes model | Growth rate | (5)% - 5% | 0.00 | % | (0.24) | | 0.24 | |
Debt securities | | | | | | |
| Other debt securities | Others | Inflation Swap Rate | 0% - 8% | 3.96 | % | (3.63) | | 3.55 | |
| | | | | | | | | | | | | | | | | | | | |
| 2024 | | | | | | |
| Portfolio/Instrument | Valuation technique | Main unobservable inputs | Range | Weighted average | Impacts (EUR million) |
| (Level 3) | Unfavourable scenario | Favourable scenario |
Non-trading financial assets mandatorily at fair value through profit or loss | | | | | | |
Debt securities | | | | | | |
| Property securities | Probability weighting | Growth rate | (5)% - 5% | 0.00 | % | (0.24) | | 0.24 | |
Equity instruments | | | | | | |
| Equities | Price Based | Price | 90% - 110% | 100.00 | % | (183.98) | | 183.98 | |
Financial assets at fair value through other comprehensive income | | | | | | |
Loans and advances to customers | | | | | | |
| Loans | Discounted Cash Flows | Credit spread | n.a. | n.a. | (18.61) | | — | |
| Loans | Discounted Cash Flows | Interest rate curve | 3.4% - 6.5% | 4.95 | % | (0.17) | | 0.17 | |
| Loans | Discounted Cash Flows | Margin of a reference portfolio | (1)bps - 1bps | 0bp | (30.36) | | 30.36 | |
| Loans | Forward estimation | Credit spread | 150bps - 232bps | 150bps | (1.96) | | — | |
| Loans | Market price | Market price | (5)% - 20% | 0.01 | % | (4.91) | | 1.23 | |
Debt securities | | | | | | |
| Corporate debt | Discounted Cash Flows | Margin of a reference portfolio | (0.01)% - 0.01% | 0.00 | % | (0.09) | | 0.09 | |
| Mortgage Letters | Discounted Cash Flows | Mortgage Letters | 1.6% - 5.2% | 3.40 | % | — | | — | |
Equity instruments | | | | | | |
| Equities | Price Based | Price | 90% - 110% | 100.00 | % | (37.56) | | 37.56 | |
Financial liabilities held for trading | | | | | | |
Derivatives | | | | | | |
| Cap&Floor | Volatility option model | Volatility | 10% - 90% | 42.20 | % | (0.11) | | 0.07 | |
| FX Options | Volatility option model | Volatility | 10% - 90% | 45.30 | % | (0.03) | | 0.02 | |
| IRS | Discounted Cash Flows | Inflation Swap Rate | 1% - 99% | 47.12 | % | (4.77) | | 4.24 | |
| IRS | Discounted Cash Flows | Credit spread | 34bps - 68bps | 44bps | (4.09) | | 1.65 | |
A.For each instrument, the valuation technique, the unobservable inputs are shown in the 'Main observable inputs' column under probable scenarios, variation range, average value and impact resulting from valuing the position in the established maximum and minimum range.
B.The breakdown of impacts is shown by type of instrument and unobservable inputs.
C.The estimation of the range of variation of the unobservable inputs has been carried out taking into account plausible movements of said parameters depending on the type of instrument.
D.Zero impacts from fully hedged or back-to-back transactions have not been included in this exercise.
| | | | | | | | | | | | | | | | | | | | |
| 2023 | | | | | | |
| Portfolio/Instrument | Valuation technique | Main unobservable inputs | Range | Weighted average | Impacts (EUR million) |
| (Level 3) | Unfavourable scenario | Favourable scenario |
Financial assets held for trading | | | | | | |
Loans and advances to customers | | | | | | |
| Repos/Reverse repos | Other | Long-term repo spread | n.a. | n.a. | (0.05) | | — | |
Debt securities | | | | | | |
| Corporate debt | Discounted Cash Flows | Credit spread | 0% - 10% | 5.06 | % | (4.50) | | 4.61 | |
| Government debt | Discounted Cash Flows | Discount curve | 0% - 8% | 3.99 | % | (8.07) | | 8.02 | |
Derivatives | | | | | | |
| CCS | Forward estimation | Interest rate | (6)bps - 6bps | 0.40 | bps | (0.90) | | 1.03 | |
| CDS | Credit default models | Illiquid credit default spread curves | 100bps - 200bps | 149.14 | bps | (0.14) | | 0.14 | |
| EQ Options | EQ option pricing model | Volatility | 0% - 70% | 41.25 | % | (0.48) | | 0.69 | |
| EQ Options | Local volatility | Volatility | 10% - 90% | 50.00 | % | (21.54) | | 21.54 | |
| FX Options | FX option pricing model | Volatility | 0% - 40% | 20.10 | % | (0.65) | | 0.66 | |
| Inflation Derivatives | Asset Swap model | Inflation Swap Rate | 2% - 8% | 4.78 | % | (0.21) | | 0.18 | |
| IR Options | IR option pricing model | Volatility | 0.0% - 30.0% | 17.34 | % | (0.16) | | 0.22 | |
| IRS | Others | Others | 5% - n.a. | n.a. | (4.09) | | — | |
| IRS | Discounted Cash Flows | Credit spread | 47.8% - 273.4% | 155.36 | % | (1.91) | | 1.74 | |
| IRS | Discounted Cash Flows | Swap rate | 1.0% - 99.0% | 49.58 | % | (2.45) | | 2.41 | |
| IRS | Forward estimation | Interest rate | (5.2)bps - 5.2bps | 0.09 | bps | (0.03) | | 0.03 | |
| IRS | Prepayment modelling | Prepayment rate | 2.5% - 9.0% | 8.92 | % | — | | 0.05 | |
| Property derivatives | Option pricing model | Growth rate | (5)% - 5% | 0.00 | % | (3.39) | | 3.39 | |
| Securitisation Swap | Discounted Cash Flows | Constant prepayment rates | 10.00% - 90.00% | 50.00 | % | (0.63) | | 0.63 | |
| Structured notes | Price based | Price | (10)% - 10% | 0.00 | % | (1.53) | | 1.53 | |
Financial assets designated at fair value through profit or loss | | | | | | |
Loans and advances to customers | | | | | | |
| Loans | Discounted Cash Flows | Credit spreads | 0.1% - 2% | 1.05 | % | (0.15) | | 0.15 | |
| Mortgage portfolio | Black Scholes model | Growth rate | (5)%- 5% | 0.00 | % | (0.24) | | 0.24 | |
Debt securities | | | | | | |
| Other debt securities | Others | Inflation Swap Rate | 0% - 8% | 3.96 | % | (3.63) | | 3.55 | |
| | | | | | | | | | | | | | | | | | | | |
| 2023 | | | | | | |
| Portfolio/Instrument | Valuation technique | Main unobservable inputs | Range | Weighted average | Impacts (EUR million) |
| (Level 3) | Unfavourable scenario | Favourable scenario |
Non-trading financial assets mandatorily at fair value through profit or loss | | | | | | |
Debt securities | | | | | | |
| Property securities | Probability weighting | Growth rate | (5)% - 5% | 0.00 | % | (0.24) | | 0.24 | |
Equity instruments | | | | | | |
| Equities | Price Based | Price | 90% - 110% | 100.00 | % | (183.98) | | 183.98 | |
Financial assets at fair value through other comprehensive income | | | | | | |
Loans and advances to customers | | | | | | |
| Loans | Discounted Cash Flows | Credit spread | n.a. | n.a. | (18.61) | | — | |
| Loans | Discounted Cash Flows | Interest rate curve | 3.4% - 6.5% | 4.95 | % | (0.17) | | 0.17 | |
| Loans | Discounted Cash Flows | Margin of a reference portfolio | (1)bp - 1bp | 0bp | (30.36) | | 30.36 | |
| Loans | Forward estimation | Credit spread | 150.0bps - 232.0bps | 150.00 | bps | (1.96) | | — | |
| Loans | Market price | Market price | (5)% - 20% | 0.01 | % | (4.91) | | 1.23 | |
Debt securities | | | | | | |
| Corporate debt | Discounted Cash Flows | Margin of a reference portfolio | (0.01)% - 0.01% | 0.00 | % | (0.09) | | 0.09 | |
| Government debt | Discounted Cash Flows | Interest rate | 0% - 2% | 0.99 | % | — | | — | |
Equity instruments | | | | | | |
| Equities | Price Based | Price | 90% - 110% | 100.00 | % | (37.56) | | 37.56 | |
Financial liabilities held for trading | | | | | | |
Derivatives | | | | | | |
| Cap&Floor | Volatility option model | Volatility | 10% - 90% | 42.20 | % | (0.11) | | 0.07 | |
| CMS | Discounted Cash Flows | Volatility | 10% - 90% | 47.66 | % | — | | — | |
| FX Options | Volatility option model | Volatility | 10% - 90% | 45.30 | % | (0.03) | | 0.02 | |
| IRS | Discounted Cash Flows | Inflation Swap Rate | 10% - 90% | 39.03 | % | (4.09) | | 1.65 | |
| Swaptions | Volatility option model | Volatility | 10% - 90% | 35.55 | % | (0.21) | | 0.10 | |
A.For each instrument, the valuation technique, the unobservable inputs are shown in the 'Main observable inputs' column under probable scenarios, variation range, average value and impact resulting from valuing the position in the established maximum and minimum range.
B.The breakdown of impacts is shown by type of instrument and unobservable inputs.
C.The estimation of the range of variation of the unobservable inputs has been carried out taking into account plausible movements of said parameters depending on the type of instrument.
D.Zero impacts from fully hedged or back-to-back transactions have not been included in this exercise.
2. Movement of financial instruments classified as Level 3
Lastly, the changes in the financial instruments classified as Level 3 in 2025, 2024 and 2023 were as follows:
| | | | | | | | | | | | | | | | | | | | | | | | | | | | | | | | |
| 01/01/2025 | | Changes | | 31/12/2025 |
| EUR million | Fair value calculated using internal models (Level 3) | | Purchases/
Issuances | Sales/Settlements | Changes in
fair value
recognised
in profit or
loss | Changes in
fair value
recognised
in equity | Level
reclassifications | Other | | Fair value
calculated
using
internal
models
(level 3) |
| Financial assets held for trading | 3,930 | | | 5,353 | | (2,748) | | 57 | | — | | (9) | | (87) | | | 6,496 | |
Central Banks | — | | | 437 | | — | | 4 | | — | | — | | — | | | 441 | |
| Credit entities | 769 | | | 128 | | (744) | | — | | — | | — | | (1) | | | 152 | |
| Customers | 1,801 | | | 4,450 | | (1,711) | | 52 | | — | | 2 | | (2) | | | 4,592 | |
| Debt securities | 413 | | | 110 | | (112) | | (13) | | — | | (21) | | (37) | | | 340 | |
| Trading derivatives | 947 | | | 228 | | (181) | | 14 | | — | | 10 | | (47) | | | 971 | |
| Swaps | 556 | | | 1 | | (81) | | (30) | | — | | (21) | | 126 | | | 551 | |
| Exchange rate options | 2 | | | — | | — | | 5 | | — | | 19 | | 13 | | | 39 | |
| Interest rate options | 30 | | | 6 | | — | | 1 | | — | | 20 | | (18) | | | 39 | |
| Index and securities options | 241 | | | 1 | | (41) | | 37 | | — | | (5) | | (113) | | | 120 | |
| Interest rate futures | — | | | — | | (14) | | — | | — | | (6) | | 20 | | | — | |
| Other | 118 | | | 220 | | (45) | | 1 | | — | | 3 | | (75) | | | 222 | |
| Hedging derivatives (Assets) | 20 | | | — | | — | | (7) | | — | | (4) | | (2) | | | 7 | |
| Swaps | 20 | | | — | | — | | (7) | | — | | (4) | | (2) | | | 7 | |
| Financial assets at fair value through profit or loss | 106 | | | 33 | | (100) | | (5) | | — | | — | | — | | | 34 | |
| Loans and advances to customers | 20 | | | — | | — | | (5) | | — | | — | | (1) | | | 14 | |
| Debt securities | 86 | | | 33 | | (100) | | — | | — | | — | | 1 | | | 20 | |
| Non-trading financial assets mandatorily at fair value through profit or loss | 2,588 | | | 324 | | (191) | | 360 | | — | | (266) | | 74 | | | 2,889 | |
| Customers | 505 | | | — | | — | | (36) | | — | | (266) | | (32) | | | 171 | |
| Debt instruments | 242 | | | 24 | | (40) | | (27) | | — | | — | | (24) | | | 175 | |
| Equity instruments | 1,841 | | | 300 | | (151) | | 423 | | — | | — | | 130 | | | 2,543 | |
| Financial assets at fair value through other comprehensive income | 8,675 | | | 7,635 | | (6,159) | | — | | (73) | | 57 | | (1,074) | | | 9,061 | |
| Loans and advances | 7,253 | | | 7,259 | | (5,621) | | — | | (87) | | 97 | | (999) | | | 7,902 | |
| Debt securities | 1,047 | | | 360 | | (530) | | — | | 16 | | (40) | | 34 | | | 887 | |
| Equity instruments | 375 | | | 16 | | (8) | | — | | (2) | | — | | (109) | | | 272 | |
| TOTAL ASSETS | 15,319 | | | 13,345 | | (9,198) | | 405 | | (73) | | (222) | | (1,089) | | | 18,487 | |
| Financial liabilities held for trading | 934 | | | 160 | | (206) | | (59) | | — | | 16 | | 19 | | | 864 | |
| Trading derivatives | 934 | | | 160 | | (206) | | (59) | | — | | 16 | | 19 | | | 864 | |
| Swaps | 479 | | | 1 | | (88) | | (90) | | — | | 19 | | 97 | | | 418 | |
| Exchange rate options | — | | | — | | (1) | | 2 | | — | | 18 | | 15 | | | 34 | |
| Interest rate options | 79 | | | — | | (25) | | 17 | | — | | (3) | | 27 | | | 95 | |
| Index and securities options | 294 | | | 1 | | (83) | | 6 | | — | | (4) | | (63) | | | 151 | |
| Securities and interest rate futures | — | | | — | | — | | — | | — | | (19) | | 19 | | | — | |
| Others | 82 | | | 158 | | (9) | | 6 | | — | | 5 | | (76) | | | 166 | |
| Hedging derivatives (Liabilities) | 12 | | | — | | (1) | | 14 | | — | | (6) | | — | | | 19 | |
| Swaps | 12 | | | — | | — | | 14 | | — | | (6) | | (1) | | | 19 | |
| Interest rate options | — | | | — | | (1) | | — | | — | | — | | 1 | | | — | |
| Financial liabilities designated at fair value through profit or loss | 160 | | | — | | (49) | | — | | — | | (111) | | — | | | — | |
| Liabilities under insurance contracts | 246 | | | — | | — | | (19) | | — | | — | | — | | | 227 | |
| TOTAL LIABILITIES | 1,352 | | | 160 | | (256) | | (64) | | — | | (101) | | 19 | | | 1,110 | |
| | | | | | | | | | | | | | | | | | | | | | | | | | | | | | | | |
| 01/01/2024 | | Changes | | 31/12/2024 |
| EUR million | Fair value
calculated
using
internal
models
(level 3) | | Purchases
/Issuances | Sales/Settlements | Changes in
fair value
recognized
in profit or
loss | Changes in
fair value
recognized
in equity | Level
reclassifications | Other | | Fair value
calculated
using
internal
models
(level 3) |
| Financial assets held for trading | 2,086 | | | 3,205 | | (813) | | 302 | | — | | (715) | | (135) | | | 3,930 | |
| Credit entities | — | | | 770 | | — | | (1) | | — | | — | | — | | | 769 | |
| Customers | 24 | | | 1,808 | | (24) | | (7) | | — | | — | | — | | | 1,801 | |
| Debt securities | 914 | | | 355 | | (384) | | (39) | | — | | (377) | | (56) | | | 413 | |
| Equity instruments | 1 | | | — | | — | | (1) | | — | | — | | — | | | — | |
| Trading derivatives | 1,147 | | | 272 | | (405) | | 350 | | — | | (338) | | (79) | | | 947 | |
| Swaps | 577 | | | 184 | | (278) | | 186 | | — | | (152) | | 39 | | | 556 | |
| Exchange rate options | 9 | | | — | | (1) | | — | | — | | (6) | | — | | | 2 | |
| Interest rate options | 153 | | | 13 | | (42) | | (20) | | — | | (74) | | — | | | 30 | |
| Index and securities options | 235 | | | 42 | | (44) | | 128 | | — | | (106) | | (14) | | | 241 | |
| Other | 173 | | | 33 | | (40) | | 56 | | — | | — | | (104) | | | 118 | |
| Hedging derivatives (Assets) | — | | | — | | — | | 15 | | — | | (1) | | 6 | | | 20 | |
| Swaps | — | | | — | | — | | 15 | | — | | (1) | | 6 | | | 20 | |
| Financial assets at fair value through profit or loss | 181 | | | 417 | | (300) | | 13 | | — | | (201) | | (4) | | | 106 | |
| Loans and advances to customers | 31 | | | — | | — | | (5) | | — | | (23) | | 17 | | | 20 | |
| Debt securities | 150 | | | 417 | | (300) | | 18 | | — | | (178) | | (21) | | | 86 | |
| Non-trading financial assets mandatorily at fair value through profit or loss | 2,095 | | | 719 | | (349) | | 73 | | — | | 132 | | (82) | | | 2,588 | |
| Customers | 287 | | | 390 | | (128) | | (31) | | — | | 41 | | (54) | | | 505 | |
| Debt instruments | 313 | | | 4 | | (96) | | 10 | | — | | 11 | | — | | | 242 | |
| Equity instruments | 1,495 | | | 325 | | (125) | | 94 | | — | | 80 | | (28) | | | 1,841 | |
| Financial assets at fair value through other comprehensive income | 5,989 | | | 6,707 | | (3,781) | | — | | (136) | | 6 | | (110) | | | 8,675 | |
| Loans and advances | 4,938 | | | 5,962 | | (3,685) | | — | | 43 | | — | | (5) | | | 7,253 | |
| Debt securities | 559 | | | 743 | | (81) | | — | | (74) | | 6 | | (106) | | | 1,047 | |
| Equity instruments | 492 | | | 2 | | (15) | | — | | (105) | | — | | 1 | | | 375 | |
| TOTAL ASSETS | 10,351 | | | 11,048 | | (5,243) | | 403 | | (136) | | (779) | | (325) | | | 15,319 | |
| Financial liabilities held for trading | 869 | | | 472 | | (200) | | (95) | | — | | (266) | | 154 | | | 934 | |
| Trading derivatives | 869 | | | 472 | | (200) | | (95) | | — | | (266) | | 154 | | | 934 | |
| Swaps | 388 | | | 371 | | (20) | | (205) | | — | | (105) | | 50 | | | 479 | |
| Exchange rate options | 8 | | | — | | (5) | | — | | — | | (3) | | — | | | — | |
| Interest rate options | 139 | | | — | | (54) | | 3 | | — | | (10) | | 1 | | | 79 | |
| Index and securities options | 187 | | | 54 | | (14) | | 113 | | — | | (40) | | (6) | | | 294 | |
| Others | 147 | | | 47 | | (107) | | (6) | | — | | (108) | | 109 | | | 82 | |
| Hedging derivatives (Liabilities) | 6 | | | — | | — | | — | | — | | — | | 6 | | | 12 | |
| Swaps | 6 | | | — | | — | | — | | — | | — | | 6 | | | 12 | |
| Financial liabilities designated at fair value through profit or loss | 29 | | | 41 | | (5) | | 1 | | — | | 94 | | — | | | 160 | |
| Liabilities under insurance contracts | 323 | | | — | | — | | (26) | | — | | — | | (51) | | | 246 | |
| TOTAL LIABILITIES | 1,227 | | | 513 | | (205) | | (120) | | — | | (172) | | 109 | | | 1,352 | |
| | | | | | | | | | | | | | | | | | | | | | | | | | | | | | | | |
| 01/01/2023 | | Changes | | 31/12/2023 |
| EUR million | Fair value
calculated
using
internal
models
(level 3) | | Purchases/ Issuances | Sales/Settlements | Changes in
fair value
recognised
in profit or
loss | Changes in
fair value
recognised
in equity | Level
reclassifications | Other | | Fair value
calculated
using
internal
models
(level 3) |
| Financial assets held for trading | 383 | | | 496 | | (149) | | 194 | | — | | 1,162 | | — | | | 2,086 | |
| Customers | — | | | 23 | | — | | 1 | | — | | — | | — | | | 24 | |
| Debt securities | 42 | | | 126 | | (63) | | 30 | | — | | 773 | | 6 | | | 914 | |
| Equity instruments | 1 | | | — | | — | | — | | — | | — | | — | | | 1 | |
| Trading derivatives | 340 | | | 347 | | (86) | | 163 | | — | | 389 | | (6) | | | 1,147 | |
| Swaps | 139 | | | 90 | | (4) | | 179 | | — | | 191 | | (18) | | | 577 | |
| Exchange rate options | 4 | | | 1 | | — | | 4 | | — | | — | | — | | | 9 | |
| Interest rate options | 39 | | | — | | — | | 2 | | — | | 112 | | — | | | 153 | |
| Index and securities options | 48 | | | 132 | | (4) | | (20) | | — | | 76 | | 3 | | | 235 | |
| Other | 110 | | | 124 | | (78) | | (2) | | — | | 10 | | 9 | | | 173 | |
| Financial assets at fair value through profit or loss | 427 | | | 51 | | — | | (21) | | — | | 22 | | (298) | | | 181 | |
| Loans and advances to customers | 5 | | | — | | — | | 4 | | — | | 22 | | — | | | 31 | |
| Debt securities | 422 | | | 51 | | — | | (25) | | — | | — | | (298) | | | 150 | |
| Non-trading financial assets mandatorily at fair value through profit or loss | 1,833 | | | 345 | | (238) | | 107 | | — | | (6) | | 54 | | | 2,095 | |
| Customers | 239 | | | 99 | | (73) | | 13 | | — | | — | | 9 | | | 287 | |
| Debt securities | 325 | | | 38 | | (48) | | (5) | | — | | — | | 3 | | | 313 | |
| Equity instruments | 1,269 | | | 208 | | (117) | | 99 | | — | | (6) | | 42 | | | 1,495 | |
| Financial assets at fair value through other comprehensive income | 5,647 | | | 3,322 | | (3,411) | | — | | (204) | | 231 | | 404 | | | 5,989 | |
| Loans and advances | 4,718 | | | 3,322 | | (3,408) | | — | | 36 | | 160 | | 110 | | | 4,938 | |
| Debt securities | 229 | | | — | | — | | — | | 5 | | 71 | | 254 | | | 559 | |
| Equity instruments | 700 | | | — | | (3) | | — | | (245) | | — | | 40 | | | 492 | |
| TOTAL ASSETS | 8,290 | | | 4,214 | | (3,798) | | 280 | | (204) | | 1,409 | | 160 | | | 10,351 | |
| Financial liabilities held for trading | 415 | | | 276 | | (167) | | (118) | | — | | 476 | | (13) | | | 869 | |
| Trading derivatives | 415 | | | 276 | | (167) | | (118) | | — | | 476 | | (13) | | | 869 | |
| Swaps | 235 | | | 53 | | (83) | | (58) | | — | | 257 | | (16) | | | 388 | |
| Exchange rate options | — | | | 6 | | — | | 2 | | — | | — | | — | | | 8 | |
| Interest rate options | 19 | | | 4 | | (5) | | (16) | | — | | 137 | | — | | | 139 | |
| Index and securities options | 42 | | | 88 | | (13) | | (15) | | — | | 82 | | 3 | | | 187 | |
| Others | 119 | | | 125 | | (66) | | (31) | | — | | — | | — | | | 147 | |
| Hedging derivatives (Liabilities) | 14 | | | — | | — | | (3) | | — | | (5) | | — | | | 6 | |
| Swaps | 14 | | | — | | — | | (3) | | — | | (5) | | — | | | 6 | |
| Financial liabilities designated at fair value through profit or loss | 151 | | | 32 | | (151) | | (3) | | — | | — | | — | | | 29 | |
| Liabilities under insurance contracts | 345 | | | — | | — | | — | | (40) | | — | | 18 | | | 323 | |
| TOTAL LIABILITIES | 925 | | | 308 | | (318) | | (124) | | (40) | | 471 | | 5 | | | 1,227 | |
51. Other disclosures
a) Residual maturity periods
The detail, by maturity, of the balances of certain items in the consolidated balance sheet at 31 December 2025, 2024 and 2023 is presented below:
| | | | | | | | | | | | | | | | | | | | | | | |
| 31 December 2025 |
| EUR million |
| On demand | Within 3 months | 3 to 12 months | 1 to 3 years | 3 to 5 years | More than 5 years | Total |
| Assets | | | | | | | |
| Cash, cash balances at Central Banks and other deposits on demand | 152,281 | | | | | | | 152,281 | |
| Financial assets at fair value through other comprehensive income | — | | 12,721 | | 8,593 | | 14,012 | | 8,315 | | 28,690 | | 72,331 | |
| Debt securities | — | | 10,677 | | 7,631 | | 12,139 | | 6,619 | | 21,239 | | 58,305 | |
| Loans and advances | — | | 2,044 | | 962 | | 1,873 | | 1,696 | | 7,451 | | 14,026 | |
| Credits institutions | — | | — | | 111 | | 3 | | 5 | | 1,001 | | 1,120 | |
| Customers | — | | 2,044 | | 851 | | 1,870 | | 1,691 | | 6,450 | | 12,906 | |
Financial assets
at amortized cost | 40,174 | | 213,109 | | 173,400 | | 208,743 | | 163,374 | | 403,889 | | 1,202,689 | |
| Debt securities | — | | 8,547 | | 9,312 | | 25,469 | | 17,474 | | 79,212 | | 140,014 | |
| Loans and advances | 40,174 | | 204,562 | | 164,088 | | 183,274 | | 145,900 | | 324,677 | | 1,062,675 | |
| Central banks | — | | 14,782 | | — | | — | | 1,134 | | 70 | | 15,986 | |
| Credits institutions | 4,577 | | 26,620 | | 10,564 | | 5,594 | | 1,198 | | 12,960 | | 61,513 | |
| Customers | 35,597 | | 163,160 | | 153,524 | | 177,680 | | 143,568 | | 311,647 | | 985,176 | |
| 192,455 | | 225,830 | | 181,993 | | 222,755 | | 171,689 | | 432,579 | | 1,427,301 | |
| Liabilities | | | | | | | |
| Financial liabilities at amortized cost | 700,717 | | 271,366 | | 147,951 | | 132,783 | | 72,048 | | 96,319 | | 1,421,184 | |
| Deposits | 688,927 | | 223,636 | | 96,132 | | 37,030 | | 9,216 | | 17,443 | | 1,072,384 | |
| Central banks | 857 | | 8,550 | | 4,615 | | 2,892 | | — | | 1,628 | | 18,542 | |
| Credit institutions | 6,342 | | 34,993 | | 11,677 | | 12,197 | | 1,845 | | 7,638 | | 74,692 | |
| Customer deposits | 681,728 | | 180,093 | | 79,840 | | 21,941 | | 7,371 | | 8,177 | | 979,150 | |
Marketable debt securitiesA | — | | 38,875 | | 48,971 | | 94,735 | | 62,275 | | 67,848 | | 312,704 | |
| Other financial liabilities | 11,790 | | 8,855 | | 2,848 | | 1,018 | | 557 | | 11,028 | | 36,096 | |
| 700,717 | | 271,366 | | 147,951 | | 132,783 | | 72,048 | | 96,319 | | 1,421,184 | |
| Difference (assets less liabilities) | (508,262) | | (45,536) | | 34,042 | | 89,972 | | 99,641 | | 336,260 | | 6,117 | |
A.Includes promissory notes, certificates of deposit and other short-term debt issues.
See breakdown by type of debt (subordinated debt, senior unsecured debt, senior secured debt, notes and other securities) (see note 22).
| | | | | | | | | | | | | | | | | | | | | | | |
| 31 December 2024 |
| EUR million |
| On demand | Within 3 months | 3 to 12 months | 1 to 3 years | 3 to 5 years | More than 5 years | Total |
| Assets | | | | | | | |
| Cash, cash balances at Central Banks and other deposits on demand | 192,208 | | — | | — | | — | | — | | — | | 192,208 | |
| Financial assets at fair value through other comprehensive income | — | | 13,401 | | 9,153 | | 23,902 | | 8,905 | | 32,344 | | 87,705 | |
| Debt securities | — | | 11,072 | | 8,449 | | 22,137 | | 7,623 | | 27,277 | | 76,558 | |
| Loans and advances | — | | 2,329 | | 704 | | 1,765 | | 1,282 | | 5,067 | | 11,147 | |
| Credits institutions | — | | 36 | | — | | 98 | | 6 | | 223 | | 363 | |
| Customers | — | | 2,293 | | 704 | | 1,667 | | 1,276 | | 4,844 | | 10,784 | |
Financial assets
at amortized cost | 41,652 | | 208,565 | | 167,974 | | 220,871 | | 176,710 | | 387,935 | | 1,203,707 | |
| Debt securities | — | | 9,628 | | 14,041 | | 17,071 | | 22,705 | | 57,504 | | 120,949 | |
| Loans and advances | 41,652 | | 198,937 | | 153,933 | | 203,800 | | 154,005 | | 330,431 | | 1,082,758 | |
| Central banks | — | | 15,067 | | — | | — | | — | | 1,112 | | 16,179 | |
| Credits institutions | 6,208 | | 23,550 | | 4,166 | | 5,760 | | 1,843 | | 14,010 | | 55,537 | |
| Customers | 35,444 | | 160,320 | | 149,767 | | 198,040 | | 152,162 | | 315,309 | | 1,011,042 | |
| 233,860 | | 221,966 | | 177,127 | | 244,773 | | 185,615 | | 420,279 | | 1,483,620 | |
| Liabilities | | | | | | | |
Financial liabilities
at amortized cost | 720,659 | | 256,651 | | 171,362 | | 155,620 | | 89,229 | | 90,801 | | 1,484,322 | |
| Deposits | 707,418 | | 213,220 | | 121,914 | | 46,431 | | 21,510 | | 15,946 | | 1,126,439 | |
| Central banks | 17 | | 9,063 | | 11,022 | | 4,772 | | — | | 8 | | 24,882 | |
| Credit institutions | 13,948 | | 27,149 | | 19,300 | | 15,655 | | 6,477 | | 7,483 | | 90,012 | |
| Customer deposits | 693,453 | | 177,008 | | 91,592 | | 26,004 | | 15,033 | | 8,455 | | 1,011,545 | |
Marketable debt
securitiesA | — | | 35,570 | | 47,977 | | 100,451 | | 60,128 | | 73,841 | | 317,967 | |
| Other financial liabilities | 13,241 | | 7,861 | | 1,471 | | 8,738 | | 7,591 | | 1,014 | | 39,916 | |
| 720,659 | | 256,651 | | 171,362 | | 155,620 | | 89,229 | | 90,801 | | 1,484,322 | |
| Difference (assets less liabilities) | (486,799) | | (34,685) | | 5,765 | | 89,153 | | 96,386 | | 329,478 | | (702) | |
A.Includes promissory notes, certificates of deposit and other short-term debt issues.
| | | | | | | | | | | | | | | | | | | | | | | |
| 31 December 2023 |
| EUR million |
| On demand | Within 3 months | 3 to 12 months | 1 to 3 years | 3 to 5 years | More than 5 years | Total |
| Assets | | | | | | | |
| Cash, cash balances at Central Banks and other deposits on demand | 220,342 | | — | | — | | — | | — | | — | | 220,342 | |
| Financial assets at fair value through other comprehensive income | — | | 13,544 | | 9,234 | | 19,372 | | 14,162 | | 25,235 | | 81,547 | |
| Debt securities | — | | 13,078 | | 8,433 | | 18,432 | | 12,764 | | 20,858 | | 73,565 | |
| Loans and advances | — | | 466 | | 801 | | 940 | | 1,398 | | 4,377 | | 7,982 | |
| Customers | — | | 466 | | 801 | | 940 | | 1,085 | | 4,377 | | 7,669 | |
Financial assets
at amortized cost | 40,687 | | 202,066 | | 171,494 | | 232,190 | | 158,556 | | 386,410 | | 1,191,403 | |
| Debt securities | — | | 12,281 | | 14,114 | | 18,608 | | 11,281 | | 47,275 | | 103,559 | |
| Loans and advances | 40,687 | | 189,785 | | 157,380 | | 213,582 | | 147,275 | | 339,135 | | 1,087,844 | |
| Central banks | — | | 18,730 | | — | | — | | — | | 1,352 | | 20,082 | |
| Credit institutions | 6,783 | | 26,671 | | 6,313 | | 7,151 | | 1,521 | | 9,478 | | 57,917 | |
| Customers | 33,904 | | 144,384 | | 151,067 | | 206,431 | | 145,754 | | 328,305 | | 1,009,845 | |
| 261,029 | | 215,610 | | 180,728 | | 251,562 | | 172,718 | | 411,645 | | 1,493,292 | |
| Liabilities | | | | | | | |
Financial liabilities
at amortized cost | 711,093 | | 246,898 | | 182,516 | | 161,784 | | 88,527 | | 77,885 | | 1,468,703 | |
| Deposits | 697,339 | | 210,538 | | 118,035 | | 61,332 | | 22,161 | | 15,903 | | 1,125,308 | |
| Central banks | 168 | | 20,224 | | 6,941 | | 16,846 | | 4,581 | | 22 | | 48,782 | |
| Credit institutions | 6,572 | | 25,990 | | 21,390 | | 13,434 | | 5,963 | | 7,897 | | 81,246 | |
| Customer deposits | 690,599 | | 164,324 | | 89,704 | | 31,052 | | 11,617 | | 7,984 | | 995,280 | |
Marketable debt
securitiesA | — | | 28,371 | | 63,440 | | 92,554 | | 57,639 | | 61,204 | | 303,208 | |
| Other financial liabilities | 13,754 | | 7,989 | | 1,041 | | 7,898 | | 8,727 | | 778 | | 40,187 | |
| 711,093 | | 246,898 | | 182,516 | | 161,784 | | 88,527 | | 77,885 | | 1,468,703 | |
| Difference (assets less liabilities) | (450,064) | | (31,288) | | (1,788) | | 89,778 | | 84,191 | | 333,760 | | 24,589 | |
A.Includes promissory notes, certificates of deposit and other short-term debt issues.
The detail of the remaining contractual maturities of the existing financial liabilities at amortised cost at 31 December 2025, 2024 and 2023 is as follows:
| | | | | | | | | | | | | | | | | | | | | | | |
| 31 December 2025 |
| EUR million |
| On demand | Within 3 months | 3 to 12 months | 1 to 3 years | 3 to 5 years | More than 5 years | Total |
| Financial liabilities at amortized cost | | | | | | | |
| Deposits | 687,708 | | 221,487 | | 95,553 | | 36,937 | | 9,204 | | 17,423 | | 1,068,312 | |
| Central banks | 857 | | 8,497 | | 4,581 | | 2,892 | | — | | 1,627 | | 18,454 | |
| Credit institutions | 6,298 | | 34,993 | | 11,677 | | 12,197 | | 1,841 | | 7,636 | | 74,642 | |
| Customer | 680,553 | | 177,997 | | 79,295 | | 21,848 | | 7,363 | | 8,160 | | 975,216 | |
| Marketable debt securities | — | | 37,742 | | 47,782 | | 93,250 | | 62,071 | | 66,107 | | 306,952 | |
| Other financial liabilities | 11,790 | | 8,855 | | 2,848 | | 1,018 | | 557 | | 11,029 | | 36,097 | |
| 699,498 | | 268,084 | | 146,183 | | 131,205 | | 71,832 | | 94,559 | | 1,411,361 | |
| | | | | | | | | | | | | | | | | | | | | | | |
| 31 December 2024 |
| EUR million |
| On demand | Within 3 months | 3 to 12 months | 1 to 3 years | 3 to 5 years | More than 5 years | Total |
| Financial liabilities at amortized cost | | | | | | | |
| Deposits | 699,007 | | 207,554 | | 117,431 | | 43,090 | | 19,248 | | 15,796 | | 1,102,126 | |
| Central banks | 17 | | 9,082 | | 11,026 | | 4,772 | | — | | 7 | | 24,904 | |
| Credit institutions | 13,634 | | 27,170 | | 19,258 | | 15,674 | | 6,482 | | 7,462 | | 89,680 | |
| Customer | 685,356 | | 171,302 | | 87,147 | | 22,644 | | 12,766 | | 8,327 | | 987,542 | |
| Marketable debt securities | — | | 36,315 | | 48,973 | | 102,306 | | 61,260 | | 74,817 | | 323,671 | |
| Other financial liabilities | 13,241 | | 7,861 | | 1,471 | | 8,738 | | 7,591 | | 1,014 | | 39,916 | |
| 712,248 | | 251,730 | | 167,875 | | 154,134 | | 88,099 | | 91,627 | | 1,465,713 | |
.
| | | | | | | | | | | | | | | | | | | | | | | |
| 31 December 2023 |
| EUR million |
| On demand | Within 3 months | 3 to 12 months | 1 to 3 years | 3 to 5 years | More than 5 years | Total |
| Financial liabilities at amortized cost | | | | | | | |
| Deposits | 698,595 | | 204,001 | | 109,311 | | 51,191 | | 20,761 | | 15,585 | | 1,099,444 | |
| Central banks | 168 | | 20,334 | | 6,853 | | 16,846 | | 4,581 | | 35 | | 48,817 | |
| Credit institutions | 6,884 | | 25,642 | | 21,334 | | 13,079 | | 5,924 | | 7,685 | | 80,548 | |
| Customer | 691,543 | | 158,025 | | 81,124 | | 21,266 | | 10,256 | | 7,865 | | 970,079 | |
| Marketable debt securities | — | | 28,258 | | 62,935 | | 91,492 | | 56,944 | | 60,166 | | 299,795 | |
| Other financial liabilities | 13,666 | | 8,078 | | 1,041 | | 7,898 | | 8,727 | | 777 | | 40,187 | |
| 712,261 | | 240,337 | | 173,287 | | 150,581 | | 86,432 | | 76,528 | | 1,439,426 | |
Below is a breakdown of contractual maturities for the rest of financial assets and liabilities as of 31 December 2025, 2024 and 2023:
| | | | | | | | | | | | | | | | | | | | |
| 31 December 2025 |
| EUR million |
| Within 3 months | 3 to 12 months | 1 to 3
years | 3 to 5
years | More than 5 years | Total |
| FINANCIAL ASSETS | | | | | | |
| Financial assets held for trading | 85,732 | | 38,979 | | 35,639 | | 22,880 | | 69,088 | | 252,318 | |
| Derivatives | 15,579 | | 4,967 | | 13,348 | | 10,446 | | 14,015 | | 58,355 | |
| Equity instruments | — | | — | | — | | — | | 22,030 | | 22,030 | |
| Debt securities | 8,666 | | 26,749 | | 20,034 | | 11,618 | | 31,501 | | 98,568 | |
| Loans and advances | 61,487 | | 7,263 | | 2,257 | | 816 | | 1,542 | | 73,365 | |
| Central banks | 13,143 | | 1,181 | | 308 | | — | | — | | 14,632 | |
| Credits institutions | 22,532 | | 2,114 | | 1,104 | | 213 | | 4 | | 25,967 | |
| Customers | 25,812 | | 3,968 | | 845 | | 603 | | 1,538 | | 32,766 | |
| Financial assets designated at fair value through profit or loss | 611 | | 893 | | 1,595 | | 819 | | 4,128 | | 8,046 | |
| Debt securities | 333 | | 480 | | 1,032 | | 394 | | 655 | | 2,894 | |
| Loans and advances | 278 | | 413 | | 563 | | 425 | | 3,473 | | 5,152 | |
| Credit institutions | 20 | | 1 | | 9 | | 30 | | 353 | | 413 | |
| Customers | 258 | | 412 | | 553 | | 396 | | 3,120 | | 4,739 | |
| Non-trading financial assets mandatorily at fair value through profit or loss | 1,091 | | 174 | | 407 | | — | | 6,089 | | 7,761 | |
| Equity instruments | | | | | 5,815 | | 5,815 | |
| Debt securities | 34 | | 9 | | 93 | | — | | 109 | | 245 | |
| Loans and advances | 1,057 | | 165 | | 314 | | — | | 165 | | 1,701 | |
| Central banks | — | | — | | — | | — | | — | | — | |
| Credits institutions | — | | — | | — | | — | | — | | — | |
| Customers | 1,057 | | 165 | | 314 | | — | | 165 | | 1,701 | |
| Financial assets at fair value through other comprehensive income | — | | — | | — | | — | | 2,281 | | 2,281 | |
| Equity instruments | — | | — | | — | | — | | 2,281 | | 2,281 | |
| Hedging derivatives | 1,066 | | 293 | | 609 | | 440 | | 1,523 | | 3,931 | |
| Changes in the fair value of hedged items in portfolio hedges of interest rate risk | (22) | | 63 | | (17) | | 72 | | (46) | | 50 | |
| TOTAL FINANCIAL ASSETS | 88,478 | | 40,402 | | 38,233 | | 24,211 | | 83,063 | | 274,387 | |
| | | | | | | | | | | | | | | | | | | | |
| 31 December 2025 |
| EUR million |
| Within 3 months | 3 to 12 months | 1 to 3
years | 3 to 5
years | More than 5 years | Total |
| FINANCIAL LIABILITIES | | | | | | |
| Financial liabilities held for trading | 131,052 | | 5,783 | | 14,084 | | 10,642 | | 9,985 | | 171,546 | |
| Derivatives | 18,105 | | 4,339 | | 11,403 | | 10,051 | | 8,070 | | 51,968 | |
| Shorts positions | 39,712 | | 661 | | 1,271 | | 478 | | 1,893 | | 44,015 | |
| Deposits | 73,235 | | 783 | | 1,410 | | 113 | | 22 | | 75,563 | |
| Central banks | 12,385 | | — | | — | | — | | — | | 12,385 | |
| Credits institutions | 24,759 | | 770 | | 1,410 | | 113 | | 6 | | 27,058 | |
| Customers | 36,091 | | 13 | | — | | — | | 16 | | 36,120 | |
| Financial liabilities designated at fair value through profit or loss | 19,717 | | 4,015 | | 6,934 | | 3,849 | | 7,633 | | 42,148 | |
| Deposits | 18,785 | | 3,177 | | 4,452 | | 1,105 | | 2,921 | | 30,440 | |
| Central banks | 3,086 | | — | | — | | — | | — | | 3,086 | |
| Credits institutions | 914 | | 23 | | 115 | | 31 | | 341 | | 1,424 | |
| Customers | 14,785 | | 3,154 | | 4,337 | | 1,074 | | 2,580 | | 25,930 | |
Marketable debt securitiesA | 910 | | 838 | | 2,482 | | 2,744 | | 4,712 | | 11,686 | |
| Other financial liabilities | 22 | | — | | — | | — | | — | | 22 | |
| Hedging derivatives | 447 | | 681 | | 735 | | 917 | | 1,468 | | 4,248 | |
| Changes in the fair value of hedged items in portfolio hedges of interest rate risk | (16) | | 25 | | 4 | | 36 | | — | | 49 | |
| TOTAL FINANCIAL LIABILITIES | 151,200 | | 10,504 | | 21,757 | | 15,444 | | 19,086 | | 217,991 | |
A.See breakdown by type of debt (subordinated debt, senior unsecured debt, senior secured debt, promissory notes and other securities) (see note 22).
| | | | | | | | | | | | | | | | | | | | |
| 31 December 2025 |
| EUR million |
| Within 3 months | 3 to 12 months | 1 to 3
years | 3 to 5
years | More than 5 years | Total |
| Memorandum items | | | | | | |
| Loans commitment granted | 146,340 | | 31,411 | | 45,392 | | 58,085 | | 40,006 | | 321,234 | |
| Financial guarantees granted | 8,348 | | 6,018 | | 1,803 | | 630 | | 650 | | 17,449 | |
| Other commitments granted | 102,278 | | 21,002 | | 11,820 | | 3,643 | | 9,375 | | 148,118 | |
| MEMORANDUM ITEMS | 256,966 | | 58,431 | | 59,015 | | 62,358 | | 50,031 | | 486,801 | |
In the Group’s experience, no outflows of cash or other financial assets take place prior to the contractual maturity date that might affect the information broken down above.
| | | | | | | | | | | | | | | | | | | | |
| 31 December 2024 |
| EUR million |
| Within 3 months | 3 to 12 months | 1 to 3
years | 3 to 5
years | More than 5 years | Total |
| FINANCIAL ASSETS | | | | | | |
| Financial assets held for trading | 64,300 | | 56,571 | | 33,945 | | 24,504 | | 50,933 | | 230,253 | |
| Derivatives | 14,231 | | 14,504 | | 16,676 | | 12,384 | | 6,305 | | 64,100 | |
| Equity instruments | — | | — | | — | | — | | 16,636 | | 16,636 | |
| Debt securities | 6,930 | | 21,305 | | 15,319 | | 11,944 | | 27,148 | | 82,646 | |
| Loans and advances | 43,139 | | 20,762 | | 1,950 | | 176 | | 844 | | 66,871 | |
| Central banks | 1,241 | | 11,725 | | — | | — | | — | | 12,966 | |
| Credits institutions | 21,840 | | 4,088 | | 1,287 | | — | | 99 | | 27,314 | |
| Customers | 20,058 | | 4,949 | | 663 | | 176 | | 745 | | 26,591 | |
| Financial assets designated at fair value through profit or loss | 152 | | 750 | | 2,421 | | 1,075 | | 3,517 | | 7,915 | |
| Debt securities | 95 | | 342 | | 1,254 | | 680 | | 526 | | 2,897 | |
| Loans and advances | 57 | | 408 | | 1,167 | | 395 | | 2,991 | | 5,018 | |
| Central banks | — | | — | | — | | — | | — | | — | |
| Credit institutions | 16 | | — | | 5 | | 34 | | 353 | | 408 | |
| Customers | 41 | | 408 | | 1,162 | | 361 | | 2,638 | | 4,610 | |
| Non-trading financial assets mandatorily at fair value through profit or loss | 794 | | 8 | | 29 | | 102 | | 5,197 | | 6,130 | |
| Equity instruments | — | | — | | — | | — | | 4,641 | | 4,641 | |
| Debt instruments | 39 | | 2 | | 3 | | 10 | | 393 | | 447 | |
| Loans and advances | 755 | | 6 | | 26 | | 92 | | 163 | | 1,042 | |
| Central banks | — | | — | | — | | — | | — | | — | |
| Credits institutions | — | | — | | — | | — | | — | | — | |
| Customers | 755 | | 6 | | 26 | | 92 | | 163 | | 1,042 | |
| Financial assets at fair value through other comprehensive income | — | | — | | — | | — | | 2,193 | | 2,193 | |
| Equity instruments | — | | — | | — | | — | | 2,193 | | 2,193 | |
| Hedging derivatives | 1,786 | | 1,423 | | 957 | | 800 | | 706 | | 5,672 | |
| Changes in the fair value of hedged items in portfolio hedges of interest rate risk | (61) | | 18 | | (569) | | (50) | | (42) | | (704) | |
| TOTAL FINANCIAL ASSETS | 66,971 | | 58,770 | | 36,783 | | 26,431 | | 62,504 | | 251,459 | |
| | | | | | | | | | | | | | | | | | | | |
| 31 December 2024 |
| EUR million |
| Within 3 months | 3 to 12 months | 1 to 3
years | 3 to 5
years | More than 5 years | Total |
| FINANCIAL LIABILITIES | | | | | | |
| Financial liabilities held for trading | 100,071 | | 16,537 | | 14,244 | | 12,530 | | 8,769 | | 152,151 | |
| Derivatives | 14,364 | | 13,296 | | 11,946 | | 12,335 | | 5,812 | | 57,753 | |
| Shorts positions | 28,548 | | 2,931 | | 1,199 | | 195 | | 2,957 | | 35,830 | |
| Deposits | 57,159 | | 310 | | 1,099 | | — | | — | | 58,568 | |
| Central banks | 13,300 | | — | | — | | — | | — | | 13,300 | |
| Credits institutions | 24,875 | | 310 | | 1,099 | | — | | — | | 26,284 | |
| Customers | 18,984 | | — | | — | | — | | — | | 18,984 | |
| Financial liabilities designated at fair value through profit or loss | 16,036 | | 6,000 | | 6,422 | | 1,918 | | 5,984 | | 36,360 | |
| Deposits | 15,193 | | 4,860 | | 4,037 | | 490 | | 4,226 | | 28,806 | |
| Central banks | 1,774 | | — | | — | | — | | — | | 1,774 | |
| Credits institutions | 1,035 | | 133 | | 15 | | 49 | | 393 | | 1,625 | |
| Customers | 12,384 | | 4,727 | | 4,022 | | 441 | | 3,833 | | 25,407 | |
Marketable debt securitiesA | 843 | | 1,140 | | 2,385 | | 1,428 | | 1,758 | | 7,554 | |
| Hedging derivatives | 832 | | 668 | | 826 | | 814 | | 1,612 | | 4,752 | |
| Changes in the fair value of hedged items in portfolio hedges of interest rate risk | — | | (5) | | 13 | | 47 | | (64) | | (9) | |
| TOTAL FINANCIAL LIABILITIES | 116,939 | | 23,200 | | 21,505 | | 15,309 | | 16,301 | | 193,254 | |
A.See breakdown by type of debt (subordinated debt, senior unsecured debt, senior secured debt, promissory notes and other securities) (see note 22).
| | | | | | | | | | | | | | | | | | | | |
| 31 December 2024 |
| EUR million |
| Within 3 months | 3 to 12 months | 1 to 3
years | 3 to 5
years | More than 5 years | Total |
| Memorandum items | | | | | | |
| Loans commitment granted | 133,084 | | 35,747 | | 57,157 | | 57,285 | | 19,588 | | 302,861 | |
| Financial guarantees granted | 5,103 | | 6,803 | | 3,691 | | 796 | | 508 | | 16,901 | |
| Other commitments granted | 92,172 | | 20,681 | | 13,197 | | 5,032 | | 3,411 | | 134,493 | |
| MEMORANDUM ITEMS | 230,359 | | 63,231 | | 74,045 | | 63,113 | | 23,507 | | 454,255 | |
| | | | | | | | | | | | | | | | | | | | |
| 31 December 2023 |
| EUR million |
| Within 3 months | 3 to 12 months | 1 to 3
years | 3 to 5
years | More than 5 years | Total |
| FINANCIAL ASSETS | | | | | | |
| Financial assets held for trading | 36,120 | | 49,668 | | 30,602 | | 17,912 | | 42,619 | | 176,921 | |
| Derivatives | 8,777 | | 10,551 | | 17,775 | | 9,532 | | 9,693 | | 56,328 | |
| Equity instruments | — | | — | | — | | — | | 15,057 | | 15,057 | |
| Debt securities | 7,598 | | 18,315 | | 10,274 | | 8,137 | | 17,800 | | 62,124 | |
| Loans and advances | 19,745 | | 20,802 | | 2,553 | | 243 | | 69 | | 43,412 | |
| Central banks | 1,146 | | 16,571 | | — | | — | | — | | 17,717 | |
| Credits institutions | 10,861 | | 2,076 | | 1,079 | | 45 | | — | | 14,061 | |
| Customers | 7,738 | | 2,155 | | 1,474 | | 198 | | 69 | | 11,634 | |
| Financial assets designated at fair value through profit or loss | 1,657 | | 557 | | 2,529 | | 1,350 | | 3,680 | | 9,773 | |
| Debt securities | 252 | | 77 | | 1,269 | | 690 | | 807 | | 3,095 | |
| Loans and advances | 1,405 | | 480 | | 1,260 | | 660 | | 2,873 | | 6,678 | |
| Credit institutions | 26 | | 22 | | 3 | | 15 | | 393 | | 459 | |
| Customers | 1,379 | | 458 | | 1,257 | | 645 | | 2,480 | | 6,219 | |
| Non-trading financial assets mandatorily at fair value through profit or loss | 591 | | 153 | | 71 | | 80 | | 5,015 | | 5,910 | |
| Equity instruments | — | | — | | — | | — | | 4,068 | | 4,068 | |
| Debt instruments | 41 | | — | | 57 | | 3 | | 759 | | 860 | |
| Loans and advances | 550 | | 153 | | 14 | | 77 | | 188 | | 982 | |
| Customers | 550 | | 153 | | 14 | | 77 | | 188 | | 982 | |
| Financial assets at fair value through other comprehensive income | — | | — | | — | | — | | 1,761 | | 1,761 | |
| Equity instruments | — | | — | | — | | — | | 1,761 | | 1,761 | |
| Hedging derivatives | 1,188 | | 412 | | 1,535 | | 937 | | 1,225 | | 5,297 | |
| Changes in the fair value of hedged items in portfolio hedges of interest rate risk | (237) | | (225) | | 156 | | (402) | | (80) | | (788) | |
| TOTAL FINANCIAL ASSETS | 39,319 | | 50,565 | | 34,893 | | 19,877 | | 54,220 | | 198,874 | |
| | | | | | | | | | | | | | | | | | | | |
| 31 December 2023 |
| EUR million |
| Within 3 months | 3 to 12 months | 1 to 3
years | 3 to 5
years | More than 5 years | Total |
| FINANCIAL LIABILITIES | | | | | | |
| Financial liabilities held for trading | 73,257 | | 12,127 | | 19,180 | | 10,591 | | 7,115 | | 122,270 | |
| Derivatives | 8,147 | | 9,486 | | 17,990 | | 10,060 | | 4,906 | | 50,589 | |
| Shorts positions | 21,381 | | 1,288 | | 765 | | 531 | | 2,209 | | 26,174 | |
| Deposits | 43,729 | | 1,353 | | 425 | | — | | — | | 45,507 | |
| Central banks | 7,808 | | — | | — | | — | | — | | 7,808 | |
| Credits institutions | 17,228 | | 209 | | 425 | | — | | — | | 17,862 | |
| Customers | 18,693 | | 1,144 | | — | | — | | — | | 19,837 | |
| Financial liabilities designated at fair value through profit or loss | 23,190 | | 7,583 | | 4,863 | | 1,359 | | 3,372 | | 40,367 | |
| Deposits | 22,688 | | 6,459 | | 3,223 | | 338 | | 2,288 | | 34,996 | |
| Central banks | 1,158 | | 51 | | — | | — | | — | | 1,209 | |
| Credits institutions | 1,161 | | 57 | | 84 | | 61 | | 372 | | 1,735 | |
| Customers | 20,369 | | 6,351 | | 3,139 | | 277 | | 1,916 | | 32,052 | |
Marketable debt securitiesA | 502 | | 1,124 | | 1,640 | | 1,021 | | 1,084 | | 5,371 | |
| Hedging derivatives | 1,525 | | 2,064 | | 1,577 | | 878 | | 1,612 | | 7,656 | |
| Changes in the fair value of hedged items in portfolio hedges of interest rate risk | (1) | | (4) | | 36 | | (5) | | 29 | | 55 | |
| TOTAL FINANCIAL LIABILITIES | 97,971 | | 21,770 | | 25,656 | | 12,823 | | 12,128 | | 170,348 | |
A.See breakdown by type of debt (subordinated debt, senior unsecured debt, senior secured debt, promissory notes and other securities) (see note 22).
| | | | | | | | | | | | | | | | | | | | |
| 31 December 2023 |
| EUR million |
| Within 3 months | 3 to 12 months | 1 to 3
years | 3 to 5
years | More than 5 years | Total |
| Memorandum items | | | | | | |
| Loans commitment granted | 125,083 | | 31,658 | | 55,344 | | 47,204 | | 20,300 | | 279,589 | |
| Financial guarantees granted | 7,870 | | 4,734 | | 1,654 | | 686 | | 491 | | 15,435 | |
| Other commitments granted | 81,146 | | 17,448 | | 9,699 | | 3,386 | | 1,594 | | 113,273 | |
| MEMORANDUM ITEMS | 214,099 | | 53,840 | | 66,697 | | 51,276 | | 22,385 | | 408,297 | |
b) Equivalent euro value of assets and liabilities
The detail of the main foreign currency balances in the consolidated balance sheet, based on the nature of the related items, is as follows:
| | | | | | | | | | | | | | | | | | | | | | | | | | |
| Equivalent value in EUR million |
| 2025 | | 2024 | | 2023 |
| Assets | Liabilities | | Assets | Liabilities | | Assets | Liabilities |
| Cash, cash balances at central banks and other deposits on demand | 89,186 | | — | | | 109,932 | | — | | | 114,410 | | — | |
| Financial assets/liabilities held for trading | 136,499 | | 75,272 | | | 130,076 | | 76,216 | | | 106,011 | | 60,581 | |
| Non-trading financial assets mandatorily at fair value through profit or loss | 3,530 | | — | | | 3,208 | | — | | | 3,291 | | — | |
| Other financial assets/liabilities at fair value through profit or loss | 666 | | 14,943 | | | 793 | | 13,844 | | | 1,721 | | 12,699 | |
| Financial assets at fair value through other comprehensive income | 45,564 | | — | | | 60,861 | | — | | | 60,516 | | — | |
| Financial assets at amortized cost | 745,401 | | — | | | 777,226 | | — | | | 773,504 | | — | |
| Investments | 1,859 | | — | | | 2,103 | | — | | | 1,689 | | — | |
| Tangible assets | 14,437 | | — | | | 18,812 | | — | | | 20,797 | | — | |
| Intangible assets | 10,296 | | — | | | 12,282 | | — | | | 12,772 | | — | |
| Financial liabilities at amortized cost | — | | 854,517 | | | — | | 938,844 | | | — | | 937,917 | |
| Liabilities under insurance contracts | — | | 227 | | | — | | 261 | | | — | | 330 | |
OtherA | 96,469 | | 82,901 | | | 25,891 | | 22,385 | | | 26,236 | | 25,740 | |
| 1,143,907 | | 1,027,860 | | | 1,141,184 | | 1,051,550 | | | 1,120,947 | | 1,037,267 | |
A.Includes the import of the Polish business held for sale.
c) Fair value of financial assets and liabilities not measured at fair value
The fair value at year-end of the financial instruments (certain portfolios of loans and advances and debt securities, on the asset side, and deposits and debt securities, on the liability side) registered in the consolidated balance sheet at amortized cost is presented below:
i) Financial assets measured at other than fair value
| | | | | | | | | | | | | | | | | | | | | | | | | | | | | | | | | | | | | | | | | | | | | | | | | | | | | |
| EUR million |
| 2025 | | 2024 | | 2023 |
| Assets | Carrying amount | Fair value | Level 1 | Level 2 | Level 3 | | Carrying amount | Fair value | Level 1 | Level 2 | Level 3 | | Carrying amount | Fair value | Level 1 | Level 2 | Level 3 |
| Loans and advances | 1,062,675 | | 1,062,981 | | — | | 113,004 | | 949,977 | | | 1,082,758 | | 1,073,530 | | — | | 104,582 | | 968,948 | | | 1,087,844 | | 1,077,543 | | — | | 103,414 | | 974,129 | |
| Debt securities | 140,014 | | 139,242 | | 103,120 | | 14,100 | | 22,022 | | | 120,949 | | 119,539 | | 87,170 | | 13,149 | | 19,220 | | | 103,559 | | 102,888 | | 67,951 | | 11,057 | | 23,880 | |
| 1,202,689 | | 1,202,223 | | 103,120 | | 127,104 | | 971,999 | | | 1,203,707 | | 1,193,069 | | 87,170 | | 117,731 | | 988,168 | | | 1,191,403 | | 1,180,431 | | 67,951 | | 114,471 | | 998,009 | |
ii) Financial liabilities measured at other than fair value
| | | | | | | | | | | | | | | | | | | | | | | | | | | | | | | | | | | | | | | | | | | | | | | | | | | | | |
| EUR million |
| 2025 | | 2024 | | 2023 |
LiabilitiesA | Carrying amount | Fair value | Level 1 | Level 2 | Level 3 | | Carrying amount | Fair value | Level 1 | Level 2 | Level 3 | | Carrying amount | Fair value | Level 1 | Level 2 | Level 3 |
| Deposits | 1,072,384 | | 1,073,147 | | — | | 235,998 | | 837,149 | | | 1,126,439 | | 1,125,532 | | — | | 250,440 | | 875,092 | | | 1,125,308 | | 1,124,373 | | — | | 263,428 | | 860,945 | |
| Debt securities | 312,704 | | 314,173 | | 162,382 | | 115,597 | | 36,194 | | | 317,967 | | 317,912 | | 170,118 | | 112,365 | | 35,429 | | | 303,208 | | 298,792 | | 136,109 | | 125,575 | | 37,108 | |
| 1,385,088 | | 1,387,320 | | 162,382 | | 351,595 | | 873,343 | | | 1,444,406 | | 1,443,444 | | 170,118 | | 362,805 | | 910,521 | | | 1,428,516 | | 1,423,165 | | 136,109 | | 389,003 | | 898,053 | |
A.At 31 December 2025, Grupo Santander had other financial liabilities that amounted to EUR 36,096 million, EUR 39,916 million in 2024 and EUR 40,187 million in 2023.
The main valuation methods and inputs used in the estimates at 31 December 2025 of the fair values of the financial assets and liabilities in the foregoing table were as follows:
•Financial assets at amortised cost: the fair value was estimated using the present value method. The estimates were made considering factors such as the expected maturity of the portfolio, market interest rates, spreads on newly approved transactions or market spreads -when available-.
•Financial liabilities at amortised cost:
i) Deposits: the fair value of short term and on demand deposits was taken to be their carrying amount. Factors such as the expected maturity of the transactions and the Group’s current cost of funding in similar transactions are consider for the estimation of long term deposits fair value. It had been used also current rates offered for deposits of similar remaining maturities.
ii) Marketable debt securities and subordinated liabilities: the fair value was calculated based on market prices for these instruments -when available- or by the present value method using market interest rates and spreads, as well as using any significant input which is not observable with market data if applicable.
iii) The fair value of cash, cash balances at central banks and other deposits on demand was taken to be their carrying amount since they are mainly short-term balances.
d) Offsetting of financial instruments
Following is the detail of financial assets and liabilities that were offset in the consolidated balance sheets as of 31 December 2025, 2024 and 2023:
| | | | | | | | | | | |
| 31 December 2025 |
| EUR million |
| Assets | Gross amount of financial assets | Gross amount of financial assets offset in the balance sheet | Net amount of financial assets presented in the balance sheet |
| Derivatives | 117,733 | | (55,447) | | 62,286 | |
| Reverse repurchase agreements | 217,509 | | (76,535) | | 140,974 | |
| Total | 335,242 | | (131,982) | | 203,260 | |
| | | | | | | | | | | |
| 31 December 2024 |
| EUR million |
| Assets | Gross amount of financial assets | Gross amount of financial assets offset in the balance sheet | Net amount of financial assets presented in the balance sheet |
| Derivatives | 152,331 | | (82,559) | | 69,772 | |
| Reverse repurchase agreements | 189,034 | | (67,488) | | 121,546 | |
| Total | 341,365 | | (150,047) | | 191,318 | |
| | | | | | | | | | | |
| 31 December 2023 |
| EUR million |
| Assets | Gross amount of financial assets | Gross amount of financial assets offset in the balance sheet | Net amount of financial assets presented in the balance sheet |
| Derivatives | 149,508 | | (87,883) | | 61,625 | |
| Reverse repurchase agreements | 179,580 | | (79,500) | | 100,080 | |
| Total | 329,088 | | (167,383) | | 161,705 | |
| | | | | | | | | | | |
| 31 December 2025 |
| EUR million |
| Liabilities | Gross amount of financial liabilities | Gross amount of financial liabilities offset in the balance sheet | Net amount of financial liabilities presented in the balance sheet |
| Derivatives | 111,664 | | (55,447) | | 56,217 | |
| Reverse repurchase agreements | 246,961 | | (76,535) | | 170,426 | |
| Total | 358,625 | | (131,982) | | 226,643 | |
| | | | | | | | | | | |
| 31 December 2024 |
| EUR million |
| Liabilities | Gross amount of financial liabilities | Gross amount of financial liabilities offset in the balance sheet | Net amount of financial liabilities presented in the balance sheet |
| Derivatives | 145,064 | | (82,559) | | 62,505 | |
| Reverse repurchase agreements | 223,141 | | (67,488) | | 155,653 | |
| Total | 368,205 | | (150,047) | | 218,158 | |
| | | | | | | | | | | |
| 31 December 2023 |
| EUR million |
| Liabilities | Gross amount of financial liabilities | Gross amount of financial liabilities offset in the balance sheet | Net amount of financial liabilities presented in the balance sheet |
| Derivatives | 146,128 | | (87,883) | | 58,245 | |
| Reverse repurchase agreements | 212,840 | | (79,500) | | 133,340 | |
| Total | 358,968 | | (167,383) | | 191,585 | |
At 31 December 2025, Grupo Santander has offset other items amounting to EUR 632 million (EUR 811 million and EUR 910 million at 31 December 2024 and 2023, respectively).
At 31 December 2025 the balance sheet shows the amounts EUR 192,621 million (EUR 176,198 million and EUR 151,044 million at 31 December 2024 and 2023) on derivatives and repos as assets and EUR 220,296 million (EUR 209,121 million and EUR 180,539 million at 31 December 2024 and 2023, respectively) on derivatives and repos as liabilities that are subject to netting and collateral arrangements.
52. Primary and secondary segments reporting
Grupo Santander bases segment reporting on financial information presented to the chief operating decision maker, which excludes certain statutory results items that distort year-on-year comparisons and are not considered for management reporting. This financial information (underlying basis) is computed by adjusting reported results for the effects of certain gains and losses (e.g. capital gains, write-downs, impairment of goodwill, etc.). These gains and losses are items that management and investors ordinarily identify and consider separately to better understand the underlying trends in the business.
Grupo Santander has aligned the information in this note with the underlying information used internally for management reporting and with that presented in Grupo Santander's other public documents.
Grupo Santander executive committee has been selected to be its chief operating decision maker. Grupo Santander's operating segments reflect its organizational and managerial structures. Grupo Santander 's executive committee reviews internal reporting based on these segments to assess performance and allocate resources.
The segments are split by global business and by country in which profits are earned. Santander prepares the information by aggregating the figures for Grupo Santander’s global businesses and countries, relating it to both the accounting data of the business units integrated in each segment and that provided by management information systems. The same general principles as those used in Grupo Santander are applied.
On 10 February 2026, the Group announced the implementation of a series of changes to its reporting structure. These changes are intended to improve the transparency and comparability of the metrics and financial statements, as well as to align the reporting with the way the bank has been managed since the beginning of 2026.
These changes, which affect the statutory and underlying income statements, the segment reporting and certain management metrics, have been applied to the periods presented herein and will apply to the information reported from the first quarter of 2026. These changes do not affect the Group’s consolidated balance sheet.
The main changes are as follows:
•In the underlying income statement, the results associated with the business subject to the Poland disposal are recorded in a single line item under 'non-recurring items'. Consequently, the global businesses, which, in accordance with IFRS 8, are reported only on an underlying basis, also exclude Poland.
•Certain charges that, until 31 December 2025, were recorded under the 'other provisions' line item are now presented in different lines of the income statement. In particular, charges mainly relating to bank levies and other taxes applicable to the banking sector, are reclassified to 'other operating costs' to ensure uniformity across the Group. In addition, certain recurring operating charges, primarily related to labour (mainly in Brazil) and legal processes, are presented in 'total costs' (comprising
'administrative expenses and amortizations' and 'other operating costs').
•Given that our payments platform strategy is now largely established, we are positioning Payments, renamed Payment Solutions, as the Group’s payments platform business. In this context, from 1 January 2026, the income statement and balance sheet items relating to the Cards business have been reclassified to Retail (previously recorded in Payments), to better align reporting with the management structure in these businesses in 2026.
•In addition to the change in the Payments business described above, two minor adjustments have been introduced to the primary segments: i) the Digital Consumer Bank (Consumer) business has been renamed Openbank; and ii) Wealth Management & Insurance has been reorganized into two business lines. These changes do not impact figures at the Group or primary segment levels.
The Group has recast the corresponding information of earlier periods to reflect these changes in the structure of its internal organization.
a) Primary segments
This primary level of segmentation, which is based on the Group’s management structure, comprises six reportable segments: five global businesses plus the Corporate Centre. The operating areas are:
•Retail & Commercial Banking (Retail): area that integrates the retail banking and commercial banking business (individuals, SMEs and corporates), except private banking clients and business originated in the consumer finance businesses.
•Openbank, formerly Digital Consumer Bank (Consumer): comprises all business originated by consumer finance companies, plus our digital bank (formerly Openbank), Open Digital Services (ODS) and SBNA Consumer.
•Corporate & Investment Banking (CIB): this business, which includes Global Transactional Banking, Global Banking (Global Debt Financing and Corporate Finance) and Global Markets, offers products and services on a global scale to corporate and institutional customers, and collaborates with other global businesses to better serve our broad customer base.
•Wealth Management & Insurance (Wealth): comprises two business lines: i) Private Banking, which includes the corporate private banking unit and International Private Banking in the US, Switzerland and the UAE; and ii) Insurance & Asset Management Solutions, which brings together the insurance business and liquid and illiquid asset management activities and includes the investment platforms and holdings that complement the traditional Wealth business.
•Payment Solutions (Payments): brings together the Group’s digital payment solutions, providing global technological solutions to Group entities and new customers in the open market. It comprises Getnet, Getnet Platforms and Ebury.
•Corporate Centre: includes the centralized activities relating to equity stakes in financial companies, financial management of the structural exchange rate position, assumed within the sphere of the Group's asset and liability committee, as well as management of liquidity and of shareholders' equity via issuances.
As Grupo Santander’s holding entity, this area manages all capital and reserves and allocations of capital and liquidity with the other businesses. It also incorporates goodwill impairments but not the costs related to the Grupo Santander’s central services (charged to the areas), except for corporate and institutional expenses related to the Grupo Santander’s functioning.
There are no customers located in any of the areas that generate income exceeding 10% of Total income.
The main masses of the balance sheets of the different segments, summarized, are indicated below:
| | | | | | | | | | | | | | | | | | | | | | | |
| EUR million | |
| 2025 |
| Balance sheet (condensed) | Retail & Commercial Banking | Openbank | Corporate & Investment Banking | Wealth Management & Insurance | Payment Solutions | Corporate Centre | Total |
| Loans and advances to customers | 594,262 | | 203,857 | | 204,210 | | 26,516 | | 977 | | 7,465 | | 1,037,288 | |
| Customer deposits | 628,026 | | 129,946 | | 221,321 | | 59,127 | | 1,392 | | 1,387 | | 1,041,200 | |
| Memorandum items | | | | | | | |
Gross loans and advances to customersA | 591,287 | | 211,894 | | 146,065 | | 26,680 | | 1,002 | | 7,537 | | 984,466 | |
| Customers funds | 726,779 | | 138,999 | | 149,731 | | 181,509 | | 1,392 | | 1,387 | | 1,199,798 | |
Customer depositsB | 616,402 | | 129,909 | | 137,267 | | 58,051 | | 1,392 | | 1,387 | | 944,409 | |
| Mutual funds | 110,377 | | 9,089 | | 12,464 | | 123,458 | | — | | — | | 255,389 | |
| | | | | | | | | | | | | | | | | | | | | | | |
| EUR million | |
| 2024 |
| Balance sheet (condensed) | Retail & Commercial Banking | Openbank | Corporate & Investment Banking | Wealth Management & Insurance | Payment Solutions | Corporate Centre | Total |
| Loans and advances to customers | 598,852 | | 207,107 | | 178,746 | | 24,478 | | 1,066 | | 6,911 | | 1,017,160 | |
| Customer deposits | 618,628 | | 128,975 | | 198,872 | | 56,663 | | 1,038 | | 1,430 | | 1,005,605 | |
| Memorandum items | | | | | | | |
Gross loans and advances to customersA | 600,230 | | 215,164 | | 130,840 | | 24,643 | | 1,087 | | 6,997 | | 978,961 | |
| Customers funds | 706,505 | | 137,122 | | 147,492 | | 161,304 | | 1,038 | | 1,299 | | 1,154,759 | |
Customer depositsB | 607,094 | | 128,933 | | 133,433 | | 55,736 | | 1,038 | | 1,299 | | 927,533 | |
| Mutual funds | 99,411 | | 8,189 | | 14,059 | | 105,568 | | — | | — | | 227,226 | |
| | | | | | | | | | | | | | | | | | | | | | | |
| EUR million | |
| 2023 |
| Balance sheet (condensed) | Retail & Commercial Banking | Openbank | Corporate & Investment Banking | Wealth Management & Insurance | Payment Solutions | Corporate Centre | Total |
| Loans and advances to customers | 610,528 | | 199,158 | | 163,627 | | 22,456 | | 1,165 | | 6,531 | | 1,003,465 | |
| Customer deposits | 629,243 | | 115,446 | | 200,592 | | 54,462 | | 1,418 | | 1,508 | | 1,002,669 | |
| Memorandum items | | | | | | | |
Gross loans and advances to customersA | 611,882 | | 206,649 | | 132,308 | | 22,550 | | 1,194 | | 6,608 | | 981,192 | |
| Customers funds | 688,569 | | 120,996 | | 166,721 | | 148,292 | | 1,418 | | 1,508 | | 1,127,503 | |
Customer depositsB | 600,871 | | 114,334 | | 152,156 | | 53,599 | | 1,418 | | 1,508 | | 923,884 | |
| Mutual funds | 87,698 | | 6,662 | | 14,565 | | 94,693 | | — | | — | | 203,618 | |
A.Excluding reverse repos.
B.Excluding repos.
The condensed income statements for the primary segments are as follows:
| | | | | | | | | | | | | | | | | | | | | | | |
| EUR million |
| 2025 |
| Underlying income statement (condensed) | Retail & Commercial Banking | Openbank | Corporate & Investment Banking | Wealth Management & Insurance | Payment Solutions | Corporate Centre | Total |
Net interest incomeA | 26,528 | | 11,036 | | 3,824 | | 1,335 | | 167 | | (490) | | 42,401 | |
| Net fee income | 6,222 | | 1,479 | | 2,552 | | 1,642 | | 1,059 | | (27) | | 12,928 | |
Gains (losses) on financial transactionsB | 680 | | (11) | | 1,281 | | 512 | | (24) | | (82) | | 2,354 | |
Other operating incomeC | (983) | | 511 | | 359 | | 552 | | 171 | | 14 | | 625 | |
| Total income | 32,447 | | 13,015 | | 8,016 | | 4,042 | | 1,373 | | (585) | | 58,308 | |
| Total Costs | (13,913) | | (5,680) | | (3,752) | | (1,444) | | (1,203) | | (417) | | (26,410) | |
Net operating incomeD | 18,534 | | 7,335 | | 4,264 | | 2,598 | | 170 | | (1,003) | | 31,898 | |
Net loan-loss provisionsE | (7,150) | | (4,457) | | (278) | | (20) | | (24) | | (198) | | (12,128) | |
Other gains (losses) and provisionsF | (385) | | (312) | | (37) | | (14) | | (12) | | (75) | | (834) | |
| Operating profit/(loss) before tax | 10,998 | | 2,566 | | 3,949 | | 2,564 | | 134 | | (1,275) | | 18,936 | |
| Tax on profit | (2,974) | | (489) | | (1,114) | | (532) | | (19) | | 190 | | (4,939) | |
| Profit from continuing operations | 8,024 | | 2,077 | | 2,835 | | 2,032 | | 115 | | (1,085) | | 13,997 | |
| Net profit from discontinued operations | — | | — | | — | | — | | — | | — | | — | |
| Consolidated profit | 8,024 | | 2,077 | | 2,835 | | 2,032 | | 115 | | (1,085) | | 13,997 | |
| Non-controlling interests | (314) | | (336) | | (127) | | (50) | | (19) | | — | | (845) | |
| Underlying profit attributable to the parent | 7,710 | | 1,741 | | 2,708 | | 1,983 | | 96 | | (1,085) | | 13,152 | |
A.Net interest income includes the net amount of the profit and loss account items 'Interest income' and 'Interest expense'. It is presented this way because it is how it is presented to the main operational decision maker.
B.Gains (losses) on financial transactions includes the following line items in the statutory income statement, which are presented net for internal reporting and management reporting purposes: Gain or losses on financial assets and liabilities not measured at fair value through profit or loss, net, Gain or losses on financial assets and liabilities held for trading, net, Gains or losses on non-trading financial assets and liabilities mandatorily at fair value through profit or loss, net, Gain or losses on financial assets and liabilities measured at fair value through profit or loss, net, Gain or losses from hedge accounting, net and Exchange differences, net.
C.Other operating income includes the following line items in the statutory income statement, which are presented net for internal reporting and management reporting purposes: Dividend income; Income from companies accounted for using the equity method, Other operating income, Other operating expenses, Income from assets under insurance or reinsurance contracts and Expenses from liabilities under insurance or reinsurance contracts.
D.Net Operating Income is used for the Group’s internal reporting and management reporting purposes but is not a line item in the statutory consolidated income statement.
E.Net loan-loss provisions refers to Impairment or reversal of impairment at financial assets not measured at fair value through profit or loss and net gains and losses from changes line item in the statutory income statement. Additionally, includes an addition of EUR 50 million mainly corresponding to the results by commitments and contingent risks includes in the line of the statutory income statement of provisions or reversal of provisions.
F.Other gains (losses) and provisions includes the following line items in the statutory income statement, which are presented net for internal reporting and management reporting purposes: Provisions or reversal of provisions except an addition EUR 50 million mainly corresponding to the results by commitments and contingent risks; Impairment of investments in joint ventures and associates, net; Impairment on non-financial assets, net; Gains or losses on non-financial assets, net; Negative goodwill recognised in results and Gains or losses on non-current assets held for sale not classified as discontinued operations.
| | | | | | | | | | | | | | | | | | | | | | | |
| EUR million |
| 2024 |
| Underlying income statement (condensed) | Retail & Commercial Banking | Openbank | Corporate & Investment Banking | Wealth Management & Insurance | Payment Solutions | Corporate Centre | Total |
Net interest incomeA | 27,854 | | 10,777 | | 3,779 | | 1,591 | | 132 | | (308) | | 43,824 | |
| Net fee income | 6,022 | | 1,508 | | 2,415 | | 1,442 | | 958 | | (11) | | 12,335 | |
Gains (losses) on financial transactionsB | 805 | | (4) | | 1,568 | | 256 | | — | | (408) | | 2,216 | |
Other operating incomeC | (1,617) | | 596 | | 136 | | 298 | | 150 | | 47 | | (391) | |
| Total income | 33,064 | | 12,877 | | 7,897 | | 3,587 | | 1,240 | | (680) | | 57,984 | |
| Total Costs | (14,704) | | (5,576) | | (3,922) | | (1,403) | | (1,209) | | (540) | | (27,354) | |
Net operating incomeD | 18,359 | | 7,302 | | 3,975 | | 2,183 | | 31 | | (1,220) | | 30,630 | |
Net loan-loss provisionsE | (7,064) | | (4,562) | | (141) | | (42) | | (16) | | 3 | | (11,822) | |
Other gains (losses) and provisionsF | (545) | | (512) | | (19) | | (8) | | (247) | | (99) | | (1,431) | |
| Operating profit/(loss) before tax | 10,750 | | 2,228 | | 3,815 | | 2,134 | | (233) | | (1,317) | | 17,377 | |
| Tax on profit | (3,132) | | (294) | | (1,023) | | (509) | | (57) | | 162 | | (4,853) | |
| Profit from continuing operations | 7,619 | | 1,934 | | 2,792 | | 1,624 | | (290) | | (1,155) | | 12,524 | |
| Net profit from discontinued operations | — | | — | | — | | — | | — | | — | | — | |
| Consolidated profit | 7,619 | | 1,934 | | 2,792 | | 1,624 | | (290) | | (1,155) | | 12,524 | |
| Non-controlling interests | (273) | | (275) | | (153) | | (40) | | (9) | | 1 | | (750) | |
| Underlying profit attributable to the parent | 7,345 | | 1,659 | | 2,639 | | 1,584 | | (299) | | (1,154) | | 11,774 | |
A.Net interest income includes the net amount of the profit and loss account items 'Interest income' and 'Interest expense'. It is presented this way because it is how it is presented to the main operational decision maker.
B.Gains (losses) on financial transactions includes the following line items in the statutory income statement, which are presented net for internal reporting and management reporting purposes: Gain or losses on financial assets and liabilities not measured at fair value through profit or loss, net, Gain or losses on financial assets and liabilities held for trading, net, Gains or losses on non-trading financial assets and liabilities mandatorily at fair value through profit or loss, net, Gain or losses on financial assets and liabilities measured at fair value through profit or loss, net, Gain or losses from hedge accounting, net and Exchange differences, net.
C.Other operating income includes the following line items in the statutory income statement, which are presented net for internal reporting and management reporting purposes: Dividend income; Income from companies accounted for using the equity method, Other operating income, Other operating expenses, Income from assets under insurance or reinsurance contracts and Expenses from liabilities under insurance or reinsurance contracts.
D.'Net Operating Income is used for the Group’s internal reporting and management reporting purposes but is not a line item in the statutory consolidated income statement.
E.'Net Loan loss provisions' refers to Impairment or reversal of impairment at financial assets not measured at fair value through profit or loss and net gains and losses from changes line item in the statutory income statement. Additionally, includes an addition of EUR 47 million mainly corresponding to the results by commitments and contingent risks includes in the line of the statutory income statement of provisions or reversal of provisions.
F.Other gains (losses) and provisions includes the following line items in the statutory income statement, which are presented net for internal reporting and management reporting purposes: Provisions or reversal of provisions except an addition of EUR 47 million mainly corresponding to the results by commitments and contingent risks; Impairment of investments in joint ventures and associates, net; Impairment on non-financial assets, net; Gains or losses on non-financial assets, net; Negative goodwill recognised in results and Gains or losses on non-current assets held for sale not classified as discontinued operations.
| | | | | | | | | | | | | | | | | | | | | | | |
| EUR million |
| 2023 |
| Underlying income statement (condensed) | Retail & Commercial Banking | Openbank | Corporate & Investment Banking | Wealth Management & Insurance | Payment Solutions | Corporate Centre | Total |
Net interest incomeA | 25,586 | | 10,221 | | 3,361 | | 1,499 | | 92 | | (41) | | 40,718 | |
| Net fee income | 6,077 | | 1,229 | | 2,013 | | 1,209 | | 954 | | (13) | | 11,468 | |
Gains (losses) on financial transactionsB | 837 | | 116 | | 1,748 | | 178 | | (10) | | (302) | | 2,566 | |
Other operating incomeC | (1,707) | | 709 | | (22) | | 197 | | 97 | | (86) | | (812) | |
| Total income | 30,792 | | 12,274 | | 7,100 | | 3,082 | | 1,134 | | (442) | | 53,940 | |
| Total Costs | (14,757) | | (5,526) | | (3,381) | | (1,266) | | (1,111) | | (460) | | (26,501) | |
Net operating incomeD | 16,036 | | 6,748 | | 3,719 | | 1,816 | | 23 | | (901) | | 27,439 | |
Net loan-loss provisionsE | (7,542) | | (4,106) | | (132) | | 19 | | (24) | | 2 | | (11,784) | |
Other gains (losses) and provisionsF | (298) | | 35 | | (9) | | (1) | | (15) | | (62) | | (350) | |
| Operating profit/(loss) before tax | 8,195 | | 2,677 | | 3,578 | | 1,834 | | (17) | | (961) | | 15,305 | |
| Tax on profit | (2,076) | | (426) | | (1,086) | | (429) | | (59) | | (36) | | (4,112) | |
| Profit from continuing operations | 6,120 | | 2,251 | | 2,491 | | 1,405 | | (75) | | (998) | | 11,193 | |
| Net profit from discontinued operations | — | | — | | — | | — | | — | | — | | — | |
| Consolidated profit | 6,120 | | 2,251 | | 2,491 | | 1,405 | | (75) | | (998) | | 11,193 | |
| Non-controlling interests | (232) | | (350) | | (163) | | (45) | | (1) | | — | | (791) | |
| Underlying profit attributable to the parent | 5,887 | | 1,901 | | 2,328 | | 1,360 | | (77) | | (998) | | 10,402 | |
A.Net interest income includes the net amount of the profit and loss account items 'Interest income' and 'Interest expense'. It is presented this way because it is how it is presented to the main operational decision maker.
B.Gains (losses) on financial transactions includes the following line items in the statutory income statement, which are presented net for internal reporting and management reporting purposes: Gain or losses on financial assets and liabilities not measured at fair value through profit or loss, net, Gain or losses on financial assets and liabilities held for trading, net, Gains or losses on non-trading financial assets and liabilities mandatorily at fair value through profit or loss, net, Gain or losses on financial assets and liabilities measured at fair value through profit or loss, net, Gain or losses from hedge accounting, net and Exchange differences, net.
C.Other operating income includes the following line items in the statutory income statement, which are presented net for internal reporting and management reporting purposes: Dividend income; Income from companies accounted for using the equity method, Other operating income, Other operating expenses, Income from assets under insurance or reinsurance contracts and Expenses from liabilities under insurance or reinsurance contracts.
D.Net Operating Income is used for the Group’s internal reporting and management reporting purposes but is not a line item in the statutory consolidated income statement.
E.Net loan-loss provisions refers to Impairment or reversal of impairment at financial assets not measured at fair value through profit or loss and net gains and losses from changes line item in the statutory income statement. Additionally, includes a release of EUR 38 million mainly corresponding to the results by commitments and contingent risks includes in the line of the statutory income statement of provisions or reversal of provisions.
F.Other gains (losses) and provisions includes the following line items in the statutory income statement, which are presented net for internal reporting and management reporting purposes: Provisions or reversal of provisions except a release of EUR 38 million mainly corresponding to the results by commitments and contingent risks; Impairment of investments in joint ventures and associates, net; Impairment on non-financial assets, net; Gains or losses on non-financial assets, net; Negative goodwill recognised in results and Gains or losses on non-current assets held for sale not classified as discontinued operations.
b) Secondary segments
This secondary level includes our main geographical units and the Corporate Centre, as described in the primary segments.
Detailed financial information is provided on Spain, the UK, Portugal, Openbank Europe (previously referred to as DCB Europe), which includes all consumer business, our digital bank in Europe and ODS, the US, Mexico, Brazil, Chile and Argentina.
Information is also provided for the 'Rest of the Group', the grouping which brings together everything that is not included in the aforementioned geographical units or the Corporate Centre.
There are no customers located in a place different from the location of the Group's assets that generate revenues in excess of 10% of ordinary revenues.
The main masses of the balance sheets of the different secondary segments, summarized, are indicated below:
| | | | | | | | | | | | | | | | | | | | |
| EUR million |
| 2025 |
| Balance sheet (condensed) | Spain | United Kingdom | Portugal | Openbank Europe | United States | Mexico |
| Loans and advances to customers | 264,950 | | 242,624 | | 41,260 | | 139,322 | | 132,659 | | 48,083 | |
| Customer deposits | 354,943 | | 225,708 | | 40,576 | | 82,359 | | 122,000 | | 55,595 | |
| Memorandum items | | | | | | |
Gross loans and advances to customersA | 237,385 | | 228,273 | | 41,980 | | 142,477 | | 108,950 | | 49,442 | |
| Customers funds | 429,464 | | 227,160 | | 46,201 | | 87,559 | | 103,178 | | 68,201 | |
Customer depositsB | 322,070 | | 219,440 | | 40,576 | | 82,359 | | 87,686 | | 45,498 | |
| Mutual funds | 107,394 | | 7,719 | | 5,625 | | 5,200 | | 15,492 | | 22,703 | |
| | | | | | | | | | | | | | | | | | | | |
EUR million |
| 2025 |
| Balance sheet (condensed) | Brazil | Chile | Argentina | Corporate Center | Rest of the Group | Total |
| Loans and advances to customers | 87,653 | | 39,924 | | 8,032 | | 7,465 | | 25,315 | | 1,037,288 | |
| Customer deposits | 92,256 | | 29,503 | | 9,959 | | 1,387 | | 26,913 | | 1,041,200 | |
| Memorandum items | | | | | | |
Gross loans and advances to customersA | 93,030 | | 40,986 | | 8,611 | | 7,537 | | 25,796 | | 984,466 | |
| Customers funds | 132,580 | | 42,256 | | 15,894 | | 1,387 | | 45,916 | | 1,199,798 | |
Customer depositsB | 80,449 | | 28,293 | | 9,959 | | 1,387 | | 26,691 | | 944,409 | |
| Mutual funds | 52,132 | | 13,963 | | 5,934 | | — | | 19,225 | | 255,389 | |
| | | | | | | | | | | | | | | | | | | | |
| EUR million |
| 2024 |
| Balance sheet (condensed) | Spain | United Kingdom | Portugal | Openbank Europe | United States | Mexico |
| Loans and advances to customers | 246,897 | | 246,453 | | 38,410 | | 137,038 | | 134,856 | | 45,054 | |
| Customer deposits | 323,425 | | 230,408 | | 38,304 | | 81,376 | | 125,403 | | 49,836 | |
| Memorandum items | | | | | | |
Gross loans and advances to customersA | 225,759 | | 236,496 | | 39,143 | | 139,927 | | 117,511 | | 44,715 | |
| Customers funds | 399,999 | | 230,479 | | 43,186 | | 85,876 | | 108,246 | | 61,160 | |
Customer depositsB | 306,389 | 222,835 | 38,304 | 81,376 | 93,545 | 41,528 |
| Mutual funds | 93,609 | 7,643 | 4,882 | 4,500 | 14,702 | 19,632 |
| | | | | | | | | | | | | | | | | | | | |
EUR million |
| 2024 |
| Balance sheet (condensed) | Brazil | Chile | Argentina | Corporate Center | Rest of the Group | Total |
| Loans and advances to customers | 88,620 | | 40,332 | | 7,684 | | 6,911 | | 24,905 | | 1,017,160 | |
| Customer deposits | 93,994 | | 30,181 | | 11,293 | | 1,430 | | 19,955 | | 1,005,605 | |
| Memorandum items | | | | | | |
Gross loans and advances to customersA | 93,785 | | 41,405 | | 7,938 | | 6,997 | | 25,285 | | 978,961 | |
| Customers funds | 129,881 | | 43,383 | | 17,047 | | 1,299 | | 34,204 | | 1,154,759 | |
Customer depositsB | 81,378 | | 30,060 | | 11,293 | | 1,299 | | 19,527 | | 927,533 | |
| Mutual funds | 48,503 | | 13,324 | | 5,754 | | — | | 14,677 | | 227,226 | |
| | | | | | | | | | | | | | | | | | | | |
| EUR million |
| 2023 |
| Balance sheet (condensed) | Spain | United Kingdom | Portugal | Openbank Europe | United States | Mexico |
| Loans and advances to customers | 239,214 | | 245,743 | | 36,864 | | 132,692 | | 126,843 | | 47,905 | |
| Customer deposits | 324,099 | | 233,453 | | 36,366 | | 69,334 | | 121,782 | | 53,703 | |
| Memorandum items | | | | | | |
Gross loans and advances to customersA | 229,803 | | 235,111 | | 37,658 | | 135,202 | | 112,671 | | 48,688 | |
| Customers funds | 386,810 | | 231,667 | | 40,618 | | 72,963 | | 108,062 | | 62,775 | |
Customer depositsB | 308,745 | | 224,396 | | 36,366 | | 69,334 | | 95,697 | | 45,693 | |
| Mutual funds | 78,065 | | 7,272 | | 4,252 | | 3,629 | | 12,364 | | 17,082 | |
| | | | | | | | | | | | | | | | | | | | |
EUR million |
| 2023 |
| Balance sheet (condensed) | Brazil | Chile | Argentina | Corporate Center | Rest of the Group | Total |
| Loans and advances to customers | 96,399 | | 42,616 | | 3,767 | | 6,531 | | 24,892 | | 1,003,465 | |
| Customer deposits | 110,162 | | 29,578 | | 6,478 | | 1,508 | | 16,207 | | 1,002,669 | |
| Memorandum items | | | | | | |
Gross loans and advances to customersA | 102,583 | | 43,823 | | 3,878 | | 6,608 | | 25,164 | | 981,192 | |
| Customers funds | 145,044 | | 40,098 | | 10,288 | | 1,508 | | 27,670 | | 1,127,503 | |
Customer depositsB | 90,297 | | 29,337 | | 6,478 | | 1,508 | | 16,034 | | 923,884 | |
| Mutual funds | 54,747 | | 10,761 | | 3,810 | | — | | 11,636 | | 203,618 | |
A.Excluding reverse repos.
B.Excluding repos.
The condensed income statements are as follow
| | | | | | | | | | | | | | | | | | | | |
EUR million |
| 2025 |
| Underlying income statement (condensed) | Spain | United Kingdom | Portugal | Openbank Europe | United States | Mexico |
Net interest incomeA | 7,305 | 5,008 | | 1,346 | | 4,685 | | 5,888 | | 4,554 | |
| Net fee income | 3,022 | | 369 | | 506 | | 804 | | 1,328 | | 1,454 | |
Gains (losses) on financial transactionsB | 841 | | (100) | | 70 | | (39) | | 547 | | 427 | |
Other operating incomeC | 720 | | (245) | | 33 | | 474 | | 165 | | (130) | |
| Total income | 11,887 | | 5,032 | | 1,956 | | 5,925 | | 7,929 | | 6,305 | |
| Total Costs | (4,465) | | (2,937) | | (544) | | (2,899) | | (3,890) | | (2,730) | |
Net operating incomeD | 7,423 | | 2,095 | | 1,412 | | 3,026 | | 4,039 | | 3,575 | |
Net loan-loss provisionsE | (1,142) | | (177) | | 8 | | (1,363) | | (2,244) | | (1,239) | |
Other gains (losses) and provisionsF | (198) | | (124) | | (3) | | (266) | | (47) | | — | |
| Operating profit/(loss) before tax | 6,083 | | 1,794 | | 1,417 | | 1,398 | | 1,748 | | 2,336 | |
| Tax on profit | (1,811) | | (486) | | (405) | | (322) | | (207) | | (627) | |
| Profit/(loss) from continuing operations | 4,272 | | 1,307 | | 1,011 | | 1,076 | | 1,541 | | 1,709 | |
| Net profit/(loss) from discontinued operations | — | | — | | — | | — | | — | | — | |
| Consolidated profit/(loss) | 4,272 | | 1,307 | | 1,011 | | 1,076 | | 1,541 | | 1,709 | |
| Non-controlling interests | — | | — | | (2) | | (304) | | — | | (4) | |
| Attributable profit/(loss) to the parent | 4,272 | | 1,307 | | 1,010 | | 772 | | 1,541 | | 1,705 | |
| | | | | | | | | | | | | | | | | | | | |
EUR million |
| 2025 |
| Underlying income statement (condensed) | Brazil | Chile | Argentina | Corporate Centre | Rest of the Group | Total Group |
Net interest incomeA | 9,380 | 1,917 | | 1,727 | | (490) | | 1,080 | | 42,401 | |
| Net fee income | 3,193 | | 582 | | 788 | | (27) | | 908 | | 12,928 | |
Gains (losses) on financial transactionsB | (64) | | 230 | | 229 | | (82) | | 296 | | 2,354 | |
Other operating incomeC | 93 | | (15) | | (510) | | 14 | | 25 | | 625 | |
| Total income | 12,602 | | 2,714 | | 2,235 | | (585) | | 2,309 | | 58,308 | |
| Total Costs | (4,957) | | (919) | | (978) | | (417) | | (1,676) | | (26,410) | |
Net operating incomeD | 7,645 | | 1,795 | | 1,257 | | (1,003) | | 634 | | 31,898 | |
Net loan-loss provisionsE | (4,409) | | (531) | | (574) | | (198) | | (260) | | (12,128) | |
Other gains (losses) and provisionsF | (11) | | (32) | | (33) | | (75) | | (45) | | (834) | |
| Operating profit/(loss) before tax | 3,224 | | 1,232 | | 650 | | (1,275) | | 328 | | 18,936 | |
| Tax on profit | (836) | | (189) | | (216) | | 190 | | (29) | | (4,939) | |
| Profit/(loss) from continuing operations | 2,388 | | 1,043 | | 434 | | (1,085) | | 300 | | 13,997 | |
| Net profit/(loss) from discontinued operations | — | | — | | — | | — | | — | | — | |
| Consolidated profit/(loss) | 2,388 | | 1,043 | | 434 | | (1,085) | | 300 | | 13,997 | |
| Non-controlling interests | (220) | | (314) | | (1) | | — | | 1 | | (845) | |
| Attributable profit/(loss) to the parent | 2,168 | | 729 | | 433 | | (1,085) | | 300 | | 13,152 | |
A.Net interest income includes the net amount of the profit and loss account items 'Interest income' and 'Interest expense'. It is presented this way because it is how it is presented to the main operational decision maker.
B.Gains (losses) on financial transactions includes the following line items in the statutory income statement, which are presented net for internal reporting and management reporting purposes: Gain or losses on financial assets and liabilities not measured at fair value through profit or loss, net, Gain or losses on financial assets and liabilities held for trading, net, Gains or losses on non-trading financial assets and liabilities mandatorily at fair value through profit or loss, net, Gain or losses on financial assets and liabilities measured at fair value through profit or loss, net, Gain or losses from hedge accounting, net and Exchange differences, net.
C.Other operating income includes the following line items in the statutory income statement, which are presented net for internal reporting and management reporting purposes: Dividend income; Income from companies accounted for using the equity method, Other operating income, Other operating expenses, Income from assets under insurance or reinsurance contracts and Expenses from liabilities under insurance or reinsurance contracts.
D.Net Operating Income is used for the Group’s internal reporting and management reporting purposes but is not a line item in the statutory consolidated income statement.
E.Net loan-loss provisions refers to Impairment or reversal of impairment at financial assets not measured at fair value through profit or loss and net gains and losses from changes line item in the statutory income statement. Additionally, includes an addition of EUR 50 million mainly corresponding to the results by commitments and contingent risks included in the line provisions or reversal of provisions, net of the statutory income statement.
F.Other gains (losses) and provisions includes the following line items in the statutory income statement, which are presented net for internal reporting and management reporting purposes: Provisions or reversal of provisions except an addition of EUR 50 million mainly corresponding to the results by commitments and contingent risks; Impairment of investments in joint ventures and associates, net; Impairment on non-financial assets, net; Gains or losses on non-financial assets, net; Negative goodwill recognized in results and Gains or losses on non-current assets held for sale not classified as discontinued operations.
| | | | | | | | | | | | | | | | | | | | |
EUR million |
| 2024 |
| Underlying income statement (condensed) | Spain | United Kingdom | Portugal | Openbank Europe | United States | Mexico |
Net interest incomeA | 7,256 | 4,950 | | 1,548 | | 4,361 | | 5,693 | | 4,631 | |
| Net fee income | 2,867 | | 283 | | 467 | | 902 | | 1,152 | | 1,385 | |
Gains (losses) on financial transactionsB | 1,100 | | (18) | | 45 | | (24) | | 371 | | 396 | |
Other operating incomeC | 358 | | (203) | | 5 | | 405 | | 365 | | (133) | |
| Total income | 11,580 | | 5,011 | | 2,065 | | 5,644 | | 7,580 | | 6,278 | |
| Total Costs | (4,509) | | (3,050) | | (574) | | (2,848) | | (3,965) | | (2,727) | |
Net operating incomeD | 7,071 | | 1,962 | | 1,492 | | 2,796 | | 3,615 | | 3,551 | |
Net loan-loss provisionsE | (1,259) | | (64) | | (11) | | (1,209) | | (2,507) | | (1,277) | |
Other gains (losses) and provisionsF | (372) | | (104) | | — | | (456) | | (55) | | — | |
| Operating profit/(loss) before tax | 5,440 | | 1,794 | | 1,481 | | 1,131 | | 1,053 | | 2,274 | |
| Tax on profit | (1,678) | | (488) | | (478) | | (255) | | 56 | | (598) | |
| Profit/(loss) from continuing operations | 3,763 | | 1,306 | | 1,003 | | 876 | | 1,109 | | 1,676 | |
| Net profit/(loss) from discontinued operations | — | | — | | — | | — | | — | | — | |
| Consolidated profit/(loss) | 3,763 | | 1,306 | | 1,003 | | 876 | | 1,109 | | 1,676 | |
| Non-controlling interests | — | | — | | (2) | | (234) | | — | | (5) | |
| Attributable profit/(loss) to the parent | 3,762 | | 1,306 | | 1,001 | | 642 | | 1,109 | | 1,671 | |
| | | | | | | | | | | | | | | | | | | | |
EUR million |
| 2024 |
| Underlying income statement (condensed) | Brazil | Chile | Argentina | Corporate Centre | Rest of the Group | Total Group |
Net interest incomeA | 10,121 | 1,822 | | 2,919 | | (308) | | 832 | | 43,824 | |
| Net fee income | 3,414 | | 551 | | 602 | | (11) | | 722 | | 12,335 | |
Gains (losses) on financial transactionsB | (37) | | 238 | | 229 | | (408) | | 326 | | 2,216 | |
Other operating incomeC | 39 | | (18) | | (1,263) | | 47 | | 9 | | (391) | |
| Total income | 13,536 | | 2,592 | | 2,487 | | (680) | | 1,889 | | 57,984 | |
| Total Costs | (5,219) | | (942) | | (1,337) | | (540) | | (1,643) | | (27,354) | |
Net operating incomeD | 8,318 | | 1,650 | | 1,150 | | (1,220) | | 246 | | 30,630 | |
Net loan-loss provisionsE | (4,487) | | (497) | | (284) | | 3 | | (230) | | (11,822) | |
Other gains (losses) and provisionsF | — | | (42) | | (39) | | (99) | | (263) | | (1,431) | |
| Operating profit/(loss) before tax | 3,830 | | 1,111 | | 827 | | (1,317) | | (248) | | 17,377 | |
| Tax on profit | (1,165) | | (211) | | (161) | | 162 | | (37) | | (4,853) | |
| Profit/(loss) from continuing operations | 2,665 | | 899 | | 666 | | (1,155) | | (285) | | 12,524 | |
| Net profit/(loss) from discontinued operations | — | | — | | — | | — | | — | | — | |
| Consolidated profit/(loss) | 2,665 | | 899 | | 666 | | (1,155) | | (285) | | 12,524 | |
| Non-controlling interests | (243) | | (271) | | (1) | | 1 | | 5 | | (750) | |
| Attributable profit/(loss) to the parent | 2,422 | | 629 | | 665 | | (1,154) | | (280) | | 11,774 | |
A.Net interest income includes the net amount of the profit and loss account items 'Interest income' and 'Interest expense'. It is presented this way because it is how it is presented to the main operational decision maker.
B.Gains (losses) on financial transactions includes the following line items in the statutory income statement, which are presented net for internal reporting and management reporting purposes: Gain or losses on financial assets and liabilities not measured at fair value through profit or loss, net, Gain or losses on financial assets and liabilities held for trading, net, Gains or losses on non-trading financial assets and liabilities mandatorily at fair value through profit or loss, net, Gain or losses on financial assets and liabilities measured at fair value through profit or loss, net, Gain or losses from hedge accounting, net and Exchange differences, net.
C.Other operating income includes the following line items in the statutory income statement, which are presented net for internal reporting and management reporting purposes: Dividend income; Income from companies accounted for using the equity method, Other operating income, Other operating expenses, Income from assets under insurance or reinsurance contracts and Expenses from liabilities under insurance or reinsurance contracts.
D.Net Operating Income is used for the Group’s internal reporting and management reporting purposes but is not a line item in the statutory consolidated income statement.
E.Net loan-loss provisions refers to Impairment or reversal of impairment at financial assets not measured at fair value through profit or loss and net gains and losses from changes line item in the statutory income statement. Additionally, includes an addition of EUR 47 million mainly corresponding to the results by commitments and contingent risks included in the line provisions or reversal of provisions, net of the statutory income statement.
F.Other gains (losses) and provisions includes the following line items in the statutory income statement, which are presented net for internal reporting and management reporting purposes: Provisions or reversal of provisions except an addition of EUR 47 million mainly corresponding to the results by commitments and contingent risks; Impairment of investments in joint ventures and associates, net; Impairment on non-financial assets, net; Gains or losses on non-financial assets, net; Negative goodwill recognized in results and Gains or losses on non-current assets held for sale not classified as discontinued operations.
| | | | | | | | | | | | | | | | | | | | |
EUR million |
| 2023 |
| Underlying income statement (condensed) | Spain | United Kingdom | Portugal | Openbank Europe | United States | Mexico |
Net interest incomeA | 6,641 | 5,152 | | 1,465 | | 4,193 | | 5,742 | | 4,408 | |
| Net fee income | 2,699 | | 338 | | 464 | | 796 | | 766 | | 1,374 | |
Gains (losses) on financial transactionsB | 688 | | 29 | | 33 | | 117 | | 294 | | 211 | |
Other operating incomeC | (190) | | (162) | | (17) | | 375 | | 406 | | (94) | |
| Total income | 9,837 | | 5,358 | | 1,944 | | 5,481 | | 7,209 | | 5,899 | |
| Total Costs | (4,815) | | (2,928) | | (567) | | (2,751) | | (3,707) | | (2,645) | |
Net operating incomeD | 5,022 | | 2,430 | | 1,378 | | 2,730 | | 3,502 | | 3,254 | |
Net loan-loss provisionsE | (1,522) | | (247) | | (77) | | (792) | | (2,593) | | (1,135) | |
Other gains (losses) and provisionsF | (100) | | (75) | | 14 | | 82 | | (46) | | — | |
| Operating profit/(loss) before tax | 3,399 | | 2,107 | | 1,314 | | 2,019 | | 863 | | 2,119 | |
| Tax on profit | (1,029) | | (563) | | (416) | | (493) | | 69 | | (541) | |
| Profit/(loss) from continuing operations | 2,371 | | 1,545 | | 898 | | 1,526 | | 932 | | 1,577 | |
| Net profit/(loss) from discontinued operations | — | | — | | — | | — | | — | | — | |
| Consolidated profit/(loss) | 2,371 | | 1,545 | | 898 | | 1,526 | | 932 | | 1,577 | |
| Non-controlling interests | — | | — | | (2) | | (327) | | — | | (17) | |
| Attributable profit/(loss) to the parent | 2,371 | | 1,545 | | 896 | | 1,199 | | 932 | | 1,560 | |
| | | | | | | | | | | | | | | | | | | | |
EUR million |
| 2023 |
| Underlying income statement (condensed) | Brazil | Chile | Argentina | Corporate Centre | Rest of the Group | Total Group |
Net interest incomeA | 9,116 | 1,383 | | 1,879 | | (41) | | 780 | | 40,718 | |
| Net fee income | 3,462 | | 572 | | 396 | | (13) | | 615 | | 11,468 | |
Gains (losses) on financial transactionsB | 483 | | 320 | | 341 | | (302) | | 353 | | 2,566 | |
Other operating incomeC | 43 | | 11 | | (1,071) | | (86) | | (26) | | (812) | |
| Total income | 13,104 | | 2,285 | | 1,544 | | (442) | | 1,721 | | 53,940 | |
| Total Costs | (5,430) | | (953) | | (831) | | (460) | | (1,415) | | (26,501) | |
Net operating incomeD | 7,674 | | 1,332 | | 713 | | (901) | | 306 | | 27,439 | |
Net loan-loss provisionsE | (4,701) | | (365) | | (150) | | 2 | | (203) | | (11,784) | |
Other gains (losses) and provisionsF | (62) | | (16) | | (58) | | (62) | | (25) | | (350) | |
| Operating profit/(loss) before tax | 2,911 | | 951 | | 505 | | (961) | | 77 | | 15,305 | |
| Tax on profit | (776) | | (135) | | (117) | | (36) | | (75) | | (4,112) | |
| Profit/(loss) from continuing operations | 2,135 | | 816 | | 388 | | (998) | | 2 | | 11,193 | |
| Net profit/(loss) from discontinued operations | — | | — | | — | | — | | — | | — | |
| Consolidated profit/(loss) | 2,135 | | 816 | | 388 | | (998) | | 2 | | 11,193 | |
| Non-controlling interests | (215) | | (234) | | (2) | | — | | 7 | | (791) | |
| Attributable profit/(loss) to the parent | 1,921 | | 582 | | 386 | | (998) | | 9 | | 10,402 | |
A.Net interest income includes the net amount of the profit and loss account items 'Interest income' and 'Interest expense'. It is presented this way because it is how it is presented to the main operational decision maker.
B.Gains (losses) on financial transactions includes the following line items in the statutory income statement, which are presented net for internal reporting and management reporting purposes: Gain or losses on financial assets and liabilities not measured at fair value through profit or loss, net, Gain or losses on financial assets and liabilities held for trading, net, Gains or losses on non-trading financial assets and liabilities mandatorily at fair value through profit or loss, net, Gain or losses on financial assets and liabilities measured at fair value through profit or loss, net, Gain or losses from hedge accounting, net and Exchange differences, net.
C.Other operating income includes the following line items in the statutory income statement, which are presented net for internal reporting and management reporting purposes: Dividend income; Income from companies accounted for using the equity method, Other operating income, Other operating expenses, Income from assets under insurance or reinsurance contracts and Expenses from liabilities under insurance or reinsurance contracts.
D.Net Operating Income is used for the Group’s internal reporting and management reporting purposes but is not a line item in the statutory consolidated income statement.
E.Net loan-loss provisions refers to Impairment or reversal of impairment at financial assets not measured at fair value through profit or loss and net gains and losses from changes line item in the statutory income statement. Additionally, includes a release of EUR 38 million mainly corresponding to the results by commitments and contingent risks included in the line provisions or reversal of provisions, net of the statutory income statement.
F.Other gains (losses) and provisions includes the following line items in the statutory income statement, which are presented net for internal reporting and management reporting purposes: Provisions or reversal of provisions except a release of EUR 38 million mainly corresponding to the results by commitments and contingent risks; Impairment of investments in joint ventures and associates, net; Impairment on non-financial assets, net; Gains or losses on non-financial assets, net; Negative goodwill recognized in results and Gains or losses on non-current assets held for sale not classified as discontinued operations.
c) Reconciliations of reportable segment results
The tables below reconcile the statutory basis results to the underlying results for each of the periods presented as required by IFRS 8. For the purposes of these reconciliations, all material reconciling items are separately identified and described.
Grupo Santander assets and liabilities for management reporting purposes do not differ from the statutory reported figures and therefore are not reconciled.
| | | | | | | | | | | | | | |
| EUR million |
| 2025 |
| Reconciliation of statutory results to underlying results | Statutory results | Adjustments related to the Poland disposal | Other adjustments | Underlying results |
Net interest incomeA | 42,348 | | 53 | | — | | 42,401 | |
| Net fee income | 12,976 | | (48) | | — | | 12,928 | |
Gains (losses) on financial transactionsB | 2,362 | | (8) | | — | | 2,354 | |
Other operating incomeC | 625 | | — | | — | | 625 | |
| Total income | 58,311 | | (3) | | — | | 58,308 | |
| Administrative expenses, depreciation and amortisation | (24,779) | | 22 | | — | | (24,757) | |
Other operating costs
| 0 | | 0 | | (1,653) | | (1,653) | |
Net operating incomeD | 33,532 | | 19 | | (1,653) | | 31,898 | |
Net loan-loss provisionsE | (12,596) | | 1 | | 467 | | (12,128) | |
Other gains (losses) and provisionsF | (2,255) | | (1) | | 1,422 | | (834) | |
| Operating profit/(loss) before tax | 18,681 | | 19 | | 236 | | 18,936 | |
| Tax on profit | (4,723) | | (6) | | (210) | | (4,939) | |
| Adjusted profit for the year from continuing operations | 13,958 | | 13 | | 26 | | 13,997 | |
| Profit from discontinued operations (net) | 1,542 | | (1,542) | | — | | — | |
| Consolidated profit/(loss) | 15,500 | | (1,529) | | 26 | | 13,997 | |
| Non-controlling interests | (1,399) | | 580 | | (26) | | (845) | |
| Attributable profit/(loss) to the parent | 14,101 | | (949) | | — | | 13,152 | |
A.Net interest income includes the net amount of the profit and loss account items 'Interest income' and 'Interest expense'. It is presented this way because it is how it is presented to the main operational decision maker.
B.Gains (losses) on financial transactions includes the following line items in the statutory income statement, which are presented net for internal reporting and management reporting purposes: Gain or losses on financial assets and liabilities not measured at fair value through profit or loss, net, Gain or losses on financial assets and liabilities held for trading, net, Gains or losses on non-trading financial assets and liabilities mandatorily at fair value through profit or loss, net, Gain or losses on financial assets and liabilities measured at fair value through profit or loss, net, Gain or losses from hedge accounting, net and Exchange differences, net.
C.Other operating income includes the following line items in the statutory income statement, which are presented net for internal reporting and management reporting purposes: Dividend income; Income from companies accounted for using the equity method, Other operating income, Other operating expenses, Income from assets under insurance or reinsurance contracts and Expenses from liabilities under insurance or reinsurance contracts.
D.Net Operating Income is used for the Group’s internal reporting and management reporting purposes but is not a line item in the statutory consolidated income statement.
E.Net loan-loss provisions refers to Impairment or reversal of impairment at financial assets not measured at fair value through profit or loss and net gains and losses from changes line item in the statutory income statement. Additionally, includes an addition of EUR 50 million mainly corresponding to the results by commitments and contingent risks includes in the line of the statutory income statement of provisions or reversal of provisions.
F.Other gains (losses) and provisions includes the following line items in the statutory income statement, which are presented net for internal reporting and management reporting purposes: Provisions or reversal of provisions except for an addition of EUR 50 million mainly corresponding to results from commitments and contingent risks; Impairment of investments in joint ventures and associates, net; Impairment on non-financial assets, net; Gains or losses on non-financial assets, net; Negative goodwill recognized in results and Gains or losses on non-current assets held for sale not classified as discontinued operations.
To better understand the business trends, we reclassified certain items under some headings of the underlying income statement. These reclassifications between the statutory and underlying income statements include:
•In the statutory income statement, results associated with the business subject to the Poland disposal are reported in the 'profit/(loss) after tax from discontinued operations' line item. However, in the underlying income statement, the results related to the business subject to the Poland disposal are excluded.
•Certain charges recorded in the statutory account under the line items that comprise 'other gains (losses) and provisions' are presented in the underlying income statement under the 'total costs' line item. These are mainly recurring operating charges, primarily related to labour and legal processes, and exclude EUR 620 million of restructuring charges and EUR 214 million of provisions for potential complaints related to motor finance dealer commissions.
•A capital gain in Q2 2025 of EUR 231 million from the sale of Santander’s remaining 30.5% stake in CACEIS was completely offset by a charge of EUR 467 million in Q2 2025 (EUR 231 million net of tax and minority interests), which strengthens the balance sheet after having updated macroeconomic parameters in Brazil’s credit provisioning models in 'Other gains (losses) and provisions'.
| | | | | | | | | | | | | | |
| EUR million |
| 2024 |
| Reconciliation of statutory results to underlying results | Statutory results | Adjustments related to the Poland disposal | Other adjustments | Underlying results |
Net interest incomeA | 43,787 | | 37 | | | 43,824 | |
| Net fee income | 12,376 | | (41) | | | 12,335 | |
Gains (losses) on financial transactionsB | 2,211 | | 5 | | | 2,216 | |
Other operating incomeC | (331) | | (60) | | | (391) | |
| Total income | 58,043 | | (59) | | — | | 57,984 | |
| Administrative expenses, depreciation and amortisation | (25,215) | | 80 | | — | | (25,135) | |
| Other operating costs | — | | — | | (2,219) | | (2,219) | |
Net operating incomeD | 32,828 | | 21 | | (2,219) | | 30,630 | |
Net loan-loss provisionsE | (12,183) | | 9 | | 352 | | (11,822) | |
Other gains (losses) and provisionsF | (3,298) | | — | | 1,867 | | (1,431) | |
| Operating profit/(loss) before tax | 17,347 | | 30 | | — | | 17,377 | |
| Tax on profit | (4,844) | | (9) | | — | | (4,853) | |
| Adjusted profit for the year from continuing operations | 12,503 | | 21 | | — | | 12,524 | |
| Profit from discontinued operations (net) | 1,241 | | (1,241) | | — | | — | |
| Consolidated profit/(loss) | 13,744 | | (1,220) | | — | | 12,524 | |
| Non-controlling interests | (1,170) | | 420 | | — | | (750) | |
| Attributable profit/(loss) to the parent | 12,574 | | (800) | | — | | 11,774 | |
A.Net interest income includes the net amount of the profit and loss account items 'Interest income' and 'Interest expense'. It is presented this way because it is how it is presented to the main operational decision maker.
B.Gains (losses) on financial transactions includes the following line items in the statutory income statement, which are presented net for internal reporting and management reporting purposes: Gain or losses on financial assets and liabilities not measured at fair value through profit or loss, net, Gain or losses on financial assets and liabilities held for trading, net, Gains or losses on non-trading financial assets and liabilities mandatorily at fair value through profit or loss, net, Gain or losses on financial assets and liabilities measured at fair value through profit or loss, net, Gain or losses from hedge accounting, net and Exchange differences, net.
C.Other operating income includes the following line items in the statutory income statement, which are presented net for internal reporting and management reporting purposes: Dividend income; Income from companies accounted for using the equity method, Other operating income, Other operating expenses, Income from assets under insurance or reinsurance contracts and Expenses from liabilities under insurance or reinsurance contracts.
D.Net Operating Income is used for the Group’s internal reporting and management reporting purposes but is not a line item in the statutory consolidated income statement.
E.Net loan-loss provisions refers to Impairment or reversal of impairment at financial assets not measured at fair value through profit or loss and net gains and losses from changes line item in the statutory income statement. Additionally, includes an addition of EUR 47 million mainly corresponding to the results by commitments and contingent risks includes in the line of the statutory income statement of provisions or reversal of provisions.
F.Other gains (losses) and provisions includes the following line items in the statutory income statement, which are presented net for internal reporting and management reporting purposes: Provisions or reversal of provisions except for an addition of EUR 47 million mainly corresponding to results from commitments and contingent risks; Impairment of investments in joint ventures and associates, net; Impairment on non-financial assets, net; Gains or losses on non-financial assets, net; Negative goodwill recognized in results and Gains or losses on non-current assets held for sale not classified as discontinued operations
To better understand the business trends, we reclassified certain items under some headings of the underlying income statement. These reclassifications between the statutory and underlying income statements include:
•In the statutory income statement, results associated with the business subject to the Poland disposal are reported in the 'profit/(loss) after tax from discontinued operations' line item. However, in the underlying income statement, the results related to the business subject to the Poland disposal are excluded.
•Certain charges recorded in the statutory account under the line items that comprise 'other gains (losses) and provisions' are presented in the underlying income statement under the 'total costs' line item. These are mainly recurring operating charges, primarily related to labour and legal processes, and exclude EUR 835 million of restructuring charges, EUR 353 million of provisions for potential complaints related to motor finance dealer commissions and EUR 243 million from charges related to the discontinuation of our merchant platform in Germany and Superdigital in Latin America.
•The recognition of provisions to strengthen the balance sheet in Brazil, amounted to EUR 352 million gross in Q2 2024 (EUR 174 million net of tax and non-controlling interests) were compensated with gains on Pluxee in Brazil in 'Other gains (losses) and provisions'.
| | | | | | | | | | | | | | |
| EUR million |
| 2023 |
| Reconciliation of statutory results to underlying results | Statutory results | Adjustments related to the Poland disposal | Other adjustments | Underlying results |
Net interest incomeA | 40,650 | | 68 | | — | | 40,718 | |
| Net fee income | 11,495 | | (27) | | — | | 11,468 | |
Gains (losses) on financial transactionsB | 2,565 | | 1 | | — | | 2,566 | |
Other operating incomeC | (759) | | (53) | | — | | (812) | |
| Total income | 53,951 | | (11) | | — | | 53,940 | |
| Administrative expenses, depreciation and amortisation | (24,684) | | 69 | | — | | (24,615) | |
| Other operating costs | 0 | | — | | (1,886) | | (1,886) | |
Net operating incomeD | 29,267 | | 58 | | (1,886) | | 27,439 | |
Net loan-loss provisionsE | (12,260) | | 2 | | 474 | | (11,784) | |
Other gains (losses) and provisionsF | (2,002) | | 1 | | 1,651 | | (350) | |
| Operating profit/(loss) before tax | 15,005 | | 61 | | 239 | | 15,305 | |
| Tax on profit | (3,880) | | (19) | | (213) | | (4,112) | |
| Adjusted profit for the year from continuing operations | 11,125 | | 42 | | 26 | | 11,193 | |
| Profit from discontinued operations (net) | 1,058 | | (1,058) | | — | | — | |
| Consolidated profit/(loss) | 12,183 | | (1,016) | | 26 | | 11,193 | |
| Non-controlling interests | (1,107) | | 342 | | (26) | | (791) | |
| Attributable profit/(loss) to the parent | 11,076 | | (674) | | — | | 10,402 | |
A.Net interest income includes the net amount of the profit and loss account items 'Interest income' and 'Interest expense'. It is presented this way because it is how it is presented to the main operational decision maker.
B.Gains (losses) on financial transactions includes the following line items in the statutory income statement, which are presented net for internal reporting and management reporting purposes: Gain or losses on financial assets and liabilities not measured at fair value through profit or loss, net, Gain or losses on financial assets and liabilities held for trading, net, Gains or losses on non-trading financial assets and liabilities mandatorily at fair value through profit or loss, net, Gain or losses on financial assets and liabilities measured at fair value through profit or loss, net, Gain or losses from hedge accounting, net and Exchange differences, net.
C.Other operating income includes the following line items in the statutory income statement, which are presented net for internal reporting and management reporting purposes: Dividend income; Income from companies accounted for using the equity method, Other operating income, Other operating expenses, Income from assets under insurance or reinsurance contracts and Expenses from liabilities under insurance or reinsurance contracts.
D.Net Operating Income is used for the Group’s internal reporting and management reporting purposes but is not a line item in the statutory consolidated income statement.
E.Net loan-loss provisions refers to Impairment or reversal of impairment at financial assets not measured at fair value through profit or loss and net gains and losses from changes line item in the statutory income statement. Additionally, includes a release of EUR 38 million mainly corresponding to the results by commitments and contingent risks includes in the line of the statutory income statement of provisions or reversal of provisions.
F.Other gains (losses) and provisions includes the following line items in the statutory income statement, which are presented net for internal reporting and management reporting purposes: Provisions or reversal of provisions except a release of EUR 38 million mainly corresponding to results from commitments and contingent risks; Impairment of investments in joint ventures and associates, net; Impairment on non-financial assets, net; Gains or losses on non-financial assets, net; Negative goodwill recognized in results and Gains or losses on non-current assets held for sale not classified as discontinued operations.
To better understand the business trends, we reclassified certain items under some headings of the underlying income statement. These reclassifications between the statutory and underlying income statements include:
•In the statutory income statement, results associated with the business subject to the Poland disposal are reported in the 'profit/(loss) after tax from discontinued operations' line item. However, in the underlying income statement, the results related to the business subject to the Poland disposal are excluded.
• Certain charges recorded in the statutory account under the line items that comprise 'other gains (losses) and provisions' are presented in the underlying income statement under the 'total costs' line item. These are mainly recurring operating charges, primarily related to labour and legal processes, and exclude EUR 385 million of restructuring charges.
•Provisions to strengthen the balance sheet in Brazil in Q1 2023, totalling EUR 235 million, net of tax and non-controlling interests (EUR 474 million recorded in net loan-loss provisions, EUR 213 million positive tax impact and EUR 26 million in non-controlling interests), were more than offset by gains of EUR 270 million resulting primarily from the divestments of stakes in Brazil and Openbank in 'Other gains (losses) and provisions'.
53. Related parties
The parties related to the Group are deemed to include, in addition to its associates and joint ventures, the Bank's key management personnel (the members of its board of directors and the senior management, together with their close family members) and the entities over which the key management personnel may exercise significant influence or control.
Following below is the balance sheet balances and amounts of the Group's income statement corresponding to operations with the parties related to it, distinguishing between associates and joint ventures, members of the Bank's board of directors, the Bank's senior management, and other related parties. Related-party transactions were made on terms equivalent to those that prevail in arm's-length transactions or, when this was not the case, the related compensation in kind was recognized.
| | | | | | | | | | | | | | |
| EUR million |
| 2025 |
| Associates and joint ventures | Members of the board of directors | Senior Management | Other related parties |
| Assets | 10,491 | | — | | 18 | | 295 | |
| Cash, cash balances at central banks and other deposits on demand | 2 | | — | | — | | — | |
| Loans and advances: credit institutions | 286 | | — | | — | | — | |
| Loans and advances: customers | 9,835 | | — | | 18 | | 274 | |
| Debt securities | 160 | | — | | — | | 2 | |
| Others | 208 | | — | | — | | 19 | |
| | | | |
| Liabilities | 2,978 | | 10 | | 5 | | 376 | |
| Financial liabilities: credit institutions | 26 | | — | | — | | — | |
| Financial liabilities: customers | 2,761 | | 10 | | 5 | | 376 | |
| Marketable debt securities | — | | — | | — | | — | |
| Others | 191 | | — | | — | | — | |
| | | | |
| Income statement | 1,724 | | — | | — | | 7 | |
| Interest income | 441 | | — | | — | | 8 | |
| Interest expense | (119) | | — | | — | | (4) | |
| Gains/losses on financial assets and liabilities and others | (53) | | — | | — | | — | |
| Commission income | 1,546 | | — | | — | | 4 | |
| Commission expense | (91) | | — | | — | | (1) | |
| | | | |
| Other | 3,732 | | 4 | | 3 | | 189 | |
| Financial guarantees granted and Others | 11 | | 3 | | 2 | | 61 | |
| Loan commitments and Other commitments granted | 335 | | 1 | | 1 | | 38 | |
| Derivative financial instruments | 3,386 | | — | | — | | 90 | |
| | | | | | | | | | | | | | |
| EUR million |
| 2024 |
| Associates and joint ventures | Members of the board of directors | Senior Management | Other related parties |
| Assets | 10,783 | | — | | 14 | | 226 | |
| Cash, cash balances at central banks and other deposits on demand | 163 | | — | | — | | — | |
| Loans and advances: credit institutions | 407 | | — | | — | | — | |
| Loans and advances: customers | 9,750 | | — | | 14 | | 221 | |
| Debt securities | 229 | | — | | — | | 5 | |
| Others | 234 | | — | | — | | — | |
| | | | |
| Liabilities | 3,243 | | 9 | | 7 | | 292 | |
| Financial liabilities: credit institutions | 228 | | — | | — | | — | |
| Financial liabilities: customers | 2,810 | | 9 | | 7 | | 292 | |
| Marketable debt securities | — | | — | | — | | — | |
| Others | 205 | | — | | — | | — | |
| | | | |
| Income statement | 1,776 | | — | | — | | 4 | |
| Interest income | 508 | | — | | — | | 9 | |
| Interest expense | (153) | | — | | — | | (5) | |
| Gains/losses on financial assets and liabilities and others | (11) | | — | | — | | — | |
| Commission income | 1,535 | | — | | — | | 1 | |
| Commission expense | (103) | | — | | — | | (1) | |
| | | | |
| Other | 4,712 | | 4 | | 3 | | 216 | |
| Financial guarantees granted and Others | 18 | | 3 | | 2 | | 64 | |
| Loan commitments and Other commitments granted | 317 | | 1 | | 1 | | 20 | |
| Derivative financial instruments | 4,377 | | — | | — | | 132 | |
| | | | | | | | | | | | | | |
| EUR million |
| 2023 |
| Associates and joint ventures | Members of the board of directors | Senior Management | Other related parties |
| Assets | 10,497 | | — | | 12 | | 186 | |
| Cash, cash balances at central banks and other deposits on demand | 154 | | — | | — | | — | |
| Loans and advances: credit institutions | 405 | | — | | — | | — | |
| Loans and advances: customers | 9,275 | | — | | 12 | | 185 | |
| Debt securities | 391 | | — | | — | | 1 | |
| Others | 272 | | — | | — | | — | |
| | | | |
| Liabilities | 2,480 | | 14 | | 5 | | 150 | |
| Financial liabilities: credit institutions | 463 | | — | | — | | — | |
| Financial liabilities: customers | 1,727 | | 14 | | 5 | | 150 | |
| Marketable debt securities | — | | — | | — | | — | |
| Others | 290 | | — | | — | | — | |
| | | | |
| Income statement | 1,698 | | — | | — | | 11 | |
| Interest income | 427 | | — | | — | | 9 | |
| Interest expense | (149) | | — | | — | | (1) | |
| Gains/losses on financial assets and liabilities and others | 43 | | — | | — | | — | |
| Commission income | 1,499 | | — | | — | | 3 | |
| Commission expense | (122) | | — | | — | | — | |
| | | | |
| Other | 4,189 | | 3 | | 2 | | 1,094 | |
| Financial guarantees granted and Others | 10 | | 2 | | 1 | | 861 | |
| Loan commitments and Other commitments granted | 274 | | 1 | | 1 | | 9 | |
| Derivative financial instruments | 3,905 | | — | | — | | 224 | |
The remaining required information is detailed in notes 5 and 46.c.
54. Risk management
a) Risk principles and culture
The principles on which Grupo Santander's risk management and control are based are detailed below. They take into account regulatory requirements, best market practices and are mandatory:
1.All employees are responsible for risk management. They must understand the risks arising from their activities and take ownership for managing them.
2.Senior management involvement. Through conduct, actions and communications, senior management promotes consistent risk management, fosters our risk culture, and oversees that the risk profile remains within the appetite set.
3.Independence: Risk management and control functions operate independently according to our three-lines-of-defence model, with clearly defined roles and responsibilities.
4.Holistic, forward-looking approach: We take a comprehensive approach to risk management and control that extends to all businesses and risk types that could have a material impact. This approach is forward-looking and considers trends across several time horizons and scenarios.
5.Corporate oversight of subsidiaries: Banco Santander sets minimum risk management and control standards through reference documents. Subsidiaries are responsible for translating these standards into their own internal policies and procedures.
1. Key risk types
Grupo Santander's risks categorization allows effective risk management, control and reporting, and includes, among others the following risk types:
•Credit risk is the risk of loss arising from the failure of a customer or counterparty to meet its obligations to which the Santander Group has provided financing or entered into a contractual commitment, or from the deterioration of their credit quality.
•Market risk is the risk incurred as a result of the effect of changes in market factors interest rates, exchange rates, equities and commodities, among others, may have on profits or capital.
•Liquidity risk is the risk incurred because of adverse movements in the factors that determine the market value of financial instruments, such as interest rates, exchange rates, equity prices and commodities, among others.
•Structural Risk is the risk of changes in the value or margin generation of the assets or liabilities in the banking book resulting from changes in market and behavioural factors. It also includes risks associated with insurance and pension activities, as well as the risk of not having an adequate amount or quality of capital to meet internal business objectives, regulatory requirements, or market expectations.
•Capital risk, included within the scope of structural risk, is the risk that arises from the possibility of having an inadequate quantity or quality of capital to meet internal business objectives, regulatory requirements or market expectations.
Grupo Santander also takes into account, on an ongoing basis in its risk management, operational (includes fraud, technological, cyber, legal and conduct risks), financial crime (includes, among others, money laundering, terrorism financing, violation of international sanctions, corruption, bribery and tax evasion), model, reputational and strategic risks.
These risks may be affected by a range of factors that we identify and assess in line with regulatory requirements and industry practice, including: geopolitical developments (international conflicts, economic and monetary decisions, new regulations or trade tensions); digital and transformation initiatives linked to technological change or shifts in business models; and sustainability factors — environmental (natural and climate-related, including extreme events and resource scarcity, as well as those arising from the transition to a more sustainable economy), social (relating to people’s rights, welfare and interests) and governance, both within Grupo Santander and among our counterparties.
In particular, from an environmental and climate perspective, the relevant elements cover, on the one hand, those stemming from the physical effects of climate change and, on the other, those linked to the transition towards a more sustainable economy, including legislative and regulatory, technological or behavioural changes among economic agents.
Given the nature of its operations, the Group has no environment-related liabilities, expenses, assets or contingencies that may be material to its consolidated equity, financial situation and results.
According to market consensus and our materiality assessment, exposure in the sectors where environmental factors may have the most impact mainly relate to wholesale customers. Our management of these customers considers environmental aspects in the preliminary assessment, credit origination and the preparation and review of their credit ratings, which influence the parameters we use to calculate their probability of default (PD). Thus, we embed the most material climate factors in our assessments and in capital loss and provisions calculations.
Moreover, to cover and anticipate potential future losses from severe climate events, such as the Valencia DANA or Hurricane Milton in Florida, we have set overlays whose amount to date has not been material to the Group's total loan loss reserves.
Grupo Santander has enhanced its methodological framework to quantify and assess transition and physical risks in credit losses for climate impacts that are not specifically captured through the forward-looking component implemented under the IFRS 9 framework. We assess these risks under several scenarios published by the NGFS, which explore varying assumptions on shifts in climate policies, emissions, temperatures and physical risk impacts. We take a proportionality approach by assessing the impact on the Group’s core markets and portfolios, especially non-financial entities and mortgage products.
Regarding impact on companies’ credit quality, the model assesses the transmission of customers’ physical and transition climate risk through defined channels (sector GVA, GHG emissions, carbon price, regional GDP, or collateral valuations).
For mortgage products, climate risk appears mainly through a deterioration in collateral values, as reflected in the loan-to-value ratio, which is the main transmission channel into LGD.
These methodologies enable us to embed potential climate-event impacts on credit losses in credit risk management. Against this backdrop, we carried out both internal capital self-assessment exercises and regulatory stress tests.
In light of the above and based on the best information available at the date of these consolidated annual financial statements, we also assessed the potential additional impact of climate and environmental risks on the Group’s equity, financial situation and results in 2025. We did not identify any significant or material impacts.
2. Risk and compliance governance
Grupo Santander robust risk and compliance governance structure allows us to conduct effective oversight in line with our risk appetite. It stands on three lines of defence, a structure of committees and strong Group-subsidiary relations, guided by our risk culture, Risk Pro.
2.1 Lines of defence
Grupo Santander model of three lines of defence effectively manages and controls risks:
•First line: formed business functions, as well as all other functions that generate risk, constitute the first line of defence. They must establish an appropriate environment to manage all risks associated with the business and support compliance with internal policies and regulation. Risk management must operate within the approved risk appetite and associated limits. The first line executes mitigation plans for risks where weaknesses are identified in its control environment.
•Second line: formed by the risk and compliance functions, independently oversees and challenges the risk management activities that the first line carries out. Its role is to help verify that we manage risks in line with the established risk appetite and to promote a strong risk culture across the organization.
•Third line: formed by Internal Audit is a permanent function, independent of any other functions or units, whose objective is to provide the Management Body and the senior management with independent assurance on the quality and effectiveness of internal control, risk management (current or emerging) and governance processes and systems, thereby helping to protect the company’s value, solvency, and reputation.
Risk, Compliance and Internal Audit are sufficiently separate and autonomous functions, with direct access to the board and its committees. The risk and compliance functions report to the risk supervision, regulation and compliance committee and the internal audit function reports to the audit committee.
2.2 Risk committee structure
The board of directors has final oversight of risk and compliance management and control to promote a sound risk culture and review and approve risk appetite and frameworks, with support from its risk, regulation and compliance committee (RSRCC) and its executive committee. The Group's risk governance keeps risk control and risk-taking areas separate.
Our governance structure also includes key roles and executive committees that strengthen oversight and support the effective performance of the control function.
The Group chief risk officer (CRO), who leads the application and execution of risk strategy and promotes proper risk culture, is in charge of overseeing all risks and challenging and advising business lines on risk management.
The Group chief compliance officer (CCO) leads the application and execution of the compliance and conduct risk strategy and reports the status of risks being monitored in order to provide the Chief Risk Officer with a comprehensive view of all risks.
The CRO and the CCO report directly to both the risk supervision, regulation and compliance committee and the board of directors.
The executive risk, risk control and compliance and conduct committees are executive committees with powers delegated from the board.
Furthermore, the executive-level committees delegate part of their responsibilities to forums and/or standing meetings to manage and control each risk type.
Their responsibilities include:
•Inform the CRO, the CCO, the risk control committee and the compliance and conduct committee if risks are being managed within risk appetite;
•Conduct regular follow-ups for each key risk type; and
•Overseeing the measures adopted to meet supervisor's and auditor's expectations.
Besides, Grupo Santander, in order to establish an adequate control environment for the management of each risk types, the risk and compliance functions have effective internal regulation to create the right environment to manage and control all risks.
Grupo Santander may introduce additional governance measures for special situations to reinforce the monitoring of all risks, with particular focus on trends in key macroeconomic indicators and liquidity, the identification of vulnerable sectors/customers, and the strengthening of cybersecurity, among other aspects. Activating these special-situations forums helps the Group address the effects of the geopolitical and macroeconomic environment with resilience.
2.3 The Group's relationship with subsidiaries
Grupo Santander subsidiaries’ risk and compliance management and control model is consistent with the frameworks approved by the Group board of directors. Subsidiaries adhere to the frameworks through their own boards and can only adapt to higher standards according to local law and regulation.
As part of Santander's aggregated risk oversight, we challenge and review subsidiaries’ internal regulations and activities. This enables us to maintain a common risk management and control model across the Group.
The risk and compliance functions support the businesses and oversee risks at both global and local levels. In addition, over the year we continued to strengthen the Group–subsidiary relationship model, leveraging our global scale to identify synergies under a common operating model and shared platforms. The model promotes process simplification and the reinforcement of control mechanisms to support the growth of our businesses.
Santander's Group–subsidiary governance model (GSGM) sets out the principles that govern the relationship between Group key roles and the subsidiaries, which helps safeguard the independence of local second lines. The CRO and CCO take part in the appointment, objectives, performance reviews and remuneration of their local counterparts, which helps confirm that they are controlling risks appropriately.
We continue to strengthen the relationship between the Group and its subsidiaries through close cooperation among our subsidiaries to develop common initiatives more efficiently, such as:
•Transformation of organizational structures, sharing benchmarks across countries and contributing to the function’s strategic vision to promote the rollout of more advanced risk-management infrastructures and practices.
•Exchange of best practices to strengthen processes and drive innovation.
•Promotion of internal talent and mobility, both geographic and functional, as well as fostering diversity within teams to reflect the diversity of the environments in which we operate.
•Developing our risk professionals, improving innovation, the quality of decisions, and fostering a global mindset is key to enhance organizational resilience and reinforcing a global mindset.
The GSGM model also applies to the Group’s global businesses. This gives us a global-local organization in which countries ultimately remain responsible for delivering the budget, the business and customer strategy, and financial management, while the global businesses lead shared initiatives through common operating models and shared technologies, improving local performance.
3. Management processes and tools
Grupo Santander has these effective risk management processes and tools:
3.1 Risk appetite and structure of limits
Risk appetite is the aggregate level and types of risk that Grupo Santander deems prudent for our business strategy, even in unforeseen circumstances. Risk appetite is governed throughout the Group by the following principles:
•Risk appetite is part of the board's duties. The board prepares the risk appetite statement (RAS) for the whole Group every year. Through a cascading-down process, each subsidiary's board also sets its own risk appetite.
•Comprehensiveness and forward-looking approach. Our appetite includes all material risks to which we are exposed and defines our target risk profile for the current and medium term, with a forward-looking view that considers stress scenarios.
•Common standards embedded in the day-to-day risk management. The Group shares the same risk appetite model, which sets common requirements for processes, metrics, governance bodies, controls and standards. This facilitates effective and traceable embedding of risk appetite into more granular management policies and limits across our subsidiaries..
•Continuous monitoring and adaptation. Risk appetite is regularly monitored, reviewed and updated to reflect changes in market conditions, regulatory requirements and supervisory expectations. Compliance with risk appetite limits is monitored on a regular basis through dedicated reporting to senior management and the board and its committees. Breaches or potential breaches are subject to predefined escalation, remediation and follow-up processes, with oversight proportionate to their materiality through senior management and the Group’s governing bodies.
•Alignment with strategy and business plans. Before approving the three-year strategic plans, annual budget, and capital and liquidity plans, the Group verifies their consistency with the limits set in the Risk Appetite Statement. We promote the alignment of strategic and business plans with our risk appetite by:
•considering the risk appetite, long-term strategic view and the risk culture when drafting strategic and business plans.
•challenging business and strategic plans against the risk appetite. Misalignments trigger a review of either the three-year strategic plan (to make sure we stay within RAS limits) or risk appetite limits, with independent governance.
•continuous monitoring of risk appetite compliance through the three lines of defence model.
The main elements underpinning Grupo Santander’s risk appetite and defining our business model are:
•a medium-low, predictable target risk profile, customer focus, internationally diversified operations and a significant market share;
•stable, recurrent earnings and shareholder remuneration, sustained by a sound base of capital, liquidity and sources of funding;
•autonomous subsidiaries that are self-sufficient in terms of capital and liquidity to safeguard their risk profiles against compromising the Group’s profile;
•an independent risk function and a senior management actively engaged in supporting a robust control environment and risk culture; and
•a conduct model that protects our customers and our Simple, Personal and Fair culture.
The risk appetite is expressed through qualitative statements and limits on metrics representative of the bank’s risk profile at present and under stress. Those metrics cover all risk types according to our corporate risk framework. Grupo Santander articulates them in five axes that provide the Bank with a holistic view of all risks it incurs in the development of its business model. These five axes are applicable to all Santander's key risk types, and comprise:
•P&L volatility: control of P&L volatility of business plan under baseline and stressed conditions (under normal and stressed conditions).
•Solvency: control of capital ratios under baseline and stressed scenarios (aligned with ICAAP).
•Liquidity: control of liquidity ratios under base and stress scenarios (aligned with ILAAP).
•Concentration: control of credit concentration on top clients, portfolios and industries.
•Non financial risk and control environment: robust control on non financial risks aimed to minimize events which could lead to financial loss, operative, technological, legal and regulatory breaches, conduct issues or reputational damage.
b) Credit risk
1. Introduction to the credit risk treatment
Grupo Santander takes a holistic view of the credit risk cycle, including the transaction, the customer and the portfolio, in order to identify, analyse, control and decide on credit risk.
Credit risk identification facilitates active and effective portfolio management and control. Grupo Santander identify and classify external and internal risk in each business to adopt any corrective or mitigating measures through:
1.1. Planning
Planning allows to set business objectives and define concrete action plans, integrating the risk appetite statement into portfolio management.
Strategic commercial plans (SCPs) are the management and control tool that the Business and Risk areas define for credit portfolios, with support from the other functions involved (Finance, Management Control, among others). They set out the commercial strategy, risk policies, and the resources and infrastructure required, providing a holistic view of portfolio management.
They also provide an up-to-date view of portfolio credit quality, enable risk measurement, support the execution of internal controls over the defined strategy, allow for periodic monitoring, and help detect material deviations or potential impacts, facilitating the adoption of corrective measures when necessary.
SCPs are aligned with subsidiaries’ risk appetite and capital objectives, as well as those of the Group, and are approved and overseen by local senior management before being reviewed and ratified at Group level.
1.2. Risk assessment and credit rating
Credit risk approval criteria focus on borrowers’ ability to meet their financial obligations. The assessment uses statistical models and an analysis of the net funds or cash flows generated by economic activity, or of regular income, to determine customers’ repayment capacity in a consistent and sustainable manner.
Some statistical credit quality assessment models feed into decision engines to deliver a credit risk assessment quickly and in a consistent, standardised way. These engines support faster and more uniform decision-making, reduce manual errors, apply the same assessment criteria to all customers, and provide traceability and support regulatory compliance. These ratings have multiple uses in risk management, including the origination process (application of limits and pre-approvals), risk monitoring, and as an input to transaction pricing.
These credit rating models may be:
•Rating: from mathematical algorithms that have a quantitative model based on balance sheet ratios or macroeconomic variables or behavioural information, and a qualitative module supplemented by the credit analyst’s expert judgement. It is used for large corporates, corporates, institutional and SME segments (with individualised treatment).
•Scoring: an automated system that assesses credit applications based on the information provided (admission scoring) or customers’ credit profiles based on their relationship with the institution (behavioural scoring). Both are complemented by other available information (for example, from external databases). The system automatically assigns each customer an individual score, which then supports the subsequent decision. It is used for individuals and small businesses with no assigned analyst.
The Group’s parameter estimation models rely on econometric models built on historical default and loss data from the portfolios. The Group uses them to calculate economic and regulatory capital, and IFRS 9 provisions, at operation, customer and portfolio level.
A rigorous governance framework covers the ongoing monitoring and continuous calibration of these models to assess their suitability, predictive power, performance and granularity, as well as compliance with credit policies.
In addition, the Group reviews ratings using the latest available financial information and other relevant data.
Grupo Santander´s limits, pre-classifications and pre-approvals processes determine the level of risk the Group can take on with each customer. Automated processes approve and monitor these decisions. Approved limits must align with expected profitability. To support this, we use profitability estimation and risk-based pricing tools that contribute to sustainable portfolio growth.
Grupo Santander applies various limits models to each segment:
•Large corporate groups are subject to a pre-classification model based on a system for measuring and monitoring economic capital. Pre-classification models express the level of risk Grupo Santander is willing to assume in transactions with customers/groups.
•In the corporate segment, for customers that meet certain predefined criteria (including internal rating and profitability), the Group applies a pre-classification model for the main products related to the customer’s recurring business. The model operates through the setting of internal nominal limits, which define the level of risk to take on with each customer based, among other factors, on their repayment capacity and leverage.
Corporate transactions that exceed certain limits or have specific features must be handled through the approval process for an ad hoc proposal.
•For individual customers and SMEs with low turnover, Grupo Santander manages large volumes of credit transactions using automated decision models that assess each case and assign a limit per customer and transaction.
1.3. Scenario analysis
Grupo Santander´s scenario analyses determine the potential risks in its credit portfolios and provide a better understanding of our portfolios' performance under various macroeconomic conditions. They allow us to anticipate management strategies that will avoid future deviations from defined plans and targets.
They simulate the impact of alternative scenarios in portfolios’ credit parameters (PD, LGD) and expected credit losses. Grupo Santander compares findings with portfolios’ credit profile indicators to find the right measures for managers to take. Credit risk management of portfolios and SCPs incorporate scenario analyses.
1.4. Monitoring
Regular, holistic monitoring of customers and portfolios is an essential element of the Group’s credit risk management, as it enables continuous monitoring of credit quality, early identification of potential impairment and analysis of business performance against predefined plans and objectives.
The monitoring process systematically analyses changes in credit exposures, customers’ financial and qualitative characteristics, and any relevant changes in their risk classification. This preventive approach draws on transactional information, behavioural indicators and advanced analytics tools, including early-warning engines, which support early identification of potential deterioration and the implementation of specific actions at both customer and portfolio level, based on the assigned monitoring level.
Monitoring adapts to customer segmentation and the applicable management approach:
•in the large corporate segment, monitoring is carried out jointly by the commercial managers and the risk analysts, which provides an up-to-date, comprehensive view of the customer’s credit quality at all times and supports the early identification of any potential deterioration.
•In the commercial banking, institutions and SMEs with an assigned a credit analyst, he teams carry out enhanced monitoring of customers whose risk profile or specific circumstances require it. This includes the periodic review of their internal ratings based on relevant financial, behavioural and environmental indicators.
•Monitoring of individual customers, businesses and smaller SMEs follows a system of automatic alerts to detect shifts in portfolios’ performance.
The Group structures this process for customers with an assigned analyst through the SCAN (Santander Customer Assessment Note) monitoring framework. SCAN assigns a specific monitoring level to each customer, sets the related operating policies, defines concrete management actions, identifies accountable owners and establishes a review frequency aligned with the customer’s risk profile and relevance.
In addition, the Group has aggregated control and analysis procedures that track portfolio performance, identify material deviations from strategic plans or defined alert thresholds, and help prioritise management focus areas. The process is complemented by contingency plans (risk playbooks), which support the early identification and management of impacts from external factors — such as macroeconomic, sector or market changes — and, where appropriate, trigger corrective measures, including adjustments to risk policies.
1.5. Credit risk mitigation techniques
Risk approval criteria generally focus on borrowers’ ability to meet their financial obligations, without prejudice to any collateral that the Bank may require. Collateral and guarantees provided by the obligor in favour of the Bank aim to modulate the level of exposure.
To determine ability to pay, the Group analyses funds or cash flows from businesses or other regular income, not including guarantors or loan collateral which are always considered at credit approval as a secondary means of recourse.
A guarantee is an additional protection mechanism in a credit transaction, intended to mitigate loss in the event of a failure to meet the payment obligation. The Group applies different credit risk mitigation techniques depending, among other factors, on the customer and product type. Some are specific to an individual transaction (e.g., real estate guarantees), while others apply to a set of transactions (e.g., derivatives netting or collateral arrangements). These techniques may be grouped into personal guarantees, real guarantees and hedges using credit derivatives.
The correct acceptance of these mitigation techniques is established by verifying their legal enforceability in all jurisdictions. The entire process is subject to internal control and effective monitoring of the valuation of the guarantees, especially real estate guarantees.
1.6. Collections & recoveries management
Recovery activity is a relevant function within Grupo Santander’s risk management and control framework, as it contributes to portfolio quality as one of the key pillars supporting the Bank’s development, growth and business sustainability. Collections and debt recovery management is a specific, ongoing focus to keep portfolio quality within the expected levels.
The Collections and Recoveries area defines a global management strategy, based on an end-to-end approach and general lines of action for subsidiaries. Recovery management operates under policies and an independent control environment defined by the risk function, aligned with regulatory requirements and with the Group Santander conduct risk management model. The Group carries out this activity in line with strategies defined by the recovery function, in coordination with the Risk areas.
The recovery strategy combines advanced customer segmentation and the intensive use of digital tools. This supports the optimisation of mass portfolio management and provides tailored support for customers who require individual treatment. The customer remains the focus, and recovery strategies are defined in the context of the relationship with the customer, prioritising the customer’s viability. As a result, teams manage the customer holistically across all phases of the cycle.
The function’s approach covers the entire credit cycle, prioritising solutions that support customer viability. Even after the asset is written off (failed risk), the Group continues to carry out the necessary actions to maximise recovery. The failed risk category includes debt instruments, whether past due or not, for which, following an individual assessment, recovery is considered remote due to a significant and irreversible deterioration in the solvency of the exposure or the holder. Classification in this category entails the full or partial cancellation of the exposure’s gross carrying amount and its derecognition from the balance sheet, without implying that the Group stops negotiations and legal proceedings to recover the amount.
2. Main aggregates and variations
Below are the main aggregates relating to credit risk from our activities with customers:
| | | | | | | | | | | | | | | | | | | | | | | | | | | | | | | | | | | |
Main credit risk performance metrics from activity with customersA |
| Credit risk with customers
(EUR million)B | | Credit impaired (EUR million) | | NPL ratio (%) |
| 2025 | 2024 | 2023 | | 2025 | 2024 | 2023 | | 2025 | 2024 | 2023 |
| Spain | 305,156 | 288,162 | 280,629 | | 5,915 | 7,677 | 8,531 | | 1.94 | | 2.66 | | 3.04 | |
| UK | 244,303 | 248,061 | 247,360 | | 2,645 | 3,299 | 3,518 | | 1.08 | | 1.33 | | 1.42 | |
| Portugal | 47,760 | 44,573 | 42,455 | | 948 | 1,014 | 1,024 | | 1.99 | | 2.27 | | 2.41 | |
| Openbank Europe | 144,039 | 141,312 | 135,608 | | 3,642 | 3,527 | 2,877 | | 2.53 | | 2.50 | | 2.12 | |
| US | 148,488 | 149,907 | 137,894 | | 7,150 | 7,012 | 6,303 | | 4.82 | | 4.68 | | 4.57 | |
| Mexico | 53,476 | 49,927 | 52,785 | | 1,420 | 1,352 | 1,489 | | 2.65 | | 2.71 | | 2.82 | |
| Brazil | 118,546 | 116,247 | 126,722 | | 8,010 | 7,090 | 7,923 | | 6.76 | | 6.10 | | 6.25 | |
| Chile | 44,146 | 44,590 | 46,565 | | 2,528 | 2,394 | 2,332 | | 5.73 | | 5.37 | | 5.01 | |
| Argentina | 8,813 | 8,411 | 3,903 | | 677 | 173 | 78 | | 7.68 | | 2.06 | | 1.99 | |
| Corporate Centre | 9,340 | 9,256 | 8,206 | | 327 | 360 | 302 | | 3.50 | | 3.89 | | 3.67 | |
| Total Group | 1,159,180 | 1,134,418 | 1,115,288 | | 33,739 | 34,383 | 34,671 | | 2.91 | | 3.03 | | 3.11 | |
| | | | | | | | | | | | | | | | | | | | | | | | | | | | | | | | | | | |
| NPL coverage ratio (%) | | Net loan-loss provisionsC
(EUR million) | | Cost of risk
(%/risk)D |
| 2025 | 2024 | 2023 | | 2025 | 2024 | 2023 | | 2025 | 2024 | 2023 |
| Spain | 55 | | 53 | | 49 | | | 1,142 | 1,259 | 1,522 | | 0.43 | | 0.50 | | 0.61 | |
| UK | 33 | | 29 | | 30 | | | 177 | 64 | 247 | | 0.07 | | 0.03 | | 0.10 | |
| Portugal | 81 | | 78 | | 83 | | | (8) | 11 | 77 | | (0.02) | | 0.03 | | 0.19 | |
| Openbank Europe | 87 | | 83 | | 88 | | | 1,363 | 1,209 | 792 | | 0.97 | | 0.88 | | 0.62 | |
| US | 55 | | 64 | | 68 | | | 2,244 | 2,507 | 2,593 | | 1.62 | | 1.82 | | 1.92 | |
| Mexico | 105 | | 100 | | 100 | | | 1,239 | 1,277 | 1,135 | | 2.69 | | 2.64 | | 2.43 | |
| Brazil | 81 | | 79 | | 83 | | | 4,409 | 4,487 | 4,701 | | 4.17 | | 4.03 | | 4.27 | |
| Chile | 48 | | 50 | | 53 | | | 531 | 497 | 365 | | 1.32 | | 1.19 | | 0.80 | |
| Argentina | 90 | | 177 | | 166 | | | 574 | 284 | 150 | | 7.34 | | 4.59 | | 6.64 | |
| Corporate Centre | 24 | | 25 | | 34 | | | 198 | (3) | (2) | | 2.79 | | (0.05) | | (0.04) | |
| Total Group | 66 | | 64 | | 66 | | | 12,128 | 11,822 | 11,784 | | 1.14 | | 1.12 | | 1.13 | |
A. Data for 2025, 2024 and 2023 reflect the new reporting structure. Management perimeter according to the reported segments.
B. Includes gross loans and advances to customers, guarantees. impaired undrawn customer balances and debt securities issued by non-financial institutions.
C. Loan-loss provisions net of post write-off recoveries (EUR 1,791 million in 2025).
D. Provisions to cover losses due to impairment of loans in the last 12 months / average customer loans and advances of the last 12 months.
Information on the estimation of impairment losses
The calculation of provisions for credit risk losses is performed at financial asset level, estimating potential credit losses through the difference between the contractual cash flows and the expected cash flows, ensuring that the results are adequate considering the status of the transaction, economic conditions and available forward-looking information.
The IFRS 9 impairment model applies to financial assets valued at amortized cost; debt instruments valued at fair value with changes in other comprehensive income; leasing receivables; and commitments and guarantees not valued at fair value.
The portfolio of financial instruments subject to IFRS 9 has three credit risk categories (or stages) according to the status of each instrument in relation to its level of credit risk:
•Stage 1: financial instruments with no significant increase in risk since initial recognition – the impairment provision reflects expected credit losses from defaults over the 12 months from the reporting date.
•Stage 2: financial instruments with a significant credit risk increase since initial recognition but no materialized impairment event – the impairment provision reflects expected losses from defaults over the financial instrument’s residual life.
•Stage 3: financial instruments with true signs of impairment as a result of one or more events resulting in a loss – the impairment provision reflects expected losses for credit risk over the instrument’s expected residual life.
The classification of financial instrument in the IFRS 9 stages is carried out in accordance with the guidelines through the risk management policies of the subsidiaries, which are consistent with the Group's policies.
Estimation of expected loss
The Group uses parameters (mainly EAD, PD, LGD and the discount rate) to calculate impairment provisions. These parameters build on the infrastructure of internal models used to calculate regulatory capital and on regulatory and management expertise, and they also reflect each financial asset’s stage classification.
However, these parameters are not a simple adaptation of existing models. We designed and validated them specifically in line with IFRS 9 requirements and guidance from bodies such as the EBA, , National Competent Authority (NCA), Bank for International Settlements (BIS) or Global Public Policy Committee (GPPC). Their development incorporates forward-looking information, a point-in-time (PIT) approach, multiple scenarios and lifetime loss estimation through lifetime PD, among other elements.
Determination of significant increase in credit risk (SICR)
To determine classification in Stage 2, the Group assesses whether a SICR has occurred since the initial recognition of the exposures. The Group performs this assessment under common principles applicable across the Group, reviewing all financial instruments subject to this analysis and taking into account the specific features of each portfolio and product type through a range of quantitative and qualitative indicators.
Expert judgement from analysts supports the SICR assessment. Analysts set the thresholds within an integrated management framework and in line with the approved corporate governance. The principles are as follows:
•Universality: all financial instruments subject to a credit rating must be assessed for their possible SICR.
•Proportionality: the definition of the SICR must take into account the particularities of each portfolio.
•Materiality: its implementation must be also consistent with the relevance of each portfolio so as not to incur in unnecessary costs or efforts.
•Holistic vision: the approach selected must be a combination of the most relevant credit risk aspects (e.g. quantitative and qualitative).
•Application of IFRS 9: the approach must take into consideration IFRS 9 characteristics, focusing on a comparison with credit risk at initial recognition, as well as considering forward-looking information.
•Risk management integration: the criteria must be consistent with those metrics considered in the day-to-day risk management.
•Documentation: appropriate documentation must be prepared.
The techniques are summarised below:
•Stability of stage 2: in the absence of significant changes in the portfolios credit quality, the volume of assets in stage 2 should maintain a certain stability as a whole.
•Economic reasonableness: at transaction level, stage 2 is expected to be a transitional rating for exposures that could eventually move to a deteriorating credit status at some point or stage 3, as well as for exposures that have suffered credit deterioration and whose credit quality is improving and returns to stage 1.
•Predictive power: it is expected that the SICR definition avoids, as far as possible, direct migrations from stage 1 to stage 3 without having been previously classified in stage 2.
•Time in stage 2: it is expected that the exposures do not remain categorized as stage 2 for an excessive time.
The application of the aforementioned techniques, conclude in the setting of one or several thresholds for each portfolio in each geography. Likewise, these thresholds are subject to a regular review by means of calibration tests, which may entail updating the thresholds types or their values.
Identifying a significant increase in credit risk: when classifying financial instruments under stage 2, Santander considers:
•Quantitative criteria: Grupo Santander reviews and quantifies changes in the risk of default during their expected life based on their credit risk level on initial recognition.
For the purposes of assessing significant changes when financial instruments are classified in Stage 2, each subsidiary has set quantitative thresholds for its portfolios in line with Group guidelines, seeking a consistent interpretation across all our geographies. The calibration principles for these thresholds are set out in the previous paragraph and may result in two types of thresholds:
•Relative. Thresholds that compare current credit quality with credit quality at origination, expressed as a percentage change.
•Absolute. Thresholds that compare current credit quality with credit quality at origination, expressed as an absolute change.
In addition, in line with the ECB’s supervisory expectations, the Group has set a 200% cap on the relative threshold, known as the 'threefold increase'. As a result, exposures whose credit quality has deteriorated by more than 200% in relative terms —using an approach analogous to the relative threshold described in the previous paragraph — transfer from Stage 1 to Stage 2.
Meeting any of the absolute thresholds, the relative thresholds or the 200% cap on the relative threshold (threefold increase) on an individual basis results in the transfer of the financial instrument exposure from Stage 1 to Stage 2.
In addition, the Group may apply the Low Credit Risk Exemption at the reporting date, so that certain exposures that continue to meet this condition may remain in Stage 1. This exemption applies only to quantitative significant increase in credit risk criteria; therefore, qualitative criteria are not eligible for exemption. The Group uses it on a limited basis, documents it and reviews it periodically. When an exposure no longer meets the low credit risk condition, it transfers to Stage 2 in line with the criteria above.
•Qualitative criteria: several indicators aligned with ordinary credit risk management indicators (e.g. past due for over 30 days, forbearance, early warning indicators system, etc.). Each subsidiary has defined these indicators for their portfolios, with special attention to reinforcing these qualitative criteria through expert judgment and aligning them to the criteria used in management.
When the presumption of a significant deterioration of credit risk is removed, due to a sufficient improvement of the credit quality, the obligor can be re-classified to stage 1, without any probationary period in stage 2.
•Definition of default: Santander incorporated the new definition to provisions calculation according to the EBA’s guidelines; the Group is also considering applying it to prudential framework. In addition, the default definition and stage 3 have been aligned.
This definition considers the following criteria to classify exposures as stage 3: financial instruments with one or more payments more than 90 consecutive days past due, representing at least 1% of the client's total exposure or the identification of other criteria demonstrating, even in the absence of defaults, that it is unlikely that the counterparty is unlikely to meet all of its financial obligations.
Grupo Santander applies the default criteria to all exposures of the impaired client. Where an obligor belongs to a group, the default criteria may also be applied to all exposures of the group.
The default classification is maintained during the 3-month test period following the disappearance of all default indicators described above, and this period is extended to one year for forbearances that have been classified as default.
•Expected life of financial instruments: Santander estimates the expected life of financial instruments according to their contractual terms (e.g. prepayments, duration, purchase options, etc.).
The contractual period (including extension options) is the maximum time frame for measuring the expected credit loss. If financial instruments have an undefined maturity period and undrawn amounts (e.g. credit cards), Santander estimates its expected life based on the total exposure period and effective management practices to mitigate exposure.
1.Forward-looking vision
Estimating expected credit losses (ECL)requires significant expert judgement and the incorporation of historical, current and forward-looking information. Expected loss estimates are therefore based on an unbiased, probability-weighted likelihood of up to five possible future scenarios that could affect the collection of contractual cash flows. These scenarios consider the time value of money, relevant information available on past events, current conditions and forecasts of the macroeconomic factors considered important in estimating this amount (e.g. GDP, house prices and the unemployment rate, among others).
Santander uses forward-looking information in internal management and regulatory processes under several scenarios. The Group's guidelines and governance seek synergy and consistency between these different processes.
2. Additional elements
Additional elements will be required when necessary because they have not been captured under the two previous elements. This has included, among others, the analysis of sectors most affected if their impacts are not sufficiently captured by the macroeconomic scenarios. Also collective analysis techniques, when the potential impairment in a group of clients cannot be identified individually.
With the elements indicated above, Grupo Santander has evaluated in each of the geographical areas the evolution of the credit quality of its customers, for the purposes of classifying them into stages and consequently calculating expected loss.
Management overlays
During 2025, the Group strengthened coverage across its portfolios by implementing overlays, mainly in Brazil, Chile and Mexico, where it increased the PMA buffer to anticipate the impact of the year’s model recalibrations, as well as other potential deviations.
In addition, the Group gradually released the adjustments related to climate events, such as the Valencia dana experienced in late October 2024, in the case of Santander Spain and the Spanish DCB office.
Overall, the amount of overlays at year-end 2025 remains immaterial compared with the Group’s total allowance for credit losses.
Exposure and loan-loss reserves
Then, considering the most relevant units of the Group (United Kingdom, Spain, United States, Brazil, also Chile, Mexico, Portugal, Argentina and Santander Consumer Finance), which represent approximately 94% of the total Group's provisions. The table below shows the loan-loss reserves associated with each stage as of 31 December 2025, 2024 and 2023. In addition, depending on the transactions credit quality, the exposure is divided into four categories according to Standard & Poor's rating scale:
| | | | | | | | | | | | | | |
Exposure and loan-loss reserves by stage |
| EUR million | | | | |
| 2025 |
Credit quality A | Stage 1 | Stage 2 | Stage 3 | Total |
| From AAA to AA- | 112,795 | | 2,243 | | — | | 115,038 | |
| From A+ to BB | 367,186 | | 14,393 | | — | | 381,579 | |
| From BB- to B- | 291,014 | | 44,363 | | — | | 335,376 | |
| CCC and below | 8,114 | | 17,114 | | 31,275 | | 56,503 | |
Total exposure B | 779,109 | | 78,112 | | 31,275 | | 888,496 | |
Loan-losses reservesC | 3,068 | | 4,698 | | 13,177 | | 20,942 | |
| | | | | | | | | | | | | | |
Exposure and loan-loss reserves by stage |
| EUR million |
| 2024 |
Credit quality A | Stage 1 | Stage 2 | Stage 3 | Total |
| From AAA to AA- | 102,394 | | 2,564 | | — | | 104,958 | |
| From A+ to BB | 411,158 | | 15,678 | | — | | 426,837 | |
| From BB- to B- | 276,422 | | 42,456 | | — | | 318,878 | |
| CCC and below | 10,385 | | 16,633 | | 31,273 | | 58,291 | |
Total exposureB | 800,360 | | 77,330 | | 31,273 | | 908,963 | |
Loan-losses reservesC | 3,184 | | 4,512 | | 12,938 | | 20,635 | |
| | | | | | | | | | | | | | |
Exposure and loan-loss reserves by stage |
| EUR million |
| 2023 |
Credit quality A | Stage 1 | Stage 2 | Stage 3 | Total |
| From AAA to AA- | 140,792 | | 2,237 | | — | | 143,029 | |
| From A+ to BB | 404,184 | | 13,746 | | — | | 417,930 | |
| From BB- to B- | 250,619 | | 39,979 | | — | | 290,599 | |
| CCC and below | 11,633 | | 18,846 | | 32,455 | | 62,933 | |
Total exposure B | 807,228 | | 74,808 | | 32,455 | | 914,491 | |
Loan-losses reservesC | 3,463 | | 4,883 | | 13,404 | | 21,750 | |
A.Detail of credit quality ratings calculated for Group management purposes.
B.Total exposure includes loan balances (drawn amounts) and off balance (letters of credit + guarantees) and excludes REPOs, FV portfolio, trading portfolio and undrawn commitments.
C.Includes provisions for undrawn authorized lines (loan commitments).
Data for 2025, 2024 and 2023 reflect the new reporting structure, mainly the disposal of Poland.
The remaining units that form the totality of the Group exposure, account for EUR 93,731 million: EUR 89,094 million in stage 1; EUR 3,528 million in stage 2; and EUR 1,109 million in stage 3 (in 2024 EUR 80,541 million in stage 1; EUR 2,534 million in stage 2, and EUR 874 million in stage 3. In 2023, EUR 68,788 million in stage 1; EUR 1,504 million in stage 2, and EUR 658 million in stage 3), and
loan-loss reserves totalled EUR 759 million, of which: EUR 213 million in stage 1; EUR 152 million for stage 2, and EUR 394 million in stage 3 (in 2024, EUR 165 million, EUR 117 million and EUR 295 million and in 2023, EUR 199 million, EUR 73 million and EUR 161 million in stage 1, stage 2 and stage 3, respectively).
The remaining exposure, including all financial instruments not included before, amounts to EUR 834,911 million (EUR 665,476 million in 2024 and EUR 598,385 million in 2023), and it includes all undrawn authorized lines (loan commitments).
As of 31 December 2025, the Group had EUR 334 million net of provisions (EUR 559 million and EUR 743 million at 31 December 2024 and 2023, respectively) of purchased credit-impaired assets, which relate mainly to the business combinations carried out by the Group.
In relation to the evolution of credit risk provisions, the Group, together with its main geographies, monitors them through sensitivity analyses that assess the impact of changes in macroeconomic scenarios and their key variables on the allocation of financial assets across stages and on the measurement of credit risk provisions.
Additionally, based on consistent macroeconomic scenarios, the Group also performs stress tests and sensitivity analysis in a regular basis, such as ICAAP, strategic plans, budgets and recovery and resolution plans. In this sense, a prospective view of the sensitivity of each of the Group’s loan portfolio is created in relation to the possible deviation from the base scenario, considering both the macroeconomic developments in different scenarios and the three year evolution of the business. These tests include potentially adverse and favourable scenarios.
3. Detail of the main geographical areas
Following is the risk information related to the most relevant geographies in exposure and credit risk allowances.
This information includes sensitivity analysis, consisting on simulations of +/-100 bp in the main macroeconomic variables. A set of specific and complete scenarios is used in each geography, where different shocks that affect both the reference macroeconomic variable as well as the rest of the parameters is simulated, with different intensities. These shocks collect mainly the most relevant risks and may be originated by productivity, tax, wages or exchange and interest rates factors.
Sensitivity is measured as the average variation on expected loss corresponding to the aforementioned movement of +/-100 bp. Following a conservative approach, the negative movements take into account one additional standard deviation in order to reflect the potential higher variability of losses.
3.1. United Kingdom
Portfolio overview
Credit risk with customers in the UK remained stable in EUR 244,303 million. This credit risk represents 21% of Santander’s loan portfolio.
At 1.08%, the NPL ratio decreased 25 bps in comparison to the year end of 2024, due to the good performance in the mortgage portfolio.
Mortgage portfolio
Because of its size, Grupo Santander closely monitor Santander UK’s mortgage portfolio for the entity itself and the Group.
As of 31 December 2025, the mortgage portfolio of Santander UK remained stable, at local currency, and reached EUR 192,047 million. It comprises residential mortgages granted to new and existing customers which are first lien mortgages. There are no second or more liens on mortgaged properties.
Originations have increased in 2025 compared to 2024, a sign of a more active housing market due to lower interest rates and less pressure on households’ purchasing power. The housing market returned to growth in 2025, with a higher level of transactions and price increases compared to 2024.
Under Santander's risk management principles, a property must be appraised independently before we can approve a new mortgage. In line with market practices and the law, we get updated values of properties used as mortgage collateral from an independent agency's automatic appraisal system.
Santander UK's wide range of mortgages include:
•Interest-only loans (21%): Customers pay interest every month and repay the principal at maturity. These mortgages, which are common in the UK, require borrowers to have an appropriate repayment vehicle, such as a pension plan or an investment fund. To mitigate inherent risk, Santander UK has restrictive approval requirements, such a maximum loan-to-value ratio of 50% and an assessment of the ability to pay both interest and capital.
•Flexible loans (2%): Loan agreements allow borrowers to modify monthly payments or draw down additional funds up to a set limit under various conditions.
•Buy-to-let (9%): Buy-to-let mortgages account for a small portion of the total portfolio and are subject to strict risk approval policies.
Santander’s NPL ratio highlights the resilience of the mortgage portfolio in a challenging economic environment and an intensely competitive market. It stood at 0.87% at the end of December 2025 (-20 bps YoY).
At 31 December 2025, 82% of the mortgage portfolio had an LTV lower than 70%.
Information on the estimation of impairment losses
The detail of Santander's UK exposure and loan-loss reserves associated with each of the stages at 31 December 2025, 2024 and 2023, is shown below.
In addition, the exposure is divided in four tranches of the Standard & Poor's rating scale, according to their current credit quality: | | | | | | | | | | | | | | |
Exposure and loan-loss reserves by stage |
| EUR million |
| 2025 |
Credit qualityA | Stage 1 | Stage 2 | Stage 3 | Total |
| From AAA to AA- | 29,963 | | 381 | | — | | 30,344 | |
| From A+ to BB | 152,981 | 9,529 | | — | | 162,510 | |
| From BB- to B- | 17,630 | 8,770 | | — | | 26,400 | |
| CCC and below | 2 | 615 | 2,475 | | 3,092 | |
Total exposureB | 200,576 | | 19,295 | | 2,475 | | 222,346 | |
Loan-loss reservesC | 163 | | 319 | | 373 | | 855 | |
| | | | | | | | | | | | | | |
Exposure and loan-loss reserves by stage |
| EUR million |
| 2024 |
Credit quality A | Stage 1 | Stage 2 | Stage 3 | Total |
| From AAA to AA- | 32,012 | | 1,184 | | — | | 33,196 | |
| From A+ to BB | 159,970 | 10,916 | — | | 170,886 | |
| From BB- to B- | 17,594 | | 11,175 | | — | | 28,769 | |
| CCC and below | 12 | | 695 | | 3,292 | | 3,999 | |
Total exposure B | 209,588 | | 23,970 | | 3,292 | | 236,850 | |
Loan-loss reservesC | 166 | | 401 | | 400 | | 967 | |
| | | | | | | | | | | | | | |
Exposure and loan-loss reserves by stage |
| EUR million |
| 2023 |
Credit quality A | Stage 1 | Stage 2 | Stage 3 | Total |
| From AAA to AA- | 46,236 | | 1,273 | | — | | 47,509 | |
| From A+ to BB | 145,884 | 10,850 | — | | 156,734 | |
| From BB- to B- | 13,588 | | 13,995 | | — | | 27,583 | |
| CCC and below | — | | — | | 3,518 | | 3,518 | |
Total exposure B | 205,708 | | 26,118 | | 3,518 | | 235,344 | |
Loan-loss reservesC | 172 | | 498 | | 396 | | 1,066 | |
A.Detail of credit quality ratings calculated for Group management purposes.
B.Total exposure includes loan balances (drawn amounts) and off balance (letters of credit + guarantees) and excludes REPOs, FV portfolio, trading portfolio and undrawn commitments.
C.Includes provisions for undrawn authorized lines (loan commitments).
For the estimation of expected losses, prospective information is taken into account. Specifically, Santander UK considers four macroeconomic scenarios, which are updated periodically. The evolution forecasted in 2025 for the next five years of the main macroeconomic indicators used by Santander UK to estimate expected losses is presented below:
| | | | | | | | | | | | | | | |
| | 2026 - 2030 |
| Variables | | Pessimistic scenario 2 | Pessimistic scenario 1 | Base scenario | Optimistic scenario |
| Interest rate | | 2.4 | % | 3.5 | % | 3.3 | % | 3.0 | % |
| Unemployment rate | | 7.3 | % | 5.8 | % | 4.5 | % | 4.2 | % |
| Housing price change | | (2.9 | %) | (0.2 | %) | 2.9 | % | 4.4 | % |
| GDP growth | | (0.02 | %) | 0.2 | % | 1.4 | % | 2.4 | % |
Each of the macroeconomic scenarios is associated with a given weight. In terms of allocation, Santander UK associates the highest weighting to the base scenario, while it associates the lowest weightings to the most extreme or severe scenarios. In addition, at 31 December 2025, 2023 and 2022, the weights used by Santander UK reflect the future prospects of the British economy in relation to its current political and economic position so that higher weights are assigned for negative scenarios:
| | | | | | | | | | | |
| 2025 | 2024 | 2023 |
| Pessimistic scenario 3 | | 20 | % | 20 | % |
| Pessimistic scenario 2 | 10 | % | 10 | % | 10 | % |
| Pessimistic scenario 1 | 25 | % | 25 | % | 10 | % |
| Base scenario | 50 | % | 50 | % | 50 | % |
| Optimistic scenario | 15 | % | 15 | % | 10 | % |
The sensitivity analysis of the main portfolios expected loss to variations of +/-100 bp for the macroeconomic variables used in the construction of the scenarios, as of December 2025, is as follows:
| | | | | | | | |
| Change in Provision |
| Mortgages | Corporates |
| GDP Growth | | |
| -100 bps | 11.6 | % | 3.9 | % |
| +100 bps | (2.9 | %) | (1.4 | %) |
| Housing price change | | |
| -100 bps | 7.3 | % | 6.0 | % |
| +100 bps | (3.5 | %) | (1.6 | %) |
| Unemployment rate | | |
| -100 bps | (12.3 | %) | (2.5 | %) |
| +100 bps | 23.7 | % | 5.7 | % |
With regard to Stage 2 classification, Santander UK applies quantitative criteria based on identifying an increase in lifetime probability of default (PD) for the transaction that exceeds both an absolute and a relative threshold. The PDs used in this assessment are adjusted to the transaction’s remaining term and annualised to facilitate the definition of thresholds that cover the full range of transaction maturities. The relative threshold is common across all portfolios, and Santander UK considers that a transaction exceeds this threshold when its lifetime PD increases by 100% compared to the PD at initial recognition. The absolute threshold, by contrast, differs across portfolios depending on the characteristics of the transactions.
In addition, each portfolio has a set of specific qualitative criteria indicating that the exposure has experienced a significant increase in credit risk, irrespective of the evolution of its PD since initial recognition. Among other criteria, Santander UK considers that a transaction shows a significant increase in credit risk when it is more than 30 days past due. It also has implemented early warning indicator system to support Stage 2 classification. These criteria align with the risk management practices of each portfolio.
3.2. Spain
Portfolio overview
Santander España’s credit risk totalled EUR 305,156 million (26% of Grupo Santander’s total). It is appropriately diversified among products and customer segments.
The NPL ratio was 1.94%, 72 bps lower than in December 2024. This decrease was driven by the portfolio’s strong performance, supported by the execution of the NPL reduction plan.
The NPL coverage ratio increased slightly to 55% (+2 p.p. year-on-year). The cost of risk decreased to 0.43% (-7 bps vs. December 2024), driven by the strong performance of all portfolios.
Macroeconomic projections suggest the economy will moderate its growth pace slightly, but will remain dynamic and well above the eurozone average, as the Spanish economy has largely been supported by stronger domestic demand amid a weaker-than-expected external sector.
Residential mortgage portfolio
Residential mortgages in Spain, including Santander Consumer Finance business, amounted to EUR 60,002 million in 2025 (EUR 59,316 million and EUR 61,097 million in 2024 and 2023, respectively), 99.64% of which have a mortgage guarantee (99.65%and 99.65% in 2024 and 2023, respectively).
| | | | | | | | |
| 2025 |
| EUR Million | Gross amount | Of which: impaired |
| Home purchase loans to families | 60,002 | | 625 | |
| Without mortgage collateral | 215 | | 7 | |
| With mortgage collateral | 59,787 | | 618 | |
| | | | | | | | |
| 2024 |
| EUR Million | Gross amount | Of which: impaired |
| Home purchase loans to families | 59,316 | | 789 | |
| Without mortgage collateral | 208 | | 11 | |
| With mortgage collateral | 59,108 | | 778 | |
| | | | | | | | |
| 2023 |
| EUR Million | Gross amount | Of which: impaired |
| Home purchase loans to families | 61,097 | | 924 | |
| Without mortgage collateral | 215 | | 16 | |
| With mortgage collateral | 60,882 | | 908 | |
The NPL ratio for the residential mortgages portfolio stood at 1.03%, with a reduction of 29 bps, compared to 31 December 2024, mainly due to by portfolio sales, although credit risk registered an increase of 1.2% compared to December 2024.
The mortgage portfolio for the acquisition of homes in Spain is characterised by its medium-low risk profile, which limits expectations of any potential additional impairment:
•Principal is repaid on all mortgages from the start.
•Early repayment is common so the average life of the transaction is well below that of the contract.
•High quality of collateral, concentrated almost exclusively in financing for first homes.
•The average affordability rate is reduce to 22% (24% and 24% in 2024 and 2023, respectively).
•The 94% of the portfolio has a LTV below 80% calculated as total risk/latest available house appraisal.
•All customers applying for a residential mortgage are subject to a rigorous credit risk and viability assessment, analysing whether their income is sufficient to meet all repayments and will remain stable over the term of the loan.
Breakdown of the credit with mortgage guarantee to households for house acquisition, according to the percentage that the total risk represents on the amount of the latest available valuation (loan to value):
| | | | | | | | | | | | | | | | | | | | |
| 2025 |
| Loan to value ratio |
| EUR Million | Less than or equal to 40% | More than 40% and less than 60% | More than 60% and less than 80% | More than 80% and less than or equal to 100% | More than 100% | Total |
| Gross amount | 17,191 | | 20,310 | | 18,811 | | 2,812 | | 663 | | 59,787 | |
| Of which impaired | 122 | | 158 | | 151 | | 84 | | 103 | | 618 | |
In November 2022, Royal Decree-Law 19/2022 was published, which establishes a Code of Good Practices in response to the rise in interest rates on mortgage loans for primary residences and Royal Decree-Law 6/2012 of protection measures for mortgage debtors without resources. The code of good practices is focused on granting capital grace periods and extending the term of the operations. The requests made have not been significant.
Corporate & SME financing
Credit risk with SME and corporates in commercial banking amounted to EUR 99,395 million, lower than December 2024, mainly due to the fall in the portfolio of SMEs of 10.1%. This portfolio accounting for 33% of the total, compared to 41% of CIB's portfolio, which from 2022 includes branches in Europe.
Most of the portfolio corresponds to clients who have been assigned a credit analyst, who performs continuous management of said clients during all phases of the risk cycle. The portfolio is broadly diversified and not concentrated by sector of activity.
The ICO loans that were granted as a result of the pandemic (25,428 million euros) are being repaid normally and there is a balance of EUR 10,857 million, so they now represent only around 3.6% of Santander Spain's total portfolio. During 2025, Santander Spain maintained its support and close engagement with SMEs and the self-employed through the various support lines, which were significantly less material than the post-pandemic programmes (Líneas ICO Empresas y Emprendedores, Línea ICO Internacional y Rehabilitación de vivienda).
In the case of delinquent operations with ICO guarantee, the transfer of the overdue guaranteed amounts will take place as the guarantee is executed, regardless of whether the guarantor is subrogated to the right to receive said amounts, according to the regulation of these guarantees. The de-recognition of the transferred guaranteed amounts will entail the recognition, at its fair value, of a collection right against the guarantor.
The portfolio’s NPL ratio stood at 4.10% in December 2025. The NPL ratio decreased by 97 bps compared to December 2024, largely due to a proactive effort to reduce the stock of NPLs in the SME portfolio, through proactive management of non-performing exposures supported by portfolio sales and the management of specific cases.
Real estate activity
Santander has specialized teams that are in charge of managing real estate business production and risk areas that cover the entire life cycle of these operations.
The changes in gross property development loans to customers were as follows:
| | | | | | | | | | | |
| EUR million | |
| 2025 | 2024 | 2023 |
| Balance at beginning of year | 2,545 | 2,433 | 2,327 |
| Foreclosed assets | — | — | (1) |
| Net variation | 441 | 112 | 115 |
| Written-off assets | (2) | — | (8) |
| Balance at end of year | 2,984 | 2,545 | 2,433 |
The NPL ratio of this portfolio (considering only the on balance amount) ended the year at 1.04% (compared with 2.28% and 3.04% at December 2024 and 2023, respectively) . The table below shows the distribution of the portfolio. The coverage ratio of the real estate doubtful exposure in Spain stands at 35.48% (36.21% and 39.19% in 2024 and 2023, respectively).
| | | | | | | | | | | |
| 2025 |
| EUR Million | Gross amount | Excess of gross exposure over maximum recoverable amount of effective collateral | Specific allowance |
| Financing for construction and property development (including land) (business in Spain) | 2,984 | 211 | 17 |
| Of which impaired | 31 | — | 11 |
| Memorandum items written-off assets | 240 | — | — |
| | | | | |
| Memorandum items: Data from the public consolidated balance sheet | |
| 2025 |
| EUR Million | Carrying amount |
| Total loans and advances to customers excluding the Public sector (business in Spain) (Book value) | 240,609 | |
| Total consolidated assets (Total business) (Book value) | 1,867,515 | |
| Impairment losses and credit risk allowances. Coverage for unimpaired assets (business in Spain) | 1,086 | |
At year-end, the distribution of this portfolio was as follows:
| | | | | |
| 2025 |
| EUR Million | Loans: gross amount |
| 1. Without mortgage guarantee | 14 | |
| 2. With mortgage guarantee | 2,970 | |
| 2.1 Completed buildings | 976 | |
| 2.1.1 Residential | 658 | |
| 2.1.2 Other | 318 | |
| 2.2 Buildings and other constructions under construction | 1,981 | |
| 2.2.1 Residential | 1,913 | |
| 2.2.2 Other | 68 | |
| 2.3 Land | 13 | |
| 2.3.1 Developed consolidated land | 9 | |
| 2.3.2 Other land | 4 | |
| Total | 2,984 | |
Foreclosed properties
At 31 December 2025, the net balance of these assets amounted to EUR 1,898 million (EUR 2,131 million and EUR 2,448 million at 31 December 2024 and 2023, respectively), gross amount of EUR 4,258 million (EUR 4,823 million and EUR 5,506 million at 31 December 2024 and 2023, respectively); recognised allowance of EUR 2,360 million (EUR 2,692 million and EUR 3,058 million at 31 December 2024 and 2023, respectively).
The following table shows the detail of the assets foreclosed by the businesses in Spain at the end of 2025:
| | | | | | | | | | | | | | |
| 2025 |
| EUR Million | Gross carrying amount | Valuation adjustments | Of which impairment losses on assets since time of foreclosure | Net Carrying amount |
| Property assets arising from financing provided to construction and property development companies | 3,843 | | 2,144 | | 1,591 | | 1,699 | |
| Of which: | | | | |
| Completed buildings | 481 | | 324 | | 282 | | 157 | |
| Residential | 129 | | 71 | | 60 | | 58 | |
| Other | 352 | | 253 | | 222 | | 99 | |
| Buildings under construction | 107 | | 49 | | 35 | | 58 | |
| Residential | — | | — | | — | | — | |
| Other | 107 | | 49 | | 35 | | 58 | |
| Land | 3,255 | | 1,771 | | 1,274 | | 1,484 | |
| Developed land | 776 | | 429 | | 260 | | 347 | |
| Other land | 2,479 | | 1,342 | | 1,014 | | 1,137 | |
| Property assets from home purchase mortgage loans to households | 334 | | 172 | | 119 | | 162 | |
| Other foreclosed property assets | 81 | | 44 | | 36 | | 37 | |
| Total property assets | 4,258 | | 2,360 | | 1,746 | | 1,898 | |
In addition, the Group has shareholdings in entities holding foreclosed assets amounting to EUR 36 million and equity instruments foreclosed or received in payment of debts amounting to EUR 10 million.
In recent years, the Group has considered foreclosure to be an option to resolve cases of default instead of legal proceedings. The Group initially recognises foreclosed assets at the lower of the carrying amount of the debt (net of provisions) and the fair value of the foreclosed asset (less estimated costs to sell). Subsequent to initial recognition, the assets are measured at the lower of fair value (less costs to sell) and the amount initially recognised.
The fair value of this type of assets is determined by the market value (appraisal) adjusted with discounts obtained according to internal valuation methodologies based on the entity's sales experience in goods with similar characteristics.
The management of real estate assets on the balance sheet is carried out through companies specializing in the sale of real estate that is complemented by the structure of the commercial network. The sale is realised with at prices in accordance with the market situation and the offer of wholesale buyers.
The gross movement in foreclosed properties were as follows (EUR billion):
| | | | | | | | | | | |
| EUR Billion |
| 2025 | 2024 | 2023 |
| Gross additions | 0.1 | | 0.1 | 0.3 |
| Disposals | (0.7) | (0.8) | (1.2) |
| Difference | (0.6) | | (0.7) | | (0.9) | |
Information on the estimation of impairment losses
The detail of Santander Spain exposure and loan-loss reserves associated with each of the stages at 31 December, 2025, 2024 and 2023, is shown below. In addition, the exposure is divided in four tranches of the Standard & Poor's rating scale, according to their current credit quality:
| | | | | | | | | | | | | | |
Exposure and loan-loss reserves by stage |
| EUR million |
| 2025 |
Credit quality A | Stage 1 | Stage 2 | Stage 3 | Total |
| From AAA to AA- | 35,407 | | 171 | | — | | 35,578 | |
| From A+ to BB | 109,001 | 1,453 | — | | 110,454 | |
| From BB- to B- | 37,089 | | 8,262 | | — | | 45,351 | |
| CCC and below | 2,189 | 1,680 | 5,761 | | 9,630 | |
Total exposureB | 183,686 | | 11,566 | | 5,761 | | 201,013 | |
Loan-loss reservesC | 382 | | 483 | | 2,204 | | 3,069 | |
| | | | | | | | | | | | | | | |
Exposure and loan-loss reserves by stage | |
| EUR million | |
| 2024 | |
Credit quality A | Stage 1 | Stage 2 | Stage 3 | Total | |
| From AAA to AA- | 35,347 | | 110 | | — | | 35,457 | | |
| From A+ to BB | 104,197 | 1,124 | — | | 105,321 | | |
| From BB- to B- | 37,413 | | 8,844 | | — | | 46,257 | | |
| CCC and below | 2,084 | 3,199 | 6,618 | | 11,901 | | |
Total exposureB | 179,041 | | 13,277 | | 6,618 | | 198,936 | | |
Loan-loss reservesC | 340 | | 570 | | 2,953 | | 3,863 | | |
| | | | | |
| | | | | | | | | | | | | | |
Exposure and loan-loss reserves by stage |
| EUR million |
| 2023 |
Credit quality A | Stage 1 | Stage 2 | Stage 3 | Total |
| From AAA to AA- | 46,827 | | 48 | | | 46,875 | |
| From A+ to BB | 101,079 | 780 | | 101,859 | |
| From BB- to B- | 33,905 | | 9,789 | | | 43,694 | |
| CCC and below | 1,513 | | 4,517 | | 7,536 | | 13,566 |
Total exposureB | 183,324 | | 15,134 | | 7,536 | | 205,994 | |
Loan-loss reservesC | 300 | | 663 | | 2,959 | | 3,922 | |
A.Detail of credit quality ratings calculated for Group management purposes. Excluding the SCIB branches business
B.Total exposure includes loan balances (drawn amounts) and off balance (letters of credit + guarantees) and excludes REPOs, FV portfolio, trading portfolio and undrawn commitments.
C.Includes provisions for undrawn authorized lines (loan commitments).
For the estimation of the expected losses, the prospective information is taken into account. Specifically, Santander Spain considers three macroeconomic scenarios, which are updated periodically. The projected evolution for a period of five years of the main macroeconomic indicators used by Santander Spain for estimating expected losses as of 2025, is presented below:
| | | | | | | | | | | |
| 2026-2030 |
| Variables | Pessimistic scenario | Base scenario | Optimistic scenario |
| Interest rate | 2.7 | % | 2.5 | % | 2.3 | % |
| Unemployment rate | 12.1 | % | 9.7 | % | 8.2 | % |
| Housing price change | 3.3 | % | 4.1 | % | 4.7 | % |
| GDP growth | 0.2 | % | 1.6 | % | 2.4 | % |
Each macroeconomic scenarios is associated with a given weight. As for its allocation, Santander Spain associates the Base scenario with the highest weight, while associating the lower weights to the most extreme scenarios:
| | | | | | | | | | | |
| 2025 | 2024 | 2023 |
| Pessimistic scenario | 30 | % | 30 | % | 30 | % |
| Base scenario | 40 | % | 40 | % | 40 | % |
| Optimistic scenario 1 | 30 | % | 30 | % | 30 | % |
The sensitivity analysis of the main portfolios expected loss to variations of +/-100 bp for the macroeconomic variables used in the construction of the scenarios, at December 31 2025, is as follows:
| | | | | | | | | | | |
| Change in Provision |
| Mortgages | Corporates | Others |
| GDP Growth | | | |
| -100 bps | 8.5 | % | 1.1 | % | 2.1 | % |
| +100 bps | (3.6 | %) | (0.9 | %) | (1.9 | %) |
| Housing price change | | | |
| -100 bps | 8.4 | % | 1.5 | % | 3.4 | % |
| +100 bps | (6.7 | %) | (0.7 | %) | (1.8 | %) |
| Unemployment rate | | | |
| -100 bps | (6.0 | %) | (1.5 | %) | (3.7 | %) |
| +100 bps | 14.7 | % | 1.8 | % | 4.7 | % |
To determine Stage 2 classification, Santander Spain applies quantitative criteria based on identifying increases in the lifetime PD of an exposure above a relative or absolute threshold. The threshold differs by portfolio depending on the characteristics of the exposures, and an exposure is considered to exceed the threshold when its lifetime PD increases by a set amount compared with the PD at initial recognition. Santander Spain calibrates these thresholds periodically, as described in previous paragraphs. In addition, Santander Spain applies a backstop to the relative threshold across all portfolios. As a result, Santander Spain classifies contracts as Stage 2 when their current PD has increased by more than two times compared with the PD at origination.
Santander Spain also considers specific qualitative criteria that indicate a significant increase in credit risk, regardless of how the PD has evolved since initial recognition. Among other criteria, Santander Spain considers that an exposure shows a significant increase in credit risk when it is more than 30 days past due or when its early warning system so determines.
3.3. United States
Portfolio overview
Santander US’s credit risk stood at EUR 148,488 million at the end of December 2025. It makes up 12.8% of Grupo Santander's total credit risk.
The NPL ratio grew to 4.82% (+14 bps in the year) due to a higher stock of delinquencies and lower portfolio growth, and the cost of risk decreased to 1.62% (-20 bps in the year).
Santander US includes the following business units:
Santander Bank, National Association (SBNA)
In 2025 lending amounted to EUR 46,677 million (representing 4% of the Group's credit risk) and presents a reduction of 15% in 2025, mainly due to the transfer of the CIB portfolio to the New York branch.
The NPL ratio increased to 2.60% (+44 bps vs December 2024, while the cost of risk remained flat at 0.93%.
Activity in the individuals segment is primarily focused on auto financing and leasing, as well as credit card origination. During 2025, the teams continued to develop the operating and systems capabilities that will enable the asset product offering to be expanded in the future through the Openbank brand.
The Commercial segment comprises seven business lines, including Commercial Real Estate, Santander Real Estate Capital, Commercial Equipment Vehicle Finance, and Commercial and Industrial. The portfolio shows a slight downward trend in exposure, driven, on the one hand, by a strategy that prioritises risk-adjusted profitability over volume growth and, on the other, by the gradual run-down of the real estate and dealer portfolios.
The credit risk profile of the Commercial Real Estate and dealer portfolios shows some deterioration, mainly due to structural uncertainties affecting these sectors, as well as the impact of an interest-rate environment that remains elevated and developments in commercial and tariff policies, which continue to weigh on the financial capacity of certain customers.
Information on the estimation of impairment losses
The detail of Santander Bank, National Association exposure and loan-loss reserves associated with each of the stages at 31 December, 2025, 2024 and 2023 is shown below. In addition, the exposure is divided in four tranches of the Standard & Poor's rating scale, according to their current credit quality:
| | | | | | | | | | | | | | |
Exposure and loan-loss reserves by stage |
| EUR million |
| 2025 |
Credit quality A | Stage 1 | Stage 2 | Stage 3 | Total |
| From AAA to AA- | 1,622 | | 24 | | — | | 1,646 | |
| From A+ to BB | 7,352 | 728 | — | | 8,080 |
| From BB- to B- | 28,758 | 4,459 | — | | 33,217 |
| CCC and below | 779 | 861 | 1,158 | 2,798 |
Total exposureB | 38,511 | | 6,072 | | 1,158 | | 45,741 | |
Loan-loss reservesC | 277 | | 325 | | 202 | | 804 | |
| | | | | | | | | | | | | | |
Exposure and loan-loss reserves by stage |
| EUR million |
| 2024 |
Credit quality A | Stage 1 | Stage 2 | Stage 3 | Total |
| From AAA to AA- | 4,215 | | 277 | | — | | 4,492 | |
| From A+ to BB | 21,422 | 930 | — | | 22,352 |
| From BB- to B- | 21,899 | 3,855 | — | | 25,754 |
| CCC and below | 33 | 482 | 1,130 | | 1,645 |
Total exposureB | 47,569 | | 5,544 | | 1,130 | | 54,243 | |
Loan-loss reservesC | 292 | | 364 | | 182 | | 838 | |
| | | | | | | | | | | | | | |
Exposure and loan-loss reserves by stage |
| EUR million |
| 2023 |
Credit quality A | Stage 1 | Stage 2 | Stage 3 | Total |
| From AAA to AA- | 4,834 | | 76 | | — | | 4,910 | |
| From A+ to BB | 20,468 | 459 | — | | 20,927 | |
| From BB- to B- | 25,312 | | 3,439 | | — | | 28,751 | |
| CCC and below | 52 | 450 | 894 | | 1,396 | |
Total exposure B | 50,666 | | 4,424 | | 894 | | 55,984 | |
Loan-loss reservesC | 409 | | 335 | | 141 | | 885 | |
A.Detail of credit quality ratings calculated for Group management purposes.
B.Total exposure includes loan balances (drawn amounts) and off-balance (letters of credit + guarantees) and excludes REPO, FV portfolio, trading portfolio and undrawn commitments.
C.Includes provisions for undrawn authorized lines (loan commitments).
For the estimation of expected losses, prospective information is taken into account. Specifically, Santander Bank, National Association considers four macroeconomic scenarios, which are updated periodically. The evolution projected in 2025 for a period of five years of the main macroeconomic indicators used Santander Bank, National Association to estimate expected losses is presented below:
| | | | | | | | | | | | | | |
| 2026-2030 |
| Variables | Pessimistic scenario 2 | Pessimistic scenario 1 | Base scenario | Optimistic scenario |
| Interest rate (annual averaged) | 1.8 | % | 2.6 | % | 3.2 | % | 3.0 | % |
| Unemployment rate | 6.4 | % | 5.0 | % | 4.2 | % | 3.7 | % |
| House price change | 0.2 | % | 0.7 | % | 1.3 | % | 2.1 | % |
| GDP growth | 1.7 | % | 1.9 | % | 2.0 | % | 2.7 | % |
Manheim growthA | (0.6 | %) | (0.1 | %) | 0.3 | % | 0.1 | % |
A. US used vehicle price car index.
Each of the macroeconomic scenarios is associated with a given weight. As for its allocation, Santander Bank, National Association associates the highest weighting to the Base scenario, while associates the lowest weightings to the most extreme scenarios:
| | | | | | | | | | | |
| 2025 | 2024 | 2023 |
| Pessimistic scenario 2 | 18 | % | 18 | % | 18 | % |
| Pessimistic scenario 1 | 20 | % | 20 | % | 20 | % |
| Base scenario | 33 | % | 33 | % | 33 | % |
| Optimistic scenario | 30 | % | 30 | % | 30 | % |
The sensitivity analysis of the main portfolios expected loss to variations of +/-100 bp for the macroeconomic variables used in the construction of the scenarios as of 2025 is as follows:
| | | | | | | | | | | |
| Change in Provision |
| Mortgages | Corporates | Auto |
| GDP Growth | | | |
| -100 bps | 13.6% | 10.9% | 2.8% |
| +100 bps | (10.6%) | (7.7%) | (2.0%) |
| Housing price change | | | |
| -100 bps | 26.9% | 18.7% | 5.0% |
| +100 bps | (12.9%) | (9.3%) | (2.5%) |
| Unemployment rate | | | |
| -100 bps | (41.6%) | (25.9%) | (7.9%) |
| +100 bps | 53.9% | 39.5% | 11.8% |
| Manheim index | | | |
| -100 bps | — | — | 1.8% |
| +100 bps | —% | —% | (1.4%) |
For the Stage 2 classification determination, this year SBNA implemented, within the Auto portfolio, a system based on the comparison of PD to determine whether there has been a significant increase in credit risk. SBNA set both relative and absolute thresholds, segmented by the customer’s credit profile, and also established a backstop to the relative threshold. As a result, SBNA will classify as Stage 2 those contracts whose current PD has increased by more than two times compared to their PD at origination.
For the remaining retail portfolios, SBNA uses the FICO (Fair Isaac Corporation) score as a quantitative criterion as a proxy for PD, considering the score at origination and its current value, and setting different limits or cut-off points depending on each portfolio’s characteristics. A significant increase in risk requires changes in the score of around 120 bps and 20 bps.
For wholesale portfolios, SBNA uses the transaction’s rating as a proxy for PD, considering the rating at origination and its current rating, and setting thresholds for different rating bands depending on each portfolio’s characteristics.
In addition, SBNA defines specific qualitative criteria to identify exposures that have recorded a significant increase in credit risk. Among other criteria, Santander Bank, National Association considers that a transaction presents a significant increase in credit risk when it has arrears positions for more than 30 days or when a system of early warning indicators determines it.
Santander Consumer USA Inc.
Santander Consumer USA Inc. (SC USA) presents higher risk indicators than other Santander US units due to the nature of its business, which focuses on auto finance via loans and leasing.
At 31 December 2025, lending amounted to EUR 25,318 million (representing 2.2% of the Group) and presents a decrease of 17.0% regarding December 2024.
Regarding the NPL ratio, it increased to 22.08% (+340 bps in the year); and the cost of risk stood at 6.10% (-50 bps YoY).
NPL coverage ratio fell to 53% (-885 pp in the year), in line with the percentages of transfers from default to bad debts, which are at historically low levels.
The business focuses on optimising the profitability-to-risk relationship through pricing management aligned with each customer’s credit quality and each transaction, while also strengthening dealer processes and the dealer experience. 2025 was marked by uncertainty stemming from tariff policy and fiscal stimulus measures, as well as the end of the exclusivity agreement with Stellantis.
Information on the estimation of impairment losses
The detail of Santander Consumer USA Inc. exposure and loan-loss reserves associated with each of the stages at 31 December 2025, 2024 and 2023, is shown below. In addition, the exposure is divided in four tranches of the Standard & Poor's rating scale, according to their current credit quality:
| | | | | | | | | | | | | | |
Exposure and loan-loss reserves by stage |
| EUR million |
| 2025 |
Credit quality A | Stage 1 | Stage 2 | Stage 3 | Total |
| From AAA to AA- | — | | — | | — | | — | |
| From A+ to BB | 54 | | — | | — | | 54 | |
| From BB- to B- | 10,167 | | 947 | | — | | 11,114 | |
| CCC and below | 3,577 | | 4,871 | | 5,588 | | 14,036 | |
Total exposure B | 13,798 | | 5,818 | | 5,588 | | 25,204 | |
Loan-loss reservesC | 419 | | 910 | | 1,688 | | 3,017 | |
| | | | | | | | | | | | | | |
Exposure and loan-loss reserves by stage |
| EUR million |
| 2024 |
Credit quality A | Stage 1 | Stage 2 | Stage 3 | Total |
| From AAA to AA- | — | | — | | — | | — | |
| From A+ to BB | 202 | — | | — | | 202 | |
| From BB- to B- | 12,802 | 451 | — | | 13,253 | |
| CCC and below | 7,259 | 4,226 | 5,729 | | 17,214 | |
Total exposure B | 20,263 | | 4,677 | | 5,729 | | 30,669 | |
Loan-loss reservesC | 630 | | 1,006 | | 1,908 | | 3,544 | |
| | | | | | | | | | | | | | |
Exposure and loan-loss reserves by stage |
| EUR million |
| 2023 |
Credit quality A | Stage 1 | Stage 2 | Stage 3 | Total |
| From AAA to AA- | — | | — | | — | | — | |
| From A+ to BB | 99 | 0 | — | | 99 | |
| From BB- to B- | 12,120 | 395 | — | | 12,515 | |
| CCC and below | 6,754 | 4,237 | 5,272 | | 16,263 | |
Total exposure B | 18,973 | | 4,632 | | 5,272 | | 28,877 | |
Loan-loss reservesC | 597 | | 1,019 | | 1,712 | | 3,328 | |
A.Detail of credit quality ratings calculated for Group management purposes.
B.Total exposure includes loan balances (drawn amounts) and off-balance (letters of credit + guarantees) and excludes REPOs, FV portfolio, trading portfolio and undrawn commitments.
C.Includes provisions for undrawn authorized lines (loan commitments).
For the expected losses estimation, prospective information should be taken into account. Specifically, SC USA considers four macroeconomic scenarios, periodically updated over a 5-year time horizon.
The evolution forecasted in 2025 for a period of five years of the main macroeconomic indicators used by in SC USA in the estimation of expected losses is shown below:
| | | | | | | | | | | | | | |
| 2026-2030 |
| Variables | Pessimistic scenario 2 | Pessimistic scenario 1 | Base scenario | Optimistic scenario |
| Interest rate (annual averaged) | 1.8 | % | 2.6 | % | 3.2 | % | 3.0 | % |
| Unemployment rate | 6.4 | % | 5.0 | % | 4.2 | % | 3.7 | % |
| House price change | 0.2 | % | 0.7 | % | 1.3 | % | 2.1 | % |
| GDP growth | 1.7 | % | 1.9 | % | 2.0 | % | 2.7 | % |
ManheimA index | (0.6 | %) | (0.1) | | 0.3 | % | 0.1 | % |
A. US used vehicle price car index.
Each of the macroeconomic scenarios is associated with a given weight. Santander Consumer USA Inc. associates the highest weighting to the Base scenario, whereas it associates the lowest weightings to the most extreme or acid scenarios:
| | | | | | | | | | | |
| 2025 | 2024 | 2023 |
| Pessimistic scenario 2 | 18 | % | 18 | % | 18 | % |
| Pessimistic scenario 1 | 20 | % | 20 | % | 20 | % |
| Base scenario | 33 | % | 33 | % | 33 | % |
| Optimistic scenario | 30 | % | 30 | % | 30 | % |
The sensitivity analysis of the main portfolios expected loss to variations of +/-100 bp for the macroeconomic variables used in the construction of the scenarios at the end of 2025 is as follows:
| | | | | |
| Change in provision |
| SC Auto |
| Manheim index | |
| -100 bps | 1.0% |
| +100 bps | (0.8%) |
| Unemployment Rate | |
| -100 bps | (4.9%) |
| +100 bps | 7.0% |
| House Price Change | |
| -100 bps | 3.1% |
| +100 bps | (1.6%) |
| GDP growth | |
| -100 bps | 1.7% |
| +100 bps | (1.2%) |
In relation to the Stage 2 classification determination, SC USA implemented a new system based on the comparison of PD at origination and current PD, replacing the previous approach based on the FICO (Fair Isaac Corporation) score. SC USA established a set of absolute and relative thresholds, segmented based on the customer’s credit profile. Finally, it introduced a backstop to the relative threshold whereby contracts whose current PD has increased by more than two times compared to their PD at origination are classified as Stage 2.
Additionally, for each portfolio, a series of specific qualitative criteria are defined, which indicate that the exposure has experienced a significant increase in credit risk, regardless of the evolution of its PD since the initial recognition. Among other criteria, the entity considers that a transaction has experienced a significant increase in credit risk when it has past-due positions for more than 30 days. These criteria align with the risk management practices of each portfolio.
3.4. Banco Santander (Brasil) S.A.
Portfolio overview
Santander Brazil's credit risk amounted to EUR 118,546 million, increasing 2.5% in constant euros from 2024. Minus the exchange rate effect, it grew by 2.0%. As of December 2025, Santander Brasil accounts for 10% of Grupo Santander's loan book.
The NPL ratio went from 6.10% in December 2024 to 6.76% in December 2025, and the coverage ratio increased from 79.0% to 81.0%.
As of 31 December 2025 loan-loss provisions reached EUR 4,409 million, a 2% year-on-year decrease. Cost of risk increased from 4.03% in 2024 to 4.17% in 2025.
In 2025, the Brazilian economy is moderating compared to the previous year. Several factors drive this performance: reduced fiscal support, a more restrictive monetary policy and a less favourable external environment.
The labour market still shows resilience, which has helped prevent a sharp deterioration in household consumption. However, some indicators suggest that this labour-market momentum is starting to cool, with private-sector employment growth gradually easing.
Inflation is expected to close the year at around 4.8%, with a trend towards further moderation in 2026. A moderate appreciation of the Brazilian real and weaker domestic demand contribute to this price moderation. The Brazilian real exchange rate remains a source of uncertainty, together with public debt sustainability and the need for fiscal adjustments to contain financial imbalances. From a sectoral perspective, the agricultural sector and certain industrial segments continue to provide relevant support, although the overall slowdown and the effects of tighter monetary conditions limit their contribution to aggregate growth.
Against this backdrop, although Brazil retains a relatively solid base — a robust labour market and competitive export sectors —2025 is shaping up as a transition year, with the economy slowing and facing multiple structural challenges (inflation, exchange rate, debt and monetary policy) that condition its performance.
The retail segment (without Consumer Finance), which represents 37% of Santander Brazil's total portfolio, mainly comprises mortgages and credit cards (29% and 26% of the total portfolio, respectively). Thanks to the risk mitigation measures implemented in origination and portfolio management, cost of risk has been kept at 4.7%, despite the high SELIC rate and inflation running above the official target, which reduces individuals’ repayment capacity.
In the SME segment, which represents 11% of total risk exposure, the Bank maintained the restrictive origination measures adopted in recent years, particularly for the higher-risk profiles with weaker performance. Teams continuously review and adjust strategies to keep credit quality within expected levels. Overall, they achieved this during the year, with an acceptable performance of new business indicators.
In Brazil’s corporate segment, 2025 was marked by an uncertain geopolitical backdrop and some weaknesses in the local economy, notably high interest rates that have affected the repayment capacity of more leveraged companies. In this environment, the portfolio’s growth slowed and NPL and cost of risk levels increased.
Information on the estimation of impairment losses
The detail of Banco Santander (Brasil) S.A. exposure and loan-loss reserves associated with each of the stages at 31 December 2025, 2024 and 2023, is shown below. In addition, the exposure is divided in four tranches of the Standard & Poor's rating scale, according to their current credit quality:
| | | | | | | | | | | | | | |
Exposure and loan-loss reserves |
| EUR million | 2025 |
Credit quality A | Stage 1 | Stage 2 | Stage 3 | Total |
| From AAA to AA- | 16,898 | | 1,513 | | — | | 18,411 | |
| From A+ to BB | 29,179 | 1,253 | — | | 30,432 | |
| From BB- to B- | 36,089 | | 7,035 | | — | | 43,124 | |
| CCC and below | 1,217 | | 3,801 | | 7,151 | | 12,169 | |
Total exposureB | 83,383 | | 13,602 | | 7,151 | | 104,136 | |
Loan-loss reservesC | 648 | | 1,128 | | 4,216 | | 5,992 | |
| | | | | | | | | | | | | | |
Exposure and loan-loss reserves |
| EUR million | | | | |
| 2024 |
Credit quality A | Stage 1 | Stage 2 | Stage 3 | Total |
| From AAA to AA- | 19,557 | | 970 | | — | | 20,527 | |
| From A+ to BB | 32,824 | 1,637 | — | | 34,461 | |
| From BB- to B- | 33,655 | | 5,285 | | — | | 38,940 | |
| CCC and below | 423 | | 2,808 | | 6,382 | | 9,613 | |
Total exposureB | 86,459 | | 10,700 | | 6,382 | | 103,541 | |
Loan-loss reservesC | 687 | | 860 | | 3,766 | | 5,313 | |
| | | | | | | | | | | | | | |
Exposure and loan-loss reserves |
| EUR million | | | | |
| 2023 |
Credit quality A | Stage 1 | Stage 2 | Stage 3 | Total |
| From AAA to AA- | 20,670 | | 468 | | — | | 21,138 | |
| From A+ to BB | 38,869 | 751 | — | | 39,620 | |
| From BB- to B- | 36,107 | | 4,177 | | — | | 40,284 | |
| CCC and below | 1,153 | | 3,735 | | 7,479 | | 12,367 | |
Total exposureB | 96,799 | | 9,131 | | 7,479 | | 113,409 | |
Loan-loss reservesC | 722 | | 1,078 | | 4,538 | | 6,338 | |
A.Detail of credit quality ratings calculated for Group management purposes.
B.Total exposure includes loan balances (drawn amounts) and off-balance (letters of credit + guarantees) and excludes REPOs, FV portfolio, trading portfolio and undrawn commitments.
C.Includes provisions for undrawn authorized lines (loan commitments).
For the expected losses estimation, prospective information is taken into account. Particularly, Santander Brazil considers three macroeconomic scenarios, periodically updated. The evolution for a period of five years of the main macroeconomic indicators used to estimate the expected losses in Santander Brazil is as follows:
| | | | | | | | | | | |
| 2026-2030 |
| Variables | Pessimistic scenario | Base scenario | Optimistic scenario |
| Interest rate (annual averaged) | 11.5 | % | 10.9 | % | 10.3 | % |
| Unemployment rate | 8.0 | % | 6.5 | % | 5.4 | % |
| House price change | 1.1 | % | 5.9 | % | 10.3 | % |
| GDP growth | (0.2 | %) | 1.9 | % | 3.8 | % |
| Burden income | 27.0 | % | 26.8 | % | 26.1 | % |
Each macroeconomic scenario is associated with a given weight. Regarding its assignation, Brazil links the highest weight to the base scenario whilst links the lowest weights to the most extreme scenarios: | | | | | | | | | | | |
| 2025 | 2024 | 2023 |
| Pessimistic scenario | 13 | % | 13 | % | 10 | % |
| Base scenario | 75 | % | 75 | % | 80 | % |
| Optimistic scenario | 13 | % | 13 | % | 10 | % |
The sensitivity analysis of the main portfolios expected loss to variations of +/-100 bp for the macroeconomic variables used in the construction of the scenarios is at the end of 2025 as follows:
| | | | | | | | | | | |
| Change in provision |
| Individuals | SME | Other |
| GDP growth | | | |
| -100 bps | 1.3 | % | 2.9 | % | 2.6 | % |
| +100 bps | (0.7 | %) | (1.3 | %) | (1.4 | %) |
| Unemployment rate | | | |
| +100 bps | (1.9 | %) | (3.8 | %) | (4.5 | %) |
| +100 bps | 2.8 | % | 6.2 | % | 6.3 | % |
| Interest rate (SELIC) | | | |
| -100 bps | (0.6 | %) | (1.6 | %) | (0.9 | %) |
| +100 bps | 1.7 | % | 4.0 | % | 3.5 | % |
Regarding the Stage 2 classification determination, Santander Brasil assesses whether the increase in lifetime PD over the expected life of the transaction exceeds the combined effect of an absolute and a relative threshold. These thresholds vary by portfolio, depending on the characteristics of the transactions. A transaction is deemed to breach the threshold when its lifetime PD increases by a specified amount compared to the PD recorded at initial recognition.
The absolute and relative threshold levels are recalibrated periodically and depend on the type of portfolio to which they apply. In addition, Santander Brasil has implemented a backstop to the relative threshold across all portfolios: contracts whose current PD doubles the PD at origination are automatically classified as Stage 2.
4. Other credit risk aspects
4.1. Credit risk by activity in the financial markets
This section covers credit risk from treasury, with money market financing and counterparty risk products to satisfy the needs of customers (especially credit institutions) and the Group.
Counterparty credit risk is defined as the risk that could arise from a total or partial failure to meet the financial obligations entered into with the entity, because a customer may default before the final settlement of the transaction’s cash flows. This risk usually increases the longer the period between the trade date and the settlement date. It is a bilateral credit risk that can affect both parties to the transaction, and its magnitude is uncertain, as it depends on volatile market factors.
Within counterparty credit risk exposure, an additional risk known as wrong-way risk may arise. It occurs when exposure to a portfolio or counterparty increases at the same time as its credit quality deteriorates. In other words, wrong-way risk exists when default risk increases and, as a result, the exposure to the counterparty also increases. Santander has specific models to measure and control this risk.
Settlement risk arises when the settlement of a transaction involves a bilateral exchange of flows or assets between two counterparties. For example, when a counterparty buys dollars in exchange for euros, settlement involves one party delivering euros and receiving an equivalent amount of dollars from the other. Settlement risk is the risk that one of the parties fails to meet its settlement obligations. We have also developed a global infrastructure and specific models to measure this risk.
To manage and control counterparty risk, it is essential to have an infrastructure that allows measuring current and potential exposure at different levels of aggregation and granularity in an agile and dynamic way, ensuring the generation of reports with sufficient detail to facilitate the understanding of exposures and the decision-making process.
To measure exposure, Grupo Santander follows two methodologies: mark-to-market (MtM or replacement value in derivatives) plus potential future exposure (add-on), and Monte Carlo simulation for calculating exposure for some countries and products. Additionally, Santander calculates capital at risk or unexpected loss, which is the loss that constitutes economic capital net of guarantees and recoveries, after deducting the expected loss.
After market close, Grupo Santander recalculates exposures by adjusting all operations to their new time horizon, adapting the potential future exposure and applying mitigation measures (netting, collateral, among others), so that exposures can be controlled daily against the limits approved by senior management within the risk appetite. Santander performs risk control through a real-time integrated system, which allows the Group to know at any moment the available exposure limit with any counterparty, in any product and term, and across all subsidiaries.
Grupo Santander runs monthly stress tests on derivatives portfolios and securities financing transactions (SFT). These exercises form an integral part of the counterparty credit risk management process. They allow us to assess the resilience of exposures under adverse scenarios and support appropriate identification, measurement and control of the associated risks.
4.2. Concentration risk
Concentration risk control is an essential aspect of Grupo Santander's management. The Group continuously monitors the level of concentration in its credit risk portfolios applying various criteria: geographic areas and countries, economic sectors and groups of customers.
The board, via the risk appetite framework, determines the maximum levels of concentration.
In line with these maximum levels and limits, the executive risk committee establishes the risk policies and reviews the appropriate exposure levels for the effective management of the degree of concentration in Santander’s credit risk portfolios.
Grupo Santander must adhere to the regulation on large risks contained in the CRR, according to which the exposure contracted by an entity with a customer or group of associated customers will be considered a large exposure when its value is equal to or greater than 10% of eligible capital.
In addition, in order to limit large exposures, no entity may assume exposures exceeding 25% of its eligible capital with a single customer or group of associated customers, having factored in the credit risk mitigation effect contained in the regulation.
At the end of December, after applying risk mitigation techniques, no group reaches the above-mentioned thresholds.
Regulatory credit exposure with the 20 largest groups within the scope of large risks represented 5.3% of the outstanding credit risk with customers (lending to customers plus off-balance sheet risks) as of December 2025. While the regulatory credit exposure with the 40 largest groups represents 8.4% of the credit risk.
The detail, by activity and geographical area of the Group's risk concentration at 31 December 2025 is as follows:
| | | | | | | | | | | | | | | | | |
| EUR million | | | | | |
| 2025A |
| Total | Spain | Other EU countries | America | Rest of the world |
| Central banks and Credit institutions | 326,316 | | 61,256 | | 71,853 | | 119,532 | | 73,675 | |
| Public sector | 267,765 | | 82,131 | | 62,620 | | 109,109 | | 13,905 | |
| Of which: | | | | | |
| Central government | 239,153 | | 66,479 | | 57,468 | | 101,768 | | 13,438 | |
| Other central government | 28,612 | | 15,652 | | 5,152 | | 7,341 | | 467 | |
| Other financial institutions (financial business activity) | 207,044 | | 16,301 | | 50,819 | | 101,600 | | 38,324 | |
| Non-financial companies and individual entrepreneurs (non-financial business activity) (broken down by purpose) | 447,496 | | 103,836 | | 94,760 | | 188,078 | | 60,822 | |
| Of which: | | | | | |
| Construction and property development | 20,322 | | 4,130 | | 2,090 | | 9,396 | | 4,706 | |
| Civil engineering construction | 5,128 | | 1,835 | | 1,740 | | 1,468 | | 85 | |
| Large companies | 291,515 | | 53,841 | | 63,635 | | 127,003 | | 47,036 | |
| SMEs and individual entrepreneurs | 130,531 | | 44,030 | | 27,295 | | 50,211 | | 8,995 | |
| Households – other (broken down by purpose) | 543,928 | | 88,602 | | 98,262 | | 142,560 | | 214,504 | |
| Of which: | | | | | |
| Residential | 333,552 | | 61,818 | | 27,030 | | 46,605 | | 198,099 | |
| Consumer loans | 192,746 | | 19,784 | | 69,670 | | 87,491 | | 15,801 | |
| Other purposes | 17,630 | | 7,000 | | 1,562 | | 8,464 | | 604 | |
| Total | 1,792,549 | | 352,126 | | 378,314 | | 660,879 | | 401,230 | |
A.For the purposes of this table, the definition of risk includes the following items in the public balance sheet: 'Loans and advances to credit institutions', 'Loans and advances to Central Banks', 'Loans and advances to Customers', 'Debt securities', 'Equity Instruments', 'Trading Derivatives', 'Hedging derivatives', 'Investments and financial guarantees given'.
4.3 Sectors identification and management
Grupo Santander conducts a quarterly review of exposure to customers operating in sectors that could be more affected by macroeconomic conditions (energy consumption, commodity prices, and key macroeconomic variables). This monitoring is complemented by the use of internal tools that allow projecting the behaviour and evolution of clients in each sector under different macroeconomic scenarios. Additionally, this process considers, among other things, the following information at the sector level:
•Market information: Industries’ stock market performance.
•Analysts’ EBITDA forecasts for the coming years.
•Internal information: Changes in credit exposure, defaults (in different timelines) and stagings.
•Our industry experts’ opinion, based on specific details about our exposures and our relationships with customers
Grupo Santander continued to strengthen our ability to analyse potential losses at the highest possible level of granularity by enhancing the methodology and sector projection tools, based on the resilience of each company’s financial statements under different macroeconomic scenarios.
4.4. Sovereign risk and exposure to other public sector entities
Sovereign risk arises from central bank transactions (including regulatory cash reserves), government bonds issued by the Treasury or equivalent bodies (public debt portfolio), and transactions with public-sector entities funded exclusively by a state’s budget revenues and with no commercial activity.
The standard historically applied by Grupo Santander differs from the one used by the EBA in its periodic stress tests. The most significant differences are that the EBA’s approach does not include deposits with central banks, exposures held in insurance companies, or indirect exposures through guarantees or other instruments. By contrast, it does include public administrations more broadly (including regional and local authorities), and not only those of the central government.
Santander continues to track and manage transactions with sovereign risk based on available information, such as reports by rating agencies and international organizations. Grupo Santander monitors each country where the Group has cross-border1 and sovereign risk. Santander analyses events that could affect the country’s political or institutional stability and assign its government or central bank a credit rating. This helps us set limits for transactions with sovereign risk.
Over recent years, total sovereign risk exposure has remained in line with regulatory requirements and the strategy defined for managing this portfolio. Changes in exposure across countries reflect the liquidity management strategy and hedging of interest rate and foreign exchange risk. International exposure is diversified across countries with different macroeconomic expectations and, consequently, different growth, interest rate and exchange rate scenarios..
At the end of December 2025, Grupo Santander´s local sovereign exposure, in currencies other than the official currency of the country of issuance, is not significant (EUR 4,908 million, 1.2% of total sovereign risk) according to our management criteria. Furthermore, exposure to non-local sovereign issuers involving cross-border risk is even less significant2 (EUR 17,002 million, 4.0% of total sovereign risk). Sovereign exposure in Latin America is mostly in local currency, and is recognised in the local accounts and concentrated in short- term maturities.
Our investment strategy for sovereign risk considers country’s credit quality to set the maximum exposure limits. The following table shows the percentage of exposure by ratingA:
| | | | | | | | | | | |
Exposure distribution by rating |
| 2025 | 2024 | 2023 |
| AAA | 18 | % | 21 | % | 18 | % |
| AA | 17 | % | 18 | % | 19 | % |
| A | 43 | % | 41 | % | 41 | % |
| BBB | 14 | % | 11 | % | 12 | % |
| Less than BBB | 9 | % | 9 | % | 10 | % |
A.Internal ratings are applied.
Sovereign exposure at the end of December 2025 is shown in the table below (data in million euros):
| | | | | | | | | | | | | | | | | | | | | | | |
| 2025 | | 2024 |
| Portfolio | | | |
| Financial assets held for trading and Financial assets designated as FV with changes in results | Financial assets
at fair value
through other
comprehensive
income | Financial
assets at
amortised cost | Non-trading financial assets mandatory at fair value through profit or loss | Total net direct exposure | | Total net direct exposure |
| Spain | 3,852 | | 112 | | 58,044 | | — | | 62,008 | | | 56,293 | |
| Portugal | (659) | | 1,199 | | 6,767 | | — | | 7,307 | | | 7,652 | |
| Italy | 2,875 | | 440 | | 12,557 | | — | | 15,872 | | | 12,915 | |
| Greece | — | | — | | — | | — | | — | | | — | |
| Ireland | (38) | | — | | — | | — | | (38) | | | — | |
| Rest Eurozone | 3,684 | | 254 | | 10,443 | | — | | 14,381 | | | 6,212 | |
| UK | 907 | | 1,001 | | 5,687 | | — | | 7,595 | | | 8,772 | |
| Poland | 1,141 | | 6,339 | | 13,333 | | — | | 20,813 | | | 14,286 | |
| Rest of Europe | 8 | | — | | 526 | | — | | 534 | | | 954 | |
| US | 4,783 | | 4,320 | | 15,943 | | — | | 25,046 | | | 24,926 | |
| Brazil | 8,089 | | 9,533 | | 8,543 | | — | | 26,165 | | | 26,641 | |
| Mexico | 10,663 | | 7,652 | | 7,599 | | — | | 25,914 | | | 21,642 | |
| Chile | 676 | | 2,666 | | 5,254 | | — | | 8,596 | | | 6,900 | |
| Rest of America | 2,593 | | 1,654 | | 2,151 | | — | | 6,398 | | | 4,431 | |
| Rest of the World | 211 | | 17 | | 4,128 | | — | | 4,356 | | | 7,003 | |
| Total | 38,785 | | 35,187 | | 150,975 | | — | | 224,947 | | | 198,627 | |
1 Risks with domestic public or private borrowers in foreign currency and originated outside the country.
2 Countries that are not considered low risk by Banco de España.
5. Forborne loan portfolio
The customer debt redirection policy incorporates the regulatory requirements of the EBA guidelines on the management of non-performing exposures, refinancing and restructuring. This policy acts as a reference for the transposition in our subsidiaries and shares the applicable supervisory expectations.
This policy also sets down rigorous criteria for evaluating, classifying and monitoring forbearances to support the strictest possible care and diligence in recovering due amounts. Thus, it dictates that Santander must adapt payment obligations to customers' current circumstances. Our forbearance policy also defines classification criteria to support Grupo Santander recognizes risks appropriately.
Forbearances must remain classified as non-performing or in watch-list for a prudential period for reasonable certainty of repayment. In no case will repayments be used to delay the immediate recognition of losses or so that their use distorts the timely recognition of the risk of non-payment.
At 31 December 2025, forbearance stock fell again and stood at EUR 25,235 million, due to the good payment behaviour in the main geographies. In terms of credit quality, 53% of the loans is classified as credit impaired, with a coverage ratio of 41%. In addition, 47% of the portfolio is classified as performing.
The following terms are used with the meanings specified below:
•Refinancing transaction: transaction that is granted or used, for reasons relating to current or foreseeable financial difficulties of the borrower, to repay one or more of the transactions granted to it, or through which the payments on such transactions are brought fully or partially up to date, in order to enable the borrowers of the cancelled or refinanced transactions to repay their debt (principal and interest) because they are unable, or might foreseeably become unable, to comply with the conditions there of in due time and form.
•Restructured transaction: transaction with respect to which, for economic or legal reasons relating to current or foreseeable financial difficulties of the borrower, the financial terms and conditions are modified in order to facilitate the payment of the debt (principal and interest) because the borrower is unable, or might foreseeably become unable, to comply with the aforementioned terms and conditions in due time and form, even if such modification is envisaged in the agreement.
| | | | | | | | | | | | | | | | | | | | | | | |
| Current refinancing and restructuring balances |
| Amounts in EUR million, except number of transactions that are in units |
| 2025 |
| Total |
| Without real guarantee | With real guarantee | |
| | | | | Maximum amount of the actual collateral that can be considered | Impairment of accumulated value or accumulated losses in fair value due to credit risk |
| Number of transactions | Gross amount | Number of transactions | Gross amount | Real estate guarantee | Rest of real guarantees |
| Credit entities | — | | — | | — | | — | | — | | — | | — | |
| Public sector | 14 | | 6 | | 9 | | 7 | | 5 | | — | | 8 | |
| Other financial institutions and: individual shareholder | 933 | | 94 | | 462 | | 182 | | 117 | | 15 | | 94 | |
| Non-financial institutions and individual shareholder | 489,192 | | 5,095 | | 42,700 | | 5,596 | | 3,271 | | 923 | | 2,713 | |
| Of which financing for constructions and property development | 249 | | 21 | | 523 | | 739 | | 695 | | 4 | | 75 | |
| Other warehouses | 3,000,071 | | 4,556 | | 515,253 | | 9,699 | | 3,752 | | 3,777 | | 3,665 | |
| Total | 3,490,210 | | 9,751 | | 558,424 | | 15,484 | | 7,145 | | 4,715 | | 6,480 | |
| Financing classified as non-current assets and disposable groups of items that have been classified as held for sale | 13,499 | | 261 | | 4,630 | | 566 | | 406 | | 14 | | 171 | |
| | | | | | | | | | | | | | | | | | | | | | | |
| Current refinancing and restructuring balances |
| Amounts in EUR million, except number of transactions that are in units |
| 2025 |
| Of which, non-performing/Doubtful |
| Without real guarantee | With real guarantee | |
| | | | | Maximum amount of the actual collateral that can be considered | Impairment of accumulated value or accumulated losses in fair value due to credit risk |
| Number of transactions | Gross amount | Number of
transactions | Gross amount | Real estate guarantee | Rest of real guarantees |
| Credit entities | — | | — | | — | | — | | — | | — | | — | |
| Public sector | 5 | | 2 | | 9 | | 7 | | 5 | | — | | 8 | |
| Other financial institutions and: individual shareholder | 579 | | 50 | | 259 | | 75 | | 22 | | 11 | | 89 | |
| Non-financial institutions and individual shareholder | 296,008 | | 2,901 | | 26,767 | | 2,585 | | 1,166 | | 420 | | 2,420 | |
| Of which financing for constructions and property development | 167 | | 3 | | 264 | | 156 | | 115 | | 4 | | 50 | |
| Other warehouses | 1,620,343 | | 2,401 | | 296,470 | | 5,313 | | 1,730 | | 2,232 | | 2,991 | |
| Total | 1,916,935 | | 5,354 | | 323,505 | | 7,980 | | 2,923 | | 2,663 | | 5,508 | |
| Financing classified as non-current assets and disposable groups of items that have been classified as held for sale | 6,901 | | 120 | | 1,720 | | 235 | | 110 | | 5 | | 145 | |
In 2025, the amortised cost of financial assets whose contractual cash flows were modified during the year when the corresponding loss adjustment was valued at an amount equal to the expected credit losses over the life of the asset amounted to EUR 3,031 million (3,940 million in 2024), without these modifications having a material impact on the income statement. Also, during 2025, the total of financial assets that have been modified since the initial recognition, and whose correction for expected loss has gone from being valued during the entire life of the asset to the following twelve months, amounts to EUR 2,092 million (2,950 million in 2024).
The transactions presented in the foregoing tables were classified at 31 December 2025 by nature, as follows:
•Credit impaired: Operations that rest on an inadequate payment scheme will be classified within the non-performing category, regardless they include contract clauses that delay the repayment of the operation throughout regular payments or present amounts written off the balance sheet for being considered irrecoverable.
•Performing: Operations not classifiable as non-performing will be classified within this category. Operations will also be classified as normal if they have been reclassified from the non-performing category for complying with the specific criteria detailed below:
•A period of a year must have passed from the refinancing or restructuring date.
•The owner must have paid for the accrued amounts of the capital and interests, thus reducing the rearranged capital amount, from the date when the restructuring of refinancing operation was formalised.
•The owner must not have any other operation with amounts past due by more than 90 consecutive days of material delay on the date of the reclassification to the normal risk category.
Attending to the credit attention 47% of the forborne loan transactions are classified as other than non-performing. Particularly noteworthy are the level of existing guarantees (47% of transactions are secured by collateral) and the coverage provided by specific allowances (representing 26% of the total forborne loan portfolio and 41% of the non-performing portfolio).
c) Market, structural and liquidity risk
1. Activities subject to market risk and types of market risk
Activities exposed to market risk encompass transactions where risk is assumed as a consequence of potential changes in interest rates, inflation rates, exchange rates, stock prices, credit spreads, commodity prices, volatility and other market factors; the liquidity risk from our products and markets, and the balance-sheet liquidity risk. Therefore, they include trading risks and structural risks.
•Interest rate risk arises from movements in interest rates that reduce the value of a financial instrument, a portfolio or the Grupo Santander. It can affect loans, deposits, debt securities, most assets and liabilities held for trading, and derivatives.
•Inflation rate risk arises from movements in inflation that can reduce the value of a financial instrument, a portfolio or the entire group. It can affect loans, debt securities and derivatives (e.g. inflation swaps and futures) whose profitability is linked to inflation.
•Exchange rate risk is the possibility of loss because the currency of a long or open position will depreciate against the base currency. It can affect debt in subsidiaries whose local currency is not the euro, as well as loans denominated in a foreign currency.
•Equity risk is the possibility of loss from open positions in securities if their market price or expected future dividends fall. It affects shares, stock market indices, convertible bonds and derivatives with shares as the underlying asset (put, call, equity swaps, etc.).
•Credit spread risk is the possibility of loss from open positions in fixed-income securities or credit derivatives if their yield curve, or the recovery rate of their issuer or type change. A spread is the yield difference between financial instruments against a benchmark (e.g. the internal rate of return (IRR) of government bonds and interbank interest rates).
•Commodity price risk is the possibility of loss from movements in commodity prices. Grupo Santander's commodity exposure is minor and stems mainly from commodity derivatives.
•Volatility risk is the possibility of loss caused by movements in interest rates, exchange rates, the stock market, credit spreads and other risk factors affecting portfolio value. It is inherent to all financial instruments whose value considers volatility (especially options contracts).
Derivative contracts (such as options, futures, forwards and swaps) can mitigate market risks partially or fully.
Additionally, other more complex coverage market risks are considered, such as correlation risk, market liquidity risk, prepayment or cancellation risk and subscription risk.
•Correlation risk is the possibility of loss due to an adverse correlation between risk variables that affect portfolio value. Risk variables could be the same (e.g. two FX rates) or different (e.g. an interest rate and a commodity price).
•Market liquidity risk is the possibility that fewer market makers or institutional investors, a large number of transactions, market instability and other factors will cause the Group or a subsidiary to exit a position at a worse market price or trade cost. Exposure to different products and currencies can also increase this risk.
•Pre-payment or cancellation risk originates when mortgages, deposits and other on-balance-sheet instruments give holders the option to buy or sell them, thus altering future cash flows. Potential mismatches on the balance sheet pose a risk since cash flows may have to be reinvested at an interest rate that is potentially lower (assets) or higher (liabilities).
•Underwriting risk is the possibility that the bank will have to hold part of a debt issue it has underwritten or agreed to place if it cannot all be placed among potential buyers.
Balance sheet liquidity risk (unlike market liquidity risk) is the possibility of loss caused by forced disposal of assets or cash flow imbalance if the bank meets its payment obligations late or at excessive cost. It can cause losses by forced asset sales or impacts on margins due to the mismatch between expected cash inflows and outflows.
Pension and actuarial risks (explained at the end of this section) also depend on market variables.
Grupo Santander aim to comply with the Basel Committee’s Fundamental Review of the Trading Book (FRTB) and the EBA’s Guidelines on the management of interest rate risk arising from non-trading book activities. The purpose of several projects Grupo Santander runs is to provide risk control managers and teams with the best market risk management tools under the right governance framework for the models Grupo Santander uses for metric reporting; and to comply with regulation on the risks mentioned above.
2. Trading market risk management
Setting market risk limits in a dynamic process according to the risk appetite in the annual limits plan prepared by senior management and extended to all subsidiaries.
The standard methodology for risk management and control in trading, measures the maximum expected loss with a specific level of confidence and time frame. The standard for historical simulation is a confidence level of 99% over one day.
Grupo Santander applies statistical adjustments efficiently to incorporate recent developments affecting our levels of risk. Our time frame is two years or at least 520 days from the reference date of the VaR calculation.
The balance sheet items in the Group’s consolidated position that are subject to market risk are shown below, distinguishing those positions for which the main risk metric is VaR from those for which risk monitoring is carried out using other metrics:
| | | | | | | | | | | | | | |
| Risk metric values on the consolidated balance sheet |
| EUR million | | | | |
|
| Main market risk metric |
|
| Balance sheet amount | VaR | Other | Main risk factor for 'Other' balance |
| Assets subject to market risk | | | | |
| Cash, cash balances at central banks and other deposits on demand | 152,281 | | | 152,281 | | Interest rate |
| Financial assets held for trading | 252,318 | | 252,318 | | | |
| Non-trading financial assets mandatorily at fair value through profit or loss | 7,761 | | 5,815 | | 1,946 | | Interest rate, spread |
| Financial assets designated at fair value through profit or loss | 8,046 | | — | | 8,046 | | Interest rate, spread |
| Financial assets designated at fair value through other comprehensive income | 74,612 | | 2,281 | | 72,331 | | Interest rate, spread |
| Financial assets at amortized cost | 1,202,689 | | | 1,202,689 | | Interest rate, spread |
| Hedging derivatives | 3,931 | | | 3,931 | | Interest rate, exchange rate |
| Changes in the fair value of hedged items in portfolio hedges of interest risk | 50 | | | 50 | | Interest rate |
| Other assets | 165,827 | | | | |
| Total assets | 1,867,515 | | | | |
| | | | |
| Liabilities subject to market risk | | | | |
| Financial liabilities held for trading | 171,546 | | 171,546 | | | |
| Financial liabilities designated at fair value through profit or loss | 42,148 | | — | | 42,148 | | Interest rate, spread |
| Financial liabilities at amortized cost | 1,421,184 | | | 1,421,184 | | Interest rate, spread |
| Hedging derivatives | 4,248 | | | 4,248 | | Interest rate, exchange rate |
| Changes in the fair value of hedged items in portfolio hedges of interest rate risk | 49 | | | 49 | | Interest rate |
| Other liabilities | 115,592 | | | | |
| Total liabilities | 1,754,767 | | | | |
| Equity | 112,748 | | | | |
The following table displays the latest and average VaR values at 99% by risk factor over the last three years. It also shows the minimum and maximum VaR values in 2025 and 97.5% ES at the end of December 2025:
| | | | | | | | | | | | | | | | | | | | | | | | | | | | | | | | | | | |
VaR statistics and expected shortfall by risk factorA |
EUR million. VaR at 99% and ES at 97.5% with one day time horizon |
| 2025 | | 2024 | | 2023 |
| VaR (99%) | ES (97.5%) | | VaR | | VaR |
| Min | Average | Max | Latest | Latest | | Average | Latest | | Average | Latest |
| Total Trading | 9.6 | | 17.6 | | 29.2 | | 18.7 | | 16.9 | | | 17.1 | | 18.7 | | | 11.7 | | 13.5 | |
| Diversification effect | (10.7) | | (21.0) | | (59.3) | | (17.7) | | (18.9) | | | (19.8) | | (27.3) | | | (14.9) | | (17.1) | |
| Interest rate | 11.2 | | 16.5 | | 23.0 | | 15.3 | | 16.4 | | | 17.0 | | 20.2 | | | 12.2 | | 11.1 | |
| Equities | 2.4 | | 6.5 | | 10.8 | | 8.1 | | 7.5 | | | 6.0 | | 9.5 | | | 3.2 | | 6.0 | |
| Exchange rate | 3.3 | | 7.4 | | 37.5 | | 6.3 | | 5.8 | | | 5.8 | | 5.9 | | | 5.3 | | 4.8 | |
| Credit spread | 3.2 | | 5.7 | | 10.2 | | 4.8 | | 4.8 | | | 4.9 | | 5.3 | | | 4.3 | | 6.1 | |
| Commodities | 0.2 | | 2.5 | | 7.0 | | 1.9 | | 1.3 | | | 3.2 | | 5.1 | | | 1.6 | | 2.6 | |
| | | | | | | | | | | |
| Total Europe | 9.6 | | 15.0 | | 28.2 | | 13.2 | | 13.2 | | | 12.7 | | 16.0 | | | 9.4 | | 11.8 | |
| Diversification effect | (8.9) | | (18.0) | | (32.4) | | (15.9) | | (17.8) | | | (15.4) | | (18.4) | | | (10.5) | | (13.8) | |
| Interest rate | 9.0 | | 13.3 | | 19.2 | | 11.4 | | 13.3 | | | 12.0 | | 14.4 | | | 9.1 | | 8.2 | |
| Equities | 2.7 | | 6.4 | | 11.0 | | 7.4 | | 7.1 | | | 5.9 | | 8.8 | | | 2.8 | | 5.8 | |
| Exchange rate | 3.7 | | 7.3 | | 19.7 | | 5.3 | | 5.7 | | | 5.1 | | 5.8 | | | 3.5 | | 5.2 | |
| Credit spread | 3.0 | | 5.8 | | 10.4 | | 4.9 | | 4.8 | | | 4.9 | | 5.3 | | | 4.3 | | 6.1 | |
| Commodities | 0.1 | | 0.2 | | 0.3 | | 0.1 | | 0.1 | | | 0.2 | | 0.1 | | | 0.2 | | 0.3 | |
| | | | | | | | | | | |
| Total North America | 3.7 | | 5.8 | | 8.9 | | 5.5 | | 5.3 | | | 6.9 | | 6.4 | | | 4.0 | | 5.0 | |
| Diversification effect | (0.4) | | (1.7) | | (6.3) | | (1.6) | | (1.8) | | | (1.1) | | (0.8) | | | (0.7) | | (0.5) | |
| Interest rate | 3.8 | | 5.9 | | 8.8 | | 4.8 | | 4.9 | | | 6.9 | | 6.6 | | | 3.7 | | 5.0 | |
| Equities | 0.1 | | 0.8 | | 3.2 | | 1.0 | | 1.0 | | | 0.2 | | 0.1 | | | 0.2 | | 0.0 | |
| Exchange rate | 0.2 | | 0.8 | | 3.2 | | 1.3 | | 1.2 | | | 0.9 | | 0.5 | | | 0.8 | | 0.5 | |
| | | | | | | | | | | |
| Total South America | 3.2 | | 7.6 | | 16.5 | | 5.8 | | 5.9 | | | 9.0 | | 9.5 | | | 7.3 | | 7.0 | |
| Diversification effect | (0.3) | | (5.2) | | (28.7) | | (8.7) | | (6.2) | | | (6.9) | | (5.5) | | | (6.2) | | (6.6) | |
| Interest rate | 2.8 | | 7.2 | | 18.1 | | 4.0 | | 3.8 | | | 8.8 | | 6.5 | | | 7.3 | | 5.6 | |
| Equities | 0.2 | | 1.5 | | 7.2 | | 2.2 | | 2.3 | | | 1.2 | | 2.1 | | | 1.4 | | 2.4 | |
| Exchange rate | 0.4 | | 1.6 | | 12.9 | | 6.5 | | 4.7 | | | 2.7 | | 1.3 | | | 3.2 | | 3.0 | |
| Commodities | 0.1 | | 2.5 | | 7.0 | | 1.8 | | 1.3 | | | 3.2 | | 5.1 | | | 1.6 | | 2.6 | |
A. In South and North America, VaR levels of credit spreads and commodities are not shown separately due to their low or null materiality.
VaR at the end of December (EUR 18.7 million) was only EUR 0.03 million lower compared to the end of 2024, reflecting sustained high market volatility, ongoing geopolitical risk and concerns over inflation trends, which could pick up again as a result of new US trade policies.
By risk factor, average VaR (EUR 17.6 million) higher across several risk factors, especially for foreign exchange, with high market volatility for certain currencies such as the US dollar and the Argentine peso. Temporary spikes in VaR across the different factors generally reflect isolated increases in market price volatility rather than significant changes in positions.
By region, average VaR was higher than the 2024 average in Europe, mainly due to interest rate and foreign exchange risk factors, while it was lower in North America and South America.
Backtesting
Actual losses can differ from predicted losses because of the VaR’s limitations. Grupo Santander measures the accuracy of the VaR calculation model to make sure it is reliable. The most important tests Grupo Santander runs involve backtesting:
•In hypothetical P&L backtesting and for the total portfolio, two exceptions (a daily loss higher than VaR or a daily gain higher than VaE) were observed in 2025 for VaR at a 99% confidence level, on 9 and 11 April, as a result of high market volatility, mainly driven by uncertainty over the potential impact of new US trade policies.
•The exceptions observed in the past year are consistent with the assumptions of the VaR calculation model.
3. Structural balance sheet risks
3.1. Main aggregates and variations
Consistent with previous years, the market risk profile of Grupo Santander’s balance sheet remained moderate in 2025 in terms of asset, shareholders’ equity and NII volumes.
Each subsidiary’s finance division manages interest rate risk from commercial banking and is responsible for handling structural risk from interest rate fluctuations.
To measure interest rate risk, Grupo Santander uses statistical models based on strategies to mitigate structural risk with interest-rate instruments (such as bonds and derivatives) to keep risk profile within risk appetite.
The NII and EVE sensitivities below are based on scenarios of parallel interest rate movements from -100 to +100 basis points.
Structural VaR
With such a homogeneous metric as VaR, Grupo Santander can fully monitor market risk in the banking book (excluding CIB trading activity). The Bank differentiates fixed income based on interest rates and credit spreads in ALCO portfolios, FX rates and shares.
In general, the structural VaR of Grupo Santander total assets and equity is minor.
| | | | | | | | | | | | | | | | | | | | | | | | | | |
| Structural VaR |
EUR million. Structural VaR 99% with a temporary horizon of one day. |
| 2025 | 2024 | 2023 |
| Min | Average | Max | Latest | Average | Latest | Average | Latest |
| Structural VaR | 598.5 | | 662.9 | | 751.9 | | 690.1 | | 747.7 | | 687.5 | | 705.0 | | 749.5 | |
| Diversification effect | (155.9) | | (258.4) | | (265.6) | | (206.6) | | (386.4) | | (268.6) | | (416.6) | | (444.7) | |
VaR Interest RateA | 158.3 | | 177.3 | | 205.8 | | 177.6 | | 412.0 | | 235.2 | | 348.4 | | 380.2 | |
| VaR Exchange Rate | 486.0 | | 597.7 | | 648.7 | | 572.4 | | 571.7 | | 594.4 | | 580.4 | | 642.9 | |
| VaR Equities | 110.1 | | 146.3 | | 163.0 | | 146.7 | | 150.4 | | 126.5 | | 192.8 | | 171.1 | |
A. Includes credit spread VaR on ALCO portfolios.
Structural interest rate risk
•Europe
At the end of December, net interest income (NII) for our main balance sheets showed positive sensitivity to interest rate increases. As of the same date, the economic value of equity (EVE) showed negative sensitivity to interest rate increases.
At the end of December 2025, under the scenarios previously described, the most significant NII sensitivity risk was concentrated in the euro, at EUR 561 million; the pound sterling, EUR 169 million; the Polish złoty, EUR 51 million; and the US dollar, EUR 50 million, all linked to interest rate cut risk.
The most significant risk to the economic value of equity was concentrated in the euro yield curve, at EUR 1,087 million; in pound sterling, at EUR 614 million; the Polish złoty, at EUR 275 million euros; and the US dollar, at EUR 104 million euros, all linked to interest rate rise risk.
Exposure was moderate in relation to annual budget and capital levels in 2025.
•North America
At the end of December, net interest income (NII) for our North America balance sheets showed positive sensitivity to interest rate increases in the United States, while showing negative sensitivity to the same scenario in Mexico. In both cases, the economic value of equity (EVE) showed negative sensitivity to interest rate increases.
Exposure was moderate in relation to annual budget and capital levels in 2025.
At the end of December 2025, significant risk to NII was mainly in the US and amounted to EUR 49 million.
The most significant risk to EVE was in the US and amounted to EUR 570 million.
•South America
EVE and NII on our main South American balance sheets are generally positioned for interest rate cuts.
In 2025, exposure across all countries remained moderate in relation to the annual budget and capital levels.
At the end of December, the most significant risk to NII was mainly in Brazil (EUR 57 million).
Most significant risk to EVE was recorded in Brazil (EUR 257 million) and in Chile (EUR 225 million).
Structural foreign currency rate risk/results hedging
Grupo Santander's structural FX risk stems mainly from the income and hedging of foreign currency transactions for permanent financial investments. In the dynamic management of this risk, Grupo Santander aims to limit the impact of FX rate movements on the core capital ratio. In 2025, the hedged of the different currencies that have an impact on our core capital ratio was close to 100%.
In December 2025, the largest permanent exposures (with their potential impact on equity) were, in this order, in pound sterling, US dollars, Brazilian reais, Mexican pesos, Polish zlotys and Chilean pesos.
Grupo Santander uses FX derivatives to hedge part of those permanent positions. The Finance division manages FX risk and hedging for the expected profits and dividends of subsidiaries whose base currency is not the euro.
Structural equity risk
Grupo Santander holds equity positions in its banking and trading books. They are either equity instruments or stock, depending on the share of ownership or control.
At the end of December 2025, the equities and shareholdings in the banking book were diversified among Spain, China, Morocco, Poland and other countries. Most of them invest in the financial and insurance sectors. Grupo Santander has minor equity exposure to property and other sectors.
Structural equity positions are exposed to market risk. The Group calculates its VaR with a set of market prices and proxies. At the end of the year 2025, VaR at a 99% confidence level over a one-day horizon was EUR 147 million (EUR 127 million and EUR 171 million in 2024 and 2023, respectively).
3.2. Methodologies
Structural interest rate risk
Grupo Santander measures the potential impact of interest rate movements on EVE and NII. Because changing rates may generate impacts, Grupo Santander must manage and control many subtypes of interest rate risk, such as repricing risk, curve risk, basis risk and option risk (e.g. behavioural or automatic).
Interest rate risk in the balance sheet and market conditions and outlooks could necessitate certain financial measures to achieve Grupo Santander's desired risk profile (such as selling positions or setting interest rates on products Grupo Santander markets).
The metrics Grupo Santander uses to monitor IRRBB include NII and EVE sensitivity to interest rate movements.
•Net interest income sensitivity
Net interest income (NII) is the difference between interest income from assets and the interest cost of liabilities in the banking book over a typical one- to three-year horizon (one year being standard in Grupo Santander). Because NII sensitivity is the difference in income between a selected scenario and the base scenario, its values can be as many as considered scenarios. It enables us to see short-term risks and supplement economic value of equity (EVE) sensitivity.
•Economic value of equity sensitivity
Economic value of equity (EVE) is the difference between the current value of all assets minus the current value of all liabilities in the banking book. It does not include shareholders’ equity and non-interest-bearing instruments. The sensitivity of the economic value of own funds is obtained as the difference between said economic value calculated with a selected scenario and that calculated with a base scenario.
Because EVE sensitivity is the difference in EVE between a selected scenario and the base scenario, it can have as many values as considered scenarios. It enables us to see long-term risks and supplement NII sensitivity.
Structural exchange-rate risk/hedging of results
Every day, Grupo Santander measures FX positions, VaR and P/L.
Structural equity risk
Grupo Santander measures equity positions, VaR and P/L.
4. Liquidity risk
Structural liquidity management aims to fund the Group’s recurring activity optimising maturities and costs, while avoiding taking on undesired liquidity risks.
Santander’s liquidity management is based on the following principles:
•Define liquidity risk and provide detailed assessments of current and emerging material liquidity risks.
•Define liquidity risk metrics, review and challenge liquidity risk appetite and limits on first line of defence proposals.
•Evaluates and challenges commercial/business proposals; It provides senior management and business units with the necessary elements to understand the liquidity risk of Santander's businesses and operations.
•Supervise the liquidity risk management of the first line of defence and assess the permanence of businesses within the limits of liquidity risk.
•Reports on compliance with risk appetite limits and exceptions, if any, to governing bodies.
•Provides a consolidated view of liquidity risk exposures and liquidity risk profile.
•Confirms the existence of adequate liquidity procedures to manage the business within the limits of risk appetite.
The effective application of these principles by all institutions comprising the Group required the development of a unique management framework built upon three fundamental pillars:
•A solid organisational and governance model that supports the involvement of the subsidiaries’ senior management in decision-taking and its integration into the Group’s global strategy. The decision-making process for all structural risks, including liquidity and funding risk, is carried out by local Asset and Liability Committees (ALCOs) in coordination with the global ALCO, which is the body empowered by the Bank's board in accordance with the corporate Asset and Liability Management (ALM) framework.
This governance model has been reinforced as it has been included within Santander's Risk Appetite Framework. This framework meets demands from regulators and market players emanating from the financial crisis to strengthen banks’ risk management and control systems.
•In-depth balance sheet analysis and measurement of liquidity risk, supporting decision-taking and its control. The Group objective is to maintains adequate liquidity levels necessary to cover its short- and long-term needs with stable funding sources, optimising the impact of their costs on the income statement. Grupo Santander’s liquidity risk management processes are contained within a conservative risk appetite framework established in each geographic area in accordance with its commercial strategy. This risk appetite establishes the limits within which the subsidiaries can operate in order to achieve their strategic objectives.
•Management adapted in practice to the liquidity needs of each business. Every year, based on business needs, a liquidity plan is developed which seeks to achieve:
•a solid balance sheet structure, with a diversified presence in the wholesale markets;
•the use of liquidity buffers and limited encumbrance of assets;
•compliance with both regulatory metrics and other metrics included in each entity’s risk appetite statement.
Over the course of the year, all dimensions of the plan are monitored.
Grupo Santander continues to develop the ILAAP (Internal Liquidity Adequacy Assessment Process), an internal self-assessment of liquidity adequacy which must be integrated into the Group’s other risk management and strategic processes. It focuses on both quantitative and qualitative matters and is used as an input to the SREP (Supervisory Review and Evaluation Process). The ILAAP evaluates the liquidity position both in ordinary and stressed scenarios.
i. Liquidity risk measurement
Grupo Santander uses the Basel regulatory definition and calculates a set of metrics and stress scenarios in relation to intraday liquidity risk to maintain a high level of management and control. On the one hand, the regulatory liquidity metrics (LCR, NSFR) are prepared following the regulatory criteria established in the CRR 2 and CRD IV. Regarding internal metrics, liquidity scenarios are determined using a combination of behavioral observation in actual liquidity crises occurred at other banks, regulatory assumptions and expert judgment.
a) Liquidity Coverage Ratio (LCR)
The liquidity coverage ratio (LCR) is a regulatory metric. Its purpose is to promote the short-term resilience of a bank’s liquidity profile and make sure it has enough high-quality liquid assets to withstand a considerable idiosyncratic or market stress scenario over 30 calendar days.
b) Net Stable Funding Ratio (NSFR)
The net stable funding ratio (NSFR) is a regulatory metric we use to measure long-term liquidity risk. It is the ratio of available stable funding to required stable funding. It requires banks to keep a robust balance sheet, with off-balance-sheet assets and operations financed by stable liabilities.
c) Liquidity buffer
The liquidity buffer is the total liquid assets a bank has to cope with cash outflows during periods of stress. The assets are free of encumbrances and can be used immediately to generate liquidity without losses or excessive discounts. The liquidity buffer is a tool for calculating most liquidity metrics. It is also a metric with defined limits for each subsidiary.
d) Wholesale liquidity metric
The wholesale liquidity metric measures the number of days Grupo Santander would survive if it used liquid assets to cover lost liquidity from a wholesale deposit run-off (without possible renewal) over a set time horizon. Grupo Santander also uses it as an internal short-term liquidity metric to reduce risk from dependence on wholesale funding.
e) Asset Encumbrance metrics
Grupo Santander calculates two metrics to measure asset encumbrance risk. On the one hand, the asset encumbrance ratio gives the proportion of encumbered assets to total assets; on the other, the structural asset encumbrance ratio gives the proportion of encumbered assets by structural funding transaction (namely long-term collateralized issues and credit transactions with central banks).
f) Other additional liquidity indicators
In addition to traditional tools to measure short and long-term liquidity and funding risk, Grupo Santander has a set of additional liquidity indicators to complement those and to measure other non-covered liquidity risk factors. These include concentration metrics, such as the main and the five largest funding counterparties, or the distribution of funding by maturity.
In this sense, deposits do not show a tendency towards concentration, maintaining a stable structure at 31 December 2024, where approximately 75% are transactional and more than 80% of retail deposits are insured by deposit guarantee systems of the different countries.
g) Liquidity scenario analysis
As liquidity stress tests, five standard scenarios have been defined:
i.An idiosyncratic scenario of events detrimental only to Santander;
ii.a local market scenario of events highly detrimental to a base country’s financial system or real economy;
iii.a global market scenario of events highly detrimental to the global financial system; and
iv.combined scenario consisting of a combination of more severe idiosyncratic and market events (local and global) occurring simultaneously and interactively.
v.climate scenarios where different stress cases derived from the effects that climate change could have on the economy are collected.
Grupo Santander uses these stress test outcomes as tools to determine risk appetite and support business decision-making.
h) Liquidity early warning indicators
Early warning indicator system consists of quantitative and qualitative liquidity indicators that help predict stress situations and weaknesses in the funding and liquidity structure of Grupo Santander entities. External indicators relate to market-based financial variables; internal indicators relate to our own performance.
i) Intraday liquidity metrics
Grupo Santander follows Basel regulation and calculates several metrics and stress scenarios for intraday liquidity risk to maintain a high level of control.
ii. Liquidity coverage ratio and net stable financing ratio
The regulatory requirement for the LCR ratio has been set at 100% since 2018.
Below is a breakdown of the Group's liquid assets composition according to the criteria established in the supervisory prudential information (Commission Implementing Regulation (EU) 2017/2114 of 9 November 2017) for the determination of high-quality liquid assets for the calculation of the LCR ratio (HQLA):
| | | | | | | | | | | |
| EUR million | |
| 2025 | 2024 | 2023 |
| Amount weighted applicable | Amount weighted applicable | Amount weighted applicable |
| High-quality liquid assets-HQLAs | | | |
| Cash and reserves available at central banks | 150,883 | | 188,745 | | 217,935 | |
| Marketable assets Level 1 | 173,744 | | 150,912 | | 119,043 | |
| Marketable assets Level 2A | 5,726 | | 4,696 | | 4,236 | |
| Marketable assets Level 2B | 7,584 | | 6,951 | | 6,814 | |
| Total high-quality liquid assets | 337,937 | | 351,304 | | 348,028 | |
| | | | | | | | | | | |
| EUR million | |
| 2025 | 2024 | 2023 |
| High-quality liquid assets-HQLAs (numerator) | 301,618 | 315,524 | 348,028 |
| Total net cash outflows (denominator) | 208,388 | 206,889 | 209,892 |
| Cash outflows | 287,044 | 278,760 | 282,982 |
| Cash inflows | 78,656 | 71,871 | 73,090 |
Consolidated LCR ratio (%) | 145 | % | 153 | % | 166 | % |
Group LCR ratio (%) | 155 | % | 168 | % | |
NSFR ratio (%) | 126 | % | 126 | % | 123 | % |
Since 2024, the calculation of the consolidated LCR ratio has been updated to comply with a series of requirements regarding asset transferability restrictions in third countries. This new consolidated ratio includes an adjustment whereby any excess liquidity above 100% of LCR outflows, which is subject to transferability restrictions (legal or operational) in third countries, is not taken into account. This applies even if the surplus liquidity can be used to cover additional outflows within the country itself, which is not subject to any restrictions.
The total high-quality liquid assets differ from the high-quality liquid assets (HQLAs) considered as the numerator within the consolidated LCR ratio, due to the aforementioned adjustment.
In addition, since 2024, we have been calculating a Group LCR ratio using an internal methodology that determines the minimum common coverage percentage simultaneously across all the Group's markets and considers all existing restrictions on liquidity transfers in third countries. This methodology reflects the Group's resilience to liquidity risk more accurately and the internal ratio presents a level that is consistent with what would be achieved by applying the criteria followed until mid-2024, which did not include restrictions on liquidity transfers between subsidiaries.
Regarding the net stable funding ratio (NSFR), its definition was approved by the Basel Committee in October 2014. The transposition of this requirement into European regulation took place in June 2019 with the publication in the Official Journal of the European Union of Regulation (EU) 2019/876 of the European Parliament and of the Council of 20 May 2019. The Regulation establishes that entities must have a net stable funding ratio, as defined in the Regulation, above 100% from June 2021.
As for the funding structure, given the inherently commercial nature of the Group's balance sheet, the loan portfolio is mainly financed by customer deposits. In note 22, 'Debt securities,' the composition of these liabilities is presented based on their nature and classification, the movements and maturity profile of the debt securities issued by the Group, reflecting the strategy of diversification by products, markets, issuers, and terms followed by the Group in its approach to wholesale markets.
iii. Asset encumbrance
Finally, the moderate use of assets by Grupo Santander as collateral in the sources of structural financing of the balance sheet should be highlighted.
In accordance with the guidelines established by the European Banking Authority (EBA) in 2014 on committed and uncommitted assets, the concept of assets committed in financing transactions (asset encumbrance) includes both on-balance sheet assets provided as collateral in transactions to obtain liquidity and off-balance sheet assets that have been received and reused for similar purposes, as well as other assets associated with liabilities for reasons other than financing.
The residual maturities of the liabilities associated with the assets and guarantees received and committed are presented below, as of 31 of December of 2025 (EUR billion):
| | | | | | | | | | | | | | | | | | | | | | | | | | | | | | | | |
| Residual maturities of the liabilities | Unmatured | <=1month | >1 month
<=3 months | >3 months
<=12 months | >1 year
<=2 years | >2 years
<=3 years | 3 years
<=5 years | 5 years
<=10 years | >10 years | Total |
| Committed assets | 24.2 | | 50.7 | | 14.1 | | 38.4 | | 38.8 | | 29.5 | | 37.7 | | 36.3 | | 36.6 | | 306.4 | |
| Guarantees received committed | 2.2 | | 85.2 | | 28.2 | | 61.8 | | 4.0 | | 0.8 | | 1.9 | | 1.1 | | — | | 185.2 | |
The reported Group information as required by the EBA at 2025 year-end is as follows:
| | | | | | | | | | | | | | |
| On-balance-sheet encumbered assets | | | | |
| EUR billion | | | | |
| Carrying amount of encumbered assets | Fair value of encumbered assets | Carrying amount of unencumbered assets | Fair value of unencumbered assets |
| Loans and advances | 152.5 | | | 1,149.4 | | |
| Equity instruments | 11.4 | | 11.4 | | 18.7 | | — | |
| Debt securities | 117.9 | | 118.5 | | 182.2 | | 180.7 | |
| Other assets | 23.1 | | | 212.4 | | |
| Total assets | 304.9 | | | 1,562.7 | | |
| | | | | | | | |
| Encumbrance of collateral received |
| EUR billion | | |
| Fair value of encumbered collateral received or own debt securities issued | Fair value of collateral received or own debt securities issued available for encumbrance |
| Collateral received | 185.2 | | 70.3 | |
| Loans and advances | 0.5 | | — | |
| Equity instruments | 12.2 | | 7.1 | |
| Debt securities | 172.5 | | 63.1 | |
| Other collateral received | — | | 0.1 | |
| Own debt securities issued other than own covered bonds or ABSs | 1.4 | | 1.1 | |
| | | | | | | | |
| Encumbered assets and collateral received and matching liabilities |
| EUR billion | | |
| Matching liabilities, contingent liabilities or securities lent | Assets, collateral received and own debt securities issued other than covered bonds and ABSs encumbered |
Total sources of encumbrance
(carrying amount) | 472.0 | | 491.5 | |
On-balance-sheet encumbered assets amounted to EUR 304,923 million, of which close to 50% are loans (mortgage loans, corporate loans, etc.). Guarantees received committed amounted to EUR 185,160 million, relating mostly to debt securities received as security in asset purchase transactions and re-used.
Taken together, these two categories represent a total of EUR 491,519 million of encumbered assets, which give rise to EUR 472,045 million matching liabilities.
As of December 2025, total asset encumbrance in funding operations represented 23.1% of the Group’s extended balance sheet under EBA criteria (total assets plus guarantees received: EUR 2,122,932 million), similar to December 2024.
d) Capital risk
The second line of defence can independently challenge business and first-line activities by:
•Supervising capital planning and adequacy exercises through a review of the main components affecting the capital ratios.
•Identifying key metrics to calculate the Group’s regulatory capital, setting tolerance levels and analysing significant variations, as well as single transactions with impact on capital.
•Reviewing and challenging the execution of capital actions proposed in line with capital planning and risk appetite.
Grupo Santander commands a sound solvency position, above the levels required by regulators and by the European Central bank.
Regulatory capital
At 31 December 2025, at a consolidated level, the Group must maintain a minimum capital ratio of 9.84% of CET1 ( 4.50% being the requirement for Pillar I, 0.98% being the requirement for Pillar 2R (requirement), 2.50% being the requirement for capital conservation buffer, 1.25% being the requirement for global systemically entity (D-SIB), 0.55% being the requirement for anti-cyclical capital buffer) and a systemic risk requirement of 0.05%
Grupo Santander must also maintain a minimum capital ratio of 11.66% of tier 1 and a minimum total ratio of 14.10%.
In 2025, the solvency target set was achieved. Santander’s CET1 ratio stood at 13.46%1 at the close of the year, demonstrating its organic capacity to generate capital. The key regulatory capital figures are indicated below:
| | | | | | | | | | | |
| Reconciliation of accounting capital with regulatory capital |
| EUR million | | | |
| 2025 | 2024 | 2023 |
| Subscribed capital | 7,345 | | 7,576 | | 8,092 | |
| Share premium account | 36,792 | | 40,079 | | 44,373 | |
| Reserves | 84,700 | | 76,568 | | 69,278 | |
| Treasury shares | (96) | | (68) | | (1,078) | |
| Attributable profit | 14,101 | | 12,574 | | 11,076 | |
Approved dividendC | (1,698) | | (1,532) | | (1,298) | |
| Shareholders’ equity on public balance sheet | 141,144 | | 135,197 | | 130,443 | |
| Valuation adjustments | (37,973) | | (36,596) | | (35,020) | |
| Non-controlling interests | 9,578 | | 8,726 | | 8,818 | |
| Total Equity on public balance sheet | 112,748 | | 107,327 | | 104,241 | |
| Goodwill and intangible assets | (15,037) | | (16,098) | | (17,313) | |
| Eligible preference shares and participating securities | 9,645 | | 10,371 | | 9,002 | |
Accrued dividendC | (1,827) | | (1,611) | | (1,471) | |
Other adjustmentsA | (11,146) | | (9,817) | | (8,717) | |
Tier 1B | 94,383 | | 90,172 | | 85,742 | |
A.Fundamentally for non-computable non-controlling interests and deductions and reasonable filters in compliance with CRR.
B.Figures calculated by applying the transitional provisions of CRR 3.
C.Assumes 25% of underlying profit, see note 4.a for proposed distribution of results.
Note: Certain figures presented in this capital note have been rounded for ease of presentation. Consequently, the amounts corresponding to the rows or columns of totals in the tables presented in this note may not coincide with the arithmetic sum of the concepts or items that make up the total.
1 Data calculated applying the transitional provisions of CRR 3.
The following table shows the capital coefficients and a detail of the eligible internal resources of the Group:
| | | | | | | | | | | |
| Capital coefficients | | | |
| EUR million | | | |
| 2025 | 2024 | 2023 |
| Level 1 ordinary eligible capital (EUR million) | 84,739 | 79,800 | 76,741 |
| Level 1 additional eligible capital (EUR million) | 9,645 | 10,371 | 9,002 |
| Level 2 eligible capital (EUR million) | 17,460 | 18,418 | 16,497 |
| Risk-weighted assets (EUR million) | 629,430 | 624,503 | 623,731 |
| Level 1 ordinary capital coefficient (CET 1) | 13.46 | % | 12.78 | % | 12.30 | % |
| Level 1 additional capital coefficient (AT1) | 1.53 | % | 1.66 | % | 1.45 | % |
| Level 1 capital coefficient (TIER1) | 15.00 | % | 14.44 | % | 13.75 | % |
| Level 2 capital coefficient (TIER 2) | 2.77 | % | 2.95 | % | 2.64 | % |
| Total capital coefficient | 17.77 | % | 17.39 | % | 16.39 | % |
| | | | | | | | | | | |
| Eligible capital | | | |
| EUR million | | | |
| 2025 | 2024 | 2023 |
| Eligible capital | | | |
| Common Equity Tier I | 84,739 | | 79,800 | | 76,741 | |
| Capital | 7,345 | | 7,576 | | 8,092 | |
| (-) Treasure shares and own shares financed | (1,892) | | (1,694) | | (2,847) | |
| Share Premium | 36,792 | | 40,079 | | 44,373 | |
| Reserves | 84,663 | | 76,608 | | 68,721 | |
| Other retained earnings | (39,918) | | (38,617) | | (35,038) | |
| Minority interests | 9,037 | | 8,479 | | 6,899 | |
| Profit net of dividends | 10,576 | | 9,431 | | 8,307 | |
| Deductions | (21,863) | | (22,061) | | (21,766) | |
| Goodwill and intangible assets | (15,037) | | (15,957) | | (17,220) | |
| Others | (6,826) | | (6,104) | | (4,546) | |
| Additional Tier I | 9,645 | | 10,371 | | 9,002 | |
| Eligible instruments AT1 | 8,937 | | 9,725 | | 8,461 | |
| AT1-excesses-subsidiaries | 708 | | 645 | | 541 | |
| Tier II | 17,460 | | 18,418 | | 16,497 | |
| Eligible instruments T2 | 17,754 | | 18,869 | | 17,101 | |
Excess IRB provision on PE | — | | — | | 76 | |
T2-excesses - subsidiaries | (294) | | (450) | | (680) | |
| Total eligible capital | 111,845 | | 108,589 | | 102,240 | |
Note: Banco Santander, S.A. and its affiliates had not taken part in any State aid programmes.
Leverage ratio
Basel III established the leverage ratio as a non-risk sensitive measure aimed at limiting excessive balance sheet growth relative to available capital.
The Group performs the calculation in accordance with Regulation (EU) 2019/876 of 20 May 2019 amending Regulation (EU) No 575/2013 as regards the leverage ratio.
This ratio is calculated as tier 1 capital divided by leverage exposure. Exposure is calculated as the sum of the following items:
•Accounting assets, excluding derivatives and items treated as deductions from tier 1 capital (for example, the balance of loans is included, but not that of goodwill) further excluding the exposures referred to in Article 429.a (1) of the regulation.
•Off-balance-sheet items (mainly guarantees, unused credit limits granted and documentary credits) weighted using credit conversion factors.
•Inclusion of net value of derivatives (gains and losses are netted with the same counterparty, minus collaterals if they comply with certain criteria) plus a charge for the future potential exposure.
•A charge for the potential risk of security funding transactions.
•Lastly, it includes a charge for the risk of credit derivative swaps (CDS).
With the publication of Regulation (EU) 2019/876 of 20 May, 2019, amending Regulation (EU) n.º 575/2013 as regards the leverage ratio, the final calibration of the ratio is set at 3% for all entities and, for systemic entities G-SIB, is established an additional surcharge which would be 50% of the cushion ratio applicable to the EISM, applicable from January 2023. In addition, modifications are included in its calculation, including the exclusion of certain exposures from the total exposure measure: public loans when exceptional circumstances arise, public loans, transfer loans and officially guaranteed export credits, transfer loans and officially guaranteed export credits.
| | | | | | | | | | | |
| EUR million | | | |
| 2025 | 2024 | 2023 |
| Leverage | | | |
| Level 1 Capital | 94,385 | | 90,170 | | 85,742 | |
| Exposure | 1,924,349 | | 1,885,572 | | 1,826,922 | |
| Leverage Ratio | 4.90 | % | 4.78 | % | 4.69 | % |
Global systemically important banks
Grupo Santander is one of 29 banks designated as global systemically important banks (G-SIBs).
The designation as a globally systemic entity comes from a measurement established by the regulators (FSB and BCBS) that they have implemented based on five indicators (size, interjurisdictional activity, interconnection with other financial entities, substitutability and complexity). The list uses data as of the end of 2024 and is based on a methodology agreed in July 2018 and implemented for the first time in the assessment of G-SIBs as of the end of 2021, incorporating, among other things, an additional score considering the Member States of the SRM as a single jurisdiction.
This definition means it has to fulfil certain additional requirements, which consist mainly of a capital buffer (1%), in TLAC requirements (total loss absorbing capacity), that Grupo Santander has to publish relevant information more frequently than other banks, greater regulatory requirements for internal control bodies, special supervision and drawing up of special reports to be submitted to supervisors.
Additionally, Grupo Santander appears both on the list of global systemic entities and on the list of domestic systemic entities. Bank of Spain, based on rule 23 of Circular 2/2016, requires the application of the highest of the two corresponding buffers, in the case of Grupo Santander being the domestic one, 1.25%, a surcharge payable by 2025.
The fact that Grupo Santander has to comply with these requirements makes it a more solid bank than its domestic rivals.
55. Additional disclosures
This note includes relevant information about additional disclosure requirements.
55.1 Parent company financial statements
Following are the summarized balance sheets of Banco Santander, S.A. as of 31 December 2025, 2024 and 2023. In the financial information of the Parent company, investments in subsidiaries, jointly controlled entities and associates are recorded at cost. As of 31 December 2025 we have reclassified assets associated with the businesses held for sale in Poland from 'Investment in affiliated companies' to 'Non-current assets held for sale' under the 'Other assets' item. See note 3 above. | | | | | | | | | | | | | | | | | | | | |
| EUR million | | | | | | |
| CONDENSED BALANCE SHEETS (Parent company only) | | 31 December 2025 | | 31 December 2024 | | 31 December 2023 |
| Assets | | | | | | |
| Cash and due from banks | | 144,292 | | | 157,665 | | | 172,524 | |
| Of which: | | | | | | |
| To bank subsidiaries | | 11,517 | | | 5,952 | | | 6,834 | |
| Trading account assets | | 154,939 | | | 135,758 | | | 102,296 | |
| Investment securities | | 91,217 | | | 77,230 | | | 63,325 | |
| Of which: | | | | | | |
| To bank subsidiaries | | 13,607 | | | 16,191 | | | 16,137 | |
| To non-bank subsidiaries | | 1,697 | | | 1,005 | | | 1,229 | |
| Net loans and leases | | 323,253 | | | 301,937 | | | 298,068 | |
| Of which: | | | | | | |
| To non-bank subsidiaries | | 23,340 | | | 21,127 | | | 22,435 | |
| Investment in affiliated companies | | 98,317 | | | 100,045 | | | 99,326 | |
| Of which: | | | | | | |
| To bank subsidiaries | | 71,796 | | | 74,624 | | | 74,016 | |
| To non-bank subsidiaries | | 26,521 | | | 25,421 | | | 25,310 | |
| Premises and equipment, net | | 5,825 | | | 6,219 | | | 6,368 | |
| Other assets | | 18,941 | | | 15,986 | | | 15,435 | |
| Total assets | | 836,784 | | | 794,840 | | | 757,342 | |
| | | | | | |
| Liabilities | | | | | | |
| Deposits | | 415,898 | | | 393,787 | | | 398,374 | |
| Of which: | | | | | | |
| To bank subsidiaries | | 8,773 | | | 6,645 | | | 7,832 | |
| To non-bank subsidiaries | | 26,412 | | | 19,176 | | | 14,610 | |
| Short-term debt | | 129,462 | | | 88,263 | | | 70,771 | |
| Long-term debt | | 114,756 | | | 137,549 | | | 129,258 | |
| Total debt | | 244,218 | | | 225,812 | | | 200,029 | |
| Of which: | | | | | | |
| To bank subsidiaries | | 3,994 | | | 100 | | | — | |
| To non-bank subsidiaries | | 1,363 | | | 2,428 | | | 1,816 | |
| Other liabilities | | 94,325 | | | 96,909 | | | 84,065 | |
| Total liabilities | | 754,441 | | | 716,508 | | | 682,468 | |
| | | | | | |
| Stockholders' equity | | | | | | |
| Capital stock | | 7,345 | | | 7,576 | | | 8,092 | |
| Retained earnings and other reserves | | 74,998 | | | 70,756 | | | 66,782 | |
| Total stockholders' equity | | 82,343 | | | 78,332 | | | 74,874 | |
| | | | | | |
| Total liabilities and Stockholders’ Equity | | 836,784 | | | 794,840 | | | 757,342 | |
Following are the condensed statements of income of Banco Santander, S.A. for the years ended 31 December 2025, 2024 and 2023. Results associated with the businesses held for sale in Poland have been reclassified to 'Income/(charges) after tax from discontinued operations' for all periods presented. See note 3 above. | | | | | | | | | | | | | | | | | | | | |
| EUR million | | | | | | |
| | Year ended |
| CONDENSED STATEMENTS OF INCOME (Parent company only) | | 31 December 2025 | | 31 December 2024 | | 31 December 2023 |
| Interest income | | 31,363 | | | 34,752 | | | 31,854 | |
| Interest from earning assets | | 25,293 | | | 27,639 | | | 23,049 | |
| Dividends from affiliated companies | | 6,070 | | | 7,113 | | | 8,805 | |
| Of which: | | | | | | |
| From bank subsidiaries | | 5,029 | | | 6,248 | | | 7,790 | |
| From non-bank subsidiaries | | 1,041 | | | 865 | | | 1,015 | |
| Interest expense | | (18,170) | | | (20,112) | | | (16,204) | |
| Interest income / (charges) | | 13,193 | | | 14,640 | | | 15,650 | |
| Provision for credit losses | | (1,162) | | | (1,334) | | | (1,372) | |
| Interest income / (charges) after provision for credit losses | | 12,031 | | | 13,306 | | | 14,278 | |
| Non-interest income | | 6,981 | | | 5,502 | | | 4,777 | |
| Non-interest expense | | (7,848) | | | (8,552) | | | (9,662) | |
| Income before income taxes | | 11,164 | | | 10,256 | | | 9,393 | |
| Tax expense or income from continuing operations | | (1,073) | | | (1,091) | | | (533) | |
| Income/ (charges) for the period from continuing operations | | 10,092 | | | 9,167 | | | 8,860 | |
| Income/ (charges) after tax from discontinued operations | | 1,021 | | | 935 | | | 378 | |
| Net income | | 11,113 | | | 10,101 | | | 9,239 | |
Following are the condensed statements of comprehensive income of Banco Santander, S.A. for the years ended 31 December 2025, 2024 and 2023:
| | | | | | | | | | | | | | | | | | | | |
| EUR million | | | | | | |
| | Year ended |
| CONDENSED STATEMENTS OF COMPREHENSIVE INCOME (Parent company only) | | 31 December 2025 | | 31 December 2024 | | 31 December 2023 |
| NET INCOME | | 11,113 | | | 10,101 | | | 9,239 | |
| OTHER COMPREHENSIVE INCOME | | (79) | | | 730 | | | (57) | |
| Items that may be reclassified subsequently to profit or loss | | (101) | | | 305 | | | 276 | |
| Hedges of net investments in foreign operations (effective portion) | | 283 | | | — | | | — | |
| Revaluation gains (losses) | | 283 | | | — | | | — | |
| Amounts transferred to income statement | | — | | | — | | | — | |
| Other reclassifications | | — | | | — | | | — | |
| Debt instruments at fair value with changes in other comprehensive income | | (27) | | | 28 | | | 104 | |
| Revaluation gains (losses) | | 36 | | | (55) | | | 65 | |
| Amounts transferred to income statement | | (63) | | | 84 | | | 39 | |
| Other reclassifications | | — | | | — | | | — | |
| Cash flow hedges: | | (100) | | | 409 | | | 284 | |
| Revaluation gains/(losses) | | (79) | | | 140 | | | (70) | |
| Amounts transferred to income statement | | (21) | | | 269 | | | 354 | |
| Amounts transferred to initial carrying amount of hedged items | | — | | | — | | | — | |
| Other reclassifications | | — | | | — | | | — | |
Hedges of net investments in foreign operations | | — | | | — | | | — | |
| Exchange differences | | (299) | | | — | | | — | |
| Revaluation gains (losses) | | (299) | | | — | | | — | |
| Amounts transferred to income statement | | — | | | — | | | — | |
| Other reclassifications | | — | | | — | | | — | |
| Non-current assets held for sale | | — | | | — | | | — | |
| Income tax | | 42 | | | (132) | | | (112) | |
| Items that will not be reclassified to profit or loss | | 21 | | | 425 | | | (333) | |
| Actuarial gains/(losses) on pension plans | | 30 | | | (16) | | | (14) | |
| Other recognised income and expense of investments in subsidiaries, joint ventures and associates | | — | | | — | | | — | |
| Changes in the fair value of equity instruments measured at fair value through other comprehensive income | | 100 | | | 262 | | | (250) | |
| Gains or losses resulting from the accounting for hedges of equity instruments measured at fair value through other comprehensive income, net | | — | | | — | | | — | |
| Changes in the fair value of equity instruments measured at fair value through other comprehensive income (hedged item) | | (76) | | | 20 | | | (31) | |
| Changes in the fair value of equity instruments measured at fair value through other comprehensive income (hedging instrument) | | 76 | | | (20) | | | 31 | |
| Changes in the fair value of financial liabilities at fair value through profit or loss attributable to changes in credit risk | | (136) | | | 247 | | | (107) | |
| Income tax relating to items that will not be reclassified | | 27 | | | (68) | | | 38 | |
| TOTAL COMPREHENSIVE INCOME | | 11,034 | | | 10,831 | | | 9,182 | |
Following are the condensed cash flow statements of Banco Santander, S.A. for the years ended 31 December 2025, 2024 and 2023.
| | | | | | | | | | | | | | | | | | | | |
| EUR million | | | | | | |
| | Year ended |
| CONDENSED CASH FLOW STATEMENTS (Parent company only) | | 31 December 2025 | | 31 December 2024 | | 31 December 2023 |
| 1. Cash flows from operating activities | | | | | | |
| Consolidated profit | | 11,113 | | | 10,101 | | | 9,239 | |
| Adjustments to profit | | (1,119) | | | (4,439) | | | (3,746) | |
| Net increase/decrease in operating assets | | (60,570) | | | (63,686) | | | (6,765) | |
| Net increase/decrease in operating liabilities | | 41,113 | | | 27,480 | | | (6,880) | |
| Reimbursements/payments of income tax | | (862) | | | (591) | | | (360) | |
| Total net cash flows from operating activities (1) | | (10,325) | | | (31,135) | | | (8,512) | |
| | | | | | |
| 2. Cash flows from investing activities | | | | | | |
| Investments (-) | | (4,231) | | | (2,915) | | | (5,458) | |
| Divestments (+) | | 9,210 | | | 9,544 | | | 10,880 | |
| Total net cash flows from investment activities (2) | | 4,979 | | | 6,629 | | | 5,422 | |
| | | | | | |
| 3. Cash flows from financing activities | | | | | | |
| Issuance of own equity instruments | | — | | | — | | | — | |
| Disposal of own equity instruments | | 578 | | | 485 | | | 649 | |
| Acquisition of own equity instruments | | (3,865) | | | (3,740) | | | (2,974) | |
| Issuance of debt securities | | 1,852 | | | 5,625 | | | 5,636 | |
| Redemption of debt securities | | (8,310) | | | (3,615) | | | (1,813) | |
| Dividends paid | | (3,341) | | | (3,017) | | | (2,261) | |
| Issuance/Redemption of equity instruments | | — | | | (751) | | | — | |
| Other collections/payments related to financing activities | | (141) | | | (300) | | | (166) | |
| Total net cash flows from financing activities (3) | | (13,227) | | | (5,313) | | | (929) | |
| | | | | | |
| 4. Effect of exchange rate changes on cash and cash equivalents (4) | | (4,099) | | | 2,256 | | | (1,044) | |
| | | | | | |
| 5. Net increase/decrease in cash and cash equivalents (1+2+3+4) | | (22,671) | | | (27,563) | | | (5,063) | |
| Cash and cash equivalents at beginning of period | | 97,457 | | | 125,020 | | | 130,083 | |
| Cash and cash equivalents at end of period | | 74,786 | | | 97,457 | | | 125,020 | |
55.2 Preference shares and preferred securities
The following table shows the balance of the preference shares and preferred securities as of 31 December 2025, 2024 and 2023:
| | | | | | | | | | | | | | | | | | | | |
| EUR million | | | | | | |
| | 2025 | | 2024 | | 2023 |
| Preference shares | | 201 | | | 211 | | | 202 | |
| Preferred securities | | 10,103 | | | 9,821 | | | 9,081 | |
| Total | | 10,304 | | | 10,032 | | | 9,283 | |
Both preference shares and preferred securities are recorded under the 'Financial liabilities at amortized cost - Subordinated Liabilities' caption in the consolidated balance sheet as of 31 December 2025, 2024 and 2023.
Preference shares include the financial instruments issued by the consolidated companies which, although equity for legal purposes, do not meet the requirements for classification as equity in the financial statements. These shares do not carry any voting rights and are non-cumulative.
Preference shares include non-cumulative preferred non-voting shares issued by Santander UK plc.
Preferred securities include non-cumulative preferred non-voting securities issued by Banco Santander, S.A.
For the purposes of payment priority, preferred securities are junior to all general creditors and to subordinated deposits. The payment of dividends on these securities, which have no voting rights, is conditional upon the obtainment of sufficient distributable profit and upon the limits imposed by Spanish banking regulations on equity.
Preference shares and preferred securities are perpetual securities and there is no obligation that requires the Group to redeem them. All securities have been fully subscribed for by third parties outside the Group.
Santander Finance Preferred, S.A. (Unipersonal)- issuer of registered securities guaranteed by Banco Santander, S.A. until November 2017, merged in that month with Banco Santander, S.A.
| | | | | | | | | | | | | | | | | | | | | | | | | | |
| | Outstanding at 31 December 2025 |
| Preference Shares Issuer/Date of issue | | Currency | | Amount in currency (million) | | Interest rate | | Redemption
Option (A) |
| | | | | | | | |
| Santander UK plc, October 1995 | | Pounds Sterling | | 80.3 | | | 10.375% | | No option |
| Santander UK plc, February 1996 | | Pounds Sterling | | 80.3 | | | 10.375% | | No option |
| | | | | | | | | | | | | | | | | | | | | | | | | | |
| | Outstanding at 31 December 2025 |
| Preferred Securities Issuer/Date of issue | | Currency | | Amount in
currency
(million) | | Interest rate | | Maturity date |
| | | | | | | | |
| Banco Santander, S.A., January 2020 | | Euro | | 1,032.4 | | | 4.375% | (B) | Perpetuity |
| Banco Santander, S.A., May 2021 | | US Dollar | | 999.9 | | | 4.750% | (C) | Perpetuity |
| Banco Santander, S.A., May 2021 | | Euro | | 749.2 | | | 4.125% | (D) | Perpetuity |
| Banco Santander, S.A., September 2021 | | Euro | | 994.0 | | | 3.625% | (E) | Perpetuity |
| Banco Santander, S.A., November 2023 | | US Dollar | | 1,149.0 | | | 9.625% | (F) | Perpetuity |
| Banco Santander, S.A., November 2023 | | US Dollar | | 1,349.7 | | | 9.625% | (G) | Perpetuity |
| Banco Santander, S.A., May 2024 | | Euro | | 1,500.0 | | | 7.00% | (H) | Perpetuity |
| Banco Santander, S.A., August 2024 | | US Dollar | | 1,494.5 | | | 8.00% | (I) | Perpetuity |
| Banco Santander, S.A., July 2025 | | Euro | | 1,500.0 | | | 6.00% | (J) | Perpetuity |
| Santander Finance Preferred, S.A. (Unipersonal), September 2004 | | Euro | | 143.8 | | | €CMS 10 + 0.05% subject to a maximum distribution of 8% per annum | | Perpetuity |
A.From these dates the issuer can redeem the shares, subject to prior authorization by the national supervisor.
B. Payment is subject to certain conditions and to the discretion of Banco Santander. The 4.375% interest rate is set for the first six years. After that, it will be reviewed every 5 years by applying a margin of 453.4 basis point on the 5-year mid-swap rate.
C.Payment is subject to certain conditions and to the discretion of Banco Santander. The 4.750% interest rate is set for the first six years, revised every 5 years thereafter by applying a margin of 375.3 basis points over the 5-year UST rate.
D.Payment is subject to certain conditions and to the discretion of Banco Santander. The 4.125% interest rate is set for the first seven years, revised every 5 years thereafter by applying a margin of 431.1 basis points over the applicable 5-year Euro mid-swap.
E. Payment is subject to certain conditions and to the discretion of Banco Santander. The 3.625% interest rate is set for the first eight years, revised every 5 years thereafter by applying a margin of 376 basis points over the 5-year mid-swap rate.
F. Payment is subject to certain conditions and to the discretion of Banco Santander. The 9.625% interest rate is set for the first five years and six months, revised every 5 years thereafter by applying a margin of 530.6 basis points on the 5-year UST rate.
G. Payment is subject to certain conditions and to the discretion of Banco Santander. The 9.625% interest rate is set for the first ten years, revised every 5 years thereafter by applying a margin of 529.8 basis points on the 5-year UST rate.
H. Payment is subject to certain conditions and to the discretion of Banco Santander. The 7.00% interest rate is set for the first six years, revised every 5 years thereafter by applying a margin of 443.2 basis points on the 5-year mid-swap rate.
I. Payment is subject to certain conditions and to the discretion of Banco Santander. The 8.00% interest rate is set for the first ten years, revised every 5 years thereafter by applying a margin of 391.1 basis points on the 5-year mid-swap rate
J. Payment is subject to certain conditions and to the discretion of Banco Santander. The 6.00% interest rate is set for the first six years, revised every 5 years thereafter by applying a margin of 381.9 basis points on the 5-year mid-swap rate.
Appendix
Appendix I
| | | | | | | | | | | | | | | | | | | | | | | |
Subsidiaries of Banco Santander, S.A. 1 |
|
| % of ownership held by Banco Santander | | Percentage of voting power (e) | |
Company | Location | Direct | Indirect | | Year 2025 | Year 2024 | Activity |
| 2 & 3 Triton Limited (d) | United Kingdom | 0.00 | % | 100.00 | % | | 100.00 | % | 100.00 | % | Real estate |
| A & L CF (Guernsey) Limited (d) (g) | Guernsey | 0.00 | % | 100.00 | % | | 100.00 | % | 100.00 | % | Leasing |
| Abbey Covered Bonds (Holdings) Limited | United Kingdom | — | | (a) | | — | | — | | Securitization |
| Abbey Covered Bonds (LM) Limited | United Kingdom | 0.00 | % | 100.00 | % | | 100.00 | % | 100.00 | % | Securitization |
| Abbey Covered Bonds LLP | United Kingdom | — | | (a) | | — | | — | | Securitization |
| Abbey National Business Office Equipment Leasing Limited (d) | United Kingdom | 0.00 | % | 100.00 | % | | 100.00 | % | 100.00 | % | Inactive |
| Abbey National Nominees Limited | United Kingdom | 0.00 | % | 100.00% | | 100.00 | % | 100.00 | % | Inactive |
| Abbey National PLP (UK) Limited (d) | United Kingdom | 0.00 | % | 100.00% | | 100.00 | % | 100.00 | % | Inactive |
| Abbey National Property Investments | United Kingdom | 0.00 | % | 100.00% | | 100.00 | % | 100.00 | % | Finance company |
| Abbey Stockbrokers (Nominees) Limited | United Kingdom | 0.00 | % | 100.00 | % | | 100.00 | % | 100.00 | % | Inactive |
| Abbey Stockbrokers Limited | United Kingdom | 0.00 | % | 100.00 | % | | 100.00 | % | 100.00 | % | Inactive |
| Abent 3T, S.A.P.I de C.V. | Mexico | 0.00 | % | 100.00 | % | | 100.00 | % | 100.00 | % | Electricity production |
| Ablasa Participaciones, S.L. Unipersonal | Spain | 100.00 | % | 0.00 | % | | 100.00 | % | 100.00 | % | Holding company |
| Aduro S.A. | Uruguay | 0.00 | % | 100.00 | % | | 100.00 | % | 100.00 | % | Payments and collection services |
| Aevis Europa, S.L. | Spain | 96.34 | % | 0.00 | % | | 96.34 | % | 96.34 | % | Cards |
| AFB SAM Holdings, S.L. | Spain | 1.00 | % | 99.00 | % | | 100.00 | % | 100.00 | % | Holding company |
| Afisa S.A. | Chile | 0.00 | % | 100.00 | % | | 100.00 | % | 100.00 | % | Fund management company |
| Agro Flex Fundo de Investimento em Direitos Creditórios | Brazil | 0.00 | % | 89.86 | % | | 100.00 | % | 100.00 | % | Investment fund |
| Allane Leasing GmbH | Austria | 0.00 | % | 46.95 | % | | 100.00 | % | 100.00 | % | Renting |
| Allane Location Longue Durée S.a.r.l. | France | 0.00 | % | 46.95 | % | | 100.00 | % | 100.00 | % | Renting |
| Allane Mobility Consulting AG | Switzerland | 0.00 | % | 46.95 | % | | 100.00 | % | 100.00 | % | Consulting services |
| Allane Mobility Consulting B.V. | Netherlands | 0.00 | % | 46.95 | % | | 100.00 | % | 100.00 | % | Consulting services |
| Allane Mobility Consulting GmbH | Germany | 0.00 | % | 46.95 | % | | 100.00 | % | 100.00 | % | Consulting services |
| Allane Mobility Consulting Österreich GmbH | Austria | 0.00 | % | 46.95 | % | | 100.00 | % | 100.00 | % | Consulting services |
| Allane Mobility Consulting S.a.r.l | France | 0.00 | % | 46.95 | % | | 100.00 | % | 100.00 | % | Consulting services |
| Allane Schweiz AG | Switzerland | 0.00 | % | 46.95 | % | | 100.00 | % | 100.00 | % | Renting |
| Allane SE | Germany | 0.00 | % | 46.95 | % | | 92.07 | % | 92.07 | % | Renting |
| Allane Services GmbH & co. KG | Germany | 0.00 | % | 46.95 | % | | 100.00 | % | 100.00 | % | Services |
| Allane Services Verwaltungs GmbH | Germany | 0.00 | % | 46.95 | % | | 100.00 | % | 100.00 | % | Management of portfolios |
| Alliance & Leicester Investments (No.2) Limited (d) | United Kingdom | 0.00 | % | 100.00 | % | | 100.00 | % | 100.00 | % | Inactive |
| Alliance & Leicester Limited | United Kingdom | 0.00 | % | 100.00 | % | | 100.00 | % | 100.00 | % | Inactive |
| Alliance & Leicester Personal Finance Limited | United Kingdom | 0.00 | % | 100.00 | % | | 100.00 | % | 100.00 | % | Finance company |
| Altamira Santander Real Estate, S.A. | Spain | 100.00 | % | 0.00 | % | | 100.00 | % | 100.00 | % | Real estate |
| | | | | | | | | | | | | | | | | | | | | | | |
Subsidiaries of Banco Santander, S.A. 1 |
|
| % of ownership held by Banco Santander | | Percentage of voting power (e) | |
Company | Location | Direct | Indirect | | Year 2025 | Year 2024 | Activity |
| Alternative Leasing, FIL (Compartimento B) | Spain | 100.00 | % | 0.00 | % | | 100.00 | % | 100.00 | % | Investment fund |
| Amazonia Trade Limited | United Kingdom | 100.00 | % | 0.00 | % | | 100.00 | % | 100.00 | % | Inactive |
| América Gestão Serviços em Energía S.A. | Brazil | 0.00 | % | 62.90 | % | | 70.00 | % | 70.00 | % | Electricity production |
| Amherst Pierpont Commercial Mortgage Securities LLC | United States | 0.00 | % | 100.00 | % | | 100.00 | % | 100.00 | % | Securitization |
| Amherst Pierpont International Ltd. | Hong-Kong | 0.00 | % | 100.00 | % | | 100.00 | % | 100.00 | % | Inactive |
| AMS Auto Markt Am Schieferstein GmbH | Germany | 0.00 | % | 90.01 | % | | 100.00 | % | 100.00 | % | Vehicle sales |
| AN (123) Limited | United Kingdom | 0.00 | % | 100.00 | % | | 100.00 | % | 100.00 | % | Inactive |
| Andromeda Principal Investments, S.L. Unipersonal | Spain | 100.00 | % | 0.00 | % | | 100.00 | % | — | | Holding company |
| ANITCO Limited | United Kingdom | 0.00 | % | 100.00 | % | | 100.00 | % | 100.00 | % | Inactive |
| AP Acquisition Trust I | United States | 0.00 | % | 100.00 | % | | 100.00 | % | 100.00 | % | Trust company |
| AP Acquisition Trust II | United States | 0.00 | % | 100.00 | % | | 100.00 | % | 100.00 | % | Inactive |
| AP Asset Acquisition LLC | United States | 0.00 | % | 100.00 | % | | 100.00 | % | 100.00 | % | Financial services |
| APSG GP LLC | United States | 0.00 | % | 100.00 | % | | 100.00 | % | 100.00 | % | Holding company |
| Aquanima Brasil Ltda. | Brazil | 0.00 | % | 100.00 | % | | 100.00 | % | 100.00 | % | E-commerce |
| Aquanima Chile S.A. | Chile | 0.00 | % | 100.00 | % | | 100.00 | % | 100.00 | % | Services |
| Aquanima México S. de R.L. de C.V. | Mexico | 0.00 | % | 100.00 | % | | 100.00 | % | 100.00 | % | E-commerce |
| Aquanima S.A. | Argentine | 0.00 | % | 100.00 | % | | 100.00 | % | 100.00 | % | Services |
| Ararinha Renda Fixa Crédito Privado - Fundo de Investimento Financeiro | Brazil | 0.00 | % | 89.86 | % | | 100.00 | % | 100.00 | % | Investment fund |
| Artarien S.A. | Uruguay | 100.00 | % | 0.00 | % | | 100.00 | % | 100.00 | % | Insurance mediation |
| Atempo Growth I - Sub-Fund 4 | Luxembourg | 100.00 | % | 0.00 | % | | 100.00 | % | 100.00 | % | Investment fund |
| Atempo Growth II - Sub Fund 3 | Luxembourg | 100.00 | % | 0.00 | % | | 100.00 | % | — | | Investment fund |
| Atlantes Mortgage No. 3 | Portugal | — | | (a) | | — | | — | | Securitization |
| Atual - Fundo de Invest Multimercado Crédito Privado Investimento no Exterior | Brazil | 0.00 | % | 89.86 | % | | 100.00 | % | 100.00 | % | Investment fund |
| Auto ABS DFP Master Compartment France 2013 | France | — | | (a) | | — | | — | | Securitization |
| Auto ABS French Leases 2023 | France | — | | (a) | | — | | — | | Securitization |
| Auto ABS French Leases 2025 | France | — | | (a) | | — | | — | | Securitization |
| Auto ABS French Leases Master Compartment 2016 | France | — | | (a) | | — | | — | | Securitization |
| Auto ABS French Loans 2024 | France | — | | (a) | | — | | — | | Securitization |
| Auto ABS French Loans Master | France | — | | (a) | | — | | — | | Securitization |
| Auto ABS Italian Balloon 2019-1 S.r.l. | Italy | — | | (a) | | — | | — | | Securitization |
| Auto ABS Italian Rainbow Loans S.r.l. (d) | Italy | — | | (a) | | — | | — | | Securitization |
| Auto ABS Italian Stella Loans 2023-1 S.r.l. | Italy | — | | (a) | | — | | — | | Securitization |
| Auto ABS Italian Stella Loans S.r.l. (series 2024-1) | Italy | — | | (a) | | — | | — | | Securitization |
| Auto ABS Italian Stella Loans S.r.l. (series 2024-2) | Italy | — | | (a) | | — | | — | | Securitization |
| Auto ABS Italian Stella Loans S.r.l. (series 2025-1) | Italy | — | | (a) | | — | | — | | Securitization |
| Auto ABS Italian Stella Loans S.r.l. (series 2025-2) | Italy | — | | (a) | | — | | — | | Securitization |
| Auto ABS Spanish Loans 2022-1, Fondo de Titulización | Spain | — | | (a) | | — | | — | | Securitization |
| | | | | | | | | | | | | | | | | | | | | | | |
Subsidiaries of Banco Santander, S.A. 1 |
|
| % of ownership held by Banco Santander | | Percentage of voting power (e) | |
Company | Location | Direct | Indirect | | Year 2025 | Year 2024 | Activity |
| Auto ABS Spanish Loans 2024-1, Fondo de Titulización | Spain | — | | (a) | | — | | — | | Securitization |
| Autodescuento, S.L. | Spain | 0.00 | % | 100.00 | % | | 100.00 | % | 100.00 | % | Vehicles purchased by internet |
| Autohaus24 GmbH | Germany | 0.00 | % | 46.95 | % | | 100.00 | % | 100.00 | % | Internet |
| Auto-Interleasing AG | Switzerland | 0.00 | % | 100.00 | % | | 100.00 | % | 100.00 | % | Renting |
| Auttar HUT Processamento de Dados Ltda. | Brazil | 0.00 | % | 100.00 | % | | 100.00 | % | 100.00 | % | IT services |
| Aviación Antares, A.I.E. | Spain | 99.99 | % | 0.01 | % | | 100.00 | % | 100.00 | % | Renting |
| Aviación Británica, A.I.E. | Spain | 99.99 | % | 0.01 | % | | 100.00 | % | 100.00 | % | Renting |
| Aviación Comillas, S.L. Unipersonal | Spain | 100.00 | % | 0.00 | % | | 100.00 | % | 100.00 | % | Renting |
| Aviación Laredo, S.L. | Spain | 99.00 | % | 1.00 | % | | 100.00 | % | 100.00 | % | Air transport |
| Aviación Oyambre, S.L. Unipersonal | Spain | 100.00 | % | 0.00 | % | | 100.00 | % | 100.00 | % | Renting |
| Aviación Santillana, S.L. | Spain | 99.00 | % | 1.00 | % | | 100.00 | % | 100.00 | % | Renting |
| Aviación Suances, S.L. | Spain | 99.00 | % | 1.00 | % | | 100.00 | % | 100.00 | % | Air transport |
| Banco Bandepe S.A. | Brazil | 0.00 | % | 89.86 | % | | 100.00 | % | 100.00 | % | Banking |
| Banco de Albacete, S.A. Unipersonal | Spain | 100.00 | % | 0.00 | % | | 100.00 | % | 100.00 | % | Banking |
| Banco Hyundai Capital Brasil S.A. | Brazil | 0.00 | % | 44.93 | % | | 50.00 | % | 50.00 | % | Banking |
| Banco Santander - Chile | Chile | 0.00 | % | 67.13 | % | | 67.18 | % | 67.18 | % | Banking |
| Banco Santander (Brasil) S.A. | Brazil | 0.04 | % | 89.82 | % | | 90.45 | % | 90.60 | % | Banking |
| Banco Santander (México), S.A., Institución de Banca Múltiple, Grupo Financiero Santander México como Fiduciaria del Fideicomiso 100740 | Mexico | 0.00 | % | 99.98 | % | | 100.00 | % | 100.00 | % | Finance company |
| Banco Santander (México), S.A., Institución de Banca Múltiple, Grupo Financiero Santander México como Fiduciaria del Fideicomiso 2002114 | Mexico | 0.00 | % | 99.98 | % | | 100.00 | % | 100.00 | % | Finance company |
| Banco Santander (México), S.A., Institución de Banca Múltiple, Grupo Financiero Santander México como Fiduciaria del Fideicomiso GFSSLPT | Mexico | 0.00 | % | 99.98 | % | | 100.00 | % | 100.00 | % | Finance company |
| Banco Santander Argentina S.A. | Argentine | 0.00 | % | 99.82 | % | | 99.77 | % | 99.77 | % | Banking |
| Banco Santander Colombia S.A. | Colombia | 92.95 | % | 7.05 | % | | 100.00 | % | 100.00 | % | Banking |
| Banco Santander International | United States | 0.00 | % | 100.00 | % | | 100.00 | % | 100.00 | % | Banking |
| Banco Santander International SA | Switzerland | 34.70 | % | 65.30 | % | | 100.00 | % | 100.00 | % | Banking |
| Banco Santander México, S.A., Institución de Banca Múltiple, Grupo Financiero Santander México | Mexico | 24.93 | % | 75.05 | % | | 99.98 | % | 99.98 | % | Banking |
| Banco Santander Perú S.A. | Peru | 99.90 | % | 0.10 | % | | 100.00 | % | 100.00 | % | Banking |
| Banco Santander S.A. | Uruguay | 97.75 | % | 2.25 | % | | 100.00 | % | 100.00 | % | Banking |
| Banco Santander Totta, S.A. | Portugal | 99.42 | % | 0.45 | % | | 99.87 | % | 99.96 | % | Banking |
| Banque Stellantis France | France | 0.00 | % | 50.00 | % | | 50.00 | % | 50.00 | % | Banking |
| Bansa Santander S.A. | Chile | 0.00 | % | 100.00 | % | | 100.00 | % | 100.00 | % | Real estate |
| Beyond Wealth, S.A. | Spain | 99.99 | % | 0.01 | % | | 100.00 | % | 100.00 | % | Consulting services |
| Bilkreditt 7 Designated Activity Company (d) | Ireland | — | | (a) | | — | | — | | Securitization |
| Blecno Investments, S.L. Unipersonal (b) | Spain | — | | — | | | — | | 100.00 | % | Real estate |
| Blue Ocean SBT, S.L. Unipersonal | Spain | 100.00 | % | 0.00 | % | | 100.00 | % | 100.00 | % | Holding company |
| BRS Investments S.A. | Argentine | 5.10 | % | 94.90 | % | | 100.00 | % | 100.00 | % | Finance company |
| Cántabro Catalana de Inversiones, S.A. | Spain | 100.00 | % | 0.00 | % | | 100.00 | % | 100.00 | % | Holding company |
| Capital Street Delaware LP | United States | 0.00 | % | 100.00 | % | | 100.00 | % | 100.00 | % | Holding company |
| Capital Street Holdings, LLC | United States | 0.00 | % | 100.00 | % | | 100.00 | % | 100.00 | % | Holding company |
| | | | | | | | | | | | | | | | | | | | | | | |
Subsidiaries of Banco Santander, S.A. 1 |
|
| % of ownership held by Banco Santander | | Percentage of voting power (e) | |
Company | Location | Direct | Indirect | | Year 2025 | Year 2024 | Activity |
| Capital Street REIT Holdings, LLC | United States | 0.00 | % | 100.00 | % | | 100.00 | % | 100.00 | % | Holding company |
| Capital Street S.A. | Luxembourg | 0.00 | % | 100.00 | % | | 100.00 | % | 100.00 | % | Finance company |
| Carmine D - Services, Unipessoal Lda. | Portugal | 0.00 | % | 100.00 | % | | 100.00 | % | 100.00 | % | Software |
| Cartasur Cards S.A. | Argentine | 0.00 | % | 99.82 | % | | 100.00 | % | 100.00 | % | Finance company |
| Casa de Bolsa Santander, S.A. de C.V., Grupo Financiero Santander México | Mexico | 0.00 | % | 99.97 | % | | 99.97 | % | 99.97 | % | Securities company |
| Cater Allen Holdings Limited | United Kingdom | 0.00 | % | 100.00 | % | | 100.00 | % | 100.00 | % | Inactive |
| Cater Allen International Limited | United Kingdom | 0.00 | % | 100.00 | % | | 100.00 | % | 100.00 | % | Inactive |
| Cater Allen Limited | United Kingdom | 0.00 | % | 100.00 | % | | 100.00 | % | 100.00 | % | Banking |
| Cater Allen Syndicate Management Limited | United Kingdom | 0.00 | % | 100.00 | % | | 100.00 | % | 100.00 | % | Inactive |
| CCAP Auto Lease Ltd. | United States | 0.00 | % | 100.00 | % | | 100.00 | % | 100.00 | % | Leasing |
| Centro de Capacitación Santander, A.C. | Mexico | 0.00 | % | 99.98 | % | | 100.00 | % | 100.00 | % | Non-profit institute |
| Certidesa, S.L. Unipersonal | Spain | 0.00 | % | 100.00 | % | | 100.00 | % | 100.00 | % | Aircraft rental |
| Charlotte 2023 Funding Plc | United Kingdom | 0.00 | % | 100.00 | % | | 100.00 | % | 100.00 | % | Securitization |
| Charlotte 2023 Holdings Limited | United Kingdom | — | | (a) | | — | | — | | Securitization |
| Cianite New Energy, S.r.l. | Italy | 0.00 | % | 49.00 | % | | 70.00 | % | 70.00 | % | Renewable energies |
| CIMA Commodities 2025-4 | Ireland | — | | (a) | | — | | — | | Securitization |
| CIMA Finance DAC Series 2022-1 | Ireland | — | | (a) | | — | | — | | Securitization |
| CIMA Finance DAC Series 2023-1 | Ireland | — | | (a) | | — | | — | | Securitization |
| CIMA Luxembourg S.à r.l. 2025-1 | Luxembourg | — | | (a) | | — | | — | | Securitization |
| CLM Fleet Management Limited | United Kingdom | 0.00 | % | 100.00 | % | | 100.00 | % | 100.00 | % | Vehicle rental |
| Cobranza Amigable, S.A.P.I. de C.V. | Mexico | 0.00 | % | 100.00 | % | | 100.00 | % | 100.00 | % | Collection services |
| Community Development and Affordable Housing Fund LLC | United States | 0.00 | % | 96.00 | % | | 96.00 | % | 96.00 | % | Asset management |
| Compagnie Generale de Credit Aux Particuliers - Credipar S.A. | France | 0.00 | % | 50.00 | % | | 100.00 | % | 100.00 | % | Banking |
| Compagnie Pour la Location de Vehicules - CLV | France | 0.00 | % | 50.00 | % | | 100.00 | % | 100.00 | % | Banking |
| Comparanet, S.A. de C.V. | Mexico | 0.00 | % | 100.00 | % | | 100.00 | % | 100.00 | % | Insurance mediation |
| Consumer Totta 1 | Portugal | — | | (a) | | — | | — | | Securitization |
| Consumer Totta 2 | Portugal | — | | (a) | | — | | — | | Securitization |
| Consumer Totta 3 2025 | Portugal | — | | (a) | | — | | — | | Securitization |
| Contrato de Fideicomiso Irrevocable de Administración INV/6206 | Mexico | — | | (a) | | — | | — | | Trust company |
| Contrato de Fideicomiso Irrevocable de Administración Nro. 6168 | Mexico | — | | (a) | | — | | — | | Trust company |
| Contrato de Fideicomiso Irrevocable Nro. F/6236 | Mexico | — | | (a) | | — | | — | | Trust company |
| Credileads S.A. | Uruguay | 0.00 | % | 100.00 | % | | 100.00 | % | 100.00 | % | Advertising |
| D365 Fundo de Investimento em Direitos Creditórios | Brazil | 0.00 | % | 89.86 | % | | 100.00 | % | 100.00 | % | Investment fund |
| Darep Designated Activity Company | Ireland | 100.00 | % | 0.00 | % | | 100.00 | % | 100.00 | % | Reinsurances |
| Decarome, S.A.P.I. de C.V. | Mexico | 0.00 | % | 100.00 | % | | 100.00 | % | 100.00 | % | Finance company |
| Decarope S.A.C. | Peru | 0.00 | % | 100.00 | % | | 100.00 | % | 100.00 | % | Investment company |
| | | | | | | | | | | | | | | | | | | | | | | |
Subsidiaries of Banco Santander, S.A. 1 |
|
| % of ownership held by Banco Santander | | Percentage of voting power (e) | |
Company | Location | Direct | Indirect | | Year 2025 | Year 2024 | Activity |
| Deva Capital Advisory Company, S.L. Unipersonal | Spain | 0.00 | % | 100.00 | % | | 100.00 | % | 100.00 | % | Advisory services |
| Deva Capital Holding Company, S.L. Unipersonal | Spain | 100.00 | % | 0.00 | % | | 100.00 | % | 100.00 | % | Holding company |
| Deva Capital Investment Company, S.L. Unipersonal | Spain | 0.00 | % | 100.00 | % | | 100.00 | % | 100.00 | % | Holding company |
| Deva Capital Management Company, S.L. Unipersonal | Spain | 0.00 | % | 100.00 | % | | 100.00 | % | 100.00 | % | Advisory services |
| Deva Capital Servicer Company, S.L. Unipersonal | Spain | 0.00 | % | 100.00 | % | | 100.00 | % | 100.00 | % | Holding company |
| Diamante New Energy S.r.l. | Italy | 0.00 | % | 80.00 | % | | 80.00 | % | — | | Renewable energies |
| Diglo Servicer Company 2021, S.L. Unipersonal | Spain | 0.00 | % | 100.00 | % | | 100.00 | % | 100.00 | % | Real estate management |
| Diners Club Spain, S.A. Unipersonal | Spain | 100.00 | % | 0.00 | % | | 100.00 | % | 100.00 | % | Cards |
| Dirección Estratega, S.C. | Mexico | 0.00 | % | 100.00 | % | | 100.00 | % | 100.00 | % | Services |
| Drive Auto Receivables Trust 2024-1 | United States | — | | (a) | | — | | — | | Securitization |
| Drive Auto Receivables Trust 2024-2 | United States | — | | (a) | | — | | — | | Securitization |
| Drive Auto Receivables Trust 2025-1 | United States | — | | (a) | | — | | — | | Securitization |
| Drive Auto Receivables Trust 2025-2 | United States | — | | (a) | | — | | — | | Securitization |
| Drive S.r.l. | Italy | 0.00 | % | 100.00 | % | | 100.00 | % | 75.00 | % | Renting |
| Ductor Real Estate, S.L. Unipersonal | Spain | 100.00 | % | 0.00 | % | | 100.00 | % | 100.00 | % | Real estate |
| Ebury Agent UK Limited | United Kingdom | 0.00 | % | 66.43 | % | | 100.00 | % | — | | Financial services |
| Ebury Banco de Cambio S.A. | Brazil | 0.00 | % | 66.43 | % | | 100.00 | % | 100.00 | % | Payment services |
| Ebury Banco Holding Participações Ltda. | Brazil | 0.00 | % | 66.43 | % | | 100.00 | % | 100.00 | % | Holding company |
| Ebury Brasil Consultoria S.A. | Brazil | 0.00 | % | 66.43 | % | | 100.00 | % | 100.00 | % | Consulting services |
| Ebury Brasil Holding Ltda. | Brazil | 0.00 | % | 66.43 | % | | 100.00 | % | 100.00 | % | Holding company |
| Ebury Brasil Participações S.A. | Brazil | 0.00 | % | 66.43 | % | | 100.00 | % | 100.00 | % | Holding company |
| Ebury Facilitadora De Pagamentos Ltda. | Brazil | 0.00 | % | 66.43 | % | | 100.00 | % | 100.00 | % | Software |
| Ebury Global Services, S.L. | Spain | 0.00 | % | 66.43 | % | | 100.00 | % | — | | Advisory services |
| Ebury Mass Payments Holdco Limited | United Kingdom | 0.00 | % | 66.43 | % | | 100.00 | % | 100.00 | % | Holding company |
| Ebury Mass Payments Limited | United Kingdom | 0.00 | % | 66.43 | % | | 100.00 | % | 100.00 | % | Payment services |
| Ebury Partners (DIFC) Limited | Arab United Emirates | 0.00 | % | 66.43 | % | | 100.00 | % | 100.00 | % | Finance company |
| Ebury Partners Australia Pty Ltd. | Australia | 0.00 | % | 66.43 | % | | 100.00 | % | 100.00 | % | Finance company |
| Ebury Partners Belgium NV /SA | Belgium | 0.00 | % | 66.43 | % | | 100.00 | % | 100.00 | % | Payment services |
| Ebury Partners Canada Limited | Canada | 0.00 | % | 66.43 | % | | 100.00 | % | 100.00 | % | Finance company |
| Ebury Partners Chile SpA | Chile | 0.00 | % | 66.43 | % | | 100.00 | % | 100.00 | % | Finance company |
| Ebury Partners China Limited | China | 0.00 | % | 66.43 | % | | 100.00 | % | 100.00 | % | Marketing |
| Ebury Partners Finance Limited | United Kingdom | 0.00 | % | 66.43 | % | | 100.00 | % | 100.00 | % | Finance company |
| Ebury Partners Hong Kong Limited | Hong-Kong | 0.00 | % | 66.43 | % | | 100.00 | % | 100.00 | % | Finance company |
| Ebury Partners Limited | United Kingdom | 0.00 | % | 66.43 | % | | 66.43 | % | 66.43 | % | Holding company |
| | | | | | | | | | | | | | | | | | | | | | | |
Subsidiaries of Banco Santander, S.A. 1 |
|
| % of ownership held by Banco Santander | | Percentage of voting power (e) | |
Company | Location | Direct | Indirect | | Year 2025 | Year 2024 | Activity |
| Ebury Partners Lithuania UAB | Lithuania | 0.00 | % | 66.43 | % | | 100.00 | % | — | | Payment services |
| Ebury Partners Markets Cyprus Limited | Cyprus | 0.00 | % | 66.43 | % | | 100.00 | % | 100.00 | % | Finance company |
| Ebury Partners Markets Limited | United Kingdom | 0.00 | % | 66.43 | % | | 100.00 | % | 100.00 | % | Finance company |
| Ebury Partners México, S.A. de C.V. | Mexico | 0.00 | % | 66.43 | % | | 100.00 | % | 100.00 | % | Payment services |
| Ebury Partners Payment Solutions Uganda Limited | Uganda | 0.00 | % | 66.43 | % | | 100.00 | % | — | | Finance company |
| Ebury Partners Payments - L.L.C. | Arab United Emirates | 0.00 | % | 66.43 | % | | 100.00 | % | — | | Payment services |
| Ebury Partners Payments Solutions Limited | Kenya | 0.00 | % | 66.43 | % | | 100.00 | % | — | | Payment services |
| Ebury Partners South Africa (Pty) Ltd | Republic of South Africa | 0.00 | % | 66.43 | % | | 100.00 | % | 100.00 | % | Finance company |
| Ebury Partners Switzerland AG | Switzerland | 0.00 | % | 66.43 | % | | 100.00 | % | 100.00 | % | Finance company |
| Ebury Partners Tanzania Limited | Tanzania | 0.00 | % | 66.43 | % | | 100.00 | % | — | | Payment services |
| Ebury Partners UK Limited | United Kingdom | 0.00 | % | 66.43 | % | | 100.00 | % | 100.00 | % | Electronic money |
| Ebury Payments PTE Ltd. | Singapore | 0.00 | % | 66.43 | % | | 100.00 | % | 100.00 | % | Payment services |
| Ebury Soluções de Pagamentos Ltda. | Brazil | 0.00 | % | 66.43 | % | | 100.00 | % | 100.00 | % | Financial services |
| Ebury Technology Limited | United Kingdom | 0.00 | % | 66.43 | % | | 100.00 | % | 100.00 | % | Software |
| Ebury Technology Spain, S.L. | Spain | 0.00 | % | 66.43 | % | | 100.00 | % | — | | IT consulting |
| EDT FTPYME Pastor 3, Fondo de Titulización de Activos | Spain | — | | (a) | | — | | — | | Securitization |
| Elcano Renovables, S.L. | Spain | 0.00 | % | 70.00 | % | | 70.00 | % | 70.00 | % | Holding company |
| Electrolyser, S.A. de C.V. | Mexico | 0.00 | % | 99.98 | % | | 100.00 | % | 100.00 | % | Services |
| Elevate Tech Platforms, S.L. Unipersonal (b) | Spain | — | | — | | | — | | 100.00 | % | Holding company |
| Emdia Serviços Especializados em Cobranças Ltda. | Brazil | 0.00 | % | 89.86 | % | | 100.00 | % | 100.00 | % | Collection services |
| Empresa de Créditos Santander Consumo Perú S.A. | Peru | 100.00 | % | 0.00 | % | | 100.00 | % | 100.00 | % | Finance company |
| Energias Renovables de Ormonde 30, S.L. Unipersonal | Spain | 0.00 | % | 100.00 | % | | 100.00 | % | 100.00 | % | Renewable energies |
| Energias Renovables de Titania, S.L. Unipersonal | Spain | 0.00 | % | 100.00 | % | | 100.00 | % | 100.00 | % | Renewable energies |
| Energias Renovables Gladiateur 45, S.L. Unipersonal | Spain | 0.00 | % | 100.00 | % | | 100.00 | % | 100.00 | % | Renewable energies |
| Energias Renovables Prometeo, S.L. Unipersonal | Spain | 0.00 | % | 100.00 | % | | 100.00 | % | 100.00 | % | Renewable energies |
| Esfera Fidelidade S.A. | Brazil | 0.00 | % | 89.86 | % | | 100.00 | % | 100.00 | % | Services |
| Evidence Previdência S.A. | Brazil | 0.00 | % | 89.86 | % | | 100.00 | % | 100.00 | % | Insurance |
| Eyemobile Tecnologia Ltda. | Brazil | 0.00 | % | 100.00 | % | | 100.00 | % | 100.00 | % | IT services |
| F1rst Tecnologia e Inovação Ltda. | Brazil | 0.00 | % | 89.86 | % | | 100.00 | % | 100.00 | % | IT services |
| Factum Identity Solutions, S.L. | Spain | 0.00 | % | 67.20 | % | | 84.00 | % | — | | IT consulting |
| Factum Information Technologies, S.L. | Spain | 0.00 | % | 80.00 | % | | 80.00 | % | — | | IT consulting |
| Factum IT Limited | United Kingdom | 0.00 | % | 80.00 | % | | 100.00 | % | — | | IT consulting |
| Factum Navarra, S.L. Unipersonal | Spain | 0.00 | % | 80.00 | % | | 100.00 | % | — | | IT consulting |
| FIDC Santander Auto Loans I Segmento Financeiro - Responsabilidade Limitada | Brazil | — | | (a) | | — | | — | | Securitization |
| Fideicomiso Empresarial Irrevocable de Administración y Garantía F/3443 | Mexico | — | | (a) | | — | | — | | Trust company |
| | | | | | | | | | | | | | | | | | | | | | | |
Subsidiaries of Banco Santander, S.A. 1 |
|
| % of ownership held by Banco Santander | | Percentage of voting power (e) | |
Company | Location | Direct | Indirect | | Year 2025 | Year 2024 | Activity |
| Financeira El Corte Inglés, Portugal, S.F.C., S.A. | Portugal | 0.00 | % | 51.00 | % | | 100.00 | % | 100.00 | % | Finance company |
| Financiera El Corte Inglés, E.F.C., S.A. | Spain | 0.00 | % | 51.00 | % | | 51.00 | % | 51.00 | % | Finance company |
| Finsantusa, S.L. Unipersonal | Spain | 0.00 | % | 100.00 | % | | 100.00 | % | 100.00 | % | Holding company |
| First National Motor plc | United Kingdom | 0.00 | % | 100.00 | % | | 100.00 | % | 100.00 | % | Inactive |
| First National Tricity Finance Limited | United Kingdom | 0.00 | % | 100.00 | % | | 100.00 | % | 100.00 | % | Inactive |
| FIT Economia de Energia S.A. | Brazil | 0.00 | % | 58.41 | % | | 65.00 | % | 65.00 | % | Electricity production |
| Flexliving Valdemarín, S.L. | Spain | 0.00 | % | 27.57 | % | | 27.57 | % | 90.00 | % | Real estate |
| Fondo de Titulización PYMES Santander 15 | Spain | — | | (a) | | — | | — | | Securitization |
| Fondo de Titulización Santander Financiación 1 | Spain | — | | (a) | | — | | — | | Securitization |
| Fondo de Titulización, RMBS Santander 7 | Spain | — | | (a) | | — | | — | | Securitization |
| Fondo de Titulización, Santander Consumo 8 | Spain | — | | (a) | | — | | — | | Securitization |
| Fondo de Titulización, Santander Consumo 9 | Spain | — | | (a) | | — | | — | | Securitization |
| Fondos Santander, S.A. Administradora de Fondos de Inversión (en liquidación) (d) | Uruguay | 0.00 | % | 100.00 | % | | 100.00 | % | 100.00 | % | Fund management company |
| Fortensky Trading, Ltd. | Ireland | 0.00 | % | 100.00 | % | | 100.00 | % | 100.00 | % | Finance company |
| Fosse (Master Issuer) Holdings Limited | United Kingdom | — | | (a) | | — | | — | | Securitization |
| Fosse Funding (No.1) Limited | United Kingdom | 0.00 | % | 100.00 | % | | 100.00 | % | 100.00 | % | Securitization |
| Fosse Master Issuer PLC | United Kingdom | 0.00 | % | 100.00 | % | | 100.00 | % | 100.00 | % | Securitization |
| Fosse Trustee (UK) Limited | United Kingdom | 0.00 | % | 100.00 | % | | 100.00 | % | 100.00 | % | Securitization |
| Freedom Depository Holdings, LLC | United States | 0.00 | % | 100.00 | % | | 100.00 | % | 100.00 | % | Holding company |
| Freedom Depository, LLC | United States | 0.00 | % | 100.00 | % | | 100.00 | % | 100.00 | % | Securitization |
| Fulvia SPV S.r.l. | Italy | — | | (a) | | — | | — | | Securitization |
| Fulvia SPV S.r.l. (2025-1) | Italy | — | | (a) | | — | | — | | Securitization |
| Fundo de Investimento em Direitos Creditórios Atacado - Não Padronizado | Brazil | 0.00 | % | 89.86 | % | | 100.00 | % | 100.00 | % | Investment fund |
| Fundo de Investimento em Direitos Creditórios Conretorno - Responsabilidade Limitada | Brazil | 0.00 | % | 89.86 | % | | 100.00 | % | — | | Investment fund |
| Fundo de Investimento em Direitos Creditórios Multisegmentos NPL Ipanema VI – Não padronizado | Brazil | 0.00 | % | 89.86 | % | | 100.00 | % | 100.00 | % | Investment fund |
| Fundo de Investimento em Direitos Creditórios Tellus | Brazil | 0.00 | % | 89.86 | % | | 100.00 | % | 100.00 | % | Investment fund |
| Gamma, Sociedade Financeira de Titularização de Créditos, S.A. | Portugal | 0.00 | % | 99.87 | % | | 100.00 | % | 100.00 | % | Securitization |
| GC FTPYME Pastor 4, Fondo de Titulización de Activos | Spain | — | | (a) | | — | | — | | Securitization |
| Generación de Energía Villahermosa, S.A.P.I. de C.V. | Mexico | 0.00 | % | 100.00 | % | | 100.00 | % | 100.00 | % | Electricity production |
| Gesban México Servicios Administrativos Globales, S.A. de C.V. | Mexico | 0.00 | % | 100.00 | % | | 100.00 | % | 100.00 | % | Services |
| Gesban Santander Servicios Profesionales Contables Limitada | Chile | 0.00 | % | 100.00 | % | | 100.00 | % | 100.00 | % | Accounting services |
| Gesban Servicios Administrativos Globales, S.L. | Spain | 99.99 | % | 0.01 | % | | 100.00 | % | 100.00 | % | Services |
| | | | | | | | | | | | | | | | | | | | | | | |
Subsidiaries of Banco Santander, S.A. 1 |
|
| % of ownership held by Banco Santander | | Percentage of voting power (e) | |
Company | Location | Direct | Indirect | | Year 2025 | Year 2024 | Activity |
| Gesban UK Limited | United Kingdom | 0.00 | % | 100.00 | % | | 100.00 | % | 100.00 | % | Payments and collection services |
| Gestión de Inversiones JILT, S.A. Unipersonal | Spain | 100.00 | % | 0.00 | % | | 100.00 | % | 100.00 | % | Services |
| Gestora de Procesos S.A. en liquidación (d) | Peru | 100.00 | % | 0.00 | % | | 100.00 | % | 100.00 | % | Financial services |
| Getnet Adquirência e Serviços para Meios de Pagamento S.A. - Instituição de Pagamento | Brazil | 0.00 | % | 100.00 | % | | 100.00 | % | 100.00 | % | Payment services |
| Getnet Argentina S.A.U. | Argentine | 0.00 | % | 100.00 | % | | 100.00 | % | 100.00 | % | Payment methods |
| Getnet Europe, Entidad de Pago, S.L. Unipersonal | Spain | 0.00 | % | 100.00 | % | | 100.00 | % | 100.00 | % | Payment services |
| Getnet Fundo de Investimento em Direitos Creditórios | Brazil | 0.00 | % | 89.86 | % | | 100.00 | % | 100.00 | % | Investment fund |
| Getnet Merchant Solutions UK Ltd | United Kingdom | 0.00 | % | 100.00 | % | | 100.00 | % | 100.00 | % | Financial services |
| Getnet México Servicios de Adquirencia, S.A. de C.V. | Mexico | 0.00 | % | 100.00 | % | | 100.00 | % | 100.00 | % | Payments and collection services |
| Getnet Payments, S.L. | Spain | 0.00 | % | 100.00 | % | | 100.00 | % | 100.00 | % | Holding company |
| Getnet Sociedade de Credito Direto S.A. | Brazil | 0.00 | % | 100.00 | % | | 100.00 | % | 100.00 | % | Finance company |
| Getnet Technology and Operations Brasil Ltda. | Brazil | 0.00 | % | 100.00 | % | | 100.00 | % | 100.00 | % | IT services |
| Getnet Uruguay S.A. | Uruguay | 0.00 | % | 100.00 | % | | 100.00 | % | 100.00 | % | Payment methods |
| GNXT Serviços de Atendimento Ltda. | Brazil | 0.00 | % | 100.00 | % | | 100.00 | % | 100.00 | % | Telemarketing |
| Golden Bar (Securitisation) S.r.l. | Italy | — | | (a) | | — | | — | | Securitization |
| Golden Bar Stand Alone 2021-1 | Italy | — | | (a) | | — | | — | | Securitization |
| Golden Bar Stand Alone 2022-1 | Italy | — | | (a) | | — | | — | | Securitization |
| Golden Bar Stand Alone 2023-2 | Italy | — | | (a) | | — | | — | | Securitization |
| Golden Bar Stand Alone 2024-1 | Italy | — | | (a) | | — | | — | | Securitization |
| Golden Bar Stand Alone 2025-1 | Italy | — | | (a) | | — | | — | | Securitization |
| Golden Bar Stand Alone 2025-2 | Italy | — | | (a) | | — | | — | | Securitization |
| Grafite New Energy, S.r.l. | Italy | 0.00 | % | 49.00 | % | | 70.00 | % | 70.00 | % | Renewable energies |
| Gravity Cloud Technology, S.L. | Spain | 100.00 | % | 0.00 | % | | 100.00 | % | 100.00 | % | IT services |
| Grupo Empresarial Santander, S.L. | Spain | 99.62 | % | 0.38 | % | | 100.00 | % | 100.00 | % | Holding company |
| Grupo Financiero Santander México, S.A. de C.V. | Mexico | 100.00 | % | 0.00 | % | | 100.00 | % | 100.00 | % | Holding company |
| Hipototta No. 13 | Portugal | — | | (a) | | — | | — | | Securitization |
| Hipototta No. 14 | Portugal | — | | (a) | | — | | — | | Securitization |
| Hipototta No. 4 plc (d) | Ireland | — | | (a) | | — | | — | | Securitization |
| Hipototta No. 5 plc (d) | Ireland | — | | (a) | | — | | — | | Securitization |
| Holbah Santander, S.L. Unipersonal | Spain | 0.00 | % | 100.00 | % | | 100.00 | % | 100.00 | % | Holding company |
| Holmes Funding Limited | United Kingdom | 0.00 | % | 100.00 | % | | 100.00 | % | 100.00 | % | Securitization |
| Holmes Holdings Limited | United Kingdom | — | | (a) | | — | | — | | Securitization |
| Holmes Master Issuer plc | United Kingdom | 0.00 | % | 100.00 | % | | 100.00 | % | 100.00 | % | Securitization |
| Holmes Trustees Limited | United Kingdom | 0.00 | % | 100.00 | % | | 100.00 | % | 100.00 | % | Securitization |
| Hyundai Capital Bank Europe GmbH | Germany | 0.00 | % | 51.00 | % | | 51.00 | % | 51.00 | % | Banking |
| | | | | | | | | | | | | | | | | | | | | | | |
Subsidiaries of Banco Santander, S.A. 1 |
|
| % of ownership held by Banco Santander | | Percentage of voting power (e) | |
Company | Location | Direct | Indirect | | Year 2025 | Year 2024 | Activity |
| Hyundai Fundo de Investimento em Direitos Creditórios | Brazil | 0.00 | % | 44.93 | % | | 100.00 | % | 100.00 | % | Investment fund |
| Ibérica de Compras Corporativas, S.L. | Spain | 97.17 | % | 2.82 | % | | 100.00 | % | 100.00 | % | E-commerce |
| Innohub, S.A.P.I. de C.V. (d) | Mexico | 0.00 | % | 62.01 | % | | 69.54 | % | 69.54 | % | IT services |
| Insurance Funding Solutions Limited | United Kingdom | 0.00 | % | 100.00 | % | | 100.00 | % | 100.00 | % | Inactive |
| Inversiones Capital Global, S.A. Unipersonal | Spain | 100.00 | % | 0.00 | % | | 100.00 | % | 100.00 | % | Holding company |
| Inversiones Marítimas del Mediterráneo, S.A., en liquidación (d) | Spain | 0.00 | % | 100.00 | % | | 100.00 | % | 100.00 | % | Inactive |
| Investment Holdings 1857, S.L. | Spain | 100.00 | % | 0.00 | % | | 100.00 | % | 100.00 | % | Holding company |
| Isar Valley S.A. | Luxembourg | — | | (a) | | — | | — | | Securitization |
| Isla de los Buques, S.A. | Spain | 99.98 | % | 0.02 | % | | 100.00 | % | 100.00 | % | Finance company |
| Klare Corredora de Seguros Limitada | Chile | 0.00 | % | 100.00 | % | | 100.00 | % | 100.00 | % | Insurance mediation |
| Landcompany 2020, S.L. Unipersonal | Spain | 100.00 | % | 0.00 | % | | 100.00 | % | 100.00 | % | Real estate management |
| Laparanza, S.A. | Spain | 61.59 | % | 0.00 | % | | 61.59 | % | 61.59 | % | Agricultural holding |
| Lerma Investments 2018, S.L. Unipersonal | Spain | 100.00 | % | 0.00 | % | | 100.00 | % | 100.00 | % | Real estate |
| Liquetine, S.L. Unipersonal | Spain | 0.00 | % | 70.00 | % | | 100.00 | % | 100.00 | % | Renewable energies |
| Lynx Financial Crime Tech, S.A. | Spain | 0.00 | % | 79.99 | % | | 79.99 | % | 79.99 | % | IT services |
| MAC No. 1 Limited | United Kingdom | — | | (a) | | — | | — | | Inactive |
| Macroscope S.L. Unipersonal | Spain | 100.00 | % | 0.00 | % | | 100.00 | % | — | | Consulting services |
| Mascor SPV 2025, S.L. | Spain | 0.00 | % | 29.10 | % | | 29.10 | % | — | | Real estate |
| Master Red Europa, S.L. | Spain | 96.34 | % | 0.00 | % | | 96.34 | % | 96.34 | % | Cards |
| Mata Alta, S.L. Unipersonal | Spain | 0.00 | % | 61.59 | % | | 100.00 | % | 100.00 | % | Agricultural holding |
| MCE Bank GmbH | Germany | 0.00 | % | 90.01 | % | | 90.01 | % | 90.01 | % | Banking |
| MCE Verwaltung GmbH | Germany | 0.00 | % | 90.01 | % | | 100.00 | % | 100.00 | % | Real estate rental |
| Mercadotecnia, Ideas y Tecnología, S.A. de C.V. | Mexico | 0.00 | % | 70.00 | % | | 70.00 | % | 70.00 | % | Payment methods |
| Merciver, S.L. | Spain | 99.90 | % | 0.10 | % | | 100.00 | % | 100.00 | % | Financial advisory |
| Midata Service GmbH | Germany | 0.00 | % | 90.01 | % | | 100.00 | % | 100.00 | % | IT services |
| Moon GC&P Investments, S.L. Unipersonal | Spain | 100.00 | % | 0.00 | % | | 100.00 | % | 100.00 | % | Holding company |
| Mouro Capital I LP | United Kingdom | 0.00 | % | 100.00 | % | | 100.00 | % | 100.00 | % | Investment fund |
| Multiplica SpA | Chile | 0.00 | % | 100.00 | % | | 100.00 | % | 100.00 | % | Payment services |
| Murattabat International Business Services | Palestine | 0.00 | % | 66.43 | % | | 100.00 | % | — | | IT consulting |
| Navegante Américo Vespucio SpA | Chile | 0.00 | % | 100.00 | % | | 100.00 | % | 100.00 | % | Real estate |
| Naviera Mirambel, S.L. Unipersonal | Spain | 0.00 | % | 100.00 | % | | 100.00 | % | 100.00 | % | Finance company |
| Naviera Trans Gas, A.I.E. | Spain | 99.99 | % | 0.01 | % | | 100.00 | % | 100.00 | % | Renting |
| | | | | | | | | | | | | | | | | | | | | | | |
Subsidiaries of Banco Santander, S.A. 1 |
| | % of ownership held by Banco Santander | | Percentage of voting power (e) | |
| Company | Location | Direct | Indirect | | Year 2025 | Year 2024 | Activity |
| Naviera Transcantábrica, S.L. | Spain | 100.00 | % | 0.00 | % | | 100.00 | % | 100.00 | % | Leasing |
| Naviera Transchem, S.L. Unipersonal | Spain | 100.00 | % | 0.00 | % | | 100.00 | % | 100.00 | % | Leasing |
| | | | | | | | | | | | | | | | | | | | | | | |
Subsidiaries of Banco Santander, S.A. 1 |
| | % of ownership held by Banco Santander | | Percentage of voting power (e) | |
| Company | Location | Direct | Indirect | | Year 2025 | Year 2024 | Activity |
| Navigator Global Limited | United Kingdom | 0.00 | % | 100.00 | % | | 100.00 | % | 100.00 | % | Internet |
| NeoAuto S.A.C. | Peru | 0.00 | % | 100.00 | % | | 100.00 | % | 100.00 | % | Vehicles purchased by internet |
| Newcomar, S.L., en liquidación (d) | Spain | 40.00 | % | 40.00 | % | | 80.00 | % | 80.00 | % | Real estate |
| Novimovest – Fundo de Investimento Imobiliário | Portugal | 0.00 | % | 78.76 | % | | 78.86 | % | 78.74 | % | Investment fund |
| NW Services CO. | United States | 0.00 | % | 100.00 | % | | 100.00 | % | 100.00 | % | E-commerce |
| One Mobility Management GmbH | Germany | 0.00 | % | 46.95 | % | | 100.00 | % | 100.00 | % | Services |
| Open Bank, S.A. Unipersonal | Spain | 100.00 | % | 0.00 | % | | 100.00 | % | 100.00 | % | Banking |
| Open Digital Market, S.L. | Spain | 0.00 | % | 100.00 | % | | 100.00 | % | 100.00 | % | Commerce |
| Open Digital Services, S.L. | Spain | 99.97 | % | 0.03 | % | | 100.00 | % | 100.00 | % | Services |
| Openbank México, S.A., Institución de Banca Múltiple, Grupo Financiero Santander México | Mexico | 0.00 | % | 100.00 | % | | 100.00 | % | 100.00 | % | Banking |
| Operadora de Carteras Gamma, S.A.P.I. de C.V. | Mexico | 100.00 | % | 0.00 | % | | 100.00 | % | 100.00 | % | Holding company |
| Optimal Investment Services SA | Switzerland | 100.00 | % | 0.00 | % | | 100.00 | % | 100.00 | % | Fund management company |
| Optimal Multiadvisors Ireland Plc / Optimal Strategic US Equity Ireland Euro Fund (c) | Ireland | 0.00 | % | 0.00 | % | | 0.00 | % | 0.00 | % | Fund management company |
| Optimal Multiadvisors Ireland Plc / Optimal Strategic US Equity Ireland US Dollar Fund (c) | Ireland | 0.00 | % | 0.00 | % | | 0.00 | % | 0.00 | % | Fund management company |
| Paga Después, S.A. de C.V. | Mexico | 0.00 | % | 100.00 | % | | 100.00 | % | 100.00 | % | Financial services |
| PagoNxt Emoney, E.D.E., S.L. | Spain | 0.00 | % | 100.00 | % | | 100.00 | % | 100.00 | % | Financial services |
| PagoNxt Ltd | United Kingdom | 100.00 | % | 0.00 | % | | 100.00 | % | 100.00 | % | Holding company |
| PagoNxt Merchant Solutions FZ-LLC (d) | Arab United Emirates | 0.00 | % | 100.00 | % | | 100.00 | % | 100.00 | % | Financial services |
| PagoNxt Merchant Solutions India Private Limited (d) | India | 0.00 | % | 100.00 | % | | 100.00 | % | 100.00 | % | Financial services |
| PagoNxt Payments Brasil Ltda. | Brazil | 0.00 | % | 100.00 | % | | 100.00 | % | 100.00 | % | Financial services |
| PagoNxt Payments Chile SpA | Chile | 0.00 | % | 100.00 | % | | 100.00 | % | 100.00 | % | Services |
| PagoNxt Payments México, S.A. de C.V. | Mexico | 0.00 | % | 100.00 | % | | 100.00 | % | 100.00 | % | IT services |
| PagoNxt Payments Services, S.L. | Spain | 0.00 | % | 100.00 | % | | 100.00 | % | 100.00 | % | Services |
| PagoNxt Payments UK Ltd | United Kingdom | 0.00 | % | 100.00 | % | | 100.00 | % | 100.00 | % | Payment services |
| PagoNxt Payments, S.L. | Spain | 0.00 | % | 100.00 | % | | 100.00 | % | 100.00 | % | IT services |
| PagoNxt US, LLC | United States | 0.00 | % | 100.00 | % | | 100.00 | % | 100.00 | % | Inactive |
| PagoNxt, S.L. | Spain | 100.00 | % | 0.00 | % | | 100.00 | % | 100.00 | % | Holding company |
| Paytec Tecnologia em Pagamentos Ltda. | Brazil | 0.00 | % | 100.00 | % | | 100.00 | % | 100.00 | % | Commerce |
| PBE Companies, LLC | United States | 0.00 | % | 100.00 | % | | 100.00 | % | 100.00 | % | Real estate |
| Pereda Gestión, S.A. | Spain | 99.99 | % | 0.01 | % | | 100.00 | % | 100.00 | % | Securities
brokerage |
| Phoenix S.A. | Uruguay | 0.00 | % | 100.00 | % | | 100.00 | % | 100.00 | % | Payment methods |
| Pinle SPV 2024, S.L. | Spain | 0.00 | % | 27.57 | % | | 27.57 | % | — | | Real estate |
| Pony S.A. | Luxembourg | — | | (a) | | — | | — | | Securitization |
| Pony S.A., Compartment German Auto Loans 2023-1 | Luxembourg | — | | (a) | | — | | — | | Securitization |
| Pony S.A., Compartment German Auto Loans 2024-1 | Luxembourg | — | | (a) | | — | | — | | Securitization |
| Pony S.A., Compartment German Auto Loans 2025-1 | Luxembourg | — | | (a) | | — | | — | | Securitization |
| | | | | | | | | | | | | | | | | | | | | | | |
Subsidiaries of Banco Santander, S.A. 1 |
| | % of ownership held by Banco Santander | | Percentage of voting power (e) | |
| Company | Location | Direct | Indirect | | Year 2025 | Year 2024 | Activity |
| Portal Universia Argentina S.A. | Argentine | 0.00 | % | 75.75 | % | | 75.75 | % | 75.75 | % | Internet |
| Portal Universia Portugal, Prestação de Serviços de Informática, S.A. | Portugal | 0.00 | % | 100.00 | % | | 100.00 | % | 100.00 | % | Internet |
| Precato IV Fundo de Investimento em Direitos Creditórios - Não Padronizados | Brazil | 0.00 | % | 89.86 | % | | 100.00 | % | 100.00 | % | Investment fund |
| Prime 16 – Fundo de Investimentos Imobiliário | Brazil | 0.00 | % | 89.86 | % | | 100.00 | % | 100.00 | % | Investment fund |
| PT Trans Skills Employer Services | Indonesia | 0.00 | % | 66.43 | % | | 100.00 | % | — | | Consulting services |
| Pulse Client Experts Ltda. | Brazil | 0.00 | % | 89.86 | % | | 100.00 | % | 100.00 | % | Telemarketing |
| Punta Lima, LLC | United States | 0.00 | % | 100.00 | % | | 100.00 | % | 100.00 | % | Leasing |
| Redoto SPV 2025, S.L. | Spain | 0.00 | % | 30.60 | % | | 30.60 | % | — | | Real estate |
| Repton 2023-1 Limited | United Kingdom | — | | (a) | | — | | — | | Securitization |
| Retailcompany 2021, S.L. Unipersonal | Spain | 100.00 | % | 0.00 | % | | 100.00 | % | 100.00 | % | Real estate |
| Retop S.A. | Uruguay | 100.00 | % | 0.00 | % | | 100.00 | % | 100.00 | % | Finance company |
| Return Capital Gestão de Ativos e Participações S.A. | Brazil | 0.00 | % | 89.86 | % | | 100.00 | % | 100.00 | % | Collection services |
| Rojo Entretenimento S.A. | Brazil | 0.00 | % | 85.01 | % | | 94.60 | % | 94.60 | % | Real estate |
| SAFO Alternative Lending, S.L. Unipersonal | Spain | 0.00 | % | 100.00 | % | | 100.00 | % | 100.00 | % | Finance company |
| SAI Alternative Investments México, S.A. de C.V. | Mexico | 0.00 | % | 100.00 | % | | 100.00 | % | 100.00 | % | Consulting services |
| SAI Lux Carry SCSp | Luxembourg | 0.00 | % | 100.00 | % | | 100.00 | % | 100.00 | % | Fund management company |
| Sainte Julie Fundo de Investimento em Direitos Creditórios Não-Padronizados Responsabilidade Limitada | Brazil | 0.00 | % | 89.86 | % | | 100.00 | % | 100.00 | % | Investment fund |
| SALCO, Servicios de Seguridad Santander, S.A. | Spain | 99.99 | % | 0.01 | % | | 100.00 | % | 100.00 | % | Safety |
| SAM Argentina Sociedad Gerente de Fondos Comunes de Inversión S.A. | Argentine | 0.00 | % | 100.00 | % | | 100.00 | % | 100.00 | % | Investment
fund
management |
| SAM Asset Management, S.A. de C.V., Sociedad Operadora de Fondos de Inversión | Mexico | 0.00 | % | 100.00 | % | | 100.00 | % | 100.00 | % | Fund management company |
| SAM Inversiones Argentina S.A. | Argentine | 0.00 | % | 100.00 | % | | 100.00 | % | 100.00 | % | Pension fund
management
company |
| SAM Investment Holdings, S.L. | Spain | 92.37 | % | 7.63 | % | | 100.00 | % | 100.00 | % | Holding company |
| San Pietro Solar PV, S.r.l. | Italy | 0.00 | % | 56.00 | % | | 80.00 | % | 80.00 | % | Renewable energies |
| San Preca Federal I Fundo de Investimento em Direitos Creditórios Não-Padronizados | Brazil | 0.00 | % | 86.59 | % | | 96.36 | % | 50.00 | % | Investment fund |
| SANB Promotora de Vendas e Cobrança S.A. | Brazil | 0.00 | % | 89.86 | % | | 100.00 | % | 100.00 | % | Finance company |
| Sancap Investimentos e Participações S.A. | Brazil | 0.00 | % | 89.86 | % | | 100.00 | % | 100.00 | % | Holding company |
| Santander (CF Trustee Property Nominee) Limited | United Kingdom | 0.00 | % | 100.00 | % | | 100.00 | % | 100.00 | % | Inactive |
| Santander (CF Trustee) Limited | United Kingdom | — | | (a) | | — | | — | | Inactive |
| Santander (Luxembourg) Issuer S.à r.l. | Luxembourg | 100.00 | % | 0.00 | % | | 100.00 | % | — | | Securitization |
| Santander (UK) Group Pension Schemes Trustees Limited | United Kingdom | 0.00 | % | 100.00 | % | | 100.00 | % | 100.00 | % | Inactive |
| Santander Alternative Investments, S.G.I.I.C., S.A. Unipersonal | Spain | 0.00 | % | 100.00 | % | | 100.00 | % | 100.00 | % | Fund management company |
| Santander AM Global Working Capital Fund I | Luxembourg | 100.00 | % | 0.00 | % | | 100.00 | % | 100.00 | % | Investment fund |
| | | | | | | | | | | | | | | | | | | | | | | |
Subsidiaries of Banco Santander, S.A. 1 |
| | % of ownership held by Banco Santander | | Percentage of voting power (e) | |
| Company | Location | Direct | Indirect | | Year 2025 | Year 2024 | Activity |
| Santander Asesorías Financieras Limitada | Chile | 0.00 | % | 67.45 | % | | 100.00 | % | 100.00 | % | Financial advisory |
| Santander Asset Finance Opportunities | Luxembourg | 100.00 | % | 0.00 | % | | 100.00 | % | 100.00 | % | Investment fund |
| Santander Asset Finance plc | United Kingdom | 0.00 | % | 100.00 | % | | 100.00 | % | 100.00 | % | Leasing |
| Santander Asset Management - SGOIC, S.A. | Portugal | 0.00 | % | 100.00 | % | | 100.00 | % | 100.00 | % | Fund management company |
| Santander Asset Management Chile S.A. | Chile | 0.00 | % | 100.00 | % | | 100.00 | % | 100.00 | % | Securities investment |
| Santander Asset Management Gerente de Fondos Comunes de Inversión S.A. | Argentine | 0.00 | % | 100.00 | % | | 100.00 | % | 100.00 | % | Fund management company |
| Santander Asset Management Luxembourg, S.A. | Luxembourg | 0.00 | % | 100.00 | % | | 100.00 | % | 100.00 | % | Fund management company |
| Santander Asset Management S.A. Administradora General de Fondos | Chile | 0.00 | % | 100.00 | % | | 100.00 | % | 100.00 | % | Fund management company |
| Santander Asset Management UK Holdings Limited | United Kingdom | 0.00 | % | 100.00 | % | | 100.00 | % | 100.00 | % | Holding company |
| Santander Asset Management UK Limited | United Kingdom | 0.00 | % | 100.00 | % | | 100.00 | % | 100.00 | % | Management of funds and portfolios |
| Santander Asset Management, S.A., SGIIC Unipersonal | Spain | 0.00 | % | 100.00 | % | | 100.00 | % | 100.00 | % | Fund management company |
| Santander Auto Lease Titling Ltd. | United States | 0.00 | % | 100.00 | % | | 100.00 | % | 100.00 | % | Leasing |
| Santander Back-Offices Globales Mayoristas, S.A. | Spain | 100.00 | % | 0.00 | % | | 100.00 | % | 100.00 | % | Services |
| Santander Banca de Inversión Colombia, S.A.S. | Colombia | 100.00 | % | 0.00 | % | | 100.00 | % | 100.00 | % | Advisory services |
| Santander Bank Polska S.A. | Poland | 58.70 | % | 0.00 | % | | 58.70 | % | 62.20 | % | Banking |
| Santander Bank, National Association | United States | 0.00 | % | 100.00 | % | | 100.00 | % | 100.00 | % | Banking |
| Santander Brasil Administradora de Consórcio Ltda. | Brazil | 0.00 | % | 89.86 | % | | 100.00 | % | 100.00 | % | Services |
| Santander Brasil Gestão de Recursos Ltda. | Brazil | 0.08 | % | 99.92 | % | | 100.00 | % | 100.00 | % | Securities investment |
| Santander Capital Holdings LLC | United States | 0.00 | % | 100.00 | % | | 100.00 | % | 100.00 | % | Holding company |
| Santander Capital Structuring, S.A. de C.V. | Mexico | 0.00 | % | 100.00 | % | | 100.00 | % | 100.00 | % | Holding company |
| Santander Capitalização S.A. | Brazil | 0.00 | % | 89.86 | % | | 100.00 | % | 100.00 | % | Insurance |
| Santander Cards Ireland Limited (g) | Ireland | 0.00 | % | 100.00 | % | | 100.00 | % | 100.00 | % | Cards |
| Santander Cards Limited | United Kingdom | 0.00 | % | 100.00 | % | | 100.00 | % | 100.00 | % | Inactive |
| Santander Cards UK Limited | United Kingdom | 0.00 | % | 100.00 | % | | 100.00 | % | 100.00 | % | Finance company |
| Santander Chile Holding S.A. | Chile | 22.11 | % | 77.75 | % | | 99.86 | % | 99.86 | % | Holding company |
| Santander Commercial Mortgage Securities LLC | United States | 0.00 | % | 100.00 | % | | 100.00 | % | — | | Finance company |
| Santander Compara Holding, S.L. | Spain | 99.97 | % | 0.03 | % | | 100.00 | % | 100.00 | % | Holding company |
| Santander Consulting (Beijing) Co., Ltd. | China | 0.00 | % | 100.00 | % | | 100.00 | % | 100.00 | % | Advisory services |
| Santander Consumer (UK) plc | United Kingdom | 0.00 | % | 100.00 | % | | 100.00 | % | 100.00 | % | Finance company |
| Santander Consumer Auto Receivables Funding 2018-L3 LLC | United States | 0.00 | % | 100.00 | % | | 100.00 | % | 100.00 | % | Finance company |
| Santander Consumer Auto Receivables Funding 2022-B1 LLC | United States | 0.00 | % | 100.00 | % | | 100.00 | % | 100.00 | % | Finance company |
| Santander Consumer Auto Receivables Funding 2022-B2 LLC | United States | 0.00 | % | 100.00 | % | | 100.00 | % | 100.00 | % | Finance company |
| | | | | | | | | | | | | | | | | | | | | | | |
Subsidiaries of Banco Santander, S.A. 1 |
| | % of ownership held by Banco Santander | | Percentage of voting power (e) | |
| Company | Location | Direct | Indirect | | Year 2025 | Year 2024 | Activity |
| Santander Consumer Auto Receivables Funding 2022-B3 LLC | United States | 0.00 | % | 100.00 | % | | 100.00 | % | 100.00 | % | Finance company |
| Santander Consumer Auto Receivables Funding 2022-B4 LLC | United States | 0.00 | % | 100.00 | % | | 100.00 | % | 100.00 | % | Finance company |
| Santander Consumer Auto Receivables Funding 2023-B1 LLC | United States | 0.00 | % | 100.00 | % | | 100.00 | % | 100.00 | % | Finance company |
| Santander Consumer Auto Receivables Funding 2023-B2 LLC | United States | 0.00 | % | 100.00 | % | | 100.00 | % | 100.00 | % | Finance company |
| Santander Consumer Auto Receivables Funding 2023-B3 LLC | United States | 0.00 | % | 100.00 | % | | 100.00 | % | 100.00 | % | Finance company |
| Santander Consumer Auto Receivables Funding 2023-B4 LLC | United States | 0.00 | % | 100.00 | % | | 100.00 | % | 100.00 | % | Finance company |
| Santander Consumer Auto Receivables Funding 2023-B5 LLC | United States | 0.00 | % | 100.00 | % | | 100.00 | % | 100.00 | % | Inactive |
| Santander Consumer Auto Receivables Funding 2023-B6 LLC | United States | 0.00 | % | 100.00 | % | | 100.00 | % | 100.00 | % | Inactive |
| Santander Consumer Auto Receivables Funding 2024-B2 LLC | United States | 0.00 | % | 100.00 | % | | 100.00 | % | 100.00 | % | Inactive |
| Santander Consumer Auto Receivables Funding 2024-B3 LLC | United States | 0.00 | % | 100.00 | % | | 100.00 | % | 100.00 | % | Inactive |
| Santander Consumer Auto Receivables Funding 2025-B1 LLC | United States | 0.00 | % | 100.00 | % | | 100.00 | % | 100.00 | % | Inactive |
| Santander Consumer Auto Receivables Funding 2025-L1 LLC | United States | 0.00 | % | 100.00 | % | | 100.00 | % | 100.00 | % | Finance company |
| Santander Consumer Auto Receivables Funding 2025-L2 LLC | United States | 0.00 | % | 100.00 | % | | 100.00 | % | 100.00 | % | Inactive |
| Santander Consumer Auto Receivables Funding 2025-L3 LLC | United States | 0.00 | % | 100.00 | % | | 100.00 | % | — | | Inactive |
| Santander Consumer Auto Receivables Funding 2025-L4 LLC | United States | 0.00 | % | 100.00 | % | | 100.00 | % | — | | Inactive |
| Santander Consumer Bank | Canada | 0.00 | % | 100.00 | % | | 100.00 | % | — | | Banking |
| Santander Consumer Bank AG | Germany | 0.00 | % | 100.00 | % | | 100.00 | % | 100.00 | % | Banking |
| Santander Consumer Bank AS | Norway | 0.00 | % | 100.00 | % | | 100.00 | % | 100.00 | % | Banking |
| Santander Consumer Bank GmbH | Austria | 0.00 | % | 100.00 | % | | 100.00 | % | 100.00 | % | Banking |
| Santander Consumer Bank S.A. | Poland | 0.00 | % | 100.00 | % | | 100.00 | % | 100.00 | % | Banking |
| Santander Consumer Bank S.A. | Peru | 100.00 | % | 0.00 | % | | 100.00 | % | — | | Banking |
| Santander Consumer Bank S.p.A. | Italy | 0.00 | % | 100.00 | % | | 100.00 | % | 100.00 | % | Banking |
| Santander Consumer Credit Services Limited | United Kingdom | 0.00 | % | 100.00 | % | | 100.00 | % | 100.00 | % | Finance company |
| Santander Consumer Finance Global Services, S.L. | Spain | 0.00 | % | 100.00 | % | | 100.00 | % | 100.00 | % | IT |
| Santander Consumer Finance Limitada | Chile | 49.00 | % | 34.24 | % | | 100.00 | % | 100.00 | % | Finance company |
| Santander Consumer Finance México, S.A. de C.V., S.O.F.O.M., E.R., Grupo Financiero Santander México | Mexico | 0.00 | % | 99.98 | % | | 100.00 | % | 100.00 | % | Inactive |
| Santander Consumer Finance Oy | Finland | 0.00 | % | 100.00 | % | | 100.00 | % | 100.00 | % | Finance company |
| Santander Consumer Finance Schweiz AG | Switzerland | 0.00 | % | 100.00 | % | | 100.00 | % | 100.00 | % | Leasing |
| Santander Consumer Finance, S.A. | Spain | 100.00 | % | 0.00 | % | | 100.00 | % | 100.00 | % | Banking |
| Santander Consumer Financial Solutions Sp. z o.o. | Poland | 0.00 | % | 100.00 | % | | 100.00 | % | 100.00 | % | Leasing |
| Santander Consumer Holding Austria GmbH | Austria | 0.00 | % | 100.00 | % | | 100.00 | % | 100.00 | % | Holding company |
| Santander Consumer Holding GmbH | Germany | 0.00 | % | 100.00 | % | | 100.00 | % | 100.00 | % | Holding company |
| Santander Consumer Lease Receivables 1 LLC | United States | 0.00 | % | 100.00 | % | | 100.00 | % | 100.00 | % | Finance company |
| Santander Consumer Leasing GmbH | Germany | 0.00 | % | 100.00 | % | | 100.00 | % | 100.00 | % | Leasing |
| Santander Consumer Leasing S.A. | France | 0.00 | % | 100.00 | % | | 100.00 | % | 100.00 | % | Renting |
| | | | | | | | | | | | | | | | | | | | | | | |
Subsidiaries of Banco Santander, S.A. 1 |
| | % of ownership held by Banco Santander | | Percentage of voting power (e) | |
| Company | Location | Direct | Indirect | | Year 2025 | Year 2024 | Activity |
| Santander Consumer Mobility Services, S.A. | Spain | 0.00 | % | 100.00 | % | | 100.00 | % | 100.00 | % | Renting |
| Santander Consumer Multirent Sp. z o.o. | Poland | 0.00 | % | 100.00 | % | | 100.00 | % | 100.00 | % | Leasing |
| Santander Consumer Operations Services GmbH | Germany | 0.00 | % | 100.00 | % | | 100.00 | % | 100.00 | % | Services |
| Santander Consumer Receivables 11 LLC | United States | 0.00 | % | 100.00 | % | | 100.00 | % | 100.00 | % | Finance company |
| Santander Consumer Receivables 15 LLC | United States | 0.00 | % | 100.00 | % | | 100.00 | % | 100.00 | % | Finance company |
| Santander Consumer Receivables 16 LLC | United States | 0.00 | % | 100.00 | % | | 100.00 | % | 100.00 | % | Finance company |
| Santander Consumer Receivables 20 LLC | United States | 0.00 | % | 100.00 | % | | 100.00 | % | 100.00 | % | Finance company |
| Santander Consumer Receivables 21 LLC | United States | 0.00 | % | 100.00 | % | | 100.00 | % | 100.00 | % | Inactive |
| Santander Consumer Receivables 7 LLC | United States | 0.00 | % | 100.00 | % | | 100.00 | % | 100.00 | % | Finance company |
| Santander Consumer Receivables Funding LLC | United States | 0.00 | % | 100.00 | % | | 100.00 | % | 100.00 | % | Finance company |
| Santander Consumer Renting S.r.l. | Italy | 0.00 | % | 100.00 | % | | 100.00 | % | 100.00 | % | Renting |
| Santander Consumer Renting, S.L. | Spain | 0.00 | % | 100.00 | % | | 100.00 | % | 100.00 | % | Renting |
| Santander Consumer S.A. | Argentine | 0.00 | % | 99.82 | % | | 100.00 | % | 100.00 | % | Finance company |
| Santander Consumer Services GmbH | Austria | 0.00 | % | 100.00 | % | | 100.00 | % | 100.00 | % | Services |
| Santander Consumer Services, S.A. | Portugal | 0.00 | % | 100.00 | % | | 100.00 | % | 100.00 | % | Finance company |
| Santander Consumer Spain Auto 2019-1, Fondo de Titulización | Spain | — | | (a) | | — | | — | | Securitization |
| Santander Consumer Spain Auto 2020-1, Fondo de Titulización | Spain | — | | (a) | | — | | — | | Securitization |
| Santander Consumer Spain Auto 2021-1, Fondo de Titulización | Spain | — | | (a) | | — | | — | | Securitization |
| Santander Consumer Spain Auto 2022-1, Fondo de Titulización | Spain | — | | (a) | | — | | — | | Securitization |
| Santander Consumer Spain Auto 2023-1, Fondo de Titulización | Spain | — | | (a) | | — | | — | | Securitization |
| Santander Consumer Spain Auto 2024-1, Fondo de Titulización | Spain | — | | (a) | | — | | — | | Securitization |
| Santander Consumer Spain Auto 2025-1, Fondo de Titulización | Spain | — | | (a) | | — | | — | | Securitization |
| Santander Consumer Technology Services GmbH | Germany | 0.00 | % | 100.00 | % | | 100.00 | % | 100.00 | % | IT services |
| Santander Consumer USA Holdings Inc. | United States | 0.00 | % | 100.00 | % | | 100.00 | % | 100.00 | % | Holding company |
| Santander Consumer USA Inc. | United States | 0.00 | % | 100.00 | % | | 100.00 | % | 100.00 | % | Finance company |
| Santander Consumo 4, F.T. | Spain | — | | (a) | | — | | — | | Securitization |
| Santander Consumo 5, F.T. | Spain | — | | (a) | | — | | — | | Securitization |
| Santander Consumo 6, F.T. | Spain | — | | (a) | | — | | — | | Securitization |
| Santander Consumo 7, F.T. | Spain | — | | (a) | | — | | — | | Securitization |
| Santander Corredora de Seguros Limitada | Chile | 0.00 | % | 67.21 | % | | 100.00 | % | 100.00 | % | Insurance mediation |
| Santander Corredores de Bolsa Limitada | Chile | 0.00 | % | 83.24 | % | | 100.00 | % | 100.00 | % | Securities company |
| Santander Corretora de Câmbio e Valores Mobiliários S.A. | Brazil | 0.00 | % | 89.86 | % | | 100.00 | % | 100.00 | % | Securities company |
| Santander Corretora de Seguros, Investimentos e Serviços S.A. | Brazil | 0.00 | % | 89.86 | % | | 100.00 | % | 100.00 | % | Insurance mediation |
| Santander Customer Voice, S.A. | Spain | 99.50 | % | 0.50 | % | | 100.00 | % | 100.00 | % | Services |
| Santander de Titulización, S.G.F.T., S.A. | Spain | 81.00 | % | 19.00 | % | | 100.00 | % | 100.00 | % | Fund management company |
| | | | | | | | | | | | | | | | | | | | | | | |
Subsidiaries of Banco Santander, S.A. 1 |
| | % of ownership held by Banco Santander | | Percentage of voting power (e) | |
| Company | Location | Direct | Indirect | | Year 2025 | Year 2024 | Activity |
| Santander Distribuidora de Títulos e Valores Mobiliários S.A. | Brazil | 0.00 | % | 89.86 | % | | 100.00 | % | 100.00 | % | Securities company |
| Santander Drive Auto Receivables LLC | United States | 0.00 | % | 100.00 | % | | 100.00 | % | 100.00 | % | Finance company |
| Santander Drive Auto Receivables Trust 2022-2 | United States | — | | (a) | | — | | — | | Securitization |
| Santander Drive Auto Receivables Trust 2022-3 | United States | — | | (a) | | — | | — | | Securitization |
| Santander Drive Auto Receivables Trust 2022-4 | United States | — | | (a) | | — | | — | | Securitization |
| Santander Drive Auto Receivables Trust 2022-5 | United States | — | | (a) | | — | | — | | Securitization |
| Santander Drive Auto Receivables Trust 2022-6 | United States | — | | (a) | | — | | — | | Securitization |
| Santander Drive Auto Receivables Trust 2022-7 | United States | — | | (a) | | — | | — | | Securitization |
| Santander Drive Auto Receivables Trust 2023-1 | United States | — | | (a) | | — | | — | | Securitization |
| Santander Drive Auto Receivables Trust 2023-2 | United States | — | | (a) | | — | | — | | Securitization |
| Santander Drive Auto Receivables Trust 2023-3 | United States | — | | (a) | | — | | — | | Securitization |
| Santander Drive Auto Receivables Trust 2023-4 | United States | — | | (a) | | — | | — | | Securitization |
| Santander Drive Auto Receivables Trust 2023-5 | United States | — | | (a) | | — | | — | | Securitization |
| Santander Drive Auto Receivables Trust 2023-6 | United States | — | | (a) | | — | | — | | Securitization |
| Santander Drive Auto Receivables Trust 2024-1 | United States | — | | (a) | | — | | — | | Securitization |
| Santander Drive Auto Receivables Trust 2024-2 | United States | — | | (a) | | — | | — | | Securitization |
| Santander Drive Auto Receivables Trust 2024-3 | United States | — | | (a) | | — | | — | | Securitization |
| Santander Drive Auto Receivables Trust 2024-4 | United States | — | | (a) | | — | | — | | Securitization |
| Santander Drive Auto Receivables Trust 2024-5 | United States | — | | (a) | | — | | — | | Securitization |
| Santander Drive Auto Receivables Trust 2025-1 | United States | — | | (a) | | — | | — | | Securitization |
| Santander Drive Auto Receivables Trust 2025-2 | United States | — | | (a) | | — | | — | | Securitization |
| Santander Drive Auto Receivables Trust 2025-3 | United States | — | | (a) | | — | | — | | Securitization |
| Santander Drive Auto Receivables Trust 2025-4 | United States | — | | (a) | | — | | — | | Securitization |
| Santander Empresa Administradora de Fondos Colectivos S.A. | Peru | 99.00 | % | 1.00 | % | | 100.00 | % | 100.00 | % | Investment company |
| Santander Equity Investments Limited | United Kingdom | 0.00 | % | 100.00 | % | | 100.00 | % | 100.00 | % | Finance company |
| Santander España Servicios Legales, S.L. | Spain | 99.97 | % | 0.03 | % | | 100.00 | % | 100.00 | % | Services |
| Santander Estates Limited | United Kingdom | 0.00 | % | 100.00 | % | | 100.00 | % | 100.00 | % | Real estate |
| Santander European Hospitality Opportunities | Luxembourg | 100.00 | % | 0.00 | % | | 100.00 | % | 100.00 | % | Investment fund |
| Santander F24 S.A. | Poland | 0.00 | % | 58.70 | % | | 100.00 | % | 100.00 | % | Finance company |
| Santander Facility Management España, S.L. Unipersonal | Spain | 0.00 | % | 100.00 | % | | 100.00 | % | 100.00 | % | Real estate |
| Santander Factoring S.A. | Chile | 0.00 | % | 99.86 | % | | 100.00 | % | 100.00 | % | Factoring |
| Santander Factoring Sp. z o.o. | Poland | 0.00 | % | 58.70 | % | | 100.00 | % | 100.00 | % | Financial services |
| | | | | | | | | | | | | | | | | | | | | | | |
Subsidiaries of Banco Santander, S.A. 1 |
| | % of ownership held by Banco Santander | | Percentage of voting power (e) | |
| Company | Location | Direct | Indirect | | Year 2025 | Year 2024 | Activity |
| Santander Factoring y Confirming, S.A. Unipersonal, E.F.C. | Spain | 100.00 | % | 0.00 | % | | 100.00 | % | 100.00 | % | Factoring |
| Santander FI Hedge Strategies | Ireland | 0.00 | % | 89.86 | % | | 100.00 | % | 100.00 | % | Investment fund |
| Santander Finance 2012-1 LLC | United States | 0.00 | % | 100.00 | % | | 100.00 | % | 100.00 | % | Financial services |
| Santander Financial Exchanges Limited (d) | United Kingdom | 100.00 | % | 0.00 | % | | 100.00 | % | 100.00 | % | Inactive |
| Santander Financial Services plc | United Kingdom | 0.00 | % | 100.00 | % | | 100.00 | % | 100.00 | % | Banking |
| Santander Financiamientos S.A. | Peru | 100.00 | % | 0.00 | % | | 100.00 | % | 100.00 | % | Finance company |
| Santander Financing S.A.S. | Colombia | 100.00 | % | 0.00 | % | | 100.00 | % | 100.00 | % | Financial advisory |
| Santander Finanse Sp. z o.o. | Poland | 0.00 | % | 58.70 | % | | 100.00 | % | 100.00 | % | Financial services |
| Santander Fundo de Investimento Amazonas Multimercado Crédito Privado Investimento no Exterior | Brazil | 0.00 | % | 89.86 | % | | 100.00 | % | 100.00 | % | Investment fund |
| Santander Fundo de Investimento Diamantina Multimercado Crédito Privado Investimento no Exterior | Brazil | 0.00 | % | 89.86 | % | | 100.00 | % | 100.00 | % | Investment fund |
| Santander Fundo de Investimento Guarujá Multimercado Crédito Privado Investimento no Exterior | Brazil | 0.00 | % | 89.86 | % | | 100.00 | % | 100.00 | % | Investment fund |
| Santander Gestión de Recaudación y Cobranzas Ltda. | Chile | 0.00 | % | 99.86 | % | | 100.00 | % | 100.00 | % | Financial services |
| Santander Global Cards & Digital Solutions Brasil S.A. | Brazil | 0.00 | % | 100.00 | % | | 100.00 | % | 100.00 | % | IT consulting |
| Santander Global Cards & Digital Solutions, S.L. | Spain | 100.00 | % | 0.00 | % | | 100.00 | % | 100.00 | % | IT services |
| Santander Global Consumer Finance Limited | United Kingdom | 0.00 | % | 100.00 | % | | 100.00 | % | 100.00 | % | Finance company |
| Santander Global Facilities, S.A. de C.V. | Mexico | 100.00 | % | 0.00 | % | | 100.00 | % | 100.00 | % | Services |
| Santander Global Services S.A. (d) | Uruguay | 0.00 | % | 100.00 | % | | 100.00 | % | 100.00 | % | Services |
| Santander Global Services, S.L. | Spain | 100.00 | % | 0.00 | % | | 100.00 | % | 100.00 | % | Real estate |
| Santander Global Technology and Operations Brasil Ltda. | Brazil | 0.00 | % | 100.00 | % | | 100.00 | % | 100.00 | % | IT services |
| Santander Global Technology and Operations Chile Limitada | Chile | 0.00 | % | 100.00 | % | | 100.00 | % | 100.00 | % | IT services |
| Santander Global Technology and Operations, S.L. Unipersonal | Spain | 100.00 | % | 0.00 | % | | 100.00 | % | 100.00 | % | IT services |
| Santander Green Investment, S.L. | Spain | 99.97 | % | 0.03 | % | | 100.00 | % | 100.00 | % | Holding company |
| Santander Group Properties, S.L. Unipersonal | Spain | 100.00 | % | 0.00 | % | | 100.00 | % | 100.00 | % | Holding company |
| Santander Guarantee Company (d) | United Kingdom | 0.00 | % | 100.00 | % | | 100.00 | % | 100.00 | % | Inactive |
| Santander Hera Renda Fixa Fundo Incentivado de Investimento em Infraestrutura Responsabilidade Limitada | Brazil | 0.00 | % | 89.86 | % | | 100.00 | % | 100.00 | % | Investment fund |
| Santander Hermes Multimercado Crédito Privado Infraestructura Fundo de Investimento | Brazil | 0.00 | % | 89.86 | % | | 100.00 | % | 100.00 | % | Investment fund |
| Santander Hipotecario 2 Fondo de Titulización de Activos | Spain | — | | (a) | | — | | — | | Securitization |
| Santander Hipotecario 3 Fondo de Titulización de Activos | Spain | — | | (a) | | — | | — | | Securitization |
| Santander Holding Imobiliária S.A. | Brazil | 0.00 | % | 89.86 | % | | 100.00 | % | 100.00 | % | Real estate |
| Santander Holding Internacional, S.A. | Spain | 99.95 | % | 0.05 | % | | 100.00 | % | 100.00 | % | Holding company |
| Santander Holdings USA, Inc. | United States | 100.00 | % | 0.00 | % | | 100.00 | % | 100.00 | % | Holding company |
| | | | | | | | | | | | | | | | | | | | | | | |
Subsidiaries of Banco Santander, S.A. 1 |
| | % of ownership held by Banco Santander | | Percentage of voting power (e) | |
| Company | Location | Direct | Indirect | | Year 2025 | Year 2024 | Activity |
| Santander Inclusión Financiera, S.A. de C.V., S.O.F.O.M., E.R., Grupo Financiero Santander México | Mexico | 0.00 | % | 99.98 | % | | 100.00 | % | 100.00 | % | Finance company |
| Santander Insurance Agency, U.S., LLC | United States | 0.00 | % | 100.00 | % | | 100.00 | % | 100.00 | % | Insurance mediation |
| Santander Insurance Services UK Limited | United Kingdom | 100.00 | % | 0.00 | % | | 100.00 | % | 100.00 | % | Wealth management |
| Santander Insurance, S.L. | Spain | 100.00 | % | 0.00 | % | | 100.00 | % | 100.00 | % | Holding company |
| Santander Intermediación Correduría de Seguros, S.A. | Spain | 100.00 | % | 0.00 | % | | 100.00 | % | 100.00 | % | Insurance mediation |
| Santander International Products, Plc. (f) | Ireland | 99.99 | % | 0.01 | % | | 100.00 | % | 100.00 | % | Finance company |
| Santander International Wealth Management México, S. de R.L. de C.V. | Mexico | 0.00 | % | 100.00 | % | | 100.00 | % | 100.00 | % | Advisory services |
| Santander International Wealth Solutions LLC | United States | 0.00 | % | 100.00 | % | | 100.00 | % | 100.00 | % | Holding company |
| Santander Inversiones S.A. | Chile | 5.12 | % | 94.88 | % | | 100.00 | % | 100.00 | % | Holding company |
| Santander Investment Chile Limitada | Chile | 16.12 | % | 83.88 | % | | 100.00 | % | 100.00 | % | Finance company |
| Santander Investment, S.A. | Spain | 100.00 | % | 0.00 | % | | 100.00 | % | 100.00 | % | Banking |
| Santander Investments GP 1 S.à.r.l. | Luxembourg | 0.00 | % | 100.00 | % | | 100.00 | % | 100.00 | % | Fund management company |
| Santander Inwestycje Sp. z o.o. | Poland | 0.00 | % | 58.70 | % | | 100.00 | % | 100.00 | % | Securities company |
| Santander ISA Managers Limited | United Kingdom | 0.00 | % | 100.00 | % | | 100.00 | % | 100.00 | % | Management of funds and portfolios |
| Santander Lease, S.A., E.F.C. | Spain | 100.00 | % | 0.00 | % | | 100.00 | % | 100.00 | % | Leasing |
| Santander Leasing AB | Sweden | 0.00 | % | 100.00 | % | | 100.00 | % | 100.00 | % | Leasing and renting |
| Santander Leasing B.V. | Netherlands | 0.00 | % | 100.00 | % | | 100.00 | % | 100.00 | % | Renting |
| Santander Leasing S.A. | Poland | 0.00 | % | 58.70 | % | | 100.00 | % | 100.00 | % | Leasing |
| Santander Leasing S.A. Arrendamento Mercantil | Brazil | 0.00 | % | 89.86 | % | | 100.00 | % | 100.00 | % | Leasing |
| Santander Leasing, LLC | United States | 0.00 | % | 100.00 | % | | 100.00 | % | 100.00 | % | Leasing |
| Santander Lending Limited | United Kingdom | 0.00 | % | 100.00 | % | | 100.00 | % | 100.00 | % | Mortgage
credit
company |
| Santander Mediación Operador de Banca-Seguros Vinculado, S.A. | Spain | 100.00 | % | 0.00 | % | | 100.00 | % | 100.00 | % | Insurance mediation |
| Santander Merchant S.A. | Argentine | 5.10 | % | 94.90 | % | | 100.00 | % | 100.00 | % | Finance company |
| Santander Mortgage Asset Depositor LLC | United States | 0.00 | % | 100.00 | % | | 100.00 | % | 100.00 | % | Finance company |
| Santander Mortgage Asset Receivable Trust 2025-CES1 | United States | — | | (a) | | — | | — | | Securitization |
| Santander Mortgage Asset Receivable Trust 2025-NQM1 | United States | — | | (a) | | — | | — | | Securitization |
| Santander Mortgage Asset Receivable Trust 2025-NQM2 | United States | — | | (a) | | — | | — | | Securitization |
| Santander Mortgage Asset Receivable Trust 2025-NQM3 | United States | — | | (a) | | — | | — | | Securitization |
| Santander Mortgage Asset Receivable Trust 2025-NQM4 | United States | — | | (a) | | — | | — | | Securitization |
| Santander Mortgage Asset Receivable Trust 2025-NQM5 | United States | — | | (a) | | — | | — | | Securitization |
| Santander Mortgage Asset Receivable Trust 2025-NQM6 | United States | — | | (a) | | — | | — | | Securitization |
| Santander Mortgage Asset Receivable Trust 2026-NQM1 | United States | — | | (a) | | — | | — | | Inactive |
| | | | | | | | | | | | | | | | | | | | | | | |
Subsidiaries of Banco Santander, S.A. 1 |
| | % of ownership held by Banco Santander | | Percentage of voting power (e) | |
| Company | Location | Direct | Indirect | | Year 2025 | Year 2024 | Activity |
| Santander Mortgage Holdings Limited | United Kingdom | 0.00 | % | 100.00 | % | | 100.00 | % | 100.00 | % | Holding company |
| Santander New Business, S.A. | Spain | 99.00 | % | 1.00 | % | | 100.00 | % | 100.00 | % | Trade intermediary |
| Santander Paraty Qif PLC | Ireland | 0.00 | % | 89.86 | % | | 100.00 | % | 100.00 | % | Investment company |
| Santander Pensiones, S.A., E.G.F.P. | Spain | 0.00 | % | 100.00 | % | | 100.00 | % | 100.00 | % | Pension fund
management
company |
| Santander Prime Auto Issuance Notes 2018-A Designated Activity Company (d) | Ireland | — | | (a) | | — | | — | | Inactive |
| Santander Prime Auto Issuance Notes 2018-B Designated Activity Company (d) | Ireland | — | | (a) | | — | | — | | Inactive |
| Santander Prime Auto Issuance Notes 2018-C Designated Activity Company (d) | Ireland | — | | (a) | | — | | — | | Inactive |
| Santander Prime Auto Issuance Notes 2018-D Designated Activity Company (d) | Ireland | — | | (a) | | — | | — | | Inactive |
| Santander Prime Auto Issuance Notes 2018-E Designated Activity Company (d) | Ireland | — | | (a) | | — | | — | | Inactive |
| Santander Private Banking S.p.A. in Liquidazione (d) | Italy | 100.00 | % | 0.00 | % | | 100.00 | % | 100.00 | % | Finance company |
| Santander Private Banking UK Limited | United Kingdom | 0.00 | % | 100.00 | % | | 100.00 | % | 100.00 | % | Holding company |
| Santander Private Real Estate Advisory, S.A. | Spain | 100.00 | % | 0.00 | % | | 100.00 | % | 100.00 | % | Real estate |
| Santander Real Estate Debt 1 sub-fund | Luxembourg | 100.00 | % | 0.00 | % | | 100.00 | % | 100.00 | % | Investment fund |
| Santander Real Estate Equity I, F.C.R. | Spain | 100.00 | % | 0.00 | % | | 100.00 | % | 100.00 | % | Venture capital fund |
| Santander Real Estate, S.A. | Spain | 100.00 | % | 0.00 | % | | 100.00 | % | 100.00 | % | Inactive |
| Santander Retail Auto Lease Funding LLC | United States | 0.00 | % | 100.00 | % | | 100.00 | % | 100.00 | % | Finance company |
| Santander RMBS 6, Fondo de Titulización | Spain | — | | (a) | | — | | — | | Securitization |
| Santander S.A. Sociedad Securitizadora | Chile | 0.00 | % | 67.25 | % | | 100.00 | % | 100.00 | % | Fund management company |
| Santander SBAC II Renda Fixa Curto Prazo - Classe de Investimento em Cotas de Fundo de Investimento Financeiro Responsabilidade Limitada | Brazil | 0.00 | % | 89.86 | % | | 100.00 | % | — | | Investment fund |
| Santander Secretariat Services Limited | United Kingdom | 0.00 | % | 100.00 | % | | 100.00 | % | 100.00 | % | Inactive |
| Santander Securities LLC | United States | 0.00 | % | 100.00 | % | | 100.00 | % | 100.00 | % | Securities company |
| Santander Seguros y Reaseguros, Compañía Aseguradora, S.A. | Spain | 0.00 | % | 100.00 | % | | 100.00 | % | 100.00 | % | Insurance |
| Santander Services Solutions, S.L. | Spain | 0.00 | % | 100.00 | % | | 100.00 | % | 100.00 | % | Payment services |
| Santander Servicios Corporativos, S.A. de C.V. | Mexico | 0.00 | % | 99.98 | % | | 100.00 | % | 100.00 | % | Services |
| Santander Servicos Digitais Brasil Ltda. | Brazil | 0.00 | % | 100.00 | % | | 100.00 | % | — | | IT services |
| Santander Sociedade de Crédito, Financiamento e Investimento S.A. | Brazil | 0.00 | % | 89.86 | % | | 100.00 | % | 100.00 | % | Finance company |
| Santander Technology USA, LLC | United States | 0.00 | % | 100.00 | % | | 100.00 | % | 100.00 | % | IT services |
| Santander Tecnología Argentina S.A. | Argentine | 0.00 | % | 99.83 | % | | 100.00 | % | 100.00 | % | IT services |
| Santander Tecnología México, S.A. de C.V. | Mexico | 0.00 | % | 99.98 | % | | 100.00 | % | 100.00 | % | IT services |
| Santander Totta Seguros, Companhia de Seguros de Vida, S.A. | Portugal | 0.00 | % | 100.00 | % | | 100.00 | % | 100.00 | % | Insurance |
| | | | | | | | | | | | | | | | | | | | | | | |
Subsidiaries of Banco Santander, S.A. 1 |
| | % of ownership held by Banco Santander | | Percentage of voting power (e) | |
| Company | Location | Direct | Indirect | | Year 2025 | Year 2024 | Activity |
| Santander Towarzystwo Funduszy Inwestycyjnych S.A. | Poland | 50.00 | % | 29.35 | % | | 100.00 | % | 100.00 | % | Fund management company |
| Santander Trade Services Limited | Hong-Kong | 0.00 | % | 100.00 | % | | 100.00 | % | 100.00 | % | Inactive |
| Santander Trust S.A. | Argentine | 0.00 | % | 100.00 | % | | 100.00 | % | 100.00 | % | Services |
| Santander UK Group Holdings plc | United Kingdom | 77.67 | % | 22.33 | % | | 100.00 | % | 100.00 | % | Holding company |
| Santander UK Investments | United Kingdom | 0.00 | % | 100.00 | % | | 100.00 | % | 100.00 | % | Finance company |
| Santander UK Operations Limited | United Kingdom | 0.00 | % | 100.00 | % | | 100.00 | % | 100.00 | % | Finance company |
| Santander UK plc | United Kingdom | 0.00 | % | 100.00 | % | | 100.00 | % | 100.00 | % | Banking |
| Santander UK Technology Limited | United Kingdom | 0.00 | % | 100.00 | % | | 100.00 | % | 100.00 | % | IT services |
| Santander US Capital Markets LLC | United States | 0.00 | % | 100.00 | % | | 100.00 | % | 100.00 | % | Securities investment |
| Santander Valores S.A. | Argentine | 5.10 | % | 94.73 | % | | 100.00 | % | 100.00 | % | Securities company |
| Santusa Holding, S.L. | Spain | 69.76 | % | 30.24 | % | | 100.00 | % | 100.00 | % | Holding company |
| SBNA Auto Lease Funding LLC | United States | 0.00 | % | 100.00 | % | | 100.00 | % | 100.00 | % | Finance company |
| SBNA Auto Lease Trust 2023-A | United States | — | | (a) | | — | | — | | Securitization |
| SBNA Auto Lease Trust 2024-A | United States | — | | (a) | | — | | — | | Securitization |
| SBNA Auto Lease Trust 2024-B | United States | — | | (a) | | — | | — | | Securitization |
| SBNA Auto Lease Trust 2024-C | United States | — | | (a) | | — | | — | | Securitization |
| SBNA Auto Lease Trust 2025-A | United States | — | | (a) | | — | | — | | Securitization |
| SBNA Auto Lease Trust 2025-B | United States | — | | (a) | | — | | — | | Inactive |
| SBNA Auto Receivables Funding LLC | United States | 0.00 | % | 100.00 | % | | 100.00 | % | 100.00 | % | Finance company |
| SBNA Auto Receivables Grantor Trust 2025-SF1 | United States | — | | (a) | | — | | — | | Inactive |
| SBNA Auto Receivables Trust 2025-SF1 | United States | — | | (a) | | — | | — | | Inactive |
| SBNA Investor LLC | United States | 0.00 | % | 100.00 | % | | 100.00 | % | 100.00 | % | Holding company |
| SC Austria Auto Finance 2020-1 Designated Activity Company | Ireland | — | | (a) | | — | | — | | Securitization |
| SC Austria Consumer Loan 2021 Designated Activity Company | Ireland | — | | (a) | | — | | — | | Securitization |
| SC Austria S.à r.l. | Luxembourg | — | | (a) | | — | | — | | Securitization |
| SC Austria S.à r.l., Compartment Consumer 2025-1 | Luxembourg | — | | (a) | | — | | — | | Securitization |
| SC Canada Asset Securitization Trust | Canada | — | | (a) | | — | | — | | Securitization |
| SC Germany Auto 2019-1 UG (haftungsbeschränkt) (d) | Germany | — | | (a) | | — | | — | | Securitization |
| SC Germany S.A. | Luxembourg | — | | (a) | | — | | — | | Securitization |
| SC Germany S.A., Compartment Consumer 2020-1 | Luxembourg | — | | (a) | | — | | — | | Securitization |
| SC Germany S.A., Compartment Consumer 2021-1 | Luxembourg | — | | (a) | | — | | — | | Securitization |
| SC Germany S.A., Compartment Consumer 2022-1 | Luxembourg | — | | (a) | | — | | — | | Securitization |
| SC Germany S.A., Compartment Consumer 2023-1 | Luxembourg | — | | (a) | | — | | — | | Securitization |
| SC Germany S.A., Compartment Consumer 2024-1 | Luxembourg | — | | (a) | | — | | — | | Securitization |
| SC Germany S.A., Compartment Consumer 2024-2 | Luxembourg | — | | (a) | | — | | — | | Securitization |
| SC Germany S.A., Compartment Consumer 2025-1 | Luxembourg | — | | (a) | | — | | — | | Securitization |
| | | | | | | | | | | | | | | | | | | | | | | |
Subsidiaries of Banco Santander, S.A. 1 |
| | % of ownership held by Banco Santander | | Percentage of voting power (e) | |
| Company | Location | Direct | Indirect | | Year 2025 | Year 2024 | Activity |
| SC Germany S.A., Compartment Consumer 2025-2 | Luxembourg | — | | (a) | | — | | — | | Securitization |
| SC Germany S.A., Compartment Consumer Private 2023-1 | Luxembourg | — | | (a) | | — | | — | | Securitization |
| SC Germany S.A., Compartment Leasing 2023-1 | Luxembourg | — | | (a) | | — | | — | | Securitization |
| SC Germany S.A., Compartment Leasing 2025-1 | Luxembourg | — | | (a) | | — | | — | | Securitization |
| SC Germany S.A., Compartment Mobility 2020-1 | Luxembourg | — | | (a) | | — | | — | | Securitization |
| SC Mobility AB | Sweden | 0.00 | % | 100.00 | % | | 100.00 | % | 100.00 | % | Renting |
| SC Mobility AS | Norway | 0.00 | % | 100.00 | % | | 100.00 | % | 100.00 | % | Renting |
| SC Nordics S.à r.l. | Luxembourg | — | | (a) | | — | | — | | Securitization |
| SC Nordics S.à r.l. , Compartment Rahoituspalvelut 2025 | Luxembourg | — | | (a) | | — | | — | | Securitization |
| SC Poland Consumer 23-1 Designated Activity Company | Ireland | — | | (a) | | — | | — | | Securitization |
| SCF Ajoneuvohallinto IX Limited (d) | Ireland | — | | (a) | | — | | — | | Securitization |
| SCF Ajoneuvohallinto X Limited | Ireland | — | | (a) | | — | | — | | Securitization |
| SCF Ajoneuvohallinto XI Limited | Ireland | — | | (a) | | — | | — | | Securitization |
| SCF Ajoneuvohallinto XII Limited | Ireland | — | | (a) | — | | — | | — | | Securitization |
| SCF Ajoneuvohallinto XIII Limited | Ireland | — | | (a) | | — | | — | | Securitization |
| SCF Eastside Locks GP Limited | United Kingdom | 0.00 | % | 100.00 | % | | 100.00 | % | 100.00 | % | Real estate management |
| SCF Rahoituspalvelut IX DAC (d) | Ireland | — | | (a) | | — | | — | | Securitization |
| SCF Rahoituspalvelut X DAC | Ireland | — | | (a) | | — | | — | | Securitization |
| SCF Rahoituspalvelut XI Designated Activity Company | Ireland | — | | (a) | | — | | — | | Securitization |
| SCF Rahoituspalvelut XII DAC | Ireland | — | | (a) | | — | | — | | Securitization |
| SCF Rahoituspalvelut XIII DAC | Ireland | — | | (a) | | — | | — | | Securitization |
| SCM Poland Auto 2019-1 DAC | Ireland | — | | (a) | | — | | — | | Securitization |
| SDMX Superdigital, S.A. de C.V., Institución de Fondos de Pago Electrónico | Mexico | 0.00 | % | 100.00 | % | | 100.00 | % | 100.00 | % | Payment platform |
| Secucor Finance 2021-1, DAC (d) | Ireland | — | | (a) | | — | | — | | Securitization |
| Secucor Finance 2025-1 Designated Activity Company | Ireland | — | | (a) | | — | | — | | Securitization |
| Services and Promotions Delaware Corporation | United States | 0.00 | % | 100.00 | % | | 100.00 | % | 100.00 | % | Holding company |
| Services and Promotions Miami LLC | United States | 0.00 | % | 100.00 | % | | 100.00 | % | 100.00 | % | Real estate |
| Servicios de Cobranza, Recuperación y Seguimiento, S.A. de C.V. | Mexico | 0.00 | % | 100.00 | % | | 100.00 | % | 100.00 | % | Finance company |
| Servicios Inmobiliarios Residencial en Venta JV2, S.L. | Spain | 0.00 | % | 27.57 | % | | 27.57 | % | 90.00 | % | Real estate |
| Sheppards Moneybrokers Limited | United Kingdom | 0.00 | % | 100.00 | % | | 100.00 | % | 100.00 | % | Inactive |
| Shiloh III Wind Project, LLC | United States | 0.00 | % | 100.00 | % | | 100.00 | % | 100.00 | % | Renewable energies |
| Silk Finance No. 5 | Portugal | — | | (a) | | — | | — | | Securitization |
| Silk Finance No. 6 | Portugal | — | | (a) | | — | | — | | Securitization |
| Sociedad Integral de Valoraciones Automatizadas, S.A. Unipersonal | Spain | 100.00 | % | 0.00 | % | | 100.00 | % | 100.00 | % | Appraisals |
| Sociedad Operadora de Tarjetas de Pago Santander Getnet Chile S.A. | Chile | 0.00 | % | 67.13 | % | | 100.00 | % | 100.00 | % | Payments and collection services |
| Socur S.A. | Uruguay | 100.00 | % | 0.00 | % | | 100.00 | % | 100.00 | % | Finance company |
| Solution 4Fleet Consultoria Empresarial S.A. | Brazil | 0.00 | % | 89.86 | % | | 100.00 | % | 100.00 | % | Vehicle rental |
| Sovereign Community Development Company | United States | 0.00 | % | 100.00 | % | | 100.00 | % | 100.00 | % | Holding company |
| | | | | | | | | | | | | | | | | | | | | | | |
Subsidiaries of Banco Santander, S.A. 1 |
| | % of ownership held by Banco Santander | | Percentage of voting power (e) | |
| Company | Location | Direct | Indirect | | Year 2025 | Year 2024 | Activity |
| Sovereign Delaware Investment Corporation | United States | 0.00 | % | 100.00 | % | | 100.00 | % | 100.00 | % | Holding company |
| Sovereign Lease Holdings, LLC | United States | 0.00 | % | 100.00 | % | | 100.00 | % | 100.00 | % | Financial services |
| Sovereign REIT Holdings, Inc. | United States | 0.00 | % | 100.00 | % | | 100.00 | % | 100.00 | % | Holding company |
| SPIRE SA Compartment 2025-148 | Luxembourg | — | | (a) | | — | | — | | Securitization |
| SSA Swiss Advisors AG | Switzerland | 0.00 | % | 100.00 | % | | 100.00 | % | 100.00 | % | Wealth management |
| Stellantis Consumer Financial Services Polska Sp. z o.o. | Poland | 0.00 | % | 50.00 | % | | 100.00 | % | 100.00 | % | Finance company |
| Stellantis Financial Services Belux SA | Belgium | 0.00 | % | 50.00 | % | | 100.00 | % | 100.00 | % | Finance company |
| Stellantis Financial Services España, E.F.C., S.A. | Spain | 0.00 | % | 50.00 | % | | 50.00 | % | 50.00 | % | Finance company |
| Stellantis Financial Services Italia S.p.A. | Italy | 0.00 | % | 50.00 | % | | 50.00 | % | 50.00 | % | Banking |
| Stellantis Financial Services Nederland B.V. | Netherlands | 0.00 | % | 50.00 | % | | 100.00 | % | 100.00 | % | Finance company |
| Stellantis Financial Services Polska Sp. z o.o. | Poland | 0.00 | % | 50.00 | % | | 50.00 | % | 50.00 | % | Finance company |
| Stellantis Renting Italia S.p.A. | Italy | 0.00 | % | 50.00 | % | | 100.00 | % | 100.00 | % | Renting |
| Sterrebeeck B.V. | Netherlands | 100.00 | % | 0.00 | % | | 100.00 | % | 100.00 | % | Holding company |
| Suleyado 2003, S.L. Unipersonal | Spain | 0.00 | % | 100.00 | % | | 100.00 | % | 100.00 | % | Securities investment |
| Superdigital Holding Company, S.L. | Spain | 0.00 | % | 100.00 | % | | 100.00 | % | 100.00 | % | Holding company |
| Superdigital Logística S.A. | Brazil | 0.00 | % | 100.00 | % | | 100.00 | % | 100.00 | % | Payment services |
| Suzuki Servicios Financieros, S.L. | Spain | 0.00 | % | 51.00 | % | | 51.00 | % | 51.00 | % | Intermediation |
| Swesant SA | Switzerland | 0.00 | % | 100.00 | % | | 100.00 | % | 100.00 | % | Holding company |
| Tabasco Energía España, S.L. Unipersonal | Spain | 100.00 | % | 0.00 | % | | 100.00 | % | 100.00 | % | Holding company |
| Taxos Luz, S.L. Unipersonal | Spain | 0.00 | % | 70.00 | % | | 100.00 | % | 100.00 | % | Renewable energies |
| Teatinos Siglo XXI Inversiones S.A. | Chile | 50.00 | % | 50.00 | % | | 100.00 | % | 100.00 | % | Holding company |
| Terras Fundo de Investimento nas Cadeias Produtivas do Agronegocio - Fiagro - Resp Limitada | Brazil | 0.00 | % | 89.86 | % | | 100.00 | % | — | | Investment fund |
| The Best Specialty Coffee, S.L. Unipersonal | Spain | 100.00 | % | 0.00 | % | | 100.00 | % | 100.00 | % | Restaurant services |
| TIMFin S.p.A. | Italy | 0.00 | % | 51.00 | % | | 51.00 | % | 51.00 | % | Finance company |
| Titularizadora Colombiana S.A. -Universalidad TIV V9 | Colombia | — | | (a) | | — | | — | | Securitization |
| Tonopah Solar I, LLC | United States | 0.00 | % | 100.00 | % | | 100.00 | % | 100.00 | % | Holding company |
| Tools Soluções e Serviços Compartilhados Ltda. | Brazil | 0.00 | % | 89.86 | % | | 100.00 | % | 100.00 | % | Services |
| Tornquist Asesores de Seguros S.A. (j) | Argentine | 0.00 | % | 99.99 | % | | 99.99 | % | 99.99 | % | Inactive |
| Toro Corretora de Títulos e Valores Mobiliários S.A. | Brazil | 0.00 | % | 89.86 | % | | 100.00 | % | 100.00 | % | Securities company |
| Toro Investimentos S.A. | Brazil | 0.00 | % | 89.86 | % | | 100.00 | % | 100.00 | % | Securities company |
| Totta (Ireland), PLC | Ireland | 0.00 | % | 99.87 | % | | 100.00 | % | 100.00 | % | Finance company |
| Totta Urbe - Empresa de Administração e Construções, S.A. | Portugal | 0.00 | % | 99.87 | % | | 100.00 | % | 100.00 | % | Real estate |
| Trainera Venture Finance I, F.C.R.-PYME | Spain | 99.00 | % | 0.00 | % | | 99.00 | % | 99.00 | % | Venture capital fund |
| | | | | | | | | | | | | | | | | | | | | | | |
Subsidiaries of Banco Santander, S.A. 1 |
| | % of ownership held by Banco Santander | | Percentage of voting power (e) | |
| Company | Location | Direct | Indirect | | Year 2025 | Year 2024 | Activity |
| Trans Skills Employment Services - Sole Proprietorship LLC | Arab United Emirates | 0.00 | % | 66.43 | % | | 100.00 | % | 100.00 | % | Human resources services |
| Trans Skills Employment Services Malaysia SDN. BHD. | Malaysia | 0.00 | % | 66.43 | % | | 100.00 | % | — | | Services |
| Trans Skills Employment Services Vietnam Company Limited | Vietnam | 0.00 | % | 66.43 | % | | 100.00 | % | — | | Consulting services |
| Trans Skills General Supplies Egypt LLC | Egypt | 0.00 | % | 66.43 | % | | 100.00 | % | — | | Consulting services |
| Trans Skills Information Technology LLC | Saudi Arabia | 0.00 | % | 66.43 | % | | 100.00 | % | 100.00 | % | Inactive |
| Trans Skills Investment in Commercial Enterprises & Management Co. LLC | Arab United Emirates | 0.00 | % | 66.43 | % | | 100.00 | % | 100.00 | % | Holding company |
| Trans Skills Services SPC | Oman | 0.00 | % | 66.43 | % | | 100.00 | % | — | | Consulting |
| Trans Skills South Africa (Pty) Limited | Republic of South Africa | 0.00 | % | 66.43 | % | | 100.00 | % | 100.00 | % | Inactive |
| Trans Skills Technology Services LLC | Arab United Emirates | 0.00 | % | 66.43 | % | | 100.00 | % | 100.00 | % | IT services |
| Transolver Finance EFC, S.A. | Spain | 0.00 | % | 51.00 | % | | 51.00 | % | 51.00 | % | Leasing |
| Transskills Employer Services Private Limited | India | 0.00 | % | 66.43 | % | | 100.00 | % | 100.00 | % | Consulting services |
| Tresmares Capital Corporate S.L. | Spain | 89.90 | % | 0.00 | % | | 89.90 | % | — | | Holding company |
| Tresmares Capital Deutschland GmbH | Germany | 0.00 | % | 89.90 | % | | 100.00 | % | — | | Finance company |
| Tresmares Capital UK Limited | United Kingdom | 0.00 | % | 89.90 | % | | 100.00 | % | — | | Fund management company |
| Tresmares Direct Lending, S.G.E.I.C, S.A. | Spain | 0.00 | % | 89.90 | % | | 100.00 | % | — | | Fund management company |
| Tresmares Growth Fund II, S.C.R., S.A. | Spain | 40.00 | % | 0.00 | % | 40.00 | % | 40.00 | % | 40.00 | % | Holding company |
| Tresmares Growth Fund III, S.C.R., S.A. | Spain | 40.00 | % | 0.00 | % | 40.00 | % | 40.00 | % | 40.00 | % | Holding company |
| Tresmares Growth Fund Santander, S.C.R., S.A. | Spain | 100.00 | % | 0.00 | % | 100.00 | % | 100.00 | % | 100.00 | % | Holding company |
| Tresmares Private Equity, S.G.E.I.C, S.A. | Spain | 0.00 | % | 89.90 | % | 100.00 | % | 100.00 | % | — | | Fund management company |
| Tresmares Santander Direct Lending, SICC, S.A. | Spain | 99.67 | % | 0.00 | % | 99.67 | % | 99.67 | % | 99.67 | % | Fund management company |
| TS HR & Payroll Services Morocco SARL AU | Morocco | 0.00 | % | 66.43 | % | 100.00 | % | 100.00 | % | — | | Consulting services |
| TVG-Trappgroup Versicherungsvermittlungs-GmbH | Germany | 0.00 | % | 90.01 | % | 100.00 | % | 100.00 | % | 100.00 | % | Insurance brokerage |
| Universia Brasil S.A. | Brazil | 0.00 | % | 100.00 | % | 100.00 | % | 100.00 | % | 100.00 | % | Internet |
| Universia Chile S.A. | Chile | 0.00 | % | 86.84 | % | 86.84 | % | 86.84 | % | 86.84 | % | Internet |
| Universia Colombia S.A.S. | Colombia | 0.00 | % | 100.00 | % | 100.00 | % | 100.00 | % | 100.00 | % | Internet |
| Universia España Red de Universidades, S.A. | Spain | 0.00 | % | 89.43 | % | 89.43 | % | 89.43 | % | 89.43 | % | Internet |
| Universia Holding, S.L. | Spain | 100.00 | % | 0.00 | % | 100.00 | % | 100.00 | % | 100.00 | % | Holding company |
| Universia México, S.A. de C.V. | Mexico | 0.00 | % | 100.00 | % | 100.00 | % | 100.00 | % | 100.00 | % | Internet |
| Universia Perú, S.A. | Peru | 0.00 | % | 99.73 | % | 99.73 | % | 99.73 | % | 99.64 | % | Internet |
| Universia Uruguay, S.A. | Uruguay | 0.00 | % | 100.00 | % | 100.00 | % | 100.00 | % | 100.00 | % | Internet |
| Uro Property Holdings, S.A. (b) | Spain | — | | — | | 0.00 | % | — | | 99.99 | % | Real estate investment |
| VERT-11 Companhia Securitizadora de Créditos Financeiros | Brazil | — | | (a) | — | | — | | — | | Securitization |
| Wallcesa, S.A. | Spain | 100.00 | % | 0.00 | % | 100.00 | % | 100.00 | % | 100.00 | % | Financial services |
| | | | | | | | | | | | | | | | | | | | | | | |
Subsidiaries of Banco Santander, S.A. 1 |
| | % of ownership held by Banco Santander | | Percentage of voting power (e) | |
| Company | Location | Direct | Indirect | | Year 2025 | Year 2024 | Activity |
| WIM Servicios Corporativos, S.A. de C.V. | Mexico | 0.00 | % | 100.00 | % | 100.00 | % | 100.00 | % | 100.00 | % | Advisory services |
| WTW Shipping Designated Activity Company | Ireland | 100.00 | % | 0.00 | % | 100.00 | % | 100.00 | % | 100.00 | % | Leasing |
a.Companies over which effective control is maintained.
b.Accounting merged company, Pending registration.
c.Companies in liquidation. Pending registration.
d.Company in liquidation as at 31 December 2025.
e.Pursuant to Article 3 of Royal Decree 1159/ 2010, of 17 September, approving the rules for the preparation of consolidated annual accounts, in order to determine the voting rights, voting rights held directly by the parent company have been added to those held by companies controlled by the parent company or by other persons acting in their own name but on behalf of a Group company. For these purposes, the number of votes corresponding to the parent company, in relation to the companies indirectly dependent on it, is that corresponding to the dependent company that directly participates in the share capital of the latter.
f.Company resident for tax purposes in Spain.
g.Company resident for tax purposes in the United Kingdom.
(1) Companies issuing preference shares are listed in Annex III, together with other relevant information.
Appendix II
| | | | | | | | | | | | | | | | | | | | | | | | | | |
| Societies of which Grupo Santander owns more than 5% (c) , entities associated with Grupo Santander and jointly controlled entities |
| | % of ownership held by Banco Santander | | Percentage of voting power (b) | | |
| Company | Location | Direct | Indirect | | Year 2025 | Year 2024 | Activity | Type of company |
| Administrador Financiero de Transantiago S.A. | Chile | 0.00 | % | 13.43 | % | | 20.00 | % | 20.00 | % | Payments and collection services | Associated |
| Adprotel Strand, S.L. (consolidado) | Spain | 0.00 | % | 38.20 | % | | 38.20 | % | 38.20 | % | Real estate development | Associated |
| Aegon Santander Portugal Não Vida - Companhia de Seguros, S.A. | Portugal | 0.00 | % | 49.00 | % | | 49.00 | % | 49.00 | % | Insurance | Joint ventures |
| Aegon Santander Portugal Vida - Companhia de Seguros Vida, S.A. | Portugal | 0.00 | % | 49.00 | % | | 49.00 | % | 49.00 | % | Insurance | Joint ventures |
| Aeroplan - Sociedade Construtora de Aeroportos, Lda. (a) | Portugal | 0.00 | % | 19.97 | % | | 20.00 | % | 20.00 | % | Inactive | — |
| Agri Tech Investments Argentina S.A.U. | Argentine | 0.00 | % | 50.00 | % | | 50.00 | % | — | | Financial services | — |
| Aguas de Fuensanta, S.A. (a) (e) | Spain | 36.78 | % | 0.00 | % | | 36.78 | % | 36.78 | % | Food | — |
| AHLC - Promoção Imobiliária, Lda. | Portugal | 0.00 | % | 35.00 | % | | 35.00 | % | — | | Real estate development | Joint ventures |
| Alcoaxarquía, S.L. | Spain | 0.00 | % | 16.00 | % | | 40.00 | % | — | | Food | — |
| Alma UK Holdings Ltd (consolidado) | United Kingdom | 30.00 | % | 0.00 | % | | 30.00 | % | 30.00 | % | Holding company | Joint ventures |
| Apolo Vault 1, S.L. | Spain | 0.00 | % | 25.00 | % | | 25.00 | % | 25.00 | % | Renewable energies | Joint ventures |
| Aranguren Comercial de Embalaje, S.L. | Spain | 0.00 | % | 9.96 | % | | 24.90 | % | — | | Industrial products | — |
| Arneplant, S.L. | Spain | 0.00 | % | 11.36 | % | | 28.41 | % | — | | Footwear and textiles | — |
| Asesoría Informática Gallega, S.L. | Spain | 0.00 | % | 12.54 | % | | 31.34 | % | — | | IT services | — |
| Atitlan Agro I, S.C.R., S.A. (f) | Spain | 42.54 | % | 0.00 | % | | 0.00 | % | 0.00 | % | Venture capital company | — |
| Attijariwafa Bank Société Anonyme (consolidado) | Morocco | 0.00 | % | 5.10 | % | | 5.10 | % | 5.10 | % | Banking | — |
| AutoFi Inc. | United States | 9.50 | % | 9.40 | % | | 4.99 | % | 4.99 | % | E-commerce | — |
| Autopistas del Sol S.A. | Argentine | 0.00 | % | 14.17 | % | | 14.17 | % | 14.17 | % | Highway concession | — |
| Avanath Affordable Housing IV LLC | United States | 0.00 | % | 7.27 | % | | 7.27 | % | 7.27 | % | Investment company | — |
| Avanzare Innovación Tecnológica, S.L. | Spain | 0.00 | % | 12.66 | % | | 31.64 | % | — | | Technology | — |
| Axle 2023-1 Ltd | United Kingdom | 0.00 | % | (d) | | — | | — | | Securitization | Joint ventures |
| Banco RCI Brasil S.A. | Brazil | 0.00 | % | 35.85 | % | | 39.89 | % | 39.89 | % | Banking | Joint ventures |
| Banco S3 Caceis México, S.A., Institución de Banca Múltiple | Mexico | 0.00 | % | 50.00 | % | | 50.00 | % | 50.00 | % | Banking | Joint ventures |
| Bank of Beijing Consumer Finance Company | China | 0.00 | % | 20.00 | % | | 20.00 | % | 20.00 | % | Finance company | Associated |
| Bank of Shanghai Co., Ltd. (consolidado) | China | 6.54 | % | 0.00 | % | | 6.54 | % | 6.54 | % | Banking | — |
| Biomas – Serviços Ambientais, Restauração e Carbono S.A. | Brazil | 0.00 | % | 14.98 | % | | 16.67 | % | 16.67 | % | Consulting services | Associated |
| Bizum, S.L. | Spain | 20.92 | % | 0.00 | % | | 20.92 | % | 20.92 | % | Payment services | Associated |
| Campo Grande Empreendimentos Ltda. (e) (a) | Brazil | 0.00 | % | 22.75 | % | | 25.32 | % | 25.32 | % | Inactive | — |
| CaptureNow Limited | United Kingdom | 0.00 | % | 22.22 | % | | 22.22 | % | — | | Software | — |
| CCPT - ComprarCasa, Rede Serviços Imobiliários, S.A. | Portugal | 0.00 | % | 49.98 | % | | 49.98 | % | 49.98 | % | Real estate services | Joint ventures |
| | | | | | | | | | | | | | | | | | | | | | | | | | |
| Societies of which Grupo Santander owns more than 5% (c) , entities associated with Grupo Santander and jointly controlled entities |
| | % of ownership held by Banco Santander | | Percentage of voting power (b) | | |
| Company | Location | Direct | Indirect | | Year 2025 | Year 2024 | Activity | Type of company |
| Centro de Compensación Automatizado S.A. | Chile | 0.00 | % | 22.38 | % | | 33.33 | % | 33.33 | % | Payments and collection services | Associated |
| Centro para el Desarrollo, Investigación y Aplicación de Nuevas Tecnologías, S.A. | Spain | 0.00 | % | 49.00 | % | | 49.00 | % | 49.00 | % | Technology | Associated |
| Cicrosa Hidraúlica, S.L. | Spain | 0.00 | % | 13.20 | % | | 33.00 | % | — | | Industrial supplies | — |
| CIP S.A. | Brazil | 0.00 | % | 15.74 | % | | 17.52 | % | 17.52 | % | Financial services | Associated |
| CNP Santander Insurance Europe Designated Activity Company | Ireland | 0.00 | % | 49.00 | % | | 49.00 | % | 49.00 | % | Insurance | Associated |
| CNP Santander Insurance Life Designated Activity Company | Ireland | 0.00 | % | 49.00 | % | | 49.00 | % | 49.00 | % | Insurance | Associated |
| CNP Santander Insurance Services Ireland Limited | Ireland | 0.00 | % | 49.00 | % | | 49.00 | % | 49.00 | % | Services | Associated |
| Companhia Promotora UCI | Brazil | 0.00 | % | 25.00 | % | | 25.00 | % | 25.00 | % | Financial services | Joint ventures |
| Compañia Española de Financiación de Desarrollo, Cofides, S.A., SME | Spain | 20.18 | % | 0.00 | % | | 20.18 | % | 20.17 | % | Finance company | — |
| Compañía Española de Seguros de Crédito a la Exportación, S.A., Compañía de Seguros y Reaseguros (consolidado) | Spain | 23.33 | % | 0.55 | % | | 23.88 | % | 23.88 | % | Credit insurance | — |
| Compañía Española de Viviendas en Alquiler, S.A. (consolidado) | Spain | 24.07 | % | 0.00 | % | | 24.07 | % | 24.07 | % | Real estate | Associated |
| Compañía para los Desarrollos Inmobiliarios de la Ciudad de Hispalis, S.L., en liquidación (a) | Spain | 21.98 | % | 0.00 | % | | 21.98 | % | 21.98 | % | Real estate development | — |
| Connecting Visions Ecosystems, S.L. | Spain | 29.96 | % | 0.00 | % | | 29.96 | % | 37.56 | % | Consulting services | Joint ventures |
| Construtora Tenda S/A | Brazil | 4.92 | % | 4.05 | % | | 9.43 | % | — | | Real estate | — |
| Corkfoc Cortiças, S.A. | Portugal | 0.00 | % | 27.54 | % | | 27.58 | % | 27.58 | % | Cork industry | — |
| CSD Central de Serviços de Registro e Depósito Aos Mercados Financeiro e de Capitais S.A. | Brazil | 0.00 | % | 16.12 | % | | 17.94 | % | 20.00 | % | Financial services | Associated |
| Decus Real Estate, S.L. | Spain | 0.00 | % | 30.00 | % | | 30.00 | % | 30.00 | % | Real estate | Joint ventures |
| Delos Financial Technologies, Inc. | United States | 0.00 | % | 22.84 | % | | 22.84 | % | — | | Finance company | — |
| DoRes Securitisation S.r.l | Italy | — | | (d) | | — | | — | | Securitization | Joint ventures |
| Ebora 220, S.L. | Spain | 0.00 | % | 44.00 | % | | 50.00 | % | — | | Renewable energies | Joint ventures |
| Ebora Evacuación, S.L. | Spain | 0.00 | % | 50.00 | % | | 50.00 | % | — | | Renewable energies | Joint ventures |
| Elaia Agro, S.L. | Spain | 49.99 | % | 0.00 | % | | 49.99 | % | 49.99 | % | Consulting services | Associated |
| Ethias Lease N.V. | Belgium | 0.00 | % | 50.00 | % | | 50.00 | % | 50.00 | % | Leasing | Associated |
| Euro Automatic Cash Entidad de Pago, S.L. | Spain | 50.00 | % | 0.00 | % | | 50.00 | % | 50.00 | % | Payment services | Associated |
| European Hospitality Opportunities S.à r.l. | Luxembourg | 0.00 | % | 49.00 | % | | 49.00 | % | 49.00 | % | Holding company | Joint ventures |
| Evacuación Liquesun, S.L. | Spain | 0.00 | % | 35.00 | % | | 50.00 | % | 50.00 | % | Electricity production | Joint ventures |
| Evolve SPV S.r.l. | Italy | — | | (d) | | — | | — | | Securitization | Joint ventures |
| Exam Papers Plus Ltd | United Kingdom | — | | 25.00 | % | | 25.00 | % | — | | Commerce | Associated |
| Federal Reserve Bank of Boston | United States | — | | 21.38 | % | | 21.38 | % | 21.09 | % | Banking | — |
| Fondo de Titulización de Activos UCI 14 | Spain | — | | (d) | | — | | — | | Securitization | Joint ventures |
| | | | | | | | | | | | | | | | | | | | | | | | | | |
| Societies of which Grupo Santander owns more than 5% (c) , entities associated with Grupo Santander and jointly controlled entities |
| | % of ownership held by Banco Santander | | Percentage of voting power (b) | | |
| Company | Location | Direct | Indirect | | Year 2025 | Year 2024 | Activity | Type of company |
| Fondo de Titulización de Activos UCI 15 | Spain | — | | (d) | | — | | — | | Securitization | Joint ventures |
| Fondo de Titulización de Activos UCI 16 | Spain | — | | (d) | | — | | — | | Securitization | Joint ventures |
| Fondo de Titulización de Activos UCI 17 | Spain | — | | (d) | | — | | — | | Securitization | Joint ventures |
| Fondo de Titulización, RMBS Green Prado XI | Spain | — | | (d) | | — | | — | | Securitization | Joint ventures |
| Fondo de Titulización, RMBS Prado IX | Spain | — | | (d) | | — | | — | | Securitization | Joint ventures |
| Fondo de Titulización, RMBS Prado VIII | Spain | — | | (d) | | — | | — | | Securitization | Joint ventures |
| Fondo de Titulización, RMBS Prado X | Spain | — | | (d) | | — | | — | | Securitization | Joint ventures |
| Forest Power Aranda, S.L. Unipersonal | Spain | 0.00 | % | 55.00 | % | | 55.00 | % | 55.00 | % | Renewable energies | Joint ventures |
| Forest Power Cantabria, S.L. Unipersonal | Spain | 0.00 | % | 55.00 | % | | 55.00 | % | — | | Electricity production | Joint ventures |
| Forest Power Delta, S.L. Unipersonal | Spain | 0.00 | % | 55.00 | % | | 55.00 | % | — | | Gas production | Joint ventures |
| Forest Power Epsilon, S.L. Unipersonal | Spain | 0.00 | % | 55.00 | % | | 55.00 | % | — | | Chemical products production | Joint ventures |
| Forest Power Gamma, S.L. Unipersonal | Spain | 0.00 | % | 55.00 | % | | 55.00 | % | — | | Chemical products production | Joint ventures |
| Forest Power Kappa, S.L. Unipersonal | Spain | 0.00 | % | 55.00 | % | | 55.00 | % | — | | Gas production | Joint ventures |
| Forest Power Lambda, S.L. Unipersonal | Spain | 0.00 | % | 55.00 | % | | 55.00 | % | — | | Chemical products production | Joint ventures |
| Forest Power Omicron, S.L. Unipersonal | Spain | 0.00 | % | 55.00 | % | | 55.00 | % | — | | Chemical products production | Joint ventures |
| Forest Power Zeta, S.L. Unipersonal | Spain | 0.00 | % | 55.00 | % | | 55.00 | % | — | | Chemical products production | Joint ventures |
| Forest Power, S.L. | Spain | 0.00 | % | 55.00 | % | | 55.00 | % | 55.00 | % | Renewable energies | Joint ventures |
| Forgepoint Capital International Management Limited | United Kingdom | 50.00 | % | 0.00 | % | | 50.00 | % | 50.00 | % | Consulting services | Joint ventures |
| Fortune Auto Finance Co., Ltd | China | 0.00 | % | 50.00 | % | | 50.00 | % | 50.00 | % | Finance company | Joint ventures |
| FrauDfense, S.L. | Spain | 33.33 | % | 0.00 | % | | 33.33 | % | 33.33 | % | IT services | Joint ventures |
| Fremman limited (consolidado) | United Kingdom | 32.99 | % | 0.00 | % | | 4.99 | % | 4.99 | % | Consulting services | Associated |
| Fundo de Investimento em Direitos Creditórios Multisegmentos NPL Ipanema X Responsabilidade Limitada | Brazil | 0.00 | % | 44.93 | % | | 50.00 | % | — | | Investment fund | Joint ventures |
| Gestamp Real Estate Assets 1, S.L. (e) | Spain | 0.00 | % | 43.89 | % | | 43.89 | % | — | | Real estate management | — |
| Gestamp Real Estate Bizkaia, S.L. (e) | Spain | 0.00 | % | 24.92 | % | | 24.92 | % | — | | Real estate management | — |
| Gestamp Real Estate Investment 2, S.L. (e) | Spain | 0.00 | % | 37.41 | % | | 37.41 | % | — | | Real estate management | — |
| Gestamp Real Estate Management 3, S.L. (e) | Spain | 0.00 | % | 36.19 | % | | 36.19 | % | — | | Real estate management | — |
| Gestora de Inteligência de Crédito S.A. | Brazil | 0.00 | % | 13.98 | % | | 16.00 | % | 16.00 | % | Collection services | Associated |
| Gire S.A. | Argentine | 0.00 | % | 58.23 | % | | 58.33 | % | 58.33 | % | Payments and collection services | Associated |
| | | | | | | | | | | | | | | | | | | | | | | | | | |
| Societies of which Grupo Santander owns more than 5% (c) , entities associated with Grupo Santander and jointly controlled entities |
| | % of ownership held by Banco Santander | | Percentage of voting power (b) | | |
| Company | Location | Direct | Indirect | | Year 2025 | Year 2024 | Activity | Type of company |
| Glenrowan Solar Holdings Pty Ltd | Australia | 49.00 | % | 0.00 | % | | 49.00 | % | 49.00 | % | Holding company | Joint ventures |
| Global Esmirna, S.L. (en liquidación) (a) | Spain | 0.00 | % | 15.00 | % | | 37.51 | % | — | | Services | — |
| HCUK Auto Funding 2017-2 Ltd | United Kingdom | — | | (d) | | — | | — | | Securitization | Joint ventures |
| HCUK Auto Funding 2022-1 Limited | United Kingdom | — | | (d) | | — | | — | | Securitization | Joint ventures |
| HCUK Auto Funding 2025-1 Ltd | United Kingdom | — | | (d) | | — | | — | | Securitization | Joint ventures |
| Healthy Neighborhoods Equity Fund I LP | United States | 0.00 | % | 22.37 | % | | 22.37 | % | 22.37 | % | Real estate | — |
| Hyundai Capital UK Limited | United Kingdom | 0.00 | % | 50.01% | | 50.01 | % | 50.01 | % | Finance company | Joint ventures |
| Hyundai Corretora de Seguros Ltda. | Brazil | 0.00 | % | 44.93% | | 50.00 | % | 50.00 | % | Insurance mediation | Joint ventures |
| Imperial Holding S.C.A. (a) | Luxembourg | 0.00 | % | 36.36% | | 36.36 | % | 36.36 | % | Securities investment | — |
| Imperial Management S.à r.l. (a) | Luxembourg | 0.00 | % | 40.20% | | 40.20 | % | 40.20 | % | Holding company | — |
| Invensa Tradeco UK Limited | United Kingdom | 25.00 | % | 0.00% | | 25.00 | % | 4.99 | % | Holding company | Associated |
| Inverlur Aguilas I, S.L. | Spain | 0.00 | % | 50.00% | | 50.00 | % | 50.00 | % | Real estate | Joint ventures |
| Inverlur Aguilas II, S.L. | Spain | 0.00 | % | 50.00% | | 50.00 | % | 50.00 | % | Real estate | Joint ventures |
| Inversiones ZS América Dos Ltda. | Chile | 0.00 | % | 49.00% | | 49.00 | % | 49.00 | % | Real estate and property investment | Associated |
| Inversiones ZS América SpA | Chile | 0.00 | % | 49.00% | | 49.00 | % | 49.00 | % | Real estate and property investment | Associated |
| Klar Holdings Limited (consolidado) | Cayman Islands | 0.00 | % | 7.35% | | 7.35 | % | — | | Holding company | — |
| LB Oprent, S.A. | Spain | 40.00 | % | 0.00 | % | | 40.00 | % | 40.00 | % | Industrial machinery rental | Associated |
| Logitek Software Ltd (e) | United Kingdom | 0.00 | % | 20.27 | % | | 20.27 | % | — | | Software | Joint ventures |
| Mapfre Santander Portugal - Companhia de Seguros, S.A. | Portugal | 0.00 | % | 49.99 | % | | 49.99 | % | 49.99 | % | Insurance | Associated |
| Massachusetts Business Development Corp. (consolidado) | United States | 0.00 | % | 21.61 | % | | 21.61 | % | 21.61 | % | Finance company | — |
| MB Capital Fund IV, LLC | United States | 0.00 | % | 21.51 | % | | 21.51 | % | 21.51 | % | Finance company | — |
| Merlin Properties, SOCIMI, S.A. (consolidado) | Spain | 20.08 | % | 4.63 | % | | 24.68 | % | 24.90 | % | Real estate investment | Associated |
| Merlion Aviation One Designated Activity Company | Ireland | — | | (g) | | — | | — | | Renting | — |
| Metrovacesa, S.A. (consolidado) | Spain | 31.94 | % | 17.46 | % | | 49.43 | % | 49.47 | % | Real estate development | Associated |
| Nera Agro Holding, S.L. | Spain | 50.00 | % | 0.00 | % | | 50.00 | % | — | | Holding company | Joint ventures |
| Nera Paraguay S.A. | Paraguay | 0.00 | % | 50.00% | | 50.00 | % | — | | Financial services | — |
| Nera Uruguay S.A. | Uruguay | 0.00 | % | 50.00 | % | | 50.00 | % | — | | Financial services | — |
| Ocyener 2008, S.L. | Spain | 0.00 | % | 45.00 | % | | 45.00 | % | 45.00 | % | Holding company | Associated |
| Operadora de Activos Beta, S.A. de C.V. | Mexico | 49.99 | % | 0.00 | % | | 49.99 | % | 49.99 | % | Finance company | Associated |
| Payever GmbH | Germany | 0.00 | % | 10.00 | % | | 10.00 | % | 10.00 | % | Software | Associated |
| | | | | | | | | | | | | | | | | | | | | | | | | | |
| Societies of which Grupo Santander owns more than 5% (c) , entities associated with Grupo Santander and jointly controlled entities |
| | % of ownership held by Banco Santander | | Percentage of voting power (b) | | |
| Company | Location | Direct | Indirect | | Year 2025 | Year 2024 | Activity | Type of company |
| Phoenix C1 Aviation Designated Activity Company (a) | Ireland | — | | (g) | | — | | — | | Renting | — |
| Play Digital S.A. | Argentine | 0.00 | % | 13.49 | % | | 13.52 | % | 14.21 | % | Payment platform | Associated |
| Pluxee Beneficios Brasil S.A. | Brazil | 0.00 | % | 17.97 | % | | 20.00 | % | 20.00 | % | Services | Associated |
| POLFUND - Fundusz Poręczeń Kredytowych S.A. | Poland | 0.00 | % | 29.35 | % | | 50.00 | % | 50.00 | % | Management | Associated |
| Portland SPV S.r.l. | Italy | — | | (d) | | — | | — | | Securitization | Joint ventures |
| Prodesa Medioambiente, S.L. | Spain | 0.00 | % | 9.80 | % | | 24.50 | % | — | | Agricultural projects | — |
| Promontoria Manzana, S.A. (consolidado) | Spain | 20.00 | % | 0.00 | % | | 20.00 | % | 20.00 | % | Holding company | Associated |
| Proteos Biotech, S.L. | Spain | 0.00 | % | 12.00 | % | | 30.00 | % | — | | Pharmaceutical | — |
| Redbanc S.A. | Chile | 0.00 | % | 22.44 | % | | 33.43 | % | 33.43 | % | Services | Associated |
| Redsys Servicios de Procesamiento, S.L. (consolidado) | Spain | 24.90 | % | 0.06 | % | | 24.96 | % | 24.96 | % | Cards | Associated |
| Resurgence, S.L. | Spain | 0.00 | % | 40.00 | % | | 40.00 | % | — | | Real estate development | Joint ventures |
| Retama Real Estate, S.A. Unipersonal | Spain | 0.00 | % | 50.00 | % | | 50.00 | % | 50.00 | % | Real estate | Joint ventures |
| Rías Redbanc S.A. | Uruguay | 0.00 | % | 25.00 | % | | 25.00 | % | 25.00 | % | Services | — |
| RMBS Belém No.2 | Portugal | — | | (d) | | — | | — | | Securitization | Joint ventures |
| Roc Aviation One Designated Activity Company | Ireland | — | | (g) | | — | | — | | Renting | — |
| Roc Shipping One Designated Activity Company | Ireland | — | | (g) | | — | | — | | Renting | — |
| RP Royal Distribution, S.L. | Spain | 0.00 | % | 23.73 | % | | 23.73 | % | — | | Food | Associated |
| S3 Caceis Brasil Distribuidora de Títulos e Valores Mobiliários S.A. | Brazil | 0.00 | % | 50.00 | % | | 50.00 | % | 50.00 | % | Securities company | Joint ventures |
| S3 Caceis Brasil Participações S.A. | Brazil | 0.00 | % | 50.00 | % | | 50.00 | % | 50.00 | % | Holding company | Joint ventures |
| S3 CACEIS Colombia S.A. Sociedad Fiduciaria | Colombia | 0.00 | % | 50.00 | % | | 50.00 | % | 50.00 | % | Finance company | Joint ventures |
| Sancus Green Investments II, S.C.R., S.A. | Spain | 0.00 | % | 33.02 | % | | 33.02 | % | 33.02 | % | Venture capital company | — |
| Santander Allianz Towarzystwo Ubezpieczeń na Życie S.A. | Poland | 0.00 | % | 28.76 | % | | 49.00 | % | 49.00 | % | Insurance | Associated |
| Santander Allianz Towarzystwo Ubezpieczeń S.A. | Poland | 0.00 | % | 28.76 | % | | 49.00 | % | 49.00 | % | Insurance | Associated |
| Santander Assurance Solutions, S.A. | Spain | 0.00 | % | 66.67 | % | | 66.67 | % | 66.67 | % | Insurance mediation | Joint ventures |
| Santander Auto S.A. | Brazil | 0.00 | % | 44.93 | % | | 50.00 | % | 50.00 | % | Insurance | Associated |
| Santander Caceis Latam Holding 1, S.L. | Spain | 0.00 | % | 50.00 | % | | 50.00 | % | 50.00 | % | Holding company | Joint ventures |
| Santander Caceis Latam Holding 2, S.L. | Spain | 0.00 | % | 50.00 | % | | 50.00 | % | 50.00 | % | Holding company | Joint ventures |
| Santander Generales Seguros y Reaseguros, S.A. | Spain | 0.00 | % | 49.00 | % | | 49.00 | % | 49.00 | % | Insurance | Joint ventures |
| Santander Mapfre Hipoteca Inversa, E.F.C., S.A. | Spain | 0.00 | % | 50.00 | % | | 50.00 | % | 50.00 | % | Finance company | Joint ventures |
| Santander Mapfre Seguros y Reaseguros, S.A. | Spain | 0.00 | % | 49.99 | % | | 49.99 | % | 49.99 | % | Insurance | Associated |
| Santander Vida Seguros y Reaseguros, S.A. | Spain | 0.00 | % | 49.00 | % | | 49.00 | % | 49.00 | % | Insurance | Joint ventures |
| Seaya Holdco, S.L. (consolidado) | Spain | 24.99 | % | 0.00 | % | | 24.99 | % | 24.99 | % | Holding company | Associated |
| Servicios de Infraestructura de Mercado OTC S.A | Chile | 0.00 | % | 8.38 | % | | 12.48 | % | 12.48 | % | Services | Associated |
| | | | | | | | | | | | | | | | | | | | | | | | | | |
| Societies of which Grupo Santander owns more than 5% (c) , entities associated with Grupo Santander and jointly controlled entities |
| | % of ownership held by Banco Santander | | Percentage of voting power (b) | | |
| Company | Location | Direct | Indirect | | Year 2025 | Year 2024 | Activity | Type of company |
| SIBS-SGPS, S.A. (consolidado) | Portugal | 0.00 | % | 15.54 | % | | 16.55 | % | 15.56 | % | Management of portfolios | — |
| SIG RCRS A/B MF 2023 Venture LLC | United States | 0.00 | % | 20.00 | % | | 20.00 | % | 20.00 | % | Finance company | — |
| Siguler Guff SBIC Fund LP | United States | 0.00 | % | 20.00 | % | | 20.00 | % | 20.00 | % | Investment company | — |
| Sistema de Tarjetas y Medios de Pago, S.A. | Spain | 20.61 | % | 0.00 | % | | 20.61 | % | 20.61 | % | Payment methods | Associated |
| Sociedad Conjunta para la Emisión y Gestión de Medios de Pago, E.F.C., S.A. | Spain | 45.70 | % | 0.00 | % | | 45.70 | % | 45.70 | % | Payment services | Joint ventures |
| Sociedad de Garantía Recíproca de Santander, S.G.R. | Spain | 24.91 | % | 0.22 | % | | 25.13 | % | 25.17 | % | Financial services | — |
| Sociedad de Gestión de Activos Procedentes de la Reestructuración Bancaria, S.A. | Spain | 22.21 | % | 0.00 | % | | 22.21 | % | 22.21 | % | Financial services | — |
| Sociedad Interbancaria de Depósitos de Valores S.A. | Chile | 0.00 | % | 19.66 | % | | 29.29 | % | 29.29 | % | Securities deposits | Associated |
| Sociedad Operadora de la Cámara de Compensación de Pagos de Alto Valor S.A. | Chile | 0.00 | % | 9.21 | % | | 13.72 | % | — | | Services | Associated |
| Solar Maritime Designated Activity Company | Ireland | — | | (d) | | — | | — | | Leasing | Joint ventures |
| STELLANTIS Insurance Europe Limited | Malta | 0.00 | % | 50.00 | % | | 50.00 | % | 50.00 | % | Insurance | Joint ventures |
| STELLANTIS Life Insurance Europe Limited | Malta | 0.00 | % | 50.00 | % | | 50.00 | % | 50.00 | % | Insurance | Joint ventures |
| Stephens Ranch Wind Energy Holdco LLC (consolidado) | United States | 0.00 | % | 15.10 | % | | 15.10 | % | 15.80 | % | Renewable energies | — |
| Tecnologia Bancária S.A. | Brazil | 0.00 | % | 17.05 | % | | 19.81 | % | 18.98 | % | ATMs | Associated |
| Tonopah Solar Energy Holdings I, LLC (e) | United States | 0.00 | % | 26.80 | % | | 26.80 | % | 26.80 | % | Holding company | Joint ventures |
| Transbank S.A. | Chile | 0.00 | % | 16.78 | % | | 25.00 | % | 25.00 | % | Cards | Associated |
| U.C.I., S.A. | Spain | 50.00 | % | 0.00 | % | | 50.00 | % | 50.00 | % | Holding company | Joint ventures |
| UCI Greece Credit and Loan Receivables Servicing Company Single Member Societe Anonyme | Greece | 0.00 | % | 50.00 | % | | 50.00 | % | 50.00 | % | Financial services | Joint ventures |
| UCI Holding Brasil Ltda. | Brazil | 0.00 | % | 50.00 | % | | 50.00 | % | 50.00 | % | Holding company | Joint ventures |
| UCI Mediação de Seguros, Unipessoal Lda. | Portugal | 0.00 | % | 50.00 | % | | 50.00 | % | 50.00 | % | Insurance mediation | Joint ventures |
| UCI Servicios para Profesionales Inmobiliarios, S.A. Unipersonal | Spain | 0.00 | % | 50.00 | % | | 50.00 | % | 50.00 | % | Real estate services | Joint ventures |
| Uncapped Limited | United Kingdom | 0.00 | % | 29.14 | % | | 29.14 | % | — | | Finance company | — |
| Unicre-Instituição Financeira de Crédito, S.A. | Portugal | 0.00 | % | 21.83 | % | | 21.86 | % | 21.86 | % | Finance company | — |
| Unión de Créditos Inmobiliarios, S.A. Unipersonal, EFC | Spain | 0.00 | % | 50.00 | % | | 50.00 | % | 50.00 | % | Mortgage lending company | Joint ventures |
| Valorhold, S.L. | Spain | 0.00 | % | 16.00 | % | | 39.99 | % | — | | Holding company | — |
| VCFS Germany GmbH | Germany | 0.00 | % | 50.00 | % | | 50.00 | % | 50.00 | % | Marketing | Joint ventures |
| Venda de Veículos Fundo de Investimento em Direitos Creditórios | Brazil | 0.00 | % | 35.85 | % | | 39.89 | % | 39.89 | % | Securitization | Joint ventures |
| Volvo Car Financial Services UK Limited | United Kingdom | 0.00 | % | 50.01 | % | | 50.01 | % | 50.01 | % | Leasing | Joint ventures |
| Waycarbon Soluções Ambientais e Projetos de Carbono S.A. | Brazil | 68.75 | % | 0.00 | % | | 50.00 | % | 100.00 | % | Consulting services | Associated |
| Webmotors S.A. | Brazil | 0.00 | % | 26.96 | % | | 30.00 | % | 30.00 | % | Services | Associated |
| | | | | | | | | | | | | | | | | | | | | | | | | | |
| Societies of which Grupo Santander owns more than 5% (c) , entities associated with Grupo Santander and jointly controlled entities |
| | % of ownership held by Banco Santander | | Percentage of voting power (b) | | |
| Company | Location | Direct | Indirect | | Year 2025 | Year 2024 | Activity | Type of company |
| WWSO II LLP | United Kingdom | 0.00 | % | 94.00 | % | | 94.00 | % | — | | Real estate investment | Joint ventures |
| Zurich Santander Brasil Seguros e Previdência S.A. | Brazil | 0.00 | % | 48.79 | % | | 48.79 | % | 48.79 | % | Insurance | Associated |
| Zurich Santander Holding (Spain), S.L. Unipersonal | Spain | 0.00 | % | 49.00 | % | | 49.00 | % | 49.00 | % | Holding company | Associated |
| Zurich Santander Holding Dos (Spain), S.L. Unipersonal | Spain | 0.00 | % | 49.00 | % | | 49.00 | % | 49.00 | % | Holding company | Associated |
| Zurich Santander Insurance América, S.L. | Spain | 0.00 | % | 49.00 | % | | 49.00 | % | 49.00 | % | Holding company | Associated |
| Zurich Santander Seguros Argentina S.A. | Argentine | 0.00 | % | 49.00 | % | | 49.00 | % | 49.00 | % | Insurance | Associated |
| Zurich Santander Seguros de Vida Chile S.A. | Chile | 0.00 | % | 49.00 | % | | 49.00 | % | 49.00 | % | Insurance | Associated |
| Zurich Santander Seguros Generales Chile S.A. | Chile | 0.00 | % | 49.00 | % | | 49.00 | % | 49.00 | % | Insurance | Associated |
| Zurich Santander Seguros México, S.A. | Mexico | 0.00 | % | 49.00 | % | | 49.00 | % | 49.00 | % | Insurance | Associated |
| Zurich Santander Seguros Uruguay S.A. | Uruguay | 0.00 | % | 49.00 | % | | 49.00 | % | 49.00 | % | Insurance | Associated |
a.Company in liquidation as at 31 December 2025.
b.Pursuant to Article 3 of Royal Decree 1159/ 2010, of 17 September, approving the rules for the preparation of consolidated annual accounts, in order to determine the voting rights, voting rights held directly by the parent company have been added to those held by companies controlled by the parent company or by other persons acting in their own name but on behalf of a group company. For these purposes, the number of votes corresponding to the parent company, in relation to the companies indirectly dependent on it, is that corresponding to the dependent company that directly participates in the share capital of the latter.
c.Excluding the Group companies listed in Appendix I, as well as those which are of negligible interest with respect to the true and fair view that the consolidated financial statements must give (in accordance with articles 48 of the Commercial Code and 260 of the Spanish Companies Act).
d.Companies over which joint control is maintained.
e.Company with no financial information available.
f.Investment managed discretionally by a manager outside the Santander Group, the voting rights not being, in this case, decisive in determining control of the entity.
g.Company over which effective control has been lost.
Appendix III
| | | | | | | | | | | | | | |
| Issuing subsidiaries of shares and preference shares |
| | % of ownership held by Banco Santander | |
| Company | Location | Direct | Indirect | Activity |
Emisora Santander España, S.A. Unipersonal (b) | Spain | — | | — | | Finance company |
| Santander UK (Structured Solutions) Limited | United Kingdom | 0.00 | % | 100.00 | % | Finance company |
Santander Global Issuances B.V. (a) | Netherlands | 100.00 | % | 0.00 | % | Finance company |
| Sovereign Real Estate Investment Trust | United States | 0.00 | % | 100.00 | % | Finance company |
a.Company with tax residence in Spain.
b.Accounting merged company. Pending registration.
Appendix IV
Notifications of acquisitions and disposals of investments in 2025
(Art. 155 of the Corporate Enterprises Act and Art. 105 of the Securities Market Law).
Regarding compliance with Art. 125 of the Securities Market Law, no required notifications were submitted during 2025.
In relation to the information required by 155 of the Corporate Enterprises Act, on the shareholdings in which Grupo Santander owns more than 10% of the capital of another company, and the successive acquisitions of more than 5% of the share capital, see appendices I, II and III.
Appendix V
Other information on the Group’s banks
Following is certain information on the share capital of the Group’s main banks based on their total assets.
1. Santander UK plc
a)Number of financial equity instruments held by the Group.
At 31 December 2025, the Company was a subsidiary of Banco Santander, S.A. and Santusa Holding, S.L.
On 12 November 2004 Banco Santander, S.A. acquired the then entire issued ordinary share capital of 1,485,893,636 Ordinary shares of 10p. each. On 12 October 2008 a further 10 billion Ordinary shares of 10p. each were issued to Banco Santander, S.A. and an additional 12,631,375,230 Ordinary shares of 10p. each were issued to Banco Santander, S.A. on 9 January on 2009. On 3 August 2010, 6,934,500,000 Ordinary shares of 10p. each were issued to Santusa Holding, S.L.. With effect from 10 January 2014, Santander UK Group Holdings Limited, a subsidiary of Banco Santander, S.A. and Santusa Holding, S.L., became the beneficial owner of 31,051,768,866 Ordinary shares of 10p. each, being the entire issued ordinary share capital of the Company, by virtue of a share exchange agreement between Santander UK Group Holdings Limited, Banco Santander, S.A. and Santusa Holding, S.L.. Santander UK Group Holdings Limited became the legal owner of the entire issued Ordinary share capital of the Company on 1 April 2014 and on 25 March 2015 became a public limited company and changed its name from Santander UK Group Holdings Limited to Santander UK Group Holdings plc. In addition to this, there are 325,000,000 Non-Cumulative Non-Redeemable 10.375% and 8.625% Sterling Preference Shares of GBP 1.00 each. In addition to this there were 13,780 Series A Fixed (6.222%)/Floating Rate Non-Cumulative Callable Preference Shares of GBP 1.00 each which were redeemed and cancelled in their entirety on 24 May 2019. The legal and beneficial title to the entire issued Preference share capital is held by third parties and is not held by Banco Santander, S.A.
b)Capital increases in progress
At 31 December 2025, there were no approved capital increases.
c)Share capital authorised by the shareholders at the general meeting
The shareholders resolved at the Annual General Meeting held on 30 June 2025, to authorise unconditionally, the company to carry out the following repurchases of the share capital:
(1) To buy back its own 8.625% Sterling Preference shares on the following terms:
(a)The Company may buy back up to 125,000,000 8.625% Sterling Preference shares;
(b)The lowest price which the Company can pay for 8.625% Sterling Preference shares is 75% of the average of the market values of the preference shares for five business days before the purchase is made; and
(c)The highest price (not including expenses) which the Company can pay for each 8.625% Sterling Preference share is 125% of the average of the market values of the preference shares for five business days before the purchase is made.
This authority shall begin on the date of the passing of this resolution and end on the conclusion of the next Annual General Meeting of the Company. The Company may agree, before this authorisation ends, to buy back its own 8.625% preference shares even though the purchase may be completed after this authorisation ends.
(2) To buy back its own 10.375% Sterling Preference shares on the following terms:
(a)The Company may buy up to 200,000,000 10.375% Sterling Preference shares;
(b)The lowest price which the Company can pay for 10.375% Sterling Preference shares is 75% of the average of the market values of the preference shares for five business days before the purchase is made; and
(c)The highest price (not including expenses) which the Company can pay for each 10.375% Sterling Preference share is 125% of the average of the market values of the preference shares for five business days before the purchase is made.
This authority shall begin on the date of the passing of this resolution and end on the conclusion of the next Annual General Meeting of the Company. The Company may agree, before this authorisation ends, to buy back its own 10.375% preference shares even though the purchase may be completed after this authorisation ends.
d) Rights on founder’s shares, 'rights' bonds, convertible debentures and similar securities or rights
Not applicable.
e) Specific circumstances that restrict the availability of reserves
Not applicable.
f) Entities outside the Group which own, directly or through subsidiaries, a stake equal to or greater than 10% of the equity.
Not applicable.
g) Equity instruments admitted to trading
The preference share capital of Santander UK plc is traded on the London Stock Exchange under the following details:
•10.375% Sterling Preference - ISIN: GB0000064393
•8.625% Sterling Preference - ISIN: GB0000044221
2. Santander Financial Services plc
a)Number of financial equity instruments held by the Group
The Group holds ordinary shares amounting to GBP 249,998,000 through Santander UK Group Holdings plc (249,998,000 ordinary shares with a par value of GBP 1 each).
The Group also holds 1,000 tracker shares (shares without voting rights but with preferential dividend rights) amounting to GBP 1,000 and 1,000 B tracker shares amounting to GBP 1,000 through Santander UK Group Holdings plc, both with a par value of GBP 1 each.
Additionally, the company issued GBP 50 million additional tier 1 (AT ) capital securities to Santander UK Group Holdings plc on 19 December 2022.
b)Capital increases in progress
No approved capital increases are in progress.
c)Capital authorised by the shareholders at the general meeting
Not applicable.
d)Rights on founder’s shares, 'rights' bonds, convertible debentures and similar securities or rights
Not applicable.
e)Specific circumstances that restrict the availability of reserves
Not applicable.
f)Entities outside the Group which own, directly or through subsidiaries, a stake equal to or greater than 10% of the equity.
Not applicable.
g)Equity instruments admitted to trading
Not applicable.
3. Banco Santander (Brasil) S.A.
a) Number of financial equity instruments held by the Group
The Group holds 3,440,170,512 ordinary shares and 3,273,507,089 preference shares through Banco Santander, S.A. and its subsidiaries Sterrebeeck B.V. and Grupo Empresarial Santander, S.L.
The shares composing the share capital of Banco Santander (Brasil) S.A. have no par value and there are no pending payments. At 2025 year-end, the bank’s treasury shares consisted of 13,666,460 ordinary shares and 13,666,460 preferred shares, with a total of 27,332,920 shares.
In accordance with current Bylaws (Article 5.7), the preference shares do not confer voting rights on their holders, except under the following circumstances:
a)In the event of transformation, merger, consolidation or spin-off of the company.
b)In the event of approval of agreements between the company and the shareholders, either directly, through third parties or other companies in which the shareholders hold a stake, provided that, due to legal or Bylaws provisions, they are submitted to a general meeting.
c)In the event of an assessment of the assets used to increase the company’s share capital.
The General Assembly may, at any moment decide to convert the preference shares into ordinary shares, establishing a reason for the conversion.
However, the preference shares do have the following advantages (Article 5.6):
a)Their dividends are 10% higher than those distributed to ordinary shares.
b)Priority in the dividends distribution.
c)Participation, on the same terms as ordinary shares, in capital increases resulting from the reserves and profits capitalization and in the distribution of bonus shares arising from the capitalization of retained earnings, reserves or any other funds.
d)Priority in the reimbursement of capital in the event company’s dissolution.
e)In the event of a public offering due to a change in control of the company, the holders of preferred shares are guaranteed the right to sell the shares at the same price paid for the block of shares transferred as part of the change of control, i.e. they are treated the same as shareholders with voting rights.
b) Capital increases in progress
No approved capital increases are in progress.
c) Capital authorised by the shareholders at the general meeting
The company is authorised to increase share capital, subject to approval by the board of directors, up to a limit of 9,090,909,090 ordinary shares or preferred shares, and without need to maintain any ratio between any of the different classes of shares, provided they remain within the limits of the maximum number of preferred shares provided in Law.
As of 31 December 2025, the share capital consists of 7,498,531,051 shares (3,818,695,031 ordinary shares and 3,679,836,020 preferred shares).
d) Rights on founder’s shares, 'rights' bonds, convertible debentures and similar securities or rights
At the general meeting held on 21 December 2016 the shareholders approved the rules relating to the deferred remuneration plans for the directors, management and other employees of the company and of companies under its control. Shares delivery is linked to achievement of certain targets. At the general meeting held on April 26, 2024, the shareholders approved an adjustment to the relevant regulations for the calculation of the average period of daily quotations for the purposes of bonus payments.
e) Specific circumstances that restrict reserves availability
The only restriction on the availability of Banco Santander (Brasil) S.A.’s reserves is connected to the requirement for the legal reserve formation (restricted reserves), which can only be used to offset losses or to increase capital.
The legal reserve requirement is set-forth in Article 193 of the Brazilian Corporations Law, which establishes that before allocating profits to any other purpose, 5% of profits must be transferred to the legal reserve, which must not exceed 20% of the company’s share capital.
f) Entities outside the Group which own, directly or through subsidiaries, a stake equal to or greater than 10% of the equity.
Not applicable.
g) Equity instruments admitted to trading
All the shares are listed on the São Paulo Stock Exchange ( B3 - Brasil, Bolsa, Balcão) and the shares deposit certificates (American Depositary Receipts - ADR) are listed on the New York Stock Exchange (NYSE).
4. Santander Bank, National Association
a) Number of financial equity instruments held by the Group
At 31 December, 2025, the Group held 530,391,043 ordinary shares that carry the same voting and dividend acquisition rights over Santander Holdings USA, Inc. (SHUSA). This holding company holds 1,237 ordinary shares of Santander Bank, National Association (SBNA) with a par value of USD 1 each, which carry the same voting rights and constitute all the share capital of SBNA.
Prior to 1 December, 2025, SHUSA held an 80.84% ownership interest in SBNA, and the remaining 19.16 % was held by Independence Community Bank Corp. (ICBC), a wholly owned subsidiary of SHUSA. ICBC was dissolved and its ownership interest in SBNA was distributed in liquidation to SHUSA on 1 December, 2025.
There is no shareholders’ meeting for the ordinary shares of SBNA.
b) Capital increases in progress
At 31 December 2025 there were no approved capital increases.
c) Capital authorised by the shareholders at the general meeting
Not applicable.
d) Rights on founder’s shares, 'rights' bonds, convertible debentures and similar securities or rights
Not applicable.
e) Specific circumstances that restrict the availability of reserves
Not applicable.
f) Entities outside the Group which own, directly or through subsidiaries, a stake equal to or greater than 10% of the equity.
Not applicable.
g) Equity instruments admitted to trading
Not applicable.
5. Banco Santander México, S.A., Institución de Banca Múltiple, Grupo Financiero Santander México
a) Number of financial instruments of capital held by the group.
Grupo Financiero Santander México, S.A. de C.V. ('Grupo Financiero') and Gesban México Servicios Administrativos Globales, S.A. de C.V. (México), hold 5,088,000,736 shares which represent the 74.97% of the capital stock of Banco Santander México and Banco Santander, S.A. holds 1,691,806,903 shares which represent the 24.92% of such capital stock.
On November 30, 2022, an Extraordinary Shareholders' Meeting of Banco Santander México, was held at which it was approved (a) to cancel the registration of all of the shares representing the capital stock of the Company in the National Securities Registry (RNV) maintained by the National Banking and Securities Commission and to delist them from the Mexican Stock Exchange (Bolsa Mexicana de Valores, S.A.B. de C.V.), and (b) delist the American Depositary Shares (each representing five series 'B' shares of the Company) from the New York Stock Exchange and delist the Company's series 'B' shares and such American Depositary Shares from registration with the US Securities and Exchange Commission; and (c) to conduct certain tender offers for the series 'B' shares representing the capital stock of the Company and the American Depositary Shares.
Tender offers for the acquisition of shares were carried out from February 7 to April 10, 2023, where Banco Santander, S.A. acquired a total of 244,306,313 series 'B' shares.
Once the offers were finalized and in accordance with the Mexican regulation, on May 8, 2023, a trust was established for a period of 6 months, to carry out the acquisition of shares of Banco Santander México, including those represented by American Depositary Shares listed on the New York Stock Exchange (which were not owned at that time by Banco Santander, S.A. or its subsidiaries) owned by shareholders who did not participate in the tender offers made by Banco Santander, S.A.
On May 4 and 12, 2023, respectively, Banco Santander México, S.A., Institución de Banca Múltiple, Grupo Financiero Santander México, was delisted from the New York Stock Exchange, LLC and the RNV .
On November 8, 2023, the trust ended; as a result, Banco Santander, S.A. repurchased 9,243,880 series 'B' shares from shareholders who did not participate in the tender offers, leaving a total of 1,714,399 shares of the series 'B' in the hands of minority shareholders.
On February 13, 2024, an Extraordinary Shareholders' Meeting of Banco Santander México, S.A. was held, at which it was approved to amend the Bylaws of the Institution to remove the obligations established by the Securities Market Law as a public company.
b) Ongoing capital stock increases.
To this date there are not ongoing capital stock increases.
c) Authorized Capital by the Shareholders Meeting.
On April 20, 2021, the Company held an Extraordinary General Shareholders' Meeting, at which, among other items, it was approved an increase in the authorized capital stock of the Company to 6,825,447,481.00 Mexican pesos represented by 1,805,300,000 unsubscribed and unpaid shares, which are held in treasury so that the Company may issue Capital Instruments representing non-preferred subordinated debt, perpetual nature and convertible into ordinary shares, together with the corresponding amendment to the Company’s Bylaws. This increase was approved by the National Banking and Securities Commission (CNBV) through official communication number 312-3/10039041/2021 dated November 8, 2021.
As a result of said agreement, the Company requested the update of the registration of the shares representing the capital stock of Banco Santander Mexico, S.A. in the RNV, which was authorized by the CNBV through official communication number 153/2800/2022 dated May 20, 2022.In the aforementioned official communication, it was requested that the Company adjusted the amounts in pesos corresponding to the capital stock to include cents, and therefore, through an Extraordinary General Stockholders' Meeting held on July 19, 2022, the corresponding adjustment was made, which was authorized by the CNBV through official communication number 312-3/93573/2023 dated January 3, 2023.
The capital stock of the Bank is 32,485,600,109.44 Mexican pesos represented by a total of 8,592,294,357 shares with a nominal value of 3.780782962 Mexican pesos each one; divided in 4,385,824,012 stocks 'F' series and 4,206,470,345 shares 'B' series. The capital stock is constituted as follows:
• Subscribed and paid-in capital of the Bank is 25,660,152,628.14 Mexican pesos represented by a total of 6,786,994,357 shares with a nominal value of 3.780782962 Mexican pesos each one; divided in 3,464,309,145 shares 'F' series and 3,322,685,212 shares series.
•The authorized capital stock for the conversion of obligations into shares of the Company is 6,825,447,481.30 Mexican pesos, represented by a total of 1,805,300,000 shares with a nominal value of 3,780782962 Mexican pesos each; divided into 921,514,867 series 'F' shares and 883,785,133 series 'B shares'.
d) Rights incorporated into parts of founder, bonds or debt, convertible obligations and securities or similar rights.
On September 20, 2018, Banco Santander México, issued and placed equity instruments, subordinated, preferential, and not convertible into shares, governed by foreign law, representative of the complementary part of the net capital of Banco Santander Mexico (tier 2 subordinated preferred capital notes), for the amount of 1,300 million American dollars (the 'Instruments'), whose resources were used mainly for the acquisition of the 94.07% of the Subordinated Notes 2013.
On June 15, 2020, the Bank’s Shareholders' Meeting was held, which approved to increase the debt securities issuance in order to be settled in the amount of 10,000 million American dollars, to be used considering the following, among others: i) issuance of debt securities in local and international markets; ii) senior or subordinated debt, including in both cases preferred and not preferred securities, and debt securities classified as capital on a regulatory point of view. The board of directors on its meeting held on June 18, 2020, ratified the 10,000 million American dollars limit approved by the above mentioned Shareholders Meeting.
On April 20, 2021, a General Extraordinary Shareholders' Meeting of Banco Santander México was held, where among other issues, it was approved that the Bank may issue subordinated non preferential perpetual and convertible capital notes, to be placed abroad, in accordance with the Banco de Mexico authorization.
On September 15, 2021, Banco Santander Mexico issued abroad the 'Perpetual Subordinated Non-Preferred Contingent Convertible Additional Tier 1 Notes', up to an amount of 700 million American dollars. On the same date, the Bank paid the '2016 Obligations' issued by the Bank, on a fixed initial rate of 4.625% up to an amount of 700 million American dollars.
On January 25, 2024, the Bank’s board of directors approved, among others, the issuance of preferred subordinated Notes tier 2 abroad, up to 1,500 million American dollars. Subsequently, the General Shareholders Meeting dated February 27, 2024, approved the issuance of capital instruments as part of the complementary capital (tier 2), to be placed abroad, up to an amount of 1,030 million American dollars (900 million American dollars were effectively placed).
On October 17, 2024, the Bank’s board of directors approved, among others, the issuance of a Senior Note abroad up to an amount of 700 million American dollars.
On April 24, 2025, the Bank’s board of directors approved, among others, the issuance of Subordinated Preferred tier2 Notes to be placed abroad, for the amount of 1,200 million American dollars during 2025. Subsequently, the Bank’s General Shareholders Meeting dated June 17, 2025, approved the issuance of capital instruments as part of the complementary capital (tier 2), to be placed abroad, up to an amount of 1,200 million US dollars (the total amount was effectively placed).
The approved debt issuance of Banco Santander México, S.A., Institución de Banca Múltiple, Grupo Financiero Santander México is currently composed as follows:
| | | | | | | | | | | | | | |
| Instrument | Type | Term | Amount | Available |
| Issuance Program of unsecured bonds and unsecured certificates of deposit | Revolving | 04-Mar-2026 | 80,000 million Mexican pesos, or its equivalent in UDIs, dollars or any other foreign currency | $31,870 million Mexican pesos |
| Private banking structured bonds Act with subsequent placements (JBSANPRIV 24-1) | Not revolvingA | 10-Oct-2029 | 100,000 million Mexican pesos | $0 million Mexican pesos |
| Private structured bonds Act with subsequent placements (JBSANPRIV 25-1) | Not revolvingA | 01-Oct-2030 | 100,000 million Mexican pesos | $85,889 million Mexican pesos |
| Public banking structured bonds Act with subsequent placements | Not revolvingA | 16-Dic-2027 | 10,000 million Mexican pesos | $10,000 million Mexican pesos |
| Subordinated Notes RegS (2025) | Not revolvingA | 27-Jun-2032 | 1,200 million American dollars | N/A |
| Capital Notes (tier 2 Capital) | Not revolvingA | 1-Oct-2028 | 1,300 million American dollars | N/A |
| Subordinated Notes, perpetual and convertible (tier 1) | Not revolvingA | perpetual | 700 million American dollars | N/A |
| Subordinated Preferred Notes (2024) | Not revolvingA | 21-Mar-2030 | 900 million American dollars | N/A |
| Senior Notes 144.ª/RegS (2024) | Not revolvingA | 10-Dic-2029 | 700 million American dollars | N/A |
A.The issuance of the structured private banking bonds is not revolving. Once placed the amount laid down in the corresponding brochure a new certificate will be issued on the authorized amount.
e) Specific circumstances restricting the availability of reserves.
According to the Law of Financial Institutions, general dispositions applicable to financial institutions, General Corporations law and the Bylaws, the Bank has to constitute or increase its capital reserves to ensure the solvency to protect the payments system and the public savings.
The Bank increases its legal reserve annually accordingly to the results obtained in the fiscal year (benefits).
The Bank must constitute the different reserves established in the legal provisions applicable to financial institutions, which are determined accordingly to the qualification granted to credits and they are released when the credit rating improves, or when it is settled.
f) Entities outside the Group which own, directly or through subsidiaries, a stake equal to or greater than 10% of the equity.
Not applicable.
g) Equity instruments admitted to trading.
Not applicable.
6. Banco Santander Totta, S.A
a) Number of equity instruments held by the Group
Banco Santander, S.A. owns 1,383,690,177 shares of Banco Santander Totta, S.A..
Banco Santander Totta, S.A. own 6.326.736 treasury shares, all of which have a par value of EUR 1 each and identical voting and dividend rights and are subscribed and paid in full.
Banco Santander, S.A. direct participation at Banco Santander Totta, S.A. arise as result of the incorporation by merger of its majority shareholder, Santander Totta, SGPS, S.A. and Taxagest – Sociedade Gestora de Participações Sociais, S.A. in Banco Santander Totta, S.A. occurred at February 28, 2025.
b) Capital increases in progress
At 31 December 2025, there were no equity increases in progress.
c) Capital authorised by the shareholders at the general meeting
Not applicable.
d) Rights on founder’s shares, 'rights' bonds, convertible debentures and similar securities or rights
Not applicable.
e) Specific circumstances that restrict the availability of reserves
Under Article 296 of the Portuguese Companies’ Code, the legal and merger reserves can only be used to offset losses or to increase capital.
Non-current asset revaluation reserves are regulated by Decree- Law 31/98, under which losses can be offset or capital increased by the amounts for which the underlying asset is depreciated, amortised or sold.
f) Entities outside the Group which own, directly or through subsidiaries, a stake equal to or greater than 10% of the equity.
Not applicable.
g) Equity instruments admitted to trading
Not applicable.
7. Santander Consumer Bank AG
a) Number of financial equity instruments held by the Group
At 31 December 2025, through Santander Consumer Holding GmbH, the Group held 30,002 ordinary shares with a par value of EUR 1,000 each, all of which carry the same voting rights.
b) Capital increases in progress
Not applicable.
c) Capital authorised by the shareholders at the general meeting
Not applicable.
d) Rights on founder’s shares, 'rights' bonds, convertible debentures and similar securities or rights
Not applicable.
e) Specific circumstances that restrict the availability of reserves
Not applicable.
f) Entities outside the Group which own, directly or through subsidiaries, a stake equal to or greater than 10% of the equity.
Not applicable.
g) Equity instruments admitted to trading
Not applicable.
8. Banco Santander - Chile
a) Number of equity instruments held by the Group
The Group holds a 67.18% ownership interest in its subsidiary in Chile corresponding to 126,593,017,845 ordinary shares of Banco Santander - Chile through its subsidiaries: Santander Chile Holding S.A. with 66,822,519,695 ordinary shares, Teatinos Siglo XXI Inversiones S.A., with 59,770,481,573 ordinary shares and Santander Inversiones S.A. with 16,577 fully subscribed and paid ordinary shares that carry the same voting and dividend rights.
b) Capital increases in progress
At 31 December 2025, there were no approved capital increases.
c) Capital authorised by the shareholders at the general meeting
Share capital at 31 December 2025 amounted to CLP 891,302,881,691.
d) Rights on founder’s shares, 'rights' bonds, convertible debentures and similar securities or rights
Not applicable.
e) Specific circumstances that restrict the availability of reserves
Remittances to foreign investors in relation to investments made under the Statute of Foreign Investment (Decree-Law 600/1974) and the amendments thereto require the prior authorisation of the foreign investment promotion agency.
f) Entities outside the Group which own, directly or through subsidiaries, a stake equal to or greater than 10% of the equity.
Not applicable.
g) Equity instruments admitted to trading
All the shares are listed on the Chilean stock exchanges and, through American Depositary Receipts (ADRs), on the New York Stock Exchange (NYSE).
9. Santander Bank Polska S.A.
a) Number of financial equity instruments held by the Group
At 31 December, 2025, Banco Santander, S.A. held 59,984,148 ordinary shares with a par value of PLN 10 each, all of which carry the same voting rights.
On 13 September 2024, Banco Santander sold 5,320,000 shares held in Santander bank Polska S.A. (ca. 5.2% of the in share capital).
On 4 December 2025, Banco Santander sold 3,576,626 shares held in Santander Bank Polska S.A. (ca. 3.5% of the in share capital).
b) Capital increases in progress
At 31 December, 2025, there were no equity increases in progress.
c) Capital authorised by the shareholders at the general meeting
There was no share capital increase in 2025.
d) Rights on founder’s shares, 'rights' bonds, convertible debentures and similar securities or rights
Not applicable.
e) Specific circumstances that restrict the availability of reserves
Not applicable.
f) Entities outside the Group which own, directly or through subsidiaries, a stake equal to or greater than 10% of the equity.
Not applicable.
g) Equity instruments admitted to trading
All the shares of Santander Bank Polska S.A. are listed on the Warsaw Stock Exchange.
Appendix VI
Annual banking report
Grupo Santander’s total tax contribution (taxes incurred directly and by third parties, generated in the course of business) is around EUR 22.1 billion, including more than EUR 9.5 billion in taxes incurred directly (corporate income tax, non-recoverable value added tax (VAT) and other indirect taxes, employer Social Security contributions, payroll taxes and other taxes and levies).
This report complies with Article 89 of Directive 2013/36/EU of the European Parliament and of the Council of 26 June 2013 on access to the activity of credit institutions and the prudential supervision of credit institutions and investment firms, and its transposition into Spanish law pursuant to Article 87 of Act 10/2014 of 26 June on the regulation, supervision and capital adequacy of credit institutions.
The criteria used to prepare this report were:
a) Name(s), activities and location
Appendices I to III to the consolidated financial statements contain details of the companies operating in each jurisdiction, including their name(s), location and activities.
Santander main activity in the jurisdictions where operate is commercial banking. The Group primarily operates in ten markets through subsidiaries that are autonomous in capital and liquidity. This has clear strategic and regulatory advantages, since it limits the risk of contagion between units, imposes a double layer of global and local oversight, and facilitates crisis management and resolution.
b) Turnover and profit or loss before tax
Turnover in this report is Total income, and profit or loss before tax, Operating profit/(loss) before tax, both as defined and presented in the consolidated income statement that forms part of the consolidated financial statements.
c) Number of full-time equivalent employees
The data on full-time equivalent employees stem from the average headcount of each jurisdiction.
d) Tax on profit or loss
In the absence of specific criteria, we have included the amount effectively paid (EUR 4,954 million in 2025, with an effective tax rate of 24.0%) in respect of taxes whose effect is recognized under Income tax in the consolidated income statement.
Taxes effectively paid by the companies in each jurisdiction include:
•Supplementary payments relating to income tax returns, usually for prior years.
•Advances, prepayments, withholdings made or borne in respect of tax on profit or loss for the year. We included taxes borne abroad in the jurisdiction of the company that bore them.
•Refunds received with respect to prior years’ returns.
•Where appropriate, the amount payable from assessments and litigation relating to these taxes.
The foregoing form part of the cash flow statement and differ from the corporate income tax expense recognized in the consolidated income statement (EUR 5,131 million in 2025, representing an effective rate of 24.9%, see note 27). This is because each country’s tax regulations establish:
•when taxes must be paid. There is often a mismatch between the payment dates and the generation of the income bearing the tax.
•their own calculation criteria to define temporary or permanent restrictions on expense deduction, exemptions and relief or deferrals of certain income, generating the differences between the accounting profit (or loss) and taxable profit (or tax loss) which is ultimately taxed; tax loss carry forwards from prior years, tax credits and/or relief, etc., must also be added. In certain cases, special regimes such as the tax consolidation of companies in the same jurisdiction are established.
e) Public subsidies
In the context of the legally-required disclosures, this was interpreted as any aid or subsidy in line with the European Commission’s Guidance on the notion of State aid. Grupo Santander did not receive significant public subsidies in 2025.
The breakdown of information is as follows:
| | | | | | | | | | | | | | |
| 2025 |
Jurisdiction | Turnover (EUR million) | Full-time equivalent employees | Gross profit or loss before tax (EUR million) | Tax on profit or loss (EUR million) |
| Germany | 1,759 | | 4,659 | | 257 | | 60 | |
| Argentina | 2,248 | | 7,964 | | 684 | | 133 | |
| Australia | 9 | | 54 | | 1 | | — | |
| Austria | 211 | | 296 | | 53 | | 15 | |
| Bahamas | 15 | | 22 | | 9 | | — | |
| Belgium | 51 | | 237 | | 15 | | 11 | |
Brazil1 | 11,687 | | 55,539 | | 1,998 | | 1,204 | |
| Bulgaria | 7 | | 15 | | 2 | | — | |
| Canada | 70 | | 322 | | 4 | | — | |
| Chile | 2,668 | | 9,066 | | 1,222 | | 35 | |
| China | 40 | | 118 | | 9 | | — | |
| Colombia | 156 | | 1,277 | | 43 | | 25 | |
| United Arab Emirates | 12 | | 143 | | (24) | | — | |
Spain2 | 12,226 | | 35,097 | | 4,625 | | 792 | |
| United States | 7,920 | | 10,915 | | 1,794 | | 268 | |
| Denmark | 152 | | 233 | | 51 | | 11 | |
| Finland | 84 | | 160 | | 26 | | 13 | |
| France | 833 | | 1,020 | | 424 | | 106 | |
| Greece | 25 | | 54 | | 10 | | — | |
| Hong Kong | 128 | | 244 | | 28 | | 7 | |
| | | | |
| Ireland | 18 | | 10 | | 11 | | 2 | |
| Isle of Man | 46 | | 78 | | 31 | | 3 | |
| Italy | 776 | | 1,282 | | 316 | | 86 | |
| Jersey | 21 | | 62 | | 12 | | 1 | |
| Luxembourg | 744 | | 37 | | 723 | | 245 | |
| Mexico | 6,139 | | 29,311 | | 2,213 | | 558 | |
| Norway | 250 | | 527 | | 143 | | 23 | |
| Netherlands | 175 | | 352 | | 94 | | 114 | |
| Peru | 373 | | 2,242 | | 135 | | 26 | |
Poland3 | 4,184 | | 13,021 | | 2,069 | | 543 | |
| Portugal | 2,032 | | 5,393 | | 1,430 | | 437 | |
| United Kingdom | 6,238 | | 18,617 | | 1,876 | | 169 | |
| Romania | 9 | | 33 | | 3 | | — | |
| Singapore | 46 | | 38 | | 25 | | 3 | |
| Sweden | 153 | | 332 | | 45 | | 20 | |
| Switzerland | 245 | | 459 | | 26 | | 15 | |
| Uruguay | 640 | | 1,512 | | 248 | | 29 | |
| Consolidated Group Total | 62,390 | | 200,741 | | 20,631 | | 4,954 | |
1.Including the information relating to a branch in the Cayman Islands, the profits of which are taxed in full in Brazil. The contribution of this branch profit before tax from continuing operations is EUR 488 million.
2.Includes the Corporate Centre.
3.Including information associated with the business subject to the Poland disposal reported under a single line in the consolidated income statement — 'profit/(loss) after tax from discontinued operations’ (see note 52.c).
At 31 December 2025, the Group’s return on assets (ROA) was 0.84%.
Exhibits
| | | | | | | | |
Exhibit Number | | Description |
| | |
101.SCH | | Inline XBRL Taxonomy Extension Schema Document |
101.CAL | | Inline XBRL Taxonomy Extension Calculation Linkbase Document |
101.LAB | | Inline XBRL Taxonomy Extension Label Linkbase Document |
101.PRE | | Inline XBRL Taxonomy Extension Presentation Linkbase Document |
101.DEF | | Inline XBRL Taxonomy Extension Definition Linkbase Document |
We will furnish to the SEC, upon request, copies of any unfiled instruments that define the rights of holders of long-term debt of Santander.
SIGNATURE
Pursuant to the requirements of the Securities Exchange Act of 1934, the registrant has duly caused this report to be signed on its behalf by the undersigned, thereunto duly authorized.
| | | | | | | | |
| | |
| Banco Santander, S.A. |
| |
| |
Date: 1 April 2026 | By: | /s/ José García Cantera |
| Name: | José García Cantera |
| Title: | Chief Financial Officer |