| 4Q’25 Earnings Presentation |

| The following is a “safe harbor” statement under the Private Securities Litigation Reform Act of 1995: Certain statements and information in this presentation may constitute “forward-looking statements” within the meaning of the Private Securities Litigation Reform Act of 1995, including, among others, statements regarding (i) our expectations about our intrinsic value or our prospects for growth and value creation and (ii) our financial outlook, position, strategies, goals, and expectations. Terms such as “anticipate,” “believe,” “could,” “estimate,” “expect,” “forecast,” “foresee,” “intend,” “may,” “plan,” “predict,” “project,” “scheduled,” “should,” “would,” and similar expressions and the negatives of such terms are intended to identify forward-looking statements. These statements are based on management’s beliefs, assumptions, and expectations based on currently available information, are not guarantees of future performance, and involve certain risks and uncertainties (some of which are beyond our control). Although we believe that the expectations reflected in these forward-looking statements are reasonable as and when made, we cannot provide assurance that our expectations will prove to be correct. Actual outcomes and results could materially differ from what is expressed, implied, or forecasted in these statements due to a number of factors, including, but not limited to: the effects of a widespread outbreak of an illness or disease or any other public health crisis, as well as regulatory measures implemented in response to such events; external events which may adversely affect us or the third parties who provide services for us, for which our business continuity plans may not adequately prepare us, including, but not limited to, acts of war or terrorism, or military conflicts; data privacy breaches, cybersecurity incidents, and/or failures of our information systems, including disruptions or failures of services essential to our operations or upon which our information technology platforms rely; interruption or failure of third-party software or information technology systems or licenses; untimely or ineffective development and implementation of, or failure to realize the potential benefits associated with, new or enhanced technology or processes, including our customer pilot offering of Vaux; the loss or reduction of business from large customers or an overall reduction in our customer base; the timing and performance of growth initiatives and the ability to manage our cost structure; the cost, integration, and performance of any recent or future acquisitions and the inability to realize the anticipated benefits of the acquisition within the expected time period or at all; unsolicited takeover proposals, proxy contests, and other proposals/actions by activist investors; maintaining our corporate reputation and intellectual property rights; nationwide or global disruption in the supply chain resulting in increased volatility in freight volumes; competitive initiatives and pricing pressures; increased prices for and decreased availability of equipment, including new revenue equipment, decreases in value of used revenue equipment, and higher costs of equipment-related operating expenses such as maintenance, fuel, and related taxes; availability of fuel, the effect of volatility in fuel prices and the associated changes in fuel surcharges on securing increases in base freight rates, and the inability to collect fuel surcharges; relationships with employees, including unions, and our ability to attract, retain, and upskill employees; unfavorable terms of, or the inability to reach agreement on, future collective bargaining agreements or a workforce stoppage by our employees covered under ABF Freight’s collective bargaining agreement; union employee wages and benefits, including changes in required contributions to multiemployer plans; availability and cost of reliable third-party services; our ability to secure independent owner-operators and/or operational or regulatory issues related to our use of their services; litigation or claims asserted against us; governmental regulations; environmental laws and regulations, including emissions-control regulations; default on covenants of financing arrangements and the availability and terms of future financing arrangements; our ability to generate sufficient cash from operations to support significant ongoing capital expenditure requirements and other business initiatives; self-insurance claims, insurance premium costs, and loss of our ability to self-insure; potential impairment of long-lived assets and goodwill and intangible assets; general economic conditions and related shifts in market demand that impact the performance and needs of industries we serve and/or limit our customers’ access to adequate financial resources; increasing costs due to inflation and higher interest rates; seasonal fluctuations, adverse weather conditions, natural disasters, and climate change; and other financial, operational, and legal risks and uncertainties detailed from time to time in ArcBest Corporation’s public filings with the Securities and Exchange Commission (“SEC”). For additional information regarding known material factors that could cause our actual results to differ from those expressed in these forward-looking statements, please see our filings with the SEC, including our Annual Report on Form 10-K, Quarterly Reports on Form 10-Q, and Current Reports on Form 8-K. Readers are cautioned not to place undue reliance on forward-looking statements, which speak only as of the date hereof. We undertake no obligation to publicly update or revise any forward-looking statements after the date they are made, whether as a result of new information, future events, or otherwise. E A R N I N G S P R E S E N T A T I O N | 4 Q ' 2 5 2 F O R W A R D L O O K I N G S T A T E M E N T S |
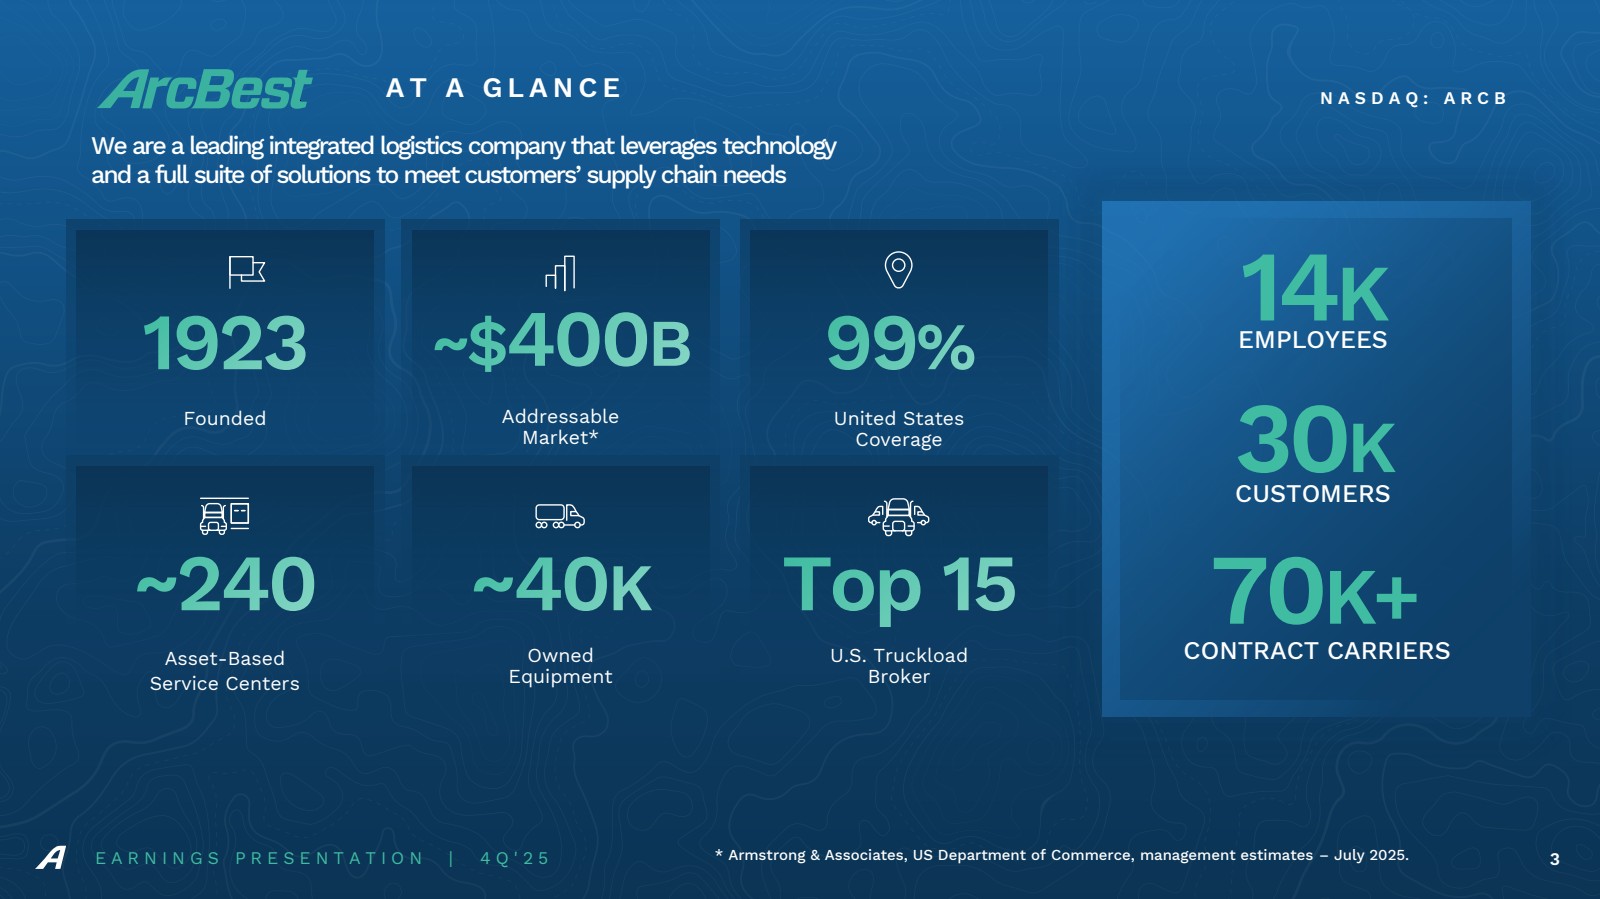
| We are a leading integrated logistics company that leverages technology and a full suite of solutions to meet customers’ supply chain needs 70K+ CONTRACT CARRIERS 30K CUSTOMERS 14K EMPLOYEES A T A G L A N C E N A S D A Q : A R C B E A R N I N G S P R E S E N T A T I O N | 4 Q ' 2 5 3 1923 Founded Addressable Market* 99% United States Coverage ~240 Asset-Based Service Centers ~40K Owned Equipment Top 15 U.S. Truckload Broker ~$400B * Armstrong & Associates, US Department of Commerce, management estimates – July 2025. |
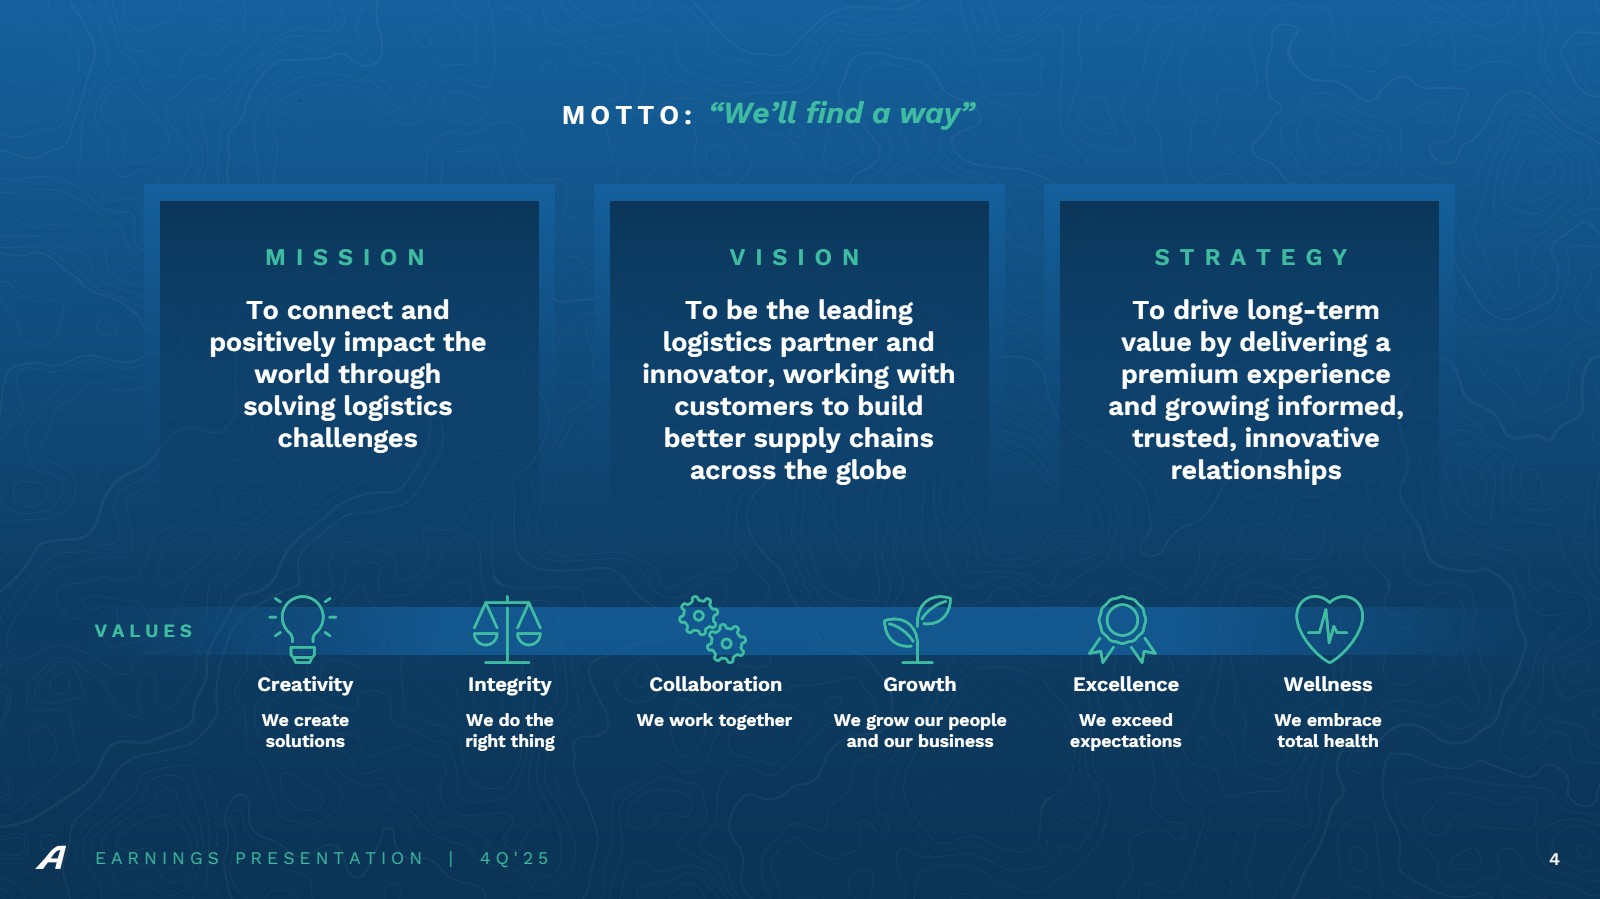
| M O T T O : V I S I O N S T R A T E G Y Creativity Integrity Collaboration Growth Excellence Wellness M I S S I O N “We’ll find a way” To connect and positively impact the world through solving logistics challenges To be the leading logistics partner and innovator, working with customers to build better supply chains across the globe To drive long-term value by delivering a premium experience and growing informed, trusted, innovative relationships V A L U E S We create solutions We do the right thing We work together We grow our people and our business We exceed expectations We embrace total health M O T T O : V I S I O N S T R A T E G Y Creativity Integrity Collaboration Growth Excellence Wellness M I S S I O N “We’ll find a way” To connect and positively impact the world through solving logistics challenges To be the leading logistics partner and innovator, working with customers to build better supply chains across the globe To drive long-term value by delivering a premium experience and growing informed, trusted, innovative relationships V A L U E S We create solutions We do the right thing We work together We grow our people and our business We exceed expectations We embrace total health E A R N I N G S P R E S E N T A T I O N | 4 Q ' 2 5 4 |
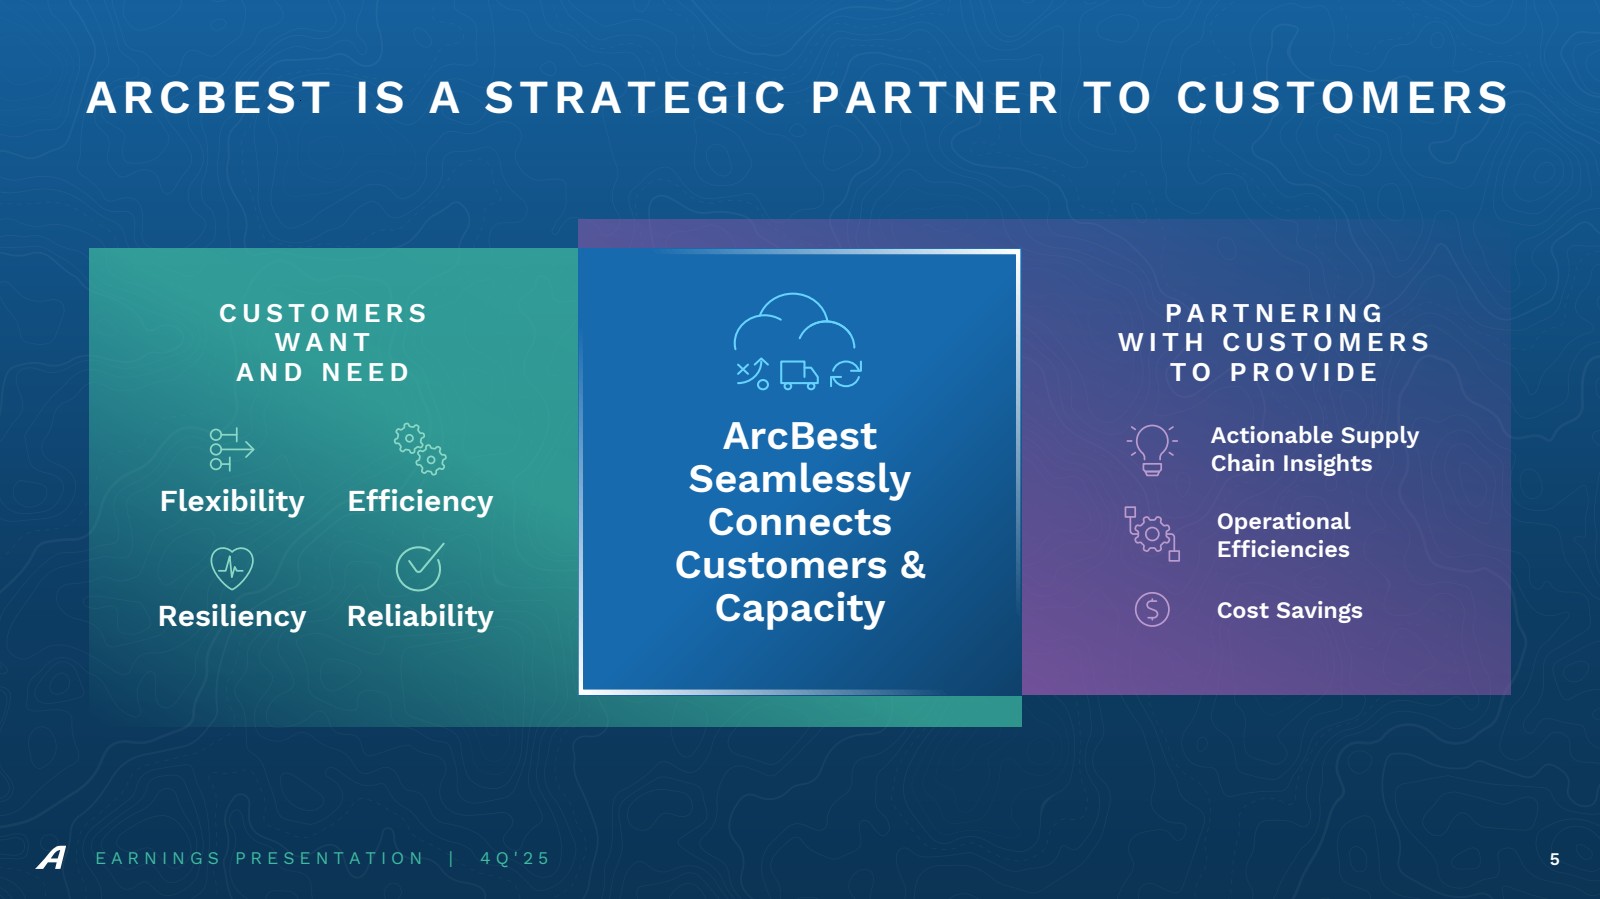
| E A R N I N G S P R E S E N T A T I O N | 4 Q ' 2 5 5 ARCBEST IS A STRATEGIC PARTNER TO CUSTOMERS Cost Savings Actionable Supply Chain Insights Operational Efficiencies P A R T N E R I N G W I T H C U S T O M E R S T O P R O V I D E C U S T O M E R S W A N T A N D N E E D Resiliency Flexibility Efficiency ArcBest Seamlessly Connects Customers & Reliability Capacity |
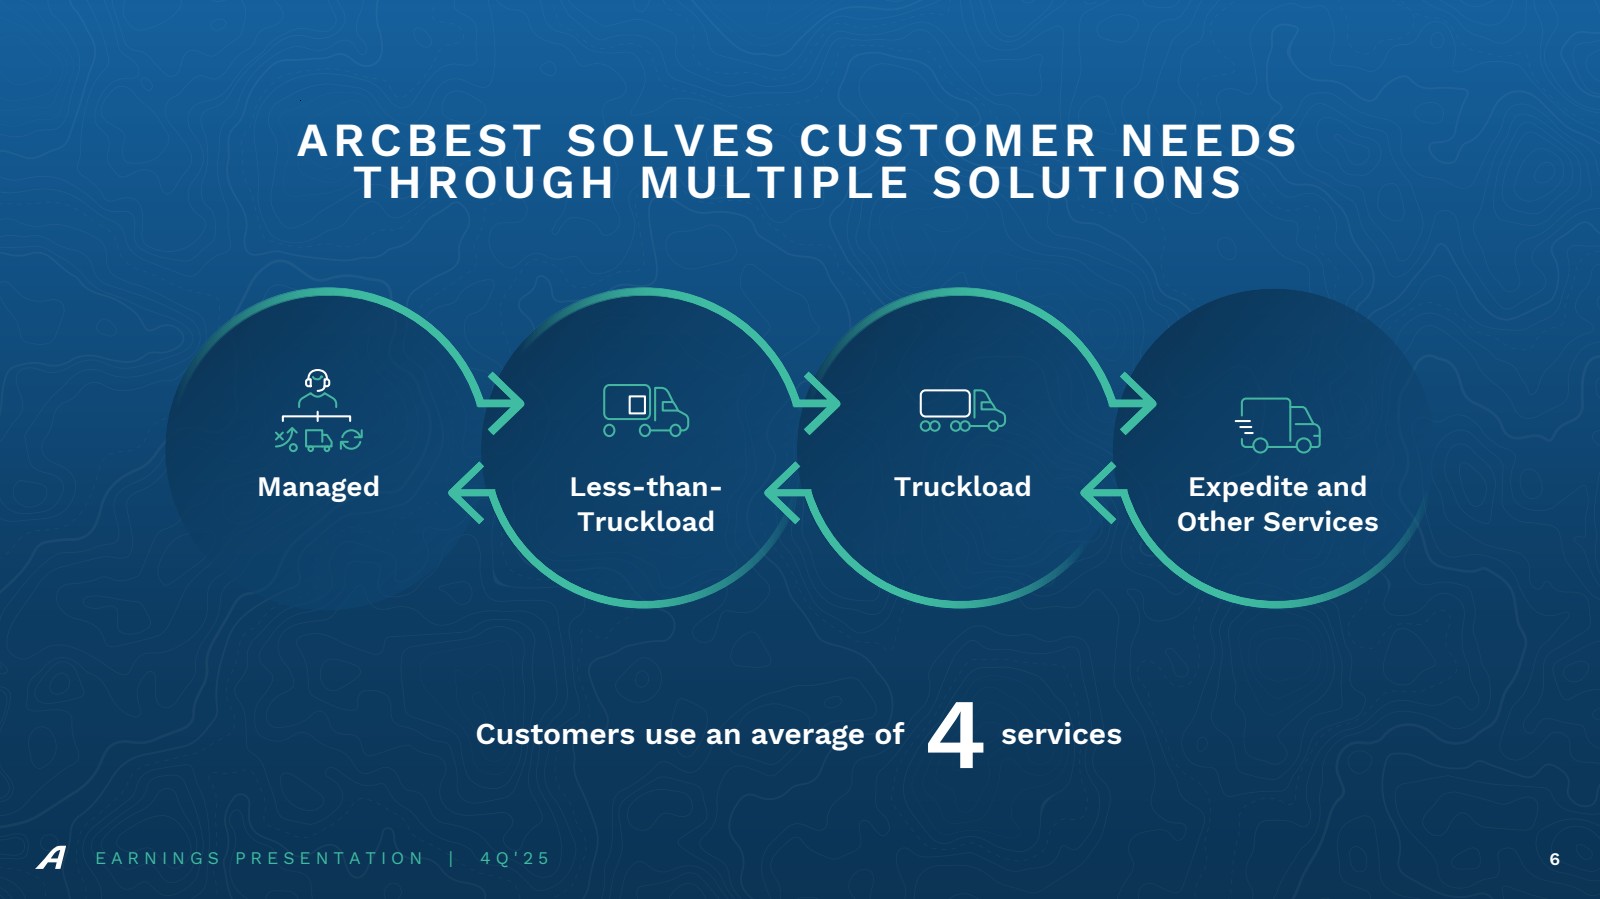
| E A R N I N G S P R E S E N T A T I O N | 4 Q ' 2 5 6 ARCBEST SOLVES CUSTOMER NEEDS THROUGH MULTIPLE SOLUTIONS Less-than- Truckload Truckload Managed Expedite and Other Services Customers use an average of 4services |
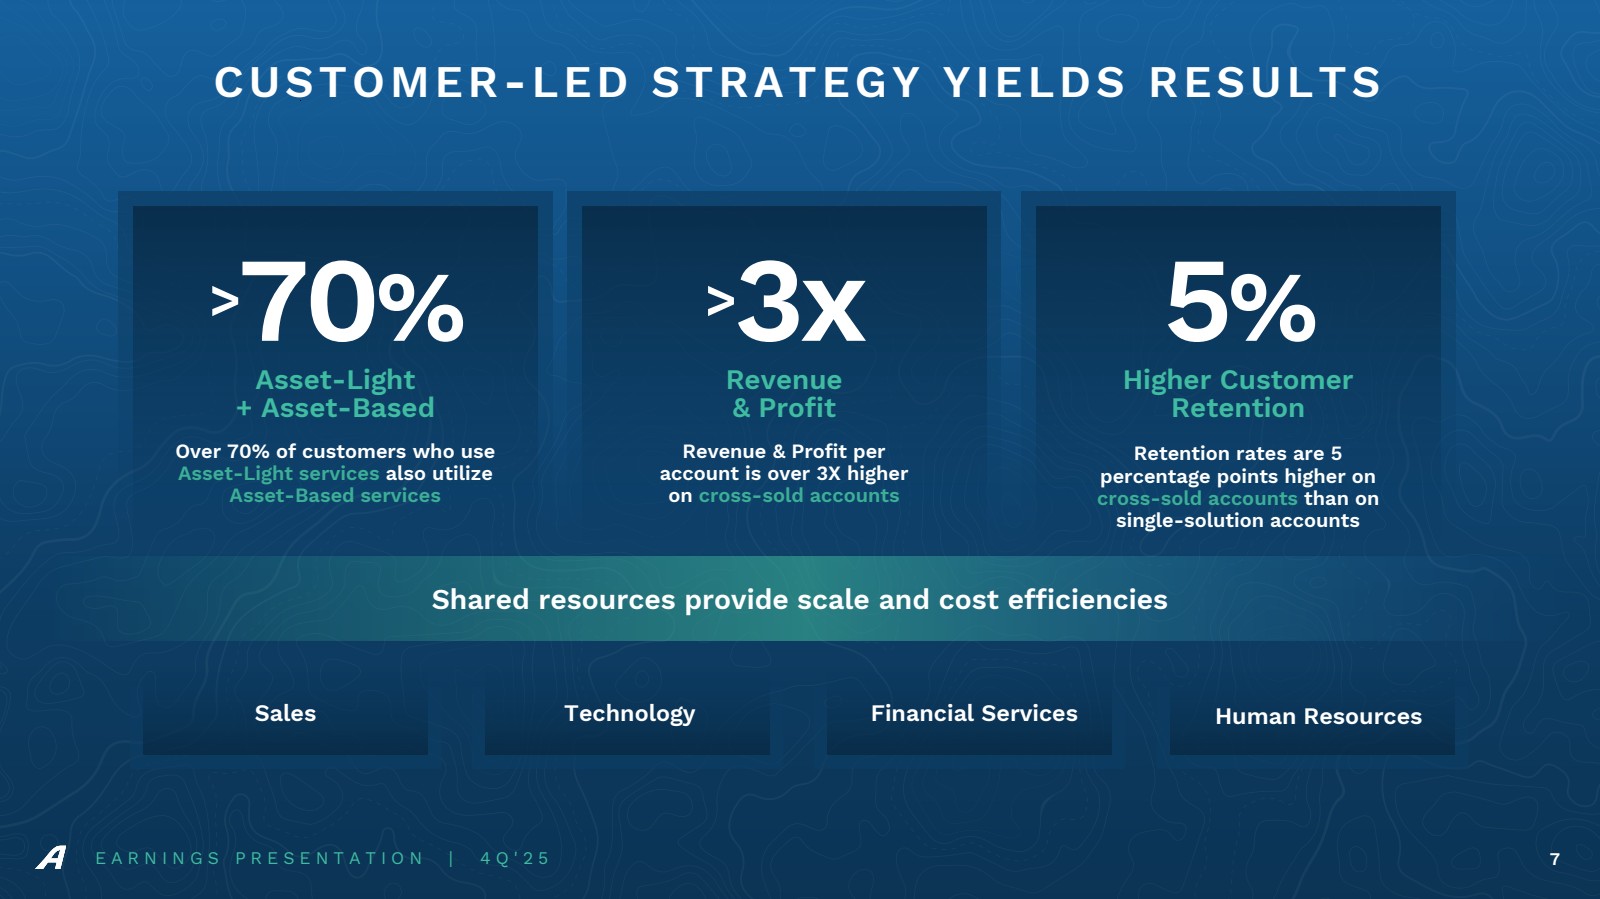
| >3x Revenue & Profit per account is over 3X higher on cross-sold accounts Revenue & Profit >70% Over 70% of customers who use Asset-Light services also utilize Asset-Based services 5% Higher Customer Retention Asset-Light + Asset-Based Retention rates are 5 percentage points higher on cross-sold accounts than on single-solution accounts Shared resources provide scale and cost efficiencies Sales Technology Financial Services Human Resources E A R N I N G S P R E S E N T A T I O N | 4 Q ' 2 5 7 CUSTOMER-LED STRATEGY YIELDS RESULTS |
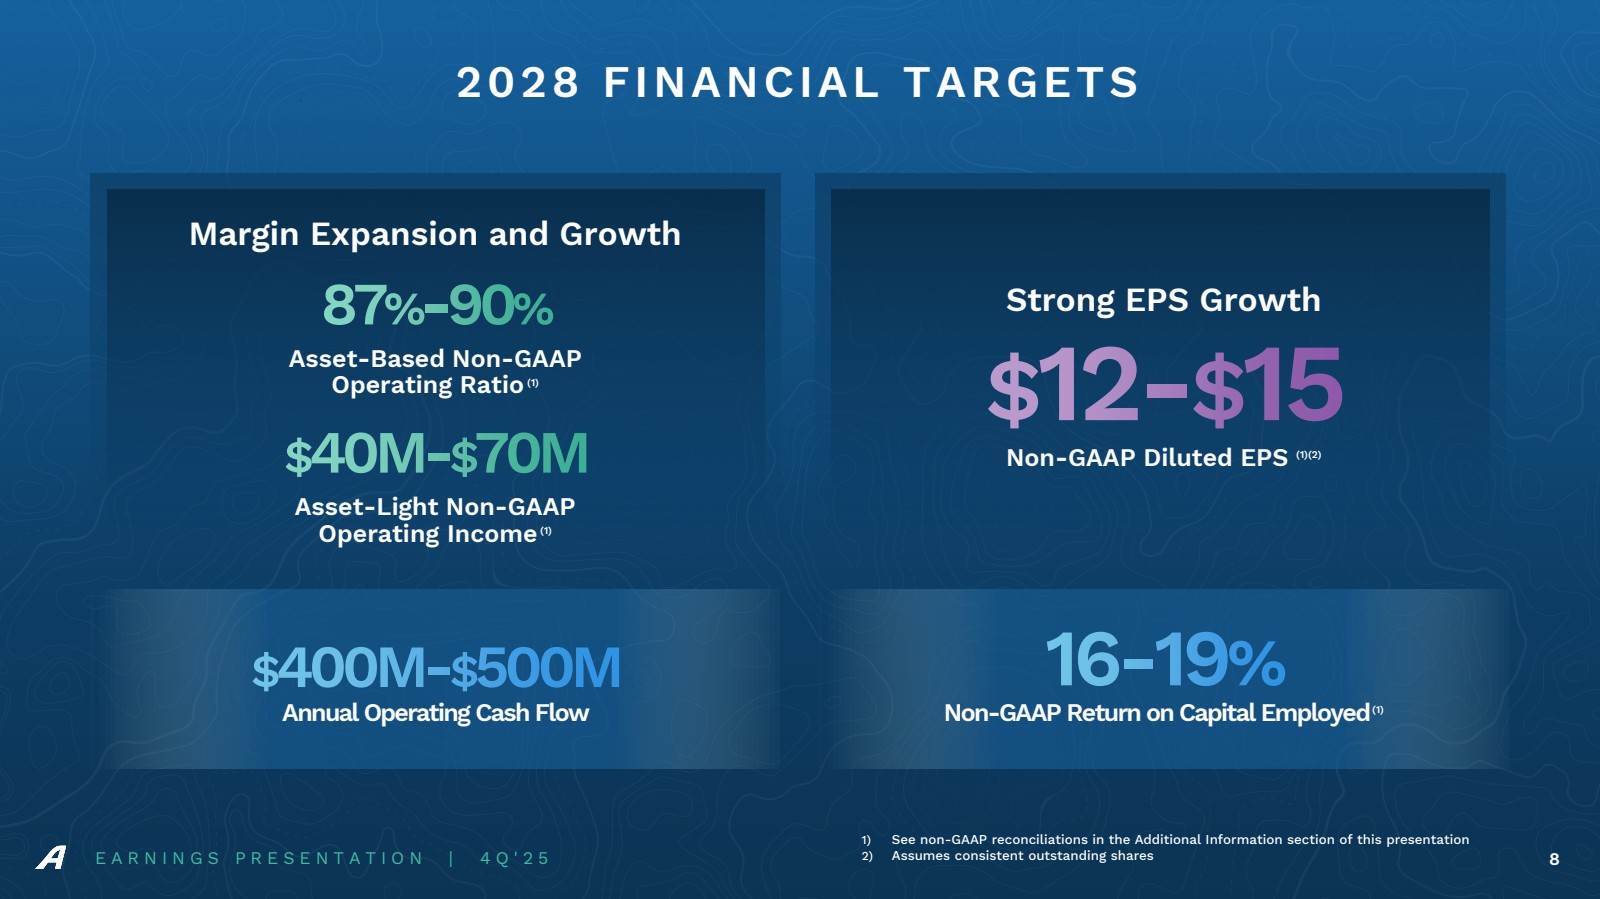
| 16-19% Margin Expansion and Growth Strong EPS Growth 2028 FINANCIAL TARGETS Annual Operating Cash Flow 87%-90% Asset-Based Non-GAAP Operating Ratio(1) $40M-$70M Asset-Light Non-GAAP Operating Income(1) $400M-$500M $12-$15 Non-GAAP Diluted EPS (1)(2) Non-GAAP Return on Capital Employed(1) 1) See non-GAAP reconciliations in the Additional Information section of this presentation E A R N I N G S P R E S E N T A T I O N | 4 Q ' 2 5 2) Assumes consistent outstanding shares 8 |
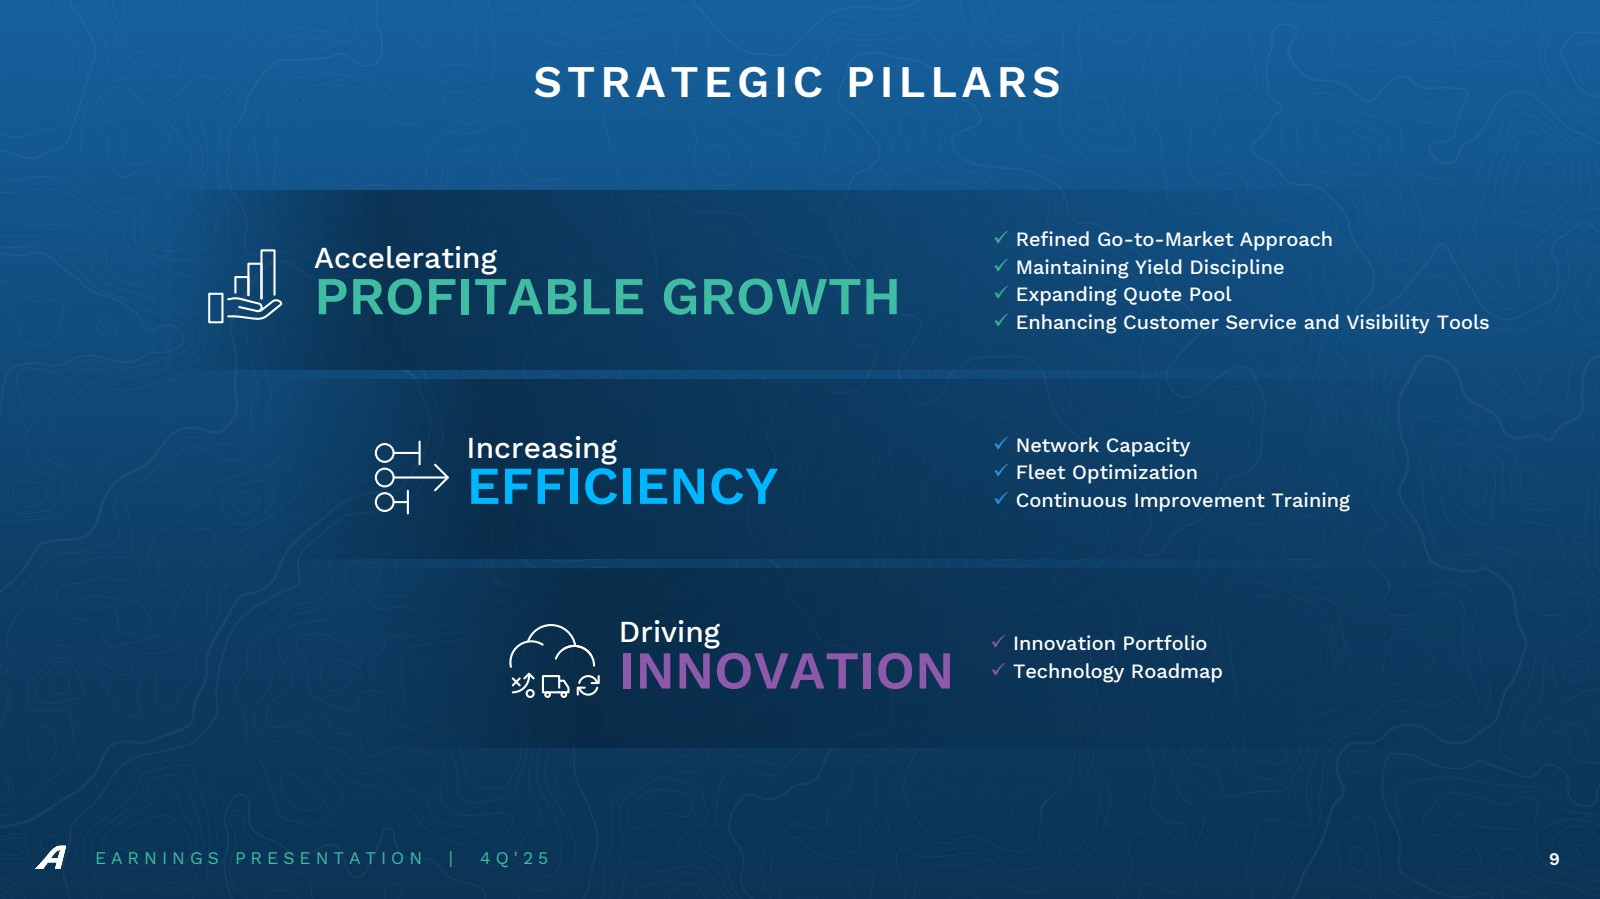
| Increasing EFFICIENCY Driving INNOVATION Accelerating PROFITABLE GROWTH ✓ Refined Go-to-Market Approach ✓ Maintaining Yield Discipline ✓ Expanding Quote Pool ✓ Enhancing Customer Service and Visibility Tools ✓ Network Capacity ✓ Fleet Optimization ✓ Continuous Improvement Training ✓ Innovation Portfolio ✓ Technology Roadmap STRATEGIC PILLARS E A R N I N G S P R E S E N T A T I O N | 4 Q ' 2 5 9 |
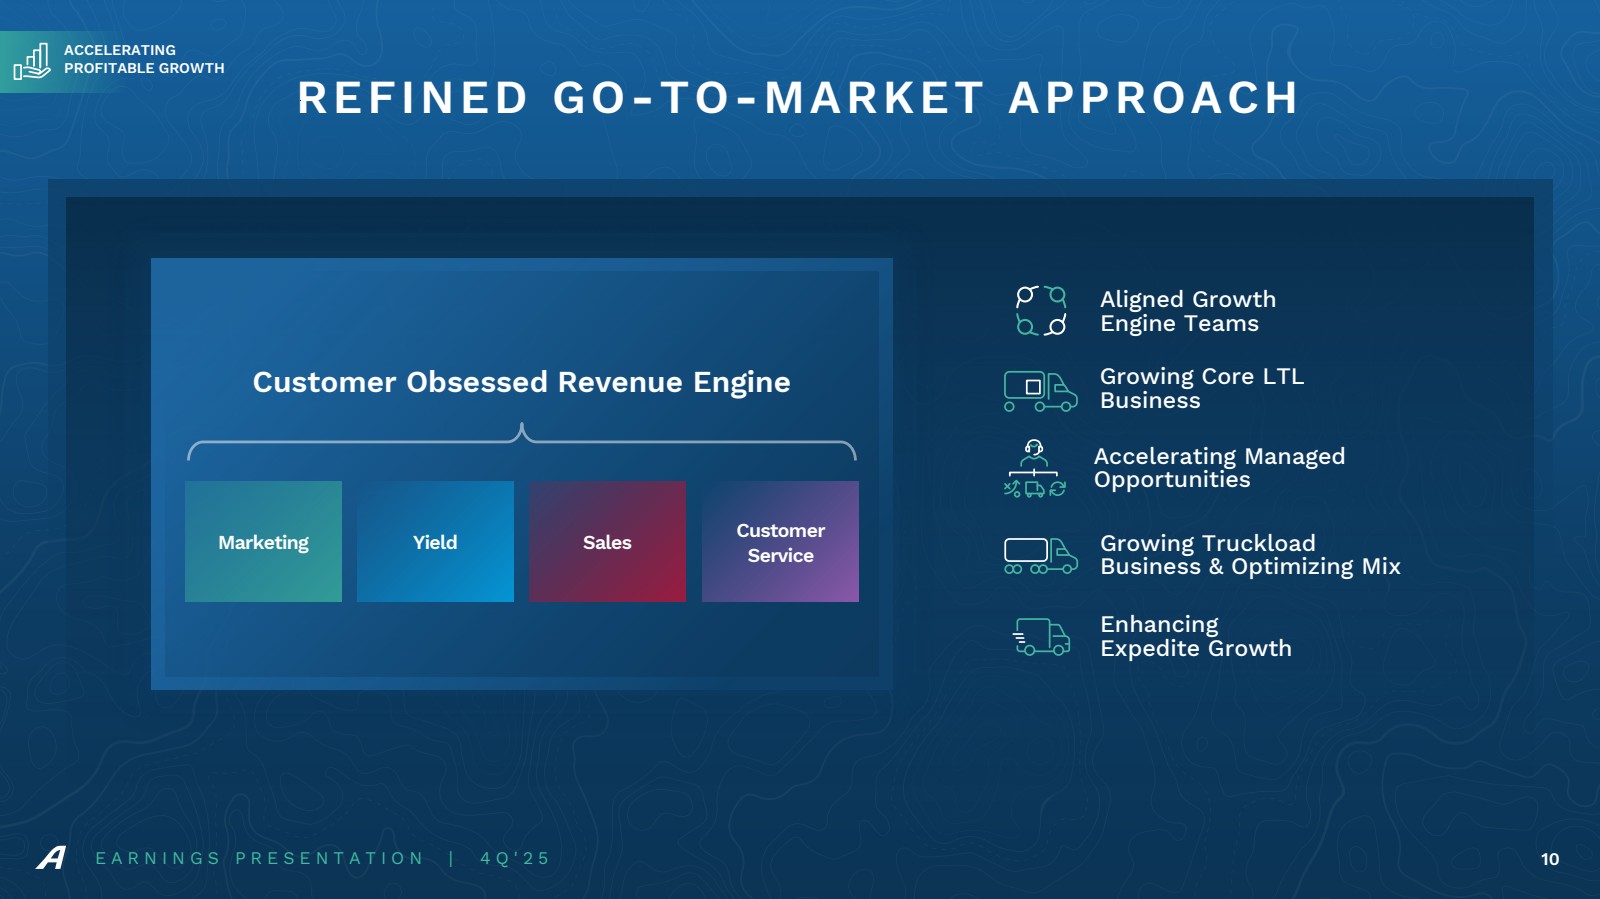
| Marketing Yield Sales Customer Service Customer Obsessed Revenue Engine Aligned Growth Engine Teams E A R N I N G S P R E S E N T A T I O N | 4 Q ' 2 5 10 REFINED GO-TO-MARKET APPROACH Accelerating Managed Opportunities Growing Core LTL Business Growing Truckload Business & Optimizing Mix Enhancing Expedite Growth ACCELERATING PROFITABLE GROWTH |
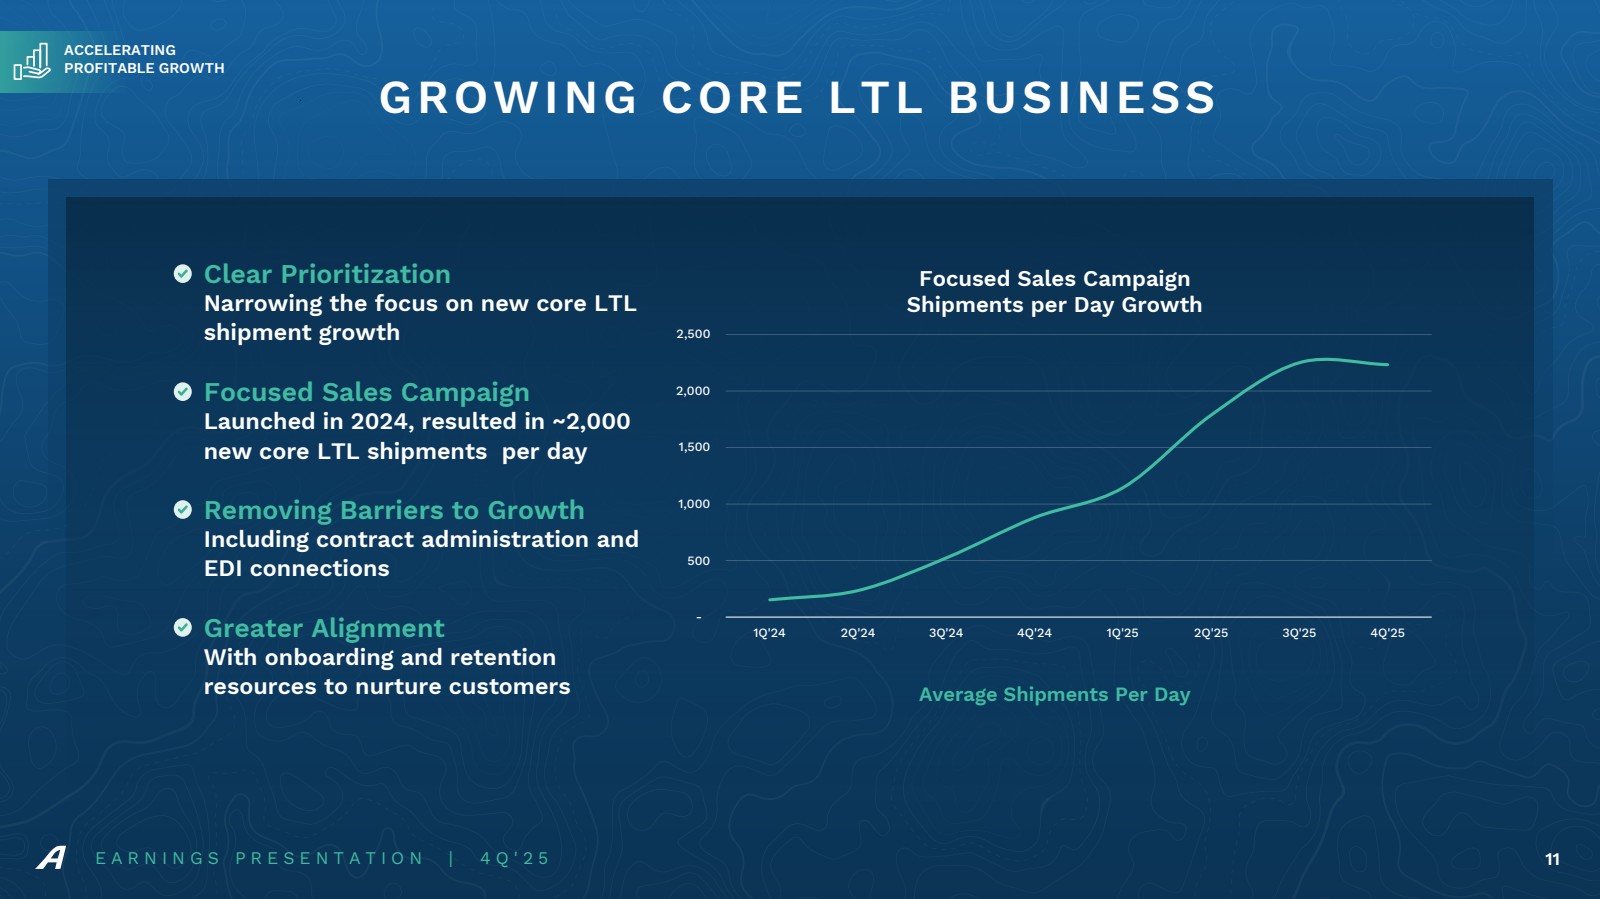
| Clear Prioritization Narrowing the focus on new core LTL shipment growth Focused Sales Campaign Launched in 2024, resulted in ~2,000 new core LTL shipments per day Removing Barriers to Growth Including contract administration and EDI connections Greater Alignment With onboarding and retention resources to nurture customers E A R N I N G S P R E S E N T A T I O N | 4 Q ' 2 5 11 GROWING CORE LTL BUSINESS - 500 1,000 1,500 2,000 2,500 1Q'24 2Q'24 3Q'24 4Q'24 1Q'25 2Q'25 3Q'25 4Q'25 Focused Sales Campaign Shipments per Day Growth Average Shipments Per Day ACCELERATING PROFITABLE GROWTH |
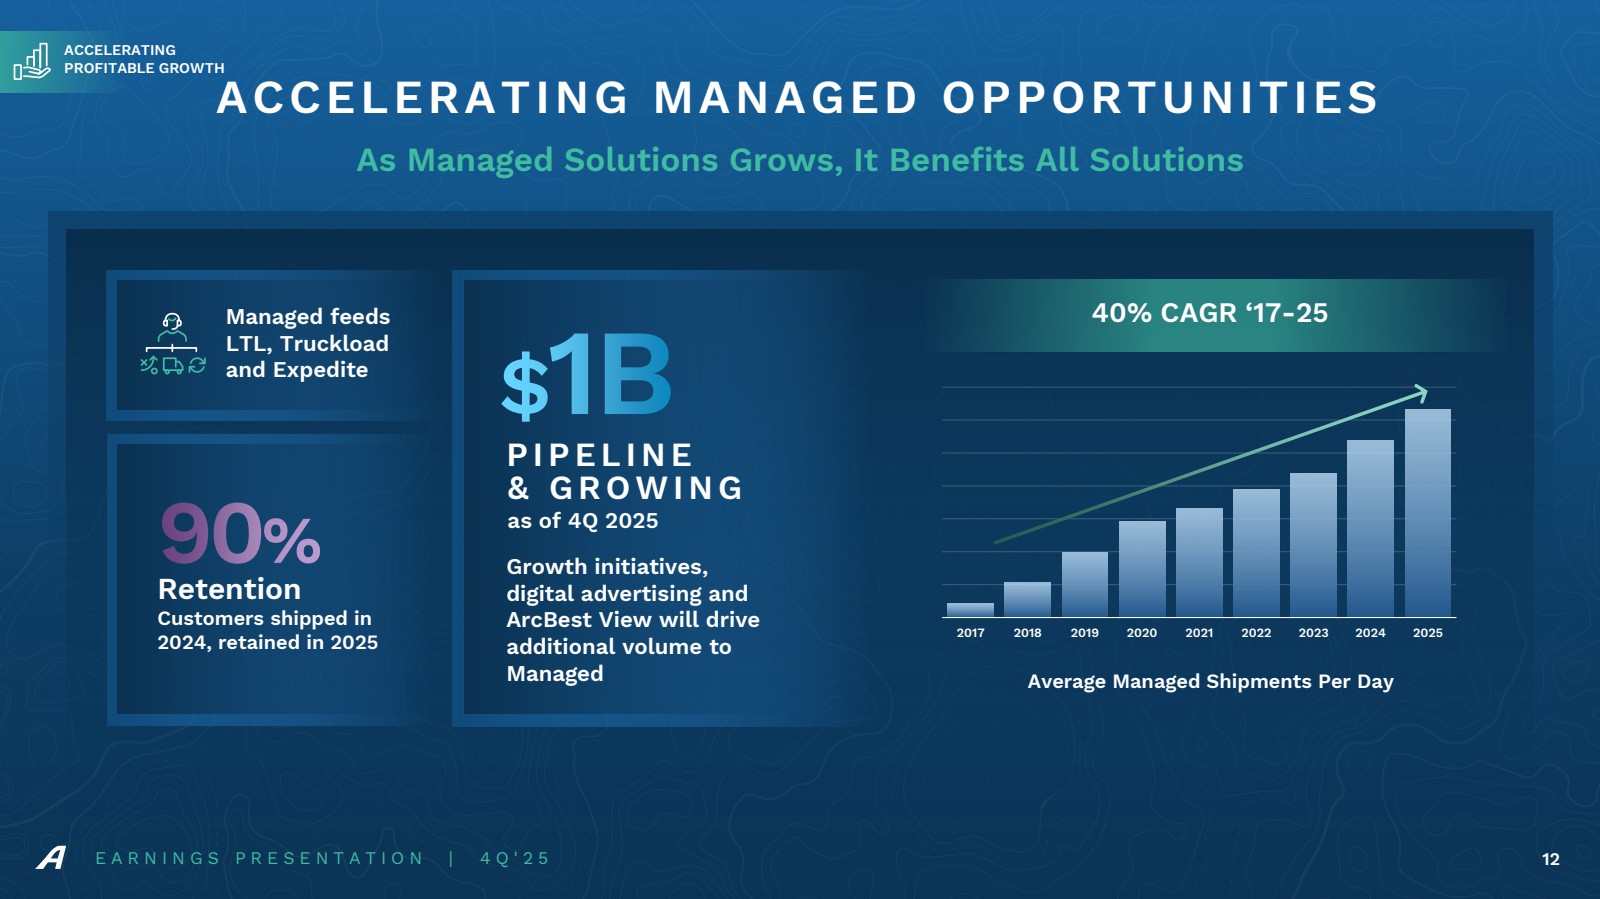
| 2017 2018 2019 2020 2021 2022 2023 2024 2025 Average Managed Shipments Per Day E A R N I N G S P R E S E N T A T I O N | 4 Q ' 2 5 12 ACCELERATING MANAGED OPPORTUNITIES As Managed Solutions Grows, It Benefits All Solutions Retention Customers shipped in 2024, retained in 2025 90% PIPELINE $1B & GROWING Growth initiatives, digital advertising and ArcBest View will drive additional volume to Managed as of 4Q 2025 ACCELERATING PROFITABLE GROWTH Managed feeds 40% CAGR ‘17-25 LTL, Truckload and Expedite |
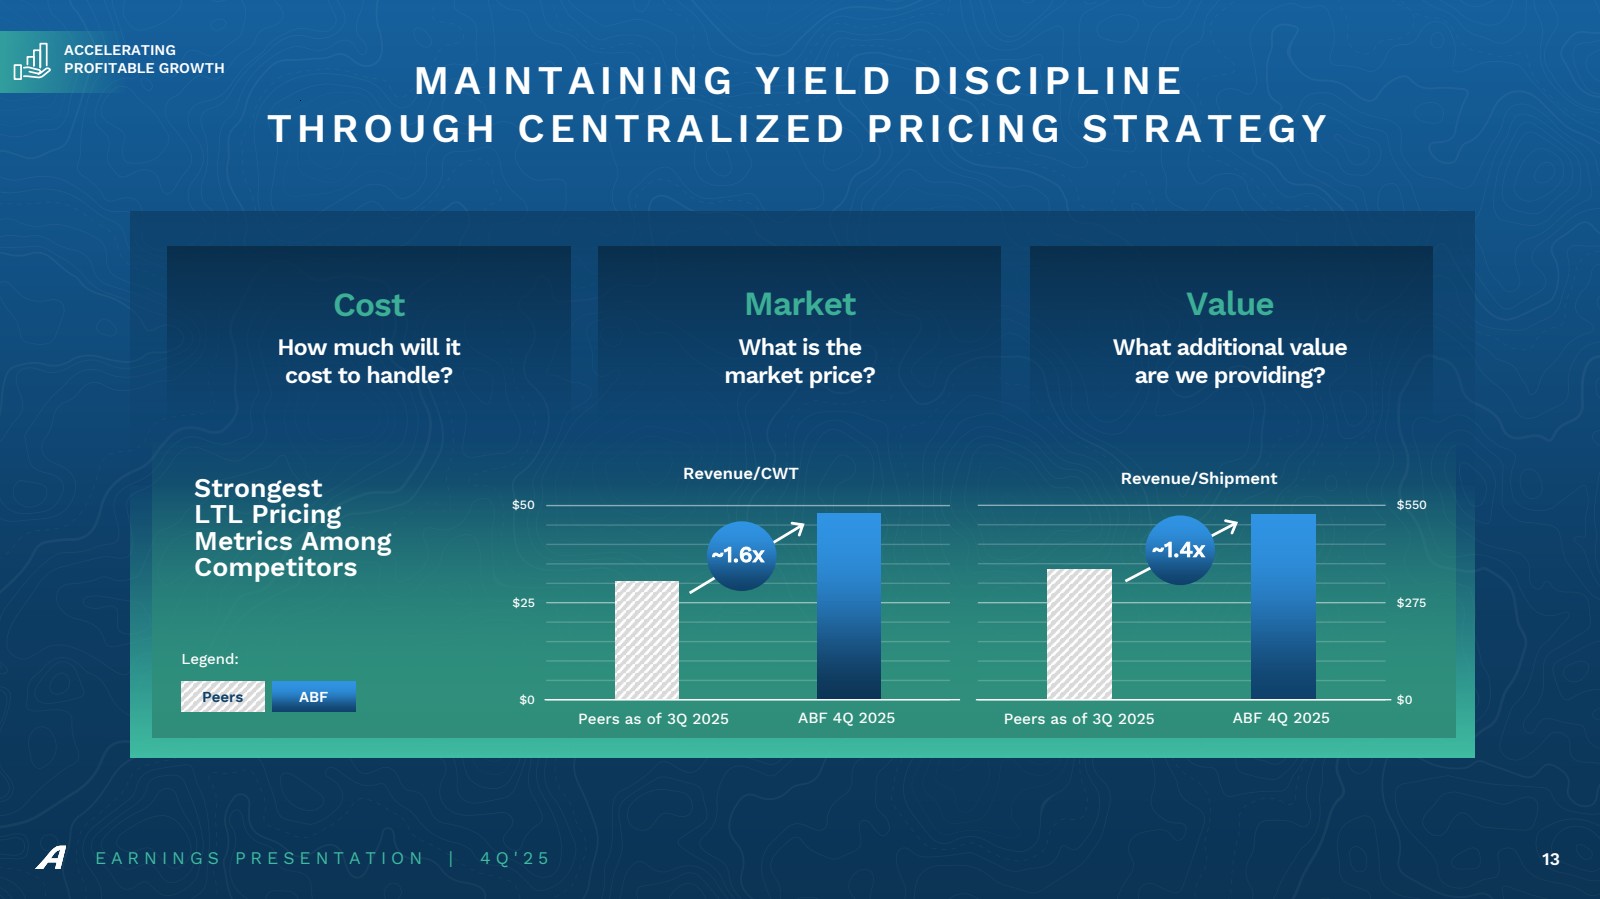
| MAINTAINING YIELD DISCIPLINE THROUGH CENTRALIZED PRICING STRATEGY $0 $25 $50 Revenue/CWT $0 $275 $550 Revenue/Shipment Cost Market Value Strongest LTL Pricing Metrics Among Competitors Peers ABF Legend: ~1.6x ~1.4x Peers as of 3Q 2025 What is the market price? How much will it cost to handle? What additional value are we providing? ABF 4Q 2025 Peers as of 3Q 2025 ABF 4Q 2025 E A R N I N G S P R E S E N T A T I O N | 4 Q ' 2 5 13 ACCELERATING PROFITABLE GROWTH |
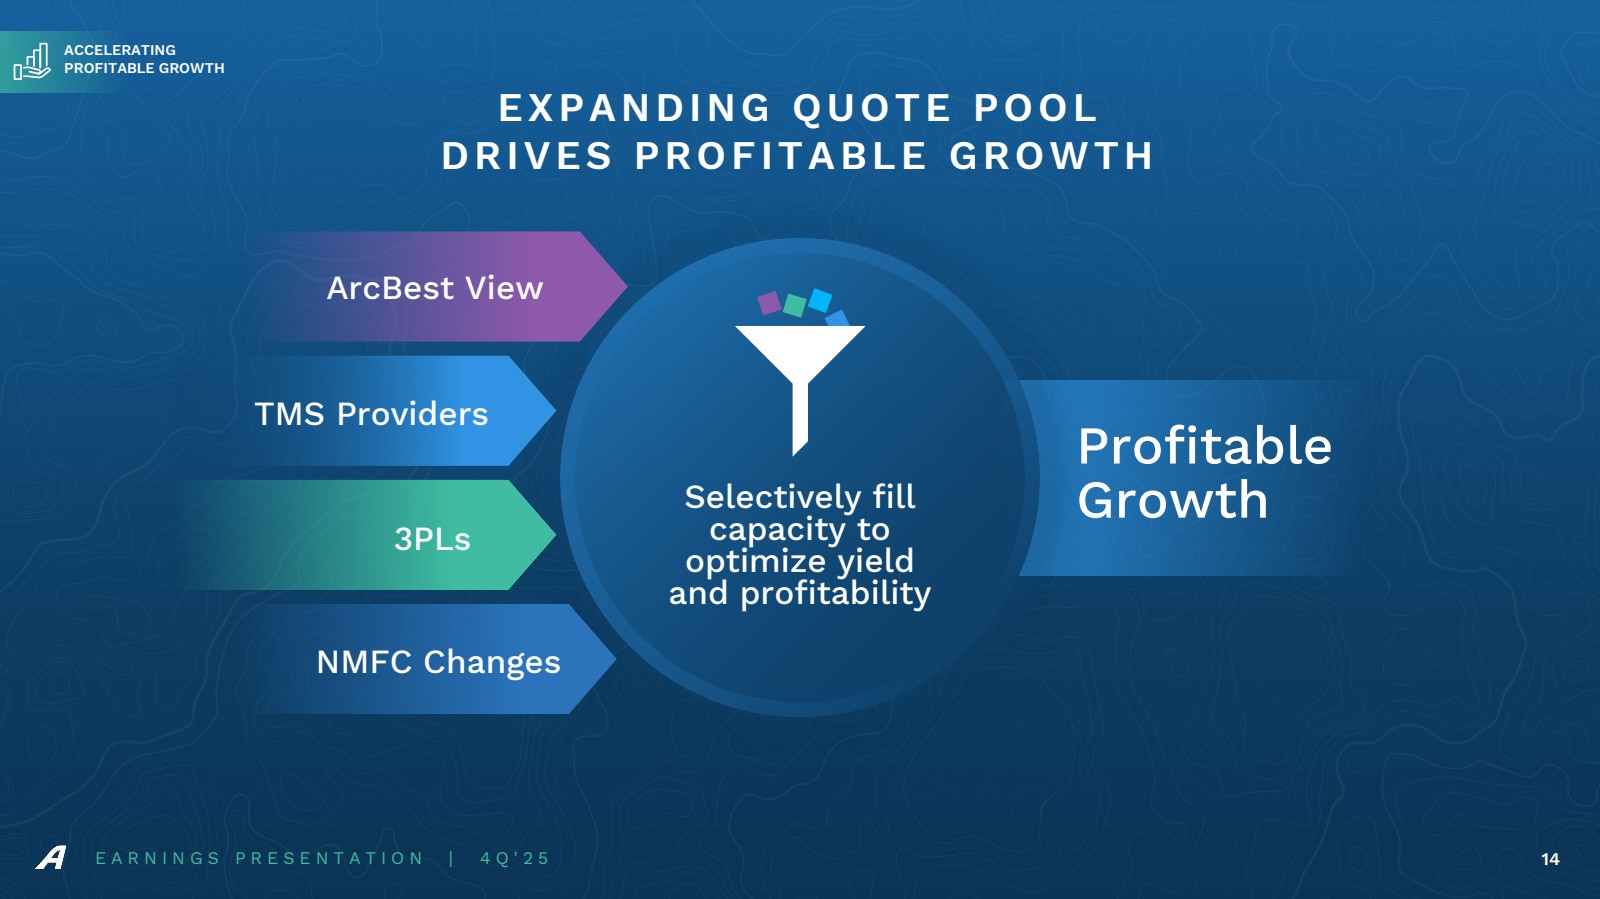
| EXPANDING QUOTE POOL DRIVES PROFITABLE GROWTH Selectively fill capacity to optimize yield and profitability ArcBest View TMS Providers 3PLs NMFC Changes Profitable Growth E A R N I N G S P R E S E N T A T I O N | 4 Q ' 2 5 14 ACCELERATING PROFITABLE GROWTH |
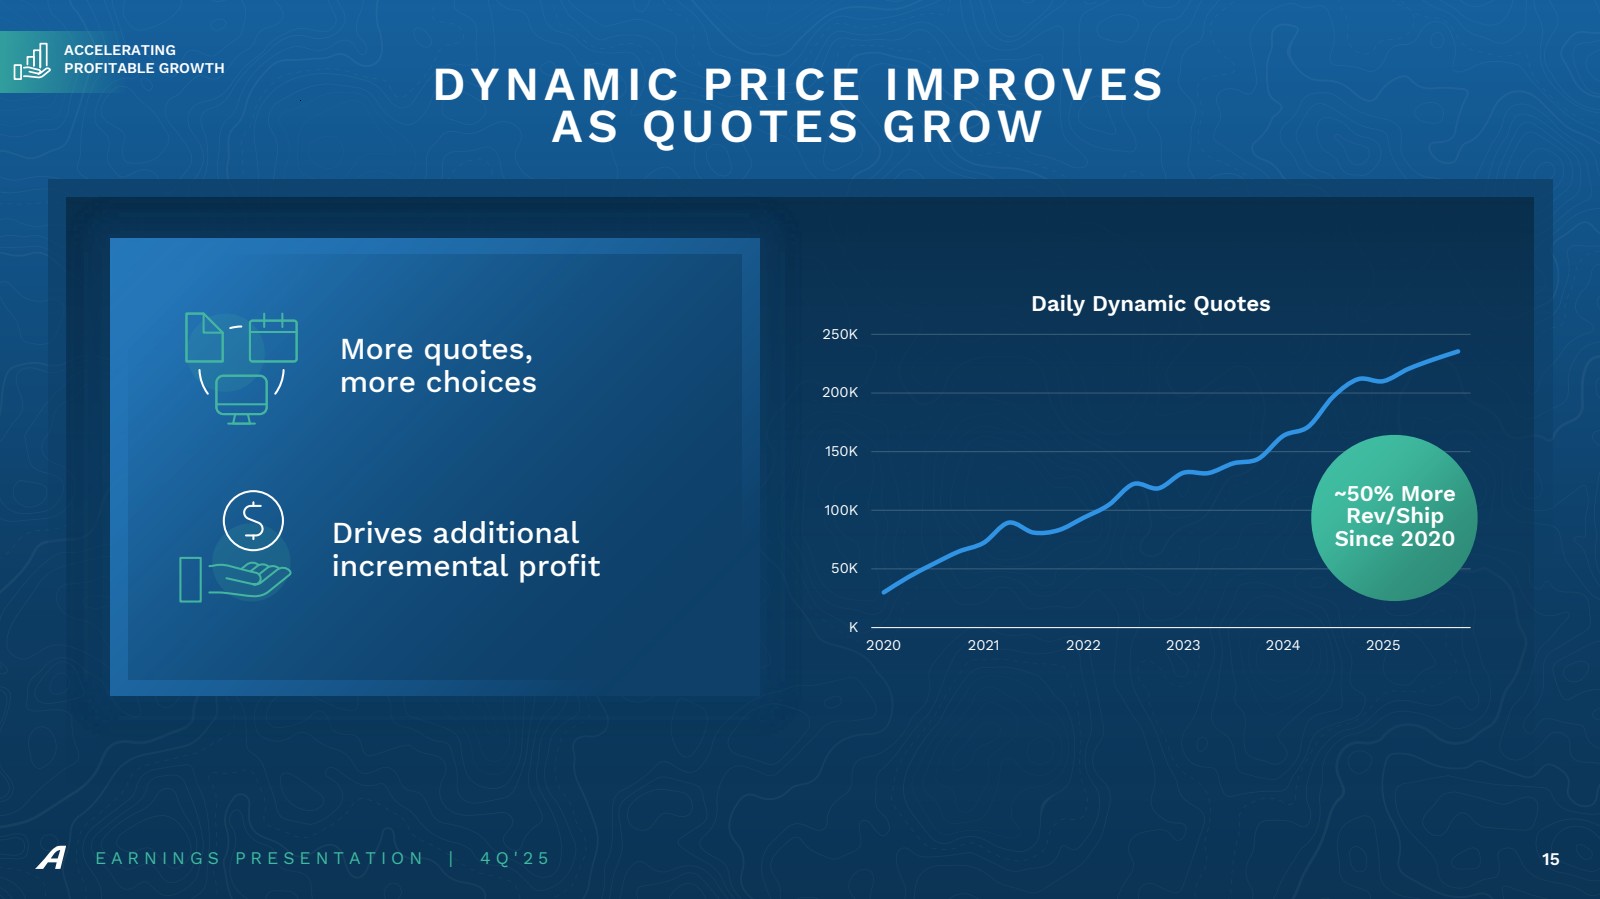
| More quotes, more choices Drives additional incremental profit E A R N I N G S P R E S E N T A T I O N | 4 Q ' 2 5 15 DYNAMIC PRICE IMPROVES AS QUOTES GROW K 50K 100K 150K 200K 250K 2020 2021 2022 2023 2024 2025 Daily Dynamic Quotes ~50% More Rev/Ship Since 2020 ACCELERATING PROFITABLE GROWTH |
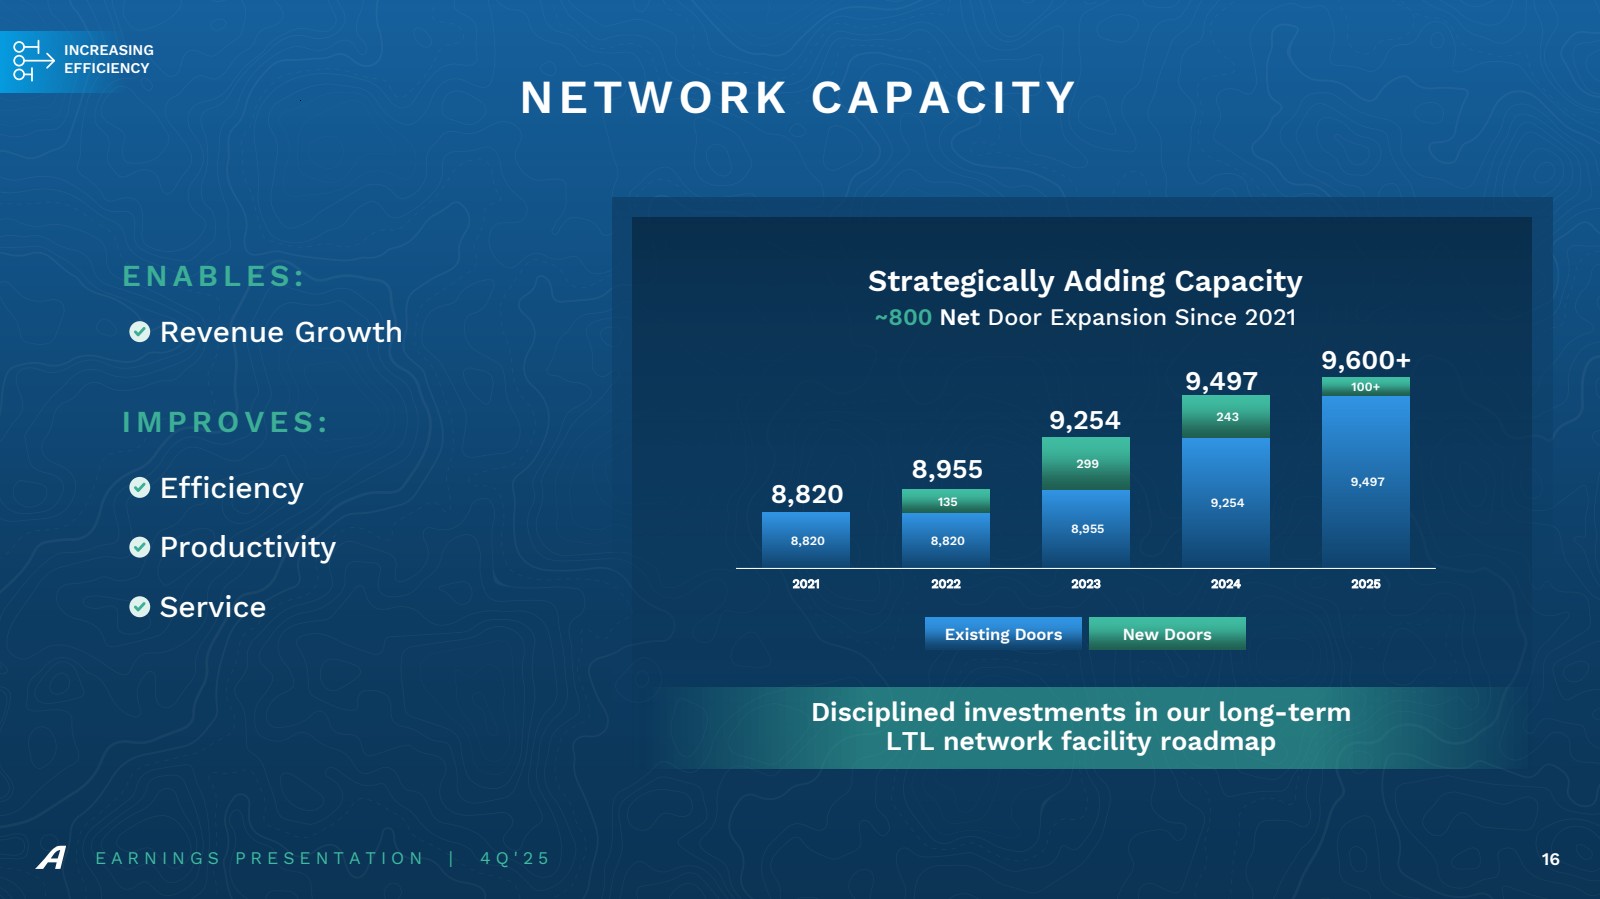
| 8,820 8,820 8,955 9,254 9,497 135 299 243 100+ 2021 2022 2023 2024 2025 ~800 Net Door Expansion Since 2021 8,820 8,955 9,254 9,497 9,600+ Existing Doors New Doors Strategically Adding Capacity Revenue Growth E N A B L E S : Efficiency Productivity Service I M P R O V E S : E A R N I N G S P R E S E N T A T I O N | 4 Q ' 2 5 16 NETWORK CAPACITY Disciplined investments in our long-term LTL network facility roadmap INCREASING EFFICIENCY |
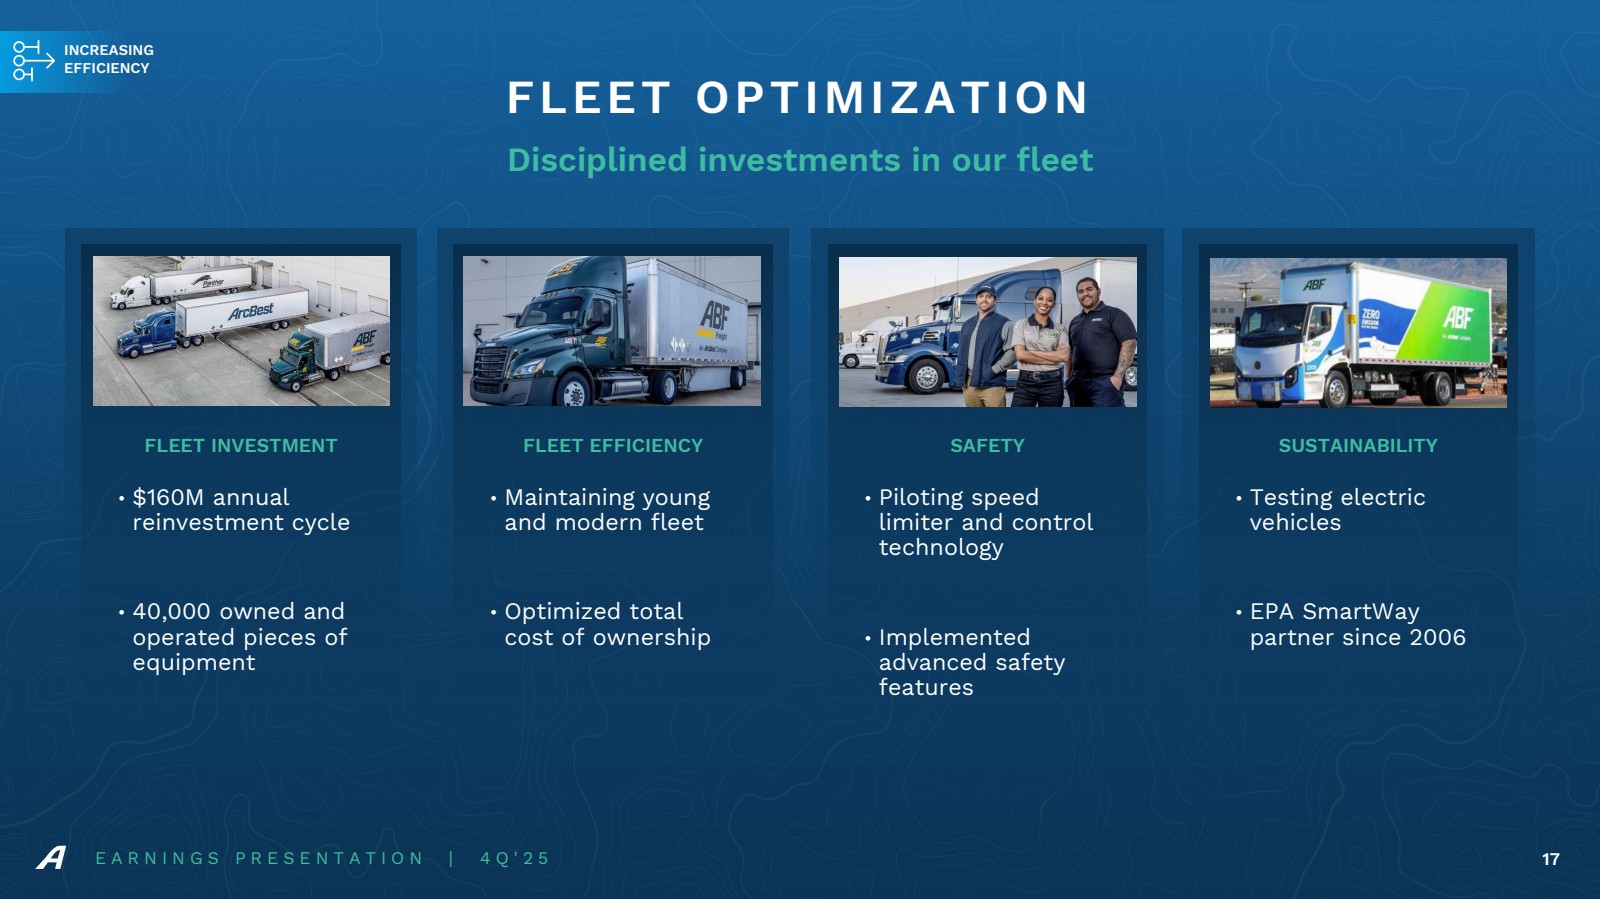
| E A R N I N G S P R E S E N T A T I O N | 4 Q ' 2 5 17 FLEET OPTIMIZATION Disciplined investments in our fleet FLEET INVESTMENT • $160M annual reinvestment cycle • 40,000 owned and operated pieces of equipment FLEET EFFICIENCY • Maintaining young and modern fleet • Optimized total cost of ownership SAFETY • Piloting speed limiter and control technology • Implemented advanced safety features SUSTAINABILITY • Testing electric vehicles • EPA SmartWay partner since 2006 INCREASING EFFICIENCY |
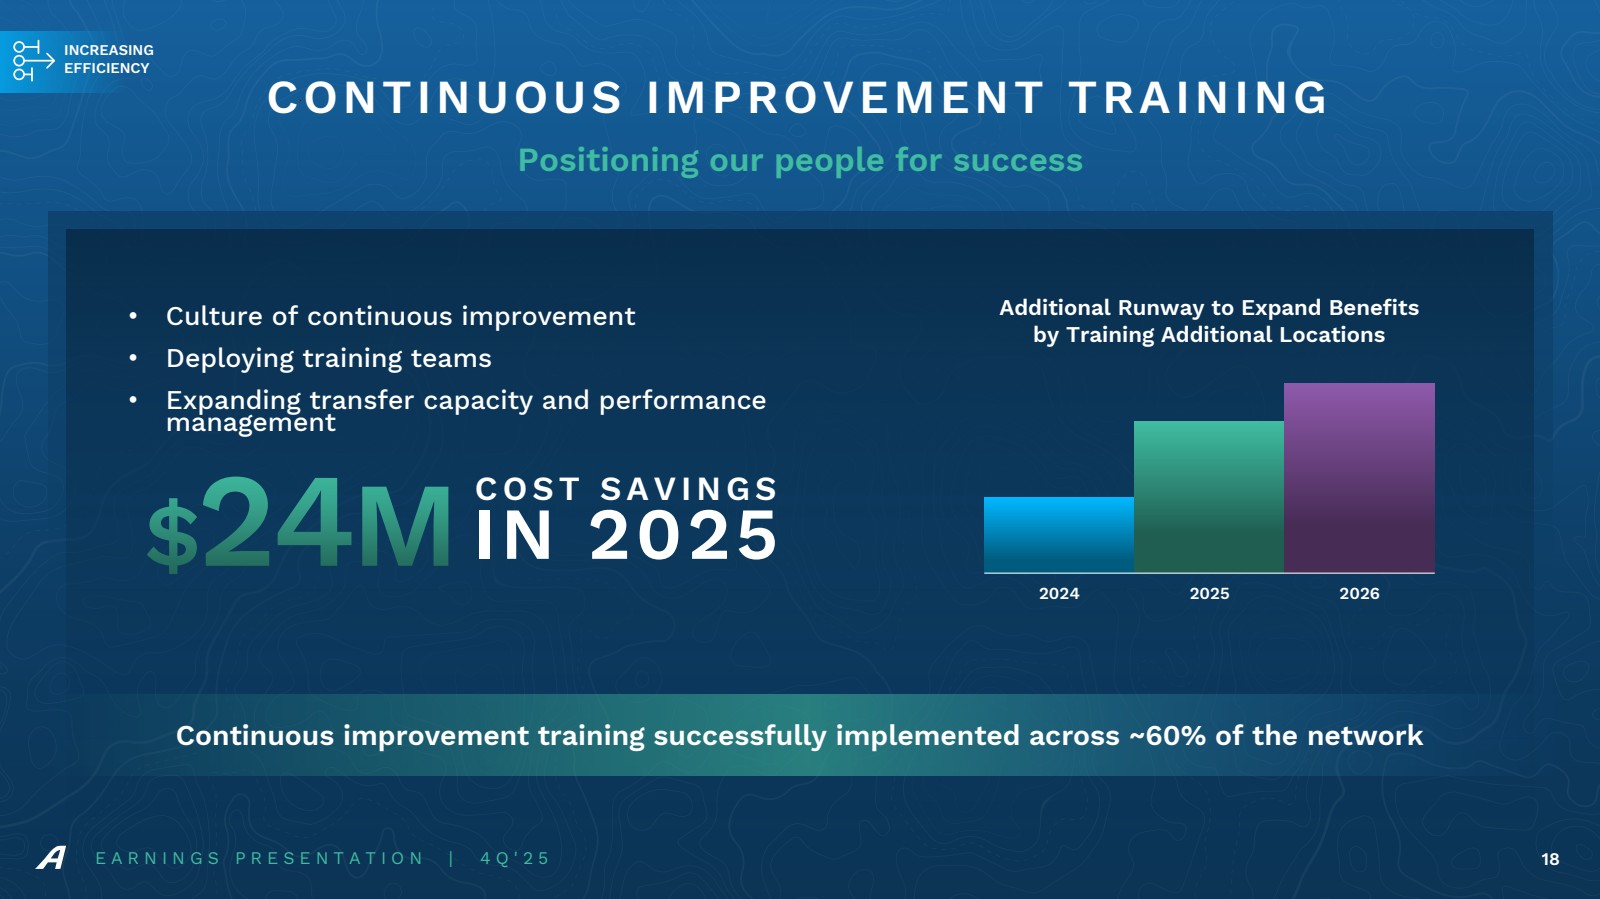
| $24M COST SAVINGS IN 2025 Additional Runway to Expand Benefits by Training Additional Locations • Culture of continuous improvement • Deploying training teams • Expanding transfer capacity and performance management E A R N I N G S P R E S E N T A T I O N | 4 Q ' 2 5 18 CONTINUOUS IMPROVEMENT TRAINING Positioning our people for success Continuous improvement training successfully implemented across ~60% of the network 2024 2025 2026 INCREASING EFFICIENCY |
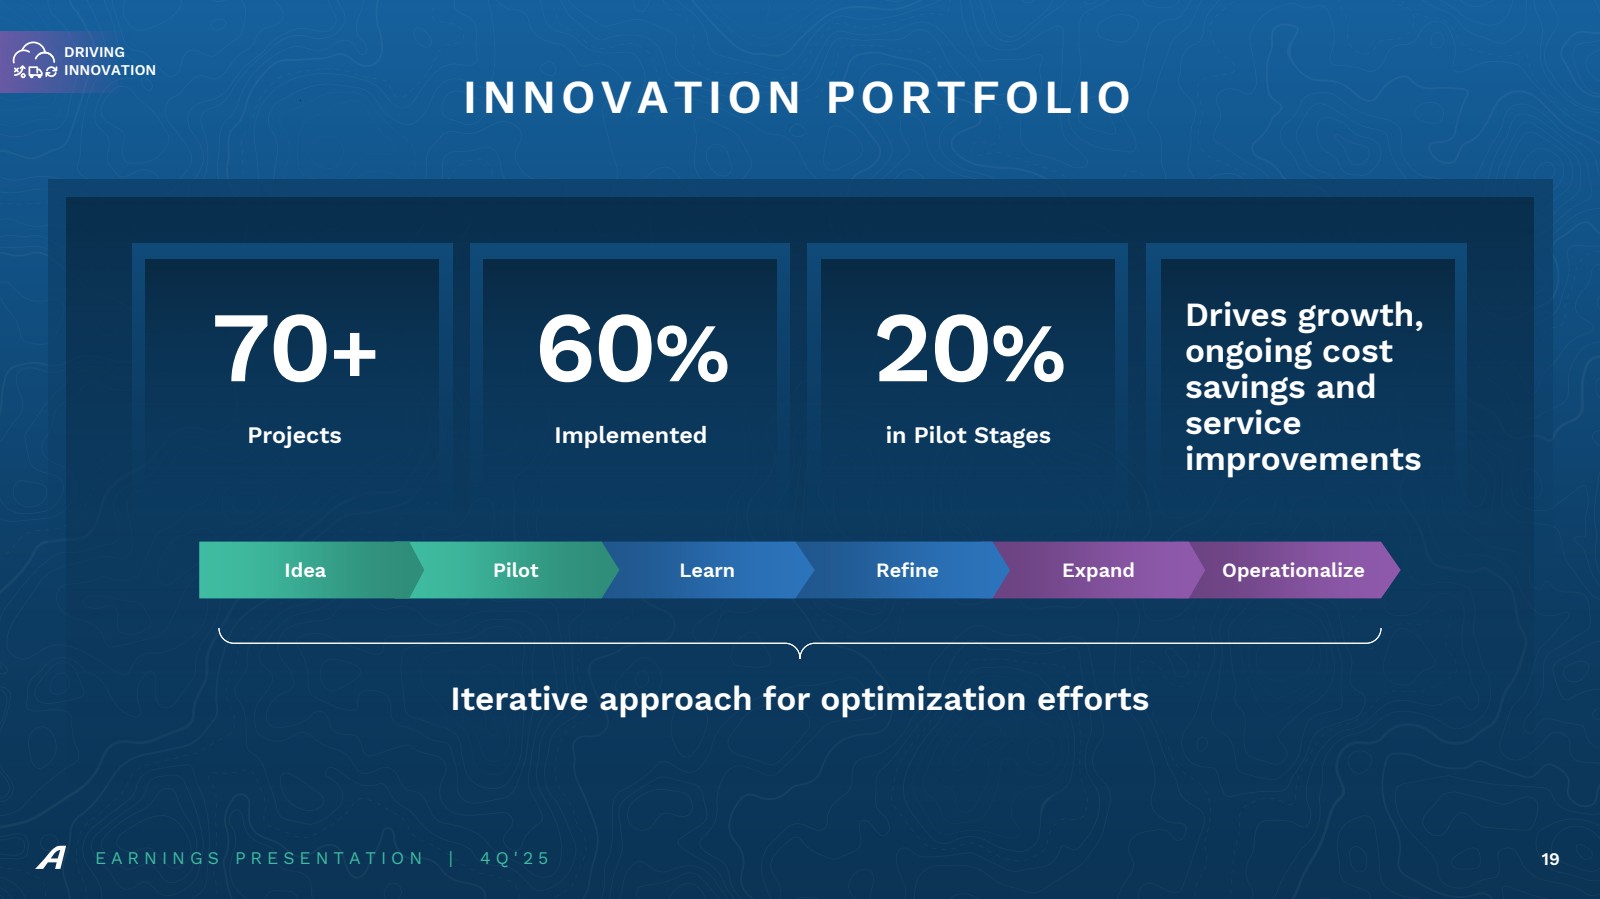
| E A R N I N G S P R E S E N T A T I O N | 4 Q ' 2 5 19 INNOVATION PORTFOLIO 70+ Projects 60% Implemented 20% in Pilot Stages Drives growth, ongoing cost savings and service improvements Idea Pilot Learn Refine Expand Operationalize Iterative approach for optimization efforts DRIVING INNOVATION |
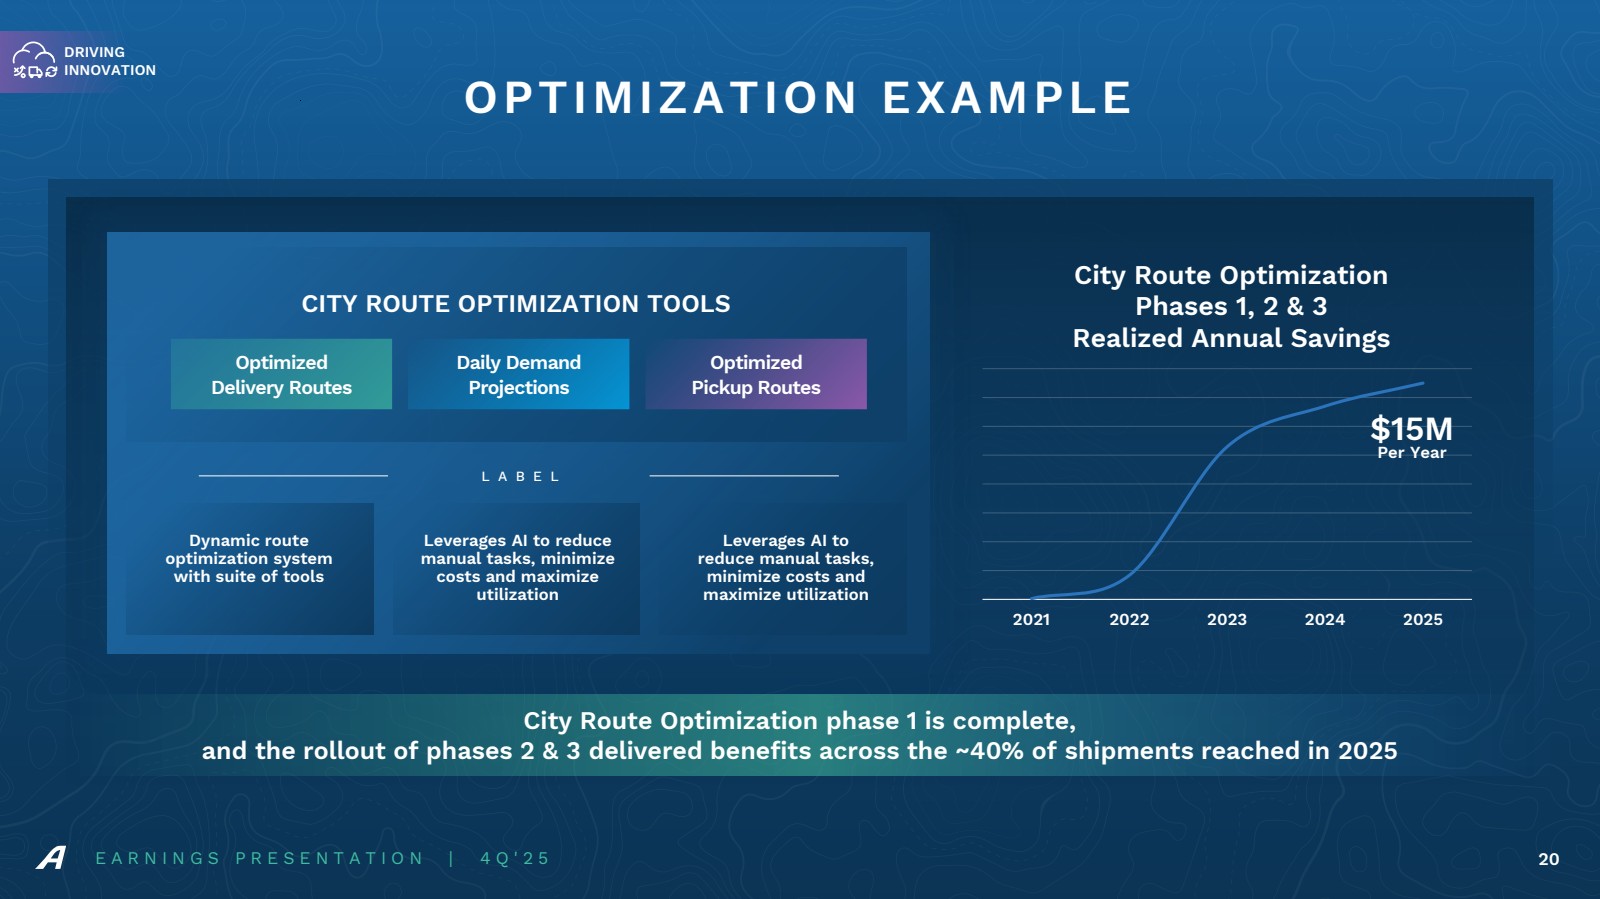
| 2021 2022 2023 2024 2025 City Route Optimization phase 1 is complete, and the rollout of phases 2 & 3 delivered benefits across the ~40% of shipments reached in 2025 City Route Optimization Phases 1, 2 & 3 Realized Annual Savings $15M Per Year E A R N I N G S P R E S E N T A T I O N | 4 Q ' 2 5 20 OPTIMIZATION EXAMPLE Dynamic route optimization system with suite of tools Optimized Delivery Routes Daily Demand Projections Optimized Pickup Routes CITY ROUTE OPTIMIZATION TOOLS Leverages AI to reduce manual tasks, minimize costs and maximize utilization Leverages AI to reduce manual tasks, minimize costs and maximize utilization L A B E L DRIVING INNOVATION |
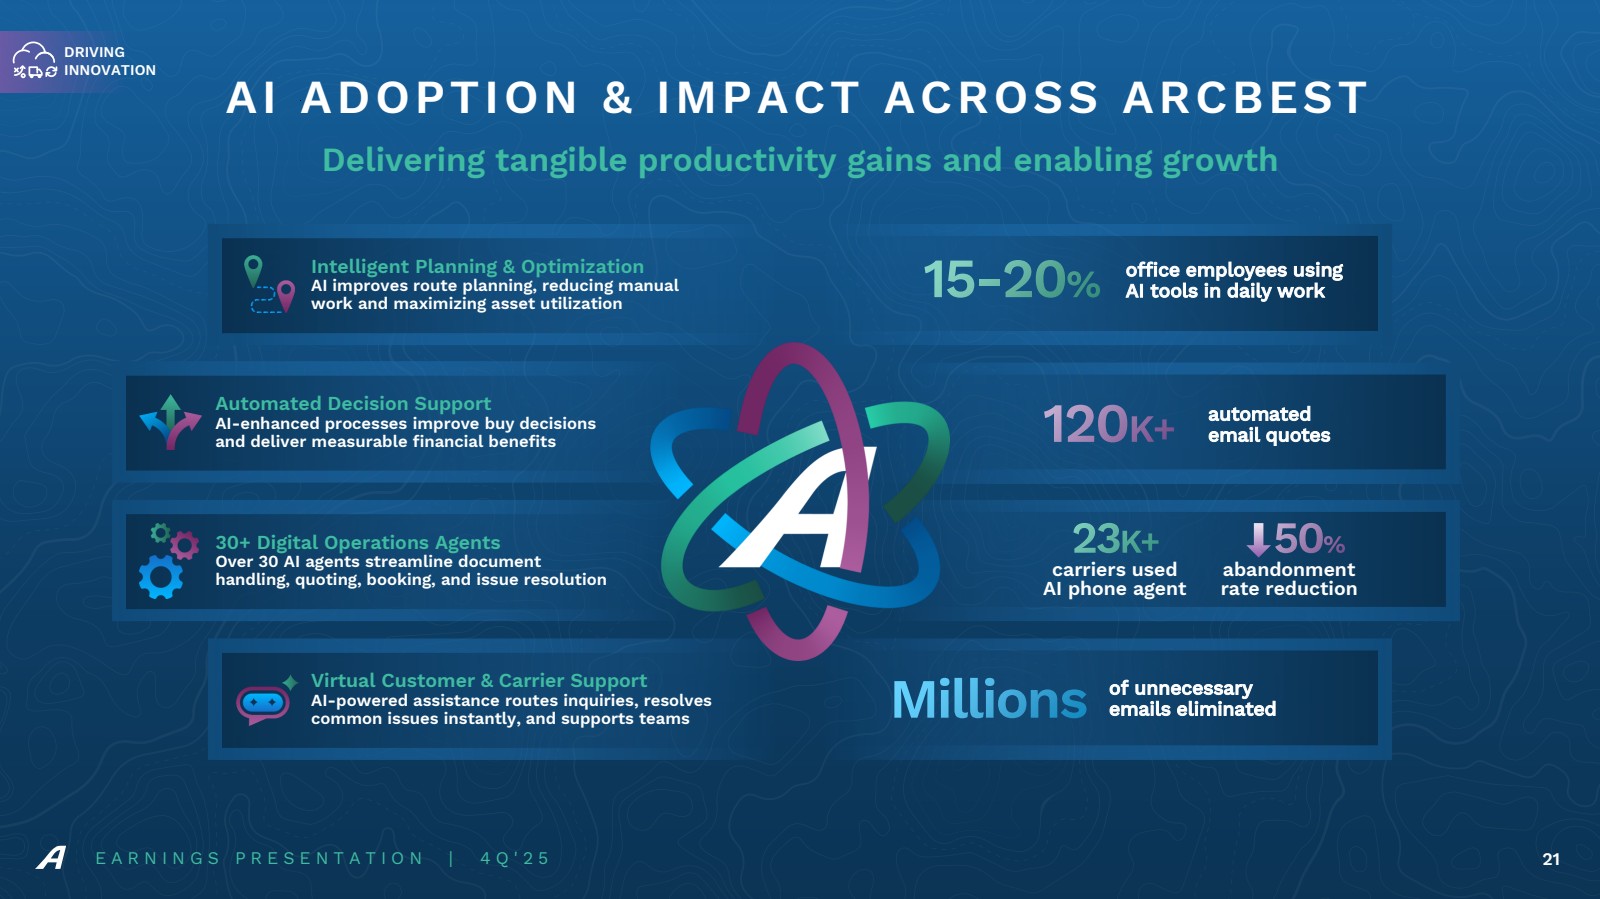
| Intelligent Planning & Optimization AI improves route planning, reducing manual work and maximizing asset utilization E A R N I N G S P R E S E N T A T I O N | 4 Q ' 2 5 21 AI ADOPTION & IMPACT ACROSS ARCBEST Delivering tangible productivity gains and enabling growth DRIVING INNOVATION Automated Decision Support AI-enhanced processes improve buy decisions and deliver measurable financial benefits 30+ Digital Operations Agents Over 30 AI agents streamline document handling, quoting, booking, and issue resolution Virtual Customer & Carrier Support AI-powered assistance routes inquiries, resolves common issues instantly, and supports teams 15-20% office employees using AI tools in daily work 120K+ automated email quotes 23K+ carriers used AI phone agent abandonment rate reduction Millions of unnecessary emails eliminated 50% |
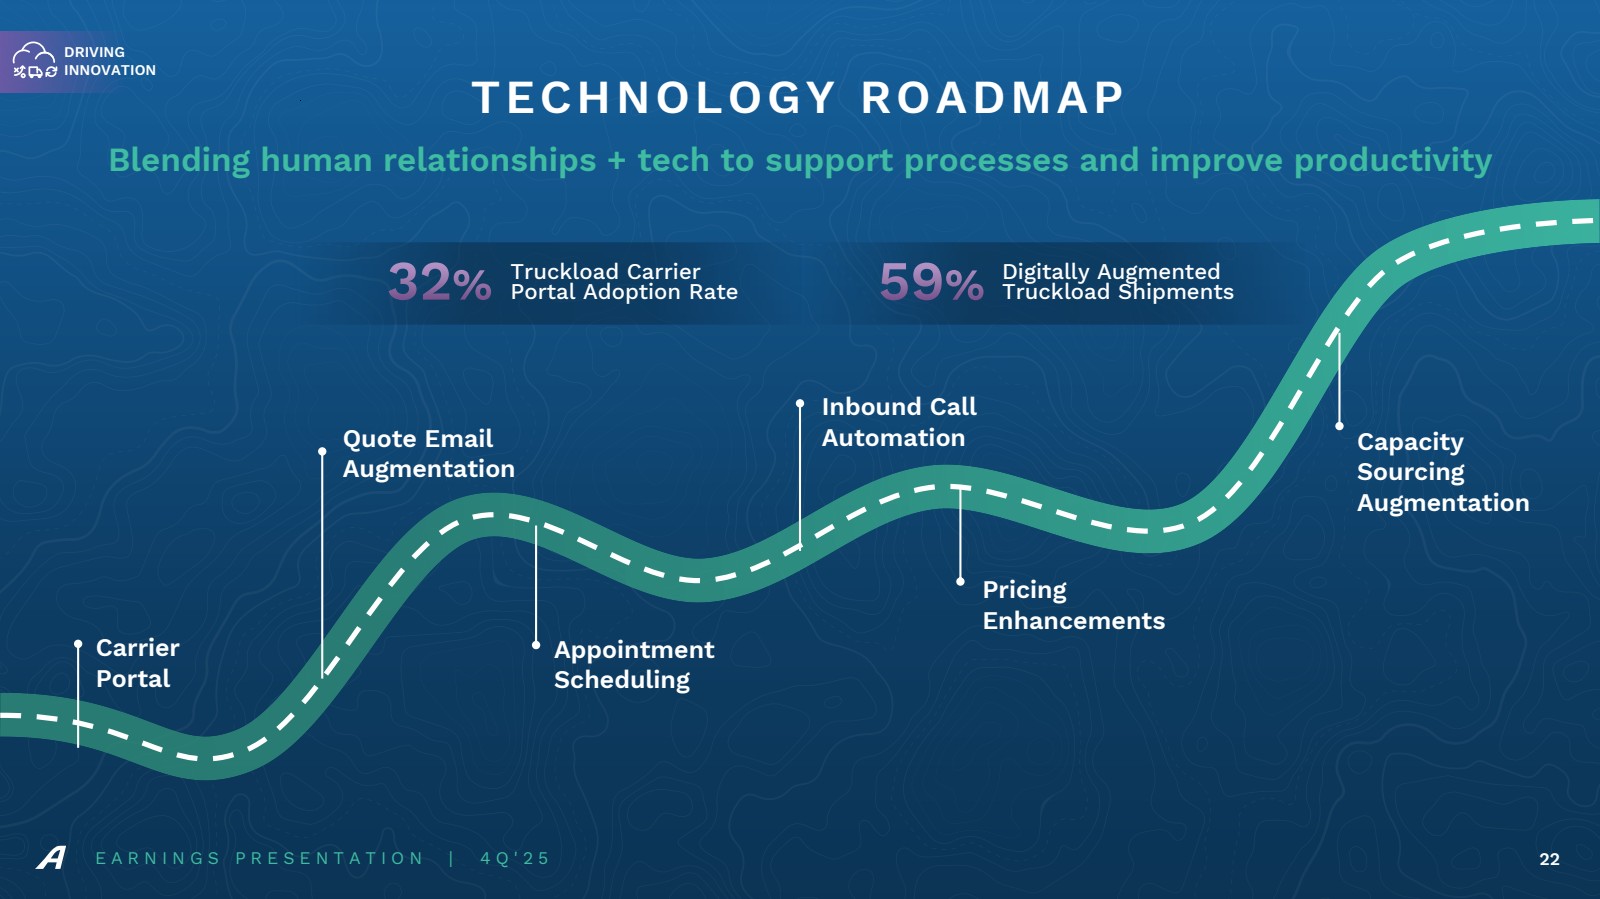
| E A R N I N G S P R E S E N T A T I O N | 4 Q ' 2 5 22 TECHNOLOGY ROADMAP Blending human relationships + tech to support processes and improve productivity Truckload Carrier 32% Portal Adoption Rate Digitally Augmented 59% Truckload Shipments Carrier Portal Quote Email Augmentation Appointment Scheduling Capacity Sourcing Augmentation Inbound Call Automation Pricing Enhancements DRIVING INNOVATION |
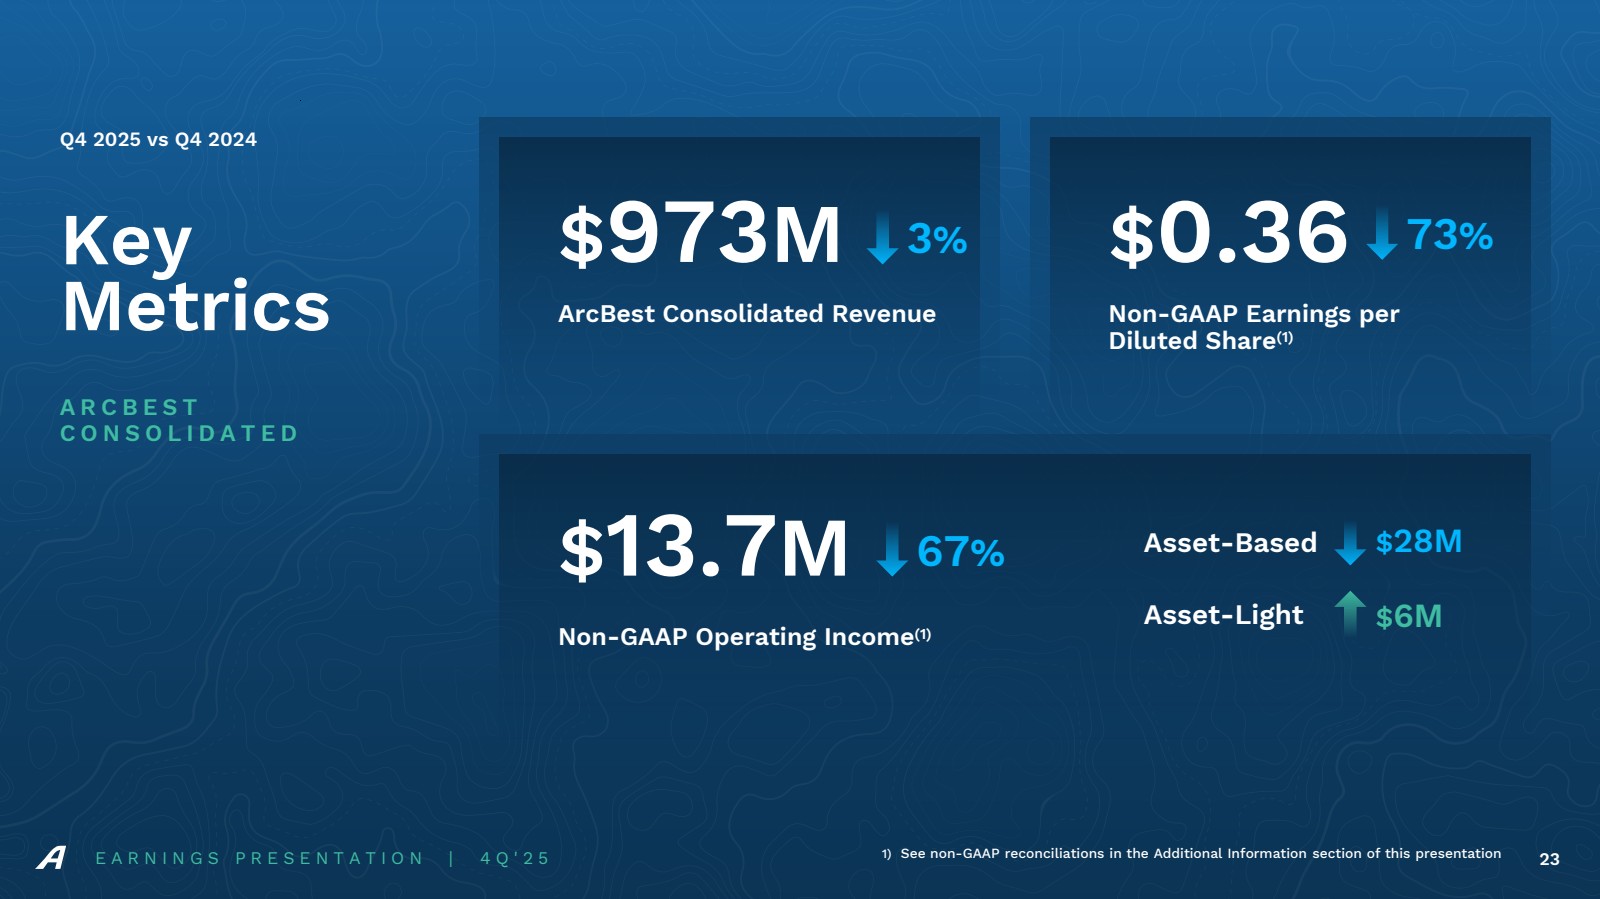
| E A R N I N G S P R E S E N T A T I O N | 4 Q ' 2 5 23 Key Metrics A R C B E S T C O N S O L I D A T E D Q4 2025 vs Q4 2024 $973M ArcBest Consolidated Revenue $0.36 Non-GAAP Earnings per Diluted Share(1) $13.7M Non-GAAP Operating Income(1) Asset-Based 3% Asset-Light 73% 67% $28M $6M 1) See non-GAAP reconciliations in the Additional Information section of this presentation |
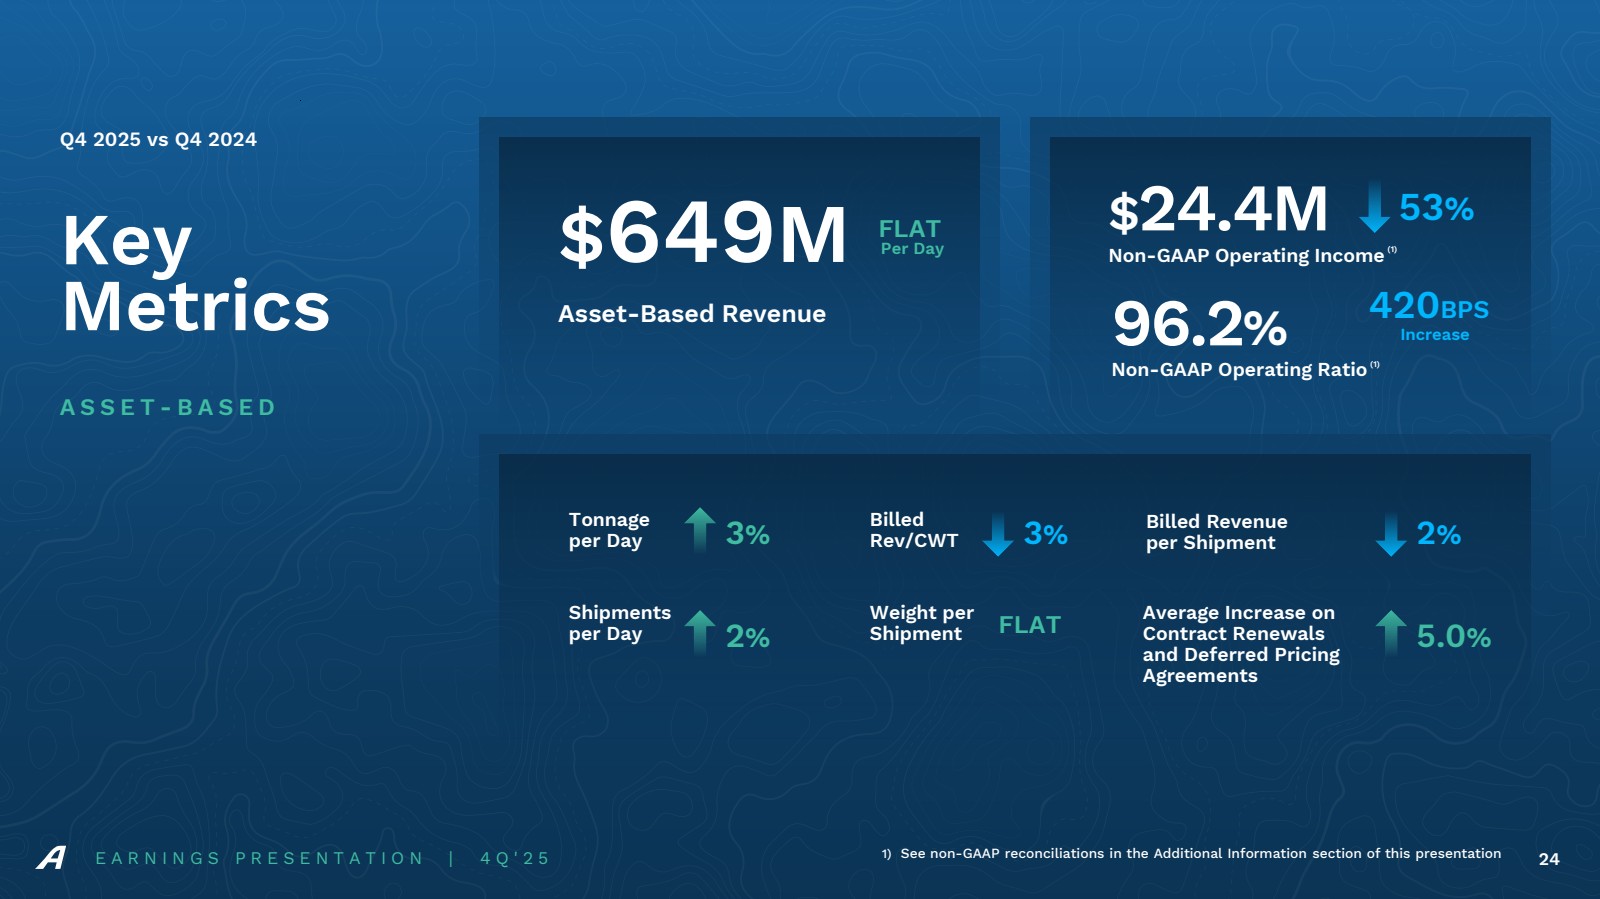
| Average Increase on Contract Renewals and Deferred Pricing Agreements Tonnage per Day Shipments per Day Billed Rev/CWT Weight per Shipment 3% Billed Revenue per Shipment 2% FLAT 3% 2% 5.0% E A R N I N G S P R E S E N T A T I O N | 4 Q ' 2 5 24 Key Metrics A S S E T - B A S E D Q4 2025 vs Q4 2024 Non-GAAP Operating Income(1) $24.4M 53% FLAT Per Day 96.2% Non-GAAP Operating Ratio(1) 420BPS Increase 1) See non-GAAP reconciliations in the Additional Information section of this presentation Asset-Based Revenue $649M |
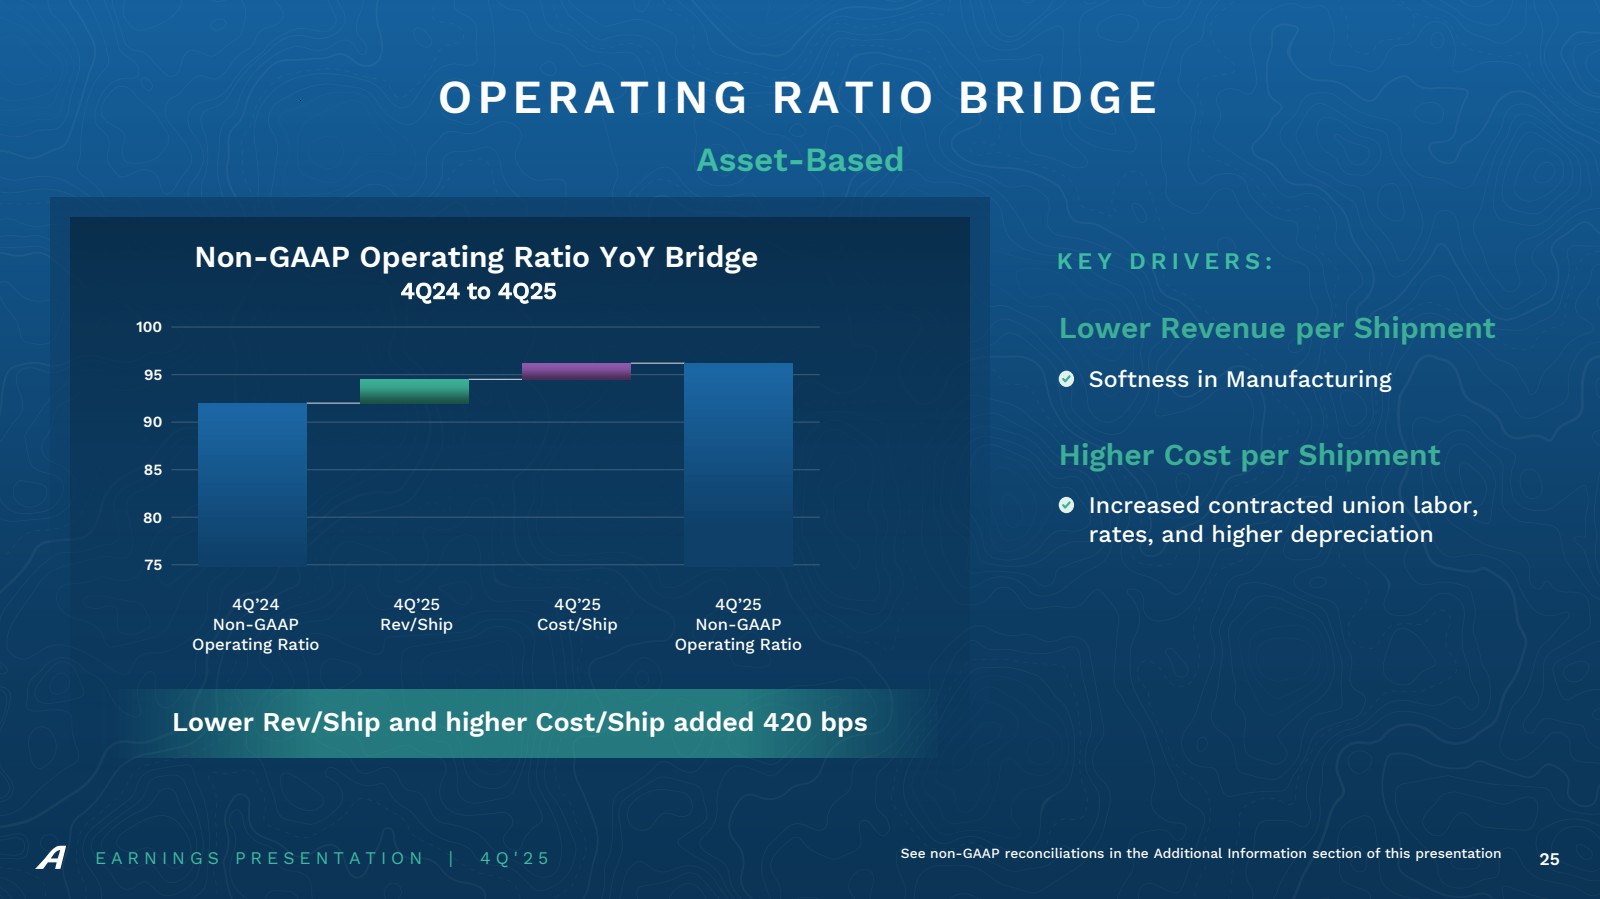
| Lower Revenue per Shipment Softness in Manufacturing Higher Cost per Shipment Increased contracted union labor, rates, and higher depreciation 75 80 85 90 95 100 Non-GAAP Operating Ratio YoY Bridge Lower Rev/Ship and higher Cost/Ship added 420 bps E A R N I N G S P R E S E N T A T I O N | 4 Q ' 2 5 25 OPERATING RATIO BRIDGE K E Y D R I V E R S : Asset-Based 4Q24 to 4Q25 4Q’24 Non-GAAP Operating Ratio 4Q’25 Rev/Ship 4Q’25 Cost/Ship 4Q’25 Non-GAAP Operating Ratio See non-GAAP reconciliations in the Additional Information section of this presentation |
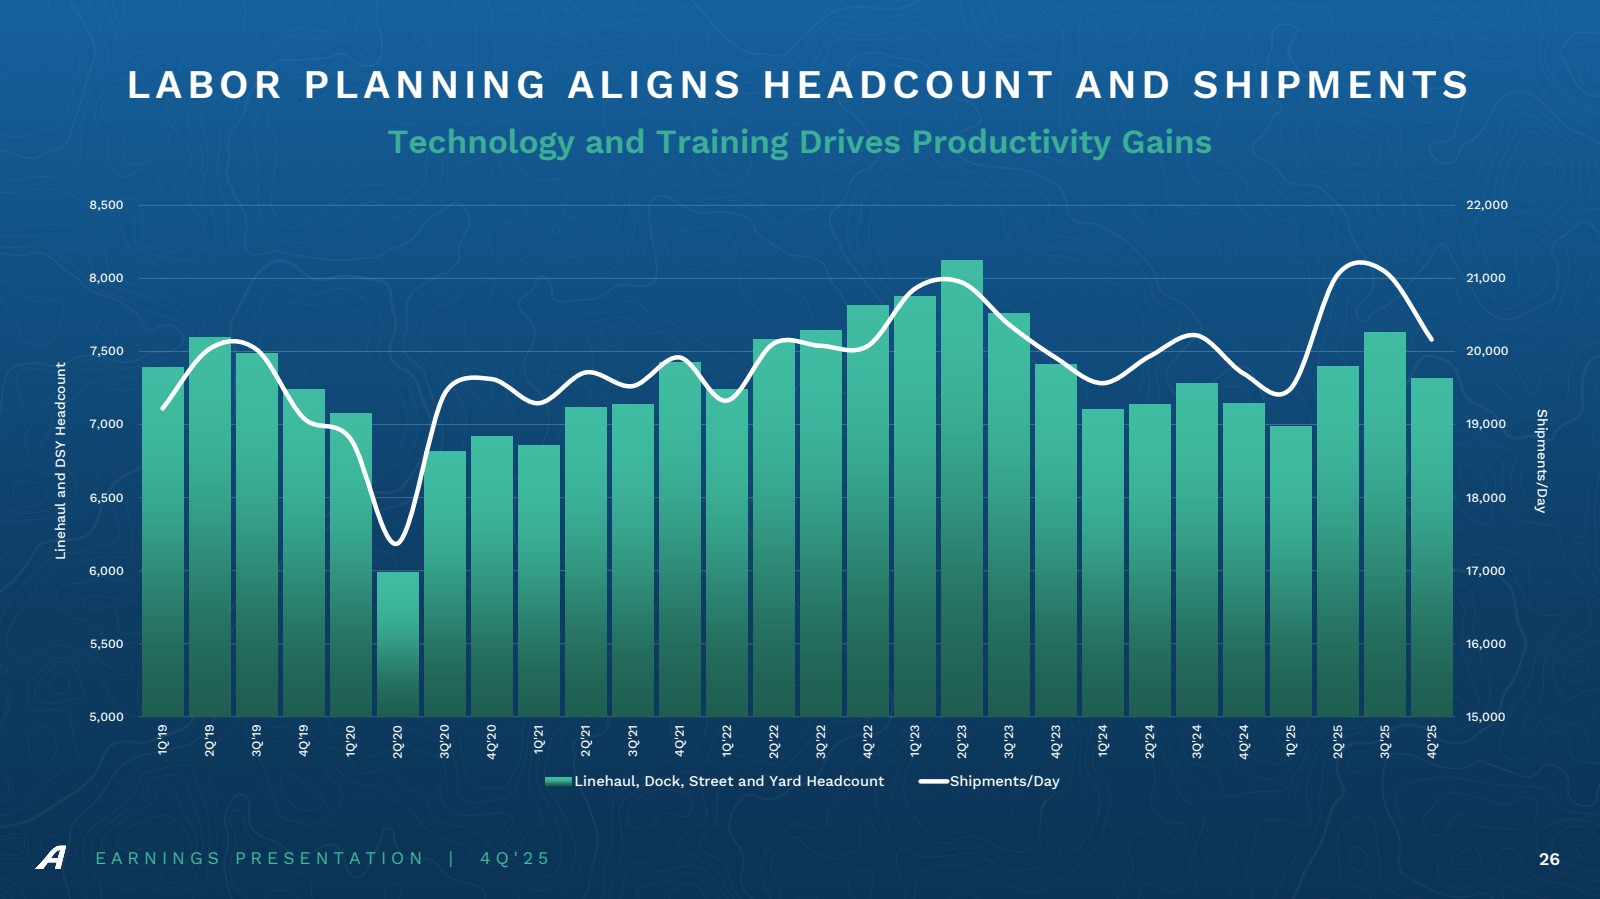
| E A R N I N G S P R E S E N T A T I O N | 4 Q ' 2 5 26 LABOR PLANNING ALIGNS HEADCOUNT AND SHIPMENTS 15,000 16,000 17,000 18,000 19,000 20,000 21,000 22,000 5,000 5,500 6,000 6,500 7,000 7,500 8,000 8,500 1Q'19 2Q'19 3Q'19 4Q'19 1Q'20 2Q'20 3Q'20 4Q'20 1Q'21 2Q'21 3Q'21 4Q'21 1Q'22 2Q'22 3Q'22 4Q'22 1Q'23 2Q'23 3Q'23 4Q'23 1Q'24 2Q'24 3Q'24 4Q'24 1Q'25 2Q'25 3Q'25 4Q'25 Shipments/Day Linehaul and DSY Headcount Linehaul, Dock, Street and Yard Headcount Shipments/Day Technology and Training Drives Productivity Gains |
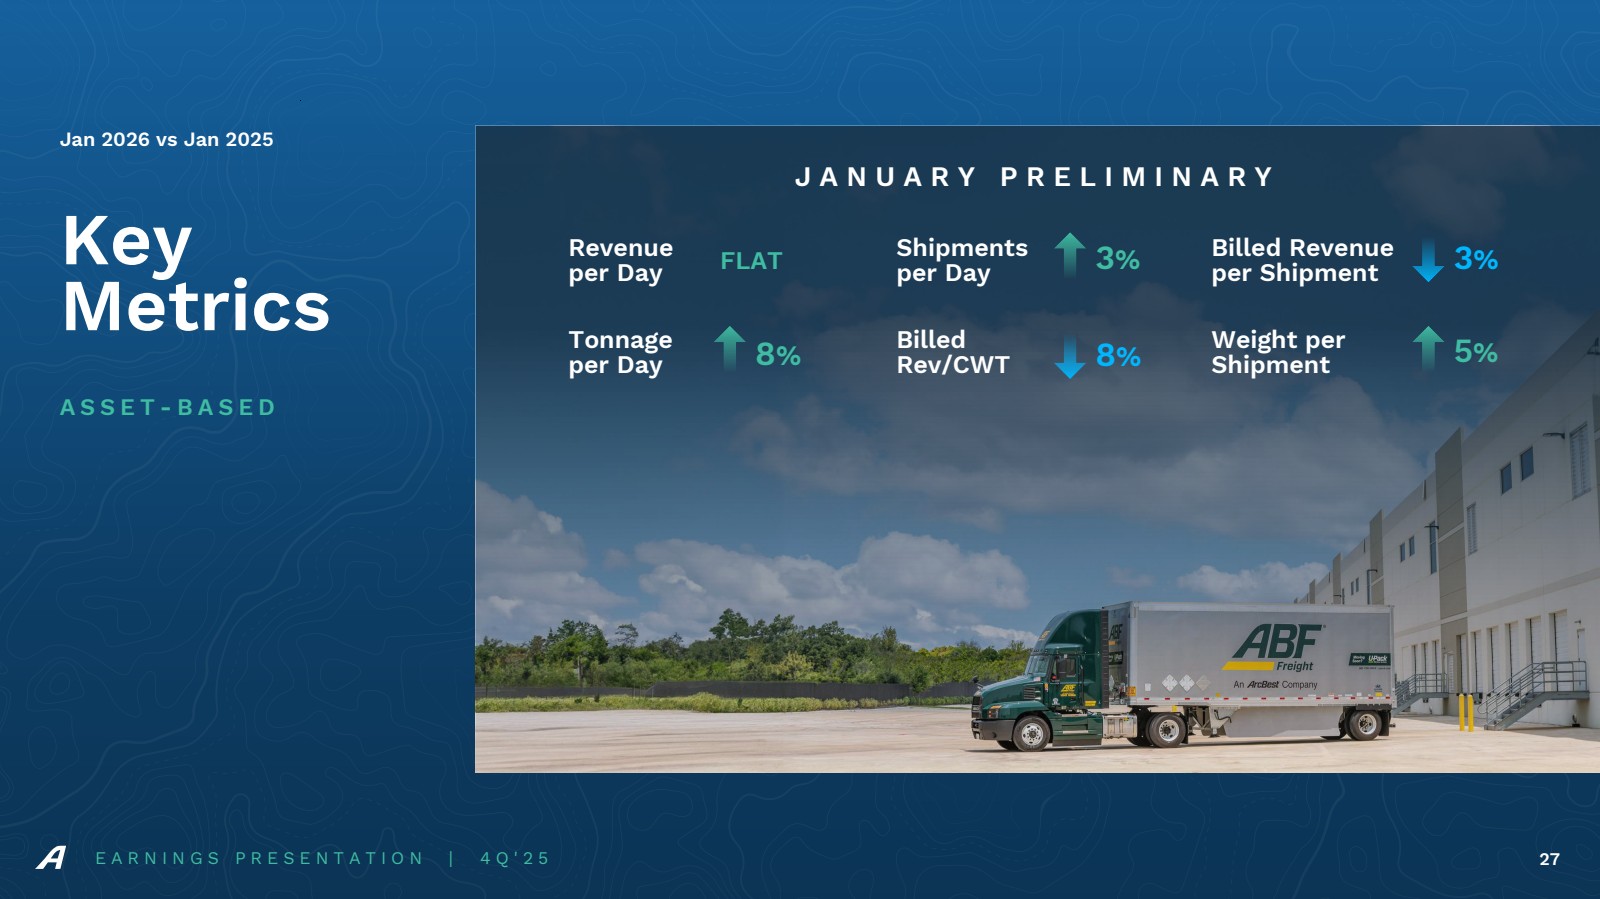
| J A N U A R Y P R E L I M I N A R Y 3% E A R N I N G S P R E S E N T A T I O N | 4 Q ' 2 5 27 Key Metrics A S S E T - B A S E D Jan 2026 vs Jan 2025 Revenue per Day Tonnage per Day Shipments per Day Billed Rev/CWT FLAT Billed Revenue per Shipment Weight per Shipment 3% 8% 8% 5% |
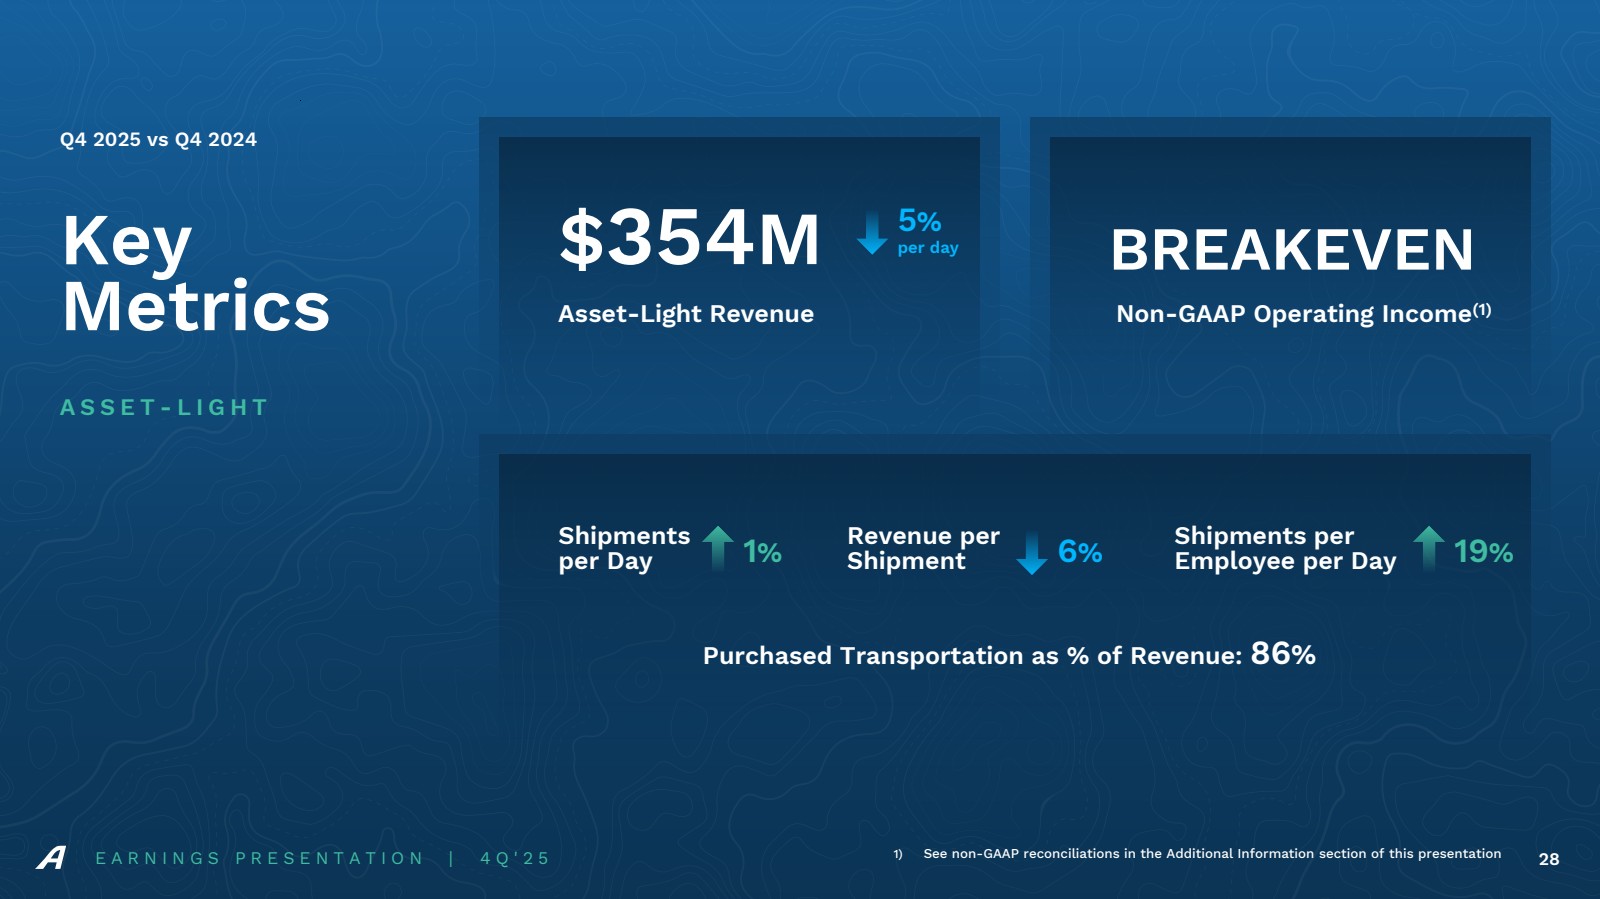
| E A R N I N G S P R E S E N T A T I O N | 4 Q ' 2 5 28 Key Metrics A S S E T - L I G H T Q4 2025 vs Q4 2024 $354M Non-GAAP Operating Income (1) BREAKEVEN Asset-Light Revenue Shipments per Day Revenue per Shipment 1) See non-GAAP reconciliations in the Additional Information section of this presentation Shipments per Employee per Day Purchased Transportation as % of Revenue: 86% 1% 6% 19% 5% per day |
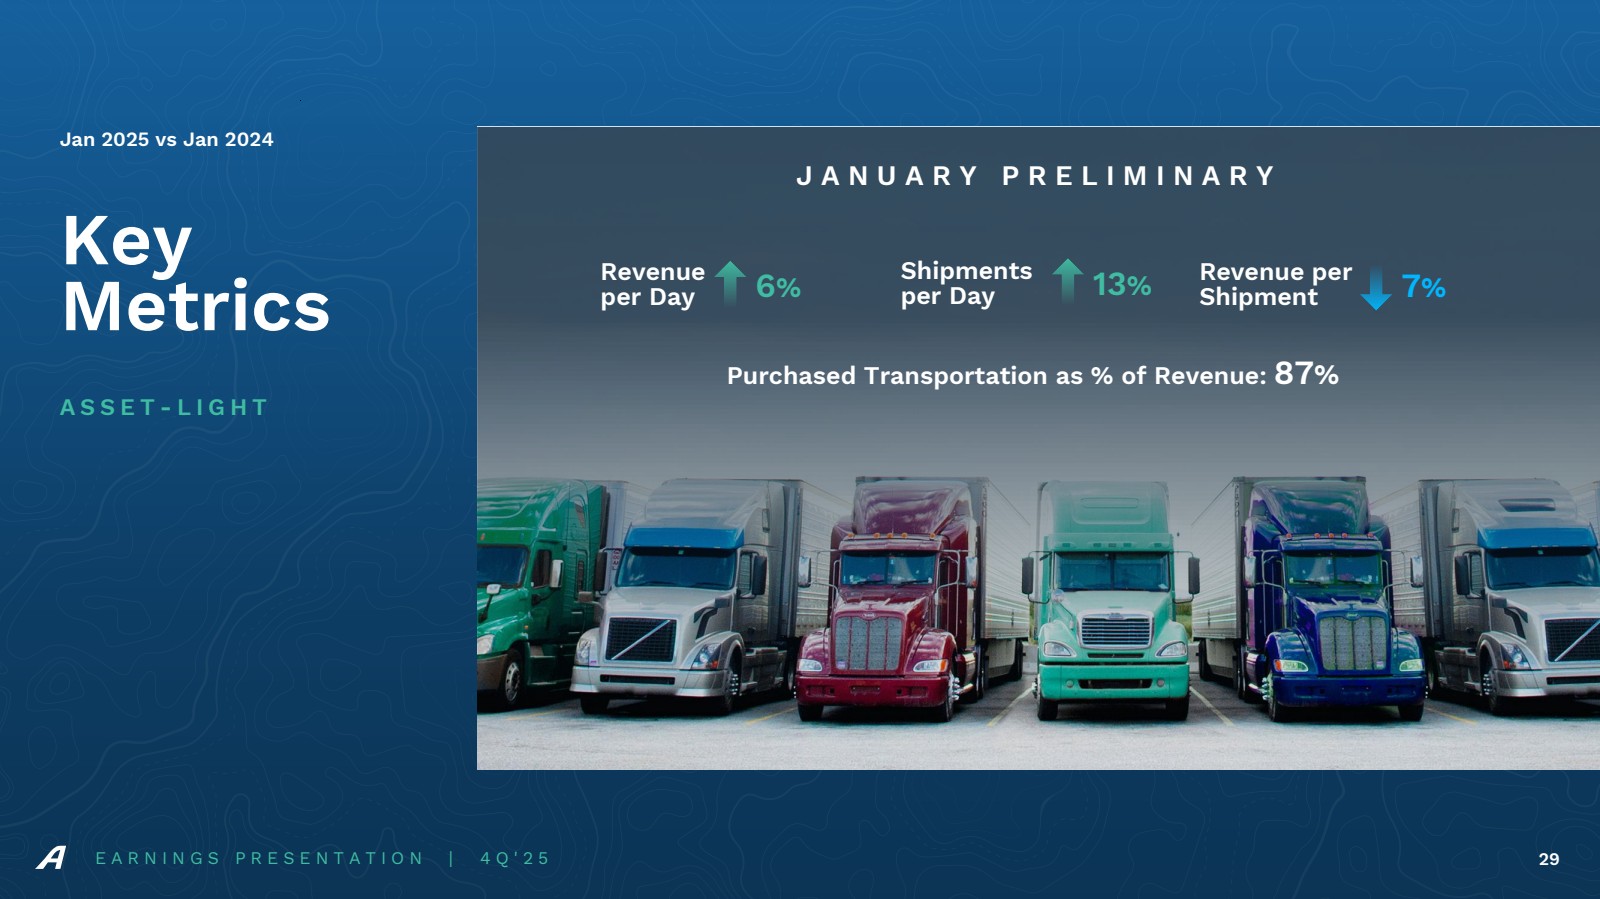
| J A N U A R Y P R E L I M I N A R Y Revenue per Shipment E A R N I N G S P R E S E N T A T I O N | 4 Q ' 2 5 29 Key Metrics A S S E T - L I G H T Jan 2025 vs Jan 2024 7% Revenue per Day Shipments per Day Purchased Transportation as % of Revenue: 87% 6% 13% |
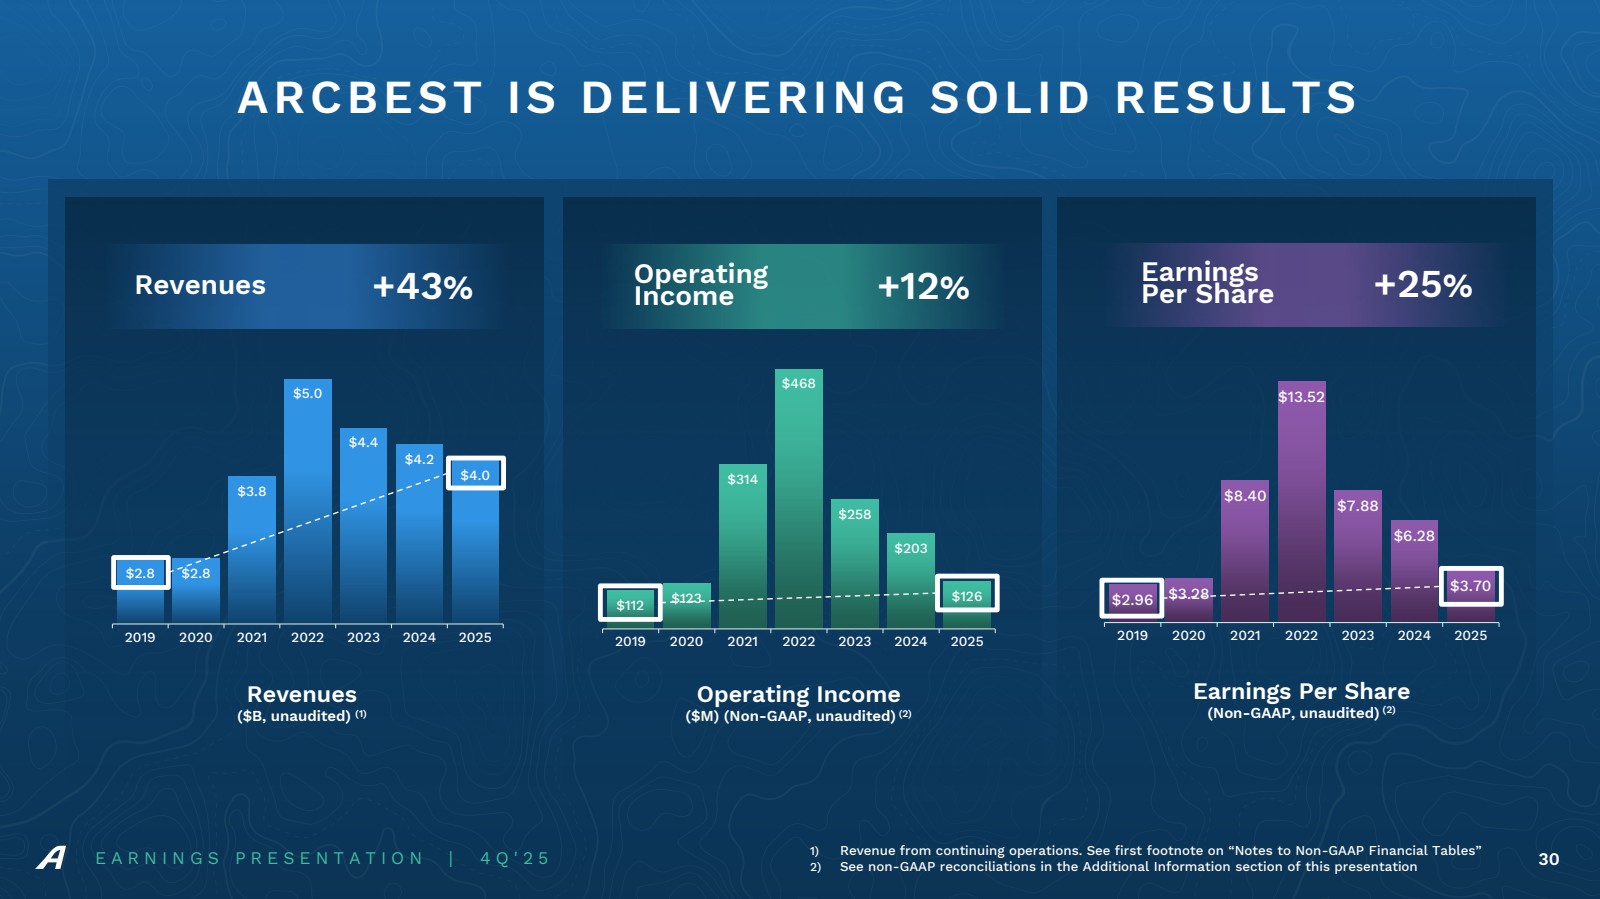
| E A R N I N G S P R E S E N T A T I O N | 4 Q ' 2 5 30 ARCBEST IS DELIVERING SOLID RESULTS $2.8 $2.8 $3.8 $5.0 $4.4 $4.2 $4.0 2019 2020 2021 2022 2023 2024 2025 $112 $123 $314 $468 $258 $203 $126 2019 2020 2021 2022 2023 2024 2025 $2.96 $3.28 $8.40 $13.52 $7.88 $6.28 $3.70 2019 2020 2021 2022 2023 2024 2025 Revenues ($B, unaudited) (1) Operating Income ($M) (Non-GAAP, unaudited)(2) Earnings Per Share (Non-GAAP, unaudited)(2) 1) Revenue from continuing operations. See first footnote on “Notes to Non-GAAP Financial Tables” 2) See non-GAAP reconciliations in the Additional Information section of this presentation Earnings Revenues +43% Operating Income +12% Per Share +25% |
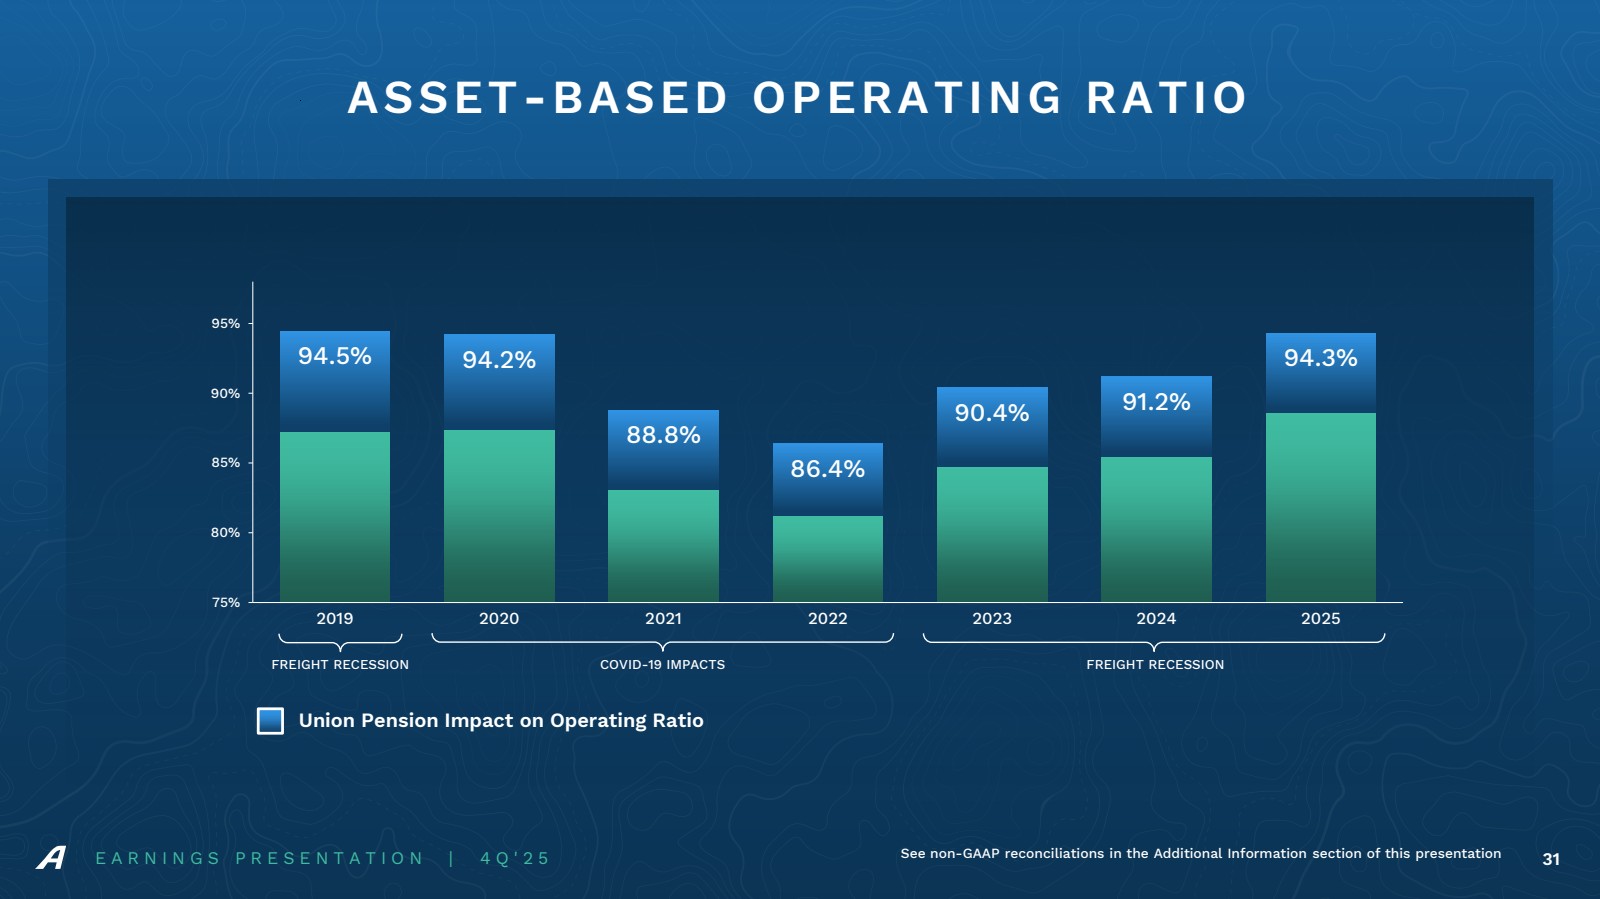
| 94.5% 94.2% 88.8% 86.4% 90.4% 91.2% 94.3% 75% 80% 85% 90% 95% 2019 2020 2021 2022 2023 2024 2025 FREIGHT RECESSION COVID-19 IMPACTS Union Pension Impact on Operating Ratio E A R N I N G S P R E S E N T A T I O N | 4 Q ' 2 5 31 ASSET-BASED OPERATING RATIO FREIGHT RECESSION See non-GAAP reconciliations in the Additional Information section of this presentation |
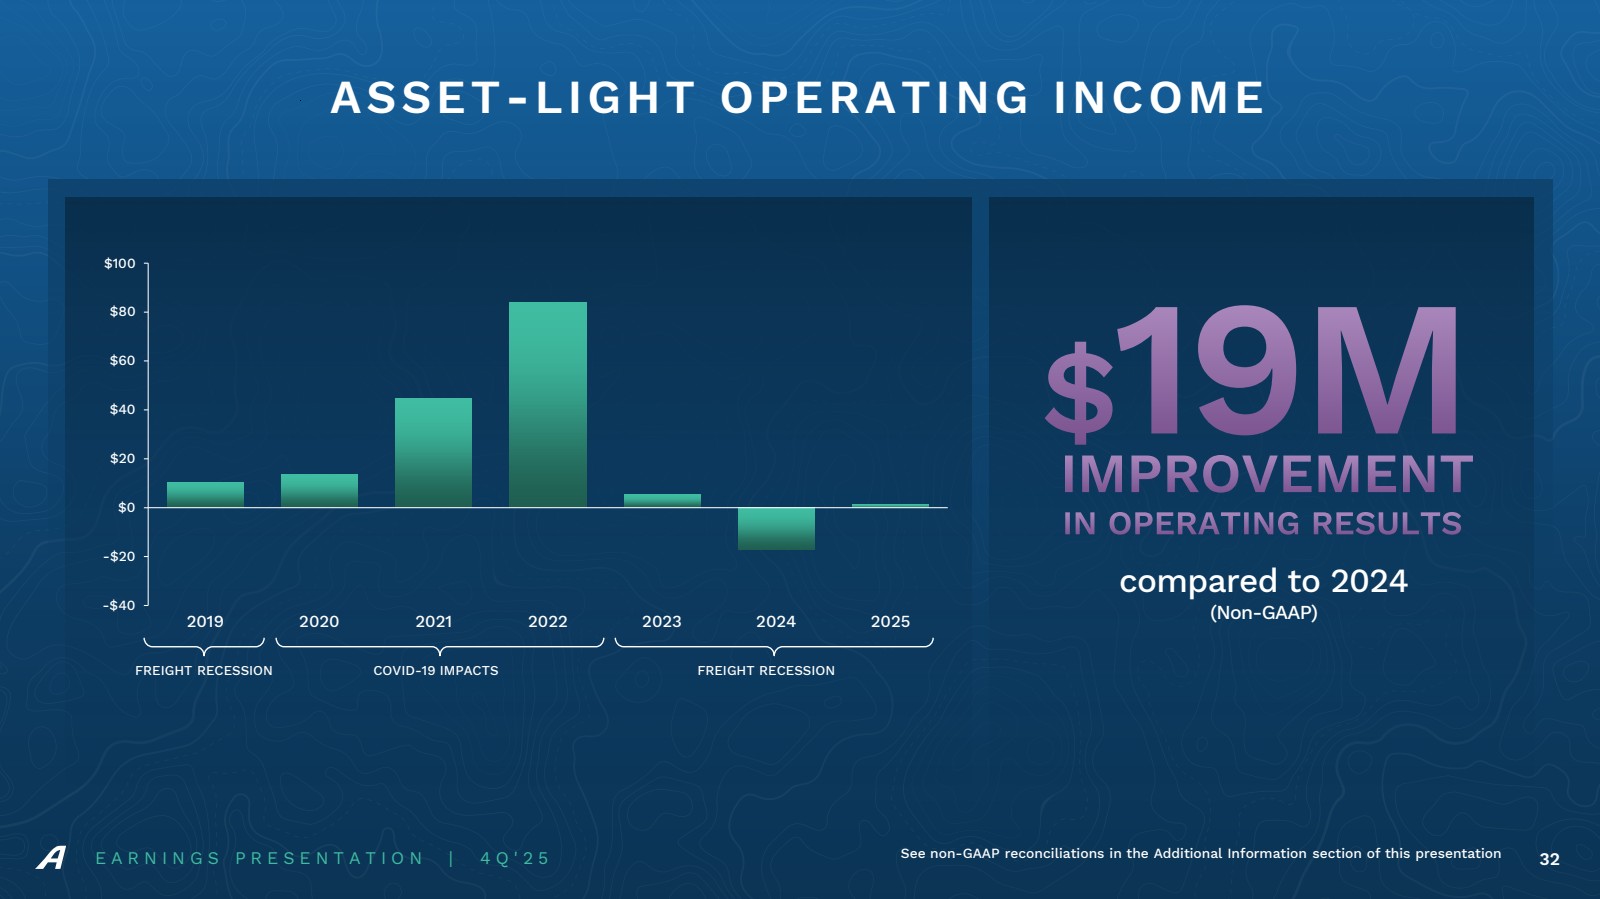
| -$40 -$20 $0 $20 $40 $60 $80 $100 2019 2020 2021 2022 2023 2024 2025 FREIGHT RECESSION COVID-19 IMPACTS FREIGHT RECESSION E A R N I N G S P R E S E N T A T I O N | 4 Q ' 2 5 32 ASSET-LIGHT OPERATING INCOME compared to 2024 (Non-GAAP) $ IMPROVEMENT 19M See non-GAAP reconciliations in the Additional Information section of this presentation IN OPERATING RESULTS |
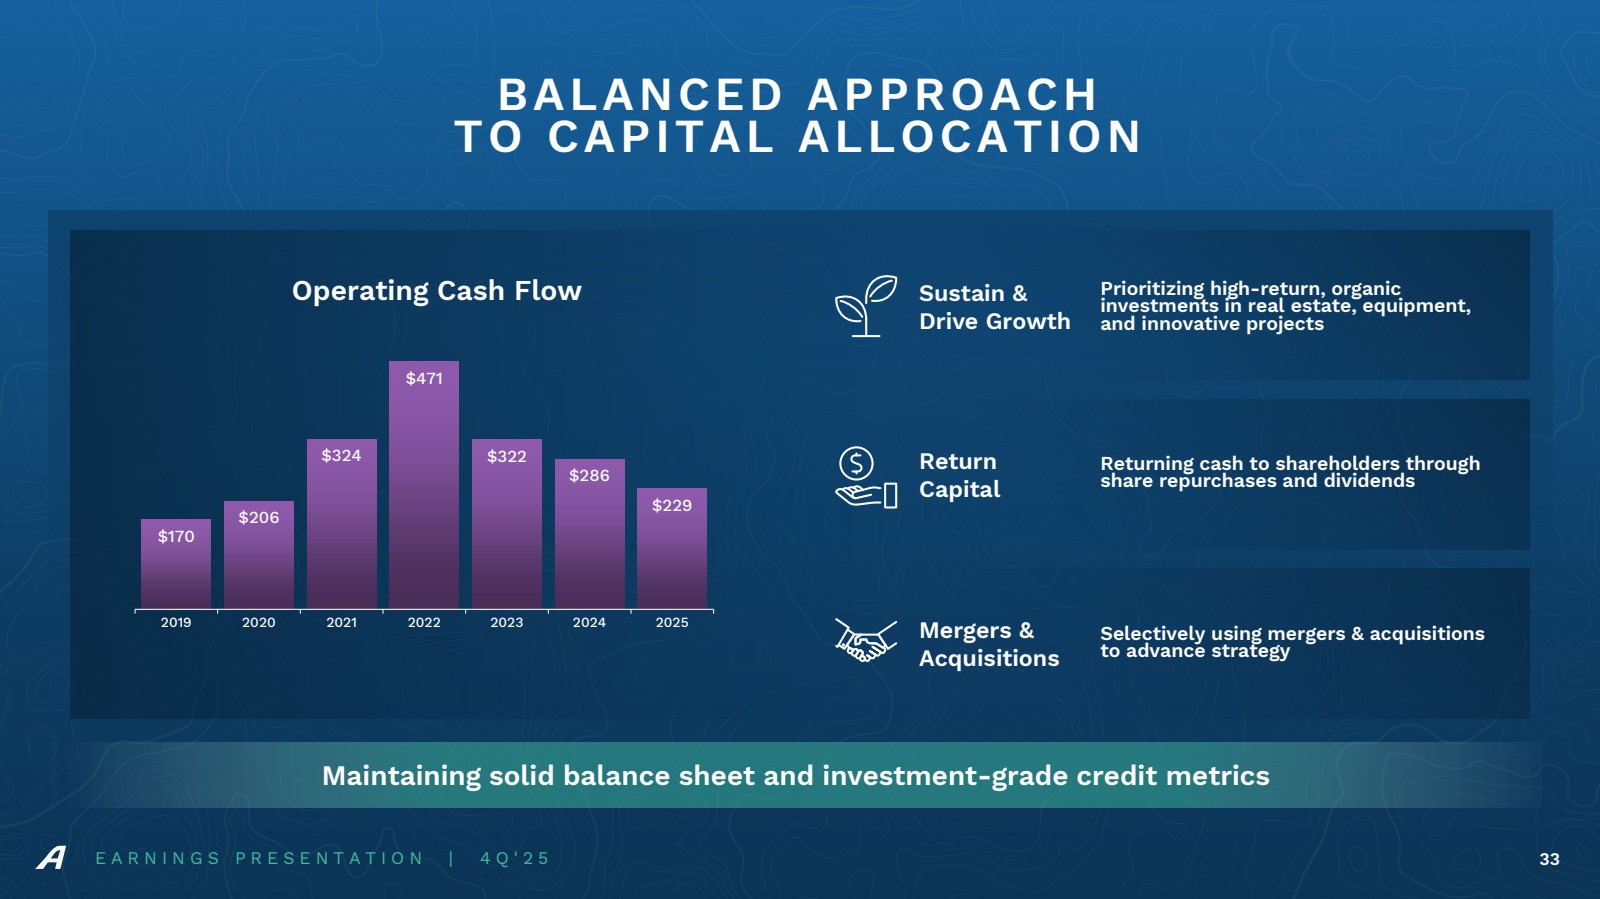
| Maintaining solid balance sheet and investment-grade credit metrics E A R N I N G S P R E S E N T A T I O N | 4 Q ' 2 5 33 BALANCED APPROACH TO CAPITAL ALLOCATION Returning cash to shareholders through share repurchases and dividends Prioritizing high-return, organic investments in real estate, equipment, and innovative projects Selectively using mergers & acquisitions to advance strategy Sustain & Drive Growth Return Capital Mergers & Acquisitions $170 $206 $324 $471 $322 $286 $229 2019 2020 2021 2022 2023 2024 2025 Operating Cash Flow |
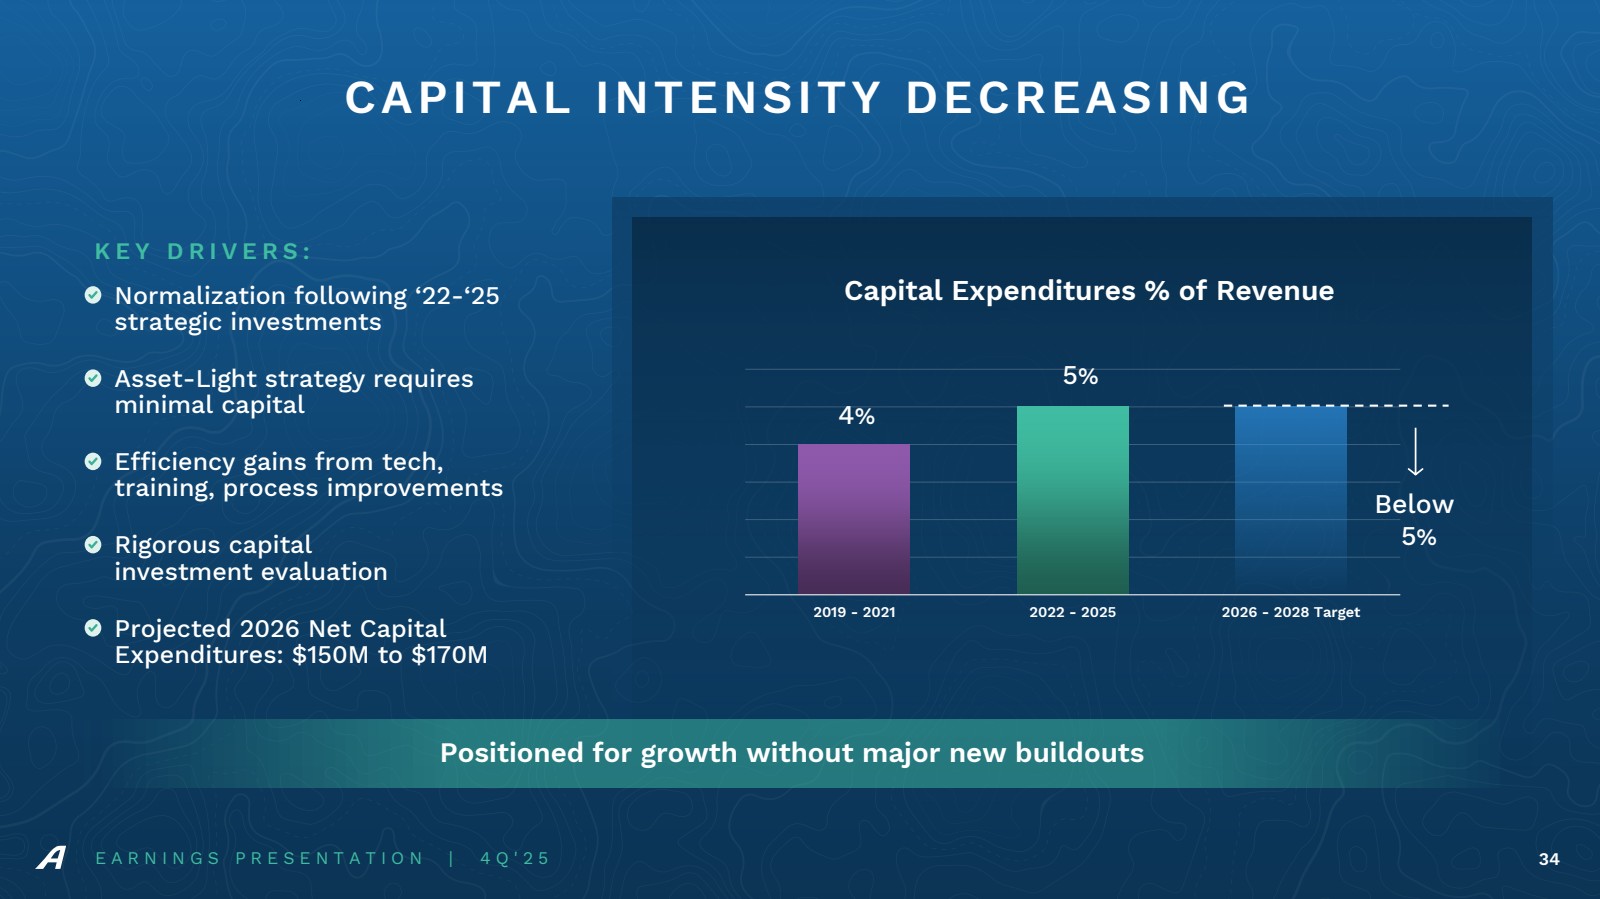
| 2019 - 2021 2022 - 2025 2026 - 2028 Target Normalization following ‘22-‘25 strategic investments Asset-Light strategy requires minimal capital Efficiency gains from tech, training, process improvements Rigorous capital investment evaluation Projected 2026 Net Capital Expenditures: $150M to $170M E A R N I N G S P R E S E N T A T I O N | 4 Q ' 2 5 34 CAPITAL INTENSITY DECREASING K E Y D R I V E R S : Positioned for growth without major new buildouts Capital Expenditures % of Revenue 4% 5% Below 5% |
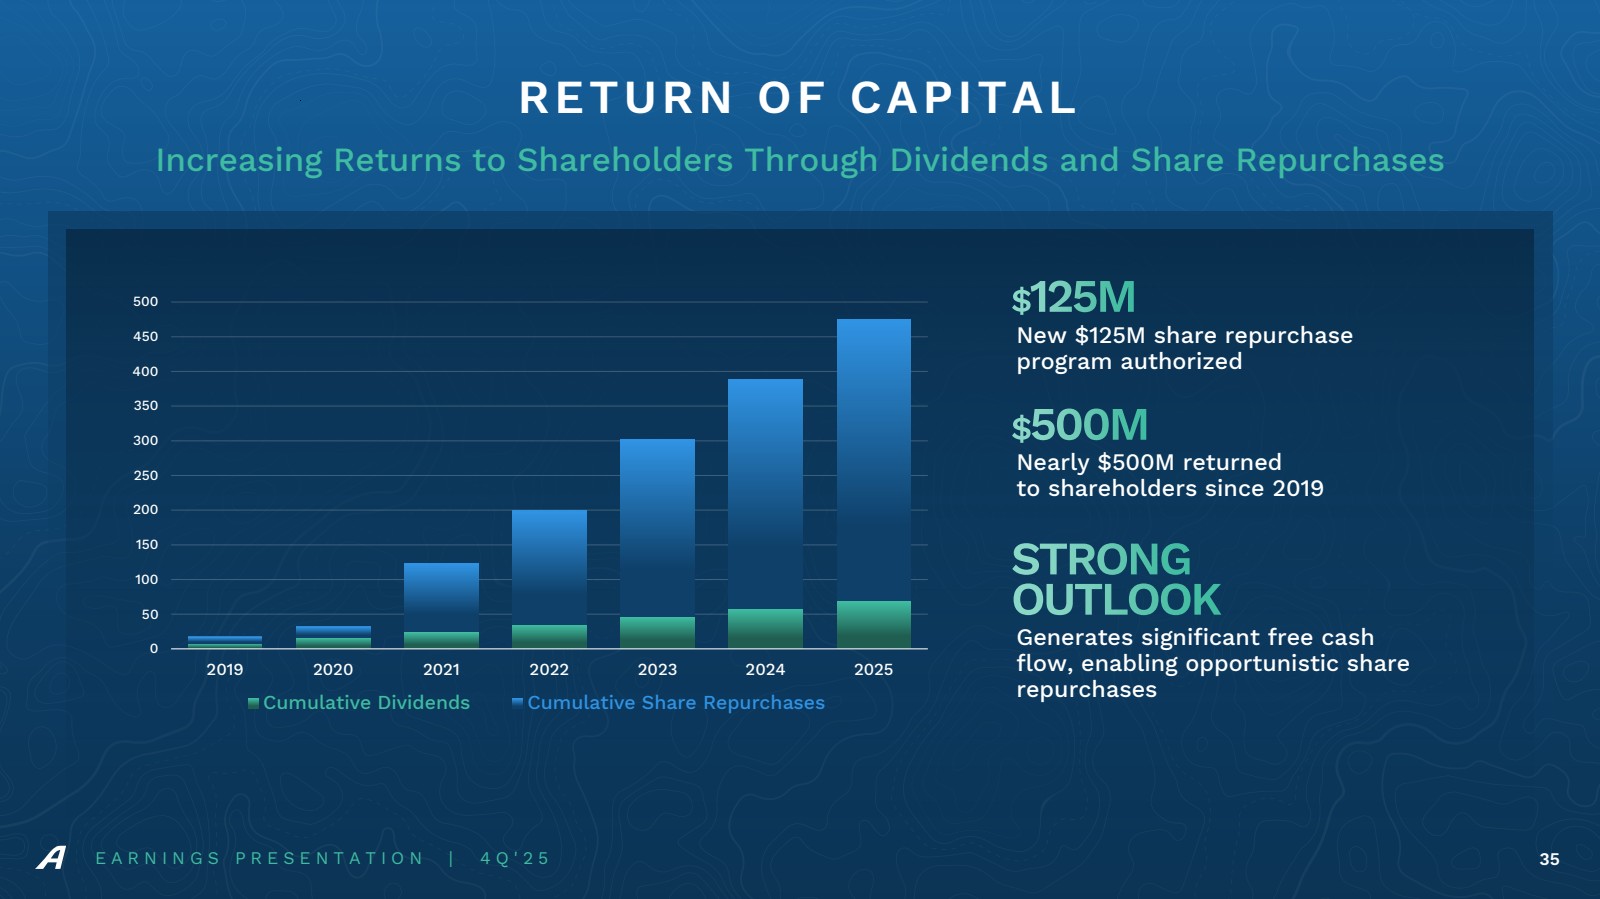
| E A R N I N G S P R E S E N T A T I O N | 4 Q ' 2 5 35 RETURN OF CAPITAL Increasing Returns to Shareholders Through Dividends and Share Repurchases $125M New $125M share repurchase program authorized $500M Nearly $500M returned to shareholders since 2019 Generates significant free cash flow, enabling opportunistic share repurchases STRONG OUTLOOK 0 50 100 150 200 250 300 350 400 450 500 2019 2020 2021 2022 2023 2024 2025 Cumulative Dividends Cumulative Share Repurchases |
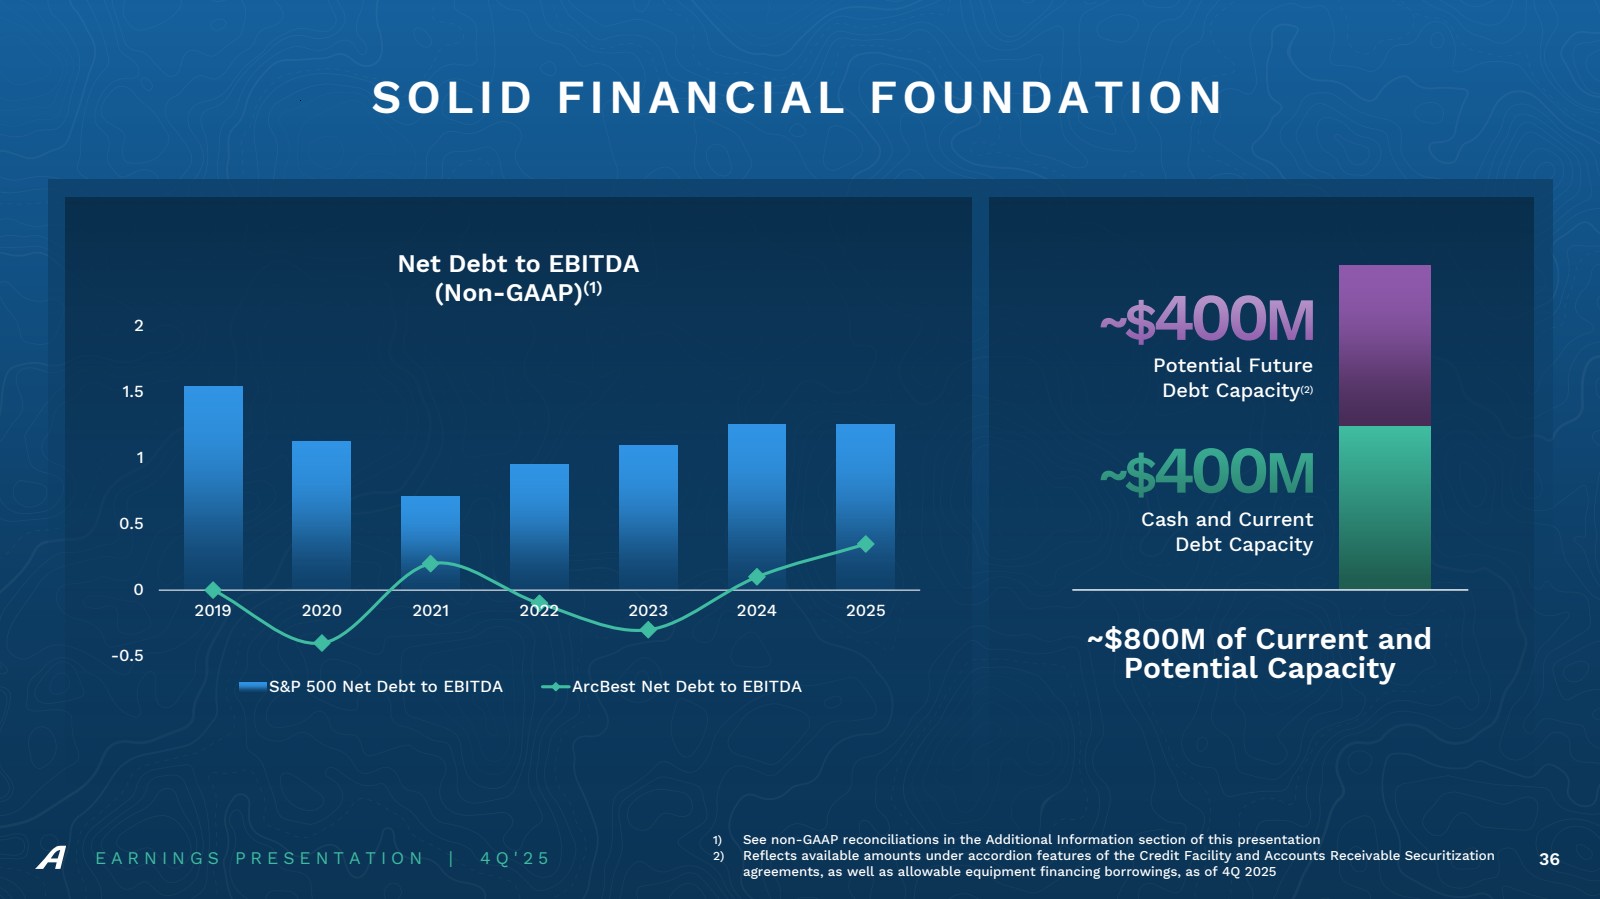
| E A R N I N G S P R E S E N T A T I O N | 4 Q ' 2 5 36 SOLID FINANCIAL FOUNDATION ~$800M of Current and Potential Capacity ~$400M Cash and Current Debt Capacity ~$400M Potential Future Debt Capacity(2) 1) See non-GAAP reconciliations in the Additional Information section of this presentation 2) Reflects available amounts under accordion features of the Credit Facility and Accounts Receivable Securitization agreements, as well as allowable equipment financing borrowings, as of 4Q 2025 -0.5 0 0.5 1 1.5 2 2019 2020 2021 2022 2023 2024 2025 Net Debt to EBITDA (Non-GAAP)(1) S&P 500 Net Debt to EBITDA ArcBest Net Debt to EBITDA |
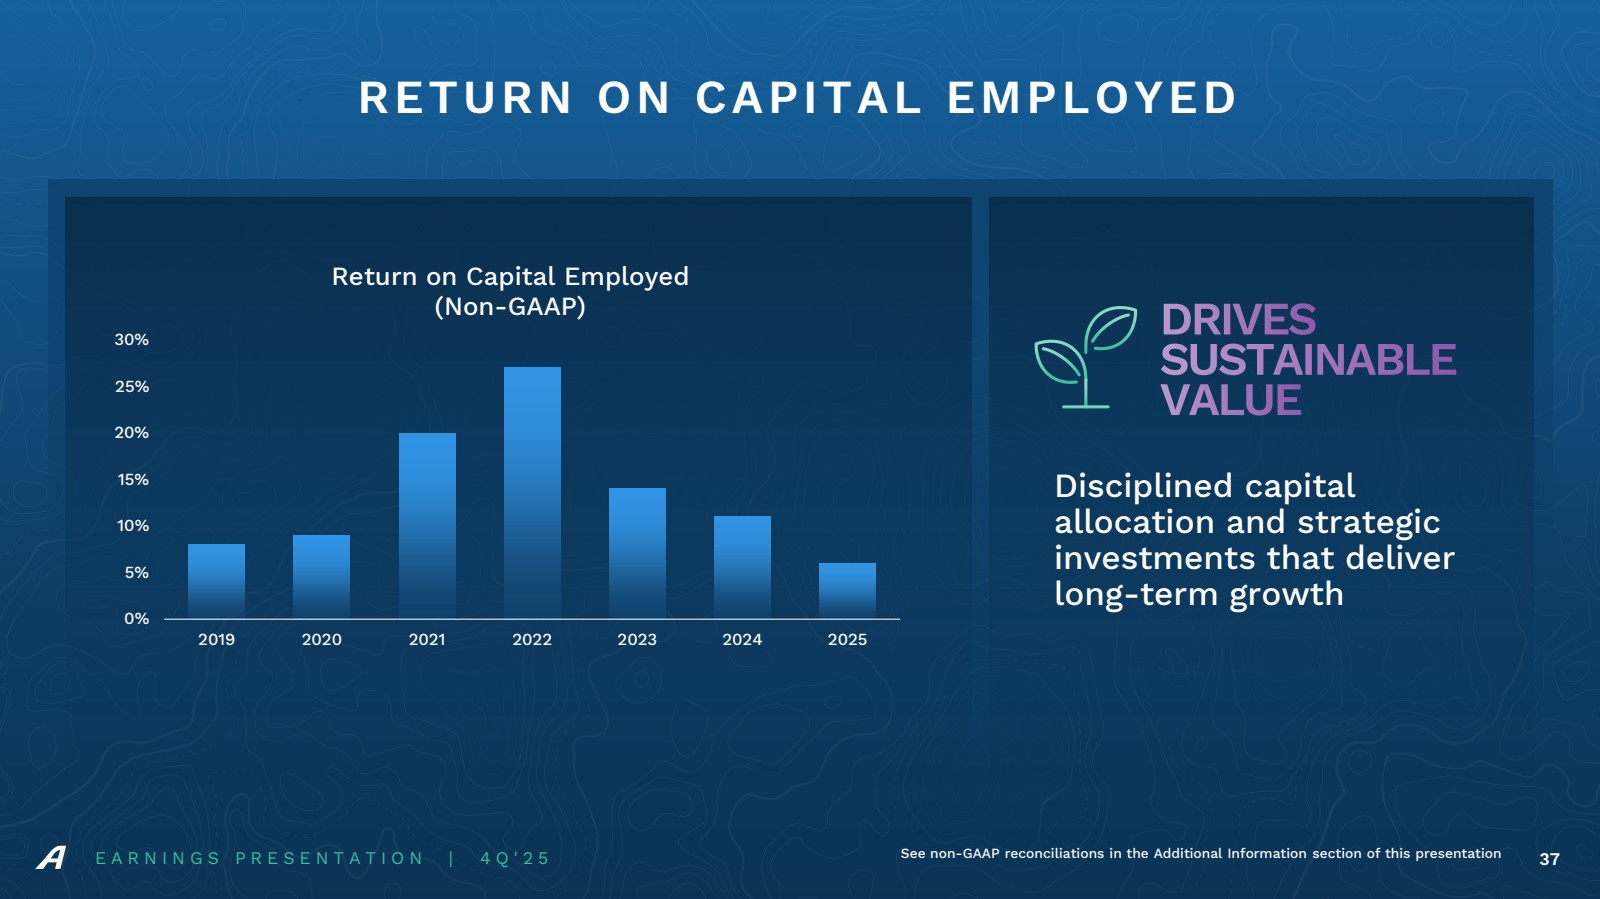
| E A R N I N G S P R E S E N T A T I O N | 4 Q ' 2 5 37 RETURN ON CAPITAL EMPLOYED 0% 5% 10% 15% 20% 25% 30% 2019 2020 2021 2022 2023 2024 2025 Return on Capital Employed (Non-GAAP) Disciplined capital allocation and strategic investments that deliver long-term growth DRIVES SUSTAINABLE VALUE See non-GAAP reconciliations in the Additional Information section of this presentation |
| E A R N I N G S P R E S E N T A T I O N | 4 Q ' 2 5 38 Reconciliations of GAAP to Non-GAAP Financial Measures (Unaudited) Note: ArcBest Corporation reports its financial results in accordance with generally accepted accounting principles (“GAAP”). However, management believes that certain non-GAAP performance measures utilized for internal analysis provides analysts, investors, and others the same information that we use internally for purposes of assessing our core operating performance and provides meaningful comparisons between current and prior period results, as well as important information regarding performance trends. Accordingly, using these measures improves comparability in analyzing our performance because it removes the impact of items from operating results that, in management's opinion, do not reflect our core operating performance. Non-GAAP financial measures should be viewed in addition to, and not as an alternative for, our reported results. These financial measures should not be construed as better measurements than operating income, operating cash flow, net income or earnings per share, as determined under GAAP. |
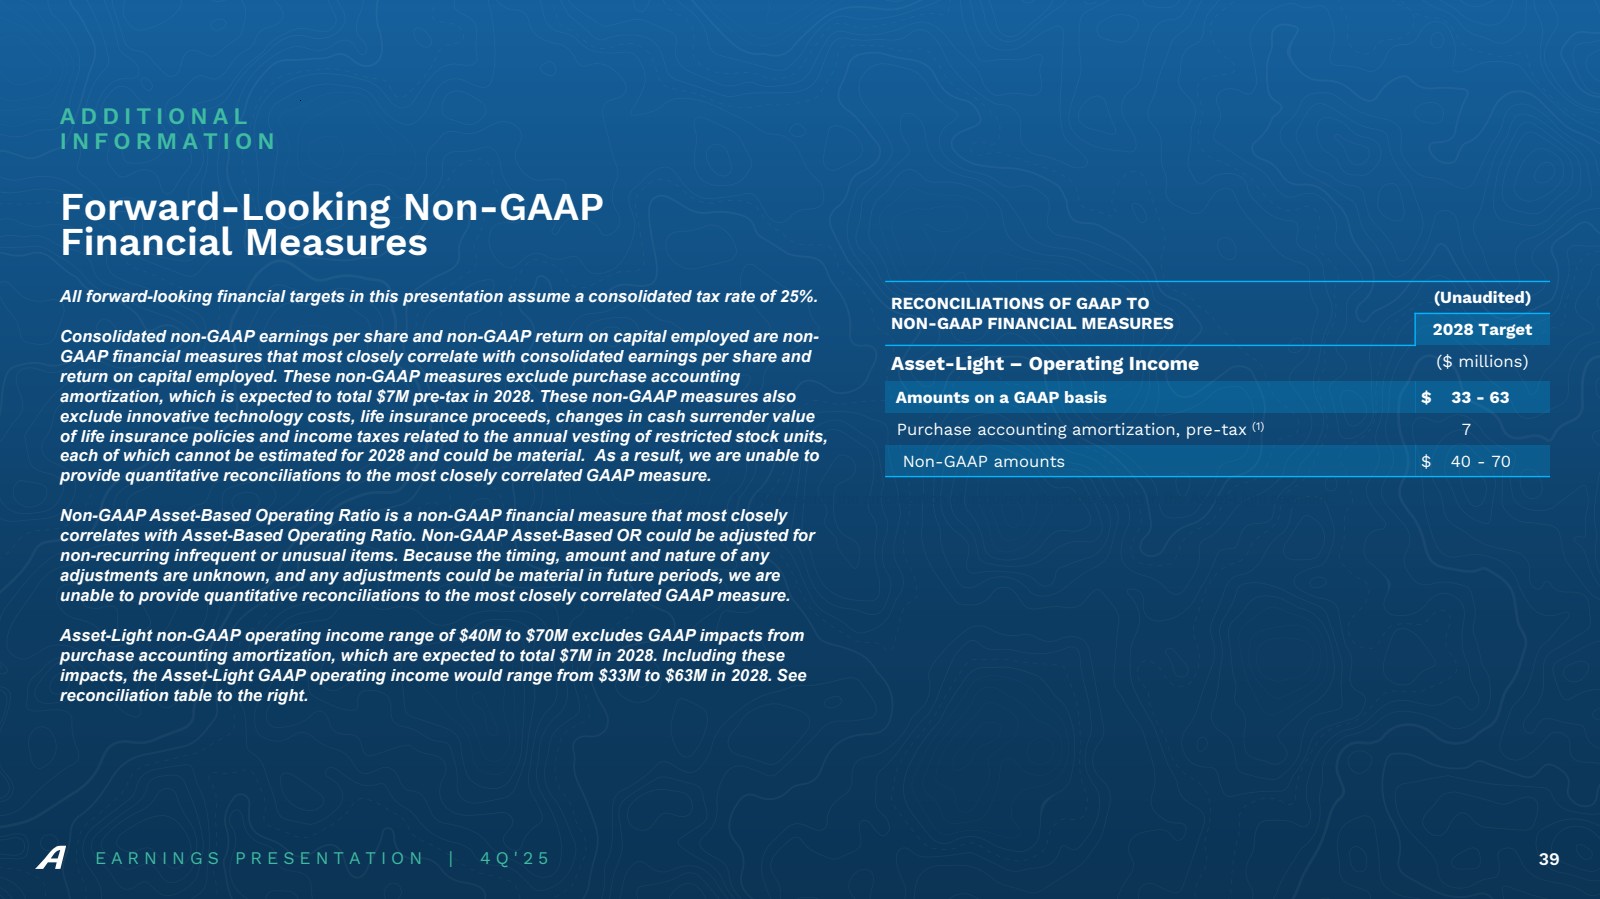
| All forward-looking financial targets in this presentation assume a consolidated tax rate of 25%. Consolidated non-GAAP earnings per share and non-GAAP return on capital employed are non-GAAP financial measures that most closely correlate with consolidated earnings per share and return on capital employed. These non-GAAP measures exclude purchase accounting amortization, which is expected to total $7M pre-tax in 2028. These non-GAAP measures also exclude innovative technology costs, life insurance proceeds, changes in cash surrender value of life insurance policies and income taxes related to the annual vesting of restricted stock units, each of which cannot be estimated for 2028 and could be material. As a result, we are unable to provide quantitative reconciliations to the most closely correlated GAAP measure. Non-GAAP Asset-Based Operating Ratio is a non-GAAP financial measure that most closely correlates with Asset-Based Operating Ratio. Non-GAAP Asset-Based OR could be adjusted for non-recurring infrequent or unusual items. Because the timing, amount and nature of any adjustments are unknown, and any adjustments could be material in future periods, we are unable to provide quantitative reconciliations to the most closely correlated GAAP measure. Asset-Light non-GAAP operating income range of $40M to $70M excludes GAAP impacts from purchase accounting amortization, which are expected to total $7M in 2028. Including these impacts, the Asset-Light GAAP operating income would range from $33M to $63M in 2028. See reconciliation table to the right. E A R N I N G S P R E S E N T A T I O N | 4 Q ' 2 5 39 Forward-Looking Non-GAAP Financial Measures A D D I T I O N A L I N F O R M A T I O N RECONCILIATIONS OF GAAP TO NON-GAAP FINANCIAL MEASURES (Unaudited) 2028 Target Asset-Light – Operating Income ($ millions) Amounts on a GAAP basis $ 33 - 63 Purchase accounting amortization, pre-tax (1) 7 Non-GAAP amounts $ 40 - 70 1. Represents the amortization of acquired intangible assets in the Asset-Light segment. |
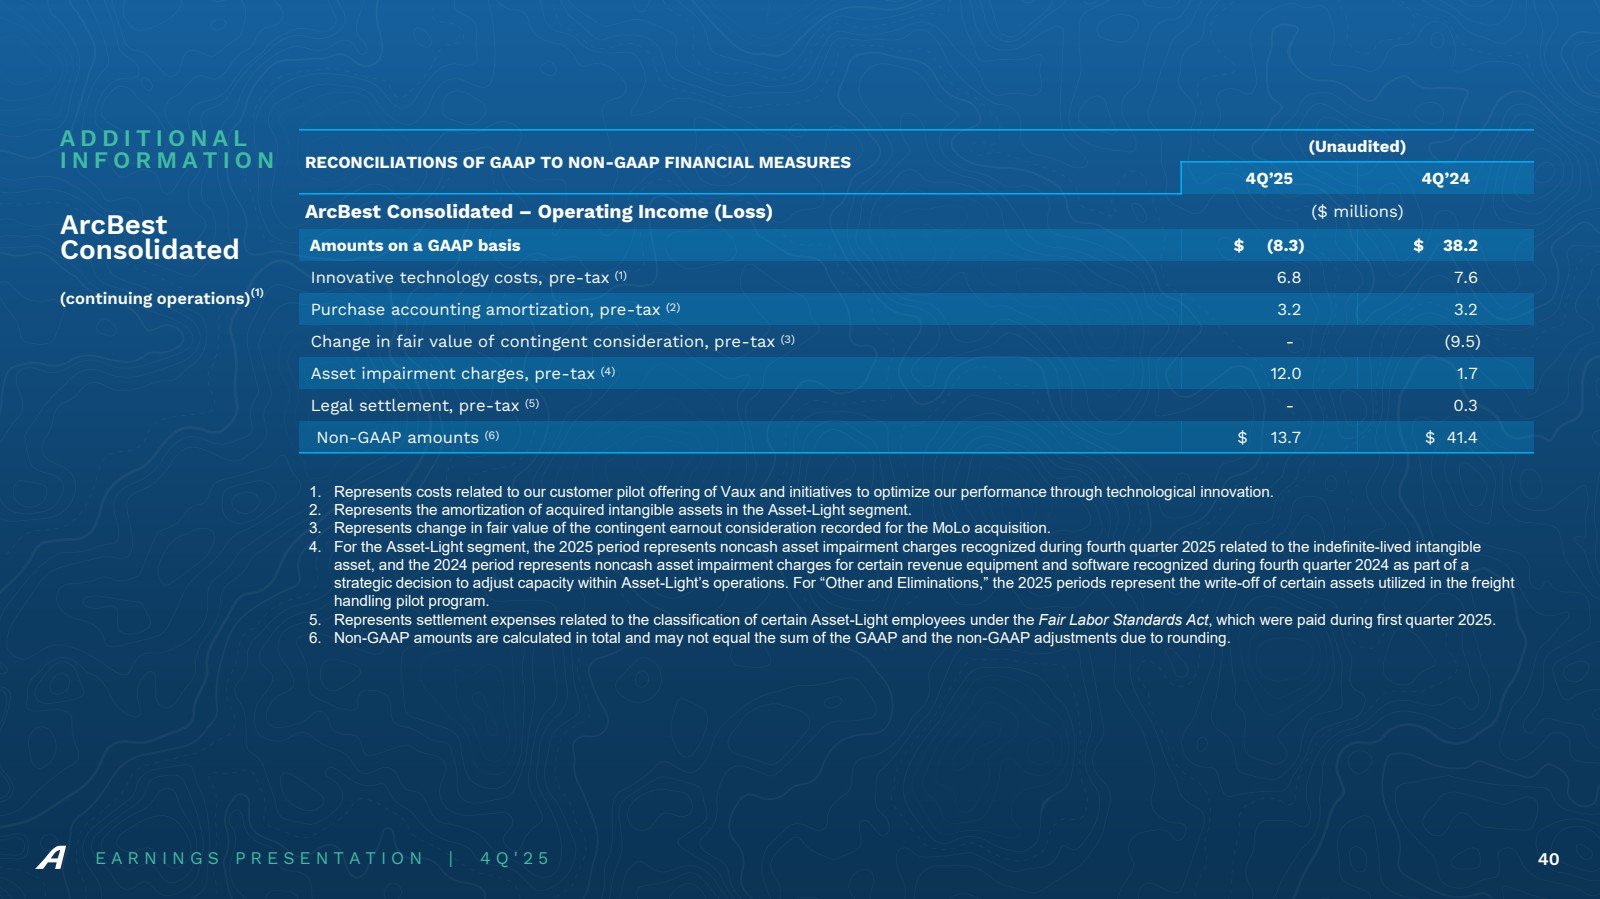
| RECONCILIATIONS OF GAAP TO NON-GAAP FINANCIAL MEASURES (Unaudited) 4Q’25 4Q’24 ArcBest Consolidated – Operating Income (Loss) ($ millions) Amounts on a GAAP basis $ (8.3) $ 38.2 Innovative technology costs, pre-tax (1) 6.8 7.6 Purchase accounting amortization, pre-tax (2) 3.2 3.2 Change in fair value of contingent consideration, pre-tax (3) - (9.5) Asset impairment charges, pre-tax (4) 12.0 1.7 Legal settlement, pre-tax (5) - 0.3 Non-GAAP amounts (6) $ 13.7 $ 41.4 E A R N I N G S P R E S E N T A T I O N | 4 Q ' 2 5 40 ArcBest Consolidated 1. Represents costs related to our customer pilot offering of Vaux and initiatives to optimize our performance through technological innovation. 2. Represents the amortization of acquired intangible assets in the Asset-Light segment. 3. Represents change in fair value of the contingent earnout consideration recorded for the MoLo acquisition. 4. For the Asset-Light segment, the 2025 period represents noncash asset impairment charges recognized during fourth quarter 2025 related to the indefinite-lived intangible asset, and the 2024 period represents noncash asset impairment charges for certain revenue equipment and software recognized during fourth quarter 2024 as part of a strategic decision to adjust capacity within Asset-Light’s operations. For “Other and Eliminations,” the 2025 periods represent the write-off of certain assets utilized in the freight handling pilot program. 5. Represents settlement expenses related to the classification of certain Asset-Light employees under the Fair Labor Standards Act, which were paid during first quarter 2025. 6. Non-GAAP amounts are calculated in total and may not equal the sum of the GAAP and the non-GAAP adjustments due to rounding. A D D I T I O N A L I N F O R M A T I O N (continuing operations)(1) |
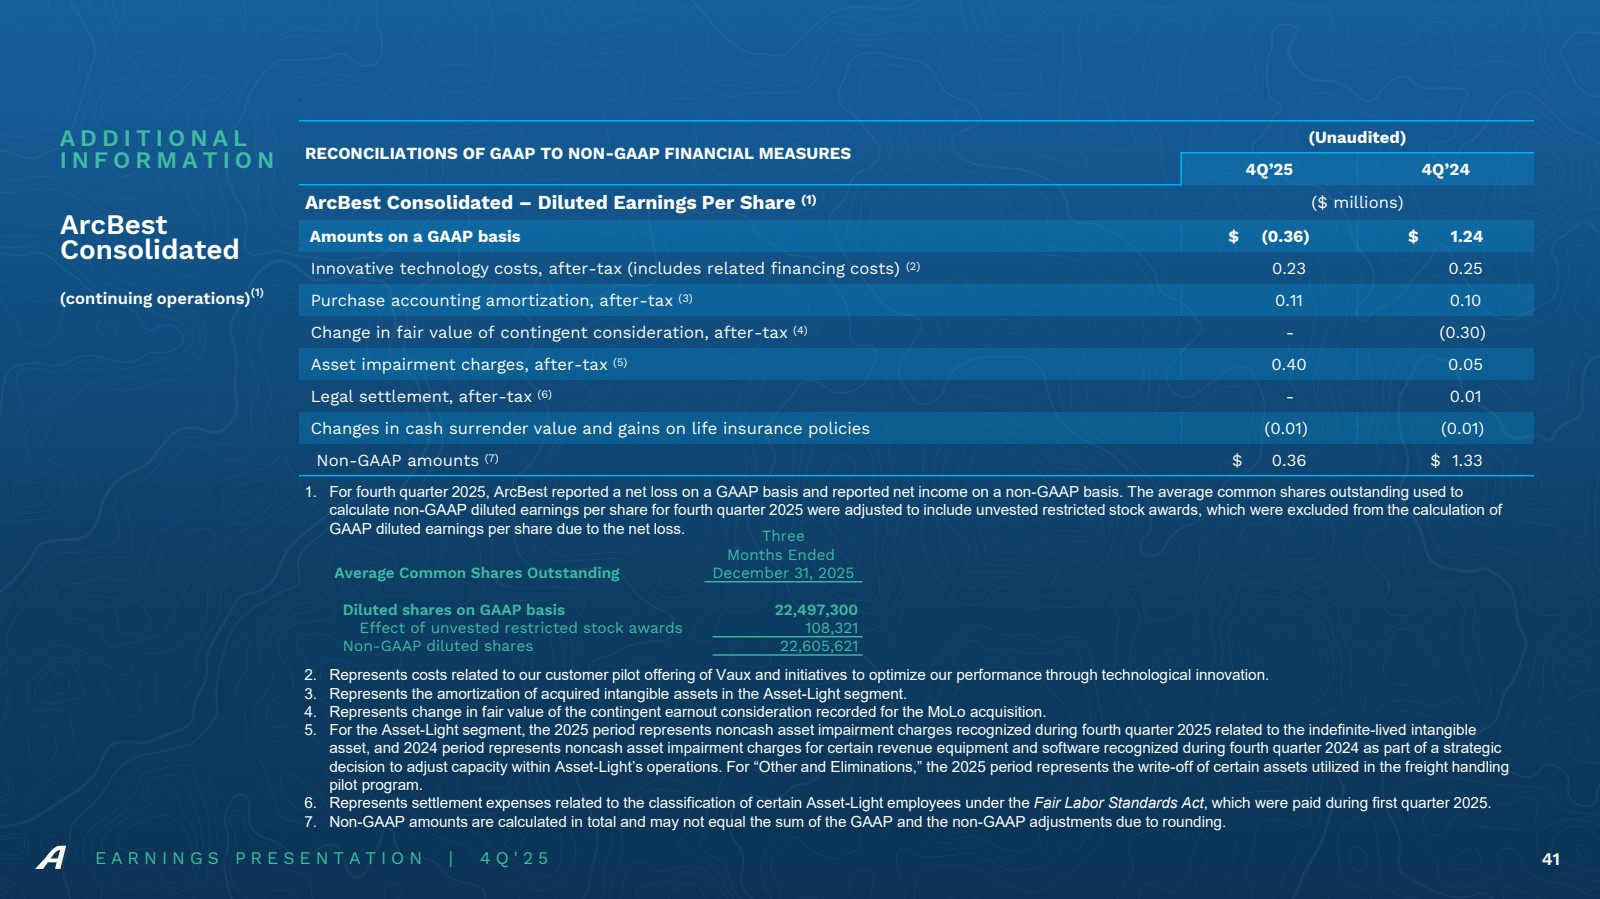
| E A R N I N G S P R E S E N T A T I O N | 4 Q ' 2 5 41 ArcBest Consolidated (continuing operations)(1) RECONCILIATIONS OF GAAP TO NON-GAAP FINANCIAL MEASURES (Unaudited) 4Q’25 4Q’24 ArcBest Consolidated – Diluted Earnings Per Share (1) ($ millions) Amounts on a GAAP basis $ (0.36) $ 1.24 Innovative technology costs, after-tax (includes related financing costs) (2) 0.23 0.25 Purchase accounting amortization, after-tax (3) 0.11 0.10 Change in fair value of contingent consideration, after-tax (4) - (0.30) Asset impairment charges, after-tax (5) 0.40 0.05 Legal settlement, after-tax (6) - 0.01 Changes in cash surrender value and gains on life insurance policies (0.01) (0.01) Non-GAAP amounts (7) $ 0.36 $ 1.33 1. For fourth quarter 2025, ArcBest reported a net loss on a GAAP basis and reported net income on a non-GAAP basis. The average common shares outstanding used to calculate non-GAAP diluted earnings per share for fourth quarter 2025 were adjusted to include unvested restricted stock awards, which were excluded from the calculation of GAAP diluted earnings per share due to the net loss. 2. Represents costs related to our customer pilot offering of Vaux and initiatives to optimize our performance through technological innovation. 3. Represents the amortization of acquired intangible assets in the Asset-Light segment. 4. Represents change in fair value of the contingent earnout consideration recorded for the MoLo acquisition. 5. For the Asset-Light segment, the 2025 period represents noncash asset impairment charges recognized during fourth quarter 2025 related to the indefinite-lived intangible asset, and 2024 period represents noncash asset impairment charges for certain revenue equipment and software recognized during fourth quarter 2024 as part of a strategic decision to adjust capacity within Asset-Light’s operations. For “Other and Eliminations,” the 2025 period represents the write-off of certain assets utilized in the freight handling pilot program. 6. Represents settlement expenses related to the classification of certain Asset-Light employees under the Fair Labor Standards Act, which were paid during first quarter 2025. 7. Non-GAAP amounts are calculated in total and may not equal the sum of the GAAP and the non-GAAP adjustments due to rounding. Three Months Ended Average Common Shares Outstanding December 31, 2025 Diluted shares on GAAP basis 22,497,300 Effect of unvested restricted stock awards 108,321 Non-GAAP diluted shares 22,605,621 A D D I T I O N A L I N F O R M A T I O N |
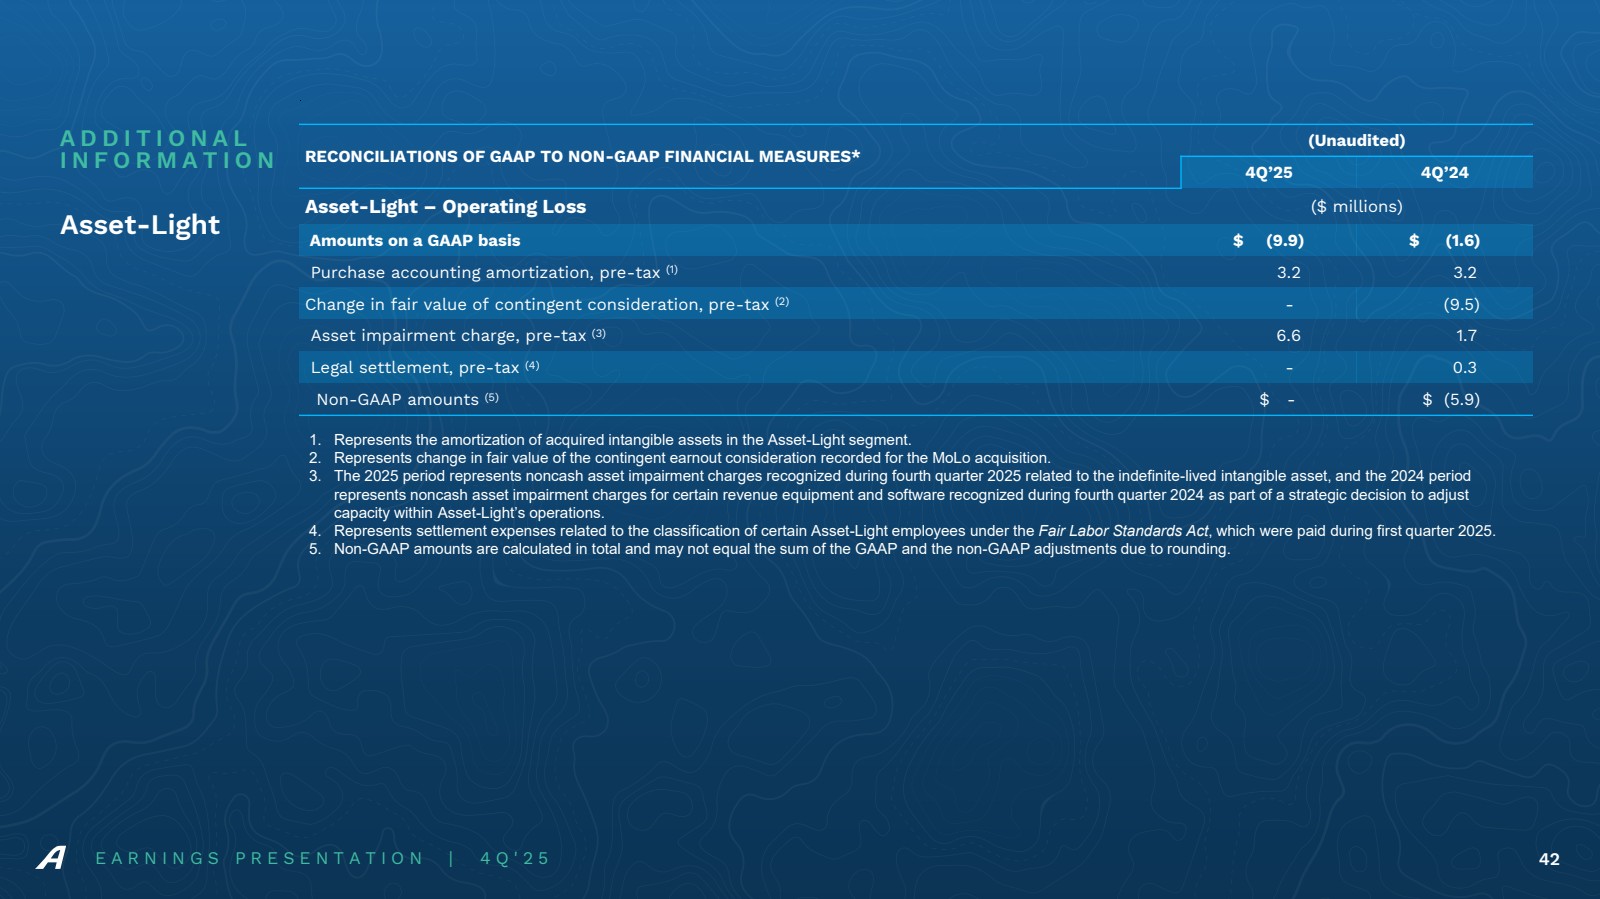
| E A R N I N G S P R E S E N T A T I O N | 4 Q ' 2 5 42 Asset-Light A D D I T I O N A L I N F O R M A T I O N RECONCILIATIONS OF GAAP TO NON-GAAP FINANCIAL MEASURES* (Unaudited) 4Q’25 4Q’24 Asset-Light – Operating Loss ($ millions) Amounts on a GAAP basis $ (9.9) $ (1.6) Purchase accounting amortization, pre-tax (1) 3.2 3.2 Change in fair value of contingent consideration, pre-tax (2) - (9.5) Asset impairment charge, pre-tax (3) 6.6 1.7 Legal settlement, pre-tax (4) - 0.3 Non-GAAP amounts (5) $ - $ (5.9) 1. Represents the amortization of acquired intangible assets in the Asset-Light segment. 2. Represents change in fair value of the contingent earnout consideration recorded for the MoLo acquisition. 3. The 2025 period represents noncash asset impairment charges recognized during fourth quarter 2025 related to the indefinite-lived intangible asset, and the 2024 period represents noncash asset impairment charges for certain revenue equipment and software recognized during fourth quarter 2024 as part of a strategic decision to adjust capacity within Asset-Light’s operations. 4. Represents settlement expenses related to the classification of certain Asset-Light employees under the Fair Labor Standards Act, which were paid during first quarter 2025. 5. Non-GAAP amounts are calculated in total and may not equal the sum of the GAAP and the non-GAAP adjustments due to rounding. |
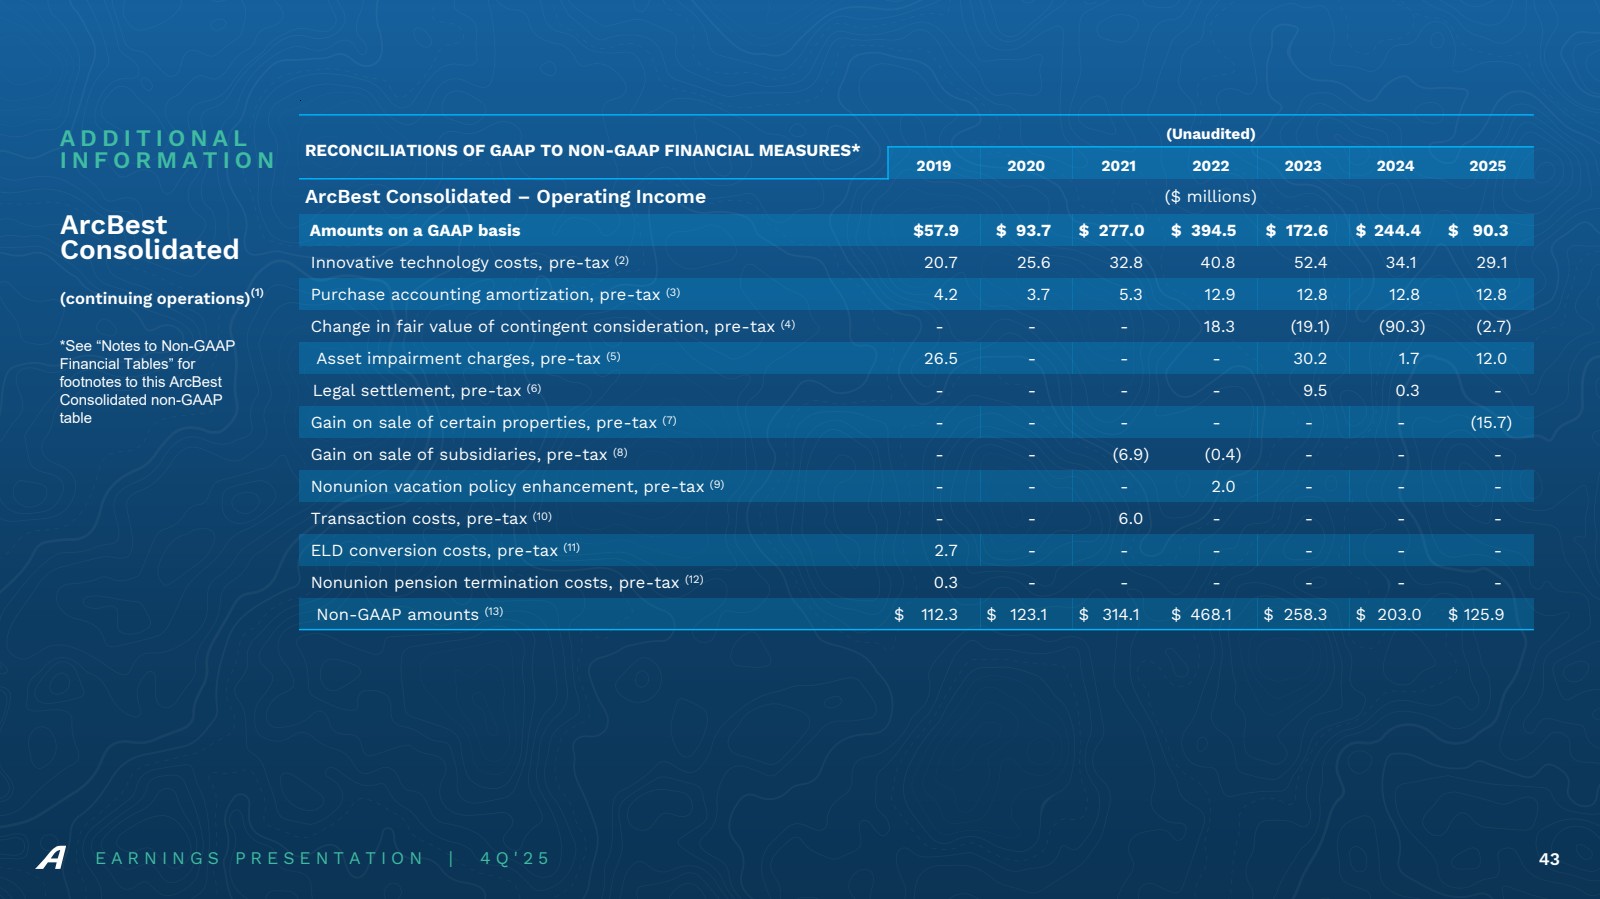
| E A R N I N G S P R E S E N T A T I O N | 4 Q ' 2 5 43 A D D I T I O N A L I N F O R M A T I O N RECONCILIATIONS OF GAAP TO NON-GAAP FINANCIAL MEASURES* (Unaudited) 2019 2020 2021 2022 2023 2024 2025 ArcBest Consolidated – Operating Income ($ millions) Amounts on a GAAP basis $57.9 $ 93.7 $ 277.0 $ 394.5 $ 172.6 $ 244.4 $ 90.3 Innovative technology costs, pre-tax (2) 20.7 25.6 32.8 40.8 52.4 34.1 29.1 Purchase accounting amortization, pre-tax (3) 4.2 3.7 5.3 12.9 12.8 12.8 12.8 Change in fair value of contingent consideration, pre-tax (4) - - - 18.3 (19.1) (90.3) (2.7) Asset impairment charges, pre-tax (5) 26.5 - - - 30.2 1.7 12.0 Legal settlement, pre-tax (6) - - - - 9.5 0.3 - Gain on sale of certain properties, pre-tax (7) - - - - - - (15.7) Gain on sale of subsidiaries, pre-tax (8) - - (6.9) (0.4) - - - Nonunion vacation policy enhancement, pre-tax (9) - - - 2.0 - - - Transaction costs, pre-tax (10) - - 6.0 - - - - ELD conversion costs, pre-tax (11) 2.7 - - - - - - Nonunion pension termination costs, pre-tax (12) 0.3 - - - - - - Non-GAAP amounts (13) $ 112.3 $ 123.1 $ 314.1 $ 468.1 $ 258.3 $ 203.0 $ 125.9 *See “Notes to Non-GAAP Financial Tables” for footnotes to this ArcBest Consolidated non-GAAP table ArcBest Consolidated (continuing operations)(1) |
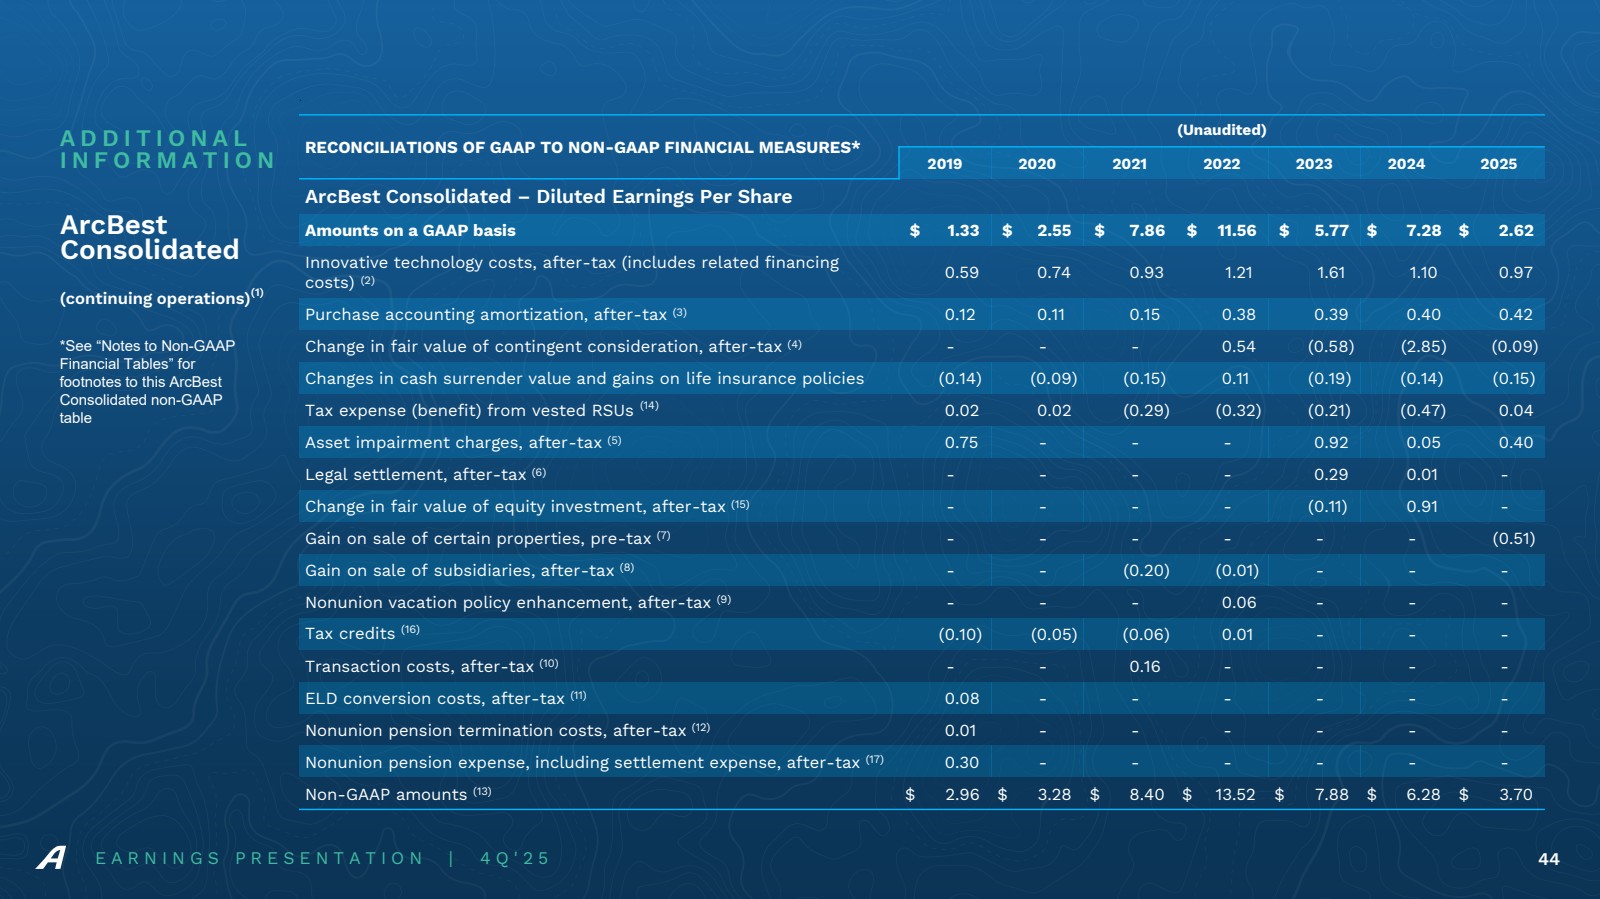
| E A R N I N G S P R E S E N T A T I O N | 4 Q ' 2 5 44 A D D I T I O N A L I N F O R M A T I O N *See “Notes to Non-GAAP Financial Tables” for footnotes to this ArcBest Consolidated non-GAAP table RECONCILIATIONS OF GAAP TO NON-GAAP FINANCIAL MEASURES* (Unaudited) 2019 2020 2021 2022 2023 2024 2025 ArcBest Consolidated – Diluted Earnings Per Share Amounts on a GAAP basis $ 1.33 $ 2.55 $ 7.86 $ 11.56 $ 5.77 $ 7.28 $ 2.62 Innovative technology costs, after-tax (includes related financing costs) (2) 0.59 0.74 0.93 1.21 1.61 1.10 0.97 Purchase accounting amortization, after-tax (3) 0.12 0.11 0.15 0.38 0.39 0.40 0.42 Change in fair value of contingent consideration, after-tax (4) - - - 0.54 (0.58) (2.85) (0.09) Changes in cash surrender value and gains on life insurance policies (0.14) (0.09) (0.15) 0.11 (0.19) (0.14) (0.15) Tax expense (benefit) from vested RSUs (14) 0.02 0.02 (0.29) (0.32) (0.21) (0.47) 0.04 Asset impairment charges, after-tax (5) 0.75 - - - 0.92 0.05 0.40 Legal settlement, after-tax (6) - - - - 0.29 0.01 - Change in fair value of equity investment, after-tax (15) - - - - (0.11) 0.91 - Gain on sale of certain properties, pre-tax (7) - - - - - - (0.51) Gain on sale of subsidiaries, after-tax (8) - - (0.20) (0.01) - - - Nonunion vacation policy enhancement, after-tax (9) - - - 0.06 - - - Tax credits (16) (0.10) (0.05) (0.06) 0.01 - - - Transaction costs, after-tax (10) - - 0.16 - - - - ELD conversion costs, after-tax (11) 0.08 - - - - - - Nonunion pension termination costs, after-tax (12) 0.01 - - - - - - Nonunion pension expense, including settlement expense, after-tax (17) 0.30 - - - - - - Non-GAAP amounts (13) $ 2.96 $ 3.28 $ 8.40 $ 13.52 $ 7.88 $ 6.28 $ 3.70 ArcBest Consolidated (continuing operations)(1) |
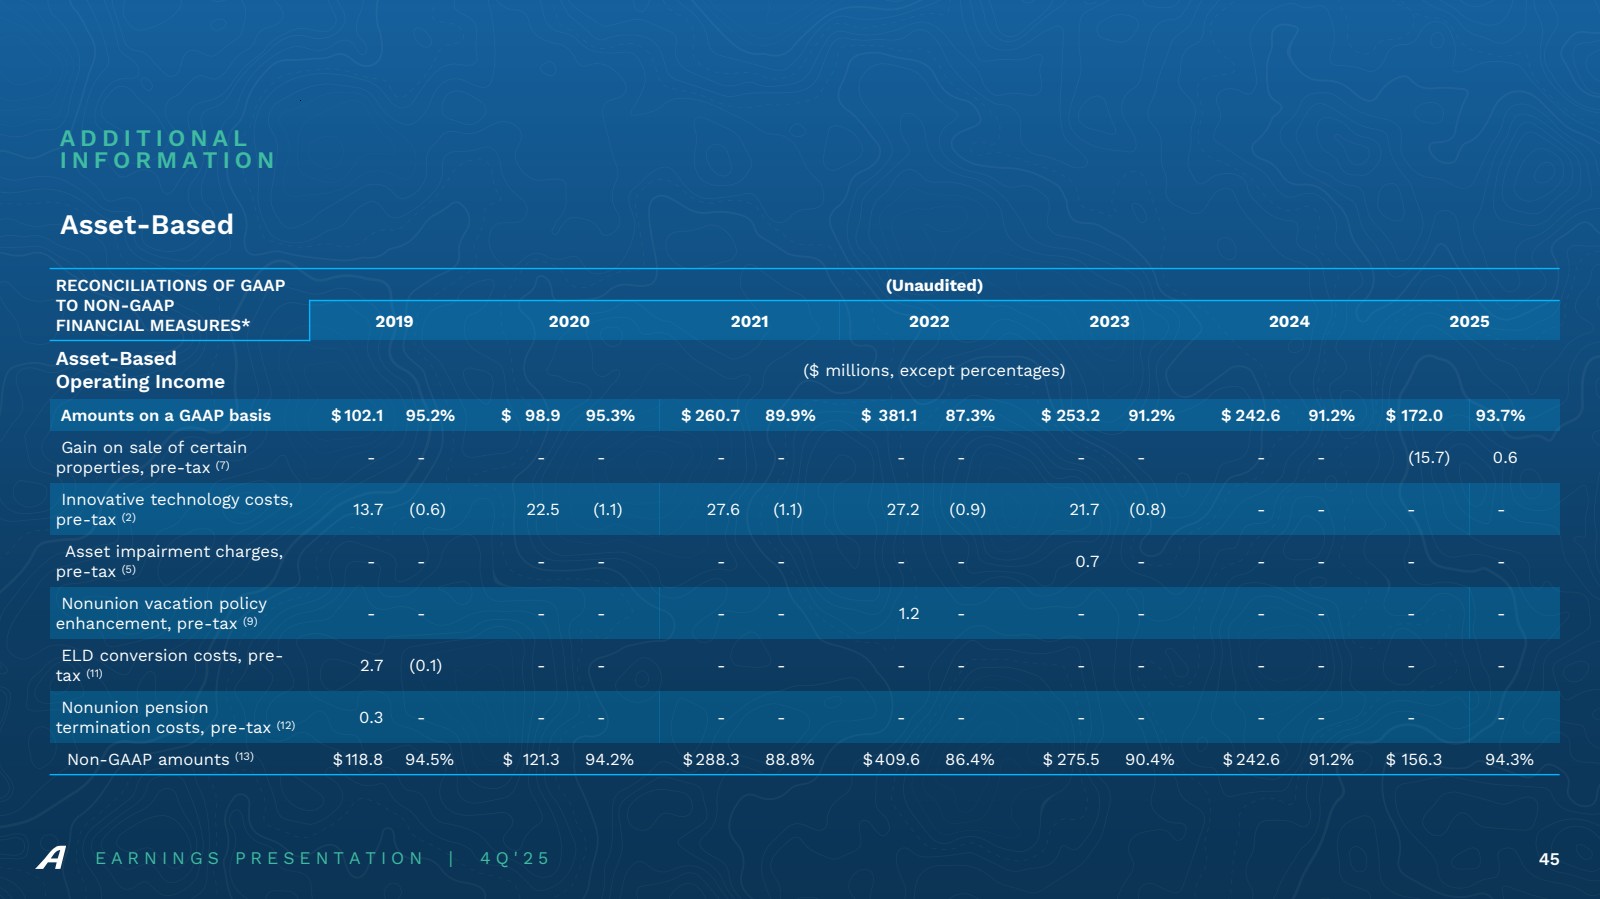
| E A R N I N G S P R E S E N T A T I O N | 4 Q ' 2 5 45 Asset-Based A D D I T I O N A L I N F O R M A T I O N RECONCILIATIONS OF GAAP TO NON-GAAP FINANCIAL MEASURES* (Unaudited) 2019 2020 2021 2022 2023 2024 2025 Asset-Based Operating Income ($ millions, except percentages) Amounts on a GAAP basis $ 102.1 95.2% $ 98.9 95.3% $ 260.7 89.9% $ 381.1 87.3% $ 253.2 91.2% $ 242.6 91.2% $ 172.0 93.7% Gain on sale of certain properties, pre-tax (7) - - - - - - - - - - - - (15.7) 0.6 Innovative technology costs, pre-tax (2) 13.7 (0.6) 22.5 (1.1) 27.6 (1.1) 27.2 (0.9) 21.7 (0.8) - - - - Asset impairment charges, pre-tax (5) - - - - - - - - 0.7 - - - - - Nonunion vacation policy enhancement, pre-tax (9) - - - - - - 1.2 - - - - - - - ELD conversion costs, pre-tax (11) 2.7 (0.1) - - - - - - - - - - - - Nonunion pension termination costs, pre-tax (12) 0.3 - - - - - - - - - - - - - Non-GAAP amounts (13) $118.8 94.5% $ 121.3 94.2% $288.3 88.8% $409.6 86.4% $ 275.5 90.4% $ 242.6 91.2% $ 156.3 94.3% |
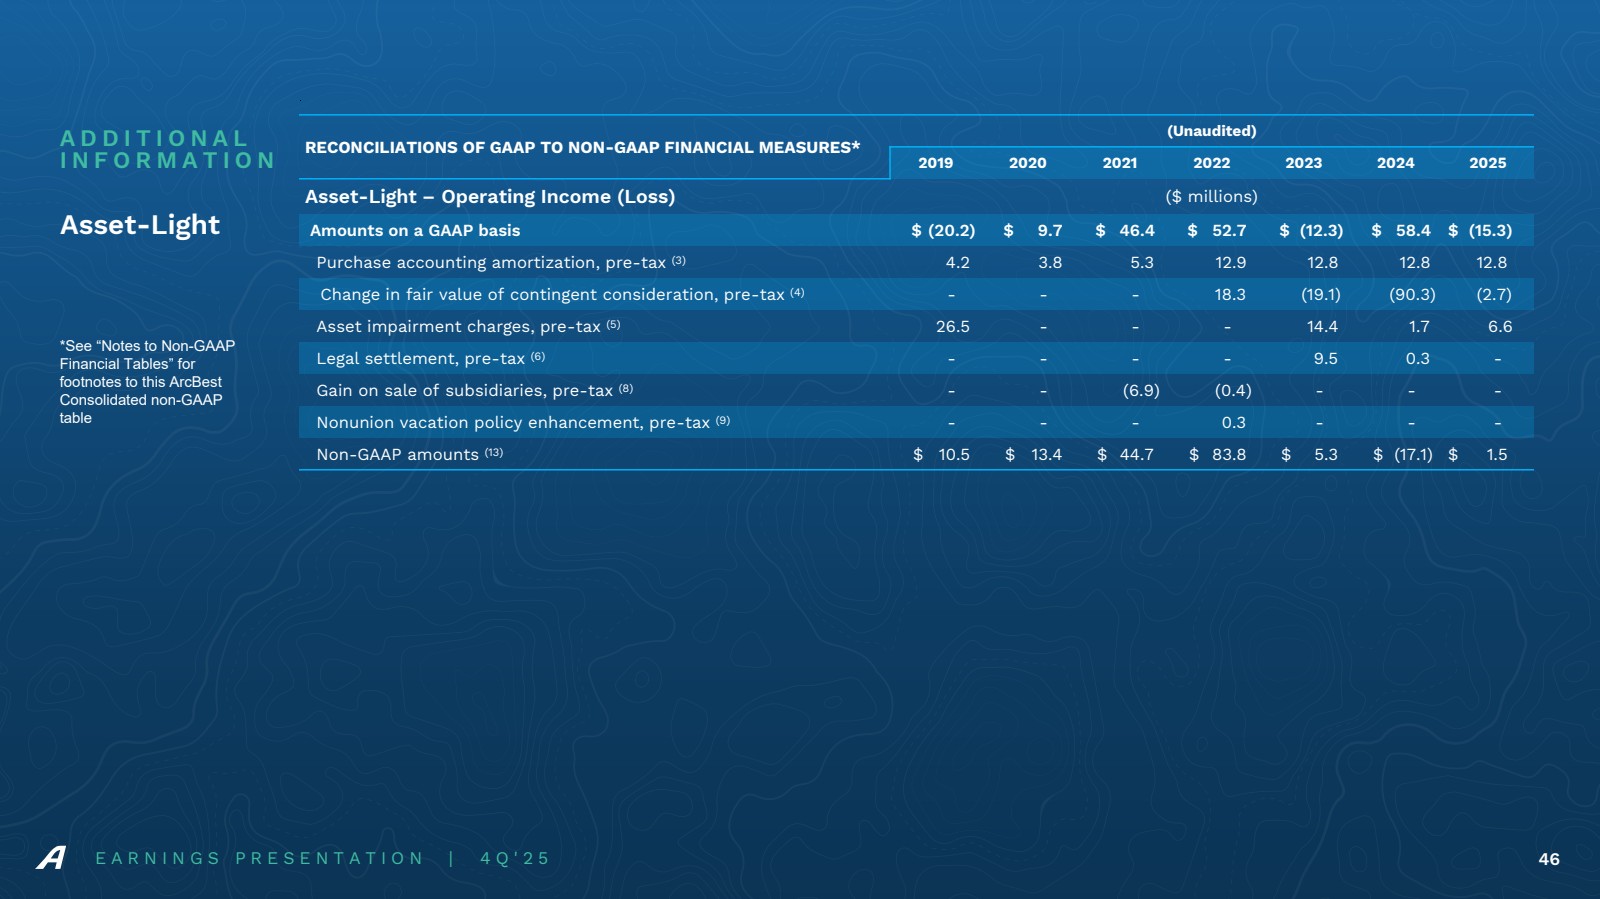
| E A R N I N G S P R E S E N T A T I O N | 4 Q ' 2 5 46 Asset-Light A D D I T I O N A L I N F O R M A T I O N *See “Notes to Non-GAAP Financial Tables” for footnotes to this ArcBest Consolidated non-GAAP table RECONCILIATIONS OF GAAP TO NON-GAAP FINANCIAL MEASURES* (Unaudited) 2019 2020 2021 2022 2023 2024 2025 Asset-Light – Operating Income (Loss) ($ millions) Amounts on a GAAP basis $ (20.2) $ 9.7 $ 46.4 $ 52.7 $ (12.3) $ 58.4 $ (15.3) Purchase accounting amortization, pre-tax (3) 4.2 3.8 5.3 12.9 12.8 12.8 12.8 Change in fair value of contingent consideration, pre-tax (4) - - - 18.3 (19.1) (90.3) (2.7) Asset impairment charges, pre-tax (5) 26.5 - - - 14.4 1.7 6.6 Legal settlement, pre-tax (6) - - - - 9.5 0.3 - Gain on sale of subsidiaries, pre-tax (8) - - (6.9) (0.4) - - - Nonunion vacation policy enhancement, pre-tax (9) - - - 0.3 - - - Non-GAAP amounts (13) $ 10.5 $ 13.4 $ 44.7 $ 83.8 $ 5.3 $ (17.1) $ 1.5 |
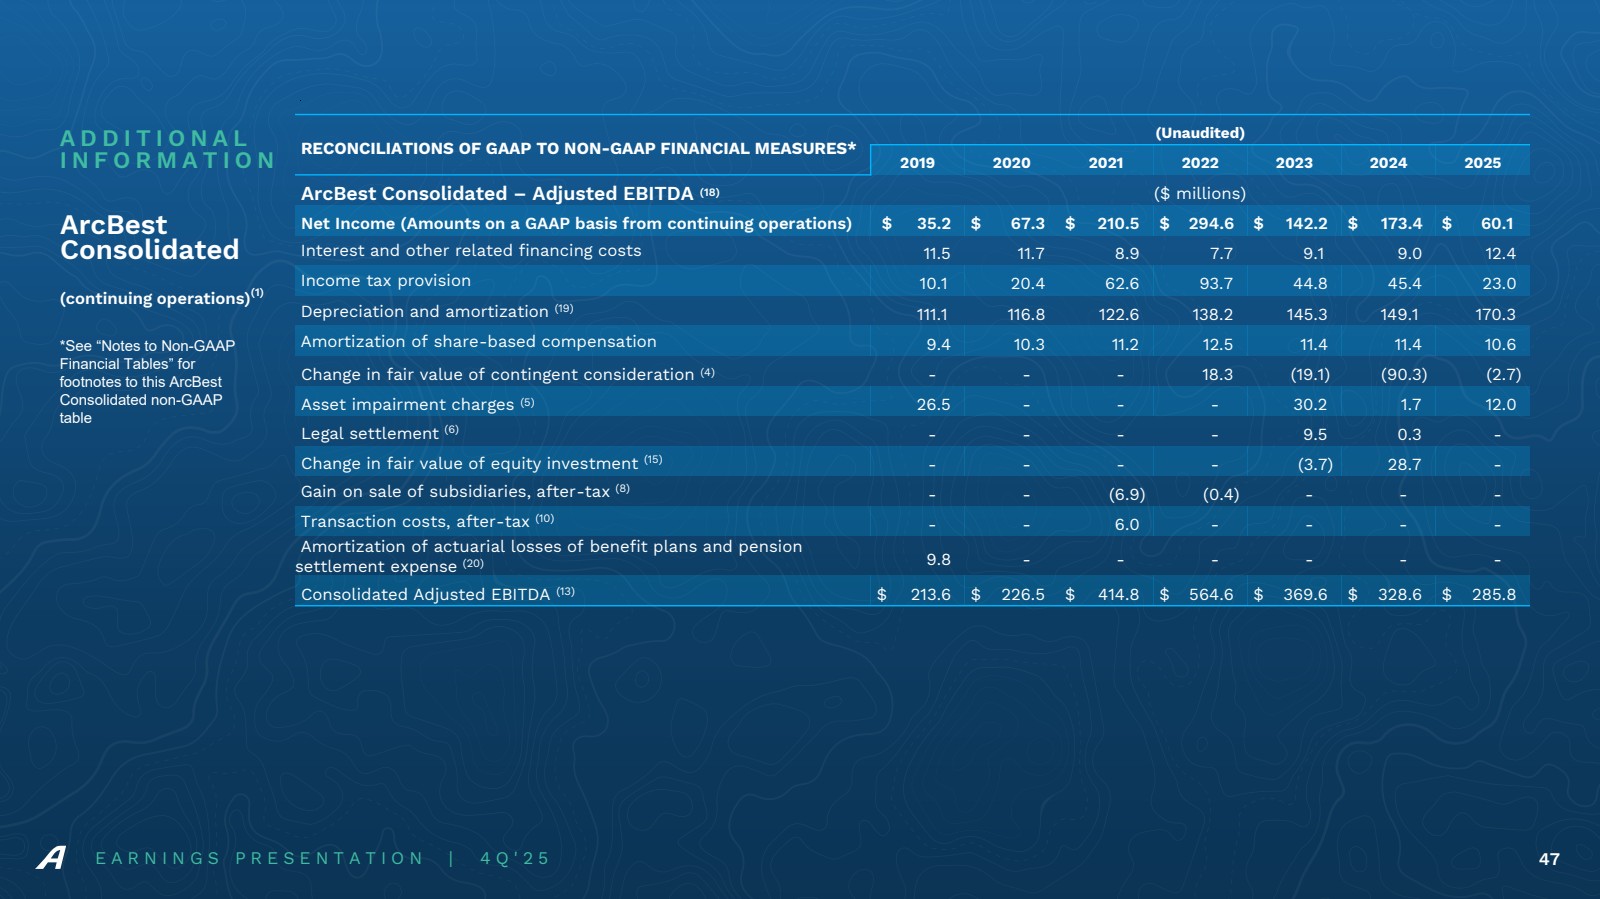
| E A R N I N G S P R E S E N T A T I O N | 4 Q ' 2 5 47 A D D I T I O N A L I N F O R M A T I O N *See “Notes to Non-GAAP Financial Tables” for footnotes to this ArcBest Consolidated non-GAAP table RECONCILIATIONS OF GAAP TO NON-GAAP FINANCIAL MEASURES* (Unaudited) 2019 2020 2021 2022 2023 2024 2025 ArcBest Consolidated – Adjusted EBITDA (18) ($ millions) Net Income (Amounts on a GAAP basis from continuing operations) $ 35.2 $ 67.3 $ 210.5 $ 294.6 $ 142.2 $ 173.4 $ 60.1 Interest and other related financing costs 11.5 11.7 8.9 7.7 9.1 9.0 12.4 Income tax provision 10.1 20.4 62.6 93.7 44.8 45.4 23.0 Depreciation and amortization (19) 111.1 116.8 122.6 138.2 145.3 149.1 170.3 Amortization of share-based compensation 9.4 10.3 11.2 12.5 11.4 11.4 10.6 Change in fair value of contingent consideration (4) - - - 18.3 (19.1) (90.3) (2.7) Asset impairment charges (5) 26.5 - - - 30.2 1.7 12.0 Legal settlement (6) - - - - 9.5 0.3 - Change in fair value of equity investment (15) - - - - (3.7) 28.7 - Gain on sale of subsidiaries, after-tax (8) - - (6.9) (0.4) - - - Transaction costs, after-tax (10) - - 6.0 - - - - Amortization of actuarial losses of benefit plans and pension settlement expense (20) 9.8 - - - - - - Consolidated Adjusted EBITDA (13) $ 213.6 $ 226.5 $ 414.8 $ 564.6 $ 369.6 $ 328.6 $ 285.8 ArcBest Consolidated (continuing operations)(1) |
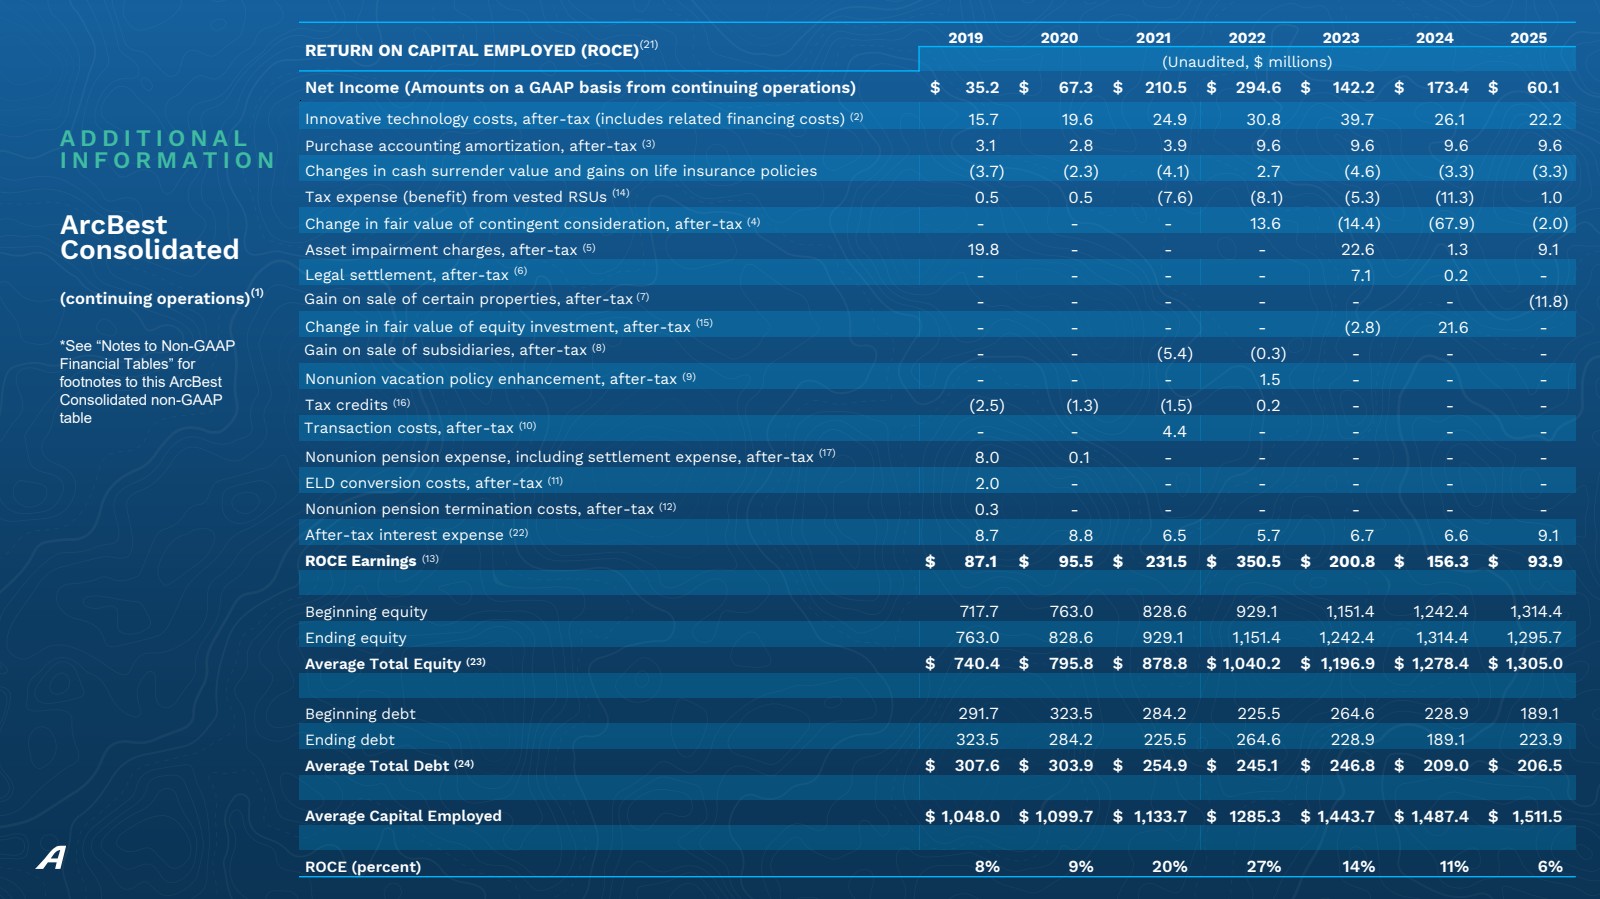
| RETURN ON CAPITAL EMPLOYED (ROCE)(21) 2019 2020 2021 2022 2023 2024 2025 (Unaudited, $ millions) Net Income (Amounts on a GAAP basis from continuing operations) $ 35.2 $ 67.3 $ 210.5 $ 294.6 $ 142.2 $ 173.4 $ 60.1 Innovative technology costs, after-tax (includes related financing costs) (2) 15.7 19.6 24.9 30.8 39.7 26.1 22.2 Purchase accounting amortization, after-tax (3) 3.1 2.8 3.9 9.6 9.6 9.6 9.6 Changes in cash surrender value and gains on life insurance policies (3.7) (2.3) (4.1) 2.7 (4.6) (3.3) (3.3) Tax expense (benefit) from vested RSUs (14) 0.5 0.5 (7.6) (8.1) (5.3) (11.3) 1.0 Change in fair value of contingent consideration, after-tax (4) - - - 13.6 (14.4) (67.9) (2.0) Asset impairment charges, after-tax (5) 19.8 - - - 22.6 1.3 9.1 Legal settlement, after-tax (6) - - - - 7.1 0.2 - Gain on sale of certain properties, after-tax (7) - - - - - - (11.8) Change in fair value of equity investment, after-tax (15) - - - - (2.8) 21.6 - Gain on sale of subsidiaries, after-tax (8) - - (5.4) (0.3) - - - Nonunion vacation policy enhancement, after-tax (9) - - - 1.5 - - - Tax credits (16) (2.5) (1.3) (1.5) 0.2 - - - Transaction costs, after-tax (10) - - 4.4 - - - - Nonunion pension expense, including settlement expense, after-tax (17) 8.0 0.1 - - - - - ELD conversion costs, after-tax (11) 2.0 - - - - - - Nonunion pension termination costs, after-tax (12) 0.3 - - - - - - After-tax interest expense (22) 8.7 8.8 6.5 5.7 6.7 6.6 9.1 ROCE Earnings (13) $ 87.1 $ 95.5 $ 231.5 $ 350.5 $ 200.8 $ 156.3 $ 93.9 Beginning equity 717.7 763.0 828.6 929.1 1,151.4 1,242.4 1,314.4 Ending equity 763.0 828.6 929.1 1,151.4 1,242.4 1,314.4 1,295.7 Average Total Equity (23) $ 740.4 $ 795.8 $ 878.8 $ 1,040.2 $ 1,196.9 $ 1,278.4 $ 1,305.0 Beginning debt 291.7 323.5 284.2 225.5 264.6 228.9 189.1 Ending debt 323.5 284.2 225.5 264.6 228.9 189.1 223.9 Average Total Debt (24) $ 307.6 $ 303.9 $ 254.9 $ 245.1 $ 246.8 $ 209.0 $ 206.5 Average Capital Employed $ 1,048.0 $ 1,099.7 $ 1,133.7 $ 1285.3 $ 1,443.7 $ 1,487.4 $ 1,511.5 ROCE (percent) 8% 9% 20% 27% 14% 11% 6% A D D I T I O N A L I N F O R M A T I O N *See “Notes to Non-GAAP Financial Tables” for footnotes to this ArcBest Consolidated non-GAAP table ArcBest Consolidated (continuing operations)(1) |
| The following footnotes apply to the non-GAAP financial tables on the previous six slides in this presentation: 1) Historical results of FleetNet have been excluded from results for all periods presented, and reclassifications have been made to the prior-period financial statements to conform to current-year presentation. 2) Represents costs related to our customer pilot offering of Vaux and initiatives to optimize our performance through technological innovation. The 2019-2023 periods also include costs associated with the freight handling pilot test program at ABF Freight, for which the decision was made to pause the pilot during third quarter 2023. Costs for 2019-2020 have been adjusted to conform to the current-year presentation. 3) Represents the amortization of acquired intangible assets in the Asset-Light segment. 4) Represents change in fair value of the contingent earnout consideration recorded for the MoLo acquisition. 5) The 2025 periods represent noncash asset impairment charges recognized during fourth quarter 2025 related to the indefinite-lived intangible assets within Asset-Light’s segment and the write-off of certain assets utilized in the freight handling pilot program. The 2024 periods represent noncash asset impairment charges for certain revenue equipment and software recognized during fourth quarter 2024 as part of a strategic decision to adjust capacity within Asset-Light’s operations. The 2023 periods represent noncash lease-related impairment charges for a freight handling pilot facility, an Asset-Based service center, and Asset-Light office spaces that were made available for sublease. The 2019 periods represent a noncash impairment charge recognized in fourth quarter related to a portion of the goodwill, customer relationship intangible assets, and revenue equipment associated with the acquisition of truckload brokerage and truckload dedicated businesses within the Asset-Light segment. 6) Represents settlement expenses related to the classification of certain Asset-Light employees under the Fair Labor Standards Act, which were paid during first quarter 2025. 7) Primarily includes gains on two service center sales within the Asset-Based operations. 8) Gains associated with the April 2021 divestures of moving services subsidiaries for which the gains were recognized in second quarter 2021, when the contingent consideration was received on the transactions, as well as including the contingent amount recognized in second quarter 2022 when the funds were released to escrow. 9) Represents a one-time, noncash charge for enhancements to our nonunion vacation policy which were effective third quarter 2022. 10) Represents costs associated with the November 1, 2021, acquisition of MoLo Solutions, LLC. 11) Impairment charges related to equipment replacement and other one-time costs incurred to comply with the electronic logging device (“ELD”) mandate which became effective in December 2019. 12) Consulting fee incurred in third quarter 2019 associated with the termination of the nonunion defined benefit pension plan. 13) Non-GAAP amounts are calculated in total and may not equal the sum of the GAAP and the non-GAAP adjustments due to rounding. 14) Represents recognition of the tax impact for the vesting of share-based compensation. 15) For 2024, represents a noncash impairment charge to write off an equity investment in Phantom Auto, a provider of human-centered remote operation software, which ceased operations during first quarter 2024. For 2023, represents the increase in fair value of an investment in Phantom Auto based on observable price changes during second quarter 2023. 16) Represents tax credits recognized in the tax provision which relate to a prior tax year due to timing of recognition or retroactive reinstatement of the tax credits. Includes amounts related to alternative fuel tax credit in 2018, 2019 and 2022. Includes amounts related to research and development tax credit in 2019, 2020 and 2021. The 2022 period also includes amounts related to the alternative fuel tax credit for the year ended December 31, 2021 which were recorded in third quarter 2022. 17) Represents nonunion pension expense, including pension settlement and termination expense, related to the Company’s nonunion defined benefit pension plan for which plan termination was completed in 2019. Also includes pension settlement expense related to the Company’s supplemental benefit plan. 18) Adjusted EBITDA is a primary component of the financial covenants contained in ArcBest Corporation’s Fifth Amended and Restated Credit Agreement. Management believes Adjusted EBITDA to be relevant and useful information, as EBITDA is a standard measure commonly reported and widely used by analysts, investors, and others to measure financial performance and ability to service debt obligations. Furthermore, management uses Adjusted EBITDA as a key measure of performance and for business planning. However, these non-GAAP financial measures should not be construed as better measurements than operating income (loss), operating cash flow, net income, or earnings per share, as determined under GAAP. Non-GAAP financial measures should be viewed in addition to, and not as an alternative for, our reported results. Other companies may calculate EBITDA differently; therefore, our Adjusted EBITDA may not be comparable to similarly titled measures of other companies 19) Includes amortization of intangibles associated with acquired businesses. 20) Includes pre-tax pension settlement expense of $4.2 million related to the Company’s nonunion defined benefit pension plan, for which plan termination was completed as of December 31, 2019, and a $4.0 million noncash pension termination expense related to an amount which was stranded in accumulated other comprehensive income until the pension benefit obligation was settled upon plan termination. 21) Management uses Adjusted Return on Capital Employed (ROCE) as a measure of the profitability of the company's capital employed in its business operations. ROCE is a good indicator of long-term company and management performance as it relates to capital efficiency. The calculation of ROCE as presented below begins with the numerator of Net Income from Continuing Operations and the denominator of Average Debt and Average Total Equity. The Net Income from Continuing Operations is adjusted for Non-GAAP items and after-tax interest expense. 22) After-tax interest expense is interest and other related financing costs, net of an assumed 26.7% tax rate in 2025. 23) Average total equity is the average of the beginning and ending total stockholders’ equity. 24) Average total debt is the average of the beginning and ending current portion of long-term debt and long-term debt, less current portion. E A R N I N G S P R E S E N T A T I O N | 4 Q ' 2 5 49 Notes to Non-GAAP Financial Tables |