



consolidated statements of condition
|
As of December 31
|
||||||||
|
|
2025
|
2024
|
||||||
|
(dollars in thousands, except per share data)
|
||||||||
|
Assets
|
||||||||
|
Cash and noninterest-bearing deposits with banks
|
$
|
|
$
|
|
||||
|
Interest-bearing deposits with banks
|
|
|
||||||
|
Total cash and cash equivalents
|
|
|
||||||
|
Securities available for sale
|
|
|
||||||
|
Securities held to maturity, net of allowance for credit losses of $
|
|
|
||||||
|
Restricted investments in bank stocks
|
|
|
||||||
|
Total loans
|
|
|
||||||
|
Less: Allowance for credit losses
|
(
|
)
|
(
|
)
|
||||
|
Net loans
|
|
|
||||||
|
Premises and equipment, net
|
|
|
||||||
|
Premises and equipment held for sale, net
|
|
|
||||||
|
Accrued interest receivable
|
|
|
||||||
|
Goodwill
|
|
|
||||||
|
Bank owned life insurance and annuity assets
|
|
|
||||||
|
Operating lease right-of-use asset, net
|
|
|
||||||
| Deferred tax assets | ||||||||
|
Other assets
|
|
|
||||||
|
Total assets
|
$
|
|
$
|
|
||||
|
Liabilities
|
||||||||
|
Noninterest-bearing deposits
|
$
|
|
$
|
|
||||
|
Interest-bearing deposits
|
|
|
||||||
|
Total deposits
|
|
|
||||||
|
Other borrowed funds
|
|
|
||||||
|
Subordinated debentures
|
|
|
||||||
|
Operating lease liability
|
|
|
||||||
| Allowance for credit losses on off-balance sheet commitments |
||||||||
|
Other liabilities
|
|
|
||||||
|
Total liabilities
|
|
|
||||||
|
Contingent Liabilities
|
||||||||
|
Shareholders’ Equity
|
||||||||
|
Common stock ($
|
|
|
||||||
|
Additional paid-in capital
|
|
|
||||||
|
Retained earnings
|
|
|
||||||
|
Accumulated other comprehensive income (loss)
|
(
|
)
|
(
|
)
|
||||
|
Treasury stock, at cost (
|
(
|
)
|
(
|
)
|
||||
|
Total shareholders’ equity
|
|
|
||||||
|
Total liabilities and shareholders’ equity
|
$
|
|
$
|
|
||||
See accompanying notes to consolidated financial statements
5
consolidated statements of income
|
For the years ended December 31
|
2025
|
2024
|
||||||
|
(dollars in thousands, except per share data)
|
||||||||
|
Interest and dividend income:
|
||||||||
|
Loans, including fees
|
$
|
|
$
|
|
||||
|
Securities:
|
||||||||
|
Taxable
|
|
|
||||||
|
Tax exempt
|
|
|
||||||
|
Dividends
|
|
|
||||||
|
Interest-bearing deposits with banks
|
|
|
||||||
|
|
|
|||||||
|
Interest expense:
|
||||||||
|
Deposits
|
|
|
||||||
|
Other borrowed funds
|
|
|
||||||
|
Subordinated debentures
|
|
|
||||||
|
|
|
|||||||
|
Net interest income
|
|
|
||||||
|
Provision for credit losses
|
|
|
||||||
|
Net interest income after provision for credit losses
|
|
|
||||||
|
Noninterest income:
|
||||||||
|
Service charges on deposit accounts
|
|
|
||||||
|
Trust fees
|
|
|
||||||
|
Income from bank owned life insurance and annuity assets
|
|
|
||||||
|
Mortgage banking income
|
|
|
||||||
|
Electronic refund check / deposit fees
|
|
|
||||||
|
Debit / credit card interchange income
|
|
|
||||||
|
Loss on sale of available for sale securities
|
( |
) | ||||||
|
Tax preparation fees
|
|
|
||||||
|
Other
|
|
|
||||||
|
|
|
|||||||
|
Noninterest expense:
|
||||||||
|
Salaries and employee benefits
|
|
|
||||||
|
Occupancy
|
|
|
||||||
|
Furniture and equipment
|
|
|
||||||
|
Professional fees
|
|
|
||||||
|
Marketing expense
|
|
|
||||||
|
FDIC insurance
|
|
|
||||||
|
Data processing
|
|
|
||||||
|
Software
|
|
|
||||||
|
Other
|
|
|
||||||
|
|
|
|||||||
|
Income before income taxes
|
|
|
||||||
|
Provision for income taxes
|
|
|
||||||
|
NET INCOME
|
$
|
|
$
|
|
||||
|
Earnings per share
|
$
|
|
$
|
|
||||
See accompanying notes to consolidated financial statements
6
consolidated statements of
comprehensive income
|
For the years ended December 31
|
2025
|
2024
|
||||||
|
(dollars in thousands)
|
||||||||
|
NET INCOME
|
$
|
|
$
|
|
||||
|
Other comprehensive income (loss):
|
||||||||
|
Change in unrealized gain (loss) on available for sale securities
|
|
|
||||||
| Reclassification adjustment for realized losses |
||||||||
|
Related tax (expense) benefit
|
(
|
)
|
(
|
)
|
||||
|
Total other comprehensive income (loss), net of tax
|
|
|
||||||
|
Total comprehensive income (loss)
|
$
|
|
$
|
|
||||
See accompanying notes to consolidated financial statements
7
consolidated statements of changes in
shareholders’ equity
|
For the years ended December 31, 2025 and 2024
|
||||||||||||||||||||||||
|
(dollars in thousands, except share and per share data)
|
||||||||||||||||||||||||
|
Common
Stock
|
Additional Paid-In
Capital
|
Retained
Earnings
|
Accumulated Other
Comprehensive
Income (Loss)
|
Treasury
Stock
|
Total
Shareholders’
Equity
|
|||||||||||||||||||
|
Balance at January 1, 2024
|
$
|
|
$
|
|
$
|
|
$
|
(
|
)
|
$
|
(
|
)
|
$
|
|
||||||||||
|
Net income
|
|
|
|
|
|
|
||||||||||||||||||
|
Other comprehensive income, net
|
|
|
|
|
|
|
||||||||||||||||||
|
Cash dividends, $
|
|
|
(
|
)
|
|
|
(
|
)
|
||||||||||||||||
|
Common stock issued
to ESOP,
|
||||||||||||||||||||||||
| Shares acquired for treasury, |
( |
) | ( |
) | ||||||||||||||||||||
|
Balance at December 31, 2024
|
|
|
|
(
|
)
|
(
|
)
|
|
||||||||||||||||
|
Net income
|
|
|
|
|
|
|
||||||||||||||||||
|
Other comprehensive income, net
|
|
|
|
|
|
|
||||||||||||||||||
|
Cash dividends, $
|
( |
) | ( |
) | ||||||||||||||||||||
|
Balance at December 31, 2025
|
$
|
|
$
|
|
$
|
|
$
|
(
|
)
|
$
|
(
|
)
|
$
|
|
||||||||||
See accompanying notes to consolidated financial statements
8
consolidated statements of cash flows
|
For the years ended December 31
|
2025
|
2024
|
||||||
|
(dollars in thousands)
|
||||||||
|
Cash flows from operating activities:
|
||||||||
|
Net income
|
$
|
|
$
|
|
||||
|
Adjustments to reconcile net income to net cash provided by operating activities:
|
||||||||
|
Provision for credit
losses
|
||||||||
|
Depreciation of premises and equipment
|
|
|
||||||
|
Accretion of building grant
|
( |
) | ( |
) | ||||
|
Net amortization (accretion) of purchase accounting adjustments
|
(
|
)
|
(
|
)
|
||||
|
Net amortization (accretion) of securities
|
(
|
)
|
(
|
)
|
||||
|
Net realized loss on sale of securities
|
||||||||
|
Proceeds from sale of loans in secondary market
|
|
|
||||||
|
Loans disbursed for sale in secondary market
|
(
|
)
|
(
|
)
|
||||
|
Amortization of mortgage servicing rights
|
|
|
||||||
|
Gain on sale of loans
|
(
|
)
|
(
|
)
|
||||
|
Accretion of purchased loan discount
|
( |
) | ||||||
|
Amortization of intangible assets
|
|
|
||||||
|
Deferred tax (benefit) expense
|
(
|
)
|
(
|
)
|
||||
|
Contribution of common stock to ESOP
|
||||||||
|
Income from bank owned life insurance and annuity assets
|
(
|
)
|
(
|
)
|
||||
|
Change in accrued interest receivable
|
(
|
)
|
(
|
)
|
||||
|
Change in other liabilities
|
(
|
)
|
|
|||||
|
Change in other assets
|
|
|
||||||
|
Net cash provided by operating activities
|
|
|
||||||
|
Cash flows from investing activities:
|
||||||||
|
Proceeds from sales of securities available for sale
|
||||||||
|
Proceeds from maturities and paydowns of securities available for sale
|
|
|
||||||
|
Purchases of securities available for sale
|
(
|
)
|
(
|
)
|
||||
|
Proceeds from calls and maturities of securities held to maturity
|
|
|
||||||
|
Purchases of restricted
investments in bank stocks
|
( |
) | ( |
) | ||||
|
Redemptions of restricted investments in bank stocks
|
||||||||
|
Net change in loans
|
( |
) | ( |
) | ||||
|
Purchases of premises and equipment
|
(
|
)
|
(
|
)
|
||||
|
Disposals of premises and equipment
|
|
|
||||||
|
Purchases of bank owned life insurance and annuity assets
|
( |
) | ( |
) | ||||
|
Withdrawals from bank owned life insurance and annuity assets
|
|
|
||||||
|
Net cash (used in) investing activities
|
(
|
)
|
(
|
)
|
||||
|
Cash flows from financing activities:
|
||||||||
|
Change in deposits
|
|
|
||||||
|
Cash dividends
|
(
|
)
|
(
|
)
|
||||
|
Purchases of treasury stock
|
( |
) | ||||||
|
Proceeds from Federal Home Loan Bank borrowings
|
|
|
||||||
|
Repayment of Federal Home Loan Bank borrowings
|
(
|
)
|
(
|
)
|
||||
|
Change in other short-term borrowings
|
|
|
||||||
|
Net cash provided by financing activities
|
|
|
||||||
|
Cash and cash equivalents:
|
||||||||
|
Change in cash and cash equivalents
|
(
|
)
|
(
|
)
|
||||
|
Cash and cash equivalents at beginning of year
|
|
|
||||||
|
Cash and cash equivalents at end of year
|
$
|
|
$
|
|
||||
|
Supplemental disclosure:
|
||||||||
|
Cash paid for interest
|
$
|
|
$
|
|
||||
|
Cash paid for income taxes
|
|
|
||||||
|
Operating lease liability arising from obtaining right-of-use asset
|
|
|
||||||
See accompanying notes to consolidated financial statements
9
notes to the consolidated financial statements
Amounts are in thousands, except share and per share data.
Note A - Summary of Significant Accounting Policies
Description of Business: Ohio Valley Banc Corp. (“Ohio Valley”) is a financial holding company
registered under the Bank Holding Company Act of 1956. Ohio Valley
has one banking subsidiary, The Ohio Valley Bank Company (the “Bank”), an Ohio state-chartered bank that is a member of the
Federal Reserve Bank (“FRB”) and is regulated primarily by the Ohio Division of Financial Institutions and the Federal Reserve Board. Ohio Valley also has a subsidiary that engages in consumer lending generally to individuals with higher
credit risk history, Loan Central, Inc.; and a subsidiary insurance agency that facilitates the receipts of insurance commissions, Ohio Valley Financial Services Agency, LLC. The Bank has one wholly-owned subsidiary, Ohio
Valley REO, LLC (“Ohio Valley REO”), an Ohio limited liability company, to which the Bank transfers certain real estate acquired by the Bank through foreclosure for sale by Ohio Valley REO. Ohio Valley and its subsidiaries are collectively
referred to herein as the “Company.”
The Company provides a
full range of commercial and retail banking services from 24 offices located in southeastern Ohio and western West Virginia. It
accepts deposits in checking, savings, time and money market accounts and makes personal, commercial, construction and real estate loans. Substantially all loans are secured by specific items of collateral, including business assets, consumer
assets, and commercial and residential real estate. Commercial loans are expected to be repaid from cash flow from business operations. The Company also offers safe deposit boxes, wire transfers and other standard banking products and
services. The Bank’s deposits are insured by the Federal Deposit Insurance Corporation (“FDIC”). In addition to accepting deposits and making loans, the Bank invests in U. S. Government and agency obligations, interest-bearing deposits in other financial institutions and investments permitted by
applicable law.
The Bank’s trust department provides a
wide variety of fiduciary services for trusts, estates and benefit plans and also provides investment and security services as an agent for its customers.
Principles of Consolidation: The consolidated financial statements include the accounts of Ohio Valley and
its wholly-owned subsidiaries, the Bank, Loan Central, Inc., and Ohio Valley Financial Services Agency, LLC. All material intercompany accounts and transactions have been eliminated.
Reclassifications:
The consolidated financial statements for 2024 have been reclassified to conform with the presentation for 2025. These reclassifications had no effect on the net results of operations or shareholders’ equity.
Use of Estimates: The accounting and reporting policies followed by the Company conform to U.S.
generally accepted accounting principles (“US GAAP”) established by the Financial Accounting Standards Board (“FASB”). The preparation of financial statements in conformity with US GAAP requires management to make estimates and assumptions
that affect the amounts reported in the financial statements and the disclosures provided, and actual results could differ.
Cash and Cash Equivalents: Cash and cash equivalents include cash on hand, noninterest-bearing deposits
with banks, federal funds sold and interest-bearing deposits with banks with maturity terms of less than 90 days. Generally, federal funds are purchased and sold for one-day periods. The Company reports net cash flows for customer loan
transactions, deposit transactions, short-term borrowings and interest-bearing deposits with other financial institutions.
Debt Securities: The Company classifies securities into held to maturity (“HTM”) and available for
sale (“AFS”) categories. HTM securities are those which the Company has the positive intent and ability to hold to maturity and are reported at amortized cost. Securities classified as AFS include securities that could be sold for liquidity,
investment management or similar reasons even if there is not a present intention of such a sale. AFS securities are reported at fair value, with unrealized gains or losses included in other comprehensive income, net of tax.
Premium amortization is deducted from,
and discount accretion is added to, interest income on securities using the level yield method without anticipating prepayments, except for mortgage-backed securities where prepayments are anticipated. Gains and losses are recognized upon the
sale of specific identified securities on the completed trade date.
10
notes to the consolidated financial statements
Amounts are in thousands, except share and per share data.
Note A - Summary of Significant Accounting Policies (continued)
Allowance for Credit Losses (“ACL”) – AFS Securities: For AFS debt securities in an unrealized position, the Company first assesses whether it intends
to sell, or it is more likely than not that it will be required to sell the security before recovery of its amortized cost basis. If either of the criteria regarding intent or requirement to sell is met, the security’s amortized cost basis is
written down to fair value through income. For debt securities AFS that do not meet the aforementioned criteria, the Company evaluates whether the decline in fair values has resulted from credit losses or other factors. In making this assessment,
management considers the extent to which fair value is less than amortized cost, any changes to the rating of the security by a rating agency, and adverse conditions specifically related to the security, among other factors. If this assessment
indicates that a credit loss exists, the present value of cash flows expected to be collected from the security are compared to the amortized cost basis of the security. If the present value of cash flows expected to be collected is less than the
amortized cost basis, a credit loss exists and an ACL is recorded for the credit loss, limited by the amount that the fair value is less than the amortized cost basis. Any impairment that has not been recorded through an ACL is recognized in
other comprehensive income.
Changes in the ACL are recorded as credit loss expense (or reversal). Losses are charged against the allowance when management believes the
uncollectibility of an AFS security is confirmed or when either of the criteria regarding intent or requirement to sell is met.
Management made the accounting policy election to exclude accrued interest receivable from the estimate of credit losses. on AFS debt securities totaled $1,330 at December 31, 2025 and $1,294 at December 31, 2024.
Management classifies the AFS portfolio into the following major security types: U.S. Government securities, U.S. Government sponsored entity
securities, and Agency mortgage-backed residential securities. At December 31, 2025 and 2024, there was no
ACL – HTM Securities: Management measures expected credit losses on HTM debt securities on a collective basis by major security type with each type sharing similar risk characteristics and considers historical credit loss information that is
adjusted for current conditions and reasonable and supportable forecasts. The ACL on securities HTM is a contra asset valuation account that is deducted from the carrying amount of HTM securities to present the net amount expected to be
collected. HTM securities are charged off against the ACL when deemed uncollectible. Adjustments to the ACL are reported in the Company’s consolidated statements of income in the provision for credit losses. Management classifies the HTM
portfolio into two major security types: Obligations of states and political subdivisions and Agency mortgage-backed residential securities. Agency mortgage-backed residential securities consist of only two securities with balances that are
not significant. With regard to obligations of states and political subdivisions, management considers (1) issuer bond ratings, (2) historical loss rates for given bond ratings, (3) the financial condition of the issuer, and (4) whether
issuers continue to make timely principal and interest payments under the contractual terms of the securities. At December 31, 2025, there was $1
in the ACL related to HTM debt securities, unchanged from December 31, 2024. There was no corresponding provision expense during the
year ended December 31, 2025, compared to a $1 recovery of provision expense during the year ended December 31, 2024.
Management made the accounting policy election to exclude accrued interest receivable from the estimate of credit
losses. on HTM debt securities totaled $13 at December 31, 2025 and $24 at December 31, 2024.
Restricted
Investments in Bank Stocks: As a member of the Federal Home Loan Bank (“FHLB”)
system and the FRB system, the Bank is required to own a certain amount of stock based on its level of borrowings and other factors and may invest in additional amounts. FHLB stock and FRB stock are carried at cost, classified as restricted
securities, and periodically evaluated for impairment based on ultimate recovery of par value. Both cash and stock dividends are reported as income.
Loans: Loans that management has the intent and ability to hold for the foreseeable future or until maturity
or payoff are reported at the principal balance outstanding, net of unearned interest, deferred loan fees and costs, and an ACL. Interest income is reported on an accrual basis using the interest method and includes amortization of net deferred
loan fees and costs over the loan term using the level yield method without anticipating prepayments. The amount of the Company’s recorded investment is not materially different than the amount of unpaid principal balance for loans.
11
notes to the consolidated financial statements
Amounts are in thousands, except share and per share data.
Note A - Summary of Significant Accounting Policies (continued)
Interest income is discontinued and
the loan moved to non-accrual status when full loan repayment is in doubt, typically when the loan payments are past due 90 days or over unless the loan is well-secured or in process of collection. Past due status is based on the contractual
terms of the loan. In all cases, loans are placed on nonaccrual or charged-off at an earlier date if collection of principal or interest is considered doubtful.
All interest accrued but not received
for loans placed on nonaccrual is reversed against interest income. Interest received on such loans is accounted for on the cash-basis method until qualifying for return to accrual. Loans are returned to accrual status when all the principal
and interest amounts contractually due are brought current and future payments are reasonably assured.
The Bank also originates long-term,
fixed-rate mortgage loans, with the full intention of being sold to the secondary market. These loans are considered held for sale during the period of time after the principal has been advanced to the borrower by the Bank, but before the Bank
has been reimbursed by the Federal Home Loan Mortgage Corporation, typically within a few business days. Loans sold to the secondary market are carried at the lower of aggregate cost or fair value. As of December 31, 2025
and 2024, there were no
ACL - Loans: The ACL for loans is a contra asset valuation account that is deducted from the
amortized cost basis of loans to present the net amount expected to be collected on the loans. Loans, or portions thereof, are charged off against the ACL when they are deemed uncollectible. Expected recoveries do not exceed the aggregate of
amounts previously charged-off and expected to be charged-off. The ACL is adjusted through the provision for credit losses and reduced by net charge offs of loans.
The ACL is an estimate of expected credit losses, measured over the contractual life of a loan, that considers
historical loss experience, current conditions and forecasts of future economic conditions. Determination of an appropriate ACL is inherently subjective and may have significant changes from period to period.
The methodology for determining the ACL has two main components: evaluation of expected credit losses for certain groups
of loans that share similar risk characteristics and evaluation of loans that do not share risk characteristics with other loans.
The ACL is measured on a collective (pool) basis when similar risk characteristics exist. The Company has identified the
following portfolio segments and measures the ACL using the following methods:
|
Portfolio Segment
|
Measurement Method
|
Loss Driver
|
||
|
Residential real estate
|
Cumulative Undiscounted Expected Loss
|
National Unemployment, National GDP
|
||
|
Commercial real estate:
|
||||
|
Owner-occupied
|
Cumulative Undiscounted Expected Loss
|
National Unemployment, National GDP
|
||
|
Nonowner-occupied
|
Cumulative Undiscounted Expected Loss
|
National Unemployment, National GDP
|
||
|
Construction
|
Cumulative Undiscounted Expected Loss
|
National Unemployment, National GDP
|
||
|
Commercial and industrial
|
Cumulative Undiscounted Expected Loss
|
National Unemployment, National GDP
|
||
|
Consumer:
|
||||
|
Automobile
|
Cumulative Undiscounted Expected Loss
|
National Unemployment
|
||
|
Home equity
|
Cumulative Undiscounted Expected Loss
|
National Unemployment
|
||
|
Other
|
Cumulative Undiscounted Expected Loss,
Remaining Life Method
|
National Unemployment
|
12
notes to the consolidated financial statements
Amounts are in thousands, except share and per share data.
Note A - Summary of Significant Accounting Policies (continued)
Historical credit loss experience is the basis for the estimation of expected credit losses. We apply historical loss rates to
pools of loans with similar risk characteristics. In defining historical loss rates and the prepayment rates and curtailment rates used to determine the expected life of loans, the use of regional and national peer data was used. After
consideration of the historic loss calculation, management applies qualitative adjustments to reflect the current conditions and reasonable and supportable forecasts not already reflected in the historical loss information at the balance
sheet date. Our reasonable and supportable forecast adjustment, referred to above as “Loss Driver”, is based on the national unemployment rate and the national gross domestic product forecast for the first year. For periods beyond our
reasonable and supportable forecast, we revert to historical loss rates utilizing a straight-line method over a two-year reversion
period. The qualitative adjustments for current conditions are based upon changes in lending policies and practices, experience and ability of lending staff, quality of the Company’s loan review system, value of underlying collateral, the
volume and severity of past due loans, the value of underlying collateral for collateral dependent loans, the existence of and changes in concentrations and other external factors. Each factor is assigned a value to reflect improving, stable,
or declining conditions based on management’s best judgment using relevant information available at the time of the evaluation. Expected credit losses are estimated over the contractual term of the loans, adjusted for expected prepayments
when appropriate. The contractual term excludes expected extensions, renewals, and modifications unless either of the following applies: management has a reasonable expectation at the reporting date that a modification will be executed with
an individual borrower, or the extension of renewal options are included in the original or modified contract at the reporting date and are not unconditionally cancellable by the Company.
The Company has elected to exclude accrued interest receivable from the measurement of its ACL. on loans totaled $4,111
at December 31, 2025 and $3,429 at December 31, 2024. When a loan is placed on non-accrual status, any outstanding accrued interest
is reversed against interest income.
Loans that do not share risk characteristics are evaluated on an individual basis. Loans evaluated individually are
not also included in the collective evaluation. We evaluate all loans that meet the following criteria: 1) when it is determined that foreclosure is probable; 2) substandard, doubtful and nonperforming loans when repayment is expected to be
provided substantially through the operation or sale of the collateral; 3) when it is determined by management that a loan does not share similar risk characteristics with other loans. Specific reserves are established based on the following
three acceptable methods for measuring the ACL: 1) the present value of expected future cash flows discounted at the loan’s original effective interest rate; 2) the loan’s observable market price; or 3) the fair value of the collateral when the
loan is collateral dependent. Our individual loan evaluations consist primarily of the fair value of collateral method because most of our loans are collateral dependent. Collateral values are discounted to consider disposition costs when
appropriate. A specific reserve is established or a charge-off is taken if the fair value of the loan is less than the loan balance.
At December 31, 2025, there was $11,519 in the ACL related to loans, compared to $10,088 at December 31, 2024. This resulted in
corresponding provision expense of $2,765 and $2,580 during the years ended December 31, 2025 and 2024, respectively.
The Company’s loan portfolio segments have been identified as follows: Commercial and Industrial, Commercial Real
Estate, Residential Real Estate, and Consumer.
Commercial and industrial: Portfolio
segment consists of borrowings for commercial purposes to individuals, corporations, partnerships, sole proprietorships, and other business enterprises. Commercial and industrial loans are generally secured by business assets such as equipment,
accounts receivable, inventory, or any other asset excluding real estate and generally made to finance capital expenditures or operations. The Company’s risk exposure is related to deterioration in the value of collateral securing the loan
should foreclosure become necessary. Generally, business assets used or produced in operations do not maintain their value upon foreclosure, which may require the Company to write down the value significantly to sell.
13
notes to the consolidated financial statements
Amounts are in thousands, except share and per share data.
Note A - Summary of Significant Accounting Policies (continued)
Commercial real estate: Portfolio segment consists of nonfarm, nonresidential loans secured by
owner-occupied and nonowner-occupied commercial real estate as well as commercial construction loans. An owner-occupied loan relates to a borrower purchased building or space for which the repayment of principal is dependent upon cash flows
from the ongoing business operations conducted by the party, or an affiliate of the party, who owns the property. Owner-occupied loans that are dependent on cash flows from operations can be adversely affected by current market conditions for
their product or service. A nonowner-occupied loan is a property loan for which the repayment of principal is dependent upon rental income associated with the property or the subsequent sale of the property. Nonowner-occupied loans that are
dependent upon rental income are primarily impacted by the level of interest rates associated with the debt and to local economic conditions, which dictate occupancy rates and the amount of rent charged. The increase in
debt service due to higher interest rates may not be able to be passed on to tenants. As part of the origination process, loan interest rates and occupancy rates are stressed to determine the impact on the borrower’s ability to maintain
adequate debt service under different economic conditions. Furthermore, the Company monitors the concentration in any one industry and has established limits relative to capital. In addition, credit quality trends are monitored by industry to determine if a change in the risk exposure to a certain industry may warrant a change in our underwriting standards. Commercial construction loans consist of borrowings to purchase and develop raw land
into 1-4 family residential properties. Construction loans are extended to individuals as well as corporations for the construction of an individual or multiple properties and are secured by raw land and the subsequent improvements. Repayment
of the loans to real estate developers is dependent upon the sale of properties to third parties in a timely fashion upon completion. Should there be delays in construction or a downturn in the market for those properties, there may be
significant erosion in value that may be absorbed by the Company.
Residential real estate: Portfolio segment consists of loans to individuals for the purchase of 1-4 family primary residences with repayment primarily
through wage or other income sources of the individual borrower. The Company’s loss exposure to these loans is dependent on local market conditions for residential properties as loan amounts are determined, in part, by the fair value of the
property at origination.
Consumer: Portfolio segment consists of loans to individuals secured by automobiles, open-end home equity loans and other loans to individuals for household, family, and other personal
expenditures, both secured and unsecured. These loans typically have maturities of six years or less with repayment dependent on
individual wages and income. The risk of loss on consumer loans is elevated as the collateral securing these loans, if any, rapidly depreciate in value or may be worthless and/or difficult to locate if repossession is necessary.
ACL – Off-Balance Sheet Credit Exposures: The Company estimates expected credit losses over the contractual period in which the Company is exposed to credit risk via a
contractual obligation to extend credit, unless that obligation is unconditionally cancellable by the Company. The ACL on off-balance sheet credit exposures is adjusted through credit loss expense. The estimate includes consideration of the
likelihood that funding will occur and an estimate of expected credit losses on commitments expected to be funded over its estimated life. At December 31, 2025, there was $871 in the ACL related to off-balance sheet credit exposures, compared to $582
at December 31, 2024. This resulted in corresponding provision expense of $289 during the year ended December 31, 2025, compared
to a $110 recovery of provision expense during the year ended December 31, 2024.
Concentrations of Credit Risk: The Company grants residential, consumer and commercial loans to customers located
primarily in the southeastern Ohio and western West Virginia areas.
The following represents the composition of the Company’s loan portfolio as of December 31:
|
% of Total Loans
|
||||||||
|
2025
|
2024
|
|||||||
|
Commercial real estate loans
|
|
%
|
|
%
|
||||
|
Residential real estate loans
|
|
%
|
|
%
|
||||
|
Commercial and industrial loans
|
|
%
|
|
%
|
||||
|
Consumer loans
|
|
%
|
|
%
|
||||
|
|
%
|
|
%
|
|||||
14
notes to the consolidated financial statements
Amounts are in thousands, except share and per share data.
Note A - Summary of Significant Accounting Policies (continued)
The Bank, in the normal
course of its operations, conducts business with correspondent financial institutions. Balances in correspondent accounts, investments in federal funds, and other short-term securities are closely monitored to ensure that prudent levels of
credit and liquidity risks are maintained. At December 31, 2025, the Bank’s primary correspondent balance was $30,260 on deposit at
the FRB, Cleveland, Ohio.
Premises and Equipment: Land is carried at cost. Premises and equipment are stated at cost less
accumulated depreciation, which is computed using the straight-line method over the estimated useful life of the owned asset and, for leasehold improvement, over the remaining term of the leased facility, whichever is shorter. The useful
lives range from to eight years for equipment, furniture and fixtures and to 39 years for buildings and improvements.
Premises and equipment held for sale are
reported at the lower of its carrying value or fair value less cost to sell. The carrying amount of the asset should be adjusted each reporting period for subsequent changes in fair value less cost to sell. A loss should be recognized for
any subsequent write-down to fair value less cost to sell. A gain should be recognized for any subsequent increase in fair value less cost to sell, but not in excess of the cumulative loss previously recognized. Once classified as held for
sale, depreciation should not be recorded.
The Company enters into leases in the
normal course of business primarily for branch buildings and office space to conduct business. The Company’s leases have remaining terms ranging from 4 months to 15.6 years, some of which include options to extend the leases for up to 15 years .
The Company includes lease extension
and termination options in the lease term if, after considering relevant economic factors, it is reasonably certain the Company will exercise the option. In addition, the Company has elected to account for any non-lease components in its real
estate leases as part of the associated lease component. The Company has also elected to not recognize leases with original lease terms of 12 months or less (short-term leases) on the Company’s balance sheet.
Leases are classified as operating or
finance leases at the lease commencement date. Lease expense for operating leases and short-term leases is recognized on a straight-line basis over the lease term. Right-of-use (“ROU”) assets represent our right to use an underlying asset for
the lease term and lease liabilities are recognized at the lease commencement date based on the estimated present value of lease payments over the lease term. At December 31, 2025 and 2024, the Company did no
The Company’s operating lease ROU
assets and operating lease liabilities are valued based on the present value of future minimum lease payments, discounted with an incremental borrowing rate for the same term as the underlying lease. The Company has one lease arrangement that
contains variable lease payments that are adjusted periodically for an index.
Foreclosed assets: Assets acquired through or instead of loan foreclosure are initially recorded at
fair value less costs to sell when acquired, establishing a new cost basis. Physical possession of residential real estate property collateralizing a consumer mortgage loan occurs when legal title is obtained upon completion of foreclosure or
when the borrower conveys all interest in the property to satisfy the loan through completion of a deed in lieu of foreclosure or through a similar legal agreement. These assets are subsequently accounted for at lower of cost or fair value less
estimated costs to sell. If fair value declines subsequent to foreclosure, a valuation allowance is recorded through expense. Operating costs after acquisition are expensed.
Goodwill: Goodwill results from business acquisitions and represents the excess of the
purchase price over the fair value of acquired tangible assets and liabilities and identifiable intangible assets. Goodwill is assessed for impairment at least annually or more frequently if events and circumstances exist that indicate that an
impairment test should be performed. For both 2025 and 2024, the Company selected November 30th as the date to perform its annual impairment test. If possible impairment is likely, the Company will utilize the assistance of an
independent third party for an appraisal and any such impairment is recognized in the period identified. The goodwill impairment analysis is used to identify potential impairment by comparing the fair value of the relevant reporting entity with
its carrying value, including goodwill. The analysis is performed under guidance of FASB ASC 350. As of December 31, 2025, the Company concluded it is unlikely impairment of goodwill has occurred from the goodwill established from the Company’s
acquisitions. See Note F for more specific disclosures related to goodwill impairment testing.
15
notes to the consolidated financial statements
Amounts are in thousands, except share and per share data.
Note A - Summary of Significant Accounting Policies (continued)
Long-term Assets: Premises and equipment and other long-term assets are reviewed for impairment
when events indicate their carrying amount may not be recoverable from future undiscounted cash flows. If impaired, the assets are recorded at fair value.
Mortgage Servicing Rights: A mortgage servicing right (“MSR”) is a contractual agreement where the right to
service a mortgage loan is sold by the original lender to another party. When the Company sells mortgage loans to the secondary market, it retains the servicing rights to these loans. The Company’s MSR is recognized separately when acquired
through sales of loans and is initially recorded at fair value with the income statement effect recorded in mortgage banking income. Subsequently, the MSR is then amortized in proportion to and over the period of estimated future servicing
income of the underlying loan. The MSR is then evaluated for impairment periodically based upon the fair value of the rights as compared to the carrying amount, with any impairment being recognized through a valuation allowance. Fair value of
the MSR is based on market prices for comparable mortgage servicing contracts. Impairment is determined by stratifying rights into groupings based on predominant risk characteristics, such as interest rate, loan type and investor type. If the
Company later determines that all or a portion of the impairment no longer exists for a particular grouping, a reduction of the allowance may be recorded as an increase to income. At December 31, 2025 and 2024, the Company’s MSR assets were $318 and $355 , respectively, and were
included within Other Assets on the Statement of Condition.
Transfers of Financial Assets:
Transfers of financial assets are accounted for as sales when control over the assets has been relinquished. Control over transferred assets is deemed to be surrendered when the assets have been legally isolated from the Company, the
transferee obtains the right to pledge or exchange the transferred assets, and the Company does not maintain effective control over the transferred assets.
Earnings Per Share: Earnings per share is based on net income divided by the following weighted
average number of common shares outstanding during the periods: 4,711,001 for 2025 and 4,736,820 for 2024. Ohio Valley had no dilutive effect and no potential common shares issuable under stock options or other agreements for any period presented.
Income Taxes: Income tax expense is the sum of the current year income tax due or refundable
and the change in deferred tax assets and liabilities. Deferred tax assets and liabilities are the expected future tax consequences of temporary differences between the carrying amounts and tax bases of assets and liabilities, computed using
enacted tax rates. The effect on deferred tax assets and liabilities of a change in tax rates is recognized at the time of enactment of such change in tax rates. A valuation allowance, if needed, reduces deferred tax assets to the amount
expected to be realized.
A tax position is recognized as a
benefit only if it is “more likely than not” that the tax position would be sustained in a tax examination, with a tax examination being presumed to occur. The amount recognized is the largest amount of tax benefit that is greater than 50% likely
of being realized on examination. For tax positions not meeting the “more likely than not” test, no tax benefit is recorded. The Company recognizes interest and/or penalties related to income tax matters in income tax expense.
Comprehensive Income: Comprehensive income consists of net income and other comprehensive
income (loss). Other comprehensive income (loss) includes unrealized gains and losses on securities available for sale which are also recognized as separate components of equity, net of tax.
Loss Contingencies: Loss contingencies, including claims and legal actions arising in the ordinary course of
business, are recorded as liabilities when the likelihood of loss is probable and an amount or range of loss can be reasonably estimated. Management does not believe there now are such matters that will have a material effect on the financial statements.
16
notes to the consolidated financial statements
Amounts are in thousands, except share and per share data.
Note A - Summary of Significant Accounting Policies (continued)
Bank Owned Life Insurance and Annuity
Assets: The Company has purchased life insurance policies on
certain key executives. Bank owned life insurance is recorded at the amount that can be realized under the insurance contract at the balance sheet date, which is the cash surrender value adjusted for other charges or other amounts due that are
probable at settlement. The Company also purchased an annuity investment for a certain key executive that earns interest.
Employee Stock Ownership Plan: Compensation expense is based on the market price of shares as they are
committed to be allocated to participant accounts.
Dividend Reinvestment Plan: The Company maintains a Dividend Reinvestment Plan. The plan enables
shareholders to elect to have their cash dividends on all or a portion of shares held automatically reinvested in additional shares of the Company’s common stock. The stock is issued out of the Company’s authorized shares and credited to
participant accounts at fair market value. Dividends are reinvested on a quarterly basis.
Loan Commitments and Related Financial
Instruments: Financial instruments include off-balance sheet
credit instruments, such as commitments to make loans and commercial letters of credit, issued to meet customer financing needs. The face amount for these items represents the exposure to loss, before considering customer collateral or ability
to repay. These financial instruments are recorded when they are funded. See Note L for more specific disclosure related to loan commitments.
Dividend Restrictions: Banking regulations require maintaining certain capital levels and may limit the
dividends paid by the Bank to Ohio Valley or by Ohio Valley to its shareholders. See Note P for more specific disclosure related to dividend restrictions.
Restrictions on Cash: Cash on hand
or on deposit with the FRB totaled $30,260 and $66,599 at year-end 2025 and 2024, respectively, and were subject to clearing requirements but not subject to any regulatory reserve
requirements. The balances on deposit with the FRB earn interest at a rate set by the FRB that is related to the federal funds rate. At December 31, 2025, the rate was 3.65 % compared to 4.40 % at December 31, 2024.
Derivatives: At the inception of a derivative contract, the Company designates the
derivative as one of three types based on the Company’s intentions and belief as to likely effectiveness as a hedge. These three types are (1) a hedge of the fair value of a recognized asset or liability or of an unrecognized firm commitment
(“fair value hedge”), (2) a hedge of a forecasted transaction or the variability of cash flows to be received or paid related to a recognized asset or liability (“cash flow hedge”), or (3) an instrument with no hedging designation
(“stand-alone derivative”).
Net cash settlements on derivatives that
qualify for hedge accounting are recorded in interest income or interest expense, based on the item being hedged. Net cash settlements on derivatives that do not qualify for hedge accounting are reported in noninterest income. Cash flows on
hedges are classified in the cash flow statement the same as the cash flows of the items being hedged.
At December 31, 2025 and 2024, the
only derivative instruments used by the Company were interest rate swaps, which are classified as stand-alone derivatives. See Note H for more specific disclosures related to interest rate swaps.
Fair Value of Financial Instruments: Fair values of
financial instruments are estimated using relevant market information and other assumptions, as more fully disclosed in Note O. Fair value estimates involve uncertainties and matters of significant judgment regarding interest rates, credit risk,
prepayments, and other factors, especially in the absence of broad markets for particular items. Changes in assumptions or in market conditions could significantly affect the estimates.
Operating
Segments: We conduct our operations through a business segment, banking, which derives interest and noninterest income
through our banking products and services and investment securities. All of our income relates to our operations in the United States.
Pursuant to Financial Accounting Standards Codification 280, Segment Reporting, operating segments represent components of an enterprise for which separate
financial information is available that is regularly evaluated by the chief operating decision makers in determining how to allocate resources and assessing performance.
17
notes to the consolidated financial statements
Amounts are in thousands, except share and per share data.
Note A - Summary of Significant Accounting Policies (continued)
Our chief operating decision maker, which is our Chief Executive Officer, evaluates interest and noninterest income streams and credit losses from our various
products and services, while expense activities, including interest expense and noninterest expense, are managed, and financial performance is evaluated, on a Company-wide basis. As a result, detailed profitability information for each interest
and noninterest income stream is not used by our chief operating decision maker to allocate resources or in assessing performance. Rather, our chief operating decision maker uses consolidated net income to assess performance by comparing it to
and monitoring against budgeted and prior year results. This information is used to manage resources to drive business and net income growth, including investment in key strategic priorities, as well as determining our ability to return capital
to shareholders. Segment assets represent total assets on our Consolidated Balance Sheets and segment net income represents net income on our Consolidated Statements of Income.
Recent Accounting Changes Adopted:
ASU No. 2023-09, Income Taxes (Topic 740): Improvements to Income Tax Disclosures. This ASU enhances income tax disclosures, including the disaggregation of existing disclosures related to the tax rate reconciliation and income taxes paid. This
ASU took effect for annual reporting periods beginning after December 15, 2024, with the first disclosure additions included in this Annual Report on Form 10-K for the year ended December 31, 2025. The amendments to this ASU were applied on a
retrospective basis. The adoption did not have a material impact on the Company’s consolidated financial statements and related disclosures. See Note K - “Income Taxes” for additional disclosure information.
New Accounting Pronouncements Pending Adoption:
In November 2024, the FASB issued ASU No. 2024-03, Disaggregation of Income Statement Expenses. ASU 2024-03 requires additional disclosure of the nature of expenses included in the income statement to be presented in a tabular format in the
footnotes to the financial statements. ASU 2024-03 is effective for annual periods beginning after December 15, 2026, and interim periods within fiscal years beginning after December 15, 2027. The amendments in ASU 20204-03 should be applied on a
prospective basis, although retrospective application is permitted. The Company is evaluating the effect the updated guidance will have on its consolidated financial statements and related disclosures.
18
notes to the consolidated financial statements
Amounts are in thousands, except share and per share data.
Note
B - Securities
The following table summarizes the amortized cost and fair value of securities AFS and securities HTM at December 31, 2025 and 2024, and the
corresponding amounts of gross unrealized gains and losses recognized in accumulated other comprehensive income (loss) and gross unrecognized gains and losses:
| Securities Available for Sale |
Amortized
Cost
|
Gross Unrealized
Gains
|
Gross Unrealized
Losses
|
Estimated
Fair Value
|
||||||||||||
|
December 31, 2025
|
||||||||||||||||
|
U.S. Government securities
|
$ | $ | $ | ( |
) | $ | ||||||||||
|
U.S. Government sponsored entity securities
|
|
|
(
|
)
|
|
|||||||||||
|
Agency mortgage-backed securities, residential
|
|
|
(
|
)
|
|
|||||||||||
|
Total securities
|
$
|
|
$
|
|
$
|
(
|
)
|
$
|
|
|||||||
|
December 31, 2024
|
||||||||||||||||
|
U.S. Government securities
|
$ | $ | $ | ( |
) | $ | ||||||||||
|
U.S. Government sponsored entity securities
|
|
|
(
|
)
|
|
|||||||||||
|
Agency mortgage-backed securities, residential
|
|
|
(
|
)
|
|
|||||||||||
|
Total securities
|
$
|
|
$
|
|
$
|
(
|
)
|
$
|
|
|||||||
| Securities Held to Maturity |
Amortized
Cost
|
Gross Unrecognized
Gains
|
Gross Unrecognized
Losses
|
Estimated
Fair Value
|
Allowance for Credit Losses
|
|||||||||||||||
|
December 31, 2025
|
||||||||||||||||||||
|
Obligations of states and political subdivisions
|
$
|
|
$
|
|
$
|
(
|
)
|
$
|
|
$ | ( |
) | ||||||||
|
Total securities
|
$
|
|
$
|
|
$
|
(
|
)
|
$
|
|
$ | ( |
) | ||||||||
|
December 31, 2024
|
||||||||||||||||||||
|
Obligations of states and political subdivisions
|
$
|
|
$
|
|
$
|
(
|
)
|
$
|
|
$ | ( |
) | ||||||||
|
Total securities
|
$
|
|
$
|
|
$
|
(
|
)
|
$
|
|
$ | ( |
) | ||||||||
At year-end 2025 and 2024, there were no
During 2025, proceeds from the sales of debt securities totaled $33,201 , with gross losses of $3,747 and no gains recognized. This was to replace lower-yielding securities with higher-yielding, longer duration securities, which are expected to increase future interest income. There were no sales of securities during 2024.
Securities with a carrying value of approximately $195,245
at December 31, 2025 and $223,484 at December 31, 2024 were pledged to secure public deposits and repurchase agreements and for other
purposes as required or permitted by law.
19
notes to the consolidated financial statements
Amounts are in thousands, except share and per share data.
Note B - Securities (continued)
The amortized cost and estimated fair value of debt securities at December 31, 2025, by contractual maturity, are shown below. Actual maturities may differ from contractual maturities because certain issuers may have the right to call or prepay the
debt obligations prior to their contractual maturities. Securities not due at a single maturity are shown separately.
|
Available for Sale
|
Held to Maturity
|
|||||||||||||||
|
Debt Securities:
|
Amortized
Cost
|
Estimated
Fair
Value
|
Amortized
Cost
|
Estimated
Fair
Value
|
||||||||||||
|
Due in one year or less
|
$
|
|
$
|
|
$
|
|
$
|
|
||||||||
|
Due in one to five years
|
|
|
|
|
||||||||||||
|
Due in five to ten years
|
|
|
|
|
||||||||||||
|
Due after ten years
|
||||||||||||||||
|
Agency mortgage-backed securities, residential
|
|
|
|
|
||||||||||||
|
Total debt securities
|
$
|
|
$
|
|
$
|
|
$
|
|
||||||||
The following table summarizes debt securities AFS in an unrealized loss position for which an ACL has not been recorded at December 31, 2025 and December 31, 2024,
aggregated by major security type and length of time in a continuous unrealized loss position:
|
December 31, 2025
|
Less than 12 Months
|
12 Months or More
|
Total
|
|||||||||||||||||||||
|
Securities Available for Sale
|
Fair
Value
|
Unrealized
Loss
|
Fair
Value
|
Unrealized
Loss
|
Fair
Value
|
Unrealized
Loss
|
||||||||||||||||||
|
U.S. Government securities
|
$ | $ | $ | $ | ( |
) | $ | $ | ( |
) | ||||||||||||||
|
U.S. Government sponsored entity securities
|
( |
) | ( |
) | ||||||||||||||||||||
|
Agency mortgage-backed securities, residential
|
|
(
|
)
|
|
(
|
)
|
|
(
|
)
|
|||||||||||||||
|
Total available for sale
|
$
|
|
$
|
(
|
)
|
$
|
|
$
|
(
|
)
|
$
|
|
$
|
(
|
)
|
|||||||||
|
December 31, 2024
|
Less than 12 Months
|
12 Months or More
|
Total
|
|||||||||||||||||||||
|
Securities Available for Sale
|
Fair
Value
|
Unrealized
Loss
|
Fair
Value
|
Unrealized
Loss
|
Fair
Value
|
Unrealized
Loss
|
||||||||||||||||||
|
U.S. Government securities
|
$ | $ | ( |
) | $ | $ | ( |
) | $ | $ | ( |
) | ||||||||||||
|
U.S. Government sponsored entity securities
|
( |
) | ( |
) | ||||||||||||||||||||
|
Agency mortgage-backed securities, residential
|
|
(
|
)
|
|
(
|
)
|
|
(
|
)
|
|||||||||||||||
|
Total available for sale
|
$
|
|
$
|
(
|
)
|
$
|
|
$
|
(
|
)
|
$
|
|
$
|
(
|
)
|
|||||||||
Management evaluates AFS debt securities in unrealized positions to determine whether impairment is due to
credit-related factors. Consideration is given to (1) the extent to which the fair value is less than cost, (2) the financial condition and near-term prospects of the issuer, and (3) the intent and ability of the Company to retain its
investment in the security for a period of time sufficient to allow for any anticipated recovery in fair value.
At December 31, 2025, the Company had 53 AFS debt securities in an unrealized position without an ACL, of which 3 were from U.S.
Government securities, 2 were from U.S. Government sponsored entity securities, and 48 were from Agency mortgage-backed residential securities. Management does not have the intent to sell any of these securities and believes that it is more likely than not
that the Company will not have to sell any such securities before a recovery of cost. The fair value is expected to recover as the securities approach their maturity date or repricing date or if market yields for such investments decline.
Accordingly, as of December 31, 2025, management believes that the unrealized losses detailed in the previous table are due to noncredit-related factors, including changes in interest rates and other market conditions and, therefore, the
Company carried no ACL on AFS debt securities at December 31, 2025.
20
notes to the consolidated financial statements
Amounts are in thousands, except share and per share data.
Note B - Securities (continued)
The following table presents the activity in the ACL for HTM debt securities for the years ended December 31, 2025 and
2024:
|
Held to Maturity Debt Securities
|
2025
|
2024 | ||||||
|
Allowance for credit losses:
|
||||||||
|
Beginning balance
|
$
|
|
$ | |||||
|
Provision for (recovery of) credit loss expense
|
|
( |
) | |||||
|
Allowance for credit losses ending balance
|
$
|
|
$ | |||||
The Company’s HTM securities primarily consist of obligations of states and
political subdivisions. The ACL on HTM securities is estimated at each measurement date on a collective basis by major security type. Risk factors such as issuer bond ratings, historical loss rates, financial condition of issuer, and timely
principal and interest payments of issuer were evaluated to determine if a credit reserve was required within the portfolio. At December 31, 2025, there were no past due principal and interest payments related to HTM securities. The
cumulative loss rate remained at 0.02 1 recovery of provision expense during the year ended December 31, 2024, and no change during 2025.
Note
C - Loans and Allowance for Credit Losses
Loans are comprised of the following at
December 31:
|
2025
|
2024
|
|||||||
|
Residential real estate
|
$
|
|
$
|
|
||||
|
Commercial real estate:
|
||||||||
|
Owner-occupied
|
|
|
||||||
|
Nonowner-occupied
|
|
|
||||||
|
Construction
|
|
|
||||||
|
Commercial and industrial
|
|
|
||||||
|
Consumer:
|
||||||||
|
Automobile
|
|
|
||||||
|
Home equity
|
|
|
||||||
|
Other
|
|
|
||||||
|
|
|
|||||||
|
Less: Allowance for credit losses
|
(
|
)
|
(
|
)
|
||||
|
Loans, net
|
$
|
|
$
|
|
||||
At December 31, 2025, net deferred loan origination fees were $357 .
At December 31, 2024, net deferred loan origination costs were $363 .
At December 31, 2025 net unaccreted loan purchase discounts were $833 . At December 31, 2024 net unamortized loan purchase premiums were $398 .
21
notes to the consolidated financial statements
Amounts are in thousands, except share and per share data.
Note C - Loans and Allowance for Credit Losses (continued)
The following table presents the recorded investment of
nonaccrual loans and loans past due 90 days or more and still accruing by class of loans as of December 31, 2025 and 2024:
| December 31, 2025 |
Loans Past
Due
90 Days And
Still Accruing
|
Nonaccrual
Loans With
No
ACL
|
Nonaccrual
Loans With an
ACL
|
Total
Nonaccrual
Loans
|
||||||||||||
|
Residential real estate
|
$
|
|
$ | $ |
$
|
|
||||||||||
|
Commercial real estate:
|
||||||||||||||||
|
Owner-occupied
|
|
|
||||||||||||||
|
Nonowner-occupied
|
|
|
||||||||||||||
|
Construction
|
|
|
||||||||||||||
|
Commercial and industrial
|
|
|
||||||||||||||
|
Consumer:
|
||||||||||||||||
|
Automobile
|
|
|
||||||||||||||
|
Home equity
|
|
|
||||||||||||||
|
Other
|
|
|
||||||||||||||
|
Total
|
$
|
|
$ | $ |
$
|
|
||||||||||
| December 31, 2024 |
Loans Past
Due
90 Days And
Still Accruing
|
Nonaccrual
Loans With
No
ACL
|
Nonaccrual
Loans With an
ACL
|
Total
Nonaccrual
Loans
|
||||||||||||
|
Residential real estate
|
$
|
|
$ | $ |
$
|
|
||||||||||
|
Commercial real estate:
|
||||||||||||||||
|
Owner-occupied
|
|
|
||||||||||||||
|
Nonowner-occupied
|
|
|
||||||||||||||
|
Construction
|
|
|
||||||||||||||
|
Commercial and industrial
|
|
|
||||||||||||||
|
Consumer:
|
||||||||||||||||
|
Automobile
|
|
|
||||||||||||||
|
Home equity
|
|
|
||||||||||||||
|
Other
|
|
|
||||||||||||||
|
Total
|
$
|
|
$ | $ |
$
|
|
||||||||||
As of January 1, 2024, total nonaccrual loans were $2,392 . The Company recognized $60
and $97 of interest income in nonaccrual loans during the years ended December 31, 2025 and 2024, respectively.
The following table presents the aging of the recorded
investment of past due loans by class of loans as of December 31, 2025 and 2024:
|
December 31, 2025
|
30-59
Days
Past Due
|
60-89
Days
Past Due
|
90 Days
Or More
Past Due
|
Total
Past Due
|
Loans Not
Past Due
|
Total
|
||||||||||||||||||
|
Residential real estate
|
$
|
|
$
|
|
$
|
|
$
|
|
$
|
|
$
|
|
||||||||||||
|
Commercial real estate:
|
||||||||||||||||||||||||
|
Owner-occupied
|
|
|
|
|
|
|
||||||||||||||||||
|
Nonowner-occupied
|
|
|
|
|
|
|
||||||||||||||||||
|
Construction
|
|
|
|
|
|
|
||||||||||||||||||
|
Commercial and industrial
|
|
|
|
|
|
|
||||||||||||||||||
|
Consumer:
|
||||||||||||||||||||||||
|
Automobile
|
|
|
|
|
|
|
||||||||||||||||||
|
Home equity
|
|
|
|
|
|
|
||||||||||||||||||
|
Other
|
|
|
|
|
|
|
||||||||||||||||||
|
Total
|
$
|
|
$
|
|
$
|
|
$
|
|
$
|
|
$
|
|
||||||||||||
22
notes to the consolidated financial statements
Amounts are in thousands, except share and per share data.
Note C - Loans and Allowance for Credit Losses (continued)
|
December 31, 2024
|
30-59
Days
Past Due
|
60-89
Days
Past Due
|
90 Days
Or More
Past Due
|
Total
Past Due
|
Loans Not
Past Due
|
Total
|
||||||||||||||||||
|
Residential real estate
|
$
|
|
$
|
|
$
|
|
$
|
|
$
|
|
$
|
|
||||||||||||
|
Commercial real estate:
|
||||||||||||||||||||||||
|
Owner-occupied
|
|
|
|
|
|
|
||||||||||||||||||
|
Nonowner-occupied
|
|
|
|
|
|
|
||||||||||||||||||
|
Construction
|
|
|
|
|
|
|
||||||||||||||||||
|
Commercial and industrial
|
|
|
|
|
|
|
||||||||||||||||||
|
Consumer:
|
||||||||||||||||||||||||
|
Automobile
|
|
|
|
|
|
|
||||||||||||||||||
|
Home equity
|
|
|
|
|
|
|
||||||||||||||||||
|
Other
|
|
|
|
|
|
|
||||||||||||||||||
|
Total
|
$
|
|
$
|
|
$
|
|
$
|
|
$
|
|
$
|
|
||||||||||||
Credit Quality Indicators:
The Company categorizes loans into risk categories based on relevant information about the ability of borrowers to service their debt, such as: current financial information, historical payment experience, credit documentation,
public information, and current economic trends, among other factors. These risk categories are represented by a loan grading scale from 1 through 11. The Company analyzes loans individually with a higher credit risk rating and groups
these loans into categories called “criticized” and “classified” assets. The Company considers its criticized assets to be loans that are graded 8 and its classified assets to be loans that are graded 9 through 11. The Company’s risk
categories are reviewed at least annually on loans that have aggregate borrowing amounts that meet or exceed $1,000 .
The Company uses the following definitions for its criticized loan risk ratings:
Special Mention. Loans classified as “special mention” are graded 8 and indicate considerable risk due to deterioration of repayment (in the earliest stages) due to potential weak primary repayment source, or payment delinquency.
These loans will be under constant supervision, are not classified and do not expose the institution to sufficient risks to warrant classification. These deficiencies should be correctable within the normal course of business, although
significant changes in company structure or policy may be necessary to correct the deficiencies. These loans are considered bankable assets with no apparent loss of principal or interest envisioned. The perceived risk in continued
lending is considered to have increased beyond the level where such loans would normally be granted.
The Company uses the following definitions for its classified loan risk ratings:
Substandard. Loans classified as “substandard” are graded 9 and represent very high risk, serious delinquency, nonaccrual, or unacceptable credit. Repayment through the primary source of repayment is in jeopardy due to
the existence of one or more well-defined weaknesses, and the collateral pledged may inadequately protect collection of the loans. Loss of principal is not likely if weaknesses are corrected, although financial statements normally
reveal significant weakness. Loans are still considered collectible, although loss of principal is more likely than with special mention loans. Collateral liquidation is considered likely to satisfy debt.
Doubtful. Loans classified as “doubtful” are graded 10 and display a high probability of loss, although the amount of actual loss at the time of classification is undetermined. This classification should be temporary until
such time that actual loss can be identified, or improvements are made to reduce the seriousness of the classification. These loans exhibit all substandard characteristics with the addition that weaknesses make collection or liquidation
in full highly questionable and improbable. This classification consists of loans where the possibility of loss is high after collateral liquidation based upon existing facts, market conditions, and value. Loss is deferred until certain
important and reasonable specific pending factors that may strengthen the credit can be more accurately determined. These factors may include proposed acquisitions, liquidation procedures, capital injection, receipt of additional
collateral, mergers, or refinancing plans. A doubtful classification for an entire credit should be avoided when collection of a specific portion appears highly probable with the adequately secured portion graded substandard.
23
notes to the consolidated financial statements
Amounts are in thousands, except share and per share data.
Note C - Loans and Allowance for Credit Losses (continued)
Loss.
Loans classified as
“loss” are graded 11 and are
considered uncollectible and are of such little value that their continuance as bankable assets is not warranted. This classification does not mean that the credit has absolutely no recovery or salvage value, but rather it is not
practical or desirable to defer writing off this asset yielding such a minimum value even though partial recovery may be affected in the future. Amounts classified as loss should be promptly charged off.
As of December 31, 2025 and 2024, and based on the most recent analysis performed, the risk category of commercial loans by class of loans was as follows:
|
Term Loans Amortized Cost Basis by Origination Year
|
||||||||||||||||||||||||||||||||
|
December 31, 2025
|
2025
|
2024
|
2023
|
2022
|
2021
|
Prior
|
Revolving
Loans
Amortized
Cost Basis
|
Total
|
||||||||||||||||||||||||
|
Commercial real estate:
|
||||||||||||||||||||||||||||||||
|
Owner-occupied
|
||||||||||||||||||||||||||||||||
|
Risk Rating
|
||||||||||||||||||||||||||||||||
|
Pass
|
$
|
|
$
|
|
$
|
|
$
|
|
$
|
|
$
|
|
$
|
|
$
|
|
||||||||||||||||
|
Special Mention
|
|
|
|
|
|
|
|
|||||||||||||||||||||||||
|
Substandard
|
|
|
|
|
|
|
|
|||||||||||||||||||||||||
|
Doubtful
|
|
|
|
|
|
|
|
|||||||||||||||||||||||||
|
Total
|
$
|
|
$
|
|
$
|
|
$
|
|
$
|
|
$
|
|
$
|
|
$
|
|
||||||||||||||||
|
Current Period gross charge-offs
|
$
|
|
$
|
|
$
|
|
$
|
|
$
|
|
$
|
|
$
|
|
$
|
|
||||||||||||||||
|
Term Loans Amortized Cost Basis by Origination Year
|
||||||||||||||||||||||||||||||||
|
December 31, 2025
|
2025
|
2024
|
2023
|
2022
|
2021
|
Prior
|
Revolving
Loans
Amortized
Cost Basis
|
Total
|
||||||||||||||||||||||||
|
Commercial real estate:
|
||||||||||||||||||||||||||||||||
|
Nonowner-occupied
|
||||||||||||||||||||||||||||||||
|
Risk Rating
|
||||||||||||||||||||||||||||||||
|
Pass
|
$
|
|
$
|
|
$
|
|
$
|
|
$
|
|
$
|
|
$
|
|
$
|
|
||||||||||||||||
|
Special Mention
|
|
|
|
|
|
|
|
|||||||||||||||||||||||||
|
Substandard
|
|
|
|
|
|
|
|
|||||||||||||||||||||||||
|
Doubtful
|
|
|
|
|
|
|
|
|||||||||||||||||||||||||
|
Total
|
$
|
|
$
|
|
$
|
|
$
|
|
$
|
|
$
|
|
$
|
|
$
|
|
||||||||||||||||
|
Current Period gross charge-offs
|
$
|
|
$
|
|
$
|
|
$
|
|
$
|
|
$
|
|
$
|
|
$
|
|
||||||||||||||||
| Term Loans Amortized Cost Basis by Origination Year | ||||||||||||||||||||||||||||||||
|
December 31, 2025
|
2025 |
2024
|
2023
|
2022
|
2021
|
Prior
|
Revolving
Loans
Amortized
Cost Basis
|
Total
|
||||||||||||||||||||||||
|
Commercial real estate:
|
||||||||||||||||||||||||||||||||
|
Construction
|
||||||||||||||||||||||||||||||||
|
Risk Rating
|
||||||||||||||||||||||||||||||||
|
Pass
|
$ |
$
|
|
$
|
|
$
|
|
$
|
|
$
|
|
$
|
|
$
|
|
|||||||||||||||||
|
Special Mention
|
|
|
|
|
|
|
||||||||||||||||||||||||||
|
Substandard
|
|
|
|
|
|
|
||||||||||||||||||||||||||
|
Doubtful
|
|
|
|
|
|
|
||||||||||||||||||||||||||
|
Total
|
$ |
$
|
|
$
|
|
$
|
|
$
|
|
$
|
|
$
|
|
$
|
|
|||||||||||||||||
|
Current Period gross charge-offs
|
$ |
$
|
|
$
|
|
$
|
|
$
|
|
$
|
|
$
|
|
$
|
|
|||||||||||||||||
24
notes to the consolidated financial statements
Amounts are in thousands, except share and per share data.
Note C – Loans and Allowance for Credit Losses (continued)
|
|
Term Loans Amortized Cost Basis by Origination Year
|
|||||||||||||||||||||||||||||||
|
December 31, 2025
|
2025
|
2024
|
2023
|
2022
|
2021
|
Prior
|
Revolving
Loans
Amortized
Cost Basis
|
Total
|
||||||||||||||||||||||||
|
Commercial and Industrial:
|
||||||||||||||||||||||||||||||||
|
Risk Rating
|
||||||||||||||||||||||||||||||||
|
Pass
|
$
|
|
$
|
|
$
|
|
$
|
|
$
|
|
$
|
|
$
|
|
$
|
|
||||||||||||||||
|
Special Mention
|
|
|
|
|
|
|
|
|||||||||||||||||||||||||
|
Substandard
|
|
|
|
|
|
|
|
|||||||||||||||||||||||||
|
Doubtful
|
|
|
|
|
|
|
|
|||||||||||||||||||||||||
|
Total
|
$
|
|
$
|
|
$
|
|
$
|
|
$
|
|
$
|
|
$
|
|
$
|
|
||||||||||||||||
|
Current Period gross charge-offs
|
$
|
|
$
|
|
$
|
|
$
|
|
$
|
|
$
|
|
$
|
|
$
|
|
||||||||||||||||
|
Term Loans Amortized Cost Basis by Origination Year
|
||||||||||||||||||||||||||||||||
|
December 31, 2024
|
2024
|
2023
|
2022
|
2021
|
2020
|
Prior
|
Revolving
Loans
Amortized
Cost Basis
|
Total
|
||||||||||||||||||||||||
|
Commercial real estate:
|
||||||||||||||||||||||||||||||||
|
Owner-occupied
|
||||||||||||||||||||||||||||||||
|
Risk Rating
|
||||||||||||||||||||||||||||||||
|
Pass
|
$
|
|
$
|
|
$
|
|
$
|
|
$
|
|
$
|
|
$
|
|
$
|
|
||||||||||||||||
|
Special Mention
|
|
|
|
|
|
|
|
|||||||||||||||||||||||||
|
Substandard
|
|
|
|
|
|
|
|
|||||||||||||||||||||||||
|
Doubtful
|
|
|
|
|
|
|
|
|||||||||||||||||||||||||
|
Total
|
$
|
|
$
|
|
$
|
|
$
|
|
$
|
|
$
|
|
$
|
|
$
|
|
||||||||||||||||
|
Current Period gross charge-offs
|
$
|
|
$
|
|
$
|
|
$
|
|
$
|
|
$
|
|
$
|
|
$
|
|
||||||||||||||||
|
Term Loans Amortized Cost Basis by Origination Year
|
||||||||||||||||||||||||||||||||
|
December 31, 2024
|
2024
|
2023
|
2022
|
2021
|
2020
|
Prior
|
Revolving
Loans
Amortized
Cost Basis
|
Total
|
||||||||||||||||||||||||
|
Commercial real estate:
|
||||||||||||||||||||||||||||||||
|
Nonowner occupied
|
||||||||||||||||||||||||||||||||
|
Risk Rating
|
||||||||||||||||||||||||||||||||
|
Pass
|
$
|
|
$
|
|
$
|
|
$
|
|
$
|
|
$
|
|
$
|
|
$
|
|
||||||||||||||||
|
Special Mention
|
|
|
|
|
|
|
|
|
||||||||||||||||||||||||
|
Substandard
|
|
|
|
|
|
|||||||||||||||||||||||||||
|
Doubtful
|
|
|
|
|
|
|
|
|||||||||||||||||||||||||
|
Total
|
$
|
|
$
|
|
$
|
|
$
|
|
$
|
|
$
|
|
$
|
|
$
|
|
||||||||||||||||
|
Current Period gross charge-offs
|
$ | $ |
$
|
|
$
|
|
$
|
|
$
|
|
$ |
$
|
|
|||||||||||||||||||
25
notes to the consolidated financial statements
Amounts are in thousands, except share and per share data.
Note C – Loans and Allowance for Credit Losses (continued)
|
Term Loans Amortized Cost Basis by Origination Year
|
||||||||||||||||||||||||||||||||
|
December 31, 2024
|
2024
|
2023
|
2022
|
2021
|
2020
|
Prior
|
Revolving
Loans
Amortized
Cost Basis
|
Total
|
||||||||||||||||||||||||
|
Commercial real estate:
|
||||||||||||||||||||||||||||||||
|
Construction
|
||||||||||||||||||||||||||||||||
|
Risk Rating
|
||||||||||||||||||||||||||||||||
|
Pass
|
$
|
|
$
|
|
$
|
|
$
|
|
$
|
|
$
|
|
$ |
$
|
|
|||||||||||||||||
|
Special Mention
|
|
|
|
|
|
|
|
|||||||||||||||||||||||||
|
Substandard
|
|
|
|
|
|
|
||||||||||||||||||||||||||
|
Doubtful
|
|
|
|
|
|
|
||||||||||||||||||||||||||
|
Total
|
$
|
|
$
|
|
$
|
|
$
|
|
$
|
|
$
|
|
$
|
|
$
|
|
||||||||||||||||
|
Current Period gross charge-offs
|
$ | $ |
$
|
|
$
|
|
$ |
$
|
|
$
|
|
$ | ||||||||||||||||||||
|
Term Loans Amortized Cost Basis by Origination Year
|
||||||||||||||||||||||||||||||||
|
December 31, 2024
|
2024
|
2023
|
2022
|
2021
|
2020
|
Prior
|
Revolving
Loans
Amortized
Cost Basis
|
Total
|
||||||||||||||||||||||||
|
Commercial and Industrial
|
||||||||||||||||||||||||||||||||
|
Risk Rating
|
||||||||||||||||||||||||||||||||
|
Pass
|
$
|
|
$
|
|
$
|
|
$
|
|
$
|
|
$
|
|
$
|
|
$
|
|
||||||||||||||||
|
Special Mention
|
|
|
|
|
|
|
||||||||||||||||||||||||||
|
Substandard
|
|
|
|
|
|
|
|
|||||||||||||||||||||||||
|
Doubtful
|
|
|
|
|
|
|
|
|||||||||||||||||||||||||
|
Total
|
$
|
|
$
|
|
$
|
|
$
|
|
$
|
|
$
|
|
$
|
|
$
|
|
||||||||||||||||
|
Current Period gross charge-offs
|
$ |
$
|
|
$ |
$
|
|
$ |
$
|
|
$
|
|
$
|
|
|||||||||||||||||||
The Company considers the performance of the loan portfolio and its impact on the ACL. For residential and consumer loan classes, the Company evaluates credit quality
based on the aging status of the loan, which was previously presented, and by payment activity. The following table presents the recorded investment of residential and consumer loans by class of loans based on repayment activity as
of December 31, 2025 and 2024:
|
Term Loans Amortized Cost Basis by Origination Year
|
||||||||||||||||||||||||||||||||
|
December 31, 2025
|
2025
|
2024
|
2023
|
2022
|
2021
|
Prior
|
Revolving
Loans
Amortized
Cost Basis
|
Total
|
||||||||||||||||||||||||
|
Residential Real Estate:
|
||||||||||||||||||||||||||||||||
|
Payment Performance
|
||||||||||||||||||||||||||||||||
|
Performing
|
$
|
|
$
|
|
$
|
|
$
|
|
$
|
|
$
|
|
$
|
|
$
|
|
||||||||||||||||
|
Nonperforming
|
|
|
|
|
|
|
|
|||||||||||||||||||||||||
|
Total
|
$
|
|
$
|
|
$
|
|
$
|
|
$
|
|
$
|
|
$
|
|
$
|
|
||||||||||||||||
|
|
||||||||||||||||||||||||||||||||
|
Current Period gross charge-offs
|
$ |
$
|
|
$
|
|
$
|
|
$ |
$
|
|
$
|
|
$
|
|
||||||||||||||||||
26
notes to the consolidated financial statements
Amounts are in thousands, except share and per share data.
Note C – Loans and Allowance for Credit Losses
(continued)
|
Term Loans Amortized Cost Basis by Origination Year
|
||||||||||||||||||||||||||||||||
|
December 31, 2025
|
2025
|
2024
|
2023
|
2022
|
2021
|
Prior
|
Revolving
Loans
Amortized
Cost Basis
|
Total
|
||||||||||||||||||||||||
| Consumer: |
||||||||||||||||||||||||||||||||
|
Automobile
|
||||||||||||||||||||||||||||||||
|
Payment Performance
|
||||||||||||||||||||||||||||||||
|
Performing
|
$
|
|
$
|
|
$
|
|
$
|
|
$
|
|
$
|
|
$
|
|
$
|
|
||||||||||||||||
|
Nonperforming
|
|
|
|
|
|
|
|
|||||||||||||||||||||||||
|
Total
|
$
|
|
$
|
|
$
|
|
$
|
|
$
|
|
$
|
|
$
|
|
$
|
|
||||||||||||||||
|
|
||||||||||||||||||||||||||||||||
|
Current Period gross charge-offs
|
$ |
$
|
|
$
|
|
$
|
|
$ |
$
|
|
$
|
|
$
|
|
||||||||||||||||||
|
Term Loans Amortized Cost Basis by Origination Year
|
||||||||||||||||||||||||||||||||
|
December 31, 2025
|
2025
|
2024
|
2023
|
2022
|
2021
|
Prior
|
Revolving
Loans
Amortized
Cost Basis
|
Total
|
||||||||||||||||||||||||
| Consumer: |
||||||||||||||||||||||||||||||||
|
Home Equity:
|
||||||||||||||||||||||||||||||||
|
Payment Performance
|
||||||||||||||||||||||||||||||||
|
Performing
|
$
|
|
$
|
|
$
|
|
$
|
|
$
|
|
$
|
|
$
|
|
$
|
|
||||||||||||||||
|
Nonperforming
|
|
|
|
|
|
|
|
|||||||||||||||||||||||||
|
Total
|
$
|
|
$
|
|
$
|
|
$
|
|
$
|
|
$
|
|
$
|
|
$
|
|
||||||||||||||||
|
|
||||||||||||||||||||||||||||||||
|
Current Period gross charge-offs
|
$ |
$
|
|
$
|
|
$
|
|
$ |
$
|
|
$
|
|
$
|
|
||||||||||||||||||
|
Term Loans Amortized Cost Basis by Origination Year
|
||||||||||||||||||||||||||||||||
|
December 31, 2025
|
2025
|
2024
|
2023
|
2022
|
2021
|
Prior
|
Revolving
Loans
Amortized
Cost Basis
|
Total
|
||||||||||||||||||||||||
| Consumer: |
||||||||||||||||||||||||||||||||
|
Other
|
||||||||||||||||||||||||||||||||
|
Payment Performance
|
||||||||||||||||||||||||||||||||
|
Performing
|
$
|
|
$
|
|
$
|
|
$
|
|
$
|
|
$
|
|
$
|
|
$
|
|
||||||||||||||||
|
Nonperforming
|
|
|
|
|
|
|
|
|||||||||||||||||||||||||
|
Total
|
$
|
|
$
|
|
$
|
|
$
|
|
$
|
|
$
|
|
$
|
|
$
|
|
||||||||||||||||
|
|
||||||||||||||||||||||||||||||||
|
Current Period gross charge-offs
|
$ |
$
|
|
$
|
|
$
|
|
$ |
$
|
|
$
|
|
$
|
|
||||||||||||||||||
|
Term Loans Amortized Cost Basis by Origination Year
|
||||||||||||||||||||||||||||||||
|
December 31, 2024
|
2024
|
2023
|
2022
|
2021
|
2020
|
Prior
|
Revolving
Loans
Amortized
Cost Basis
|
Total
|
||||||||||||||||||||||||
|
Residential Real Estate:
|
||||||||||||||||||||||||||||||||
|
Payment Performance
|
||||||||||||||||||||||||||||||||
|
Performing
|
$
|
|
$
|
|
$
|
|
$
|
|
$
|
|
$
|
|
$
|
|
$
|
|
||||||||||||||||
|
Nonperforming
|
|
|
|
|
|
|
|
|||||||||||||||||||||||||
|
Total
|
$
|
|
$
|
|
$
|
|
$
|
|
$
|
|
$
|
|
$
|
|
$
|
|
||||||||||||||||
|
|
||||||||||||||||||||||||||||||||
|
Current Period gross charge-offs
|
$ |
$
|
|
$
|
|
$
|
|
$ |
$
|
|
$
|
|
$
|
|
||||||||||||||||||
27
notes to the consolidated financial statements
Amounts are in thousands, except share and per share data.
Note C – Loans and Allowance for Credit Losses
(continued)
|
Term Loans Amortized Cost Basis by Origination Year
|
||||||||||||||||||||||||||||||||
|
December 31, 2024
|
2024
|
2023
|
2022
|
2021
|
2020
|
Prior
|
Revolving
Loans
Amortized
Cost Basis
|
Total
|
||||||||||||||||||||||||
|
Consumer:
|
||||||||||||||||||||||||||||||||
|
Automobile
|
||||||||||||||||||||||||||||||||
|
Payment Performance
|
||||||||||||||||||||||||||||||||
|
Performing
|
$
|
|
$
|
|
$
|
|
$
|
|
$
|
|
$
|
|
$ |
$
|
|
|||||||||||||||||
|
Nonperforming
|
|
|
|
|
|
|
|
|
||||||||||||||||||||||||
|
Total
|
$
|
|
$
|
|
$
|
|
$
|
|
$
|
|
$
|
|
$
|
|
$
|
|
||||||||||||||||
|
|
||||||||||||||||||||||||||||||||
|
Current Period gross charge-offs
|
$
|
|
$
|
|
$
|
|
$
|
|
$
|
|
$
|
|
$
|
|
$
|
|
||||||||||||||||
|
Term Loans Amortized Cost Basis by Origination Year
|
||||||||||||||||||||||||||||||||
|
December 31, 2024
|
2024
|
2023
|
2022
|
2021
|
2020
|
Prior
|
Revolving
Loans
Amortized
Cost Basis
|
Total
|
||||||||||||||||||||||||
|
Consumer:
|
||||||||||||||||||||||||||||||||
|
Home Equity
|
||||||||||||||||||||||||||||||||
|
Payment Performance
|
||||||||||||||||||||||||||||||||
|
Performing
|
$
|
|
$
|
|
$ |
$
|
|
$
|
|
$
|
|
$
|
|
$
|
|
|||||||||||||||||
|
Nonperforming
|
|
|
|
|
|
|
|
|
||||||||||||||||||||||||
|
Total
|
$
|
|
$
|
|
$
|
|
$
|
|
$
|
|
$ |
$
|
|
$
|
|
|||||||||||||||||
|
|
||||||||||||||||||||||||||||||||
|
Current Period gross charge-offs
|
$
|
|
$
|
|
$
|
|
$
|
|
$
|
|
$ |
$
|
|
$
|
|
|||||||||||||||||
|
Term Loans Amortized Cost Basis by Origination Year
|
||||||||||||||||||||||||||||||||
|
December 31, 2024
|
2024
|
2023
|
2022
|
2021
|
2020
|
Prior
|
Revolving
Loans
Amortized
Cost Basis
|
Total
|
||||||||||||||||||||||||
|
Consumer:
|
||||||||||||||||||||||||||||||||
|
Other
|
||||||||||||||||||||||||||||||||
|
Payment Performance
|
||||||||||||||||||||||||||||||||
|
Performing
|
$
|
|
$
|
|
$
|
|
$
|
|
$
|
|
$
|
|
$
|
|
$
|
|
||||||||||||||||
|
Nonperforming
|
|
|
|
|
|
|
|
|
||||||||||||||||||||||||
|
Total
|
$
|
|
$
|
|
$
|
|
$
|
|
$
|
|
$
|
|
$
|
|
$
|
|
||||||||||||||||
|
|
||||||||||||||||||||||||||||||||
|
Current Period gross charge-offs
|
$
|
|
$
|
|
$
|
|
$
|
|
$
|
|
$
|
|
$
|
|
$
|
|
||||||||||||||||
The Company
originates residential, consumer, and commercial loans to customers located primarily in the southeastern areas of Ohio as well as the western counties of West Virginia. Approximately 3.73 % of total loans were unsecured at December 31, 2025, down from 4.16 %
at December 31, 2024.
Modifications to Borrowers Experiencing Financial Difficulty:
Occasionally, the
Company modifies loans to borrowers experiencing financial difficulty. These modifications may include one or a combination of the following: a reduction of the stated interest rate of the loan; an extension of the maturity date at a stated
rate of interest lower than the current market rate for new debt with similar risk; a reduction in the contractual principal and interest payments of the loan; or short-term interest-only payment terms. All modifications to borrowers
experiencing financial difficulty are considered to be impaired.
During the years ended December 31, 2025 and 2024, the Company experienced no new modifications to borrowers
experiencing financial difficulty.
28
notes to the consolidated financial statements
Amounts are in thousands, except share and per share data.
Note C – Loans and Allowance for Credit Losses (continued)
The following table presents the activity in the ACL by
portfolio segment for the years ended December 31, 2025 and 2024:
|
December 31, 2025
|
Residential
Real Estate
|
Commercial
Real Estate
|
Commercial
& Industrial
|
Consumer
|
Total
|
|||||||||||||||
|
Allowance for credit losses:
|
||||||||||||||||||||
|
Beginning balance
|
$
|
|
$
|
|
$
|
|
$
|
|
$
|
|
||||||||||
|
Provision for credit losses
|
|
|
|
|
|
|||||||||||||||
|
Loans charged off
|
(
|
)
|
|
(
|
)
|
(
|
)
|
(
|
)
|
|||||||||||
|
Recoveries
|
|
|
|
|
|
|||||||||||||||
|
Total ending allowance balance
|
$
|
|
$
|
|
$
|
|
$
|
|
$
|
|
||||||||||
|
December 31, 2024
|
Residential
Real Estate
|
Commercial
Real Estate
|
Commercial
& Industrial
|
Consumer
|
Total
|
|||||||||||||||
|
Allowance for credit losses:
|
||||||||||||||||||||
|
Beginning balance
|
$
|
|
$
|
|
$
|
|
$
|
|
$
|
|
||||||||||
|
Provision for credit losses
|
|
|
(
|
)
|
|
|
||||||||||||||
|
Loans charged off
|
(
|
)
|
|
(
|
)
|
(
|
)
|
(
|
)
|
|||||||||||
|
Recoveries
|
|
|
|
|
|
|||||||||||||||
|
Total ending allowance balance
|
$
|
|
$
|
|
$
|
|
$
|
|
$
|
|
||||||||||
The following table
presents the amortized cost basis of collateral dependent loans by class of loans as of December 31, 2025 and 2024:
|
Collateral Type
|
||||||||||||
|
December 31, 2025
|
Real Estate
|
Business Assets
|
Total
|
|||||||||
|
Residential real estate
|
$
|
|
$
|
|
$
|
|
||||||
|
Commercial real estate:
|
||||||||||||
|
Owner-occupied
|
|
|
|
|||||||||
|
Nonowner-occupied
|
||||||||||||
|
Construction
|
||||||||||||
|
Commercial & Industrial
|
||||||||||||
|
Consumer:
|
||||||||||||
|
Automobile
|
||||||||||||
|
Home equity
|
|
|
|
|||||||||
|
Other
|
||||||||||||
|
Total collateral dependent loans
|
$
|
|
$
|
|
$
|
|
||||||
|
Collateral Type
|
||||||||||||
|
December 31, 2024
|
Real Estate
|
Business Assets
|
Total
|
|||||||||
|
Residential real estate
|
$
|
|
$
|
|
$
|
|
||||||
|
Commercial real estate:
|
||||||||||||
|
Owner-occupied
|
|
|
|
|||||||||
|
Nonowner-occupied
|
||||||||||||
|
Construction
|
||||||||||||
|
Commercial & Industrial
|
||||||||||||
|
Consumer:
|
||||||||||||
|
Automobile
|
||||||||||||
|
Home equity
|
|
|
|
|||||||||
|
Other
|
||||||||||||
|
Total collateral dependent loans
|
$
|
|
$
|
|
$
|
|
||||||
The recorded investment of a loan excludes accrued interest and net deferred origination fees and costs due to immateriality.
Nonaccrual loans and loans past due 90 days or more and still accruing include both smaller balance homogenous loans that are collectively evaluated for impairment and individually classified as impaired loans.
29
notes to the consolidated financial statements
Amounts are in thousands, except share and per share data.
Note C - Loans and Allowance for Credit Losses (continued)
The Company transfers loans to other real estate owned (“OREO”), at fair
value less cost to sell, in the period the Company obtains physical possession of the property (through legal title or through a deed in lieu). The Company had no 788 and $342 as of December 31,
2025 and 2024, respectively.
Note D - Premises and Equipment
Following is a summary of premises and equipment at December 31:
|
2025
|
2024
|
|||||||
|
Land
|
$
|
|
$
|
|
||||
|
Buildings
|
|
|
||||||
|
Leasehold improvements
|
|
|
||||||
|
Furniture and equipment
|
|
|
||||||
|
|
|
|||||||
|
Less accumulated depreciation
|
|
|
||||||
|
Total premises and equipment
|
$
|
|
$
|
|
||||
Following is a summary of premises and equipment held for sale at December 31:
|
2025
|
2024
|
|||||||
|
Land
|
$
|
|
$
|
|
||||
|
Buildings
|
|
|
||||||
|
|
|
|||||||
|
Less accumulated depreciation
|
|
|
||||||
|
Total premises and equipment held for sale
|
$
|
|
$
|
|
||||
Note E – Leases
Balance sheet information related to
leases at December 31 was as follows:
|
2025
|
2024
|
|||||||
|
Operating leases:
|
||||||||
|
Operating lease right-of-use assets
|
$
|
|
$
|
|
||||
|
Operating lease liabilities
|
|
|
||||||
The components of lease cost were as follows for the year ending December 31:
|
2025
|
2024
|
|||||||
|
Operating lease cost
|
$
|
|
$
|
|
||||
|
Short-term lease expense
|
|
|
||||||
Future undiscounted lease payments for operating leases
with initial terms of one year or more as of December 31, 2025 are as follows:
|
Operating
Leases
|
||||
|
2026
|
$
|
|
||
|
2027
|
|
|||
|
2028
|
|
|||
|
2029
|
|
|||
|
2030
|
|
|||
|
Thereafter
|
|
|||
|
Total lease payments
|
|
|||
|
Less: Imputed Interest
|
( |
) | ||
|
Total operating leases
|
$
|
|
||
30
notes to the consolidated financial statements
Amounts are in thousands, except share and per share data.
Note E – Leases (continued)
Other information at December 31 was as follows:
|
2025
|
2024
|
|||||||
|
Weighted-average remaining lease term for operating leases
|
|
|
||||||
|
Weighted-average discount rate for operating leases
|
|
%
|
|
%
|
||||
Note F – Goodwill and Intangible Assets
Goodwill: The reported amount of goodwill as of December 31 was as follows:
| Gross Carrying Amount |
||||||||
|
2025
|
2024
|
|||||||
|
Goodwill
|
$
|
|
$
|
|
||||
Impairment exists when a reporting unit’s carrying value of goodwill exceeds its fair value. At November 30, 2025, the Company performed a quantitative goodwill impairment test to identify potential impairment by
comparing the fair value of the relevant reporting entity with its carrying value, including goodwill. The Company concluded it is unlikely that impairment of goodwill has occurred. There were no changes in circumstances as of December 31, 2025.
During 2024, the general economic conditions that the Company operates in had trended from generally stable to improving in select markets in relation to economic development. While asset levels continued to grow and
capital levels remained strong, the Company’s stock price continued to trade below book value during 2024. Given that the Company’s stock is thinly traded and has institutional ownership of less than 10 %, the market price may not always be reflective of actual value. Furthermore, the Company’s stock price to book will typically trend below peers due to carrying higher
capital levels than peers. Due to these factors, management could not conclude that evidence provided by a qualitative assessment would support that it is more likely than not that the fair value of goodwill is more than the carrying amount.
Therefore, the Company proceeded to complete the quantitative impairment test using November 30, 2024 as the measurement date.
The quantitative impairment test includes comparing the carrying value of the reporting unit, including the existing goodwill and intangible assets, to the fair value of the reporting unit. If the carrying amount of the
reporting unit exceeds its fair value, a goodwill impairment charge is recorded for the amount in which the carrying value of the reporting unit exceeds the fair value of the reporting unit, up to the amount of goodwill attributed to the
reporting unit. After performing the quantitative testing, it was determined that the reporting unit’s fair value exceeded the reporting unit’s carrying value as of November 30, 2024, resulting in no impairment for the year ended December 31, 2024.
Acquired
intangible assets: Acquired intangible assets were as follows at year-end:
|
2025
|
2024
|
|||||||||||||||
|
Gross Carrying
Amount
|
Accumulated
Amortization
|
Gross Carrying
Amount
|
Accumulated
Amortization
|
|||||||||||||
|
Amortized intangible assets:
|
||||||||||||||||
|
Core deposit intangibles
|
$
|
|
$
|
|
$
|
|
$
|
|
||||||||
Aggregate
amortization expense was $0 for 2025 and $8
for 2024.
31
notes to the consolidated financial statements
Amounts are in thousands, except share and per share data.
Note G - Deposits
Following is a summary of deposits at December 31:
|
2025
|
2024
|
|||||||
|
Noninterest-bearing deposits
|
$ | $ | ||||||
|
Interest-bearing deposits:
|
||||||||
|
NOW accounts
|
|
|
||||||
|
Savings and Money Market
|
|
|
||||||
|
Time deposits of $250 or less
|
|
|
||||||
|
Time deposits of more than $250
|
|
|
||||||
|
Total time deposits
|
|
|
||||||
|
Total interest-bearing deposits
|
|
|
||||||
|
Total deposits
|
$ | $ | ||||||
Following is a summary of total time deposits by remaining maturity at December 31,
2025:
|
2026
|
$
|
|
||
|
2027
|
|
|||
|
2028
|
|
|||
|
2029
|
|
|||
|
2030
|
|
|||
|
Thereafter
|
|
|||
|
Total
|
$
|
|
Brokered deposits, included in time
deposits, were $61,464 and $48,395
at December 31, 2025 and 2024, respectively.
Note H - Interest Rate Swaps
The
Company manages economic risks, including interest rate, liquidity, and credit risk, primarily by managing the amount, sources, and duration of its assets and liabilities. The Company utilizes interest rate swap agreements as part of its
asset/liability management strategy to help manage its interest rate risk position. As part of this strategy, the Company provides its customer with a fixed-rate loan while creating a variable-rate asset for the Company by the customer entering
into an interest rate swap with the Company on terms that match the loan. The Company offsets its risk exposure by entering into an offsetting interest rate swap with an unaffiliated institution. These interest rate swaps do not qualify as
designated hedges; therefore, each swap is accounted for as a standalone derivative. At December 31, 2025, the Company had offsetting interest rate swaps associated with commercial loans with a notional value of $11,055 and a fair value asset of $754 11,802 and a fair value asset and liability of $657 no
Note I - Other Borrowed Funds
Other
borrowed funds at December 31, 2025 and 2024 are comprised of advances from the FHLB of Cincinnati and promissory notes.
|
FHLB
Borrowings
|
Promissory
Notes
|
Totals
|
||||||||||
|
2025
|
$
|
|
$
|
|
$
|
|
||||||
|
2024
|
$
|
|
$
|
|
$
|
|
||||||
32
notes to the consolidated financial statements
Amounts are in thousands, except share and per share data.
Note I - Other Borrowed Funds (continued)
Pursuant
to collateral agreements with the FHLB, advances are secured by $410,568 in qualifying mortgage loans, $39,118 in commercial loans and $3,118
in FHLB stock at December 31, 2025. Fixed-rate FHLB advances of $42,247 mature through 2042 and have interest rates ranging from 1.53 % to 4.91 % and a year-to-date
weighted average cost of 4.03 % and 4.02 %
at December 31, 2025 and 2024, respectively. There were no variable-rate FHLB borrowings at December 31, 2025.
At December 31, 2025, the Company had a cash management line of credit enabling it to borrow up to $100,000 from the FHLB, subject to the stock ownership and collateral limitations described below. All cash management advances have an original maturity of 90 days. The line of credit must be renewed on an annual basis. There was $100,000
available on this line of credit at December 31, 2025.
Based
on the Company’s current FHLB stock ownership, total assets and pledgeable loans, the Company had the ability to obtain borrowings from the FHLB up to a maximum of $250,501 at December 31, 2025. Of this maximum borrowing capacity, the Company had $156,254
available to use as additional borrowings, of which $156,254 could be used for short term, cash management advances, as mentioned
above. Furthermore, the Company pledged collateral to the FRB to establish a borrowing line, which had availability of $41,891 at
December 31, 2025.
At December 31, 2025, the Company had a federal funds line of credit with two correspondent banks totaling $25,000 . The lines of credit are not committed and are provided at the discretion of the correspondent bank. No collateral has been pledged to the lines of credit. Any advance is due to be repaid the next business day. At December 31, 2025, there was $25,000 available on these lines of credit.
Promissory
notes, issued primarily by Ohio Valley, are due at various dates through a final maturity date of November 18, 2026 , and have fixed rates ranging from 4.25 % to 4.60 % and a year-to-date weighted average cost of 4.49 % at December 31, 2025, as compared to 4.71 % at December 31, 2024. At
December 31, 2025 and 2024, there were six promissory notes payable by Ohio Valley to totaling $2,601 and $2,501 ,
respectively. See Note M for further discussion of related party transactions. There were no
Letters of credit issued on the Bank’s behalf by the FHLB to collateralize certain public unit deposits as required by law totaled $52,000
at December 31, 2025 and $58,500 at December 31, 2024.
Scheduled principal payments over the next five years:
| |
FHLB
Borrowings
|
Promissory
Notes
|
Totals
|
|||||||||
|
2026
|
$
|
|
$
|
|
$
|
|
||||||
|
2027
|
|
|
|
|||||||||
|
2028
|
|
|
|
|||||||||
|
2029
|
|
|
|
|||||||||
|
2030
|
|
|
|
|||||||||
|
Thereafter
|
|
|
|
|||||||||
|
$
|
|
$
|
|
$
|
|
|||||||
Note J - Subordinated Debentures and Trust
Preferred Securities
On March 22, 2007, a trust formed by Ohio Valley issued $8,500 of adjustable-rate trust preferred securities as part of a pooled
offering of such securities. The rate on these trust preferred securities was fixed at 6.58 % for five years and then converted to a floating-rate term on March 15, 2012, based on a rate equal to the 3-month LIBOR plus 1.68 %. Beginning September 15, 2023, the
rate converted from a 3-month LIBOR index to a 3-month CME Term SOFR index plus a spread adjustment of 0.26 % and a margin of 1.68 %. The interest rate on these trust preferred securities was 5.66 % at December 31, 2025 and 6.33 % at December 31, 2024. There were no June 15, 2037 .
33
notes to the consolidated financial statements
Amounts are in thousands, except share and per share data.
Note J - Subordinated Debentures and Trust Preferred Securities (continued)
Under the provisions of the related indenture agreements, the interest payable on the trust preferred securities is deferrable for up to five years
and any such deferral is not considered a default. During any period of deferral, the Company would be precluded from declaring or paying dividends to shareholders or repurchasing any of the Company’s common stock. Under generally accepted
accounting principles, the trusts are not consolidated with the Company. Accordingly, the Company does not report the securities issued by the trust as liabilities and instead reports as liabilities the subordinated debentures issued by the
Company and held by the trust. Since the Company’s equity interest in the trusts cannot be received until the subordinated debentures are repaid, these amounts have been netted. The subordinated debentures may be included in Tier 1 capital
(with certain limitations applicable) under current regulatory guidelines and interpretations.
Note K - Income Taxes
Income taxes paid pursuant to the adoption of ASU 2023-09, on a retrospective basis:
|
2025
|
2024
|
|||||||
|
Federal
|
$
|
|
$
|
|
||||
|
States
|
||||||||
|
West Virginia
|
||||||||
| Foreign |
||||||||
|
Total
|
$
|
|
$
|
|
||||
Pretax income is entirely related to
domestic activities; the Company did not have any foreign operations.
The provision for income taxes from
continuing operations consists of the following:
|
2025
|
2024
|
|||||||
|
Current tax expense:
|
||||||||
|
Federal
|
$ | $ | ||||||
|
State
|
||||||||
|
Total
|
||||||||
|
Deferred tax (benefit) expense:
|
||||||||
|
Federal
|
( |
) | ( |
) | ||||
|
State
|
( |
) | ( |
) | ||||
|
Total
|
( |
) | ( |
) | ||||
|
Net provision for income taxes from continuing operations
|
$
|
|
$
|
|
||||
The
Company did no
The
difference between the financial statement tax provision and amounts computed by applying the statutory federal income tax rate of 21
| 2025 |
2024 | |||||||||||||||
| Amount |
% of Pretax Income |
Amount |
% of Pretax Income
|
|||||||||||||
|
Taxes at federal statutory rate
|
$ |
|
|
|
%
|
$ | % | |||||||||
|
State and local income tax, net of federal income tax benefit (a)
|
|
|
%
|
% | ||||||||||||
| Tax credits: | ||||||||||||||||
|
Qualified zone academy bond credits
|
(
|
)
|
(
|
)%
|
( |
) | ( |
)% | ||||||||
|
Nontaxable or nondeductible items:
|
||||||||||||||||
| Tax-exempt income, net |
(
|
)
|
(
|
)%
|
( |
) | ( |
)% | ||||||||
|
Bank owned life insurance
|
(
|
)
|
(
|
)%
|
( |
) | ( |
)% | ||||||||
| Other |
% | % | ||||||||||||||
| Other adjustments |
% | % | ||||||||||||||
|
Total income taxes
|
$
|
|
|
%
|
$ | % | ||||||||||
(a) State taxes in West Virginia made up the majority (greater than 50%) of the tax effect in this category.
34
notes to the consolidated financial statements
Amounts are in thousands, except share and per share data.
Note K - Income Taxes (continued)
The source of deferred
tax assets and deferred tax liabilities at December 31:
|
2025
|
2024
|
|||||||
|
Items giving rise to deferred tax assets:
|
||||||||
|
Other reserves
|
$ | $ | ||||||
|
Allowance for credit losses
|
|
|
||||||
|
Unrealized loss on securities available for sale
|
||||||||
|
Deferred compensation
|
|
|
||||||
|
Deferred loan fees/costs
|
|
|
||||||
|
Accrued bonus
|
|
|
||||||
|
Purchase accounting adjustments
|
|
|
||||||
|
Net operating loss
|
|
|
||||||
|
Lease liability
|
|
|
||||||
|
Nonaccrual interest income
|
||||||||
|
Other
|
|
|
||||||
|
Items giving rise to deferred tax liabilities:
|
||||||||
|
Mortgage servicing rights
|
(
|
)
|
(
|
)
|
||||
|
FHLB stock dividends
|
(
|
)
|
(
|
)
|
||||
|
Prepaid expenses
|
(
|
)
|
(
|
)
|
||||
|
Depreciation and amortization
|
(
|
)
|
(
|
)
|
||||
|
Right-of-use asset
|
(
|
)
|
(
|
)
|
||||
|
Other
|
( |
) | ( |
) | ||||
|
Net deferred tax asset
|
$
|
|
$
|
|
||||
The Company determined that it was not required to establish a valuation allowance for deferred tax assets since management believes that the deferred tax assets are likely to be realized through the future reversals
of existing taxable temporary differences, deductions against forecasted income and tax planning strategies.
At December 31, 2025, the Company’s deferred tax asset related to Section 382 net operating loss carryforwards was $76 , which will
expire in .
At
December 31, 2025 and December 31, 2024, the Company had no
Note L - Commitments and Contingent
Liabilities
The Bank is a party to financial instruments with off-balance sheet risk in the normal course of business to meet the financing needs of its customers.
These financial instruments include commitments to extend credit, standby letters of credit and financial guarantees. The Bank’s exposure to credit loss in the event of nonperformance by the other party to the financial instrument for
commitments to extend credit and standby letters of credit, and financial guarantees written, is represented by the contractual amount of those instruments. The contract
amounts of these instruments are not included in the consolidated financial statements. At December 31, 2025, the contract amounts of these instruments totaled approximately $226,570 , compared to $203,019 at December 31, 2024. The Bank estimates expected credit losses over the contractual period in which the Bank is exposed to credit risk via a contractual obligation to extend credit. At
December 31, 2025, the estimated ACL related to off-balance sheet commitments
was $871 , compared to $582
at December 31, 2024. This included $289 in provision expense during the year ended December 31, 2025, compared to a $110 recovery of provision expense during the year ended December 31, 2024. The Bank uses the same credit policies in making commitments and
conditional obligations as it does for instruments recorded on the balance sheet. Since many of these instruments are expected to expire without being drawn upon, the total contract amounts do not necessarily represent future cash
requirements.
35
notes to the consolidated financial statements
Amounts are in thousands, except share and per share data.
Note L - Commitments and Contingent Liabilities (continued)
Following is a
summary of such commitments at December 31:
|
2025
|
2024
|
|||||||
|
Fixed rate
|
$
|
|
$
|
|
||||
|
Variable rate
|
|
|
||||||
|
Standby letters of credit
|
|
|
||||||
At
December 31, 2025, the fixed-rate commitments have interest rates ranging from 4.75 % to 6.13 % and maturities of 30 years .
Commitments
to extend credit are agreements to lend to a customer as long as there is no violation of any condition established in the contract. Commitments generally have fixed expiration dates or other termination clauses and may require payment of a
fee. Standby letters of credit are conditional commitments issued by the Bank to guarantee the performance of a customer to a third party. Since many of the commitments are expected to expire without being drawn upon, the total commitment
amounts do not necessarily represent future cash requirements. The Bank evaluates each customer’s credit worthiness on a case-by-case basis. The amount of collateral obtained, if deemed necessary by the Bank upon extension of credit, is based
on management’s credit evaluation of the counterparty. Collateral held varies but may include accounts receivable, inventory, property, plant and equipment and income-producing commercial properties.
There
are various contingent liabilities that are not reflected in the financial statements, including claims and legal actions arising in the ordinary course of business. In the opinion of management, after consultation with legal counsel, the
ultimate disposition of these matters is not expected to have a material effect on financial condition or results of operations.
Note M - Related Party Transactions
Certain directors, executive officers and companies with which they are affiliated were loan customers during 2025. A summary of activity on these borrower relationships with aggregate debt greater than $120 is as follows:
|
Total loans at January 1, 2025
|
$
|
|
||
|
New loans
|
|
|||
|
Repayments
|
(
|
)
|
||
|
Other changes
|
(
|
)
|
||
|
Total loans at December 31, 2025
|
$
|
|
Other
changes include adjustments for loans applicable to one reporting period that are excludable from the other reporting period, such
as changes in persons classified as directors, executive officers and companies’ affiliates.
Deposits
from principal officers, directors, and their affiliates at year-end 2025 and 2024 were $19,686 and $22,847 , respectively. In addition, the Company had promissory notes outstanding with directors and their affiliates totaling $2,601 at year-end 2025 and $2,501 at
year-end 2024. The interest rates ranged from 4.25 % to 5.25 %, with terms ranging from 8 to 14 months .
Note N - Employee
Benefits
The
Bank has a profit-sharing plan for the benefit of its employees and their beneficiaries. Contributions to the plan are determined by the Board of Directors of Ohio Valley. Contributions charged to expense were $299 and $267 for 2025 and 2024.
Ohio Valley maintains an Employee Stock Ownership Plan (“ESOP”) covering substantially all employees of the Company. Ohio Valley issues shares to the ESOP, purchased by the ESOP with subsidiary cash contributions, which
are allocated to ESOP participants based on relative compensation. The total number of shares held by the ESOP, all of which have been allocated to participant accounts, were 332,569 340,562 In addition, the subsidiaries made contributions to the ESOP as
follows:
|
Years ended December 31
|
||||||||
|
2025
|
2024
|
|||||||
|
Number of shares issued
|
|
|
||||||
|
Fair value of stock contributed
|
$
|
|
$
|
|
||||
|
Cash contributed
|
|
|
||||||
|
Total expense
|
$
|
|
$
|
|
||||
36
notes to the consolidated financial statements
Amounts are in thousands, except share and per share data.
Note N - Employee Benefits (continued)
Life
insurance contracts with a cash surrender value of $41,615 and annuity assets of $1,690 at December 31, 2025 have been purchased by the Company, the owner of the policies. The purpose of these contracts was to replace a current group life insurance
program for executive officers, implement a deferred compensation plan for directors and executive officers, implement a director retirement plan and implement supplemental retirement plans for certain officers. Under the deferred compensation
plan, Ohio Valley pays each participant the amount of fees deferred plus interest over the participant’s desired term, upon termination of service. Under the director retirement plan, participants are eligible to receive ongoing compensation
payments upon retirement subject to length of service. The supplemental retirement plans provide payments to select executive officers upon retirement based upon a compensation formula determined by Ohio Valley’s Board of Directors. The present
value of payments expected to be provided are accrued during the service period of the covered individuals and amounted to $10,490
and $10,054 at December 31, 2025 and 2024, respectively. Expenses related to the plans for each of the last two years amounted to $772 and $707 , respectively. In
association with the split-dollar life insurance plan, the present value of the postretirement payments expected to be provided and accrued for totaled $3,731 at December 31, 2025 and $3,570 at December 31, 2024 and is recorded in Other Liabilities on
the Statement of Condition.
Note O - Fair Value of Financial Instruments
Fair value is the
exchange price that would be received for an asset or paid to transfer a liability (exit price) in the principal or most advantageous market for the asset or liability in an orderly transaction between market participants on the measurement
date. There are three levels of inputs that may be used to measure fair values:
Level 1: Quoted prices (unadjusted) for identical assets or liabilities
in active markets that the entity has the ability to access as of the measurement date.
Level 2: Significant other observable inputs other than Level 1 prices,
such as quoted prices for similar assets or liabilities, quoted prices in markets that are not active, or other inputs that are observable or can be corroborated by observable market data.
Level 3: Significant unobservable inputs that reflect a company’s own
assumptions about the assumptions that market participants would use in pricing an asset or liability.
The
following is a description of the Company’s valuation methodologies used to measure and disclose the fair values of its financial assets and liabilities on a recurring or nonrecurring basis:
Securities: Debt securities classified as AFS are measured at fair value on a recurring basis. The fair values for securities are determined by quoted market prices, if available (Level 1). For securities
where quoted prices are not available, fair values are calculated based on market prices of similar securities (Level 2). For securities where quoted prices or market prices of similar securities are not available, fair values are calculated
using discounted cash flows or other market indicators (Level 3). During times when trading is more liquid, broker quotes are used (if available) to validate the model. Rating agency and industry research reports as well as defaults and
deferrals on individual securities are reviewed and incorporated into the calculations.
37
notes to the consolidated financial statements
Amounts are in thousands, except share and per share data.
Note O - Fair Value of Financial Instruments (continued)
Individually Evaluated Collateral Dependent Loans: Loans with specific reserves based on their fair value of collateral are measured on an as-needed, nonrecurring basis. The fair
value of individually evaluated collateral dependent loans with specific allocations of the ACL is generally based on the fair value of collateral, less costs to sell, based on recent real estate appraisals. These appraisals may utilize a
single valuation approach or a combination of approaches including comparable sales and the income approach. Adjustments are routinely made in the appraisal process by the independent appraisers to adjust for differences between the
comparable sales and income data available. Such adjustments are usually significant and typically result in a Level 3 classification of the inputs for determining fair value. Non-real estate collateral may be valued using an appraisal, net
book value per the borrower’s financial statements, or aging reports, adjusted or discounted based on management’s historical knowledge, changes in market conditions from the time of the valuation, and management’s expertise and knowledge
of the client and client’s business, resulting in a Level 3 fair value classification. In some instances, fair value adjustments can be made based on a quoted price from an observable input, such as a purchase agreement. Such adjustments
would be classified as a Level 2 classification. Individually evaluated collateral dependent loans are evaluated on a quarterly basis for additional impairment and adjusted accordingly.
OREO: The value of foreclosed assets is measured on a nonrecurring basis. Assets acquired through or instead of loan foreclosure are initially recorded at fair value less costs to sell when acquired,
establishing a new cost basis. These assets are subsequently accounted for at lower of cost or fair value less estimated costs to sell. Fair value is commonly based on recent real estate appraisals. These appraisals may utilize a single
valuation approach or a combination of approaches including comparable sales and the income approach. Adjustments are routinely made in the appraisal process by the independent appraisers to adjust for differences between the comparable sales
and income data available. Such adjustments are usually significant and typically result in a Level 3 classification of the inputs for determining fair value. In some instances, fair value adjustments can be made based on a quoted price from an
observable input, such as a purchase agreement. Such adjustments would be classified as a Level 2 classification.
Appraisals
for collateral securing both individually evaluated collateral dependent loans and OREO owned are performed by certified general appraisers (for commercial properties) or certified residential appraisers (for residential properties) whose
qualifications and licenses have been reviewed and verified by the Company. Once received, a member of management reviews the assumptions and approaches utilized in the appraisal as well as the overall resulting fair value in comparison with
management’s own assumptions of fair value based on factors that include recent market data or industry-wide statistics.
On
an as-needed basis, the Company reviews the fair value of collateral, taking into consideration current market data, as well as all selling costs, which typically amount to approximately 10 %.
Interest Rate Swap Agreements: Interest rate swap contracts are carried at fair value on a recurring basis. The fair value of interest rate swap agreements is determined using the market standard methodology
of netting the discounted future fixed cash payments (or receipts) and the discounted expected variable cash receipts (or payments). The variable cash receipts (or payments) are based on the expectation of future interest rates (forward
curves) derived from observed market interest rate curves (Level 2).
Assets and Liabilities Measured on a
Recurring Basis
Assets and liabilities measured at fair value on a recurring
basis are summarized below:
|
Fair Value Measurements at December 31, 2025, Using
|
||||||||||||
|
Quoted Prices in
Active Markets
for Identical
Assets
(Level 1)
|
Significant Other
Observable
Inputs
(Level 2)
|
Significant
Unobservable
Inputs
(Level 3)
|
||||||||||
|
Assets:
|
||||||||||||
| U.S. Government securities | $ |
$ |
$ |
|||||||||
|
U.S. Government sponsored entity securities
|
|
|
|
|
||||||||
|
Agency mortgage-backed securities, residential
|
|
|
|
|||||||||
|
Interest rate swap derivatives
|
|
|
|
|||||||||
|
Liabilities:
|
||||||||||||
|
Interest rate swap derivatives
|
|
(
|
)
|
|
||||||||
38
notes to the consolidated financial statements
Amounts are in thousands, except share and per share data.
Note O - Fair Value of Financial
Instruments (continued)
|
Fair Value Measurements at December 31, 2024, Using
|
||||||||||||
|
Quoted Prices in
Active Markets
for Identical
Assets
(Level 1)
|
Significant Other
Observable
Inputs
(Level 2)
|
Significant
Unobservable
Inputs
(Level 3)
|
||||||||||
|
Assets:
|
||||||||||||
| U.S. Government securities | $ |
$ |
$ |
|||||||||
|
U.S. Government sponsored entity securities
|
|
|
|
|
||||||||
|
Agency mortgage-backed securities, residential
|
|
|
|
|||||||||
|
Interest rate swap derivatives
|
|
|
|
|||||||||
|
Liabilities:
|
||||||||||||
|
Interest rate swap derivatives
|
|
(
|
)
|
|
||||||||
There were no
transfers into or out of Level 3 during the years ended December 31, 2025 or 2024.
Assets and Liabilities Measured on a
Nonrecurring Basis
There were no
The carrying amounts and estimated fair
values of financial instruments at December 31, 2025 and December 31, 2024 are as follows:
|
Fair Value Measurements at December 31, 2025 Using:
|
||||||||||||||||||||
|
Carrying
Value
|
Level 1
|
Level 2
|
Level 3
|
Total
|
||||||||||||||||
|
Financial Assets:
|
||||||||||||||||||||
|
Cash and cash equivalents
|
$
|
|
$
|
|
$
|
|
$
|
|
$
|
|
||||||||||
|
Securities available for sale
|
|
|
|
|
|
|||||||||||||||
|
Securities held to maturity
|
|
|
|
|
|
|||||||||||||||
|
Loans, net
|
|
|
|
|
|
|||||||||||||||
|
|
|
|
|
|
|
|||||||||||||||
|
Accrued interest receivable
|
|
|
|
|
|
|||||||||||||||
|
Financial Liabilities:
|
||||||||||||||||||||
|
Deposits
|
|
|
|
|
|
|||||||||||||||
|
Other borrowed funds
|
|
|
|
|
|
|||||||||||||||
|
Subordinated debentures
|
|
|
|
|
|
|||||||||||||||
|
|
|
|
|
|
|
|||||||||||||||
|
Accrued interest payable
|
|
|
|
|
|
|||||||||||||||
|
Fair Value Measurements at December 31, 2024 Using:
|
||||||||||||||||||||
|
Carrying
Value
|
Level 1
|
Level 2
|
Level 3
|
Total
|
||||||||||||||||
|
Financial Assets:
|
||||||||||||||||||||
|
Cash and cash equivalents
|
$
|
|
$
|
|
$
|
|
$
|
|
$
|
|
||||||||||
|
Securities available for sale
|
|
|
|
|
|
|||||||||||||||
|
Securities held to maturity
|
|
|
|
|
|
|||||||||||||||
|
Loans, net
|
|
|
|
|
|
|||||||||||||||
|
|
|
|
|
|
|
|||||||||||||||
|
Accrued interest receivable
|
|
|
|
|
|
|||||||||||||||
|
Financial Liabilities:
|
||||||||||||||||||||
|
Deposits
|
|
|
|
|
|
|||||||||||||||
|
Other borrowed funds
|
|
|
|
|
|
|||||||||||||||
|
Subordinated debentures
|
|
|
|
|
|
|||||||||||||||
|
|
|
|
|
|
|
|||||||||||||||
|
Accrued interest payable
|
|
|
|
|
|
|||||||||||||||
39
notes to the consolidated financial statements
Amounts are in thousands, except share and per share data.
Note O - Fair Value of Financial
Instruments (continued)
Fair
value estimates are made at a specific point in time, based on relevant market information and information about the financial instrument. These estimates do not reflect any premium or discount that could result from offering for sale at one time
the Company’s entire holdings of a particular financial instrument. Because no market exists for a significant portion of the Company’s financial instruments, fair value estimates are based on judgments regarding future expected loss experience,
current economic conditions, risk characteristics of various financial instruments and other factors. These estimates are subjective in nature and involve uncertainties and matters of significant judgment and therefore cannot be determined with
precision. Changes in assumptions could significantly affect the estimates.
Note P - Regulatory Matters
Banks and bank holding
companies are subject to regulatory capital requirements administered by federal banking agencies. Capital adequacy guidelines and, additionally for banks, prompt corrective action regulations, involve quantitative measures of assets,
liabilities, and certain off-balance-sheet items calculated under regulatory accounting practices. Capital amounts and classifications are also subject to qualitative judgements by regulators. Failure to meet capital requirements can initiate
regulatory action. The net unrealized gain or loss on AFS securities is not included in computing regulatory capital. Management believes as of December 31, 2025, the Bank met all capital adequacy requirements to which they are subject. Based on
asset size, the bank holding company was not required to meet the consolidated capital requirements of the FRB.
Prompt corrective
action regulations applicable to insured depository institutions provide five classifications: well capitalized, adequately
capitalized, undercapitalized, significantly undercapitalized, and critically undercapitalized, although these terms are not used to represent overall financial condition. If adequately capitalized, regulatory approval is required to accept
brokered deposits. If undercapitalized, capital distributions are limited, as is asset growth and expansion, and capital restoration plans are required. At year-end 2025 and 2024, the Bank met the capital requirements to be deemed well
capitalized under the regulatory framework for prompt corrective action. There are no conditions or events since year-end 2025 or 2024 that management believes have changed the institution’s well capitalized category.
In 2019, the federal
banking agencies jointly issued a final rule that provides for an optional, simplified measure of capital adequacy, the community bank leverage ratio (“CBLR”) framework, for qualifying community banking organizations (banks and holding
companies), consistent with Section 201 of the Economic Growth, Regulatory Relief, and Consumer Protection Act. The final rule became effective on January 1, 2020 and was elected by the Bank as of March 31, 2020. In April 2020, the federal
banking agencies issued an interim final rule that made temporary changes to the CBLR framework, pursuant to Section 4012 of the CARES Act, and a second interim final rule that provided a graduated increase in the CBLR requirement after the
expiration of the temporary changes implemented pursuant to Section 4012 of the CARES Act.
The CBLR removes the
requirement for qualifying banking organizations to calculate and report risk-based capital and only requires a Tier 1 to average assets (“leverage”) ratio. Qualifying banking organizations that elect to use the CBLR framework and that maintain a
leverage ratio of greater than required minimums are considered to have satisfied the generally applicable risk based and leverage capital requirements in the agencies’ capital rules and, if applicable, are considered to have met the well
capitalized ratio requirements for purposes of Section 38 of the Federal Deposit Insurance Act. Under the interim final rules, the CBLR minimum requirement was 8% as of December 31, 2020, 8.5% for calendar year 2021, and 9% for calendar year 2022
and beyond. The interim rule allowed for a two-quarter grace period to correct a ratio that fell below the required amount, provided that the Bank maintained a leverage ratio of 7% as of December 31, 2020, 7.5% for calendar year 2021, and 8% for
calendar year 2022 and beyond.
Under the final rule,
an eligible banking organization can opt out of the CBLR framework and revert back to the risk-weighting framework without restriction. As of December 31, 2025 and 2024, the Bank qualified as a community banking organization as defined by the
federal banking agencies and elected to measure capital adequacy under the CBLR framework.
40
notes to the consolidated financial statements
Amounts are in thousands, except share and per share data.
Note P - Regulatory Matters
(continued)
The current rules were impacted by the
Company’s adoption of ASC 326 and its election to apply the 3-year CECL transition provision on January 1, 2023. By making this election, the Bank, in accordance with Section 301 of the regulatory capital rules, will increase it retained
earnings (Tier 1 Capital) and average assets by 75% of its CECL transition amount during the first year of the transition period, 50% of its CECL transition amount during the second year, and 25% of its CECL transitional amount during the third
year of the transition period. The Bank’s transition amount from the adoption of CECL totaled $2,276 , which resulted in the add-back
of $569 1,138
The
following tables summarize the actual and required capital amounts of the Bank as of year-end.
|
Actual
|
To Be Well Capitalized
Under Prompt Corrective
Action Regulations
|
|||||||||||||||
|
Bank
|
Amount
|
Ratio
|
Amount
|
Ratio
|
||||||||||||
|
Tier 1 capital (to average assets)
|
||||||||||||||||
|
December 31, 2025
|
$
|
|
|
%
|
$
|
|
|
%
|
||||||||
|
December 31, 2024
|
|
|
|
|
||||||||||||
Dividends
paid by the subsidiaries are the primary source of funds available to Ohio Valley for payment of dividends to shareholders and for other working capital needs. The payment of dividends by the subsidiaries to Ohio Valley is subject to restrictions
by regulatory authorities and state law. These restrictions generally limit dividends to the current and prior two years retained earnings of the Bank and Loan Central, Inc. At January 1, 2026 approximately $16,828 of the subsidiaries’ retained earnings were available for dividends under these guidelines. The ability of Ohio Valley to borrow funds from the
Bank is limited as to amount and terms by banking regulations. The Board of Governors of the Federal Reserve System also has a policy requiring Ohio Valley to provide notice to the FRB in advance of the payment of a dividend to Ohio Valley’s
shareholders under certain circumstances, and the FRB may disapprove of such dividend payment if the FRB determines the payment would be an unsafe or unsound practice.
Note Q - Parent Company Only Condensed
Financial Information
Below
is condensed financial information of Ohio Valley. In this information, Ohio Valley’s investment in its subsidiaries is stated at cost plus equity in undistributed earnings of the subsidiaries since acquisition. This information should be read
in conjunction with the consolidated financial statements of the Company.
CONDENSED STATEMENTS OF CONDITION
|
Years ended December 31:
|
||||||||
|
Assets
|
2025
|
2024
|
||||||
|
Cash and cash equivalents
|
$
|
|
$
|
|
||||
|
Investment in subsidiaries
|
|
|
||||||
|
– subsidiaries
|
|
|
||||||
|
Other assets
|
|
|
||||||
|
Total assets
|
$
|
|
$
|
|
||||
|
Liabilities
|
||||||||
|
Notes payable
|
$
|
|
$
|
|
||||
|
Subordinated debentures
|
|
|
||||||
|
Other liabilities
|
|
|
||||||
|
Total liabilities
|
|
|
||||||
|
Shareholders’ Equity
|
||||||||
|
Total shareholders’ equity
|
|
|
||||||
|
Total liabilities and shareholders’ equity
|
$
|
|
$
|
|
||||
41
notes to the consolidated financial statements
Amounts are in thousands, except share and per share data.
Note Q - Parent Company Only Condensed Financial Information (continued)
CONDENSED STATEMENTS OF COMPREHENSIVE INCOME
|
Years ended December 31:
|
||||||||
|
Income:
|
2025
|
2024
|
||||||
|
Interest on notes
|
$
|
|
$
|
|
||||
|
Dividends from subsidiaries
|
|
|
||||||
|
Expenses:
|
||||||||
|
Interest on notes
|
|
|
||||||
|
Interest on subordinated debentures
|
|
|
||||||
|
Operating expenses
|
|
|
||||||
|
Income before income taxes and equity in undistributed earnings of subsidiaries
|
|
|
||||||
|
Income tax benefit
|
|
|
||||||
|
Equity in undistributed earnings of subsidiaries
|
|
|
||||||
|
Net Income
|
$
|
|
$
|
|
||||
|
Other comprehensive income (loss), net of tax
|
||||||||
|
Comprehensive Income
|
$
|
|
$
|
|
||||
CONDENSED STATEMENTS OF CASH FLOWS
|
Years ended December 31:
|
||||||||
|
Cash flows from operating activities:
|
2025
|
2024
|
||||||
|
Net Income
|
$
|
|
$
|
|
||||
|
Adjustments to reconcile net income to net cash provided by operating activities:
|
||||||||
|
Equity in undistributed earnings of subsidiaries
|
(
|
)
|
(
|
)
|
||||
|
Common stock issued to ESOP
|
||||||||
|
Change in other assets
|
|
|
||||||
|
Change in other liabilities
|
(
|
)
|
(
|
)
|
||||
|
Net cash provided by operating activities
|
|
|
||||||
|
Cash flows from investing activities:
|
||||||||
|
Change in notes receivable
|
|
|
||||||
|
Net cash provided by investing activities
|
|
|
||||||
|
Cash flows from financing activities:
|
||||||||
|
Change in notes payable
|
|
|
||||||
|
Purchases of treasury stock
|
( |
) | ||||||
|
Cash dividends paid
|
(
|
)
|
(
|
)
|
||||
|
Net cash (used in) financing activities
|
(
|
)
|
(
|
)
|
||||
|
Cash and cash equivalents:
|
||||||||
|
Change in cash and cash equivalents
|
|
(
|
)
|
|||||
|
Cash and cash equivalents at beginning of year
|
|
|
||||||
|
Cash and cash equivalents at end of year
|
$
|
|
$
|
|
||||
42
notes to the consolidated financial statements
Amounts are in thousands, except share and per share data.
Note R – Revenue From Contracts With Customers
Revenue
is segregated based on the nature of products and services offered as part of contractual arrangements. Revenue from contracts with customers within the scope of ASC 606 is broadly segregated within the following noninterest income categories:
• Service charges on deposit accounts – These include general service fees charged for deposit account maintenance and activity and
transaction-based fees charged for certain services, such as debit card, wire transfer, or overdraft activities. Revenue is recognized when the performance obligation is completed, which is generally after a transaction is completed or monthly for
account maintenance services.
• Trust fees - This includes periodic fees due from trust customers for managing the customers' financial assets. Fees are generally charged on a
quarterly or annual basis and are recognized ratably throughout the period, as the services are provided on an ongoing basis.
• Electronic refund check/deposit fees – A tax refund clearing agreement between the Bank and a tax refund processor requires the Bank to process
electronic refund checks and electronic refund deposits presented for payment on behalf of taxpayers through accounts containing taxpayer refunds. The Bank, in turn, receives a fee paid by the third-party tax refund processor for each transaction
that is processed. The amount of fees received are tiered based on the tax refund product selected. Since the Bank acts as a sub servicer in the tax process relationship, a portion of the fee collected is passed on to the tax refund processor.
• Debit/credit card interchange income – This includes interchange income from cardholder transactions conducted with merchants, throughout various
interchange networks with which the Company participates. Interchange fees from cardholder transactions represent a percentage of the underlying transaction value and are recognized daily, as transaction processing services are provided to the
deposit customer. Gross fees from interchange are recorded in operating income separately from gross network costs, which are recorded in operating expense.
• Tax preparation fees – This includes fees received by tax preparation customers of Loan Central as part of the Bank’s TAL business. After Loan
Central prepares a customer’s tax return, the customer is offered the opportunity to have immediate access to a portion of the anticipated tax refund by entering into a TAL with the Bank. As part of the process, the tax customer completes a loan
application and authorizes the expected tax refund to be deposited with the Bank once it is issued by the IRS. Once the Bank receives the tax refund, the refund is used to repay the TAL and Loan Central’s tax preparation fees, then the remainder of
the refund is remitted to Loan Central’s tax customer.
• Float income from tax product processor – This is associated with the tax refund clearing agreement between the Bank and a third-party tax refund
processor. The revenue earned is based on the estimated compensating balances associated with processing the contractual minimum number of check items multiplied by the interest rate paid by the Federal Reserve on reserves for the respective
period. The float income is paid by the tax refund product processor at the end of each year of the tax agreement, which expired at the end of 2025.
Note S - Risks and Uncertainties
The risks pertinent to the Bank regarding liquidity and rising deposit costs have increased due to an elevated
interest rate environment and increased deposit competition within our markets. Our liquidity position is supported by the management of liquid assets such as cash and interest-bearing deposits with banks, and liabilities such as core deposits. The
Bank can also access other sources of funds such as brokered deposits and FHLB advances. With the present economic conditions putting a strain on liquidity and higher borrowing costs, the Company believes it has sufficient liquid assets and funding
sources should there be a liquidity need.
report of independent registered
public accounting firm
To the Shareholders and Board of Directors
Ohio Valley Banc Corp.
Opinion on the Financial Statements
We have audited the accompanying consolidated statement of condition of Ohio Valley Banc Corp. and its subsidiaries (the “Company”) as of December 31, 2025 and 2024, the
related consolidated statements of income, comprehensive income, changes in shareholders’ equity, and cash flows for the years then ended, and the related notes (collectively referred to as the “financial statements”). In our opinion, the financial
statements referred to above present fairly, in all material respects, the financial position of the Company as of December 31, 2025 and 2024 and the results of its operations and its cash flows for each of the years then ended, in conformity with
accounting principles generally accepted in the United States of America.
Basis for Opinion
The Company’s management is responsible for these financial statements. Our responsibility is to express an opinion on the Company’s financial statements based on our
audits. We are a public accounting firm registered with the Public Company Accounting Oversight Board (United States) (the “PCAOB”) and are required to be independent with respect to the Company in accordance with the U.S. federal securities laws and
the applicable rules and regulations of the Securities and Exchange Commission and the PCAOB.
We conducted our audits in accordance with the standards of the PCAOB. Those standards require that we plan and perform the audits to obtain reasonable assurance about
whether the financial statements are free of material misstatement, whether due to error or fraud. The Company is not required to have, nor were we engaged to perform, an audit of its internal control over financial reporting. As part of our audits,
we are required to obtain an understanding of internal control over financial reporting but not for the purpose of expressing an opinion on the effectiveness of the Company’s internal control over financial reporting. Accordingly, we express no such
opinion.
Our audits included performing procedures to assess the risks of material misstatement of the financial statements, whether due to error or fraud, and performing
procedures that respond to those risks. Such procedures included examining, on a test basis, evidence regarding the amounts and disclosures in the financial statements. Our audits also included evaluating the accounting principles used and
significant estimates made by management, as well as evaluating the overall presentation of the financial statements. We believe that our audits provide a reasonable basis for our opinion.
Critical Audit Matter
The critical audit matter communicated below is a matter arising from the current period audit of the financial statements that was communicated or required to be
communicated to the audit committee and that (1) relates to accounts or disclosures that are material to the financial statements and (2) involved our especially challenging, subjective, or complex judgments. The communication of critical audit
matters does not alter in any way our opinion on the financial statements, taken as a whole, and we are not, by communicating the critical audit matter below, providing a separate opinion on the critical audit matter or on the accounts or disclosures
to which it relates.
Allowance for Credit Losses on Collectively Evaluated Loans - Refer to Notes A and C to the Financial Statements
Critical Audit Matter Description
Management’s estimate of the allowance for credit losses (the “ACL”) includes a reserve on collectively evaluated loans. The reserve on collectively evaluated loans is
based on peer group historical credit loss experience, which is adjusted for qualitative and forecast factors over the expected remaining lives of the collectively evaluated loans. Significant assumptions in management’s estimate of the reserve on
collectively evaluated loans include (i) the loan segments utilized to classify loans; (ii) the peer group utilized to determine historic loss rates; (iii) the loss drivers utilized to project losses during the forecast period; and (iv) qualitative
factor adjustments. In evaluating whether qualitative factor adjustments are necessary, management considers internal and external qualitative and credit risk factors.
Significant judgment was required by management in the selection and application of subjective assumptions used to derive the reserve on collectively evaluated loans.
Accordingly, performing audit procedures to evaluate the Company’s estimated ACL involved a high degree of auditor judgment and required significant effort, including the involvement of professionals with specialized skill and knowledge.
report of independent registered
public accounting firm
How the Critical Audit Matter Was Addressed in the Audit
Our audit procedures related to the Company’s estimate of the ACL included, but were not limited to, the following:
|
•
|
Obtaining an understanding of the Company’s process for establishing the ACL on collectively evaluated loans.
|
|
•
|
Evaluating the appropriateness of management’s methodology used for estimating the ACL on collectively evaluated loans.
|
|
•
|
Testing the completeness and accuracy of data utilized by management.
|
|
•
|
Evaluating the relevance and reliability of information used by management in the development of the estimate.
|
|
•
|
Evaluating the reasonableness of significant assumptions used in management’s estimate through a combination of evaluating the reasonableness of certain
assumptions and developing an independent range of reasonable outcomes for the collectively evaluated component of the ACL for comparison to management’s estimate.
|
We have served as the Company’s auditor since 2024.
/s/ Plante & Moran, PLLC
Plante & Moran, PLLC
Cleveland, Ohio
March 13, 2026
managements’ report on internal control
over financial reporting
Board of Directors and Shareholders
Ohio Valley Banc Corp.
The management of Ohio Valley Banc Corp. (the Company) is responsible for establishing and maintaining adequate internal control over financial reporting as defined in Rules 13a-15(f) and 15d-15(f)
under the Securities Exchange Act of 1934. The Company’s internal control over financial reporting is designed to provide reasonable assurance regarding the reliability of financial reporting and the preparation of financial statements for external
purposes in accordance with generally accepted accounting principles. The Company’s internal control over financial reporting includes those policies and procedures that: (i) pertain to the maintenance of records that, in reasonable detail,
accurately and fairly reflect the transactions and dispositions of the assets of the Company; (ii) provide reasonable assurance that transactions are recorded as necessary to permit preparation of financial statements in accordance with generally
accepted accounting principles, and that receipts and expenditures of the Company are being made only in accordance with authorizations of management and directors of the Company; and (iii) provide reasonable assurance regarding prevention or timely
detection of unauthorized acquisition, use or disposition of the Company’s assets that could have a material effect on the financial statements.
The system of internal control over financial reporting as it relates to the consolidated financial statements is evaluated for effectiveness by management. Because of its inherent limitations,
internal control over financial reporting may not prevent or detect misstatements. Also, projections of any evaluation of effectiveness to future periods are subject to the risk that controls may become inadequate because of changes in conditions, or
that the degree of compliance with the policies or procedures may deteriorate.
Management assessed the Company’s system of internal control over financial reporting as of December 31, 2025, in relation to criteria for effective internal control over financial reporting as
described in the 2013 “Internal Control Integrated Framework,” issued by the Committee of Sponsoring Organizations of the Treadway Commission (COSO). Based on this assessment, management concluded that, as of December 31, 2025, its system of internal
control over financial reporting is effective and meets the criteria of the “Internal Control Integrated Framework.”
Ohio Valley Banc Corp.
|
/s/Larry E. Miller, II
|
/s/Scott W. Shockey
|
|
Larry E. Miller, II
President and Chief Executive Officer
|
Scott W. Shockey
Senior Vice President, CFO
|
|
March 13, 2026
|
management’s discussion and analysis of
financial condition and results of operations
FORWARD LOOKING STATEMENTS
Certain statements contained in this report and other publicly available documents incorporated herein by reference constitute “forward looking statements”
within the meaning of Section 27A of the Securities Act of 1933, as amended, and Section 21E of the Securities Act of 1934, as amended (the “Exchange Act”), and as defined in the Private Securities Litigation Reform Act of 1995. Such statements are
often, but not always, identified by the use of such words as “believes,” “anticipates,” “expects,” “intends,” “plan,” “goal,” “seek,” “project,” “estimate,” “strategy,” “future,” “likely,” “may,” “should,” “will,” and other similar expressions. Such
statements involve various important assumptions, risks, uncertainties, and other factors, many of which are beyond our control, particularly with regard to developments related to the current economic and geopolitical landscape, and which could
cause actual results to differ materially from those expressed in such forward looking statements. However, it is difficult to predict the effect of known factors, and Ohio Valley Banc Corp. (“Ohio Valley”) cannot anticipate all factors that could
affect future results. Important factors that could cause actual results to differ materially from expectations expressed in or implied in forward looking statements include, but are not limited to: the effects of fluctuating interest rates on our
customers’ operations and financial condition; changes in political, economic or other factors, such as inflation rates, recessionary or expansive trends, taxes, tariffs, the effects of implementation of legislation and the continuing economic
uncertainty in various parts of the world; competitive pressures; the level of defaults and prepayment on loans made by Ohio Valley and its direct and indirect subsidiaries (collectively, the “Company”); unanticipated litigation, claims, or
assessments; fluctuations in the cost of obtaining funds to make loans; and regulatory changes. Additional detailed information concerning such factors is available in the Company’s filings with the Securities and Exchange Commission, under the
Exchange Act, including the disclosure under the heading “Item 1A. Risk Factors” of Part I of the Company’s Annual Report on Form 10-K for the fiscal year ended December 31, 2025 and elsewhere in this document (including, without limitation, in
conjunction with the forward looking statements themselves and under the heading “Critical Accounting Estimates”). All forward looking statements are qualified in their entirety by these and other cautionary statements that the Company makes from
time to time in its other SEC filings and public communications. Readers are cautioned not to place undue reliance on such forward looking statements, which speak only as of the date hereof. The Company undertakes no obligation and disclaims any
duty to update or revise any forward looking statements, whether as a result of new information, unanticipated future events or otherwise, except as required by applicable law.
ANALYSIS OF FINANCIAL CONDITION AND RESULTS OF OPERATIONS
The purpose of this discussion is to provide an analysis of the financial condition and results of operations of the Company that is not otherwise apparent from
the audited consolidated financial statements included in this report. The accompanying consolidated financial information has been prepared by management in conformity with U.S. generally accepted accounting principles (“US GAAP”) and is consistent
with that reported in the consolidated financial statements. Reference should be made to those statements and the selected financial data presented elsewhere in this report for an understanding of the following tables and related discussion. All
dollars are reported in thousands, except share and per share data.
management’s discussion and analysis of
financial condition and results of operations
BUSINESS OVERVIEW:
The following discussion on consolidated financial statements include the accounts of Ohio Valley and its wholly-owned subsidiaries, The Ohio Valley Bank Company (the “Bank”), Loan
Central, Inc., a consumer finance company (“Loan Central”), and Ohio Valley Financial Services Agency, LLC, an insurance agency. The Bank has one active, wholly-owned subsidiary, Ohio Valley REO, LLC, an Ohio limited liability company.
The Company is primarily engaged in commercial and retail banking, offering a blend of commercial and consumer banking services within southeastern Ohio as well as western West
Virginia. The banking services offered by the Bank include the acceptance of deposits in checking, savings, time and money market accounts; the making and servicing of personal and commercial loans; the making of construction and real estate loans;
and credit card services. The Bank also offers individual retirement accounts, safe deposit boxes, wire transfers and other standard banking products and services. Furthermore, the Bank offers Tax Refund Advance Loans (“TALs”) to Loan Central tax
customers. A TAL represents a short-term loan offered by the Bank to tax preparation customers of Loan Central.
IMPACT OF PARTICIPATING IN THE OHIO HOMEBUYER PLUS PROGRAM:
During the third quarter of 2024, the Company began participating in a program offered by the Ohio Treasurer (the “Treasurer”) called the Ohio Homebuyer Plus. The program is
designed to encourage Ohio residents to save for the purchase of a home. As a participant in the program, the Company developed the “Sweet Home Ohio” deposit account to offer participants an above-market interest rate of 5.83%, along with a deposit
bonus to assist customers in achieving their home savings goals. For each Sweet Home Ohio account that was opened, the Company received a deposit from the Treasurer at a subsidized interest rate of 0.86%. In relation to program changes implemented by
the Treasurer post implementation, the rate on the matching funds increased to 1.66% at December 31, 2025. Accounts connected with Ohio Homebuyer Plus must be used within five years and the corresponding balance of Treasurer deposits will fluctuate
based upon active customer accounts. At December 31, 2025, the balance of Sweet Home Ohio accounts totaled $9,478 compared to $6,775 at December 31, 2024. At December 31, 2025, the amount of Treasurer deposits totaled $69,899 compared to $97,366 at
December 31, 2024. Since the Treasurer deposits are classified as public funds, which are required to be collateralized, the Company invested the funds in securities to be pledged as collateral to the Treasurer. At December 31, 2025, the balance of
securities used to collateralize the Treasurer deposits totaled $61,315 compared to $102,871 at December 31, 2024. In addition, at December 31, 2025, the Company utilized $12,050 in letters of credit issued on the Bank’s behalf by the FHLB to
collateralize the amount of the Treasurer’s balance not covered by securities. The balance at December 31, 2024 was fully collateralized by securities.
RESULTS OF OPERATIONS:
SUMMARY
2025 v. 2024
Ohio Valley generated net income of $15,601 for 2025, an increase of $4,602, or 41.8%, from 2024. Earnings per share were $3.31 for 2025, an increase of 42.7%
from 2024. The increase in net income and earnings per share for 2025 was largely impacted by average earning asset growth and the net interest margin. The average growth was impacted by a composition shift into higher-yielding loans and securities,
combined with a consumer shift to more lower-cost deposit sources that helped minimize the higher average costs paid on deposits and borrowings.
management’s discussion and analysis of
financial condition and results of operations
The Company’s net interest income in 2025 was $57,745, representing an increase of $8,941, or 18.3%, from 2024. Net interest income during 2025 was positively
impacted by a $102,674 increase in average earning assets, with higher relative balances being maintained in loans, as opposed to interest-bearing deposits with banks or securities, which generally yield less than loans. This led to a $75,080
increase in average loans and a $52,599 increase in average securities, while average interest-bearing deposits with banks decreased $25,005 from year-end 2024. The benefits of higher earning assets were further enhanced by a year-to-date increase in
the Company’s fully tax-equivalent net interest income as a percentage of average earning assets (“net interest margin”), which increased 36 basis points to 4.07% at December 31, 2025. The increase in the net interest margin was related to the yield
on earning assets increasing, while the cost of interest-bearing liabilities decreased.
Net interest income increased $8,941, or 18.3%, during 2025, compared to 2024. Growth in net interest earnings was mostly impacted by growth in average earning
assets, which increased 7.7% during 2025. This was further enhanced by a higher net interest margin, increasing 36 basis points during 2025. The growth in average earning assets came primarily from loans and securities. Loan increases were led by the
commercial real estate, commercial and industrial, and residential real estate loan segments. Average securities grew in large part to increased pledging requirements on public fund deposits as part of the Ohio Homebuyer Plus program. The decrease in
interest-bearing deposits with banks consisted mostly of average balances maintained at the Company’s interest-bearing Federal Reserve Bank (“FRB”) clearing account. Increases in the net interest margin were largely related to the yield on earning
assets increasing while the cost of funding sources decreased. The increase in the yield on earning assets was related to the growth in higher yielding loans and securities, along with the recognition of market discounts on purchased loans totaling
$1,648. The cost of funding sources decreased as the composition of funding sources shifted to lower cost deposit sources such as negotiable order of withdrawal (“NOW”), money market, and savings accounts. Furthermore, the cost of certificates of
deposit (“CDs”) decreased as higher costing CDs repriced to lower current market rates.
Provision for credit losses during 2025 increased $585, or 23.7%, from 2024. The increase was primarily due to growth in both loans and off-balance sheet
commitments related to unused commercial lines, as well as an increase in modeled loss rates due to the regression in gross domestic product (“GDP”) and unemployment projections.
The Company’s noninterest income decreased $4,201, or 31.9%, from 2024. The year-to-date decrease in noninterest income was largely due to the loss on sales of
securities totaling $3,747. During the third and fourth quarters of 2025, the Company sold $36,950 in securities that were yielding 1.35% and replaced them with longer duration securities yielding 4.52%, which is expected to increase future interest
income. Decreases to noninterest income also came from other noninterest income, which lowered by $690 during 2025 and were largely related to lower earnings from a tax processing agreement and the disposition of certain assets. Partially offsetting
these decreases was interchange income earned on debit and credit card transactions, which increased $196 during 2025, benefiting from an increase in the number of transactions.
The Company’s noninterest expenses during 2025 decreased $1,921, or 4.2%, from 2024. This decrease was mostly impacted by salary and employee
benefit expense, which lowered by $2,873, or 10.3%, during 2025, as compared to 2024. The decrease was largely the result of a voluntary early retirement program offered to employees meeting certain criteria
during the fourth quarter of 2024, which resulted in a one-time expense of $3,338 in 2024. The savings from the early retirement program were partially offset by annual merit increases and data processing and
marketing expense. During 2025, data processing expense increased $457 due to higher debit and credit card processing costs associated with higher transaction volume and conversion costs for the Company’s new rewards platform. Increases in
marketing expense of $385 were primarily related to advertising, a higher contribution to our own foundation fund and costs associated with supporting the communities we serve.
The Company’s provision for income taxes increased $1,474 during 2025, largely due to the changes in taxable income affected by the factors mentioned above.
management’s discussion and analysis of
financial condition and results of operations
NET INTEREST INCOME
The most significant portion of the Company’s revenue, net interest income, results from properly managing the spread between interest income on earning assets
and interest expense incurred on interest-bearing liabilities. The Company earns interest and dividend income from loans, investment securities and short-term investments while incurring interest expense on interest-bearing deposits and short- and
long-term borrowings. Net interest income is affected by changes in both the average volume and mix of assets and liabilities and the level of interest rates for financial instruments. Changes in net interest income are measured by net interest
margin and net interest spread. Net interest margin is expressed as the percentage of net interest income to average interest-earning assets. Net interest spread is the difference between the average yield earned on interest-earning assets and the
average rate paid on interest-bearing liabilities. Both of these are reported on a fully tax-equivalent (“FTE”) basis. Net interest margin exceeds the net interest rate spread because noninterest-bearing sources of funds, principally
noninterest-bearing demand deposits and stockholders’ equity, also support interest-earning assets. The following is a discussion of changes in interest-earning assets, interest-bearing liabilities and the associated impact on interest income and
interest expense for the two years ended December 31, 2025 and 2024. Tables I and II have been prepared to summarize the significant changes outlined in this analysis.
Net interest income in 2025 totaled $58,279 on an FTE basis, up $8,939, or 18.1%, from 2024. This increase reflects the positive contributions from a 7.7%
increase in average earning assets and a 36 basis point improvement in the net interest margin. The increase in average earning assets came mostly from a 7.3% increase in loans and a 23.6% increase in securities, partially offset by a 29.0% decrease
in interest-bearing balances with banks during 2025, as compared to the same period in 2024. The increase in the net interest margin was related to an increase in the earning asset yield combined with a decrease in the cost of funding sources. The
earning asset yield increased 25 basis points in large part due to the growth in higher yielding loans and securities, along with the recognition of $1,648 in market discounts on purchased loans during 2025. The decreases in the cost of funding
sources were partially linked to higher costing CDs repricing to lower current market rates along with a shift in the composition of funding sources to lower cost deposit sources such as NOW, money market, and savings accounts. These factors
contributed to a decrease in the Company’s average interest-bearing liability costs by 20 basis points during 2025. As a result, the net interest margin increased 36 basis points from 3.71% in 2024 to 4.07% in 2025. The net interest margin increase
of 36 basis points reflects a 25 basis point increase from the mix and yield on earning assets and a 20 basis point decrease in funding costs impacted by CD market rate decreases and a composition shift to a greater number of lower-costing deposits.
These positive effects were partially offset by a 9 basis point decrease from the use of noninterest-bearing funding (i.e., demand deposits and shareholders’ equity).
Net interest income increased in 2025 primarily due to the increase in both the average volume and yield of earning assets combined with the
decrease in the average cost of interest-bearing liabilities. These positive factors were partially offset by an increase in the average volume of interest-bearing liabilities in 2025. The volume increase in average earning assets contributed to a
$5,515 increase in FTE interest income during 2025 compared to 2024, while the yield increase in average earning assets was responsible for increasing FTE interest income by $3,957 during the same period. Furthermore, the decrease in average
interest-bearing liability costs contributed to a $1,643 decrease in interest expense during 2025, which also contributed to the growth in net interest income. These positive impacts were partially offset by a volume increase in average
interest-bearing liabilities that contributed to a $2,176 increase in interest expense during 2025 compared to 2024. The volume increase in average earning assets was led by loans, which increased $75,080, or 7.3%, during 2025, which contributed to
$4,951 in additional FTE interest income during 2025 compared to 2024. Average balance growth occurred within the Company’s commercial real estate, commercial and industrial, and residential real estate loan portfolio segments, partially offset by
a decrease in the consumer loan segment. While average loans increased in 2025, average securities experienced more accelerated growth in 2025. As a result, the Company’s average loan composition decreased to 76.5% of average earning assets at
year-end 2025, as compared to 76.8% for 2024. The increase in average earning asset yield for 2025 was largely impacted by loans, which included the recognition of $1,648 in market discounts on one purchased commercial and industrial loan during
2025. Loan yields were mostly impacted by the commercial and residential real estate loan portfolios. The increase in loan yields was only partially limited by the actions taken by the FRB to decrease short-term rates during 2024 and 2025, which had a direct impact on the repricing of a portion of the Company’s loan portfolio. As a result, the average loan yield grew to 6.73% at year-end 2025, as compared to 6.40% at
year-end 2024, which contributed to $3,441 in additional FTE interest income during 2025 compared to 2024.
management’s discussion and analysis of
financial condition and results of operations
Securities also had a positive impact to net interest income, with average balances of $275,098 at year-end 2025, representing a 23.6% increase from the $222,499
in average securities at year-end 2024. The $52,599 increase came primarily from average taxable securities and was largely impacted by the purchase of $100,497 in U.S. Government securities during the third quarter of 2024 as part of the Company’s
participation in the state’s Homebuyer Plus program. The securities were purchased at a “higher-than-portfolio” weighted average yield of 4.7% with maturity terms ranging from 6 to 18 months. The security purchases were used to collateralize $100,000
in public fund deposits received by the Treasurer as part of the program, which contributed to the 23.6% increase in average security balances and expanded its composition of earnings assets during 2025 compared to 2024. Additionally, the Company
took opportunities during the third and fourth quarters of 2025 to sell $36,950 in taxable securities that were yielding 1.35% and replace them with similar taxable securities yielding 4.52% with a longer duration. While this strategy did not impact
the volume growth of securities in 2025, it did contribute to the overall yield improvement on average securities in 2025. As a result, the composition of average taxable securities increased to 18.8% of average earning assets at year-end 2025, as
compared to 16.2% at year-end 2024, which contributed to a $1,713 increase in FTE interest income during 2025. Furthermore, the average yield for taxable securities grew to 3.40% at year-end 2025, as compared to 2.89% at year-end 2024, which
contributed to $1,379 in additional FTE interest income during 2025 compared to 2024. Average tax exempt securities were down 12.6% from the prior year, largely related to maturities of state and municipal investments. As a result, the composition of
average state and municipal investments trended down to 0.4% of average earning assets at year-end 2025, as compared to 0.5% at year-end 2024. Management continues to focus on generating loan growth as loans provide the greatest return to the
Company. Management also maintains securities at a dollar level adequate enough to provide ample liquidity and cover pledging requirements.
Interest-bearing balances with banks experienced decreases in both the average volume and yield factors that contributed to a $1,985 decrease in interest income
during 2025, as compared to 2024. The majority of average interest-bearing balances with banks consist of the Company’s interest-bearing FRB clearing account. The Company utilizes its interest-bearing FRB clearing account to manage excess funds, as
well as to assist in funding earning asset growth. During 2025, excess funds from the FRB account were used to assist in funding loan growth, which contributed a $25,005, or 29.0%, decrease in average interest-bearing balances with other banks, and
led to a lower composition of average interest-bearing balances with banks, finishing at 4.3% of average earning assets in 2025 compared to 6.5% in 2024. Short-term rate decreases during 2024 and 2025 also had a negative impact to interest income
growth during 2025. Between September and December 2024, the FRB took action to reduce the rate associated with the FRB clearing account by 100 basis points due to inflationary pressures, which lowered the target federal funds rate to a range of
4.25% to 4.50% going into 2025. Between October and December 2025, the FRB again reduced the rate associated with the FRB clearing account by 75 basis points due to concerns of a weakening labor market. This lowered the target federal funds rate to
a range of 3.50% to 3.75% at the end of 2025. The decreases in interest rates had a negative impact on the FRB clearing account’s interest earnings. As a result, the average yield on interest-bearing balances with banks decreased from 5.16% at
year-end 2024 to 4.03% at year-end 2025.
management’s discussion and analysis of
financial condition and results of operations
Net interest income during 2025 was negatively impacted by an increase in the average volume of interest-bearing liabilities and positively impacted by a
decrease in the average cost of interest-bearing liabilities. The volume increase in average interest-bearing liabilities contributed to a $2,176 increase in interest expense during 2025 compared to 2024, while the cost decrease in average
interest-bearing liabilities was responsible for decreasing interest expense by $1,643 during the same period. These impacts came largely from the Company’s time deposits. During the second half of 2025, the Company was successful in raising
additional retail deposits used to assist in funding loan demand by issuing several special CD rate offerings during that time. This growth in retail CDs contributed to a $34,289 increase in average time deposits, which contributed to a $1,515
increase to interest expense. While retail CDs contributed to an 8.9% increase in average time deposits for 2025, average NOW, savings and money market accounts experienced more accelerated growth in 2025. As a result, the Company’s composition of
average time deposits decreased from 41.6% at year-end 2024 to 41.3% at year-end 2025. While the movement of higher time deposit balances had a corresponding impact to higher interest expense, the average cost associated with time deposits has
decreased. During 2024, rate offerings on retail CDs continued to adjust up because of market competition. The Company had offered various “short-term” CD rate specials with maturity terms of less than one year to attract and retain its core deposit
funding during this time. Since then, product rates on retail CDs have decreased during 2025, which has allowed a large portion of those short-term retail CDs to renew at lower rates, or in some cases, be reinvested into lower-costing NOW, savings or
money market accounts. As a result of the rate repricings on retail CDs and the deposit shift into lower-cost funding sources, the average cost of time deposits decreased from 4.65% at year-end 2024 to 4.11% at year-end 2025. This contributed to a
$2,188 decrease in interest expense.
Growth in the Company’s average interest-bearing liabilities also came from the Company’s core deposit segments that include NOW, savings and money market
accounts. A large portion of this growth came from lower-costing NOW and savings account balances related to the Company’s participation in the Homebuyers Plus program. The additions of the municipal NOW Treasurer account and new Home Sweet Home
savings accounts during the second half of 2024 led to a $43,129 increase within average interest-bearing deposits during 2025 compared to 2024. Average interest-bearing deposit growth also came from the Company’s new tiered money market product that
offered competitive rates (Money Fund), which increased $32,929 during 2025. As a result of additional deposits from the Homebuyers Plus program and consumer demand for the Money Fund product, average balances during 2025 increased 12.4% within NOW
accounts and increased 11.3% within savings and money market accounts, altogether representing 54.0% of average interest-bearing liabilities in 2025, as compared to 52.9% in 2024. Interest expense on these accounts were also impacted by higher rates
on NOW accounts and tiered Money Fund product. This also included Sweet Home Ohio savings accounts at an above-market rate of 5.83%. As a result, the Company’s average cost of savings and money market accounts increased from 1.50% in 2024 to 1.56% in
2025, while the average cost of NOW accounts increased from 1.16% in 2024 to 1.36% in 2025. Collectively, this contributed to a $1,442 increase to interest expense during 2025.
management’s discussion and analysis of
financial condition and results of operations
The Company’s average other borrowings and subordinated debentures collectively decreased $3,818, or 7.4%, during 2025. The decrease was related to monthly
principal repayments on various FHLB advances. Borrowings and subordinated debentures continue to represent the smallest composition of average interest-bearing liabilities, finishing at 4.7% and 5.6% at the end of 2025 and 2024, respectively. The
decreasing rate environment also impacted the average cost on subordinated debentures, which decreased from 7.27% at year-end 2024 to 6.25% at year-end 2025, while the average cost on other borrowings remained unchanged at 3.93% for both year-end
2024 and 2025.
Total interest and fee income on average earning assets increased $9,472, or 12.4%, during 2025, and $13,843, or 22.2%, during 2024. The increase was primarily
due to average net loan and securities growth, and elevated asset yields. Higher earnings during 2025 included the recognition of $1,648 in market discounts on one purchased commercial and industrial loan. Higher earnings during 2024 included the
benefits of a rising rate environment from 2023 that carried over into 2024.
The Company’s interest income from its interest-bearing balances with banks decreased $1,985 and increased $1,567 during 2025 and 2024, respectively.
This contrast in earnings came from the changes in volume and rate associated with the interest-bearing FRB clearing account. Lower earnings in 2025 was the result of utilizing more excess funds from the FRB clearing account to assist in funding
loan growth, while also being impacted by decreases in market rates associated with reducing the FRB clearing account rate during 2025. Higher earnings in 2024 were impacted primarily by increases in average FRB clearing account balances coming
from higher interest-bearing deposit liabilities.
The Company’s interest and fees from its commercial loan portfolio increased $8,353, or 25.6%, during 2025. The increase came primarily from commercial loan
interest, which was positively impacted by commercial loan demand, which was successful in generating a 13.8% increase in average balances within the Company’s commercial real estate and commercial and industrial portfolios. Also contributing to
higher interest income was the recognition of $1,648 in market discounts on one purchased commercial and industrial loan during 2025. During 2024, the Company’s interest and fees from its commercial loan portfolio increased $5,833, or 21.8%. The
increase came primarily from commercial loan interest, which was positively impacted by commercial loan demand and elevated market rate adjustments from 2023 that contributed to higher earnings in 2024. Commercial loan demand in 2024 generated a
10.6% increase in average commercial real estate and commercial and industrial loan portfolio balances.
The Company’s interest and fees from its residential real estate loan portfolio increased $1,330, or 8.1%, during 2025, and increased $3,011, or 22.6%, during
2024. The increases were impacted by higher yields, as well as a 7.1% and 12.0% increase in average residential real estate loan balances during 2025 and 2024, respectively. The growth has been impacted mostly by in-house variable rate mortgage
products while long-term fixed rate products decreased. The consumer demand for variable rate mortgage products was impacted by the increase in mortgage rates that began in 2022 and carried through most of 2024 up until mortgage rates began to
decline. As a result, interest income on residential real estate loans increased $1,306 and $3,021 during 2025 and 2024, respectively.
management’s discussion and analysis of
financial condition and results of operations
The Company’s interest and fees from its consumer loan portfolio decreased $1,294, or 8.1%, during 2025. Conversely, consumer loan interest and fees
during 2024 increased $1,273, or 8.7%. The decrease during 2025 was primarily the result of an 11.9% decrease in average consumer loan balances. The decrease in average consumer loans came primarily from average automobile and other consumer loan
balances, which were collectively down $25,561, or 20.4%, during 2025. This balance decrease was partially offset by higher consumer capital line loan balances, which were up $5,802, or 14.6%, during 2025. The Company has deemphasized the consumer
loan segment due to other loan portfolio segments being more profitable. In the fourth quarter of 2024, the Company exited the indirect lending business for automobiles and recreational vehicles to focus on growing the more profitable loan segments
within the commercial and residential real estate portfolios. During 2024, the increase in consumer loan interest and fee income was primarily the result of higher consumer loan yields, and to a lesser extent, a 0.2% increase in average consumer
loan balances. Higher consumer loan yields were impacted by elevated market rate adjustments from 2023 that contributed to higher interest earnings in 2024. The minimal increase in average consumer loans was due to the deemphasis on consumer
lending, which saw a 6.3% decrease in average automobile and other consumer loan balances almost completely offset a 28.3% increase in consumer capital line loan balances.
The Company’s interest income from taxable investment securities increased $3,092, or 49.5%, in 2025, and increased $2,244, or 56.1%, during 2024. The
increases during both 2025 and 2024 were primarily due to the purchase of $100,497 in higher-yielding U.S. Government securities in July and August of 2024 from the Company’s participation in the Ohio Homebuyer Plus program. As part of the program,
the Company received $100,000 in funds from the Treasurer that were deposited into a special public fund NOW account. Since public funds are required to be collateralized, the Company invested the funds in securities that were pledged as collateral
to this Treasurer deposit account. The large securities purchased had a positive impact on generating higher average balances in taxable securities, which increased $53,397, or 24.7%, during 2025, and $36,645, or 20.4%, during 2024. These
securities were purchased at a weighted average yield of 4.7%, which had a positive impact on increasing the yield on taxable securities during both 2025 and 2024. The yield on average taxable securities for 2025 was further impacted by the
Company’s decision to sell $36,950 in taxable securities during the second half of 2025 that were yielding 1.35% and replace them with similar taxable securities yielding 4.52% with longer durations. As a result of these positive factors, the yield
on taxable securities increased 51 basis points to 3.40% in 2025 and increased 66 basis points to 2.89% in 2024.
During 2025, total interest expense incurred on the Company’s interest-bearing liabilities totaled $27,492, an increase of $533, or 2.0%. The
increase was impacted by an $88,367, or 9.5%, increase in average interest-bearing liabilities, coming mostly from higher NOW, savings, money market, and time deposit balances. The increases in NOW and
savings account balances were impacted by the additions of lower- costing accounts related to the Company’s participation in the Homebuyers Plus program during the second half of 2024. The increase in money market account balances were largely
impacted by deposit growth within the Company’s tiered money market product (Money Fund) that offered competitive rates. The increase in time deposit balances was impacted by the Company’s strategy to raise additional retail deposits during the
second half of 2025 by offering several special CD rate offerings during that time. The growth in interest expense from higher average interest-bearing liabilities was partially offset by the benefits of a lower
average cost on average interest-bearing liabilities during 2025, primarily within time deposits. Prior to 2025, market competition for deposits had resulted in higher rates on short-term CD
offerings. Since then, product rates on retail CDs have decreased during 2025, which allowed a large portion of those short-term retail CDs to renew at lower rates, or in some cases, be reinvested into lower-costing NOW, savings or money market
accounts. As a result, the average cost of interest-bearing liabilities decreased from 2.89% at year-end 2024 to 2.69% at year-end 2025. During 2024, total interest expense incurred on the Company’s interest-bearing
liabilities totaled $26,959, an increase of $11,121, or 70.2%. The increase in interest expense was largely the result of an increase in rates on CDs, NOW, savings and money market account products during 2023 that contributed to higher expenses
during 2024. The combination of higher CD volume and upward repricing of CD rates in 2024 had a negative effect on earnings by elevating interest expenses. As a result, the weighted average cost of interest-bearing liabilities increased from
2.01% in 2023 to 2.89% in 2024.
54
management’s discussion and analysis of
financial condition and results of operations
The Company’s interest expenses were also impacted by other borrowed money and subordinated debentures, which were down collectively by $236 during the year ended 2025. The decrease
was primarily the result of continued monthly principal repayments applied to the Company’s FHLB advances that contributed to a $3,818, or 7.4%, decrease in the average balance of other borrowed money and subordinated debentures, collectively, during
2025. Interest expense during 2025 was also impacted by decreases in market rates that had a corresponding effect to the rate tied to subordinated debentures, which caused the average cost of subordinated debentures to decrease from 7.27% at year-end
2024 to 6.25% at year-end 2025. During 2024, the interest expenses on other borrowed money and subordinated debentures were up $656 collectively during the year ended 2024. The increase was primarily the result of an average balance increase in FHLB
borrowings to assist in funding earning asset growth during 2024. As a result, the average balance of other borrowed money and subordinated debentures collectively increased $11,481, or 28.4%, during 2024. Interest expense during 2024 was also
impacted by an increase in market rates that had a corresponding effect to the rates tied to FHLB borrowings and subordinated debentures. This resulted in the average costs of other borrowed money and subordinated debentures collectively increasing
36 basis points to 4.48% in 2024.
During 2025, the Company’s net interest margin increased from 3.71% in 2024 to 4.07% in 2025. The margin has benefited from increases in both the average balance and yield on earning
assets, primarily from higher-yielding loans and securities. Margin improvement also come from a decrease in the average costs on interest-bearing deposits associated with the repricing of CDs at lower market rates and a deposit composition shift
from higher-costing time deposits to lower-costing savings, NOW, money market and checking account deposits. The Company’s primary focus is to invest its funds into higher-yielding assets, particularly loans, as opportunities arise. However, if loan
balances do not continue to expand and remain a larger component of overall earning assets, the Company will face pressure within its net interest income and margin improvement.
55
management’s discussion and analysis of
financial condition and results of operations
CONSOLIDATED AVERAGE BALANCE SHEET & ANALYSIS OF NET INTEREST INCOME
|
December 31
|
||||||||||||||||||||||||
|
Table I
|
2025
|
2024
|
||||||||||||||||||||||
|
(dollars in thousands)
|
Average Balance
|
Income/
Expense
|
Yield/
Average
|
Average Balance
|
Income/
Expense
|
Yield/
Average
|
||||||||||||||||||
|
Assets
|
||||||||||||||||||||||||
|
Interest-earning assets:
|
||||||||||||||||||||||||
|
Interest-bearing balances with banks
|
$
|
61,117
|
$
|
2,462
|
4.03
|
%
|
$
|
86,122
|
$
|
4,447
|
5.16
|
%
|
||||||||||||
|
Securities:
|
||||||||||||||||||||||||
|
Taxable
|
269,543
|
9,338
|
3.40
|
216,146
|
6,246
|
2.89
|
||||||||||||||||||
|
Tax exempt
|
5,555
|
134
|
2.41
|
6,353
|
161
|
2.53
|
||||||||||||||||||
|
Loans
|
1,097,300
|
73,837
|
6.73
|
1,022,220
|
65,445
|
6.40
|
||||||||||||||||||
|
Total interest-earning assets
|
1,433,515
|
85,771
|
5.98
|
%
|
1,330,841
|
76,299
|
5.73
|
%
|
||||||||||||||||
|
|
||||||||||||||||||||||||
|
Noninterest-earning assets:
|
||||||||||||||||||||||||
|
Cash and due from banks
|
16,687
|
15,839
|
||||||||||||||||||||||
|
Other nonearning assets
|
89,111
|
87,883
|
||||||||||||||||||||||
|
Allowance for credit losses
|
(10,726
|
)
|
(9,411
|
)
|
||||||||||||||||||||
|
Total noninterest-earning assets
|
95,072
|
94,311
|
||||||||||||||||||||||
|
Total assets
|
$
|
1,528,587
|
$
|
1,425,152
|
||||||||||||||||||||
|
|
||||||||||||||||||||||||
|
Liabilities and Shareholders’ Equity
|
||||||||||||||||||||||||
|
Interest-bearing liabilities:
|
||||||||||||||||||||||||
|
NOW accounts
|
$
|
252,900
|
$
|
3,429
|
1.36
|
%
|
$
|
225,088
|
$
|
2,614
|
1.16
|
%
|
||||||||||||
|
Savings and money market
|
297,428
|
4,646
|
1.56
|
267,344
|
4,019
|
1.50
|
||||||||||||||||||
|
Time deposits
|
421,548
|
17,333
|
4.11
|
387,259
|
18,006
|
4.65
|
||||||||||||||||||
|
Other borrowed money
|
39,528
|
1,553
|
3.93
|
43,346
|
1,702
|
3.93
|
||||||||||||||||||
|
Subordinated debentures
|
8,500
|
531
|
6.25
|
8,500
|
618
|
7.27
|
||||||||||||||||||
|
Total int.-bearing liabilities
|
1,019,904
|
27,492
|
2.69
|
%
|
931,537
|
26,959
|
2.89
|
%
|
||||||||||||||||
|
|
||||||||||||||||||||||||
|
Noninterest-bearing liabilities:
|
||||||||||||||||||||||||
|
Demand deposit accounts
|
323,961
|
320,681
|
||||||||||||||||||||||
|
Other liabilities
|
26,029
|
26,217
|
||||||||||||||||||||||
|
Total noninterest-bearing liabilities
|
349,990
|
346,898
|
||||||||||||||||||||||
|
|
||||||||||||||||||||||||
|
Shareholders’ equity
|
158,693
|
146,717
|
||||||||||||||||||||||
|
Total liabilities and shareholders’ equity
|
$
|
1,528,587
|
$
|
1,425,152
|
||||||||||||||||||||
|
|
||||||||||||||||||||||||
|
Net interest earnings
|
$
|
58,279
|
$
|
49,340
|
||||||||||||||||||||
|
Net interest margin
|
4.07
|
%
|
3.71
|
%
|
||||||||||||||||||||
|
Net interest rate spread
|
3.29
|
%
|
2.84
|
%
|
||||||||||||||||||||
|
Average interest-bearing liabilities to average earning assets
|
71.15
|
%
|
70.00
|
%
|
||||||||||||||||||||
Fully taxable equivalent yields are reported for tax exempt securities and loans and calculated assuming a 21% tax rate, net of nondeductible interest expense.
Tax-equivalent adjustments for securities during the years ended December 31, 2025 and 2024 totaled $24 and $29, respectively. Tax-equivalent adjustments for loans during the years ended December 31, 2025 and 2024 totaled $510 and $507, respectively.
Average balances are computed on an average daily basis. The average balance for AFS securities includes the market value adjustment. However, the calculated yield is based on the securities’ amortized cost. Average loan balances include nonaccruing
loans. Loan income includes cash received on nonaccruing loans.
56
management’s discussion and analysis of
financial condition and results of operations
RATE VOLUME ANALYSIS OF CHANGES IN INTEREST INCOME & EXPENSE
Table II
|
(dollars in thousands)
|
2025
|
2024
|
||||||||||||||||||||||
|
|
Increase (Decrease)
From Previous Year Due to
|
Increase (Decrease)
From Previous Year Due to
|
||||||||||||||||||||||
|
|
Volume
|
Yield/Rate
|
Total
|
Volume
|
Yield/Rate
|
Total
|
||||||||||||||||||
|
Interest income
|
||||||||||||||||||||||||
|
Interest-bearing balances with banks
|
$
|
(1,129
|
)
|
$
|
(856
|
)
|
$
|
(1,985
|
)
|
$
|
1,365
|
$
|
202
|
$
|
1,567
|
|||||||||
|
Securities:
|
||||||||||||||||||||||||
|
Taxable
|
1,713
|
1,379
|
3,092
|
915
|
1,329
|
2,244
|
||||||||||||||||||
|
Tax exempt
|
(20
|
)
|
(7
|
)
|
(27
|
)
|
(27
|
)
|
(12
|
)
|
(39
|
)
|
||||||||||||
|
Loans
|
4,951
|
3,441
|
8,392
|
5,338
|
4,733
|
10,071
|
||||||||||||||||||
|
Total interest income
|
5,515
|
3,957
|
9,472
|
7,591
|
6,252
|
13,843
|
||||||||||||||||||
|
|
||||||||||||||||||||||||
|
Interest expense
|
||||||||||||||||||||||||
|
NOW accounts
|
346
|
469
|
815
|
316
|
310
|
626
|
||||||||||||||||||
|
Savings and money market
|
465
|
162
|
627
|
(41
|
)
|
1,847
|
1,806
|
|||||||||||||||||
|
Time deposits
|
1,515
|
(2,188
|
)
|
(673
|
)
|
4,511
|
3,522
|
8,033
|
||||||||||||||||
|
Other borrowed money
|
(150
|
)
|
1
|
(149
|
)
|
429
|
206
|
635
|
||||||||||||||||
|
Subordinated debentures
|
----
|
(87
|
)
|
(87
|
)
|
----
|
21
|
21
|
||||||||||||||||
|
Total interest expense
|
2,176
|
(1,643
|
)
|
533
|
5,215
|
5,906
|
11,121
|
|||||||||||||||||
|
Net interest earnings
|
$
|
3,339
|
$
|
5,600
|
$
|
8,939
|
$
|
2,376
|
$
|
346
|
$
|
2,722
|
||||||||||||
|
The change in interest due to volume and rate is determined as follows: Volume Variance change in volume multiplied by the previous year’s rate; Yield/Rate Variance change in rate multiplied by the
previous year’s volume; Total Variance change in volume multiplied by the change in rate. The change in interest due to both volume and rate has been allocated to volume and rate changes in proportion to the relationship of the absolute
dollar amounts of the change in each. The tax exempt securities and loan income is presented on an FTE basis. FTE yield assumes a 21% tax rate, net of related nondeductible interest expense.
|
PROVISION EXPENSE
The Company sets aside an ACL through charges to income, which are reflected in the consolidated statement of income as the provision for credit losses.
Provision for credit loss is recorded to achieve an ACL that is adequate to absorb estimated losses inherent in the Company’s loan portfolio, unfunded loans, and held to maturity debt securities. Management performs, on a quarterly basis, a detailed
analysis of the ACL that encompasses asset portfolio composition, asset quality, loss experience and other relevant economic factors.
During 2025, the Company recorded $3,054 in provision expense, an increase of $585, or 23.7%, from the provision expense in 2024. Total provision expense during
2025 consisted of $2,765 in provision expense from loans and $289 in provision expense from unfunded commitments, as no provision expense was required for HTM securities.
Provision expense on loans during 2025 was impacted by increases in loan balances generally allocated
for during 2025. The risk associated with a $134,193 increase in loans generated higher general reserves and a corresponding increase to provision expense. In addition, provision expense on loans was further impacted by an increase in modeled
loss rates due to the regression in GDP and unemployment projections. Collectively, this contributed to additional provision expense during 2025, primarily within the commercial real estate loan segment.
Provision expense on loans during 2025 was also impacted by net loan charge-offs, which totaled $1,334 for the year. Net loan
charge-offs came mostly from the consumer loan portfolio, which totaled $1,258, and required a corresponding increase to provision expense during 2025.
57
management’s discussion and analysis of
financial condition and results of operations
Credit loss expense during 2025 was also impacted by unfunded commitments on off-balance sheet liabilities. The Company re-evaluated its unfunded commitments to
extend credit at December 31, 2025 and determined a reserve of $871 was required, which resulted in additional provision expense of $289 during the year ended 2025. The impact came mostly from an increase in commitment balances and an increase in the
expected funding rate.
The Company re-evaluated its reserve for HTM debt securities at December 31, 2025 and determined a reserve of $1 was required, which represents no change from
2024.
During 2024, the Company recorded $2,469 in provision expense, an increase of $379, or 18.1%, from the provision expense in 2023. Total provision expense during
2024 consisted of $2,580 in provision expense from loans, partially offset by recoveries of provision expense from both unfunded commitments and HTM securities that totaled $110 and $1, respectively.
Provision expense on loans during 2024 was impacted primarily by net loan charge-offs, which totaled $1,259 for the year. Net loan charge-offs came mostly from
the consumer loan portfolio, which totaled $1,587, and required a corresponding increase to provision expense during 2024.
Provision expense on loans during 2024 was also impacted by increases in loan balances generally allocated for during 2024. The risk associated with an $89,925
increase in loans generated higher general reserves and a corresponding increase to provision expense.
Provision expense on loans during 2024 was further impacted by reserves associated with certain qualitative risk factors. The loss drivers within these factors,
including unemployment and gross domestic product, which all regressed during 2024. This contributed to additional provision expense during 2024, primarily within the commercial real estate loan segment.
Credit loss expense during 2024 was also impacted by unfunded commitments on off-balance sheet liabilities. The Company re-evaluated its unfunded commitments to
extend credit at December 31, 2024 and determined a reserve of $582 was required, which resulted in the recovery of provision expense of $110 during the year ended 2024. The impact came mostly from the commercial real estate construction segment.
Credit loss expense during 2024 was further impacted by HTM debt securities. The Company re-evaluated its reserve for HTM debt securities at December 31, 2024
and determined a reserve of $1 was required, which resulted in a $1 recovery of provision expense during the year ended 2024.
Future provisions to the ACL will continue to be based on management’s quarterly in-depth evaluation that is discussed in further detail below under the caption
“Critical Accounting Estimates - Allowance for Credit Losses” within this Management’s Discussion and Analysis.
NONINTEREST INCOME
During 2025, total noninterest income decreased $4,201, or 31.9%, as compared to 2024. The decrease came primarily from losses associated with the sales of
investment securities. During 2025, the Company sold $36,950 in Agency mortgage-backed securities. These securities carrying a weighted average yield of 1.35% were replaced with similar securities at a higher weighted average yield of 4.52%. While
this sale and repurchase of securities resulted in a realized loss of $3,747, the Company will benefit from the shift to higher-yielding securities that is expected to increase future interest income and have a positive impact to the net interest
margin.
58
management’s discussion and analysis of
financial condition and results of operations
Noninterest income was impacted by a decrease in other noninterest income, which for 2025 decreased $690 from 2024. The decrease was largely related to lower
earnings from a tax processing agreement and the disposition of certain assets. As of December 31, 2025, the tax processing agreement with the third-party vendor expired and was not renewed. For 2025, the revenue derived from the contract totaled $1,446, as compared to $1,819 for 2024. The Company is looking to provide these services for another tax refund product provider and presently is performing these services on a very limited
basis for another provider. At this time, the revenue derived from the new provider is minimal and is not expected to replace the revenue earned from the previous provider.
Partially offsetting these decreases in noninterest income was interchange income earned on debit and credit cards. For 2025, interchange income increased $196,
or 3.9%, from 2024. This was primarily due to an increase in the number of transactions during 2025.
NONINTEREST EXPENSE
Management continues to work diligently to minimize noninterest expense. For 2025, total noninterest expense decreased $1,921, or 4.2%, as compared to 2024. The
Company’s largest noninterest expense item, salaries and employee benefits, decreased $2,873, or 10.3%, from 2024. The decrease was largely the result of a voluntary severance package offered to employees meeting certain criteria during 2024. Based
on the number of employees that accepted the severance package, the Company incurred an expense of $3,338. The savings from the early retirement program were partially offset by annual performance-based merit increases awarded in 2025.
Further impacting higher noninterest expense was data processing expense, which increased $457, or 14.8%, during 2025. Higher costs in this category were related
to debit and credit card processing due to higher transaction volume and conversion costs for the Company’s new rewards platform. In addition, marketing expense also increased $385 during 2025, primarily from advertising costs, a higher contribution
to our own foundation fund and costs associated with supporting the communities we serve.
The Company’s other noninterest expense activity decreased $80 during 2025. This was primarily due to a decrease in customer rewards for new accounts from the
Company’s facilitation of the Sweet Home Ohio program. During the fourth quarter of 2024, the Company paid account bonuses totaling $496 to the new Sweet Home Ohio deposit customers. This decrease was partially offset by increases in various overhead
expenses, such as, debit and credit card rewards, recruiting costs, and costs associated with fraudulent activity, which collectively increased $316 from 2024.
The Company’s efficiency ratio is a non-GAAP measurement and is defined as noninterest expense as a percentage of fully tax-equivalent net interest income plus
noninterest income. The effects from provision expense are excluded from the efficiency ratio. Management continues to place emphasis on managing its balance sheet mix and interest rate sensitivity as well as developing more innovative ways to
generate noninterest revenue. For 2025, net interest income grew $8,941, or 18.3%, from 2024 driven by the growth in average earning assets and the increase in the net interest margin. The growth in this revenue source was partially offset by a
$4,201, or 31.9% decrease in noninterest income. This decrease was largely attributed to the $3,747 loss on sale of securities. In total, the net increase in these two revenue sources was $4,740 from 2024. For 2025, noninterest expense decreased
$1,921, or 4.2%, due largely to lower salaries and employee benefits that resulted from management’s implementation of a voluntary retirement program in 2024. Based on the net increase in revenue sources and the decrease in overhead expenses, the
Company’s efficiency ratio decreased (improved) from 73.79% at December 31, 2024, to 65.74% at December 31, 2025.
PROVISION FOR INCOME TAXES
The provision for income taxes during 2025 totaled $3,851, compared to $2,377 in 2024. The effective tax rate for 2025 was 19.8%, compared to 17.8% in 2024. The
effective tax rate for 2025 was above 2024’s effective tax rate as a result of the increase in higher relative taxable income.
59
management’s discussion and analysis of
financial condition and results of operations
FINANCIAL CONDITION:
CASH AND CASH EQUIVALENTS
The Company’s cash and cash equivalents consist of cash, as well as interest- and noninterest- bearing balances due from other banks. The amounts of cash and
cash equivalents fluctuate on a daily basis due to customer activity and liquidity needs. At December 31, 2025, cash and cash equivalents decreased $37,210 to $45,897, compared to $83,107 at December 31, 2024. The decrease in cash and cash
equivalents came mostly from lower interest-bearing deposits on hand with correspondent banks. At December 31, 2025, the Company’s interest-bearing FRB clearing account represented 66% of cash and cash equivalents. The Company utilizes its
interest-bearing FRB clearing account to manage excess funds, as well as to assist in funding earning asset growth. During 2025, the net growth in loans and securities exceeded the growth in deposits. As a result, the balance in the FRB clearing
account decreased to cover the funding requirement. The interest rate paid on both the required and excess reserve balances of the FRB account is based on the targeted federal funds rate established by the Federal Open Market Committee (“FOMC”).
During 2025, the rate associated with the Company’s FRB clearing account decreased 75 basis points due to actions taken by the FOMC to reduce the target federal funds rate to a range of 3.50% to 3.75%. The interest-bearing deposit balances in the FRB
are 100% secured by the U.S. Government.
As liquidity levels continuously vary based on
consumer activities, amounts of cash and cash equivalents can vary widely at any given point in time. The Company’s focus during periods of heightened liquidity will be to invest excess funds into longer-term, higher-yielding assets, primarily
loans, when the opportunities arise. Further information regarding the Company’s liquidity can be found below under the caption “Liquidity” in this Management’s Discussion and Analysis
SECURITIES
Management’s goal in structuring its investment securities portfolio is to maintain a prudent level of liquidity and to provide an acceptable rate of return without sacrificing asset
quality. During 2025, the balance of total securities decreased $15,811, or 5.7%, compared to year-end 2024. The decrease in total securities was related to a decrease in the pledging requirement for balances maintained by the Ohio Treasurer, as
part of Ohio Homebuyer Plus program. At December 31, 2025, the amount deposited by the Treasurer totaled $69,899, a decrease from $97,366 million at December 31, 2024. This decrease in balance contributed partially to the $81,251 decrease in U.S.
Government securities from year-end 2024. The Company utilized the supplemental maturities of U.S. Government securities to help fund additional purchases in U.S. Government agency (“Agency”) mortgage-backed securities, which were up $67,801, or
72.0%, from year-end 2024. Agency mortgage-backed securities represent 62.5% of total securities at December 31, 2025, an increase from 34.2% the prior year. The shift to a higher concentration in Agency mortgage-backed securities was based on the
strategy to improve the yield on the portfolio as these type of securities generally yield more than U.S. Government securities. Furthermore, during 2025, the Company sold $36,950 in Agency mortgage-backed securities. These securities carrying a
weighted average yield of 1.35% were replaced with similar securities at a higher weighted average yield of 4.52%. While this sale and repurchase of securities resulted in a realized loss of $3,747 with little change to the balance of earning assets,
the Company will benefit from the shift to higher-yielding securities that is expected to increase future interest income and have a positive impact to the net interest margin.
|
Investment Portfolio Composition
|
|
|
at December 31, 2025
|
at December 31, 2024
|
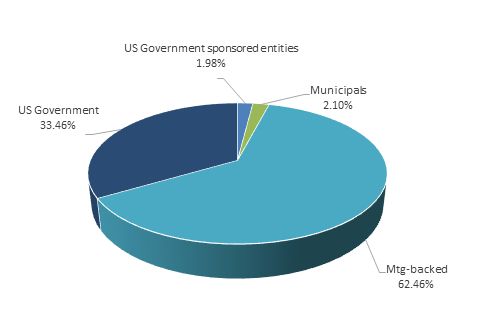 |
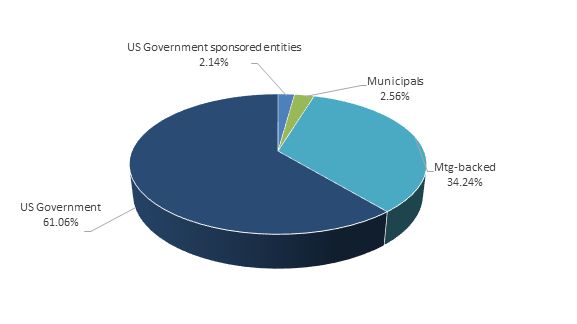 |
60
management’s discussion and analysis of
financial condition and results of operations
SECURITIES
Table III
|
|
MATURING
|
|||||||||||||||||||||||||||||||
|
As of December 31, 2025
|
Within
One Year
|
After One but Within Five Years
|
After Five but Within Ten Years
|
After Ten Years
|
||||||||||||||||||||||||||||
|
(dollars in thousands)
|
Amount
|
Yield
|
Amount
|
Yield
|
Amount
|
Yield
|
Amount
|
Yield
|
||||||||||||||||||||||||
|
|
||||||||||||||||||||||||||||||||
|
U.S. Government securities
|
$
|
45,808
|
3.53
|
%
|
$
|
40,971
|
3.77
|
%
|
$
|
----
|
----
|
$
|
----
|
----
|
||||||||||||||||||
|
U.S. Government sponsored entity securities
|
----
|
----
|
5,124
|
1.58
|
%
|
----
|
----
|
----
|
----
|
|||||||||||||||||||||||
|
Obligations of states and political subdivisions
|
620
|
1.31
|
%
|
2,343
|
2.55
|
%
|
2,111
|
2.89
|
%
|
----
|
----
|
|||||||||||||||||||||
|
Agency mortgage-backed securities, residential
|
----
|
----
|
3,505
|
2.19
|
%
|
31,866
|
2.00
|
%
|
126,632
|
4.45
|
%
|
|||||||||||||||||||||
|
Total securities
|
$
|
46,428
|
3.50
|
%
|
$
|
51,943
|
3.39
|
%
|
$
|
33,977
|
2.06
|
%
|
$
|
126,632
|
4.45
|
%
|
||||||||||||||||
|
Tax-equivalent adjustments of $24 have been made in calculating yields on obligations of states and political subdivisions using a 21% rate. Weighted average yields are calculated on the basis of the cost and effective yields weighted
for the scheduled maturity of each security. Mortgage-backed securities, which have prepayment provisions, are assigned to a maturity category based on estimated average lives. Securities are shown at their fair values, which include the
market value adjustments for AFS securities.
|
The Company’s focus will be to continue generating interest revenue primarily through loan growth, as loans generate the highest yields of total earning
assets. Table III provides a summary of the securities portfolio by category and remaining contractual maturity. Issues classified as equity securities have no stated maturity date and are not included in Table III.
LOANS
In 2025, the Company’s primary category of earning assets and most significant source of interest income, total loans, increased $134,193, or 12.6%, to
$1,196,018. The increase in loan balances came from commercial and real estate lending, which was partially reduced by consumer lending.
61
management’s discussion and analysis of
financial condition and results of operations
Management continues to place emphasis on its commercial lending, which generally yields a higher return on investment as compared to other types
of loans. The commercial lending segment increased $105,709, or 19.9%, from year-end 2024, which came mostly from commercial real estate loans. The commercial real estate loan segment comprised 39.3% of the Company’s total loan portfolio at
December 31, 2025. Commercial real estate consists of owner-occupied, nonowner-occupied and construction loans. Owner-occupied loans consist of nonfarm, nonresidential properties. A commercial owner-occupied loan is a borrower purchased building or
space for which the repayment of principal is dependent upon cash flows from the ongoing operations conducted by the party, or an affiliate of the party, who owns the property. Owner-occupied loans of the Company include loans secured by hospitals,
churches, and hardware and convenience stores. Nonowner-occupied loans are property loans for which the repayment of principal is dependent upon rental income associated with the property or the subsequent sale of the property, such as apartment
buildings, condominiums, hotels, and motels. These loans are primarily impacted by the level of interest rates associated with the debt and to local economic conditions, which dictate occupancy rates and the amount of rent charged. The increase in
debt service due to higher interest rates may not be able to be passed on to tenants. As part of the origination process, loan interest rates and occupancy rates are stressed to determine the impact on the borrower’s ability to maintain adequate
debt service under different economic conditions. Furthermore, the Company monitors the concentration in any one industry and has established limits relative to capital. In addition, credit quality trends are monitored by industry to determine if a
change in the risk exposure to a certain industry may warrant a change in our underwriting standards. Table IV has been provided to illustrate the industry composition of the commercial real estate portfolio.
Commercial construction loans are extended to individuals as well as corporations for the construction of an individual property or multiple properties and are secured by raw land and the subsequent improvements.
Commercial real estate also includes loan participations with other banks outside the Company’s primary market area. Although the Company is not actively seeking to participate in loans originated outside its primary market area, it has taken
advantage of the relationships it has with certain lenders in those areas where the Company believes it can profitably participate with an acceptable level of risk. Commercial real estate loans totaled $470,037 at December 31, 2025, an increase
of $97,050, or 26.0%, over the balance of commercial real estate loans at year-end 2024. Most of this growth came from larger originations from nonowner-occupied loans, with balances increasing $62,438, or 30.2%, from year-end 2024. Also,
contributing to growth was the owner-occupied commercial loan portfolio, which increased $28,253, or 32.7%, from year-end 2024. Lastly, the construction loan portfolio increased $6,359, or 8.0%, from year-end 2024.
|
Loan Portfolio Composition
|
|
|
at December 31,2025
|
at December 31, 2024
|
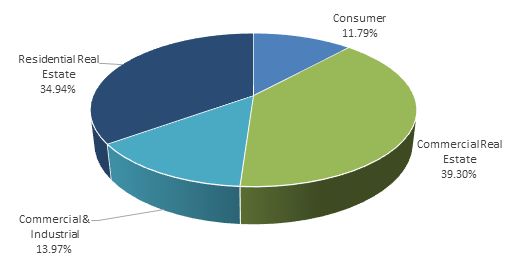 |
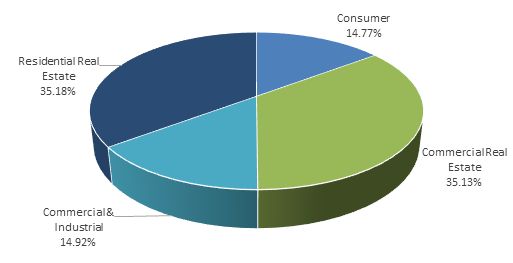 |
62
management’s discussion and analysis of
financial condition and results of operations
Commercial loans were also positively impacted by growth in commercial and industrial loans. Commercial and industrial loans consist of loans to
corporate borrowers primarily in small to mid-sized industrial and commercial companies that include service, retail, and wholesale merchants. Collateral securing these loans includes equipment, inventory, and stock. During 2025, the commercial and industrial loan portfolio increased $8,659 from year-end 2024.
Generating residential real estate loans remains a significant focus of the Company’s lending efforts. The residential real estate loan portfolio segment
represented 34.9% of the Company’s overall loan portfolio in 2025, consists primarily of one- to four-family residential mortgages, and carries many of the same customer and industry risks as the commercial loan portfolio. During 2025, mortgage rates
remained elevated relative to variable rate options, which provided the Company with less opportunities to originate and sell long-term fixed-rate residential mortgages to the Federal Home Loan Mortgage Corporation. Due to the elevated mortgage
rates, mortgage customers were selecting more in-house variable rate mortgage products than long-term fixed rate products, which enhanced the growth in the portfolio. As a result, residential real estate loans increased $44,386, or 11.9%, during 2025
as compared to year-end 2024. The Company’s loan balances were impacted by a decrease in the consumer loan portfolio, which was down $15,902, or 10.1%, from year-end 2024. The Company’s consumer loans are primarily secured by automobiles, mobile
homes, recreational vehicles, and other personal property. Personal loans and unsecured credit card receivables are also included as consumer loans. Leading the decline in consumer loans was a decrease in auto loans of $12,969, or 25.8%, and a
decrease in other consumer loans of $11,065, or 17.3%, from year-end 2024. The decrease in these portfolio segments is consistent with the Company’s strategy to deemphasize consumer loans as other loan portfolio segments are more profitable. In line
with its decision to deemphasize consumer loans, the Company exited the indirect lending business for automobiles and recreational vehicles effective October 11, 2024. As a result, these portfolio segments are expected to decrease going forward.
Partially offsetting the decrease in these portfolios was the $8,132, or 19.1%, increase in home equity lines of credit. The growth was related to the Company’s home equity line product with no closing costs that was introduced in 2022.
While management believes lending opportunities exist in the Company’s markets, future commercial lending activities will depend upon economic and related conditions, such as general demand for
loans in the Company’s primary markets, interest rates offered by the Company, and the effects of competitive pressure and normal underwriting considerations. Management will continue to place emphasis on its commercial lending, which generally
yields a higher return on investment as compared to other types of loans.
|
COMMERCIAL REAL ESTATE BY INDUSTRY
As of December 31, 2025
Table IV
The following table provides the composition of commercial real estate loans by industry classification (as defined by the North American Industry Classification System).
|
|
(dollars in thousands)
|
||||||||
|
|
Amount
|
% of Total
|
||||||
|
Real Estate Rental and Leasing
|
$
|
242,082
|
51.50
|
%
|
||||
|
Accommodation and Food Services
|
77,981
|
16.59
|
%
|
|||||
|
Retail Trade
|
40,281
|
8.57
|
%
|
|||||
|
Health Care and Social Assistance
|
23,838
|
5.07
|
%
|
|||||
|
Manufacturing
|
19,858
|
4.22
|
%
|
|||||
|
Construction
|
16,348
|
3.48
|
%
|
|||||
|
All Other
|
49,649
|
10.57
|
%
|
|||||
| Total | 470,037 |
100.00 | % |
|||||
63
management’s discussion and analysis of
financial condition and results of operations
MATURITY AND REPRICING DATA OF LOANS
As of December 31, 2024
Table V
|
(dollars in thousands)
|
Within One Year
|
After One
but Within
Five Years
|
After Five
but Within
Fifteen Years
|
After
Fifteen Years
|
Total
|
|||||||||||||||
|
Residential real estate loans
|
$
|
113,180
|
$
|
265,116
|
$
|
36,888
|
$
|
2,736
|
$
|
417,920
|
||||||||||
|
Commercial real estate loans
|
167,959
|
269,127
|
32,163
|
788
|
470,037
|
|||||||||||||||
|
Commercial and industrial loans
|
58,275
|
38,364
|
39,010
|
31,450
|
167,099
|
|||||||||||||||
|
Consumer loans (1)
|
74,991
|
56,743
|
9,212
|
16
|
140,962
|
|||||||||||||||
|
Total loans
|
$
|
414,405
|
$
|
629,350
|
$
|
117,273
|
$
|
34,990
|
$
|
1,196,018
|
||||||||||
|
Loans maturing or repricing after one year with:
|
Variable Interest
Rates
|
Fixed Interest Rates
|
Total
|
|||||||||
|
Residential real estate loans
|
$
|
267,177
|
$
|
37,564
|
$
|
304,741
|
||||||
|
Commercial real estate loans
|
250,836
|
51,242
|
302,078
|
|||||||||
|
Commercial and industrial loans
|
13,111
|
95,712
|
108,823
|
|||||||||
|
Consumer loans (1)
|
16
|
65,955
|
65,971
|
|||||||||
|
Total loans
|
$
|
531,140
|
$
|
250,473
|
$
|
781,613
|
||||||
(1) Includes automobile, home equity and other consumer loans.
The Company will continue to sell a portion of its long-term fixed-rate loans to the secondary market even though there is no significant demand for such loans
under the current rate environment. Furthermore, the Company will continue to monitor the pace of its loan volume and will remain consistent in its approach to sound underwriting practices with a focus on asset quality.
ALLOWANCE FOR CREDIT LOSSES
Tables VI and VII have been provided to enhance the understanding of the loan portfolio and the ACL. The Company maintains an ACL that represents management’s
best estimate of the appropriate level of losses and risks inherent in our applicable financial assets under the CECL model. The amount of the ACL should not be interpreted as an indication that charge-offs in future periods will necessarily occur in
those amounts, or at all. The determination of the ACL involves a high degree of judgement and subjectivity. Please refer to Note A – Summary of Significant Accounting Policies of the notes to the financial statements for discussion regarding our ACL
methodologies for securities and loans.
For AFS debt securities, the Company evaluates the securities at each measurement date to determine whether the decline in the fair value below the amortized
costs basis is due to credit-related factors or noncredit-related factors. Upon adoption of ASC 326 on January 1, 2023, and as of December 31, 2025, the Company determined that all AFS securities that experienced a decline in fair value below the
amortized cost basis were due to non-credit related factors. Therefore, no ACL was recorded, and no provision expense was recognized during the year ended December 31, 2025.
64
management’s discussion and analysis of
financial condition and results of operations
For held to maturity (“HTM”) debt securities, the Company evaluates the securities collectively by major security type at each measurement date to determine
expected credit losses based on issuer’s bond rating, historical loss, financial condition, and timely principal and interest payments. At December 31, 2025, the ACL for HTM debt securities was $1 based on a .02% cumulative default rate taken from
the S&P and Moody’s bond rating index. This compares to an ACL of $1 at December 31, 2024.
For loans, the Company’s ACL is management’s estimate of expected lifetime credit losses, measured over the contractual life of a loan, that considers historical
loss experience, current conditions, and forecasts of future economic conditions. The ACL on loans is established through a provision for credit losses recognized in earnings. The ACL on loans is reduced by charge-offs on loans and is increased by
recoveries of amounts previously charged off. Management employs a process and methodology to estimate the ACL on loans that evaluates both quantitative and qualitative factors within two main components. The first component involves pooling loans
into portfolio segments for loans that share similar risk characteristics. The second component involves individually analyzed loans that do not share similar risk characteristics with loans that are pooled into portfolio segments. The ACL for loans
with similar risk characteristics are collectively evaluated for expected credit losses based on certain quantitative information that include historical loss rates, prepayment rates, and curtailment rates. Expected credit losses on loans with
similar characteristics are also determined by considering certain qualitative factors that include national unemployment rates, national gross domestic product forecasts, changes in lending policy, quality of loan review, and delinquency status. The
ACL for loans that do not share similar risk characteristics are individually evaluated for expected credit losses primarily based on foreclosure status and whether a loan is collateral-dependent. Expected credit losses on individually evaluated
loans are then determined using the present value of expected future cash flows based upon the loan’s original effective interest rate, at the loan’s observable market price, or if the loan was collateral dependent, at the fair value of the
collateral.
As of December 31, 2025, the ACL for loans totaled $11,519, or 0.96%, of total loans. As of December 31, 2024, the ACL for loans totaled $10,088, or 0.95%, of
total loans. The increase in the ACL was mostly impacted by additional reserves associated with loan growth of $134 million, and an increase in modeled loss rates due to the regression in GDP and unemployment projections.
The Company experienced higher delinquency levels from year-end 2024. Nonperforming loans to total loans increased to 1.40% at December 31, 2025,
compared to 0.46% at December 31, 2024, and nonperforming assets to total assets increased to 1.06% at December 31, 2025, compared to 0.33% at December 31, 2024. The increase in
nonperforming loans was primarily related to two commercial loans being placed on nonaccrual status. The loans are secured by commercial real estate and deemed adequately collateralized.
During 2025, the Company individually evaluated several loans for expected credit loss. The fair value of the loans’ collateral was measured to the loans’
recorded investment and no expected losses were identified as part of that review. As a result, there were no specific reserves recorded as of December 31, 2025. In addition, there were no specific reserves recorded as of December 31, 2024.
Management believes that the ACL at December 31, 2025, was appropriate to absorb expected losses in the loan portfolio. Changes in the circumstances of
particular borrowers, as well as adverse developments in the economy, are factors that could change, and management will make adjustments to the ACL as needed. Asset quality will continue to remain a key focus of the Company as management continues
to stress not just loan growth, but quality in loan underwriting.
65
management’s discussion and analysis of
financial condition and results of operations
ALLOCATION OF THE ALLOWANCE FOR CREDIT LOSSES
Table VI
|
(dollars in thousands)
|
||||||||
|
Years Ended December 31
|
||||||||
|
|
2025
|
2024
|
||||||
|
Residential real estate loans
|
$
|
2,793
|
$
|
2.684
|
||||
|
Percentage of loans to total loans
|
34.94
|
%
|
35.18
|
%
|
||||
|
Percentage of net charge-offs to average loans
|
.01
|
%
|
-.01
|
%
|
||||
|
Commercial real estate loans
|
5,331
|
3,653
|
||||||
|
Percentage of loans to total loans
|
39.30
|
%
|
35.13
|
%
|
||||
|
Percentage of net charge-offs to average loans
|
.00
|
%
|
-.01
|
%
|
||||
|
Commercial and industrial loans
|
1,738
|
1,536
|
||||||
|
Percentage of loans to total loans
|
13.97
|
%
|
14.92
|
%
|
||||
|
Percentage of net charge-offs to average loans
|
.02
|
%
|
-.16
|
%
|
||||
|
Consumer loans (1)
|
1,657
|
2,215
|
||||||
|
Percentage of loans to total loans
|
11.79
|
%
|
14.77
|
%
|
||||
|
Percentage of net charge-offs to average loans
|
.86
|
%
|
.96
|
%
|
||||
|
Allowance for credit losses
|
$
|
11,519
|
$
|
10,088
|
||||
|
Total loans percentage
|
100.00
|
%
|
100.00
|
%
|
||||
|
Net charge-offs to average loans
|
.12
|
%
|
.12
|
%
|
||||
The above allocation is based on estimates and subjective judgments and is not necessarily indicative of the specific amounts or loan categories in which losses may ultimately occur.
(1) Includes automobile, home equity and other consumer loans.
CREDIT RATIOS
Table VII
|
(dollars in thousands)
|
||||||||
|
Years Ended December 31
|
||||||||
|
|
2025
|
2024
|
||||||
|
Loans
|
$
|
1,196,018
|
$
|
1,061,825
|
||||
|
Allowance for credit losses
|
11,519
|
10,088
|
||||||
|
Past due 90 days or more and still accruing
|
1,258
|
116
|
||||||
|
Nonaccrual
|
15,474
|
4,817
|
||||||
|
Allowance for credit losses to total loans
|
.96
|
%
|
.95
|
%
|
||||
|
Nonaccrual loans to total loans
|
1.29
|
%
|
.45
|
%
|
||||
|
Allowance for credit losses to nonaccrual loans
|
74.44
|
%
|
209.42
|
%
|
||||
Management formally considers placing a loan on nonaccrual status when collection of principal or interest has become doubtful. Furthermore, generally, a loan is not returned to
accrual status unless either all delinquent principal or interest has been brought current or the loan becomes well secured and is in the process of collection.
66
management’s discussion and analysis of
financial condition and results of operations
DEPOSITS
Deposits are used as part of the Company’s liquidity management strategy to meet obligations for depositor withdrawals, to fund the borrowing needs of loan
customers, and to fund ongoing operations. Deposits, both interest- and noninterest-bearing, continue to be the most significant source of funds used by the Company to support earning assets. Deposits are attractive sources of funding because of
their stability and general low cost as compared to other funding sources. The Company seeks to maintain a proper balance of core deposit relationships on hand while also utilizing various wholesale deposit sources, such as brokered and internet CD
balances, as an alternative funding source to manage efficiently the net interest margin. Deposits are influenced by changes in interest rates, economic conditions, and competition from other banks.
Total deposits consist mostly of “core” deposits, which include noninterest-bearing deposits, as well as interest-bearing demand, savings, and money market
deposits. The Bank focuses on core deposit relationships with consumers from local markets who can maintain multiple accounts and services at the Bank. The Company believes such core deposits are more stable and less sensitive to changing interest
rates and other economic factors. Total deposits increased $54,489, or 4.3%, from year-end 2024 to $1,329,667 at December 31, 2025. The increase was related to higher interest-bearing deposit balances, which were up $62,741, or 6.6%, from year-end
2024, while noninterest-bearing deposits decreased $8,252, or 2.6%, from year-end 2024.
The increase in interest-bearing deposits came primarily from time deposits, which include CDs and individual retirement accounts, money market and savings
deposits. Time deposit balances increased $95,848, or 24.3%, from year-end 2024. The increase came primarily from retail time deposits, which increased $80,809 from year-end 2024. The Company targeted growth in retail CDs by promoting special CD rate
offerings during 2025 to assist in funding loan growth. The growth in retail CDs was supplemented by growth in wholesale CDs, which increased $15,039 from year-end 2024.
Further increases in interest-bearing deposits came from savings and money market balances, which increased $21,402, or 7.5%, from year-end 2024. The increase
came primarily from money market accounts, which increased $17,425 from year-end 2024, impacted mostly by increases in the Company’s tiered money market product (Money Fund) that was introduced in 2023 and offers a higher rate on tiered deposit
balances. Savings account balances increased $3,977, impacted mostly by the Company’s Sweet Home Ohio account that is part of the Ohio Homebuyer Plus program. The balance of the customers’ accounts participating in the Ohio Homebuyer program totaled
$9,478 at December 31, 2025 compared to $6,775 at December 31, 2024.
|
Composition of Total Deposits
|
|
|
at December 31, 2025
|
at December 31, 2024
|
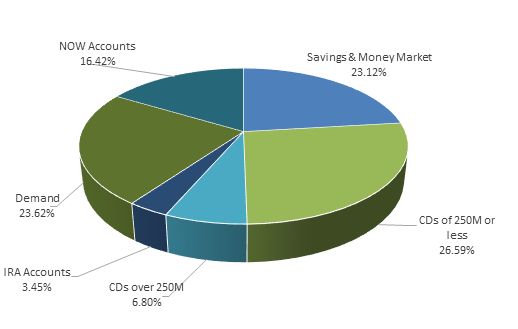 |
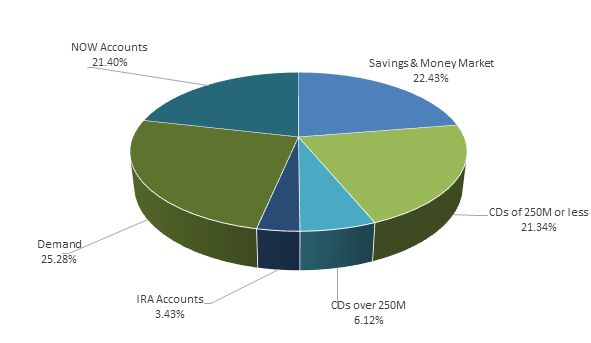 |
67
management’s discussion and analysis of
financial condition and results of operations
Partially offsetting the increases in time, savings and money market deposit balances were lower NOW account balances, which decreased $54,509, or 20.0%, from
year-end 2024. The decrease was largely from a $27,468 decrease in the Company’s municipal NOW account with the Ohio Treasurer in relation to the Homebuyer Plus program. The Treasurer’s deposit balance is subject to the participating customers’
account being open. As the accounts close, which the account must be used within five years of the opening date, the Treasurer will withdraw $100 per account. Excluding this decrease in the Ohio Treasurer account balance, the Company would have
experienced a $27,041 decrease in its other municipal NOW product balances, particularly within the Gallia County, Ohio, and Mason County, West Virginia, market areas.
The Company’s noninterest-bearing balances at year-end 2025 decreased $8,252, or 2.6%, when compared to year-end 2024 and represented 23.6% of total deposits.
The stability of consumer and business checking accounts is important as these type of accounts are typically considered the foundation of the customers’ relationship with the bank.
The Company expects to continue to experience increased competition for deposits in its market areas, which could challenge its net growth. The Company will
continue to emphasize growth and retention within its core deposit relationships during 2026, reflecting the Company’s efforts to reduce its reliance on higher cost funding and improving net interest income.
OTHER BORROWED FUNDS
The Company also accesses other funding sources, including short-term and long-term borrowings, to fund potential asset growth and satisfy short-term liquidity
needs. Other borrowed funds consist primarily of FHLB advances and promissory notes. During 2025, other borrowed funds increased from $39,740 at year-end 2024 to $44,848, an increase of $5,108. The increase was primarily related to a $10,000 FHLB
advance offset by the scheduled principal amortization of $4,992 for applicable FHLB advances. While deposits continue to be the primary source of funding for growth in earning assets, management will continue to utilize FHLB advances and promissory
notes to help manage interest rate sensitivity and liquidity.
SUBORDINATED DEBENTURES
The Company received proceeds from the issuance of one trust preferred security on March 22, 2007, totaling $8,500 at a fixed rate of 6.58%. The trust preferred
security is now at an adjustable rate equal to the 3-month CME Term SOFR index plus a spread adjustment of 0.26% and a margin of 1.68%. The Company does not report the securities issued by the trust as a liability, but instead, reports as a liability
the subordinated debenture issued by the Company and held by the trust.
OFF-BALANCE SHEET ARRANGEMENTS
As discussed in Notes I and L to the financial statements at December 31, 2025 and 2024, the Company engages in certain off-balance sheet
credit-related activities, including commitments to extend credit and standby letters of credit, which could require the Company to make cash payments in the event that specified future events occur. Commitments to extend credit are agreements to
lend to a customer as long as there is no violation of any condition established in the contract. Commitments generally have fixed expiration dates or other termination clauses and may require payment of a fee. Standby letters of credit are
conditional commitments to guarantee the performance of a customer to a third party. While these commitments are necessary to meet the financing needs of the Company’s customers, many of these commitments are expected to expire without being drawn
upon. Therefore, the total amount of commitments does not necessarily represent future cash requirements. Management does not anticipate that the Company’s current off-balance sheet activities will have a material impact on the results of
operations or financial condition. The Bank estimates expected credit losses over the contractual period in which the Bank is exposed to credit risk via a contractual obligation to extend credit. At December 31, 2025, the estimated ACL related to
off-balance sheet commitments was $871, compared to $582 at December 31, 2024. The Bank uses the same credit policies in making commitments and conditional obligations as it does
for instruments recorded on the balance sheet.
68
management’s discussion and analysis of
financial condition and results of operations
CAPITAL RESOURCES
Federal regulators have classified and defined capital into the following components: (i) Tier 1 capital, which includes tangible shareholders’ equity for
common stock, qualifying preferred stock and certain qualifying hybrid instruments, and (ii) Tier 2 capital, which includes a portion of the allowance for credit losses, certain qualifying long-term debt, preferred stock and hybrid instruments which
do not qualify as Tier 1 capital.
In September 2019, consistent with Section 201 of the Economic Growth, Regulatory Relief, and Consumer Protection Act, the federal banking agencies issued a
final rule providing simplified capital requirements for certain community banking organizations (banks and holding companies). Under the rule, a qualifying community banking organization (“QCBO”) is eligible to opt into the Community Bank Leverage
Ratio (“CBLR”) framework in lieu of the Basel III capital requirements if it has less than $10 billion in total consolidated assets, limited amounts of certain trading assets and liabilities, limited amounts of off-balance sheet exposure and a
leverage ratio greater than 9.0%. The new rule took effect January 1, 2020, and QCBOs were allowed to opt into the new CBLR framework in their Call Report beginning the first quarter of 2020.
A QCBO opting into the CBLR framework must maintain a CBLR of 9.0%, subject to a two quarter grace period to come back into compliance, provided that the QCBO
maintains a leverage ratio of more than 8.0% during the grace period. A QCBO failing to satisfy these requirements must comply with the existing Basel III capital requirements as implemented by the banking regulators in July 2013.
The Bank opted into the CBLR, and therefore, is not required to comply with the Basel III capital requirements. The numerator of the CBLR is Tier 1 capital, as
calculated under present rules. The denominator of the CBLR is the QCBO’s average assets, calculated in accordance with the QCBO’s Call Report instructions and less assets deducted from Tier 1 capital. The current rules and Call Report instructions
were impacted by the Company’s adoption of ASC 326 and its election to apply the 3-year CECL transition provision on January 1, 2023. By making this election, the Bank, in accordance with Section 301 of the regulatory capital rules, will increase it
retained earnings (Tier 1 Capital) and average assets by 75% of its CECL transition amount during the first year of the transition period, 50% of its CECL transition amount during the second year, and 25% of its CECL transitional amount during the
third year of the transition period. The Bank’s transition amount from the adoption of CECL totaled $2,276, which resulted in the add-back of $569 to both Tier 1 capital and average assets as part of the CBLR calculation for December 31, 2025. As of
December 31, 2025, the Bank’s CBLR was 10.1%.
As detailed in Note P to the financial statements, at December 31, 2025, the Bank was deemed to be “well capitalized” under applicable prompt corrective action
regulations. The Company’s total shareholders’ equity at December 31, 2025 of $170,257 increased $19,929, or 13.3%, as compared to $150,328 at December 31, 2024. Capital grew during 2025 primarily from year-to-date net income of $15,601, less
dividends paid of $4,287. This net growth was further impacted by an $8,615 after-tax increase in net unrealized gains on AFS securities from year-end 2024. During 2025, the sale of securities in an unrealized loss position and the increase in
long-term market rates, caused an increase in the fair value of the Company’s available for sale investment portfolio. The Company presently has an announced stock buyback plan permitting the repurchase of $5,000 in stock. There were no shares
purchased during 2025. At December 31, 2025, the cumulative amount of common shares purchased under the plan totaled $2,967 of the $5,000 permitted.
69
management’s discussion and analysis of
financial condition and results of operations
LIQUIDITY
Liquidity relates to the Company’s ability to meet the cash demands and credit needs of its customers and is provided by the ability to readily convert assets to
cash and raise funds in the marketplace. The Company manages funding and liquidity based on point-in-time metrics as well as forward-looking projections, which incorporate different sources and uses of funds under base and stress scenarios. Liquidity
risk is monitored and managed by the Asset Liability Committee using a series of policy limits and key risk indicators are established to ensure risks are managed within the Company’s risk tolerance. The Company maintains a contingency funding plan
that provides for liquidity stress testing, which assesses the liquidity needs under varying market conditions, time horizons and other events. The stress testing provides for ongoing monitoring of unused borrowing capacity and available sources of
contingent liquidity to prepare for unexpected liquidity needs and to cover unanticipated events that could affect liquidity.
Total cash and cash equivalents, HTM securities maturing within one year, and AFS securities, which totaled $300,436, represented 19.0% of total assets at
December 31, 2025 compared to $352,563 and 23.5% of total assets at December 31, 2024. The decrease in liquid funds came primarily from the $37,210 decrease in cash and cash equivalents and the $15,811 decrease in total securities. These funds were
utilized to fund growth in earning assets.
In addition to the on-balance sheet liquidity discussed above, the Bank has established multiple sources of funding to further enhance the Bank’s ability to meet
liquidity demands. The Bank has pledged collateral to the FHLB and the FRB to establish committed borrowing lines. At December 31, 2025, the Bank could borrow an additional $156,254 from the FHLB and the borrowing line with the FRB had availability
of $41,891. For each of these sources, the Bank has established an internal limit of 85% of our borrowing capacity. In addition to the committed borrowing lines, the Bank has access to several wholesale funding sources, such as, brokered CDs, a $25
million federal funds purchase limit with two correspondent banks, and the ability to bid on available funds from select deposit placement services. The Bank has established limits for each respective funding source and a collective limit on all
wholesale funding sources. The Bank’s internal limit on brokered CDs is 10% of total assets. At December 31, 2025, the amount of brokered CDs outstanding was 3.92% of total assets, an increase from 3.25% at December 31, 2024. At December 31, 2025,
the Bank had utilized 37.62% of our FHLB capacity, a decrease from 52.21% at December 31, 2024. The collective internal limit on all wholesale funding sources is 40% of total assets. At December 31, 2025, the Bank’s total wholesale funding sources
represented 11.89% of total assets, an increase from 11.62% at December 31, 2024. Based on the collective internal wholesale funding limit, the Bank had the capacity to borrow an additional $441 million in wholesale funds and the available funding
from the respective wholesale funding sources exceeded this amount, which provides the flexibility to utilize one source more than another due to pricing or availability.
As part of performing liquidity stress tests, the Bank monitors and evaluates the exposure to uninsured deposits. Of the Company’s $1,329,667 in total deposit
balances at December 31, 2025, only 35.6%, or $473,108, were deemed uninsured as per the $250 FDIC threshold. A portion of these deposits were related to public entities, which require the Bank to pledge securities or FHLB letters of credit to cover
the amount of the deposit balance that is deemed uninsured. To the extent these deposits left the Bank, the level of unpledged securities and the borrowing capacity at the FHLB would increase or could be utilized to fund the deposit outflow. The sum
of current on-balance sheet liquidity and available wholesale funding sources exceeded the balance of uninsured deposits at December 31, 2025. Included in on-balance sheet liquidity are AFS securities in an unrealized loss position. Although
management does not intend to sell the securities before the recovery of its cost basis, they are a contingent resource from a liquidity perspective.
70
management’s discussion and analysis of
financial condition and results of operations
|
KEY RATIOS
Table VIII
|
|
|
2025
|
2024
|
2023
|
2022
|
2021
|
|||||||||||||||
|
|
||||||||||||||||||||
|
Return on average assets
|
1.02
|
%
|
.77
|
%
|
.99
|
%
|
1.06
|
%
|
.95
|
%
|
||||||||||
|
Return on average equity
|
9.83
|
%
|
7.50
|
%
|
9.24
|
%
|
9.86
|
%
|
8.45
|
%
|
||||||||||
|
Dividend payout ratio
|
27.48
|
%
|
37.98
|
%
|
38.56
|
%
|
35.39
|
%
|
34.25
|
%
|
||||||||||
|
Average equity to average assets
|
10.38
|
%
|
10.29
|
%
|
10.72
|
%
|
10.78
|
%
|
11.25
|
%
|
||||||||||
As our liquidity position dictates, the preceding funding sources may be utilized to supplement our liquidity position. If the utilization of wholesale funding
increases to fund asset growth or for liquidity management purposes, the net interest margin may be negatively impacted due to the higher relative cost of these sources as compared to core deposits. For further cash flow information, see the
consolidated statement of cash flows. Management does not rely on any single source of liquidity and monitors the level of liquidity based on many factors affecting the Company’s financial condition.
INFLATION
Consolidated financial data included herein has been prepared in accordance with US GAAP. Presently, US GAAP requires the Company to measure financial position
and operating results in terms of historical dollars with the exception of securities AFS, which are carried at fair value. Changes in the relative value of money due to inflation or deflation are generally not considered.
In management’s opinion, changes in interest rates affect the financial institution to a far greater degree than changes in the inflation rate. While interest
rates are greatly influenced by changes in the inflation rate, they do not change at the same rate or in the same manner as the inflation rate. Rather, interest rate volatility is based on changes in the expected rate of inflation, as well as
monetary and fiscal policies. A financial institution’s ability to be relatively unaffected by changes in interest rates is a good indicator of its capability to perform in today’s volatile economic environment. The Company seeks to insulate itself
from interest rate volatility by ensuring that rate sensitive assets and rate sensitive liabilities respond to changes in interest rates in a similar time frame and to a similar degree.
CRITICAL ACCOUNTING ESTIMATES
The Company believes the determination of the ACL involves a higher degree of judgment and complexity than its other significant accounting estimates. The ACL is calculated with the
objective of maintaining a reserve level believed by management to be sufficient to absorb estimated credit losses over the life of an asset or off-balance sheet credit exposure. Management’s determination of the adequacy of the ACL is based on
periodic evaluations of past events, including historical credit loss experience on financial assets with similar risk characteristics, current conditions, and reasonable and supportable forecasts that affect the collectability of the remaining cash
flows over the contractual term of the financial assets. However, this evaluation has subjective components requiring material estimates, including expected default probabilities, the expected loss given default, the amounts and timing of expected
future cash flows on individually evaluated loans, and estimated losses based on historical loss experience and forecasted economic conditions. All of these factors may be susceptible to significant change. To the extent that actual results differ
from management estimates, additional provisions for credit losses may be required that would adversely impact earnings in future periods. Refer to “Allowance for Credit Losses” and “Provision for Credit Losses” sections within this MD&A for
additional discussion.
71
management’s discussion and analysis of
financial condition and results of operations
CONCENTRATIONS OF CREDIT RISK
The Company maintains a diversified credit portfolio, with residential real estate loans currently comprising the most significant portion. Credit risk is
primarily subject to loans made to businesses and individuals in southeastern Ohio and western West Virginia. Management believes this risk to be general in nature, as there are no material concentrations of loans to any industry or consumer group.
To the extent possible, the Company diversifies its loan portfolio to limit credit risk by avoiding industry concentrations.