QUARTERLY REPORT PURSUANT TO SECTION 13 OR 15(d) OF THE SECURITIES EXCHANGE ACT OF 1934
For the quarterly period ended March 31, 2025
Commission File Number 1-11758
(Exact name of Registrant as specified in its charter)
Delaware
1585 Broadway
36-3145972
(212)
761-4000
(State or other jurisdiction of incorporation or organization)
New York,
NY
10036
(I.R.S. Employer Identification No.)
(Registrant’s telephone number, including area code)
(Address of principal executive offices, including Zip Code)
Securities registered pursuant to Section 12(b) of the Act:
Title of each class
Trading Symbol(s)
Name of exchange on which registered
Common Stock, $0.01 par value
MS
New York Stock Exchange
Depositary Shares, each representing 1/1,000th interest in a share of Floating Rate
MS/PA
New York Stock Exchange
Non-Cumulative Preferred Stock, Series A, $0.01 par value
Depositary Shares, each representing 1/1,000th interest in a share of Fixed-to-Floating Rate
MS/PE
New York Stock Exchange
Non-Cumulative Preferred Stock, Series E, $0.01 par value
Depositary Shares, each representing 1/1,000th interest in a share of Fixed-to-Floating Rate
MS/PF
New York Stock Exchange
Non-Cumulative Preferred Stock, Series F, $0.01 par value
Depositary Shares, each representing 1/1,000th interest in a share of Fixed-to-Floating Rate
MS/PI
New York Stock Exchange
Non-Cumulative Preferred Stock, Series I, $0.01 par value
Depositary Shares, each representing 1/1,000th interest in a share of Fixed-to-Floating Rate
MS/PK
New York Stock Exchange
Non-Cumulative Preferred Stock, Series K, $0.01 par value
Depositary Shares, each representing 1/1,000th interest in a share of 4.875%
MS/PL
New York Stock Exchange
Non-Cumulative Preferred Stock, Series L, $0.01 par value
Depositary Shares, each representing 1/1,000th interest in a share of 4.250%
MS/PO
New York Stock Exchange
Non-Cumulative Preferred Stock, Series O, $0.01 par value
Depositary Shares, each representing 1/1,000th interest in a share of 6.500%
MS/PP
New York Stock Exchange
Non-Cumulative Preferred Stock, Series P, $0.01 par value
Depositary Shares, each representing 1/1,000th interest in a share of 6.625%
MS/PQ
New York Stock Exchange
Non-Cumulative Preferred Stock, Series Q, $0.01 par value
Global Medium-Term Notes, Series A, Fixed Rate Step-Up Senior Notes Due 2026
MS/26C
New York Stock Exchange
of Morgan Stanley Finance LLC (and Registrant’s guarantee with respect thereto)
Global Medium-Term Notes, Series A, Floating Rate Notes Due 2029
MS/29
New York Stock Exchange
of Morgan Stanley Finance LLC (and Registrant’s guarantee with respect thereto)
Indicate by check mark whether the Registrant (1) has filed all reports required to be filed by Section 13 or 15(d) of the Securities Exchange Act of 1934 during the preceding 12 months (or for such shorter period that the Registrant was required to file such reports), and (2) has been subject to such filing requirements for the past 90 days. Yes ☒ No ☐
Indicate by check mark whether the Registrant has submitted electronically every Interactive Data File required to be submitted pursuant to Rule 405 of Regulation S-T (§ 232.405 of this chapter) during the preceding 12 months (or for such shorter period that the Registrant was required to submit such files). Yes ☒ No ☐
Indicate by check mark whether the Registrant is a large accelerated filer, an accelerated filer, a non-accelerated filer, smaller reporting company, or an emerging growth company. See the definitions of “large accelerated filer,” “accelerated filer,” “smaller reporting company,” and “emerging growth company” in Rule 12b-2 of the Exchange Act. (Check one):
Large accelerated filer
☒
Accelerated filer
☐
Non-accelerated filer
☐
Smaller reporting company
☐
Emerging growth company
☐
If an emerging growth company, indicate by check mark if the Registrant has elected not to use the extended transition period for complying with any new or revised financial accounting standards provided pursuant to Section 13(a) of the Exchange Act. ☐
Indicate by check mark whether the Registrant is a shell company (as defined in Rule 12b-2 of the Exchange Act). Yes ☐ No ☒
As of April 30, 2025, there were 1,604,319,158 shares of the Registrant’s Common Stock, par value $0.01 per share, outstanding.
We file annual, quarterly and current reports, proxy statements and other information with the Securities and Exchange Commission (“SEC”). The SEC maintains a website, www.sec.gov, that contains annual, quarterly and current reports, proxy and information statements, and other information that issuers file electronically with the SEC. Our electronic SEC filings are available to the public at the SEC’s website.
Our website is www.morganstanley.com. You can access our Investor Relations webpage at www.morganstanley.com/about-us-ir. We make available free of charge, on or through our Investor Relations webpage, our proxy statements, annual reports on Form 10-K, quarterly reports on Form 10-Q, current reports on Form 8-K and any amendments to those reports filed or furnished pursuant to the Securities Exchange Act of 1934, as amended (“Exchange Act”), as soon as reasonably practicable after such material is electronically filed with, or furnished to, the SEC. We also make available, through our Investor Relations webpage, via a link to the SEC’s website, statements of beneficial ownership of our equity securities filed by our directors, officers, 10% or greater shareholders and others under Section 16 of the Exchange Act.
You can access information about our corporate governance at www.morganstanley.com/about-us-governance, our sustainability initiatives at www.morganstanley.com/about-us/sustainability-at-morgan-stanley, and our commitment to diversity and inclusion at www.morganstanley.com/about-us/diversity. Our webpages include:
•Amended and Restated Certificate of Incorporation;
•Amended and Restated Bylaws;
•Charters for our Audit Committee, Compensation, Management Development and Succession Committee, Governance and Sustainability Committee, Operations and Technology Committee, and Risk Committee;
•Corporate Governance Policies;
•Policy Regarding Corporate Political Activities;
•Policy Regarding Shareholder Rights Plan;
•Equity Ownership Commitment;
•Code of Ethics and Business Conduct;
•Code of Conduct;
•Integrity Hotline Information;
•Environmental and Social Policies; and
•2023 ESG Report.
Our Code of Ethics and Business Conduct applies to all directors, officers and employees, including our Chief Executive Officer, Chief Financial Officer and Deputy Chief Financial Officer. We will post any amendments to the Code of Ethics and Business Conduct and any waivers that are required to be disclosed by the rules of either the SEC or the New York Stock Exchange LLC on our website. You can request a copy of these documents, excluding exhibits, at no cost, by contacting Investor Relations, 1585 Broadway, New York, NY 10036 (212-761-4000). The information on our website is not incorporated by reference into this report.
Management’s Discussion and Analysis of Financial Condition and Results of Operations
Introduction
Morgan Stanley is a global financial services firm that maintains significant market positions in each of its business segments—Institutional Securities, Wealth Management and Investment Management. Morgan Stanley, through its subsidiaries and affiliates, provides a wide variety of products and services to a large and diversified group of clients and customers, including corporations, governments, financial institutions and individuals. Unless the context otherwise requires, the terms “Morgan Stanley,” “Firm,” “us,” “we” or “our” mean Morgan Stanley (the “Parent Company”) together with its consolidated subsidiaries. See the “Glossary of Common Terms and Acronyms” for the definition of certain terms and acronyms used throughout this Form 10-Q.
A description of the clients and principal products and services of each of our business segments is as follows:
Institutional Securities provides a variety of products and services to corporations, governments, financial institutions and ultra-high net worth clients. Investment Banking services consist of capital raising and financial advisory services, including the underwriting of debt, equity securities and other products, as well as advice on mergers and acquisitions, restructurings and project finance. Our Markets business, which comprises Equity and Fixed Income, provides sales, financing, prime brokerage, market-making, Asia wealth management services and certain business-related investments. Lending activities include originating corporate loans and commercial real estate loans, providing secured lending facilities, and extending securities-based and other financing to clients. Other activities include research.
Wealth Management provides a comprehensive array of financial services and solutions to individual investors and small to medium-sized businesses and institutions. Wealth Management covers: financial advisor-led brokerage, custody, administrative and investment advisory services; self-directed brokerage services; financial and wealth planning services; workplace services, including stock plan administration; securities-based lending, residential and commercial real estate loans and other lending products; banking; and retirement plan services.
Investment Management provides a broad range of investment strategies and products that span geographies, asset classes, and public and private markets to a diverse group of clients across institutional and intermediary channels. Strategies and products, which are offered through a variety of investment vehicles, include equity, fixed income, alternatives and solutions, and liquidity and overlay services. Institutional clients include defined benefit/defined contribution plans, foundations, endowments, government entities, sovereign wealth funds, insurance companies, third-party fund sponsors and corporations. Individual clients are generally served through intermediaries, including affiliated and non-affiliated distributors.
Management’s Discussion and Analysis includes certain metrics that we believe to be useful to us, investors, analysts and other stakeholders by providing further transparency about, or an additional means of assessing, our financial condition and operating results. Such metrics, when used, are defined and may be different from or inconsistent with metrics used by other companies.
The results of operations in the past have been, and in the future may continue to be, materially affected by: competition; legislative, legal and regulatory developments; and other risk factors. These factors also may have an adverse impact on our ability to achieve our strategic objectives. Additionally, the discussion of our results of operations herein may contain forward-looking statements. These statements, which reflect management’s beliefs and expectations, are subject to risks and uncertainties that may cause actual results to differ materially. For a discussion of the risks and uncertainties that may affect our future results, see “Forward-Looking Statements”, “Business—Competition”, “Business—Supervision and Regulation” and “Risk Factors” in the 2024 Form 10-K and “Liquidity and Capital Resources—Regulatory Requirements” herein.
Consolidated Results—Three Months Ended March 31, 2025
•The Firm reported net revenues of $17.7 billion and net income of $4.3 billion reflecting strong results across our business segments.
•The Firm delivered ROE of 17.4% and ROTCE of 23.0% (see “Selected Non-GAAP Financial Information” herein).
•The Firm’s expense efficiency ratio was 68%. Expenses for the quarter included $144 million of severance costs related to a March employee action across our business segments. (See “Non-Interest Expenses” herein for more information).
•The Firm accreted $1.9 billion of Common Equity Tier 1 capital. At March 31, 2025, the Firm’s Standardized Common Equity Tier 1 capital ratio was 15.3%.
•Institutional Securities reported net revenues of $9.0 billion reflecting strong performance in Equity and in Investment Banking on higher Fixed Income underwriting revenues.
•Wealth Management delivered a pre-tax margin of 26.6%. Net revenues of $7.3 billion reflect strong Asset management revenues. The business added net new assets of $94 billion and fee-based asset flows were $30 billion.
•Investment Management results reflect net revenues of $1.6 billion, primarily driven by asset management fees on higher average AUM of $1.7 trillion.
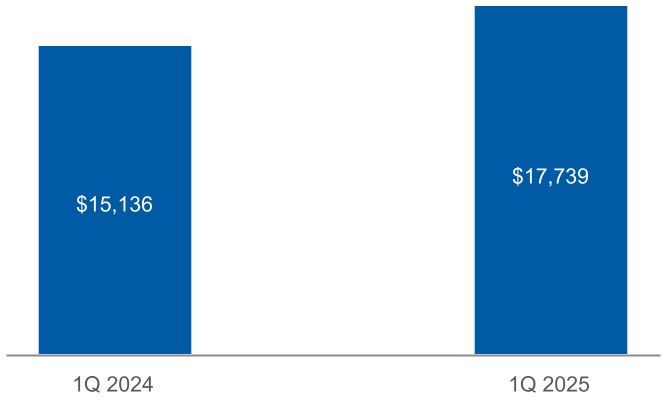
Net Revenues
($ in millions)
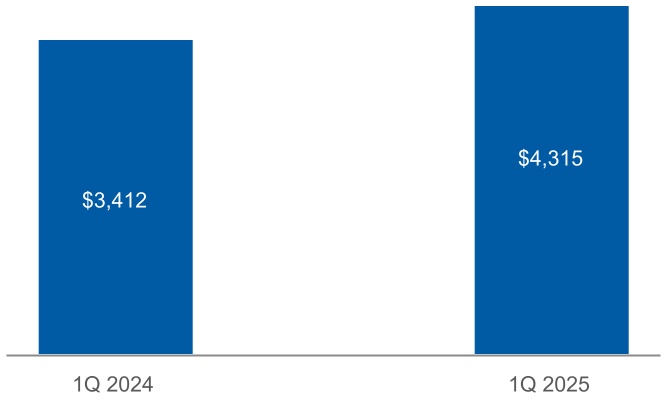
Net Income Applicable to Morgan Stanley
($ in millions)
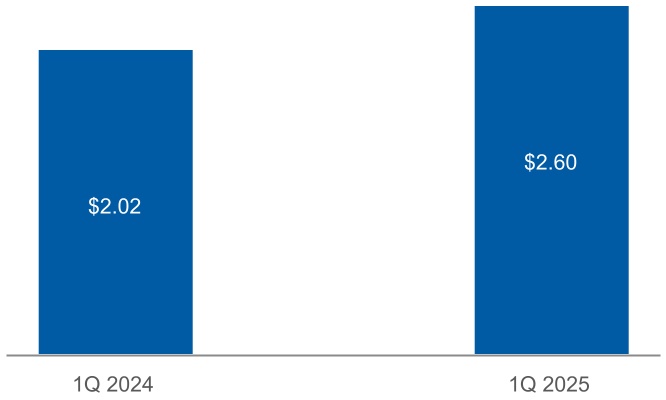
Earnings per Diluted Common Share
We reported net revenues of $17.7 billion in the quarter ended March 31, 2025 (“current quarter,” or “1Q 2025”), which increased by 17% compared with $15.1 billion in the quarter ended March 31, 2024 (“prior year quarter,” or “1Q 2024”). Net income applicable to Morgan Stanley was $4.3 billion in the current quarter, which increased by 26% compared with $3.4 billion in the prior year quarter. Diluted earnings per common share was $2.60 in the current quarter, which increased by 29% compared with $2.02 in the prior year quarter.
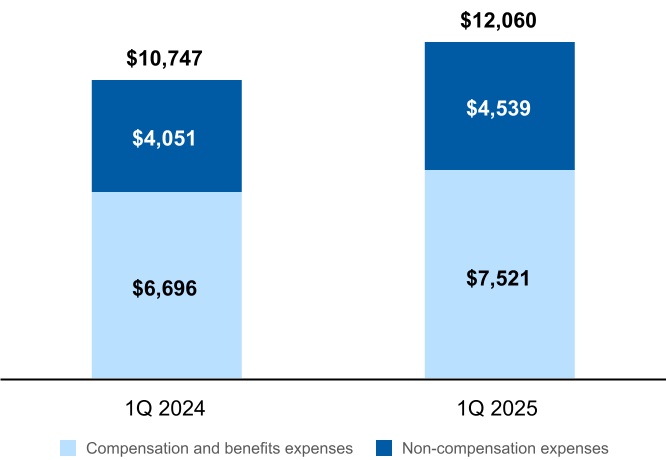
•Compensation and benefits expenses of $7,521 million in the current quarter increased 12% from the prior year quarter, primarily due to higher discretionary incentive compensation and higher formulaic payout to Wealth Management representatives, both on higher revenues, and higher severance costs, partially offset by lower expenses related to certain employee deferred cash-based compensation plans linked to investment performance (“DCP”).
During the current quarter, as a result of a March employee action, we recognized severance costs associated with a reduction in force (“RIF”) of $144 million, included in Compensation and benefits expenses. The RIF occurred across our business segments and geographic regions and impacted approximately 2% of our global workforce at that time. The RIF was related to performance management and the alignment of our workforce to our business needs, rather than a change in strategy or exit of businesses. We recorded severance costs of $78 million in the Institutional Securities business segment, $50 million in the Wealth Management business segment, and $16 million in the Investment Management business segment for the current quarter. These costs were incurred across all regions, with the majority in the Americas.
•Non-compensation expenses of $4,539 million in the current quarter increased 12% from the prior year quarter, primarily due to higher execution-related expenses.
Provision for Credit Losses
The Provision for credit losses on loans and lending commitments of $135 million in the current quarter was primarily related to portfolio growth in secured lending facilities and corporate loans, provisions for certain specific loans, including residential real estate loans related to the California wildfires, and deterioration in the macroeconomic outlook. The macroeconomic outlook assumed in our ACL models and Provision for credit losses incorporated the weaker economic outlook and conditions as of March 31, 2025. The Provision for credit losses on loans and lending commitments in the prior year quarter was a net release of $6 million, primarily as a result of improvements in the macroeconomic outlook, partially offset by provisions for certain specific commercial real estate and corporate loans and modest growth in certain other loan portfolios.
For further information on the Provision for credit losses, see “Credit Risk” herein.
Business Segment Results
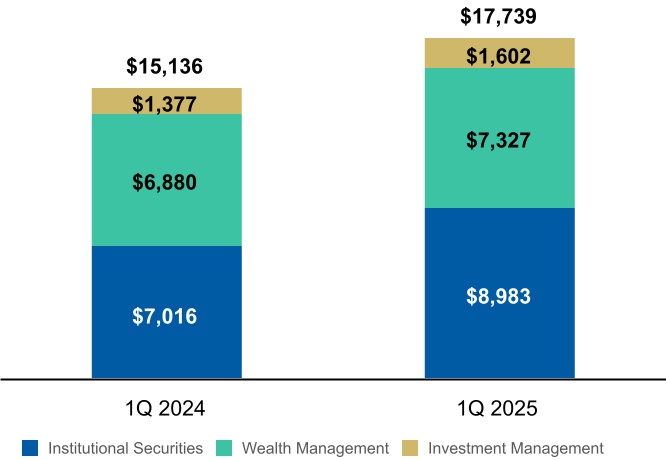
Net Revenues by Segment1
($ in millions)
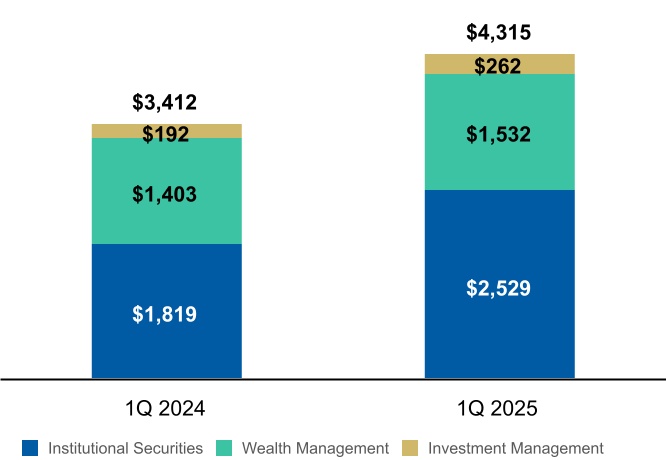
Net Income Applicable to Morgan Stanley by Segment1
($ in millions)
1.The amounts in the charts represent the contribution of each business segment to the total of the applicable financial category and may not sum to the total presented on top of the bars due to intersegment eliminations. See Note 19 to the financial statements for details of intersegment eliminations.
•Institutional Securities net revenues of $8,983 million in the current quarter increased 28% from the prior year quarter, primarily reflecting higher results in Equity and gains on the sale of corporate loans held-for-sale compared with mark-to-market losses, inclusive of hedges, in the prior year quarter within Other net revenues.
•Wealth Management net revenues of $7,327 million in the current quarter increased 6% from the prior year quarter, primarily reflecting higher Asset management revenues, partially offset by lower Transactional revenues.
•Investment Management net revenues of $1,602 million in the current quarter increased 16% from the prior year quarter, reflecting higher Performance-based income and other revenues and higher Asset management and related fees.
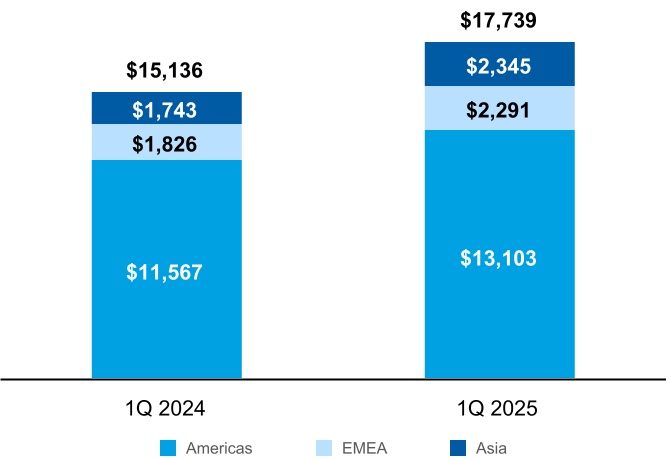
1.For a discussion of how the geographic breakdown of net revenues is determined, see Note 22 to the financial statements in the 2024 Form 10-K.
•Americas net revenues in the current quarter increased 13% from the prior year quarter, driven by higher results across all business segments.
•EMEA net revenues in the current quarter increased 25% from the prior year quarter, primarily driven by higher Equity revenues within the Institutional Securities business segment and higher results within the Investment Management business segment.
•Asia net revenues in the current quarter increased 35% from the prior year quarter, primarily driven by higher Equity revenues within the Institutional Securities business segment.
Selected Financial Information and Other Statistical Data
Three Months Ended March 31,
$ in millions, except per share data
2025
2024
Consolidated results
Net revenues
$
17,739
$
15,136
Earnings applicable to Morgan Stanley common shareholders
$
4,157
$
3,266
Earnings per diluted common share
$
2.60
$
2.02
Consolidated financial measures
Expense efficiency ratio1
68
%
71
%
ROE2
17.4
%
14.5
%
ROTCE2, 3
23.0
%
19.7
%
Pre-tax margin4
31
%
29
%
Effective tax rate
21.2
%
21.2
%
Pre-tax margin by segment4
Institutional Securities
37
%
34
%
Wealth Management
27
%
26
%
Investment Management
20
%
18
%
$ in millions, except per share data, worldwide employees and client assets
At March 31, 2025
At December 31, 2024
Average liquidity resources for three months ended5
$
351,740
$
345,440
Loans6
$
258,969
$
246,814
Total assets
$
1,300,296
$
1,215,071
Deposits
$
381,563
$
376,007
Borrowings
$
305,390
$
288,819
Common equity
$
97,062
$
94,761
Tangible common equity3
$
74,044
$
71,604
Common shares outstanding
1,607
1,607
Book value per common share7
$
60.41
$
58.98
Tangible book value per common share3, 7
$
46.08
$
44.57
Worldwide employees (in thousands)
81
80
Client assets8 (in billions)
$
7,662
$
7,860
Capital Ratios9
Common Equity Tier 1 capital—Standardized
15.3
%
15.9
%
Tier 1 capital—Standardized
17.2
%
18.0
%
Common Equity Tier 1 capital—Advanced
15.7
%
15.7
%
Tier 1 capital—Advanced
17.7
%
17.8
%
Tier 1 leverage
6.9
%
6.9
%
SLR
5.6
%
5.6
%
1.The expense efficiency ratio represents total non-interest expenses as a percentage of net revenues.
2.ROE and ROTCE represent annualized earnings applicable to Morgan Stanley common shareholders as a percentage of average common equity and average tangible common equity, respectively.
3.Represents a non-GAAP financial measure. See “Selected Non-GAAP Financial Information” herein.
4.Pre-tax margin represents income before provision for income taxes as a percentage of net revenues.
5.For a discussion of Liquidity resources, see “Liquidity and Capital Resources—Balance Sheet—Liquidity Risk Management Framework—Liquidity Resources” herein.
6.Includes loans held for investment, net of ACL, loans held for sale and also includes loans at fair value, which are included in Trading assets in the balance sheet.
7.Book value per common share and tangible book value per common share equal common equity and tangible common equity, respectively, divided by common shares outstanding.
8.Client assets represents the sum of Wealth Management client assets and Investment Management AUM. Certain Wealth Management client assets are invested in Investment Management products and are therefore also included in Investment Management’s AUM.
9.For a discussion of our capital ratios, see “Liquidity and Capital Resources—Regulatory Requirements” herein.
The economic environment, client and investor confidence and overall market sentiment deteriorated in 2025, as recent developments around global trade and government policies resulted in increased economic uncertainty and market volatility. Geopolitical risks, inflation, as well as the timing and pace of central bank actions related to interest rates present ongoing risks to the economic environment and growth. These factors have impacted, and could continue to impact capital markets and our businesses, as discussed further in “Business Segments” herein.
For more information on economic and market conditions, and the potential effects of geopolitical events and acts of war or aggression on our future results, refer to “Risk Factors” and “Forward-Looking Statements” in the 2024 Form 10-K.
Selected Non-GAAP Financial Information
We prepare our financial statements using U.S. GAAP. From time to time, we may disclose certain “non-GAAP financial measures” in this document or in the course of our earnings releases, earnings and other conference calls, financial presentations, definitive proxy statements and other public disclosures. A “non-GAAP financial measure” excludes, or includes, amounts from the most directly comparable measure calculated and presented in accordance with U.S. GAAP. We consider the non-GAAP financial measures we disclose to be useful to us, investors, analysts and other stakeholders by providing further transparency about, or an alternate means of assessing or comparing our financial condition, operating results and capital adequacy.
These measures are not in accordance with, or a substitute for, U.S. GAAP and may be different from or inconsistent with non-GAAP financial measures used by other companies. Whenever we refer to a non-GAAP financial measure, we will also generally define it or present the most directly comparable financial measure calculated and presented in accordance with U.S. GAAP, along with a reconciliation of the differences between the U.S. GAAP financial measure and the non-GAAP financial measure.
We present certain non-GAAP financial measures that exclude the impact of mark-to-market gains and losses on DCP investments from net revenues and compensation expenses. The impact of DCP is primarily reflected in our Wealth Management business segment results. These measures allow for better comparability of period-to-period underlying operating performance and revenue trends, especially in our Wealth Management business segment. By excluding the impact of these items, we are better able to describe the business drivers and resulting impact to net revenues and corresponding change to the associated compensation expenses. For additional information, see “Management’s Discussion and Analysis of Financial Condition and Results of Operations—Other Matters” in the 2024 Form 10-K.
Tangible common equity is a non-GAAP financial measure that we believe analysts, investors and other stakeholders consider useful to allow for comparability to peers and of the period-to-period use of our equity. The calculation of tangible common equity represents common shareholders’ equity less goodwill and intangible assets net of allowable mortgage servicing rights deduction. In addition, we believe that certain ratios that utilize tangible common equity, such as return on average tangible common equity (“ROTCE”) and tangible book value per common share, also non-GAAP financial measures, are useful for evaluating the operating performance and capital adequacy of the business period-to-period, respectively. The calculation of ROTCE represents annualized earnings applicable to Morgan Stanley common shareholders as a percentage of average tangible common equity. The calculation of tangible book value per common share represents tangible common equity divided by common shares outstanding.
The principal non-GAAP financial measures presented in this document are set forth in the following tables.
Reconciliations from U.S. GAAP to Non-GAAP Consolidated Financial Measures
Three Months Ended March 31,
$ in millions
2025
2024
Net revenues
$
17,739
$
15,136
Adjustment for mark-to-market losses (gains) on DCP1
149
(187)
Adjusted Net revenues—non-GAAP
$
17,888
$
14,949
Compensation expense
$
7,521
$
6,696
Adjustment for mark-to-market gains (losses) on DCP1
2
(249)
Adjusted Compensation expense—non-GAAP
$
7,523
$
6,447
Wealth Management Net revenues
$
7,327
$
6,880
Adjustment for mark-to-market losses (gains) on DCP1
131
(140)
Adjusted Wealth Management Net revenues—non-GAAP
$
7,458
$
6,740
Wealth Management Compensation expense
$
3,999
$
3,788
Adjustment for mark-to-market gains (losses) on DCP1
1.Net revenues and compensation expense are adjusted for DCP for both Firm and Wealth Management business segment. See “Management’s Discussion and Analysis of Financial Condition and Results of Operations—Other Matters” in the 2024 Form 10-K for more information.
1.Average common equity and average tangible common equity for each business segment is determined using our Required Capital framework (see “Liquidity and Capital Resources—Regulatory Requirements—Attribution of Average Common Equity According to the Required Capital Framework” herein). The sums of the segments’ Average common equity and Average tangible common equity do not equal the Consolidated measures due to Parent Company equity.
2.The calculation of ROE and ROTCE by segment uses net income applicable to Morgan Stanley by segment less preferred dividends allocated to each segment, annualized as a percentage of average common equity and average tangible common equity, respectively, allocated to each segment.
Return on Tangible Common Equity Goal
We have an ROTCE goal of 20%. Our ROTCE goal is a forward-looking statement that is based on a normal market environment and may be materially affected by many factors.
See “Risk Factors” and “Forward-Looking Statements” in the 2024 Form 10-K for further information on market and economic conditions and their potential effects on our future operating results.
ROTCE represents a non-GAAP financial measure. For further information on non-GAAP measures, see “Selected Non-GAAP Financial Information” herein.
Business Segments
Substantially all of our operating revenues and operating expenses are directly attributable to our business segments. Certain revenues and expenses have been allocated to each business segment, generally in proportion to its respective net revenues, non-interest expenses or other relevant measures. See Note 19 to the financial statements for segment net revenues by income statement line item and information on intersegment transactions.
For an overview of the components of our business segments, net revenues, provision for credit losses, compensation expense and income taxes, see “Management’s Discussion and Analysis of Financial Condition and Results of Operations—Business Segments” in the 2024 Form 10-K.
Source: LSEG Data & Risk Analytics (formerly known as Refinitiv) as of April 1, 2025. Transaction volumes may not be indicative of net revenues in a given period. In addition, transaction volumes for prior periods may vary from amounts previously reported due to the subsequent withdrawal, change in value or change in timing of certain transactions.
1.Includes transactions of $100 million or more. Based on full credit to each of the advisors in a transaction.
2.Based on full credit for single book managers and equal credit for joint book managers.
3.Includes Rule 144A issuances and registered public offerings of common stock, convertible securities and rights offerings.
4.Includes Rule 144A and publicly registered issuances, non-convertible preferred stock, mortgage-backed and asset-backed securities, and taxable municipal debt. Excludes leveraged loans and self-led issuances.
Investment Banking Revenues
Net revenues of $1,559 million in the current quarter increased 8% from the prior year quarter, reflecting higher Fixed Income underwriting and Advisory revenues, partially offset by lower Equity underwriting revenues.
•Advisory revenues increased on higher completed M&A transactions.
•Equity underwriting revenues decreased primarily on lower secondary block share trades and initial public offerings.
•Fixed Income underwriting revenues increased primarily in non-investment grade loan issuances.
While Investment Banking results have shown improvement in recent quarters, we continue to operate in a market environment with lower completed M&A activity relative to longer-term averages. The current economic environment may continue to delay expectations of increased M&A activity.
See “Investment Banking Volumes” herein.
Equity, Fixed Income and Other Net Revenues
Equity and Fixed Income Net Revenues
Three Months Ended March 31, 2025
Net Interest2
All Other3
$ in millions
Trading
Fees1
Total
Financing
$
2,267
$
156
$
(596)
$
1
$
1,828
Execution services
1,469
798
(98)
131
2,300
Total Equity
$
3,736
$
954
$
(694)
$
132
$
4,128
Total Fixed Income
$
2,407
$
107
$
19
$
71
$
2,604
Three Months Ended March 31, 2024
Net Interest2
All Other3
$ in millions
Trading
Fees1
Total
Financing
$
2,022
$
136
$
(891)
$
1
$
1,268
Execution services
972
609
(41)
34
1,574
Total Equity
$
2,994
$
745
$
(932)
$
35
$
2,842
Total Fixed Income
$
2,594
$
104
$
(292)
$
79
$
2,485
1.Includes Commissions and fees and Asset management revenues.
2.Includes funding costs, which are allocated to the businesses based on funding usage.
3.Includes Investments and Other revenues.
Equity
Net revenues of $4,128 million in the current quarter increased 45% compared with the prior year quarter, reflecting an increase in both Execution services and Financing.
•Financing revenues increased primarily due to higher gains on inventory held to facilitate client activity and increased client activity.
•Execution services revenues increased primarily due to higher gains on inventory held to facilitate client activity and increased client activity in derivatives and cash equities.
Fixed Income
Net revenues of $2,604 million in the current quarter increased 5% from the prior year quarter, primarily reflecting an increase in Global macro products, partially offset by a decrease in Commodities and Credit products.
•Global macro products revenues increased primarily on foreign exchange products due to gains compared with
losses in the prior year quarter on inventory held to facilitate client activity and increased client activity.
•Credit products revenues decreased primarily due to lower gains on inventory held to facilitate client activity, partially offset by higher lending and securitized products activity.
•Commodities products and other fixed income revenues decreased primarily due to lower gains on inventory held to facilitate client activity.
Other Net Revenues
Other net revenues were $692 million in the current quarter, compared with $242 million in the prior year quarter, primarily reflecting gains on the sale of corporate loans held-for-sale compared with mark-to-market losses, inclusive of hedges, in the prior year quarter.
Provision for Credit Losses
The Provision for credit losses on loans and lending commitments of $91 million in the current quarter was primarily related to portfolio growth in secured lending facilities and corporate loans and deterioration in the macroeconomic outlook. The Provision for credit losses on loans and lending commitments of $2 million in the prior year quarter was primarily related to modest growth in certain loan portfolios and provisions for certain specific commercial real estate and corporate loans, partially offset by improvements in the macroeconomic outlook.
For further information on the Provision for credit losses, see “Credit Risk” herein.
Non-Interest Expenses
Non-interest expenses of $5,611 million in the current quarter increased 20% compared with the prior year quarter as a result of higher Compensation and benefits expenses and Non-compensation expenses.
•Compensation and benefits expenses increased primarily due to higher discretionary incentive compensation on higher revenues, higher expenses related to outstanding deferred cash- and equity-based compensation and higher severance costs associated with a RIF in March.
1.Transactional includes Investment banking, Trading, and Commissions and fees revenues.
2.Other includes Investments and Other revenues.
Wealth Management Metrics
$ in billions
At March 31, 2025
At December 31, 2024
Total client assets1
$
6,015
$
6,194
U.S. Bank Subsidiary loans
$
163
$
160
Margin and other lending2
$
28
$
28
Deposits3
$
375
$
370
Annualized weighted average cost of deposits4
Period end
2.77%
2.73%
Period average for three months ended
2.77%
2.94%
Three Months Ended March 31,
2025
2024
Net new assets
$
93.8
$
94.9
1.Client assets represent those for which Wealth Management is providing services including financial advisor-led brokerage, custody, administrative and investment advisory services; self-directed brokerage and investment advisory services; financial and wealth planning services; workplace services, including stock plan administration, and retirement plan services. See “Advisor-Led Channel” and “Self-Directed Channel” herein for additional information.
2.Margin and other lending represents margin lending arrangements, which allow customers to borrow against the value of qualifying securities and other lending which includes non‐purpose securities-based lending on non‐bank entities.
3.Deposits reflect liabilities sourced from Wealth Management clients and other sources of funding on our U.S. Bank Subsidiaries. Deposits include sweep deposit programs, savings and other deposits, and time deposits.
4.Annualized weighted average represents the total annualized weighted average cost of the various deposit products. Amounts include the effect of related hedging derivatives. The period end cost of deposits is based upon balances and rates as of March 31, 2025 and December 31, 2024. The period average is based on daily balances and rates for the period.
Net New Assets
NNA represent client asset inflows, inclusive of interest, dividends and asset acquisitions, less client asset outflows, and exclude the impact of business combinations/divestitures and the impact of fees and commissions. The level of NNA in a given period is influenced by a variety of factors, including
macroeconomic factors that impact client investment and spending behaviors, seasonality, our ability to attract and retain financial advisors and clients, capital market and corporate activities which may impact the amount of assets in certain client channels, and large idiosyncratic inflows and outflows. These factors have had an impact on our NNA in recent periods. Should these factors continue, the growth rate of our NNA may be impacted.
Advisor-Led Channel
$ in billions
At March 31, 2025
At December 31, 2024
Advisor-led client assets1
$
4,719
$
4,758
Fee-based client assets2
$
2,349
$
2,347
Fee-based client assets as a percentage of advisor-led client assets
50%
49%
Three Months Ended March 31,
2025
2024
Fee-based asset flows3
$
29.8
$
26.2
1.Advisor-led client assets represent client assets in accounts that have a Wealth Management representative assigned.
2.Fee‐based client assets represent the amount of client assets where the basis of payment for services is a fee calculated on those assets.
3.Fee-based asset flows include net new fee-based assets (including asset acquisitions), net account transfers, dividends, interest and client fees, and exclude institutional cash management related activity. For a description of the Inflows and Outflows included in Fee-based asset flows, see Fee-based client assets herein.
Self-Directed Channel
At March 31, 2025
At December 31, 2024
Self-directed client assets1 (in billions)
$
1,295
$
1,437
Self-directed households2 (in millions)
8.3
8.3
Three Months Ended March 31,
2025
2024
Daily average revenue trades (“DARTs”)3 (in thousands)
1,003
841
1.Self-directed client assets represent active accounts which are not advisor led. Active accounts are defined as having at least $25 in assets.
2.Self-directed households represent the total number of households that include at least one active account with self-directed assets. Individual households or participants that are engaged in one or more of our Wealth Management channels are included in each of the respective channel counts.
3.DARTs represent the total self-directed trades in a period divided by the number of trading days during that period.
Workplace Channel1
At March 31, 2025
At December 31, 2024
Stock plan unvested assets2 (in billions)
$
431
$
475
Stock plan participants3 (in millions)
6.7
6.6
1.The workplace channel includes equity compensation solutions for companies, their executives and employees.
2.Stock plan unvested assets represent the market value of public company securities at the end of the period..
3.Stock plan participants represent total accounts with vested and/or unvested stock plan assets in the workplace channel. Individuals with accounts in multiple plans are counted as participants in each plan.
Net Revenues
Asset Management
Asset management revenues of $4,396 million in the current quarter increased 15% compared with the prior quarter, primarily reflecting higher fee-based assets due to higher
market levels and the cumulative impact of positive fee-based flows.
See “Fee-Based Client Assets Rollforwards” herein.
Transactional Revenues
Transactional revenues of $873 million in the current quarter decreased 15% compared with the prior year quarter, primarily driven by losses on DCP investments compared with gains in the prior year quarter, partially offset by higher client activity particularly in equity-related transactions.
For further information on the impact of DCP, see “Selected Non-GAAP Financial Information” herein.
Net Interest
Net interest revenues of $1,902 million in the current quarter increased 2% compared with the prior year quarter, primarily due to lending growth and higher yields on the investment portfolio, partially offset by lower average sweep deposits.
The level and pace of interest rate changes and other macroeconomic factors have impacted client preferences for cash allocation to higher-yielding products and client demand for loans. These factors, along with other developments, such as pricing changes to certain deposit types due to various competitive dynamics, have impacted our net interest income. To the extent they persist, or other factors arise, such as central bank actions and changes in the path of interest rates, net interest income may be impacted in future periods.
Provision for Credit Losses
The Provision for credit losses on loans and lending commitments of $44 million in the current quarter was primarily related to certain specific loans, including residential real estate loans related to the California wildfires. The Provision for credit losses on loans and lending commitments was a net release of $8 million in the prior year quarter as a result of improvements in the macroeconomic outlook. This was partially offset by provisions for certain specific commercial real estate loans.
Non-Interest Expenses
Non-interest expenses of $5,332 million in the current quarter increased 5% compared with the prior year quarter, primarily as a result of higher Compensation and benefits expenses.
•Compensation and benefits expenses increased in the current quarter, primarily as a result of an increase in the formulaic payout to Wealth Management representatives on higher compensable revenues and higher severance costs associated with a RIF in March, partially offset by lower expenses related to DCP.
For further information on the impact of DCP, see “Selected Non-GAAP Financial Information” herein.
•Non-compensation expenses were relatively unchanged compared with the prior year quarter.
Fee-Based Client Assets Rollforwards
$ in billions
At
Dec 31,
2024
Inflows1
Outflows2
Market Impact3
At March 31, 2025
Separately managed4
$
719
$
20
$
(12)
$
(5)
$
722
Unified managed
613
35
(18)
(7)
623
Advisor
207
9
(11)
(4)
201
Portfolio manager
750
33
(27)
(13)
743
Subtotal
$
2,289
$
97
$
(68)
$
(29)
$
2,289
Cash management
58
11
(9)
—
60
Total fee-based client assets
$
2,347
$
108
$
(77)
$
(29)
$
2,349
$ in billions
At
Dec 31,
2023
Inflows1
Outflows2
Market Impact3
At
Mar 31,
2024
Separately managed4
$
589
$
16
$
(13)
$
39
$
631
Unified managed
501
31
(14)
27
545
Advisor
188
9
(11)
12
198
Portfolio manager
645
32
(24)
35
688
Subtotal
$
1,923
$
88
$
(62)
$
113
$
2,062
Cash management
60
12
(10)
—
62
Total fee-based
client assets
$
1,983
$
100
$
(72)
$
113
$
2,124
1.Inflows include new accounts, account transfers, deposits, dividends and interest.
2.Outflows include closed or terminated accounts, account transfers, withdrawals and client fees.
3.Market impact includes realized and unrealized gains and losses on portfolio investments.
4.Includes non-custody account values based on asset values reported on a quarter lag by third-party custodians.
1.Based on Asset management revenues related to advisory services associated with fee-based assets.
For a description of fee-based client assets in the previous tables, see “Management’s Discussion and Analysis of Financial Condition and Results of Operations—Business Segments—Wealth Management Fee-Based Client Assets” in the 2024 Form 10-K.
1.Includes Investments and Trading, Net interest, and Other revenues.
Net Revenues
Asset Management and Related Fees
Asset management and related fees of $1,451 million in the current quarter increased 8% from the prior year quarter, primarily driven by higher average AUM on higher market levels.
Asset management revenues are influenced by the level, relative mix of AUM and related fee rates. While higher market levels drove increases in average AUM in the current quarter, there were continued net outflows in the Equity asset class, which may be influenced by the structure and performance of our investment strategies and products relative to their benchmarks, offset by higher net inflows in the Alternatives and Solutions and Fixed Income asset classes reflecting client preferences. To the extent these conditions continue, we would expect our Asset management revenue to continue to be impacted.
See “Assets Under Management or Supervision” herein.
Performance-based Income and Other
Performance-based income and other revenues of $151 million in the current quarter increased from the prior year quarter, as a result of higher accrued carried interest in infrastructure funds.
Non-Interest Expenses
Non-interest expenses of $1,279 million in the current quarter increased 13% from the prior year quarter, as a result of higher Compensation and benefits expenses.
•Compensation and benefits expenses increased in the current quarter, primarily due to higher compensation
associated with carried interest and higher severance costs associated with a RIF in March.
•Non-compensation expenses increased in the current quarter, primarily due to higher distribution expenses on higher average AUM.
Assets Under Management or Supervision Rollforwards
$ in billions
At
Dec 31,
2024
Inflows1
Outflows2
Market Impact3
Other4
At
Mar 31,
2025
Equity
$
312
$
11
$
(16)
$
(9)
$
3
$
301
Fixed Income
192
18
(13)
3
(1)
199
Alternatives and Solutions
593
40
(32)
(10)
—
591
Long-Term AUM
$
1,097
$
69
$
(61)
$
(16)
$
2
$
1,091
Liquidity and Overlay Services
569
687
(702)
6
(4)
556
Total
$
1,666
$
756
$
(763)
$
(10)
$
(2)
$
1,647
$ in billions
At
Dec 31,
2023
Inflows1
Outflows2
Market Impact3
Other4
At
Mar 31,
2024
Equity
$
295
$
11
$
(16)
$
24
$
(4)
$
310
Fixed Income
171
17
(13)
1
(2)
174
Alternatives and Solutions
508
35
(24)
26
(2)
543
Long-Term AUM
$
974
$
63
$
(53)
$
51
$
(8)
$
1,027
Liquidity and Overlay Services
485
522
(531)
6
(4)
478
Total
$
1,459
$
585
$
(584)
$
57
$
(12)
$
1,505
1.Inflows represent investments or commitments from new and existing clients in new or existing investment products, including reinvestments of client dividends and increases in invested capital. Inflows exclude the impact of exchanges, whereby a client changes positions within the same asset class.
2.Outflows represent redemptions from clients’ funds, transition of funds from the committed capital period to the invested capital period and decreases in invested capital. Outflows exclude the impact of exchanges, whereby a client changes positions within the same asset class.
3.Market impact includes realized and unrealized gains and losses on portfolio investments. This excludes any funds where market impact does not impact management fees.
4.Other contains both distributions and foreign currency impact for all periods. Distributions represent decreases in invested capital due to returns of capital after the investment period of a fund. It also includes fund dividends that the client has not reinvested. Foreign currency impact reflects foreign currency changes for non-U.S. dollar denominated funds.
1.Based on Asset management revenues, net of waivers, excluding performance-based fees and other non-management fees. For certain non-U.S. funds, it includes the portion of advisory fees that the advisor collects on behalf of third-party distributors. The payment of those fees to the distributor is included in Non-compensation expenses in the income statement.
For a description of the asset classes in the previous tables, see “Management’s Discussion and Analysis of Financial Condition and Results of Operations—Business Segments—Investment Management—Assets Under Management or Supervision” in the 2024 Form 10-K.
Our U.S. Bank Subsidiaries, Morgan Stanley Bank N.A. (“MSBNA”) and Morgan Stanley Private Bank, National Association (“MSPBNA”) (together, “U.S. Bank Subsidiaries”), accept deposits, provide loans to a variety of customers, including large corporate and institutional clients, as well as high to ultra-high net worth individuals, and invest in securities. Lending activity in our U.S. Bank Subsidiaries from the Institutional Securities business segment primarily includes Secured lending facilities, Commercial and Residential real estate and Corporate loans. Lending activity in our U.S. Bank Subsidiaries from the Wealth Management business segment primarily includes Securities-based lending, which allows clients to borrow money against the value of qualifying securities, and Residential real estate loans.
For a further discussion of our credit risks, see “Quantitative and Qualitative Disclosures about Risk—Credit Risk” herein. For a further discussion about loans and lending commitments, see Notes 9 and 13 to the financial statements.
U.S. Bank Subsidiaries’ Supplemental Financial Information1
$ in billions
At March 31, 2025
At December 31, 2024
Investment securities:
Available-for-sale at fair value
$
78.2
$
76.5
Held-to-maturity
47.2
47.8
Total Investment securities
$
125.4
$
124.3
Wealth Management loans2
Residential real estate
$
67.5
$
66.6
Securities-based lending and Other3
95.0
92.9
Total Wealth Management loans
$
162.5
$
159.5
Institutional Securities loans2
Corporate
$
10.9
$
7.1
Secured lending facilities
54.0
50.2
Commercial and Residential real estate
11.2
10.5
Securities-based lending and Other
6.1
5.6
Total Institutional Securities loans
$
82.2
$
73.4
Total assets
$
442.4
$
434.8
Deposits4
$
375.5
$
369.7
1.Amounts exclude transactions between the bank subsidiaries, as well as deposits from the Parent Company and affiliates.
2.Represents loans, net of ACL. For a further discussion of loans in the Wealth Management and Institutional Securities business segments, see “Quantitative and Qualitative Disclosures about Risk—Credit Risk” herein.
3.Other loans primarily include tailored lending. For a further discussion of Other loans, see “Quantitative and Qualitative Disclosures about Risk—Credit Risk” herein.
4.For further information on deposits, see “Liquidity and Capital Resources—Funding Management—Balance Sheet—Unsecured Financing” herein.
Accounting Development Updates
The Financial Accounting Standards Board has issued certain accounting updates that apply to us. Accounting updates not referenced below were assessed and determined to be either not applicable or to not have a material impact on our financial condition or results of operations upon adoption.
We continue to evaluate accounting updates disclosed in the “Accounting Development Updates” section of the 2024 Form 10-K, including the implementation of the Income Tax Disclosures accounting update, and do not expect a material impact on our financial condition or results of operations upon adoption.
Critical Accounting Estimates
Our financial statements are prepared in accordance with U.S. GAAP, which requires us to make estimates and assumptions (see Note 1 to the financial statements). We believe that of our significant accounting policies (see Note 2 to the financial statements in the 2024 Form 10-K and Note 2 to the financial statements), the fair value of financial instruments, goodwill and intangible assets, legal and regulatory contingencies (see Note 14 to the financial statements in the 2024 Form 10-K and Note 13 to the financial statements) and income taxes policies involve a higher degree of judgment and complexity. For a further discussion about our critical accounting policies, see “Management’s Discussion and Analysis of Financial Condition and Results of Operations—Critical Accounting Estimates” in the 2024 Form 10-K.
Liquidity and Capital Resources
Our liquidity and capital policies are established and maintained by senior management, with oversight by the Asset/Liability Management Committee and our Board of Directors (“Board”). Through various risk and control committees, senior management reviews business performance relative to these policies, monitors the availability of alternative sources of financing, and oversees the liquidity, interest rate and currency sensitivity of our asset and liability position. Our Corporate Treasury department (“Treasury”), Firm Risk Committee, Asset/Liability Management Committee, and other committees and control groups assist in evaluating, monitoring and managing the impact that our business activities have on our balance sheet, liquidity and capital structure. Liquidity and capital matters are reported regularly to the Board and the Risk Committee of the Board.
Balance Sheet
We monitor and evaluate the composition and size of our balance sheet on a regular basis. Our balance sheet management process includes quarterly planning, business-specific thresholds, monitoring of business-specific usage versus key performance metrics and new business impact assessments.
We establish balance sheet thresholds at the consolidated and business segment levels. We monitor balance sheet utilization and review variances resulting from business activity and market fluctuations. On a regular basis, we review current performance versus established thresholds and assess the need to re-allocate our balance sheet based on business segment
needs. We also monitor key metrics, including asset and liability size and capital usage.
Total Assets by Business Segment
At March 31, 2025
$ in millions
IS
WM
IM
Total
Assets
Cash and cash equivalents
$
73,451
$
17,204
$
84
$
90,739
Trading assets at fair value
385,402
9,614
5,227
400,243
Investment securities
34,722
123,560
—
158,282
Securities purchased under agreements to resell
94,954
24,094
—
119,048
Securities borrowed
139,436
790
—
140,226
Customer and other receivables
53,650
37,018
1,485
92,153
Loans1
86,402
162,497
4
248,903
Goodwill
438
10,192
6,084
16,714
Intangible assets
25
2,818
3,462
6,305
Other assets2
15,239
11,192
1,252
27,683
Total assets
$
883,719
$
398,979
$
17,598
$
1,300,296
At December 31, 2024
$ in millions
IS
WM
IM
Total
Assets
Cash and cash equivalents
$
74,079
$
31,072
$
235
$
105,386
Trading assets at fair value
320,003
6,915
4,966
331,884
Investment securities
38,096
121,583
—
159,679
Securities purchased under agreements to resell
100,404
18,161
—
118,565
Securities borrowed
121,901
1,958
—
123,859
Customer and other receivables
47,321
37,196
1,641
86,158
Loans1
78,607
159,542
4
238,153
Goodwill
435
10,190
6,081
16,706
Intangible assets
27
2,939
3,487
6,453
Other assets2
15,735
11,292
1,201
28,228
Total assets
$
796,608
$
400,848
$
17,615
$
1,215,071
1.Amounts include loans held for investment, net of ACL, and loans held for sale but exclude loans at fair value, which are included in Trading assets in the balance sheet (see Note 9 to the financial statements).
2.Other assets primarily includes premises, equipment and software, ROU assets related to leases, other investments, and deferred tax assets.
A substantial portion of total assets consists of cash and cash equivalents, liquid marketable securities and short-term receivables. In the Institutional Securities business segment, these arise from market-making, financing and prime brokerage activities, and in the Wealth Management business segment, these arise from banking activities, including management of the investment portfolio.
Liquidity Risk Management Framework
The core components of our Liquidity Risk Management Framework are the Required Liquidity Framework, Liquidity Stress Tests and Liquidity Resources, which support our target liquidity profile. For a further discussion about the Firm’s Required Liquidity Framework and Liquidity Stress Tests, see “Management’s Discussion and Analysis of Financial Condition and Results of Operations—Liquidity and Capital Resources—Liquidity Risk Management Framework” in the 2024 Form 10-K.
At March 31, 2025 and December 31, 2024, we maintained sufficient liquidity to meet current and contingent funding obligations as modeled in our Liquidity Stress Tests.
Liquidity Resources
We maintain sufficient liquidity resources, which consist of HQLA and cash deposits with banks (“Liquidity Resources”), to cover daily funding needs and to meet strategic liquidity targets sized by the Required Liquidity Framework and Liquidity Stress Tests. We actively manage the amount of our Liquidity Resources considering the following components: unsecured debt maturity profile; balance sheet size and composition; funding needs in a stressed environment, inclusive of contingent cash outflows; legal entity, regional and segment liquidity requirements; regulatory requirements; and collateral requirements.
The amount of Liquidity Resources we hold is based on our risk appetite and is calibrated to meet various internal and regulatory requirements and to fund prospective business activities. The Liquidity Resources are primarily held within the Parent Company and its major operating subsidiaries. The Total HQLA values in the tables immediately following are different from Eligible HQLA, which, in accordance with the LCR rule, also takes into account certain regulatory weightings and other operational considerations.
Liquidity Resources by Type of Investment
Average Daily Balance Three Months Ended
$ in millions
March 31, 2025
December 31, 2024
Cash deposits with central banks
$
58,279
$
58,493
Unencumbered HQLA Securities1:
U.S. government obligations
167,173
161,952
U.S. agency and agency mortgage-backed securities
92,728
94,512
Non-U.S. sovereign obligations2
26,132
22,646
Other investment grade securities
182
600
Total HQLA1
$
344,494
$
338,203
Cash deposits with banks (non-HQLA)
7,246
7,237
Total Liquidity Resources
$
351,740
$
345,440
1.HQLA is presented prior to applying weightings and includes all HQLA held in subsidiaries.
2.Primarily composed of unencumbered French, U.K., Japanese, Italian, German, and Spanish government obligations.
Liquidity Resources by Non-Bank and Bank Legal Entities
Average Daily Balance Three Months Ended
$ in millions
March 31, 2025
December 31, 2024
Non-Bank legal entities
U.S.:
Parent Company
$
79,172
$
71,981
Non-Parent Company
58,994
61,684
Total U.S.
138,166
133,665
Non-U.S.
63,092
61,432
Total Non-Bank legal entities
201,258
195,097
Bank legal entities
U.S.
144,302
144,735
Non-U.S.
6,180
5,608
Total Bank legal entities
150,482
150,343
Total Liquidity Resources
$
351,740
$
345,440
Liquidity Resources may fluctuate from period to period based on the overall size and composition of our balance sheet, the maturity profile of our unsecured debt, and estimates of funding needs in a stressed environment, among other factors.
Regulatory Liquidity Framework
Liquidity Coverage Ratio and Net Stable Funding Ratio
We and our U.S. Bank Subsidiaries are required to maintain a minimum LCR and NSFR of 100%.
The LCR rule requires large banking organizations to have sufficient Eligible HQLA to cover net cash outflows arising from significant stress over 30 calendar days, thus promoting the short-term resilience of the liquidity risk profile of banking organizations. In determining Eligible HQLA for LCR purposes, weightings (or asset haircuts) are applied to HQLA, and certain HQLA held in subsidiaries is excluded.
The NSFR rule requires large banking organizations to maintain an amount of available stable funding, which is their regulatory capital and liabilities subject to standardized weightings, equal to or greater than their required stable funding, which is their projected minimum funding needs, over a one-year time horizon.
As of March 31, 2025, we and our U.S. Bank Subsidiaries are compliant with the minimum LCR and NSFR requirements of 100%.
Liquidity Coverage Ratio
Average Daily Balance Three Months Ended
$ in millions
March 31, 2025
December 31, 2024
Eligible HQLA
Cash deposits with central banks
$
53,674
$
53,836
Securities1
221,883
213,394
Total Eligible HQLA
$
275,557
$
267,230
Net cash outflows
$
212,276
$
205,780
LCR
130
%
130
%
1.Primarily includes U.S. Treasuries, U.S. agency mortgage-backed securities, sovereign bonds and investment grade corporate bonds.
Funding Management
We manage our funding in a manner that reduces the risk of disruption to our operations. We pursue a strategy of diversification of secured and unsecured funding sources (by product, investor and region) and attempt to ensure that the tenor of our liabilities equals or exceeds the expected holding period of the assets being financed. Our goal is to achieve an optimal mix of durable secured and unsecured financing.
We fund our balance sheet on a global basis through diverse sources. These sources include our equity capital, borrowings, bank notes, securities sold under agreements to repurchase, securities lending, deposits, letters of credit and lines of credit. We have active financing programs for both standard and structured products targeting global investors and currencies.
Treasury allocates interest expense to our businesses based on the tenor and interest rate profile of the assets being funded. Treasury similarly allocates interest income to businesses carrying deposit products and other liabilities across the businesses based on the characteristics of those deposits and other liabilities.
Secured Financing
For a discussion of our secured financing activities, see “Management’s Discussion and Analysis of Financial Condition and Results of Operations—Liquidity and Capital Resources—Funding Management—Secured Financing” in the 2024 Form 10-K.
Collateralized Financing Transactions
$ in millions
At March 31, 2025
At December 31, 2024
Securities purchased under agreements to resell and Securities borrowed
$
259,274
$
242,424
Securities sold under agreements to repurchase and Securities loaned
$
85,876
$
65,293
Securities received as collateral1
$
3,159
$
9,625
1.Included within Trading assets in the balance sheet.
Securities purchased under agreements to resell and Securities borrowed
$
237,750
$
250,354
Securities sold under agreements to repurchase and Securities loaned
$
84,782
$
74,949
See “Total Assets by Business Segment” herein for additional information on the assets shown in the previous table and Note 2 to the financial statements in the 2024 Form 10-K and Note 8 to the financial statements for additional information on collateralized financing transactions.
In addition to the collateralized financing transactions shown in the previous table, we engage in financing transactions collateralized by customer-owned securities, which are segregated in accordance with regulatory requirements. Receivables under these financing transactions, primarily margin loans, are included in Customer and other receivables in the balance sheet, and payables under these financing transactions, primarily to prime brokerage customers, are included in Customer and other payables in the balance sheet. Our risk exposure on these transactions is mitigated by collateral maintenance policies and the elements of our Liquidity Risk Management Framework.
Unsecured Financing
For a discussion of our unsecured financing activities, see “Management’s Discussion and Analysis of Financial Condition and Results of Operations—Liquidity and Capital Resources—Funding Management—Unsecured Financing” in the 2024 Form 10-K.
Deposits
$ in millions
At March 31, 2025
At December 31, 2024
Savings and demand deposits:
Brokerage sweep deposits1
$
138,013
$
142,550
Savings and other
163,877
157,348
Total Savings and demand deposits
301,890
299,898
Time deposits2
79,673
76,109
Total3
$
381,563
$
376,007
1.Amounts represent balances swept from client brokerage accounts.
2.Our Time deposits are predominantly brokered certificates of deposit.
3.Our deposits are primarily held in U.S. offices.
Deposits are primarily sourced from our Wealth Management clients and are considered to have stable, low-cost funding characteristics relative to other sources of funding. Each category of deposits presented above has a different cost profile and clients may respond differently to changes in interest rates and other macroeconomic conditions. Total deposits in the current quarter increased primarily due to increases in Savings and Time Deposits, partially offset by a reduction in Brokerage sweep deposits, largely due to net outflows to alternative cash equivalent and other investment products.
Borrowings by Maturity at March 31, 20251
$ in millions
Parent Company
Subsidiaries
Total
Original maturities of one year or less
$
—
$
8,393
$
8,393
Original maturities greater than one year
2025
$
5,874
$
10,644
$
16,518
2026
22,605
13,799
36,404
2027
21,175
13,500
34,675
2028
14,025
16,682
30,707
2029
16,636
13,466
30,102
Thereafter
106,898
41,693
148,591
Total greater than one year
$
187,213
$
109,784
$
296,997
Total
$
187,213
$
118,177
$
305,390
Maturities over next 12 months2
$
22,963
1.Original maturity in the table is generally based on contractual final maturity. For borrowings with put options, maturity represents the earliest put date.
2.Includes only borrowings with original maturities greater than one year.
Borrowings of $305 billion as of March 31, 2025 increased compared with $289 billion at December 31, 2024, primarily due to issuances net of maturities and redemptions.
We believe that accessing debt investors through multiple distribution channels helps provide consistent access to the unsecured markets. In addition, the issuance of borrowings with original maturities greater than one year allows us to reduce reliance on short-term credit-sensitive instruments. Borrowings with original maturities greater than one year are generally managed to achieve staggered maturities, thereby mitigating refinancing risk, and to maximize investor diversification through sales to global institutional and retail clients across regions, currencies and product types.
The availability and cost of financing to us can vary depending on market conditions, the volume of certain trading and lending activities, our credit ratings and the overall availability of credit. We also engage in, and may continue to engage in, repurchases of our borrowings as part of our market-making activities.
For further information on Borrowings, see Note 12 to the financial statements.
Credit Ratings
We rely on external sources to finance a significant portion of our daily operations. Our credit ratings are one of the factors in the cost and availability of financing and can have an impact on certain trading revenues, particularly in those businesses where longer-term counterparty performance is a key consideration, such as certain OTC derivative transactions. When determining credit ratings, rating agencies consider both company-specific and industry-wide factors. See also “Risk Factors—Liquidity Risk” in the 2024 Form 10-K.
Parent Company and U.S. Bank Subsidiaries Issuer Ratings at April 30, 2025
Parent Company
Short-Term Debt
Long-Term Debt
Rating Outlook
DBRS, Inc.
R-1 (middle)
A (high)
Positive
Fitch Ratings, Inc.
F1
A+
Stable
Moody’s Investors Service, Inc.
P-1
A1
Stable
Rating and Investment Information, Inc.
a-1
A+
Stable
S&P Global Ratings
A-2
A-
Stable
MSBNA
Short-Term Debt
Long-Term Debt
Rating Outlook
Fitch Ratings, Inc.
F1+
AA-
Stable
Moody’s Investors Service, Inc.
P-1
Aa3
Stable
S&P Global Ratings
A-1
A+
Stable
MSPBNA
Short-Term Debt
Long-Term Debt
Rating Outlook
Fitch Ratings, Inc.
F1+
AA-
Stable
Moody’s Investors Service, Inc.
P-1
Aa3
Stable
S&P Global Ratings
A-1
A+
Stable
Incremental Collateral or Terminating Payments
In connection with certain OTC derivatives and certain other agreements where we are a liquidity provider to certain financing vehicles associated with the Institutional Securities business segment, we may be required to provide additional collateral, immediately settle any outstanding liability balances with certain counterparties or pledge additional collateral to certain clearing organizations in the event of a future credit rating downgrade irrespective of whether we are in a net asset or net liability position. See Note 6 to the financial statements for additional information on OTC derivatives that contain such contingent features.
While certain aspects of a credit rating downgrade are quantifiable pursuant to contractual provisions, the impact it would have on our business and results of operations in future periods is inherently uncertain and would depend on a number of interrelated factors, including, among other things, the magnitude of the downgrade, the rating relative to peers, the rating assigned by the relevant agency before the downgrade, individual client behavior and future mitigating actions we might take. The liquidity impact of additional collateral requirements is included in our Liquidity Stress Tests.
Capital Management
We view capital as an important source of financial strength and actively manage our consolidated capital position based upon, among other things, business opportunities, risks, capital availability and rates of return together with internal capital policies, regulatory requirements, such as the SCB, and rating agency guidelines. In the future, we may expand or contract our capital base to address the changing needs of our businesses.
Common Stock Repurchases
Three Months Ended March 31,
in millions, except for per share data
2025
2024
Number of shares
8
12
Average price per share
$
125.88
$
86.79
Total
$
1,000
$
1,000
For additional information on our common stock repurchases, see Note 16 to the financial statements.
For a description of our capital plan, see “Liquidity and Capital Resources—Regulatory Requirements—Capital Plans, Stress Tests and the Stress Capital Buffer” herein.
Common Stock Dividend Announcement
Announcement date
April 11, 2025
Amount per share
$0.925
Date to be paid
May 15, 2025
Shareholders of record as of
April 30, 2025
For additional information on our common stock dividends, see “Liquidity and Capital Resources—Regulatory Requirements—Capital Plans, Stress Tests and the Stress Capital Buffer” herein.
For additional information on our common stock and information on our preferred stock, see Note 16 to the financial statements.
Off-Balance Sheet Arrangements
We enter into various off-balance sheet arrangements, including through unconsolidated SPEs and lending-related financial instruments (e.g., guarantees and commitments), primarily in connection with the Institutional Securities and Investment Management business segments.
We utilize SPEs primarily in connection with securitization activities. For information on our securitization activities, see Note 15 to the financial statements in the 2024 Form 10-K.
For information on our commitments, obligations under certain guarantee arrangements and indemnities, see Note 13 to the financial statements. For a further discussion of our lending commitments, see “Quantitative and Qualitative Disclosures about Risk—Credit Risk—Loans and Lending Commitments” herein.
Regulatory Requirements
Regulatory Capital Framework
We are a financial holding company (“FHC”) under the Bank Holding Company Act of 1956, as amended (“BHC Act”) and are subject to the regulation and oversight of the Board of Governors of the Federal Reserve System (“Federal Reserve”). The Federal Reserve establishes capital requirements for us, including “well-capitalized” standards, and evaluates our compliance with such capital requirements. The OCC establishes similar capital requirements and
standards for our U.S. Bank Subsidiaries. The regulatory capital requirements are largely based on the Basel III capital standards established by the Basel Committee and also implement certain provisions of the Dodd-Frank Act. For us to remain an FHC, we must remain well-capitalized in accordance with standards established by the Federal Reserve, and our U.S. Bank Subsidiaries must remain well-capitalized in accordance with standards established by the OCC. In addition, many of our regulated subsidiaries are subject to regulatory capital requirements, including regulated subsidiaries registered as swap dealers with the CFTC or conditionally registered as security-based swap dealers with the SEC or registered as broker-dealers or futures commission merchants. For additional information on regulatory capital requirements for our U.S. Bank Subsidiaries, as well as our subsidiaries that are swap entities, see Note 15 to the financial statements.
Regulatory Capital Requirements
We are required to maintain minimum risk-based and leverage-based capital and TLAC ratios. For more information, see “Management’s Discussion and Analysis of Financial Condition and Results of Operations—Liquidity and Capital Resources—Regulatory Capital Requirements” in the 2024 Form 10-K. For additional information on TLAC, see “Total Loss-Absorbing Capacity, Long-Term Debt and Clean Holding Company Requirements” herein.
Risk-Based Regulatory Capital. Risk-based capital ratio requirements apply to Common Equity Tier 1 (“CET1”) capital, Tier 1 capital and Total capital (which includes Tier 2 capital), each as a percentage of RWA, and consist of regulatory minimum required ratios plus our capital buffer requirement. Capital requirements require certain adjustments to, and deductions from, capital for purposes of determining these ratios.
Risk-Based Regulatory Capital Ratio Requirements
At March 31, 2025 andDecember 31, 2024
Standardized
Advanced
Capital buffers
Capital conservation buffer
—
2.5%
SCB1
6.0%
N/A
G-SIB capital surcharge2
3.0%
3.0%
CCyB3
0%
0%
Capital buffer requirement
9.0%
5.5%
1.For additional information on the SCB, see “Capital Plans, Stress Tests and the Stress Capital Buffer” herein and in the 2024 Form 10-K.
2.For a further discussion of the G-SIB capital surcharge, see “Management’s Discussion and Analysis of Financial Condition and Results of Operations—Liquidity and Capital Resources—Regulatory Requirements—G-SIB Capital Surcharge” in the 2024 Form 10-K.
3.The CCyB can be set up to 2.5%, but is currently set by the Federal Reserve at zero.
The capital buffer requirement represents the amount of CET1 capital we must maintain above the minimum risk-based capital requirements in order to avoid restrictions on our ability to make capital distributions, including the payment of dividends and the repurchase of stock, and to pay
discretionary bonuses to executive officers. Our capital buffer requirement computed under the standardized approaches for calculating credit risk and market RWAs (“Standardized Approach”) is equal to the sum of our SCB, G-SIB capital surcharge and CCyB, and our capital buffer requirement computed under the applicable advanced approaches for calculating credit risk, market risk and operational risk RWAs (“Advanced Approach”) is equal to our 2.5% capital conservation buffer, G-SIB capital surcharge and CCyB.
Regulatory Minimum
At March 31, 2025 andDecember 31, 2024
Standardized
Advanced
Required ratios1
CET1 capital ratio
4.5
%
13.5%
10.0%
Tier 1 capital ratio
6.0
%
15.0%
11.5%
Total capital ratio
8.0
%
17.0%
13.5%
1.Required ratios represent the regulatory minimum plus the capital buffer requirement.
Our risk-based capital ratios are computed under each of (i) the Standardized Approach and (ii) the Advanced Approach. The credit risk RWA calculations between the two approaches differ in that the Standardized Approach requires calculation of RWA using prescribed risk weights and exposure methodologies, whereas the Advanced Approach utilizes models to calculate exposure amounts and risk weights. At March 31, 2025 and December 31, 2024, the differences between the actual and required ratios were lower under the Standardized Approach.
Leverage-Based Regulatory Capital. Leverage-based capital requirements include a minimum Tier 1 leverage ratio of 4%, a minimum SLR of 3% and an enhanced SLR capital buffer of at least 2%.
CECL Deferral. Beginning on January 1, 2020, we elected to defer the effect of the adoption of CECL on our risk-based and leverage-based capital amounts and ratios, as well as our RWA, adjusted average assets and supplementary leverage exposure calculations, over a five-year transition period. The deferral impacts began to phase in at 25% per year from January 1, 2022, were phased-in at 75% from January 1, 2024 and were fully phased-in from January 1, 2025.
1.Required ratios are inclusive of any buffers applicable as of the date presented.
Leveraged-based capital
$ in millions
At March 31, 2025
At December 31, 2024
Leveraged-based capital
Adjusted average assets1
$
1,251,047
$
1,223,779
Supplementary leverage exposure2
1,552,615
1,517,687
Leveraged-based capital ratios
Tier 1 leverage
6.9
%
6.9
%
SLR
5.6
%
5.6
%
Required ratios3
Tier 1 leverage
4.0
%
4.0
%
SLR
5.0
%
5.0
%
1.Adjusted average assets represents the denominator of the Tier 1 leverage ratio and is composed of the average daily balance of consolidated on-balance sheet assets for the quarters ending on the respective balance sheet dates, reduced by disallowed goodwill, intangible assets, investments in covered funds, defined benefit pension plan assets, after-tax gain on sale from assets sold into securitizations, investments in our own capital instruments, certain deferred tax assets and other capital deductions.
2.Supplementary leverage exposure is the sum of Adjusted average assets used in the Tier 1 leverage ratio and other adjustments, primarily: (i) for derivatives, potential future exposure and the effective notional principal amount of sold credit protection offset by qualifying purchased credit protection; (ii) the counterparty credit risk for repo-style transactions; and (iii) the credit equivalent amount for off-balance sheet exposures.
3.Required ratios are inclusive of any buffers applicable as of the date presented.
Regulatory Capital
$ in millions
At March 31, 2025
At December 31, 2024
Change
CET1 capital
Common shareholders' equity
$
97,062
$
94,761
$
2,301
Regulatory adjustments and deductions:
Net goodwill
(16,371)
(16,354)
(17)
Net intangible assets
(4,888)
(5,003)
115
Impact of CECL transition
—
62
(62)
Other adjustments and deductions1
1,172
1,629
(457)
Total CET1 capital
$
76,975
$
75,095
$
1,880
Additional Tier 1 capital
Preferred stock
$
9,750
$
9,750
$
—
Noncontrolling interests
881
807
74
Additional Tier 1 capital
$
10,631
$
10,557
$
74
Deduction for investments in covered funds
(932)
(862)
(70)
Total Tier 1 capital
$
86,674
$
84,790
$
1,884
Standardized Tier 2 capital
Subordinated debt
$
9,051
$
8,851
$
200
Eligible ACL
2,299
2,065
234
Other adjustments and deductions
(252)
(139)
(113)
Total Standardized Tier 2 capital
$
11,098
$
10,777
$
321
Total Standardized capital
$
97,772
$
95,567
$
2,205
Advanced Tier 2 capital
Subordinated debt
$
9,051
$
8,851
$
200
Eligible credit reserves
1,547
1,344
203
Other adjustments and deductions
(252)
(139)
(113)
Total Advanced Tier 2 capital
$
10,346
$
10,056
$
290
Total Advanced capital
$
97,020
$
94,846
$
2,174
1.Other adjustments and deductions used in the calculation of CET1 capital primarily includes net after-tax DVA, the credit spread premium over risk-free rate for derivative liabilities, defined benefit pension plan assets, after-tax gain on sale from assets sold into securitizations, investments in our own capital instruments and certain deferred tax assets.
Regulatory VaR—VaR for regulatory capital requirements
In the current quarter, Credit risk RWA increased under both the Standardized and Advanced Approaches. Under the Standardized Approach, the increase was primarily due to higher Securities financing transactions, Derivatives exposures, Other credit risk driven by higher deferred tax assets and securitizations, and growth in lending. Under the Advanced Approach, the increase was primarily due to higher Derivatives exposures, Securities financing transactions and Other credit risk driven by higher deferred tax assets and securitizations, partially offset by decreased Corporate lending commitments.
Market risk RWA increased in the current quarter under both the Standardized and Advanced Approaches, primarily driven by higher charges on Specific risk, and higher Regulatory Stressed VaR and Regulatory VaR, partially offset by decreased charges on incremental risk.
The decrease in Operational risk RWA in the current quarter is related to lower execution-related losses.
Total Loss-Absorbing Capacity, Long-Term Debt and Clean Holding Company Requirements
The Federal Reserve has established external TLAC, long-term debt (“LTD”) and clean holding company requirements for top-tier BHCs of U.S. G-SIBs (“covered BHCs”), including the Parent Company. These requirements are designed to ensure that covered BHCs will have enough loss-
absorbing resources at the point of failure to be recapitalized through the conversion of eligible LTD to equity or otherwise by imposing losses on eligible LTD or other forms of TLAC where an SPOE resolution strategy is used.
Required and Actual TLAC and Eligible LTD Ratios
Actual Amount/Ratio
$ in millions
Regulatory Minimum
Required Ratio1
At March 31, 2025
At December 31, 2024
External TLAC2
$
268,879
$
266,146
External TLAC as a % of RWA
18.0
%
21.5
%
53.5
%
55.8
%
External TLAC as a % of leverage exposure
7.5
%
9.5
%
17.3
%
17.5
%
Eligible LTD3
$
169,619
$
169,690
Eligible LTD as a % of RWA
9.0
%
9.0
%
33.7
%
35.5
%
Eligible LTD as a % of leverage exposure
4.5
%
4.5
%
10.9
%
11.2
%
1.Required ratios are inclusive of applicable buffers.
2.External TLAC consists of CET1 capital and Additional Tier 1 capital (each excluding any noncontrolling minority interests), as well as eligible LTD.
3.Consists of TLAC-eligible LTD reduced by 50% for amounts of unpaid principal due to be paid in more than one year but less than two years from each respective balance sheet date.
We are in compliance with all TLAC requirements as of March 31, 2025 and December 31, 2024.
For a further discussion of TLAC and related requirements, see “Management’s Discussion and Analysis of Financial Condition and Results of Operations—Liquidity and Capital Resources—Regulatory Requirements—Total Loss-Absorbing Capacity, Long-Term Debt and Clean Holding Company Requirements” in the 2024 Form 10-K.
Capital Plans, Stress Tests and the Stress Capital Buffer
The Federal Reserve has capital planning and stress test requirements for large BHCs, which form part of the Federal Reserve’s annual CCAR framework.
We must submit, on at least an annual basis, a capital plan to the Federal Reserve, taking into account the results of separate annual stress tests designed by us and the Federal Reserve, so that the Federal Reserve may assess our systems and processes that incorporate forward-looking projections of revenues and losses to monitor and maintain our internal capital adequacy. As banks with less than $250 billion of total assets, our U.S. Bank Subsidiaries are not subject to company-run stress test regulatory requirements.
As part of its annual capital supervisory stress testing process, the Federal Reserve determines an SCB for each large BHC, including us.
Our SCB will remain at 6.0% through September 30, 2025. Together with other features of the regulatory capital framework, this SCB resulted in an aggregate Standardized Approach Common Equity Tier 1 required ratio of 13.5%.
For the 2025 capital planning and stress test cycle, we submitted our capital plan and company-run stress test results
to the Federal Reserve on April 7, 2025. The Federal Reserve is expected to publish summary results of the CCAR and Dodd-Frank Act supervisory stress tests of each large BHC, including us, by June 30, 2025. We are required to disclose a summary of the results of our company-run stress tests within 15 days of the date the Federal Reserve discloses the results of the supervisory stress tests.
For additional information, see “Management’s Discussion and Analysis of Financial Condition and Results of Operations—Liquidity and Capital Resources—Regulatory Requirements—Capital Plans, Stress Tests and the Stress Capital Buffer” in the 2024 Form 10-K.
Attribution of Average Common Equity According to the Required Capital Framework
Our required capital (“Required Capital”) estimation is based on the Required Capital framework, an internal capital adequacy measure. Common equity attribution to the business segments is based on capital usage calculated under the Required Capital framework, as well as each business segment’s relative contribution to our total Required Capital.
The Required Capital framework is a risk-based and leverage-based capital measure, which is compared with our regulatory capital to ensure that we maintain an amount of going concern capital after absorbing potential losses from stress events, where applicable, at a point in time. The amount of capital allocated to the business segments is generally set at the beginning of each year and remains fixed throughout the year until the next annual reset unless a significant business change occurs (e.g., acquisition or disposition). We define the difference between our total average common equity and the sum of the average common equity amounts allocated to our business segments as Parent Company common equity. We generally hold Parent Company common equity for prospective regulatory requirements, organic growth, potential future acquisitions and other capital needs.
Average Common Equity Attribution under the Required Capital Framework1
Three Months Ended March 31,
$ in billions
2025
2024
Institutional Securities
$
48.4
$
45.0
Wealth Management
29.4
29.1
Investment Management
10.6
10.8
Parent Company
7.1
5.0
Total
$
95.5
$
89.9
1.The attribution of average common equity to the business segments is a non-GAAP financial measure. See “Selected Non-GAAP Financial Information” herein.
We continue to evaluate our Required Capital framework with respect to the impact of evolving regulatory requirements, as appropriate.
Resolution and Recovery Planning
We are required to submit once every two years to the Federal Reserve and the FDIC (“Agencies”) a resolution plan that describes our strategy for a rapid and orderly resolution under the U.S. Bankruptcy Code in the event of our material financial distress or failure. Our next resolution plan submission is due in July 2025.
As described in our most recent resolution plan, our preferred resolution strategy is an SPOE strategy, which would impose losses on the holders of eligible LTD and other forms of eligible TLAC issued by the Parent Company before any losses are imposed on creditors of our supported entities and without requiring taxpayer or government financial support.
For more information about resolution and recovery planning requirements and our activities in these areas, including the implications of such activities in a resolution scenario, see “Business—Supervision and Regulation—Financial Holding Company—Resolution and Recovery Planning,” “Risk Factors—Legal, Regulatory and Compliance Risk” and “Management’s Discussion and Analysis of Financial Condition and Results of Operations—Liquidity and Capital Resources—Regulatory Requirements—Resolution and Recovery Planning” in the 2024 Form 10-K.
Regulatory Developments and Other Matters
Proposed Changes to Capital Requirements
On April 17, 2025, the Federal Reserve proposed revisions to the SCB and CCAR frameworks applicable to us, aimed at reducing the volatility of the capital requirements stemming from the Federal Reserve’s annual stress test results. Under the proposal, our SCB would be based, in part, on the average of the post-stress capital decline embedded in the Federal Reserve’s stress test results over two consecutive years. Additionally, the proposal would shift the annual effective date of the revised SCB from October 1 to January 1 of the following year and modify certain elements of the Federal Reserve’s CCAR program.
Quantitative and Qualitative Disclosures about Risk
Management believes effective risk management is vital to the success of our business activities. For a discussion of our Enterprise Risk Management framework and risk management functions, see “Quantitative and Qualitative Disclosures about Risk—Risk Management” in the 2024 Form 10-K.
Market Risk
Market risk refers to the risk that a change in the level of one or more market prices, rates, spreads, indices, volatilities, correlations or other market factors, such as market liquidity, will result in losses for a position or portfolio. Generally, we incur market risk as a result of trading, investing and client facilitation activities, principally within the Institutional Securities business segment where the substantial majority of our VaR for market risk exposures is generated. In addition, we incur non-trading market risk, principally within the Wealth Management and Investment Management business segments. The Wealth Management business segment primarily incurs non-trading market risk (including interest rate risk) from lending and deposit-taking activities. The Investment Management business segment primarily incurs non-trading market risk from capital investments in its funds. For a further discussion of market risk, see “Quantitative and Qualitative Disclosures about Risk—Market Risk” in the 2024 Form 10-K.
Trading Risks
We have exposures to a wide range of risks related to interest rates and credit spreads, equity prices, foreign exchange rates and commodity prices as well as the associated implied volatilities, correlations and spreads of the global markets in which we conduct our trading activities.
The statistical technique known as VaR is one of the tools we use to measure, monitor and review the market risk exposures of our trading portfolios.
For information regarding our primary risk exposures and market risk management, VaR methodology, assumptions and limitations, see “Quantitative and Qualitative Disclosures about Risk—Market Risk—Trading Risks” in the 2024 Form 10-K.
95%/One-Day Management VaR for the Trading Portfolio
Three Months Ended
March 31, 2025
$ in millions
Period End
Average
High1
Low1
Interest rate and credit spread
$
25
$
30
$
39
$
22
Equity price
23
23
26
19
Foreign exchange rate
9
11
15
7
Commodity price
22
17
27
12
Less: Diversification benefit2
(40)
(35)
N/A
N/A
Primary Risk Categories
$
39
$
46
$
54
$
39
Credit Portfolio
18
19
23
18
Less: Diversification benefit2
(11)
(15)
N/A
N/A
Total Management VaR
$
46
$
50
$
60
$
43
Three Months Ended
December 31, 2024
$ in millions
Period End
Average
High1
Low1
Interest rate and credit spread
$
23
$
28
$
43
$
19
Equity price
21
24
39
18
Foreign exchange rate
10
9
13
6
Commodity price
18
15
20
11
Less: Diversification benefit2
(37)
(36)
N/A
N/A
Primary Risk Categories
$
35
$
40
$
59
$
32
Credit Portfolio
20
21
23
20
Less: Diversification benefit2
(16)
(15)
N/A
N/A
Total Management VaR
$
39
$
46
$
64
$
39
1.The high and low VaR values for the Total Management VaR and each of the component VaRs might have occurred on different days during the quarter, and, therefore, the diversification benefit is not an applicable measure.
2.Diversification benefit equals the difference between the total VaR and the sum of the component VaRs. This benefit arises because the simulated one-day losses for each of the components occur on different days. Similar diversification benefits are also taken into account within each component.
Average Total Management VaR and average Management VaR for the Primary Risk Categories increased from the three months ended December 31, 2024, primarily driven by increased exposure in credit spread risk category and higher market volatility.
Distribution of VaR Statistics and Net Revenues
We evaluate the reasonableness of our VaR model by comparing the potential declines in portfolio values generated by the model with corresponding actual trading results for the Firm, as well as individual business units. For days where losses exceed the VaR statistic, we examine the drivers of trading losses to evaluate the VaR model’s accuracy. There was one trading loss day in the current quarter, which did not exceed 95% Total Management VaR.
Daily 95%/One-Day Total Management VaR for the Current Quarter
($ in millions)
Daily Net Trading Revenues for the Current Quarter
($ in millions)
Daily net trading revenues include profits and losses from Interest rate and credit spread, Equity price, Foreign exchange rate, Commodity price, and Credit Portfolio positions and intraday trading activities for our trading businesses. Certain items such as fees, commissions, net interest income and counterparty default risk are excluded from daily net trading revenues and the VaR model. Revenues required for Regulatory VaR backtesting further exclude intraday trading.
Non-Trading Risks
We believe that sensitivity analysis is an appropriate representation of our non-trading risks. The following sensitivity analyses cover substantially all of the non-trading market risk in our portfolio.
Credit Spread Risk Sensitivity1
$ in millions
At March 31, 2025
At December 31, 2024
Derivatives
$
6
$
6
Borrowings carried at fair value
52
49
1.Amounts represent the potential gain for each 1 bps widening of our credit spread.
The Wealth Management business segment reflects a substantial portion of our non-trading interest rate risk. Net interest income in the Wealth Management business segment primarily consists of interest income earned on non-trading assets held, including loans and investment securities, as well as margin and other lending on non-bank entities and interest expense incurred on non-trading liabilities, primarily deposits.
Wealth Management Net Interest Income Sensitivity Analysis
$ in millions
At March 31, 2025
At December 31, 2024
Basis point change
+200
$
563
$
699
+100
285
350
-100
(313)
(371)
-200
(697)
(803)
The previous table presents an analysis of selected instantaneous upward and downward parallel interest rate shocks (subject to a floor of zero percent in the downward scenario) on net interest income over the next 12 months for our Wealth Management business segment. These shocks are applied to our 12-month forecast for our Wealth Management business segment, which incorporates market expectations of interest rates and our forecasted balance sheet and business activity. The forecast includes modeled prepayment behavior, reinvestment of net cash flows from maturing assets and liabilities, and deposit pricing sensitivity to interest rates. These key assumptions are updated periodically based on historical data and future expectations.
We do not manage to any single rate scenario but rather manage net interest income in our Wealth Management business segment across a range of possible outcomes, including non-parallel rate change scenarios. The sensitivity analysis assumes that we take no action in response to these scenarios, assumes there are no changes in other macroeconomic variables normally correlated with changes in interest rates and includes subjective assumptions regarding customer and market re-pricing behavior and other factors.
Our Wealth Management business segment balance sheet is asset sensitive, given assets reprice faster than liabilities,
resulting in higher net interest income in higher interest rate scenarios and lower net interest income in lower interest rate scenarios. The level of interest rates may impact the amount of deposits held at the Firm, given competition for deposits from other institutions and alternative cash-equivalent products available to depositors. Further, the level of interest rates could also impact client demand for loans.
Net interest income sensitivity to interest rates at March 31, 2025 decreased from December 31, 2024, primarily driven by the effects of changes in the mix of our assets and liabilities and changes in market rates.
Investments Sensitivity, Including Related Carried Interest
Loss from 10% Decline
$ in millions
At March 31, 2025
At December 31, 2024
Investments related to Investment Management activities
$
537
$
571
Other investments:
MUMSS
132
122
Other Firm investments
475
463
We have exposure to public and private companies through direct investments, as well as through funds that invest in these assets. These investments are predominantly equity positions with long investment horizons, a portion of which is for business facilitation purposes. The market risk related to these investments is measured by estimating the potential reduction in net revenues associated with a reasonably possible 10% decline in investment values and related impact on performance-based income, as applicable. The measures reflected in the table above do not reflect the effect of any economic hedges or diversification that may reduce the risk of loss.
Asset Management Revenue Sensitivity
Certain asset management revenues in the Wealth Management and Investment Management business segments are derived from management fees, which are based on fee-based client assets in Wealth Management or AUM in Investment Management (together, “client holdings”). The assets underlying client holdings are primarily composed of equity, fixed income and alternative investments and are sensitive to changes in related markets. These revenues depend on multiple factors including, but not limited to, the level and duration of a market increase or decline, price volatility, the geographic and industry mix of client assets, and client behavior such as the rate and magnitude of client investments and redemptions. Therefore, overall revenues may not correlate completely with changes in the related markets.
Credit Risk
Credit risk refers to the risk of loss arising when a borrower, counterparty or issuer does not meet its financial obligations to us. We are primarily exposed to credit risk from institutions and individuals through our Institutional Securities and Wealth Management business segments. For a further discussion of our credit risks, see “Quantitative and Qualitative Disclosures about Risk—Credit Risk” in the 2024 Form 10-K.
Loans and Lending Commitments
At March 31, 2025
$ in millions
HFI
HFS
FVO1
Total
Institutional Securities:
Corporate
$
7,733
$
11,994
$
—
$
19,727
Secured lending facilities
51,329
3,680
—
55,009
Commercial and Residential real estate
8,610
290
3,344
12,244
Securities-based lending and Other
3,372
147
6,471
9,990
Total Institutional Securities
71,044
16,111
9,815
96,970
Wealth Management:
Residential real estate
67,579
—
—
67,579
Securities-based lending and Other
95,298
—
—
95,298
Total Wealth Management
162,877
—
—
162,877
Total Investment Management2
4
—
251
255
Total loans
233,925
16,111
10,066
260,102
ACL
(1,133)
(1,133)
Total loans, net of ACL
$
232,792
$
16,111
$
10,066
$
258,969
Lending commitments3
$
151,574
$
27,924
$
562
$
180,060
Total exposure
$
384,366
$
44,035
$
10,628
$
439,029
At December 31, 2024
$ in millions
HFI
HFS
FVO1
Total
Institutional Securities:
Corporate
$
6,889
$
9,183
$
—
$
16,072
Secured lending facilities
48,842
2,507
—
51,349
Commercial and Residential real estate
8,412
628
2,420
11,460
Securities-based lending and Other
2,876
—
6,041
8,917
Total Institutional Securities
67,019
12,318
8,461
87,798
Wealth Management:
Residential real estate
66,738
—
—
66,738
Securities-based lending and Other
93,139
1
—
93,140
Total Wealth Management
159,877
1
—
159,878
Total Investment Management2
4
—
200
204
Total loans
226,900
12,319
8,661
247,880
ACL
(1,066)
(1,066)
Total loans, net of ACL
$
225,834
$
12,319
$
8,661
$
246,814
Lending commitments3
$
148,818
$
26,955
$
758
$
176,531
Total exposure
$
374,652
$
39,274
$
9,419
$
423,345
Total exposure—consists of Total loans, net of ACL, and Lending commitments
1.FVO includes the fair value of certain unfunded lending commitments.
2.Investment Management business segment loans are related to certain of our activities as an investment adviser and manager. Loans held at fair value are the result of the consolidation of investment vehicles (including CLOs) managed by Investment Management, composed primarily of senior secured loans to corporations.
3.Lending commitments represent the notional amount of legally binding obligations to provide funding to clients for lending transactions. Since commitments associated with these business activities may expire unused or may not be utilized to full capacity, they do not necessarily reflect the actual future cash funding requirements.
We provide loans and lending commitments to a variety of customers, including large corporate and institutional clients, as well as high to ultra-high net worth individuals. In addition, we purchase loans in the secondary market. Loans and lending commitments are either held for investment, held for sale or carried at fair value. For more information on these loan classifications, see Note 2 to the financial statements in the 2024 Form 10-K.
Total loans and lending commitments increased by approximately $16 billion since December 31, 2024, primarily due to an increase in Secured lending facilities and Corporate lending within the Institutional Securities business segment and growth in Securities-based loans within the Wealth Management business segment.
See Notes 4, 5, 9 and 13 to the financial statements for further information.
Allowance for Credit Losses—Loans and Lending Commitments
$ in millions
Three Months Ended March 31, 2025
ACL—Loans
Beginning balance
$
1,066
Gross charge-offs
(31)
Recoveries
8
Net (charge-offs)/recoveries
(23)
Provision for credit losses
81
Other
9
Ending balance
$
1,133
ACL—Lending commitments
Beginning balance
$
656
Provision for credit losses
54
Other
8
Ending balance
$
718
Total ending balance
$
1,851
Provision for Credit Losses by Business Segment
Three Months Ended March 31, 2025
$ in millions
IS
WM
Total
Loans
$
37
$
44
$
81
Lending commitments
54
—
54
Total
$
91
$
44
$
135
Credit exposure arising from our loans and lending commitments is measured in accordance with our internal risk management standards. Risk factors considered in determining the allowance for credit losses for loans and lending commitments include the borrower’s financial strength, industry, facility structure, LTV ratio, debt service ratio, collateral and covenants. Qualitative and environmental factors such as economic and business conditions, nature and volume of the portfolio and lending terms, and volume and severity of past due loans may also be considered.
The allowance for credit losses for loans and lending commitments increased since December 31, 2024, primarily related to portfolio growth in secured lending facilities and corporate loans, provisions for certain specific loans, including residential real estate loans related to the California wildfires, and deterioration in the macroeconomic outlook. Charge-offs in the current quarter were primarily related to commercial real estate loans.
The base scenario used in our ACL models as of March 31, 2025 was generated using a combination of consensus economic forecasts, forward rates, and internally developed and validated models. This scenario assumes slower economic growth as well as higher interest rates relative to the prior quarter forecast. The revised real GDP growth rates assumed in our ACL models incorporated the weaker economic outlook and conditions as of March 31, 2025. The ACL calculation incorporates key macroeconomic variables, including U.S. real GDP growth rate. The significance of key macroeconomic variables on the ACL calculation varies depending on portfolio composition and economic conditions.
Forecasted U.S. Real GDP Growth Rates in Base Scenario
4Q 2025
4Q 2026
Year-over-year growth rate
1.5
%
1.9
%
Other key macroeconomic variables used in the ACL calculation include corporate credit spreads, interest rates and commercial real estate indices. See Note 2 to the financial statements in the 2024 Form 10-K for a discussion of the Firm’s ACL methodology under CECL.
Recent developments around global trade policies have the potential to adversely impact our credit portfolios. The magnitude of such impacts, as well as the implications for global growth, will depend on specific details of how global trade policies evolve and also how effectively our clients adapt. While we are carefully monitoring all of our exposures, certain types of borrowers and counterparties are more vulnerable to trade policy effects. There remains significant uncertainty as to how trade policies will evolve; therefore, the borrowers and counterparties impacted may change over time.
Status of Loans Held for Investment
At March 31, 2025
At December 31, 2024
IS
WM
IS
WM
Accrual
99.1
%
99.7
%
99.2
%
99.7
%
Nonaccrual1
0.9
%
0.3
%
0.8
%
0.3
%
1.Nonaccrual loans are loans where principal or interest is not expected when contractually due or are past due 90 days or more.
Net Charge-off Ratios for Loans Held for Investment
$ in millions
Corporate
Secured Lending Facilities
CRE
Residential Real Estate
SBL and Other
Total
For the Three Months Ended March 31, 2025
Net charge-off/(recovery) ratio1
—
%
—
%
0.27
%
—
%
—
%
0.01
%
Average loans
$
7,210
$
50,310
$
8,493
$
51,572
$
97,249
$
214,834
CRE—Commercial real estate
SBL—Securities-based lending
1.Net charge-off ratio represents gross charge-offs net of recoveries divided by total average loans held for investment before ACL.
There were no material charge-offs during the three months ended March 31, 2024.
Institutional Securities Loans and Lending Commitments1
At March 31, 2025
Contractual Years to Maturity
$ in millions
<1
1-5
5-15
>15
Total
Loans
AA
$
1,452
$
—
$
8
$
—
$
1,460
A
883
763
164
—
1,810
BBB
5,282
14,272
111
157
19,822
BB
10,144
29,329
2,466
498
42,437
Other NIG
7,954
11,369
5,508
149
24,980
Unrated2
324
1,334
1,117
2,933
5,708
Total loans, net of ACL
26,039
57,067
9,374
3,737
96,217
Lending commitments
AAA
—
75
—
—
75
AA
2,345
3,051
855
—
6,251
A
5,233
21,385
2,036
—
28,654
BBB
10,100
57,465
948
158
68,671
BB
1,754
25,493
7,026
902
35,175
Other NIG
1,828
17,699
2,223
2
21,752
Unrated2
81
27
4
—
112
Total lending commitments
21,341
125,195
13,092
1,062
160,690
Total exposure
$
47,380
$
182,262
$
22,466
$
4,799
$
256,907
At December 31, 2024
Contractual Years to Maturity
$ in millions
<1
1-5
5-15
>15
Total
Loans
AA
$
3
$
575
$
187
$
—
$
765
A
894
588
164
—
1,646
BBB
5,165
13,185
91
124
18,565
BB
11,235
24,467
2,592
358
38,652
Other NIG
8,520
12,776
1,673
145
23,114
Unrated2
227
1,176
420
2,503
4,326
Total loans, net of ACL
26,044
52,767
5,127
3,130
87,068
Lending commitments
AAA
—
75
—
—
75
AA
2,560
4,285
88
—
6,933
A
8,226
21,372
1,091
—
30,689
BBB
10,135
54,752
1,507
146
66,540
BB
3,174
23,239
3,062
941
30,416
Other NIG
1,074
17,436
3,956
2
22,468
Unrated2
14
93
33
—
140
Total lending commitments
25,183
121,252
9,737
1,089
157,261
Total exposure
$
51,227
$
174,019
$
14,864
$
4,219
$
244,329
NIG–Non-investment grade
1.Counterparty credit ratings are internally determined by the CRM.
2.Unrated loans and lending commitments are primarily trading positions that are measured at fair value and risk-managed as a component of market risk. For a further discussion of our market risk, see “Quantitative and Qualitative Disclosures about Risk—Market Risk” herein.
Institutional Securities Loans and Lending Commitments by Industry
$ in millions
At March 31, 2025
At December 31, 2024
Industry
Financials
$
76,168
$
68,512
Real estate
41,535
40,041
Industrials
22,748
20,024
Information technology
18,652
15,666
Communications services
18,532
20,425
Consumer discretionary
15,406
14,699
Healthcare
14,827
15,455
Utilities
12,071
11,755
Consumer staples
10,617
12,098
Energy
8,593
9,036
Materials
7,144
7,378
Insurance
6,848
6,812
Other
3,766
2,428
Total exposure
$
256,907
$
244,329
Institutional Securities Lending Activities
The Institutional Securities business segment lending activities include Corporate, Secured lending facilities, Commercial and Residential real estate, and Securities-based lending and Other. As of March 31, 2025 and December 31, 2024, over 90% of our Institutional Securities total exposure, which consisted of loans and lending commitments, was investment grade and/or secured by collateral. For a description of Institutional Securities’ lending activities, see “Quantitative and Qualitative Disclosures about Risk—Credit Risk” in the 2024 Form 10-K.
Institutional Securities Event-Driven Loans and Lending Commitments
At March 31, 2025
Contractual Years to Maturity
$ in millions
<1
1-5
5-15
Total
Loans, net of ACL
$
2,782
$
1,165
$
4,743
$
8,690
Lending commitments
3,464
2,865
3,208
9,537
Total exposure
$
6,246
$
4,030
$
7,951
$
18,227
At December 31, 2024
Contractual Years to Maturity
$ in millions
<1
1-5
5-15
Total
Loans, net of ACL
$
2,253
$
2,839
$
733
$
5,825
Lending commitments
5,153
2,152
2,918
10,223
Total exposure
$
7,406
$
4,991
$
3,651
$
16,048
Event-driven loans and lending commitments are associated with certain underwritings and/or syndications to finance a specific transaction, such as merger, acquisition, recapitalization or project finance activities. Balances may fluctuate as such lending is related to transactions that vary in timing and size from period to period.
Institutional Securities Loans and Lending Commitments Held for Investment
At March 31, 2025
$ in millions
Loans
Lending Commitments
Total
Corporate
$
7,733
$
107,667
$
115,400
Secured lending facilities
51,329
23,001
74,330
Commercial real estate
8,610
303
8,913
Securities-based lending and Other
3,372
1,233
4,605
Total, before ACL
$
71,044
$
132,204
$
203,248
ACL
$
(753)
$
(702)
$
(1,455)
At December 31, 2024
$ in millions
Loans
Lending Commitments
Total
Corporate
$
6,889
$
105,824
$
112,713
Secured lending facilities
48,842
20,971
69,813
Commercial real estate
8,412
1,249
9,661
Securities-based lending and Other
2,876
1,504
4,380
Total, before ACL
$
67,019
$
129,548
$
196,567
ACL
$
(730)
$
(640)
$
(1,370)
Institutional Securities Commercial Real Estate Loans and Lending Commitments
By Region
At March 31, 2025
At December 31, 2024
$ in millions
Loans1
LC1
Total Exposure
Loans1
LC1
Total Exposure
Americas
$
5,238
$
177
$
5,415
$
5,066
$
820
$
5,886
EMEA
3,861
204
4,065
3,806
522
4,328
Asia
420
17
437
467
13
480
Total
$
9,519
$
398
$
9,917
$
9,339
$
1,355
$
10,694
By Property Type
At March 31, 2025
At December 31, 2024
$ in millions
Loans1
LC1
Total Exposure
Loans1
LC1
Total Exposure
Office
$
2,941
$
108
$
3,049
$
2,846
$
109
$
2,955
Industrial
2,709
145
2,854
2,610
125
2,735
Multifamily
1,988
76
2,064
2,042
80
2,122
Retail
1,007
13
1,020
1,105
971
2,076
Hotel
874
56
930
736
70
806
Total
$
9,519
$
398
$
9,917
$
9,339
$
1,355
$
10,694
LC–Lending Commitments
1. Amounts include HFI, HFS and FVO loans and lending commitments. HFI loans are presented net of ACL.
The current economic environment and changes in business and consumer behavior have adversely impacted commercial real estate borrowers due to pressure from higher interest rates, tenant lease renewals, and elevated refinancing risks for loans with near-term maturities, among other issues. While we continue to actively monitor all our loan portfolios, the commercial real estate sector remains under heightened focus given the sector’s sensitivity to economic and secular factors, credit conditions, and difficulties specific to certain property types, most notably office.
As of March 31, 2025 and December 31, 2024, our lending against commercial real estate (“CRE”) properties within the Institutional Securities business segment totaled $9.9 billion and $10.7 billion, respectively. This represents 3.9% and 4.4%, respectively, of total exposure reflected in the Institutional Securities Loans and Lending Commitments table above. Those CRE loans are originated for experienced sponsors and are generally secured by specific institutional CRE properties. In many cases, loans are subsequently syndicated or securitized on a full or partial basis, reducing our ongoing exposure.
In addition to the amounts included in the table above, we provide certain secured lending facilities which are typically collateralized by pooled CRE mortgage loans and are included in Secured lending facilities in the Institutional Securities Loans and Lending Commitments Held for Investment table above. These secured lending facilities benefit from structural protections including cross-collateralization and diversification across property types.
Institutional Securities Allowance for Credit Losses—Loans and Lending Commitments
Three Months Ended March 31, 2025
$ in millions
Corporate
Secured Lending Facilities
CRE
SBL and Other
Total
ACL—Loans
Beginning balance
$
200
$
140
$
373
$
17
$
730
Gross charge-offs
—
—
(31)
—
(31)
Recoveries
—
—
8
—
8
Net (charge-offs)/ recoveries
—
—
(23)
—
(23)
Provision (release)
2
7
24
4
37
Other
3
2
5
(1)
9
Ending balance
$
205
$
149
$
379
$
20
$
753
ACL—Lending commitments
Beginning balance
$
507
$
88
$
40
$
5
$
640
Provision (release)
37
41
(27)
3
54
Other
5
1
—
2
8
Ending balance
$
549
$
130
$
13
$
10
$
702
Total ending balance
$
754
$
279
$
392
$
30
$
1,455
Institutional Securities HFI Loans—Ratios of Allowance for Credit Losses to Balance Before Allowance
At March 31, 2025
At December 31, 2024
Corporate
2.7
%
2.9
%
Secured lending facilities
0.3
%
0.3
%
Commercial real estate
4.4
%
4.4
%
Securities-based lending and Other
0.6
%
0.6
%
Total Institutional Securities loans
1.1
%
1.1
%
Wealth Management Loans and Lending Commitments
At March 31, 2025
Contractual Years to Maturity
$ in millions
<1
1-5
5-15
>15
Total
Securities-based lending and Other
$
83,582
$
10,326
$
986
$
144
$
95,038
Residential real estate
1
111
1,084
66,263
67,459
Total loans, net of ACL
$
83,583
$
10,437
$
2,070
$
66,407
$
162,497
Lending commitments
16,061
2,861
49
399
19,370
Total exposure
$
99,644
$
13,298
$
2,119
$
66,806
$
181,867
At December 31, 2024
Contractual Years to Maturity
$ in millions
<1
1-5
5-15
>15
Total
Securities-based lending and Other
$
82,788
$
8,944
$
1,024
$
145
$
92,901
Residential real estate
1
111
1,106
65,423
66,641
Total loans, net of ACL
$
82,789
$
9,055
$
2,130
$
65,568
$
159,542
Lending commitments
16,318
2,523
43
386
19,270
Total exposure
$
99,107
$
11,578
$
2,173
$
65,954
$
178,812
The principal Wealth Management business segment lending activities include Securities-based lending and Residential real estate loans.
For more information about our Securities-based lending and Residential real estate loans, see “Quantitative and Qualitative Disclosures about Risk—Credit Risk” in the 2024 Form 10-K.
Wealth Management Commercial Real Estate Loans and Lending Commitments by Property Type
At March 31, 2025
At December 31, 2024
$ in millions
Loans1
LC1
Total exposure
Loans1
LC1
Total exposure
Retail
$
2,304
$
—
$
2,304
$
2,293
$
—
$
2,293
Multifamily
1,931
231
2,162
1,928
261
2,189
Office
2,013
1
2,014
1,951
11
1,962
Industrial
466
—
466
456
—
456
Hotel
442
—
442
442
—
442
Other
394
—
394
309
—
309
Total
$
7,550
$
232
$
7,782
$
7,379
$
272
$
7,651
LC–Lending Commitments
1.Amounts include HFI loans and lending commitments. HFI loans are presented net of ACL.
As of March 31, 2025 and December 31, 2024, our direct lending against CRE properties totaled $7.8 billion and $7.7 billion, respectively, within the Wealth Management business segment. This represents 4.3% and 4.3%, respectively, of total exposure reflected in the Wealth Management Loans and Lending Commitmentstable above, primarily included within Securities-based lending and Other loans. Such loans are originated through our private banking platform, are both secured and generally benefiting from full or partial guarantees from high or ultra-high net worth clients, which partially reduce associated credit risk. At both March 31, 2025 and December 31, 2024, greater than 95% of the CRE loans balance in the Wealth Management business segment received guarantees. All of our lending against CRE properties within Wealth Management are in the Americas region.
Wealth Management Allowance for Credit Losses—Loans and Lending Commitments
Three Months Ended March 31, 2025
$ in millions
Residential Real Estate
SBL and Other
Total
ACL—Loans
Beginning balance
$
97
$
239
$
336
Provision (release)
23
21
44
Ending balance
$
120
$
260
$
380
ACL—Lending commitments
Beginning balance
$
4
$
12
$
16
Ending balance
$
4
$
12
$
16
Total ending balance
$
124
$
272
$
396
As of March 31, 2025 and December 31, 2024, more than 75% of Wealth Management residential real estate loans were to borrowers with “Exceptional” or “Very Good” FICO scores (i.e., exceeding 740). Additionally, Wealth Management’s securities-based lending portfolio remains well-collateralized and subject to daily client margining, which includes requiring customers to deposit additional collateral or reduce debt positions, when necessary.
The Institutional Securities and Wealth Management business segments provide margin lending arrangements that allow customers to borrow against the value of qualifying securities, primarily for the purpose of purchasing additional securities, as well as to collateralize short positions. Institutional Securities primarily includes margin loans in the Equity Financing business. Wealth Management includes margin loans as well as non-purpose securities-based lending on non-bank entities. Amounts may fluctuate from period to period as overall client balances change as a result of market levels, client positioning and leverage.
Credit exposures arising from margin lending activities are generally mitigated by their short-term nature, the value of collateral held and our right to call for additional margin when collateral values decline. However, we could incur losses in the event that the customer fails to meet margin calls and collateral values decline below the loan amount. This risk is elevated in loans backed by collateral pools with significant concentrations in individual issuers or securities with similar risk characteristics. For a further discussion, see “Risk Factors—Credit Risk” in the 2024 Form 10-K.
Employee Loans
For information on employee loans and related ACL, see Note 9 to the financial statements.
Derivatives
Fair Value of OTC Derivative Assets
At March 31, 2025
Counterparty Credit Rating1
$ in millions
AAA
AA
A
BBB
NIG
Total
Less than 1 year
$
1,319
$
13,363
$
33,083
$
17,284
$
9,978
$
75,027
1-3 years
354
5,091
15,176
9,060
6,256
35,937
3-5 years
963
6,676
9,215
5,777
3,755
26,386
Over 5 years
3,254
24,739
48,670
26,922
6,604
110,189
Total, gross
$
5,890
$
49,869
$
106,144
$
59,043
$
26,593
$
247,539
Counterparty netting
(2,976)
(38,471)
(77,888)
(41,466)
(14,907)
(175,708)
Cash and securities collateral
(2,335)
(9,703)
(24,219)
(12,667)
(5,592)
(54,516)
Total, net
$
579
$
1,695
$
4,037
$
4,910
$
6,094
$
17,315
At December 31, 2024
Counterparty Credit Rating1
$ in millions
AAA
AA
A
BBB
NIG
Total
Less than 1 year
$
1,711
$
17,625
$
50,643
$
22,643
$
9,793
$
102,415
1-3 years
541
6,249
19,068
10,248
6,095
42,201
3-5 years
973
7,308
9,821
5,631
3,750
27,483
Over 5 years
3,330
25,406
49,469
28,206
6,398
112,809
Total, gross
$
6,555
$
56,588
$
129,001
$
66,728
$
26,036
$
284,908
Counterparty netting
(3,320)
(44,604)
(98,598)
(47,132)
(14,691)
(208,345)
Cash and securities collateral
(2,559)
(10,632)
(25,568)
(13,729)
(5,558)
(58,046)
Total, net
$
676
$
1,352
$
4,835
$
5,867
$
5,787
$
18,517
$ in millions
At March 31, 2025
At December 31, 2024
Industry
Financials
$
5,437
$
5,678
Utilities
3,719
3,733
Industrials
1,004
1,315
Energy
949
987
Consumer discretionary
912
1,046
Communications services
837
914
Regional governments
760
799
Information technology
590
634
Consumer staples
588
734
Sovereign governments
511
683
Healthcare
458
353
Materials
377
409
Insurance
153
207
Real estate
124
91
Not-for-profit organizations
124
94
Other
772
840
Total
$
17,315
$
18,517
1.Counterparty credit ratings are determined internally by the CRM.
We are exposed to credit risk as a dealer in OTC derivatives. Credit risk with respect to derivative instruments arises from the possibility that a counterparty may fail to perform according to the terms of the contract. For more information on derivatives, see “Quantitative and Qualitative Disclosures about Risk—Credit Risk—Derivatives” in the 2024 Form 10-K and Note 6 to the financial statements.
Country risk exposure is the risk that events in, or that affect, a foreign country (any country other than the U.S.) might adversely affect us. We actively manage country risk exposure through a comprehensive risk management framework that combines credit and other market fundamentals and allows us to effectively identify, monitor and limit country risk. For a further discussion of our country risk exposure see “Quantitative and Qualitative Disclosures about Risk—Country and Other Risks” in the 2024 Form 10-K.
Top 10 Non-U.S. Country Exposures
At March 31, 2025
$ in millions
United Kingdom
France
Germany
Brazil
Japan
Sovereign
Net inventory1
$
(289)
$
4,943
$
(1,796)
$
5,926
$
2,393
Net counterparty exposure2
13
2
72
—
9
Exposure before hedges
(276)
4,945
(1,724)
5,926
2,402
Hedges3
(55)
(162)
(242)
(134)
(173)
Net exposure
$
(331)
$
4,783
$
(1,966)
$
5,792
$
2,229
Non-sovereign
Net inventory1
$
2,355
$
1,698
$
1,407
$
37
$
756
Net counterparty exposure2
9,790
3,553
2,905
334
3,239
Loans
8,384
575
2,557
162
668
Lending commitments
9,451
3,198
5,717
404
—
Exposure before hedges
29,980
9,024
12,586
937
4,663
Hedges3
(1,838)
(1,443)
(1,825)
(57)
(222)
Net exposure
$
28,142
$
7,581
$
10,761
$
880
$
4,441
Total net exposure
$
27,811
$
12,364
$
8,795
$
6,672
$
6,670
$ in millions
Spain
Netherlands
Korea
India
Italy
Sovereign
Net inventory1
$
1,136
$
509
$
2,737
$
2,176
$
2,092
Net counterparty exposure2
—
—
338
—
12
Exposure before hedges
1,136
509
3,075
2,176
2,104
Hedges3
(8)
(12)
(35)
—
(29)
Net exposure
$
1,128
$
497
$
3,040
$
2,176
$
2,075
Non-sovereign
Net inventory1
$
712
$
759
$
180
$
953
$
167
Net counterparty exposure2
427
674
963
749
843
Loans
2,158
1,397
—
52
174
Lending commitments
689
974
—
—
881
Exposure before hedges
3,986
3,804
1,143
1,754
2,065
Hedges3
(277)
(130)
(35)
(10)
(335)
Net exposure
$
3,709
$
3,674
$
1,108
$
1,744
$
1,730
Total net exposure
$
4,837
$
4,171
$
4,148
$
3,920
$
3,805
1.Net inventory represents exposure to both long and short single-name and index positions (i.e., bonds and equities at fair value and CDS based on a notional amount assuming zero recovery adjusted for the fair value of any receivable or payable).
2.Net counterparty exposure (e.g., repurchase transactions, securities lending and OTC derivatives) is net of the benefit of collateral received and also is net by counterparty when legally enforceable master netting agreements are in place.
3.Amounts represent net CDS hedges (purchased and sold) on net counterparty exposure and lending executed by trading desks responsible for hedging counterparty and lending credit risk exposures. Amounts are based on the CDS notional amount assuming zero recovery adjusted for the fair value of any receivable or payable. For further description of the contractual terms for purchased credit protection and whether they may limit the effectiveness of our hedges, see “Quantitative and Qualitative Disclosures about Risk—Credit Risk—Derivatives” in the 2024 Form 10-K.
Operational Risk
Operational risk refers to the risk of loss, or of damage to our reputation, resulting from inadequate or failed processes or systems, human factors (e.g., inappropriate or unlawful conduct) or external events (e.g., cyberattacks or third-party vulnerabilities) that may manifest as, for example, loss of information, business disruption, theft and fraud, legal and compliance risks, or damage to physical assets. We may incur operational risk across the full scope of our business activities, including revenue-generating activities and support and control groups (e.g., IT and trade processing). For a further discussion about our operational risk, see “Quantitative and Qualitative Disclosures about Risk—Operational Risk” in the 2024 Form 10-K.
Model Risk
Model risk is the potential for adverse consequences from decisions based on incorrect or misused model outputs. Model risk can lead to financial loss, poor business and strategic decision-making, noncompliance with applicable laws and/or regulations or damage to the Firm's reputation. The risk inherent in a model is a function of the materiality, complexity and uncertainty around inputs and assumptions. Model risk is generated from the use of models impacting financial statements, regulatory filings, capital adequacy assessments and the formulation of strategy. For a further discussion about our model risk, see “Quantitative and Qualitative Disclosures about Risk—Model Risk” in the 2024 Form 10-K.
Liquidity Risk
Liquidity risk refers to the risk that we will be unable to finance our operations due to a loss of access to the capital markets or difficulty in liquidating our assets. Liquidity risk also encompasses our ability (or perceived ability) to meet our financial obligations without experiencing significant business disruption or reputational damage that may threaten our viability as a going concern. For a further discussion about our liquidity risk, see “Quantitative and Qualitative Disclosures about Risk—Liquidity Risk” in the 2024 Form 10-K and “Management’s Discussion and Analysis of Financial Condition and Results of Operations—Liquidity and Capital Resources” herein.
Legal, Regulatory and Compliance Risk
Legal, regulatory and compliance risk includes the risk of legal or regulatory sanctions, material financial loss, including fines, penalties, judgments, damages and/or settlements, limitations on our business, or loss to reputation that we may suffer as a result of failure to comply with laws, regulations, rules, related self-regulatory organization standards and codes of conduct applicable to our business activities. This risk also includes contractual and commercial risk, such as the risk that a counterparty’s performance obligations will be unenforceable. It also includes compliance with AML,
terrorist financing, and anti-corruption rules and regulations. For a further discussion about our legal and compliance risk, see “Quantitative and Qualitative Disclosures about Risk—Legal, Regulatory and Compliance Risk” in the 2024 Form 10-K.
Climate Risk
Climate change manifests as physical and transition risks. The physical risks of climate change include harm to people and property arising from acute climate-related events, such as floods, hurricanes, heatwaves, droughts and wildfires, and chronic, longer-term shifts in climate patterns, such as higher global average temperatures, rising sea levels and long-term droughts. The transition risks of climate change include policy, legal, technology and market changes. Examples of these transition risks include changes in consumer and business sentiment, related technologies, shareholder preferences and any additional regulatory and legislative requirements, including increased disclosure or regulation of carbon emissions. Climate risk, which is not expected to have a significant effect on our consolidated results of operations or financial condition in the near term, is an overarching risk that can impact other categories of risk. For a further discussion about our climate risk, see “Quantitative and Qualitative Disclosures about Risk—Climate Risk” in the 2024 Form 10-K.
Report of Independent Registered Public Accounting Firm
To the Shareholders and the Board of Directors of Morgan Stanley:
Results of Review of Interim Financial Information
We have reviewed the accompanying condensed consolidated balance sheet of Morgan Stanley and subsidiaries (the “Firm”) as of March 31, 2025, and the related condensed consolidated income statements, comprehensive income statements, cash flow statements and statements of changes in total equity for the three-month periods ended March 31, 2025 and 2024, and the related notes (collectively referred to as the “interim financial information”). Based on our reviews, we are not aware of any material modifications that should be made to the accompanying interim financial information for it to be in conformity with accounting principles generally accepted in the United States of America.
We have previously audited, in accordance with the standards of the Public Company Accounting Oversight Board (United States) (PCAOB), the consolidated balance sheet of the Firm as of December 31, 2024, and the related consolidated income statement, comprehensive income statement, cash flow statement and statement of changes in total equity for the year then ended (not presented herein) included in the Firm’s Annual Report on Form 10-K; and in our report dated February 21, 2025, we expressed an unqualified opinion on those consolidated financial statements. In our opinion, the information set forth in the accompanying condensed consolidated balance sheet as of December 31, 2024, is fairly stated, in all material respects, in relation to the consolidated balance sheet from which it has been derived.
Basis for Review Results
This interim financial information is the responsibility of the Firm’s management. We are a public accounting firm registered with the PCAOB and are required to be independent with respect to the Firm in accordance with the U.S. federal securities laws and the applicable rules and regulations of the Securities and Exchange Commission and the PCAOB.
We conducted our reviews in accordance with the standards of the PCAOB. A review of interim financial information consists principally of applying analytical procedures and making inquiries of persons responsible for financial and accounting matters. It is substantially less in scope than an audit conducted in accordance with the standards of the PCAOB, the objective of which is the expression of an opinion regarding the financial statements taken as a whole. Accordingly, we do not express such an opinion.
Cumulative adjustment related to the adoption of an accounting standard update1
—
(60)
Net income applicable to Morgan Stanley
4,315
3,412
Preferred stock dividends2
(158)
(146)
Common stock dividends2
(1,492)
(1,390)
Other net increases (decreases)
(1)
(1)
Ending balance
107,653
99,811
Employee stock trusts
Beginning balance
5,103
5,314
Share-based award activity
174
(64)
Ending balance
5,277
5,250
Accumulated other comprehensive income (loss)
Beginning balance
(6,814)
(6,421)
Net change in Accumulated other comprehensive income (loss)
853
(636)
Ending balance
(5,961)
(7,057)
Common stock held in treasury at cost
Beginning balance
(33,613)
(31,139)
Share-based award activity
1,220
1,485
Repurchases of common stock and employee tax withholdings
(2,030)
(1,718)
Ending balance
(34,423)
(31,372)
Common stock issued to employee stock trusts
Beginning balance
(5,103)
(5,314)
Share-based award activity
(174)
64
Ending balance
(5,277)
(5,250)
Noncontrolling interests
Beginning balance
917
944
Net income applicable to noncontrolling interests
56
50
Net change in Accumulated other comprehensive income (loss) applicable to noncontrolling interests
50
(56)
Other net increases (decreases)
12
4
Ending balance
1,035
942
Total equity
$
107,847
$
100,140
1.The Firm adopted the Investments - Tax Credit Structures accounting standard update on January 1, 2024. Refer to Note 2 to the financial statements in the 2024 Form 10-K for further information.
2. See Note 16 for information regarding dividends per share for each class of stock.
Notes to Consolidated Financial Statements (Unaudited)
1. Introduction and Basis of Presentation
The Firm
Morgan Stanley is a global financial services firm that maintains significant market positions in each of its business segments—Institutional Securities, Wealth Management and Investment Management. Morgan Stanley, through its subsidiaries and affiliates, provides a wide variety of products and services to a large and diversified group of clients and customers, including corporations, governments, financial institutions and individuals. Unless the context otherwise requires, the terms “Morgan Stanley” or the “Firm” mean Morgan Stanley (the “Parent Company”) together with its consolidated subsidiaries. See the “Glossary of Common Terms and Acronyms” for the definition of certain terms and acronyms used throughout this Form 10-Q.
A description of the clients and principal products and services of each of the Firm’s business segments is as follows:
Institutional Securities provides a variety of products and services to corporations, governments, financial institutions and ultra-high net worth clients. Investment Banking services consist of capital raising and financial advisory services, including the underwriting of debt, equity securities and other products, as well as advice on mergers and acquisitions, restructurings and project finance. Our Markets business, which comprises Equity and Fixed Income, provides sales, financing, prime brokerage, market-making, Asia wealth management services and certain business-related investments. Lending activities include originating corporate loans and commercial real estate loans, providing secured lending facilities, and extending securities-based and other financing to clients. Other activities include research.
Wealth Management provides a comprehensive array of financial services and solutions to individual investors and small to medium-sized businesses and institutions. Wealth Management covers: financial advisor-led brokerage, custody, administrative and investment advisory services; self-directed brokerage services; financial and wealth planning services; workplace services, including stock plan administration; securities-based lending, residential and commercial real estate loans and other lending products; banking; and retirement plan services.
Investment Management provides a broad range of investment strategies and products that span geographies, asset classes, and public and private markets to a diverse group of clients across institutional and intermediary channels. Strategies and products, which are offered through a variety of investment vehicles, include equity, fixed income, alternatives and solutions, and liquidity and overlay services. Institutional clients include defined benefit/defined contribution plans, foundations,
endowments, government entities, sovereign wealth funds, insurance companies, third-party fund sponsors and corporations. Individual clients are generally served through intermediaries, including affiliated and non-affiliated distributors.
Basis of Financial Information
The financial statements are prepared in accordance with U.S. GAAP, which requires the Firm to make estimates and assumptions regarding the valuations of certain financial instruments, the valuations of goodwill and intangible assets, the outcome of legal and tax matters, deferred tax assets, ACL, and other matters that affect its financial statements and related disclosures. The Firm believes that the estimates utilized in the preparation of its financial statements are prudent and reasonable. Actual results could differ materially from these estimates.
The Notes are an integral part of the Firm’s financial statements. The Firm has evaluated subsequent events for adjustment to or disclosure in these financial statements through the date of this report and has not identified any recordable or disclosable events not otherwise reported in these financial statements or the notes thereto.
The accompanying financial statements should be read in conjunction with the Firm’s financial statements and notes thereto included in the 2024 Form 10-K. Certain footnote disclosures included in the 2024 Form 10-K have been condensed or omitted from these financial statements as they are not required for interim reporting under U.S. GAAP. The financial statements reflect all adjustments of a normal, recurring nature that are, in the opinion of management, necessary for the fair presentation of the results for the interim period. The results of operations for interim periods are not necessarily indicative of results for the entire year.
Consolidation
The financial statements include the accounts of the Firm, its wholly owned subsidiaries and other entities in which the Firm has a controlling financial interest, including certain VIEs (see Note 14). Intercompany balances and transactions have been eliminated. For consolidated subsidiaries that are not wholly owned, the third-party holdings of equity interests are referred to as Noncontrolling interests. The net income attributable to Noncontrolling interests for such subsidiaries is presented as Net income applicable to noncontrolling interests in the income statement. The portion of shareholders’ equity that is attributable to Noncontrolling interests for such subsidiaries is presented as Noncontrolling interests, a component of Total equity, in the balance sheet.
For a discussion of the Firm’s significant regulated U.S. and international subsidiaries and its involvement with VIEs, see Note 1 to the financial statements in the 2024 Form 10-K.
Notes to Consolidated Financial Statements (Unaudited)
2. Significant Accounting Policies
For a detailed discussion about the Firm’s significant accounting policies and for further information on accounting updates adopted in the prior year, see Note 2 to the financial statements in the 2024 Form 10-K.
During the three months ended March 31, 2025 there were no significant updates to the Firm’s significant accounting policies.
3. Cash and Cash Equivalents
$ in millions
At March 31, 2025
At December 31, 2024
Cash and due from banks
$
4,450
$
4,436
Interest bearing deposits with banks
86,289
100,950
Total Cash and cash equivalents
$
90,739
$
105,386
Restricted cash
$
29,904
$
29,643
For additional information on cash and cash equivalents, including restricted cash, see Note 2 to the financial statements in the 2024 Form 10-K.
4. Fair Values
Recurring Fair Value Measurements
Assets and Liabilities Measured at Fair Value on a Recurring Basis
Notes to Consolidated Financial Statements (Unaudited)
At December 31, 2024
$ in millions
Level 1
Level 2
Level 3
Netting1
Total
Liabilities at fair value
Deposits
$
—
$
6,498
$
1
$
—
$
6,499
Trading liabilities:
U.S. Treasury and agency securities
21,505
3
—
—
21,508
Other sovereign government obligations
20,724
3,712
84
—
24,520
Corporate and other debt
—
9,032
11
—
9,043
Corporate equities3
60,653
95
15
—
60,763
Derivative and other contracts:
Interest rate
3,615
114,179
396
—
118,190
Credit
—
9,302
270
—
9,572
Foreign exchange
147
104,793
31
—
104,971
Equity
3,241
90,639
1,594
—
95,474
Commodity and other
1,461
11,215
887
—
13,563
Netting1
(6,471)
(251,771)
(645)
(44,953)
(303,840)
Total derivative and other contracts
1,993
78,357
2,533
(44,953)
37,930
Total trading liabilities
104,875
91,199
2,643
(44,953)
153,764
Securities sold under agreements to repurchase
—
512
444
—
956
Other secured financings
—
14,012
76
—
14,088
Borrowings
—
102,385
947
—
103,332
Total liabilities at fair value
$
104,875
$
214,606
$
4,111
$
(44,953)
$
278,639
MABS—Mortgage- and asset-backed securities
1.For positions with the same counterparty that cross over the levels of the fair value hierarchy, both counterparty netting and cash collateral netting are included in the column titled “Netting.” Positions classified within the same level that are with the same counterparty are netted within that level. For further information on derivative instruments and hedging activities, see Note 6.
2.For a further breakdown by type, see the following Detail of Loans and Lending Commitments at Fair Value table.
3.For trading purposes, the Firm holds or sells short equity securities issued by entities in diverse industries and of varying sizes.
4.Amounts exclude certain investments that are measured based on NAV per share, which are not classified in the fair value hierarchy. For additional disclosure about such investments, see “Net Asset Value Measurements” herein.
5.At March 31, 2025 and December 31, 2024, the Firm’s Trading assets included an insignificant amount of equity securities subject to contractual sale restrictions that generally prohibit the Firm from selling the security for a period of time as of the measurement date.
Detail of Loans and Lending Commitments at Fair Value
$ in millions
At March 31, 2025
At December 31, 2024
Commercial real estate
$
823
$
498
Residential real estate
2,521
1,922
Securities-based lending and Other loans
6,722
6,241
Total
$
10,066
$
8,661
Unsettled Fair Value of Futures Contracts1
$ in millions
At March 31, 2025
At December 31, 2024
Customer and other receivables (payables), net
$
1,823
$
1,914
1.These contracts are primarily Level 1, actively traded, valued based on quoted prices from the exchange and are excluded from the previous recurring fair value tables.
For a description of the valuation techniques applied to the Firm’s major categories of assets and liabilities measured at fair value on a recurring basis, see Note 4 to the financial statements in the 2024 Form 10-K. During the current quarter, there were no significant revisions made to the Firm’s valuation techniques.
Rollforward of Level 3 Assets and Liabilities Measured at Fair Value on a Recurring Basis
Notes to Consolidated Financial Statements (Unaudited)
Three Months Ended March 31,
$ in millions
2025
2024
Investments
Beginning balance
$
754
$
949
Realized and unrealized gains (losses)
22
20
Purchases
24
3
Sales
(25)
(2)
Net transfers
4
—
Ending balance
$
779
$
970
Unrealized gains (losses)
$
10
$
(5)
Net derivatives: Interest rate
Beginning balance
$
(53)
$
(73)
Realized and unrealized gains (losses)
(119)
113
Purchases
10
31
Issuances
(12)
(16)
Settlements
18
(112)
Net transfers
33
105
Ending balance
$
(123)
$
48
Unrealized gains (losses)
$
(116)
$
119
Net derivatives: Credit
Beginning balance
$
97
$
96
Realized and unrealized gains (losses)
(22)
(11)
Settlements
34
48
Net transfers
20
(6)
Ending balance
$
129
$
127
Unrealized gains (losses)
$
(54)
$
(9)
Net derivatives: Foreign exchange
Beginning balance
$
589
$
(365)
Realized and unrealized gains (losses)
(243)
301
Purchases
—
9
Settlements
(30)
(28)
Net transfers
(11)
103
Ending balance
$
305
$
20
Unrealized gains (losses)
$
(201)
$
348
Net derivatives: Equity
Beginning balance
$
(1,148)
$
(1,102)
Realized and unrealized gains (losses)
380
171
Purchases
175
47
Issuances
(144)
(49)
Settlements
(288)
77
Net transfers
140
(133)
Ending balance
$
(885)
$
(989)
Unrealized gains (losses)
$
298
$
192
Net derivatives: Commodity and other
Beginning balance
$
1,308
$
1,290
Realized and unrealized gains (losses)
23
44
Purchases
22
87
Issuances
(22)
(44)
Settlements
(64)
(153)
Net transfers
(405)
(14)
Ending balance
$
862
$
1,210
Unrealized gains (losses)
$
(5)
$
(132)
Deposits
Beginning balance
$
1
$
33
Realized and unrealized losses (gains)
—
1
Issuances
2
2
Settlements
(1)
(1)
Net transfers
1
16
Ending balance
$
3
$
51
Unrealized losses (gains)
$
—
$
1
Three Months Ended March 31,
$ in millions
2025
2024
Nonderivative trading liabilities
Beginning balance
$
110
$
60
Realized and unrealized losses (gains)
(4)
4
Purchases
(26)
(38)
Sales
25
27
Net transfers
(77)
20
Ending balance
$
28
$
73
Unrealized losses (gains)
$
—
$
4
Securities sold under agreements to repurchase
Beginning balance
$
444
$
449
Realized and unrealized losses (gains)
13
11
Net transfers
203
—
Ending balance
$
660
$
460
Unrealized losses (gains)
$
13
$
11
Other secured financings
Beginning balance
$
76
$
92
Realized and unrealized losses (gains)
10
(4)
Issuances
139
7
Settlements
(5)
(21)
Net transfers
215
—
Ending balance
$
435
$
74
Unrealized losses (gains)
$
10
$
(4)
Borrowings
Beginning balance
$
947
$
1,878
Realized and unrealized losses (gains)
7
51
Issuances
91
217
Settlements
(86)
(109)
Net transfers
(57)
(10)
Ending balance
$
902
$
2,027
Unrealized losses (gains)
$
3
$
50
Portion of Unrealized losses (gains) recorded in OCI—Change in net DVA
(2)
22
Level 3 instruments may be hedged with instruments classified in Level 1 and Level 2. The realized and unrealized gains or losses for assets and liabilities within the Level 3 category presented in the previous tables do not reflect the related realized and unrealized gains or losses on hedging instruments that have been classified by the Firm within the Level 1 and/or Level 2 categories.
The unrealized gains (losses) during the period for assets and liabilities within the Level 3 category may include changes in fair value during the period that were attributable to both observable and unobservable inputs. Total realized and unrealized gains (losses) are primarily included in Trading revenues in the income statement.
Additionally, in the previous tables, consolidations of VIEs are included in Purchases, and deconsolidations of VIEs are included in Settlements.
Notes to Consolidated Financial Statements (Unaudited)
Significant Unobservable Inputs Used in Recurring and Nonrecurring Level 3 Fair Value Measurements
Valuation Techniques and Unobservable Inputs
Balance / Range (Average1)
$ in millions, except inputs
At March 31, 2025
At December 31, 2024
Assets at Fair Value on a Recurring Basis
Other sovereign government obligations
$
29
$
17
Comparable pricing:
Bond price
60 to 104 points (92 points)
45 to 104 points (75 points)
MABS
$
346
$
281
Comparable pricing:
Bond price
29 to 98 points (71 points)
27 to 98 points (67 points)
Loans and lending commitments
$
2,026
$
1,059
Margin loan model:
Margin loan rate
1% to 3% (2%)
1% to 4% (3%)
Comparable pricing:
Loan price
50 to 102 points (94 points)
49 to 102 points (90 points)
Corporate and other debt
$
1,434
$
1,258
Comparable pricing:
Bond price
28 to 131 points (84 points)
28 to 130 points (83 points)
Discounted cash flow:
Loss given default
54% to 85% (68% / 54%)
54% to 84% (62% / 54%)
Corporate equities
$
163
$
154
Comparable pricing:
Equity price
100%
100%
Investments
$
779
$
754
Discounted cash flow:
WACC
10% to 21% (15%)
12% to 21% (16%)
Exit multiple
9 to 10 times (10 times)
9 to 10 times (10 times)
Market approach:
EBITDA multiple
18 times
20 times
Comparable pricing:
Equity price
24% to 100% (85%)
24% to 100% (84%)
Net derivative and other contracts:
Interest rate
$
(123)
$
(53)
Option model:
IR volatility skew
44% to 97% (74% / 78%)
72% to 97% (81% / 79%)
IR curve correlation
28% to 98% (82% / 85%)
28% to 99% (83% / 86%)
Bond volatility
81% to 152% (100% / 98%)
78% to 148% (92% / 92%)
Inflation volatility
32% to 67% (44% / 40%)
30% to 68% (44% / 38%)
Credit
$
129
$
97
Credit default swap model:
Cash-synthetic
basis
7 points
7 points
Bond price
0 to 92 points (46 points)
0 to 90 points (48 points)
Credit spread
40 to 1,667 bps (158 bps)
10 to 360 bps (90 bps)
Funding spread
10 to 597 bps (73 bps)
10 to 590 bps (76 bps)
Foreign exchange2
$
305
$
589
Option model:
IR curve
10% to 10% (10% / 10%)
5% to 10% (8% / 8%)
Contingency probability
90% to 95% (91% / 95%)
90% to 95% (91% / 95%)
Balance / Range (Average1)
$ in millions, except inputs
At March 31, 2025
At December 31, 2024
Equity2
$
(885)
$
(1,148)
Option model:
Equity volatility
6% to 92% (18%)
7% to 98% (20%)
Equity volatility skew
-2% to 0% (-1%)
-2% to 0% (-1%)
Equity correlation
15% to 96% (59%)
20% to 94% (58%)
FX correlation
-67% to 60% (-32%)
-68% to 60% (-36%)
IR correlation
10% to 15% (10%)
N/M
Commodity and other
$
862
$
1,308
Option model:
Forward power price
$1 to $173 ($53) per MWh
$0 to $185 ($48) per MWh
Commodity volatility
17% to 100% (34%)
0% to 165% (37%)
Cross-commodity correlation
69% to 99% (94%)
54% to 100% (94%)
Liabilities Measured at Fair Value on a Recurring Basis
Securities sold under agreements to repurchase
$
660
$
444
Discounted cash flow:
Funding spread
21 to 132 bps (68 / 69 bps)
11 to 102 bps (36 / 26 bps)
Other secured financings
$
435
$
76
Comparable pricing:
Loan price
0 to 106 points (96 points)
0 to 100 points (33 points)
Borrowings
$
902
$
947
Option model:
Equity volatility
5% to 68% (26%)
7% to 71% (21%)
Equity volatility skew
-2% to 1% (-1%)
-2% to 0% (0%)
Equity correlation
41% to 94% (78%)
53% to 64% (58%)
Equity - FX correlation
-62% to 27% (-23%)
-52% to 24% (-12%)
Credit default swap model:
Credit spread
341 to 539 bps (440 bps)
247 to 433 bps (340 bps)
Discounted cash flow:
Loss given default
54% to 85% (68% / 54%)
54% to 84% (62% / 54%)
Nonrecurring Fair Value Measurement
Loans
$
2,332
$
4,518
Corporate loan model:
Credit spread
94 to 1,086 bps (468 bps)
109 to 1,469 bps (1,007 bps)
Comparable pricing:
Loan price
25 to 100 points (84 points)
25 to 100 points (71 points)
Warehouse model:
Credit spread
202 to 285 bps (255 bps)
207 to 280 bps (254 bps)
Points—Percentage of par
IR—Interest rate
FX—Foreign exchange
1.A single amount is disclosed for range and average when there is no significant difference between the minimum, maximum and average. Amounts represent weighted averages except where simple averages and the median of the inputs are more relevant.
2.Includes derivative contracts with multiple risks (i.e., hybrid products).
The previous table provides information on the valuation techniques, significant unobservable inputs, and the ranges and averages for each major category of assets and liabilities measured at fair value on a recurring and nonrecurring basis with a significant Level 3 balance. The level of aggregation and breadth of products cause the range of inputs to be wide
Notes to Consolidated Financial Statements (Unaudited)
and not evenly distributed across the inventory of financial instruments. Further, the range of unobservable inputs may differ across firms in the financial services industry because of diversity in the types of products included in each firm’s inventory. Generally, there are no predictable relationships between multiple significant unobservable inputs attributable to a given valuation technique.
For a description of the Firm’s significant unobservable inputs and qualitative information about the effect of hypothetical changes in the values of those inputs, see Note 4 to the financial statements in the 2024 Form 10-K. During the three months ended March 31, 2025, there were no significant revisions made to the descriptions of the Firm’s significant unobservable inputs.
Net Asset Value Measurements
Fund Interests
At March 31, 2025
At December 31, 2024
$ in millions
Carrying Value
Commitment
Carrying Value
Commitment
Private equity and other
$
2,916
$
616
$
2,653
$
644
Real estate
3,446
198
3,461
214
Hedge
96
2
92
2
Total
$
6,458
$
816
$
6,206
$
860
Amounts in the previous table represent the Firm’s carrying value of general and limited partnership interests in fund investments, as well as any related performance-based income in the form of carried interest. The carrying amounts are measured based on the NAV of the fund taking into account the distribution terms applicable to the interest held. This same measurement applies whether the fund investments are accounted for under the equity method or fair value.
For a description of the Firm’s investments in private equity and other funds, real estate funds and hedge funds, which are measured based on NAV, see Note 4 to the financial statements in the 2024 Form 10-K.
See Note 13 for information regarding general partner guarantees, which include potential obligations to return performance fee distributions previously received. See Note 19 for information regarding unrealized carried interest at risk of reversal.
Nonredeemable Funds by Contractual Maturity
Carrying Value at March 31, 2025
$ in millions
Private Equity and Other
Real Estate
Less than 5 years
$
1,074
$
2,070
5-10 years
1,670
1,245
Over 10 years
172
131
Total
$
2,916
$
3,446
Nonrecurring Fair Value Measurements
Assets and Liabilities Measured at Fair Value on a Nonrecurring Basis
At March 31, 2025
Fair Value
$ in millions
Level 2
Level 31
Total
Assets
Loans
$
1,749
$
2,332
$
4,081
Other assets—Other investments
—
59
59
Total
$
1,749
$
2,391
$
4,140
Liabilities
Other liabilities and accrued expenses—Lending commitments
$
56
$
23
$
79
Total
$
56
$
23
$
79
At December 31, 2024
Fair Value
$ in millions
Level 2
Level 31
Total
Assets
Loans
$
1,607
$
4,518
$
6,125
Other assets—Other investments
—
58
58
Other assets—ROU assets
23
—
23
Total
$
1,630
$
4,576
$
6,206
Liabilities
Other liabilities and accrued expenses—Lending commitments
$
48
$
33
$
81
Total
$
48
$
33
$
81
1.For significant Level 3 balances, refer to “Significant Unobservable Inputs Used in Recurring and Nonrecurring Level 3 Fair Value Measurements” section herein for details of the significant unobservable inputs used for nonrecurring fair value measurement.
Gains (Losses) from Nonrecurring Fair Value Remeasurements1
Three Months Ended March 31,
$ in millions
2025
2024
Assets
Loans2
$
19
$
(22)
Other assets—Other investments3
(6)
—
Other assets—Premises, equipment and software4
(5)
—
Total
$
8
$
(22)
Liabilities
Other liabilities and accrued expenses—Lending commitments2
$
(8)
$
1
Total
$
(8)
$
1
1.Gains and losses for Loans and Other assets—Other investments are classified in Other revenues. For other items, gains and losses are recorded in Other revenues if the item is held for sale; otherwise, they are recorded in Other expenses.
2.Nonrecurring changes in the fair value of loans and lending commitments, which exclude the impact of related economic hedges, are calculated as follows: for the held-for-investment category, based on the value of the underlying collateral; and for the held-for-sale category, based on recently executed transactions, market price quotations, valuation models that incorporate market observable inputs where possible, such as comparable loan or debt prices and CDS spread levels adjusted for any basis difference between cash and derivative instruments, or default recovery analysis where such transactions and quotations are unobservable.
Notes to Consolidated Financial Statements (Unaudited)
3.Losses related to Other assets—Other investments were determined using techniques that included discounted cash flow models, methodologies that incorporate multiples of certain comparable companies and recently executed transactions.
4.Losses related to Other assets—Premises, equipment and software generally include impairments as well as write-offs related to the disposal of certain assets.
Financial Instruments Not Measured at Fair Value
At March 31, 2025
Carrying Value
Fair Value
$ in millions
Level 1
Level 2
Level 3
Total
Financial assets
Cash and cash equivalents
$
90,739
$
90,739
$
—
$
—
$
90,739
Investment securities—HTM
59,394
15,064
34,283
1,202
50,549
Securities purchased under agreements to resell
119,048
—
117,539
1,550
119,089
Securities borrowed
140,226
—
140,226
—
140,226
Customer and other receivables
85,428
—
81,167
4,131
85,298
Loans1
Held for investment
232,792
—
15,388
212,932
228,320
Held for sale
16,111
—
11,181
5,043
16,224
Other assets
704
—
704
—
704
Financial liabilities
Deposits
$
374,882
$
—
$
375,281
$
—
$
375,281
Securities sold under agreements to repurchase
68,286
—
68,268
—
68,268
Securities loaned
16,604
—
16,598
—
16,598
Other secured financings
4,510
—
4,507
—
4,507
Customer and other payables
201,626
—
201,626
—
201,626
Borrowings
193,296
—
195,133
173
195,306
Commitment Amount
Lending commitments2
$
179,499
$
—
$
1,207
$
1,046
$
2,253
At December 31, 2024
Carrying Value
Fair Value
$ in millions
Level 1
Level 2
Level 3
Total
Financial assets
Cash and cash equivalents
$
105,386
$
105,386
$
—
$
—
$
105,386
Investment securities—HTM
61,071
15,803
34,180
1,220
51,203
Securities purchased under agreements to resell
118,565
—
117,151
1,450
118,601
Securities borrowed
123,859
—
123,859
—
123,859
Customer and other receivables
79,586
—
75,361
4,056
79,417
Loans1
Held for investment
225,834
—
17,859
202,297
220,156
Held for sale
12,319
—
6,324
6,115
12,439
Other assets
839
—
839
—
839
Financial liabilities
Deposits
$
369,508
$
—
$
370,039
$
—
$
370,039
Securities sold under agreements to repurchase
49,111
—
49,103
—
49,103
Securities loaned
15,226
—
15,228
—
15,228
Other secured financings
7,514
—
7,511
—
7,511
Customer and other payables
175,890
—
175,890
—
175,890
Borrowings
185,487
—
188,269
93
188,362
Commitment Amount
Lending commitments2
$
175,774
$
—
$
1,094
$
839
$
1,933
1.Amounts include loans measured at fair value on a nonrecurring basis.
2.Represents Lending commitments accounted for as Held for Investment and Held for Sale. For a further discussion on lending commitments, see Note 13.
The previous tables exclude all non-financial assets and liabilities, such as Goodwill and Intangible assets, and certain financial instruments, such as equity method investments and certain receivables.
5. Fair Value Option
The Firm has elected the fair value option for certain eligible instruments that are risk managed on a fair value basis to mitigate income statement volatility caused by measurement basis differences between the elected instruments and their associated risk management transactions or to eliminate complexities of applying certain accounting models.
Borrowings Measured at Fair Value on a Recurring Basis
Notes to Consolidated Financial Statements (Unaudited)
Net Revenues from Liabilities under the Fair Value Option
$ in millions
Trading Revenues
Interest Expense
Net Revenues1
Three Months Ended March 31, 2025
Borrowings
$
(1,788)
$
200
$
(1,988)
Deposits
(37)
53
(90)
Three Months Ended March 31, 2024
Borrowings
$
(114)
$
144
$
(258)
1.Amounts do not reflect any gains or losses from related economic hedges.
Gains (losses) from changes in fair value are recorded in Trading revenues and are mainly attributable to movements in the reference price or index, interest rates or foreign exchange rates.
Gains (Losses) Due to Changes in Instrument-Specific Credit Risk
Three Months Ended March 31,
2025
2024
$ in millions
Trading Revenues
OCI
Trading Revenues
OCI
Loans and other receivables1
$
(6)
$
—
$
26
$
—
Lending commitments
(1)
—
(3)
—
Deposits
—
50
—
(4)
Borrowings
(9)
398
(10)
(737)
$ in millions
At March 31, 2025
At December 31, 2024
Cumulative pre-tax DVA gain (loss) recognized in AOCI
$
(2,420)
$
(2,868)
1.Loans and other receivables-specific credit gains (losses) were determined by excluding the non-credit components of gains and losses.
Difference Between Contractual Principal and Fair Value1
$ in millions
At March 31, 2025
At December 31, 2024
Loans and other receivables2
$
10,430
$
10,207
Nonaccrual loans2
7,821
7,719
Borrowings3
3,483
3,249
1.Amounts indicate contractual principal greater than or (less than) fair value.
2.The majority of the difference between principal and fair value amounts for loans and other receivables relates to distressed debt positions purchased at amounts well below par.
3.Excludes borrowings where the repayment of the initial principal amount fluctuates based on changes in a reference price or index.
The previous tables exclude non-recourse debt from consolidated VIEs, liabilities related to transfers of financial assets treated as collateralized financings, pledged commodities and other liabilities that have specified assets attributable to them.
Fair Value Loans on Nonaccrual Status
$ in millions
At March 31, 2025
At December 31, 2024
Nonaccrual loans
$
993
$
647
Nonaccrual loans 90 or more days past due
169
155
6. Derivative Instruments and Hedging Activities
Fair Values of Derivative Contracts
Assets at March 31, 2025
$ in millions
Bilateral OTC
Cleared OTC
Exchange-Traded
Total
Designated as accounting hedges
Interest rate
$
3
$
1
$
—
$
4
Foreign exchange
24
36
—
60
Total
27
37
—
64
Not designated as accounting hedges
Economic hedges of loans
Credit
10
41
—
51
Other derivatives
Interest rate
112,780
13,552
233
126,565
Credit
5,334
5,950
—
11,284
Foreign exchange
69,758
3,201
49
73,008
Equity
23,812
—
52,365
76,177
Commodity and other
13,037
—
2,902
15,939
Total
224,731
22,744
55,549
303,024
Total gross derivatives
$
224,758
$
22,781
$
55,549
$
303,088
Amounts offset
Counterparty netting
(155,334)
(20,374)
(52,628)
(228,336)
Cash collateral netting
(36,365)
(2,162)
—
(38,527)
Total in Trading assets
$
33,059
$
245
$
2,921
$
36,225
Amounts not offset1
Financial instruments collateral
(15,989)
—
—
(15,989)
Net amounts
$
17,070
$
245
$
2,921
$
20,236
Net amounts for which master netting or collateral agreements are not in place or may not be legally enforceable
$
2,816
Liabilities at March 31, 2025
$ in millions
Bilateral OTC
Cleared OTC
Exchange-Traded
Total
Designated as accounting hedges
Interest rate
$
471
$
—
$
—
$
471
Foreign exchange
51
12
—
63
Total
522
12
—
534
Not designated as accounting hedges
Economic hedges of loans
Credit
45
629
—
674
Other derivatives
Interest rate
102,629
11,842
218
114,689
Credit
5,458
5,514
—
10,972
Foreign exchange
64,762
3,190
216
68,168
Equity
39,848
—
54,441
94,289
Commodity and other
11,322
1
2,962
14,285
Total
224,064
21,176
57,837
303,077
Total gross derivatives
$
224,586
$
21,188
$
57,837
$
303,611
Amounts offset
Counterparty netting
(155,333)
(20,374)
(52,628)
(228,335)
Cash collateral netting
(38,682)
(791)
—
(39,473)
Total in Trading liabilities
$
30,571
$
23
$
5,209
$
35,803
Amounts not offset1
Financial instruments collateral
(5,475)
—
(3,451)
(8,926)
Net amounts
$
25,096
$
23
$
1,758
$
26,877
Net amounts for which master netting or collateral agreements are not in place or may not be legally enforceable
Notes to Consolidated Financial Statements (Unaudited)
Assets at December 31, 2024
$ in millions
Bilateral OTC
Cleared OTC
Exchange-Traded
Total
Designated as accounting hedges
Interest rate
$
4
$
—
$
—
$
4
Foreign exchange
185
122
—
307
Total
189
122
—
311
Not designated as accounting hedges
Economic hedges of loans
Credit
—
28
—
28
Other derivatives
Interest rate
115,520
13,163
119
128,802
Credit
4,711
4,411
—
9,122
Foreign exchange
104,024
4,301
90
108,415
Equity
24,368
—
51,314
75,682
Commodity and other
14,071
—
1,860
15,931
Total
262,694
21,903
53,383
337,980
Total gross derivatives
$
262,883
$
22,025
$
53,383
$
338,291
Amounts offset
Counterparty netting
(188,069)
(20,276)
(51,168)
(259,513)
Cash collateral netting
(38,511)
(1,698)
—
(40,209)
Total in Trading assets
$
36,303
$
51
$
2,215
$
38,569
Amounts not offset1
Financial instruments collateral
(17,837)
—
—
(17,837)
Net amounts
$
18,466
$
51
$
2,215
$
20,732
Net amounts for which master netting or collateral agreements are not in place or may not be legally enforceable
$
3,354
Liabilities at December 31, 2024
$ in millions
Bilateral OTC
Cleared OTC
Exchange-Traded
Total
Designated as accounting hedges
Interest rate
$
533
$
—
$
—
$
533
Foreign exchange
3
—
—
3
Total
536
—
—
536
Not designated as accounting hedges
Economic hedges of loans
Credit
53
718
—
771
Other derivatives
Interest rate
104,495
13,038
124
117,657
Credit
4,941
3,860
—
8,801
Foreign exchange
100,730
4,085
153
104,968
Equity
42,332
—
53,142
95,474
Commodity and other
11,584
—
1,979
13,563
Total
264,135
21,701
55,398
341,234
Total gross derivatives
$
264,671
$
21,701
$
55,398
$
341,770
Amounts offset
Counterparty netting
(188,070)
(20,276)
(51,168)
(259,514)
Cash collateral netting
(43,126)
(1,200)
—
(44,326)
Total in Trading liabilities
$
33,475
$
225
$
4,230
$
37,930
Amounts not offset1
Financial instruments collateral
(6,338)
—
(2,658)
(8,996)
Net amounts
$
27,137
$
225
$
1,572
$
28,934
Net amounts for which master netting or collateral agreements are not in place or may not be legally enforceable
$
4,321
1.Amounts relate to master netting agreements and collateral agreements that have been determined by the Firm to be legally enforceable in the event of default but where certain other netting criteria are not met in accordance with applicable offsetting accounting guidance.
See Note 4 for information related to the unsettled fair value of futures contracts not designated as accounting hedges, which are excluded from the previous tables.
Notes to Consolidated Financial Statements (Unaudited)
Liabilities at December 31, 2024
$ in billions
Bilateral OTC
Cleared OTC
Exchange-Traded
Total
Designated as accounting hedges
Interest rate
$
2
$
193
$
—
$
195
Foreign exchange
1
—
—
1
Total
3
193
—
196
Not designated as accounting hedges
Economic hedges of loans
Credit
2
20
—
22
Other derivatives
Interest rate
3,626
4,468
417
8,511
Credit
230
133
—
363
Foreign exchange
2,763
178
18
2,959
Equity
754
—
826
1,580
Commodity and other
100
—
89
189
Total
7,475
4,799
1,350
13,624
Total gross derivatives
$
7,478
$
4,992
$
1,350
$
13,820
The notional amounts of derivative contracts generally overstate the Firm’s exposure. In most circumstances, notional amounts are used only as a reference point from which to calculate amounts owed between the parties to the contract. Furthermore, notional amounts do not reflect the benefit of legally enforceable netting arrangements or risk mitigating transactions.
For a discussion of the Firm’s derivative instruments and hedging activities, see Note 6 to the financial statements in the 2024 Form 10-K.
Gains (Losses) on Accounting Hedges
Three Months Ended
March 31,
$ in millions
2025
2024
Fair value hedges—Recognized in Interest income
Interest rate contracts
$
(493)
$
572
Investment Securities—AFS
503
(552)
Fair value hedges—Recognized in Interest expense
Interest rate contracts
$
2,317
$
(2,127)
Deposits
(49)
10
Borrowings
(2,272)
2,109
Net investment hedges—Foreign exchange contracts
Recognized in OCI
$
(435)
$
371
Forward points excluded from hedge effectiveness testing—Recognized in Interest income
17
48
Cash flow hedges—Interest rate contracts1
Recognized in OCI
$
17
$
(47)
Less: Realized gains (losses) (pre-tax) reclassified from AOCI to interest income
(5)
(11)
Net change in cash flow hedges included within AOCI
22
(36)
1.During the three months ended March 31, 2025, there were no forecasted transactions that failed to occur. The net gains (losses) associated with cash flow hedges expected to be reclassified from AOCI within 12 months as of March 31, 2025, is approximately $(21) million. The maximum length of time over which forecasted cash flows are hedged is 32 months.
Fair Value Hedges—Hedged Items
$ in millions
At March 31, 2025
At December 31, 2024
Investment Securities—AFS
Amortized cost basis currently or previously hedged1
$
54,849
$
54,809
Basis adjustments included in amortized cost2
$
(214)
$
(741)
Deposits
Carrying amountcurrently or previously hedged
$
27,536
$
21,524
Basis adjustments included in carrying amount2
$
93
$
44
Borrowings
Carrying amountcurrently or previously hedged
$
177,477
$
171,834
Basis adjustments included in carrying amount—Outstanding hedges
$
(7,821)
$
(10,072)
Basis adjustments included in carrying amount—Terminated hedges
$
(642)
$
(648)
1.Carrying amount represents the amortized cost. At March 31, 2025 and December 31, 2024, the amortized cost of the portfolio layer method closed portfolios was $325 million, of which $178 million was designated as hedged. The cumulative amount of basis adjustments was immaterial as of March 31, 2025 and $(2) million as of December 31, 2024. Refer to Note 2 to the financial statements in the 2024 Form 10-K and Note 7 herein for additional information.
2.Hedge accounting basis adjustments are primarily related to outstanding hedges.
Gains (Losses) on Economic Hedges of Loans
Three Months Ended
March 31,
$ in millions
2025
2024
Recognized in Other revenues
Credit contracts1
$
(17)
$
(123)
1.Amounts related to hedges of certain held-for-investment and held-for-sale loans.
Net Derivative Liabilities and Collateral Posted
$ in millions
At March 31, 2025
At December 31, 2024
Net derivative liabilities with credit risk-related contingent features
$
19,944
$
22,414
Collateral posted
14,630
16,252
The previous table presents the aggregate fair value of certain derivative contracts that contain credit risk-related contingent features that are in a net liability position for which the Firm has posted collateral in the normal course of business.
Incremental Collateral and Termination Payments upon Potential Future Ratings Downgrade
$ in millions
At March 31, 2025
One-notch downgrade
$
255
Two-notch downgrade
437
Bilateral downgrade agreements included in the amounts above1
$
558
1.Amount represents arrangements between the Firm and other parties where upon the downgrade of one party, the downgraded party must deliver collateral to the other party. These bilateral downgrade arrangements are used by the Firm to manage the risk of counterparty downgrades.
The additional collateral or termination payments that may be called in the event of a future credit rating downgrade vary by contract and can be based on ratings by Moody’s Investors Service, Inc., S&P Global Ratings and/or other rating
Notes to Consolidated Financial Statements (Unaudited)
agencies. The previous table shows the future potential collateral amounts and termination payments that could be called or required by counterparties or exchange and clearing organizations in the event of one-notch or two-notch downgrade scenarios based on the relevant contractual downgrade triggers.
Maximum Potential Payout/Notional of Credit Protection Sold1
Years to Maturity at March 31, 2025
$ in billions
< 1
1-3
3-5
Over 5
Total
Single-name CDS
Investment grade
$
16
$
33
$
40
$
15
$
104
Non-investment grade
8
16
17
4
45
Total
$
24
$
49
$
57
$
19
$
149
Index and basket CDS
Investment grade
$
4
$
12
$
7
$
3
$
26
Non-investment grade
10
22
172
92
296
Total
$
14
$
34
$
179
$
95
$
322
Total CDS sold
$
38
$
83
$
236
$
114
$
471
Other credit contracts
—
—
—
3
3
Total credit protection sold
$
38
$
83
$
236
$
117
$
474
CDS protection sold with identical protection purchased
$
410
Years to Maturity at December 31, 2024
$ in billions
< 1
1-3
3-5
Over 5
Total
Single-name CDS
Investment grade
$
15
$
31
$
37
$
10
$
93
Non-investment grade
7
16
16
1
40
Total
$
22
$
47
$
53
$
11
$
133
Index and basket CDS
Investment grade
$
3
$
12
$
10
$
—
$
25
Non-investment grade
11
22
158
16
207
Total
$
14
$
34
$
168
$
16
$
232
Total CDS sold
$
36
$
81
$
221
$
27
$
365
Other credit contracts
—
—
—
3
3
Total credit protection sold
$
36
$
81
$
221
$
30
$
368
CDS protection sold with identical protection purchased
$
303
Fair Value Asset (Liability) of Credit Protection Sold1
$ in millions
At March 31, 2025
At December 31, 2024
Single-name CDS
Investment grade
$
2,029
$
1,890
Non-investment grade
512
585
Total
$
2,541
$
2,475
Index and basket CDS
Investment grade
$
916
$
799
Non-investment grade
1,357
489
Total
$
2,273
$
1,288
Total CDS sold
$
4,814
$
3,763
Other credit contracts
125
133
Total credit protection sold
$
4,939
$
3,896
1.Investment grade/non-investment grade determination is based on the internal credit rating of the reference obligation. Internal credit ratings serve as the CRM’s assessment of credit risk and the basis for a comprehensive credit limits framework used to control credit risk. The Firm uses quantitative models and judgment to estimate the various risk parameters related to each obligor.
Protection Purchased with CDS
Notional
$ in billions
At March 31, 2025
At December 31, 2024
Single name
$
169
$
156
Index and basket
288
193
Tranched index and basket
29
28
Total
$
486
$
377
Fair Value Asset (Liability)
$ in millions
At March 31, 2025
At December 31, 2024
Single name
$
(2,639)
$
(2,693)
Index and basket
(1,741)
(654)
Tranched index and basket
(872)
(962)
Total
$
(5,252)
$
(4,309)
The Firm enters into credit derivatives, principally CDS, under which it receives or provides protection against the risk of default on a set of debt obligations issued by a specified reference entity or entities. A majority of the Firm’s counterparties for these derivatives are banks, broker-dealers, and insurance and other financial institutions.
The fair value amounts as shown in the previous tables are prior to cash collateral or counterparty netting. For further information on credit derivatives and other credit contracts, see Note 6 to the financial statements in the 2024 Form 10-K.
Notes to Consolidated Financial Statements (Unaudited)
7. Investment Securities
AFS and HTM Securities
At March 31, 2025
$ in millions
Amortized Cost1
Gross Unrealized Gains
Gross Unrealized Losses
Fair Value
AFS securities
U.S. Treasury securities
$
70,638
$
83
$
239
$
70,482
U.S. agency securities2
24,317
5
2,362
21,960
Agency CMBS
5,697
—
349
5,348
State and municipal securities
522
—
14
508
FFELP student loan ABS3
596
2
8
590
Unallocated basis adjustment4
—
—
—
—
Total AFS securities
101,770
90
2,972
98,888
HTM securities
U.S. Treasury securities
15,951
—
887
15,064
U.S. agency securities2
40,865
28
7,823
33,070
Agency CMBS
1,115
—
72
1,043
Non-agency CMBS
1,463
7
98
1,372
Total HTM securities
59,394
35
8,880
50,549
Total investment securities
$
161,164
$
125
$
11,852
$
149,437
At December 31, 2024
$ in millions
Amortized Cost1
Gross Unrealized Gains
Gross Unrealized Losses
Fair Value
AFS securities
U.S. Treasury securities
$
70,160
$
62
$
388
$
69,834
U.S. agency securities2
24,113
6
2,652
21,467
Agency CMBS
5,704
—
388
5,316
State and municipal securities
1,373
18
4
1,387
FFELP student loan ABS3
612
1
9
604
Unallocated basis adjustment4
(2)
2
—
—
Total AFS securities
101,960
89
3,441
98,608
HTM securities
U.S. Treasury securities
16,885
—
1,082
15,803
U.S. agency securities2
41,582
4
8,592
32,994
Agency CMBS
1,154
—
88
1,066
Non-agency CMBS
1,450
3
113
1,340
Total HTM securities
61,071
7
9,875
51,203
Total investment securities
$
163,031
$
96
$
13,316
$
149,811
1.Amounts are net of any ACL.
2.U.S. agency securities consist mainly of agency mortgage pass-through pool securities, CMOs and agency-issued debt.
3.Underlying loans are backed by a guarantee, ultimately from the U.S. Department of Education, of at least 95% of the principal balance and interest outstanding.
4.Represents the amount of unallocated portfolio layer method basis adjustments related to AFS securities hedged in a closed portfolio. Portfolio layer method basis adjustments are not allocated to individual securities. Refer to Note 2 to the financial statements in the 2024 Form 10-K and Note 6 herein for additional information.
AFS Securities in an Unrealized Loss Position
At March 31, 2025
At December 31, 2024
$ in millions
Fair Value
Gross Unrealized Losses
Fair Value
Gross Unrealized Losses
U.S. Treasury securities
Less than 12 months
$
10,689
$
21
$
18,338
$
65
12 months or longer
15,825
218
19,629
323
Total
26,514
239
37,967
388
U.S. agency securities
Less than 12 months
1,397
8
765
11
12 months or longer
18,627
2,354
18,996
2,641
Total
20,024
2,362
19,761
2,652
Agency CMBS
12 months or longer
5,004
349
5,018
388
Total
5,004
349
5,018
388
State and municipal securities
Less than 12 months
385
10
242
2
12 months or longer
57
4
62
2
Total
442
14
304
4
FFELP student loan ABS
Less than 12 months
8
—
—
—
12 months or longer
432
8
442
9
Total
440
8
442
9
Total AFS securities in an unrealized loss position
Less than 12 months
12,479
39
19,345
78
12 months or longer
39,945
2,933
44,147
3,363
Total
$
52,424
$
2,972
$
63,492
$
3,441
For AFS securities, the Firm believes there are no securities in an unrealized loss position that have credit losses after performing the analysis described in Note 2 in the 2024 Form 10-K and the Firm expects to recover the amortized cost basis of these securities. Additionally, the Firm does not intend to sell these securities and is not likely to be required to sell these securities prior to recovery of the amortized cost basis. As of March 31, 2025 and December 31, 2024, the securities in an unrealized loss position are predominantly investment grade.
The HTM securities net carrying amounts at March 31, 2025 and December 31, 2024 reflect an ACL of $59 million and $52 million, respectively, predominantly related to Non-agency CMBS. See Note 2 in the 2024 Form 10-K for a description of the ACL methodology used for HTM Securities.
As of March 31, 2025 and December 31, 2024, 98% of the Firm’s portfolio of HTM securities were investment grade U.S. agency securities, U.S. Treasury securities and Agency CMBS, which were on accrual status and for which there is an underlying assumption of zero credit losses. Non-investment grade HTM securities primarily consisted of certain Non-agency CMBS securities, for which the expected credit losses were insignificant and were predominantly on accrual status at March 31, 2025 and December 31, 2024.
Notes to Consolidated Financial Statements (Unaudited)
See Note 14 for additional information on securities issued by VIEs, including U.S. agency mortgage-backed securities, non-agency CMBS, and FFELP student loan ABS.
Investment Securities by Contractual Maturity
At March 31, 2025
$ in millions
Amortized Cost1
Fair Value
Annualized Average Yield2,3
AFS securities
U.S. Treasury securities:
Due within 1 year
$
19,725
$
19,580
2.5
%
After 1 year through 5 years
46,075
46,066
3.8
%
After 5 years through 10 years
4,838
4,836
4.2
%
After 10 years
—
—
—
%
Total
70,638
70,482
U.S. agency securities:
Due within 1 year
17
17
0.2
%
After 1 year through 5 years
206
198
1.7
%
After 5 years through 10 years
426
394
1.8
%
After 10 years
23,668
21,351
3.4
%
Total
24,317
21,960
Agency CMBS:
Due within 1 year
74
72
1.8
%
After 1 year through 5 years
4,153
4,018
1.9
%
After 5 years through 10 years
382
375
1.6
%
After 10 years
1,088
883
1.5
%
Total
5,697
5,348
State and municipal securities:
Due within 1 year
27
27
4.9
%
After 1 year through 5 years
203
202
4.7
%
After 5 years through 10 years
47
44
5.3
%
After 10 Years
245
235
4.2
%
Total
522
508
FFELP student loan ABS:
Due within 1 year
11
11
5.1
%
After 1 year through 5 years
111
108
5.1
%
After 5 years through 10 years
23
23
5.3
%
After 10 years
451
448
5.2
%
Total
596
590
Unallocated basis adjustment4
—
—
—
Total AFS securities
$
101,770
$
98,888
3.4
%
At March 31, 2025
$ in millions
Amortized Cost1
Fair Value
Annualized Average Yield2
HTM securities
U.S. Treasury securities:
Due within 1 year
$
6,511
$
6,417
1.5
%
After 1 year through 5 years
7,382
7,129
2.4
%
After 5 years through 10 years
503
427
1.1
%
After 10 years
1,555
1,091
2.3
%
Total
15,951
15,064
U.S. agency securities:
Due within 1 year
—
—
—
%
After 1 year through 5 years
9
9
1.9
%
After 5 years through 10 years
205
194
2.1
%
After 10 years
40,651
32,867
2.1
%
Total
40,865
33,070
Agency CMBS:
Due within 1 year
377
370
1.4
%
After 1 year through 5 years
530
499
1.3
%
After 5 years through 10 years
157
132
1.6
%
After 10 years
51
42
1.3
%
Total
1,115
1,043
Non-agency CMBS:
Due within 1 year
135
118
4.2
%
After 1 year through 5 years
695
665
4.3
%
After 5 years through 10 years
401
361
4.2
%
After 10 years
232
228
7.4
%
Total
1,463
1,372
Total HTM securities
$
59,394
$
50,549
2.1
%
Total investment securities
$
161,164
$
149,437
2.9
%
1.Amounts are net of any ACL.
2.Annualized average yield is computed using the effective yield, weighted based on the amortized cost of each security. The effective yield is shown pre-tax and excludes the effect of related hedging derivatives.
3.At March 31, 2025, the annualized average yield, including the interest rate swap accrual of related hedges, was 2.8% for AFS securities contractually maturing within 1 year and 3.8% for all AFS securities.
4.Represents the amount of unallocated portfolio layer method basis adjustments related to AFS securities hedged in a closed portfolio. Portfolio layer method basis adjustments are not allocated to individual securities. Refer to Note 2 to the financial statements in the 2024 Form 10-K and Note 6 herein for additional information.
Gross Realized Gains (Losses) on Sales of AFS Securities
Three Months Ended March 31,
$ in millions
2025
2024
Gross realized gains
$
21
$
43
Gross realized (losses)
—
—
Total1
$
21
$
43
1.Realized gains and losses are recognized in Other revenues in the income statement.
Notes to Consolidated Financial Statements (Unaudited)
8. Collateralized Transactions
Offsetting of Certain Collateralized Transactions
At March 31, 2025
$ in millions
Gross Amounts
Amounts Offset
Balance Sheet Net Amounts
Amounts Not Offset1
Net Amounts
Assets
Securities purchased under agreements to resell
$
458,756
$
(339,708)
$
119,048
$
(117,355)
$
1,693
Securities borrowed
194,241
(54,015)
140,226
(133,353)
6,873
Liabilities
Securities sold under agreements to repurchase
$
408,980
$
(339,708)
$
69,272
$
(63,573)
$
5,699
Securities loaned
70,619
(54,015)
16,604
(16,580)
24
Net amounts for which master netting agreements are not in place or may not be legally enforceable
Securities purchased under agreements to resell
$
1,566
Securities borrowed
2,005
Securities sold under agreements to repurchase
3,958
At December 31, 2024
$ in millions
Gross Amounts
Amounts Offset
Balance Sheet Net Amounts
Amounts Not Offset1
Net Amounts
Assets
Securities purchased under agreements to resell
$
409,635
$
(291,070)
$
118,565
$
(116,157)
$
2,408
Securities borrowed
165,642
(41,783)
123,859
(117,573)
6,286
Liabilities
Securities sold under agreements to repurchase
$
341,137
$
(291,070)
$
50,067
$
(45,520)
$
4,547
Securities loaned
57,009
(41,783)
15,226
(15,211)
15
Net amounts for which master netting agreements are not in place or may not be legally enforceable
Securities purchased under agreements to resell
$
2,054
Securities borrowed
2,079
Securities sold under agreements to repurchase
3,448
1.Amounts relate to master netting agreements that have been determined by the Firm to be legally enforceable in the event of default but where certain other criteria are not met in accordance with applicable offsetting accounting guidance.
For further discussion of the Firm’s collateralized transactions, see Notes 2 and 8 to the financial statements in the 2024 Form 10-K. For information related to offsetting of derivatives, see Note 6.
Gross Secured Financing Balances by Remaining Contractual Maturity
At March 31, 2025
$ in millions
Overnight and Open
Less than 30 Days
30-90 Days
Over 90 Days
Total
Securities sold under agreements to repurchase
$
196,112
$
136,728
$
34,558
$
41,582
$
408,980
Securities loaned
55,564
—
485
14,570
70,619
Total included in the offsetting disclosure
$
251,676
$
136,728
$
35,043
$
56,152
$
479,599
Trading liabilities— Obligation to return securities received as collateral
7,567
—
—
—
7,567
Total
$
259,243
$
136,728
$
35,043
$
56,152
$
487,166
At December 31, 2024
$ in millions
Overnight and Open
Less than 30 Days
30-90 Days
Over 90 Days
Total
Securities sold under agreements to repurchase
$
180,793
$
104,551
$
25,071
$
30,722
$
341,137
Securities loaned
42,473
—
317
14,219
57,009
Total included in the offsetting disclosure
$
223,266
$
104,551
$
25,388
$
44,941
$
398,146
Trading liabilities— Obligation to return securities received as collateral
18,067
—
—
—
18,067
Total
$
241,333
$
104,551
$
25,388
$
44,941
$
416,213
Gross Secured Financing Balances by Class of Collateral Pledged
$ in millions
At March 31, 2025
At December 31, 2024
Securities sold under agreements to repurchase
U.S. Treasury and agency securities
$
196,508
$
177,464
Other sovereign government obligations
175,107
135,806
Corporate equities
17,175
14,993
Other
20,190
12,874
Total
$
408,980
$
341,137
Securities loaned
Other sovereign government obligations
$
2,506
$
1,805
Corporate equities
66,370
54,144
Other
1,743
1,060
Total
$
70,619
$
57,009
Total included in the offsetting disclosure
$
479,599
$
398,146
Trading liabilities—Obligation to return securities received as collateral
Corporate equities
$
7,557
$
18,059
Other
10
8
Total
$
7,567
$
18,067
Total
$
487,166
$
416,213
Carrying Value of Assets Loaned or Pledged without Counterparty Right to Sell or Repledge
$ in millions
At March 31, 2025
At December 31, 2024
Trading assets
$
39,331
$
30,867
The Firm pledges certain of its trading assets to collateralize securities sold under agreements to repurchase, securities loaned, other secured financings and derivatives and to cover customer short sales.
Pledged financial instruments that can be sold or repledged by the secured party are identified as Trading assets (pledged as collateral) in the balance sheet. Pledged financial instruments that cannot be sold or repledged by the secured party are included within Trading Assets, but not identified as pledged assets parenthetically in the balance sheet.
Notes to Consolidated Financial Statements (Unaudited)
Fair Value of Collateral Received with Right to Sell or Repledge
$ in millions
At March 31, 2025
At December 31, 2024
Collateral received with right to sell or repledge
$
1,029,009
$
932,626
Collateral that was sold or repledged1
789,978
724,177
1.Does not include securities used to meet federal regulations for the Firm’s U.S. broker-dealers.
The Firm receives collateral in the form of securities in connection with securities purchased under agreements to resell, securities borrowed, securities-for-securities transactions, derivative transactions, customer margin loans and securities-based lending. In many cases, the Firm is permitted to sell or repledge this collateral to secure securities sold under agreements to repurchase, to enter into securities lending and derivative transactions or to deliver to counterparties to cover short positions.
Securities Segregated for Regulatory Purposes
$ in millions
At March 31, 2025
At December 31, 2024
Segregated securities1
$
33,236
$
26,329
1.Securities segregated under federal regulations for the Firm’s U.S. broker-dealers are sourced from Securities purchased under agreements to resell and Trading assets in the balance sheet.
Customer Margin and Other Lending
$ in millions
At March 31, 2025
At December 31, 2024
Margin and other lending
$
56,848
$
55,882
The Firm provides margin lending arrangements that allow customers to borrow against the value of qualifying securities. Receivables from these arrangements are included within Customer and other receivables in the balance sheet. Under these arrangements, the Firm receives collateral, which includes U.S. government and agency securities, other sovereign government obligations, corporate and other debt, and corporate equities. Margin loans are collateralized by customer-owned securities held by the Firm. The Firm monitors required margin levels and established credit terms daily and, pursuant to such guidelines, requires customers to deposit additional collateral, or reduce positions, when necessary.
For a further discussion of the Firm’s margin lending activities, see Note 8 to the financial statements in the 2024 Form 10-K.
Also included in the amounts in the previous table is non-purpose securities-based lending on entities in the Wealth Management business segment.
Other Secured Financings
The Firm has additional secured liabilities. For a further discussion of other secured financings, see Note 12.
Additionally, for certain secured financing transactions that meet applicable netting criteria, the Firm offset Other secured financing liabilities against financing receivables recorded within Trading assets in the amount of $1,896 million and $437 million as of March 31, 2025 and December 31, 2024, respectively.
9. Loans, Lending Commitments and Related Allowance for Credit Losses
Loans by Type
At March 31, 2025
$ in millions
HFI Loans
HFS Loans
Total Loans
Corporate
$
7,733
$
11,994
$
19,727
Secured lending facilities
51,329
3,680
55,009
Commercial real estate
8,610
290
8,900
Residential real estate
67,579
—
67,579
Securities-based lending and Other
98,674
147
98,821
Total loans
233,925
16,111
250,036
ACL
(1,133)
(1,133)
Total loans, net
$
232,792
$
16,111
$
248,903
Loans to non-U.S. borrowers, net
$
26,936
$
7,064
$
34,000
At December 31, 2024
$ in millions
HFI Loans
HFS Loans
Total Loans
Corporate
$
6,889
$
9,183
$
16,072
Secured lending facilities
48,842
2,507
51,349
Commercial real estate
8,412
628
9,040
Residential real estate
66,738
—
66,738
Securities-based lending and Other
96,019
1
96,020
Total loans
226,900
12,319
239,219
ACL
(1,066)
(1,066)
Total loans, net
$
225,834
$
12,319
$
238,153
Loans to non-U.S. borrowers, net
$
23,335
$
4,763
$
28,098
For additional information on the Firm’s held-for-investment and held-for-sale loan portfolios, see Note 9 to the financial statements in the 2024 Form 10-K.
Loans by Interest Rate Type
At March 31, 2025
At December 31, 2024
$ in millions
Fixed Rate
Floating or Adjustable Rate
Fixed Rate
Floating or Adjustable Rate
Corporate
$
11
$
19,715
$
—
$
16,071
Secured lending facilities
—
55,008
—
51,349
Commercial real estate
240
8,661
—
9,041
Residential real estate
31,327
36,252
31,014
35,724
Securities-based lending and Other
24,890
73,932
25,478
70,542
Total loans, before ACL
$
56,468
$
193,568
$
56,492
$
182,727
See Note 4 for further information regarding Loans and lending commitments held at fair value. See Note 13 for details of current commitments to lend in the future.
Notes to Consolidated Financial Statements (Unaudited)
Loans Held for Investment before Allowance by Credit Quality and Origination Year
At March 31, 2025
At December 31, 2024
Corporate
$ in millions
IG
NIG
Total
IG
NIG
Total
Revolving
$
3,084
$
4,422
$
7,506
$
2,668
$
3,963
$
6,631
2025
—
—
—
2024
76
50
126
76
58
134
2023
—
50
50
—
50
50
2022
—
26
26
—
25
25
2021
15
—
15
15
—
15
Prior
9
1
10
31
3
34
Total
$
3,184
$
4,549
$
7,733
$
2,790
$
4,099
$
6,889
At March 31, 2025
At December 31, 2024
Secured Lending Facilities
$ in millions
IG
NIG
Total
IG
NIG
Total
Revolving
$
11,829
$
29,083
$
40,912
$
11,405
$
27,753
$
39,158
2025
2
1,354
1,356
2024
938
3,171
4,109
818
2,863
3,681
2023
588
1,217
1,805
1,371
1,359
2,730
2022
271
1,748
2,019
279
1,909
2,188
2021
—
210
210
—
198
198
Prior
100
818
918
100
787
887
Total
$
13,728
$
37,601
$
51,329
$
13,973
$
34,869
$
48,842
At March 31, 2025
At December 31, 2024
Commercial Real Estate
$ in millions
IG
NIG
Total
IG
NIG
Total
Revolving
$
—
$
147
$
147
$
—
$
161
$
161
2025
—
266
266
2024
153
2,395
2,548
147
2,202
2,349
2023
356
667
1,023
351
772
1,123
2022
313
1,448
1,761
305
1,488
1,793
2021
170
1,608
1,778
166
1,603
1,769
Prior
—
1,087
1,087
—
1,217
1,217
Total
$
992
$
7,618
$
8,610
$
969
$
7,443
$
8,412
At March 31, 2025
Residential Real Estate
by FICO Scores
by LTV Ratio
Total
$ in millions
≥ 740
680-739
≤ 679
≤ 80%
> 80%
Revolving
$
143
$
34
$
5
$
182
$
—
$
182
2025
1,656
348
30
1,848
186
2,034
2024
8,481
1,592
189
9,284
978
10,262
2023
6,595
1,398
198
7,322
869
8,191
2022
10,172
2,252
368
11,785
1,007
12,792
2021
10,374
2,221
224
11,944
875
12,819
Prior
16,745
4,074
480
19,939
1,360
21,299
Total
$
54,166
$
11,919
$
1,494
$
62,304
$
5,275
$
67,579
At December 31, 2024
Residential Real Estate
by FICO Scores
by LTV Ratio
Total
$ in millions
≥ 740
680-739
≤ 679
≤ 80%
> 80%
Revolving
$
136
$
39
$
5
$
180
$
—
$
180
2024
8,653
1,607
191
9,458
993
10,451
2023
6,778
1,431
201
7,529
881
8,410
2022
10,294
2,298
370
11,941
1,021
12,962
2021
10,510
2,247
228
12,094
891
12,985
Prior
17,088
4,171
491
20,355
1,395
21,750
Total
$
53,459
$
11,793
$
1,486
$
61,557
$
5,181
$
66,738
At March 31, 2025
Securities-based lending1
Other2
$ in millions
IG
NIG
Total
Revolving
$
78,213
$
6,552
$
1,600
$
86,365
2025
358
37
300
695
2024
1,464
908
285
2,657
2023
949
370
769
2,088
2022
375
441
1,086
1,902
2021
100
18
534
652
Prior
278
1,360
2,677
4,315
Total
$
81,737
$
9,686
$
7,251
$
98,674
At December 31, 2024
Securities-based lending1
Other2
$ in millions
IG
NIG
Total
Revolving
$
76,432
$
6,342
$
1,551
$
84,325
2024
1,291
719
453
2,463
2023
949
424
685
2,058
2022
449
472
1,053
1,974
2021
100
14
538
652
Prior
270
1,430
2,847
4,547
Total
$
79,491
$
9,401
$
7,127
$
96,019
IG—Investment Grade
NIG—Non-investment Grade
1. Securities-based loans are subject to collateral maintenance provisions, and at March 31, 2025 and December 31, 2024, these loans are predominantly over-collateralized. For more information on the ACL methodology related to securities-based loans, see Note 2 to the financial statements in the 2024 Form 10-K.
2. Other loans primarily include certain loans originated in the tailored lending business within the Wealth Management business segment, which typically consist of bespoke lending arrangements provided to ultra-high worth net clients. These facilities are generally secured by eligible collateral.
Past Due Loans Held for Investment before Allowance1
$ in millions
At March 31, 2025
At December 31, 2024
Commercial real estate
$
343
$
272
Residential real estate
204
186
Securities-based lending and Other
92
86
Total
$
639
$
544
1.As of March 31, 2025 and December 31, 2024, the majority of the amounts are 90 days or more past due.
Nonaccrual Loans Held for Investment before Allowance1
$ in millions
At March 31, 2025
At December 31, 2024
Corporate
$
164
$
108
Secured lending facilities
6
6
Commercial real estate
454
447
Residential real estate
189
160
Securities-based lending and Other
308
298
Total
$
1,121
$
1,019
Nonaccrual loans without an ACL
$
173
$
162
1.There were no loans held for investment that were 90 days or more past due and still accruing as of March 31, 2025 and December 31, 2024. For further information on the Firm’s nonaccrual policy, see Note 2 to the financial statements in the 2024 Form 10-K.
Loan Modifications to Borrowers Experiencing Financial Difficulty
The Firm may modify the terms of certain loans for economic or legal reasons related to a borrower’s financial difficulties, and these modifications include interest rate reductions,
Notes to Consolidated Financial Statements (Unaudited)
principal forgiveness, term extensions and other-than-insignificant payment delays or a combination of these aforementioned modifications. Modified loans are typically evaluated individually for allowance for credit losses.
Modified Loans Held for Investment
Period-end loans held for investment modified during the following periods1
Three Months Ended March 31,
2025
2024
$ in millions
Amortized Cost
% of Total Loans2
Amortized Cost
% of Total Loans2
Term Extension
Corporate
$
42
0.5
%
$
52
0.7
%
Secured lending facilities
41
0.1
%
—
—
%
Commercial real estate
292
3.4
%
127
1.5
%
Securities-based lending and Other
34
—
%
41
—
%
Total
$
409
0.2
%
$
220
0.2
%
Other-than-insignificant Payment Delay
Securities-based lending and Other
$
30
—
%
$
—
—
%
Total
$
30
—
%
$
—
—
%
Multiple Modifications - Term Extension and Other-than-insignificant Payment Delay
Commercial real estate
—
—
%
40
0.5
%
Total
$
—
—
%
$
40
0.5
%
Total Modifications
$
439
0.3
%
$
260
0.2
%
1.Lending commitments to borrowers for which the Firm has modified terms of the receivable during the three months ended March 31, 2025 and 2024, were $214 million and $301 million, as of March 31, 2025 and 2024, respectively.
2.Percentage of total loans represents the percentage of modified loans to total loans held for investment by loan type.
Financial Effect of Modifications on Loans Held for Investment
Three Months Ended March 31, 20251
Term Extension (Months)
Other-than-insignificant Payment Delay (Months)
Principal Forgiveness
($ millions)
Interest Rate Reduction (%)
Single Modifications
Corporate
37
0
$
—
—
%
Secured lending facilities
3
0
—
—
%
Commercial real estate
1
0
—
—
%
Securities-based lending and Other
12
11
—
—
%
Three Months Ended March 31, 20241
Term Extension (Months)
Other-than-insignificant Payment Delay (Months)
Principal Forgiveness
($ millions)
Interest Rate Reduction (%)
Single Modifications
Corporate
30
0
$
—
—
%
Commercial real estate
5
0
—
—
%
Securities-based lending and Other
36
0
—
—
%
Multiple Modifications - Term Extension and Other-than-insignificant Payment Delay
Commercial real estate
16
16
$
—
—
%
1.In instances where more than one loan was modified, modification impact is presented on a weighted-average basis.
Past Due Loans Held for Investment Modified in the Last 12 months
At March 31, 2025
$ in millions
30-89 Days Past Due
90+ Days Past Due
Total
Commercial real estate
$
—
$
63
$
63
At March 31, 2024
$ in millions
30-89 Days Past Due
90+ days Past Due
Total
Commercial real estate
$
—
$
45
$
45
At March 31, 2025, there was one commercial real estate loan held for investment with an amortized cost of $63 million that defaulted during the three months ended March 31, 2025 and had been modified in the 12 month period prior to default. There were no loans held for investment that defaulted during the three months ended March 31, 2024 that had been modified in the 12 month period prior.
Allowance for Credit Losses Rollforward and Allocation—Loans and Lending Commitments
Notes to Consolidated Financial Statements (Unaudited)
Three Months Ended March 31, 2024
$ in millions
Corporate
Secured Lending Facilities
CRE
Residential Real Estate
SBL and Other
Total
ACL—Loans
Beginning balance
$
241
$
153
$
463
$
100
$
212
$
1,169
Provision (release)
1
(17)
1
(11)
4
(22)
Other
(1)
(1)
(3)
—
(1)
(6)
Ending balance
$
241
$
135
$
461
$
89
$
215
$
1,141
Percent of loans to total loans1
4
%
19
%
4
%
30
%
43
%
100
%
ACL—Lending commitments
Beginning balance
$
431
$
70
$
26
$
4
$
20
$
551
Provision (release)
(2)
25
(3)
—
(4)
16
Other
(3)
(1)
—
—
2
(2)
Ending balance
$
426
$
94
$
23
$
4
$
18
$
565
Total ending balance
$
667
$
229
$
484
$
93
$
233
$
1,706
CRE—Commercial real estate
SBL—Securities-based lending
1.Percent of loans to total loans represents loans held for investment by loan type to total loans held for investment.
The allowance for credit losses for loans and lending commitments increased during the three months ended March 31, 2025, primarily related to portfolio growth in secured lending facilities and corporate loans, provisions for certain specific loans, including residential real estate loans related to the California wildfires, and deterioration in the macroeconomic outlook. Charge-offs in the current quarter were primarily related to commercial real estate loans.
The base scenario used in our ACL models as of March 31, 2025 was generated using a combination of consensus economic forecasts, forward rates, and internally developed and validated models. This scenario assumes slower economic growth as well as higher interest rates relative to the prior quarter forecast. The revised real GDP growth rates assumed in our ACL models incorporated the weaker economic outlook and conditions as of March 31, 2025. The ACL calculation incorporates key macroeconomic variables, including U.S. real GDP growth rate. The significance of key macroeconomic variables on the ACL calculation varies depending on portfolio composition and economic conditions. Other key macroeconomic variables used in the ACL calculation include corporate credit spreads, interest rates and commercial real estate indices.
For a further discussion of the Firm’s loans as well as the Firm’s allowance methodology, refer to Notes 2 and 9 to the financial statements in the 2024 Form 10-K.
Gross Charge-offs by Origination Year
Three Months Ended March 31, 2025
$ in millions
Corporate
Secured Lending Facilities
CRE
Residential Real Estate
SBL and Other
Total
2022
—
—
$
(10)
$
—
$
—
$
(10)
2021
—
—
(1)
—
—
(1)
Prior
—
—
(20)
—
—
(20)
Total
$
—
$
—
$
(31)
$
—
$
—
$
(31)
CRE—Commercial real estate
SBL—Securities-based lending
There were no charge-offs during the three months ended March 31, 2024.
Selected Credit Ratios
At March 31, 2025
At December 31, 2024
ACL for loans to total HFI loans
0.5
%
0.5
%
Nonaccrual HFI loans to total HFI loans
0.5
%
0.4
%
ACL for loans to nonaccrual HFI loans
101.1
%
104.6
%
Employee Loans
$ in millions
At March 31, 2025
At December 31, 2024
Currently employed by the Firm1
$
4,287
$
4,255
No longer employed by the Firm2
89
83
Employee loans
$
4,376
$
4,338
ACL
(115)
(112)
Employee loans, net of ACL
$
4,261
$
4,226
Remaining repayment term, weighted average in years
5.6
5.6
1.These loans are predominantly current.
2.These loans are predominantly past due for a period of 90 days or more.
Employee loans are granted in conjunction with a program established primarily to recruit certain Wealth Management financial advisors, are full recourse and generally require periodic repayments, and are due in full upon termination of employment with the Firm. These loans are recorded in Customer and other receivables in the balance sheet. See Note 2 to the financial statements in the 2024 Form 10-K for a description of the CECL allowance methodology, including credit quality indicators, for employee loans.
10. Other Assets
Equity Method Investments
$ in millions
At March 31, 2025
At December 31, 2024
Investments
$
1,984
$
1,869
Three Months Ended March 31,
$ in millions
2025
2024
Income (loss)
$
62
$
56
Equity method investments, other than investments in certain fund interests, are summarized above and are included in Other assets in the balance sheet with related income or loss included in Other revenues in the income statement. See “Net
Notes to Consolidated Financial Statements (Unaudited)
Asset Value Measurements—Fund Interests” in Note 4 for the carrying value of certain of the Firm’s fund interests, which are composed of general and limited partnership interests, as well as any related carried interest.
Japanese Securities Joint Venture
Three Months Ended March 31,
$ in millions
2025
2024
Income (loss) from investment in MUMSS
$
36
$
40
For more information on MUMSS and other relationships with MUFG, see Note 11 to the financial statements in the 2024 Form 10-K.
Tax Equity Investments
The Firm invests in tax equity investment interests which entitle the Firm to a share of tax credits and other income tax benefits generated by the projects underlying the investments.
The Firm accounts for certain renewable energy and other tax equity investments programs using the proportional amortization method.
Tax Equity Investments under the Proportional Amortization Method
$ in millions
At March 31, 2025
At December 31, 2024
Low-income housing
$
1,847
$
1,787
Renewable energy and other
25
67
Total1,2
$
1,872
$
1,854
1.Amounts include unfunded equity contributions of $648 million and $613 million as of March 31, 2025 and December 31, 2024, respectively. The corresponding liabilities for the commitments to fund these equity contributions are recorded in Other liabilities and accrued expenses. The majority of these commitments are expected to be funded within 5 years.
2.Amounts exclude $48 million and $48 million as of March 31, 2025 and December 31, 2024, respectively, of tax equity investments within programs for which the Firm elected the proportional amortization method that do not meet the conditions to apply the proportional amortization method, which are accounted for as equity method investments.
Income tax credits and other income tax benefits recognized as well as proportional amortization are included in the Provision for income taxes line in the consolidated income statement and in the Depreciation and amortization line in the consolidated cash flow statement.
Net Benefits Attributable to Tax Equity Investments under the Proportional Amortization Method
Three Months Ended March 31,
$ in millions
2025
2024
Income tax credits and other income tax benefits
$
75
$
75
Proportional amortization
(62)
(60)
Net benefits
$
13
$
15
11. Deposits
Deposits
$ in millions
At March 31, 2025
At December 31, 2024
Savings and demand deposits
$
301,890
$
299,898
Time deposits
79,673
76,109
Total
$
381,563
$
376,007
Deposits subject to FDIC insurance
$
304,589
$
298,351
Deposits not subject to FDIC insurance
$
76,974
$
77,656
Time Deposit Maturities
$ in millions
At March 31, 2025
2025
$
28,663
2026
24,531
2027
12,662
2028
7,548
2029
4,840
Thereafter
1,429
Total
$
79,673
12. Borrowings and Other Secured Financings
Borrowings
$ in millions
At March 31, 2025
At December 31, 2024
Original maturities of one year or less
$
8,393
$
4,512
Original maturities greater than one year
Senior
$
283,049
$
270,594
Subordinated
13,948
13,713
Total greater than one year
$
296,997
$
284,307
Total
$
305,390
$
288,819
Weighted average stated maturity, in years1
6.6
6.6
1.Only includes borrowings with original maturities greater than one year.
Other Secured Financings
$ in millions
At March 31, 2025
At December 31, 2024
Original maturities:
One year or less
$
15,332
$
17,133
Greater than one year
6,935
4,469
Total
$
22,267
$
21,602
Transfers of assets accounted for as secured financings
$
11,589
$
10,275
Other secured financings include the liabilities related to collateralized notes, transfers of financial assets that are accounted for as financings rather than sales and consolidated VIEs where the Firm is deemed to be the primary beneficiary. These liabilities are generally payable from the cash flows of the related assets accounted for as Trading assets. See Note 14 for further information on other secured financings related to VIEs and securitization activities.
For transfers of assets that fail to meet accounting criteria for a sale, the Firm continues to record the assets and recognizes the associated liabilities in the balance sheet.
Notes to Consolidated Financial Statements (Unaudited)
13. Commitments, Guarantees and Contingencies
Commitments
Years to Maturity at March 31, 2025
$ in millions
Less than 1
1-3
3-5
Over 5
Total
Lending:
Corporate
$
14,629
$
40,433
$
67,573
$
7,491
$
130,126
Secured lending facilities
6,480
7,232
8,489
6,228
28,429
Commercial and Residential real estate
72
134
133
430
769
Securities-based lending and Other
16,222
3,688
372
454
20,736
Forward-starting secured financing receivables1
200,590
1,196
—
—
201,786
Central counterparty
300
—
—
20,979
21,279
Underwriting
89
—
—
—
89
Investment activities
1,823
82
140
368
2,413
Letters of credit and other financial guarantees
30
—
—
4
34
Total
$
240,235
$
52,765
$
76,707
$
35,954
$
405,661
Lending commitments participated to third parties
$
11,418
1.These amounts primarily include secured financing receivables yet to settle as of March 31, 2025, with settlement generally occurring within three business days. These amounts also include commitments to enter into certain collateralized financing transactions.
Since commitments associated with these instruments may expire unused, the amounts shown do not necessarily reflect the actual future cash funding requirements.
For a further description of these commitments, refer to Note 14 to the financial statements in the 2024 Form 10-K.
Guarantees
At March 31, 2025
Maximum Potential Payout/Notional of Obligations by Years to Maturity
Carrying Amount Asset (Liability)
$ in millions
Less than 1
1-3
3-5
Over 5
Non-credit derivatives1
$
1,395,280
$
648,411
$
210,570
$
515,558
$
(42,768)
Standby letters of credit and other financial guarantees issued2,3
1,613
736
1,249
2,556
14
Liquidity facilities
2,432
—
—
—
2
Whole loan sales guarantees
50
34
—
23,050
—
Securitization representations and warranties4
—
—
—
90,735
—
General partner guarantees
191
133
74
14
(99)
Client clearing guarantees
1,257
—
—
—
—
1.The carrying amounts of derivative contracts that meet the accounting definition of a guarantee are shown on a gross basis. For further information on derivatives contracts, see Note 6.
2.These amounts include certain issued standby letters of credit participated to third parties, totaling $0.5 billion of notional and collateral/recourse, due to the nature of the Firm’s obligations under these arrangements.
3.As of March 31, 2025, the carrying amount of standby letters of credit and other financial guarantees issued includes an allowance for credit losses of $56 million.
4.Related to commercial, residential mortgage and asset backed securitizations.
The Firm has obligations under certain guarantee arrangements, including contracts and indemnification agreements, that contingently require the Firm to make
payments to the guaranteed party based on changes in an underlying measure (such as an interest or foreign exchange rate, security or commodity price, an index, or the occurrence or non-occurrence of a specified event) related to an asset, liability or equity security of a guaranteed party. Also included as guarantees are contracts that contingently require the Firm to make payments to the guaranteed party based on another entity’s failure to perform under an agreement, as well as indirect guarantees of the indebtedness of others.
For more information on the nature of the obligations and related business activities for our guarantees, see Note 14 to the financial statements in the 2024 Form 10-K.
Other Guarantees and Indemnities
In the normal course of business, the Firm provides guarantees and indemnifications in a variety of transactions. These provisions generally are standard contractual terms. Certain of these guarantees and indemnifications related to indemnities, market value guarantees, exchange and clearinghouse member guarantees, futures and over-the-counter derivatives clearing guarantees and merger and acquisition guarantees are described in Note 14 to the financial statements in the 2024 Form 10-K.
In addition, in the ordinary course of business, the Firm guarantees the debt and/or certain trading obligations (including obligations associated with derivatives, foreign exchange contracts and the settlement of physical commodities) of certain subsidiaries. These guarantees generally are entity or product specific and are required by investors or trading counterparties. The activities of the Firm’s subsidiaries covered by these guarantees (including any related debt or trading obligations) are included in the financial statements.
Finance Subsidiary
The Parent Company fully and unconditionally guarantees the securities issued by Morgan Stanley Finance LLC, a wholly owned finance subsidiary. No other subsidiary of the Parent Company guarantees these securities.
Contingencies
Legal
In addition to the matters described below, in the normal course of business, the Firm has been named, from time to time, as a defendant in various legal actions, including arbitrations, class actions and other litigation, arising in connection with its activities as a global diversified financial services institution. Certain of the actual or threatened legal actions include claims for substantial compensatory and/or punitive damages or claims for indeterminate amounts of damages. In some cases, the third-party entities that are, or would otherwise be, the primary defendants in such cases are bankrupt, in financial distress, or may not honor applicable
Notes to Consolidated Financial Statements (Unaudited)
indemnification obligations. These actions have included, but are not limited to, antitrust claims, claims under various false claims act statutes, and matters arising from our wealth management businesses, sales and trading businesses, and our activities in the capital markets.
The Firm is also involved, from time to time, in other reviews, investigations and proceedings (both formal and informal) by governmental or other regulatory agencies regarding the Firm’s business, and involving, among other matters, sales, trading, financing, prime brokerage, market-making activities, investment banking advisory services, capital markets activities, financial products or offerings sponsored, underwritten or sold by the Firm, wealth and investment management services, and accounting and operational matters, certain of which may result in adverse judgments, settlements, fines, penalties, disgorgement, restitution, forfeiture, injunctions, limitations on our ability to conduct certain business, or other relief.
The Firm contests liability and/or the amount of damages as appropriate in each pending matter. Where available information indicates that it is probable a liability had been incurred at the date of the financial statements and the Firm can reasonably estimate the amount of that loss or the range of loss, the Firm accrues an estimated loss by a charge to income, including with respect to certain of the individual proceedings or investigations described below.
The Firm’s legal expenses can, and may in the future, fluctuate from period to period, given the current environment regarding government or regulatory agency investigations and private litigation affecting global financial services firms, including the Firm.
In many legal proceedings and investigations, it is inherently difficult to determine whether any loss is probable or reasonably possible, or to estimate the amount of any loss. In addition, even where the Firm has determined that a loss is probable or reasonably possible or an exposure to loss or range of loss exists in excess of the liability already accrued with respect to a previously recognized loss contingency, the Firm may be unable to reasonably estimate the amount of the loss or range of loss. It is particularly difficult to determine if a loss is probable or reasonably possible, or to estimate the amount of loss, where the factual record is being developed or contested or where plaintiffs or government entities seek substantial or indeterminate damages, restitution, forfeiture, disgorgement or penalties. Numerous issues may need to be resolved in an investigation or proceeding before a determination can be made that a loss or additional loss (or range of loss or range of additional loss) is probable or reasonably possible, or to estimate the amount of loss, including through potentially lengthy discovery or determination of important factual matters, determination of issues related to class certification, the calculation of damages or other relief, and consideration of novel or unsettled legal
questions relevant to the proceedings or investigations in question.
The Firm has identified below any individual proceedings or investigations where the Firm believes a material loss to be reasonably possible. In certain legal proceedings in which the Firm has determined that a material loss is reasonably possible, the Firm is unable to reasonably estimate the loss or range of loss. There are other matters in which the Firm has determined a loss or range of loss to be reasonably possible, but the Firm does not believe, based on current knowledge and after consultation with counsel, that such losses could have a material adverse effect on the Firm’s financial statements as a whole, although the outcome of such proceedings or investigations may significantly impact the Firm’s business or results of operations for any particular reporting period, or cause significant reputational harm.
While the Firm has identified below certain proceedings or investigations that the Firm believes to be material, individually or collectively, there can be no assurance that material losses will not be incurred from claims that have not yet been asserted or those where potential losses have not yet been determined to be probable or reasonably possible.
Antitrust Related Matters
The Firm and other financial institutions are responding to a number of governmental investigations and civil litigation matters related to allegations of anticompetitive conduct in various aspects of the financial services industry, including the matters described below.
Beginning in February of 2016, the Firm was named as a defendant in multiple purported antitrust class actions now consolidated into a single proceeding in the United States District Court for the Southern District of New York (“SDNY”) styled In Re: Interest Rate Swaps Antitrust Litigation. Plaintiffs allege, inter alia, that the Firm, together with a number of other financial institution defendants, violated U.S. and New York state antitrust laws from 2008 through December of 2016 in connection with alleged efforts to prevent the development of electronic exchange-based platforms for interest rate swaps trading. Complaints were filed both on behalf of a purported class of investors who purchased interest rate swaps from defendants, as well as on behalf of three operators of swap execution facilities that allegedly were thwarted by the defendants in their efforts to develop such platforms. The consolidated complaints seek, inter alia, certification of the investor class of plaintiffs and treble damages. On July 28, 2017, the court granted in part and denied in part the defendants’ motion to dismiss the complaints. On December 15, 2023, the court denied the class plaintiffs’ motion for class certification. On December 29, 2023, the class plaintiffs petitioned the United States Court of Appeals for the Second Circuit for leave to appeal that decision. On February 28, 2024, the parties reached an agreement in principle to settle the class claims. On July 11,
Notes to Consolidated Financial Statements (Unaudited)
2024, the court granted preliminary approval of the settlement.
The Firm is a defendant in three antitrust class action complaints which have been consolidated into one proceeding in the United States District Court for the SDNY under the caption City of Philadelphia, et al. v. Bank of America Corporation, et al. Plaintiffs allege, inter alia, that the Firm, together with a number of other financial institution defendants, violated U.S. antitrust laws and relevant state laws in connection with alleged efforts to artificially inflate interest rates for Variable Rate Demand Obligations (“VRDO”). The consolidated complaint seeks, inter alia, certification of the class of plaintiffs and treble damages. The complaint was filed on behalf of a class of municipal issuers of VRDO for which defendants served as remarketing agent. On November 2, 2020, the court granted in part and denied in part the defendants’ motion to dismiss the consolidated complaint, dismissing state law claims, but denying dismissal of the U.S. antitrust claims. On September 21, 2023, the court granted plaintiffs’ motion for class certification. On February 5, 2024, the United States Court of Appeals for the Second Circuit granted leave to appeal that decision.
European Matters
Tax
In matters styled Case number 15/3637 and Case number 15/4353, the Dutch Tax Authority (“Dutch Authority”) challenged in the Dutch courts the prior set-off by the Firm of approximately €124 million (approximately $134 million) plus accrued interest of withholding tax credits against the Firm’s corporation tax liabilities for the tax years 2007 to 2012. The Dutch Authority alleged that the Firm was not entitled to receive the withholding tax credits on the basis, inter alia, that a Firm subsidiary did not hold legal title to certain securities subject to withholding tax on the relevant dates. On April 26, 2018, the District Court in Amsterdam issued a decision dismissing the Dutch Authority’s claims with respect to certain of the tax years in dispute. On May 12, 2020, the Court of Appeal in Amsterdam granted the Dutch Authority’s appeal in matters re-styled Case number 18/00318 and Case number 18/00319. On January 19, 2024, the Dutch High Court granted the Firm’s appeal in matters re-styled Case number 20/01884 and referred the case to the Court of Appeal in The Hague. On November 11, 2024, the Firm reached an agreement to settle the Dutch Authority’s challenges for the tax years 2007 to 2012 and made payment of the prior set-off amounts and interest indicated above. The case has been withdrawn.
On June 22, 2021, Dutch criminal authorities sought various documents in connection with an investigation of the Firm related to the civil claims asserted by the Dutch Authority concerning the accuracy of the Firm subsidiary’s tax returns for 2007 to 2012. The Dutch criminal authorities have requested additional information, and the Firm is continuing
to respond to them in connection with their ongoing investigation, and is engaging with them as the criminal process progresses.
U.K. Government Bond Matter
On February 21, 2025, the U.K. Competition and Markets Authority announced a settlement with the Firm, as well as other financial institutions, in connection with its investigation of suspected anti-competitive arrangements in the financial services sector, specifically regarding the Firm’s activities concerning certain liquid fixed income products between 2009 and 2012. Separately, on June 16, 2023, the Firm was named as a defendant in a purported antitrust class action in the United States District Court for the SDNY styled Oklahoma Firefighters Pension and Retirement System v. Deutsche Bank Aktiengesellschaft, et al., alleging, inter alia, that the Firm, together with a number of other financial institution defendants, violated U.S. antitrust laws in connection with their alleged effort to fix prices of gilts traded in the United States between 2009 and 2013. The complaint seeks, inter alia, certification of the class of plaintiffs and treble damages. On September 16, 2024, the court granted defendants’ joint motion to dismiss, and the complaint was dismissed without prejudice. In October of 2024, the Firm and certain other defendants reached an agreement in principle to settle the U.S. litigation. On March 17, 2025, the court granted preliminary approval of the settlement.
Other
On August 13, 2021, the plaintiff in Camelot Event Driven Fund, a Series of Frank Funds Trust v. Morgan Stanley & Co. LLC, et al. filed in the Supreme Court of the State of New York, New York County (“Supreme Court of NY”) a purported class action complaint alleging violations of federal securities laws against ViacomCBS (“Viacom”), certain of its officers and directors, and the underwriters, including the Firm, of two March 2021 Viacom offerings: a $1.7 billion Viacom Class B Common Stock offering and a $1 billion offering of 5.75% Series A Mandatory Convertible Preferred Stock (collectively, the “Offerings”). The complaint seeks certification of the class of plaintiffs and unspecified compensatory damages and alleges, inter alia, that the Viacom offering documents for both issuances contained material misrepresentations and omissions because they did not disclose that certain of the underwriters, including the Firm, had prime brokerage relationships and/or served as counterparties to certain derivative transactions with Archegos Capital Management LP (“Archegos”), a fund with significant exposure to Viacom securities across multiple prime brokers. The complaint also alleges that the offering documents did not adequately disclose the risks associated with Archegos’s concentrated Viacom positions at the various prime brokers, including that the unwind of those positions could have a deleterious impact on the stock price of Viacom. On November 5, 2021, the complaint was amended to add allegations that defendants failed to disclose that certain
Notes to Consolidated Financial Statements (Unaudited)
underwriters, including the Firm, had intended to unwind Archegos’s Viacom positions while simultaneously distributing the Offerings. On February 6, 2023, the court issued a decision denying motions to dismiss as to the Firm and the other underwriters, but granting the motion to dismiss as to Viacom and the Viacom individual defendants. On February 15, 2023, the underwriters, including the Firm, filed their notices of appeal of the denial of their motions to dismiss. On March 10, 2023, the plaintiff appealed the dismissal of Viacom and the individual Viacom defendants. On April 4, 2024, the Appellate Division upheld the lower court’s decision as to the Firm and other underwriter defendants that had prime brokerage relationships and/or served as counterparties to certain derivative transactions with Archegos, dismissed the remaining underwriters, and upheld the dismissal of Viacom and its officers and directors. On July 25, 2024, the Appellate Division denied the plaintiff’s and the Firm’s respective motions for leave to reargue or appeal the April 4, 2024 decision. On January 4, 2024, the court granted the plaintiff’s motion for class certification, which the defendants appealed. In February of 2025, the parties reached an agreement in principle to settle the litigation. On April 3, 2025, the court granted preliminary approval of the settlement.
On May 17, 2013, the plaintiff in IKB International S.A. in Liquidation, et al. v. Morgan Stanley, et al. filed a complaint against the Firm and certain affiliates in the Supreme Court of NY. The complaint alleges that defendants made material misrepresentations and omissions in the sale to the plaintiff of certain mortgage pass-through certificates backed by securitization trusts containing residential mortgage loans. The total amount of certificates allegedly sponsored, underwritten and/or sold by the Firm to the plaintiff was approximately $133 million. The complaint alleges causes of action against the Firm for common law fraud, fraudulent concealment, aiding and abetting fraud, and negligent misrepresentation, and seeks, inter alia, compensatory and punitive damages. On October 29, 2014, the court granted in part and denied in part the Firm’s motion to dismiss. All claims regarding four certificates were dismissed. After these dismissals, the remaining amount of certificates allegedly issued by the Firm or sold to the plaintiff by the Firm was approximately $116 million. On August 11, 2016, the Appellate Division affirmed the trial court’s order denying in part the Firm’s motion to dismiss the complaint. On July 15, 2022, the Firm filed a motion for summary judgment on all remaining claims. On March 1, 2023, the court granted in part and denied in part the Firm’s motion for summary judgment, narrowing the alleged misrepresentations at issue in the case. On March 26, 2024, the Appellate Division affirmed the trial court’s summary judgment order. On August 27, 2024, the plaintiff notified the court that in light of the court’s rulings to exclude certain evidence at trial, the plaintiff could not prove its claims at trial, and requested that the court dismiss the case, subject to its right to appeal the evidentiary rulings. On August 28, 2024, the court dismissed the case, and judgment was entered in the Firm’s favor. The plaintiff has appealed.
Beginning in February of 2024, Morgan Stanley Smith Barney LLC (“MSSB”) and E*TRADE Securities LLC (“E*TRADE Securities”), among others, have been named as defendants in multiple putative class actions pending in the federal district courts for the District of New Jersey and SDNY. The class action claims have been brought on behalf of brokerage, advisory and retirement account holders, alleging various contractual, fiduciary, and statutory claims (including under the Racketeer Influenced and Corrupt Organizations Act, 18 U.S.C. §1962(c)-(d)) that MSSB and/or E*TRADE Securities failed to pay a reasonable rate of interest on its cash sweep products. The cases are at an early stage with motions for consolidation and transfer currently pending. Together, the complaints seek, inter alia, certification of a class of plaintiffs, unspecified compensatory damages, equitable and injunctive relief, and treble damages.
The Firm was engaged with and responded to requests for information from the Enforcement Division of the SEC regarding advisory account cash balances swept to the affiliate bank deposit program and compliance with the Investment Advisers Act of 1940, and is responding to requests from a state securities regulator regarding brokerage account cash balances swept to the affiliate bank deposit program. On March 11, 2025, the Enforcement Division of the SEC informed the Firm that it had concluded its investigation and did not intend to recommend an enforcement action against the Firm.
14. Variable Interest Entities and Securitization Activities
Consolidated VIE Assets and Liabilities by Type of Activity
At March 31, 2025
At December 31, 2024
$ in millions
VIE Assets
VIE Liabilities
VIE Assets
VIE Liabilities
MABS1
$
389
$
223
$
575
$
236
Investment vehicles2
497
289
378
189
MTOB
485
461
619
578
Other
132
6
156
4
Total
$
1,503
$
979
$
1,728
$
1,007
MTOB—Municipal tender option bonds
1.Amounts include transactions backed by residential mortgage loans, commercial mortgage loans and other types of assets, including consumer or commercial assets and may be in loan or security form. The value of assets is determined based on the fair value of the liabilities and the interests owned by the Firm in such VIEs as the fair values for the liabilities and interests owned are more observable.
Notes to Consolidated Financial Statements (Unaudited)
Consolidated VIE Assets and Liabilities by Balance Sheet Caption
$ in millions
At March 31, 2025
At December 31, 2024
Assets
Cash and cash equivalents
$
27
$
37
Trading assets at fair value
1,258
1,395
Investment securities
196
278
Customer and other receivables
20
16
Other assets
2
2
Total
$
1,503
$
1,728
Liabilities
Trading liabilities at fair value
$
1
$
—
Other secured financings
$
883
$
921
Other liabilities and accrued expenses
91
82
Borrowings
4
4
Total
$
979
$
1,007
Noncontrolling interests
$
61
$
42
Consolidated VIE assets and liabilities are presented in the previous tables after intercompany eliminations. Generally, most assets owned by consolidated VIEs cannot be removed unilaterally by the Firm and are not available to the Firm while the related liabilities issued by consolidated VIEs are non-recourse to the Firm. However, in certain consolidated VIEs, the Firm either has the unilateral right to remove assets or provides additional recourse through derivatives such as total return swaps, guarantees or other forms of involvement.
In general, the Firm’s exposure to loss in consolidated VIEs is limited to losses that would be absorbed on the VIE net assets recognized in its financial statements, net of amounts absorbed by third-party variable interest holders.
Non-consolidated VIEs
At March 31, 2025
$ in millions
MABS1
CDO
MTOB
OSF
Other2
VIE assets (UPB)
$
204,184
$
2,710
$
3,615
$
3,821
$
78,188
Maximum exposure to loss3
Debt and equity interests
$
32,048
$
110
$
—
$
2,441
$
12,229
Derivative and other contracts
—
—
2,432
—
4,427
Commitments, guarantees and other
10,230
—
—
—
213
Total
$
42,278
$
110
$
2,432
$
2,441
$
16,869
Carrying value of variable interests—Assets
Debt and equity interests
$
32,048
$
110
$
—
$
1,873
$
12,198
Derivative and other contracts
—
—
6
—
1,856
Total
$
32,048
$
110
$
6
$
1,873
$
14,054
Additional VIE assets owned4
$
16,144
Carrying value of variable interests—Liabilities
Derivative and other contracts
$
—
$
—
$
3
$
—
$
451
Total
$
—
$
—
$
3
$
—
$
451
At December 31, 2024
$ in millions
MABS1
CDO
MTOB
OSF
Other2
VIE assets (UPB)
$
179,686
$
1,621
$
3,654
$
3,603
$
74,665
Maximum exposure to loss3
Debt and equity interests
$
26,974
$
62
$
—
$
2,267
$
12,097
Derivative and other contracts
—
—
2,454
—
3,936
Commitments, guarantees and other
8,554
—
—
—
535
Total
$
35,528
$
62
$
2,454
$
2,267
$
16,568
Carrying value of variable interests–Assets
Debt and equity interests
$
26,974
$
62
$
—
$
1,821
$
12,067
Derivative and other contracts
—
—
6
—
1,772
Total
$
26,974
$
62
$
6
$
1,821
$
13,839
Additional VIE assets owned4
$
15,777
Carrying value of variable interests—Liabilities
Derivative and other contracts
$
—
$
—
$
4
$
—
$
448
OSF–Other structured financings
1.Amounts include transactions backed by residential mortgage loans, commercial mortgage loans and other types of assets, including consumer or commercial assets, and may be in loan or security form.
2.Other primarily includes exposures to commercial real estate property and investment funds.
3.Where notional amounts are utilized in quantifying the maximum exposure related to derivatives, such amounts do not reflect changes in fair value recorded by the Firm.
4.Additional VIE assets owned represents the carrying value of total exposure to non-consolidated VIEs for which the maximum exposure to loss is less than specific thresholds, primarily interests issued by securitization SPEs. The Firm’s maximum exposure to loss generally equals the fair value of the assets owned. These assets are primarily included in Trading assets and Investment securities and are measured at fair value (see Note 4). The Firm does not provide additional support in these transactions through contractual facilities, guarantees or similar derivatives.
The previous tables include VIEs sponsored by unrelated parties, as well as VIEs sponsored by the Firm; examples of the Firm’s involvement with these VIEs include its secondary market-making activities and the securities held in its Investment securities portfolio (see Note 7).
The Firm’s maximum exposure to loss is dependent on the nature of the Firm’s variable interest in the VIE and is limited to the notional amounts of certain liquidity facilities and other credit support, total return swaps and written put options, as well as the fair value of certain other derivatives and investments the Firm has made in the VIE.
The Firm’s maximum exposure to loss in the previous tables does not include the offsetting benefit of hedges or any reductions associated with the amount of collateral held as part of a transaction with the VIE or any party to the VIE directly against a specific exposure to loss.
Liabilities issued by VIEs generally are non-recourse to the Firm.
Notes to Consolidated Financial Statements (Unaudited)
Detail of Mortgage- and Asset-Backed Securitization Assets
At March 31, 2025
At December 31, 2024
$ in millions
UPB
Debt and Equity Interests
UPB
Debt and Equity Interests
Residential mortgages
$
17,831
$
3,176
$
17,316
$
2,497
Commercial mortgages
84,923
9,877
82,730
8,445
U.S. agency collateralized mortgage obligations
57,053
6,449
39,317
6,260
Other consumer or commercial loans
44,377
12,546
40,323
9,772
Total
$
204,184
$
32,048
$
179,686
$
26,974
Transferred Assets with Continuing Involvement
At March 31, 2025
$ in millions
RML
CML
U.S. Agency CMO
CLN and Other1
SPE assets (UPB)2,3
$
8,384
$
76,839
$
18,899
$
13,911
Retained interests
Investment grade
$
277
$
530
$
802
$
—
Non-investment grade
202
931
—
116
Total
$
479
$
1,461
$
802
$
116
Interests purchased in the secondary market3
Investment grade
$
75
$
77
$
61
$
—
Non-investment grade
16
31
—
—
Total
$
91
$
108
$
61
$
—
Derivative assets
$
—
$
—
$
—
$
1,493
Derivative liabilities
—
—
—
399
At December 31, 2024
$ in millions
RML
CML
U.S. Agency CMO
CLN and Other1
SPE assets (UPB)2,3
$
6,989
$
78,232
$
18,174
$
12,725
Retained interests
Investment grade
$
198
$
543
$
967
$
—
Non-investment grade
175
923
—
71
Total
$
373
$
1,466
$
967
$
71
Interests purchased in the secondary market3
Investment grade
$
45
$
34
$
79
$
—
Non-investment grade
5
24
—
—
Total
$
50
$
58
$
79
$
—
Derivative assets
$
—
$
—
$
—
$
1,408
Derivative liabilities
—
—
—
400
Fair Value At March 31, 2025
$ in millions
Level 2
Level 3
Total
Retained interests
Investment grade
$
998
$
—
$
998
Non-investment grade
84
76
160
Total
$
1,082
$
76
$
1,158
Interests purchased in the secondary market3
Investment grade
$
213
$
—
$
213
Non-investment grade
25
22
47
Total
$
238
$
22
$
260
Derivative assets
$
1,493
$
—
$
1,493
Derivative liabilities
399
—
399
Fair Value At December 31, 2024
$ in millions
Level 2
Level 3
Total
Retained interests
Investment grade
$
1,080
$
—
$
1,080
Non-investment grade
71
50
121
Total
$
1,151
$
50
$
1,201
Interests purchased in the secondary market3
Investment grade
$
158
$
—
$
158
Non-investment grade
18
11
29
Total
$
176
$
11
$
187
Derivative assets
$
1,408
$
—
$
1,408
Derivative liabilities
400
—
400
RML—Residential mortgage loans
CML—Commercial mortgage loans
1.Amounts include CLO transactions managed by unrelated third parties.
2.Amounts include assets transferred by unrelated transferors.
3.Amounts include transactions where the Firm also holds retained interests as part of the transfer.
The previous tables include transactions with SPEs in which the Firm, acting as principal, transferred financial assets with continuing involvement and received sales treatment. The transferred assets are carried at fair value prior to securitization, and any changes in fair value are recognized in the income statement. The Firm may act as underwriter of the beneficial interests issued by these securitization vehicles, for which Investment banking revenues are recognized. The Firm may retain interests in the securitized financial assets as one or more tranches of the securitization. Certain retained interests are carried at fair value in the balance sheet with changes in fair value recognized in the income statement. Fair value for these interests is measured using techniques that are consistent with the valuation techniques applied to the Firm’s major categories of assets and liabilities as described in Note 2 in the 2024 Form 10-K and Note 4 herein. Further, as permitted by applicable guidance, certain transfers of assets where the Firm’s only continuing involvement is a derivative are only reported in the following Assets Sold with Retained Exposure table.
Proceeds from New Securitization Transactions and Sales of Loans
Three Months Ended March 31,
$ in millions
2025
2024
New transactions1
$
14,310
$
6,550
Retained interests
2,780
2,099
1.Net gains on new transactions and sales of corporate loans to CLO entities at the time of the sale were not material for all periods presented.
The Firm has provided, or otherwise agreed to be responsible for, representations and warranties regarding certain assets transferred in securitization transactions sponsored by the Firm (see Note 13).
Notes to Consolidated Financial Statements (Unaudited)
Assets Sold with Retained Exposure
$ in millions
At March 31, 2025
At December 31, 2024
Gross cash proceeds from sale of assets1
$
84,321
$
92,229
Fair value
Assets sold
$
80,576
$
92,580
Derivative assets recognized in the balance sheet
282
998
Derivative liabilities recognized in the balance sheet
4,037
648
1.The carrying value of assets derecognized at the time of sale approximates gross cash proceeds.
The Firm enters into transactions in which it sells securities, primarily equities, and contemporaneously enters into bilateral OTC derivatives with the purchasers of the securities, through which it retains exposure to the sold securities.
For a discussion of the Firm’s VIEs, the determination and structure of VIEs and securitization activities, see Note 15 to the financial statements in the 2024 Form 10-K.
15. Regulatory Requirements
Regulatory Capital Framework and Requirements
For a discussion of the Firm’s regulatory capital framework, see Note 16 to the financial statements in the 2024 Form 10-K.
The Firm is required to maintain minimum risk-based and leverage-based capital ratios under regulatory capital requirements. A summary of the calculations of regulatory capital and RWA follows.
Risk-Based Regulatory Capital. Risk-based capital ratio requirements apply to Common Equity Tier 1 (“CET1”) capital, Tier 1 capital and Total capital (which includes Tier 2 capital), each as a percentage of RWA, and consist of regulatory minimum required ratios plus the Firm’s capital buffer requirement. Capital requirements require certain adjustments to, and deductions from, capital for purposes of determining these ratios. At March 31, 2025 and December 31, 2024, the differences between the actual and required ratios were lower under the Standardized Approach.
CECL Deferral. Beginning on January 1, 2020, the Firm elected to defer the effect of the adoption of CECL on its risk-based and leverage-based capital amounts and ratios, as well as RWA, adjusted average assets and supplementary leverage exposure calculations, over a five-year transition period. The deferral impacts began to phase in at 25% per year from January 1, 2022, were phased-in at 75% from January 1, 2024 and were fully phased-in from January 1, 2025.
Capital Buffer Requirements
At March 31, 2025 andDecember 31, 2024
Standardized
Advanced
Capital buffers
Capital conservation buffer
—
2.5%
SCB
6.0%
N/A
G-SIB capital surcharge
3.0%
3.0%
CCyB1
0%
0%
Capital buffer requirement
9.0%
5.5%
1.The CCyB can be set up to 2.5%, but is currently set by the Federal Reserve at zero.
The capital buffer requirement represents the amount of CET1 capital the Firm must maintain above the minimum risk-based capital requirements in order to avoid restrictions on the Firm’s ability to make capital distributions, including the payment of dividends and the repurchase of stock, and to pay discretionary bonuses to executive officers. The Firm’s capital buffer requirement computed under the standardized approaches for calculating credit risk and market risk RWA (“Standardized Approach”) is equal to the sum of the SCB, G-SIB capital surcharge and CCyB, and the capital buffer requirement computed under the applicable advanced approaches for calculating credit risk, market risk and operational risk RWA (“Advanced Approach”) is equal to the sum of the 2.5% capital conservation buffer, G-SIB capital surcharge and CCyB.
Risk-Based Regulatory Capital Ratio Requirements
Regulatory Minimum
At March 31, 2025 andDecember 31, 2024
Standardized
Advanced
Required ratios1
CET1 capital ratio
4.5
%
13.5%
10.0%
Tier 1 capital ratio
6.0
%
15.0%
11.5%
Total capital ratio
8.0
%
17.0%
13.5%
1.Required ratios represent the regulatory minimum plus the capital buffer requirement.
Notes to Consolidated Financial Statements (Unaudited)
The Firm’s Regulatory Capital and Capital Ratios
Risk-based capital
Standardized
$ in millions
At March 31, 2025
At December 31, 2024
Risk-based capital
CET1 capital
$
76,975
$
75,095
Tier 1 capital
86,674
84,790
Total capital
97,772
95,567
Total RWA
502,622
471,834
Risk-based capital ratio
CET1 capital
15.3
%
15.9
%
Tier 1 capital
17.2
%
18.0
%
Total capital
19.5
%
20.3
%
Required ratio1
CET1 capital
13.5
%
13.5
%
Tier 1 capital
15.0
%
15.0
%
Total capital
17.0
%
17.0
%
1.Required ratios are inclusive of any buffers applicable as of the date presented.
Leveraged-based capital
$ in millions
At March 31, 2025
At December 31, 2024
Leveraged-based capital
Adjusted average assets1
$
1,251,047
$
1,223,779
Supplementary leverage exposure2
1,552,615
1,517,687
Leveraged-based capital ratio
Tier 1 leverage
6.9
%
6.9
%
SLR
5.6
%
5.6
%
Required ratio3
Tier 1 leverage
4.0
%
4.0
%
SLR
5.0
%
5.0
%
1.Adjusted average assets represents the denominator of the Tier 1 leverage ratio and is composed of the average daily balance of consolidated on-balance sheet assets for the quarters ending on the respective balance sheet dates, reduced by disallowed goodwill, intangible assets, investments in covered funds, defined benefit pension plan assets, after-tax gain on sale from assets sold into securitizations, investments in our own capital instruments, certain deferred tax assets and other capital deductions.
2.Supplementary leverage exposure is the sum of Adjusted average assets used in the Tier 1 leverage ratio and other adjustments, primarily: (i) for derivatives, potential future exposure and the effective notional principal amount of sold credit protection offset by qualifying purchased credit protection; (ii) the counterparty credit risk for repo-style transactions; and (iii) the credit equivalent amount for off-balance sheet exposures.
3.Required ratios are inclusive of any buffers applicable as of the date presented.
U.S. Bank Subsidiaries’ Regulatory Capital and Capital Ratios
The OCC establishes capital requirements for the U.S. Bank Subsidiaries, and evaluates their compliance with such capital requirements. Regulatory capital requirements for the U.S. Bank Subsidiaries are calculated in a similar manner to the Firm’s regulatory capital requirements, although G-SIB capital surcharge and SCB requirements do not apply to the U.S. Bank Subsidiaries.
The OCC’s regulatory capital framework includes Prompt Corrective Action (“PCA”) standards, including “well-capitalized” PCA standards that are based on specified regulatory capital ratio minimums. For the Firm to remain an FHC, its U.S. Bank Subsidiaries must remain well-capitalized in accordance with the OCC’s PCA standards. In addition,
failure by the U.S. Bank Subsidiaries to meet minimum capital requirements may result in certain mandatory and discretionary actions by regulators that, if undertaken, could have a direct material effect on the U.S. Bank Subsidiaries’ and the Firm’s financial statements.
At March 31, 2025 and December 31, 2024, MSBNA and MSPBNA risk-based capital ratios are based on the Standardized Approach rules. Beginning on January 1, 2020, MSBNA and MSPBNA elected to defer the effect of the adoption of CECL on risk-based capital amounts and ratios, as well as RWA, adjusted average assets and supplementary leverage exposure calculations, over a five-year transition period. The deferral impacts began to phase in at 25% per year from January 1, 2022, were phased-in at 75% from January 1, 2024 and were fully phased-in from January 1, 2025.
MSBNA’s Regulatory Capital
Well-Capitalized Requirement
Required Ratio1
At March 31, 2025
At December 31, 2024
$ in millions
Amount
Ratio
Amount
Ratio
Risk-based capital
CET1 capital
6.5
%
7.0
%
$
23,477
20.6
%
$
22,165
20.1
%
Tier 1 capital
8.0
%
8.5
%
23,477
20.6
%
22,165
20.1
%
Total capital
10.0
%
10.5
%
24,368
21.4
%
22,993
20.9
%
Leverage-based capital
Tier 1 leverage
5.0
%
4.0
%
$
23,477
10.1
%
$
22,165
9.7
%
SLR
6.0
%
3.0
%
23,477
7.6
%
22,165
7.4
%
MSPBNA’s Regulatory Capital
Well-Capitalized Requirement
Required Ratio1
At March 31, 2025
At December 31, 2024
$ in millions
Amount
Ratio
Amount
Ratio
Risk-based capital
CET1 capital
6.5
%
7.0
%
$
17,318
26.5
%
$
16,672
26.1
%
Tier 1 capital
8.0
%
8.5
%
17,318
26.5
%
16,672
26.1
%
Total capital
10.0
%
10.5
%
17,703
27.0
%
17,004
26.6
%
Leverage-based capital
Tier 1 leverage
5.0
%
4.0
%
$
17,318
7.9
%
$
16,672
7.7
%
SLR
6.0
%
3.0
%
17,318
7.6
%
16,672
7.5
%
1.Required ratios are inclusive of any buffers applicable as of the date presented. Failure to maintain the buffers would result in restrictions on the ability to make capital distributions, including the payment of dividends.
Additionally, MSBNA is conditionally registered with the SEC as a security-based swap dealer and is registered with the CFTC as a swap dealer. However, as MSBNA is prudentially regulated as a bank, its capital requirements continue to be determined by the OCC.
Other Regulatory Capital Requirements
MS&Co. Regulatory Capital
$ in millions
At March 31, 2025
At December 31, 2024
Net capital
$
18,353
$
18,483
Excess net capital
13,595
13,883
MS&Co. is registered as a broker-dealer and a futures commission merchant with the SEC and the CFTC,
Notes to Consolidated Financial Statements (Unaudited)
respectively, and is registered as a swap dealer with the CFTC.
As an Alternative Net Capital broker-dealer, and in accordance with Securities Exchange Act of 1934 (“Exchange Act”) Rule 15c3-1, Appendix E, MS&Co. is subject to minimum net capital and tentative net capital requirements and operates with capital in excess of its regulatory capital requirements. As a futures commission merchant and registered swap dealer, MS&Co. is subject to CFTC capital requirements. In addition, MS&Co. must notify the SEC if its tentative net capital falls below certain levels. At March 31, 2025 and December 31, 2024, MS&Co. exceeded its net capital requirement and had tentative net capital in excess of the minimum and notification requirements.
Other Regulated Subsidiaries
Certain other subsidiaries are also subject to various regulatory capital requirements. Such subsidiaries include the following, each of which operated with capital in excess of their respective regulatory capital requirements as of March 31, 2025 and December 31, 2024, as applicable:
•MSSB,
•MSIP,
•MSESE,
•MSMS,
•MSCS, and
•MSCG.
See Note 16 to the financial statements in the 2024 Form 10-K for further information.
16. Total Equity
Preferred Stock
Shares Outstanding
Carrying Value
$ in millions, except per share data
At March 31, 2025
Liquidation Preference per Share
At March 31, 2025
At December 31, 2024
Series
A
44,000
$
25,000
$
1,100
$
1,100
C1
519,882
1,000
408
408
E
34,500
25,000
862
862
F
34,000
25,000
850
850
I
40,000
25,000
1,000
1,000
K
40,000
25,000
1,000
1,000
L
20,000
25,000
500
500
M
400,000
1,000
430
430
N
3,000
100,000
300
300
O
52,000
25,000
1,300
1,300
P
40,000
25,000
1,000
1,000
Q
40,000
25,000
1,000
1,000
Total
$
9,750
$
9,750
Shares authorized
30,000,000
1.Series C preferred stock is held by MUFG.
For a description of Series A through Series Q preferred stock, see Note 17 to the financial statements in the 2024
Form 10-K. The Firm’s preferred stock has a preference over its common stock upon liquidation. The Firm’s preferred stock qualifies as and is included in Tier 1 capital in accordance with regulatory capital requirements (see Note 15).
Share Repurchases
Three Months Ended March 31,
$ in millions
2025
2024
Repurchases of common stock under the Firm’s Share Repurchase Authorization
$
1,000
$
1,000
On June 28, 2024, the Firm announced that its Board of Directors reauthorized a multi-year repurchase program of up to $20 billion of outstanding common stock (the “Share Repurchase Authorization”), without a set expiration date, beginning in the third quarter of 2024, which will be exercised from time to time as conditions warrant. For more information on share repurchases, see Note 17 to the financial statements in the 2024 Form 10-K.
Common Shares Outstanding for Basic and Diluted EPS
Three Months Ended March 31,
in millions
2025
2024
Weighted average common shares outstanding, basic
1,584
1,601
Effect of dilutive RSUs and PSUs
16
15
Weighted average common shares outstanding and common stock equivalents, diluted
1,600
1,616
Weighted average antidilutive common stock equivalents (excluded from the computation of diluted EPS)
Notes to Consolidated Financial Statements (Unaudited)
17. Interest Income and Interest Expense
Three Months Ended March 31,
$ in millions
2025
2024
Interest income
Cash and cash equivalents
$
659
903
Investment securities
1,280
1,197
Loans
3,325
3,305
Securities purchased under agreements to resell1
3,416
2,530
Securities borrowed2
1,116
1,376
Trading assets, net of Trading liabilities
1,439
1,382
Customer receivables and Other
2,513
2,237
Total interest income
$
13,748
$
12,930
Interest expense
Deposits
$
2,522
$
2,476
Borrowings
3,018
3,223
Securities sold under agreements to repurchase3
3,069
2,402
Securities loaned4
256
224
Customer payables and Other5
2,530
2,809
Total interest expense
$
11,395
$
11,134
Net interest
$
2,353
$
1,796
1.Includes interest paid on Securities purchased under agreements to resell.
2.Includes fees paid on Securities borrowed.
3.Includes interest received on Securities sold under agreements to repurchase.
4.Includes fees received on Securities loaned.
5.Includes fees received from Equity Financing customers related to their short transactions, which can be under either margin or securities lending arrangements.
Interest income and Interest expense are classified in the income statement based on the nature of the instrument and related market conventions. When included as a component of the instrument’s fair value, interest is included within Trading revenues or Investments revenues. Otherwise, it is included within Interest income or Interest expense.
Accrued Interest
$ in millions
At March 31, 2025
At December 31, 2024
Customer and other receivables
$
3,737
$
3,322
Customer and other payables
3,790
3,938
18. Income Taxes
The Firm is routinely under examination by the IRS and other tax authorities in certain countries, such as Japan and the U.K., and in states and localities in which it has significant business operations, such as New York.
The Firm believes that the resolution of these tax examinations will not have a material effect on the annual financial statements, although a resolution could have a material impact in the income statement and on the effective tax rate for any period in which such resolutions occur.
19. Segment, Geographic and Revenue Information
Selected Financial Information by Business Segment
Three Months Ended March 31, 2025
$ in millions
IS
WM
IM
I/E
Total
Investment banking
$
1,559
$
190
$
—
$
(38)
$
1,711
Trading
5,113
(12)
(7)
17
5,111
Investments
149
33
187
—
369
Commissions and fees1
869
695
—
(83)
1,481
Asset management1,2
191
4,396
1,451
(75)
5,963
Other
633
123
—
(5)
751
Total non-interest revenues
8,514
5,425
1,631
(184)
15,386
Interest income
10,073
3,959
23
(307)
13,748
Interest expense
9,604
2,057
52
(318)
11,395
Net interest
469
1,902
(29)
11
2,353
Net revenues
$
8,983
$
7,327
$
1,602
$
(173)
$
17,739
Provision for credit losses
91
44
—
—
135
Compensation and benefits3
2,854
3,999
668
—
7,521
Non-compensation expenses3
2,757
1,333
611
(162)
4,539
Total non-interest expenses
$
5,611
$
5,332
$
1,279
$
(162)
$
12,060
Income before provision for income taxes
3,281
1,951
323
(11)
5,544
Provision for income taxes
696
419
61
(3)
1,173
Net income
2,585
1,532
262
(8)
4,371
Net income applicable to noncontrolling interests
56
—
—
—
56
Net income applicable to Morgan Stanley
$
2,529
$
1,532
$
262
$
(8)
$
4,315
Pre-tax margin4
37
%
27
%
20
%
N/M
31
%
Three Months Ended March 31, 2024
$ in millions
IS
WM
IM
I/E
Total
Investment banking
$
1,447
$
166
$
—
$
(24)
$
1,589
Trading
4,583
262
(7)
14
4,852
Investments
49
19
69
—
137
Commissions and fees1
691
605
—
(69)
1,227
Asset management1,2
157
3,829
1,346
(63)
5,269
Other
124
143
3
(4)
266
Total non-interest revenues
7,051
5,024
1,411
(146)
13,340
Interest income
9,308
3,973
26
(377)
12,930
Interest expense
9,343
2,117
60
(386)
11,134
Net interest
(35)
1,856
(34)
9
1,796
Net revenues
$
7,016
$
6,880
$
1,377
$
(137)
$
15,136
Provision for credit losses
2
(8)
—
—
(6)
Compensation and benefits3
2,343
3,788
565
—
6,696
Non-compensation expenses3
2,320
1,294
571
(134)
4,051
Total non-interest expenses
$
4,663
$
5,082
$
1,136
$
(134)
$
10,747
Income before provision for income taxes
2,351
1,806
241
(3)
4,395
Provision for income taxes
482
403
49
(1)
933
Net income
1,869
1,403
192
(2)
3,462
Net income applicable to noncontrolling interests
50
—
—
—
50
Net income applicable to Morgan Stanley
$
1,819
$
1,403
$
192
$
(2)
$
3,412
Pre-tax margin4
34
%
26
%
18
%
N/M
29
%
1.Substantially all revenues are from contracts with customers.
2.Includes certain fees that may relate to services performed in prior periods.
Notes to Consolidated Financial Statements (Unaudited)
3.The significant expense categories and amounts align with the segment-level information that is regularly provided to the Firm’s chief operating decision maker (“CODM”).
4.Pre-tax margin represents income before provision for income taxes as a percentage of net revenues.
For a discussion about the Firm’s business segments, see Note 22 to the financial statements in the 2024 Form 10-K.
Detail of Investment Banking Revenues
Three Months Ended March 31,
$ in millions
2025
2024
Institutional Securities Advisory
$
563
$
461
Institutional Securities Underwriting
996
986
Firm Investment banking revenues from contracts with customers
81
%
90
%
Trading Revenues by Product Type
Three Months Ended March 31,
$ in millions
2025
2024
Interest rate
$
1,373
$
1,826
Foreign exchange
628
272
Equity1
3,027
2,304
Commodity and other
324
595
Credit
(241)
(145)
Total
$
5,111
$
4,852
1.Dividend income is included within equity contracts.
The previous table summarizes realized and unrealized gains and losses primarily related to the Firm’s Trading assets and liabilities, from derivative and non-derivative financial instruments, included in Trading revenues in the income statement. The Firm generally utilizes financial instruments across a variety of product types in connection with its market-making and related risk management strategies. The trading revenues presented in the table are not representative of the manner in which the Firm manages its business activities and are prepared in a manner similar to the presentation of trading revenues for regulatory reporting purposes.
Net cumulative unrealized performance-based fees at risk of reversing
$
855
$
796
The Firm’s portion of net cumulative performance-based fees in the form of unrealized carried interest, for which the Firm is not obligated to pay compensation, is at risk of reversing when the returns in certain funds fall below specified performance targets. See Note 13 for information regarding general partner guarantees, which include potential obligations to return performance fee distributions previously received.
Investment Management Asset Management Revenues—Reduction of Fees Due to Fee Waivers
Three Months Ended March 31,
$ in millions
2025
2024
Fee waivers
$
30
$
24
The Firm waives a portion of its fees in the Investment Management business segment from certain registered money market funds that comply with the requirements of Rule 2a-7 of the Investment Company Act of 1940.
Certain Other Fee Waivers
Separately, the Firm’s employees, including its senior officers, may participate on the same terms and conditions as other investors in certain funds that the Firm sponsors primarily for client investment, and the Firm may waive or lower applicable fees and charges for its employees.
Other Expenses—Transaction Taxes
Three Months Ended March 31,
$ in millions
2025
2024
Transaction taxes
$
266
$
206
Transaction taxes are composed of securities transaction taxes and stamp duties, which are levied on the sale or purchase of securities listed on recognized stock exchanges in certain markets. These taxes are imposed mainly on trades of equity securities in Asia and EMEA. Similar transaction taxes are levied on trades of listed derivative instruments in certain countries.
Net Revenues by Region
Three Months Ended March 31,
$ in millions
2025
2024
Americas
$
13,103
$
11,567
EMEA
2,291
1,826
Asia
2,345
1,743
Total
$
17,739
$
15,136
For a discussion about the Firm’s geographic net revenues, see Note 22 to the financial statements in the 2024 Form 10-K.
Revenues Recognized from Prior Services
Three Months Ended March 31,
$ in millions
2025
2024
Non-interest revenues
$
595
$
476
The previous table includes revenues from contracts with customers recognized where some or all services were performed in prior periods. These revenues primarily include investment banking advisory fees.
Notes to Consolidated Financial Statements (Unaudited)
Receivables from Contracts with Customers
$ in millions
At March 31, 2025
At December 31, 2024
Customer and other receivables
$
2,515
$
2,628
Receivables from contracts with customers, which are included within Customer and other receivables in the balance sheet, arise when the Firm has both recorded revenues and the right per the contract to bill the customer.
Assets by Business Segment
$ in millions
At March 31, 2025
At December 31, 2024
Institutional Securities
$
883,719
$
796,608
Wealth Management
398,979
400,848
Investment Management
17,598
17,615
Total1
$
1,300,296
$
1,215,071
1. Parent assets have been fully allocated to the business segments.
Average Balances and Interest Rates and Net Interest Income
Three Months Ended March 31,
2025
2024
$ in millions
Average Daily Balance
Interest
Annualized Average Rate
Average Daily Balance
Interest
Annualized Average Rate
Interest earning assets
Cash and cash equivalents:
U.S.
$
55,223
$
447
3.3
%
$
52,696
$
633
4.8
%
Non-U.S.
42,083
212
2.0
%
43,661
270
2.5
%
Investment securities1
158,395
1,280
3.3
%
153,866
1,197
3.1
%
Loans1
241,885
3,325
5.6
%
217,921
3,305
6.1
%
Securities purchased under agreements to resell2:
U.S.
66,638
2,213
13.5
%
52,260
1,496
11.5
%
Non-U.S.
41,448
1,203
11.8
%
49,595
1,034
8.4
%
Securities borrowed3:
U.S.
113,539
1,048
3.7
%
108,288
1,257
4.7
%
Non-U.S.
16,125
68
1.7
%
18,835
119
2.5
%
Trading assets, net of Trading liabilities:
U.S.
111,891
1,248
4.5
%
107,970
1,175
4.4
%
Non-U.S.
18,435
191
4.2
%
18,329
207
4.5
%
Customer receivables and Other:
U.S.
60,918
2,006
13.4
%
47,180
1,700
14.5
%
Non-U.S.
16,474
507
12.5
%
17,502
537
12.3
%
Total
$
943,054
$
13,748
5.9
%
$
888,103
$
12,930
5.9
%
Interest bearing liabilities
Deposits1
$
370,745
$
2,522
2.8
%
$
346,946
$
2,476
2.9
%
Borrowings1,4
282,999
3,018
4.3
%
251,956
3,223
5.1
%
Securities sold under agreements to repurchase5,7:
U.S.
18,108
1,786
40.0
%
24,410
1,221
20.1
%
Non-U.S.
50,533
1,283
10.3
%
58,316
1,181
8.1
%
Securities loaned6,7:
U.S.
10,093
29
1.2
%
5,790
17
1.2
%
Non-U.S.
6,048
227
15.2
%
8,979
207
9.3
%
Customer payables and Other8:
U.S.
119,309
1,776
6.0
%
124,018
1,891
6.1
%
Non-U.S.
58,052
754
5.3
%
64,756
918
5.7
%
Total
$
915,887
$
11,395
5.0
%
$
885,171
$
11,134
5.1
%
Net interest income and net interest rate spread
$
2,353
0.9
%
$
1,796
0.8
%
1.Amounts include primarily U.S. balances.
2.Includes interest paid on Securities purchased under agreements to resell.
3.Includes fees paid on Securities borrowed.
4.Average daily balance includes borrowings carried at fair value but, for certain borrowings, interest expense is considered part of fair value and is recorded in Trading revenues.
5.Includes interest received on Securities sold under agreements to repurchase.
6.Includes fees received on Securities loaned.
7.The annualized average rate was calculated using (a) interest expense incurred on all securities sold under agreements to repurchase and securities-loaned transactions, whether or not such transactions were reported in the balance sheet and (b) net average on-balance sheet balances, which exclude certain securities-for-securities transactions.
8.Includes fees received from Equity Financing customers related to their short transactions, which can be under either margin or securities lending arrangements.
Under the supervision and with the participation of the Firm’s management, including the Chief Executive Officer and Chief Financial Officer, the Firm conducted an evaluation of the effectiveness of the Firm’s disclosure controls and procedures (as defined in Rule 13a-15(e) of the Securities Exchange Act of 1934, as amended (the “Exchange Act”)). Based on this evaluation, the Chief Executive Officer and Chief Financial Officer concluded that the Firm’s disclosure controls and procedures were effective as of the end of the period covered by this report.
No change in the Firm’s internal control over financial reporting (as defined in Rule 13a-15(f) of the Exchange Act) occurred during the period covered by this report that materially affected, or is reasonably likely to materially affect, the Firm’s internal control over financial reporting.
Legal Proceedings
See “Contingencies—Legal” in Note 13 to the Financial Statements for information about our material legal proceedings.
Risk Factors
For a discussion of the risk factors affecting the Firm, see “Risk Factors” in Part I, Item 1A of the 2024 Form 10-K.
Unregistered Sales of Equity Securities and Use of Proceeds
Issuer Purchases of Equity Securities
$ in millions, except per share data
Total Number of Shares Purchased1
Average Price Paid per Share2
Total Shares Purchased as Part of Share Repurchase Authorization2,3
Dollar Value of Remaining Authorized Repurchase
January
7,818,953
$
136.00
1,115,300
$
18,347
February
3,124,925
$
135.90
2,378,100
$
18,023
March
4,594,211
$
117.94
4,450,384
$
17,500
Three Months Ended March 31, 2025
15,538,089
$
130.64
7,943,784
1.Includes 7,594,305 shares acquired by the Firm in satisfaction of the tax withholding obligations on stock-based awards granted under the Firm’s stock-based compensation plans during the three months ended March 31, 2025.
2.Share purchases under publicly announced authorizations are made pursuant to open-market purchases, Rule 10b5-1 plans or privately negotiated transactions (including with employee benefit plans) as market conditions warrant and at prices the Firm deems appropriate and may be suspended at any time.
3.The Firm announced that its Board of Directors reauthorized a multi-year repurchase authorization of up to $20 billion of outstanding common stock (the “Share Repurchase Authorization”) from time to time as conditions warrant and subject to limitations on distributions from the Federal Reserve. The Share Repurchase Authorization is for capital management purposes and considers, among other things, business segment capital needs, as well as equity-based compensation and benefit plan requirements. The Share Repurchase Authorization has no set expiration or termination date.
On June 28, 2024, the Firm announced that its Board of Directors reauthorized a multi-year repurchase authorization of up to $20 billion of outstanding common stock, without a set expiration date, beginning in the third quarter of 2024, which will be exercised from time to time as conditions
warrant. For further information, see “Liquidity and Capital Resources—Regulatory Requirements—Capital Plans, Stress Tests and the Stress Capital Buffer.”
Other Information
On May 2, 2025, Victoria Worster, age 52, was appointed Chief Accounting Officer and Controller, effective May 15, 2025.
Ms. Worster joined the Firm in 1998 and has served as the Chief Financial Officer of the U.S. Bank Subsidiaries since February 2025. Previously, Ms. Worster served in various leadership roles within the Firm’s Finance Division, including as Asia Pacific Chief Financial Officer, Co-Global Head of Legal Entity Control and Head of International Accounting and Regulatory Policy.
Interactive Data Files pursuant to Rule 405 of Regulation S-T formatted in Inline eXtensible Business Reporting Language (“Inline XBRL”).
104
Cover Page Interactive Data File (formatted in Inline XBRL and contained in Exhibit 101).
Signatures
Pursuant to the requirements of the Securities Exchange Act of 1934, the Registrant has duly caused this report to be signed on its behalf by the undersigned thereunto duly authorized.
MORGAN STANLEY
(Registrant)
By:
/s/ SHARON YESHAYA
Sharon Yeshaya Executive Vice President and Chief Financial Officer
By:
/s/ RAJA J. AKRAM
Raja J. Akram Deputy Chief Financial Officer, Chief Accounting Officer and Controller