UNITED STATES
SECURITIES AND EXCHANGE COMMISSION
Washington, D.C. 20549
SCHEDULE 14A
Proxy Statement
Pursuant to Section 14(a) of the
Securities Exchange
Act of 1934
(Amendment No.)
Filed by the
Registrant ☒
Filed by a Party
other than the Registrant ☐
Check the appropriate
box:
|
☐
|
| |
Preliminary Proxy Statement
|
|
☐
|
| |
Confidential, for Use of the Commission Only (as permitted by Rule 14a-6(e)(2))
|
|
☐
|
| |
Definitive Proxy Statement
|
|
☒
|
| |
Definitive Additional Materials
|
|
☐
|
| |
Soliciting Material Pursuant to §240.14a-12
|
|
MORGAN STANLEY
|
|
(Name of Registrant as Specified In Its Charter)
|
|
|
|
(Name of Person(s) Filing Proxy Statement, if other than the Registrant)
|
Payment of Filing Fee
(Check the appropriate box):
|
☒
|
| |
No fee required.
|
|||
|
☐
|
| |
Fee paid previously with preliminary materials.
|
|||
|
☐
|
| |
Fee computed on table in exhibit required by Item 25(b) per Exchange Act Rules 14a-6(i)(1) and
0-11.
|
|||
Morgan Stanley Compensation & Governance Practices April 2026
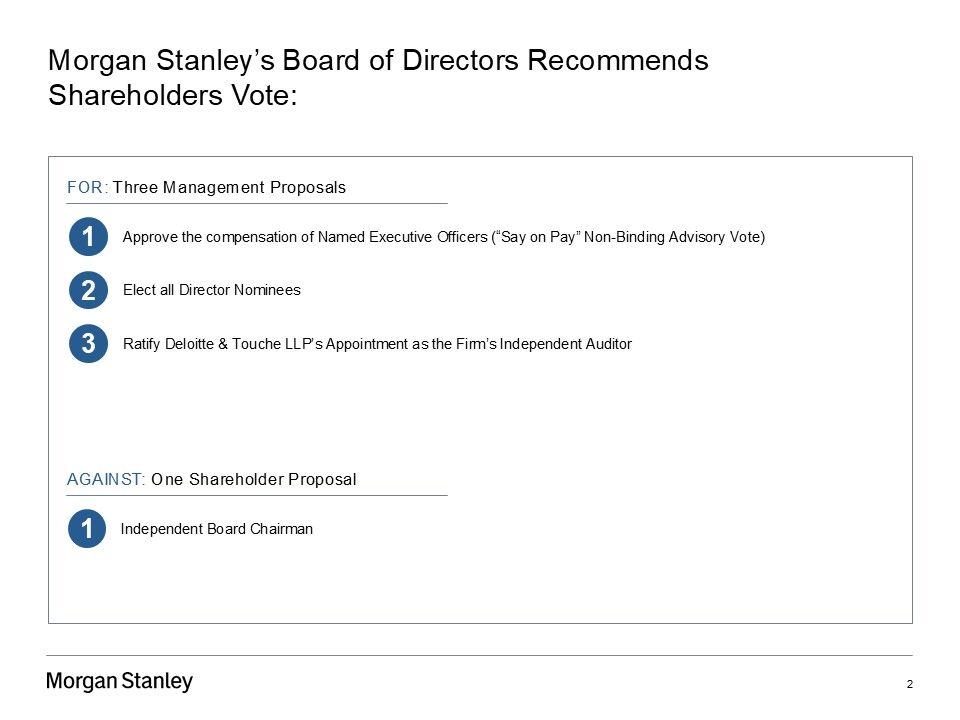
Morgan Stanley’s Board of Directors RecommendsShareholders Vote: FOR: Three
Management Proposals Approve the compensation of Named Executive Officers (“Say on Pay” Non-Binding Advisory Vote) 1 Elect all Director Nominees 2 Ratify Deloitte & Touche LLP’s Appointment as the Firm’s Independent
Auditor 3 AGAINST: One Shareholder Proposal Independent Board Chairman 1
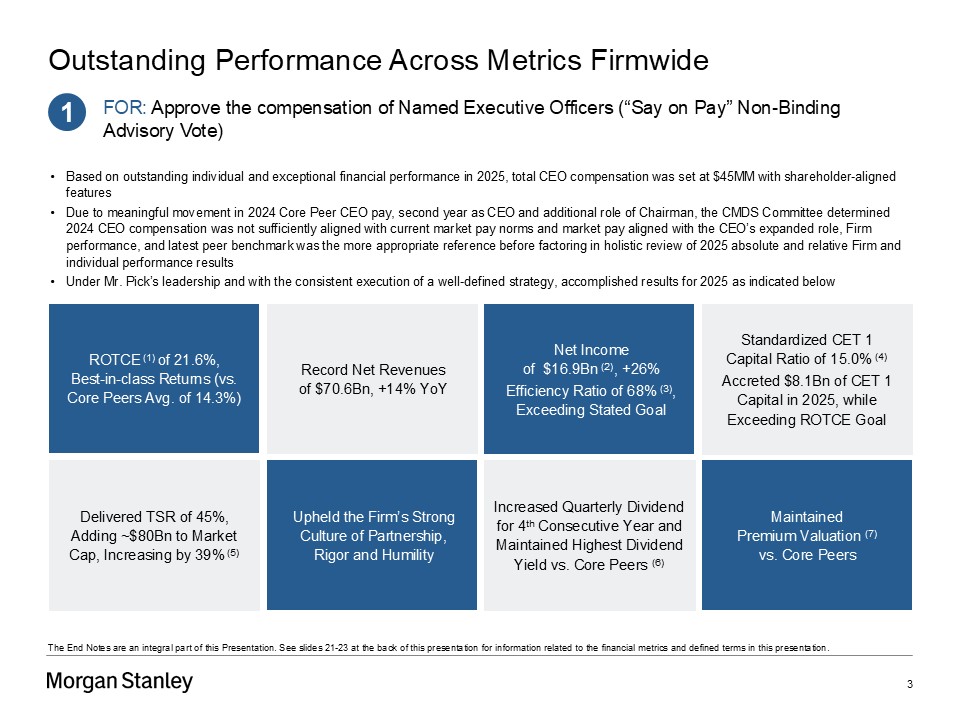
Outstanding Performance Across Metrics Firmwide The End Notes are an integral
part of this Presentation. See slides 21-23 at the back of this presentation for information related to the financial metrics and defined terms in this presentation. Based on outstanding individual and exceptional financial performance in
2025, total CEO compensation was set at $45MM with shareholder-aligned features Due to meaningful movement in 2024 Core Peer CEO pay, second year as CEO and additional role of Chairman, the CMDS Committee determined 2024 CEO compensation was
not sufficiently aligned with current market pay norms and market pay aligned with the CEO’s expanded role, Firm performance, and latest peer benchmark was the more appropriate reference before factoring in holistic review of 2025 absolute
and relative Firm and individual performance results Under Mr. Pick’s leadership and with the consistent execution of a well-defined strategy, accomplished results for 2025 as indicated below Upheld the Firm’s Strong Culture of Partnership,
Rigor and Humility Delivered TSR of 45%, Adding ~$80Bn to Market Cap, Increasing by 39% (5) ROTCE (1) of 21.6%, Best-in-class Returns (vs. Core Peers Avg. of 14.3%) Net Income of $16.9Bn (2), +26% Efficiency Ratio of 68% (3), Exceeding
Stated Goal Record Net Revenues of $70.6Bn, +14% YoY Increased Quarterly Dividend for 4th Consecutive Year and Maintained Highest Dividend Yield vs. Core Peers (6) Standardized CET 1 Capital Ratio of 15.0% (4) Accreted $8.1Bn of CET 1
Capital in 2025, while Exceeding ROTCE Goal Maintained Premium Valuation (7) vs. Core Peers FOR: Approve the compensation of Named Executive Officers (“Say on Pay” Non-Binding Advisory Vote) 1
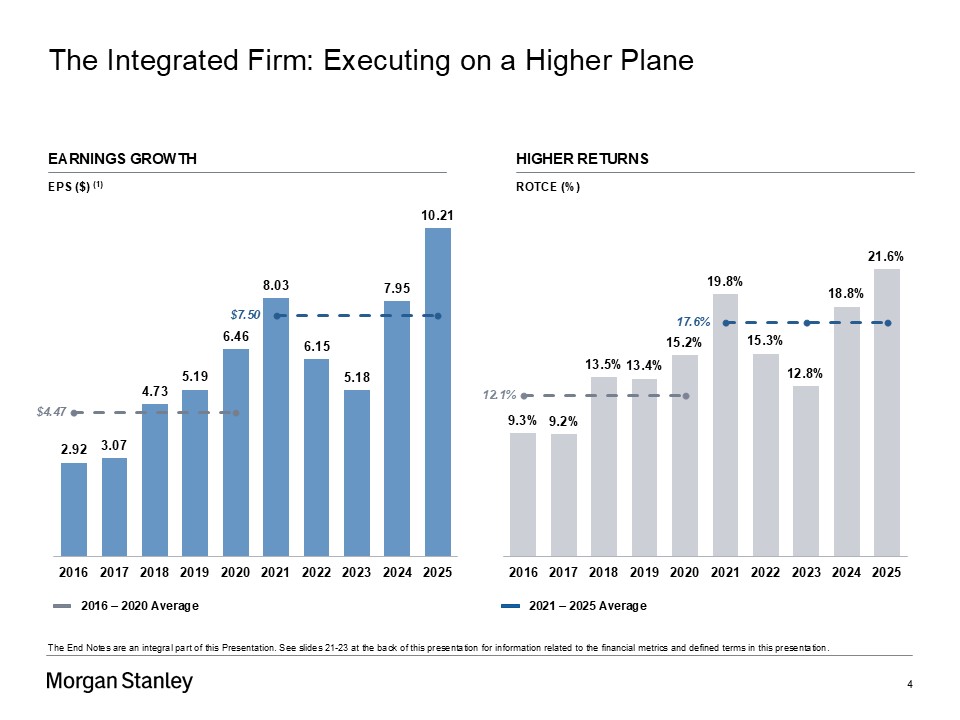
The Integrated Firm: Executing on a Higher Plane The End Notes are an integral
part of this Presentation. See slides 21-23 at the back of this presentation for information related to the financial metrics and defined terms in this presentation. EARNINGS GROWTH EPS ($) (1) HIGHER RETURNS ROTCE (%)
$7.50 $4.47 2016 – 2020 Average 2021 – 2025 Average 17.6% 12.1%
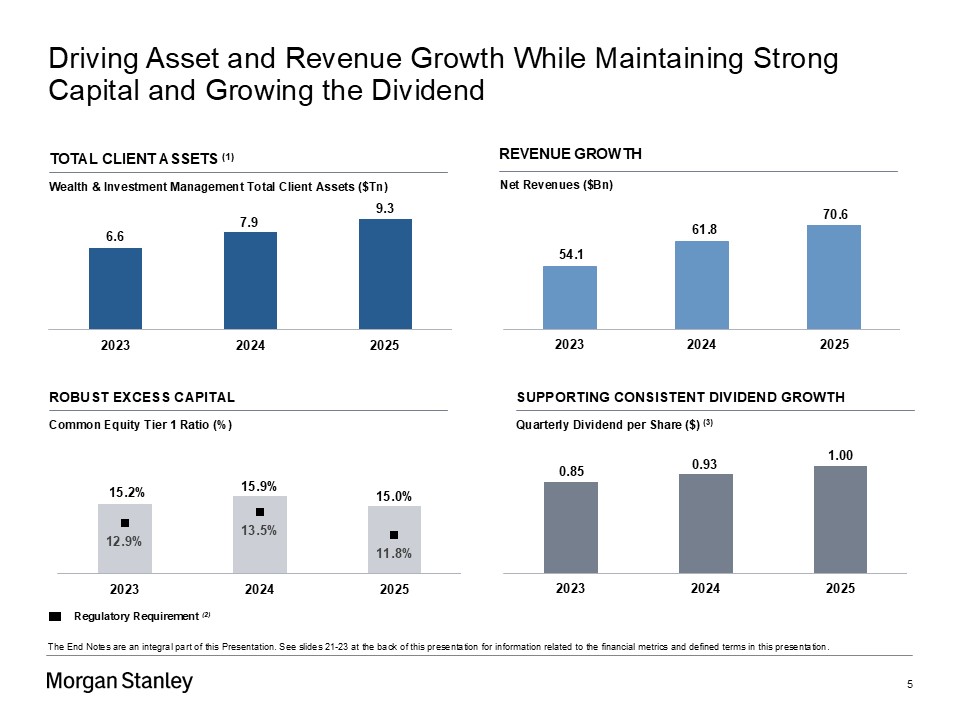
Net Revenues ($Bn) Regulatory Requirement (2) The End Notes are an integral
part of this Presentation. See slides 21-23 at the back of this presentation for information related to the financial metrics and defined terms in this presentation. Total Client Assets (1) Robust Excess Capital Common Equity Tier 1 Ratio
(%) Revenue Growth Supporting Consistent Dividend Growth Quarterly Dividend per Share ($) (3) Wealth & Investment Management Total Client Assets ($Tn) Driving Asset and Revenue Growth While Maintaining Strong Capital and Growing
the Dividend 6.6 7.9 9.3 0.85 0.93 1.00 54.1 61.8 70.6
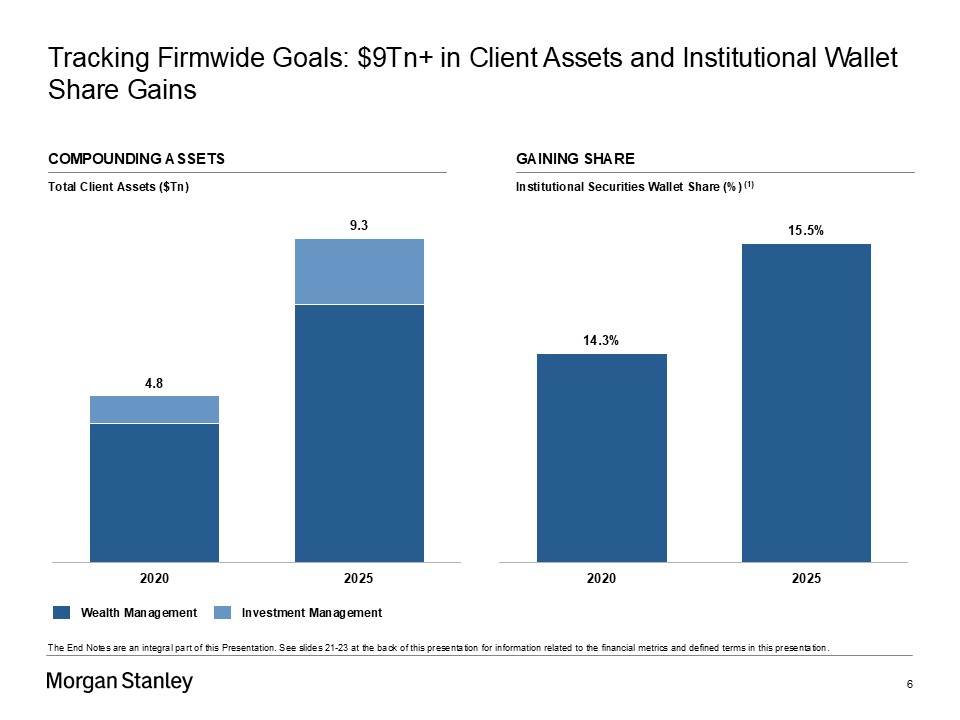
Tracking Firmwide Goals: $9Tn+ in Client Assets and Institutional Wallet Share
Gains The End Notes are an integral part of this Presentation. See slides 21-23 at the back of this presentation for information related to the financial metrics and defined terms in this presentation. Compounding Assets Total Client
Assets ($Tn) Gaining Share Institutional Securities Wallet Share (%) (1) Wealth Management Investment Management
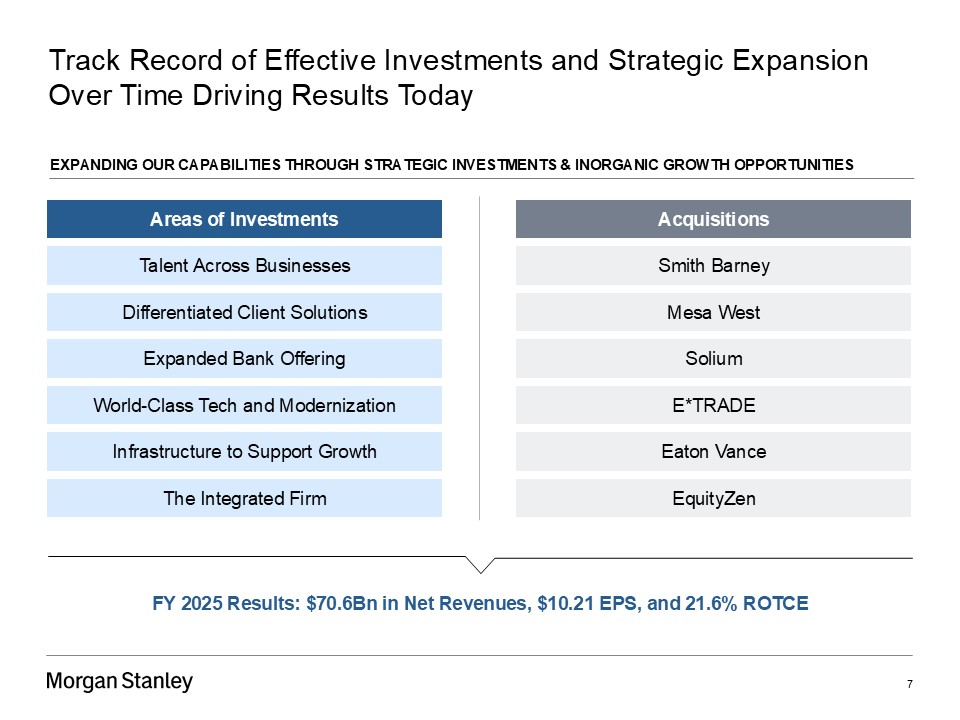
Track Record of Effective Investments and Strategic Expansion Over Time Driving
Results Today FY 2025 Results: $70.6Bn in Net Revenues, $10.21 EPS, and 21.6% ROTCE EXPANDING OUR CAPABILITIES THROUGH STRATEGIC INVESTMENTS & INORGANIC GROWTH OPPORTUNITIES Differentiated Client Solutions Mesa West Smith
Barney Talent Across Businesses Expanded Bank Offering Solium Areas of Investments World-Class Tech and Modernization E*TRADE Infrastructure to Support Growth Eaton Vance The Integrated Firm EquityZen Acquisitions
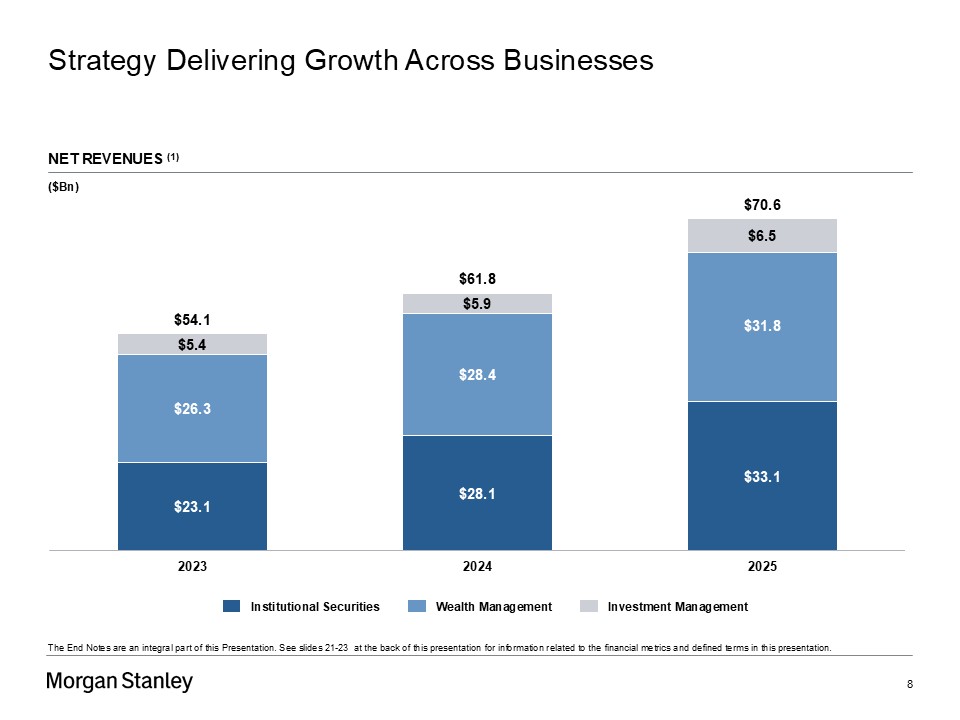
Strategy Delivering Growth Across Businesses The End Notes are an integral part
of this Presentation. See slides 21-23 at the back of this presentation for information related to the financial metrics and defined terms in this presentation. Net Revenues (1) ($Bn) Institutional Securities Wealth Management Investment
Management
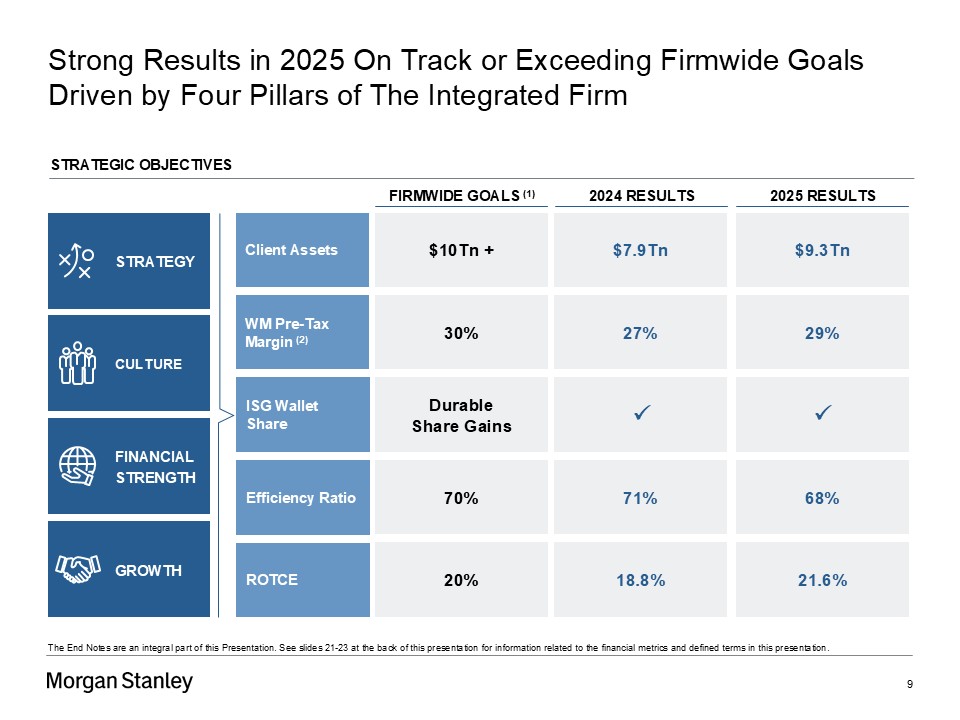
Strong Results in 2025 On Track or Exceeding Firmwide Goals Driven by Four
Pillars of The Integrated Firm STRATEGIC OBJECTIVES FIRMWIDE GOALS (1) ISG Wallet Share WM Pre-Tax Margin (2) ROTCE Efficiency Ratio Client Assets $7.9Tn $9.3Tn $10Tn + 27% 29% 30% P P Durable Share
Gains 71% 68% 70% 18.8% 21.6% 20% 2025 RESULTS 2024 RESULTS The End Notes are an integral part of this Presentation. See slides 21-23 at the back of this presentation for information related to the financial metrics and defined terms
in this presentation. STRATEGY CULTURE FINANCIAL STRENGTH GROWTH
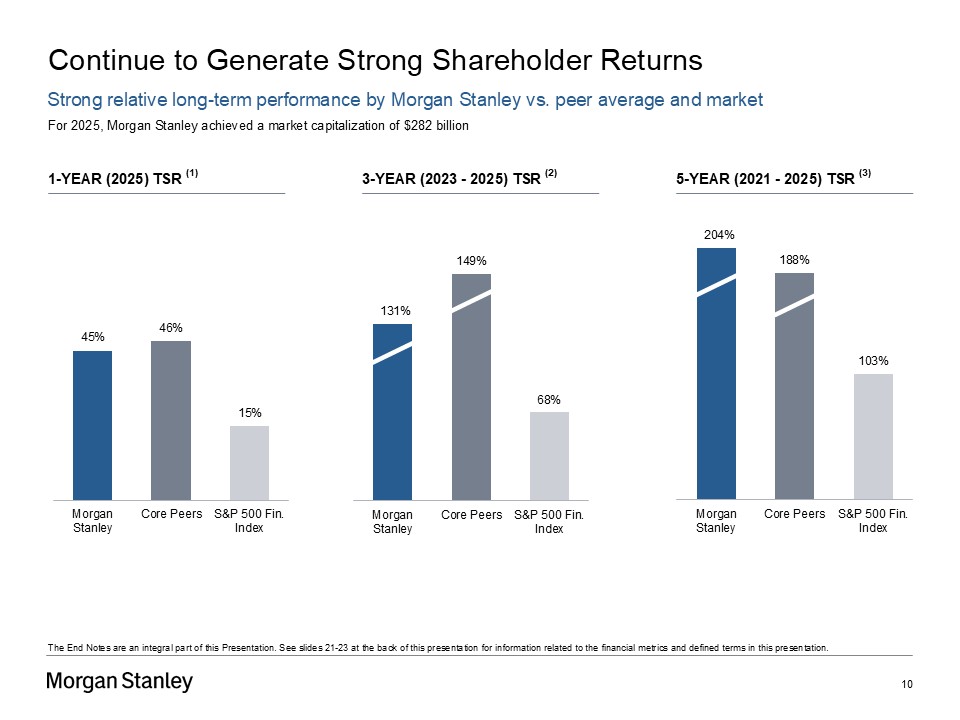
Continue to Generate Strong Shareholder Returns The End Notes are an integral
part of this Presentation. See slides 21-23 at the back of this presentation for information related to the financial metrics and defined terms in this presentation. 1-YEAR (2025) TSR (1) Strong relative long-term performance by Morgan
Stanley vs. peer average and market For 2025, Morgan Stanley achieved a market capitalization of $282 billion 3-YEAR (2023 - 2025) TSR (2) 5-YEAR (2021 - 2025) TSR (3)
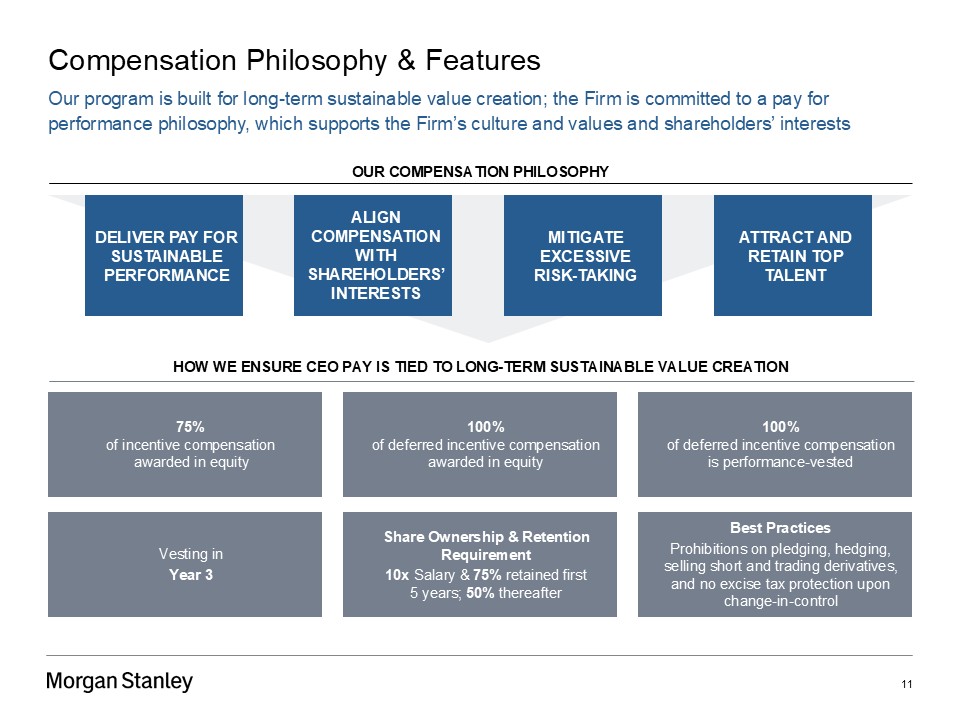
Our program is built for long-term sustainable value creation; the Firm is
committed to a pay for performance philosophy, which supports the Firm’s culture and values and shareholders’ interests Compensation Philosophy & Features 75% of incentive compensation awarded in equity 100% of deferred incentive
compensationis performance-vested Share Ownership & Retention Requirement 10x Salary & 75% retained first 5 years; 50% thereafter Best Practices Prohibitions on pledging, hedging, selling short and trading derivatives, and no
excise tax protection upon change-in-control 100% of deferred incentive compensation awarded in equity Vesting in Year 3 Deliver Pay for Sustainable Performance Align Compensation with Shareholders’ Interests Mitigate Excessive
Risk-Taking Attract and Retain Top Talent OUR COMPENSATION PHILOSOPHY HOW WE ENSURE CEO PAY IS TIED TO LONG-TERM SUSTAINABLE VALUE CREATION
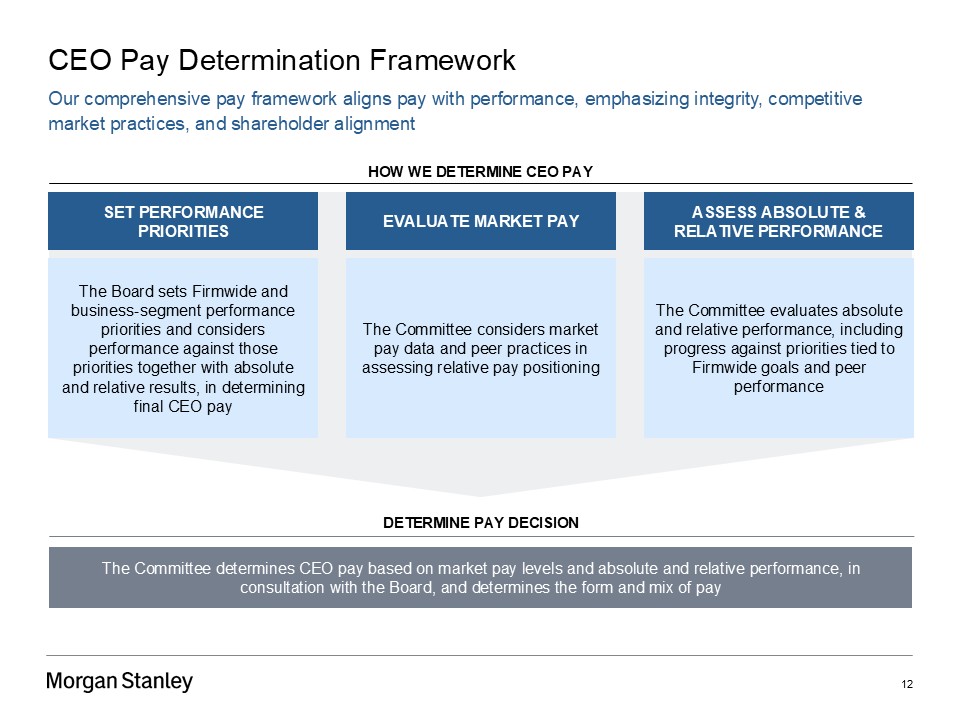
Our comprehensive pay framework aligns pay with performance, emphasizing
integrity, competitive market practices, and shareholder alignment CEO Pay Determination Framework HOW WE DETERMINE CEO PAY DETERMINE PAY DECISION Set Performance Priorities The Board sets Firmwide and business-segment performance
priorities and considers performance against those priorities together with absolute and relative results, in determining final CEO pay Evaluate Market Pay Assess Absolute & Relative Performance The Committee evaluates absolute and
relative performance, including progress against priorities tied to Firmwide goals and peer performance The Committee considers market pay data and peer practices in assessing relative pay positioning The Committee determines CEO pay based
on market pay levels and absolute and relative performance, in consultation with the Board, and determines the form and mix of pay
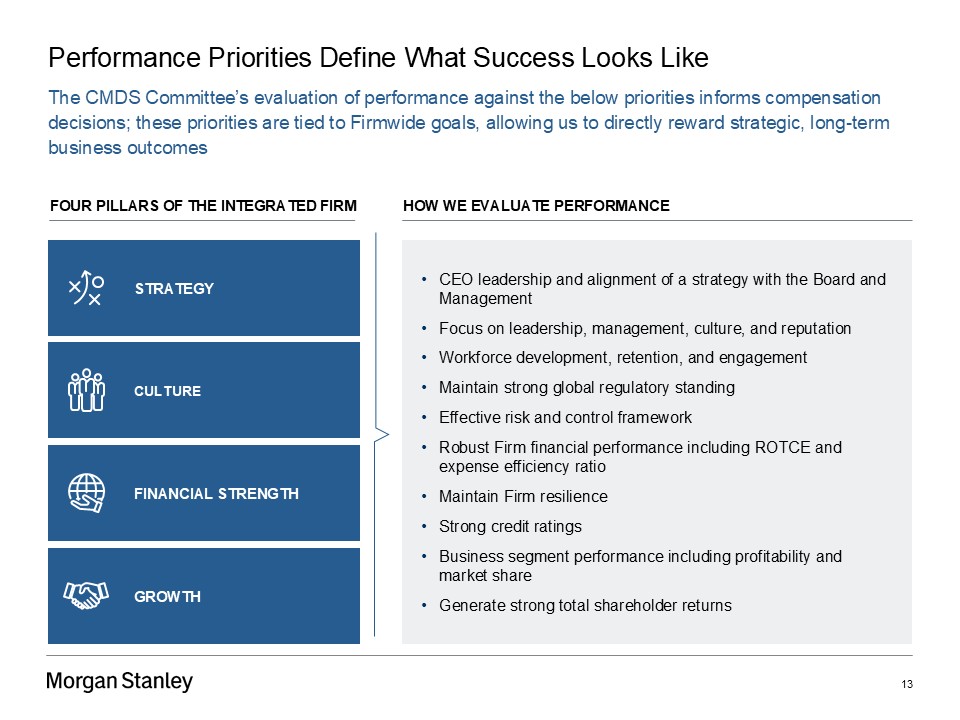
The CMDS Committee’s evaluation of performance against the below priorities
informs compensation decisions; these priorities are tied to Firmwide goals, allowing us to directly reward strategic, long-term business outcomes Performance Priorities Define What Success Looks Like FOUR PILLARS OF THE INTEGRATED
FIRM HOW WE EVALUATE PERFORMANCE CEO leadership and alignment of a strategy with the Board and Management Focus on leadership, management, culture, and reputation Workforce development, retention, and engagement Maintain strong global
regulatory standing Effective risk and control framework Robust Firm financial performance including ROTCE and expense efficiency ratio Maintain Firm resilience Strong credit ratings Business segment performance including profitability
and market share Generate strong total shareholder returns STRATEGY CULTURE FINANCIAL STRENGTH GROWTH
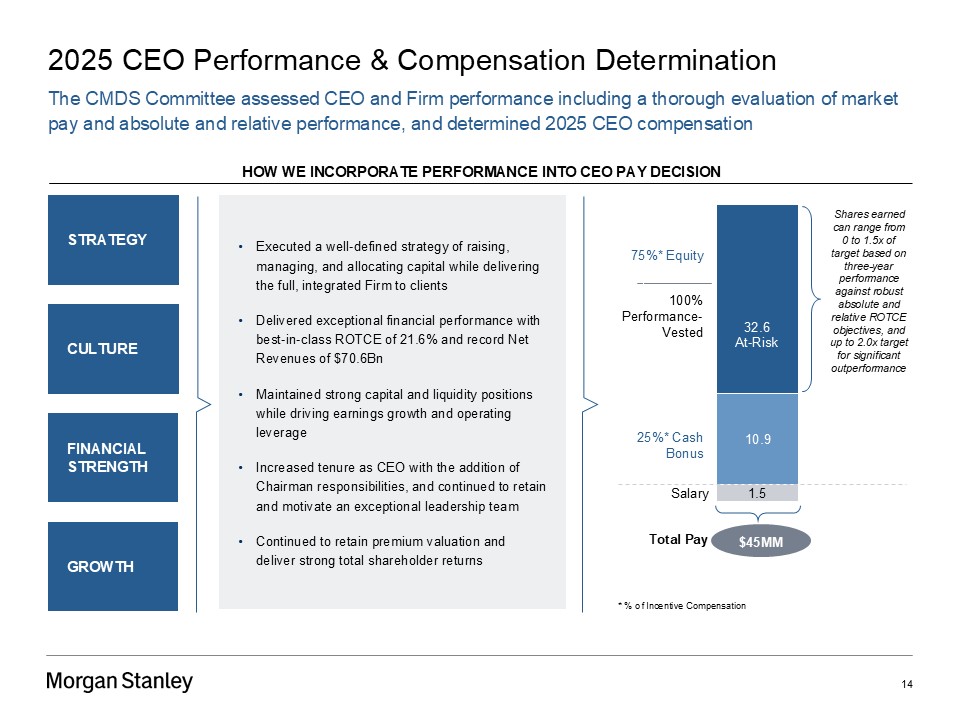
The CMDS Committee assessed CEO and Firm performance including a thorough
evaluation of market pay and absolute and relative performance, and determined 2025 CEO compensation 2025 CEO Performance & Compensation Determination HOW WE INCORPORATE PERFORMANCE INTO CEO PAY DECISION Executed a well-defined
strategy of raising, managing, and allocating capital while delivering the full, integrated Firm to clients Delivered exceptional financial performance with best-in-class ROTCE of 21.6% and record Net Revenues of $70.6Bn Maintained strong
capital and liquidity positions while driving earnings growth and operating leverage Increased tenure as CEO with the addition of Chairman responsibilities, and continued to retain and motivate an exceptional leadership team Continued to
retain premium valuation and deliver strong total shareholder returns STRATEGY CULTURE FINANCIAL STRENGTH GROWTH $45MM 75%* Equity 100% Performance-Vested 25%* Cash Bonus Salary Total Pay * % of Incentive Compensation Shares
earned can range from 0 to 1.5x of target based on three-year performance against robust absolute and relative ROTCE objectives, and up to 2.0x target for significant outperformance
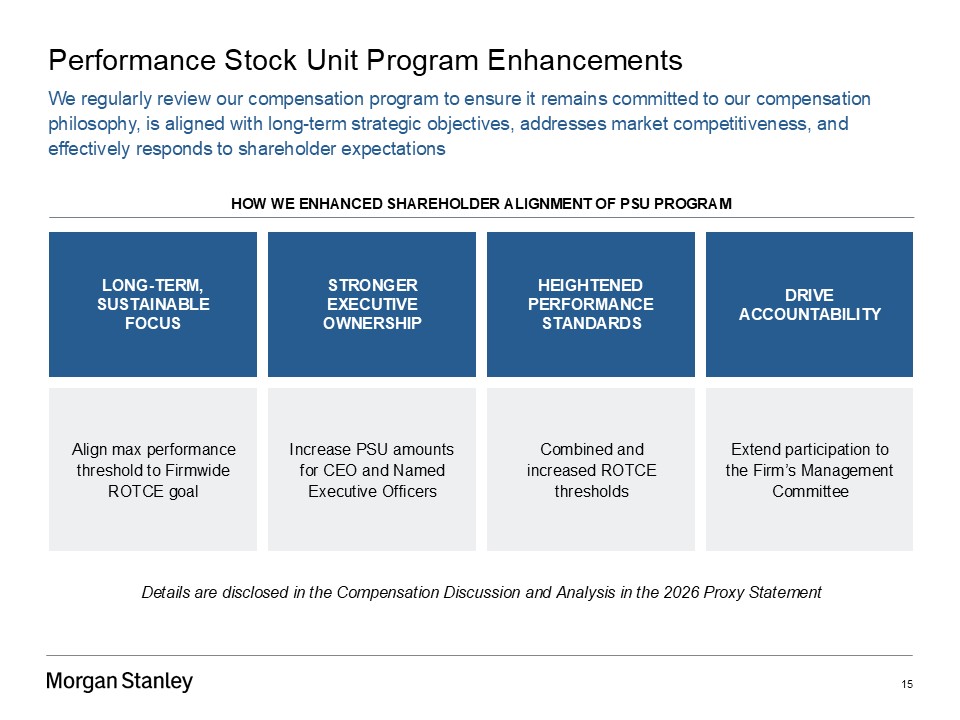
We regularly review our compensation program to ensure it remains committed to
our compensation philosophy, is aligned with long-term strategic objectives, addresses market competitiveness, and effectively responds to shareholder expectations Performance Stock Unit Program Enhancements HOW WE ENHANCED SHAREHOLDER
ALIGNMENT OF PSU PROGRAM Align max performance threshold to Firmwide ROTCE goal LONG-TERM, sustainable FOCUS Increase PSU amounts for CEO and Named Executive Officers Stronger executive ownership Combined and increased ROTCE
thresholds Heightened Performance Standards Extend participation to the Firm’s Management Committee Drive ACCOUNTABILITY Details are disclosed in the Compensation Discussion and Analysis in the 2026 Proxy Statement
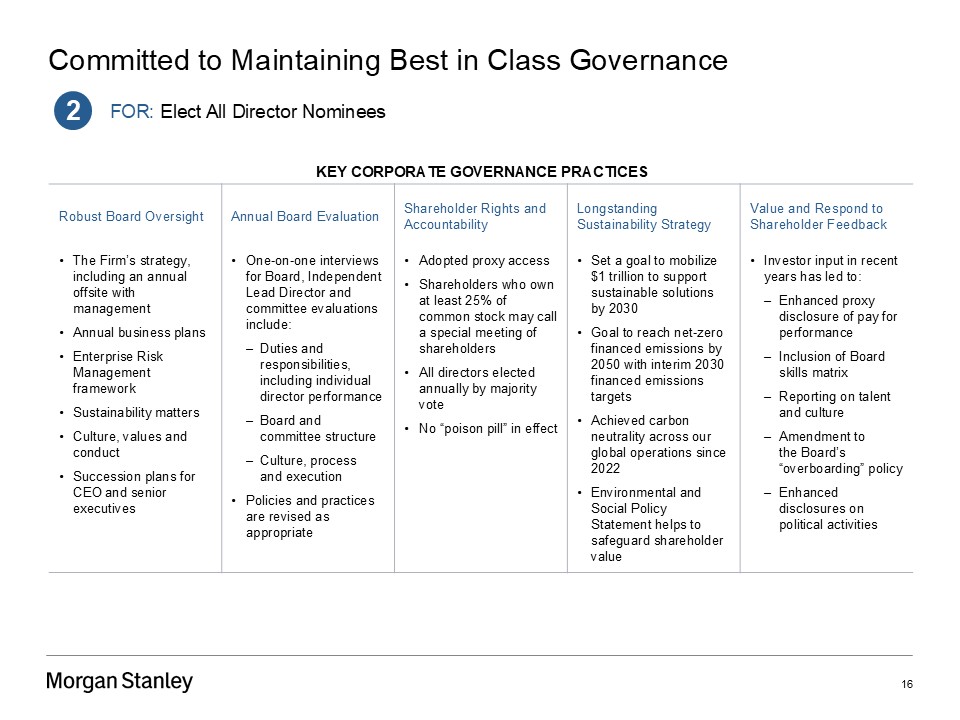
Committed to Maintaining Best in Class Governance KEY CORPORATE GOVERNANCE
PRACTICES Robust Board Oversight Annual Board Evaluation Shareholder Rights and Accountability Longstanding Sustainability Strategy Value and Respond to Shareholder Feedback The Firm’s strategy, including an annual offsite with
management Annual business plans Enterprise Risk Management framework Sustainability matters Culture, values and conduct Succession plans for CEO and senior executives One-on-one interviews for Board, Independent Lead Director and
committee evaluations include: Duties and responsibilities,including individual director performance Board and committee structure Culture, process and execution Policies and practices are revised as appropriate Adopted proxy
access Shareholders who own at least 25% of common stock may call a special meeting of shareholders All directors elected annually by majority vote No “poison pill” in effect Set a goal to mobilize $1 trillion to support sustainable
solutions by 2030 Goal to reach net-zero financed emissions by 2050 with interim 2030 financed emissions targets Achieved carbon neutrality across our global operations since 2022 Environmental and Social Policy Statement helps to
safeguard shareholder value Investor input in recentyears has led to: Enhanced proxy disclosure of pay for performance Inclusion of Board skills matrix Reporting on talent and culture Amendment to the Board’s “overboarding”
policy Enhanced disclosures on political activities 2 FOR: Elect All Director Nominees
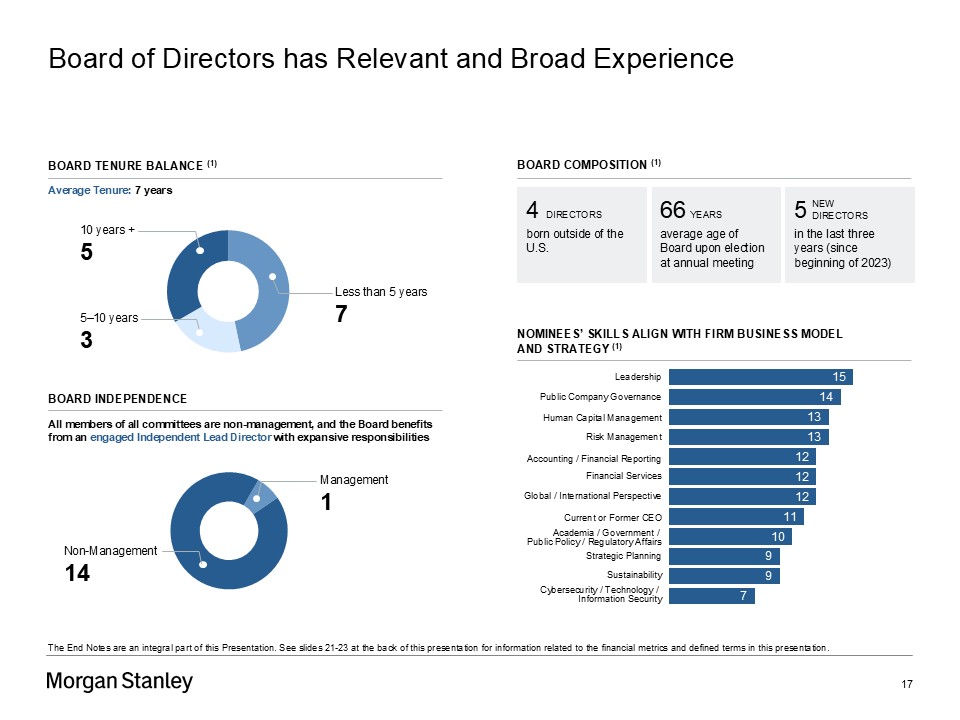
Board of Directors has Relevant and Broad Experience The End Notes are an
integral part of this Presentation. See slides 21-23 at the back of this presentation for information related to the financial metrics and defined terms in this presentation. Management1 Non-Management14 Human Capital Management Global /
International Perspective Current or Former CEO Leadership Financial Services Risk Management Strategic Planning Cybersecurity / Technology / Information Security Sustainability Accounting / Financial Reporting Public Company
Governance BOARD TENURE BALANCE (1) BOARD INDEPENDENCE BOARD COMPOSITION (1) NOMINEES’ SKILLS ALIGN WITH FIRM BUSINESS MODEL AND STRATEGY (1) Average Tenure: 7 years Less than 5 years7 5–10 years3 10 years +5 All members of all
committees are non-management, and the Board benefits from an engaged Independent Lead Director with expansive responsibilities Academia / Government / Public Policy / Regulatory Affairs 66 average age of Board upon election at annual
meeting 4 born outside of the U.S. 5 in the last three years (since beginning of 2023) DIRECTORS YEARS NEW DIRECTORS
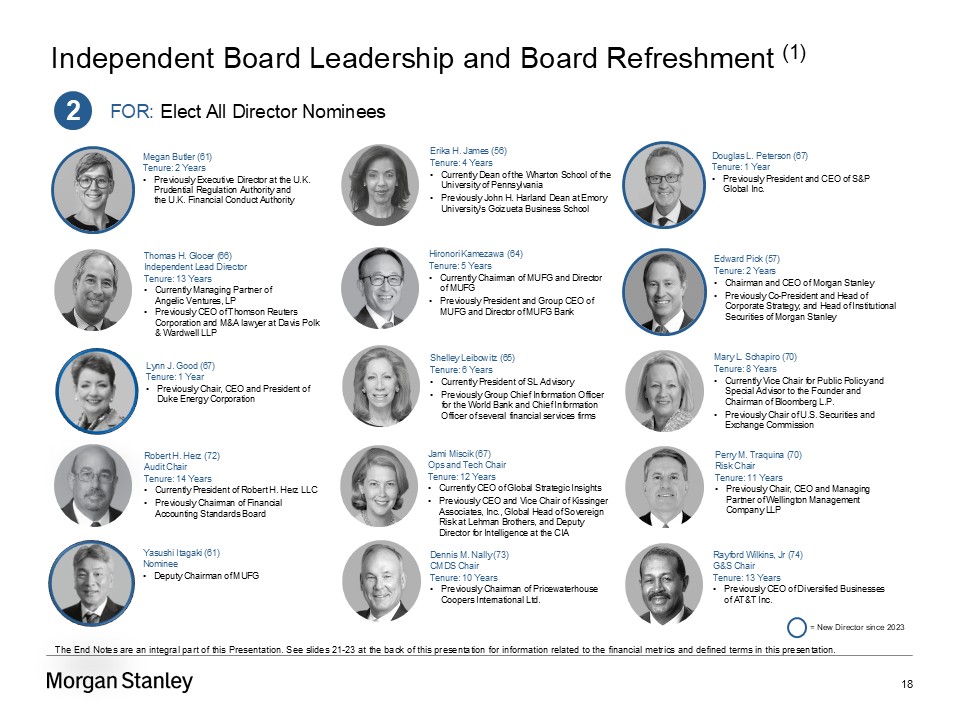
Independent Board Leadership and Board Refreshment (1) 2 FOR: Elect All
Director Nominees The End Notes are an integral part of this Presentation. See slides 21-23 at the back of this presentation for information related to the financial metrics and defined terms in this presentation. Thomas H. Glocer (66)
Independent Lead Director Tenure: 13 Years Currently Managing Partner of Angelic Ventures, LP Previously CEO of Thomson Reuters Corporation and M&A lawyer at Davis Polk & Wardwell LLP Erika H. James (56) Tenure: 4
Years Currently Dean of the Wharton School of the University of Pennsylvania Previously John H. Harland Dean at Emory University’s Goizueta Business School Robert H. Herz (72)Audit Chair Tenure: 14 Years Currently President of Robert H.
Herz LLC Previously Chairman of Financial Accounting Standards Board Megan Butler (61)Tenure: 2 Years Previously Executive Director at the U.K. Prudential Regulation Authority and the U.K. Financial Conduct Authority Hironori Kamezawa
(64) Tenure: 5 Years Currently Chairman of MUFG and Director of MUFG Previously President and Group CEO of MUFG and Director of MUFG Bank Mary L. Schapiro (70) Tenure: 8 Years Currently Vice Chair for Public Policy and Special Advisor
to the Founder and Chairman of Bloomberg L.P. Previously Chair of U.S. Securities and Exchange Commission Rayford Wilkins, Jr (74) G&S Chair Tenure: 13 Years Previously CEO of Diversified Businesses of AT&T Inc. Perry M. Traquina
(70) Risk Chair Tenure: 11 Years Previously Chair, CEO and Managing Partner of Wellington Management Company LLP Edward Pick (57) Tenure: 2 Years Chairman and CEO of Morgan Stanley Previously Co-President and Head of Corporate
Strategy, and Head of Institutional Securities of Morgan Stanley = New Director since 2023 Jami Miscik (67) Ops and Tech Chair Tenure: 12 Years Currently CEO of Global Strategic Insights Previously CEO and Vice Chair of Kissinger
Associates, Inc., Global Head of Sovereign Risk at Lehman Brothers, and Deputy Director for Intelligence at the CIA Dennis M. Nally (73)CMDS Chair Tenure: 10 Years Previously Chairman of PricewaterhouseCoopers International Ltd. Shelley
Leibowitz (65) Tenure: 6 Years Currently President of SL Advisory Previously Group Chief Information Officer for the World Bank and Chief Information Officer of several financial services firms Douglas L. Peterson (67)Tenure: 1
Year Previously President and CEO of S&P Global Inc. Lynn J. Good (67) Tenure: 1 Year Previously Chair, CEO and President of Duke Energy Corporation Yasushi Itagaki (61) Nominee Deputy Chairman of MUFG
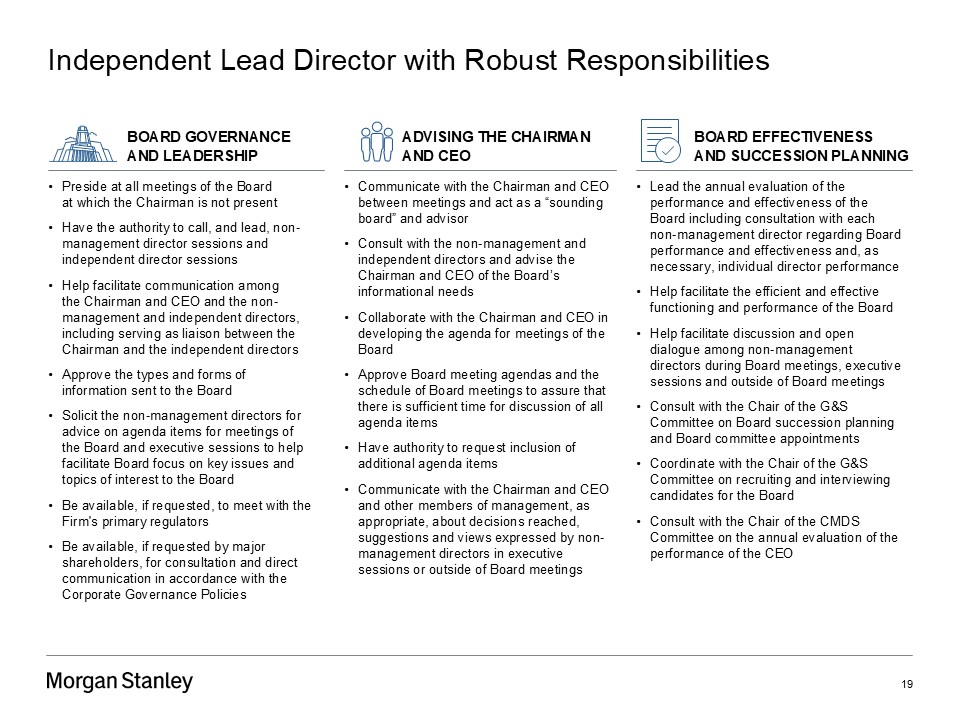
Independent Lead Director with Robust Responsibilities BOARD GOVERNANCE AND
LEADERSHIP ADVISING THE CHAIRMAN AND CEO BOARD EFFECTIVENESSAND SUCCESSION PLANNING Preside at all meetings of the Board at which the Chairman is not present Have the authority to call, and lead, non-management director sessions and
independent director sessions Help facilitate communication among the Chairman and CEO and the non-management and independent directors, including serving as liaison between the Chairman and the independent directors Approve the types and
forms of information sent to the Board Solicit the non-management directors for advice on agenda items for meetings of the Board and executive sessions to help facilitate Board focus on key issues and topics of interest to the Board Be
available, if requested, to meet with the Firm's primary regulators Be available, if requested by major shareholders, for consultation and direct communication in accordance with the Corporate Governance Policies Communicate with the
Chairman and CEO between meetings and act as a “sounding board” and advisor Consult with the non-management and independent directors and advise the Chairman and CEO of the Board’s informational needs Collaborate with the Chairman and CEO
in developing the agenda for meetings of the Board Approve Board meeting agendas and the schedule of Board meetings to assure that there is sufficient time for discussion of all agenda items Have authority to request inclusion of additional
agenda items Communicate with the Chairman and CEO and other members of management, as appropriate, about decisions reached, suggestions and views expressed by non-management directors in executive sessions or outside of Board meetings Lead
the annual evaluation of the performance and effectiveness of the Board including consultation with each non-management director regarding Board performance and effectiveness and, as necessary, individual director performance Help facilitate
the efficient and effective functioning and performance of the Board Help facilitate discussion and open dialogue among non-management directors during Board meetings, executive sessions and outside of Board meetings Consult with the Chair
of the G&S Committee on Board succession planning and Board committee appointments Coordinate with the Chair of the G&S Committee on recruiting and interviewing candidates for the Board Consult with the Chair of the CMDS Committee
on the annual evaluation of the performance of the CEO
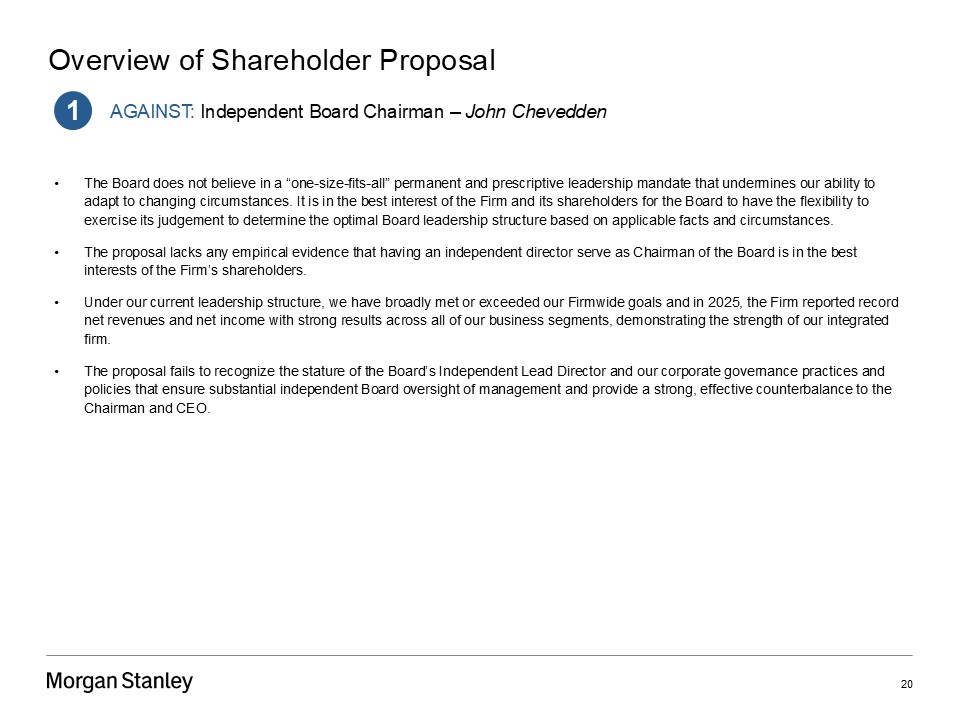
Overview of Shareholder Proposal 1 AGAINST: Independent Board Chairman –
John Chevedden The Board does not believe in a “one-size-fits-all” permanent and prescriptive leadership mandate that undermines our ability to adapt to changing circumstances. It is in the best interest of the Firm and its shareholders for
the Board to have the flexibility to exercise its judgement to determine the optimal Board leadership structure based on applicable facts and circumstances. The proposal lacks any empirical evidence that having an independent director serve
as Chairman of the Board is in the best interests of the Firm’s shareholders. Under our current leadership structure, we have broadly met or exceeded our Firmwide goals and in 2025, the Firm reported record net revenues and net income with
strong results across all of our business segments, demonstrating the strength of our integrated firm. The proposal fails to recognize the stature of the Board’s Independent Lead Director and our corporate governance practices and policies
that ensure substantial independent Board oversight of management and provide a strong, effective counterbalance to the Chairman and CEO.
Notes The information provided herein includes certain non-GAAP financial
measures. The definition of such measures and/or the reconciliation of such measures to the comparable U.S. GAAP figures are included in this presentation, or in Morgan Stanley's (the ‘Firm’) Annual Report on Form 10-K, Definitive Proxy
Statement, Quarterly Reports on Form 10-Q and the Firm’s Current Reports on Form 8-K, as applicable, including any amendments thereto, which are available on www.morganstanley.com, or within this presentation. The End Notes are an integral
part of this presentation. This presentation may contain forward-looking statements including the attainment of certain financial and other targets, and objectives and goals. You are cautioned not to place undue reliance on forward-looking
statements, which speak only as of the date on which they are made, which reflect management’s current estimates, projections, expectations, assumptions, interpretation or beliefs and which are subject to risks and uncertainties that may
cause actual results to differ materially. The Firm does not undertake to update the forward-looking statements to reflect the impact of circumstances or events that may arise after the date of forward-looking statements. For a discussion of
risks and uncertainties that may affect the future results of the Firm, please see the Firm’s most recent Annual Report on Form 10-K, Quarterly Reports on Form 10-Q and Current Reports on Form 8-K, as applicable, which are available on
www.morganstanley.com. This presentation is not an offer to buy or sell any security. For information and impact of the Firm’s acquisitions, please refer to prior period filings of the Firm’s Annual Reports on Form 10-K and Quarterly Reports
on Form 10-Q. The statements in this presentation are current only as of their respective dates.
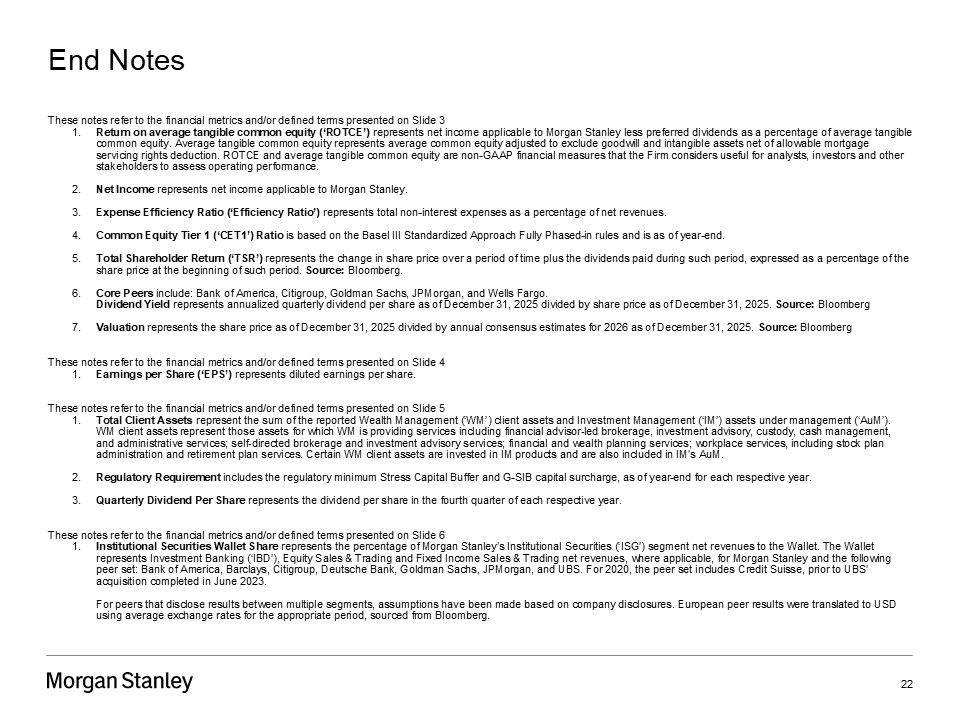
End Notes These notes refer to the financial metrics and/or defined terms
presented on Slide 3 Return on average tangible common equity (‘ROTCE’) represents net income applicable to Morgan Stanley less preferred dividends as a percentage of average tangible common equity. Average tangible common equity represents
average common equity adjusted to exclude goodwill and intangible assets net of allowable mortgage servicing rights deduction. ROTCE and average tangible common equity are non-GAAP financial measures that the Firm considers useful for
analysts, investors and other stakeholders to assess operating performance. Net Income represents net income applicable to Morgan Stanley. Expense Efficiency Ratio (‘Efficiency Ratio’) represents total non-interest expenses as a
percentage of net revenues. Common Equity Tier 1 (‘CET1’) Ratio is based on the Basel III Standardized Approach Fully Phased-in rules and is as of year-end. Total Shareholder Return (‘TSR’) represents the change in share price over a
period of time plus the dividends paid during such period, expressed as a percentage of the share price at the beginning of such period. Source: Bloomberg. Core Peers include: Bank of America, Citigroup, Goldman Sachs, JPMorgan, and Wells
Fargo. Dividend Yield represents annualized quarterly dividend per share as of December 31, 2025 divided by share price as of December 31, 2025. Source: Bloomberg 7. Valuation represents the share price as of December 31, 2025 divided by
annual consensus estimates for 2026 as of December 31, 2025. Source: Bloomberg These notes refer to the financial metrics and/or defined terms presented on Slide 4 Earnings per Share (‘EPS’) represents diluted earnings per share. These
notes refer to the financial metrics and/or defined terms presented on Slide 5 Total Client Assets represent the sum of the reported Wealth Management (‘WM’) client assets and Investment Management (‘IM’) assets under management (‘AuM’). WM
client assets represent those assets for which WM is providing services including financial advisor‐led brokerage, investment advisory, custody, cash management, and administrative services; self‐directed brokerage and investment advisory
services; financial and wealth planning services; workplace services, including stock plan administration and retirement plan services. Certain WM client assets are invested in IM products and are also included in IM’s AuM. Regulatory
Requirement includes the regulatory minimum Stress Capital Buffer and G-SIB capital surcharge, as of year-end for each respective year. Quarterly Dividend Per Share represents the dividend per share in the fourth quarter of each respective
year. These notes refer to the financial metrics and/or defined terms presented on Slide 6 Institutional Securities Wallet Share represents the percentage of Morgan Stanley’s Institutional Securities (‘ISG’) segment net revenues to the
Wallet. The Wallet represents Investment Banking (‘IBD’), Equity Sales & Trading and Fixed Income Sales & Trading net revenues, where applicable, for Morgan Stanley and the following peer set: Bank of America, Barclays, Citigroup,
Deutsche Bank, Goldman Sachs, JPMorgan, and UBS. For 2020, the peer set includes Credit Suisse, prior to UBS’ acquisition completed in June 2023. For peers that disclose results between multiple segments, assumptions have been made based on
company disclosures. European peer results were translated to USD using average exchange rates for the appropriate period, sourced from Bloomberg.
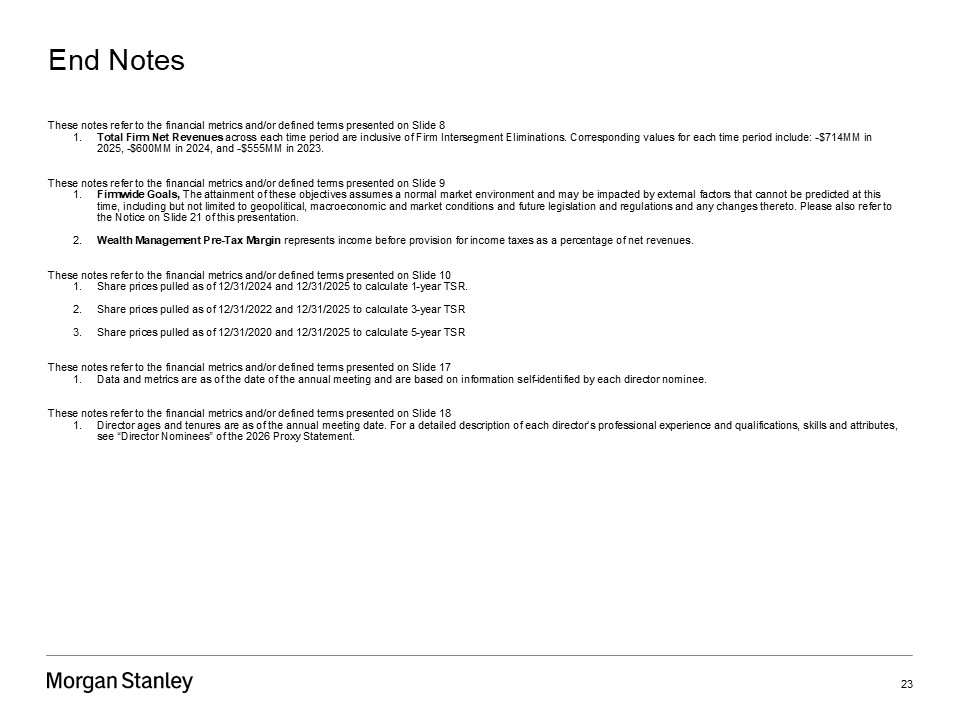
End Notes These notes refer to the financial metrics and/or defined terms
presented on Slide 8 Total Firm Net Revenues across each time period are inclusive of Firm Intersegment Eliminations. Corresponding values for each time period include: -$714MM in 2025, -$600MM in 2024, and -$555MM in 2023. These notes
refer to the financial metrics and/or defined terms presented on Slide 9 Firmwide Goals, The attainment of these objectives assumes a normal market environment and may be impacted by external factors that cannot be predicted at this time,
including but not limited to geopolitical, macroeconomic and market conditions and future legislation and regulations and any changes thereto. Please also refer to the Notice on Slide 21 of this presentation. Wealth Management Pre-Tax
Margin represents income before provision for income taxes as a percentage of net revenues. These notes refer to the financial metrics and/or defined terms presented on Slide 10 Share prices pulled as of 12/31/2024 and 12/31/2025 to
calculate 1-year TSR. Share prices pulled as of 12/31/2022 and 12/31/2025 to calculate 3-year TSR Share prices pulled as of 12/31/2020 and 12/31/2025 to calculate 5-year TSR These notes refer to the financial metrics and/or defined terms
presented on Slide 17 Data and metrics are as of the date of the annual meeting and are based on information self-identified by each director nominee. These notes refer to the financial metrics and/or defined terms presented on Slide
18 Director ages and tenures are as of the annual meeting date. For a detailed description of each director’s professional experience and qualifications, skills and attributes, see “Director Nominees” of the 2026 Proxy Statement.