Certain statements contained herein constitute forward-looking statements as such term is defined in Section 27A of the Securities Act of 1933, as amended, and Section 21E of the Securities Exchange Act of 1934, as amended. Forward-looking statements are not guarantees of future performance. They represent our intentions, plans, expectations and beliefs and are subject to numerous assumptions, risks and uncertainties. Our future results, financial condition and business may differ materially from those expressed in these forward-looking statements. You can find many of these statements by looking for words such as "approximates," "believes," "expects," "anticipates," "estimates," "intends," "plans," "would," "may" or other similar expressions in this supplemental package. We also note the following forward-looking statements: in the case of our development and redevelopment projects, the estimated completion date, estimated project cost, projected incremental cash yield, stabilization date and cost to complete; estimates of future capital expenditures, dividends to common and preferred shareholders and operating partnership distributions. Many of the factors that will determine the outcome of these and our other forward-looking statements are beyond our ability to control or predict. Currently, some of the factors are interest rate fluctuations and the effects of inflation on our business, financial condition, results of operations, cash flows, operating performance and the effect that these factors have had and may continue to have on our tenants, the global, national, regional and local economies and financial markets and the real estate market in general. For further discussion of factors that could materially affect the outcome of our forward-looking statements, see "Item 1A. Risk Factors" in Part I of our Annual Report on Form 10-K for the year ended December 31, 2024. For these statements, we claim the protection of the safe harbor for forward-looking statements contained in the Private Securities Litigation Reform Act of 1995. You are cautioned not to place undue reliance on our forward-looking statements, which speak only as of the date of this supplemental package. All subsequent written and oral forward-looking statements attributable to us or any person acting on our behalf are expressly qualified in their entirety by the cautionary statements contained or referred to in this section. We do not undertake any obligation to release publicly any revisions to our forward-looking statements to reflect events or circumstances occurring after the date of this supplemental package. This supplemental package includes certain non-GAAP financial measures, which are accompanied by what Vornado Realty Trust and subsidiaries (the "Company") considers the most directly comparable financial measures calculated and presented in accordance with accounting principles generally accepted in the United States of America ("GAAP"). These include Earnings Before Interest, Taxes, Depreciation and Amortization for Real Estate ("EBITDAre"). Quantitative reconciliations of the differences between the most directly comparable GAAP financial measures and the non-GAAP financial measures presented are provided within this supplemental package. Definitions of these non-GAAP financial measures and statements of the reasons why management believes the non-GAAP measures provide useful information to investors about the Company's financial condition and results of operations, and, if applicable, the purposes for which management uses the measures, can be found in the Definitions section of this supplemental package on page ii in the Appendix.
This supplemental package should be read in conjunction with the Company’s Quarterly Report on Form 10-Q for the quarter ended March 31, 2025 and the Company’s Supplemental Operating and Financial Data package for the quarter ended March 31, 2025, both of which can be accessed at the Company’s website www.vno.com.
2
FINANCIAL HIGHLIGHTS AND BUSINESS DEVELOPMENTS (unaudited)
First Quarter 2025 Financial Highlights
Net income attributable to common shareholders for the quarter ended March 31, 2025 was $86,842,000, or $0.43 per diluted share, compared to a net loss attributable to common shareholders of $9,034,000, or $0.05 per diluted share, for the prior year's quarter. The increase is primarily due to the $76,162,000 net gain recognized upon the disposition of a portion of the 666 Fifth condominium to UNIQLO, and the $17,240,000 reversal of PENN 1 rent expense previously accrued following the April 2025 rent reset determination.
EBITDAre, as adjusted (non-GAAP) for the quarter ended March 31, 2025 was $273,697,000, compared to $255,858,000 for the prior year’s quarter.
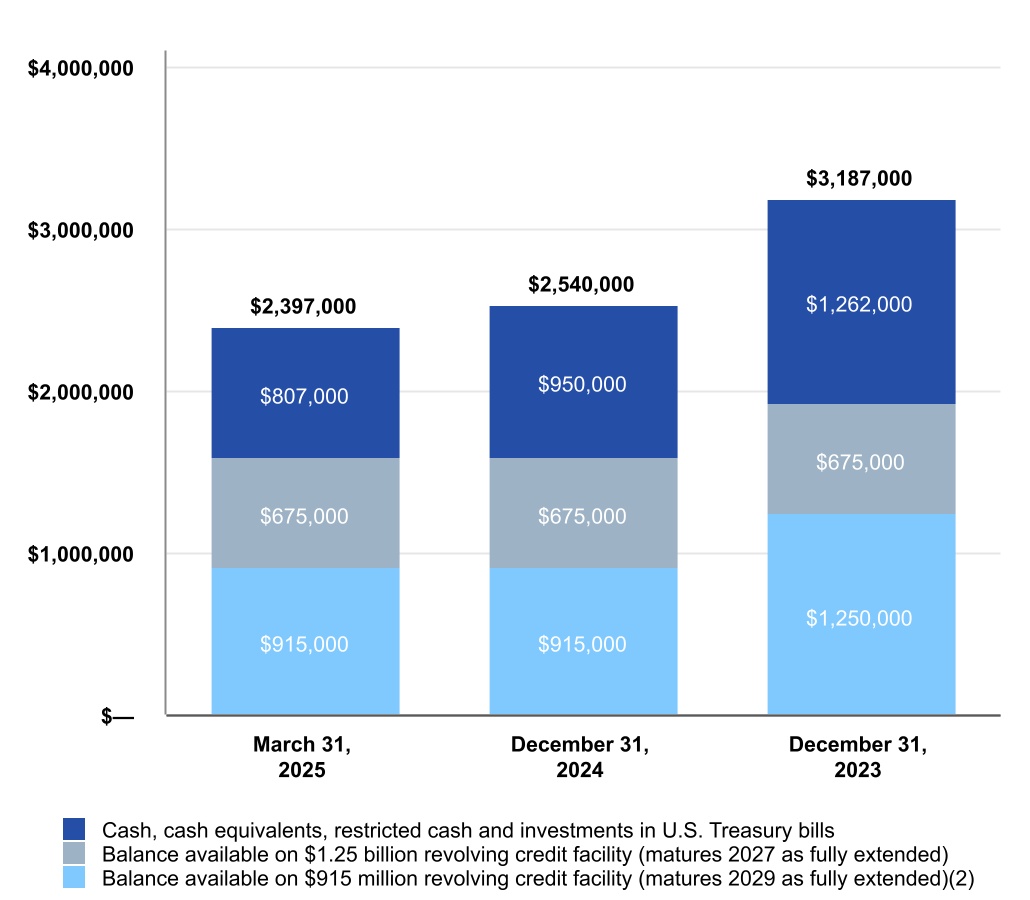
Liquidity
As of March 31, 2025, we had $2.3 billion of liquidity comprised of $807.0 million of cash and cash equivalents and restricted cash and $1.5 billion available on our $2.2 billion revolving credit facilities.
Active Development
As of March 31, 2025, we have expended $783,456,000 of cash with an estimated $66,544,000 remaining to be spent for PENN 2 and PENN districtwide improvements.
We have a 49.9% interest in a joint venture that is developing Sunset Pier 94 Studios. During 2024, we fully funded our $34,000,000 share of cash contributions.
There can be no assurance that the above projects will be completed, completed on schedule or within budget. In addition, there can be no assurance that the Company will be successful in leasing the properties on the expected schedule or at the assumed rental rates.
2025 Business Developments
770 Broadway
On May 5, 2025, we completed a master lease with New York University (“NYU”) to lease 1,076,000 square feet at 770 Broadway, on an “as is”, triple net basis for a 70-year lease term. Under the terms of the master lease, a rental agreement under Section 467 of the Internal Revenue Code, NYU made a prepaid lease payment of $935,000,000 and will also make annual lease payments of approximately $9,300,000 during the lease term. NYU has an option to purchase the leased premises in both 2055 and at the end of the lease term in 2095. NYU will assume the existing office leases and related tenant income at the property.
We used a portion of the prepaid lease payment to repay the $700,000,000 mortgage loan which previously encumbered the property.
We will retain the 92,000 square feet retail condominium leased to Wegmans.
PENN 1 Ground Rent Reset Determination
On April 22, 2025, an arbitration panel (the “Panel”) appointed to determine the ground rent payable by Vornado’s subsidiary for the PENN 1 land parcel for the 25-year period beginning June 17, 2023 determined that the annual rent payable will be $15,000,000.
Further, litigation is currently pending between the parties in New York County Supreme Court relating to the matter. To date, the court denied the Vornado subsidiary’s motion to dismiss the action and Vornado’s subsidiary has filed a notice of appeal. The Panel’s decision provides that if the fee owner prevails in a final judgment in the litigation, the annual rent for the 25-year term will be $20,220,000, retroactive to June 17, 2023.
We were accruing $26,205,000 per annum of ground rent based on a previous estimate and therefore, in connection with the Panel’s determination, we reversed $17,240,000 of previously accrued rent expense during the three months ended March 31, 2025. Additionally, commencing in the first quarter of 2025, we are now paying based on the $15,000,000 annual rent.
Please refer to the Appendix for reconciliations of GAAP to non-GAAP measures
3
FINANCIAL HIGHLIGHTS AND BUSINESS DEVELOPMENTS (unaudited)
2025 Business Developments - continued
Dispositions
666 Fifth Avenue (Fifth Avenue and Times Square JV)
On January 8, 2025, the Fifth Avenue and Times Square JV completed the sale to UNIQLO of the portion of its U.S. flagship store at 666 Fifth Avenue owned by the joint venture for $350,000,000 and realized net proceeds of $342,000,000. The net proceeds were used to partially redeem Vornado’s preferred equity on the asset. The joint venture continues to own 23,832 square feet of retail space (7,416 square feet at grade) at 666 Fifth Avenue consisting of the Abercrombie & Fitch and Tissot stores. We recognized a financial statement gain of $76,162,000, which is included in “income from partially owned entities” on our consolidated statements of income.
220 Central Park South
During the three months ended March 31, 2025, we closed on the sale of two condominium units and ancillary amenities at 220 Central Park South (“220 CPS”) for net proceeds of $24,713,000, resulting in a financial statement net gain of $13,576,000 which is included in "net gains on disposition of wholly owned and partially owned assets" on our consolidated statements of income. In connection with these sales, $2,548,000 of income tax expense was recognized on our consolidated statements of income. Two units remain unsold.
Financing Activity
Senior Unsecured Notes due 2025
We repaid our $450,000,000 3.50% senior unsecured notes on their January 15, 2025 maturity date.
1535 Broadway (Fifth Avenue and Times Square JV)
On April 14, 2025, the Fifth Avenue and Times Square JV completed a $450,000,000 financing of 1535 Broadway. The interest-only non-recourse loan bears interest at a fixed rate of 6.90% and matures in May 2030. After transaction costs and reserves, $407,000,000 of the net proceeds from the financing were used to partially redeem Vornado’s Fifth Avenue and Times Square JV preferred equity. In connection with the financing, the annual coupon for the remaining preferred equity interest in 1535 Broadway was increased to 5.75% from 4.75% through the maturity of the new loan and then will be based on a formulaic rate.
Sustainability Margin Adjustment
In April 2025, we qualified for a sustainability margin adjustment on our unsecured term loan and revolving credit facilities by achieving certain KPI metrics, which will reduce our interest rate by 0.05% and 0.04%, respectively.
4
FINANCIAL HIGHLIGHTS AND BUSINESS DEVELOPMENTS (unaudited)
2025 Business Developments - continued
Leasing Activity
The leasing activity and related statistics in the table below are based on leases signed during the period and are not intended to coincide with the commencement of rental revenue in accordance with GAAP. Second generation relet space represents square footage that has not been vacant for more than nine months and tenant improvements and leasing commissions are based on our share of square feet leased during the period.
(Square feet in thousands)
New York
555 California Street
Office
Retail
THE MART
Three Months Ended March 31, 2025
Total square feet leased
709
25
83
222
Our share of square feet leased:
685
18
83
155
Initial rent(1)
$
95.53
$
222.20
$
51.33
$
120.65
Weighted average lease term (years)
14.7
14.3
8.0
13.1
Second generation relet space:
Square feet
254
10
42
155
GAAP basis:
Straight-line rent(2)
$
80.23
$
139.99
$
51.80
$
132.08
Prior straight-line rent
$
73.25
$
108.59
$
54.68
$
110.28
Percentage increase (decrease)
9.5
%
28.9
%
(5.3)
%
19.8
%
Cash basis (non-GAAP):
Initial rent(1)
$
84.72
$
139.40
$
51.67
$
121.04
Prior escalated rent
$
79.56
$
112.57
$
60.43
$
117.37
Percentage increase (decrease)
6.5
%
23.8
%
(14.5)
%
3.1
%
Tenant improvements and leasing commissions:
Per square foot
$
168.88
$
377.61
$
90.82
$
229.71
Per square foot per annum
$
11.49
$
26.41
$
11.35
$
17.54
Percentage of initial rent
12.0
%
11.9
%
22.1
%
14.5
%
________________________________
(1)Represents the cash basis weighted average starting rent per square foot, which is generally indicative of market rents. Most leases include free rent and periodic step-ups in rent which are not included in the initial cash basis rent per square foot but are included in the GAAP basis straight-line rent per square foot.
(2)Represents the GAAP basis weighted average rent per square foot that is recognized over the term of the respective leases and includes the effect of free rent and periodic step-ups in rent.
5
UNSECURED NOTES COVENANT RATIOS AND CREDIT RATINGS (unaudited)
(Amounts in thousands)
As of
Unsecured Notes Covenant Ratios(1)
Required
March 31, 2025
December 31, 2024
September 30, 2024
June 30, 2024
Total outstanding debt/total assets(2)
Less than 65%
48%
49%
49%
47%
Secured debt/total assets
Less than 50%
35%
35%
35%
33%
Interest coverage ratio (annualized combined EBITDA to annualized interest expense)
Greater than 1.50
1.87
1.77
1.71
1.87
Unencumbered assets/unsecured debt
Greater than 150%
470%
388%
396%
425%
Consolidated Unencumbered EBITDA(1) (non-GAAP):
Q1 2025 Annualized
New York
$
313,860
Other
84,440
Total
$
398,300
Credit Ratings(3):
Rating
Outlook
Moody’s
Ba1
Stable
S&P
BBB-
Negative
Fitch
BB+
Stable
________________________________
(1)Our debt covenant ratios and consolidated unencumbered EBITDA are computed in accordance with the terms of our senior unsecured notes. The methodology used for these computations may differ significantly from similarly titled ratios and amounts of other companies. For additional information regarding the methodology used to compute these ratios and amounts, please see our filings with the SEC of our senior debt indentures and applicable prospectuses and prospectus supplements.
(2)Total assets include EBITDA capped at 7.0% per the terms of our senior unsecured notes covenants.
(3)Credit ratings are provided for informational purposes only and are not a recommendation to buy or sell our securities.
6
LIQUIDITY AND CAPITALIZATION (unaudited)
(Amounts in thousands, except per share amounts)
Liquidity Snapshot
(1)
The debt balances presented represent contractual debt balances. See reconciliation on page iii in the Appendix of consolidated debt, net as presented on our consolidated balance sheets to consolidated contractual debt as of March 31, 2025.
(2)
Prior to May 3, 2024, the $915 million revolving credit facility had full capacity of $1.25 billion.
(3)
Based on the Vornado Realty Trust (NYSE: VNO) March 31, 2025 quarter end closing common share price of $36.99.
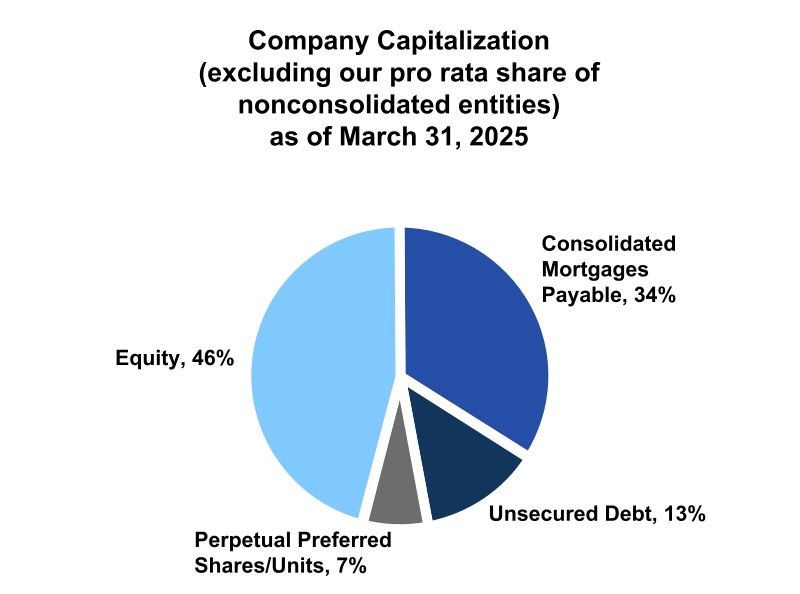
Company capitalization(1):
Amount
% Total
Consolidated mortgages payable (at 100%)
$
5,702,807
34%
Unsecured debt (contractual)
2,125,000
13%
Perpetual preferred shares/units
1,223,035
7%
Equity(3)
7,769,750
46%
Total
16,820,592
100%
Pro rata share of debt of non-consolidated entities
2,487,104
Less: Noncontrolling interests' share of consolidated debt
(682,059)
Total at share
$
18,625,637
7
NET DEBT TO EBITDAre, AS ADJUSTED (unaudited)
(Amounts in thousands)
As of and For the Trailing Twelve Months Ended March 31, 2025
As of and For the Year Ended December 31,
2024
2023
2022
Secured debt
$
5,702,807
$
5,707,176
$
5,729,615
$
5,877,615
Unsecured debt
2,125,000
2,575,000
2,575,000
2,575,000
Pro rata share of debt of non-consolidated entities
2,487,104
2,477,701
2,654,701
2,697,226
Less: Noncontrolling interests’ share of consolidated debt
(682,059)
(682,059)
(682,059)
(682,059)
Company’s pro rata share of total debt
$
9,632,852
$
10,077,818
$
10,277,257
$
10,467,782
% Unsecured debt
26%
25%
25%
Company’s pro rata share of total debt
$
9,632,852
$
10,077,818
$
10,277,257
$
10,467,782
Less: Cash and cash equivalents and investments in U.S. Treasury bills
(568,861)
(733,947)
(997,002)
(1,361,651)
Less: Escrowed cash included within restricted cash on our balance sheet
(202,429)
(187,416)
(221,578)
(94,374)
Less: Pro rata share of unconsolidated partially owned entities’ cash and cash equivalents and escrowed cash
(262,927)
(248,835)
(295,983)
(316,385)
Plus: Noncontrolling interests’ share of cash and cash equivalents, escrowed cash and investments in U.S. Treasury bills
116,181
129,160
101,564
94,100
Less: Participation in 150 West 34th Street mortgage loan
—
—
—
(105,000)
Net debt
$
8,714,816
$
9,036,780
$
8,864,258
$
8,684,472
EBITDAre, as adjusted (non-GAAP)
$
1,067,159
$
1,049,320
$
1,081,332
$
1,090,564
Net debt / EBITDAre, as adjusted (non-GAAP)
8.2
x
8.6
x
8.2
x
8.0
x
See page ii in the Appendix for definitions of EBITDAre and net debt to EBITDAre, as adjusted. See reconciliation of net income (loss) to EBITDAre on page iv in the Appendix and reconciliation of EBITDAre to EBITDAre, as adjusted on page v in the Appendix.
DEBT SNAPSHOT (unaudited)
(Amounts in thousands)
As of March 31, 2025
Total
Variable
Fixed(1)
(Contractual debt balances)
Amount
Weighted Average Interest Rate
Amount
Weighted Average Interest Rate
Amount
Weighted Average Interest Rate
Consolidated debt(2)
$
7,827,807
4.61%
$
1,307,807
5.92%(3)
$
6,520,000
4.34%
Pro rata share of debt of non-consolidated entities
2,487,104
5.13%
458,282
6.39%
2,028,822
4.85%
Total
10,314,911
4.73%
1,766,089
6.04%
8,548,822
4.46%
Less: Noncontrolling interests' share of consolidated debt (primarily 1290 Avenue of the Americas and 555 California Street)
(682,059)
(397,059)
(285,000)
Company's pro rata share of total debt
$
9,632,852
4.73%
$
1,369,030
5.95%
$
8,263,822
4.53%
As of March 31, 2025, $843,617 of variable rate debt (at share) is subject to interest rate cap arrangements, the $525,413 of variable rate debt not subject to interest rate cap arrangements represents 5% of our total pro rata share of debt. See the following page for details.
________________________________
(1) Includes variable rate debt with interest rates fixed by interest rate swap arrangements and the $950,000 1290 Avenue of the Americas mortgage loan which is subject to a 1.00% SOFR interest rate cap arrangement.
(2) See reconciliation on page iii in the Appendix of consolidated debt, net as presented on our consolidated balance sheets to consolidated contractual debt as of March 31, 2025.
(3) Excludes additional 3.00% default interest on the 606 Broadway mortgage loan.
8
HEDGING INSTRUMENTS AS OF MARCH 31, 2025 (unaudited)
Fashion Centre Mall/Washington Tower mortgage loan
34,125
05/26
S+305
34,125
05/25
3.00%
6.05%
7.61%
Debt subject to interest rate swaps and subject to a 1.00% SOFR interest rate cap
$
5,369,700
Variable rate debt subject to interest rate caps
843,617
Fixed rate debt per loan agreements
2,894,122
Variable rate debt not subject to interest rate swaps or caps
525,413
(4)
Total debt at share
$
9,632,852
________________________________
(1)Assumes the exercise of as-of-right extension options.
(2)Equals the sum of (i) the index rate in effect as of the most recent contractual reset date, adjusted for hedging instruments, and (ii) the contractual spread.
(3)Equals the sum of (i) the cash interest rate and (ii) the effect of amortization of the interest rate cap premium over the term.
(4)Our exposure to SOFR index increases is partially mitigated by an increase in interest income on our cash, cash equivalents and restricted cash.
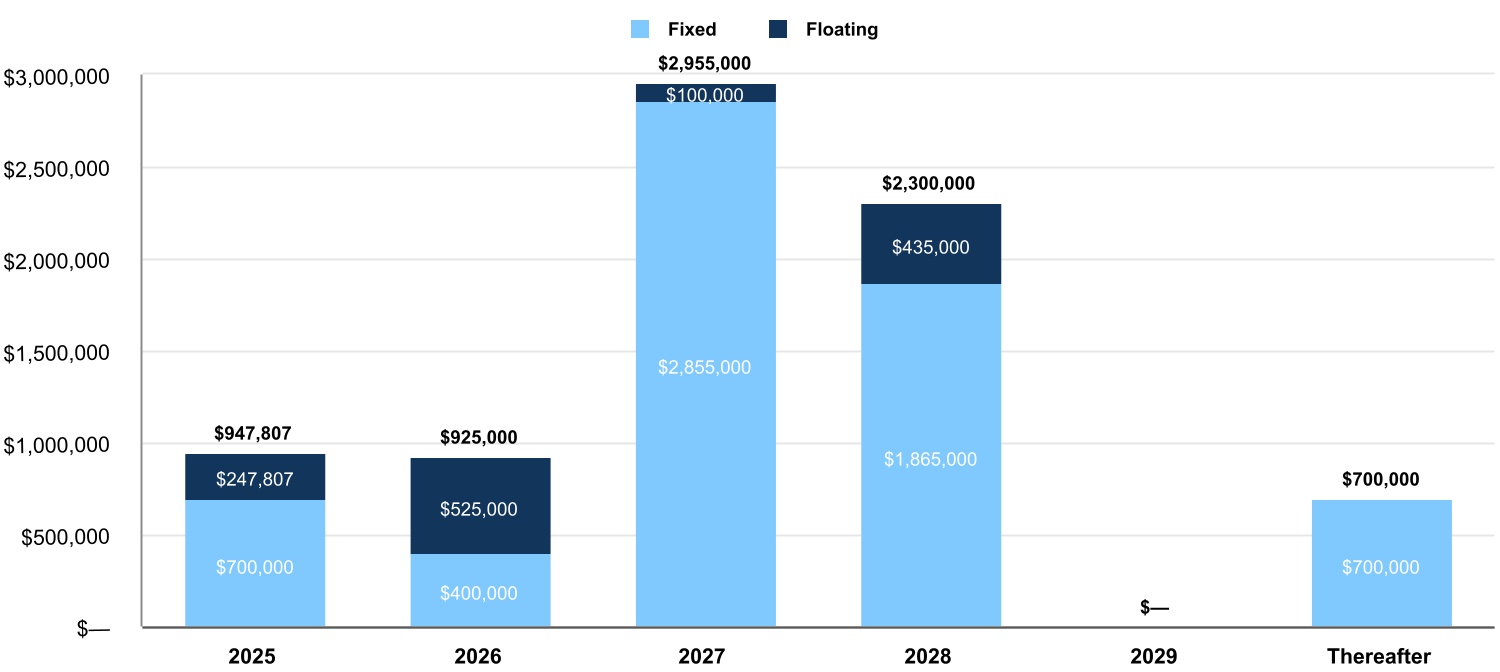
Consolidated Debt Maturity Schedule(1) as of March 31, 2025
(Excludes pro rata share of JV debt)(2)
Consolidated (100%):
Secured
$
947,807
(3)
$
525,000
$
1,580,000
$
2,300,000
$
—
$
350,000
Unsecured
—
400,000
1,375,000
—
—
350,000
Total consolidated debt (100%)
$
947,807
$
925,000
$
2,955,000
$
2,300,000
$
—
$
700,000
% of total consolidated debt
12.1
%
11.8
%
37.8
%
29.4
%
0.00
%
8.9
%
Debt maturities at share:
Consolidated debt (100%)
$
947,807
$
925,000
$
2,955,000
$
2,300,000
$
—
$
700,000
Pro rata share of debt of non-consolidated entities
569,324
650,310
577,158
288,949
366,538
34,825
Less: Noncontrolling interests' share of consolidated debt
(37,059)
—
—
(645,000)
—
—
Total debt at share
$
1,480,072
$
1,575,310
$
3,532,158
$
1,943,949
$
366,538
$
734,825
% of total debt at share
15.4
%
16.4
%
36.7
%
20.2
%
3.8
%
7.5
%
_______________________________
(1)Assumes the exercise of as-of-right extension options. Debt classified as fixed rate includes the effect of interest rate swap arrangements which may expire prior to debt maturity, and the $950,000 1290 Avenue of the Americas mortgage loan which is subject to a 1.00% SOFR interest rate cap arrangement. See the previous page for information on interest rate swap arrangements.
(2)The Operating Partnership guarantees an aggregate $303,000 of JV partnership debt, primarily comprised of the $300,000 mortgage loan on 7 West 34th Street. These amounts are excluded from the consolidated debt maturity chart presented above.
(3)Includes the 606 Broadway $74,119 non-recourse mortgage loan, which in September 2024 matured and was not repaid, resulting in the lenders declaring an event of default.
10
CONSOLIDATED DEBT MATURITIES AT 100% (CONTRACTUAL BALANCES) (unaudited)
(Amounts in thousands)
Property
Maturity Date(1)
Spread over SOFR
Interest Rate(2)
2025
2026
2027
2028
2029
Thereafter
Total
Secured Debt:
606 Broadway (50.0% interest)
(3)
S+191
6.24%
(4)
$
74,119
$
—
$
—
$
—
$
—
$
—
$
74,119
4 Union Square South
08/25
S+150
5.82%
120,000
—
—
—
—
—
120,000
PENN 11
10/25
6.28%
500,000
—
—
—
—
—
500,000
888 Seventh Avenue
12/25
S+180
(5)
5.05%
253,688
—
—
—
—
—
253,688
One Park Avenue
03/26
S+122
5.54%
—
525,000
—
—
—
—
525,000
350 Park Avenue
01/27
3.92%
—
—
400,000
—
—
—
400,000
100 West 33rd Street
06/27
5.26%
—
—
480,000
—
—
—
480,000
770 Broadway
07/27
4.98%
—
—
700,000
—
—
—
700,000
150 West 34th Street
02/28
S+215
6.46%
—
—
—
75,000
—
—
75,000
435 Seventh Avenue
04/28
6.96%
—
—
—
75,000
—
—
75,000
555 California Street (70.0% interest)
05/28
S+205
(5)
6.13%
—
—
—
1,200,000
—
—
1,200,000
1290 Avenue of the Americas (70.0% interest)
11/28
2.62%
—
—
—
950,000
—
—
950,000
909 Third Avenue
04/31
3.23%
—
—
—
—
—
350,000
350,000
Total Secured Debt
947,807
525,000
1,580,000
2,300,000
—
350,000
5,702,807
Unsecured Debt:
Senior unsecured notes due 2026
06/26
2.15%
—
400,000
—
—
—
—
400,000
$1.25 Billion unsecured revolving credit facility
12/27
3.88%
(6)
—
—
575,000
—
—
—
575,000
$800 Million unsecured term loan
12/27
S+130
(5)
4.66%
(6)
—
—
800,000
—
—
—
800,000
$915 Million unsecured revolving credit facility
04/29
S+120
—
—
—
—
—
—
—
—
Senior unsecured notes due 2031
06/31
3.40%
—
—
—
—
—
350,000
350,000
Total Unsecured Debt
—
400,000
1,375,000
—
—
350,000
2,125,000
Total Debt
$
947,807
$
925,000
$
2,955,000
$
2,300,000
$
—
$
700,000
$
7,827,807
Weighted average rate
5.89%
4.07%
4.58%
4.72%
0.00%
3.32%
4.61%
Fixed rate debt(7)
$
700,000
$
400,000
$
2,855,000
$
1,865,000
$
—
$
700,000
$
6,520,000
Fixed weighted average rate expiring
5.84%
2.15%
4.54%
4.33%
0.00%
3.32%
4.34%
Floating rate debt
$
247,807
$
525,000
$
100,000
$
435,000
$
—
$
—
$
1,307,807
Floating weighted average rate expiring
6.01%
5.54%
5.62%
6.38%
0.00%
0.00%
5.92%
________________________________
(1)Assumes the exercise of as-of-right extension options.
(2)Represents the interest rate in effect as of period end based on the appropriate reference rate as of the contractual reset date plus contractual spread, adjusted for hedging instruments, as applicable. See page 9 for information on interest rate swap and interest rate cap arrangements.
(3)On September 5, 2024, the non-recourse loan matured and was not repaid, at which time the lenders declared an event of default.
(4)Excludes additional 3.00% default interest on the 606 Broadway mortgage loan.
(5)Balance is partially hedged by interest rate swap arrangements. See page 9 for details.
(6)In April 2025, we qualified for a sustainability margin adjustment on our unsecured term loan and revolving credit facilities by achieving certain KPI metrics, which will reduce our interest rate by 0.05% and 0.04%, respectively.
(7)Debt classified as fixed rate includes the effect of interest rate swap arrangements which may expire prior to debt maturity, and the $950,000 1290 Avenue of the Americas mortgage loan which is subject to a 1.00% SOFR interest rate cap arrangement. See page 9 for information on interest rate swap arrangements.
11
TOP 15 TENANTS (unaudited)
(Amounts in thousands, except square feet)
Tenants
Square Footage At Share
Annualized Escalated Rents
At Share(1)
% of Total Annualized Escalated Rents At Share
Meta Platforms, Inc.
1,176,828
$
141,813
7.6
%
IPG and affiliates
955,211
63,844
3.5
%
Citadel
585,460
62,498
3.4
%
New York University
685,290
48,998
2.6
%
Madison Square Garden & Affiliates
449,053
45,451
2.4
%
Bloomberg L.P.
306,768
43,867
2.3
%
Google/Motorola Mobility (guaranteed by Google)
759,446
43,355
2.3
%
UMG Recordings, Inc,
336,700
35,411
1.9
%
Amazon (including its Whole Foods subsidiary)
312,694
31,044
1.6
%
Neuberger Berman Group LLC
306,612
28,363
1.5
%
Bank of America
247,615
27,452
1.5
%
Apple Inc.
473,311
26,948
1.4
%
LVMH Brands
65,060
26,786
1.4
%
AMC Networks, Inc.
326,717
26,183
1.4
%
WeWork
303,741
25,818
1.4
%
36.2
%
________________________________
(1)Represents monthly contractual base rent before free rent plus tenant reimbursements multiplied by 12. Annualized escalated rents at share include leases signed but not yet commenced in place of current tenants or vacancy in the same space.
12
LEASE EXPIRATIONS (unaudited)
(Amounts in thousands)
Our Share of Square Feet of Expiring Leases As of March 31, 2025
New York Office
421
1,068
1,357
1,082
1,289
713
783
1,039
548
748
970
4,500
New York Retail
183
21
52
26
53
146
68
52
39
147
33
436
THE MART
97
284
199
712
187
94
227
508
54
51
48
376
555 California Street
123
160
86
112
143
85
29
13
15
—
210
177
Total
824
1,533
1,694
1,932
1,672
1,038
1,107
1,612
656
946
1,261
5,489
% of total
4.2%
7.8%
8.6%
9.8%
8.5%
5.3%
5.6%
8.2%
3.3%
4.8%
6.4%
27.5%
_______________________________
(1) Includes month-to-month leases, holdover tenants, and leases expiring on the last day of the current quarter.
13
DEVELOPMENT/REDEVELOPMENT - ACTIVE PROJECTS
(Amounts in thousands, except square feet)
(at Vornado’s share)
Projected Incremental Cash Yield
New York segment:
Property Rentable Sq. Ft.
Budget
Cash Amount Expended
Remaining Expenditures
Stabilization Year
PENN District:
PENN 2
1,815,000
$
750,000
$
708,267
$
41,733
2026
10.2%
Districtwide Improvements
N/A
100,000
75,189
24,811
N/A
N/A
Total PENN District
850,000
(1)
783,456
66,544
Sunset Pier 94 Studios (49.9% interest)
266,000
125,000
(2)
66,551
58,449
2026
10.3%
Total Active Development Projects
$
975,000
$
850,007
$
124,993
________________________________
(1)Excluding debt and equity carry.
(2)Represents our 49.9% share of the $350,000 development budget, excluding the $40,000 value of our contributed leasehold interest and net of an estimated $9,000 for our share of development fees and reimbursement for overhead costs incurred by us. During 2024, we fully funded our $34,000 share of cash contributions.
There can be no assurance that the above projects will be completed, completed on schedule or within budget. In addition, there can be no assurance that the Company will be successful in leasing the properties on the expected schedule or at the assumed rental rates.
14
APPENDIX
DEFINITIONS AND NON-GAAP RECONCILIATIONS
i
FIXED INCOME SUPPLEMENTAL DEFINITIONS
The fixed income supplement includes various non-GAAP financial measures. Descriptions of these non-GAAP measures are provided below. Reconciliations of these non-GAAP measures to the most directly comparable GAAP measures are provided within this supplemental package.
EBITDAre - EBITDAre (i.e., EBITDA for real estate companies) is a non-GAAP financial measure established by the National Association of Real Estate Investment Trusts ("NAREIT"), which may not be comparable to EBITDA reported by other REITs that do not compute EBITDAre in accordance with the NAREIT definition. NAREIT defines EBITDAre as GAAP net income or loss, plus interest expense, plus income tax expense, plus depreciation and amortization, plus (minus) losses and gains on the disposition of depreciated property including losses and gains on change of control, plus impairment write-downs of depreciated property and of investments in unconsolidated entities caused by a decrease in value of depreciated property in the joint venture, plus adjustments to reflect the entity's share of EBITDA of unconsolidated entities. The Company has included EBITDAre because it is a performance measure used by other REITs and therefore may provide useful information to investors in comparing Vornado's performance to that of other REITs.
Net Debt to EBITDAre, as adjusted - Net debt to EBITDAre, as adjusted represents the ratio of net debt to annualized EBITDAre, as adjusted. Net debt is calculated as (i) the Company’s consolidated debt less noncontrolling interests’ share of consolidated debt plus the Company’s pro rata share of debt of unconsolidated entities less (ii) the Company’s consolidated cash and cash equivalents, cash held in escrow and investments in U.S. Treasury bills less noncontrolling interests’ share of these amounts plus the Company’s pro rata share of these amounts for unconsolidated entities. Cash held in escrow represents cash escrowed under loan agreements including for debt service, real estate taxes, property insurance, and capital improvements, and the Company is not able to direct the use of this cash. The availability of cash and cash equivalents for use in debt reduction cannot be assumed, as the Company may use its cash and cash equivalents for other purposes. Further, the Company may not be able to direct the use of its pro rata share of cash and cash equivalents of unconsolidated entities. The Company discloses net debt to EBITDAre, as adjusted because management believes it is useful to investors as a supplemental measure in evaluating the Company’s balance sheet leverage. Net debt to EBITDAre, as adjusted may not be comparable to similarly titled measures employed by other companies.
ii
NON-GAAP RECONCILIATIONS
RECONCILIATION OF CONSOLIDATED DEBT, NET TO CONSOLIDATED CONTRACTUAL DEBT (unaudited)