| What science can do AstraZeneca Annual Report and Form 20-F Information 2024 |
| What science can do We are a global, science-led, patient-focused pharmaceutical business, committed to excellence in the research, development and commercialisation of prescription medicines. We aim to transform the lives of patients with improved outcomes and a better quality of life. Our Supplements Detailed information on our Development Pipeline, Patent Expiries of Key Marketed Products and Risk. See our website, www.astrazeneca.com/annualreport2024. Our sustainability reporting Our sustainability reporting is prepared in line with the UK Companies Act 2006, sections 414CA and 414CB. In anticipation of the EU Corporate Sustainability Reporting Directive (CSRD), we have started to incorporate selected disclosures in this Annual Report. Our key topics covered include material sustainability topics, which have been identified through our double materiality assessment, see page 60 for more information. Front cover image: Oncology research and development (R&D) strategy. In Oncology R&D, we have a breadth of scientific platforms to attack cancer from multiple angles, and we are harnessing the power of combinations to drive even deeper responses and bring potential for cure to more patients. Use of terms: In this Annual Report, unless the context otherwise requires, ‘AstraZeneca’, ‘the Group’, ‘we’, ‘us’ and ‘our’ refer to AstraZeneca PLC and its consolidated entities. Welcome |

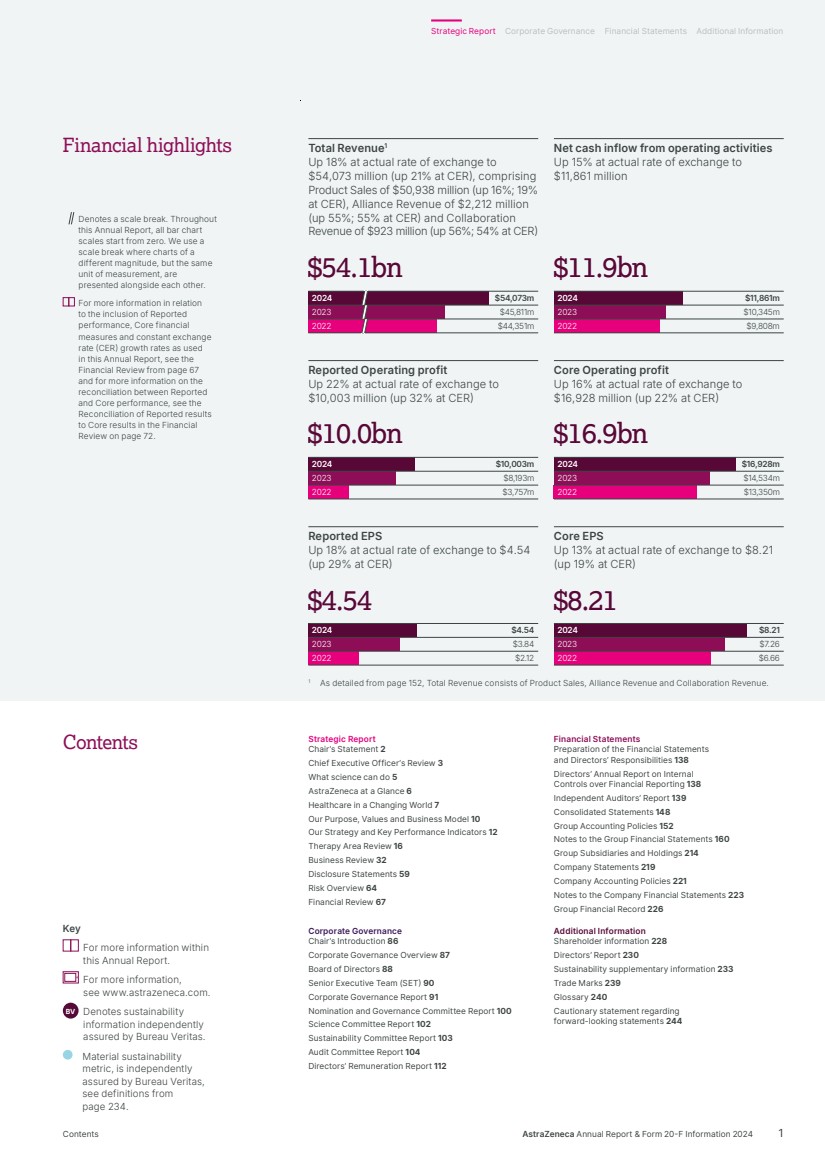
| Strategic Report Chair’s Statement 2 Chief Executive Officer’s Review 3 What science can do 5 AstraZeneca at a Glance 6 Healthcare in a Changing World 7 Our Purpose, Values and Business Model 10 Our Strategy and Key Performance Indicators 12 Therapy Area Review 16 Business Review 32 Disclosure Statements 59 Risk Overview 64 Financial Review 67 Financial Statements Preparation of the Financial Statements and Directors’ Responsibilities 138 Directors’ Annual Report on Internal Controls over Financial Reporting 138 Independent Auditors’ Report 139 Consolidated Statements 148 Group Accounting Policies 152 Notes to the Group Financial Statements 160 Group Subsidiaries and Holdings 214 Company Statements 219 Company Accounting Policies 221 Notes to the Company Financial Statements 223 Group Financial Record 226 Corporate Governance Chair’s Introduction 86 Corporate Governance Overview 87 Board of Directors 88 Senior Executive Team (SET) 90 Corporate Governance Report 91 Nomination and Governance Committee Report 100 Science Committee Report 102 Sustainability Committee Report 103 Audit Committee Report 104 Directors’ Remuneration Report 112 Additional Information Shareholder information 228 Directors’ Report 230 Sustainability supplementary information 233 Trade Marks 239 Glossary 240 Cautionary statement regarding forward-looking statements 244 Contents Key For more information within this Annual Report. For more information, see www.astrazeneca.com. BV Denotes sustainability information independently assured by Bureau Veritas. Material sustainability metric, is independently assured by Bureau Veritas, see definitions from page 234. Total Revenue1 Up 18% at actual rate of exchange to $54,073 million (up 21% at CER), comprising Product Sales of $50,938 million (up 16%; 19% at CER), Alliance Revenue of $2,212 million (up 55%; 55% at CER) and Collaboration Revenue of $923 million (up 56%; 54% at CER) Net cash inflow from operating activities Up 15% at actual rate of exchange to $11,861 million 2024 2023 2022 $45,811m $44,351m $54,073m $54.1bn $54.1bn $11,861m $10,345m $9,808m 2024 2023 2022 $11.9bn $11.9bn Reported Operating profit Up 22% at actual rate of exchange to $10,003 million (up 32% at CER) Core Operating profit Up 16% at actual rate of exchange to $16,928 million (up 22% at CER) $10,003m $8,193m $3,757m 2024 2023 2022 $10.0bn $10.0bn $16.9bn $16.9bn $16,928m $14,534m $13,350m 2024 2023 2022 Reported EPS Up 18% at actual rate of exchange to $4.54 (up 29% at CER) Core EPS Up 13% at actual rate of exchange to $8.21 (up 19% at CER) $4.54 $3.84 $2.12 2024 2023 2022 $4.54 $4.54 $8.21 $7.26 $6.66 2024 2023 2022 $8.21 $8.21 1 As detailed from page 152, Total Revenue consists of Product Sales, Alliance Revenue and Collaboration Revenue. Denotes a scale break. Throughout this Annual Report, all bar chart scales start from zero. We use a scale break where charts of a different magnitude, but the same unit of measurement, are presented alongside each other. For more information in relation to the inclusion of Reported performance, Core financial measures and constant exchange rate (CER) growth rates as used in this Annual Report, see the Financial Review from page 67 and for more information on the reconciliation between Reported and Core performance, see the Reconciliation of Reported results to Core results in the Financial Review on page 72. Financial highlights AstraZeneca Annual Report & Form 20-F Information 2024 1 Strategic Report Corporate Governance Financial Statements Additional Information Contents |
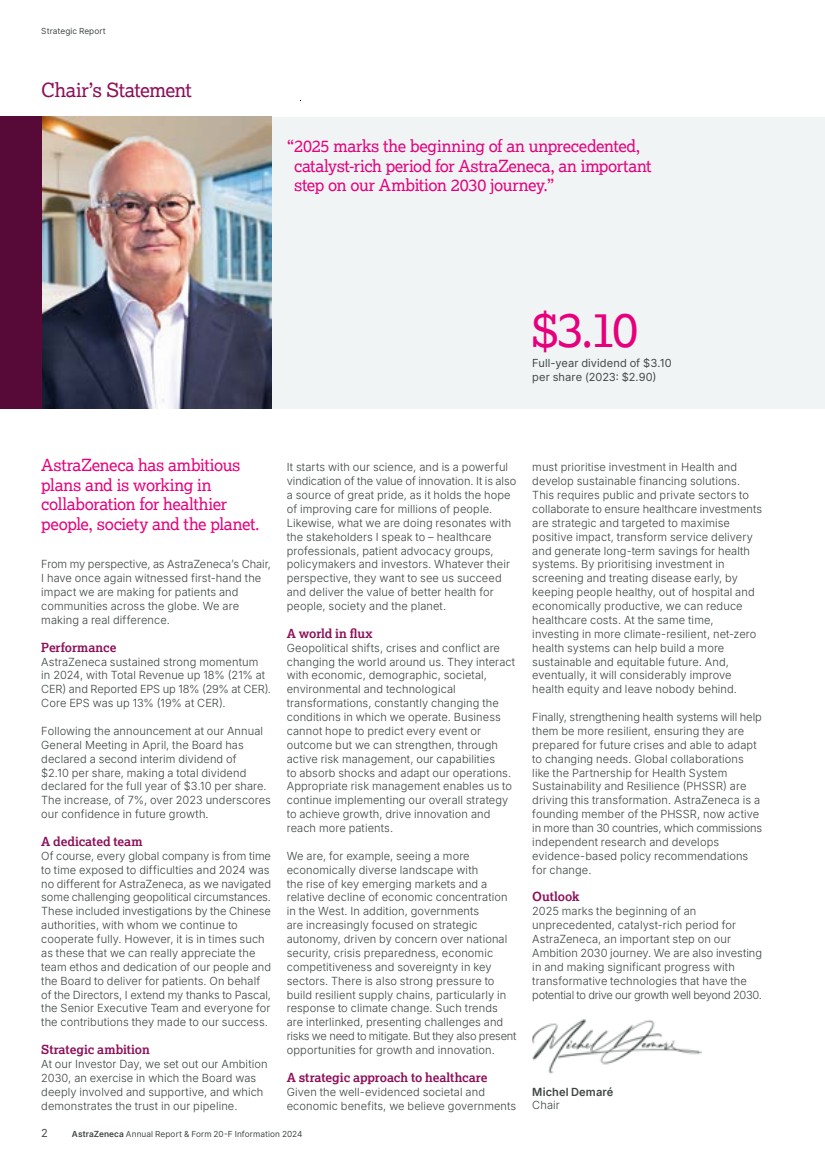
| $3.10 Full-year dividend of $3.10 per share (2023: $2.90) “2025 marks the beginning of an unprecedented, catalyst-rich period for AstraZeneca, an important step on our Ambition 2030 journey.” It starts with our science, and is a powerful vindication of the value of innovation. It is also a source of great pride, as it holds the hope of improving care for millions of people. Likewise, what we are doing resonates with the stakeholders I speak to – healthcare professionals, patient advocacy groups, policymakers and investors. Whatever their perspective, they want to see us succeed and deliver the value of better health for people, society and the planet. A world in flux Geopolitical shifts, crises and conflict are changing the world around us. They interact with economic, demographic, societal, environmental and technological transformations, constantly changing the conditions in which we operate. Business cannot hope to predict every event or outcome but we can strengthen, through active risk management, our capabilities to absorb shocks and adapt our operations. Appropriate risk management enables us to continue implementing our overall strategy to achieve growth, drive innovation and reach more patients. We are, for example, seeing a more economically diverse landscape with the rise of key emerging markets and a relative decline of economic concentration in the West. In addition, governments are increasingly focused on strategic autonomy, driven by concern over national security, crisis preparedness, economic competitiveness and sovereignty in key sectors. There is also strong pressure to build resilient supply chains, particularly in response to climate change. Such trends are interlinked, presenting challenges and risks we need to mitigate. But they also present opportunities for growth and innovation. A strategic approach to healthcare Given the well-evidenced societal and economic benefits, we believe governments must prioritise investment in Health and develop sustainable financing solutions. This requires public and private sectors to collaborate to ensure healthcare investments are strategic and targeted to maximise positive impact, transform service delivery and generate long-term savings for health systems. By prioritising investment in screening and treating disease early, by keeping people healthy, out of hospital and economically productive, we can reduce healthcare costs. At the same time, investing in more climate-resilient, net-zero health systems can help build a more sustainable and equitable future. And, eventually, it will considerably improve health equity and leave nobody behind. Finally, strengthening health systems will help them be more resilient, ensuring they are prepared for future crises and able to adapt to changing needs. Global collaborations like the Partnership for Health System Sustainability and Resilience (PHSSR) are driving this transformation. AstraZeneca is a founding member of the PHSSR, now active in more than 30 countries, which commissions independent research and develops evidence-based policy recommendations for change. Outlook 2025 marks the beginning of an unprecedented, catalyst-rich period for AstraZeneca, an important step on our Ambition 2030 journey. We are also investing in and making significant progress with transformative technologies that have the potential to drive our growth well beyond 2030. Michel Demaré Chair From my perspective, as AstraZeneca’s Chair, I have once again witnessed first-hand the impact we are making for patients and communities across the globe. We are making a real difference. Performance AstraZeneca sustained strong momentum in 2024, with Total Revenue up 18% (21% at CER) and Reported EPS up 18% (29% at CER). Core EPS was up 13% (19% at CER). Following the announcement at our Annual General Meeting in April, the Board has declared a second interim dividend of $2.10 per share, making a total dividend declared for the full year of $3.10 per share. The increase, of 7%, over 2023 underscores our confidence in future growth. A dedicated team Of course, every global company is from time to time exposed to difficulties and 2024 was no different for AstraZeneca, as we navigated some challenging geopolitical circumstances. These included investigations by the Chinese authorities, with whom we continue to cooperate fully. However, it is in times such as these that we can really appreciate the team ethos and dedication of our people and the Board to deliver for patients. On behalf of the Directors, I extend my thanks to Pascal, the Senior Executive Team and everyone for the contributions they made to our success. Strategic ambition At our Investor Day, we set out our Ambition 2030, an exercise in which the Board was deeply involved and supportive, and which demonstrates the trust in our pipeline. AstraZeneca has ambitious plans and is working in collaboration for healthier people, society and the planet. 2 AstraZeneca Annual Report & Form 20-F Information 2024 Strategic Report Chair’s Statement |
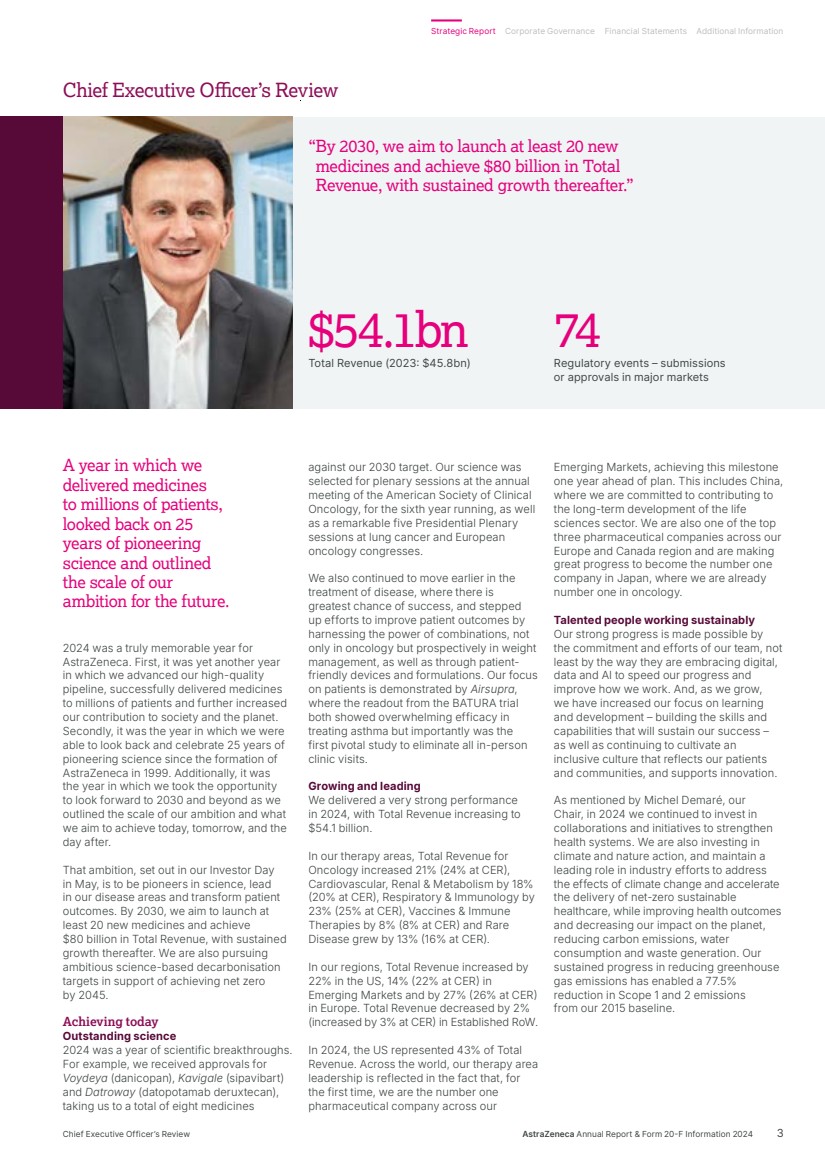
| $54.1bn Total Revenue (2023: $45.8bn) 74 Regulatory events – submissions or approvals in major markets “By 2030, we aim to launch at least 20 new medicines and achieve $80 billion in Total Revenue, with sustained growth thereafter.” against our 2030 target. Our science was selected for plenary sessions at the annual meeting of the American Society of Clinical Oncology, for the sixth year running, as well as a remarkable five Presidential Plenary sessions at lung cancer and European oncology congresses. We also continued to move earlier in the treatment of disease, where there is greatest chance of success, and stepped up efforts to improve patient outcomes by harnessing the power of combinations, not only in oncology but prospectively in weight management, as well as through patient-friendly devices and formulations. Our focus on patients is demonstrated by Airsupra, where the readout from the BATURA trial both showed overwhelming efficacy in treating asthma but importantly was the first pivotal study to eliminate all in-person clinic visits. Growing and leading We delivered a very strong performance in 2024, with Total Revenue increasing to $54.1 billion. In our therapy areas, Total Revenue for Oncology increased 21% (24% at CER), Cardiovascular, Renal & Metabolism by 18% (20% at CER), Respiratory & Immunology by 23% (25% at CER), Vaccines & Immune Therapies by 8% (8% at CER) and Rare Disease grew by 13% (16% at CER). In our regions, Total Revenue increased by 22% in the US, 14% (22% at CER) in Emerging Markets and by 27% (26% at CER) in Europe. Total Revenue decreased by 2% (increased by 3% at CER) in Established RoW. In 2024, the US represented 43% of Total Revenue. Across the world, our therapy area leadership is reflected in the fact that, for the first time, we are the number one pharmaceutical company across our 2024 was a truly memorable year for AstraZeneca. First, it was yet another year in which we advanced our high-quality pipeline, successfully delivered medicines to millions of patients and further increased our contribution to society and the planet. Secondly, it was the year in which we were able to look back and celebrate 25 years of pioneering science since the formation of AstraZeneca in 1999. Additionally, it was the year in which we took the opportunity to look forward to 2030 and beyond as we outlined the scale of our ambition and what we aim to achieve today, tomorrow, and the day after. That ambition, set out in our Investor Day in May, is to be pioneers in science, lead in our disease areas and transform patient outcomes. By 2030, we aim to launch at least 20 new medicines and achieve $80 billion in Total Revenue, with sustained growth thereafter. We are also pursuing ambitious science-based decarbonisation targets in support of achieving net zero by 2045. Achieving today Outstanding science 2024 was a year of scientific breakthroughs. For example, we received approvals for Voydeya (danicopan), Kavigale (sipavibart) and Datroway (datopotamab deruxtecan), taking us to a total of eight medicines A year in which we delivered medicines to millions of patients, looked back on 25 years of pioneering science and outlined the scale of our ambition for the future. Emerging Markets, achieving this milestone one year ahead of plan. This includes China, where we are committed to contributing to the long-term development of the life sciences sector. We are also one of the top three pharmaceutical companies across our Europe and Canada region and are making great progress to become the number one company in Japan, where we are already number one in oncology. Talented people working sustainably Our strong progress is made possible by the commitment and efforts of our team, not least by the way they are embracing digital, data and AI to speed our progress and improve how we work. And, as we grow, we have increased our focus on learning and development – building the skills and capabilities that will sustain our success – as well as continuing to cultivate an inclusive culture that reflects our patients and communities, and supports innovation. As mentioned by Michel Demaré, our Chair, in 2024 we continued to invest in collaborations and initiatives to strengthen health systems. We are also investing in climate and nature action, and maintain a leading role in industry efforts to address the effects of climate change and accelerate the delivery of net-zero sustainable healthcare, while improving health outcomes and decreasing our impact on the planet, reducing carbon emissions, water consumption and waste generation. Our sustained progress in reducing greenhouse gas emissions has enabled a 77.5% reduction in Scope 1 and 2 emissions from our 2015 baseline. AstraZeneca Annual Report & Form 20-F Information 2024 3 Strategic Report Corporate Governance Financial Statements Additional Information Chief Executive Officer’s Review Chief Executive Officer’s Review |
| Delivering tomorrow Industry-leading pipeline Our ability to deliver for patients tomorrow was underlined in 2024 by our pipeline which saw a record number of 74 regulatory events, namely submissions or approvals for our medicines in a major market, an increase of almost one third over 2023. The year also saw nine positive high-value Phase III readouts. In Oncology, Imfinzi’s further potential was apparent in two trials: NIAGARA demonstrated that immunotherapy could significantly extend the lives of patients with bladder cancer while, in ADRIATIC, it was the first and only immuno-oncology to show survival benefit in limited-stage small cell lung cancer. The ECHO and AMPLIFY trials demonstrated the potential for Calquence in mantle cell lymphoma and chronic lymphocytic leukaemia. It was also great to see positive results from LAURA, which cemented Tagrisso as the standard of care in unresectable EGFRm non-small cell lung cancer. DESTINY-Breast06 confirmed Enhertu’s potential to evolve the current HR-positive breast cancer treatment landscape. In BioPharmaceuticals, the WAYPOINT trial showed Tezspire’s potential as an important new treatment option for patients with nasal polyps while, in Rare Disease, the KOMET trial results for Koselugo support its potential expanded use in adults living with NF1 PN – a devastating rare genetic disease. Additionally, we had 24 pipeline progressions in 2024, being Phase II starts/progressions and Phase III investment decisions. Once again, the strength and quality of our pipeline was recognised in the granting by regulators of 28 designations across 18 projects, including Breakthrough Therapy, Priority Review or Fast Track designations. Even in such a year of success, when pushing the boundaries of science, it is normal to experience setbacks which included the termination of the vemircopan (ALXN2050) Phase II development programme for rare diseases. On such occasions, we are committed to living our Values of following the science and putting patients first, by learning from what challenges tell us and how they can help us in realising the full potential of our medicines and benefit as many patients as possible. We also share data with the wider scientific community. Datroway exemplifies our approach. While we voluntarily withdrew applications in the US and EU for the treatment of non-squamous non-small cell lung cancer (NSCLC), it was subsequently granted Breakthrough Therapy Designation in the US for patients with previously treated advanced EGFR-mutated NSCLC. In January 2025, it was also granted Priority Review, given by the FDA to applications for medicines that, if approved, would offer significant improvements over available options. I was also delighted when, in December, our partner, Daiichi Sankyo, received the first approval for Datroway for the treatment of patients with metastatic HR-positive, HER2-negative breast cancer in Japan. This was swiftly followed in January by the approval in the US of the similar AstraZeneca-led application. Datroway offers patients an effective and better tolerated alternative to traditional chemotherapy and the approvals underscore the potential of the medicine to replace chemotherapy and deliver improved outcomes across multiple cancer types. Health equity and climate In Rare Disease, as part of our ambition for 2030, we are committed to reaching six times as many patients as 2022 across 100 countries with our transformative rare disease medicines. We are on track to reach this commitment – in 2024, our medicines were available in more than 70 countries. As we grow across new and existing markets, we are working with local rare disease advocates, healthcare systems and policy makers to help shape the rare disease ecosystem to shorten the diagnostic journey, improve access to treatment and ensure stakeholders understand the societal value of rare disease innovation. Our efforts in Rare Disease complement those across all our therapy areas to close healthcare gaps and give people everywhere the chance to be as healthy as possible. We are doing so by embedding health equity across the whole enterprise, from science to the delivery of care. We want to better understand the factors that drive poor health outcomes among diverse populations, partnering with governments, health systems and communities to co-create solutions. The climate crisis is the largest health crisis of our time and has a significant impact on respiratory diseases which can be complex, difficult to treat, often poorly controlled and associated with a higher carbon footprint of care. We are focused on addressing this challenge by optimising care with our portfolio of respiratory medicines. At the same time, we are transitioning our inhaled medicines to a next-generation propellant (NGP) with near-zero global warming potential – 99.9% lower than current propellants, and were proud to make our first regulatory submission for Breztri NGP in the EU in 2024. Preparing for the day after tomorrow Our ambition for AstraZeneca extends beyond 2030 and, as shown on the next page, we are working on technologies that will, we believe, shape the future of medicine and sustain our growth. Our work is built on our internal efforts but we have also leveraged external innovation to expand and accelerate our pipeline. For example, the acquisition of Fusion brought new expertise in actinium-based radioconjugates, including one for prostate cancer, as well as state-of-the-art manufacturing capabilities, while our acquisition of Gracell in China allows us to accelerate our ambitions in cell therapy, particularly in haematology and autoimmune disease. Weight management is a particular challenge as many affected people are living with complex, interconnected diseases. Treating each disease separately without addressing obesity as a root cause does not optimise outcomes for them or healthcare systems. Building on our existing expertise, our rapidly developing weight management portfolio looks beyond short-term weight loss to address individual patient needs. Our aim with these therapies is to provide durable weight loss, with cardiometabolic benefit and new options for patients by targeting linked disease biology. Appreciation AstraZeneca only achieved what we did in 2024, and can only deliver our ambition for 2030 – and beyond – with great people in high-performing teams. On behalf of the Senior Executive Team, I would like to thank everyone in AstraZeneca for all they accomplished in 2024 and for their focus on realising our goals for people, society and the planet. Pascal Soriot Chief Executive Officer 4 AstraZeneca Annual Report & Form 20-F Information 2024 Strategic Report |
| For more information, see Research & Development from page 34. Investing in transformative new technologies and modalities that will shape the future of medicine and sustain AstraZeneca’s growth post 2030. Our investments in transformative R&D technologies include: Antibody drug conjugates and radioconjugates that aim to replace systemic chemotherapy and radiotherapy, see page 36. Cell therapy and T-cell engagers that are more scalable across therapy areas, see page 44. Gene therapy and gene editing that could make cures possible for a range of rare diseases, see page 49. Next-generation immuno-oncology bispecifics that establish new immuno-oncology segments, see page 55. Weight management that looks beyond short-term weight loss to address individual patient needs, see page 46. What science can do Medicines for today, tomorrow and the day after. Strategic Report Corporate Governance Financial Statements Additional Information What Science Can Do AstraZeneca Annual Report & Form 20-F Information 2024 5 |

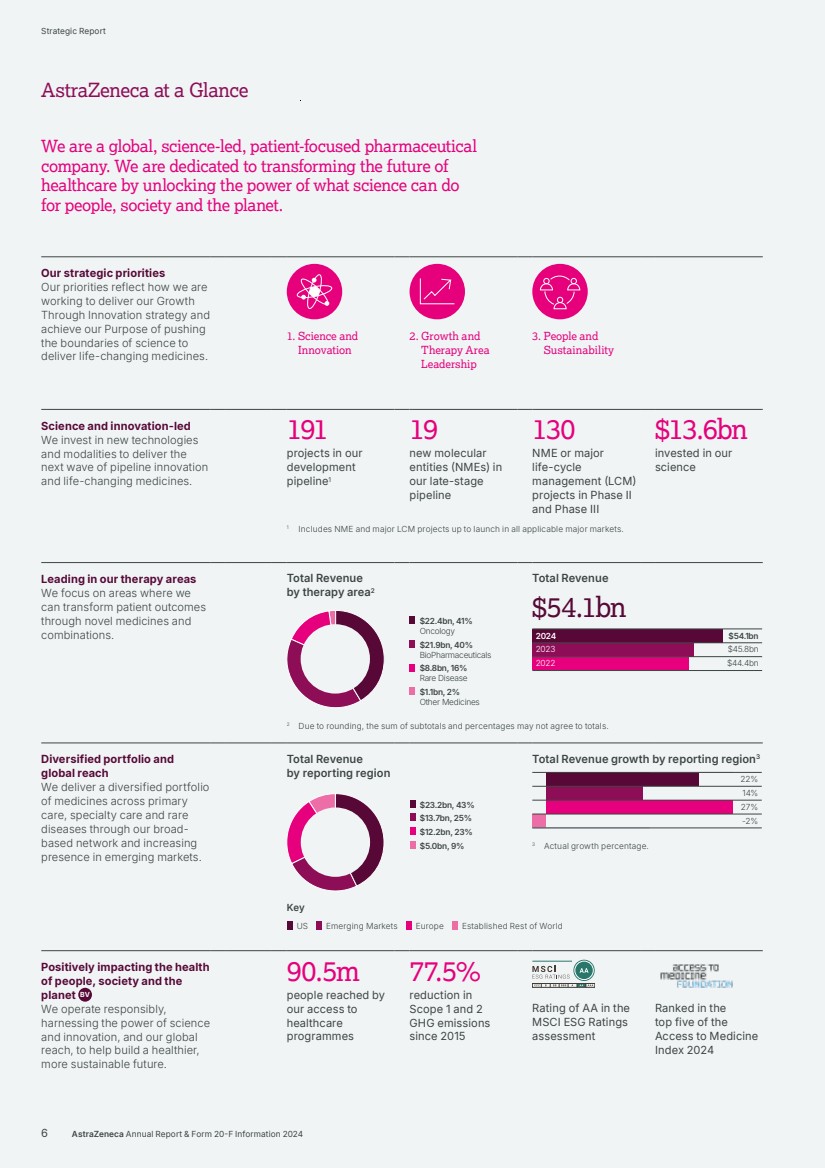
| Our strategic priorities Our priorities reflect how we are working to deliver our Growth Through Innovation strategy and achieve our Purpose of pushing the boundaries of science to deliver life‑changing medicines. 1. Science and Innovation 2. Growth and Therapy Area Leadership 3. People and Sustainability Science and innovation-led We invest in new technologies and modalities to deliver the next wave of pipeline innovation and life-changing medicines. 191 projects in our development pipeline1 19 new molecular entities (NMEs) in our late-stage pipeline 130 NME or major life-cycle management (LCM) projects in Phase II and Phase III $13.6bn invested in our science 1 Includes NME and major LCM projects up to launch in all applicable major markets. Leading in our therapy areas We focus on areas where we can transform patient outcomes through novel medicines and combinations. Total Revenue by therapy area2 $22.4bn, 41% Oncology $21.9bn, 40% BioPharmaceuticals $8.8bn, 16% Rare Disease $1.1bn, 2% Other Medicines Total Revenue $54.1bn $54.1bn $45.8bn $44.4bn 2024 2023 2022 2 Due to rounding, the sum of subtotals and percentages may not agree to totals. Diversified portfolio and global reach We deliver a diversified portfolio of medicines across primary care, specialty care and rare diseases through our broad-based network and increasing presence in emerging markets. Total Revenue by reporting region $23.2bn, 43% $13.7bn, 25% $12.2bn, 23% $5.0bn, 9% Total Revenue growth by reporting region3 22% 14% 27% -2% 3 Actual growth percentage. Positively impacting the health of people, society and the planet BV We operate responsibly, harnessing the power of science and innovation, and our global reach, to help build a healthier, more sustainable future. 90.5m people reached by our access to healthcare programmes 77.5% reduction in Scope 1 and 2 GHG emissions since 2015 Rating of AA in the MSCI ESG Ratings assessment Ranked in the top five of the Access to Medicine Index 2024 Key US Emerging Markets Europe Established Rest of World 6 AstraZeneca Annual Report & Form 20-F Information 2024 Strategic Report AstraZeneca at a Glance We are a global, science-led, patient-focused pharmaceutical company. We are dedicated to transforming the future of healthcare by unlocking the power of what science can do for people, society and the planet. |
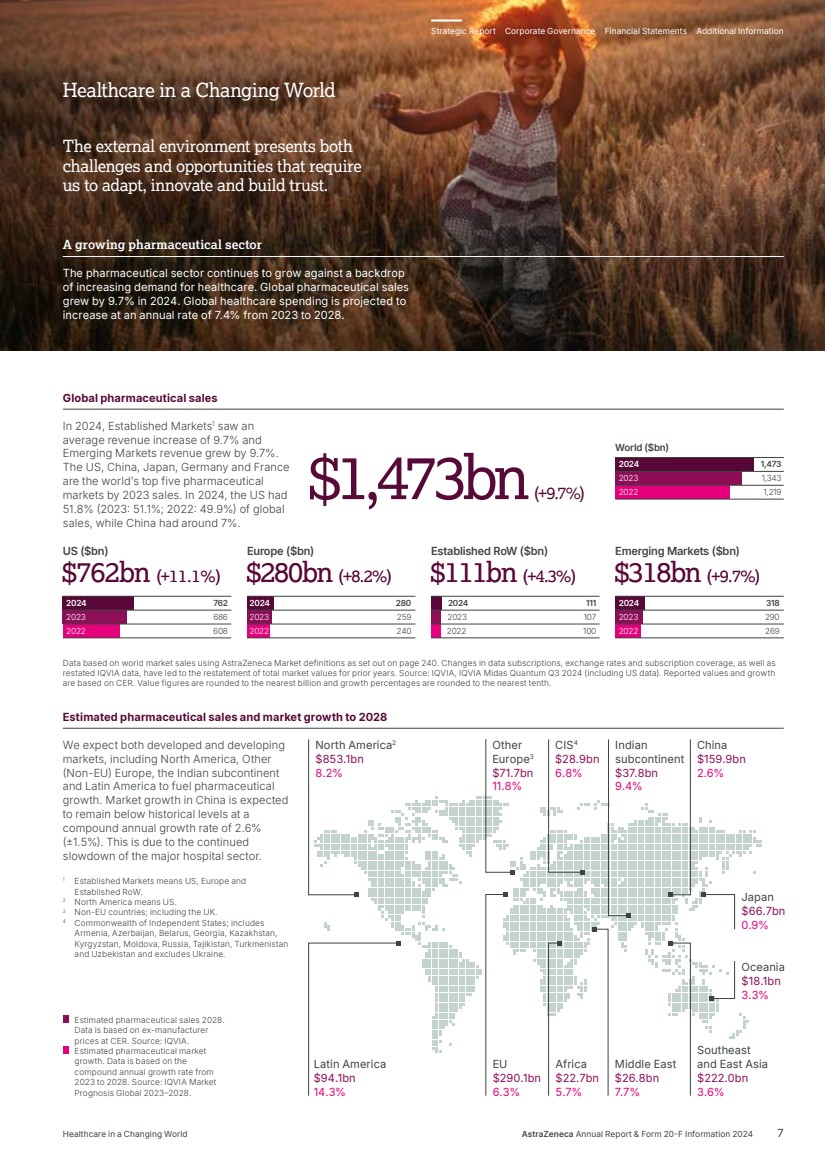
| 2024 2023 2022 107 100 111 Established RoW ($bn) $111bn $111bn (+4.3%) (+4.3%) 686 608 762 US ($bn) 2024 2023 2022 $762bn $762bn ((++11.1 11.1%%)) 290 269 318 Emerging Markets ($bn) 2024 2023 2022 $318bn $318bn (+9.7%) (+9.7%) 259 240 280 Europe ($bn) 2024 2023 2022 $280bn $280bn (+8.2%) (+8.2%) 1,343 1,219 1,473 World ($bn) 2024 2023 2022 The external environment presents both challenges and opportunities that require us to adapt, innovate and build trust. Global pharmaceutical sales In 2024, Established Markets1 saw an average revenue increase of 9.7% and Emerging Markets revenue grew by 9.7%. The US, China, Japan, Germany and France are the world’s top five pharmaceutical markets by 2023 sales. In 2024, the US had 51.8% (2023: 51.1%; 2022: 49.9%) of global sales, while China had around 7%. Data based on world market sales using AstraZeneca Market definitions as set out on page 240. Changes in data subscriptions, exchange rates and subscription coverage, as well as restated IQVIA data, have led to the restatement of total market values for prior years. Source: IQVIA, IQVIA Midas Quantum Q3 2024 (including US data). Reported values and growth are based on CER. Value figures are rounded to the nearest billion and growth percentages are rounded to the nearest tenth. We expect both developed and developing markets, including North America, Other (Non-EU) Europe, the Indian subcontinent and Latin America to fuel pharmaceutical growth. Market growth in China is expected to remain below historical levels at a compound annual growth rate of 2.6% (±1.5%). This is due to the continued slowdown of the major hospital sector. 1 Established Markets means US, Europe and Established RoW. 2 North America means US. 3 Non-EU countries; including the UK. 4 Commonwealth of Independent States; includes Armenia, Azerbaijan, Belarus, Georgia, Kazakhstan, Kyrgyzstan, Moldova, Russia, Tajikistan, Turkmenistan and Uzbekistan and excludes Ukraine. $1,473bn(+9.7%) Estimated pharmaceutical sales 2028. Data is based on ex-manufacturer prices at CER. Source: IQVIA. Estimated pharmaceutical market growth. Data is based on the compound annual growth rate from 2023 to 2028. Source: IQVIA Market Prognosis Global 2023–2028. Other Europe3 $71.7bn 11.8% Japan $66.7bn 0.9% China $159.9bn 2.6% Oceania $18.1bn 3.3% Southeast and East Asia $222.0bn 3.6% Middle East $26.8bn 7.7% Africa $22.7bn 5.7% Indian subcontinent $37.8bn 9.4% CIS4 $28.9bn 6.8% EU $290.1bn 6.3% North America2 $853.1bn 8.2% Latin America $94.1bn 14.3% Estimated pharmaceutical sales and market growth to 2028 A growing pharmaceutical sector The pharmaceutical sector continues to grow against a backdrop of increasing demand for healthcare. Global pharmaceutical sales grew by 9.7% in 2024. Global healthcare spending is projected to increase at an annual rate of 7.4% from 2023 to 2028. Healthcare in a Changing World Strategic Report Corporate Governance Financial Statements Additional Information Healthcare in a Changing World AstraZeneca Annual Report & Form 20-F Information 2024 7 |
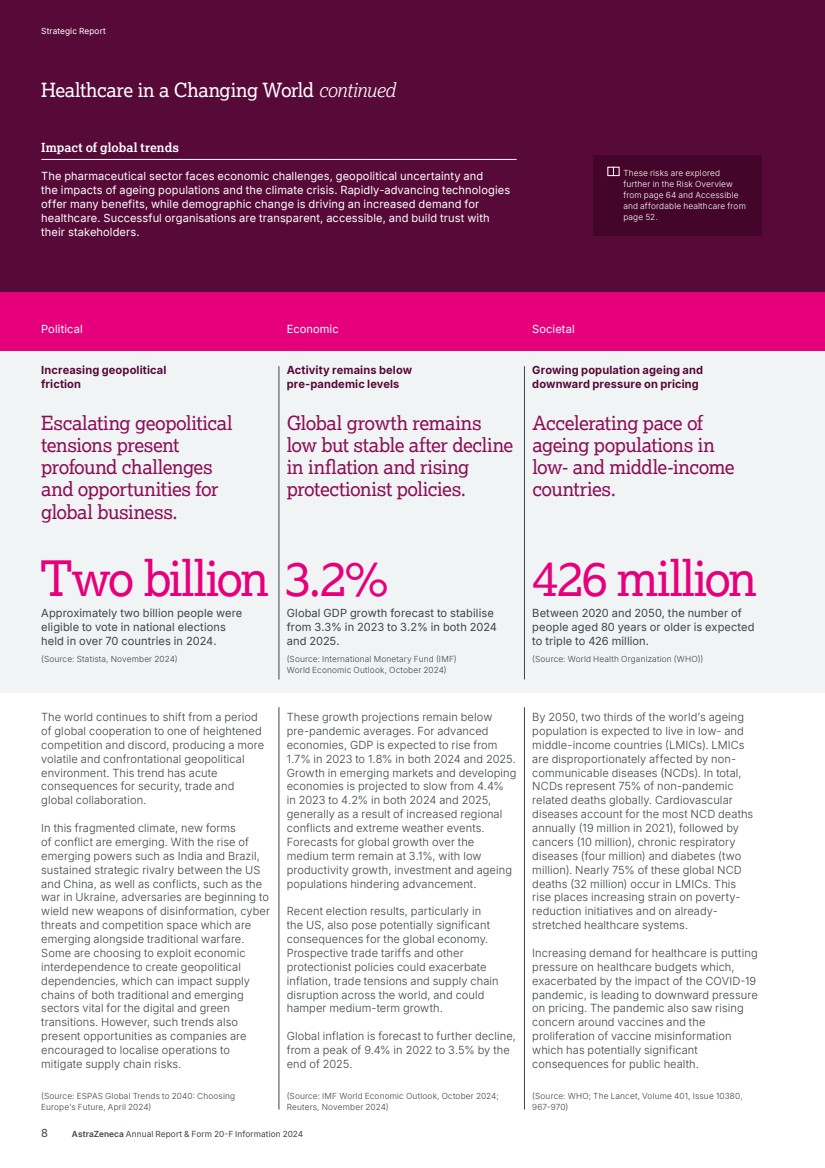
| The pharmaceutical sector faces economic challenges, geopolitical uncertainty and the impacts of ageing populations and the climate crisis. Rapidly-advancing technologies offer many benefits, while demographic change is driving an increased demand for healthcare. Successful organisations are transparent, accessible, and build trust with their stakeholders. Impact of global trends Escalating geopolitical tensions present profound challenges and opportunities for global business. Global growth remains low but stable after decline in inflation and rising protectionist policies. Accelerating pace of ageing populations in low- and middle-income countries. The world continues to shift from a period of global cooperation to one of heightened competition and discord, producing a more volatile and confrontational geopolitical environment. This trend has acute consequences for security, trade and global collaboration. In this fragmented climate, new forms of conflict are emerging. With the rise of emerging powers such as India and Brazil, sustained strategic rivalry between the US and China, as well as conflicts, such as the war in Ukraine, adversaries are beginning to wield new weapons of disinformation, cyber threats and competition space which are emerging alongside traditional warfare. Some are choosing to exploit economic interdependence to create geopolitical dependencies, which can impact supply chains of both traditional and emerging sectors vital for the digital and green transitions. However, such trends also present opportunities as companies are encouraged to localise operations to mitigate supply chain risks. (Source: ESPAS Global Trends to 2040: Choosing Europe’s Future, April 2024) These growth projections remain below pre-pandemic averages. For advanced economies, GDP is expected to rise from 1.7% in 2023 to 1.8% in both 2024 and 2025. Growth in emerging markets and developing economies is projected to slow from 4.4% in 2023 to 4.2% in both 2024 and 2025, generally as a result of increased regional conflicts and extreme weather events. Forecasts for global growth over the medium term remain at 3.1%, with low productivity growth, investment and ageing populations hindering advancement. Recent election results, particularly in the US, also pose potentially significant consequences for the global economy. Prospective trade tariffs and other protectionist policies could exacerbate inflation, trade tensions and supply chain disruption across the world, and could hamper medium-term growth. Global inflation is forecast to further decline, from a peak of 9.4% in 2022 to 3.5% by the end of 2025. (Source: IMF World Economic Outlook, October 2024; Reuters, November 2024) By 2050, two thirds of the world’s ageing population is expected to live in low- and middle-income countries (LMICs). LMICs are disproportionately affected by non-communicable diseases (NCDs). In total, NCDs represent 75% of non-pandemic related deaths globally. Cardiovascular diseases account for the most NCD deaths annually (19 million in 2021), followed by cancers (10 million), chronic respiratory diseases (four million) and diabetes (two million). Nearly 75% of these global NCD deaths (32 million) occur in LMICs. This rise places increasing strain on poverty-reduction initiatives and on already-stretched healthcare systems. Increasing demand for healthcare is putting pressure on healthcare budgets which, exacerbated by the impact of the COVID-19 pandemic, is leading to downward pressure on pricing. The pandemic also saw rising concern around vaccines and the proliferation of vaccine misinformation which has potentially significant consequences for public health. (Source: WHO; The Lancet, Volume 401, Issue 10380, 967-970) Two billion Approximately two billion people were eligible to vote in national elections held in over 70 countries in 2024. (Source: Statista, November 2024) 3.2% Global GDP growth forecast to stabilise from 3.3% in 2023 to 3.2% in both 2024 and 2025. (Source: International Monetary Fund (IMF) World Economic Outlook, October 2024) 426 million Between 2020 and 2050, the number of people aged 80 years or older is expected to triple to 426 million. (Source: World Health Organization (WHO)) Political Increasing geopolitical friction Economic Activity remains below pre-pandemic levels Societal Growing population ageing and downward pressure on pricing These risks are explored further in the Risk Overview from page 64 and Accessible and affordable healthcare from page 52. Strategic Report 8 AstraZeneca Annual Report & Form 20-F Information 2024 Healthcare in a Changing World continued |
| The significant potential of AI is already transforming the pharmaceutical industry. The climate crisis is the greatest public health crisis of our time, increasing ill health and jeopardising access to healthcare. In research and early discovery, data and AI could accelerate the identification processes for potential new drugs and increase our understanding of the underlying conditions, helping new medicines to be approved and marketed for use more quickly. For medical professionals, data and AI could also boost productivity and reduce errors and costs by automating the more time-consuming exercises of record keeping and document creation. However, these new technologies have inherent risks. For example, the dangers of IP infringement and data privacy, AI hallucination and inaccuracy. Against the backdrop of the evolving uncharted regulatory landscape and high stakes associated with developing treatments for disease, these risks mean that companies will need to put strong controls and policies in place to manage data and AI and to fully realise the benefits. (Source: McKinsey & Company, January 2024) The impacts of the climate emergency, coupled with ageing populations and a rise in chronic diseases, are worsening health inequities and adding further pressure to health systems. Certain populations are disproportionately impacted including women, the elderly, children, those with existing health issues and the most marginalised in society, who have often contributed least to the climate crisis, making this a health equity crisis. The immediate health impacts of climate change could also limit the ability of primary care resources to treat longer-term, complex diseases. Furthermore, there is a growing recognition of the importance of nature and acting to protect and restore ecosystems for the health of people and the planet. (Source: The Lancet, Volume 404, Issue 10465, 1847-1896) The accelerating pace of innovation offers potential for success but may exacerbate issues with trust. With the continued advancements in science and digital technologies, the rate of innovation in society is accelerating at an unprecedented pace. With the rise of AI, multi-omics, gene-based therapies and functional genomics, the scientific industry is flourishing. Pharmaceutical companies are using these innovations to uncover novel drivers of disease and progress new drug modalities, ultimately leading to more successful outcomes for patients. While offering the potential to revolutionise the healthcare industry, this rapid rise could exacerbate already-present trust issues. Concerns around the politicisation of science and the regulation of these emerging innovations remain at the heart of discussions around the acceptance of these innovations. To succeed, pharmaceutical companies and the scientific industry as a whole need to more effectively communicate with the general public, engaging them in dialogue and making science more transparent and accessible. (Source: 2024 Edelman Trust Barometer) $110 billion Generative AI is estimated to produce $60 billion to $110 billion in economic value annually for the pharmaceutical industry. (Source: McKinsey & Company, January 2024) 167% Record-breaking increase in heat-related deaths among those over 65 years old in 2023. (Source: The Lancet, Volume 404, Issue 10465, 1847-1896) 73% In a 28-country survey, 73% of people questioned rated the healthcare industry trustworthy, but only 50% trusted gene-based medicine. (Source: 2024 Edelman Trust Barometer) Technological Emerging opportunities and risks with data and AI Environmental Deep interconnection between climate and health Outlook Opportunities and challenges for the sector Strategic Report Corporate Governance Financial Statements Additional Information Healthcare in a Changing World AstraZeneca Annual Report & Form 20-F Information 2024 9 |

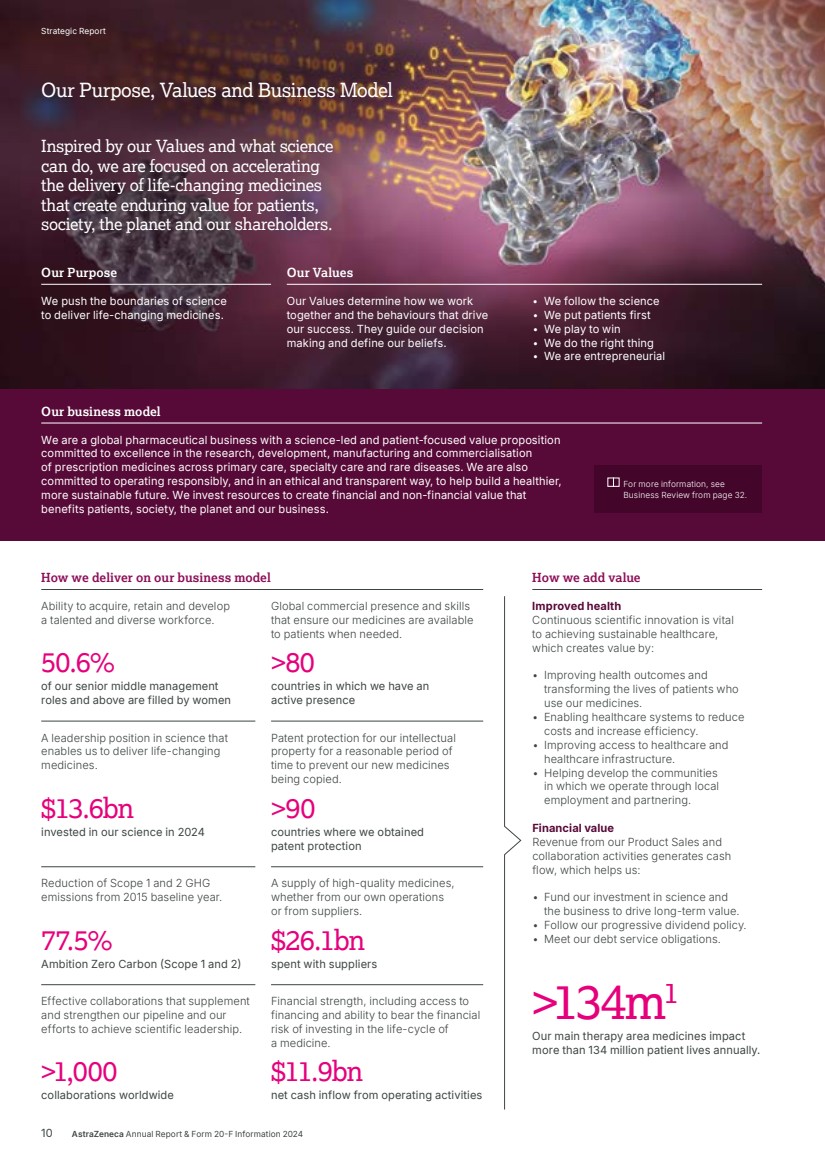
| How we deliver on our business model How we add value Improved health Continuous scientific innovation is vital to achieving sustainable healthcare, which creates value by: • Improving health outcomes and transforming the lives of patients who use our medicines. • Enabling healthcare systems to reduce costs and increase efficiency. • Improving access to healthcare and healthcare infrastructure. • Helping develop the communities in which we operate through local employment and partnering. Financial value Revenue from our Product Sales and collaboration activities generates cash flow, which helps us: • Fund our investment in science and the business to drive long-term value. • Follow our progressive dividend policy. • Meet our debt service obligations. >134m1 Our main therapy area medicines impact more than 134 million patient lives annually. Inspired by our Values and what science can do, we are focused on accelerating the delivery of life-changing medicines that create enduring value for patients, society, the planet and our shareholders. Our Purpose Our Values Our business model We push the boundaries of science to deliver life-changing medicines. Our Values determine how we work together and the behaviours that drive our success. They guide our decision making and define our beliefs. • We follow the science • We put patients first • We play to win • We do the right thing • We are entrepreneurial We are a global pharmaceutical business with a science-led and patient-focused value proposition committed to excellence in the research, development, manufacturing and commercialisation of prescription medicines across primary care, specialty care and rare diseases. We are also committed to operating responsibly, and in an ethical and transparent way, to help build a healthier, more sustainable future. We invest resources to create financial and non‑financial value that benefits patients, society, the planet and our business. Our Purpose, Values and Business Model For more information, see Business Review from page 32. Strategic Report Ability to acquire, retain and develop a talented and diverse workforce. 50.6% of our senior middle management roles and above are filled by women Global commercial presence and skills that ensure our medicines are available to patients when needed. >80 countries in which we have an active presence A leadership position in science that enables us to deliver life-changing medicines. $13.6bn invested in our science in 2024 Patent protection for our intellectual property for a reasonable period of time to prevent our new medicines being copied. >90 countries where we obtained patent protection Reduction of Scope 1 and 2 GHG emissions from 2015 baseline year. 77.5% Ambition Zero Carbon (Scope 1 and 2) A supply of high-quality medicines, whether from our own operations or from suppliers. $26.1bn spent with suppliers Effective collaborations that supplement and strengthen our pipeline and our efforts to achieve scientific leadership. >1,000 collaborations worldwide Financial strength, including access to financing and ability to bear the financial risk of investing in the life‑cycle of a medicine. $11.9bn net cash inflow from operating activities 10 AstraZeneca Annual Report & Form 20-F Information 2024 |
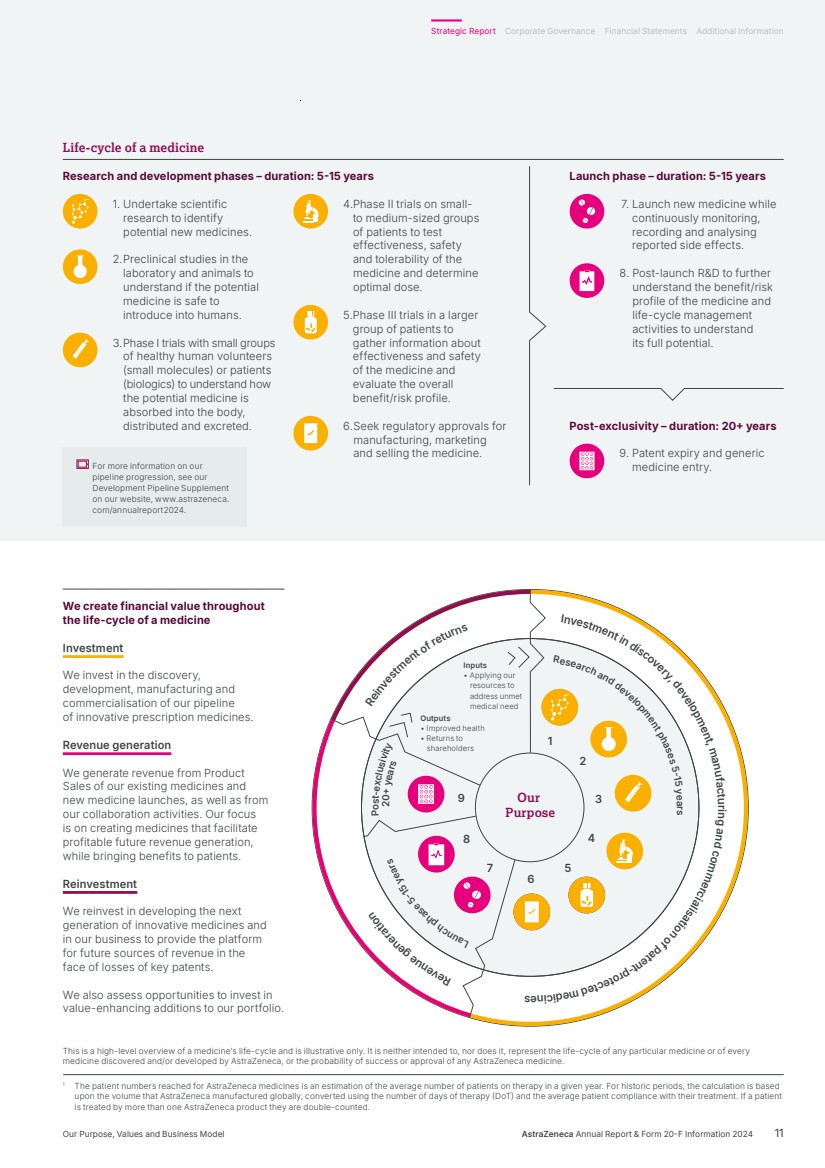
| Investment in discovery, development, man ufactur ni g and commerc ai l si at oi n of pa et n -t r p t o ce det ci de m seni eR ev nue generat oi n Reinvestment of returns Inputs • Applying our resources to address unmet medical need Outputs • Improved health • Returns to shareholders Our Purpose Research and development phases 5-15 years aL unch phase 5-15 years Post-exclusivity 20+ years 1 2 3 4 5 6 7 8 9 1 The patient numbers reached for AstraZeneca medicines is an estimation of the average number of patients on therapy in a given year. For historic periods, the calculation is based upon the volume that AstraZeneca manufactured globally, converted using the number of days of therapy (DoT) and the average patient compliance with their treatment. If a patient is treated by more than one AstraZeneca product they are double-counted. This is a high-level overview of a medicine’s life-cycle and is illustrative only. It is neither intended to, nor does it, represent the life-cycle of any particular medicine or of every medicine discovered and/or developed by AstraZeneca, or the probability of success or approval of any AstraZeneca medicine. We create financial value throughout the life-cycle of a medicine Investment We invest in the discovery, development, manufacturing and commercialisation of our pipeline of innovative prescription medicines. Revenue generation We generate revenue from Product Sales of our existing medicines and new medicine launches, as well as from our collaboration activities. Our focus is on creating medicines that facilitate profitable future revenue generation, while bringing benefits to patients. Reinvestment We reinvest in developing the next generation of innovative medicines and in our business to provide the platform for future sources of revenue in the face of losses of key patents. We also assess opportunities to invest in value-enhancing additions to our portfolio. Launch phase – duration: 5-15 years 7. Launch new medicine while continuously monitoring, recording and analysing reported side effects. 8. Post-launch R&D to further understand the benefit/risk profile of the medicine and life-cycle management activities to understand its full potential. Post-exclusivity – duration: 20+ years 9. Patent expiry and generic medicine entry. Research and development phases – duration: 5-15 years 1. Undertake scientific research to identify potential new medicines. 2. Preclinical studies in the laboratory and animals to understand if the potential medicine is safe to introduce into humans. 3. Phase I trials with small groups of healthy human volunteers (small molecules) or patients (biologics) to understand how the potential medicine is absorbed into the body, distributed and excreted. 4. Phase II trials on small-to medium-sized groups of patients to test effectiveness, safety and tolerability of the medicine and determine optimal dose. 5.Phase III trials in a larger group of patients to gather information about effectiveness and safety of the medicine and evaluate the overall benefit/risk profile. 6. Seek regulatory approvals for manufacturing, marketing and selling the medicine. Life-cycle of a medicine For more information on our pipeline progression, see our Development Pipeline Supplement on our website, www.astrazeneca. com/annualreport2024. AstraZeneca Annual Report & Form 20-F Information 2024 11 Strategic Report Corporate Governance Financial Statements Additional Information Our Purpose, Values and Business Model |
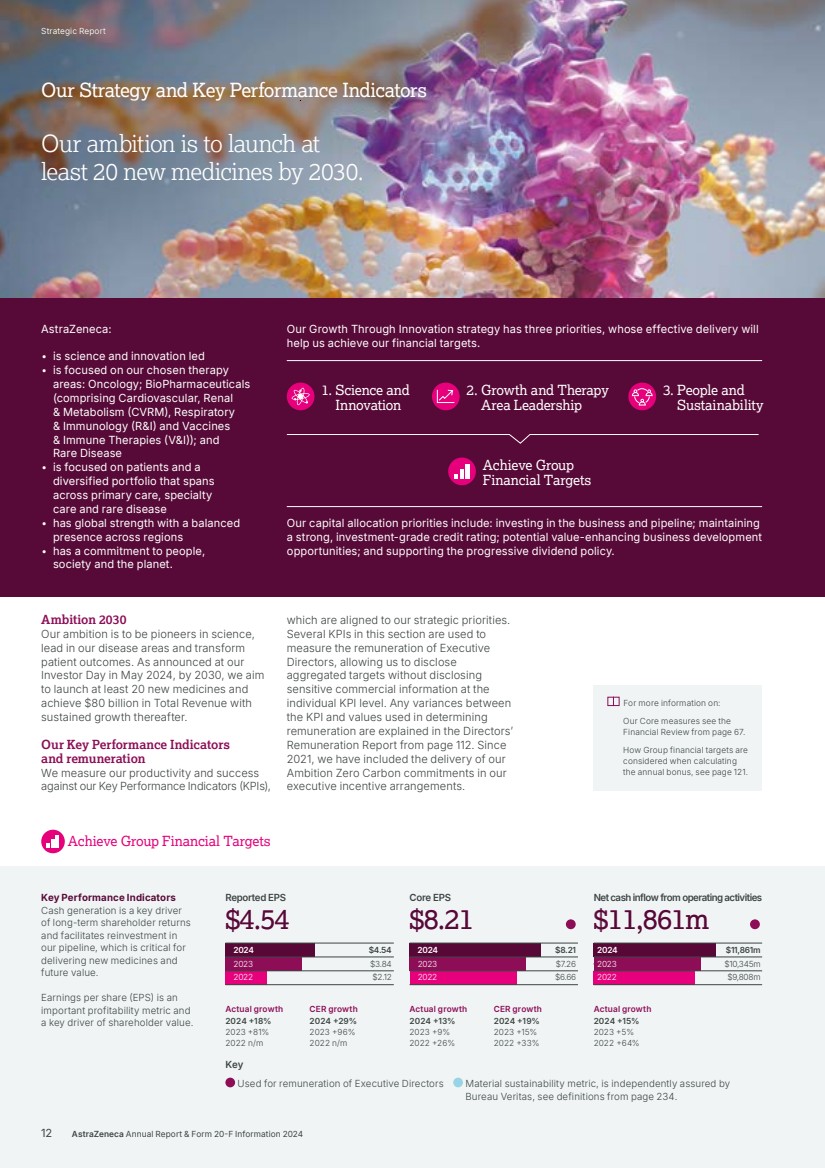
| 2024 2023 2022 $11,861m $10,345m $9,808m $11,861m $11,861m Net cash inflow from operating activities $8.21 $7.26 $6.66 Core EPS 2024 2023 2022 $8.21 $8.21 2024 2023 2022 $4.54 $3.84 $2.12 $4.54 $4.54 Key Performance Indicators Reported EPS Cash generation is a key driver of long-term shareholder returns and facilitates reinvestment in our pipeline, which is critical for delivering new medicines and future value. Earnings per share (EPS) is an important profitability metric and a key driver of shareholder value. Actual growth 2024 +15% 2023 +5% 2022 +64% Actual growth 2024 +13% 2023 +9% 2022 +26% CER growth 2024 +19% 2023 +15% 2022 +33% Actual growth 2024 +18% 2023 +81% 2022 n/m CER growth 2024 +29% 2023 +96% 2022 n/m Key Used for remuneration of Executive Directors Material sustainability metric, is independently assured by Bureau Veritas, see definitions from page 234. For more information on: Our Core measures see the Financial Review from page 67. How Group financial targets are considered when calculating the annual bonus, see page 121. Ambition 2030 Our ambition is to be pioneers in science, lead in our disease areas and transform patient outcomes. As announced at our Investor Day in May 2024, by 2030, we aim to launch at least 20 new medicines and achieve $80 billion in Total Revenue with sustained growth thereafter. Our Key Performance Indicators and remuneration We measure our productivity and success against our Key Performance Indicators (KPIs), which are aligned to our strategic priorities. Several KPIs in this section are used to measure the remuneration of Executive Directors, allowing us to disclose aggregated targets without disclosing sensitive commercial information at the individual KPI level. Any variances between the KPI and values used in determining remuneration are explained in the Directors’ Remuneration Report from page 112. Since 2021, we have included the delivery of our Ambition Zero Carbon commitments in our executive incentive arrangements. Achieve Group Financial Targets Our ambition is to launch at least 20 new medicines by 2030. AstraZeneca: • is science and innovation led • is focused on our chosen therapy areas: Oncology; BioPharmaceuticals (comprising Cardiovascular, Renal & Metabolism (CVRM), Respiratory & Immunology (R&I) and Vaccines & Immune Therapies (V&I)); and Rare Disease • is focused on patients and a diversified portfolio that spans across primary care, specialty care and rare disease • has global strength with a balanced presence across regions • has a commitment to people, society and the planet. Our Growth Through Innovation strategy has three priorities, whose effective delivery will help us achieve our financial targets. Our capital allocation priorities include: investing in the business and pipeline; maintaining a strong, investment-grade credit rating; potential value-enhancing business development opportunities; and supporting the progressive dividend policy. 1. Science and Innovation 3. People and Sustainability 2. Growth and Therapy Area Leadership Achieve Group Financial Targets 12 AstraZeneca Annual Report & Form 20-F Information 2024 Strategic Report Our Strategy and Key Performance Indicators |
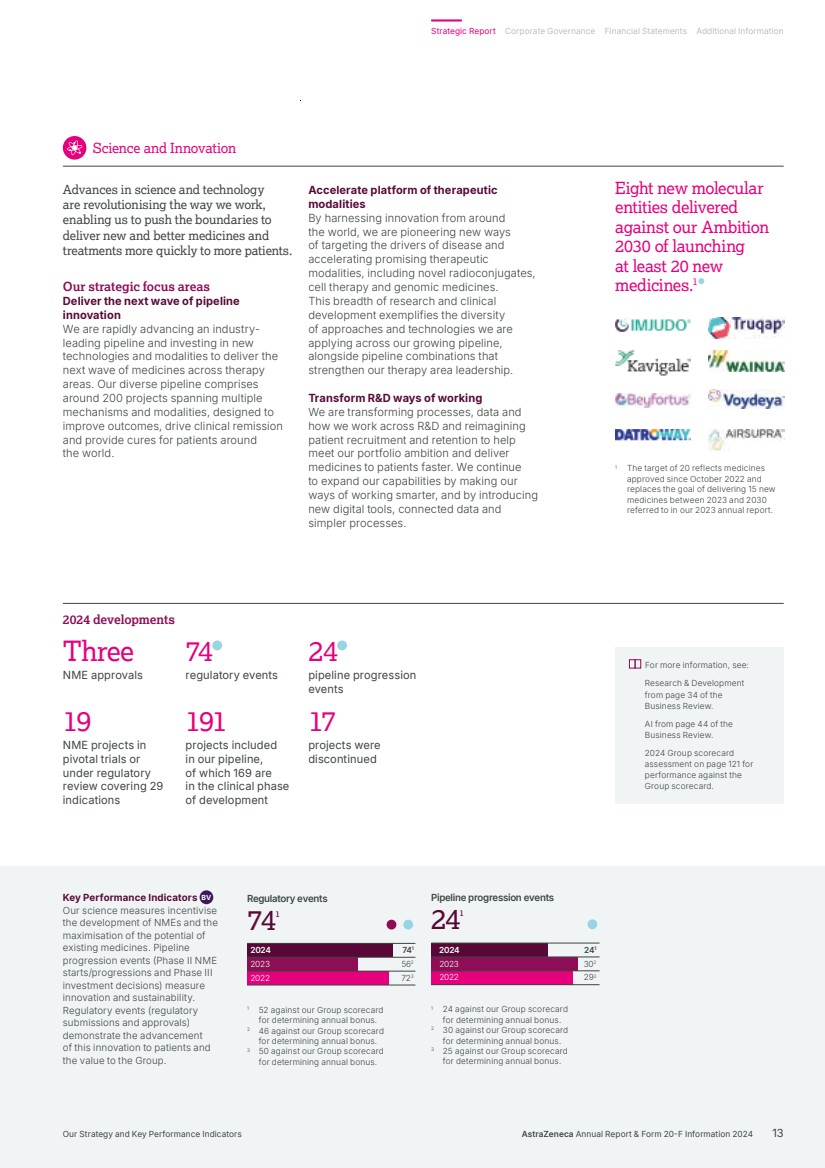
| 241 302 293 241 241 Pipeline progression events 2024 2023 2022 2024 2023 2022 741 562 723 741 74 1 Regulatory events 1 The target of 20 reflects medicines approved since October 2022 and replaces the goal of delivering 15 new medicines between 2023 and 2030 referred to in our 2023 annual report. Three NME approvals 74 regulatory events 24 pipeline progression events 191 projects included in our pipeline, of which 169 are in the clinical phase of development 19 NME projects in pivotal trials or under regulatory review covering 29 indications 17 projects were discontinued 2024 developments For more information, see: Research & Development from page 34 of the Business Review. AI from page 44 of the Business Review. 2024 Group scorecard assessment on page 121 for performance against the Group scorecard. Key Performance Indicators BV Our science measures incentivise the development of NMEs and the maximisation of the potential of existing medicines. Pipeline progression events (Phase II NME starts/progressions and Phase III investment decisions) measure innovation and sustainability. Regulatory events (regulatory submissions and approvals) demonstrate the advancement of this innovation to patients and the value to the Group. 1 24 against our Group scorecard for determining annual bonus. 2 30 against our Group scorecard for determining annual bonus. 3 25 against our Group scorecard for determining annual bonus. 1 52 against our Group scorecard for determining annual bonus. 2 46 against our Group scorecard for determining annual bonus. 3 50 against our Group scorecard for determining annual bonus. Accelerate platform of therapeutic modalities By harnessing innovation from around the world, we are pioneering new ways of targeting the drivers of disease and accelerating promising therapeutic modalities, including novel radioconjugates, cell therapy and genomic medicines. This breadth of research and clinical development exemplifies the diversity of approaches and technologies we are applying across our growing pipeline, alongside pipeline combinations that strengthen our therapy area leadership. Transform R&D ways of working We are transforming processes, data and how we work across R&D and reimagining patient recruitment and retention to help meet our portfolio ambition and deliver medicines to patients faster. We continue to expand our capabilities by making our ways of working smarter, and by introducing new digital tools, connected data and simpler processes. Advances in science and technology are revolutionising the way we work, enabling us to push the boundaries to deliver new and better medicines and treatments more quickly to more patients. Our strategic focus areas Deliver the next wave of pipeline innovation We are rapidly advancing an industry-leading pipeline and investing in new technologies and modalities to deliver the next wave of medicines across therapy areas. Our diverse pipeline comprises around 200 projects spanning multiple mechanisms and modalities, designed to improve outcomes, drive clinical remission and provide cures for patients around the world. Science and Innovation Eight new molecular entities delivered against our Ambition 2030 of launching at least 20 new medicines.1 AstraZeneca Annual Report & Form 20-F Information 2024 13 Strategic Report Corporate Governance Financial Statements Additional Information Our Strategy and Key Performance Indicators |
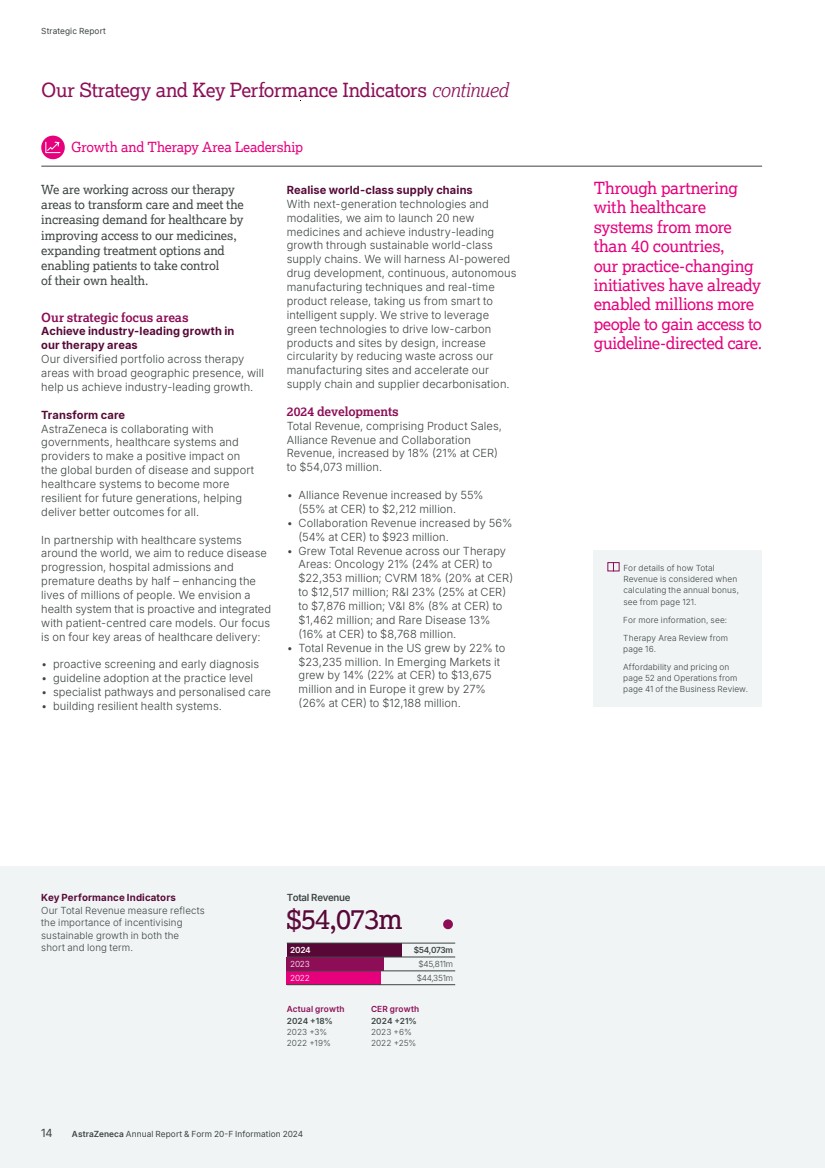
| $54,073m $45,811m $44,351m $54,073m $54,073m Total Revenue 2024 2023 2022 Realise world-class supply chains With next‑generation technologies and modalities, we aim to launch 20 new medicines and achieve industry-leading growth through sustainable world-class supply chains. We will harness AI-powered drug development, continuous, autonomous manufacturing techniques and real-time product release, taking us from smart to intelligent supply. We strive to leverage green technologies to drive low‑carbon products and sites by design, increase circularity by reducing waste across our manufacturing sites and accelerate our supply chain and supplier decarbonisation. 2024 developments Total Revenue, comprising Product Sales, Alliance Revenue and Collaboration Revenue, increased by 18% (21% at CER) to $54,073 million. • Alliance Revenue increased by 55% (55% at CER) to $2,212 million. • Collaboration Revenue increased by 56% (54% at CER) to $923 million. • Grew Total Revenue across our Therapy Areas: Oncology 21% (24% at CER) to $22,353 million; CVRM 18% (20% at CER) to $12,517 million; R&I 23% (25% at CER) to $7,876 million; V&I 8% (8% at CER) to $1,462 million; and Rare Disease 13% (16% at CER) to $8,768 million. • Total Revenue in the US grew by 22% to $23,235 million. In Emerging Markets it grew by 14% (22% at CER) to $13,675 million and in Europe it grew by 27% (26% at CER) to $12,188 million. Key Performance Indicators Our Total Revenue measure reflects the importance of incentivising sustainable growth in both the short and long term. We are working across our therapy areas to transform care and meet the increasing demand for healthcare by improving access to our medicines, expanding treatment options and enabling patients to take control of their own health. Our strategic focus areas Achieve industry-leading growth in our therapy areas Our diversified portfolio across therapy areas with broad geographic presence, will help us achieve industry-leading growth. Transform care AstraZeneca is collaborating with governments, healthcare systems and providers to make a positive impact on the global burden of disease and support healthcare systems to become more resilient for future generations, helping deliver better outcomes for all. In partnership with healthcare systems around the world, we aim to reduce disease progression, hospital admissions and premature deaths by half – enhancing the lives of millions of people. We envision a health system that is proactive and integrated with patient-centred care models. Our focus is on four key areas of healthcare delivery: • proactive screening and early diagnosis • guideline adoption at the practice level • specialist pathways and personalised care • building resilient health systems. Growth and Therapy Area Leadership Actual growth 2024 +18% 2023 +3% 2022 +19% CER growth 2024 +21% 2023 +6% 2022 +25% Through partnering with healthcare systems from more than 40 countries, our practice-changing initiatives have already enabled millions more people to gain access to guideline-directed care. For details of how Total Revenue is considered when calculating the annual bonus, see from page 121. For more information, see: Therapy Area Review from page 16. Affordability and pricing on page 52 and Operations from page 41 of the Business Review. Our Strategy and Key Performance Indicators continued 14 AstraZeneca Annual Report & Form 20-F Information 2024 Strategic Report |
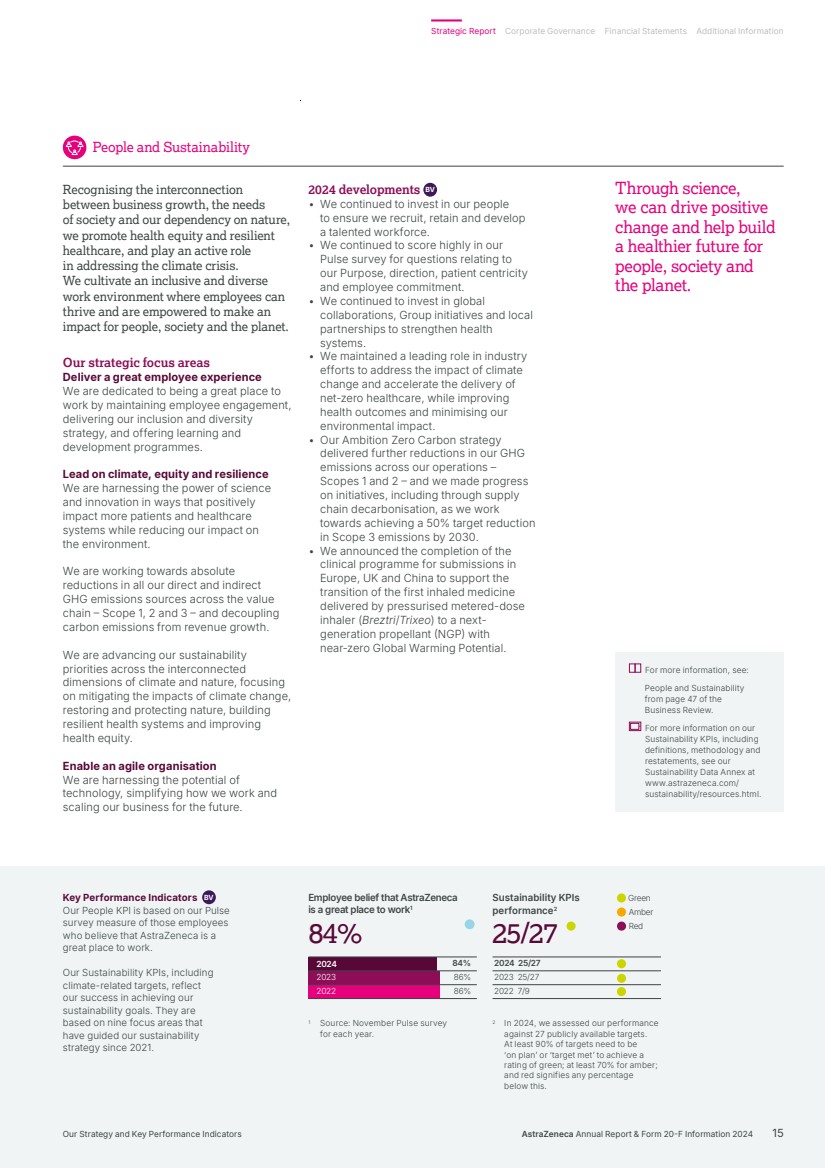
| 86% 84% 86% 84%84% Employee belief that AstraZeneca is a great place to work1 2024 2023 2022 2024 25/27 2023 25/27 2022 7/9 Green Amber Red 25/27 25/27 Sustainability KPIs performance2 2024 developments BV • We continued to invest in our people to ensure we recruit, retain and develop a talented workforce. • We continued to score highly in our Pulse survey for questions relating to our Purpose, direction, patient centricity and employee commitment. • We continued to invest in global collaborations, Group initiatives and local partnerships to strengthen health systems. • We maintained a leading role in industry efforts to address the impact of climate change and accelerate the delivery of net-zero healthcare, while improving health outcomes and minimising our environmental impact. • Our Ambition Zero Carbon strategy delivered further reductions in our GHG emissions across our operations – Scopes 1 and 2 – and we made progress on initiatives, including through supply chain decarbonisation, as we work towards achieving a 50% target reduction in Scope 3 emissions by 2030. • We announced the completion of the clinical programme for submissions in Europe, UK and China to support the transition of the first inhaled medicine delivered by pressurised metered-dose inhaler (Breztri/Trixeo) to a next-generation propellant (NGP) with near-zero Global Warming Potential. Key Performance Indicators BV Our People KPI is based on our Pulse survey measure of those employees who believe that AstraZeneca is a great place to work. Our Sustainability KPIs, including climate-related targets, reflect our success in achieving our sustainability goals. They are based on nine focus areas that have guided our sustainability strategy since 2021. Recognising the interconnection between business growth, the needs of society and our dependency on nature, we promote health equity and resilient healthcare, and play an active role in addressing the climate crisis. We cultivate an inclusive and diverse work environment where employees can thrive and are empowered to make an impact for people, society and the planet. Our strategic focus areas Deliver a great employee experience We are dedicated to being a great place to work by maintaining employee engagement, delivering our inclusion and diversity strategy, and offering learning and development programmes. Lead on climate, equity and resilience We are harnessing the power of science and innovation in ways that positively impact more patients and healthcare systems while reducing our impact on the environment. We are working towards absolute reductions in all our direct and indirect GHG emissions sources across the value chain – Scope 1, 2 and 3 – and decoupling carbon emissions from revenue growth. We are advancing our sustainability priorities across the interconnected dimensions of climate and nature, focusing on mitigating the impacts of climate change, restoring and protecting nature, building resilient health systems and improving health equity. Enable an agile organisation We are harnessing the potential of technology, simplifying how we work and scaling our business for the future. For more information, see: People and Sustainability from page 47 of the Business Review. For more information on our Sustainability KPIs, including definitions, methodology and restatements, see our Sustainability Data Annex at www.astrazeneca.com/ sustainability/resources.html. People and Sustainability Through science, we can drive positive change and help build a healthier future for people, society and the planet. 1 Source: November Pulse survey for each year. 2 In 2024, we assessed our performance against 27 publicly available targets. At least 90% of targets need to be ‘on plan’ or ‘target met’ to achieve a rating of green; at least 70% for amber; and red signifies any percentage below this. AstraZeneca Annual Report & Form 20-F Information 2024 15 Strategic Report Corporate Governance Financial Statements Additional Information Our Strategy and Key Performance Indicators |
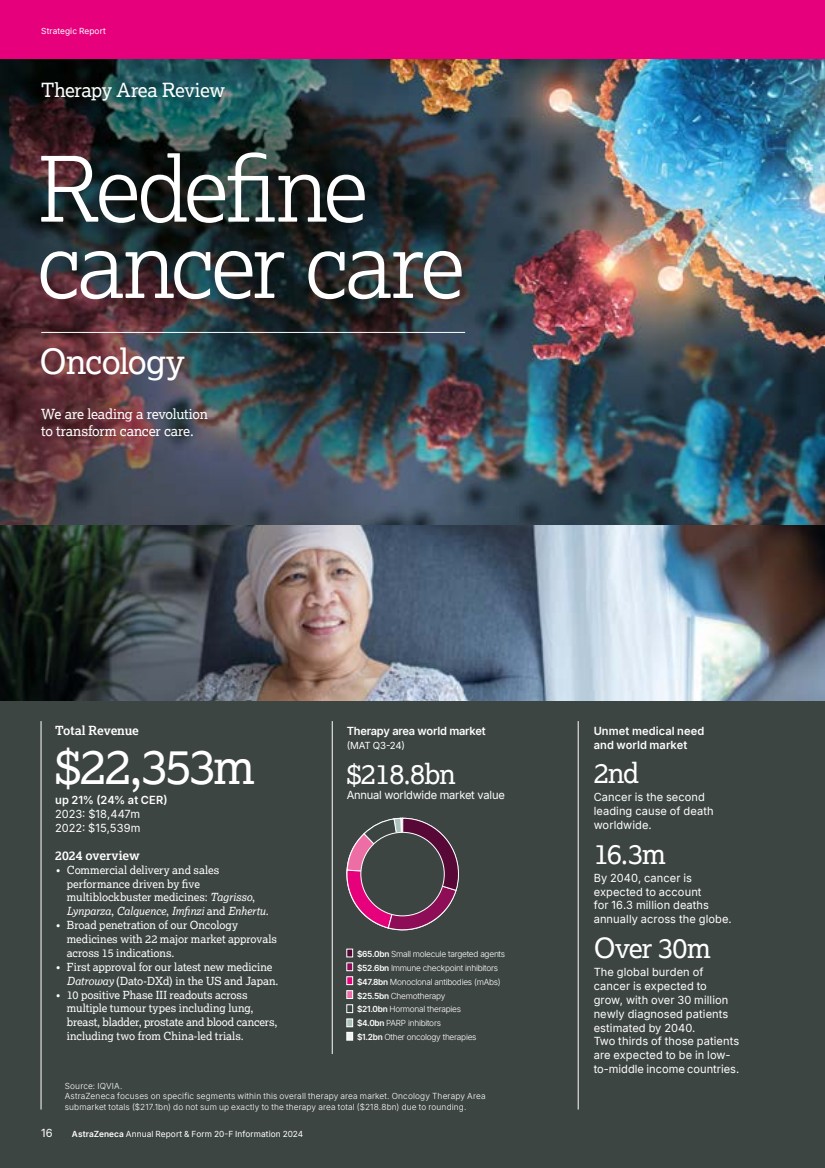
| Redefine cancer care Oncology Source: IQVIA. AstraZeneca focuses on specific segments within this overall therapy area market. Oncology Therapy Area submarket totals ($217.1bn) do not sum up exactly to the therapy area total ($218.8bn) due to rounding. 2024 overview • Commercial delivery and sales performance driven by five multiblockbuster medicines: Tagrisso, Lynparza, Calquence, Imfinzi and Enhertu. • Broad penetration of our Oncology medicines with 22 major market approvals across 15 indications. • First approval for our latest new medicine Datroway (Dato-DXd) in the US and Japan. • 10 positive Phase III readouts across multiple tumour types including lung, breast, bladder, prostate and blood cancers, including two from China-led trials. Total Revenue $22,353m up 21% (24% at CER) 2023: $18,447m 2022: $15,539m $65.0bn Small molecule targeted agents $52.6bn Immune checkpoint inhibitors $47.8bn Monoclonal antibodies (mAbs) $25.5bn Chemotherapy $21.0bn Hormonal therapies $4.0bn PARP inhibitors $1.2bn Other oncology therapies $218.8bn Annual worldwide market value Therapy area world market (MAT Q3-24) Therapy Area Review Unmet medical need and world market 2nd Cancer is the second leading cause of death worldwide. 16.3m By 2040, cancer is expected to account for 16.3 million deaths annually across the globe. Over 30m The global burden of cancer is expected to grow, with over 30 million newly diagnosed patients estimated by 2040. Two thirds of those patients are expected to be in low-to-middle income countries. We are leading a revolution to transform cancer care. 16 AstraZeneca Annual Report & Form 20-F Information 2024 Strategic Report |
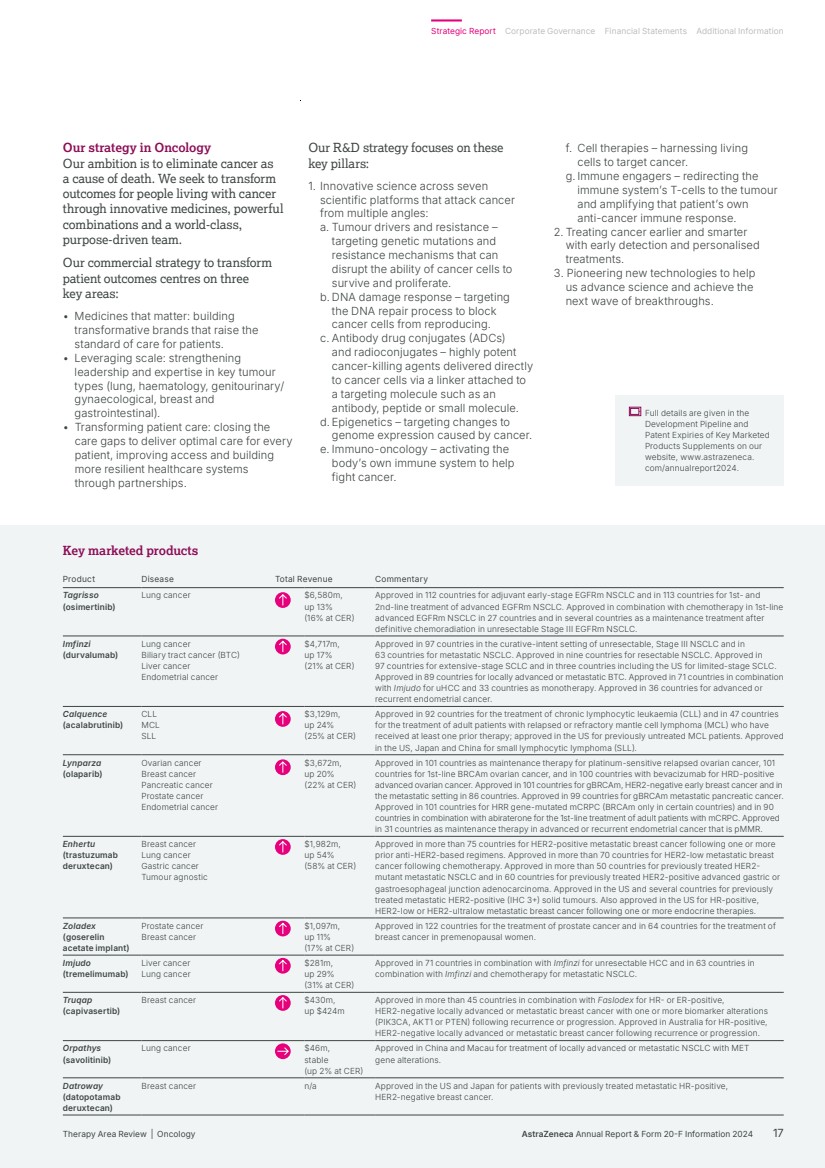
| Our strategy in Oncology Our ambition is to eliminate cancer as a cause of death. We seek to transform outcomes for people living with cancer through innovative medicines, powerful combinations and a world-class, purpose-driven team. Our commercial strategy to transform patient outcomes centres on three key areas: • Medicines that matter: building transformative brands that raise the standard of care for patients. • Leveraging scale: strengthening leadership and expertise in key tumour types (lung, haematology, genitourinary/ gynaecological, breast and gastrointestinal). • Transforming patient care: closing the care gaps to deliver optimal care for every patient, improving access and building more resilient healthcare systems through partnerships. Our R&D strategy focuses on these key pillars: 1. Innovative science across seven scientific platforms that attack cancer from multiple angles: a. Tumour drivers and resistance – targeting genetic mutations and resistance mechanisms that can disrupt the ability of cancer cells to survive and proliferate. b. DNA damage response – targeting the DNA repair process to block cancer cells from reproducing. c. Antibody drug conjugates (ADCs) and radioconjugates – highly potent cancer-killing agents delivered directly to cancer cells via a linker attached to a targeting molecule such as an antibody, peptide or small molecule. d. Epigenetics – targeting changes to genome expression caused by cancer. e. Immuno-oncology – activating the body’s own immune system to help fight cancer. f. Cell therapies – harnessing living cells to target cancer. g. Immune engagers – redirecting the immune system’s T-cells to the tumour and amplifying that patient’s own anti-cancer immune response. 2. Treating cancer earlier and smarter with early detection and personalised treatments. 3. Pioneering new technologies to help us advance science and achieve the next wave of breakthroughs. Full details are given in the Development Pipeline and Patent Expiries of Key Marketed Products Supplements on our website, www.astrazeneca. com/annualreport2024. Key marketed products Product Disease Total Revenue Commentary Tagrisso (osimertinib) Lung cancer $6,580m, up 13% (16% at CER) Approved in 112 countries for adjuvant early-stage EGFRm NSCLC and in 113 countries for 1st- and 2nd-line treatment of advanced EGFRm NSCLC. Approved in combination with chemotherapy in 1st-line advanced EGFRm NSCLC in 27 countries and in several countries as a maintenance treatment after definitive chemoradiation in unresectable Stage III EGFRm NSCLC. Imfinzi (durvalumab) Lung cancer Biliary tract cancer (BTC) Liver cancer Endometrial cancer $4,717m, up 17% (21% at CER) Approved in 97 countries in the curative-intent setting of unresectable, Stage III NSCLC and in 63 countries for metastatic NSCLC. Approved in nine countries for resectable NSCLC. Approved in 97 countries for extensive-stage SCLC and in three countries including the US for limited-stage SCLC. Approved in 89 countries for locally advanced or metastatic BTC. Approved in 71 countries in combination with Imjudo for uHCC and 33 countries as monotherapy. Approved in 36 countries for advanced or recurrent endometrial cancer. Calquence (acalabrutinib) CLL MCL SLL $3,129m, up 24% (25% at CER) Approved in 92 countries for the treatment of chronic lymphocytic leukaemia (CLL) and in 47 countries for the treatment of adult patients with relapsed or refractory mantle cell lymphoma (MCL) who have received at least one prior therapy; approved in the US for previously untreated MCL patients. Approved in the US, Japan and China for small lymphocytic lymphoma (SLL). Lynparza (olaparib) Ovarian cancer Breast cancer Pancreatic cancer Prostate cancer Endometrial cancer $3,672m, up 20% (22% at CER) Approved in 101 countries as maintenance therapy for platinum-sensitive relapsed ovarian cancer, 101 countries for 1st-line BRCAm ovarian cancer, and in 100 countries with bevacizumab for HRD-positive advanced ovarian cancer. Approved in 101 countries for gBRCAm, HER2-negative early breast cancer and in the metastatic setting in 86 countries. Approved in 99 countries for gBRCAm metastatic pancreatic cancer. Approved in 101 countries for HRR gene-mutated mCRPC (BRCAm only in certain countries) and in 90 countries in combination with abiraterone for the 1st-line treatment of adult patients with mCRPC. Approved in 31 countries as maintenance therapy in advanced or recurrent endometrial cancer that is pMMR. Enhertu (trastuzumab deruxtecan) Breast cancer Lung cancer Gastric cancer Tumour agnostic $1,982m, up 54% (58% at CER) Approved in more than 75 countries for HER2-positive metastatic breast cancer following one or more prior anti-HER2-based regimens. Approved in more than 70 countries for HER2-low metastatic breast cancer following chemotherapy. Approved in more than 50 countries for previously treated HER2- mutant metastatic NSCLC and in 60 countries for previously treated HER2-positive advanced gastric or gastroesophageal junction adenocarcinoma. Approved in the US and several countries for previously treated metastatic HER2-positive (IHC 3+) solid tumours. Also approved in the US for HR-positive, HER2-low or HER2-ultralow metastatic breast cancer following one or more endocrine therapies. Zoladex (goserelin acetate implant) Prostate cancer Breast cancer $1,097m, up 11% (17% at CER) Approved in 122 countries for the treatment of prostate cancer and in 64 countries for the treatment of breast cancer in premenopausal women. Imjudo (tremelimumab) Liver cancer Lung cancer $281m, up 29% (31% at CER) Approved in 71 countries in combination with Imfinzi for unresectable HCC and in 63 countries in combination with Imfinzi and chemotherapy for metastatic NSCLC. Truqap (capivasertib) Breast cancer $430m, up $424m Approved in more than 45 countries in combination with Faslodex for HR- or ER-positive, HER2-negative locally advanced or metastatic breast cancer with one or more biomarker alterations (PIK3CA, AKT1 or PTEN) following recurrence or progression. Approved in Australia for HR-positive, HER2-negative locally advanced or metastatic breast cancer following recurrence or progression. Orpathys (savolitinib) Lung cancer $46m, stable (up 2% at CER) Approved in China and Macau for treatment of locally advanced or metastatic NSCLC with MET gene alterations. Datroway (datopotamab deruxtecan) Breast cancer n/a Approved in the US and Japan for patients with previously treated metastatic HR-positive, HER2-negative breast cancer. AstraZeneca Annual Report & Form 20-F Information 2024 17 Strategic Report Corporate Governance Financial Statements Additional Information Therapy Area Review | Oncology |
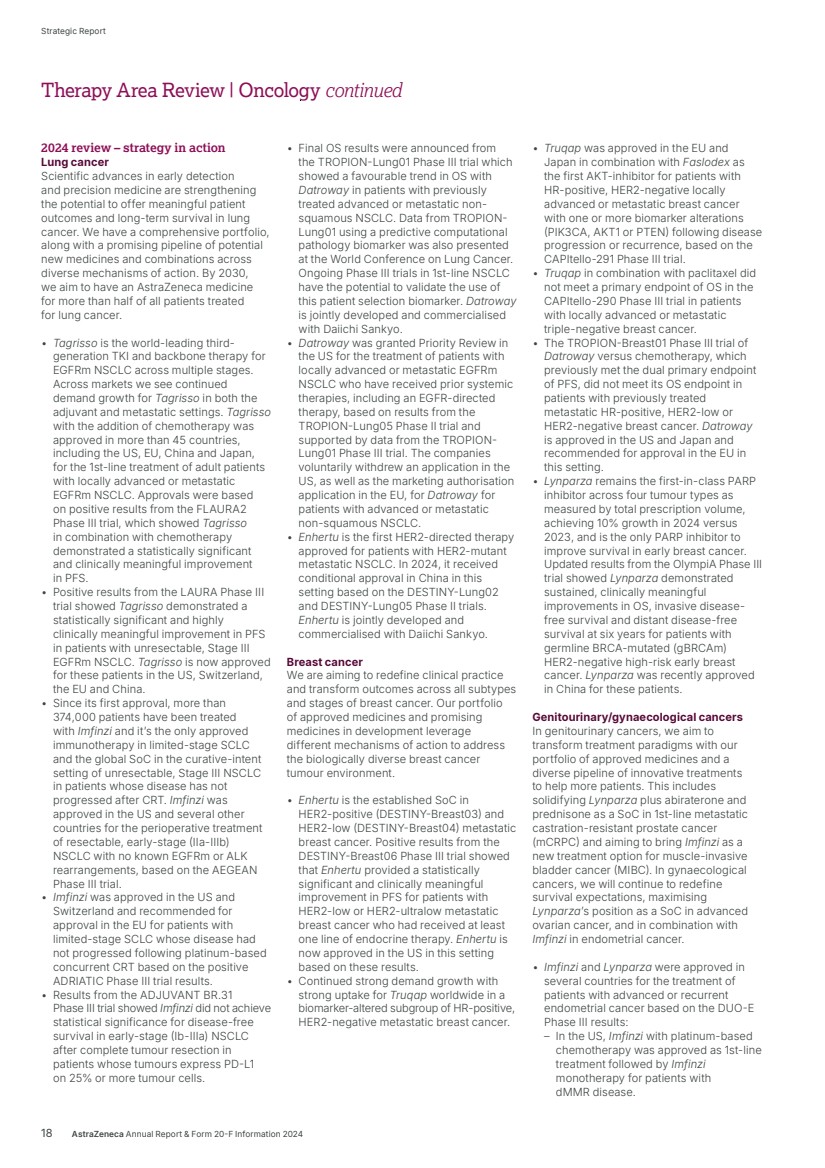
| 2024 review – strategy in action Lung cancer Scientific advances in early detection and precision medicine are strengthening the potential to offer meaningful patient outcomes and long-term survival in lung cancer. We have a comprehensive portfolio, along with a promising pipeline of potential new medicines and combinations across diverse mechanisms of action. By 2030, we aim to have an AstraZeneca medicine for more than half of all patients treated for lung cancer. • Tagrisso is the world-leading third-generation TKI and backbone therapy for EGFRm NSCLC across multiple stages. Across markets we see continued demand growth for Tagrisso in both the adjuvant and metastatic settings. Tagrisso with the addition of chemotherapy was approved in more than 45 countries, including the US, EU, China and Japan, for the 1st-line treatment of adult patients with locally advanced or metastatic EGFRm NSCLC. Approvals were based on positive results from the FLAURA2 Phase III trial, which showed Tagrisso in combination with chemotherapy demonstrated a statistically significant and clinically meaningful improvement in PFS. • Positive results from the LAURA Phase III trial showed Tagrisso demonstrated a statistically significant and highly clinically meaningful improvement in PFS in patients with unresectable, Stage III EGFRm NSCLC. Tagrisso is now approved for these patients in the US, Switzerland, the EU and China. • Since its first approval, more than 374,000 patients have been treated with Imfinzi and it’s the only approved immunotherapy in limited-stage SCLC and the global SoC in the curative-intent setting of unresectable, Stage III NSCLC in patients whose disease has not progressed after CRT. Imfinzi was approved in the US and several other countries for the perioperative treatment of resectable, early-stage (IIa-IIIb) NSCLC with no known EGFRm or ALK rearrangements, based on the AEGEAN Phase III trial. • Imfinzi was approved in the US and Switzerland and recommended for approval in the EU for patients with limited-stage SCLC whose disease had not progressed following platinum-based concurrent CRT based on the positive ADRIATIC Phase III trial results. • Results from the ADJUVANT BR.31 Phase III trial showed Imfinzi did not achieve statistical significance for disease-free survival in early-stage (Ib-IIIa) NSCLC after complete tumour resection in patients whose tumours express PD-L1 on 25% or more tumour cells. • Final OS results were announced from the TROPION-Lung01 Phase III trial which showed a favourable trend in OS with Datroway in patients with previously treated advanced or metastatic non-squamous NSCLC. Data from TROPION-Lung01 using a predictive computational pathology biomarker was also presented at the World Conference on Lung Cancer. Ongoing Phase III trials in 1st-line NSCLC have the potential to validate the use of this patient selection biomarker. Datroway is jointly developed and commercialised with Daiichi Sankyo. • Datroway was granted Priority Review in the US for the treatment of patients with locally advanced or metastatic EGFRm NSCLC who have received prior systemic therapies, including an EGFR-directed therapy, based on results from the TROPION-Lung05 Phase II trial and supported by data from the TROPION-Lung01 Phase III trial. The companies voluntarily withdrew an application in the US, as well as the marketing authorisation application in the EU, for Datroway for patients with advanced or metastatic non-squamous NSCLC. • Enhertu is the first HER2-directed therapy approved for patients with HER2-mutant metastatic NSCLC. In 2024, it received conditional approval in China in this setting based on the DESTINY-Lung02 and DESTINY-Lung05 Phase II trials. Enhertu is jointly developed and commercialised with Daiichi Sankyo. Breast cancer We are aiming to redefine clinical practice and transform outcomes across all subtypes and stages of breast cancer. Our portfolio of approved medicines and promising medicines in development leverage different mechanisms of action to address the biologically diverse breast cancer tumour environment. • Enhertu is the established SoC in HER2-positive (DESTINY-Breast03) and HER2-low (DESTINY-Breast04) metastatic breast cancer. Positive results from the DESTINY-Breast06 Phase III trial showed that Enhertu provided a statistically significant and clinically meaningful improvement in PFS for patients with HER2-low or HER2-ultralow metastatic breast cancer who had received at least one line of endocrine therapy. Enhertu is now approved in the US in this setting based on these results. • Continued strong demand growth with strong uptake for Truqap worldwide in a biomarker-altered subgroup of HR-positive, HER2-negative metastatic breast cancer. • Truqap was approved in the EU and Japan in combination with Faslodex as the first AKT-inhibitor for patients with HR-positive, HER2-negative locally advanced or metastatic breast cancer with one or more biomarker alterations (PIK3CA, AKT1 or PTEN) following disease progression or recurrence, based on the CAPItello-291 Phase III trial. • Truqap in combination with paclitaxel did not meet a primary endpoint of OS in the CAPItello-290 Phase III trial in patients with locally advanced or metastatic triple-negative breast cancer. • The TROPION-Breast01 Phase III trial of Datroway versus chemotherapy, which previously met the dual primary endpoint of PFS, did not meet its OS endpoint in patients with previously treated metastatic HR-positive, HER2-low or HER2-negative breast cancer. Datroway is approved in the US and Japan and recommended for approval in the EU in this setting. • Lynparza remains the first-in-class PARP inhibitor across four tumour types as measured by total prescription volume, achieving 10% growth in 2024 versus 2023, and is the only PARP inhibitor to improve survival in early breast cancer. Updated results from the OlympiA Phase III trial showed Lynparza demonstrated sustained, clinically meaningful improvements in OS, invasive disease-free survival and distant disease-free survival at six years for patients with germline BRCA-mutated (gBRCAm) HER2-negative high-risk early breast cancer. Lynparza was recently approved in China for these patients. Genitourinary/gynaecological cancers In genitourinary cancers, we aim to transform treatment paradigms with our portfolio of approved medicines and a diverse pipeline of innovative treatments to help more patients. This includes solidifying Lynparza plus abiraterone and prednisone as a SoC in 1st-line metastatic castration-resistant prostate cancer (mCRPC) and aiming to bring Imfinzi as a new treatment option for muscle-invasive bladder cancer (MIBC). In gynaecological cancers, we will continue to redefine survival expectations, maximising Lynparza’s position as a SoC in advanced ovarian cancer, and in combination with Imfinzi in endometrial cancer. • Imfinzi and Lynparza were approved in several countries for the treatment of patients with advanced or recurrent endometrial cancer based on the DUO-E Phase III results: – In the US, Imfinzi with platinum-based chemotherapy was approved as 1st-line treatment followed by Imfinzi monotherapy for patients with dMMR disease. 18 AstraZeneca Annual Report & Form 20-F Information 2024 Strategic Report Therapy Area Review | Oncology continued |
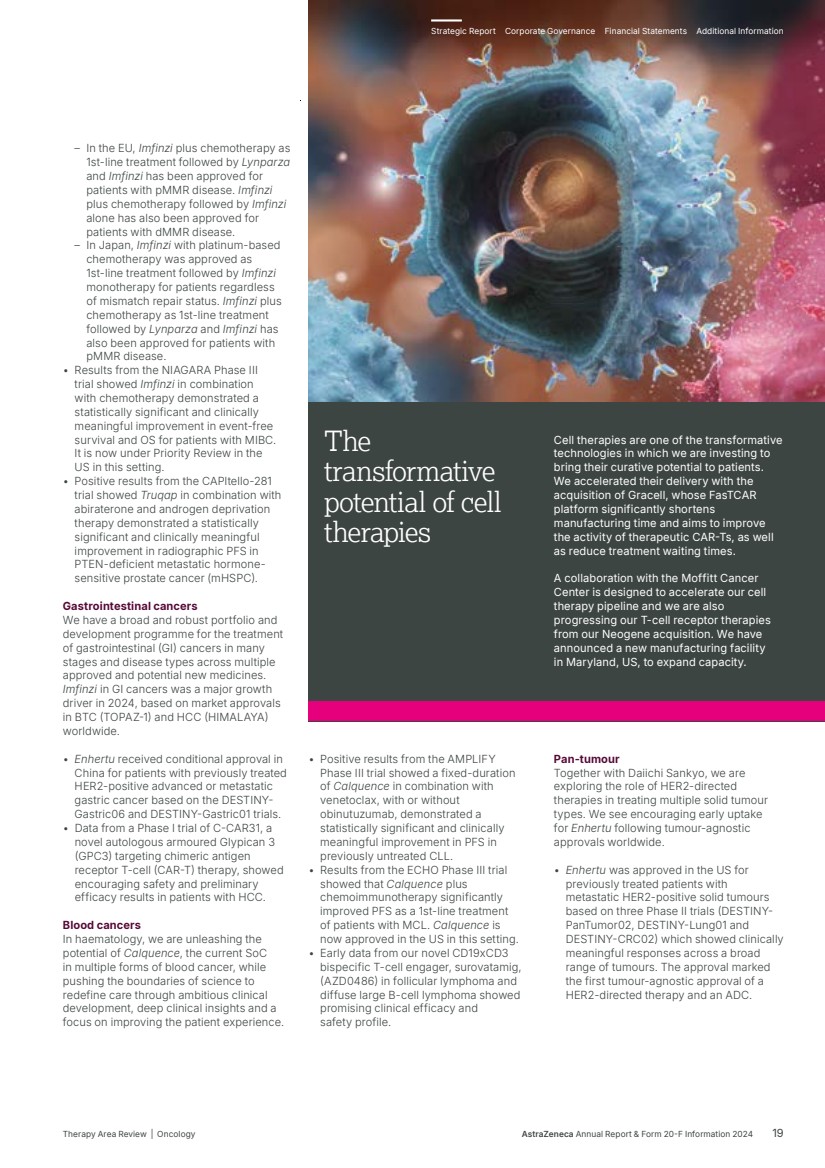
| – In the EU, Imfinzi plus chemotherapy as 1st-line treatment followed by Lynparza and Imfinzi has been approved for patients with pMMR disease. Imfinzi plus chemotherapy followed by Imfinzi alone has also been approved for patients with dMMR disease. – In Japan, Imfinzi with platinum-based chemotherapy was approved as 1st-line treatment followed by Imfinzi monotherapy for patients regardless of mismatch repair status. Imfinzi plus chemotherapy as 1st-line treatment followed by Lynparza and Imfinzi has also been approved for patients with pMMR disease. • Results from the NIAGARA Phase III trial showed Imfinzi in combination with chemotherapy demonstrated a statistically significant and clinically meaningful improvement in event-free survival and OS for patients with MIBC. It is now under Priority Review in the US in this setting. • Positive results from the CAPItello-281 trial showed Truqap in combination with abiraterone and androgen deprivation therapy demonstrated a statistically significant and clinically meaningful improvement in radiographic PFS in PTEN-deficient metastatic hormone-sensitive prostate cancer (mHSPC). Gastrointestinal cancers We have a broad and robust portfolio and development programme for the treatment of gastrointestinal (GI) cancers in many stages and disease types across multiple approved and potential new medicines. Imfinzi in GI cancers was a major growth driver in 2024, based on market approvals in BTC (TOPAZ-1) and HCC (HIMALAYA) worldwide. • Enhertu received conditional approval in China for patients with previously treated HER2-positive advanced or metastatic gastric cancer based on the DESTINY-Gastric06 and DESTINY-Gastric01 trials. • Data from a Phase I trial of C-CAR31, a novel autologous armoured Glypican 3 (GPC3) targeting chimeric antigen receptor T-cell (CAR-T) therapy, showed encouraging safety and preliminary efficacy results in patients with HCC. Blood cancers In haematology, we are unleashing the potential of Calquence, the current SoC in multiple forms of blood cancer, while pushing the boundaries of science to redefine care through ambitious clinical development, deep clinical insights and a focus on improving the patient experience. • Positive results from the AMPLIFY Phase III trial showed a fixed-duration of Calquence in combination with venetoclax, with or without obinutuzumab, demonstrated a statistically significant and clinically meaningful improvement in PFS in previously untreated CLL. • Results from the ECHO Phase III trial showed that Calquence plus chemoimmunotherapy significantly improved PFS as a 1st-line treatment of patients with MCL. Calquence is now approved in the US in this setting. • Early data from our novel CD19xCD3 bispecific T-cell engager, surovatamig, (AZD0486) in follicular lymphoma and diffuse large B-cell lymphoma showed promising clinical efficacy and safety profile. Pan-tumour Together with Daiichi Sankyo, we are exploring the role of HER2-directed therapies in treating multiple solid tumour types. We see encouraging early uptake for Enhertu following tumour-agnostic approvals worldwide. • Enhertu was approved in the US for previously treated patients with metastatic HER2-positive solid tumours based on three Phase II trials (DESTINY-PanTumor02, DESTINY-Lung01 and DESTINY-CRC02) which showed clinically meaningful responses across a broad range of tumours. The approval marked the first tumour-agnostic approval of a HER2-directed therapy and an ADC. The transformative potential of cell therapies Cell therapies are one of the transformative technologies in which we are investing to bring their curative potential to patients. We accelerated their delivery with the acquisition of Gracell, whose FasTCAR platform significantly shortens manufacturing time and aims to improve the activity of therapeutic CAR-Ts, as well as reduce treatment waiting times. A collaboration with the Moffitt Cancer Center is designed to accelerate our cell therapy pipeline and we are also progressing our T-cell receptor therapies from our Neogene acquisition. We have announced a new manufacturing facility in Maryland, US, to expand capacity. AstraZeneca Annual Report & Form 20-F Information 2024 19 Strategic Report Corporate Governance Financial Statements Additional Information Therapy Area Review | Oncology |
| Our ambition is to transform care for billions of people living with chronic diseases and deliver long-lasting immunity. We are working to intervene earlier to protect vital organs, slow or reverse disease progression, and achieve remission for often degenerative, debilitating and life-threatening conditions, so many more people can live better, healthier lives. Transform care for billions BioPharmaceuticals Therapy Area Review 20 AstraZeneca Annual Report & Form 20-F Information 2024 Strategic Report |

| Total Revenue $12,517m up 18% (20% at CER) 2023: $10,628m 2022: $9,211m Total Revenue $7,876m up 23% (25% at CER) 2023: $6,404m 2022: $5,963m Total Revenue $1,462m up 8% (8% at CER) 2023: $1,357m 2022: $4,836m Our ambition is to improve care to save lives for the millions living with cardiovascular, renal and metabolic diseases, stop disease progression and, ultimately, pave the way to a cure. Our ambition is to transform respiratory and immunology care for millions of patients worldwide, moving beyond symptom control to disease modification, remission and, one day, cure. Our ambition is to develop and deliver innovative vaccines and antibodies to protect patients from serious viral and bacterial infections, providing long-lasting immunity to millions. Unmet medical need and world market 1.4 billion people across the globe are affected by CVRM diseases. 4 of the top 7 causes of death worldwide are predicted to be CVRM diseases by 2040. Unmet medical need and world market ~500 million people worldwide have chronic respiratory diseases, which carry a high disease burden. >40 million people worldwide have the immune-mediated diseases we are targeting, with few achieving remission. $4.8 trillion the estimated global burden of chronic obstructive pulmonary disease (COPD) by 2050, a leading cause of hospital admissions and the world’s third leading cause of death.¹ ¹ Excluding COVID-19. Unmet medical need and world market ~300,000 hMPV and RSV-related hospitalisations combined among older adults in the US each year. One billion cases of seasonal influenza annually. Up to 4% of the population is immunocompromised and is at a higher risk of hospitalisation from COVID-19 than the general population. 2024 overview • Farxiga retained its position as the number one SGLT2 inhibitor worldwide by volume, growing faster than the overall SGLT2 market in all major regions, driven by continued demand in heart failure (HF) and chronic kidney disease (CKD). • Wainzua recommended for approval in the EU for the treatment of adult patients with polyneuropathy of hereditary transthyretin-mediated amyloidosis. • The CVRM pipeline was bolstered by an exclusive licence agreement with CSPC Pharmaceutical Group Ltd. to develop an early stage, novel small molecule Lipoprotein (a) (Lp(a)) disruptor. 2024 overview • Achieved double-digit growth driven by key launch brands (Breztri, Fasenra, Tezspire, Saphnelo, Airsupra). Tezspire secured blockbuster status with combined sales recorded by Amgen and AstraZeneca of $1.2 billion, of which AstraZeneca recorded Total Revenue of $684 million. • Progressed the late-stage portfolio including four major market approvals and four Phase II and Phase III data readouts. • Submitted the first regulatory filings to support the transition of Breztri to next-generation propellant with near-zero Global Warming Potential (GWP). 2024 overview • Completed the acquisition of Icosavax enhancing late-stage pipeline with potential first-in-class RSV/human metapneumovirus (hMPV) combination vaccine. • Beyfortus demonstrated a 90% reduction in RSV-related hospitalisations in its first season. Following 2023 and 2024 approvals in the US and China, Beyfortus is now approved in 50 countries as the first and only RSV lower respiratory tract disease (LRTD) preventative option for a broad infant population. • FluMist was approved in the US as the only influenza vaccine for self- or caregiver-administration at home, recognised in TIME Magazine 2024 Innovations of the Year. Cardiovascular, Renal & Metabolism Respiratory & Immunology Vaccines & Immune Therapies Strategic Report Corporate Governance Financial Statements Additional Information Therapy Area Review | BioPharmaceuticals AstraZeneca Annual Report & Form 20-F Information 2024 21 |
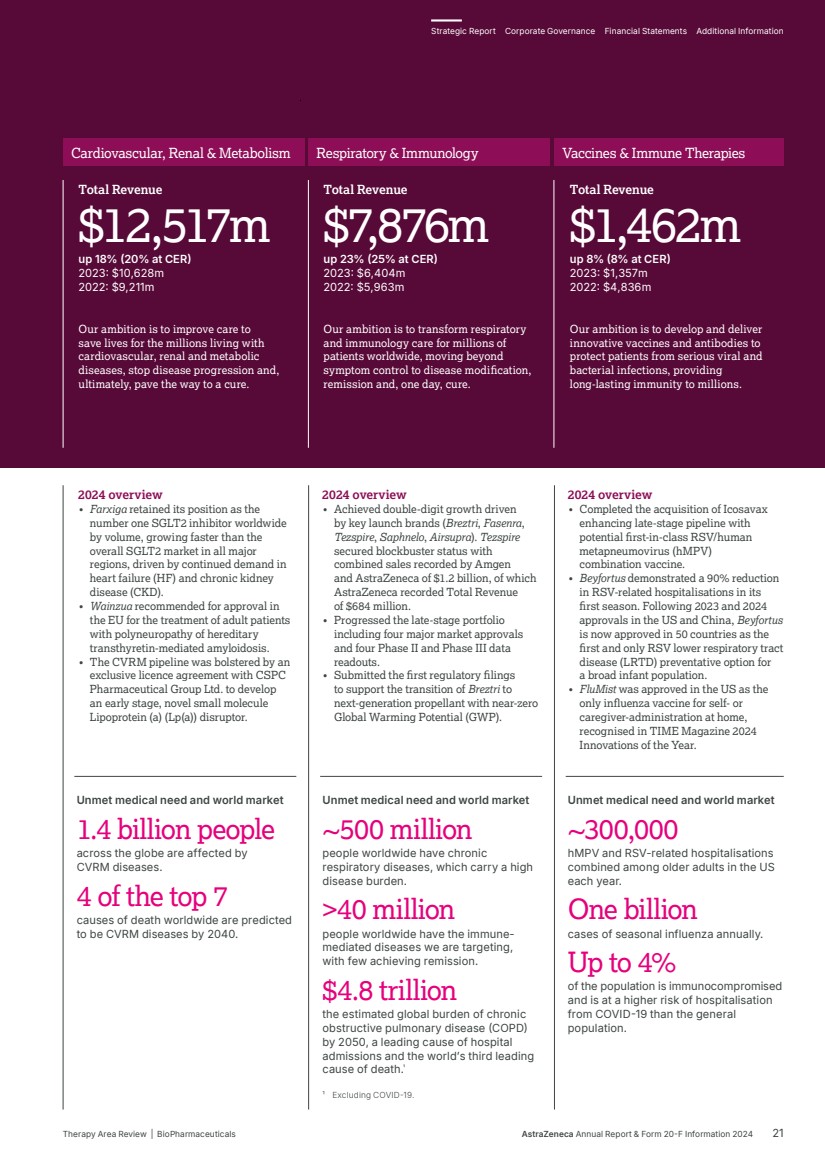
| $194.1bn Diabetes $39.5bn High blood pressure $21.8bn Abnormal levels of blood cholesterol $9.6bn CKD $7.2bn Thrombosis $5.0bn CKD-associated anaemia $1.0bn Hyperkalaemia $72.6bn Other CV $323.0bn $323.0bn Annual worldwide market value Therapy area world market (MAT Q3-24) Our strategy in CVRM Our ambition is to improve and save lives for the millions of people who are living with the complexities of CVRM diseases. • The impact of CVRM diseases on people, society and our planet is immense and growing, yet these diseases remain underdiagnosed, undertreated, and their interconnections under-recognised. • By 2040, it is expected that CVRM diseases and comorbidities will account for four of the top seven causes of death globally (heart disease, diabetes, kidney disease and stroke), and five of the top eight leading risk factors of premature death (high blood pressure, BMI, glucose, cholesterol and impaired kidney function). These are complex and interconnected conditions, with the majority of patients living with two or more of them. • We are building the broadest and deepest pipelines through novel mechanisms and combinations to: – Slow and stop cardiorenal disease and protect vital organs. – Address major risk factors of hypertension, dyslipidaemia and obesity to help prevent them. • By understanding their interconnections and targeting the mechanisms that drive CVRM diseases, we will be able to detect, diagnose and treat people earlier and more effectively, stop disease progression and, ultimately, pave the way to a cure. 2024 review – strategy in action Our strategy focuses on three areas: cardiovascular, renal, and metabolic diseases. Cardiovascular (CV) CV disease is the leading cause of death worldwide. Our ambition is to reduce CV disease by addressing risk factors such as hypertension control and dyslipidaemia, as well as treating CVRM comorbidities. • In February 2024, together with Ionis, we received Fast Track designation in the US for Wainua in the treatment of transthyretin-mediated amyloid cardiomyopathy of wild-type or hereditary transthyretin-mediated amyloidosis (ATTRv) in adults. • Wainzua (Wainua in the US) was recommended for approval in the EU for the treatment of ATTRv in adult patients with Stage 1 or Stage 2 polyneuropathy. This follows the US FDA approval in 2023. • New real-world evidence demonstrated the need for earlier diagnosis and rapid initiation of guideline-directed medical therapy in HF patients. REVOLUTION HF showed that delayed diagnosis led to increased hospitalisations, mortality rates, and four-times higher healthcare costs. • Baxdrostat, an aldosterone synthase inhibitor, has progressed into Phase III trials for treatment-resistant and uncontrolled hypertension. Targeting aldosterone aims to reduce the risk of Key marketed products Product Disease Total Revenue Commentary Farxiga/Forxiga (dapagliflozin) Type 2 diabetes (T2D) Heart failure (HF) Chronic kidney disease (CKD) $7,717m, up 29% (31% at CER) Farxiga continues to be the number one SGLT2 inhibitor worldwide by volume, growing faster than the overall SGLT2 market in all major regions, driven by continued demand in HF and CKD. Brilinta/Brilique (ticagrelor) Acute coronary syndromes (ACS) $1,333m, up 1% (2% at CER) Brilinta plus aspirin is currently approved in more than 124 countries for the prevention of atherothrombotic events in adult patients with ACS and in 80 countries for the secondary prevention of CV events among high-risk patients who have experienced a heart attack. Crestor (rosuvastatin calcium) Dyslipidaemia Hyper-cholesterolaemia $1,155m, up 4% (8% at CER) Approved in 91 countries as an adjunct to diet to reduce elevated Total-C, LDL-C, ApoB, non-HDL-C, and triglycerides and to increase HDL-C in adult patients with primary hyperlipidaemia or mixed dyslipidaemia. Seloken/Toprol-XL (metoprolol succinate) Hypertension HF Angina $606m, down 5% (stable at CER) Approved in 62 countries to treat hypertension, angina, cardiac arrhythmias and post-CV event prophylaxis. Lokelma (sodium zirconium cyclosilicate) Hyperkalaemia (HK) $542m, up 32% (34% at CER) Approved in 56 markets and is market leader by days-of-therapy volume in branded HK market and the number one ranked K+ binder across 13 countries. Roxadustat Anaemia of CKD $336m, up 22% (23% at CER) Roxadustat is used to treat adults with symptomatic anaemia associated with CKD. Andexxa/Ondexxya (andexanet alfa) Factor Xa (FXa) inhibitor reversal agent $219m, up 20% (22% at CER) Andexxa holds an accelerated approval in the US and a conditional approval by the EMA for reversal of the anticoagulant effect of FXa in patients with life-threatening or uncontrolled bleeds. In the third quarter of 2024, following a strategic review of portfolio priorities, the business decision was made to cease promotional activity for Andexxa. Wainua/Wainzua (eplontersen) Polyneuropathy of hereditary transthyretin-mediated amyloidosis (ATTRv-PN) $85m Approved in six countries, including in the US, for the treatment of adult patients with stage one or two ATTRv-PN. Source: IQVIA. AstraZeneca focuses on specific segments within this overall therapy area market. Sales for CKD ($9.6bn) and CKD-associated anaemia ($5.0bn) fall outside the CVRM total market. All sales for CKD-associated anaemia ($5.0bn) fall within the CKD market and should not be double counted. Full details are given in the Development Pipeline and Patent Expiries of Key Marketed Products Supplements on our website, www.astrazeneca. com/annualreport2024. Cardiovascular, Renal & Metabolism 22 AstraZeneca Annual Report & Form 20-F Information 2024 Strategic Report Therapy Area Review | BioPharmaceuticals continued |
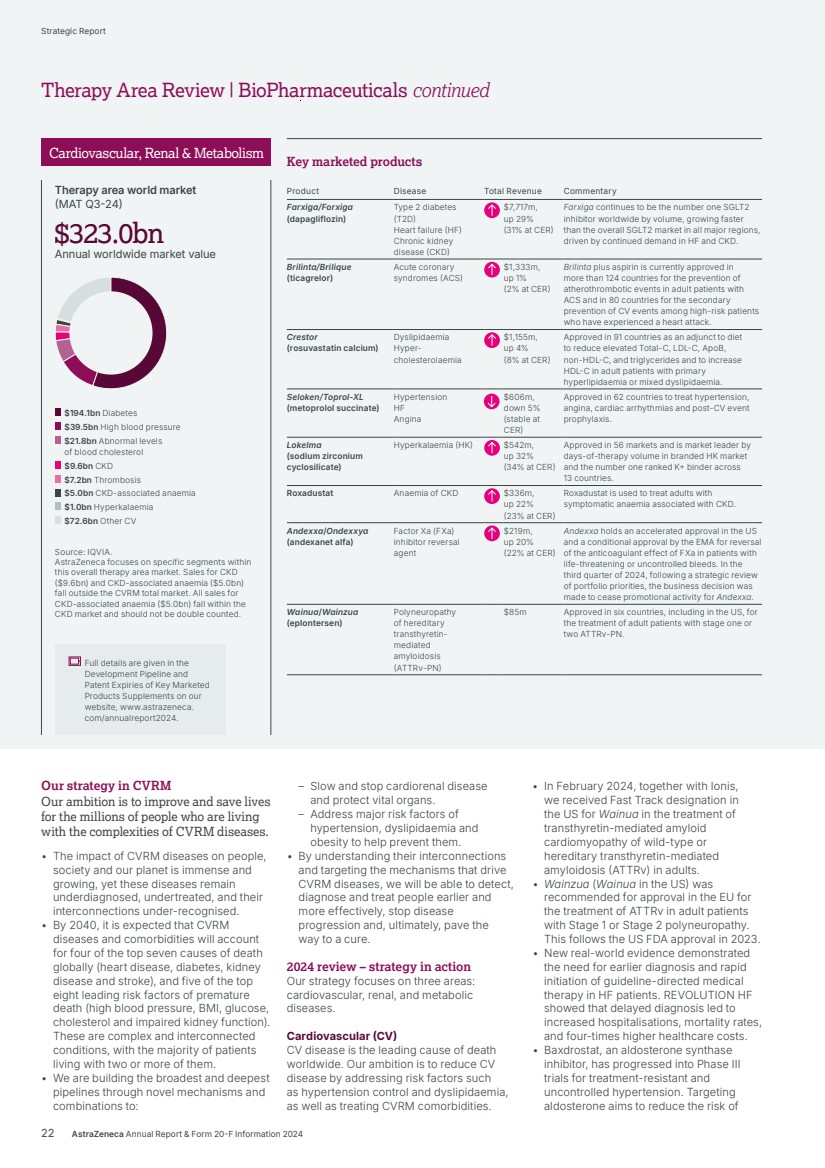
| mortality, cardiovascular outcomes, and deterioration of kidney function that is independent of blood pressure. • Balcinrenone/dapagliflozin aims to address the unmet medical need in HF patients with impaired kidney function by delivering the benefits of mineralocorticoid receptor antagonists (MRAs) without hyperkalaemia risk. The Phase III BalanceD-HF trial commenced recruitment. • Our ambition is to lead dyslipidaemia care, helping patients to reduce risk of chronic CV disease. Our pipeline includes AZD0780 (oPCSK9i) as an adjunct to statins and in combination with other lipid-lowering therapies. Phase II studies of AZD0780 will complete and be presented in 2025. • Our relaxin portfolio aims to improve cardiac function by recapitulating the biology of relaxin, a natural pregnancy hormone, in patients with HF and pulmonary hypertension (PH). AZD3427, currently in Phase IIb trials, is a long-acting peptide analogue of relaxin and one of the first therapies to specifically address group 2 PH, the largest PH population, in HF. AZD5462 is the first and only small molecule targeting relaxin biology to enter clinical trials, currently in Phase IIb. We are exploring its potential to become a foundational therapy in a broad range of patients with HF. Renal Nearly 850 million people worldwide are affected by kidney disease. Our ambition in CKD is to eliminate progression to kidney failure. • In 2024, the Kidney Disease Improving Global Outcomes CKD guidelines included use of SGLT2s as a class 1a recommendation for patients with CKD regardless of T2D status, including use in patients with CKD and HF. • New modelling analyses (IMPACT CKD, DISCOVER CKD, PaCE CKD) demonstrated the benefits of earlier CKD diagnosis and access to guideline-directed medical therapies for economies, healthcare systems, and quality of life for patients. • We are focusing on subpopulations of patients with CKD in our clinical development programme, with unique mechanisms that target disease drivers and risk factors that impact disease progression, on top of the proven cardiorenal protection of dapagliflozin. • Zibotentan/dapagliflozin has advanced into Phase III ZENITH High Proteinuria for patients with CKD and high proteinuria. The combination is also being developed in liver cirrhosis and entered Phase II development with the ZEAL trial. • Baxdrostat/dapagliflozin has advanced into Phase III BaxDuo Arctic for patients with CKD and hypertension. • Balcinrenone/dapagliflozin has advanced into Phase IIb MIRO-CKD for patients with CKD at higher risk of developing hyperkalaemia. • AZD2373, developed in collaboration with Ionis, has the potential to be the first precision medicine in our renal pipeline for treatment of APOL-1 mediated kidney disease (AMKD). Phase I data has demonstrated safety, tolerability and proof of mechanism in healthy participants. Metabolism Sixty per cent of people diagnosed with obesity or as overweight (BMI >27kg/m2) have at least one comorbidity. • We continue to build a comprehensive weight management portfolio to deliver durable weight management and to provide organ protection. Three key assets (AZD5004 (oral GLP-1RA), AZD6234 (LA amylin) and AZD9550 (GLP‑1/GCG RA)) delivered positive Phase I data in 2024. We have entered Phase II trials in T2D (AZD5004 SOLSTICE) and obesity (AZD5004 VISTA and AZD6234 APRICUS studies). A triple mechanism combination therapy (AZD9550+AZD6234) is set to enter Phase II in the first half of 2025. • We are also advancing an innovative pipeline in metabolic dysfunction-associated steatohepatitis (MASH) and advanced liver disease to specifically target the main disease drivers. This includes a precision medicine approach with AZD2693 (PNPLA3 ASO) in patients with a genetic predisposition to MASH, currently in Phase IIb studies, and AZD2389 (small molecule FAP inhibitor) targeting advanced liver fibrosis currently in Phase II studies. • In June 2024, following the T2NOW Phase III trial, Farxiga was approved by the FDA to improve glycaemic control in paediatric patients aged 10 years and older with T2D. Healthcare in the community AstraZeneca is proud to support the Everton in the Community (Everton Football Club’s official charity) NexGen Breathlessness Hub. The Hub enables prompt review of people with chronic breathlessness to establish a diagnosis, such as heart failure or COPD. It serves one of the most deprived UK neighbourhoods, and its convenient location in Everton’s ‘The People’s Place’ embeds rapid, equitable access to essential diagnostics in the community. Over 1,000 people have received lung and heart health checks, 25% underwent NT-proBNP testing and AI-assisted echocardiography to assess cardiac function with ~3% newly diagnosed with HF. There is a significant correlation between deprivation levels and HF hospitalisation and survival; providing rapid diagnosis and early treatment could improve long-term outcomes. Strategic Report Corporate Governance Financial Statements Additional Information Therapy Area Review | BioPharmaceuticals | Cardiovascular, Renal & Metabolism AstraZeneca Annual Report & Form 20-F Information 2024 23 |
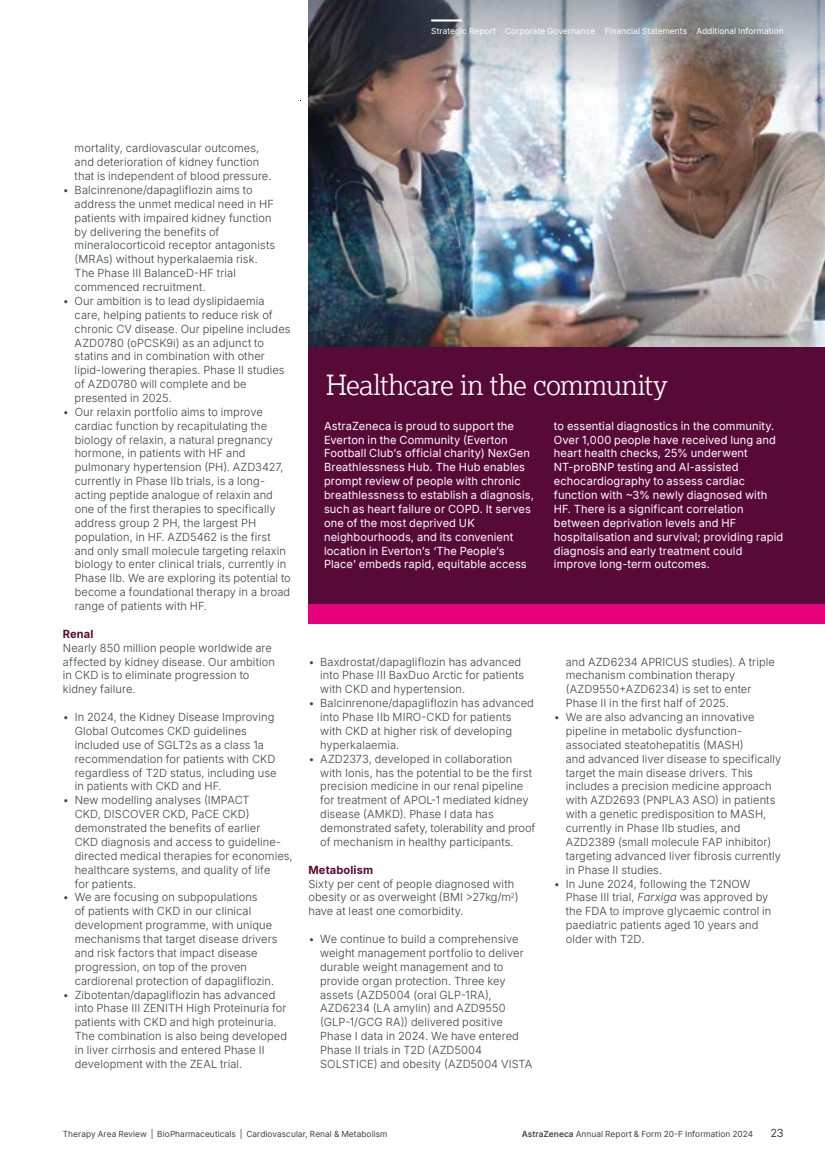
| $29.7bn Asthma $17.1bn COPD $44.9bn Other $91.9bn $91.9bn Annual worldwide market value Therapy area world market (MAT Q3-24) Our strategy in R&I Our ambition is to transform care in respiratory and immune-mediated diseases by moving beyond symptom control to achieve disease modification, remission and, one day, cures for millions of patients worldwide. COPD We are working to eliminate COPD as a leading cause of death, transforming care through our broad portfolio by: • Driving timely diagnosis, optimising therapeutic intervention and reducing mortality by addressing cardiopulmonary risk. • Advancing innovative medicines including next-generation biologics and orals to slow disease progression and reverse the structural damage caused by COPD. Asthma We strive to eliminate asthma attacks and achieve clinical remission by: • Reinforcing our anti-inflammatory reliever inhaled portfolio as the backbone of care. • Driving towards clinical remission with systemic biologics. • Introducing novel oral and inhaled medicines to address patients who are not controlled on SoC inhaled therapy. Other Respiratory We are moving beyond asthma and COPD to address other respiratory diseases with significant unmet medical need, including severe viral lower respiratory tract disease, non-cystic fibrosis bronchiectasis, interstitial lung disease and idiopathic pulmonary fibrosis (IPF). Immunology We aim to disrupt in immunology, redefining treatment paradigms in areas of high unmet medical need, moving to clinical remission and eventually cure by: • Targeting underlying disease drivers in lupus and related diseases to address high unmet medical need at each stage of the patient journey. • Exceeding current efficacy expectations in established diseases with suboptimal treatment outcomes through targeting novel mechanisms and applying precision medicine in diseases such as Crohn’s disease and rheumatoid arthritis. • Accelerating transformative technologies, such as complex biologics and cell therapy, with the goal of moving towards cure. Sustainability Within R&I, we are leading the way in reducing the environmental burden of care by driving improvements in patient outcomes as well as transitioning to inhaled respiratory medicines with a propellant that has near-zero GWP. Key marketed products Product Disease Total Revenue Commentary Symbicort (budesonide/ formoterol) Asthma COPD $2,879m, up 22% (25% at CER) Symbicort continued its volume market leadership as the number one inhaled corticosteroid (ICS)/ LABA combination globally and had significant growth across Emerging Markets. It is the only branded ICS/LABA approved in mild asthma as an anti-inflammatory reliever in 47 countries. Fasenra (benralizumab) Severe eosinophilic asthma (SEA) Eosinophilic granulomatosis with polyangiitis (EGPA) $1,689m, up 9% (9% at CER) Approved as an add-on maintenance treatment for SEA in 83 countries including the US, EU, Japan and now China. Also broadened the population in the US and Japan to patients six years and older. Expanded into immunology with approvals in more than 35 countries including the US, EU and Japan for the treatment of EGPA. Pulmicort (budesonide) Asthma COPD Croup $682m, down 4% (1% at CER) Approved in more than 115 countries. Breztri/Trixeo (budesonide/ glycopyrrolate/ formoterol) COPD $978m, up 44% (46% at CER) Approved in more than 80 countries, including the US, EU, Japan and China. GOLD 2025 emphasises the important role of fixed-dose triple therapy1 , particularly for reducing mortality, preventing exacerbations and addressing CV risk. It also highlights more direct pathways for patients to get treated with triple therapy. Tezspire (tezepelumab) Severe asthma $684m, up 98% (99% at CER) Approved in more than 60 countries including the US, EU and Japan for the treatment of severe asthma without biomarkers or phenotypic limitations. Saphnelo (anifrolumab) Systemic lupus erythematosus (SLE) $474m, up 69% (70% at CER) Approved for the treatment of SLE in more than 65 countries, including the US, EU and Japan. First biologic to demonstrate sustained SLE remission in a clinical trial over four years compared to standard therapy; aligned with updated 2023 EULAR recommendations, which focus on remission as a treatment goal. Airsupra (albuterol/budesonide) Asthma $66m The only FDA-approved short-acting beta2- agonist (SABA)/ICS anti-inflammatory rescue treatment approved in asthma for the treatment of symptoms and prevention of exacerbations. The anti-inflammatory rescue approach is the preferred treatment approach as recommended by the Global Initiative for Asthma. 1 Global triple therapy market definition: Breztri, Enerzair, Trelegy, Trimbow. Source: IQVIA. AstraZeneca focuses on specific segments within this overall therapy area market. Full details are given in the Development Pipeline and Patent Expiries of Key Marketed Products Supplements on our website, www.astrazeneca. com/annualreport2024. Respiratory & Immunology 24 AstraZeneca Annual Report & Form 20-F Information 2024 Strategic Report Therapy Area Review | BioPharmaceuticals continued |
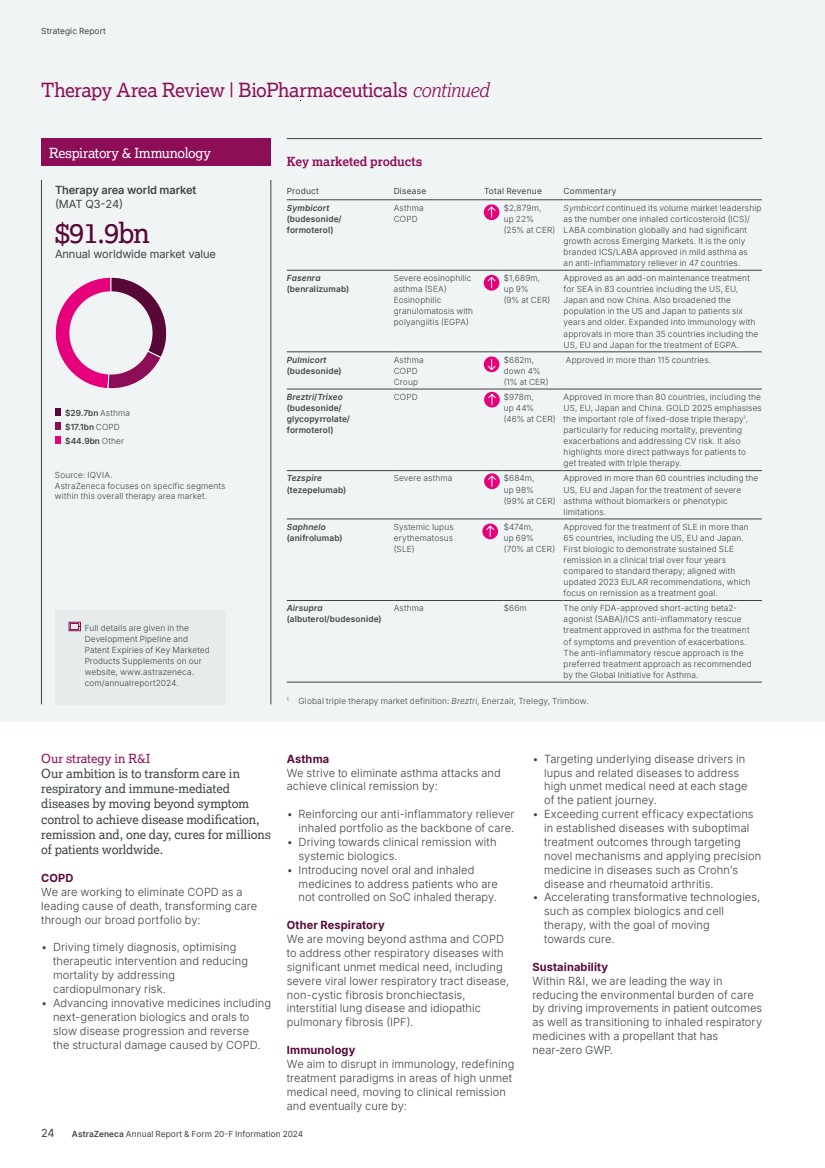
| 2024 review – strategy in action COPD Breztri remains the fastest-growing triple inhaled therapy within the growing fixed‑dose combination triple class¹ across major markets. Breztri has demonstrated a reduction in mortality that has been recognised in the 2025 Report published by the Global Initiative for Lung Disease (GOLD). In March 2024, we initiated the first Phase III cardiopulmonary outcomes trial in COPD, THARROS, to investigate Breztri’s potential to improve cardiopulmonary outcomes, including death from respiratory and cardiac causes. In the fourth quarter of 2024, we submitted regulatory filings in the EU, UK and China to support the transition of Breztri (marketed as Trixeo in Europe) as the first medicine in our inhaled portfolio to use our next-generation propellant with near-zero GWP. We remain on track to transition our portfolio of inhaled respiratory medicines delivered by pressurised metered-dose inhalers (pMDIs) by 2030, as part of our Ambition Zero Carbon strategy. While pMDIs contribute less than 0.04% of GHG emissions, AstraZeneca is committed to significantly reducing this burden. We have a robust late-stage biologics programme in COPD: tozorakimab (Phase III LUNA programme), which has a unique dual mechanism of action targeting IL-33, plus indication expansion opportunities with Fasenra (Phase III RESOLUTE trial) and Tezspire (Phase III trial planned). Our innovative early pipeline in COPD is aimed at reaching patients who will not have access to biologics, but no longer respond to inhaled therapy. AZD6793 is an oral small molecule IRAK4 inhibitor in Phase I development targeting key COPD disease drivers triggered by bacterial and viral infections, smoke and other environmental factors. Asthma Airsupra has had strong uptake in the US as the first and only FDA-approved anti-inflammatory rescue therapy that treats symptoms and prevents exacerbations. In October 2024, we announced that Airsupra demonstrated a statistically significant and clinically meaningful reduction in the risk of a severe exacerbation in patients with intermittent or mild or persistent asthma in the BATURA Phase III trial. Symbicort maintained its position as the leading inhaled corticosteroid (ICS)/long acting beta2-agonist (LABA) globally by volume and value. Performance has been driven by strong growth in Emerging Markets, and resilient performance in the US offset by generic erosion in the EU and Japan. Tezspire continues gaining market share, achieving labels for a broad population of severe asthma patients, and securing reimbursement globally. We also announced positive high-level results from the Phase III WAYPOINT trial studying Tezspire for the treatment of chronic rhinosinusitis with nasal polyps. In 2024, US and Japan regulatory authorities approved the paediatric indication for Fasenra for SEA, in patients as young as six years old. In August 2024, we announced the approval of Fasenra for SEA in China in people 12 years of age and older based on positive results from the MIRACLE Phase III trial. Two Phase III pivotal trials, KALOS and LOGOS are investigating Breztri in asthma. Our early pipeline is exploring innovative compounds including new modalities, aimed at targeting key disease mechanisms: • AZD8630, an inhaled fragment antibody (inhaled biologic) in Phase II in co‑development with Amgen, targets thymic stromal lymphopoietin (TSLP). • Atuliflapon, an oral 5-lipoxygenase-activating protein (FLAP) inhibitor in Phase IIa, could offer an alternative for uncontrolled patients before systemic biologics. • AZD4604, an inhaled JAK1 inhibitor in Phase IIa has the potential to block the effects of T2-high pro-inflammatory pathways (IL4/13, TSLP) and T2-lower pathways (IL6, interferon). Other Respiratory The TILIA Phase III trial of tozorakimab in severe viral lower respiratory tract disease is ongoing. AZD8965, an oral small molecule arginase inhibitor, in Phase I for IPF has the potential to stop disease progression by blocking collagen synthesis, which is deposited in the lungs of patients with IPF. Immunology Saphnelo continues its rapid growth. At the European Lupus Meeting 2024, we announced results from a post-hoc analysis of the Phase III TULIP programme in SLE that showed 30% of patients treated with Saphnelo achieved remission using the Definition of Remission in SLE (DORIS) criteria. Phase III trials are ongoing exploring Saphnelo for SLE in China as well as globally in lupus nephritis, cutaneous lupus erythematosus, idiopathic inflammatory myopathies, systemic sclerosis, and in SLE for subcutaneous delivery. For more information on: pMDI inhalers, Scope 1 and 2 Decarbonisation levers, Scope 3 Decarbonisation levers and Transition risk and opportunities, see Climate Change from page 53. Fasenra is now approved for the treatment of EGPA in more than 35 countries including the US, EU and Japan, based on positive results from the MANDARA Phase III trial. Tezspire is also being investigated in eosinophilic oesophagitis, a chronic inflammatory disease of the gastrointestinal tract. Compounds in early-stage clinical development include three potential first-in-class medicines: • AZD0120, a CD19xBCMA biCAR-T therapy in Phase I that may lead to a complete immune reset by targeting both B-cells and plasma cells in SLE patients. • AZD7798, a CCR9-depleting mAb in Phase II. CCR9 is the main chemokine receptor for trafficking lymphocytes to the small intestine and considered central to the generation of small bowel inflammation in Crohn’s disease. • AZD1163, a PAD2/4 inhibitor in Phase I targeting the enzyme activity which drives the autoimmune response leading to inflammation and tissue damage in rheumatoid arthritis. AstraZeneca Annual Report & Form 20-F Information 2024 25 Strategic Report Corporate Governance Financial Statements Additional Information Therapy Area Review | BioPharmaceuticals | Respiratory & Immunology |
| Key marketed products Product Disease Total Revenue Commentary Beyfortus (nirsevimab) Respiratory syncytial virus (RSV) $722m, up 176% (173% at CER) Approved in 50 countries. Commercialised in collaboration with Sanofi in all territories except the US where Sanofi has full commercial control. Synagis (palivizumab) RSV $447m, down 18% (14% at CER) Available in more than 100 countries outside the US. Sobi holds the US rights. FluMist (live attenuated influenza vaccine) Influenza $258m, up 14% (10% at CER) Approved in the US, EU and other countries. Approved for self-administration in the US. Daiichi Sankyo holds rights to FluMist in Japan. COVID-19 mAbs1 (tixagevimab and cilgavimab, and sipavibart) COVID-19 $31m, down 90% (90% at CER) Use of COVID-19 mAbs is extremely limited due to the high prevalence of non-susceptible variants. 1 In 2024 Evusheld was no longer a key marketed product. Source: IQVIA. AstraZeneca focuses on specific segments within this overall therapy area market. Therapy area world market (MAT Q3-24) $21.7bn Annual worldwide market value 26 AstraZeneca Annual Report & Form 20-F Information 2024 Strategic Report Our strategy in V&I Our ambition is to develop innovative vaccines and antibodies to protect patients from serious viral and bacterial infections. Our complementary approach includes vaccines for broad populations and antibodies for targeted patient groups including the immunocompromised, older adults and infants. Vaccines We are engineering next-generation vaccines utilising innovations such as mRNA, virus-like particles and bioconjugates. These technologies have the potential to generate potent and long-lasting immune responses against viral and bacterial pathogens. The acquisition of Icosavax included the potential first-in-class combination RSV and human metapneumovirus (hMPV) vaccine, building on our expertise in RSV prevention and accelerating our ambition to deliver a portfolio of protective interventions to address high unmet medical need in infectious diseases. The collaboration agreement with US-based biotechnology company Omniose enabled research vaccines for serious bacterial diseases. AstraZeneca holds exclusive rights to Omniose’s proprietary bioconjugation platform for up to three years. Antibodies We are pioneering novel approaches to develop highly-targeted, long-acting antibodies, using several engineering advances to isolate highly potent antibodies to deliver protection to vulnerable patients, including the immunocompromised, older adults and infants. 2024 review – strategy in action Our V&I strategy is focused on reducing the burden of infectious diseases among people at highest risk of more severe outcomes. This includes patients that we already serve, such as those with chronic respiratory or CV disease whose underlying condition may worsen due to serious infection. RSV • In February 2024, AstraZeneca announced the successful completion of the acquisition of Icosavax, a US-based clinical-stage biopharmaceutical company, including IVX-A12, a potential first-in-class combination protein virus-like particle vaccine which targets both RSV and hMPV. These two viruses are leading causes of severe respiratory infection and hospitalisation in adults 60 years of age and older and those with chronic conditions such as CV, renal and respiratory disease. • Beyfortus is a long-acting antibody (LAAB), developed by AstraZeneca and commercialised from an alliance with Sanofi, using AstraZeneca’s YTE extended half-life technology. In its first year of implementation, Beyfortus has demonstrated significant real-world effectiveness, showing a 90% reduction in RSV-associated hospitalisations across multiple countries. • In March 2024, Beyfortus was approved in Japan for the prevention of RSV LRTD in all neonates, infants and children entering their first RSV season, and the prevention of RSV LRTD in neonates, infants and children at risk of serious RSV infection entering their first or second RSV season. Beyfortus is now approved in 50 countries, with further regulatory applications currently under review. • 2024 saw significant expansion of Beyfortus supply ahead of the 2024 to 2025 RSV season to meet global demand through an expanded manufacturing network, and a second manufacturing filling line approved by regulatory authorities in the US, Canada and Europe. A third filling line was approved by the EMA and is under review by the US FDA. • Since its initial approval in 1998, Synagis has become a global SoC for RSV prevention and helps protect at-risk babies against the virus. Our agreement with Sobi for the rights to Synagis in the US remains ongoing. As anticipated, Synagis demand decreased following rapid adoption of Beyfortus. Influenza • FluMist is a live attenuated influenza vaccine, given as an intranasal spray. FluMist is recommended as an influenza vaccine option by the Advisory Committee on Immunization Practices and American Academy of Pediatrics. • In September 2024, FluMist was approved in the US as the only self-administered influenza vaccine. The US FDA approved an expansion to those who can administer FluMist to include self-administration for eligible 18 to 49 year olds or administration by a caregiver for eligible two to 17 year olds. The self-/caregiver-administration option will be available as early as the 2025 to 2026 influenza season. COVID-19 • Kavigale (sipavibart), our LAAB designed to provide COVID-19 protection in immunocompromised individuals, received approvals in Japan and the EU. Both approvals are supported by positive data from the SUPERNOVA Phase III COVID-19 prevention trial. Full details are given in the Development Pipeline and Patent Expiries of Key Marketed Products Supplements on our website, www.astrazeneca. com/annualreport2024. Vaccines & Immune Therapies Therapy Area Review | BioPharmaceuticals continued |
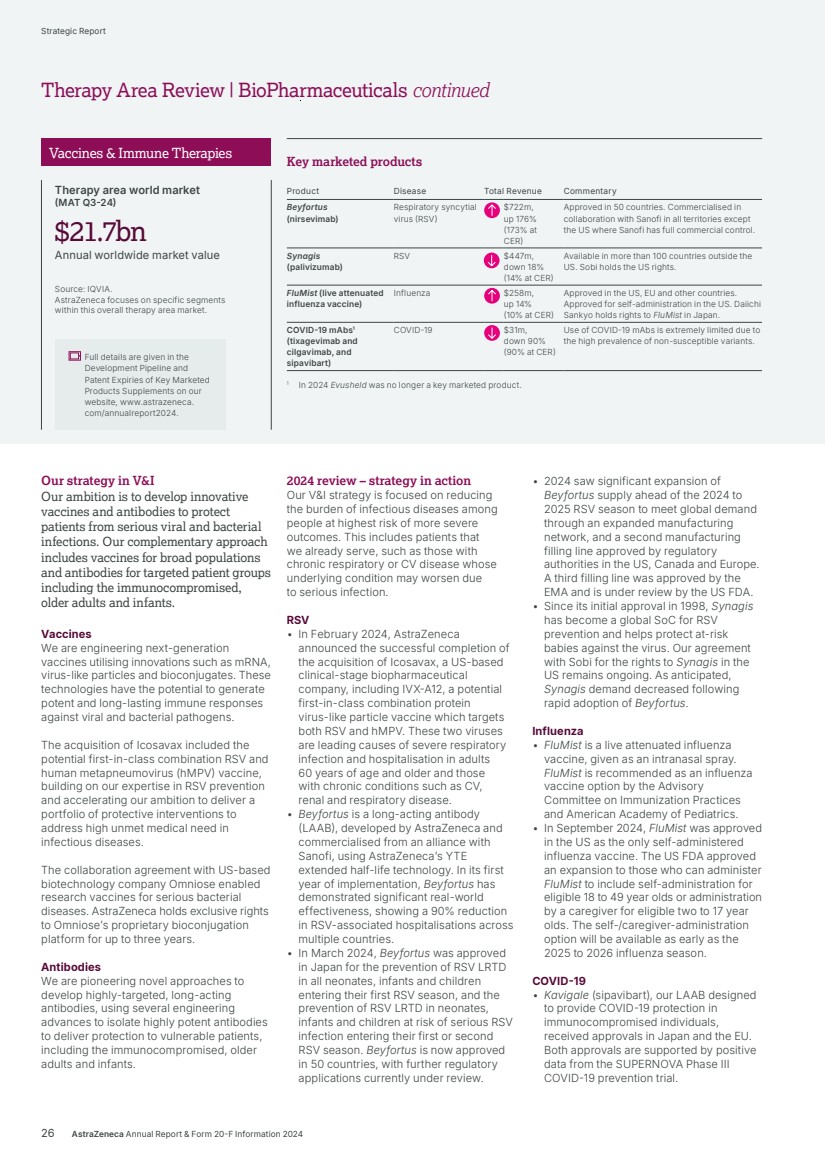
| AstraZeneca Annual Report & Form 20-F Information 2024 27 Strategic Report Corporate Governance Financial Statements Additional Information Therapy Area Review | BioPharmaceuticals | Vaccine & Immune Therapies • 2024 saw the withdrawal of marketing authorisations globally for Vaxzevria, the Oxford-AstraZeneca vaccine, concluding AstraZeneca’s significant contribution to the COVID-19 pandemic, with over three billion doses made available across 180 countries, estimated to have saved over six million lives. Early science Compounds in early-stage clinical development include AZD5148, an anti-toxin B neutralising mAb now in Phase I trials, which may provide protection against Clostridioides difficile (C. diff) infection, a condition that can cause life-threatening diarrhoea and intestinal inflammation. Preclinical data for AZD5148 were presented at the 34th European Congress of Clinical Microbiology & Infectious Diseases and IDWeek 2024. In January 2025, the first patient was dosed in the Staphylococcus aureus mAb combination trial. Delivering public health impact through reducing the burden of RSV in infants The introduction of Beyfortus marked a significant step forward in our ambition to improve public health globally, as for the first time we could protect a broad infant population against RSV. While our confidence in the value of RSV prevention was underscored by our extensive trial programme, real-world data collected following our first season surpassed all expectations, with ~90% reduction in RSV hospitalisations seen across many countries. Beyond its impact on RSV, clinicians also reported a reduction in all-cause hospitalisations, demonstrating the value of RSV prevention with Beyfortus in not only reducing the burden on infants and their families, but delivering against our commitment to support sustainable and resilient healthcare systems. |
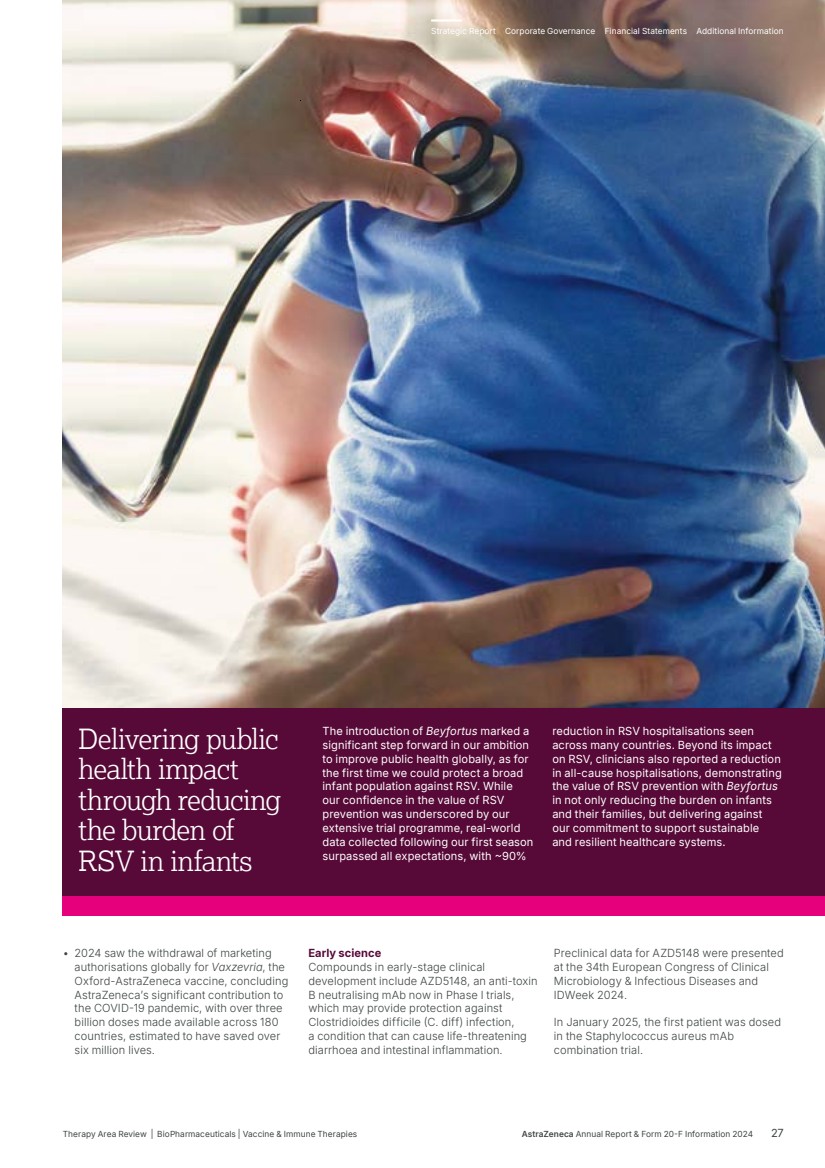
| 2024 overview • Delivering robust and sustainable growth since AstraZeneca’s acquisition of Alexion. • Performance driven by durable growth in C5 inhibition, increased demand beyond complement inhibition, as well as market expansion. • Advancing next wave of innovative therapies with a focus on first- and/or best-in-class medicines and new modalities with curative potential. • A continued focus in launching in new countries globally and addressing underserved rare populations. • Furthering a commitment to overcome societal and policy challenges and improve health equity for people living with rare diseases. Total Revenue $8,768m up 13% (16% at CER) 2023: $7,764m 2022: $7,053m Therapy Area Review Transform lives Rare Disease Alexion, AstraZeneca Rare Disease continues to build a diversified pipeline across disease areas with significant unmet medical need, using an array of innovative modalities, while expanding our global geographic footprint. Unmet medical need and world market 400m people around the world are living with a rare disease. <10% of rare diseases have approved treatment options. >70 countries we are reaching with rare disease treatments, with an ambition to reach 100 countries by 2030. 28 AstraZeneca Annual Report & Form 20-F Information 2024 Strategic Report |
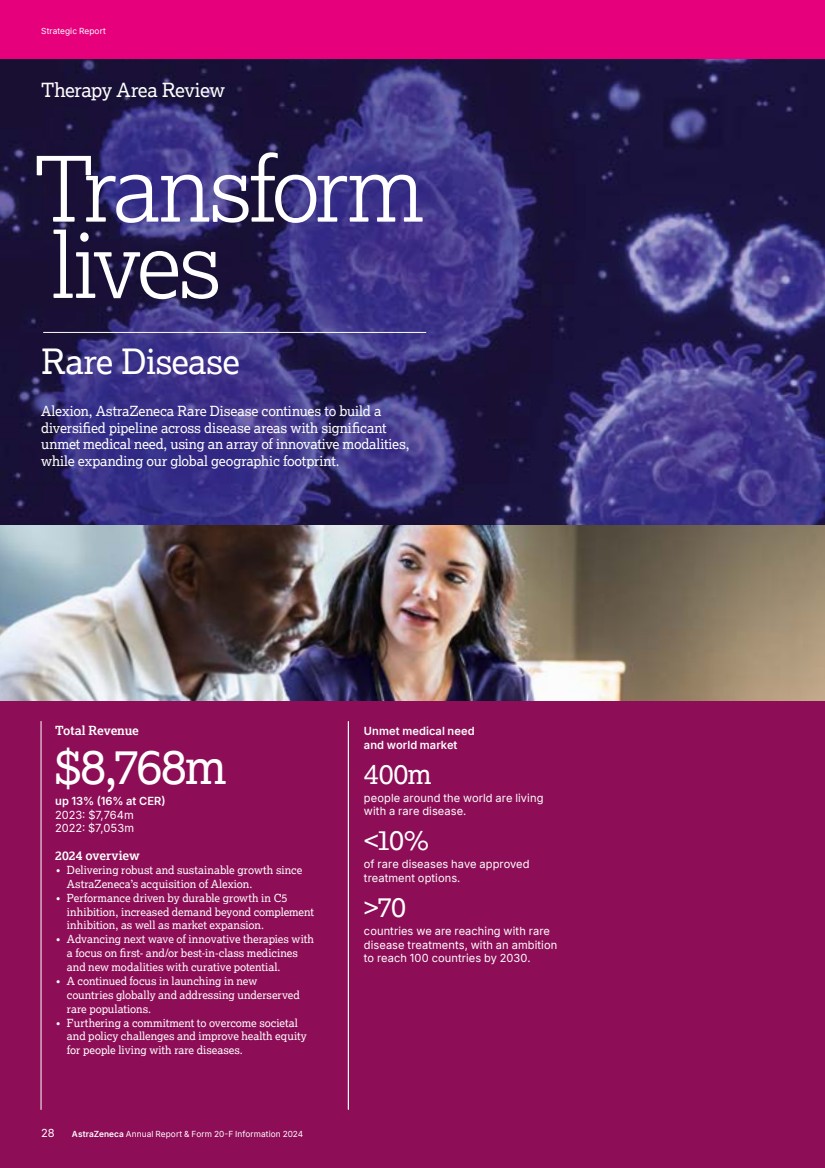
| Our strategy in Rare Disease We are dedicated to improving the lives of those living with rare diseases, and the people who support them, through: • Building on our pioneering legacy of innovation and diversifying our portfolio to advance innovative therapies with a focus on developing first- and/or best-in-class medicines. • Investing in promising new and potentially curative modalities including cell and gene therapy. • Enhancing science-led innovation across the enterprise to accelerate drug development and delivery. • Bringing transformative medicines to new markets, reaching more patients in a sustainable and equitable way. 2024 review – strategy in action Sustained leadership in complement In 2024, we saw durable growth in our C5 franchise, driven particularly by demand growth in neurology indications, including in gMG and NMOSD. Additionally, we continue to see successful conversion from Soliris to Ultomiris across indications. gMG is a rare autoimmune disorder which can impact mobility, speech and breathing, and can occur at any age, but most commonly begins for women before the age of 40 and for men after the age of 60. NMOSD is a rare and debilitating autoimmune disease characterised by unpredictable relapses that can lead to permanent disability. In March 2024, Ultomiris was approved in the US for the treatment of adults with AQP4 Ab+ NMOSD. The FDA approval was based on positive results from the CHAMPION-NMOSD Phase III trial, in which zero relapses were observed among Ultomiris-treated patients. Data presented at scientific congresses throughout the year, including at the Annual meetings of the American Academy of Neurology and the European Academy of Neurology, reinforce the long-term safety and efficacy profiles of Ultomiris and Soliris, and demonstrates how these medicines can transform outcomes for rare neurological diseases, including gMG and NMOSD. Ultomiris is also being investigated in several disease areas in which the complement pathway is thought to play a role, including ongoing Phase III trials in haematopoietic stem cell transplant-associated thrombotic microangiopathy (HSCT-TMA), cardiac surgery-associated acute kidney injury (CSA-AKI) and immunoglobulin A nephropathy (IgAN). HSCT-TMA is a potentially life-threatening complication of HSCT which in some cases can be worsened by overactivation of the complement system, believed to fuel Key marketed products Product Disease Total Revenue Commentary Ultomiris1 (ravulizumab) Paroxysmal nocturnal haemoglobinuria (PNH) Atypical haemolytic uremic syndrome (aHUS) Generalised myasthenia gravis (gMG) Neuromyelitis optica spectrum disorder (NMOSD) $3,924m, up 32% (34% at CER) Approved in 70 countries for the treatment of patients with PNH and patients with aHUS, including the US, EU and Japan. Approved in 68 countries for the treatment of adult patients with gMG who are anti-acetylcholine receptor antibody-positive (AChR Ab+), including the US, EU and Japan. Approved in 61 countries for the treatment of adult patients with NMOSD who are anti-aquaporin-4 antibody-positive (AQP4 Ab+), including the US, EU and Japan. Soliris2 (eculizumab) PNH aHUS gMG NMOSD $2,588m, down 18% (14% at CER) Approved in 56 countries for the treatment of patients with PNH and patients with aHUS, including the US, EU, Japan and China. Approved in 46 countries for the treatment of patients with gMG who are AChR Ab+ including the US, EU, Japan and China. Approved in 47 countries for the treatment of adult patients with NMOSD who are AQP4 Ab+, including the US, EU, Japan and China. Strensiq (asfotase alfa) Hypophosphatasia (HPP) $1,416m, up 23% (24% at CER) Approved in 60 countries for the treatment of certain patients with HPP, including the US, EU and Japan. Koselugo (selumetinib) Neurofibromatosis type 1 (NF1) Plexiform neurofibromas (PN) $631m, up 91% (96% at CER) Approved in 66 countries for the treatment of paediatric patients, including the US, EU, Japan and China. Kanuma (sebelipase alfa) Lysosomal acid lipase deficiency (LAL-D) $209m, up 22% (24% at CER) Approved in 51 countries, including the US, EU and Japan. 1 Ultomiris Total Revenue includes revenue of Voydeya which commenced in 2024. 2 We continue to see successful conversion from Soliris to Ultomiris across indications. Full details are given in the Development Pipeline and Patent Expiries of Key Marketed Products Supplements on our website, www.astrazeneca. com/annualreport2024. endothelial cell damage and the development of TMAs. Survival and clinical outcomes are poor, with a mortality rate of >50% at one year post-HSCT, and currently there are no approved treatments. IgAN is a rare, chronic kidney disease that begins when the body develops abnormal IgA proteins that result in the build-up of immune complexes in the kidneys, causing damage. This can impact the ability of the kidneys to function properly, resulting in chronic kidney disease that can progress to end-stage kidney disease. Approximately 25-30% of people with IgAN will progress to end-stage kidney disease, or kidney failure. Complement innovation beyond Soliris and Ultomiris We are developing a broad portfolio of potential medicines that target various components of the complement system, with opportunities to pursue indications across a wide range of therapeutic areas of interest, including haematology, nephrology and neurology. AstraZeneca Annual Report & Form 20-F Information 2024 29 Strategic Report Corporate Governance Financial Statements Additional Information Therapy Area Review | Rare Disease |
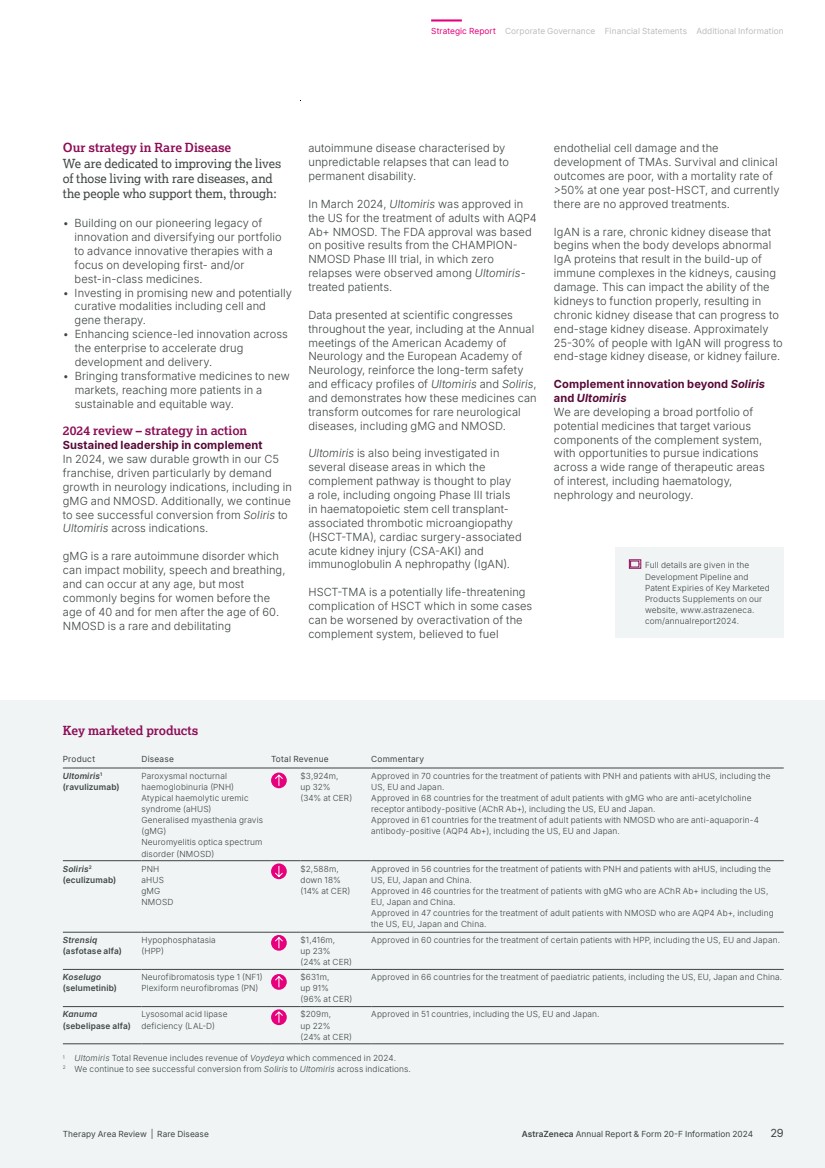
| Our next-generation investigational ALP replacement therapy, efzimfotase alfa, is designed to help reduce the treatment burden for patients via more convenient, less frequent dosing. Through patient-centred innovation, three Phase III trials have been initiated to evaluate efzimfotase alfa. These include: paediatric patients who have not been treated with Strensiq; paediatric patients switching from Strensiq to efzimfotase alfa; and adolescent and adult patients who have not been treated with Strensiq. Hypoparathyroidism (HypoPT) In 2024, we acquired Amolyt Pharma, expanding into endocrine disease and extending our bone metabolism franchise with the addition of eneboparatide, a Phase III investigational parathyroid hormone receptor 1 (PTHR1) agonist with a novel mechanism of action designed to meet key therapeutic goals for HypoPT. In patients with HypoPT, a deficiency in parathyroid hormone production results in significant dysregulation of calcium and phosphate, which can lead to life-altering symptoms and complications, including CKD. Encouraging Phase II data for eneboparatide has demonstrated normalisation of serum calcium levels as well as the potential to eliminate dependence on daily calcium and vitamin D supplementation. In adults with chronic HypoPT and hypercalciuria, results showed that eneboparatide normalised calcium in urine. In addition, for patients with HypoPT, eneboparatide preserved bone mineral density, an important potential benefit in patients with an increased risk of osteopenia or osteoporosis. Data from the Phase III trial are anticipated in 2025. Neurofibromatosis Type 1 (NF1) Plexiform Neurofibromas (PN) NF1 PN is a rare, progressive, genetic condition that involves the development of non-malignant (non-cancerous) tumours that may affect the brain, spinal cord and nerves. NF1 affects an estimated 1.7 million individuals worldwide, approximately 70% of whom are adults. In 30-50% of patients, tumours develop on the nerve sheaths and may cause debilitating symptoms. High-level results from the KOMET Phase III trial with Koselugo demonstrated a statistically significant and clinically meaningful objective response rate compared to placebo in adults with NF1 who have symptomatic, inoperable PN. In January 2024, Voydeya (danicopan) – our first-in-class oral Factor D inhibitor – received its first-ever regulatory approval in Japan, followed by additional approvals in the US, EU and other countries. Voydeya is approved as add-on therapy to ravulizumab or eculizumab to address the needs of the subset of patients (approximately 10-20%) with PNH who experience extravascular haemolysis while treated with a C5 inhibitor. Approval was based on the positive results from the pivotal ALPHA Phase III trial; results from the 12-week primary evaluation period of the trial were published in The Lancet Haematology. Through a global Phase III trial, we are evaluating the efficacy and safety of gefurulimab, an investigational bispecific VHH antibody targeting C5, designed for weekly subcutaneous self-administration, in adults with AChR Ab+ gMG, and exploring the ability to treat earlier-line and broader gMG patient populations. In January 2025, the vemircopan (ALXN2050) Phase II development programme was terminated. The decision was based on safety and efficacy data from Phase II trials across multiple indications. Expanding beyond complement We have continued to expand our rare disease focus with novel assets for non-complement-mediated diseases with a focus on first- and/or best-in-class medicines. Amyloidosis Amyloidosis is a group of complex rare diseases with significant unmet medical need caused by abnormal proteins that misfold and clump together to form amyloid that deposits in tissues or organs, including the heart. The build-up of these amyloids can result in significant organ damage and organ failure that can severely impact quality of life and ultimately be fatal. We are advancing one of the industry’s broadest and fastest-growing amyloidosis pipelines across our therapeutic areas, evaluating a broad range of modalities to address the two most common types of cardiac amyloidosis. Our portfolio includes two novel anti-fibril depleters, anselamimab and ALXN2220, that seek to address the most prevalent amyloidosis cardiomyopathies, light-chain amyloidosis and transthyretin amyloidosis, respectively, by selectively binding to and removing amyloid deposits. It also includes acoramidis, a stabiliser designed to prevent further breakdown of transthyretin (TTR) proteins and their deposition in tissue. Amyloid light-chain (AL) amyloidosis AL amyloidosis occurs when defective plasma cells in bone marrow produce abnormal proteins which aggregate to form toxic amyloid fibril deposits. Amyloid fibril accumulation in organs, particularly in the heart and kidneys, may cause systemic and progressive organ damage and high mortality rates caused most often from cardiac failure. Anselamimab is being investigated in a Phase III clinical programme in patients with AL amyloidosis. By removing amyloid fibrils from affected organs, anselamimab has the potential to be the first treatment to address the devastating organ damage caused by amyloidosis on top of SoC. Transthyretin amyloidosis (ATTR) ATTR cardiomyopathy (ATTR-CM) is a systemic, progressive, debilitating condition that can lead to HF. Median survival in patients with advanced cardiomyopathy is between one to two years from diagnosis. Because the symptoms can be similar to other diseases, there are frequent misdiagnoses and ATTR-CM can often go undetected. ALXN2220 is an investigational mAb designed to selectively bind to and remove ATTR amyloid fibrils, with the potential to reverse the course of disease. A Phase III trial is underway evaluating ALXN2220 as an add-on treatment to SoC in patients with ATTR-CM. In September 2024, ALXN2220 was granted Fast Track Designation by the FDA based on efficacy and safety data from the positive Phase Ib trial, which were published in the New England Journal of Medicine, and additional non-clinical data. We also hold an exclusive licence from BridgeBio’s affiliate, Eidos, to develop and commercialise acoramidis, an investigational, next-generation, orally-administered, highly-potent, small-molecule stabiliser of TTR, in Japan. In February 2024, positive high-level results from the Japan Phase III trial of acoramidis in adults with ATTR-CM showed consistency to those in the global BridgeBio ATTRibute-CM Phase III trial, including survival, cardiac-related hospitalisations and other measures of improved functions and quality of life at 30 months. In November 2024, BridgeBio announced the US approval of acoramidis for the treatment of adults with ATTR-CM. Hypophosphatasia (HPP) HPP is a rare, inherited and progressive metabolic disease characterised by defective mineralisation, impaired calcium and phosphate regulation and non-skeletal manifestations such as muscle weakness, generalised fatigue and pain. HPP is caused by deficient activity of an enzyme known as alkaline phosphatase (ALP). 30 AstraZeneca Annual Report & Form 20-F Information 2024 Strategic Report Therapy Area Review | Rare Disease continued |
| Genomic medicine and cell therapy Supported by recent strategic acquisitions, investments and collaborations, we are advancing an industry-leading suite of next-generation genomic medicines, cell therapies and platforms, with the objective to develop innovative therapies with improved safety and efficacy profiles. This includes filing an Investigational New Drug (IND) Application for a potential first-in-class gene therapy in a rare cardiovascular disease and plans to expand clinical investigations in cell therapy into rare diseases in 2025. Rare cancers Rare cancers account for approximately a quarter of cancer deaths and have a lower five-year survival rate than most common cancers, representing a significant unmet medical need. We are partnering with colleagues across AstraZeneca to follow the science and identify opportunities where we intend to leverage our expertise and infrastructure to deliver transformative outcomes for patients. Expansion into rare endocrinology We expanded our pipeline into rare endocrinology with the acquisition of Amolyt Pharma and the addition of eneboparatide, a Phase III investigational peptide. HypoPT is a rare disease affecting over 200,000 people in the US and EU, approximately 80% of whom are women. Eneboparatide is a parathyroid hormone (PTH) receptor 1 (PTHR1) agonist with a novel mechanism of action rationally designed to restore PTH function to manage the symptoms of HypoPT, while preserving kidney function and bone health. Encouraging Phase II data supports the potential for eneboparatide to lessen the often debilitating impact of low parathyroid hormone and avoid the risks of high-dose calcium supplementation. A commitment to health equity in rare disease Being born with a rare disease is inherently inequitable. We are committed to taking bold steps to overcome societal and policy challenges and improve health equity for people living with rare diseases. This includes improving access to care and treatment. Rare disease patients – regardless of where they live – face significant obstacles to accessing quality healthcare and treatment. We are working to reduce these obstacles by focusing on developing and delivering new medicines, serving more patients in more geographies as we grow our global footprint, improving the reach and diversity of our clinical trials, and enabling access by bridging treatment gaps with our alternative access programmes. It also includes reducing time to diagnosis. Access to effective screening and diagnostic tools remains inequitable for many patients with rare conditions. We are working to expand access to screenings for newborn babies and next-generation sequencing, to provide needed answers more rapidly. Strategic Report Corporate Governance Financial Statements Additional Information Therapy Area Review | Rare Disease AstraZeneca Annual Report & Form 20-F Information 2024 31 |

| Delivering our strategic priorities sustainably, supporting scientific innovation and promoting commercial excellence. Our business is organised to deliver our Growth Through Innovation strategy. The success of our functions is built on recruiting, retaining and developing talented people. Our key topics covered include material sustainability topics, which have been identified through our double materiality assessment, see page 60 for more information. Science and Innovation We are focused on science and innovation, from discovery through to development and life-cycle management, and on transforming care and outcomes for patients. We have three therapy area focused R&D organisations – Oncology, BioPharmaceuticals and Rare Disease. Key topics covered Summary and performance indicators Research & Development Development pipeline overview Sustainable innovation BV Patient safety and product quality BV Growth and Therapy Area Leadership We are focused on launching medicines that deliver sustainable growth and realising the potential of our pipeline. Our Commercial regions align product strategy and commercial delivery while our Operations function manufactures and delivers our medicines. Key topics covered Summary and performance indicators Sales and marketing Operations Business conduct BV IT and IS resources Cybersecurity and data privacy BV Business development People and Sustainability We are committed to our people, ensuring that AstraZeneca remains a great place to work. We promote health equity and resilient healthcare, and play an active role in addressing the climate crisis. We operate in a responsible and sustainable way to build a healthy future for people, society and the planet. Key topics covered Summary and performance indicators BV People • Talent attraction and retention BV Sustainability • Accessible and affordable healthcare BV • Climate change BV • Pollution BV Material sustainability metric, is independently assured by Bureau Veritas. Strategic Report 32 AstraZeneca Annual Report & Form 20-F Information 2024 Business Review |

| Global reach and presence 2 4 5 6 7 8 9 10 3 1 4 1 2 5 3 18,400 (19%) US 7,000 (7%) Established Rest of World 37,100 (39%) Europe 31,800 (34%) Emerging Markets Our Strategic R&D centres 1. Gaithersburg, MD, US 2. Boston, MA, US 3. Cambridge, UK (HQ) 4. Gothenburg, Sweden 5. Shanghai, China Our Global hubs 1. Guadalajara, Mexico 2. San José, Costa Rica 3. Mississauga, Canada 4. Lisbon, Portugal 5. Dublin, Ireland 6. Barcelona, Spain 7. Warsaw, Poland 8. Bangalore, India 9. Chennai, India 10. Kuala Lumpur, Malaysia Operations sites Employees by reporting region1 16,300 employees across our manufacturing sites 94,300 employees 44 countries of origin represented in executive levels Strategic R&D centres We have five global strategic R&D centres that are the driving force of our R&D strategy, leveraging cutting-edge science and technology to deliver life-changing medicines. Operations Manufacturing supports business growth and pipeline development, maintaining excellence in product launch, quality and supply. 26 Operations sites in 16 countries 202 successful market launches People We have a global commitment to inclusion and diversity. 15,200 R&D employees across our global sites Global hubs Our network of 10 global hubs bring together complementary capabilities, skills and expertise to help build resilience for the future. 1 Due to rounding, the sum of percentages may not agree to totals. 47,200 Commercial employees AstraZeneca Annual Report & Form 20-F Information 2024 33 Strategic Report Corporate Governance Financial Statements Additional Information Business Review | Global reach and presence |
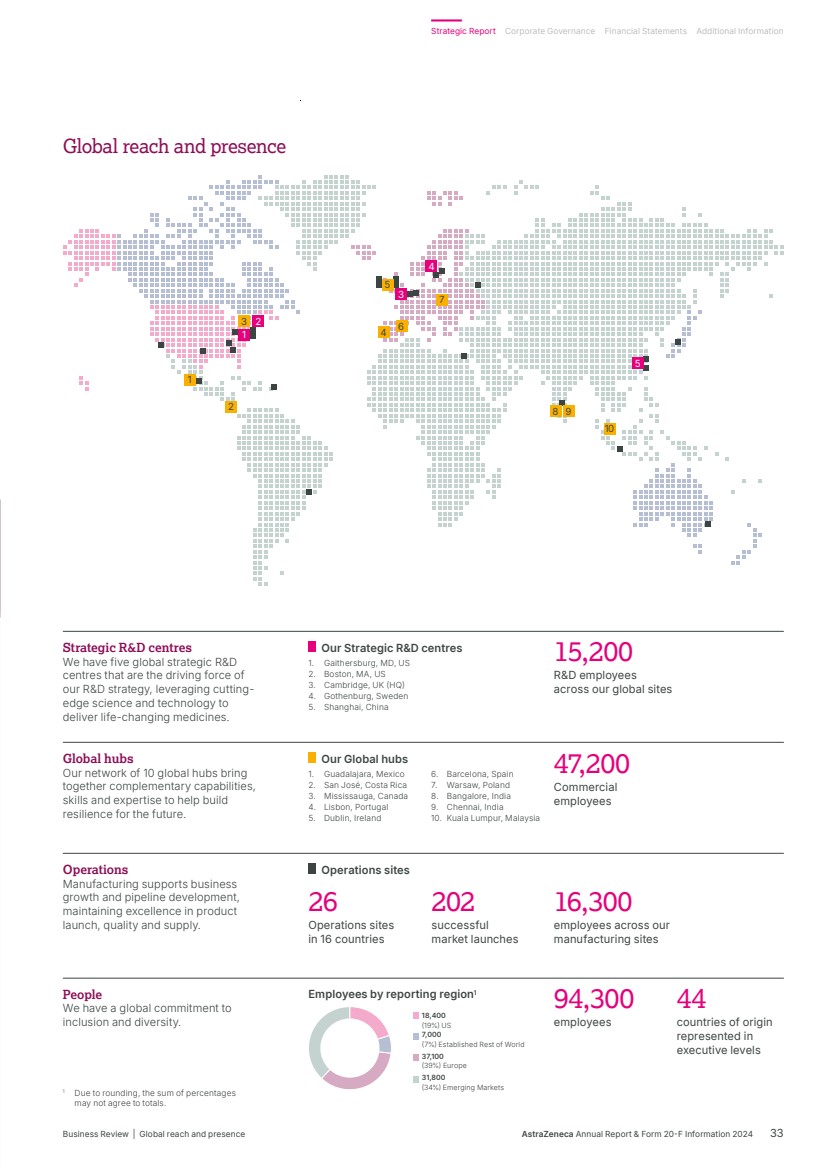
| 39% Discovery and early-stage development 61% Late-stage development Research & Development 2024 2023 2022 10 6 6 [8] [8] NME Phase II starts/ progressions 1010 2024 2023 2022 43 31 38 NME and major LCM submissions 4343 2024 2023 2022 14 24 23 NME and major LCM Phase III investment decisions 1414 2024 2023 2022 31 25 34 NME and major LCM approvals 3131 1 Thomson Reuters five-year impact factor score. Science and Innovation Performance indicators Our Key Performance Indicators include the measurement of Phase II and III pipeline progressions, which are critical for ensuring both near-term and long-term delivery. The initiation of Phase II new molecular entities (NMEs) is essential for maintaining the robustness and stability of our pipeline. Meanwhile, investments in Phase III are focused on delivering near-term value. Additionally, our submission and approval metrics serve as indicators of our innovation’s advancement in four major markets: the US, EU, China and Japan. Research & Development In 2024, we continued to progress our science and pipeline, committed to early diagnosis and treatment, improving our understanding of disease biology and advancing our scientific modalities across disease areas. Summary and performance indicators We are using our scientific capabilities and focusing on transformative science to accelerate the delivery of high quality, life-changing medicines. Our performance in 2024 • Invested $13.6 billion in our R&D. • Three first approvals for new medicines. • 74 regulatory events and 24 pipeline progressions. • 191 pipeline projects, of which 169 are in the clinical phase of development. • More than 2,000 people working in The Discovery Centre in Cambridge, UK. • Published 1,223 manuscripts with 175 in ‘high-impact’ journals. • Invested in new technologies and modalities such as cell therapies, genomic medicines and radioconjugates. Our R&D resources Our strategic R&D centres As we deliver on our strategy, we are focused on maximising our investment in science and innovation, embracing new ways of working to become even more productive, and have a bigger impact on people, society and the planet. Our five strategic R&D centres are the driving force of our strategy, our science and our long-term success. We are also investing in a network of global hubs to ensure we are best positioned to deliver our Ambition 2030. Further expanding our footprint opens new opportunities for us around the world and provides greater access to the talent and capabilities we need to achieve our growth ambitions. We are creating sustainable, digitally-enabled workplaces of the future, designed to inspire and motivate people to produce their most innovative work. Investing in R&D In 2024, R&D expenditure was $13,583 million (2023: $10,935 million; 2022: $9,762 million), including Core R&D costs of $12,211 million (2023: $10,267 million; 2022: $9,500 million). In addition, we spent $2,226 million on acquiring product rights (such as through in-licensing) (2023: $2,530 million; 2022: $2,051 million). We also invested $275 million in the implementation of our R&D restructuring strategy (2023: $212 million; 2022: $111 million). Allocations of spend by early- and late-stage development are shown in the chart to the left. Our R&D in 2024 In 2024, we continued to focus on key areas of transformative science. Our scientists published 1,223 manuscripts with 175 in ‘high-impact’ peer-reviewed journals, each with an impact factor exceeding 15.1 The ongoing high impact continues to reflect the quality of, and drive to share, our science. 34 AstraZeneca Annual Report & Form 20-F Information 2024 Strategic Report Business Review continued |
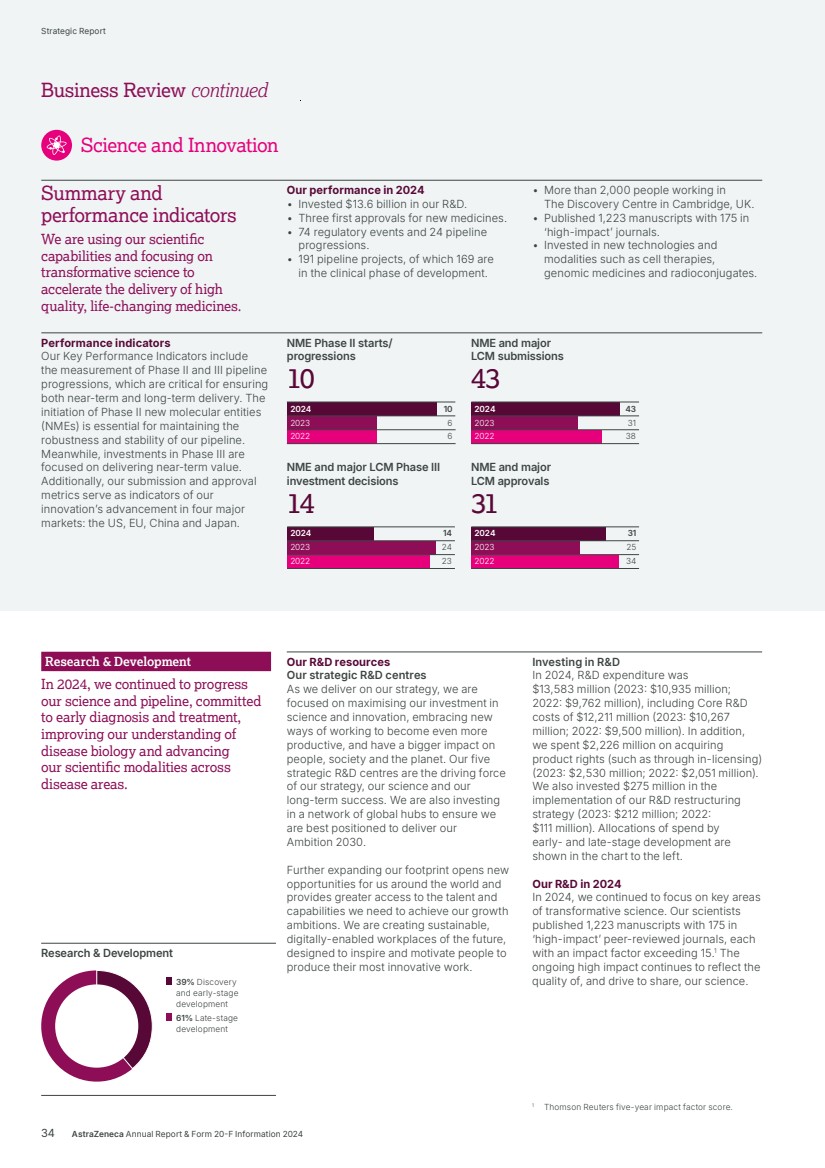
| Enhancing our understanding of disease biology Advancing our understanding of disease biology is helping uncover novel drivers for the diseases we aim to prevent, treat and even cure. Selecting the right target remains the most important decision in drug discovery. 2024 developments included: • Through the Centre for Genomics Research, we leveraged clinical and genetic data from 1.4 million people to enable 60 novel hypotheses, 16 new target selections and 50 pipeline decisions. On track for two million people by 2026. • Published several high-impact papers showcasing how multi-omic data impacts our understanding of disease biology and enables the advancement of our pipeline, for example by helping us better segment diseases such as prostate cancer. • Developed the first genome-wide CRISPR activation screen at the Functional Genomics Centre to identify overexpression genes that drive resistance to Enhertu. • Opened a genomic medicine research centre in Cambridge, Massachusetts, US, to advance our pipeline of genomic therapies. Creating the next generation of therapeutics We continue to expand our modalities across therapy areas and design new ways of targeting drivers of disease with novel platform technologies such as cell therapies and T-cell engagers, biologics, including antibodies or their fragments, ADCs and radioconjugates. We are also progressing a pipeline of genomic medicines and innovative small molecules, including oligonucleotides and PROTACs. 2024 developments included: • Accelerated our cell therapy strategy with the acquisition of Gracell, including AZD0120 (BCMAxCD19 CAR-T) for haematologic and immune-mediated diseases. Initiated Phase I study in refractory systemic lupus erythematosus (SLE) patients in China. Presented early clinical data at ASCO for AZD7003 (GPC3 CAR-T) which is being co-developed with AbelZeta in solid tumours, and developed a collaboration with Moffitt Cancer Center to accelerate our oncology cell therapy pipeline. • Advanced first next-generation CD8+ guided T-cell engager designed using our proprietary Target Induced T-cell Activating Nanobody (TITAN) platform into the clinic (AZD5492: CD20xCD8xTCR) in R/R B-cell malignancies. • Showcased proprietary ADC technology with promising first clinical data at ESMO for AZD8205 (B7H4 Top1i) and AZD5335 (FRα Top1i). • Accelerated pipeline of actinium-based radioconjugates through the acquisition of Fusion, including Phase II FPI-2265 targeting prostate-specific membrane antigen in prostate cancer. • Expanded CVRM portfolio via collaboration with SixPeaks Bio and in-licensing deal with CSPC, and advanced early clinical development for three novel therapies that could transform weight management and interconnected CVRM diseases. • Expanded into rare endocrinology with Amolyt Pharma acquisition and eneboparatide (AZP-3601), a Phase III novel parathyroid hormone receptor 1 (PTHR1) agonist in hypoparathyroidism. Better predicting clinical success of our candidate drug molecules We are adopting a range of cutting-edge technologies, generating data that are more relevant to patients than previous methods, to help us predict the clinical effectiveness of our candidate drug molecules. 2024 developments included: • Advanced genomic medicine in rare diseases with enhanced precision gene editing using novel CRISPR enzyme, ePsCas9, published in Nature Communications. • Unveiled MILTON, a cutting-edge machine learning genomics research tool with potential to accelerate target discovery and advance early disease detection. • Advanced integration of AI into biologics drug discovery, with 85% of our small molecule and PROTAC projects being already AI assisted. • Developing advanced organoids to model kidney disease in collaboration with Center for iPS Cell Research and Application (CiRA), Kyoto University and Rege Nephro Co., Ltd. • Collaborating with Novoheart, a wholly-owned subsidiary of Medera Inc, to develop an innovative cardiac screening platform using bioengineered human cardiac tissue strips that can advance research and drug development. • Demonstrated that our novel computational pathology-based TROP2 biomarker was predictive of clinical outcomes in patients with non-small cell lung cancer at WCLC Presidential Symposium, and announced the extension of our collaboration with Roche Tissue Diagnostics to co-develop and commercialise the companion diagnostic. Pioneering new approaches to engagement in the clinic We are pioneering clinical innovation to design and deliver patient-centric clinical trials that improve the patient and site team experience while optimising the use of data, digital technologies and AI to improve patient outcomes in clinical trials and beyond. 2024 developments included: • Collaborated with the Karolinska Institute to advance positron emission tomography (PET) tracer as a non-invasive clinical imaging tool to monitor Crohn’s disease treatment response. • Commercialised Evinova, with multiple contracts in place including Parexel and Fortrea, empowering the industry to accelerate better health outcomes with digital solutions to optimise clinical development. • Implemented clinical trial simulations to identify and address potential barriers to help reduce the burden of participation and improve protocol adherence, including informed protocol changes, mitigation plans and enhanced support services. • Advanced collaborations to bring to market novel AI Software as a Medical Device to improve diagnosis of rare diseases, including with InVision (cardiac amyloidosis). • Announced collaboration with ImmunAI to generate and contextualise data through a single cell multi-omics platform, with the aim of better informing patient selection. • Delivered BATURA, the first fully decentralised trial for asthma, which employed approaches including 100% virtual clinic visits and home delivery of study medication, to reduce patient burden to significantly accelerate trial recruitment and expand trial access to a broader patient population. For more information on Fusion, Amolyt Pharma and CSPC deals, see Business development on page 46. AstraZeneca Annual Report & Form 20-F Information 2024 35 Strategic Report Corporate Governance Financial Statements Additional Information Business Review | Science and Innovation |
| Phase I1 Phase II1 Late-stage development1 Life-cycle management projects2 54% Oncology 13% CVRM 13% R&I 10% V&I 8% Rare Disease 3% Other 3939 44% Oncology 28% CVRM 16% R&I 3% V&I 3% Rare Disease 6% Other 3232 53% Oncology 16% CVRM 13% R&I 3% V&I 16% Rare Disease 0% Other 3838 73% Oncology 1% CVRM 17% R&I 0% V&I 9% Rare Disease 0% Other 8282 Science and Innovation 1 Includes NMEs and additional indications if the lead is not yet launched. Due to rounding, the sum of percentages may not agree to totals. 2 Only includes major LCM projects. Investing in transformative R&D technologies Development pipeline overview 2024 was another remarkable year. We achieved 74 regulatory events, either submissions or approvals for our medicines in major markets, including three NME first approvals. This success is supported by a robust pipeline of promising medicines. We had 24 significant pipeline progression events, including NME Phase II starts and Phase III investment decisions, showcasing our potential for sustainable growth. Our pipeline comprises 191 projects, with 169 in the clinical phase of development. We have 19 NME projects in pivotal trials or under regulatory review, up from 17 at the end of 2023. In 2024, 27 NMEs progressed to their next development phase, while 17 projects were discontinued: 10 due to safety or efficacy and seven due to strategic shifts. Accelerating our pipeline We are prioritising our investment in specific programmes, focusing on scientific innovation. This has led to receiving 23 Regulatory Designations for Breakthrough Therapy, Priority Review, Accelerated or Fast Track for 17 new medicines which offer potential to address unmet medical need in certain diseases. We also secured Orphan Drug Designation for the development of two medicines to treat rare diseases and Qualified Infectious Disease Product Designation for three projects. Antibody drug conjugates and radioconjugates Building on antibody drug conjugate (ADC) technology, our vision is for ADCs and radioconjugates to become the backbone of novel cancer therapies, including combination approaches, by improving and, in some cases, replacing current chemotherapy and radiotherapy treatments. Radioconjugates have emerged as a promising modality in cancer treatment, aiming to deliver a DNA-damaging radioactive isotope directly to cancer cells, to provide a more precise mechanism of killing cancer cells. For more information, see Therapy Area Review from page 16. We have also begun to identify complementary mechanisms between modalities to help develop effective, transformative combinations of ADCs, radioconjugates, and next-generation immuno-oncology medicines. We are working to use these regimens to treat earlier stages of cancer, where there is the greatest potential for deeper and durable responses for some patients. As such, we are building our oncology portfolio with a multitude of diverse mechanisms that can effectively combine to deliver these transformative regimens. 36 AstraZeneca Annual Report & Form 20-F Information 2024 Strategic Report Business Review continued |
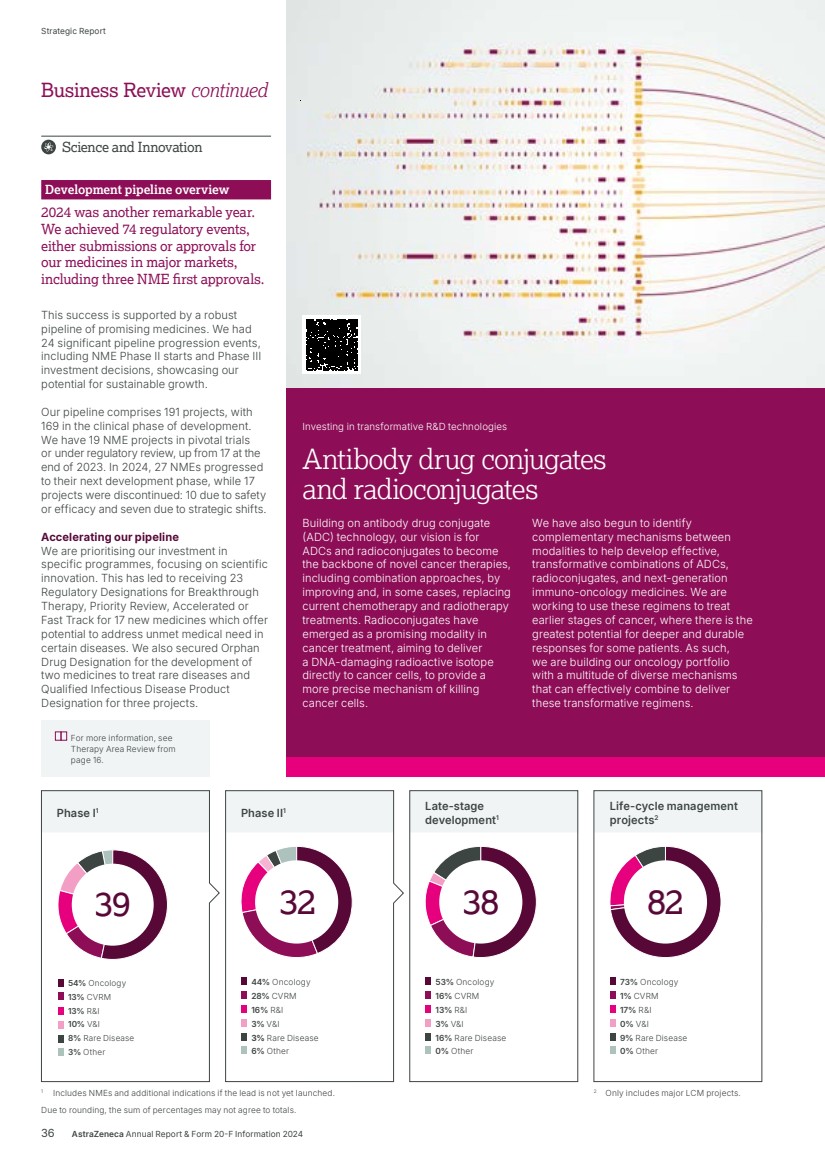
| Sustainable innovation We are focused on accelerating the delivery of life-changing medicines that create enduring value, pushing the boundaries of science to discover innovations that transform and sustain health. BV In our Code of Ethics, we outline our belief that science is at the core of everything we do; it is the heart of our business and our Values. By leading in science, we improve the lives of patients around the world. We conduct innovative research, development and manufacturing to high standards of ethics and integrity everywhere we operate, following the laws, regulations, codes, guidelines, and good practice standards related to safety, quality, research and bioethics. Our holistic health equity strategy is built on science and embedded across the entire R&D process. We are committed to improving diversity through inclusive and accessible studies, to develop innovative medicines that work for all patient groups. We are also strengthening the research ecosystem by increasing the breadth and diversity of human data, and sharing our science and capabilities with researchers, recognising that scientific breakthroughs only happen through open collaboration. Pipeline governance The pipeline governance and review processes follow AstraZeneca’s Product to Patient (P2P) Pathway. The P2P Pathway comprises vital investment decisions and other key development milestones from the Candidate Drug Investment Decision to health authority approval. The framework relies on empowered teams supported by cross-functional governance committees and review bodies to enable investment decisions and optimise clinical delivery to advance the pipeline, to the benefit of both patients and AstraZeneca. These committees, comprised of executive and senior leaders, play an integral role in a range of key decisions throughout the development pathway. Presentations to the committees are given to enable the right decisions at any given stage. Key decision factors include R&D resource allocation, based on overall therapeutic considerations and strategy. The P2P Pathway is managed by the Pipeline and Portfolio Operations team within Global Portfolio and Project Management. The Early-Stage Product Committee and Late-Stage Product Committee are governance advisory bodies that review, debate, endorse and make recommendations in support of investment decisions. Our drug discovery and development is informed by our 5R Framework – (right target, right patient, right tissue/right exposure, right safety, right commercial potential) which champions quality over quantity and has helped transform the For more information, see: Life-cycle of a medicine, page 11. Standards and policies, including Code of Ethics, page 42. Material sustainability metrics associated with Sustainable innovation, page 234. Accessible and affordable healthcare on page 52, for more information on IP. Details of the Science Committee’s activities during 2024, page 102. Screening for better patient outcomes Up to 59% of patients attending lung cancer screening programmes globally have evidence of COPD and many are missing opportunities for earlier diagnosis, treatment and participation in clinical research. As a pilot, we collaborated with two National Health Service sites in the UK delivering targeted lung health checks to a general population to determine if we could identify more patients with COPD and increase enrolment in our Phase II COPD trial (CRESCENDO). As a result, 33% (17 of 51), of those randomised for the CRESCENDO trial in the UK were identified directly from targeted lung health checks, triple the average site randomisation rate for the study from other sources (such as referral from primary care physicians). Based on this successful pilot, we are scaling the initiative more broadly in the UK and expanding to the US and Canada to accelerate clinical trial delivery and broaden diversity of participants within our studies, also helping identify undiagnosed symptomatic patients with COPD within this high-risk group to support optimised intervention with guidelines-based therapy. culture of R&D and our business. Looking at our productivity and success rates over the past five years we can see a transformation in our productivity, enabling us to discover more innovative therapies for patients than ever before. Intellectual property IP rights provide the incentives our industry needs to do R&D that leads to new medicines. Developing a drug is a long process and bringing a new drug to market is typically a lengthy and cost-intensive process, considering the cost of failures. Thousands and sometimes millions of compounds may be screened and assessed early in the R&D process to get the few that will ultimately receive regulatory approval. AstraZeneca innovates to make discoveries that improve patients’ lives and may one day eliminate disease altogether. The ability to obtain and maintain patent protection, under a robust IP protection and enforcement framework, is an important part of a sustainable framework for innovations in R&D that result in life-changing medicines. Strategic Report Corporate Governance Financial Statements Additional Information Business Review | Science and Innovation AstraZeneca Annual Report & Form 20-F Information 2024 37 |

| 49 inspections from all health authorities relating to Good Manufacturing Practice (GMP) Seven product recalls Zero critical findings from health authorities relating to GMP Patient safety and product quality Our business model requires the supply of safe and high-quality medicines, which are constantly and carefully monitored during their entire life-cycle. We are dedicated to patient safety and base our behaviours and decisions on our belief that everyone deserves to have confidence in the safety, quality and efficacy of our medicines. BV Science and Innovation Pharmacovigilance We have a comprehensive pharmacovigilance programme which constantly monitors all products throughout their life-cycle. Our pharmacovigilance system follows global regulatory requirements, GxP principles and quality management standards. For all our medicines, including those under development as well as those on the market, we have systems and processes in place for identifying and evaluating possible adverse drug effects. Information concerning the safety profile of our medicines is provided to regulators, healthcare professionals and, where appropriate, patients. Each medicine has a dedicated safety team, which includes a responsible global safety physician and one or more pharmacovigilance scientists. Marketing companies have assigned patient safety directors in place. AstraZeneca Medical is a public website to report on adverse events (AEs) or ask for medical information. We actively promote these communication channels with all our key stakeholders, including healthcare providers and patients, through our Commercial teams and at congresses. For this purpose, personal data that could be used for identification will be added as a pseudonym, according to legal requirements, when added to our AE database. Our Privacy Policy outlines how AstraZeneca handles the processing of personal information when dealing with any enquiry, complaint or AE report. AstraZeneca employees, as well as contractors and third-party employees who sign a contract with AstraZeneca, are obliged to collect and report AEs involving AstraZeneca products or partner products, to ensure that the Company complies with regulations and/or contractual requirements and fulfils the mission of protecting patients. AE training on what and how to report is given to new hires and regularly repeated to employees. Patient safety The Global Patient Safety organisation is part of the Chief Medical Office and has product responsibility from the time of initial development all the way through to the end of the life-cycle. Two major areas of accountability include clinical safety strategies for investigational and marketed products and activities linked to our licence to operate. Clinical safety strategy involves the anticipation and prioritisation of potential safety concerns, understanding their possible consequences and the proactive development of appropriate management plans to address these. Licence to operate includes collecting and processing safety data from various sources, performing comprehensive safety surveillance, providing both individual case reports and summary periodic safety reports to various health authority stakeholders, on time and to a high quality. Health authorities globally conduct regular inspections of the AstraZeneca pharmacovigilance system to check and ensure robustness of processes and technology tools. Feedback from inspections supports continuous improvement of the pharmacovigilance system. As part of our commitment to patient safety, we continue to develop the capabilities of the patient safety team, and refine our processes, systems and tools. This includes exploring the use of emerging technologies, such as automation support, machine learning and digital communication interfaces which have the potential to further enhance our product safety evaluation, communication and risk mitigation capabilities. Product quality Our Operations Quality function has the remit of GMP/Good Distribution Practice (GDP) quality oversight from clinical and commercial product manufacturing and throughout the further life-cycle of a product. Operations Quality is accountable for ensuring all manufacturing, testing and distribution, whether internal or through our contract manufacturing organisations, is carried out following all applicable GMP/GDP regulations, to ensure the highest levels of product quality and protect our licence to operate. The function ensures continuous improvement of our Quality Management System (QMS) via multiple mechanisms such as Corrective and Preventative Actions, Risk Management and Internal Audits. Periodic Quality Management reviews are performed at all management levels of the Operations organisation to ensure QMS performance, issue awareness and action accountability are maintained in alignment with management responsibilities. Product and process performance assessments are executed to review, evaluate and investigate product and process data and customer feedback. This ensures the identity, quality, durability, reliability, usability, safety, efficacy and performance of our products all meet our quality standards throughout the product life-cycle. We have a process for issue management in place to address quality issues affecting patients, products or processes, where we escalate, communicate, and take appropriate actions as required by regulations and in a timely manner. In 2024, we carried out seven recalls of our products, none of which were at the patient level. Ensuring quality and compliance As outlined in our Code of Ethics in Standards and policies on page 42, we are committed to high ethical standards. As members of the Biotechnology Innovation Organization, International Federation of Pharmaceutical Manufacturers and Associations and the European Federation of Pharmaceutical Industries and Associations (EFPIA), we adhere to their codes. The development, product licensing, manufacture, distribution and monitoring of active pharmaceutical ingredients (APIs), medicinal products and devices by the Group must be conducted in compliance with relevant international codes and standards, regulations for Good Pharmaceutical Practices (GxP), including GMP, Good Pharmacovigilance Practices and AstraZeneca Good Regulatory Practice. Health authorities regularly carry out inspections and in 2024, 49 GMP inspections were carried out. No critical findings related to GMP were identified in AstraZeneca’s operations. For more information, see: Standards and policies, including Code of Ethics, page 42. Cybersecurity and data privacy, see page 45. 38 AstraZeneca Annual Report & Form 20-F Information 2024 Strategic Report Business Review continued |
| Actual growth 2024 +22% 2023 +6% 2022 +47% CER growth 2024 +22% 2023 +6% 2022 +47% 2024 2023 2022 $19,077m $17,920m $23,235m US $23,235 $23,235mm Actual growth 2024 +27% 2023 +10% 2022 +9% CER growth 2024 +26% 2023 +8% 2022 +21% $9,611m $8,738m $12,188m Europe 2024 2023 2022 $$12,188m 12,188m Actual growth 2024 +14% 2023 +2% 2022 -4% CER growth 2024 +22% 2023 +9% 2022 +1% $12,025m $11,745m $13,675m Emerging Markets 2024 2023 2022 $$13,675m 13,675m Actual growth 2024 -2% 2023 -14% 2022 +22% CER growth 2024 +3% 2023 -8% 2022 +40% 2024 2023 2022 $5,099m $5,948m $4,975m Established RoW $$xxxbn xxxbn (+x.x%) (+x.x%) $$4,975m 4,975m Growth and Therapy Area Leadership Summary and performance indicators We grow our business and serve more patients globally by working ethically, maintaining excellence in manufacturing and supply, and through the use of AI and new technologies. Our performance in 2024 • Total Revenue, comprising Product Sales, Alliance Revenue and Collaboration Revenue, increased by 18% (21% at CER) to $54,073 million. • Total Revenue in the US increased by 22% to $23,235 million, Emerging Markets increased by 14% (22% at CER) to $13,675 million and Europe increased by 27% (26% at CER) to $12,188 million. • Committed to high ethical standards: 401 employees and third parties were removed from their role as a result of a breach. • Delivered 202 successful market launches. • Completed more than 20 major or strategically important business development transactions. Performance indicators Global Total Revenue by geography Our regions We strive to meet our growth and profitability goals through commercial excellence and by aligning product strategy and commercial delivery in each of the three regions into which we are organised: the US, Europe-Canada and International (which comprises Emerging Markets, including China, Australia and New Zealand). Japan reports separately. The reconciliation of these organisational regions to our financial reporting regions of the US, Europe, Established RoW and Emerging Markets can be found in Market definitions on page 240. Within the International region, AstraZeneca is aware of a number of investigations by Chinese authorities which, to the best of AstraZeneca’s knowledge, relate to allegations of medical insurance fraud, illegal drug importation, and personal information breaches by current and former AstraZeneca employees. In January 2025, AstraZeneca received a Notice of Transfer to the Prosecutor and an Appraisal Opinion from the Shenzhen City Customs Office regarding suspected unpaid importation taxes as further described on page 211 in Note 30 to the Financial Statements. AstraZeneca continues to fully cooperate with the Chinese authorities. In December 2024, AstraZeneca announced the appointment of Iskra Reic as Executive Vice-President, International. Iskra succeeded Leon Wang who is on extended leave from the Company while under investigation in China. AstraZeneca Annual Report & Form 20-F Information 2024 39 Strategic Report Corporate Governance Financial Statements Additional Information Business Review | Growth and Therapy Area Leadership |
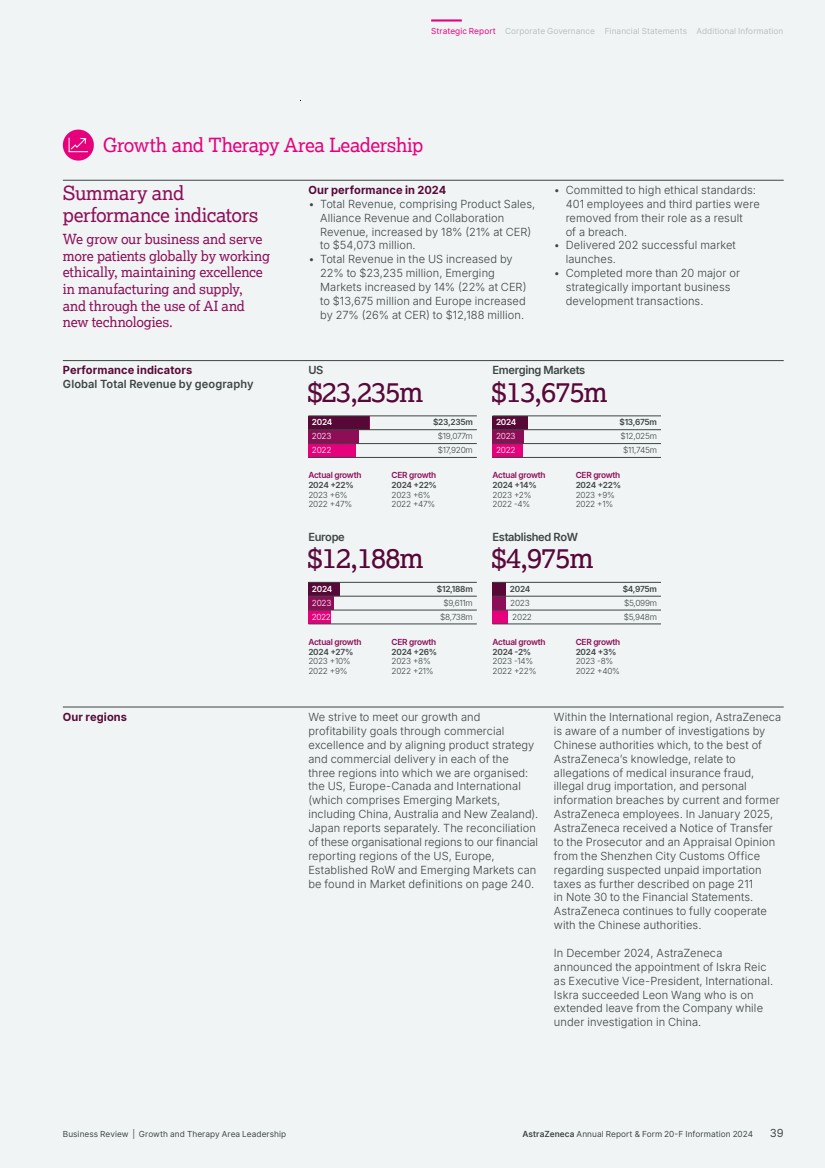
| Sales and marketing Our growth is delivered by our Commercial teams, which employed 47,200 people at the end of 2024. During the year, we had an active presence in more than 80 countries and sold our products in more than 125 countries. In most markets, we sell our medicines through wholly-owned local marketing companies. We also sell through distributors and local representative offices. We market our products largely to primary and specialty care physicians. Growth and Therapy Area Leadership US As the twelfth largest prescription-based pharmaceutical company in the US, we have a 3.5% market share of US pharmaceuticals by sales value.1 Total Revenue increased by 22% in 2024 to $23,235 million, driven by the continued growth of our Oncology and BioPharmaceuticals medicines. Recent launches of Wainua and Airsupra are significant additions to our product portfolio, expanding our offerings in key therapeutic areas and strengthening our position in the market. The US healthcare system is complex. Multiple payers and intermediaries influence patient access to branded medicines through regulatory rebates in government programmes and voluntary rebates paid to managed care organisations and pharmacy benefit managers for commercially insured patients. Significant pricing pressure is driven by payer consolidation, restrictive reimbursement policies and cost control tools, such as exclusionary formularies and price protection clauses. Many formularies employ ‘generic first’ strategies and/or require physicians to obtain prior approval for the use of a branded medicine where a generic alternative exists. The Inflation Reduction Act (IRA) of 2022 was passed to address Medicare spending concerns. Farxiga was selected for the first round of Medicare price negotiations under the IRA. As the Maximum Fair Price for Medicare will take effect in 2026, which is the same year we expect to lose market exclusivity that will also reduce Farxiga’s price, the impact is expected to be manageable. Calquence has been selected for the second round of price negotiations in 2025. Its Maximum Fair Price for Medicare would take effect in 2027 and the business impact is also expected to be manageable. We are well-positioned to communicate to the Centers for Medicare & Medicaid Services the value of Calquence for people covered by Medicare. We have a diversified product portfolio providing a broad spectrum of treatments in different therapy areas, allowing access for patients in need of our innovative medicine. Emerging Markets AstraZeneca was the largest multinational pharmaceutical company, as measured by prescription sales, and the fastest-growing top 10 multinational pharmaceutical company in Emerging Markets in 2024. Total Revenue was $13,675 million, up 14% (22% at CER). In China, AstraZeneca is the largest pharmaceutical company in the hospital sector, as measured by sales value. In 2024, Total Revenue for China increased by 9% (11% at CER) to $6,413 million (2023: $5,876 million). In the fourth quarter, sales of respiratory medicines such as Pulmicort and Symbicort were impacted by a reduction in hospitalisations from seasonal respiratory viruses. Roxadustat and Lokelma were renewed in the National Reimbursement Drug List (NRDL) and Xigduo, Tagrisso (ADAURA), Lynparza (PAOLA-1), Calquence, Soliris and Koselugo achieved listing for the first time. Since the implementation of VBP, several AstraZeneca brands have been impacted. In the most recent cycles of VBP implementation, Faslodex was included and a number of previously included brands such as Crestor and Losec faced International Reference Pricing (IRP) driven price cuts. Additional AstraZeneca brands are expected to be included in future VBP and IRP cycles. We were shocked following the Russian invasion of Ukraine in February 2022 and, since then, have provided practical support to ensure the safety, health and wellbeing of our employees. As a healthcare business, we are doing everything possible to ensure medical supply chains continue to operate and that patients in both countries are able to access our medicines, while complying with sanctions imposed on Russia. Europe The total European pharmaceutical market was worth $280 billion in 2024. We are the fourth largest prescription-based pharmaceutical company in Europe (see Market definitions on page 240) with a 3.8% market share of pharmaceutical sales by value.1 Total Revenue was $12,188 million, up 27% (26% at CER). Established RoW In Japan, AstraZeneca was the second largest prescription-based pharmaceutical manufacturer with a 6.5% value market share of Innovative Branded pharmaceutical sales by value.1 Established RoW comprises Japan, Canada, Australia and New Zealand. In 2024, Total Revenue decreased by 2% (increased by 3% at CER) to $4,975 million, with sales in Japan down 4% (increase of 4% at CER) to $3,564 million. ¹ In the US and Japan, IQVIA data does not include Alexion. 40 AstraZeneca Annual Report & Form 20-F Information 2024 Strategic Report Business Review continued |
| Operations Our manufacturing and supply function continued to support business growth and pipeline development, maintaining excellence in product launch, quality and resilient supply, with focus on progressive, sustainable processes. In 2024, we made strong progress against our Operations strategic goals, expanding capacity and new modality capability, while leveraging new technology and digital innovations to sustainably support the demands of the business. • Delivered 202 launches across markets. • Progressed our investments in manufacturing footprint, technology and digital innovations. • As we continue to progress our Ambition Zero Carbon strategy, Södertälje is our latest site that has delivered a 98% reduction in Scope 1 and Scope 2 GHG emissions (from 2015 baseline) measured against science-based targets. Managing our supply chain The global environment remains challenging, volatile and uncertain. The conflict in the Middle East has disrupted shipping lanes, resulting in increased sea lane transit times and the closure of several seaports. Furthermore, the impact of climate change has exacerbated the occurrence of weather events, from floods in Brazil in the second quarter to strong typhoons in Asia and hurricanes in the Americas. Despite the external environment, we have continued to meet our responsibilities to patients by maintaining high customer service levels. We have demonstrated flexibility to adapt the network to new challenges and capitalise on growth opportunities. In 2024, AstraZeneca maintained industry-leading quality performance, with zero patient-level recalls during this period. Supply chain finance AstraZeneca has a supply chain finance programme to support the cash flow of our external supply base. The programme is managed by Taulia Inc. (with funding provided by some of the Group’s relationship banks) and provides suppliers with visibility of invoices and payment dates via a dedicated platform. Suppliers can access this platform free of charge and have flexibility to select individual invoices for early payment. On election of an early payment, a charge is incurred by the supplier based on the period of acceleration, central bank interest rate and the rate agreed between Taulia Inc. and each supplier. All early payments are processed by the funders and AstraZeneca settles the original invoice amount with the funders at maturity of the original invoice due date. The programme operates in the US, UK, Sweden and Germany. As at 31 December 2024, the programme had 432 suppliers enrolled and a potential early payment balance of $105 million. We have a separate programme in China with 26 suppliers enrolled and a potential early payment balance of $1 million. Global manufacturing capability Our principal tablet and capsule formulation and packing sites are in the UK, Sweden, China, Puerto Rico and the US, with local supply sites in Egypt, India, Japan and Russia, and regional supply sites in Brazil, Indonesia and Mexico. We also have major formulation sites for the global supply of parenteral and/or inhalation products in the US, Sweden, France, Australia and the UK. Most of the manufacture of active pharmaceutical ingredients (APIs) is delivered through the efficient use of external sourcing that is complemented by internal capabilities. For biologics, our principal commercial manufacturing facilities are in the US, Ireland, Sweden, the UK and the Netherlands. Our network contains capabilities in process development, drug substance and drug product manufacturing, and distribution. In May 2024, we announced our intention to build a $1.5 billion manufacturing facility in Singapore for antibody drug conjugates (ADCs), enhancing global supply of our ADC portfolio. The facility will be ready for commercial production in 2029. As part of AstraZeneca’s commitment to driving sustainability in healthcare, the Company will work with Singapore’s government and others on green solutions for the ADC facility. This facility will be designed to contribute positively to Ambition Zero Carbon from its first day of operations. In November 2024, manufacturing ceased at our tablet packing facility in Reims, France. The intent to exit was announced in September 2022. At the end of 2024, we employed 16,300 people at 26 manufacturing sites in 16 countries. For more information on progress we are making with ADCs, see our Oncology Therapy Area Review, from page 16. AstraZeneca Annual Report & Form 20-F Information 2024 41 Strategic Report Corporate Governance Financial Statements Additional Information Business Review | Growth and Therapy Area Leadership |
| Growth and Therapy Area Leadership Building trust by demonstrating integrity, transparency and fair treatment is central to everything we do, and supports our ability to operate, innovate and bring healthcare to patients. Our shared Values underpin all our activities and serve as a compass to guide us. Standards and policies Our Code of Ethics (the Code), and its supporting Standards, embodies our Values, including expected behaviours, principles and policies, and is the foundation of our global compliance programme. The Code covers global policies on: Science, Interactions, Workplace and Sustainability. It applies to all Executive and Non-Executive Directors, officers, employees and contract staff of our Group, empowering them to make the right decisions in the best interests of the Group, our communities and those we serve. The Code is implemented through our Chief Compliance Officer and Chief Executive Officer and supported by all members of the Senior Executive Team (SET). In 2024, 100% of active employees, including the SET, completed mandatory annual training on the Code. A Finance Code complements the Code of Ethics and applies to the Chief Financial Officer (CFO), the Group’s principal accounting officers (including key finance staff in all overseas subsidiaries) and all managers in the Finance function. This reinforces the importance of the integrity of the Group’s Financial Statements, the reliability of the accounting records on which they are based, and the robustness of the relevant controls and processes. The Code of Ethics and Finance Code ask employees to report possible violations and provide information on how to do so, including via the AZ Ethics helpline and website which are also available to third parties, including anonymously where permitted by local law. Anyone who raises a potential breach in good faith is fully supported by management on a confidential basis (subject to disclosure obligations in local markets) and we do not tolerate retaliation. Most cases are reported through line managers, local Human Resources (HR), Legal or Compliance functions. Cases are investigated by HR, Compliance Assurance, or the Global Compliance Investigations (GCI) team, an above-market investigatory unit within the Global Compliance function, depending on the nature of the matter. There were 3,853 instances (instances can involve multiple people) of employee and third-party non-compliance with our policies (2023: 3,756). A total of 401 employees and third parties were removed from their role as a result of a breach (2023: 296) and 2,498 received warnings (2023: 2,968). We brief the Audit Committee quarterly on breach statistics, serious incidents and corresponding remediation. Breaches primarily consist of low-impact incidents. We continue to foster a culture where employees can speak their minds, with strong first-line oversight (and related reporting) as well as targeted second-line monitoring to identify concerns early and use learnings to improve our programme. Our Pulse survey enables management and Board Directors to understand the views and sentiments of our employees, including the proportion of employees who feel comfortable speaking up at work. The resulting report also demonstrates how our Values and behaviours are embedded across the workforce, including a summary metric dashboard organised by category, with remedial action taken on any concerns identified and discussed as necessary. Anti-bribery and anti-corruption We do not tolerate bribery or any other form of corruption. Potential bribery and corruption risk factors vary, for example by geography, the nature of the business, and the role of third-party vendors, as well as over time. Preventing bribery and corruption is a focus of our third-party risk management (3PRM) and due diligence processes, as well as our monitoring and audit programmes. Our Anti-Bribery and Anti-Corruption Global Standard outlines our key anti-bribery and anti-corruption principles and is complemented by additional Global Standards and local requirements. Through our Global Compliance programme and associated policies and other controls, we strive to comply with all applicable anti-bribery and anti-corruption legislation, including the UK Bribery Act 2010 which is aligned with the United Nations Convention against Corruption. There are three lines of defence in our risk management framework: line management, Risk and Global Compliance functions and Group Internal Audit (GIA). GIA is responsible for reporting significant risk exposures and control issues to the Board and senior management, including matters that are referred by the Audit Committee. In addition to the GIA review of risk, Global Compliance provides overviews of significant incidents and their outcomes to the Audit Committee. Business conduct We seek to create positive societal impact beyond the direct benefit of our life-changing medicines. We embed ethical behaviour in all our business activities, markets and across our value chain. We promote ethical, transparent and inclusive policies, both internally and with our partners and suppliers. BV 42 AstraZeneca Annual Report & Form 20-F Information 2024 Strategic Report Business Review continued |
| As outlined, we provide various methods by which ethical concerns can be confidentially reported to the Group and these are centrally recorded within our incident reporting systems. Any whistleblower will have the opportunity to report violations inside and outside of the organisation (to the designated authority or to the media), and we ensure that the level of protection is the same, regardless of the means of reporting. The most material incident reports from whistleblowers – those implicating senior leaders or involving other allegations of serious misconduct (including alleged bribery or corruption) – are promptly, independently and objectively investigated by our GCI team. We maintain confidentiality and separation between reporters and implicated parties during our compliance investigations to ensure a safe environment that encourages employees to feel comfortable speaking up. Learning pathways are available to Global Ethics & Compliance and Employee Relations employees focusing on the principles of conducting an investigation. Modules include connecting with the reporter, planning and fact gathering, interview techniques, credibility assessments, reporting and case closure. In 2024, work was undertaken to update and improve our global investigations Standard Operating Procedure and develop a global investigations playbook to enhance the consistency and quality of the investigations our employees conduct. Material government investigations or proceedings including material investigations related to anti-bribery and anti-corruption are detailed in Note 30 to the Financial Statements on page 203. Responsible sales and marketing Our compliance professionals advise on, and monitor adherence to, our Code and policies, and work with local staff to ensure we meet our commitment to high ethical standards. Nominated signatories review product promotional materials and activities to ensure compliance with applicable regulations and codes of practice, and that information is accurate and balanced. GIA conducts audits of selected marketing companies. In 2024, we identified 12 confirmed external breaches across our Commercial business (2023: four). Confirmed external breaches comprise cases where AstraZeneca has been found to violate a law, industry code, or regulation by an external authority. Animals in research The responsible use of animals is a vital part of biomedical research and product safety testing, where suitable alternatives are not available. At the centre of our commitment to quality science and animal welfare are the Replacement, Reduction and Refinement of animals in research (the 3Rs). All animal studies are undertaken in compliance with all relevant local and national laws and regulations, and with the principles of the ‘Guide for the Care and Use of Laboratory Animals’ 8th Edition (Institute for Laboratory Animal Research). Wherever possible, we work with third parties accredited by the Association for the Assessment and Accreditation of Laboratory Animal Care International. Animals were needed for in-house studies 141,947 times in 2024 (2023: 122,768), and on our behalf in contract research studies 63,810 times (2023: 59,690). In total, over 97% were rodents or fish, with the majority being mice (86%). The remainder is made up of rabbits, camelids, ferrets, dogs, pigs, non-human primates, chickens and sheep. Dogs and non-human primates make up less than 1% of the total. AstraZeneca does not conduct research using wild-caught non-human primates or great ape species. AstraZeneca is committed to transparency and is signatory to the Concordat on Openness on Animal Research (UK), the Openness Agreement on Animal Research and Teaching (Australia/New Zealand) and has endorsed the statement of intent for a U.S. Animal Research Openness Agreement. AstraZeneca has an animal welfare assurance programme that ensures research conducted by third parties meets our high standards. Supplier management All employees and contractors who source goods and services on behalf of AstraZeneca are expected to follow our Global Standard for Procuring Goods and Services. Through assessments and improvement programmes, including our 3PRM system, we monitor supplier compliance with our published Expectations of Third Parties policy. Before and after we contract with third parties, we assess whether their reputation and actions align with our expectations and any concerns or changes are addressed. As a member of the Pharmaceutical Supply Chain Initiative (PSCI), AstraZeneca supports the PSCI Principles for Responsible Supply Chain Management, which outline industry expectations of the supply chain in ethics, human rights and labour, health and safety, environment, and related management systems. We have a 3PRM process in place to identify and assess potential risks with our suppliers. This includes human and labour rights as a standalone risk area and assessing risks such as forced or bonded labour, child labour, wages and benefits, hours/rest periods and leave, collective bargaining, grievance procedures, discrimination and harassment. Relevant commitments and policies are detailed in our published Modern Slavery Statement. The 3PRM process also identifies and assesses supplier activities across multiple other risk areas, including safety, health and environment, anti-bribery and anti-corruption, data privacy and IT security. In 2024, we conducted 59 audits (2023: 47) on high-risk commercial suppliers (external manufacturing partners) to ensure appropriate practices and controls. Of these, 48% fully met our expectations while 52% had improvement plans for minor instances of non-compliance. There were two audits indicating a high risk to AstraZeneca and action has been taken to mitigate these supply and/or reputational risks. Our Global Procurement function uses the EcoVadis platform to assess the sustainability performance of our suppliers, rating their environmental, social and governance (ESG) performance against four themes: Environment, Labour & Human Rights, Ethics, and Sustainable Procurement. Our Sustainable Procurement programme embeds responsible sourcing practices through our procurement activity and promotes ethical behaviour by our suppliers in support of our own procurement policies, targets and commitments. Our Supplier Diversity Programme maximises opportunities for small and diverse businesses to be part of our value chain and supports their growth. As part of our Ambition Zero Carbon strategy, we aim to engage with the top 95% of our suppliers by spend covering purchased goods and services and capital goods, and 50% of our suppliers by spend covering upstream transportation and distribution and business travel, to support them to set validated science-based GHG emissions targets (SBTs) by end of 2025. AstraZeneca Annual Report & Form 20-F Information 2024 43 Strategic Report Corporate Governance Financial Statements Additional Information Business Review | Growth and Therapy Area Leadership |
| Cell therapy and T-cell engagers IT and IS resources AI is transforming how we work and helping us push the boundaries of science, enabling us to deliver new medicines faster and improve the patient experience. We continue to expand our core competencies in data science and AI engineering and are investing in our people to ensure our workforce can maximise the potential of emerging technologies. We are building communities of practice, delivering world-class training and bringing together people for collaboration and insight. In R&D, we are now using AI and data science across 85% of our small molecule programmes – from target identification to clinical trials. AI is also being used to design and develop other therapeutic modalities including peptide or protein therapeutics, nucleotide-based therapeutics and cell-based therapeutics. Our researchers and scientists now have access to a range of generative AI tools to guide complex tasks such as hypothesis generation and protocol authoring. Early measurement shows that 92% of 1,200 employees surveyed who use the Microsoft CoPilot tool are experiencing time savings as a result. In Commercial, we are partnering with leading technology companies to apply AI to global healthcare challenges. In one example, our work with local healthcare systems in 22 countries has led to 3.5 million AI-powered, routine chest x-rays being used as early screening to identify high-risk lung nodules. We are also deploying AI-powered, integrated, marketing technology platforms to support our increasing number of new brands and indications. In Operations, technology is transforming our supply chain into an intelligent, autonomous system with an emphasis on sustainability. By implementing over 30 digital tools and AI solutions, for selected processes and products, our plant in Wuxi, China, has achieved a 55% output increase, 44% lead time reduction and a 54% boost in productivity. In Sweden, which is responsible for a significant part of our global production, digital and AI solutions have elevated productivity by 56% and cut product launch lead times by 67%. Both have earned recognition in 2024 from the World Economic Forum as lighthouse manufacturing sites. Our Enterprise AI Governance Framework aligns with international regulations and standards, including the EU AI Act and the NIST AI Risk Management Framework. The framework contains policies, processes and guardrails for building, buying, deploying and using AI, including for procurement, third-party due diligence and guidelines on employee usage. Growth and Therapy Area Leadership Investing in transformative R&D technologies We are investing in these therapies to bring them to more patients, across oncology, immune-mediated diseases and rare disease. In Oncology, we are exploring new ways to harness the immune system to fight cancer, including T-cell engagers that can engage and activate a patient’s T-cells against cancer. We are advancing next-generation CAR-T and TCR-T-cell therapies that are genetically engineered to target a patient’s specific tumour, and developing new ways to enhance the cells’ potential effectiveness, for example by resisting the immunosuppressive microenvironment. In Immunology, we aim to use similar approaches, including CAR-T-cells and CAR-Tregs, to target the root cause of immune-mediated diseases, to ‘reset’ the immune system and correct the immune dysfunction to return people to health. We are also working to overcome the barriers to widespread adoption of cell therapy in terms of access, manufacturing and scale. Strategic Report 44 Business Review continued |
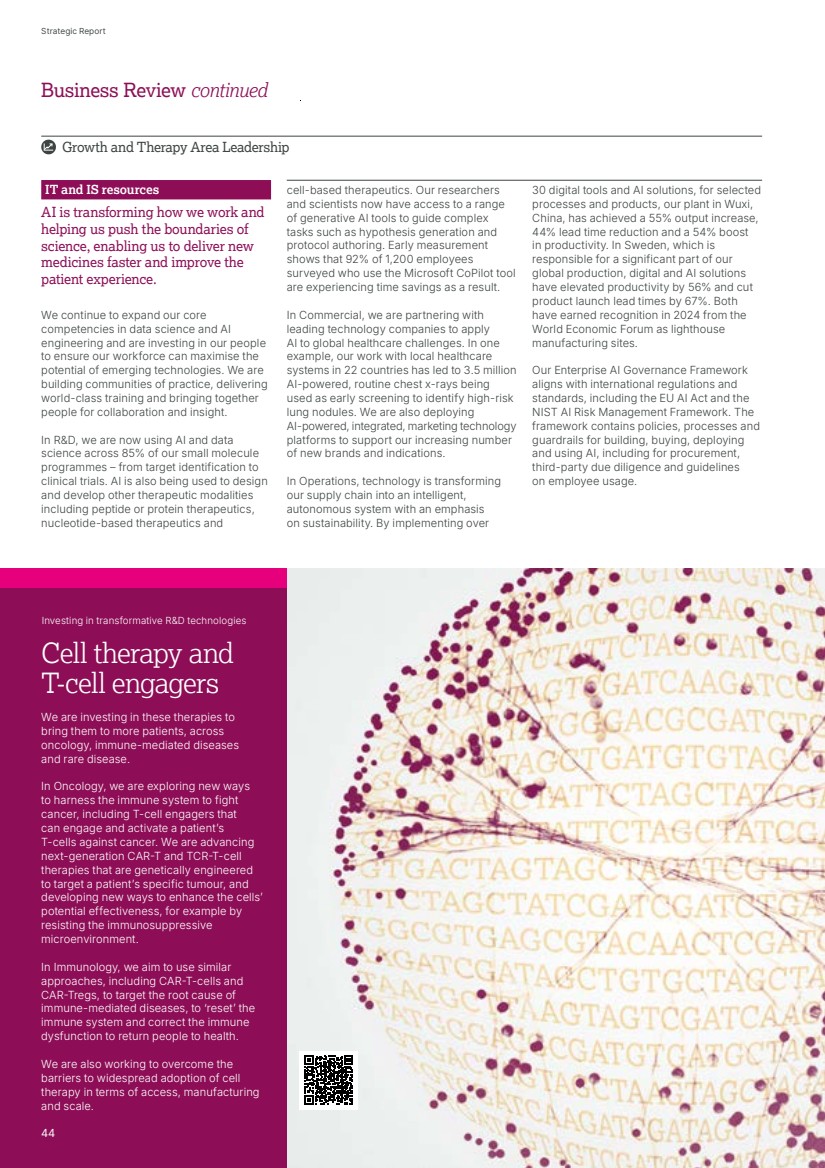
| Zero material cybersecurity incidents Zero material security breaches involving personal data Cybersecurity and data privacy Innovative technology platforms are transforming the way we work, and we have measures in place to address the related cybersecurity and data privacy risks. BV Cybersecurity We operate an evergreen cybersecurity training and awareness programme that is mandatory for all employees and is designed to reduce risk and improve resilience. Cybersecurity performance is reviewed monthly and based on standardised service delivery, programme management, and operational performance metrics, with recurring oversight presentations to the SET, the Audit Committee and Board of Directors. There were no material business disruptions due to a cybersecurity incident in 2024, and we have recruited a third-party alert triage partner to free up capacity in our cyber team for forensic investigations and proactive threat detection. This year we also launched a process to re-baseline and prioritise critical business applications for our disaster recovery plans over a three-year period to 2026. This will improve resilience and preparedness for unexpected or uncontrolled events. Effectiveness is measured through standardised service delivery, programme management and operational performance metrics. We emphasise cybersecurity culture and workforce awareness via mandatory annual training, phishing tests and communication on internal social media. Recognising the elevated threat and risk environment, we have delivered workforce-wide messaging regarding each person’s responsibility to protect AstraZeneca. Data privacy Our three principles of data privacy are: 1. We respect and protect privacy by collecting, using, retaining, sharing and/or disclosing personal data lawfully, fairly, transparently and securely. 2. We respect data subject rights and respond to queries and requests made by individuals about their personal data in a timely manner. 3. We hold third parties with whom we work to the same expectations set out in the Global Privacy Standard. Enhanced data governance practices are in place through our Enterprise Data Office (EDO), established in 2023, and sponsored by our Enterprise Data Council (EDC). The EDO strengthens and standardises data governance, including by partnering with other data functions across the Company and acting as a central hub for data management and related regulatory compliance. This approach also ensures that our data policies and standards are streamlined, clear and effective. Key privacy compliance concerns are reported via the SET data governance boards, EDO, EDC and appointed senior leaders. Breaches and policy deviations can also be reported to AZ Ethics via the helpline or website. In 2024, our data privacy focus has been to develop a set of new standards, aligned to evolving global privacy legislation and those of the EDO; the format standardisation and updating of content for global privacy notices; and enhancement and refinement of privacy risk assessments and management process. In 2025, we will focus on continued alignment and refinement of processes with the EDO and Global Business Services, in particular regulatory intelligence and readiness, privacy risk management and reporting, and the automation and refinement of privacy operational activities. For more information, see: Cybersecurity in the Risk overview, page 64. AZ Ethics, page 42. AstraZeneca Annual Report & Form 20-F Information 2024 45 Strategic Report Corporate Governance Financial Statements Additional Information Business Review | Growth and Therapy Area Leadership |
| Growth and Therapy Area Leadership In business development, we assess cutting-edge technologies and products that can help enhance the quality, effectiveness and productivity of our research and translational capabilities across our therapy areas. Partnerships include accessing key innovations across AI, precision medicine and genomics as well as data and digital technologies, to help inform the optimal treatments for patients. Our Business Development teams pursue opportunities to access the best science and innovation, and partners range from academia and governments to peer companies and biotechnology companies. Our global strength, with balanced presence across regions and disease areas is supported by more than 1,000 collaborations worldwide. In 2024, we completed more than 20 major, or strategically important, business development transactions, some of which are summarised below. In 2024, new deals included: Fusion The acquisition of all outstanding shares in Fusion Pharmaceuticals Inc., a clinical stage biopharmaceutical company developing next-generation radioconjugates. The acquisition complements AstraZeneca’s leading Oncology portfolio with the addition of the Fusion pipeline of radioconjugates, including FPI-2265, a potential new treatment for patients with metastatic castration-resistant prostate cancer, and brings new expertise and pioneering R&D, manufacturing and supply chain capabilities in actinium-based radioconjugates to AstraZeneca. Combined, the upfront payment and maximum potential contingent value payment, if achieved, represent a transaction value of approximately $2.4 billion. Amolyt Pharma The acquisition of Amolyt Pharma SAS, a clinical-stage biotechnology company focused on developing novel treatments for rare endocrine diseases. The acquisition Business development Business development is an essential part of our strategy and portfolio prioritisation process, contributing to accelerating delivery of new medicines targeting unmet medical need. bolsters the Alexion, AstraZeneca Rare Disease late-stage pipeline and expands on its bone metabolism franchise with the notable addition of eneboparatide (AZP-3601), a Phase III investigational therapeutic peptide with a novel mechanism of action designed to meet key therapeutic goals for hypoparathyroidism. AstraZeneca has acquired all of Amolyt Pharma’s outstanding shares for a total consideration of up to $1.05 billion, on a cash and debt-free basis. CSPC The licence agreement with CSPC Pharmaceutical Group Ltd to advance the development of an early stage, novel small molecule Lipoprotein (a) (Lp(a)) disruptor (YS2302018), which will be developed as a novel lipid-lowering therapy with potential in a range of cardiovascular disease indications alone or in combination, including with an oral small molecule PCSK9 inhibitor. CSPC will receive an upfront payment of $100 million from AstraZeneca. CSPC is also eligible to receive up to $1.92 billion in further development and commercialisation milestone payments plus tiered royalties. Weight management and risk factors Investing in transformative R&D technologies The World Health Organization recognises obesity as one of the most important public health challenges facing the world today. Approximately 60% of people diagnosed with obesity or as overweight have at least one comorbidity, such as type 2 diabetes, cardiovascular disease, heart failure and chronic kidney disease. We are targeting the underlying causes of obesity with our growing pipeline of novel treatments and combinations with complementary (or synergistic) mechanisms. Our portfolio of molecules is designed to go beyond short-term weight loss targets and focus on healthy weight management, quality of weight loss, and cardiometabolic benefit. Strategic Report 46 Business Review continued |
| People and Sustainability Summary and performance indicators Our team values diversity and high performance, using technology and AI to make our work easier and more efficient. We focus on climate, nature and healthcare challenges in an ethical and transparent way. Our performance in 2024 BV People • Received 1.3 million applications and hired 23,000 employees (7,700 internal and 15,300 external). • 4,300 of these hires were a direct result of our employee referral scheme. • Over 5,900 employees participated in a development programme. • 50.6% of our senior middle management roles and above are filled by women. Sustainability • Reached 90.5 million people through our flagship access to healthcare programmes. • Conducted climate and water risk assessments at 40 sites to improve resilience. • Reduced Scope 1 and 2 GHG emissions by 77.5% from 2015 baseline year. -77.5% -67.6% -58.7% 2024 2023 2022 -77.5% -77.5% Ambition Zero Carbon (Scope 1 and 2)1 2024 2023 2022 82% 83% 83% 82%82% Speak up culture2 2024 2023 2022 90.5m 66.4m 44.6m 90.5m 90.5m People reached by our access to healthcare programmes3 Performance indicators BV People This priority is built on being a great place to work, patient-oriented, advancing a culture of lifelong learning, and achieving inclusion and diversity goals. Performance indicators BV Sustainability Achieving a healthier, more sustainable future requires tackling the biggest challenges of our time – from climate change and nature loss to health equity and health system resilience – and doing so in a way that is ethical, transparent and inclusive. 1 Reduction of Scope 1 and 2 GHG emissions from 2015 baseline year. 2 Based on an internal survey which asked all AstraZeneca employees if they felt comfortable to speak up/speak my mind and express my opinion at work. 3 Cumulative data including current and historical programmes: Healthy Heart Africa, Young Health Programme, Healthy Lung and Phakamisa. For more information, see People from page 48 and Sustainability from page 51. Great place to work 84% believe that AstraZeneca is a great place to work Patient-oriented 87% believe that AstraZeneca is patient-oriented Advance culture of lifelong learning 84% receive coaching to improve contribution Achieve inclusion and diversity goals 80% feel valued for diverse opinions and thinking AstraZeneca Annual Report & Form 20-F Information 2024 47 Strategic Report Corporate Governance Financial Statements Additional Information Business Review | People and Sustainability |
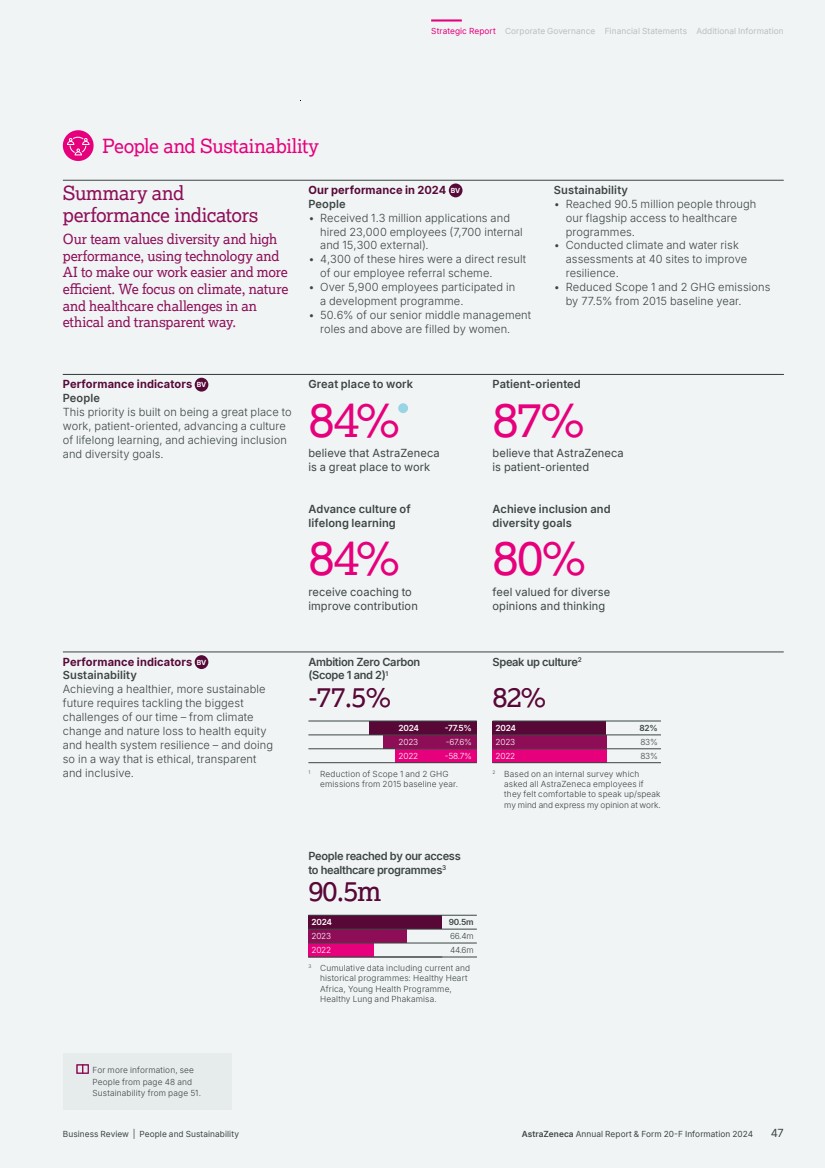
| People and Sustainability Achieving our inclusion and diversity goals At AstraZeneca, we place Inclusion before Diversity. That is because we first focus on creating a culture of inclusion and belonging, which enables us to attract and retain a rich and diverse workforce. Our global commitment to inclusion and diversity is woven into what we do, and is reflected in our Values and the behaviours that underpin them. Women comprise 54% (approximately 51,000) of our global workforce and men 46% (approximately 43,000). At the end of 2024, there were six women on our Board (46% of the total). Five out of 10 SET members (50%) were women and five were men (50%). Directors of the Company’s subsidiaries comprised of 136 women (30%) and 310 men (70%).1 Our employees represent a diverse range of backgrounds and we recognise that everyone plays a role in inclusion and diversity. Our Global Inclusion and Diversity Ambassador Group, sponsored by our CEO, reflects the diversity of our global workforce and organisational structure. They are responsible for collaborating with local leaders to customise approaches that address local needs and drive progress towards our global inclusion and diversity commitments. Our Board of Directors and the SET conduct biannual and quarterly reviews, respectively, of our workforce composition, covering gender, ethnicity and age representation. In the US, where we have more comprehensive data available, 37.9% of our workforce identify as an ethnic minority (2023: 36.8%). We are committed to hiring and promoting talent ethically and in compliance with applicable laws. Our Code of Ethics and its supporting Standards are designed to help protect against unlawful discrimination on any grounds, including disability. The Code covers recruitment and selection, performance management, career development and promotion, transfer, training (including, if needed, for people who have become disabled), and reward. AstraZeneca embraces the cognitive differences of neurodivergent employees and supports employees with both seen and unseen disabilities in line with their country-specific laws and regulations. Where risk assessments can be performed, we will consider accommodating adjustments to the working environment that support an inclusive and safe workplace. Our Global Standard for Inclusion and Diversity sets out how we foster an inclusive and diverse workforce where everyone feels valued and respected because of their individual abilities and perspectives. In 2024, our inclusion and diversity efforts earned recognition externally. We were featured in: • Forbes World’s Top Companies for Women • Forbes World’s Best Employers • Financial Times, Diversity Leaders 2025 • TIME World’s Best Companies. Human rights BV Our human rights principles support the basic rights of all people, such as the right to health, freedom from slavery, and privacy. Our Code of Ethics, Human Rights Statement and Expectations of Third Parties commit us to respecting and promoting international human rights, both within our own operations and our wider spheres of influence. To that end, we integrate human rights considerations into our processes and practices. We are also committed to ensuring that there is no modern slavery or human trafficking in any part of our business, including our value chain. Our human rights policies are designed to ensure we consider the impact of our operations on all human rights including those of the communities around our operations. The output of our work to mitigate human rights risks is detailed in our Modern Slavery Statement, which is published annually. We also provide assurance annually to the Audit Committee. Workforce safety and health BV We are committed to providing a safe and healthy working environment for our employees and partners. Our Global Safety, Health and Environment (SHE) Standard describes our commitment to, management of, and accountability for SHE. We set and monitor our safety and health targets to support our workforce and aim to achieve the highest performance standards. In 2024, our work-related injury rate reduced by 58% and our collision rate reduced 51% from the 2015 baselines. We are also committed to supporting employee mental health and wellness and there are several resources available. This includes our Safe Space Employee Resource Group and our Healthy Minds app, which provides access to mental health and wellbeing support anytime in 24 languages. People We rely on our global workforce to uphold our Code of Ethics and behaviours in line with our Values, to deliver our strategic priorities and work to sustain and improve short-and long-term performance. For more information on our standards and Code of Ethics and for our full statement detailing how we work to mitigate the risks of modern slavery, see our website, www.astrazeneca.com/ sustainability/resources.html. 1 For the purposes of section 414C(8)(c)(ii) of the Companies Act 2006, ‘Senior Managers’ are the SET, the Directors of all of the subsidiaries of the Company and other individuals holding named positions within those subsidiaries. Individuals on multiple boards are counted once. Enabling an agile organisation In 2024, we continued to build talent internally by developing critical skills across our workforce, ensuring we have the capabilities to achieve our Ambition 2030. Key highlights: • Increased focus on building capability at our Global hubs: Mississauga, Lisbon, Barcelona and Warsaw. In 2024, 1,700 external hires were made in these locations. • Continued to develop internal talent and made 5,800 promotions during 2024. • Received external recognition for our female leaders: Sharon Barr and Susan Galbraith were awarded in the Women in Biopharma 2024 report, Pam Cheng was recognised in the TIME100 Health leaders and Iskra Reic was acknowledged by Fierce Pharma. Listening to our workforce Encouraging employees to provide continuous feedback through various mechanisms helps us to foster an inclusive culture and be a great place to work. We collect feedback through onboarding surveys, exit interviews and our global employee engagement survey. We encourage managers to listen to the workforce by providing them with access to the aggregated results for their teams and, in 2024, we launched a new reporting tool to further support managers with understanding engagement across their teams. To ensure we are fully transparent we share our global results with the Board of Directors, the SET, line managers and employees. 48 AstraZeneca Annual Report & Form 20-F Information 2024 Strategic Report Business Review continued |
| 84% employee belief that AstraZeneca is a great place to work 10.9% employee turnover 6.5% employee overall promotion rate 88% employee belief that in the last 12 months, I have improved my existing skills, or learned new skills, or had a development opportunity Central to our success is ensuring all our employees have the potential to develop and grow and we are committed to being a great place to work. We face increasing external competition for market-leading talent. We must attract and retain highly skilled personnel to support critical position succession planning and the implementation of our strategic objectives and business operations. Our recruitment, deployment, reward and development practices, and our approach to working arrangements, are designed to attract and retain diverse individual talent at different career and life stages. As a Group, our global footprint, bolstered by the locations of our strategic sites and Global hubs, provides AstraZeneca with access to a greater diversity of talent to strengthen market and global teams. Talent acquisition We target our recruitment and retention activities to secure critical skills and capabilities and invest in innovative technology (such as AI-automated interview scheduling and job advert writing tools) to reduce administrative tasks and enable Talent attraction and retention Attracting, retaining and developing talented individuals is key to our growth and success. We achieve this by cultivating a great place to work that values and rewards innovation, entrepreneurship and outstanding performance. BV positive candidate and employee experiences. Our deployment team is focused on providing an exceptional talent acquisition partnering service to secure the best talent for our business from the 1.3 million applications we receive for 24,800 roles each year. Talent scouts are an integral part of our approach. Working globally, their deep understanding of business needs develops robust capability pipelines, ensuring that engaged, validated candidates are available when needed. They also build external succession plans for critical senior executive roles, sourcing market-leading talent, particularly where internal succession plans do not fully meet business requirements, thus mitigating risk to business continuity. In 2024, we expanded the remit of our talent scout organisation to include niche and critical skill hiring and pipeline-building, and proactive engagement with top talent to share opportunities and provide expert coaching and guidance throughout the hiring experience. Gene therapy and gene editing Investing in transformative R&D technologies Gene therapy and gene editing have the potential to transform patient outcomes by directly addressing the underlying cause of genetic diseases, which represent an estimated 80% of rare diseases. We are focusing on diseases with a well-established genetic basis and indications where we can apply our expertise, including diseases affecting the liver, heart, muscle and brain. We are developing and advancing new technologies to improve the precision and delivery of gene therapies and gene editing, opening new possibilities to meet the needs of patients with few, if any, treatment options. AstraZeneca Annual Report & Form 20-F Information 2024 49 Strategic Report Corporate Governance Financial Statements Additional Information Business Review | People and Sustainability |
| This extended model has created capacity for business partnerships beyond executive search and succession planning, strengthening the business’s overall talent agenda and allowing us to move at pace to fill niche roles where competition for talent is high. We are also building talent attraction and sourcing centres in Guadalajara, Lisbon and Chennai, and expanding our scouting model across the new global hub locations, enabling pipeline-building and sourcing of top talent and reducing the time taken to fill key roles, working enterprise-wide to enhance the service offered. Future initiatives as part of our employee experience workstream include deploying a talent intelligence platform, which will connect people to opportunities by leveraging data-led insights, breaking barriers to internal mobility and democratising how our employees discover and prepare for their next career move. Another future initiative is Onboarding 2030, which aims to deliver inspiring onboarding experiences that accelerate performance, foster connection and unlock potential. Development programmes We develop capabilities for the future through targeted and inclusive development programmes, from early talent to enterprise leaders. Our digital learning portal supports a continuous learning mindset underpinning a high-performing and innovative organisation. Our development programmes help us to unlock potential, drive innovation and foster an inclusive culture, building the capabilities of diverse future leaders in support of our People strategy. All employees (and contingent workers) have access to our global learning platform. Global learning and development opportunities are provided alongside high potential talent initiatives, such as our talent development centres. We evaluate the impact of our development programmes two years after attendance, looking at promotions, talent moves and retention. During 2024, we launched foreign language skills development in 70 languages to support talent mobility and employee progression. We also offered all employees the opportunity to join a generative AI programme and have seen over 10,000 enrolments. We have a global operating model and governance in place which includes all our SET areas. We can therefore measure the impact of our global development programmes, experiences and platforms across all our geographies and stakeholders. In 2024, 88% of employees believe they have improved their existing skills, learned new skills or had a development opportunity. Coaching and recognition We focus on performance coaching, development and continuous recognition of the contributions of our employees. Our approach’s effectiveness can be seen in the completion rate of end-of-year insights by managers and employees, which consider deliverables, impacts and key learnings to carry forward which were completed by over 90% of employees. This is reinforced through quarterly coaching check-ins between employees and their manager and regular coaching conversations, the frequency of which is measured in our Pulse survey, where 84% of employees said that they have regular coaching from their line manager. Our Values are central to employee reward and performance, and are the basis of our CatAlyZe global recognition platform. Employee relations We have a Global Employee Relations team that supports the application of our global employment standards and policies, ensuring consistency in managing issues such as sexual harassment, and bullying and harassment. In addition, our local Employee Relations resource applies these Standards in the context of local law and practices, and provides advice on country-specific policies. Many markets within AstraZeneca have a dedicated Employee Relations function engaging with employee representative groups and trade unions. Our ambition is to build a positive and safe working environment for employees. To achieve this, Employee Relations works in partnership with Legal, Compliance and HR functions and employee representative groups, such as the European Consultation Committee, Works Councils and, where applicable, our nationally recognised trade unions. According to our internal Human Rights survey carried out in 2024, we have a relationship with trade unions in 29% of the countries in which AstraZeneca operates. Where trade unions do not exist, all countries have established arrangements for similar workforce engagement. Accountability for these processes is with the Chief Human Resources Officer and delegated to members of the leadership team. On a day-to-day basis, this is managed by senior leaders. We regularly receive feedback on engagement with our workforce through a range of sources including team meetings, townhall meetings, and our internal social media platform. Our annual Pulse survey also provides structured employee feedback and we use a Pulse GPT tool to analyse comments and provide additional insights into themes raised. We also hear the views of employee representatives and trade unions in relevant countries, and from our Employee Resource Groups (ERGs), which are voluntary, employee-led groups based on shared identities and other diversity cohorts. We have seven Global ERGs with chapters in more than 15 countries as well as 12 country-specific ERGs. Examples of ERGs include Network of Women and Allies, TH!NK Neurodiversity and AZ Pride. Leadership teams work with their HR functions to drive employee engagement activity in their areas. Engagement feedback gives us a good understanding of employees’ views and priorities and is an important input as we develop and review our employment policies and practices. We have pledged our commitment to the United Nations Global LGBTI Standards of Conduct and United Nations Women’s Empowerment Principles. We are committed to equal pay and regularly monitor the reward of employees at all levels in the organisation to ensure that it is equitable. People and Sustainability For more information, see: Standards and Policies, including Code of Ethics, on page 42. Engaging with our workforce, on page 98. Talent attraction and retention continued BV 50 AstraZeneca Annual Report & Form 20-F Information 2024 Strategic Report Business Review continued |
| Overview We seek to create value beyond the impact of our medicines by embedding sustainability into everything we do – from the lab to the patient – supporting health system resilience and increasing access to sustainable healthcare. During 2024, we were recognised for our efforts across all our sustainability priorities, including: • Received a rating of AA (on a scale of AAA-CCC) in the MSCI ESG Ratings assessment. • Included in the Dow Jones Sustainability World Enlarged and Europe Index. • Included in the 2024 Access to Medicine Index top five. • Listed in the Financial Times European Climate Leaders for the third consecutive year. Our approach to sustainability Our Purpose, to push the boundaries of science to deliver life-changing medicines, is underpinned by our commitment to contribute to the health of people, society and the planet. As a global business, we are playing our part by operating ethically and responsibly, and helping tackle the biggest challenges of our time, including climate change, nature loss and health equity. These challenges are interdependent and require collaboration to be successfully addressed, implementing a variety of approaches across a network of relationships. By working together to find science-based solutions, we believe we can drive real change and build a better future. Governance Our sustainability strategy is developed by the SET, which reviews our Group scorecard quarterly, and is approved by the Board, whose Sustainability Committee monitors the execution of the strategy, overseeing our approach to communicating sustainability activities with stakeholders, and providing input to the Board and other Board Committees on sustainability matters as required. The Audit Committee is responsible for overseeing sustainability reporting in the Company’s Annual Reports, Form 20-F filings and quarterly results announcements. For further details on Corporate Governance, see from page 85. Our executive Sustainability Reporting Steering Committee is comprised of leaders representing functions relevant to the sustainability strategy and reporting. The Committee is co-chaired by the SVP, Finance, Group Controller and Head of Global Finance Services and the VP, Global Sustainability and SHE, and reports on progress to the Audit and Sustainability Committees and keeps the SET updated on current developments. Sustainability Sustainability at AstraZeneca means harnessing the power of science and innovation and our global reach, to build a healthier future for people, society and the planet. BV Benchmarking and assurance We contribute to key global ESG performance evaluations, recognising the value of independent third-party assessment and insights. Our performance is also assessed independently based on the information and data we make publicly available. Bureau Veritas has provided limited independent assurance for the sustainability information contained within this Annual Report and Form 20-F. Assurance is in accordance with the International Standard on Assurance Engagements (ISAE) 3000 (Revised) and ISAE 3410 Assurance Engagements on Greenhouse Gas (GHG) Statements. Community investment Community investment at AstraZeneca is built upon the principles of equity, transparency and partnership, and we work together to build healthy and resilient communities. In 2024, we contributed $126.8 million in financial and non-financial donations, including product donations, to 928 non-profit organisations across 65 countries. We also donated $4.6 billion (2023: $4.7 billion) of medicines through patient assistance programmes around the world, the largest of which is our AZ&Me Prescription Savings Program in the US. AstraZeneca Annual Report & Form 20-F Information 2024 51 Strategic Report Corporate Governance Financial Statements Additional Information Business Review | People and Sustainability |
| People and Sustainability In support of our commitments and approach, AstraZeneca engages in ongoing access initiatives enterprise-wide. We continue to implement innovative solutions to optimise affordability and accessibility, where necessary, addressing barriers beyond a medicine’s price. Each market makes decisions based on their local context to implement initiatives or access strategies that ensure broader access to our medicines, tracking and evaluating outcomes to assess their effectiveness and impact. Affordability and pricing The price of a medicine should reflect its value, maximise patient access and provide flexibility to accommodate variation in global health systems and economic realities for patients. Working closely with payers and policymakers, we tailor approaches and programmes to address local health system resilience and patient needs to deliver locally affordable medicines. We work with payers to conclude value-based reimbursement models that improve patient outcomes and enable access to medicines across key therapeutic areas and geographic regions, adapting our prices across the countries in which we operate. For patients, this includes offering local solutions to help bridge out-of-pocket payment gaps, enabling patients to begin and continue their prescribed treatments. We also have various initiatives which provide discounts and assistance. At a market level, we offer training to healthcare providers, promote health education and awareness-raising activities and facilitate access to treatment where appropriate. Since 2017, we have implemented and evolved a tiered pricing model to support broader and accelerated patient access to medicines in low- and middle-income countries (LMICs). This establishes four tiers of countries based on standardised Gross National Income per capita aligned to the World Bank classifications and allows us to recognise income and ability to pay differences across countries, providing price flexibility in a commercially sustainable way. Patent protection and access We are committed to not filing patent applications in any low-income or least-developed countries and many LMICs. We will consider approaches from third parties seeking non-exclusive voluntary IP licences in developing countries. We are committed to providing transparency about where our patents are filed and enforced. Where we maintain patent protection for assets which may have relevance to Access to Medicine Index diseases, we provide patent identity and expiry information. We also provide patent expiry information for the US, China, the EU and Japan. The best way to address the healthcare challenges faced by LMICs is through the engagement of our industry with other stakeholders to find constructive ways to improve access to medicines and delivery of healthcare. However, we recognise the right of countries to use the provisions of the World Trade Organization Agreement on Trade-Related Aspects of Intellectual Property Rights, and we support the principles outlined in the Doha Declaration, including compulsory licensing in a ‘national emergency or other circumstances of extreme urgency’ where no appropriate alternative is available. Early and post-trial access to medicines We will provide access in certain circumstances to a medicine before approval within a country where other treatments are not available. As such, prior to commercial availability of our medicines, we prioritise access to our medicinal products through participation in a clinical trial. We have ongoing clinical trials across our therapy areas, details of which are given in the Development Pipeline Supplement on our website, www.astrazeneca.com/ annualreport2024. Promoting access to healthcare products for priority diseases and in priority countries For our access initiatives we had a 2025 target of 50 million people reached, which was met in 2023, two years ahead of schedule. In 2024, we continue to track progress in reaching people through our patient access programmes and new targets relating to health equity will be communicated in 2025. We work across our main disease areas to address non-communicable diseases (NCDs) for patients with unmet medical needs and collaborate with experts within health systems to improve outcomes for patients. Our ongoing access programmes include: • Oncology: Cancer Care Africa, the Lung Ambition Alliance • BioPharmaceuticals (CVRM): Accelerate Change Together on Chronic Kidney Disease, Healthy Heart Africa • BioPharmaceuticals (R&I): PUMUA (Africa), Breeze of Air (Egypt), Healthy Lungs • Rare Disease: BeginNGS Consortium, deciphEHR, Genomenon. Disease prevention Our Young Health Programme, which is active in 41 countries and has directly reached more than 19 million young people, advances disease prevention and awareness with the aim to prevent the most common NCDs such as cancer, diabetes, heart disease and respiratory disease among young people. Health system strengthening We participate in the Partnership for Health System Sustainability and Resilience (PHSSR), which is a non-profit, multisector, global collaboration with a unified goal of building more sustainable and resilient health systems, active in more than 30 countries. PHSSR has commissioned over 20 research reports to date, providing independent, evidence-based recommendations to strengthen health systems and facilitate cross-border best practice sharing, working with national experts with first-hand experience. Accessible and affordable healthcare We are committed to addressing barriers to access to healthcare and innovating to deliver our life-changing medicines in a sustainable and equitable way. Our approach includes integrating health equity within our core business and therapy areas, understanding the factors that drive poor outcomes in certain populations, and addressing health equity issues along the entire patient pathway. BV For more information, see Patent Expiries of Key Marketed Products Supplement on our website: www.astrazeneca.com/ annualreport2024. 52 AstraZeneca Annual Report & Form 20-F Information 2024 Strategic Report Business Review continued |
| 139,594 gross Scope 1 and 2 GHG emissions (market-based) (tonnes CO2e) 2.58 Scope 1 and 2 GHG emissions intensity (tCO2 per million of Total Revenue) 5,897,822 gross Scope 3 GHG emissions (tonnes CO2e) 59% primary activity data in Scope 3 reporting In 2020, we launched our Ambition Zero Carbon strategy, through which we are pursuing ambitious science-based decarbonisation targets and making progress towards achieving net zero by 2045. We also aim to become carbon negative from 2030 for all residual GHG emissions. Transition plan for climate change Achieving our verified Science Based Targets initiative (SBTi) Net-Zero Corporate standard targets will require decarbonisation across the whole value chain. We are using decarbonisation levers to address every aspect of our GHG footprint, following a hierarchy (eliminate-reduce-substitute) to address each emission source across Scopes 1, 2 and 3. Specific decarbonisation levers are described below. Over 95% of our total GHG emissions are in the upstream and downstream value chain, reported under Scope 3. Target achievement will therefore require extensive decarbonisation across our supply chain, including our product portfolios. We are progressing towards our SBTi near-term target of 98% absolute reduction in Scope 1 and 2 GHG emissions by 2026 from a 2015 baseline, having already doubled our energy productivity since 2015 (unit revenue per unit of energy consumed at our sites), continuing the transition to electric vehicles in our road fleet (EV100) by the end of 2025 and using 100% renewable energy (RE100) for electricity and heat by 2026. To support delivery of our longer-term target of 50% reduction in total Scope 3 GHG emissions by 2030 and 90% reduction by 2045, from a 2019 baseline, we are engaging with suppliers for them to set validated SBTs to cover most of our supplier spend by the end of 2025. Pharmaceutical products have a long development cycle, which makes it critical to design and embed climate considerations at an early stage. To achieve our goals, we must tackle emissions from our existing commercial portfolio, which creates challenges with heavily regulated production processes and materials. Climate governance The guide for our Environmental Management System is embedded in our Code of Ethics and supported by our already defined SHE Standard, together with our OneSHE Framework of internal standards, procedures and guidelines. Our SHE management system ensures the environmental risks of our activities are assessed, operational controls are in place, checks are completed through a risk-based audit programme guided by an independent organisation and there is an annual Climate change As part of our Ambition 2030, we are focused on leading on climate, equity and resilience, including strategic initiatives to address the interconnection between climate and health. BV management review process. Climate change adaptation is managed under our Standards on Business Continuity Process, Enterprise Risk, Management of Change, Minimum Environmental Requirements for the Built Environment and SHE Assurance. The Sustainability Committee monitors progress on Ambition Zero Carbon. Sustainability reporting is overseen by the Audit Committee. The CEO’s responsibilities to the Board include the development and performance of the Ambition Zero Carbon strategy and related risks and opportunities. The EVP, Global Operations, IT & Chief Sustainability Officer is responsible for the Ambition Zero Carbon strategy and its execution, and all SET members have responsibility for working with their teams to ensure alignment of the Ambition Zero Carbon strategy with business priorities and climate risks and opportunities. Our executive-led Ambition Zero Carbon Governance Group is accountable for the delivery of Ambition Zero Carbon. Regular governance updates and proposals are provided to the Governance Group, which in 2024 included our CEO, CFO, and the EVP, Global Operations, IT & Chief Sustainability Officer. The Climate and Nature Steering Group co-ordinates the management of physical and transitional climate risks and opportunities and supports the Group’s adaptation and resilience actions. Our Ambition Zero Carbon investment is now being embedded into business financial planning, which is being adapted to incorporate the choices that will be made across our global portfolio and the impacts on the cost of goods. As our sites and markets develop their zero carbon roadmaps, they are identifying potential investments and embedding them into the annual long-range budgeting process. Scope 1 and 2 Decarbonisation levers Electrification (road fleet) At the end of 2024 we had successfully transitioned 63% of our total owned and leased road vehicle fleet (over 20,000 vehicles) to battery electric vehicles (BEVs). Our fleet accounts for 23% of our Scope 1 and 2 GHG footprint in 2024 and switching to BEVs contributes to our Ambition Zero Carbon target through eliminating tailpipe GHG emissions and procuring renewable electricity certificates equivalent to the charging electricity requirements. For more information, see: Standards and Policies, including Code of Ethics, on page 42. Streamlined Energy and Carbon Reporting, on page 233. Remuneration Report, from page 112. AstraZeneca Annual Report & Form 20-F Information 2024 53 Strategic Report Corporate Governance Financial Statements Additional Information Business Review | People and Sustainability |
| People and Sustainability We are now operating over 14,000 BEVs globally and we are on track to achieve our target to transition 100% of our company-owned and leased vehicles to BEVs where technically feasible by the end of 2025. The global transition is being delivered while some markets are experiencing challenges with the supply of vehicles and the availability of charging infrastructure. Site F-gas management F-gases released during the production process of current pMDI medicines are reported as part of our Scope 1 GHG footprint and accounted for 80% of our global Scope 1 F-gas emissions in 2024, making them the priority for mitigation. Through a process change involving purging empty canisters in a vacuum instead of using a propellant, we have significantly reduced F-gas emissions. A second reduction initiative of capturing F-gas emissions from the production process, using cryogenic technology that liquefies the gases, has been scaled up during 2024, enabling the storage and removal from site for either incineration or recycling. Energy efficiency and renewable energy We have used Climate Group’s RE100 corporate renewable energy initiative quality criteria as a robust baseline on which we have developed internal standards and scoring mechanisms for energy sourcing proposals – not only for electricity but also heat and fuels. Focus areas include targeting new-to-grid renewable energy capacity (additionality), energy purchase agreements that displace fossil energy sources close to where we consume that energy (geographic relevance), and investigating how to improve the alignment between when our energy is generated and consumed (temporal relevance) to improve utilisation and deliver GHG emissions reductions. We have achieved a 20% absolute reduction in total energy consumption at sites from our 2015 baseline and our target is to use 100% renewable energy sources to meet all our needs by the end of 2025. Clean power On-site solar photovoltaic installations We recognise the benefits of self-generated renewables to site energy costs, resilience, temporal relevance and employee engagement, and have invested in on-site solar photovoltaic (PV) installations at 20 locations in 11 countries. Once operational, the total output from all our on-site solar PV will be 21,000 megawatt hours of electricity, equivalent to 3% of our global electricity use. Power Purchase Agreements There is a limit to the scale that can be achieved through on-site solar PV, and so to deliver additional renewables with geographic and temporal relevance in line with our focus areas, we are aiming to meet most of our electricity needs in our primary locations – Sweden, the UK and US – through Power Purchase Agreements (PPAs) in the grids where we operate. At the beginning of 2024, a 10-year PPA came into effect with Statkraft, Europe’s largest renewable energy producer, to source electricity from three new wind farms in Sweden that will supply 200 gigawatt hours (GWh) per year from new-to-grid projects. This provides additional zero carbon electricity to the grid and is expected to correspond to approximately 80% of our total electricity needs at our Gothenburg and Södertälje sites. Fuel switching (clean heat) AstraZeneca signed a clean heat agreement in March 2024 to decarbonise our medicines manufacturing in China. Through this agreement, biomethane and biomethane-based steam will be supplied to our Wuxi manufacturing site, supporting the broader decarbonisation of the healthcare system. Since 2023, we have been collaborating with Vanguard Renewables to enable the delivery of renewable natural gas (RNG – biomethane) to all of our sites in the US by the end of 2026, launching at our Newark campus in Delaware. By 2026, this collaboration is expected to enable up to 230 GWh per year of RNG to be used across AstraZeneca’s US sites, equivalent to 46% of our total global gas consumption. As part of our 15-year agreement with Future Biogas, in 2024 construction progressed on the first unsubsidised supply of biomethane in the UK, to our sites in Macclesfield, Cambridge, Luton and Speke. The new plant will add renewable energy capacity to existing UK infrastructure and is expected to supply more than 100 GWh of biomethane, equivalent to 20% of our total global gas consumption. Scope 3 Decarbonisation levers Product manufacture Manufacturing products is responsible for a significant proportion of our Scope 3 footprint and decarbonising products is a key pillar of our strategy to achieve our 2030 Scope 3 target. This will include collaborating with manufacturers of APIs used in our medicines, to identify opportunities for eliminating, reducing or substituting sources of GHG emissions. Interventions to decarbonise must be guided by data such as that from product Life-Cycle Assessments (LCAs). Similarly, the requirements for eco-design will be incorporated into new product development. We are also participating in initiatives including the Activate programme, which brings global pharmaceutical companies together with suppliers to decarbonise API supply chains, and Energize, which is increasing access to renewable sources of energy at scale for pharmaceutical suppliers. Non-product supplier emissions To address the Scope 3 footprint associated with purchased goods and services procured outside of product manufacture, we must understand the relative GHG emissions of activities across a diverse set of categories, from clinical trials to professional services and advertising. This will involve identifying emission hotspots for collaborative action and a drive towards improved activity-based emissions data. Efforts to reduce emissions across our supply chain include advocating that suppliers set SBTs of their own to reduce the environmental impact of the products and services supplied, cascading these expectations up the value chain and prioritising the use of renewable energy in their operations as an effective decarbonisation lever. Product use Chronic respiratory diseases such as asthma and COPD are complex, difficult to treat and often poorly controlled and are associated with a greater carbon footprint of care. As part of our efforts to provide patients with access to treatment with a lower carbon footprint, in 2024, we continued to focus on the next-generation propellant (NGP) transition for pMDI For more information, see Streamlined Energy and Carbon Reporting on page 233. Climate change continued BV 54 AstraZeneca Annual Report & Form 20-F Information 2024 Strategic Report Business Review continued |
| through our global AZ Forest initiative, which aims to mitigate the effects of climate change while also delivering multiple ecological, health, economic and community co-benefits. We do not purchase land for reforestation or own the trees but have the rights to carbon certificates generated by some projects. Climate adaptation and resilience We follow the science to manage the risks and opportunities presented by climate change and to build resilience against any such risks. The strategy for adaptation to physical climate risks is aligned to a high-emission scenario for significant sites, so that the Group builds resilience under a worst-case scenario. Our climate strategy is designed to address transition risks and opportunities in a low-carbon scenario and a pathway aligned with our SBTs of limiting global warming to 1.5°C. The Group products in our respiratory portfolio. pMDIs deliver essential, life-saving medicines for millions of people living with respiratory diseases worldwide. The new propellant HFO-1234ze(E) has up to 99.9% less Global Warming Potential (GWP) than propellants currently used in respiratory medicines, which makes the transition to the NGP a key product-related element of our Ambition Zero Carbon strategy. In 2024, project milestones achieved included completion of key registrational studies and the first regulatory filing submissions of our NGP with Breztri/Trixeo in COPD to the EU, UK and China with further filings anticipated in 2025. Transport – distribution and business travel Product distribution is another key focus area within our Scope 3 footprint that we will work to decarbonise to meet our 2030 Scope 3 target. This category of suppliers has a specific target to set SBTs by the end of 2025 to establish decarbonisation pathways which will inform actions. A modal switching programme is underway that aims to switch key distribution routes from air freight to sea freight and we will look to maximise its potential to deliver our emissions target. We will also support innovation for alternative technologies and fuels where the whole life-cycle sustainability impact can be demonstrated and quantified. Employee business travel is a small but visible part of our Scope 3 emissions. New ways of working established in recent years have demonstrated that business travel can be reduced through efficient scheduling and target-setting, supported by management information providing visibility across the organisation. Carbon removals Recognising the urgency of the climate crisis, we have investigated how we can supplement our emission reduction targets and activities by also taking responsibility for all our residual emissions. This requires modelling our future emissions and establishing high-quality climate projects of sufficient scale and quality to remove the equivalent amount of carbon dioxide from the atmosphere. For our Scope 1 and 2 emissions we aim to balance the residual footprint from 2026 onwards and for our Scope 3 emissions from 2030. Projects identified to date include our $400 million multi-year investment in nature-based solutions considers that it has built resilience into its strategy to respond to transition and physical risks identified on pages 56 and 57. In line with the guidance from the Task Force on Climate-related Financial Disclosures, we used a low/medium/high case scenario based on the Intergovernmental Panel on Climate Change scenarios, namely Shared Socioeconomic Pathways (SSPs) and Representative Concentration Pathways (RCPs). See page 236 for details. The identification and assessment of climate risk forms part of our existing risk management processes and as of 2024, the time horizons have also been updated to align; see page 64 for our Risk Overview. Next-generation immuno-oncology bispecifics Bispecific antibodies are engineered to bind to two different epitopes, or antigens, at the same time. Next-generation immuno‑oncology (IO) bispecifics will play a crucial part in shaping the future of medicine in many fields. We are working to expand immuno-oncology treatments beyond existing PD-L1 inhibitors and, in particular, are developing IO bispecifics that combine the potential of PD-1 together with additional targets that harness distinct T-cell biology, bringing the power of immuno-oncology into one molecule. By harnessing our broad oncology portfolio, we have the opportunity to combine bispecifics with other targeted therapies, such as ADCs, with the aim of transforming the outcomes of cancer diagnoses for patients. Investing in transformative R&D technologies Strategic Report Corporate Governance Financial Statements Additional Information Business Review | People and Sustainability AstraZeneca Annual Report & Form 20-F Information 2024 55 |
| People and Sustainability Key Low risk Time horizon for impact Medium risk Short: one year High risk Medium: up to three years Opportunity Long: more than three years Physical risks Since 2020, we have completed a deep dive risk assessment for all significant sites. These assessments are based on a broad range of climate scenarios (SSP1-RCP2.6, SSP2-RCP4.5 and SSP5-RCP8.5) but focus on a worst-case assessment from actual and future events. Where appropriate, the risk mitigation measures and interventions are escalated to site management and captured on the local risk register. Identified risks are addressed in local business continuity plans or by technical mitigations in site master plans. Mid- and long-term financial planning includes required investments. In 2024, we complemented our existing assessments with a review of office-based locations at high climate risk locations. For new, significant sites, we are integrating adaptation solutions which reduce the most important physical risks at the time of design and construction before operating at the site, such as elevating the site floor in response to flood risk. In 2022, chronic and acute physical risks were mapped to the supply chain, based on location, and then assessed using climate scenarios in the same way as for our own locations. The data has been used to map vulnerabilities in the unique supply chain for 10 selected medicines. We have also reviewed third-party owned distribution centres in high-risk areas. These locations Physical risks Time horizon Short/Medium/Long Potential impact Mitigation Acute Event-driven climate-related physical risks (e.g. flood, high wind speed). Natural disasters can lead to immediate damage and business interruption to our own operations or suppliers. Examples of this damage include: • Heavy rainfall causing local flooding and resulting in flooded assets. • High wind events resulting in damaged site structures. Increased resilience to mitigate exposure to acute extreme weather events. Identified risks are integrated into local business continuity and mitigation plans and are covered by supply chain design (e.g. dual sourcing, holding safety stock) as part of product-level business continuity management. Nature-based mitigations are favoured where possible, e.g. storm water buffering ponds. Chronic Increased frequency of extreme weather and climate-related natural disasters (e.g. extreme heat, wildfires, precipitation patterns, water scarcity, water quality). Disruption to own and third-party supplier sites and distribution due to: • Increased exposure to extreme heat events and an increased need for cooling. • Inability to secure a consistent high-quality water supply, which may lead to disruption of manufacturing and supply chain activity. Increased resilience to mitigate exposure to longer-term shifts (chronic) in climate patterns. Identified risks are integrated into local business continuity and mitigation plans and are covered by supply chain design (e.g. dual sourcing, holding safety stock) as part of product-level business continuity management. Nature-based mitigations are favoured, where possible. Ongoing efforts to decouple water use from business growth, including targets to decrease water demand from products and sites. For more information, see Risk Overview from page 64. have been added to a global risk register with a risk mitigation plan in place where needed. Physical risks from climate change primarily relate to disruption or delays to manufacturing and/or distribution, including cold chain logistics, increased insurance premiums, reputational damage and other resulting consequences. Climate change continued BV 56 AstraZeneca Annual Report & Form 20-F Information 2024 Strategic Report Business Review continued |
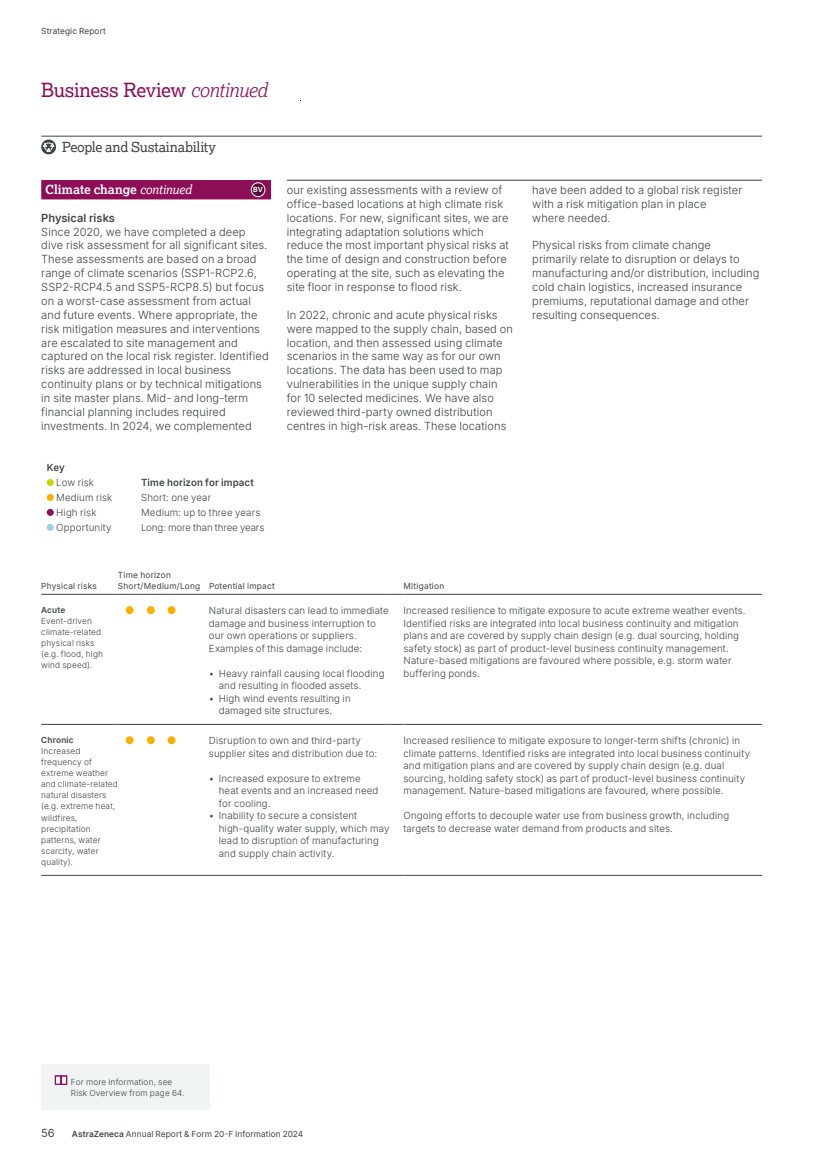
| Transitional risks and opportunities Time horizon Short/Medium/Long Potential impact Mitigation Reputation Failure to meet our sustainability targets, regulatory requirements and stakeholder expectations. Failure to deliver on our commitments could impact our reputation and put us at a commercial disadvantage relative to our peers. Reduction plans for Scope 1, 2 and 3 net-zero emissions are integrated in our internal governance model, with Scope 1 and 2 reduction plans integrated in our remuneration programme. Reduction plans for Scope 3 emissions are established in contractual agreements with suppliers. Required investments in the respiratory portfolio and in nature-based removal projects for residual emissions are approved. Progress against targets is part of external reporting. For more details, see the 2024 Risk Supplement on our website: www.astrazeneca.com/annualreport2024. Market Transition to net-zero healthcare systems. Some healthcare providers are transitioning to net-zero healthcare systems to meet their own climate targets, which may alter the demand for medicinal products based on their carbon footprint. Reduction plans for Scope 1, 2 and 3 net-zero emissions integrated in internal governance model, with Scope 1 and 2 reduction plans integrated in our remuneration programme. Requirements for eco-design have been incorporated into new product development. AstraZeneca’s LCAs and Product Sustainability Index (PSI) for medicines enable assessment and proactive interventions to reduce the environmental footprint of medicines. Policy and Legal New EU F-gas Regulation. The final EU F-gas Regulation includes the necessary safeguards allowing us to transition our pMDI portfolio to our NGP, which has near-zero GWP, by 2030. Transition to near-zero GWP propellant across our respiratory pMDI portfolio by 2030, reducing the risk of F-gas exposure with opportunity to maintain patient access to inhaled respiratory medicines delivered by pMDIs. The transition to the NGP is expected to maintain continuity for pMDI medicines, while delivering a lower environmental impact. We are committed to completing this work as quickly and safely for patients as possible. For more information from page 54. Policy and Legal Uncertainty over carbon pricing and future environmental taxation. Potential for increased carbon pricing and environmental taxation driving increased costs, but also a commercial opportunity if managed correctly. Our Ambition Zero Carbon strategy drives decarbonisation in our operations and wider value chain, mitigating some exposure to future carbon pricing and environmental taxation. We monitor market developments for carbon pricing to inform our strategy. Market Supply/demand of renewable energy. Ensuring access to renewable energy requires higher investments and changes in geopolitics can lead to loss of access, which causes increased costs. By reducing energy consumption at sites by 20% and achieving a 77.5% reduction in Scope 1 and 2 (market-based) emissions since 2015, we are reducing our exposure to incremental costs of renewable energy alternatives. Collaboration with key organisations to scale renewable energy sources and secure access to supply chain. Market Cost of raw material/sourcing, and low-carbon technologies. Impact of rising costs of raw material or sourcing, and transition to low-carbon technologies, on our supply chain. Engagement with strategic supply chain organisations on their transition to a low-carbon economy. Costing for drugs considers transition-related risks, such as fuel costs and changes to approval mechanisms. Some carbon costs are factored into decision making. Transition risk and opportunities Transition risks and opportunities are primarily regulatory and market changes, technology shift and/or pressure, and ability to reduce product carbon footprints and decarbonise our value chain. To understand the financial consequences of the transition to a low-carbon economy, risks and opportunities are assessed both at enterprise and product levels, including prioritised medicines where LCA data is available. Through scenario analysis, risks and opportunities were identified to now cover medicines in the therapy areas of Oncology, CVRM and R&I to see how drivers such as regulations, access to renewable energy, technology shifts, market expectations and reputational aspects can impact our financial forecast. In addition, transition risks and opportunities have been identified at enterprise level for transportation, renewable energy and raw materials represented by F-gases used in our inhaled respiratory portfolio. The climate scenarios used are described on page 236. Significant findings are reflected in the financial planning process. Investments in GHG reduction and removal projects will be balanced out against maintaining revenue and avoiding costs of future regulations, carbon taxation and customer requirements in a low-carbon economy. AstraZeneca Annual Report & Form 20-F Information 2024 57 Strategic Report Corporate Governance Financial Statements Additional Information Business Review | People and Sustainability |
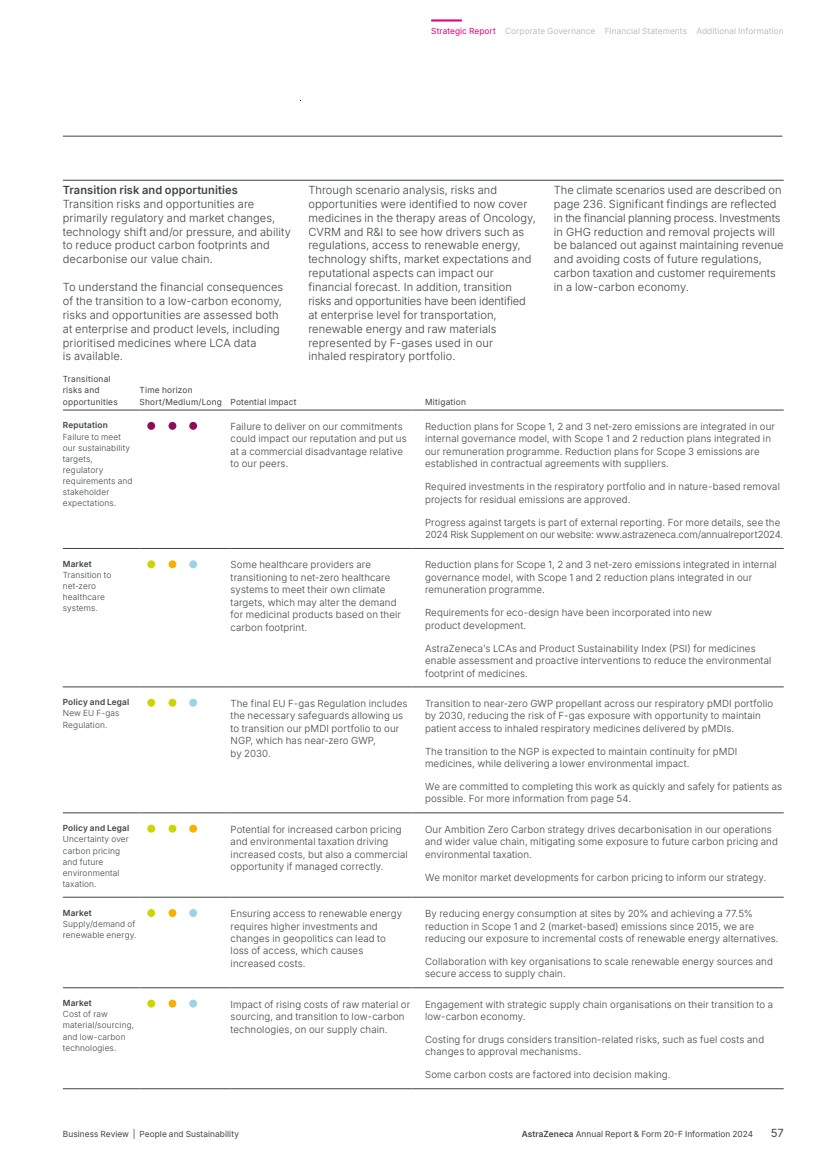
| People and Sustainability Delivering medicines to patients leads to pharmaceuticals in the environment (PIE), which are APIs resulting mainly from patient use and absent or ineffective removal from wastewater, as well as improper disposal of medicines and waste from production. We have ongoing programmes and processes across the value chain to minimise the impact of PIE, as part of our ambition to lower the economic and environmental burden of healthcare, while improving health outcomes and reducing our exposure to environmental risks. To understand the risks of PIE resulting from patient use and disposal, we complete Environmental Risk Assessments (ERAs) before the approval of a new medicine and, using experimental data, identify safe concentrations of our APIs. These demonstrate that PIE resulting from most of our products pose a low or insignificant environmental risk and are unlikely to cause adverse impacts. The data meets the international standards set by regulators and summaries of the results and ERAs are published on our website, www.astrazeneca.com/sustainability/ resources.html. The data and safe concentrations are also utilised to manage our own and contracted manufacturing emissions, ensuring risks from our supply chain are minimised. Product Sustainability Index Our internal Product Sustainability Index (PSI) is a key contributor to our management of pollution through using PIE as a metric for impact under water releases. The PSI indicates a product’s environmental footprint across six environmental impact categories: carbon, power, water resource, water releases, resource use, and innovation and improvement. EcoPharmacoVigilance Our EcoPharmacoVigilance (EPV) approach reviews emerging science and peer-reviewed literature to inform and improve our ERAs associated with our APIs. We collate and publish relevant reported measurements of our medicines in the environment to demonstrate transparently our potential impact. Our industry-leading dashboard, where users can visualise the relative risks of our APIs that are found in the environment, is available on our website. When our APIs have been detected, in almost all cases these APIs have been shown via our EPV process to pose low or insignificant environmental risk. There can be some location-specific environmental risks for particular pharmaceuticals, especially in regions where there may be inadequate sewage treatment and high populations of people discharging waste into rivers with low-dilution conditions. Improper disposal Our ERAs account for disposal through worst-case assumptions about disposal of unused medicines. However, to tackle the improper disposal of unused pharmaceuticals we also encourage our patients to return unwanted medicines for safe disposal. IHI PREMIER As part of our commitment to drive thought leadership and innovation to manage PIE, we are the industry lead of the IHI PREMIER consortium, a public-private partnership between the European Commission and EFPIA. PREMIER is helping develop tools to identify potential environmental risks of APIs and make these tools and data more accessible to all stakeholders. Through our sector-wide collaborations, such as the PREMIER project, we are exploring the challenge of developing new medicinal products which are both safe and effective in patients and have less environmental impact after use. Taking environmental considerations into account in the R&D process is feasible. However, the properties which make medicines safe and effective for patients are not always fully compatible with properties which present the lowest risk in the environment. Therefore, while we are progressing with considerations which lower the pollution impact of new medicines, a prerequisite is the explicit recognition that patient health should not be compromised. Potential restriction of PFAS in Europe The European Chemical Agency is currently evaluating a proposal to ban PFAS, often referred to as ‘forever chemicals’ in the EU. The proposal potentially impacts a family of more than 10,000 chemicals across many industries. However, not all PFAS present the same risks to the environment or health. PFAS are widely used in the biopharmaceutical industry, and it may not be possible to substitute all of them. Legislators have signalled a willingness to protect APIs in medicines and take a sector-based approach to the legislation. Importantly, the medical grade HFO-1234ze(E), AstraZeneca’s NGP with near-zero GWP, is backed by comprehensive evidence that shows it is rapidly broken down in the environment, is non-bioaccumulative and non-toxic, and therefore does not possess the properties that are the stimulus for the legislation. Unsaturated molecules such as HFO-1234ze(E) do not fall under the definition of PFAS by other environmental regulatory agencies, such as the US Environmental Protection Agency. We are working with authorities and relevant stakeholders to ensure the differential characteristics of HFO-1234ze(E) are recognised in the regulations and they fully account for patient needs and public health while protecting the environment. Pollution Pollution comprises the introduction of pollutants into the environment which may be harmful, including to human health. For AstraZeneca, key potential pollutants include APIs and per- and polyfluoroalkyl substances (PFAS). Reduction of chemical pollution, including from pharmaceuticals, is a societal challenge as recognised by the development of a United Nations science policy panel on chemicals, waste and pollution prevention. BV 58 AstraZeneca Annual Report & Form 20-F Information 2024 Strategic Report Business Review continued |
| Our approach to sustainability reporting BV Our sustainability reporting is prepared in line with the UK Companies Act 2006, the EU Non-Financial Reporting Directive, EU Taxonomy on Sustainable Activities and the recommendations of the Task Force on Climate-related Financial Disclosures (TCFD). In anticipation of the EU Corporate Sustainability Reporting Directive (CSRD), we have conducted a double materiality assessment and have incorporated selected disclosures from the European Sustainability Reporting Standards in this Annual Report. In this section, we present our approach to sustainability reporting, Section 172(1) statement, and Viability statement. UK statutory sustainability reporting Non-Financial and Sustainability Information Statement and the TCFD recommended disclosures Under sections 414CA and 414CB of the UK Companies Act 2006, as introduced by the Companies, Partnerships and Groups (Accounts and Non-Financial Reporting) Regulations 2016 and amended by the Companies (Strategic Report) (Climate-related Financial Disclosure) Regulations 2022, AstraZeneca is required to include in its Strategic Report, a non-financial and sustainability statement containing certain information. The areas listed below include references to our relevant policies, due diligence processes and information on how we are performing against various measures. Information on the key non-financial performance indicators relevant to our business are presented alongside the material sustainability matters. • Business model, page 10 and 11 • Environmental matters, pages 53 to 58 • Climate-related disclosures, pages 53 to 57, 233, 235 to 236. • Employees, page 48 to 50 • Social matters, pages 38 and 52 • Human rights, page 48 • Anti-corruption and anti-bribery matters, pages 42 and 43 • Principal risks, page 64 to 66. We have made disclosures within the Annual Report consistent with the four recommendations of the TCFD, the 11 recommended disclosures and all sector guidance, and in compliance with the requirements of UK Listing Rule 6.6.6(8) of the UK Financial Conduct Authority. The table on this page sets out the required climate-related financial disclosures from the TCFD framework and UK Companies Act 2006, section 414CB, and shows where further information can be found. BV TCFD recommendations and recommended disclosures UK Companies Act 2006, section 414CB Page Governance Describe the Board’s oversight of climate-related risks. Describe management’s role in assessing and managing climate-related risks and opportunities. Description of the company’s governance arrangements in relation to assessing and managing climate-related risks and opportunities. 53 103 104 to 111 Strategy Describe the climate-related risks and opportunities the organisation has identified over the short, medium and long term. Description of: (i) the principal climate-related risks and opportunities arising in connection with the company’s operations, and (ii) the time periods by reference to which those risks and opportunities are assessed. 55 to 57 64 236 Describe the impact of climate-related risks and opportunities on the organisation’s businesses, strategy and financial planning. Description of the actual and potential impacts of the principal climate-related risks and opportunities on the company’s business model and strategy. Describe the resilience of the organisation’s strategy, taking into consideration different climate-related scenarios, including a 2°C or lower scenario. An analysis of the resilience of the company’s business model and strategy, taking into consideration different climate-related scenarios. Risk management Describe the organisation’s processes for identifying and assessing climate-related risks. Description of how the company identifies, assesses, and manages climate-related risks and opportunities. 55 to 57 64 Describe the organisation’s processes for managing climate-related risks. Describe how processes for identifying, assessing and managing climate-related risks are integrated into the organisation’s overall risk management. Description of how processes for identifying, assessing, and managing climate-related risks are integrated into the company’s overall risk management process. Metrics and targets Disclose the metrics used by the organisation to assess climate-related risks and opportunities in line with its strategy and risk management process. Description of the key performance indicators used to assess progress against targets used to manage climate-related risks and realise climate-related opportunities and of the calculations on which those key performance indicators are based. 53 233 235 Disclose Scope 1, Scope 2 and, if appropriate, Scope 3 GHG emissions, and the related risks. Description of the targets used by the company to manage climate-related risks and to realise climate-related opportunities and of performance against those targets. Describe the targets used by the organisation to manage climate-related risks and opportunities and performance against targets. AstraZeneca Annual Report & Form 20-F Information 2024 59 Strategic Report Corporate Governance Financial Statements Additional Information Disclosure Statements AstraZeneca Annual Report & Form 20-F Information 2024 59 Disclosure Statements |
| EU Corporate Sustainability Reporting Directive In 2023, the EU CSRD entered into force. The new directive aims to provide investors and other stakeholders with information about companies’ sustainability-related impacts, risks and opportunities. AstraZeneca PLC is in scope of the CSRD from the 2025 financial year due to its listing on Nasdaq Stockholm, an EU-regulated market. In preparation for future reporting requirements, we are disclosing the outcomes of our double materiality assessment and selected disclosures from the European Sustainability Reporting Standards in this Annual Report. Double materiality assessment The EU CSRD mandates companies in scope of the directive to conduct a double materiality assessment. The assessment identifies sustainability-related risks and opportunities to a company and a company’s impacts on people and the environment. AstraZeneca performed a Group-level double materiality assessment in 2024. The Group’s impacts on people and the environment were identified through research using a variety of sources such as sector guidance and benchmarking, as well as understanding the interests and views of stakeholders through dialogue. Negative and positive impacts were initially scored using results of due diligence findings, internal assessments and research, based on factors such as scale, scope, irremediability and likelihood. Subsequently the assessment was confirmed by internal and external stakeholders. External stakeholders represented patient groups, suppliers, investors, academia and non-governmental organisations. Their input was used to refine and validate the assessments and scores. BV The Group’s capital expenditure (Capex) and operating expenditure (Opex) is also eligible for four other activities included in the Climate Delegated Act, with the most significant being activity 7.1 Construction of new buildings. Capex was assessed for Taxonomy-eligibility on a project basis. Projects were assessed for alignment based on a set quantitative threshold. Opex was assessed for Taxonomy-eligibility based on the nature of the expense. Alignment assessment Substantial contribution Manufacture of medicinal products The Manufacture of medicinal products criteria requires that products be both degradable1 and a substitute for an existing non-degradable product, in order to be aligned. The Group’s portfolio of eligible products includes both biologics active pharmaceutical ingredients (APIs) and small molecule APIs. Innovative medicines by their very nature are not alternatives to existing products, hence they do not meet the substantial contribution criteria. Eligible products where the APIs are small molecules are generally considered to be not readily biodegradable. The biologics used in the Group’s APIs are mostly naturally occurring and generally considered to be degradable. However, in some instances excipients used in products may not be considered degradable. We have therefore assessed that, overall, our products do not meet the substantial contribution criteria and are not aligned for the Manufacture of medicinal products activity. The identification and assessment of sustainability-related risks and opportunities was carried out based on prevailing exposures, taking account of mitigations in place at the reporting date. This approach is aligned to the Group’s risk management framework (see page 64 for our Risk Overview). The double materiality assessment utilised quantitative and qualitative thresholds, aligned with the Group’s risk appetite, to determine material sustainability topics. The assessment was then reviewed by representatives of the SET and the Board. For information on the impact of material sustainability topics on the Group’s financial statements, see the Group Accounting Policies in the Financial Statements from page 152. EU Taxonomy Disclosure The EU Taxonomy (Regulation (EU) 2020/852) and associated Delegated Acts represent an evolving classification system for sustainable economic activities. An economic activity is Taxonomy-eligible if it is described in the Taxonomy Delegated Acts. An economic activity is Taxonomy-aligned if it makes a substantial contribution to one or more of the specified environmental objectives, meets specified ‘Do no significant harm’ (DNSH) criteria and is carried out in compliance with minimum safeguards. Eligibility assessment The Group has identified its Taxonomy-eligible activities by screening the economic activities in the Climate Delegated Act and the Environmental Delegated Act. The Group is eligible for a revenue generating economic activity included in the Environmental Delegated Act for the environmental objective of Pollution prevention and control (PPC), namely, PPC 1.2 Manufacture of medicinal products. BV 1 Whilst the criteria do refer to an alternative pathway where a product within a substance class cannot be degradable, it demands that the manufacturer performs an analysis that there is no degradable option for the product, publishes the core results of that analysis and demonstrates that they started initiatives to develop that alternative. As we have not performed this in the year, we have dismissed this pathway. Science and Innovation • Sustainable innovation, see page 37. • Patient safety and product quality, see page 38. Growth and Therapy Area Leadership • Business conduct, see pages 42 and 43. • Cybersecurity and data privacy, see page 45. People and Sustainability • Talent attraction and retention, see page 49 and 50. • Accessible and affordable healthcare, see page 52. • Climate change, see pages 53 to 57. • Pollution, see page 58. Our material sustainability topics BV The following sustainability topics were assessed as material in our double materiality assessment. Disclosures relating to these topics can be found in the Business Review, from page 32. 60 AstraZeneca Annual Report & Form 20-F Information 2024 Strategic Report Disclosure Statements continued |
| Identification of economic activities in the Taxonomy which are in scope for the Group. Step Action Activities Assessment of whether identified in scope activities meet the activity-specific criteria to qualify as substantially contributing to an environmental objective. Assessment of whether activities which contribute substantially to an environmental objective, do no significant harm to other environmental objectives. Assessment of minimum safeguards at the Group level for specified social and governance areas. Calculation of proportions of aligned Revenue, Capex and Opex. Eligibility 1 Substantial contribution 2 Do no significant harm 3 Minimum safeguards 4 Alignment 5 Sustainable use and protection of water and marine resources and Pollution prevention and control The Group has assessed relevant sites against the technical specifications and, in specific cases, the criteria have been met as part of being expected to achieve the LEED (Gold level) label. However, for certain construction sites based outside the EU, an equivalent Environmental Impact Assessment (EIA) as would be required within the EU is not available or locally mandated for those sites, hence criteria have not been met. Transition to a circular economy The Group expects to incorporate circular economy principles in the construction of new buildings and renovation of existing buildings as part of those projects being expected to achieve a LEED (Gold level) label. However, for some projects the relevant DNSH criteria have not been met, hence they are considered to be not aligned. Protection and restoration of biodiversity and ecosystems For activity 7.1, EIAs have been completed for specific construction sites and we have assessed these against the criteria. For certain sites based outside the EU, an equivalent EIA as that which would be required within the EU, is not available or locally-mandated for those sites and therefore the Group has assessed these sites as not aligned with the criteria. A proportion of activity 7.2 Renovation of existing buildings has been assessed as aligned in 2024. Double-counting was avoided by reconciliation to underlying financial records and only assessing activities substantially contributing to a single environmental objective. Minimum safeguards The Group has performed an assessment of its compliance with the minimum safeguards criteria against published documents. These cover four key topics: • Human Rights (including Labour and Consumer Rights) • Anti-bribery and anti-corruption • Taxation • Fair Competition. The Group’s Values, incorporated in the Code of Ethics (the Code), are the foundation of our compliance with the minimum safeguards, which are expanded through our policies and practices including our Global Standard on Expectations of Third Parties and Group’s Approach to Taxation. Our commitment to human rights is formalised in the Code and we integrate human rights considerations into our processes and practices. We do not tolerate bribery and corruption and violation of fair competition. The Group publishes its Approach to Taxation annually and we aim to pay the right amount of tax in compliance with all relevant tax law and regulations in every country in which we operate and do not tolerate tax evasion or facilitation of tax evasion. Construction of new buildings Climate change mitigation The Group is eligible where it is constructing new buildings. These buildings are expected to be aligned with a major environmental standard, namely Leadership in Energy and Environmental Design (LEED) Gold level. From the specifications expected to be met, the criteria related to Primary Energy Demand and life-cycle Global Warming Potential have been fulfilled. The Group expects to adopt robust controls for building airtightness and thermal integrity on newly-constructed sites. The specific projects which the Group has assessed have therefore met the relevant substantial contribution criteria. Renovation of existing buildings Climate change mitigation A renovation of an existing building project was analysed under the Taxonomy’s technical screening criteria. The renovation is designed to achieve a net Primary Energy Demand saving of more than 30%. Hence, this project meets the relevant substantial contribution criteria. Do no significant harm Climate change adaptation Sites which have met the substantial contribution criteria are included in the physical climate risk assessment. The Group’s assessment has identified no material physical climate risks and therefore this has been assessed to be aligned. For further information on the Group’s physical climate risk assessment see page 56. For more information, see: Human rights, on page 48. Anti-corruption and anti-bribery matters, on pages 42 and 43. Standards and Policies, including Code of Ethics, on page 42. AstraZeneca’s Approach to Taxation can be found on our website, www.astrazeneca.com/ sustainability/resources.html. Key Manufacture of medicinal products Construction of new buildings Renovation of existing buildings Acquisition and ownership of buildings Transport by motorbikes, passenger cars and light commercial vehicles EU Taxonomy assessment process AstraZeneca Annual Report & Form 20-F Information 2024 61 Strategic Report Corporate Governance Financial Statements Additional Information Disclosure Statements |
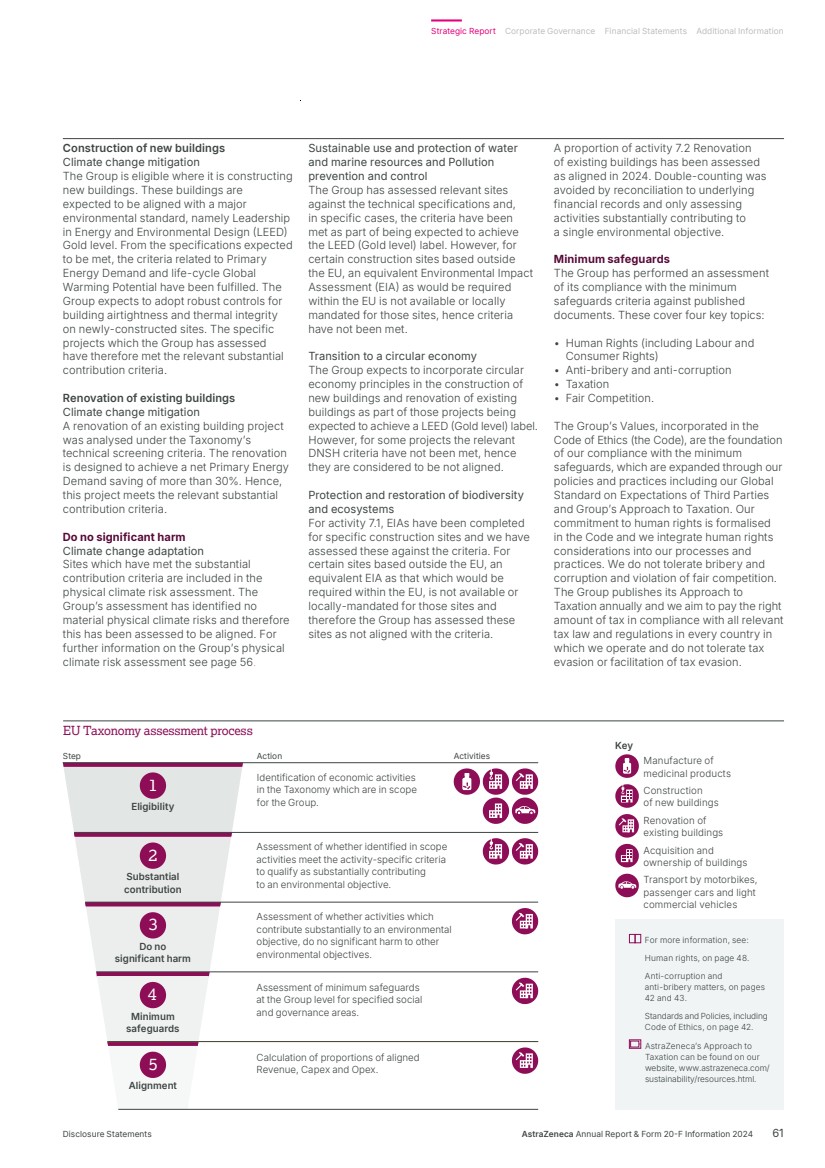
| Capital expenditure The Taxonomy-eligible Capex KPI is defined as Taxonomy-eligible Capex divided by Total Capex. • Taxonomy-eligible Capex is Capex related to assets or processes associated with Taxonomy-eligible activities. Purchase of IP, marketing and distribution rights over medicinal products is considered in total for Taxonomy-eligibility under the activity ‘Manufacture of medicinal products’. • Total Capex corresponds to the total of the ‘Additions through business combinations’ and ‘Capital expenditure’ movement types, the total of the ‘Additions – separately acquired’ and ‘Additions through business combinations’ movement types as detailed in Note 7 – Property, plant and equipment (page 169), the total of the ‘Additions – separately acquired’ and ‘Additions through business combinations’ movement types as detailed in Note 8 – Leases (page 170), and the total of the ‘Additions – separately acquired’ and ‘Additions through business combinations’ movement types as detailed in Note 10 – Intangible assets (page 172). The Group’s Taxonomy-eligible Capex KPI for the year ended 31 December 2024 is 86% (2023: 83%). Operating expenditure The Taxonomy-eligible Opex KPI is defined as Taxonomy-eligible Opex divided by Taxonomy-defined Opex. • The Group’s Taxonomy-eligible Opex is expenses related to assets or processes associated with Taxonomy-eligible economic activities. R&D expenses associated with functional areas which are involved directly in the manufacture and procurement of medicinal products are considered Taxonomy-eligible under the activity ‘Manufacture of medicinal products’. • The Group’s Taxonomy-defined Opex is the total of R&D expenses, and other direct non-capitalised costs that relate to building renovation measures, short-term leases, maintenance and repair, and any other direct expenditures incurred in the day-to-day servicing of property, plant and equipment. The Group’s Taxonomy-eligible Opex KPI for the year ended 31 December 2024 is 18% (2023: 18%1 ). EU Taxonomy Disclosure continued BV Interpretation of the EU Taxonomy and company-specific assumptions are required to fulfil the reporting requirements. Revenue The Taxonomy-eligible Revenue KPI is defined as Taxonomy-eligible Revenue divided by Total Revenue, which corresponds to ‘Total Revenue’ in our Consolidated Statement of Comprehensive Income as detailed on page 148. The Group’s Product Sales and sales milestones within Collaboration Revenue are associated with the manufacture of medicinal products, which we consider in total for Taxonomy-eligibility under the activity ‘Manufacture of medicinal products’. Consequently, our Taxonomy-eligible Revenue KPI for the year ended 31 December 2024 is 96% (2023: 96%1 ). Taxonomy eligibility and alignment KPIs Total $m Proportion of Taxonomy-eligible (non-aligned) economic activities Proportion of Taxonomy-aligned economic activities Proportion of Taxonomy-non-eligible economic activities 2024 2023 2024 2023 2024 2023 2024 2023 Revenue 54,073 45,811 96% 96%1 0% 0% 4% 4% Capex 7,755 4,918 86% 83% 2% 0% 12% 17% Opex 14,130 11,380 18% 18%1 0% 0% 82% 82% 1 For information on revised prior year amounts see EU Taxonomy templates in the Sustainability supplementary information, from page 237. The Group’s Taxonomy eligibility and alignment are summarised in the table above. For more information, including the EU Taxonomy templates in Sustainability supplementary information section, see from page 237. 62 AstraZeneca Annual Report & Form 20-F Information 2024 Strategic Report Disclosure Statements continued |
| The Board and management engaged with key stakeholders throughout the year to understand the issues and factors that are significant for these stakeholders, and a number of actions were taken as a result of this engagement. These interactions, and impact thereof, are set out in the Connecting with our stakeholders section from page 94 and throughout the Strategic Report. We are committed to being a great place to work for the global workforce. Details on engagement with employees can be found from page 48 of the Business Review, from page 98 of the Corporate Governance Report, page 107 in the Audit Committee Report and page 131 and 132 of the Remuneration Committee Report. We are committed to employing high ethical standards when carrying out all aspects of our business globally. Our Code of Ethics (the Code) is based on our Values, expected behaviours and key policy principles. More information on the Code can be found on page 42. We recognise patients as people first and put them at the heart of what we do. Further information on the importance of patients to the business can be found on page 94. The consideration and impact of the Group’s operations on the environment and how the Group has considered other factors, such as communities and suppliers, can be found throughout the People and Sustainability section from page 47. Details of how the Board operates and matters considered by the Board are set out in the Corporate Governance Report from page 91. Details on the Board and SET composition and gender diversity can be found on pages 48, 88, and 101. Examples of how Directors discharged their duties and considered stakeholders when making Principal Decisions during 2024 are set out from page 97. Principal Decisions are decisions and discussions which are material or strategic to the Group and also those that are significant to our key stakeholder groups. Section 172(1) statement The Board is required to promote the success of AstraZeneca for the shareholders and wider stakeholders who interact with and are impacted by our business. Throughout the year the Directors have considered the factors set out in section 172(1) (a)-(f) of the UK Companies Act 2006, as well as other factors relevant to the decision being made. The Board acknowledges that not every decision made will necessarily result in a positive outcome for all stakeholders. By considering our Purpose and Values, together with AstraZeneca’s strategic priorities, the Board aims to ensure that the decisions made are consistent and intended to promote the Company’s long-term success. • Principal Risks: Pricing, affordability, access, competitive pressures and failures or delays in the quality or execution of the Group’s commercial strategies. – Scenario 1: Government action on pricing, higher than anticipated competition and other commercial headwinds result in lower than anticipated growth rates for our medicines. – Scenario 2: A significant incident leads to reputational damage in a key market resulting in an ongoing 10% reduction in revenue achieved in this market. • Principal Risk: Failure or delay in the delivery of our pipeline or launch of new medicines. – Scenario 3: Assumes no launches of new products. • Principal Risk: Failure to maintain supply of compliant, quality medicines. – Scenario 4: Major equipment failure or significant regulatory observation at one of our major manufacturing sites results in a 12-month loss of manufacturing capability for one of our key oncology products, leading to supply interruption. • Principal Risks: Failure in information technology or cybersecurity, adverse outcome of litigation and/or government investigations. – Scenario 5: Legal, regulatory, cyber or other non-compliance results in a payment of $500 million in 2026. In addition, the Board has considered more stressed scenarios, including restrictions on debt factoring and no access to capital markets to raise new debt. In each scenario (or combination of scenarios above), the Group is able to rely on its existing cash, cash equivalents and short-term fixed income investments, committed credit facilities, leverage its cost base, reduce capital expenditure and take other cash management measures to mitigate the impacts and still have residual capacity to absorb further shocks. Based on the results of this analysis, the Directors have a reasonable expectation that the Company will be able to continue in operation and meet its liabilities, as they fall due, over the three-year period of their assessment. Viability statement In accordance with provision 31 of the 2018 UK Corporate Governance Code, the Board has determined that a three-year period to 31 December 2027 constitutes an appropriate period over which to provide its viability statement. The Board assesses the Company’s prospects using a 10-year long-range projection. It notes the rich and varied portfolio of medicines in development across a range of therapy areas and the medicines currently commercialised in more than 100 markets, concluding that the Company’s long-term prospects remain strong. The Board also considers annually and on a rolling basis, a three-year bottom-up detailed business plan and, given the inherent uncertainty involved, believes that the three-year statement presents readers of this Annual Report with a reasonable degree of assurance over the ongoing viability of the Company, while still providing a longer-term perspective. The three-year detailed business plan captures risks to the sales and cost forecasts at market and SET functional levels. The plan is used to perform central net debt and headroom-profile analysis. The following scenarios have been applied to this analysis to create a severe but plausible downside combining a number of the Principal Risks detailed on pages 65 and 66. Our Risk Overview can be found from page 64 to 66. Full details are given in the Risk Supplement on our website, www.astrazeneca.com/ annualreport2024. AstraZeneca Annual Report & Form 20-F Information 2024 63 Strategic Report Corporate Governance Financial Statements Additional Information Disclosure Statements |
| Managing risk Our approach to risk management is designed to encourage clear decision making on which risks we take and how we manage and mitigate these risks. We strive to embed sound risk management within our strategy, planning, budgeting and performance management processes. The Board defines the Group’s risk appetite. This enables the Group, in both quantitative and qualitative terms, to judge the level of risk it is prepared to take in achieving its overall objectives. The Board expresses the acceptable levels of risk for the Group using three key dimensions: (i) earnings and cash flow, (ii) return on investment and (iii) ethics and reputation. Annually, the Group develops a detailed three-year bottom-up business plan and 10-year long-range projection to support the delivery of its strategy. The Board considers these in the context of the Group’s risk appetite. Adjustments are made to the plan or risk appetite to ensure they remain aligned. The Senior Executive Team (SET) is required by the Board to oversee and monitor the effectiveness of the risk management processes implemented by management. Within each SET function, leadership teams discuss the risks the business faces. Quarterly, each SET function assesses changes to these risks, new and emerging, and mitigation plans. These are assimilated into a Group Risk Report for the Board, Audit Committee and SET. Global Compliance, Finance and Group Internal Audit support the SET by advising on policy and standard setting, monitoring and auditing, communication and training, as well as reporting on the adequacy of line management processes as they apply to risk management. The Board believes that existing processes provide it with adequate information on the risks and uncertainties we face. The Board has carried out a robust assessment of the emerging and Principal Risks facing the Group. Our Principal Risks are those risks that are most likely to significantly impact delivery of our business strategy or future performance and are a subset of the total risk landscape facing the Group. The table on pages 65 and 66 provides insight into these Principal Risks. Emerging risks Emerging risks are ‘new’ risks that have the potential to crystallise in the future but are unlikely to impact the business during the next year. The outcome of such risks is often more uncertain. They may begin to evolve rapidly or simply not materialise. We monitor our business activities and external and internal environments for new, emerging and changing risks to ensure these are managed appropriately. Annually, we combine input from each SET function and external insight to scan the horizon for emerging risks and a summary is presented to the Audit Committee and the Board. Emerging risks continue to be monitored as part of the ongoing risk management processes outlined above. Climate risk The identification and assessment of climate risk form part of our existing risk management processes. ‘Failure to meet our sustainability targets, regulatory requirements and stakeholder expectations with respect to the environment’ incorporates climate risk within its scope and is a component of the Group’s risk landscape but is not currently considered to be a Principal Risk for the Group. We support the Task Force on Climate-related Financial Disclosures (TCFD) framework and continue to develop our disclosures in line with its recommendations. Our climate change disclosures from page 53 summarise the work undertaken to date to understand the potential impact of climate change on our business and outlines future areas of management focus. Cybersecurity risk Our approach to identifying, assessing and managing material cybersecurity risks (including those that result from the use of third parties in business processes and data management) is integrated within our Group-wide approach to managing risk. ‘Failure in information technology or cybersecurity’ has been identified as a Principal Risk. Mitigations are in place to manage these risks and these are monitored and their effectiveness regularly reported, for example, in KPI dashboards provided to management and the Audit Committee. Incidents are managed and reported using the cybersecurity incident management framework which in turn is connected to the Group’s crisis management framework. Cybersecurity risks are overseen by the Audit Committee which performs an in-depth review annually. Its reviews are supported by senior management, the VP, Group Internal Audit and other assurance or providers as required. Cybersecurity risks (including previous incidents) have not materially affected our business strategy, results of operations or financial condition. “We strive to embed sound risk management in our strategy.” 64 AstraZeneca Annual Report & Form 20-F Information 2024 Strategic Report Risk Overview |
| Risk category and Principal Risks Context/potential impact Management actions Trend versus prior year Product pipeline risks Failure or delay in the delivery of our pipeline or launch of new medicines The development of pharmaceutical product candidates is a complex, risky and lengthy process involving significant resources. A project may fail at any stage of the process due to a number of factors, which could adversely affect our future business and results of operations. • Prioritise and accelerate our pipeline. • Strengthen pipeline through acquisitions, licensing and collaborations. • Focus on innovative science in our main therapy areas. • Improve R&D productivity. Failure to meet regulatory or ethical requirements for medicine development or approval We are subject to laws and regulations that control our ability to market our pharmaceutical products. Delays in regulatory approvals could delay our ability to market our products and may adversely affect our revenue. • Quality management systems incorporating monitoring, training and assurance activities. • Collaborating with regulatory bodies and advocacy groups to monitor and respond to changes in the regulatory environment, including revised processes, timelines and guidance. Commercialisation risks Pricing, affordability, access and competitive pressures The pricing and market access environment is highly complex and subject to dynamic economic, political and social pressures. Deterioration in socio-economic conditions may affect customers’ ability or willingness to purchase our medicines and may adversely affect our business and results of operations. • Implement pricing, reimbursement and policy frameworks. • Focus on key products. • Demonstrate value of medicines/health economics. • Implement innovative value-based agreements focused on patient outcomes. • Global footprint. • Diversified portfolio. Failures or delays in the quality or execution of the Group’s commercial strategies A failure to execute our commercial strategies or achieve the level of sales anticipated for a medicine could materially impact our business results. • Focus on key products. • Substantial investment in sales and marketing activities. • Accelerate execution of plans and risk share through business development and strategic collaborations and alliances. Supply chain and business execution risks Failure to maintain supply of compliant, quality medicines Supply chain difficulties may result in product shortages which could lead to lost product sales and materially affect our reputation and results of operations. • Establishment of new manufacturing facilities, creating capacity and technical capability to support new product launches. • Contingency plans, including dual sourcing, multiple suppliers and close monitoring and maintenance of stock levels. • Business continuity and resilience initiatives, disaster and data recovery, and emergency response plans. • Quality management systems. Failure in information technology or cybersecurity Significant disruption to our IT systems, including cybersecurity breaches, or failure to comply with applicable laws or regulations could harm our reputation and materially affect our financial condition or results of operations. • Cybersecurity incident management framework and dashboard. • Disaster and data recovery plans. • Strategies to secure critical systems and processes. • Regular cybersecurity and privacy training for employees. Growing multi-faceted cyber threat. Failure to collect and manage data or AI in line with legal and regulatory requirements and strategic objectives There is an increasing range of legislative and regulatory requirements to manage data across all countries where we conduct business such as restricting the movement of data between countries or how we make use of new technological capabilities such as AI. Failure to protect data effectively or the inappropriate use of technologies such as AI may lead to competitive disadvantage and/or loss of trust from key stakeholders, including patients, and prevent us from reaching our strategic objectives. • Enterprise Data Council established. • Enterprise AI Governance Framework and Standard established. • Data Privacy Framework and privacy impact assessment process implemented. Proliferation of more onerous data regulation may restrict, or require changes to, existing data processing practices. Principal Risks Strategy key Science and Innovation Growth and Therapy Area Leadership People and Sustainability Achieve Group Financial Targets Trend key Increasing risk Decreasing risk Unchanged AstraZeneca Annual Report & Form 20-F Information 2024 65 Strategic Report Corporate Governance Financial Statements Additional Information Risk Overview |
| Risk category and Principal Risks Context/potential impact Management actions Trend versus prior year Legal, regulatory and compliance risks Safety and efficacy of marketed medicines is questioned Safety concerns relating to our products may lead to recalls, seizures, interruption of supply and loss of product approvals, which could adversely affect patient access, our reputation and our revenues. Significant product liability claims could also arise, which may be costly, divert management attention, reduce demand for our products and damage our reputation. • Robust processes and systems in place to manage patient safety and efficacy trends as well as externally reported risks through regulatory agencies and other parties. This includes a comprehensive pharmacovigilance programme supplemented by close monitoring and review of adverse events. Adverse outcome of litigation and/or governmental investigations Our business is subject to a wide range of laws and regulations around the world. Actual or perceived failure to comply may result in AstraZeneca and/or its employees being investigated by government agencies and authorities and/or in civil legal proceedings. Government investigations, litigations, and other legal proceedings, regardless of outcome, could be costly, divert management attention, or damage our reputation and demand for our products. Unfavourable resolutions to proceedings against us could subject us to criminal liability, fines, penalties or other monetary or non-monetary remedies, including enhanced damages, requiring us to make significant provisions in our accounts relating to legal proceedings, and could materially adversely affect our business or results of operations. • Established compliance framework with strong ethical and compliance culture. • Combined internal and external counsel management. Broadening of government investigations into the healthcare industry in China. IP risks related to our products The pharmaceutical industry is experiencing pressure from governments and other payers to impose limits on IP protections to manage healthcare costs. If we are unable to obtain, defend and enforce our IP, we may experience accelerated and intensified competition. • Active management of IP rights and IP litigation. Economic and financial risks Geopolitical and/or macro-economic volatility disrupts the operation of our global business Operating in more than 100 countries, we are subject to political, socio-economic and financial factors around the world. A sustained global economic downturn may adversely impact our business. Geopolitical tensions may lead to the imposition or escalation of trade controls, tariffs, taxes or other restrictions to market access, which may increase our costs or reduce revenues. • Focus on key products. • Demonstrate value of medicines/health economics. • Diversified portfolio. Failure to achieve strategic plans or meet targets or expectations Failure to successfully implement our business strategy may frustrate the achievement of our targets and materially damage our brand, business, financial position or results of operations. • Focus on key products and innovative science in our core therapy areas. • Strengthen pipeline through acquisitions, licensing and collaborations. • Appropriate capital structure and balance sheet. • Portfolio-driven decision-making process governed by senior executive-led committees. 66 AstraZeneca Annual Report & Form 20-F Information 2024 Strategic Report Risk Overview continued |
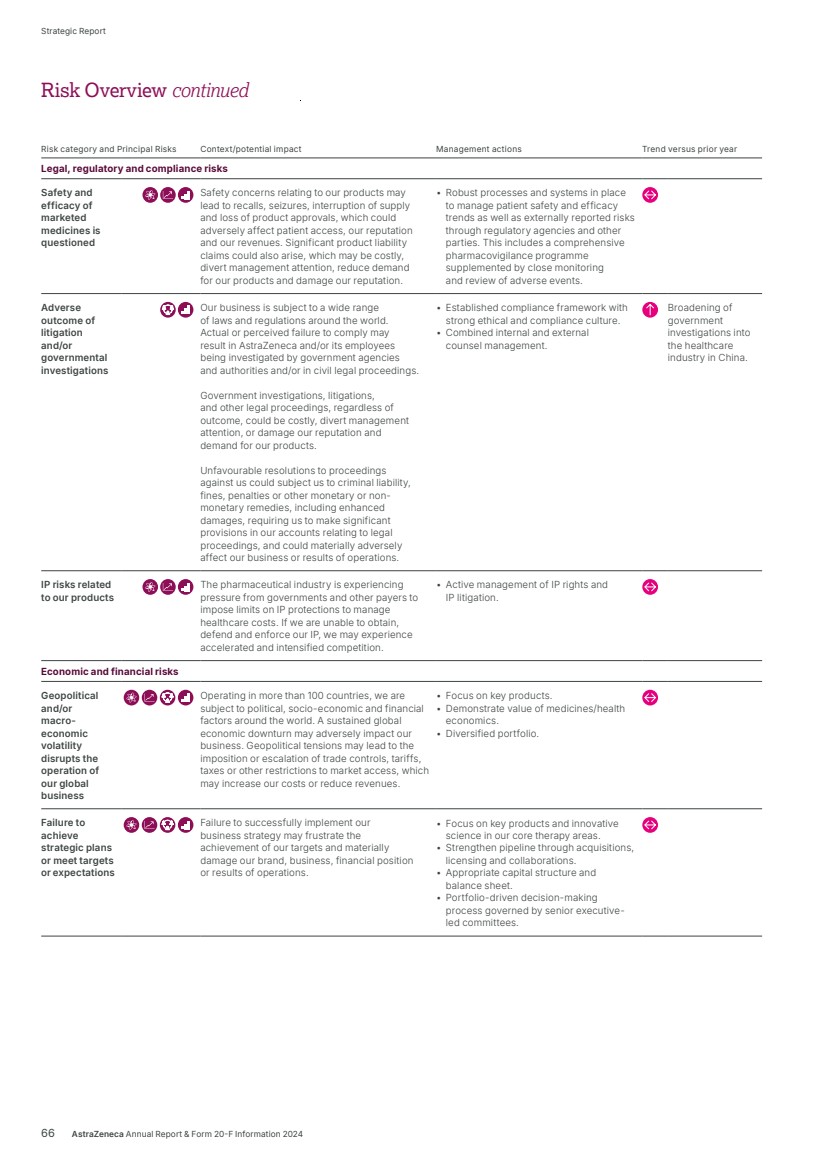
| “AstraZeneca achieved Total Revenue of $54.1 billion in 2024, including $2.2 billion of Alliance Revenue and $0.9 billion of Collaboration Revenue, with growth of 18% (CER: 21%).” 2024 delivered excellent revenue growth and business performance, underpinned by strong growth momentum and encouraging pipeline progress. Within Rare Disease, Ultomiris achieved Product Sales of $3.9 billion, an increase of 32% (CER: 34%), due to geographic expansion, increased demand and continued conversion from Soliris. In the US, we had overall growth of 21%, with Product Sales of $21.7 billion. In Emerging Markets, Product Sales grew by 15% (CER: 23%) to $13.5 billion, with notable growth in Oncology and Farxiga. In Europe, Product Sales increased by 20% (CER: 19%) to $10.8 billion, reflecting strong performances from Oncology and Forxiga and in Established Rest of World markets, there was a decline of 3% (CER: growth of 3%) to $4.9 billion due to decreases in Oncology offset by growth in CVRM. Alliance Revenue increased by 55% (CER: 55%) to $2.2 billion, including $1.4 billion from Enhertu, which has showed continued growth since achieving blockbuster status in 2023. Collaboration Revenue increased by 56% (CER: 54%) to $0.9 billion. Profitability Reported EPS was $4.54 in the year (2023: $3.84) and Core EPS was $8.21 (2023: $7.26) driven by improved Product Sales Gross Margin from Total Revenue growth offset by a decline in Other operating income and expense following gains in 2023 on updated contractual relationships with Sobi and Sanofi and the disposal of US rights to Pulmicort Flexhaler. Reported EPS also includes impairment charges of $753 million related to the vemircopan (ALXN2050) intangible asset and $504 million recorded against the Andexxa intangible asset. Key milestones/approvals Our continued investment in the pipeline yielded several significant approvals and milestones in the year, including Voydeya, Kavigale and Datroway. Voydeya has been approved in Japan and in the US as an 2024 was another remarkable year. Performance across the business continued to be strong and we had the opportunity to increase our guidance twice during the year. In May 2024, we hosted our first Investor Day in 10 years setting forth our ambition for 2030. In order to achieve our ambition, we will need to continue to invest not only in R&D but also transform the organisation from a technology and ways of working standpoint. We have started our journey to get onto a single Enterprise Resource Planning (ERP) platform and are looking into ways of incorporating the advances in AI into our processes across the Group. Total Revenue growth AstraZeneca achieved Total Revenue of $54.1 billion in 2024, including $2.2 billion of Alliance Revenue and $0.9 billion of Collaboration Revenue, with growth of 18% (CER: 21%). In 2024, we delivered 16 blockbuster medicines in total, including Tezspire, Enhertu and Beyfortus which are medicines included in collaborations with alliance partners. Product Sales grew by 16% (CER: 19%) to $50.9 billion, with 13 blockbuster medicines. Our continued investment in Oncology and increased demand for CVRM medicines, supported sustained Product Sales growth, with Oncology achieving 18% (CER: 21%) and CVRM achieving 18% (CER: 20%). Standout performances came once again from Farxiga ($7.7 billion), Tagrisso ($6.6 billion) and Imfinzi ($4.7 billion). add-on therapy to Ultomiris or Soliris. Kavigale was accepted, under an accelerated assessment procedure by the EMA, for the prevention of COVID-19 in immunocompromised patients. Datroway, an ADC discovered by Daiichi Sankyo being jointly developed by AstraZeneca and Daiichi Sankyo, has been approved in Japan for the treatment of adult patients with HR-positive, HER2-negative unresectable or recurrent breast cancer after prior chemotherapy. I am really proud of the achievements across the Group that allowed us to achieve the results that we did in 2024; 2025 looks set to be another catalyst-rich year that will unlock a number of derisking events towards our 2030 ambition of new medicines. We will continue to maintain strong discipline to invest in the highest value opportunities while building a technology-enabled organisation. It is my privilege to be part of this incredible organisation. Aradhana Sarin Chief Financial Officer AstraZeneca Annual Report & Form 20-F Information 2024 67 Strategic Report Corporate Governance Financial Statements Additional Information Financial Review Financial Review |
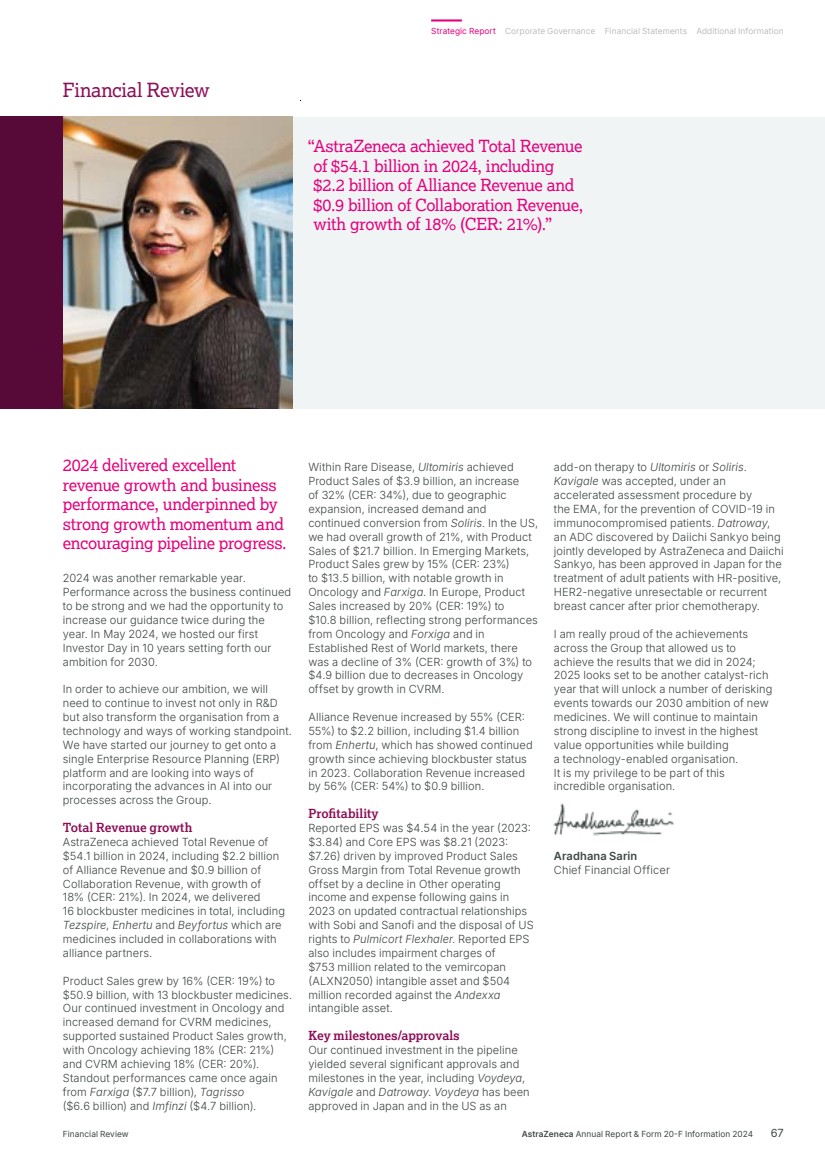
| ProductSales ar oball oC oit nRevenue Operatingprofit EPS All ai nceReve un e Summary performance in 2024 Reported CER Core 2024 $m 2023 $m % Actual change CER growth1 $m Growth due to exchange effects $m % CER change 2024 $m 2023 $m % Actual change Product Sales 50,938 43,789 16 8,308 (1,159) 19 50,938 43,789 16 Alliance Revenue 2,212 1,428 55 792 (8) 55 2,212 1,428 55 Collaboration Revenue 923 594 56 323 6 54 923 594 56 Total Revenue 54,073 45,811 18 9,423 (1,161) 21 54,073 45,811 18 Cost of sales (10,207) (8,268) 23 (1,993) 54 25 (9,601) (8,011) 20 Gross profit 43,866 37,543 17 7,430 (1,107) 20 44,472 37,800 18 Operating expenses (34,115) (30,690) 11 (3,684) 259 12 (27,794) (24,545) 13 Other operating income and expense 252 1,340 (81) (1,088) 1 (81) 250 1,279 (81) Operating profit 10,003 8,193 22 2,658 (848) 32 16,928 14,534 16 Net finance expense (1,284) (1,282) – 42 (44) (3) (1,169) (984) 19 Share of after tax losses of joint ventures and associates (28) (12) >2x (16) – >2x (28) (12) >2x Profit before tax 8,691 6,899 26 2,683 (891) 38 15,731 13,538 16 Taxation (1,650) (938) 76 (894) 184 92 (3,001) (2,291) 31 Profit after tax 7,041 5,961 18 1,789 (709) 29 12,730 11,247 13 Basic earnings per share ($) 4.54 3.84 18 1.15 (0.46) 29 8.21 7.26 13 1 As detailed on page 70, CER growth is calculated using prior year actual results adjusted for certain exchange rate effects, including hedging. Highlights Financial performance Total Revenue: Therapy Areas Total Revenue: geographical areas Emerging Markets 14% growth (CER: 22%) CVRM 18% growth (CER: 20%) US 22% growth Oncology 21% growth (CER: 24%) Europe 27% growth (CER: 26%) Rare Disease 13% growth (CER: 16%) Established RoW -2% decrease (CER: 3% growth) Respiratory & Immunology 23% growth (CER: 25%) Vaccines & Immune Therapies 8% growth (CER: 8%) Other Medicines -9% decrease (CER: -5%) $50.9bn 16% growth (CER: 19%) $2.2bn 55% growth (CER: 55%) $10.0bn 22% growth (CER: 32%) $0.9bn 56% growth (CER: 54%) $16.9bn 16% growth (CER: 22%) $4.54 18% growth (CER: 29%) $8.21 13% growth (CER: 19%) Product Sales Alliance Revenue Operating profit – Reported Operating profit – Core Collaboration Revenue EPS – Reported EPS – Core 68 AstraZeneca Annual Report & Form 20-F Information 2024 Strategic Report Financial Review continued |
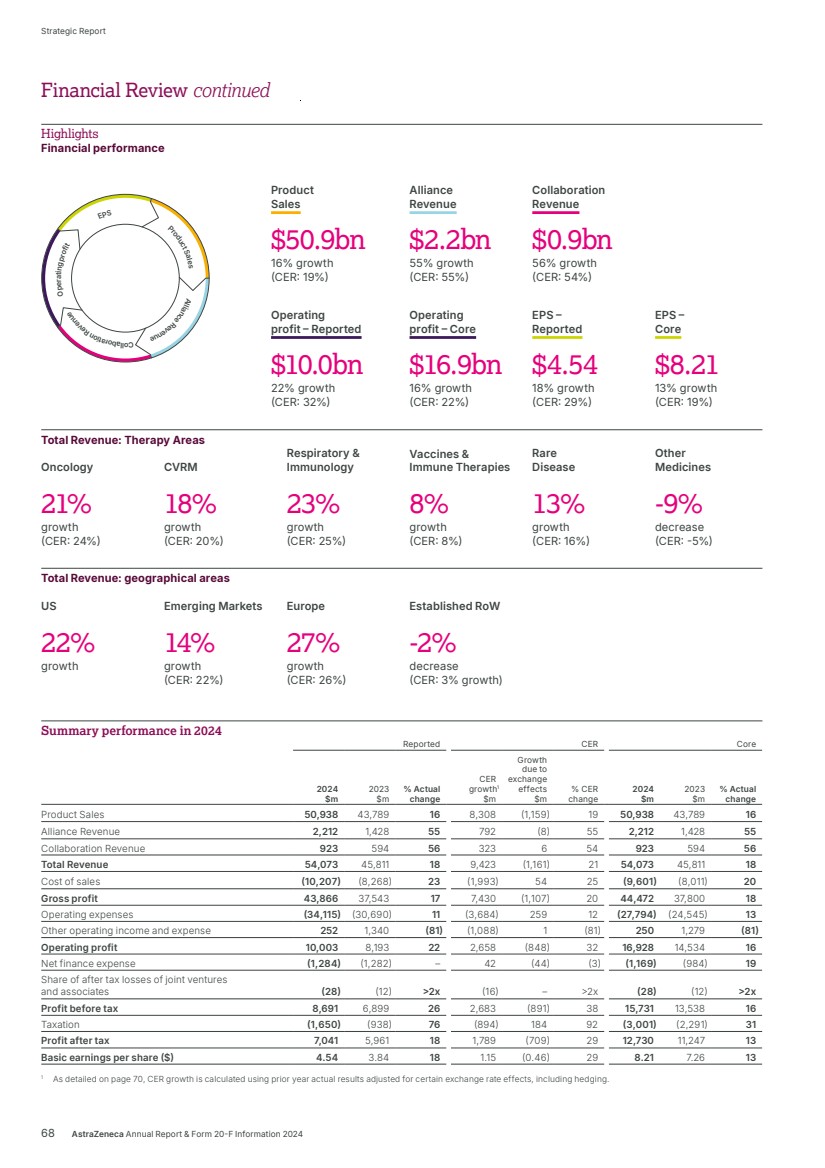
| Business background and results overview The business background is covered in the Healthcare in a Changing World section from page 7, the Therapy Area Review from page 16, and the Our Strategy and Key Performance Indicators section from page 12, which describe in detail the business developments of our products. As described earlier in this Annual Report, sales of our products are directly influenced by medical need and are generally paid for by health insurance schemes or national healthcare budgets. Our operating results can be affected by a number of factors other than the delivery of operating plans and normal competition. Over the longer term, the success of our R&D is crucial and we devote substantial resources to this area. The benefits of this investment are expected to emerge over the long term and there is considerable inherent uncertainty as to the scale and timing of outcomes and their transition to saleable products. Measuring performance Reported and Core performance are referred to in this Financial Review when reporting on our performance in absolute terms, but more often in comparison with earlier years: • Reported performance takes into account all the factors (including those which we cannot influence, such as currency exchange rates) that have affected the results of our business. The Consolidated Financial Statements have been prepared in accordance with UK-adopted IAS and with the requirements of the Companies Act 2006 as applicable to companies reporting under those standards. The Consolidated Financial Statements also comply fully with IFRS Accounting Standards as issued by the IASB and IAS as adopted by the EU. • Core performance measures are adjusted to exclude certain significant items, using a set of established principles. Use of non-GAAP performance measures CER, Core performance measures, Product Sales Gross Margin, Operating Margin, EBITDA and Net debt are non-GAAP performance measures because they cannot be derived directly from the Financial Statements. By disclosing non-GAAP performance and growth measures, in addition to our Reported financial information, we are enhancing investors’ ability to evaluate and analyse the financial performance and trends of our ongoing business and the related key business drivers. The adjustments are made to our Reported financial information in order to show non-GAAP performance measures that illustrate clearly the impact on our performance of factors such as changes in revenues and expenses driven by volume, prices and cost levels relative to such prior years or periods. These non-GAAP performance measures are not a substitute for, or superior to, financial measures prepared in accordance with GAAP. As shown in the 2024 Reconciliation of Reported results to Core results table on page 72, our reconciliation of Reported financial information to Core performance measures includes a breakdown of the items for which our Reported financial information is adjusted, and a further breakdown by specific line item, as such items are reflected in our Reported income statement. This illustrates the significant items that are excluded from Core performance measures and their impact on our Reported financial information, both as a whole and in respect of specific line items. Management presents these results externally to meet investors’ requirements for transparency and clarity. Core financial measures are also used internally in the management of our business performance, in our budgeting process and when determining compensation. As a result, Core performance measures allow investors to differentiate between different kinds of costs, but they should not be used in isolation. Our determination of non-GAAP measures, and our presentation of them within this Financial Review, may differ from similarly titled non-GAAP measures of other companies. The SET retains strategic management of the costs excluded from Reported financial information in arriving at Core financial measures, tracking their impact on Reported Operating profit and EPS, with operational management being delegated on a case-by-case basis to ensure clear accountability and consistency for each cost category. We strongly encourage readers of this Annual Report not to rely on any single financial measure but to review our Financial Statements, including the Notes thereto, and our other publicly filed reports, carefully and in their entirety. Further details of the risks faced by the business are given in Risk Overview from page 64 and in the Risk Supplement at www.astrazeneca.com/ annualreport2024. For a detailed definition of Core measures, see page 70. Also refer to the Summary performance in 2024 table on page 68, the 2024 Reconciliation of Reported results to Core results and the Excluded from Core results tables on page 72, for our discussion of comparative growth measures. AstraZeneca Annual Report & Form 20-F Information 2024 69 Strategic Report Corporate Governance Financial Statements Additional Information Financial Review |
| Non-GAAP measures: definitions Revenue Constant exchange rate (CER) growth rates Reconciliation, see page 72 Definition: Retranslation of the current year’s performance at the previous year’s average exchange rates, adjusted for other exchange effects, including hedging. Why we use them: CER measures allow us to focus on the changes in revenues and expenses driven by volume, prices and cost levels relative to the prior period. Revenues and cost growth expressed in CER allow management to understand the true local movement in revenues and costs, in order to compare recent trends and relative return on investment. CER growth rates can be used to analyse revenues in a number of ways but, most often, we consider CER growth by products and groups of products, and by countries and regions. CER revenue growth can be further analysed by revenue volumes and selling price. Similarly, CER cost growth helps us to focus on the real local change in costs so that we can manage the cost base effectively. Limitations: CER measures are not always better indicators of performance. Where countries are subject to high inflation and currencies that depreciate persistently, adjusting out the effect of foreign exchange fluctuations could give an overly optimistic view of growth. Profitability Core performance measures Reconciliation, see page 72 Core performance measures are adjusted to exclude certain significant items. In determining the adjustments to arrive at the Core result, we use a set of established principles relating to the nature or materiality of individual items or groups of items, excluding, for example, events which are (i) outside the normal course of business, (ii) incurred in a pattern that is unrelated to the trends in the underlying financial performance of our ongoing business, or (iii) related to major acquisitions, to ensure that investors’ ability to evaluate and analyse the underlying financial performance of our ongoing business is enhanced. Our Core adjustments are summarised as: Restructuring costs, including charges and provisions related to our global restructuring programmes on our capitalised manufacturing facilities and IT assets. These can take place over multiple reporting periods, given the long life-cycle of our business. Why we use them: We adjust for these charges and provisions because they primarily reflect the financial impact of change to legacy arrangements, rather than the underlying performance of our ongoing business. Intangible amortisation and impairments, including impairment reversals but excluding any charges relating to IT assets. Intangibles generally arise from business combinations and individual licence acquisitions. Why we use them: We adjust for these charges because their pattern of recognition is largely uncorrelated with the underlying performance of the business. Prior year Alexion acquisition-related items, primarily fair value adjustments on acquired inventories and fair value impact of replacement employee share awards. Why we use them: We adjust for this item to enable a more meaningful comparison of the performance of acquired businesses and products to that of internally developed products, as well as removing charges whose pattern of recognition is largely uncorrelated to the underlying performance of the business. Other specified items, principally comprise acquisition-related costs and credits, which include the imputed finance charges and fair value movements relating to contingent consideration on business combinations, imputed finance charges and remeasurement adjustments on certain Other payables arising from intangible asset acquisitions, remeasurement adjustments relating to Other payables and debt items assumed from the Alexion acquisition and legal settlements. Why we use them: We adjust for these items to enable a more meaningful comparison of the performance of acquired businesses and products to that of internally developed products, as well as removing charges whose pattern of recognition is largely uncorrelated to the underlying performance of the business. It should be noted that some costs excluded from our Core results, such as intangible amortisation and finance charges related to contingent consideration, will recur in future years, and other excluded items such as impairments and legal settlement costs, along with other acquisition‑related costs, may recur in the future. Limitations: Core results exclude significant costs (such as restructuring, intangible amortisation and impairments, and other acquisition-related adjustments), but incorporate associated benefits, including Product Sales arising from business combinations, asset acquisitions and assets which have been amortised, as well as the benefits resulting from restructuring activities and, as such, they should not be regarded as a complete picture of the Group’s financial performance, which is presented in its Reported results. The exclusion of the adjusting items may result in Core earnings being materially higher or lower than Reported earnings. Product Sales Gross Margin Reconciliation, see page 72 Definition: Product Sales Gross Margin is the percentage by which Product Sales exceeds the Cost of sales, calculated by dividing the difference between the two by the sales figure. The calculation of Reported and Core Product Sales Gross Margin excludes the impact of Alliance Revenue and Collaboration Revenue and any associated costs, thereby reflecting the underlying performance of Product Sales. Why we use it: This measure sets out gross profitability of Product Sales when taking account of only direct Cost of sales. It is a key performance measure of the contribution to fund operating costs and overall quality of the business. Limitations: Product Sales Gross Margin percentage excludes the impact of Alliance Revenue and Collaboration Revenue and related costs and therefore should not be regarded as giving a full picture of Total Revenue performance. 70 AstraZeneca Annual Report & Form 20-F Information 2024 Strategic Report Financial Review continued |
| Operating Margin Reconciliation, see page 72 Definition: Operating profit as a percentage of Total Revenue. Why we use it: This measure sets out profitability derived from operating activities before the impact of finance costs and tax. It is a key performance measure of the overall quality of the operations of the business. Limitations: Operating Margin excludes the impact of financing costs and therefore should not be regarded as a full picture of revenue performance. EBITDA Reconciliation, see page 76 Definition: Reported Profit before tax plus Net finance expense, Share of after tax losses of joint ventures and associates, and charges for Depreciation, amortisation and impairment. Why we use it: EBITDA allows us to understand our baseline profitability, removing any ‘non-operational’ expenses and non-cash items that are not considered by management to be reflective of the underlying performance of the Group. Limitations: EBITDA does not take account of the cost of investment to generate revenues, hence is not always the best indicator of performance. Cash flow and liquidity Net debt Reconciliation, see page 78 Definition: Interest-bearing loans and borrowings and Lease liabilities, net of Cash and cash equivalents, Other investments and Net derivative financial instruments. Why we use it: Net debt is a measure that provides valuable additional information regarding the Group’s net financial liabilities and is a measure commonly used by investors and rating agencies. It facilitates the tracking of one of our key financial priorities: deleveraging. Non-GAAP measures: definitions continued AstraZeneca Annual Report & Form 20-F Information 2024 71 Strategic Report Corporate Governance Financial Statements Additional Information Financial Review |
| Excluded from Core results Restructuring costs • Restructuring costs totalling $1,154 million (2023: $467 million) mainly comprise those incurred on the PAAGR of $1,115 million (2023: $362 million), including $480 million for inventory and related product provisions following the decision to cease promotional activities for Andexxa. Intangible amortisation and impairments • Amortisation totalling $3,839 million (2023: $3,846 million) relating to intangible assets, except those related to IT. Further information on our intangible assets is contained in Note 10 to the Financial Statements from page 172. Intangible impairment charges were $1,569 million (2023: $434 million), excluding those related to IT and other intangibles. This includes $753 million related to the impairment of the vemircopan (ALXN2050) intangible asset, following the decision to discontinue this development programme, $504 million related to the Andexxa intangible asset, which was fully impaired following the decision to cease promotional activity for Andexxa, and $165 million relating to product in development FPI-2059 due to decisions made to terminate the related activities and prioritise resources on the development of FPI-2265 and AZD2068. Further details relating to intangible asset impairments are included in Note 10 to the Financial Statements from page 172. Other • Other adjustments, excluding taxation adjustments, amounted to $478 million (2023: $1,755 million). • Other adjustments to Reported SG&A expense were $351 million (2023: $1,458 million), primarily relating to net fair value adjustments to contingent consideration balances of $311 million (2023: $549 million). Other adjustments to Reported SG&A expenses in 2023 included a charge to legal provisions of $425 million in relation to Nexium and Losec/Prilosec product liability litigation, $510 million in relation to Bristol-Myers Squibb Co. and E.R. Squibb & Sons, LLC and $70 million in relation to Alexion shareholder litigation. Further details relating to contingent consideration balances are contained in Note 20 to the Financial Statements from page 181. Further details of legal proceedings, ongoing at 31 December 2024, are contained within Note 30 to the Financial Statements from page 203. • Other adjustments to Reported Net finance expense of $115 million (2023: $298 million) include discount unwind charges on liabilities arising from business combinations and on liabilities resulting from the Enhertu collaboration agreement. • Other adjustments to Reported Taxation amounted to $88 million (2023: $405 million). 2024 Reconciliation of Reported results to Core results 2024 Reported $m Restructuring costs $m Intangible amortisation and impairments $m Other1 $m 2024 Core2 $m Core 2024 compared with Core 20232 Actual growth % CER growth % Gross profit 43,866 569 32 5 44,472 18 20 Product Sales Gross Margin % 80 81 Distribution expense (555) – – – (555) 3 5 Research and development expense (13,583) 275 1,090 7 (12,211) 19 19 Selling, general and administrative expense (19,977) 312 4,286 351 (15,028) 9 11 Other operating income and expense 252 (2) – – 250 (81) (81) Operating profit 10,003 1,154 5,408 363 16,928 16 22 Operating Margin % 18 31 Net finance expense (1,284) – – 115 (1,169) 19 15 Taxation (1,650) (219) (1,044) (88) (3,001) 31 38 Basic earnings per share ($) 4.54 0.60 2.82 0.25 8.21 13 19 2023 Reconciliation of Reported results to Core results 2023 Reported $m Restructuring costs $m Intangible amortisation and impairments $m Acquisition of Alexion $m Other1 $m 2023 Core2 $m Core 2023 compared with Core 20222 Actual growth % CER growth % Gross profit 37,543 109 32 119 (3) 37,800 6 9 Product Sales Gross Margin % 81 82 Distribution expense (539) – – – – (539) 1 2 Research and development expense (10,935) 212 447 7 2 (10,267) 8 9 Selling, general and administrative expense (19,216) 207 3,801 11 1,458 (13,739) 7 9 Other operating income and expense 1,340 (61) – – – 1,279 >2x >2x Operating profit 8,193 467 4,280 137 1,457 14,534 9 14 Operating Margin % 18 32 Net finance expense (1,282) – – – 298 (984) 1 (1) Taxation (938) (107) (809) (32) (405) (2,291) 11 17 Basic earnings per share ($) 3.84 0.23 2.24 0.07 0.88 7.26 9 15 1 See Excluded from Core results table below for further details of other adjustments. 2 Each of the measures in the Core columns is a non-GAAP measure. 72 AstraZeneca Annual Report & Form 20-F Information 2024 Strategic Report Financial Review continued |
| Product Sales By geography US Product Sales were up 21% to $21,655 million, reflecting the continued growth of our Oncology medicines, Ultomiris, which increased by 29% due to a rise in patient demand in gMG and NMOSD, and Symbicort which was up 63% due to continued demand. Product Sales in Emerging Markets increased by 15% (CER: 23%) to $13,535 million in 2024 with growth in Oncology and CVRM, driven by Forxiga which was up by 29% (CER: 35%) with increased reimbursement supporting solid growth. Product Sales in ex-China Emerging Markets grew by 21% (CER: 36%) at $7,133 million, with continued increases in Oncology and Farxiga. In Europe, Product Sales grew by 20% (CER: 19%) to $10,848 million, reflecting a strong performance in Oncology and Forxiga. Established Rest of World Product Sales decreased by 3% (CER: growth of 3%) to $4,900 million, with sales in Japan down 5% (CER: growth of 3%) to $3,489 million, driven by slight decreases in Oncology partially offset by increases in CVRM. By product In 2024, we succeeded in delivering 13 blockbuster drugs. Our largest selling products in the year were Farxiga ($7,656 million), Tagrisso ($6,580 million), Imfinzi ($4,717 million), Ultomiris ($3,924 million) and Calquence ($3,129 million). Farxiga sales increased by 28% (CER: 31%), growing faster than the overall SGLT2 market in all major regions, driven by continued demand in heart failure and CKD. Tagrisso sales grew by 13% (CER: 16%) reflecting a strong global demand in adjuvant and 1st-line settings. Imfinzi Product Sales grew by 17% (CER: 21%) due to growing demand. Ultomiris increased by 32% (CER: 34%) due to higher use in neurology, geographic expansion, increasing patient demand and further conversion from Soliris. Calquence continued its growth with an increase of 24% (CER: 25%) in the year, driven by sustained leadership in front-line CLL. Total Revenue Total Revenue for 2024 was up 18% (CER: 21%) to $54,073 million, comprising Product Sales of $50,938 million, up 16% (CER: 19%), Alliance Revenue of $2,212 million, an increase of 55% (CER: 55%), and Collaboration Revenue of $923 million, an increase of 56% (CER: 54%). Product Sales 2024 Product Sales $m 2023 Product Sales $m Actual growth % CER growth % Product Sales by Therapy Area Oncology 20,275 17,145 18 21 CVRM 12,448 10,585 18 20 Respiratory & Immunology 7,416 6,107 21 23 Vaccines & Immune Therapies 1,058 1,012 5 6 Rare Disease 8,668 7,764 12 14 Other Medicines 1,073 1,176 (9) (4) Total 50,938 43,789 16 19 2024 Product Sales $m 2023 Product Sales $m Actual growth % CER growth % Product Sales by geographical area US 21,655 17,961 21 21 Emerging Markets 13,535 11,751 15 23 Europe 10,848 9,029 20 19 Established RoW 4,900 5,048 (3) 3 Total 50,938 43,789 16 19 AstraZeneca Annual Report & Form 20-F Information 2024 73 Strategic Report Corporate Governance Financial Statements Additional Information Financial Review |
| Alliance Revenue 2024 $m 2023 $m Alliance Revenue Enhertu 1,437 1,022 Tezspire 436 259 Beyfortus 237 57 Other royalty income 91 81 Other Alliance Revenue 11 9 Total Alliance Revenue 2,212 1,428 Collaboration Revenue 2024 $m 2023 $m Collaboration Revenue Lynparza: sales milestone 600 – Beyfortus: sales milestones 167 27 Koselugo: sales milestone 100 – Farxiga: sales milestones 56 29 Lynparza: regulatory milestone – 245 COVID-19 mAbs: licence fees – 180 Beyfortus: regulatory milestones – 71 tralokinumab: milestones – 20 Other Collaboration Revenue – 22 Total Collaboration Revenue 923 594 Tezspire (Amgen) In 2012, AstraZeneca entered into a collaboration agreement with Amgen to co-develop and co-commercialise five development stage programmes. Of these, only Tezspire remains in the collaboration. A second active molecule (AZD8630) was added in 2021. Manufacturing will be undertaken by Amgen, while commercialisation activity will be undertaken either jointly, or by AstraZeneca or Amgen individually, dependent on the market and on the agreed terms. AstraZeneca recognises 100% of the sales as principal in all markets other than the US, as well as 100% of the associated cost of sales. In markets other than the US, where AstraZeneca is recognising sales, the share of gross margin payable to Amgen is shown as additional cost of sales. In the US, where Amgen is recognising sales, AstraZeneca records its share of gross profit as Alliance Revenue. • Prior to 2024, we recognised $338 million in respect of Alliance Revenue. • In 2024, we recognised Alliance Revenue of $436 million. Beyfortus (Sanofi) In March 2017, AstraZeneca entered into an alliance with Sanofi to develop and commercialise Beyfortus jointly. Under the terms of the global agreement, Sanofi made an upfront payment of €120 million and agreed to pay up to €495 million upon achievement of certain development and sales-related milestones. All costs and profits are shared equally. The US element of this collaboration was subject to a participation agreement with Sobi, effective from January 2019 until April 2023, at which point there was an update to the contractual relationships between AstraZeneca, Sobi and Sanofi relating to the future sales of Beyfortus. Alliance Revenue includes AstraZeneca’s 50% share of gross profits on sales of Beyfortus in major markets outside the US. • Prior to 2024, we recognised $57 million in respect of Alliance Revenue. • In 2024, we recognised Alliance Revenue of $237 million. Collaboration Revenue Collaboration Revenue, consisting of upfront payments and event-triggered milestones, increased in the year by 56% (CER: 54%) to $923 million. Details of our significant business development transactions which give rise to Collaboration Revenue are given below. Lynparza/Koselugo (MSD) In July 2017, the Group announced a global strategic oncology collaboration with MSD to co-develop and co-commercialise AstraZeneca’s Lynparza for multiple cancer types and Koselugo for neurofibromatosis type 1. As part of the agreement, MSD agreed to pay AstraZeneca up to $8.5 billion in total consideration, including $1.6 billion upfront, $750 million for certain licence options and up to $6.2 billion contingent upon successful achievement of future regulatory and sales-related milestones. Of the $1.6 billion upfront payment, $1.0 billion was recognised as Collaboration Revenue on deal completion in 2017, with the remaining $0.6 billion deferred to the balance sheet, virtually all of which has been released to the Consolidated Statement of Comprehensive Income as at 31 December 2024. AstraZeneca records all product sales for Lynparza and Koselugo, with the share of gross profits due to MSD under the collaboration being recorded under Cost of sales. Additionally, AstraZeneca recognises Collaboration Revenue relating to regulatory milestones and sales-related milestones. Alliance Revenue Alliance Revenue, comprising our share of gross profits, share of revenues and royalties, increased in the year by 55% (CER: 55%), to $2,212 million, including $1,437 million from Enhertu and $436 million from Tezspire, which achieved blockbuster status in 2024. Details of our significant business development transactions which give rise to Alliance Revenue are given below. Enhertu (Daiichi Sankyo) In March 2019, AstraZeneca entered into an alliance with Daiichi Sankyo to develop and commercialise Enhertu for multiple cancer types. In markets where Daiichi Sankyo is selling the product, AstraZeneca is entitled to receive a royalty (in Japan) or a share of costs and income (in other territories). Share of gross profits and royalty income from Daiichi Sankyo are recognised as Alliance Revenue. Enhertu launched in the US on 31 December 2019. • Prior to 2024, we recognised $1,828 million in respect of Alliance Revenue. • In 2024, we recognised Alliance Revenue of $1,437 million. 74 AstraZeneca Annual Report & Form 20-F Information 2024 Strategic Report Financial Review continued |
| Operating expenses Reported Operating expenses increased by 11% (CER: 12%) in the year to $34,115 million. Core Operating expenses decreased by 13% (CER: 14%) to $27,794 million. Reported R&D expense increased by 24% (CER: 25%) to $13,583 million and Core R&D expense increased by 19% (CER: 19%) to $12,211 million. Both Reported and Core R&D expense were impacted by recent positive data readouts for several high-priority medicines, increased investment in new platforms, technologies and capabilities and additional R&D projects following completion of previously announced business development activity including Icosavax, Gracell, Fusion and Amolyt Pharma. The Reported R&D expense was also impacted by intangible asset impairments of $1,065 million (2023: $417 million) which includes $753 million related to the impairment of the vemircopan (ALXN2050) intangible asset, following the decision to discontinue this development programme, and $165 million relating to product in development, FPI-2059, due to decisions made to terminate the related activities and prioritise resources on the development of FPI-2265 and AZD2068. Reported SG&A expense increased by 4% (CER: 5%) to $19,977 million and Core SG&A expense increased by 9% (CER: 11%) to $15,028 million. Both Reported and Core SG&A expense increases were driven primarily by market development activities for launches and to support continued growth in existing brands. Reported SG&A expense also includes an impairment charge of $504 million recorded against the Andexxa intangible asset following the decision to cease promotional activity for this product. The prior year Reported SG&A expense was impacted by a $510 million charge to provisions relating to a legal settlement with Bristol-Myers Squibb and Ono Pharmaceutical, and a $425 million charge to provisions for product liability litigations related to Nexium and Prilosec. Other operating income and expense Reported Other operating income and expense in the year was down 81% (CER: 81%) to $252 million. Core Other operating income and expense in the year was down 81% (CER: 81%) to $250 million. In 2023, both Reported and Core Other operating income and expense included a gain of $712 million on replacement of the contractual relationship between AstraZeneca, Sobi and Sanofi with a royalty relationship between Sanofi and Sobi and income of $241 million on the disposal of the US rights to Pulmicort Flexhaler. Operating profit Reported Operating profit increased by 22% (CER: 32%) to $10,003 million in the year. Reported Operating Margin remained flat at 18% of Total Revenue (CER: increased by two percentage points). Core Operating profit grew by 16% (CER: 22%) in the year to $16,928 million. Net finance expense Reported Net finance expense remained flat (CER: decreased by 3%) in the year totalling $1,284 million. Core Net finance expense increased by 19% (CER: 15%) in the year to $1,169 million. Reported Net finance expense was impacted by the discount unwind on acquisition-related liabilities. Core Net finance expense increased due to the increased level of debt and new debt issued at higher interest rates. • Prior to 2024, we have recognised Collaboration Revenue totalling $3,110 million, comprising $750 million resulting from the exercise of options, $1,400 million in respect of sales-related milestones and $960 million in respect of regulatory milestones. • In 2024, we recognised Collaboration Revenue of $600 million in respect of a Lynparza sales-related milestone and $100 million in respect of a Koselugo sales-related milestone. Beyfortus (Sanofi) Details of this business development transaction are summarised in the Alliance Revenue section on page 74. • Prior to 2024, we recognised Collaboration Revenue totalling $284 million, comprising $127 million (€120 million) of upfront consideration, $130 million (€120 million) in respect of regulatory milestones, and $27 million (€25 million) in respect of sales-related milestones. • In 2024, we recognised Collaboration Revenue of $167 million (€150 million) in respect of sales-related milestones. Gross profit Reported Gross profit increased by 17% (CER: 20%) to $43,866 million. Core Gross profit increased by 18% (CER: 20%) to $44,472 million. Reported Product Sales Gross Margin decreased by one (CER: one) percentage point to 80%. Core Product Sales Gross Margin decreased by one percentage point (CER: remained flat) to 81%. Both Reported and Core Product Sales Gross Margin reflected positive product mix effects from Rare Disease and Oncology medicines, negative product mix effects from rising contributions of products with share of gross profit arrangements, and negative geographic mix effects as Emerging Markets grew as a proportion of Total Revenue. AstraZeneca Annual Report & Form 20-F Information 2024 75 Strategic Report Corporate Governance Financial Statements Additional Information Financial Review |
| Total comprehensive income Total comprehensive income decreased by $453 million to $6,241 million in 2024. Other comprehensive expense, net of tax, was $800 million, a decrease of $1,533 million. This expense was primarily driven by foreign exchange losses arising on consolidation of $957 million (2023: gains of $608 million). EPS Reported EPS was $4.54 in the year (2023: $3.84). Core EPS was $8.21 (2023: $7.26). Restructuring Post Alexion Acquisition Group Review (PAAGR) In conjunction with the acquisition of Alexion in 2021, the enlarged Group initiated a comprehensive review, aimed at integrating systems, structure and processes, optimising the global footprint and prioritising resource allocations and investments. Except as referenced below, these activities are expected to be substantially complete by the end of 2026. During 2023, the Group identified all remaining activities and finalised the scope of the programme. During 2024, the Group undertook a further assessment of those planned activities. Updated estimates of the planned activities have resulted in an increase to the expected one-time restructuring costs of $0.8 billion, of which $0.3 billion are non-cash costs, and an increase in capital investments of $0.6 billion. This includes the commencement of work on the planned upgrade of the Group’s ERP IT systems (Axial Project), which is expected to be substantially complete by the end of 2030, resulting in capital investments for software assets of $1.3 billion and one-time restructuring cash costs of $0.5 billion, over the full course of the project. Consequently, the total programme activities are now anticipated to incur one-time restructuring costs of approximately $4.4 billion, of which approximately $3.0 billion are cash costs and $1.4 billion are non-cash costs, and capital investments of approximately $2.2 billion. Run-rate pre-tax benefits, before reinvestment, are now expected to be approximately $2.3 billion by the end of 2026. In line with established practice, restructuring costs will be excluded from our Core (non-GAAP) financial measures. During 2024, the Group has recorded restructuring charges of approximately $1.1 billion in relation to the PAAGR (2023: $0.4 billion), bringing the cumulative charges to date under this programme to $3.2 billion. Of these costs, $0.8 billion are non-cash costs arising from impairments and accelerated depreciation on affected assets. As at 31 December 2024, the PAAGR has realised annual run-rate pre-tax benefits, before reinvestment, of $1.5 billion. Other programmes Legacy programmes include the centralisation of our global R&D footprint and the transformation of SG&A functions (principally Finance and HR). Net costs for legacy programmes in 2024 were $39 million (2023: $92 million). The aggregate restructuring charge incurred in 2024 across all our restructuring programmes was $1,154 million (2023: $467 million). Final estimates for programme costs, benefits and headcount impact in all functions are subject to completion of the requisite consultation in the various areas. Our priority, as we undertake these restructuring initiatives, is to work with our affected employees on the proposed changes, acting in accordance with relevant local consultation requirements and employment law. Profit before tax Reported Profit before tax increased by 26% (CER: 38%) to $8,691 million in the year. Core Profit before tax increased by 16% (CER: 22%) to $15,731 million. Pre-tax adjustments to arrive at Core Profit before tax amounted to $7,040 million in 2024 (2023: $6,639 million), comprising $6,925 million adjustments to Reported Operating profit (2023: $6,341 million) and $115 million to Reported Net finance expense (2023: $298 million). EBITDA EBITDA increased by 23% (CER: 29%) to $16,691 million in the year (2023: $13,580 million). Taxation The Reported and Core tax rates for the year were both 19%. The income tax paid for the year was $2,750 million (2023: $2,366 million). This was $1,100 million higher than the Reported tax charge for the year, which benefited from a net deferred tax credit of $795 million (2023: $1,507 million), relating to intangible amortisation and impairments, and other deferred tax items and payment of prior period tax liabilities, and the timing differences for cash payments. Additional information on these items is contained in Note 4 to the Financial Statements from page 163. We pay corporate income taxes, customs duties, excise taxes, stamp duties, employment, environmental and many other business taxes in all jurisdictions in which we operate. We also collect and pay employee taxes and other indirect taxes such as value-added tax in these jurisdictions. Reconciliation of Reported Profit before tax to EBITDA 2024 $m 2023 $m Actual growth % CER growth % Reported Profit before tax 8,691 6,899 26 38 Net finance expense 1,284 1,282 – (3) Share of after tax losses of joint ventures and associates 28 12 >2x >2x Depreciation, amortisation and impairment 6,688 5,387 24 24 EBITDA 16,691 13,580 23 29 For more information regarding the AstraZeneca tax policy, see our website, www.astrazeneca.com. 76 AstraZeneca Annual Report & Form 20-F Information 2024 Strategic Report Financial Review continued |
| Cash flow and liquidity – for the year ended 31 December 2024 Net cash generated from operating activities was $11,861 million (2023: $10,345 million). This primarily reflects an underlying improvement in business performance. Net investment cash outflows were $8,353 million (2023: $4,638 million). Investment cash outflows for 2024 include: • Payments of contingent consideration from business combinations of $1,008 million (2023: $826 million). • $2,662 million (2023: $2,417 million) for the purchase of intangible assets, including $800 million for the Amolyt Pharma asset acquisition, $639 million for the Icosavax asset acquisition, and $200 million of sales-related milestones paid to Daiichi Sankyo in respect of Enhertu. • $2,771 million (2023: $189 million) for the acquisition of subsidiaries, net of cash acquired, including $1,997 million for the Fusion acquisition, and $774 million for the Gracell acquisition. Investment cash inflows include: • $123 million (2023: $291 million) from the sale of intangible assets. Net cash distributions to shareholders were $4,591 million (2023: $4,448 million), including proceeds from the issue of share capital of $38 million (2023: $33 million) less dividends paid of $4,629 million (2023: $4,481 million). Summary cash flows 2024 $m 2023 $m 2022 $m Net debt brought forward at 1 January (22,510) (22,923) (24,322) Profit before tax 8,691 6,899 2,501 Sum of changes in interest, depreciation, amortisation, impairment and share of after tax losses on joint ventures and associates 8,000 6,681 6,736 Decrease in working capital and short-term provisions (893) 300 3,757 Tax paid (2,750) (2,366) (1,623) Interest paid (1,313) (1,081) (849) Gains on disposal of intangible assets (64) (251) (104) Fair value movements on contingent consideration arising from business combinations 311 549 82 Non-cash and other movements (121) (386) (692) Net cash available from operating activities 11,861 10,345 9,808 Purchase of intangibles, net of disposals (2,539) (2,126) (1,033) Acquisition of subsidiaries, net of cash acquired (2,771) (189) (48) Share-based payments attributable to business combinations (3) (84) (215) Payment of contingent consideration from business combinations (1,008) (826) (772) Other capital expenditure (net) (2,032) (1,413) (838) Investments (8,353) (4,638) (2,906) Dividends (4,629) (4,481) (4,364) Proceeds from the issue of share capital 38 33 29 Distributions (4,591) (4,448) (4,335) Repayment of obligations under leases (316) (268) (244) Payment of Acerta Pharma share purchase liability (833) (867) (920) Other movements 172 289 (4) Net debt carried forward at 31 December (24,570) (22,510) (22,923) AstraZeneca Annual Report & Form 20-F Information 2024 77 Strategic Report Corporate Governance Financial Statements Additional Information Financial Review |
| Bonds In March 2024, AstraZeneca issued $5,000 million of USD bonds and, in August 2024, AstraZeneca issued $1,517 million of EUR bonds with a notional face value of €1,400 million. In March 2023, AstraZeneca issued $3,832 million of bonds. USD bonds with a notional face value of $2,250 million and EUR bonds with a notional face value of €1,500 million were issued. In 2024, AstraZeneca repaid floating rate bank loans of $2,000 million, which matured in July 2024 and a $1,600 million USD bond, which matured in May 2024. $1,026 million was also repaid in respect of a EUR bond, with a notional face value of €900 million, which was held in a cash flow hedge and matured in May 2024. In 2023, AstraZeneca repaid $2,000 million of floating rate bank loans in March 2023, which were due to mature in July 2023, a $1,400 million 0.3% callable bond, which matured in May 2023, $400 million of floating rate notes and an $850 million 3.5% callable bond, both of which matured in August 2023, and $287 million of 7% guaranteed debentures, which matured in November 2023. Net debt Net debt at 31 December 2024 was $24,570 million (2023: $22,510 million). At 31 December 2024, gross debt (interest-bearing loans and borrowings) was $30,295 million (2023: $28,622 million). Of the gross debt outstanding, $2,676 million is due within one year (2023: $5,400 million). At 31 December 2024, Cash and cash equivalents and Other investments totalled $5,654 million (2023: $5,962 million). The Group maintains committed bank facilities to manage liquidity. At 31 December 2024, the Group held $4,875 million of such facilities with a maturity date of April 2029. In January 2025 the maturity of these facilities was extended by one year to April 2030. These facilities contain no covenants and were undrawn at 31 December 2024. The Group regularly monitors the credit standing of the banks providing the facilities and currently does not anticipate any issue with drawing on the committed facilities should this be necessary. Advances under these facilities currently bear an interest rate per annum based on SOFR (Secured Overnight Financing Rate) plus a margin. Repayment dates Face value of bond $m Net book value of bond at 31 December 2024 $m Bonds issued in 2024: 4.8% USD bond 2027 1,250 1,247 4.85% USD bond 2029 1,250 1,246 3.121% EUR bond 2030 704 682 4.9% USD bond 2031 1,000 994 3.278% EUR bond 2033 813 786 5.0% USD bond 2034 1,500 1,489 Total 2024 6,517 6,444 Bonds issued in 2023: 3.625% EUR bond 2027 791 780 4.875% USD bond 2028 1,100 1,096 4.9% USD bond 2030 650 646 3.75% EUR bond 2032 791 778 4.875% USD bond 2033 500 497 Total 2023 3,832 3,797 Net debt reconciliation 2024 $m 2023 $m 2022 $m Cash and cash equivalents 5,488 5,840 6,166 Other investments1 166 122 239 Cash and investments 5,654 5,962 6,405 Overdraft and short-term borrowings (330) (515) (350) Lease liabilities (1,452) (1,128) (953) Current instalments of loans and borrowings (2,007) (4,614) (4,964) Loans due after one year (26,506) (22,365) (22,965) Loans and borrowings (30,295) (28,622) (29,232) Net derivative financial instruments 71 150 (96) Net debt2 (24,570) (22,510) (22,923) 1 Other investments exclude non-current investments, which are included within the balance of $1,632 million (2023: $1,530 million) in the Consolidated Statement of Financial Position on page 149. 2 The equivalent GAAP measure to Net debt is ‘liabilities arising from financing activities’, which excludes the amounts for cash and overdrafts, other investments and non-financing derivatives shown above, and includes the Acerta Pharma share purchase liability of $nil (2023: $833 million) presented in current Other payables. Payments due by period Less than 1 year $m 1-3 years $m 3-5 years $m Over 5 years $m Total 2024 $m Total 2023 $m Bank loans and other borrowings1 3,390 7,107 7,758 19,929 38,184 35,959 Lease liabilities 339 575 250 288 1,452 1,128 Contracted capital expenditure 546 157 53 819 1,575 1,368 Total 4,275 7,839 8,061 21,036 41,211 38,455 1 Bank loans and other borrowings include interest charges payable in the period, as detailed in Note 28 to the Financial Statements from page 194. Bonds issued in 2024 and 2023 78 AstraZeneca Annual Report & Form 20-F Information 2024 Strategic Report Financial Review continued |
| Gracell In February 2024, AstraZeneca completed the acquisition of Gracell, a global clinical-stage biopharmaceutical company developing innovative cell therapies for the treatment of cancer and autoimmune diseases. The purchase price allocation review has been completed. The total consideration fair value of $1,037 million includes cash consideration of $983 million and future regulatory milestone-based consideration of $54 million. Intangible assets of $1,038 million and goodwill of $136 million were recognised in the acquisition balance sheet, as well as a net deferred tax liability of $260 million. AstraZeneca acquired the cash and cash equivalents on Gracell’s balance sheet, which totalled $209 million at the close of the transaction. Gracell’s results have been consolidated into the Group’s results from 22 February 2024. Neogene In January 2023, AstraZeneca completed the acquisition of Neogene, a global clinical-stage biotechnology company pioneering the discovery, development and manufacturing of next-generation TCR-T. The purchase price allocation exercise has completed, with the fair value of total consideration determined at $267 million. Intangible assets of $100 million and goodwill of $158 million were recognised in the acquisition balance sheet, as well as a cash outflow of $189 million net of cash acquired. Following achievement of agreed milestones in 2024, contingent milestones-based consideration and non-contingent consideration of $120 million is payable. Neogene’s results have been consolidated into the Group’s results from 16 January 2023. The acquisitions have been accounted for as business combinations using the acquisition method of accounting in accordance with IFRS 3 ‘Business Combinations’. Acquisitions treated as asset acquisitions Amolyt Pharma In July 2024, AstraZeneca completed the acquisition of Amolyt Pharma, a clinical-stage biotechnology company focused on developing novel treatments for rare endocrine diseases. AstraZeneca acquired all outstanding equity of Amolyt Pharma with consideration of $857 million, principally relating to $800 million of intangible assets and $98 million of cash and cash equivalents. Contingent consideration of up to $250 million could be paid on achievement of a regulatory milestone; this potential liability would be recorded when the relevant recognition event for a regulatory milestone is achieved. Icosavax In February 2024, AstraZeneca completed the acquisition of Icosavax, a US-based clinical-stage biopharmaceutical company focused on developing differentiated, high-potential vaccines using an innovative, protein virus-like particle platform. Consideration totalled $841 million, principally relating to $639 million of intangible assets, $141 million of cash and cash equivalents and $51 million of marketable securities. Contingent consideration of up to $300 million could be paid on achievement of regulatory and sales milestones; these potential liabilities would be recorded when the relevant recognition event for a regulatory or sales milestone is achieved. CinCor In February 2023, AstraZeneca completed the acquisition of 100% of the issued shares of CinCor, for consideration of $1,268 million, which included intangible assets acquired of $780 million, $424 million of cash and cash equivalents, and $75 million of marketable securities. Contingent consideration of up to $496 million could be paid on achievement of regulatory milestones and those liabilities will be recorded when milestones are triggered, or performance conditions have been satisfied. Pfizer portfolio In September 2023, AstraZeneca completed the definitive purchase and licence agreement for a portfolio of preclinical rare disease gene therapy programmes and enabling technologies from Pfizer. The agreement has a total consideration of up to $1 billion, consisting of a $300 million upfront payment and $700 million of contingent consideration, plus tiered royalties on sales. Commitments and contingencies We have commitments and contingencies which are accounted for in line with Group Accounting Policies and are described in Note 30 to the Financial Statements from page 203. We also have taxation contingencies. These are described in this Financial Review, in the Taxation section in the Critical accounting policies and estimates section from page 152, and in Note 30 to the Financial Statements from page 211. Financial position – 31 December 2024 All data in this section are on a Reported basis. Acquisitions In assessing whether an acquired set of assets and activities is a business or an asset, management will first elect whether to apply an optional concentration test to simplify the assessment. Where the concentration test is applied, the acquisition will be treated as the acquisition of an asset if substantially all of the fair value of the gross assets acquired (excluding cash and cash equivalents, deferred tax assets and related goodwill) is concentrated in a single asset or group of similar identifiable assets. Where the concentration test is not applied, or is not met, a further assessment of whether the acquired set of assets and activities is a business will be performed. Acquisitions treated as business combinations Fusion In June 2024, AstraZeneca completed the acquisition of Fusion, a clinical-stage biopharmaceutical company developing next-generation radioconjugates. The purchase price allocation review has been completed. The total consideration fair value of $2,195 million includes cash consideration of $2,051 million and future regulatory milestone-based consideration of $144 million. Intangible assets of $1,326 million and goodwill of $947 million were recognised in the acquisition balance sheet, as well as a net deferred tax liability of $246 million. AstraZeneca acquired the cash and cash equivalents on Fusion’s balance sheet, which totalled $30 million at the close of the transaction. Immediately prior to the acquisition, AstraZeneca held an approximately 1% shareholding in Fusion with a fair value of $24 million. Fusion’s results have been consolidated into the Group’s results from 4 June 2024. In December 2024, the intangible asset relating to the product in development, FPI-2059, was fully impaired by $165 million due to portfolio prioritisation decisions. Development of FPI-2265 and AZD2068 are still ongoing and continue to be a priority. For full details of acquisitions, see Note 27 to the Financial Statements from page 193. For further information, see Business Development on page 46. AstraZeneca Annual Report & Form 20-F Information 2024 79 Strategic Report Corporate Governance Financial Statements Additional Information Financial Review |
| Cellectis In November 2023, AstraZeneca entered into an agreement with Cellectis, a clinical-stage biotechnology company, to accelerate the development of next-generation therapeutics in areas of high unmet medical need, including oncology, immunology and rare diseases. Cellectis received an initial payment of $105 million from AstraZeneca, which comprised a $25 million upfront cash payment under the terms of a research collaboration agreement and an $80 million equity investment. In May 2024, AstraZeneca completed an additional $140 million equity investment in Cellectis. The equity investment and a research collaboration agreement will leverage the Cellectis proprietary gene editing technologies and manufacturing capabilities, to design up to 10 novel cell and gene therapy products for areas of high unmet medical need, including oncology, immunology and rare diseases. Following completion of the additional $140 million equity investment, AstraZeneca holds a total equity stake of 44% in the associate entity. Eccogene In November 2023, AstraZeneca and Eccogene entered into an exclusive licence agreement for AZD5004, an investigational oral once-daily GLP-1RA for the treatment of obesity, type-2 diabetes and other cardiometabolic conditions. Preliminary results from the Phase I trial have shown a differentiating clinical profile for AZD5004, with good tolerability and encouraging glucose and body weight reduction across the dose levels tested compared to placebo. Under the terms of the agreement, Eccogene received an initial upfront payment of $185 million and is eligible to receive up to an additional $1.8 billion in future clinical, regulatory, and commercial milestones and tiered royalties. AstraZeneca is granted exclusive global rights for the development and commercialisation of AZD5004 for any indication in all territories except China, where Eccogene has the right to co-develop and co-commercialise alongside AstraZeneca. In addition to the business development transactions detailed under Alliance Revenue and Collaboration Revenue from page 74 of this Financial Review, the following significant collaborations remain in the development phase: Daiichi Sankyo In July 2020, AstraZeneca entered into a new global development and commercialisation agreement with Daiichi Sankyo for Datroway, its proprietary TROP2-directed ADC and potential new medicine for the treatment of multiple tumour types. AstraZeneca paid Daiichi Sankyo an upfront payment of $1 billion in three staged payments and also agreed to pay additional conditional amounts of up to $1 billion for the successful achievement of regulatory approvals and up to $4 billion for sales-related milestones. The transaction was accounted for as an intangible asset acquisition, recognised initially at the present value of non-contingent consideration, with any potential future milestone payments capitalised into the intangible asset as they are recognised. The companies will jointly develop and commercialise Datroway worldwide and will share, equally, development and commercialisation expenses as well as profits relating to Datroway worldwide, except for Japan, where Daiichi Sankyo will retain exclusive rights and be responsible for such costs and will pay AstraZeneca mid single-digit royalties. Daiichi Sankyo will record sales in the US, certain countries in Europe and certain other countries where Daiichi Sankyo has affiliates. Profits shared with AstraZeneca will be recorded as Alliance Revenue. AstraZeneca will record Product Sales in other countries worldwide. Profits shared with Daiichi Sankyo will be recorded within Cost of sales. Daiichi Sankyo will manufacture and supply Datroway, which was approved in Japan in 2024 and the US in January 2025. Innate Pharma In April 2015, we entered into two oncology agreements with Innate Pharma: a licence which provides us with exclusive global rights to co-develop and commercialise IPH2201 in combination with Imfinzi; and an option to license exclusive global rights to co-develop and commercialise IPH2201 in monotherapy and other combinations in certain treatment areas. We jointly fund Phase II studies with Innate Pharma and we lead the execution of these studies. In respect of these agreements, we made an initial payment to Innate Pharma of $250 million. The agreement also includes a Phase III initiation milestone of $100 million, as well as additional regulatory and sales-related milestones. We record all sales and pay Innate Pharma double-digit royalties on net sales. The arrangement includes the right for Innate Pharma to co-promote in Europe for an equal share of costs and income in the territory. Off balance sheet transactions and commitments We have no off balance sheet arrangements and our derivative activities are non‑speculative. The table on page 78 sets out our minimum contractual obligations at the year end. Research and development collaboration payments Details of future potential R&D collaboration payments are also included in Note 30 to the Financial Statements from page 203. As detailed in Note 30, payments to our partners may not become payable due to the inherent uncertainty in achieving the development and revenue milestones linked to the future payments. We may enter into further collaboration projects in the future that may include milestone payments and, as certain milestone payments fail to crystallise due to, for example, failure to obtain regulatory approval, unfavourable data from key studies, adverse reactions to the product candidate or indications of other safety concerns, they may be replaced by potential payments under new collaborations. Investments, divestments and capital expenditure We have completed more than 60 major or strategically important business development transactions over the past three years, including: CSPC Pharmaceutical Group In October 2024, AstraZeneca entered into an exclusive licence agreement with CSPC Pharmaceutical Group Ltd (CSPC) to advance the development of an early stage, novel small molecule Lipoprotein (a) (Lp(a)) disruptor that has the potential to offer additional benefits for patients with dyslipidaemia. This further strengthens the Group’s cardiovascular portfolio to help address the major risk factors driving chronic cardiovascular disease. Under the terms of the agreement, AstraZeneca will receive access to CSPC’s preclinical candidate small molecule, YS2302018, an oral Lp(a) disruptor, with the aim of developing this as a novel lipid-lowering therapy with potential in a range of cardiovascular disease indications, alone or in combination, including with AstraZeneca’s oral small molecule PCSK9 inhibitor, AZD0780. CSPC will receive an upfront payment of $100 million and is eligible to receive up to $1,920 million for further development, regulatory and commercialisation milestones, plus tiered royalties. 80 AstraZeneca Annual Report & Form 20-F Information 2024 Strategic Report Financial Review continued |
| The Board regularly reviews its distribution policy and its overall financial strategy to continue to strike a balance between the interests of the business, our financial creditors and our shareholders. Having regard for business investment, funding the progressive dividend policy and meeting our debt service obligations, the Board currently believes it is appropriate to continue the suspension of the share repurchase programme which was announced in 2012. The Board reviews the level of distributable reserves of the Parent Company annually and aims to maintain distributable reserves that provide adequate cover for dividend payments. At 31 December 2024, the overwhelming majority of the Profit and loss account reserve of $13,495 million (2023: $17,640 million) was available for distribution, subject to filing these Financial Statements with Companies House. When making a distribution to shareholders, the Directors determine profits available for distribution by reference to guidance on realised and distributable profits under the Companies Act 2006 issued by the Institute of Chartered Accountants in England and Wales and the Institute of Chartered Accountants of Scotland in April 2017. The profits of the Parent Company have been received in the form of receivables due from subsidiaries. The availability of distributable reserves in the Parent Company is dependent on those receivables meeting the definition of qualifying consideration within the guidance, and in particular on the ability of subsidiaries to settle those receivables within a reasonable period of time. The Directors consider that, based on the nature of these receivables and the available cash resources of the Group and other accessible sources of funds, at 31 December 2024, the overwhelming majority (2023: the overwhelming majority) of the Company’s profit and loss reserves were available for distribution. Future prospects As outlined earlier in this Annual Report, our strategic priorities support delivery of our Growth Through Innovation strategy and our Purpose: to push the boundaries of science to deliver life‑changing medicines. In support of this, we made certain choices around our three strategic priorities: • Science and Innovation • Growth and Therapy Area Leadership • People and Sustainability. Full year 2025: additional commentary Total Revenue is expected to increase by a high single-digit percentage. Core EPS is expected to increase by a low double-digit percentage. The Core Tax rate is expected to be between 18-22%. The Group is unable to provide guidance on a Reported basis because it cannot reliably forecast material elements of the Reported results, including any fair value adjustments arising on acquisition-related liabilities, intangible asset impairment charges and legal settlement provisions. Please refer to the Cautionary statement regarding forward-looking statements on page 244. Currency impact If foreign exchange rates for February 2025 to December 2025 were to remain at the average rates seen in January 2025, it is anticipated that 2025 Total Revenue for the year would incur a low single-digit percentage adverse impact and 2025 Core EPS would incur a mid single-digit percentage adverse impact versus the performance at CER. This commentary represents management’s current estimates and is subject to change. See the Cautionary statement regarding forward-looking statements on page 244. Financial risk management Financial risk management policies Our risk management processes are described in Risk Overview from page 64. These processes enable us to identify risks that can be partly or entirely mitigated through the use of insurance. We focus our insurance resources on the most critical areas, or where there is a legal requirement, and where we can get the best value for money through captive, structured and traditional insurance placements. Treasury The principal financial risks to which we are exposed are those arising from liquidity, interest rates, foreign currency and credit. We have a centralised treasury function to manage these risks in accordance with Board-approved policies. Note 28 to the Financial Statements from page 194 sets out the relevant policies and the way we manage these risks and our capital management objectives, as well as a sensitivity analysis of the Group’s exposure to exchange rate and interest rate movements. In October 2018, we exercised our option over IPH2201 and simultaneously entered into a further multi-element transaction with Innate Pharma. Under the agreement, we paid $50 million to collaborate on, and acquire an option to license, IPH5201, a potentially first-in-class anti-CD39 mAb. Additionally, we paid $20 million to acquire options over four future programmes currently being developed by Innate Pharma, which was expensed as R&D expenditure over four years, and paid €62.6 million to acquire a 9.8% stake in Innate Pharma. The $100 million option fee and $50 million premium paid over market price for the investment in Innate Pharma were capitalised as intangible assets. We determine these business development transactions to be significant using a range of factors. We look at the specific circumstances of the individual arrangement and apply several quantitative and qualitative criteria. As we consider business development transactions to be an extension of our R&D strategy, the expected total value of development payments under the transaction and its proportion of our annual R&D spend, both of which are proxies for overall R&D effort and cost, are important elements of the determination of the significance. Other quantitative criteria we apply include, without limitation, expected levels of future sales, the possible value of milestone payments and the resources used for commercialisation activities (for example, the number of staff). Qualitative factors we consider include, without limitation, new market developments, new territories, new areas of research and strategic implications. Capitalisation and shareholder return Capitalisation The total number of shares in issue at 31 December 2024 was 1,551 million (2023: 1,550 million). Shareholders’ equity increased by $1,643 million to $40,786 million at the year end. Non-controlling interests were $85 million (2023: $23 million). Dividend and share repurchases The Board has recommended a second interim dividend of $2.10 (168.0 pence, 22.96 SEK) to be paid on 24 March 2025. This brings the full-year dividend to $3.10 (245.6 pence, 33.75 SEK). Against Reported EPS, the Group had a dividend cover ratio of 1.46:1 in 2024 (2023: 1.32:1). Against Core EPS, the Group had a dividend cover ratio of 2.65:1 in 2024 (2023: 2.50:1). This dividend is consistent with the progressive dividend policy, by which, the Board intends to maintain or grow the dividend each year. For more information regarding Dividends, see Note 25 on page 192. For more information, see Our Strategy and Key Performance Indicators from page 12. AstraZeneca Annual Report & Form 20-F Information 2024 81 Strategic Report Corporate Governance Financial Statements Additional Information Financial Review |
| Revenue recognition Product Sales are recorded at the invoiced amount (excluding inter-company sales and value-added taxes), less movements in estimated accruals for rebates and chargebacks given to managed care and other customers, which are a particular feature in the US and are considered to be key estimates. It is the Group’s policy to offer a credit note for all returns and to destroy all returned stock in all markets. Cash discounts for prompt payments are also discounted from sales. Sales are recognised when the control of the goods has been transferred to a third party, which is usually when title passes to the customer, either on shipment or on the receipt of goods by the customer, depending on local trading terms. Rebates, chargebacks and returns in the US When invoicing Product Sales in the US, we estimate the rebates and chargebacks that we expect to pay, which are considered to be estimates. These rebates typically arise from sales contracts with third-party managed care organisations, hospitals, long-term care facilities, group purchasing organisations and various federal or state programmes (Medicaid contracts, supplemental rebates, etc.). They can be classified as follows: • Chargebacks, where we enter into arrangements under which certain parties, typically hospitals, long-term care facilities, group purchasing organisations, the Department of Veterans Affairs, Public Health Service Covered Entities, and the Department of Defense, are able to buy products from wholesalers at the lower prices we have contracted with them. The chargeback is the difference between the price we invoice to the wholesaler and the contracted price charged by the wholesaler to the other party. Chargebacks are credited directly to the wholesalers. • Regulatory, including Medicaid and other federal and state programmes, where we pay rebates based on the specific terms of agreements with the US Department of Health and Human Services and with individual states, which include product usage and information on best prices and average market price benchmarks. • Contractual, under which entities such as third-party managed care organisations are entitled to rebates depending on specified performance provisions, which vary from contract to contract. The effects of these deductions on our US pharmaceuticals revenue and the movements on US pharmaceuticals revenue provisions are set out on page 83. Accrual assumptions are built up on a product-by-product and customer-by-customer basis, taking into account specific contract provisions coupled with expected performance, and are then aggregated into a weighted average rebate accrual rate for each of our products. Accrual rates are reviewed and adjusted on an as-needed basis. There may be further adjustments when actual rebates are invoiced based on utilisation information submitted to us (in the case of contractual rebates) and claims/invoices are received (in the case of regulatory rebates and chargebacks). We believe that we have made reasonable estimates for future rebates using a similar methodology to that of previous years. Inevitably, however, these estimates involve assumptions in respect of aggregate future sales levels, segment mix and customers’ contractual performance. Overall adjustments between gross and net US Product Sales amounted to $18,986 million in 2024 (2023: $18,607 million) with the increase driven predominantly by increased chargebacks. Cash discounts are offered to customers to encourage prompt payment. Accruals are calculated based on historical experience and are adjusted to reflect actual experience. Our revenue recognition policy is described within Group Accounting Policies from page 152. Industry practice in the US allows wholesalers and pharmacies to return unused stocks within a certain time frame based on shelf-life expiry. The customer is credited for the returned product by the issuance of a credit note. Returned products are not exchanged for products from inventory and once a return claim has been determined to be valid and a credit note has been issued to the customer, the returned products are destroyed. At the point of sale in the US, we estimate the quantity and value of products which may ultimately be returned. Our returns accruals in the US are based on actual experience. Our estimate is based on the historical sales and returns information for established products together with market-related information, such as estimated shelf life, product recall, and estimated stock levels at wholesalers, which we receive via third-party information services. For newly launched products, we use rates based on our experience with similar products or a pre-determined percentage. Critical accounting policies and estimates The Consolidated Financial Statements have been prepared in accordance with UK‑adopted IAS and with the requirements of the Companies Act 2006 as applicable to companies reporting under those standards. The Consolidated Financial Statements also comply fully with IFRS Accounting Standards as issued by the IASB and IAS as adopted by the EU. The accounting policies employed are set out in the Group Accounting Policies section from page 152. In applying these policies, we make estimates and assumptions that affect the Reported amounts of assets and liabilities, and disclosure of contingent assets and liabilities. The actual outcome could differ from those estimates. Some of these policies require a high level of judgement because the areas are especially subjective or complex. We believe that the most critical accounting policies and significant areas of judgement and estimation are in the following areas and align with the accounting policies containing our key accounting judgements, and significant accounting estimates, as disclosed in the Financial Statements from page 152: • Revenue recognition – see Revenue accounting policy on page 152 and Note 1 on page 160 • Expensing of internal development expenses – see Research and development accounting policy on page 154 • Impairment review of Intangible assets – see Note 10 on page 173 • Useful economic life of Intangible assets – see Research and development accounting policy on page 154 • Business combinations and Goodwill – see Business combinations and goodwill accounting policy on page 157 • Litigation liabilities – see Litigation and Environmental Liabilities within Note 30 on page 205 • Operating segments – see Note 6 on page 166 • Employee benefits – see Note 22 on page 190 • Taxation – see Tax in Note 30 on page 211. 82 AstraZeneca Annual Report & Form 20-F Information 2024 Strategic Report Financial Review continued |
| Gross to Net Product Sales US pharmaceuticals 2024 $m 2023 $m 2022 $m Gross Product Sales 40,641 36,568 32,100 Chargebacks (3,969) (3,075) (2,401) Regulatory – Medicaid and state programmes (2,184) (2,417) (1,879) Contractual – Managed care and Medicare (10,825) (11,035) (8,821) Cash and other discounts (430) (428) (359) Customer returns (111) (222) (132) US branded pharmaceutical fee (114) (124) (150) Other (1,353) (1,306) (1,104) Net Product Sales 21,655 17,961 17,254 Movements in accruals US pharmaceuticals Brought forward at 1 January 2024 $m Provision for current year $m Adjustment in respect of prior years $m Returns and payments $m Carried forward at 31 December 2024 $m Chargebacks 245 3,530 46 (3,477) 344 Regulatory – Medicaid and state programmes 986 2,185 (18) (2,293) 860 Contractual – Managed care and Medicare 3,127 10,962 (122) (10,901) 3,066 Cash and other discounts 31 430 – (438) 23 Customer returns 273 98 – (91) 280 US branded pharmaceutical fee 172 159 (44) (110) 177 Other 282 1,346 – (1,400) 228 Total 5,116 18,710 (138) (18,710) 4,978 Brought forward at 1 January 2023 $m Provision for current year $m Adjustment in respect of prior years $m Returns and payments $m Carried forward at 31 December 2023 $m Chargebacks 233 2,743 (22) (2,709) 245 Regulatory – Medicaid and state programmes 771 2,468 (59) (2,194) 986 Contractual – Managed care and Medicare 2,426 11,166 (92) (10,373) 3,127 Cash and other discounts 27 428 – (424) 31 Customer returns 205 204 – (136) 273 US branded pharmaceutical fee 137 133 (5) (93) 172 Other 162 1,303 – (1,183) 282 Total 3,961 18,445 (178) (17,112) 5,116 Brought forward at 1 January 2022 $m Provision for current year $m Adjustment in respect of prior years $m Returns and payments $m Carried forward at 31 December 2022 $m Chargebacks 181 2,103 (13) (2,038) 233 Regulatory – Medicaid and state programmes 510 1,953 (79) (1,613) 771 Contractual – Managed care and Medicare 2,031 8,971 (141) (8,435) 2,426 Cash and other discounts 21 359 – (353) 27 Customer returns 196 112 – (103) 205 US branded pharmaceutical fee 79 138 16 (96) 137 Other 154 1,036 – (1,028) 162 Total 3,172 14,672 (217) (13,666) 3,961 AstraZeneca Annual Report & Form 20-F Information 2024 83 Strategic Report Corporate Governance Financial Statements Additional Information Corporate Governance Financial Review |
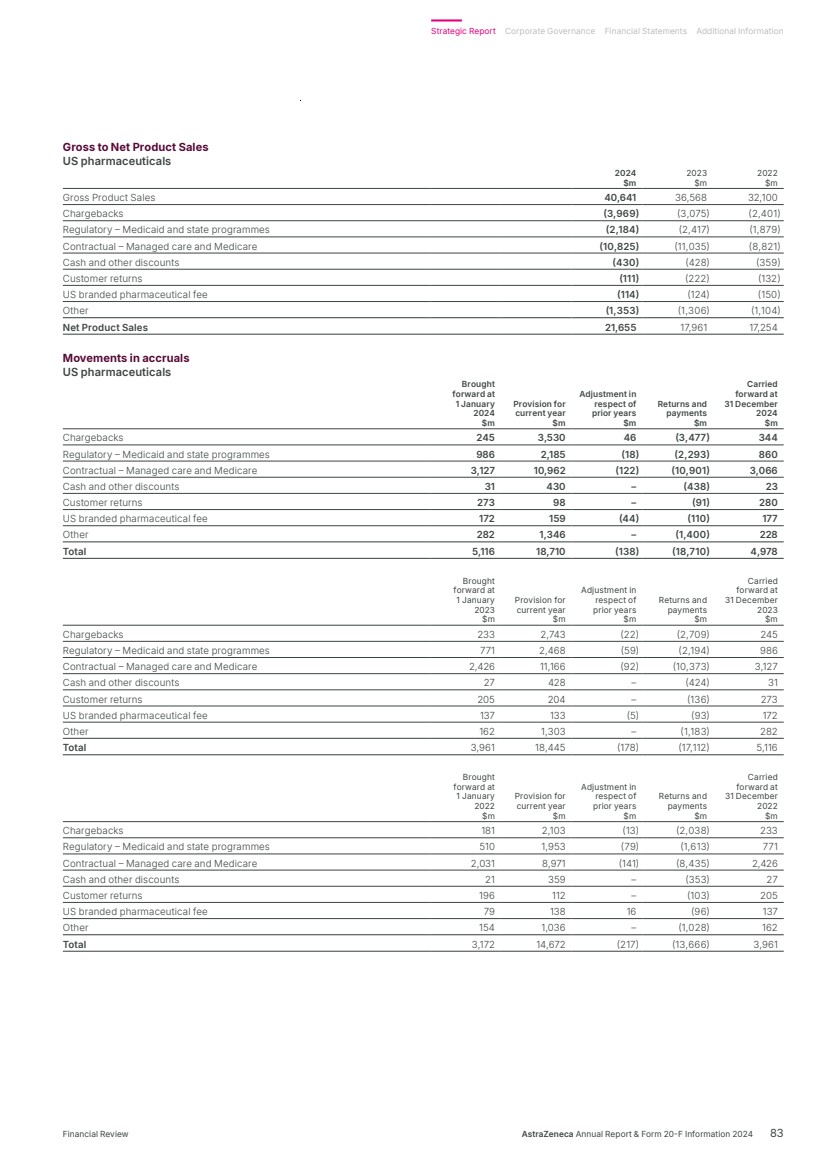
| Strategic Report The following sections make up the Strategic Report, which has been prepared in accordance with the requirements of the Companies Act 2006: • Chair’s Statement • Chief Executive Officer’s Review • What science can do • AstraZeneca at a Glance • Healthcare in a Changing World • Our Purpose, Values and Business Model • Our Strategy and Key Performance Indicators • Therapy Area Review • Business Review • Disclosure Statements • Risk Overview • Financial Review and has been approved and signed on behalf of the Board. A C N Kemp Company Secretary 6 February 2025 Sarbanes-Oxley Act section 404 As a consequence of our Nasdaq listing, we are required to comply with those provisions of the Sarbanes-Oxley Act applicable to foreign issuers. Section 404 of the Sarbanes-Oxley Act requires companies annually to assess and make public statements about the effectiveness of their internal control over financial reporting. As regards to Sarbanes-Oxley Act section 404, our approach is based on the Committee of Sponsoring Organizations (COSO) 2013 framework. Our approach to the assessment has been to select key transaction and financial reporting processes in our largest operating units and a number of specialist areas (e.g. financial consolidation and reporting, treasury operations and taxation), so that, in aggregate, we have covered a significant proportion of the key lines in our Financial Statements. Each of these operating units and specialist areas has ensured that its relevant processes and controls are documented to appropriate standards, taking into account, in particular, the guidance provided by the US Securities and Exchange Commission (SEC). We have also reviewed the structure and operation of our ‘entity level’ control environment. This refers to the overarching control environment, including structure of reviews, checks and balances that are essential to the management of a well-controlled business. 84 AstraZeneca Annual Report & Form 20-F Information 2024 Strategic Report Financial Review continued |

| Corporate Governance Contents Chair’s Introduction 86 Corporate Governance Overview 87 Board of Directors 88 Senior Executive Team (SET) 90 Corporate Governance Report 91 Nomination and Governance Committee Report 100 Science Committee Report 102 Sustainability Committee Report 103 Audit Committee Report 104 Directors’ Remuneration Report 112 Strategic Report Corporate Governance Financial Statements Additional Information Corporate Governance AstraZeneca Annual Report & Form 20-F Information 2024 85 |

| “In all its deliberations, the Board considers the interests of stakeholders and, in addition to management’s interactions, undertakes direct engagement with stakeholders.” The Board During 2024, the Board continued to support the Company’s delivery of its strategy to promote its long-term sustainable success. This included approving the Budget and Funding Plan as well as the Annual Strategy Review and Long-Term Plan. We also considered, and approved, a number of acquisitions to strengthen the Group’s pipeline and accelerate the development of potentially life-changing medicines. In all its deliberations, the Board considers the interests of stakeholders and, in addition to management’s interactions, undertakes direct engagement with stakeholders. In 2024, this included engaging with employees and external stakeholders at our meeting in Gothenburg, Sweden. I continue to engage with shareholders directly, in particular at the World Economic Forum in Davos and as part of the European Round Table of Industry. Board Committees The work of the full Board is complemented by the work of its Committees. The Audit Committee has an important role to play in monitoring the integrity of financial reporting, reviewing the effectiveness of internal controls, risk management and compliance. Key activities in 2024 included consideration as well as in-depth reviews related to our key risks. This included consideration of the investigations by Chinese authorities into current and former AstraZeneca employees and the Company; a topic which was also reviewed by the full Board. During the year, the Audit and Sustainability Committees worked together on developments in the reporting and regulatory environment in relation to sustainability-related disclosures, including the approach we have adopted in 2024 and intend to take in 2025. The Science Committee continues to carry out its valuable work providing assurance regarding the quality, competitiveness and integrity of the Group’s R&D activities. In 2024, this included a two-day meeting at our site in Shanghai, China which provided opportunities to engage with R&D employees. Finally, the Remuneration Committee was pleased that the majority of shareholders supported the new Remuneration Policy at the 2024 AGM. This allows us to continue to provide competitive executive remuneration and drive a high-performance culture. During the year, the Committee engaged with investors, including discussions about details of its proposed implementation of the Policy. It also worked closely with the Sustainability Committee when reviewing the sustainability metric within the long-term incentive which, for awards granted from 2025 onwards, will focus on reduction in Value Chain (Scope 3) GHG emissions. Annual General Meeting In 2024, the Board held its first digitally-enabled AGM. It was broadcast live, which allowed our geographically diverse shareholder base to participate in the meeting and engage with the Directors. I look forward to chairing our 2025 digitally-enabled AGM in April and engaging with as many of you as possible. Michel Demaré Chair In my first full year as Chair, I am grateful to my fellow Directors for the continued role they play in overseeing the highest standards of governance in the Company and carrying out their roles with integrity, diligence and professionalism. I am particularly grateful to the Chairs of the Board Committees for the important additional responsibilities they bear. New Non-Executive Directors I would like to welcome Rene Haas and Birgit Conix to the Board. Both joined at the start of 2025, with Rene bringing deep and broad knowledge of technology including data science, computing and AI from his experience in the microprocessor, semiconductor and software engineering industry. Birgit brings significant financial and executive experience through successive Chief Financial Officer roles as well as experience of the pharmaceutical industry, and will be a valuable addition to the Audit Committee. The appointment of Rene and Birgit highlights the importance of the Nomination and Governance Committee in succession planning, including taking the lead in the search for and recruitment of new Directors. We also ensure the Board has a balance of expertise, experience and diversity. The Committee also manages, on a continuous basis, the process of anticipating the potential succession of our CEO, combining a thorough review of our internal bench with a careful monitoring of external talent. Good corporate governance underpins any successful business and is a prime responsibility of the Board. Corporate Governance 86 AstraZeneca Annual Report & Form 20-F Information 2024 Chair’s Introduction |
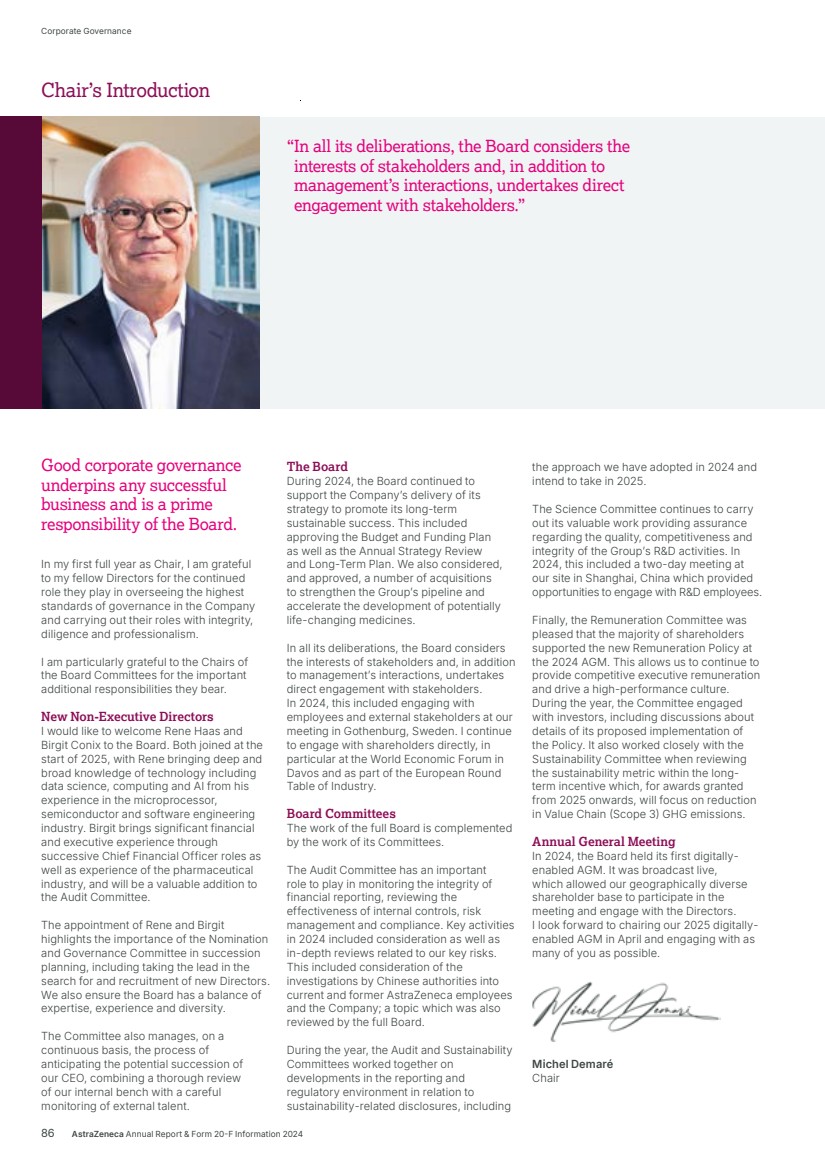
| The Board’s responsibilities include setting our strategy and policies, overseeing risk and corporate governance, and monitoring progress towards meeting our objectives and annual plans. It is accountable to our shareholders for the proper conduct of the business and our long-term success, and seeks to represent the interests of all stakeholders. The CEO, CFO and the SET take the lead in developing our strategy; proposals are reviewed and constructively challenged by the Board, before the strategy is approved. The Directors are collectively responsible for the success of the Group. The Board maintains and periodically reviews a list of matters that can only be approved by the Board. Matters that have not been expressly reserved to the Board in this way are delegated to the CEO or one of the Board’s five Committees. The diagram below illustrates this governance structure. Governance structure Audit Committee Report from page 104 Nomination and Governance Committee Report from page 100 Remuneration Committee Report from page 112 Science Committee Report from page 102 Sustainability Committee Report from page 103 The Board has delegated some of its powers to the CEO and operates with the assistance of five Committees: Board Corporate Governance Report from page 91 Attendance in 2024 Board Committee membership and meeting attendance in 2024 Board/Committee Chair Director Appointment date1 Board2 Audit Committee Remuneration Committee Nomination and Governance Committee Science Committee Sustainability Committee Non-Executive Chair and Executive Directors Michel Demaré 01/09/2019 10/10 7/7 5/5 Pascal Soriot 01/10/2012 10/10 Aradhana Sarin 01/08/2021 10/10 Non-Executive Directors Euan Ashley3 01/10/2020 9/10 5/5 5/5 Philip Broadley4 27/04/2017 10/10 6/6 6/7 4/5 Deborah DiSanzo3,4 01/12/2017 8/10 6/6 Diana Layfield3 01/11/2020 9/10 5/5 Sheri McCoy 01/10/2017 10/10 6/6 7/7 5/5 2/2 Tony Mok4 01/01/2019 9/10 5/5 Nazneen Rahman 01/06/2017 10/10 7/7 5/5 5/5 2/2 Andreas Rummelt3 01/08/2021 9/10 2/2 Marcus Wallenberg4 05/04/1999 9/10 2/5 1/2 Anna Manz4 01/09/2023 9/10 6/6 1 Date of first appointment or election to the Board. 2 Six Board meetings in 2024 were held by videoconference and four were held in person at the Company’s sites in Cambridge and London, UK and Gothenburg, Sweden. 3 One Board meeting was called urgently at very short notice during the year. Due to time zones, a medical appointment and the very short notice, as reflected in the table above, these Board members were unable to participate but were fully briefed following the meeting. 4 These Board members missed one or more meetings due to scheduling conflicts with other board meetings and/or travel plans. Strategic Report Corporate Governance Financial Statements Additional Information Corporate Governance Overview AstraZeneca Annual Report & Form 20-F Information 2024 87 Corporate Governance Overview |
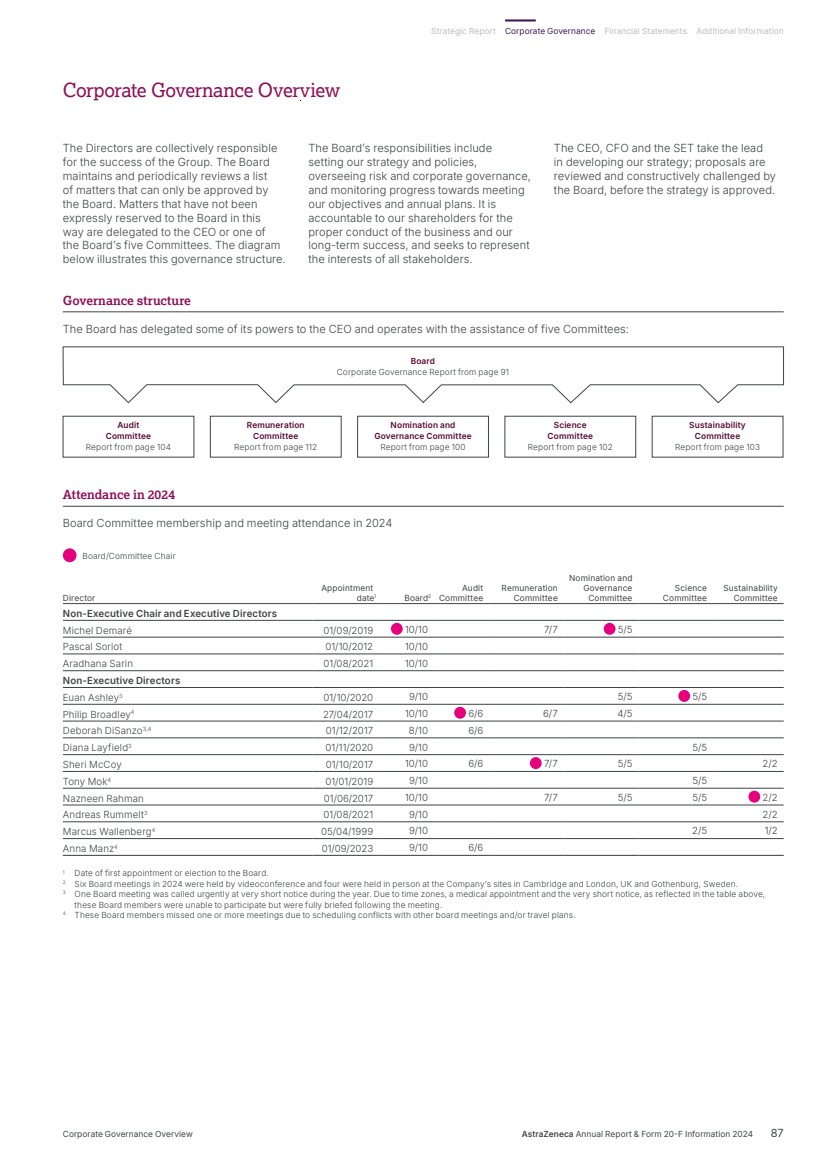
| Michel Demaré NG R Non-Executive Chair of the Board Skills and experience: Michel was previously Vice-Chairman of UBS Group AG (2010-2019), Chairman of Syngenta and Syngenta Foundation for Sustainable Agriculture (2013-2017) and Chairman of SwissHoldings (2013-2015). Between 2005 and 2013, Michel was CFO of ABB Ltd and interim CEO during 2008. He joined ABB from Baxter International Inc., where he was CFO Europe from 2002 to 2005. Prior to that, he spent 18 years at The Dow Chemical Company, serving as CFO of Dow’s Global Polyolefins and Elastomers division between 1997 and 2002. Other appointments: Michel is a Non-Executive Director of Vodafone Group plc and Louis Dreyfus Int’l Holding BV and Chairman of IMD Business School. Philip Broadley A NG R Senior independent Non-Executive Director Skills and experience: Philip was previously Group Finance Director of Prudential and Old Mutual. He has served as Chairman of the 100 Group of Finance Directors and as a member of the Takeover Panel. He is a Fellow of the Institute of Chartered Accountants in England and Wales. Philip graduated in Philosophy, Politics and Economics from the University of Oxford, where he is a St Edmund Fellow, and holds an MSc in Behavioural Science from LSE. Other appointments: Philip is the Non-Executive Chair of Lancashire Holdings Limited and serves as a Non-Executive Director of Legal & General Group plc. Pascal Soriot Executive Director and CEO Skills and experience: Pascal brings a passion for science and medicine, significant experience in established and emerging markets, strength of strategic thinking and execution, a successful track record of managing change and executing strategy, and the ability to lead a diverse organisation. He served as COO of Roche’s pharmaceuticals division and, prior to that, as CEO of Genentech. Pascal has worked in senior management roles in several major companies around the world. He is a Doctor of Veterinary Medicine and holds an MBA from HEC Paris. In 2022, Pascal received a knighthood for services to life sciences and leadership in the global response to the COVID-19 pandemic. Other appointments: Pascal is on the Board of Sustainable Markets Initiative Limited. Euan Ashley Sc NG Non-Executive Director Skills and experience: Euan studied physiology and medicine at Glasgow University, trained as a junior doctor at Oxford University Hospitals NHS Trust, and gained a DPhil in cardiovascular cellular biology and molecular genetics at the University of Oxford. In 2002, Euan moved to Stanford University, where his research focuses on genetic mechanisms of cardiovascular health and disease. His laboratory leverages AI and digital health tools, alongside biotechnology partners, to advance translational and clinical research. Euan’s awards include recognition from the White House for contributions to personalised medicine and the American Heart Association’s Medal of Honor for precision medicine. Other appointments: Euan is the Arthur L. Bloomfield Professor of Medicine, Genetics and Biomedical Data Science, and the Chair of the Department of Medicine at Stanford University. Aradhana Sarin Executive Director and CFO Skills and experience: Before joining AstraZeneca, Aradhana was CFO for Alexion, responsible for driving strategic growth, financial performance and business development. She has eight years of operational experience in biopharma, plus more than 20 years of professional experience at global financial institutions and extensive knowledge of global healthcare systems. This includes tenures at Citi Global Banking, UBS, and JP Morgan. Aradhana trained as a medical doctor in India and spent two years practising in both India and Africa. She completed her medical training at the University of Delhi and received her MBA from Stanford Business School. Other appointments: Aradhana is on the Board of Governors of the American Red Cross and is an Independent Director and Audit Committee member of Anheuser-Busch InBev. Deborah DiSanzo A Non-Executive Director Skills and experience: Deborah has more than 30 years’ experience in healthcare and technology. She is currently President of Best Buy Health, which provides digital health solutions in ageing and care at home. Until the end of 2018, she served as General Manager of IBM Watson Health and prior to IBM, held multiple senior executive positions at Philips Healthcare where she also was Chief Executive Officer. Deborah has an appointment at and teaches Artificial Intelligence in Health at the Harvard TH Chan School of Public Health. She has been honoured by multiple organisations as a top health influencer. She holds an MBA from Babson College and is a Harvard University Advanced Leadership Initiative 2019 Fellow. Other appointments: Deborah is President of Best Buy Health. 0-3 years 3 Anna Manz Rene Haas Birgit Conix 6 years plus 6 Philip Broadley Deborah DiSanzo Sheri McCoy Tony Mok Nazneen Rahman Marcus Wallenberg 3-6 years 4 Michel Demaré Euan Ashley Diana Layfield Andreas Rummelt 8 Men 7 Women 5 British 4 American 2 Belgian 1 Swedish 1 Canadian 1 French 1 German Gender split of Directors Directorsʼ nationalities Length of tenure of Non-Executive Directors Board composition as at 6 February 2025 Committee membership key Committee Chair NG Nomination and Governance A Audit Sc Science R Remuneration Su Sustainability Corporate Governance 88 AstraZeneca Annual Report & Form 20-F Information 2024 Board of Directors as at 6 February 2025 |

| Appointed post year-end Diana Layfield Sc Non-Executive Director Skills and experience: Diana has broad global business experience across technology, life sciences and financial services. She has held senior leadership roles at Google, Standard Chartered Bank, as the CEO of a start-up technology company, and in Healthcare and Life Sciences at McKinsey & Co. Previously at Google, Diana was General Manager, Search International & Growth (including Product and Engineering) and President, EMEA Partnerships and Vice-President, ‘Next Billion Users’. Until December 2020, Diana was a Non-Executive Director of Aggreko plc. She has a BA from Oxford University and an MA in International Economics and Public Administration from Harvard University. Other appointments: Diana is the Chair of British International Investment plc and a Council Member of the London School of Hygiene & Tropical Medicine. Anna Manz A Non-Executive Director Skills and experience: Anna was CFO and a member of the Board of Directors of London Stock Exchange Group plc until 2024. From 2016 to 2020, she was an Executive Director and the CFO of Johnson Matthey Plc and, before that, spent 17 years at Diageo plc in a number of senior finance roles. She brings extensive expertise in accounting, corporate finance and M&A, as well as experience of business diversification, transformation and strategy. Anna was previously a Non-Executive Director of ITV plc and served on its Audit Committee and Remuneration Committee during most of that period. Other appointments: Anna is CFO of Nestlé S.A. and a member of Nestlé’s Executive Board. Sheri McCoy R A NG Su Non-Executive Director Skills and experience: Until February 2018, Sheri was CEO and a Director of Avon Products, Inc. and, prior to that, had a 30-year career at Johnson & Johnson (J&J), latterly serving as Vice-Chairman of the Executive Committee, responsible for the Pharmaceuticals and Consumer business segments. Sheri joined J&J as an R&D scientist and subsequently managed businesses in every major product sector. She holds a BSc in Textile Chemistry from the University of Massachusetts Dartmouth, an MSc in Chemical Engineering from Princeton University and an MBA from Rutgers University. Other appointments: Sheri serves on the Boards of Stryker, Kimberly‑Clark, Galderma and Sail Biomedicines. She is also an industrial adviser for EQT, and in connection serves as Chair of Parexel and Chair of Dechra. Tony Mok Sc Non-Executive Director Skills and experience: Tony is the Li Shu Fan Medical Foundation endowed Professor and Chairman of the Department of Clinical Oncology at the Chinese University of Hong Kong. His work includes multiple aspects of lung cancer research, including biomarker and molecular targeted therapy in lung cancer. Tony is the Past President of the International Association for the Study of Lung Cancer and a past Board member of the American Society of Clinical Oncology. He has achieved numerous awards including the European Society for Medical Oncology (ESMO) Lifetime Achievement Award, Giant of Cancer Care, and the Bronze Bauhinia Star. Other appointments: Tony is Non-Executive Director of HUTCHMED (China) Limited, member of the Scientific Advisory Board of Prenetics Global Limited and serves on the Board of Insighta. Nazneen Rahman Su NG R Sc Non-Executive Director Skills and experience: Nazneen has significant experience in rare disease and cancer genomics and sustainable healthcare. She qualified in medicine from Oxford University, is an accredited specialist in medical genetics and has a PhD in molecular genetics. Nazneen was Professor of Genetics at the Institute of Cancer Research, Head of Cancer Genetics at the Royal Marsden NHS Foundation Trust, and founder and Director of the TGLclinical Genetic Testing Laboratory until 2018. In 2020, Nazneen founded YewMaker to build science-based sustainable healthcare solutions. Nazneen has a strong commitment to open science and has garnered numerous awards, including a CBE in recognition of her contribution to medical sciences. Other appointments: Nazneen is CEO of YewMaker and Director of the Sustainable Medicines Partnership. Andreas Rummelt Su Non-Executive Director Skills and experience: Andreas joined the Board following the acquisition of Alexion, where he had been a Director since 2010. Previously he was at Novartis AG where he served on the Executive Committee from 2006 to 2010. He had been Group Head of Technical Operations and Quality from 2009 until 2010. He was Global CEO of Sandoz, the Generics Division of Novartis from 2004 to 2008, having originally joined in 1985. Andreas earned his PhD in pharmaceutical sciences from the University of Erlangen-Nuremberg and received his executive training in general management and leadership from IMD in Lausanne, INSEAD in Fontainebleau and Harvard Business School. Other appointments: Andreas is Chairman of InterPharmaLink AG since 2011 and a director of various privately-held biotech and pharmaceutical companies. Marcus Wallenberg Sc Su Non-Executive Director Skills and experience: Marcus has international business experience across various industry sectors, including the pharmaceutical industry from his directorship with Astra prior to 1999. Other appointments: Marcus is Chair of Skandinaviska Enskilda Banken AB, Saab AB, Wallenberg Investments AB and FAM AB. He is Vice-Chair of Investor AB and Vice-Chair of EQT AB. Marcus is also Chair of the Royal Swedish Academy of Engineering Sciences and a Board member of the Knut and Alice Wallenberg Foundation. Rene Haas Non-Executive Director Rene Haas has been Arm’s CEO since February 2022. He previously held roles at NVIDIA, Scintera Networks and Tensilica, and serves on the Boards of Arm China and SoftBank. Birgit Conix A Non-Executive Director Birgit Conix is former CFO at Sonova, TUI and Telenet. She previously held roles at J&J, Heineken, Tenneco and Reed Elsevier. She is on the Supervisory Board of ASML and is Chair of its ESG Committee and a member of its Audit Committee. Strategic Report Corporate Governance Financial Statements Additional Information Board of Directors AstraZeneca Annual Report & Form 20-F Information 2024 89 |

| The SET is the body through which the CEO exercises the authority delegated to him by the Board. The CEO leads the SET and has executive responsibility for the management, development and performance of the business. The CEO, CFO and the SET also take the lead in developing the strategy for review, constructive challenge and approval by the Board as part of the annual strategy review process. The SET members who sit on the Board: • Pascal Soriot, CEO • Aradhana Sarin, CFO Sharon Barr Executive Vice-President, BioPharmaceuticals R&D Sharon was appointed as Executive Vice-President, BioPharmaceuticals R&D in August 2023. She is responsible for discovery through to late-stage development across CVRM and Respiratory & Immunology. Previously, Sharon was SVP, Head of Research and Product Development of Alexion. Sharon undertook a PhD in molecular biology from NYU and a postdoctoral fellowship at Stanford University. Marc Dunoyer CEO, Alexion and Chief Strategy Officer, AstraZeneca Marc served as AstraZeneca’s Chief Financial Officer until 2021. Previously, he served as Global Head of Rare Diseases at GSK and (concurrently) Chairman of GSK Japan. He holds an MBA from HEC Paris and a Bachelor of Law degree from Paris University. Jeff Pott Chief Human Resources Officer, Chief Compliance Officer and General Counsel Jeff is responsible for all aspects of AstraZeneca’s People strategy and leads our HR, Compliance, Legal and IP functions. Jeff joined in 1995, before which he specialised in pharmaceutical product liability and antitrust litigation. He holds a Bachelor’s degree from Wheaton College and a Juris Doctor Degree from Villanova University. Pam Cheng Executive Vice-President, Global Operations, IT & Chief Sustainability Officer Pam was appointed Executive Vice-President, Operations & IT in June 2015 and took on the sustainability strategy in January 2023. Prior to AstraZeneca, she worked for Merck/MSD, Universal Oil Products, Union Carbide and GAF Chemicals. She holds Bachelor’s and Master’s degrees in chemical engineering from Stevens Institute of Technology and an MBA from Pace University. David Fredrickson Executive Vice-President, Oncology Haematology Business Unit Dave is responsible for driving growth and maximising commercial performance of the AstraZeneca global Oncology and Haematology portfolio. Before joining AstraZeneca, Dave worked at Roche/Genentech, where he served in several functions and leadership positions. Dave is a graduate of Georgetown University in Washington DC. Iskra Reic Executive Vice-President, International Iskra serves as the Executive Vice-President, International. She is responsible for overall strategy and driving sustainable growth across the International region, which includes China, Asian and Eurasian markets, Middle East & Africa, Latin America, Australia and New Zealand. Iskra has a PhD in Strategy and Leadership and an International Executive MBA in Business and Leadership from the IEDC-Bled School of Management, Slovenia. Ruud Dobber Executive Vice-President, BioPharmaceuticals Business Unit Ruud is responsible for the disease areas of CVRM, Respiratory & Immunology and Vaccines & Immune Therapies. Ruud joined AstraZeneca in 1997 and held various executive roles externally before this. Ruud was previously a research scientist in immunology and ageing, holding a PhD in Immunology from the University of Leiden, the Netherlands. Susan Galbraith Executive Vice-President, Oncology Haematology R&D Susan has global accountability for Oncology and Haematology R&D from discovery through to late-stage development. Susan joined AstraZeneca in 2010, having previously worked at BMS. She graduated in medicine from Cambridge University, has a PhD from the University of London and qualified as a Clinical Oncologist in 2001. Menelas (Mene) Pangalos Formerly Executive Vice-President, BioPharmaceuticals R&D and SET member 2013-2023 Mene retired from AstraZeneca in early 2024. Leon Wang Formerly Executive Vice-President, International and China President and SET member 2017-2024 Leon was Iskra Reic’s predecessor as Executive Vice-President, International. He is on extended leave from the Company while under Further information on the SET investigation in China. members is available on our website, www.astrazeneca.com. See Board of Directors biographies from page 88. Corporate Governance 90 AstraZeneca Annual Report & Form 20-F Information 2024 Senior Executive Team (SET) as at 6 February 2025 |

| B. Purpose, culture and strategy The Board believes that our Purpose, to push the boundaries of science to deliver life-changing medicines, positions AstraZeneca for long-term sustainable success. Our Code of Ethics and our Values underpin how we work together and the behaviours that drive our success and support our culture. The Board is responsible for setting our strategy and policies, overseeing risk and corporate governance, and monitoring progress towards meeting our objectives and annual plans. The Board conducts an annual review of the Group’s overall strategy. C. Resources and controls The Board ensures that the necessary resources are in place to help the Company meet its objectives and measure its performance against them. The Group Internal Audit (GIA) and Compliance functions provide quarterly reports to the Audit Committee on their activities and annual reviews of key themes, processes and systems (including arrangements for whistleblowing). The Board has full oversight of these matters by way of the Audit Committee Chair’s reports to the Board after each Committee meeting. Board members are also able to access the information provided to the Audit Committee. The Board has a formal system in place for Directors to declare a conflict, or potential conflict, of interest. D. Stakeholder engagement The Board aims to ensure a good dialogue is maintained with shareholders, so that their views are understood and considered. The Board also engages with and considers wider stakeholder groups, including the workforce, in its decision making. E. Workforce policies Based on our Values, expected behaviours and key policy principles, the Code of Ethics empowers employees to make decisions in the best interests of the Group, the Company, society and the patients we serve. It is applicable to the Group worldwide, including the Board. Employees are able to raise concerns anonymously via the AZ Ethics helpline. 2. Division of responsibilities F. Chair of the Board Michel Demaré, our Non-Executive Chair, is responsible for the Board’s overall effectiveness in directing the Company. Mr Demaré was first appointed to the Board in 2019 and was considered to be independent on his appointment as Chair in April 2023. G. Board composition, independence and division of responsibilities The composition of the Board is set out on pages 88 and 89. The majority of the Board consists of independent Non-Executive Directors. Directors’ independence is considered annually by the Board, as described on page 93. The Directors are collectively responsible for the success of the Group. The roles of the Board, Board Committees, Chair, senior independent Non-Executive Director and CEO are documented, as are the Board’s reserved powers and delegated authorities. The Board’s responsibilities and the governance structure by which it delegates authority are outlined in the Corporate Governance Overview on page 87. The Board maintains a list of matters that are reserved to, and can only be approved by, the Board. These include: the appointment, termination and remuneration of any Director; approval of the annual budget; approval of any item of fixed capital expenditure or any proposal for the acquisition or disposal of an investment or business which exceeds $300 million; the raising of capital or loans by the Company (subject to certain exceptions); the giving of any guarantee in respect of any borrowing of the Company; and allotting shares of the Company. Matters that have not been expressly reserved to the Board are delegated to the Committees of the Board or the CEO. H. Non-Executive Directors’ role and time commitment The Non-Executive Directors exercise objective judgement in respect of Board decisions, providing scrutiny and challenge and holding management to account. Non-Executive Directors offer strategic guidance and specialist advice based on their breadth of experience and knowledge. The Non-Executive Directors regularly meet without the Executive Directors or other management present. Statement of compliance Our statement of compliance below describes how we applied the principles in the 2018 UK Corporate Governance Code (the Code) for the year ended 31 December 2024. A copy of the Code can be found on the Financial Reporting Council’s (FRC) website, www.frc.org.uk. Throughout the accounting period we have complied with all the provisions of the Code. Additional information for Swedish shareholders The Company is incorporated under the laws of England and Wales and its shares are listed on the London Stock Exchange, Nasdaq Stockholm and the Nasdaq Global Select Market in the US. In accordance with the Company’s listing on the London Stock Exchange, it applies the principles set out in the Code. As a result of its listing on Nasdaq Stockholm and in accordance with Swedish regulations, the Company is required to disclose the material ways in which its corporate governance practices differ from those applied by Swedish companies following the Swedish Corporate Governance Code (the Swedish Code). The Company has made available on its website, www.astrazeneca.com/investor-relations/corporate-governance.html, a summary of the material ways in which the corporate governance practices applied by the Company differ from the principles of the Swedish Code. In addition, as required by Swedish regulations, the Company has also made available on its website a general description of the main differences in minority shareholders’ rights between the Company’s place of domicile (the UK) and Sweden, where the Company’s shares are also admitted to trading. 1. Board leadership and Company purpose A. Board’s role The Board’s role is to promote the long-term sustainable success of the Company. The Directors’ diverse range of skills, experience and industry knowledge, and ability to exercise independent and objective judgement, help the Board to operate effectively in its oversight of delivery of the Group’s strategy, generation of shareholder value and contributions to wider society. The Board’s effective operation is underpinned by a sound governance structure, described on page 87. Through a programme of regular Board and Board Committee meetings, Directors receive information on AstraZeneca’s financial performance, the R&D pipeline and critical business issues. The Board is accountable to our shareholders for the proper conduct of the business and our long-term success and seeks to represent the interests of all stakeholders. For more information on: Our Purpose, our Values and our Business Model, see page 10. Standards and Policies, including Code of Ethics, see page 42. Our resources and controls, see the Audit Committee Report from page 104. Conflicts of interest, see page 228. Stakeholder engagement, see pages 94 to 96 and throughout the Strategic Report. Our section 172(1) statement is set out on page 63. Strategic Report Corporate Governance Financial Statements Additional Information Corporate Governance Report | Compliance with the UK Corporate Governance Code AstraZeneca Annual Report & Form 20-F Information 2024 91 Corporate Governance Report | Compliance with the UK Corporate Governance Code |
| The performance of the Non-Executive Directors is assessed annually as part of the Board’s performance evaluation, as described on page 99. Subject to specific Board approval, Executive Directors and the SET members may accept external appointments as non-executive directors of other companies and retain any related fees paid to them, provided that such appointments are not considered by the Board to prevent or reduce the ability of the executive to perform his or her role within the Group to the required standard. I. Company Secretary The Company Secretary is responsible to the Chair for ensuring that all Board and Board Committee meetings are properly conducted, that the Directors receive appropriate information prior to meetings to enable them to make an effective contribution and that governance requirements are considered and implemented. The 2024 Board performance evaluation set out on page 99 provides details of the effective operation of the Board. 3. Composition, succession and evaluation J. Appointments and succession planning The Nomination and Governance Committee and, where appropriate, the full Board, regularly review the composition of the Board and the status of succession to both the SET- and Board-level positions. Directors have regular contact with, and access to, succession candidates for the SET positions. The Committee also recognises the importance of diversity when considering potential appointments. There is a formal, rigorous and transparent procedure for appointments to the Board. The Nomination and Governance Committee Report details the process for appointments approved during the year from page 100. The Nomination and Governance Committee also reviews succession plans for the Board and senior management. In accordance with Article 66 of the Articles of Association of the Company, all Directors retire at each AGM and may offer themselves for re-election by shareholders. The Notice of AGM will give details of those Directors seeking election or re-election. K. Skills, experience and knowledge When the Nomination and Governance Committee reviews the composition of the Board and its Committees, it uses a matrix that records the skills and experience of current Board members and compares this with the skills and experience it believes are appropriate to the Company’s overall business and strategic needs, both now and in the future. The Committee is also mindful of Directors’ lengths of tenure and the need to refresh Board membership over time. L. Board evaluation In 2024, the Board undertook an external Board performance evaluation. More information on the evaluation process, including the results and actions taken, can be found on page 99. 4. Audit, risk and internal control M. Internal and external audit The Audit Committee is responsible for reviewing the relationship and independence of our external auditor, PwC. The Committee maintains a policy for the pre-approval of all audit services and audit-related services undertaken by the external auditor, the principal purpose of which is to ensure that the independence of the external auditor is not impaired. A tender of audit services was conducted during the year as described on page 111. The Audit Committee also reviews the independence and effectiveness of GIA. N. Fair, balanced and understandable assessment The Board considers this Annual Report, taken as a whole, to be fair, balanced and understandable, and provides the information necessary for shareholders to assess AstraZeneca’s position and performance, business model and strategy. The Board’s assessment is described on page 110. The Board and the Audit Committee review the Company’s quarterly financial results announcements to ensure they present a fair, balanced and understandable assessment of the Company’s position and prospects to shareholders. O. Risk management The Board is responsible for the Company’s risk management system and internal controls, and their effectiveness. The Board delegates some responsibilities for risk management oversight to the Audit Committee, such as quarterly reviews of the Company’s principal and key active risks. During 2024, the Directors continued to review the effectiveness of our system of controls, risk management (including a robust assessment of the emerging and principal risks) and high-level internal control processes. This included an annual Governance and Assurance Report to all Directors, which is considered in detail by the Audit Committee and reviewed by the Board. Any areas of concern are highlighted in the Audit Committee Chair’s update to Directors at the relevant Board meeting and discussed by the Board. The report is based on a full year-end review of the Company’s risk and The Company’s senior independent Non-Executive Director serves as a sounding board for the Chair and as an intermediary for the other Directors when necessary. The senior independent Non-Executive Director is also available to shareholders if they have concerns that contact through the normal channels of Chair or Executive Directors has failed to resolve, or for which such contact is inappropriate. Philip Broadley was appointed senior independent Non-Executive Director on 1 March 2021. As well as their work in relation to formal Board and Board Committee meetings, Non-Executive Directors commit time throughout the year to meetings and telephone calls with various levels of executive management and other key stakeholders, visits to AstraZeneca’s sites throughout the world (whether in person or virtually) and, for new Directors, induction sessions and site visits. The Chair and individual Board members ensure that Board members’ time commitment to the Company is sufficient to fulfil their duties as Directors and fully discharge their obligations to shareholders, particularly in the case of the Chairs of Board Committees. For the Chair of the Board, generally, as a basic commitment, it is expected that they would need to devote about 40% of their time or the equivalent of not less than 90 days per annum in the fulfilment of their duties. When contemplating taking up additional appointments, Non-Executive Directors consult the Chair to ensure thought is given to any potential impact on their time commitment to AstraZeneca. Careful consideration is given to the nature of the potential appointment and the type of company involved (for example, whether the company is a public listed company or privately held), to help assess the likely time requirement. For significant additional appointments, the full Board would typically be involved in this process. For more information on: The work of the Nomination and Governance Committee, see from page 100. External audit, see page 106 and Note 31 to the Financial Statements, see page 213. Internal Audit, see page 106. Our Viability statement on page 63 and the ways in which we identify and manage our risks, see Further information on risk management and controls on the following page, and the Risk Overview from page 64. Corporate Governance 92 AstraZeneca Annual Report & Form 20-F Information 2024 Corporate Governance Report | Compliance with the UK Corporate Governance Code continued |
| shareholder – the Board does not believe that he can be determined independent under the Code. As well as being a Non-Executive Director of AstraZeneca and Chair of the Board’s Sustainability Committee, Nazneen Rahman is the Director of the Sustainable Medicines Partnership (SMP), a multi-stakeholder, not-for-profit collaboration with the aim of advancing the environmental sustainability of medicines. AstraZeneca is a strategic collaborator in the SMP. Dr Rahman has recused herself from acting as the lead contact for the SMP in its relationship with AstraZeneca, and this relationship, including project work and overall programme management, is handled by other members of the SMP team. 2024 AGM voting outcomes At the Company’s 2024 AGM, some shareholders expressed concerns regarding the re-election of Marcus Wallenberg and resolutions in relation to Directors’ remuneration. In relation to Mr Wallenberg, 77.93% of shareholders voted in favour of his re-election as a Director of the Company. The Board understands that some shareholders have concerns regarding Mr Wallenberg’s other directorships and the potential for those to impact his time commitment to the Company. The Board recognises that Mr Wallenberg has a wide portfolio of other roles, but believes he has brought, and continues to bring, considerable business experience and makes a valuable contribution to the work of the Board, which his portfolio of other roles supports. The Board is also satisfied that he is able to devote sufficient time to discharge his responsibilities as a Director. The Board therefore supports his re-election as a Director at the 2025 AGM. Although resolutions to approve a new Remuneration Policy and amendments to the AstraZeneca Performance Share Plan 2020 were passed by shareholders with 64.43% and 65.34% of the votes respectively, a significant proportion of shareholders voted against each resolution. Following the AGM, the Remuneration Committee Chair undertook an extensive consultation process to listen to the feedback of our shareholders’ and the proxy agencies, and to discuss the implementation of the 2024 Policy. Further information is included in the Directors’ Remuneration Report from page 112. Further information on risk management and controls Global Compliance and GIA Through our compliance programme and three lines of defence risk management framework (line management; Risk and Compliance functions; GIA), Global Compliance helps the Group achieve its priorities and do business the right way. It takes a global approach that addresses key risk areas, including those related to third parties and anti-bribery/anti-corruption. Its work helps us to reinforce compliant behaviours through our Code of Ethics, policies, training, advice and guidance. We also conduct risk assessment activities and foster a culture where individuals can raise concerns. We take alleged compliance breaches and concerns seriously. We investigate and take appropriate disciplinary and remediation action to address and prevent reoccurrence through internal functions and external advisers. Depending on breach severity, the Group may need to disclose and/or report the incident to a regulatory or government authority. Global Compliance provides assurance insights to the Audit Committee on compliance matters. GIA carries out a range of audits and periodically reviews the assurance activities of other Group functions. The results from these activities are reported to the Audit Committee. Global Compliance and GIA share outcomes and coordinate reporting on compliance matters throughout the organisation. GIA is established by the Audit Committee on behalf of the Board and acts as an independent and objective assurance function guided by a philosophy of adding value to improve the operational control framework of the Group. The scope of GIA’s responsibilities encompasses, but is not limited to, the examination and evaluation of the adequacy and effectiveness of the Group’s governance, risk management and internal control processes in relation to the Group’s defined goals and objectives. Among others, internal control objectives considered by GIA include: • Compliance with significant policies, plans, procedures, laws and regulations. • Consistency of operations or programmes with established objectives and goals, and effective performance. • Safeguarding of assets. Based on its activity, GIA is responsible for reporting significant risk exposures and control issues identified to the Board and to senior management, including fraud risks, governance issues and other matters needed or requested by the Audit Committee. It may also evaluate specific operations at the request of the Audit Committee or management, as appropriate. control processes (incorporating financial, operational and compliance controls) and findings from assurance processes. The Directors believe that the Group maintains an effective, embedded system of internal controls and complies with the FRC’s guidance entitled ‘Guidance on Risk Management, Internal Control and Related Financial and Business Reporting’. 5. Remuneration P. Remuneration policies and practices The Remuneration Committee is responsible for determining, approving and reviewing the Company’s global remuneration principles and frameworks, to ensure that they support the strategy of the Company and are designed to promote long-term sustainable success. Q. Developing executive remuneration policy The Remuneration Committee routinely reviews the Directors’ Remuneration Policy and executive remuneration arrangements to ensure they continue to promote the delivery of the long-term strategy and support the Company’s ability to recruit and retain executive talent to deliver against that strategy. The Committee also considers remuneration arrangements in the context of corporate governance best practice and arrangements for the wider workforce, and regularly consults with its major investors on remuneration proposals. No Director is involved in determining their own remuneration arrangements or outcomes. R. Remuneration outcomes and independent judgement To ensure it maintains independent judgement when determining remuneration outcomes, the Remuneration Committee considers a range of data, including detailed business and individual performance information, and also consults with other Board Committees to utilise their expertise when determining performance outcomes. Further information on Directors’ independence In December 2024, the Board considered the independence of the Non-Executive Directors, other than the Chair of the Board, for the purposes of the Code and the Nasdaq Listing Rules. Taking into account the recommendations set out in the Code and the Nasdaq Listing Rules, the Board considers that all the Non-Executive Directors except Marcus Wallenberg, are independent. Marcus Wallenberg was appointed as a Director of Astra in May 1989 and subsequently became a Director of the Company in 1999. He is a Non-Executive Director of Investor AB, which has a 3.33% interest in the issued share capital of the Company as at 31 January 2025. For these reasons – his overall length of tenure and relationship with a significant For more information on the work of the Remuneration Committee see from page 112. Strategic Report Corporate Governance Financial Statements Additional Information Corporate Governance Report | Compliance with the UK Corporate Governance Code AstraZeneca Annual Report & Form 20-F Information 2024 93 |
| Patients and patient networks Payers Investor community Healthcare professionals Academic and R&D partners Commercial collaborators and partners Overview Significance of the stakeholder to the business Patients are at the heart of what we do. Our stakeholders include individual patients, caregivers and patient advocacy organisations. We listen to their experiences, embedding these insights into every aspect of our work, and partner with them to enable access to high quality, resilient healthcare systems, ensuring that the medicines and services we develop have the greatest impact on their lives. AstraZeneca works closely with payers, which includes governments and medical insurance companies among others, to understand the impact of pricing medicines on public and private budgets. The Board and management maintain regular and constructive dialogue with investors to communicate our strategy. We provide objective information about performance to enable investors to put a fair value on the Company and ensure our continued access to capital. Overview Significance of the stakeholder to the business Healthcare professionals (HCPs) are the interface with patients. They provide insights into clinical trial design and prescribing, advising patients on administering medicines, providing safety reports, collaborating in clinical studies and assisting with the ethical and transparent distribution of medicines. We collaborate with academic institutions and non-profit R&D partners globally to access the best science, to stimulate innovation and to deliver life-changing medicines to patients. Partnering is an increasingly important part of our business. By combining forces, AstraZeneca and our partners can accelerate innovative science to bring life-changing medicines to patients. Interests Issues and factors which are most important to the stakeholder group • Diverse insights gathered and incorporated throughout the drug development process to minimise patient burden and measure outcomes they care about most. • Ensuring healthcare systems are designed and delivered with the patient in mind. • Providing transparent, accessible information. • Ensuring the safety, efficacy and affordable accessibility of our medicines. • Sustainable access to safe and effective innovative medicines. • Pricing of medicines, including breakthrough therapies and impact on public budgets. • Containing reimbursement expenditure. • Attracting business investment. • Investing in research and scientific collaborations. • Financial and commercial performance. • R&D strategy, resource allocation and pipeline development. • Culture, values and behaviours. • Exposure to geopolitical and macroeconomic risks. • ESG matters. Interests Issues and factors which are most important to the stakeholder group • Development of medicines for unmet medical need. • Education and information on advances in medical science. • Accurate and balanced information on licensed medicines, including up-to-date safety data. • Uninterrupted supply of quality medicines. • Ethical and transparent interactions with industry. AstraZeneca had more than 1,500 active academic collaborations during 2024: • To advance innovative technology and science. • To address key scientific challenges. • To access the next generation of science leaders. • Shared vision and values. • Development of innovative medicines and improving access to them. • Trust and transparency in research, disclosures and relationships with stakeholders. • Willingness to collaborate with industry peers to optimise outcomes for common stakeholders, e.g. patients, physicians, policymakers and healthcare systems. Engagement Examples of engagement in 2024 • Increased number of diverse patient engagements throughout drug development. • Involved patients and caregivers in co-creation of multiple programmes. • Expanded patient support and affordability programmes. • Collaborated with patient advocacy organisations on key healthcare system transformation projects, enabling access to improved healthcare and medicines across the globe. • Engaged governments and policymakers to increase understanding of the AstraZeneca business model, to support investment in life sciences and to improve access to new medicines. • Engaged in discussions on evolving the current reimbursement system for medicines in the US. • Hosted site visits and tours at our manufacturing and R&D facilities for international and local politicians. • Ongoing communications including quarterly results calls, in-person and virtual meetings and roadshows. • Investor Day held in May 2024, set out new strategic ambitions. • Regular events, including presentation of Health Equity strategy in November 2024. • Receptions hosted by the Chair of the Board. Engagement Examples of engagement in 2024 • Engaged in HCP educational events, advisory boards and in clinical trials. • Responded to more than 171,000 HCP enquiries and processed adverse event reports from HCPs which contribute to the understanding of the safety profile of our medicines. • We support more than 900 early career positions in R&D globally, including apprentices, graduates, placement students, sponsored PhDs, postdoctoral researchers and clinical fellows. • Through our Open Innovation programme, we openly share molecules, data and scientific expertise with academic researchers and start-ups; we currently have two ongoing clinical trials, over 100 preclinical studies and collaborative research projects, and over 20 public-private partnership projects aimed at addressing key scientific challenges under this programme. • Joint seminars, education sessions and consortia with research institutions, e.g. Royal Society Conference on Gene Editing Medicines, Partners of Choice Network. • Regular alliance leadership meetings established to enhance collaboration and create a ‘One Team’ mentality across organisations. • Joint responsibility for deliverables and outcomes across functions at all levels. • Multiple discussions with regulators, policy makers, patient groups and clinicians, to inform development and commercial strategy to best meet patient needs. Outcomes Actions which resulted • Delivery of impactful and actionable insight to drive patient-focused drug development. • Increased patient support programmes across therapy areas. • Driven global consensus and supported the community to strengthen national healthcare systems. • Established working relationships with key government stakeholders. • Regular meetings and events organised to increase understanding about how governments can better support life sciences investment and improve patient access to new medicines. • Maintained access to senior and next-level/operational management, including increased virtual engagement. • Continued to streamline external-facing materials to provide increased transparency, following discussion with shareholders. • Increased focus on ESG matters within results announcements and shareholder engagements. Outcomes Actions which resulted • Advisory boards informed clinical research and product strategy. • Clinical studies have led to new products. • Exchange of information supported HCP clinical decision making. • Enabled new technologies, new target identification and validation, and new biomarkers. • Publications. • Capability to offer apprenticeship, studentship, postgraduate and postdoctoral programmes to facilitate scientific discovery. • Optimisation of outcomes through combined skillsets and use of technologies/platforms to research new medicines, enabling faster delivery of medicines to patients. • Multiple late-stage trials initiated across multiple disease/patient types. • Accelerated launch of new medicines in unique areas. • Greater collaboration and relationships with industry partners and stakeholders. Considering the interests of our stakeholders is fundamental to our Group’s strategy. The following table identifies our most strategically significant stakeholders and summarises the engagement that has been undertaken by management during 2024. 94 AstraZeneca Annual Report & Form 20-F Information 2024 Corporate Governance Corporate Governance Report | Connecting with our stakeholders |
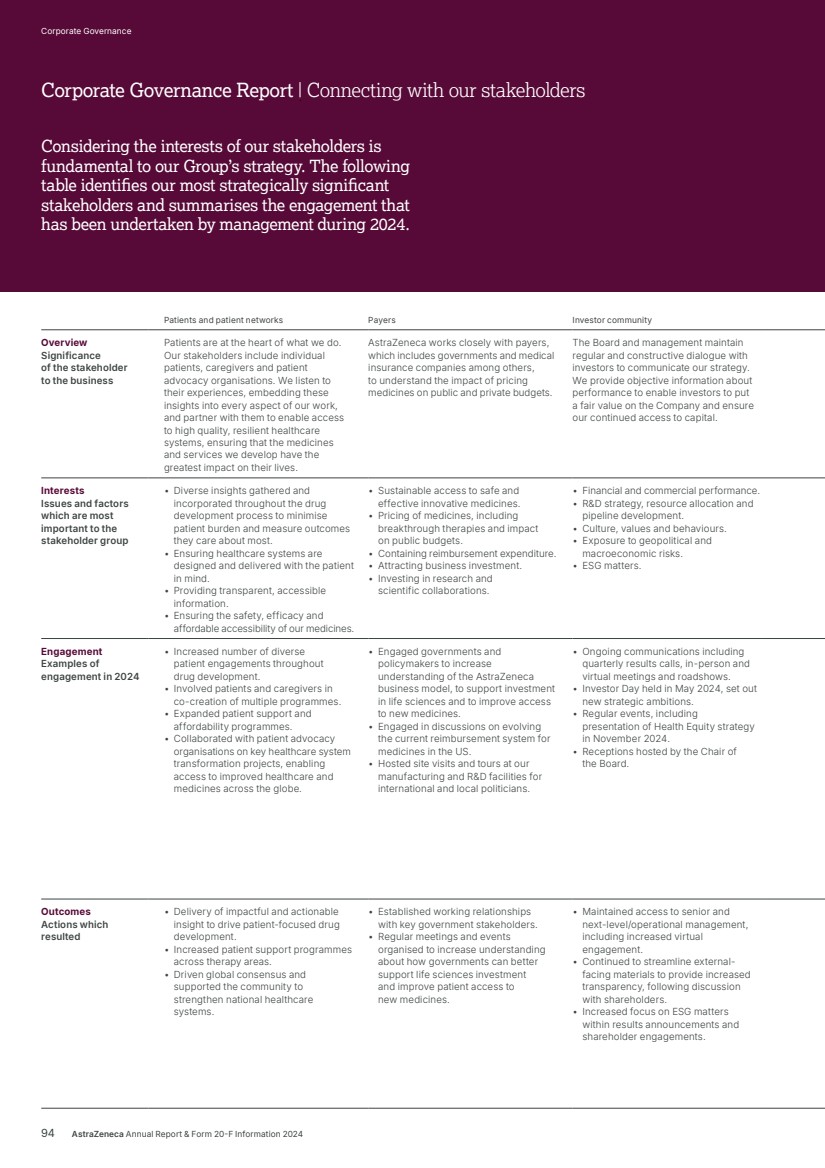
| Patients and patient networks Payers Investor community Healthcare professionals Academic and R&D partners Commercial collaborators and partners Overview Significance of the stakeholder to the business Patients are at the heart of what we do. Our stakeholders include individual patients, caregivers and patient advocacy organisations. We listen to their experiences, embedding these insights into every aspect of our work, and partner with them to enable access to high quality, resilient healthcare systems, ensuring that the medicines and services we develop have the greatest impact on their lives. AstraZeneca works closely with payers, which includes governments and medical insurance companies among others, to understand the impact of pricing medicines on public and private budgets. The Board and management maintain regular and constructive dialogue with investors to communicate our strategy. We provide objective information about performance to enable investors to put a fair value on the Company and ensure our continued access to capital. Overview Significance of the stakeholder to the business Healthcare professionals (HCPs) are the interface with patients. They provide insights into clinical trial design and prescribing, advising patients on administering medicines, providing safety reports, collaborating in clinical studies and assisting with the ethical and transparent distribution of medicines. We collaborate with academic institutions and non-profit R&D partners globally to access the best science, to stimulate innovation and to deliver life-changing medicines to patients. Partnering is an increasingly important part of our business. By combining forces, AstraZeneca and our partners can accelerate innovative science to bring life-changing medicines to patients. Interests Issues and factors which are most important to the stakeholder group • Diverse insights gathered and incorporated throughout the drug development process to minimise patient burden and measure outcomes they care about most. • Ensuring healthcare systems are designed and delivered with the patient in mind. • Providing transparent, accessible information. • Ensuring the safety, efficacy and affordable accessibility of our medicines. • Sustainable access to safe and effective innovative medicines. • Pricing of medicines, including breakthrough therapies and impact on public budgets. • Containing reimbursement expenditure. • Attracting business investment. • Investing in research and scientific collaborations. • Financial and commercial performance. • R&D strategy, resource allocation and pipeline development. • Culture, values and behaviours. • Exposure to geopolitical and macroeconomic risks. • ESG matters. Interests Issues and factors which are most important to the stakeholder group • Development of medicines for unmet medical need. • Education and information on advances in medical science. • Accurate and balanced information on licensed medicines, including up-to-date safety data. • Uninterrupted supply of quality medicines. • Ethical and transparent interactions with industry. AstraZeneca had more than 1,500 active academic collaborations during 2024: • To advance innovative technology and science. • To address key scientific challenges. • To access the next generation of science leaders. • Shared vision and values. • Development of innovative medicines and improving access to them. • Trust and transparency in research, disclosures and relationships with stakeholders. • Willingness to collaborate with industry peers to optimise outcomes for common stakeholders, e.g. patients, physicians, policymakers and healthcare systems. Engagement Examples of engagement in 2024 • Increased number of diverse patient engagements throughout drug development. • Involved patients and caregivers in co-creation of multiple programmes. • Expanded patient support and affordability programmes. • Collaborated with patient advocacy organisations on key healthcare system transformation projects, enabling access to improved healthcare and medicines across the globe. • Engaged governments and policymakers to increase understanding of the AstraZeneca business model, to support investment in life sciences and to improve access to new medicines. • Engaged in discussions on evolving the current reimbursement system for medicines in the US. • Hosted site visits and tours at our manufacturing and R&D facilities for international and local politicians. • Ongoing communications including quarterly results calls, in-person and virtual meetings and roadshows. • Investor Day held in May 2024, set out new strategic ambitions. • Regular events, including presentation of Health Equity strategy in November 2024. • Receptions hosted by the Chair of the Board. Engagement Examples of engagement in 2024 • Engaged in HCP educational events, advisory boards and in clinical trials. • Responded to more than 171,000 HCP enquiries and processed adverse event reports from HCPs which contribute to the understanding of the safety profile of our medicines. • We support more than 900 early career positions in R&D globally, including apprentices, graduates, placement students, sponsored PhDs, postdoctoral researchers and clinical fellows. • Through our Open Innovation programme, we openly share molecules, data and scientific expertise with academic researchers and start-ups; we currently have two ongoing clinical trials, over 100 preclinical studies and collaborative research projects, and over 20 public-private partnership projects aimed at addressing key scientific challenges under this programme. • Joint seminars, education sessions and consortia with research institutions, e.g. Royal Society Conference on Gene Editing Medicines, Partners of Choice Network. • Regular alliance leadership meetings established to enhance collaboration and create a ‘One Team’ mentality across organisations. • Joint responsibility for deliverables and outcomes across functions at all levels. • Multiple discussions with regulators, policy makers, patient groups and clinicians, to inform development and commercial strategy to best meet patient needs. Outcomes Actions which resulted • Delivery of impactful and actionable insight to drive patient-focused drug development. • Increased patient support programmes across therapy areas. • Driven global consensus and supported the community to strengthen national healthcare systems. • Established working relationships with key government stakeholders. • Regular meetings and events organised to increase understanding about how governments can better support life sciences investment and improve patient access to new medicines. • Maintained access to senior and next-level/operational management, including increased virtual engagement. • Continued to streamline external-facing materials to provide increased transparency, following discussion with shareholders. • Increased focus on ESG matters within results announcements and shareholder engagements. Outcomes Actions which resulted • Advisory boards informed clinical research and product strategy. • Clinical studies have led to new products. • Exchange of information supported HCP clinical decision making. • Enabled new technologies, new target identification and validation, and new biomarkers. • Publications. • Capability to offer apprenticeship, studentship, postgraduate and postdoctoral programmes to facilitate scientific discovery. • Optimisation of outcomes through combined skillsets and use of technologies/platforms to research new medicines, enabling faster delivery of medicines to patients. • Multiple late-stage trials initiated across multiple disease/patient types. • Accelerated launch of new medicines in unique areas. • Greater collaboration and relationships with industry partners and stakeholders. Strategic Report Corporate Governance Financial Statements Additional Information Corporate Governance Report | Connecting with our stakeholders AstraZeneca Annual Report & Form 20-F Information 2024 95 |
| How the Board engages with stakeholders For more information on how management and the Board have considered Modern Slavery, see the Audit Committee Report from page 104, Human Rights on page 48 and AstraZeneca’s Modern Slavery Act Statement, which is available on our website, www.astrazeneca.com. Community We believe that creating a positive impact for people, society and the planet requires meaningful investments in the communities where we live and work, with a focus on the underserved. Our Community Investment activities support non-profit organisations all over the world to advance health equity, increase access to care, drive science innovation and build healthy and resilient communities for all. Workforce Successfully attracting, retaining and developing a talented and diverse workforce is critical to achieving our Ambition 2030. Our employees are a key part of our strategy and we are committed to being a great place to work. More information is included on pages 48 to 50. In addition to the principal stakeholders described on pages 94 and 95, the Board considers the following stakeholder groups important for the business operations and strategic direction of the Company. Health authorities We engage regulators globally about the manufacture, development, review, approval and marketing of our products. Governments AstraZeneca partners closely with governments around the world to promote health, support healthcare research and innovation, facilitate equitable access to innovative care solutions, and build resilient and sustainable healthcare systems. Multilateral and non-governmental organisations AstraZeneca partners with multilateral organisations and non-governmental organisations (NGOs) to deliver meaningful progress to advance health equity and support the United Nations Sustainable Development Goals. AstraZeneca’s commitment is demonstrated through science-based health programming and disaster relief efforts that prioritise the needs of the underserved. Media An active and constructive relationship with the media is important to build trust with the Company’s key stakeholders by transparently reporting on the Group’s activities, including the results of key trials and business updates, as well as seeking to enhance and protect the reputation of the organisation. Suppliers and third-party providers We work with a broad range of third-party suppliers to provide the goods and services needed to deliver life-changing medicines to patients globally. Our Procurement function operates efficiently and effectively to drive collaboration with those third-parties, fostering innovative, ethical and sustainable ways of working across the entire supply chain. The stakeholder table on pages 94 and 95 sets out management’s main interactions with certain key stakeholders. Feedback from these interactions is provided to the Board in a variety of ways, which allows the Board to understand the key interests of stakeholders and consider them in its decision-making process. The Board undertakes additional direct engagement with stakeholders to better understand their interests and concerns, so these can be factored into its decision making. Examples of the Board’s engagement are set out in the following columns. Information on how stakeholders and other factors were considered in the Board’s principal decisions in 2024 is set out on the following page. Full Board/Other • During 2024, a number of Directors, including the CEO and the CFO, met investors at roadshows and in one-on-one meetings. The Chair conducted a series of governance meetings with major shareholders in the UK, Germany and Sweden. • The 2024 AGM was digitally-enabled and broadcast live, which allowed the Company’s geographically diverse shareholder base to participate in the meeting and engage with the Board. The digitally-enabled format allowed Directors and shareholders to join from locations across the globe. • Investor reports and financial analysts’ consensus data are made available to the Board. Feedback is regularly provided to the Board by management on their interactions with investors. • The CEO and the CFO, along with other members of management, met governmental agencies and regulators to discuss matters including the pricing of medicines and equitable access. • The CEO and other members of management attended a number of scientific conferences in 2024, relevant to the Company’s main areas of R&D and Commercial activity. • During the World Economic Forum in Davos, the Chair and senior leaders met with 25 governments, and held seven media interviews and seven speaking engagements, highlighting the need to advance the sustainable transformation of health systems. • The Chair attended two plenary sessions of the European Round Table of Industry (ERT), where he engaged high-level officials from the EU, Spain and Switzerland on strengthening European economic competitiveness and building more resilient and sustainable health systems. • The CEO, CFO and the Chair, regularly engaged with employees through in-person and online events, including ‘townhalls’ and ‘fireside chat’ sessions. Employees had the opportunity to ask questions in advance or during sessions. • The Board held one of its scheduled meetings during 2024 at AstraZeneca’s R&D site in Gothenburg, Sweden. During the meeting, the Board met employees, including scientists and commercial teams, and hosted a ‘townhall’ meeting. The Board also met external stakeholders, including Swedish government officials, academics, scientists and university health partners through a series of meetings and roundtable discussions. Alongside a scheduled Board meeting in Cambridge, UK, the Board hosted select employees for a lunch and a dinner. • The Committees of the Board also engage with employees and other stakeholders on matters within their areas of responsibility. For further information on Board Committees’ engagement activities, see: – Science Committee Report on page 102 – Sustainability Committee Report on page 103 – Audit Committee Report on page 107 – Directors’ Remuneration Report from page 112. Corporate Governance 96 AstraZeneca Annual Report & Form 20-F Information 2024 Corporate Governance Report | Connecting with our stakeholders continued |
| 2024 Group funding plan In February 2024, the Board reviewed and approved the Group’s funding plan for 2024. Later, in July 2024, the Board considered an update to the 2024 funding plan. The Board considered: investors; the long-term success of the Company; and maintaining high standards of business conduct. How the Board had regard to these matters: • Reviewed the expected funding requirements for the year ahead as well as the mid- and long-term funding and liquidity prospects. • Discussed the Group’s capital allocation priorities, the long-term strategy and the measures required to deliver the strategy, including investment in the pipeline and potential external acquisitions to further strengthen the pipeline. The Board considered the benefit of these investments for patients and investors, alongside the potential impact of acquiring debt. • Considered the Group’s liquidity position and the expectations of investors regarding the progressive dividend policy. Acquisitions to strengthen the pipeline During 2024, the Board considered, and approved, a number of acquisitions to strengthen the Group’s pipeline and accelerate the development of potentially life-changing medicines. These included the acquisition of Amolyt Pharma SAS and Fusion Pharmaceuticals Inc. The Board considered: investors; patients; the long-term success of the Company; and maintaining high standards of business conduct. How the Board had regard to these matters: • Reviewed the unmet medical need and considered how the acquisitions would further strengthen the Group’s pipeline. • Considered the benefits to patients if the Group was able to accelerate the development of novel treatments, which could potentially deepen clinical responses and improve patient outcomes. • Considered the Ambition 2030, and the importance of new technologies (such as next-generation radioconjugates) to delivering the Ambition 2030. • Considered the financial impact of the acquisitions on the Group’s viability and capital allocation priorities, alongside the financial benefits from the acquisitions if the technologies were successful. Annual strategy review and Long-Term Plan In July 2024, the Board reviewed and approved the Company’s strategy and the 2024 Long-Term Plan (2024 LTP). Later in December 2024, the Board approved the mid-term plan and capital expenditure for 2025. The Board considered: investors; employees; the long-term success of the Company; and maintaining high standards of business conduct. How the Board had regard for these matters: • Considered the Group’s Purpose, to push the boundaries of science to deliver life-changing medicines to patients, and how the Company’s strategy and the 2024 LTP align with this Purpose. • Evaluated how the strategy would foster innovation and enhance the Company’s competitive position. • Considered how the strategy and 2024 LTP would impact current, and future, employees and the level of resourcing needed to deliver the Company’s ambitious strategy. • Reviewed and challenged the assumptions within the 2024 LTP. • Considered investor expectations and analysts’ consensus, and how these aligned to the 2024 LTP. 2024 Group budget In February 2024, the Board reviewed and approved the Group’s 2024 budget. The Board considered: investors; employees; and the long-term success of the Company. How the Board had regard to these matters: • Discussed the Group’s long-term plan, strategic goals and priorities, as well as the stretching Ambition 2030, and reviewed how the 2024 budget supported the delivery of these long- and mid-term plans. • Considered consensus expectations, the anticipated challenges and opportunities, and provided challenge to ensure that the 2024 budget was appropriate as well as stretching. • Reviewed the assumptions that underpinned the budget and considered the resources that would be needed to deliver the budget, including how employees would be impacted, the number of launches that would be needed and the medicines that would be delivered to patients. • Reviewed the Group’s capital allocation priorities and whether the 2024 Group budget supported the delivery of these priorities. Dividends During 2024, the Board approved the 2023 second interim dividend (paid in March 2024), the 2024 first interim dividend (paid in September 2024) and also established a Board committee to decide the Board’s intended approach to dividends to be declared in relation to the 2024 financial year. The Board considered: investors; the long-term success of the Company; and maintaining high standards of business conduct. How the Board had regard for these matters: • Reviewed the Group’s distributable reserves and financial performance for the period, to ensure that the Company was in a good position to increase and pay a dividend. • Considered the progressive dividend policy, capital allocation priorities and investor expectations as to the expected level of dividend. • Weighed the investor expectations, alongside the 2024 Group budget, as well as the mid- and long-term plans, and the level of investment that was required by the Company to deliver these. Set out below are examples of how key stakeholders, Section 172(1) of the Companies Act 2006 duties and other matters are considered by the Board when making its Principal Decisions in 2024. Principal Decisions in 2024 For the Section 172(1) statement, see page 63. For more information, on the: Dividends, see Note 25 to the Financial Statement from page 192. Funding, see Note 28 to the Financial Statement from page 194. Acquisitions and collaborations, see Business development from page 46. Group‘s Growth Through Innovation strategy and our Ambition 2030, see Our Strategy and Key Performance Indicators from page 12, and for how we are delivering our strategy, see our Business Review from page 32. Committees’ composition and succession planning, see the Nomination and Governance Committee Report from page 100. Strategic Report Corporate Governance Financial Statements Additional Information Corporate Governance Report | Principal Decisions AstraZeneca Annual Report & Form 20-F Information 2024 97 Corporate Governance Report | Principal Decisions |
| Engaging with our workforce AstraZeneca is committed to being a great place to work. Engagement with our employees and wider workforce is an important element in ensuring an environment in which everyone is respected, where openness is valued, diversity celebrated and every voice heard. We rely on our global workforce to uphold our Values, deliver our strategic priorities and work to sustain and improve short- and long-term performance. For AstraZeneca, ‘global workforce’ includes our full-time and part-time employees, fixed-term workers and external contractors working full- or part-time, anywhere in the world. The Directors believe that the Board as a whole should be responsible for engaging with and understanding the views of the workforce. Consequently, the Board has chosen not to implement any of the three methods set out in the Code. Instead, it uses various mechanisms and long-standing communication channels in place across the Group that enable and facilitate engagement with the global workforce. These include the Board’s review of the global workforce Pulse survey and the biannual Workforce Culture and Employee Engagement Report; Board members hosting ‘townhall’ meetings for the workforce, including ‘fireside chats’ and Q&A sessions; and review of data relating to talent, development, inclusion and diversity initiatives, and internal engagement channels. Directors also visit our sites and carry out virtual engagements, which facilitate understanding of business operations and also provide opportunities for interactions between Directors and the workforce, including engagement with high-potential employees. Where required, issues or concerns raised by the workforce are fed back to management and discussed by the Board. To maximise reach across the global workforce and ensure engagements take place with the many different role types that exist, individual Directors, as well as Board and Board Committees, also host virtual engagements to hear and understand their views. The Board believes that the holistic approaches deployed provides comprehensive access to the views of the workforce regardless of location and provides meaningful information and data that the Board can use when considering the impact of strategic decisions on employees. Workforce culture During 2024, the Board reviewed the biannual Workforce Culture and Employee Engagement Report, which demonstrated how our Values and behaviours are embedded throughout all levels of the workforce. The report contains a summary metric dashboard which is divided into categories reflecting AstraZeneca’s Values and behaviours. Where the Board has concerns that the culture does not reflect our Values, the Board seeks assurances from management that remedial action has been taken and, where necessary, requests senior management’s attendance at Board meetings to discuss corrective actions. >84,400 employees took part in the November 2024 Pulse survey. ‘Townhall’ meetings and ‘fireside chats’ Both Non-Executive Directors and Executive Directors regularly participate in meetings with sites, or large groups of the workforce – either virtually or in person. These enable direct engagement between the Board and employees, including Q&A sessions, such as the Chair’s ‘fireside chats’. During the year, among other events, Board members hosted in-person ‘townhall’ meetings for employees at the Company’s sites in Canada, Switzerland, Spain and Sweden, which were also broadcast to other sites in those regions to increase reach and participation. Employee opinion survey (Pulse) Each year, employees are invited to take part in an opinion survey, which seeks their views of the business. The results are reviewed by management and trends are monitored. The results are shared with the Board, which enables the Directors to understand the views and sentiments of the workforce. 87% of employees stated they believe strongly in AstraZeneca’s future direction and key priorities in the November 2024 Pulse survey. Site visits During 2024, Directors visited various Group sites across the world in person, including those in Canada, Switzerland, Spain, Sweden and the UK. 7 AstraZeneca Group sites around the world were visited by Non-Executive Directors during 2024. Wellbeing Where appropriate – for example in relation to humanitarian events – the Board receives regular updates on the steps taken by management to create safe working environments and support the mental and physical wellbeing of the workforce. • Considered the Group’s capital allocation priorities, progressive dividend policy and funding plans and how these will be impacted by the 2024 LTP. • Reviewed the capital expenditure plan for 2025 and whether the proposed investments will drive sustainable growth and deliver value to the Company and its stakeholders. Appointment of Rene Haas and Birgit Conix as Non-Executive Directors In December 2024, the Board appointed Rene Haas and Birgit Conix as Non-Executive Directors with effect from 1 January 2025 and 1 February 2025 respectively. Birgit joined the Audit Committee upon her appointment. The Board considered: investors; the long-term success of the Company; and maintaining high standards of business conduct. How the Board had regard for these matters: • Considered the Board’s diversity, time commitments of the candidates and other relevant governance considerations, including UK Corporate Governance Code provisions, as well as Board and Board Committee succession planning considerations. • Assessed the skill composition of its Committees and reviewed the requirements for each Committee to ensure that newly appointed Directors possess the necessary skills to succeed Directors approaching retirement. • Reviewed the experience of potential candidates and met those who were shortlisted to evaluate which individuals had the skills required to support management in the continued delivery of value to shareholders and life-changing medicines to patients, while also maintaining high standards of business conduct. • Considered the independence of Non-Executive Directors by assessing candidates’ potential conflicts of interest and affiliations to maintain objectivity and unbiased judgement in Board deliberations. • Considered changes to the wider business environment, such as the increasing importance of technology and AI, and changes in modalities, and what skills the Board needed to ensure that it could provide appropriate oversight to help the Company continue to grow in such an environment. • Considered whether the selected Non-Executive Directors have the skills necessary to contribute to the Company’s long-term strategy and assessed their ability to challenge assumptions and support sustainable growth. Corporate Governance 98 AstraZeneca Annual Report & Form 20-F Information 2024 Corporate Governance Report | Principal Decisions continued |
| 2024 overview An externally-facilitated evaluation of the performance of the Board and its Committees was conducted during 2024 by Christopher Saul Associates (CSA), an independent, external corporate governance advisory firm. CSA was selected following a review of potential firms by the Chair and in consultation with the senior independent Non-Executive Director and has no other commercial relationship with the Company or any individual Directors. As noted in the 2023 Annual Report, under the UK Corporate Governance Code, the Company was due to have an externally-facilitated evaluation in 2023, which the Board elected to postpone until 2024 in light of the change in Chair during 2023. The Board concluded that it would be a better use of time and resources for the next externally-facilitated annual performance evaluation to take place in 2024, so that at least the first 12 to 18 months of the Board’s work under the new Chair could be taken into account. To obtain feedback on the effectiveness of the Board and its Committees, CSA’s evaluation included a structured one-on-one interview process with Board members, certain members of the SET, the VP, Group Internal Audit and the lead audit engagement partner of the Group’s auditor, PwC. CSA also observed certain Board and Board Committee meetings during June and July 2024. CSA issued its final report on the findings of the performance evaluation to the Board in September 2024, which was discussed by the Board at its meetings in September and November 2024, and at Board Committee meetings thereafter. The initial Board discussion was facilitated by CSA. As part of each Director’s individual discussion with the Chair during each year, his or her contribution to the work of the Board and personal development needs are considered. Directors’ training needs are met by a combination of: internal presentations and updates, and external speaker presentations, as part of Board and Board Committee meetings; specific training sessions on particular topics, where required; and the opportunity for Directors to attend external courses at the Company’s expense, should they wish to do so. The Nomination and Governance Committee also reviews the composition of the Board to ensure that it has the appropriate expertise, while also recognising the importance of diversity. For more information on the Nomination and Governance Committee’s work, see the Nomination and Governance Committee Report from page 100. 2024 outcomes and actions against prior year recommendations The key conclusions were: • The Board continues to operate effectively. It is collegiate and well-led, it operates to high standards of professionalism and benefits from good-quality support. • All of the Board’s Committees work hard and effectively and are well-integrated into overall Board processes. • The relationship between the Board and the SET is respectful and constructive and the Chair transition from Leif Johansson to Michel Demaré has developed well. • Key priorities for 2025 include succession planning, the continuous improvement of agendas, papers and meeting processes and continued focus on AI strategy. To address areas highlighted by the 2023 annual Board performance evaluation, various steps were taken during 2024, including: • The provision of greater detail to the Board about the work of the Nomination and Governance Committee, including routine Executive Director succession planning and Non-Executive Director succession planning with a focus on those Non-Executive Directors due to reach nine years’ tenure in 2026. • Arranging briefing sessions for the Board on geopolitical risk, the wider pharmaceutical landscape and investor perspectives on the Company and the pharmaceutical sector. • Enhancing the content of the Board’s annual strategy review days to provide more in-depth focus on incremental or newer areas of the business, more competitive analysis, and increased review of strategic trends. As part of the Board performance evaluation, Directors were asked to consider the following areas: • Board dynamics • Succession • Agendas and papers • Board meetings • Board Committees • Senior Executive Team and Board • Business understanding • Engagement with stakeholders • Areas for focus Strategic Report Corporate Governance Financial Statements Additional Information Corporate Governance Report | Board performance evaluation AstraZeneca Annual Report & Form 20-F Information 2024 99 Corporate Governance Report | Board performance evaluation |
| “The Nomination and Governance Committee works on behalf of the full Board to review the composition of the Board and its Committees and carry out succession planning for all Board positions.” Nomination and Governance Committee members • Michel Demaré (Chair) • Euan Ashley • Philip Broadley • Sheri McCoy • Nazneen Rahman The full role of the Nomination and Governance Committee is set out in its terms of reference, available at www.astrazeneca.com. For more information on each Director’s individual experience in these areas, see the Board biographies on pages 88 and 89. Non-Executive Directors’ experience, as at 1 February 2025 Skills and experience Total Business Finance Experience in accounting, corporate finance, internal controls and associated risk management. 7 Management Experience working in senior management roles of major companies, business transformation and strategy. 9 Sales and marketing Understanding and experience in sales and marketing. 4 Technology, digital and AI Knowledge and experience in technology, biotechnology, AI and digital health tools. 6 Sustainability Experience in managing the issues and opportunities associated with business sustainability, including corporate social performance, stakeholder engagement, and science-based solutions. 5 Geographic The regions where the Non-Executive Directors are primarily based. UK 3 US 4 Europe 5 Asia 1 Industry-specific Science Practical knowledge and experience in scientific research, development and innovation. 7 Pre-AstraZeneca pharma Professional experience in the pharmaceutical industry prior to joining AstraZeneca. 8 Medical doctor/physician Clinically trained medical doctor and/or physician. 3 Committee’s role The Committee works on behalf of the full Board to review the composition of the Board and its Committees and carry out succession planning for all Board positions, including taking the lead in the search for and recruitment of new Directors. The Committee ensures the Board has an appropriate balance of expertise, experience and diversity. A matrix that records the skills and experience of current Board members is one of the main tools used by the Committee to do this. The matrix is shown in the table above. Decisions relating to the appointment of Directors are made by the entire Board based on the Committee’s recommendations, taking into account the merits of the candidates and the relevance of their background and experience, measured against objective criteria, with care taken to ensure appointees have enough time to devote to the Board’s business. Board and Board Committee composition and succession planning The Committee considers both planned and unplanned (unanticipated) succession scenarios. The Committee spent the majority of its time in 2024 on succession planning for Non-Executive Directors, successfully concluding the appointment of Rene Haas and Birgit Conix as Non-Executive Directors with effect from 1 January 2025 and 1 February 2025 respectively. Birgit became a member of the Audit Committee on appointment. The search process was led by the Committee and involved Rene and Birgit meeting with multiple Directors. Rene brings deep and broad knowledge of technology including data science, computing and AI from his experience in the microprocessor, semiconductor and software engineering industry, and experience of leading a large Cambridge, UK-based technology company. Birgit brings significant financial and executive experience through successive CFO roles over the last decade and 15 years’ prior experience of the pharmaceutical industry. The Committee also continued routine succession planning work for the role of CEO, which as in previous years included desktop research relating to potential external candidates and continued monitoring of the development of potential internal candidates. Board and Technology, Coulter Partners, Heidrick & Struggles, Korn Ferry and Lygon Group assisted the Committee with its succession planning and non-executive search work this year. Board and Technology, Coulter Partners, Heidrick & Struggles, and Lygon Group undertake executive search assignments for the Company, and Korn Ferry On behalf of the Nomination and Governance Committee (the Committee), I am pleased to present the Committee’s report on its activities during 2024. Corporate Governance 100 AstraZeneca Annual Report & Form 20-F Information 2024 Nomination and Governance Committee Report |
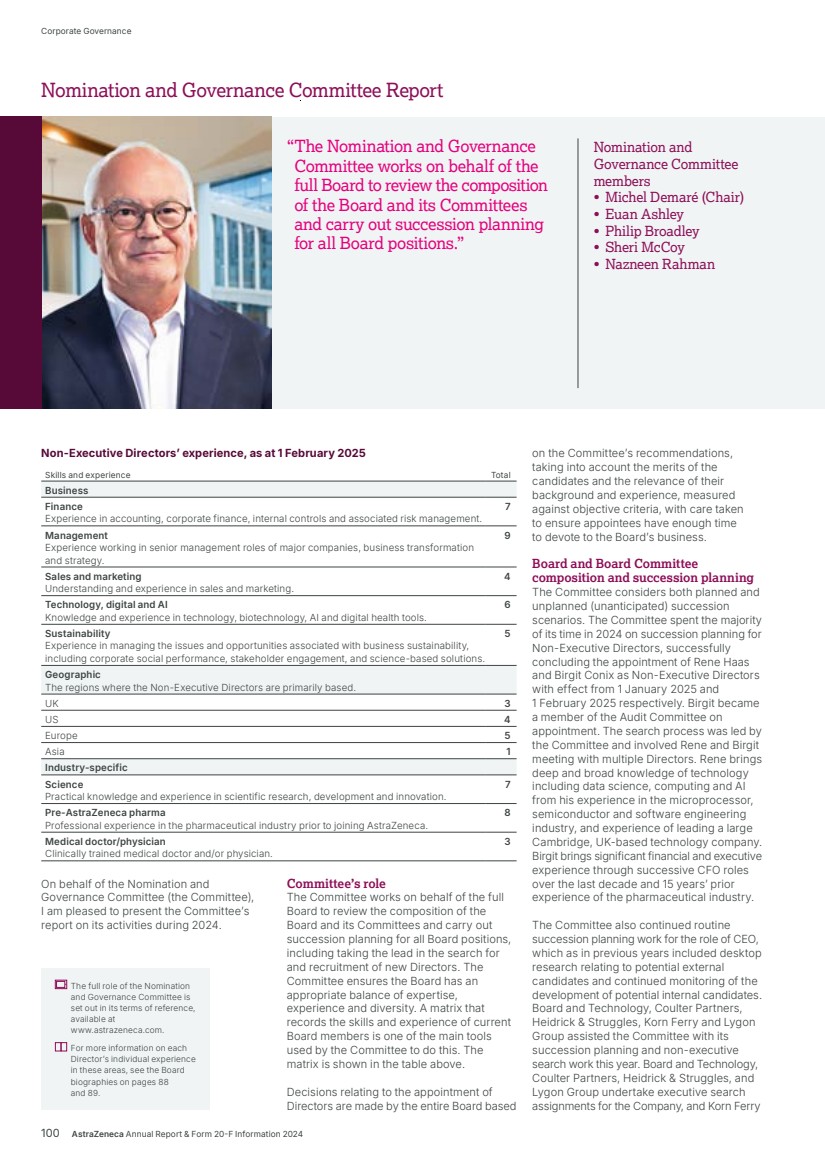
| As well as being considered in decisions about succession and Board appointments, inclusion and diversity is integrated across our Code of Ethics and associated workforce policy for the organisation as a whole. We were named first ranking healthcare company in the FTSE 100 for women on boards and in leadership in the FTSE Women Leaders Review. For the year ended 31 December 2024, women represented 50% of the SET and its leadership teams. Ongoing training and development Following their appointment, Rene and Birgit commenced tailored induction programmes to provide an understanding of the Group, reflecting their existing expertise and Committee membership. In addition to arranging comprehensive induction programmes when new Non-Executive Directors are appointed to the Board, the Committee recognises the importance of continuing development and training opportunities for all Directors. We are committed to developing a culture of lifelong learning throughout our organisation. Specific sessions with internal and external experts are periodically arranged for the full Board, to ensure that Directors have access to specialist knowledge across a broad range of areas to support their strategic decision making. For example, this year the Board had sessions with external experts on geopolitical risk, the wider pharmaceutical landscape and investor perspectives on the Company and the pharmaceutical sector. At least annually, I discuss with each Director their contribution to the work of the Board and personal development needs. Directors’ training needs are met by: a combination of internal presentations and updates, and external speaker presentations, as part of Board and Board Committee meetings; specific training sessions on particular topics, where required; and the opportunity for Directors to attend external courses at the Company’s expense, should they wish to do so. Directors are encouraged to visit the Group’s sites, providing opportunities to meet local employees and tour AstraZeneca facilities. Virtual visits are also arranged to allow further interactions with employees and sites. These visits further Directors’ understanding of the Group’s business and operations, as well as provide an insight into the particular challenges faced locally and opportunities to engage directly with employees and other stakeholders. Corporate governance The Committee advises the Board periodically on significant developments in corporate governance and the Company’s compliance with the UK Corporate Governance Code. Further information on our corporate governance arrangements, including the Company’s statement of compliance with the Code during the year, is set out from page 91. Michel Demaré Chair of the Nomination and Governance Committee undertakes executive search assignments and other recruitment-related activities for the Company. The five firms used for succession planning work during the year have no other connection with AstraZeneca or its individual Directors. Inclusion and diversity The Board views all aspects of diversity among Board members as important considerations when reviewing its composition. The Board aims to maintain a balance in terms of the range of experience and skills of individual Board members, which includes relevant international business, pharmaceutical industry, sustainability, and financial experience, and appropriate scientific and regulatory knowledge. The biographies of current Directors are set out on pages 88 and 89. The Board’s Inclusion and Diversity Policy (the Policy), which is applicable to the Board and its Committees, reinforces the Board’s ongoing commitment to all aspects of diversity and to fostering an inclusive environment in which each Director feels valued and respected. Although the Board appoints candidates using objective criteria, primarily based on merit and relevant experience, it recognises that an effective Board requires diversity. To help recruit Directors from a broad, qualified group of candidates, the Policy requires the use of at least one professional search firm that has signed up to the ‘Voluntary Code of Conduct for Executive Search Firms’, which the Company has complied with in 2024. The Board’s approach to inclusion and diversity continues to yield successful results, as shown in the following tables. The information presented in the tables was collected on a self-reporting basis. The Board, SET and Company Secretary were provided with the prescribed table, and asked to complete it based on how they identify. As at 31 December 2024, the Board is pleased that the Company met the updated diversity policy targets as specified in the FCA’s April 2022 Policy Statement on ‘Diversity and inclusion on company boards and executive management’: • 46% of the Board (and 45% of Non-Executive Directors) were women, above the target of at least 40%. • The Company met the policy target that at least one of the Chair of the Board, Chief Executive Officer, Senior independent Non-Executive Director or Chief Financial Officer be a woman. • 31% of the Board identified as an ethnic minority, above the target of at least one Board member being from a non‑white ethnic minority background. As at 6 February 2025, these targets continue to be met, following the appointment of Rene and Birgit. The Board’s Inclusion and Diversity Policy can be read in full on our website, www.astrazeneca.com. Information about our approach to diversity in the organisation below Board level can be found in People, from page 48. Table 1. Reporting table on sex/gender representation as at 31 December 2024 Number of Board members Percentage of the Board Number of senior positions on the Board1 Number in executive management Percentage of executive management Men 7 54% 3 6 55% Women 6 46% 1 5 45% Non-binary – – – – – Not specified/prefer not to say – – – – – Table 2. Reporting table on ethnicity representation as at 31 December 2024 Number of Board members Percentage of the Board Number of senior positions on the Board1 Number in executive management Percentage of executive management White British or other White (including minority-white groups) 9 69% 3 9 82% Mixed/Multiple Ethnic Groups 1 8% – – – Asian/Asian British 3 23% 1 2 18% Black/African/Caribbean/ Black British – – – – – Other ethnic group, including Arab – – – – – Not specified/prefer not to say – – – – – 1 CEO, CFO, Senior independent Non-Executive Director and Chair. Strategic Report Corporate Governance Financial Statements Additional Information Nomination and Governance Committee Report AstraZeneca Annual Report & Form 20-F Information 2024 101 |
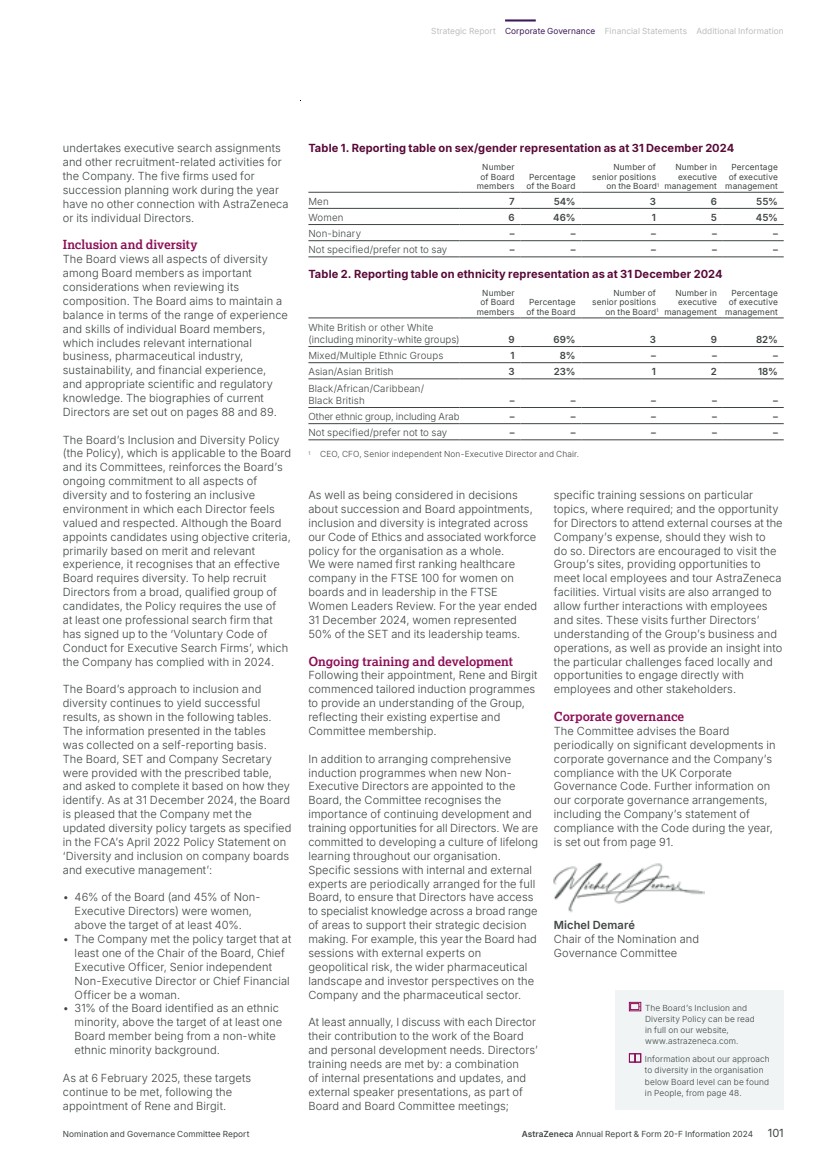
| Activities during the year The Committee met five times during 2024, both virtually and face-to-face. This included a two-day meeting at the AstraZeneca site in Shanghai, China which provided a wealth of opportunities to engage with R&D employees. Committee members visited the Gracell office, attended a poster session with AstraZeneca scientists from China and Japan, and had one-to-one meetings with global R&D leaders. The Committee also hosted a lunch with AstraZeneca scientists, including rising stars nominated by functions, received a presentation from two academic researchers, and completed a lab tour and visit with Eccogene. Our key areas of focus during the year included: • Company strategy and strategic priorities for R&D: including key prioritised science platforms across R&D (Oncology, BioPharmaceuticals and Rare Disease) and areas of focus for long-term success, including business development strategy. • AstraZeneca R&D strategic science capabilities: a deep dive on immunotherapy across R&D including vaccines, immune therapies and cell therapies, as well as a focus on AI capabilities and strategy and a deep dive on chronic weight management targets and mechanisms. • Acquisitions and in-licensing agreements: review for the Board the scientific case for acquisition and licensing opportunities, including: – Acquisition of Fusion Pharmaceuticals Inc., a clinical-stage biopharmaceutical company developing next-generation radioconjugates. – Acquisition of Amolyt Pharma SAS, which bolstered the Rare Disease late-stage pipeline. – Exclusive licence agreement with CSPC Pharmaceutical Group Ltd to advance the development of an early stage, novel small molecule Lipoprotein (a) disruptor. • Regulatory affairs: a review of regulatory affairs focusing on trends shaping the global regulatory affairs landscape including new digital tools and country level innovations. • R&D in China: the Committee held an in-person meeting at our R&D site in Shanghai, China. This included visits to Gracell and Eccogene and presentations from AstraZeneca’s local scientist employees. • Corporate scorecard outturn and goal setting: providing insight and feedback to the Remuneration Committee in support of 2024 achievements and 2025 goal setting relating to R&D. Euan Ashley Chair of the Science Committee Chair’s introduction The Science Committee’s (the Committee) core role is to provide assurance to the Board regarding the quality, competitiveness and integrity of the Group’s R&D activities. We achieve this through dialogue with AstraZeneca’s R&D leaders and other scientist employees, as well as visits to our R&D sites throughout the world. Our role is to review and assess: • The approaches we adopt in respect of our chosen therapy areas. • The scientific technology and R&D capabilities we deploy. • The scientific strategy for maintaining our pipeline and competitiveness. • The decision-making processes for R&D projects and programmes. • The quality of our scientists, their career opportunities and talent development. • Benchmarking against industry and scientific best practice, where appropriate. We also periodically review important bioethical issues and assist in the formulation of appropriate policies in relation to such issues, agreeing these on behalf of the Board. The Committee also considers future trends in medical science and technology, and reviews, on behalf of the Board, the R&D aspects of specific business development or acquisition proposals, advising the Board on its conclusions. Science Committee members • Euan Ashley (Chair) • Diana Layfield • Tony Mok • Nazneen Rahman • Marcus Wallenberg • EVP, Oncology Haematology R&D1 • EVP, BioPharmaceuticals R&D1 • CEO, Alexion1 1 Co-opted member of the Committee. The full role of the Science Committee is set out in its terms of reference, available at www.astrazeneca.com. “The Science Committee’s core role is to provide assurance to the Board regarding the quality, competitiveness and integrity of the Group’s R&D activities.” Corporate Governance 102 AstraZeneca Annual Report & Form 20-F Information 2024 Science Committee Report |
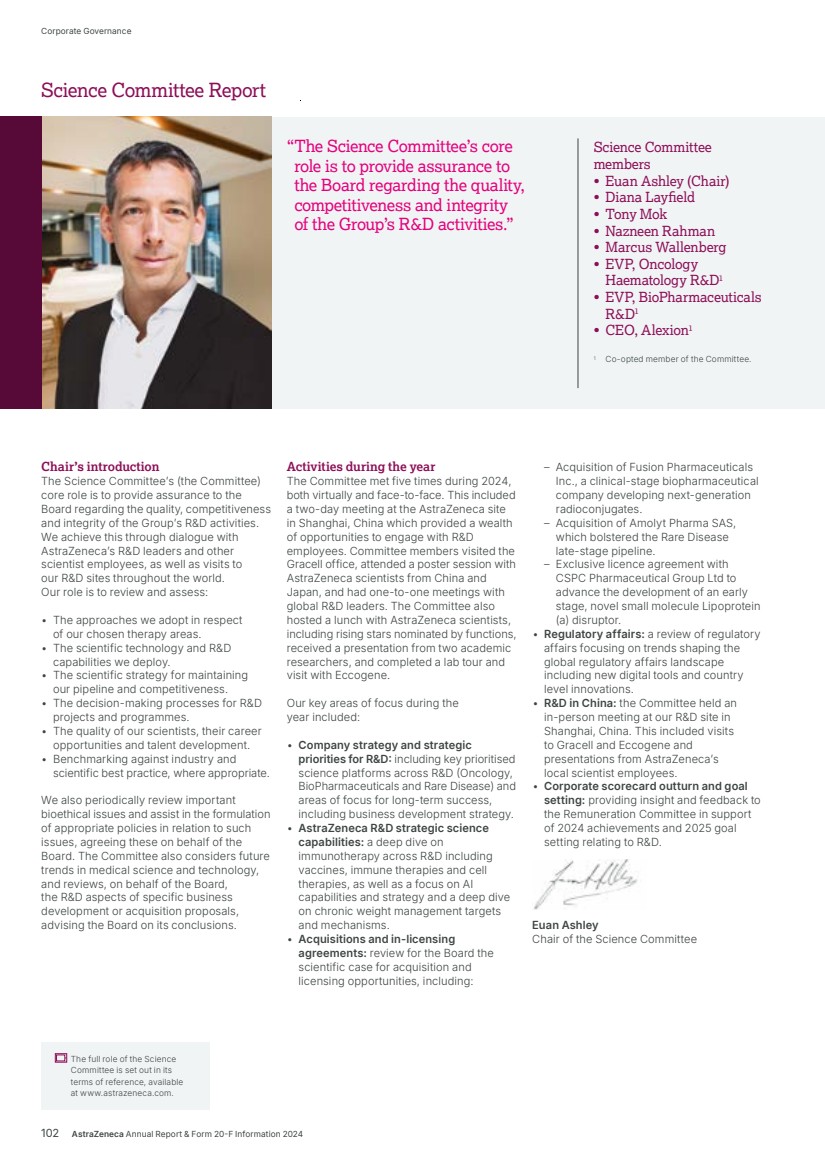
| “The Sustainability Committee continued its important work in 2024 to oversee the execution of the Company’s sustainability strategy.” Virtual coffees were also arranged for individual Committee members to meet informally with small groups of employees and learn more about implementation of our sustainability strategy at local level. This included site-specific projects lowering carbon emissions and increasing water, energy and waste efficiencies, AZ Forest activities, and affordability and health equity considerations as well as specific programmes, such as Green Labs to reduce the environmental impact of our lab operations, and global community investment initiatives, such as the Young Health Programme. Our focus areas during the year included: • The next-generation propellant transition programme, as a component of achieving AstraZeneca’s 2030 sustainability targets. • The progress of AZ Forest, including consideration of the broader nature, biodiversity and social impacts of the programme. • A strengthened approach to the governance and due diligence of AstraZeneca’s product donations for disaster relief, humanitarian relief and public health need. • Trends in sustainability reporting and the different regulations that will apply to AstraZeneca, including the IFRS Sustainability Disclosure Standards, Corporate Sustainability Reporting Directive (CSRD), European Sustainability Reporting Standards and Corporate Sustainability Due Diligence Directive. • The measures and processes under implementation to enhance the Company’s sustainability reporting, covering data, processes, systems and controls. • A double materiality assessment in line with CSRD, and recommendation to the Audit Committee of the material topics identified and integrated into this Annual Report. • Reviewing AstraZeneca’s sustainability strategy framework. • Supporting the Remuneration Committee in its consideration of how the delivery of our ESG priorities is incentivised. This included reviewing performance of the sustainability metric, ‘Ambition Zero Carbon’, in the 2022 LTI, which focused on Scope 1 and 2 GHG emissions, and reviewing the updated sustainability metric and targets, which from 2025 will focus on value chain (Scope 3) GHG emissions. • Overseeing engagement with investors and other stakeholders on sustainability-related matters and reviewing AstraZeneca’s external disclosures in collaboration with the Audit Committee. Nazneen Rahman Chair of the Sustainability Committee Chair’s introduction The Sustainability Committee (the Committee) continued its important work during 2024 to oversee the execution of the Company’s sustainability strategy. In addition to this important function, the Committee’s other roles are: • To collaborate with the Audit Committee to review the Company’s regulatory disclosures relating to sustainability and provide information and advice to support the Board and Audit Committee in relation to those disclosures, as required. • To oversee other communication of our sustainability activities with our stakeholders. • To monitor developments and best practice and provide input to the Board and other Board Committees on sustainability matters as required. • To advise the Remuneration Committee on the Company’s performance against sustainability metrics and targets. Committee meetings and other informal interactions with employees allow Committee members to engage closely with those charged with executing our sustainability strategy. This helps us develop a deeper understanding of sustainability initiatives, their progress, who executes them, and how this is done, to share with the wider Board. Activities during the year During 2024, the Committee met twice formally. To enhance our understanding of the sustainability initiatives in action at AstraZeneca and hear colleagues’ personal perspectives, the Committee invited employees who were involved in workstreams and projects from across our sustainability strategy to its meetings. Sustainability Committee members • Nazneen Rahman (Chair) • Sheri McCoy • Andreas Rummelt • Marcus Wallenberg Standing attendees at Committee meetings during 2024 included the: EVP, Global Operations, IT and the Chief Sustainability Officer; and VP Global Sustainability and SHE. The full role of the Sustainability Committee is set out in its terms of reference, available at www.astrazeneca.com. For more information about sustainability at AstraZeneca, visit www.astrazeneca.com/ sustainability. Strategic Report Corporate Governance Financial Statements Additional Information Sustainability Committee Report AstraZeneca Annual Report & Form 20-F Information 2024 103 Sustainability Committee Report |
| Audit Committee members • Philip Broadley (Chair) • Deborah DiSanzo • Sheri McCoy • Anna Manz • Birgit Conix¹ 1 Appointed as a member of the Committee on 1 February 2025. • The planned upgrade of the Group’s Enterprise Resource Planning IT systems (Project Axial). • The impact on our operations of sanctions on Russia and measures in place to ensure ongoing compliance with applicable sanctions regimes whilst ensuring patient access to essential medicines. • Our IT/IS function and how we continue to manage and mitigate cybersecurity threats. • Our Operations function, as we continue to evolve our supply chain capabilities. • The prevention and detection of fraud in clinical trials. • The investigations by Chinese authorities into current and former AstraZeneca employees regarding allegations of medical insurance fraud, illegal drug importation and personal information breaches, and the receipt by the Company of a Notice of Transfer to the Prosecutor and an Appraisal Opinion from the Shenzhen City Customs Office regarding suspected unpaid importation taxes. Committee members also participated in Board briefings and discussions on these topics. These sessions allowed the Committee to continue exploring specific aspects of risks in their ‘real world’ business contexts, in direct dialogue with people in the business that have responsibility for managing these risks. During the year, the Committee undertook an external audit services tender process as the current auditors, PwC, have been in role since the financial year ended 31 December 2017. Following a rigorous process, the Committee recommended, and the Board endorsed, the appointment of KPMG as the Group’s external auditor for the financial year ending 31 December 2026. Provision of assurance over sustainability reporting will also transition to KPMG from the financial year ending 31 December 2025. For details on the tender process, see page 111. The Committee also spent considerable time continuing to keep ourselves updated on developments in the reporting and regulatory environment, particularly in relation to sustainability-related reporting. The Committee has also been updated on preparations for upcoming changes to the UK Corporate Governance Code, including the requirement to review material controls under Provision 29 which will require additional disclosures and a Board declaration regarding the effectiveness of these controls. We continued our approach of a combination of in-person and virtual Committee meetings and interactions with colleagues from across the organisation, including in-person visits by Committee members to AstraZeneca’s sites in Canada, Sweden and Switzerland, details of which are provided on page 107. These interactions, along with the in-depth sessions I refer to above, have allowed Committee members to maximise our engagement with colleagues across the business, deepen our understanding of the priorities and challenges facing many different markets and business areas, and hear a wide range of employees’ views directly. We also recently welcomed Birgit Conix as a member of the Committee following her appointment to the Board on 1 February 2025. Birgit brings significant financial, executive and pharmaceutical industry experience, which will assist the Committee with its activities, and we look forward to working with her. We hope you find the Committee’s Report useful and informative and, as ever, I welcome any feedback. Philip Broadley Chair of the Audit Committee Chair’s introduction On behalf of the Audit Committee (the Committee), I am pleased to present the Committee’s report on its activities and the significant matters it considered during 2024. The Committee’s main responsibilities include monitoring the integrity of financial reporting and formal announcements relating to financial performance, reviewing the effectiveness of internal controls, risk management and compliance systems and processes, and overseeing the external and internal audit processes. The Committee believes that it has carried out its responsibilities effectively throughout the year, and to a high standard, providing independent oversight. It has had good support from AstraZeneca personnel and PwC, the Company’s auditors. The Committee continues to apply appropriate challenge to the Company’s management; for example, the valuation and presentation of the Andexxa intangible asset impairment, together with the inventory and related contract provisions as non-core items. This matter was subject to robust discussions and scrutiny from the Committee before it was satisfied with management’s approach. The Committee also closely monitored the revenue recognition approach and control environment in respect of major milestone payments that are recognised as Collaboration Revenue, in particular Lynparza sales in the context of the $600 million sales-related milestone receivable from Merck. The Committee’s agenda continues to be driven by the Company’s key active risks and key strategic programmes which are considered at every Committee meeting, and inform the Committee’s agenda of in-depth sessions which, this year, have included: “The Committee’s main responsibilities include monitoring the integrity of financial reporting and formal announcements relating to financial performance, reviewing the effectiveness of internal controls, risk management and compliance systems and processes, and overseeing the external and internal audit processes.” Corporate Governance 104 AstraZeneca Annual Report & Form 20-F Information 2024 Audit Committee Report |
| Activities during the year Financial reporting Effective internal controls, appropriate accounting practices and policies, and the exercise of experienced judgement by the Committee and the Board underpin AstraZeneca’s financial reporting integrity. The Committee’s activities in this area in 2024 included: • Reviewing key elements of the Financial Statements and the estimates and judgements contained in the Group’s financial disclosures, as well as considering the appropriateness of management’s and the external auditor’s analysis and conclusions on judgemental accounting matters. The significant financial reporting issues considered are described in detail in the table on pages 108 and 109. Further information on the significant accounting matters considered is included in the Financial Review under Critical accounting policies and estimates on page 82 and within our Group Accounting Policies from page 152. • Considering the completeness and accuracy of the Group’s reported financial performance against its internal and external key performance indicators on a quarterly and annual basis. • Reviewing the preparation of the Directors’ Viability statement and considering the adequacy of the analysis supporting the assurance provided by that statement, as well as the going concern assessment and adoption of the going concern basis in preparing this Annual Report and the Financial Statements. • Reviewing quarterly updates from both management and PwC on the programme of activities relating to control over financial reporting and the effectiveness of testing that has been performed across the internal control environment. • Considering the external auditor’s reports on its audit of the Group Financial Statements, as well as reports from management, Global Compliance and the external auditor on the effectiveness of our system of internal controls and, in particular, our internal control over financial reporting. This included consideration of compliance with applicable provisions of the Sarbanes-Oxley Act – in particular, the status of compliance with the programme of internal controls over financial reporting implemented pursuant to section 404 of that Act. • Discussing financial reporting considerations in relation to significant transactions that occurred in the year including the acquisitions of Fusion and Amolyt Pharma, the amortisation and impairment of intangible assets, restructuring programmes and the presentation of Alliance Revenue and Collaboration Revenue. • Reviewing developments in sustainability reporting requirements, the Company’s sustainability reporting approach for 2024 and the double materiality assessment as described in more detail in the Sustainability reporting and climate-related risk section on page 106. • Reviewing, with appropriate challenge, the outcomes from the Group’s budgeting and forecasting process for the near term, including capital expenditure projections. Risk identification and management The Committee continued its regular reviews of the Group’s approach to risk management, the operation of its risk reporting framework and risk mitigation. This included consideration of the manner in which the risk management process was embedded in the Group such that the Committee could be assured that management’s accountability for risks was clear and functioning effectively. The Company’s risk framework, described further from page 64, provides the context for the Committee to consider the Directors’ Viability statement which is underpinned by the assurance provided through a ‘stress test’ analysis under which key profitability, liquidity and funding metrics are tested against severe downside scenarios. Committee overview Committee composition In December 2024, the Board determined the Committee met the UK, US and Swedish composition requirements by virtue of Philip Broadley and Anna Manz having recent and relevant financial experience for the purpose of the UK Corporate Governance Code (the Code), having competence in accounting and/or auditing for the purpose of the Disclosure and Transparency Rules, being financial experts for the purposes of the Sarbanes-Oxley Act, and having expertise in accounting and auditing for the purposes of the Swedish Corporate Governance Code and Swedish Companies Act. The Board determined that all members of the Committee are independent for the purposes of the Code and that the Committee members as a whole have competence relevant to the sector in which the Company operates, by virtue of their experience of working in science-driven, healthcare and/or pharmaceutical industries, or as a result of their tenure with AstraZeneca. The Committee members’ qualifications, skills and experience are detailed in their biographies on pages 88 and 89 and meeting attendance is shown on page 87. Role of the Committee The Committee’s main responsibilities include monitoring the integrity of financial reporting and formal announcements relating to financial performance, reviewing the effectiveness of internal controls, risk management and compliance systems and processes, and overseeing the external and internal audit processes. The Committee reports to the Board the principal matters it considers and any significant concerns it has or that have been reported to it. Further information about the Committee’s role and work during the year is set out in this Audit Committee Report. Attendance at Committee meetings Routine attendees at Committee meetings include the CFO; the Chief Human Resources Officer, Chief Compliance Officer and General Counsel; the VP, Ethics & Transparency and Deputy Chief Compliance Officer; the Deputy General Counsel; the VP, Group Internal Audit; the SVP Finance, Group Controller & Head of Global Finance Services; and the Company’s external auditor. The Committee, and separately the Committee Chair, also meet privately and on an individual basis with attendees which helps ensure the effective flow of material information between the Committee and management. The CEO and other members of the SET attend when required by the Committee. The full role of the Audit Committee is set out in its terms of reference, available at www.astrazeneca.com. For more information on: The basis of preparation of the Financial Statements on a going concern basis, see page 230 and in the Financial Statements, page 152. The significant financial reporting issues considered, see the table set out from page 108. The Viability statement on page 63 and Principal Risks faced by the Group, see Risk Overview from page 64. Strategic Report Corporate Governance Financial Statements Additional Information Audit Committee Report AstraZeneca Annual Report & Form 20-F Information 2024 105 |
| Sustainability reporting and climate-related risk The Committee is responsible for reviewing the approach to sustainability reporting in the Company’s annual reports, Form 20-F filings and quarterly results announcements, including the Group’s double materiality assessment, TCFD disclosures and the EU Taxonomy disclosures in this Annual Report. These statements, as well as the Sustainability Data Annex, are also reviewed by the Sustainability Committee to support the Committee’s review. Bureau Veritas, an external assurance provider, provides limited assurance over selected key elements of these reports. The Committee received updates during the year on proposed and new regulations by the US, EU, Sweden, the UK and the International Sustainability Standards Board (ISSB) on sustainability reporting. The Committee was briefed on the Company’s sustainability reporting plans for 2024, including the obligation to report under Corporate Sustainability Reporting Directive (CSRD) requirements for the financial year ending 31 December 2025. To facilitate a smoother transition to CSRD reporting in 2025, the Committee approved the inclusion of a double materiality assessment and the adoption of reporting in a manner consistent to, but not in compliance with, CSRD requirements for sustainability information in this Annual Report, whilst maintaining continued adherence to current requirements in the UK Companies Act, EU Taxonomy and TCFD requirements. Legal and Compliance The Committee’s activities in this area included reviewing: • Quarterly reports from the Legal function to monitor the status of significant litigation matters and governmental investigations. • Quarterly reports from Global Compliance to provide oversight of key compliance incidents (both substantiated and unsubstantiated), possible trends and the dispersion of incidents across our business functions and management hierarchy. The reports included corrective actions taken so that the Committee could assess the effectiveness of controls, and monitor and ensure timely remediation. • Reporting on compliance with AstraZeneca’s Code of Ethics to ensure high ethical standards and that AstraZeneca operates within the law in all countries where we operate. • The monitoring, review, education and improvements made to support assurance that the risk of modern slavery and human trafficking is eliminated, to the fullest extent possible, from AstraZeneca’s supply chain. Internal Audit The Committee reviewed Group Internal Audit’s (GIA) activities, including: • Reviewing quarterly reports of work carried out by GIA, including the status of follow-up actions with management. In 2024, GIA provided assurance over compliance with significant policies, plans, procedures, laws and regulations, as well as risk-based audits across a broad range of key business activities and continued its thematic reporting to the business. The 2024 audit plan was aligned to our key active risks and wider risk taxonomy. Separate meetings are arranged to discuss follow-up actions in more depth with specific teams, when required by the Committee. • Carrying out the annual effectiveness review of GIA in late 2024 by considering its performance against the internal audit plan and key activities. • Approving the 2025 internal audit plan, which is aligned to our key active risks and wider risk taxonomy. • Considering the geographic presence, reach and capabilities of GIA and the appropriateness of the Group’s resource allocation for this vital assurance function. The Committee supports GIA’s efforts to deploy its resources in line with the continuously evolving shape and size of the overall organisation and was satisfied with the quality, experience and expertise of the GIA function. An independent External Quality Assessment of GIA is performed every five years and was last performed in 2021. External audit The Company’s external auditor, PwC, provided quarterly reports to the Committee over key audit and accounting matters, and business processes, internal controls and IT systems. The Committee oversaw the conduct, performance and quality of the external audit, in particular through its review and challenge of the coverage of the external auditor’s audit plan and subsequent monitoring of progress against it. The Committee maintained regular contact with PwC through formal and informal reporting and discussion throughout the year, with a continued focus on maintaining audit efficiency and quality. The Committee also sought management’s feedback on the conduct of the audit and considered the level of and extent to which the auditors challenged management’s assumptions. Each of these scenarios assumes that the associated risks crystallise and that management will take mitigating actions against those risks. The Committee considered in detail the validity of each scenario. The Committee also assessed whether the proposed mitigations were viable. The Committee is updated on key active and emerging risks facing the Company through a quarterly risk management report from the CFO. The likelihood of each of the risks materialising and its potential impact was monitored by the Committee and the reports from the CFO enabled the Committee to track the trend applicable to each risk compared with the previous quarter. The composition and profile of these risks informs the Committee’s agenda of in-depth sessions. Cybersecurity risk, digital security and information governance Our approach to identifying, assessing and managing material cybersecurity risks (including those that result from the use of third parties in business processes and data management) is integrated within our Group-wide approach to managing risk. Failure in information technology or cybersecurity has been identified as a Principal Risk. Mitigations are in place to manage these risks, and these are monitored, and their effectiveness regularly reported, for example in KPI dashboards provided to management and the Committee. Incidents are managed and reported using the cybersecurity incident management framework which in turn is connected to the Group’s crisis management framework. Cybersecurity risks are overseen by the Committee, who also carry out regular reviews due to the increased importance of cybersecurity risk. Their reviews are supported by senior management, the VP, Group Internal Audit and other assurance providers as required. Cybersecurity risks (including previous incidents) have not materially affected our business strategy, results of operations or financial condition. For more information, see IT and IS resources on page 44. For more information on our Code of Ethics and on Anti-bribery and anti-corruption, see from page 42. AstraZeneca’s Modern Slavery Act Statement is available on our website, www.astrazeneca.com. Corporate Governance 106 AstraZeneca Annual Report & Form 20-F Information 2024 Audit Committee Report continued |
| Reporting and regulatory environment The Committee has kept abreast of developments in the reporting and regulatory environment. This has included governance and audit reforms in the UK, proposed financial reporting changes following the publication of IFRS 18 ‘Presentation and Disclosures in Financial Statements’, changes to the UK Listing Rules, and developments in sustainability-related reporting requirements in a number of jurisdictions. Ensuring the quality of external financial reporting to shareholders and other stakeholders remains paramount to the Committee. This includes its assessment of the annual reports to ensure that, taken as a whole, they are fair, balanced and understandable (for which the process is described on page 110). External validation of the Annual Report is an important indicator of the quality of our reporting. Committee performance The Committee conducted the annual evaluation of its own performance, referring to the Committee-specific results of the Board effectiveness review prepared by Christopher Saul Associates. The results were reported to, and discussed with, the Committee and the Board. The overall results of the review were positive and noted the Committee’s efforts and focus. A number of interactions took place between Committee members and PwC during the year, outside of formal Committee meetings, to enhance the Committee’s understanding of the audit process, including the Committee Chair joining PwC’s Account Planning Workshop to meet face-to-face with PwC team members responsible for auditing AstraZeneca’s in-scope global entities in April as well as presenting virtually to the global PwC statutory audit teams in September. The Committee reviewed audit and non-audit fees of the external auditor during the year, including the objectivity and independence of the external auditor through the application of the Audit and Audit-Related Services Approval Policy, as described further on page 110. Engagement with employees and other stakeholders The Committee regularly interacts with members of management below the SET and seeks wider engagement with the Group’s employees and other stakeholders, during deep dive sessions at formal Committee meetings and as separate engagements. Committee members undertook a mixture of in-person and virtual interactions with a wide range of teams from across the organisation. This included teams from Information Technology and Information Security; Operations, Finance; International, Alexion US; and in-person visits to AstraZeneca’s offices in Baar, Switzerland, and AstraZeneca’s Canadian operations, which included the manufacturing and discovery facilities of Fusion Pharmaceuticals Inc. and the Company’s global hub in Mississauga, Ontario. Philip Broadley also made an in-person visit with the Company’s auditor, PwC, to AstraZeneca’s manufacturing site in Sӧdertälje in Sweden. The breadth of these interactions is crucial in enhancing the Committee’s understanding of the business and provides valuable insights into the key issues and challenges relating to, and current and emerging risks associated with, our activities in these areas. The Committee welcomes the opportunity to engage directly with employees in these meetings which provide an opportunity to gauge employee sentiment and hear their views directly. The Committee also uses these interactions to communicate the importance it attaches to compliance and our ‘speak up’ culture. Further information about the audit and non-audit fees for 2024 is disclosed in Note 31 to the Financial Statements on page 213. Strategic Report Corporate Governance Financial Statements Additional Information Audit Committee Report AstraZeneca Annual Report & Form 20-F Information 2024 107 |
| Significant financial reporting issues considered by the Committee in 2024 Matter considered Committee’s conclusion and response Valuation of intangible assets See Financial Review from page 67 and Note 10 to the Financial Statements from page 172. The Group carries significant intangible assets on its Consolidated Statement of Financial Position arising from the acquisition of businesses and intellectual property (IP) rights to medicines in development and on the market. Each quarter, the CFO reports on the carrying value of the Group’s intangible assets as well as the specific assets identified as at risk of impairment. In respect of intangible assets that are identified as at risk of impairment, the Committee receives information on the difference between the carrying value and management’s current estimate of discounted future cash flows for these products (the headroom). Products will be identified as ‘at risk’ if the headroom is small or, for medicines in development, there is a significant potentially adverse event such as the publication of clinical trial results which could significantly alter management’s forecasts for the product. The reviews also cover the impact on any related contingent consideration arising from previous business combinations. The Committee considered the impairment reviews of the Group’s intangible assets. Impairments of $504 million arose in relation to launched products and $1,073 million in relation to products in development. The Committee assured itself of the integrity of the Group’s accounting policy and models for its assessment and valuation of its intangible assets, including understanding the key assumptions and sensitivities within those models. The Committee also considered the internal and external estimates and forecasts for the Group’s cost of capital relative to the broader industry. The Committee was satisfied that the Group had appropriately accounted for the identified impairments. Revenue recognition See Financial Review from page 67 and Note 1 to the Financial Statements from page 160. The US is our largest single market and accounted for 43% of our Total Revenue in 2024. Revenue recognition, particularly in the US, is affected by rebates, chargebacks, returns, other revenue accruals and cash discounts. More generally, milestone payments, including the receivable of $600 million from Merck in respect of Lynparza, are often calculated on Product Sales and form part of Total Revenue. The Committee pays attention to management’s estimates of these items, its analysis of any unusual movements and their impact on revenue recognition. The Committee receives regular reports from management and the external auditor on this complex area. The US market remains highly competitive with diverse marketing and pricing strategies adopted by the Group and its peers. The Committee recognised the close monitoring and control by management of the overall gross-to-net deductions. The Committee reviewed the approach and control environment in respect of the recognition of Product Sales in instances where it triggers the recognition of a major sales-related milestone payment, contributing to Total Revenue. Alternative performance measures (APMs) See Financial Review from page 67. AstraZeneca reports APMs to provide helpful supplementary information to the IFRS measures to enable a better understanding of the Group’s financial performance and position. In the current period, net restructuring charges of $1,154 million were recorded within non-core items once the restructuring programmes were approved. Additionally, in the prior year, the accounting for the acquisition of Alexion in 2021 resulted in more significant items being classified as non-core. Management carefully analyses the presentation of various items to ensure it is fair and balanced, and follows guidelines issued by the European Securities and Markets Authority and the SEC, as well as FRC thematic reviews. The Committee carefully considered management’s presentation of the non-core items, including the removal of the Acquisition of Alexion category, and concurred with management’s presentation. The Committee further considered management’s assessment and recommendation to present the $459 million inventory and related provision costs related to Andexxa as non-core items, and concurred with management that the presentation was appropriate due to their significance and was consistent with classification within PAAGR in prior years. The Committee reviewed proposed disclosures for non-GAAP items in line with the various regulatory guidance and concurred with management that the presentation enabled additional helpful guidance. Litigation and contingent liabilities See Note 30 to the Financial Statements from page 203. AstraZeneca is involved in various legal proceedings considered typical to its business and the pharmaceutical industry as a whole, including litigation and investigations relating to product liability, commercial disputes, infringement of IP rights, the validity of certain patents, antitrust law, and sales and marketing practices. The Committee considers the Group’s approach to disclosure of, and any liabilities for, relevant matters. In the current period, net legal provisions of $44 million were recorded for two legal proceedings within non-core items once the criteria for recognising a provision were met. Of the matters the Committee considered in 2024, the more significant included: the continued defence of the IP litigation for Tagrisso and the commercial litigation relating to Syntimmune, Inc. The Committee carefully considered the progress of these legal proceedings in relation to the requirement of any provision and concurred with management’s assessment that none were required. The Committee was satisfied that the Group was effectively managing its litigation risks including seeking appropriate remedies and continuing to defend its IP rights vigorously. Corporate Governance 108 AstraZeneca Annual Report & Form 20-F Information 2024 Audit Committee Report continued |
| Matter considered Committee’s conclusion and response Tax charges and liabilities See Note 4 to the Financial Statements from page 163. AstraZeneca’s Approach to Taxation, which was published in December 2024 and covers its approach to governance, risk management and compliance, tax planning, dealing with tax authorities and the level of tax risk the Group is prepared to accept, can be found on our website, www.astrazeneca.com. The Group has business activities around the world and incurs a substantial amount and variety of business taxes. AstraZeneca pays corporate income taxes, customs duties, excise taxes, stamp duties, employment and many other business taxes in all jurisdictions where due. In addition, we collect and pay employee taxes and indirect taxes such as value-added tax. The taxes the Group pays and collects represent a significant contribution to the countries and societies in which we operate. Tax risk can arise from unclear laws and regulations as well as differences in their interpretation. The Committee reviews the Group’s approach to tax, including governance, risk management and compliance, tax planning, dealings with tax authorities and the level of tax risk the Group is prepared to accept. During 2024, the Committee considered the tax and tax accounting implications of projects including a cash repatriation project. The Committee considered the analysis provided by management and concurred with the presentation and reporting of these items. The Committee was satisfied with the Group’s practices regarding tax liabilities, including, most notably, its response to developments in the corporate income tax environment. Segmental reporting See the Key Judgement within Note 6 to the Financial Statements from page 166. Management has reviewed the developments in the year and determined the Group continues to operate as a single segment based on key decisions on resource allocation and performance monitoring being carried out at a Group level by the SET. There were no significant changes in the Group’s business during the year. The Committee received reports from management regarding considerations for segmental reporting based on the current operations and management of the business. The Committee considered the analysis provided by management and concurred with management that presenting AstraZeneca’s performance under one segment was appropriate. Retirement benefits See Financial Review from page 67 and Note 22 to the Financial Statements from page 184. Accounting for defined benefit pension and other post-retirement benefits remains an important area of focus. The present value of these liabilities is sensitive to changes in long-term interest rates, future inflation and mortality expectations. The assumptions used to value the liabilities for the Group’s main post-retirement benefit obligations are updated every quarter along with asset valuations. The Group is cognisant of the regulatory environment and local requirements around funding levels and contributions. The Group monitors its defined benefit pension risks and provides input and support to local fiduciaries to ensure requirements are met. The Committee monitors the funding level of the Group’s defined benefit obligations on a quarterly basis, alongside key developments. The Committee was satisfied that the actuarial assumptions used to value liabilities were appropriate during the year. The Committee was reassured by the Group’s engaged and balanced approach to managing the risks associated with its defined benefit obligations including its contribution policy. The Committee reviewed and concurred with management’s accounting and presentation of pension balances. The Committee is aware of the need to adhere to local funding regulations and is satisfied that the Group is complying with requirements. Strategic Report Corporate Governance Financial Statements Additional Information Audit Committee Report AstraZeneca Annual Report & Form 20-F Information 2024 109 |
| External auditor PwC is the Company’s external auditor. In April 2024, PwC was reappointed as the Company’s auditor for the financial year ended 31 December 2024, its eighth consecutive year as auditor, having first been appointed for the financial year ended 31 December 2017, following a competitive tender carried out in 2015. Sarah Quinn continued as the lead audit partner at PwC for 2024 following her appointment in January 2022. Audit, audit-related and other assurance services provided by the external auditor The Committee maintains the Audit and Audit-Related Services Approval Policy (the Policy) for the pre-approval of all audit services, audit-related services and other assurance services undertaken by the external auditor. The principal purpose of the Policy is to ensure that the independence of the external auditor is not impaired. The pre-approval procedures permit certain audit and audit-related services to be performed by the external auditor, subject to annual fee limits agreed with the Committee in advance. Pre-approved audit and audit-related services below the clearly trivial threshold (within the overall annual fee limit) are subject to case-by-case approval by the SVP Finance, Group Controller & Head of Global Finance Services. Pre-approved audit services included services in respect of the annual financial statement audit (including quarterly and half-year reviews), attestation opinion under section 404 of the Sarbanes-Oxley Act, statutory audits for subsidiary entities, and other procedures to be performed by the independent auditor in order to form an opinion on the Group’s Consolidated Financial Statements. The pre-approved audit-related services, which the Committee believes are services reasonably related to the performance of the audit or review of the Company’s Financial Statements, included certain services required by law or regulation, such as financial statement audits of employee benefit plans and capital market transactions. The Policy prohibits any tax services. Audit-related services included the assurance in relation to tax regulatory certificates required to be issued by the external auditor. The CFO (supported by the SVP Finance, Group Controller & Head of Global Finance Services), monitors the status of all services being provided by the external auditor. Authority to approve work exceeding the pre-agreed annual fee limits and for any individual service above the clearly trivial threshold is delegated to the Chair of the Committee. A standing agenda item at Committee meetings covers the operation of the pre-approval procedures and regular reports are provided to the full Committee. All services other than the pre-approved audit and audit-related services, require approval by the Committee on a case-by-case basis. In 2024, PwC provided audit services including interim reviews of the results of the Group for the period ended 30 June 2024 and audit-related and other assurance services. The increase to the statutory audit fee for 2024 is largely driven by scope changes and inflationary increases. Fees for audit-related and other assurance services amounted to 10% of the fees payable to PwC for audit services in 2024 (2023: 6%). The Committee is mindful of the 70% non-audit services fee cap under EU regulation, together with the overall proportion of fees for audit and audit-related services in determining whether to pre-approve such services. Fees for audit-related and other assurance services payable to PwC in 2024 were 11% (2023: 7%) of average audit fees over 2021 to 2023 (2023: 2020 to 2022). PwC were better placed than any alternative provider to provide these services in terms of their familiarity with the Company’s business, skills, capability and efficiency with which they could deliver the relevant services. All such services were either within the scope of the pre-approved services set out in the Policy or were presented to Committee members for pre-approval and all such services were permitted by the FRC Ethical Standard. $31.8m $30.1m 2024 2023 Audit/audit-related and other assurance services Statutory audit fee Audit-related and other assurance services Fair, balanced and understandable assessment As in previous years, at the instruction of the Board, the Committee undertook an assessment of this Annual Report to ensure that, taken as a whole, it is fair, balanced and understandable and provides the information necessary for shareholders to assess the Company’s position and performance, business model and strategy. The Committee reviewed the Company’s governance structure and assurance mechanisms for the preparation of this Annual Report and, in particular, the contributor and SET member verification process. The Committee received an early draft of this Annual Report to review its proposed content and the structural changes from the prior year and to undertake a review of the reporting for the year, following which the Committee members provided their individual and collective feedback. Additionally, in accordance with its terms of reference, the Committee (alongside the Board) took an active part in reviewing the Company’s quarterly announcements and considered the Company’s other public disclosures which are managed through its Disclosure Committee (the Committee was updated on matters considered by the Disclosure Committee regularly throughout the year). To aid its review further, the Committee also received a summary of the final Annual Report’s content, including AstraZeneca’s successes and setbacks during the year and an indication of where they were disclosed within the document. The processes described above allowed the Committee to provide assurance to the Board to assist it in making the statement required of it under the Code, which is set out from page 91. Internal controls Information on the Company’s internal controls is included in the Audit, risk and internal control section in the Corporate Governance Report on page 92. During the period covered by this Annual Report there was no change in our internal control over financial reporting that occurred that has materially affected, or is reasonably likely to materially affect, our internal control over financial reporting. At the January 2025 Committee meeting, the CFO presented the conclusions of the evaluation by the CEO and CFO of the effectiveness of our disclosure controls and procedures that is required by Item 15(a) of Form 20-F as at 31 December 2024. Based on their evaluation, the CEO and the CFO concluded that, as at that date, the Company maintained an effective system of disclosure controls and procedures. Corporate Governance 110 AstraZeneca Annual Report & Form 20-F Information 2024 Audit Committee Report continued |
| Each of the big four audit firms and two challenger firms were invited to participate in the tender. PwC and KPMG were the only two firms that were able and willing to tender for the audit. The Committee reviewed and approved the selection criteria which covered FRC Audit Quality assessments over the preceding three years, expertise of the proposed global audit teams, audit methodology, use of audit technologies and expertise in auditing organisations upgrading their Enterprise Resource Planning systems technology. The process focused on the quality criteria, in line with the FRC guidance, and was fee-blind. The tender process was supervised by the Audit Tender Panel, which comprised the Chair of the Audit Committee and Anna Manz as well as management representatives. To provide a better understanding of AstraZeneca’s business, processes and teams, both firms were provided with access to an online data room of relevant information, along with additional information where requested. Management also organised over 20 workshops for the firms to meet senior finance and business management across different business units and functions. Both firms provided written proposals and gave presentations to, and answered questions from, the Audit Tender Panel on their respective use of innovative tools for the performance of the audit in future years, their proposed teams and audit proposals. Mr Broadley and Ms Manz interviewed the proposed lead audit partners of both firms and met a cross section of the proposed audit teams, including specialist partners and audit staff. The Committee discussed Mr Broadley and Ms Manz’s conclusions from the tender process and management’s qualitative and quantitative assessment of the two firms based on the selection criteria. Following that discussion, the Committee recommended, and the Board endorsed, the appointment of KPMG as the Group’s external auditor for the financial year ending 31 December 2026. A resolution will be put to shareholders at the 2026 AGM to approve this appointment. It is intended that PwC will continue as the Group’s auditors for the years ended 31 December 2024 and 2025 and will cease to hold office at the conclusion of the Company’s 2026 AGM. The Committee also aligned with transitioning the limited assurance of sustainability reporting to KPMG for the financial year ending 31 December 2025 upon adoption of mandatory CSRD reporting. The Committee also commenced reviewing reporting covering KPMG’s journey to independence to meet regulatory requirements in time for the commencement of sustainability assurance in 2025 as well as financial audit in 2026. Regulation The Committee considers that the Company has complied with the Competition and Markets Authority’s Statutory Audit Services for Large Companies Market Investigation (Mandatory Use of Competitive Tender Processes and Audit Committee Responsibilities) Order 2014 in respect of its financial year commencing 1 January 2024. Assessing external audit effectiveness In accordance with its normal practice, the Committee considered the performance of PwC and its compliance with the independence criteria under the relevant statutory, regulatory and ethical standards applicable to auditors. The Committee assessed PwC’s effectiveness principally against four key factors, namely: judgement; mindset and culture; skills, character and knowledge; and quality control. As part of that assessment, it also took account of the views of senior management within the Finance function and regular Committee attendees. As part of the Committee’s assessment of the quality of the audit, the Committee focused on the auditor’s effective use of experts and technology as well as appropriate challenge of management’s judgements especially in relation to areas of significant financial reporting issues (as described in the table on pages 108 and 109). Areas that were reviewed by the Committee included PwC’s extensive and detailed review of the valuations and assumptions related to defined benefit pension valuations, assumptions and calculations over Gross to Net Product Sales, legal settlements in the year, intangible asset assumptions used in cashflow modelling, and the recognition and measurement of uncertain tax liabilities. The Committee concluded that the PwC audit was effective for the financial year ended 31 December 2024. In February 2025, the Committee recommended to the Board the reappointment of PwC as the Company’s auditor for the financial year ending 31 December 2025. Accordingly, a resolution to reappoint PwC as auditor will be put to shareholders at the Company’s AGM in April 2025. External audit tender In November 2023, with the UK legal requirements for the Company to tender the external auditor every 10 years in mind, the Committee began a tendering process for both the financial audit and sustainability assurance to enable the selection of an auditor in 2024 for the 2026 or 2027 financial year. The Committee committed to a fair, open and transparent process and reviewed and approved the process, timetable and information requirements, which followed best practice corporate governance requirements, including all relevant FRC guidance on audit tendering. Strategic Report Corporate Governance Financial Statements Additional Information Audit Committee Report AstraZeneca Annual Report & Form 20-F Information 2024 111 |
| “On behalf of the Committee, I thank those shareholders who supported our new Remuneration policy, which allows us to incentivise the delivery of our Ambition 2030 through our pay for performance philosophy.” Remuneration Committee members • Sheri McCoy (Chair) • Philip Broadley • Michel Demaré • Nazneen Rahman On behalf of the Board, I am pleased to present AstraZeneca’s Directors’ Remuneration Report for the year ended 31 December 2024. 2024 has seen AstraZeneca successfully continue on its strong growth trajectory towards delivery of Ambition 2030. Our sustained performance over the year delivered Total Revenue of $54.1 billion, an increase of 18% at actual rates of exchange (21% at CER) since 2023. In May, we held our Investor Day, which gave us the opportunity to share in detail our strategy for Ambition 2030, our continued commitment to long-term growth and how we plan to continue to deliver shareholder value. Over 2024, significant progress has already been made towards these goals. We have invested in transformative technologies, such as antibody drug conjugates, radioconjugates, cell therapy and T-cell engagers, with a view to eliminating cancer as a cause of death; and invested in gene therapy and gene editing for our Rare Disease portfolio, all of which will help to drive our growth. Over the year, we have continued to see significant positive readouts and regulatory approvals which reinforce the quality of our pipeline and our ambition to launch 20 new molecular entities (NMEs) by 2030. Eight of these NMEs have already been launched, including Imjudo, Beyfortus, Voydeya and Datroway. Our global commercial footprint continues to provide substantial growth opportunity for our medicines across all therapy areas and regions. In the US, Total Revenue increased by 22% in 2024 to $23.2 billion driven by continued strong growth of our Oncology and BioPharmaceuticals business units. In Emerging Markets, AstraZeneca was the largest multinational pharmaceutical company, as measured by prescription sales. In Europe, Total Revenue was $12.2 billion, an increase of 27% (26% at CER) on 2023. More information on some of our 2024 achievements is set out on page 114. Key Committee activities in 2024 At the Company’s 2024 Annual General Meeting (AGM), the Board was pleased that the 2023 Directors’ Remuneration Report received support from 95% of shareholders. The Board also put a new Remuneration Policy (the Policy) and amendments to the AstraZeneca Performance Share Plan (PSP) (together, the Remuneration Resolutions) to shareholders for approval at the 2024 AGM. The Remuneration Resolutions were approved with 64.43% and 65.34% support, respectively. However, the Committee acknowledged that a notable proportion of shareholders did not support the Remuneration Resolutions at the 2024 AGM. Following the AGM, I undertook an extensive consultation process to listen to the feedback of our shareholders and the proxy advisors and to discuss the implementation of the 2024 Policy. The engagement reached over 50% of our issued share capital and included written communications with our 75 largest shareholders, plus meetings with eight of our largest shareholders and three proxy advisers. AstraZeneca’s largest investors remain fully supportive of the leadership team, our pay for performance philosophy and of our Ambition 2030. Our major shareholders understand the rationale for the Policy changes, the global nature of the business and the need to be able to compete for talent globally, and recognise that the Committee believes that UK- listed FTSE companies are not the right peer group for us to use, given AstraZeneca’s size, complexity and global footprint relative to FTSE peers, and the influence of pay practice within the global pharmaceutical industry. The role of the Remuneration Committee is set out in its terms of reference, available at www.astrazeneca.com. We aim to be clear and transparent in how we link remuneration of our executives to the successful delivery of our strategy and shareholder returns. The Directors’ Remuneration Report contains the following sections: • Chair’s letter, page 112 • Remuneration at a glance, page 116 • How our performance measures for 2025 support the delivery of our strategy, page 117 • How the Remuneration Committee ensures targets are stretching, page 118 • Annual Report on Remuneration, page 119 Corporate Governance 112 AstraZeneca Annual Report & Form 20-F Information 2024 Directors’ Remuneration Report |
| AstraZeneca Global pharma peers average European pharma peers average FTSE 100 400 300 200 100 Dec 14 Dec 15 Dec 16 Dec 17 Dec 18 Dec 19 Dec 20 Dec 21 Dec 22 Dec 23 Dec 24 the sustainability metric will comprise of the aggregate reductions from the next-generation propellant (NGP) transition, primary distribution and business travel, which represent approximately 25% of our 2024 value chain (Scope 3) GHG emissions. The Committee has continued to evaluate the reward of the wider workforce and in 2024 reviewed the full collective offering of our long-term incentives available to employees around the world. Currently 35% of the workforce is eligible to participate in long-term incentive (LTI) programmes and the Committee continues to explore ways in which this might be expanded further. During 2024, we have approved increases to the quantum of LTIs we offer to ensure we remain market competitive across the globe. Our emphasis remains firmly on performance, market competitiveness and equitable reward and we are supportive of the level of importance the Company continues to place on enabling total reward decisions to be made without bias. We endorse the ongoing efforts to educate managers on making equitable reward decisions and to build internal capability in relation to this topic, including the development of tools to help with reward decision making. A number of our shareholders and proxy advisers voiced their concerns in relation to the increased opportunity at threshold provided under the new Policy and requested to hear more about the process for making decisions on outcomes and setting targets. In response to these concerns, we confirmed that the Committee made a conscious decision for the uplift in remuneration opportunity to be through performance-based pay, and that we remain committed to transparent disclosures and to stretching performance targets which are aligned to the creation of shareholder value. The process of setting our targets is comprehensive and robust. We rigorously review stretch in conjunction with management, the Audit Committee, the Science Committee and the Sustainability Committee, along with our external independent advisers, not only in relation to our internal ambitions, but also relative to consensus and how analysts view our potential. The same scrutiny is used to assess performance outcomes and we can demonstrate a consistently clear link between incentive outcomes and performance. The new Policy allows us to continue to provide competitive executive remuneration in a high performance culture, and is structured such that the Executive Directors will only benefit from the increased remuneration when they deliver strong returns for investors. It has provided headroom to deploy appropriately leveraged pay for performance compensation across our most senior leadership levels (below our Executive Directors), and it enables us to retain and compete for the best talent, including in the US. The Committee is confident that the Policy reflects AstraZeneca’s global market position, the strength of our pipeline and will incentivise the delivery of our ambitions in the future. I would like to thank those that took part in the consultation for their constructive feedback and those shareholders who supported our proposals. Our short- and long-term incentive metrics will remain broadly unchanged for 2025. We continue to be happy with the balance and choice of metrics which we believe appropriately underpin our strategy and incentivise performance. As we reach the end of our Scope 1 and 2 greenhouse gas (GHG) emission glide path, the PSP sustainability metric will encompass aspects of value chain (Scope 3) GHG emissions from 2025 onwards. For the 2025 PSP, How we have performed in 2024 Total shareholder return (TSR) 2022 to 20241 +33% AstraZeneca Global pharmaceutical peers average European pharmaceutical peers average FTSE 100 1 Calculated using a three-month calendar average, from 1 October to 31 December, prior to the start and at the end of the relevant period. Delivery against strategy – 2024 Group scorecard performance2 Target 2024 outcome Science and Innovation: Annual pipeline progression Pipeline progression events 27 24 Regulatory events 42 52 Growth and Therapy Area Leadership3 Total Revenue $52.1bn $53.8bn Achieve Group Financial Targets Cash flow4 $10.2bn $10.1bn Core EPS5 $7.82 $8.22 2 For details of the Committee’s consideration of Group scorecard outcomes and a description of performance measures, see from page 121. 3 Total Revenue target and outcome are at 2024 budget rates of exchange. 4 The Cash flow measure is set and evaluated at the actual exchange rate and is evaluated by reference to net cash flow from operating activities less capital expenditure, adding back proceeds from disposal of intangible assets. 5 Core EPS target and outcome are at 2024 budget rates of exchange. More information on the TSR peer groups for PSP awards can be found on page 125. Further detail of 2024 commercial and scientific performance can be found in the Strategic Report from page 12. Strategic Report Corporate Governance Financial Statements Additional Information Directors’ Remuneration Report AstraZeneca Annual Report & Form 20-F Information 2024 113 |
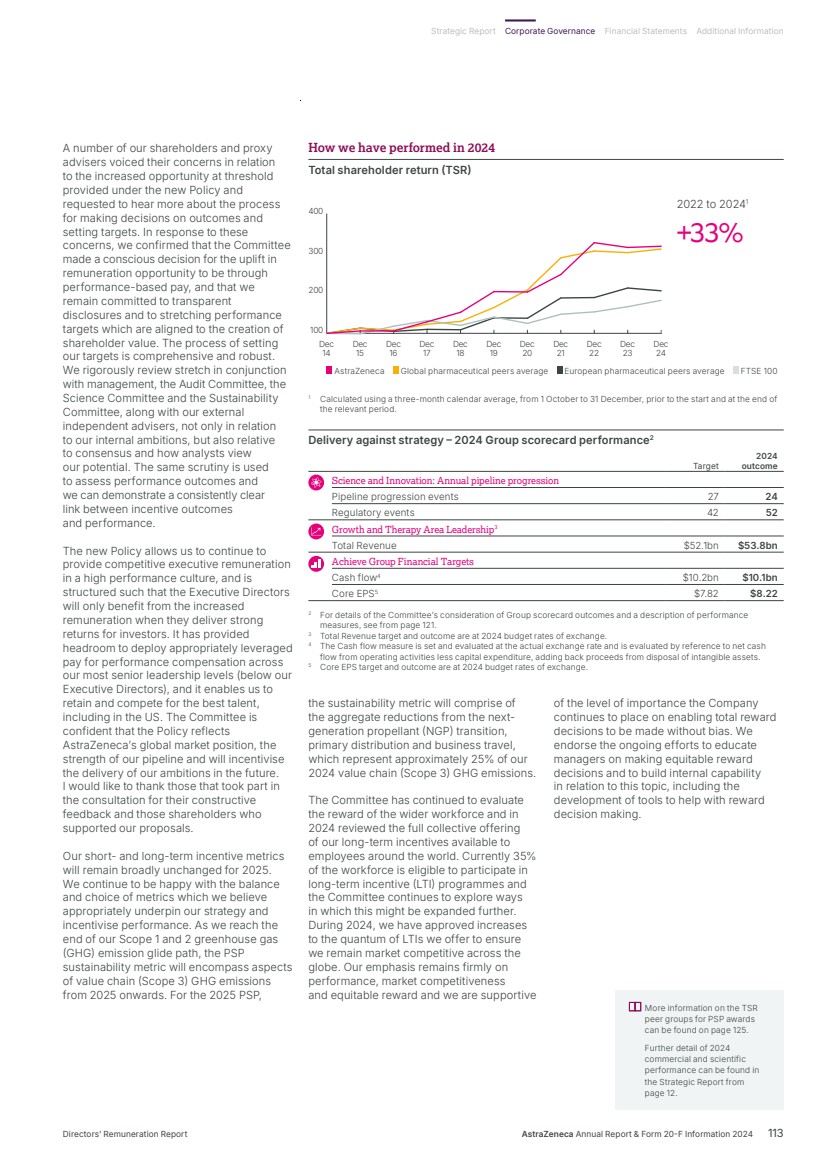
| TSR People and Sustainability: Being a great place to work is a commitment to our people and we aim to create great employee experiences that ignite innovation, unite diverse talent and unlock capacity. We are recognised externally for our work prioritising inclusion and diversity and are pleased that 44 countries of origin are represented at executive levels and 50.6% of our senior leaders are women. We remain dedicated to promoting personal growth, lifelong learning and enterprise leadership. We celebrated Learning at Work Week, and have seen over 1.96 million Degreed learning completions over the year. We have enabled over 2.1 million hours of total learning for our employees and have seen over 10,000 employees participate in our Generative AI Accreditation programme. Our Pulse results demonstrate that we have a highly engaged workforce with 80% of our employees agreeing that they feel valued for diverse opinions and thinking, and 84% of our employees saying that they receive coaching to improve their contribution. Sustainability remains core to our strategy of improving the health of people, society and the planet and we believe that through science we can make a positive impact. We have made significant progress towards Ambition Zero Carbon, despite the Group almost doubling in size since 2020. In 2024, we reached the significant milestone of over 60% of our global fleet being battery electric vehicles. We are also very proud that Södertälje has reduced Scope 1 and 2 GHG emissions by 98% (from 2015 baseline), which is an outstanding achievement. We also continue to work towards achieving a 50% target reduction in Scope 3 emissions from the 2019 baseline by 2030. In 2024, we made the first regulatory submission for Breztri NGP in the EU in 2024, an important step in transitioning our inhaled medicines to a NGP with near-zero global warming potential – 99.9% lower than current propellants. Through our Green Labs programme, we are embedding sustainability into research processes to reduce laboratory emissions and waste and to date, over 4,000 colleagues have optimised ways of working and championed a sustainability culture in their labs. We were proud to have been awarded the EcoVadis Sustainability Achievement Award for ‘Best Mature Program’ and we continued to drive global change at Climate Week NYC, the biggest annual climate event of its kind, and being a signatory on an open letter from The Alliance of CEO Climate Leaders to world leaders about the changes that need to be implemented to make a difference. AstraZeneca’s 2024 performance Science and Innovation: 2024 has been a significant year for AstraZeneca in advancing our science and medicines, and investing in new transformative technologies and modalities. These developments have enabled us to deliver medicines to patients while sustaining long-term growth. We continued to drive progress in our pipeline, delivering 24 pipeline progression events – including Phase II NME starts and Phase III investment decisions – which are critical steps in developing new treatments. While this number is slightly lower than last year’s 30 events, it reflects our focused approach on high-impact projects that will bring meaningful benefits to patients. We achieved 74 regulatory events, with 52 contributing to the Group scorecard for determining the annual bonus, exceeding our target. These regulatory milestones underscore our commitment to bringing new medicines to market efficiently and effectively. Externally, the quality of our scientific research was recognised at key medical congresses throughout the year. We reinforced our leadership in R&D through novel treatment and combination approaches, showcasing our dedication to innovation and excellence in science. Growth and Therapy Area Leadership: Overall the Company has seen strong underlying performance with double-digit growth in Total Revenue across four therapy areas. Total Revenue increased by 18% (21% at CER), driven by a 16% (19% at CER) increase in Product Sales, continued growth of partnered medicines (Alliance Revenue) and the achievement of sales-based milestones (Collaboration Revenue). Oncology Total Revenue increased by 21% (24% at CER) to $22,353 million. BioPharmaceuticals Total Revenue increased by 19% (21% at CER) to $21,855 million, with CVRM and R&I both experiencing double-digit growth in Total Revenue. Total Revenue from Rare Disease medicines increased by 13% (16% at CER) to $8,768 million. Achieved Science and Innovation: Annual pipeline progression 65% Growth and Therapy Area Leadership 100% Achieve Group Financial Targets 73% Achieved Achieved Science and Innovation: First approvals and NME volume over three years 100% Growth and Therapy Area Leadership 100% Net Cash flow 100% Relative TSR 20% Sustainability: Ambition Zero Carbon 100% Achieved 1 When determining bonus outturns, the Committee considered the formulaic outcome from the Group scorecard along with wider business and individual impact and performance in 2024, including ESG achievements. 2024 Annual bonus scorecard performance1 2022 PSP performance Corporate Governance 114 AstraZeneca Annual Report & Form 20-F Information 2024 Directors’ Remuneration Report continued |
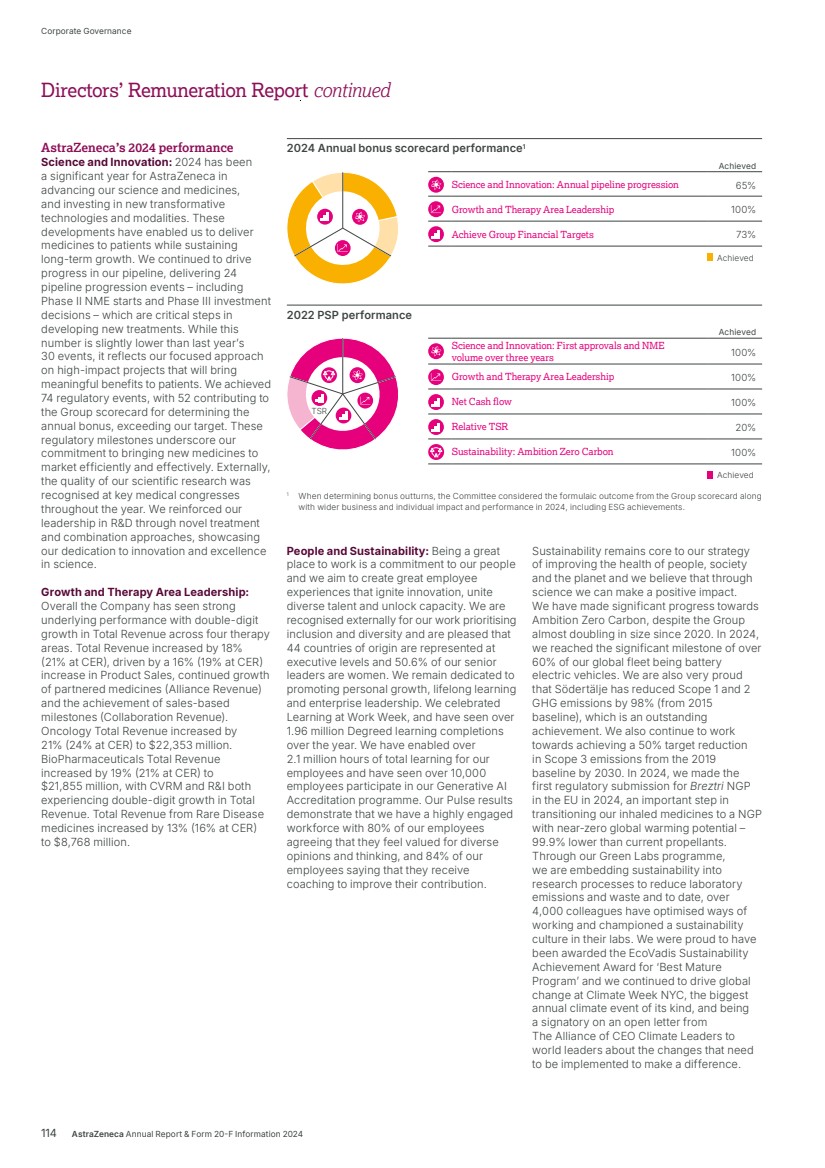
| Global median £15.3m AstraZeneca £11.3m AstraZeneca £11.3m AstraZeneca £5.0m AstraZeneca £5.0m Global pharmaceuticals1 European pharmaceuticals2 Global median £5.4m Global pharmaceuticals1 European pharmaceuticals2 Positioning of our executives against global and European pharmaceutical peers European median £7.5m European median £4.3m Target Total Direct Compensation (base pay, target annual bonus and target LTI) Target Total Direct Compensation (base pay, target annual bonus and target LTI) 21 9 12 15 18 6 3 10 2 4 6 8 0 CEO (£m) CFO (£m) Non-Executive Directors’ fees From January 2025, certain of the Non-Executive Directors’ fees, including the Chair’s fee, have been increased. In addition, a fee has been introduced for membership of the Nomination and Governance Committee. From December 2024, the Chair and Non-Executive Director fees will be reviewed annually to ensure they reflect the workload and responsibilities of non-executive directors of a large, listed company, and remain competitive with other major listed companies. No Board member participates in any decisions relating to their own fees. Further detail is provided on page 128. Next steps I hope that you find this Remuneration Report clear in explaining the implementation of our Policy during 2024. We trust that we have provided the information you need to be able to support this Remuneration Report at the Company’s AGM in April 2025. Our ongoing dialogue with shareholders and other stakeholders is valued greatly and, as always, we welcome your feedback on this Directors’ Remuneration Report. Sheri McCoy Chair of the Remuneration Committee 2024 remuneration outcome The Committee always seeks to ensure that the remuneration of our Executive Directors and our wider workforce reflects the underlying performance of the business. When approving outcomes, we therefore considered the Group scorecard along with wider business and individual performance over 2024, including other achievements across the enterprise, such as advancing our People and Sustainability priorities. In that context, the Committee believes that the payments outlined below fairly reflect their performance. Annual bonus 157% of target – 78.5% of maximum When determining bonus outturns, the Committee considered the formulaic outcome from the Group scorecard along with wider business and individual impact and performance in 2024, including ESG achievements. The Committee determined to award an annual bonus equivalent to 157% of target (78.5% of maximum) to Mr Pascal Soriot and Dr Aradhana Sarin (equivalent to 235.5% and 157% of base pay respectively), in line with the Group scorecard outcome. Details of the factors considered to determine the bonuses are provided from page 121. Long-term incentives 2022 PSP – 84% of maximum Our approach aims to reward sustainable outperformance and as a result of three very strong years, our 2022 award will vest towards the upper end of the possible range. The three-year performance period for PSP awards granted to our senior leaders in 2022, ended on 31 December 2024. Awards for all participants will vest at 84% of maximum, as shown from page 124 and reflects continued strong performance. 1 Global pharma peer group consists of: AbbVie, Amgen, BMS, Eli Lilly, Gilead, GSK, Johnson & Johnson, Merck, Novartis, Novo Nordisk, Pfizer, Roche and Sanofi (Sanofi within CEO comparator group only). 2 European pharma peer group consists of: Bayer, GSK, Merck KGaA, Novartis, Novo Nordisk, Roche and Sanofi (Sanofi within CEO comparator group only). Remuneration includes base pay, target annual bonus and the expected value of LTI awards. Benchmarking data has been provided by the Committee’s independent adviser. Strategic Report Corporate Governance Financial Statements Additional Information Directors’ Remuneration Report AstraZeneca Annual Report & Form 20-F Information 2024 115 |
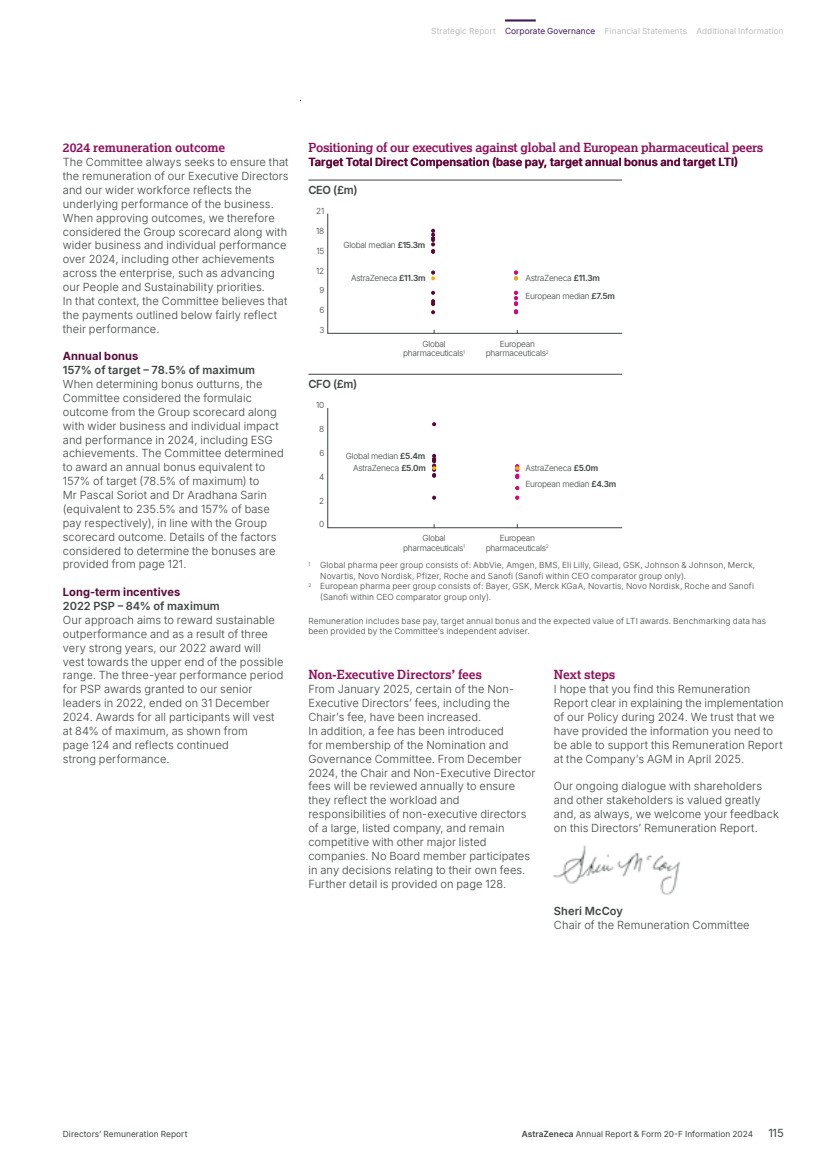
| CEO CFO 6,751 14,728 £0 £5,000 £10,000 £15,000 £ʼ000 Share price appreciation on long-term incentive awards PSP (subject to a 2-year holding period) Annual bonus (50% subject to deferral for 3 years) Fixed pay CEO fixed vs performance-linked (%) CEO fixed vs performance-linked (%) 33% Short-term 67% Long-term Fixed 9% Performance-linked 91% Base pay Benefits fund Pension Annual bonus – cash Annual bonus – shares PSP CFO fixed vs performance-linked (%) CFO fixed vs performance-linked (%) 36% Short-term 64% Long-term Fixed 13% Performance-linked 87% Base salary Benefits fund Pension Annual bonus – cash Annual bonus – shares PSP Annual bonus (halved)1 PSP ʼ25 Executive Directorsʼ variable pay Executive Directorsʼ variable pay Performance period Deferral period Holding period ʼ26 ʼ27 ʼ28 ʼ29 See from page 119 for further information on the annual bonus and PSP outcome. When determining bonus awards, the Committee considered the formulaic outcome from the Group scorecard along with wider business and individual impact and performance in 2024, including ESG achievements. Fixed pay consists of base pay and benefits funding. Further information on Executive Directors’ realised pay for 2024 is on page 119. Based on maximum payout scenarios for the CEO assuming maximum of 300% and 850% of base pay for annual bonus and PSP respectively. Based on maximum payout scenarios for the CFO assuming maximum of 200% and 550% of base pay for annual bonus and PSP respectively. 1 Half of the annual bonus is deferred for three years. See from page 121 for further details on plan design. Group scorecard performance Achieved 78.5% of max Lapsed 21.5% 2022 PSP performance Achieved 84% Lapsed 16% Fixed remuneration Annual bonus Long-term incentives Shareholding requirement Post-cessation shareholding requirement Pascal Soriot (CEO) Base pay: £1,545,084 Benefits fund Pension: £169,959 (equivalent to 11% of base pay) Max: 300% base pay Target: 150% base pay Deferred: 50% for three years Max: 850% base pay Performance period: three years Holding period: two years Holding requirement: 1,150% base pay Holding requirement 1,150% base pay for two years post-cessation Aradhana Sarin (CFO) Base pay: £989,554 Benefits fund Pension: £108,851 (equivalent to 11% of base pay) Max: 200% base pay Target: 100% base pay Deferred: 50% for three years Max: 550% base pay Performance period: three years Holding period: two years Holding requirement: 750% base pay Holding requirement: 750% base pay for two years post-cessation What our Executive Executive Directors’ realised pay 2024 outcomes Directors earned Formulaic outcome of 2024 Group scorecard and 2022 PSP Looking ahead Executive Directors’ remuneration for 2025 116 AstraZeneca Annual Report & Form 20-F Information 2024 Corporate Governance Remuneration at a glance |
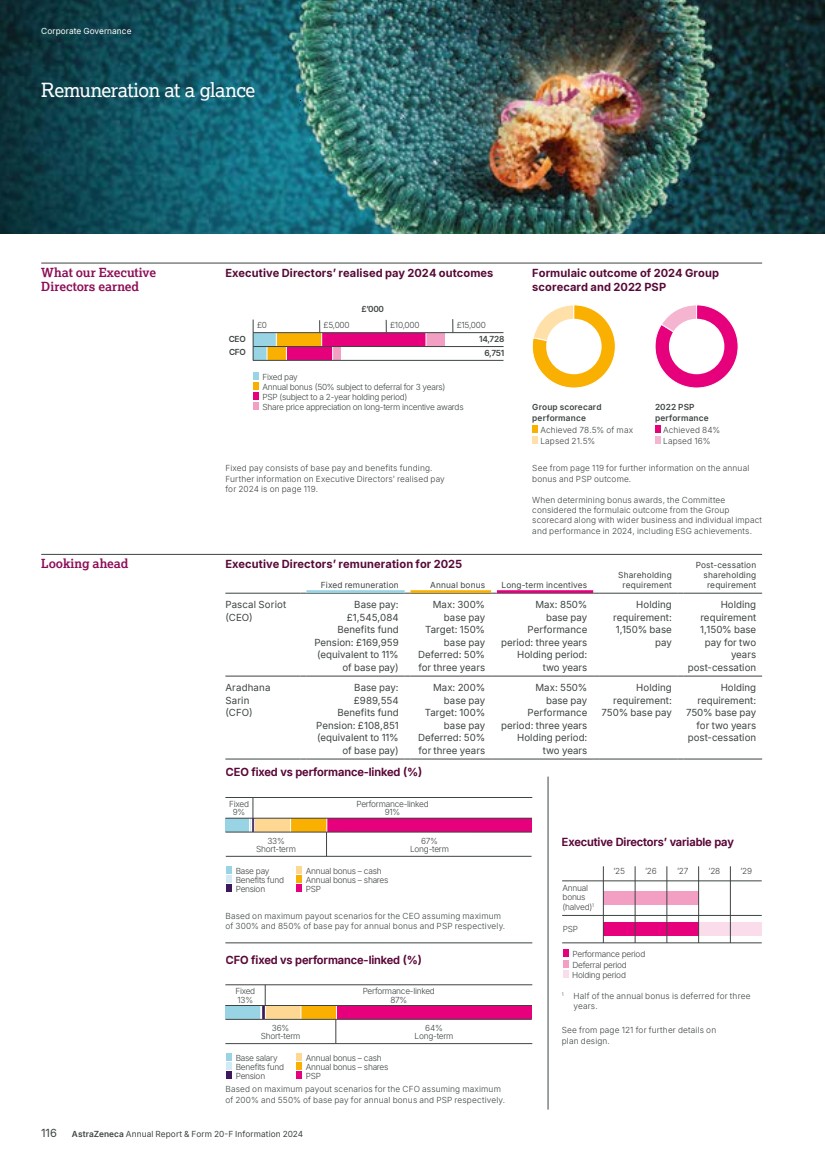
| Our focus on incentivising innovative science aligns with our patient-centric culture, as we strive to push the boundaries of science to deliver life-changing medicines to patients. The 2025 performance measures are closely aligned with our strategic priorities, as shown below. AstraZeneca aims to continue to deliver great medicines to patients while maintaining cost discipline and a flexible cost base, driving operating leverage and increased cash generation. To incentivise and reward delivery of great performance over the short and longer term, the Committee carefully considers the balance of science, financial and ESG measures between the Annual bonus and PSP. Strategic pillar Science and Innovation Remuneration performance measures Science indices Our science measures incentivise the development of NMEs and the maximisation of the potential of existing medicines. Bonus performance is assessed on pipeline progressions through Phase II and Phase III clinical trials. These reflect the outcome of nearer-term strategic investment decisions. As registrational Phase II trials become more common practice (for example in relation to cell therapy), pipeline progression events for bonus performance includes pivotal investment decisions for registrational Phase II and Phase III trials. In contrast, PSP performance is assessed on the volume of NMEs in Phase III and the registration stage, which reflects the outcome of longer-term strategic investment decisions. Additionally, we measure regulatory submissions and approvals for bonus, and regulatory approvals for PSP to drive the conversion of scientific progress into commercial revenue over the short term (bonus) and the longer term (PSP). Together, these science measures incentivise innovation and sustainable success along the length and breadth of the pipeline, leading to commercial growth. Strategic pillar People and Sustainability We are committed to people and making a difference to society. Assessment of performance against this pillar is captured through our holistic review of each Executive Director’s individual performance (detailed on pages 122 and 123) as part of the final determination of annual bonus, including consideration of our progress against our People and Sustainability aspirations: • Deliver a great employee experience by promoting inclusion and diversity, and fostering personal growth and enterprise leadership. • Leading on climate, equity and resilience by accelerating Ambition Zero Carbon, leading in addressing the connection between climate and health, and driving health equity and system resilience. • Enabling an agile organisation by developing and implementing Gen AI strategy, investing in site footprint and workplaces, and simplifying processes. Value Chain Emissions This measure encompasses aspects of our value chain (Scope 3) GHG emissions and for the 2025 PSP comprises the aggregate reductions from the NGP transition, primary distribution and business travel, representing approximately 25% of our 2024 value chain (Scope 3) GHG emissions. Strategic pillar Growth and Therapy Area Leadership Remuneration performance measures Total Revenue Our Total Revenue measure is included in the bonus and the PSP, reflecting the importance of incentivising sustainable growth in both the short and longer term. For more information about our strategic priorities, see from page 12. For more information about the 2025 performance measures, see from page 127. Financial targets Achieve Group Financial Targets Remuneration performance measures Cash flow Ensures that we can sustain investment in our pipeline and therapy areas while at the same time meeting our capital allocation priorities. Cash flow is included in both the bonus and the PSP, ensuring a focus on both short- and longer-term cash flow generation and balance sheet strength. Core EPS Incentivises operational efficiency and cost discipline, and remains a key measure of our profitability and a focus for our investors. Total shareholder return Assessed relative to our peer group of companies, the TSR measure rewards positive performance that our shareholders also directly benefit from. This measure incentivises outperformance versus our peer group, and promotes the delivery of long-term sustainable returns for our shareholders. Key Annual bonus PSP KPI Strategic Report Corporate Governance Financial Statements Additional Information Directors’ Remuneration Report AstraZeneca Annual Report & Form 20-F Information 2024 117 How our performance measures for 2025 support the delivery of our strategy |
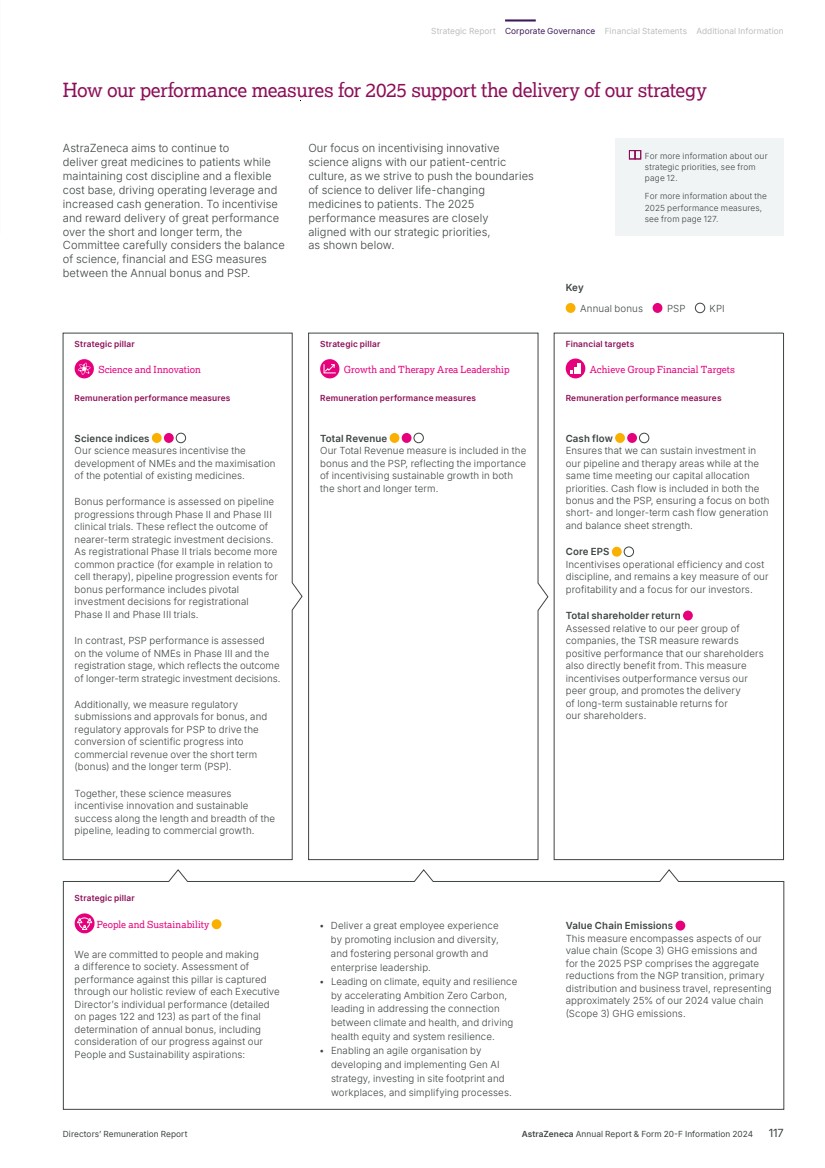
| We set stretching targets that incentivise our leaders to deliver exceptional performance, and to drive sustainable results for our patients, our employees and our shareholders. For the 2025 targets: • The Committee has reviewed the proposed targets against internal and external forecasts, including market consensus and peer group performance, and is comfortable that the level of stretch promotes truly exceptional performance in line with the delivery of the 2030 Ambition. • In real terms, taking into account exchange rate differences, financial performance goals under the 2025 Group scorecard and PSP would require achievement above prior year outturns and growth in excess of the average expected of the industry, particularly when taking the significant capital investment expected to be made during the performance period. Consistent with our approach in prior years, we undertake the following robust process to setting annual bonus and PSP targets and assessing outcomes: Stage 1 – Target setting Science targets are based on a cohort of scientific opportunities specified at the start of the performance period. Opportunities represent potential achievements through the pipeline, from an early stage where our scientists work to discover new molecules, through to ultimately obtaining approvals and getting new medicines to patients. Rewarding success at each stage recognises the importance of creating and maintaining a long-term sustainable pipeline. Stretch of proposed targets is reviewed by the Science Committee, taking into account factors such as the expected net present value of the pipeline and the anticipated financial contribution it will make, past performance, the external regulatory environment, and internal resourcing and efficiencies. Targets for realisation of these opportunities are ambitious. The outlook for the delivery of the pipeline is increasingly challenging given the rising proportion of new modalities and innovation, representing previously untested science. Proposed targets for the Sustainability measure are reviewed and endorsed by the Sustainability Committee and exceed the 1.5°C Paris Agreement glide path. Our decarbonisation ambitions are increasingly challenging to deliver in the context of broader enterprise growth, particularly the higher supply volumes required to fulfil demand for our medicines. Financial target metrics align with the Company’s Mid-Term Plan (MTP), which sets out the financial framework for delivering our ambitious strategy over a three-year period. The MTP process includes detailed business reviews, during which plans and efficiencies of each unit are challenged, leading to a proposed MTP for the Board to review and challenge. The Committee sets targets based on the Board‑approved MTP, considering consensus expectations, independent analytics, and anticipated challenges and opportunities. Whilst Total Revenue and Core EPS targets are set at budget exchange rates at the beginning of the performance period and evaluated at those rates at the end of the performance period (so that any beneficial or adverse movements in currency do not impact reward outcomes), the Committee also compares targets against prior plans at constant exchange rates, to ensure that new targets incentivise ambitious levels of growth. Where consensus figures do not align with internal forecasts, the Committee seeks to understand why a difference exists (such as differences in assumed capital expenditure). This range of data is used by the Committee to ensure the stretching nature of performance targets is robustly tested. Additionally, the PSP TSR measure is designed to reward strong performance relative to our peers. Stage 2 – Committee review and approval of targets The Committee thoroughly reviews and challenges targets proposed by management, working in partnership with the Science and Sustainability Committees to ensure targets are stretching and robust. The Committee is provided with considerable supporting material for each metric and receives briefings from senior leaders across AstraZeneca. The science measures are reviewed and endorsed by the Science Committee, with a focus on ensuring that the targets will result in long-term sustainable value creation, and the Committee reviews and approves the full cohort of opportunities. The sustainability metric within the PSP is aligned to our Ambition Zero Carbon goal and reflects the importance of decarbonisation, with a new focus on value chain (Scope 3) GHG emissions. The sustainability metric has been reviewed and endorsed by our Sustainability Committee. Committee members participate in the full Board discussions on the strategy, MTP and budget, which form the basis for the targets. The Committee considers how proposed financial targets align with the MTP and budget; prior years’ outcomes (in absolute terms and against target); how the ambition has changed from the prior MTP and budget; external guidance the Company has provided or plans to give; consensus from external financial analysts and factors it may be impacted by; and the underlying assumptions. Statistical analysis conducted by the Committee’s independent adviser is also used to assess the proposals. This includes an assessment of historical levels of performance volatility. Stage 3 – Performance assessment At the end of the period, final performance against each metric is assessed. Outcomes are calculated based on performance against each weighted metric. Each performance measure is assessed on a standalone basis, so that underperformance against one measure cannot be compensated for by overperformance against another. Data for the metrics is taken from the Group’s financial reports which are reviewed by the Audit Committee and approved by the Board. The Science Committee independently considers and informs the Committee whether science achievements represent a fair and balanced outcome, reflecting genuine achievements and pipeline progression. The sustainability metric within the PSP is validated by the Sustainability Committee. Apart from Cash flow, which is set at actual rates of exchange, financial metrics are set at budget rates of exchange and evaluated at those rates at year end, which means they are not directly comparable year-on-year. The Committee is, however, provided with data to allow it to conduct year-on-year analyses. Stage 4 – Determination of Executive Directors’ bonuses For annual bonus, the fairness of the formulaic Group scorecard outcome is considered in the context of overall business performance and the experience of shareholders. Such considerations include TSR performance and each Executive Director’s personal impact on the delivery of the strategy, wider ESG performance and other organisational achievements, such as inclusion and diversity targets and the realisation of technology‑based milestones. Each year, there are important individual deliverables beyond the scorecard metrics which are taken into account when determining individual bonuses. Having considered the Group scorecard outcome, overall business performance, the experience of shareholders and individual performance, as detailed from page 122, the Committee carefully determines a final bonus outcome for each Executive Director that is considered fair and appropriate for the year’s performance, and is in the best interests of shareholders. Corporate Governance 118 AstraZeneca Annual Report & Form 20-F Information 2024 How the Remuneration Committee ensures targets are stretching |
| The elements within the Executive Directors’ realised pay are colour coded: • Fixed remuneration has a light blue border and is found on page 120. • Annual bonus has a yellow border and can be found on pages 120 to 124. • Long-term incentives (LTI) has a magenta border and can be found on pages 124 to 127. Executive Directors’ remuneration This section of the Directors’ Remuneration Report sets out the Executive Directors’ remuneration for the year ended 31 December 2024, alongside the remuneration that will be paid to Executive Directors during 2025. Audited Executive Directors’ realised pay for 2024 (single total figure of remuneration) The table below sets out all elements of realised pay receivable by the Executive Directors in respect of the year ended 31 December 2024, alongside comparator figures for 2023. This includes the vesting of PSP awards from 2022 following the three-year performance period. These shares are subject to a further two-year holding period. The increase in AstraZeneca’s share price over the period of grant to vest has provided the Executive Directors with a significant increase in value of the equity components of their reward. £1,397,676 of Mr Soriot’s and £619,702 of Dr Sarin’s 2024 realised pay is attributable to share price increases. The benefit of the increased share price has also been experienced by shareholders. The Committee did not exercise any discretion in relation to the LTI outcomes or the formulaic outcome of the Group scorecard. £’000 Base pay Taxable benefits Pension Other Total fixed Annual bonus Long-term incentives1 Total variable Single total figure Share price appreciation as % of single total figure Pascal Soriot 2024 1,486 138 163 – 1,787 3,499 9,442 12,941 14,728 9% 2023 1,429 140 157 – 1,726 2,839 12,806 15,645 17,371 26% Aradhana Sarin 2024 951 14 105 – 1,070 1,494 4,187 5,681 6,751 9% 2023 915 46 101 – 1,062 1,455 1,972 3,427 4,489 10% 1 Long-term incentive values disclosed in 2023 have been recalculated using the average closing share price for the three months ended 31 December 2024. See page 124. The following sections provide further detail on the figures in the above table, including the underlying calculations and assumptions and the Committee’s performance assessments for variable remuneration. The Annual bonus section is set out from page 120 and the Long-term incentives section from page 124. Information about the Executive Directors’ remuneration arrangements for the coming year, ending 31 December 2025, is highlighted in grey boxes. Planned implementation for 2025 Content contained within a grey box indicates planned implementation for 2025. Audited information Audited Content contained within the Audited panel indicates that all the information within has been subject to audit. Key: Strategic Report Corporate Governance Financial Statements Additional Information Directors’ Remuneration Report AstraZeneca Annual Report & Form 20-F Information 2024 119 Annual Report on Remuneration |
| Annual bonus 2024 Annual bonus Annual bonuses earned in respect of performance during 2024 are included in the realised pay table. Detailed information on the Committee’s approach to target setting and assessment of performance is set out from page 121. Half of the Executive Directors’ pre-tax bonus is compulsorily deferred into Ordinary Shares which are released three years from the date of deferral. Bonuses are not pensionable. Taxable benefits The totals within taxable benefits include the CEO’s allowance under AstraZeneca’s UK Flexible Benefits Programme, under which he can select benefits or take his allowance, or any proportion remaining after the selection of benefits, in cash (£118,156 taken as cash). In 2024, benefits included additional healthcare/death in service insurance, as well as personal tax advice. The value of this personal tax advice provided to each Executive Director in 2024 was £14,542 and £12,105 for the CEO and CFO respectively. Fixed remuneration Base pay When awarding base pay increases, the Committee considers, among other factors, base pay increases applied across the UK employee population. The increase to current Executive Directors’ base pay for 2025 will be in line with the UK all-employee base pay budget at 4%. Pension The Executive Directors receive a pension allowance of 11% of base pay, in line with the wider UK workforce. During 2024, the Executive Directors took their pension allowance as a cash alternative to participation in a defined contribution pension scheme. Neither of the Executive Directors has a prospective entitlement to a defined benefit pension by reason of qualifying service. Audited Audited Audited Audited Annual bonus in respect of performance during 2024 Bonus potential as % of base pay Bonus payable in cash Bonus deferred into shares Total bonus £’000 Target Maximum awarded Pascal Soriot 150% 300% 1,749 1,750 3,499 78.5% max Aradhana Sarin 100% 200% 747 747 1,494 78.5% max 2024 2025 £’000 Total taxable benefits Taxable benefits Pascal Soriot 138 In line with 2024 Aradhana Sarin 14 In line with 2024 2024 2025 £’000 Change from 2023 Base pay Change from 2024 Base pay Pascal Soriot 4% 1,486 4% 1,545 Aradhana Sarin 4% 951 4% 990 2024 2025 £’000 Pensionable base pay Pension allowance Cash in lieu of pension Pension allowance Pascal Soriot 1,486 11% of base pay 163 11% of base pay Aradhana Sarin 951 11% of base pay 105 11% of base pay Corporate Governance 120 AstraZeneca Annual Report & Form 20-F Information 2024 Annual Report on Remuneration continued |
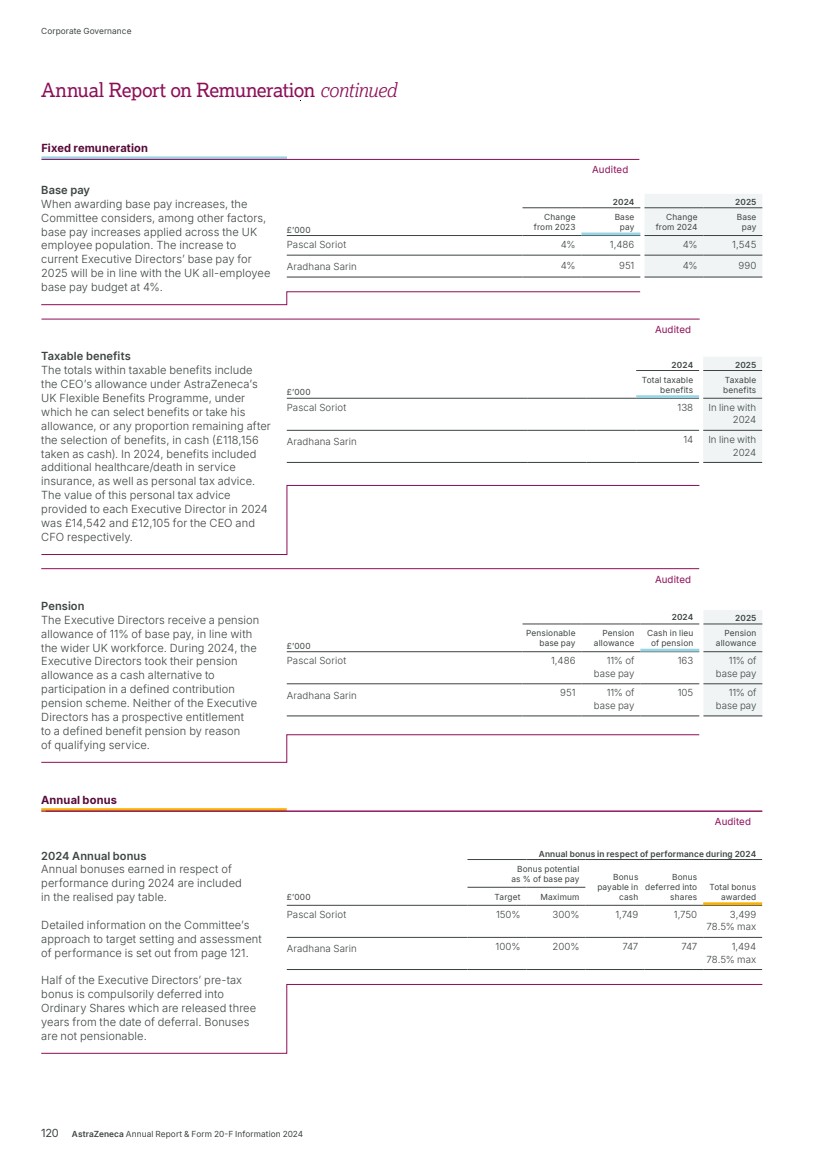
| 2024 Group scorecard assessment Performance against the 2024 Group scorecard is set out below. The Group scorecard is used in the determination of bonus payouts for all AstraZeneca employees. Each metric within the scorecard is assessed on a standalone basis and has a defined payout range. Performance below the specified threshold level for a metric will result in 0% payout for that metric. 100% of target bonus will pay out for on-target performance, and 200% of target bonus will pay out for performance at or above maximum. Performance between threshold and maximum is assessed on a pro rata basis. Maximum bonus payouts for the CEO and CFO for 2024 were capped at 300% and 200% of base pay respectively. The payout range for each metric is capped in line with each Executive Director’s maximum bonus opportunity to ensure underperformance against one metric cannot be compensated for by overachievement against another. The table below shows the scorecard formulaic outcomes for the CEO and CFO as a percentage of target bonus. 2024 Group scorecard performance measures and metrics Weighting Threshold (0% payout) Target (100% payout) Maximum (200% payout) Outcome Formulaic outcome (% of target bonus) Science and Innovation measures Science and Innovation: Annual pipeline progression Pipeline progression events 15% 14 27 41 24 12% Regulatory events 15% 29 42 55 52 27% Subtotal – Science and Innovation measures 30% 39% Financial measures Growth and Therapy Area Leadership Total Revenue ($bn) 30% 50.5 52.1 53.7 53.8 60% Achieve Group Financial Targets Cash flow ($bn) 20% 8.7 10.2 11.7 10.1 18% Core EPS ($) 20% 7.43 7.82 8.21 8.22 40% Subtotal – Financial measures 70% 118% Total 100% 157% Key: Bar charts are indicative of 2024 performance; scales do not start from zero. Due to rounding, the total formulaic outcome differs from the arithmetic total of the individual metric outcomes disclosed above. Pipeline progression events include Phase II starts and progressions, and NME and life-cycle management (LCM) positive pivotal trial investment decisions. Regulatory events include NME and major LCM regional submissions and approvals. Further detail on our Science and Innovation strategic priority and these events is included from page 12 of this Annual Report. Annual bonus continued Audited Strategic Report Corporate Governance Financial Statements Additional Information Directors’ Remuneration Report AstraZeneca Annual Report & Form 20-F Information 2024 121 |
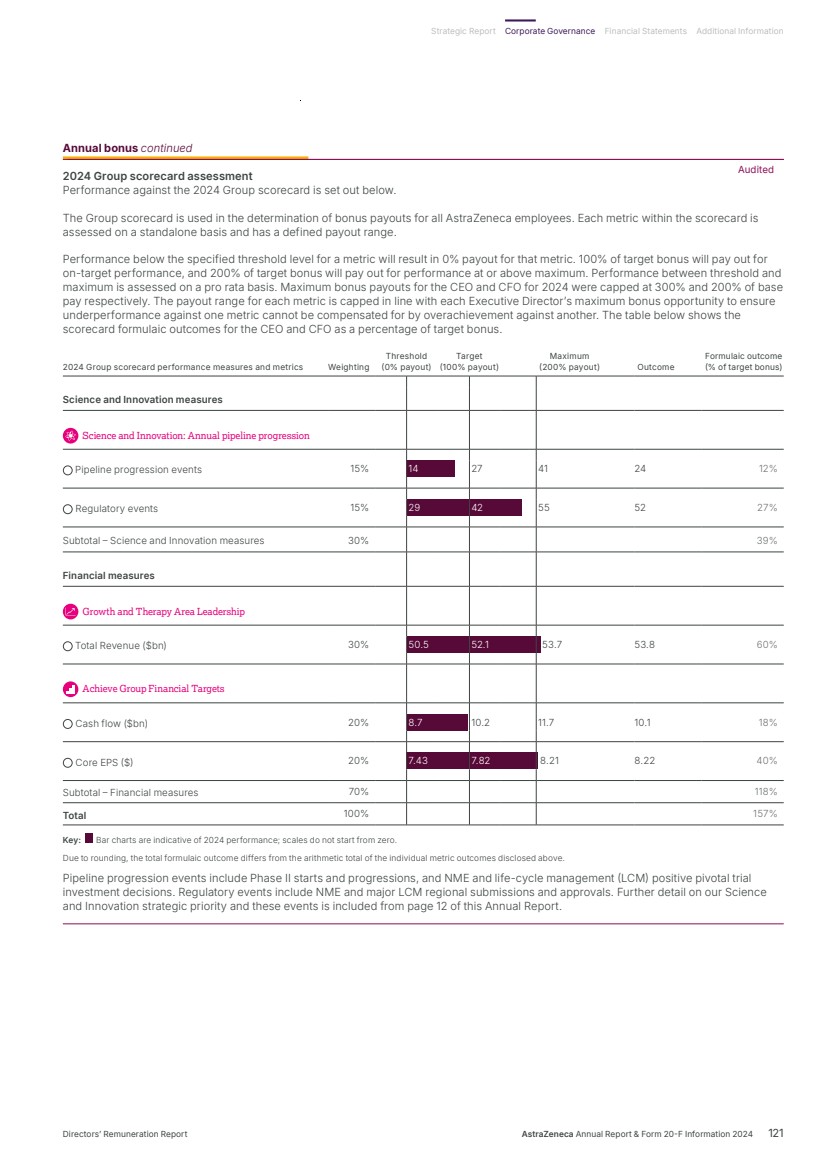
| In 2024, the Growth and Therapy Area Leadership measure was based on Total Revenue. The Total Revenue and Core EPS measures are both set and evaluated at budget exchange rates at the beginning of the year and evaluated at those rates at the end of the performance period, so that any beneficial or adverse movements in currency, which are outside the Company’s control, do not impact reward outcomes. The Cash flow measure is set and evaluated at the actual exchange rate and is evaluated by reference to net cash flow from operating activities less capital expenditure, adding back proceeds from disposal of intangible assets, to be fully transparent with all elements easily derived from the Group IFRS Cash Flow Statement. Overall assessment During 2024, the Executive Directors’ individual performance was assessed in the following key areas which align with the Company’s objectives. Pascal Soriot Despite an increasingly volatile environment globally, Mr Soriot has led AstraZeneca to deliver strong results in 2024, with another year of robust top line growth and impressive results from the pipeline. In addition, the Committee considered Mr Soriot’s leadership across other dimensions of performance: Demonstrating leadership to support developments in global life sciences Mr Soriot has continued to champion and shape groundbreaking scientific innovation, the sustainable development of healthcare and health education, and to further strengthen AstraZeneca’s growth. He has achieved this through multiple engagements with a diverse audience of government officials globally including leaders from the UK, the US, China and Singapore; along with attending many leading scientific congresses and societies. He also continues to chair the SMI Health Systems Task Force, engaging with HM King Charles III and global CEOs from multiple sectors. Leading in Environmental, Social & Governance (ESG) performance Mr Soriot continues to ensure that AstraZeneca’s name is synonymous with sustainability and purposefully drives the Company to lead in the efforts of climate action and decarbonisation. Under Mr Soriot’s leadership, the Södertälje, Sweden operations site reached the milestone of reducing its Scope 1 and Scope 2 greenhouse gas emissions by over 98% compared with the 2015 baseline. AstraZeneca also saw the completion of the clinical program to support the first regulatory filings for the transition of inhaled medicines to an innovative, next generation propellant with 99.9% lower global warming potential than propellant used in currently available inhaled medicines. The Healthy Heart Africa programme surpassed its ambition by identifying 12.5 million people with elevated blood pressure and has now successfully conducted more than 63 million blood pressure screenings, and activated more than 1,500 facilities across nine countries in Sub-Saharan Africa. The Company retained its EcoVadis Gold Medal ranking for the second year placing AstraZeneca in the top three percent of companies evaluated, was included in TIME Best Companies 2024 for sustainability transparency, and the Financial Times and Statista’s list of Europe Climate leaders 2024. Making AstraZeneca a Great Place to Work Mr Soriot has ensured that inclusion and diversity (I&D) is embedded as part of the culture at AstraZeneca, with a determination to provide an environment which fosters innovation and collaboration. I&D priorities focus on psychological safety, inclusive leadership at all levels, pay equity education, sponsorship and mentoring programmes. Progress has been recognised externally in 2024 by Forbes World’s Top Companies for Women, Forbes World’s Best Employers, TIME World’s Best Companies and the 2025 Financial Times Diversity Leaders awards. Mr Soriot has continued to champion a culture of learning and growth across the business, sponsoring a range of offerings that enable employees to perform, grow, adapt and belong. Key investments over the year include “Leading our Future”, a new custom built leadership offering for middle and senior leaders, ”Leading Ambition”, a programme for our Executives; “Manager in Action” which is a new flexible learning journey supporting all Line Managers; and the Company’s bespoke generative AI accreditation programme, which supports all employees to build the confidence, knowledge and experience of using AI tools. Annual bonus continued Audited Corporate Governance 122 AstraZeneca Annual Report & Form 20-F Information 2024 Annual Report on Remuneration continued |
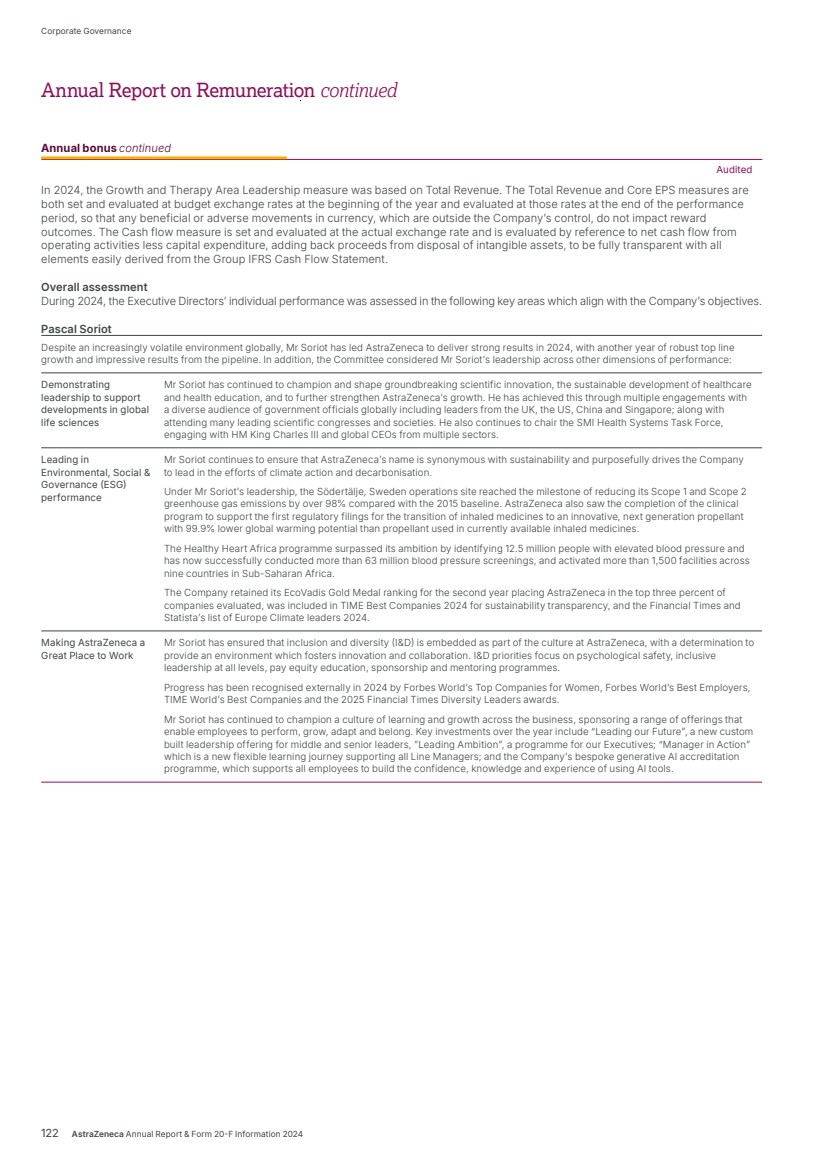
| Aradhana Sarin Over 2024 Dr Sarin has focussed on fostering a high-performance culture whilst driving productivity and empowering change. Performance delivery Guided by Dr Sarin’s leadership, the Finance function delivered another year of strong performance. She has successfully led the refinancing of debt at attractive rates and overseen significant investment in Capex. Dr Sarin remains closely involved with business development teams, and over 2024 has provided guidance for negotiations, and also post-acquisition integration and risk management for acquisitions including Gracell, Icosavax and Fusion. Building a Finance function of the future Dr Sarin has spearheaded significant steps in the development of technology within the Finance function including systems for tax forecasting and improvements to ensure compliance with digital tax laws. Dr Sarin has been an advocate for implementing the use of AI across the Company and has encouraged the upskilling of the entire Finance function and the wider enterprise, on AI use. Greater standardisation is being driven by automation. The Global Business Service (GBS) function continues to transform and drive significant efficiencies. GBS delivered annual savings of more than $45 million over 2024 by strategically insourcing from third party providers and improving productivity, and also expanding their global footprint in some of our new strategic hubs. They also developed and implemented innovative process solutions such as process mining, resulting in freeing up approximately 250,000 hours allowing the enterprise to operate more efficiently and focus on high value activities. Axial Throughout 2024 Dr Sarin has overseen the launch of the Axial programme, under which the enterprise will adopt the S/4HANA platform, transitioning seven Enterprise Resource Planning (ERP) systems into one. This impactful programme is on track to transform the way we work across the entire financial management and supply chain, removing complexity, standardise ways of working and simplify processes. In 2024, the project team became fully operational, a detailed plan was created, and data organisation and cleanse activities progressed to strengthen our data foundations and set the programme up for long term success. Great Place to Work Dr Sarin has supported the effort to unify multiple women’s forums across the enterprise into one global Network of Women, launching chapters in Ireland, Sweden, Dubai and other regions. Over 2024 she continued to host a well-received podcast series called “In Conversation with”, that features informal conversations with high-profile female leaders in business. She is also the Executive sponsor of AstraZeneca’s Asian Employee Resource Group. Audited Final determination of Executive Directors’ bonuses In determining the annual bonus outturn for Executive Directors, the Committee considers the formulaic Group scorecard outcome, as well as the overall business performance, shareholder experience and the personal contribution of the individual Executive Director. A description of the Executive Directors’ personal achievements is detailed above. Given the contributions made by both Mr Soriot and Dr Sarin in 2024 as outlined above, the Committee determined the bonus outturns for both Executive Directors should be 157% of target (or 78.5% of maximum), in line with the formulaic Group scorecard outcome. Deferred Bonus Plan Half of each Executive Director’s pre-tax annual bonus is ordinarily deferred under the Deferred Bonus Plan (DBP). In respect of the bonus deferred, the Executive Director is granted a conditional award over shares. No further conditions apply to DBP shares. One half of the bonus earned in respect of performance during 2023 was deferred and details of the consequent DBP awards granted in 2024 are shown below. One half of the Executive Directors’ bonus earned in respect of performance during 2024 has been deferred and the consequent DBP awards are expected to be granted in March 2025. Audited 2024 Grant1 2025 Grant Ordinary Shares granted Grant date Grant price (pence per share)2 Face value £’000 2024 Bonus deferred £’000 Pascal Soriot 14,081 4 March 2024 10081 1,420 1,750 Aradhana Sarin 7,214 4 March 2024 10081 728 747 1 One half of the bonus earned in respect of performance during 2023 was deferred into shares, with the consequent DBP awards granted in 2024. 2 The grant price is the average closing share price over the three dealing days preceding grant. 2025 Group scorecard performance measures and metrics Measure weighting Underlying metrics (if applicable) Metric weighting 2025 target Science and Innovation: Annual pipeline progression 30% Pipeline progression events 15% C Regulatory events 15% C Growth and Therapy Area Leadership 30% Total Revenue 30% C Achieve Group Financial Targets 40% Cash flow 20% C Core EPS 20% C Key: Target increased vs 2024 target Target decreased vs 2024 target Target constant C Commercially sensitive Annual bonus continued Audited Strategic Report Corporate Governance Financial Statements Additional Information Directors’ Remuneration Report AstraZeneca Annual Report & Form 20-F Information 2024 123 |

| Long-term incentives included in the Executive Directors’ realised pay for 2024 figure: 2022 PSP The Executive Directors’ realised pay for 2024 includes the value of PSP awards with performance period ended 31 December 2024. These shares and dividend equivalents will not be released to the Executive Directors until the awards vest at the end of the holding period. The value of the shares due to vest has been calculated using the average closing share price over the three-month period ended 31 December 2024 (10868 pence). The table below provides a breakdown showing the face value of these shares at the time they were granted, the value that is attributable to share price appreciation since grant, and the value of dividend equivalents accrued on these shares over the relevant performance period. Further information about the individual awards and performance assessments follows the table. Audited Long-term incentive awards with performance periods ended 31 December 2024 Value of shares due to vest Ordinary Shares granted Performance outcome Face value at time of grant1 £’000 Value due to share price appreciation2 £’000 Dividend equivalent accrued over performance period £’000 Long-term incentives total £’000 Pascal Soriot 2022 PSP 97,066 84% 7,464 1,398 580 9,442 Aradhana Sarin 2022 PSP 43,038 84% 3,309 620 258 4,187 1 Calculated using the grant price of 9154 pence, being the average closing share price over the three dealing days preceding the grant of the 2022 PSP awards. 2 Calculated using the difference between the grant price and the average closing share price over the three-month period ended 31 December 2024. The average closing share price over the three-month period ended 31 December 2024 was 10868 pence. The 2022 PSP awards granted to Mr Soriot and Dr Sarin on 4 March 2022, are due to vest and be released on 4 March 2027 on completion of a further two-year holding period. Performance over the period from 1 January 2022 to 31 December 2024 will result in 84% of the awards vesting, based on the following assessment of performance. Annual bonus continued Long-term incentives We intend to disclose the 2025 Group scorecard outcome and details of the performance hurdles and targets in the 2025 Directors’ Remuneration Report following the end of the performance period. The performance targets are currently considered to be commercially sensitive as prospective disclosure may prejudice the Company’s commercial interests. Executive Directors’ individual contribution will be assessed by reference to individual goals in line with the Company’s objectives for the year. Audited Corporate Governance 124 AstraZeneca Annual Report & Form 20-F Information 2024 Annual Report on Remuneration continued |
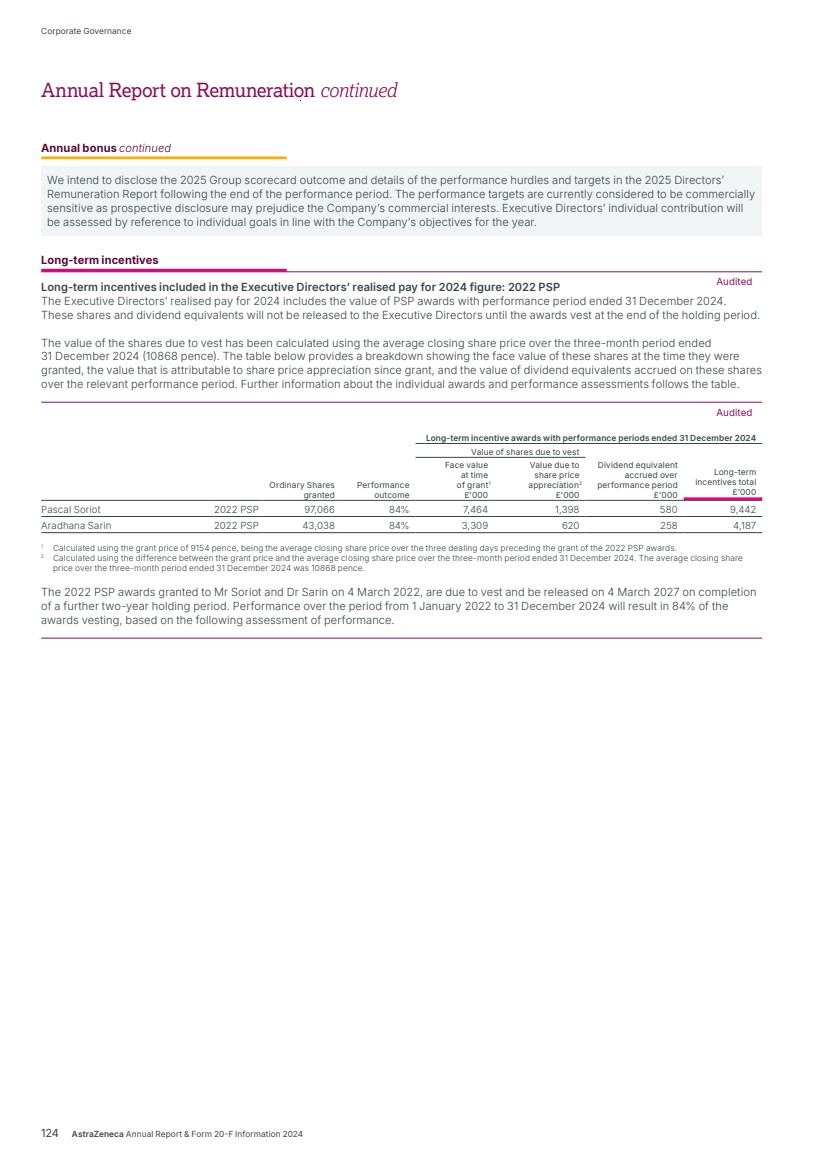
| The Growth and Therapy Area Leadership target (measuring Total Revenue) is set at budget exchange rates at the beginning of the performance period and evaluated at those rates at the end of the performance period, so that any beneficial or adverse movements in currency, which are outside the Company’s control, do not impact reward outcomes. The Cash flow measure is assessed using cumulative net cash flow from operating activities less capital expenditure, adding back proceeds from the disposal of intangible assets. The 2022 PSP sustainability metric focused on reduction in Scope 1 and Scope 2 GHG emissions glide path (Ambition Zero Carbon). For more information about the Company’s sustainability initiatives, including Ambition Zero Carbon see Climate change from page 53. AstraZeneca ranked tenth within the TSR peer group. The TSR peer group for the 2022 PSP consisted of AbbVie, Amgen, Astellas, BMS, Daiichi Sankyo, Eli Lilly, Gilead, GSK, Johnson & Johnson, Merck KGaA, Moderna, MSD, Novartis, Novo Nordisk, Pfizer, Roche, Sanofi and Takeda. PSP awards granted during 2024 During 2024, conditional awards of shares were granted to the Executive Directors with face values equivalent to 850% of base pay for Mr Soriot and 550% of base pay for Dr Sarin under the PSP. Face value is calculated using the grant price, being the average closing share price over the three dealing days preceding grant. Following the approval of the Policy at the 2024 AGM, the 13 May 2024 grant was made at the same share price as the 4 March 2024 grant. Performance will be assessed over the period from 1 January 2024 to 31 December 2026 against the measures outlined below to determine the proportion of the award that vests. A further two-year holding period will then apply before vesting, which is scheduled to occur on the fifth anniversary of grant. Ordinary Shares granted Grant date Grant price (pence per share) Face value £’000 End of performance period End of holding period Pascal Soriot 95,791 4 March 2024 10081 9,657 31 December 2026 4 March 2029 Pascal Soriot1 29,474 13 May 2024 10081 2,971 31 December 2026 13 May 2029 Aradhana Sarin 51,911 4 March 2024 10081 5,233 31 December 2026 4 March 2029 1 This award forms part of the PSP award granted to Mr Soriot on 4 March 2024 and was made to take account of the revised limits for the PSP approved by shareholders at the Company’s 2024 AGM. The 2024 PSP performance measures focus on scientific, ESG, commercial and financial performance over the three-year performance period. The five performance metrics attached to the 2024 PSP awards are detailed below. Twenty per cent of the award will vest if the threshold level of performance is achieved; the maximum level of performance must be achieved under each measure for 100% of the award to vest. Relative total shareholder return (TSR) (20% of award) TSR performance is assessed against a predetermined peer group of global pharmaceutical companies and consists of AbbVie, Amgen, Astellas, BMS, Daiichi Sankyo, Eli Lilly, Gilead, GSK, Johnson & Johnson, Merck KGaA, Moderna, MSD, Novartis, Novo Nordisk, Pfizer, Roche, Sanofi and Takeda. The rank which the Company’s TSR achieves over the performance period will determine how many shares will vest under this measure. TSR ranking of the Company % of award that vests Median 20% (threshold for payout) Between median and upper quartile Pro rata Upper quartile 100% Long-term incentives continued Audited 2022 PSP performance measures and metrics Outcome Payout Science and Innovation: First approvals and NME volume over three years NME Phase III/registrational volume 12% 7 14 19 12% Regulatory events 18% 14 28 28 18% Subtotal – Science and Innovation1 30% 30% Growth and Therapy Area Leadership ($bn) 20% 40.5 47.5 59.5 20% Cash flow ($bn) 20% 20.0 28.5 28.5 20% Total shareholder return 20% Median UQ2 10th 4% Ambition Zero Carbon 10% 207 ktCO2e 155 ktCO2e 140ktCO2e 10% Total1 100% 84% Key: Bar charts are indicative of 2022 PSP performance; scales do not start from zero. Due to rounding, the total outcome differs from the arithmetic total of the individual metric outcomes disclosed above. 1 The subtotal and total reflect the weightings of the individual metrics. 2 UQ = Upper Quartile. Weighting Maximum (100% vesting) Threshold (20% vesting) Strategic Report Corporate Governance Financial Statements Additional Information Directors’ Remuneration Report AstraZeneca Annual Report & Form 20-F Information 2024 125 |
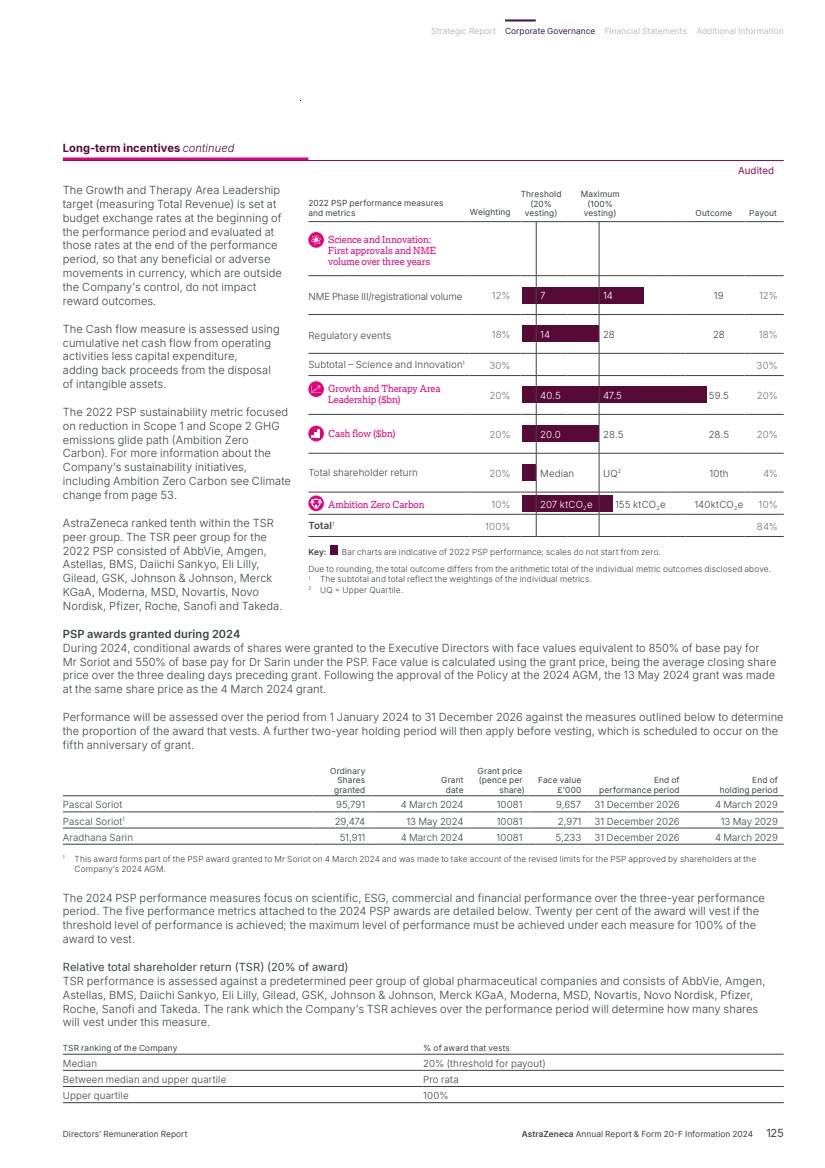
| Net Cash flow (20% of award) The Cash flow measure is assessed using cumulative net cash flow from operating activities less capital expenditure adding back proceeds from the disposal of intangible assets. The level of vesting under this measure is based on a scale between a threshold target and an upper target. Cash flow % of award that vests $23.0bn 20% (threshold for payout) Between $23.0bn and $28.0bn Pro rata $28.0bn 75% Between $28.0bn and $33.0bn Pro rata $33.0bn and above 100% Growth and Therapy Area Leadership (20% of award) For PSP awards granted in 2024, the Growth and Therapy Area Leadership metric is Total Revenue. Disclosing the threshold and maximum hurdles for this measure could be construed to constitute financial guidance, which is not the Company’s intention. The Growth and Therapy Area Leadership (Total Revenue) measure is thus considered to be commercially sensitive and will be disclosed following the end of the performance period, in the 2026 Directors’ Remuneration Report. This measure is evaluated by reference to budget exchange rates. Science and Innovation: First approvals and NME volume over three years (30% of award) Performance is assessed using dual indices which measure NME Phase III/registrational volume and regulatory events, allowing disclosure of targets at the beginning of the performance period. NME Phase III/registrational volume (12% of award) % of award that vests Regulatory events (18% of award) % of award that vests 14 20% (threshold for payout) 16 20% (threshold for payout) Between 14 and 21 Pro rata Between 16 and 24 Pro rata 21 75% 24 75% Between 21 and 28 Pro rata Between 24 and 32 Pro rata 28 100% 32 100% Ambition Zero Carbon (10% of award) For the 2024 PSP, this measure reflects the importance of eliminating GHG emissions from our Scope 1 and Scope 2 operations through 2026. Reductions are measured against our 2015 baseline, and calculated in line with the World Resources Institute/World Business Council for Sustainable Development GHG Protocol methodology for accounting and reporting of our emissions footprint. Emissions % of award that vests 26 ktCO2e 20% (threshold for payout) Between 26 ktCO2e and 19 ktCO2e Pro rata 19 ktCO2e 75% Between 19 ktCO2e and 13 ktCO2e Pro rata 13 ktCO2e and below 100% Long-term incentives continued Audited Corporate Governance 126 AstraZeneca Annual Report & Form 20-F Information 2024 Annual Report on Remuneration continued |
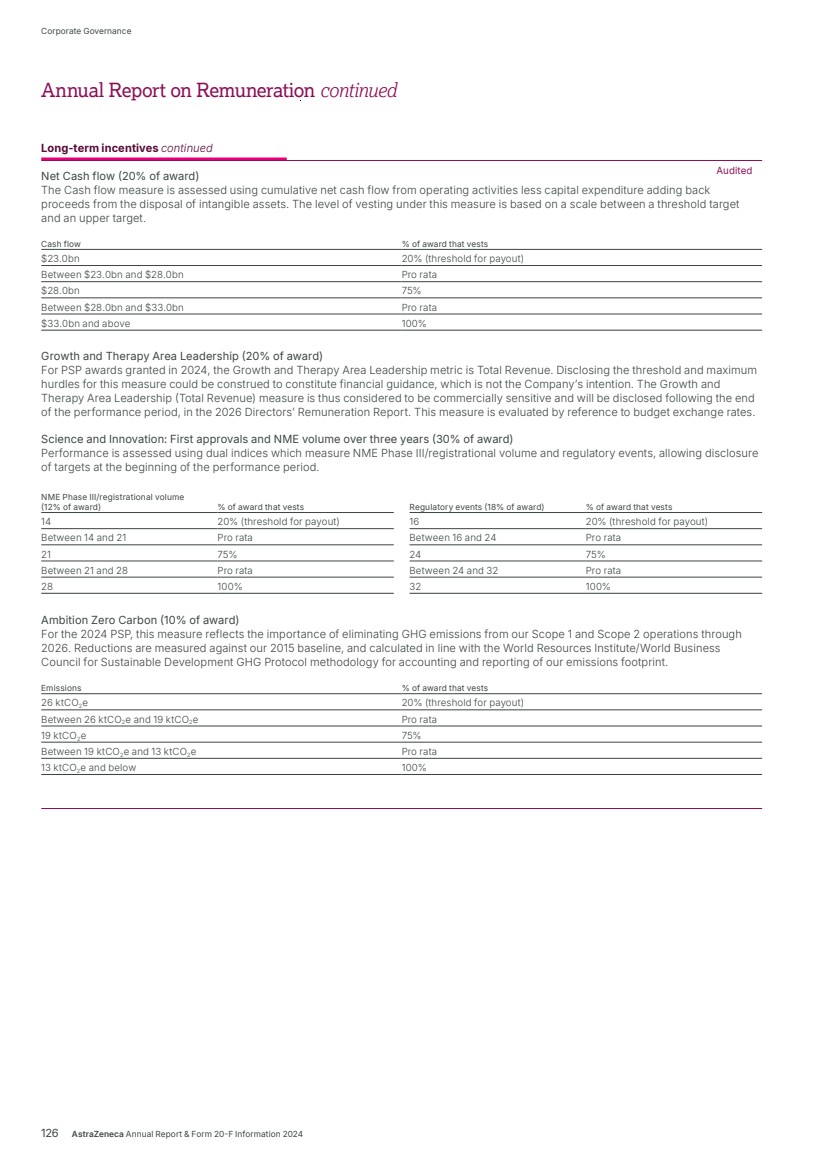
| PSP performance measures for 2025 grant The sustainability measure within the 2025 PSP has been updated as set out below. All other measures remain unchanged from the 2024 PSP award. PSP performance measure Measure weighting Underlying metrics (if applicable) Metric weighting Threshold (20% vesting) Maximum (100% vesting) Science and Innovation: First approvals and NME volume over three years 30% NME Phase III/registrational volume 12% 14 28 Regulatory events 18% 18 35 Growth and Therapy Area Leadership 20% Total Revenue Commercially sensitive until end of performance period Cash flow 20% $27.5bn $35.5bn Relative TSR 20% Median Upper Quartile Sustainability 10% Value Chain emissions (Scope 3) 1,846 ktCO2e 1,434 ktCO2e Regulatory events measure NME and major life-cycle management approvals (taking into account the first approval over the performance period). NME Phase III/registrational volume measures the total NME pipeline volume at the end of the performance period. These two items ensure that management is assessed on both R&D late-stage delivery (approvals) and also future pipeline sustainability (volume). Disclosing the threshold and maximum hurdles for the Growth and Therapy Area Leadership (Total Revenue) measure could be construed to constitute financial guidance, which is not the Company’s intention. The Total Revenue measure is thus considered to be commercially sensitive and will be disclosed following the end of the performance period. The Total Revenue measure is evaluated by reference to budget exchange rates such that beneficial or adverse movements in currency, which are outside the Company’s control, do not impact reward outcomes. The companies in the TSR comparator group are shown on page 125. The Cash flow measure is assessed using cumulative net cash flow from operating activities less capital expenditure adding back proceeds from the disposal of intangible assets. Capital expenditure is expected to increase significantly during the performance period, driven by investment in several major manufacturing capabilities such as active pharmaceutical ingredients, inhaled products, monoclonal antibodies, antibody drug conjugates and cell therapy. As we reach the end of our Scope 1 and Scope 2 GHG emission glide path, our 2025 sustainability metric, Ambition Zero Carbon, will focus on value chain (Scope 3) GHG emissions and aggregate reductions from the next-generation propellant transition, primary distribution and business travel, which represent approximately 25% of our 2024 value chain (Scope 3) GHG emissions. For more information on Ambition Zero Carbon, see Climate change from page 53. As described on page 118, the Committee takes into account a wide range of data to ensure that the stretching nature of PSP hurdles is robustly tested and that financial targets are aligned with the Company’s Mid-Term Plan. The Committee takes consensus and exchange rates into account when determining the appropriate level of stretch relative to prior plans and performance outturns. PSP awards are expected to be granted to the Executive Directors in March 2025. The PSP award to be granted to Mr Soriot will be equivalent to 850% of base pay. The PSP award to be granted to Dr Sarin will be equivalent to 550% of base pay. Long-term incentives continued For more information about How our performance measures for 2025 support the delivery of our strategy, and How the Remuneration Committee ensures targets are stretching, see pages 117 and 118, respectively. Strategic Report Corporate Governance Financial Statements Additional Information Directors’ Remuneration Report AstraZeneca Annual Report & Form 20-F Information 2024 127 |
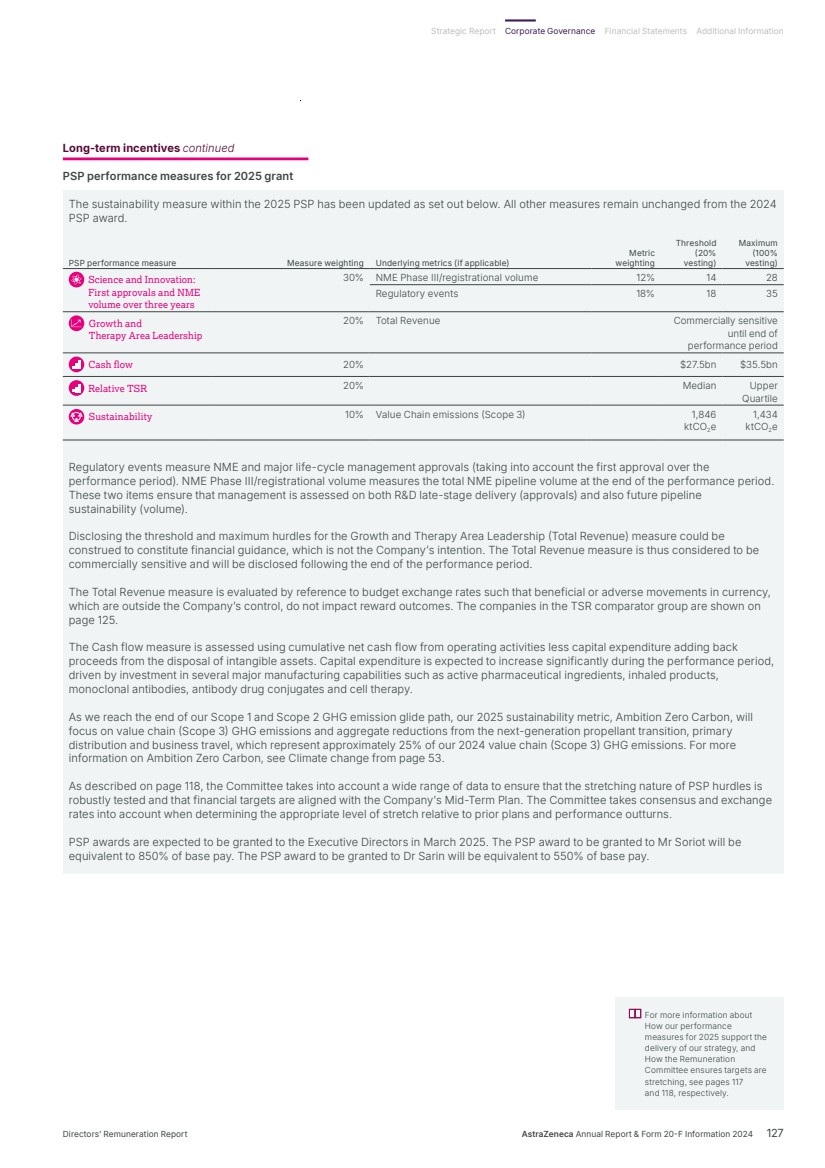
| Non-Executive Directors’ realised pay for 2024 (single total figure of remuneration) The table sets out all elements of remuneration receivable by the Non-Executive Directors in respect of the year ended 31 December 2024, alongside comparative figures for the prior year. 2024 Fees £’000 2023 Fees £’000 2024 Other £’000 2023 Other £’000 2024 Total £’000 2023 Total £’000 Michel Demaré1 800 584 – – 800 584 Euan Ashley 160 119 – – 160 119 Philip Broadley 233 200 – – 233 200 Deborah DiSanzo 140 120 – – 140 120 Diana Layfield 135 110 – – 135 110 Anna Manz2 140 40 – – 140 40 Sheri McCoy 205 175 – – 205 175 Tony Mok 135 110 – – 135 110 Nazneen Rahman 200 160 – – 200 160 Andreas Rummelt 135 110 – – 135 110 Marcus Wallenberg 155 125 – – 155 125 Former Non-Executive Directors Leif Johansson3 – 203 – 22 – 225 Total 2,438 2,056 – 22 2,438 2,078 1 Michel Demaré was appointed Chair of the Board from 27 April 2023. 2 Anna Manz was appointed as a Non-Executive Director and member of the Audit Committee on 1 September 2023. 3 Leif Johansson retired from the Board on 27 April 2023. Mr Johansson’s single total figure includes office costs (invoiced in Swedish kronor) of £21,955 for the period in 2023 during which he was Chair of the Board. Non-Executive Directors’ fee structure The Non-Executive Directors’ fees effective from January 2025 are set out in the table below, alongside the fees applicable during 2024. Fees for the Non-Executive Directors (other than the Chair of the Board) were determined by the Chair of the Board and the Executive Directors. Changes to the Chair of the Board’s fee were determined by the Remuneration Committee, excluding the Chair of the Board. No Board member participated in any decisions relating to their own fees. From December 2024, the fee structure will be reviewed annually, but not necessarily increased. The Chair’s fee was last reviewed in July 2022 and increased with effect from May 2023. Certain of the other Non-Executive Directors’ fees were last increased in January 2024. In the latest review, the size and complexity of the AstraZeneca Group was considered, together with the continuing increase in workload, responsibilities, and time commitment for non-executive directors of global, publicly listed companies, in part driven by changes in the corporate governance and regulatory landscape in multiple jurisdictions. Independent market data from FTSE 30 and FTSE 10 companies was also reviewed to ensure that AstraZeneca’s fees do not hinder the recruitment of Directors of the right experience and calibre for a Group of our scale in a global market. With effect from January 2025, the Chair’s fee has been increased from £800,000 to £890,000 and the Company will reimburse the Chair’s reasonable office costs up to £75,000 per annum. Other increases have been made to the basic Non-Executive Director fee, the senior independent Non-Executive Director’s fee, the Chairs’ fees for the Audit and Remuneration Committees, as well as the fees for membership of the Audit, Remuneration, Sustainability and Science Committee. A fee has also been introduced for membership of the Nomination and Governance Committee, in line with market practice and reflecting its important role in succession planning. No fee has been introduced for the Chair of the Nomination and Governance Committee. Non-Executive Director fees 2024 £’000 2025 £’000 Chair of the Board1 800 890 Basic Non-Executive Director 115 120 Senior independent Non-Executive Director 48 50 Chair of the Audit Committee2 50 55 Member of the Audit Committee 25 27.5 Chair of the Remuneration Committee2 45 50 Member of the Remuneration Committee 20 25 Chair of the Sustainability Committee2 45 45 Member of the Sustainability Committee 20 22.5 Chair of the Science Committee2 45 50 Member of the Science Committee 20 25 Chair of the Nomination and Governance Committee – – Member of the Nomination and Governance Committee – 17.5 1 The Chair of the Board does not receive any additional fees for chairing, or being a member of a Committee. 2 The Committee Chairs do not receive additional fees for being a member of the Committee. Non-Executive Directors’ remuneration Audited Corporate Governance 128 AstraZeneca Annual Report & Form 20-F Information 2024 Annual Report on Remuneration continued |
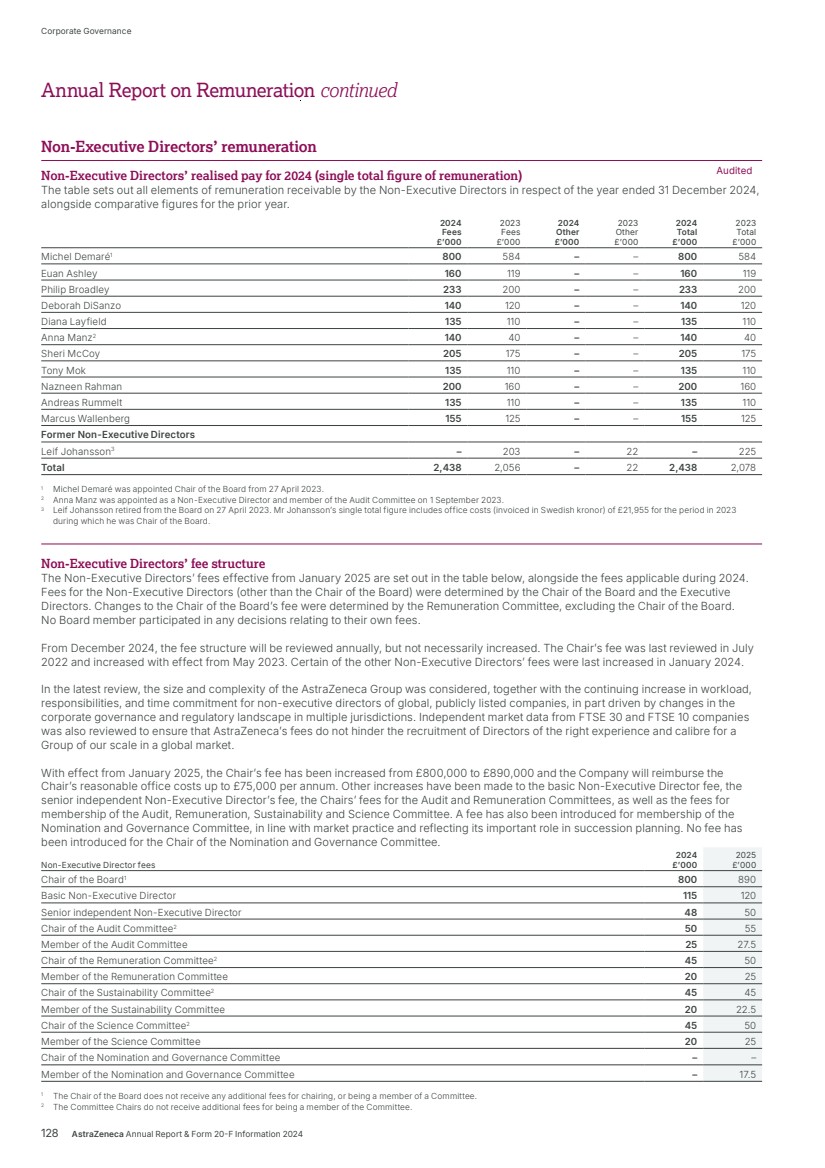
| Minimum shareholding requirements The CEO and CFO are each required to build a shareholding to satisfy their respective minimum shareholding requirements (MSR), each within five years of their dates of appointment or, if the MSR is increased at any time, within five years of that increase. Following approval of the Policy at the 2024 AGM, the minimum shareholder requirements for the Executive Directors was increased to match their variable pay opportunity, being 1,150% of base pay for Mr Soriot (increased from 650%), and 750% of base pay for Dr Sarin (increased from 450%). The Executive Directors have five years from 11 April 2024, when the Policy was approved, to meet this requirement. Shares that count towards the MSR are shares beneficially held by the Executive Director and their connected persons and share awards that are not subject to further performance conditions. Share awards included are DBP shares in deferral periods, and PSP shares in holding periods, on a net-of-tax basis. The value is calculated using the closing share price on 31 December 2024. As at 31 December 2024, Dr Sarin exceeded her increased minimum shareholding requirement and Mr Soriot’s holding was slightly below the increased MSR but above his previous MSR of 650%. 50% of Mr Soriot’s 2024 annual bonus will be deferred into shares and 84% of Mr Soriot’s 2022 PSP award will move into a two-year holding period, following completion of the performance period on 31 December 2024. These shares will count towards Mr Soriot’s MSR in 2025. A further post-employment shareholding requirement applies to Executive Directors. For two years following cessation of employment, Executive Directors are required to hold shares to the value of the shareholding requirement that applied at the cessation of their employment; or, in cases where the individual has not had sufficient time to build up shares to meet their guideline, the actual level of shareholding at cessation. The post-cessation requirement will be maintained through self-certification, with the Committee keeping this approach under review. Position against the 2024 minimum shareholding requirement (MSR) as a percentage of base pay Beneficially owned shares and shares in a holding period1 Shares in deferral period2 Shares subject to performance conditions Value of shares counted towards MSR as a % of base pay3 Pascal Soriot 224,116 45,745 308,139 1,021% Aradhana Sarin 99,498 17,866 132,996 1,099% 1 Holding period shares included are those which are not subject to continued employment. 2 Shares in deferral periods which are not subject to continued employment. 3 Holding as at 31 December 2024. Shares subject to deferral and holding periods calculated net of a theoretical 50% tax rate. Shares subject to performance conditions are not included in the value of shares counted towards MSR. Non-Executive Directors are encouraged to build up, over a period of three years, a shareholding in the Company with a value approximately equivalent to the basic annual fee for a Non-Executive Director (which was increased to £115,000 during 2024) or, in the case of the Chair, approximately equivalent to his basic annual fee (£800,000 during 2024). The majority of Non-Executive Directors who had served for a period of three years or more as at 31 December 2024 met this expectation, based on the three-month average closing share price for the period ended 31 December 2024 (10868 pence). Audited Directors’ interests as at 31 December 2024 The following table shows the beneficial interests of the Directors (including the interests of their connected persons) in Ordinary Shares as at 31 December 2024. Executive Directors Beneficial interest in Ordinary Shares at 31 December 20241 Beneficial interest in Ordinary Shares at 31 December 20231 Pascal Soriot 269,861 363,489 Aradhana Sarin 117,364 82,514 Non-Executive Directors Michel Demaré2 10,000 6,000 Euan Ashley 1,545 1,150 Philip Broadley 8,025 7,045 Deborah DiSanzo 1,000 1,000 Diana Layfield 1,400 1,400 Anna Manz3 487 487 Sheri McCoy 1,736 1,736 Tony Mok 3,500 2,000 Nazneen Rahman 1,017 1,017 Andreas Rummelt 27,205 27,205 Marcus Wallenberg 60,028 60,028 1 For the Executive Directors, beneficial interests include shares in holding periods and deferral periods which are not subject to performance measures or continued employment. Shares in a holding or deferral period are included on a gross basis. 2 Michel Demaré was appointed Chair of the Board on 27 April 2023. 3 Anna Manz was appointed on 1 September 2023. 1,150% 1,021% 750% 1,099% CEO CFO Key: 2024 MSR Shares counted towards MSR Directors’ shareholdings Audited Strategic Report Corporate Governance Financial Statements Additional Information Directors’ Remuneration Report AstraZeneca Annual Report & Form 20-F Information 2024 129 |
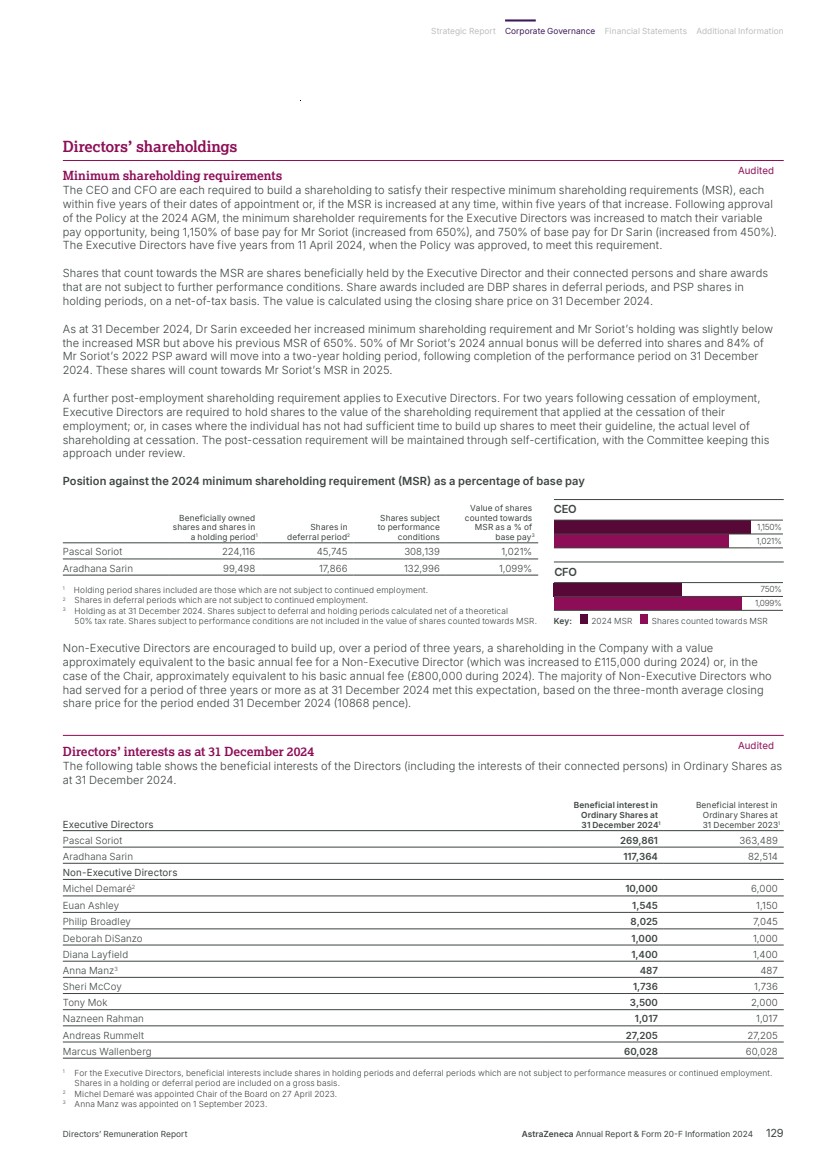
| Executive Directors’ share plan interests The following tables set out the Executive Directors’ interests in Ordinary Shares under the Company’s share plans. Pascal Soriot Shares outstanding at 31 December 2024 Share scheme interests Grant date Shares outstanding at 1 January 2024 Grant price (pence) Shares granted in year Shares released in year Shares lapsed in year Shares subject to performance Shares in deferral/ holding period1 Performance period end Vesting and release date DBP 05/03/2021 16,944 6844 – 16,944 – n/a – n/a 05/03/20242,3 04/03/2022 17,216 9154 – – – n/a 17,216 n/a 04/03/2025 04/03/2023 14,448 10821 – – – n/a 14,448 n/a 04/03/2026 04/03/2024 – 10081 14,081 – – n/a 14,081 n/a 04/03/20274 PSP 08/03/2019 97,351 6287 – 97,351 – – – 31/12/2021 08/03/20245,6 06/03/2020 84,725 7376 – – – – 84,725 31/12/2022 06/03/2025 21/05/2020 8,471 7376 – – – – 8,471 31/12/2022 21/05/2025 05/03/2021 106,655 6844 – – (12,799) – 93,856 31/12/2023 05/03/20267 14/05/2021 19,391 6844 – – (2,327) – 17,064 31/12/2023 14/05/20267 04/03/2022 97,066 9154 – – – 97,066 – 31/12/2024 04/03/2027 04/03/2023 85,808 10821 – – – 85,808 – 31/12/2025 04/03/2028 04/03/2024 – 10081 95,791 – – 95,791 – 31/12/2026 04/03/20298 13/05/2024 – 10081 29,474 – – 29,474 – 31/12/2026 13/05/20298 AZIP 24/03/2016 10,809 3923 – 10,809 – – – 31/12/2019 01/01/20249,10 Total 558,884 139,346 125,104 (15,126) 308,139 249,861 1 Shares in deferral/holding period are not subject to performance conditions. 2 Market price on 5 March 2024, the actual date of release, was 10112 pence. 3 An additional 1,171 Ordinary Shares were released as a result of the reinvestment of dividend equivalents accrued during the deferral period. 4 Award granted following deferral of one half of the annual bonus earned in respect of performance during 2023, see page 123 for further detail. 5 Market price on 8 March 2024, the actual date of release, was 10196 pence. 6 An additional 11,866 Ordinary Shares were released as a result of the reinvestment of dividend equivalents accrued during the performance and holding period. 7 88% of the shares entered the holding period, following assessment of performance over the period to 31 December 2023. The remaining shares lapsed. 8 Details of PSP awards granted during 2024 are shown on page 125. 9 Market price on 20 February 2024, the actual date of release, was 10204 pence. 10 An additional 2,223 Ordinary Shares were released as a result of the reinvestment of dividend equivalents accrued during the performance and holding period. Aradhana Sarin Shares outstanding at 31 December 2024 Share scheme interests Grant date Shares outstanding at 1 January 2024 Grant price (pence) Shares granted in year Shares released in year Shares lapsed in year Shares subject to performance Shares in deferral/ holding period1 Performance period end Vesting and release date DBP 04/03/2022 3,249 9154 – – – n/a 3,249 n/a 04/03/2025 04/03/2023 7,403 10821 – – – n/a 7,403 n/a 04/03/2026 04/03/2024 – 10081 7,214 – – n/a 7,214 n/a 04/03/20272 PSP 13/08/2021 19,414 8209 – – (2,330) – 17,084 31/12/2023 13/08/20263 04/03/2022 43,038 9154 – – – 43,038 – 31/12/2024 04/03/2027 04/03/2023 38,046 10821 – – – 38,046 – 31/12/2025 04/03/2028 04/03/2024 – 10081 51,911 – – 51,911 – 31/12/2026 04/03/20294 Total 111,150 59,125 – (2,330) 132,995 34,950 1 Shares in deferral/holding period are not subject to performance conditions. 2 Award granted following deferral of one half of the annual bonus earned in respect of performance during 2023, see page 123 for further detail. 3 88% of the shares entered the holding period, following assessment of performance over the period to 31 December 2023. The remaining shares lapsed. 4 Details of PSP awards granted during 2024 are shown on page 125. No Director or senior executive beneficially owns, or has options over, 1% or more of the issued share capital of the Company, nor do they have different voting rights from other shareholders. None of the Directors has a beneficial interest in the shares of any of the Company’s subsidiaries. Between 31 December 2024 and 6 February 2025, there was no change in the interests in Ordinary Shares for current Directors shown in the table above. Directors’ shareholdings continued Audited Corporate Governance 130 AstraZeneca Annual Report & Form 20-F Information 2024 Annual Report on Remuneration continued |
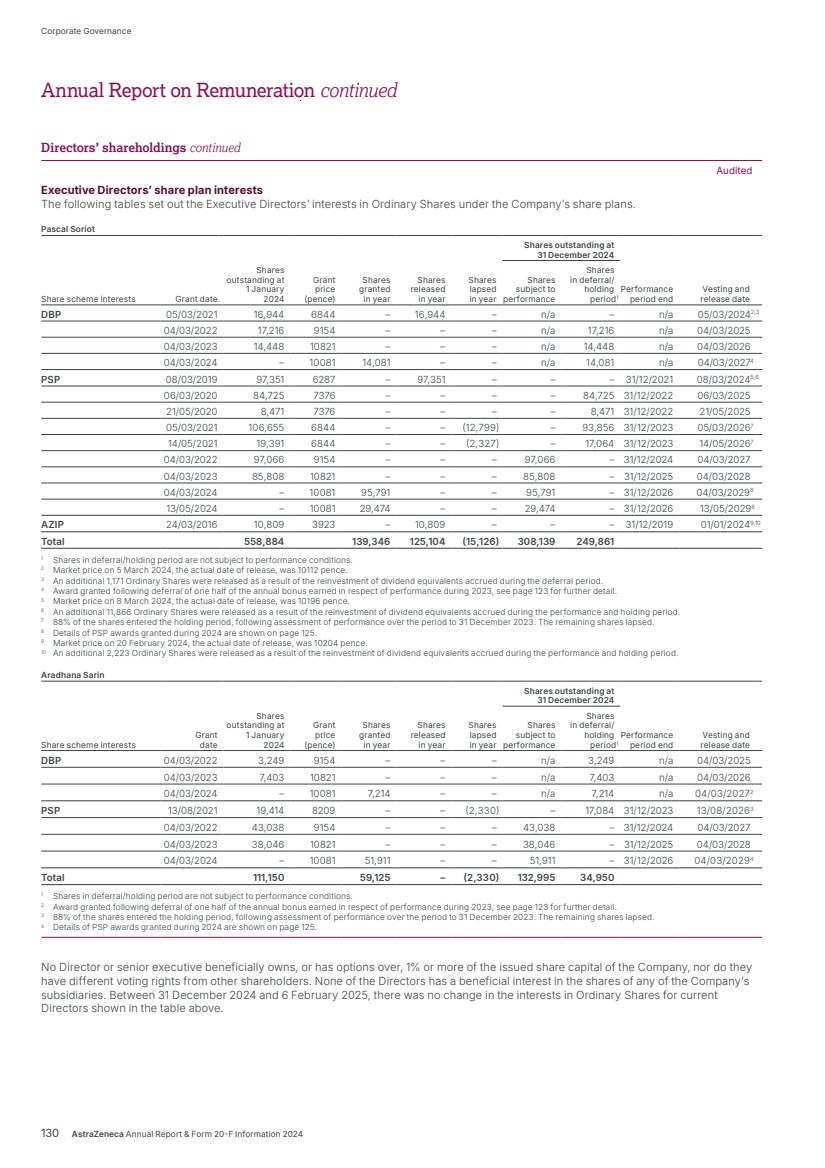
| Audited Payments to former Directors During 2024, no payments were made to former Directors. Payments for loss of office During 2024, no payments were made to Directors for loss of office. Remuneration in the wider context In our Corporate Governance Report on page 98, we explain in detail how the Board has chosen to engage with AstraZeneca’s workforce, and how important engagement with our employees is if we are to be a great place to work and continue to deliver outstanding performance. The Directors believe that the Board as a whole should continue to take responsibility for gathering the views of the workforce. Consequently, instead of implementing one of the three methods for workforce engagement prescribed in the 2018 UK Corporate Governance Code, the Board chose to enhance and develop the long-standing channels of engagement which already exist in the organisation to ensure that the Board continues to understand the global workforce’s views on a wide variety of topics, including matters relating to remuneration. The Committee communicates with, and receives feedback from, employees through a variety of channels, including meetings with high-potential employees and attending site visits, both virtually and in person. This allows the Committee to communicate with employees on remuneration matters where appropriate. Committee members review wide-ranging data on reward across our global workforce, as well as broader information on workforce trends and culture, which is also provided to the full Board. The Committee receives in-depth reports throughout the year on colleague pay, benefits, incentives, performance management approach and broader talent policies at AstraZeneca to ensure that the Committee is informed of wider workforce remuneration when making executive pay decisions. Decisions of the Committee affecting employees, such as the annual Group scorecard outcomes, are shared with employees through internal communications as well as through the Directors’ Remuneration Report. Additionally, we publish materials on executive remuneration and its implementation for employees on our intranet site. In the event that more significant changes to workforce remuneration are proposed, active engagement with employee representative groups provides feedback to help the Committee understand the impact upon the broader workforce. When reviewing executive remuneration, the Committee takes into consideration our global workforce, looking to ensure the global total reward offering is competitive, compelling and aligned to our business performance, while supporting a culture where everyone feels valued and included, as outlined in the table on page 132. People and Sustainability is one of our three strategic priorities, and we explain in our Business Review from page 32 the role that reward plays in developing an inclusive and diverse culture that encourages and rewards innovation, entrepreneurship and performance. In carrying out its responsibilities and when setting the Policy, the Committee has taken into account the principles of the UK Corporate Governance Code and the factors outlined within Provision 40 as described in the table below. Area Our approach Clarity Remuneration arrangements should be transparent and promote effective engagement with shareholders and the workforce. The Committee believes the remuneration structures under the Policy, and those for the wider workforce as set out below, are clearly understood. The Committee regularly engages with employees and shareholders and considers their feedback when reviewing the Directors’ Remuneration Policy and implementation. Simplicity Remuneration structures should avoid complexity and their rationale and operation should be easy to understand. We operate a simple remuneration framework for our executives across both fixed and variable pay which is, where possible, aligned with the wider workforce. The purpose, structure and strategic alignment of each element of pay has been clearly laid out in our Directors’ Remuneration Policy. Risk Remuneration arrangements should ensure reputational and other risks from excessive rewards, and behavioural risks that can arise from target-based incentive plans, are identified and mitigated. We seek to ensure alignment with long-term shareholder interests and to mitigate any potential risk through several mechanisms within our approach to executive remuneration. These include the two-year holding period under the PSP on vesting, 50% mandatory deferral into shares for three years for any annual bonus award, operation of malus and clawback provisions as summarised in our Directors’ Remuneration Policy, and a shareholding requirement for two years post-cessation of employment. Predictability The range of possible values of rewards to individual directors and any other limits or discretions should be identified and explained at the time of approving the Policy. The Committee set out under the Directors’ Remuneration Policy approved in April 2024 the range of possible values under specific performance scenarios. Proportionality The link between individual awards, the delivery of strategy and the long-term performance of the company should be clear. Outcomes should not reward poor performance. As set out on page 118, the Committee follows a robust target-setting and assessment process to ensure variable pay outcomes under the annual bonus and PSP are proportional to our wider performance. Our Directors’ Remuneration Policy operated as intended in terms of Company performance and quantums during 2024, supporting the delivery of our strategy and another exceptional year for AstraZeneca. Strategic Report Corporate Governance Financial Statements Additional Information Directors’ Remuneration Report AstraZeneca Annual Report & Form 20-F Information 2024 131 |
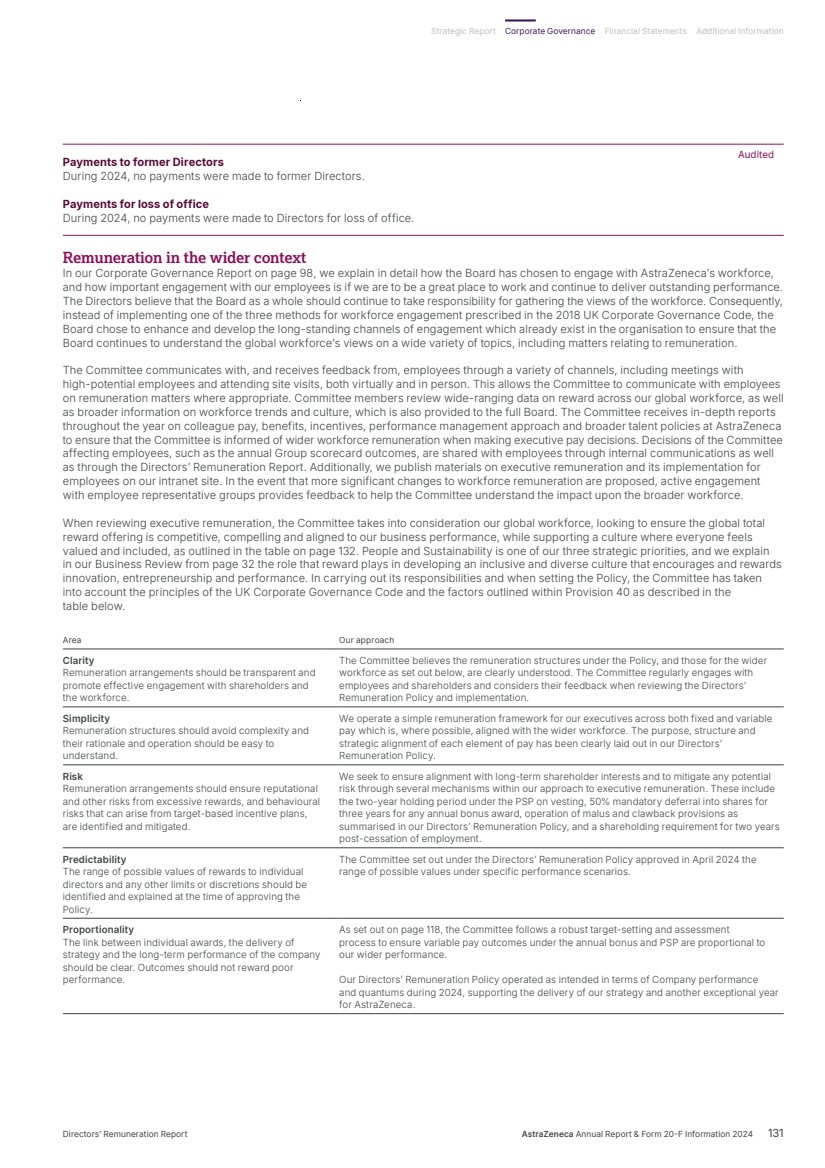
| Area Our approach Alignment to culture Incentive schemes should drive behaviours consistent with company purpose, values and strategy. The Committee believes that the remuneration structures in place are aligned to the Company’s performance culture and values and ensure the successful delivery of our strategy, with alignment between strategy and reward set out on page 117. For example, alongside the formulaic outcome, our annual bonus scheme for Executive Directors includes a holistic assessment of their performance and broader ESG factors, further reinforcing the importance of our Purpose and Values. Element Policy features for the wider workforce Comparison with Executive Director and Senior Executive Team remuneration Base pay Our base pay is the basis for a competitive total reward package for all employees, and we review base pay annually. This review takes account of country budget, relevant market comparators, the skills, capabilities, knowledge and experience of each individual, relative to peers within the Company, and individual contribution. In setting the budget each year, we consider affordability as well as assessing how employee base pay is currently positioned relative to inflation, market rates, forecasts of any further market increases, and turnover. The base pay of our Executive Directors and the Senior Executive Team (SET) forms the basis of their total remuneration, and we review their base pay annually. The primary purpose of the review is to ensure base pay remains competitive and reflects the contribution each individual makes to the organisation. Pensions and benefits We offer market-aligned wellbeing benefit packages reflecting market practice in each country in which we operate. Where appropriate, we offer elements of personal benefit choice to our employees. The benefit packages of our Executive Directors and the SET are broadly aligned with the wider workforce of the country in which they are employed. Pension allowances for current UK Executive Directors are in line with the wider UK workforce. Annual bonus With the exception of our sales representatives receiving sales-related incentives, our global workforce participates in the same annual cash bonus plan as the Executive Directors and the SET, with the same Group scorecard performance measures outlined on page 121. Achievement against the scorecard creates a bonus pool from which all awards are made. For employees within our commercial organisation, the country-level share of the global bonus pool also takes into account country performance against Key Performance Indicators (KPIs). Individual outcomes are based on manager assessment of contribution against individual objectives and peers. Awards are based on a 0-200% target range. The ranges for Executive Directors and the SET align with the wider workforce at 0-200% of target. Half of any award to an Executive Director under the plan is subject to deferral into shares subject to a three-year holding period. One sixth of any award to the SET under the plan is deferred into shares and is subject to a three-year holding period. Long-term incentives The PSP is operated with a three-year performance period for employees at Vice-President and Senior Vice-President level, with the same performance measures that apply to PSP awards made to the Executive Directors and the SET (outlined from page 124). A proportion of our workforce below this level is eligible to be considered for other LTI awards, such as restricted stock awards. 35% of our global employee population are eligible to receive an award under our LTI plans. PSP awards to Executive Directors and the SET are granted under the same plan as PSP awards granted to Vice‑Presidents and Senior Vice-Presidents. PSP awards to Executive Directors and the SET are subject to a two-year holding period following the three-year performance period. Change in Director remuneration compared to other employees In the table below, as per the requirements of the Companies (Directors’ Remuneration Policy and Directors’ Remuneration Report) Regulations 2019, changes to the base pay (or fees), taxable benefits and annual bonus of Directors are compared to employees for the previous financial year. The regulations require comparison between the remuneration of each Director and that of all employees of the parent company on a full-time equivalent basis. As AstraZeneca PLC has no direct employees, and in line with our disclosure approach in prior years to changes in employee remuneration, the selected comparator group is comprised of employees in the UK, US and Sweden who represent approximately 38% of our total employee population. We consider that this group is representative of the Group’s major science, business and enabling units. These employee populations are also well balanced in terms of seniority and demographics. Remuneration in the wider context continued Corporate Governance 132 AstraZeneca Annual Report & Form 20-F Information 2024 Annual Report on Remuneration continued Summary of remuneration structure for employees below the Board |
| Change in 2024 against 2023 (%) Change in 2023 against 2022 (%) Change in 2022 against 2021 (%) Change in 2021 against 2020 (%) Change in 2020 against 2019 (%) Base pay/ fees Benefits Annual bonus Base pay/ fees Benefits Annual bonus Base pay/ fees Benefits Annual bonus Base pay/ fees Benefits Annual bonus Base pay/ fees Benefits Annual bonus Executive Directors Pascal Soriot 4.0 -0.9 23.2 4.5 3.1 -9.2 3.0 10.5 -0.8 3.0 1.1 35.9 0.0 -2.7 20.0 Aradhana Sarin 4.0 -70.4 2.7 4.5 -71.6 -9.2 147.2 2,753.2 169.3 – – – – – – Non-Executive Directors Michel Demaré1 37.0 – – 268.9 – – 7.0 – – 18.7 – – 247.2 – – Euan Ashley 34.7 – – 8.0 – – 6.8 – – 300.0 – – – – – Philip Broadley 16.5 – – 0.0 – – 15.6 – – 16.9 – – 2.8 – – Deborah DiSanzo 16.7 – – 0.0 – – 11.1 – – 0.0 – – 0.0 – – Diana Layfield 22.7 – – 0.0 – – 19.9 – – 525.6 – – – – – Anna Manz2 250.0 – – – – – – – – – – – – – – Sheri McCoy 17.1 – – 11.7 – – 23.6 – – 3.0 – – 0.0 – – Tony Mok 22.7 – – 0.0 – – 6.8 – – 0.0 – – 0.0 – – Nazneen Rahman 25.3 – – 3.0 – – 18.2 – – 11.0 – – 0.0 – – Andreas Rummelt 22.7 – – 0.0 – – 172.2 – – – – – – – – Marcus Wallenberg 24.0 – – 0.0 – – 17.1 – – 3.6 – – 0.0 – – Employees 5.8 5.8 7.7 7.0 7.0 3.2 6.0 6.0 19.3 4.9 4.9 44.4 4.1 4.1 -11.6 1 Michel Demaré was appointed Chair of the Board on 27 April 2023. 2 Anna Manz was appointed on 1 September 2023. CEO and employee pay ratios The table below sets out the ratios of the CEO’s realised pay to the equivalent pay for the lower quartile, median and upper quartile UK employees (calculated on a full-time equivalent basis). The ratios have been calculated in accordance with the Companies (Miscellaneous Reporting) Regulations 2018 (the Regulations). Year Method 25th percentile pay ratio 50th percentile pay ratio 75th percentile pay ratio 2024 Option A 231:1 153:1 102:1 2023 Option A 271:1 182:1 121:1 2022 Option A 230:1 159:1 107:1 2021 Option A 240:1 162:1 106:1 2020 Option A 284:1 197:1 130:1 2019 Option A 280:1 190:1 123:1 2018 Option A 230:1 160:1 103:1 The comparison with UK employees is specified by the Regulations. This group represents approximately 11% of our total employee population. The Regulations provide flexibility to adopt one of three methods of calculation; we continue to use Option A which is a calculation based on all UK employees on a full-time equivalent basis as we consider this to be the most appropriate method of comparison and in line with the calculation of CEO’s realised pay (shown on page 119 for 2024). The ratios are based on total pay, which includes base pay, benefits, bonus and LTI awards with all elements adjusted on a full-time equivalent basis if required. Our calculations are in line with the single figure methodology for UK employees where possible, with quartile data determined as at 31 December 2024. Calculations for UK employees are based on actual base pay and benefits data for the year, with estimates only used for annual bonus outcomes and LTI dividend equivalents. These estimates are based on the 2024 bonus budget and projected payouts, and anticipated dividends on LTI awards, respectively. No elements of pay have been excluded from the calculation, which has been determined following the approach of previous years. CEO UK employees 25th percentile 50th percentile 75th percentile Pay data (£’000)1 Base pay Total pay Base pay Total pay Base pay Total pay Base pay Total pay 2024 1,486 14,728 50 64 70 96 91 144 2023 1,429 16,853 46 62 65 92 88 139 2022 1,367 15,323 48 67 67 96 88 143 2021 1,327 13,858 43 58 61 86 86 130 2020 1,289 15,447 41 54 60 78 82 119 2019 1,289 14,330 38 51 53 75 71 117 2018 1,251 11,356 36 49 50 71 70 110 1 The prior years’ figures have not been restated for subsequent share price changes (as shown in the CEO realised pay for 2024 table on page 119). The pay ratios at each quartile were lower in 2024 when compared to last year, due to a lower long-term incentive value realised for the CEO in 2024. Strategic Report Corporate Governance Financial Statements Additional Information Directors’ Remuneration Report AstraZeneca Annual Report & Form 20-F Information 2024 133 |
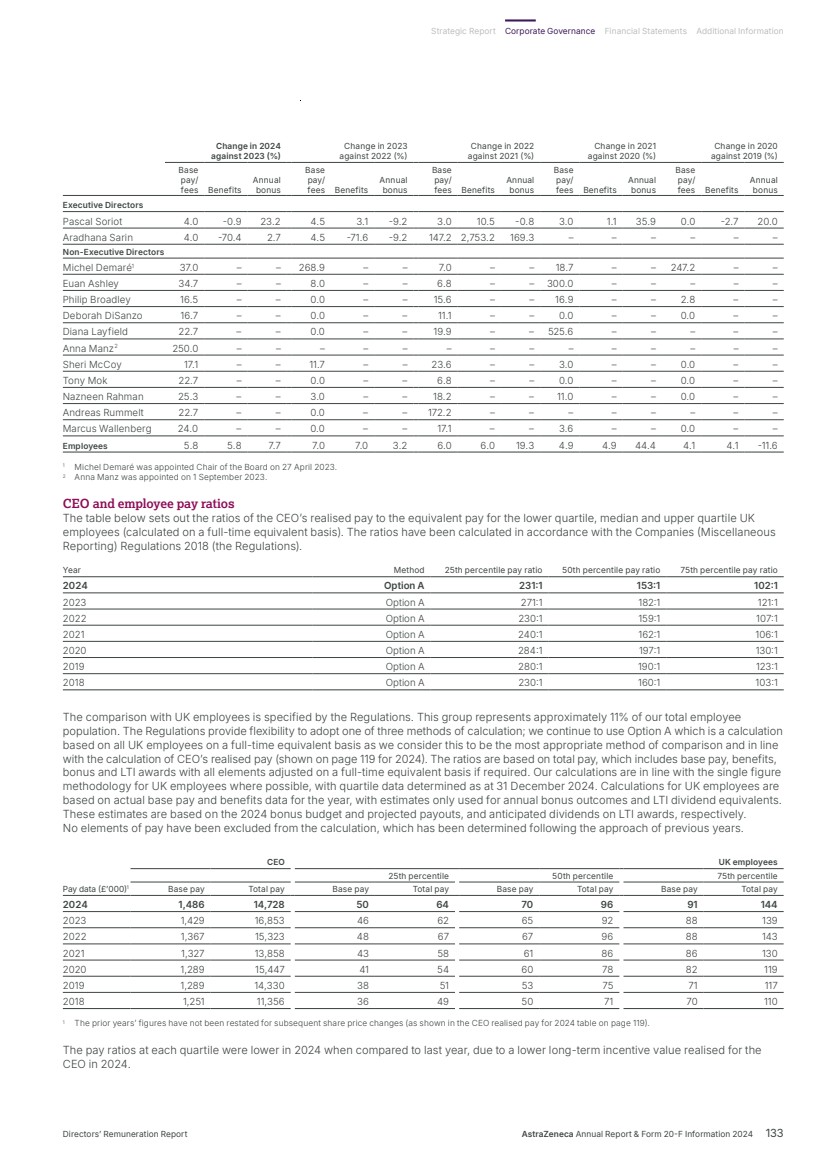
| Given the Committee’s focus on ensuring CEO pay is performance-driven (and as demonstrated again this year), the majority of the single figure is comprised of variable pay and therefore may vary significantly year-on-year due to annual bonus and PSP outcomes, as well as share price movements. The Committee therefore also considers the CEO pay ratio without the LTI impact. When excluding LTI, the pay ratio of the CEO compared to the median UK employee is 57:1. 2018 2019 2020 2021 2022 2023 2024 50th percentile ratio excluding LTI 51:1 51:1 53:1 57:1 51:1 52:1 57:1 The Committee remains mindful of the debate on executive pay and seeks to ensure that when determining the remuneration of the CEO it finds the right balance when rewarding performance in a highly competitive global executive talent market. It believes the median ratio is consistent with the pay and progression policies for UK employees, which ensures our total reward offering is competitive and compelling, and aligned to individual and business performance as set out on page 131. Relative importance of spend on pay The table below shows the remuneration paid to all employees in the Group, including the Executive Directors, and expenditure on shareholder distributions through dividends. The figures have been calculated in accordance with the Group Accounting Policies and drawn from either the Group’s Consolidated Statement of Comprehensive Income on page 148, or its Consolidated Statement of Cash Flows on page 151. Further information on the Group’s Accounting Policies can be found from page 152. 2024 2023 Difference in spend between years $m Difference in spend between years % Total employee remuneration 13,709 12,335 1,374 11 Distributions to shareholders: dividends paid 4,629 4,481 148 3 Total shareholder return The graph below compares the TSR performance of the Company over the past 10 years with the TSR of the FTSE 100 Index and our global pharmaceutical peers. This graph is re-based to 100 at the start of the relevant period. These indices represent appropriate reference points for AstraZeneca reflecting our primary listing as a constituent of the FTSE 100 and a comparison against our global pharmaceutical peers. The pharmaceutical comparator group is also used to assess relative TSR performance for PSP awards to be granted in 2025 and consists of AbbVie, Amgen, Astellas, BMS, Daiichi Sankyo, Eli Lilly, Gilead, GSK, Johnson & Johnson, Merck KGaA, Moderna, MSD, Novartis, Novo Nordisk, Pfizer, Roche, Sanofi and Takeda. CEO remuneration over the same 10-year period is shown after the TSR graph. AstraZeneca Global pharmaceutical peers average FTSE 100 400 300 200 100 Dec 14 Dec 15 Dec 16 Dec 17 Dec 18 Dec 19 Dec 20 Dec 21 Dec 22 Dec 23 Dec 24 TSR over a 10-year period CEO total remuneration table Year CEO CEO realised pay £’000 Annual bonus payout against maximum opportunity % LTI vesting rates against maximum opportunity % 2024 Pascal Soriot 14,7281 78.5 84 2023 Pascal Soriot 17,3712 79.5 88 2022 Pascal Soriot 15,085 92 97 2021 Pascal Soriot 15,740 95 95 2020 Pascal Soriot 15,934 90 99 2019 Pascal Soriot 15,307 83 90 2018 Pascal Soriot 12,868 83 79 2017 Pascal Soriot 10,429 87 81 2016 Pascal Soriot 14,3423 54 95 2015 Pascal Soriot 7,963 97 78 1 The 2024 realised pay is shown on page 119. 2 This figure has been revised using the average closing share price over the three-month period to 31 December 2024, as explained on page 124. 3 This figure includes shares awarded to Mr Soriot in 2013 under the AZIP to compensate him for LTI awards from previous employment forfeited on his recruitment as the Company’s CEO. Remuneration in the wider context continued Corporate Governance 134 AstraZeneca Annual Report & Form 20-F Information 2024 Annual Report on Remuneration continued |
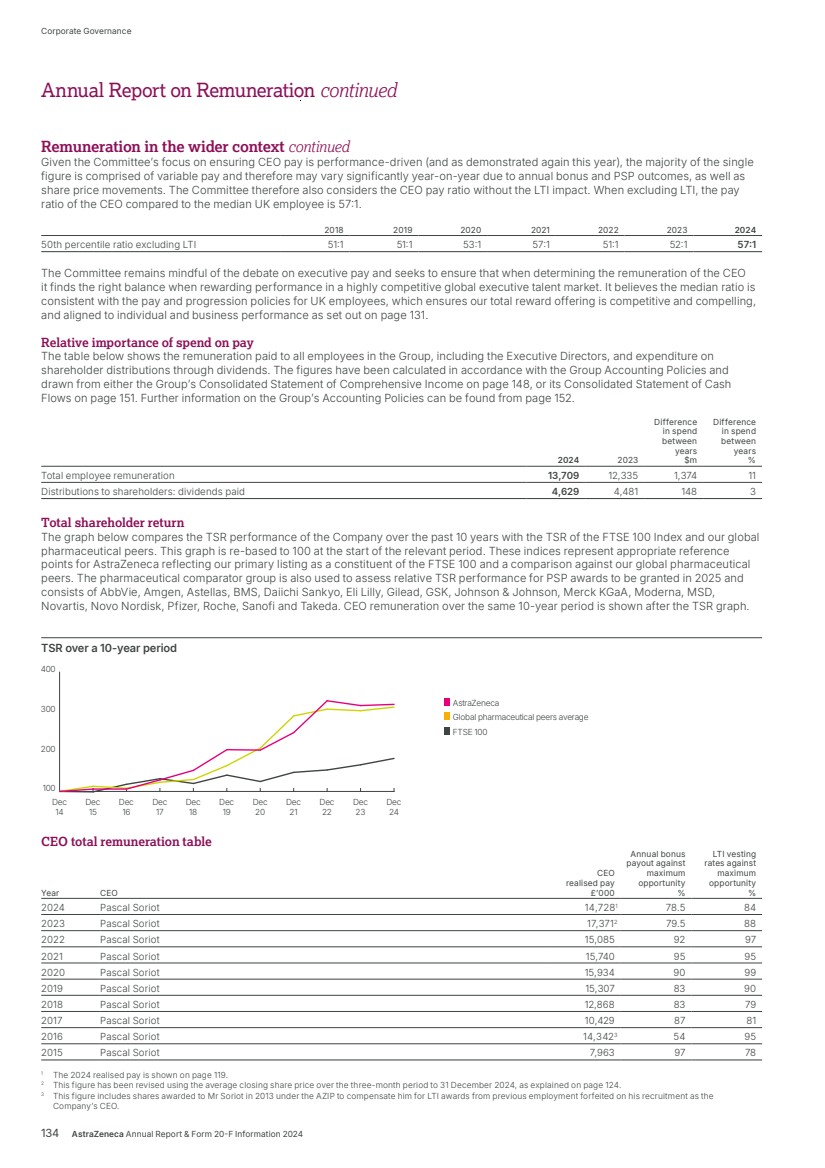
| Governance Committee membership The Committee members as at 31 December 2024 were Sheri McCoy (Chair of the Committee), Philip Broadley, Michel Demaré and Nazneen Rahman. The Deputy Company Secretary acts as secretary to the Committee. The Committee met seven times in 2024 and members’ attendance records are set out on page 87. During the year, the Committee was materially assisted, except in relation to their own remuneration, by the CEO; the CFO; the SVP, Finance, Group Controller & Head of Global Finance Services; the SVP, Group Planning & Finance Business Partnering; the SVP, Global Portfolio/Project Management and Strategic Planning; the VP, Global Sustainability and SHE; the Chief Human Resources Officer, Chief Compliance Officer and General Counsel; the SVP, Reward; the Senior Director Executive Reward; the Company Secretary; the Deputy Company Secretary; and the Non‑Executive Directors forming the Science and Sustainability Committees. The Committee’s independent adviser attended all Committee meetings. Independent adviser to the Committee The Committee reappointed Willis Towers Watson (WTW) as its independent adviser. WTW were first appointed in September 2018, following a tender process undertaken in 2018. The tender process involved submission of written proposals, followed by shortlisted candidates being interviewed by both Committee members and members of the Company’s management. WTW’s service to the Committee during 2024 was provided on a time spent basis at a cost to the Company of £218,700, excluding VAT. During 2024, WTW also provided pensions advice and administration, and advice and support to management including market data to assist in the annual employee pay review, global pay survey data and employee benefits review. WTW have no other connection with the Company or individual Directors. The Committee reviewed the potential for conflicts of interest related to WTW and judged that there were no conflicts. WTW is a member of the Remuneration Consultants Group, which is responsible for the stewardship and development of the voluntary code of conduct in relation to executive remuneration consulting in the UK. The principles on which the code is based are transparency, integrity, objectivity, competence, due care and confidentiality. WTW adheres to the code. Strategic Report Corporate Governance Financial Statements Additional Information Directors’ Remuneration Report AstraZeneca Annual Report & Form 20-F Information 2024 135 |

| Governance continued Malus and clawback The Committee regularly reviews the Company’s approach to malus and clawback and market practice in this area, and our Global Standard on Malus and Clawback sets out the trigger events and the time periods these provisions may apply to. As a condition of annual bonus and PSP awards, the Committee seeks active acceptance of the malus and clawback terms applicable each year before any payment or grant is made to an individual. Additionally, the Committee’s practice is to fully document and evidence any application of malus or clawback to show that it has not acted arbitrarily, capriciously or irrationally in making any determination. This allows the Committee to: • Reduce the amount of bonus or PSP payable, or clawback some or all of any award in the circumstances and periods as set out within our Global Standard on Malus and Clawback. • Cancel bonus eligibility. • Prevent vesting of the PSP and/or DBP awards by holding the shares in AstraZeneca’s LTI nominee platform to prevent transactions. Shareholder voting at the AGM At the Company’s AGM on 11 April 2024, shareholders voted in favour of a resolution to approve the Directors’ Remuneration Policy and Annual Statement of the Chair of the Remuneration Committee and the Annual Report on Remuneration for the year ended 31 December 2023. The Policy can be found on the Company’s website, www.astrazeneca.com/annualreport2024. Resolution Votes for % for Votes against % against Total votes cast % of issued share capital voted Withheld votes Ordinary Resolution to approve the Annual Statement of the Chair of the Remuneration Committee and the Annual Report on Remuneration for the year ended 31 December 2023 1,158,470,360 95.32 56,835,406 4.68 1,215,305,766 78.40 1,558,941 Ordinary Resolution to approve the Directors’ Remuneration Policy 761,702,826 64.43 420,514,520 35.57 1,182,217,346 76.26 34,645,873 The response to the shareholder vote to approve the Directors’ Remuneration Policy at the 2024 AGM is outlined in the Remuneration Committee Chair’s letter on page 112. Directors’ service contracts and letters of appointment The notice periods and unexpired terms of Executive Directors’ service contracts at 31 December 2024 are shown in the table below. Executive Director Effective date of service contract Unexpired term at 31 December 2024 Notice period Pascal Soriot 15 December 2016 12 months 12 months Aradhana Sarin 1 August 2021 12 months 12 months None of the Non-Executive Directors has a service contract but each has a letter of appointment. In accordance with the Company’s Articles of Association, following their appointment, all Directors must retire at each AGM and may present themselves for re-election. All of the Non-Executive Directors, including the Chair of the Board, may terminate their appointment at any time, on three months’ notice. None of the Non-Executive Directors has any provision in their letters of appointment giving them a right to compensation upon early termination of appointment. Basis of preparation of this Directors’ Remuneration Report This Directors’ Remuneration Report has been prepared in accordance with the Large and Medium-sized Companies and Groups (Accounts and Reports) (Amendment) Regulations 2013 (as amended) (the 2013 Regulations). A resolution to receive and approve the Directors’ Remuneration Report will be proposed at the AGM on 11 April 2025. On behalf of the Board A C N Kemp Company Secretary 6 February 2025 Corporate Governance 136 AstraZeneca Annual Report & Form 20-F Information 2024 Annual Report on Remuneration continued |
| Contents Preparation of the Financial Statements and Directors’ Responsibilities 138 Directors’ Annual Report on Internal Controls over Financial Reporting 138 Independent Auditors’ Report 139 Consolidated Statements 148 Group Accounting Policies 152 Notes to the Group Financial Statements 160 Group Subsidiaries and Holdings 214 Company Statements 219 Company Accounting Policies 221 Notes to the Company Financial Statements 223 Group Financial Record 226 Financial Statements Strategic Report Corporate Governance Financial Statements Additional Information Financial Statements AstraZeneca Annual Report & Form 20-F Information 2024 137 |

| Under company law, the Directors must not approve the Financial Statements unless they are satisfied that they give a true and fair view of the state of affairs of the Group and Parent Company and of their profit or loss for that period. In preparing each of the Group and Parent Company Financial Statements, the Directors are required to: • Select suitable accounting policies and then apply them consistently. • Make judgements and estimates that are reasonable and prudent. • For the Group Financial Statements, state whether they have been prepared in accordance with UK-adopted International Accounting Standards. • For the Parent Company Financial Statements, state whether FRS 101 has been followed, subject to any material departures disclosed and explained in the Parent Company Financial Statements. • Prepare the Financial Statements on a going concern basis unless it is inappropriate to presume that the Group and the Parent Company will continue in business. The Directors are responsible for keeping adequate accounting records that are sufficient to show and explain the Parent Company’s transactions and disclose with reasonable accuracy at any time the financial position of the Parent Company. This enables them to ensure that the Financial Statements comply with the Companies Act 2006. They have general responsibility for taking such steps as are reasonably open to them to safeguard the assets of the Group and to prevent and detect fraud and other irregularities. The Directors assessed the effectiveness of AstraZeneca’s internal control over financial reporting as at 31 December 2024 based on the criteria set forth by the Committee of Sponsoring Organizations of the Treadway Commission in Internal Control-Integrated Framework (2013). Based on this assessment, internal control over financial reporting is effective. PricewaterhouseCoopers LLP, an independent registered public accounting firm, has audited the effectiveness of internal control over financial reporting as at 31 December 2024 and has issued an unqualified report thereon. Under applicable law and regulations, the Directors are also responsible for preparing a Directors’ Report, Strategic Report, Directors’ Remuneration Report, Corporate Governance Report and Audit Committee Report that comply with that law and those regulations. The Directors are responsible for the maintenance and integrity of the corporate and financial information included on our website. Legislation in the UK governing the preparation and dissemination of Financial Statements may differ from legislation in other jurisdictions. Directors’ responsibility statement pursuant to DTR 4 The Directors confirm that to the best of our knowledge: • The Financial Statements, prepared in accordance with the applicable set of accounting standards, give a true and fair view of the assets, liabilities, financial position and profit or loss of the Company and the undertakings included in the consolidation taken as a whole. • The Directors’ Report includes a fair review of the development and performance of the business and the position of the Company and the undertakings included in the consolidation taken as a whole, together with a description of the principal risks and uncertainties that they face. On behalf of the Board of Directors on 6 February 2025. Pascal Soriot Director The Directors are responsible for preparing this Annual Report and Form 20-F Information and the Group and Parent Company Financial Statements in accordance with applicable law and regulations. Company law requires the Directors to prepare Financial Statements for each financial year. Under that law, the Directors have prepared the Group Financial Statements in accordance with UK-adopted international accounting standards and with the requirements of the Companies Act 2006, as applicable to companies reporting under those standards and Parent Company Financial Statements in accordance with United Kingdom Generally Accepted Accounting Practice (United Kingdom Accounting Standards, comprising FRS 101 ‘Reduced Disclosure Framework’, and applicable law). In preparing the Group Financial Statements, the Directors have also elected to comply with IFRS Accounting Standards as issued by the International Accounting Standards Board (IASB) and International Accounting Standards as adopted by the European Union. The Directors are responsible for establishing and maintaining adequate internal control over financial reporting. AstraZeneca’s internal control over financial reporting is designed to provide reasonable assurance over the reliability of financial reporting and the preparation of consolidated financial statements in accordance with generally accepted accounting principles. Due to its inherent limitations, internal control over financial reporting may not prevent or detect misstatements. Projections of any evaluation of effectiveness to future periods are subject to the risk that controls may become inadequate because of changes in conditions, or that the degree of compliance with the policies or procedures may deteriorate. 138 AstraZeneca Annual Report & Form 20-F Information 2024 Financial Statements Preparation of the Financial Statements and Directors’ Responsibilities Directors’ Annual Report on Internal Controls over Financial Reporting |
| Separate opinion in relation to IFRS Accounting Standards as issued by the IASB As explained in the Group Accounting Policies to the financial statements, the Group, in addition to applying UK-adopted international accounting standards, has also applied IFRS Accounting Standards as issued by the International Accounting Standards Board (IASB). In our opinion, the Group financial statements have been properly prepared in accordance with IFRS Accounting Standards as issued by the IASB. Basis for opinion We conducted our audit in accordance with International Standards on Auditing (UK) (“ISAs (UK)”) and applicable law. Our responsibilities under ISAs (UK) are further described in the Auditors’ responsibilities for the audit of the financial statements section of our report. We believe that the audit evidence we have obtained is sufficient and appropriate to provide a basis for our opinion. Independence We remained independent of the Group in accordance with the ethical requirements that are relevant to our audit of the financial statements in the UK, which includes the FRC’s Ethical Standard, as applicable to listed public interest entities, and we have fulfilled our other ethical responsibilities in accordance with these requirements. To the best of our knowledge and belief, we declare that non-audit services prohibited by the FRC’s Ethical Standard were not provided. Other than those disclosed in Note 31, we have provided no non-audit services to the Company or its controlled undertakings in the period under audit. Our audit approach Overview Audit scope • Our audit included full scope audits, audit of specific significant line item or specified procedures at each of the Group’s 19 in-scope components. • Taken together, the components at which audit work was performed accounted for more than 70% of the Group’s revenue. Our scoping provided sufficient coverage over each significant financial statement line item of the Group financial statements and, provided us with the evidence we needed for our opinion on the Group financial statements taken as a whole. Key audit matters • Recognition and measurement of accruals for Managed Care, Medicaid and Medicare Part D rebates on US Product Sales (excluding Rare Diseases) (Group) • Impairment assessment of the product, marketing and distribution rights and other intangibles (Group) • Recognition and measurement of legal provisions and disclosure of contingent liabilities (Group) • Recognition, measurement and disclosure of tax liabilities for uncertain tax treatments (Group) • Valuation of defined benefit obligations in the UK and Sweden (Group) • Distributable reserves in the Company (Parent) Materiality • Overall Group materiality: $500m (2023: $440m) based on approximately 5% of profit before tax after adding back intangible asset impairment charges (Note 10), fair value movements and discount unwind on contingent consideration (Note 20), and the discount unwind on certain other payables arising from intangible asset acquisitions (Note 3). • Overall Company materiality: $155m (2023: $110m) based on 0.2% of net assets as constrained by the allocation of overall Group materiality. • Performance materiality: $375m (2023: $330m) (Group) and $116.25m (2023: $82.5m) (Company). The scope of our audit As part of designing our audit, we determined materiality and assessed the risks of material misstatement in the financial statements. Key audit matters Key audit matters are those matters that, in the auditors’ professional judgement, were of most significance in the audit of the financial statements of the current period and include the most significant assessed risks of material misstatement (whether or not due to fraud) identified by the auditors, including those which had the greatest effect on: the overall audit strategy; the allocation of resources in the audit; and directing the efforts of the engagement team. These matters, and any comments we make on the results of our procedures thereon, were addressed in the context of our audit of the financial statements as a whole, and in forming our opinion thereon, and we do not provide a separate opinion on these matters. This is not a complete list of all risks identified by our audit. The key audit matters below are consistent with last year. Report on the audit of the financial statements Opinion In our opinion: • AstraZeneca PLC’s Group financial statements and Company financial statements (the “financial statements”) give a true and fair view of the state of the Group’s and of the Company’s affairs as at 31 December 2024 and of the Group’s profit and the Group’s cash flows for the year then ended; • the Group financial statements have been properly prepared in accordance with UK-adopted international accounting standards as applied in accordance with the provisions of the Companies Act 2006; • the Company financial statements have been properly prepared in accordance with United Kingdom Generally Accepted Accounting Practice (United Kingdom Accounting Standards, including FRS 101 “Reduced Disclosure Framework”, and applicable law); and • the financial statements have been prepared in accordance with the requirements of the Companies Act 2006. We have audited the financial statements, included within the Annual Report and Form 20-F Information 2024 (the “Annual Report”), which comprise: the Consolidated Statement of Financial Position and the Company Balance Sheet as at 31 December 2024; the Consolidated Statement of Comprehensive Income, the Consolidated Statement of Cash Flows, and the Consolidated and Company Statements of Changes in Equity for the year then ended; the Group and Company Accounting Policies; and the Notes to the Group and Company Financial Statements. Our opinion is consistent with our reporting to the Audit Committee. Separate opinion in relation to International Accounting Standards as adopted by the European Union As explained in the Group Accounting Policies to the financial statements, the Group, in addition to applying UK-adopted international accounting standards, has also applied International Accounting Standards as adopted by the European Union. In our opinion, the Group financial statements have been properly prepared in accordance with International Accounting Standards as adopted by the European Union. Financial Statements | Independent auditors’ report to the members of AstraZeneca PLC AstraZeneca Annual Report & Form 20-F Information 2024 139 Strategic Report Corporate Governance Financial Statements Additional Information Independent auditors’ report to the members of AstraZeneca PLC |
| Recognition and measurement of accruals for Managed Care, Medicaid and Medicare Part D rebates on US Product Sales (excluding Rare Diseases) (Group) Impacted FSLIs 2024 2023 US Rebates, chargebacks, returns and other revenue accruals liability (excluding Rare Diseases) (which principally consists of rebates related to Managed Care, Medicaid and Medicare Part D) $4,738m $4,926m In the US the Group recognises revenue on Product Sales under various commercial and government mandated contracts and reimbursement arrangements that include rebates, of which the most significant are Managed Care, Medicaid and Medicare Part D relating to US Product Sales. Rebates provided to customers under these arrangements are accounted for as variable consideration, and recognised as a reduction to revenue, for which unsettled amounts are accrued. At the time Product Sales are invoiced, rebates and deductions that the Group expects to pay, are estimated. There is significant management estimation in determining the accruals in the US. Assumptions used to estimate the rebates are monitored and adjusted regularly in light of contractual and legal obligations, historical trends, past experience and projected market conditions. Discussions with the Audit Committee How our audit addressed the Key Audit Matter Our discussions with and reporting to the Audit Committee included: • Our approach to the audit of rebates including details of planned substantive procedures and the extent of our controls reliance; • For the recorded accruals, whether the Group’s estimate is comparable to our developed estimates; and • Our views of management’s assessment over the accuracy of the accruals. Relevant references in the Annual Report Refer to the Audit Committee Report, Group Accounting Policies and Notes 1 and 20 in the Group financial statements. We evaluated the design and tested the operating effectiveness of controls relating to the recognition and measurement of the accruals for the Managed Care, Medicaid and Medicare Part D. We determined that we could rely on these controls for the purposes of our audit. We: i) developed an independent estimate of the Managed Care, Medicaid and Medicare Part D accruals using the terms of the specific rebate programmes and/or contracts with customers, historical revenue data; market demand and market conditions in the US; third party information on inventory held by direct and indirect customers; and the historical trend of actual rebate claims paid; ii) compared our independent estimates to the accruals recorded by management; iii) assessed the effect of any adjustments to prior years’ accruals in the current year’s results; and iv) tested actual payments made and rebate claims processed by the Group, and evaluated those claims for consistency with the contractual and mandated terms of the Group’s arrangements. We considered the disclosures in Notes 1 and 20 of the Group financial statements for reasonableness. 140 AstraZeneca Annual Report & Form 20-F Information 2024 Financial Statements Independent auditors’ report to the members of AstraZeneca PLC continued |
| Impairment assessment of the product, marketing and distribution rights and other intangibles (Group) Impacted FSLIs 2024 2023 Product, marketing and distribution rights and other intangibles (hereafter referred to as the intangible assets) $36,505m $37,587m Net impairment charges $1,572m $434m The recoverability of the carrying value of cash generating units (to which the intangible assets belong) depends on future cash flows and/or the outcome of research and development (‘R&D’) activities including decisions by the Group to terminate development. The determination of the recoverable amounts include significant estimates, which are highly sensitive and depend upon key assumptions including the outcome of R&D activities, probability of technical and regulatory success, market volume, share and pricing (to derive peak year sales), the amount and timing of projected future cash flows and sales erosion curves following patent expiry. Changes in these assumptions could have an impact on the recoverable amount of the Group’s intangible assets. During 2024, $1,572m (2023: $434m) of net impairment charges were recorded (of which $1,065m (2023: $417m) was recorded in Research and development expense and $507m (2023: $17m) within Selling, general and administrative costs). Discussions with the Audit Committee How our audit addressed the Key Audit Matter Our discussions with and reporting to the Audit Committee included: • Our approach to audit the impairment assessment of the carrying value of cash generating units (to which the intangible assets belong) including details of planned substantive procedures and the extent of our controls reliance; • the methodologies and significant assumptions used to determine the recoverable values of the intangible assets; and • our experts’ assessments of evaluation of the probability of technical and regulatory success. Relevant references in the Annual Report Refer to the Audit Committee Report, Group Accounting Policies and Note 10 in the Group financial statements. We evaluated the design and tested the operating effectiveness of controls over management’s assessment of the impairment of intangible assets. We determined that we could rely on these controls for the purposes of our audit. For those assets or cash generating units in the scope of our audit we: i) tested management’s process for assessing whether there is an indication of impairment and the process for determining the recoverable amount; ii) tested the completeness and accuracy of the models as well as the underlying data used in the models, which included reconciling the cash flows to the Board approved Group level budgets and forecasts; and iii) evaluated the significant assumptions used by management in determining future cash flows, including the probability of technical and regulatory success, peak year sales and sales erosion curves. In evaluating the reasonableness of management’s assumptions we: i) compared significant assumptions to external data and benchmarks; and ii) performed a retrospective comparison of forecasted revenues and costs to actual performance. We utilised our in-house valuation experts to assist with the evaluation of the probability of technical and regulatory success. We considered the disclosures in Note 10 of the Group financial statements for reasonableness. Financial Statements | Independent auditors’ report to the members of AstraZeneca PLC AstraZeneca Annual Report & Form 20-F Information 2024 141 Strategic Report Corporate Governance Financial Statements Additional Information |
| Recognition and measurement of legal provisions and disclosure of contingent liabilities (Group) Impacted FSLIs 2024 2023 Provisions in respect of legal claims and settlements (together, legal provisions) $859m $1,016m Financial statements disclosure: Contingent liabilities disclosure in respect of legal proceedings Note 30 Note 30 The Group is involved in various legal proceedings, including actual or threatened litigation and actual or potential government investigations relating to employment matters, product liability, commercial disputes, pricing, sales and marketing practices, infringement of IP rights and the validity of certain patents and competition laws. There is significant judgement by management when assessing the timing and likelihood of loss being incurred and whether a legal provision can be reasonably estimated and recorded or if a contingent liability needs to be disclosed. Management’s assessment of the amounts concerned relies heavily on estimates and assumptions. Discussions with the Audit Committee How our audit addressed the Key Audit Matter Our discussions with and reporting to the Audit Committee included: • Our approach to audit the assessment of the ongoing litigations and claims including details of planned substantive procedures and the extent of our controls reliance; • The assessment of management’s judgement in the outcome of the Group’s legal matters; • Consideration of any potential impacts on the financial statements in respect of the investigations by Chinese authorities into current and former AstraZeneca employees regarding allegations of medical insurance fraud, illegal drug importation and personal information breaches; and • Our conclusions on the appropriateness of the in-year movements in the legal provisions. Relevant references in the Annual Report Refer to the Audit Committee Report, Group Accounting Policies, Notes 21 and 30 in the Group financial statements. We evaluated the design and tested the operating effectiveness of controls in respect of the recognition and measurement of legal proceedings and related disclosures. We determined that we could rely on these controls for the purposes of our audit. We enquired of internal legal counsel and where appropriate external legal counsel. We obtained and evaluated letters of audit enquiry with the Group’s internal and external legal counsel for significant litigation. We have inspected certain external legal documents. Where appropriate, with the support of PwC Forensic specialists, we considered the scope, preliminary findings and conclusions of investigations. We tested the completeness of management’s assessment of both the identification of legal proceedings and possible outcomes of each significant legal matter. We evaluated the reasonableness of management’s assessment regarding whether an adverse outcome is probable and estimated reliably. We evaluated management’s judgement regarding the proceedings set out as contingent liabilities within Note 30. We considered the disclosures in Notes 21 and 30 of the Group financial statements for reasonableness. Recognition, measurement and disclosure of tax liabilities for uncertain tax treatments (Group) Impacted FSLIs 2024 2023 Net tax liability in respect of Uncertain tax treatments $1,321m $1,336m Financial statements disclosure: Contingent liabilities disclosure in respect of tax matters $636m $679m The Group faces a number of audits and reviews in jurisdictions around the world and, in some cases, is in dispute with tax authorities. Tax liabilities recognised for uncertain tax treatments require management to make key judgements with respect to the outcome of current and potential future tax audits, reviews and disputes with tax authorities, and actual results could vary from these estimates. Discussions with the Audit Committee How our audit addressed the Key Audit Matter Our discussions with and reporting to the Audit Committee included: • Our approach to the audit of the assessment of the tax liabilities for uncertain tax treatments and related contingent liabilities disclosures including details of planned substantive procedures and the extent of our controls reliance; and • Our experts’ assessments of evaluation of the reasonableness of the assumptions relating to the most likely amount or expected value provision. Relevant references in the Annual Report Refer to the Audit Committee Report, Group Accounting Policies and Note 30 in the Group financial statements. We evaluated the design and tested the operating effectiveness of controls in respect of the recognition and measurement of uncertain tax treatments. We determined that we could rely on these controls for the purposes of our audit. We tested the completeness of management’s assessment of the identification of tax liabilities and evaluated management’s process for estimating the possible outcomes of each tax liability. We obtained the status and results of tax audits and discussions with the relevant tax authorities. With the assistance of our local and international tax specialists, we: i) evaluated management’s assessment of the technical merits of tax treatments (including where relevant evaluating any advice received from the Group’s external advisors) and estimates of the amount of tax benefit expected to be sustained; ii) tested the completeness and accuracy of the information used in the determination of the probability of different outcomes for uncertain tax treatments and the estimation of the liability for those tax treatments; and iii) evaluated the reasonableness of significant assumptions related to the outcome of tax audits and assumptions relating to the most likely amount or expected value depending on the resolution of the uncertainty. We considered the disclosures in Note 30 of the Group financial statements for reasonableness. 142 AstraZeneca Annual Report & Form 20-F Information 2024 Financial Statements Independent auditors’ report to the members of AstraZeneca PLC continued |
| Valuation of defined benefit obligations in the UK and Sweden (Group) Impacted FSLIs 2024 2023 Defined benefit obligations in the UK and Sweden $6,100m $6,736m The Group’s most significant schemes are in the UK and Sweden. The valuation of pension plan obligations requires significant estimation in determining appropriate assumptions such as mortality (for the UK scheme only), discount rates and inflation levels (for both the UK and Sweden schemes). Movements in these assumptions can have a material impact on the determination of the defined benefit obligations. Management uses external actuaries to assist in determining the assumptions. Discussions with the Audit Committee How our audit addressed the Key Audit Matter Our discussions with and reporting to the Audit Committee included: • Our approach to the audit of the valuation of the defined benefit obligations in the UK and Sweden including details of planned substantive procedures and the extent of our controls reliance; and • For the significant assumptions used by management, whether and where the Group’s assumptions lay within our reasonable range. Relevant references in the Annual Report Refer to the Audit Committee Report, Group Accounting Policies and Note 22 in the Group financial statements. We evaluated the design and tested the operating effectiveness of controls in respect of the assumptions used and accuracy of the Group’s most significant defined benefit obligations. We determined that we could rely on these controls for the purposes of our audit. We used actuarial experts to assess whether the assumptions used in calculating the defined benefit obligations for the UK and Sweden were reasonable. Our actuarial experts assisted in developing an independent expectation of the defined benefit obligations for the UK and Sweden. Our experts evaluated whether the mortality assumptions (UK scheme only) and the discount rates and inflation rates (for both the UK and Sweden schemes) were: i) consistent with the specifics of each plan and where relevant considering national information; ii) consistent with independently developed estimates; and iii) in line with other companies’ recent external reporting. We evaluated the calculations prepared by management’s external actuaries which included testing the completeness and accuracy of the underlying data. In order to evaluate the reasonableness of management’s estimate, our experts also compared the independent estimate to management’s estimate. We considered the disclosures in Note 22 of the Group financial statements for reasonableness. Distributable reserves in the Company (Parent) Impacted FSLIs 2024 2023 The Company’s Profit and loss account $13,495m $ 17,640m The directors review and disclose the level of distributable reserves of the Company annually and aim to maintain distributable reserves that provide adequate cover for dividend payments. At 31 December 2024, the overwhelming majority of the Profit and loss account reserve of $13,495m (31 December 2023: the overwhelming majority of $17,640m) was available for distribution, subject to filing the Company financial statements with Companies House. There is judgement when determining the profits available for distribution by reference to guidance on realised and distributable profits in accordance with Companies Act 2006 issued by the Institute of Chartered Accountants in England and Wales and the Institute of Chartered Accountants of Scotland in April 2017. Discussions with the Audit Committee How our audit addressed the Key Audit Matter Our discussions with and reporting to the Audit Committee included: • Our approach to audit the assessment of the distributable reserves in the Company including involvement of our internal experts; and • Our experts’ assessments in relation to the appropriateness of management’s judgements. Relevant references in the Annual Report Refer to the Company Statement of Changes in Equity in the Company financial statements. We obtained and audited the analysis of distributable reserves. We used our distributable reserves experts to assess whether judgements made were appropriate and the analysis was aligned with the relevant technical guidance on the determination of realised profits under the Companies Act 2006. We assessed whether there is qualifying consideration in determining whether the Profit and loss account reserve is distributable. We considered the disclosure related to the profits available for distribution for reasonableness. Financial Statements | Independent auditors’ report to the members of AstraZeneca PLC AstraZeneca Annual Report & Form 20-F Information 2024 143 Strategic Report Corporate Governance Financial Statements Additional Information |
| Note that, based on the structure of the Group, work on some parts or the entirety of some of these line items was performed centrally, including by our SSC component teams. • Our SSC component teams represented five out of the remaining nine components and were located in Poland, Malaysia, India, Costa Rica and Romania. These teams performed audit procedures over certain controls and transactions. • Three out of the remaining four components, which represent US tax reporting entities, were scoped in for taxation line items in the financial statements because of the size or risk. • As an element of unpredictability, one final component in Brazil was scoped in for an audit of specific individual financial statement line items with our work focussed on revenue, and trade and other receivables. • Additionally, for non-full scope components which were not considered inconsequential components, we performed targeted risk assessments procedures. • Audit procedures were performed centrally at the Group level in relation to various balances and activities accounted for and managed centrally including: goodwill, intangible assets (excluding software), centralised cash, borrowings and financial instruments, taxation, other investments and litigation matters as well as the consolidation. In April 2024, we held a meeting with the partners and senior staff from the key PwC member firms involved in the audit. At this meeting we considered developments specific to the Group, key audit matters and discussed our approach to the Group audit including the work performed at shared service centre locations. We heard from key members of management and the Chair of the Audit Committee. How we tailored the audit scope We tailored the scope of our audit to ensure that we performed enough work to be able to give an opinion on the financial statements as a whole, taking into account the structure of the Group and the Company, the accounting and consolidation processes and controls, and the industry in which they operate. The Group operates in over 100 countries and the size of operations within each territory varies. As a consequence of implementing ISA (UK) 600 (Revised) in this year’s audit, we have refined how we identify a component by defining each distinct legal or reporting entity and each Shared Service Centre (SSC) as a component. Each component subsequently reports to the Group through an integrated consolidation system. In selecting the components that are in scope each year and establishing the overall approach to the Group audit, we determined the type of work that needed to be performed by us, as the Group engagement team, or component auditors within PwC UK and other PwC network firms operating under our instruction, to ensure that we had sufficient coverage from our audit work over each significant line of the Group financial statements. Where the work was performed by component auditors, we determined the level of involvement we needed to have in the audit work in these territories to be able to conclude whether sufficient appropriate audit evidence had been obtained as a basis for our opinion on the Group financial statements as a whole. As a result of our risk assessment procedures and the detailed scoping exercise performed at the planning stage of our audit, we identified 19 components across 13 countries at which we determined that we need to perform audit work. Taken together, these components accounted for more than 70% of the Group’s revenue. The in-scope components were audited by the Group engagement team and 13 component teams. • Out of the 19 components, we identified four reporting components which required a full scope audit of their complete financial information, either due to their size or risk characteristics. These components are the principal operating units in the US (one component) and China (two components), as well as the Company. • For six out of the remaining 15 components, we performed audit procedures on a specific line item or line items within that component that we considered had the potential for the greatest impact on the significant accounts in the financial statements because of the size of these accounts. The table opposite illustrates the work covered in these six components. As part of our cycle of in person oversight we visited: China, the US, Sweden, Ireland and Brazil. In addition, we were in regular contact with our UK component team in Cambridge. We also visited the SSCs in Poland, Malaysia and India. In addition to these on-site visits, regular virtual meetings with the component auditors were held, whereby we performed reviews of the component auditors’ planned response to significant risks and reviewed the component auditors working papers. Alongside our team oversight we attended meetings with local management. The impact of climate risk on our audit In planning and executing our audit, we considered the potential impact of climate change on the Group’s business and the financial statements. The Group has set out its intention – as part of the Ambition Zero Carbon programme – to achieve net zero greenhouse gas emissions by maximising energy efficiency, shifting to renewable energy sources and investing in nature-based removals to compensate for any residual GHG footprint. As a part of our audit, we made enquiries of management to understand the extent of the potential impact of the physical and transitional climate change risk on the financial statements. We also discussed the climate change initiatives and commitments from Ambition Zero Carbon and other initiatives to reduce CO2 emissions, and the impact these have on the Group including on future cash flow forecasts. This includes the committed investment to the ‘AZ Forest’ through 2030 and the continued commitment to develop next-generation respiratory inhalers with near-zero global warming potential propellants for the pMDI inhaled medicines portfolio. Management considers that the impact of climate change does not give rise to a material financial statement impact. With the assistance of our climate change experts, Financial statement line item Locations in specific scope Revenue UK, Sweden, US, Japan and Germany Cost of sales UK, Sweden, US and Ireland Research and development expense UK, Sweden and US Selling, general and administrative expense UK, Sweden, US and Ireland Taxation Sweden and US Property, plant and equipment UK, Sweden and Ireland Non-current other receivables UK Inventories UK, Sweden and Ireland Trade and other receivables UK, Sweden and US Cash and cash equivalents US Trade and other payables UK and Sweden Retirement benefit obligations UK and Sweden Non-current other payables UK and Sweden 144 AstraZeneca Annual Report & Form 20-F Information 2024 Financial Statements Independent auditors’ report to the members of AstraZeneca PLC continued |
| we evaluated management’s risk assessment and understood the Group’s governance processes including the Sustainability Committee. We performed an audit risk assessment of how the impact of the Group’s commitments in respect of climate change including Ambition Zero Carbon may affect the financial statements and our audit. We challenged the extent to which climate change considerations including the expected cash flows from the initiatives and commitments had been reflected, where appropriate, in management’s impairment assessment process, going concern assessment and viability assessment. We found that climate change impacts are included within management’s forecasts although the initiatives and commitments did not have a material impact including on our key audit matters. We assessed the consistency of other information disclosed in the Annual Report with the financial statements, and with our knowledge obtained from the audit. Materiality The scope of our audit was influenced by our application of materiality. We set certain quantitative thresholds for materiality. These, together with qualitative considerations, helped us to determine the scope of our audit and the nature, timing and extent of our audit procedures on the individual financial statement line items and disclosures and in evaluating the effect of misstatements, both individually and in aggregate on the financial statements as a whole. Based on our professional judgement, we determined materiality for the financial statements as a whole as follows: Financial statements – Group Financial statements – Company Overall materiality $500m (2023: $440m). $155m (2023: $110m). How we determined it Approximately 5% of profit before tax after adding back intangible asset impairment charges (Note 10), fair value movements and discount unwind on contingent consideration (Note 20), and the discount unwind on certain other payables arising from intangible asset acquisitions (Note 3). 0.2% of net assets as constrained by the allocation of overall Group materiality. Rationale for benchmark applied The reported profit of the Group can fluctuate due to intangible asset impairment charges, fair value and discount unwind movements on contingent consideration, and the discount unwind on certain other payables arising from intangible asset acquisitions. These amounts are prone to year on year volatility and are not necessarily reflective of the operating performance of the Group and as such they have been excluded from the benchmark amount. Our approach is consistent with the prior year. We have considered the nature of the business of AstraZeneca PLC (being a holding company for investment activities) and have determined that net assets are an appropriate basis for the calculation of the overall materiality level. For each component in the scope of our Group audit, we allocated a materiality that is less than our overall Group materiality. The range of materiality allocated across components was between $50m and $350m. We use performance materiality to reduce to an appropriately low level the probability that the aggregate of uncorrected and undetected misstatements exceeds overall materiality. Specifically, we use performance materiality in determining the scope of our audit and the nature and extent of our testing of account balances, classes of transactions and disclosures, for example in determining sample sizes. Our performance materiality was 75% (2023: 75%) of overall materiality, amounting to $375m (2023: $330m) for the Group financial statements and $116.25m (2023: $82.5m) for the Company financial statements. In determining the performance materiality, we considered a number of factors – the history of misstatements, risk assessment and aggregation risk and the effectiveness of controls – and concluded that an amount at the upper end of our normal range was appropriate. We agreed with the Audit Committee that we would report to them misstatements identified during our audit above $50m (Group audit) (2023: $22m) and $50m (Company audit) (2023: $22m) as well as misstatements below those amounts that, in our view, warranted reporting for qualitative reasons. Conclusions relating to going concern Our evaluation of the directors’ assessment of the Group’s and the Company’s ability to continue to adopt the going concern basis of accounting included: • agreeing the underlying cash flow projections to Board approved Group level budgets and forecasts, assessing how these forecasts are compiled, and assessing the accuracy of management’s forecasts; • evaluating the key assumptions within management’s forecasts and ensuring that such assumptions are consistent with those modelled in relation to impairments; • considering liquidity and available financial resources; • assessing whether the stress testing performed by management appropriately considered the principal risks facing the business; and • evaluating the feasibility of management’s mitigating actions in the stress testing scenarios and performing our own sensitivities. Based on the work we have performed, we have not identified any material uncertainties relating to events or conditions that, individually or collectively, may cast significant doubt on the Group’s and the Company’s ability to continue as a going concern for a period of at least twelve months from when the financial statements are authorised for issue. In auditing the financial statements, we have concluded that the directors’ use of the going concern basis of accounting in the preparation of the financial statements is appropriate. However, because not all future events or conditions can be predicted, this conclusion is not a guarantee as to the Group’s and the Company’s ability to continue as a going concern. In relation to the directors’ reporting on how they have applied the UK Corporate Governance Code, we have nothing material to add or draw attention to in relation to the directors’ statement in the financial statements about whether the directors considered it appropriate to adopt the going concern basis of accounting. Our responsibilities and the responsibilities of the directors with respect to going concern are described in the relevant sections of this report. Financial Statements | Independent auditors’ report to the members of AstraZeneca PLC AstraZeneca Annual Report & Form 20-F Information 2024 145 Strategic Report Corporate Governance Financial Statements Additional Information |
| Reporting on other information The other information comprises all of the information in the Annual Report other than the financial statements and our auditors’ report thereon. The directors are responsible for the other information. Our opinion on the financial statements does not cover the other information and, accordingly, we do not express an audit opinion or, except to the extent otherwise explicitly stated in this report, any form of assurance thereon. In connection with our audit of the financial statements, our responsibility is to read the other information and, in doing so, consider whether the other information is materially inconsistent with the financial statements or our knowledge obtained in the audit, or otherwise appears to be materially misstated. If we identify an apparent material inconsistency or material misstatement, we are required to perform procedures to conclude whether there is a material misstatement of the financial statements or a material misstatement of the other information. If, based on the work we have performed, we conclude that there is a material misstatement of this other information, we are required to report that fact. We have nothing to report based on these responsibilities. With respect to the Strategic Report and Directors’ Report, we also considered whether the disclosures required by the UK Companies Act 2006 have been included. Based on our work undertaken in the course of the audit, the Companies Act 2006 requires us also to report certain opinions and matters as described below. Strategic report and Directors’ Report In our opinion, based on the work undertaken in the course of the audit, the information given in the Strategic Report and Directors’ Report for the year ended 31 December 2024 is consistent with the financial statements and has been prepared in accordance with applicable legal requirements. In light of the knowledge and understanding of the Group and Company and their environment obtained in the course of the audit, we did not identify any material misstatements in the Strategic Report and Directors’ Report. Directors’ Remuneration In our opinion, the part of the Directors’ Remuneration Report to be audited has been properly prepared in accordance with the Companies Act 2006. Corporate governance statement The UK Listing Rules require us to review the directors’ statements in relation to going concern, longer-term viability and that part of the corporate governance statement relating to the Company’s compliance with the provisions of the UK Corporate Governance Code specified for our review. Our additional responsibilities with respect to the corporate governance statement as other information are described in the Reporting on other information section of this report. Based on the work undertaken as part of our audit, we have concluded that each of the following elements of the corporate governance statement, included within the Corporate Governance Overview, Corporate Governance Report, Nomination and Governance Committee Report, Science Committee Report, Sustainability Committee Report and Audit Committee Report is materially consistent with the financial statements and our knowledge obtained during the audit, and we have nothing material to add or draw attention to in relation to: • The directors’ confirmation that they have carried out a robust assessment of the emerging and principal risks; • The disclosures in the Annual Report that describe those principal risks, what procedures are in place to identify emerging risks and an explanation of how these are being managed or mitigated; • The directors’ statement in the financial statements about whether they considered it appropriate to adopt the going concern basis of accounting in preparing them, and their identification of any material uncertainties to the Group’s and Company’s ability to continue to do so over a period of at least twelve months from the date of approval of the financial statements; • The directors’ explanation as to their assessment of the Group’s and Company’s prospects, the period this assessment covers and why the period is appropriate; and • The directors’ statement as to whether they have a reasonable expectation that the Company will be able to continue in operation and meet its liabilities as they fall due over the period of its assessment, including any related disclosures drawing attention to any necessary qualifications or assumptions. Our review of the directors’ statement regarding the longer-term viability of the Group and Company was substantially less in scope than an audit and only consisted of making inquiries and considering the directors’ process supporting their statement; checking that the statement is in alignment with the relevant provisions of the UK Corporate Governance Code; and considering whether the statement is consistent with the financial statements and our knowledge and understanding of the Group and Company and their environment obtained in the course of the audit. In addition, based on the work undertaken as part of our audit, we have concluded that each of the following elements of the corporate governance statement is materially consistent with the financial statements and our knowledge obtained during the audit: • The directors’ statement that they consider the Annual Report, taken as a whole, is fair, balanced and understandable, and provides the information necessary for the members to assess the Group’s and Company’s position, performance, business model and strategy; • The section of the Annual Report that describes the review of effectiveness of risk management and internal control systems; and • The section of the Annual Report describing the work of the Audit Committee. We have nothing to report in respect of our responsibility to report when the directors’ statement relating to the Company’s compliance with the Code does not properly disclose a departure from a relevant provision of the Code specified under the UK Listing Rules for review by the auditors. Responsibilities for the financial statements and the audit Responsibilities of the directors for the financial statements As explained more fully in the Preparation of the Financial Statements and Directors’ Responsibilities section, the directors are responsible for the preparation of the financial statements in accordance with the applicable framework and for being satisfied that they give a true and fair view. The directors are also responsible for such internal control as they determine is necessary to enable the preparation of financial statements that are free from material misstatement, whether due to fraud or error. In preparing the financial statements, the directors are responsible for assessing the Group’s and the Company’s ability to continue as a going concern, disclosing, as applicable, matters related to going concern and using the going concern basis of accounting unless the directors either intend to liquidate the Group or the Company or to cease operations, or have no realistic alternative but to do so. Auditors’ responsibilities for the audit of the financial statements Our objectives are to obtain reasonable assurance about whether the financial statements as a whole are free from material misstatement, whether due to fraud or error, and to issue an auditors’ report that includes our opinion. Reasonable assurance is a high level of assurance, but is not a guarantee that an audit conducted in accordance with 146 AstraZeneca Annual Report & Form 20-F Information 2024 Financial Statements Independent auditors’ report to the members of AstraZeneca PLC continued |
| ISAs (UK) will always detect a material misstatement when it exists. Misstatements can arise from fraud or error and are considered material if, individually or in the aggregate, they could reasonably be expected to influence the economic decisions of users taken on the basis of these financial statements. Irregularities, including fraud, are instances of non-compliance with laws and regulations. We design procedures in line with our responsibilities, outlined above, to detect material misstatements in respect of irregularities, including fraud. The extent to which our procedures are capable of detecting irregularities, including fraud, is detailed below. Based on our understanding of the Group and industry, we identified that the principal risks of non-compliance with laws and regulations related to patent protection, product safety (including but not limited to the US Food and Drug Administration regulation, the European Medicines Agency, the UK Medicines and Healthcare products Regulatory Agency, China Food and Drug Administration), data protection legislation, antibribery and competition law (including but not limited to the Foreign Corrupt Practices Act, the Proceeds of Crime Act and the provisions set out by the National Healthcare Security Administration in China), and we considered the extent to which non-compliance might have a material effect on the financial statements. We also considered those laws and regulations that have a direct impact on the financial statements such as the Companies Act 2006, listing rules and tax legislation. We evaluated management’s incentives and opportunities for fraudulent manipulation of the financial statements (including the risk of override of controls) and determined that the principal risks were related to journal entries to manipulate financial results and potential management bias in accounting estimates. The Group engagement team shared this risk assessment with the component auditors so that they could include appropriate audit procedures in response to such risks in their work. Audit procedures performed by the Group engagement team and/or component auditors included: • Evaluation and testing of the design and operating effectiveness of management’s controls to prevent and detect irregularities; • Discussions with VP Group Internal Audit, the Deputy Chief Compliance Officer, the Head of Global Investigations and the Group’s General Counsel and Deputy General Counsels along with other members of Group legal and external counsel where applicable, including consideration of known or suspected instances of non-compliance with laws and regulations and fraud; • Assessment of matters reported on the Group’s whistleblowing helpline; • Assessment of the results of management’s investigations, with the involvement of PwC Forensic specialists where appropriate; • Challenging assumptions made by management in its significant accounting estimates, in particular in relation to the recognition and measurement of certain rebate accruals in the US (excluding Rare Diseases), the impairment of intangible assets (excluding goodwill and software development costs), the recognition and measurement of legal provisions and disclosure of contingent liabilities, the recognition and measurement of uncertain tax treatments, and the valuation of the defined benefit obligations (see related key audit matters above); and • Identifying and testing the validity of selected journal entries, including certain journal entries posted with unusual account combinations, and certain consolidation journals. There are inherent limitations in the audit procedures described above. We are less likely to become aware of instances of non-compliance with laws and regulations that are not closely related to events and transactions reflected in the financial statements. Also, the risk of not detecting a material misstatement due to fraud is higher than the risk of not detecting one resulting from error, as fraud may involve deliberate concealment by, for example, forgery or intentional misrepresentations, or through collusion. Our audit testing might include testing complete populations of certain transactions and balances, possibly using data auditing techniques. However, it typically involves selecting a limited number of items for testing, rather than testing complete populations. We will often seek to target particular items for testing based on their size or risk characteristics. In other cases, we will use audit sampling to enable us to draw a conclusion about the population from which the sample is selected. A further description of our responsibilities for the audit of the financial statements is located on the FRC’s website at: www.frc.org.uk/auditorsresponsibilities. This description forms part of our auditors’ report. Use of this report This report, including the opinions, has been prepared for and only for the Company’s members as a body in accordance with Chapter 3 of Part 16 of the Companies Act 2006 and for no other purpose. We do not, in giving these opinions, accept or assume responsibility for any other purpose or to any other person to whom this report is shown or into whose hands it may come save where expressly agreed by our prior consent in writing. Other required reporting Companies Act 2006 exception reporting Under the Companies Act 2006 we are required to report to you if, in our opinion: • we have not obtained all the information and explanations we require for our audit; or • adequate accounting records have not been kept by the Company, or returns adequate for our audit have not been received from branches not visited by us; or • certain disclosures of directors’ remuneration specified by law are not made; or • the Company financial statements and the part of the Directors’ Remuneration Report to be audited are not in agreement with the accounting records and returns. We have no exceptions to report arising from this responsibility. Appointment Following the recommendation of the Audit Committee, we were appointed by the members on 27 April 2017 to audit the financial statements for the year ended 31 December 2017 and subsequent financial periods. The period of total uninterrupted engagement is eight years, covering the years ended 31 December 2017 to 31 December 2024. Other matter The Company is required by the Financial Conduct Authority Disclosure Guidance and Transparency Rules to include these financial statements in an annual financial report prepared under the structured digital format required by DTR 4.1.15R – 4.1.18R and filed on the National Storage Mechanism of the Financial Conduct Authority. This auditors’ report provides no assurance over whether the structured digital format annual financial report has been prepared in accordance with those requirements. Sarah Quinn (Senior Statutory Auditor) for and on behalf of PricewaterhouseCoopers LLP Chartered Accountants and Statutory Auditors London 6 February 2025 Financial Statements | Independent auditors’ report to the members of AstraZeneca PLC AstraZeneca Annual Report & Form 20-F Information 2024 147 Strategic Report Corporate Governance Financial Statements Additional Information |
| Consolidated Statement of Comprehensive Income for the year ended 31 December 2024 2023 2022 Notes $m $m $m Product Sales 1 50,938 43,789 42,998 Alliance Revenue 1 2,212 1,428 755 Collaboration Revenue 1 923 594 598 Total Revenue 54,073 45,811 44,351 Cost of sales (10,207) (8,268) (12,391) Gross profit 43,866 37,543 31,960 Distribution expense (555) (539) (536) Research and development expense 2 (13,583) (10,935) (9,762) Selling, general and administrative expense 2 (19,977) (19,216) (18,419) Other operating income and expense 2 252 1,340 514 Operating profit 10,003 8,193 3,757 Finance income 3 458 344 95 Finance expense 3 (1,742) (1,626) (1,346) Share of after tax losses in associates and joint ventures 11 (28) (12) (5) Profit before tax 8,691 6,899 2,501 Taxation 4 (1,650) (938) 792 Profit for the period 7,041 5,961 3,293 Other comprehensive income: Items that will not be reclassified to profit and loss: Remeasurement of the defined benefit pension liability 22 80 (406) 1,118 Net gains/(losses) on equity investments measured at fair value through Other comprehensive income 139 278 (88) Fair value movements related to own credit risk on bonds designated as fair value through profit or loss 12 (6) 2 Tax on items that will not be reclassified to profit and loss 4 (43) 101 (216) 188 (33) 816 Items that may be reclassified subsequently to profit and loss: Foreign exchange arising on consolidation 23 (957) 608 (1,446) Foreign exchange arising on designated liabilities in net investment hedges 23 (122) 24 (282) Fair value movements on cash flow hedges (129) 266 (97) Fair value movements on cash flow hedges transferred to profit and loss 177 (145) 73 Fair value movements on derivatives designated in net investment hedges 23 39 44 (8) Costs of hedging (21) (19) (7) Tax on items that may be reclassified subsequently to profit and loss 4 25 (12) 73 (988) 766 (1,694) Other comprehensive (expense)/income for the period, net of tax (800) 733 (878) Total comprehensive income for the period 6,241 6,694 2,415 Profit attributable to: Owners of the Parent 7,035 5,955 3,288 Non-controlling interests 26 6 6 5 Total comprehensive income attributable to: Owners of the Parent 6,236 6,688 2,413 Non-controlling interests 26 5 6 2 Basic earnings per $0.25 Ordinary Share 5 $4.54 $3.84 $2.12 Diluted earnings per $0.25 Ordinary Share 5 $4.50 $3.81 $2.11 Weighted average number of Ordinary Shares in issue (millions) 5 1,550 1,549 1,548 Diluted weighted average number of Ordinary Shares in issue (millions) 5 1,563 1,562 1,560 Dividends declared and paid in the period 25 4,602 4,487 4,485 All activities were in respect of continuing operations. $m means millions of US dollars. 148 AstraZeneca Annual Report & Form 20-F Information 2024 Financial Statements |
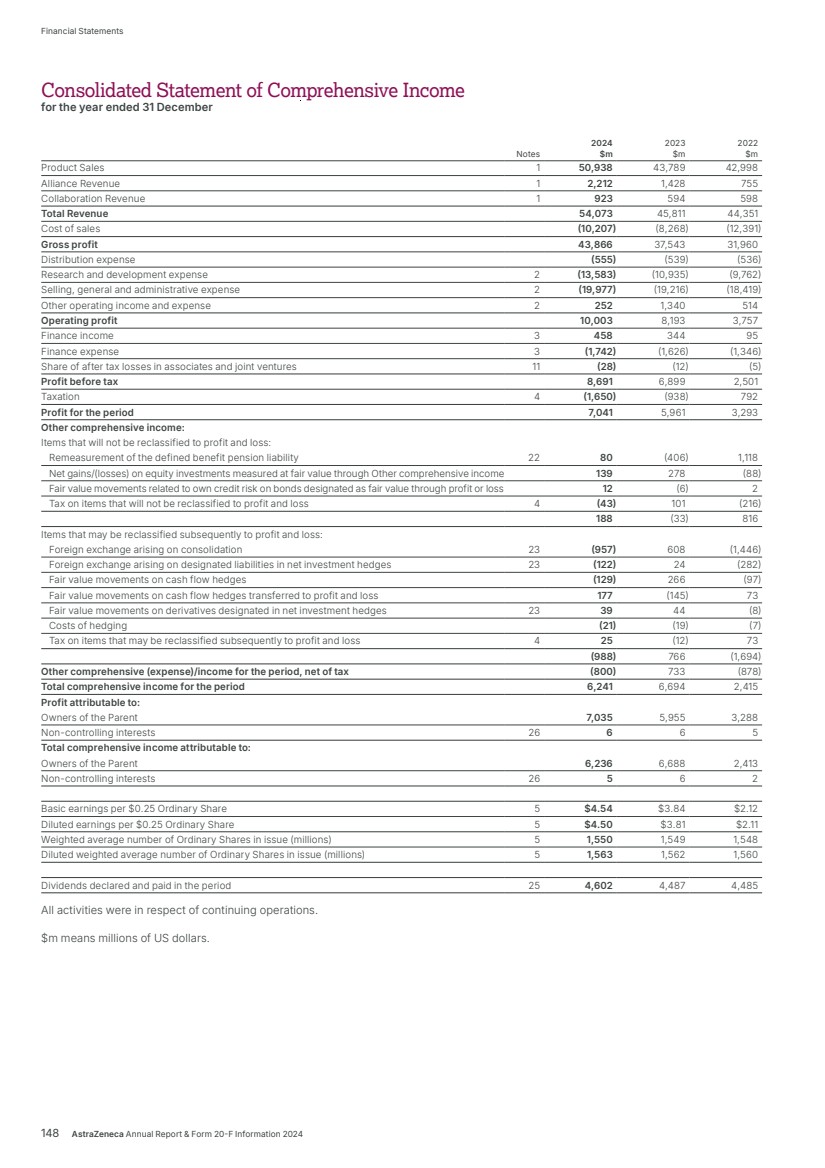
| Consolidated Statement of Financial Position at 31 December 2024 2023 2022 Notes $m $m $m Assets Non-current assets Property, plant and equipment 7 10,252 9,402 8,507 Right-of-use assets 8 1,395 1,100 942 Goodwill 9 21,025 20,048 19,820 Intangible assets 10 37,177 38,089 39,307 Investments in associates and joint ventures 11 268 147 76 Other investments 12 1,632 1,530 1,066 Derivative financial instruments 13 182 228 74 Other receivables 14 930 803 835 Deferred tax assets 4 5,347 4,718 3,263 78,208 76,065 73,890 Current assets Inventories 15 5,288 5,424 4,699 Trade and other receivables 16 12,972 12,126 10,521 Other investments 12 166 122 239 Derivative financial instruments 13 54 116 87 Income tax receivable 1,859 1,426 731 Cash and cash equivalents 17 5,488 5,840 6,166 Assets held for sale 18 – – 150 25,827 25,054 22,593 Total assets 104,035 101,119 96,483 Liabilities Current liabilities Interest-bearing loans and borrowings 19 (2,337) (5,129) (5,314) Lease liabilities 8 (339) (271) (228) Trade and other payables 20 (22,465) (22,374) (19,040) Derivative financial instruments 13 (50) (156) (93) Provisions 21 (1,269) (1,028) (722) Income tax payable (1,406) (1,584) (896) (27,866) (30,542) (26,293) Non-current liabilities Interest-bearing loans and borrowings 19 (26,506) (22,365) (22,965) Lease liabilities 8 (1,113) (857) (725) Derivative financial instruments 13 (115) (38) (164) Deferred tax liabilities 4 (3,305) (2,844) (2,944) Retirement benefit obligations 22 (1,330) (1,520) (1,168) Provisions 21 (921) (1,127) (896) Income tax payable (238) – – Other payables 20 (1,770) (2,660) (4,270) (35,298) (31,411) (33,132) Total liabilities (63,164) (61,953) (59,425) Net assets 40,871 39,166 37,058 Equity Capital and reserves attributable to equity holders of the Company Share capital 24 388 388 387 Share premium account 35,226 35,188 35,155 Capital redemption reserve 153 153 153 Merger reserve 448 448 448 Other reserves 23 1,411 1,464 1,468 Retained earnings 23 3,160 1,502 (574) 40,786 39,143 37,037 Non-controlling interests 26 85 23 21 Total equity 40,871 39,166 37,058 The Financial Statements from pages 148 to 218 were approved by the Board and were signed on its behalf by Pascal Soriot Aradhana Sarin Director Director 6 February 2025 AstraZeneca Annual Report & Form 20-F Information 2024 149 Strategic Report Corporate Governance Financial Statements Additional Information Consolidated Statement of Financial Position |
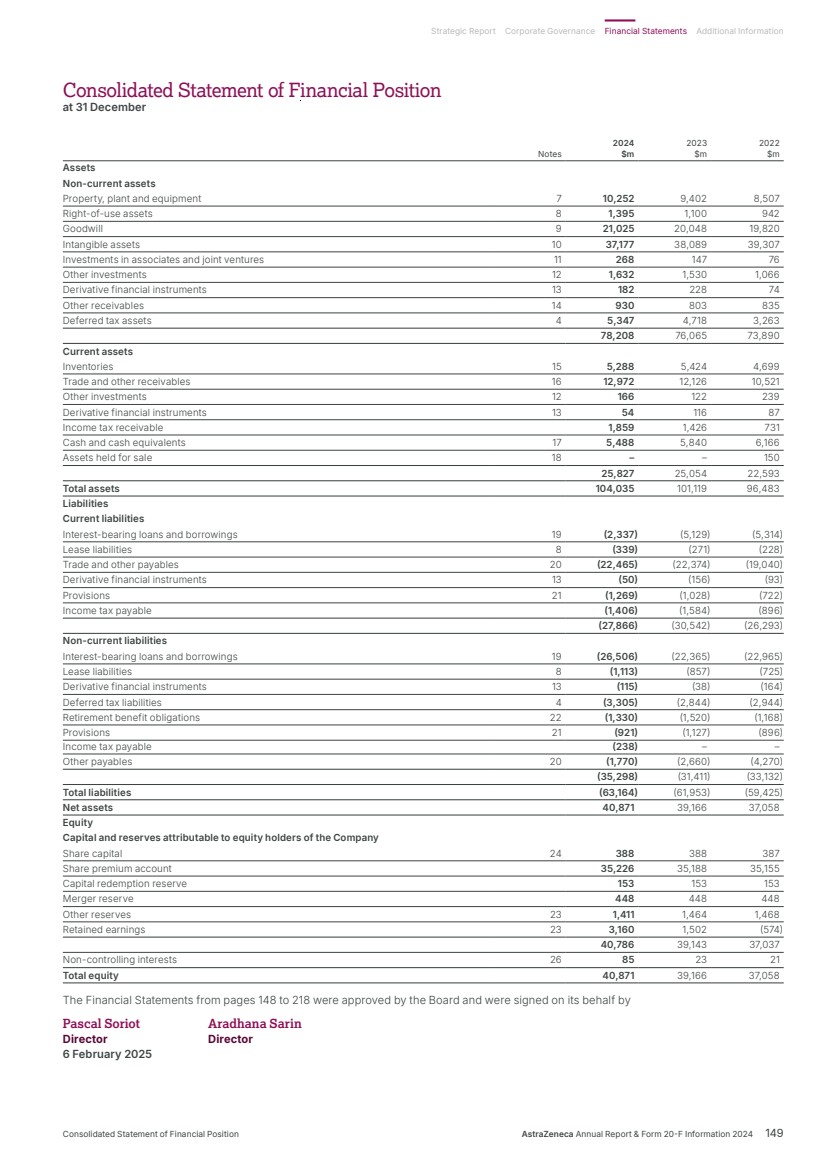
| Consolidated Statement of Changes in Equity for the year ended 31 December Share Capital Total Non-Share premium redemption Merger Other Retained attributable controlling Total capital account reserve reserve reserves earnings to owners interests equity $m $m $m $m $m $m $m $m $m At 1 January 2022 387 35,126 153 448 1,444 1,710 39,268 19 39,287 Profit for the period – – – – – 3,288 3,288 5 3,293 Other comprehensive expense1 – – – – – (875) (875) (3) (878) Transfer to other reserves2 – – – – 24 (24) – – – Transactions with owners Dividends (Note 25) – – – – – (4,485) (4,485) – (4,485) Issue of Ordinary Shares – 29 – – – – 29 – 29 Share-based payments charge for the period (Note 29) – – – – – 619 619 – 619 Settlement of share plan awards – – – – – (807) (807) – (807) Net movement – 29 – – 24 (2,284) (2,231) 2 (2,229) At 31 December 2022 387 35,155 153 448 1,468 (574) 37,037 21 37,058 Profit for the period – – – – – 5,955 5,955 6 5,961 Other comprehensive income1 – – – – – 733 733 – 733 Transfer to other reserves2 – – – – (4) 4 – – – Transactions with owners Dividends (Note 25) – – – – – (4,487) (4,487) – (4,487) Dividends paid to non-controlling interests (Note 25) – – – – – – – (4) (4) Issue of Ordinary Shares 1 33 – – – – 34 – 34 Share-based payments charge for the period (Note 29) – – – – – 579 579 – 579 Settlement of share plan awards – – – – – (708) (708) – (708) Net movement 1 33 – – (4) 2,076 2,106 2 2,108 At 31 December 2023 388 35,188 153 448 1,464 1,502 39,143 23 39,166 Profit for the period – – – – – 7,035 7,035 6 7,041 Other comprehensive expense1 – – – – – (799) (799) (1) (800) Transfer to other reserves2 – – – – 15 (15) – – – Transactions with owners Dividends (Note 25) – – – – – (4,602) (4,602) – (4,602) Dividends paid to non-controlling interests (Note 25) – – – – – – – (4) (4) Issue of Ordinary Shares – 38 – – – – 38 – 38 Changes in non-controlling interests – – – – – – – 61 61 Movement in shares held by Employee Benefit Trusts2 – – – – (68) – (68) – (68) Share-based payments charge for the period (Note 29) – – – – – 660 660 – 660 Settlement of share plan awards – – – – – (621) (621) – (621) Net movement – 38 – – (53) 1,658 1,643 62 1,705 At 31 December 2024 388 35,226 153 448 1,411 3,160 40,786 85 40,871 1 Included within Other comprehensive expense of $800m (2023: income of $733m; 2022: expense of $878m) is a charge of $21m (2023: $19m; 2022: $7m), relating to Costs of hedging. 2 Amounts charged or credited to other reserves relate to exchange adjustments arising on goodwill and movements in shares held by Employee Benefit Trusts. 150 AstraZeneca Annual Report & Form 20-F Information 2024 Financial Statements |
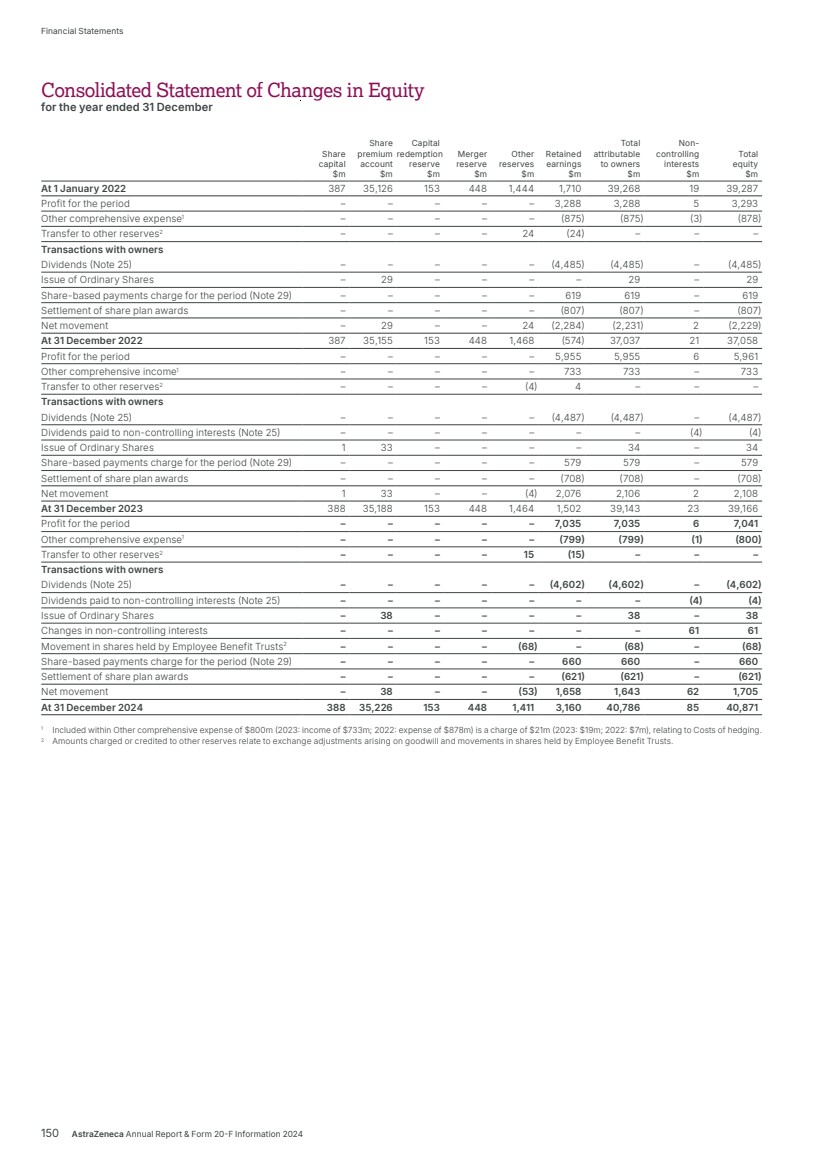
| Consolidated Statement of Cash Flows for the year ended 31 December 2024 2023 2022 Notes $m $m $m Cash flows from operating activities Profit before tax 8,691 6,899 2,501 Finance income and expense 3 1,284 1,282 1,251 Share of after tax losses of associates and joint ventures 11 28 12 5 Depreciation, amortisation and impairment 6,688 5,387 5,480 Increase in trade and other receivables (1,624) (1,425) (1,349) (Increase)/decrease in inventories (131) (669) 3,941 Increase in trade and other payables and provisions 862 2,394 1,165 Gains on disposal of intangible assets 2 (64) (251) (104) Fair value movements on contingent consideration arising from business combinations 20 311 549 82 Non-cash and other movements 17 (121) (386) (692) Cash generated from operations 15,924 13,792 12,280 Interest paid (1,313) (1,081) (849) Tax paid (2,750) (2,366) (1,623) Net cash inflow from operating activities 11,861 10,345 9,808 Cash flows from investing activities Acquisition of subsidiaries, net of cash acquired 27 (2,771) (189) (48) Payments upon vesting of employee share awards attributable to business combinations 27 (3) (84) (215) Payment of contingent consideration from business combinations 20 (1,008) (826) (772) Purchase of property, plant and equipment (1,924) (1,361) (1,091) Disposal of property, plant and equipment 55 132 282 Purchase of intangible assets (2,662) (2,417) (1,480) Disposal of intangible assets 123 291 447 Movement in profit-participation liability 2 – 190 – Purchase of non-current asset investments (96) (136) (45) Disposal of non-current asset investments 78 32 42 Movement in short-term investments, fixed deposits and other investing instruments 30 97 (114) Payments to associates and joint ventures 11 (158) (80) (26) Disposal of investments in associates and joint ventures 13 – – Interest received 343 287 60 Net cash outflow from investing activities (7,980) (4,064) (2,960) Net cash inflow before financing activities 3,881 6,281 6,848 Cash flows from financing activities Proceeds from issue of share capital 38 33 29 Own shares purchased by Employee Benefit Trusts (81) – – Issue of loans and borrowings 6,492 3,816 – Repayment of loans and borrowings (4,652) (4,942) (1,271) Dividends paid 25 (4,629) (4,481) (4,364) Hedge contracts relating to dividend payments 25 16 (19) (127) Repayment of obligations under leases (316) (268) (244) Movement in short-term borrowings (31) 161 74 Payment of Acerta Pharma share purchase liability (833) (867) (920) Net cash outflow from financing activities (3,996) (6,567) (6,823) Net (decrease)/increase in Cash and cash equivalents in the period (115) (286) 25 Cash and cash equivalents at the beginning of the period 5,637 5,983 6,038 Exchange rate effects (93) (60) (80) Cash and cash equivalents at the end of the period 17 5,429 5,637 5,983 AstraZeneca Annual Report & Form 20-F Information 2024 151 Strategic Report Corporate Governance Financial Statements Additional Information Consolidated Statement of Cash Flows |
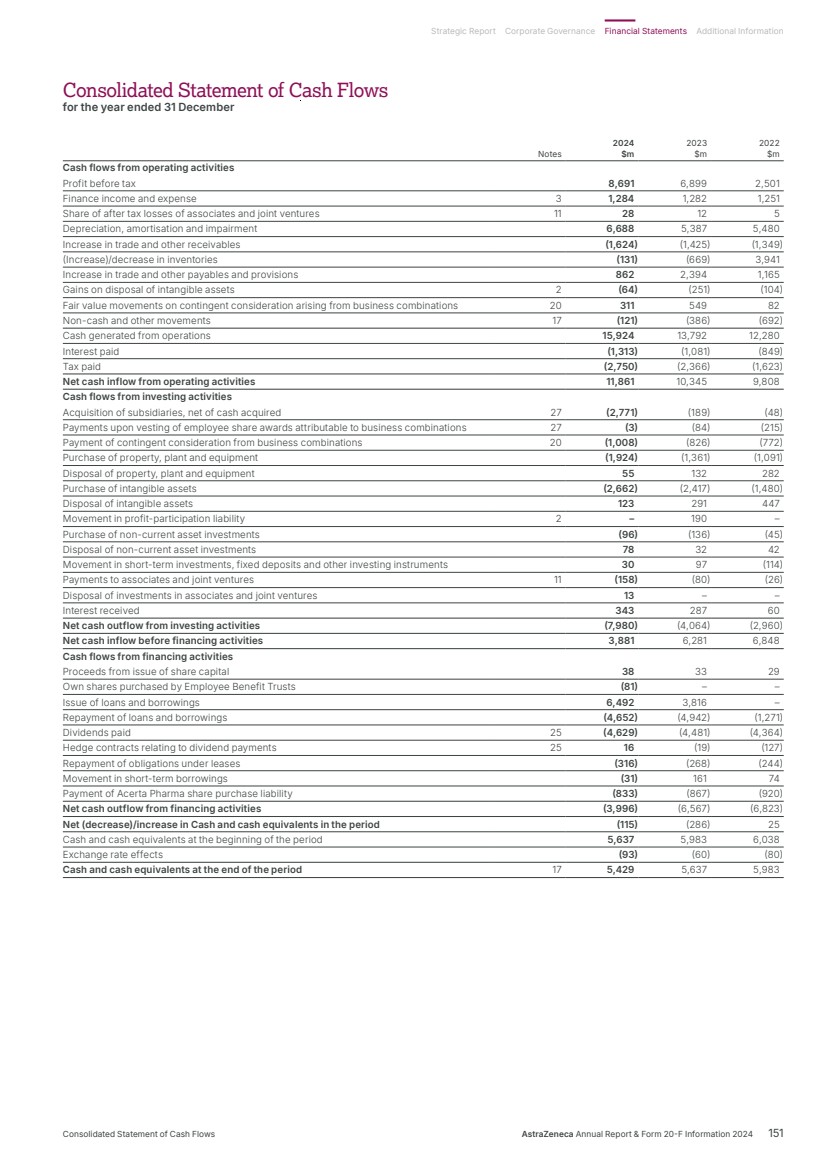
| Group Accounting Policies Basis of accounting and preparation of financial information The Consolidated Financial Statements have been prepared under the historical cost convention, modified to include revaluation to fair value of certain financial instruments and pension plan assets and liabilities as described below, in accordance with UK-adopted international accounting standards and with the requirements of the Companies Act 2006 as applicable to companies reporting under those standards. The Consolidated Financial Statements also comply fully with IFRS Accounting Standards as issued by the International Accounting Standards Board (IASB) and International Accounting Standards as adopted by the European Union. The Consolidated Financial Statements are presented in US dollars, which is the Company’s functional currency. In preparing their individual financial statements, the accounting policies of some overseas subsidiaries do not conform with IASB-issued IFRSs. Therefore, where appropriate, adjustments are made in order to present the Consolidated Financial Statements on a consistent basis. New accounting requirements The following amendments and interpretations have been issued and adopted: • amendments to IAS 1 ‘Presentation of Financial Statements’, effective for periods beginning on or after 1 January 2024 – endorsed by the United Kingdom Endorsement Board (UKEB) on 21 July 2023 • amendments to IFRS 16 ‘Leases’, effective for periods beginning on or after 1 January 2024 – endorsed by the UKEB on 11 May 2023 • amendments to IAS 7 ‘Statement of Cash Flows’, effective for periods beginning on or after 1 January 2024 – endorsed by the UKEB on 28 November 2023 • amendments to IFRS 7 ‘Financial Instruments’, effective for periods beginning on or after 1 January 2024 – endorsed by the UKEB on 28 November 2023. The above amendments and interpretations did not have a significant impact on the Group’s net results, net assets or disclosures. Employee Benefit Trusts Following an amendment to the Employee Benefit Trust (EBT) Deed on 10 June 2024, AstraZeneca obtained control and commenced consolidation of the EBT from June 2024. From that date, cash paid on purchases of AstraZeneca Ordinary shares or American Depository Receipts is presented within Financing activities in the Consolidated Statement of Cash Flows. Basis for preparation of Financial Statements on a going concern basis The Group has considerable financial resources available. As at 31 December 2024, the Group has $10.4bn in financial resources (cash and cash equivalent balances of $5.5bn and undrawn committed bank facilities of $4.9bn that were available until April 2029), with $2.7bn of borrowings due within one year. These facilities contain no financial covenants, and in January 2025 their maturity was extended to April 2030. The Group has assessed the prospects of the Group over a period longer than the required 12 months from the date of Board approval of these Consolidated Financial Statements, with no deterioration noted requiring a further extension of this review. The Group’s revenues are largely derived from sales of medicines covered by patents, which provide a relatively high level of resilience and predictability to cash inflows, although government price interventions in response to budgetary constraints are expected to continue to adversely affect revenues in some of our significant markets. The Group, however, anticipates new revenue streams from both recently launched medicines and those in development, and the Group has a wide diversity of customers and suppliers across different geographic areas. Consequently, the Directors believe that, overall, the Group is well placed to manage its business risks successfully. Accordingly, they continue to adopt the going concern basis in preparing the Annual Report and Financial Statements. Estimates and judgements The preparation of the Financial Statements in conformity with generally accepted accounting principles requires management to make estimates and judgements that affect the reported amounts of assets and liabilities at the date of the Financial Statements and the reported amounts of revenues and expenses during the reporting period. Actual results could differ from those estimates. The accounting policy descriptions set out the areas where judgements and estimates need exercising, the most significant of which include the following Key Judgements KJ and Significant Estimates SE : • revenue recognition – see Revenue accounting policy on page 153 KJ and Note 1 on page 160 SE • expensing of internal development expenses – see Research and development accounting policy on page 154 KJ • impairment reviews of Intangible assets – see Note 10 on page 173 SE • useful economic life of Intangible assets – see Research and development accounting policy on page 154 KJ • business combinations and Goodwill – see Business combinations and goodwill accounting policy on page 157 KJ • litigation liabilities – see Litigation and Environmental Liabilities within Note 30 on page 205 KJ • operating segments – see Note 6 on page 166 KJ • employee benefits – see Note 22 on page 190 SE • taxation – see Note 30 on page 211 KJ . The Group has assessed the impact of sustainability topics on its financial reporting. This includes an impact assessment on the valuation and useful lives of Intangible assets and the identification and measurement of provisions and contingent liabilities in response to climate and pollution risks. Sustainability-related opportunities on innovation are integral to the Financial Statements with a key indicator of the Group’s investment being R&D expense. Business conduct and patient safety are both considered as part of our recognition and measurement of provisions and contingent liabilities, noted within sections of Government investigations and proceedings and Product liability litigation as relevant, of Note 30. No material accounting impacts or changes to judgements or other required disclosures were noted. KJ Key Judgements are those judgements made in applying the Group’s accounting policies that have a material effect on the amounts of assets and liabilities recognised in the Financial Statements. SE A Significant Estimate has a significant risk of material adjustment to the carrying amounts of assets and liabilities within the next financial year. Financial risk management policies are detailed in Note 28 to the Financial Statements from page 194. AstraZeneca’s management considers the following to be the material accounting policies in the context of the Group’s operations. Revenue Revenue comprises Product Sales, Alliance Revenue and Collaboration Revenue. Revenue excludes inter-company revenues and value-added taxes. Product Sales Product Sales represent net invoice value less estimated rebates, returns and chargebacks, which are considered to be variable consideration and include significant estimates. Sales are recognised when the control of the goods has been transferred to a third party. This is usually when title passes to the customer, either on shipment or on 152 AstraZeneca Annual Report & Form 20-F Information 2024 Financial Statements |
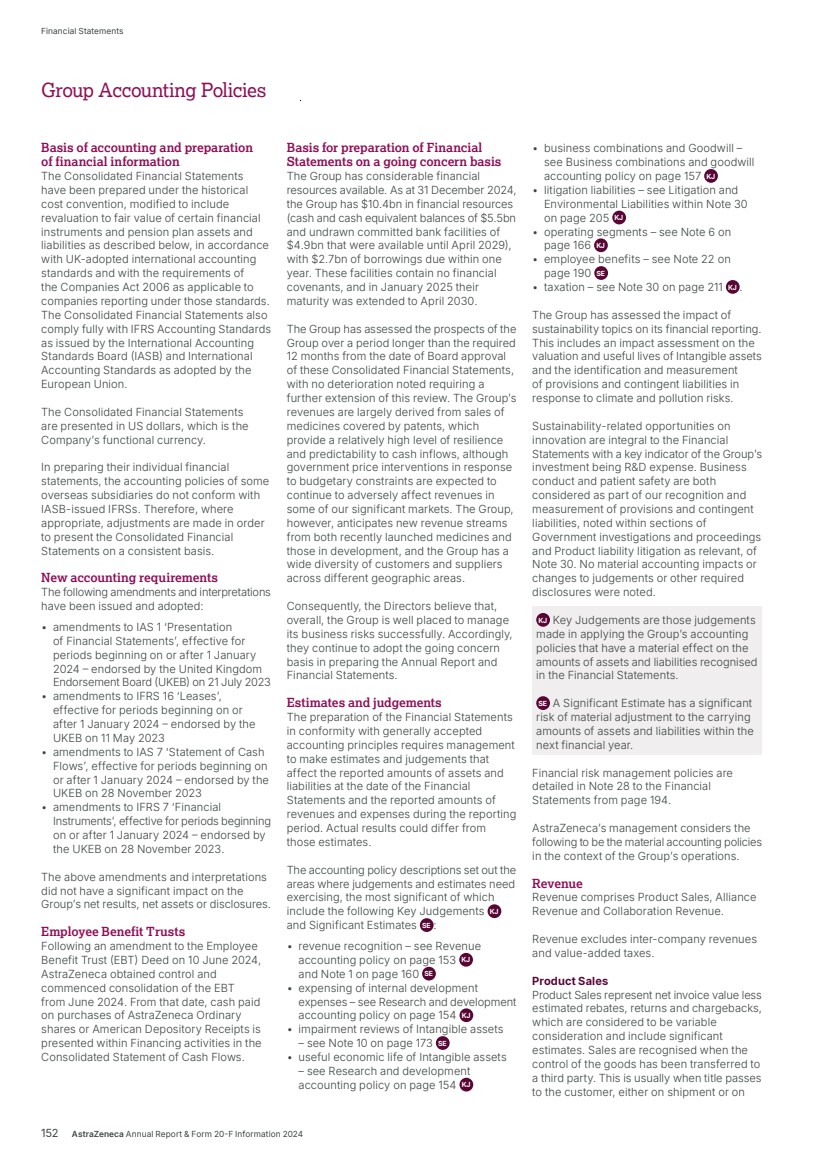
| receipt of goods by the customer, depending on local trading terms. Revenue is not recognised in full until it is highly probable that a significant reversal in the amount of cumulative revenue recognised will not occur. Rebates are amounts payable or credited to a customer, usually based on the quantity or value of Product Sales to the customer for specific products in a certain period. Product Sales rebates, which relate to Product Sales that occur over a period of time, are normally issued retrospectively. At the time Product Sales are invoiced, rebates and deductions that the Group expects to pay are estimated based upon assumptions developed using contractual terms, historical experience and market-related information. The rebates and deductions are recognised as variable consideration and recorded as a reduction to revenue with an accrual recorded. These rebates typically arise from sales contracts with government payers, third-party managed care organisations, hospitals, long-term care facilities, group purchasing organisations and various state programmes. In markets where returns are significant, estimates of the quantity and value of goods which may ultimately be returned are accounted for at the point revenue is recognised. Our returns accruals are based on actual experience over the preceding 12 months for established products together with market-related information such as estimated stock levels at wholesalers and competitor activity which we receive via third-party information services. For newly launched products, we use rates based on our experience with similar products or a predetermined percentage. When a product faces generic competition, particular attention is given to the possible levels of returns and, in cases where the circumstances are such that the level of Product Sales are considered highly probable to reverse, revenues are only recognised when the right of return expires, which is generally on ultimate prescription of the product to patients. The methodology and assumptions used to estimate rebates and returns are monitored and adjusted regularly in the light of contractual and legal obligations, historical trends, past experience and projected market conditions. Once the uncertainty associated with returns is resolved, revenue is adjusted accordingly. Under certain collaboration agreements which include a profit sharing mechanism, our recognition of Product Sales depends on which party acts as principal in sales to the end customer. In the cases where AstraZeneca acts as principal, we record 100% of sales to the end customer. In the cases where AstraZeneca does not act as principal, we record the share of gross profits received within Alliance Revenue. Contracts relating to the supply of certain Vaccines & Immune Therapies medicines relating to the COVID-19 pandemic include conditions whereby payments are receivable from customers in advance of the delivery of product. Such amounts are held on the Statement of Financial Position as contract liabilities until the related revenue is recognised, generally upon product delivery. Certain of these contracts contain further provisions that restrict the use of inventory manufactured in specified supply chains to specified customers, resulting in an enforceable right to payment as the activities are performed. Under IFRS 15 ‘Revenue from Contracts with Customers’, such contracts require revenue to be recognised over time using an appropriate and reasonably measurable method to measure progress. Revenue is recognised on these contracts based on the proportion of product delivered compared to the total contracted volumes. Certain arrangements include bill-and-hold arrangements under which the Group invoices a customer for a product but retains physical possession of the product until it is transferred to the customer at a point in time in the future. For these types of arrangements, an assessment is made to determine when the performance obligation has been satisfied, which is when control of the product is transferred to the customer. If the customer has obtained control of the product even though that product remains in the Group’s physical possession, the performance obligation to transfer a product has been satisfied and Product Sales are recognised. Control is considered to have transferred when the reason for the bill-and-hold arrangement is substantive, the product can be identified separately as belonging to the customer, the product is ready for physical transfer to the customer and AstraZeneca is unable to use or sell the product to another customer. Alliance Revenue Alliance Revenue comprises income arising from the ongoing operation of collaborative arrangements related to sales made by collaboration partners, where AstraZeneca is entitled to a share of gross profits, share of revenues or royalties, which are recurring in nature while the collaboration agreement remains in place. Alliance Revenue does not include Product Sales where AstraZeneca is leading commercialisation in a territory, or reimbursement for AstraZeneca-incurred expenses such as R&D or promotion costs, which arise from the license of intellectual property. The Group periodically enters into transactions where it acquires part of the rights to a product intangible (either on-market or in-process R&D), but for commercial reasons does not act as principal in selling the product to the customer and therefore does not recognise income from the product in the form of Product Sales. This may occur where, for example, a collaboration partner retains the right to commercialise in a specific territory, and has sufficient local control over that commercialisation to book Product Sales, while the Group instead receives a proportion of the value generated by those Product Sales, either in the form of a share of gross profits, a share of revenues or a royalty. This revenue is recognised when the Group’s right to receive the share of the collaboration partner’s income is established and can be reliably measured. Where an out-licensing arrangement meets the definition of a licence agreement, sales royalties are recognised when achieved by applying the royalty exemption under IFRS 15. Where the arrangement meets the definition of a licence agreement, share of gross profits, share of revenues and sales royalties are recognised when achieved by applying the royalty exemption under IFRS 15. All other sales royalties are recognised when considered it is highly probable there will not be a significant reversal of cumulative income. The determination requires estimates to be made in relation to future Product Sales. Collaboration Revenue Collaboration Revenue includes income arising from entering into collaborative arrangements where the Group has out-licensed (sold) certain rights associated with products and where AstraZeneca retains a significant ongoing economic interest in the product. Significant interest can include ongoing supply of finished goods, profit sharing arrangements or being principal in the sales of medicines. These collaborations may include development, manufacturing and/or commercialisation arrangements with the collaborator. Income from out-licences may take the form of upfront fees and milestones. KJ Timing of recognition of clinical and regulatory milestones is considered to be a Key Judgement. There can be significant uncertainty over whether it is highly probable that there would not be a significant reversal of revenue in respect of specific milestones if these are recognised before they are triggered due to them being subject to the actions of third parties. In general, where the triggering of a milestone is subject to the decisions of third parties (e.g. the acceptance or approval of a filing by a regulatory authority), the Group does not consider that the threshold for recognition is met until that decision is made. AstraZeneca Annual Report & Form 20-F Information 2024 153 Strategic Report Corporate Governance Financial Statements Additional Information Group Accounting Policies |
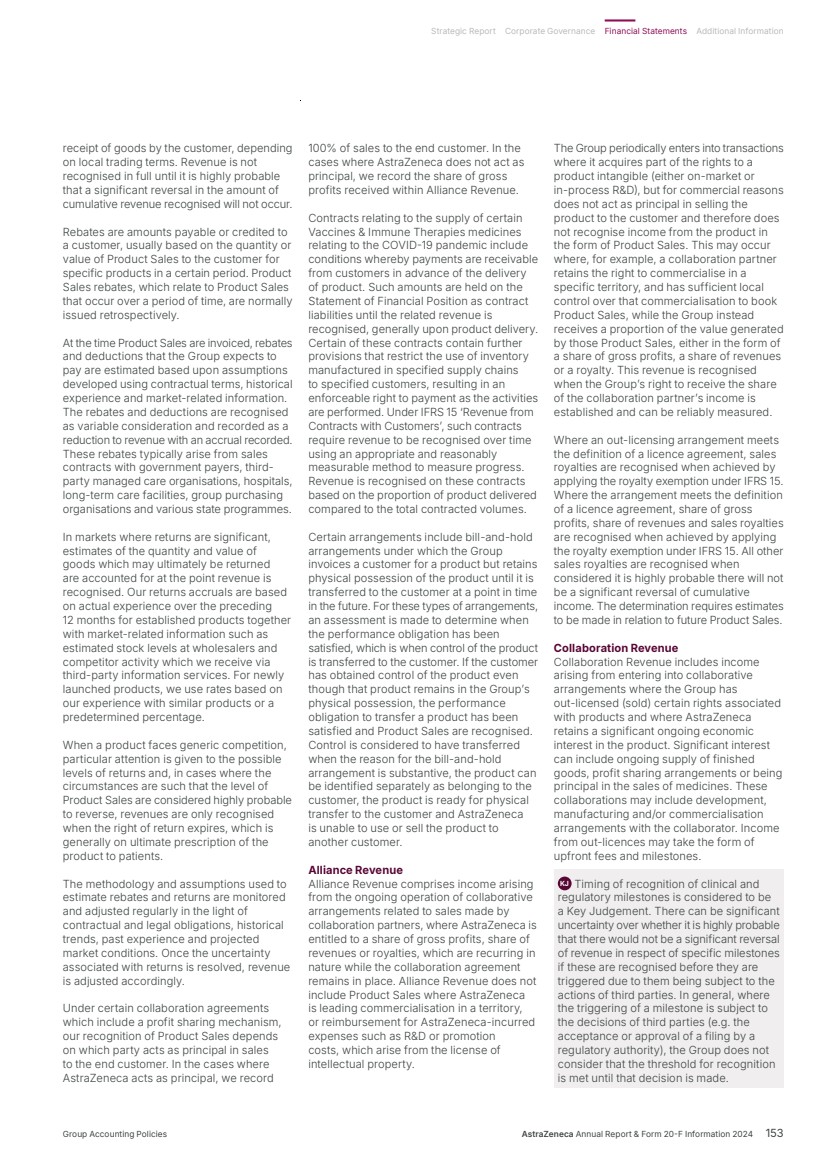
| Where Collaboration Revenue arises from the licensing of the Group’s own intellectual property, the licences we grant are typically rights to use intellectual property which do not change during the period of the licence and therefore related non-conditional revenue is recognised at the point the licence is granted and variable consideration as soon as recognition criteria are met. Other performance obligations in the contract might include the supply of product. These arrangements typically involve the receipt of an upfront payment, which the contract attributes to the license of the intangible assets, and ongoing receipts for supply, which the contract attributes to the sale of the product we manufacture. In cases where the transaction has two or more components, we account for the delivered item (for example, the transfer of title to the intangible asset) as a separate unit of account and record revenue on delivery of that component. Where practicable, consideration is allocated to performance obligations on the basis of the standalone selling price of each performance obligation. However, where there is a licence of intellectual property, it is not always possible to establish a reliable estimate of the standalone selling price of the licence as they are unique. Therefore, in these rare situations, the residual approach is used to determine the consideration attributable to the licence. Where fixed amounts are payable over one year from the effective date of a contract, an assessment is made as to whether a significant financing component exists, and if so, the fair value of this component is deferred and recognised as financing income over the period to the expected date of receipt. Where control of a right-to-use licence for an intangible asset passes at the outset of an arrangement, revenue is recognised at the point in time control is transferred. Where the substance of a licence arrangement is that of a right-to-access rights attributable to an intangible asset, revenue, in the form of an upfront fee, is recognised over time, normally on a straight-line basis over the life of the contract. Where the Group provides ongoing development services, revenue in respect of this element is recognised over the duration of those services. Where Collaboration Revenue is recorded and there is a related intangible asset that is licensed as part of the arrangement, an appropriate amount of that intangible asset is charged to Cost of sales based on an allocation of cost or value to the rights that have been licensed. Cost of sales Cost of sales are recognised as the associated revenue is recognised. Cost of sales include manufacturing costs, royalties payable on revenues recognised, movements in provisions for inventories, inventory write-offs and impairment charges in relation to manufacturing assets. Cost of sales also includes co-collaborator sharing of profit arising from collaborations, and foreign exchange gains and losses arising from business trading activities. Research and development Research expenditure is charged to profit and loss in the year in which it is incurred. KJ Internal development expenditure is capitalised only if it meets the recognition criteria of IAS 38 ‘Intangible Assets’. This is considered a Key Judgement. Where regulatory and other uncertainties are such that the criteria are not met, the expenditure is charged to profit and loss and this is almost invariably the case prior to approval of the drug by the relevant regulatory authority. Where, however, recognition criteria are met, Intangible assets are capitalised and amortised on a straight-line basis over their useful economic lives from product launch. At 31 December 2024, no amounts have met the recognition criteria. Payments to in-license products and compounds from third parties for new research and development projects (in process research and development) generally take the form of upfront payments, milestones and royalty payments. Where payments made to third parties represent consideration for future research and development activities, an evaluation is made as to the nature of the payments. Such payments are expensed if they represent compensation for sub-contracted research and development services not resulting in a transfer of intellectual property. By contrast, payments are capitalised if they represent compensation for the transfer of identifiable intellectual property developed at the risk of the third party. Such payments may be made once development or regulatory milestones are met and may also be made on the basis of sales volumes once a product is launched. Development and regulatory milestone payments are capitalised as the milestone is triggered. Sales-related payments are accrued and capitalised with reference to the latest Group sales forecasts for approved indications at the present value of expected future cash flows. Assets capitalised are amortised, on a straight-line basis, over their useful economic lives from product launch. KJ The determination of useful economic life is considered to be a Key Judgement. On product launch, the Group makes a judgement as to the expected useful economic life with reference to the expiry of associated patents for the product, expectation around the competitive environment specific to the product and our detailed long-term risk-adjusted sales projections compiled annually across the Group and approved by the Board. The useful economic life can extend beyond patent expiry dependent upon the nature of the product and the complexity of the development and manufacturing process. Significant sales can often be achieved post patent expiration. Intangible assets Intangible assets are stated at cost less accumulated amortisation and impairments. Intangible assets relating to products in development are subject to impairment testing annually. All Intangible assets are tested for impairment when there are indications that the carrying value may not be recoverable. The determination of the recoverable amounts includes key estimates which are highly sensitive to, and depend upon, key assumptions as detailed in Note 10 to the Financial Statements from page 172. Impairment reviews have been carried out on all Intangible assets that are in development (and not being amortised), all major intangible assets acquired during the year and all other intangible assets that have had indicators of impairment during the year. Recoverable amount is determined as the higher of value-in-use or fair value less costs to sell using a discounted cash flow calculation, with the products’ expected cash flows risk-adjusted over their estimated remaining useful economic life. Sales forecasts and specific allocated costs (which have both been subject to appropriate senior management review and approval) are risk-adjusted and discounted using appropriate rates based on our post-tax weighted average cost of capital or for fair value less costs to sell, a required rate of return for a market participant. Our weighted average cost of capital reflects factors such as our capital structure and our costs of debt and equity. Any impairment losses are recognised immediately in Operating profit. Intangible assets relating to products which fail during development (or for which development ceases for other reasons) are also tested for impairment and are written down to their recoverable amount (which is usually nil). Group Accounting Policies continued 154 AstraZeneca Annual Report & Form 20-F Information 2024 Financial Statements |
| If, subsequent to an impairment loss being recognised, development restarts or other facts and circumstances change indicating that the impairment is less or no longer exists, the value of the asset is re-estimated and its carrying value is increased to the recoverable amount, but not exceeding the original value, by recognising an impairment reversal in Operating profit. Government grants Government grants are recognised in the Consolidated Statement of Comprehensive Income so as to match with the related expenses that they are intended to compensate. Where grants are received in advance of the related expenses, they are initially recognised in the Consolidated Statement of Financial Position under Trade and other payables as deferred income and released to net off against the related expenditure when incurred. Each contract is assessed to determine whether there are both grant elements and supply of product which need to be separated. In each case, the contracts set out the specified terms for the supply of the product and the provisions for funding for certain costs, primarily research and development associated with the IP. It is considered whether there are any conditions for the funding to be refunded. The consideration in the contract is allocated between the grant and supply elements. The standalone selling price for the supply of products is determined by reference to observed prices with other customers. The amount allocated as a government grant is determined by reference to the specific agreed costs and activities identified in the contract as not directly attributable to the supply of product. Government grants are recorded as an offset to the relevant expense in the Consolidated Statement of Comprehensive Income and are capped to match the relevant costs incurred. Other operating income and expense Other operating income and expense is generated from activities outside of the Group’s normal course of business, which includes Other income from divestments of or full out-license of assets and businesses including royalties and milestones where the Group does not retain a significant continued interest. Where the arrangement meets the definition of a licence agreement, sales milestones and sales royalties are recognised when achieved by applying the royalty exemption under IFRS 15 ‘Revenue from Contracts with Customers’. All other milestones and sales royalties are recognised when it is considered highly probable that there will not be a significant reversal of cumulative income. The determination requires estimates to be made in relation to future Product Sales. Joint arrangements and associates The Group has arrangements over which it has joint control and which qualify as joint operations or joint ventures under IFRS 11 ‘Joint Arrangements’. For joint operations, the Group recognises its share of revenue that it earns from the joint operations and its share of expenses incurred. The Group also recognises the assets associated with the joint operations that it controls and the liabilities it incurs under the joint arrangement. For joint ventures and associates, the Group recognises its interest in the joint venture or associate as an investment and uses the equity method of accounting. Employee benefits The Group accounts for pensions and other employee benefits (principally healthcare) under IAS 19 ‘Employee Benefits’. In respect of defined benefit plans, obligations are determined using the projected unit credit method and are discounted to present value by reference to market yields on high-quality corporate bonds, while plan assets are measured at fair value. Given the extent of the assumptions used to determine the value of scheme assets and scheme liabilities, these are considered to be significant estimates. The operating and financing costs of such plans are recognised separately in profit and loss; current service costs are spread systematically over the lives of employees and financing costs are recognised in full in the periods in which they arise. Remeasurements of the net defined benefit pension liability, including actuarial gains and losses, are recognised immediately in Other comprehensive income. Where the calculation results in a surplus to the Group, the recognised asset is limited to the present value of any available future refunds from the plan or reductions in future contributions to the plan subject to consideration of the effect any minimum funding requirement for future service has on the benefit available as a reduction in future contributions. Payments to defined contribution plans are recognised in profit and loss as they fall due. Taxation The current tax payable is based on taxable profit for the year. Taxable profit differs from reported profit because taxable profit excludes items that are either never taxable or tax deductible or items that are taxable or tax deductible in a different period. The Group’s current tax assets and liabilities are calculated using tax rates that have been enacted or substantively enacted by the reporting date. Current tax includes the Group’s charge for any Pillar Two income taxes. Deferred tax is provided using the balance sheet liability method, providing for temporary differences between the carrying amounts of assets and liabilities for financial reporting purposes and the amounts used for taxation purposes. Deferred tax liabilities are recognised unless they arise from the initial recognition (other than in a business combination) of assets and liabilities in a transaction that affects neither the taxable profit nor the accounting profit. Deferred tax liabilities are not recognised to the extent they arise from the initial recognition of non-tax deductible goodwill. Deferred tax assets are recognised to the extent that there are future taxable temporary differences or it is probable that future taxable profit will be available against which the asset can be utilised. This requires judgements to be made in respect of the availability of future taxable income. The Group applies the exception to recognising and disclosing information about deferred tax assets and liabilities related to Pillar Two income taxes, as provided in the amendments to IAS 12 ‘Income Taxes’ issued in May 2023. No deferred tax asset or liability is recognised in respect of temporary differences associated with investments in subsidiaries and branches where the Group is able to control the timing of reversal of the temporary differences and it is probable that the temporary differences will not reverse in the foreseeable future. The Group’s deferred tax assets and liabilities are calculated using tax rates that are expected to apply in the period when the liability is settled or the asset realised based on tax rates that have been enacted or substantively enacted by the reporting date. Deferred tax liabilities relating to assets recognised because of a business combination which may qualify for intellectual property incentives are measured at the relevant statutory tax rate. Deferred tax assets and liabilities are offset in the Consolidated Statement of Financial Position if, and only if, the taxable entity has a legally enforceable right to set off current tax assets and liabilities, and the Deferred tax assets and liabilities relate to taxes levied by the same taxation authority on the same taxable entity. Liabilities for uncertain tax positions require management to make judgements of potential exposures in relation to tax audit issues. Tax benefits are not recognised unless the tax positions will probably be accepted by the tax authorities. This is based upon management’s interpretation of applicable laws and regulations and the expectation of how the tax authority will resolve the matter. Once considered probable of not being accepted, management reviews each material tax benefit and reflects the effect of the uncertainty in determining the related taxable result. AstraZeneca Annual Report & Form 20-F Information 2024 155 Strategic Report Corporate Governance Financial Statements Additional Information Group Accounting Policies |
| Liabilities for uncertain tax positions are measured using either the most likely amount or the expected value amount depending on which method the entity expects to better predict the resolution of the uncertainty. Further details of the estimates and assumptions made in determining our recorded liability for transfer pricing contingencies and other tax contingencies are included in Note 30 to the Financial Statements from page 211. Share-based payments All plans have been classified as equity settled after assessment. The grant date fair value of the market-based performance elements of employee share plan awards is calculated using a modified Monte Carlo model, with other elements at market price. In accordance with IFRS 2 ‘Share-based Payment’, the resulting cost is recognised in profit on a straight-line basis over the vesting period of the awards. The value of the charge is adjusted to reflect expected and actual levels of awards vesting, except where the failure to vest is as a result of not meeting a market condition. Cancellations of equity instruments are treated as an acceleration of the vesting period and any outstanding charge is recognised in profit immediately. Cash outflows relating to the purchase of shares by consolidated Employee Benefit Trusts (EBTs) relating to the vesting of share plans are recognised within financing activities. Cash outflows relating to the employer and employee taxes paid on vesting of share plans are recognised in operating activities as they relate to employee remuneration. The cash flows relating to replacement awards issued to employees as part of the Alexion acquisition are classified within investing activities, as they are part of the aggregate cash flows arising from obtaining control of the subsidiary. Property, plant and equipment The Group’s policy is to depreciate the difference between the cost of each item of Property, plant and equipment and its residual value over its estimated useful life on a straight-line basis. Assets under construction are not depreciated until the asset is available for use, at which point the asset is transferred into either Land and buildings or Plant and equipment, and depreciated over its estimated useful economic life. Reviews are made annually of the estimated remaining lives and residual values of individual productive assets, taking account of commercial and technological obsolescence as well as normal wear and tear. It is impractical to calculate average asset lives exactly. However, the useful economic lives range from approximately 10 to 50 years for buildings, and three to 15 years for plant and equipment. All items of Property, plant and equipment are tested for impairment when there are indications that the carrying value may not be recoverable. Any impairment losses are recognised immediately in Operating profit. Leases The Group’s lease arrangements are principally for property, most notably a portfolio of office premises and employee accommodation, and for a global car fleet, utilised primarily by our sales and marketing teams. The lease liability and corresponding right-of-use asset arising from a lease are initially measured on a present value basis. Lease liabilities include the net present value of the following lease payments: • fixed payments, less any lease incentives receivable • variable lease payments that depend on an index or a rate, initially measured using the index or rate as at the commencement date • the exercise price of a purchase option if the Group is reasonably certain to exercise that option • payments of penalties for terminating the lease, if the lease term reflects the Group exercising that option, and • amounts expected to be payable by the Group under residual value guarantees. Right-of-use assets are measured at cost comprising the following: • the amount of the initial measurement of lease liability • any lease payments made at or before the commencement date less any lease incentives received • any initial direct costs, and • restoration costs. Judgements made in calculating the lease liability include assessing whether arrangements contain a lease and determining the lease term. Lease terms are negotiated on an individual basis and contain a wide range of different terms and conditions. Property leases will often include an early termination or extension option to the lease term. Fleet management policies vary by jurisdiction and may include renewal of a lease until a measurement threshold, such as mileage, is reached. Extension and termination options have been considered when determining the lease term, along with all facts and circumstances that may create an economic incentive to exercise an extension option, or not exercise a termination option. Extension periods (or periods after termination options) are only included in the lease term if the lease is reasonably certain to be extended (or not terminated). The lease payments are discounted using incremental borrowing rates, as in the majority of leases held by the Group the interest rate implicit in the lease is not readily identifiable. Calculating the discount rate is an estimate made in calculating the lease liability. This rate is the rate that the Group would have to pay to borrow the funds necessary to obtain an asset of similar value to the right-of-use asset in a similar economic environment with similar terms, security and conditions. To determine the incremental borrowing rate, the Group uses a risk-free interest rate adjusted for credit risk, adjusting for terms specific to the lease including term, country and currency. The Group is exposed to potential future increases in variable lease payments that are based on an index or rate, which are initially measured as at the commencement date, with any future changes in the index or rate excluded from the lease liability until they take effect. When adjustments to lease payments based on an index or rate take effect, the lease liability is reassessed and adjusted against the right-of-use asset. Lease payments are allocated between principal and finance cost. The finance cost is charged to the Consolidated Statement of Comprehensive Income over the lease period so as to produce a constant periodic rate of interest on the remaining balance of the liability for each period. Payments associated with short-term leases of Property, plant and equipment and all leases of low-value assets are recognised on a straight-line basis as an expense in the Consolidated Statement of Comprehensive Income. Short-term leases are leases with a lease term of 12 months or less. Low-value leases are those where the underlying asset value, when new, is $5,000 or less and includes IT equipment and small items of office furniture. Contracts may contain both lease and non-lease components. The Group allocates the consideration in the contract to the lease and non-lease components based on their relative standalone prices. Right-of-use assets are generally depreciated over the shorter of the asset’s useful life and the lease term on a straight-line basis. If the Group is reasonably certain to exercise a purchase option, the right-of-use asset is depreciated over the underlying asset’s useful life. It is impractical to calculate average asset lives exactly. However, the total lives range from approximately 10 to 50 years for buildings, and three to 15 years for motor vehicles and other assets. There are no material lease agreements under which the Group is a lessor. Group Accounting Policies continued 156 AstraZeneca Annual Report & Form 20-F Information 2024 Financial Statements |
| Business combinations and goodwill In assessing whether an acquired set of assets and activities is a business or an asset, management will first elect whether to apply an optional concentration test to simplify the assessment. Where the concentration test is applied, the acquisition will be treated as the acquisition of an asset if substantially all of the fair value of the gross assets acquired (excluding cash and cash equivalents, deferred tax assets, and related goodwill) is concentrated in a single asset or group of similar identifiable assets. Where the concentration test is not applied, or is not met, a further assessment of whether the acquired set of assets and activities is a business will be performed. KJ The determination of whether an acquired set of assets and activities is a business or an asset can be judgemental, particularly if the target is not producing outputs. Management uses a number of factors to make this determination, which are primarily focused on whether the acquired set of assets and activities include substantive processes that mean the set is capable of being managed for the purpose of providing a return. Key determining factors include the stage of development of any assets acquired, the readiness and ability of the acquired set to produce outputs and the presence of key experienced employees capable of conducting activities required to develop or manufacture the assets. Typically, the specialised nature of many pharmaceutical assets and processes is such that until assets are substantively ready for production and promotion, there are not the required processes for a set of assets and activities to meet the definition of a business in IFRS 3 ‘Business Combinations’. On the acquisition of a business, fair values are attributed to the identifiable assets and liabilities. Attributing fair values is a judgement. Contingent liabilities are also recorded at fair value unless the fair value cannot be measured reliably, in which case the value is subsumed into goodwill. Where fair values of acquired contingent liabilities cannot be measured reliably, the assumed contingent liability is not recognised but is disclosed in the same manner as other contingent liabilities. Where not all of the equity of a subsidiary is acquired, the non-controlling interest is recognised either at fair value or at the non-controlling interest’s proportionate share of the net assets of the subsidiary, on a case-by-case basis. Put options over non-controlling interests are recognised as a financial liability, with a corresponding entry in either Retained earnings or against non-controlling interest reserves on a case-by-case basis. The timing and amount of future contingent elements of consideration is an estimate. Contingent consideration, which may include development and launch milestones, revenue threshold milestones and revenue-based royalties, is fair valued at the date of acquisition using decision-tree analysis with key inputs including probability of success, consideration of potential delays and revenue projections based on the Group’s internal forecasts. Unsettled amounts of consideration are held at fair value within payables with changes in fair value recognised immediately in profit. Goodwill is the difference between the fair value of the consideration and the fair value of net assets acquired. Goodwill arising on acquisitions is capitalised and subject to an impairment review, both annually and when there is an indication that the carrying value may not be recoverable. The Group’s policy up to and including 1997 was to eliminate Goodwill arising upon acquisitions against reserves. Under IFRS 1 ‘First-time Adoption of International Financial Reporting Standards’ and IFRS 3 ‘Business Combinations’, such Goodwill will remain eliminated against reserves. Subsidiaries A subsidiary is an entity controlled, directly or indirectly, by AstraZeneca PLC. Control is regarded as the exposure or rights to the variable returns of the entity when combined with the power to affect those returns. Control is normally evidenced by holding more than 50% of the share capital of the company, however other agreements may be in place that result in control where they give AstraZeneca finance decision-making authority over the relevant activities of the company. The financial results of subsidiaries are consolidated from the date control is obtained until the date that control ceases. Inventories Inventories are stated at the lower of cost and net realisable value. The first in, first out or an average method of valuation is used. For finished goods and work in progress, cost includes directly attributable costs and certain overhead expenses (including depreciation). Selling expenses and certain other overhead expenses (principally central administration costs) are excluded. Net realisable value is determined as estimated selling price less all estimated costs of completion and costs to be incurred in selling and distribution. Write-downs of inventory occur in the general course of business and are recognised in Cost of sales for launched or approved products and in Research and development expense for products in development. Assets held for sale Non-current assets are classified as Assets held for sale when their carrying amount is to be recovered principally through a sale transaction and a sale is considered highly probable. A sale is considered highly probable only when the appropriate level of management has committed to the sale. Assets held for sale are stated at the lower of carrying amount and fair value less costs to sell. Where there is a partial transfer of a non-current asset to held for sale, an allocation of value is made between the current and non-current portions of the asset based on the relative value of the two portions, unless there is a methodology that better reflects the asset to be disposed of. Assets held for sale are neither depreciated nor amortised. Trade and other receivables Financial assets included in Trade and other receivables are recognised initially at fair value. The Group holds the Trade receivables with the objective to collect the contractual cash flows and therefore measures them subsequently at amortised cost using the effective interest method, less any impairment, based on expected credit losses. Trade receivables that are subject to debt factoring arrangements are derecognised if they meet the conditions for derecognition detailed in IFRS 9 ‘Financial Instruments’. Trade and other payables Financial liabilities included in Trade and other payables are recognised initially at fair value. Subsequent to initial recognition they are measured at amortised cost using the effective interest method. Contingent consideration payables are held at fair value within Level 3 of the fair value hierarchy as defined in Note 12. Financial instruments The Group’s financial instruments include Lease liabilities, Trade and other receivables and payables, liabilities for contingent consideration and put options under business combinations, and rights and obligations under employee benefit plans which are dealt with in specific accounting policies. The Group’s other financial instruments include: • Cash and cash equivalents • Fixed deposits • Other investments • Bank and other borrowings • Derivatives. AstraZeneca Annual Report & Form 20-F Information 2024 157 Strategic Report Corporate Governance Financial Statements Additional Information Group Accounting Policies |
| Cash and cash equivalents Cash and cash equivalents comprise cash in hand, current balances with banks and similar institutions, and highly liquid investments with maturities of three months or less when acquired. They are readily convertible into known amounts of cash and are held at amortised cost under the hold to collect classification, where they meet the hold to collect ‘solely payments of principal and interest’ test criteria under IFRS 9 ‘Financial Instruments’. Those not meeting these criteria are held at fair value through profit or loss. Cash and cash equivalents in the Consolidated Statement of Cash Flows include unsecured bank overdrafts at the balance sheet date where balances often fluctuate between a cash and overdraft position. Fixed deposits Fixed deposits, principally comprising funds held with banks and other financial institutions, are initially measured at fair value, plus direct transaction costs, and are subsequently measured at amortised cost using the effective interest method at each reporting date. Changes in carrying value are recognised in the Consolidated Statement of Comprehensive Income. Other investments Investments are classified as fair value through profit or loss (FVPL), unless the Group makes an irrevocable election at initial recognition for certain non-current equity investments to present changes in Other comprehensive income (FVOCI). If this election is made, there is no subsequent reclassification of fair value gains and losses to profit and loss following the derecognition of the investment. Bank and other borrowings The Group uses derivatives, principally interest rate swaps, to hedge the interest rate exposure inherent in a portion of its fixed interest rate debt. In such cases the Group will either designate the debt as FVPL when certain criteria are met or as the hedged item under a fair value hedge. If the debt instrument is designated as FVPL, the debt is initially measured at fair value (with direct transaction costs being included in profit and loss as an expense) and is remeasured to fair value at each reporting date with changes in carrying value being recognised in profit and loss (along with changes in the fair value of the related derivative), with the exception of changes in the fair value of the debt instrument relating to own credit risk which are recorded in Other comprehensive income in accordance with IFRS 9 ‘Financial Instruments’. Such a designation has been made where this significantly reduces an accounting mismatch which would result from recognising gains and losses on different bases. If the debt is designated as the hedged item under a fair value hedge, the debt is initially measured at fair value (with direct transaction costs being amortised over the life of the debt) and is remeasured for fair value changes in respect of the hedged risk at each reporting date with changes in carrying value being recognised in profit and loss (along with changes in the fair value of the related derivative). If the debt is designated in a cash flow hedge, the debt is measured at amortised cost (with gains or losses taken to profit and loss and direct transaction costs being amortised over the life of the debt). The related derivative is remeasured for fair value changes at each reporting date with the portion of the gain or loss on the derivative that is determined to be an effective hedge recognised in Other comprehensive income. The amounts that have been recognised in Other comprehensive income are reclassified to profit and loss in the same period that the hedged forecast cash flows affect profit. The reclassification adjustment is included in Finance expense in the Consolidated Statement of Comprehensive Income. Other interest-bearing loans are initially measured at fair value (with direct transaction costs being amortised over the life of the loan) and are subsequently measured at amortised cost using the effective interest method at each reporting date. Changes in carrying value are recognised in the Consolidated Statement of Comprehensive Income. Derivatives Derivatives are initially measured at fair value (with direct transaction costs being included in profit and loss as an expense) and are subsequently remeasured to fair value at each reporting date. Changes in carrying value of derivatives not designated in hedging relationships are recognised in profit and loss. The Group has agreements with some bank counterparties whereby the parties agree to post cash collateral, for the benefit of the other, equivalent to the market valuation of all of the derivative positions above a predetermined threshold. Cash collateral received from counterparties is included within current Interest-bearing loans and borrowings within the Consolidated Statement of Financial Position. Cash collateral pledged to counterparties is recognised as a financial asset and is included in current Other investments within the Consolidated Statement of Financial Position. Cash collateral received is included in Movement in short-term borrowings within financing activities in the Consolidated Statement of Cash Flows. Cash collateral paid is included in Movements in short-term investments within investing activities in the Consolidated Statement of Cash Flows. The cash flow presentation of cash paid and received follows the Consolidated Statement of Financial Position presentation of the financial asset and financial liability that is recognised from posting the collateral. Foreign currencies Foreign currency transactions, being transactions denominated in a currency other than an individual Group entity’s functional currency, are translated into the relevant functional currencies of individual Group entities at average rates for the relevant monthly accounting periods, which approximate to actual rates. Monetary assets and liabilities arising from foreign currency transactions are retranslated at exchange rates prevailing at the reporting date. Exchange gains and losses on loans and on short-term foreign currency borrowings and deposits are included within Finance expense. Exchange differences on all other foreign currency transactions are recognised in Operating profit in the individual Group entity’s accounting records. Non-monetary items arising from foreign currency transactions are not retranslated in the individual Group entity’s accounting records. In the Consolidated Financial Statements, income and expense items for Group entities with a functional currency other than US dollars are translated into US dollars at average exchange rates, which approximate to actual rates, for the relevant accounting periods. Assets and liabilities are translated at the US dollar exchange rates prevailing at the reporting date. Exchange differences arising on consolidation are recognised in Other comprehensive income. If certain criteria are met, non-US dollar-denominated loans or derivatives are designated as net investment hedges of foreign operations. Exchange differences arising on retranslation of net investments, and of foreign currency loans which are designated in an effective net investment hedge relationship, are recognised in Other comprehensive income in the Consolidated Financial Statements. Foreign exchange derivatives hedging net investments in foreign operations are carried at fair value. Effective fair value movements are recognised in Other comprehensive income, with any ineffectiveness taken to profit. Gains and losses accumulated in the translation reserve will be recycled to profit and loss when the foreign operation is sold. Group Accounting Policies continued 158 AstraZeneca Annual Report & Form 20-F Information 2024 Financial Statements |

| Provisions Provisions are recognised when there is either a legal or constructive present obligation as a result of a past event, it is probable that an outflow of economic resources will be required to settle the obligation and a reliable estimate can be made of the amount of the obligation. If the effect of the time value of money is material, provisions are discounted at the relevant pre-tax discount rate. Where provisions are discounted, the increase in the provision resulting from the passage of time is recognised as a finance cost. Litigation and environmental liabilities AstraZeneca is involved in legal disputes, the settlement of which may involve cost to the Group. A provision is made where an adverse outcome is probable and associated costs, including related legal costs, can be estimated reliably. Determining the timing of recognition of when an adverse outcome is probable is considered a Key Judgement, refer to Note 30 to the Financial Statements on page 205. Where it is considered that the Group is more likely than not to prevail, or in the extremely rare circumstances where the amount of the legal liability cannot be estimated reliably, legal costs involved in defending the claim are charged to the Consolidated Statement of Comprehensive Income as they are incurred. Where it is considered that the Group has a valid contract which provides the right to reimbursement (from insurance or otherwise) of legal costs and/or all or part of any loss incurred or for which a provision has been established, the amount expected to be received is recognised as an asset only when it is virtually certain. AstraZeneca is exposed to environmental liabilities relating to its past operations, principally in respect of soil and groundwater remediation costs. Provisions for these costs are made when there is a present obligation and where it is probable that expenditure on remedial work will be required and a reliable estimate can be made of the cost. Restructuring Restructuring costs are incurred in programmes that are planned and controlled by the Group which materially change either the scope of a business undertaken by the Group, or the manner in which that business is conducted. A provision for restructuring costs is recognised when a detailed formal plan is in place and has either been announced to those affected or has started to be implemented. The general recognition criteria for provisions must also be met, as described in the Provisions policy. Impairment The carrying values of non-financial assets, other than Inventories and Deferred tax assets, are reviewed at least annually to determine whether there is any indication of impairment. For Goodwill, Intangible assets under development and for any other assets where such indication exists, the asset’s recoverable amount is estimated based on the greater of its value in use and its fair value less cost to sell. In assessing the recoverable amount, the estimated future cash flows, adjusted for the risks associated with the probability of success specific to each asset, as well as inflationary impacts, are discounted to their present value using a nominal discount rate that reflects current market assessments of the time value of money, the general risks affecting the pharmaceutical industry and other risks specific to each asset. For the purpose of impairment testing, assets are grouped together into the smallest group of assets that generates cash inflows from continuing use that are largely independent of the cash flows of other assets. Impairment losses are recognised immediately in the Consolidated Statement of Comprehensive Income. Applicable accounting standards and interpretations issued but not yet adopted At the date of authorisation of these Financial Statements, certain new accounting standards and amendments were in issue relating to the following standards and interpretations but not yet adopted by the Group: • IFRS 18 ‘Presentation and Disclosure in Financial Statements’ is effective for accounting periods beginning on or after 1 January 2027 and will replace IAS 1 ‘Presentation of Financial Statements’. IFRS 18 sets out new presentation requirements for the Statement of Comprehensive Income, as well as more stringent and additional requirements on the aggregation, disaggregation and categorisation of income and expenses within the Statement of Comprehensive Income. Additionally, alternative performance measures included within the Annual Report which meet the definition of Management-defined Performance Measures are required to be disclosed within the Notes to the Financial Statements. • The Group is currently assessing the impact of IFRS 18. It is expected that IFRS 18 will have a significant impact on the presentation of the Consolidated Statement of Comprehensive Income, and may require judgements around aggregation and disaggregation of certain balances, as well as requiring additional disclosures relating to Management-defined Performance Measures, aggregation and disaggregation, and EPS. IFRS 18 is yet to be endorsed by the UKEB and the Group is not seeking to early adopt the standard. In addition, the following amendment was issued but not yet adopted: • amendments to IAS 21 ‘The Effects of Changes in Foreign Exchange Rates’, effective for periods beginning on or after 1 January 2025 – endorsed by the UKEB on 15 July 2024. AstraZeneca Annual Report & Form 20-F Information 2024 159 Strategic Report Corporate Governance Financial Statements Additional Information Group Accounting Policies |
| Notes to the Group Financial Statements 1 Revenue Product Sales 2024 2023 2022 Emerging Rest of Emerging Rest of Emerging Rest of US Markets Europe World Total US Markets Europe World Total US Markets Europe World Total $m $m $m $m $m $m $m $m $m $m $m $m $m $m $m Oncology: Tagrisso 2,763 1,755 1,301 761 6,580 2,276 1,621 1,120 782 5,799 2,007 1,567 1,023 847 5,444 Imfinzi 2,603 479 948 687 4,717 2,171 355 742 751 4,019 1,539 287 544 401 2,771 Calquence 2,190 153 656 130 3,129 1,815 98 493 108 2,514 1,657 45 286 69 2,057 Lynparza 1,332 655 832 253 3,072 1,254 542 734 281 2,811 1,226 488 655 269 2,638 Enhertu – 350 126 69 545 – 169 60 32 261 – 51 21 7 79 Zoladex 16 795 148 99 1,058 14 687 133 118 952 15 657 133 122 927 Imjudo 180 16 36 49 281 146 5 16 51 218 13 – – – 13 Truqap 408 2 12 8 430 6 – – – 6 – – – – – Orpathys – 44 – – 44 – 44 – – 44 – 33 – – 33 Others 18 253 23 125 419 37 307 34 143 521 27 409 64 169 669 9,510 4,502 4,082 2,181 20,275 7,719 3,828 3,332 2,266 17,145 6,484 3,537 2,726 1,884 14,631 Cardiovascular, Renal & Metabolism: Farxiga 1,750 2,853 2,634 419 7,656 1,451 2,211 1,881 420 5,963 1,071 1,665 1,297 348 4,381 Brilinta 751 294 268 20 1,333 744 285 271 24 1,324 744 286 282 46 1,358 Crestor 46 934 37 136 1,153 55 862 52 138 1,107 65 794 41 148 1,048 Seloken/Toprol-XL – 589 13 3 605 1 621 11 7 640 – 839 14 9 862 Lokelma 256 86 92 108 542 214 50 58 90 412 170 20 30 69 289 Roxadustat – 331 – – 331 – 271 – – 271 – 197 – – 197 Andexxa 81 3 80 55 219 75 – 62 45 182 77 – 41 32 150 Wainua 85 – – – 85 – – – – – – – – – – Others 106 249 146 23 524 212 286 168 20 686 352 318 201 32 903 3,075 5,339 3,270 764 12,448 2,752 4,586 2,503 744 10,585 2,479 4,119 1,906 684 9,188 Respiratory & Immunology: Symbicort 1,187 805 559 328 2,879 726 753 549 334 2,362 973 608 582 375 2,538 Fasenra 1,049 92 404 144 1,689 992 64 355 142 1,553 906 43 305 142 1,396 Pulmicort 6 568 71 37 682 28 575 68 42 713 65 462 69 49 645 Breztri 516 245 143 74 978 383 161 81 52 677 239 92 33 34 398 Tezspire – 11 156 81 248 – 1 48 37 86 – – 2 2 4 Saphnelo 425 7 26 16 474 260 2 8 10 280 111 – 2 3 116 Airsupra 66 – – – 66 2 – – – 2 – – – – – Others 167 169 57 7 400 156 215 55 8 434 361 238 61 8 668 3,416 1,897 1,416 687 7,416 2,547 1,771 1,164 625 6,107 2,655 1,443 1,054 613 5,765 Vaccines & Immune Therapies: Synagis (8) 210 116 129 447 (1) 195 175 177 546 1 173 213 191 578 Beyfortus 232 – 84 2 318 87 – 19 – 106 – – – – – FluMist 28 1 204 25 258 23 1 188 4 216 21 1 151 2 175 COVID-19 mAbs 28 – 3 – 31 – 6 12 114 132 1,067 413 298 407 2,185 Others – 2 2 – 4 – 10 2 – 12 79 729 365 625 1,798 280 213 409 156 1,058 109 212 396 295 1,012 1,168 1,316 1,027 1,225 4,736 Rare Disease: Ultomiris 2,261 141 884 638 3,924 1,750 71 668 476 2,965 1,136 38 481 310 1,965 Soliris 1,523 443 416 206 2,588 1,734 424 670 317 3,145 2,180 301 805 476 3,762 Strensiq 1,167 54 99 96 1,416 937 40 89 86 1,152 769 35 78 76 958 Koselugo 212 177 103 39 531 195 59 53 24 331 162 26 20 – 208 Kanuma 100 34 66 9 209 85 29 49 8 171 77 31 44 8 160 5,263 849 1,568 988 8,668 4,701 623 1,529 911 7,764 4,324 431 1,428 870 7,053 Other: Nexium 96 591 60 120 867 115 578 53 199 945 120 568 46 551 1,285 Others 15 144 43 4 206 18 153 52 8 231 24 220 77 19 340 111 735 103 124 1,073 133 731 105 207 1,176 144 788 123 570 1,625 Product Sales 21,655 13,535 10,848 4,900 50,938 17,961 11,751 9,029 5,048 43,789 17,254 11,634 8,264 5,846 42,998 SE Rebates and chargebacks in the US The major market where estimates are seen as significant is the US. When invoicing Product Sales in the US, we estimate the rebates and chargebacks we expect to pay and we consider there to be a significant estimate associated with the rebates for Managed Care, Medicaid and Medicare Part D. The total adjustment in respect of prior year net US Product Sales in 2024 was 0.6% (2023: 1.0%; 2022: 1.3%); this represents the difference between our prior year estimates for rebates and chargebacks against actual amounts paid for the US business. The most significant of these relate to the Medicaid and state programmes with an adjustment in respect of prior year net US Product Sales in 2024 of 0.1% (2023: 0.3%; 2022: 0.5%) and Managed Care and Medicare of 0.6% (2023: 0.5%; 2022: 0.8%). 160 AstraZeneca Annual Report & Form 20-F Information 2024 Financial Statements |
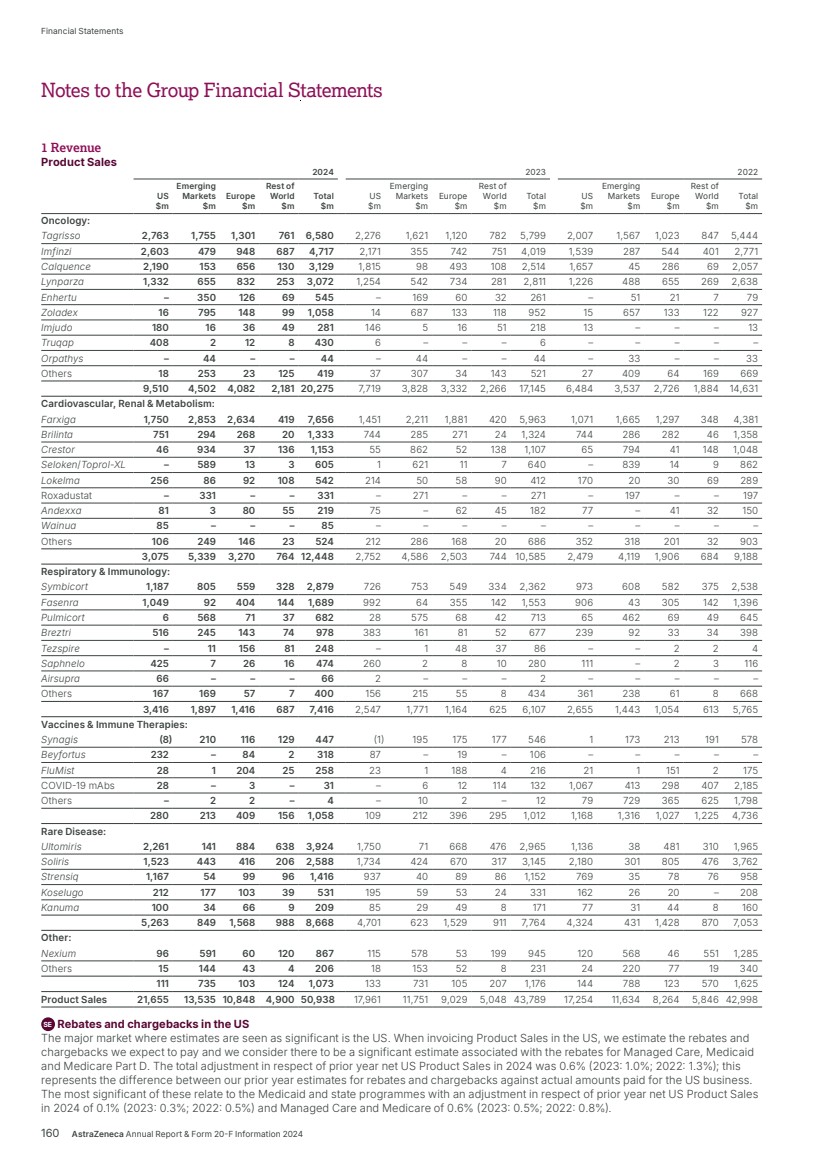
| The adjustment in respect of the prior year net US Product Sales, excluding the Rare Disease therapy area in 2024, was 0.8% (2023: 1.4%; 2022: 1.6%), with Medicaid and state programmes of 0.1% (2023: 0.4%; 2022: 0.6%) and Managed Care and Medicare of 0.7% (2023: 0.7%; 2022: 1.1%). These values demonstrate the level of sensitivity; further meaningful sensitivity is not able to be provided due to the large volume of variables that contribute to the overall rebates, chargebacks, returns and other revenue accruals. These variables include assumptions in respect of aggregate future sales levels, segment mix and customers’ contractual performance, and in addition for Managed Care, US Medicaid and Medicare Part D, the channel inventory levels, and assumptions related to lag time. These assumptions are built up on a product-by-product and customer-by-customer basis, taking into account specific contract provisions coupled with expected performance, and are then aggregated into a weighted average rebate accrual rate for each of our products. Accrual rates are reviewed and adjusted on an as-needed basis. There may be further adjustments when actual rebates are invoiced based on utilisation information submitted to AstraZeneca (in the case of contractual rebates) and claims/invoices are received (in the case of regulatory rebates and chargebacks). Alliance Revenue 2024 2023 2022 $m $m $m Enhertu 1,437 1,022 523 Tezspire 436 259 79 Beyfortus 237 57 – Vaxzevria: royalties – – 76 Other royalty income 91 81 68 Other Alliance Revenue 11 9 9 2,212 1,428 755 Collaboration Revenue 2024 2023 2022 $m $m $m Lynparza: sales milestones 600 – – Beyfortus: sales milestones 167 27 – Koselugo: sales milestones 100 – – Farxiga: sales milestones 56 29 – Lynparza: regulatory milestones – 245 355 COVID-19 mAbs: licence fees – 180 – Beyfortus: regulatory milestones – 71 25 tralokinumab: sales milestones – 20 110 Nexium: sale of rights – – 62 Other Collaboration Revenue – 22 46 923 594 598 2 Operating profit Operating profit includes the following significant items: Cost of sales In 2024, Cost of sales includes a charge of $nil (2023: $114m; 2022: $3,484m) in relation to the release, in line with sales, of fair value uplift to inventory that was recognised under IFRS 3 ‘Business Combinations’ upon the acquisition of Alexion. Selling, general and administrative expense In 2024, Selling, general and administrative expense includes a charge of $260m (2023: $520m; 2022: $182m) resulting from changes in the fair value of contingent consideration arising from the acquisition of the diabetes alliance from BMS. These adjustments reflect revised estimates for future sales performance for the products acquired and, as a result, revised estimates for future royalties payable. In 2024, Selling, general and administrative expense also includes a charge of $48m (2023: $1,013m; 2022: $789m) relating to a number of legal proceedings, including settlements in various jurisdictions in relation to several marketed products (see Note 30). Research and development expense: Government grants During the year $nil (2023: $74m; 2022: $113m) of government grants were recognised within Research and development expense. The grants recognised relate to funding for Research and development and related expenses for COVID-19 mAbs of $nil (2023: $nil; 2022: $112m) and Vaxzevria of $nil (2023: $74m; 2022: $1m). Other operating income and expense 2024 2023 2022 $m $m $m Royalty income 103 107 59 Gains on disposal of intangible assets 64 251 104 Net (losses)/gains on disposal of other non-current assets (4) 41 112 Update to the contractual relationships for Beyfortus – 712 – Other income1 210 393 439 Other expense (121) (164) (200) Other operating income and expense 252 1,340 514 1 Other income in 2024 includes $nil of income from Allergan Plc. in respect of the development of brazikumab (2023: $75m; 2022: $138m). Notes to the Group Financial Statements AstraZeneca Annual Report & Form 20-F Information 2024 161 Strategic Report Corporate Governance Financial Statements Additional Information |

| Gains on disposal of intangible assets in 2023 includes $241m on disposal of commercial rights to Pulmicort Flexhaler to Cheplapharm in the US. Net (losses)/gains on disposal of other non-current assets in 2022 includes a $125m gain in respect of the Waltham R&D site sale and leaseback in MA, US (see Note 8). As part of the total consideration received in respect of the agreement to sell US rights to Synagis in 2019, $400m in total has been received related to the rights to participate in the future cash flows from the US profits or losses for Beyfortus, with $190m cash inflows in 2023 primarily relating to a cash receipt from Sobi following achievement of a regulatory milestone. At 31 December 2022, the full amount of $522m was recognised as a financial liability within non-current Other payables (the Profit Participation Liability) as the Group had not fully transferred the risks and rewards of the underlying cash flows arising from Beyfortus to Sobi. All associated cash flows have been presented within investing activities as the Group has received the cash in exchange for agreeing to transfer future cash flows relating to an intangible asset. In 2023, the contractual relationship between AstraZeneca and Sobi relating to future sales of Beyfortus in the US was replaced by a royalty relationship between Sanofi and Sobi. As a result, the Profit Participation Liability was extinguished and derecognised from the Consolidated Statement of Financial Position, with a gain of $712m recorded in Other operating income and expense. Restructuring costs In conjunction with the acquisition of Alexion in 2021, the enlarged Group initiated the Post Alexion Acquisition Group Review (PAAGR); a global restructuring programme aimed at integrating systems, structure and processes, optimising the global footprint and prioritising resource allocations and investments. During 2023, the Group identified all remaining activities and finalised the scope of the programme. During 2024, the Group has undertaken a further assessment of those planned activities. This included the commencement of work on the planned upgrade of the Group’s Enterprise Resource Planning IT systems (Axial Project), which is expected to be substantially complete by the end of 2030. The Group has also continued to progress other legacy restructuring programmes. During 2024, the Group has incurred $1,154m of restructuring costs, of which $1,115m resulted from activities that are part of the PAAGR, bringing the cumulative charges under this programme to $3,182m. Costs in 2024 included $529m within Cost of sales primarily due to inventory and related product provisions related to Andexxa following the decision to cease promotional activities, $312m within Selling, general and administrative expense in relation to severance, HR, Finance, IT and other integration costs and $275m within Research and development expense in relation to the transformation of clinical, regulatory and other R&D data and systems. Total restructuring costs in 2024 includes a net impairment charge to Property, plant and equipment of $43m (2023: charge of $7m; 2022: reversal of $4m), a $7m impairment charge to Right-of-use assets (2023: $13m; 2022: $nil) and no impairment of Intangible assets (2023: $nil; 2022: reversal of $17m relating to software development costs). The tables below show the costs that have been charged in respect of restructuring programmes by cost category and type. Severance provisions are detailed in Note 21. 2024 2023 2022 $m $m $m Cost of sales 569 109 266 Distribution expense – – 2 Research and development expense 275 212 111 Selling, general and administrative expense 312 207 405 Other operating income and expense (2) (61) (67) Total charge 1,154 467 717 2024 2023 2022 $m $m $m Severance costs 213 57 187 Accelerated depreciation and impairment charges 64 68 135 Other1 877 342 395 Total charge 1,154 467 717 1 Other costs are those incurred in designing and implementing the Group’s various restructuring initiatives. In 2024, Other costs included $480m for inventory and related product provisions related to Andexxa following the decision to cease promotional activities. Other costs also include the costs of integrating systems, structure and processes as part of the PAAGR, costs relating to the Alexion acquisition, internal project costs and external service fees. Financial instruments Included within Operating profit are the following net gains and losses on financial instruments: 2024 2023 2022 $m $m $m (Losses)/gains on forward foreign exchange contracts (81) 42 150 Losses on receivables and payables (143) (260) (203) Total (224) (218) (53) Impairment charges Details of impairment charges for 2024, 2023 and 2022 are included in Notes 7, 8 and 10. Notes to the Group Financial Statements continued 2 Operating profit continued 162 AstraZeneca Annual Report & Form 20-F Information 2024 Financial Statements |
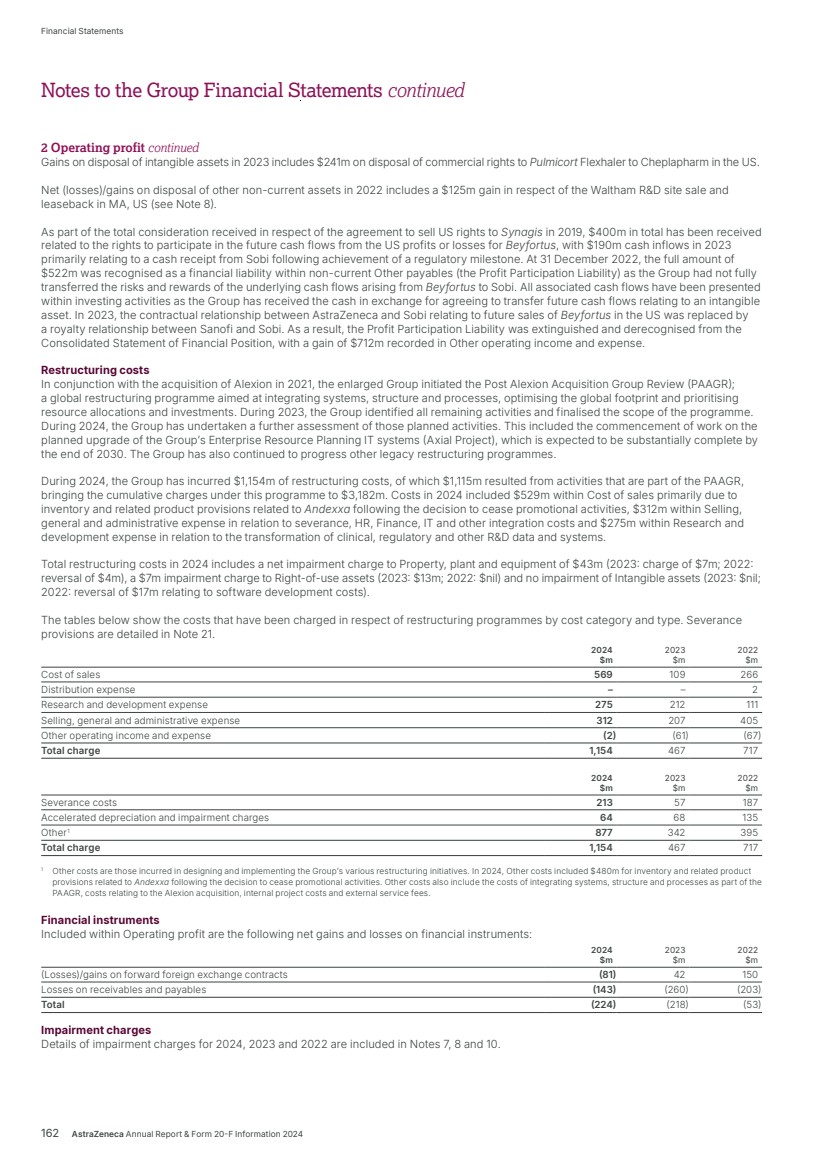
| 3 Finance income and expense 2024 2023 2022 $m $m $m Finance income Returns on deposits and equity securities 339 291 78 Fair value gains on debt and interest rate swaps 113 43 14 Interest income on income tax balances 6 10 3 Total 458 344 95 Finance expense Interest on debt, leases and other financing costs (1,391) (1,132) (889) Net interest on post-employment defined benefit plan net liabilities (Note 22) (50) (38) (29) Net exchange losses (42) (34) (16) Discount unwind on contingent consideration arising from business combinations (Note 20) (113) (132) (168) Discount unwind on other long-term liabilities1 (116) (200) (216) Fair value losses on debt and interest rate swaps (18) (3) – Interest expense on income tax balances (12) (87) (28) Total (1,742) (1,626) (1,346) Net finance expense (1,284) (1,282) (1,251) 1 Included within Discount unwind on other long-term liabilities is $nil relating to the Acerta Pharma share purchase liability (2023: $55m; 2022: $108m) and the discount unwind of other payables of $91m (2023: $100m; 2022: $nil) that have arisen from intangible asset additions, see Note 20 for further details. There was no interest capitalised during the year. Financial instruments Included within Finance income and expense are the following net gains and losses on financial instruments: 2024 2023 2022 $m $m $m Interest and fair value adjustments in respect of debt designated at fair value through profit or loss, net of derivatives 107 13 (9) Interest and changes in carrying values of debt designated as hedged items in fair value hedges, net of derivatives (38) – – Interest and fair value changes on fixed and short-term deposits, equity securities, other derivatives and tax balances 306 177 54 Interest on debt, commercial paper, overdrafts and lease liabilities held at amortised cost (1,251) (1,004) (837) The Group held derivatives that economically hedged a debt instrument designated at fair value through profit or loss. Both the derivatives and debt instrument matured in 2023. The Interest and fair value adjustments in respect of debt designated at fair value through profit or loss, net of derivatives, includes the following amounts related to these matured instruments; derivatives $nil (2023: loss of $1m; 2022: loss of $25m); debt $nil (2023: gain of $7m; 2022: gain of $26m). 4 Taxation Taxation charge/(credit) recognised in the Consolidated Statement of Comprehensive Income is as follows: 2024 2023 2022 $m $m $m Current tax Current year 2,314 2,417 1,823 Pillar Two income tax charge 238 – – Adjustment to prior years (107) 28 (187) Total 2,445 2,445 1,636 Deferred tax Origination and reversal of temporary differences (818) (1,473) (2,563) Adjustment to prior years 23 (34) 135 Total (795) (1,507) (2,428) Taxation charge/(credit) recognised in the profit for the year 1,650 938 (792) Taxation (charge)/credit recognised in Other comprehensive income is as follows: 2024 2023 2022 $m $m $m Current and deferred tax Items that will not be reclassified to profit and loss: Remeasurement of the defined benefit liability (23) 102 (231) Equity investments measured at fair value through Other comprehensive income (20) (1) 15 Total (43) 101 (216) Items that may be reclassified subsequently to profit and loss: Foreign exchange arising on designated liabilities in net investment hedges 28 (24) 73 Fair value movement on cash flow hedges (3) 12 – Total 25 (12) 73 Taxation (charge)/credit recognised in Other comprehensive income (18) 89 (143) Notes to the Group Financial Statements AstraZeneca Annual Report & Form 20-F Information 2024 163 Strategic Report Corporate Governance Financial Statements Additional Information |
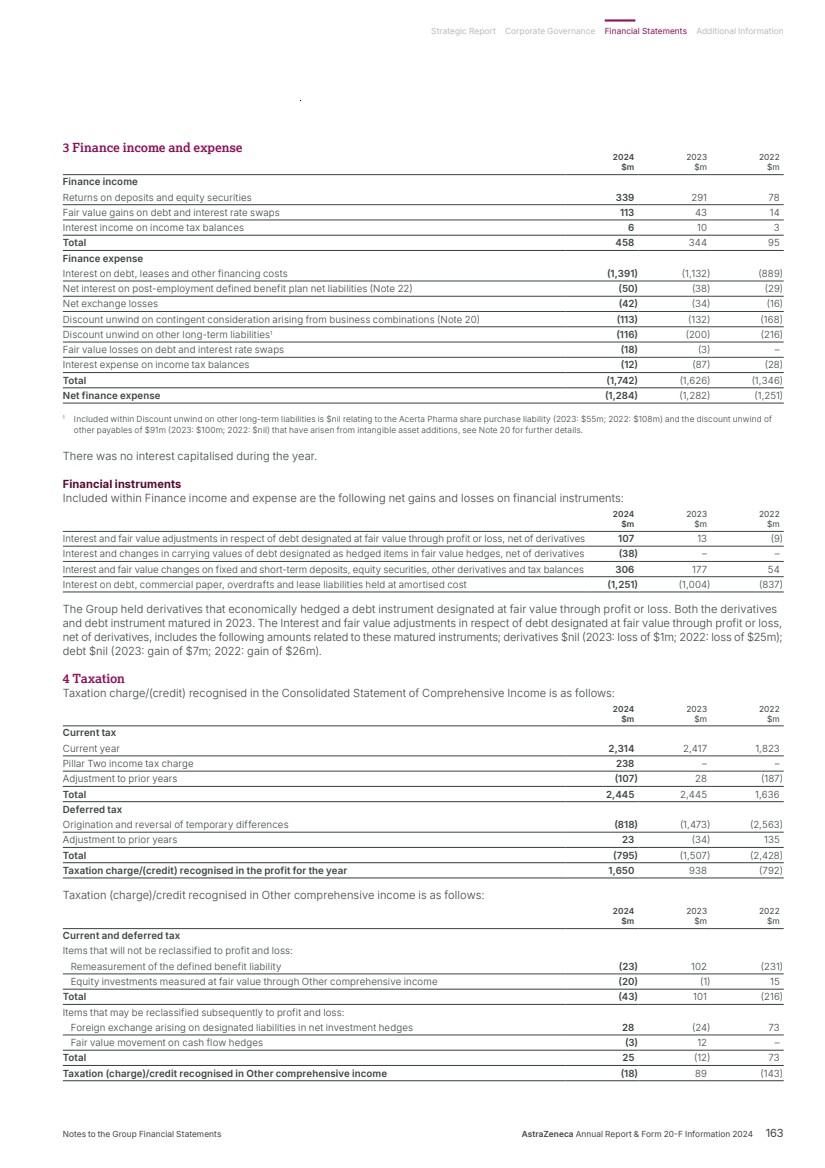
| The reported tax rate in the year was 19%. The income tax paid for the year was $2,750m. Taxation has been provided at current rates on the profits earned for the years covered by the Group Financial Statements. The 2024, 2023 and 2022 prior year current tax adjustments relate mainly to tax accrual to tax return adjustments and updates to provisions for tax contingencies. The 2024 prior year deferred tax adjustment relates mainly to tax accrual to tax return adjustments and updates to provisions for tax contingencies. The 2023 prior year deferred tax adjustment relates mainly to tax accrual to tax return adjustments and adjustments to the recognition of deferred tax assets. The 2022 prior year deferred tax adjustments relate mainly to tax accrual to tax return adjustments and updates to provisions for tax contingencies. To the extent that dividends remitted from overseas subsidiaries, joint ventures and associates are expected to result in additional taxes, appropriate amounts have been provided for. Unremitted earnings or differences in the carrying value and tax basis of investments may be liable to additional taxes if distributed as dividends or on a liquidation event. Deferred tax is provided for such differences in relation to Group entities where management is intending to remit earnings in the foreseeable future. The aggregate amount of gross temporary differences associated with investments in subsidiaries, partnerships and branches for which deferred tax liabilities have not been recognised totalled approximately $7,586m at 31 December 2024, $3,585m of which has a corresponding deductible temporary difference of the same gross value which is not recognised as it is not probable of reversing in the foreseeable future but on which different tax rates apply. Factors affecting future tax charges As a group with worldwide operations, AstraZeneca is subject to several factors that may affect future tax charges, principally the levels and mix of profitability in different jurisdictions, transfer pricing regulations, tax rates imposed and tax regime reforms. Tax reconciliation to UK statutory rate The table below reconciles the UK statutory tax charge to the Group’s total tax charge/(credit): 2024 2023 2022 $m $m $m Profit before tax 8,691 6,899 2,501 Notional taxation charge at UK corporation tax rate of 25% (2023: 23.5%; 2022: 19%) 2,173 1,621 475 Differences in effective overseas tax rates1 (60) (224) (59) Deferred tax credit relating to change in tax rates2 (24) (66) (108) Unrecognised deferred tax asset3 104 341 68 Items not deductible for tax purposes 64 46 90 Intellectual Property incentive regimes (561) (367) (265) Pillar Two income taxes 238 – – Other items4 (200) (406) (941) Adjustments to prior periods5 (84) (7) (52) Total tax charge/(credit) for the year 1,650 938 (792) 1 Includes the impact of the reversal of a $1.9bn deferred tax liability that was recognised in a previous business combination (31 December 2024: $0.5bn) and originated in goodwill. Some of this liability reverses in an intellectual property incentive regime and gives rise to a post-acquisition benefit to the tax charge that is not material year-on-year. Determining the cumulative post-acquisition benefit over the life of the asset involves estimates and judgements as the amount of income that qualifies for the intellectual property incentive regime varies. The actual tax rates applied over the life of the asset are expected to be a blend between the Dutch statutory tax rate and intellectual property incentive regime rate. 2 The 2023 item relates to the impact of the difference in the UK current and deferred tax rates during 2023. The 2022 item relates to the impact of the US state tax rate change and the impact of the difference in the UK current tax and deferred tax rates during 2022. 3 This includes the derecognition of deferred tax assets where it is no longer probable that there will be sufficient forecast future profits to utilise the assets. 4 Other items in 2024 includes a net credit following internal transfers of assets. Other items in 2023 include a favourable adjustment of $828m to deferred taxes arising from a UK company undertaking an intragroup purchase of certain intellectual property offset by a charge of $422m mainly relating to updates to tax liabilities following progress of reviews by tax authorities, administrative appeal processes and adjustments arising on expiry of the relevant statute of limitations (see Note 30 for more details). Other items in 2022 includes a one-time favourable net adjustment of $876m to deferred taxes arising from an internal reorganisation to integrate the Alexion organisation which took place in 2022 and a credit of $65m relating to the reduction of tax liabilities arising from adjustments on expiry of the relevant statute of limitations. 5 Further details explaining the adjustments in respect of prior years are set out above. AstraZeneca is domiciled in the UK but operates in other countries where the tax rates and laws are different to those in the UK. The impact on differences in effective overseas tax rates on the Group’s overall tax charge is noted above. Profits arising from our manufacturing operation in Puerto Rico are granted special status and are taxed at a reduced rate compared with the normal rate of tax in that territory under a tax incentive grant continuing until 2031. The Group receives intellectual property incentives in certain jurisdictions, resulting in a reduction to the tax charge in the Consolidated Statement of Comprehensive Income of $561m in 2024. Notes to the Group Financial Statements continued 4 Taxation continued 164 AstraZeneca Annual Report & Form 20-F Information 2024 Financial Statements |
| Deferred tax The total movement in the net deferred tax balance in the year was $168m. The movements are as follows: Intangibles, Elimination of Losses and Property, plant unrealised profit Untaxed tax credits Accrued and equipment on inventory reserves1 carried forward expenses Other2 Total $m $m $m $m $m $m $m Net deferred tax balance at 1 January 2022 (5,480) 1,861 (862) 1,518 85 1,002 (1,876) Income statement3 1,414 274 38 (126) 778 50 2,428 Other comprehensive income 72 – – – – (215) (143) Equity – – – – – 38 38 Exchange 63 (111) 108 (134) 17 (71) (128) Net deferred tax balance at 31 December 2022 (3,931) 2,024 (716) 1,258 880 804 319 Income statement3 1,518 426 96 (308) (23) (202) 1,507 Other comprehensive income (16) – – – – 83 67 Equity – – – – – (21) (21) Additions and disposals (24) – – 50 – (1) 25 Exchange (38) (64) (40) 106 32 (19) (23) Net deferred tax balance at 31 December 2023 (2,491) 2,386 (660) 1,106 889 644 1,874 Income statement 803 238 (186) 36 74 (170) 795 Other comprehensive income 34 – – – – (42) (8) Equity – – – – – (28) (28) Additions and disposals (605) – – 127 2 (1) (477) Exchange 93 (152) 68 (70) (40) (13) (114) Net deferred tax balance at 31 December 2024⁴ (2,166)5 2,472 (778) 1,199 925 390 2,042 1 Untaxed reserves relate to taxable profits where the tax liability is deferred to later periods. 2 The Group revised its presentation of deferred taxes on pension and post-retirement benefits in 2024 to present this within Other. 3 The Income statement movement in 2023 includes $828m arising from a UK company undertaking an intragroup purchase of certain intellectual property. The Income statement movement in 2022 includes the aforementioned net adjustment to deferred taxes of $876m arising on the internal legal entity reorganisation to integrate the Alexion organisation, the majority of which arises on Intangibles, Property, plant and equipment. 4 The Group recognises deferred tax assets to the extent that there are either taxable temporary differences or that it is probable that sufficient future taxable profits will arise, against which these deductible temporary differences can be utilised. The US includes a net deferred tax asset of $122m and the UK includes a net deferred tax asset of $1,597m as at 31 December 2024 which includes tax losses and other deductible temporary differences. The Group has performed an assessment of recovery of deferred tax assets and for these respective entities, the Group has forecasted future taxable profits and considers that it is probable that sufficient future taxable profits will arise against which these deductible temporary differences can be utilised. In arriving at these forecasts, the Group has reviewed the Group-level budgets and forecasts and the ability of those entities to generate future income from developing and commercialising products, including local tax laws and the scheduling of reversal of deductible temporary differences. Deferred tax assets are recognised on the basis there is sufficient forecast future taxable profits arising from the performance of on-market products and pipeline assets, including Imfinzi. For the UK, losses are forecast to be utilised within five years. For the US, recognised deferred taxes on losses and other items are forecast to be utilised within 10 years. It is considered that these sources of income are sufficiently predictable or diversified to support these recognition periods. A sensitivity assessment has been performed which shows that a change in profit of 10% results in an immaterial adjustment to the amount of deferred tax asset recognised. Assessing the availability of future taxable income to support recognition of deferred tax assets relies upon our Group forecasts and changes in these Group forecasts will impact the recoverability of deferred tax assets. To the extent that there are neither taxable temporary differences nor sufficient taxable profits, no deferred tax asset is recognised and details of unrecognised deferred tax assets are included in the table below. 5 Includes deferred tax assets of $384m on liabilities in respect of intangibles and $221m on lease liabilities in respect of right-of-use assets. The net deferred tax balance, before the offset of balances within countries, consists of: Intangibles, Elimination of Losses and Property, plant unrealised profit Untaxed tax credits Accrued and equipment on inventory reserves carried forward expenses Other1 Total $m $m $m $m $m $m $m Deferred tax assets at 31 December 2022 1,499 2,048 – 1,274 1,005 885 6,711 Deferred tax liabilities at 31 December 2022 (5,430) (24) (716) (16) (125) (81) (6,392) Net deferred tax balance at 31 December 2022 (3,931) 2,024 (716) 1,258 880 804 319 Deferred tax assets at 31 December 2023 1,883 2,386 – 1,141 1,011 801 7,222 Deferred tax liabilities at 31 December 2023 (4,374) – (660) (35) (122) (157) (5,348) Net deferred tax balance at 31 December 2023 (2,491) 2,386 (660) 1,106 889 644 1,874 Deferred tax assets at 31 December 2024 1,781 2,472 – 1,221 1,039 688 7,201 Deferred tax liabilities at 31 December 2024 (3,947) – (778) (22) (114) (298) (5,159) Net deferred tax balance at 31 December 2024 (2,166) 2,472 (778) 1,199 925 390 2,042 1 The Group revised its presentation of deferred taxes on pension and post-retirement benefits in 2024 to present this within Other. Analysed in the Consolidated Statement of Financial Position, after offset of balances within countries, as follows: 2024 2023 2022 $m $m $m Deferred tax assets 5,347 4,718 3,263 Deferred tax liabilities (3,305) (2,844) (2,944) Net deferred tax balance 2,042 1,874 319 Notes to the Group Financial Statements AstraZeneca Annual Report & Form 20-F Information 2024 165 Strategic Report Corporate Governance Financial Statements Additional Information |
| Unrecognised deferred tax assets Deferred tax assets (DTA) of $1,523m (2023: $1,251m; 2022: $807m) have not been recognised in respect of deductible temporary differences because it is not probable that future taxable profit will be available against which the Group can utilise the benefits therefrom. 2024 2024 2023 2023 2022 2022 Temporary Unrecognised Temporary Unrecognised Temporary Unrecognised differences DTA differences DTA differences DTA $m $m $m $m $m $m Temporary differences expiring: Within 10 years 161 37 87 22 104 26 More than 10 years 217 46 153 32 153 32 Indefinite 3,883 816 2,788 595 686 163 4,261 899 3,028 649 943 221 Tax credits and State tax losses expiring: Within 10 years 162 152 115 More than 10 years 373 363 384 Indefinite 89 87 87 624 602 586 Total 1,523 1,251 807 5 Earnings per $0.25 Ordinary Share 2024 2023 2022 Profit for the year attributable to equity holders ($m) 7,035 5,955 3,288 Basic earnings per Ordinary Share $4.54 $3.84 $2.12 Diluted earnings per Ordinary Share $4.50 $3.81 $2.11 Weighted average number of Ordinary Shares in issue for basic earnings (millions) 1,550 1,549 1,548 Dilutive impact of share options outstanding (millions) 13 13 12 Diluted weighted average number of Ordinary Shares in issue (millions) 1,563 1,562 1,560 The earnings figures used in the calculations above are post-tax. The weighted average number of Ordinary Shares in issue is calculated by taking the number of Ordinary Shares outstanding each day weighted by the number of days that those shares were outstanding. 6 Segment information The Group has reviewed its assessment of reportable segments under IFRS 8 ‘Operating Segments’ and concluded that the Group continues to have one reportable segment. KJ This determination is considered to be a Key Judgement and this judgement has been taken with reference to the following factors: 1 The level of integration across the different functions of the Group’s pharmaceutical business: AstraZeneca is engaged in a single business activity of pharmaceuticals and the Group does not have multiple operating segments. AstraZeneca’s pharmaceuticals business consists of the discovery and development of new products, which are then manufactured, marketed and sold. All of these functional activities take place (and are managed) globally on a highly integrated basis. These individual functional areas are not managed separately. 2 The identification of the Chief Operating Decision Maker (CODM) and the nature and extent of the financial information reviewed by the CODM: The SET, established and chaired by the CEO, is the vehicle through which the CEO exercises the authority delegated to him from the Board for the management, development and performance of AstraZeneca as a whole. It is considered that the SET is AstraZeneca’s Chief Operating Decision Making body (as defined by IFRS 8). The operation of the SET is principally driven by the management of the Commercial operations, R&D, manufacturing and supply and enabling functions. All significant operating decisions are undertaken by the SET. While members of the SET have responsibility for implementation of decisions in their respective areas, operating decision making is at SET level as a whole. Where necessary, these are implemented through cross-functional sub-committees that consider the Group-wide impact of a new decision. For example, product launch decisions would be initially considered by the SET and, on approval, passed to an appropriate sub team for implementation. The ability of the enterprise to develop, produce, deliver and commercialise a wide range of pharmaceutical products are central to the SET decision-making process. Notes to the Group Financial Statements continued 4 Taxation continued 166 AstraZeneca Annual Report & Form 20-F Information 2024 Financial Statements |

| In assessing performance, the SET reviews financial information on an integrated basis for the Group as a whole, substantially in the form of, and on the same basis as, the Group’s IFRS Financial Statements. The high upfront cost of discovering and developing new products, coupled with the relatively insignificant and stable unit cost of production, means that there is not the clear link that exists in many manufacturing businesses between the revenue generated on an individual product sale and the associated cost and hence margin generated on a product. Consequently, the profitability of individual drugs or classes of drugs is not considered a key measure of performance for the business and is not monitored by the SET. The focus of additional financial information reviewed is at brand sales and Gross Margin level within specific geographies. Expenditure analysis is completed for the science units, operations and enabling functions; there is no allocation of these centrally-managed Group costs to the individual product or brands. The bonus of SET members’ continues to be derived from the Group scorecard outcome as discussed in our Directors’ Remuneration Report. 3 How resources are allocated: Resources are allocated on a Group-wide basis according to need. In particular, capital expenditure, in-licensing, and R&D resources are allocated between activities on merit, based on overall therapeutic considerations and strategy under the aegis of the Group’s Early-Stage Product Committees and Late-Stage Product Committees. Geographic areas The following table shows information for Total Revenue by geographic area and material countries. Product Sales by geographic area are included in the country/region where the legal entity resides and from which those sales were made. The additional tables show the Operating profit and Profit before tax made by companies located in that area, together with Non-current assets, Total assets, Assets acquired, Net operating assets, and Property, plant and equipment owned by the same companies. Total Revenue 2024 2023 2022 $m $m $m UK 4,740 3,368 3,117 Rest of Europe France 1,283 1,152 1,107 Germany 2,524 2,099 1,902 Italy 949 813 735 Spain 994 847 738 Sweden 2,290 1,704 1,721 Others 3,663 3,110 2,706 11,703 9,725 8,909 The Americas Canada 937 967 1,166 US 21,806 18,121 17,278 Others 2,246 1,683 1,175 24,989 20,771 19,619 Asia, Africa & Australasia Australia 439 390 571 China 6,419 5,872 5,743 Japan 3,452 3,640 3,986 Others 2,331 2,045 2,406 12,641 11,947 12,706 Total Revenue 54,073 45,811 44,351 Total Revenue outside of the UK totalled $49,333m for the year ended 31 December 2024 (2023: $42,443m; 2022: $41,234m). Operating profit/(loss) Profit/(loss) before tax 2024 2023 2022 2024 2023 2022 $m $m $m $m $m $m UK 2,680 665 1,120 1,349 (577) 272 Rest of Europe 5,924 4,885 2,945 6,057 4,999 2,709 The Americas 423 1,495 (954) 318 1,328 (1,140) Asia, Africa & Australasia 976 1,148 646 967 1,149 660 Continuing operations 10,003 8,193 3,757 8,691 6,899 2,501 Notes to the Group Financial Statements AstraZeneca Annual Report & Form 20-F Information 2024 167 Strategic Report Corporate Governance Financial Statements Additional Information |
| Non-current assets1,2 Total assets 2024 2023 2022 2024 2023 2022 $m $m $m $m $m $m UK 8,699 8,626 8,208 20,139 19,616 16,786 Rest of Europe 30,654 32,905 34,301 37,884 40,638 40,669 The Americas 28,730 26,524 25,425 38,544 34,754 32,990 Asia, Africa & Australasia 2,181 910 929 7,468 6,111 6,038 Continuing operations 70,264 68,965 68,863 104,035 101,119 96,483 Assets acquired3 Net operating assets4 2024 2023 2022 2024 2023 2022 $m $m $m $m $m $m UK 582 812 2,301 7,173 5,275 3,863 Rest of Europe 2,225 1,770 522 30,852 32,920 32,726 The Americas 3,925 1,925 421 24,501 22,746 23,290 Asia, Africa & Australasia 1,394 117 51 2,602 1,405 1,895 Continuing operations 8,126 4,624 3,295 65,128 62,346 61,774 1 Non-current assets exclude Deferred tax assets and Derivative financial instruments. 2 In 2023, the Group revised the presentation of Non-current assets to exclude certain financial assets and post-employment benefit assets which previously had been included in this disclosure. This resulted in a decrease in 2022 of $1,690m. 3 Included in Assets acquired are those assets that are expected to be used during more than one period (Property, plant and equipment, Goodwill and Intangible assets) and include those acquired through business combinations (Note 27). 4 Net operating assets exclude short-term investments, cash, short-term borrowings, loans, Derivative financial instruments, Retirement benefit obligations and non-operating receivables and payables. Property, plant and equipment 2024 2023 2022 $m $m $m UK 2,847 2,831 2,526 Ireland 1,323 1,164 1,040 Sweden 1,692 1,678 1,472 US 2,856 2,371 2,176 Rest of the world 1,534 1,358 1,293 Continuing operations 10,252 9,402 8,507 Geographic markets The table below shows Product Sales in each geographic market in which customers are located. 2024 2023 2022 $m $m $m UK 1,314 978 996 Rest of Europe 10,686 8,201 7,503 The Americas 25,081 20,855 20,126 Asia, Africa & Australasia 13,857 13,755 14,373 Continuing operations 50,938 43,789 42,998 Product Sales are recognised when control of the goods has been transferred to a third party. A significant proportion of this is upon delivery of the products to wholesalers. One wholesaler (2023: one; 2022: one) individually represented greater than 10% of Product Sales. The value of Product Sales to this wholesaler was $7,567m (2023: $6,513m; 2022: $5,387m). Notes to the Group Financial Statements continued 6 Segment information continued 168 AstraZeneca Annual Report & Form 20-F Information 2024 Financial Statements |
| 7 Property, plant and equipment Assets in Total Property, Land and Plant and course of plant and buildings equipment construction equipment $m $m $m $m Cost At 1 January 2022 6,377 7,903 2,728 17,008 Capital expenditure 5 19 1,042 1,066 Transfer of assets into use 226 683 (909) – Transfer of Assets held for sale (Note 18) (434) (293) – (727) Disposals and other movements (425) (146) 28 (543) Exchange adjustments (309) (610) (236) (1,155) At 31 December 2022 5,440 7,556 2,653 15,649 Additions through business combinations (Note 27) 2 10 – 12 Capital expenditure 9 43 1,402 1,454 Transfer of assets into use 959 1,158 (2,117) – Disposals and other movements (6) (255) (11) (272) Exchange adjustments 65 192 118 375 At 31 December 2023 6,469 8,704 2,045 17,218 Additions through business combinations (Note 27) 1 15 2 18 Capital expenditure 27 63 1,905 1,995 Transfer of assets into use 312 729 (1,041) – Disposals and other movements (44) (271) (40) (355) Exchange adjustments (185) (386) (82) (653) At 31 December 2024 6,580 8,854 2,789 18,223 Depreciation and impairment At 1 January 2022 2,877 4,948 – 7,825 Depreciation charge for the year 286 566 – 852 Impairment charge/(reversal) 20 8 (28) – Transferred to Assets held for sale (Note 18) (300) (277) – (577) Disposals and other movements (227) (188) 28 (387) Exchange adjustments (167) (404) – (571) At 31 December 2022 2,489 4,653 – 7,142 Depreciation charge for the year 241 492 – 733 Impairment charge 4 4 – 8 Disposals and other movements (13) (220) – (233) Exchange adjustments 44 122 – 166 At 31 December 2023 2,765 5,051 – 7,816 Depreciation charge for the year 231 568 – 799 Impairment charge – (7) 49 42 Disposals and other movements (39) (252) (49) (340) Exchange adjustments (101) (245) – (346) At 31 December 2024 2,856 5,115 – 7,971 Net book value At 31 December 2022 2,951 2,903 2,653 8,507 At 31 December 2023 3,704 3,653 2,045 9,402 At 31 December 2024 3,724 3,739 2,789 10,252 2024 2023 2022 $m $m $m The net book value of land and buildings comprised: Freeholds 3,329 2,976 2,555 Leaseholds 395 728 396 Notes to the Group Financial Statements AstraZeneca Annual Report & Form 20-F Information 2024 169 Strategic Report Corporate Governance Financial Statements Additional Information |
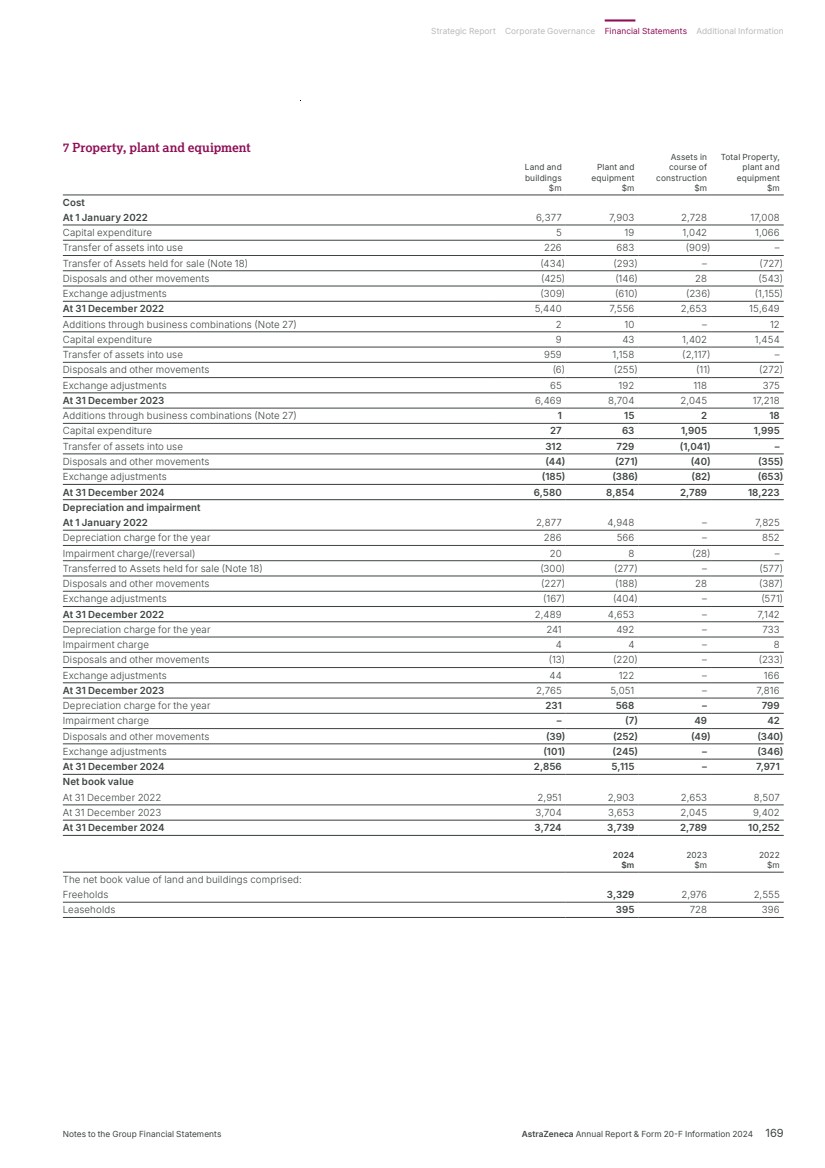
| 8 Leases Right-of-use assets Total Land and Motor Right-of-use buildings vehicles Other assets $m $m $m $m Cost At 1 January 2022 1,133 321 33 1,487 Additions through business combinations (Note 27) 4 – – 4 Additions – separately acquired 140 81 14 235 Disposals and other movements (33) (58) (13) (104) Exchange adjustments (62) (15) (2) (79) At 31 December 2022 1,182 329 32 1,543 Additions through business combinations (Note 27) 8 – – 8 Additions – separately acquired 220 219 5 444 Disposals and other movements (71) (57) (2) (130) Exchange adjustments 13 4 1 18 At 31 December 2023 1,352 495 36 1,883 Additions through business combinations (Note 27) 20 – – 20 Additions – separately acquired 332 342 18 692 Disposals and other movements (73) (140) (5) (218) Exchange adjustments (43) (33) (2) (78) At 31 December 2024 1,588 664 47 2,299 Depreciation and impairment At 1 January 2022 326 154 19 499 Depreciation charge for the year 160 80 6 246 Impairment charge 2 – – 2 Disposals and other movements (54) (50) (10) (114) Exchange adjustments (23) (8) (1) (32) At 31 December 2022 411 176 14 601 Depreciation charge for the year 170 98 7 275 Impairment charge 14 – – 14 Disposals and other movements (53) (61) (2) (116) Exchange adjustments 7 2 – 9 At 31 December 2023 549 215 19 783 Depreciation charge for the year 183 151 9 343 Impairment charge 7 – – 7 Disposals and other movements (71) (115) (6) (192) Exchange adjustments (22) (14) (1) (37) At 31 December 2024 646 237 21 904 Net book value At 31 December 2022 771 153 18 942 At 31 December 2023 803 280 17 1,100 At 31 December 2024 942 427 26 1,395 Lease liabilities 2024 2023 2022 $m $m $m The present value of lease liabilities is as follows: Within one year (339) (271) (228) Later than one year and not later than five years (825) (657) (549) Later than five years (288) (200) (176) Total lease liabilities (1,452) (1,128) (953) The interest expense on lease liabilities included within Finance expense was $61m (2023: $33m; 2022: $24m). The total cash outflow for leases in 2024 was $377m (2023: $301m; 2022: $268m). Notes to the Group Financial Statements continued 170 AstraZeneca Annual Report & Form 20-F Information 2024 Financial Statements |
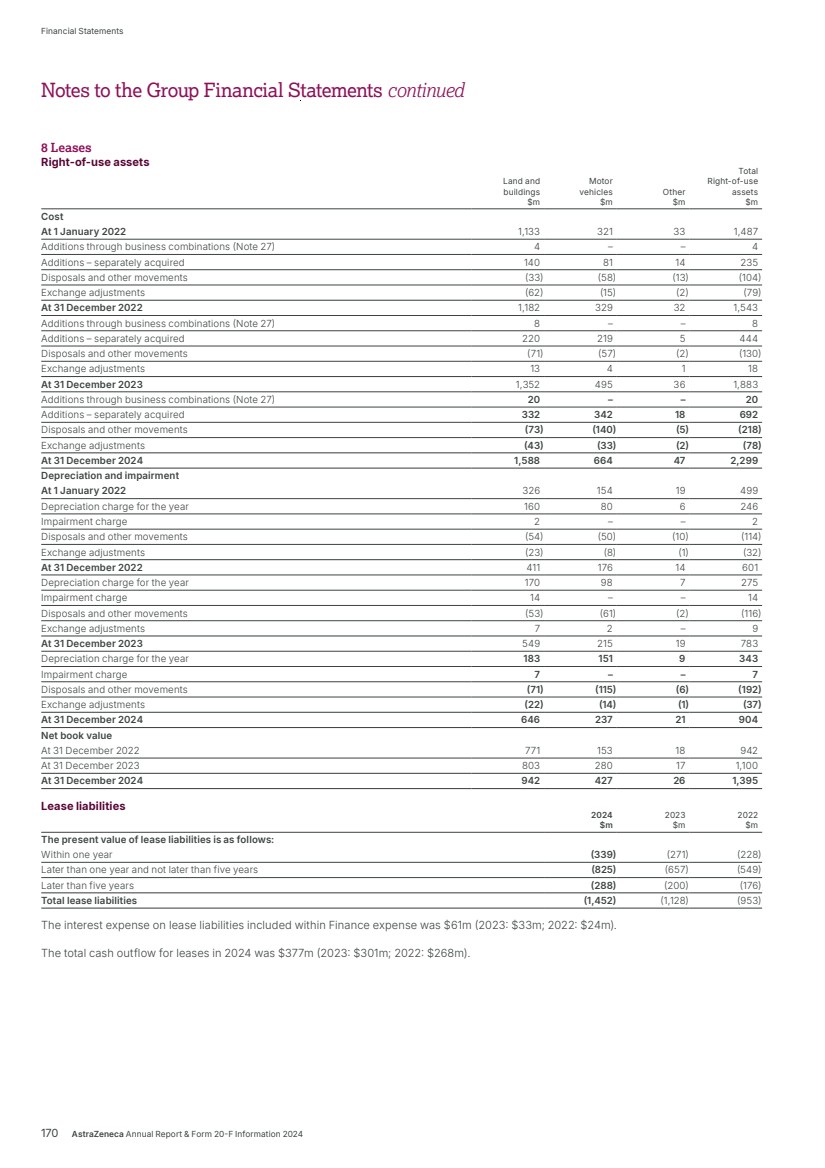
| The Group has entered into lease contracts that have not yet commenced. The nominal value of estimated future lease payments under these lease contracts approximates $1,515m as of 31 December 2024. Of this value, $1,348m relates to a property lease in the US which is expected to commence in 2026 with a lease term of 15 years. In 2022 the Group entered into a sale and leaseback agreement in relation to the Waltham R&D site in MA, US. Prior to the sale, the carrying value of the Property, plant and equipment was $124m. Cash proceeds of $265m were received, recorded within Disposal of property, plant and equipment within the Consolidated Statement of Cash Flows, and a gain on disposal of $125m was recorded within Other operating income and expense within the Consolidated Statement of Comprehensive Income. A lease liability and a corresponding right-of-use asset were recorded of $28m and $13m, respectively. 9 Goodwill 2024 2023 2022 $m $m $m Cost At 1 January 20,361 20,131 20,311 Additions through business combinations (Note 27) 1,083 158 15 Exchange and other adjustments (109) 72 (195) At 31 December 21,335 20,361 20,131 Amortisation and impairment losses At 1 January 313 311 314 Exchange and other adjustments (3) 2 (3) At 31 December 310 313 311 Net book value At 31 December 21,025 20,048 19,820 Goodwill is tested for impairment at the operating segment level, this being the level at which goodwill is monitored for internal management purposes. As detailed in Note 6, the Group does not have multiple operating segments and is engaged in a single business activity of pharmaceuticals. Recoverable amount is determined on a fair value less costs to sell basis using the market value of the Company’s outstanding Ordinary Shares. Our market capitalisation is compared to the book value of the Group’s net assets and this indicates a significant surplus at 31 December 2024 (and 31 December 2023 and 31 December 2022). No goodwill impairment was identified. Notes to the Group Financial Statements AstraZeneca Annual Report & Form 20-F Information 2024 171 Strategic Report Corporate Governance Financial Statements Additional Information |
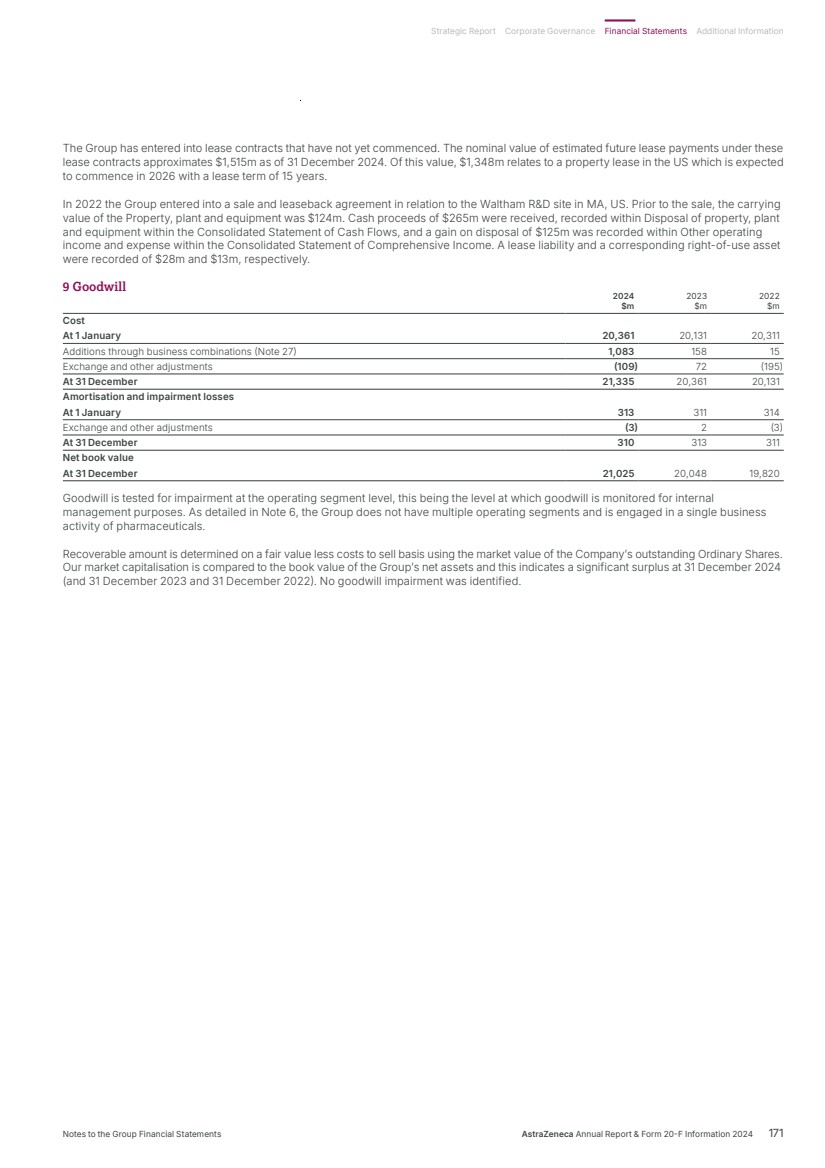
| 10 Intangible assets Product, Software marketing and Other development distribution rights intangibles costs Total $m $m $m $m Cost At 1 January 2022 66,590 2,611 1,432 70,633 Additions through business combinations (Note 27) – 46 – 46 Additions – separately acquired 2,051 12 105 2,168 Disposals (57) (105) (36) (198) Exchange and other adjustments (1,799) (122) (106) (2,027) At 31 December 2022 66,785 2,442 1,395 70,622 Additions through business combinations (Note 27) 65 35 – 100 Additions – separately acquired 2,530 200 170 2,900 Disposals (669) – (14) (683) Exchange and other adjustments 496 30 24 550 At 31 December 2023 69,207 2,707 1,575 73,489 Additions through business combinations (Note 27) 2,308 56 – 2,364 Additions – separately acquired 2,226 150 290 2,666 Disposals (294) – (285) (579) Exchange and other adjustments (964) (13) (50) (1,027) At 31 December 2024 72,483 2,900 1,530 76,913 Amortisation and impairment losses At 1 January 2022 25,276 1,863 1,002 28,141 Amortisation for year 3,899 181 76 4,156 Impairment charges 236 82 – 318 Impairment reversals (77) – (17) (94) Disposals (55) (105) (20) (180) Exchange and other adjustments (887) (76) (63) (1,026) At 31 December 2022 28,392 1,945 978 31,315 Amortisation for year 3,771 75 80 3,926 Impairment charges 434 – – 434 Disposals (667) – (12) (679) Exchange and other adjustments 336 41 27 404 At 31 December 2023 32,266 2,061 1,073 35,400 Amortisation for year 3,761 78 84 3,923 Impairment charges 1,577 3 2 1,582 Impairment reversals (8) – – (8) Disposals (286) – (283) (569) Exchange and other adjustments (561) (13) (18) (592) At 31 December 2024 36,749 2,129 858 39,736 Net book value At 31 December 2022 38,393 497 417 39,307 At 31 December 2023 36,941 646 502 38,089 At 31 December 2024 35,734 771 672 37,177 Other intangibles consist mainly of research and device technologies and the Alexion brand name. Included within Software development costs are assets currently in development that will commence amortisation when ready for use. Included within Additions − separately acquired are amounts of $365m (2023: $625m; 2022: $1,135m), relating to deferred payments and other non-cash consideration for the acquisition of Product, marketing and distribution rights, which are not reflected in the current year Consolidated Statement of Cash Flows. Disposals include amounts related to fully amortised or impaired assets that are no longer in use by the Group. Notes to the Group Financial Statements continued 172 AstraZeneca Annual Report & Form 20-F Information 2024 Financial Statements |
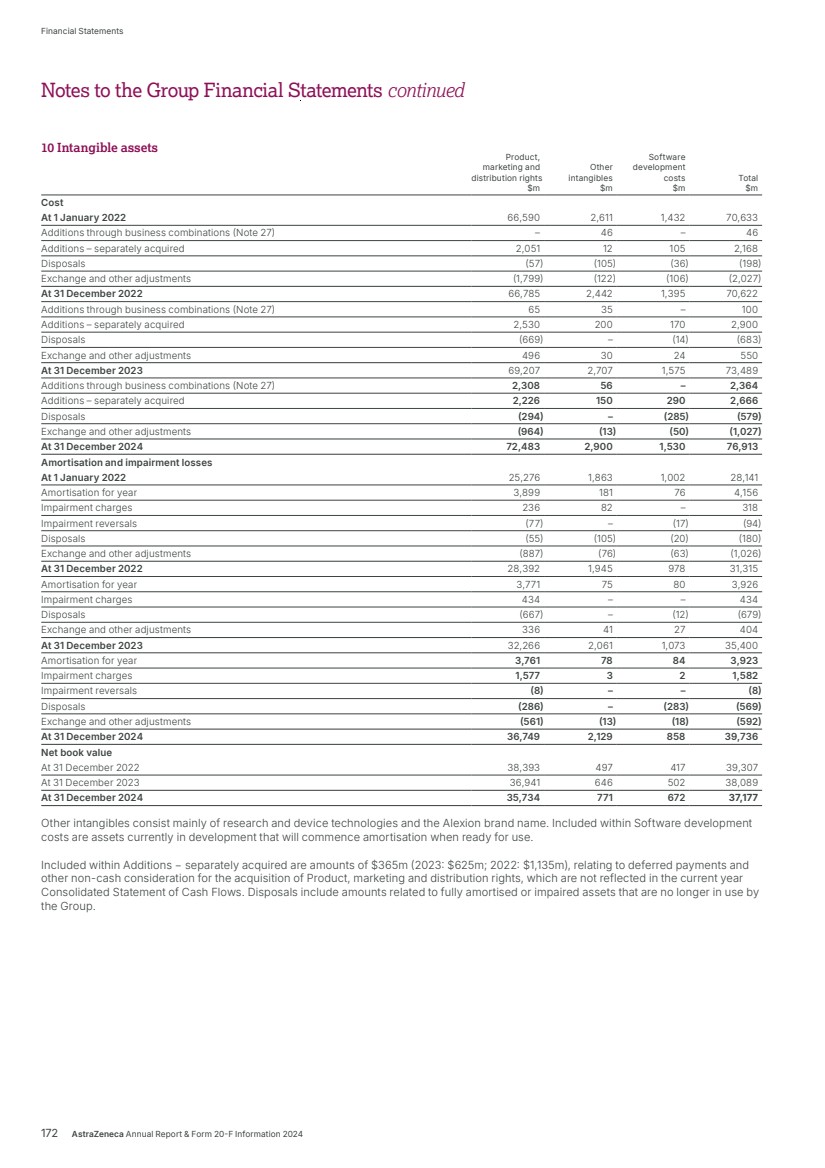
| Amortisation charges are recognised in the Consolidated Statement of Comprehensive Income as follows: Product, Software marketing and Other development distribution rights intangibles costs Total $m $m $m $m Year ended 31 December 2022 Cost of sales 32 – – 32 Research and development expense – 30 – 30 Selling, general and administrative expense 3,867 151 76 4,094 Total 3,899 181 76 4,156 Year ended 31 December 2023 Cost of sales 32 – – 32 Research and development expense – 28 – 28 Selling, general and administrative expense 3,739 47 80 3,866 Total 3,771 75 80 3,926 Year ended 31 December 2024 Cost of sales 32 1 – 33 Research and development expense 3 22 – 25 Selling, general and administrative expense 3,726 55 84 3,865 Total 3,761 78 84 3,923 Net impairment charges are recognised in the Consolidated Statement of Comprehensive Income as follows: Product, Software marketing and Other development distribution rights intangibles costs Total $m $m $m $m Year ended 31 December 2022 Research and development expense 95 – – 95 Selling, general and administrative expense 64 82 (17) 129 Total 159 82 (17) 224 Year ended 31 December 2023 Research and development expense 417 – – 417 Selling, general and administrative expense 17 – – 17 Total 434 – – 434 Year ended 31 December 2024 Research and development expense 1,065 – – 1,065 Selling, general and administrative expense 504 3 2 509 Total 1,569 3 2 1,574 Impairment charges and reversals We perform a rigorous impairment trigger assessment for all our intangible assets. Intangible assets under development and not available for use are tested annually for impairment and other intangible assets are tested when there is an indication of impairment loss or reversal. Where testing is required, the recoverable amount of the assets is estimated in order to determine the extent of the impairment loss or reversal. Where it is not possible to estimate the recoverable amount of an individual asset, the Group estimates the recoverable amount of the Cash Generating Unit (CGU) to which it belongs. The Group considers that as the intangible assets are linked to individual products and that product cash flows are considered to be largely independent of other product cash flows, the CGU for intangibles is at the product level. Group-level budgets and forecasts include forecast capital investment and operational impacts related to sustainability projects, as well as inflationary impacts, and form the basis for the value in use models used for impairment testing. An asset’s recoverable amount is determined as the higher of an asset’s or CGU’s fair value less costs to sell or value in use, in both cases using discounted cash flow calculations where the asset’s expected post-tax cash flows are risk-adjusted over their estimated remaining period of expected economic benefit. Where the value in use approach is used, the post-tax risk-adjusted cash flows are discounted using AstraZeneca’s post-tax weighted average cost of capital (7.5% for 2024, 7.5% for 2023 and 7% for 2022) which is a nominal rate. There is no material difference in the approach taken to using pre-tax cash flows and a pre-tax rate compared to post-tax cash flows and a post-tax rate, as required by IAS 36 ‘Impairment of Assets’. Where fair value less costs to sell is used to determine recoverable value, the discount rate is assessed with reference to a market participant, this is not usually materially different to the AstraZeneca post-tax weighted average cost of capital of 7.5%. Intangible assets have been tested for impairment under the value in use basis at risk-adjusted post-tax discount rates ranging between 7.5% to 9.5%. SE Key assumptions and significant estimates used in calculating the recoverable amounts are highly sensitive and specific to the nature of the Group’s activities including: • outcome of R&D activities • probability of technical and regulatory success • market volume, share and pricing (to derive peak year sales) • amount and timing of projected future cash flows • sales erosion curves following patent expiry. Notes to the Group Financial Statements AstraZeneca Annual Report & Form 20-F Information 2024 173 Strategic Report Corporate Governance Financial Statements Additional Information |
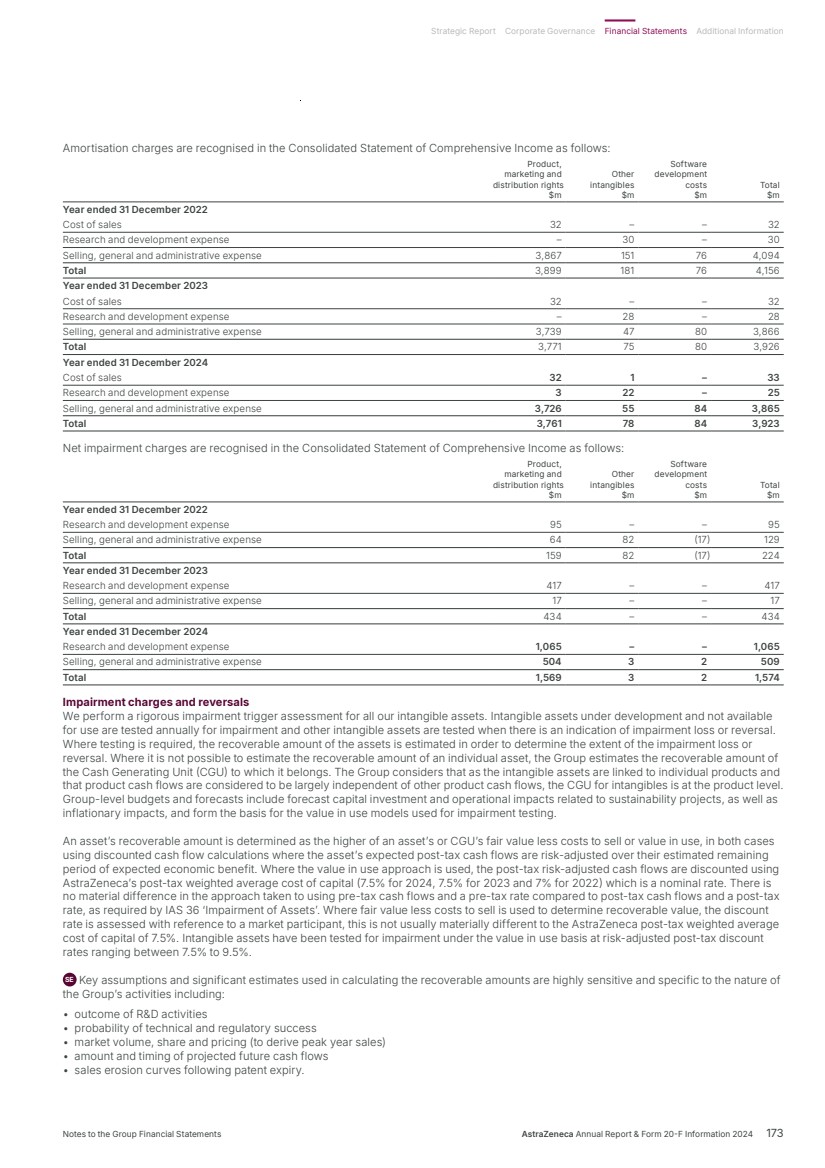
| Whilst the intangible assets portfolio is generally exposed to significant impairment risk within the next financial year, no sensitivities have been disclosed since no specific asset has been identified as having a significant risk of a material impairment arising from reasonably possible changes in key assumptions. For assets held at fair value less costs to sell, we make appropriate adjustments to reflect market participant assessments. In 2024, the Group recorded impairment charges of $504m in respect of launched products. Following a strategic review of our portfolio priorities, a business decision was made to cease promotional activity for Andexxa resulting in impairment charges of $504m recorded against the Andexxa intangible asset under a value-in-use model applying a discount rate of 7.5% (revised carrying amount: $nil). Impairment charges recorded against products in development totalled $1,073m. This included full impairments of vemircopan (ALXN2050) ($753m, acquired as part of the Alexion business combination in 2021), following outcome of research activities, and FPI-2059 ($165m, acquired as part of the Fusion business combination in 2024) due to portfolio prioritisation decisions. The remaining impairments of $155m relate to impairments of various products in development, due to either management’s decision to discontinue development as part of Group-wide portfolio prioritisation decisions, or due to the outcome of research activities. In 2023, the Group recorded impairment charges of $17m in respect of launched products. Impairment charges recorded against products in development totalled $417m, including $244m related to ALXN1840 which was fully impaired following the decision to discontinue development. In 2022, the Group recorded impairment charges of $146m in respect of launched products. Impairment charges recorded against products in development totalled $172m due to decisions made to terminate the related activities. The Group has performed an assessment on assets which have had impairments recorded in previous periods to determine if any reversals of impairments were required. Impairment reversals of $8m were recorded in 2024 against products in development. No impairment reversals were recorded in 2023. Impairment reversals of $94m were recorded in 2022, including $77m in respect of products in development. When launched products are partially impaired, the carrying values of these assets in future periods are particularly sensitive to changes in forecast assumptions, including those assumptions set out above, as the asset is impaired down to its recoverable amount. Significant assets Carrying Remaining value amortisation $m period C5 franchise (Soliris/Ultomiris) intangible assets arising from the acquisition of Alexion 12,667 3 to 11 years Intangible assets arising from the acquisition of Acerta Pharma 3,853 8 years Strensiq, Kanuma intangible assets arising from the acquisition of Alexion 3,221 8 to 14 years Enhertu intangible assets acquired from Daiichi Sankyo 2,534 9 years Intangible asset products in development arising from the acquisition of Alexion1 1,913 Not amortised Intangible assets arising from the acquisition of ZS Pharma 1,548 7 years Intangible asset products in development arising from the acquisition of Fusion1 1,161 Not amortised Intangible asset products in development arising from the acquisition of Gracell1 983 Not amortised Datroway intangible assets acquired from Daiichi Sankyo1 974 Not amortised Baxdrostat intangible asset acquired from CinCor1 790 Not amortised Intangible asset products in development arising from the acquisition of Amolyt1 768 Not amortised Intangible asset products in development arising from the acquisition of Icosavax1 639 Not amortised Airsupra intangible asset 500 10 years Intangible assets arising from the restructuring of a historical joint venture with MSD 375 2 to 5 years Monalizumab intangible assets acquired from Innate Pharma1 364 Not amortised Intangible assets arising from the acquisition of Pearl Therapeutics 309 4 to 5 years Rare disease portfolio assets acquired from Pfizer1 300 Not amortised 1 Assets in development are not amortised but are tested annually for impairment. In 2024, the intangible assets recognised on acquisition of Amolyt and Icosavax were separately assessed under the optional concentration test in IFRS 3 ‘Business Combinations’ and were individually determined to be asset acquisitions, as substantially all of the value of the gross assets acquired in each transaction was concentrated in these single assets. The intangible asset baxdrostat recognised on acquisition of CinCor in 2023 was assessed under the optional concentration test in IFRS 3 and was determined to be an asset acquisition, as substantially all of the value of the gross assets acquired was concentrated in this single asset. The acquisition of Pfizer’s pre-clinical rare disease gene therapy portfolio in 2023 was assessed under IFRS 3 and the transaction was treated as an asset acquisition. Notes to the Group Financial Statements continued 10 Intangible assets continued 174 AstraZeneca Annual Report & Form 20-F Information 2024 Financial Statements |
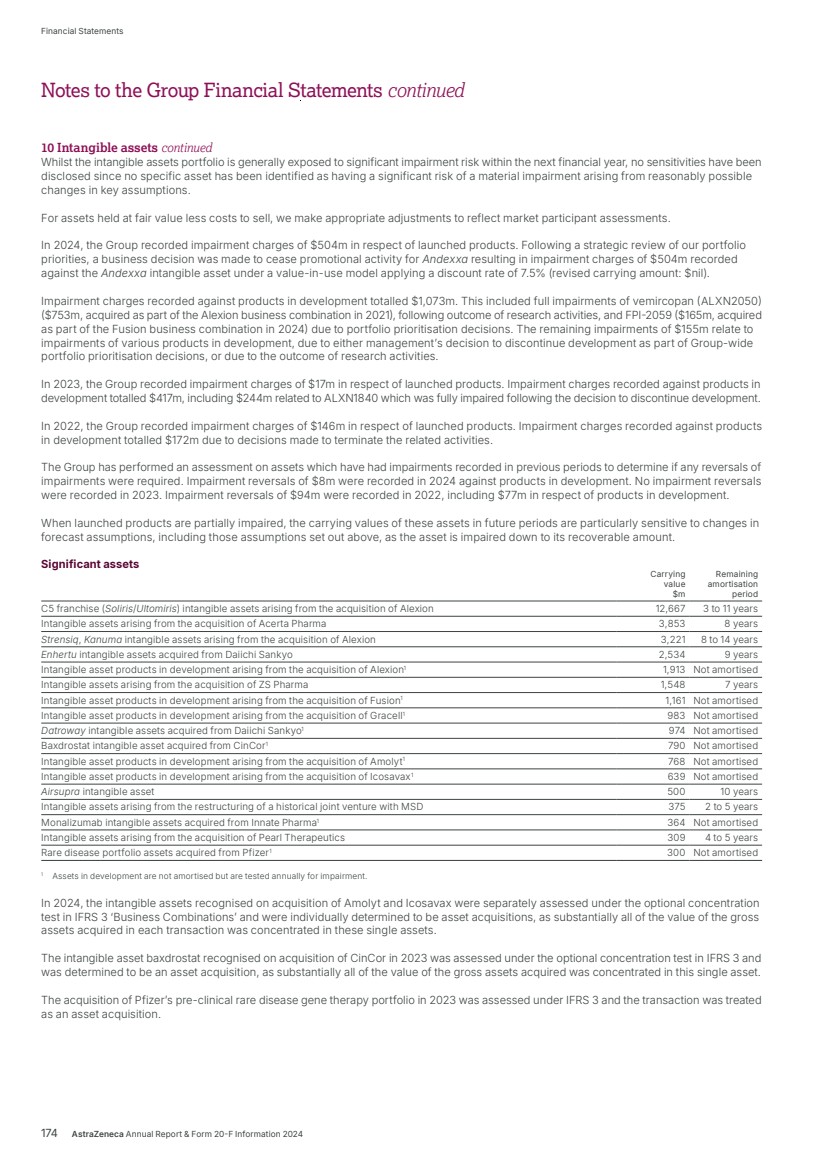
| 11 Investments in associates and joint ventures 2024 2023 2022 $m $m $m At 1 January 147 76 69 Additions 158 80 26 Share of after tax losses (28) (12) (5) Exchange and other adjustments (9) 3 (14) At 31 December 268 147 76 On 22 May 2024, AstraZeneca entered into an agreement with Fuse Biosciences (Cayman) Limited to acquire equity. Under the terms of the agreement, AstraZeneca contributed $11m in initial funds, holds 25% board representation, and holds a 18.75% interest in the associate entity. On 1 November 2023, AstraZeneca entered into an agreement with Cellectis, a clinical-stage biotechnology company, to accelerate the development of next generation therapeutics in areas of high unmet medical need, including oncology, immunology and rare diseases. Under the terms of the agreement, AstraZeneca contributed $80m in funds for a 22% interest in the associate entity. On 22 May 2024, a further contribution of $140m was made for a further 22% interest. AstraZeneca holds a 44% interest in the associate entity. On 29 January 2021, AstraZeneca entered into an agreement with IHP Holdings Limited to create and run an online platform (iHospital) offering consultations with physicians, repeat prescriptions and e-pharmacy in China. The agreement resulted in the formation of a new entity, IHP HK Holdings Limited. AstraZeneca contributed $30m in initial funds and holds a 50% interest in the associate entity. On 1 December 2020, AstraZeneca and China International Capital Corporation (CICC) entered into an agreement to set up a Global Healthcare Industrial Fund to drive healthcare system innovation by leveraging local capital and accelerating China-related innovation incubation. The agreement resulted in the formation of a new entity, Wuxi AstraZeneca-CICC Venture Capital Partnership (Limited Partnership). AstraZeneca holds a 22% interest in the associate entity and contributed $1m in initial funds in 2020, with contributions of $45m, $21m and $7m made in 2021, 2022 and 2024 respectively. On 23 September 2021, AstraZeneca entered into an agreement with VaxEquity Limited (‘VaxEquity’) to collaborate and develop self-amplifying RNA technology with the aim of generating treatments for target diseases. AstraZeneca contributed $14m in initial funds and holds a 40% interest in the associate entity. On 13 April 2024, VaxEquity entered a voluntary liquidation process. On 27 November 2017, AstraZeneca entered into a joint venture agreement with Chinese Future Industry Investment Fund (FIIF), to discover, develop and commercialise potential new medicines to help address unmet medical needs globally, and to bring innovative new medicines to patients in China more quickly. The agreement resulted in the formation of a joint venture entity based in China, Dizal (Jiangsu) Pharmaceutical Co., Ltd. Since its establishment, AstraZeneca has contributed $80m in cash to the joint venture entity and has a 26% interest in the joint venture. On 1 December 2015, AstraZeneca entered into a joint venture agreement with Fujifilm Kyowa Kirin Biologics Co., Ltd. to develop a biosimilar using the combined capabilities of the two parties. The agreement resulted in the formation of a joint venture entity based in the UK, Centus Biotherapeutics Limited (‘Centus’). Since its establishment, AstraZeneca has contributed $135m in cash to the joint venture entity and has a 50% interest in the joint venture which has a carrying value of $nil (2023: $nil; 2022: $nil). On 7 May 2024 Centus was dissolved. All investments are accounted for using the equity method. At 31 December 2024, unrecognised losses in associates and joint ventures totalled $177m (2023: $140m; 2022: $92m) which have not been recognised due to the investment carrying value reaching $nil value. Aggregated summarised financial information for the associate and joint venture entities is set out below: 2024 2023 2022 $m $m $m Non-current assets 577 424 290 Current assets 508 362 300 Total liabilities (516) (287) (72) Net assets 569 499 518 Amount attributable to AstraZeneca 131 85 91 Goodwill 152 52 – Exchange adjustments (15) 10 (15) Carrying value of investments in associates and joint ventures 268 147 76 Joint contractual arrangements were entered into between AstraZeneca and Daiichi Sankyo; in March 2019 for the co-development and co-commercialisation of Enhertu and in July 2020 for the co-development and co-commercialisation of Datroway. Each party shares global pre-tax net income from the collaboration on a 50:50 basis (with the exception of Japan where Daiichi Sankyo maintains exclusive rights and AstraZeneca receives a royalty). The joint operation is not structured through a separate legal entity, and it operates from AstraZeneca and Daiichi Sankyo’s respective principal places of business. Notes to the Group Financial Statements AstraZeneca Annual Report & Form 20-F Information 2024 175 Strategic Report Corporate Governance Financial Statements Additional Information |
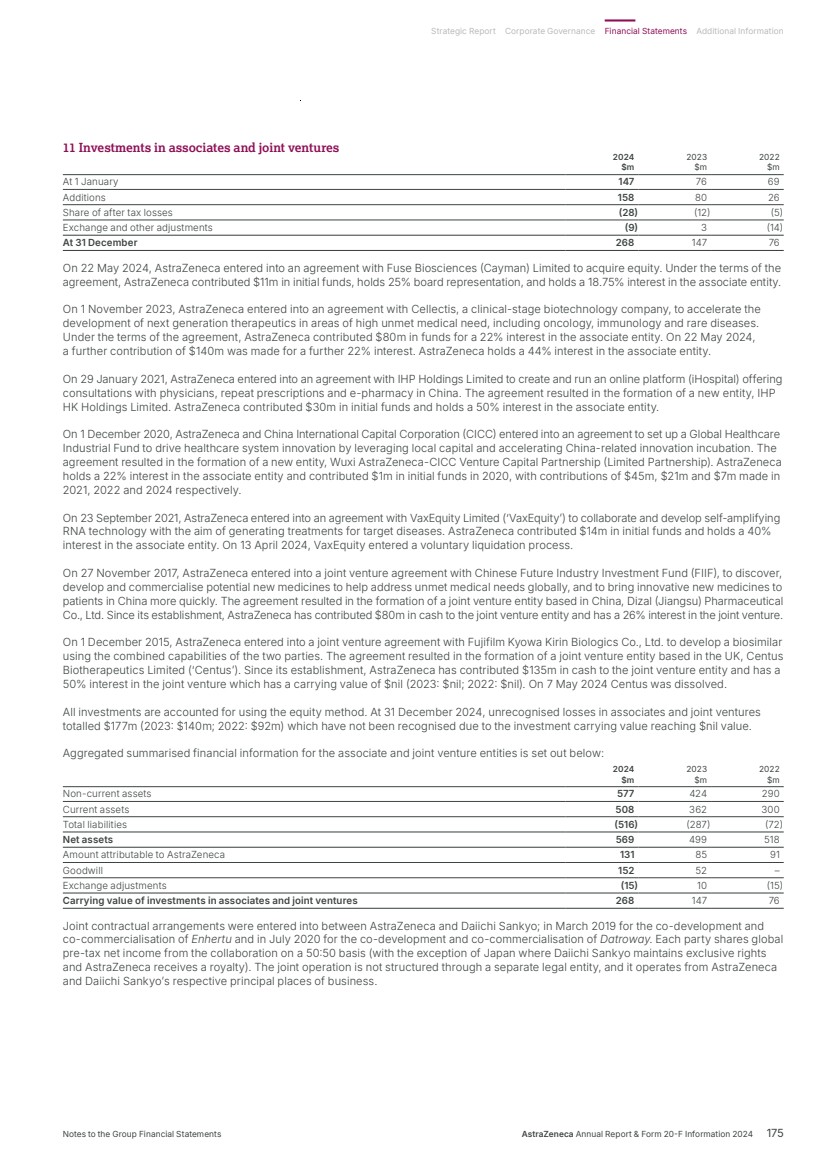
| 12 Other investments 2024 2023 2022 $m $m $m Non-current investments Equity securities at fair value through Other comprehensive income 1,632 1,530 1,056 Fixed income securities at fair value through profit or loss – – 10 Total 1,632 1,530 1,066 Current investments Fixed income securities at fair value through profit or loss 37 20 13 Cash collateral pledged to counterparties 129 102 162 Fixed deposits – – 64 Total 166 122 239 Other investments held at FVOCI include equity securities which are not held for trading and which the Group has irrevocably elected at initial recognition to recognise in this category. Other investments held at FVPL mainly comprise fixed income securities that the Group holds to sell. The fair value of listed investments is based on year end quoted market prices. Fixed deposits and Cash collateral pledged to counterparties are held at amortised cost with carrying value being a reasonable approximation of fair value given their short-term nature. Cash collateral pledged to counterparties relates to collateral pledged on derivatives entered into to hedge the Group’s risk exposures. Fair value hierarchy The table below analyses equity securities and bonds, contained within Other investments and carried at fair value, by valuation method. The different levels have been defined as follows: • Level 1: quoted prices (unadjusted) in active markets for identical assets or liabilities • Level 2: inputs other than quoted prices included within Level 1 that are observable for the asset or liability, either directly (i.e. as prices) or indirectly (i.e. derived from prices) • Level 3: inputs for the asset or liability that are not based on observable market data (unobservable inputs). 2024 2024 2023 2023 2022 2022 FVPL FVOCI FVPL FVOCI FVPL FVOCI $m $m $m $m $m $m Level 1 37 1,279 20 1,217 13 880 Level 2 – – – – – – Level 3 – 353 – 313 10 176 Total 37 1,632 20 1,530 23 1,056 Assets are transferred in or out of each Level on the date of the event or change in circumstances that caused the transfer. Equity securities that are analysed at Level 3 include investments in private biotech companies. In the absence of specific market data, these unlisted investments are held at fair value based on the cost of investment and adjusting as necessary for impairments and revaluations on new funding rounds, which approximates to fair value. Movements in Level 3 investments are detailed below: 2024 2024 2023 2023 2022 2022 FVPL FVOCI FVPL FVOCI FVPL FVOCI $m $m $m $m $m $m At 1 January – 313 10 176 – 104 Additions – 56 – 127 10 32 Revaluations – (9) 3 14 – 50 Net transfers out from Level 3 to Level 1 – – – – – (4) Disposals – – (13) (8) – (5) Impairments and exchange adjustments – (7) – 4 – (1) At 31 December – 353 – 313 10 176 Notes to the Group Financial Statements continued 176 AstraZeneca Annual Report & Form 20-F Information 2024 Financial Statements |
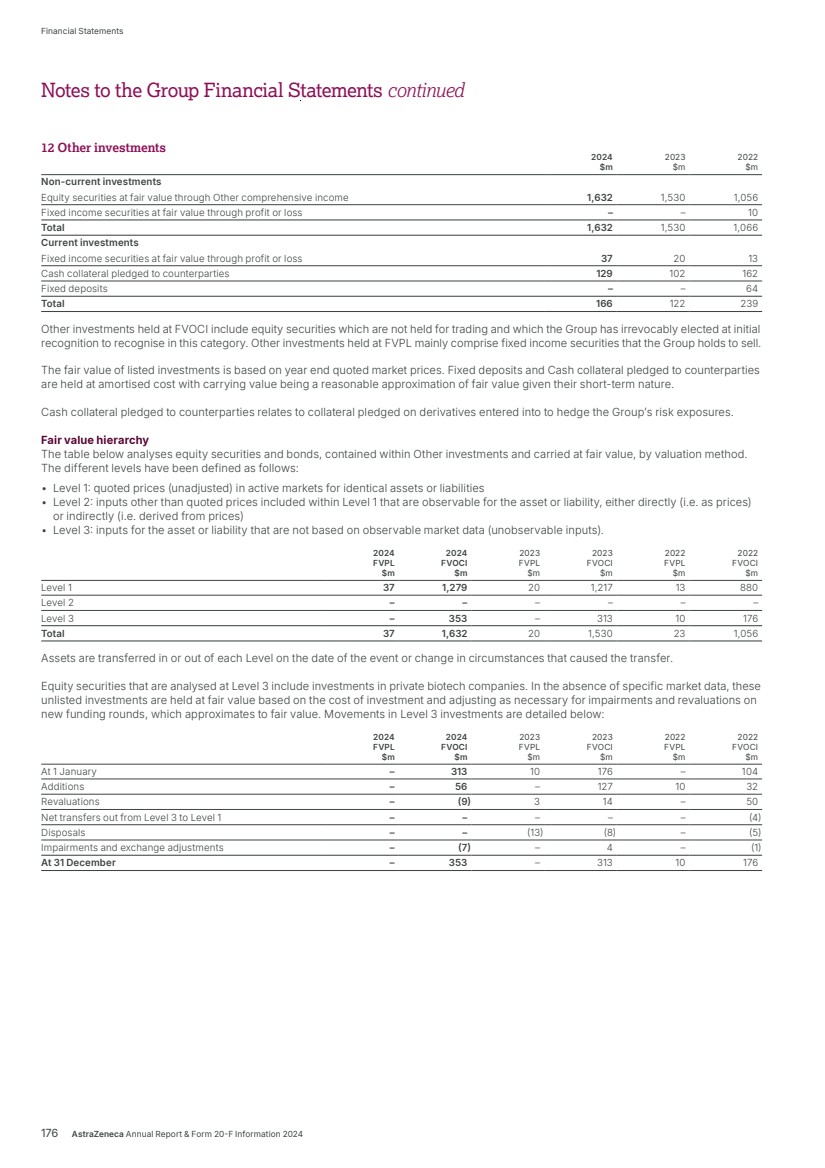
| 13 Derivative financial instruments Non-current Current Current Non-current assets assets liabilities liabilities Total $m $m $m $m $m Interest rate swaps related to instruments designated at fair value through profit or loss1 – 1 – – 1 Cross-currency swaps designated in a net investment hedge 55 – – (4) 51 Cross-currency swaps designated in a cash flow hedge – – – (160) (160) Forward FX designated in a cash flow hedge2 – 1 (13) – (12) Other derivatives 19 85 (80) – 24 31 December 2022 74 87 (93) (164) (96) Non-current Current Current Non-current assets assets liabilities liabilities Total $m $m $m $m $m Cross-currency swaps designated in a net investment hedge 100 – – (1) 99 Cross-currency swaps designated in a cash flow hedge 116 – (30) (37) 49 Forward FX designated in a cash flow hedge2 – 19 (4) – 15 Other derivatives 12 97 (122) – (13) 31 December 2023 228 116 (156) (38) 150 Non-current Current Current Non-current assets assets liabilities liabilities Total $m $m $m $m $m Cross-currency swaps designated in a net investment hedge 148 – – – 148 Cross-currency swaps designated in a cash flow hedge 34 – – (71) (37) Cross-currency swaps designated in a fair value hedge – – – (44) (44) Forward FX designated in a cash flow hedge2 – 5 (1) – 4 Other derivatives – 49 (49) – – 31 December 2024 182 54 (50) (115) 71 1 Interest rate swaps related to instruments designated at fair value through profit or loss matured in 2023. 2 Forward FX designated in a cash flow hedge relates to contracts hedging anticipated CNY, EUR, GBP, JPY and SEK transactions occurring in the quarter immediately after the balance sheet date. All derivatives are held at fair value and fall within Level 2 of the fair value hierarchy as defined in Note 12, except for an equity warrant which falls within Level 3 (valued at $nil (2023: $12m; 2022: $19m), held within Non-current assets). None of the derivatives have been reclassified in the year. The equity warrant expired on 31 December 2024. Its value at that date was recorded as zero. The fair value of interest rate swaps and cross-currency swaps is estimated using appropriate zero coupon curve valuation techniques to discount future contractual cash flows based on rates at the current year end. The fair value of forward foreign exchange contracts and currency options are estimated by cash flow accounting models using appropriate yield curves based on market forward foreign exchange rates at the year end. The majority of forward foreign exchange contracts for existing transactions had maturities of less than one month from year end. The interest rates used to discount future cash flows for fair value adjustments, where applicable, are based on market swap curves at the reporting date, and were as follows: 2024 2023 2022 Derivatives 0.6% to 4.1% 0.1% to 5.3% 0.1% to 4.7% 14 Non-current other receivables 2024 2023 2022 $m $m $m Prepayments 356 274 243 Accrued income 60 52 44 Retirement benefit scheme surpluses (Note 22) 99 92 90 Other receivables 415 385 458 Non-current other receivables 930 803 835 Other receivables include $nil (2023: $51m; 2022: $71m) owed by FibroGen, Inc. for promotional activity in China pursuant to the roxadustat collaboration. Notes to the Group Financial Statements AstraZeneca Annual Report & Form 20-F Information 2024 177 Strategic Report Corporate Governance Financial Statements Additional Information |
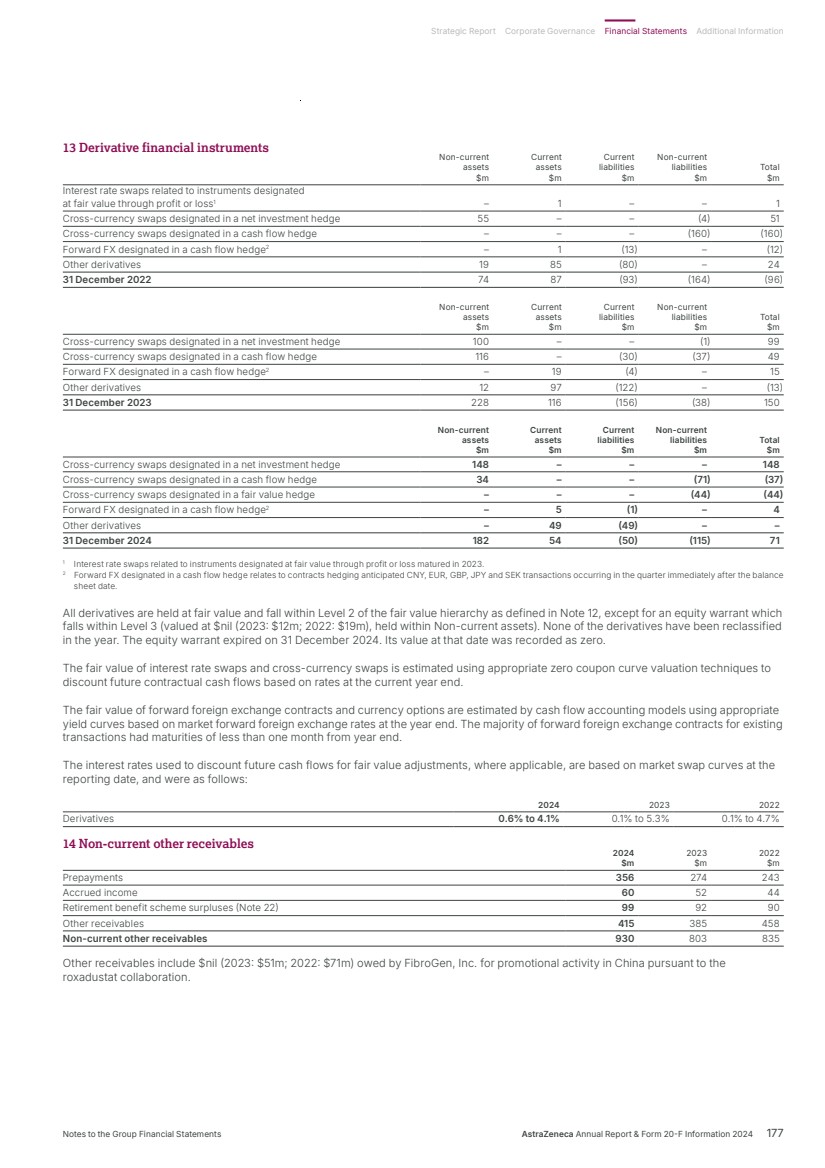
| 15 Inventories 2024 2023 2022 $m $m $m Raw materials and consumables 1,489 1,531 1,422 Inventories in process 2,282 2,325 1,864 Finished goods and goods for resale 1,517 1,568 1,413 Inventories 5,288 5,424 4,699 The Group recognised $7,001m (2023: $6,038m; 2022: $9,618m) of inventories as an expense within Cost of sales during the year. Inventory write-downs in the year amounted to $664m (2023: $574m; 2022: $479m), principally arising from the reassessment of usage or demand expectations prior to inventory expiration. Inventory write-downs in the year included $407m in relation to Andexxa following the decision to cease promotional activities. 16 Current trade and other receivables 2024 2023 2022 $m $m $m Trade receivables 8,335 8,452 7,271 Less: Expected credit loss provision (Note 28) (33) (45) (59) 8,302 8,407 7,212 Other receivables 1,579 1,639 1,659 Prepayments 1,737 1,617 1,329 Government grants receivable 25 11 25 Accrued income 1,329 452 296 Trade and other receivables 12,972 12,126 10,521 Trade receivables include $667m (2023: $1,977m; 2022: $2,470m) measured at FVOCI classified ‘hold to collect and sell’ as they are due from customers that the Group has the option to factor, or relate to bank acceptance drafts received in settlement of trade receivables per common practice in China. All other financial assets included within Current trade and other receivables are held at amortised cost with carrying value being a reasonable approximation of fair value. 17 Cash and cash equivalents 2024 2023 2022 $m $m $m Cash at bank and in hand 1,215 1,325 1,411 Short-term deposits 4,273 4,515 4,755 Cash and cash equivalents 5,488 5,840 6,166 Unsecured bank overdrafts (59) (203) (183) Cash and cash equivalents in the Consolidated Statement of Cash Flows 5,429 5,637 5,983 AstraZeneca invests in constant net asset value funds, low-volatility net asset value funds and short-term variable net asset value funds with same day access for subscription and redemption. These investments fail the ‘solely payments of principal and interest’ test criteria under IFRS 9 ‘Financial Instruments’. They are therefore measured at FVPL, although the fair value is materially the same as amortised cost. Non-cash and other movements, within operating activities in the Consolidated Statement of Cash Flows, includes: 2024 2023 2022 $m $m $m Share-based payments charge for the period 660 579 619 Settlement of share plan awards (618) (650) (592) Pension contributions (166) (188) (205) Pension charges recorded in operating profit 86 55 101 Long-term provision charges recorded in operating profit 106 460 87 Loss/(gain) on disposal of tangible assets 4 (41) (112) Update to the contractual relationships for Beyfortus – (729) – Foreign exchange and other1 (193) 128 (590) Total operating activities non-cash and other movements (121) (386) (692) 1 Foreign exchange and other includes, among other items, the foreign exchange of inter-company transactions, including dividends, across Group entities and the related impact from hedging those transactions. 18 Assets held for sale Assets held for sale amount to $nil (2023: $nil; 2022: $150m). In 2022, Assets held for sale comprised Property, plant and equipment assets relating to the West Chester site in Ohio, US. The transaction closed on 30 January 2023. Notes to the Group Financial Statements continued 178 AstraZeneca Annual Report & Form 20-F Information 2024 Financial Statements |
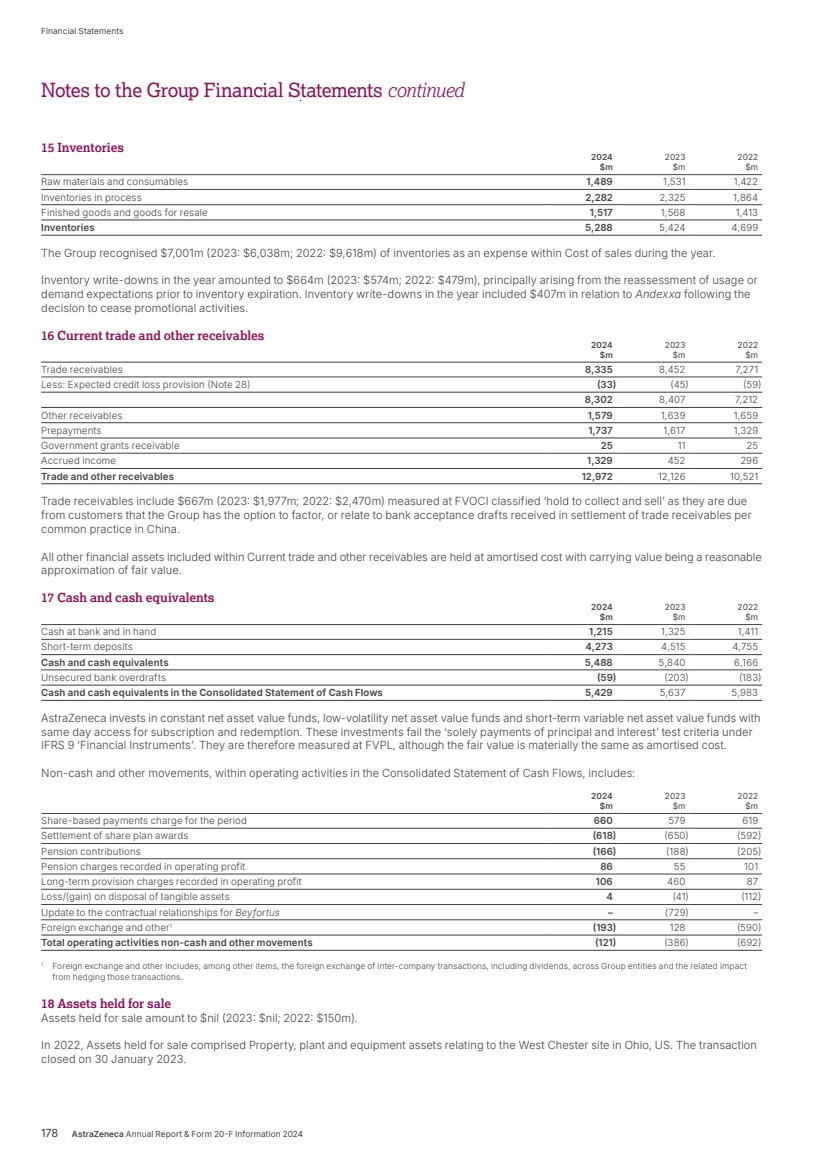
| 19 Interest-bearing loans and borrowings Repayment 2024 2023 2022 dates $m $m $m Current liabilities Bank overdrafts On demand 59 203 183 Other short-term borrowings excluding overdrafts 90 97 78 Collateral received from derivative counterparties 181 215 89 Lease liabilities 339 271 228 0.3% Callable bond US dollars 2023 – – 1,399 2023 Floating bank loan US dollars 2023 – – 2,000 Floating rate notes US dollars 2023 – – 400 3.5% Callable bond US dollars 2023 – – 849 7% Guaranteed debentures US dollars 2023 – – 294 0.75% Callable bond euros 2024 – 995 – 0.7% Callable bond US dollars 2024 – 1,600 – 2024 Floating rate bank loans US dollars 2024 – 2,000 – 3.375% Callable bond US dollars 2025 1,997 – – Other loans Within one year 10 19 22 Total 2,676 5,400 5,542 Non-current liabilities Lease liabilities 1,113 857 725 0.75% Callable bond euros 2024 – – 957 0.7% Callable bond US dollars 2024 – – 1,598 2024 Floating bank loans US dollars 2024 – – 1,998 3.375% Callable bond US dollars 2025 – 1,994 1,992 0.7% Callable bond US dollars 2026 1,198 1,196 1,195 1.2% Callable bond US dollars 2026 1,249 1,248 1,246 4.8% Callable bond US dollars 2027 1,247 – – 3.625% Callable bond euros 2027 780 829 – 3.125% Callable bond US dollars 2027 748 747 746 4.875% Callable bond US dollars 2028 1,096 1,095 – 1.25% Callable bond euros 2028 829 879 845 1.75% Callable bond US dollars 2028 1,247 1,246 1,245 4% Callable bond US dollars 2029 996 995 995 4.85% Callable bond US dollars 2029 1,246 – – 0.375% Callable bond euros 2029 829 881 846 4.9% Callable bond US dollars 2030 646 645 – 3.121% Callable bond euros 2030 682 – – 1.375% Callable bond US dollars 2030 1,295 1,294 1,293 4.9% Callable bond US dollars 2031 994 – – 2.25% Callable bond US dollars 2031 747 747 747 5.75% Non-callable bond pound sterling 2031 438 444 420 3.75% Callable bond euros 2032 778 827 – 4.875% Callable bond US dollars 2033 497 497 – 3.278% Callable bond euros 2033 786 – – 5% Callable bond US dollars 2034 1,489 – – 6.45% Callable bond US dollars 2037 2,727 2,725 2,724 4% Callable bond US dollars 2042 989 989 988 4.375% Callable bond US dollars 2045 982 981 981 4.375% Callable bond US dollars 2048 738 738 737 2.125% Callable bond US dollars 2050 487 487 487 3% Callable bond US dollars 2051 735 735 735 Other loans US dollars 31 146 190 Total 27,619 23,222 23,690 Total interest-bearing loans and borrowings1 30,295 28,622 29,232 1 All loans and borrowings above are unsecured. In previous years, there were current (2023: $nil; 2022: $22m) and non-current (2023: $nil; 2022: $181m) secured loans, both included within Other loans. Notes to the Group Financial Statements AstraZeneca Annual Report & Form 20-F Information 2024 179 Strategic Report Corporate Governance Financial Statements Additional Information |
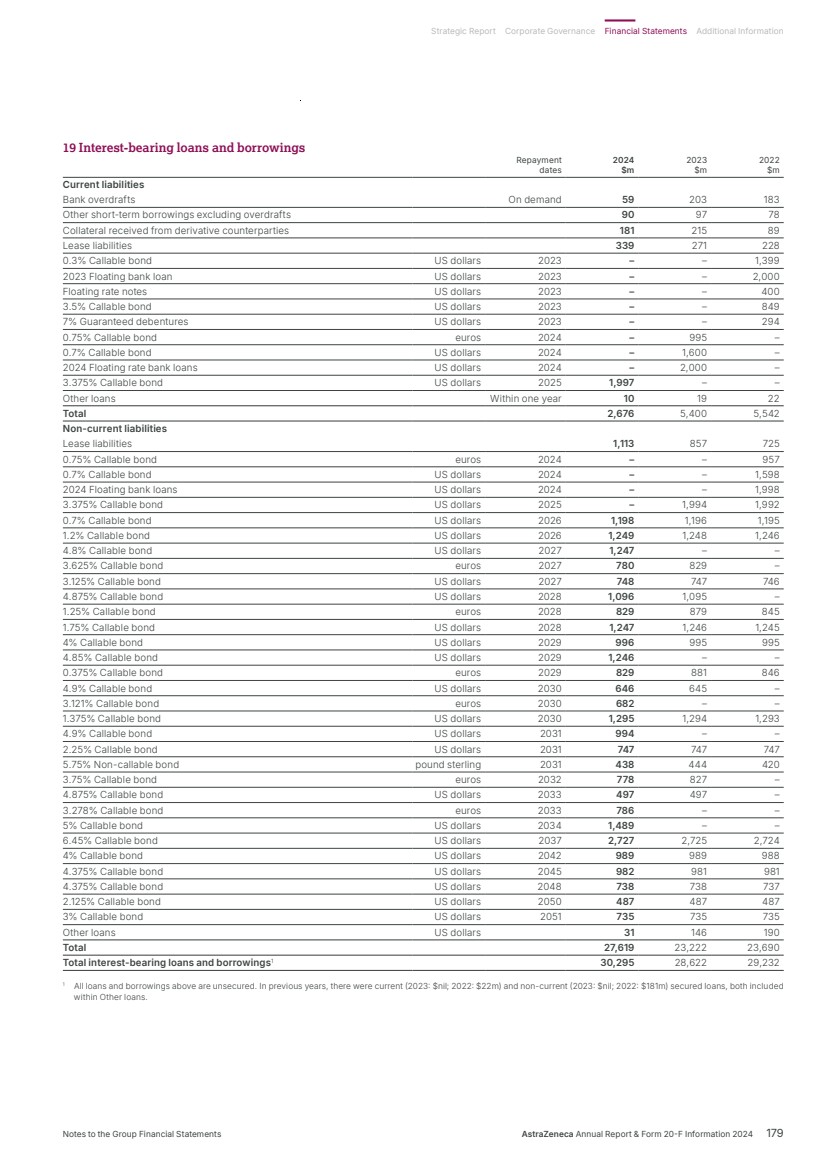
| Total Total Total loans and loans and loans and borrowings borrowings borrowings 2024 2023 2022 $m $m $m At 1 January 28,622 29,232 30,781 Changes from financing cash flows Issue of loans and borrowings 6,492 3,816 – Repayment of loans and borrowings (4,652) (4,942) (1,271) Movement in short-term borrowings (31) 161 74 Repayment of obligations under leases (316) (268) (244) Total changes in cash flows arising on financing activities from borrowings 1,493 (1,233) (1,441) Movement in overdrafts (144) 20 (85) New lease liabilities 710 444 253 Additions through business combinations 12 – 5 Exchange (361) 187 (287) Other movements (37) (28) 6 At 31 December 30,295 28,622 29,232 Also included within Cash flows from financing activities within the Consolidated Statement of Cash Flows is a $833m cash outflow (2023: $867m; 2022: $920m) related to the Acerta Pharma share purchase liability which has a closing liability at 31 December 2024 of $nil (2023: $833m; 2022: $1,646m) within Trade and other payables (see Note 20). Set out below is a comparison by category of carrying values and fair values of all the Group’s interest-bearing loans and borrowings: Instruments Instruments Instruments Total designated designated in designated in Amortised carrying Fair at fair value1 cash flow hedge2 fair value hedge3 cost value value $m $m $m $m $m $m 2022 Overdrafts – – – 183 183 183 Lease liabilities due within one year – – – 228 228 228 Lease liabilities due after more than one year – – – 725 725 725 Loans and borrowings due within one year 294 – – 4,837 5,131 5,105 Loans and borrowings due after more than one year – 1,802 – 21,163 22,965 21,657 Total at 31 December 2022 294 1,802 – 27,136 29,232 27,898 2023 Overdrafts – – – 203 203 203 Lease liabilities due within one year – – – 271 271 271 Lease liabilities due after more than one year – – – 857 857 857 Loans and borrowings due within one year – 995 – 3,931 4,926 4,887 Loans and borrowings due after more than one year – 2,535 – 19,830 22,365 21,769 Total at 31 December 2023 – 3,530 – 25,092 28,622 27,987 2024 Overdrafts – – – 59 59 59 Lease liabilities due within one year – – – 339 339 339 Lease liabilities due after more than one year – – – 1,113 1,113 1,113 Loans and borrowings due within one year – – – 2,278 2,278 2,263 Loans and borrowings due after more than one year – 2,387 1,468 22,651 26,506 25,405 Total at 31 December 2024³ – 2,387 1,468 26,440 30,295 29,179 1 Instruments designated at FVPL include the US dollar 7% guaranteed debentures which matured on 15 November 2023. 2 Instruments designated in cash flow hedges are our euro 900m 0.75% 2024 Callable bond which matured in 2024, our euro 750m 3.625% 2027 Callable bond, our euro 800m 1.25% 2028 Callable bond, and our euro 750m 3.75% 2032 Callable bond. 3 Instruments designated in fair value hedges are our euro 650m 3.121% 2030 Callable bond, and our euro 750m 3.278% 2033 Callable bond. The fair value of fixed-rate publicly traded debt is based on year end quoted market prices; the fair value of floating rate debt is nominal value, as mark-to-market differences would be minimal given the frequency of resets. The carrying value of loans designated at FVPL is the fair value; this falls within the Level 1 valuation method as defined in Note 12. For loans designated in a fair value hedge relationship, carrying value is initially measured at fair value and remeasured for fair value changes in respect of the hedged risk at each reporting date. All other loans are held at amortised cost. Fair values, as disclosed in the table above, are all determined using the Level 1 valuation method as defined in Note 12, with the exception of overdrafts and lease liabilities, where fair value approximates to carrying values. Notes to the Group Financial Statements continued 19 Interest-bearing loans and borrowings continued 180 AstraZeneca Annual Report & Form 20-F Information 2024 Financial Statements |
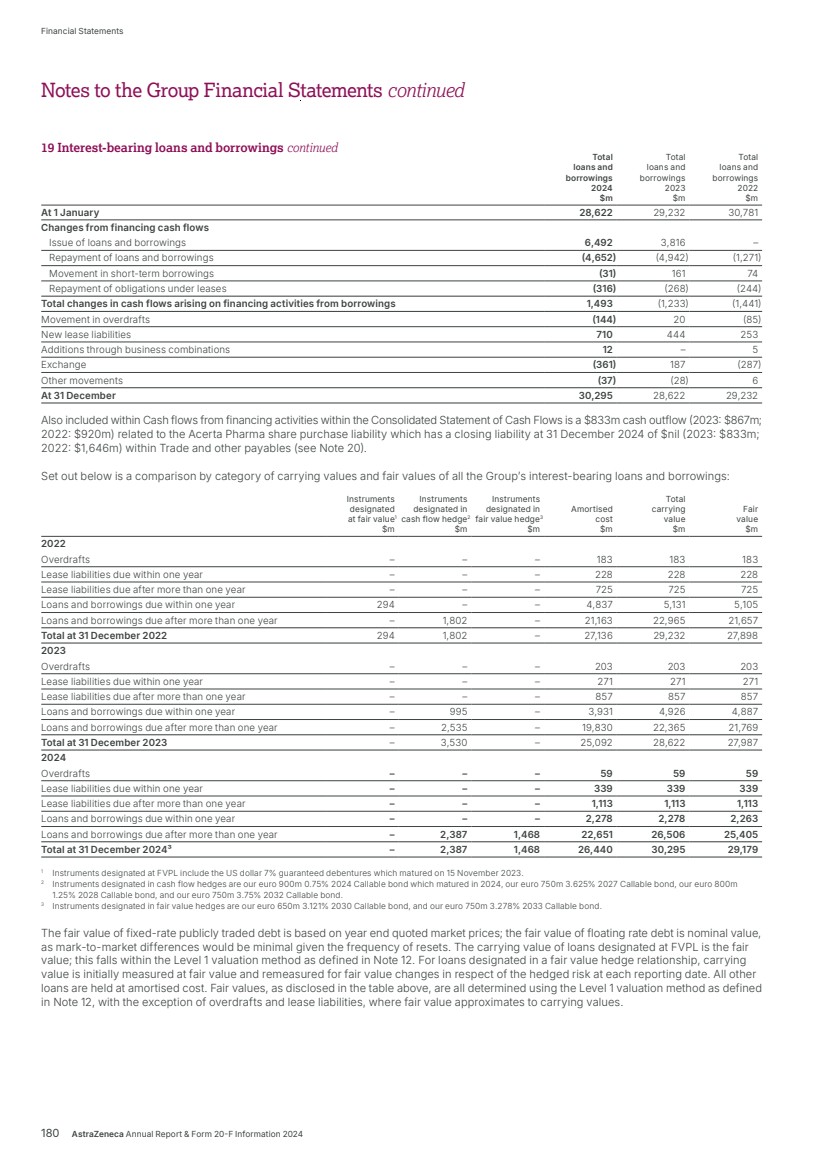
| The cumulative adjustment to the carrying value of bonds designated in a fair value hedge relationship in the year was an increase in the liability of $16m. A loss of $2m was made during the year on the fair value of bonds designated in a fair value hedge, due to increased credit risk. Under IFRS 9 ‘Financial Instruments’, the Group records the component of fair value changes relating to the component of own credit risk through Other comprehensive income. Changes in credit risk had no material effect on any other financial assets and liabilities recognised at fair value in the Group Financial Statements. The change in fair value attributable to changes in credit risk is calculated as the change in fair value not attributable to market risk. The interest rates used to discount future cash flows for fair value adjustments, where applicable, are based on market swap curves at the reporting date, and were as follows: 2024 2023 2022 Loans and borrowings 2.0% to 2.9% n/a to n/a1 4.3% to 4.9% 1 All bonds designated as FVPL in 2023 matured prior to the reporting date. 20 Trade and other payables 2024 2023 2022 $m $m $m Current liabilities Trade payables 3,640 3,267 2,550 Value-added and payroll taxes and social security 401 492 468 Rebates, chargebacks, returns and other revenue accruals 7,805 7,817 6,078 Clinical trial accruals 1,419 1,424 1,417 Other accruals 6,463 6,112 5,551 Collaboration Revenue contract liabilities 7 7 12 Vaccine contract liabilities 119 142 169 Deferred government grant income – – 1 Contingent consideration 1,170 966 757 Acerta Pharma share purchase liability – 833 867 Other payables 1,441 1,314 1,170 Total 22,465 22,374 19,040 Non-current liabilities Accruals 65 36 37 Collaboration Revenue contract liabilities – 7 14 Contingent consideration 581 1,171 1,465 Acerta Pharma share purchase liability – – 779 Other payables 1,124 1,446 1,975 Total 1,770 2,660 4,270 Included within Rebates, chargebacks, returns and other revenue accruals are contract liabilities of $114m (2023: $102m; 2022: $87m). The revenue recognised in the year from opening contract liabilities is $96m, comprising $89m relating to other revenue accruals and $7m Collaboration Revenue contract liabilities. The major markets with Rebates, chargebacks, returns and other revenue accruals are the US where the liability at 31 December 2024 amounted to $4,978m (2023: $5,116m; 2022: $3,961m), of which Rare Disease comprises $240m (2023: $190m; 2022: $139m), and China where the liability at 31 December 2024 amounted to $532m (2023: $567m; 2022: $579m). Trade payables includes $105m (2023: $123m; 2022: $67m) due to suppliers that have signed up to a supply chain financing programme, under which the suppliers can elect on an invoice-by-invoice basis to receive a discounted early payment from the relationship bank rather than being paid in line with the agreed payment terms. If the option is taken, the Group’s liability is assigned by the supplier to be due to the relationship bank rather than the supplier. The value of the liability payable by the Group remains unchanged. The Group assesses the arrangement against indicators to assess if debts which vendors have sold to the funder under the supplier financing scheme continue to meet the definition of trade payables or should be classified as borrowings. At 31 December 2024, the payables met the criteria of Trade payables. The supply chain financing programme operates in the US, UK, Sweden, China and Germany, and as at 31 December 2024, the programme had 458 suppliers enrolled across these countries. Vaccine contract liabilities relate to amounts received from customers, primarily government bodies, in advance of supply of product. Included within current Other payables are liabilities to Daiichi Sankyo totalling $377m (2023: $199m; 2022: $100m) resulting from the collaboration agreement in relation to Enhertu entered into in March 2019. Additionally, included within non-current Other payables are liabilities totalling $456m (2023: $774m; 2022: $1,125m) as a result of the Enhertu collaboration agreement and $462m (2023: $464m; 2022: $nil) owed to Avillion as a result of the Airsupra collaboration agreement entered into in March 2018. Notes to the Group Financial Statements AstraZeneca Annual Report & Form 20-F Information 2024 181 Strategic Report Corporate Governance Financial Statements Additional Information |
| In November 2020, Calquence received marketing approval in the EU, which removed all remaining conditionality in respect of the Acerta Pharma put and call options regarding the non-controlling interest; the option was exercised in April 2021. The payments were made in similar annual instalments in 2022 through to 2024, with the first payment of $920m made in 2022, the second payment of $867m made in 2023 and the final payment of $833m made in 2024, with a closing liability as at 31 December 2024 of $nil (2023: $833m; 2022: $1,646m). Interest arising from amortising the liability is included within Finance expense (see Note 3). The associated cash flows were disclosed as financing activities within the Consolidated Statement of Cash Flows. With the exception of Contingent consideration payables of $1,751m (2023: $2,137m; 2022: $2,222m) which are held at fair value within Level 3 of the fair value hierarchy as defined in Note 12, all other financial liabilities are held at amortised cost with carrying value being a reasonable approximation of fair value. Contingent consideration 2024 2023 2022 $m $m $m At 1 January 2,137 2,222 2,865 Additions through business combinations 198 60 – Settlements (1,008) (826) (772) Disposals – – (121) Revaluations 311 549 82 Discount unwind (Note 3) 113 132 168 At 31 December 1,751 2,137 2,222 Contingent consideration arising from business combinations is fair valued using decision-tree analysis, with key inputs including the probability of success, consideration of potential delays and the expected levels of future revenues. Revaluations of Contingent consideration are recognised in Selling, general and administrative expense and include an increase of $260m in 2024 (2023: $520m; 2022: $182m) based on revised milestone probabilities, and revenue and royalty forecasts, relating to the acquisition of BMS’s share of the Global Diabetes Alliance. Discount unwind on the liability is included within Finance expense (see Note 3). The discount rate used for the Contingent consideration balances range from 5% to 8%. The most significant Contingent consideration balance is the Global Diabetes Alliance which is discounted at 8% and is reviewed against comparable benchmarks on a regular basis. Management has identified that reasonably possible changes in certain key assumptions, including the likelihood of achieving successful trial results, obtaining regulatory approval, the projected market share of the therapy area and expected pricing for launched products, may cause the calculated fair value of the above contingent consideration to vary materially in future years. The contingent consideration balance relating to BMS’s share of Global Diabetes Alliance of $1,309m (2023: $1,945m; 2022: $2,124m) would increase/decrease by $131m with an increase/decrease in sales of 10% as compared with the current estimates. The maximum development and sales milestones payable under outstanding Contingent consideration arrangements arising on business combinations are as follows: Nature of Maximum future milestones Acquisitions Year contingent consideration $m Spirogen 2013 Milestones 171 Amplimmune, Inc. 2013 Milestones 150 Almirall 2014 Milestones and royalties 345 Neogene 2023 Milestones 110 Fusion 2024 Milestones 304 Gracell 2024 Milestones 149 The amount of royalties payable under the arrangements is inherently uncertain and difficult to predict, given the direct link to future sales and the range of outcomes. The maximum amount of royalties payable in each year is with reference to net sales. Notes to the Group Financial Statements continued 20 Trade and other payables continued 182 AstraZeneca Annual Report & Form 20-F Information 2024 Financial Statements |
| 21 Provisions Employee Other Severance Environmental benefits Legal provisions Total $m $m $m $m $m $m At 1 January 2022 212 90 195 239 988 1,724 Charge for year 227 61 1 830 365 1,484 Cash paid (223) (19) (41) (814) (185) (1,282) Reversals (43) – (27) (94) (98) (262) Exchange and other movements (8) (1) 15 – (52) (46) At 31 December 2022 165 131 143 161 1,018 1,618 Charge for year 123 21 22 1,102 245 1,513 Cash paid (87) (41) (14) (219) (404) (765) Reversals (28) (3) (3) (23) (143) (200) Exchange and other movements 3 4 20 (5) (33) (11) At 31 December 2023 176 112 168 1,016 683 2,155 Additions arising on business acquisitions – – – – 50 50 Charge for year 283 26 30 44 478 861 Cash paid (101) (33) (7) (189) (146) (476) Reversals (83) – (1) (9) (255) (348) Exchange and other movements – – (24) (3) (25) (52) At 31 December 2024 275 105 166 859 785 2,190 2024 2023 2022 $m $m $m Due within one year 1,269 1,028 722 Due after more than one year 921 1,127 896 Total 2,190 2,155 1,618 Provisions are often subject to substantial uncertainties with regard to the timing and final amounts of any payments. Once established, these amounts remain in Provisions even after settlement is reached and uncertainty resolved, with no transfer to Trade and other payables prior to payment. This is to provide more transparent disclosure of subsequent movements in brought forward and carried forward balances. Settled legal claims included within Provisions are held at amortised cost with carrying value being a reasonable approximation of fair value. Severance provisions arise predominantly in connection with global restructuring initiatives, including the PAAGR, which involve rationalisation of the global supply chain, the sales and marketing organisation, IT and business support infrastructure, and R&D. In conjunction with the acquisition of Alexion in 2021, the enlarged Group initiated the PAAGR; a global restructuring programme, aimed at integrating systems, structure and processes, optimising the global footprint and prioritising resource allocations and investments. The Group has also continued to progress other legacy restructuring programmes. Employee costs in connection with the initiatives are recognised in severance provisions when a detailed formal plan has been communicated to those employees affected. Final severance costs are often subject to the completion of the requisite consultations on the areas impacted, with the majority of the cost expected to be paid within one year. AstraZeneca endeavours to support employees affected by restructuring initiatives to seek alternative roles within the organisation. Where the employee is successful, any severance provisions will be released. Details of the Environmental provisions totalling $105m (2023: $112m; 2022: $131m) and ongoing matters are provided in Note 30. These uncertainties can also cause reversal in previously established provisions once final settlement is reached. Legal issues are often subject to substantial uncertainties with regard to the timing and final amounts of any payments. A significant proportion of the total legal provision ($626m (2023: $616m; 2022: $30m) due within one year and $210m (2023: $372m; 2022: $92m) due after more than one year1 ) relates to matters settled, but not paid, in previous periods; further details are provided in Note 30. The majority of Employee benefit provisions relate to Executive Deferred Compensation Plans, which include uncertainty over the ultimate timing and amount of payment to be made to the executives. Other provisions comprise amounts relating to specific contractual or constructive obligations and disputes. Included within Other provisions are amounts associated with long-standing product liability settlements that arose prior to the merger of Astra and Zeneca, which given the nature of the provision, the amounts are expected to be settled over many years; the final settlement values and timings are uncertain. Also included in Other provisions is an amount of $145m (2023: $163m; 2022: $165m), in relation to third-party liability and other risks (including incurred but not yet reported claims); the claims are considered to be uncertain as to timing and amount. Charges to Other provisions in 2024 included $184m (2023: $87m; 2022: $12m) in relation to the PAAGR restructuring programme, which has a closing provision of $80m (2023: $49m; 2022: $143m), including $58m (2023: $8m; 2022: $95m) held in non-current provisions expected to be settled over time by 2028. In 2022, charges to Other provisions included $301m in relation to termination fees and onerous contracts with contract manufacturing organisations, the vast majority of which were settled in 2023. No provision has been released or applied for any purpose other than that for which it was established. 1 The profile of future payments of legal provisions due after one year is as follows: in one to two years $167m (2023: $180m; 2022: $22m); in two to three years $9m (2023: $159m; 2022: $21m); in three to four years $12m (2023: $10m; 2022: $9m); in four to five years $9m (2023: $9m; 2022: $9m); and in more than five years $13m (2023: $14m; 2022: $31m). Notes to the Group Financial Statements AstraZeneca Annual Report & Form 20-F Information 2024 183 Strategic Report Corporate Governance Financial Statements Additional Information |
| 22 Post-retirement pension and other defined benefit schemes Background This section predominantly covers defined benefit arrangements like post-retirement pension and medical plans which make up the vast bulk of these liabilities. However, it also incorporates other benefits which fall under IAS 19 ‘Employee Benefits’ rules and which require an actuarial valuation, including but not limited to: lump sum plans, long-service awards and defined contribution pension plans which have some defined benefit characteristics (e.g. a minimum guaranteed level of benefit). In total, over 50 plans in 28 countries are covered. The Group and most of its subsidiaries offer post-retirement pension plans which cover the majority of employees. The Group’s policy is to provide defined contribution (DC) orientated pension provision to its employees unless otherwise compelled by local regulation. As a result, many of these retirement plans are DC, where the Group contribution and resulting charge is fixed at a set level, or is a set percentage of employees’ pay. However, several plans, mainly in the UK and Sweden, are defined benefit (DB), where benefits are based on employees’ length of service and salary. The major DB plans are largely legacy arrangements as they have been closed to new entrants since 2000, apart from the collectively bargained Swedish plan (which is still open to employees born before 1979). During 2010, following consultation with its UK employees’ representatives, the Group introduced a freeze on pensionable pay at 30 June 2010 levels for DB members of the UK Pension Fund. The number of active members in the Fund continues to decline and is now 351 employees. The Group’s DB plans are largely funded through ringfenced, fiduciary-administered assets. The cash funding of the plans, which may from time to time involve payments from the Group, is designed, in consultation with independent qualified actuaries, to ensure that the assets are sufficient to meet future obligations as and when they fall due. The funding level is monitored by the Group and local fiduciaries, who may take into account various factors, including: the strength of the Group’s covenant, local regulation, cash flows, and the solvency and maturity of the pension plan. Funding Framework Eighty six per cent of the Group’s total DB obligations (or 62% of net obligations) at 31 December 2024 are in plans within the UK and Sweden. The Group has developed a long-term funding framework for such plans which targets either full funding on a low-risk funding measure, or buyout with an external third-party as the pension plans mature, with pragmatic long-term de-risking of investment strategy along the way. Unless local regulation dictates otherwise, this framework determines the cash contributions payable. UK The UK Pension Fund represents approximately 65% of the Group’s DB obligations at 31 December 2024. The funding framework is modified in light of the UK regulatory requirements (summarised below) and resulting discussions with the Trustee. Role of Trustee and Regulation The UK Pension Fund is governed and administered by a corporate Trustee. The Trustee Directors are comprised of representatives appointed by both the employer and Fund members and include an independent professional Trustee Director. The Trustee Directors are required by law to act in the interest of all relevant beneficiaries and are responsible in particular, for investment strategy and the day-to-day administration of the benefits. They are also responsible for jointly agreeing with the employer the level of contributions required to ensure the funding objective is met. The UK pensions industry is regulated by The Pensions Regulator whose statutory objectives and regulatory powers are described on its website, www.thepensionsregulator.gov.uk. The Pension Scheme Act 2021 became effective in the UK from 1 October 2021. A section of this Act places additional legal requirements on companies who sponsor UK defined benefit pension schemes, to monitor and assess corporate activity, with a focus on the potential impact of such activity on the ongoing security of these benefits. The Group maintains a framework to ensure it meets its responsibilities under the Act. There have been two UK High Court Rulings relating to Guaranteed Minimum Pensions (GMP) equalisation in 2018 and 2020. Following the publication of guidance around implementation in 2021, the Trustee, with input from the Group, has completed the equalisation of benefits for pensioner members, and a process is in place to equalise non-pensioner members’ benefits at the point of retirement. Further details are set out later in this Note. An estimate of the impact of these changes has already been recognised in 2018 and 2020, and actual experience is in line with the estimates previously recognised. In June 2023, the UK High Court (Virgin Media Limited v NTL Pension Trustees II Limited) ruled that certain historical amendments for contracted-out defined benefit pension plans were invalid if they were not accompanied by the correct actuarial confirmation. Whilst the Court of Appeal upheld this ruling in July 2024, there remains material uncertainty in relation to the legal position itself and in particular, the application of the ruling. The Group has discussed the ruling with the Trustee and its potential implications for the UK Pension Fund. The Trustee has considered this matter with their legal adviser. Whilst the Trustee has not conducted any detailed investigations at this point, we note their position that they have no reason to believe that any such confirmations were not provided, in which case the ruling will have no impact on the UK Pension Fund. The Trustee is monitoring developments as further government guidance and/or case law emerges and the Group will maintain a dialogue on this matter. Funding requirements and security UK legislation requires that an actuarial valuation is completed for all DB pension schemes every three years, which compares the schemes’ liabilities to its assets. As part of the triennial valuation process, the Trustee and the Group must agree on a set of assumptions to value the liabilities and determine the contributions required, if any, to ensure the UK Pension Fund is fully funded over an appropriate time period and on a suitably prudent measure. The assumptions used to value the liabilities for the triennial actuarial valuation are required to be prudent, whereas the assumptions used to prepare an IAS 19 accounting valuation are required to be ‘best estimate’. Notes to the Group Financial Statements continued 184 AstraZeneca Annual Report & Form 20-F Information 2024 Financial Statements |
| The last full actuarial valuation of the UK Pension Fund was carried out by a qualified actuary as at 31 March 2022 and finalised in May 2023, ahead of the statutory deadline. The funding assumptions used in this actuarial valuation were set out in the Group’s prior year report. The next actuarial valuation is due to take place as at 31 March 2025, with a likely timescale for completion in early to mid-2026. The Group is aware that this actuarial valuation will fall under the Pensions Regulator’s new defined benefit funding code of practice. Aspects of the triennial actuarial valuation are governed by a long-term funding agreement, effective since October 2016, which sets out a path to full funding on a low-risk measure. Under this agreement, if a deficit exists, the Group is required to provide security. This security takes the form of a charge in favour of the Trustee over all land and buildings on the Group’s Cambridge Biomedical Campus site. This charge was enacted in December 2023, and provides long-term security to the Trustee in respect of the Group’s future deficit recovery contributions. At the last assessment date (1 December 2023), the value of the charge was £317m ($398m) and it is capped at £350m ($440m). The value of the charge will vary and is expected to reduce over time, before falling away. Under the terms of the charge, the Trustee can only exercise its right over the ownership of the site in a Group insolvency event. In relation to deficit recovery contributions, a lump sum contribution of £39m ($49m) was made in March 2024, with a further annual contribution of £39m ($49m) due before 31 March 2025, and each year up to 31 March 2028. Based on 31 December 2024 IAS 19 assumptions, it is expected that ongoing contributions (excluding past service deficit contributions) during the year ending 31 December 2025 for the UK will be approximately $18m. GMP equalisation of member benefits has been completed. The method of equalisation converts GMP to non-GMP pension to simplify the structure and administration of benefits. As at 31 December 2024, all pensioner and dependent members have had their benefits equalised and, for non-pensioner members, a process is in place to equalise their benefits at their point of retirement. Under the governing documentation of the UK Pension Fund, any future surplus in the Fund would be returnable to the Group by refund assuming gradual settlement of the liabilities over the lifetime of the Fund. In particular, the Trustee has no unilateral right to wind up the Fund without Company consent nor does it have the power to unilaterally use any surplus to augment benefits prior to wind-up. As such, there are no adjustments required in respect of ‘IFRIC 14 IAS 19 – The Limit on a Defined Benefit Asset, Minimum Funding Requirements and their Interaction’. Sweden The Swedish plans account for 21% of the Group’s defined benefit obligations. They are governed by Fiduciary Bodies with responsibility for the investment of the assets. These plans are funded in line with the Group’s long-term funding framework and local regulations. The Swedish defined benefit pension plans were actuarially valued at 31 December 2023, when plan obligations were estimated to amount to $1,602m and plan assets were $1,068m. The local Swedish GAAP funding position can influence contribution policy. Over 2024, for the largest material pension plan, the Group did not request a reimbursement of benefit payments made throughout the year as the funding level was below 100% on the Swedish GAAP basis and so any such reimbursement is not permitted. These benefit payments over 2024, totalling approximately $50m, are therefore regarded as Group contributions. Based on 31 December 2024 IAS 19 assumptions, it is expected that contributions during the year ending 31 December 2025 for Sweden will be approximately $50m. US Following a buy out in May 2023 of the AZ Pharmaceutical LP qualified US Defined Benefit Pension Plan, all remaining US benefit plans which fall under IAS 19 are now disclosed within the ‘Rest of Group’ category, given the material reduction in aggregate obligation and to therefore ensure consistency with the Group’s classification methodology. Other defined benefit plans The Group provides defined benefit plans other than pensions which are reported under IAS 19. These include lump sum plans, long-service awards and defined contribution pension plans which have a guaranteed minimum benefit. However, the largest category of these ‘other’ non-pension plans are healthcare benefits. The cost of post-retirement benefits other than pensions for the Group in 2024 was $1m (2023: $1m; 2022: $1m). Plan assets were $146m and plan obligations were $105m at 31 December 2024. Financial assumptions Qualified independent actuaries have updated the actuarial valuations under IAS 19 for the major defined benefit plans operated by the Group to 31 December 2024. The assumptions used may not necessarily be borne out in practice, due to the inherent financial and demographic uncertainty associated with making long-term projections. These assumptions reflect the changes which have the most material impact on the results of the Group and were as follows: 2023 UK US Sweden Rest of Group1 Inflation assumption 3.1% – 1.6% 2.2% Rate of increase in salaries –3 – 3.1% 3.7% Rate of increase in pensions in payment 2.9% – 1.6% 2.2% Discount rate – defined benefit obligation 4.6% 4.7% 3.3% 3.3% Discount rate – interest cost 4.6% 4.7% 3.3% 3.3% Discount rate – service cost 4.5% n/a 3.3% 3.3% Notes to the Group Financial Statements AstraZeneca Annual Report & Form 20-F Information 2024 185 Strategic Report Corporate Governance Financial Statements Additional Information |
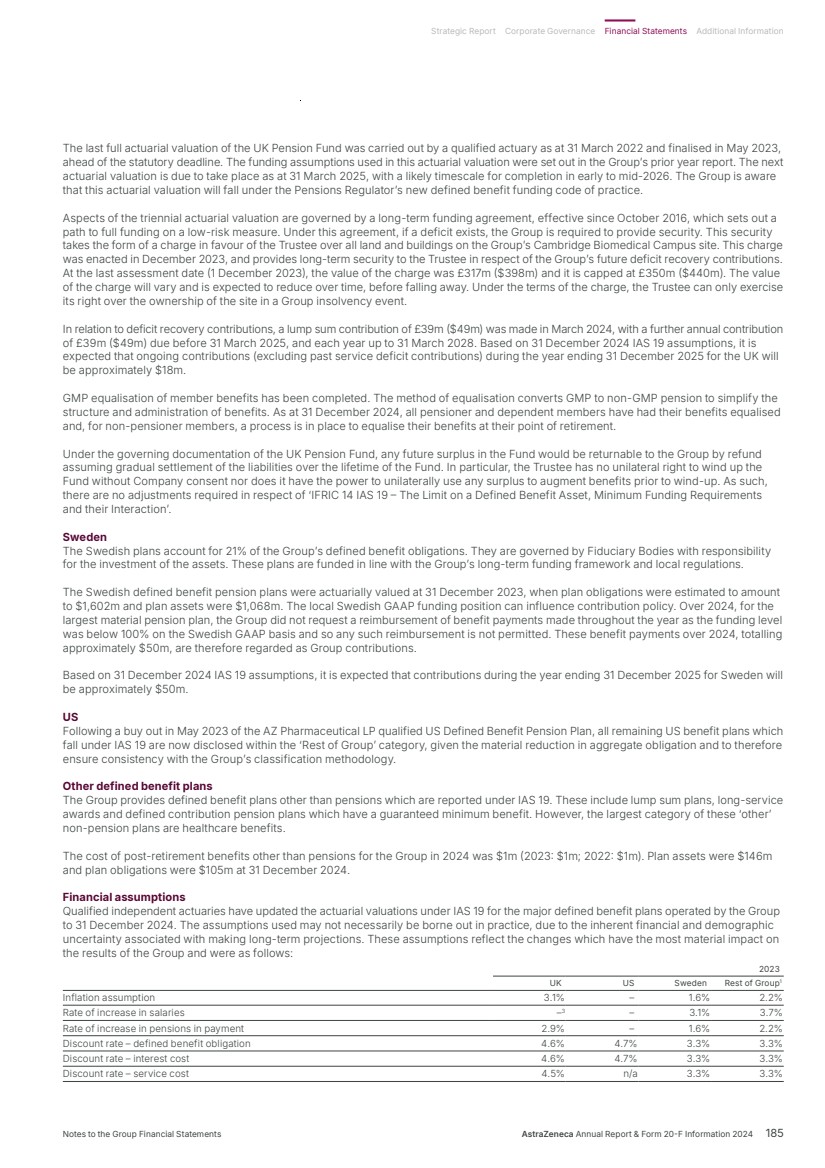
| 2024 UK Sweden Rest of Group1 Inflation assumption 3.2%2 1.8% 2.1% Rate of increase in salaries –3 3.3% 3.6% Rate of increase in pensions in payment 3.0% 1.8% 2.1% Discount rate – defined benefit obligation4 5.5% 3.5% 3.5% Discount rate – interest cost5 5.4% 3.4% 3.5% Discount rate – service cost5 5.5% 3.5% 3.5% 1 Rest of Group reflects the assumptions in Germany as these have the most material impact on the Group. 2 The UK inflation assumption includes an allowance for some UK inflation experience over 2024. 3 Pensionable pay frozen at 30 June 2010 levels following UK fund changes. 4 Group defined benefit obligation as at 31 December 2024 calculated using discount rates based on market conditions as at 31 December 2024. 5 2024 interest costs and service costs calculated using discount rates based on market conditions as at 31 December 2023. The weighted average duration of the post-retirement scheme obligations is approximately 11 years in the UK, 16 years in Sweden and 13 years for the Rest of the Group (including Germany). Demographic assumptions The mortality assumptions are based on country-specific mortality tables. These are compared to actual experience and adjusted where sufficient data are available. Additional allowance for future improvements in life expectancy is included for all major plans where there is credible data to support a continuing trend. The table below illustrates life expectancy assumptions at age 65 for male and female members retiring in 2024 and male and female members expected to retire in 2044 (2023: 2023 and 2043 respectively). Life expectancy assumption for a male member retiring at age 65 Life expectancy assumption for a female member retiring at age 65 Country 2024 2044 2023 2043 2024 2044 2023 2043 UK 22.1 23.1 22.1 23.1 23.7 24.8 23.7 24.8 Sweden 21.8 24.1 21.8 23.6 23.9 26.3 23.9 26.0 In the UK, the Group adopted the CMI Core 2023 Mortality Projections Model with an addition to initial rates of improvement of 0.5% p.a., core (7.0) smoothing parameter and a 1% long-term improvement rate. The Group has assumed that 15% of members (2023: 25%) will transfer out of the defined benefit section of the UK Pension Fund at an average age of 57. No other demographic assumptions have changed since they were updated in 2022 following the actuarial valuation. In Sweden, the Group adopted DUS23 (2023: DUS21) as the mortality base table. All other demographic assumptions are unchanged from 2023. Risks associated with the Group’s defined benefit pension plans The UK defined benefit plan accounts for 65% of the Group’s defined benefit obligations and exposes the Group to a number of risks which the Group monitors and works with the Trustee to mitigate (noting it is the Trustee who has the remit and ultimate decision making powers). The most significant of which are: Risk Description Mitigation 1 Asset pricing The Defined Benefit Obligation (DBO) is calculated using a discount rate set with reference to AA-rated corporate bond yields; asset returns that differ from the discount rate will create an element of volatility in the solvency ratio. Approximately 44% of the UK Pension Fund is exposed to growth assets, including global investments, most of which are not sterling dominated. Although these growth assets are expected to outperform AA-rated corporate bonds in the long term, they can lead to volatility and mismatching risk in the short term. The allocation to growth assets is monitored to ensure it remains appropriate given the UK Pension Fund’s long-term objectives and risk budget. The Trustee invests in a suitably diversified range of asset classes with different return drivers and investment managers. Investment strategy will evolve to further improve the expected risk/return profile as opportunities arise and funding solvency improves. The Trustee has hedged approximately 89% of unintended non-sterling, overseas currency risk within the UK Pension Fund assets. 2 Interest rate A decrease in corporate bond yields will increase the present value placed on the DBO under IAS 19. The interest rate hedge of the UK Pension Fund is predominantly implemented via holding gilts (and gilt repurchase agreements or ‘gilt repo’) of appropriate duration. This hedge protects to a large degree against falls in long-term interest rates and the UK Pension Fund is approximately 98% hedged as a percentage of assets at the end of 2024 (versus target of 100%). Nonetheless, there remain differences in the bonds and instruments held by the UK Pension Fund to hedge interest rate risk on the statutory and long-term funding basis (gilts and ‘gilt repo’) and the bonds included in the yield curve to set the DBO discount rate on an IAS 19 basis (AA corporate bonds). As such, there remains mismatching risk on an IAS 19 basis should yields on gilts diverge compared to AA corporate bonds. Notes to the Group Financial Statements continued 22 Post-retirement pension and other defined benefit schemes continued 186 AstraZeneca Annual Report & Form 20-F Information 2024 Financial Statements |
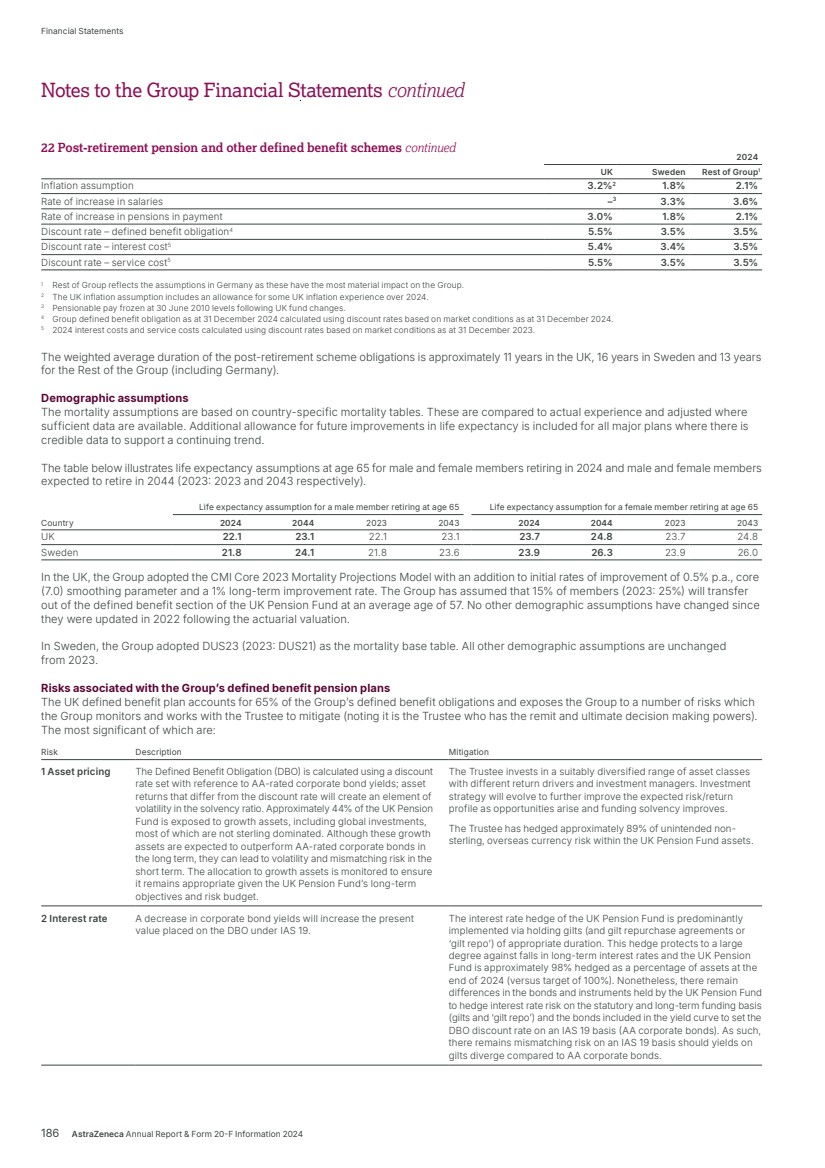
| Risk Description Mitigation 3 Inflation The majority of the DBO is indexed in line with price inflation (mainly inflation as measured by the UK Retail Price Index (RPI) but also for some members, a component of pensions is indexed by the UK Consumer Price Index (CPI)) and higher inflation will lead to higher liabilities (although, in the vast majority of cases, this is capped at an annual increase of 5%, known as Limited Price Indexation or LPI). The UK Pension Fund holds RPI index-linked gilts and ‘gilt repo’. The inflation hedge of the UK Pension Fund protects to some degree against higher-than-expected inflation increases on the DBO and is approximately 98% hedged as a percentage of assets at the end of 2024 (versus a target of 100%). 4 Longevity The majority of the UK Pension Fund’s obligations are to provide benefits for the life of the member, so increases in life expectancy will result in an increase in the liabilities. In 2013, the Trustee entered into a longevity swap to hedge against the risk of increasing life expectancy over the next circa 70 years. The swap currently covers approximately 8,000 of the UK Pension Fund’s pensioners, equivalent to $2.2bn of Pension Fund liability. A one-year increase in life expectancy would result in a $178m increase in Pension Fund obligations, which would be partially offset by a $89m increase in the value of the longevity swap and hence the pension fund assets. 5 Cash flow and liquidity The UK Pension Fund is maturing and cash flow negative. Assets are liquidated to meet benefit outgo and potentially from time to time, to supplement the collateral pool required to post margin for derivative holdings. There is a risk of the Trustee requesting liquidity support from the Group to meet margin calls or expenditure, if the liquidity position of the UK Pension Fund is not effectively monitored and managed. The Trustee invests in a diversified portfolio of highly liquid assets to manage sequencing risk and operates a collateral management policy, maintaining a minimum liquidity ‘buffer’. As at the end of 2024, the buffer is well above recommended regulatory guidelines and the minimum thresholds, and can be quickly supplemented in an orderly manner. At 31 December 2024, 8% of assets are invested in a cash-flow driven investment portfolio, consisting of investment-grade corporate bonds. The purpose of this portfolio is to generate income to help meet the Fund’s benefit outgo. The portfolio is expected to grow over time as further de-risking occurs and when attractive pricing points present. Other risks There are a number of other risks of administering the UK Pension Fund which the Trustee manages with Group input. Some of the major risks include counterparty risks from using derivatives (mitigated by using a specialist investment manager to oversee a diversified range of counterparties of high standing and ensuring positions are collateralised daily). Furthermore, there are operational risks (such as paying out the wrong benefits) and regulatory risks (such as the UK Government introducing new legislation). These are mitigated so far as possible via the governance structure in place which oversees and administers the Pension Funds. Fiduciary Boards who govern the Swedish pension plans also monitor and manage these key risks, where relevant and possible to do so, in a similar way, by investing in a diversified manner (to mitigate the first risk) and employing a framework to hedge interest rate risk where practicable (to mitigate the second risk). It is not possible to hedge inflation risk (third risk) nor longevity risk (fourth risk) due to a lack of available instruments in the local market. As the Swedish plans are less mature and have a longer investment horizon, the fifth risk is not as significant compared to the UK Pension Fund. Fiduciary boards are aware of Environmental, Social and Governance (ESG) risks as they pertain to investment policy, and where local regulation allows, have policies in place to monitor and manage such risks and comply with local legislation and disclosure requirements. Assets and obligations of defined benefit plans The assets and obligations of the defined benefit schemes operated by the Group at 31 December 2024, as calculated in accordance with IAS 19, are shown below. The fair values of the schemes’ assets are not intended to be realised in the short term and may be subject to significant change before they are realised. The present value of the schemes’ obligations is derived from cash-flow projections over long periods and is therefore inherently uncertain. Scheme assets 2023 UK US Sweden Rest of Group Total Quoted Unquoted Quoted Unquoted Quoted Unquoted Quoted Unquoted Quoted Unquoted Total $m $m $m $m $m $m $m $m $m $m $m Government bonds1 2,383 – 61 – – – 51 – 2,495 – 2,495 Corporate bonds2 373 – 94 – – – 6 – 473 – 473 Derivatives3 – (532) – – – 440 – – – (92) (92) Investment funds: Listed Equities4 – 321 – – – – 53 3 53 324 377 Investment funds: Absolute Return/ Multi Strategy4 – 1,131 – – – 461 5 8 5 1,600 1,605 Investment funds: Corporate Bonds/Credit4 – 667 – – – 165 48 – 48 832 880 Cash and cash equivalents 53 363 5 – – 2 – 3 58 368 426 Other – – – – – – (1) 316 (1) 316 315 Total fair value of scheme assets5 2,809 1,950 160 – – 1,068 162 330 3,131 3,348 6,479 Notes to the Group Financial Statements AstraZeneca Annual Report & Form 20-F Information 2024 187 Strategic Report Corporate Governance Financial Statements Additional Information |
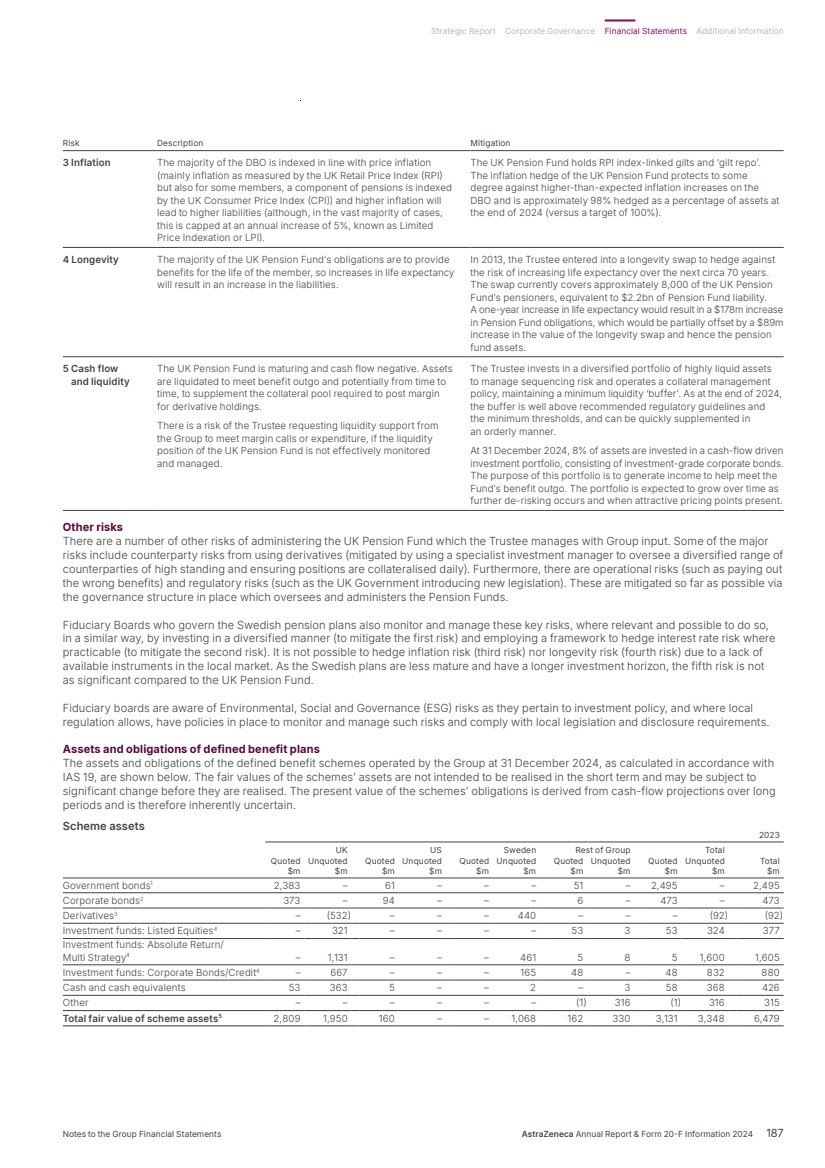
| 2024 UK Sweden Rest of Group Total Quoted Unquoted Quoted Unquoted Quoted Unquoted Quoted Unquoted Total $m $m $m $m $m $m $m $m $m Government bonds1 1,884 – – – 45 – 1,929 – 1,929 Corporate bonds2 352 – – – 6 – 358 – 358 Derivatives3 – (355) – 475 – – – 120 120 Investment funds: Listed Equities4 – 374 – – 38 23 38 397 435 Investment funds: Absolute Return/Multi Strategy4 – 1,051 – 420 5 7 5 1,478 1,483 Investment funds: Corporate Bonds/Credit4 – 601 – 159 182 19 182 779 961 Cash and cash equivalents 32 336 – 2 2 2 34 340 374 Other – – – – (6) 194 (6) 194 188 Total fair value of scheme assets5 2,268 2,007 – 1,056 272 245 2,540 3,308 5,848 1 Predominantly developed markets in nature. 2 Predominantly developed markets in nature and investment grade (AAA-BBB). 3 Includes interest rate swaps, inflation swaps, longevity swaps, equity total return swaps and other contracts. More detail is given in the section Risks associated with the Group’s defined benefit pension plans on page 186. Valuations are determined by independent third parties. 4 Investment Funds are pooled, commingled vehicles, whereby the pension plan owns units in the fund, alongside other investors. The pension plans invest in a number of Investment Funds, including Listed Equities (primarily developed markets with some emerging markets), Corporate Bonds/Credit (a range of investment-grade and non investment-grade credit) and Absolute Return/Multi Strategy (actively managed multi-asset exposure both across and within traditional and alternative asset classes). The price of the funds is set by independent administrators/custodians employed by the investment managers and based on the value of the underlying assets held in the fund. Details of pricing methodology is set out within internal control reports provided for each fund. Prices are updated daily, weekly or monthly depending upon the frequency of the fund’s dealing. 5 None of the Group’s own assets were included in the scheme assets (2023: $nil). Scheme obligations 2023 UK US Sweden Rest of Group Total $m $m $m $m $m Present value of scheme obligations in respect of: Active membership (233) (45) (553) (442) (1,273) Deferred membership (853) (2) (443) (294) (1,592) Pensioners (4,075) (107) (606) (254) (5,042) Total value of scheme obligations (5,161) (154) (1,602) (990) (7,907) 2024 UK Sweden Rest of Group Total $m $m $m $m Present value of scheme obligations in respect of: Active membership (200) (543) (481) (1,224) Deferred membership (667) (393) (197) (1,257) Pensioners (3,725) (572) (301) (4,598) Total value of scheme obligations (4,592) (1,508) (979) (7,079) Net (deficit)/surplus in the scheme 2023 UK US Sweden Rest of Group Total $m $m $m $m $m Total fair value of scheme assets 4,759 160 1,068 492 6,479 Total value of scheme obligations (5,161) (154) (1,602) (990) (7,907) (Deficit)/surplus in the scheme as recognised in the Consolidated Statement of Financial Position (402) 6 (534) (498) (1,428) Included in Non-current other receivables (Note 14) – 66 – 261 92 Included in Retirement benefit obligations (402) (60) (534) (524) (1,520) (402) 6 (534) (498) (1,428) 2024 UK Sweden Rest of Group Total $m $m $m $m Total fair value of scheme assets 4,275 1,056 517 5,848 Total value of scheme obligations (4,592) (1,508) (979) (7,079) Deficit in the scheme as recognised in the Consolidated Statement of Financial Position (317) (452) (462) (1,231) Included in Non-current other receivables (Note 14) – – 992 99 Included in Retirement benefit obligations (317) (452) (561) (1,330) (317) (452) (462) (1,231) 1 Surpluses were recognised in Ireland and Belgium. 2 Surpluses were recognised in the US, Ireland and Belgium. Notes to the Group Financial Statements continued 22 Post-retirement pension and other defined benefit schemes continued 188 AstraZeneca Annual Report & Form 20-F Information 2024 Financial Statements |
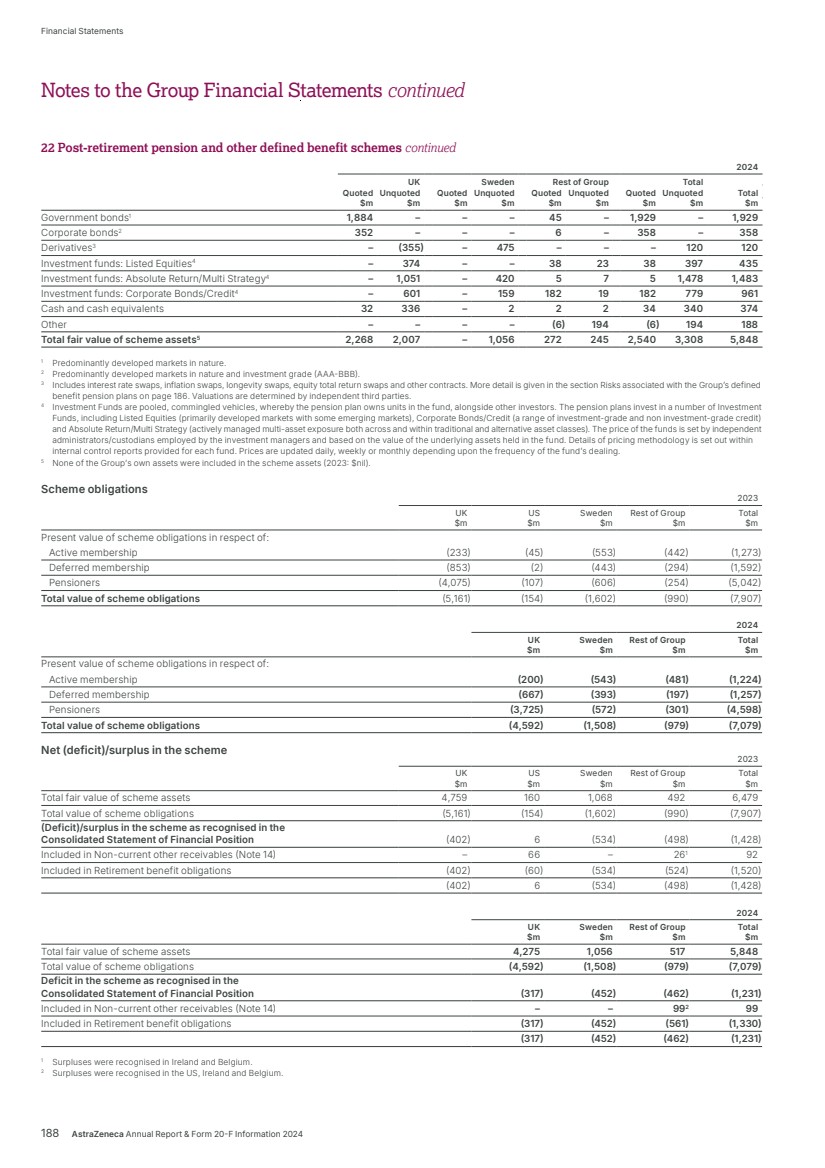
| Fair value of scheme assets 2024 2023 UK Sweden Rest of Group Total UK US Sweden Rest of Group Total $m $m $m $m $m $m $m $m $m At beginning of year 4,759 1,068 652 6,479 4,573 1,008 946 503 7,030 Interest income on scheme assets 214 33 15 262 229 22 38 11 300 Expenses (5) – – (5) (9) (1) – (1) (11) Actuarial (losses)/gains (370) 55 – (315) (59) 2 37 (45) (65) Exchange and other adjustments (67) (98) (20) (185) 262 (1) 48 20 329 Employer contributions 66 50 50 166 65 35 46 42 188 Participant contributions 1 – 12 13 1 4 – 7 12 Benefits paid (323) (52) (76) (451) (303) (68) (47) (45) (463) Settlements1 – – (116) (116) – (841) – – (841) Scheme assets’ fair value at end of year 4,275 1,056 517 5,848 4,759 160 1,068 492 6,479 1 The 2024 settlement is the buyout of post-retirement pension plans in Norway and the Netherlands. The actual return on the plan assets was a loss of $53m (2023: gain of $235m). Movement in post-retirement scheme obligations 2024 2023 UK Sweden Rest of Group Total UK US Sweden Rest of Group Total $m $m $m $m $m $m $m $m $m Present value of obligations in scheme at beginning of year (5,161) (1,602) (1,144) (7,907) (4,801) (1,022) (1,312) (973) (8,108) Current service cost (6) (26) (40) (72) (6) (2) (13) (35) (56) Past service (cost)/credit (2) (8) 1 (9) 12 – (2) 2 12 Participant contributions (1) – (12) (13) (1) (4) – (7) (12) Benefits paid 323 52 76 451 303 68 47 45 463 Interest expense on post-retirement scheme obligations (231) (47) (34) (312) (239) (22) (50) (27) (338) Actuarial gains/(losses) 416 (23) 2 395 (155) (12) (202) 28 (341) Exchange and other adjustments 70 146 56 272 (274) 1 (70) (34) (377) Settlements1 – – 116 116 – 839 – 11 850 Present value of obligations in scheme at end of year (4,592) (1,508) (979) (7,079) (5,161) (154) (1,602) (990) (7,907) 1 The 2024 settlement is the buyout of post-retirement pension plans in Norway and the Netherlands. The obligations arise from over 50 plans in 28 countries: 2024 2023 UK Sweden Rest of Group Total UK US Sweden Rest of Group Total $m $m $m $m $m $m $m $m $m Funded – pension schemes1 (4,582) (1,505) (717) (6,804) (5,151) – (1,599) (868) (7,618) Funded – post-retirement healthcare – – (78) (78) – (94) – – (94) Unfunded – pension schemes1 – (3) (167) (170) – (60) (3) (113) (176) Unfunded – post-retirement healthcare (10) – (17) (27) (10) – – (9) (19) Total (4,592) (1,508) (979) (7,079) (5,161) (154) (1,602) (990) (7,907) 1 Includes defined benefit pension schemes and other plans, such as lump sum, long service awards and DC plans with underpins. Notes to the Group Financial Statements AstraZeneca Annual Report & Form 20-F Information 2024 189 Strategic Report Corporate Governance Financial Statements Additional Information |
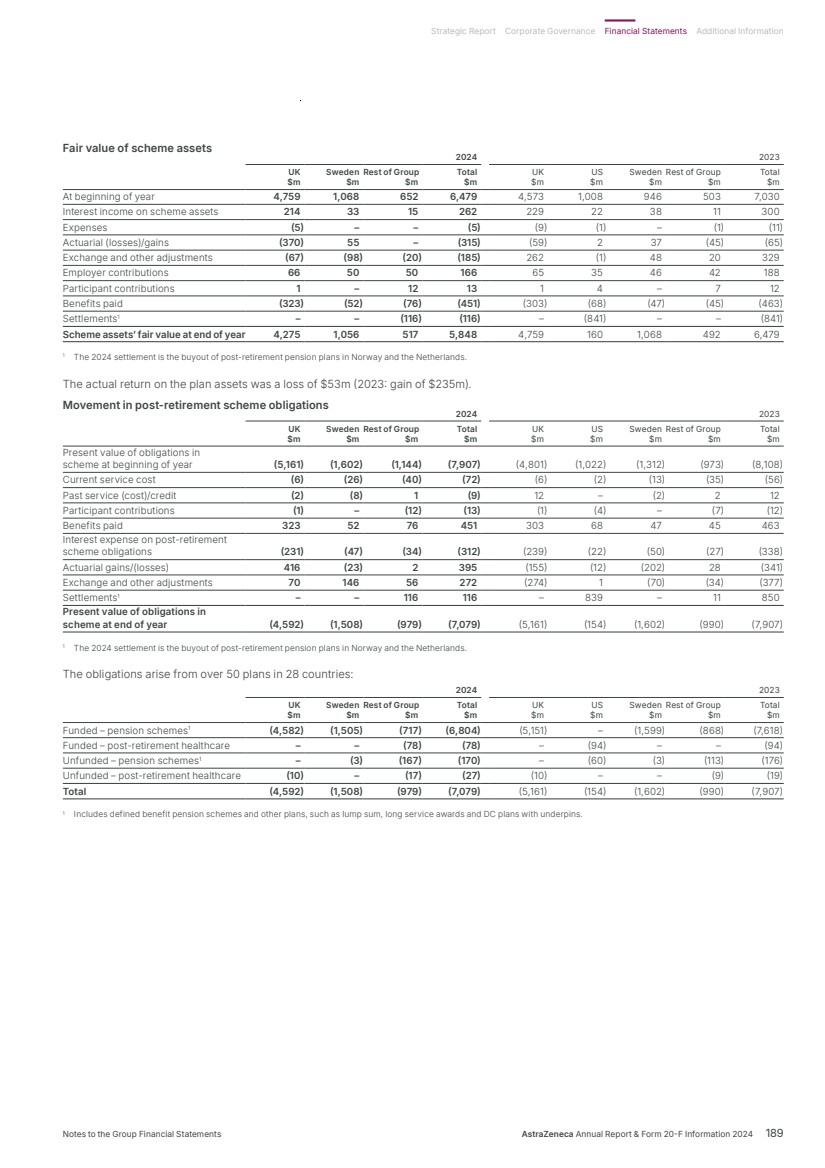
| Consolidated Statement of Comprehensive Income disclosures The amounts that have been charged to the Consolidated Statement of Comprehensive Income, in respect of defined benefit schemes for the years ended 31 December 2024 and 31 December 2023, are set out below. 2024 2023 UK Sweden Rest of Group Total UK US Sweden Rest of Group Total $m $m $m $m $m $m $m $m $m Operating profit Current service cost (6) (26) (40) (72) (6) (2) (13) (35) (56) Past service (cost)/credit (2) (8) 1 (9) 12 – (2) 2 12 Expenses (5) – – (5) (9) (1) – (1) (11) Total charge to Operating profit (13) (34) (39) (86) (3) (3) (15) (34) (55) Finance expense Interest income on scheme assets 214 33 15 262 229 22 38 11 300 Interest expense on post-retirement scheme obligations (231) (47) (34) (312) (239) (22) (50) (27) (338) Net interest on post-employment defined benefit plan liabilities (17) (14) (19) (50) (10) – (12) (16) (38) Charge before taxation (30) (48) (58) (136) (13) (3) (27) (50) (93) Other comprehensive income Difference between the actual return and the expected return on the post-retirement scheme assets (370) 55 – (315) (59) 2 37 (45) (65) Experience gains/(losses) arising on the post-retirement scheme obligations 3 (33) (10) (40) (25) (2) (67) (13) (107) Changes in financial assumptions underlying the present value of the post-retirement scheme obligations 414 11 11 436 (142) (10) (135) 44 (243) Changes in demographic assumptions (1) (1) 1 (1) 12 – – (3) 9 Remeasurement of the defined benefit liability 46 32 2 80 (214) (10) (165) (17) (406) Past service cost includes granting early retirement in UK and Sweden. Total Group pension costs in respect of defined contribution and defined benefit schemes during the year are set out below (see Note 29). 2024 2023 $m $m Defined contribution plans 528 482 Defined benefit plans − Current service cost and Expenses 77 67 Defined benefit plans − Past service cost/(credit) 9 (12) Pension costs 614 537 SE Rate sensitivities The following tables show the US dollar effect of a change in the significant actuarial assumptions used to determine the retirement benefits obligations in our two main defined benefit pension obligation countries. 2024 2023 +0.5% −0.5% +0.5% −0.5% Discount rate UK ($m) 219 (239) 269 (308) Sweden ($m) 110 (126) 109 (123) Total ($m) 329 (365) 378 (431) 2024 2023 +0.5% −0.5% +0.5% −0.5% Inflation rate1 UK ($m) (148) 142 (189) 184 Sweden ($m) (119) 104 (116) 104 Total ($m) (267) 246 (305) 288 2024 2023 +0.5% −0.5% +0.5% −0.5% Rate of increase in salaries UK ($m) n/a n/a n/a n/a Sweden ($m) (46) 43 (46) 42 Total ($m) (46) 43 (46) 42 Notes to the Group Financial Statements continued 22 Post-retirement pension and other defined benefit schemes continued 190 AstraZeneca Annual Report & Form 20-F Information 2024 Financial Statements |
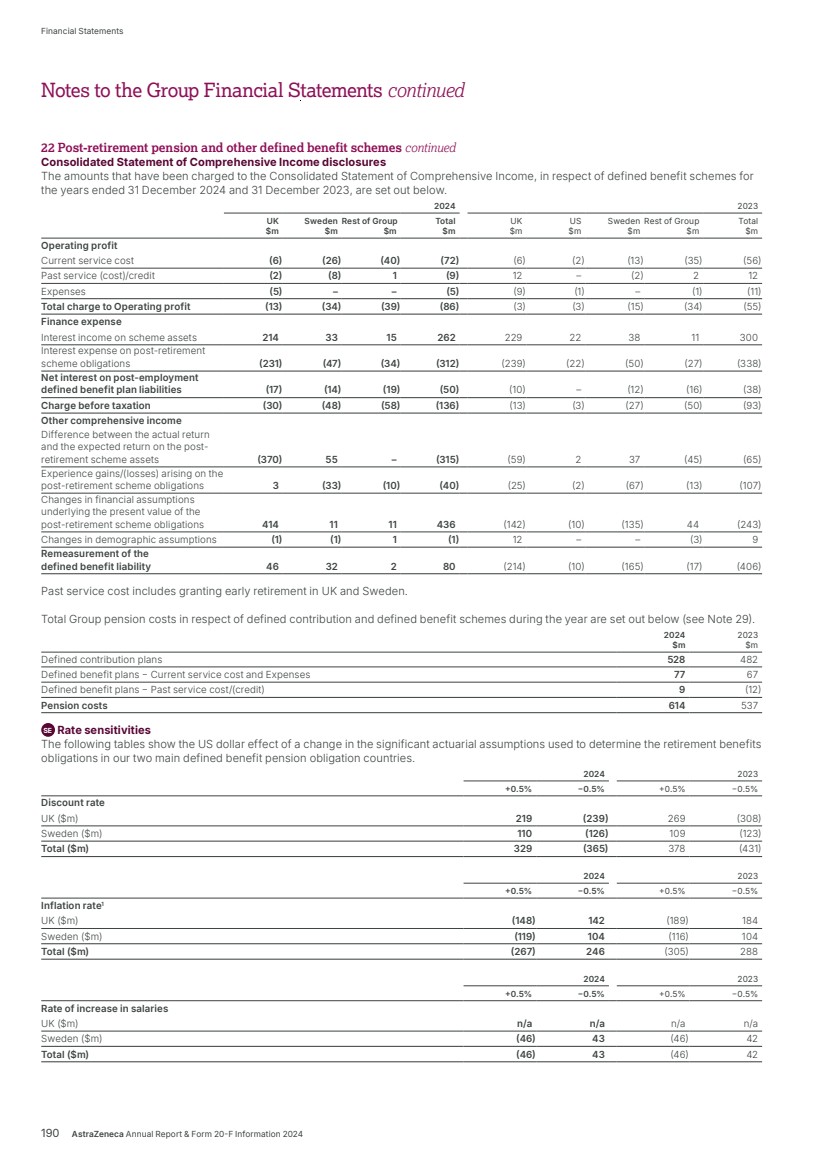
| 2024 2023 +1 year −1 year +1 year −1 year Mortality rate UK ($m) (178)2 1753 (214) 212 Sweden ($m) (74) 54 (51) 51 Total ($m) (252) 229 (265) 263 1 Rate of increase in pensions in payment follows inflation. 2 Of the $178m increase, $89m is covered by the longevity swap. 3 Of the $175m decrease, $88m is covered by the longevity swap. Due to market conditions at 31 December 2023 the following additional sensitivities for 1.0% assumption changes were calculated and disclosed in the 2023 Group Financial Statements: $525m (UK) and $210m (Sweden) if the discount rate is increased; $(634)m (UK) and $(254)m (Sweden) if the discount rate is decreased; $(384)m (UK) and $(240)m (Sweden) if the inflation rate is increased; and $363m (UK) and $201m (Sweden) if the inflation rate is decreased. The Group does not consider market conditions at 31 December 2024 warrant the updating of these sensitivities. The sensitivity to the financial assumptions shown above has been estimated taking into account the approximate duration of the liabilities and the overall profile of the plan membership. The inflation sensitivity allows for the impact of a change in inflation on salary increases and pension increases (where these assumptions are inflation-linked). The salary increase sensitivity reflects the impact of an increase of only salary relative to inflation. The sensitivity to the life expectancy assumption is estimated based on a revised mortality assumption that extends/reduces the current life expectancy by one year for a particular age. 23 Reserves Retained earnings The cumulative amount of goodwill written off directly to reserves resulting from acquisitions, net of disposals, amounted to $580m (2023: $595m; 2022: $591m) using year-end rates of exchange. At 31 December 2024, 442,342 shares, at a cost of $68m, have been deducted from Retained earnings (2023: 1,580,137 shares, at a cost of $129m; 2022: 1,671,446 shares, at a cost of $112m) to satisfy future vesting of employee share plans. There are no significant statutory or contractual restrictions on the distribution of current profits of subsidiaries; undistributed profits of prior years are, in the main, permanently employed in the businesses of these companies. The undistributed income of AstraZeneca companies overseas might be liable to overseas taxes and/or UK taxation (after allowing for double taxation relief) if they were to be distributed as dividends (see Note 4). 2024 2023 2022 $m $m $m Cumulative translation differences included within Retained earnings At 1 January (3,014) (3,694) (1,934) Foreign exchange arising on consolidation (957) 608 (1,446) Exchange adjustments on goodwill (recorded against other reserves) (15) 4 (24) Foreign exchange arising on designated liabilities in net investment hedges1 (122) 24 (282) Fair value movements on derivatives designated in net investment hedges 39 44 (8) Net exchange movement in Retained earnings (1,055) 680 (1,760) At 31 December (4,069) (3,014) (3,694) 1 Foreign exchange arising on designated liabilities in net investment hedges includes $59m in respect of designated bonds and $(181)m in respect of designated contingent consideration and other liabilities. The change in value of designated contingent consideration liabilities relates to $(180)m in respect of BMS’ share of Global Diabetes Alliance. The cumulative loss with respect to costs of hedging is $43m (2023: $22m; 2022: $3m) and the loss during the year was $21m (2023: $19m; 2022: $7m). The balance remaining in the foreign currency translation reserve from net investment hedging relationships for which hedge accounting no longer applied is a gain of $527m. For further detail relating to hedging balances, please see the Hedge accounting section within Note 28, from page 199. Other reserves The other reserves arose from the cancellation of £1,255m of share premium account by the Company in 1993 and the redenomination of share capital of $157m in 1999. The reserves are available for writing off goodwill arising on consolidation and, subject to guarantees given to preserve creditors at the date of the court order, are available for distribution. Following an amendment to the Employee Benefit Trust (EBT) Deed on 10 June 2024, AstraZeneca obtained control and commenced consolidation of the EBT. The value of shares held by the consolidated EBTs will be reflected as an adjustment against Other reserves. Notes to the Group Financial Statements AstraZeneca Annual Report & Form 20-F Information 2024 191 Strategic Report Corporate Governance Financial Statements Additional Information |
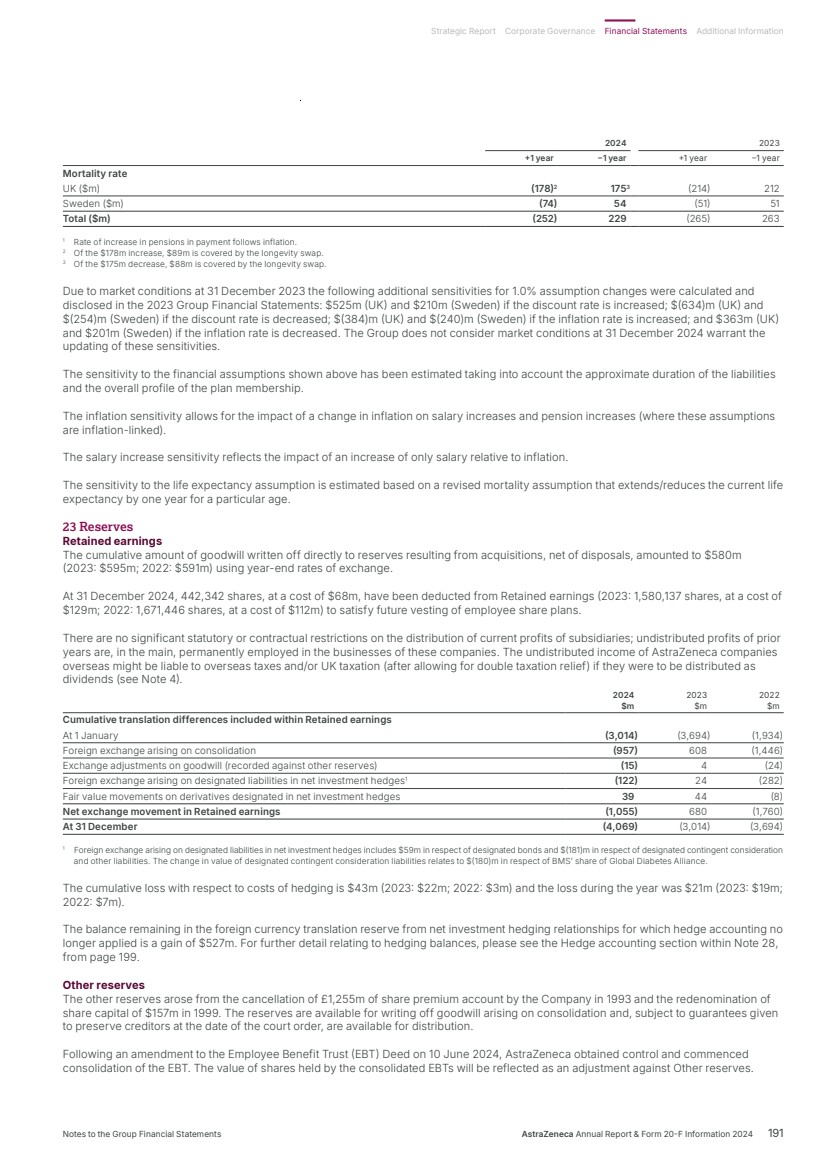
| 24 Share capital Allotted, called-up and fully paid 2024 2023 2022 $m $m $m Issued Ordinary Shares ($0.25 each) 388 388 387 Redeemable Preference Shares (£1 each – £50,000) – – – At 31 December 388 388 387 The Redeemable Preference Shares carry limited class-voting rights and no dividend rights. This class of shares is capable of redemption at par at the option of the Company on the giving of seven days’ written notice to the registered holder of the shares. The Company does not have a limited amount of authorised share capital. The movements in the number of Ordinary Shares during the year can be summarised as follows: No. of shares 2024 2023 2022 At 1 January 1,550,162,626 1,549,800,030 1,549,400,665 Issue of shares (share schemes) 383,613 362,596 399,365 At 31 December 1,550,546,239 1,550,162,626 1,549,800,030 Share issues Issue of shares (share schemes) represents share capital issued as part of the Group’s equity incentivisation schemes (see Note 29). Share repurchases No Ordinary Shares were repurchased by the Company in 2024 (2023: nil; 2022: nil). Shares held by subsidiaries At 31 December 2024, AstraZeneca-controlled Employee Benefit Trust arrangements held 442,342 Ordinary Shares in the Company at a weighted average cost of $68m. The market value of these Ordinary Shares at 31 December 2024 was $58m. No comparable arrangements were in place at 31 December 2023 or 31 December 2022. 25 Dividends to shareholders 2024 2023 2022 2024 2023 2022 Per share Per share Per share $m $m $m Second interim (March 2024) $1.97 $1.97 $1.97 3,052 3,047 3,046 First interim (September 2024) $1.00 $0.93 $0.93 1,550 1,440 1,440 Total $2.97 $2.90 $2.90 4,602 4,487 4,486 The Company has exercised its authority in accordance with the provisions set out in the Company’s Articles of Association, that the balance of unclaimed dividends outstanding past 12 years be forfeited. Unclaimed dividends of $nil (2023: $nil; 2022: $1m) have been adjusted for in Retained earnings in 2024. The 2023 second interim dividend of $1.97 per share was paid on 25 March 2024. The 2024 first interim dividend of $1.00 per share was paid on 9 September 2024. Reconciliation of dividends charged to equity to the Consolidated Statement of Cash Flows: 2024 2023 2022 $m $m $m Dividends charged to equity 4,602 4,487 4,486 Exchange losses on payment of dividend 3 5 5 Hedge contracts relating to payment of dividends (Consolidated Statement of Cash Flows) 16 (19) (127) Dividends paid to non-controlling interests 4 4 – Net movement of unclaimed dividends in the year 4 4 – Dividends paid (Consolidated Statement of Cash Flows) 4,629 4,481 4,364 26 Non-controlling interests The Group Financial Statements at 31 December 2024 reflect equity of $85m (2023: $23m; 2022: $21m) and Total comprehensive income of $5m (2023: $6m; 2022: $2m) attributable to the non-controlling interests in AstraZeneca Pharma India Limited, P.T. AstraZeneca Indonesia, Beijing Falikang Pharmaceutical (China) Co. Ltd., AstraZeneca Algeria Pharmaceutical Industries SPA, VaxNewMo LLC and SixPeaks Bio AG. Notes to the Group Financial Statements continued 192 AstraZeneca Annual Report & Form 20-F Information 2024 Financial Statements |
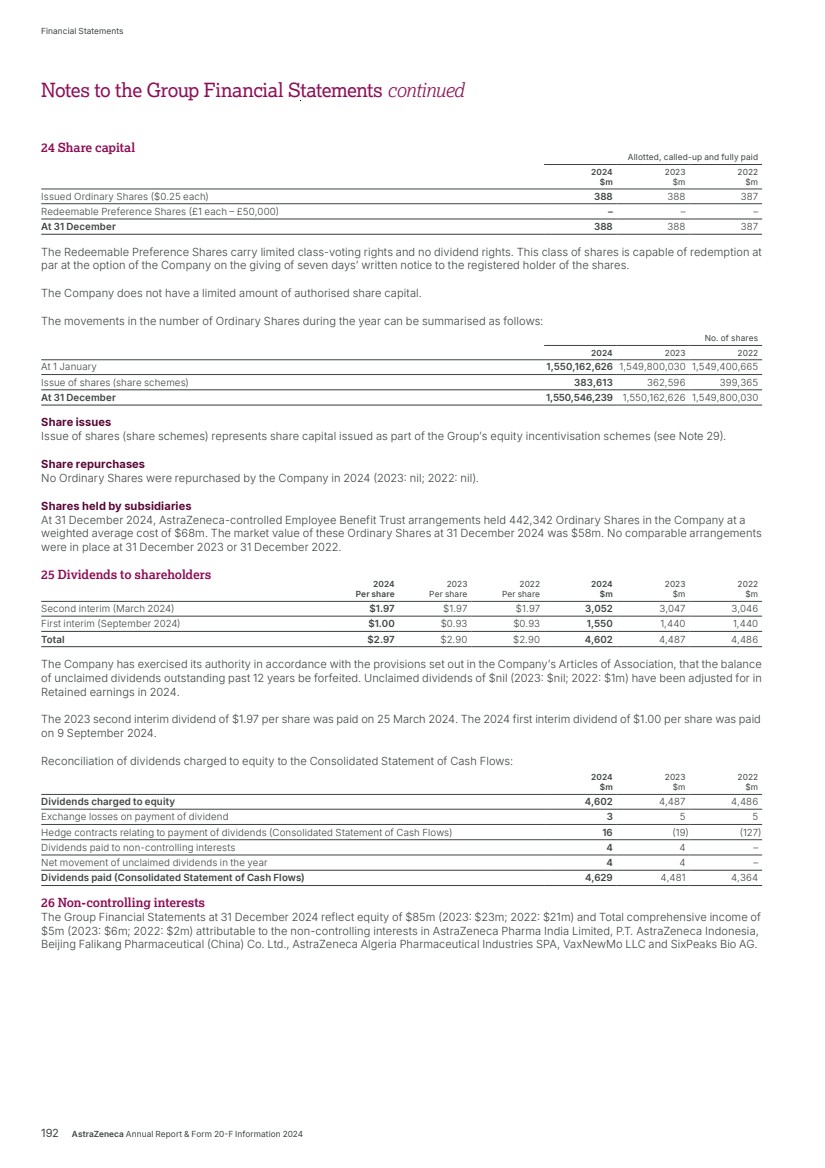
| 27 Acquisitions of business operations Acquisitions of business operations in 2024 Gracell On 22 February 2024, AstraZeneca completed the acquisition of Gracell Biotechnologies Inc. (Gracell), a global clinical-stage biopharmaceutical company developing innovative cell therapies for the treatment of cancer and autoimmune-diseases. Gracell will operate as a wholly-owned subsidiary of AstraZeneca, with operations in China and the US. The acquisition enriches AstraZeneca’s growing pipeline of cell therapies with AZD0120 (formerly GC012F), a novel, clinical-stage T-cell (CAR-T: therapeutic chimeric antigen receptor) therapy. AZD0120 is a potential new treatment for multiple myeloma, as well as other haematologic malignancies and autoimmune-diseases, including Systemic Lupus Erythematosus (SLE). The transaction is recorded as a business combination using the acquisition method of accounting in accordance with IFRS 3 ‘Business Combinations’. Consequently, the assets acquired, and liabilities assumed are recorded at fair value. The purchase price allocation review has been completed. Fair value $m Intangible assets 1,038 Cash and cash equivalents1 212 Net deferred tax liability (260) Other immaterial net balances (89) Total net assets acquired 901 Goodwill 136 Consideration 1,037 1 Cash and cash equivalents acquired includes $3m relating to marketable securities. The total consideration fair value of $1,037m comprises cash consideration of $983m and future regulatory milestone-based consideration of $54m. Intangible assets recognised relate to products in development, principally AZD0120, and were fair valued using the multi-period excess earnings method, which uses several estimates regarding the amount and timing of future cash flows. The key assumptions in the cash flows are the probability of technical and regulatory success, peak year sales and revenue erosion profiles. The net deferred tax liability of $260m principally arises from the deferred tax impact of the uplift in fair value of intangible assets. Goodwill of $136m has been recognised, which principally comprises the premium attributable to the core technological capabilities and knowledge base of the company. Goodwill is not expected to be deductible for tax purposes. Gracell’s results have been consolidated into the Group’s results from 22 February 2024. Fusion On 4 June 2024, AstraZeneca completed the acquisition of Fusion Pharmaceuticals Inc., (Fusion) a clinical-stage biopharmaceutical company developing next-generation radioconjugates. The acquisition marks a major step forward in AstraZeneca delivering on its ambition to transform cancer treatment and outcomes for patients by replacing traditional regimens like chemotherapy and radiotherapy with more targeted treatments. As a result of the acquisition, Fusion became a wholly owned subsidiary of AstraZeneca, with operations in Canada and the US. Immediately prior to the acquisition, AstraZeneca held approximately 1% shareholding in Fusion considered to have a fair value of $24m. This acquisition complements AstraZeneca’s leading oncology portfolio with the addition of the Fusion pipeline of radioconjugates, including their most advanced programme, FPI-2265, a potential new treatment for patients with metastatic castration-resistant prostate cancer (mCRPC), and brings new expertise and pioneering R&D, manufacturing and supply chain capabilities in actinium-based radioconjugates to AstraZeneca. The transaction is recorded as a business combination using the acquisition method of accounting in accordance with IFRS 3 ‘Business Combinations’. Consequently, the assets acquired, and liabilities assumed are recorded at fair value. The purchase price allocation review has been completed. Fair value $m Intangible assets 1,326 Cash and cash equivalents 30 Current investments 87 Net deferred tax liability (246) Other immaterial net balances 51 Total net assets acquired 1,248 Goodwill 947 Consideration 2,195 The total consideration fair value of $2,195m includes cash consideration of $2,027m (net of $24m proceeds from disposal of the existing approximately 1% shareholding) and future regulatory milestone-based consideration of $144m. Intangible assets relating to products in development comprise the FPI-2265 ($848m), FPI-2059 ($165m) and AZD2068 ($313m) programmes. These were fair valued using the multi-period excess earnings method, which uses several estimates regarding the amount and timing of future cash flows. The key assumptions in the cash flows are the probability of technical and regulatory success, peak year sales and revenue erosion profiles. Notes to the Group Financial Statements AstraZeneca Annual Report & Form 20-F Information 2024 193 Strategic Report Corporate Governance Financial Statements Additional Information |
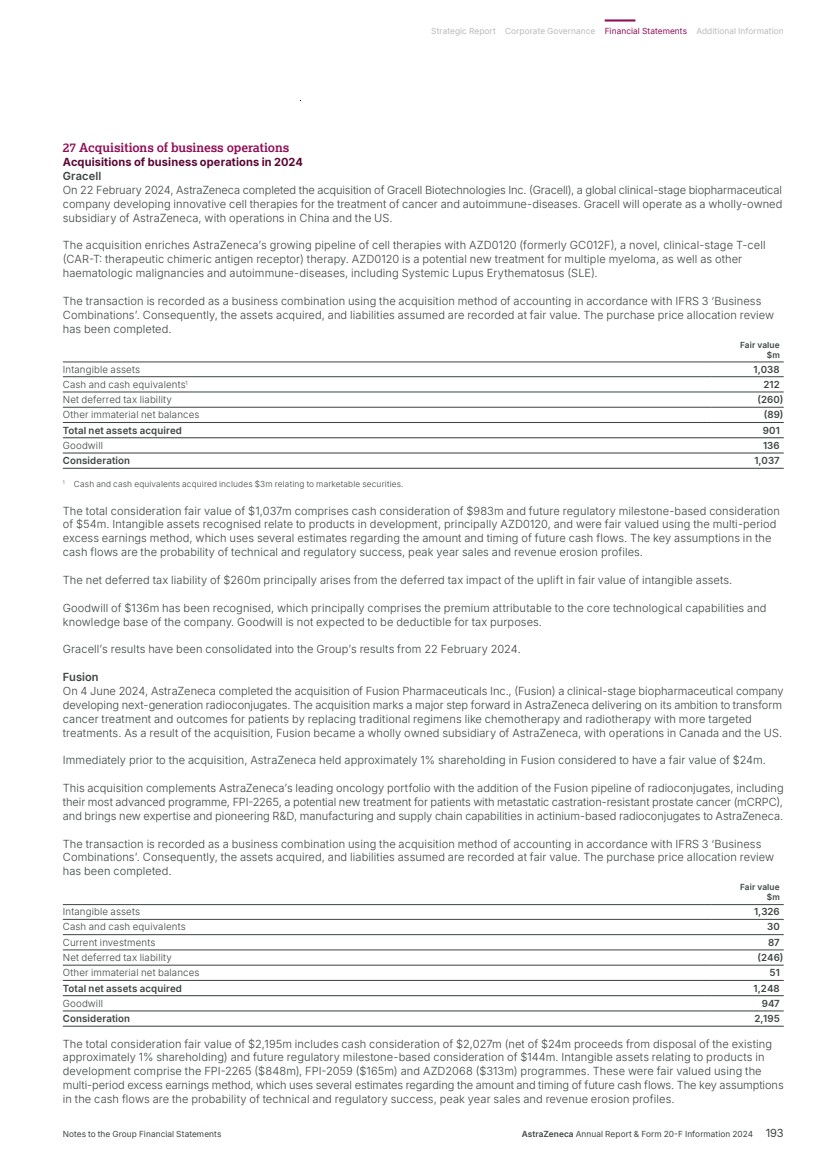
| The net deferred tax liability of $246m principally arises from the deferred tax impact of the uplift in fair value of intangible assets. Goodwill amounting to $947m was recognised on acquisition and is underpinned by a number of elements, which individually could not be quantified. These include the premium attributable to a pre-existing, well positioned business in the innovation intensive biopharmaceuticals market with a highly skilled workforce, unidentified potential products that future research and development may yield, and the core capabilities and knowledge base of the company including radioisotope supply and manufacturing expertise. Goodwill is not expected to be deductible for tax purposes. Fusion’s results have been consolidated into the Group’s results from 4 June 2024. In December 2024, the intangible asset relating to product in development FPI-2059 was fully impaired by $165m due to decisions made to terminate the related activities and prioritise resources on the development of FPI-2265 and AZD2068 (see Note 10). Acquisitions of business operations in 2023 On 16 January 2023, AstraZeneca completed the acquisition of Neogene Therapeutics Inc. (Neogene), a global clinical-stage biotechnology company pioneering the discovery, development and manufacturing of next-generation T-cell receptor therapies (TCR-Ts). The total consideration was $267m. Intangible assets of $100m and goodwill of $158m were recognised in the acquisition balance sheet, as well as a cash outflow of $189m, net of cash acquired. Following achievement of agreed milestones in 2024, contingent milestones-based consideration and non-contingent consideration of $120m is payable. Neogene’s results have been consolidated into the Group’s results from 16 January 2023. Acquisitions of business operations in 2022 On 16 November 2022, AstraZeneca completed the acquisition of 100% of the issued shares of LogicBio Therapeutics, Inc. (LogicBio) based in Lexington, MA, US. LogicBio is a clinical-stage genetic medicine company pioneering genome editing and gene delivery platforms to address rare and serious diseases from infancy through adulthood. The total consideration was $72m. Cash of $68m was paid on the completion date, with $4m of outstanding options, which will be settled in cash, recorded in current Trade and other payables. Goodwill of $15m, assets of $82m, including $46m of intangible assets, and liabilities of $25m were recognised on acquisition. LogicBio’s results have been consolidated into the Group’s results from 16 November 2022. 28 Financial risk management objectives and policies The Group’s principal financial instruments, other than derivatives, comprise bank overdrafts, loans and other borrowings, lease liabilities, current and non-current investments, cash and short-term deposits. The main purpose of these financial instruments is to manage the Group’s funding and liquidity requirements. The Group has other financial assets and liabilities such as trade receivables and trade payables, which arise directly from its operations. The principal financial risks to which the Group is exposed are those of liquidity, interest rate, foreign currency and credit. Each of these is managed in accordance with Board-approved policies. These policies, together with the Group’s approach to capital management, are set out below. Capital management The capital structure of the Group consists of Shareholders’ equity (Note 24), Debt (Note 19), Other current investments (Note 12) and Cash (Note 17). For the foreseeable future, the Board will maintain a capital structure that supports the Group’s strategic objectives through: • managing funding and liquidity risk • optimising shareholder return • maintaining a strong, investment-grade credit rating. The Group utilises factoring arrangements and bank acceptance drafts discounting for selected trade receivables. These arrangements qualify for full derecognition of the associated trade receivables under IFRS 9 ‘Financial Instruments’. Amounts due on invoices that have not been factored at year end, from customers that are subject to these arrangements, are disclosed in Note 16. Funding and liquidity risk are reviewed regularly by the Board and managed in accordance with the policies described below. The Board regularly reviews its shareholders’ distribution policy, which comprises a regular cash dividend and potentially a share repurchase component. No share repurchases have been made since 2012. The Group’s net debt position (loans and borrowings net of Cash and cash equivalents, Other investments and Derivative financial instruments) has increased by $2,060m from a net debt position of $22,510m at the beginning of the year to a net debt position of $24,570m at 31 December 2024. Gross debt increased from $28,622m to $30,295m, principally due to the issuance of $6,492m debt offset by the repayment of $4,652m debt. Liquidity risk The Board reviews the Group’s ongoing liquidity risks annually as part of the planning process and on an ad hoc basis. The Board considers short-term requirements against available sources of funding, taking into account forecast cash flows. The Group manages liquidity risk by maintaining access to a number of sources of funding which are sufficient to meet anticipated funding requirements. Specifically, the Group uses US and European commercial paper, bank loans, committed bank facilities and cash resources to manage short-term liquidity and manages long-term liquidity by raising funds through the capital markets. At 31 December 2024, the Group was assigned short-term credit ratings of P-1 by Moody’s and A-1 by Standard and Poor’s. The Group’s long-term credit rating was A2 by Moody’s and A+ by Standard and Poor’s. Notes to the Group Financial Statements continued 27 Acquisition of business operations continued 194 AstraZeneca Annual Report & Form 20-F Information 2024 Financial Statements |
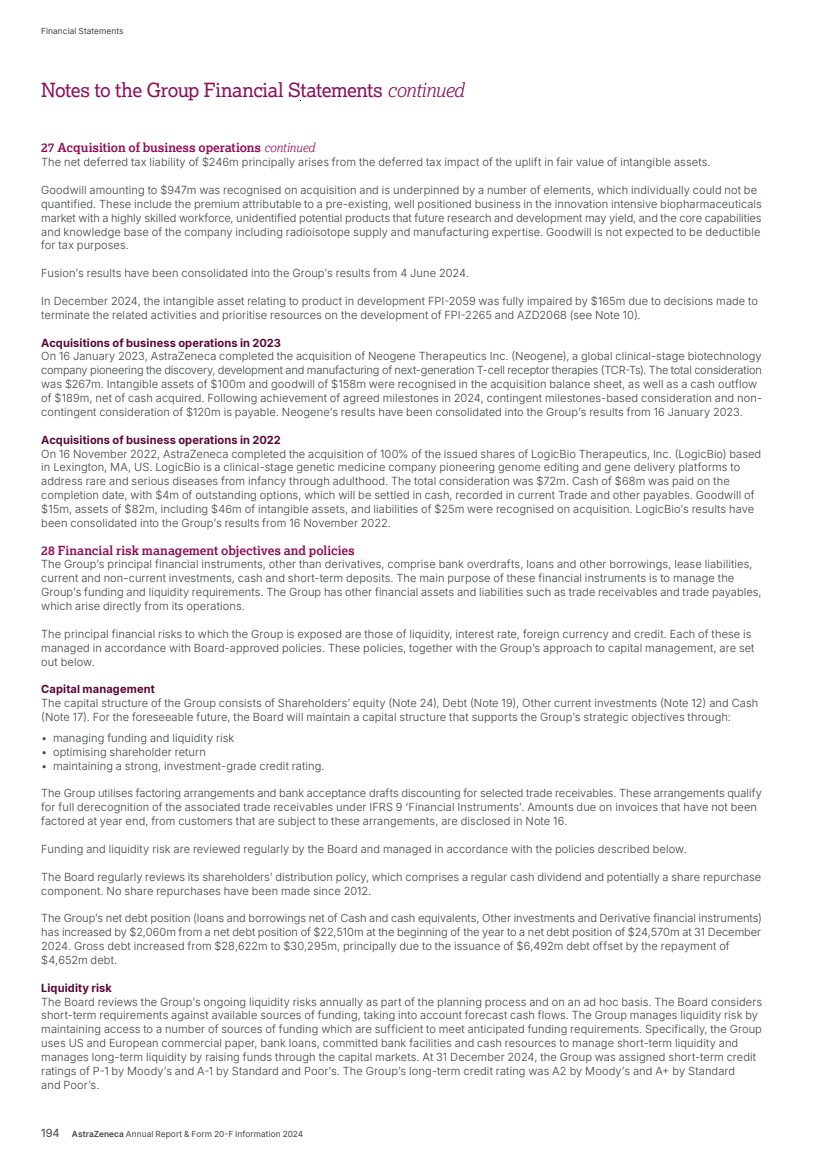
| In addition to Cash and cash equivalents of $5,488m, short-term fixed income investments of $37m, less overdrafts of $59m at 31 December 2024, the Group has committed bank facilities of $4,875m available to manage liquidity. These committed bank facilities have no financial covenants. The maturity of the $4,875m facilities was extended in January 2025 from April 2029 to April 2030. The Group regularly monitors the credit standing of the banks providing the facilities and currently does not anticipate any issue with drawing on the committed facilities should this be necessary. Advances under these facilities currently bear an interest rate per annum based on Secured Overnight Financing Rate (SOFR) plus a margin. At 31 December 2024, the Group has $5,122m outstanding from debt issued under a Euro Medium Term Note programme and $23,350m under an SEC-registered programme. The funds made available under these facility agreements may be used for the general corporate purposes of the Group. The maturity profile of the anticipated future contractual cash flows including interest in relation to the Group’s financial liabilities, on an undiscounted basis, which therefore differs from both the carrying value and fair value, is as follows: Bank Total Derivative Derivative Total overdrafts Trade non-derivative financial financial derivative and other Bonds and Lease and other financial instruments instruments financial loans bank loans liabilities payables instruments receivable payable instruments Total $m $m $m $m $m $m $m $m $m Within one year 365 5,777 249 19,065 25,456 (12,445) 12,478 33 25,489 In one to two years – 5,233 208 2,086 7,527 (1,012) 1,078 66 7,593 In two to three years – 2,608 172 872 3,652 (34) 38 4 3,656 In three to four years – 2,983 128 595 3,706 (103) 103 – 3,706 In four to five years – 1,267 84 814 2,165 (32) 35 3 2,168 In more than five years – 18,156 184 3,177 21,517 (1,436) 1,378 (58) 21,459 365 36,024 1,025 26,609 64,023 (15,062) 15,110 48 64,071 Effect of interest (15) (7,982) – – (7,997) 227 (249) (22) (8,019) Effect of discounting, fair values and issue costs – (113) (72) (3,299) (3,484) 63 7 70 (3,414) 31 December 2022 350 27,929 953 23,310 52,542 (14,772) 14,868 96 52,638 Bank Total Derivative Derivative Total overdrafts Trade non-derivative financial financial derivative and other Bonds and Lease and other financial instruments instruments financial loans bank loans liabilities payables instruments receivable payable instruments Total $m $m $m $m $m $m $m $m $m Within one year 542 5,469 313 22,401 28,725 (11,302) 11,366 64 28,789 In one to two years – 2,764 261 1,482 4,507 (100) 114 14 4,521 In two to three years – 3,137 208 788 4,133 (164) 179 15 4,148 In three to four years – 2,230 138 625 2,993 (924) 883 (41) 2,952 In four to five years – 3,822 88 12 3,922 (949) 971 22 3,944 In more than five years – 17,995 271 35 18,301 (1,507) 1,340 (167) 18,134 542 35,417 1,279 25,343 62,581 (14,946) 14,853 (93) 62,488 Effect of interest (27) (8,270) – – (8,297) 589 (644) (55) (8,352) Effect of discounting, fair values and issue costs – (168) (151) (309) (628) 44 (46) (2) (630) 31 December 2023 515 26,979 1,128 25,034 53,656 (14,313) 14,163 (150) 53,506 Bank Total Derivative Derivative Total overdrafts Trade non-derivative financial financial derivative and other Bonds and Lease and other financial instruments instruments financial loans bank loans liabilities payables instruments receivable payable instruments Total $m $m $m $m $m $m $m $m $m Within one year 345 3,045 396 22,501 26,287 (16,227) 16,282 55 26,342 In one to two years – 3,437 345 1,086 4,868 (207) 250 43 4,911 In two to three years – 3,670 266 105 4,041 (917) 956 39 4,080 In three to four years – 3,978 170 750 4,898 (941) 1,044 103 5,001 In four to five years – 3,780 117 – 3,897 (627) 489 (138) 3,759 In more than five years – 19,929 406 – 20,335 (2,437) 2,583 146 20,481 345 37,839 1,700 24,442 64,326 (21,356) 21,604 248 64,574 Effect of interest (15) (9,173) – – (9,188) 808 (1,068) (260) (9,448) Effect of discounting, fair values and issue costs – (153) (248) (207) (608) 36 (95) (59) (667) 31 December 2024 330 28,513 1,452 24,235 54,530 (20,512) 20,441 (71) 54,459 Where interest payments are on a floating rate basis, it is assumed that rates will remain unchanged from the last business day of each year ended 31 December. It is not expected that the cash flows in the maturity profile could occur significantly earlier or at significantly different amounts, with the exception of $1,751m of Contingent consideration held within Trade and other payables (see Note 20). Notes to the Group Financial Statements AstraZeneca Annual Report & Form 20-F Information 2024 195 Strategic Report Corporate Governance Financial Statements Additional Information |
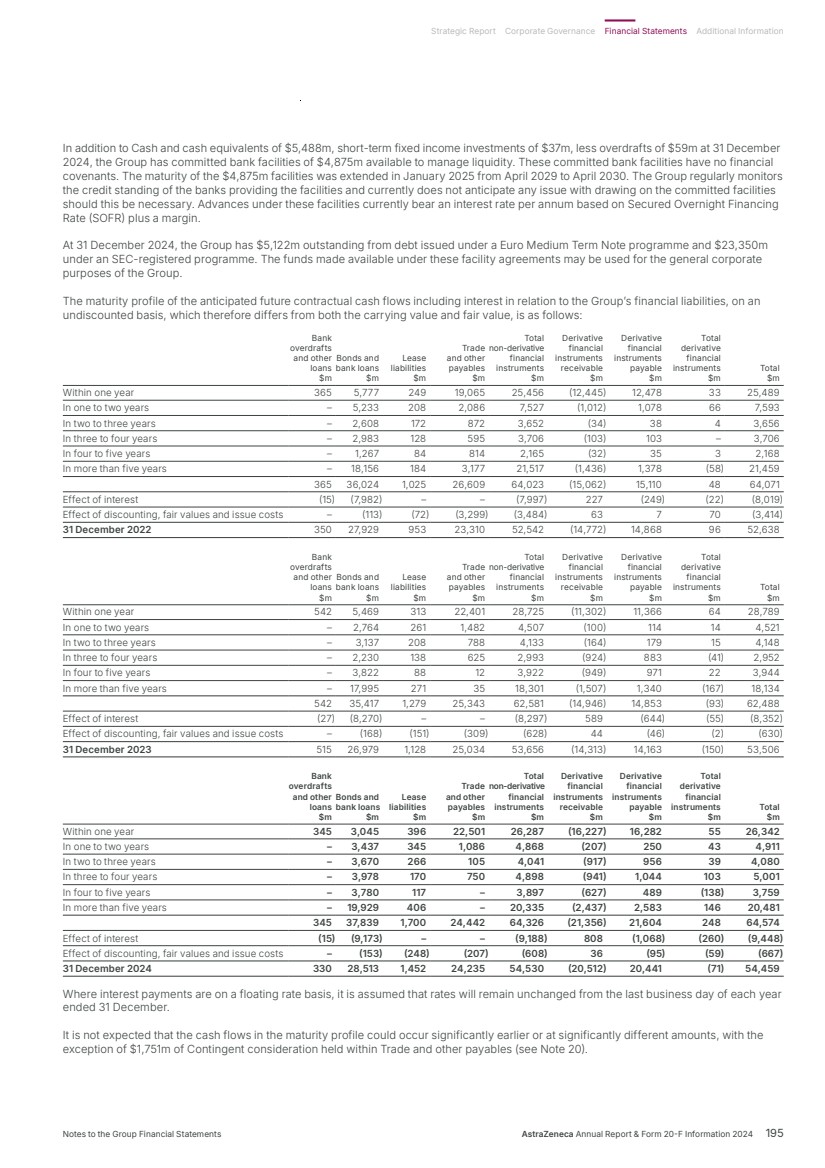
| Market risk Interest rate risk The Group maintains a Board-approved mix of fixed and floating rate debt and uses underlying debt, interest rate swaps and forward rate agreements to manage this mix. The majority of surplus cash is currently invested in US dollar liquidity funds. The interest rate profile of the Group’s interest-bearing financial instruments is set out below. In the case of current and non-current financial liabilities, the classification includes the impact of interest rate swaps which convert the debt to floating rate. 2024 2023 2022 Fixed rate Floating rate Total Fixed rate Floating rate Total Fixed rate Floating rate Total $m $m $m $m $m $m $m $m $m Financial liabilities Current 2,346 330 2,676 2,885 2,515 5,400 2,476 3,066 5,542 Non-current 26,151 1,468 27,619 23,222 – 23,222 21,511 2,179 23,690 Total 28,497 1,798 30,295 26,107 2,515 28,622 23,987 5,245 29,232 Financial assets Fixed deposits – – – – – – 64 – 64 Cash collateral pledged to counterparties – 129 129 – 102 102 – 162 162 Cash and cash equivalents – 5,488 5,488 – 5,840 5,840 250 5,916 6,166 Total – 5,617 5,617 – 5,942 5,942 314 6,078 6,392 In addition to the financial assets above, there are $11,115m (2023: $11,288m; 2022: $9,546m) of other current and non-current asset investments and other financial assets. The Group is also exposed to market risk on other investments. 2024 2023 2022 $m $m $m Equity securities at fair value through Other comprehensive income (Note 12) 1,632 1,530 1,056 Non-current fixed income securities at fair value through profit or loss (Note 12) – – 10 Total 1,632 1,530 1,066 Foreign currency risk The US dollar is the Group’s most significant currency. As a consequence, the Group results are presented in US dollars and exposures are managed against US dollars accordingly. Translational Approximately 60% of Group external sales in 2024 were denominated in currencies other than the US dollar, while a significant proportion of manufacturing, and research and development costs were denominated in pound sterling and Swedish krona. Surplus cash generated by business units is substantially converted to, and held centrally in, US dollars. As a result, operating profit and total cash flow in US dollars will be affected by movements in exchange rates. This currency exposure is managed centrally, based on forecast cash flows. The impact of movements in exchange rates is mitigated significantly by the correlations which exist between the major currencies to which the Group is exposed and the US dollar. Monitoring of currency exposures and correlations is undertaken on a regular basis and hedging is subject to pre-execution approval. As at 31 December 2024, before the impact of derivatives or other forms of hedging, the Group held $548m of interest-bearing loans and borrowings denominated in pound sterling and $4,876m denominated in euros. $438m of the pound sterling loan and $829m of the euro loans balances are designated in a net investment hedge where they hedge an underlying net investment of that amount in the same currency. $2,387m of the euro loans are designated in cashflow hedges, where they are hedged with cross-currency swaps. Exchange differences on the retranslation of debt designated in a net investment hedge or a cashflow hedge are recognised in Other comprehensive income to the extent the hedge is effective. $1,468m of the euro loans are designated in fair value hedges, hedged with cross-currency swaps. Exchange difference on the retranslation of debt designated in a fair value hedge is recognised within Finance income and expense. For further details of all designated hedging relationships please refer to the Hedge accounting section within this Note 28, from page 199. The accounting treatment for any hedge ineffectiveness is disclosed in the Bank and other borrowings accounting policy and the Foreign currencies accounting policy on page 158 within Group Accounting Policies. As at 31 December 2024, the Group operates in three countries designated as hyperinflationary, being Argentina, Venezuela and Turkey. The foreign exchange risk of these markets has been assessed and deemed to be immaterial. Transactional The Group aims to hedge all its forecasted major transactional currency exposures on working capital balances, which typically extend for up to three months. Where practicable, these are hedged using forward foreign exchange contracts. In addition, external dividend payments in pound sterling to UK shareholders and in Swedish krona to Swedish shareholders are fully hedged from announcement date to payment date. Foreign exchange gains and losses on forward contracts transacted for transactional hedging are taken to profit and loss or to Other comprehensive income if the contract is in a designated cash flow hedge. Notes to the Group Financial Statements continued 28 Financial risk management objectives and policies continued 196 AstraZeneca Annual Report & Form 20-F Information 2024 Financial Statements |

| Sensitivity analysis The sensitivity analysis set out below summarises the sensitivity of the market value of our financial instruments to hypothetical changes in market rates and prices. The range of variables chosen for the sensitivity analysis reflects our view of changes which are reasonably possible over a one-year period. Market values are the present value of future cash flows based on market rates and prices at the valuation date. For long-term debt, an increase in interest rates results in a decline in the fair value of debt. The sensitivity analysis assumes an instantaneous 100 basis point change in interest rates in all currencies from their levels at 31 December 2024, with all other variables held constant. Based on the composition of our long-term debt portfolio and cash reserves as at 31 December 2024, a 1% increase in interest rates would result in an additional $18m in interest expense on the debt and an additional $56m interest income on the cash reserves. The exchange rate sensitivity analysis assumes an instantaneous 10% change in foreign currency exchange rates from their levels at 31 December 2024, with all other variables held constant. The +10% case assumes a 10% strengthening of the US dollar against all other currencies and the -10% case assumes a 10% weakening of the US dollar. Each incremental 10% movement in foreign currency exchange rates would have approximately the same effect as the initial 10% detailed in the table below and each incremental 1% change in interest rates would have approximately the same effect as the 1% detailed in the table below. Interest rates Exchange rates 31 December 2022 +1% −1% +10% −10% Increase/(decrease) in fair value of financial instruments ($m) 1,317 (1,490) 81 (89) Impact on profit: gain/(loss) ($m) – – 26 (15) Impact on equity: gain/(loss) ($m) – – 55 (74) Interest rates Exchange rates 31 December 2023 +1% −1% +10% −10% Increase/(decrease) in fair value of financial instruments ($m) 1,361 (1,534) 196 (212) Impact on profit: gain/(loss) ($m) – – 134 (128) Impact on equity: gain/(loss) ($m) – – 62 (83) Interest rates Exchange rates 31 December 2024 +1% −1% +10% −10% Increase/(decrease) in fair value of financial instruments ($m) 1,407 (1,561) 11 (20) Impact on profit: (loss)/gain ($m) – – (117) 133 Impact on equity: gain/(loss) ($m) – – 128 (152) Credit risk The Group is exposed to credit risk on financial assets, such as cash investments, derivative instruments, and Trade and other receivables. The Group was also exposed in its Net asset position to its own credit risk in respect of the 2023 debentures which were accounted for at FVPL. Under IFRS 9, the effect of the losses and gains arising from own credit risk on the fair value of bonds designated at FVPL are recorded in Other comprehensive income. Financial counterparty credit risk The majority of the Group’s cash is centralised within the Group treasury entity and is subject to counterparty risk on the principal invested. The level of the Group’s cash investments and hence credit risk will depend on the cash flow generated by the Group and the timing of the use of that cash. The credit risk is mitigated through a policy of prioritising security and liquidity over return and, as such, cash is only invested in high credit-quality investments. Counterparty limits are set according to the assessed risk of each counterparty and exposures are monitored against these limits on a regular basis. The Group’s principal financial counterparty credit risks at 31 December were as follows: Current assets 2024 2023 2022 $m $m $m Cash at bank and in hand 1,215 1,325 1,411 Money market liquidity funds 4,177 4,425 4,486 Other short-term cash equivalents 96 90 269 Total Cash and cash equivalents (Note 17) 5,488 5,840 6,166 Fixed income securities at fair value through profit or loss (Note 12) 37 20 13 Cash collateral pledged to counterparties (Note 12) 129 102 162 Fixed deposits (Note 12) – – 64 Total derivative financial instruments (Note 13) 54 116 87 Current assets subject to credit risk 5,708 6,078 6,492 Non-current assets 2024 2023 2022 $m $m $m Derivative financial instruments (Note 13) 182 228 74 Non-current assets subject to credit risk 182 228 74 Notes to the Group Financial Statements AstraZeneca Annual Report & Form 20-F Information 2024 197 Strategic Report Corporate Governance Financial Statements Additional Information |
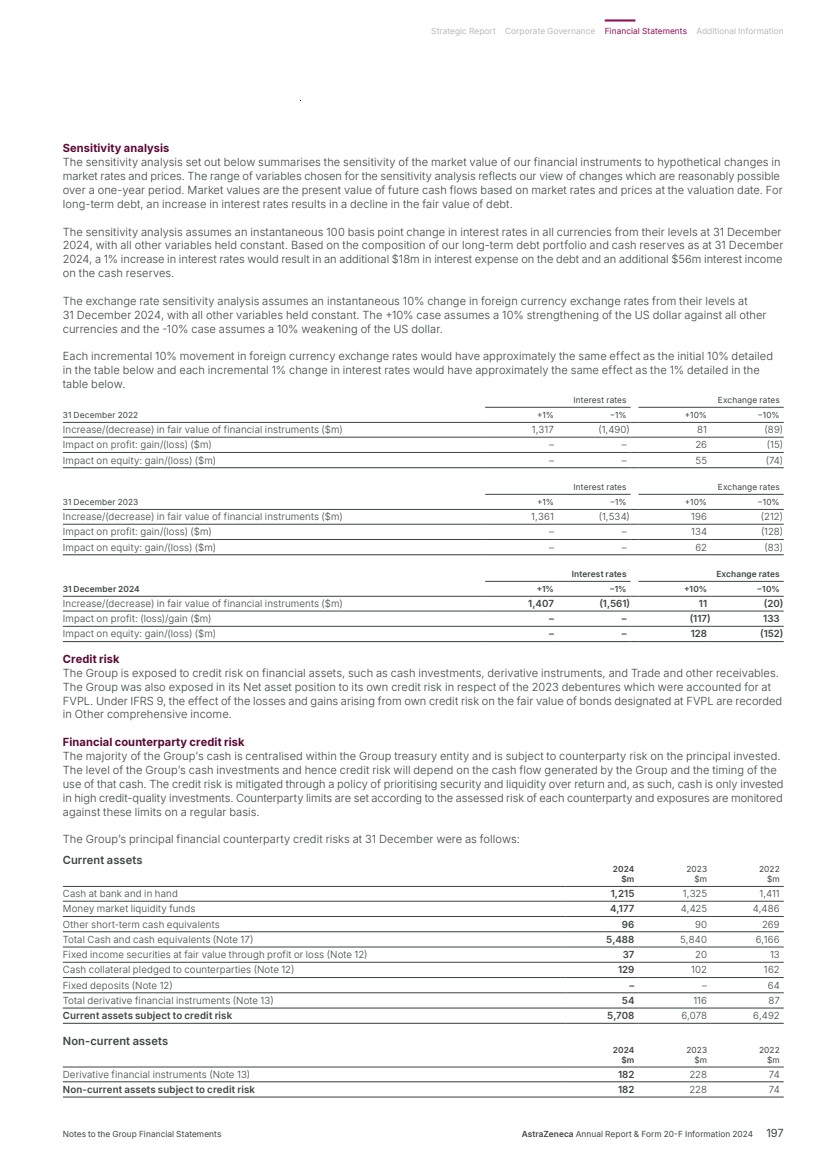
| The majority of the Group’s cash is invested in US dollar AAA-rated money market liquidity funds. The money market liquidity fund portfolios are managed by six external third-party fund managers to maintain an AAA rating. The Group’s investments represent no more than 10% of each overall fund value. There were no other significant concentrations of financial credit risk at the reporting date. All financial derivatives are transacted with commercial banks, in line with standard market practice. The Group has agreements with some bank counterparties whereby the parties agree to post cash collateral, for the benefit of the other, equivalent to the market valuation of the derivative positions above a predetermined threshold. The carrying value of such cash collateral held by the Group at 31 December 2024 was $181m (2023: $215m; 2022: $89m) and the carrying value of such cash collateral posted by the Group at 31 December 2024 was $129m (2023: $102m; 2022: $162m). The impairment provision for other financial assets at 31 December 2024 was immaterial (2023: immaterial; 2022: immaterial). Offsetting of financial assets and liabilities Financial assets and liabilities are offset and the net amount reported in the Consolidated Statement of Financial Position where there is both a legally enforceable right and an intention to settle the balances on a net basis. There are also arrangements that would not normally meet the requirement for offsetting but may be offset in certain circumstances such as the termination of a contract or bankruptcy. The tables below show the impact on the Consolidated Statement of Financial Position if all offset rights were exercised by the Group or its financial counterparties. Related amounts not offset Gross Subject to Financial financial assets/(liabilities) master netting agreement instrument collateral Net Amount 31 December 2022 $m $m $m $m Financial assets Derivatives 161 (29) (61) 71 Other investments1 162 – (161) 1 Total assets 323 (29) (222) 72 Financial liabilities Derivatives (257) 29 161 (67) Other payables1 (89) – 61 (28) Total liabilities (346) 29 222 (95) Related amounts not offset Gross Subject to Financial financial assets/(liabilities) master netting agreement instrument collateral Net Amount 31 December 2023 $m $m $m $m Financial assets Derivatives 344 (107) (203) 34 Other investments1 102 – (65) 37 Total assets 446 (107) (268) 71 Financial liabilities Derivatives (194) 107 65 (22) Other payables1 (215) – 203 (12) Total liabilities (409) 107 268 (34) Related amounts not offset Gross Subject to Financial financial assets/(liabilities) master netting agreement instrument collateral Net Amount 31 December 2024 $m $m $m $m Financial assets Derivatives 236 (45) (169) 22 Other investments1 129 – (112) 17 Total assets 365 (45) (281) 39 Financial liabilities Derivatives (165) 45 112 (8) Other payables1 (181) – 169 (12) Total liabilities (346) 45 281 (20) 1 Balances are collateral pledged/received. Trade receivables Trade receivable exposures are managed locally in the operating units where they arise and credit limits are set as deemed appropriate for the customer. The Group is exposed to customers ranging from government-backed agencies and large private wholesalers to privately-owned pharmacies, and the underlying local economic and sovereign risks vary throughout the world. Where appropriate, the Group endeavours to minimise risks by the use of trade finance instruments such as letters of credit and insurance. The Group applies the expected credit loss approach to establish an allowance for impairment that represents its estimate of expected losses in respect of Trade receivables. Notes to the Group Financial Statements continued 28 Financial risk management objectives and policies continued 198 AstraZeneca Annual Report & Form 20-F Information 2024 Financial Statements |
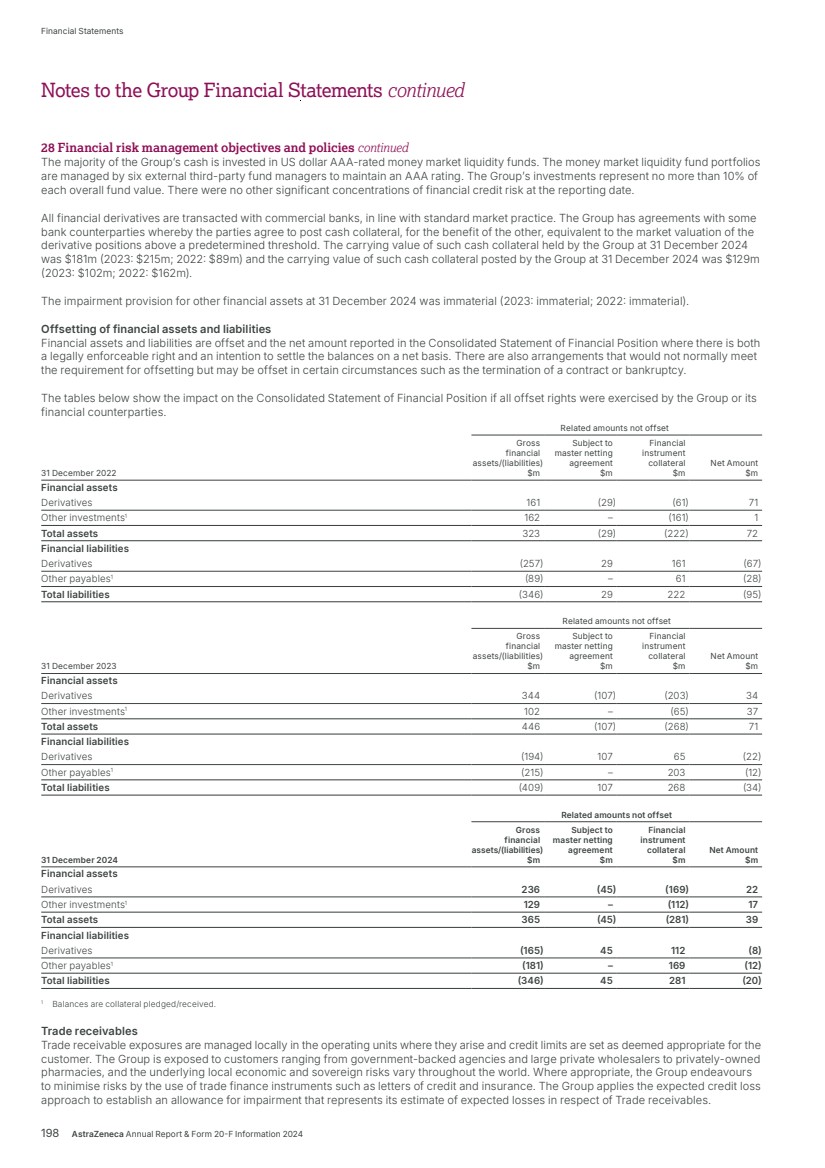
| The Group applies the IFRS 9 simplified approach to measuring expected credit losses which uses a lifetime expected loss allowance to Trade receivables. To measure expected credit losses, Trade receivables have been grouped based on shared credit characteristics and the days past due. The expected loss rates are based on payment profiles over a period of 36 months before 31 December 2024, 31 December 2023, or 31 December 2022 respectively and the corresponding historical credit losses experienced within this period. The historical loss rates are adjusted to reflect current and forward-looking information on macroeconomic factors affecting the ability of the customer to settle the receivables. On that basis, the loss allowance was determined as follows: 0-90 days 90-180 days Over 180 days 31 December 2022 Current past due past due past due Total Expected loss rate 0.03% 0.3% 32.0% 40.6% Gross carrying amount ($m) 6,791 331 50 99 7,271 Loss allowance ($m) 2 1 16 40 59 0-90 days 90-180 days Over 180 days 31 December 2023 Current past due past due past due Total Expected loss rate 0.01% 0.3% 0.8% 15.0% Gross carrying amount ($m) 7,709 342 121 280 8,452 Loss allowance ($m) 1 1 1 42 45 0-90 days 90-180 days Over 180 days 31 December 2024 Current past due past due past due Total Expected loss rate 0.01% 0.6% 3.5% 7.0% Gross carrying amount ($m) 7,679 171 86 399 8,335 Loss allowance ($m) 1 1 3 28 33 Trade receivables are written off where there is no reasonable expectation of recovery. Impairment losses on Trade receivables are presented as net impairment losses within Operating profit, any subsequent recoveries are credited against the same line. In the US, sales to three wholesalers accounted for approximately 74% (2023: 80%; 2022: 73%) of US sales. The movements of the Group expected credit losses provision are as follows: 2024 2023 2022 $m $m $m At 1 January 45 59 23 Net movement recognised in the Consolidated Statement of Comprehensive Income (3) (14) 37 Amounts utilised, exchange and other movements (9) – (1) At 31 December 33 45 59 Given the profile of our customers, including large wholesalers and government-backed agencies, no further credit risk has been identified with the Trade receivables not past due other than those balances for which an allowance has been made. Hedge accounting The Group uses foreign currency borrowings, foreign currency forwards and swaps, currency options, interest rate swaps and cross-currency interest rate swaps for the purpose of hedging its foreign currency and interest rate risks. The Group may designate certain financial instruments as fair value hedges, cash flow hedges or net investment hedges in accordance with IFRS 9. Hedge effectiveness is determined at the inception of the hedge relationship, and through periodic prospective effectiveness assessments to ensure that an economic relationship exists between the hedged item and hedging instrument. Sources of hedge effectiveness will depend on the hedge relationship designation but may include: • a significant change in the credit risk of either party to the hedging relationship • a timing mismatch between the hedging instrument and the hedged item • movements in foreign currency basis spread for derivatives in a fair value hedge • a significant change in the value of the foreign currency-denominated net assets of the Group in a net investment hedge. The hedge ratio for each designation will be established by comparing the quantity of the hedging instrument and the quantity of the hedged item to determine their relative weighting, for all of the Group’s existing hedge relationships the hedge ratio has been determined as 1:1. Designated hedges are expected to be effective and therefore the impact of ineffectiveness on profit and loss not expected to be material. The accounting treatment for fair value hedges and debt designated as FVPL is disclosed in the Bank and other borrowings accounting policy in the Group accounting policies section on page 158. Notes to the Group Financial Statements AstraZeneca Annual Report & Form 20-F Information 2024 199 Strategic Report Corporate Governance Financial Statements Additional Information |
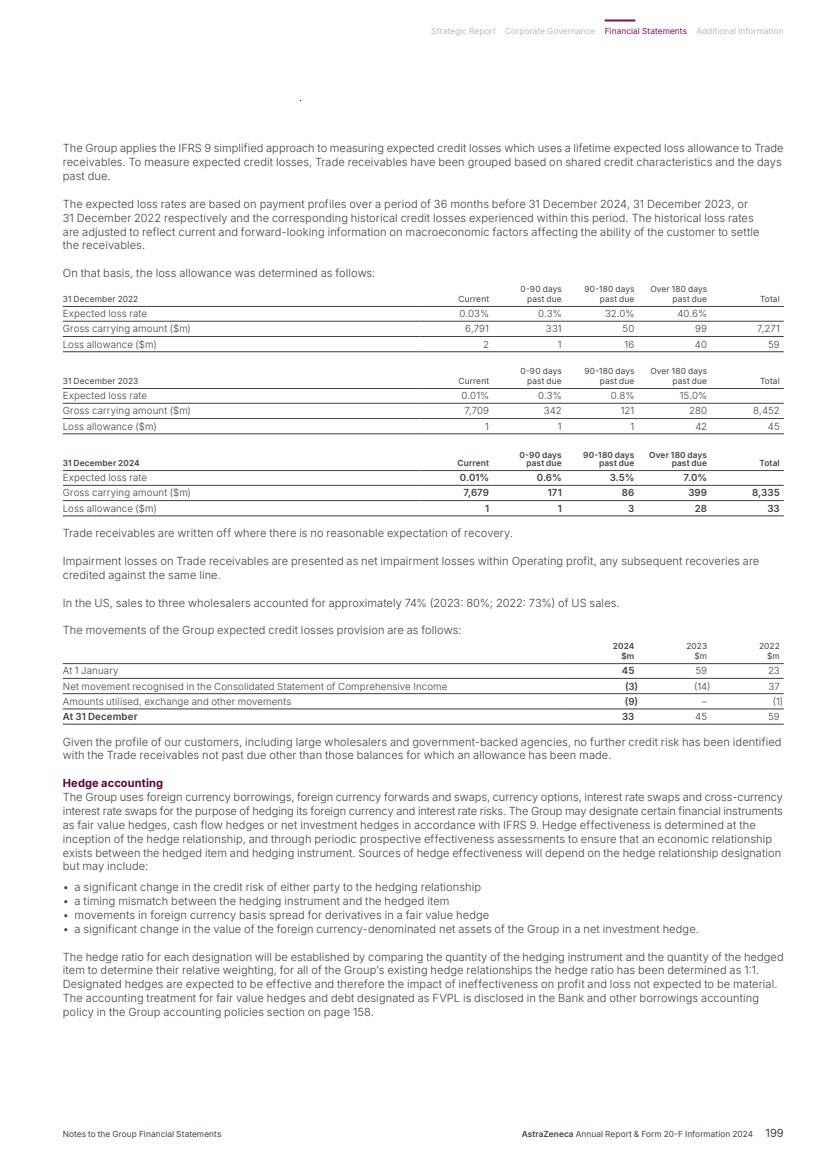
| The following table represents the Group’s continuing designated hedge relationships under IFRS 9. 2022 Other comprehensive income Fair value (gain)/loss Opening Fair value recycled Closing Nominal balance (gain)/loss to the balance Average amounts Carrying 1 January deferred Income 31 December Average Average pay in local value 2022 to OCI statement 2022 maturity USD FX interest currency $m $m $m $m $m year rate rate Cash flow hedges – foreign currency and interest rate risk1,3,4 Cross-currency interest rate swaps – Euro bonds EUR 1,700m (160) 27 118 (111) 34 2026 1.14 USD 2.85% FX Forwards – short-term FX risk USD 1,126m (12) (12) (14) 38 12 2023 – – Net investment hedge – foreign exchange risk2,3 Transactions matured pre-2022 – (527) – – (527) – – – Cross-currency interest rate swap – JPY investment JPY 58.3bn 55 (62) 7 – (55) 2029 108.03 JPY 1.53% Cross-currency interest rate swap – CNY investment CNY 458m (4) 2 2 – 4 2026 6.68 CNY 4.80% Foreign currency borrowing – GBP investment GBP 350m 420 (238) (50) – (288) 2031 n/a GBP 5.75% Foreign currency borrowing – EUR investment5 EUR 800m 846 (50) (52) – (102) 2029 n/a EUR 0.38% Contingent consideration liabilities and Acerta Pharma share purchase liability – AZUK and AZAB USD investments USD 2,093m (2,093) 1,832 384 – 2,216 – – – 2023 Other comprehensive income Fair value (gain)/loss Opening Fair value recycled Closing Nominal balance (gain)/loss to the balance Average amounts Carrying 1 January deferred Income 31 December Average Average pay in local value 2023 to OCI statement 2023 maturity USD FX interest currency $m $m $m $m $m year rate rate Cash flow hedges – foreign currency and interest rate risk1,3,4 Cross-currency interest rate swaps – Euro bonds EUR 3,200m 49 34 (210) 139 (37) 2027 1.10 USD 3.80% FX Forwards – short-term FX risk USD 2,009m 15 12 (33) 6 (15) 2024 – – Net investment hedge – foreign exchange risk2,3 Transactions matured pre-2023 – (527) – – (527) – – – Cross-currency interest rate swap – JPY investment JPY 58.3bn 100 (55) (45) – (100) 2029 108.03 JPY 1.53% Cross-currency interest rate swap – CNY investment CNY 458m (1) 4 (3) – 1 2026 6.68 CNY 4.80% Foreign currency borrowing – GBP investment GBP 350m 444 (288) 24 – (264) 2031 n/a GBP 5.75% Foreign currency borrowing – EUR investment5 EUR 800m 881 (102) 33 – (69) 2029 n/a EUR 0.38% Contingent consideration liabilities and Acerta Pharma share purchase liability – AZUK and AZAB USD investments USD 1,937m (1,937) 2,216 (81) – 2,135 – – – 2024 Other comprehensive income Fair value (gain)/loss Opening Fair value recycled Closing Nominal balance (gain)/loss to the balance Average amounts Carrying 1 January deferred Income 31 December Average Average pay in local value 2024 to OCI statement 2024 maturity USD FX interest currency $m $m $m $m $m year rate rate Cash flow hedges – foreign currency and interest rate risk1,3,4 Cross-currency interest rate swaps – Euro bonds EUR 2,300m (36) (37) 151 (180) (66) 2029 1.08 USD 4.24% FX Forwards – short-term FX risk USD 2,252m 4 (15) 8 3 (4) 2025 – – Net investment hedge – foreign exchange risk2,3 Transactions matured pre-2024 – (527) – – (527) – – – Cross-currency interest rate swap – JPY investment JPY 58.3bn 146 (100) (45) – (145) 2029 108.03 JPY 1.53% Cross-currency interest rate swap – CNY investment CNY 458m 2 1 (4) – (3) 2026 6.68 CNY 4.80% Foreign currency borrowing – GBP investment GBP 350m 438 (264) (7) – (271) 2031 n/a GBP 5.75% Foreign currency borrowing – EUR investment5 EUR 800m 829 (69) (52) – (121) 2029 n/a EUR 0.38% Contingent consideration liabilities and Acerta Pharma share purchase liability – AZUK and AZAB USD investments USD 1,367m (1,367) 2,135 181 – 2,316 – – – 1 Hedge ineffectiveness recognised on swaps designated in a cash flow hedge during the period was $nil (2023: $nil; 2022: $nil). 2 Hedge ineffectiveness recognised on swaps designated in a net investment hedge during the period was $nil (2023: $nil; 2022: $nil). 3 Fair value movements on cross-currency interest rate swaps in cash flow hedge and net investment hedge relationships are shown inclusive of the impact of costs of hedging. 4 Nominal amount of FX forwards in a cash flow hedge of $2,252m represents the USD equivalent notional of the FX forwards. By currency, the nominal amounts were SEK 10,792m at FX rate 10.9999, JPY 31,013m at 156.195, GBP 168m at 0.7962 and EUR 375m at 0.9605. All FX forwards in a cash flow hedge mature on 27 January 2025. 5 The EUR 800m 0.375% 2029 Non-callable bond is designated in a net investment hedge of the foreign currency exposure in relation to an equivalent amount of EUR-denominated net assets. Notes to the Group Financial Statements continued 28 Financial risk management objectives and policies continued 200 AstraZeneca Annual Report & Form 20-F Information 2024 Financial Statements |
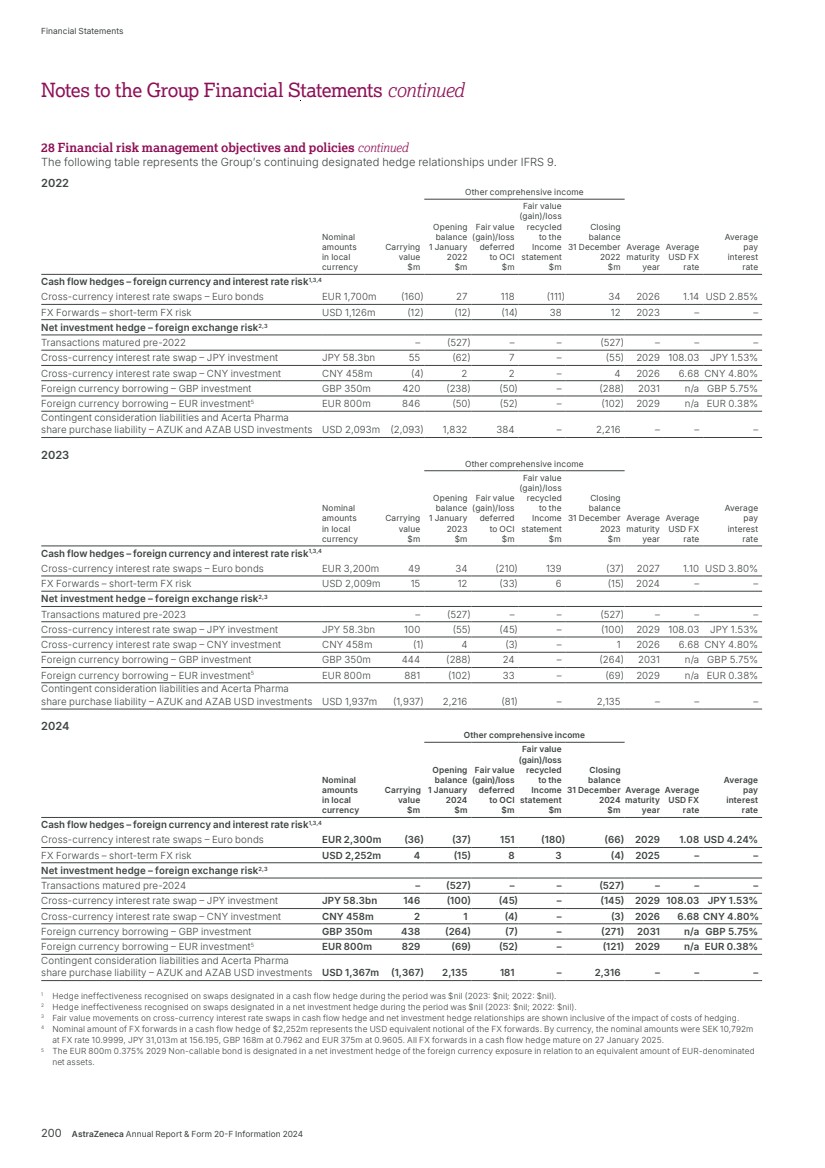
| Key controls applied to transactions in derivative financial instruments are to use only instruments where good market liquidity exists, to revalue all financial instruments regularly using current market rates and to sell options only to offset previously purchased options or as part of a risk management strategy. The Group is not a net seller of options, and does not use derivative financial instruments for speculative purposes. The Group held no options during the reporting period. The table below summarises the change in the fair value of hedging instruments and the hedged item designated in a fair value hedging relationship used to calculate ineffectiveness in the period. The hedge relates to the EUR 2030 and EUR 2033 bonds issued during 2024, consequently there are no prior year comparatives. Change in fair value Change in fair value Hedge Nominal of hedging instrument of hedged item ineffectiveness amounts in used to calculate used to calculate recognised in As at 31 December 2024 currency ineffectiveness ineffectiveness profit and loss Interest rate and foreign currency risk on finance debt EUR 1,400m (56) 54 (2) 29 Employee costs and share plans for employees Employee costs The monthly average number of people, to the nearest hundred, employed by the Group is set out in the table below. In accordance with the Companies Act 2006, this includes part-time employees. 2024 2023 2022 Employees UK 11,100 10,700 9,800 Rest of Europe 25,500 23,000 20,600 The Americas 24,700 22,400 20,900 Asia, Africa & Australasia 31,600 30,300 30,700 Continuing operations 92,900 86,400 82,000 Geographical distribution described in the table above is by location of legal entity employing staff. Certain staff will undertake some or all of their activity in a different location. The number of people employed by the Group at the end of 2024 was 94,300 (2023: 89,900; 2022: 83,500). The costs incurred during the year in respect of these employees were: 2024 2023 2022 $m $m $m Wages and salaries 10,340 9,341 8,656 Social security costs 1,224 1,100 991 Pension costs 614 537 546 Other employment costs 1,531 1,357 1,338 Total 13,709 12,335 11,531 Severance costs of $283m are not included above (2023: $123m; 2022: $227m). The charge for share-based payments in respect of share plans is $660m (2023: $579m; 2022: $619m). Payments totalling $354m made to the EBT upon the vesting of share awards are recognised within operating cash flows, reflecting the substance of the arrangement in place between the Group and the Trust prior to 10 June 2024. Following an amendment to the EBT on that date, AstraZeneca obtained control and commenced consolidation of the EBT from June 2024 onward. Consequently, $81m in cash used by the EBT for purchasing shares since 10 June 2024 is now presented within financing cash flows. The plans are equity settled. The Directors believe that, together with the basic salary system, the Group’s employee incentive schemes provide competitive and market-related packages to motivate employees. They should also align the interests of employees with those of shareholders, as a whole, through long-term share ownership in the Company. The Group’s current US, UK and Swedish schemes are described below; other arrangements apply elsewhere. Bonus and share plans US In the US, there are two employee short-term performance bonus plans in operation to differentiate and reward strong individual performance. Performance bonuses are paid in cash. The AstraZeneca Performance Share Plan and the AstraZeneca Global Restricted Share Plan operate in respect of relevant employees in the US. AstraZeneca ADRs necessary to satisfy the awards are purchased on the market or funded via a trust. UK The AstraZeneca UK Performance Bonus Plan Employees of participating AstraZeneca UK companies are invited to participate in this bonus plan, which rewards strong individual performance. Bonuses are paid in cash. Notes to the Group Financial Statements AstraZeneca Annual Report & Form 20-F Information 2024 201 Strategic Report Corporate Governance Financial Statements Additional Information |
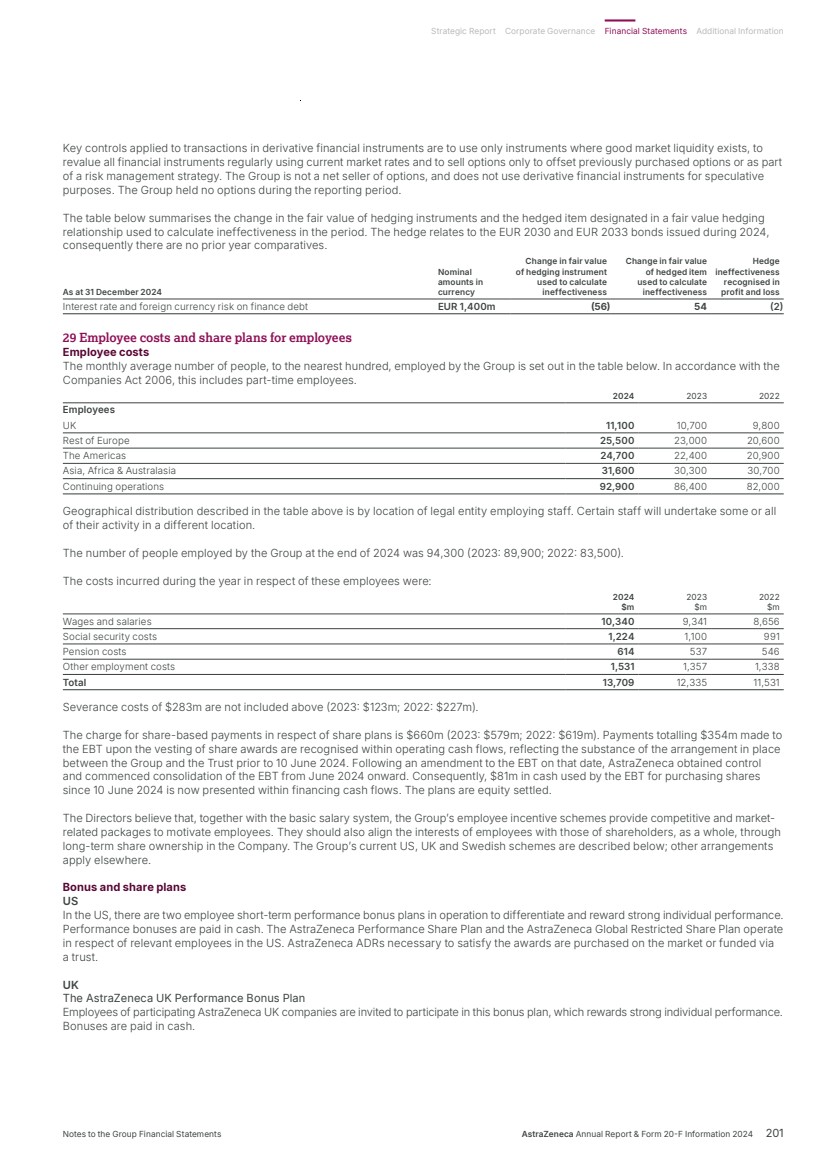
| The AstraZeneca UK All-Employee Share Plans AstraZeneca Share Incentive Plan (SIP) The Company offers UK employees the opportunity to buy Partnership Shares (Ordinary Shares). Employees may invest up to £150 a month to purchase Partnership Shares in the Company at the current market value. In 2010, the Company introduced a Matching Share element, the first award of which was made in 2011. Currently one Matching Share is awarded for every four Partnership Shares purchased. Partnership Shares and Matching Shares are held in the HM Revenue & Customs (HMRC)-approved All-Employee Share Plan. At the Company’s AGM in 2002, shareholders approved the issue of new shares for the purposes of the All-Employee Share Plan. AstraZeneca Sharesave Plan The Company provides UK employees with the opportunity to participate in the HMRC-approved Sharesave Plan. Employees can choose between a 3-year or 5-year savings contract, allowing them to contribute a minimum of £5 and a maximum of £500 per month. At the end of the savings term, participants have the option to purchase AstraZeneca shares at a predetermined share price, offering a valuable opportunity to invest in the Company’s future. Sweden In Sweden, an all-employee performance bonus plan is in operation, which rewards strong individual performance. Bonuses are paid 50% into a fund investing in AstraZeneca equities and 50% in cash. The AstraZeneca Executive Annual Bonus Scheme, the AstraZeneca Performance Share Plan and the AstraZeneca Global Restricted Stock Plan all operate in respect of relevant AstraZeneca employees in Sweden. Other bonus and share plans that operate across the Group are described below. The AstraZeneca Executive Annual Bonus Scheme This scheme is a performance bonus scheme for Directors and senior employees who do not participate in the AstraZeneca UK Performance Bonus Plan. Annual bonuses are paid in cash and reflect both corporate and individual performance measures. The Remuneration Committee has discretion to reduce or withhold bonuses if business performance falls sufficiently short of expectations in any year such as to make the payment of bonuses inappropriate. The AstraZeneca Deferred Bonus Plan This plan was introduced in 2006 and is used to defer a portion of the bonus earned under the AstraZeneca Executive Annual Bonus Scheme into Ordinary Shares in the Company for a period of three years. The plan currently operates only in respect of Executive Directors and members of the SET (with awards granted as AstraZeneca ADRs for members of SET employed within the US). Awards of shares under this plan are typically made in March each year, the first award having been made in February 2006. The AstraZeneca Performance Share Plan This plan was approved by shareholders in 2020 for a period of 10 years (subsequently amended by approval of shareholders in 2021) and replaces the 2014 AstraZeneca Performance Share Plan. Generally, awards can be granted at any time, but not during a closed period of the Company. The first grant of Performance Share Plan awards was made in May 2014 under the 2014 AstraZeneca Performance Share Plan. Awards granted under the plan vest after three years, or in the case of Executive Directors and members of the SET, after an additional two-year holding period, and is subject to the achievement of performance conditions. For awards granted to all participants in 2024, vesting is subject to a combination of measures focused on science and innovation, revenue growth, financial performance and carbon reduction. The Remuneration Committee has responsibility for agreeing any awards under the plan and for setting the policy for the way in which the plan should be operated, including agreeing performance targets and which employees should be eligible to participate. The AstraZeneca Investment Plan This plan was introduced in 2010 and approved by shareholders at the 2010 AGM. The final grant of awards under this plan took place in March 2016. Awards granted under the plan vest after eight years and are subject to performance conditions measured over a period of four years. The AstraZeneca Global Restricted Stock Plan The Global Restricted Stock Plan (GRSP) was introduced in 2010. This plan provides for the grant of restricted stock unit (RSU) awards to selected below SET-level employees and is used in conjunction with the AstraZeneca Performance Share Plan to provide a mix of RSUs and performance share units (PSUs). Awards typically vest on the third anniversary of the date of grant and are contingent on continued employment with the Company. The Remuneration Committee has responsibility for agreeing any awards under the plan and for setting the policy for the way in which the plan should be operated. The AstraZeneca Restricted Share Plan This plan was introduced in 2008 and provides for the grant of restricted stock unit (RSU) awards to key employees, excluding Executive Directors. Awards are made on an ad hoc basis with variable vesting dates. The plan has been used four times in 2024 to make awards to 537 employees. The Remuneration Committee has responsibility for agreeing any awards under the plan and for setting the policy for the way in which the plan should be operated. The AstraZeneca Extended Incentive Plan This plan was introduced in 2018 and provides for the grant of awards to key employees, excluding Executive Directors. Awards are made on an ad hoc basis and 50% of the award will normally vest on the fifth anniversary of grant, with the balance vesting on the tenth anniversary of grant. The award can be subject to the achievement of performance conditions. The Remuneration Committee has responsibility for agreeing any awards under the plan and for setting the policy for the way in which the plan should be operated, including agreeing performance targets (if any) and which employees should be invited to participate. Notes to the Group Financial Statements continued 29 Employee costs and share plans for employees continued 202 AstraZeneca Annual Report & Form 20-F Information 2024 Financial Statements |
| Details of share options outstanding during the year for the main share plans are shown below: The AstraZeneca Performance Share Plan The AstraZeneca Global Restricted Stock Plan The AstraZeneca Restricted Share Plan The AstraZeneca Extended Incentive Plan Ordinary Shares ADR Shares Ordinary Shares ADR Shares1 Ordinary Shares ADR Shares Ordinary Shares ADR Shares ʼ000 ʼ000 ʼ000 ʼ000 ʼ000 ʼ000 ʼ000 ʼ000 Outstanding at 1 January 2022 3,459 5,178 2,028 9,541 255 763 282 195 Granted 1,059 2,339 1,237 6,478 75 216 – – Forfeited (132) (570) (190) (1,627) (25) (136) (23) – Cancelled – – – (3) – – – – Exercised (756) (1,223) (606) (2,706) (72) (165) – – Outstanding at 31 December 2022 3,630 5,724 2,469 11,683 233 678 259 195 Granted 976 2,071 1,185 6,343 208 436 71 95 Forfeited (148) (437) (187) (1,417) (20) (59) (8) – Cancelled – – – (3) – – – (34) Exercised (813) (1,470) (570) (2,738) (86) (288) (107) (9) Outstanding at 31 December 2023 3,645 5,888 2,897 13,868 335 767 215 247 Granted 1,064 2,250 1,262 7,014 100 699 – – Forfeited (137) (400) (235) (1,414) (8) (57) (31) – Cancelled (2) (2) – (6) (1) – – – Exercised (999) (1,586) (755) (3,296) (88) (352) (22) – Outstanding at 31 December 2024 3,571 6,150 3,169 16,166 338 1,057 162 247 1 Shares issued to Alexion employees under the GRSP are covered under the Alexion employee share award below. The AstraZeneca Performance Share Plan The AstraZeneca Global Restricted Stock Plan The AstraZeneca Restricted Share Plan The AstraZeneca Extended Incentive Plan WAFV1 WAFV WAFV WAFV WAFV WAFV WAFV WAFV pence $ pence $ pence $ pence $ WAFV of 2022 grants 8328 55.73 9167 61.21 9894 63.35 – – WAFV of 2023 grants 9929 59.95 10822 65.38 11135 65.37 11748 74.78 WAFV of 2024 grants 9028 57.99 10085 64.91 11111 75.23 – – 1 Weighted average fair value. Alexion employee share award plan At acquisition in 2021 Alexion employee share awards were converted into AstraZeneca restricted stock awards that continue to have, and shall be subject to, the same terms and conditions as applied in the corresponding Alexion awards immediately prior to completion. The fair value at the grant date was $57.54 and of the 15,220,000 shares outstanding at 31 December 2021, 8,627,000 were exercised and 980,000 were forfeited during 2022. During 2022, Alexion employees had the option to defer awards due to vest in July 2022 until February 2023 when they would also receive an additional vest equivalent to 15% of the shares deferred. As a result, 1,780,000 shares were deferred, resulting in an additional 267,000 shares being issued with a grant date fair value of $65.62, that vested in 2023. During 2023, 2,060,000 shares vested, 531,000 were forfeited/cancelled and the closing balance of these awards as of 31 December 2023 was 3,022,000. During 2024, 2,047,000 shares vested, 156,000 were forfeited and the closing balance of these awards as of 31 December 2024 was 819,000. The weighted average fair value for awards granted under the AstraZeneca Performance Share Plan is primarily based on the market price at the point of grant adjusted for the market-based performance elements which are valued using a Monte Carlo valuation model. The fair values of all other plans are set using the market price at the point of award. These awards are settled in equity including dividends accumulated from the date of award to vesting. 30 Commitments, contingent liabilities and contingent assets 2024 2023 2022 Commitments $m $m $m Contracts placed for future capital expenditure on Property, plant and equipment and software development costs not provided for in these Financial Statements 1,575 1,368 502 Guarantees and contingencies arising in the ordinary course of business, for which no security has been given, are not expected to result in any material financial loss. Research and development collaboration payments The Group has various ongoing collaborations, including in-licensing and similar arrangements with development partners. Such collaborations may require the Group to make payments on achievement of stages of development, launch or revenue milestones, although the Group generally has the right to terminate these agreements at no cost. The Group recognises research and development milestones as an intangible asset once it is committed to payment, which is generally when the Group reaches set trigger points in the development cycle. Revenue-related milestones are recognised as intangible assets on product launch at a value based on the Group’s long-term revenue forecasts for the related product. The table below indicates potential development and revenue-related payments that the Group may be required to make under such collaborations. Years 5 Total Under 1 year Years 1 and 2 Years 3 and 4 and greater $m $m $m $m $m Future potential research and development milestone payments 11,213 1,993 2,823 3,291 3,106 Future potential revenue milestone payments 22,064 41 1,166 3,026 17,831 Notes to the Group Financial Statements AstraZeneca Annual Report & Form 20-F Information 2024 203 Strategic Report Corporate Governance Financial Statements Additional Information |
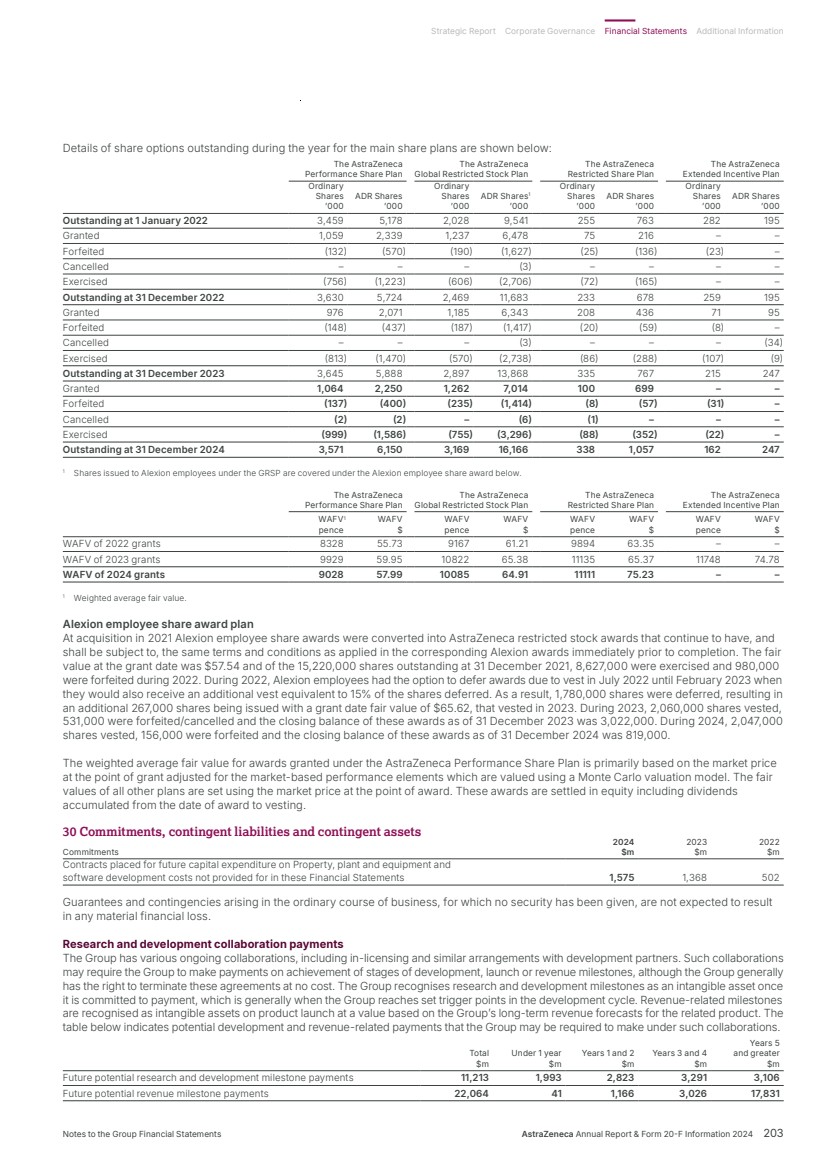
| The table includes all potential payments for achievement of milestones under ongoing research and development arrangements. Revenue-related milestone payments represent the maximum possible amount payable on achievement of specified levels of revenue as set out in individual contract agreements, but exclude variable payments that are based on unit sales (e.g. royalty-type payments) which are expensed as the associated sale is recognised. The table excludes any payments already capitalised in the Financial Statements for the year ended 31 December 2024 which have been capitalised with reference to the latest Group sales forecasts for approved indications. The future payments we disclose represent contracted payments and, as such, are not discounted and are not risk-adjusted. As detailed in the Risk Overview section from page 64, the development of any pharmaceutical product candidate is a complex and risky process that may fail at any stage in the development process due to a number of factors (including items such as failure to obtain regulatory approval, unfavourable data from key studies, adverse reactions to the product candidate or indications of other safety concerns). The timing of the payments is based on the Group’s current best estimate of achievement of the relevant milestone. Environmental costs and liabilities The Group’s expenditure on environmental protection, including both capital and revenue items, relates to costs that are necessary for implementing internal systems and programmes, and meeting legal and regulatory requirements for processes and products. This includes investment to conserve natural resources and otherwise minimise the impact of our activities on the environment. They are an integral part of normal ongoing expenditure for carrying out the Group’s research, manufacturing and commercial operations and are not separated from overall operating and development costs. There are no known changes in legal, regulatory or other requirements resulting in material changes to the levels of expenditure for 2022, 2023 or 2024. In addition to expenditure for meeting current and foreseen environmental protection requirements, the Group incurs costs in investigating and cleaning up legacy land and groundwater contamination. In particular, AstraZeneca has environmental liabilities at some currently or formerly owned, leased and third-party sites. In the US, Zeneca Inc., and/or its indemnitees, have been named as potentially responsible parties (PRPs) or defendants at a number of sites where Zeneca Inc. is likely to incur future environmental investigation, remediation, operation and maintenance costs under federal, state, statutory or common law environmental liability allocation schemes (together, US Environmental Consequences). Similarly, Stauffer Management Company LLC (SMC), which was established to own and manage certain assets and liabilities of Stauffer Chemical Company, and/ or its indemnitees, have been named as PRPs or defendants at a number of sites where SMC is likely to incur US Environmental Consequences. AstraZeneca has also given indemnities to third parties for a number of sites outside the US. These environmental liabilities arise from legacy operations that are not currently part of the Group’s business and, at most of these sites, remediation, where required, is either completed or in progress. AstraZeneca has made provisions for the estimated costs of future environmental investigation, remediation, operation and maintenance activity beyond normal ongoing expenditure for maintaining the Group’s R&D and manufacturing capacity and product ranges, where a present obligation exists, it is probable that such costs will be incurred and they can be estimated reliably. With respect to such estimated future costs, there were provisions at 31 December 2024 in the aggregate of $105m (2023: $112m; 2022: $131m), mainly relating to the US. Where we are jointly liable or otherwise have cost-sharing agreements with third parties, we reflect only our share of the obligation. Where the liability is insured in part or in whole by insurance or other arrangements for reimbursement, an asset is recognised to the extent that this recovery is virtually certain. It is possible that AstraZeneca could incur future environmental costs beyond the extent of our current provisions. The extent of such possible additional costs is inherently difficult to estimate due to a number of factors, including: (1) the nature and extent of claims that may be asserted in the future; (2) whether AstraZeneca has or will have any legal obligation with respect to asserted or unasserted claims; (3) the type of remedial action, if any, that may be selected at sites where the remedy is presently not known; (4) the potential for recoveries from or allocation of liability to third parties; and (5) the length of time that the environmental investigation, remediation and liability allocation process can take. As per our provisions accounting policy on page 159, Provisions for these costs are made when there is a present obligation and where it is probable that expenditure on remedial work will be required and a reliable estimate can be made of the cost. Notwithstanding and subject to the foregoing, we estimate the potential additional loss for future environmental investigation, remediation, remedial operation and maintenance activity above and beyond our provisions to be, in aggregate, between $113m and $190m (2023: $114m and $191m; 2022: $113m and $188m) which relates mainly to the US. Legal proceedings AstraZeneca is involved in various legal proceedings considered typical to its business, including actual or threatened litigation and actual or potential government investigations relating to employment matters, product liability, commercial disputes, pricing, sales and marketing practices, infringement of IP rights, and the validity of certain patents and competition laws. The more significant matters are discussed below. Most of the claims involve highly complex issues. Often these issues are subject to substantial uncertainties and, therefore, the probability of a loss, if any, being sustained and/or an estimate of the amount of any loss is difficult to ascertain. Unless specifically identified below that a provision has been taken, AstraZeneca considers each of the claims to represent a contingent liability and discloses information with respect to the nature and facts of the cases in accordance with IAS 37 ‘Provisions, Contingent Liabilities and Contingent Assets’. We do not believe that disclosure of the amounts sought by plaintiffs, if known, would be meaningful with respect to these legal proceedings. This is due to a number of factors, including (i) the stage of the proceedings (in many cases trial dates have not been set) and the overall length and extent of pre-trial discovery; (ii) the entitlement of the parties to an action to appeal a decision; (iii) clarity as to theories of liability, damages and governing law; (iv) uncertainties in timing of litigation; and (v) the possible need for further legal proceedings to establish the appropriate amount of damages, if any. 30 Commitments, contingent liabilities and contingent assets continued Notes to the Group Financial Statements continued 204 AstraZeneca Annual Report & Form 20-F Information 2024 Financial Statements |
| While there can be no assurance regarding the outcome of any of the legal proceedings referred to in this Note 30, based on management’s current and considered view of each situation, we do not currently expect them to have a material adverse effect on our financial position including within the next financial year. This position could of course change over time, not least because of the factors referred to above. In cases that have been settled or adjudicated, or where quantifiable fines and penalties have been assessed and which are not subject to appeal (or other similar forms of relief), or where a loss is probable and we are able to make a reasonable estimate of the loss, we generally indicate the loss absorbed or make a provision for our best estimate of the expected loss. Where it is considered that the Group is more likely than not to prevail, legal costs involved in defending the claim are charged to profit and loss as they are incurred. Where it is considered that the Group has a valid contract which provides the right to reimbursement (from insurance or otherwise) of legal costs and/or all or part of any loss incurred or for which a provision has been established, and we consider recovery to be virtually certain, the best estimate of the amount expected to be received is recognised as an asset. KJ Assessments as to whether or not to recognise provisions or assets, and of the amounts concerned, usually involve a series of complex judgements about future events and can rely heavily on estimates and assumptions. AstraZeneca believes that the provisions recorded are adequate based on currently available information and that the insurance recoveries recorded will be received. However, given the inherent uncertainties involved in assessing the outcomes of these cases, and in estimating the amount of the potential losses and the associated insurance recoveries, we could in the future incur judgments or insurance settlements that could have a material adverse effect on our results in any particular period. IP claims include challenges to the Group’s patents on various products or processes and assertions of non-infringement of patents. A loss in any of these cases could result in loss of patent protection on the related product. The consequences of any such loss could be a significant decrease in Product Sales, which could have a material adverse effect on our results. The lawsuits filed by AstraZeneca for patent infringement against companies that have filed abbreviated new drug applications (ANDAs) in the US, seeking to market generic forms of products sold by the Group prior to the expiry of the applicable patents covering these products, typically also involve allegations of non-infringement, invalidity and unenforceability of these patents by the ANDA filers. In the event that the Group is unsuccessful in these actions or the statutory 30-month stay expires before a ruling is obtained, the ANDA filers involved will also have the ability, subject to FDA approval, to introduce generic versions of the product concerned. AstraZeneca has full confidence in, and will vigorously defend and enforce, its IP. Over the course of the past several years, including in 2024, a significant number of commercial litigation claims in which AstraZeneca is involved have been resolved, particularly in the US, thereby reducing potential contingent liability exposure arising from such litigation. Similarly, in part due to patent litigation and settlement developments, greater certainty has been achieved regarding possible generic entry dates with respect to some of our patented products. At the same time, like other companies in the pharmaceutical sector and other industries, AstraZeneca continues to be subject to government investigations around the world. Patent litigation Legal proceedings brought against AstraZeneca Enhertu patent proceedings Considered to be a contingent liability US • In October 2020, Seagen Inc. (Seagen) filed a complaint against Daiichi Sankyo Company, Limited (Daiichi Sankyo) in the US District Court for the Eastern District of Texas (District Court) alleging that Enhertu infringes a Seagen patent. AstraZeneca co-commercialises Enhertu with Daiichi Sankyo, Inc. in the US. After trial in April 2022, the jury found that the patent was infringed and awarded Seagen $41.82m in past damages. In July 2022, the District Court entered final judgment and declined to enhance damages on the basis of wilfulness. In October 2023, the District Court entered an amended final judgment that requires Daiichi Sankyo to pay Seagen a royalty of 8% on US sales of Enhertu from 1 April 2022 through to 4 November 2024, in addition to the past damages previously awarded by the District Court. AstraZeneca and Daiichi Sankyo have appealed the District Court’s decision. • In December 2020 and January 2021, AstraZeneca and Daiichi Sankyo, Inc. filed post-grant review (PGR) petitions with the US Patent and Trademark Office (USPTO) alleging, among other things, that the Seagen patent is invalid for lack of written description and enablement. The USPTO initially declined to institute the PGRs, but, in April 2022, the USPTO granted the rehearing requests and instituted both PGR petitions. Seagen subsequently disclaimed all patent claims at issue in one of the PGR proceedings. In July 2022, the USPTO reversed its institution decision and declined to institute the other PGR petition. AstraZeneca and Daiichi Sankyo, Inc. requested reconsideration of the decision not to institute review of the patent. In February 2023, the USPTO reinstituted the PGR proceeding. In February 2024, the USPTO issued a decision that the claims were unpatentable. Seagen has appealed this decision; the USPTO has intervened in the appeal. Faslodex patent proceedings Matter concluded Japan • In 2021, in Japan, AstraZeneca received notice from the Japan Patent Office (JPO) that Sandoz K.K. (Sandoz) and Sun Pharma Japan Ltd. (Sun) were seeking to invalidate the Faslodex formulation patent. • AstraZeneca defended the challenged patent and Sun withdrew from the JPO patent challenge. • In July 2023, the JPO issued a final decision upholding various claims of the challenged patent and determining that other patent claims were invalid. • In August 2023, Sandoz appealed the JPO decision to the Japan IP High Court (High Court). • In October 2024, the High Court affirmed the decision by the JPO. • This matter is now concluded. Notes to the Group Financial Statements AstraZeneca Annual Report & Form 20-F Information 2024 205 Strategic Report Corporate Governance Financial Statements Additional Information |
| Forxiga patent proceedings Considered to be a contingent liability UK • In the UK, one of AstraZeneca’s patents relating to Forxiga is being challenged by Generics (UK) Limited, Teva Pharmaceutical Industries Limited, and Glenmark Pharmaceuticals Europe Limited. • Trial is scheduled for March 2025. Soliris patent proceedings Considered to be a contingent liability Turkey • In November 2024, Salute HC İlaçları Sanayi ve Ticaret A.Ş (Salute) served an action in the Industrial and Intellectual Property Rights Court in Istanbul, Turkey seeking to invalidate and enjoin enforcement of Alexion’s patent relating to eculizumab. Tagrisso patent proceedings Considered to be a contingent liability US • In September 2021, Puma Biotechnology, Inc. (Puma) and Wyeth LLC (Wyeth) filed a patent infringement lawsuit in the US District Court for the District of Delaware (District Court) against AstraZeneca relating to Tagrisso. • In March 2024, the District Court dismissed Puma. • The jury trial, with Wyeth as the plaintiff, took place in May 2024. The jury found Wyeth’s patents infringed and awarded Wyeth $107.5m in past damages. The jury also found that the infringement was not wilful. • In proceedings following the jury award, the District Court rejected AstraZeneca’s indefiniteness and equitable defences but granted judgment as a matter of law in favour of AstraZeneca on the grounds that the patents were invalid for lack of written description and enablement. • Wyeth has filed an appeal. Legal proceedings brought by AstraZeneca Brilinta patent proceedings Considered to be a contingent asset US • In 2015 and subsequently, in response to Paragraph IV notices from ANDA filers, AstraZeneca filed patent infringement lawsuits in the US District Court for the District of Delaware (District Court). In its complaints, AstraZeneca alleged that a generic version of Brilinta, if approved and marketed, would infringe patents that are owned or licensed by AstraZeneca. • In 2024, AstraZeneca entered into separate settlements and the District Court entered consent judgments to dismiss each of the corresponding litigations. Additional proceedings are ongoing in the District Court. • No trial date has been set. Calquence patent proceedings Considered to be a contingent asset US • In February 2022, in response to Paragraph IV notices from multiple ANDA filers, AstraZeneca filed patent infringement lawsuits in the US District Court for the District of Delaware (District Court). In its complaints, AstraZeneca alleged that a generic version of Calquence capsules, if approved and marketed, would infringe patents that are owned or licensed by AstraZeneca. • In 2024, AstraZeneca entered into settlement agreements with all five generic manufacturers, resolving the Calquence capsule ANDA litigation proceedings. • AstraZeneca received Paragraph IV notices relating to patents listed in the FDA Orange Book with reference to Calquence tablets from Cipla USA, Inc. and Cipla Limited (collectively, Cipla) in April 2024 and from MSN Pharmaceuticals Inc. and MSN Laboratories Pvt. Ltd. (collectively, MSN) in November 2024. • In response to these Paragraph IV notices, AstraZeneca filed patent infringement lawsuits against Cipla in May 2024 and against MSN in January 2025 in the District Court. In the complaints, AstraZeneca alleges that a generic version of Calquence tablets, if approved and marketed, would infringe patents that are owned or licensed by AstraZeneca. No trial date has been scheduled. Daliresp patent litigation Considered to be a contingent asset US • In 2015 and subsequently, in response to Paragraph IV notices from ANDA filers, AstraZeneca filed patent infringement lawsuits in the US District Court for the District of New Jersey (District Court) relating to patents listed in the FDA Orange Book with reference to Daliresp. • In 2022, AstraZeneca entered into a settlement agreement and the District Court entered a consent judgment to dismiss the corresponding litigation. Additional ANDA challenges are pending. Farxiga patent proceedings Considered to be a contingent asset US • In May 2021, AstraZeneca proceeded to trial against ANDA filer Zydus Pharmaceuticals (USA) Inc. (Zydus) in the US District Court for the District of Delaware (District Court). In October 2021, the District Court issued a decision finding the asserted claims of AstraZeneca’s patent as valid and infringed by Zydus’s ANDA product. In August 2022, Zydus appealed the District Court decision. Zydus’s appeal has been dismissed. • In December 2023, AstraZeneca initiated ANDA litigation against Sun Pharmaceutical Industries Ltd. and Sun Pharmaceutical Industries, Inc. in the District Court. No trial date has been set. Lokelma patent proceedings Considered to be a contingent asset US • In August 2022, in response to Paragraph IV notices, AstraZeneca initiated ANDA litigation against multiple generic filers in the US District Court for the District of Delaware (District Court). AstraZeneca alleged that a generic version of Lokelma would infringe patents that are owned or licensed by AstraZeneca. • AstraZeneca has entered into separate settlement agreements with four generic manufacturers which resulted in dismissal of the corresponding litigations. • Additional proceedings with the remaining generic manufacturer are ongoing in the District Court. Trial is scheduled for March 2025. 30 Commitments, contingent liabilities and contingent assets continued Notes to the Group Financial Statements continued 206 AstraZeneca Annual Report & Form 20-F Information 2024 Financial Statements |
| Lynparza patent proceedings Considered to be a contingent asset US • AstraZeneca received a Paragraph IV notice relating to Lynparza patents from Natco Pharma Limited (Natco) in December 2022, Sandoz Inc. (Sandoz) in December 2023, Cipla USA, Inc. and Cipla Limited (collectively, Cipla) in May 2024, and Zydus Pharmaceuticals (USA) Inc. (Zydus) in November 2024. In response to these Paragraph IV notices, AstraZeneca, MSD International Business GmbH, and the University of Sheffield initiated ANDA litigations against Natco, Sandoz, Cipla, and Zydus in the US District Court for the District of New Jersey. In the complaints, AstraZeneca alleged that the defendants’ generic versions of Lynparza, if approved and marketed, would infringe AstraZeneca’s patents. • No trial date has been scheduled. Soliris patent proceedings Considered to be a contingent asset Canada • In May 2023, Alexion initiated patent litigation in Canada alleging that Amgen Pharmaceuticals, Inc.’s (Amgen) biosimilar eculizumab product will infringe Alexion patents. • In September 2023, Alexion initiated patent litigations in Canada alleging that Samsung Bioepis Co. Ltd.’s (Samsung) biosimilar eculizumab product will infringe Alexion patents. The filing of the litigation triggered an automatic 24-month stay of the approval of each defendant’s biosimilar eculizumab product. • Trial against Amgen is scheduled to begin in January 2025 while trial against Samsung is scheduled to begin in June 2025. • In July and August 2023, in Canada, both Amgen and Samsung brought actions challenging the validity of Alexion’s patent relating to the use of eculizumab in treating aHUS. Trial is scheduled for November 2025. Soliris patent proceedings Matter concluded US • In January 2024, Alexion initiated patent infringement litigation against Samsung Bioepis Co. Ltd. (Samsung) in the US District Court for the District of Delaware (District Court) alleging that Samsung’s biosimilar eculizumab product, for which Samsung is currently seeking FDA approval, will infringe six Soliris-related patents. • Five of the six asserted patents were also the subject of inter partes review proceedings before the US Patent and Trademark Office. • Alexion filed a motion for a preliminary injunction seeking to enjoin Samsung from launching its biosimilar eculizumab product upon FDA approval. The District Court denied Alexion’s motion and Alexion appealed that decision. • In August 2024, the parties reached resolution of the matter. All legal proceedings in the US courts have terminated as have the inter partes review proceedings. Soliris patent proceedings Considered to be a contingent asset Europe • In March 2024, Alexion filed motions for provisional measures against Amgen Pharmaceuticals Inc (Amgen) and Samsung Bioepis Co. Ltd. (Samsung) and their respective affiliates at the Hamburg Local Division of the Unified Patent Court (UPC) on the basis that Amgen’s and Samsung’s biosimilar eculizumab products infringe an Alexion patent. Alexion appealed and in December 2024 the UPC appellate division denied Alexion’s appeal requesting provisional measures. • In parallel, Samsung and Amgen have filed oppositions to the patent at the European Patent Office. • In November 2024, Amgen filed a revocation action for the patent at the UPC Central Division in Milan. Soliris patent proceedings Considered to be a contingent asset UK • In May 2024, Alexion initiated patent infringement proceedings against Amgen Ltd and Samsung Bioepis UK Ltd (Samsung UK) in the UK High Court of Justice alleging that their respective biosimilar eculizumab products infringe an Alexion patent; on the same day, Samsung UK initiated a revocation action for the same patent. • Trial has been scheduled for March 2025. Tagrisso patent proceedings Considered to be a contingent asset Russia • In Russia, in August 2023, AstraZeneca filed lawsuits in the Arbitration Court of the Moscow Region (Court) against the Ministry of Health of the Russian Federation and Axelpharm LLC (Axelpharm) related to Axelpharm’s improper use of AstraZeneca’s information to obtain authorisation to market a generic version of Tagrisso. In December 2023, the Court dismissed the lawsuit against the Ministry of Health of the Russian Federation. The appellate court affirmed the dismissal in March 2024. AstraZeneca filed a further appeal, which was dismissed in July 2024. The lawsuit against Axelpharm was dismissed in September 2024, and AstraZeneca appealed. • In November 2023, Axelpharm filed a compulsory licensing action against AstraZeneca in the Court related to a patent that covers Tagrisso. The compulsory licensing action remains pending. AstraZeneca has also challenged before the Russian Patent and Trademark Office (PTO) the validity of the Axelpharm patent on which the compulsory licensing action is predicated. In August 2024, the PTO determined that Axelpharm’s patent is invalid and, in November 2024, Axelpharm filed an appeal. • In July 2024, AstraZeneca filed a patent infringement lawsuit, which remains pending, and an unfair competition claim with the Federal Anti-Monopoly Service of Russia (FAS) against AxelPharm and others related to the securing of state contracts in Russia for its generic version of Osimertinib. • In August 2024, the FAS initiated an unfair competition case against Axelpharm and OncoTarget based on AstraZeneca’s unfair competition claim. In November 2024, the FAS determined that Axelpharm had committed unfair competition and that OncoTarget had not; the FAS ordered Axelpharm to cease sales of its generic osimertinib and pay the Russian government the income it received from its sales of its generic Osimertinib. In December 2024, Axelpharm appealed. Notes to the Group Financial Statements AstraZeneca Annual Report & Form 20-F Information 2024 207 Strategic Report Corporate Governance Financial Statements Additional Information |
| Product liability litigation Legal proceedings brought against AstraZeneca Farxiga and Xigduo XR Considered to be a contingent liability US • AstraZeneca has been named as a defendant in lawsuits involving plaintiffs claiming physical injury, including Fournier’s Gangrene and necrotising fasciitis, from treatment with Farxiga and/or Xigduo XR. In September 2023, the parties resolved by settlement agreement one case, filed in state court in Minnesota, previously scheduled for trial in October 2023. All remaining claims are filed in Delaware state court and remain pending, with the earliest trial scheduled for March 2026. Nexium and Prilosec A provision has been taken US • AstraZeneca has been defending lawsuits brought in federal and state courts involving claims that plaintiffs have been diagnosed with various injuries following treatment with proton pump inhibitors (PPIs), including Nexium and Prilosec. Most of the lawsuits alleged kidney injury. • In addition, AstraZeneca has been defending lawsuits involving allegations of gastric cancer following treatment with PPIs, including one such claim in the US District Court for the Middle District of Louisiana (District Court). • In October 2023, AstraZeneca resolved all pending claims in the MDL, as well as all pending claims in Delaware and New Jersey state courts, for $425m, for which a provision has been taken. • In December 2024, AstraZeneca resolved the sole remaining case, which had been pending in the District Court. Nexium and Losec Considered to be a contingent liability Canada • In Canada, in July and August 2017, AstraZeneca was served with three putative class action lawsuits. Two of the lawsuits have been dismissed, one in 2019 and one in 2021. • The third lawsuit seeks authorisation to represent individual residents in Canada who allegedly suffered kidney injuries from the use of proton pump inhibitors, including Nexium and Losec. No trial date has been scheduled. Onglyza and Kombiglyze Matter concluded US • In the US, AstraZeneca has been defending various lawsuits in both California state court and in a consolidated federal proceeding alleging heart failure, cardiac injuries, and/or death from treatment with Onglyza or Kombiglyze. In the California state court proceeding, the trial court granted summary judgment for AstraZeneca, which the California appellate court affirmed. The California Supreme Court has declined further review, and the California matter has concluded. • The consolidated federal cases were dismissed in August 2022 by the US District Court for the Eastern District of Kentucky. That dismissal was affirmed by the US Court of Appeals for the Sixth Circuit in February 2024. This matter is concluded. Vaxzevria Considered to be a contingent liability UK • AstraZeneca is defending lawsuits in multiple jurisdictions, including the UK, involving multiple claimants alleging injuries following vaccination with AstraZeneca’s COVID-19 vaccine. Most of the lawsuits involve claims of thrombosis with thrombocytopenia syndrome. • No trial dates have been scheduled. Commercial litigation Legal proceedings brought against AstraZeneca 340B Antitrust litigation Considered to be a contingent liability US • In September 2021, AstraZeneca was served with a class-action antitrust complaint filed in the US District Court for the Western District of New York (District Court) by Mosaic Health alleging a conspiracy to restrict access to 340B discounts in the diabetes market through contract pharmacies. In September 2022, the District Court granted AstraZeneca’s motion to dismiss the Complaint. In February 2024, the District Court denied Plaintiffs’ request to file an amended complaint and entered an order closing the matter. • In March 2024, Plaintiffs filed an appeal. Amyndas Trade Secrets Litigation Considered to be a contingent liability US • AstraZeneca has been defending a matter filed by Amyndas Pharmaceuticals Member P.C. and Amyndas Pharmaceuticals, LLC, in the US District Court for the District of Massachusetts alleging trade secret misappropriation and breach of contract claims against Alexion and Zealand Pharma U.S. Inc. related to Amyndas’ C3 inhibitor candidate. • No trial date has been set. Anti-Terrorism Act Civil Lawsuit Considered to be a contingent liability US • In the US, in October 2017, AstraZeneca and certain other pharmaceutical and/or medical device companies were named as defendants in a complaint filed in the US District Court for the District of Columbia (District Court) by US nationals (or their estates, survivors, or heirs) who were killed or wounded in Iraq between 2005 and 2013. The plaintiffs allege that the defendants violated the US Anti-Terrorism Act and various state laws by selling pharmaceuticals and medical supplies to the Iraqi Ministry of Health. In July 2020, the District Court granted AstraZeneca’s and the other defendants’ motion to dismiss the lawsuit, which the DC Circuit Court of Appeals (the Appellate Court) reversed in January 2022. • In June 2024, the United States Supreme Court issued an order vacating the 2022 decision and granted AstraZeneca’s and the other defendants’ request for a remand to the Appellate Court for reconsideration under new case law. 30 Commitments, contingent liabilities and contingent assets continued Notes to the Group Financial Statements continued 208 AstraZeneca Annual Report & Form 20-F Information 2024 Financial Statements |
| Caelum Trade Secrets Litigation Matter concluded US • AstraZeneca has been defending a matter filed by the University of Tennessee Research Foundation in the US District Court for the Eastern District of Tennessee related to CAEL-101. • In September 2024, the parties resolved the matter by settlement. Definiens Considered to be a contingent liability Germany • In Germany, in July 2020, AstraZeneca received a notice of arbitration filed with the German Institution of Arbitration from the sellers of Definiens AG (the Sellers) regarding the 2014 Share Purchase Agreement (SPA) between AstraZeneca and the Sellers. The Sellers claim that they are owed approximately $140m in earn-outs under the SPA. In December 2023, after an arbitration hearing, the arbitration panel made a final award of $46.43m in favour of the Sellers. • In March 2024, AstraZeneca filed an application with the Bavarian Supreme Court to set aside the arbitration award. • A hearing is scheduled for February 2025. Employment Litigation Considered to be a contingent liability US • In December 2022, AstraZeneca was served with a lawsuit filed by seven former employees in the US District Court for the District of Delaware (District Court) asserting claims of discrimination on grounds of age and religion, related to AstraZeneca’s vaccination requirement. In June 2024, the District Court granted AstraZeneca’s partial motion to dismiss and denied without prejudice Plaintiff’s motion for conditional certification. • AstraZeneca is defending against numerous other litigation matters pending in federal and state courts asserting claims of discrimination in connection with AstraZeneca’s vaccine requirement. In November 2024, in a matter pending in the US District Court for the Northern District of Ohio, the court entered summary judgment in favour of the plaintiff. • A trial on the issues of damages is scheduled for June 2025. Pay Equity Litigation Considered to be a contingent liability US • AstraZeneca is defending a putative class and collective action in the US District Court for the Northern District of Illinois (District Court) brought by three named plaintiffs, who are former AstraZeneca employees. The case involves claims under the federal and Illinois Equal Pay Acts, with the plaintiffs alleging they were paid less than male employees who performed substantially similar and/or equal work. • In May 2024, the District Court conditionally certified a collective under the federal Equal Pay Act and authorised the sending of notice to potential collective action members. The notice was distributed in June 2024. Securities Litigation Considered to be a contingent liability US • In December 2024, a putative securities class action lawsuit was filed in the US District Court for the Central District of California against AstraZeneca PLC and certain officers, on behalf of purchasers of AstraZeneca publicly traded securities between February 2022 and December 2024. The complaint alleges that defendants made materially false and misleading statements in connection with the Company’s business in China. Seroquel XR Antitrust Litigation Considered to be a contingent liability US • In 2019, AstraZeneca was named in several related complaints now proceeding in US District Court in Delaware (District Court), including several putative class action lawsuits that were purportedly brought on behalf of classes of direct purchasers or end payors of Seroquel XR, that allege AstraZeneca and generic drug manufacturers violated US antitrust laws when settling patent litigation related to Seroquel XR. • In July 2022, the District Court dismissed claims relating to one of the generic manufacturers while allowing claims relating to the second generic manufacturer to proceed. • In September 2024, AstraZeneca reached a settlement agreement with one of the plaintiff classes and the parties are now seeking judicial review and approval of the settlement. • Trial with the remaining class of plaintiffs is currently scheduled for May 2025. Syntimmune Milestone Litigation Considered to be a contingent liability US • In connection with Alexion’s acquisition of Syntimmune, Inc. (Syntimmune) in December 2020, Alexion was served with a lawsuit filed by the stockholders’ representative for Syntimmune in Delaware state court that alleged, among other things, breaches of the 2018 merger agreement (Merger Agreement). • The stockholders’ representative alleges that Alexion failed to meet its obligations under the Merger Agreement to use commercially reasonable efforts to achieve the milestones. Alexion also filed a claim for breach of the representations in the Merger Agreement. • A trial was held in July 2023. • The court issued a partial decision in September 2024, concluding that the first milestone was achieved, and that Alexion had breached its contractual obligation to use commercially reasonable efforts to achieve the milestones. The court has requested additional briefing regarding damages and further proceedings regarding Alexion’s claim for breach. University of Sheffield Contract Dispute Considered to be a contingent liability UK • In June 2024, AstraZeneca was served with a lawsuit filed by the University of Sheffield (Sheffield). In its complaint, Sheffield alleges that AstraZeneca made misrepresentations to induce Sheffield to amend a patent license relating to Lynparza. • AstraZeneca filed its defence in August 2024. No trial date has been scheduled. Notes to the Group Financial Statements AstraZeneca Annual Report & Form 20-F Information 2024 209 Strategic Report Corporate Governance Financial Statements Additional Information |
| Viela Bio, Inc. Shareholder Litigation Considered to be a contingent liability US • In February 2023, AstraZeneca was served with a lawsuit filed in the Delaware state court against AstraZeneca and certain officers (collectively, Defendants), on behalf of a putative class of Viela Bio, Inc. (Viela) shareholders. The complaint alleged that the Defendants breached their fiduciary duty to Viela shareholders in the course of Viela’s 2021 merger with Horizon Therapeutics, plc. • In July 2024, the Court granted with prejudice AstraZeneca’s motion to dismiss. • In August 2024, plaintiffs appealed the dismissal. Legal proceedings brought by AstraZeneca PARP Inhibitor Royalty Dispute Considered to be a contingent asset UK • In October 2012, Tesaro, Inc. (now wholly owned by GlaxoSmithKline plc (GSK)) entered into two worldwide, royalty-bearing patent license agreements with AstraZeneca related to GSK’s product niraparib. In May 2021, AstraZeneca filed a lawsuit against GSK in the Commercial Court of England and Wales alleging that GSK had failed to pay all of the royalties due on niraparib sales under the license agreements. In April 2023, after trial, the trial court issued a decision in AstraZeneca’s favour. In February 2024, the Court of Appeal reversed the decision. In March 2024, AstraZeneca filed a request for permission to appeal with the Supreme Court of the United Kingdom. • In May 2024, the Supreme Court denied permission to appeal. The case will return to the trial court for further proceedings. Government investigations and proceedings Legal proceedings brought against AstraZeneca 340B Qui Tam Considered to be a contingent liability US • In July 2023, AstraZeneca was served with an unsealed civil lawsuit brought by a qui tam relator on behalf of the United States, several states, and the District of Columbia in the US District Court for the Central District of California (District Court). The complaint alleges that AstraZeneca violated the US False Claims Act and state law analogues. In March 2024, the District Court granted AstraZeneca’s motion to dismiss the First Amended Complaint without leave to amend. • In April 2024, the relator filed an appeal. Boston US Attorney Investigation Considered to be a contingent liability US • In June 2024, AstraZeneca was served with a subpoena issued by the US Attorney’s Office in Boston, seeking documents and information relating to payments by AstraZeneca to healthcare providers. • AstraZeneca is cooperating with this enquiry. Brazilian Tax Assessment Matter Considered to be a contingent liability Brazil • In connection with an ongoing matter, in August 2019, the Brazilian Federal Revenue Service provided a Notice of Tax and Description of the Facts (the Tax Assessment) to two Alexion subsidiaries in Brazil, as well as to two additional entities, a logistics provider utilised by Alexion and a distributor. The Tax Assessment focuses on the importation of Soliris vials pursuant to Alexion’s free drug supply to patients programme in Brazil. • Alexion prevailed in the first level of administrative appeals in the Brazilian federal administrative proceeding system based on a deficiency in the Brazil Tax Assessment. The decision was subject to an automatic appeal to the second level of the administrative courts. • In March 2023, the second level of the administrative courts issued a decision to remand the matter to the first level of administrative courts for a determination on the merits. Texas Qui Tam Considered to be a contingent liability US • In December 2022, AstraZeneca was served with an unsealed civil lawsuit brought by qui tam relators on behalf of the State of Texas in Texas state court, which alleges that AstraZeneca engaged in unlawful marketing practices. • Trial is scheduled for October 2025. Turkish Ministry of Health Matter Matter concluded Turkey • In Turkey, in July 2020, the Turkish Ministry of Health (Ministry of Health) initiated an investigation regarding payments to healthcare providers by Alexion and former employees and consultants. The investigation arose from Alexion’s disclosure of a $21.5m civil settlement with the US Securities & Exchange Commission (SEC) in July 2020 fully resolving the SEC’s investigation into possible violations of the US Foreign Corrupt Practices Act. • In September 2021, the Ministry of Health completed its draft investigation report and referred the matter to the Ankara Public Prosecutor’s Office with a recommendation for further proceedings against certain former employees. In June 2024, the Ankara Public Prosecutor’s Office closed its investigation without further action. This matter is now concluded. US Congressional Inquiry Matter concluded US • In January 2024, AstraZeneca received a letter from the US Senate Committee on Health, Education, Labor and Pensions (HELP Committee) seeking information related to AstraZeneca’s inhaled Respiratory products. • AstraZeneca cooperated with this inquiry and this matter is now concluded. 30 Commitments, contingent liabilities and contingent assets continued Notes to the Group Financial Statements continued 210 AstraZeneca Annual Report & Form 20-F Information 2024 Financial Statements |

| Vermont US Attorney Investigation Considered to be a contingent liability US • In April 2020, AstraZeneca received a Civil Investigative Demand from the US Attorney’s Office in Vermont and the Department of Justice, Civil Division, seeking documents and information relating to AstraZeneca’s relationships with electronic health-record vendors. • AstraZeneca continues to cooperate with this enquiry. Shenzhen City Customs Office Considered to be a contingent liability China • In relation to the illegal drug importation allegations, in January 2025, AstraZeneca received a Notice of Transfer to the Prosecutor and an Appraisal Opinion from the Shenzhen City Customs Office regarding suspected unpaid importation taxes amounting to $0.9m. • To the best of AstraZeneca’s knowledge, the importation taxes referred to in the Appraisal Opinion relate to Imfinzi and Imjudo. • A fine of between one and five times the amount of unpaid importation taxes may also be levied if AstraZeneca is found liable. Legal proceedings brought by AstraZeneca 340B State Litigation Considered to be a contingent asset US • AstraZeneca has filed lawsuits against Arkansas, Kansas, Louisiana, Maryland, Minnesota, Mississippi, Missouri, and West Virginia challenging the constitutionality of each state’s 340B statute. • In the Arkansas matter, trial is scheduled for April 2025. In the Arkansas administrative proceeding, the state has moved for a preliminary injunction to enjoin AstraZeneca’s 340B policy in Arkansas. • In the Kansas matter, after obtaining a stipulation from the state that AstraZeneca’s policy does not violate the Kansas 340B statute, AstraZeneca agreed to dismiss its complaint. • In the Louisiana matter, the Court granted the state’s motion for summary judgment. AstraZeneca has filed an appeal. • In the Maryland, Minnesota, and Missouri matters, the state has moved to dismiss AstraZeneca’s complaint. • In the Maryland and Mississippi matters, the Court has rejected AstraZeneca’s preliminary injunction motion. • The West Virginia matter remains in its preliminary stages. Inflation Reduction Act Litigation Considered to be a contingent asset US • In August 2023, AstraZeneca filed a lawsuit in the US District Court for the District of Delaware (District Court) against the US Department of Health and Human Services (HHS) challenging aspects of the drug price negotiation provisions of the Inflation Reduction Act and the implementing guidance and regulations. In March 2024, the District Court granted HHS’ motions and dismissed AstraZeneca’s lawsuit. • AstraZeneca has appealed the District Court’s decision. Other Additional government inquiries As is true for most, if not all, major prescription pharmaceutical companies, AstraZeneca is currently involved in multiple inquiries into drug marketing and pricing practices. In addition to the investigations described above, various law enforcement offices have, from time to time, requested information from the Group. There have been no material developments in those matters. Tax AstraZeneca considers whether it is probable that a taxation authority will accept an uncertain tax treatment. Where it is concluded that it is not probable the taxation authority will accept an uncertain tax treatment, a tax liability is recognised based on either the most likely amount method or the expected value method depending on which method management expects to better predict the resolution of the uncertainty. Tax liabilities for uncertain tax treatments can be built up over a long period of time but the resolution of the uncertain tax treatments usually occurs at a point in time. Given the inherent uncertainties in assessing the outcomes (which can sometimes be binary), the probability and amount of any tax liability occurring are difficult to ascertain which may see adjustments to the liabilities recognised for uncertain tax treatments in future periods that could have a material positive or negative effect on our results. Details of the movements in relation to material uncertain tax treatments are discussed below. KJ AstraZeneca faces a number of audits and reviews in jurisdictions around the world and, in some cases, is in dispute with the tax authorities. The issues under discussion are often complex and can require many years to resolve. Tax liabilities recognised for uncertain tax treatments require management to make key judgements with respect to the outcome of current and potential future tax audits, and actual results could vary from these estimates. Management does not believe a significant risk exists of material change to uncertain tax positions in the next 12 months. The total net tax liability recognised in the Group Financial Statements in respect of uncertain tax positions is $1,321m (2023: $1,336m; 2022: $830m) as explained below. The net tax liability consists of $1,157m (2023: $1,241m; 2022: $632m) included within income tax payable, $1,304m (2023: $441m; 2022: $291m) included within deferred tax asset, partially offset by $122m (2023: $9m; 2022: $(20)m) included within deferred tax liabilities, and $1,018m (2023: $337m; 2022: $113m) included within income tax receivable. Notes to the Group Financial Statements AstraZeneca Annual Report & Form 20-F Information 2024 211 Strategic Report Corporate Governance Financial Statements Additional Information |
| Transfer pricing The net tax liability included in the Group Financial Statements in relation to management’s current assessment of tax risks in relation to worldwide transfer pricing exposures is $384m (2023: $401m; 2022: $260m). The decrease in the net tax liability for uncertain tax positions relating to transfer pricing of $17m compared with 2023 is mainly as a result of a decrease of tax liabilities arising from updates to estimates of prior period tax liabilities following progression of tax authority reviews. The liability includes uncertain tax treatments which are estimated using the expected value method and depend on AstraZeneca’s assessment of the likelihood of the approach taken by the tax authorities. These matters can be complex and judgemental and could change in the future to reflect progress in tax authority reviews, the extent that any tax authority challenge is concluded including via negotiation between governments under competent authority procedures in relevant double tax treaties which can take many years to resolve, or matters lapse including following expiry of the relevant statutes of limitation. Depending upon progress in these matters, we could experience adjustments to the liabilities recognised in respect of uncertain tax treatments in future periods. Whilst it is impracticable to specify the possible effects of such changes at this stage, it is reasonably possible that an adjustment to the carrying amounts of tax assets and liabilities could be required within the next financial year. For transfer pricing matters, including items under tax audit, AstraZeneca estimates the potential for additional tax liabilities above the amount provided where the possibility of the additional liabilities falling due is more than remote, to be up to $422m (2023: $386m; 2022: $245m) including associated interest. Management believes that it is unlikely that these additional liabilities will arise. It is possible that some of these contingencies may change in the future to reflect progress in tax authority reviews, to the extent that any tax authority challenge is concluded or matters lapse including following expiry of the relevant statutes of limitation resulting in a reduction in the tax charge in future periods. Management continues to believe that AstraZeneca’s positions on all its transfer pricing positions, audits and disputes are robust, and that AstraZeneca has recognised appropriate tax balances, including consideration of whether corresponding relief will be available under Mutual Agreement procedures or unilaterally. Other uncertain tax treatments Included in the net tax liability is $937m (2023: $935m; 2022: $570m) relating to a number of other uncertain tax treatments. The increase of $2m in the net tax liability relating to the other uncertain tax treatments mainly relates to an update to tax liabilities following progress of reviews by tax authorities and administrative appeal processes which are offset by movements relating to uncertainty over the timing of tax deductions. This uncertainty includes movements between income taxes receivable of $742m, and deferred tax liabilities of $133m offset by related deferred tax assets of $929m and income taxes payable of $269m. The liability includes tax liabilities in respect of uncertain tax treatments which are estimated using the most likely amount method and the expected value method and depend on AstraZeneca’s assessment of the likelihood of the approach taken by the tax authorities. This could change in the future to reflect progress in tax authority reviews, the extent that any tax authority challenge is concluded, or matters lapse including following expiry of the relevant statutes of limitation resulting in a reduction in the tax charge in future periods. For these other tax liabilities in respect of uncertain tax treatments, AstraZeneca estimates the potential for additional liabilities above the amount provided where the possibility of the additional liabilities falling due is more than remote, to be up to $214m (2023: $293m; 2022: $209m) including associated interest. It is possible that some of these liabilities may reduce in the future if any tax authority challenge is concluded or matters lapse following expiry of the relevant statutes of limitation, resulting in a reduction in the tax charge in future periods. AstraZeneca does not believe there are any significant other uncertain tax treatments where the possibility of the additional liabilities falling due is more than remote (2023: $nil; 2022: $280m). Timing of cash flows and interest The Group is currently under audit in several countries and the timing of any resolution of these audits is uncertain. It is anticipated that tax payments may be required in relation to a number of significant disputes which may be resolved over the next one to two years. AstraZeneca considers the tax liabilities set out above to appropriately reflect the expected value of any final settlement. Some of the items discussed above are not currently within the scope of tax authority audits and may take longer to resolve. Included within other payables is a net amount of interest arising on tax contingencies of $164m (2023: $184m; 2022: $106m). 30 Commitments, contingent liabilities and contingent assets continued Notes to the Group Financial Statements continued 212 AstraZeneca Annual Report & Form 20-F Information 2024 Financial Statements |
| 31 Statutory and other information 2024 2023 2022 $m $m $m Fees payable to PricewaterhouseCoopers LLP and its associates: Group audit fee 10.6 10.2 9.9 Fees payable to PricewaterhouseCoopers LLP and its associates for other services: The audit of subsidiaries pursuant to legislation 14.8 15.0 15.1 Attestation under s404 of Sarbanes-Oxley Act 2002 3.5 3.3 3.1 Audit-related assurance services 2.2 1.1 0.7 Other assurance services 0.3 0.2 0.2 Fees payable to PricewaterhouseCoopers Associates in respect of the Group’s pension schemes: The audit of subsidiaries’ pension schemes 0.4 0.3 0.3 31.8 30.1 29.3 Fees payable in the year of $0.2m (2023: $0.7m) are in respect of the Group audit and audit of subsidiaries related to prior years. Related party transactions The Group had no material related party transactions which might reasonably be expected to influence decisions made by the users of these Financial Statements. Key management personnel compensation Key management personnel are defined for the purpose of disclosure under IAS 24 ‘Related Party Disclosures’ as the members of the Board and the members of the SET. 2024 2023 2022 $’000 $’000 $’000 Short-term employee benefits 40,893 38,636 38,632 Post-employment benefits 1,045 1,354 1,388 Share-based payments 49,121 58,242 56,297 91,059 98,232 96,317 Total remuneration is included within employee costs (see Note 29). 32 Subsequent events There were no material subsequent events. Notes to the Group Financial Statements AstraZeneca Annual Report & Form 20-F Information 2024 213 Strategic Report Corporate Governance Financial Statements Additional Information |

| Group Subsidiaries and Holdings In accordance with section 409 of the Companies Act 2006, a full list of subsidiaries, partnerships, associates, joint ventures and joint arrangements, the place of incorporation, registered office address, and the effective percentage of equity owned as at 31 December 2024 are disclosed below. Unless otherwise stated, the share capital disclosed comprises ordinary shares which are indirectly held by AstraZeneca PLC. Unless otherwise stated, the accounting year ends of subsidiaries are 31 December. The Group Financial Statements consolidate the Financial Statements of the Company and its subsidiaries at 31 December 2024. Wholly owned subsidiaries Algeria AAPM SARL 100% 20, Zone Macro-Economique, Hydra, Dar El Medina, Algiers, Algeria Argentina AstraZeneca S.A. 100% Olga Cossettini 363, 3° floor, Buenos Aires, Argentina Alexion Pharma Argentina SRL 100% Avenida Leandro N. Alem 592 Piso 6, Buenos Aires, Argentina Australia AstraZeneca Holdings Pty Limited 100% AstraZeneca Pty Limited 100% Alexion Pharmaceuticals Australasia Pty Ltd 100% 66 Talavera Road, Macquarie Park, NSW 2113, Australia LogicBio Australia Pty Limited 100% Level 40, 2-26 Park Street, Sydney, NSW 2000, Australia Austria AstraZeneca Österreich GmbH 100% Alexion Pharma Austria GmbH 100% Rechte Wienzeile 223 1120 Wien, Austria Portola Österreich GmbH (in liquidation) 100% Mooslackengasse 17, 1190 Wien, Austria Belgium AstraZeneca S.A. / N.V. 100% Alfons Gossetlaan 40 bus 201 at 1702 Groot‑Bijgaarden, Belgium Alexion Pharma Belgium Sprl 100% Alexion Services Europe Sprl 100% Rue des Deux Eglises 29-33, 1000 Brussels, Belgium Bermuda Alexion Bermuda Holding ULC 100% Alexion Bermuda Limited 100% Alexion Bermuda Partners LP 100% Victoria Place, 5th Floor, 31 Victoria Street, Hamilton, HM 10, Bermuda Brazil AstraZeneca do Brasil Limitada 100% Rod. Raposo Tavares, KM 26, 9, Cotia, Brazil Alexion Farmacêutica América Latina Serviços de Administração de Vendas Ltda. 100% Alexion Serviços e Farmacêutica do Brasil Ltda. 100% Av. Dr Chucri Zaidan, 1240, 15° andar, CEP 04711-130, Ed. Morumbi Corporate – Golden Tower Vila São Francisco, São Paulo, Brazil British Virgin Islands Gracell Biotechnologies Holdings Limited 100% Office of Sertus Incorporations (BVI) Limited, Sertus Chambers, P.O. Box 905, Quastisky Building, Road Town, Tortola, British Virgin Islands Bulgaria AstraZeneca Bulgaria EOOD 100% 51 Cherni Vrah Bld., Business Garden Office X, floor 10, Lozenets district, 1407 Sofia, Bulgaria Canada AstraZeneca Canada Inc.1 100% Evinova Canada Inc. 100% Suite 5000, 1004 Middlegate Road, Mississauga, ON, L4Y 1M4, Canada Alexion Pharma Canada Corporation 100% Suite 1300, 1969 Upper Water St, Halifax, NS, B3J 3R7, Canada Fusion Pharmaceuticals Inc. 100% 270 Longwood Road South, Hamilton, ON, L8P 0A6, Canada Cayman Islands AZ Reinsurance Limited 100% 18 Forum Lane, 2nd Floor, Camana Bay, Grand Cayman, P.O. Box 69, Cayman Islands Gracell Biotechnologies Inc. 100% P.O. Box 309, Ugland House, Grand Cayman, KY1-1104, Cayman Islands Chile AstraZeneca S.A. 100% AstraZeneca Farmaceutica Chile Limitada 100% Av. Isidora Goyenechea 3477, 2nd Floor, Las Condes, Santiago, Chile China Alexion Pharmaceuticals (Shanghai) Company Limited 100% Room 1703, Level 17, No. 88 Xizang North Road, Jing’an District, Shanghai, China AstraZeneca Global R&D (China) Co., Ltd. 100% 16F, 88 Xizang North Road, Jing’an District, Shanghai, China AstraZeneca Investment (China) Co., Ltd. 100% 199 Liangjing Road, Pilot Free Trade Zone, Shanghai, China AstraZeneca Investment Consulting (Wuxi) Co., Ltd. 100% Room 808, 8F, Building 99-2 Linghu Avenue, Xinwu District, Wuxi, Jiangsu, China AstraZeneca Pharmaceutical Co., Ltd. 100% No. 2, Huangshan Road, Wuxi, Jiangsu Province, China AstraZeneca Pharmaceutical (Beijing) Co., Ltd. 100% 1F, Building No. 4, No. 8 Courtyard, No. 1 Kegu Street, Beijing Economic-Technological Development Area, Beijing, China AstraZeneca Pharmaceutical (Chengdu) Co., Ltd. 100% 10th Floor, Building 11 (Building E11), No. 366, Hemin Street, Chengdu High-tech Zone, China (Sichuan) Pilot Free Trade Zone, China AstraZeneca Pharmaceutical (Guangzhou) Co., Ltd. 100% Room 406-178, No. 1, Yichuang Street, (China-Singapore Guangzhou Knowledge City) Huangpu District, Guangzhou City, China AstraZeneca Pharmaceutical (Hangzhou) Co., Ltd. 100% 12F & 14F, Building 1, Shuli Plaza, 758 Fei Jia Tang Road, Gongshu District, Hangzhou, Zhejiang Province, China AstraZeneca Pharmaceutical Manufacturing (Qingdao) Co., Ltd. 100% Room 806, Building 2, 82 Juxianqiao Road, High-tech Zone, Qingdao, Shandong Province, China AstraZeneca Pharmaceutical (Qingdao) Co., Ltd. 100% Floor 8, Building 2, 82 Juxianqiao Road, High-tech Zone, Qingdao, Shandong Province, China AstraZeneca Pharmaceutical (Shanghai) Co., Ltd. 100% B1F, 8F & 9F, 88 Xizang North Road, Jing’an District, Shanghai, China AstraZeneca Pharmaceuticals (China) Co., Ltd. 100% 88 Yaocheng Avenue, Jiangsu Province, Taizhou, China AstraZeneca (Wuxi) Trading Co., Ltd. 100% Building E (Building No. 5), Huirong Commercial Plaza, East Jinghui Road, Xinwu District, Wuxi, China Gracell Biomedicine (Shanghai) Co., Ltd.2 100% Shanghai Evinova Medical Technology Co., Ltd.2 100% Building C, No. 888, Huanhu 2nd Road West, Lingang New District, Shanghai, Pilot Free Trade Zone, China Gracell Bioscience (Shanghai) Co., Ltd. 100% 1st-4th Floor, Building 1, No. 418 Guilin Road, Xuhui District, Shanghai 200233, China Hainan Gracell Biomedicine Co., Ltd. (in liquidation)2 100% A132-81, 4th Floor, Joint Inspection Building, Haikou Comprehensive Bonded Zone, Haikou Free Trade Zone, Hainan Province, China Suzhou Gracell Bioscience Co., Ltd. 100% Unit E547, 5th Floor, Lecheng Plaza, Phase II, Biobay Industrial Park, 218 Sangtian Street, Suzhou Industrial Park, Suzhou Area, Jiangsu, Pilot Free Trade Zone 215123, China At 31 December 2024 Group Interest At 31 December 2024 Group Interest At 31 December 2024 Group Interest 214 AstraZeneca Annual Report & Form 20-F Information 2024 Financial Statements |

| Colombia AstraZeneca Colombia S.A.S. 100% Av Carrera 9 No. 101-67 Office 601, Bogotá, 110231, Colombia Alexion Pharma Colombia S.A.S. (in liquidation) 100% Carrera 9 No. 115 - 06 /30 Edificio Tierra Firme Oficina 2904 Bogotá D.C., Colombia Costa Rica AstraZeneca CAMCAR Costa Rica, S.A. 100% San José, Escazú, Roble Corporate Center, 5to piso, Costa Rica Croatia AstraZeneca d.o.o. 100% Vjekoslava Heinzela 70, 10 000 Zagreb, Croatia Czech Republic AstraZeneca Czech Republic, s.r.o. 100% Alexion Pharma Czech s.r.o. 100% U Trezorky 921/2, 158 00 Prague 5, Czech Republic Denmark AstraZeneca A/S 100% Johanne Møllers Passage 1, Dk-1799, Copenhagen V, Denmark Egypt AstraZeneca Egypt for Pharmaceutical Industries SAE 100% 6th of October City, 6th Industrial Zone, Plot 2, Giza, Egypt AstraZeneca Egypt LLC 100% 47 St. 270 New Maadi, Cairo, Egypt Drimex LLC 100% Plot 133, Banks’ District, 5th Settlement, New Cairo, Cairo, Egypt Estonia AstraZeneca Eesti OÜ 100% Harju maakond, Tallinn, Lasnamäe linnaosa, Valukoja tn 8/1, 11415, Estonia Finland AstraZeneca Oy. 100% Keilaranta 18, 02150 Espoo, Finland France Amolyt Pharma SAS3 100% 15 Chemin du Saquin, Espace Européen, 69130 Écully, France AstraZeneca SAS 100% Tour Carpe Diem-31, Place des Corolles, 92400 Courbevoie, France AstraZeneca Reims Production SAS 100% Chemin de Vrilly Parc, Industriel de la Pompelle, 51100 Reims, France AstraZeneca Dunkerque Production SCS 100% 224 Avenue de la Dordogne, 59640 Dunkerque, France Alexion Europe SAS 100% Alexion Pharma France SAS 100% 103-105 Rue Anatole France, 92300 Levallois‑Perret, France Germany AstraZeneca GmbH 100% AstraZeneca Holding GmbH4 100% Sofotec GmbH5 100% Friesenweg 26, 22763, Hamburg, Germany AstraZeneca Computational Pathology GmbH3 100% Bernhard-Wicki-Straße 5, 80636, Munich, Germany Alexion Pharma Germany GmbH 100% Landsberger Straße 300, 80687, Munich, Germany Greece AstraZeneca S.A. 100% Agisilaou 6-8 Marousi, Athens, Greece Hong Kong AstraZeneca HK Holdings Company Limited 100% AstraZeneca Hong Kong Limited 100% Unit 1 – 3, 11/F., China Taiping Finance Centre, 18 King Wah Road, North Point, Hong Kong Gracell Biotechnologies (HK) Limited 100% C&F Secretarial Services Limited, Unit 3A, 12/F, Kaiser Centre, No. 18 Centre Street, Sai Ying Pun, Hong Kong Hungary AstraZeneca Kft 100% 1st floor, 4 building B, Alíz str., Budapest, 1117, Hungary India AstraZeneca India Private Limited6 100% Block A, Neville Tower, 11th Floor, Ramanujan IT SEZ, Taramani, Chennai, Tamil Nadu, PIN 600113, India Alexion Business Services Private Limited 100% 9th Floor, Platina, G Block Plot No. C-59, Bandra-Kurla Complex Bandra (East), Mumbai 400051, India Iran AstraZeneca Pars Company 100% Suite 1, 1st Floor No. 39, Alvand Ave., Argantin Sq., Tehran 1516673114, Iran Ireland AstraZeneca Pharmaceuticals (Ireland) Designated Activity Company 100% 4th Floor, South Bank House, Barrow Street, Dublin 4, Republic of Ireland Alexion Pharma Holding Limited 100% Alexion Pharma International Operations Limited 100% Alexion Pharma Development Limited 100% AstraZeneca Ireland Limited 100% College Business & Technology Park, Blanchardstown Road North, Dublin 15, Republic of Ireland Israel AstraZeneca (Israel) Ltd 100% Atirei Yeda 1, Building O-Tech 2, POB 8044, Kfar Saba, 4464301, Israel Alexion Pharma Israel Ltd 100% 16 Derech Aba Hille St., Ramat Gan 5250608, Israel Italy Simesa SpA 100% AstraZeneca SpA 100% Alexion Pharma Italy Srl 100% Viale Decumano 39, 20157 Milan, Italy Japan AstraZeneca K.K. 100% 3-1, Ofuka-cho, Kita-ku, Osaka, 530-0011, Japan Alexion Pharma GK 100% Tamachi Station Tower N 3-1-1, Shibaura, Minato-ku Tokyo 108-0023, Japan Kazakhstan AstraZeneca Kazakhstan Limited Liability Partnership 100% Office 101, 77 Kunayev Street, Almaty 050000, Kazakhstan Kenya AstraZeneca Pharmaceuticals Limited 100% L.R. No.1/1327, Avenue 5, 1st Floor, Rose Avenue, Nairobi, Kenya Latvia AstraZeneca Latvija SIA 100% Skanstes iela 50, Riga, LV-1013, Latvia Lithuania AstraZeneca Lietuva UAB 100% Spaudos g., Vilnius, LT-05132, Lithuania Luxembourg AstraZeneca Luxembourg S.A. 100% Rue Nicolas Bové 2A – L-1253, Luxembourg Malaysia AstraZeneca Asia-Pacific Business Services Sdn Bhd 100% 12th Floor, Menara Symphony, No. 5 Jalan Prof, Khoo Kay Kim, Seksyen 13, 46200 Petaling Jaya, Selangor Darul Ehsan, Malaysia AstraZeneca Sdn Bhd 100% Nucleus Tower, Level 11 & 12, No. 10 Jalan PJU 7/6, Mutiara Damansara, 47800 Petaling Jaya, Selangor Darul Ehsan, Malaysia Mexico AstraZeneca Health Care Division, S.A. de C.V. 100% AstraZeneca, S.A. de C.V. 100% Av. Periferico Sur 4305 interior 5, Colonia Jardines en la Montaña, Mexico City, Tlalpan Distrito Federal, CP 14210, Mexico Alexion Pharma Mexico S. de R.L. de C.V. 100% Paseo de los Tamarindos 90, Torre 1 piso 6 - A Col., Bosques de la Lomas, CP 05120 D.F, Mexico Morocco AstraZeneca Maroc SARLAU 100% CFC (Casablanca Finance City), Le Continental Business Center, Bâtiment C, 7ème étage, Quartier Hay Hassani, Casablanca, Morocco At 31 December 2024 Group Interest At 31 December 2024 Group Interest At 31 December 2024 Group Interest AstraZeneca Annual Report & Form 20-F Information 2024 215 Strategic Report Corporate Governance Financial Statements Additional Information Group Subsidiaries and Holdings |
| The Netherlands Alexion Holding B.V. 100% Alexion Pharma Foreign Holdings, B.V. 100% Alexion Pharma Netherlands B.V. 100% AstraZeneca B.V. 100% AstraZeneca Continent B.V. 100% AstraZeneca Gamma B.V. 100% AstraZeneca Holdings B.V. 100% AstraZeneca Jota B.V. 100% AstraZeneca Rho B.V. 100% AstraZeneca Sigma B.V. 100% AstraZeneca Treasury B.V. 100% AstraZeneca Zeta B.V. 100% Prinses Beatrixlaan 582, 2595 BM, The Hague, The Netherlands AstraZeneca Nijmegen B.V. 100% Lagelandseweg 78, 6545 CG Nijmegen, The Netherlands Acerta Pharma B.V. 100% Aspire Therapeutics B.V. 100% Kloosterstraat 9, 5349 AB, Oss, The Netherlands Portola Netherlands B.V. 100% Basisweg 10, 1043 AP, Amsterdam, The Netherlands Neogene Therapeutics B.V. 100% Science Park 106, 1098 XG Amsterdam, The Netherlands New Zealand AstraZeneca Limited 100% Pharmacy Retailing (NZ) Limited t/a Healthcare Logistics, 58 Richard Pearse Drive, Mangere, Auckland, 1142, New Zealand Nigeria AstraZeneca Nigeria Limited 100% 11A, Alfred Olaiya Street, Awuse Estate, Off Salvation Street, Opebi, Ikeja, Lagos, Nigeria Norway AstraZeneca AS 100% Karvesvingen 7, 0579 Oslo, Norway Pakistan AstraZeneca Pharmaceuticals Pakistan (Private) Limited7 100% Office No 1, 2nd Floor, Sasi Arcade, Block 7, Main Clifton Road, Karachi, Pakistan Panama AstraZeneca CAMCAR, S.A. 100% Bodega #1, Parque Logistico MIT, Carretera Hacia Coco Solo, Colon, Panama Peru AstraZeneca Peru S.A. 100% Calle Las Orquídeas N° 675, Int. 802, Edificio Pacific Tower, San Isidro, Lima, Peru Philippines AstraZeneca Pharmaceuticals (Phils.) Inc. 100% 16th Floor, Inoza Tower, 40th Street, Bonifacio Global City, Taguig 1634, Philippines Poland AstraZeneca Pharma Poland Sp.z.o.o. 100% Alexion Pharma Poland Sp.z.o.o. 100% Postepu 14, 02-676, Warszawa, Poland Evinova Poland sp. z o.o 100% Towarowa 28, 00-839 Warszawa, Poland Portugal Astra Alpha Produtos Farmacêuticos Lda 100% AstraZeneca Produtos Farmacêuticos Lda 100% Novastra Promoção e Comércio Farmacêutico Lda 100% Novastuart Produtos Farmacêuticos Lda 100% Stuart-Produtos Farmacêuticos Lda 100% Zeneca Epsilon – Produtos Farmacêuticos Lda 100% Zenecapharma Produtos Farmacêuticos, Unipessoal Lda 100% Rua Humberto Madeira, No 7, Queluz de Baixo, 2730-097, Barcarena, Portugal Puerto Rico IPR Pharmaceuticals, Inc. 100% Road 188, San Isidro Industrial Park, Canóvanas, 00729, Puerto Rico Romania AstraZeneca Pharma S.R.L. 100% Bucharest, 1A Tipografilor Street, MUSE Offices, 2nd and 3rd Floor, District 1, 013714, Romania Russia AstraZeneca Industries LLC 100% 81 Vostochniy Lane, Dobrino Village, Borovskiy District, Kaluga Region, 249006, Russian Federation AstraZeneca Pharmaceuticals LLC 100% 1 Krasnogvardeyskiy Lane 21, Bld.1, Floors 20-30, Moscow, 123112, Russian Federation Alexion Pharma LLC 100% 12 Presnenskaya Embankment, Premises 1/36, Moscow, 123112, Russian Federation Saudi Arabia AstraZeneca Continent – Regional Headquarter 100% Al-Nakhlah Tower, Floor 13th Ath Thumamah Road, Al Sahafa District, P.O. Box 42150, Riyadh, Kingdom of Saudi Arabia AstraZeneca Trading Company 100% 8125 Prince Sultan, 2086 Ar Rawdah District, 23435, Jeddah, Kingdom of Saudi Arabia Singapore AstraZeneca Pharmaceuticals Singapore Pte. Limited 100% AstraZeneca Singapore Pte Ltd 100% 10 Kallang Avenue #12-10, Aperia Tower 2, 339510, Singapore South Africa AstraZeneca Pharmaceuticals (Pty) Limited 100% 17 Georgian Crescent West, Northdowns Office Park, Bryanston, 2191, South Africa South Korea AstraZeneca Korea Co. Ltd 100% 21st Floor, Asem Tower, 517, Yeongdong-daero, Gangnam-gu, Seoul, 06164, Republic of Korea Alexion Pharma Korea LLC 100% 41 FL., 152 Teheran-ro (Yeoksam-dong Gangnam Finance Center), Gangnam-gu, Seoul, Republic of Korea Spain AstraZeneca Farmaceutica Holding Spain SA 100% AstraZeneca Farmaceutica Spain SA 100% Evinova Spain SL 100% Fundación AstraZeneca 100% Laboratorio Beta SA 100% Laboratorio Lailan SA 100% Laboratorio Tau SA 100% Calle del Puerto de Somport, 21-23, Madrid 28050, Spain Alexion Pharma Spain SL 100% Av Diagonal Num.601 P.1, Barcelona 08028, Spain Sweden AstraZeneca AB 100% AstraZeneca Biotech AB 100% AstraZeneca BioVentureHub AB 100% AstraZeneca International Holdings Aktiebolag 100% AstraZeneca Pharmaceuticals Aktiebolag 100% AstraZeneca Södertälje 2 AB 100% Evinova AB 100% SE-151 85 Södertälje, Sweden Alexion Pharma Nordics Holding AB 100% Alexion Pharma Nordics AB 100% Hagaplan 4, 113 68 Stockholm, Sweden Switzerland Alexion Pharma GmbH 100% AstraZeneca AG 100% Evinova AG 100% Neuhofstrasse 34, 6340 Baar, Switzerland Spirogen Sarl (in liquidation) 100% Rue du Grand-Chêne 5, CH-1003 Lausanne, Switzerland Taiwan Alexion Pharma Taiwan Ltd 100% AstraZeneca Taiwan Limited 100% 21st Floor, Taipei Metro Building 207, Tun Hwa South Road, SEC 2 Taipei, Taiwan Thailand AstraZeneca (Thailand) Limited 100% Asia Centre 19th floor, 173/20, South Sathorn Rd, Khwaeng Thungmahamek, Khet Sathorn, Bangkok, 10120, Thailand Tunisia AstraZeneca Tunisie SaRL 100% Lot n°1.5.5 les jardins du lac, bloc B les berges du lac Tunis, Tunisia At 31 December 2024 Group Interest At 31 December 2024 Group Interest At 31 December 2024 Group Interest Group Subsidiaries and Holdings continued 216 AstraZeneca Annual Report & Form 20-F Information 2024 Financial Statements |
| Turkey AstraZeneca Ilac Sanayi ve Ticaret Limited Sirketi 100% Y.K.B Plaza, B Blok, Kat:3-4, Levent/Beşiktaş, Istanbul, Turkey Zeneca Ilac Sanayi ve Ticaret Anonim Sirketi 100% Büyükdere Cad., Y.K.B. Plaza, B Blok, Kat:4, Levent/Beşiktaş, Istanbul, Turkey Alexion Ilac Ticaret Limited Sirketi 100% İçerenköy Mahellisi Umut SK. and Ofis Sit. No: 10 12/73 Ataşehir, Istanbul 10-12/73, Turkey Ukraine AstraZeneca Ukraina LLC 100% 54 Simi Prakhovykh Street, Kyiv, 01033, Ukraine United Arab Emirates AstraZeneca FZ-LLC 100% Dubai Sciences Park Towers, Tower South, S1706S, Dubai Sciences Park, Dubai, United Arab Emirates Alexion Pharma Middle East FZ-LLC 100% Dubai Science Park, 501, Floor 5, EIB Building No. 2, Dubai, United Arab Emirates United Kingdom Alexion Pharma UK Limited 100% Ardea Biosciences Limited 100% Arrow Therapeutics Limited 100% Astra Pharmaceuticals Limited 100% AstraPharm 100% AstraZeneca China UK Limited 100% AstraZeneca Death In Service Trustee Limited 100% AstraZeneca Employee Share Trust Limited 100% AstraZeneca Finance Limited 100% AstraZeneca Intermediate Holdings Limited8 100% AstraZeneca Investments Limited 100% AstraZeneca Japan Limited 100% AstraZeneca Nominees Limited 100% AstraZeneca Quest Limited 100% AstraZeneca Share Trust Limited 100% AstraZeneca Sweden Investments Limited 100% AstraZeneca Treasury Limited 100% AstraZeneca UK Limited 100% AstraZeneca US Investments Limited8 100% AZENCO2 Limited 100% AZENCO4 Limited 100% AZENCO5 Limited 100% AZENCO6 Limited 100% Cambridge Antibody Technology Group Limited 100% Evinova Limited 100% KuDOS Horsham Limited 100% KuDOS Pharmaceuticals Limited 100% Zenco (No. 8) Limited 100% Zeneca Finance (Netherlands) Company 100% MedImmune Limited 100% 1 Francis Crick Avenue, Cambridge Biomedical Campus, Cambridge, CB2 0AA, United Kingdom MedImmune U.K. Limited 100% Plot 6, Renaissance Way, Boulevard Industry Park, Liverpool, L24 9JW, United Kingdom Syntimmune Limited 100% 21 Holborn Viaduct, London, EC1A 2DY, United Kingdom United States Acerta Pharma LLC9 100% 121 Oyster Point Boulevard, South San Francisco, CA 94080, United States Alexion Pharmaceuticals, Inc. 100% Achillion Pharmaceuticals Inc. 100% Alexion US1 LLC9 100% Savoy Therapeutics Corp 100% Syntimmune LLC9 100% TeneoTwo, Inc. 100% 121 Seaport Boulevard Boston, MA 02210, United States Alexion Services Latin America Inc. 100% 600 Brickell Ave, Miami, FL 33131, United States AlphaCore Pharma, LLC9 100% 333 Parkland Plaza, Suite 5, Ann Arbor, MI 48103, United States Amolyt Pharma Inc. 100% 185 Alewife Brook Pkwy, Suite 210, Cambridge, MA 02138, United States Amylin Ohio LLC9 100% Amylin Pharmaceuticals, LLC9 100% Ardea Biosciences, Inc. 100% AstraZeneca Collaboration Ventures, LLC9 100% AstraZeneca Finance and Holdings Inc. 100% AstraZeneca Finance LLC9 100% AstraZeneca Pharmaceuticals LP10 100% Atkemix Nine Inc. 100% Atkemix Ten Inc. 100% Corpus Christi Holdings Inc. 100% LogicBio Securities Corporation 100% LogicBio Therapeutics, Inc. 100% Neogene Therapeutics, Inc. 100% Omthera Pharmaceuticals, Inc. 100% Optein, Inc. 100% Stauffer Management Company LLC9 100% Zeneca Inc. 100% Zeneca Holdings Inc. 100% Zeneca Wilmington Inc.8 100% 1800 Concord Pike, Wilmington, DE 19803, United States AZ-Mont Insurance Company 100% 100 Bank Street, Suite 630, Burlington, VT 05401, United States Caelum Biosciences Inc. 100% 1200 Florence Columbus Road, Bordentown, NJ 08505, United States Cincor Pharma Inc. 100% 100 College Street, New Haven, CT 06510, United States Evinova Inc. 100% 101 Orchard Ridge Drive, Gaithersburg, MD 20878, United States Fusion Pharmaceuticals US Inc. 100% 2 International Place, Suite 2310, Boston, MA 02110, United States Gracell Biopharmaceuticals, Inc. 100% 530 Lytton Avenue, 2nd Floor, Palo Alto, CA 94301, United States Icosavax, Inc. 100% 1930 Boren Avenue, Suite 1000, Seattle, WA 98101, United States MedImmune, LLC9 100% MedImmune Ventures, Inc. 100% One MedImmune Way, Gaithersburg, MD 20878, United States Pearl Therapeutics, Inc. 100% 200 Cardinal Way, Redwood City, CA 94063, United States Portola Pharmaceuticals LLC 100% Portola USA, Inc. 100% 270 East Grand Avenue, South San Francisco, CA 94080, United States ZS Pharma, Inc. 100% 1100 Park Place, Suite 300, San Mateo, CA 94403, United States Uruguay AstraZeneca S.A. 100% Yaguarón 1407 of 1205, 11.100, Montevideo, Uruguay Venezuela AstraZeneca Venezuela S.A. 100% Gotland Pharma S.A. 100% Av. La Castellana, Torre La Castellana, Piso 5, Oficina 5-G, 5-H, 5-I, Urbanización La Castellana, Municipio Chacao, Estado Bolivariano de Miranda, Venezuela Vietnam AstraZeneca Vietnam Company Limited 100% 18th Floor, A&B Tower, 76 Le Lai, Ben Thanh Ward, District 1, Ho Chi Minh City, Vietnam At 31 December 2024 Group Interest At 31 December 2024 Group Interest At 31 December 2024 Group Interest AstraZeneca Annual Report & Form 20-F Information 2024 217 Strategic Report Corporate Governance Financial Statements Additional Information Group Subsidiaries and Holdings |
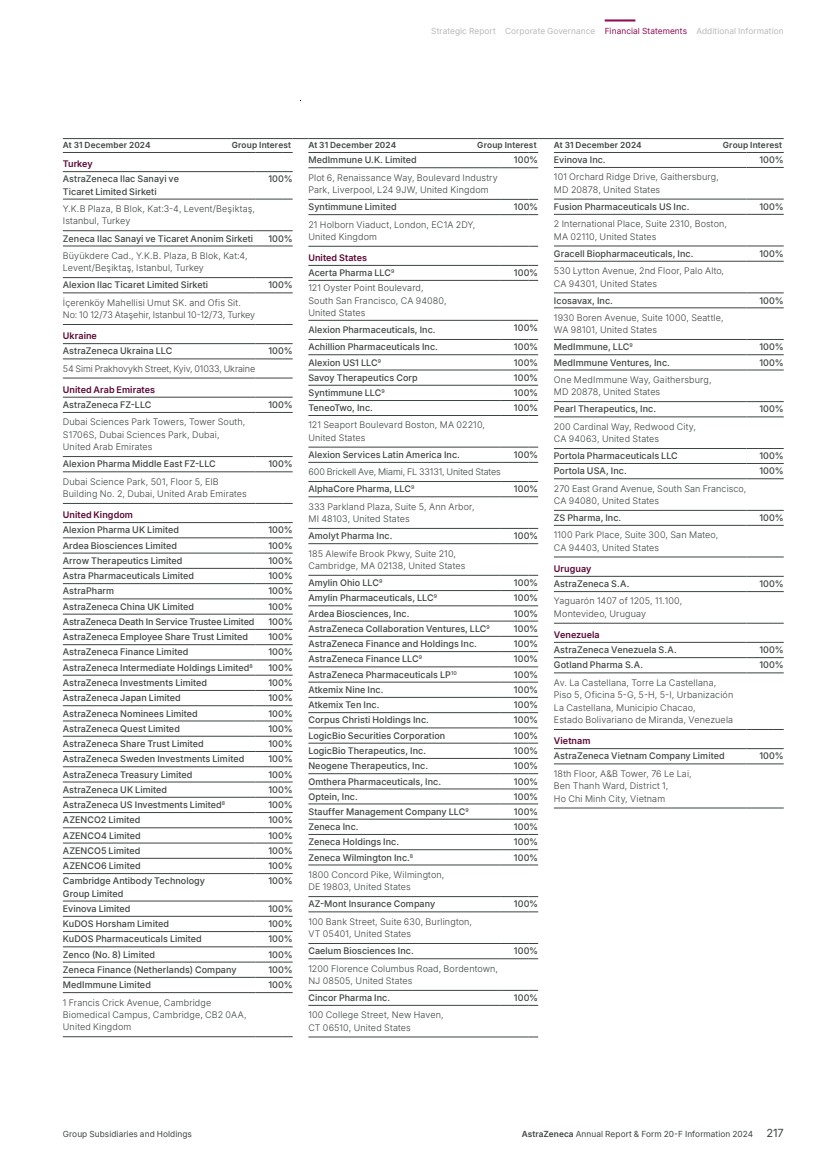
| Subsidiaries where the effective interest is less than 100% Algeria AstraZeneca Algeria Pharmaceutical Industries SPA 49% N° 20, Micro Zone d’Activité Hydra, Centre des Affaires Dar El Madina, Bloc A, 6th Floor, Hydra, Algiers, Algeria China Beijing Falikang Pharmaceutical Co., Ltd. 48.90% Room 113, Floor 1, Unit 1, Building No. 6, 88 Kechuang 6th Street, Economic-Technological Development Area, Beijing, China India AstraZeneca Pharma India Limited6 75% Block N1, 12th Floor, Manyata Embassy Business Park, Rachenahalli, Outer Ring Road, Bangalore-560 045, India Indonesia P.T. AstraZeneca Indonesia 95% Perkantoran Hijau Arkadia Tower F, 3rd Floor, JI. T.B. Simatupang Kav. 88, South Jakarta, 12520, Indonesia Switzerland SixPeaks Bio AG11,13 34.10% Aeschenvorstadt 36, 4501 Basel, Switzerland United States VaxNewMo, LLC12,13 19.90% 4447 McPherson Avenue, St. Louis, MO 63108, United States Joint Ventures Hong Kong IHP HK Holdings Limited 50% Unit 1402, 14th Floor, Henley Building, No. 5 Queen’s Road Central, Hong Kong WuXi MedImmune Biopharmaceutical Co., Limited (in liquidation) 50% Room 1902, 19/F, Lee Garden One, 33 Hysan Avenue, Causeway Bay, Hong Kong United States Montrose Chemical Corporation of California 50% Suite 380, 600 Ericksen Ave N/E, Bainbridge Island, WA 98110, United States Significant Holdings China Dizal (Jiangsu) Pharmaceutical Co., Ltd. 26.21% 199 Liangjing Rd, Zhangjiang Hi-Tech Park, Pudong District, Shanghai, 201203, China Wuxi AstraZeneca-CICC Venture Capital Partnership (Limited Partnership) 22.13% Wuxi AstraZeneca-CICC No.1 Venture Capital Partnership (Limited Partnership) 22.13% Room 808, 8F, Building 99-2 Linghu Avenue, Xinwu District, Wuxi, Jiangsu, China United Kingdom VaxEquity Ltd.13 (in liquidation) 40% Victory House, Vision Park, Chivers Way, Histon, Cambridge, CB24 9ZR, United Kingdom United States C.C. Global Chemicals Company 37.50% P.O. Box 7, MS2901, TX 76101-0007, United States Associated Holdings Cayman Islands Fuse Biosciences (Cayman) Limited13 18.75% 3-212 Governors Square, 23 Lime Tree Bay Avenue, P.O. Box 30746, Seven Mile Beach, Grand Cayman KY1-1203, Cayman Islands France Medetia SAS13 10% Institute Imagine, 24 Boulevard du Montparnasse, 75015 Paris, France Cellectis S.A.3 43.96% 8, rue de la Croix Jarry, 75013 Paris, France Israel AION Labs Innovation Lab Ltd. 19.23% CombinAble.AI Ltd.13 11.25% ProPhet Bio Ltd.13 11.94% TenAces Biosciences Ltd.13 12.50% 4 Oppenheimer Street, Building B, Rehovot, 7670104, Israel Sweden Swedish Orphan Biovitrum AB (publ) 9.74% Tomtebodavägen 23A, Stockholm, Sweden OnDosis AB 19.80% GoCo House, 5 tr, Gemenskapens gata 9, 431 53 Mölndal, Sweden CCRM Nordic AB 19.90% Förändringens Gata 10, 431 53 Mölndal, Sweden United Kingdom Niox Group plc 16.61% Magdalen Centre, 1 Robert Robinson Ave, Science Park, Oxford, OX4 4GA, United Kingdom United States AbMed Corporation3 18% 68 Cummings Park Drive, Woburn, MA 01801, United States Baergic Bio, Inc. 19.95% 1111 Kane Concourse, Suite 301, Bay Harbor Islands, FL 33154, United States Regio Biosciences, Inc.13 19.54% 5237 River Road, #361 Bethesda, MD 20816, United States Employee Benefit Trusts The AstraZeneca Employee Benefit Trust AstraZeneca PSP/GRSP EBP for Canadian Employees 1 Ownership held in ordinary and special shares. 2 Ownership held by way of capital contribution. 3 Ownership held in ordinary and preference shares. 4 10% directly held by AstraZeneca PLC. 5 Sold to external third party effective 17 January 2025. 6 Accounting year end is 31 March. 7 Accounting year end is 30 June. 8 Directly held by AstraZeneca PLC. 9 Ownership held as membership interest. 10 Ownership held as partnership interest. 11 Consolidated due to AstraZeneca AB having an option to acquire. 12 Consolidated due to Zeneca Inc. having an option to acquire. 13 Ownership held in preference shares. Group Subsidiaries and Holdings continued At 31 December 2024 Group Interest At 31 December 2024 Group Interest At 31 December 2024 Group Interest 218 AstraZeneca Annual Report & Form 20-F Information 2024 Financial Statements |
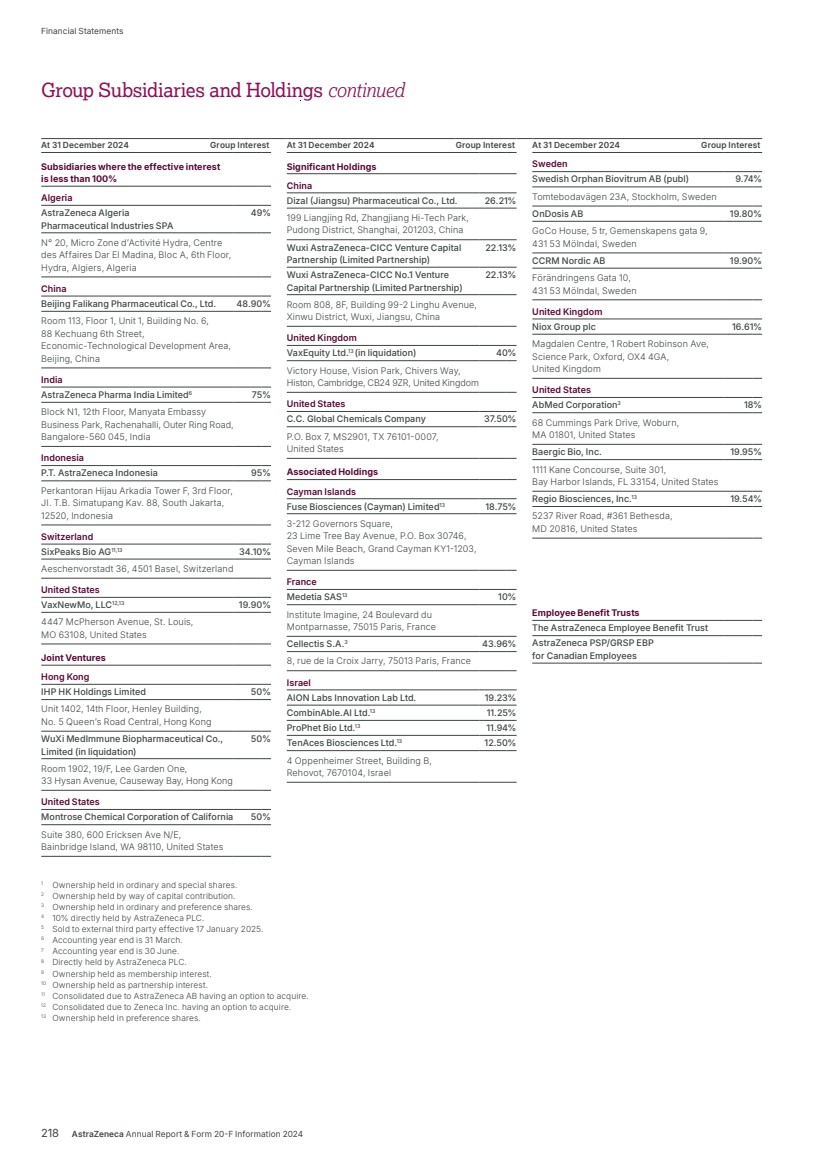
| Company Balance Sheet at 31 December AstraZeneca PLC 2024 2023 Notes $m $m Fixed assets Fixed asset investments 1 62,019 64,189 62,019 64,189 Current assets Debtors – other 8 4 Debtors – amounts owed by Group undertakings 5,807 10,928 5,815 10,932 Creditors: Amounts falling due within one year Other payables 2 (202) (216) Interest-bearing loans and borrowings 3 (1,997) (2,995) (2,199) (3,211) Net current assets 3,616 7,721 Total assets less current liabilities 65,635 71,910 Creditors: Amounts falling due after more than one year Interest-bearing loans and borrowings 3 (14,549) (16,741) Income tax payable (36) – Other payables 2 (47) (21) (14,632) (16,762) Net assets 51,003 55,148 Capital and reserves Called-up share capital 4 388 388 Share premium account 35,226 35,188 Capital redemption reserve 153 153 Other reserves 1,741 1,779 Profit and loss account 13,495 17,640 Shareholders’ funds 51,003 55,148 $m means millions of US dollars. The Company’s profit for the year was $457m (2023: $14,669m). The Company Financial Statements from pages 219 to 225 were approved by the Board and were signed on its behalf by Pascal Soriot Aradhana Sarin Director Director 6 February 2025 Company’s registered number 02723534 AstraZeneca Annual Report & Form 20-F Information 2024 219 Strategic Report Corporate Governance Financial Statements Additional Information Company Balance Sheet |
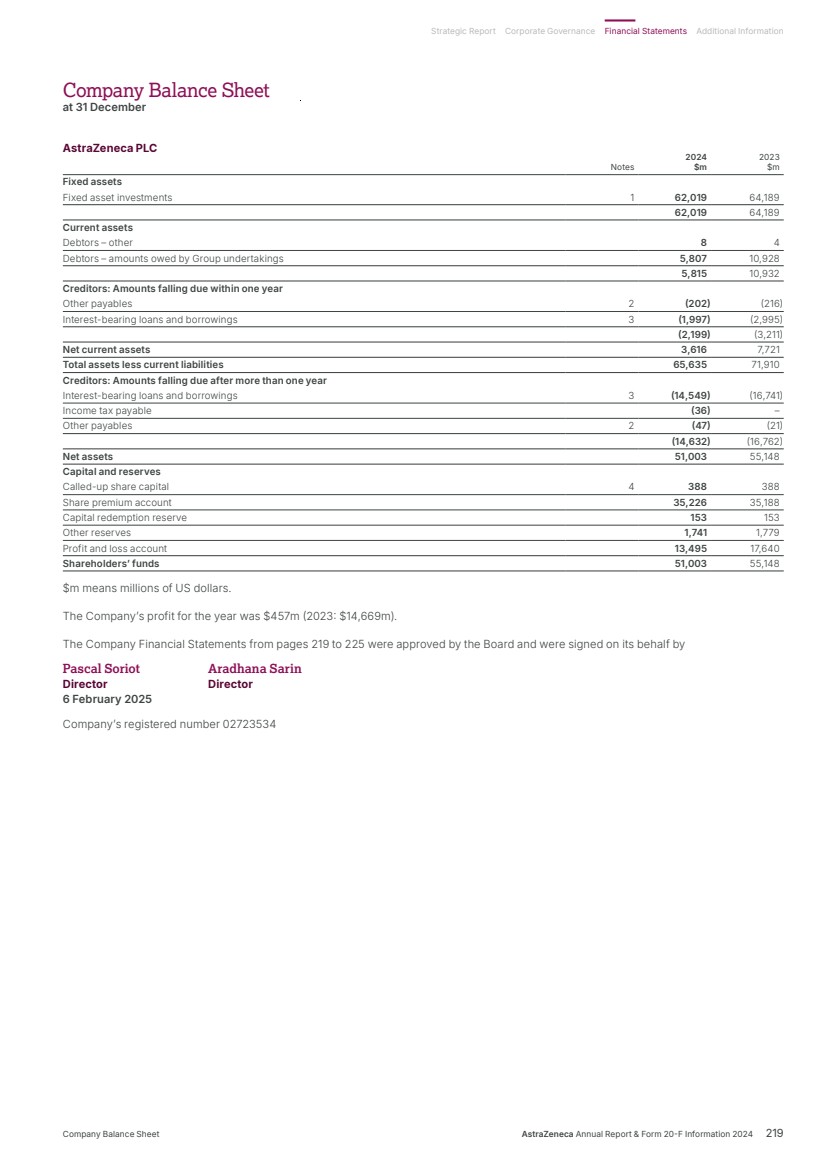
| Company Statement of Changes in Equity for the year ended 31 December Share Capital Share premium redemption Other Profit and Total capital account reserve reserves1 loss account2 equity $m $m $m $m $m $m At 1 January 2023 387 35,155 153 1,927 7,458 45,080 Total comprehensive income for the period Profit for the period – – – – 14,669 14,669 Total comprehensive income for the period – – – – 14,669 14,669 Transactions with owners, recorded directly in equity Dividends – – – – (4,487) (4,487) Capital contributions for share-based payments – – – (148) – (148) Issue of Ordinary Shares 1 33 – – – 34 Total contributions by and distributions to owners 1 33 – (148) (4,487) (4,601) At 31 December 2023 388 35,188 153 1,779 17,640 55,148 Total comprehensive income for the period Profit for the period – – – – 457 457 Total comprehensive income for the period – – – – 457 457 Transactions with owners, recorded directly in equity Dividends – – – – (4,602) (4,602) Capital contributions for share-based payments – – – (38) – (38) Issue of Ordinary Shares – 38 – – – 38 Total contributions by and distributions to owners – 38 – (38) (4,602) (4,602) At 31 December 2024 388 35,226 153 1,741 13,495 51,003 1 The Other reserves arose from the cancellation of £1,255m share premium by the Company in 1993 and the redenomination of share capital of $157m in 1999. Included within Other reserves at 31 December 2024 is $(100)m (31 December 2023: $(62)m) in respect of cumulative share-based payment awards, which are not available for distribution. 2 At 31 December 2024, the overwhelming majority of the Profit and loss account reserve of $13,495m (31 December 2023: the overwhelming majority of $17,640m) was available for distribution, subject to filing these Financial Statements with Companies House. When making a distribution to shareholders, the Directors determine profits available for distribution by reference to guidance on realised and distributable profits under the Companies Act 2006 issued by the Institute of Chartered Accountants in England and Wales and the Institute of Chartered Accountants of Scotland in April 2017. The profits of the Company have been received in the form of receivables due from subsidiaries. The availability of distributable reserves in the Company is dependent on those receivables meeting the definition of qualifying consideration within the guidance, and in particular on the ability of subsidiaries to settle those receivables within a reasonable period of time. The Directors consider that, based on the nature of these receivables and the available cash resources of the Group and other accessible sources of funds, at 31 December 2024, the overwhelming majority (31 December 2023: the overwhelming majority) of the Company’s profit and loss reserves were available for distribution. 220 AstraZeneca Annual Report & Form 20-F Information 2024 Financial Statements |
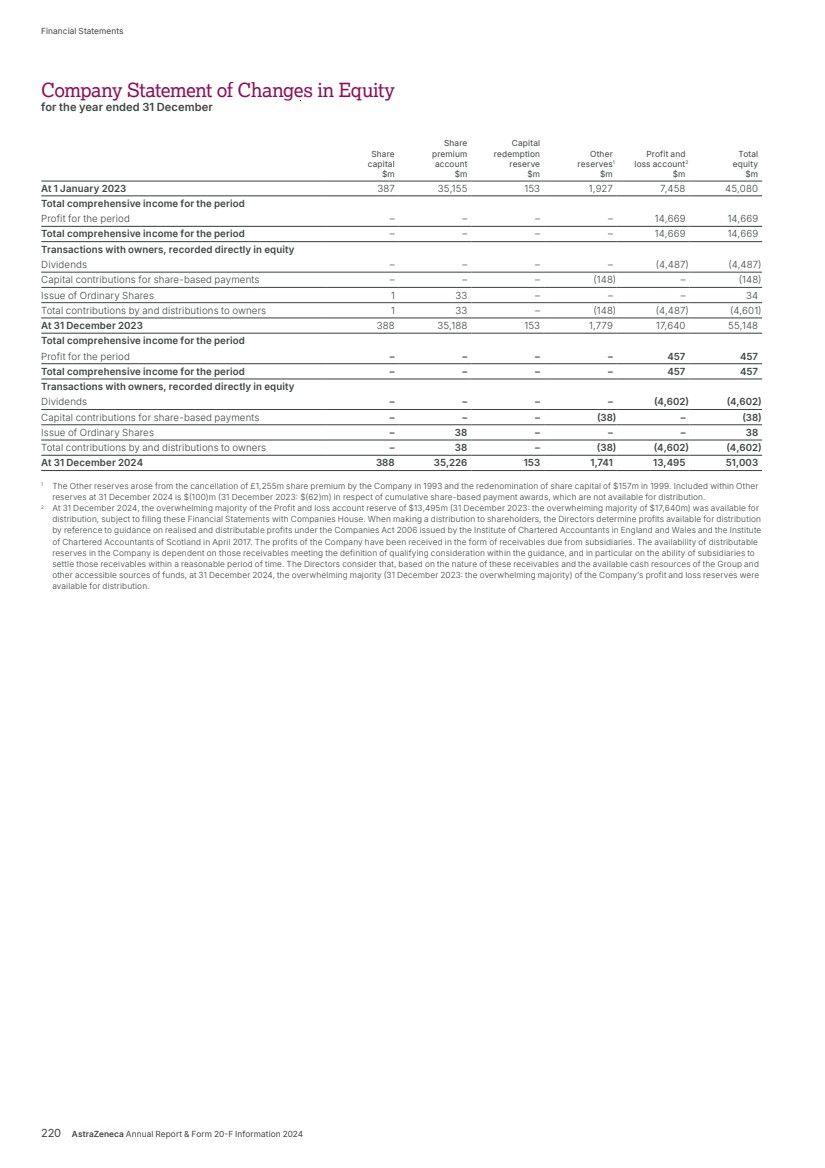
| Company Accounting Policies Basis of presentation of financial information The Company is a public limited company, limited by shares, incorporated and domiciled in England & Wales. The registered address is 1 Francis Crick Avenue, Cambridge Biomedical Campus, Cambridge, CB2 0AA. These financial statements were prepared in accordance with FRS 101 ‘Reduced Disclosure Framework’. In preparing these financial statements, the Company applied the recognition, measurement and disclosure requirements of International Financial Reporting Standards as adopted by the UK (UK-adopted international accounting standards), but made amendments where necessary in order to comply with the Companies Act 2006 and to take advantage of FRS 101 disclosure exemptions. In these financial statements, the Company has applied the exemptions available under FRS 101 in respect of the following disclosures: • Statement of Cash Flows and related notes • disclosures in respect of transactions with wholly owned subsidiaries • disclosures in respect of capital management • the effects of new but not yet effective IFRSs • disclosures in respect of the compensation of Key Management Personnel. As the Group Financial Statements (presented on pages 148 to 218) include the equivalent disclosures, the Company has also taken the exemptions under FRS 101 available in respect of the following disclosures: • IFRS 2 ‘Share-based Payment’ in respect of Group settled share-based payments • certain disclosures required by IFRS 13 ‘Fair Value Measurement’ and the disclosures required by IFRS 7 ‘Financial Instruments: Disclosures’. No individual profit and loss account is prepared as provided by section 408 of the Companies Act 2006. Basis of accounting The Company Financial Statements are prepared under the historical cost convention and on a going concern basis, in accordance with the Companies Act 2006. The following paragraphs describe the main accounting policies, which have been applied consistently. Estimates and judgements The preparation of the Company Financial Statements in conformity with generally accepted accounting principles requires management to make estimates and judgements that affect the reported amounts of assets and liabilities at the date of the Financial Statements and the reported amounts of revenues and expenses during the reporting period. Actual results could differ from those estimates. There are no key judgements or significant estimates. Foreign currencies Foreign currency transactions, being transactions denominated in a currency other than the Company’s functional currency, are translated into US dollars at average rates for the relevant monthly accounting periods, which approximate to actual rates. Monetary assets and liabilities arising from foreign currency transactions are retranslated at exchange rates prevailing at the reporting date. Exchange gains and losses on loans and on short-term foreign currency borrowings and deposits are included within Finance expense. Exchange differences on all other foreign currency transactions are recognised in Operating profit. Non-monetary items arising from foreign currency transactions are not retranslated in the Company’s accounting records. Taxation The current tax payable is based on taxable profit for the year. Taxable profit differs from reported profit because taxable profit excludes items that are either never taxable or tax deductible or items that are taxable or tax deductible in a different period. The Company’s current tax assets and liabilities are calculated using tax rates that have been enacted or substantively enacted by the reporting date. Current tax includes the Company’s charge for any Pillar Two income taxes. Deferred tax is provided using the balance sheet liability method, providing for temporary differences between the carrying amounts of assets and liabilities for financial reporting purposes and the amounts used for taxation purposes. Deferred tax liabilities are recognised unless they arise from the initial recognition (other than in a business combination) of assets and liabilities in a transaction that affects neither the taxable profit nor the accounting profit. Deferred tax liabilities are not recognised to the extent they arise from the initial recognition of non-tax deductible goodwill. Deferred tax assets are recognised to the extent that there are future taxable temporary differences or it is probable that future taxable profit will be available against which the asset can be utilised. This requires judgements to be made in respect of the availability of future taxable income. No deferred tax asset or liability is recognised in respect of temporary differences associated with investments in subsidiaries and branches where the Company is able to control the timing of reversal of the temporary differences and it is probable that the temporary differences will not reverse in the foreseeable future. The Company’s deferred tax assets and liabilities are calculated using tax rates that are expected to apply in the period when the liability is settled or the asset realised based on tax rates that have been enacted or substantively enacted by the reporting date. The Company applies the exception to recognising and disclosing information about deferred tax assets and liabilities related to Pillar Two income taxes, as provided in the amendments to IAS 12 ‘Incomes Taxes’ issued in May 2023. Liabilities for uncertain tax positions require management to make judgements of potential exposures in relation to tax audit issues. Tax benefits are not recognised unless the tax positions will probably be accepted by the tax authorities. This is based upon management’s interpretation of applicable laws and regulations and the expectation of how the tax authority will resolve the matter. Once considered probable of not being accepted, management reviews each material tax benefit and reflects the effect of the uncertainty in determining the related taxable result. AstraZeneca Annual Report & Form 20-F Information 2024 221 Strategic Report Corporate Governance Financial Statements Additional Information Company Accounting Policies |
| Liabilities for uncertain tax positions are measured using either the most likely amount or the expected value amount depending on which method the Company expects to better predict the resolution of the uncertainty. Investments Fixed asset investments, including investments in subsidiaries, are stated at cost and reviewed for impairment if there are indications that the carrying value may not be recoverable. Debtors Amounts owed by Group undertakings are recognised initially at fair value. Subsequent to initial recognition they are measured at amortised cost using the effective interest method, less any impairment losses. The recoverability of these balances has been assessed in accordance with IFRS 9 ‘Financial Instruments’ and no impairment has been identified. The amounts owed by Group undertakings are considered to have low credit risk, due to timely payment of interest and settlement of principal amounts on agreed due dates, limiting the loss allowance to 12-month expected credit losses. Amounts owed by Group undertakings are written off where there is no reasonable expectation of recovery. Impairment losses are presented as net impairment losses within Operating profit, any subsequent recoveries are credited against the same line. Other payables Liabilities included in Other payables are recognised initially at fair value. Subsequent to initial recognition they are remeasured at either amortised cost using the effective interest method or at fair value using an expected credit loss model. Financial instruments Interest-bearing loans are initially measured at fair value (with direct transaction costs being amortised over the life of the loan) and are subsequently measured at amortised cost using the effective interest method at each reporting date. Changes in carrying value are recognised in profit. Share-based payments The issuance by the Company to employees of its subsidiaries of a grant of awards over the Company’s shares, represents additional capital contributions by the Company to its subsidiaries (or capital reimbursement from those subsidiaries). An additional investment/ divestment in subsidiaries results in a corresponding increase/decrease in shareholders’ equity. The additional capital contribution/reimbursement is based on the fair value of the grant issued, allocated over the underlying grant’s vesting period, less the market cost of shares charged to subsidiaries in settlement of such share awards. Litigation Through the normal course of business, the AstraZeneca Group is involved in legal disputes, the settlement of which may involve cost to the Company. A provision is made where an adverse outcome is probable and associated costs, including related legal costs, can be estimated reliably. In other cases, appropriate disclosures are included. Company Accounting Policies continued 222 AstraZeneca Annual Report & Form 20-F Information 2024 Financial Statements |
| Notes to the Company Financial Statements 1 Fixed asset investments Investments in subsidiaries Shares Loans Total $m $m $m At 1 January 2023 49,192 14,363 63,555 Additions during the year – 1,588 1,588 Transfer to Debtors – amounts owed by Group undertakings – (991) (991) Capital reimbursement (131) – (131) Exchange – 158 158 Amortisation – 12 12 Other movements (2) – (2) At 31 December 2023 49,059 15,130 64,189 Additions during the year 33,745 – 33,745 Disposals during the year (33,745) – (33,745) Transfer to Debtors – amounts owed by Group undertakings – (1,997) (1,997) Capital reimbursement (54) – (54) Exchange – (156) (156) Amortisation – 11 11 Other movements 26 – 26 At 31 December 2024 49,031 12,988 62,019 Loans to subsidiaries consists of bonds which are issued externally and are issued back to Group undertakings with comparable terms on interest rates and are repayable on maturity, details of which are disclosed in Note 3. The recoverability of these inter-company loans has been assessed in accordance with IFRS 9 ‘Financial Instruments’ with no impairment identified. The inter-company balances are considered to have low credit risk due to timely payment of interest and settlement of principal amount on agreed due dates, limiting the loss allowance to 12-month expected credit losses. In 2024, there have been no credit losses (2023: $nil). The other movements comprise $26m representing issue and revaluation of carrying value of guarantees provided by the Company to its subsidiary as explained in Notes 2 and 3. 2 Other payables 2024 2023 $m $m Amounts falling due within one year Other creditors 199 214 Deferred income 3 2 202 216 Amounts falling due after more than one year Other creditors 47 21 Other creditors due after more than one year comprise an amount representing the carrying value of the guarantees provided by the Company to its subsidiary for the bonds issued externally as explained in Note 3. As at 31 December 2024, the carrying value of the guarantees was $47m (2023: $21m). AstraZeneca Annual Report & Form 20-F Information 2024 223 Strategic Report Corporate Governance Financial Statements Additional Information Notes to the Company Financial Statements |

| 3 Loans and borrowings Repayment 2024 2023 dates $m $m Amounts due within one year Interest-bearing loans and borrowings (unsecured) 0.75% Callable bond euros 2024 – 995 2024 Floating rate bank loans US dollars 2024 – 2,000 3.375% Callable bond US dollars 2025 1,997 – Total amounts due within one year 1,997 2,995 Amounts due after more than one year Interest-bearing loans and borrowings (unsecured) 3.375% Callable bond US dollars 2025 – 1,994 0.7% Callable bond US dollars 2026 1,198 1,196 3.625% Callable bond euros 2027 780 829 3.125% Callable bond US dollars 2027 748 747 1.25% Callable bond euros 2028 829 879 4% Callable bond US dollars 2029 996 995 0.375% Callable bond euros 2029 829 881 1.375% Callable bond US dollars 2030 1,295 1,294 5.75% Non-callable bond pounds sterling 2031 438 444 3.75% Callable bond euros 2032 778 827 6.45% Callable bond US dollars 2037 2,727 2,725 4% Callable bond US dollars 2042 989 989 4.375% Callable bond US dollars 2045 982 981 4.375% Callable bond US dollars 2048 738 738 2.125% Callable bond US dollars 2050 487 487 3% Callable bond US dollars 2051 735 735 Total amounts due after more than one year 14,549 16,741 Total loans and borrowings 16,546 19,736 2024 2023 $m $m Loans and borrowings are repayable: After five years from balance sheet date 9,169 11,096 From two to five years 4,182 3,651 From one to two years 1,198 1,994 Within one year 1,997 2,995 Total unsecured 16,546 19,736 All borrowings are issued with fixed interest rates, with the exception of the $2bn 2024 floating rate loans, which transitioned from LIBOR to a rate based on compounded daily USD Secured Overnight Funding Rate (SOFR) during the prior year. In addition, the Company acts as guarantor for bonds issued by its wholly-owned subsidiary, AstraZeneca Finance LLC. AstraZeneca Finance LLC is the issuer of $1,250m 1.200% Notes due 2026, $1,250m 4.800% Notes due 2027, $1,100m 4.875% Notes due 2028, $1,250m 1.750% Notes due 2028, $1,250m 4.850% Notes due 2029, $650m 4.900% Notes due 2030, €650m 3.121% Notes due 2030, $1,000m 4.900% Notes due 2031, $750m 2.250% Notes due 2031, $500m 4.875% Notes due 2033, €750m 3.278% Notes due 2033 and $1,500m 5.000% Notes due 2034 (the ‘AstraZeneca Finance Notes’). Each series of AstraZeneca Finance Notes has been fully and unconditionally guaranteed by the Company. Each of the guarantees by AstraZeneca PLC is full and unconditional and joint and several. The guarantee by AstraZeneca PLC of the AstraZeneca Finance Notes is the senior unsecured obligation of AstraZeneca PLC and ranks equally with all of AstraZeneca PLC’s existing and future senior unsecured and unsubordinated indebtedness. Each guarantee by AstraZeneca PLC is effectively subordinated to any secured indebtedness of AstraZeneca PLC to the extent of the value of the assets securing such indebtedness. The AstraZeneca Finance Notes are structurally subordinated to indebtedness and other liabilities of the subsidiaries of AstraZeneca PLC, none of which guarantee the AstraZeneca Finance Notes. 4 Called-up share capital Details of share capital movements in the year are included in Note 24 to the Group Financial Statements. Notes to the Company Financial Statements continued 224 AstraZeneca Annual Report & Form 20-F Information 2024 Financial Statements |
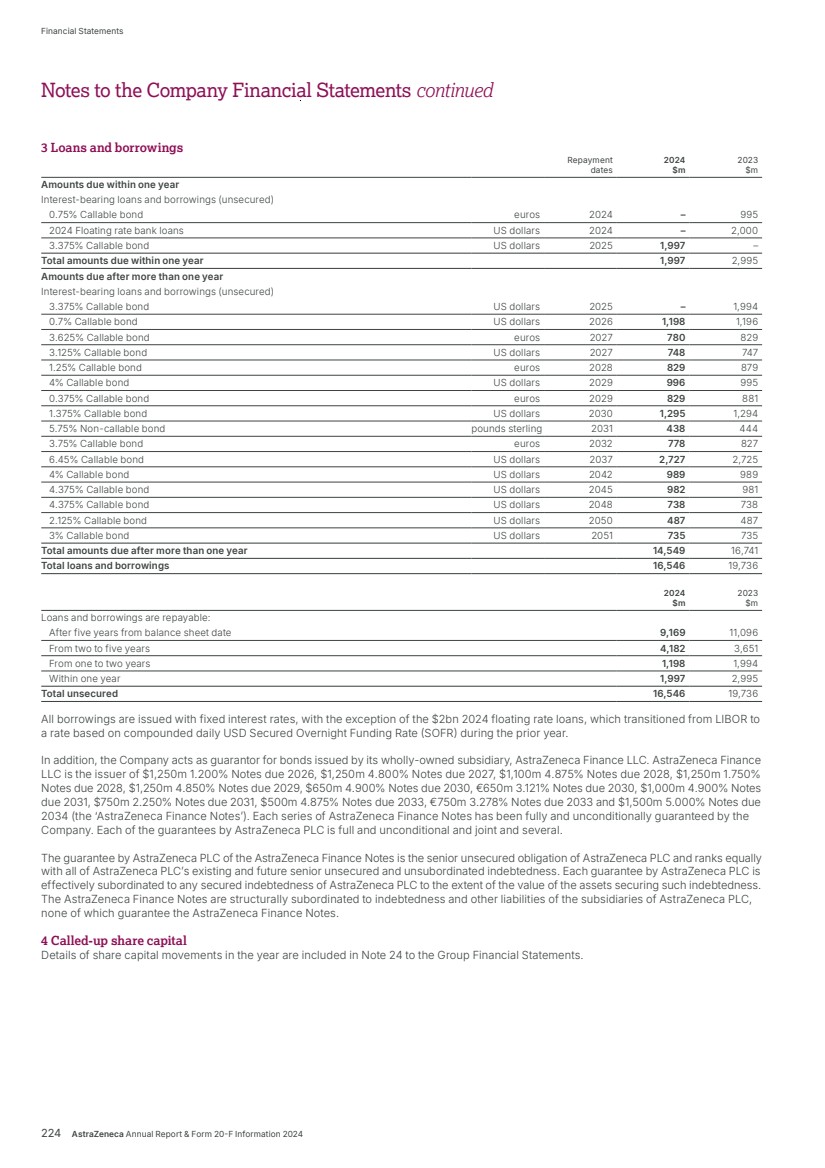
| 5 Contingent liabilities Vaxzevria Considered to be a contingent liability UK • AstraZeneca is defending lawsuits in multiple jurisdictions, including the UK, involving multiple claimants alleging injuries following vaccination with AstraZeneca’s COVID-19 vaccine. Most of the lawsuits involve claims of thrombosis with thrombocytopenia syndrome. • No trial dates have been scheduled. Securities Litigation Considered to be a contingent liability US • In December 2024, a putative securities class action lawsuit was filed in the US District Court for the Central District of California against AstraZeneca PLC and certain officers, on behalf of purchasers of AstraZeneca publicly traded securities between February 2022 and December 2024. The complaint alleges that defendants made materially false and misleading statements in connection with the Company’s business in China. University of Sheffield Contract Dispute Considered to be a contingent liability UK • In June 2024, AstraZeneca was served with a lawsuit filed by the University of Sheffield (Sheffield). In its complaint, Sheffield alleges that AstraZeneca made misrepresentations to induce Sheffield to amend a patent license relating to Lynparza. • AstraZeneca filed its defence in August 2024. No trial date has been scheduled. Viela Bio, Inc. Shareholder Litigation Considered to be a contingent liability US • In February 2023, AstraZeneca was served with a lawsuit filed in the Delaware state court against AstraZeneca and certain officers (collectively, Defendants), on behalf of a putative class of Viela Bio, Inc. (Viela) shareholders. The complaint alleged that the Defendants breached their fiduciary duty to Viela shareholders in the course of Viela’s 2021 merger with Horizon Therapeutics, plc. • In July 2024, the Court granted with prejudice AstraZeneca’s motion to dismiss. • In August 2024, plaintiffs appealed the dismissal. US Congressional Inquiry Matter concluded US • In January 2024, AstraZeneca received a letter from the US Senate Committee on Health, Education, Labor and Pensions (HELP Committee) seeking information related to AstraZeneca’s inhaled Respiratory products. • AstraZeneca cooperated with this inquiry and this matter is now concluded. Vermont US Attorney Investigation Considered to be a contingent liability US • In April 2020, AstraZeneca received a Civil Investigative Demand from the US Attorney’s Office in Vermont and the Department of Justice, Civil Division, seeking documents and information relating to AstraZeneca’s relationships with electronic health-record vendors. • AstraZeneca continues to cooperate with this enquiry. 6 Statutory and other information The Directors of the Company were paid by another Group company in 2024 and 2023. 7 Subsequent events There were no material subsequent events. AstraZeneca Annual Report & Form 20-F Information 2024 225 Strategic Report Corporate Governance Financial Statements Additional Information Notes to the Company Financial Statements |
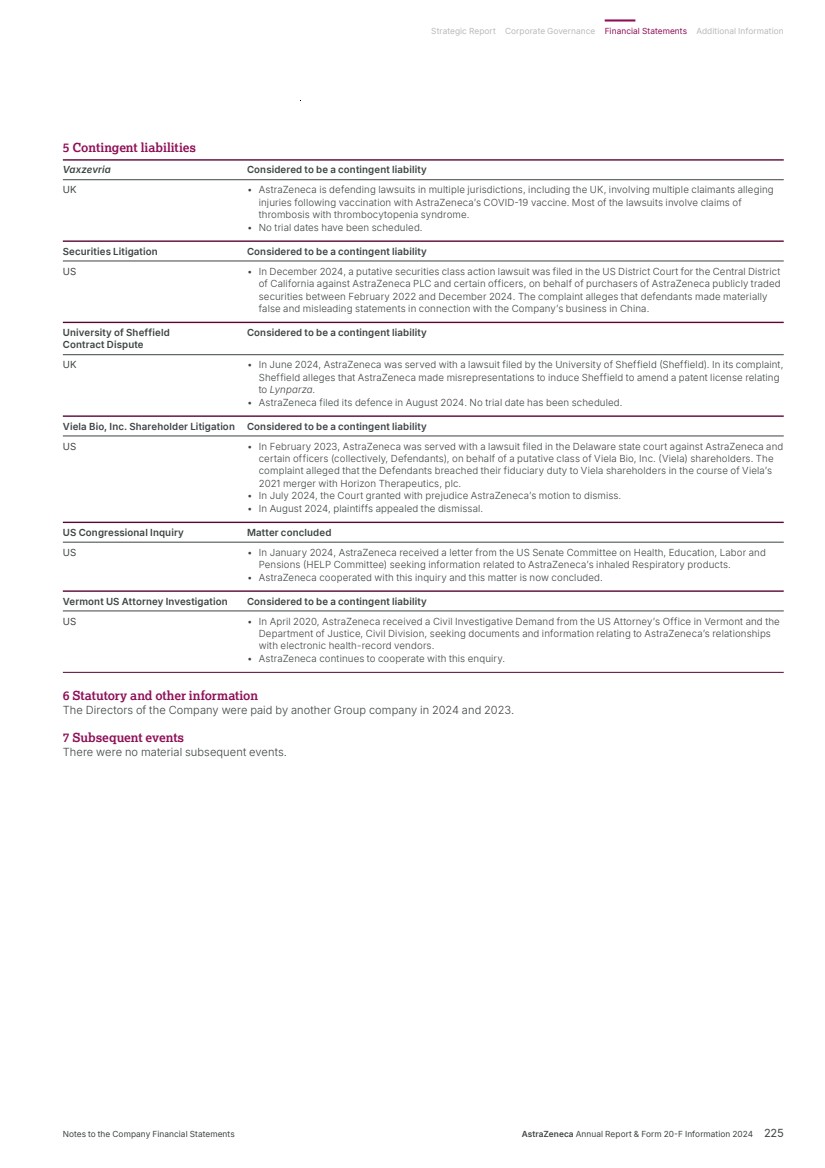
| Group Financial Record 2020 2021 2022 2023 2024 For the year ended 31 December $m $m $m $m $m Revenue and profits Product Sales 25,890 36,541 42,998 43,789 50,938 Alliance Revenue 190 388 755 1,428 2,212 Collaboration Revenue 537 488 598 594 923 Cost of sales (5,299) (12,437) (12,391) (8,268) (10,207) Distribution expense (399) (446) (536) (539) (555) Research and development expense (5,991) (9,736) (9,762) (10,935) (13,583) Selling, general and administrative expense (11,294) (15,234) (18,419) (19,216) (19,977) Other operating income and expense 1,528 1,492 514 1,340 252 Operating profit 5,162 1,056 3,757 8,193 10,003 Finance income 87 43 95 344 458 Finance expense (1,306) (1,300) (1,346) (1,626) (1,742) Share of after tax losses in associates and joint ventures (27) (64) (5) (12) (28) Profit/(loss) before tax 3,916 (265) 2,501 6,899 8,691 Taxation (772) 380 792 (938) (1,650) Profit for the period 3,144 115 3,293 5,961 7,041 Other comprehensive income/(expense) for the period, net of tax 1,608 (145) (878) 733 (800) Total comprehensive income/(expense) for the period 4,752 (30) 2,415 6,694 6,241 Profit attributable to: Owners of the Parent 3,196 112 3,288 5,955 7,035 Non-controlling interests (52) 3 5 6 6 Earnings per share Basic earnings per $0.25 Ordinary Share $2.44 $0.08 $2.12 $3.84 $4.54 Diluted earnings per $0.25 Ordinary Share $2.44 $0.08 $2.11 $3.81 $4.50 Dividends $2.80 $2.80 $2.90 $2.90 $2.97 226 AstraZeneca Annual Report & Form 20-F Information 2024 Financial Statements |
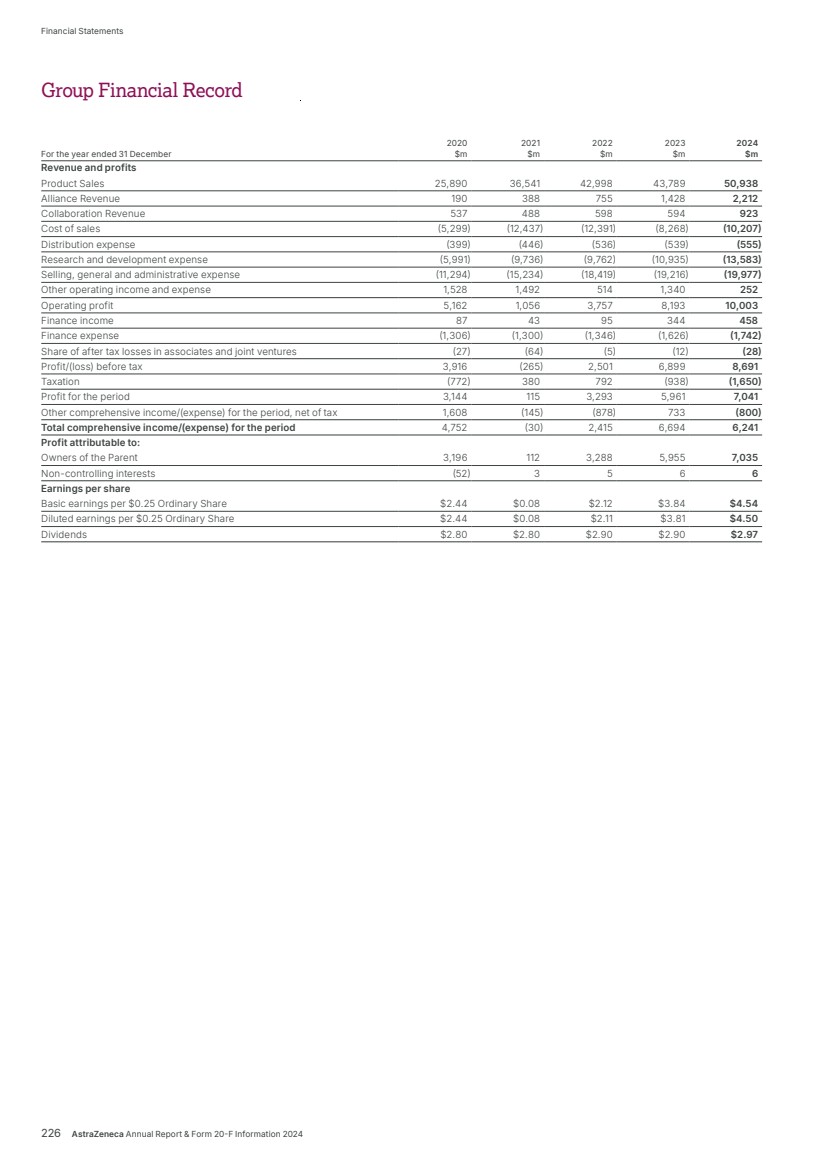
| Additional Information Contents Shareholder information 228 Directors’ Report 230 Sustainability supplementary information 233 Trade Marks 239 Glossary 240 Cautionary statement regarding forward-looking statements 244 Strategic Report Corporate Governance Financial Statements Additional Information Additional Information AstraZeneca Annual Report & Form 20-F Information 2024 227 |

| This section of the Annual Report contains information for shareholders that is required by regulation in the UK. Further information that may be of use to shareholders is available on the Shareholder information page of our website at www.astrazeneca.com. Additional information required by SEC regulations is included in AstraZeneca’s Form 20-F filing for 2024, which is available on the SEC website at www.sec.gov. The principal markets for trading in AstraZeneca shares are the London Stock Exchange, Nasdaq Stockholm and the Nasdaq Global Select Market (Nasdaq). AstraZeneca shares were listed on Nasdaq on 25 September 2020, prior to which they were listed on the New York Stock Exchange. Ordinary Shares of $0.25 each in AstraZeneca PLC are listed on the London Stock Exchange and the shareholder register is maintained by Equiniti Limited, the Ordinary Share registrar. Shares listed on Nasdaq Stockholm are issued under the Euroclear Services Agreement by Euroclear Sweden AB, the Swedish Central Securities Depositary. Shares listed on Nasdaq are in the form of American Depositary Shares (ADSs), evidenced by American Depositary Receipts (ADRs) issued by the Company’s ADR depositary. On 6 February 2025, J.P. Morgan Chase Bank, N.A. was appointed as the Company’s ADR Depositary, replacing Deutsche Bank Trust Company Americas. Two ADSs are equivalent to one Ordinary Share. Shares are listed on all three markets under the stock symbol AZN. Ordinary Share registrar Equiniti Limited Aspect House Spencer Road Lancing West Sussex BN99 6DA UK Tel (freephone in UK): +44 (0)800 389 1580 Swedish Central Securities Depositary Euroclear Sweden AB PO Box 191 SE-101 23 Stockholm Sweden Tel: +46 (0)8 402 9000 ADR depositary J.P. Morgan Chase Bank, N.A Shareowner Services PO Box 64504 St. Paul, MN 55164-0504 USA Tel (general): +1 888 697 8018 Tel (outside US): +1 651 453 2128 Annual General Meeting (AGM) The 2025 AGM will be held on 11 April 2025 and further details will be set out in the Notice of AGM. If you hold shares listed on Nasdaq Stockholm or hold ADRs, information relating to voting and participation will be included in the relevant Notice of AGM. If you hold shares through a nominee, your nominee provider will be able to advise you of their arrangements in relation to voting and participation. Dividends Dividend dates for 2025 are shown in the financial calendar below. A first interim dividend is normally announced in July/ August and paid in September and a second interim dividend is normally announced in January/February and paid in March. Dividends are paid in GBP, SEK and USD, depending on where the eligible shares are listed. Financial calendar Event Provisional date Second interim dividend for 2024 Ex-dividend date 20 February 2025 Record date 21 February 2025 Payment date 24 March 2025 Annual General Meeting 11 April 2025 Announcement of first quarter results for 2025 29 April 2025 Financial year end 31 December 2025 Related party transactions During the period 1 January 2025 to 31 January 2025, there were no transactions, loans, or proposed transactions between the Company and any related parties which were material to either the Company or the related party, or which were unusual in their nature or conditions (see also Note 31 to the Financial Statements on page 213). Conflicts of interest The Articles of Association of the Company enable the Directors to authorise any situation in which a Director has an interest that conflicts or has the potential to conflict with the Company’s interests and which would otherwise be a breach of the Director’s duty, under section 175 of the Companies Act 2006. The Board has a formal system in place for Directors to declare such situations to be considered for authorisation by those Directors who have no interest in the matter being considered. In deciding whether to authorise a situation, the non-conflicted Directors must act in the way they consider, in good faith, would be most likely to promote the success of the Company, and they may impose limits or conditions when giving the authorisation, or subsequently, if they think this is appropriate. Situations considered by the Board and authorisations given are recorded in the Board minutes and in a register of conflicts maintained by the Company Secretary and are reviewed annually by the Board. The Board believes that this system operates effectively. Shareholder fraud warning Shareholders of AstraZeneca and many other companies have reported receiving unsolicited calls and correspondence relating to their shareholdings and investment matters. Shareholders are advised to be very cautious of any unsolicited approaches and to note that reputable firms authorised by the Financial Conduct Authority (FCA) are very unlikely to make such approaches. Such approaches are likely to be part of a ‘boiler room scam’ attempting to defraud shareholders. Shareholders are advised to familiarise themselves with the information on scams available on the FCA website, www.fca.org.uk/consumers and with the FAQs in the Investors section of our website, www.astrazeneca.com. Any suspected scams or fraudulent approaches should be reported to the FCA via its website and to AstraZeneca’s Ordinary Share registrar, using the contact details on this page. For more information on dividends declared, see the Shareholder information section of our website, www.astrazeneca.com. 228 AstraZeneca Annual Report & Form 20-F Information 2024 Additional Information Shareholder information |
| Issued share capital, shareholdings and share prices At 31 December 2024, the Company had 63,435 registered holders of 1,550,546,239 Ordinary Shares. There were 171,061 holders of Ordinary Shares held under the Euroclear Services Agreement, representing 9.9% of the issued share capital of the Company and 1,513 registered holders of ADSs, representing 19.2% of the issued share capital of the Company. Ordinary Shares in issue 2024 2023 2022 Ordinary Shares in issue – millions At year-end 1,551 1,550 1,550 Weighted average for year 1,550 1,549 1,548 Stock market closing price per Ordinary Share (London Stock Exchange) Highest (pence) 13276 12294 11440 Lowest (pence) 9501 9900 8282 At year end (pence) 10468 10600 11218 Analysis of shareholdings as a percentage of issued share capital at 31 December Number of Ordinary Shares1 2024 % 2023 % 2022 % 1-250 0.2 0.3 0.3 251-500 0.3 0.3 0.3 501-1,000 0.3 0.4 0.4 1,001-5,000 0.5 0.5 0.5 5,001-10,000 0.2 0.2 0.2 10,001-50,000 1.1 1.1 1.1 50,001-1,000,000 11.2 11.3 1.1 Over 1,000,000 86.2 85.9 96.1 1 Includes Euroclear and ADR holdings. For more information on the Company’s share price, including historical closing prices and volumes, and an interactive share price graph, see the Investor Relations section on our website, www.astrazeneca.com. AstraZeneca Annual Report & Form 20-F Information 2024 229 Strategic Report Corporate Governance Financial Statements Additional Information Shareholder information |
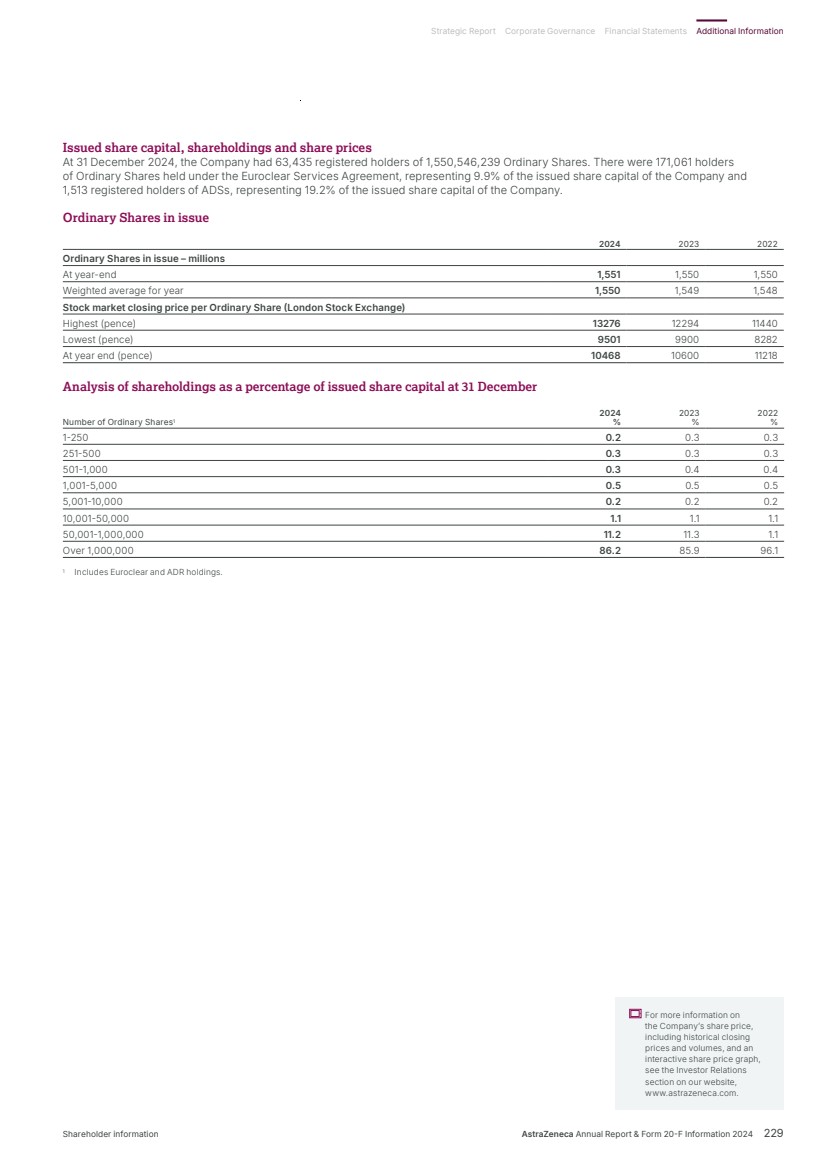
| The Directors’ Report includes information required to be given in accordance with the Companies Act 2006. Relevant information below, which is contained elsewhere in the Annual Report, is incorporated by cross reference herein. Subsidiaries and principal activities The Company is the holding company for a group of subsidiaries whose principal activities are described in this Annual Report. The Group’s subsidiaries and their locations are set out in Group Subsidiaries and Holdings in the Financial Statements from page 214. Branches and countries in which the Group conducts business In accordance with the Companies Act 2006, we disclose below countries of our representative, scientific or branch offices outside of the UK, established through various subsidiaries of the Company: Algeria, Angola, China, Costa Rica, Cuba, Denmark, Egypt, Georgia, Ghana, Jordan, Lebanon, Norway, Portugal, Romania, Russia, Saudi Arabia, Slovakia, Slovenia, Switzerland, Syria, Ukraine, United Arab Emirates, the US, Vietnam and Yemen. Disclosure of information to auditors The Directors who held office at the date of approval of this Annual Report confirm that, so far as they are each aware, there is no relevant audit information of which the Company’s auditors are unaware; and each Director has taken all the steps that he or she ought to have taken as a Director to make himself or herself aware of any relevant audit information and to establish that the Company’s auditors are aware of that information. Going concern accounting basis Information on the business environment in which AstraZeneca operates, including the factors underpinning the industry’s future growth prospects, is included in the Strategic Report. Details of the product portfolio of the Group are contained in the Strategic Report (in the Therapy Area Review from page 16). For information on patent expiry dates for key marketed products, see the Patent Expiries of Key Marketed Products Supplement on our website, www.astrazeneca.com/ annualreport2024. Our approach to product development is covered in detail, with additional information by therapy area in the Strategic Report. For information on our development pipeline, see the Development Pipeline Supplement on our website, www.astrazeneca.com/annualreport2024. The financial position of the Group, its cash flows, liquidity position and borrowing facilities are described in the Financial Review from page 67. In addition, Note 28 to the Financial Statements from page 194 includes the Group’s objectives, policies and processes for: managing capital; financial risk management objectives; details of its financial instruments and hedging activities; and its exposures to credit, market and liquidity risk. Further details of the Group’s cash balances and borrowings are included in Notes 17 and 19 to the Financial Statements from page 178. Having assessed the Principal Risks and other matters considered in connection with the Viability statement on page 63, the Board considers it appropriate to adopt the going concern basis of accounting in preparing the Annual Report and Financial Statements. Shares A shareholders’ resolution was passed at the 2024 AGM authorising the Company to purchase its own shares. The Company did not purchase any of its own shares in 2024. On 31 December 2024, the Company did not hold any shares in treasury. Rights, preferences and restrictions attaching to shares As at 31 December 2024, the Company had 1,550,546,239 Ordinary Shares and 50,000 Redeemable Preference Shares in issue. The Ordinary Shares represent 99.98% and the Redeemable Preference Shares represent 0.02% of the Company’s total share capital (these percentages have been calculated by reference to the 8am WM/ Reuters USD/GBP exchange rate on 31 December 2024). As agreed by the shareholders at the Company’s AGM held on 29 April 2010, the Articles of Association of the Company (the Articles) were amended with immediate effect to remove the requirement for the Company to have an authorised share capital, the concept of which was abolished under the Companies Act 2006. Each Ordinary Share carries the right to vote at general meetings of the Company. The rights and restrictions attaching to the Redeemable Preference Shares differ from those attaching to Ordinary Shares as follows: • The Redeemable Preference Shares carry no rights to receive dividends. • The holders of Redeemable Preference Shares have no rights to receive notices of, attend or vote at general meetings, except in certain limited circumstances. They have one vote for every 50,000 Redeemable Preference Shares held. • On a distribution of assets of the Company, on a winding-up or other return of capital (subject to certain exceptions), the holders of Redeemable Preference Shares have priority over the holders of Ordinary Shares to receive the capital paid up on those shares. • Subject to the provisions of the Companies Act 2006, the Company has the right to redeem the Redeemable Preference Shares at any time on giving not less than seven days’ written notice. There are no specific restrictions on the transfer of shares in the Company, which is governed by the Articles and prevailing legislation. The Company is not aware of any agreements between holders of shares that may result in restrictions on the transfer of shares or that may result in restrictions on voting rights. The Company is also not aware of any arrangements under which financial rights are held by a person other than the holder of the shares. Action necessary to change the rights of shareholders In order to vary the rights attached to any class of shares, the consent in writing of the holders of three quarters in nominal value of the issued shares of that class or the sanction of a special resolution passed at a general meeting of such holders is required. Changes in share capital Changes in the Company’s Ordinary Share capital during 2024, including details of the allotment of new shares under the Company’s share plans, are given in Note 24 to the Financial Statements from page 192. Employee share trust ownership rights The trustee of the AstraZeneca Employee Benefit Trust (the EBT, the Trustee) will not exercise voting rights attached to shares held in the EBT (Shares). Any decision as to acceptance or rejection of an offer for Shares subject to subsisting awards would be made by the Trustee, having regard to the interests of award holders. There is a further employee benefit trust for the benefit of employees who are residents in Canada (the Canada EBT). The trustees of the Canada EBT will not exercise voting rights attached to shares held in the Canada EBT. For more information on shares, see Issued share capital, shareholdings and share prices on page 229. 230 AstraZeneca Annual Report & Form 20-F Information 2024 Additional Information Directors’ Report |
| Distributions to shareholders – dividends for 2024 Details of our distribution policy are set out in the Financial Review from page 67 and Note 28 to the Financial Statements from page 194. The Company’s dividend for 2024 of $3.10 (245.6 pence, 33.75 SEK) per Ordinary Share is estimated to amount to, in aggregate, a total dividend payment to shareholders of $4,806 million. Two employee share trusts, AstraZeneca EBT and AstraZeneca Share Trust Limited, waived their rights to a dividend on the Ordinary Shares they hold and instead received nominal dividends. A further employee share trust, the Canada EBT, waived its right to receive the first interim dividend of 2024 on the Ordinary Shares it held on the applicable record date. Articles of Association AstraZeneca PLC’s current Articles were adopted by shareholders at the Company’s AGM held on 27 April 2023. Any amendment to the Articles requires the approval of shareholders by a special resolution at a general meeting of the Company. Objects The Company’s objects are unrestricted. Directors The Board has the authority to manage the business of the Company, for example, through powers to allot and repurchase its shares, subject where required to shareholder resolutions. Subject to certain exceptions, Directors do not have power to vote at Board meetings on matters in which they have a material interest. The quorum for meetings of the Board is a majority of the full Board, of whom at least four must be Non-Executive Directors. In the absence of a quorum, the Directors do not have power to determine compensation arrangements for themselves or any member of the Board. The Board may exercise all the powers of the Company to borrow money. Variation of these borrowing powers would require the passing of a special resolution of the Company’s shareholders. All Directors must retire from office at the Company’s AGM each year and may present themselves for election or re-election. Directors are not prohibited, upon reaching a particular age, from submitting themselves for election or re-election. General meetings AGMs require 21 clear days’ notice to shareholders. Subject to the Companies Act 2006, other general meetings require 14 clear days’ notice. For all general meetings, a quorum of two shareholders present in person or by proxy, and entitled to vote on the business transacted, is required unless each of the two persons present is a corporate representative of the same corporation, or each of the two persons present is a proxy of the same shareholder. Shareholders and their duly appointed proxies and corporate representatives are entitled to be admitted to general meetings. Limitations on the rights to own shares There are no limitations on the rights to own shares. Major shareholdings At 31 December 2024, the following persons had disclosed an interest in the issued Ordinary Share capital of the Company in accordance with the requirements of rules 5.1.2 or 5.1.5 of the UK Financial Conduct Authority’s (FCA) Disclosure Guidance and Transparency Rules. Changes in the percentage ownerships disclosed by major shareholders are set out below. Major shareholders do not have different voting rights. Number of Ordinary Shares disclosed as a percentage of issued share capital at: Shareholder Date of the latest disclosure to the Company1 Number of Ordinary Shares disclosed % as at the date of the latest disclosure to the Company 31 December 2022 31 December 2023 31 December 2024 31 January 2025 BlackRock, Inc. 4 December 2009 100,885,181 6.96 6.51 6.51 6.51 6.51 Investor AB 3 April 2019 51,587,810 3.93 3.33 3.33 3.33 3.33 The Capital Group Companies, Inc. 17 July 2018 63,802,495 5.04 4.12 4.12 4.11 4.11 Wellington Management Group LLP2 21 July 2020 65,120,892 4.96 4.20 4.20 4.20 4.20 Wellington Management Company LLP2 21 July 2020 65,118,411 4.96 4.20 4.20 4.20 4.20 1 Since the date of disclosure to the Company, the interest of any person listed above in Ordinary Shares may have increased or decreased. No requirement to notify the Company of any increase or decrease arises unless the holding passes a notifiable threshold in accordance with rules 5.1.2 or 5.1.5 of the UK FCA’s Disclosure Guidance and Transparency Rules. 2 The Company was notified at the time of the disclosure that Wellington Management Company LLP was a subsidiary of Wellington Management Group LLP and that the shareholding percentage notified by Wellington Management Company LLP was included within the aggregate shareholding percentage notified by Wellington Management Group LLP. So far as the Company is aware, no other person held a notifiable interest in the issued Ordinary Share capital of the Company. No changes to major shareholdings were disclosed to the Company between 31 December 2024 and 31 January 2025. So far as the Company is aware, it is neither directly nor indirectly owned or controlled by one or more corporations or by any government. The Company does not know of any arrangements, the operation of which might result in a change in the control of the Company. AstraZeneca Annual Report & Form 20-F Information 2024 231 Strategic Report Corporate Governance Financial Statements Additional Information Directors’ Report |
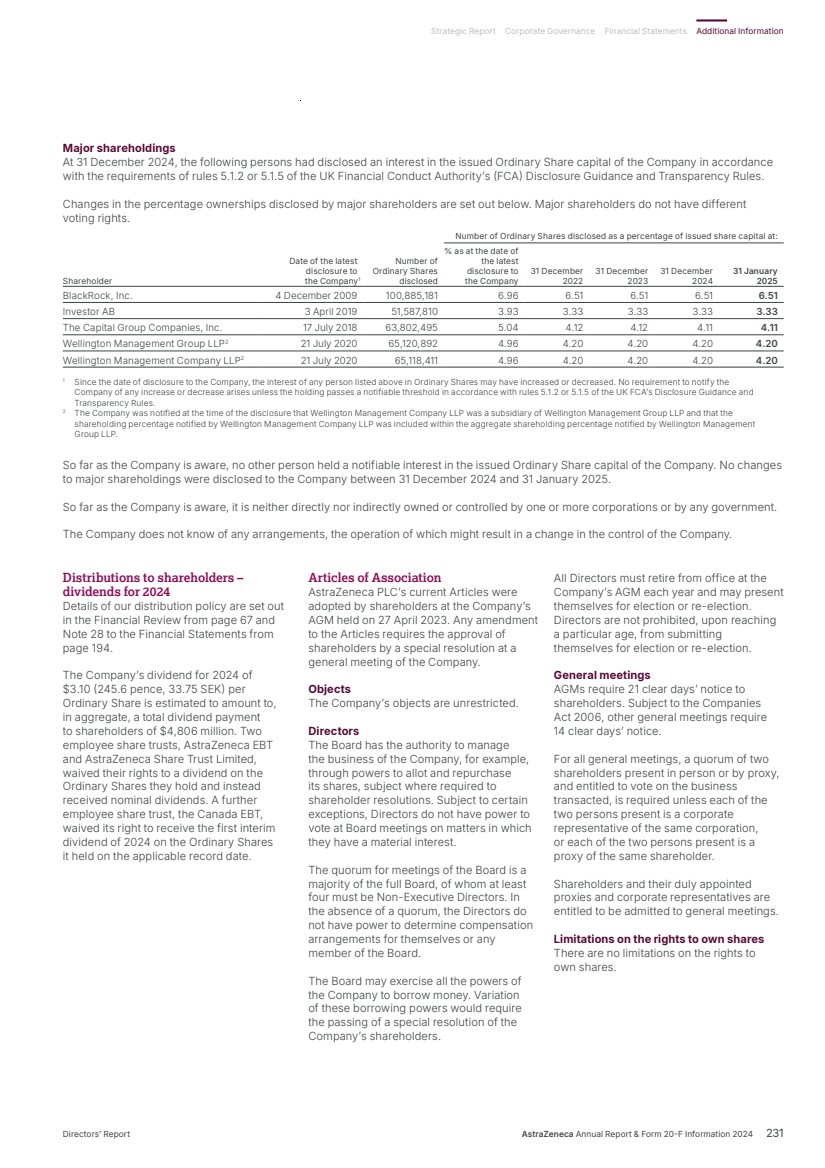
| • Make donations to political parties or independent election candidates. • Make donations to political organisations other than political parties. • Incur political expenditure, up to an aggregate limit of $250,000. Corporate political contributions in the US are permitted in defined circumstances under the First Amendment of the US Constitution and are subject to both federal and state laws and regulations. In 2024, the Group’s US legal entities made contributions amounting in aggregate to $1,156,800 (2023: $1,687,650) to national political organisations, state-level political party committees and to campaign committees of various state candidates. No corporate political donations were made at the federal level and all contributions were made only where allowed by US federal and state law. We publicly disclose details of our corporate US political contributions, which can be found on our website, www.astrazeneca-us.com. The annual corporate contributions budget is reviewed and approved by the US VP, Corporate Affairs and the President of our US business to ensure robust governance and oversight. US citizens or individuals holding valid green cards exercised decision making over the contributions and the funds were not provided or reimbursed by any non-US legal entity. Such contributions do not constitute political donations or political expenditure for the purposes of the Companies Act 2006 and were made without any involvement of persons or entities outside the US. Significant agreements There are no significant agreements to which the Company is a party that take effect, alter or terminate on a change of control of the Company following a takeover bid. There are no persons with whom we have contractual or other arrangements, who are deemed by the Directors to be essential to our business. Use of financial instruments The Notes to the Financial Statements, including Note 28 from page 194, include further information on our use of financial instruments. Insurance and indemnities The Company maintained directors’ and officers’ liability insurance cover throughout 2024. The Directors are also able to obtain independent legal advice at the expense of the Company, as necessary, in their capacity as Directors. Since 2006, the Company has entered into a deed of indemnity in favour of each Board member. These deeds of indemnity are still in force and provide that the Company shall indemnify the Directors to the fullest extent permitted by law and the Articles, in respect of all losses arising out of, or in connection with, the execution of their powers, duties and responsibilities as Directors of the Company or any of its subsidiaries. This is in line with current market practice and helps us attract and retain high-quality, skilled Directors. Compliance requirements under UK Listing Rule 6.6.1 The only matter to report is the shareholder waiver of dividends on page 231. Directors’ Report The Directors’ Report, which has been prepared in accordance with the requirements of the Companies Act 2006, comprises the following sections: • Chair’s Statement • Chief Executive Officer’s Review • Therapy Area Review • Business Review • Risk Overview • Financial Review: Financial risk management • Corporate Governance: including the Corporate Governance Overview, Corporate Governance Report, Nomination and Governance Committee Report, Science Committee Report, Sustainability Committee Report and Audit Committee Report • Directors’ responsibility statement • Shareholder information • Sustainability supplementary information and has been approved by the Board and signed on its behalf. On behalf of the Board A C N Kemp Company Secretary 6 February 2025 Stakeholder engagement The discussion on stakeholder engagement and the impact of these interactions is contained in Connecting with our stakeholders from page 94 and throughout the Strategic Report. This includes engagement with our employees, suppliers and other stakeholders, as well as the impact of our operations on the community and environment. Information on how we encourage employee involvement in the Company’s performance is set out in People and Sustainability from page 47. Details of some of the employee share plans are described in the Directors’ Remuneration Report from page 112, and in Note 29 to the Financial Statements from page 201. All employees are provided with information on matters of concern to them through regular meetings and updates on the Group’s intranet and internal social media. ‘Townhall’ meetings and Q&A sessions are hosted regularly by members of senior management, including the SET, including global and targeted broadcasts on internal social media. During 2024, these broadcasts provided updates on the business, including pipeline developments and strategic initiatives, as well as the Group’s response to global issues such as climate change. In addition, information about the Group’s quarterly results is shared with employees. These updates inform employees of the financial and economic factors which affect the performance of the Group. Political donations Neither the Company nor its subsidiaries made any EU political donations or incurred any EU political expenditure in 2024 and they do not intend to do so in the future in respect of which shareholder authority is required, or for which disclosure in this Annual Report is required, under the Companies Act 2006. However, to enable the Company and its subsidiaries to continue to support interest groups or lobbying organisations concerned with the review of government policy or law reform without inadvertently breaching the Companies Act 2006, which defines political donations and other political expenditure in broad terms, a resolution will be put to shareholders at the 2025 AGM, similar to that passed at the 2024 AGM, to authorise the Company and its subsidiaries to: For more information on dividend distributions, the AGM and results announcements, see Financial calendar on page 228. For more information on the Directors, see Board of Directors on pages 88 and 89. 232 AstraZeneca Annual Report & Form 20-F Information 2024 Additional Information Directors’ Report continued |
| GHG reporting We have reported on all the emission sources required under Streamlined Energy and Carbon Reporting (SECR). These sources fall within our Group Financial Statements. We do not have responsibility for any emission sources that are not included in our Group Financial Statements. Global GHG emissions data for the period 1 January 2024 to 31 December 20241,2 Unit 2024 2023 2022 Baseline 2015 Scope 1: Combustion of fuel and operation of facilities3 Tonnes CO₂e 125,386 180,898 237,703 298,498 Scope 2 (Market-based): Electricity (net of market instruments), heat, steam and cooling purchased for own use4 Tonnes CO₂e 14,210 19,940 18,491 322,319 Scope 2 (Location-based): Electricity, heat, steam and cooling purchased for own use4 Tonnes CO₂e 217,026 183,332 180,403 266,372 Company’s chosen intensity measurement: Scope 1 + Scope 2 (Market-based) Tonnes CO₂e per million of Total Revenue 2.58 4.38 5.78 Total energy consumption5 Megawatt hours (MWh) 1,676,076 1,733,325 1,828,612 Unit 2024 2023 2022 Baseline 2019 Scope 3 Total: Emissions from all 15 GHG Protocol Scope 3 Categories6 Tonnes CO₂e 5,897,822 5,917,160 6,330,308 5,722,797 Scope 3 intensity measurement: Scope 3 emissions from all 15 GHG Protocol Scope 3 Categories Tonnes CO₂e per million of Total Revenue 109.07 129.16 142.73 1 The Group reports GHG emissions in accordance with the World Resources Institute/World Business Council for Sustainable Development (WRI/WBCSD) Greenhouse Gas Protocol: A Corporate Accounting and Reporting Standard, Revised Edition (2015) and Corporate Value Chain (Scope 3), Accounting and Reporting Standard (2011). 2 Under the Companies (Directors’ Report) and Limited Liability Partnerships (Energy and Carbon Report) Regulations 2018, the Company needs to disclose what proportion of this figure relates to energy use in the UK and offshore area. For 2024, the proportion of total global energy and emissions originating from AstraZeneca’s UK and offshore area footprint were as follows: energy use 245,902 MWh (15%); Scope 1 site energy, non-energy and fleet emissions 20,462 tCO2e (16%); Scope 2 site imported energy emissions using Market-based accounting 0 tCO2e (0%) and Scope 2 site imported energy emissions using Location‑based accounting 22,195 tCO2e (10%). In the period covered by the Annual Report, AstraZeneca has installed LED lighting, upgraded chillers, improved controls for heating, ventilation and air conditioning systems, maintained ISO 50001 certification at the Macclesfield facility, UK, and deployed electric vehicles across the commercial vehicle fleet. 3 Included in this section are GHGs from direct fuel combustion, process and engineering emissions at our sites and from fuel use in our vehicle fleet. In 2024, 134,695 MWh of biomethane certificates have been purchased globally and accounted in our Scope 1 GHG reporting with a CO2 factor of zero. Accounting for this quantity of gas with fossil fuel CO2 factors equates to 24,595 tCO2e, we account for all non-CO2 emissions. The UK accounted for 34,431 MWh of biomethane and 6,285 tCO2e. In the UK, Renewable Gas Guarantees of Origin for biomethane are retired through the Green Gas Certification Scheme. In the US, Renewable Thermal Certificates are tracked via the Midwest Renewable Energy Tracking System. 4 GHGs from imported electricity are calculated using the GHG Protocol Scope 2 Guidance (January 2015) requiring dual reporting using two emissions factors for each site – Market-based and Location-based. Our corporate emissions reporting and targets follow the Market-based approach. Emission factors for electricity have been derived from the International Energy Agency, US Environmental Protection Agency eGRID, US Green-e and the Association of Issuing Bodies databases. 5 The aggregate of: (i) the annual quantity of energy consumed from activities for which the Company is responsible, including the combustion of fuel at a facility; (ii) the annual quantity of energy consumed resulting from the purchase of electricity, heat, steam or cooling by the Company for its own use; (iii) the combustion of fuel from the commercial operation of vehicle fleet; and (iv) the annual quantity of energy consumed resulting from the purchase of electricity to operate Electric Vehicles (EVs) as part of the commercial vehicle fleet. 6 Regular data review is carried out to ensure accuracy, consistency and reflect major business change, which has led to changes to reported figures in data in previous years. Key changes include (i) from 2023, Scope 3 Category 1,2,4 and 6 – AstraZeneca has changed the source of procurement spend data and classification of spend, which impacts emissions that are calculated from it (secondary data). In addition, AstraZeneca has integrated the latest version of Comprehensive Environmental Data Archive (CEDA) emission factors to 2023 data, which reflect decarbonisation that occurred between 2018 and 2022; (ii) Scope 3 Category 6 – AstraZeneca has identified air travel data that originated outside its primary travel provider. This data has been incorporated back to the 2019 baseline year; (iii) Scope 3 Category 11 – AstraZeneca has revised prior period manufacture volumes (2022 and 2023) to align with current reporting methodology. For further information, see our GHG Reporting Methodology document which can be found on www.astrazeneca.com/sustainability/resources.html. External assurance Bureau Veritas has provided independent external assurance to a limited level on the following sustainability information contained within this Annual Report: • Positively impacting people, society and the planet, see page 6. • Science and Innovation, Key Performance Indicators, see page 13 • People and Sustainability, including 2024 developments and Key Performance Indicators, see page 15. • Sustainable innovation, see page 37. • Patient safety and product quality, see page 38. • Business conduct, see pages 42 and 43. • Cybersecurity and data privacy, see page 45. • People and Sustainability, Summary and performance indicators, see page 47. • Human rights, see page 48. • Workforce safety and health, see page 48. • Talent attraction and retention, see pages 49 and 50. • Sustainability, see page 51. • Accessible and affordable healthcare, see page 52. • Climate change, see pages 53 to 57. • Pollution, see page 58. • Disclosure Statements, including Our approach to sustainability reporting, UK statutory sustainability reporting, EU Corporate Sustainability Reporting Directive and EU Taxonomy Disclosure, see pages 59 to 62. • Supplementary information, including GHG reporting, see this page, Material sustainability metrics definitions, see pages 234 and 235, Climate risk scenarios, see page 236 and EU Taxonomy templates, see pages 237 and 238. BV Used throughout this Annual Report to denote the sustainability information listed above, which has been independently assured by Bureau Veritas. Material sustainability metrics independently assured by Bureau Veritas. Based on the evidence provided and subject to the scope, objectives and limitations defined in the Assurance Report by Bureau Veritas, nothing has come to the attention of Bureau Veritas causing them to believe that the sustainability information contained within this Annual Report is materially misstated. Bureau Veritas is a professional services company that has a long history of providing independent assurance services in environmental, health, safety, social and ethical management and disclosure. The Assurance Report, which includes Bureau Veritas’ scope of work, standard used, overall opinion, and limitations and exclusions, is available on our website, www.astrazeneca.com/sustainability/ resources.html. For more information, see Climate change from page 53. AstraZeneca Annual Report & Form 20-F Information 2024 233 Strategic Report Corporate Governance Financial Statements Additional Information Sustainability supplementary information Sustainability supplementary information BV |
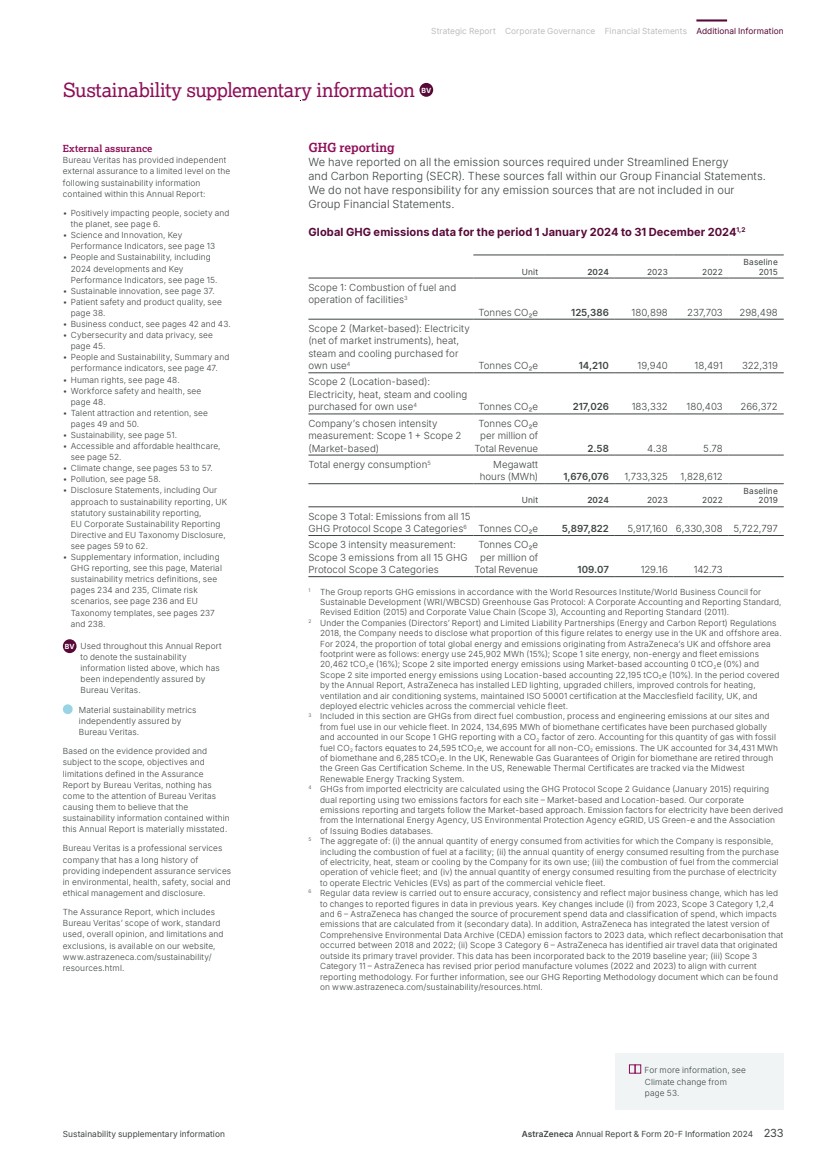
| Material sustainability metrics definitions Definitions and methodology of quantitative metrics used to track the effectiveness of our actions related to managing our material sustainability topics are detailed below. The metrics cover the Group, unless otherwise stated, and are subject to limited assurance by Bureau Veritas. Of the 16 sustainability metrics, three are Key Performance Indicators: • Number of pipeline progression events • Number of regulatory events • Employee belief that AstraZeneca is a great place to work. Sustainability topic Metric Definitions and calculations (if applicable) Methodology Sustainable innovation See page 37 Number of new molecular entities (NMEs) approvals (cumulative) ‘NME approvals’ refers to medicines approved since October 2022 to meet our Ambition 2030. Data is collected via a monthly reporting process, captured on AstraZeneca’s project planning and forecasting tool, and maintained by the Global Portfolio and Project Management team. Number of pipeline progression events ‘Pipeline progression events’ refers to Phase II NME starts/ progressions and Phase III investment decisions. Number of regulatory events ‘Regulatory events’ refers to submissions or approvals for our medicines in major markets. Patient safety and product quality See page 38 Number of inspections from all health authorities relating to Good Manufacturing Practice (GMP) ‘Health authorities’ refers to government agencies that are responsible for protecting and promoting public health through the supervision of pharmaceutical products. ‘Inspections’ refers to assessments of manufacturing facilities and processes for regulated products to verify compliance with relevant regulations, by health authorities. ‘Good Manufacturing Practice’ (GMP) is part of a quality management system which ensures that products are consistently produced and controlled to the quality standards appropriate to their intended use and as required by the marketing authorisation. This covers commercial product manufacture and marketing companies’ Good Distribution Practice (GDP), products in development going into clinical trials and device manufacturing. Inspection is counted once closed and observations have been received. Data is captured on an internal quality management system by the Operations Quality Assurance team. Number of critical findings from health authorities relating to GMP ‘Critical findings‘ are deficiencies with GMP reported by health authorities, that provide an immediate and significant risk to patient safety. A ‘critical finding‘ can also be a combination or repetition of major findings that indicate a critical failure of GMP. Number of product recalls ‘Recalls’ can be initiated at various levels: • Level 1 is at wholesale level • Level 2 is at pharmacy/hospital level • Level 3 is at patient level. Cyber-security and data privacy See page 45 Number of material cybersecurity incidents A ‘material cybersecurity incident’ is defined as material unauthorised access, disclosure or disruption of information systems of data that significantly impacts the confidentiality, integrity or availability of critical assets, operations or stakeholders. Data is collected through incident reports, security logs and continuous monitoring tools. Designated cybersecurity and data privacy members are responsible for data collection. Number of material security breaches involving personal data ‘Material security breaches’ refers to material unauthorised access to personal data. A reported breach alone does not constitute a material breach. For more information on our Key Performance Indicators, see pages 12 to 15. For more information on required disclosures under UK Streamlined Energy and Carbon Reporting, see page 233. 234 AstraZeneca Annual Report & Form 20-F Information 2024 Additional Information Sustainability supplementary information continued BV |
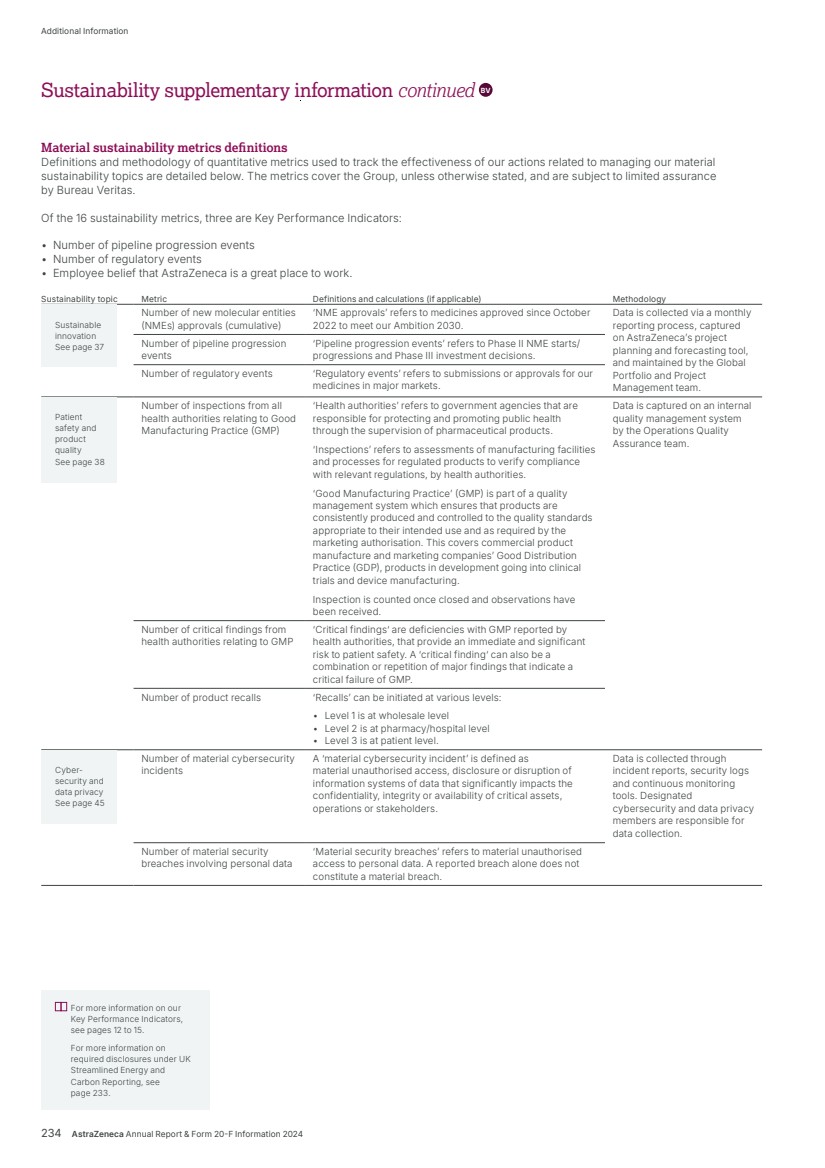
| Sustainability topic Metric Definitions and calculations (if applicable) Methodology Talent attraction and retention See from page 49 Employee belief that AstraZeneca is a great place to work (%) ‘Employee belief’ refers to the positive response (agree and tend to agree) to each respective statement in our annual employee opinion survey, Pulse. Calculation: Total number of responses that either agree or tend to agree divided by total number of responses, then multiplied by 100. Data is captured annually through our Pulse survey conducted by HR and shared Company-wide. Employee belief that in the last 12 months, I have improved my existing skills, or learned new skills, or had a development opportunity (%) Employee overall promotion rate (%) ‘Promotion’ refers to when an employee advances to a position that is classified at a higher grade. Calculation: Total number of promotions made during the reporting year divided by the average permanent headcount across those 12 months, then multiplied by 100. Data is captured in the HR data insights dashboard by our Workforce Insights and Analytics team. The dashboard uses data automatically pulled through from our HR data Employee turnover (%) ‘Employee turnover’ refers to the exit of a permanent management systems. employee, including those leaving on a voluntary or involuntary basis. Calculation: Total number of permanent exits (voluntary or involuntary) in the reporting year divided by the average permanent headcount across those 12 months, then multiplied by 100. Climate change See from page 53 Gross Scope 1 and 2 (Market‑based) GHG emissions (tonnes CO2e) This is the combined Scope 1 and Scope 2 (Market-based) GHG emissions during the reporting period. ‘Scope 1 GHG emissions‘ are direct emissions that occur from sources that are controlled or owned by AstraZeneca. ‘Scope 2 GHG emissions‘ are indirect emissions from the generation of purchased energy consumed by AstraZeneca, and includes electricity and imported steam, imported or district heat and cooling systems. ‘Market-based‘ refers to factors that are more specific to the site and local energy market, taking account of the residual energy mix and any certified renewable power purchased by a site. Data is captured through the centralised Safety, Health and Environmental reporting system with consumption data multiplied by relevant GHG emission factors in accordance with the Greenhouse Gas Protocol: A Corporate Accounting and Reporting Standard, Revised Edition (2015). Gross Scope 3 GHG emissions (tonnes CO2e) ‘Scope 3 GHG emissions‘ are all indirect emissions (not included in Scope 2) that occur in the value chain of AstraZeneca, including both upstream and downstream emissions. Data for Scope 3 is captured from multiple sources and consolidated into the 15 categories of Scope 3 according to the Greenhouse Gas Protocol: Corporate Value Chain (Scope 3), Accounting and Reporting Standard (2011). Scope 1 and 2 (Market-based) GHG emissions intensity (tonnes CO2e per million of Total Revenue) Scope 1 and 2 intensity metric normalises the Scope 1 and 2 (Market-based) GHG footprint relative to revenue. Calculation: Gross Scope 1 and 2 (Market-based) GHG emissions divided by Total Revenue. Data is captured through the centralised Safety, Health and Environmental reporting system. Share of primary activity data in Scope 3 reporting (%) ‘Primary data‘ is data from specific activities within AstraZeneca’s value chain. ‘Secondary data‘ is data that is not from specific activities within AstraZeneca’s value chain. Calculation: Scope 3 GHG emissions from primary data divided by total Scope 3 GHG emissions. For further information, see our GHG Reporting Methodology document which can be found on www.astrazeneca.com/ sustainability/resources.html. Supplier data is captured through several supplier and third-party systems, including CDP. AstraZeneca Annual Report & Form 20-F Information 2024 235 Strategic Report Corporate Governance Financial Statements Additional Information Sustainability supplementary information |
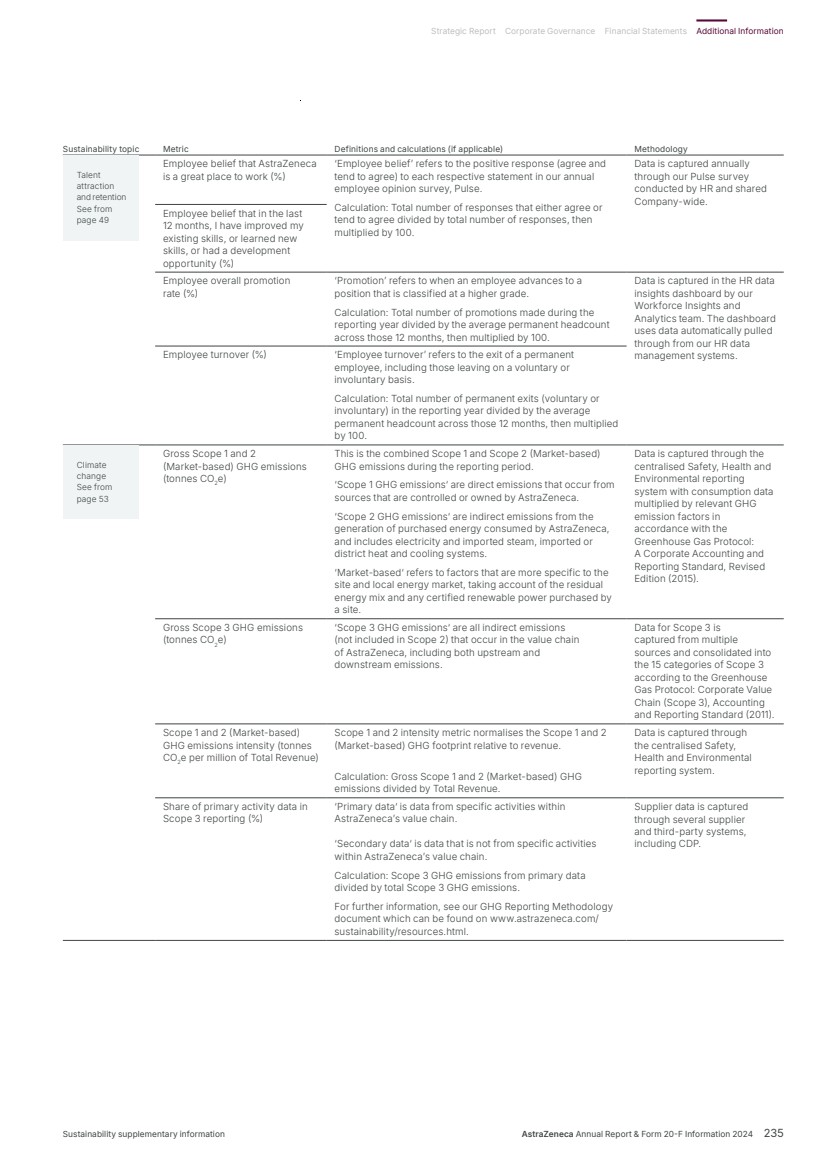
| Climate risk scenarios To assess the potential impacts of climate change on our business, we have used the scenarios listed below. Physical risks and temperature scenarios by 2100 Physical climate system conditions represented in the scenario analysis below are based on a set of assumptions about driving forces (such as demographic and socio-economic development, policymaking, technological change, energy and land use) and their key relationships that correlate with how the emission pathways impact elements of society or ecosystems. Scenario1 Description Key forces and drivers included in the scenario Low emission scenario, +1.8°C (SSP1-RCP2.6) This scenario lays out a pathway and emissions trajectory that is aligned with the objectives of the Paris Agreement to limit global warming to well below 2°C, preferably to 1.5°C, by 2100, compared with pre-industrial levels. This scenario assumes a rapid transition to a low-carbon economy, reducing the risk of extreme climate change and its potential hazards (such as sea level rise, increasing temperatures, extreme weather conditions and loss of biodiversity). This is the main scenario used to review climate hazards for our suppliers. Current trajectory scenario, +2.7°C (SSP2-RCP4.5) This is an intermediate scenario with emissions peaking in 2040 and falling rapidly thereafter until 2080. Deemed to be the ‘most likely’ scenario. In this scenario, the Paris Agreement of keeping temperature increases ‘well below 2°C above pre-industrial levels‘ is breached. This scenario leads to an increase in the frequency and intensity of extreme weather events, rising sea levels, loss of biodiversity and other negative consequences of climate change. This scenario model assumes a degree of adaptation and mitigation of emissions, which helps mitigate some hazards compared to more high-risk scenarios. As a scenario with high likelihood, metrics to quantify exposure to hazards in this scenario are shared externally for our sites where deep-dive risk assessments have been completed. High emission scenario, +4.4°C (SSP5-RCP8.5) This is a worst-case scenario consistent with no policy changes to reduce emissions, where CO2 concentrations in the atmosphere are approximately doubled by 2050 and continue to increase until 2100. The dangers of a significant and rapid increase in the global average temperature leads to extreme climate conditions, such as severe warming, sea level rise, loss of ice masses, changes in precipitation patterns and increased risk of extreme weather events. This scenario also implies a high degree of impact on ecosystems and communities, including loss of biodiversity, altered habitats and disruption of community infrastructure. It is the most extreme scenario in terms of climate change. Metrics to quantify exposure to hazards in this scenario are used in deep-dive risks assessments for certain sites to pressure test how effective existing mitigations will be in 2030 and 2050. For new projects, data modelling is used for the full life-cycle of an asset. 1 Key inputs and constraints of the scenarios: In the three scenarios, the main metrics considered to quantify hazards are: heat, cold, fire, flood, wind, convective storms, water scarcity and water quality. Flood depth estimates assume no existing flood defences. Transition risks and opportunities scenarios used Scenario2 Description Key forces and drivers included in the scenario 1.7°C (International Energy Agency’s World Energy Outlook (IEA WEO) Announced Pledges Scenario (APS) – equivalent to RCP2.6) The IEA WEO APS was used as the primary low-carbon future scenario. As a ‘well below 2°C’ pathway, the APS represents a gateway to the outcomes targeted by the Paris Agreement. The APS assumes that governments will meet, in full and on time, all the climate-related commitments they have announced, including longer-term net-zero emissions targets and pledges in Nationally Determined Contributions. 1. Widespread policy implementation 2. Technological advancements 3. Significant emissions reductions. 1.5°C (IEA WEO Net-Zero Emissions by 2050 scenario (NZE) – equivalent to RCP1.9) The IEA WEO NZE is a normative IEA scenario that shows a narrow but achievable pathway for the global energy sector to achieve net-zero CO2 emissions by 2050, with advanced economies reaching NZE in advance of others. 1. Significant low-carbon investment and policy implementation 2. Rapid decarbonisation 3. Extensive increases in energy efficiency. 2.4°C (IEA WEO Stated Policies Scenario – (STEPS) – equivalent to RCP4.5) The IEA WEO STEPS provides a more conservative benchmark for the future because it does not take for granted that governments will reach all announced goals. 1. Current policy implementation 2. Energy demand growth 3. Widespread fossil fuel use 4. Technological developments. 2 Key inputs and constraints of the scenarios: The three scenarios are used for projections of energy cost, forecasting of carbon price, change in raw material costs and supply-demand of renewable energy to see how those will relate to our roadmap to net-zero GHG emissions and impact our transition risks and opportunities, and cost of goods and profits. 236 AstraZeneca Annual Report & Form 20-F Information 2024 Additional Information Sustainability supplementary information continued BV |
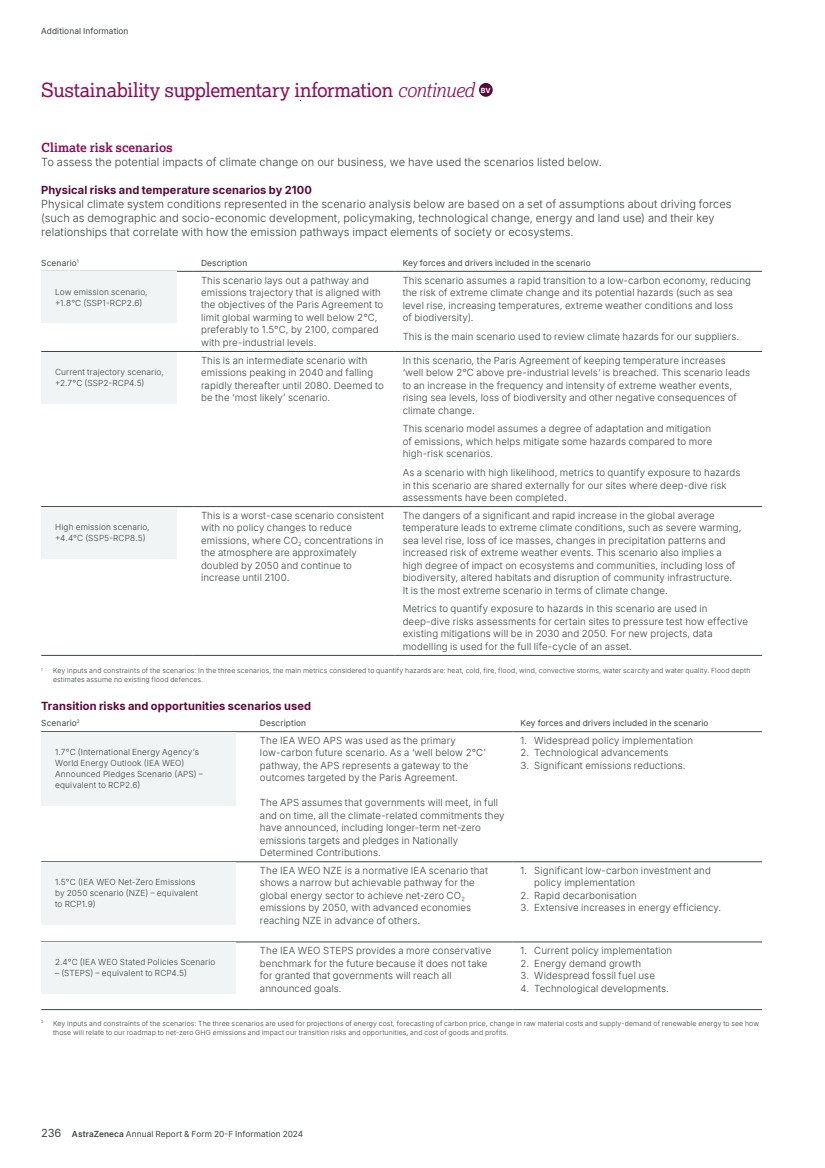
| EU Taxonomy templates Revenue 2024 Substantial contribution criteria DNSH criteria (’Do No Significant Harm’) Economic Activities Code Revenue Proportion of Revenue Climate Change Mitigation Climate Change Adaptation Water Pollution Circular Economy Biodiversity Climate Change Mitigation Climate Change Adaptation Water Pollution Circular Economy Biodiversity Minimum Safeguards Proportion of Taxonomy-aligned (A.1.) or eligible (A.2.) Revenue 2023 Category enabling activity Category transitional activity $m % Y;N; EL; N/EL1 Y;N; EL; N/EL Y;N; EL; N/EL Y;N; EL; N/EL Y;N; EL; N/EL Y;N; EL; N/EL Y/N Y/N Y/N Y/N Y/N Y/N Y/N % E T A. TAXONOMY-ELIGIBLE ACTIVITIES A.2. Taxonomy-eligible but not environmentally sustainable activities (not Taxonomy-aligned activities) Manufacture of medicinal products PPC 1.2 51,861 96 N/EL N/EL N/EL EL N/EL N/EL 96² Revenue of Taxonomy-eligible but not environmentally sustainable activities (not Taxonomy-aligned activities) (A.2.) 51,861 96 0% 0% 0% 96% 0% 0% 96 A. Revenue of Taxonomy-eligible activities (A.1.+A.2.) 51,861 96 0% 0% 0% 96% 0% 0% 96 B. TAXONOMY-NON-ELIGIBLE ACTIVITIES Revenue of Taxonomy-non-eligible activities 2,212 4 Total 54,073 100 Capex 2024 Substantial contribution criteria DNSH criteria (‘Do No Significant Harm’) Economic Activities Code Capex Proportion of Capex Climate Change Mitigation Climate Change Adaptation Water Pollution Circular Economy Biodiversity Climate Change Mitigation Climate Change Adaptation Water Pollution Circular Economy Biodiversity Minimum Safeguards Proportion of Taxonomy-aligned (A.1.) or eligible (A.2.) Capex, 2023 Category enabling activity Category transitional activity $m % Y;N; EL; N/EL Y;N; EL; N/EL Y;N; EL; N/EL Y;N; EL; N/EL Y;N; EL; N/EL Y;N; EL; N/EL Y/N Y/N Y/N Y/N Y/N Y/N Y/N % E T A. TAXONOMY-ELIGIBLE ACTIVITIES A.1. Environmentally sustainable activities (Taxonomy-aligned) Renovation of existing buildings CCM 7.2/CCA 7.2/ CE 3.2 137 2 Y N N/EL N/EL N/EL N/EL Y Y Y Y Y Y Y 0 E Capex of environmentally sustainable activities (Taxonomy-aligned) (A.1.) 137 2 2% 0% 0% 0% 0% 0% Y Y Y Y Y Y Y 0 Of which Enabling 137 2 2% 0% 0% 0% 0% 0% Y Y Y Y Y Y Y 0 E Of which Transitional 0 0 0 T A.2. Taxonomy-eligible but not environmentally sustainable activities (not Taxonomy-aligned activities) Manufacture of medicinal products PPC 1.2 5,244 68 N/EL N/EL N/EL EL N/EL N/EL 65 Construction of new buildings CCM 7.1/CCA 7.1/ CE 3.1 542 7 EL EL N/EL N/EL EL N/EL 6 Acquisition and ownership of buildings CCM 7.7/CCA 7.7 352 5 EL EL N/EL N/EL N/EL N/EL 5 Renovation of existing buildings CCM 7.2/CCA 7.2/ CE 3.2 167 2 EL EL N/EL N/EL EL N/EL 2 Transport by motorbikes, passenger cars and light commercial vehicles CCM 6.5/CCA 6.5 342 4 EL EL N/EL N/EL N/EL N/EL 4 Capex of Taxonomy-eligible but not environmentally sustainable activities (not Taxonomy-aligned activities) (A.2.) 6,647 86 A. Capex of Taxonomy-eligible activities (A.1.+A.2.) 6,784 88 B. TAXONOMY-NON-ELIGIBLE ACTIVITIES Capex of Taxonomy-non-eligible activities 971 12 Total 7,755 100 1 EL – Taxonomy-eligible activity for the relevant environmental objective. N/EL – Taxonomy-non-eligible activity for the relevant environmental objective. Y – Yes, Taxonomy-eligible and Taxonomy-aligned activity with the relevant environmental objective. N – No, Taxonomy-eligible but not Taxonomy-aligned activity with the relevant environmental objective. 2 Revised (previously: 100%) to reflect eligible revenue being the Group’s Product Sales and sales milestones within Collaboration Revenue. AstraZeneca Annual Report & Form 20-F Information 2024 237 Strategic Report Corporate Governance Financial Statements Additional Information Sustainability supplementary information |
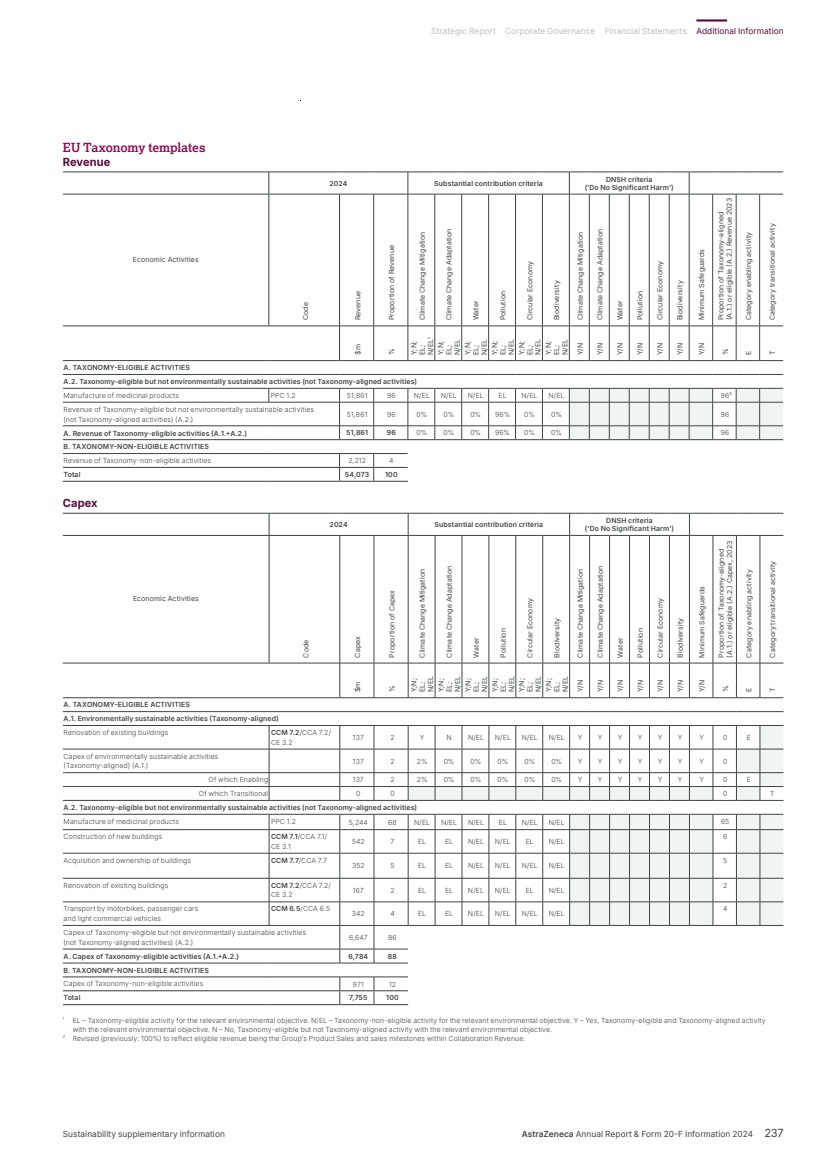
| EU Taxonomy templates continued Opex 2024 Substantial contribution criteria DNSH criteria (‘Do No Significant Harm’) Economic Activities Code Opex Proportion of Opex Climate Change Mitigation Climate Change Adaptation Water Pollution Circular Economy Biodiversity Climate Change Mitigation Climate Change Adaptation Water Pollution Circular Economy Biodiversity Minimum Safeguards Proportion of Taxonomy-aligned (A.1.) or eligible (A.2.) Opex, 2023 Category enabling activity Category transitional activity $m % Y; N; EL; N/EL1 Y; N; EL; N/EL Y; N; EL; N/EL Y; N; EL; N/EL Y; N; EL; N/EL Y; N; EL; N/EL Y/N Y/N Y/N Y/N Y/N Y/N Y/N % E T A. TAXONOMY-ELIGIBLE ACTIVITIES A.2. Taxonomy-eligible but not environmentally sustainable activities (not Taxonomy-aligned activities) Manufacture of medicinal products PPC 1.2 2,016 14 N/EL N/EL N/EL EL N/EL N/EL 142 Renovation of existing buildings CCM 7.2/CCA 7.2/ CE 3.2 541 4 EL EL N/EL N/EL EL N/EL 3 A. Opex of Taxonomy-eligible activities (A.1.+A.2.) 2,557 18 B. TAXONOMY-NON-ELIGIBLE ACTIVITIES Opex of Taxonomy-non-eligible activities 11,573 82 Total 14,130 100 1 EL – Taxonomy-eligible activity for the relevant environmental objective. N/EL – Taxonomy-non-eligible activity for the relevant environmental objective. Y – Yes, Taxonomy-eligible and Taxonomy-aligned activity with the relevant environmental objective. N – No, Taxonomy-eligible but not Taxonomy-aligned activity with the relevant environmental objective. 2 Revised (previously: 96%), to reflect eligible R&D expenses associated with functional areas which are involved directly in the manufacture and procurement of medicinal products. 238 AstraZeneca Annual Report & Form 20-F Information 2024 Additional Information Sustainability supplementary information continued BV |

| AstraZeneca, the AstraZeneca logotype, and the AstraZeneca symbol are all trade marks of the Group. The following medicine names which appear in italics in this Annual Report are trade marks of the Group: Trade mark Airsupra Faslodex Ondexxya Symlin Andexxa Fluenz Onglyza Synagis4 Bevespi Aerosphere FluMist Orpathys Tagrisso Breztri Forxiga Plendil2 Toprol-XL Breztri Aerosphere Imfinzi Prilosec Trixeo Brilinta Imjudo Pulmicort Trixeo Aerosphere Brilique Kanuma Pulmicort Flexhaler Truqap Bydureon Kavigale Qtern Ultomiris Calquence Kombiglyze Saphnelo Vaxzevria Crestor Koselugo Seloken Voydeya Daliresp Losec1 Seroquel3 Wainua Daxas Lokelma Seroquel XR3 Wainzua Evusheld Lynparza Soliris Xigduo Farxiga Movantik Strensiq Zoladex Fasenra Nexium Symbicort 1 AstraZeneca divested certain trademark rights to Cheplapharm effective 30 September 2019. AstraZeneca retains rights in a limited number of countries. 2 Effective 18 May 2022, AstraZeneca divested Plendil in 35 markets to Glenwood. 3 AstraZeneca divested certain trademark rights to Cheplapharm effective 13 December 2019 and other trademark rights to Luye effective 14 July 2021. AstraZeneca retains rights in a limited number of other countries. 4 Effective 25 January 2019, AstraZeneca sold its rights to Synagis in the US to Sobi. AbbVie Inc. transferred its ownership rights to this trademark to MedImmune LLC, effective 1 July 2021. The following medicine names, which appear in italics in this Annual Report, are trade marks licensed to the Group by the entities set out below: Trade mark Licensor or Owner Beyfortus Sanofi Pasteur Inc. Datroway Daiichi Sankyo Company, Limited Duaklir Almirall, S.A. Enhertu Daiichi Sankyo Company, Limited Tezspire Amgen Inc. Tudorza Almirall, S.A. AstraZeneca Annual Report & Form 20-F Information 2024 239 Strategic Report Corporate Governance Financial Statements Additional Information Trade Marks Trade Marks |
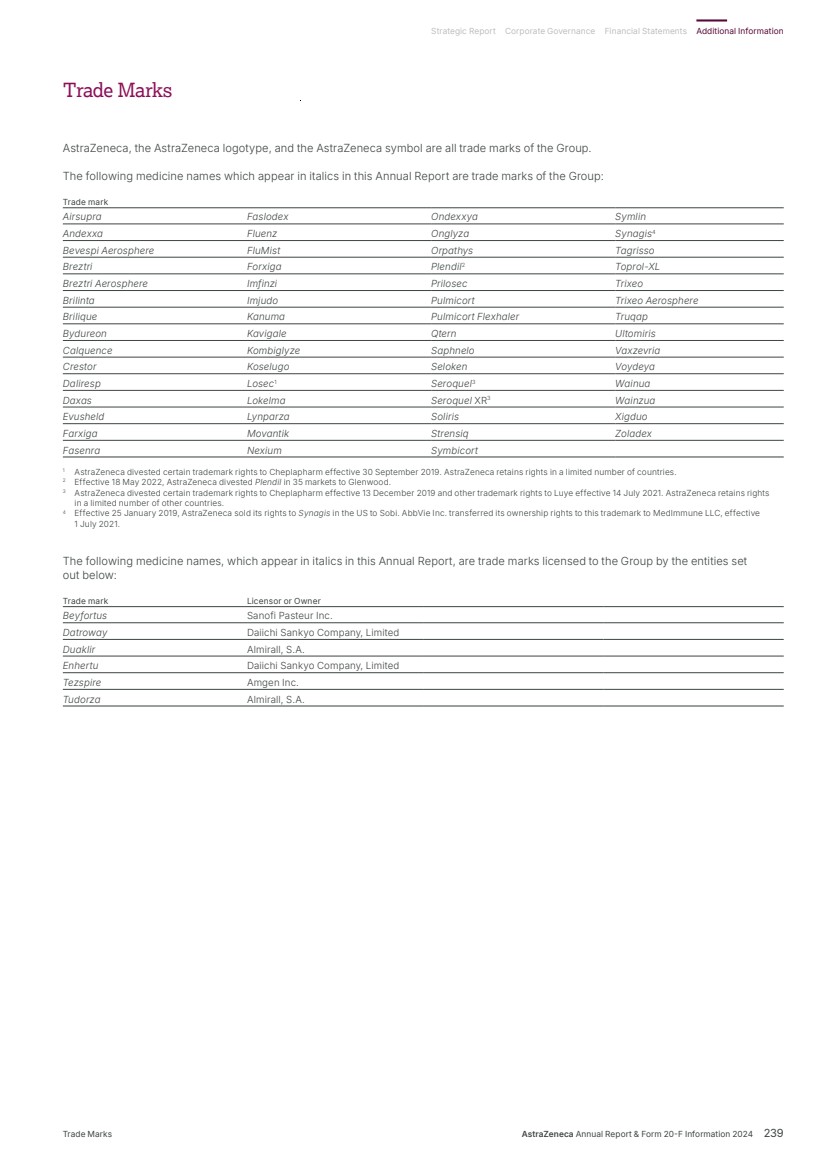
| Market definitions1 Region Country US US Europe Austria* Finland Italy Portugal UK Belgium France Latvia* Romania Bulgaria Germany Lithuania* Serbia and Montenegro* Croatia Greece Luxembourg* Slovakia* Cyprus* Hungary Malta* Slovenia* Czech Republic Iceland* Netherlands Spain Denmark Ireland Norway Sweden Estonia* Israel* Poland Switzerland Established RoW Australia Canada Japan New Zealand* Emerging Markets Algeria Costa Rica Kuwait Philippines United Arab Emirates Argentina Dominican Republic Lebanon Qatar* Uruguay* Aruba* Ecuador* Libya* Russia Uzbekistan* Bahamas* Egypt Malaysia Saudi Arabia Venezuela* Bahrain* El Salvador Maldives* Singapore Vietnam Barbados* Georgia* Mexico South Africa Yemen* Belarus* Guatemala Moldova* South Korea Bermuda* Honduras Mongolia* Sri Lanka Brazil Hong Kong Morocco Sudan* Brunei* India Nicaragua Syria* Cambodia* Indonesia Oman* Taiwan Chile Iran* Other Africa2 Thailand Cayman Islands* Iraq* Pakistan* Trinidad and Tobago* China Jamaica* Palestine* Tunisia* Cuba* Jordan Panama Turkey Colombia Kazakhstan Peru Ukraine * Q3 2024 IQVIA and IQVIA Midas Quantum Q3 2024 data are not available or AstraZeneca does not subscribe for IQVIA quarterly data for these countries. 1 The above table is not an exhaustive list of all the countries in which AstraZeneca operates and excludes countries with revenue in 2024 of less than $1 million. 2 Other Africa includes Angola, Botswana, Ethiopia, Ghana, Kenya, Mauritius, Mozambique, Namibia, Nigeria, Eswatini, Tanzania, Uganda, Zambia and Zimbabwe. US equivalents Terms used in this Annual Report US equivalent or brief description Accruals Accrued expenses Called-up share capital Issued share capital Earnings Net income Employee share schemes Employee stock benefit plans Fixed asset investments Non-current investments Freehold Ownership with absolute rights in perpetuity Loans Long-term debt Prepayments Prepaid expenses Profit Income Share premium account Additional paid-in capital or paid-in surplus (not distributable) Short-term investments Redeemable securities and short-term deposits Trade payables Accounts payable Trade receivables Accounts receivable 240 AstraZeneca Annual Report & Form 20-F Information 2024 Additional Information Glossary |
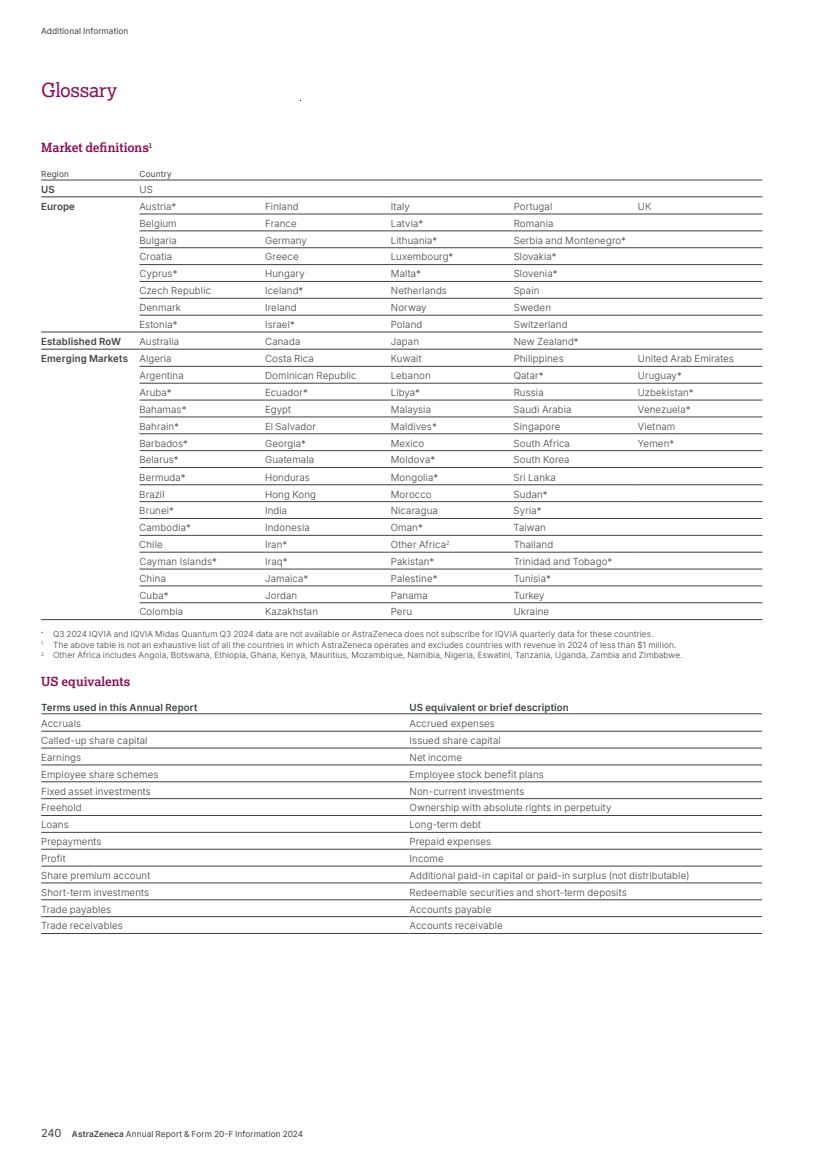
| CKD – chronic kidney disease. CLDN 18.2 – a positive therapeutic target in gastric cancer. CLL – chronic lymphocytic leukaemia. Company or Parent Company – AstraZeneca PLC (formerly Zeneca Group PLC (Zeneca)). COPD – chronic obstructive pulmonary disease. CRT – chemoradiotherapy. CSPC – CSPC Pharmaceutical Group Ltd. CSRD – Corporate Sustainability Reporting Directive. CTLA-4 – cytotoxic T-lymphocyte-associated antigen-4. CV – cardiovascular. CVRM – Cardiovascular, Renal & Metabolism. Daiichi Sankyo – Daiichi Sankyo, Inc. or a company within the Daiichi Sankyo group of companies. Director – a director of the Company. dMMR – deficient mismatch repair. DTR – UK Disclosure Guidance and Transparency Rules. EBITDA – Reported Profit before tax plus net finance expense, share of after tax losses of joint ventures and associates and charges for depreciation, amortisation and impairment. EFPIA – European Federation of Pharmaceutical Industries and Associations. EGFR – epidermal growth factor receptor. EGFRm – EGFR-mutated. EMA – European Medicines Agency. EPS – earnings per share: profit for the year after tax and non-controlling interests, divided by the weighted average number of Ordinary Shares in issue during the year. ESG – environmental, social and governance. ESMO – European Society for Medical Oncology. EVP – Executive Vice-President. EU – the European Union. F-gas – fluorinated greenhouse gases include: hydrofluorocarbons (HFCs), perfluorocarbons (PFCs) and sulphur hexafluoride (SF6). FDA – the US Food and Drug Administration, which is part of the US Department of Health and Human Services Agency, which is the regulatory authority for all pharmaceuticals (including biologics and vaccines) and medical devices in the US. FRC – the UK Financial Reporting Council. Fusion – Fusion Pharmaceuticals Inc. FX – foreign exchange. GAAP – Generally Accepted Accounting Principles. gBRCAm – germline BRCA1/2 mutations. GHG – greenhouse gas. GIA – the Group’s Internal Audit function. gMG – generalised myasthenia gravis. Gracell – Gracell Biotechnologies Inc. Group – AstraZeneca PLC and its subsidiaries. GSK – GSK plc. GWP – Global Warming Potential. The following abbreviations and expressions have the meanings given below when used in this Annual Report: Acerta Pharma – Acerta Pharma B.V. ACS – acute coronary syndromes. ADC(s) – antibody drug conjugate(s). ADRs – American Depositary Receipts. ADSs – American Depositary Shares. AGM – Annual General Meeting of the Company. AI – artificial intelligence. AI Hallucination – when an AI produces false or misleading information. AKT1 – serine/threonine protein kinase 1. Alexion – Alexion Pharmaceuticals, Inc. ALK – anaplastic lymphoma kinase. Amgen – Amgen Inc. Amolyt Pharma – Amolyt Pharma SAS. Annual Report – this Annual Report and Form 20-F Information 2024. API – active pharmaceutical ingredient. Articles – the Articles of Association of the Company. ASCO – American Society of Clinical Oncology. Astra – Astra AB, being the company with whom the Company merged in 1999. AstraZeneca – the Company and its subsidiaries. ATTR – transthyretin amyloidosis. ATTR-CM – transthyretin-mediated amyloid cardiomyopathy. ATTRv – hereditary transthyretin-mediated amyloidosis. ATTRv-PN – hereditary transthyretin-mediated amyloidosis with polyneuropathy. biologic(s) or biologic medicine(s) – a class of drugs that are produced in living cells. BMS – Bristol-Myers Squibb Company. Board – the Board of Directors of the Company. BRCA – BReast CAncer gene. BRCAm – BRCA-mutated. BTC – biliary tract cancer. Bureau Veritas – Bureau Veritas UK Limited. Capex – capital expenditure. CAR-T – therapeutic chimeric antigen receptor. CDP (formerly the Carbon Disclosure Project) – a not-for-profit organisation that runs the global disclosure system for investors, companies, cities, states and regions to manage their environmental impacts. Cellectis – Cellectis S.A. CEO – the Chief Executive Officer of the Company. CER – constant exchange rates. CFO – the Chief Financial Officer of the Company. Cheplapharm – Cheplapharm Arzneimittel GmbH. CinCor – CinCor Pharma, Inc. AstraZeneca Annual Report & Form 20-F Information 2024 241 Strategic Report Corporate Governance Financial Statements Additional Information Glossary |
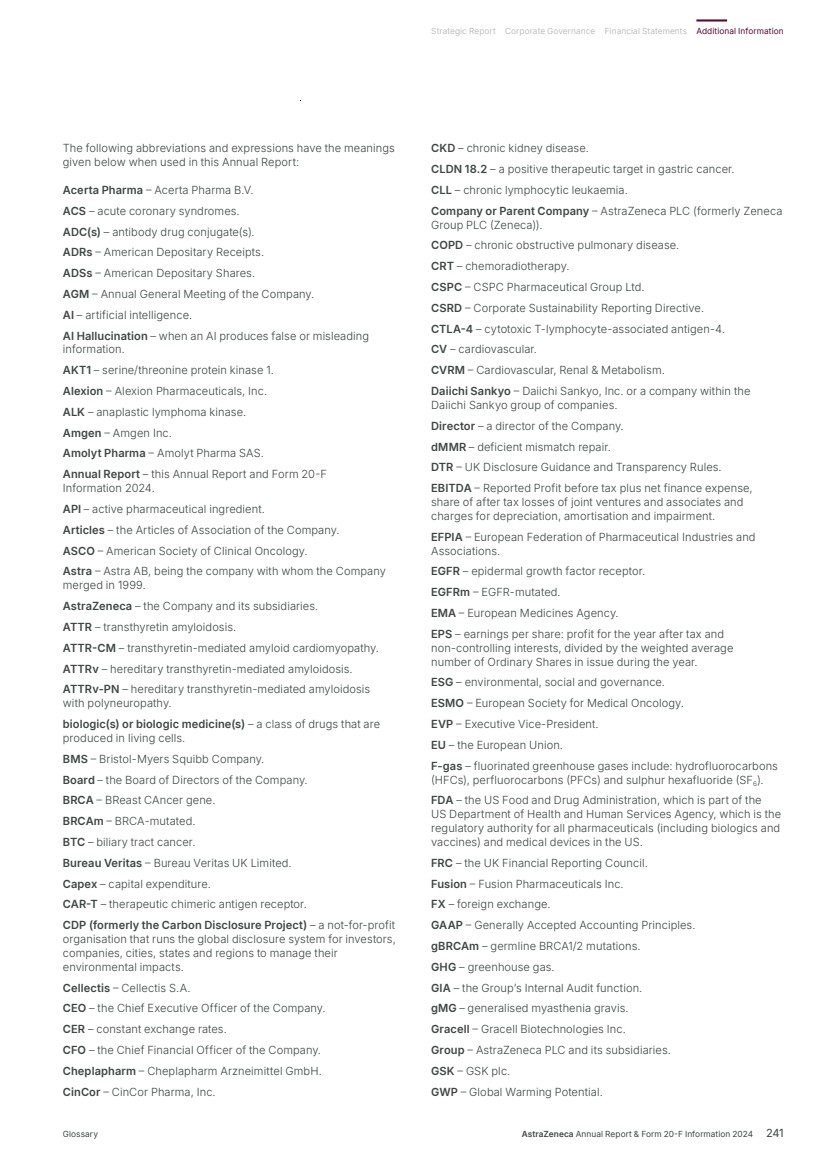
| NSCLC – non-small cell lung cancer. NT-proBNP - N-terminal pro B-type natriuretic peptide. oPCSK9 – oral proprotein convertase subtilisin/kexin type 9. Operating profit – Total Revenue, less cost of sales, less operating costs, plus operating income. Opex – operating expenditure. Ordinary Share – an ordinary share of $0.25 each in the share capital of the Company. Orphan Drug – a drug that has been approved for use in a relatively low-incidence indication (an orphan indication) and has been rewarded with a period of market exclusivity; the period of exclusivity and the available orphan indications vary between markets. OS – overall survival. PAAGR – post Alexion Acquisition Group Review. Paediatric Exclusivity – in the US, a six-month period of exclusivity to market a drug which is awarded by the FDA in return for certain paediatric clinical studies using that drug. This six-month period runs from the date of relevant patent expiry. Analogous provisions are available in certain other territories (such as European Supplementary Protection Certificate paediatric extensions). PARP – an oral poly (ADP-ribose) polymerase. PD-1 – programmed cell death protein 1. PD-L1 – an anti-programmed death-ligand 1. Pfizer – Pfizer, Inc. PFS – progression-free survival. The length of time during and after the treatment of a disease, such as cancer, that a patient lives with the disease without it getting worse. Phase I – the phase of clinical research where a new drug or treatment is tested in small groups of people (20 to 80) to check that the drug can achieve appropriate concentrations in the body, determine a safe dosage range and identify side effects. This phase includes healthy volunteer studies. Phase II – the phase of clinical research which includes the controlled clinical activities conducted to evaluate the effectiveness of the drug in patients with the disease under study and to begin to determine the safety profile of the drug. Phase II studies are typically conducted in small- or medium-sized groups of patients and can be divided into Phase IIa studies, which tend to be designed to assess dosing requirements, and Phase IIb studies, which tend to assess safety and efficacy. Phase III – the phase of clinical research which is performed to gather additional information about effectiveness and safety of the drug, often in a comparative setting, to evaluate the overall benefit/ risk profile of the drug. Phase III studies usually include between several hundred and several thousand patients. PIK3CA – phosphatidylinositol-4,5-bisphosphate 3-kinase, catalytic subunit alpha. pMDI – pressurised metered-dose inhaler. pMMR – proficient mismatch repair. PNH – paroxysmal nocturnal haemoglobinuria. pound sterling, £, GBP or pence – references to the currency of the UK. primary care – general healthcare provided by physicians who ordinarily have first contact with patients and who may have continuing care for them. Product Sales Gross Margin – the margin, as a percentage, by which sales exceed the cost of sales, calculated by dividing the difference between the two by the sales figure. HCC – hepatocellular carcinoma. HER2 – human epidermal growth factor receptor 2. HF – heart failure. HK – hyperkalaemia. hMPV – human metapneumovirus. HRD – homologous recombination repair deficiency. HRR – homologous recombination repair. IAS – International Accounting Standards. IASB – International Accounting Standards Board. Icosavax – Icosavax, Inc. IFRS – International Financial Reporting Standards or International Financial Reporting Standard, as the context requires. Innate Pharma – Innate Pharma S.A. Ionis – Ionis Pharmaceuticals, Inc. IP – intellectual property. IQVIA – IQVIA Solutions HQ Limited. IS – information services. IT – information technology. KPI – Key Performance Indicator. krona, kronor or SEK – references to the currency of Sweden. LABA – long-acting beta2-agonist. LAL – lysosomal acid lipase. LAMA – long-acting muscarinic antagonist. LCA – Life-Cycle Assessment. LCM – significant life-cycle management projects (as determined by potential revenue generation), or line extensions. LRTD – lower respiratory tract disease. mAb – monoclonal antibody, a biologic that is specific, meaning it binds to and modulates one particular antigen. major market – US, Europe, Japan and China. MASH – metabolic dysfunction-associated steatohepatitis, previously NASH. MAT – moving annual total. MCL – mantle cell lymphoma. mCRPC – metastatic castration-resistant prostate cancer. MedImmune – MedImmune, LLC (formerly MedImmune, Inc.). MET – a tyrosine kinase receptor. mHSPC – metastatic hormone-sensitive prostate cancer. Moderna – Moderna Therapeutics, Inc. MSD – Merck & Co., Inc., (which is known as Merck in the US and Canada, and MSD in other territories). n/a – not applicable. n/m – not meaningful. Nasdaq – Nasdaq Global Select Market. Nasdaq Stockholm – previously the Stockholm Stock Exchange. Neogene – Neogene Therapeutics Inc. NME – new molecular entity. NMOSD – neuromyelitis optica spectrum disorder. 242 AstraZeneca Annual Report & Form 20-F Information 2024 Additional Information Glossary continued |
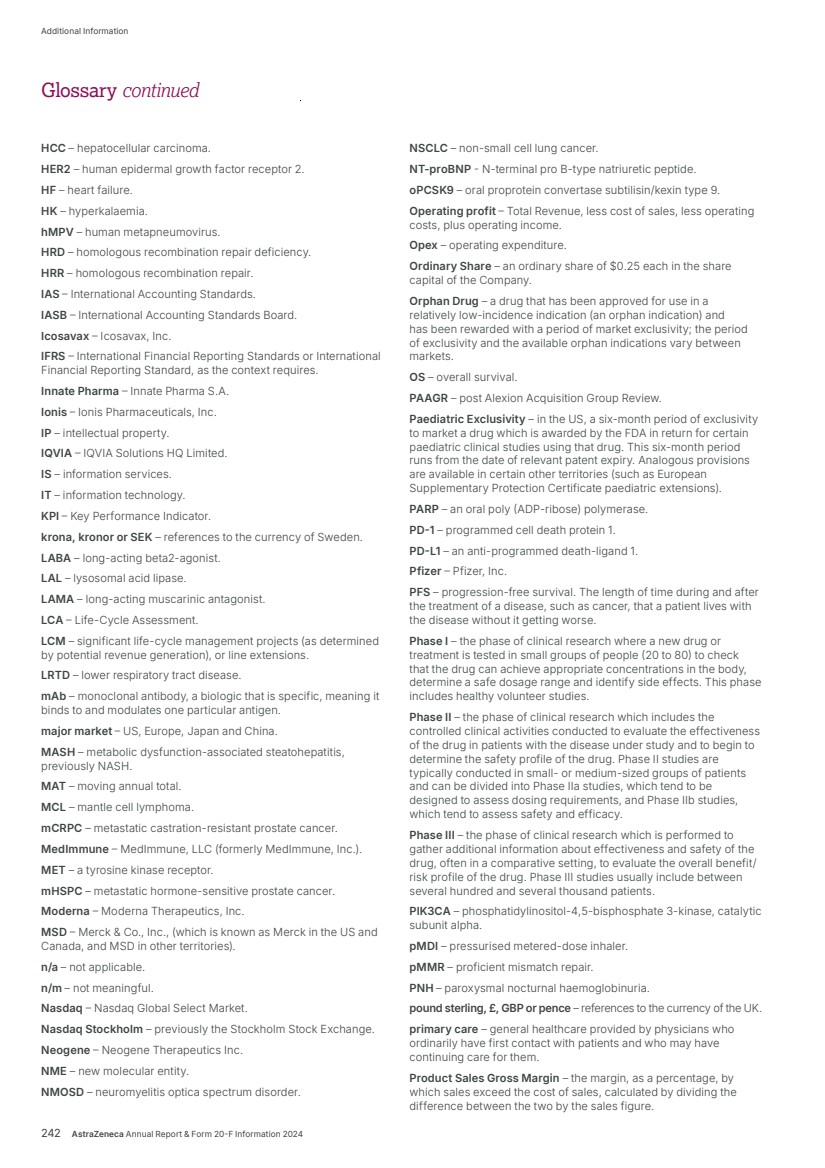
| SET – Senior Executive Team. SG&A – selling, general and administrative expenses. SLE – systemic lupus erythematosus. siRNA – small interfering RNA. SixPeaks Bio – SixPeaks Bio AG. Sobi – Swedish Orphan Biovitrum AB. SGLT2 – sodium-glucose cotransporter 2. SPC – supplementary protection certificate. specialty care – specific healthcare provided by medical specialists who do not generally have first contact with patients. SoC – standard of care. Treatment that is accepted by medical experts as a proper treatment for a certain type of disease and that is widely used by healthcare professionals. SVP – Senior Vice-President. T2D – type 2 diabetes. TCFD – Task Force on Climate-related Financial Disclosures. TCR-T – T-cell receptor therapies. TKI - tyrosine kinase inhibitor. Total Revenue – the sum of Product Sales, Collaboration Revenue and Alliance Revenue. Treg – T-regulator. TROP2 – trophoblast cell-surface antigen 2. TSLP – thymic stromal lymphopoietin. TSR – total shareholder return, being the total return on a share over a period of time, including dividends reinvested. uHCC – unresectable hepatocellular carcinoma. UK – United Kingdom of Great Britain and Northern Ireland. UK Corporate Governance Code – the UK Corporate Governance Code published by the FRC in July 2018, as amended, that sets out standards of good practice in corporate governance for the UK. US – United States of America. US dollar, US$, USD or $ – references to the currency of the US. V&I – Vaccines & Immune Therapies. VBP – value-based procurement. WHO – World Health Organization, the United Nations’ specialised agency for health. YTE – A technology that introduces the so-called YTE (amino acid) mutation into the antibody, which prolongs the antibody’s half-life. PROTACs – a proteolysis targeting chimera, which is a heterobifunctional small molecule composed of two active domains and a linker capable of removing specific unwanted proteins. PSMA – prostate-specific membrane antigen. PTEN – phosphatase and tensin homolog. Pulse survey – an AstraZeneca employee opinion survey, which seeks employees’ views of the business. PwC – PricewaterhouseCoopers LLP. R&D – research and development. R&I – Respiratory & Immunology. rare disease – the EU defines a disease or condition as rare if it affects fewer than 1 in 2,000 people within the general population and in the US, the Orphan Drug Act defines a rare disease as a disease or condition that affects less than 200,000 people in the US. Redeemable Preference Shares – a redeemable preference share of £1 each in the share capital of the Company. RCPs – Representative Concentration Pathways. RNA – ribonucleic acid. Roche – F. Hoffmann-La Roche AG. RoW – rest of world. RSV – respiratory syncytial virus. Sanofi – Sanofi S.A./Sanofi Pasteur, Inc. Sarbanes-Oxley Act – the US Sarbanes-Oxley Act of 2002. SBTi – science-based targets initiative. SBTs – science-based targets. SCLC – small cell lung cancer. Scope 1 – Combustion of fuel and operation of facilities. Scope 2 – (Market-based): Electricity (net of market instruments), heat, steam and cooling purchased for own use. (Location-based): Electricity, heat, steam and cooling purchased for own use. Scope 3 – Total: Emissions from all 15 GMG Protocol Scope 3 categories SEC – the US Securities and Exchange Commission, the governmental agency that regulates the US securities industry and stock markets. SEK – Swedish krona (or kronor). AstraZeneca Annual Report & Form 20-F Information 2024 243 Strategic Report Corporate Governance Financial Statements Additional Information Glossary |
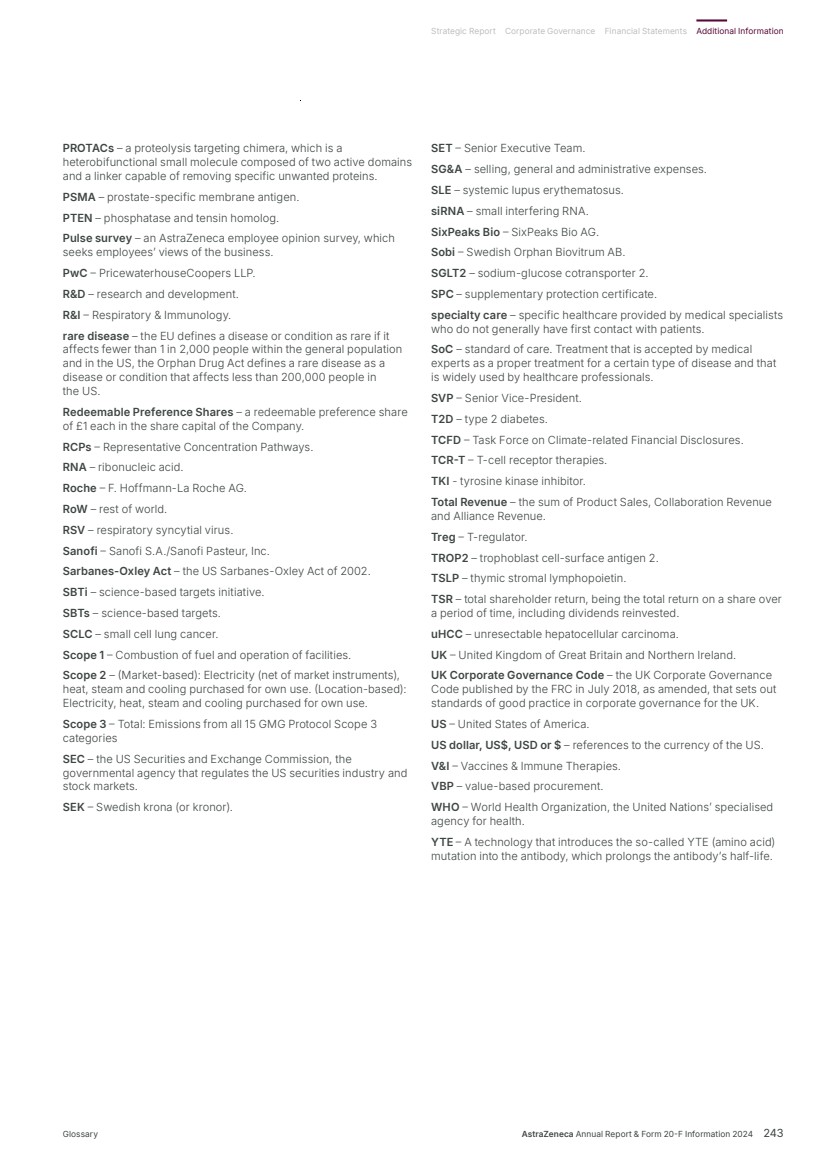
| • the risk of failure to collect and manage data and AI in line with legal and regulatory requirements and strategic objectives • the risk of failure to attract, develop, engage and retain a diverse, talented and capable workforce • the risk of failure to meet our sustainability targets, regulatory requirements or stakeholder expectations with respect to the environment • the risk of the safety and efficacy of marketed medicines being questioned • the risk of adverse outcome of litigation and/or governmental investigations • intellectual property-related risks to the Group’s products • the risk of failure to achieve strategic plans or meet targets or expectations • the risk of failure in financial control or the occurrence of fraud • the risk of unexpected deterioration in the Group’s financial position • the impact that global and/or geopolitical events may have or continue to have on these risks, on the Group’s ability to continue to mitigate these risks, and on the Group’s operations, financial results or financial condition. Certain of these factors are discussed in more detail, without limitation, in the Risk Supplement available on our website, www.astrazeneca.com/annualreport2024, and reproduced in AstraZeneca’s Form 20-F filing for 2024, available on the SEC website www.sec.gov. Nothing in this Annual Report should be construed as a profit forecast. Inclusion of Reported performance, Core financial measures and constant exchange rate growth rates AstraZeneca’s determination of non-GAAP measures, together with our presentation of them within our financial information, may differ from similarly titled non-GAAP measures of other companies. Statements of competitive position, growth rates and sales In this Annual Report, except as otherwise stated, market information regarding the position of our business or products relative to its or their competition is based upon published statistical sales data for the 12 months ended 30 September 2024 obtained from IQVIA, a leading supplier of statistical data to the pharmaceutical industry. Unless otherwise noted, for the US, dispensed new or total prescription data and audited sales data are taken, respectively, from IQVIA National Prescription Audit and IQVIA National Sales Perspectives for the 12 months ended 30 September 2024; such data are not adjusted for Medicaid and similar rebates. Except as otherwise stated, these market share and industry data from IQVIA have been derived by comparing our sales revenue with competitors’ and total market sales revenues for that period, and except as otherwise stated, growth rates are given at CER. For the purposes of this Annual Report, unless otherwise stated, references to the world pharmaceutical market or similar phrases are to the 58 countries contained in the IQVIA database, which amounted to approximately 95% (in value) of the countries audited by IQVIA. Changes in data subscriptions, exchange rates and subscription coverage, as well as restated IQVIA data, have led to the restatement of total market values for prior years. AstraZeneca websites Information on or information accessible through our websites, including www.astrazeneca.com, www.astrazenecaclinicaltrials.com and on any websites referenced in this Annual Report, does not form part of and is not incorporated into this Annual Report. External/third-party websites Information on or information accessible through any third-party or external website does not form part of and is not incorporated into this Annual Report. Figures Figures in parentheses in tables and in the Financial Statements are used to represent negative numbers. Supplements For detailed information on our Development Pipeline, Patent Expiries of Key Marketed Products and Risk, see our website, www.astrazeneca.com/ annualreport2024. Cautionary statement regarding forward‑looking statements The purpose of this Annual Report is to provide information to the members of the Company. The Company and its Directors, employees, agents and advisers do not accept or assume responsibility for any other person to whom this Annual Report is shown or into whose hands it may come and any such responsibility or liability is expressly disclaimed. In order, among other things, to utilise the ‘safe harbour’ provisions of the US Private Securities Litigation Reform Act of 1995 and the UK Companies Act 2006, we are providing the following cautionary statement: This Annual Report contains certain forward-looking statements with respect to the operations, performance and financial condition of the Group, including, among other things, statements about expected revenues, margins, earnings per share or other financial or other measures. Forward-looking statements are statements relating to the future which are based on information available at the time such statements are made, including information relating to risks and uncertainties. Although we believe that the forward-looking statements in this Annual Report are based on reasonable assumptions, the matters discussed in the forward-looking statements may be influenced by factors that could cause actual outcomes and results to be materially different from those predicted. The forward-looking statements reflect knowledge and information available at the date of the preparation of this Annual Report and the Company undertakes no obligation to update these forward-looking statements. We identify the forward-looking statements by using the words ‘anticipates’, ‘believes’, ‘expects’, ‘intends’ and similar expressions in such statements. Important factors that could cause actual results to differ materially from those contained in forward-looking statements, certain of which are beyond our control, include, among other things: • the risk of failure or delay in delivery of pipeline or launch of new medicines • the risk of failure to meet regulatory or ethical requirements for medicine development or approval • the risk of failures or delays in the quality or execution of the Group’s commercial strategies • the risk of pricing, affordability, access and competitive pressures • the risk of failure to maintain supply of compliant, quality medicines • the risk of illegal trade in our Group’s medicines • the impact of reliance on third-party goods and services • the risk of failure in IT or cybersecurity • the risk of failure of critical processes 244 AstraZeneca Annual Report & Form 20-F Information 2024 Additional Information Important information for readers of this Annual Report |
| Design and production Design Bridge and Partners, London. www.designbridge.com Board photography Igor Emmerich Marcus Lyon Alex Telfer SET photography Scott Nibauer Philip Mynott Ossi Piispanen Vanguard site photography Todd Balfour This Annual Report is printed on Revive Silk 100 paper, manufactured from FSC® Recycled certified fibre derived from 100% pre- and post-consumer waste and Carbon Balanced with the World Land Trust. Printed in the UK by Pureprint using its pureprint® environmental printing technology, and vegetable inks were used throughout. Pureprint is a CarbonNeutral® company. Both the manufacturing mill and the printer are registered to the Environmental Management System ISO14001 and are FSC® chain-of-custody certified. |

| Registered office and corporate headquarters AstraZeneca PLC 1 Francis Crick Avenue Cambridge Biomedical Campus Cambridge CB2 0AA UK Tel: +44 (0)20 3749 5000 This Annual Report is also available on our website, www.astrazeneca.com/annualreport2024 |