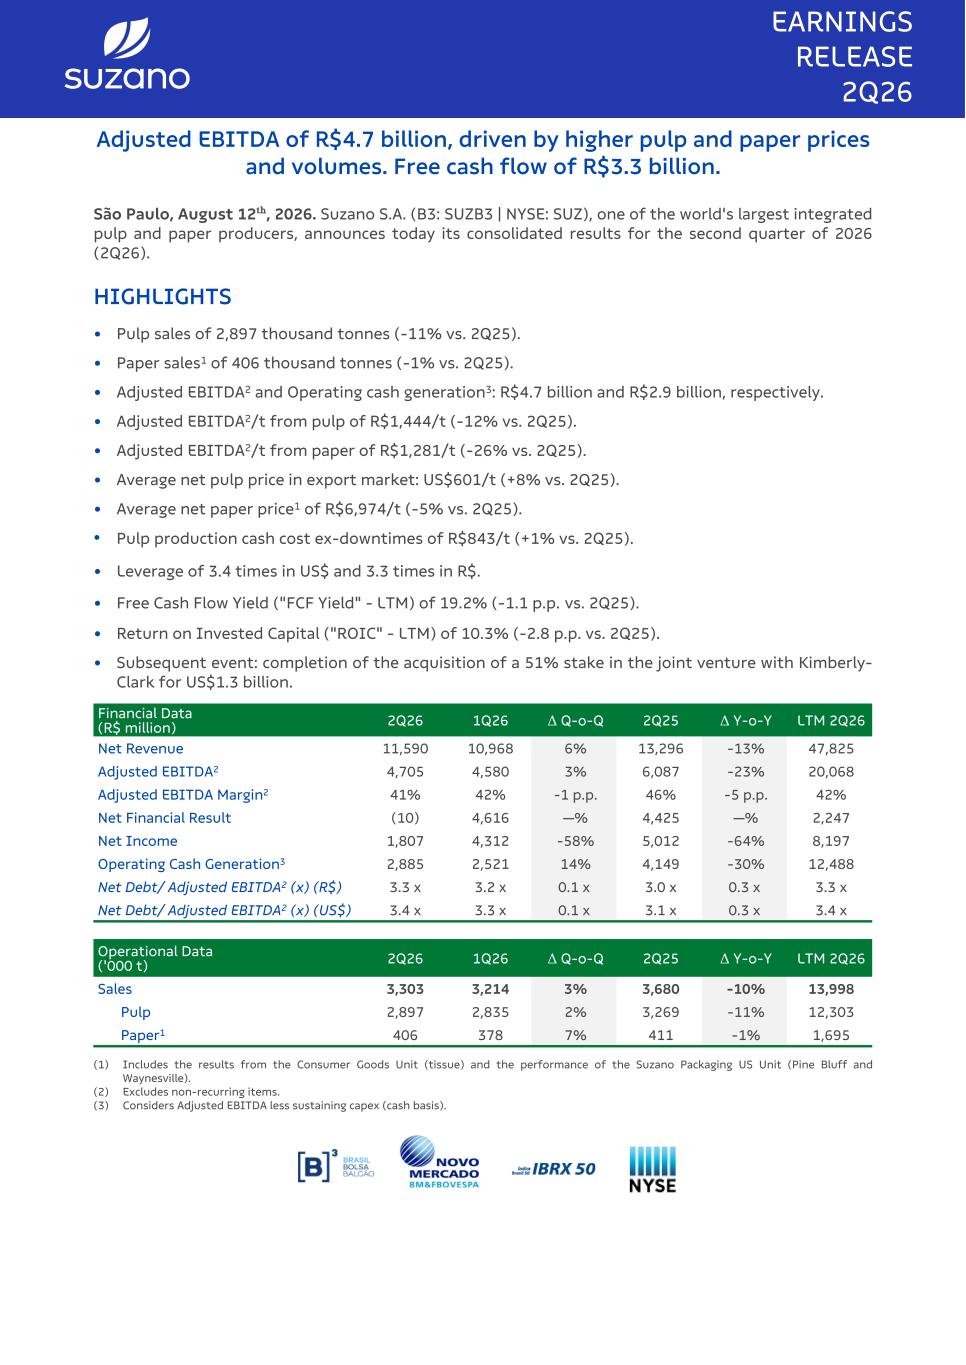
Adjusted EBITDA of R$4.7 billion, driven by higher pulp and paper prices and volumes. Free cash flow of R$3.3 billion. São Paulo, August 12ᵗʰ, 2026. Suzano S.A. (B3: SUZB3 | NYSE: SUZ), one of the world's largest integrated pulp and paper producers, announces today its consolidated results for the second quarter of 2026 (2Q26). HIGHLIGHTS • Pulp sales of 2,897 thousand tonnes (-11% vs. 2Q25). • Paper sales1 of 406 thousand tonnes (-1% vs. 2Q25). • Adjusted EBITDA2 and Operating cash generation3: R$4.7 billion and R$2.9 billion, respectively. • Adjusted EBITDA2/t from pulp of R$1,444/t (-12% vs. 2Q25). • Adjusted EBITDA2/t from paper of R$1,281/t (-26% vs. 2Q25). • Average net pulp price in export market: US$601/t (+8% vs. 2Q25). • Average net paper price1 of R$6,974/t (-5% vs. 2Q25). • Pulp production cash cost ex-downtimes of R$843/t (+1% vs. 2Q25). • Leverage of 3.4 times in US$ and 3.3 times in R$. • Free Cash Flow Yield ("FCF Yield" - LTM) of 19.2% (-1.1 p.p. vs. 2Q25). • Return on Invested Capital ("ROIC" - LTM) of 10.3% (-2.8 p.p. vs. 2Q25). • Subsequent event: completion of the acquisition of a 51% stake in the joint venture with Kimberly- Clark for US$1.3 billion. Financial Data (R$ million) 2Q26 1Q26 Δ Q-o-Q 2Q25 Δ Y-o-Y LTM 2Q26 Net Revenue 11,590 10,968 6% 13,296 -13% 47,825 Adjusted EBITDA2 4,705 4,580 3% 6,087 -23% 20,068 Adjusted EBITDA Margin2 41% 42% -1 p.p. 46% -5 p.p. 42% Net Financial Result (10) 4,616 —% 4,425 —% 2,247 Net Income 1,807 4,312 -58% 5,012 -64% 8,197 Operating Cash Generation3 2,885 2,521 14% 4,149 -30% 12,488 Net Debt/ Adjusted EBITDA2 (x) (R$) 3.3 x 3.2 x 0.1 x 3.0 x 0.3 x 3.3 x Net Debt/ Adjusted EBITDA2 (x) (US$) 3.4 x 3.3 x 0.1 x 3.1 x 0.3 x 3.4 x Operational Data ('000 t) 2Q26 1Q26 Δ Q-o-Q 2Q25 Δ Y-o-Y LTM 2Q26 Sales 3,303 3,214 3% 3,680 -10% 13,998 Pulp 2,897 2,835 2% 3,269 -11% 12,303 Paper1 406 378 7% 411 -1% 1,695 (1) Includes the results from the Consumer Goods Unit (tissue) and the performance of the Suzano Packaging US Unit (Pine Bluff and Waynesville). (2) Excludes non-recurring items. (3) Considers Adjusted EBITDA less sustaining capex (cash basis). EARNINGS RELEASE 2Q26
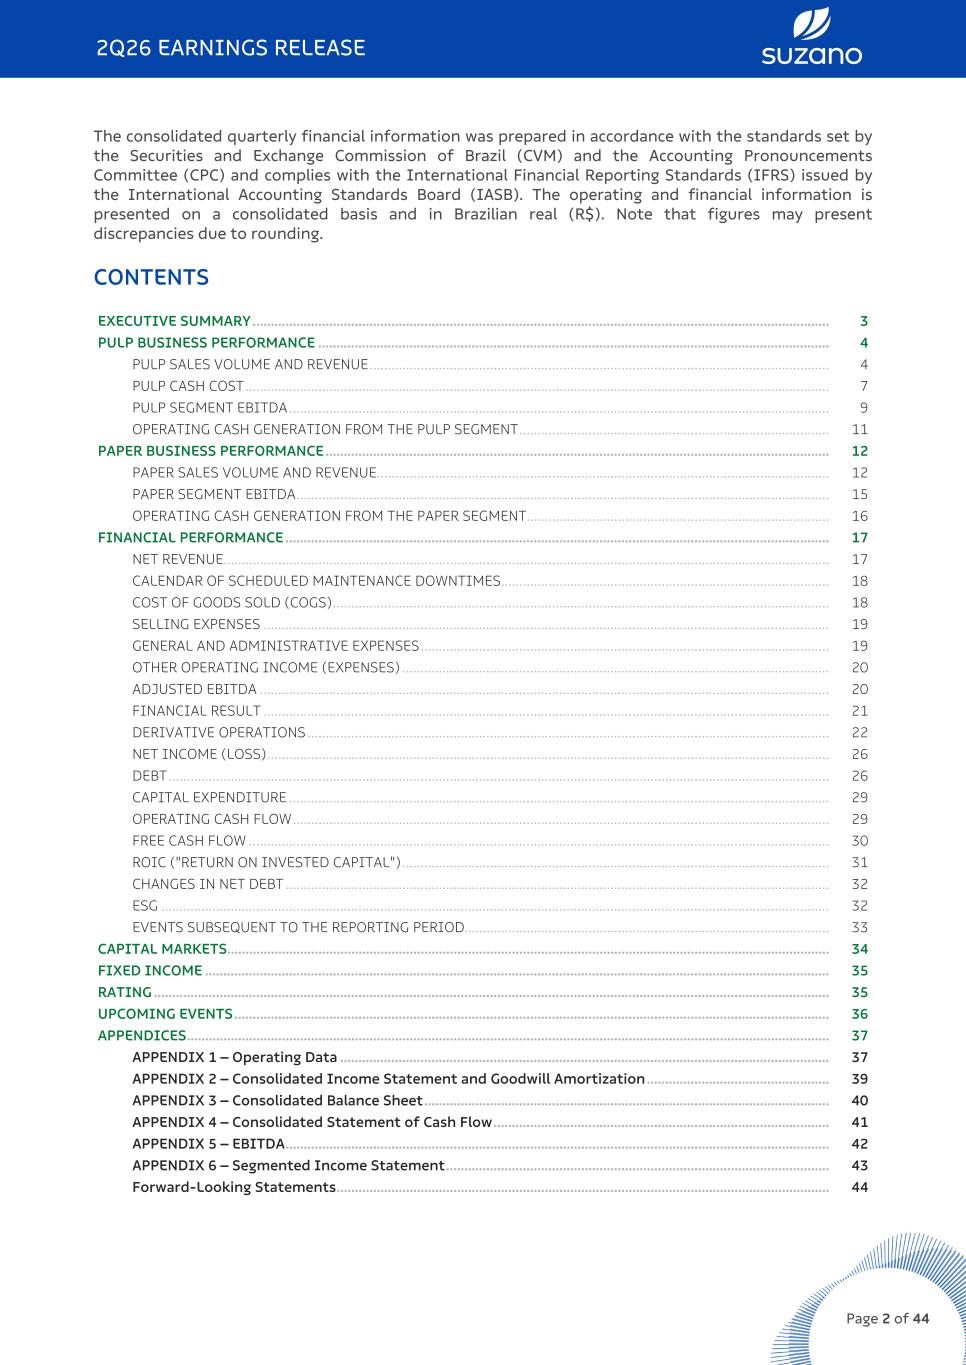
The consolidated quarterly financial information was prepared in accordance with the standards set by the Securities and Exchange Commission of Brazil (CVM) and the Accounting Pronouncements Committee (CPC) and complies with the International Financial Reporting Standards (IFRS) issued by the International Accounting Standards Board (IASB). The operating and financial information is presented on a consolidated basis and in Brazilian real (R$). Note that figures may present discrepancies due to rounding. CONTENTS EXECUTIVE SUMMARY .............................................................................................................................................................. 3 PULP BUSINESS PERFORMANCE ............................................................................................................................................ 4 PULP SALES VOLUME AND REVENUE .............................................................................................................................. 4 PULP CASH COST ................................................................................................................................................................ 7 PULP SEGMENT EBITDA .................................................................................................................................................... 9 OPERATING CASH GENERATION FROM THE PULP SEGMENT ..................................................................................... 11 PAPER BUSINESS PERFORMANCE .......................................................................................................................................... 12 PAPER SALES VOLUME AND REVENUE ............................................................................................................................ 12 PAPER SEGMENT EBITDA .................................................................................................................................................. 15 OPERATING CASH GENERATION FROM THE PAPER SEGMENT ................................................................................... 16 FINANCIAL PERFORMANCE ..................................................................................................................................................... 17 NET REVENUE ...................................................................................................................................................................... 17 CALENDAR OF SCHEDULED MAINTENANCE DOWNTIMES .......................................................................................... 18 COST OF GOODS SOLD (COGS) ........................................................................................................................................ 18 SELLING EXPENSES ........................................................................................................................................................... 19 GENERAL AND ADMINISTRATIVE EXPENSES ................................................................................................................ 19 OTHER OPERATING INCOME (EXPENSES) ..................................................................................................................... 20 ADJUSTED EBITDA ............................................................................................................................................................ 20 FINANCIAL RESULT ........................................................................................................................................................... 21 DERIVATIVE OPERATIONS ............................................................................................................................................... 22 NET INCOME (LOSS) .......................................................................................................................................................... 26 DEBT ..................................................................................................................................................................................... 26 CAPITAL EXPENDITURE .................................................................................................................................................... 29 OPERATING CASH FLOW ................................................................................................................................................... 29 FREE CASH FLOW ............................................................................................................................................................... 30 ROIC ("RETURN ON INVESTED CAPITAL") ..................................................................................................................... 31 CHANGES IN NET DEBT ..................................................................................................................................................... 32 ESG ....................................................................................................................................................................................... 32 EVENTS SUBSEQUENT TO THE REPORTING PERIOD .................................................................................................... 33 CAPITAL MARKETS ..................................................................................................................................................................... 34 FIXED INCOME ........................................................................................................................................................................... 35 RATING ......................................................................................................................................................................................... 35 UPCOMING EVENTS ................................................................................................................................................................... 36 APPENDICES ................................................................................................................................................................................ 37 APPENDIX 1 – Operating Data ...................................................................................................................................... 37 APPENDIX 2 – Consolidated Income Statement and Goodwill Amortization .................................................. 39 APPENDIX 3 – Consolidated Balance Sheet ............................................................................................................... 40 APPENDIX 4 – Consolidated Statement of Cash Flow ............................................................................................ 41 APPENDIX 5 – EBITDA ..................................................................................................................................................... 42 APPENDIX 6 – Segmented Income Statement ......................................................................................................... 43 Forward-Looking Statements ....................................................................................................................................... 44 2Q26 EARNINGS RELEASE Page 2 of 44
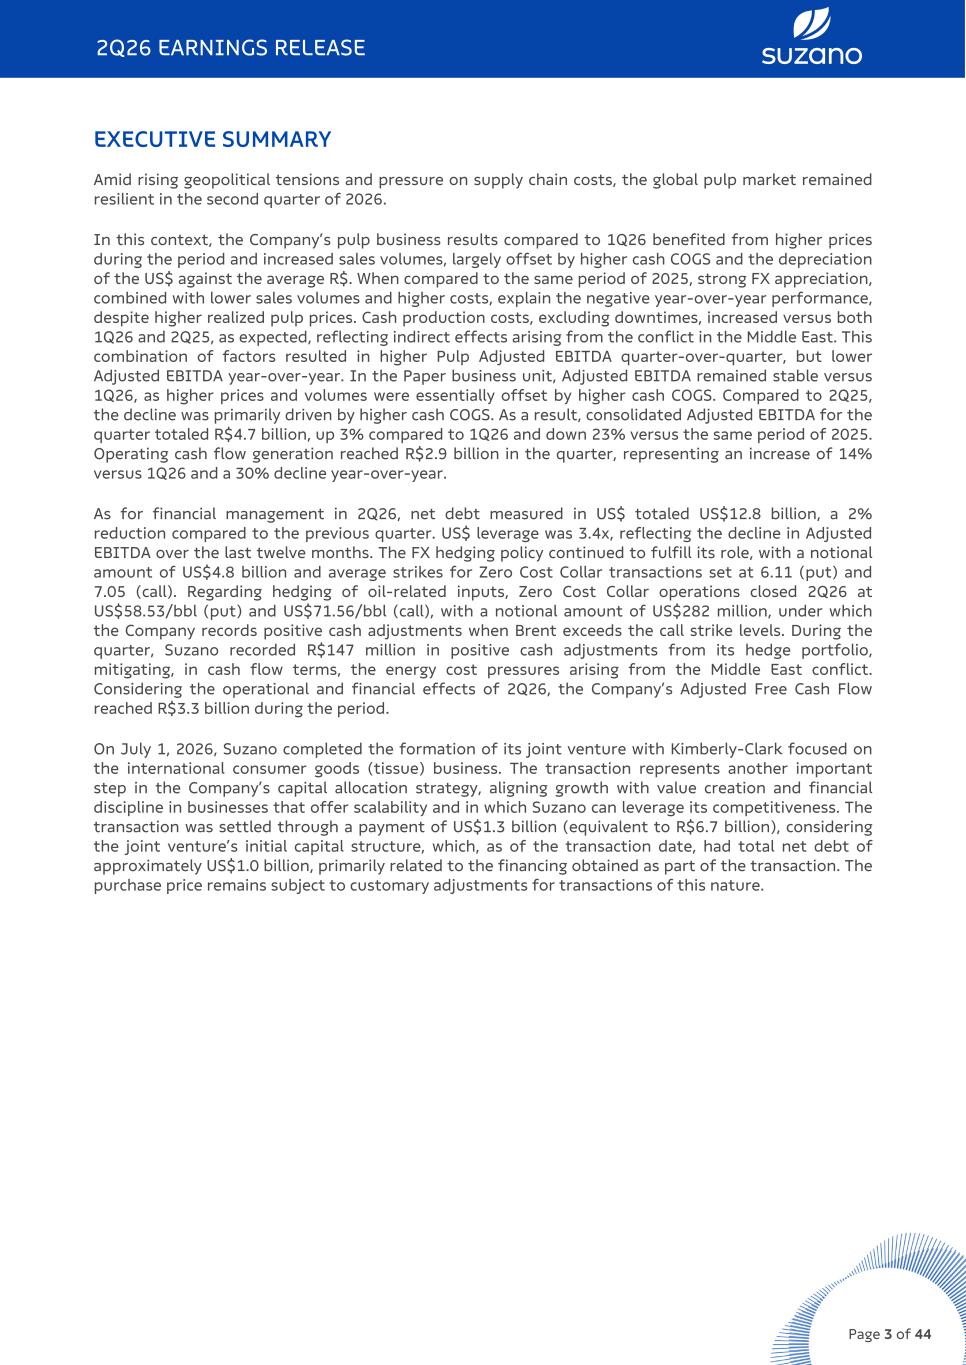
EXECUTIVE SUMMARY Amid rising geopolitical tensions and pressure on supply chain costs, the global pulp market remained resilient in the second quarter of 2026. In this context, the Company’s pulp business results compared to 1Q26 benefited from higher prices during the period and increased sales volumes, largely offset by higher cash COGS and the depreciation of the US$ against the average R$. When compared to the same period of 2025, strong FX appreciation, combined with lower sales volumes and higher costs, explain the negative year-over-year performance, despite higher realized pulp prices. Cash production costs, excluding downtimes, increased versus both 1Q26 and 2Q25, as expected, reflecting indirect effects arising from the conflict in the Middle East. This combination of factors resulted in higher Pulp Adjusted EBITDA quarter-over-quarter, but lower Adjusted EBITDA year-over-year. In the Paper business unit, Adjusted EBITDA remained stable versus 1Q26, as higher prices and volumes were essentially offset by higher cash COGS. Compared to 2Q25, the decline was primarily driven by higher cash COGS. As a result, consolidated Adjusted EBITDA for the quarter totaled R$4.7 billion, up 3% compared to 1Q26 and down 23% versus the same period of 2025. Operating cash flow generation reached R$2.9 billion in the quarter, representing an increase of 14% versus 1Q26 and a 30% decline year-over-year. As for financial management in 2Q26, net debt measured in US$ totaled US$12.8 billion, a 2% reduction compared to the previous quarter. US$ leverage was 3.4x, reflecting the decline in Adjusted EBITDA over the last twelve months. The FX hedging policy continued to fulfill its role, with a notional amount of US$4.8 billion and average strikes for Zero Cost Collar transactions set at 6.11 (put) and 7.05 (call). Regarding hedging of oil-related inputs, Zero Cost Collar operations closed 2Q26 at US$58.53/bbl (put) and US$71.56/bbl (call), with a notional amount of US$282 million, under which the Company records positive cash adjustments when Brent exceeds the call strike levels. During the quarter, Suzano recorded R$147 million in positive cash adjustments from its hedge portfolio, mitigating, in cash flow terms, the energy cost pressures arising from the Middle East conflict. Considering the operational and financial effects of 2Q26, the Company’s Adjusted Free Cash Flow reached R$3.3 billion during the period. On July 1, 2026, Suzano completed the formation of its joint venture with Kimberly-Clark focused on the international consumer goods (tissue) business. The transaction represents another important step in the Company’s capital allocation strategy, aligning growth with value creation and financial discipline in businesses that offer scalability and in which Suzano can leverage its competitiveness. The transaction was settled through a payment of US$1.3 billion (equivalent to R$6.7 billion), considering the joint venture’s initial capital structure, which, as of the transaction date, had total net debt of approximately US$1.0 billion, primarily related to the financing obtained as part of the transaction. The purchase price remains subject to customary adjustments for transactions of this nature. 2Q26 EARNINGS RELEASE Page 3 of 44
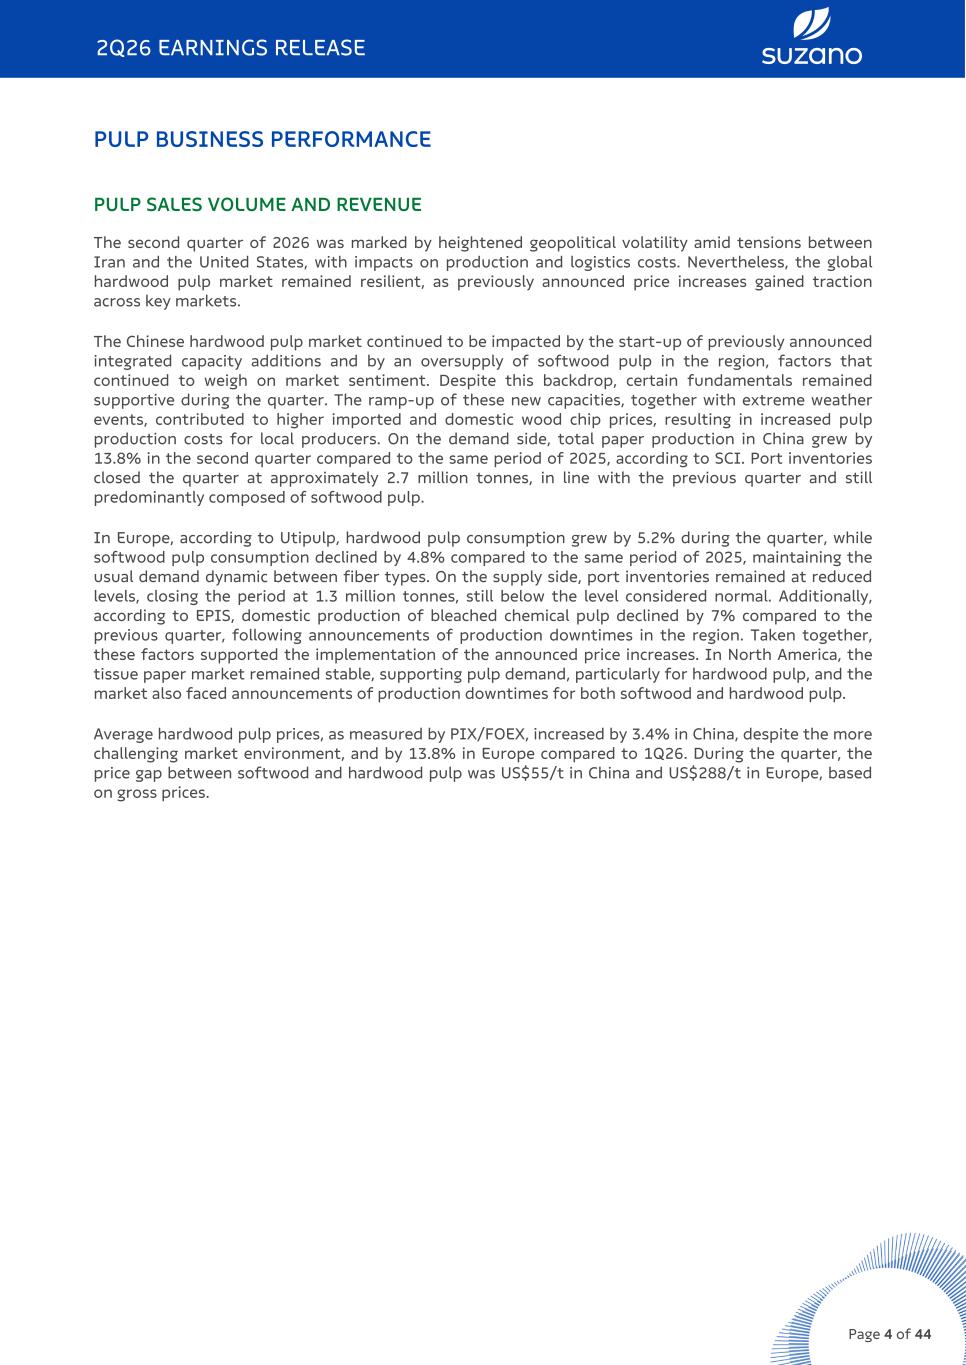
PULP BUSINESS PERFORMANCE PULP SALES VOLUME AND REVENUE The second quarter of 2026 was marked by heightened geopolitical volatility amid tensions between Iran and the United States, with impacts on production and logistics costs. Nevertheless, the global hardwood pulp market remained resilient, as previously announced price increases gained traction across key markets. The Chinese hardwood pulp market continued to be impacted by the start-up of previously announced integrated capacity additions and by an oversupply of softwood pulp in the region, factors that continued to weigh on market sentiment. Despite this backdrop, certain fundamentals remained supportive during the quarter. The ramp-up of these new capacities, together with extreme weather events, contributed to higher imported and domestic wood chip prices, resulting in increased pulp production costs for local producers. On the demand side, total paper production in China grew by 13.8% in the second quarter compared to the same period of 2025, according to SCI. Port inventories closed the quarter at approximately 2.7 million tonnes, in line with the previous quarter and still predominantly composed of softwood pulp. In Europe, according to Utipulp, hardwood pulp consumption grew by 5.2% during the quarter, while softwood pulp consumption declined by 4.8% compared to the same period of 2025, maintaining the usual demand dynamic between fiber types. On the supply side, port inventories remained at reduced levels, closing the period at 1.3 million tonnes, still below the level considered normal. Additionally, according to EPIS, domestic production of bleached chemical pulp declined by 7% compared to the previous quarter, following announcements of production downtimes in the region. Taken together, these factors supported the implementation of the announced price increases. In North America, the tissue paper market remained stable, supporting pulp demand, particularly for hardwood pulp, and the market also faced announcements of production downtimes for both softwood and hardwood pulp. Average hardwood pulp prices, as measured by PIX/FOEX, increased by 3.4% in China, despite the more challenging market environment, and by 13.8% in Europe compared to 1Q26. During the quarter, the price gap between softwood and hardwood pulp was US$55/t in China and US$288/t in Europe, based on gross prices. 2Q26 EARNINGS RELEASE Page 4 of 44
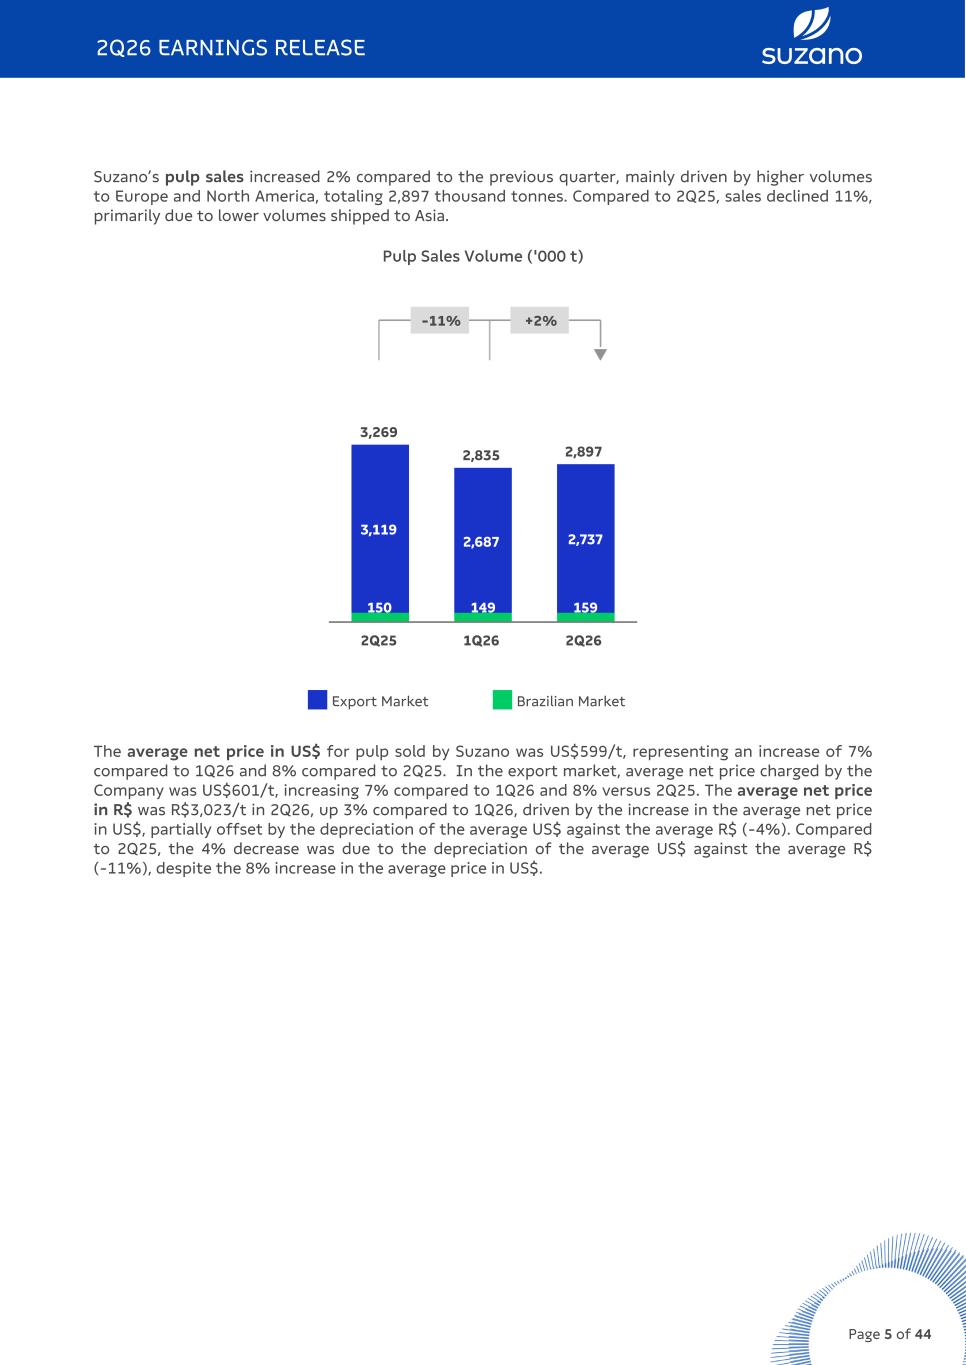
Suzano’s pulp sales increased 2% compared to the previous quarter, mainly driven by higher volumes to Europe and North America, totaling 2,897 thousand tonnes. Compared to 2Q25, sales declined 11%, primarily due to lower volumes shipped to Asia. Pulp Sales Volume ('000 t) -11% +2% q 3,269 2,835 2,897 150 149 159 3,119 2,687 2,737 2Q25 1Q26 2Q26 Export Market Brazilian Market The average net price in US$ for pulp sold by Suzano was US$599/t, representing an increase of 7% compared to 1Q26 and 8% compared to 2Q25. In the export market, average net price charged by the Company was US$601/t, increasing 7% compared to 1Q26 and 8% versus 2Q25. The average net price in R$ was R$3,023/t in 2Q26, up 3% compared to 1Q26, driven by the increase in the average net price in US$, partially offset by the depreciation of the average US$ against the average R$ (-4%). Compared to 2Q25, the 4% decrease was due to the depreciation of the average US$ against the average R$ (-11%), despite the 8% increase in the average price in US$. 2Q26 EARNINGS RELEASE Page 5 of 44
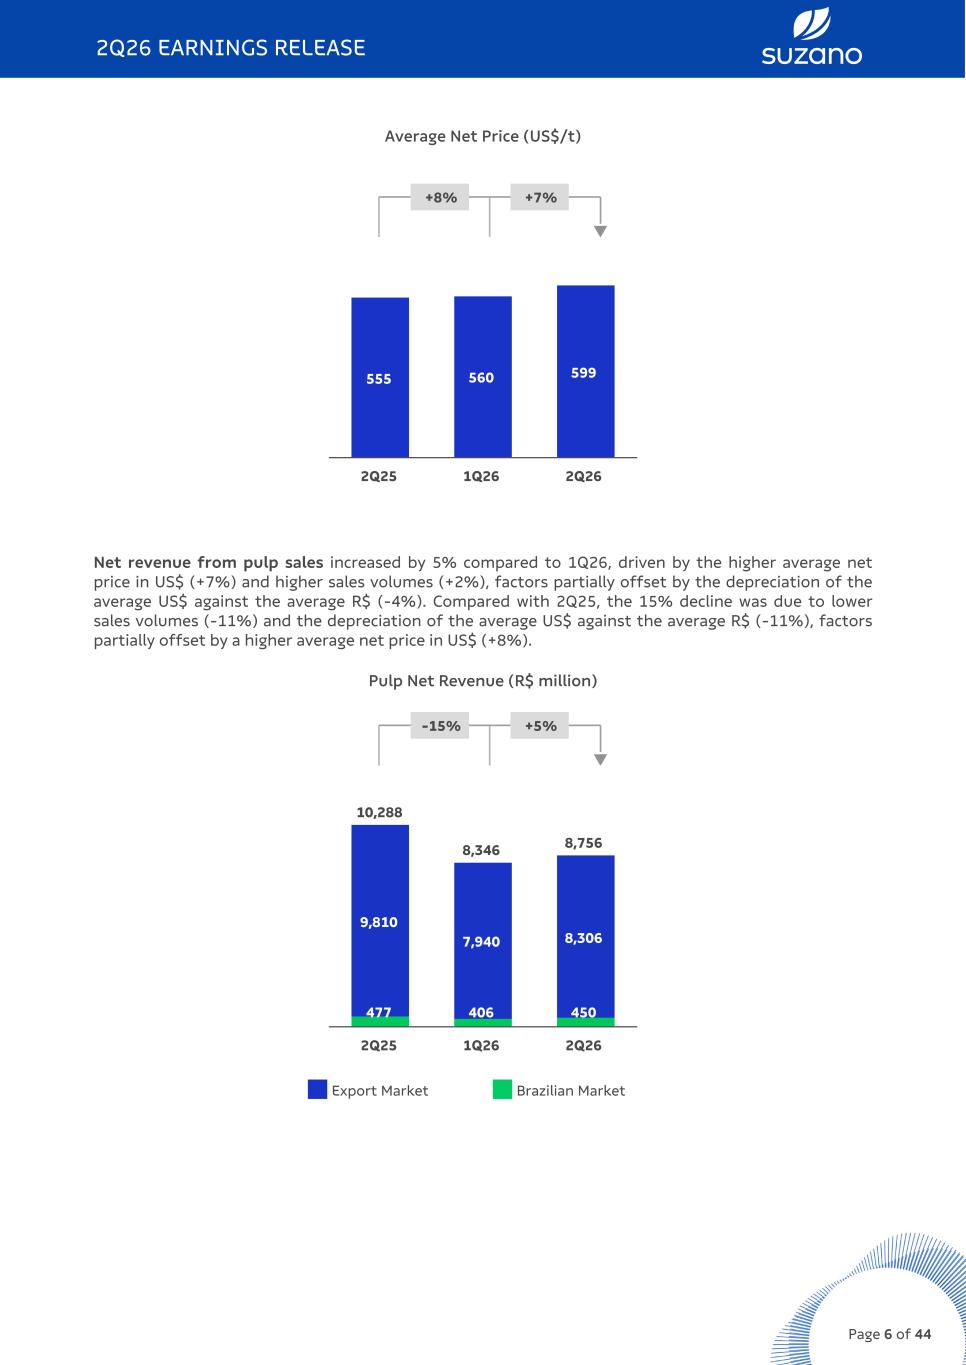
Average Net Price (US$/t) +8% +7% q 555 560 599 2Q25 1Q26 2Q26 Net revenue from pulp sales increased by 5% compared to 1Q26, driven by the higher average net price in US$ (+7%) and higher sales volumes (+2%), factors partially offset by the depreciation of the average US$ against the average R$ (-4%). Compared with 2Q25, the 15% decline was due to lower sales volumes (-11%) and the depreciation of the average US$ against the average R$ (-11%), factors partially offset by a higher average net price in US$ (+8%). Pulp Net Revenue (R$ million) -15% +5% q 10,288 8,346 8,756 477 406 450 9,810 7,940 8,306 2Q25 1Q26 2Q26 Export Market Brazilian Market 2Q26 EARNINGS RELEASE Page 6 of 44
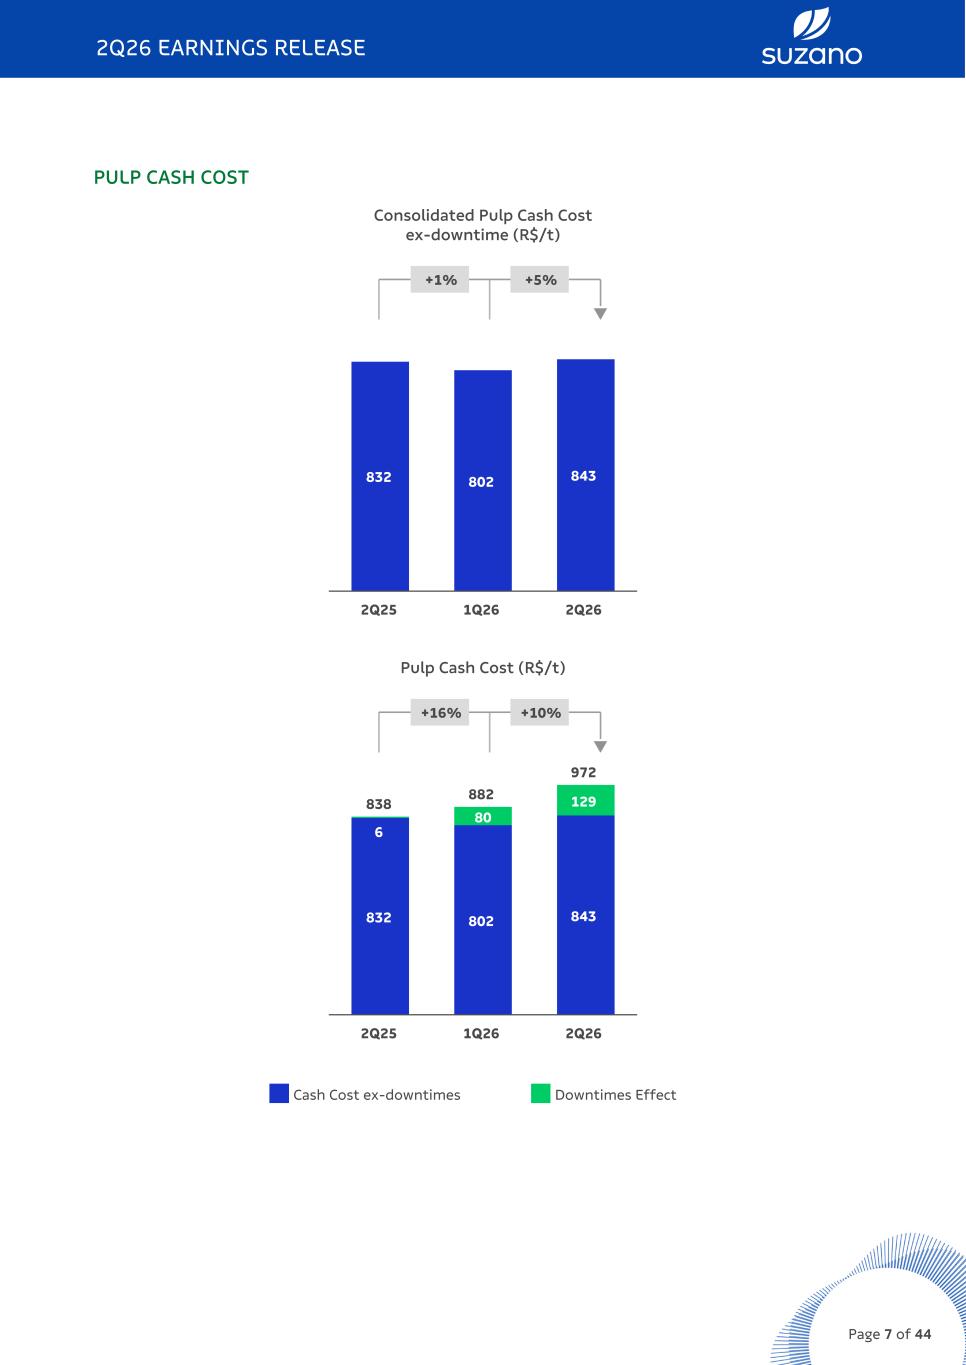
PULP CASH COST Consolidated Pulp Cash Cost ex-downtime (R$/t) +1% +5% q 832 802 843 2Q25 1Q26 2Q26 Pulp Cash Cost (R$/t) +16% +10% q 838 882 972 832 802 843 6 80 129 2Q25 1Q26 2Q26 Cash Cost ex-downtimes Downtimes Effect 2Q26 EARNINGS RELEASE Page 7 of 44
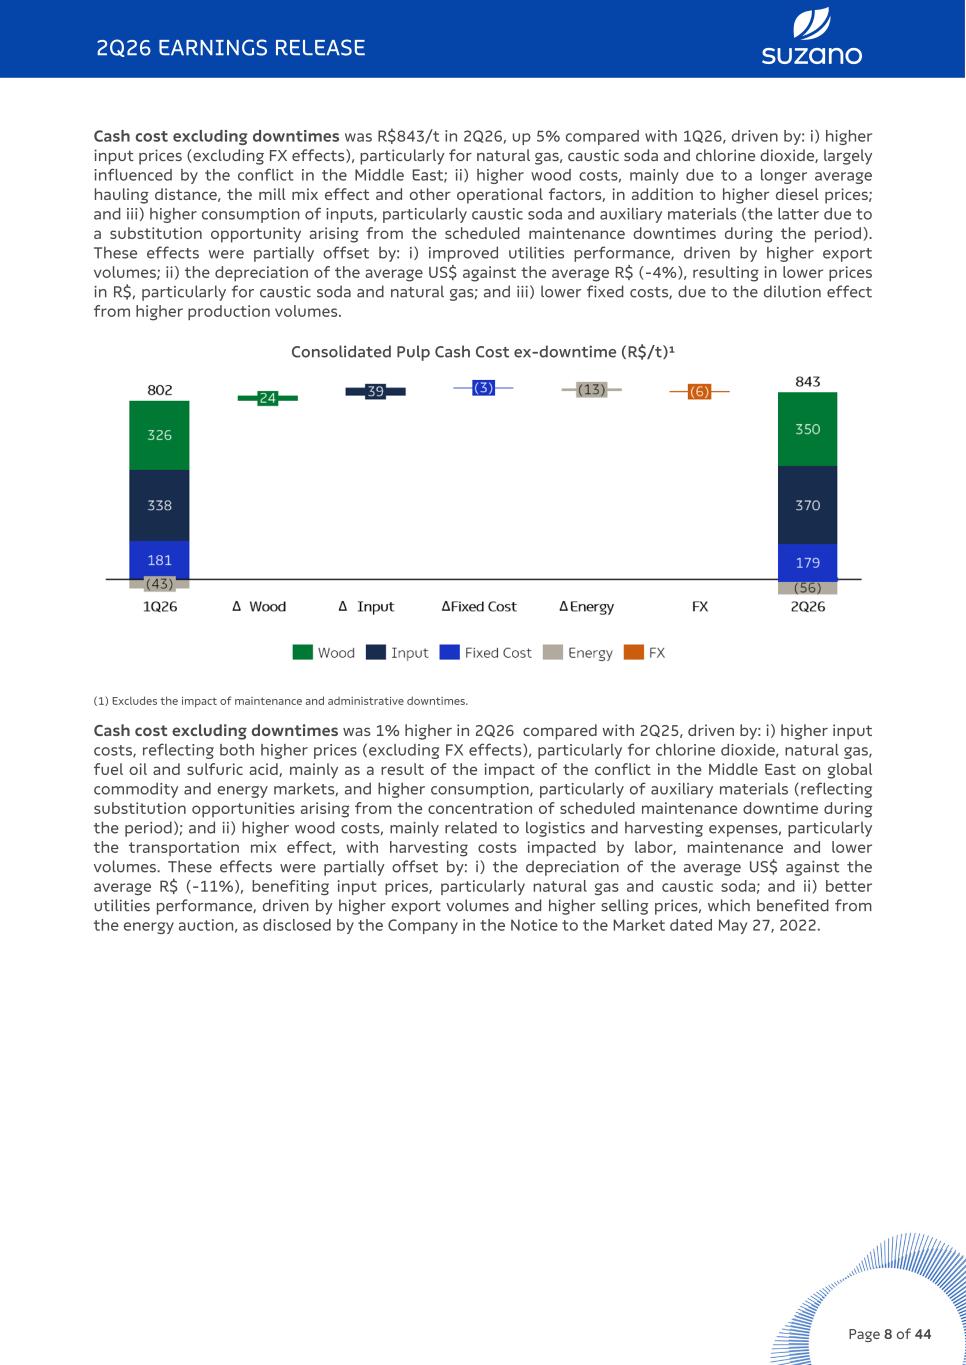
Cash cost excluding downtimes was R$843/t in 2Q26, up 5% compared with 1Q26, driven by: i) higher input prices (excluding FX effects), particularly for natural gas, caustic soda and chlorine dioxide, largely influenced by the conflict in the Middle East; ii) higher wood costs, mainly due to a longer average hauling distance, the mill mix effect and other operational factors, in addition to higher diesel prices; and iii) higher consumption of inputs, particularly caustic soda and auxiliary materials (the latter due to a substitution opportunity arising from the scheduled maintenance downtimes during the period). These effects were partially offset by: i) improved utilities performance, driven by higher export volumes; ii) the depreciation of the average US$ against the average R$ (-4%), resulting in lower prices in R$, particularly for caustic soda and natural gas; and iii) lower fixed costs, due to the dilution effect from higher production volumes. Consolidated Pulp Cash Cost ex-downtime (R$/t)¹ (1) Excludes the impact of maintenance and administrative downtimes. Cash cost excluding downtimes was 1% higher in 2Q26 compared with 2Q25, driven by: i) higher input costs, reflecting both higher prices (excluding FX effects), particularly for chlorine dioxide, natural gas, fuel oil and sulfuric acid, mainly as a result of the impact of the conflict in the Middle East on global commodity and energy markets, and higher consumption, particularly of auxiliary materials (reflecting substitution opportunities arising from the concentration of scheduled maintenance downtime during the period); and ii) higher wood costs, mainly related to logistics and harvesting expenses, particularly the transportation mix effect, with harvesting costs impacted by labor, maintenance and lower volumes. These effects were partially offset by: i) the depreciation of the average US$ against the average R$ (-11%), benefiting input prices, particularly natural gas and caustic soda; and ii) better utilities performance, driven by higher export volumes and higher selling prices, which benefited from the energy auction, as disclosed by the Company in the Notice to the Market dated May 27, 2022. 2Q26 EARNINGS RELEASE Page 8 of 44
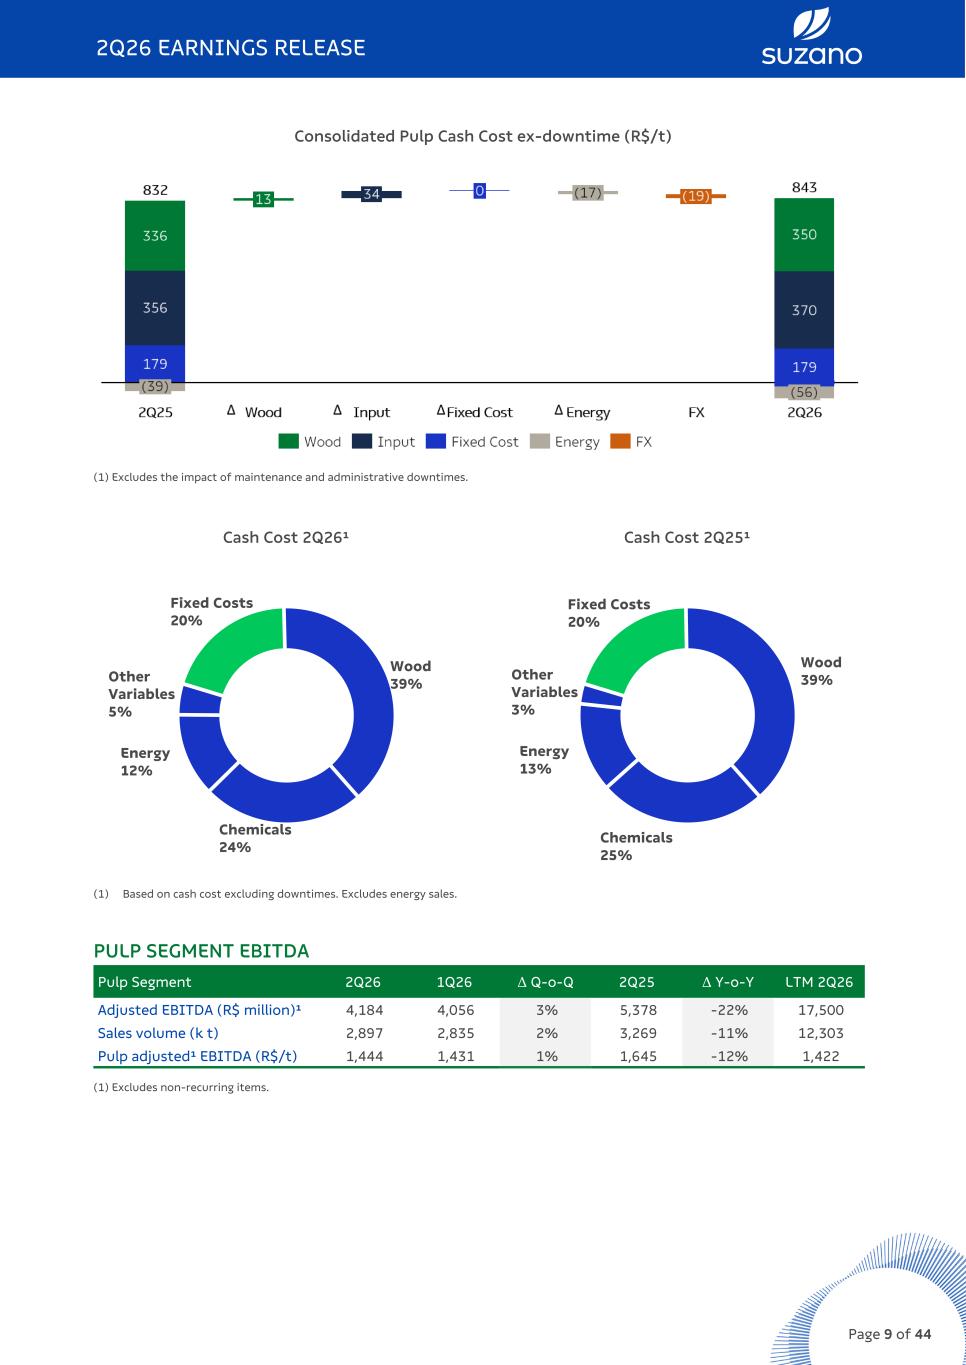
Consolidated Pulp Cash Cost ex-downtime (R$/t) (1) Excludes the impact of maintenance and administrative downtimes. Cash Cost 2Q26¹ Fixed Costs 20% Wood 39% Chemicals 24% Energy 12% Other Variables 5% Cash Cost 2Q25¹ Fixed Costs 20% Wood 39% Chemicals 25% Energy 13% Other Variables 3% (1) Based on cash cost excluding downtimes. Excludes energy sales. PULP SEGMENT EBITDA Pulp Segment 2Q26 1Q26 Δ Q-o-Q 2Q25 Δ Y-o-Y LTM 2Q26 Adjusted EBITDA (R$ million)¹ 4,184 4,056 3% 5,378 -22% 17,500 Sales volume (k t) 2,897 2,835 2% 3,269 -11% 12,303 Pulp adjusted¹ EBITDA (R$/t) 1,444 1,431 1% 1,645 -12% 1,422 (1) Excludes non-recurring items. 2Q26 EARNINGS RELEASE Page 9 of 44
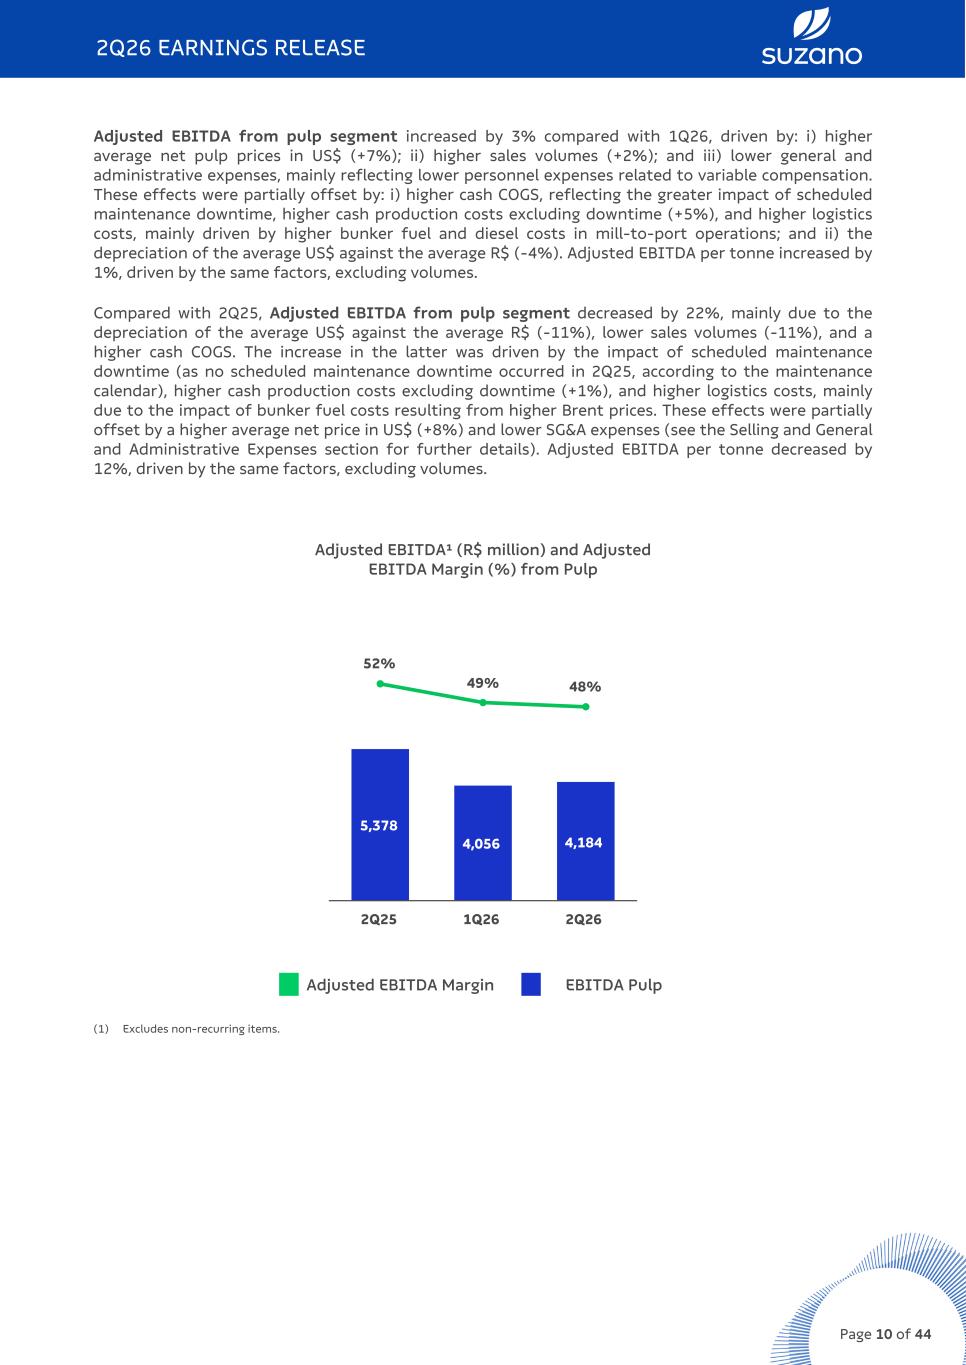
Adjusted EBITDA from pulp segment increased by 3% compared with 1Q26, driven by: i) higher average net pulp prices in US$ (+7%); ii) higher sales volumes (+2%); and iii) lower general and administrative expenses, mainly reflecting lower personnel expenses related to variable compensation. These effects were partially offset by: i) higher cash COGS, reflecting the greater impact of scheduled maintenance downtime, higher cash production costs excluding downtime (+5%), and higher logistics costs, mainly driven by higher bunker fuel and diesel costs in mill-to-port operations; and ii) the depreciation of the average US$ against the average R$ (-4%). Adjusted EBITDA per tonne increased by 1%, driven by the same factors, excluding volumes. Compared with 2Q25, Adjusted EBITDA from pulp segment decreased by 22%, mainly due to the depreciation of the average US$ against the average R$ (-11%), lower sales volumes (-11%), and a higher cash COGS. The increase in the latter was driven by the impact of scheduled maintenance downtime (as no scheduled maintenance downtime occurred in 2Q25, according to the maintenance calendar), higher cash production costs excluding downtime (+1%), and higher logistics costs, mainly due to the impact of bunker fuel costs resulting from higher Brent prices. These effects were partially offset by a higher average net price in US$ (+8%) and lower SG&A expenses (see the Selling and General and Administrative Expenses section for further details). Adjusted EBITDA per tonne decreased by 12%, driven by the same factors, excluding volumes. Adjusted EBITDA¹ (R$ million) and Adjusted EBITDA Margin (%) from Pulp 5,378 4,056 4,184 52% 49% 48% 2Q25 1Q26 2Q26 Adjusted EBITDA Margin EBITDA Pulp (1) Excludes non-recurring items. 2Q26 EARNINGS RELEASE Page 10 of 44
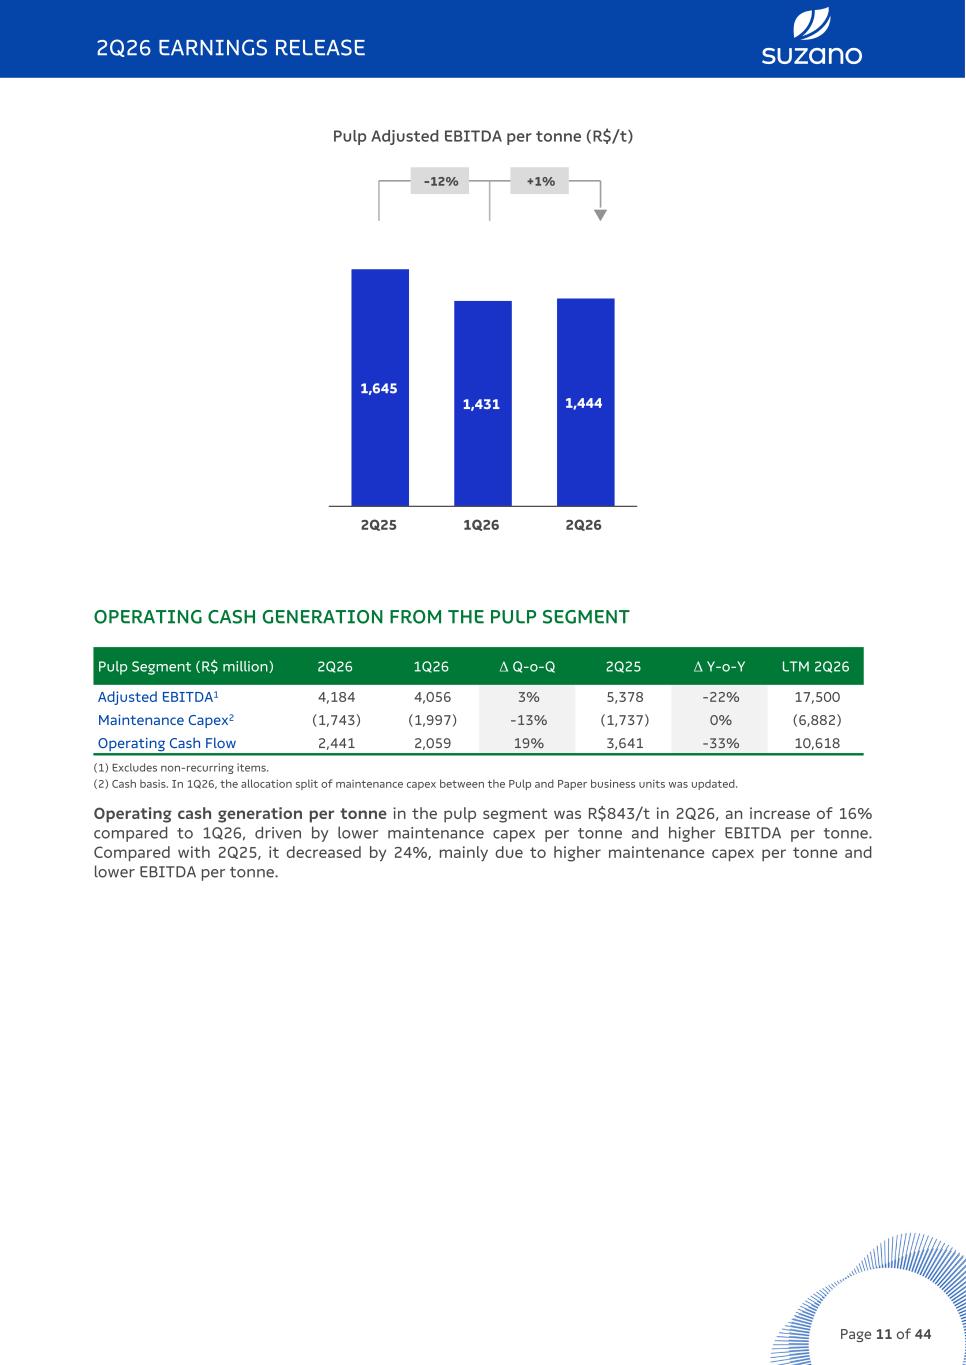
Pulp Adjusted EBITDA per tonne (R$/t) -12% +1% q 1,645 1,431 1,444 2Q25 1Q26 2Q26 OPERATING CASH GENERATION FROM THE PULP SEGMENT Pulp Segment (R$ million) 2Q26 1Q26 Δ Q-o-Q 2Q25 Δ Y-o-Y LTM 2Q26 Adjusted EBITDA1 4,184 4,056 3% 5,378 -22% 17,500 Maintenance Capex2 (1,743) (1,997) -13% (1,737) 0% (6,882) Operating Cash Flow 2,441 2,059 19% 3,641 -33% 10,618 (1) Excludes non-recurring items. (2) Cash basis. In 1Q26, the allocation split of maintenance capex between the Pulp and Paper business units was updated. Operating cash generation per tonne in the pulp segment was R$843/t in 2Q26, an increase of 16% compared to 1Q26, driven by lower maintenance capex per tonne and higher EBITDA per tonne. Compared with 2Q25, it decreased by 24%, mainly due to higher maintenance capex per tonne and lower EBITDA per tonne. 2Q26 EARNINGS RELEASE Page 11 of 44
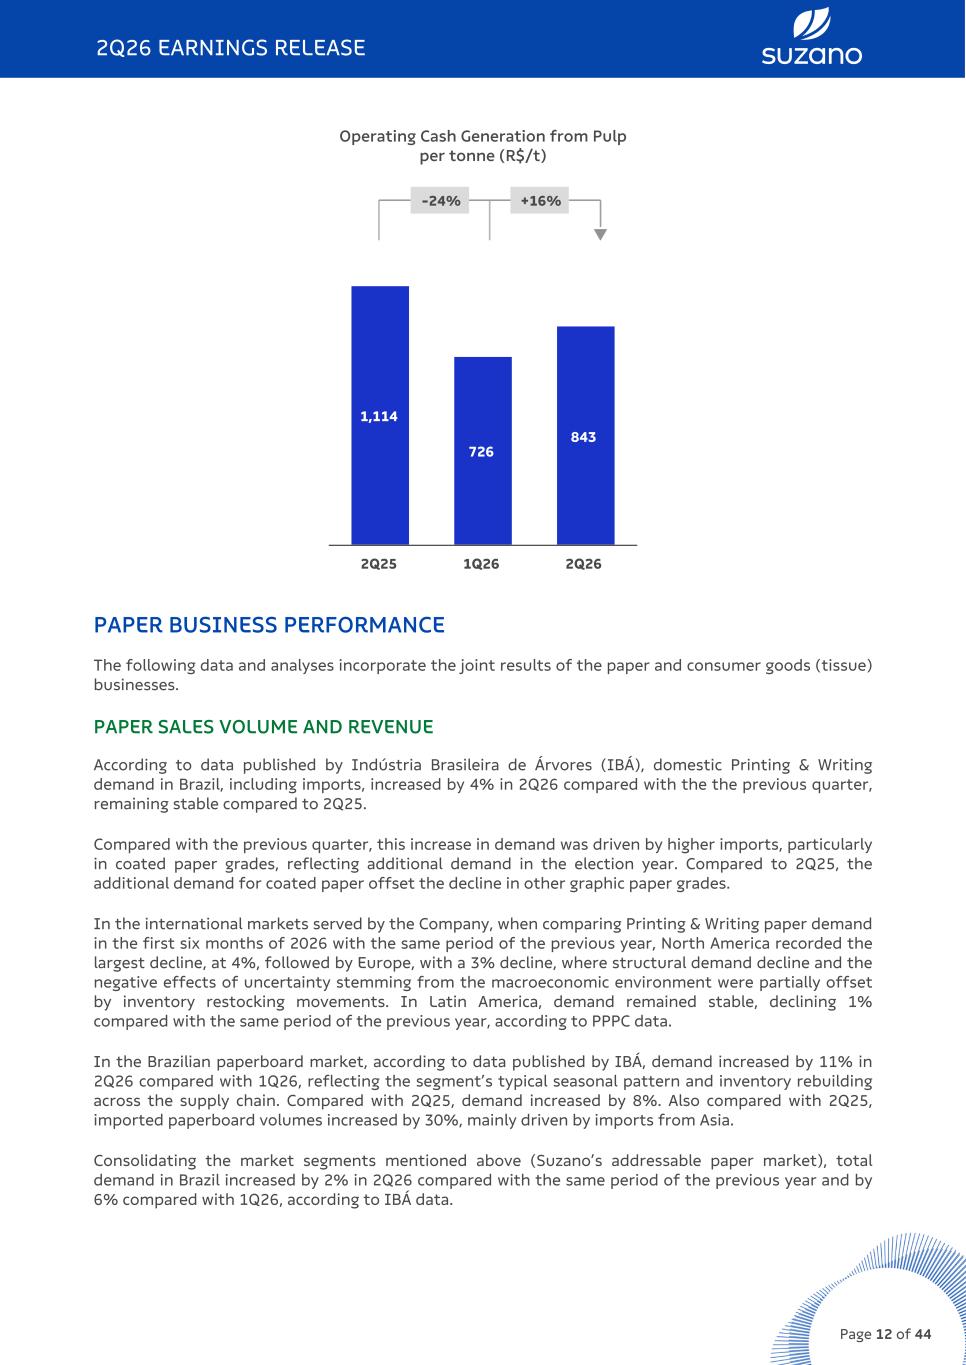
Operating Cash Generation from Pulp per tonne (R$/t) -24% +16% q 1,114 726 843 2Q25 1Q26 2Q26 PAPER BUSINESS PERFORMANCE The following data and analyses incorporate the joint results of the paper and consumer goods (tissue) businesses. PAPER SALES VOLUME AND REVENUE According to data published by Indústria Brasileira de Árvores (IBÁ), domestic Printing & Writing demand in Brazil, including imports, increased by 4% in 2Q26 compared with the the previous quarter, remaining stable compared to 2Q25. Compared with the previous quarter, this increase in demand was driven by higher imports, particularly in coated paper grades, reflecting additional demand in the election year. Compared to 2Q25, the additional demand for coated paper offset the decline in other graphic paper grades. In the international markets served by the Company, when comparing Printing & Writing paper demand in the first six months of 2026 with the same period of the previous year, North America recorded the largest decline, at 4%, followed by Europe, with a 3% decline, where structural demand decline and the negative effects of uncertainty stemming from the macroeconomic environment were partially offset by inventory restocking movements. In Latin America, demand remained stable, declining 1% compared with the same period of the previous year, according to PPPC data. In the Brazilian paperboard market, according to data published by IBÁ, demand increased by 11% in 2Q26 compared with 1Q26, reflecting the segment’s typical seasonal pattern and inventory rebuilding across the supply chain. Compared with 2Q25, demand increased by 8%. Also compared with 2Q25, imported paperboard volumes increased by 30%, mainly driven by imports from Asia. Consolidating the market segments mentioned above (Suzano’s addressable paper market), total demand in Brazil increased by 2% in 2Q26 compared with the same period of the previous year and by 6% compared with 1Q26, according to IBÁ data. 2Q26 EARNINGS RELEASE Page 12 of 44
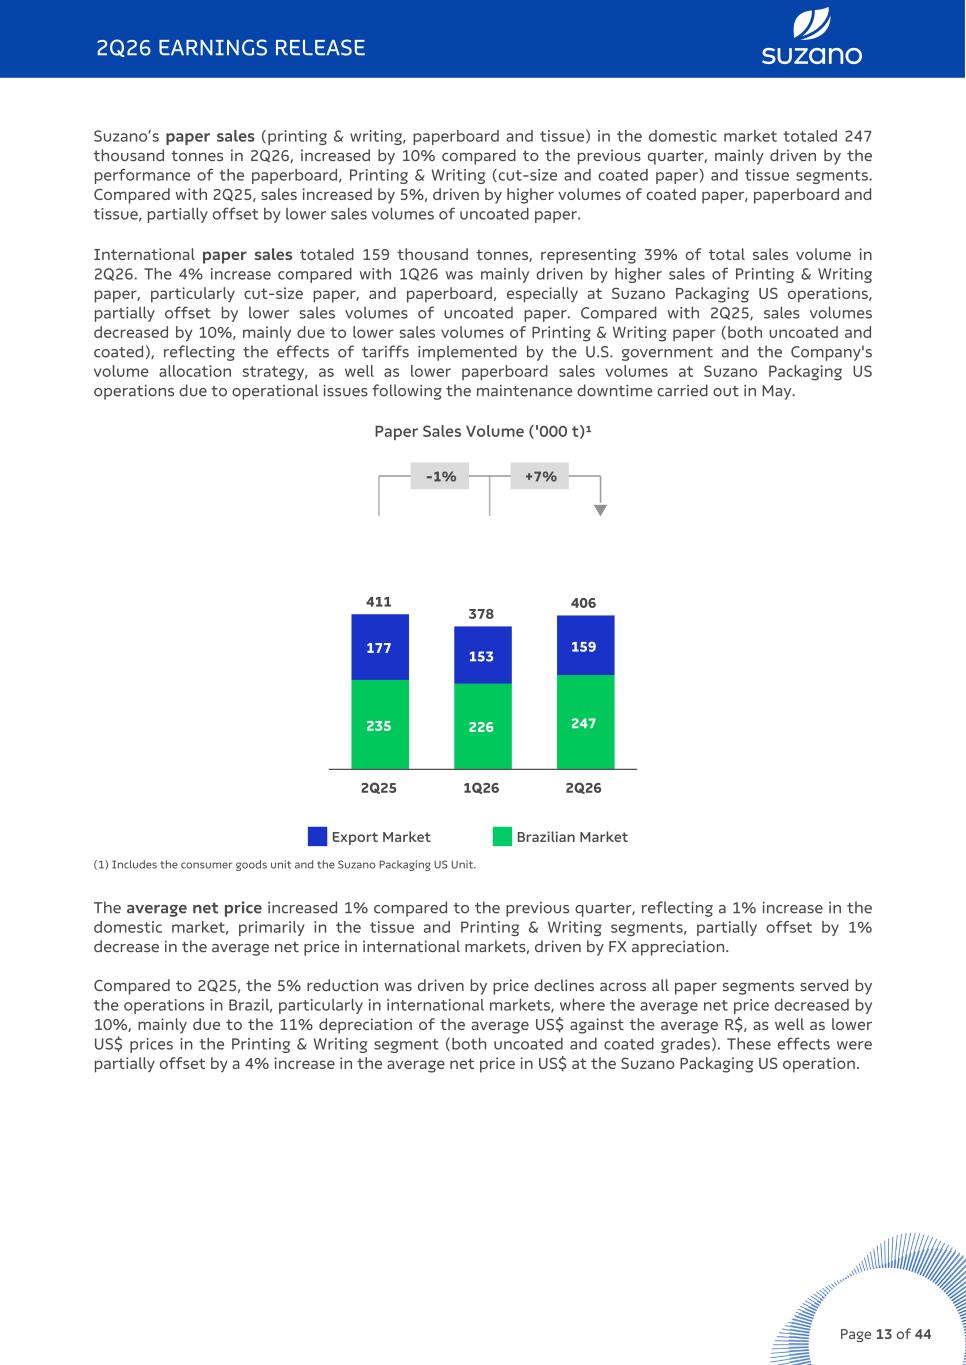
Suzano’s paper sales (printing & writing, paperboard and tissue) in the domestic market totaled 247 thousand tonnes in 2Q26, increased by 10% compared to the previous quarter, mainly driven by the performance of the paperboard, Printing & Writing (cut-size and coated paper) and tissue segments. Compared with 2Q25, sales increased by 5%, driven by higher volumes of coated paper, paperboard and tissue, partially offset by lower sales volumes of uncoated paper. International paper sales totaled 159 thousand tonnes, representing 39% of total sales volume in 2Q26. The 4% increase compared with 1Q26 was mainly driven by higher sales of Printing & Writing paper, particularly cut-size paper, and paperboard, especially at Suzano Packaging US operations, partially offset by lower sales volumes of uncoated paper. Compared with 2Q25, sales volumes decreased by 10%, mainly due to lower sales volumes of Printing & Writing paper (both uncoated and coated), reflecting the effects of tariffs implemented by the U.S. government and the Company's volume allocation strategy, as well as lower paperboard sales volumes at Suzano Packaging US operations due to operational issues following the maintenance downtime carried out in May. Paper Sales Volume ('000 t)¹ -1% +7% q 411 378 406 235 226 247 177 153 159 2Q25 1Q26 2Q26 Export Market Brazilian Market (1) Includes the consumer goods unit and the Suzano Packaging US Unit. The average net price increased 1% compared to the previous quarter, reflecting a 1% increase in the domestic market, primarily in the tissue and Printing & Writing segments, partially offset by 1% decrease in the average net price in international markets, driven by FX appreciation. Compared to 2Q25, the 5% reduction was driven by price declines across all paper segments served by the operations in Brazil, particularly in international markets, where the average net price decreased by 10%, mainly due to the 11% depreciation of the average US$ against the average R$, as well as lower US$ prices in the Printing & Writing segment (both uncoated and coated grades). These effects were partially offset by a 4% increase in the average net price in US$ at the Suzano Packaging US operation. 2Q26 EARNINGS RELEASE Page 13 of 44
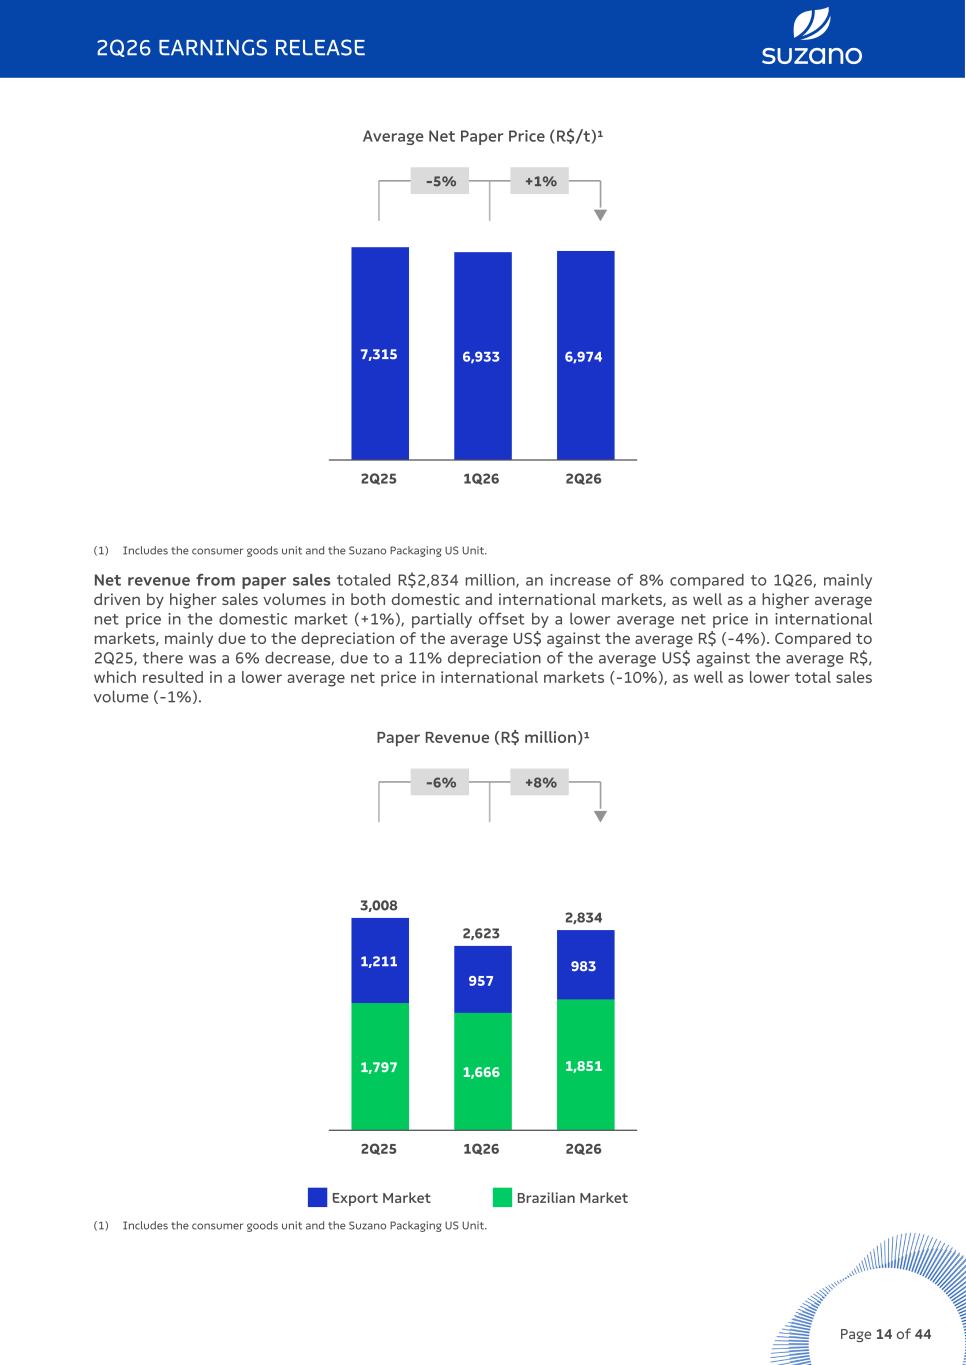
Average Net Paper Price (R$/t)¹ -5% +1% q 7,315 6,933 6,974 2Q25 1Q26 2Q26 (1) Includes the consumer goods unit and the Suzano Packaging US Unit. Net revenue from paper sales totaled R$2,834 million, an increase of 8% compared to 1Q26, mainly driven by higher sales volumes in both domestic and international markets, as well as a higher average net price in the domestic market (+1%), partially offset by a lower average net price in international markets, mainly due to the depreciation of the average US$ against the average R$ (-4%). Compared to 2Q25, there was a 6% decrease, due to a 11% depreciation of the average US$ against the average R$, which resulted in a lower average net price in international markets (-10%), as well as lower total sales volume (-1%). Paper Revenue (R$ million)¹ -6% +8% q 3,008 2,623 2,834 1,797 1,666 1,851 1,211 957 983 2Q25 1Q26 2Q26 Export Market Brazilian Market (1) Includes the consumer goods unit and the Suzano Packaging US Unit. 2Q26 EARNINGS RELEASE Page 14 of 44
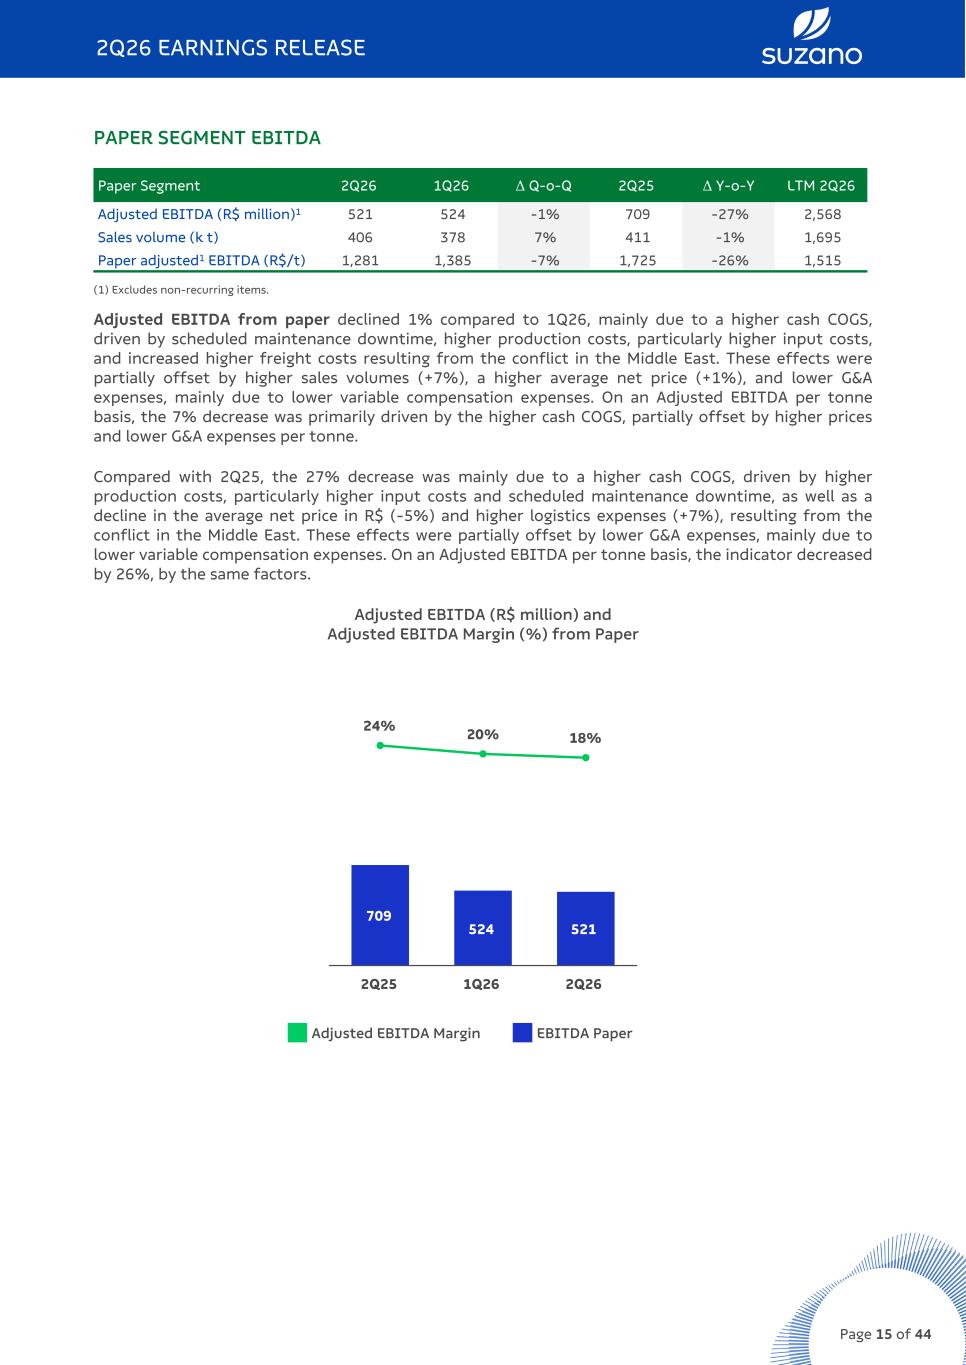
PAPER SEGMENT EBITDA Paper Segment 2Q26 1Q26 Δ Q-o-Q 2Q25 Δ Y-o-Y LTM 2Q26 Adjusted EBITDA (R$ million)1 521 524 -1% 709 -27% 2,568 Sales volume (k t) 406 378 7% 411 -1% 1,695 Paper adjusted1 EBITDA (R$/t) 1,281 1,385 -7% 1,725 -26% 1,515 (1) Excludes non-recurring items. Adjusted EBITDA from paper declined 1% compared to 1Q26, mainly due to a higher cash COGS, driven by scheduled maintenance downtime, higher production costs, particularly higher input costs, and increased higher freight costs resulting from the conflict in the Middle East. These effects were partially offset by higher sales volumes (+7%), a higher average net price (+1%), and lower G&A expenses, mainly due to lower variable compensation expenses. On an Adjusted EBITDA per tonne basis, the 7% decrease was primarily driven by the higher cash COGS, partially offset by higher prices and lower G&A expenses per tonne. Compared with 2Q25, the 27% decrease was mainly due to a higher cash COGS, driven by higher production costs, particularly higher input costs and scheduled maintenance downtime, as well as a decline in the average net price in R$ (-5%) and higher logistics expenses (+7%), resulting from the conflict in the Middle East. These effects were partially offset by lower G&A expenses, mainly due to lower variable compensation expenses. On an Adjusted EBITDA per tonne basis, the indicator decreased by 26%, by the same factors. Adjusted EBITDA (R$ million) and Adjusted EBITDA Margin (%) from Paper 709 524 521 24% 20% 18% 2Q25 1Q26 2Q26 Adjusted EBITDA Margin EBITDA Paper 2Q26 EARNINGS RELEASE Page 15 of 44
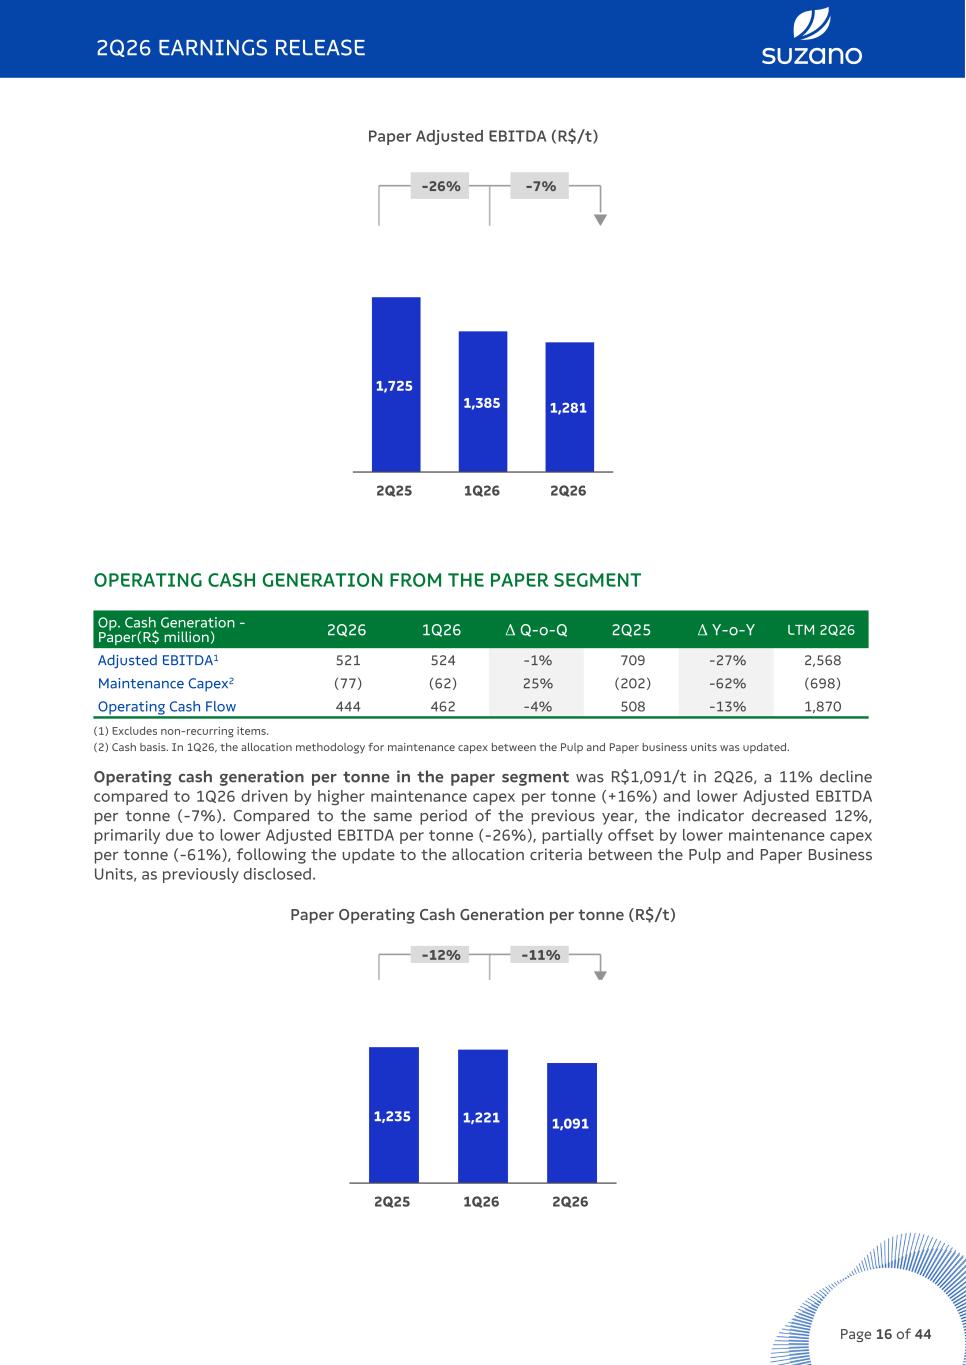
Paper Adjusted EBITDA (R$/t) -26% -7% q 1,725 1,385 1,281 2Q25 1Q26 2Q26 OPERATING CASH GENERATION FROM THE PAPER SEGMENT Op. Cash Generation - Paper(R$ million) 2Q26 1Q26 Δ Q-o-Q 2Q25 Δ Y-o-Y LTM 2Q26 Adjusted EBITDA1 521 524 -1% 709 -27% 2,568 Maintenance Capex2 (77) (62) 25% (202) -62% (698) Operating Cash Flow 444 462 -4% 508 -13% 1,870 (1) Excludes non-recurring items. (2) Cash basis. In 1Q26, the allocation methodology for maintenance capex between the Pulp and Paper business units was updated. Operating cash generation per tonne in the paper segment was R$1,091/t in 2Q26, a 11% decline compared to 1Q26 driven by higher maintenance capex per tonne (+16%) and lower Adjusted EBITDA per tonne (-7%). Compared to the same period of the previous year, the indicator decreased 12%, primarily due to lower Adjusted EBITDA per tonne (-26%), partially offset by lower maintenance capex per tonne (-61%), following the update to the allocation criteria between the Pulp and Paper Business Units, as previously disclosed. Paper Operating Cash Generation per tonne (R$/t) -12% -11% q 1,235 1,221 1,091 2Q25 1Q26 2Q26 2Q26 EARNINGS RELEASE Page 16 of 44
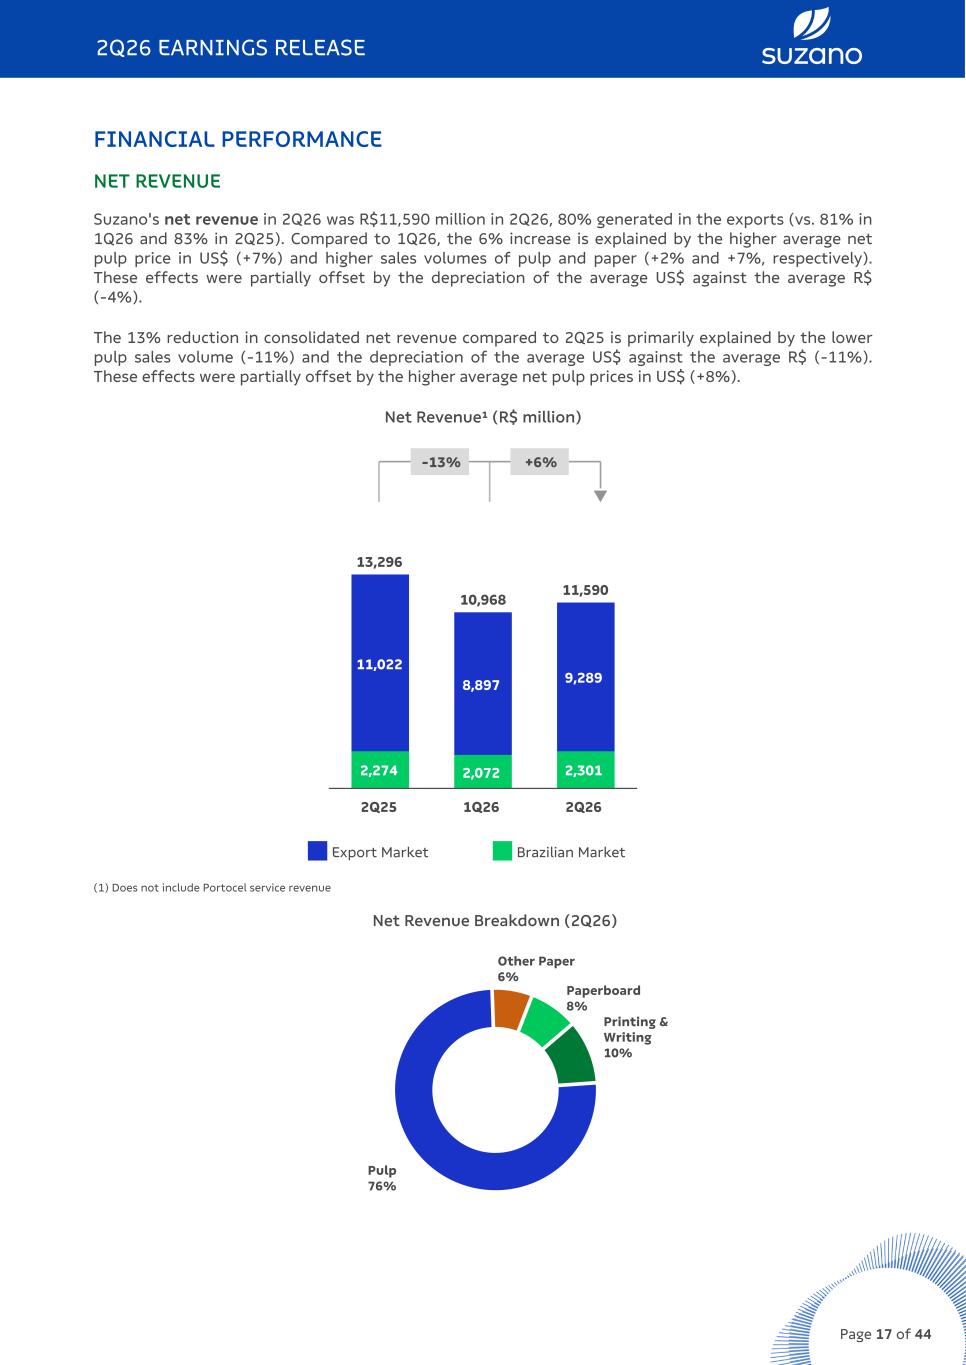
FINANCIAL PERFORMANCE NET REVENUE Suzano's net revenue in 2Q26 was R$11,590 million in 2Q26, 80% generated in the exports (vs. 81% in 1Q26 and 83% in 2Q25). Compared to 1Q26, the 6% increase is explained by the higher average net pulp price in US$ (+7%) and higher sales volumes of pulp and paper (+2% and +7%, respectively). These effects were partially offset by the depreciation of the average US$ against the average R$ (-4%). The 13% reduction in consolidated net revenue compared to 2Q25 is primarily explained by the lower pulp sales volume (-11%) and the depreciation of the average US$ against the average R$ (-11%). These effects were partially offset by the higher average net pulp prices in US$ (+8%). Net Revenue¹ (R$ million) -13% +6% q 13,296 10,968 11,590 2,274 2,072 2,301 11,022 8,897 9,289 2Q25 1Q26 2Q26 Export Market Brazilian Market (1) Does not include Portocel service revenue Net Revenue Breakdown (2Q26) Other Paper 6% Paperboard 8% Printing & Writing 10% Pulp 76% 2Q26 EARNINGS RELEASE Page 17 of 44
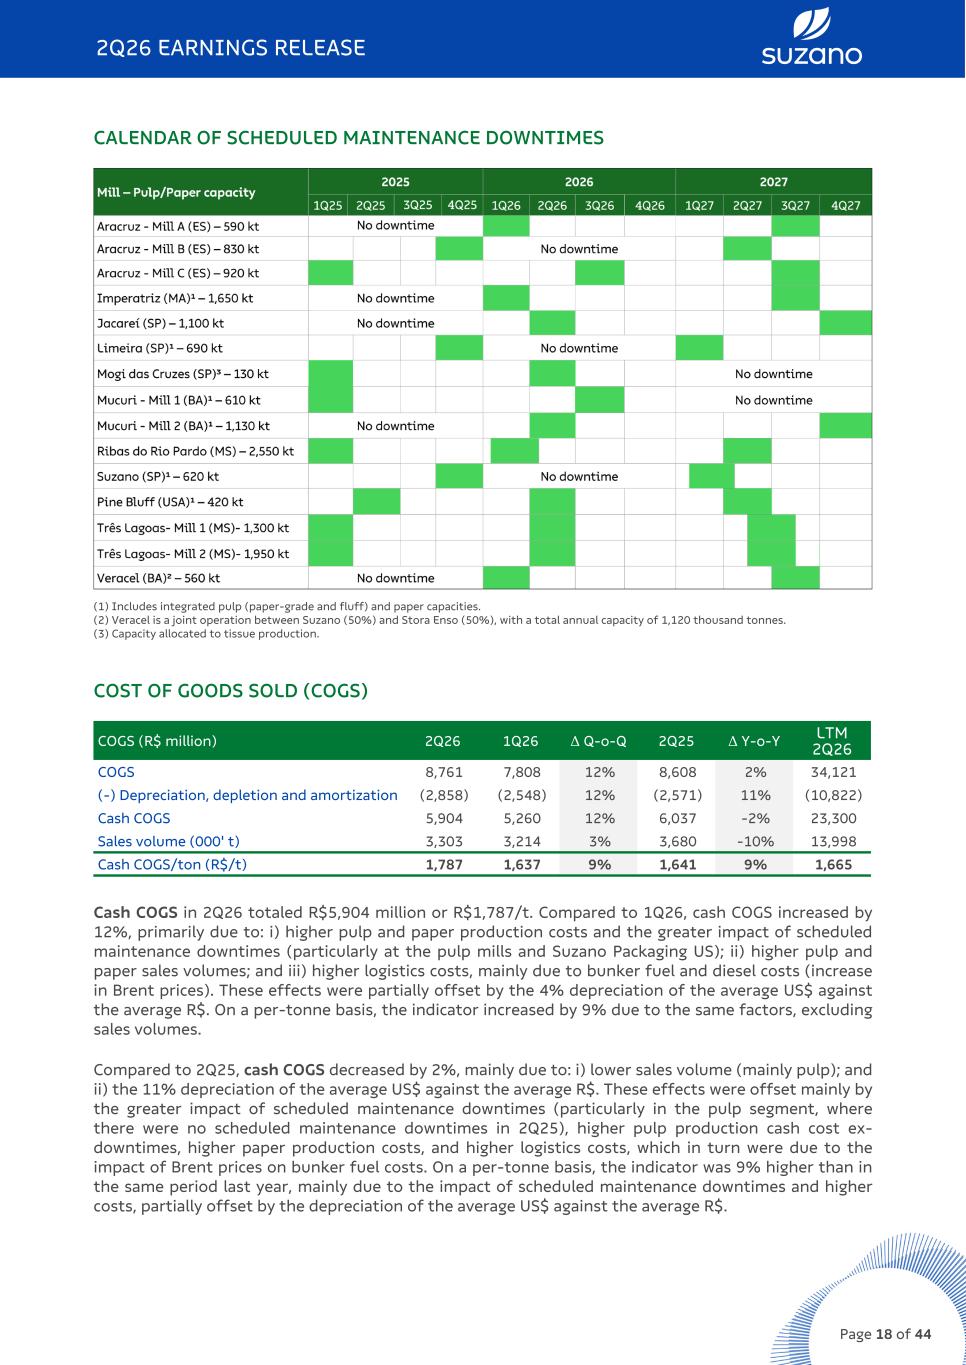
CALENDAR OF SCHEDULED MAINTENANCE DOWNTIMES (1) Includes integrated pulp (paper-grade and fluff) and paper capacities. (2) Veracel is a joint operation between Suzano (50%) and Stora Enso (50%), with a total annual capacity of 1,120 thousand tonnes. (3) Capacity allocated to tissue production. COST OF GOODS SOLD (COGS) COGS (R$ million) 2Q26 1Q26 Δ Q-o-Q 2Q25 Δ Y-o-Y LTM 2Q26 COGS 8,761 7,808 12% 8,608 2% 34,121 (-) Depreciation, depletion and amortization (2,858) (2,548) 12% (2,571) 11% (10,822) Cash COGS 5,904 5,260 12% 6,037 -2% 23,300 Sales volume (000' t) 3,303 3,214 3% 3,680 -10% 13,998 Cash COGS/ton (R$/t) 1,787 1,637 9% 1,641 9% 1,665 Cash COGS in 2Q26 totaled R$5,904 million or R$1,787/t. Compared to 1Q26, cash COGS increased by 12%, primarily due to: i) higher pulp and paper production costs and the greater impact of scheduled maintenance downtimes (particularly at the pulp mills and Suzano Packaging US); ii) higher pulp and paper sales volumes; and iii) higher logistics costs, mainly due to bunker fuel and diesel costs (increase in Brent prices). These effects were partially offset by the 4% depreciation of the average US$ against the average R$. On a per-tonne basis, the indicator increased by 9% due to the same factors, excluding sales volumes. Compared to 2Q25, cash COGS decreased by 2%, mainly due to: i) lower sales volume (mainly pulp); and ii) the 11% depreciation of the average US$ against the average R$. These effects were offset mainly by the greater impact of scheduled maintenance downtimes (particularly in the pulp segment, where there were no scheduled maintenance downtimes in 2Q25), higher pulp production cash cost ex- downtimes, higher paper production costs, and higher logistics costs, which in turn were due to the impact of Brent prices on bunker fuel costs. On a per-tonne basis, the indicator was 9% higher than in the same period last year, mainly due to the impact of scheduled maintenance downtimes and higher costs, partially offset by the depreciation of the average US$ against the average R$. 2Q26 EARNINGS RELEASE Page 18 of 44
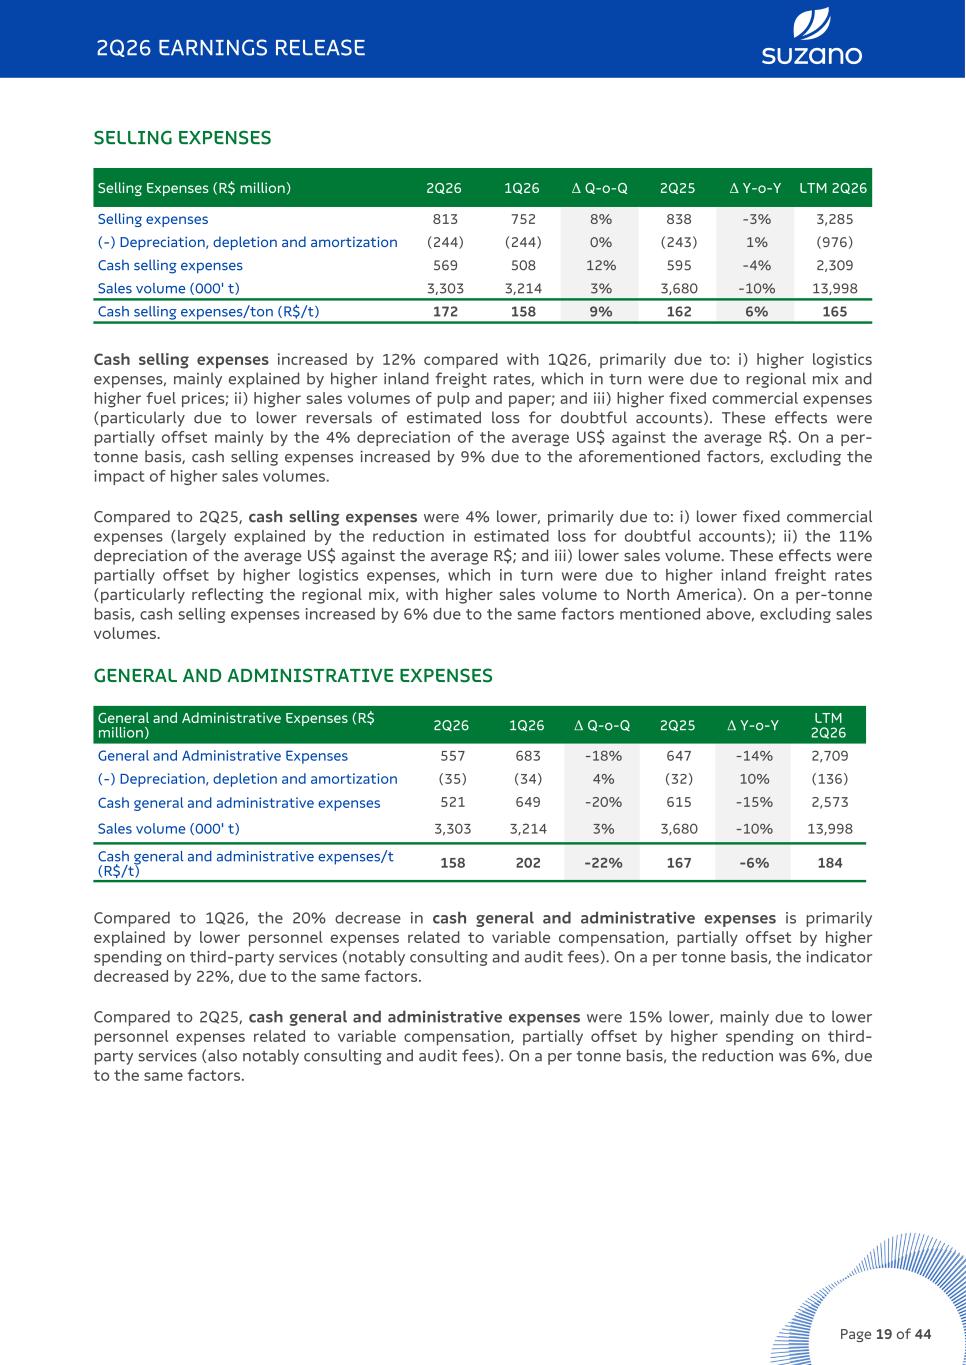
SELLING EXPENSES Selling Expenses (R$ million) 2Q26 1Q26 Δ Q-o-Q 2Q25 Δ Y-o-Y LTM 2Q26 Selling expenses 813 752 8% 838 -3% 3,285 (-) Depreciation, depletion and amortization (244) (244) 0% (243) 1% (976) Cash selling expenses 569 508 12% 595 -4% 2,309 Sales volume (000' t) 3,303 3,214 3% 3,680 -10% 13,998 Cash selling expenses/ton (R$/t) 172 158 9% 162 6% 165 Cash selling expenses increased by 12% compared with 1Q26, primarily due to: i) higher logistics expenses, mainly explained by higher inland freight rates, which in turn were due to regional mix and higher fuel prices; ii) higher sales volumes of pulp and paper; and iii) higher fixed commercial expenses (particularly due to lower reversals of estimated loss for doubtful accounts). These effects were partially offset mainly by the 4% depreciation of the average US$ against the average R$. On a per- tonne basis, cash selling expenses increased by 9% due to the aforementioned factors, excluding the impact of higher sales volumes. Compared to 2Q25, cash selling expenses were 4% lower, primarily due to: i) lower fixed commercial expenses (largely explained by the reduction in estimated loss for doubtful accounts); ii) the 11% depreciation of the average US$ against the average R$; and iii) lower sales volume. These effects were partially offset by higher logistics expenses, which in turn were due to higher inland freight rates (particularly reflecting the regional mix, with higher sales volume to North America). On a per-tonne basis, cash selling expenses increased by 6% due to the same factors mentioned above, excluding sales volumes. GENERAL AND ADMINISTRATIVE EXPENSES General and Administrative Expenses (R$ million) 2Q26 1Q26 Δ Q-o-Q 2Q25 Δ Y-o-Y LTM 2Q26 General and Administrative Expenses 557 683 -18% 647 -14% 2,709 (-) Depreciation, depletion and amortization (35) (34) 4% (32) 10% (136) Cash general and administrative expenses 521 649 -20% 615 -15% 2,573 Sales volume (000' t) 3,303 3,214 3% 3,680 -10% 13,998 Cash general and administrative expenses/t (R$/t) 158 202 -22% 167 -6% 184 Compared to 1Q26, the 20% decrease in cash general and administrative expenses is primarily explained by lower personnel expenses related to variable compensation, partially offset by higher spending on third-party services (notably consulting and audit fees). On a per tonne basis, the indicator decreased by 22%, due to the same factors. Compared to 2Q25, cash general and administrative expenses were 15% lower, mainly due to lower personnel expenses related to variable compensation, partially offset by higher spending on third- party services (also notably consulting and audit fees). On a per tonne basis, the reduction was 6%, due to the same factors. 2Q26 EARNINGS RELEASE Page 19 of 44
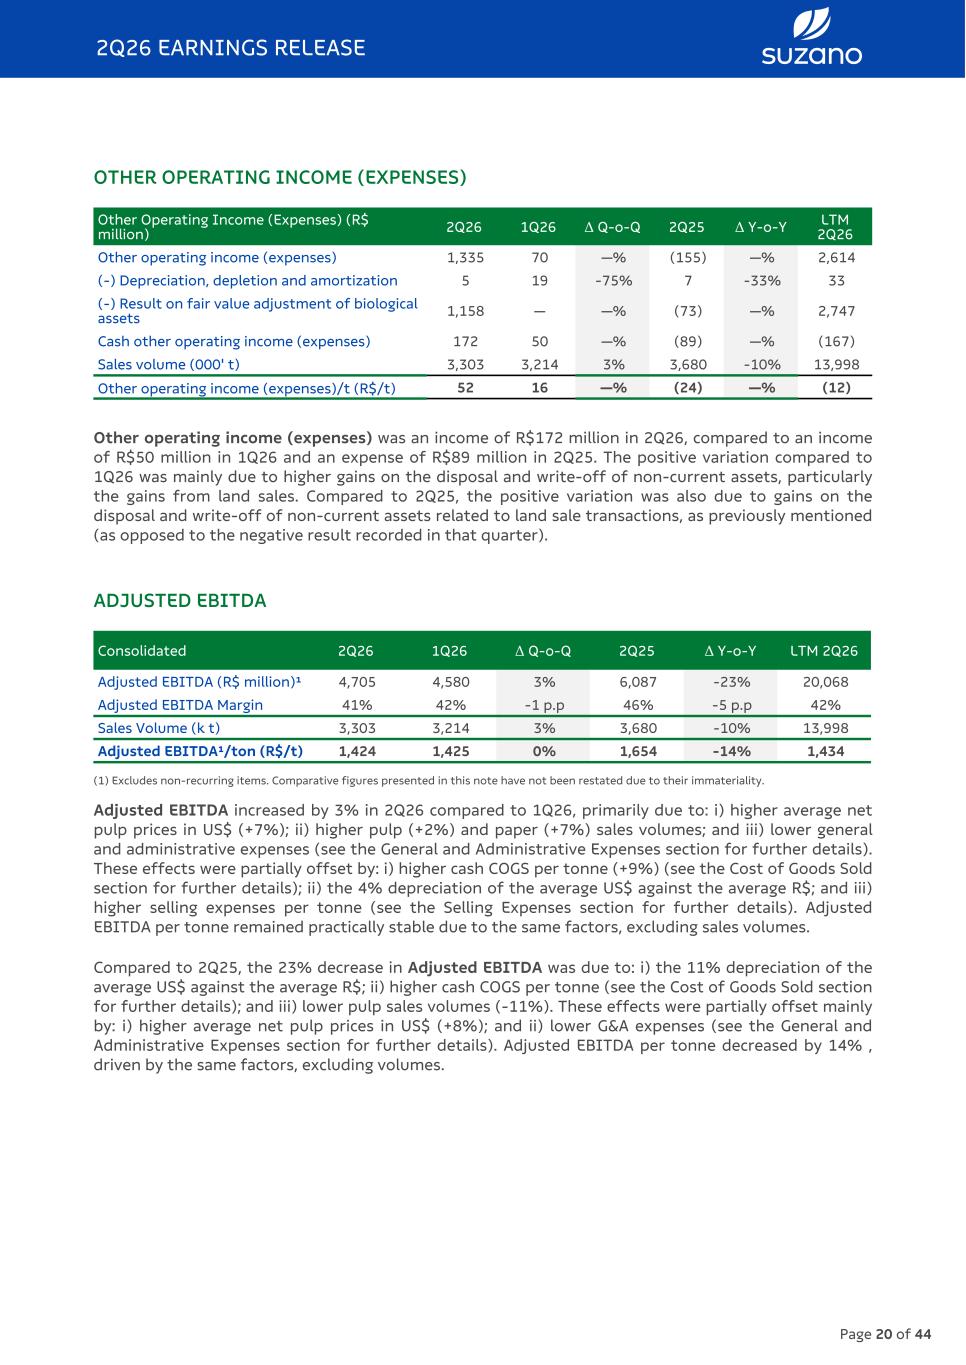
OTHER OPERATING INCOME (EXPENSES) Other Operating Income (Expenses) (R$ million) 2Q26 1Q26 Δ Q-o-Q 2Q25 Δ Y-o-Y LTM 2Q26 Other operating income (expenses) 1,335 70 —% (155) —% 2,614 (-) Depreciation, depletion and amortization 5 19 -75% 7 -33% 33 (-) Result on fair value adjustment of biological assets 1,158 — —% (73) —% 2,747 Cash other operating income (expenses) 172 50 —% (89) —% (167) Sales volume (000' t) 3,303 3,214 3% 3,680 -10% 13,998 Other operating income (expenses)/t (R$/t) 52 16 —% (24) —% (12) Other operating income (expenses) was an income of R$172 million in 2Q26, compared to an income of R$50 million in 1Q26 and an expense of R$89 million in 2Q25. The positive variation compared to 1Q26 was mainly due to higher gains on the disposal and write-off of non-current assets, particularly the gains from land sales. Compared to 2Q25, the positive variation was also due to gains on the disposal and write-off of non-current assets related to land sale transactions, as previously mentioned (as opposed to the negative result recorded in that quarter). ADJUSTED EBITDA Consolidated 2Q26 1Q26 Δ Q-o-Q 2Q25 Δ Y-o-Y LTM 2Q26 Adjusted EBITDA (R$ million)¹ 4,705 4,580 3% 6,087 -23% 20,068 Adjusted EBITDA Margin 41% 42% -1 p.p 46% -5 p.p 42% Sales Volume (k t) 3,303 3,214 3% 3,680 -10% 13,998 Adjusted EBITDA¹/ton (R$/t) 1,424 1,425 0% 1,654 -14% 1,434 (1) Excludes non-recurring items. Comparative figures presented in this note have not been restated due to their immateriality. Adjusted EBITDA increased by 3% in 2Q26 compared to 1Q26, primarily due to: i) higher average net pulp prices in US$ (+7%); ii) higher pulp (+2%) and paper (+7%) sales volumes; and iii) lower general and administrative expenses (see the General and Administrative Expenses section for further details). These effects were partially offset by: i) higher cash COGS per tonne (+9%) (see the Cost of Goods Sold section for further details); ii) the 4% depreciation of the average US$ against the average R$; and iii) higher selling expenses per tonne (see the Selling Expenses section for further details). Adjusted EBITDA per tonne remained practically stable due to the same factors, excluding sales volumes. Compared to 2Q25, the 23% decrease in Adjusted EBITDA was due to: i) the 11% depreciation of the average US$ against the average R$; ii) higher cash COGS per tonne (see the Cost of Goods Sold section for further details); and iii) lower pulp sales volumes (-11%). These effects were partially offset mainly by: i) higher average net pulp prices in US$ (+8%); and ii) lower G&A expenses (see the General and Administrative Expenses section for further details). Adjusted EBITDA per tonne decreased by 14% , driven by the same factors, excluding volumes. 2Q26 EARNINGS RELEASE Page 20 of 44
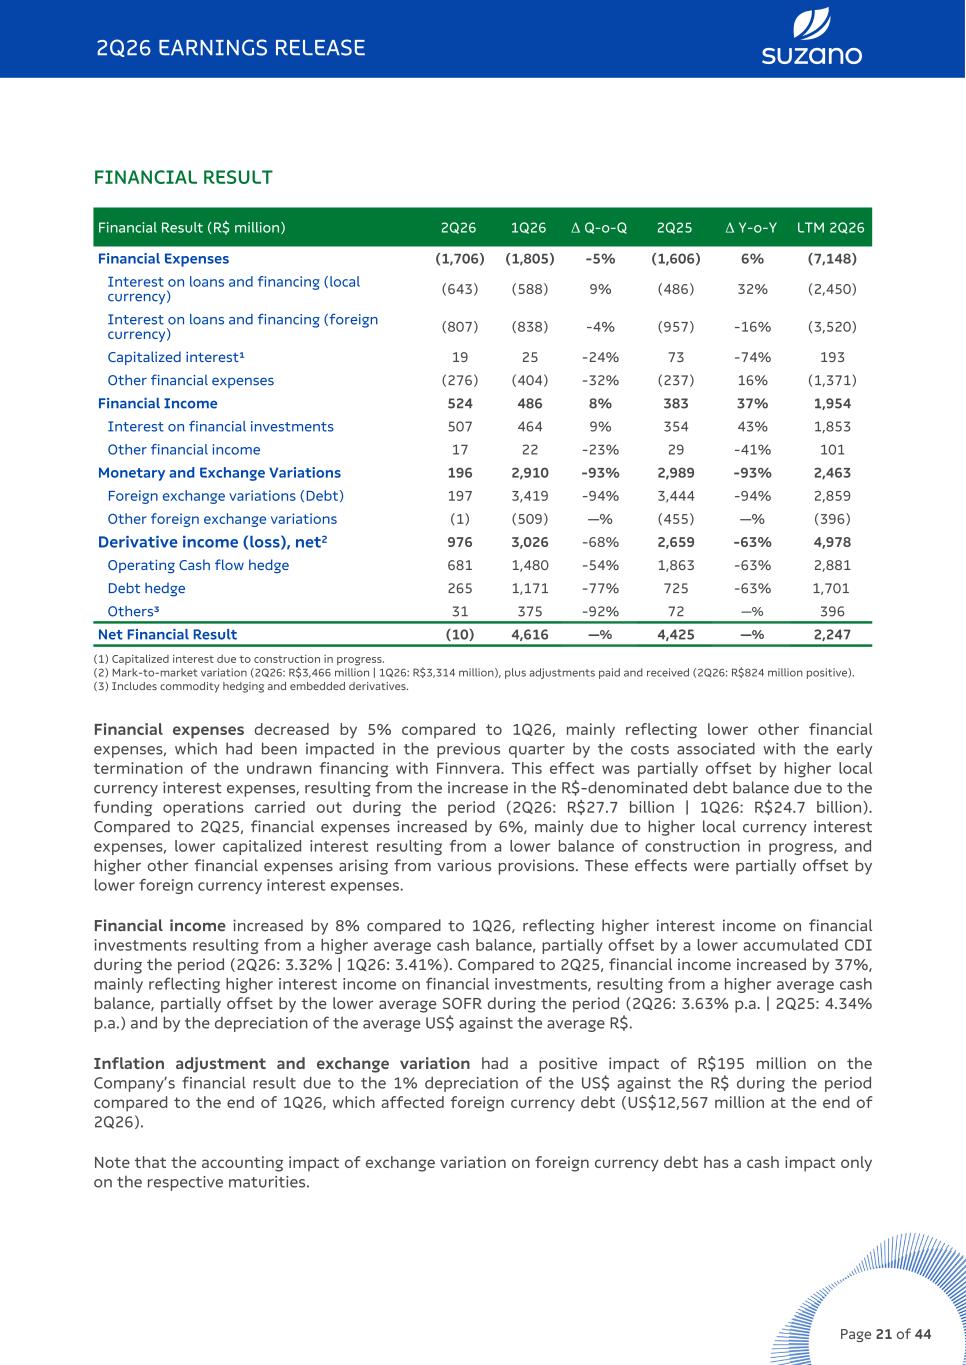
FINANCIAL RESULT Financial Result (R$ million) 2Q26 1Q26 Δ Q-o-Q 2Q25 Δ Y-o-Y LTM 2Q26 Financial Expenses (1,706) (1,805) -5% (1,606) 6% (7,148) Interest on loans and financing (local currency) (643) (588) 9% (486) 32% (2,450) Interest on loans and financing (foreign currency) (807) (838) -4% (957) -16% (3,520) Capitalized interest¹ 19 25 -24% 73 -74% 193 Other financial expenses (276) (404) -32% (237) 16% (1,371) Financial Income 524 486 8% 383 37% 1,954 Interest on financial investments 507 464 9% 354 43% 1,853 Other financial income 17 22 -23% 29 -41% 101 Monetary and Exchange Variations 196 2,910 -93% 2,989 -93% 2,463 Foreign exchange variations (Debt) 197 3,419 -94% 3,444 -94% 2,859 Other foreign exchange variations (1) (509) —% (455) —% (396) Derivative income (loss), net2 976 3,026 -68% 2,659 -63% 4,978 Operating Cash flow hedge 681 1,480 -54% 1,863 -63% 2,881 Debt hedge 265 1,171 -77% 725 -63% 1,701 Others³ 31 375 -92% 72 —% 396 Net Financial Result (10) 4,616 —% 4,425 —% 2,247 (1) Capitalized interest due to construction in progress. (2) Mark-to-market variation (2Q26: R$3,466 million | 1Q26: R$3,314 million), plus adjustments paid and received (2Q26: R$824 million positive). (3) Includes commodity hedging and embedded derivatives. Financial expenses decreased by 5% compared to 1Q26, mainly reflecting lower other financial expenses, which had been impacted in the previous quarter by the costs associated with the early termination of the undrawn financing with Finnvera. This effect was partially offset by higher local currency interest expenses, resulting from the increase in the R$-denominated debt balance due to the funding operations carried out during the period (2Q26: R$27.7 billion | 1Q26: R$24.7 billion). Compared to 2Q25, financial expenses increased by 6%, mainly due to higher local currency interest expenses, lower capitalized interest resulting from a lower balance of construction in progress, and higher other financial expenses arising from various provisions. These effects were partially offset by lower foreign currency interest expenses. Financial income increased by 8% compared to 1Q26, reflecting higher interest income on financial investments resulting from a higher average cash balance, partially offset by a lower accumulated CDI during the period (2Q26: 3.32% | 1Q26: 3.41%). Compared to 2Q25, financial income increased by 37%, mainly reflecting higher interest income on financial investments, resulting from a higher average cash balance, partially offset by the lower average SOFR during the period (2Q26: 3.63% p.a. | 2Q25: 4.34% p.a.) and by the depreciation of the average US$ against the average R$. Inflation adjustment and exchange variation had a positive impact of R$195 million on the Company’s financial result due to the 1% depreciation of the US$ against the R$ during the period compared to the end of 1Q26, which affected foreign currency debt (US$12,567 million at the end of 2Q26). Note that the accounting impact of exchange variation on foreign currency debt has a cash impact only on the respective maturities. 2Q26 EARNINGS RELEASE Page 21 of 44
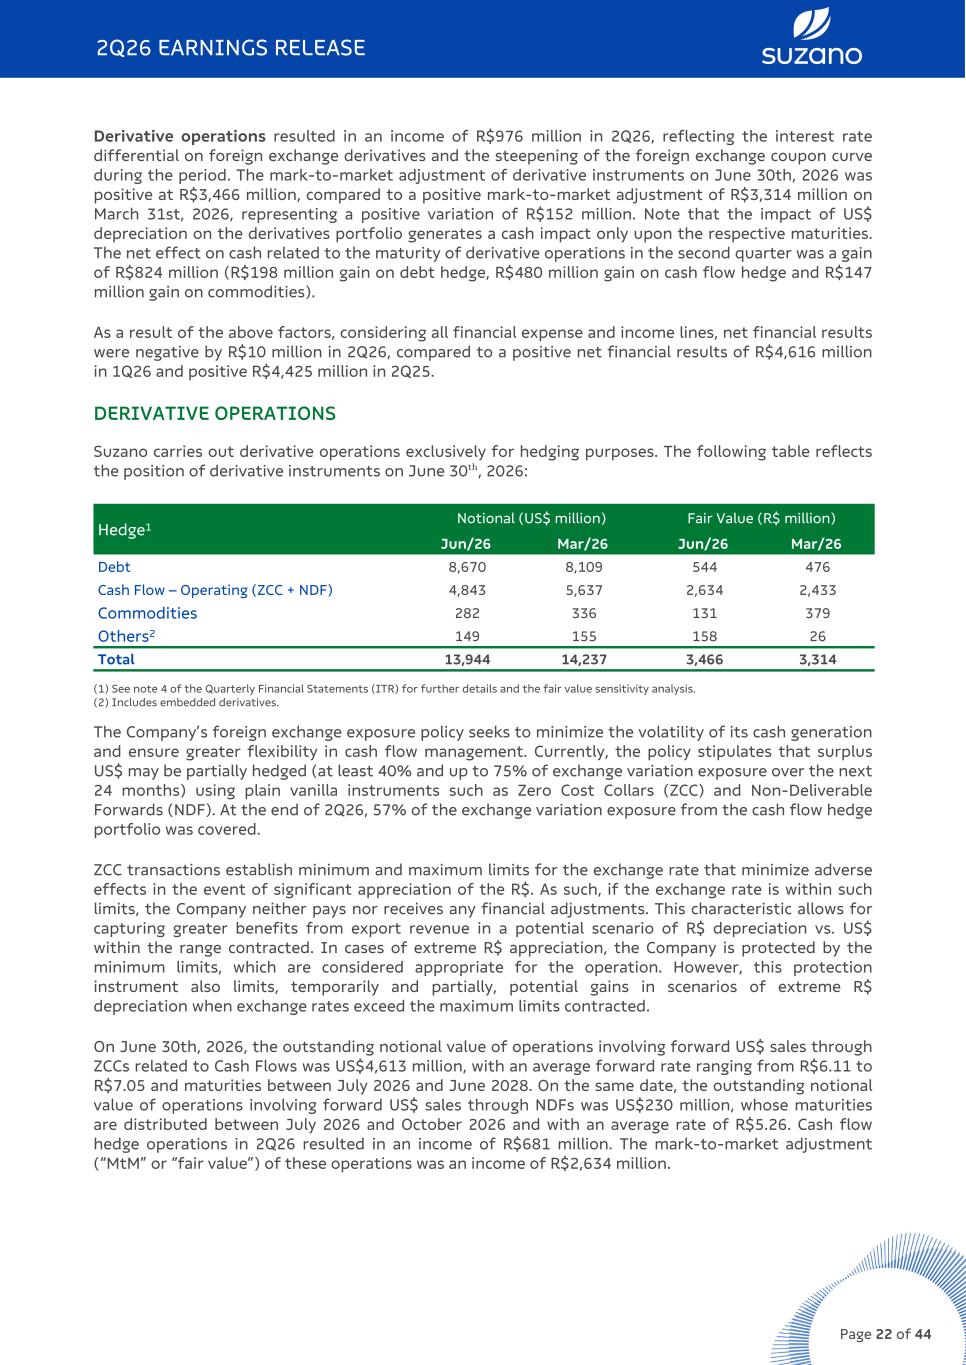
Derivative operations resulted in an income of R$976 million in 2Q26, reflecting the interest rate differential on foreign exchange derivatives and the steepening of the foreign exchange coupon curve during the period. The mark-to-market adjustment of derivative instruments on June 30th, 2026 was positive at R$3,466 million, compared to a positive mark-to-market adjustment of R$3,314 million on March 31st, 2026, representing a positive variation of R$152 million. Note that the impact of US$ depreciation on the derivatives portfolio generates a cash impact only upon the respective maturities. The net effect on cash related to the maturity of derivative operations in the second quarter was a gain of R$824 million (R$198 million gain on debt hedge, R$480 million gain on cash flow hedge and R$147 million gain on commodities). As a result of the above factors, considering all financial expense and income lines, net financial results were negative by R$10 million in 2Q26, compared to a positive net financial results of R$4,616 million in 1Q26 and positive R$4,425 million in 2Q25. DERIVATIVE OPERATIONS Suzano carries out derivative operations exclusively for hedging purposes. The following table reflects the position of derivative instruments on June 30ᵗʰ, 2026: Hedge1 Notional (US$ million) Fair Value (R$ million) Jun/26 Mar/26 Jun/26 Mar/26 Debt 8,670 8,109 544 476 Cash Flow – Operating (ZCC + NDF) 4,843 5,637 2,634 2,433 Commodities 282 336 131 379 Others2 149 155 158 26 Total 13,944 14,237 3,466 3,314 (1) See note 4 of the Quarterly Financial Statements (ITR) for further details and the fair value sensitivity analysis. (2) Includes embedded derivatives. The Company’s foreign exchange exposure policy seeks to minimize the volatility of its cash generation and ensure greater flexibility in cash flow management. Currently, the policy stipulates that surplus US$ may be partially hedged (at least 40% and up to 75% of exchange variation exposure over the next 24 months) using plain vanilla instruments such as Zero Cost Collars (ZCC) and Non-Deliverable Forwards (NDF). At the end of 2Q26, 57% of the exchange variation exposure from the cash flow hedge portfolio was covered. ZCC transactions establish minimum and maximum limits for the exchange rate that minimize adverse effects in the event of significant appreciation of the R$. As such, if the exchange rate is within such limits, the Company neither pays nor receives any financial adjustments. This characteristic allows for capturing greater benefits from export revenue in a potential scenario of R$ depreciation vs. US$ within the range contracted. In cases of extreme R$ appreciation, the Company is protected by the minimum limits, which are considered appropriate for the operation. However, this protection instrument also limits, temporarily and partially, potential gains in scenarios of extreme R$ depreciation when exchange rates exceed the maximum limits contracted. On June 30th, 2026, the outstanding notional value of operations involving forward US$ sales through ZCCs related to Cash Flows was US$4,613 million, with an average forward rate ranging from R$6.11 to R$7.05 and maturities between July 2026 and June 2028. On the same date, the outstanding notional value of operations involving forward US$ sales through NDFs was US$230 million, whose maturities are distributed between July 2026 and October 2026 and with an average rate of R$5.26. Cash flow hedge operations in 2Q26 resulted in an income of R$681 million. The mark-to-market adjustment (“MtM” or “fair value”) of these operations was an income of R$2,634 million. 2Q26 EARNINGS RELEASE Page 22 of 44
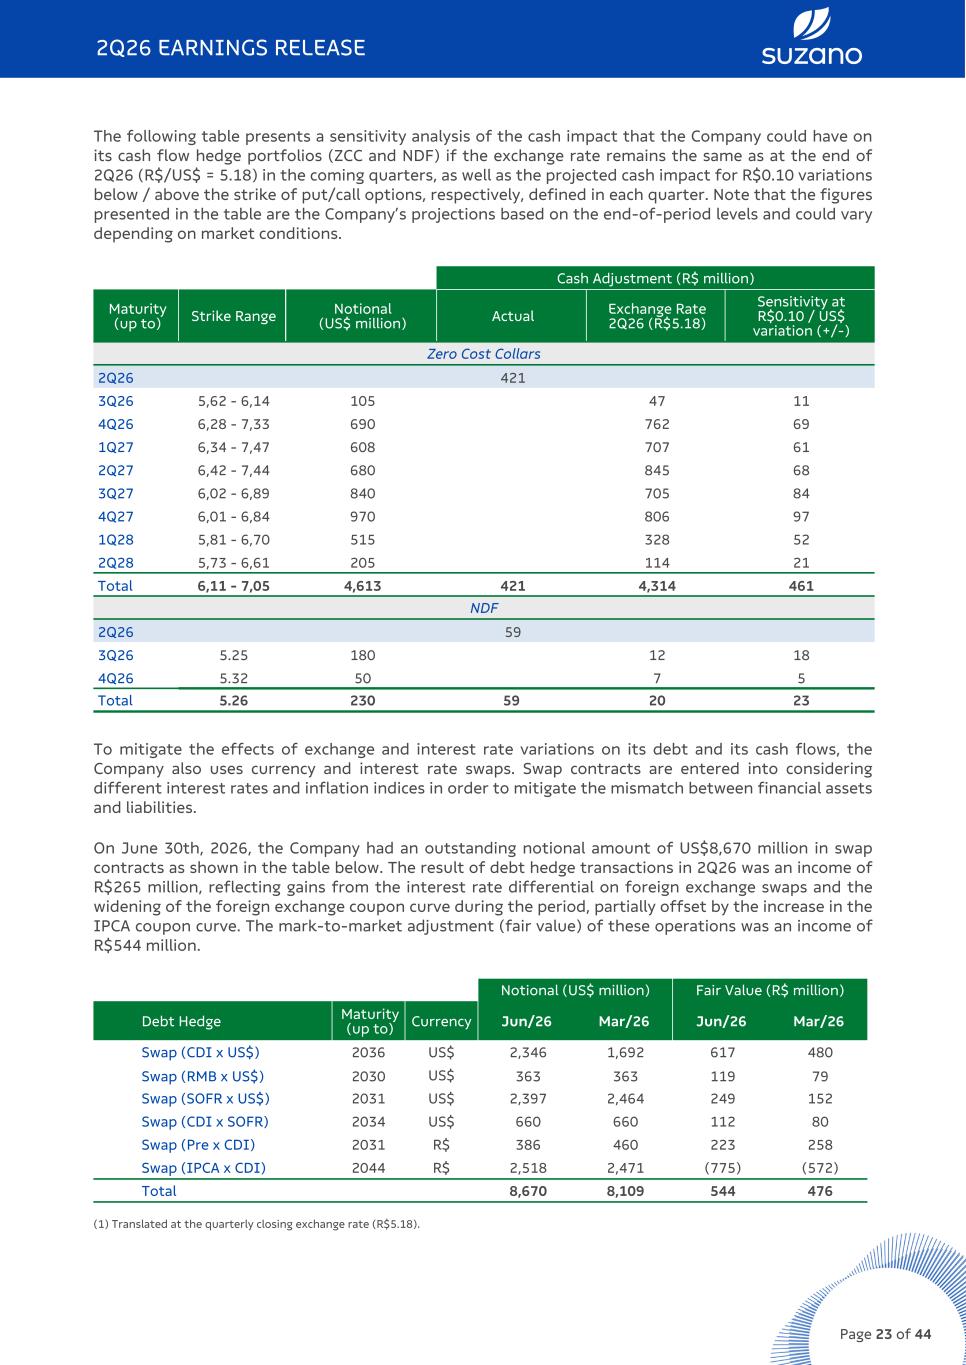
The following table presents a sensitivity analysis of the cash impact that the Company could have on its cash flow hedge portfolios (ZCC and NDF) if the exchange rate remains the same as at the end of 2Q26 (R$/US$ = 5.18) in the coming quarters, as well as the projected cash impact for R$0.10 variations below / above the strike of put/call options, respectively, defined in each quarter. Note that the figures presented in the table are the Company’s projections based on the end-of-period levels and could vary depending on market conditions. Cash Adjustment (R$ million) Maturity (up to) Strike Range Notional (US$ million) Actual Exchange Rate 2Q26 (R$5.18) Sensitivity at R$0.10 / US$ variation (+/-) Zero Cost Collars 2Q26 421 3Q26 5,62 - 6,14 105 47 11 4Q26 6,28 - 7,33 690 762 69 1Q27 6,34 - 7,47 608 707 61 2Q27 6,42 - 7,44 680 845 68 3Q27 6,02 - 6,89 840 705 84 4Q27 6,01 - 6,84 970 806 97 1Q28 5,81 - 6,70 515 328 52 2Q28 5,73 - 6,61 205 114 21 Total 6,11 - 7,05 4,613 421 4,314 461 NDF 2Q26 59 3Q26 5.25 180 12 18 4Q26 5.32 50 7 5 Total 5.26 230 59 20 23 To mitigate the effects of exchange and interest rate variations on its debt and its cash flows, the Company also uses currency and interest rate swaps. Swap contracts are entered into considering different interest rates and inflation indices in order to mitigate the mismatch between financial assets and liabilities. On June 30th, 2026, the Company had an outstanding notional amount of US$8,670 million in swap contracts as shown in the table below. The result of debt hedge transactions in 2Q26 was an income of R$265 million, reflecting gains from the interest rate differential on foreign exchange swaps and the widening of the foreign exchange coupon curve during the period, partially offset by the increase in the IPCA coupon curve. The mark-to-market adjustment (fair value) of these operations was an income of R$544 million. Notional (US$ million) Fair Value (R$ million) Debt Hedge Maturity (up to) Currency Jun/26 Mar/26 Jun/26 Mar/26 Swap (CDI x US$) 2036 US$ 2,346 1,692 617 480 Swap (RMB x US$) 2030 US$ 363 363 119 79 Swap (SOFR x US$) 2031 US$ 2,397 2,464 249 152 Swap (CDI x SOFR) 2034 US$ 660 660 112 80 Swap (Pre x CDI) 2031 R$ 386 460 223 258 Swap (IPCA x CDI) 2044 R$ 2,518 2,471 (775) (572) Total 8,670 8,109 544 476 (1) Translated at the quarterly closing exchange rate (R$5.18). 2Q26 EARNINGS RELEASE Page 23 of 44
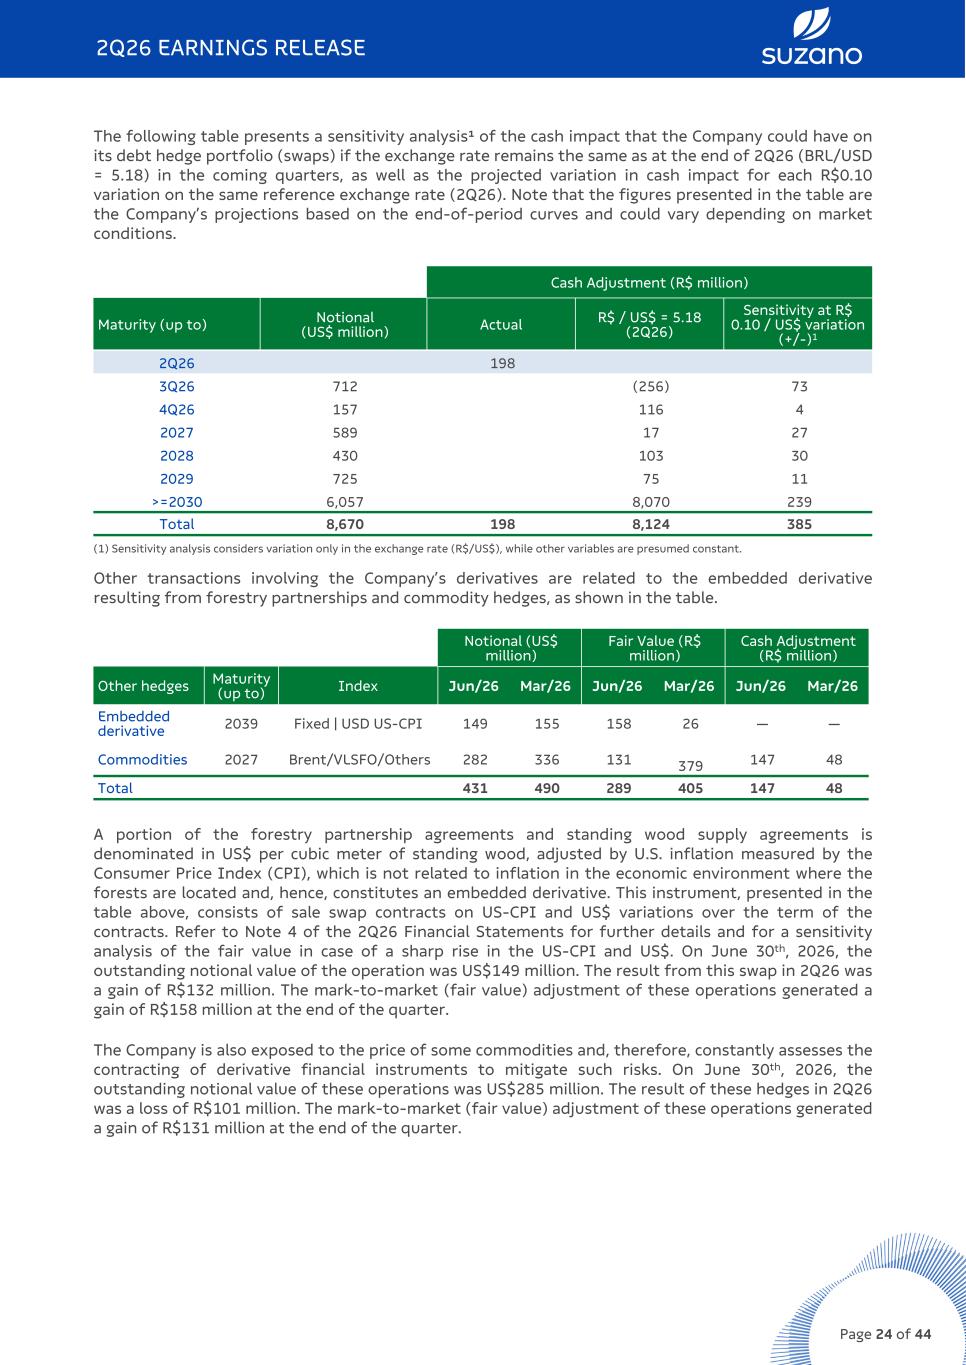
The following table presents a sensitivity analysis¹ of the cash impact that the Company could have on its debt hedge portfolio (swaps) if the exchange rate remains the same as at the end of 2Q26 (BRL/USD = 5.18) in the coming quarters, as well as the projected variation in cash impact for each R$0.10 variation on the same reference exchange rate (2Q26). Note that the figures presented in the table are the Company’s projections based on the end-of-period curves and could vary depending on market conditions. Cash Adjustment (R$ million) Maturity (up to) Notional (US$ million) Actual R$ / US$ = 5.18 (2Q26) Sensitivity at R$ 0.10 / US$ variation (+/-)1 2Q26 198 3Q26 712 (256) 73 4Q26 157 116 4 2027 589 17 27 2028 430 103 30 2029 725 75 11 >=2030 6,057 8,070 239 Total 8,670 198 8,124 385 (1) Sensitivity analysis considers variation only in the exchange rate (R$/US$), while other variables are presumed constant. Other transactions involving the Company’s derivatives are related to the embedded derivative resulting from forestry partnerships and commodity hedges, as shown in the table. Notional (US$ million) Fair Value (R$ million) Cash Adjustment (R$ million) Other hedges Maturity (up to) Index Jun/26 Mar/26 Jun/26 Mar/26 Jun/26 Mar/26 Embedded derivative 2039 Fixed | USD US-CPI 149 155 158 26 — — Commodities 2027 Brent/VLSFO/Others 282 336 131 379 147 48 Total 431 490 289 405 147 48 A portion of the forestry partnership agreements and standing wood supply agreements is denominated in US$ per cubic meter of standing wood, adjusted by U.S. inflation measured by the Consumer Price Index (CPI), which is not related to inflation in the economic environment where the forests are located and, hence, constitutes an embedded derivative. This instrument, presented in the table above, consists of sale swap contracts on US-CPI and US$ variations over the term of the contracts. Refer to Note 4 of the 2Q26 Financial Statements for further details and for a sensitivity analysis of the fair value in case of a sharp rise in the US-CPI and US$. On June 30th, 2026, the outstanding notional value of the operation was US$149 million. The result from this swap in 2Q26 was a gain of R$132 million. The mark-to-market (fair value) adjustment of these operations generated a gain of R$158 million at the end of the quarter. The Company is also exposed to the price of some commodities and, therefore, constantly assesses the contracting of derivative financial instruments to mitigate such risks. On June 30th, 2026, the outstanding notional value of these operations was US$285 million. The result of these hedges in 2Q26 was a loss of R$101 million. The mark-to-market (fair value) adjustment of these operations generated a gain of R$131 million at the end of the quarter. 2Q26 EARNINGS RELEASE Page 24 of 44
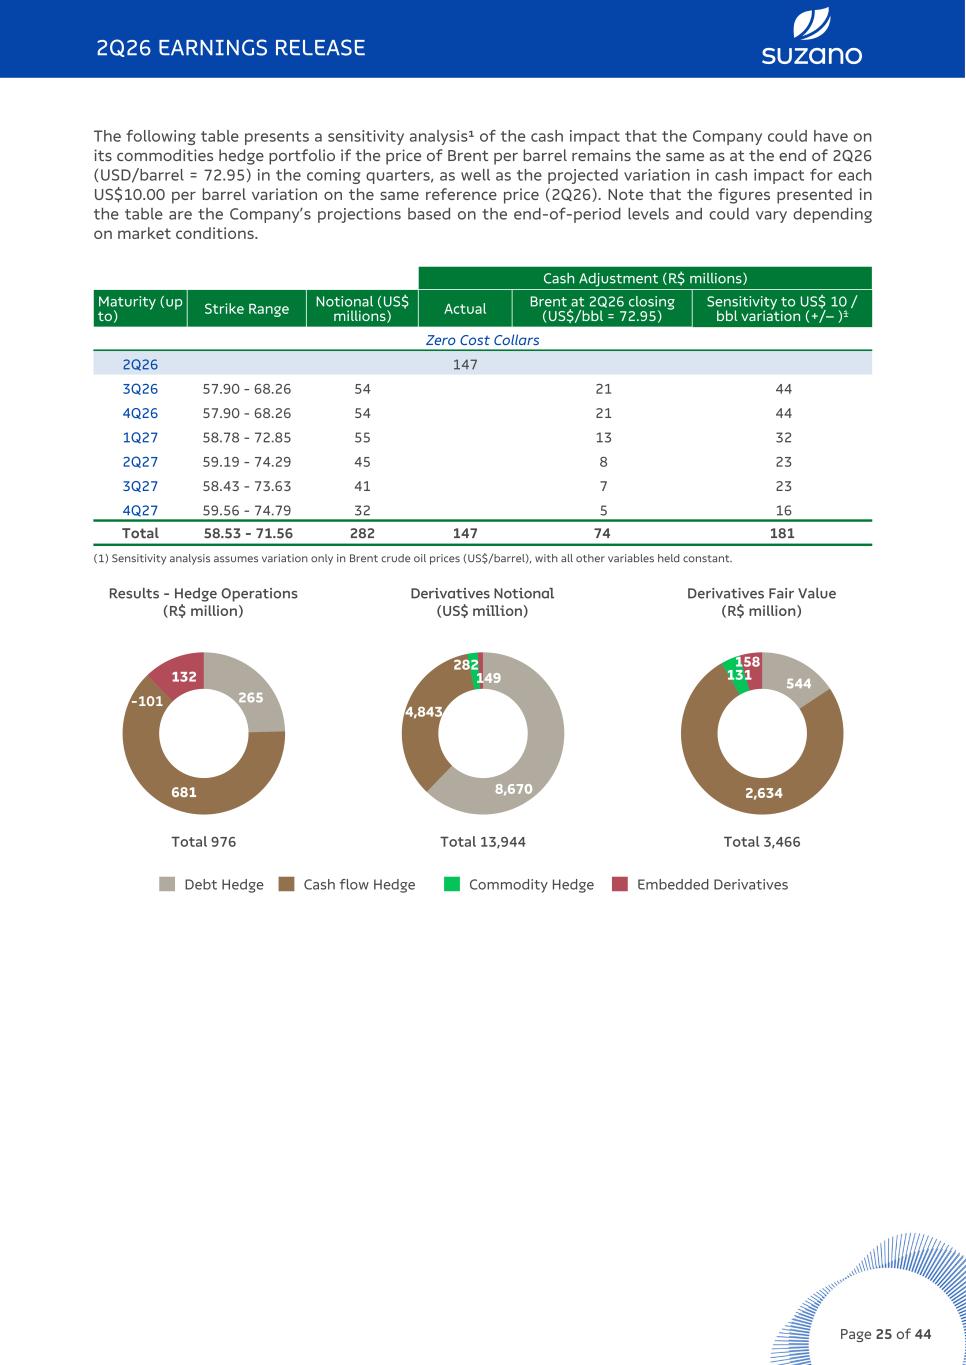
The following table presents a sensitivity analysis¹ of the cash impact that the Company could have on its commodities hedge portfolio if the price of Brent per barrel remains the same as at the end of 2Q26 (USD/barrel = 72.95) in the coming quarters, as well as the projected variation in cash impact for each US$10.00 per barrel variation on the same reference price (2Q26). Note that the figures presented in the table are the Company’s projections based on the end-of-period levels and could vary depending on market conditions. Cash Adjustment (R$ millions) Maturity (up to) Strike Range Notional (US$ millions) Actual Brent at 2Q26 closing (US$/bbl = 72.95) Sensitivity to US$ 10 / bbl variation (+/– )1 Zero Cost Collars 2Q26 147 3Q26 57.90 - 68.26 54 21 44 4Q26 57.90 - 68.26 54 21 44 1Q27 58.78 - 72.85 55 13 32 2Q27 59.19 - 74.29 45 8 23 3Q27 58.43 - 73.63 41 7 23 4Q27 59.56 - 74.79 32 5 16 Total 58.53 - 71.56 282 147 74 181 (1) Sensitivity analysis assumes variation only in Brent crude oil prices (US$/barrel), with all other variables held constant. Results - Hedge Operations (R$ million) 265 681 132 Total 976 Derivatives Notional (US$ million) 8,670 4,843 282 149 Total 13,944 Derivatives Fair Value (R$ million) 544 2,634 131 158 Total 3,466 Debt Hedge Cash flow Hedge Commodity Hedge Embedded Derivatives 2Q26 EARNINGS RELEASE Page 25 of 44 -101
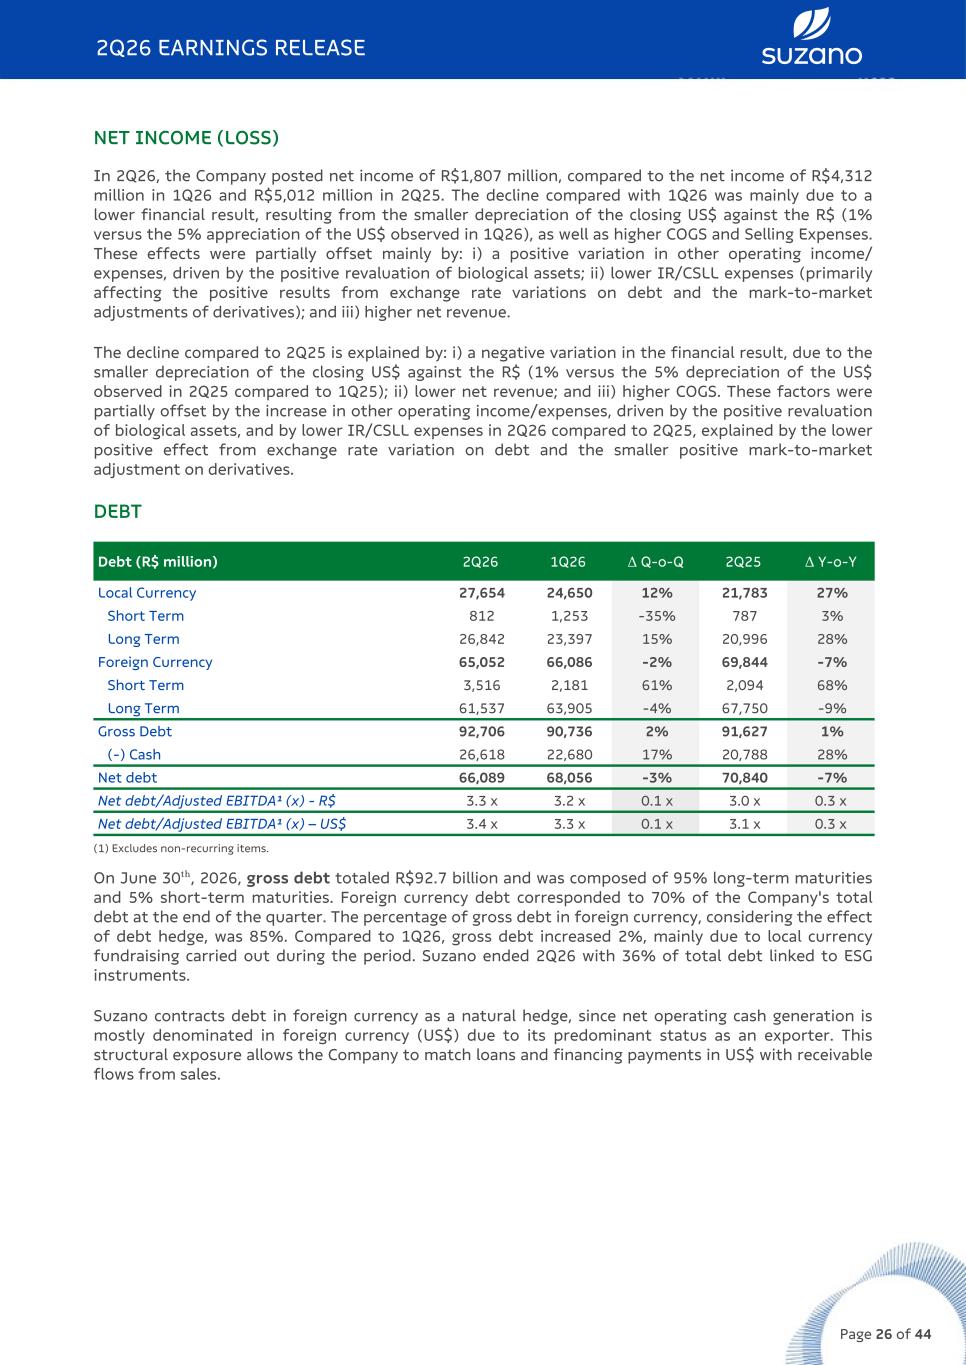
NET INCOME (LOSS) In 2Q26, the Company posted net income of R$1,807 million, compared to the net income of R$4,312 million in 1Q26 and R$5,012 million in 2Q25. The decline compared with 1Q26 was mainly due to a lower financial result, resulting from the smaller depreciation of the closing US$ against the R$ (1% versus the 5% appreciation of the US$ observed in 1Q26), as well as higher COGS and Selling Expenses. These effects were partially offset mainly by: i) a positive variation in other operating income/ expenses, driven by the positive revaluation of biological assets; ii) lower IR/CSLL expenses (primarily affecting the positive results from exchange rate variations on debt and the mark-to-market adjustments of derivatives); and iii) higher net revenue. The decline compared to 2Q25 is explained by: i) a negative variation in the financial result, due to the smaller depreciation of the closing US$ against the R$ (1% versus the 5% depreciation of the US$ observed in 2Q25 compared to 1Q25); ii) lower net revenue; and iii) higher COGS. These factors were partially offset by the increase in other operating income/expenses, driven by the positive revaluation of biological assets, and by lower IR/CSLL expenses in 2Q26 compared to 2Q25, explained by the lower positive effect from exchange rate variation on debt and the smaller positive mark-to-market adjustment on derivatives. DEBT Debt (R$ million) 2Q26 1Q26 Δ Q-o-Q 2Q25 Δ Y-o-Y Local Currency 27,654 24,650 12% 21,783 27% Short Term 812 1,253 -35% 787 3% Long Term 26,842 23,397 15% 20,996 28% Foreign Currency 65,052 66,086 -2% 69,844 -7% Short Term 3,516 2,181 61% 2,094 68% Long Term 61,537 63,905 -4% 67,750 -9% Gross Debt 92,706 90,736 2% 91,627 1% (-) Cash 26,618 22,680 17% 20,788 28% Net debt 66,089 68,056 -3% 70,840 -7% Net debt/Adjusted EBITDA¹ (x) - R$ 3.3 x 3.2 x 0.1 x 3.0 x 0.3 x Net debt/Adjusted EBITDA¹ (x) – US$ 3.4 x 3.3 x 0.1 x 3.1 x 0.3 x (1) Excludes non-recurring items. On June 30ᵗʰ, 2026, gross debt totaled R$92.7 billion and was composed of 95% long-term maturities and 5% short-term maturities. Foreign currency debt corresponded to 70% of the Company's total debt at the end of the quarter. The percentage of gross debt in foreign currency, considering the effect of debt hedge, was 85%. Compared to 1Q26, gross debt increased 2%, mainly due to local currency fundraising carried out during the period. Suzano ended 2Q26 with 36% of total debt linked to ESG instruments. Suzano contracts debt in foreign currency as a natural hedge, since net operating cash generation is mostly denominated in foreign currency (US$) due to its predominant status as an exporter. This structural exposure allows the Company to match loans and financing payments in US$ with receivable flows from sales. 2Q26 EARNINGS RELEASE Page 26 of 44
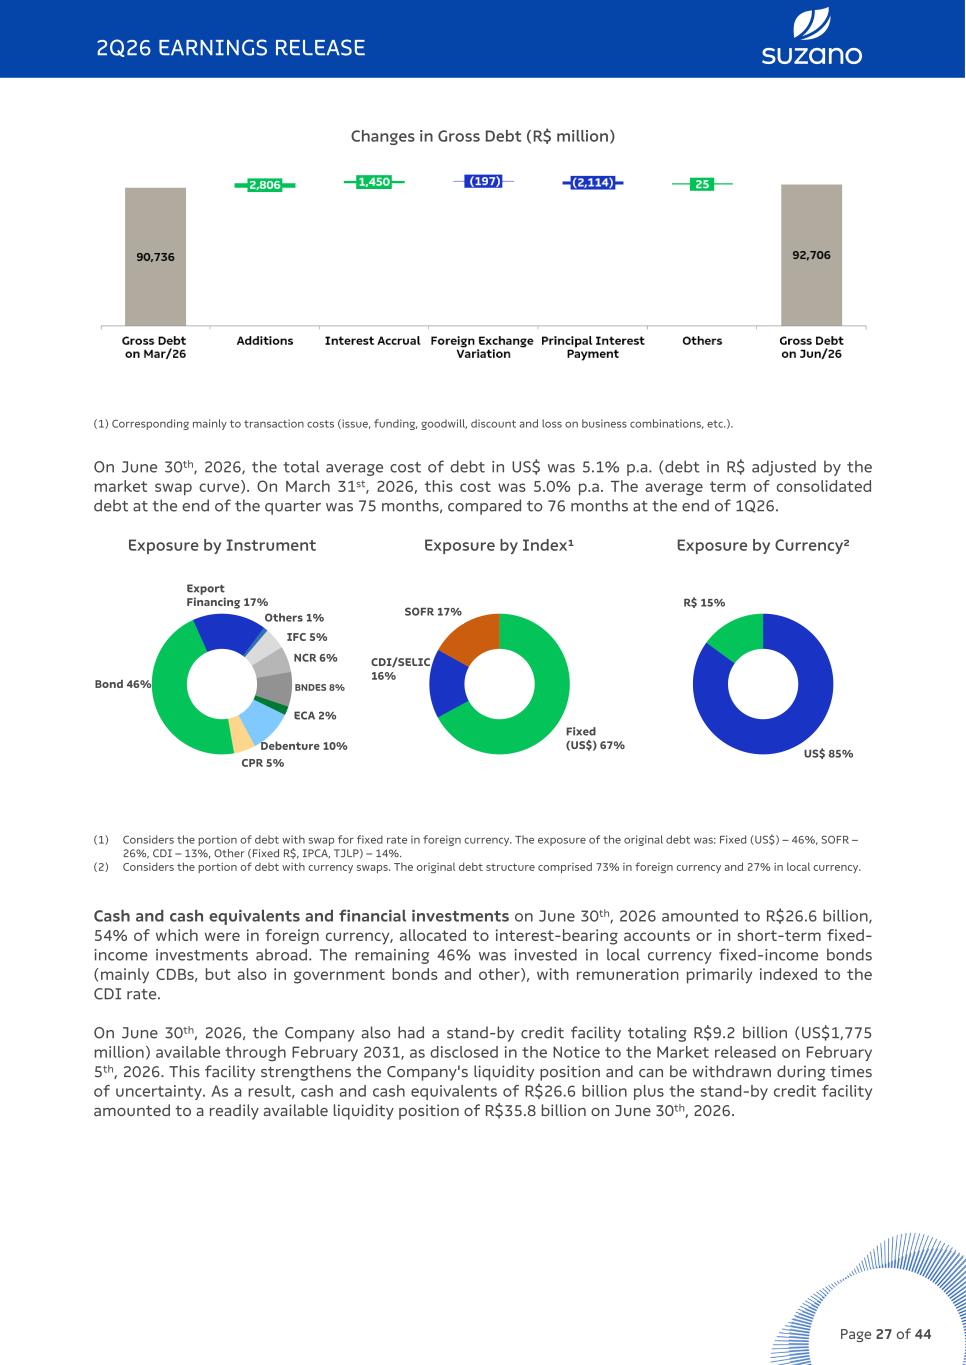
Changes in Gross Debt (R$ million) (1) Corresponding mainly to transaction costs (issue, funding, goodwill, discount and loss on business combinations, etc.). On June 30th, 2026, the total average cost of debt in US$ was 5.1% p.a. (debt in R$ adjusted by the market swap curve). On March 31st, 2026, this cost was 5.0% p.a. The average term of consolidated debt at the end of the quarter was 75 months, compared to 76 months at the end of 1Q26. Exposure by Instrument Bond 46% Export Financing 17% Others 1% IFC 5% NCR 6% BNDES 8% ECA 2% Debenture 10% CPR 5% Exposure by Index¹ Fixed (US$) 67% CDI/SELIC 16% SOFR 17% Exposure by Currency² US$ 85% R$ 15% (1) Considers the portion of debt with swap for fixed rate in foreign currency. The exposure of the original debt was: Fixed (US$) – 46%, SOFR – 26%, CDI – 13%, Other (Fixed R$, IPCA, TJLP) – 14%. (2) Considers the portion of debt with currency swaps. The original debt structure comprised 73% in foreign currency and 27% in local currency. Cash and cash equivalents and financial investments on June 30th, 2026 amounted to R$26.6 billion, 54% of which were in foreign currency, allocated to interest-bearing accounts or in short-term fixed- income investments abroad. The remaining 46% was invested in local currency fixed-income bonds (mainly CDBs, but also in government bonds and other), with remuneration primarily indexed to the CDI rate. On June 30th, 2026, the Company also had a stand-by credit facility totaling R$9.2 billion (US$1,775 million) available through February 2031, as disclosed in the Notice to the Market released on February 5th, 2026. This facility strengthens the Company's liquidity position and can be withdrawn during times of uncertainty. As a result, cash and cash equivalents of R$26.6 billion plus the stand-by credit facility amounted to a readily available liquidity position of R$35.8 billion on June 30th, 2026. 2Q26 EARNINGS RELEASE Page 27 of 44
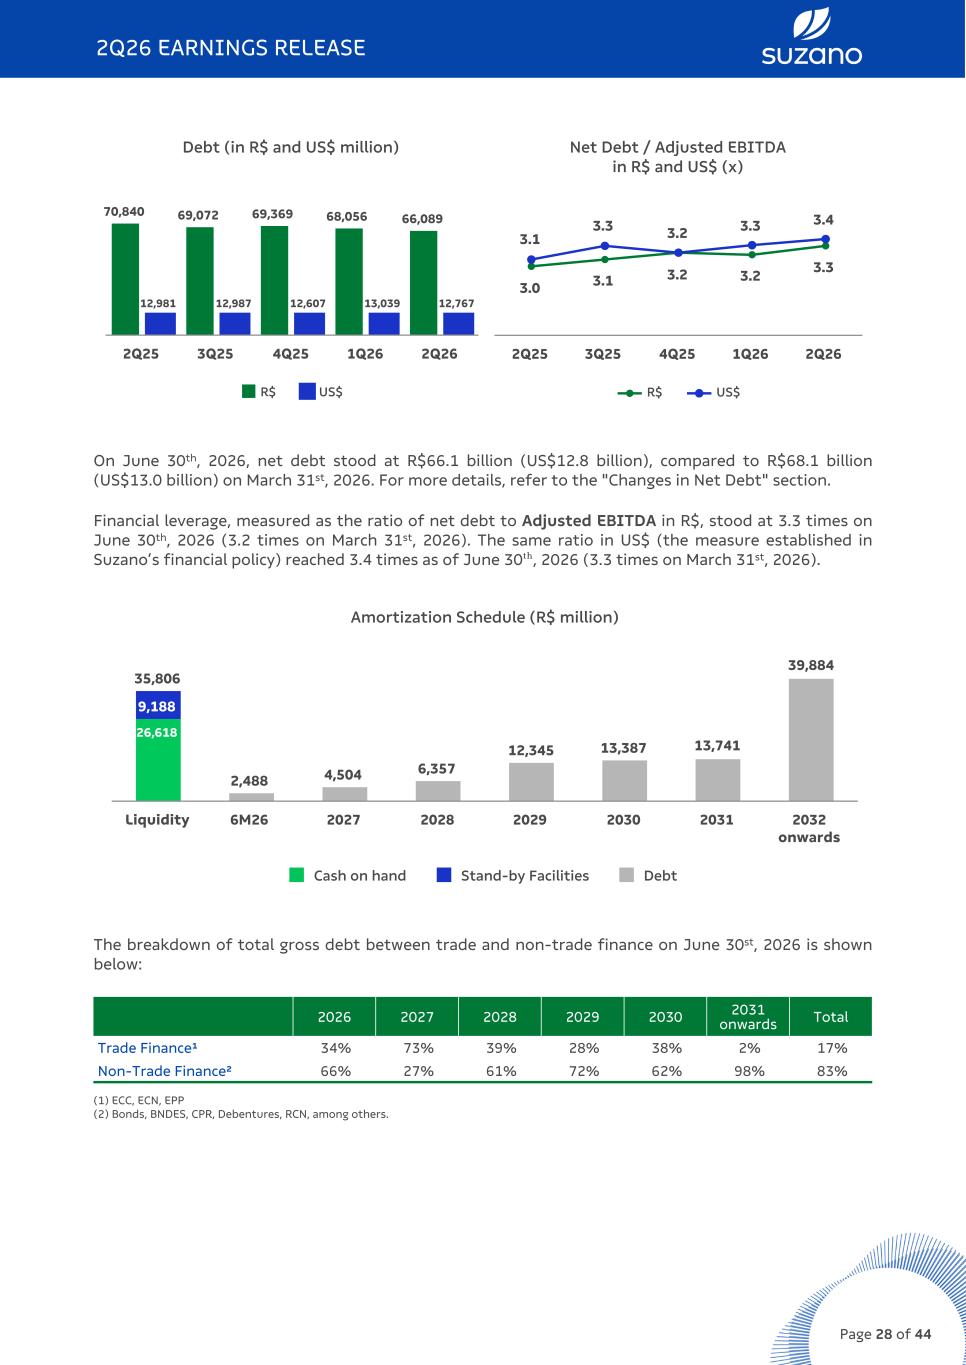
Debt (in R$ and US$ million) 70,840 69,072 69,369 68,056 66,089 12,981 12,987 12,607 13,039 12,767 R$ US$ 2Q25 3Q25 4Q25 1Q26 2Q26 Net Debt / Adjusted EBITDA in R$ and US$ (x) 3.0 3.1 3.2 3.2 3.3 3.1 3.3 3.2 3.3 3.4 R$ US$ 2Q25 3Q25 4Q25 1Q26 2Q26 On June 30th, 2026, net debt stood at R$66.1 billion (US$12.8 billion), compared to R$68.1 billion (US$13.0 billion) on March 31st, 2026. For more details, refer to the "Changes in Net Debt" section. Financial leverage, measured as the ratio of net debt to Adjusted EBITDA in R$, stood at 3.3 times on June 30th, 2026 (3.2 times on March 31st, 2026). The same ratio in US$ (the measure established in Suzano’s financial policy) reached 3.4 times as of June 30ᵗʰ, 2026 (3.3 times on March 31st, 2026). Amortization Schedule (R$ million) 35,806 2,488 4,504 6,357 12,345 13,387 13,741 39,884 26,618 9,188 Cash on hand Stand-by Facilities Debt Liquidity 6M26 2027 2028 2029 2030 2031 2032 onwards The breakdown of total gross debt between trade and non-trade finance on June 30st, 2026 is shown below: 2026 2027 2028 2029 2030 2031 onwards Total Trade Finance¹ 34% 73% 39% 28% 38% 2% 17% Non-Trade Finance² 66% 27% 61% 72% 62% 98% 83% (1) ECC, ECN, EPP (2) Bonds, BNDES, CPR, Debentures, RCN, among others. 2Q26 EARNINGS RELEASE Page 28 of 44
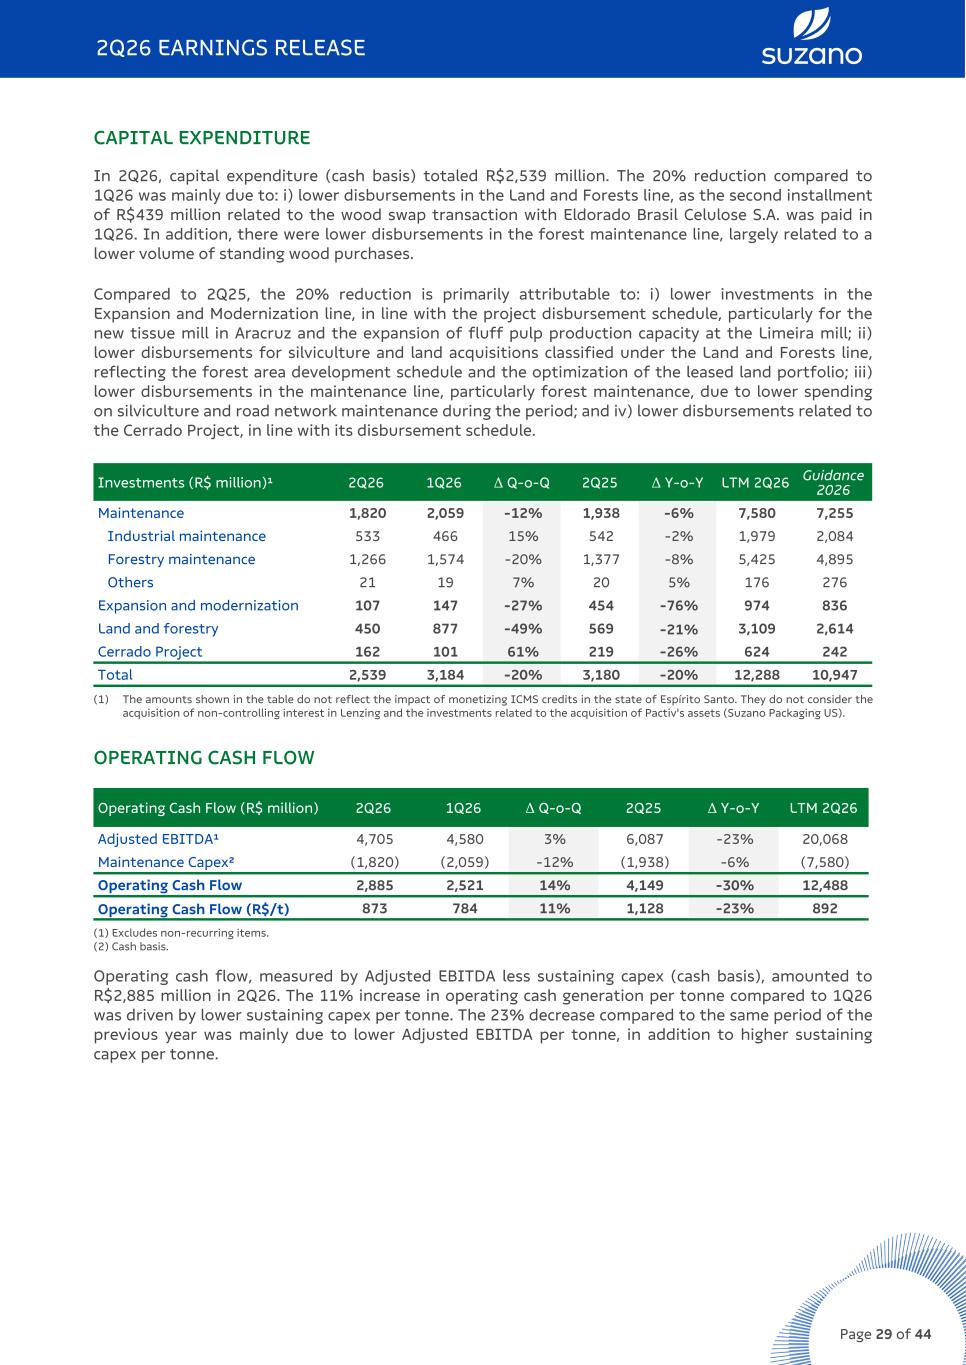
CAPITAL EXPENDITURE In 2Q26, capital expenditure (cash basis) totaled R$2,539 million. The 20% reduction compared to 1Q26 was mainly due to: i) lower disbursements in the Land and Forests line, as the second installment of R$439 million related to the wood swap transaction with Eldorado Brasil Celulose S.A. was paid in 1Q26. In addition, there were lower disbursements in the forest maintenance line, largely related to a lower volume of standing wood purchases. Compared to 2Q25, the 20% reduction is primarily attributable to: i) lower investments in the Expansion and Modernization line, in line with the project disbursement schedule, particularly for the new tissue mill in Aracruz and the expansion of fluff pulp production capacity at the Limeira mill; ii) lower disbursements for silviculture and land acquisitions classified under the Land and Forests line, reflecting the forest area development schedule and the optimization of the leased land portfolio; iii) lower disbursements in the maintenance line, particularly forest maintenance, due to lower spending on silviculture and road network maintenance during the period; and iv) lower disbursements related to the Cerrado Project, in line with its disbursement schedule. Investments (R$ million)¹ 2Q26 1Q26 Δ Q-o-Q 2Q25 Δ Y-o-Y LTM 2Q26 Guidance 2026 Maintenance 1,820 2,059 -12% 1,938 -6% 7,580 7,255 Industrial maintenance 533 466 15% 542 -2% 1,979 2,084 Forestry maintenance 1,266 1,574 -20% 1,377 -8% 5,425 4,895 Others 21 19 7% 20 5% 176 276 Expansion and modernization 107 147 -27% 454 -76% 974 836 Land and forestry 450 877 -49% 569 -21% 3,109 2,614 Cerrado Project 162 101 61% 219 -26% 624 242 Total 2,539 3,184 -20% 3,180 -20% 12,288 10,947 (1) The amounts shown in the table do not reflect the impact of monetizing ICMS credits in the state of Espírito Santo. They do not consider the acquisition of non-controlling interest in Lenzing and the investments related to the acquisition of Pactiv's assets (Suzano Packaging US). OPERATING CASH FLOW Operating Cash Flow (R$ million) 2Q26 1Q26 Δ Q-o-Q 2Q25 Δ Y-o-Y LTM 2Q26 Adjusted EBITDA¹ 4,705 4,580 3% 6,087 -23% 20,068 Maintenance Capex² (1,820) (2,059) -12% (1,938) -6% (7,580) Operating Cash Flow 2,885 2,521 14% 4,149 -30% 12,488 Operating Cash Flow (R$/t) 873 784 11% 1,128 -23% 892 (1) Excludes non-recurring items. (2) Cash basis. Operating cash flow, measured by Adjusted EBITDA less sustaining capex (cash basis), amounted to R$2,885 million in 2Q26. The 11% increase in operating cash generation per tonne compared to 1Q26 was driven by lower sustaining capex per tonne. The 23% decrease compared to the same period of the previous year was mainly due to lower Adjusted EBITDA per tonne, in addition to higher sustaining capex per tonne. 2Q26 EARNINGS RELEASE Page 29 of 44
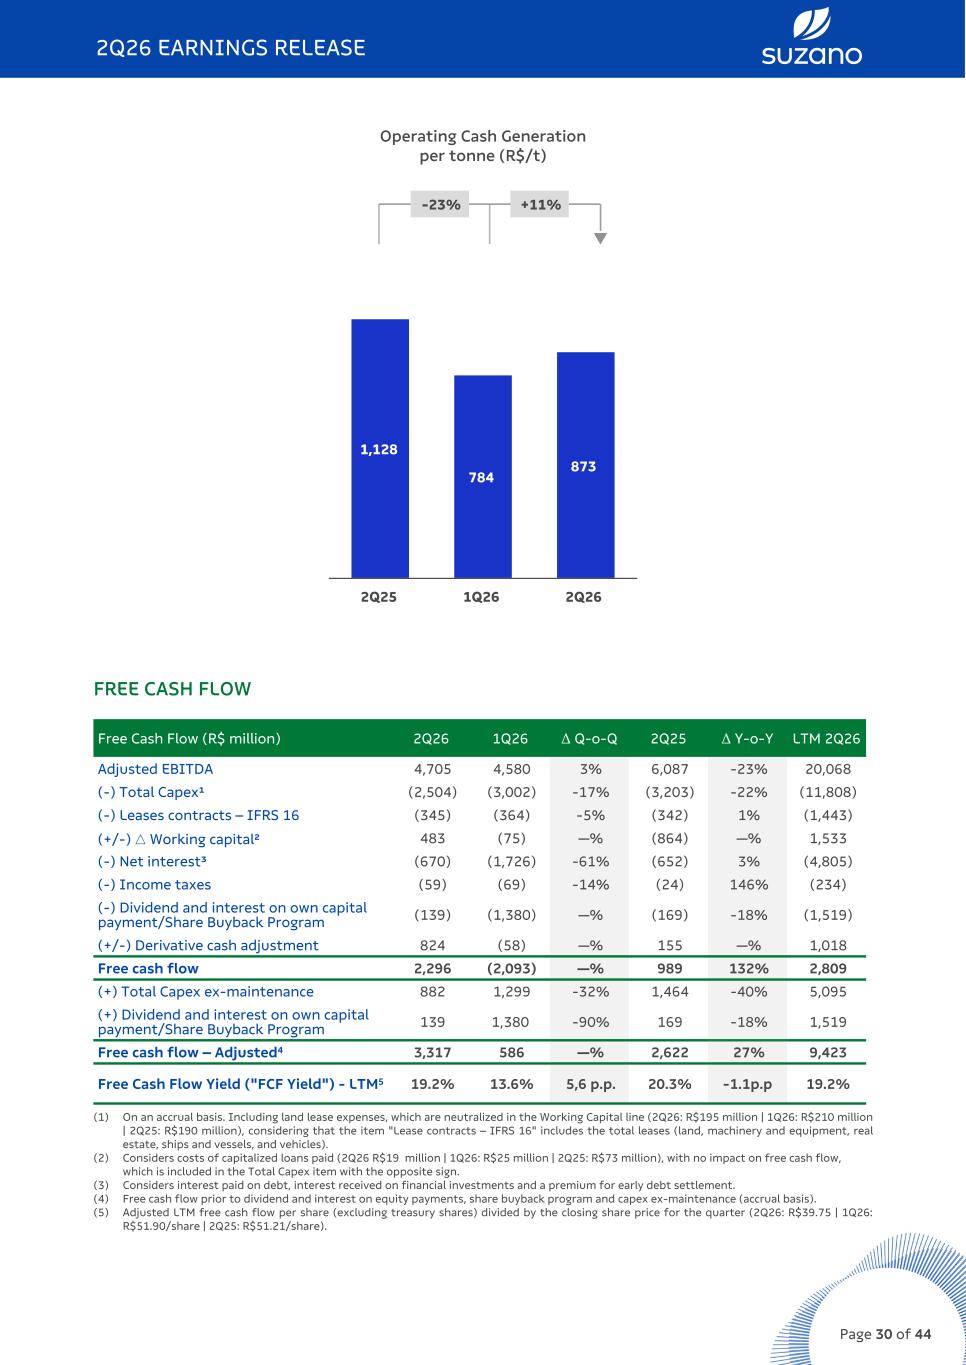
Operating Cash Generation per tonne (R$/t) -23% +11% q 1,128 784 873 2Q25 1Q26 2Q26 FREE CASH FLOW Free Cash Flow (R$ million) 2Q26 1Q26 Δ Q-o-Q 2Q25 Δ Y-o-Y LTM 2Q26 Adjusted EBITDA 4,705 4,580 3% 6,087 -23% 20,068 (-) Total Capex¹ (2,504) (3,002) -17% (3,203) -22% (11,808) (-) Leases contracts – IFRS 16 (345) (364) -5% (342) 1% (1,443) (+/-) △ Working capital² 483 (75) —% (864) —% 1,533 (-) Net interest³ (670) (1,726) -61% (652) 3% (4,805) (-) Income taxes (59) (69) -14% (24) 146% (234) (-) Dividend and interest on own capital payment/Share Buyback Program (139) (1,380) —% (169) -18% (1,519) (+/-) Derivative cash adjustment 824 (58) —% 155 —% 1,018 Free cash flow 2,296 (2,093) —% 989 132% 2,809 (+) Total Capex ex-maintenance 882 1,299 -32% 1,464 -40% 5,095 (+) Dividend and interest on own capital payment/Share Buyback Program 139 1,380 -90% 169 -18% 1,519 Free cash flow – Adjusted4 3,317 586 —% 2,622 27% 9,423 Free Cash Flow Yield ("FCF Yield") - LTM5 19.2% 13.6% 5,6 p.p. 20.3% -1.1p.p 19.2% (1) On an accrual basis. Including land lease expenses, which are neutralized in the Working Capital line (2Q26: R$195 million | 1Q26: R$210 million | 2Q25: R$190 million), considering that the item "Lease contracts – IFRS 16" includes the total leases (land, machinery and equipment, real estate, ships and vessels, and vehicles). (2) Considers costs of capitalized loans paid (2Q26 R$19 million | 1Q26: R$25 million | 2Q25: R$73 million), with no impact on free cash flow, which is included in the Total Capex item with the opposite sign. (3) Considers interest paid on debt, interest received on financial investments and a premium for early debt settlement. (4) Free cash flow prior to dividend and interest on equity payments, share buyback program and capex ex-maintenance (accrual basis). (5) Adjusted LTM free cash flow per share (excluding treasury shares) divided by the closing share price for the quarter (2Q26: R$39.75 | 1Q26: R$51.90/share | 2Q25: R$51.21/share). 2Q26 EARNINGS RELEASE Page 30 of 44
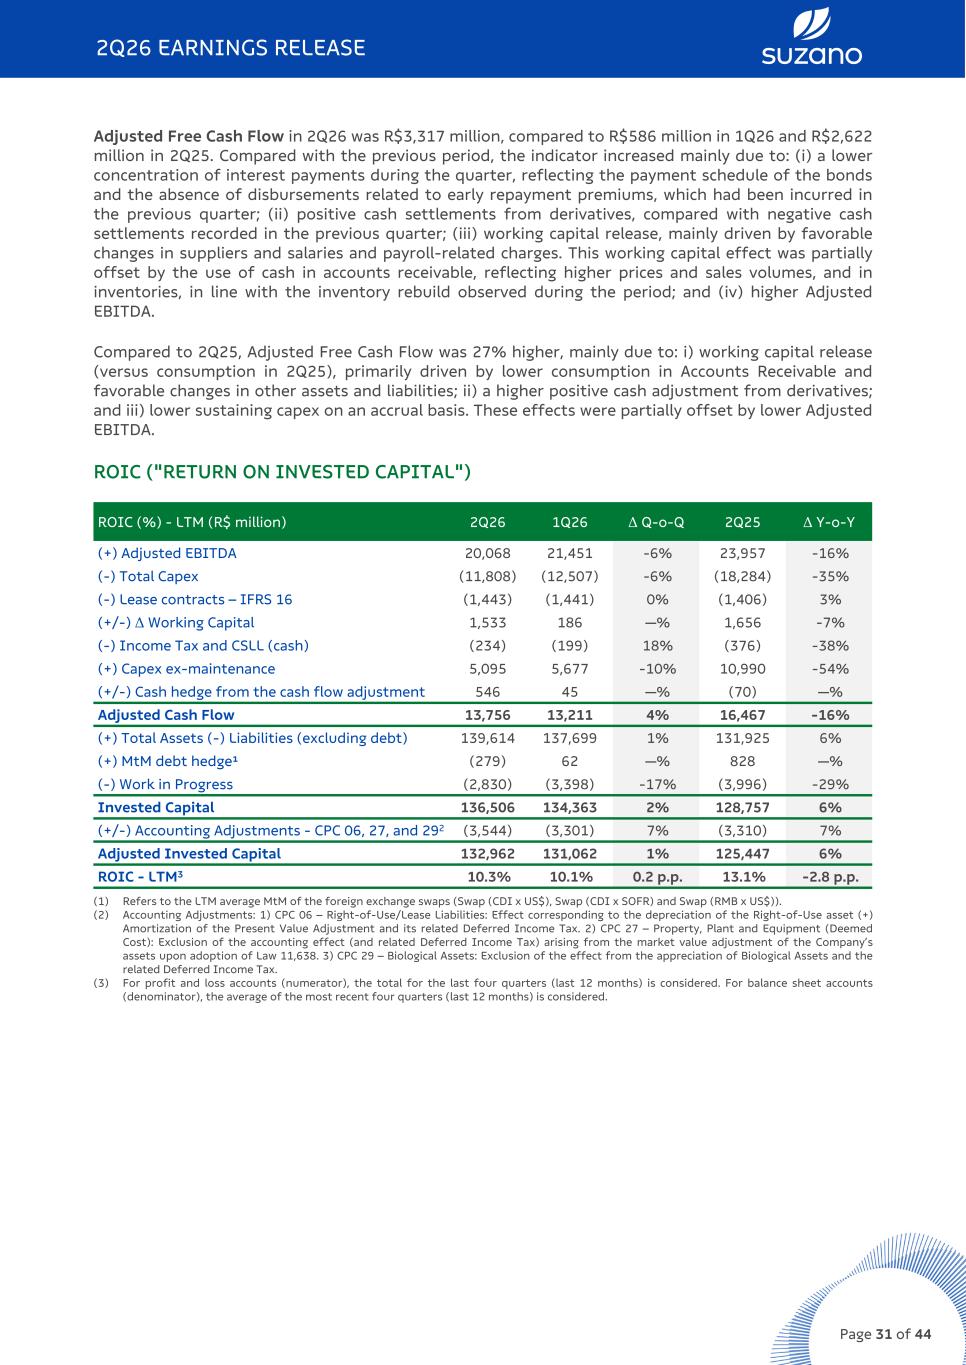
Adjusted Free Cash Flow in 2Q26 was R$3,317 million, compared to R$586 million in 1Q26 and R$2,622 million in 2Q25. Compared with the previous period, the indicator increased mainly due to: (i) a lower concentration of interest payments during the quarter, reflecting the payment schedule of the bonds and the absence of disbursements related to early repayment premiums, which had been incurred in the previous quarter; (ii) positive cash settlements from derivatives, compared with negative cash settlements recorded in the previous quarter; (iii) working capital release, mainly driven by favorable changes in suppliers and salaries and payroll-related charges. This working capital effect was partially offset by the use of cash in accounts receivable, reflecting higher prices and sales volumes, and in inventories, in line with the inventory rebuild observed during the period; and (iv) higher Adjusted EBITDA. Compared to 2Q25, Adjusted Free Cash Flow was 27% higher, mainly due to: i) working capital release (versus consumption in 2Q25), primarily driven by lower consumption in Accounts Receivable and favorable changes in other assets and liabilities; ii) a higher positive cash adjustment from derivatives; and iii) lower sustaining capex on an accrual basis. These effects were partially offset by lower Adjusted EBITDA. ROIC ("RETURN ON INVESTED CAPITAL") ROIC (%) - LTM (R$ million) 2Q26 1Q26 Δ Q-o-Q 2Q25 Δ Y-o-Y (+) Adjusted EBITDA 20,068 21,451 -6% 23,957 -16% (-) Total Capex (11,808) (12,507) -6% (18,284) -35% (-) Lease contracts – IFRS 16 (1,443) (1,441) 0% (1,406) 3% (+/-) Δ Working Capital 1,533 186 —% 1,656 -7% (-) Income Tax and CSLL (cash) (234) (199) 18% (376) -38% (+) Capex ex-maintenance 5,095 5,677 -10% 10,990 -54% (+/-) Cash hedge from the cash flow adjustment 546 45 —% (70) —% Adjusted Cash Flow 13,756 13,211 4% 16,467 -16% (+) Total Assets (-) Liabilities (excluding debt) 139,614 137,699 1% 131,925 6% (+) MtM debt hedge¹ (279) 62 —% 828 —% (-) Work in Progress (2,830) (3,398) -17% (3,996) -29% Invested Capital 136,506 134,363 2% 128,757 6% (+/-) Accounting Adjustments - CPC 06, 27, and 292 (3,544) (3,301) 7% (3,310) 7% Adjusted Invested Capital 132,962 131,062 1% 125,447 6% ROIC - LTM3 10.3% 10.1% 0.2 p.p. 13.1% -2.8 p.p. (1) Refers to the LTM average MtM of the foreign exchange swaps (Swap (CDI x US$), Swap (CDI x SOFR) and Swap (RMB x US$)). (2) Accounting Adjustments: 1) CPC 06 – Right-of-Use/Lease Liabilities: Effect corresponding to the depreciation of the Right-of-Use asset (+) Amortization of the Present Value Adjustment and its related Deferred Income Tax. 2) CPC 27 – Property, Plant and Equipment (Deemed Cost): Exclusion of the accounting effect (and related Deferred Income Tax) arising from the market value adjustment of the Company’s assets upon adoption of Law 11,638. 3) CPC 29 – Biological Assets: Exclusion of the effect from the appreciation of Biological Assets and the related Deferred Income Tax. (3) For profit and loss accounts (numerator), the total for the last four quarters (last 12 months) is considered. For balance sheet accounts (denominator), the average of the most recent four quarters (last 12 months) is considered. 2Q26 EARNINGS RELEASE Page 31 of 44
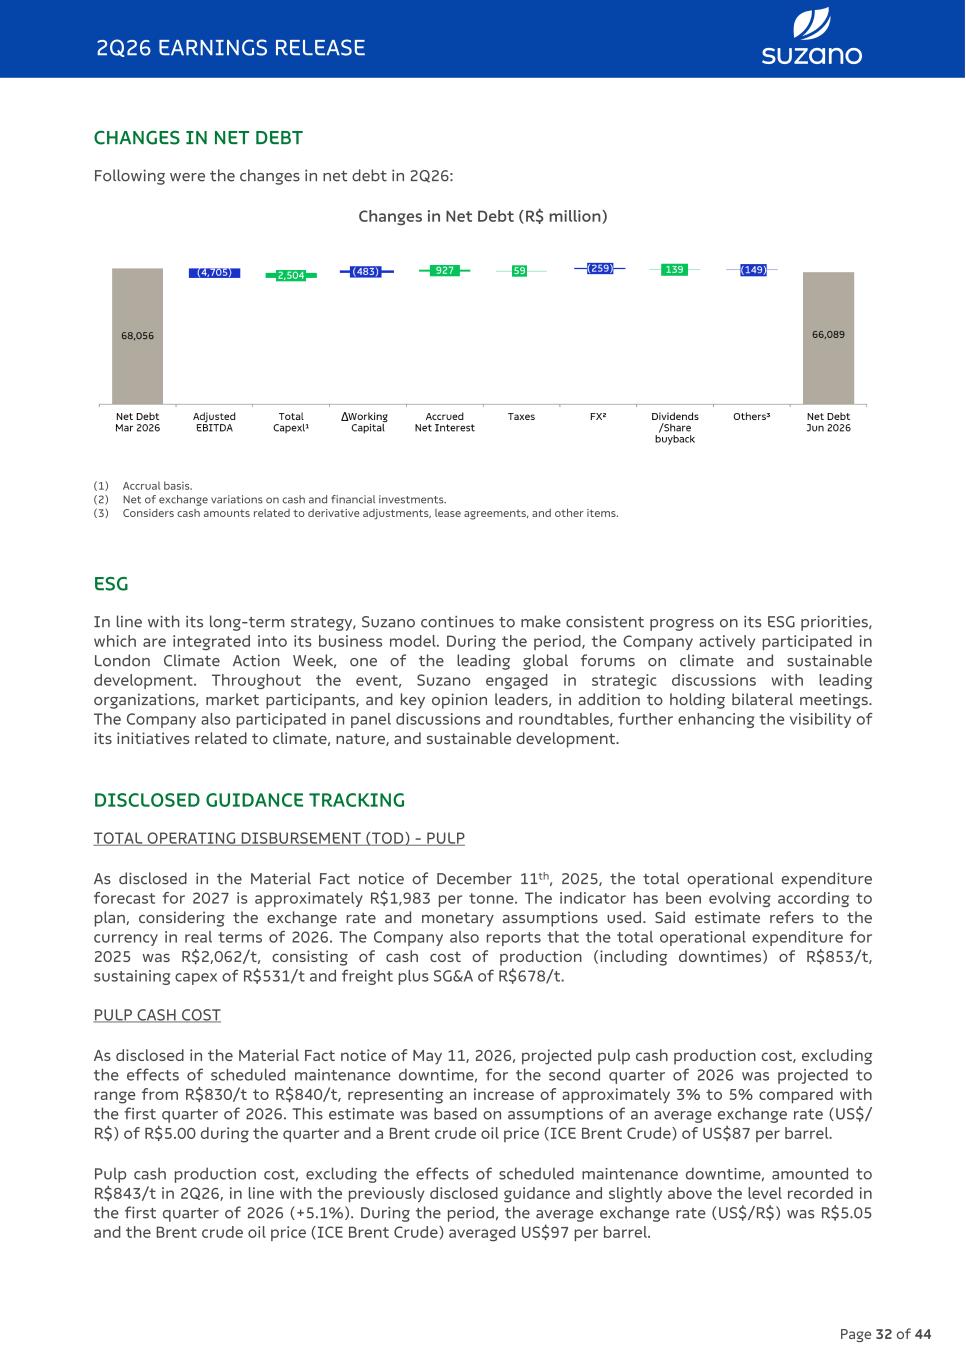
CHANGES IN NET DEBT Following were the changes in net debt in 2Q26: Changes in Net Debt (R$ million) (1) Accrual basis. (2) Net of exchange variations on cash and financial investments. (3) Considers cash amounts related to derivative adjustments, lease agreements, and other items. ESG In line with its long-term strategy, Suzano continues to make consistent progress on its ESG priorities, which are integrated into its business model. During the period, the Company actively participated in London Climate Action Week, one of the leading global forums on climate and sustainable development. Throughout the event, Suzano engaged in strategic discussions with leading organizations, market participants, and key opinion leaders, in addition to holding bilateral meetings. The Company also participated in panel discussions and roundtables, further enhancing the visibility of its initiatives related to climate, nature, and sustainable development. DISCLOSED GUIDANCE TRACKING TOTAL OPERATING DISBURSEMENT (TOD) - PULP As disclosed in the Material Fact notice of December 11th, 2025, the total operational expenditure forecast for 2027 is approximately R$1,983 per tonne. The indicator has been evolving according to plan, considering the exchange rate and monetary assumptions used. Said estimate refers to the currency in real terms of 2026. The Company also reports that the total operational expenditure for 2025 was R$2,062/t, consisting of cash cost of production (including downtimes) of R$853/t, sustaining capex of R$531/t and freight plus SG&A of R$678/t. PULP CASH COST As disclosed in the Material Fact notice of May 11, 2026, projected pulp cash production cost, excluding the effects of scheduled maintenance downtime, for the second quarter of 2026 was projected to range from R$830/t to R$840/t, representing an increase of approximately 3% to 5% compared with the first quarter of 2026. This estimate was based on assumptions of an average exchange rate (US$/ R$) of R$5.00 during the quarter and a Brent crude oil price (ICE Brent Crude) of US$87 per barrel. Pulp cash production cost, excluding the effects of scheduled maintenance downtime, amounted to R$843/t in 2Q26, in line with the previously disclosed guidance and slightly above the level recorded in the first quarter of 2026 (+5.1%). During the period, the average exchange rate (US$/R$) was R$5.05 and the Brent crude oil price (ICE Brent Crude) averaged US$97 per barrel. 2Q26 EARNINGS RELEASE Page 32 of 44
The Company maintains its guidance for this indicator at approximately R$800/t for 2026, based on assumptions of an average exchange rate of R$5.07/US$ and a Brent crude oil price of US$84 per barrel for the full year. NET DEBT AND LEVERAGE As disclosed in the Material Fact notice of May 11, 2026, the Company’s net debt and leverage targets in US$ were, respectively: (a) US$11.0 billion and (b) below 2.5x, with the expectation that such targets will be achieved during fiscal years 2027 and 2028. The leverage ratio is measured as net debt divided by Adjusted EBITDA for the preceding twelve-month period. These estimates were based on average exchange rate (US$/R$) assumptions of R$5.17 for 2026, R$5.25 for 2027 and R$5.28 for 2028, in nominal terms (according to average exchange rate projections based on the Central Bank’s Market Expectations System). Net debt in US$ amounted to US$12.8 billion in 2Q26, representing a 2% reduction compared with the previous quarter. US$ leverage increased to 3.4x as of June 30, 2026 (3.1x as of June 30, 2025). EVENTS SUBSEQUENT TO THE REPORTING PERIOD On June 5, 2025, the Company announced that its wholly owned subsidiary, Suzano International Holding B.V., incorporated in the Netherlands, entered into an Equity and Asset Purchase Agreement with Kimberly-Clark Corporation (“K-C”) for the acquisition of a 51% equity interest (the “Transaction”) in FamPro Tissue Holdings B.V. (“Arbex”), a newly incorporated company in the Netherlands. As part of the Transaction, Suzano was granted a call option to acquire the remaining 49% equity interest in Arbex, exercisable from the third anniversary of the closing of the Transaction or, under certain circumstances, prior to that date. The exercise of the option is at Suzano’s sole discretion. The Transaction involves the acquisition of assets and businesses related to the manufacturing, marketing, distribution, and sale of tissue products in selected jurisdictions across the Americas, Europe, Asia, Africa, and Oceania. The Transaction includes 22 production facilities located in 14 countries, as well as the transfer of certain regional brands and the royalty-free licensing of K-C’s global brands to Arbex in the covered regions. Kimberly-Clark will retain ownership of the remaining 49% equity interest in Arbex. The Transaction also provides for a call option granted to Suzano to acquire K-C’s remaining interest, exercisable from the third anniversary of Closing or, under certain circumstances, prior to such date. The exercise of the option is at Suzano’s sole discretion. On May 28, 2026, the Company and K-C obtained final approval from the antitrust authorities for the completion of the Transaction. On July 1, 2026 (“Closing”), Suzano, through its wholly owned subsidiary in the Netherlands (Suzano International Holding B.V.), completed the acquisition of a 51% equity interest in Arbex, thereby obtaining exclusive control of that entity on that date. Additional information regarding the Transaction is disclosed in Note 29 – Subsequent Events. The Transaction did not result in any accounting impacts on the Company’s separate and consolidated interim financial information up to the date of issuance of these financial statements. 2Q26 EARNINGS RELEASE Page 33 of 44
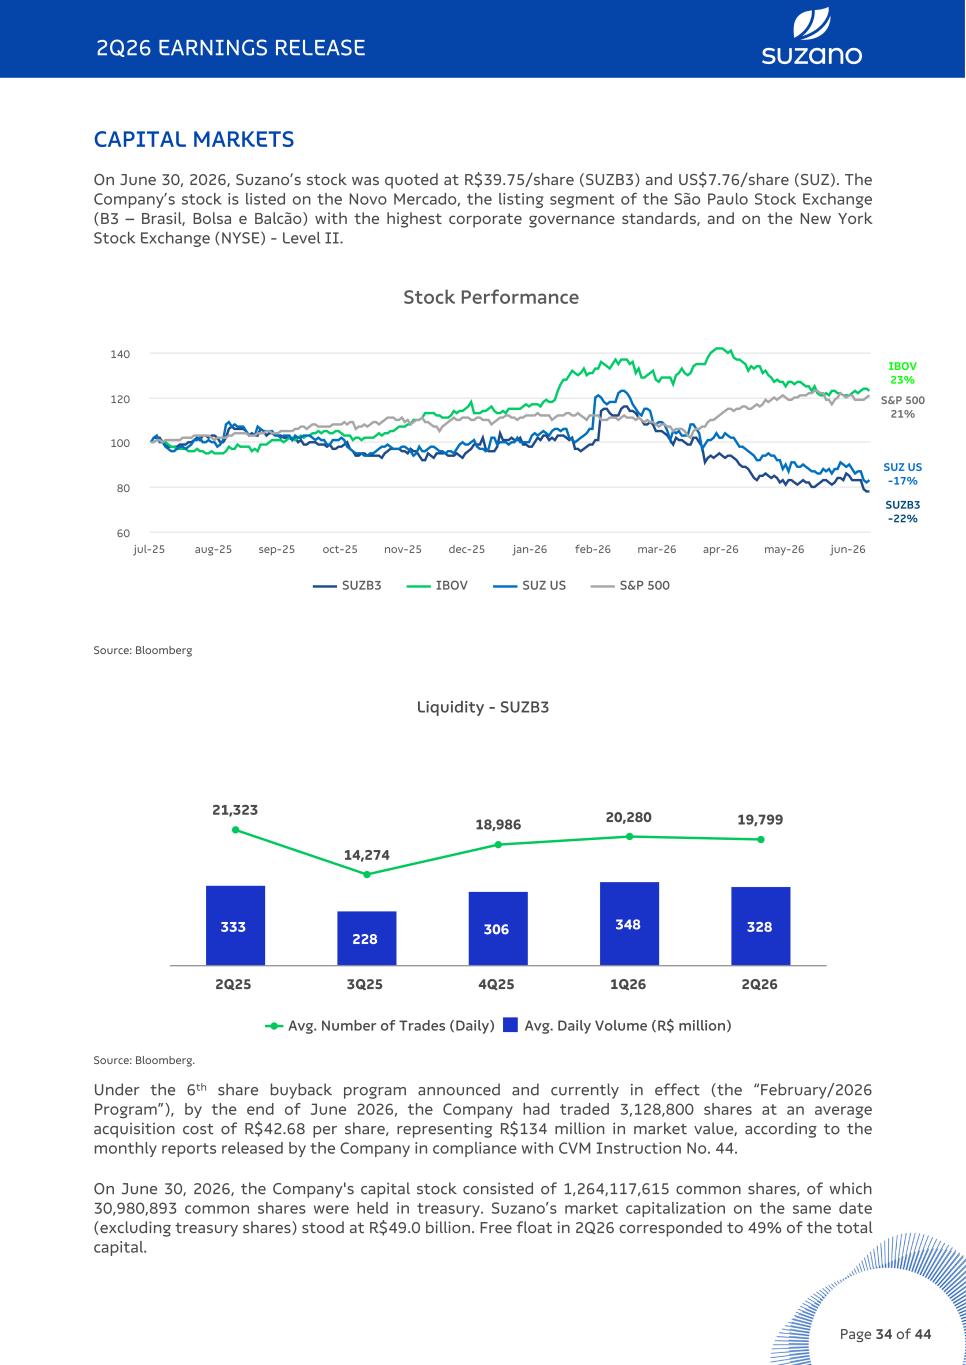
CAPITAL MARKETS On June 30, 2026, Suzano’s stock was quoted at R$39.75/share (SUZB3) and US$7.76/share (SUZ). The Company’s stock is listed on the Novo Mercado, the listing segment of the São Paulo Stock Exchange (B3 – Brasil, Bolsa e Balcão) with the highest corporate governance standards, and on the New York Stock Exchange (NYSE) - Level II. Stock Performance SUZB3 IBOV SUZ US S&P 500 jul-25 aug-25 sep-25 oct-25 nov-25 dec-25 jan-26 feb-26 mar-26 apr-26 may-26 jun-26 60 80 100 120 140 Source: Bloomberg Liquidity - SUZB3 333 228 306 348 328 21,323 14,274 18,986 20,280 19,799 Avg. Number of Trades (Daily) Avg. Daily Volume (R$ million) 2Q25 3Q25 4Q25 1Q26 2Q26 Source: Bloomberg. Under the 6th share buyback program announced and currently in effect (the “February/2026 Program”), by the end of June 2026, the Company had traded 3,128,800 shares at an average acquisition cost of R$42.68 per share, representing R$134 million in market value, according to the monthly reports released by the Company in compliance with CVM Instruction No. 44. On June 30, 2026, the Company's capital stock consisted of 1,264,117,615 common shares, of which 30,980,893 common shares were held in treasury. Suzano’s market capitalization on the same date (excluding treasury shares) stood at R$49.0 billion. Free float in 2Q26 corresponded to 49% of the total capital. 2Q26 EARNINGS RELEASE Page 34 of 44 SUZB3 -22% IBOV 23% S&P 500 21% SUZ US -17%
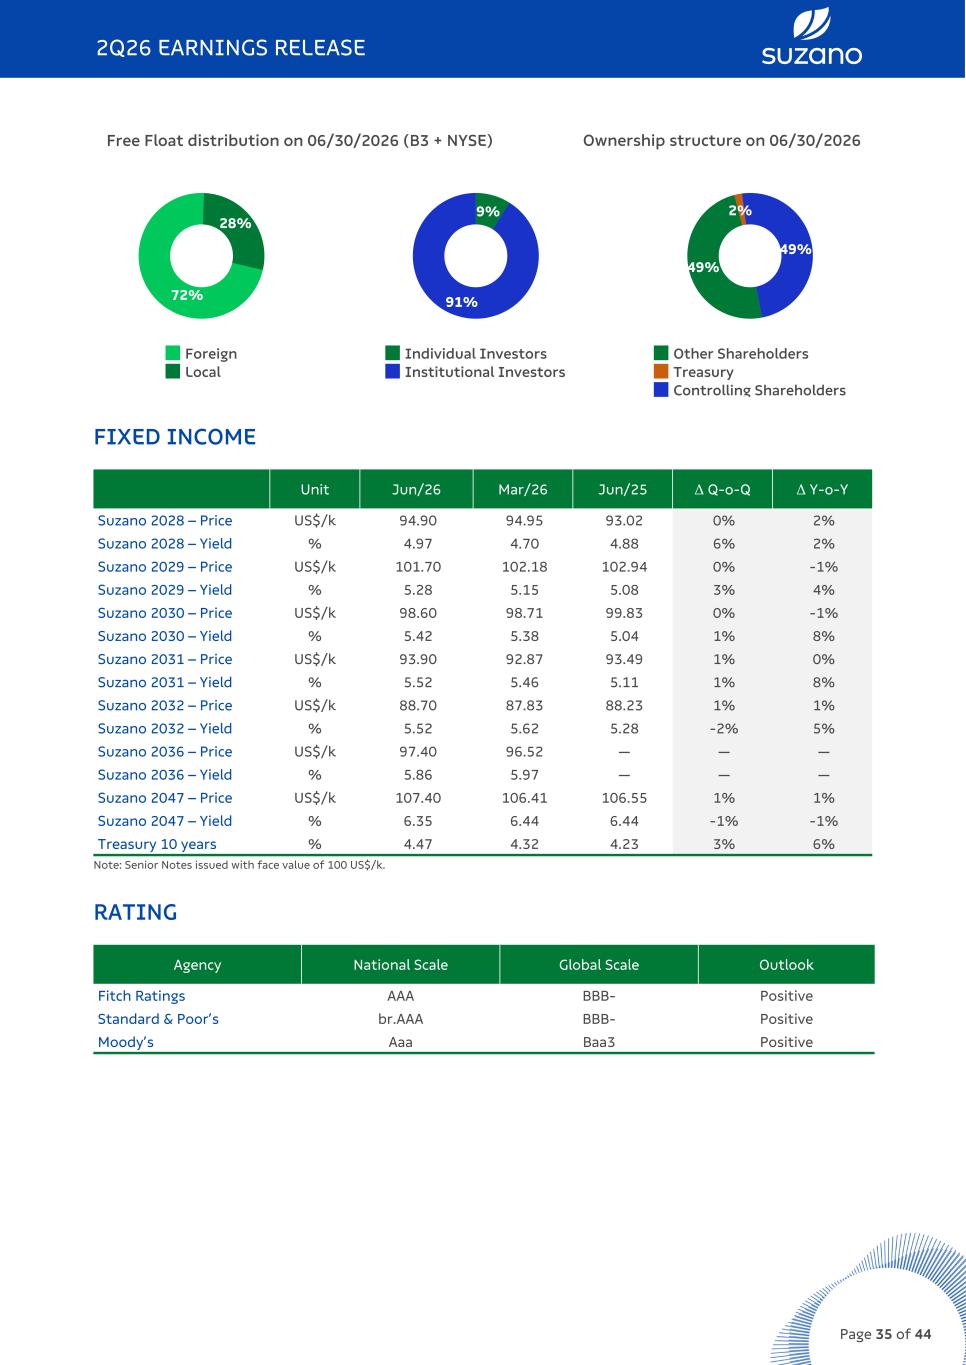
Free Float distribution on 06/30/2026 (B3 + NYSE) Ownership structure on 06/30/2026 72% 28% Foreign Local 9% 91% Individual Investors Institutional Investors 49% 2% 49% Other Shareholders Treasury Controlling Shareholders FIXED INCOME Unit Jun/26 Mar/26 Jun/25 Δ Q-o-Q Δ Y-o-Y Suzano 2028 – Price US$/k 94.90 94.95 93.02 0% 2% Suzano 2028 – Yield % 4.97 4.70 4.88 6% 2% Suzano 2029 – Price US$/k 101.70 102.18 102.94 0% -1% Suzano 2029 – Yield % 5.28 5.15 5.08 3% 4% Suzano 2030 – Price US$/k 98.60 98.71 99.83 0% -1% Suzano 2030 – Yield % 5.42 5.38 5.04 1% 8% Suzano 2031 – Price US$/k 93.90 92.87 93.49 1% 0% Suzano 2031 – Yield % 5.52 5.46 5.11 1% 8% Suzano 2032 – Price US$/k 88.70 87.83 88.23 1% 1% Suzano 2032 – Yield % 5.52 5.62 5.28 -2% 5% Suzano 2036 – Price US$/k 97.40 96.52 — — — Suzano 2036 – Yield % 5.86 5.97 — — — Suzano 2047 – Price US$/k 107.40 106.41 106.55 1% 1% Suzano 2047 – Yield % 6.35 6.44 6.44 -1% -1% Treasury 10 years % 4.47 4.32 4.23 3% 6% Note: Senior Notes issued with face value of 100 US$/k. RATING Agency National Scale Global Scale Outlook Fitch Ratings AAA BBB- Positive Standard & Poor’s br.AAA BBB- Positive Moody’s Aaa Baa3 Positive 2Q26 EARNINGS RELEASE Page 35 of 44
UPCOMING EVENTS Earnings Conference Call (2Q26) Date: August 13th, 2026 (Thursday) Portuguese (simultaneous translation) English 10h00 (Brasília) 10:00 a.m. (Brasília) 09h00 (New York) 09:00 a.m. (New York) 14h00 (London) 02:00 p.m. (London) The conference call will be held in English and feature a presentation, with simultaneous webcast. The access links will be available on the Company’s Investor Relations website (https://ir.suzano.com.br). If you are unable to participate, the webcast link will be available for future consultation on the Investor Relations website of Suzano. IR CONTACTS Marcos Assumpção Camila Nogueira Roberto Costa Mariana Spinola Victor Valladares Chayrerison Bezerra Gabriela Bonassi Tel.: +55 (11) 3503-9330 ri@suzano.com.br www.suzano.com.br/ri 2Q26 EARNINGS RELEASE Page 36 of 44
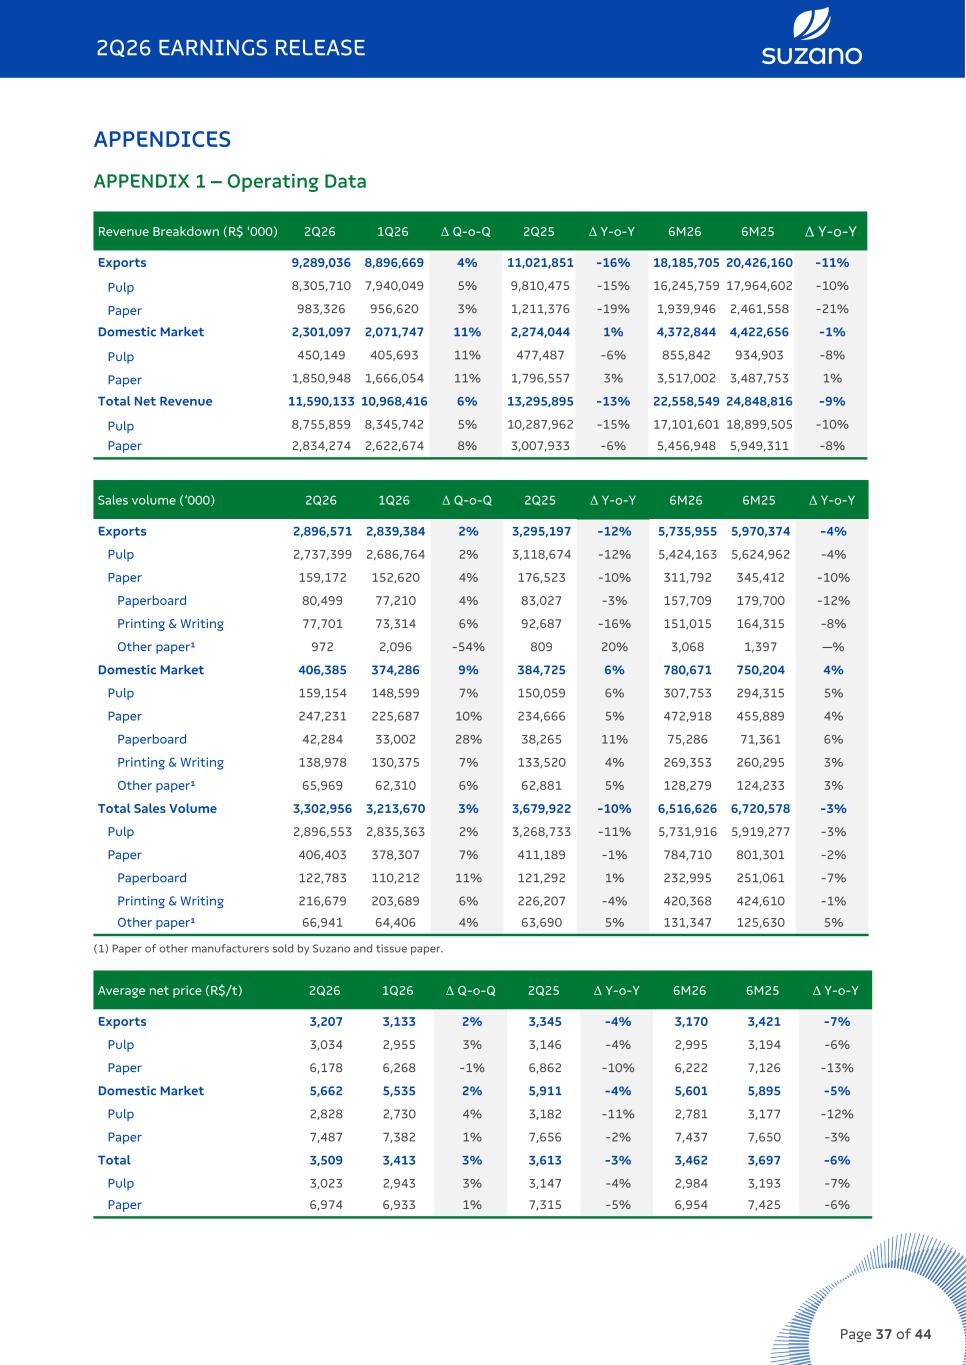
APPENDICES APPENDIX 1 – Operating Data Revenue Breakdown (R$ '000) 2Q26 1Q26 Δ Q-o-Q 2Q25 Δ Y-o-Y 6M26 6M25 Δ Y-o-Y Exports 9,289,036 8,896,669 4% 11,021,851 -16% 18,185,705 20,426,160 -11% Pulp 8,305,710 7,940,049 5% 9,810,475 -15% 16,245,759 17,964,602 -10% Paper 983,326 956,620 3% 1,211,376 -19% 1,939,946 2,461,558 -21% Domestic Market 2,301,097 2,071,747 11% 2,274,044 1% 4,372,844 4,422,656 -1% Pulp 450,149 405,693 11% 477,487 -6% 855,842 934,903 -8% Paper 1,850,948 1,666,054 11% 1,796,557 3% 3,517,002 3,487,753 1% Total Net Revenue 11,590,133 10,968,416 6% 13,295,895 -13% 22,558,549 24,848,816 -9% Pulp 8,755,859 8,345,742 5% 10,287,962 -15% 17,101,601 18,899,505 -10% Paper 2,834,274 2,622,674 8% 3,007,933 -6% 5,456,948 5,949,311 -8% Sales volume (‘000) 2Q26 1Q26 Δ Q-o-Q 2Q25 Δ Y-o-Y 6M26 6M25 Δ Y-o-Y Exports 2,896,571 2,839,384 2% 3,295,197 -12% 5,735,955 5,970,374 -4% Pulp 2,737,399 2,686,764 2% 3,118,674 -12% 5,424,163 5,624,962 -4% Paper 159,172 152,620 4% 176,523 -10% 311,792 345,412 -10% Paperboard 80,499 77,210 4% 83,027 -3% 157,709 179,700 -12% Printing & Writing 77,701 73,314 6% 92,687 -16% 151,015 164,315 -8% Other paper¹ 972 2,096 -54% 809 20% 3,068 1,397 —% Domestic Market 406,385 374,286 9% 384,725 6% 780,671 750,204 4% Pulp 159,154 148,599 7% 150,059 6% 307,753 294,315 5% Paper 247,231 225,687 10% 234,666 5% 472,918 455,889 4% Paperboard 42,284 33,002 28% 38,265 11% 75,286 71,361 6% Printing & Writing 138,978 130,375 7% 133,520 4% 269,353 260,295 3% Other paper¹ 65,969 62,310 6% 62,881 5% 128,279 124,233 3% Total Sales Volume 3,302,956 3,213,670 3% 3,679,922 -10% 6,516,626 6,720,578 -3% Pulp 2,896,553 2,835,363 2% 3,268,733 -11% 5,731,916 5,919,277 -3% Paper 406,403 378,307 7% 411,189 -1% 784,710 801,301 -2% Paperboard 122,783 110,212 11% 121,292 1% 232,995 251,061 -7% Printing & Writing 216,679 203,689 6% 226,207 -4% 420,368 424,610 -1% Other paper¹ 66,941 64,406 4% 63,690 5% 131,347 125,630 5% (1) Paper of other manufacturers sold by Suzano and tissue paper. Average net price (R$/t) 2Q26 1Q26 Δ Q-o-Q 2Q25 Δ Y-o-Y 6M26 6M25 Δ Y-o-Y Exports 3,207 3,133 2% 3,345 -4% 3,170 3,421 -7% Pulp 3,034 2,955 3% 3,146 -4% 2,995 3,194 -6% Paper 6,178 6,268 -1% 6,862 -10% 6,222 7,126 -13% Domestic Market 5,662 5,535 2% 5,911 -4% 5,601 5,895 -5% Pulp 2,828 2,730 4% 3,182 -11% 2,781 3,177 -12% Paper 7,487 7,382 1% 7,656 -2% 7,437 7,650 -3% Total 3,509 3,413 3% 3,613 -3% 3,462 3,697 -6% Pulp 3,023 2,943 3% 3,147 -4% 2,984 3,193 -7% Paper 6,974 6,933 1% 7,315 -5% 6,954 7,425 -6% 2Q26 EARNINGS RELEASE Page 37 of 44
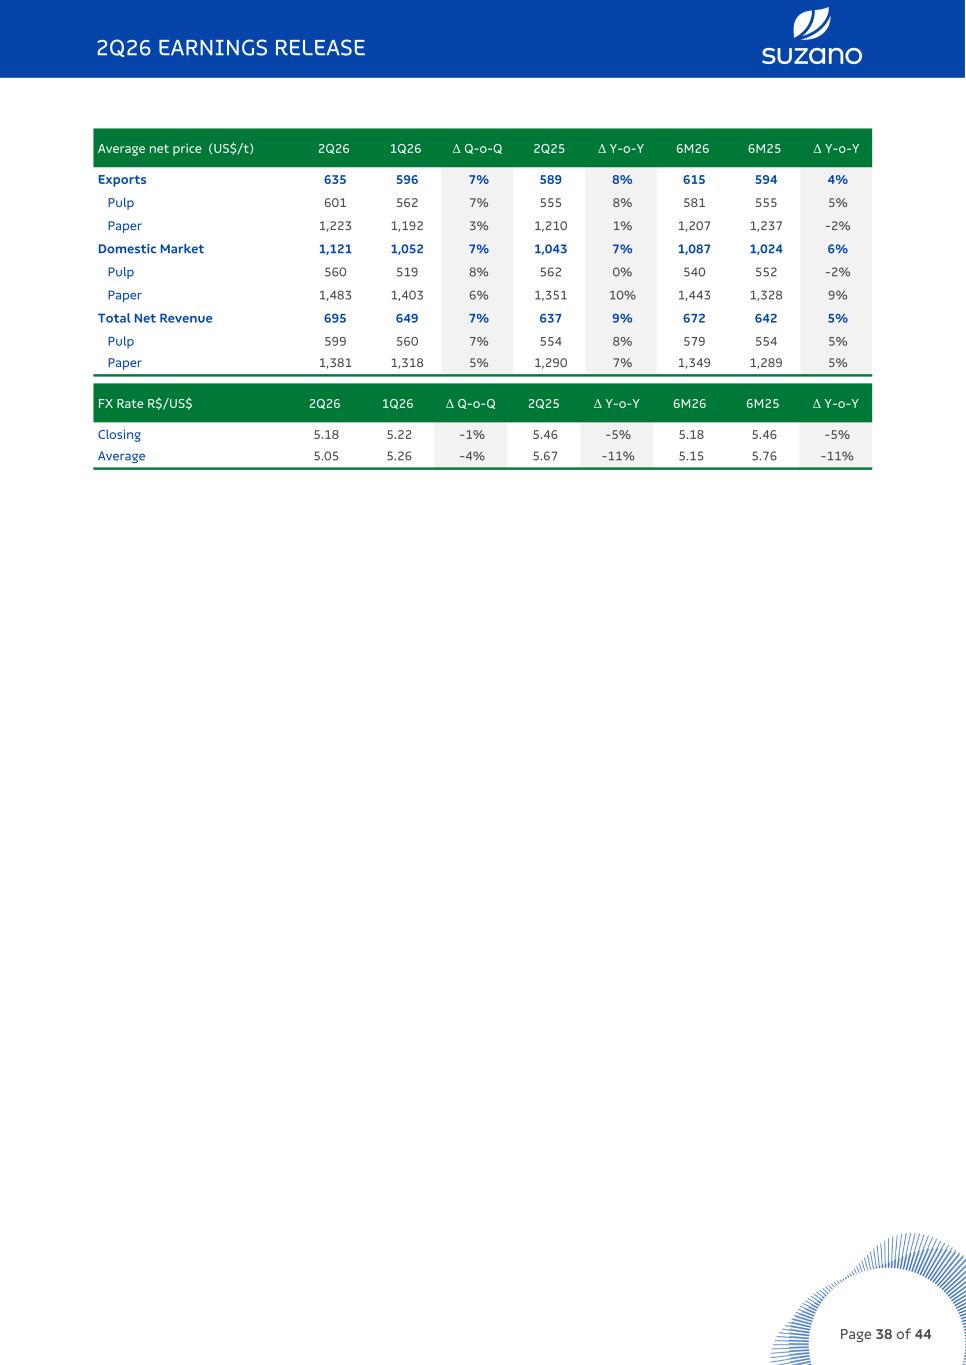
Average net price (US$/t) 2Q26 1Q26 Δ Q-o-Q 2Q25 Δ Y-o-Y 6M26 6M25 Δ Y-o-Y Exports 635 596 7% 589 8% 615 594 4% Pulp 601 562 7% 555 8% 581 555 5% Paper 1,223 1,192 3% 1,210 1% 1,207 1,237 -2% Domestic Market 1,121 1,052 7% 1,043 7% 1,087 1,024 6% Pulp 560 519 8% 562 0% 540 552 -2% Paper 1,483 1,403 6% 1,351 10% 1,443 1,328 9% Total Net Revenue 695 649 7% 637 9% 672 642 5% Pulp 599 560 7% 554 8% 579 554 5% Paper 1,381 1,318 5% 1,290 7% 1,349 1,289 5% FX Rate R$/US$ 2Q26 1Q26 Δ Q-o-Q 2Q25 Δ Y-o-Y 6M26 6M25 Δ Y-o-Y Closing 5.18 5.22 -1% 5.46 -5% 5.18 5.46 -5% Average 5.05 5.26 -4% 5.67 -11% 5.15 5.76 -11% 2Q26 EARNINGS RELEASE Page 38 of 44
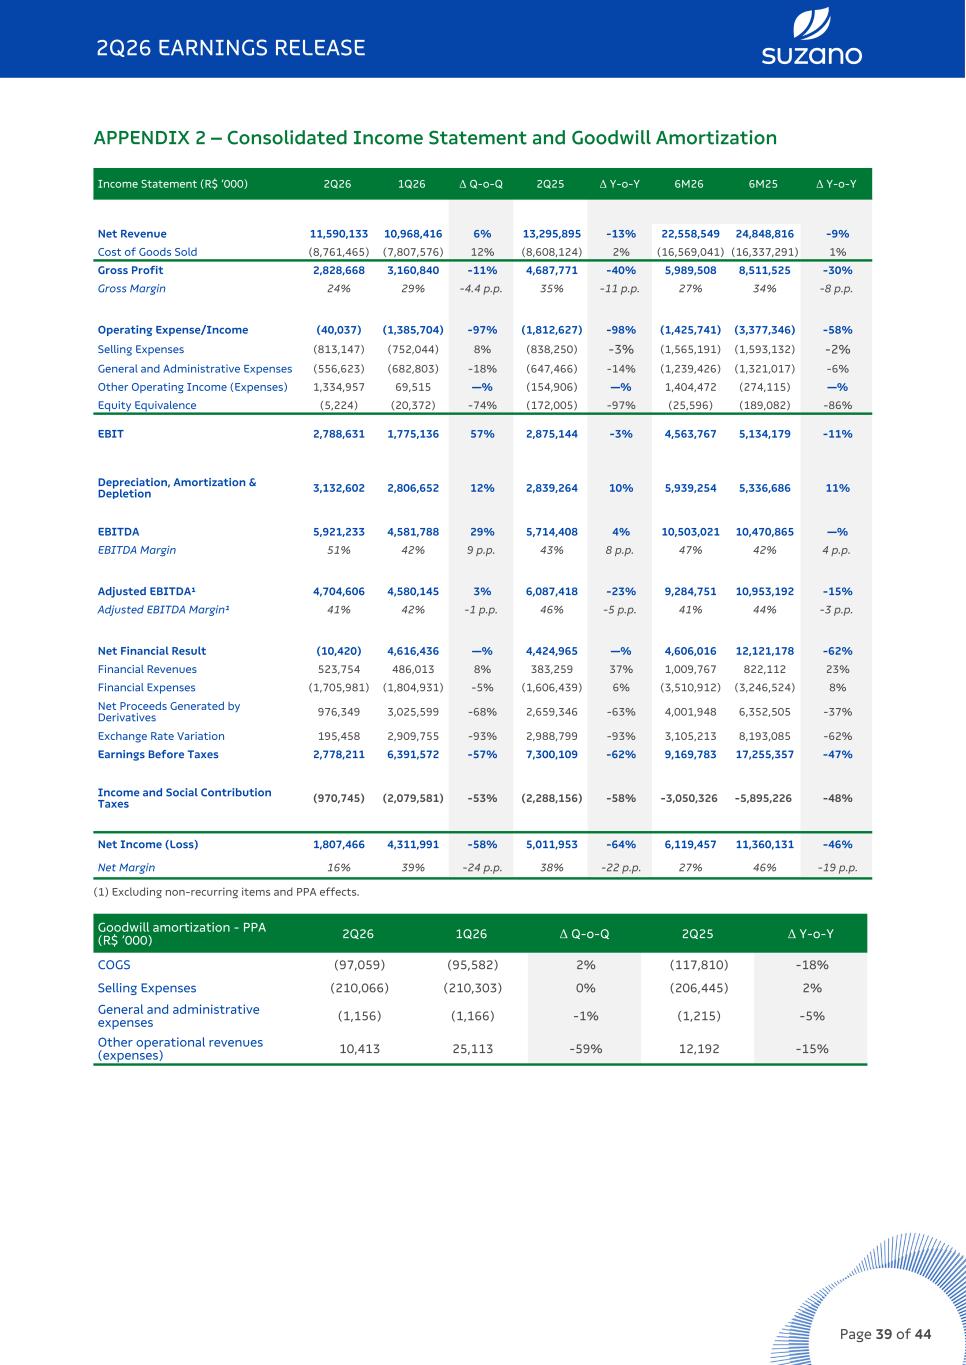
APPENDIX 2 – Consolidated Income Statement and Goodwill Amortization Income Statement (R$ ‘000) 2Q26 1Q26 Δ Q-o-Q 2Q25 Δ Y-o-Y 6M26 6M25 Δ Y-o-Y Net Revenue 11,590,133 10,968,416 6% 13,295,895 -13% 22,558,549 24,848,816 -9% Cost of Goods Sold (8,761,465) (7,807,576) 12% (8,608,124) 2% (16,569,041) (16,337,291) 1% Gross Profit 2,828,668 3,160,840 -11% 4,687,771 -40% 5,989,508 8,511,525 -30% Gross Margin 24% 29% -4.4 p.p. 35% -11 p.p. 27% 34% -8 p.p. Operating Expense/Income (40,037) (1,385,704) -97% (1,812,627) -98% (1,425,741) (3,377,346) -58% Selling Expenses (813,147) (752,044) 8% (838,250) -3% (1,565,191) (1,593,132) -2% General and Administrative Expenses (556,623) (682,803) -18% (647,466) -14% (1,239,426) (1,321,017) -6% Other Operating Income (Expenses) 1,334,957 69,515 —% (154,906) —% 1,404,472 (274,115) —% Equity Equivalence (5,224) (20,372) -74% (172,005) -97% (25,596) (189,082) -86% EBIT 2,788,631 1,775,136 57% 2,875,144 -3% 4,563,767 5,134,179 -11% Depreciation, Amortization & Depletion 3,132,602 2,806,652 12% 2,839,264 10% 5,939,254 5,336,686 11% EBITDA 5,921,233 4,581,788 29% 5,714,408 4% 10,503,021 10,470,865 —% EBITDA Margin 51% 42% 9 p.p. 43% 8 p.p. 47% 42% 4 p.p. Adjusted EBITDA¹ 4,704,606 4,580,145 3% 6,087,418 -23% 9,284,751 10,953,192 -15% Adjusted EBITDA Margin¹ 41% 42% -1 p.p. 46% -5 p.p. 41% 44% -3 p.p. Net Financial Result (10,420) 4,616,436 —% 4,424,965 —% 4,606,016 12,121,178 -62% Financial Revenues 523,754 486,013 8% 383,259 37% 1,009,767 822,112 23% Financial Expenses (1,705,981) (1,804,931) -5% (1,606,439) 6% (3,510,912) (3,246,524) 8% Net Proceeds Generated by Derivatives 976,349 3,025,599 -68% 2,659,346 -63% 4,001,948 6,352,505 -37% Exchange Rate Variation 195,458 2,909,755 -93% 2,988,799 -93% 3,105,213 8,193,085 -62% Earnings Before Taxes 2,778,211 6,391,572 -57% 7,300,109 -62% 9,169,783 17,255,357 -47% Income and Social Contribution Taxes (970,745) (2,079,581) -53% (2,288,156) -58% -3,050,326 -5,895,226 -48% Net Income (Loss) 1,807,466 4,311,991 -58% 5,011,953 -64% 6,119,457 11,360,131 -46% Net Margin 16% 39% -24 p.p. 38% -22 p.p. 27% 46% -19 p.p. (1) Excluding non-recurring items and PPA effects. Goodwill amortization - PPA (R$ ‘000) 2Q26 1Q26 Δ Q-o-Q 2Q25 Δ Y-o-Y COGS (97,059) (95,582) 2% (117,810) -18% Selling Expenses (210,066) (210,303) 0% (206,445) 2% General and administrative expenses (1,156) (1,166) -1% (1,215) -5% Other operational revenues (expenses) 10,413 25,113 -59% 12,192 -15% 2Q26 EARNINGS RELEASE Page 39 of 44
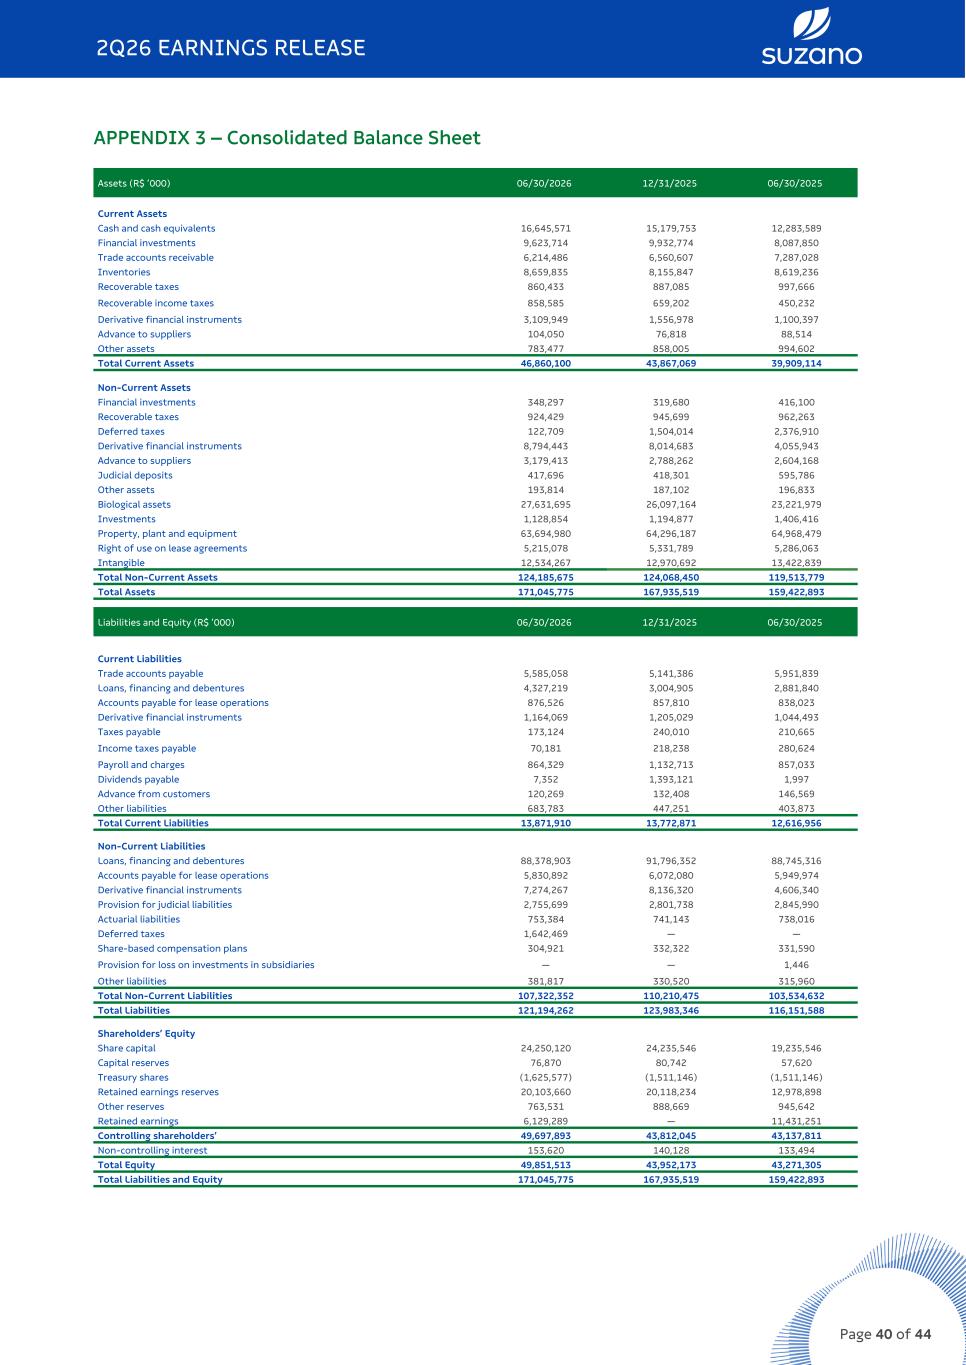
APPENDIX 3 – Consolidated Balance Sheet Assets (R$ ’000) 06/30/2026 12/31/2025 06/30/2025 Current Assets Cash and cash equivalents 16,645,571 15,179,753 12,283,589 Financial investments 9,623,714 9,932,774 8,087,850 Trade accounts receivable 6,214,486 6,560,607 7,287,028 Inventories 8,659,835 8,155,847 8,619,236 Recoverable taxes 860,433 887,085 997,666 Recoverable income taxes 858,585 659,202 450,232 Derivative financial instruments 3,109,949 1,556,978 1,100,397 Advance to suppliers 104,050 76,818 88,514 Other assets 783,477 858,005 994,602 Total Current Assets 46,860,100 43,867,069 39,909,114 Non-Current Assets Financial investments 348,297 319,680 416,100 Recoverable taxes 924,429 945,699 962,263 Deferred taxes 122,709 1,504,014 2,376,910 Derivative financial instruments 8,794,443 8,014,683 4,055,943 Advance to suppliers 3,179,413 2,788,262 2,604,168 Judicial deposits 417,696 418,301 595,786 Other assets 193,814 187,102 196,833 Biological assets 27,631,695 26,097,164 23,221,979 Investments 1,128,854 1,194,877 1,406,416 Property, plant and equipment 63,694,980 64,296,187 64,968,479 Right of use on lease agreements 5,215,078 5,331,789 5,286,063 Intangible 12,534,267 12,970,692 13,422,839 Total Non-Current Assets 124,185,675 124,068,450 119,513,779 Total Assets 171,045,775 167,935,519 159,422,893 Liabilities and Equity (R$ ’000) 06/30/2026 12/31/2025 06/30/2025 Current Liabilities Trade accounts payable 5,585,058 5,141,386 5,951,839 Loans, financing and debentures 4,327,219 3,004,905 2,881,840 Accounts payable for lease operations 876,526 857,810 838,023 Derivative financial instruments 1,164,069 1,205,029 1,044,493 Taxes payable 173,124 240,010 210,665 Income taxes payable 70,181 218,238 280,624 Payroll and charges 864,329 1,132,713 857,033 Dividends payable 7,352 1,393,121 1,997 Advance from customers 120,269 132,408 146,569 Other liabilities 683,783 447,251 403,873 Total Current Liabilities 13,871,910 13,772,871 12,616,956 Non-Current Liabilities Loans, financing and debentures 88,378,903 91,796,352 88,745,316 Accounts payable for lease operations 5,830,892 6,072,080 5,949,974 Derivative financial instruments 7,274,267 8,136,320 4,606,340 Provision for judicial liabilities 2,755,699 2,801,738 2,845,990 Actuarial liabilities 753,384 741,143 738,016 Deferred taxes 1,642,469 — — Share-based compensation plans 304,921 332,322 331,590 Provision for loss on investments in subsidiaries — — 1,446 Other liabilities 381,817 330,520 315,960 Total Non-Current Liabilities 107,322,352 110,210,475 103,534,632 Total Liabilities 121,194,262 123,983,346 116,151,588 Shareholders’ Equity Share capital 24,250,120 24,235,546 19,235,546 Capital reserves 76,870 80,742 57,620 Treasury shares (1,625,577) (1,511,146) (1,511,146) Retained earnings reserves 20,103,660 20,118,234 12,978,898 Other reserves 763,531 888,669 945,642 Retained earnings 6,129,289 — 11,431,251 Controlling shareholders’ 49,697,893 43,812,045 43,137,811 Non-controlling interest 153,620 140,128 133,494 Total Equity 49,851,513 43,952,173 43,271,305 Total Liabilities and Equity 171,045,775 167,935,519 159,422,893 2Q26 EARNINGS RELEASE Page 40 of 44
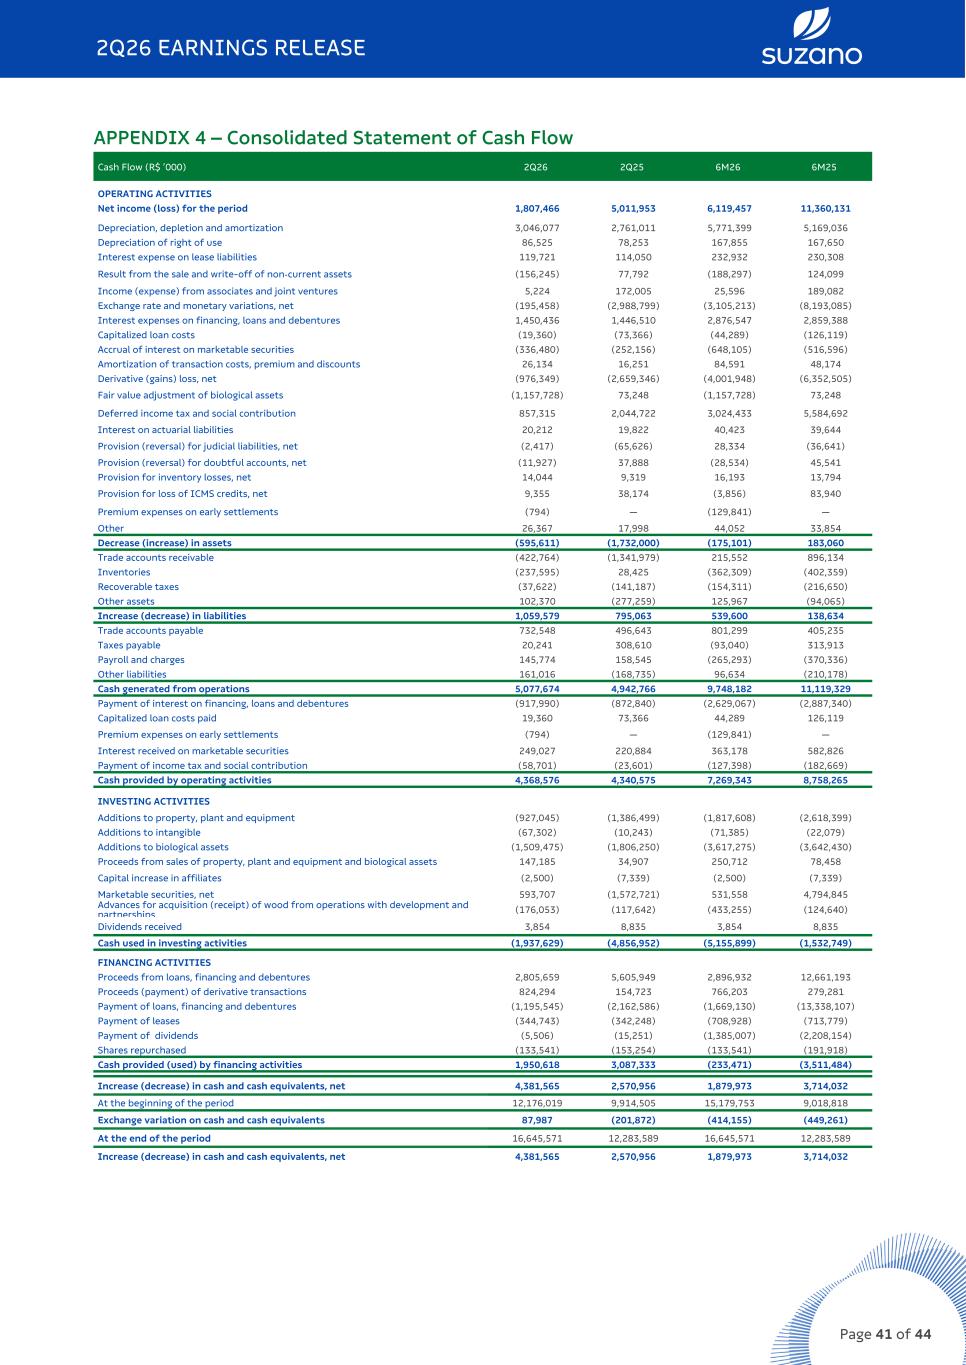
APPENDIX 4 – Consolidated Statement of Cash Flow OPERATING ACTIVITIES Net income (loss) for the period 1,807,466 5,011,953 6,119,457 11,360,131 Depreciation, depletion and amortization 3,046,077 2,761,011 5,771,399 5,169,036 Depreciation of right of use 86,525 78,253 167,855 167,650 Interest expense on lease liabilities 119,721 114,050 232,932 230,308 Result from the sale and write-off of non-current assets (156,245) 77,792 (188,297) 124,099 Income (expense) from associates and joint ventures 5,224 172,005 25,596 189,082 Exchange rate and monetary variations, net (195,458) (2,988,799) (3,105,213) (8,193,085) Interest expenses on financing, loans and debentures 1,450,436 1,446,510 2,876,547 2,859,388 Capitalized loan costs (19,360) (73,366) (44,289) (126,119) Accrual of interest on marketable securities (336,480) (252,156) (648,105) (516,596) Amortization of transaction costs, premium and discounts 26,134 16,251 84,591 48,174 Derivative (gains) loss, net (976,349) (2,659,346) (4,001,948) (6,352,505) Fair value adjustment of biological assets (1,157,728) 73,248 (1,157,728) 73,248 Deferred income tax and social contribution 857,315 2,044,722 3,024,433 5,584,692 Interest on actuarial liabilities 20,212 19,822 40,423 39,644 Provision (reversal) for judicial liabilities, net (2,417) (65,626) 28,334 (36,641) Provision (reversal) for doubtful accounts, net (11,927) 37,888 (28,534) 45,541 Provision for inventory losses, net 14,044 9,319 16,193 13,794 Provision for loss of ICMS credits, net 9,355 38,174 (3,856) 83,940 Premium expenses on early settlements (794) — (129,841) — Other 26,367 17,998 44,052 33,854 Decrease (increase) in assets (595,611) (1,732,000) (175,101) 183,060 Trade accounts receivable (422,764) (1,341,979) 215,552 896,134 Inventories (237,595) 28,425 (362,309) (402,359) Recoverable taxes (37,622) (141,187) (154,311) (216,650) Other assets 102,370 (277,259) 125,967 (94,065) Increase (decrease) in liabilities 1,059,579 795,063 539,600 138,634 Trade accounts payable 732,548 496,643 801,299 405,235 Taxes payable 20,241 308,610 (93,040) 313,913 Payroll and charges 145,774 158,545 (265,293) (370,336) Other liabilities 161,016 (168,735) 96,634 (210,178) Cash generated from operations 5,077,674 4,942,766 9,748,182 11,119,329 Payment of interest on financing, loans and debentures (917,990) (872,840) (2,629,067) (2,887,340) Capitalized loan costs paid 19,360 73,366 44,289 126,119 Premium expenses on early settlements (794) — (129,841) — Interest received on marketable securities 249,027 220,884 363,178 582,826 Payment of income tax and social contribution (58,701) (23,601) (127,398) (182,669) Cash provided by operating activities 4,368,576 4,340,575 7,269,343 8,758,265 INVESTING ACTIVITIES Additions to property, plant and equipment (927,045) (1,386,499) (1,817,608) (2,618,399) Additions to intangible (67,302) (10,243) (71,385) (22,079) Additions to biological assets (1,509,475) (1,806,250) (3,617,275) (3,642,430) Proceeds from sales of property, plant and equipment and biological assets 147,185 34,907 250,712 78,458 Capital increase in affiliates (2,500) (7,339) (2,500) (7,339) Marketable securities, net 593,707 (1,572,721) 531,558 4,794,845 Advances for acquisition (receipt) of wood from operations with development and partnerships (176,053) (117,642) (433,255) (124,640) Dividends received 3,854 8,835 3,854 8,835 Cash used in investing activities (1,937,629) (4,856,952) (5,155,899) (1,532,749) FINANCING ACTIVITIES Proceeds from loans, financing and debentures 2,805,659 5,605,949 2,896,932 12,661,193 Proceeds (payment) of derivative transactions 824,294 154,723 766,203 279,281 Payment of loans, financing and debentures (1,195,545) (2,162,586) (1,669,130) (13,338,107) Payment of leases (344,743) (342,248) (708,928) (713,779) Payment of dividends (5,506) (15,251) (1,385,007) (2,208,154) Shares repurchased (133,541) (153,254) (133,541) (191,918) Cash provided (used) by financing activities 1,950,618 3,087,333 (233,471) (3,511,484) Increase (decrease) in cash and cash equivalents, net 4,381,565 2,570,956 1,879,973 3,714,032 At the beginning of the period 12,176,019 9,914,505 15,179,753 9,018,818 Exchange variation on cash and cash equivalents 87,987 (201,872) (414,155) (449,261) At the end of the period 16,645,571 12,283,589 16,645,571 12,283,589 Increase (decrease) in cash and cash equivalents, net 4,381,565 2,570,956 1,879,973 3,714,032 Cash Flow (R$ ’000) 2Q26 2Q25 6M26 6M25 2Q26 EARNINGS RELEASE Page 41 of 44
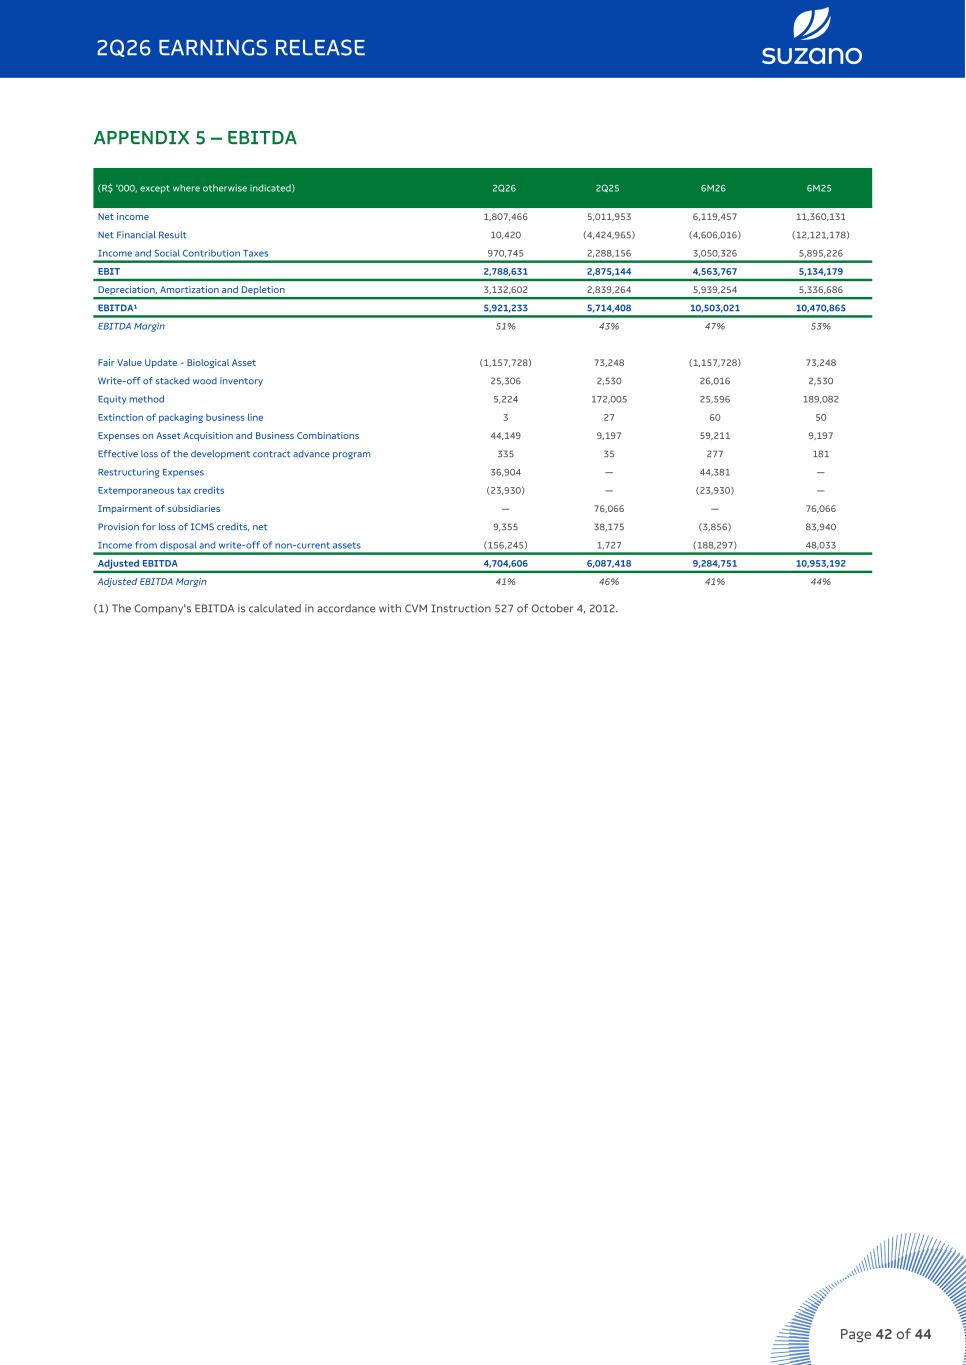
APPENDIX 5 – EBITDA (R$ '000, except where otherwise indicated) 2Q26 2Q25 6M26 6M25 Net income 1,807,466 5,011,953 6,119,457 11,360,131 Net Financial Result 10,420 (4,424,965) (4,606,016) (12,121,178) Income and Social Contribution Taxes 970,745 2,288,156 3,050,326 5,895,226 EBIT 2,788,631 2,875,144 4,563,767 5,134,179 Depreciation, Amortization and Depletion 3,132,602 2,839,264 5,939,254 5,336,686 EBITDA¹ 5,921,233 5,714,408 10,503,021 10,470,865 EBITDA Margin 51% 43% 47% 53% Fair Value Update - Biological Asset (1,157,728) 73,248 (1,157,728) 73,248 Write-off of stacked wood inventory 25,306 2,530 26,016 2,530 Equity method 5,224 172,005 25,596 189,082 Extinction of packaging business line 3 27 60 50 Expenses on Asset Acquisition and Business Combinations 44,149 9,197 59,211 9,197 Effective loss of the development contract advance program 335 35 277 181 Restructuring Expenses 36,904 — 44,381 — Extemporaneous tax credits (23,930) — (23,930) — Impairment of subsidiaries — 76,066 — 76,066 Provision for loss of ICMS credits, net 9,355 38,175 (3,856) 83,940 Income from disposal and write-off of non-current assets (156,245) 1,727 (188,297) 48,033 Adjusted EBITDA 4,704,606 6,087,418 9,284,751 10,953,192 Adjusted EBITDA Margin 41% 46% 41% 44% (1) The Company's EBITDA is calculated in accordance with CVM Instruction 527 of October 4, 2012. 2Q26 EARNINGS RELEASE Page 42 of 44
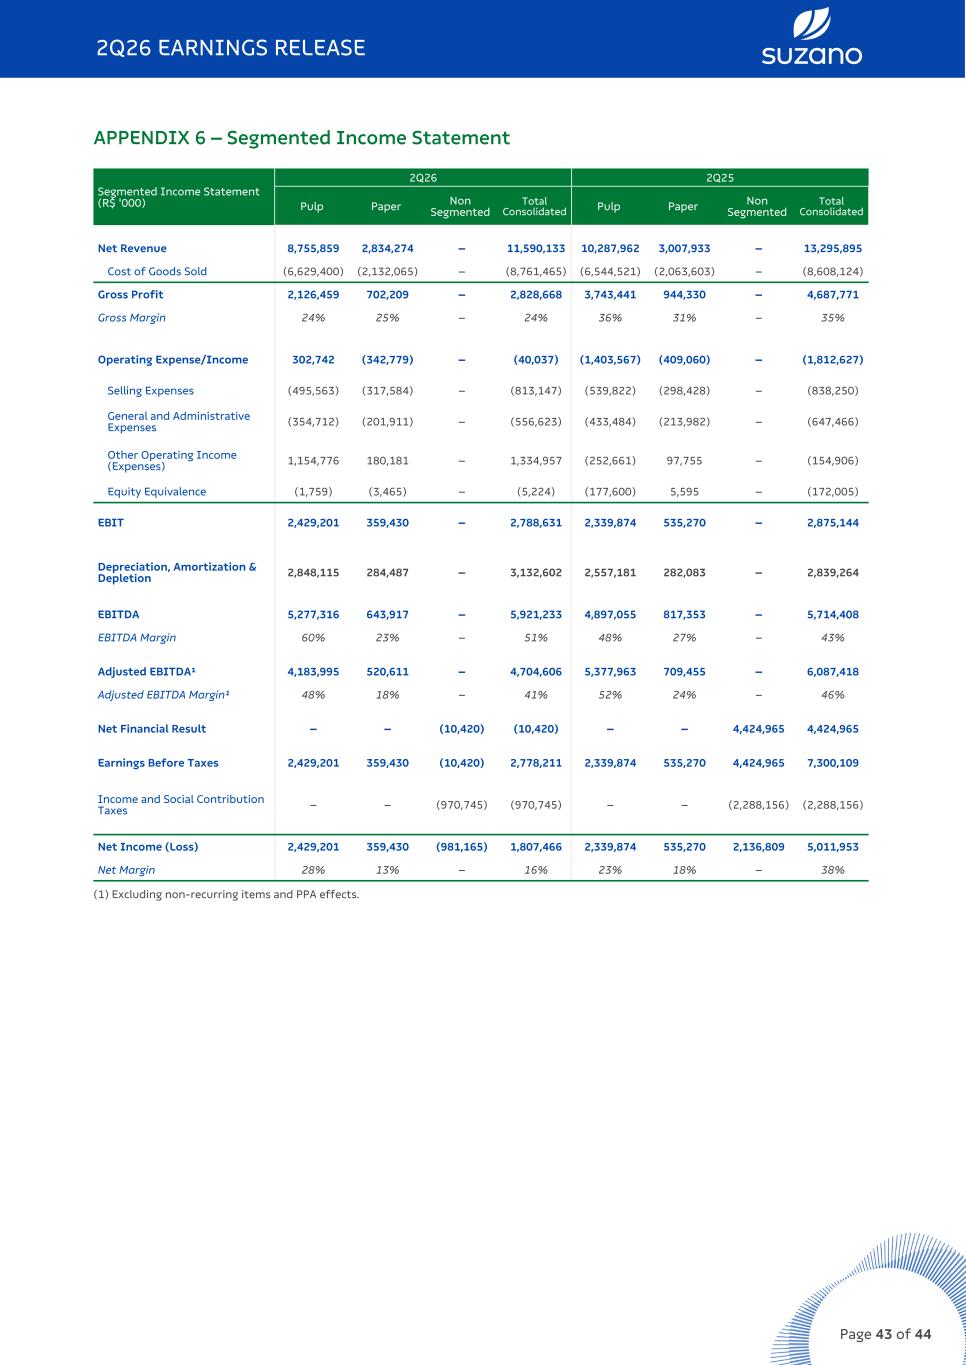
APPENDIX 6 – Segmented Income Statement Segmented Income Statement (R$ '000) 2Q26 2Q25 Pulp Paper Non Segmented Total Consolidated Pulp Paper Non Segmented Total Consolidated Net Revenue 8,755,859 2,834,274 – 11,590,133 10,287,962 3,007,933 – 13,295,895 Cost of Goods Sold (6,629,400) (2,132,065) – (8,761,465) (6,544,521) (2,063,603) – (8,608,124) Gross Profit 2,126,459 702,209 – 2,828,668 3,743,441 944,330 – 4,687,771 Gross Margin 24% 25% – 24% 36% 31% – 35% Operating Expense/Income 302,742 (342,779) – (40,037) (1,403,567) (409,060) – (1,812,627) Selling Expenses (495,563) (317,584) – (813,147) (539,822) (298,428) – (838,250) General and Administrative Expenses (354,712) (201,911) – (556,623) (433,484) (213,982) – (647,466) Other Operating Income (Expenses) 1,154,776 180,181 – 1,334,957 (252,661) 97,755 – (154,906) Equity Equivalence (1,759) (3,465) – (5,224) (177,600) 5,595 – (172,005) EBIT 2,429,201 359,430 – 2,788,631 2,339,874 535,270 – 2,875,144 Depreciation, Amortization & Depletion 2,848,115 284,487 – 3,132,602 2,557,181 282,083 – 2,839,264 EBITDA 5,277,316 643,917 – 5,921,233 4,897,055 817,353 – 5,714,408 EBITDA Margin 60% 23% – 51% 48% 27% – 43% Adjusted EBITDA¹ 4,183,995 520,611 – 4,704,606 5,377,963 709,455 – 6,087,418 Adjusted EBITDA Margin¹ 48% 18% – 41% 52% 24% – 46% Net Financial Result – – (10,420) (10,420) – – 4,424,965 4,424,965 Earnings Before Taxes 2,429,201 359,430 (10,420) 2,778,211 2,339,874 535,270 4,424,965 7,300,109 Income and Social Contribution Taxes – – (970,745) (970,745) – – (2,288,156) (2,288,156) Net Income (Loss) 2,429,201 359,430 (981,165) 1,807,466 2,339,874 535,270 2,136,809 5,011,953 Net Margin 28% 13% – 16% 23% 18% – 38% (1) Excluding non-recurring items and PPA effects. 2Q26 EARNINGS RELEASE Page 43 of 44

Forward-Looking Statements This release may contain forward-looking statements. Such statements are subject to known and unknown risks and uncertainties due to which such expectations may not happen at all or may substantially differ from what was expected. These risks include, among others, changes in future demand for the Company’s products, changes in factors affecting domestic and international product prices, changes in the cost structure, changes in the seasonal patterns of markets, changes in prices charged by competitors, foreign exchange variations, changes in the political or economic situation of Brazil, as well as emerging and international markets. The forward-looking statements were not reviewed by our independent auditors. 2Q26 EARNINGS RELEASE Page 44 of 44