Third Quarter 2025 Results October 24, 2025
23rd Quarter 2025 Cautionary Statement Forward-Looking Information This earnings presentation and the associated conference call may include forward‐looking statements by us and our authorized officers pertaining to such matters as our goals, beliefs, intentions, and expectations regarding, among other things: (a) revenues, earnings, loan production, asset quality, liquidity position, capital levels, risk analysis, divestitures, acquisitions, and other material transactions, among other matters; (b) the future costs and benefits of the actions we may take; (c) our assessments of credit risk and probable losses on loans and associated allowances and reserves; (d) our assessments of interest rate and other market risks; (e) our ability to achieve profitability goals within projected timeframes and to execute on our strategic plan, including the sufficiency of our internal resources, procedures and systems; (f) our ability to attract, incentivize, and retain key personnel and the roles of key personnel; (g) our ability to achieve our financial and other strategic goals, including those related to the Reorganization, our merger with Flagstar Bancorp, Inc., which was completed in December 2022, our acquisition of substantial portions of the former Signature Bank through an FDIC-assisted transaction, which was completed in March 2023, and our ability to comply with the heightened regulatory standards with respect to governance and risk management which we are subject to as a national bank with assets of $50 billion or more; (h) the impact of the $1.05 billion capital raise we completed in March 2024; (i) our previously disclosed material weaknesses in internal control over financial reporting; (j) the conversion or exchange of shares of our preferred stock; (k) the payment of dividends on shares of our capital stock, including adjustments to the amount of dividends payable on shares of our preferred stock; (l) the availability of equity and dilution of existing equity holders associated with future equity awards and stock issuances; (m) the effects of the reverse stock split we effected in July 2024; and (n) the impact of the recent sale of our mortgage servicing operations, third party mortgage loan origination business, and mortgage warehouse business. Forward‐looking statements are typically identified by such words as “believe,” “expect,” “anticipate,” “intend,” “outlook,” “estimate,” “forecast,” “project,” “should,” "confident," and other similar words and expressions, and are subject to numerous assumptions, risks, and uncertainties, which change over time. Additionally, forward‐looking statements speak only as of the date they are made; we do not assume any duty, and do not undertake, to update our forward‐looking statements. Furthermore, because forward‐looking statements are subject to assumptions and uncertainties, actual results or future events could differ, possibly materially, from those anticipated in our statements, and our future performance could differ materially from our historical results. Our forward‐looking statements are subject to, among others, the following principal risks and uncertainties: general economic conditions and trends, either nationally or locally; conditions in the securities, credit and financial markets; changes in interest rates; changes in deposit flows, and in the demand for deposit, loan, and investment products and other financial services; changes in real estate values; changes in the quality or composition of our loan or investment portfolios, including associated allowances and reserves; changes in future allowance for credit losses, including changes required under relevant accounting and regulatory requirements; the ability to pay future dividends; changes in our capital management and balance sheet strategies and our ability to successfully implement such strategies; our ability to achieve the anticipated benefits of the Reorganization; recent turnover in our Board of Directors and our executive management team; changes in our strategic plan, including changes in our internal resources, procedures and systems, and our ability to successfully implement such plan; our ability to successfully remediate our previously disclosed material weaknesses in internal control over financial reporting; changes in competitive pressures among financial institutions or from non‐financial institutions; changes in legislation, regulations, and policies; the impacts of tariffs, sanctions and other trade policies of the United States and its global trading counterparts; the outcome of federal, state, and local elections and the resulting economic and other impact on the areas in which we conduct business; the impact of changing political conditions or federal government shutdowns; the imposition of restrictions on our operations by bank regulators; the outcome of pending or threatened litigation, or of investigations or any other matters before regulatory agencies, whether currently existing or commencing in the future; our ability to comply with heightened regulatory standards with respect to governance and risk management which we are subject to as a national bank with assets $50 billion or more; the restructuring of our mortgage business; our ability to recognize anticipated cost savings and enhanced efficiencies with respect to our balance sheet and expense reduction strategies; the impact of failures or disruptions in or breaches of our operational or security systems, data or infrastructure, or those of third parties, including as a result of cyberattacks or campaigns; the impact of natural disasters, extreme weather events, civil unrest, international military conflict, terrorism or other geopolitical events; and a variety of other matters which, by their nature, are subject to significant uncertainties and/or are beyond our control. Our forward-looking statements are also subject to the following principal risks and uncertainties with respect to our merger with Flagstar Bancorp, which was completed in December 2022, and our acquisition of substantial portions of the former Signature Bank through an FDIC-assisted transaction, which was completed in March 2023: the possibility that the anticipated benefits of the transactions will not be realized when expected or at all; the possibility of increased legal and compliance costs, including with respect to any litigation or regulatory actions related to the business practices of acquired companies or the combined business; diversion of management’s attention from ongoing business operations and opportunities; the possibility that we may be unable to achieve expected synergies and operating efficiencies in or as a result of the transactions within the expected timeframes or at all; and revenues following the transactions may be lower than expected. More information regarding some of these factors is provided in the Risk Factors section of our Annual Report on Form 10‐K for the year ended December 31, 2024, our Quarterly Report on Form 10-Q for the quarter ended June 30, 2025, and in other SEC reports we file. Our forward‐looking statements may also be subject to other risks and uncertainties, including those we may discuss in this news release, on our conference call, during investor presentations, or in our SEC filings, which are accessible on our website and at the SEC’s website, www.sec.gov.
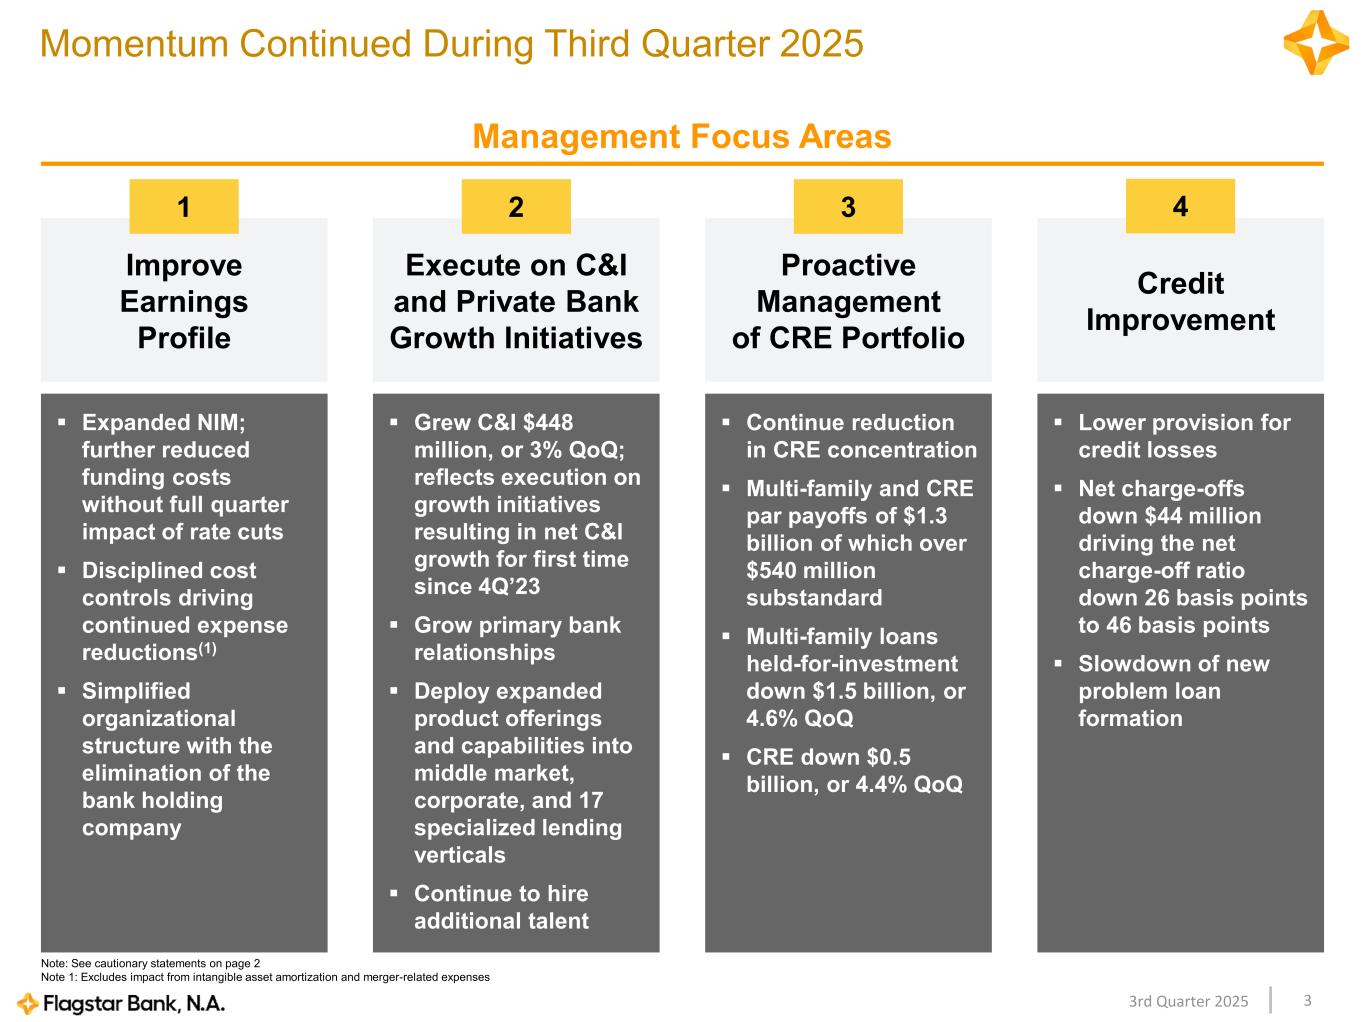
33rd Quarter 2025 Management Focus Areas Momentum Continued During Third Quarter 2025 Grew C&I $448 million, or 3% QoQ; reflects execution on growth initiatives resulting in net C&I growth for first time since 4Q’23 Grow primary bank relationships Deploy expanded product offerings and capabilities into middle market, corporate, and 17 specialized lending verticals Continue to hire additional talent Execute on C&I and Private Bank Growth Initiatives Lower provision for credit losses Net charge-offs down $44 million driving the net charge-off ratio down 26 basis points to 46 basis points Slowdown of new problem loan formation Proactive Management of CRE Portfolio Continue reduction in CRE concentration Multi-family and CRE par payoffs of $1.3 billion of which over $540 million substandard Multi-family loans held-for-investment down $1.5 billion, or 4.6% QoQ CRE down $0.5 billion, or 4.4% QoQ Credit Improvement Expanded NIM; further reduced funding costs without full quarter impact of rate cuts Disciplined cost controls driving continued expense reductions(1) Simplified organizational structure with the elimination of the bank holding company Improve Earnings Profile 1 2 3 4 Note: See cautionary statements on page 2 Note 1: Excludes impact from intangible asset amortization and merger-related expenses
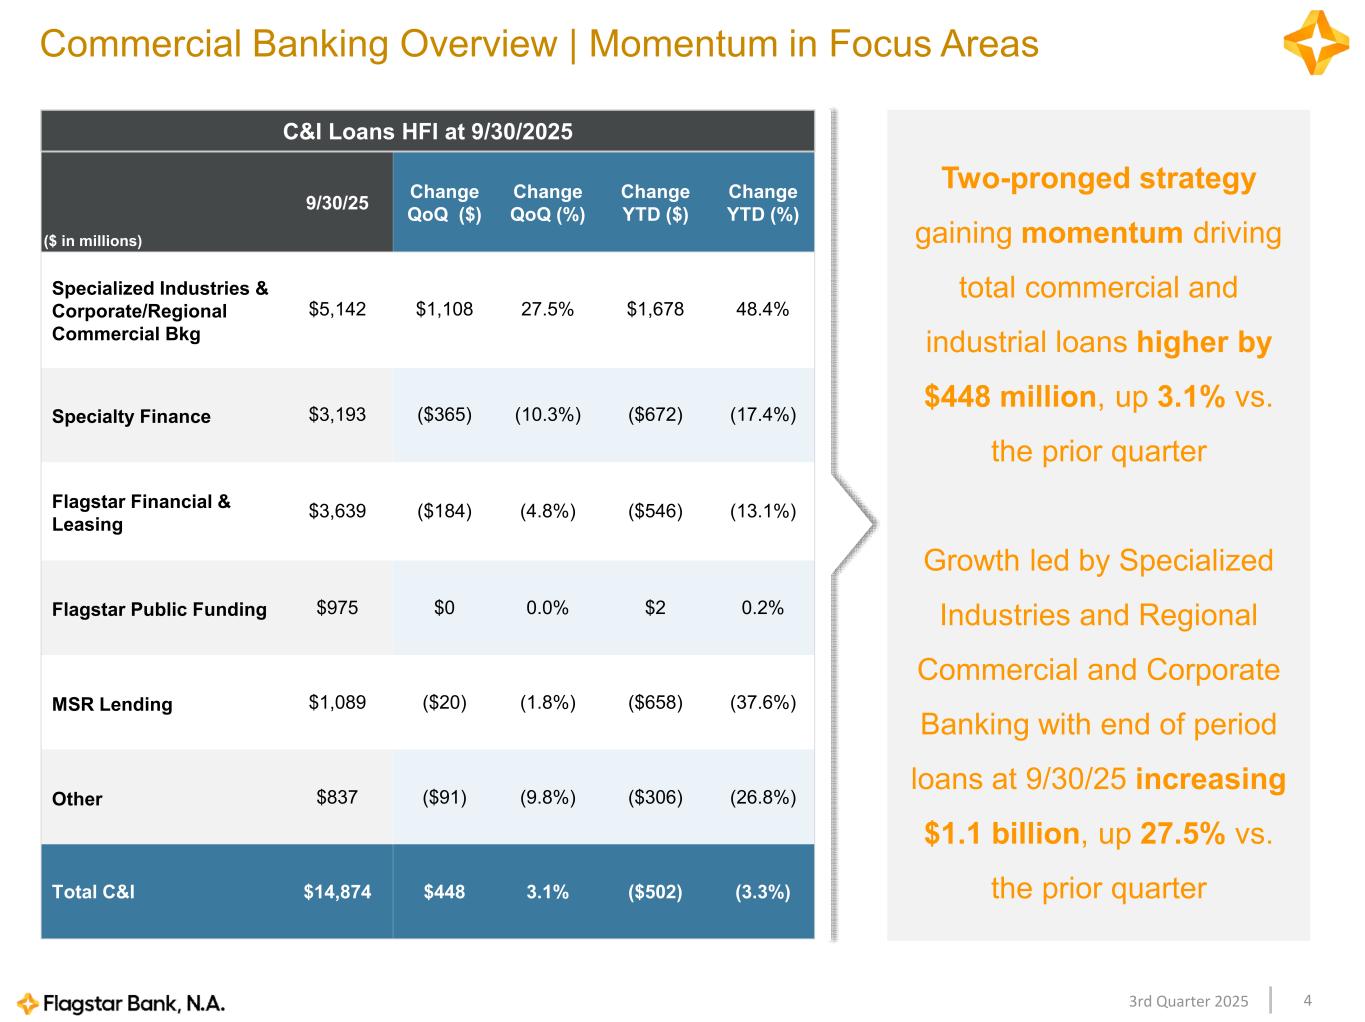
43rd Quarter 2025 Commercial Banking Overview | Momentum in Focus Areas Two-pronged strategy gaining momentum driving total commercial and industrial loans higher by $448 million, up 3.1% vs. the prior quarter Growth led by Specialized Industries and Regional Commercial and Corporate Banking with end of period loans at 9/30/25 increasing $1.1 billion, up 27.5% vs. the prior quarter C&I Loans HFI at 9/30/2025 ($ in millions) 9/30/25 Change QoQ ($) Change QoQ (%) Change YTD ($) Change YTD (%) Specialized Industries & Corporate/Regional Commercial Bkg $5,142 $1,108 27.5% $1,678 48.4% Specialty Finance $3,193 ($365) (10.3%) ($672) (17.4%) Flagstar Financial & Leasing $3,639 ($184) (4.8%) ($546) (13.1%) Flagstar Public Funding $975 $0 0.0% $2 0.2% MSR Lending $1,089 ($20) (1.8%) ($658) (37.6%) Other $837 ($91) (9.8%) ($306) (26.8%) Total C&I $14,874 $448 3.1% ($502) (3.3%)
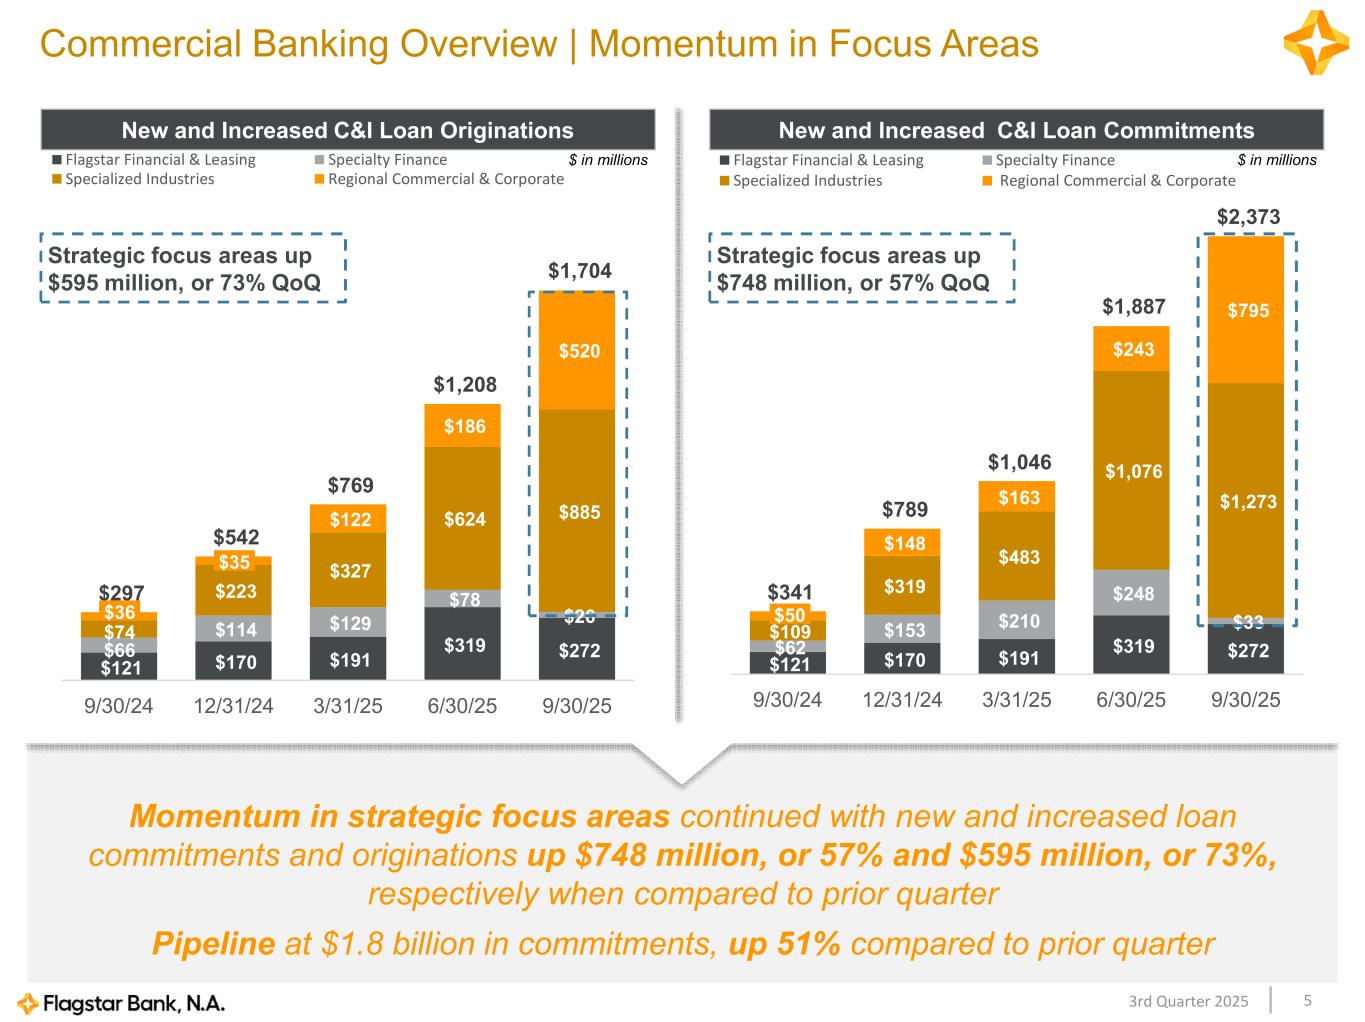
53rd Quarter 2025 $121 $170 $191 $319 $272 $66 $114 $129 $78 $26 $74 $223 $327 $624 $885 $122 $186 $520 $297 $542 $769 $1,208 $1,704 9/30/24 12/31/24 3/31/25 6/30/25 9/30/25 Flagstar Financial & Leasing Specialty Finance Specialized Industries Regional Commercial & Corporate Commercial Banking Overview | Momentum in Focus Areas New and Increased C&I Loan Commitments $ in millions New and Increased C&I Loan Originations $ in millions $121 $170 $191 $319 $272 $62 $153 $210 $248 $33 $109 $319 $483 $1,076 $1,273 $148 $163 $243 $795 $341 $789 $1,046 $1,887 $2,373 9/30/24 12/31/24 3/31/25 6/30/25 9/30/25 Flagstar Financial & Leasing Specialty Finance Specialized Industries Regional Commercial & Corporate Strategic focus areas up $595 million, or 73% QoQ Strategic focus areas up $748 million, or 57% QoQ Momentum in strategic focus areas continued with new and increased loan commitments and originations up $748 million, or 57% and $595 million, or 73%, respectively when compared to prior quarter Pipeline at $1.8 billion in commitments, up 51% compared to prior quarter $50$36 $35
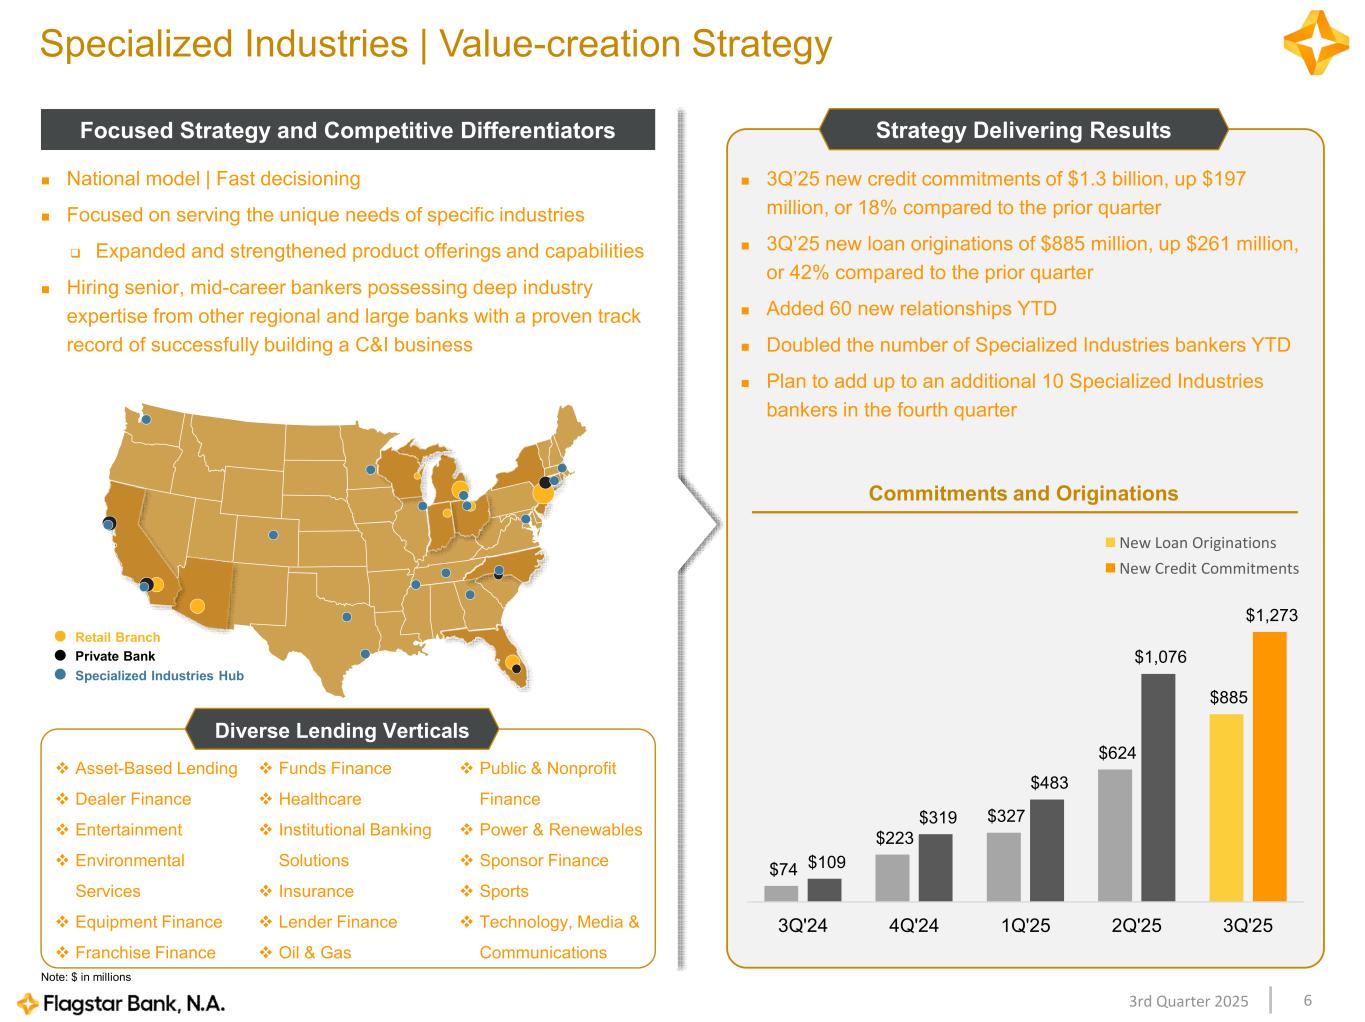
63rd Quarter 2025 Specialized Industries | Value-creation Strategy Focused Strategy and Competitive Differentiators Strategy Delivering Results Public & Nonprofit Finance Power & Renewables Sponsor Finance Sports Technology, Media & Communications Asset-Based Lending Dealer Finance Entertainment Environmental Services Equipment Finance Franchise Finance Funds Finance Healthcare Institutional Banking Solutions Insurance Lender Finance Oil & Gas Diverse Lending Verticals National model | Fast decisioning Focused on serving the unique needs of specific industries Expanded and strengthened product offerings and capabilities Hiring senior, mid-career bankers possessing deep industry expertise from other regional and large banks with a proven track record of successfully building a C&I business $74 $223 $327 $624 $885 $109 $319 $483 $1,076 $1,273 3Q'24 4Q'24 1Q'25 2Q'25 3Q'25 New Loan Originations New Credit Commitments Commitments and Originations Note: $ in millions Retail Branch Private Bank 3Q’25 new credit commitments of $1.3 billion, up $197 million, or 18% compared to the prior quarter 3Q’25 new loan originations of $885 million, up $261 million, or 42% compared to the prior quarter Added 60 new relationships YTD Doubled the number of Specialized Industries bankers YTD Plan to add up to an additional 10 Specialized Industries bankers in the fourth quarter Specialized Industries Hub
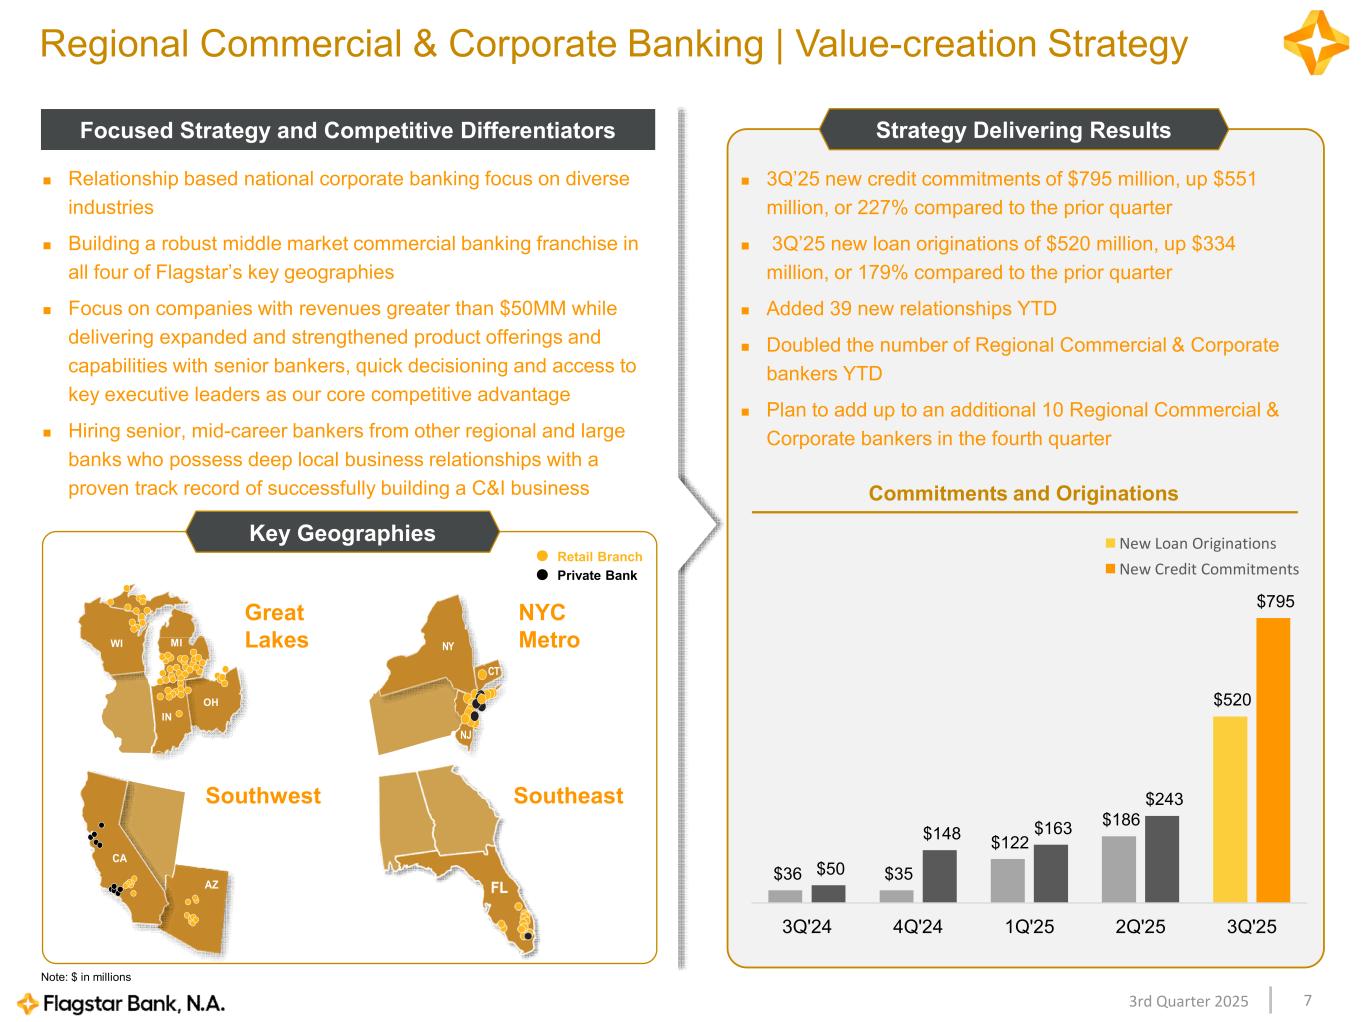
73rd Quarter 2025 Regional Commercial & Corporate Banking | Value-creation Strategy Focused Strategy and Competitive Differentiators Strategy Delivering Results NY CT NJ WI MI IN OH Relationship based national corporate banking focus on diverse industries Building a robust middle market commercial banking franchise in all four of Flagstar’s key geographies Focus on companies with revenues greater than $50MM while delivering expanded and strengthened product offerings and capabilities with senior bankers, quick decisioning and access to key executive leaders as our core competitive advantage Hiring senior, mid-career bankers from other regional and large banks who possess deep local business relationships with a proven track record of successfully building a C&I business 3Q’25 new credit commitments of $795 million, up $551 million, or 227% compared to the prior quarter 3Q’25 new loan originations of $520 million, up $334 million, or 179% compared to the prior quarter Added 39 new relationships YTD Doubled the number of Regional Commercial & Corporate bankers YTD Plan to add up to an additional 10 Regional Commercial & Corporate bankers in the fourth quarter Note: $ in millions $36 $35 $122 $186 $520 $50 $148 $163 $243 $795 3Q'24 4Q'24 1Q'25 2Q'25 3Q'25 New Loan Originations New Credit Commitments Great Lakes NYC Metro Southwest Southeast Key Geographies Retail Branch Private Bank Commitments and Originations CA AZ
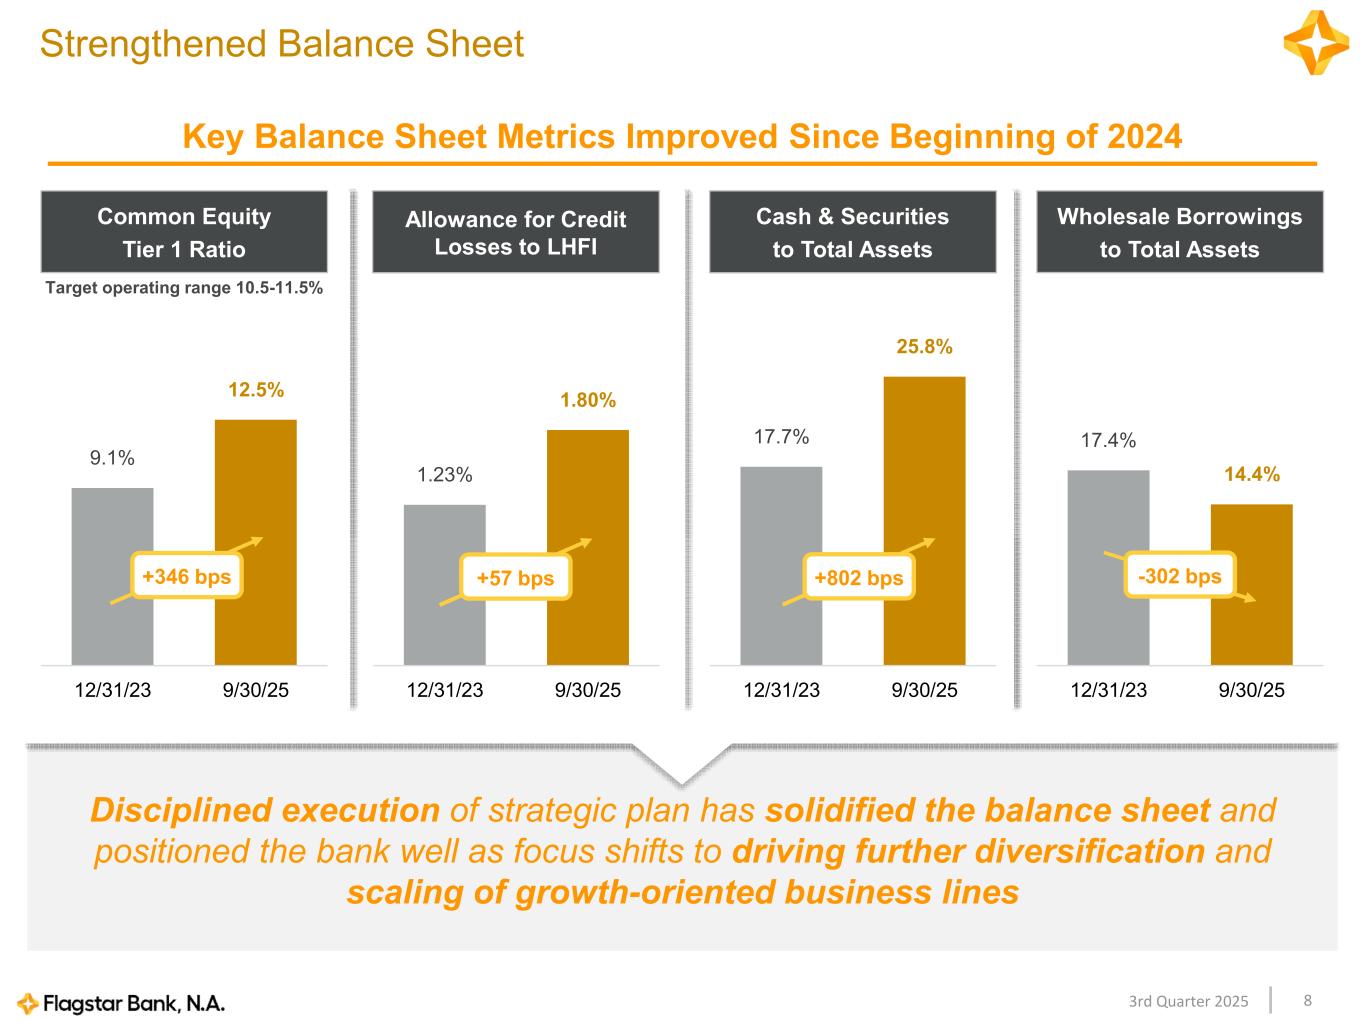
83rd Quarter 2025 Disciplined execution of strategic plan has solidified the balance sheet and positioned the bank well as focus shifts to driving further diversification and scaling of growth-oriented business lines 9.1% 12.5% 12/31/23 9/30/25 Strengthened Balance Sheet Wholesale Borrowings to Total Assets Target operating range 10.5-11.5% 17.4% 14.4% 12/31/23 9/30/25 -302 bps Cash & Securities to Total Assets 17.7% 25.8% 12/31/23 9/30/25 +802 bps Allowance for Credit Losses to LHFI 1.23% 1.80% 12/31/23 9/30/25 +57 bps Common Equity Tier 1 Ratio +346 bps Key Balance Sheet Metrics Improved Since Beginning of 2024
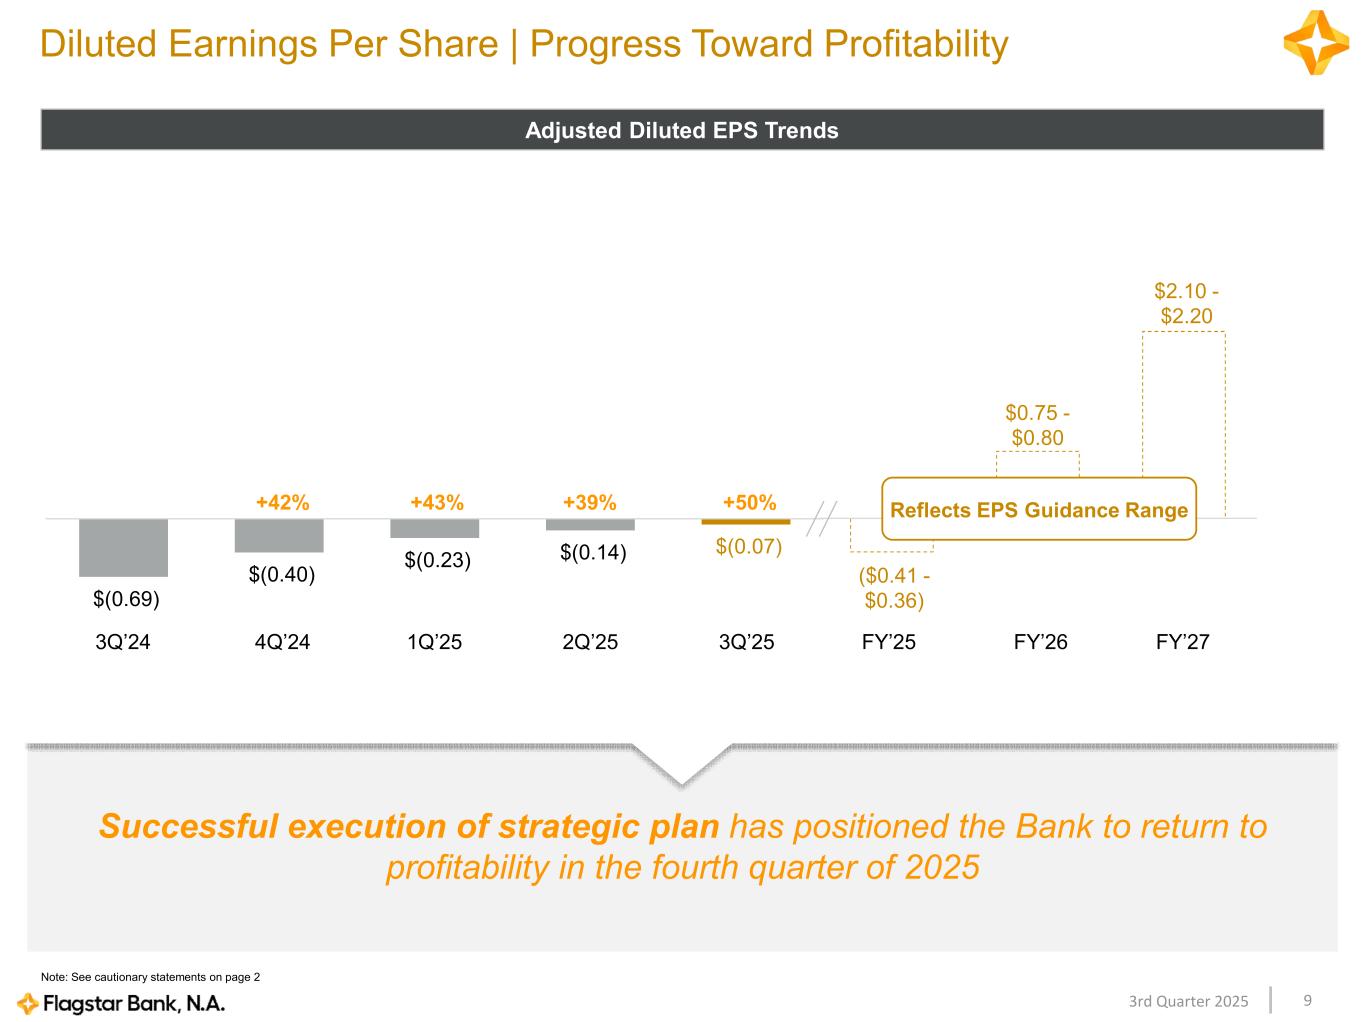
93rd Quarter 2025 $(0.69) $(0.40) $(0.23) $(0.14) $(0.07) 3Q'24 4Q'24 1Q'25 2Q'25 3Q'25 FY25 FY26 FY27 Diluted Earnings Per Share | Progress Toward Profitability Adjusted Diluted EPS Trends Note: See cautionary statements on page 2 Reflects EPS Guidance Range $0.75 - $0.80 Successful execution of strategic plan has positioned the Bank to return to profitability in the fourth quarter of 2025 $2.10 - $2.20 +42% +43% +39% +50% 3Q’24 4Q’24 1Q’25 2Q’25 3Q’25 FY’26 FY’27 ($0.41 - $0.36) FY’25
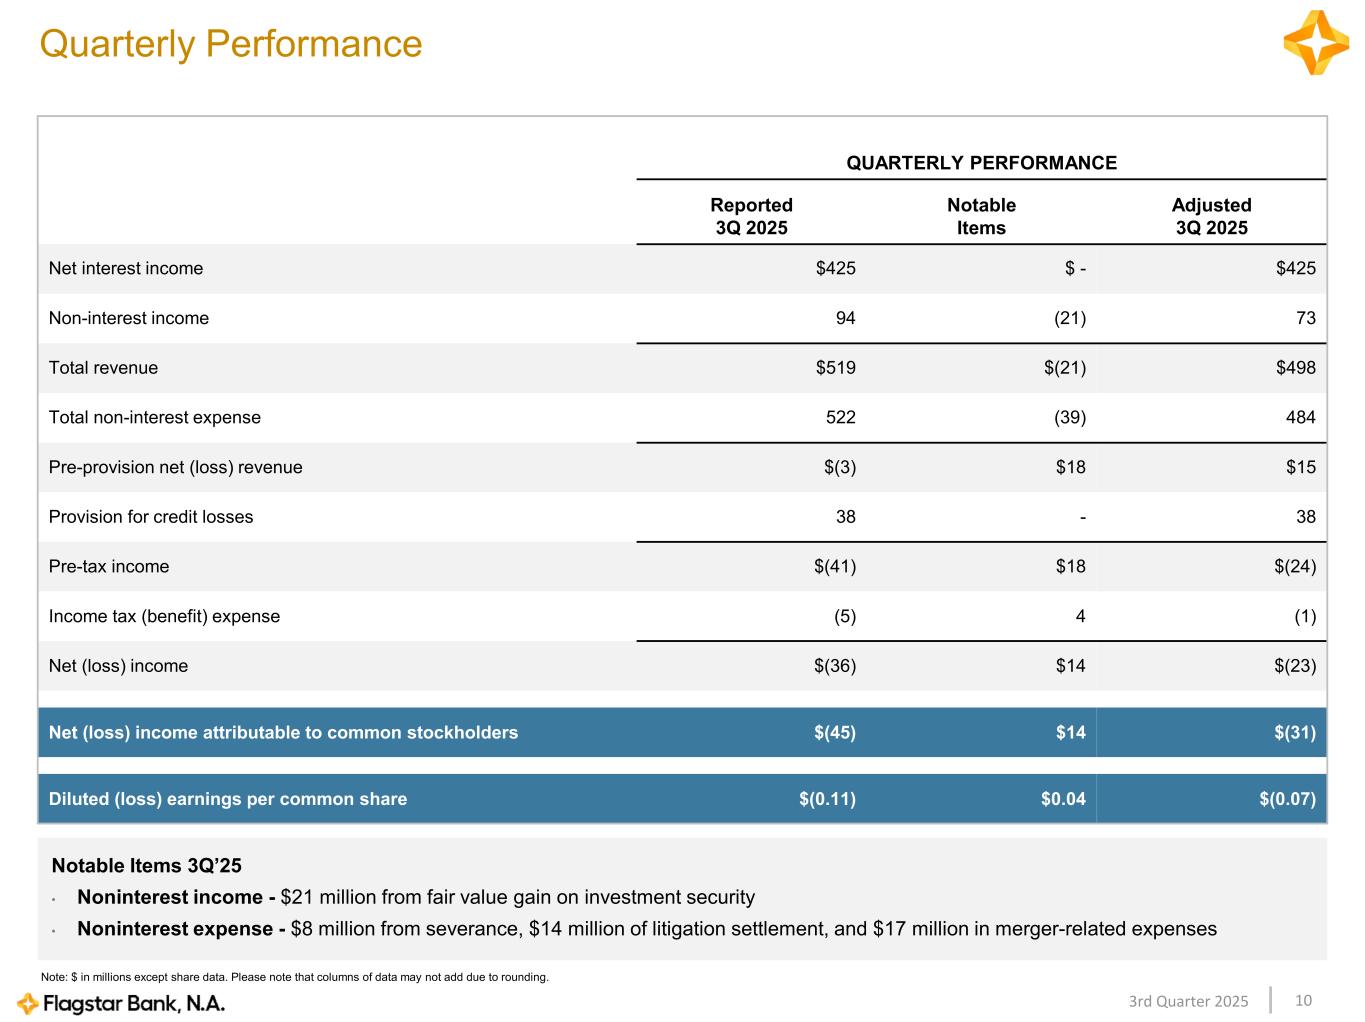
103rd Quarter 2025 Note: $ in millions except share data. Please note that columns of data may not add due to rounding. Quarterly Performance QUARTERLY PERFORMANCE Reported 3Q 2025 Notable Items Adjusted 3Q 2025 Net interest income $425 $ - $425 Non-interest income 94 (21) 73 Total revenue $519 $(21) $498 Total non-interest expense 522 (39) 484 Pre-provision net (loss) revenue $(3) $18 $15 Provision for credit losses 38 - 38 Pre-tax income $(41) $18 $(24) Income tax (benefit) expense (5) 4 (1) Net (loss) income $(36) $14 $(23) Net (loss) income attributable to common stockholders $(45) $14 $(31) Diluted (loss) earnings per common share $(0.11) $0.04 $(0.07) Notable Items 3Q’25 • Noninterest income - $21 million from fair value gain on investment security • Noninterest expense - $8 million from severance, $14 million of litigation settlement, and $17 million in merger-related expenses
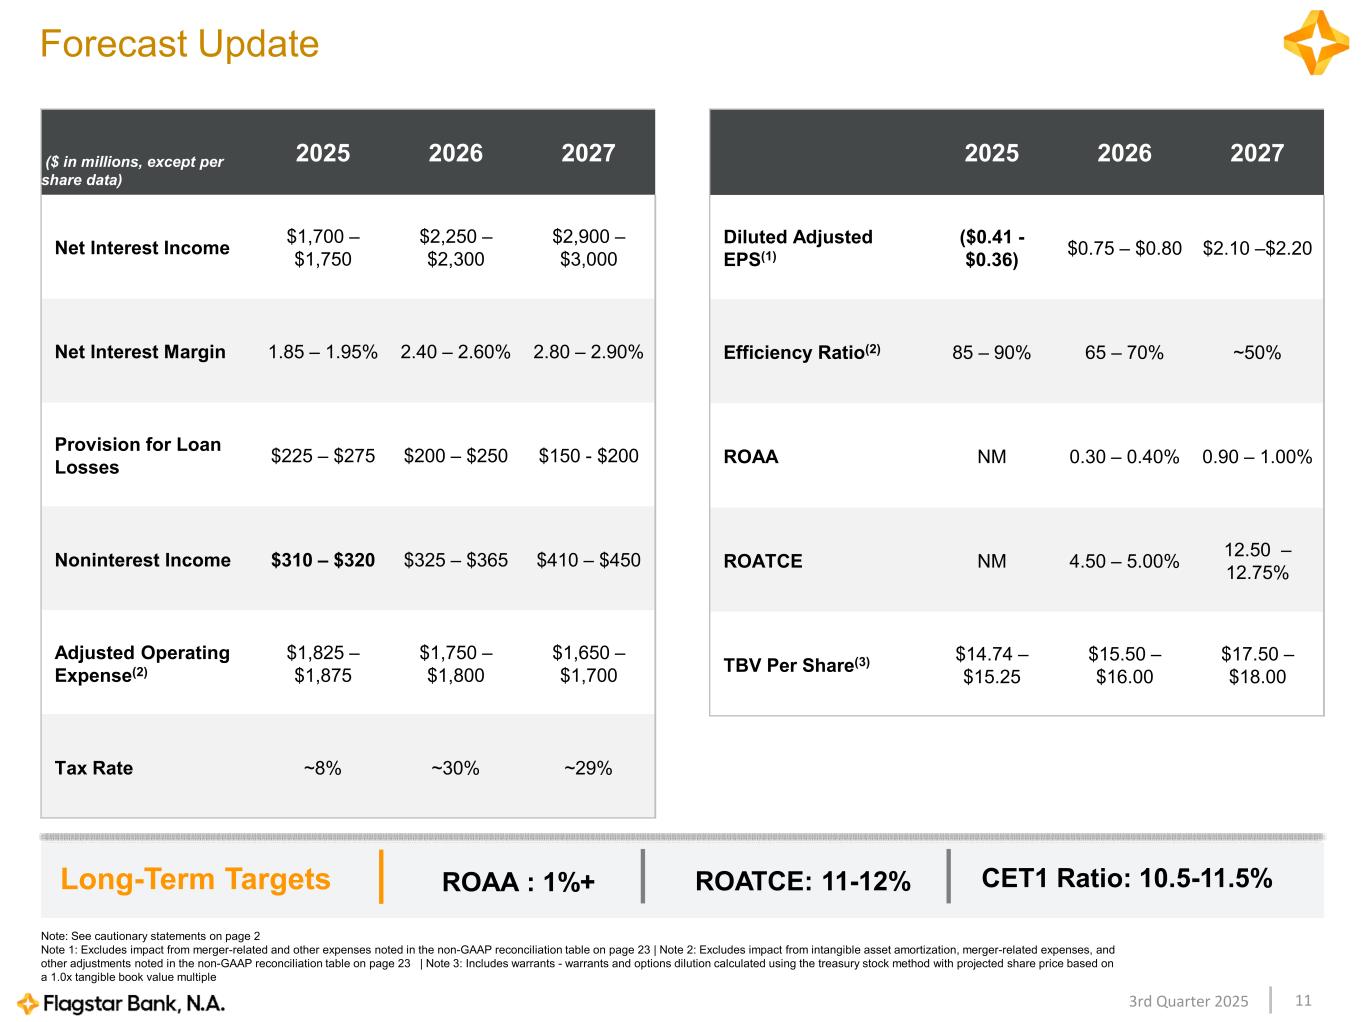
113rd Quarter 2025 2025 2026 2027 Diluted Adjusted EPS(1) ($0.41 - $0.36) $0.75 – $0.80 $2.10 –$2.20 Efficiency Ratio(2) 85 – 90% 65 – 70% ~50% ROAA NM 0.30 – 0.40% 0.90 – 1.00% ROATCE NM 4.50 – 5.00% 12.50 – 12.75% TBV Per Share(3) $14.74 – $15.25 $15.50 – $16.00 $17.50 – $18.00 Forecast Update Note: See cautionary statements on page 2 Note 1: Excludes impact from merger-related and other expenses noted in the non-GAAP reconciliation table on page 23 | Note 2: Excludes impact from intangible asset amortization, merger-related expenses, and other adjustments noted in the non-GAAP reconciliation table on page 23 | Note 3: Includes warrants - warrants and options dilution calculated using the treasury stock method with projected share price based on a 1.0x tangible book value multiple ($ in millions, except per share data) 2025 2026 2027 Net Interest Income $1,700 – $1,750 $2,250 – $2,300 $2,900 – $3,000 Net Interest Margin 1.85 – 1.95% 2.40 – 2.60% 2.80 – 2.90% Provision for Loan Losses $225 – $275 $200 – $250 $150 - $200 Noninterest Income $310 – $320 $325 – $365 $410 – $450 Adjusted Operating Expense(2) $1,825 – $1,875 $1,750 – $1,800 $1,650 – $1,700 Tax Rate ~8% ~30% ~29% Long-Term Targets ROAA : 1%+ ROATCE: 11-12% CET1 Ratio: 10.5-11.5%
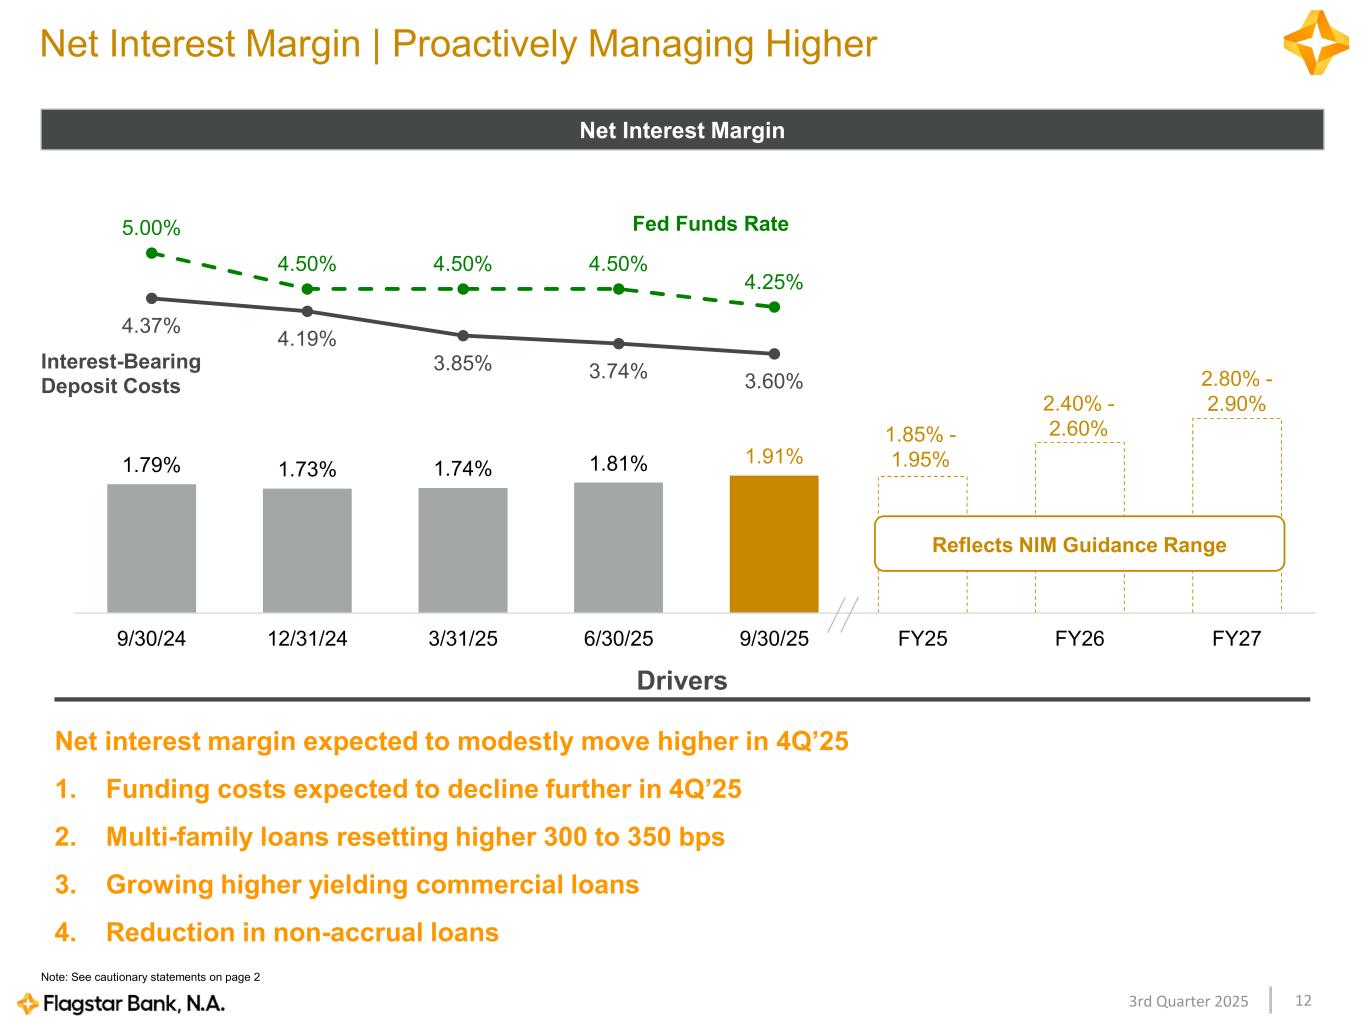
123rd Quarter 2025 FY25 FY26 FY27 1.79% 1.73% 1.74% 1.81% 1.91% 4.37% 4.19% 3.85% 3.74% 3.60% 5.00% 4.50% 4.50% 4.50% 4.25% 9/30/24 12/31/24 3/31/25 6/30/25 9/30/25 Net Interest Margin | Proactively Managing Higher Net Interest Margin Net interest margin expected to modestly move higher in 4Q’25 1. Funding costs expected to decline further in 4Q’25 2. Multi-family loans resetting higher 300 to 350 bps 3. Growing higher yielding commercial loans 4. Reduction in non-accrual loans Drivers Note: See cautionary statements on page 2 Interest-Bearing Deposit Costs Fed Funds Rate Reflects NIM Guidance Range 1.85% - 1.95% 2.40% - 2.60% 2.80% - 2.90%
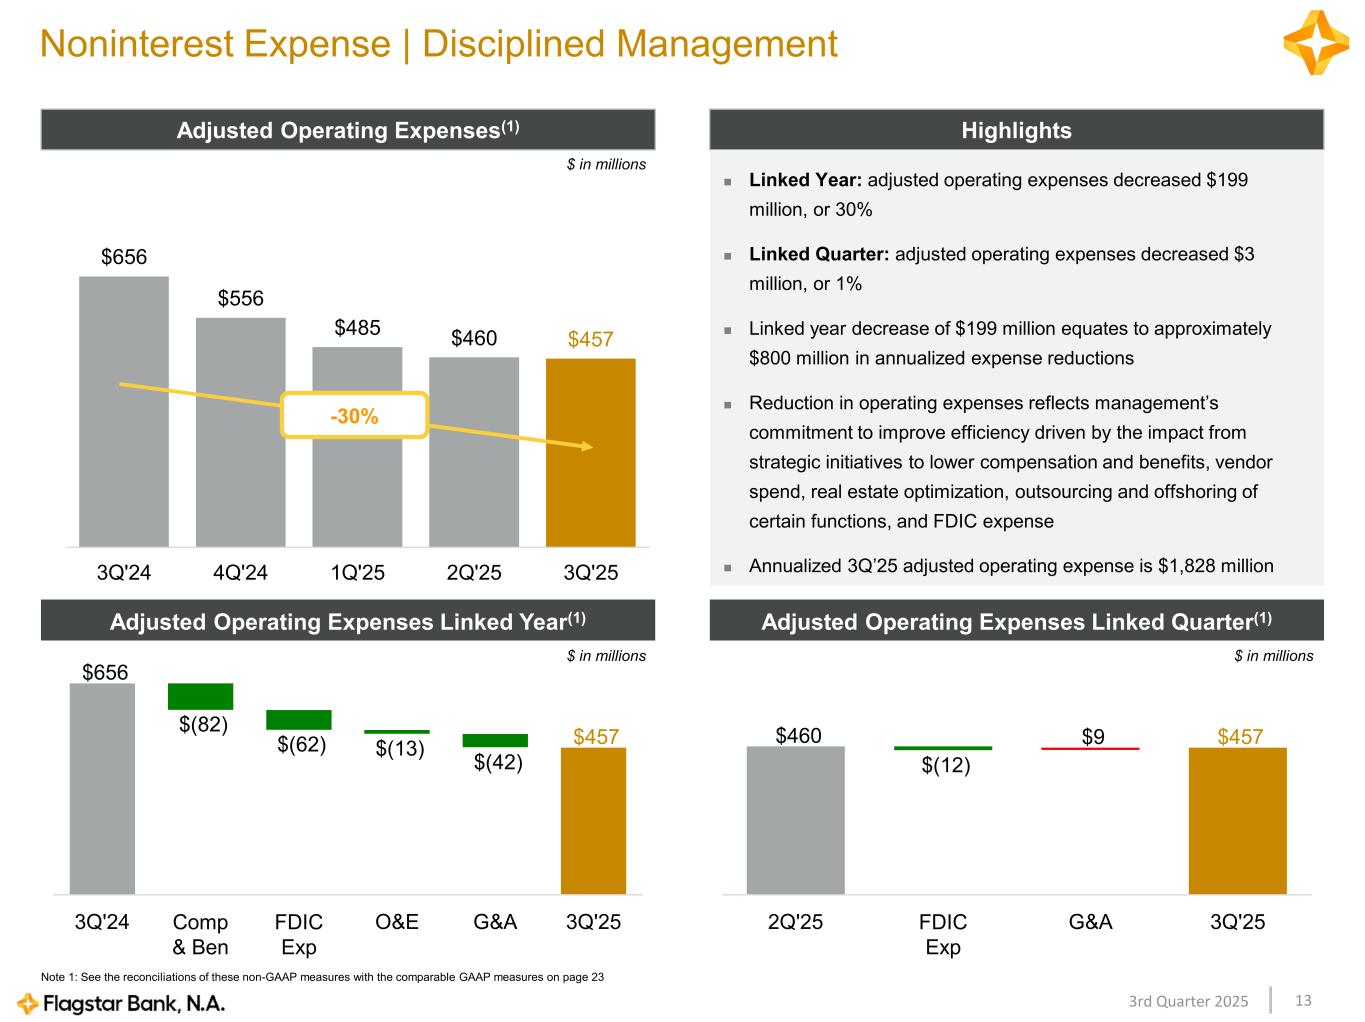
133rd Quarter 2025 $656 $556 $485 $460 $457 3Q'24 4Q'24 1Q'25 2Q'25 3Q'25 Noninterest Expense | Disciplined Management Highlights Linked Year: adjusted operating expenses decreased $199 million, or 30% Linked Quarter: adjusted operating expenses decreased $3 million, or 1% Linked year decrease of $199 million equates to approximately $800 million in annualized expense reductions Reduction in operating expenses reflects management’s commitment to improve efficiency driven by the impact from strategic initiatives to lower compensation and benefits, vendor spend, real estate optimization, outsourcing and offshoring of certain functions, and FDIC expense Annualized 3Q’25 adjusted operating expense is $1,828 million Adjusted Operating Expenses(1) -30% $460 $(12) $9 $457 2Q'25 FDIC Exp G&A 3Q'25 Adjusted Operating Expenses Linked Quarter(1) Note 1: See the reconciliations of these non-GAAP measures with the comparable GAAP measures on page 23 Adjusted Operating Expenses Linked Year(1) $656 $(82) $(62) $(13) $(42) $457 3Q'24 Comp & Ben FDIC Exp O&E G&A 3Q'25 $ in millions $ in millions $ in millions
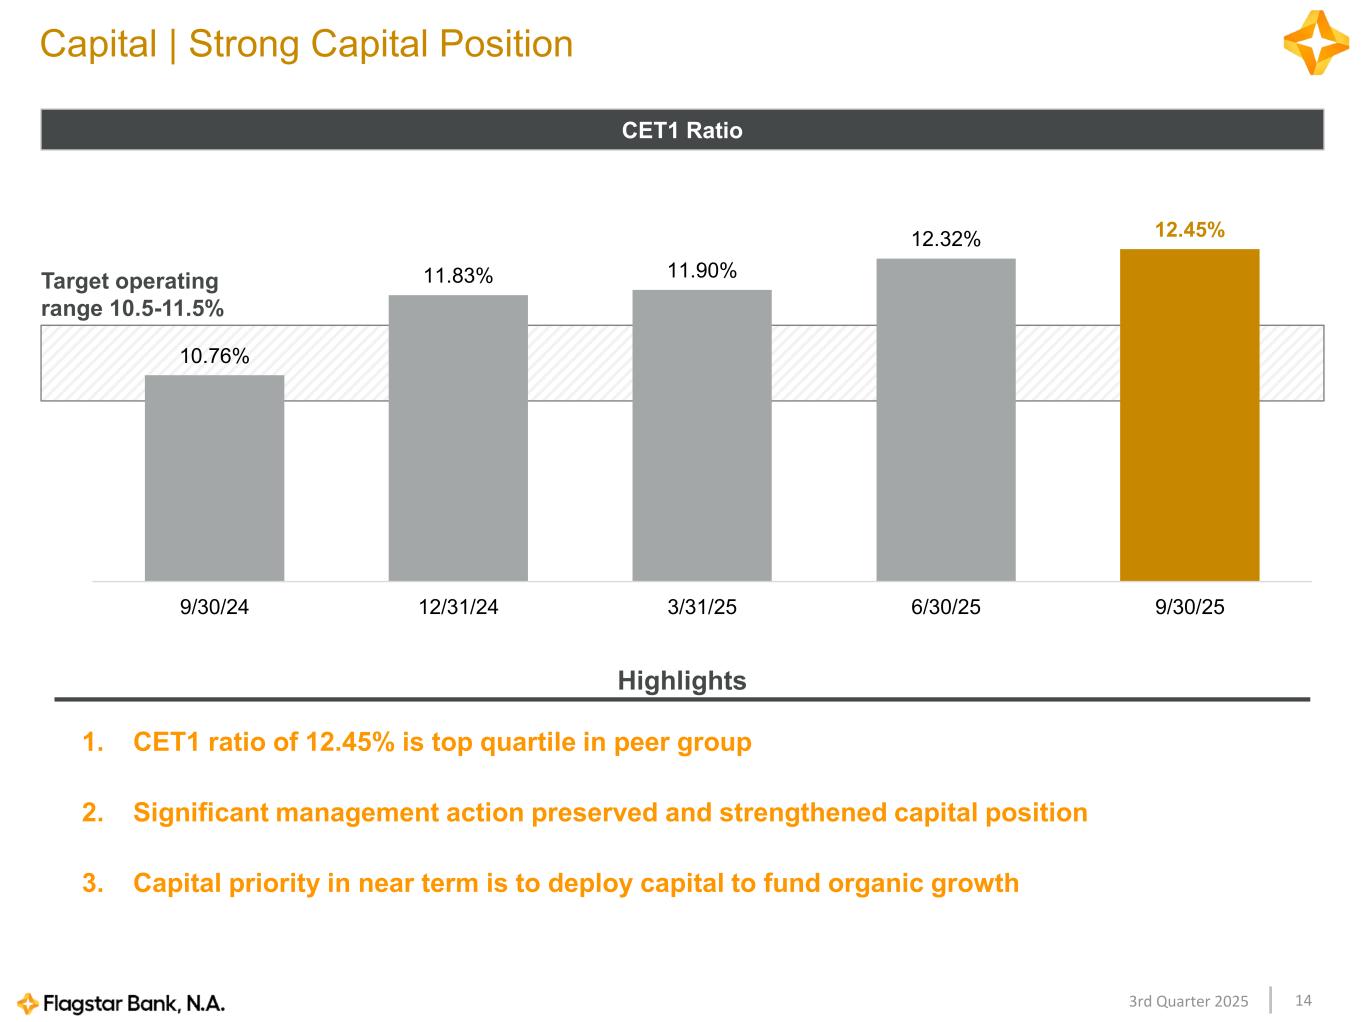
143rd Quarter 2025 10.76% 11.83% 11.90% 12.32% 12.45% 9/30/24 12/31/24 3/31/25 6/30/25 9/30/25 Capital | Strong Capital Position CET1 Ratio Target operating range 10.5-11.5% 1. CET1 ratio of 12.45% is top quartile in peer group 2. Significant management action preserved and strengthened capital position 3. Capital priority in near term is to deploy capital to fund organic growth Highlights
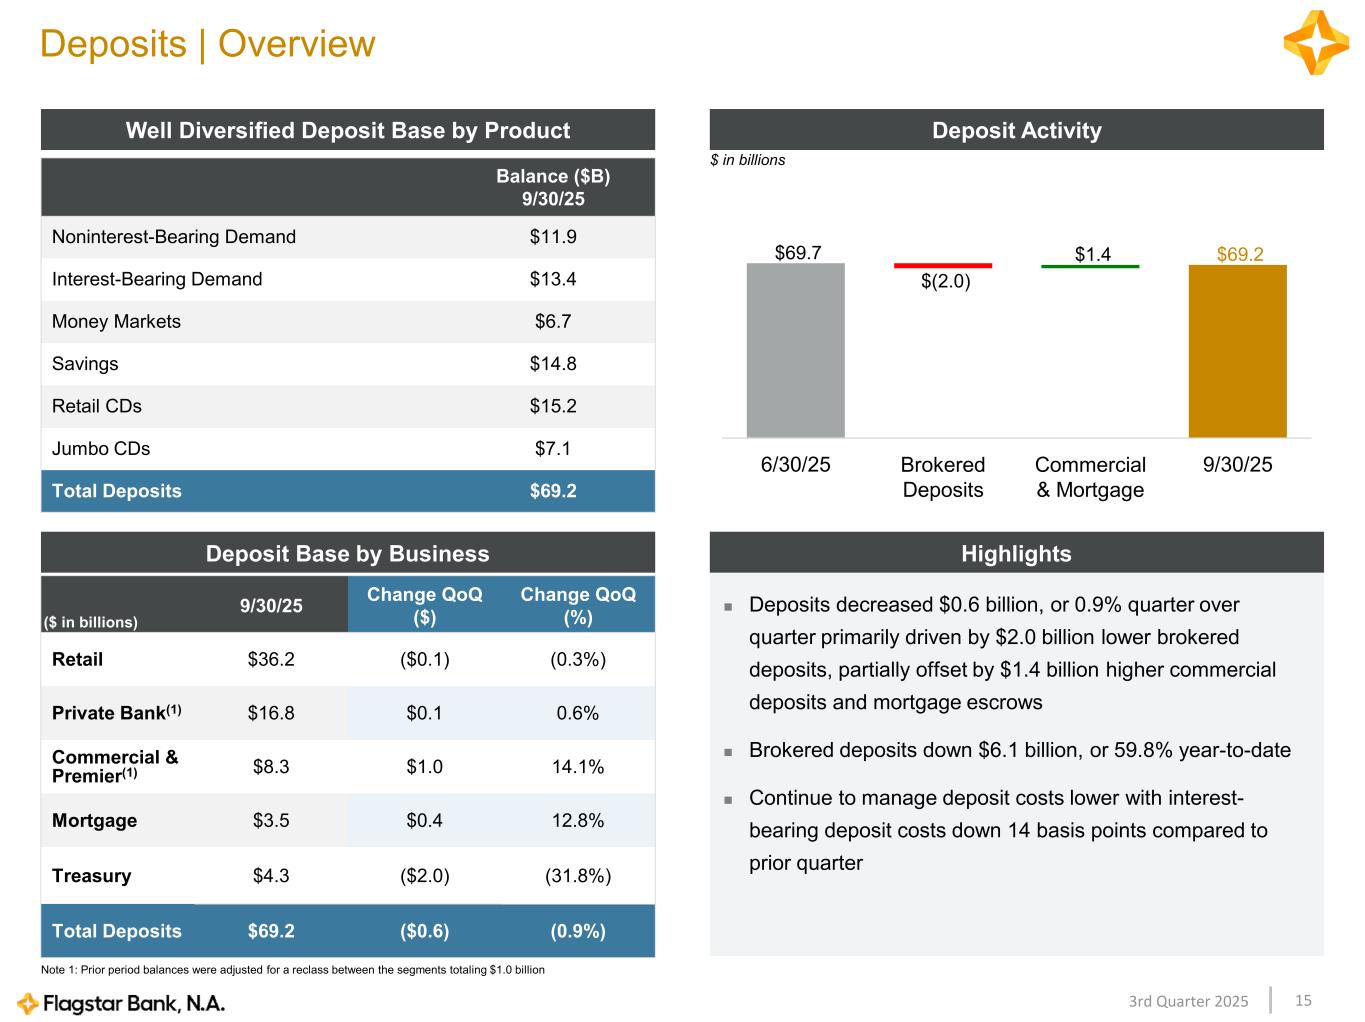
153rd Quarter 2025 Balance ($B) 9/30/25 Noninterest-Bearing Demand $11.9 Interest-Bearing Demand $13.4 Money Markets $6.7 Savings $14.8 Retail CDs $15.2 Jumbo CDs $7.1 Total Deposits $69.2 Deposits | Overview Deposit ActivityWell Diversified Deposit Base by Product Deposits decreased $0.6 billion, or 0.9% quarter over quarter primarily driven by $2.0 billion lower brokered deposits, partially offset by $1.4 billion higher commercial deposits and mortgage escrows Brokered deposits down $6.1 billion, or 59.8% year-to-date Continue to manage deposit costs lower with interest- bearing deposit costs down 14 basis points compared to prior quarter HighlightsDeposit Base by Business ($ in billions) 9/30/25 Change QoQ ($) Change QoQ (%) Retail $36.2 ($0.1) (0.3%) Private Bank(1) $16.8 $0.1 0.6% Commercial & Premier(1) $8.3 $1.0 14.1% Mortgage $3.5 $0.4 12.8% Treasury $4.3 ($2.0) (31.8%) Total Deposits $69.2 ($0.6) (0.9%) $ in billions $69.7 $(2.0) $1.4 $69.2 6/30/25 Brokered Deposits Commercial & Mortgage 9/30/25 Note 1: Prior period balances were adjusted for a reclass between the segments totaling $1.0 billion
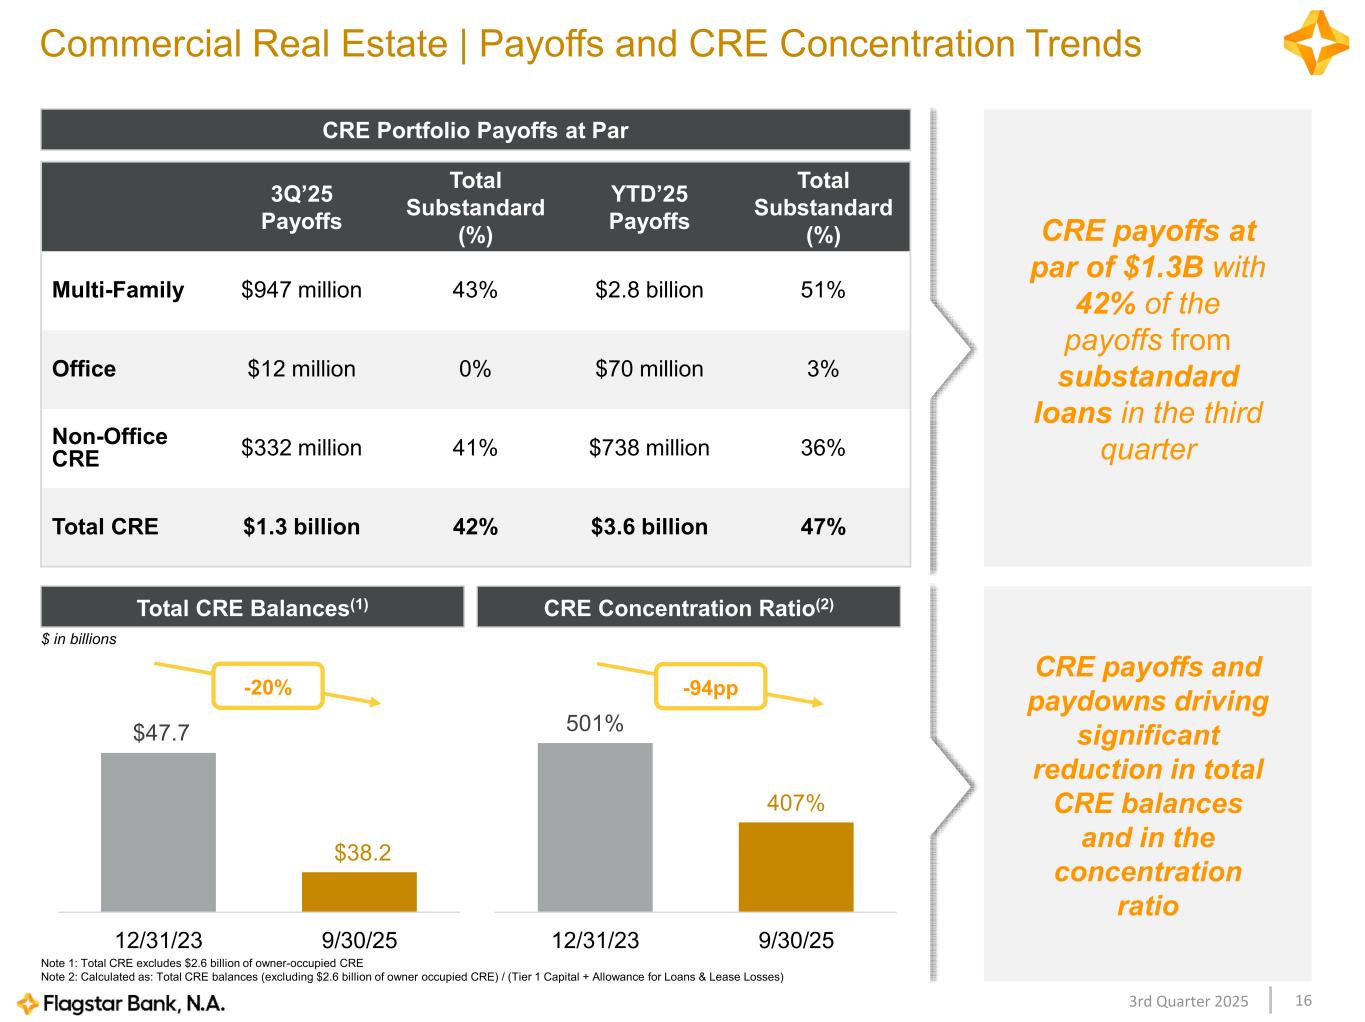
163rd Quarter 2025 Commercial Real Estate | Payoffs and CRE Concentration Trends 3Q’25 Payoffs Total Substandard (%) YTD’25 Payoffs Total Substandard (%) Multi-Family $947 million 43% $2.8 billion 51% Office $12 million 0% $70 million 3% Non-Office CRE $332 million 41% $738 million 36% Total CRE $1.3 billion 42% $3.6 billion 47% CRE payoffs at par of $1.3B with 42% of the payoffs from substandard loans in the third quarter CRE Portfolio Payoffs at Par 501% 407% 12/31/23 9/30/25 Total CRE Balances(1) CRE payoffs and paydowns driving significant reduction in total CRE balances and in the concentration ratio -94pp $47.7 $38.2 12/31/23 9/30/25 CRE Concentration Ratio(2) $ in billions -20% Note 1: Total CRE excludes $2.6 billion of owner-occupied CRE Note 2: Calculated as: Total CRE balances (excluding $2.6 billion of owner occupied CRE) / (Tier 1 Capital + Allowance for Loans & Lease Losses)
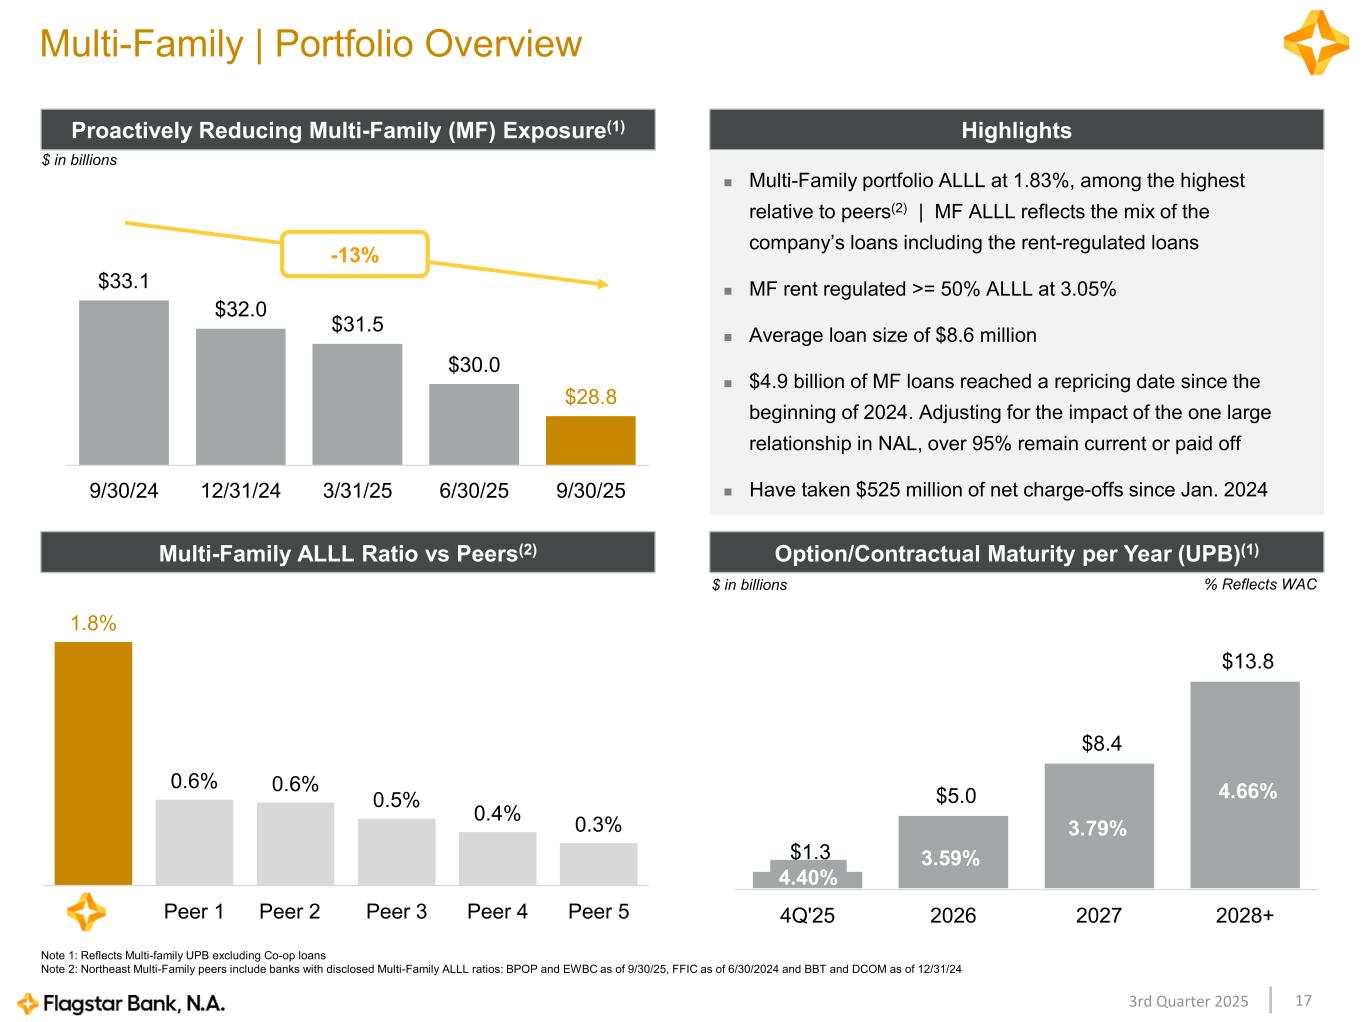
173rd Quarter 2025 Multi-Family | Portfolio Overview Highlights Multi-Family portfolio ALLL at 1.83%, among the highest relative to peers(2) | MF ALLL reflects the mix of the company’s loans including the rent-regulated loans MF rent regulated >= 50% ALLL at 3.05% Average loan size of $8.6 million $4.9 billion of MF loans reached a repricing date since the beginning of 2024. Adjusting for the impact of the one large relationship in NAL, over 95% remain current or paid off Have taken $525 million of net charge-offs since Jan. 2024 $33.1 $32.0 $31.5 $30.0 $28.8 9/30/24 12/31/24 3/31/25 6/30/25 9/30/25 Proactively Reducing Multi-Family (MF) Exposure(1) -13% Note 1: Reflects Multi-family UPB excluding Co-op loans Note 2: Northeast Multi-Family peers include banks with disclosed Multi-Family ALLL ratios: BPOP and EWBC as of 9/30/25, FFIC as of 6/30/2024 and BBT and DCOM as of 12/31/24 $ in billions 1.8% 0.6% 0.6% 0.5% 0.4% 0.3% Peer 1 Peer 2 Peer 3 Peer 4 Peer 5 Multi-Family ALLL Ratio vs Peers(2) $1.3 $5.0 $8.4 $13.8 4Q'25 2026 2027 2028+ Option/Contractual Maturity per Year (UPB)(1) $ in billions 4.40% 3.59% 3.79% 4.66% % Reflects WAC
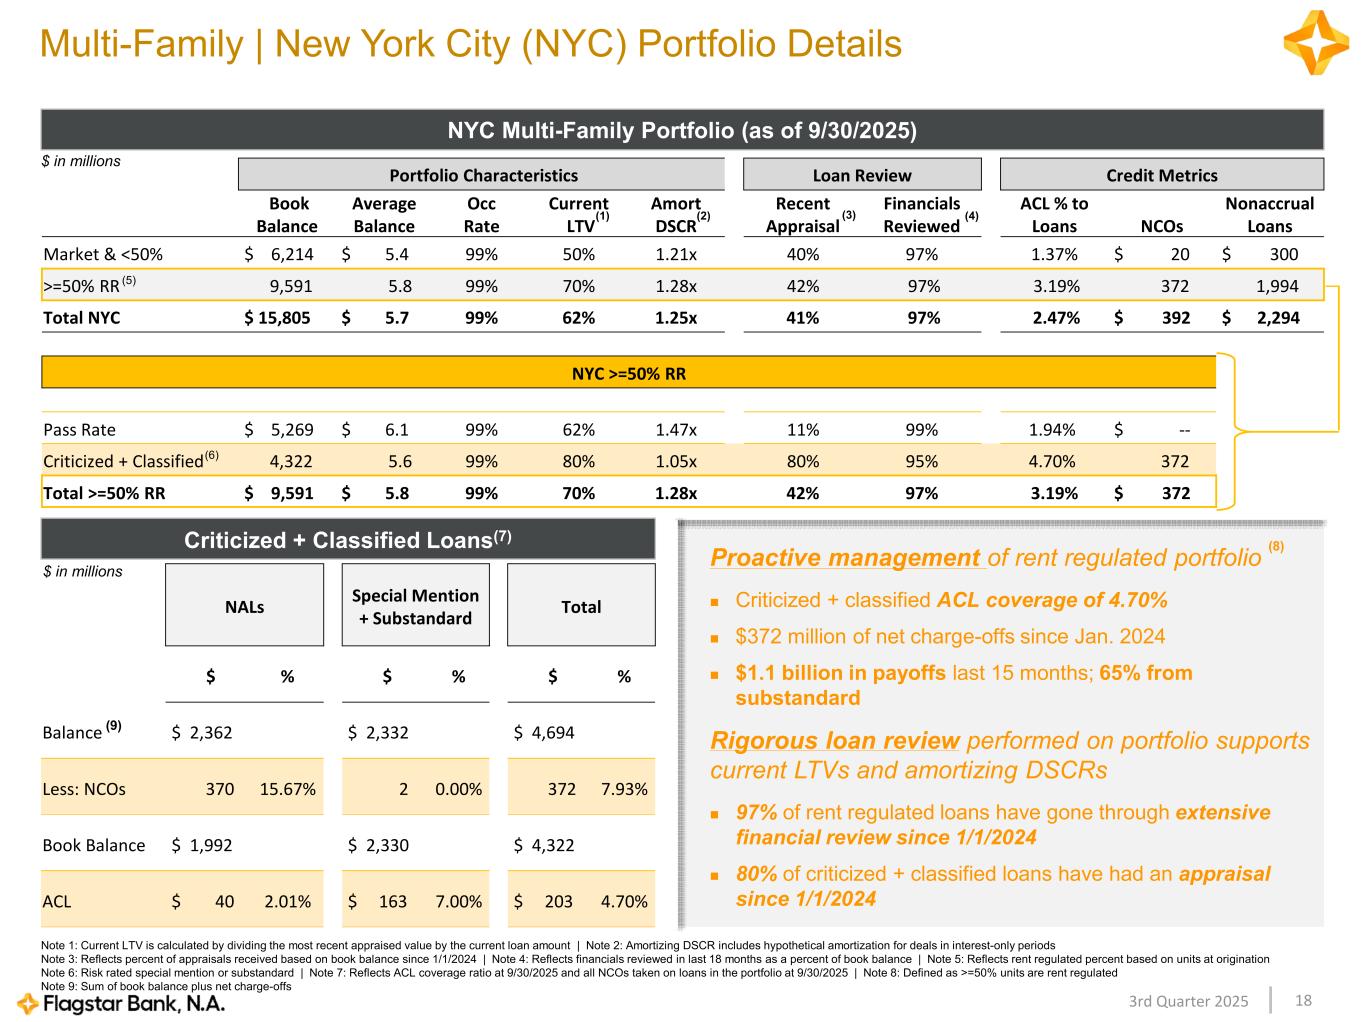
183rd Quarter 2025 Portfolio Characteristics Loan Review Credit Metrics Book Balance Average Balance Occ Rate Current LTV Amort DSCR Recent Appraisal Financials Reviewed ACL % to Loans NCOs Nonaccrual Loans Market & <50% $ 6,214 $ 5.4 99% 50% 1.21x 40% 97% 1.37% $ 20 $ 300 >=50% RR 9,591 5.8 99% 70% 1.28x 42% 97% 3.19% 372 1,994 Total NYC $ 15,805 $ 5.7 99% 62% 1.25x 41% 97% 2.47% $ 392 $ 2,294 NYC >=50% RR Pass Rate $ 5,269 $ 6.1 99% 62% 1.47x 11% 99% 1.94% $ -- Criticized + Classified 4,322 5.6 99% 80% 1.05x 80% 95% 4.70% 372 Total >=50% RR $ 9,591 $ 5.8 99% 70% 1.28x 42% 97% 3.19% $ 372 Multi-Family | New York City (NYC) Portfolio Details NYC Multi-Family Portfolio (as of 9/30/2025) $ in millions (5) (1) (2) (3) (4) Proactive management of rent regulated portfolio Criticized + classified ACL coverage of 4.70% $372 million of net charge-offs since Jan. 2024 $1.1 billion in payoffs last 15 months; 65% from substandard Rigorous loan review performed on portfolio supports current LTVs and amortizing DSCRs 97% of rent regulated loans have gone through extensive financial review since 1/1/2024 80% of criticized + classified loans have had an appraisal since 1/1/2024 Criticized + Classified Loans(7) $ in millions (6) Note 1: Current LTV is calculated by dividing the most recent appraised value by the current loan amount | Note 2: Amortizing DSCR includes hypothetical amortization for deals in interest-only periods Note 3: Reflects percent of appraisals received based on book balance since 1/1/2024 | Note 4: Reflects financials reviewed in last 18 months as a percent of book balance | Note 5: Reflects rent regulated percent based on units at origination Note 6: Risk rated special mention or substandard | Note 7: Reflects ACL coverage ratio at 9/30/2025 and all NCOs taken on loans in the portfolio at 9/30/2025 | Note 8: Defined as >=50% units are rent regulated Note 9: Sum of book balance plus net charge-offs (8) NALs Special Mention + Substandard Total $ % $ % $ % Balance $ 2,362 $ 2,332 $ 4,694 Less: NCOs 370 15.67% 2 0.00% 372 7.93% Book Balance $ 1,992 $ 2,330 $ 4,322 ACL $ 40 2.01% $ 163 7.00% $ 203 4.70% (9)
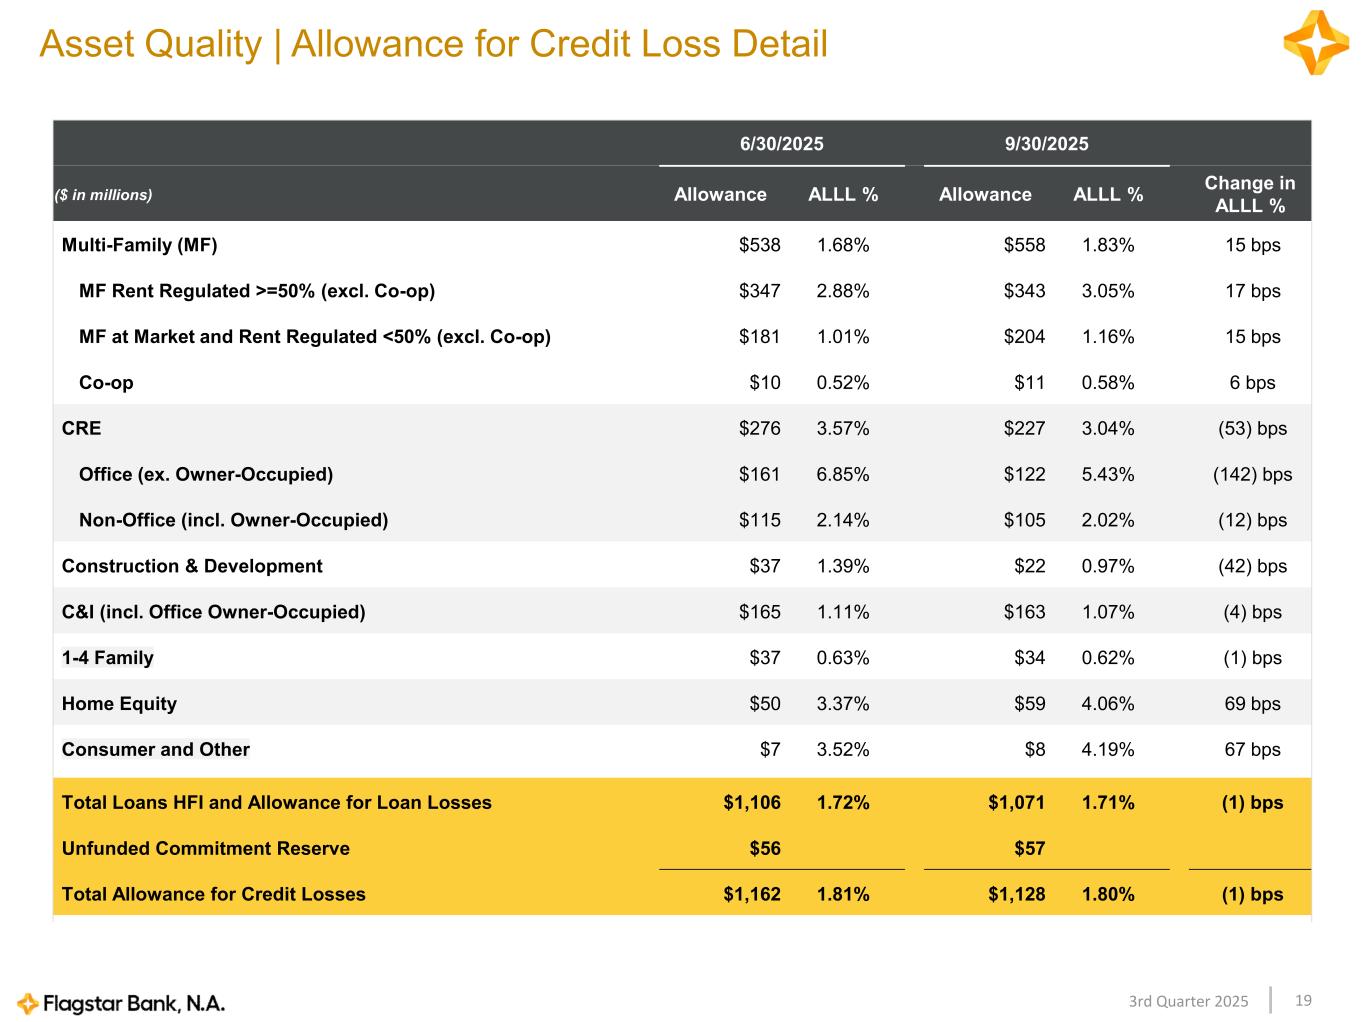
193rd Quarter 2025 6/30/2025 9/30/2025 ($ in millions) Allowance ALLL % Allowance ALLL % Change in ALLL % Multi-Family (MF) $538 1.68% $558 1.83% 15 bps MF Rent Regulated >=50% (excl. Co-op) $347 2.88% $343 3.05% 17 bps MF at Market and Rent Regulated <50% (excl. Co-op) $181 1.01% $204 1.16% 15 bps Co-op $10 0.52% $11 0.58% 6 bps CRE $276 3.57% $227 3.04% (53) bps Office (ex. Owner-Occupied) $161 6.85% $122 5.43% (142) bps Non-Office (incl. Owner-Occupied) $115 2.14% $105 2.02% (12) bps Construction & Development $37 1.39% $22 0.97% (42) bps C&I (incl. Office Owner-Occupied) $165 1.11% $163 1.07% (4) bps 1-4 Family $37 0.63% $34 0.62% (1) bps Home Equity $50 3.37% $59 4.06% 69 bps Consumer and Other $7 3.52% $8 4.19% 67 bps Total Loans HFI and Allowance for Loan Losses $1,106 1.72% $1,071 1.71% (1) bps Unfunded Commitment Reserve $56 $57 Total Allowance for Credit Losses $1,162 1.81% $1,128 1.80% (1) bps Asset Quality | Allowance for Credit Loss Detail
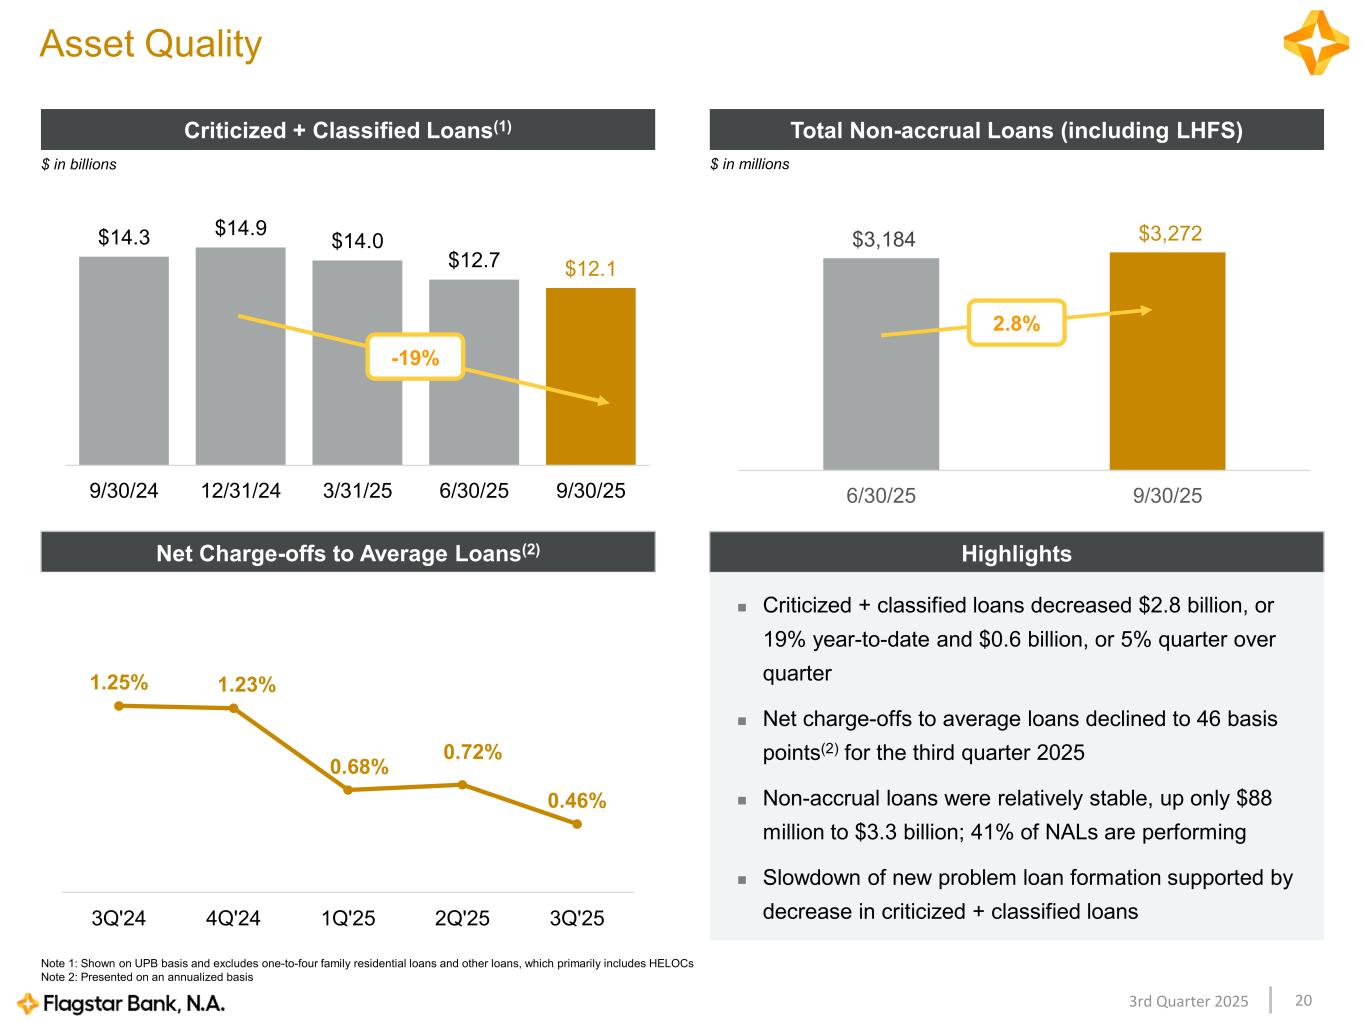
203rd Quarter 2025 Asset Quality Criticized + Classified Loans(1) Total Non-accrual Loans (including LHFS) Note 1: Shown on UPB basis and excludes one-to-four family residential loans and other loans, which primarily includes HELOCs Note 2: Presented on an annualized basis Highlights Criticized + classified loans decreased $2.8 billion, or 19% year-to-date and $0.6 billion, or 5% quarter over quarter Net charge-offs to average loans declined to 46 basis points(2) for the third quarter 2025 Non-accrual loans were relatively stable, up only $88 million to $3.3 billion; 41% of NALs are performing Slowdown of new problem loan formation supported by decrease in criticized + classified loans Net Charge-offs to Average Loans(2) 1.25% 1.23% 0.68% 0.72% 0.46% 3Q'24 4Q'24 1Q'25 2Q'25 3Q'25 $14.3 $14.9 $14.0 $12.7 $12.1 9/30/24 12/31/24 3/31/25 6/30/25 9/30/25 $3,184 $3,272 6/30/25 9/30/25 $ in millions$ in billions 2.8% -19%

Appendix
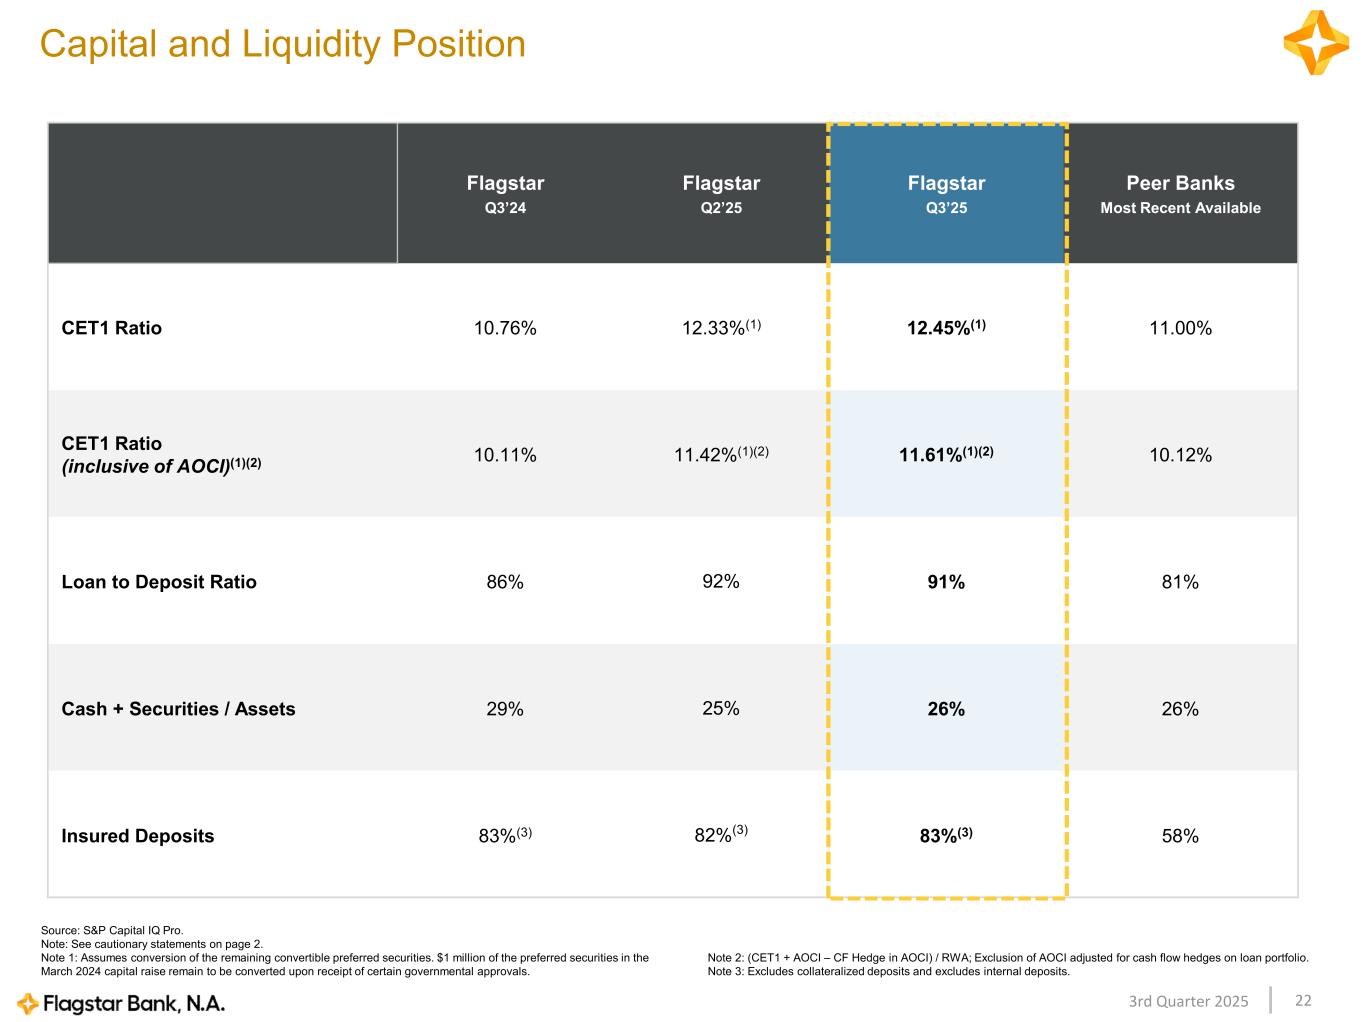
223rd Quarter 2025 Flagstar Q3’24 Flagstar Q2’25 Flagstar Q3’25 Peer Banks Most Recent Available CET1 Ratio 10.76% 12.33%(1) 12.45%(1) 11.00% CET1 Ratio (inclusive of AOCI)(1)(2) 10.11% 11.42%(1)(2) 11.61%(1)(2) 10.12% Loan to Deposit Ratio 86% 92% 91% 81% Cash + Securities / Assets 29% 25% 26% 26% Insured Deposits 83%(3) 82%(3) 83%(3) 58% Source: S&P Capital IQ Pro. Note: See cautionary statements on page 2. Note 1: Assumes conversion of the remaining convertible preferred securities. $1 million of the preferred securities in the March 2024 capital raise remain to be converted upon receipt of certain governmental approvals. Note 2: (CET1 + AOCI – CF Hedge in AOCI) / RWA; Exclusion of AOCI adjusted for cash flow hedges on loan portfolio. Note 3: Excludes collateralized deposits and excludes internal deposits. Capital and Liquidity Position
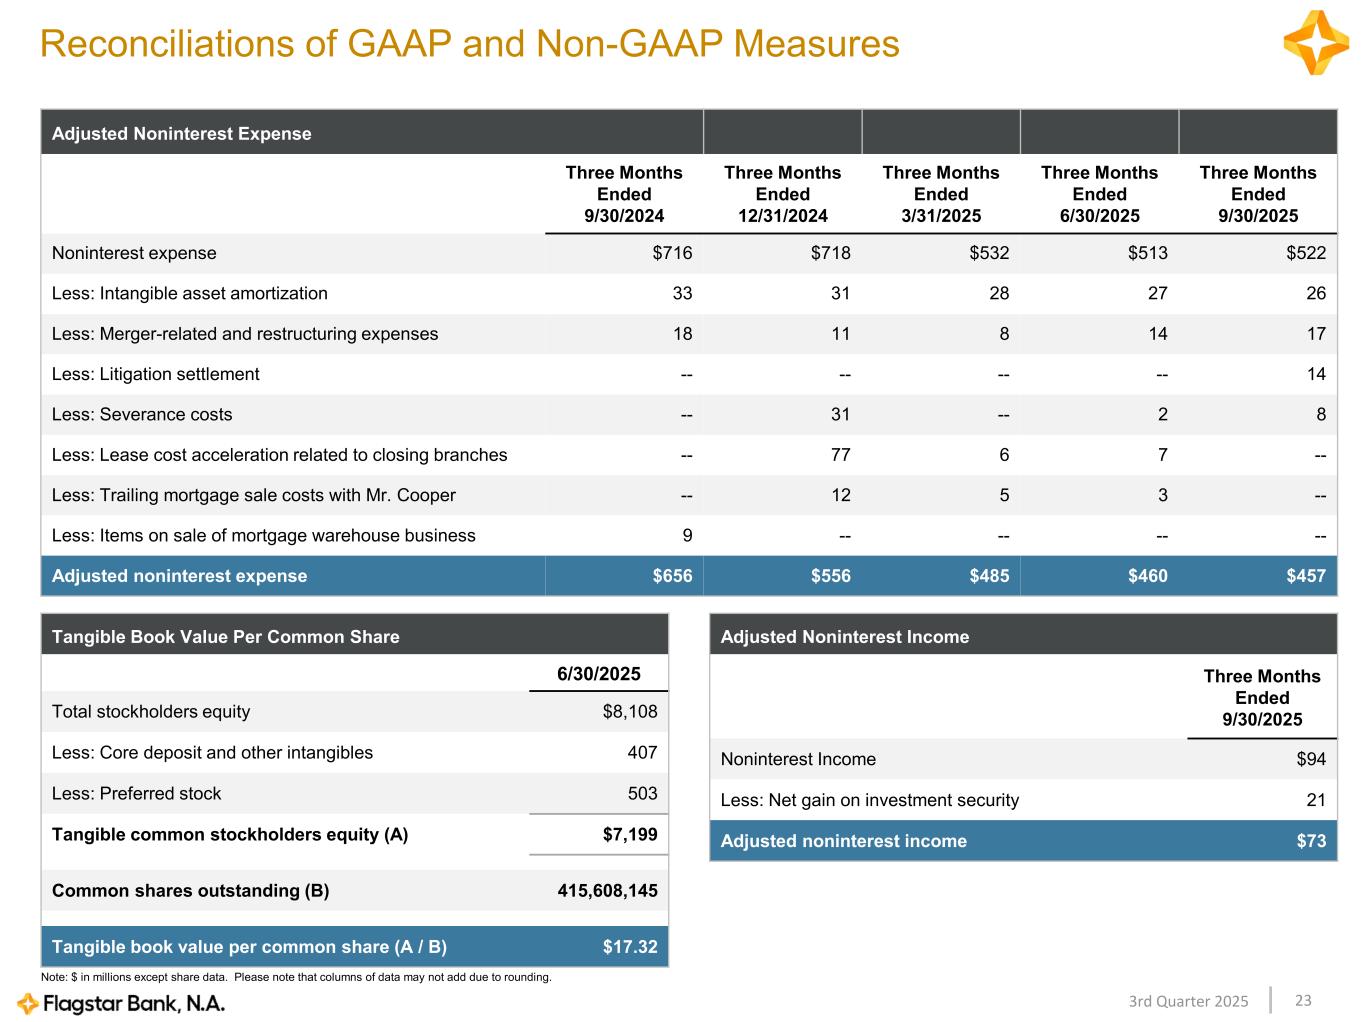
233rd Quarter 2025 Note: $ in millions except share data. Please note that columns of data may not add due to rounding. Reconciliations of GAAP and Non-GAAP Measures Tangible Book Value Per Common Share 6/30/2025 Total stockholders equity $8,108 Less: Core deposit and other intangibles 407 Less: Preferred stock 503 Tangible common stockholders equity (A) $7,199 Common shares outstanding (B) 415,608,145 Tangible book value per common share (A / B) $17.32 Adjusted Noninterest Expense Three Months Ended 9/30/2024 Three Months Ended 12/31/2024 Three Months Ended 3/31/2025 Three Months Ended 6/30/2025 Three Months Ended 9/30/2025 Noninterest expense $716 $718 $532 $513 $522 Less: Intangible asset amortization 33 31 28 27 26 Less: Merger-related and restructuring expenses 18 11 8 14 17 Less: Litigation settlement -- -- -- -- 14 Less: Severance costs -- 31 -- 2 8 Less: Lease cost acceleration related to closing branches -- 77 6 7 -- Less: Trailing mortgage sale costs with Mr. Cooper -- 12 5 3 -- Less: Items on sale of mortgage warehouse business 9 -- -- -- -- Adjusted noninterest expense $656 $556 $485 $460 $457 Adjusted Noninterest Income Three Months Ended 9/30/2025 Noninterest Income $94 Less: Net gain on investment security 21 Adjusted noninterest income $73
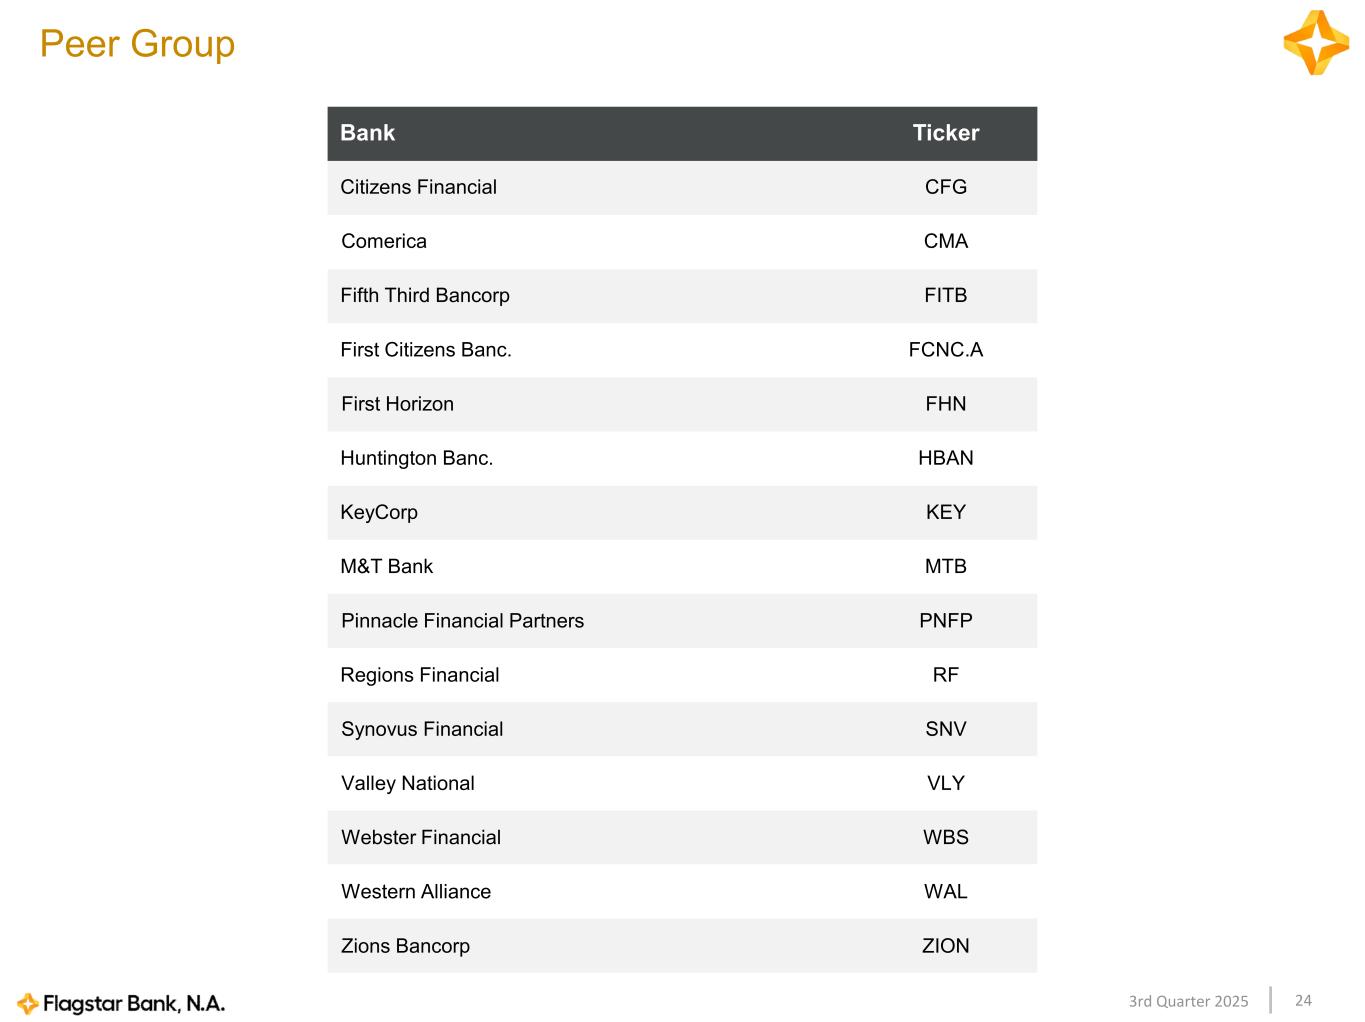
243rd Quarter 2025 Bank Ticker Citizens Financial CFG Comerica CMA Fifth Third Bancorp FITB First Citizens Banc. FCNC.A First Horizon FHN Huntington Banc. HBAN KeyCorp KEY M&T Bank MTB Pinnacle Financial Partners PNFP Regions Financial RF Synovus Financial SNV Valley National VLY Webster Financial WBS Western Alliance WAL Zions Bancorp ZION Peer Group