We own 42 million square feet of real estate consisting primarily of interests in 39 regional retail centers that serve as community cornerstones. As a leading owner, operator and developer of high-quality retail real estate in densely populated and attractive U.S. markets, our portfolio is concentrated in California, the Pacific Northwest, Phoenix/Scottsdale, and the Metro New York to Washington, D.C. corridor. We are firmly dedicated to advancing environmental goals, social good and sound corporate governance. As a recognized leader in sustainability, The Macerich Company (the “Company”) has achieved a #1 GRESB ranking for the North American retail sector for ten consecutive years.
Results for the Quarter:
•The net loss attributable to the Company was $40.9 million, or $0.16 per share-diluted, during the second quarter of 2025, compared to the net income attributable to the Company of $252.0 million, or $1.16 per share-diluted, for the quarter ended June 30, 2024. The primary change in net (loss) income attributable to the Company between the second quarter of 2025 compared to the same period in 2024 is the gain on sale of asset of $334.3 million recorded in the three months ended June 30, 2024 related to the Chandler Fashion Center transaction.
•Funds from Operations (“FFO”) excluding financing expense in connection with Chandler Freehold, accrued default interest expense and loss on non-real estate investments was $87.3 million, or $0.33 per share-diluted, during the second quarter of 2025, compared to $88.1 million, or $0.39 per share-diluted, for FFO excluding financing expense in connection with Chandler Freehold, accrued default interest expense and loss on non-real estate investments for the quarter ended June 30, 2024.
•Go-Forward Portfolio Centers net operating income (“NOI”), excluding lease termination income, increased 2.4% in the second quarter of 2025 compared to the second quarter of 2024.
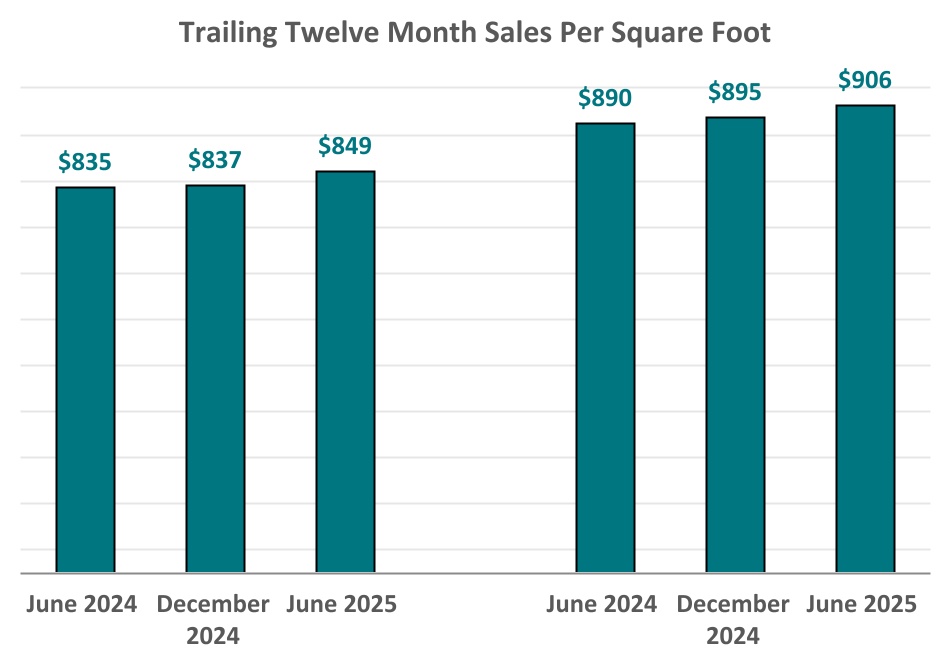
•Portfolio tenant sales per square foot for space less than 10,000 square feet for the trailing twelve months ended June 30, 2025 were $849 compared to $837 for the twelve months ended March 31, 2025 and $835 for the twelve months ended June 30, 2024. Go-forward Portfolio Centers sales per square foot for spaces less than 10,000 square feet for the trailing twelve months ended June 30, 2025 were $906.
•Portfolio occupancy as of June 30, 2025 was 92.0%, a 1.4% decrease compared to the 93.3% occupancy rate at June 30, 2024 and a 0.6% decrease compared to the 92.6% occupancy rate at March 31, 2025. The decrease was driven primarily by Forever 21 closures. Go-forward Portfolio Center occupancy as of June 30, 2025 was 92.8%.
•During the second quarter of 2025, we signed leases for 1.7 million square feet, an 137% increase in leased square footage compared to the second quarter of 2024, on a comparable center basis.
•New store leases are expected to produce total gross revenue of approximately $87 million at our share in excess of the revenue generated in 2024 from prior uses in those same spaces. This new store leasing pipeline represents a cumulative and incremental estimate and includes open stores, leases signed not open, and leases in documentation that will or have commenced from 2024 through 2028.
•Base rent re-leasing spreads were 10.5% greater than expiring base rent for the trailing twelve months ended June 30, 2025. This was the fifteenth consecutive quarter of positive base rent leasing spreads.
Balance Sheet:
During the second quarter of 2025, and subsequent-to quarter-end, we were actively engaged in numerous transactions, including the following financing, acquisition, and disposition activity:
•On April 30, 2025, we closed on the sale of SouthPark for $11 million. This asset was unencumbered.
•On June 23, 2025, we closed on the acquisition of Crabtree Mall, a market-dominant, Class A retail center totaling approximately 1.3 million square feet in Raleigh, North Carolina for approximately $290 million. The acquisition was initially funded with cash on hand and $100 million of borrowings on our revolving line of credit.
•On July 30, 2025, the Company's joint venture closed on the sale of Atlas Park for $72 million. We used our portion of the net proceeds from this sale to repay our portion of the $65 million loan on the property that had an effective interest rate of approximately 9.3% and a 2026 maturity date.
1
The Macerich Company
Executive Summary
June 30, 2025
•On August 7, 2025, we closed on a previously disclosed approximately $160 million two-year term loan with two, one-year extension options on Crabtree Mall. The new loan bears interest at a rate of SOFR + 250. We used a portion of the net proceeds from this financing to fully repay borrowings on the revolving line of credit associated with the purchase of Crabtree Mall.
As of the date of this filing, we had approximately $915 million of liquidity, including $650 million of available capacity on our $650 million revolving line of credit.
Fiscal Year 2024 Guidance
Dividend:
On July 31, 2025, we announced a quarterly cash dividend of $0.17 per share of common stock. The dividend is payable on September 23, 2025 to stockholders of record at the close of business on September 9, 2025.
Investor Conference Call:
We will provide an online Web simulcast and rebroadcast of our quarterly earnings conference call. The call will be available on The Macerich Company’s website at www.macerich.com (Investors Section). The call begins on August 11, 2025 at 2:00 p.m. Pacific Time. To listen to the call, please visit the website at least 15 minutes prior to the call-in order to register and download audio software if needed. An online replay can be accessed at www.macerich.com (Investors Section) until August 25, 2025.
About Macerich and this Document:
The Company is a fully integrated, self-managed and self-administered real estate investment trust, which focuses on the acquisition, leasing, management, development and redevelopment of regional retail centers throughout the United States. The Company is the sole general partner of, and owns a majority of the ownership interests in, The Macerich Partnership, L.P., a Delaware limited partnership (the “Operating Partnership”) and conducts all of its operations through the Operating Partnership and the Company’s management companies.
As of the date of this filing, the Operating Partnership owned or had an ownership interest in 42 million square feet of gross leasable area (“GLA”) consisting primarily of interests in 39 regional retail centers, and one community/power shopping centers. These 40 centers are referred to hereinafter as the “Centers” unless the context requires otherwise. All references to the Company in this document include the Company, those entities owned or controlled by the Company and predecessors of the Company, unless the context indicates otherwise. The Company's "Go-Forward Portfolio Centers" represents the assets included in the go-forward portfolio as described in the Path Forward Plan, which can be found on the Company's website at https://investing.macerich.com/. The Go-Forward Portfolio Centers are subject to change.
Macerich uses, and intends to continue to use, its Investor Relations website, which can be found at https://investing.macerich.com/, as a means of disclosing material nonpublic information and for complying with its disclosure obligations under Regulation FD. Additional information about Macerich can be found though social media platforms such as LinkedIn and Twitter.
The Company presents certain measures in this document on a pro rata basis, which represents (i) the measure on a consolidated basis, minus the Company’s partners’ share of the measure from its consolidated joint ventures (calculated based upon the partners’ percentage ownership interest); plus (ii) the Company’s share of the measure from its unconsolidated joint ventures (calculated based upon the Company’s percentage ownership interest). Management believes that these measures provide useful information to investors regarding its financial condition and/or results of operations because they include the Company’s share of the applicable amount from unconsolidated joint ventures and exclude the Company’s partners’ share from consolidated joint ventures, in each case presented on the same basis. The Company has several significant joint ventures, and the Company believes that presenting various measures in this manner can help investors better understand the Company’s financial condition and/or results of operations after taking into account its economic interest in these joint ventures. Management also uses these measures to evaluate regional property level performance and to make decisions about resource allocations. The Company’s economic interest (as distinct from its legal ownership interest) in certain of its joint ventures could fluctuate from time to time and may not wholly align with its legal ownership interests because of provisions in certain joint venture agreements regarding distributions of cash flow based on capital account balances, allocations of profits and losses, payments of preferred returns and control over major decisions. Additionally, the Company does not control its unconsolidated joint ventures and the presentation of certain items, such as assets, liabilities, revenues and expenses, from these unconsolidated joint ventures does not represent the Company’s legal claim to such items.
Note: This document contains statements that constitute forward-looking statements, which can be identified by the use of words, such as “will,” “expects,” “anticipates,” “assumes,” “believes,” “estimated,” “guidance,” “projects,” “scheduled” and similar expressions that do not relate to historical matters, and includes expectations regarding the Company’s future operational results, including the Path Forward Plan and its ability to meet the established goals under such Plan, as well as development, redevelopment and expansion activities. Stockholders are cautioned that any such forward-looking statements are not guarantees of future performance and involve risks, uncertainties and other factors that may cause actual results, performance or achievements of the Company to vary materially
2
The Macerich Company
Executive Summary
June 30, 2025
from those anticipated, expected or projected. Such factors include, among others, general industry, as well as global, national, regional and local economic and business conditions, including the impact of tariffs and elevated interest rates and inflation, which will, among other things, affect demand for retail space or retail goods, availability and creditworthiness of current and prospective tenants, anchor or tenant bankruptcies, closures, mergers or consolidations, lease rates, terms and payments, elevated interest rates and its impact on the financial condition and results of operations of the Company, including as a result of any increased borrowing costs on the Company's outstanding floating-rate debt and defaults on mortgage loans, availability, terms and cost of financing, and operating expenses; adverse changes in the real estate markets including, among other things, competition from other companies, retail formats and technology, risks of real estate development and redevelopment (including elevated inflation, supply chain disruptions and construction delays), acquisitions and dispositions; adverse impacts from any pandemic, epidemic or outbreak of any highly infectious disease on the U.S., regional and global economies and the financial condition and results of operations of the Company and its tenants; the liquidity of real estate investments; governmental actions and initiatives (including legislative and regulatory changes); environmental and safety requirements; and terrorist activities or other acts of violence, which could adversely affect all of the above factors. The reader is directed to the Company’s various filings with the Securities and Exchange Commission, including the Annual Report on Form 10-K for the year ended December 31, 2024, for a discussion of such risks and uncertainties, which discussion is incorporated herein by reference. You are cautioned not to place undue reliance on these forward-looking statements, which speak only as of the date of this document. The Company does not intend, and undertakes no obligation, to update any forward-looking information to reflect events or circumstances after the date of this document or to reflect the occurrence of unanticipated events unless required by law to do so.
(See attached tables)
3
THE MACERICH COMPANY
FINANCIAL HIGHLIGHTS
(IN THOUSANDS, EXCEPT PER SHARE AMOUNTS)
Results of Operations:
For the Three Months Ended June 30,
For the Six Months Ended June 30,
Unaudited
Unaudited
2025
2024
2025
2024
Revenues:
Leasing revenue
$
232,725
$
197,961
$
468,372
$
389,613
Other income
11,130
10,781
19,786
19,683
Management Companies' revenues
5,938
6,779
10,859
15,008
Total revenues
249,793
215,521
499,017
424,304
Expenses:
Shopping center and operating expenses
79,848
70,446
165,011
144,633
Management Companies' operating expenses
21,871
19,450
42,654
38,649
Leasing expenses
10,624
9,590
21,843
20,112
REIT general and administrative expenses
7,798
6,996
15,410
14,639
Depreciation and amortization
88,500
71,676
181,062
140,027
Interest expense (a)
71,925
39,765
140,999
91,955
Total expenses
280,566
217,923
566,979
450,015
Equity in loss of unconsolidated joint ventures
(475)
(56,837)
(1,274)
(130,113)
Income tax benefit (expense)
188
(258)
1,010
966
(Loss) gain on sale or write down of assets, net (a)
(10,484)
324,996
(24,472)
288,911
Net (loss) income
(41,544)
265,499
(92,698)
134,053
Less net (loss) income attributable to noncontrolling interests
(639)
13,492
(1,669)
8,774
Net (loss) income attributable to the Company
$
(40,905)
$
252,007
$
(91,029)
$
125,279
Weighted average number of shares outstanding - basic
253,085
216,180
253,039
216,108
Weighted average shares outstanding - Funds From Operations ("FFO") - diluted (b)
263,967
226,270
263,922
226,206
Earnings per share ("EPS") - basic
$
(0.16)
$
1.16
$
(0.36)
$
0.58
EPS - diluted
$
(0.16)
$
1.16
$
(0.36)
$
0.58
Dividend paid per share
$
0.17
$
0.17
$
0.34
$
0.34
FFO - basic and diluted (b) (c)
$
83,977
$
99,702
$
164,950
$
166,245
FFO - basic and diluted, excluding financing expense in connection with Chandler Freehold, accrued default interest expense and loss on non-real estate investments(b) (c)
$
87,294
$
88,099
$
174,666
$
162,697
FFO per share - basic and diluted (b) (c)
$
0.32
$
0.44
$
0.63
$
0.73
FFO per share - basic and diluted, excluding financing expense in connection with Chandler Freehold, accrued default interest expense and loss on non-real estate investments(b) (c)
$
0.33
$
0.39
$
0.66
$
0.72
4
THE MACERICH COMPANY
FINANCIAL HIGHLIGHTS
(IN THOUSANDS, EXCEPT PER SHARE AMOUNTS)
(a)Prior to June 13, 2024, the Company accounted for its investment in the Chandler Fashion Center and Freehold Raceway Mall ("Chandler Freehold") joint venture as a financing arrangement. As a result, the Company included in interest expense (i) a credit of $16,734 and $13,795 to adjust for the change in the fair value of the financing arrangement obligation during the three and six months ended June 30, 2024, respectively; (ii) distributions of $766 and $1,565 to its partner representing the partner's share of net income for the three and six months ended June 30, 2024, respectively; and (iii) distributions of $266 and $966 to its partner in excess of the partner's share of net income for the three and six months ended June 30, 2024, respectively. On November 16, 2023, the Company acquired its partners' interest in Freehold Raceway Mall and as a result that property is no longer part of the financing arrangement and is 100% owned by the Company. On June 13, 2024, the partnership agreement between the Company and its partner was amended. As a result of this modification, the Company no longer accounts for its investment in Chandler Fashion Center as a financing arrangement and deconsolidated the joint venture and recorded a gain on sale of asset of $334.3 million during the three months ended June 30, 2024. Effective June 13, 2024, the Company accounts for its investment in Chandler Fashion Center under the equity method of accounting. References to "Chandler Freehold" for the period November 16, 2023 through June 13, 2024 shall be deemed to only refer to Chandler Fashion Center.
(b)The Operating Partnership has operating partnership units ("OP Units"). OP Units can be converted into shares of Company common stock. Conversion of the OP Units not owned by the Company has been assumed for purposes of calculating FFO per share and the weighted average number of shares outstanding. The computation of average shares for FFO-diluted includes the effect of share and unit-based compensation plans. It also assumes conversion of MACWH, LP preferred and common units to the extent they are dilutive to the calculation.
(c)The Company uses FFO in addition to net income to report its operating and financial results and considers FFO and FFO-diluted as supplemental measures for the real estate industry and a supplement to Generally Accepted Accounting Principles ("GAAP") measures. The National Association of Real Estate Investment Trusts ("Nareit") defines FFO as net income (loss) (computed in accordance with GAAP), excluding gains (or losses) from sales of properties, plus real estate related depreciation and amortization, impairment write-downs of real estate and write-downs of investments in an affiliate where the write-downs have been driven by a decrease in the value of real estate held by the affiliate and after adjustments for unconsolidated joint ventures. Adjustments for unconsolidated joint ventures are calculated to reflect FFO on the same basis.
Prior to June 13, 2024, the Company accounted for its joint venture in Chandler Freehold as a financing arrangement. In connection with this treatment, the Company recognized financing expense on (i) the changes in fair value of the financing arrangement, (ii) any payments to such joint venture partner equal to their pro rata share of net income and (iii) any payments to such joint venture partner less than or in excess of their pro rata share of net income. The Company excluded the noted expenses related to the changes in fair value and for the payments to such joint venture partner less than or in excess of their pro rata share of net income.
The Company also presents FFO excluding financing expense in connection with Chandler Freehold, gain or loss on extinguishment of debt, accrued default interest expense and gain or loss on non-real estate investments.
FFO and FFO on a diluted basis are useful to investors in comparing operating and financial results between periods. This is especially true since FFO excludes real estate depreciation and amortization, as the Company believes real estate values fluctuate based on market conditions rather than depreciating in value ratably on a straight-line basis over time. The Company believes that such a presentation also provides investors with a more meaningful measure of its operating results in comparison to the operating results of other REITs. In addition, the Company believes that FFO excluding financing expense in connection with Chandler Freehold, impact associated with extinguishment of debt, accrued default interest expense and impact of non-cash changes in the market value of non-real estate investments provides useful supplemental information regarding the Company's performance as it shows a more meaningful and consistent comparison of the Company's operating performance and allows investors to more easily compare the Company's results. On March 19, 2024, the Company closed on a three-year extension of the Fashion Outlets of Niagara non-recourse loan and all default interest expense was reversed. Effective April 9, 2024, default interest expense has been accrued on the non-recourse loan on Santa Monica Place. GAAP requires that the Company accrue default interest expense, which is not expected to be paid and is expected to be reversed once a loan is modified or once title to the mortgaged loan collateral is transferred. The Company believes that the accrual of default interest on non-recourse loans, and the related reversal thereof should be excluded. The Company holds certain non-real estate investments that are subject to mark to market changes every quarter. These investments are not core to the Company's business, and the changes to market value and the related gain or loss are entirely non-cash in nature. As a result, the Company believes that the gain or loss on non-real estate investments should be excluded.
The Company further believes that FFO does not represent cash flow from operations as defined by GAAP, should not be considered as an alternative to net income (loss) as defined by GAAP, and is not indicative of cash available to fund all cash flow needs. The Company also cautions that FFO as presented, may not be comparable to similarly titled measures reported by other REITs.
5
THE MACERICH COMPANY
FINANCIAL HIGHLIGHTS
(IN THOUSANDS, EXCEPT PER SHARE AMOUNTS)
Reconciliation of Net (loss) income attributable to the Company to FFO attributable to common stockholders and unit holders - basic and diluted, excluding financing expense in connection with Chandler Freehold, accrued default interest expense and loss on non-real estate investments (c):
For the Three Months Ended June 30,
For the Six Months Ended June 30,
Unaudited
Unaudited
2025
2024
2025
2024
Net (loss) income attributable to the Company
$
(40,905)
$252,007
($91,029)
$125,279
Adjustments to reconcile net (loss) income attributable to the Company to FFO attributable to common stockholders and unit holders - basic and diluted:
Noncontrolling interests in the OP
(1,758)
11,778
(3,914)
5,847
Loss (gain) on sale or write down of consolidated assets, net
10,484
(324,996)
24,472
(288,911)
Add: gain on undepreciated asset sales from consolidated assets
157
233
1,080
233
Noncontrolling interests share of gain on sale or write-down of consolidated joint ventures, net
—
330
—
330
Loss on sale or write down of assets from unconsolidated joint ventures (pro rata), net
948
51,526
2,059
109,181
Add: (loss) gain on undepreciated asset sales from unconsolidated joint ventures (pro rata)
(81)
1,093
(291)
1,076
Depreciation and amortization on consolidated assets
88,500
71,676
181,062
140,027
Less depreciation and amortization allocable to noncontrolling interests in consolidated joint ventures
(570)
(1,523)
(1,134)
(3,256)
Depreciation and amortization on unconsolidated joint ventures (pro rata)
28,736
39,310
56,519
80,007
Less: depreciation on personal property
(1,534)
(1,732)
(3,874)
(3,568)
FFO attributable to common stockholders and unit holders - basic and diluted
83,977
99,702
164,950
166,245
Financing expense in connection with Chandler Freehold
—
(16,467)
—
(12,829)
Accrued default interest expense
3,033
3
2,767
6,033
1,722
Loss on non-real estate investments
284
2
2,097
3,683
7,559
FFO attributable to common stockholders and unit holders, excluding financing expense in connection with Chandler Freehold, accrued default interest expense and loss on non-real estate investments - basic and diluted
$
87,294
$
88,099
$
174,666
$
162,697
Reconciliation of EPS to FFO per share—diluted (c):
For the Three Months Ended June 30,
For the Six Months Ended June 30,
Unaudited
Unaudited
2025
2024
2025
2024
EPS - diluted
$
(0.16)
$
1.16
$
(0.36)
$
0.58
Per share impact of depreciation and amortization of real estate
0.44
0.48
0.89
0.94
Per share impact of loss (gain) on sale or write down of assets, net
0.04
(1.20)
0.10
(0.79)
FFO per share - basic and diluted
0.32
0.44
0.63
0.73
Per share impact of financing expense in connection with Chandler Freehold
—
(0.07)
—
(0.05)
Per share impact of accrued default interest expense
0.01
0.01
0.02
0.01
Per share impact of loss on non-real estate investments
—
0.01
0.01
0.03
FFO per share - basic and diluted, excluding financing expense in connection with Chandler Freehold, accrued default interest expense and loss on non-real estate investments
$
0.33
$
0.39
$
0.66
$
0.72
6
THE MACERICH COMPANY
FINANCIAL HIGHLIGHTS
(IN THOUSANDS, EXCEPT PER SHARE AMOUNTS)
Reconciliation of Net (loss) income attributable to the Company to Adjusted EBITDA, to Net Operating Income ("NOI") and to NOI - Go-Forward Portfolio Centers:
Depreciation and amortization - consolidated assets
88,500
71,676
181,062
140,027
Depreciation and amortization - unconsolidated joint ventures (pro rata)
28,736
39,310
56,519
80,007
Noncontrolling interests in the OP
(1,758)
11,778
(3,914)
5,847
Less: Interest expense and depreciation and amortization allocable to noncontrolling interests in consolidated joint ventures
(930)
(3,692)
(1,853)
(7,892)
Loss (gain) on sale or write down of assets, net - consolidated assets
10,484
(324,996)
24,472
(288,911)
Loss on sale or write down of assets, net - unconsolidated joint ventures (pro rata)
948
51,526
2,059
109,181
Add: Noncontrolling interests share of gain on sale or write-down of consolidated joint ventures, net
—
330
—
330
Income tax (benefit) expense
(188)
258
(1,010)
(966)
Distributions on preferred units
87
87
174
174
Adjusted EBITDA (a)
177,622
172,010
350,360
324,282
REIT general and administrative expenses
7,798
6,996
15,410
14,639
Management Companies' revenues
(5,938)
(6,779)
(10,859)
(15,008)
Management Companies' operating expenses
21,871
19,450
42,654
38,649
Leasing expenses, including joint ventures at pro rata
11,343
10,248
23,386
21,632
Corporate and other (income) expenses (b)
(2,062)
(143)
(8,149)
1,925
Straight-line and above/below market adjustments
(3,184)
(2,667)
(4,165)
836
NOI - All Centers
207,450
199,115
408,637
386,955
NOI of non-Go-Forward Portfolio Centers (c)
(25,502)
(21,970)
(49,573)
(38,994)
NOI - Go-Forward Portfolio Centers (c)
181,948
177,145
359,064
347,961
Lease termination income of Go-Forward Portfolio Centers
(735)
(112)
(5,596)
(1,333)
NOI - Go-Forward Portfolio Centers, excluding lease termination income (c)
$
181,213
$
177,033
$
353,468
$
346,628
NOI - Go-Forward Portfolio Centers percentage change, including lease termination income (c)
2.7
%
3.2
%
NOI - Go-Forward Portfolio Centers percentage change, excluding lease termination income (c)
2.4
%
2.0
%
(a) Adjusted EBITDA represents earnings before interest, income taxes, depreciation, amortization, noncontrolling interests in the OP, extraordinary items, loss (gain) on remeasurement, sale or write down of assets, loss (gain) on extinguishment of debt, and preferred dividends and includes joint ventures at their pro rata share. Management considers Adjusted EBITDA to be an appropriate supplemental measure to net income because it helps investors understand the ability of the Company to incur and service debt and make capital expenditures. The Company believes that Adjusted EBITDA should not be construed as an alternative to operating income as an indicator of the Company's operating performance, or to cash flows from operating activities (as determined in accordance with GAAP), or as a measure of liquidity. The Company also cautions that Adjusted EBITDA, as presented, may not be comparable to similarly titled measurements reported by other companies.
(b) Includes (income) expense components excluded from NOI - All Centers, including legal claims settlement income, interest income, non-real estate investments, and other assets.
(c) NOI – Go-Forward Portfolio Centers represents the NOI from the Go-Forward Portfolio Centers as defined on page 25 (See note (c) of the Company’s Property Listing Table), excluding Crabtree Mall, which was acquired on June 23, 2025 and was not held for the same period in 2024. The Company believes that only showing the results of the Go-Forward Portfolio Centers better reflects the ongoing operating performance of the Company. Go-Forward Portfolio NOI is calculated using total Adjusted EBITDA and eliminating the impact of the Management Companies’ revenues and operating expenses, leasing expenses (including joint ventures at pro rata), the Company’s REIT general and administrative expenses, corporate and other income and expenses and the straight-line and above/below market adjustments and subtracting out NOI from non-Go-Forward Portfolio Centers. The Company also presents NOI – Go-Forward Portfolio Centers, excluding lease termination income, as the Company believes that it is useful for investors to evaluate operating performance without the impact of lease termination income.
7
The Macerich Company
Supplemental Financial and Operating Information (unaudited)
Capital Information and Market Capitalization
Period Ended
6/30/2025
12/31/2024
12/31/2023
(dollars in thousands, except per share data)
Closing common stock price per share
$
16.18
$
19.92
$
15.43
52 week high
$
22.27
$
22.27
$
16.54
52 week low
$
12.48
$
12.99
$
8.77
Shares outstanding at end of period
Class A non participating convertible preferred units
99,565
99,565
99,565
Common shares and partnership units
264,080,704
263,739,694
226,095,455
Total common and equivalent shares/units outstanding
264,180,269
263,839,259
226,195,020
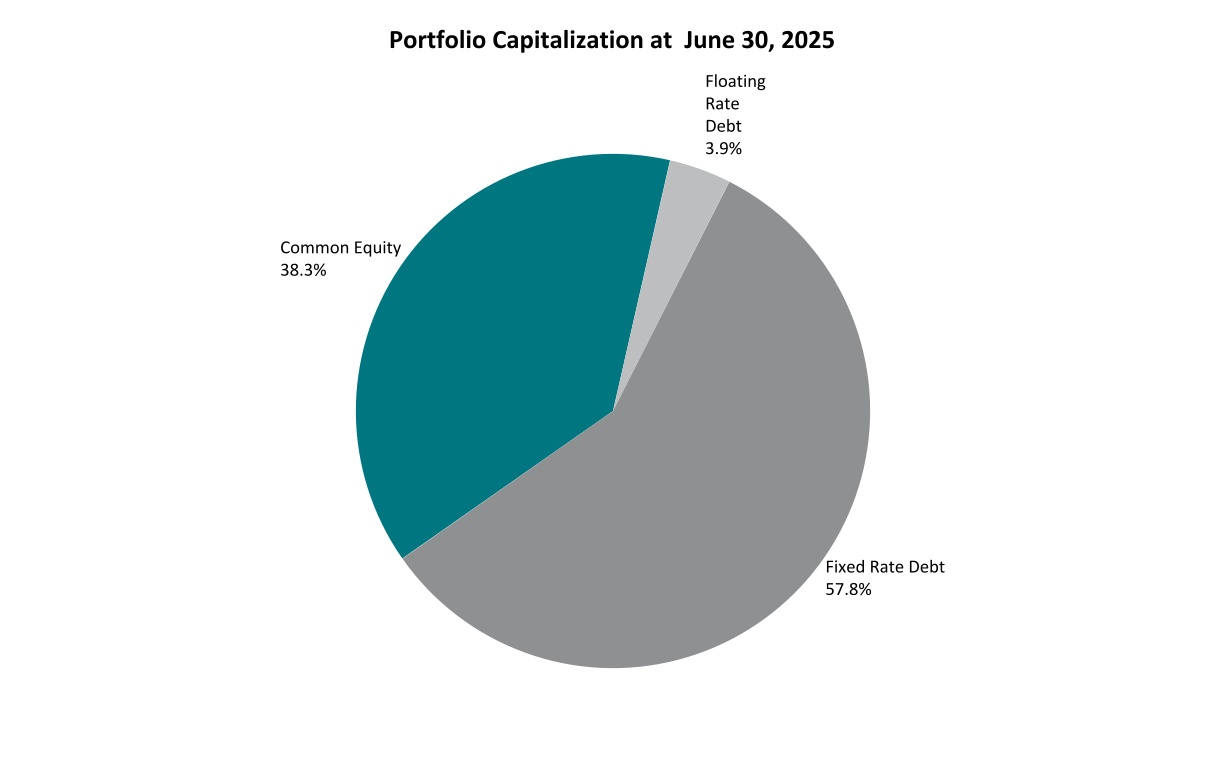
Portfolio capitalization data
Total portfolio debt, including joint ventures at pro rata
$
6,879,883
$
6,647,576
$
6,919,579
Equity market capitalization
4,274,437
5,255,678
3,490,189
Total market capitalization
$
11,154,320
$
11,903,254
$
10,409,768
Debt as a percentage of total market capitalization
61.7
%
55.9
%
66.5
%
8
The Macerich Company
Supplemental Financial and Operating Information (unaudited)
Changes in Total Common and Equivalent Shares/Units
Partnership Units
Company Common Shares
Class A
Non-Participating Convertible Preferred Units
Total Common and Equivalent Shares/ Units
Balance as of December 31, 2024
10,814,198
252,925,496
99,565
263,839,259
Conversion of partnership units to common shares
(6,100)
6,100
—
—
Issuance of stock/partnership units from restricted stock issuance or other share or unit-based plans
73,363
98,829
—
172,192
Balance as of March 31, 2025
10,881,461
253,030,425
99,565
264,011,451
Issuance of stock/partnership units from restricted stock issuance or other share or unit-based plans
—
168,818
—
168,818
Balance as of June 30, 2025
10,881,461
253,199,243
99,565
264,180,269
9
THE MACERICH COMPANY
CONSOLIDATED STATEMENTS OF OPERATIONS (UNAUDITED)
(Dollars in thousands)
For the Three Months Ended June 30,
For the Six Months Ended June 30,
2025
2025
Revenues:
Leasing revenue
$
232,725
$
468,372
Other income
11,130
19,786
Management Companies' revenues
5,938
10,859
Total revenues
249,793
499,017
Expenses:
Shopping center and operating expenses
79,848
165,011
Management Companies' operating expenses
21,871
42,654
Leasing expenses
10,624
21,843
REIT general and administrative expenses
7,798
15,410
Depreciation and amortization
88,500
181,062
Interest expense
71,925
140,999
Total expenses
280,566
566,979
Equity in loss of unconsolidated joint ventures
(475)
(1,274)
Income tax benefit
188
1,010
Loss on sale or write down of assets, net
(10,484)
(24,472)
Net loss
(41,544)
(92,698)
Less net loss attributable to noncontrolling interests
(639)
(1,669)
Net loss attributable to the Company
$
(40,905)
$
(91,029)
10
THE MACERICH COMPANY
CONSOLIDATED BALANCE SHEET (UNAUDITED)
As of June 30, 2025
(Dollars in thousands)
ASSETS:
Property, net (a)
$
7,165,363
Cash and cash equivalents
131,092
Restricted cash
94,381
Tenant and other receivables, net
129,215
Right-of-use assets, net
114,181
Deferred charges and other assets, net
372,621
Due from affiliates
3,481
Investments in unconsolidated joint ventures
718,917
Total assets
$
8,729,251
LIABILITIES AND EQUITY:
Mortgage notes payable
$
5,229,832
Bank and other notes payable
90,216
Accounts payable and accrued expenses
98,800
Lease liabilities
71,542
Other accrued liabilities
369,657
Distributions in excess of investments in unconsolidated joint ventures
206,389
Total liabilities
6,066,436
Commitments and contingencies
Equity:
Stockholders' equity:
Common stock
2,530
Additional paid-in capital
6,167,547
Accumulated deficit
(3,584,742)
Accumulated other comprehensive loss
(13)
Total stockholders' equity
2,585,322
Noncontrolling interests
77,493
Total equity
2,662,815
Total liabilities and equity
$
8,729,251
(a)Includes construction in progress of $354,800.
11
THE MACERICH COMPANY
NON-GAAP PRO RATA FINANCIAL INFORMATION (UNAUDITED)
(DOLLARS IN THOUSANDS)
For the Three Months Ended June 30, 2025
For the Six Months Ended June 30, 2025
Noncontrolling Interests of Consolidated Joint Ventures (a)
Company's Share of Unconsolidated Joint Ventures
Noncontrolling Interests of Consolidated
Joint Ventures (a)
Company's Share of Unconsolidated Joint Ventures
Revenues:
Leasing revenue
$
(1,356)
$
73,229
$
(2,762)
$
145,496
Other income
(955)
3,452
(1,894)
9,315
Total revenues
(2,311)
76,681
(4,656)
154,811
Expenses:
Shopping center and operating expenses
(246)
26,013
(526)
53,051
Leasing expense
(16)
736
(32)
1,575
Depreciation and amortization
(570)
28,736
(1,134)
56,519
Interest expense
(360)
20,723
(719)
42,881
Total expenses
(1,192)
76,208
(2,411)
154,026
Equity in loss of unconsolidated joint ventures
—
475
—
1,274
Loss on sale or write down of assets, net
—
(948)
—
(2,059)
Net income
(1,119)
—
(2,245)
—
Less net income attributable to noncontrolling interests
(1,119)
—
(2,245)
—
Net income attributable to the Company
$
—
$
—
$
—
$
—
(a)Represents the Company’s partners’ share of consolidated joint ventures.
12
THE MACERICH COMPANY
NON-GAAP PRO RATA FINANCIAL INFORMATION (UNAUDITED)
(DOLLARS IN THOUSANDS)
As of June 30, 2025
Noncontrolling Interests of Consolidated Joint Ventures (a)
Company's Share of Unconsolidated Joint Ventures
ASSETS:
Property, net (b)
$
(18,744)
$
2,034,603
Cash and cash equivalents
(1,215)
57,564
Restricted cash
—
19,542
Tenant and other receivables, net
(164)
56,387
Right-of-use assets, net
—
66,092
Deferred charges and other assets, net
(716)
36,619
Due from affiliates
58
(1,739)
Investments in unconsolidated joint ventures, at equity
—
(718,917)
Total assets
$
(20,781)
$
1,550,151
LIABILITIES AND EQUITY:
Mortgage notes payable
$
(33,078)
$
1,592,913
Accounts payable and accrued expenses
(286)
29,061
Lease liabilities
—
65,168
Other accrued liabilities
(21,019)
69,398
Distributions in excess of investments in unconsolidated joint ventures
—
(206,389)
Total liabilities
(54,383)
1,550,151
Equity:
Stockholders' equity
—
—
Noncontrolling interests
33,602
—
Total equity
33,602
—
Total liabilities and equity
$
(20,781)
$
1,550,151
(a)Represents the Company's partners' share of consolidated joint ventures.
(b)This includes $169 of construction in progress relating to the Company's partners' share from consolidated joint ventures and $108,243 of construction in progress relating to the Company's share from unconsolidated joint ventures.
13
THE MACERICH COMPANY
NON GAAP PRO RATA SCHEDULE OF LEASING REVENUE (unaudited)
(Dollars in thousands)
For the Three Months Ended June 30, 2025
Consolidated
Non- Controlling Interests (a)
Company's Consolidated Share
Company's Share of Unconsolidated Joint Ventures
Company's Total Share
Revenues:
Minimum rents (b)
$
155,468
$
(996)
$
154,472
$
50,980
$
205,452
Percentage rents
4,148
(8)
4,140
1,584
5,724
Tenant recoveries
66,832
(325)
66,507
19,036
85,543
Other
7,075
(25)
7,050
1,993
9,043
Bad debt expense
(798)
(2)
(800)
(364)
(1,164)
Total leasing revenue
$
232,725
$
(1,356)
$
231,369
$
73,229
$
304,598
For the Six Months Ended June 30, 2025
Consolidated
Non- Controlling Interests (a)
Company's Consolidated Share
Company's Share of Unconsolidated Joint Ventures
Company's Total Share
Revenues:
Minimum rents (b)
$
315,614
$
(2,011)
$
313,603
$
101,115
$
414,718
Percentage rents
8,403
(24)
8,379
3,269
11,648
Tenant recoveries
134,095
(665)
133,430
37,970
171,400
Other
12,616
(68)
12,548
3,583
16,131
Bad debt expense
(2,356)
6
(2,350)
(441)
(2,791)
Total leasing revenue
$
468,372
$
(2,762)
$
465,610
$
145,496
$
611,106
(a)Represents the Company’s partners’ share of consolidated joint ventures.
(b)Includes lease termination income, straight-line rental income and above/below market adjustments to minimum rents.
14
The Macerich Company
Supplemental Financial and Operating Information (unaudited)
Supplemental FFO Information(a)
(Dollars in millions)
As of June 30,
2025
2024
Straight-line rent receivable
$
134.0
$
151.7
For the Three Months Ended June 30,
For the Six Months Ended June 30,
2025
2024
2025
2024
Lease termination income (b)
$
0.8
$
0.1
$
5.8
$
1.3
Straight-line rental income (expense) (b)
$
1.0
$
(0.1)
$
0.8
$
(4.0)
Business development and parking income (c)
$
15.0
$
13.2
$
27.8
$
27.5
Gain on sales or write down of undepreciated assets
$
0.1
$
1.3
$
0.8
$
1.3
Amortization of acquired above and below-market leases, net revenue (b)
$
2.2
$
2.7
$
3.4
$
3.1
Amortization of debt discounts, net (d)
$
(9.1)
$
(2.6)
$
(18.2)
$
(3.0)
Bad debt (income) expense (b)
$
1.2
$
1.6
$
2.8
$
5.6
Leasing expense
$
11.3
$
10.2
$
23.3
$
21.6
Interest capitalized (d)
$
6.2
$
7.9
$
12.6
$
15.5
Employee severance costs (e)
$
0.3
$
0.2
$
2.1
$
0.7
Legal claims settlement income, net (f)
$
—
$
—
$
6.0
$
—
Chandler Freehold financing arrangement (d):
Distributions equal to partners' share of net income (loss)
$
—
$
0.7
$
—
$
1.6
Distributions in excess of partners' share of net income (g)
—
0.3
—
1.0
Fair value adjustment (g)
—
(16.7)
—
(13.8)
Total Chandler Freehold financing arrangement expense (d)
$
—
$
(15.7)
$
—
$
(11.2)
(a)All joint venture amounts included at pro rata.
(b)Included in leasing revenue.
(c)Included in leasing revenue and other income.
(d)Included in interest expense.
(e)Included in management companies' operating expenses.
(f)Included in other income.
(g)The Company presents FFO excluding the expenses related to changes in fair value of the financing arrangement and the payments to such joint venture partner less than or in excess of their pro rata share of net income. Effective with the quarter ending September 30, 2024, these accounting adjustments are no longer applicable due to the Company accounting for its investment in Chandler Fashion Center under the equity method of accounting effective June 13, 2024.
15
The Macerich Company
Supplemental Financial and Operating Information (unaudited)
Capital Expenditures(a)
(Dollars in millions)
For the Six Months Ended June 30,
For the Twelve Months Ended December 31,
2025
2024
2024
2023
Consolidated Centers
Acquisitions of property (b)
$
290.0
$
41.8
$
170.8
$
46.7
Property improvements
7.5
15.8
43.3
36.3
Development, redevelopment, expansions and renovations of Centers
59.4
39.4
104.5
94.6
Tenant allowances
10.0
7.0
20.6
27.1
Deferred leasing charges
2.1
2.6
4.4
5.6
Total
$
369.0
$
106.6
$
343.6
$
210.3
Unconsolidated Joint Venture Centers
Property improvements
$
2.5
$
6.6
$
14.4
$
17.6
Development, redevelopment, expansions and renovations of Centers
29.4
16.5
39.8
58.1
Tenant allowances
5.8
6.8
21.0
18.5
Deferred leasing charges
1.8
2.8
5.6
4.6
Total
$
39.5
$
32.7
$
80.8
$
98.8
(a)All joint venture amounts at pro rata.
(b)Breakdown of acquisitions of property:
Acquisition Date
For the Six Months Ended June 30,
For the Twelve Months Ended December 31,
2025
2024
2024
2023
Acquisition of Crabtree Mall
6-23-2025
(c)
$
290.0
$
—
$
—
$
—
Acquisition of the Company's joint venture partner's 40% interest in Lakewood Center, Los Cerritos Center and Washington Square
10-24-2024
—
—
129.0
—
Acquisition of former Sears parcel at Inland Center
5-17-2024
—
5.4
5.4
—
Acquisition of the Company's joint venture partner's 40% interest in Arrowhead Towne Center and South Plains Mall
5-14-2024
—
36.4
36.4
—
Acquisition of the Company’s joint venture partner's 50% interest in five former Sears parcels. These five parcels are located at Chandler Fashion Center, Danbury Fair Mall, Freehold Raceway Mall, Los Cerritos Center and Washington Square
5-18-2023
—
—
—
46.7
Total
$
290.0
$
41.8
$
170.8
$
46.7
(c) This represents the gross purchase price excluding closing adjustments and other related transaction costs.
16
The Macerich Company
Supplemental Financial and Operating Information (unaudited)
Asset Dispositions / Loan Give-Backs
(Dollars in millions)
The following is a summary of the Company’s Asset Dispositions and Loan Givebacks for the six months ended June 30, 2025, and for the twelve months ended December 31, 2024:
Property/Location
Disposition Date
Gross Sale Price (at 100%)
Gross Sale Price (at Company's Share)
Reduction of Debt (at Company's Share)
I. Asset Dispositions
Paradise Valley Mall, Phoenix, Arizona
06-30-2025
(a)
$
5.5
$
5.5
$
3.1
1010-1016 Market Street parcels at Fashion District Philadelphia, Philadelphia, Pennsylvania
06-30-2025
10.8
10.8
—
Former department store parcel at Washington Square, Petaluma, California
06-11-2025
2.6
2.6
—
Paradise Valley Office Park, Phoenix, Arizona
05-28-2025
6.2
6.2
—
SouthPark Mall, Moline, Illinois
04-30-2025
10.5
10.5
—
Various parcels at Santan Adjacent, Gilbert, Arizona
04-28-2025
24.5
24.5
—
Portillo's parcel at Santan Adjacent, Gilbert, Arizona
04-16-2025
3.0
3.0
—
Wilton Mall, Saratoga Springs, New York
03-27-2025
24.8
24.8
—
The Oaks, Thousand Oaks, California
12-10-2024
157.0
157.0
147.8
Southridge Mall, Des Moines, Iowa
11-25-2024
4.0
4.0
—
Biltmore Fashion Park, Phoenix, Arizona
07-31-2024
(b)
110.0
110.0
—
Former department store parcel at Valle Vista Mall, Harlingen, Texas
06-28-2024
7.1
7.1
—
Country Club Plaza, Kansas City, Missouri
06-28-2024
(c)
175.6
147.7
147.7
Subtotal
$
541.6
$
513.7
$
298.6
Various land parcels (undepreciated asset sales), including separate transactions with certain joint venture partners:
For the six months ending June 30, 2025
2025
(d)
$
28.6
$
11.3
$
—
For the twelve months ending December 31, 2024
2024
(d)
36.3
6.3
—
Subtotal
64.9
17.6
$
—
Total - Asset Dispositions
$
606.5
$
531.3
$
298.6
II. Loan Give-Backs
Santa Monica Place, Santa Monica, California
Pending
(e)
$
300.0
$
300.0
$
300.0
Total - Loan Give-Backs
$
300.0
$
300.0
$
300.0
Grand Total - Asset Dispositions/Loan Give-Backs (f)
$
906.5
$
831.3
$
598.6
(a) The Company sold its 5% joint venture partnership interest in the property.
(b)The Company sold its 50% joint venture partnership interest in the property.
(c)The total sales price for Country Club Plaza was $175.6 million. Concurrent with the sale, the remaining amount owed by the joint venture under the $295.5 million loan ($147.7 million at the Company's share) was forgiven by the lender.
(d) These represent sales of undepreciated assets and the Company includes any gains or losses from these transactions in FFO.
(e) For purposes of this schedule, the Company has included Santa Monica Place. The Company has completed transition of the property to a receiver but is still owner of record. The above loan balance excludes loan amortization costs of $0.5 million.
(f)For purposes of this schedule, the Company aggregated asset dispositions and loan give-backs.
17
The Macerich Company
Supplemental Financial and Operating Information (unaudited)
Trailing Twelve Month Sales Per Square Foot (a)
Consolidated Centers
Unconsolidated Joint Venture Centers
Total
Centers
Total
Go-Forward Portfolio Centers
6/30/2025
$
756
$
1,060
$
849
$
906
6/30/2024
$
713
$
1,009
$
835
$
890
12/31/2024
$
743
$
1,054
$
837
$
895
(a)Sales are based on reports by retailers leasing mall and freestanding stores for the trailing 12 months for tenants that have occupied such stores for a minimum of 12 months. Sales per square foot are based on tenants 10,000 square feet and under for retail Centers. Sales per square foot excludes Community Centers and Santa Monica Place.
Total Centers
Go-Forward Portfolio Centers
18
The Macerich Company
Supplemental Financial and Operating Information (unaudited)
Portfolio Occupancy(a)
Period Ended
Consolidated Centers
Unconsolidated Joint Venture Centers
Total
Centers
Total Go-Forward Portfolio Centers
6/30/2025
90.7
%
94.2
%
92.0
%
92.8
%
6/30/2024
92.9
%
93.8
%
93.3
%
93.5
%
12/31/2024
93.7
%
95.0
%
94.1
%
94.6
%
12/31/2023
93.6
%
93.5
%
93.5
%
94.4
%
(a)Portfolio Occupancy is the percentage of mall and freestanding GLA leased as of the last day of the reporting period. Portfolio Occupancy excludes Community Centers, Santa Monica Place, and spaces under redevelopment.
19
The Macerich Company
Supplemental Financial and Operating Information (unaudited)
Average Base Rent Per Square Foot (a)
Average Base Rent PSF(b)
Average Base Rent PSF on Leases Executed During the Twelve Months Ended(c)
Average Base Rent PSF on Leases Expiring During the Twelve Months Ended(d)
Consolidated Centers
6/30/2025
$
67.04
$
67.05
$
63.45
6/30/2024
$
62.77
$
60.19
$
56.25
12/31/2024
$
65.62
$
61.16
$
61.45
12/31/2023
$
61.66
$
58.97
$
50.14
Unconsolidated Joint Venture Centers
6/30/2025
$
79.06
$
83.22
$
65.61
6/30/2024
$
73.02
$
72.28
$
60.44
12/31/2024
$
76.11
$
86.78
$
64.79
12/31/2023
$
70.42
$
64.42
$
55.74
All Retail Centers
6/30/2025
$
69.46
$
70.57
$
63.85
6/30/2024
$
65.91
$
63.35
$
57.54
12/31/2024
$
67.72
$
67.74
$
62.27
12/31/2023
$
64.68
$
61.00
$
52.04
Go-Forward Portfolio Centers
6/30/2025
$
73.06
$
72.91
$
67.37
6/30/2024
$
70.84
$
67.13
$
61.60
12/31/2024
$
71.69
$
70.64
$
65.78
(a)Average base rent per square foot is based on spaces 10,000 square feet and under, excluding Santa Monica Place; and Fashion District Philadelphia is excluded from 2024 and prior. All joint venture amounts are included at pro rata.
(b)Average base rent per square foot gives effect to the terms of each lease in effect, as of the applicable date, including any concessions, abatements and other adjustments or allowances that have been granted to the tenants. Go-Forward Portfolio Centers average base rent is based on pro rata ownership as of June 30, 2025.
(c)The average base rent per square foot on leases executed during the period represents the actual rent to be paid during the first twelve months.
(d)The average base rent per square foot on leases expiring during the period represents the final year minimum rent on a cash basis.
20
The Macerich Company
Supplemental Financial and Operating Information (unaudited)
Cost of Occupancy
For the Twelve Months Ended
June 30, 2025
December 31, 2024
Consolidated Centers
Minimum rents
8.2
%
8.1
%
Percentage rents
0.6
%
0.6
%
Expense recoveries (a)
3.2
%
3.1
%
Total
12.0
%
11.8
%
Unconsolidated Joint Venture Centers
Minimum rents
7.5
%
7.6
%
Percentage rents
1.0
%
1.0
%
Expense recoveries (a)
3.2
%
3.2
%
Total
11.7
%
11.8
%
All Centers
Minimum rents
7.9
%
7.8
%
Percentage rents
0.8
%
0.8
%
Expense recoveries (a)
3.2
%
3.2
%
Total
11.9
%
11.8
%
Go-Forward Portfolio Centers
Minimum rents
8.0
%
8.0
%
Percentage rents
0.8
%
0.8
%
Expense recoveries (a)
3.3
%
3.3
%
Total
12.1
%
12.1
%
(a)Represents real estate tax and common area maintenance charges.
21
The Macerich Company
Supplemental Financial and Operating Information (unaudited)
Percentage of Go-Forward Portfolio Centers Net Operating Income by State
State
% of Go-Forward Portfolio Centers Real Estate NOI (a)
California
23.4
%
Arizona
20.1
%
New York
18.9
%
Pennsylvania & Virginia
10.6
%
New Jersey & Connecticut
9.4
%
Oregon
7.2
%
Colorado & Illinois
6.1
%
Other(b)
4.3
%
Total
100.0
%
(a)The percentage of Go-Forward Portfolio Centers 2024 Pro Rata Real Estate NOI excludes disposed properties, straight-line and above/below market adjustments to minimum rents. Go-Forward Portfolio Centers 2024 Pro Rata Real Estate NOI excludes REIT general and administrative expenses, management company revenues, management company expenses and leasing expenses (including joint ventures at pro rata).
(b)“Other” includes Indiana, Iowa, North Dakota, and Texas.
22
The Macerich Company
Property Listing
June 30, 2025
The following table sets forth certain information regarding the Centers and other locations that are wholly owned or partly owned by the Company.
Count
Company’s Ownership(a)
Name of Center/Location
Year of Original
Construction/
Acquisition
Year of Most Recent Expansion/Renovation
Total GLA(b)
CONSOLIDATED CENTERS:
1
100
%
Arrowhead Towne Center(c) Glendale, Arizona
1993/2002
2015
1,077,000
2
100
%
Crabtree Mall(c) Raleigh, North Carolina
1972/2025
ongoing
1,325,000
3
100
%
Danbury Fair Mall(c) Danbury, Connecticut
1986/2005
2016
1,272,000
4
100
%
Desert Sky Mall(c) Phoenix, Arizona
1981/2002
2007
736,000
5
100
%
Eastland Mall(c)(d) Evansville, Indiana
1978/1998
1996
1,016,000
6
100
%
Fashion District Philadelphia(c) Philadelphia, Pennsylvania
1977/2014
2019
799,000
7
100
%
Fashion Outlets of Chicago(c) Rosemont, Illinois
2013/—
—
529,000
8
100
%
Fashion Outlets of Niagara Falls USA Niagara Falls, New York
1982/2011
2014
685,000
9
100
%
Freehold Raceway Mall(c) Freehold, New Jersey
1990/2005
2007
1,534,000
10
100
%
Fresno Fashion Fair(c) Fresno, California
1970/1996
2006
974,000
11
100
%
Green Acres Mall(c)(d) Valley Stream, New York
1956/2013
ongoing
2,073,000
12
100
%
Inland Center(c) San Bernardino, California
1966/2004
2016
670,000
13
100
%
Kings Plaza Shopping Center(c)(d) Brooklyn, New York
1971/2012
2018
1,092,000
14
100
%
La Cumbre Plaza(d) Santa Barbara, California
1967/2004
1989
325,000
15
100
%
Lakewood Center(e) Lakewood, California
1953/1975
2008
2,048,000
16
100
%
Los Cerritos Center(c)(e) Cerritos, California
1971/1999
2016
1,011,000
17
100
%
NorthPark Mall(c) Davenport, Iowa
1973/1998
2001
900,000
18
100
%
Pacific View(c) Ventura, California
1965/1996
2001
883,000
19
100
%
Queens Center(c)(d) Queens, New York
1973/1995
2004
966,000
20
100
%
Santa Monica Place(f) Santa Monica, California
1980/1999
ongoing
533,000
21
84.9
%
SanTan Village Regional Center(c) Gilbert, Arizona
2007/—
2018
1,191,000
22
100
%
South Plains Mall(c) Lubbock, Texas
1972/1998
2017
1,313,000
23
100
%
Stonewood Center(c)(d) Downey, California
1953/1997
1991
925,000
23
The Macerich Company
Property Listing
June 30, 2025
Count
Company’s Ownership(a)
Name of Center/Location
Year of Original
Construction/
Acquisition
Year of Most Recent Expansion/Renovation
Total GLA(b)
24
100
%
Superstition Springs Center(c) Mesa, Arizona
1990/2002
2002
950,000
25
100
%
Valley Mall Harrisonburg, Virginia
1978/1998
1992
506,000
26
100
%
Valley River Center(c) Eugene, Oregon
1969/2006
2007
813,000
27
100
%
Victor Valley, Mall of(c) Victorville, California
1986/2004
2012
576,000
28
100
%
Vintage Faire Mall(c) Modesto, California
1977/1996
2020
916,000
29
100
%
Washington Square(c)(e) Portland, Oregon
1974/1999
2005
1,299,000
Total Consolidated Centers
28,937,000
UNCONSOLIDATED JOINT VENTURE CENTERS:
30
50
%
Broadway Plaza(c) Walnut Creek, California
1951/1985
2016
996,000
31
50.1
%
Chandler Fashion Center(c) Chandler, Arizona
2001/2002
2023
1,401,000
32
50.1
%
Corte Madera, The Village at(c) Corte Madera, California
Tysons Corner Center-Office(c)(g) Tysons Corner, Virginia
1999/2005
2012
171,000
50
%
Hyatt Regency Tysons Corner Center(c)(g) Tysons Corner, Virginia
2015
2015
290,000
50
%
VITA Tysons Corner Center(c)(g) Tysons Corner, Virginia
2015
2015
399,000
50
%
Tysons Tower(c)(g) Tysons Corner, Virginia
2014
2014
547,000
Total Other Assets
1,856,000
Grand Total
42,195,000
The Company owned or had an ownership interest in 39 retail centers (including office, hotel and residential space adjacent to these shopping centers), and two community/power shopping centers. With the exception of the Centers indicated with footnote (d) in the table above, the underlying land controlled by the Company is owned in fee entirely by the Company, or, in the case of jointly-owned Centers, by the joint venture property partnership or limited liability company.
(a)The Company’s ownership interest in this table reflects its legal ownership interest. See footnotes (a) and (b) in the Joint Venture List regarding the legal versus economic ownership of joint venture entities.
(b)Includes GLA attributable to anchors (whether owned or non-owned) and mall and freestanding stores.
(c)These Centers represent the Company’s go-forward portfolio Centers as described in the Path Forward Plan (the “Go-Forward Portfolio Centers”). The Go-Forward Portfolio Centers are subject to change.
(d)Portions of the land on which the Center is situated are subject to one or more long-term ground leases.
(e)On October 24, 2024, the Company acquired its partner’s 40% interest in the Pacific Premier Retail Trust portfolio, which includes Washington Square, Los Cerritos Center, and Lakewood Center. All three assets are now wholly owned by the Company.
(f)The Company has completed transition of the property to a receiver, but is still the owner on record.
(g)Included in Unconsolidated Joint Venture Centers.
(h)On July 30, 2025, the Company's joint venture closed on the sale of Atlas Park for $72 million.
(i)Included in Consolidated Centers.
25
The Macerich Company
Joint Venture List
June 30, 2025
The following table sets forth certain information regarding the Centers and other operating properties that are not wholly owned by the Company. This list of properties includes unconsolidated joint ventures and consolidated joint ventures. The percentages shown are the effective legal ownership and economic ownership interests of the Company.
Properties
Legal Ownership(a)
Economic Ownership(b)
Joint Venture
Total GLA(c)
Atlas Park, The Shops at(d)
50
%
50
%
WMAP, L.L.C.
374,000
Boulevard Shops
50
%
50
%
Propcor II Associates, LLC
205,000
Broadway Plaza
50
%
50
%
Macerich HHF Broadway Plaza LLC
996,000
Chandler Fashion Center(e)(f)
50.1
%
50.1
%
Freehold Chandler Holdings LP
1,401,000
Corte Madera, The Village at
50.1
%
50.1
%
Corte Madera Village, LLC
501,000
Deptford Mall
51
%
51
%
Macerich HHF Centers LLC
1,008,000
FlatIron Crossing
51
%
51
%
Macerich HHF Centers LLC
1,396,000
Hyatt Regency Tysons Corner Center
50
%
50
%
Tysons Corner Hotel I LLC
290,000
Kierland Commons
50
%
50
%
Kierland Commons Investment LLC
439,000
Los Angeles Premium Outlets
50
%
50
%
CAM-CARSON LLC
—
SanTan Village Regional Center
84.9
%
84.9
%
Westcor SanTan Village LLC
1,191,000
Scottsdale Fashion Square
50
%
50
%
Scottsdale Fashion Square Partnership
1,877,000
Scottsdale Fashion Square-Office
50
%
50
%
Scottsdale Fashion Square Partnership
121,000
Scottsdale Fashion Square-Hotel
50
%
50
%
Scottsdale Fashion Square Partnership
245,000
Twenty Ninth Street
51
%
51
%
Macerich HHF Centers LLC
685,000
Tysons Corner Center
50
%
50
%
Tysons Corner LLC
1,847,000
Tysons Corner Center-Office
50
%
50
%
Tysons Corner Property LLC
171,000
Tysons Tower
50
%
50
%
Tysons Corner Property LLC
547,000
VITA Tysons Corner Center
50
%
50
%
Tysons Corner Property LLC
399,000
West Acres
19
%
19
%
West Acres Development, LLP
673,000
(a)This column reflects the Company’s legal ownership in the listed properties. Legal ownership may, at times, not equal the Company’s economic interest in the listed properties because of various provisions in certain joint venture agreements regarding distributions of cash flow based on capital account balances, allocations of profits and losses and payments of preferred returns. As a result, the Company’s actual economic interest (as distinct from its legal ownership interest) in certain of the properties could fluctuate from time to time and may not wholly align with its legal ownership interests. Substantially all of the Company’s joint venture agreements contain rights of first refusal, buy-sell provisions, exit rights, default dilution remedies and/or other break up provisions or remedies which are customary in real estate joint venture agreements and which may, positively or negatively, affect the ultimate realization of cash flow and/or capital or liquidation proceeds.
(b)Economic ownership represents the allocation of cash flow to the Company, except as noted below. In cases where the Company receives a current cash distribution greater than its legal ownership percentage due to a capital account greater than its legal ownership percentage, only the legal ownership percentage is shown in this column. The Company’s economic ownership of these properties may fluctuate based on a number of factors, including mortgage refinancings, partnership capital contributions and distributions, and proceeds and gains or losses from asset sales, and the matters set forth in the preceding paragraph.
(c)Includes GLA attributable to anchors (whether owned or non-owned) and mall and freestanding stores.
(d)On July 30, 2025, the Company's joint venture closed on the sale of Atlas Park for $72 million.
(e)This Center has a former Sears store, which was acquired from joint venture partner Seritage Growth Properties and is now wholly owned and controlled by the Company. The GLA of the former Sears store, or tenant replacing the former Sears store, at this Center is included in Total GLA at the center level.
(f)The joint venture entity was formed in September 2009. Upon liquidation of the partnership or a loan refinancing event, distributions are made in the following order: pro rata 49.9% to the third-party partner and 50.1% to the Company until a 14% internal rate of return on and of certain capital expenditures is received; to the Company until it receives approximately $38.0 million; and, thereafter, pro rata 49.9% to the third-party partner and 50.1% to the Company.
26
The Macerich Company
Net Debt to Adjusted EBITDA
As of June 30, 2025 (Unaudited)
(Dollars in Thousands, at Company's Pro Rata Share)
Total Company's Pro Rata Share of Debt
$
6,879,883
(a)
Less: Cash, including joint ventures at the Company's share
(187,441)
Restricted Cash, including joint ventures at the Company's share
$
(113,923)
Exclude: Restricted Cash that is not loan cash collateral
55,054
Less: Restricted Cash - loan cash collateral
(58,869)
(b)
Less: Debt for Santa Monica Place (lender-controlled)
(299,451)
Net Debt
6,334,122
(c)
Adjusted EBITDA (trailing twelve months)
$
733,285
(d)
Plus: Leasing expenses (trailing twelve months)
45,906
(e)
Plus: EBITDA Impact from investment (gains)/ losses on non-real estate investments (trailing twelve months)
8,516
(f)
Plus: Adjustment for acquisitions and dispositions (trailing twelve months)
13,875
(g)
Plus: Other Adjustments (trailing twelve months)
(2,442)
(h)
Adjusted EBITDA, as further modified (trailing twelve months)
$
799,140
Net Debt to Adjusted EBITDA, as further modified
7.93x
(i)
(a)The debt balances include the unamortized debt discounts and loan finance costs. Debt discounts represent the deficiency of the fair value of debt below the principal value of debt assumed in various acquisitions. Debt discounts and loan finance costs are amortized into interest expense over the remaining term of the related debt in a manner that approximates the effective interest method. As of June 30, 2025, the Company's pro rata share of unamortized debt discounts and loan finance costs were $57.7 million and $36.1 million, respectively.
(b)Represents Restricted Cash that is held by lenders for various purposes, which effectively serves as cash collateral to the underlying loan until the cash is recouped into liquid resources by the borrower.
(c)Net Debt is a non-GAAP measure which represents Debt less Cash and Restricted Cash. Management believes that the presentation of Net Debt provides useful information to investors because it reviews Net Debt as part of its management of the Company's overall liquidity, financial flexibility, capital structure and financial leverage.
(d)Adjusted EBITDA for the trailing twelve months is calculated as follows:
Add:
Subtract:
Add:
For the Six Months Ended
For the Six Months Ended
For the Twelve Months Ended
Trailing Twelve Months
June 30, 2025
June 30, 2024
December 31, 2024
June 30, 2025
Adjusted EBITDA, as reported
$350,360
$324,282
$ 707,207
$733,285
For a reconciliation of net loss to Adjusted EBITDA for the six months ended June 30, 2025 and 2024 see page 7 and for the twelve months ended December 31, 2024, see the Company’s Supplemental Information for the fourth quarter on the Company’s website.
(e)GAAP provides that leasing costs incurred through outside, external leasing brokers may be capitalized. However, leasing compensation incurred through internally staffed leasing personnel generally may not be capitalized and must be expensed. Management believes adding back these leasing expenses provides useful information to investors because it allows them to more easily compare the Company's results to other REIT's.
(f)The Company holds certain non-real estate investments that are subject to mark to market changes every quarter. These investments are not core to the Company's business, and the changes to market value and the related gain or loss are entirely non-cash in nature. As a result, the Company believes that the gain or loss on non-real estate investments should be excluded from Adjusted EBITDA.
(g)Represents the net forward EBITDA adjustment to properly account for the trailing twelve-months Adjusted EBITDA for: A) the acquisitions of: i) Arrowhead Towne Center, ii) South Plains Mall; iii) Lakewood Center, iv) Los Cerritos Center, v) Washington Square and Square Too and vi) Crabtree Mall; B) the dispositions of i) Country Club Plaza, ii) Biltmore Fashion Park, iii) the stand-alone parcel at Valle Vista Mall, iv) Southridge Mall, v) The Oaks, vi) Wilton Mall, vii) SouthPark Mall, viii) the stand alone parcel at Washington Square in Petaluma, Ca.; and ix) other outparcel sales; and C) loans in default for which the Company anticipates transferring title to the underlying property for Santa Monica Place.
(h)Represents the adjustment for employee severance costs and legal claims settlement income, net.
(i)Net Debt to Adjusted EBITDA, as further modified, is calculated using net debt as of period end divided by Adjusted EBITDA, as further modified, for the twelve months then ended. Management uses this ratio to evaluate the Company's capital structure and financial leverage. This ratio is also commonly used in the Company's industry, and management believes it provides a meaningful supplemental measure of the Company's overall liquidity, financial flexibility, capital structure and financial leverage.
27
The Macerich Company
Supplemental Financial and Operating Information (Unaudited)
Debt Summary (at Company's pro rata share) (a)
As of June 30, 2025
Fixed Rate
Floating Rate
Total
Dollars in thousands
Mortgage notes payable
$
4,930,381
$
299,451
$
5,229,832
Bank and other notes payable
—
90,216
90,216
Total debt per Consolidated Balance Sheet
4,930,381
389,667
5,320,048
Adjustments:
Less: Noncontrolling interests share of debt from consolidated joint ventures
(33,078)
—
(33,078)
Adjusted Consolidated Debt
4,897,303
389,667
5,286,970
Add: Company’s share of debt from unconsolidated joint ventures
1,548,603
44,310
1,592,913
Total Company’s Pro Rata Share of Debt
$
6,445,906
$
433,977
$
6,879,883
Weighted average interest rate
5.40
%
6.71
%
5.48
%
Weighted average maturity (years)
3.54
(a)The Company’s pro rata share of debt represents (i) consolidated debt, minus the Company’s partners’ share of the amount from consolidated joint ventures (calculated based upon the partners’ percentage ownership interest); plus (ii) the Company’s share of debt from unconsolidated joint ventures (calculated based upon the Company’s percentage ownership interest). Management believes that this measure provides useful information to investors regarding the Company’s financial condition because it includes the Company’s share of debt from unconsolidated joint ventures and, for consolidated debt, excludes the Company’s partners’ share from consolidated joint ventures, in each case presented on the same basis. The Company has several significant joint ventures and presenting its pro rata share of debt in this manner can help investors better understand the Company’s financial condition after taking into account the Company’s economic interest in these joint ventures. The Company’s pro rata share of debt should not be considered as a substitute to the Company’s total debt determined in accordance with GAAP or any other GAAP financial measures and should only be considered together with and as a supplement to the Company’s financial information prepared in accordance with GAAP.
28
The Macerich Company
Supplemental Financial and Operating Information (Unaudited)
Outstanding Debt by Maturity Date
As of June 30, 2025
Center/Entity (dollars in thousands)
Maturity Date
Effective Interest Rate (a)
Fixed
Floating
Total Debt Balance (a)
I. Consolidated Assets:
South Plains Mall
11/06/25
7.97
%
$
197,213
$
—
$
197,213
Vintage Faire Mall
03/06/26
3.55
%
216,365
—
216,365
Lakewood Center
06/01/26
8.00
%
305,765
—
305,765
Fashion Outlets of Niagara Falls USA
10/06/26
6.52
%
79,144
—
79,144
Fresno Fashion Fair
11/01/26
3.67
%
324,752
—
324,752
Los Cerritos Center
11/01/27
5.77
%
471,542
—
471,542
Green Acres Mall
01/06/28
6.62
%
363,290
—
363,290
Arrowhead Towne Center
02/01/28
6.75
%
352,380
—
352,380
SanTan Village Regional Center (b)
07/01/29
4.34
%
186,564
—
186,564
Freehold Raceway Mall
11/01/29
3.94
%
399,293
—
399,293
Queens Center
11/06/29
5.45
%
523,134
—
523,134
Kings Plaza Shopping Center
01/01/30
3.71
%
533,595
—
533,595
Fashion Outlets of Chicago
02/01/31
4.61
%
299,509
—
299,509
Pacific View
05/06/32
5.45
%
70,132
—
70,132
Danbury Fair Mall
02/06/34
6.59
%
152,302
—
152,302
Victor Valley, Mall of
09/06/34
6.85
%
83,984
—
83,984
Washington Square
04/06/35
5.63
%
338,339
—
338,339
Total Fixed Rate Debt for Consolidated Assets
5.40
%
$
4,897,303
$
—
$
4,897,303
Santa Monica Place (c)
12/09/24
6.27%
$
—
$
299,451
$
299,451
The Macerich Partnership, L.P. - Line of Credit (d)
02/01/28
7.17
%
—
90,216
90,216
Total Floating Rate Debt for Consolidated Assets
6.48
%
$
—
$
389,667
$
389,667
Total Debt for Consolidated Assets
5.48
%
$
4,897,303
$
389,667
$
5,286,970
II. Unconsolidated Assets (At Company’s pro rata share):
Twenty Ninth Street (51%)
02/06/26
4.10
%
$
76,500
$
—
$
76,500
Deptford Mall (51%)
04/03/26
4.00
%
69,417
—
69,417
Kierland Commons (50%)
04/01/27
3.98
%
93,587
—
93,587
Scottsdale Fashion Square (50%)
03/06/28
6.28
%
349,349
—
349,349
Corte Madera, The Village at (50.1%)
09/01/28
3.53
%
106,468
—
106,468
Tysons Corner Center (50%)
12/06/28
6.89
%
351,518
—
351,518
Chandler Fashion Center (50.1%)
07/01/29
7.15
%
137,254
—
137,254
West Acres - Development (19%)
10/10/29
3.72
%
1,133
—
1,133
Tysons Tower (50%)
10/11/29
3.38
%
94,731
—
94,731
Broadway Plaza (50%)
04/01/30
4.19
%
212,023
—
212,023
Tysons VITA (50%)
12/01/30
3.43
%
44,705
—
44,705
West Acres (19%)
03/01/32
4.61
%
11,918
—
11,918
Total Fixed Rate Debt for Unconsolidated Assets
5.40
%
$
1,548,603
$
—
$
1,548,603
Atlas Park (50%) (d) (e)
11/09/26
9.32
%
$
—
$
32,472
$
32,472
Boulevard Shops (50%)
12/05/28
7.20
%
—
11,838
11,838
Total Floating Rate Debt for Unconsolidated Assets
8.76
%
$
—
$
44,310
$
44,310
Total Debt for Unconsolidated Assets
5.49
%
$
1,548,603
$
44,310
$
1,592,913
Total Debt
5.48
%
$
6,445,906
$
433,977
$
6,879,883
Percentage to Total
93.69
%
6.31
%
100.00
%
29
The Macerich Company
Supplemental Financial and Operating Information (Unaudited)
Outstanding Debt by Maturity Date
(a)The debt balances include the unamortized debt discounts and loan finance costs. Debt discounts represent the deficiency of the fair value of debt below the principal value of debt assumed in various acquisitions. Debt discounts and loan finance costs are amortized into interest expense over the remaining term of the related debt in a manner that approximates the effective interest method. The annual interest rate in the table represents the effective interest rate, including the debt discounts and loan finance costs.
(b)The property is owned by a consolidated joint venture. The loan amount represents the Company's pro rata share of 84.9%.
(c)The Company has completed transition of the property to a receiver, but is still the owner of record.
(d)The maturity date assumes that all available extension options are fully exercised and that the Company and/or its affiliates do not opt to refinance the debt prior to these dates.
(e)On July 30, 2025, the Company's joint venture in Atlas Park repaid the loan in full, concurrent with the sale of the property.
30
The Macerich Company
Supplemental Financial and Operating Information (Unaudited)
Development and Redevelopment Pipeline Forecast
(Dollars in millions)
As of June 30, 2025
In-Process Developments and Redevelopments:
Property
Project Type
Total Cost (a)(b) at 100%
Ownership %
Pro Rata Total Cost (a)(b)
Pro Rata Capitalized Costs Incurred-to-Date(b)
Expected Opening (a)
Stabilized Yield (a)(b)(c)
FlatIron Crossing Broomfield, CO
Development of luxury, multi-family residential units, new/repurposed retail and food & beverage uses, and a community plaza, and redevelopment of the vacant former Nordstrom store.
$245
—
$265
43.4% and 51% (d)
$125
—
$135
$15
2027/2029 (e)
6.75% - 7.75% (f)
Green Acres Mall Valley Stream, NY
Redevelopment of northeast quadrant of mall property, new exterior shops and façade, approx. 375,000 sf of leasing including new grocery use, redevelopment of vacant anchor building and demolition of another vacant anchor building.
$130
—
$150
100%
$130
—
$150
$26
2026/2027 (g)
12.5% - 13.5%
Scottsdale Fashion Square Scottsdale, AZ
Redevelopment of two-level Nordstrom wing with luxury-focused retail and restaurant uses
$84
—
$90
50%
$42
—
$45
$31
2024/2025
16% - 18%
TOTAL
$459
—
$505
$297
—
$330
$72
(a)Much of this information is estimated and may change from time to time. See the Company's forward-looking disclosure in the Executive Summary for factors that may affect the information provided in this table.
(b)This excludes GAAP allocations of non-cash and indirect costs.
(c)Stabilized Yield is calculated based on stabilized income after development divided by project direct costs excluding GAAP allocations of non-cash and indirect costs.
(d)The Company's ownership percentage in the residential project is expected to be 43.4% until stabilization in 2029 and 51% thereafter. Ownership interest in the balance of the property other than the residential component is 51%.
(e)The community plaza/former Nordstrom is expected to open in 2027, and stabilization is estimated to occur in 2029 for residential and 2030-2031 for retail components.
(f)After considering estimated residential financing, the Company's estimated share of net equity is $70 - $80 million and the Company's estimated levered, stabilized yield is 7.0% - 8.0%.
(g)The majority of tenants are expected to open in 2026, with one anchor tenant expected to open in 2027.
31
The Macerich Company
Corporate Information
Stock Exchange Listing
New York Stock Exchange
Symbol: MAC
The following table shows high and low sales prices per share of common stock during each quarter in 2025, 2024 and 2023 and dividends per share of common stock declared and paid by quarter:
Market Quotation per Share
Dividends
Quarter Ended:
High
Low
Declared and Paid
March 31, 2023
$
14.51
$
8.77
$
0.17
June 30, 2023
$
11.58
$
9.05
$
0.17
September 30, 2023
$
12.99
$
10.65
$
0.17
December 31, 2023
$
16.54
$
9.21
$
0.17
March 31, 2024
$
17.69
$
14.66
$
0.17
June 30, 2024
$
17.20
$
12.99
$
0.17
September 30, 2024
$
18.33
$
13.85
$
0.17
December 31, 2024
$
22.27
$
17.29
$
0.17
March 31, 2025
$
21.12
$
15.71
$
0.17
June 30, 2025
$
17.94
$
12.48
$
0.17
Dividend Reinvestment Plan
Stockholders may automatically reinvest their dividends in additional common stock of the Company through the Direct Investment Program, which also provides for purchase by voluntary cash contributions. For additional information, please contact Computershare Trust Company, N.A. at 877-373-6374.
Corporate Headquarters
Transfer Agent
The Macerich Company
Computershare
401 Wilshire Boulevard, Suite 700
P.O. Box 43006
Santa Monica, California 90401
Providence, RI 02940-3006
310-394-6000
877-373-6374
www.macerich.com
1-781-575-2879 International calls
www.computershare.com
Macerich Website
For an electronic version of our annual report, our SEC filings and documents relating to Corporate Governance, please visit www.macerich.com.