Exhibit (c)(1)

PROJECT GLOW DISCUSSION MATERIALS AUGUST 19, 2025
Exhibit (c)(1)
PROJECT GLOW DISCUSSION MATERIALS AUGUST 19, 2025
DISCLAIMER The following pages contain material provided to the Special Committee of the Board of Directors (the “Special Committee”) and the Board of Directors (the “Board”) of Guess ?, Inc. (the “Company” or “Glow”) by Solomon Partners Securities, LLC (“Solomon”) in connection with Project Glow. These materials were prepared on a confidential basis in connection with an oral presentation to the Special Committee and the Board and not with a view toward complying with the disclosure standards under state or federal securities laws or otherwise. These materials are solely for use of the Special Committee and the Board in its evaluation of the proposed transaction and may not be used for any other purpose or disclosed to any party without Solomon’s prior written consent. The information contained in this presentation was based solely on publicly available information or information furnished to Solomon by the Company. Solomon has relied, without independent investigation or verification, on the accuracy, completeness and fair presentation of all such information and the conclusions contained herein are conditioned upon such information (whether written or oral) being accurate, complete and fairly presented in all respects. This presentation includes certain statements, estimates and projections provided by the Company with respect to the historical and anticipated future performance of the Company. Such statements, estimates and projections contain or are based on significant assumptions and subjective judgments made by the Company’s management. None of Solomon, its affiliates or its or their respective employees, directors, officers, contractors, advisors, members, successors or agents makes any representation or warranty in respect of the accuracy, completeness or fair presentation of any information, projections or any conclusion contained herein. Solomon, its affiliates and its and their respective employees, directors, officers, contractors, advisors, members, successors and agents shall have no liability with respect to any information, projections or matter contained herein, or any oral information provided herewith or data any of them generates. The information contained herein should not be assumed to have been updated at any time subsequent to date shown on the first page of the presentation and the delivery of the presentation does not constitute a representation by Solomon that such information will be updated at any time after the date of the presentation. Neither Solomon nor any of its affiliates is an advisor as to legal, tax, accounting or regulatory matters in any jurisdiction. The Company, the Special Committee and the Board acknowledge that Solomon is an affiliate of Natixis, a global full service commercial and investment bank. These materials are not and should not be construed as a fairness opinion.
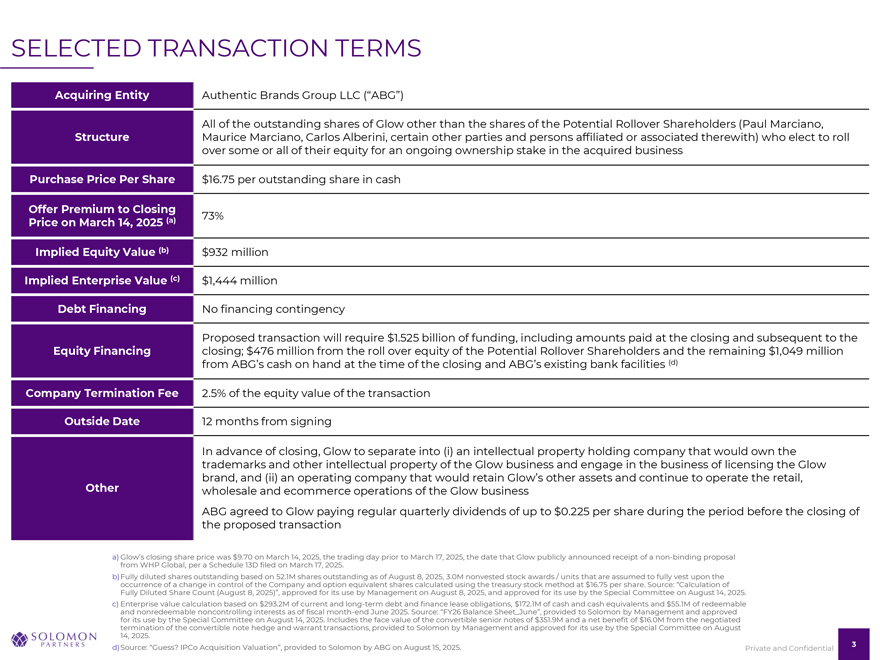
SELECTED TRANSACTION TERMS Acquiring Entity Authentic Brands Group LLC (“ABG”) All of the outstanding shares of Glow other than the shares of the Potential Rollover Shareholders (Paul Marciano, Structure Maurice Marciano, Carlos Alberini, certain other parties and persons affiliated or associated therewith) who elect to roll over some or all of their equity for an ongoing ownership stake in the acquired business Purchase Price Per Share $16.75 per outstanding share in cash Offer Premium to Closing (a) 73% Price on March 14, 2025 Implied Equity Value (b) $932 million Implied Enterprise Value (c) $1,444 million Debt Financing No financing contingency Proposed transaction will require $1.525 billion of funding, including amounts paid at the closing and subsequent to the Equity Financing closing; $476 million from the roll over equity of the Potential Rollover Shareholders and the remaining $1,049 million from ABG’s cash on hand at the time of the closing and ABG’s existing bank facilities (d) Company Termination Fee 2.5% of the equity value of the transaction Outside Date 12 months from signing In advance of closing, Glow to separate into (i) an intellectual property holding company that would own the trademarks and other intellectual property of the Glow business and engage in the business of licensing the Glow Other brand, and (ii) an operating company that would retain Glow’s other assets and continue to operate the retail, wholesale and ecommerce operations of the Glow business ABG agreed to Glow paying regular quarterly dividends of up to $0.225 per share during the period before the closing of the proposed transaction Glow’s closing share price was $9.70 on March 14, 2025, the trading day prior to March 17, 2025, the date that Glow publicly announced receipt of a non-binding proposal from WHP Global, per a Schedule 13D filed on March 17, 2025. Fully diluted shares outstanding based on 52.1M shares outstanding as of August 8, 2025, 3.0M nonvested stock awards / units that are assumed to fully vest upon the occurrence of a change in control of the Company and option equivalent shares calculated using the treasury stock method at $16.75 per share. Source: “Calculation of Fully Diluted Share Count (August 8, 2025)”, approved for its use by Management on August 8, 2025, and approved for its use by the Special Committee on August 14, 2025. Enterprise value calculation based on $293.2M of current and long-term debt and finance lease obligations, $172.1M of cash and cash equivalents and $55.1M of redeemable and nonredeemable noncontrolling interests as of fiscal month-end June 2025. Source: “FY26 Balance Sheet_June”, provided to Solomon by Management and approved for its use by the Special Committee on August 14, 2025. Includes the face value of the convertible senior notes of $351.9M and a net benefit of $16.0M from the negotiated termination of the convertible note hedge and warrant transactions, provided to Solomon by Management and approved for its use by the Special Committee on August 14, 2025. Source: “Guess? IPCo Acquisition Valuation”, provided to Solomon by ABG on August 15, 2025.
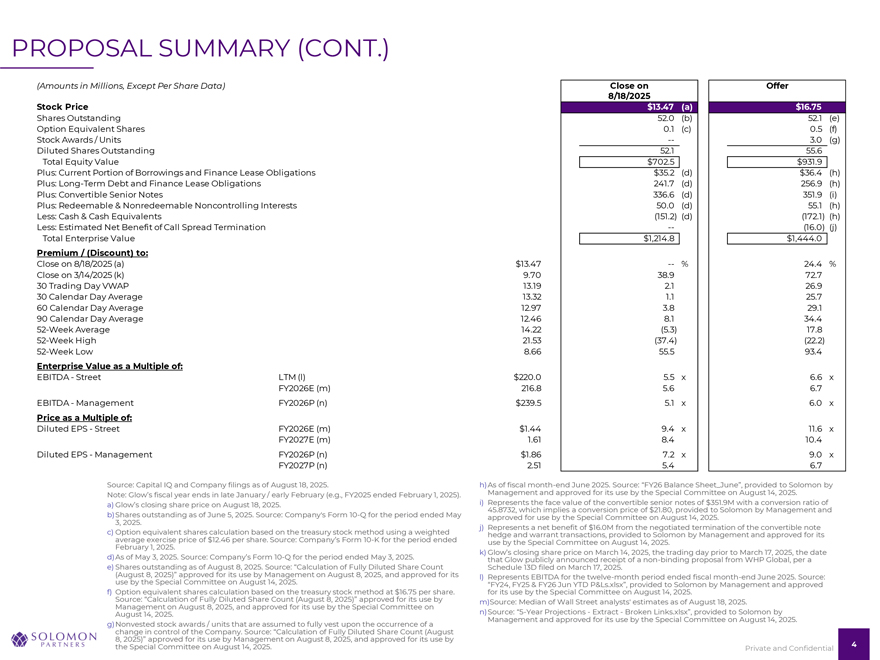
PROPOSAL SUMMARY (CONT.) (Amounts in Millions, Except Per Share Data) Close on Offer 8/18/2025 Stock Price $13.47 (a) $16.75 Shares Outstanding 52.0 (b) 52.1 (e) Option Equivalent Shares 0.1 (c) 0.5 (f) Stock Awards / Units — 3.0 (g) Diluted Shares Outstanding 52.1 55.6 Total Equity Value $702.5 $931.9 Plus: Current Portion of Borrowings and Finance Lease Obligations $35.2 (d) $36.4 (h) Plus: Long-Term Debt and Finance Lease Obligations 241.7 (d) 256.9 (h) Plus: Convertible Senior Notes 336.6 (d) 351.9 (i) Plus: Redeemable & Nonredeemable Noncontrolling Interests 50.0 (d) 55.1 (h) Less: Cash & Cash Equivalents (151.2) (d) (172.1) (h) Less: Estimated Net Benefit of Call Spread Termination — (16.0) (j) Total Enterprise Value $1,214.8 $1,444.0 Premium / (Discount) to: Close on 8/18/2025 (a) $13.47 — % 24.4 % Close on 3/14/2025 (k) 9.70 38.9 72.7 30 Trading Day VWAP 13.19 2.1 26.9 30 Calendar Day Average 13.32 1.1 25.7 60 Calendar Day Average 12.97 3.8 29.1 90 Calendar Day Average 12.46 8.1 34.4 52-Week Average 14.22 (5.3) 17.8 52-Week High 21.53 (37.4) (22.2) 52-Week Low 8.66 55.5 93.4 Enterprise Value as a Multiple of: EBITDA—Street LTM (l) $220.0 5.5 x 6.6 x FY2026E (m) 216.8 5.6 6.7 EBITDA—Management FY2026P (n) $239.5 5.1 x 6.0 x Price as a Multiple of: Diluted EPS—Street FY2026E (m) $1.44 9.4 x 11.6 x FY2027E (m) 1.61 8.4 10.4 Diluted EPS—Management FY2026P (n) $1.86 7.2 x 9.0 x FY2027P (n) 2.51 5.4 6.7 Source: Capital IQ and Company filings as of August 18, 2025. h)Management As of fiscal month and- end approved June 2025 for its . Source: use by the “FY26 Special Balance Committee Sheet_June”, on August provided 14, 2025 to Solomon . by Note: Glow’s fiscal year ends in late January / early February (e.g., FY2025 ended February 1, 2025). i) Represents the face value of the convertible senior notes of $351.9M with a conversion ratio of a) Glow’s closing share price on August 18, 2025. 45.8732, which implies a conversion price of $21.80, provided to Solomon by Management and b)Shares 3, 2025 .outstanding as of June 5, 2025. Source: Company’s Form 10-Q for the period ended May approved for use by the Special Committee on August 14, 2025. j) Represents a net benefit of $16.0M from the negotiated termination of the convertible note c) average Option equivalent exercise price shares of $ calculation 12.46 per share based . Source: on the Company’s treasury stock Form method 10-K for using the period a weighted ended hedge and warrant transactions, provided to Solomon by Management and approved for its use by the Special Committee on August 14, 2025. February 1, 2025. k) Glow’s closing share price on March 14, 2025, the trading day prior to March 17, 2025, the date d)As of May 3, 2025. Source: Company’s Form 10-Q for the period ended May 3, 2025. that Glow publicly announced receipt of a non-binding proposal from WHP Global, per a e) (August Shares outstanding 8, 2025)” approved as of August for its 8, use 2025 by. Management Source: “Calculation on August of Fully 8, 2025, Diluted and Share approved Count for its Schedule 13D filed on March 17, 2025. l) Represents EBITDA for the twelve-month period ended fiscal month-end June 2025. Source: use by the Special Committee on August 14, 2025. “FY24, FY25 & FY26 Jun YTD P&Ls.xlsx”, provided to Solomon by Management and approved f) Source: Option equivalent “Calculation shares of Fully calculation Diluted Share based Count on the (August treasury 8, stock 2025)” method approved at $ for 16 .75 its per use share by . for its use by the Special Committee on August 14, 2025. m)Source: Median of Wall Street analysts’ estimates as of August 18, 2025. Management on August 8, 2025, and approved for its use by the Special Committee on August 14, 2025. n)Management Source: “5-Year and Projections approved — Extract for its use —Broken by the Links Special .xlsx”, Committee provided on to Solomon August 14, by 2025. g)Nonvested change in control stock awards of the Company / units that . Source: are assumed “Calculation to fully of vest Fully upon Diluted the occurrence Share Count of (August a 8, the 2025)” Special approved Committee for its on use August by Management 14, 2025. on August 8, 2025, and approved for its use by Private and Confidential
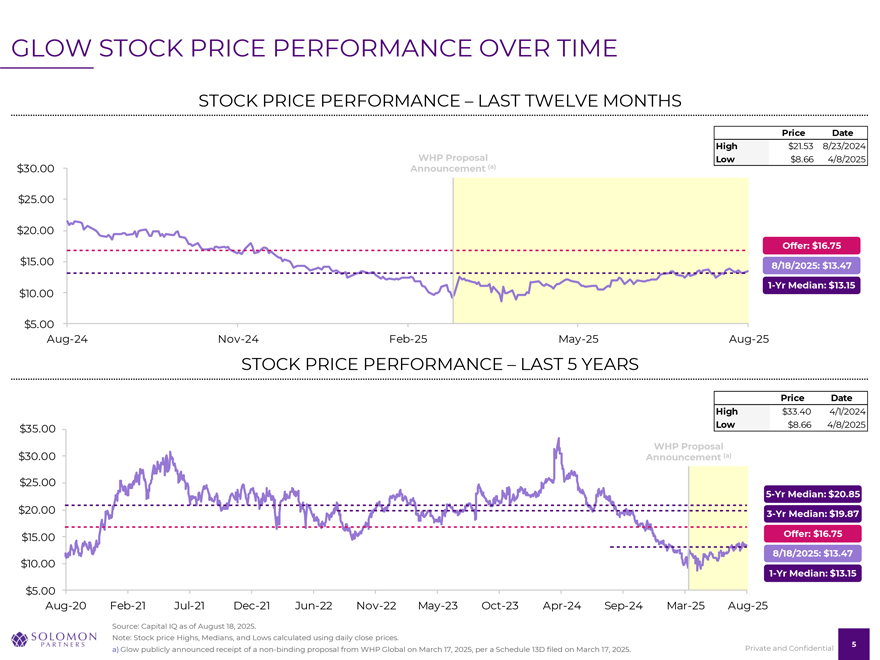
GLOW STOCK PRICE PERFORMANCE OVER TIME STOCK PRICE PERFORMANCE – LAST TWELVE MONTHS Price Date High $21.53 8/23/2024 WHP Proposal Low $8.66 4/8/2025 $30.00 Announcement (a) $25.00 $20.00 Offer: $16.75 $15.00 8/18/2025: $13.47 1-Yr Median: $13.15 $10.00 $5.00 Aug 24 Nov 24 Feb 25 May 25 Aug 25 STOCK PRICE PERFORMANCE – LAST 5 YEARS Price Date High $33.40 4/1/2024 $35.00 Low $8.66 4/8/2025 WHP Proposal $30.00 Announcement (a) $25.00 5-Yr Median: $20.85 $20.00 3-Yr Median: $19.87 $15.00 Offer: $16.75 $10.00 8/18/2025: $13.47 1-Yr Median: $13.15 $5.00 Aug 20 Feb 21 Jul 21 Dec 21 Jun 22 Nov 22 May 23 ct 23 Apr 24 Sep 24 Mar 25 Aug 25 Source: Capital IQ as of August 18, 2025. Note: Stock price Highs, Medians, and Lows calculated using daily close prices. 5 a) Glow publicly announced receipt of a non-binding proposal from WHP Global on March 17, 2025, per a Schedule 13D filed on March 17, 2025. Private and Confidential
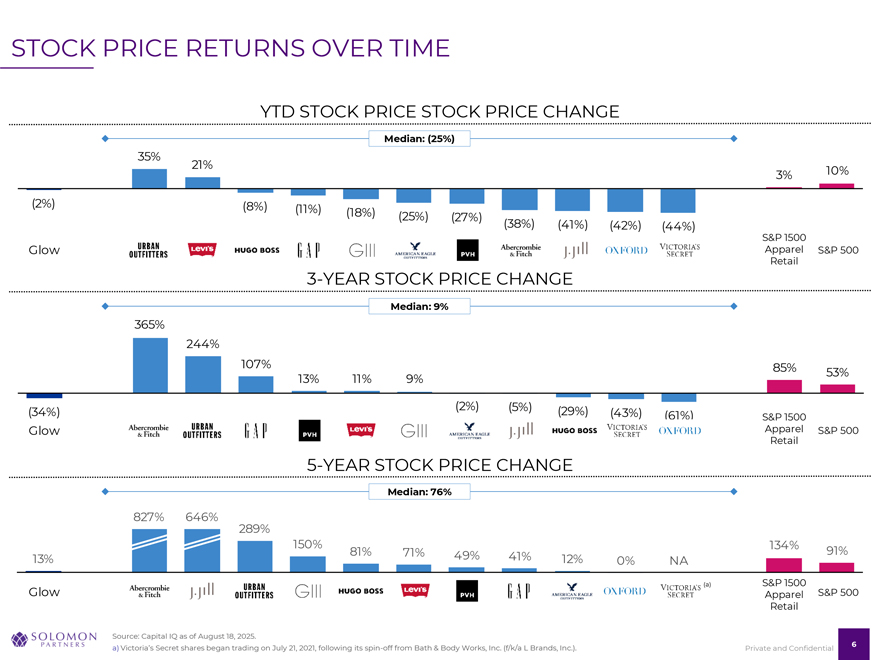
STOCK PRICE RETURNS OVER TIME YTD STOCK PRICE STOCK PRICE CHANGE Median: (25%) 35 21 10 3 (2 ) (8 ) (11 ) (18 ) (25 ) (27 ) (38 ) (41 ) (42 ) (44 ) S&P 1500 Glow Apparel S&P 500 Retail 3-YEAR STOCK PRICE CHANGE Median: 9% 365 244 107 85 53 13 11 9 (34 ) (2 ) (5 ) (29 ) (43 ) (61 ) S&P 1500 Glow Apparel S&P 500 Retail 5-YEAR STOCK PRICE CHANGE Median: 76% 827 646 289 150 134 81 71 49 41 91 13 12 0 NA (a) S&P 1500 S&P 500 Glow Apparel Retail Source: Capital IQ as of August 18, 2025. a) Victoria’s Secret shares began trading on July 21, 2021, following its spin-off from Bath & Body Works, Inc. (f/k/a L Brands, Inc.). 6 Private and Confidential
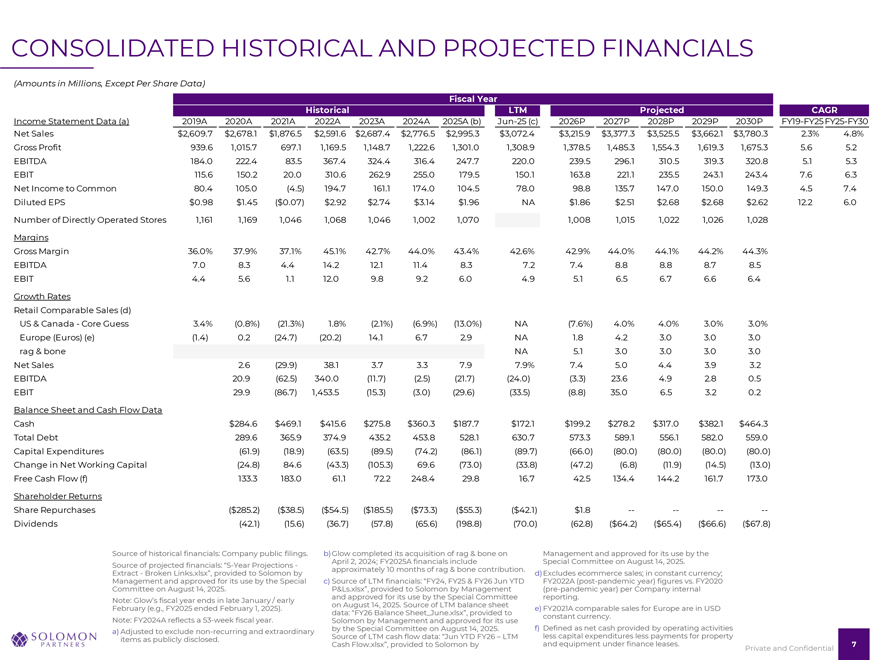
CONSOLIDATED HISTORICAL AND PROJECTED FINANCIALS (Amounts in Millions, Except Per Share Data) Fiscal Year Historical LTM Projected CAGR Income Statement Data (a) 2019A 2020A 2021A 2022A 2023A 2024A 2025A (b) Jun-25 (c) 2026P 2027P 2028P 2029P 2030P FY19-FY25FY25-FY30 Net Sales $2,609.7 $2,678.1 $1,876.5 $2,591.6 $2,687.4 $2,776.5 $2,995.3 $3,072.4 $3,215.9 $3,377.3 $3,525.5 $3,662.1 $3,780.3 2.3% 4.8% Gross Profit 939.6 1,015.7 697.1 1,169.5 1,148.7 1,222.6 1,301.0 1,308.9 1,378.5 1,485.3 1,554.3 1,619.3 1,675.3 5.6 5.2 EBITDA 184.0 222.4 83.5 367.4 324.4 316.4 247.7 220.0 239.5 296.1 310.5 319.3 320.8 5.1 5.3 EBIT 115.6 150.2 20.0 310.6 262.9 255.0 179.5 150.1 163.8 221.1 235.5 243.1 243.4 7.6 6.3 Net Income to Common 80.4 105.0 (4.5) 194.7 161.1 174.0 104.5 78.0 98.8 135.7 147.0 150.0 149.3 4.5 7.4 Diluted EPS $0.98 $1.45 ($0.07) $2.92 $2.74 $3.14 $1.96 NA $1.86 $2.51 $2.68 $2.68 $2.62 12.2 6.0 Number of Directly Operated Stores 1,161 1,169 1,046 1,068 1,046 1,002 1,070 1,008 1,015 1,022 1,026 1,028 Margins Gross Margin 36.0% 37.9% 37.1% 45.1% 42.7% 44.0% 43.4% 42.6% 42.9% 44.0% 44.1% 44.2% 44.3% EBITDA 7.0 8.3 4.4 14.2 12.1 11.4 8.3 7.2 7.4 8.8 8.8 8.7 8.5 EBIT 4.4 5.6 1.1 12.0 9.8 9.2 6.0 4.9 5.1 6.5 6.7 6.6 6.4 Growth Rates Retail Comparable Sales (d) US & Canada—Core Guess 3.4% (0.8%) (21.3%) 1.8% (2.1%) (6.9%) (13.0%) NA (7.6%) 4.0% 4.0% 3.0% 3.0% Europe (Euros) (e) (1.4) 0.2 (24.7) (20.2) 14.1 6.7 2.9 NA 1.8 4.2 3.0 3.0 3.0 rag & bone NA 5.1 3.0 3.0 3.0 3.0 Net Sales 2.6 (29.9) 38.1 3.7 3.3 7.9 7.9% 7.4 5.0 4.4 3.9 3.2 EBITDA 20.9 (62.5) 340.0 (11.7) (2.5) (21.7) (24.0) (3.3) 23.6 4.9 2.8 0.5 EBIT 29.9 (86.7) 1,453.5 (15.3) (3.0) (29.6) (33.5) (8.8) 35.0 6.5 3.2 0.2 Balance Sheet and Cash Flow Data Cash $284.6 $469.1 $415.6 $275.8 $360.3 $187.7 $172.1 $199.2 $278.2 $317.0 $382.1 $464.3 Total Debt 289.6 365.9 374.9 435.2 453.8 528.1 630.7 573.3 589.1 556.1 582.0 559.0 Capital Expenditures (61.9) (18.9) (63.5) (89.5) (74.2) (86.1) (89.7) (66.0) (80.0) (80.0) (80.0) (80.0) Change in Net Working Capital (24.8) 84.6 (43.3) (105.3) 69.6 (73.0) (33.8) (47.2) (6.8) (11.9) (14.5) (13.0) Free Cash Flow (f) 133.3 183.0 61.1 72.2 248.4 29.8 16.7 42.5 134.4 144.2 161.7 173.0 Shareholder Returns Share Repurchases ($285.2) ($38.5) ($54.5) ($185.5) ($73.3) ($55.3) ($42.1) $1.8 -———-Dividends (42.1) (15.6) (36.7) (57.8) (65.6) (198.8) (70.0) (62.8) ($64.2) ($65.4) ($66.6) ($67.8) Source of historical financials: Company public filings. b)Glow completed its acquisition of rag & bone on Management and approved for its use by the April 2, 2024; FY2025A financials include Special Committee on August 14, 2025. Source of projected financials: “5-Year Projections—approximately 10 months of rag & bone contribution. Extract—Broken Links.xlsx”, provided to Solomon by d)Excludes ecommerce sales; in constant currency; Management and approved for its use by the Special c) Source of LTM financials: “FY24, FY25 & FY26 Jun YTD FY2022A (post-pandemic year) figures vs. FY2020 Committee on August 14, 2025. P&Ls.xlsx”, provided to Solomon by Management (pre-pandemic year) per Company internal and approved for its use by the Special Committee reporting. Note: Glow’s fiscal year ends in late January / early on August 14, 2025. Source of LTM balance sheet February (e.g., FY2025 ended February 1, 2025). e) FY2021A comparable sales for Europe are in USD data: “FY26 Balance Sheet_June.xlsx”, provided to constant currency. Note: FY2024A reflects a 53-week fiscal year. Solomon by Management and approved for its use by the Special Committee on August 14, 2025. f) Defined as net cash provided by operating activities a) Adjusted to exclude non-recurring and extraordinary Source of LTM cash flow data: “Jun YTD FY26 – LTM less capital expenditures less payments for property items as publicly disclosed. Cash Flow.xlsx”, provided to Solomon by and equipment under finance leases. 7 Private and Confidential
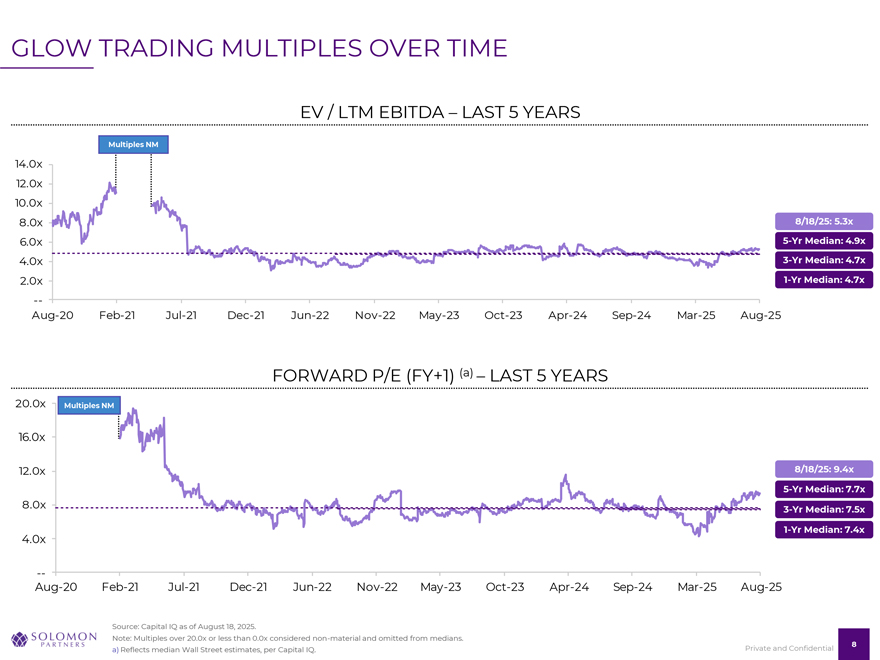
GLOW TRADING MULTIPLES OVER TIME EV / LTM EBITDA – LAST 5 YEARS Multiples NM 14.0x 12.0x 10.0x 8.0x 8/18/25: 5.3x 6.0x 5-Yr Median: 4.9x 4.0x 3-Yr Median: 4.7x 2.0x 1-Yr Median: 4.7x Aug 20 Feb 21 Jul 21 Dec 21 Jun 22 Nov 22 May 23 ct 23 Apr 24 Sep 24 Mar 25 Aug 25 FORWARD P/E (FY+1) (a) – LAST 5 YEARS 20.0x Multiples NM 16.0x 12.0x 8/18/25: 9.4x 5-Yr Median: 7.7x 8.0x 3-Yr Median: 7.5x 1-Yr Median: 7.4x 4.0x Aug 20 Feb 21 Jul 21 Dec 21 Jun 22 Nov 22 May 23 ct 23 Apr 24 Sep 24 Mar 25 Aug 25 Source: Capital IQ as of August 18, 2025. Note: Multiples over 20.0x or less than 0.0x considered non-material and omitted from medians. 8 a) Reflects median Wall Street estimates, per Capital IQ. Private and Confidential
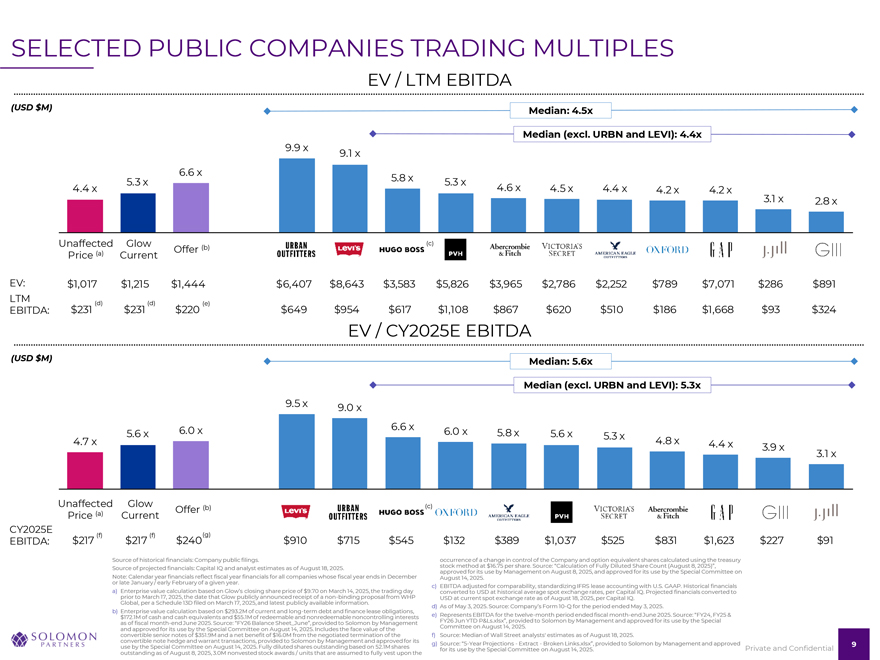
SELECTED PUBLIC COMPANIES TRADING MULTIPLES EV / LTM EBITDA (USD $M) Median: 4.5x Median (excl. URBN and LEVI): 4.4x 9.9 x 9.1 x 6.6 x 4.4 x 5.3 x 5.8 x 5.3 x 4.6 x 4.5 x 4.4 x 4.2 x 4.2 x 3.1 x 2.8 x Unaffected Glow (c) (a) Offer (b) Price Current EV: $1,017 $1,215 $1,444 $6,407 $8,643 $3,583 $5,826 $3,965 $2,786 $2,252 $789 $7,071 $286 $891 LTM (d) (d) (e) EBITDA: $231 $231 $220 $649 $954 $617 $1,108 $867 $620 $510 $186 $1,668 $93 $324 EV / CY2025E EBITDA (USD $M) Median: 5.6x Median (excl. URBN and LEVI): 5.3x 9.5 x 9.0 x 6.0 x 6.6 x 6.0 x 5.6 x 5.8 x 5.6 x 5.3 x 4.7 x 4.8 x 4.4 x 3.9 x 3.1 x Unaffected Glow (b) (c) (a) Offer Price Current CY2025E (f) (f) (g) EBITDA: $217 $217 $240 $910 $715 $545 $132 $389 $1,037 $525 $831 $1,623 $227 $91 Source of historical financials: Company public filings. occurrence of a change in control of the Company and option equivalent shares calculated using the treasury Source of projected financials: Capital IQ and analyst estimates as of August 18, 2025. approved stock method for its at use $16 by .75 Management per share. Source: on August “Calculation 8, 2025, of and Fully approved Diluted Share for its Count use by (August the Special 8, 2025)”, Committee on or Note: late Calendar January /year early financials February reflect of a given fiscal year year . financials for all companies whose fiscal year ends in December August 14, 2025. a) nterprise value calculation based on Glow’s closing share price of $9.70 on March 14, 2025, the trading day c) converted EBITDA adjusted to USD for at comparability, historical average standardizing spot exchange IFRS rates, lease per accounting Capital IQ with . Projected U.S. GAAP financials . Historical converted financials to Global, prior to per March a Schedule 17, 2025, 13D the filed date on that March Glow 17, publicly 2025, and announced latest publicly receipt available of a non information -binding proposal . from WHP USD at current spot exchange rate as of August 18, 2025, per Capital IQ. b) Enterprise value calculation based on $293.2M of current and long-term debt and finance lease obligations, d) As of May 3, 2025. Source: Company’s Form 10-Q for the period ended May 3, 2025. $172.1M of cash and cash equivalents and $55.1M of redeemable and nonredeemable noncontrolling interests e) Represents EBITDA for the twelve-month period ended fiscal month-end June 2025. Source: “FY24, FY25 & as of fiscal month-end June 2025. Source: “FY26 Balance Sheet_June”, provided to Solomon by Management FY26 Committee Jun YTD on P&Ls August .xlsx”, 14, provided 2025. to Solomon by Management and approved for its use by the Special convertible and approved senior for its notes use by of $ the 351 .Special 9M and Committee a net benefit on of August $16.0M 14, from 2025 the . Includes negotiated the termination face value of of the the f) Source: Median of Wall Street analysts’ estimates as of August 18, 2025. convertible use by the Special note hedge Committee and warrant on August transactions, 14, 2025. provided Fully diluted to Solomon shares outstanding by Management based and on 52 approved .1M shares for its g) Source: “5-Year Projections—Extract—Broken Links.xlsx”, provided to Solomon by Management and approved 9 for its use by the Special Committee on August 14, 2025. Private and Confidential outstanding as of August 8, 2025, 3.0M nonvested stock awards / units that are assumed to fully vest upon the
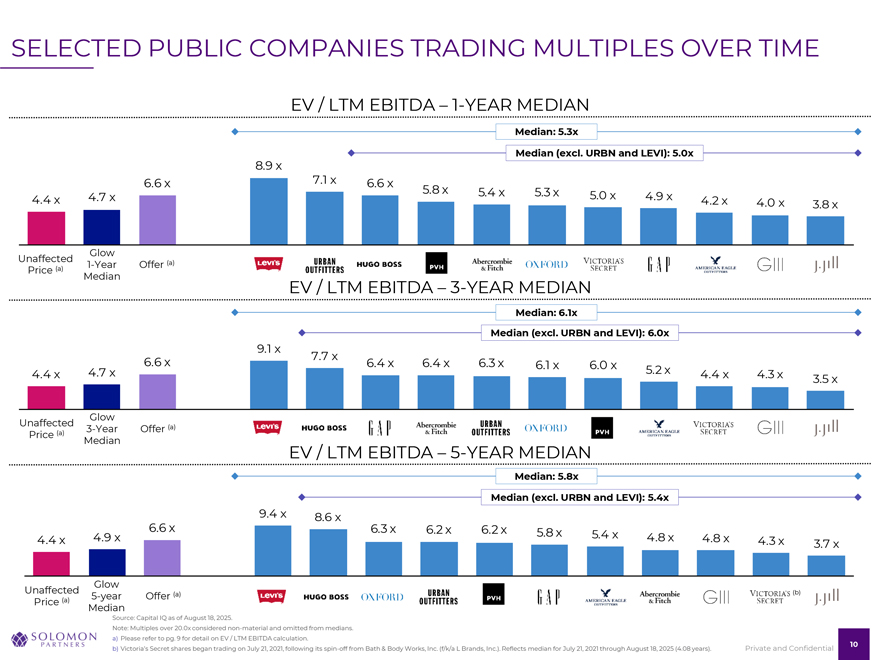
SELECTED PUBLIC COMPANIES TRADING MULTIPLES OVER TIME EV / LTM EBITDA – 1-YEAR MEDIAN Median: 5.3x Median (excl. URBN and LEVI): 5.0x 8.9 x 6.6 x 7.1 x 6.6 x 5.8 x 5.4 x 5.3 x 5.0 x 4.4 x 4.7 x 4.9 x 4.2 x 4.0 x 3.8 x Glow Unaffected (a) (a) 1-Year Offer Price Median EV / LTM EBITDA – 3-YEAR MEDIAN Median: 6.1x Median (excl. URBN and LEVI): 6.0x 9.1 x 7.7 x 6.6 x 6.4 x 6.4 x 6.3 x 6.1 x 6.0 x 4.4 x 4.7 x 5.2 x 4.4 x 4.3 x 3.5 x Glow Unaffected (a) (a) 3-Year Offer Price Median EV / LTM EBITDA – 5-YEAR MEDIAN Median: 5.8x Median (excl. URBN and LEVI): 5.4x 9.4 x 8.6 x 6.6 x 6.3 x 6.2 x 6.2 x 5.8 x 4.4 x 4.9 x 5.4 x 4.8 x 4.8 x 4.3 x 3.7 x Glow Unaffected (a) (b) (a) 5-year Offer Price Median Source: Capital IQ as of August 18, 2025. Note: Multiples over 20.0x considered non-material and omitted from medians. a) Please refer to pg. 9 for detail on EV / LTM EBITDA calculation. 10 b) Victoria’s Secret shares began trading on July 21, 2021, following its spin-off from Bath & Body Works, Inc. (f/k/a L Brands, Inc.). Reflects median for July 21, 2021 through August 18, 2025 (4.08 years). Private and Confidential
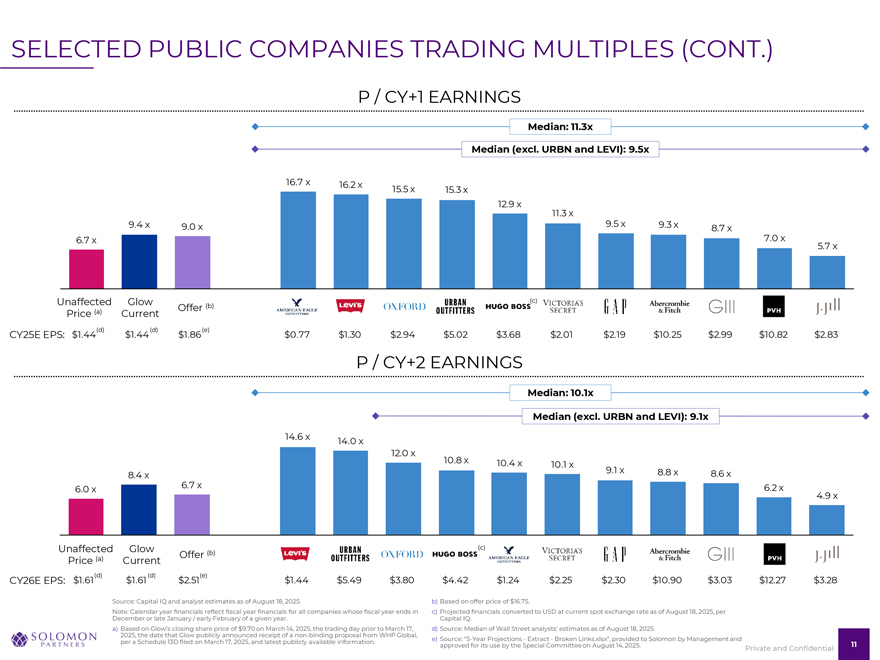
SELECTED PUBLIC COMPANIES TRADING MULTIPLES (CONT.) P / CY+1 EARNINGS Median: 11.3x Median (excl. URBN and LEVI): 9.5x 16.7 x 16.2 x 15.5 x 15.3 x 12.9 x 11.3 x 9.4 x 9.0 x 9.5 x 9.3 x 8.7 x 6.7 x 7.0 x 5.7 x Unaffected Glow (b) (c) (a) Offer Price Current (d) (d) (e) CY25E EPS: $1.44 $1.44 $1.86 $0.77 $1.30 $2.94 $5.02 $3.68 $2.01 $2.19 $10.25 $2.99 $10.82 $2.83 P / CY+2 EARNINGS Median: 10.1x Median (excl. URBN and LEVI): 9.1x 14.6 x 14.0 x 12.0 x 10.8 x 10.4 x 10.1 x 9.1 x 8.8 x 8.6 x 8.4 x 6.0 x 6.7 x 6.2 x 4.9 x Unaffected Glow (c) (a) Offer (b) Price Current CY26E EPS: $1.61(d) $1.61(d) $2.51(e) $1.44 $5.49 $3.80 $4.42 $1.24 $2.25 $2.30 $10.90 $3.03 $12.27 $3.28 Source: Capital IQ and analyst estimates as of August 18, 2025. b) Based on offer price of $16.75. Note: Calendar year financials reflect fiscal year financials for all companies whose fiscal year ends in c) Projected financials converted to USD at current spot exchange rate as of August 18, 2025, per December or late January / early February of a given year. Capital IQ. a) Based on Glow’s closing share price of $9.70 on March 14, 2025, the trading day prior to March 17, d) Source: Median of Wall Street analysts’ estimates as of August 18, 2025. 2025, the date that Glow publicly announced receipt of a non-binding proposal from WHP Global, per a Schedule 13D filed on March 17, 2025, and latest publicly available information. e) Source: “5-Year Projections—Extract—Broken Links.xlsx”, provided to Solomon by Management and approved for its use by the Special Committee on August 14, 2025. 11 Private and Confidential
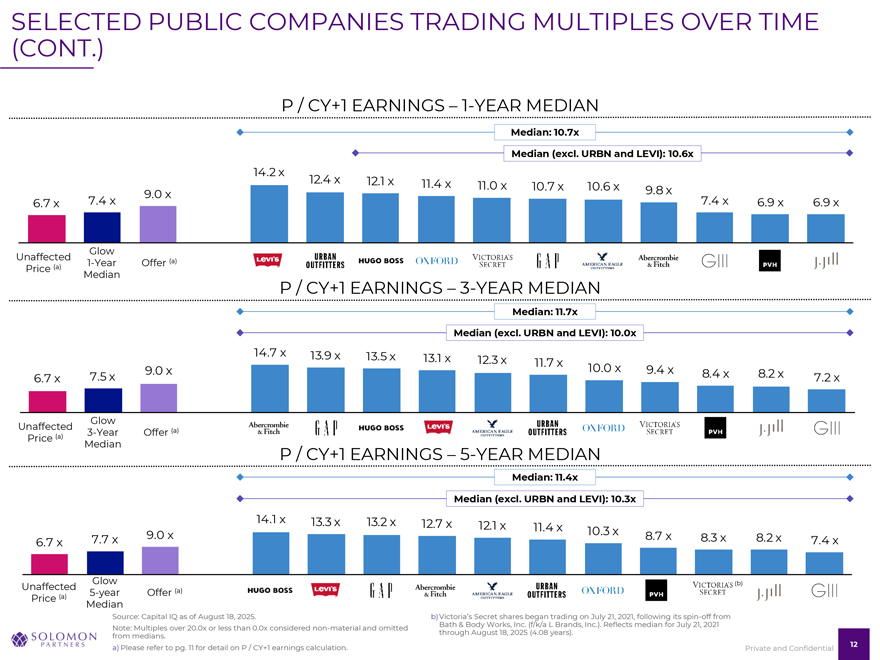
SELECTED PUBLIC COMPANIES TRADING MULTIPLES OVER TIME (CONT.) P / CY+1 EARNINGS – 1-YEAR MEDIAN Median: 10.7x Median (excl. URBN and LEVI): 10.6x 14.2 x 12.4 x 12.1 x 11.4 x 11.0 x 10.7 x 10.6 x 9.8 x 9.0 x 6.7 x 7.4 x 7.4 x 6.9 x 6.9 x Glow Unaffected (a) (a) 1-Year Offer Price Median P / CY+1 EARNINGS – 3-YEAR MEDIAN Median: 11.7x Median (excl. URBN and LEVI): 10.0x 14.7 x 13.9 x 13.5 x 13.1 x 12.3 x 11.7 x 9.0 x 10.0 x 9.4 x 8.4 x 8.2 x 6.7 x 7.5 x 7.2 x Glow Unaffected (a) (a) 3-Year Offer Price Median P / CY+1 EARNINGS – 5-YEAR MEDIAN Median: 11.4x Median (excl. URBN and LEVI): 10.3x 14.1 x 13.3 x 13.2 x 12.7 x 12.1 x 11.4 x 10.3 x 7.7 x 9.0 x 8.7 x 8.3 x 8.2 x 7.4 x 6.7 x Glow (b) Unaffected (a) (a) 5-year Offer Price Median Source: Capital IQ as of August 18, 2025. b)Victoria’s Secret shares began trading on July 21, 2021, following its spin-off from Bath & Body Works, Inc. (f/k/a L Brands, Inc.). Reflects median for July 21, 2021 Note: Multiples over 20.0x or less than 0.0x considered non-material and omitted through August 18, 2025 (4.08 years). from medians. a) Please refer to pg. 11 for detail on P / CY+1 earnings calculation. 12 Private and Confidential
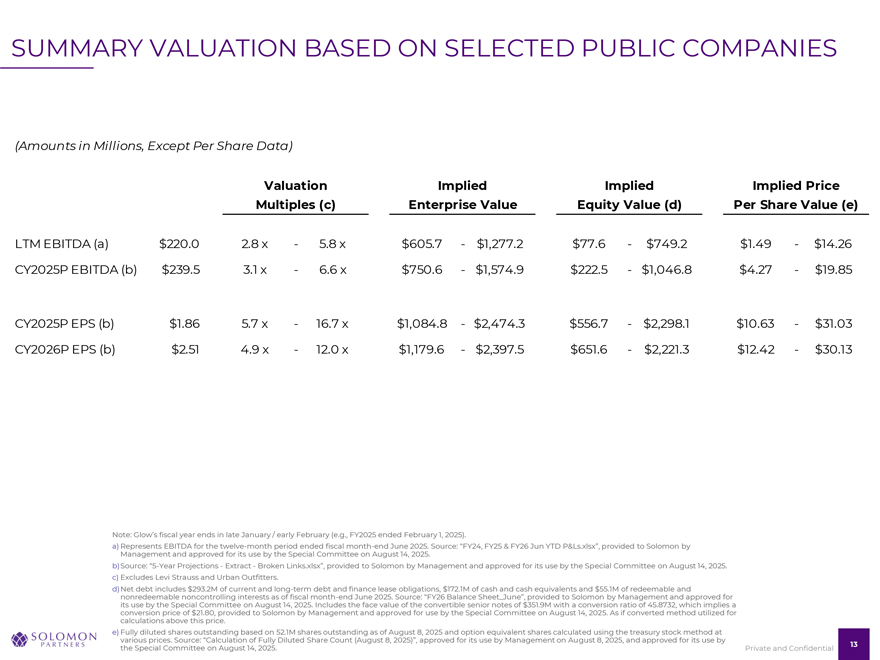
SUMMARY VALUATION BASED ON SELECTED PUBLIC COMPANIES (Amounts in Millions, Except Per Share Data) Valuation Implied Implied Implied Price Multiples (c) Enterprise Value Equity Value (d) Per Share Value (e) LTM EBITDA (a) $220.0 2.8 x—5.8 x $605.7—$1,277.2 $77.6—$749.2 $1.49—$14.26 CY2025P EBITDA (b) $239.5 3.1 x—6.6 x $750.6—$1,574.9 $222.5—$1,046.8 $4.27—$19.85 CY2025P EPS (b) $1.86 5.7 x—16.7 x $1,084.8—$2,474.3 $556.7—$2,298.1 $10.63—$31.03 CY2026P EPS (b) $2.51 4.9 x—12.0 x $1,179.6—$2,397.5 $651.6—$2,221.3 $12.42—$30.13 Note: Glow’s fiscal year ends in late January / early February (e.g., FY2025 ended February 1, 2025). a) Represents EBITDA for the twelve-month period ended fiscal month-end June 2025. Source: “FY24, FY25 & FY26 Jun YTD P&Ls.xlsx”, provided to Solomon by Management and approved for its use by the Special Committee on August 14, 2025. b)Source: “5-Year Projections—Extract—Broken Links.xlsx”, provided to Solomon by Management and approved for its use by the Special Committee on August 14, 2025. c) Excludes Levi Strauss and Urban Outfitters. d)Net debt includes $293.2M of current and long-term debt and finance lease obligations, $172.1M of cash and cash equivalents and $55.1M of redeemable and nonredeemable noncontrolling interests as of fiscal month-end June 2025. Source: “FY26 Balance Sheet_June”, provided to Solomon by Management and approved for its use by the Special Committee on August 14, 2025. Includes the face value of the convertible senior notes of $351.9M with a conversion ratio of 45.8732, which implies a conversion price of $21.80, provided to Solomon by Management and approved for use by the Special Committee on August 14, 2025. As if converted method utilized for calculations above this price. e) Fully diluted shares outstanding based on 52.1M shares outstanding as of August 8, 2025 and option equivalent shares calculated using the treasury stock method at various prices. Source: “Calculation of Fully Diluted Share Count (August 8, 2025)”, approved for its use by Management on August 8, 2025, and approved for its use by the Special Committee on August 14, 2025. 13 Private and Confidential
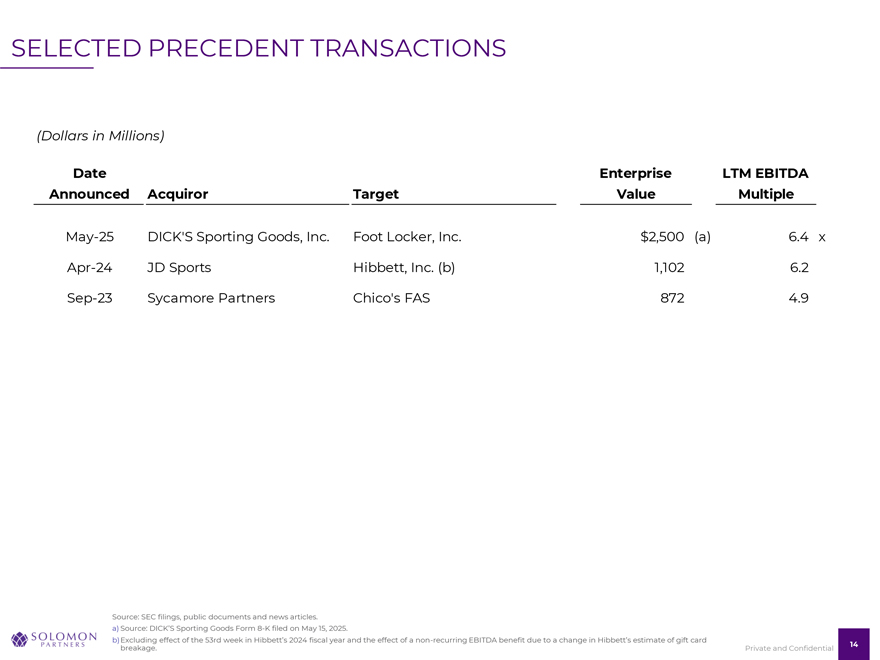
SELECTED PRECEDENT TRANSACTIONS (Dollars in Millions) Date Enterprise LTM EBITDA Announced Acquiror Target Value Multiple May-25 DICK’S Sporting Goods, Inc. Foot Locker, Inc. $2,500 (a) 6.4 x Apr-24 JD Sports Hibbett, Inc. (b) 1,102 6.2 Sep-23 Sycamore Partners Chico’s FAS 872 4.9 Source: SEC filings, public documents and news articles. a) Source: DICK’S Sporting Goods Form 8-K filed on May 15, 2025. b) xcluding effect of the 53rd week in ibbett’s 2024 fiscal year and the effect of a non-recurring EBITDA benefit due to a change in ibbett’s estimate of gift card breakage. 14 Private and Confidential
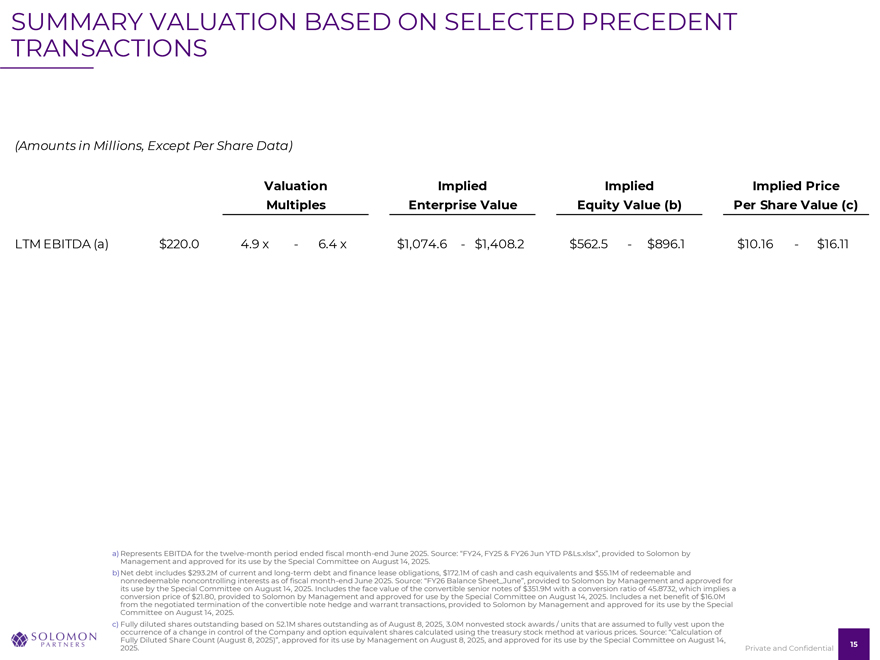
SUMMARY VALUATION BASED ON SELECTED PRECEDENT TRANSACTIONS (Amounts in Millions, Except Per Share Data) Valuation Implied Implied Implied Price Multiples Enterprise Value Equity Value (b) Per Share Value (c) LTM EBITDA (a) $220.0 4.9 x—6.4 x $1,074.6—$1,408.2 $562.5—$896.1 $10.16—$16.11 a) Represents EBITDA for the twelve-month period ended fiscal month-end June 2025. Source: “FY24, FY25 & FY26 Jun YTD P&Ls.xlsx”, provided to Solomon by Management and approved for its use by the Special Committee on August 14, 2025. b)Net debt includes $293.2M of current and long-term debt and finance lease obligations, $172.1M of cash and cash equivalents and $55.1M of redeemable and nonredeemable noncontrolling interests as of fiscal month-end June 2025. Source: “FY26 Balance Sheet_June”, provided to Solomon by Management and approved for its use by the Special Committee on August 14, 2025. Includes the face value of the convertible senior notes of $351.9M with a conversion ratio of 45.8732, which implies a conversion price of $21.80, provided to Solomon by Management and approved for use by the Special Committee on August 14, 2025. Includes a net benefit of $16.0M from the negotiated termination of the convertible note hedge and warrant transactions, provided to Solomon by Management and approved for its use by the Special Committee on August 14, 2025. c) Fully diluted shares outstanding based on 52.1M shares outstanding as of August 8, 2025, 3.0M nonvested stock awards / units that are assumed to fully vest upon the occurrence of a change in control of the Company and option equivalent shares calculated using the treasury stock method at various prices. Source: “Calculation of Fully Diluted Share Count (August 8, 2025)”, approved for its use by Management on August 8, 2025, and approved for its use by the Special Committee on August 14, 2025. 15 Private and Confidential
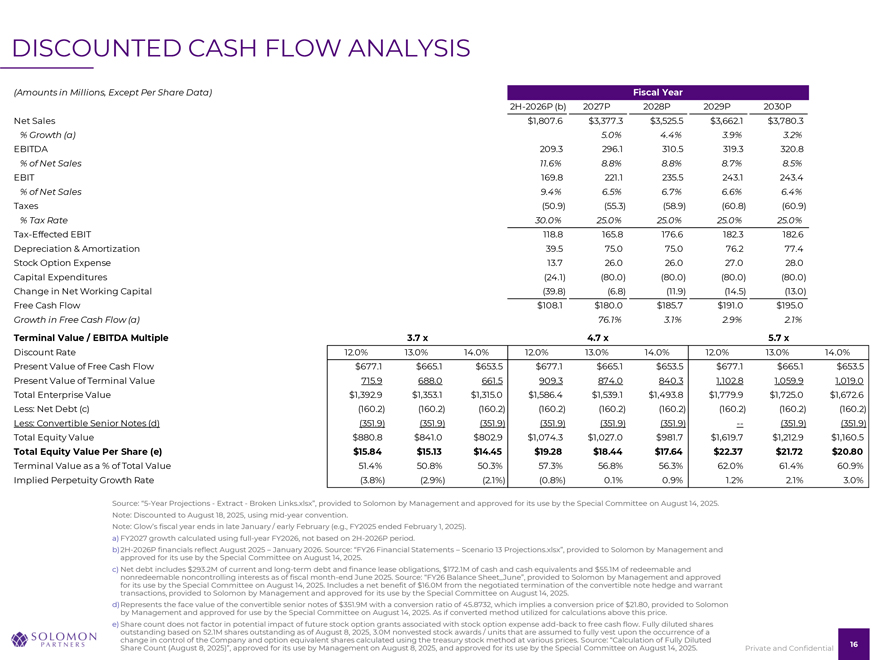
DISCOUNTED CASH FLOW ANALYSIS (Amounts in Millions, Except Per Share Data) Fiscal Year 2H-2026P (b) 2027P 2028P 2029P 2030P Net Sales $1,807.6 $3,377.3 $3,525.5 $3,662.1 $3,780.3 % Growth (a) 5.0% 4.4% 3.9% 3.2% EBITDA 209.3 296.1 310.5 319.3 320.8 % of Net Sales 11.6% 8.8% 8.8% 8.7% 8.5% EBIT 169.8 221.1 235.5 243.1 243.4 % of Net Sales 9.4% 6.5% 6.7% 6.6% 6.4% Taxes (50.9) (55.3) (58.9) (60.8) (60.9) % Tax Rate 30.0% 25.0% 25.0% 25.0% 25.0% Tax-Effected EBIT 118.8 165.8 176.6 182.3 182.6 Depreciation & Amortization 39.5 75.0 75.0 76.2 77.4 Stock Option Expense 13.7 26.0 26.0 27.0 28.0 Capital Expenditures (24.1) (80.0) (80.0) (80.0) (80.0) Change in Net Working Capital (39.8) (6.8) (11.9) (14.5) (13.0) Free Cash Flow $108.1 $180.0 $185.7 $191.0 $195.0 Growth in Free Cash Flow (a) 76.1% 3.1% 2.9% 2.1% Terminal Value / EBITDA Multiple 3.7 x 3.7 x 3.7 x 4.7 x 4.7 x 4.7 x 5.7 x 5.7 x 5.7 x Discount Rate 12.0% 13.0% 14.0% 12.0% 13.0% 14.0% 12.0% 13.0% 14.0% Present Value of Free Cash Flow $677.1 $665.1 $653.5 $677.1 $665.1 $653.5 $677.1 $665.1 $653.5 Present Value of Terminal Value 715.9 688.0 661.5 909.3 874.0 840.3 1,102.8 1,059.9 1,019.0 Total Enterprise Value $1,392.9 $1,353.1 $1,315.0 $1,586.4 $1,539.1 $1,493.8 $1,779.9 $1,725.0 $1,672.6 Less: Net Debt (c) (160.2) (160.2) (160.2) (160.2) (160.2) (160.2) (160.2) (160.2) (160.2) Less: Convertible Senior Notes (d) (351.9) (351.9) (351.9) (351.9) (351.9) (351.9) — (351.9) (351.9) Total Equity Value $880.8 $841.0 $802.9 $1,074.3 $1,027.0 $981.7 $1,619.7 $1,212.9 $1,160.5 Total Equity Value Per Share (e) $15.84 $15.13 $14.45 $19.28 $18.44 $17.64 $22.37 $21.72 $20.80 Terminal Value as a % of Total Value 51.4% 50.8% 50.3% 57.3% 56.8% 56.3% 62.0% 61.4% 60.9% Implied Perpetuity Growth Rate (3.8%) (2.9%) (2.1%) (0.8%) 0.1% 0.9% 1.2% 2.1% 3.0% Source: “5-Year Projections—Extract—Broken Links.xlsx”, provided to Solomon by Management and approved for its use by the Special Committee on August 14, 2025. Note: Discounted to August 18, 2025, using mid-year convention. Note: Glow’s fiscal year ends in late January / early February (e.g., FY2025 ended February 1, 2025). a) FY2027 growth calculated using full-year FY2026, not based on 2H-2026P period. b)2H-2026P financials reflect August 2025 – January 2026. Source: “FY26 Financial Statements – Scenario 13 Projections.xlsx”, provided to Solomon by Management and approved for its use by the Special Committee on August 14, 2025. c) Net debt includes $293.2M of current and long-term debt and finance lease obligations, $172.1M of cash and cash equivalents and $55.1M of redeemable and nonredeemable noncontrolling interests as of fiscal month-end June 2025. Source: “FY26 Balance Sheet_June”, provided to Solomon by Management and approved for its use by the Special Committee on August 14, 2025. Includes a net benefit of $16.0M from the negotiated termination of the convertible note hedge and warrant transactions, provided to Solomon by Management and approved for its use by the Special Committee on August 14, 2025. d)Represents the face value of the convertible senior notes of $351.9M with a conversion ratio of 45.8732, which implies a conversion price of $21.80, provided to Solomon by Management and approved for use by the Special Committee on August 14, 2025. As if converted method utilized for calculations above this price. e) Share count does not factor in potential impact of future stock option grants associated with stock option expense add-back to free cash flow. Fully diluted shares outstanding based on 52.1M shares outstanding as of August 8, 2025, 3.0M nonvested stock awards / units that are assumed to fully vest upon the occurrence of a change in control of the Company and option equivalent shares calculated using the treasury stock method at various prices. Source: “Calculation of Fully Diluted Share Count (August 8, 2025)”, approved for its use by Management on August 8, 2025, and approved for its use by the Special Committee on August 14, 2025. 16 Private and Confidential
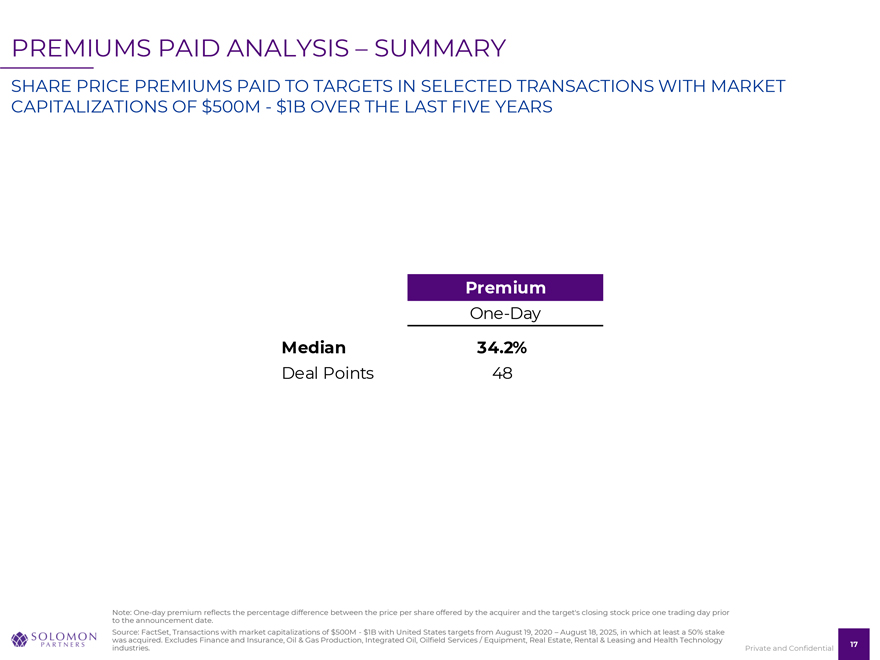
PREMIUMS PAID ANALYSIS – SUMMARY SHARE PRICE PREMIUMS PAID TO TARGETS IN SELECTED TRANSACTIONS WITH MARKET CAPITALIZATIONS OF $500M—$1B OVER THE LAST FIVE YEARS Premium One-Day Median 34.2% Deal Points 48 Note: One-day premium reflects the percentage difference between the price per share offered by the acquirer and the target’s closing stock price one trading day prior to the announcement date. Source: FactSet, Transactions with market capitalizations of $500M—$1B with United States targets from August 19, 2020 – August 18, 2025, in which at least a 50% stake was acquired. Excludes Finance and Insurance, Oil & Gas Production, Integrated Oil, Oilfield Services / Equipment, Real Estate, Rental & Leasing and Health Technology industries. 17 Private and Confidential
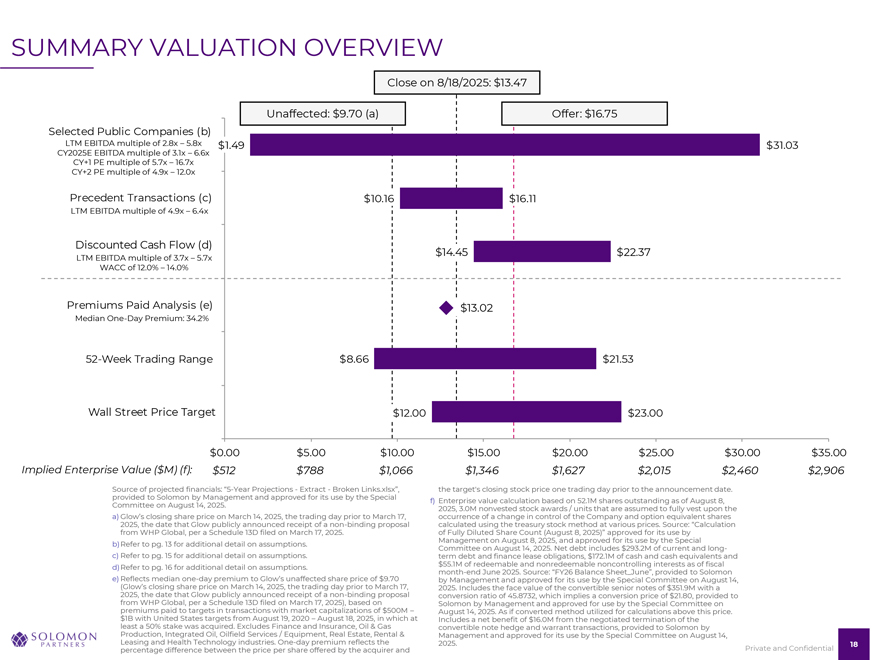
SUMMARY VALUATION OVERVIEW Close on 8/18/2025: $13.47 Unaffected: $9.70 (a) Offer: $16.75 Selected Public Companies (b) LTM EBITDA multiple of 2.8x – 5.8x $1.49 $31.03 CY2025E EBITDA multiple of 3.1x – 6.6x CY+1 PE multiple of 5.7x – 16.7x CY+2 PE multiple of 4.9x – 12.0x Precedent Transactions (c) $10.16 $16.11 LTM EBITDA multiple of 4.9x – 6.4x Discounted Cash Flow (d) $14.45 $22.37 LTM EBITDA multiple of 3.7x – 5.7x WACC of 12.0% – 14.0% Premiums Paid Analysis (e) $13.02 Median One-Day Premium: 34.2% 52 eek Trading ange $8.66 $21.53 all Street Price Target $12.00 $23.00 $0.00 $5.00 $10.00 $15.00 $20.00 $25.00 $30.00 $35.00 Implied Enterprise Value ($M) (f): $512 $788 $1,066 $1,346 $1,627 $2,015 $2,460 $2,906 Source of projected financials: “5-Year Projections—Extract—Broken Links.xlsx”, the target’s closing stock price one trading day prior to the announcement date. provided to Solomon by Management and approved for its use by the Special f) Enterprise value calculation based on 52.1M shares outstanding as of August 8, Committee on August 14, 2025. 2025, 3.0M nonvested stock awards / units that are assumed to fully vest upon the a) Glow’s closing share price on March 14, 2025, the trading day prior to March 17, occurrence of a change in control of the Company and option equivalent shares 2025, the date that Glow publicly announced receipt of a non-binding proposal calculated using the treasury stock method at various prices. Source: “Calculation from WHP Global, per a Schedule 13D filed on March 17, 2025. of Fully Diluted Share Count (August 8, 2025)” approved for its use by Management on August 8, 2025, and approved for its use by the Special b)Refer to pg. 13 for additional detail on assumptions. c) Refer to pg. 15 for additional detail on assumptions. Committee on August 14, 2025. Net debt includes $293.2M of current and long-term debt and finance lease obligations, $172.1M of cash and cash equivalents and d)Refer to pg. 16 for additional detail on assumptions. $55.1M of redeemable and nonredeemable noncontrolling interests as of fiscal e) Reflects median one-day premium to Glow’s unaffected share price of $9.70 month-end June 2025. Source: “FY26 Balance Sheet_June”, provided to Solomon (Glow’s closing share price on March 14, 2025, the trading day prior to March 17, by Management and approved for its use by the Special Committee on August 14, 2025, the date that Glow publicly announced receipt of a non-binding proposal 2025. Includes the face value of the convertible senior notes of $351.9M with a from WHP Global, per a Schedule 13D filed on March 17, 2025), based on conversion ratio of 45.8732, which implies a conversion price of $21.80, provided to premiums paid to targets in transactions with market capitalizations of $500M – Solomon by Management and approved for use by the Special Committee on $1B with United States targets from August 19, 2020 – August 18, 2025, in which at August 14, 2025. As if converted method utilized for calculations above this price. least a 50% stake was acquired. Excludes Finance and Insurance, Oil & Gas Includes a net benefit of $16.0M from the negotiated termination of the Production, Integrated Oil, Oilfield Services / Equipment, Real Estate, Rental & convertible note hedge and warrant transactions, provided to Solomon by Leasing and Health Technology industries. One-day premium reflects the Management and approved for its use by the Special Committee on August 14, 2025. percentage difference between the price per share offered by the acquirer and Private and Confidential

APPENDIX
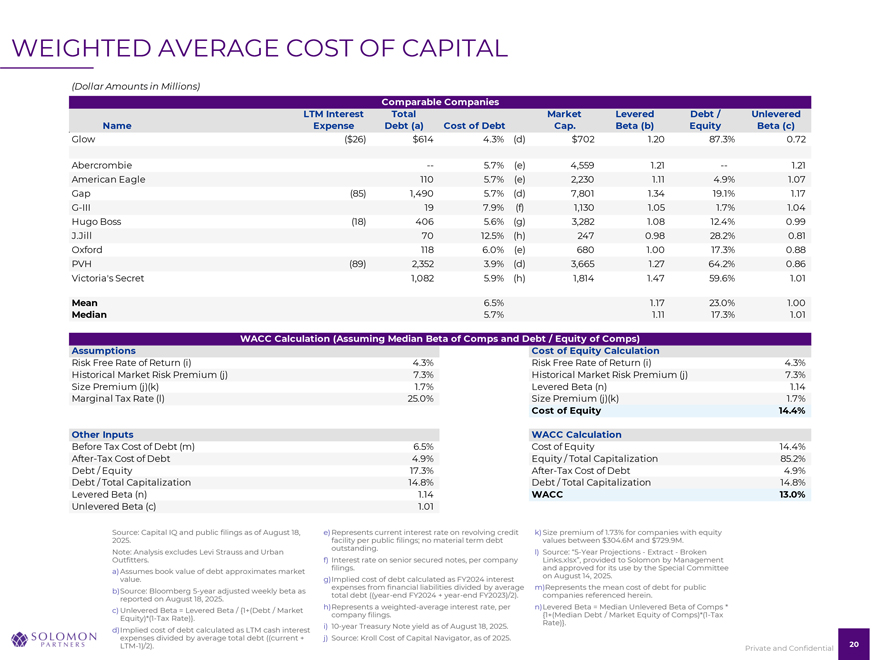
WEIGHTED AVERAGE COST OF CAPITAL (Dollar Amounts in Millions) Comparable Companies LTM Interest Total Market Levered Debt / Unlevered Name Expense Debt (a) Cost of Debt Cap. Beta (b) Equity Beta (c) Glow ($26) $614 4.3% (d) $702 1.20 87.3% 0.72 Abercrombie — 5.7% (e) 4,559 1.21 — 1.21 American Eagle 110 5.7% (e) 2,230 1.11 4.9% 1.07 Gap (85) 1,490 5.7% (d) 7,801 1.34 19.1% 1.17 G-III 19 7.9% (f) 1,130 1.05 1.7% 1.04 Hugo Boss (18) 406 5.6% (g) 3,282 1.08 12.4% 0.99 J.Jill 70 12.5% (h) 247 0.98 28.2% 0.81 Oxford 118 6.0% (e) 680 1.00 17.3% 0.88 PVH (89) 2,352 3.9% (d) 3,665 1.27 64.2% 0.86 Victoria’s Secret 1,082 5.9% (h) 1,814 1.47 59.6% 1.01 Mean 6.5% 1.17 23.0% 1.00 Median 5.7% 1.11 17.3% 1.01 WACC Calculation (Assuming Median Beta of Comps and Debt / Equity of Comps) Assumptions Cost of Equity Calculation Risk Free Rate of Return (i) 4.3% Risk Free Rate of Return (i) 4.3% Historical Market Risk Premium (j) 7.3% Historical Market Risk Premium (j) 7.3% Size Premium (j)(k) 1.7% Levered Beta (n) 1.14 Marginal Tax Rate (l) 25.0% Size Premium (j)(k) 1.7% Cost of Equity 14.4% Other Inputs WACC Calculation Before Tax Cost of Debt (m) 6.5% Cost of Equity 14.4% After-Tax Cost of Debt 4.9% Equity / Total Capitalization 85.2% Debt / Equity 17.3% After-Tax Cost of Debt 4.9% Debt / Total Capitalization 14.8% Debt / Total Capitalization 14.8% Levered Beta (n) 1.14 WACC 13.0% Unlevered Beta (c) 1.01 Source: Capital IQ and public filings as of August 18, e)Represents current interest rate on revolving credit k)Size premium of 1.73% for companies with equity 2025. facility per public filings; no material term debt values between $304.6M and $729.9M. outstanding. Note: Analysis excludes Levi Strauss and Urban l) Source: “5-Year Projections—Extract—Broken Outfitters. f) Interest rate on senior secured notes, per company Links.xlsx”, provided to Solomon by Management filings. and approved for its use by the Special Committee a)Assumes book value of debt approximates market on August 14, 2025. value. g)Implied cost of debt calculated as FY2024 interest expenses from financial liabilities divided by average m)Represents the mean cost of debt for public b)Source: Bloomberg 5-year adjusted weekly beta as total debt ((year-end FY2024 + year-end FY2023)/2). companies referenced herein. reported on August 18, 2025. h)Represents a weighted-average interest rate, per n)Levered Beta = Median Unlevered Beta of Comps * c) Unlevered Beta = Levered Beta / {1+(Debt / Market company filings. {1+(Median Debt / Market Equity of Comps)*(1-Tax Equity)*(1-Tax Rate)}. Rate)}. i) 10-year Treasury Note yield as of August 18, 2025. d)Implied cost of debt calculated as LTM cash interest expenses divided by average total debt ((current + j) Source: Kroll Cost of Capital Navigator, as of 2025. 20 LTM-1)/2). Private and Confidential
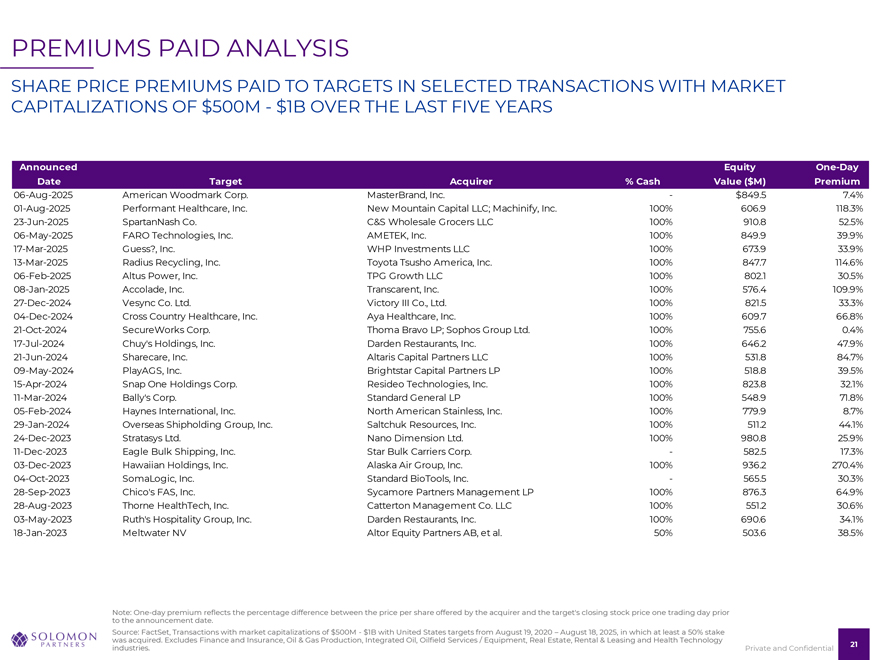
PREMIUMS PAID ANALYSIS SHARE PRICE PREMIUMS PAID TO TARGETS IN SELECTED TRANSACTIONS WITH MARKET CAPITALIZATIONS OF $500M—$1B OVER THE LAST FIVE YEARS Announced Equity One-Day Date Target Acquirer % Cash Value ($M) Premium 06-Aug-2025 American Woodmark Corp. MasterBrand, Inc.—$849.5 7.4% 01-Aug-2025 Performant Healthcare, Inc. New Mountain Capital LLC; Machinify, Inc. 100% 606.9 118.3% 23-Jun-2025 SpartanNash Co. C&S Wholesale Grocers LLC 100% 910.8 52.5% 06-May-2025 FARO Technologies, Inc. AMETEK, Inc. 100% 849.9 39.9% 17-Mar-2025 Guess?, Inc. WHP Investments LLC 100% 673.9 33.9% 13-Mar-2025 Radius Recycling, Inc. Toyota Tsusho America, Inc. 100% 847.7 114.6% 06-Feb-2025 Altus Power, Inc. TPG Growth LLC 100% 802.1 30.5% 08-Jan-2025 Accolade, Inc. Transcarent, Inc. 100% 576.4 109.9% 27-Dec-2024 Vesync Co. Ltd. Victory III Co., Ltd. 100% 821.5 33.3% 04-Dec-2024 Cross Country Healthcare, Inc. Aya Healthcare, Inc. 100% 609.7 66.8% 21-Oct-2024 SecureWorks Corp. Thoma Bravo LP; Sophos Group Ltd. 100% 755.6 0.4% 17-Jul-2024 Chuy’s Holdings, Inc. Darden Restaurants, Inc. 100% 646.2 47.9% 21-Jun-2024 Sharecare, Inc. Altaris Capital Partners LLC 100% 531.8 84.7% 09-May-2024 PlayAGS, Inc. Brightstar Capital Partners LP 100% 518.8 39.5% 15-Apr-2024 Snap One Holdings Corp. Resideo Technologies, Inc. 100% 823.8 32.1% 11-Mar-2024 Bally’s Corp. Standard General LP 100% 548.9 71.8% 05-Feb-2024 Haynes International, Inc. North American Stainless, Inc. 100% 779.9 8.7% 29-Jan-2024 Overseas Shipholding Group, Inc. Saltchuk Resources, Inc. 100% 511.2 44.1% 24-Dec-2023 Stratasys Ltd. Nano Dimension Ltd. 100% 980.8 25.9% 11-Dec-2023 Eagle Bulk Shipping, Inc. Star Bulk Carriers Corp.—582.5 17.3% 03-Dec-2023 Hawaiian Holdings, Inc. Alaska Air Group, Inc. 100% 936.2 270.4% 04-Oct-2023 SomaLogic, Inc. Standard BioTools, Inc.—565.5 30.3% 28-Sep-2023 Chico’s FAS, Inc. Sycamore Partners Management LP 100% 876.3 64.9% 28-Aug-2023 Thorne HealthTech, Inc. Catterton Management Co. LLC 100% 551.2 30.6% 03-May-2023 Ruth’s Hospitality Group, Inc. Darden Restaurants, Inc. 100% 690.6 34.1% 18-Jan-2023 Meltwater NV Altor Equity Partners AB, et al. 50% 503.6 38.5% Note: One-day premium reflects the percentage difference between the price per share offered by the acquirer and the target’s closing stock price one trading day prior to the announcement date. Source: FactSet, Transactions with market capitalizations of $500M—$1B with United States targets from August 19, 2020 – August 18, 2025, in which at least a 50% stake was acquired. Excludes Finance and Insurance, Oil & Gas Production, Integrated Oil, Oilfield Services / Equipment, Real Estate, Rental & Leasing and Health Technology industries. 21 Private and Confidential
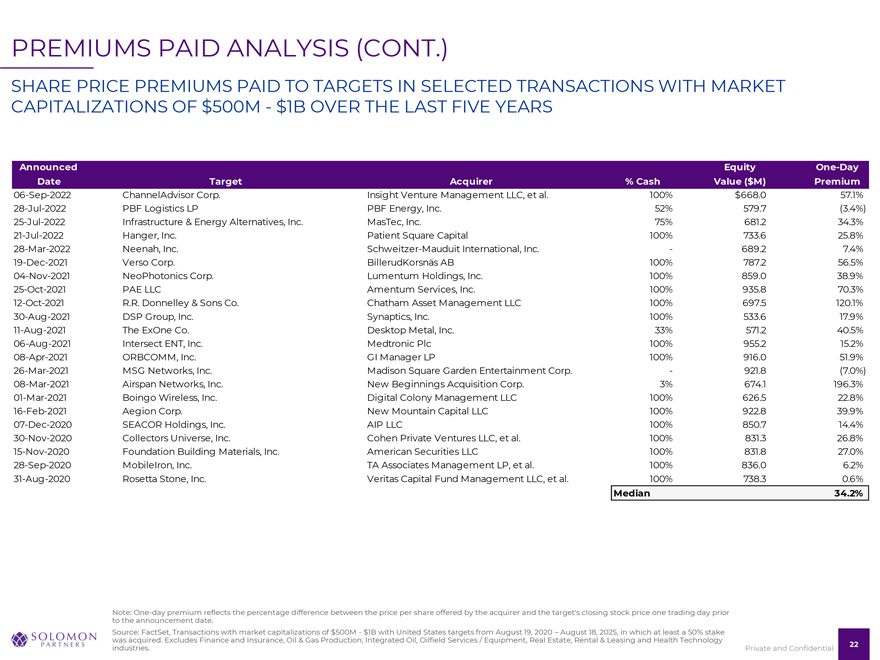
PREMIUMS PAID ANALYSIS (CONT.) SHARE PRICE PREMIUMS PAID TO TARGETS IN SELECTED TRANSACTIONS WITH MARKET CAPITALIZATIONS OF $500M—$1B OVER THE LAST FIVE YEARS Announced Equity One-Day Date Target Acquirer % Cash Value ($M) Premium 06-Sep-2022 ChannelAdvisor Corp. Insight Venture Management LLC, et al. 100% $668.0 57.1% 28-Jul-2022 PBF Logistics LP PBF Energy, Inc. 52% 579.7 (3.4%) 25-Jul-2022 Infrastructure & Energy Alternatives, Inc. MasTec, Inc. 75% 681.2 34.3% 21-Jul-2022 Hanger, Inc. Patient Square Capital 100% 733.6 25.8% 28-Mar-2022 Neenah, Inc. Schweitzer-Mauduit International, Inc.—689.2 7.4% 19-Dec-2021 Verso Corp. BillerudKorsnäs AB 100% 787.2 56.5% 04-Nov-2021 NeoPhotonics Corp. Lumentum Holdings, Inc. 100% 859.0 38.9% 25-Oct-2021 PAE LLC Amentum Services, Inc. 100% 935.8 70.3% 12-Oct-2021 R.R. Donnelley & Sons Co. Chatham Asset Management LLC 100% 697.5 120.1% 30-Aug-2021 DSP Group, Inc. Synaptics, Inc. 100% 533.6 17.9% 11-Aug-2021 The ExOne Co. Desktop Metal, Inc. 33% 571.2 40.5% 06-Aug-2021 Intersect ENT, Inc. Medtronic Plc 100% 955.2 15.2% 08-Apr-2021 ORBCOMM, Inc. GI Manager LP 100% 916.0 51.9% 26-Mar-2021 MSG Networks, Inc. Madison Square Garden Entertainment Corp.—921.8 (7.0%) 08-Mar-2021 Airspan Networks, Inc. New Beginnings Acquisition Corp. 3% 674.1 196.3% 01-Mar-2021 Boingo Wireless, Inc. Digital Colony Management LLC 100% 626.5 22.8% 16-Feb-2021 Aegion Corp. New Mountain Capital LLC 100% 922.8 39.9% 07-Dec-2020 SEACOR Holdings, Inc. AIP LLC 100% 850.7 14.4% 30-Nov-2020 Collectors Universe, Inc. Cohen Private Ventures LLC, et al. 100% 831.3 26.8% 15-Nov-2020 Foundation Building Materials, Inc. American Securities LLC 100% 831.8 27.0% 28-Sep-2020 MobileIron, Inc. TA Associates Management LP, et al. 100% 836.0 6.2% 31-Aug-2020 Rosetta Stone, Inc. Veritas Capital Fund Management LLC, et al. 100% 738.3 0.6% Median 34.2% Note: One-day premium reflects the percentage difference between the price per share offered by the acquirer and the target’s closing stock price one trading day prior to the announcement date. Source: FactSet, Transactions with market capitalizations of $500M—$1B with United States targets from August 19, 2020 – August 18, 2025, in which at least a 50% stake was acquired. Excludes Finance and Insurance, Oil & Gas Production, Integrated Oil, Oilfield Services / Equipment, Real Estate, Rental & Leasing and Health Technology industries. 22 Private and Confidential
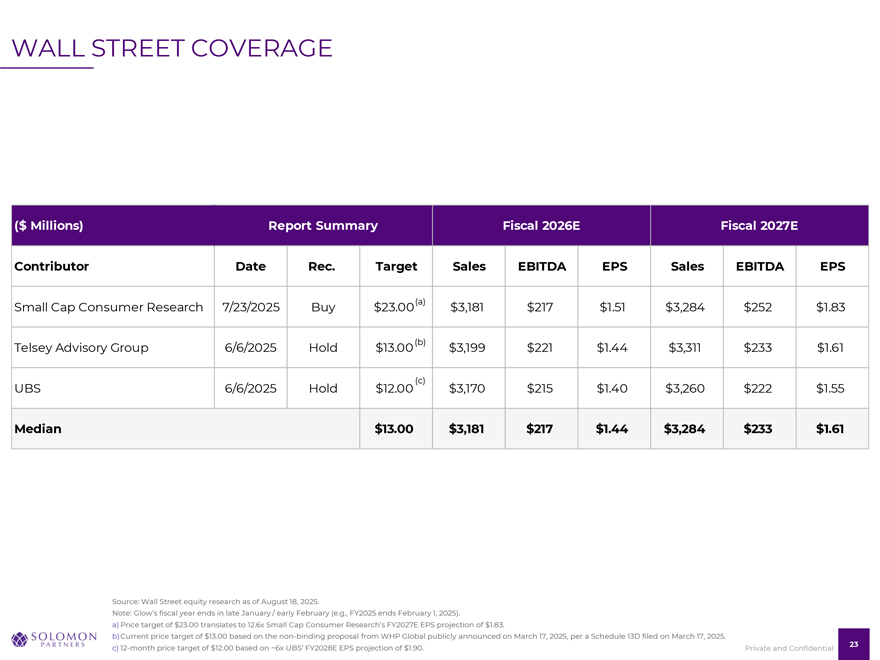
WALL STREET COVERAGE ($ Millions) Report Summary Fiscal 2026E Fiscal 2027E Contributor Date Rec. Target Sales EBITDA EPS Sales EBITDA EPS Small Cap Consumer Research 7/23/2025 Buy $23.00(a) $3,181 $217 $1.51 $3,284 $252 $1.83 Telsey Advisory Group 6/6/2025 Hold $13.00(b) $3,199 $221 $1.44 $3,311 $233 $1.61 (c) UBS 6/6/2025 Hold $12.00 $3,170 $215 $1.40 $3,260 $222 $1.55 Median $13.00 $3,181 $217 $1.44 $3,284 $233 $1.61 Source: Wall Street equity research as of August 18, 2025. Note: Glow’s fiscal year ends in late January / early February (e.g., FY2025 ends February 1, 2025). a) Price target of $23.00 translates to 12.6x Small Cap Consumer esearch’s FY2027 PS projection of $1.83. b)Current price target of $13.00 based on the non-binding proposal from WHP Global publicly announced on March 17, 2025, per a Schedule 13D filed on March 17, 2025. c) 12-month price target of $12.00 based on ~6x BS’ FY2028 PS projection of $1.90. 23 Private and Confidential
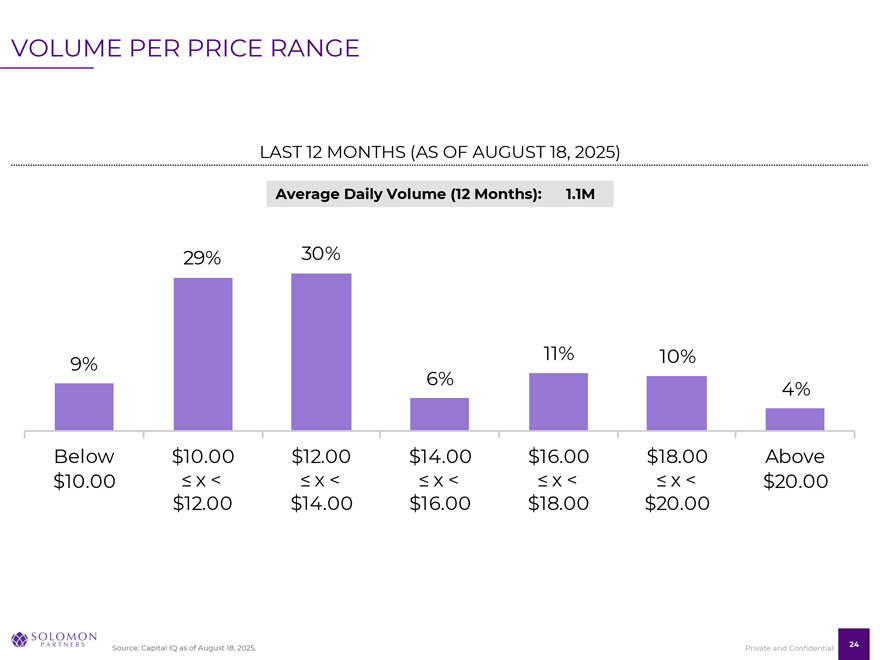
VOLUME PER PRICE RANGE LAST 12 MONTHS (AS OF AUGUST 18, 2025) Average Daily Volume (12 Months): 1.1M 29 30 11 10 9 6 4 Below $10.00 $12.00 $14.00 $16.00 $18.00 Above $10.00 x x x x x $20.00 $12.00 $14.00 $16.00 $18.00 $20.00 Source: Capital IQ as of August 18, 2025. 24 Private and Confidential