
.2
Third Quarter 2026 Results September 30, 2026 COMMERCIAL REAL ESTATE | ENGINEERING | INVESTMENT MANAGEMENT
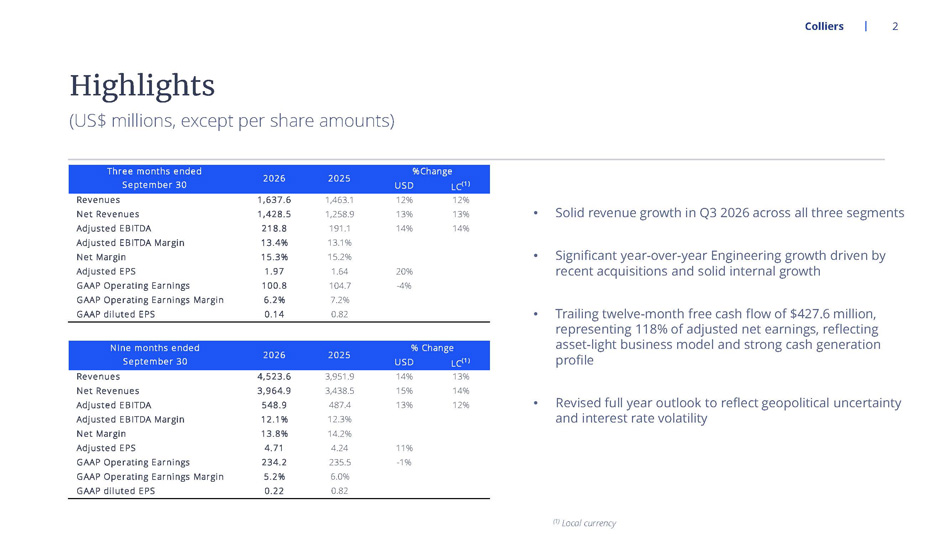
2 Colliers (US$ millions, except per share amounts) Highlights • Solid revenue growth in Q3 2026 across all three segments • Significant year - over - year Engineering growth driven by recent acquisitions and solid internal growth • Trailing twelve - month free cash flow of $427.6 million, representing 118% of adjusted net earnings, reflecting asset - light business model and strong cash generation profile • Revised full year outlook to reflect geopolitical uncertainty and interest rate volatility USD LC (1) Revenues 1,637.6 1,463.1 12% 12% Net Revenues 1,428.5 1,258.9 13% 13% Adjusted EBITDA 218.8 191.1 14% 14% Adjusted EBITDA Margin 13.4% 13.1% Net Margin 15.3% 15.2% Adjusted EPS 1.97 1.64 20% GAAP Operating Earnings 100.8 104.7 -4% GAAP Operating Earnings Margin 6.2% 7.2% GAAP diluted EPS 0.14 0.82 USD LC (1) Revenues 4,523.6 3,951.9 14% 13% Net Revenues 3,964.9 3,438.5 15% 14% Adjusted EBITDA 548.9 487.4 13% 12% Adjusted EBITDA Margin 12.1% 12.3% Net Margin 13.8% 14.2% Adjusted EPS 4.71 4.24 11% GAAP Operating Earnings 234.2 235.5 -1% GAAP Operating Earnings Margin 5.2% 6.0% GAAP diluted EPS 0.22 0.82 Three months ended September 30 2026 2025 %Change Nine months ended September 30 2026 2025 % Change (1) Local currency
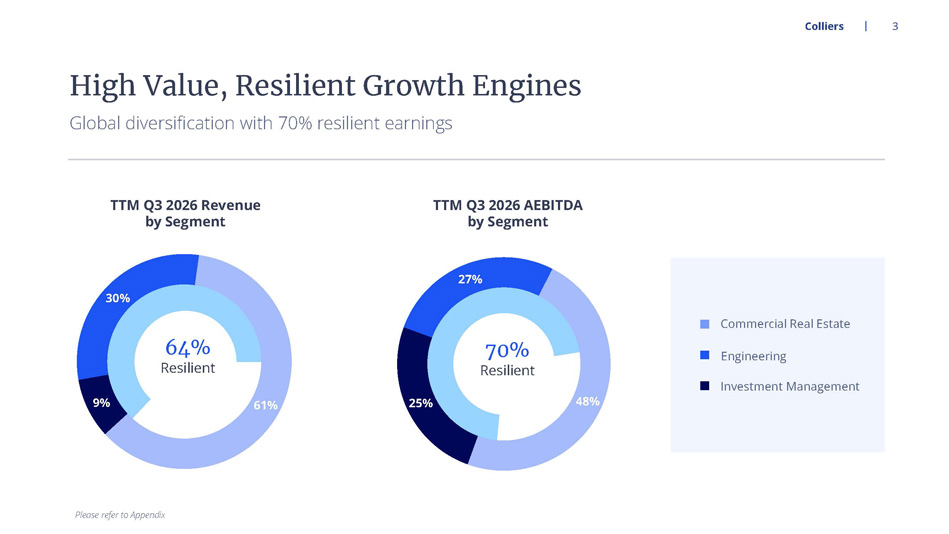
27% 48% 25% 70% Resilient TTM Q3 2026 AEBITDA by Segment 30% 61% 9% TTM Q3 2026 Revenue by Segment 64% Resilient Colliers Commercial Real Estate Engineering Investment Management Global diversification with 70% resilient earnings High Value, Resilient Growth Engines Please refer to Appendix 3
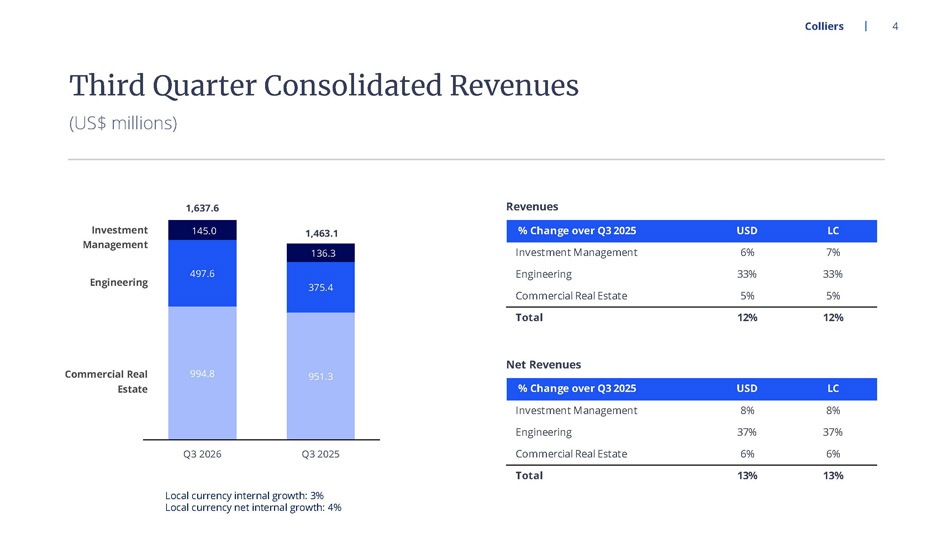
4 Colliers Third Quarter Consolidated Revenues Engineering Investment Management Commercial Real Estate % Change over Q3 2025 USD LC Investment Management 6% 7% Engineering 33% 33% Commercial Real Estate 5% 5% Total 12% 12% 994.8 951.3 497.6 375.4 145.0 136.3 1,637.6 1,463.1 Q3 2026 Q3 2025 (US$ millions) Local currency internal growth: 3% Local currency net internal growth: 4% Revenues % Change over Q3 2025 USD LC Investment Management 8% 8% Engineering 37% 37% Commercial Real Estate 6% 6% Total 13% 13% Net Revenues
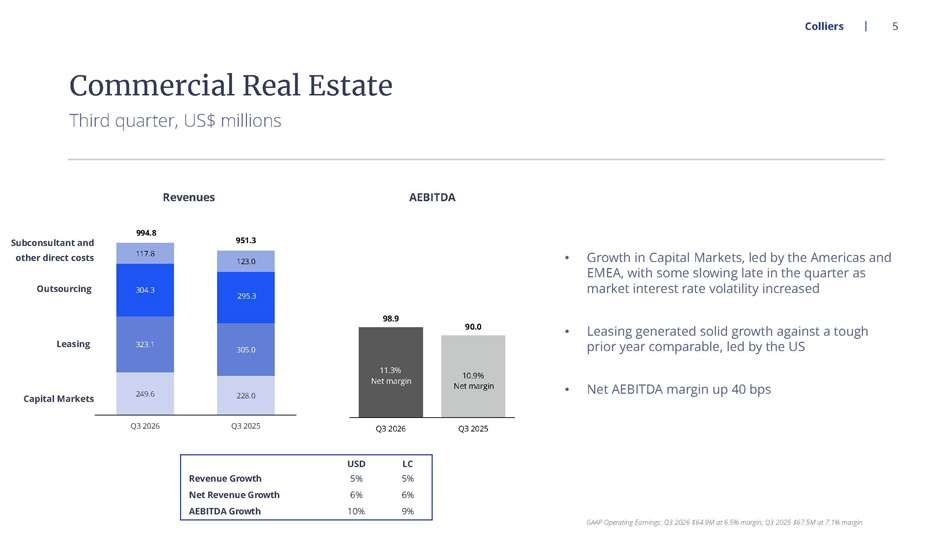
249.6 228.0 323.1 305.0 304.3 295.3 117.8 123.0 994.8 951.3 Q3 2026 Q3 2025 5 Colliers Third quarter, US$ millions Commercial Real Estate • Growth in Capital Markets, led by the Americas and EMEA, with some slowing late in the quarter as market interest rate volatility increased • Leasing generated solid growth against a tough prior year comparable, led by the US • Net AEBITDA margin up 40 bps 98.9 90.0 Q3 2026 Q3 2025 11.3% Net margin 10.9% Net margin USD LC Revenue Growth 5% 5% Net Revenue Growth 6% 6% AEBITDA Growth 10% 9% Revenues AEBITDA Outsourcing Leasing Capital Markets Subconsultant and other direct costs GAAP Operating Earnings: Q3 2026 $64.9M at 6.5% margin; Q3 2025 $67.5M at 7.1% margin
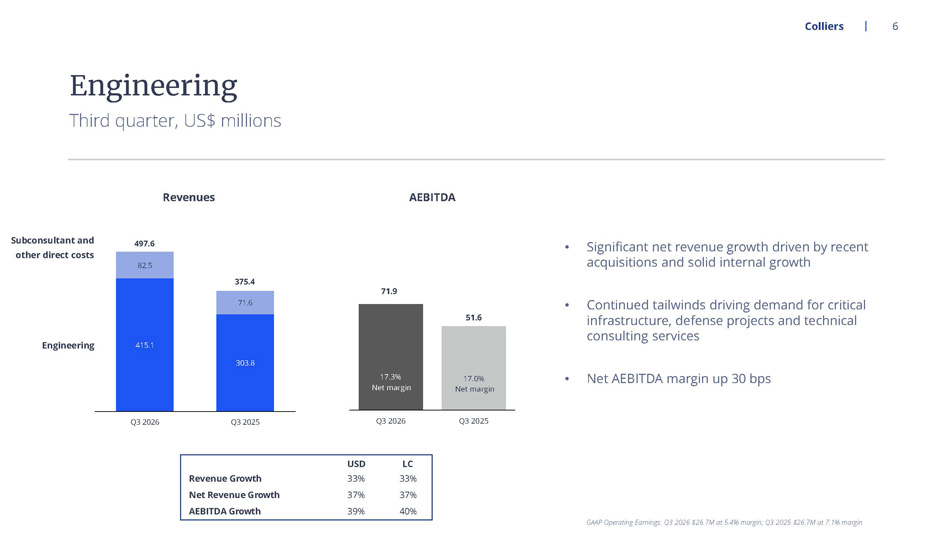
6 Colliers Third quarter, US$ millions Engineering • Significant net revenue growth driven by recent acquisitions and solid internal growth • Continued tailwinds driving demand for critical infrastructure, defense projects and technical consulting services • Net AEBITDA margin up 30 bps 415.1 303.8 82.5 71.6 497.6 375.4 Q3 2026 Q3 2025 GAAP Operating Earnings: Q3 2026 $26.7M at 5.4% margin; Q3 2025 $26.7M at 7.1% margin 71.9 51.6 Q3 2026 Q3 2025 17.3% Net margin 17.0% Net margin USD LC Revenue Growth 33% 33% Net Revenue Growth 37% 37% AEBITDA Growth 39% 40% Revenues AEBITDA Engineering Subconsultant and other direct costs
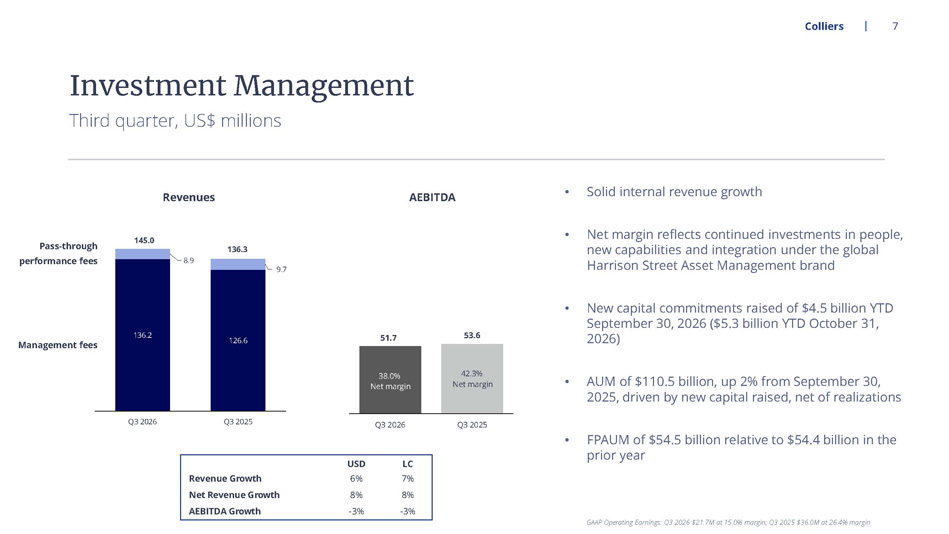
7 Colliers Third quarter, US$ millions Investment Management • Solid internal revenue growth • Net margin reflects continued investments in people, new capabilities and integration under the global Harrison Street Asset Management brand • New capital commitments raised of $4.5 billion YTD September 30, 2026 ($5.3 billion YTD October 31, 2026) • AUM of $110.5 billion, up 2% from September 30, 2025, driven by new capital raised, net of realizations • FPAUM of $54.5 billion relative to $54.4 billion in the prior year 136.2 126.6 8.9 9.7 145.0 136.3 Q3 2026 Q3 2025 GAAP Operating Earnings: Q3 2026 $21.7M at 15.0% margin; Q3 2025 $36.0M at 26.4% margin 51.7 53.6 Q3 2026 Q3 2025 38.0% Net margin 42.3% Net margin USD LC Revenue Growth 6% 7% Net Revenue Growth 8% 8% AEBITDA Growth -3% -3% Management fees Pass - through performance fees Revenues AEBITDA
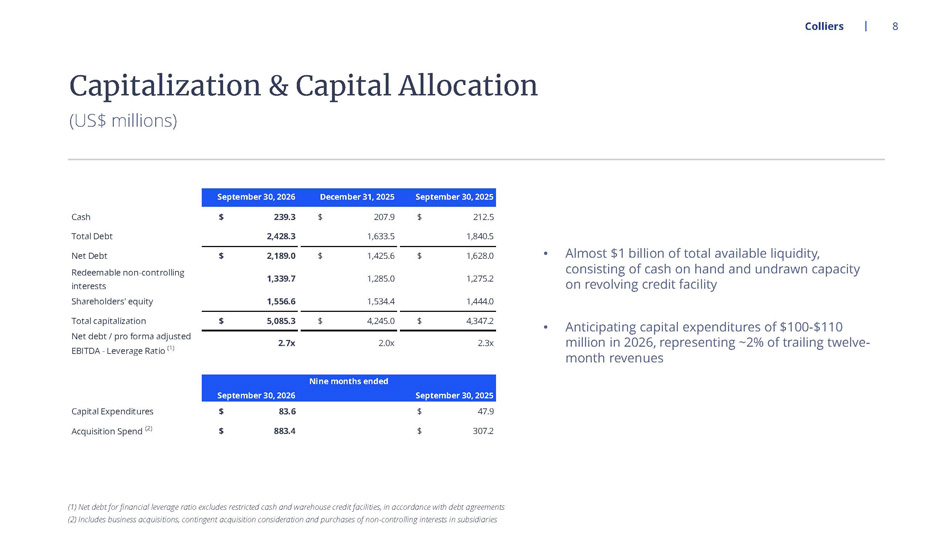
8 Colliers (US$ millions) Capitalization & Capital Allocation • Almost $1 billion of total available liquidity, consisting of cash on hand and undrawn capacity on revolving credit facility • Anticipating capital expenditures of $100 - $110 million in 2026, representing ~2% of trailing twelve - month revenues Cash $ 239.3 $ 207.9 $ 212.5 Total Debt 2,428.3 1,633.5 1,840.5 Net Debt $ 2,189.0 $ 1,425.6 $ 1,628.0 Redeemable non-controlling interests 1,339.7 1,285.0 1,275.2 Shareholders' equity 1,556.6 1,534.4 1,444.0 Total capitalization $ 5,085.3 $ 4,245.0 $ 4,347.2 Net debt / pro forma adjusted EBITDA - Leverage Ratio (1) 2.7x 2.0x 2.3x Capital Expenditures $ 83.6 $ 47.9 Acquisition Spend (2) $ 883.4 $ 307.2 Nine months ended September 30, 2026 September 30, 2025 September 30, 2026 December 31, 2025 September 30, 2025 (1) Net debt for financial leverage ratio excludes restricted cash and warehouse credit facilities, in accordance with debt a gre ements (2) Includes business acquisitions, contingent acquisition consideration and purchases of non - controlling interests in subsidiar ies
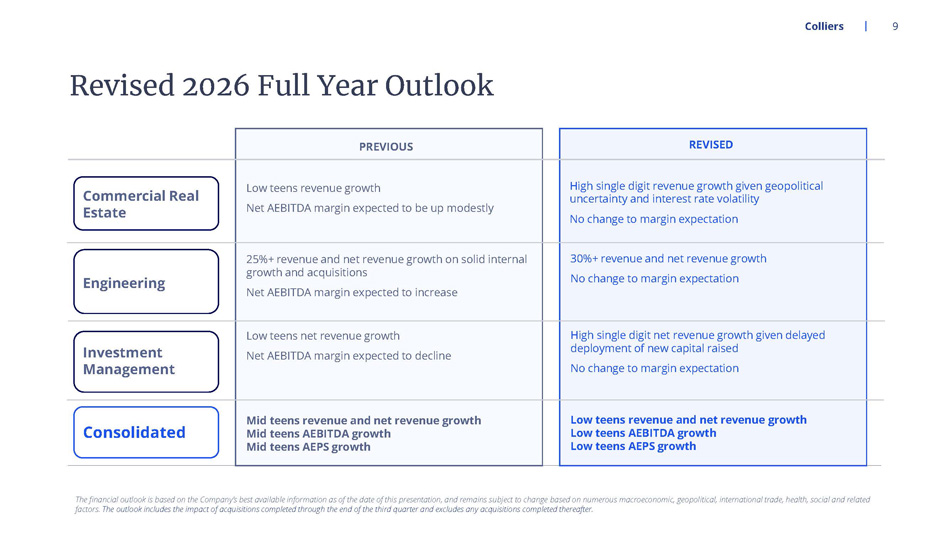
Colliers 9 Revised 2026 Full Year Outlook The financial outlook is based on the Company’s best available information as of the date of this presentation, and remains s ubj ect to change based on numerous macroeconomic, geopolitical, international trade, health, social and related factors. The outlook includes the impact of acquisitions completed through the end of the third quarter and excludes any acquisitions com pleted thereafter. Commercial Real Estate Engineering Investment Management Consolidated Mid teens revenue and net revenue growth Mid teens AEBITDA growth Mid teens AEPS growth Low teens revenue growth Net AEBITDA margin expected to be up modestly 25%+ revenue and net revenue growth on solid internal growth and acquisitions Net AEBITDA margin expected to increase Low teens net revenue growth Net AEBITDA margin expected to decline PREVIOUS Low teens revenue and net revenue growth Low teens AEBITDA growth Low teens AEPS growth High single digit revenue growth given geopolitical uncertainty and interest rate volatility No change to margin expectation 30%+ revenue and net revenue growth No change to margin expectation High single digit net revenue growth given delayed deployment of new capital raised No change to margin expectation REVISED

Appendix Colliers 10 Reconciliation of non - GAAP Measures
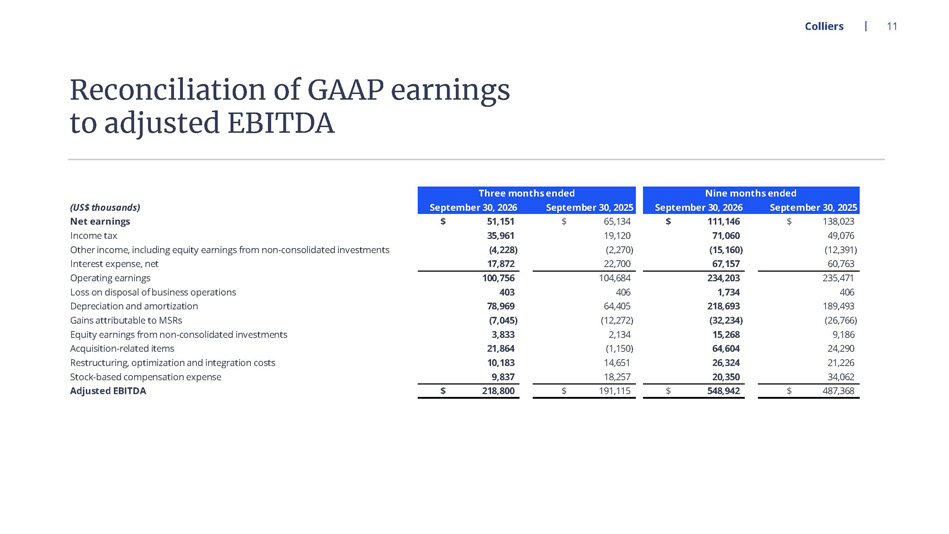
Colliers 11 (US$ thousands) Net earnings $ 51,151 $ 65,134 $ 111,146 $ 138,023 Income tax 35,961 19,120 71,060 49,076 Other income, including equity earnings from non-consolidated investments (4,228) (2,270) (15,160) (12,391) Interest expense, net 17,872 22,700 67,157 60,763 Operating earnings 100,756 104,684 234,203 235,471 Loss on disposal of business operations 403 406 1,734 406 Depreciation and amortization 78,969 64,405 218,693 189,493 Gains attributable to MSRs (7,045) (12,272) (32,234) (26,766) Equity earnings from non-consolidated investments 3,833 2,134 15,268 9,186 Acquisition-related items 21,864 (1,150) 64,604 24,290 Restructuring, optimization and integration costs 10,183 14,651 26,324 21,226 Stock-based compensation expense 9,837 18,257 20,350 34,062 Adjusted EBITDA $ 218,800 $ 191,115 $ 548,942 $ 487,368 Three months ended Nine months ended September 30, 2026 September 30, 2025 September 30, 2026 September 30, 2025 Reconciliation of GAAP earnings to adjusted EBITDA
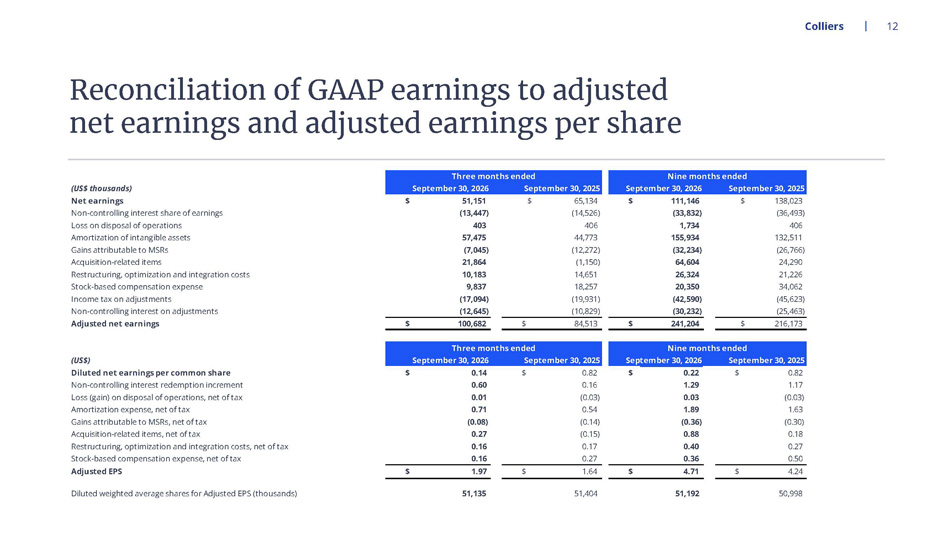
Colliers 12 (US$ thousands) Net earnings $ 51,151 $ 65,134 $ 111,146 $ 138,023 Non-controlling interest share of earnings (13,447) (14,526) (33,832) (36,493) Loss on disposal of operations 403 406 1,734 406 Amortization of intangible assets 57,475 44,773 155,934 132,511 Gains attributable to MSRs (7,045) (12,272) (32,234) (26,766) Acquisition-related items 21,864 (1,150) 64,604 24,290 Restructuring, optimization and integration costs 10,183 14,651 26,324 21,226 Stock-based compensation expense 9,837 18,257 20,350 34,062 Income tax on adjustments (17,094) (19,931) (42,590) (45,623) Non-controlling interest on adjustments (12,645) (10,829) (30,232) (25,463) Adjusted net earnings $ 100,682 $ 84,513 $ 241,204 $ 216,173 (US$) Diluted net earnings per common share $ 0.14 $ 0.82 $ 0.22 $ 0.82 Non-controlling interest redemption increment 0.60 0.16 1.29 1.17 Loss (gain) on disposal of operations, net of tax 0.01 (0.03) 0.03 (0.03) Amortization expense, net of tax 0.71 0.54 1.89 1.63 Gains attributable to MSRs, net of tax (0.08) (0.14) (0.36) (0.30) Acquisition-related items, net of tax 0.27 (0.15) 0.88 0.18 Restructuring, optimization and integration costs, net of tax 0.16 0.17 0.40 0.27 Stock-based compensation expense, net of tax 0.16 0.27 0.36 0.50 Adjusted EPS $ 1.97 $ 1.64 $ 4.71 $ 4.24 Diluted weighted average shares for Adjusted EPS (thousands) 51,135 51,404 51,192 50,998 Three months ended Nine months ended September 30, 2026 September 30, 2025 September 30, 2026 September 30, 2025 Three months ended Nine months ended September 30, 2026 September 30, 2025 September 30, 2026 September 30, 2025 Reconciliation of GAAP earnings to adjusted net earnings and adjusted earnings per share
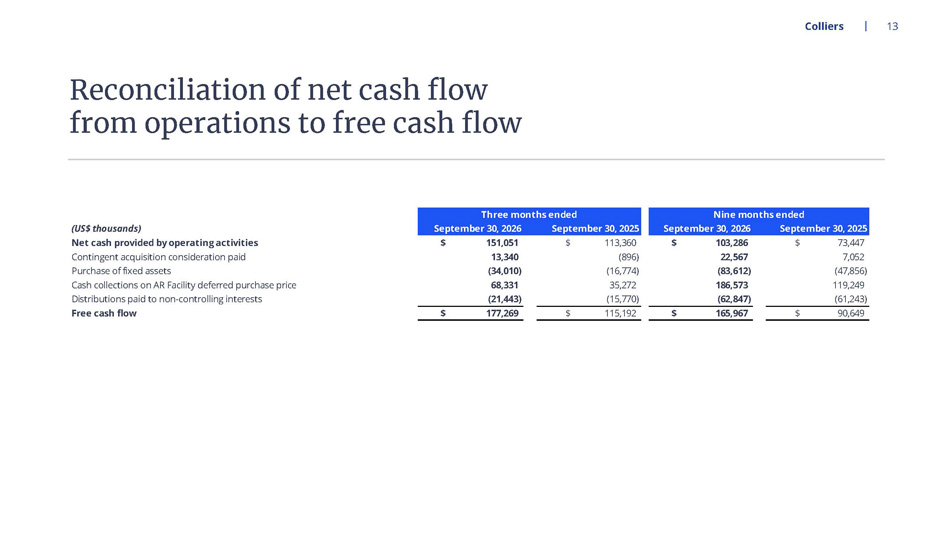
Colliers 13 Reconciliation of net cash flow from operations to free cash flow (US$ thousands) Net cash provided by operating activities $ 151,051 $ 113,360 $ 103,286 $ 73,447 Contingent acquisition consideration paid 13,340 (896) 22,567 7,052 Purchase of fixed assets (34,010) (16,774) (83,612) (47,856) Cash collections on AR Facility deferred purchase price 68,331 35,272 186,573 119,249 Distributions paid to non-controlling interests (21,443) (15,770) (62,847) (61,243) Free cash flow $ 177,269 $ 115,192 $ 165,967 $ 90,649 Three months ended Nine months ended September 30, 2026 September 30, 2025 September 30, 2026 September 30, 2025
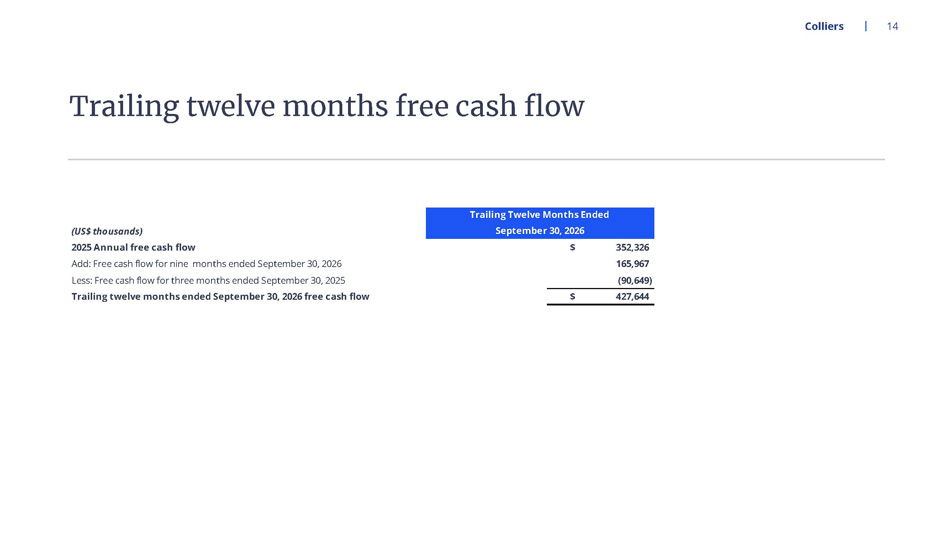
Colliers 14 Trailing twelve months free cash flow (US$ thousands) 2025 Annual free cash flow $ 352,326 Add: Free cash flow for nine months ended September 30, 2026 165,967 Less: Free cash flow for three months ended September 30, 2025 (90,649) Trailing twelve months ended September 30, 2026 free cash flow $ 427,644 Trailing Twelve Months Ended September 30, 2026
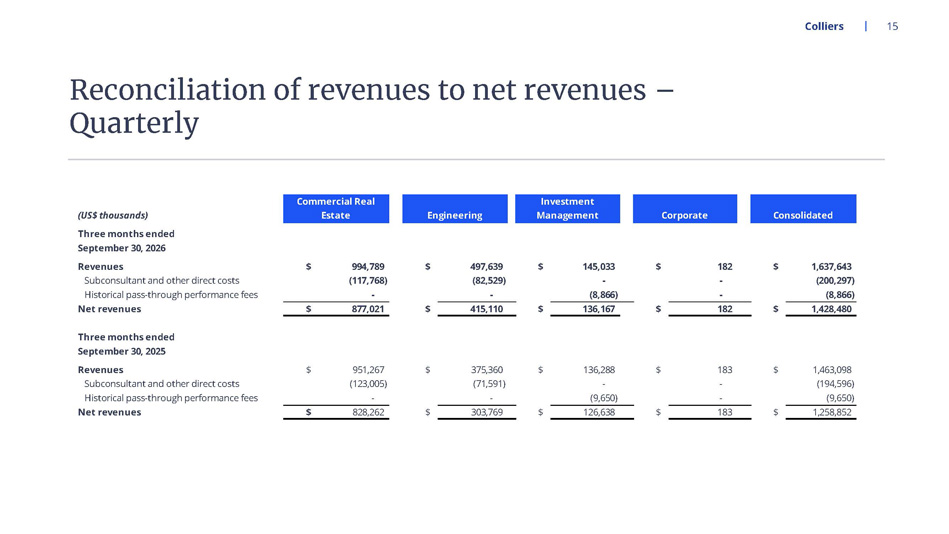
Colliers 15 Reconciliation of revenues to net revenues – Quarterly (US$ thousands) Three months ended September 30, 2026 Revenues $ 994,789 $ 497,639 $ 145,033 $ 182 $ 1,637,643 Subconsultant and other direct costs (117,768) (82,529) - - (200,297) Historical pass-through performance fees - - (8,866) - (8,866) Net revenues $ 877,021 $ 415,110 $ 136,167 $ 182 $ 1,428,480 Three months ended September 30, 2025 Revenues $ 951,267 $ 375,360 $ 136,288 $ 183 $ 1,463,098 Subconsultant and other direct costs (123,005) (71,591) - - (194,596) Historical pass-through performance fees - - (9,650) - (9,650) Net revenues $ 828,262 $ 303,769 $ 126,638 $ 183 $ 1,258,852 Commercial Real Estate Investment ManagementEngineering Corporate Consolidated
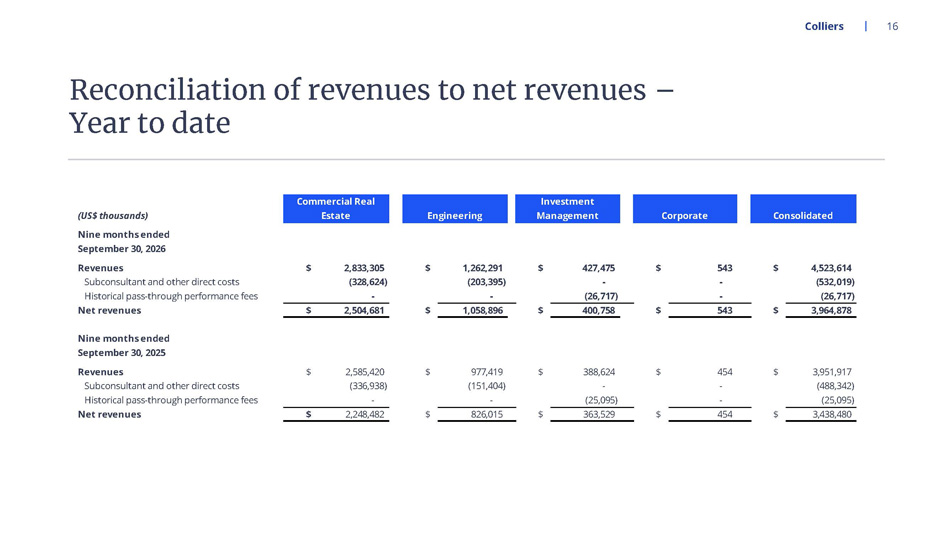
Colliers 16 Reconciliation of revenues to net revenues – Year to date (US$ thousands) Nine months ended Revenues $ 2,833,305 $ 1,262,291 $ 427,475 $ 543 $ 4,523,614 Subconsultant and other direct costs (328,624) (203,395) - - (532,019) Historical pass-through performance fees - - (26,717) - (26,717) Net revenues $ 2,504,681 $ 1,058,896 $ 400,758 $ 543 $ 3,964,878 Nine months ended September 30, 2025 Revenues $ 2,585,420 $ 977,419 $ 388,624 $ 454 $ 3,951,917 Subconsultant and other direct costs (336,938) (151,404) - - (488,342) Historical pass-through performance fees - - (25,095) - (25,095) Net revenues $ 2,248,482 $ 826,015 $ 363,529 $ 454 $ 3,438,480 September 30, 2026 Commercial Real Estate Investment ManagementEngineering Corporate Consolidated
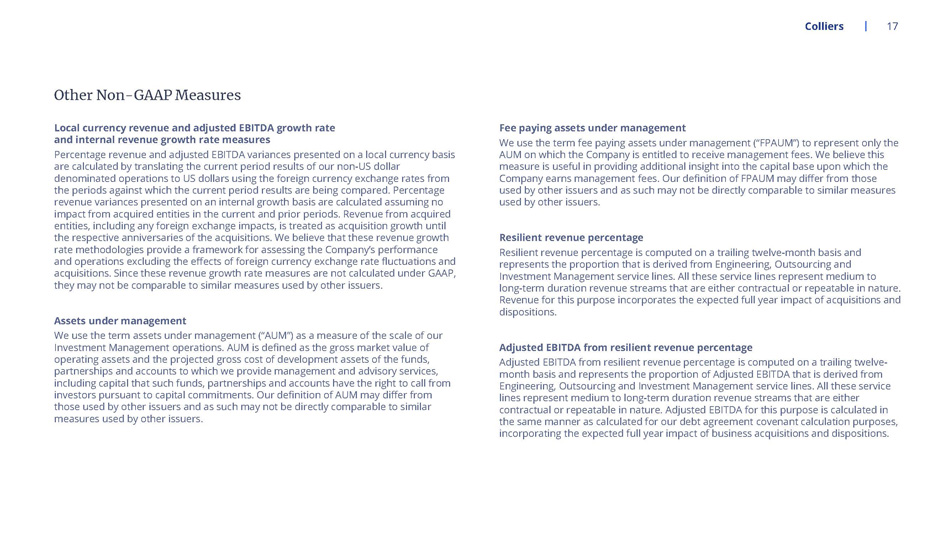
Local currency revenue and adjusted EBITDA growth rate and internal revenue growth rate measures Percentage revenue and adjusted EBITDA variances presented on a local currency basis are calculated by translating the current period results of our non - US dollar denominated operations to US dollars using the foreign currency exchange rates from the periods against which the current period results are being compared. Percentage revenue variances presented on an internal growth basis are calculated assuming no impact from acquired entities in the current and prior periods. Revenue from acquired entities, including any foreign exchange impacts, is treated as acquisition growth until the respective anniversaries of the acquisitions. We believe that these revenue growth rate methodologies provide a framework for assessing the Company’s performance and operations excluding the effects of foreign currency exchange rate fluctuations and acquisitions. Since these revenue growth rate measures are not calculated under GAAP, they may not be comparable to similar measures used by other issuers. Assets under management We use the term assets under management (“AUM”) as a measure of the scale of our Investment Management operations. AUM is defined as the gross market value of operating assets and the projected gross cost of development assets of the funds, partnerships and accounts to which we provide management and advisory services, including capital that such funds, partnerships and accounts have the right to call from investors pursuant to capital commitments. Our definition of AUM may differ from those used by other issuers and as such may not be directly comparable to similar measures used by other issuers. Fee paying assets under management We use the term fee paying assets under management (“FPAUM”) to represent only the AUM on which the Company is entitled to receive management fees. We believe this measure is useful in providing additional insight into the capital base upon which the Company earns management fees. Our definition of FPAUM may differ from those used by other issuers and as such may not be directly comparable to similar measures used by other issuers. Resilient revenue percentage Resilient revenue percentage is computed on a trailing twelve - month basis and represents the proportion that is derived from Engineering, Outsourcing and Investment Management service lines. All these service lines represent medium to long - term duration revenue streams that are either contractual or repeatable in nature. Revenue for this purpose incorporates the expected full year impact of acquisitions and dispositions. Adjusted EBITDA from resilient revenue percentage Adjusted EBITDA from resilient revenue percentage is computed on a trailing twelve - month basis and represents the proportion of Adjusted EBITDA that is derived from Engineering, Outsourcing and Investment Management service lines. All these service lines represent medium to long - term duration revenue streams that are either contractual or repeatable in nature. Adjusted EBITDA for this purpose is calculated in the same manner as calculated for our debt agreement covenant calculation purposes, incorporating the expected full year impact of business acquisitions and dispositions. Colliers 17 Other Non - GAAP Measures