
Exhibit (c) (1)
Fairness Opinion for Steel Connect, Inc. Prepared as of November 26, 2024
Objectives and Limiting Conditions The Audit Committee of the Board of Directors (the “Audit Committee”) of Steel Connect, Inc . (“STCN” or the “Company”) engaged and retained Management Planning, Inc . (“MPI” or the “Advisor”) to deliver an opinion (the “Opinion”) to the Board as to the fairness, from a financial point of view, of the Cash Consideration (subsequently defined) being remitted to certain of the Company’s common stockholders in connection with a short - form merger transaction, as more fully described in the following paragraph . Steel Partners Holdings, L . P . (“Steel Partners), which, together with its affiliates, owns greater than 90 % of the outstanding common stock, par value $ 0 . 01 per share (the “Common Stock”) of STCN, on an as - converted basis, intends to effect a short - form merger transaction with STCN pursuant to Section 253 of the Delaware General Corporation Law (the “Short - Form Merger, or the “Transaction”) with the Company surviving the Short - Form Merger and becoming an indirect, wholly owned subsidiary of Steel Partners . In the Transaction, STCN common stockholders, other than Acquisition Co . (subsequently defined) and holders who properly exercise appraisal rights , will receive $ 11 . 45 in cash per share of STCN common stock (the “Cash Consideration”) . In addition, Steel Partners expects to grant certain stockholders of STCN a contingent value right relating to the settlement of the Reith Litigation (subsequently defined) (referred to on certain tables herein as “Reith”) which contingent value right reflects the provisions of Article 3 of the Stockholders ’ Agreement among the parties . The effective date of the Opinion is November 26 , 2024 (the “Effective Date”) . To that end, our Opinion and supporting analysis is subject to change for dates subsequent to November 26 , 2024 . MPI’s Opinion is limited to the Cash Consideration and does not address the Reith CVR (subsequently defined on page 8 ) in any way . Hence, references herein to the Transaction are generally intended to exclude the Reith CVR . The Opinion does not address the relative merits of the Transaction as compared to other business transactions that may be available, nor does it address the underlying business decision of the Company to proceed with a transaction structured in the manner contemplated by the Transaction . Moreover, MPI’s Opinion is not intended to be and does not constitute a recommendation to the Audit Committee or Board of the Company as to how such parties should vote with respect to the Transaction . This Opinion and supporting analysis have been prepared by Management Planning, Inc . (“MPI”) from information furnished to us by management of STCN (“Management”) and other trade and statistical sources that we deemed reliable . While we understand Management believes that the information contained herein is accurate, we make no covenants, representations or warranties about such information . MPI was provided and is relying upon a representation letter from Ryan O’Herrin, Chief Financial Officer, regarding, among other things, the accuracy and completeness of the information provided to MPI by STCN and in connection with rendering the Opinion . The supporting analysis contains certain information with respect to the Company’s anticipated future performance . Such information is based on estimates and assumptions made by Management and is subject to significant economic and competitive uncertainties beyond their control . MPI has not attempted to independently verify any such statements and makes no representation or warranty with respect to the statements . There can be no assurance that the future results can be realized or that actual results will not be materially different from those projected . MPI has been engaged in preparing financial analyses of closely held businesses and in evaluating the securities of such businesses since 1939 . We have prepared thousands of valuations of companies, large and small, public and private, across a broad range of industries . Our studies have been conducted for a wide variety of uses including in connection with corporate transactions . Our officers and principal employees have extensive experience and educational training relating to this work and are fully qualified to prepare an opinion, from a financial point of view, of the Transaction . www.mpival.com | © Management Planning, Inc. All rights reserved. 2
Section 1. Executive Summary………………………………................................................................................................ ... ................. 4 2. Overview of Opinion…………………………….……………………………………………………………………………………..7 3. Company Financial Statements….……………………………………………………………………………………………........16 I. Steel Connect, Inc. Financial Information…….…….……….……………………………………………………… 17 II. ModusLink Financial Information……………..……………………………………………………………………....21 4. Analysis of Steel Connect.…………………………………..…………………………………………………………………........28 I. ModusLink Discounted Cash Flow Analysis …………………..……….…………………..……………………….29 II. ModusLink Guideline Company Analysis…………………..………………………….…………………………….33 III. ModusLink Guideline Transaction Analysis ………………………..…….…………………………………………38 IV. Corporate Costs Discounted Cash Flow Analysis……………………………..………………..………………….40 V. Net Operating Loss Analysis………………………………...…………………..………………..…...……….…….42 VI. Cash and Investments……..……………………………………………………..………………..………………….44 5. Ranges of value of Steel Connect, Inc.………………………………....………………………………………………………....46 Exhibits A. Guideline Publicly Traded Companies B. Guideline Transaction Comparables C. Determination of ModusLink WACC D. Determination of Corporate Costs and NOLs WACC E. Corporate Costs F. VWAP and Implied Premiums 3 Table of Contents www.mpival.com | © Management Planning, Inc. All rights reserved.

Executive Summary 4
Executive Summary Overview of STCN www.mpival.com | © Management Planning, Inc. All rights reserved. 5 ▪ Steel Connect is a holding company which operates through its wholly - owned subsidiary, ModusLink Corporation (“ ModusLink ”) . ModusLink is a supply chain business process management company serving clients in markets such as consumer electronics, communications, computing, medical devices, software, and retail . ModusLink designs and executes elements in its clients’ global supply chains to improve speed to market, product customization, flexibility, cost, quality, and service . ModusLink also produces and licenses an entitlement management solution for activation, provisioning, entitlement subscription, and data collection from physical goods (connected products) and digital products . ▪ The components of value of Steel Connect include : ( 1 ) ModusLink ; ( 2 ) Corporate Costs ; ( 3 ) NOLs ; and ( 4 ) Other Non - Operating Assets, namely cash and equivalents and investment securities . The largest asset is cash and equivalents and investment securities which together account for the vast majority of STCN’s total value . Shares of Helix are listed on the OTC Markets. Overview of Steel Partners ▪ Steel Partners is a diversified global holding company that engages in multiple businesses through consolidated subsidiaries and other interests . It owns and operates businesses and has significant interests in various companies, including diversified industrial products, energy, defense, supply chain management and logistics, banking and youth sports . Steel Partners operates through the following segments : Diversified Industrial, Energy, Financial Services and Supply Chain, which are managed separately and offer different products and services . Steel Partners has an equity market capitalization of approximately $ 790 . 0 million .
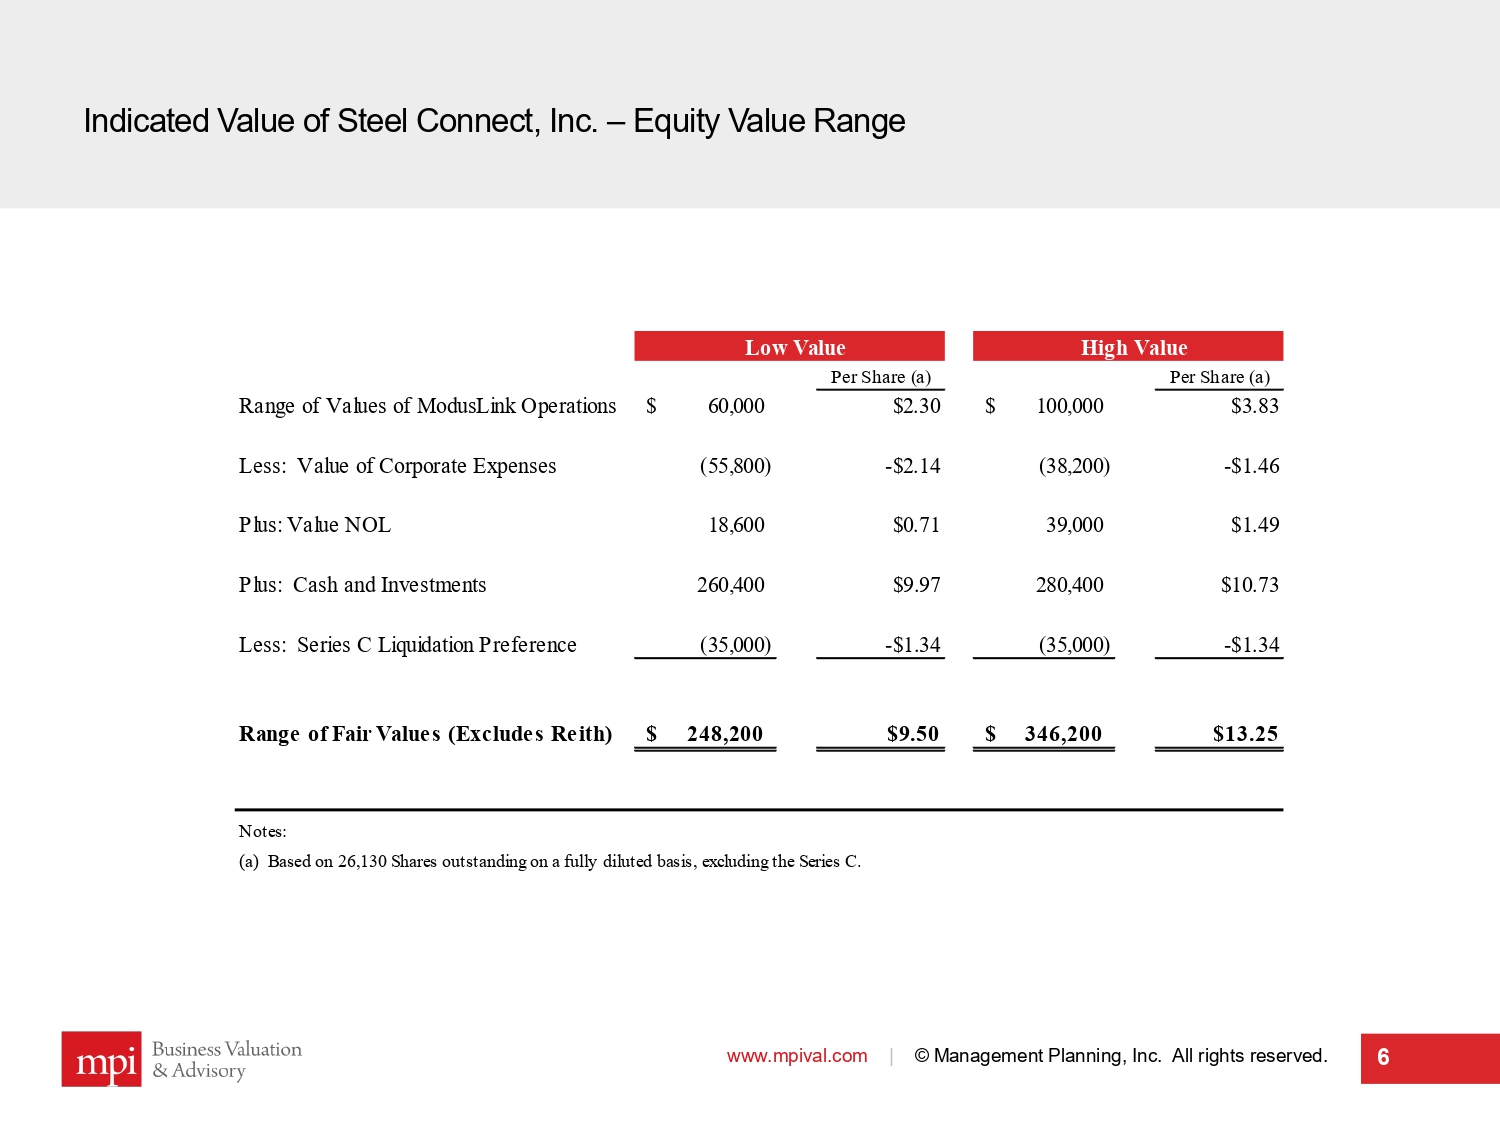
Indicated Value of Steel Connect, Inc. – Equity Value Range www.mpival.com | © Management Planning, Inc. All rights reserved. 6 Low Value High Value Per Share (a) Per Share (a) Range of Values of ModusLink Operations 60,000$ $2.30 100,000$ $3.83 Less: Value of Corporate Expenses (55,800) -$2.14 (38,200) -$1.46 Plus: Value NOL 18,600 $0.71 39,000 $1.49 Plus: Cash and Investments 260,400 $9.97 280,400 $10.73 Less: Series C Liquidation Preference (35,000) -$1.34 (35,000) -$1.34 Range of Fair Values (Excludes Reith) 248,200$ $9.50 346,200$ $13.25 Notes: (a) Based on 26,130 Shares outstanding on a fully diluted basis, excluding the Series C.

Overview of Opinion 7
Overview of Opinion – Transaction Summary www.mpival.com | © Management Planning, Inc. All rights reserved. 8 ▪ Steel Partners, which, together with its affiliates, owns greater than 90 % of the outstanding common stock, par value $ 0 . 01 per share of STCN on an as - converted basis . ▪ Steel Partners initiated discussions with the Audit Committee regarding a short - form merger transaction with the Company pursuant to which at the effective time of the Short - Form Merger (the “Effective Time”), an indirect, wholly - owned subsidiary of Steel Partners (“Acquisition Co . ”), would, in compliance with Section 253 of the Delaware General Corporation Law, merge with and into the Company, with the Company surviving the Short - Form Merger and becoming an indirect, wholly owned subsidiary of Steel Partners . ▪ Holders of Common Stock, other than Acquisition Co . and holders who properly exercise appraisal rights, will receive $ 11 . 45 in cash per share of Common Stock (the “Cash Consideration”) . ▪ If, prior to the Effective Time, Steel Connect has not distributed to the holders of Common Stock the Reith Net Litigation Proceeds, if any, from the proposed settlement of the class and derivative action filed in the Delaware Court of Chancery styled Reith v . Lichtenstein, et al naming Steel Connect as a nominal defendant, and then - current and former directors of Steel Connect and Steel Partners and several of its affiliated companies as defendants (the “Reith Litigation”), at the Effective Time, Steel Partners and the rights agent named therein (“Rights Agent”) will enter into a Contingent Value Rights Agreement (the “CVR Agreement”) . In accordance with the CVR Agreement, at the Effective Time, each share of Common Stock (other than Waived Shares (as defined below)) shall receive one contingent value right to receive a portion of the Reith Net Litigation Proceeds, if any, pursuant to the terms of the CVR Agreement (such right, a “Reith CVR”) . ▪ Pursuant to a CVR Agreement, which is consistent with the requirements of the Stockholders’ Agreement, (i) the SP Investors have waived any right to receive any portion of the Reith Net Litigation Proceeds to the extent of any shares of Common Stock held by them as of May 1 , 2023 (the “May 2023 Shares”) or issuable upon conversion of the Convertible Instruments (as defined in the Stockholders’ Agreement) (the “Conversion Shares”) and (ii) the current directors and officers of Steel Connect, including Messrs . Lichtenstein and Howard, have agreed to waive any right to receive any portion of the Reith Net Litigation Proceeds with respect to any shares of Common Stock they hold (the “O&D Shares,” and together with the May 2023 Shares and the Conversion Shares, the “Waived Shares”) . The SP Investors (other than Messrs . Lichtenstein and Howard) will be entitled to receive a Reith CVR with respect to any shares of Common Stock acquired by them after May 1 , 2023 .
Overview of Opinion – Scope of the Analysis In conducting this analysis, our evaluation included, but was not necessarily limited to, the following : ▪ Reviewed the request for approval of the Short - Form Merger, as presented by Steel Partners to the Audit Committee ; ▪ Reviewed certain corporate governing documents and other corporate and shareholder organization materials that were deemed pertinent ; ▪ Examined historical and projected financial information provided by management of STCN and ModusLink ; ▪ Reviewed other documents and related industry information and statistics deemed relevant ; ▪ Interviewed management of both STCN and ModusLink concerning their histories, operations, financial performance and condition, competition, outlooks, strengths, weaknesses, opportunities, and threats, as well as other aspects of the businesses we considered pertinent ; ▪ Reviewed publicly available information on selected guideline public companies and guideline precedent transactions ; ▪ Performed discounted cash flow analyses and sensitized the results based on a range of selected inputs ; ▪ Performed guideline publicly traded company analyses and sensitized the results based on a range of selected inputs ; ▪ Performed guideline transaction analyses and sensitize the results based on a range of selected inputs ; ▪ Reviewed and analyzed the trading history of STCN Common Stock ; ▪ Considered such other information regarding the Company, its securities, and its industry deemed relevant by MPI, including the terms and features of its capital stack, the current economic environment, in general, and the specific economic factors bearing on firms competing in the industry ; and ▪ Conducted studies, analyses, and inquiries as MPI deemed appropriate . www.mpival.com | © Management Planning, Inc. All rights reserved. 9
Overview of Opinion – Sources of Information In the course of preparing this analysis, Management supplied us with financial records, statistics, and other material . We have relied, without independent verification, on the accuracy, completeness, and fairness of the information that was furnished to us by Management of STCN and ModusLink and their representatives as well as regularly published resources and databases . While reproduced only partially herein, these data should be considered a part of this presentation . Specifically, we received the following key pieces of information : ▪ STCN 2020 - 2024 form 10 - K Annual Reports ▪ STCN form 10 - Q Quarterly Report for the period ended October 31 , 2023 ▪ STCN internally prepared financial statements for the period ended October 31 , 2024 ▪ ModusLink internally prepared financial statements for the periods ended July 31 , 2020 , through 2024 , and as of October 31 , 2024 ▪ ModusLink Q 1 2025 Results Deck ▪ ModusLink financial projections for fiscal years 2025 - 2028 as prepared by Management ▪ Historical corporate costs for ModusLink associated with STCN (FY 2022 – FY 2024 ) ▪ Draft Contingent Value Rights Agreement by and among Steel Partners, STCN, and Equiniti Trust Company, LLC ▪ Memorandum of Understanding for Reith V . Lichtenstein, et al . ▪ Information related to STCN’s federal, state, and international NOLs ▪ Information related to Steel Partners’s prior purchases of common stock ▪ Other corporate documents and agreements www.mpival.com | © Management Planning, Inc. All rights reserved. 10
Overview of Opinion – Sources of Information (cont’d) Data concerning publicly held companies engaged in similar lines of business were obtained from publicly available documents, such as annual reports to stockholders, prospectuses, reports to the Securities and Exchange Commission (“SEC”), and from standard financial references, including, but not limited to, online services such as Bloomberg Professional (“Bloomberg”) and S&P Capital IQ (“Capital IQ”) . Data concerning equity required rates of return were obtained from Kroll Cost of Capital Navigator and represents information effective as of November 26 , 2024 . www.mpival.com | © Management Planning, Inc. All rights reserved. 11
Overview of Opinion – Valuation Process In arriving at its Opinion, MPI reviewed details pertaining to STCN and the Transaction and determined its valuation process, approaches, and methodologies accordingly . The Opinion contemplates the indicated values of STCN and its underlying assets the fairness, from a financial point of view, of the Transaction (Cash Consideration only) to the Stockholders . In determining the value of STCN, MPI completed the following : ▪ Determined the value of the equity of ModusLink ; ▪ Determined the value associated with Corporate Costs ; and ▪ Determined the value of the STCN’s net remaining assets including NOLs and other non - operating assets, primarily cash and equivalents and investment securities . It should be noted that MPI’s analysis did not contemplate any post - Transaction synergies which may become available to STCN relating to becoming a wholly - owned subsidiary of Steel Partners . www.mpival.com | © Management Planning, Inc. All rights reserved. 12
Overview of Opinion – Valuation Approaches The earnings capacity of an operating company is of paramount importance in the valuation process . This is not to say that earnings are the only means by which a company can be valued . Rather, there are three fundamental approaches to valuing any asset ; namely, the asset, market, and income approaches . (a) ▪ The asset approach (also known as the cost approach) involves the determination of the total asset value (marked - to - market) of a business and reducing that value by the market value of its outstanding liabilities . Generally, the asset approach is appropriate to consider when an operating company has marginal or no demonstrated earning power relative to the value of the underlying assets, or where liquidation is a reasonable possibility . The most common method of the asset approach is the adjusted book value method, which is sometimes referred to as the net asset value (“NAV”) method . The NAV method is often the appropriate method to use to evaluate a holding or investment company formed for the purpose of owning and managing securities of other companies, real estate or natural resources . ▪ The essence of the market approach is to use companies in the same general industry as the subject business to provide valuation guidelines . Comparisons can then be made between the subject company and publicly traded companies whose stocks are actively traded (the guideline public company analysis and/or companies which were recently acquired) . Overall, the market approach entails selecting relevant financial information of the subject company and capitalizing those amounts using valuation multiples that are based on empirical market observations from the selected guideline companies (or transactions) . For example, the relationship between the market price (or deal value) of a company and its cash flow or earnings base forms a multiple (i . e . , valuation ratio) that can be applied to estimate value . Importantly, the valuation multiples derived from the selected group of guidelines incorporate expectations of growth and rests on the implicit assumption that some level of economic earnings will be generated by the company into perpetuity . www.mpival.com | © Management Planning, Inc. All rights reserved. 13 (a) There are also subsets to the approaches listed above (modified versions) that may be appropriate depending on the facts and circumstances associated with the company or security/asset being valued, as well as the purpose for which the analysis is being conducted .
Overview of Opinion – Valuation Approaches (cont’d) ▪ The income approach involves projecting the future benefits generated by the subject company (usually some measure of economic income such as cash flow, earnings or dividends) to the firm or owners, and estimating the present value of those future benefits by discounting them based upon the time value of money and the investment risks associated with ownership . The discount rate used is intended to reflect all risks associated with realizing the stream of future benefits (e . g . , cash flows) . The discount rate can also be interpreted as the rate of return that would be required by providers of capital to compensate them for the risk - adjusted time value of their money . The income approach can generally be broken down into two broad subsets : ( 1 ) the capitalization of earnings and ( 2 ) the discounted cash flow analysis . The capitalization of earnings methodology involves identifying the normalized earning power of a company (typically based on its historical financial performance) and capitalizing that figure into perpetuity by a market - based capitalization rate that captures the investment attributes and risk profile of the business . The discounted cash flow analysis is a multi - period discounting model that estimates the subject company’s discrete period cash flows (e . g . , 3 to 10 years) and residual cash flow into perpetuity (i . e . , the terminal value) . Selected Methodology - ModusLink We considered all the aforementioned approaches . Given that ModusLink is a value - added logistics company with a lean balance sheet and liquidation was not contemplated, we did not employ the asset approach . During the course of this analysis, we were provided with a financial forecast for ModusLink as prepared by Management . As a result, we elected to conduct an income - based approach using discounted cash flow analyses . www.mpival.com | © Management Planning, Inc. All rights reserved. 14
Overview of Opinion – Valuation Approaches (cont’d) With regard to the market approach, we identified a group of publicly traded companies that exhibited investment characteristics somewhat similar to ModusLink for use as valuation guidelines . Based on our search, we identified the following companies suitable for use as guidelines in this analysis . Celestica Inc. Deutsche Post AG Distribution Solutions Group, Inc. FedEx Corporation GXO Logistics, Inc. Kerry Logistics, Inc. Kuehne + Nagel International AG Ryder System, Inc. United Parcel Service, Inc. The market approach was applied herein and considered in our range of values . We also identified a group of guideline transactions in companies within similar industries and lines of business as ModusLink . The transactions identified had limited comparability to ModusLink , and we had limited access to financial and other information . Therefore, we elected to not rely upon a guideline transaction analysis in our range of value for ModusLink and the analysis is included for illustrative purposes only . www.mpival.com | © Management Planning, Inc. All rights reserved. 15

Company Financial Statements 16

Sub - section I Steel Connect, Inc. Financial Information www.mpival.com | © Management Planning, Inc. All rights reserved. 17
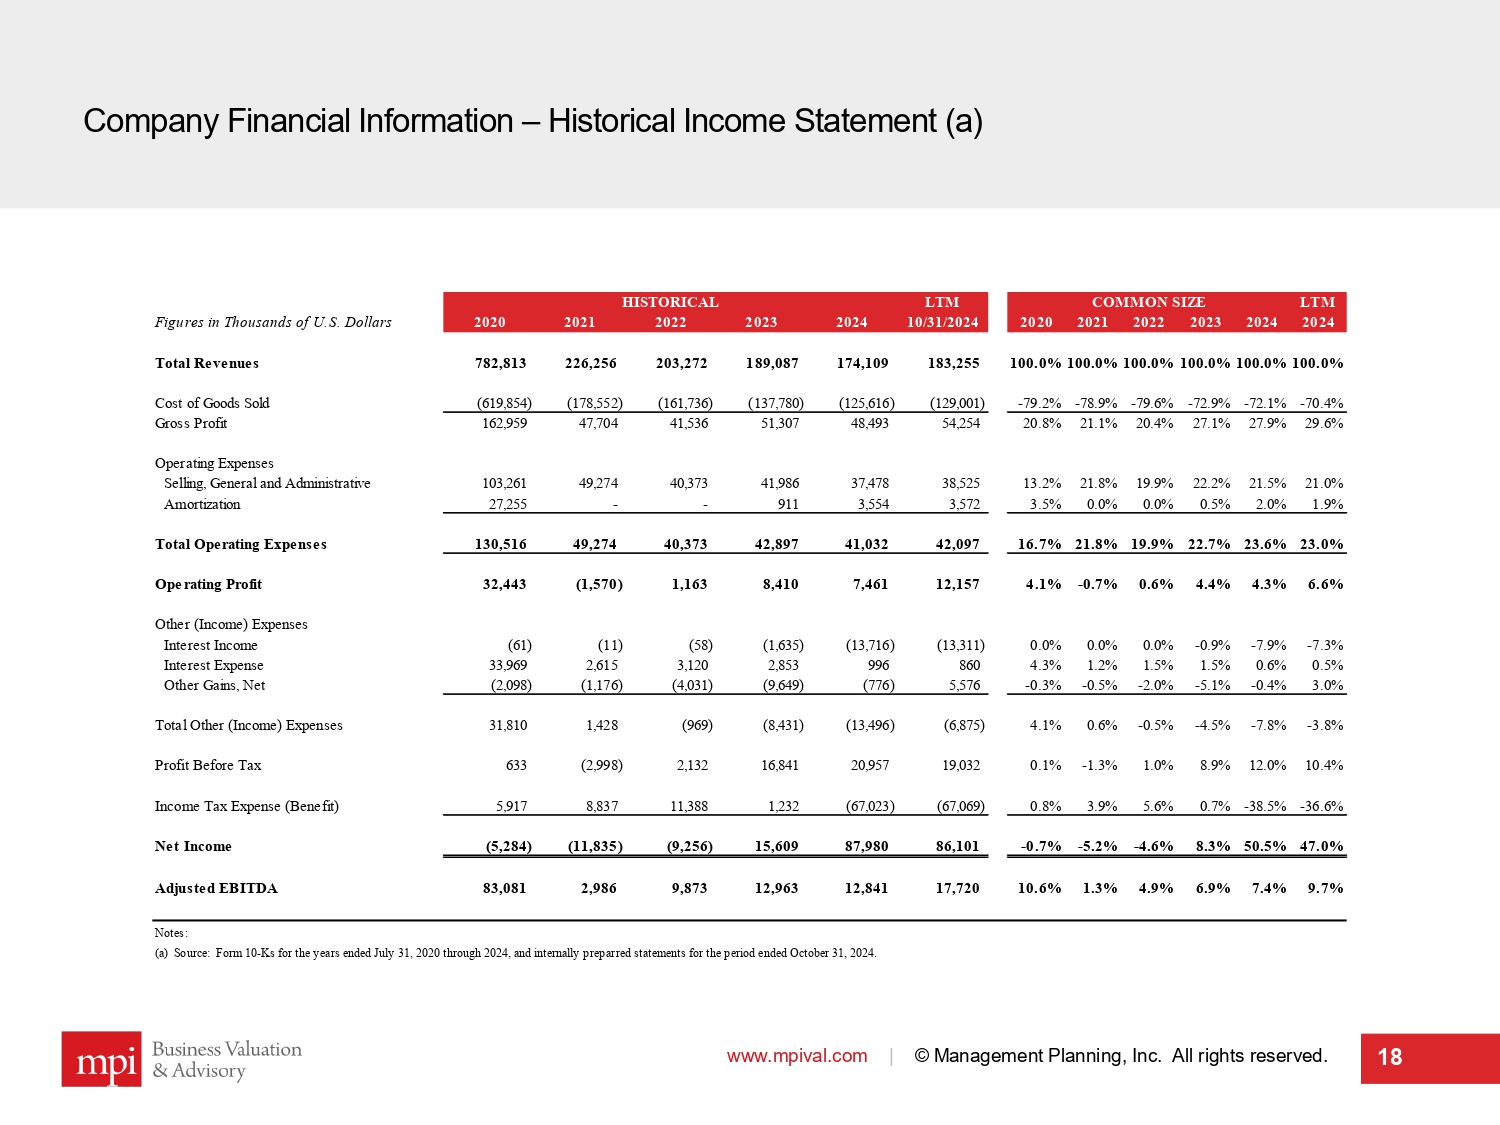
Company Financial Information – Historical Income Statement (a) www.mpival.com | © Management Planning, Inc. All rights reserved. 18 HISTORICAL LTM COMMON SIZE LTM Figures in Thousands of U.S. Dollars 2020 2021 2022 2023 2024 10/31/2024 2020 2021 2022 2023 2024 2024 Total Revenues 782,813 226,256 203,272 189,087 174,109 183,255 100.0%100.0%100.0%100.0%100.0%100.0% Cost of Goods Sold (619,854) (178,552) (161,736) (137,780) (125,616) (129,001) -79.2% -78.9% -79.6% -72.9% -72.1% -70.4% Gross Profit 162,959 47,704 41,536 51,307 48,493 54,254 20.8% 21.1% 20.4% 27.1% 27.9% 29.6% Operating Expenses Selling, General and Administrative 103,261 49,274 40,373 41,986 37,478 38,525 13.2% 21.8% 19.9% 22.2% 21.5% 21.0% Amortization 27,255 - - 911 3,554 3,572 3.5% 0.0% 0.0% 0.5% 2.0% 1.9% Total Operating Expenses 130,516 49,274 40,373 42,897 41,032 42,097 16.7% 21.8% 19.9% 22.7% 23.6% 23.0% Operating Profit 32,443 (1,570) 1,163 8,410 7,461 12,157 4.1% -0.7% 0.6% 4.4% 4.3% 6.6% Other (Income) Expenses Interest Income (61) (11) (58) (1,635) (13,716) (13,311) 0.0% 0.0% 0.0% -0.9% -7.9% -7.3% Interest Expense 33,969 2,615 3,120 2,853 996 860 4.3% 1.2% 1.5% 1.5% 0.6% 0.5% Other Gains, Net (2,098) (1,176) (4,031) (9,649) (776) 5,576 -0.3% -0.5% -2.0% -5.1% -0.4% 3.0% Total Other (Income) Expenses 31,810 1,428 (969) (8,431) (13,496) (6,875) 4.1% 0.6% -0.5% -4.5% -7.8% -3.8% Profit Before Tax 633 (2,998) 2,132 16,841 20,957 19,032 0.1% -1.3% 1.0% 8.9% 12.0% 10.4% Income Tax Expense (Benefit) 5,917 8,837 11,388 1,232 (67,023) (67,069) 0.8% 3.9% 5.6% 0.7% -38.5% -36.6% Net Income (5,284) (11,835) (9,256) 15,609 87,980 86,101 -0.7% -5.2% -4.6% 8.3% 50.5% 47.0% Adjusted EBITDA 83,081 2,986 9,873 12,963 12,841 17,720 10.6% 1.3% 4.9% 6.9% 7.4% 9.7% Notes: (a) Source: Form 10-Ks for the years ended July 31, 2020 through 2024, and internally preparred statements for the period ended October 31, 2024.
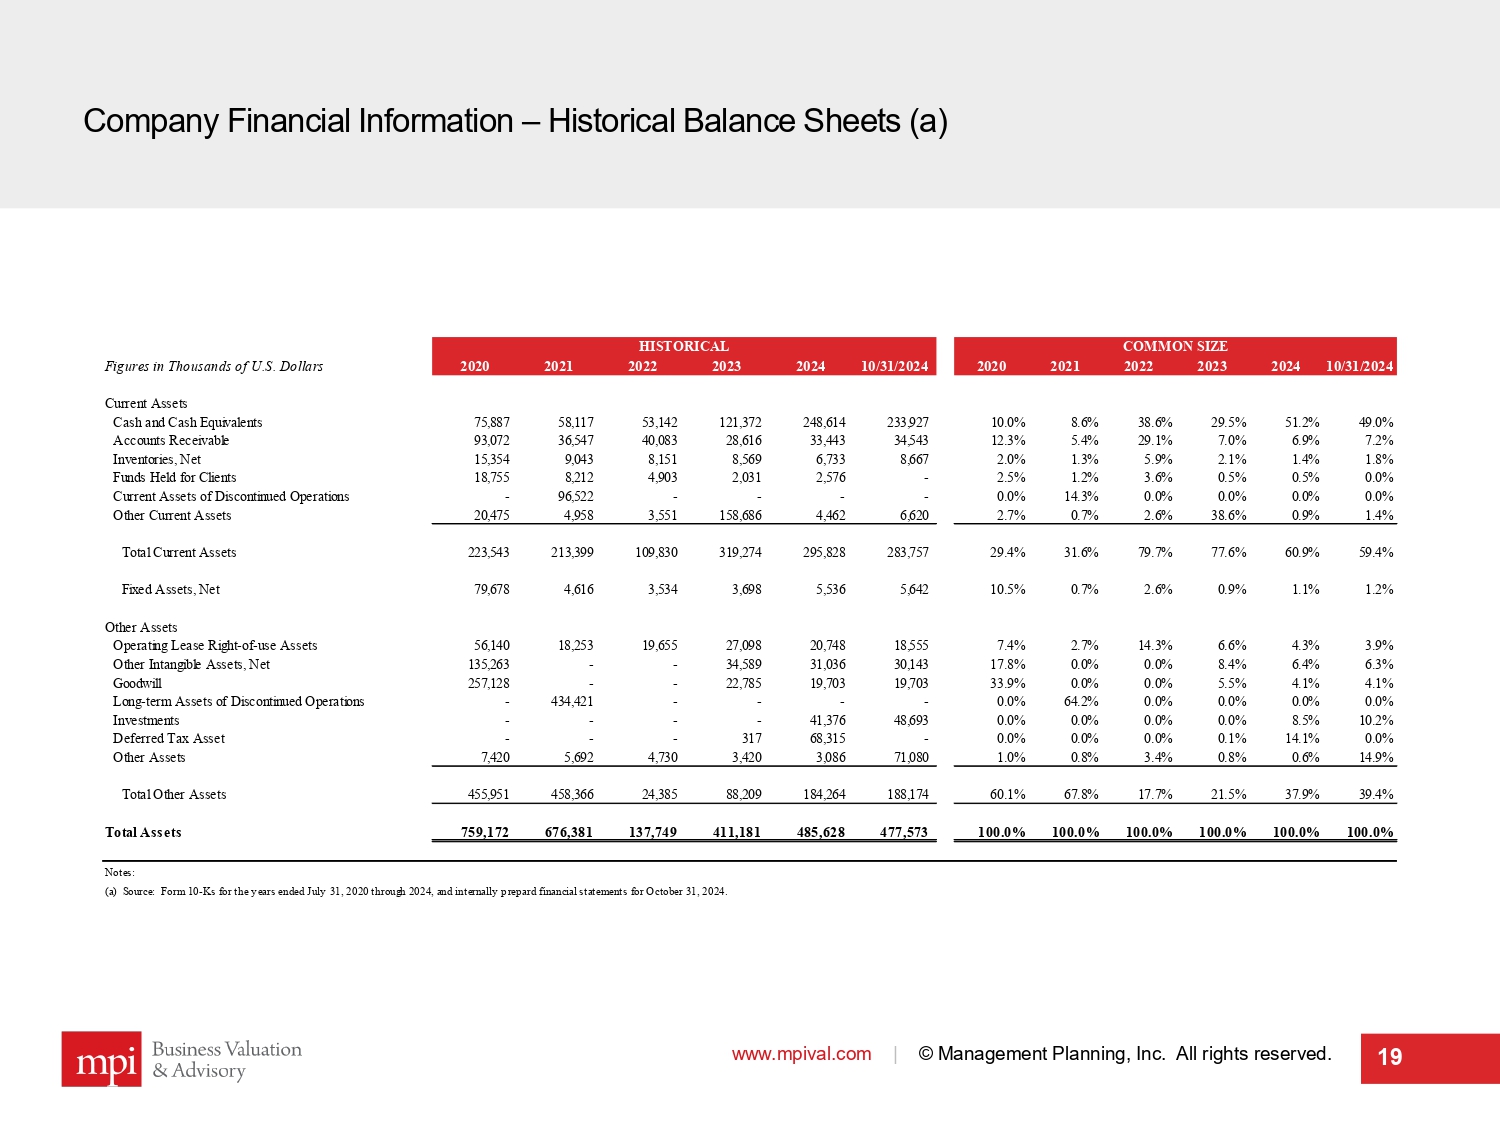
Company Financial Information – Historical Balance Sheets (a) www.mpival.com | © Management Planning, Inc. All rights reserved. 19 HISTORICAL COMMON SIZE Figures in Thousands of U.S. Dollars 2020 2021 2022 2023 2024 10/31/2024 2020 2021 2022 2023 2024 10/31/2024 Current Assets Cash and Cash Equivalents 75,887 58,117 53,142 121,372 248,614 233,927 10.0% 8.6% 38.6% 29.5% 51.2% 49.0% Accounts Receivable 93,072 36,547 40,083 28,616 33,443 34,543 12.3% 5.4% 29.1% 7.0% 6.9% 7.2% Inventories, Net 15,354 9,043 8,151 8,569 6,733 8,667 2.0% 1.3% 5.9% 2.1% 1.4% 1.8% Funds Held for Clients 18,755 8,212 4,903 2,031 2,576 - 2.5% 1.2% 3.6% 0.5% 0.5% 0.0% Current Assets of Discontinued Operations - 96,522 - - - - 0.0% 14.3% 0.0% 0.0% 0.0% 0.0% Other Current Assets 20,475 4,958 3,551 158,686 4,462 6,620 2.7% 0.7% 2.6% 38.6% 0.9% 1.4% Total Current Assets 223,543 213,399 109,830 319,274 295,828 283,757 29.4% 31.6% 79.7% 77.6% 60.9% 59.4% Fixed Assets, Net 79,678 4,616 3,534 3,698 5,536 5,642 10.5% 0.7% 2.6% 0.9% 1.1% 1.2% Other Assets Operating Lease Right-of-use Assets 56,140 18,253 19,655 27,098 20,748 18,555 7.4% 2.7% 14.3% 6.6% 4.3% 3.9% Other Intangible Assets, Net 135,263 - - 34,589 31,036 30,143 17.8% 0.0% 0.0% 8.4% 6.4% 6.3% Goodwill 257,128 - - 22,785 19,703 19,703 33.9% 0.0% 0.0% 5.5% 4.1% 4.1% Long-term Assets of Discontinued Operations - 434,421 - - - - 0.0% 64.2% 0.0% 0.0% 0.0% 0.0% Investments - - - - 41,376 48,693 0.0% 0.0% 0.0% 0.0% 8.5% 10.2% Deferred Tax Asset - - - 317 68,315 - 0.0% 0.0% 0.0% 0.1% 14.1% 0.0% Other Assets 7,420 5,692 4,730 3,420 3,086 71,080 1.0% 0.8% 3.4% 0.8% 0.6% 14.9% Total Other Assets 455,951 458,366 24,385 88,209 184,264 188,174 60.1% 67.8% 17.7% 21.5% 37.9% 39.4% Total Assets 759,172 676,381 137,749 411,181 485,628 477,573 100.0% 100.0% 100.0% 100.0% 100.0% 100.0% Notes: (a) Source: Form 10-Ks for the years ended July 31, 2020 through 2024, and internally prepard financial statements for October 31, 2024.
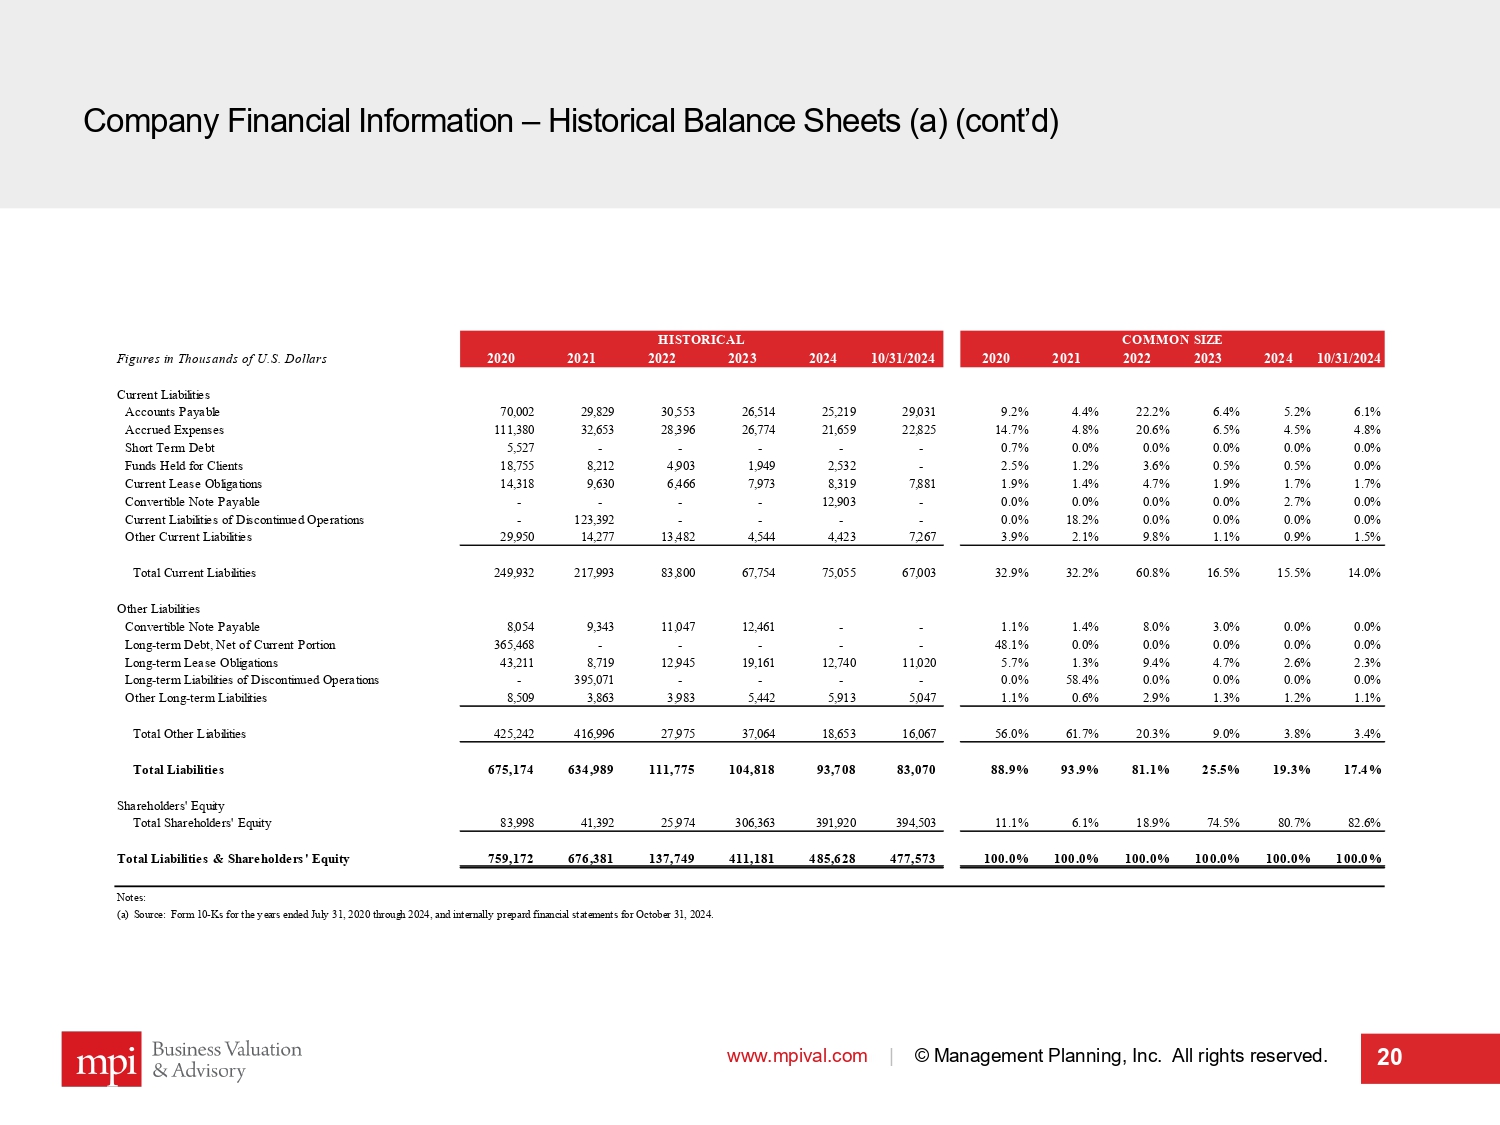
Company Financial Information – Historical Balance Sheets (a) (cont’d) www.mpival.com | © Management Planning, Inc. All rights reserved. 20 HISTORICAL COMMON SIZE Figures in Thousands of U.S. Dollars 2020 2021 2022 2023 2024 10/31/2024 2020 2021 2022 2023 2024 10/31/2024 Current Liabilities Accounts Payable 70,002 29,829 30,553 26,514 25,219 29,031 9.2% 4.4% 22.2% 6.4% 5.2% 6.1% Accrued Expenses 111,380 32,653 28,396 26,774 21,659 22,825 14.7% 4.8% 20.6% 6.5% 4.5% 4.8% Short Term Debt 5,527 - - - - - 0.7% 0.0% 0.0% 0.0% 0.0% 0.0% Funds Held for Clients 18,755 8,212 4,903 1,949 2,532 - 2.5% 1.2% 3.6% 0.5% 0.5% 0.0% Current Lease Obligations 14,318 9,630 6,466 7,973 8,319 7,881 1.9% 1.4% 4.7% 1.9% 1.7% 1.7% Convertible Note Payable - - - - 12,903 - 0.0% 0.0% 0.0% 0.0% 2.7% 0.0% Current Liabilities of Discontinued Operations - 123,392 - - - - 0.0% 18.2% 0.0% 0.0% 0.0% 0.0% Other Current Liabilities 29,950 14,277 13,482 4,544 4,423 7,267 3.9% 2.1% 9.8% 1.1% 0.9% 1.5% Total Current Liabilities 249,932 217,993 83,800 67,754 75,055 67,003 32.9% 32.2% 60.8% 16.5% 15.5% 14.0% Other Liabilities Convertible Note Payable 8,054 9,343 11,047 12,461 - - 1.1% 1.4% 8.0% 3.0% 0.0% 0.0% Long-term Debt, Net of Current Portion 365,468 - - - - - 48.1% 0.0% 0.0% 0.0% 0.0% 0.0% Long-term Lease Obligations 43,211 8,719 12,945 19,161 12,740 11,020 5.7% 1.3% 9.4% 4.7% 2.6% 2.3% Long-term Liabilities of Discontinued Operations - 395,071 - - - - 0.0% 58.4% 0.0% 0.0% 0.0% 0.0% Other Long-term Liabilities 8,509 3,863 3,983 5,442 5,913 5,047 1.1% 0.6% 2.9% 1.3% 1.2% 1.1% Total Other Liabilities 425,242 416,996 27,975 37,064 18,653 16,067 56.0% 61.7% 20.3% 9.0% 3.8% 3.4% Total Liabilities 675,174 634,989 111,775 104,818 93,708 83,070 88.9% 93.9% 81.1% 25.5% 19.3% 17.4% Shareholders' Equity Total Shareholders' Equity 83,998 41,392 25,974 306,363 391,920 394,503 11.1% 6.1% 18.9% 74.5% 80.7% 82.6% Total Liabilities & Shareholders' Equity 759,172 676,381 137,749 411,181 485,628 477,573 100.0% 100.0% 100.0% 100.0% 100.0% 100.0% Notes: (a) Source: Form 10-Ks for the years ended July 31, 2020 through 2024, and internally prepard financial statements for October 31, 2024.
Sub - section II ModusLink Financial Information www.mpival.com | © Management Planning, Inc. All rights reserved. 21
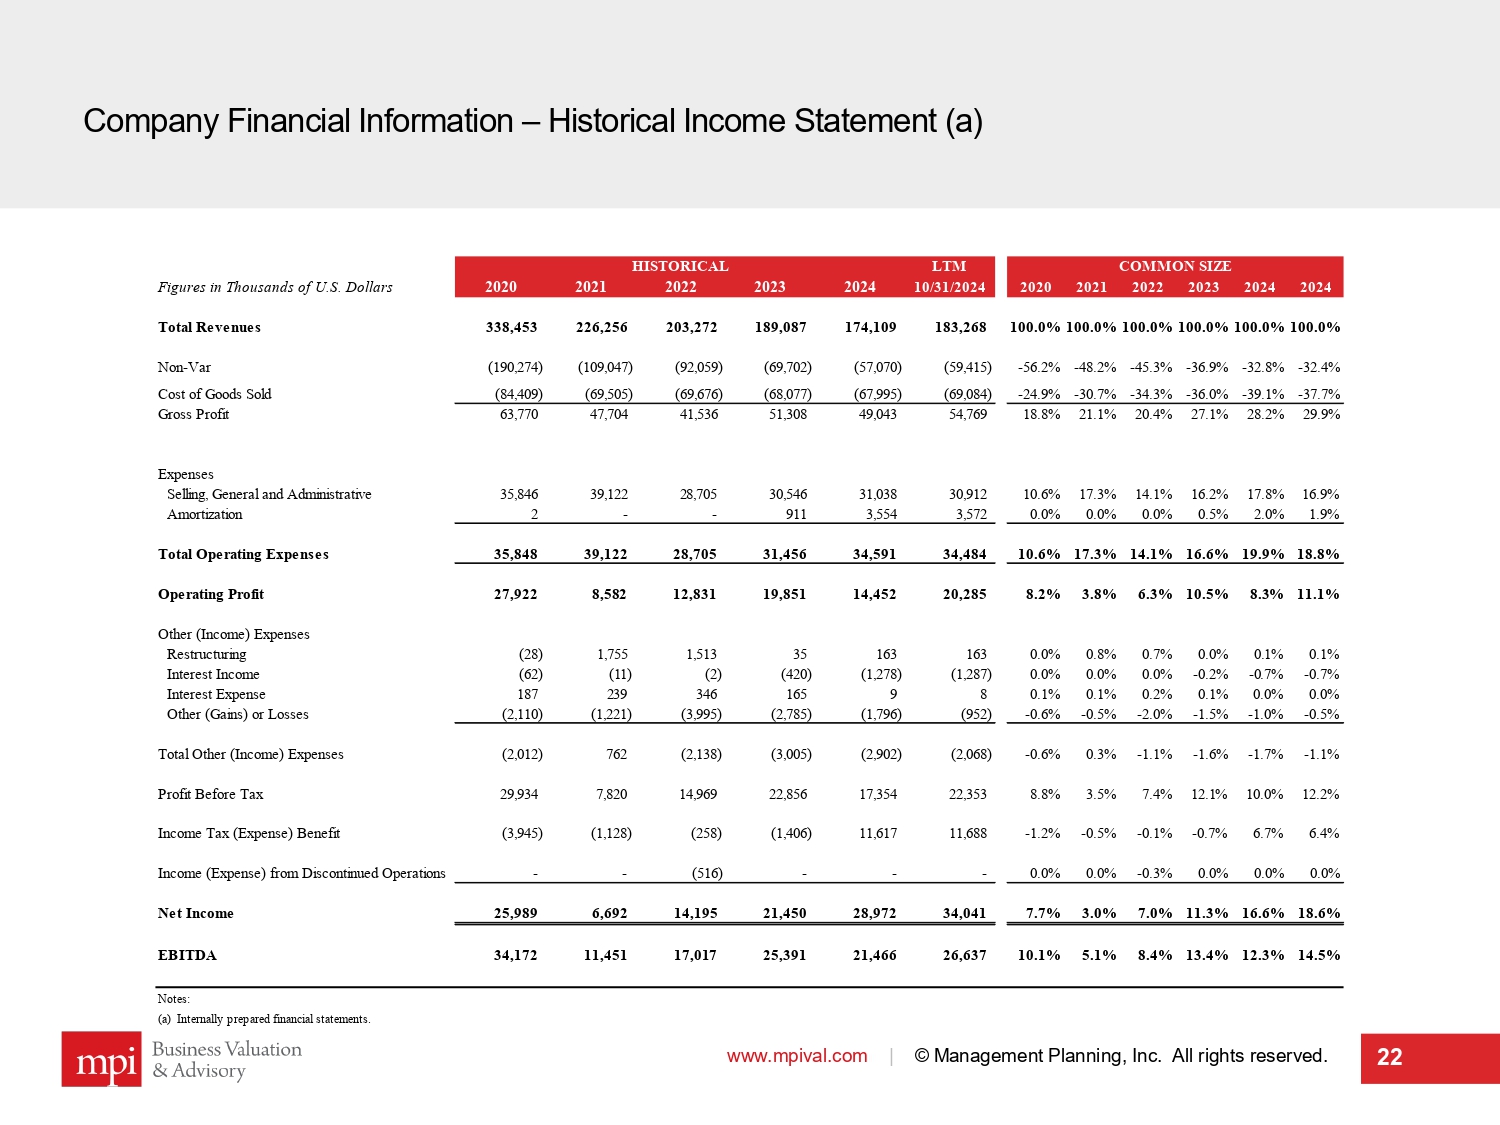
Company Financial Information – Historical Income Statement (a) www.mpival.com | © Management Planning, Inc. All rights reserved. 22 HISTORICAL LTM COMMON SIZE Figures in Thousands of U.S. Dollars 2020 2021 2022 2023 2024 10/31/2024 2020 2021 2022 2023 2024 2024 Total Revenues 338,453 226,256 203,272 189,087 174,109 183,268 100.0%100.0%100.0%100.0%100.0%100.0% Non-Var (190,274) (109,047) (92,059) (69,702) (57,070) (59,415) -56.2% -48.2% -45.3% -36.9% -32.8% -32.4% Cost of Goods Sold (84,409) (69,505) (69,676) (68,077) (67,995) (69,084) -24.9% -30.7% -34.3% -36.0% -39.1% -37.7% Gross Profit 63,770 47,704 41,536 51,308 49,043 54,769 18.8% 21.1% 20.4% 27.1% 28.2% 29.9% Expenses Selling, General and Administrative 35,846 39,122 28,705 30,546 31,038 30,912 10.6% 17.3% 14.1% 16.2% 17.8% 16.9% Amortization 2 - - 911 3,554 3,572 0.0% 0.0% 0.0% 0.5% 2.0% 1.9% Total Operating Expenses 35,848 39,122 28,705 31,456 34,591 34,484 10.6% 17.3% 14.1% 16.6% 19.9% 18.8% Operating Profit 27,922 8,582 12,831 19,851 14,452 20,285 8.2% 3.8% 6.3% 10.5% 8.3% 11.1% Other (Income) Expenses Restructuring (28) 1,755 1,513 35 163 163 0.0% 0.8% 0.7% 0.0% 0.1% 0.1% Interest Income (62) (11) (2) (420) (1,278) (1,287) 0.0% 0.0% 0.0% -0.2% -0.7% -0.7% Interest Expense 187 239 346 165 9 8 0.1% 0.1% 0.2% 0.1% 0.0% 0.0% Other (Gains) or Losses (2,110) (1,221) (3,995) (2,785) (1,796) (952) -0.6% -0.5% -2.0% -1.5% -1.0% -0.5% Total Other (Income) Expenses (2,012) 762 (2,138) (3,005) (2,902) (2,068) -0.6% 0.3% -1.1% -1.6% -1.7% -1.1% Profit Before Tax 29,934 7,820 14,969 22,856 17,354 22,353 8.8% 3.5% 7.4% 12.1% 10.0% 12.2% Income Tax (Expense) Benefit (3,945) (1,128) (258) (1,406) 11,617 11,688 -1.2% -0.5% -0.1% -0.7% 6.7% 6.4% Income (Expense) from Discontinued Operations - - (516) - - - 0.0% 0.0% -0.3% 0.0% 0.0% 0.0% Net Income 25,989 6,692 14,195 21,450 28,972 34,041 7.7% 3.0% 7.0% 11.3% 16.6% 18.6% EBITDA 34,172 11,451 17,017 25,391 21,466 26,637 10.1% 5.1% 8.4% 13.4% 12.3% 14.5% Notes: (a) Internally prepared financial statements.
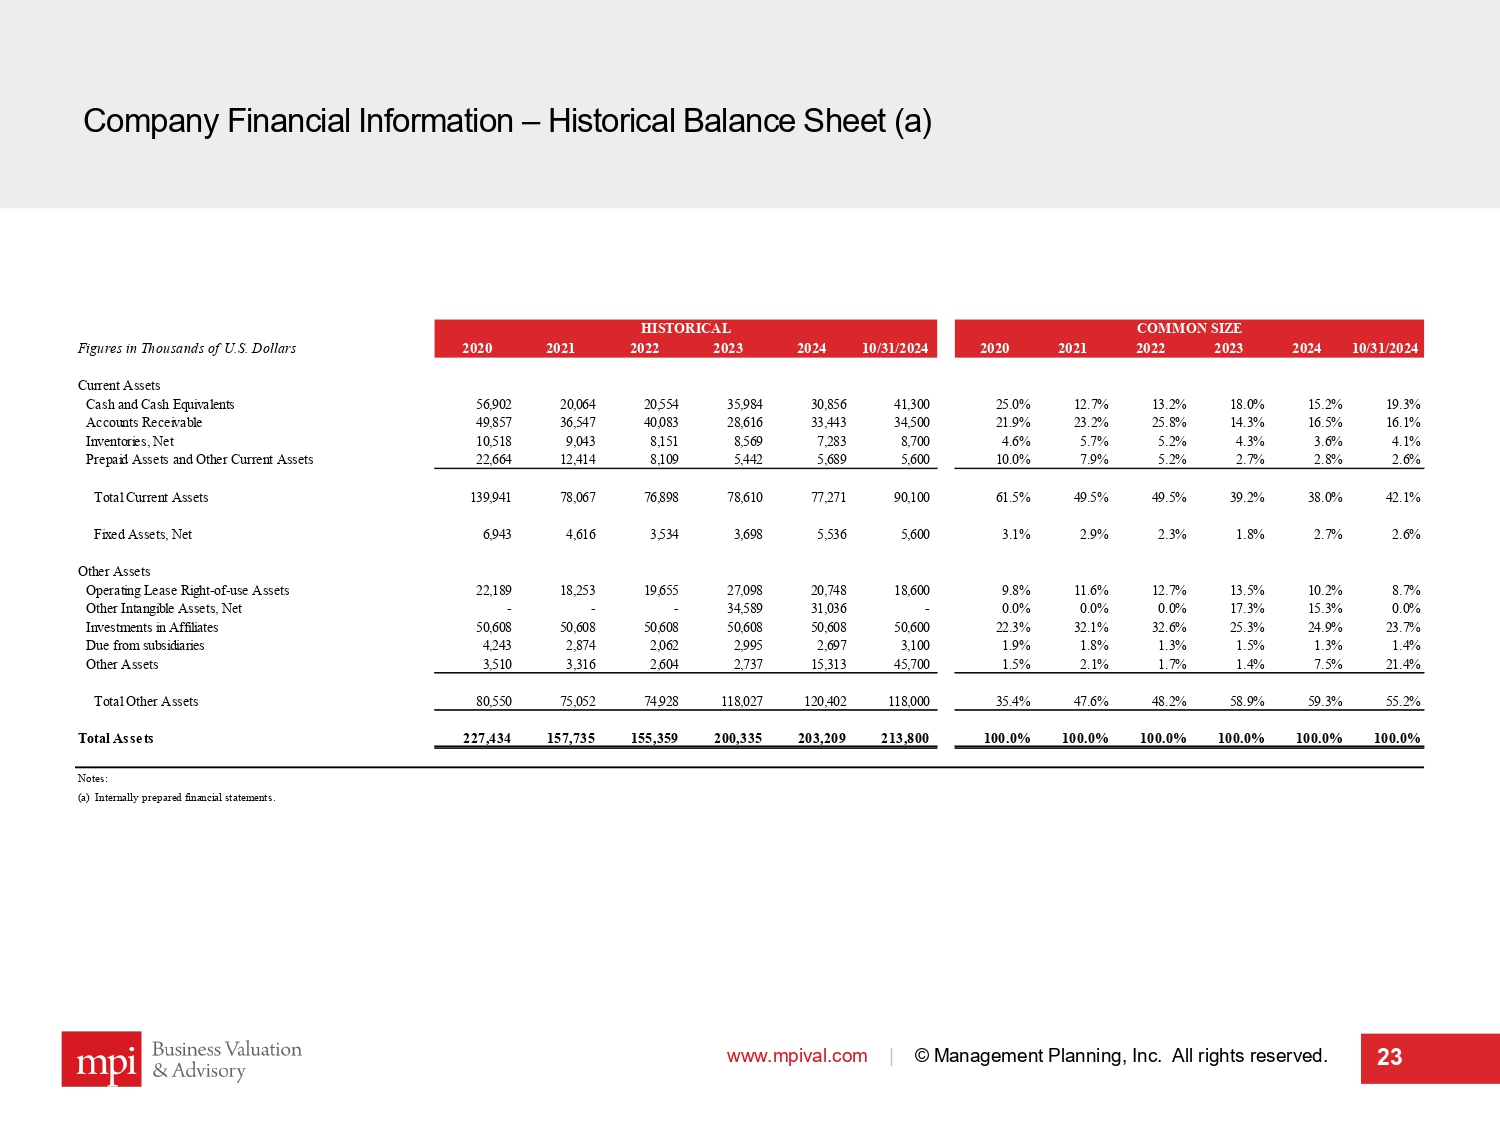
Company Financial Information – Historical Balance Sheet (a) www.mpival.com | © Management Planning, Inc. All rights reserved. 23 HISTORICAL COMMON SIZE Figures in Thousands of U.S. Dollars 2020 2021 2022 2023 2024 10/31/2024 2020 2021 2022 2023 2024 10/31/2024 Current Assets Cash and Cash Equivalents 56,902 20,064 20,554 35,984 30,856 41,300 25.0% 12.7% 13.2% 18.0% 15.2% 19.3% Accounts Receivable 49,857 36,547 40,083 28,616 33,443 34,500 21.9% 23.2% 25.8% 14.3% 16.5% 16.1% Inventories, Net 10,518 9,043 8,151 8,569 7,283 8,700 4.6% 5.7% 5.2% 4.3% 3.6% 4.1% Prepaid Assets and Other Current Assets 22,664 12,414 8,109 5,442 5,689 5,600 10.0% 7.9% 5.2% 2.7% 2.8% 2.6% Total Current Assets 139,941 78,067 76,898 78,610 77,271 90,100 61.5% 49.5% 49.5% 39.2% 38.0% 42.1% Fixed Assets, Net 6,943 4,616 3,534 3,698 5,536 5,600 3.1% 2.9% 2.3% 1.8% 2.7% 2.6% Other Assets Operating Lease Right-of-use Assets 22,189 18,253 19,655 27,098 20,748 18,600 9.8% 11.6% 12.7% 13.5% 10.2% 8.7% Other Intangible Assets, Net - - - 34,589 31,036 - 0.0% 0.0% 0.0% 17.3% 15.3% 0.0% Investments in Affiliates 50,608 50,608 50,608 50,608 50,608 50,600 22.3% 32.1% 32.6% 25.3% 24.9% 23.7% Due from subsidiaries 4,243 2,874 2,062 2,995 2,697 3,100 1.9% 1.8% 1.3% 1.5% 1.3% 1.4% Other Assets 3,510 3,316 2,604 2,737 15,313 45,700 1.5% 2.1% 1.7% 1.4% 7.5% 21.4% Total Other Assets 80,550 75,052 74,928 118,027 120,402 118,000 35.4% 47.6% 48.2% 58.9% 59.3% 55.2% Total Assets 227,434 157,735 155,359 200,335 203,209 213,800 100.0% 100.0% 100.0% 100.0% 100.0% 100.0% Notes: (a) Internally prepared financial statements.
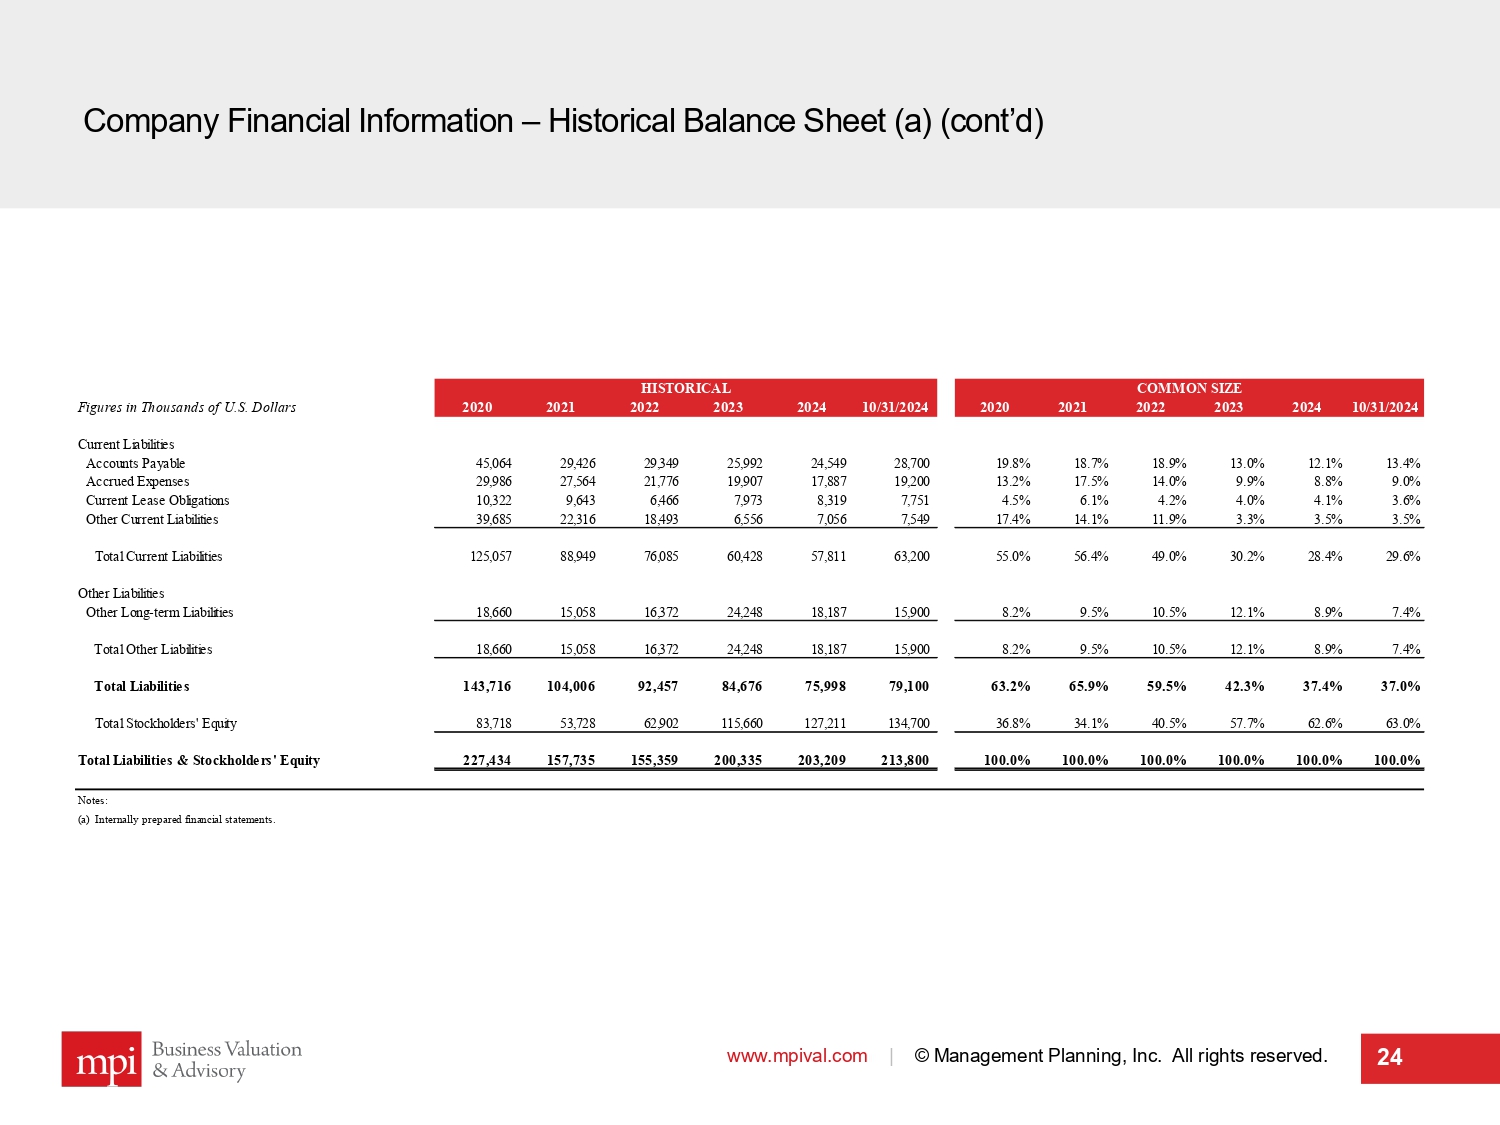
Company Financial Information – Historical Balance Sheet (a) (cont’d) www.mpival.com | © Management Planning, Inc. All rights reserved. 24 HISTORICAL COMMON SIZE Figures in Thousands of U.S. Dollars 2020 2021 2022 2023 2024 10/31/2024 2020 2021 2022 2023 2024 10/31/2024 Current Liabilities Accounts Payable 45,064 29,426 29,349 25,992 24,549 28,700 19.8% 18.7% 18.9% 13.0% 12.1% 13.4% Accrued Expenses 29,986 27,564 21,776 19,907 17,887 19,200 13.2% 17.5% 14.0% 9.9% 8.8% 9.0% Current Lease Obligations 10,322 9,643 6,466 7,973 8,319 7,751 4.5% 6.1% 4.2% 4.0% 4.1% 3.6% Other Current Liabilities 39,685 22,316 18,493 6,556 7,056 7,549 17.4% 14.1% 11.9% 3.3% 3.5% 3.5% Total Current Liabilities 125,057 88,949 76,085 60,428 57,811 63,200 55.0% 56.4% 49.0% 30.2% 28.4% 29.6% Other Liabilities Other Long-term Liabilities 18,660 15,058 16,372 24,248 18,187 15,900 8.2% 9.5% 10.5% 12.1% 8.9% 7.4% Total Other Liabilities 18,660 15,058 16,372 24,248 18,187 15,900 8.2% 9.5% 10.5% 12.1% 8.9% 7.4% Total Liabilities 143,716 104,006 92,457 84,676 75,998 79,100 63.2% 65.9% 59.5% 42.3% 37.4% 37.0% Total Stockholders' Equity 83,718 53,728 62,902 115,660 127,211 134,700 36.8% 34.1% 40.5% 57.7% 62.6% 63.0% Total Liabilities & Stockholders' Equity 227,434 157,735 155,359 200,335 203,209 213,800 100.0% 100.0% 100.0% 100.0% 100.0% 100.0% Notes: (a) Internally prepared financial statements.
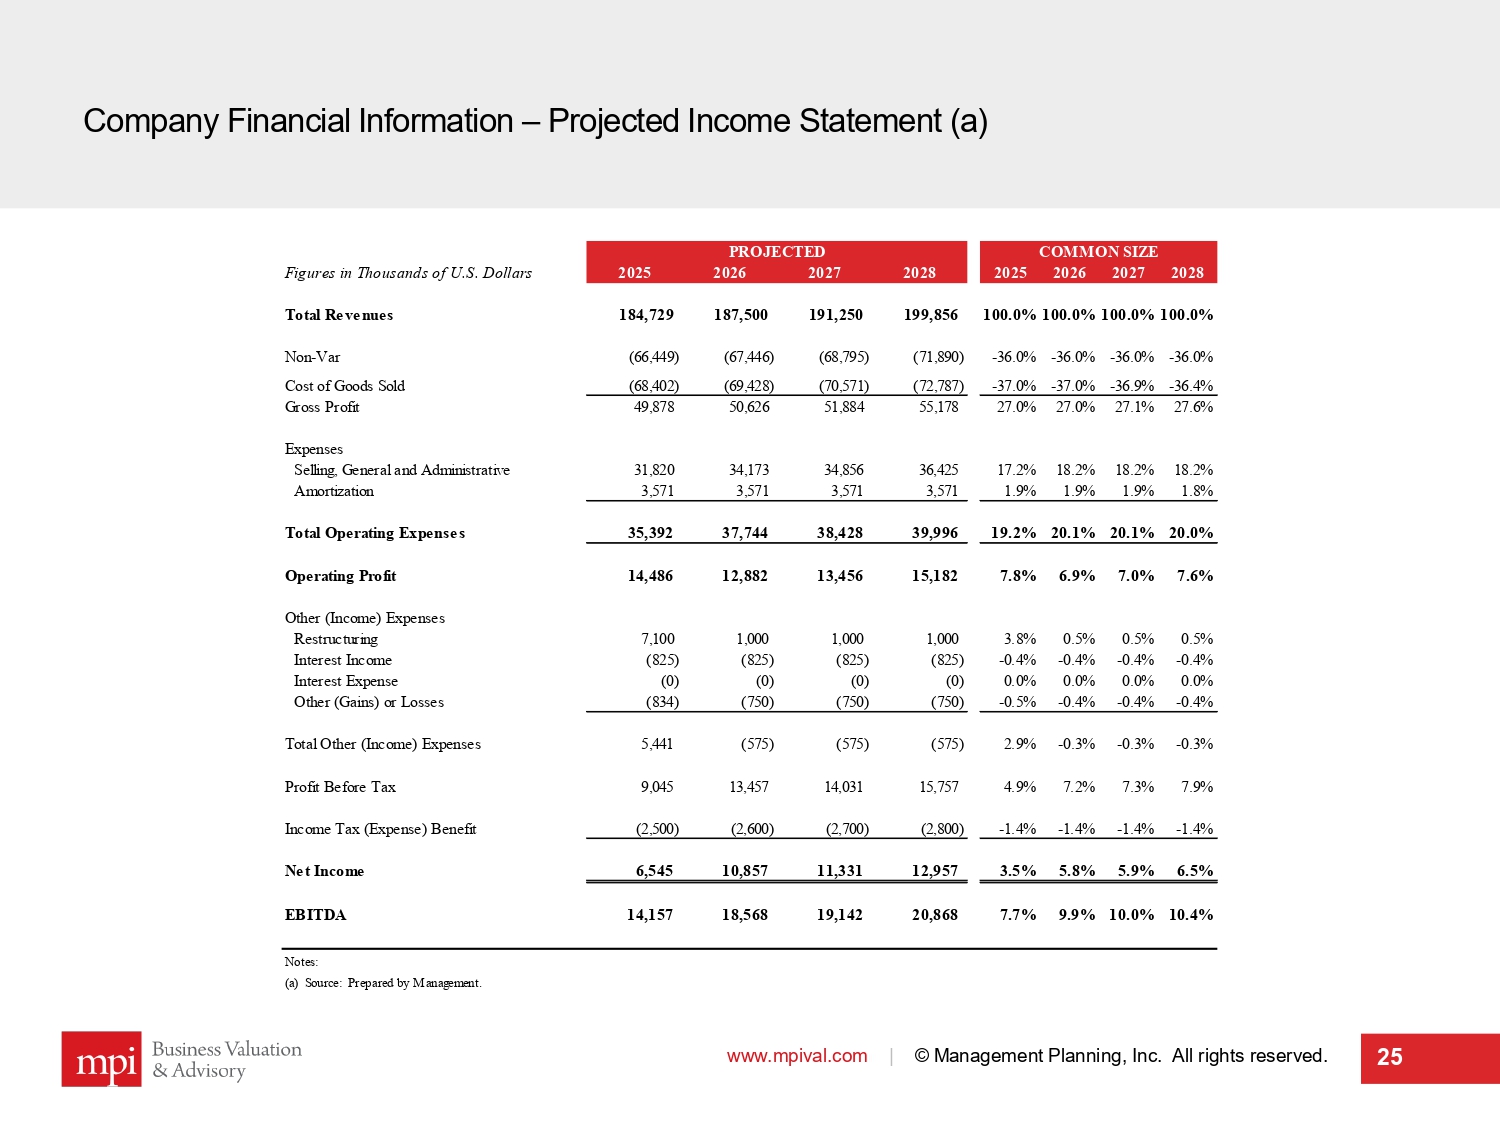
Company Financial Information – Projected Income Statement (a) www.mpival.com | © Management Planning, Inc. All rights reserved. 25 PROJECTED COMMON SIZE Figures in Thousands of U.S. Dollars 2025 2026 2027 2028 2025 2026 2027 2028 Total Revenues 184,729 187,500 191,250 199,856 100.0%100.0%100.0%100.0% Non-Var (66,449) (67,446) (68,795) (71,890) -36.0% -36.0% -36.0% -36.0% Cost of Goods Sold (68,402) (69,428) (70,571) (72,787) -37.0% -37.0% -36.9% -36.4% Gross Profit 49,878 50,626 51,884 55,178 27.0% 27.0% 27.1% 27.6% Expenses Selling, General and Administrative 31,820 34,173 34,856 36,425 17.2% 18.2% 18.2% 18.2% Amortization 3,571 3,571 3,571 3,571 1.9% 1.9% 1.9% 1.8% Total Operating Expenses 35,392 37,744 38,428 39,996 19.2% 20.1% 20.1% 20.0% Operating Profit 14,486 12,882 13,456 15,182 7.8% 6.9% 7.0% 7.6% Other (Income) Expenses Restructuring 7,100 1,000 1,000 1,000 3.8% 0.5% 0.5% 0.5% Interest Income (825) (825) (825) (825) -0.4% -0.4% -0.4% -0.4% Interest Expense (0) (0) (0) (0) 0.0% 0.0% 0.0% 0.0% Other (Gains) or Losses (834) (750) (750) (750) -0.5% -0.4% -0.4% -0.4% Total Other (Income) Expenses 5,441 (575) (575) (575) 2.9% -0.3% -0.3% -0.3% Profit Before Tax 9,045 13,457 14,031 15,757 4.9% 7.2% 7.3% 7.9% Income Tax (Expense) Benefit (2,500) (2,600) (2,700) (2,800) -1.4% -1.4% -1.4% -1.4% Net Income 6,545 10,857 11,331 12,957 3.5% 5.8% 5.9% 6.5% EBITDA 14,157 18,568 19,142 20,868 7.7% 9.9% 10.0% 10.4% Notes: (a) Source: Prepared by Management.
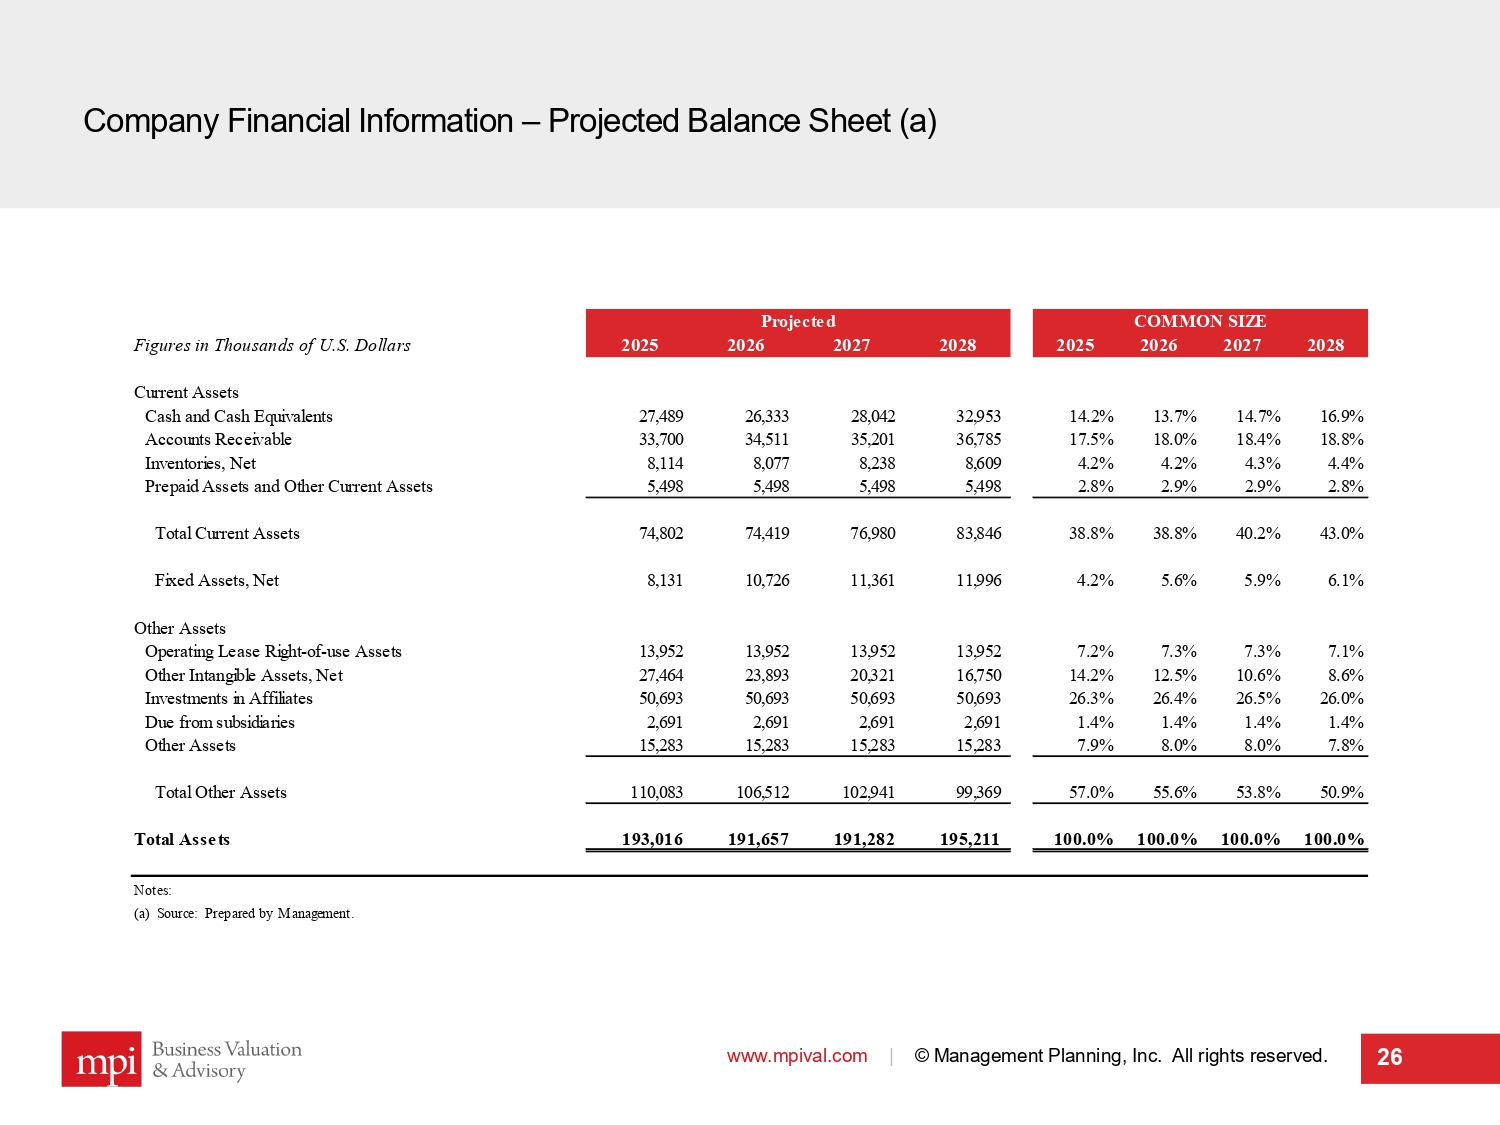
Company Financial Information – Projected Balance Sheet (a) www.mpival.com | © Management Planning, Inc. All rights reserved. 26 Projected COMMON SIZE Figures in Thousands of U.S. Dollars 2025 2026 2027 2028 2025 2026 2027 2028 Current Assets Cash and Cash Equivalents 27,489 26,333 28,042 32,953 14.2% 13.7% 14.7% 16.9% Accounts Receivable 33,700 34,511 35,201 36,785 17.5% 18.0% 18.4% 18.8% Inventories, Net 8,114 8,077 8,238 8,609 4.2% 4.2% 4.3% 4.4% Prepaid Assets and Other Current Assets 5,498 5,498 5,498 5,498 2.8% 2.9% 2.9% 2.8% Total Current Assets 74,802 74,419 76,980 83,846 38.8% 38.8% 40.2% 43.0% Fixed Assets, Net 8,131 10,726 11,361 11,996 4.2% 5.6% 5.9% 6.1% Other Assets Operating Lease Right-of-use Assets 13,952 13,952 13,952 13,952 7.2% 7.3% 7.3% 7.1% Other Intangible Assets, Net 27,464 23,893 20,321 16,750 14.2% 12.5% 10.6% 8.6% Investments in Affiliates 50,693 50,693 50,693 50,693 26.3% 26.4% 26.5% 26.0% Due from subsidiaries 2,691 2,691 2,691 2,691 1.4% 1.4% 1.4% 1.4% Other Assets 15,283 15,283 15,283 15,283 7.9% 8.0% 8.0% 7.8% Total Other Assets 110,083 106,512 102,941 99,369 57.0% 55.6% 53.8% 50.9% Total Assets 193,016 191,657 191,282 195,211 100.0% 100.0% 100.0% 100.0% Notes: (a) Source: Prepared by Management.
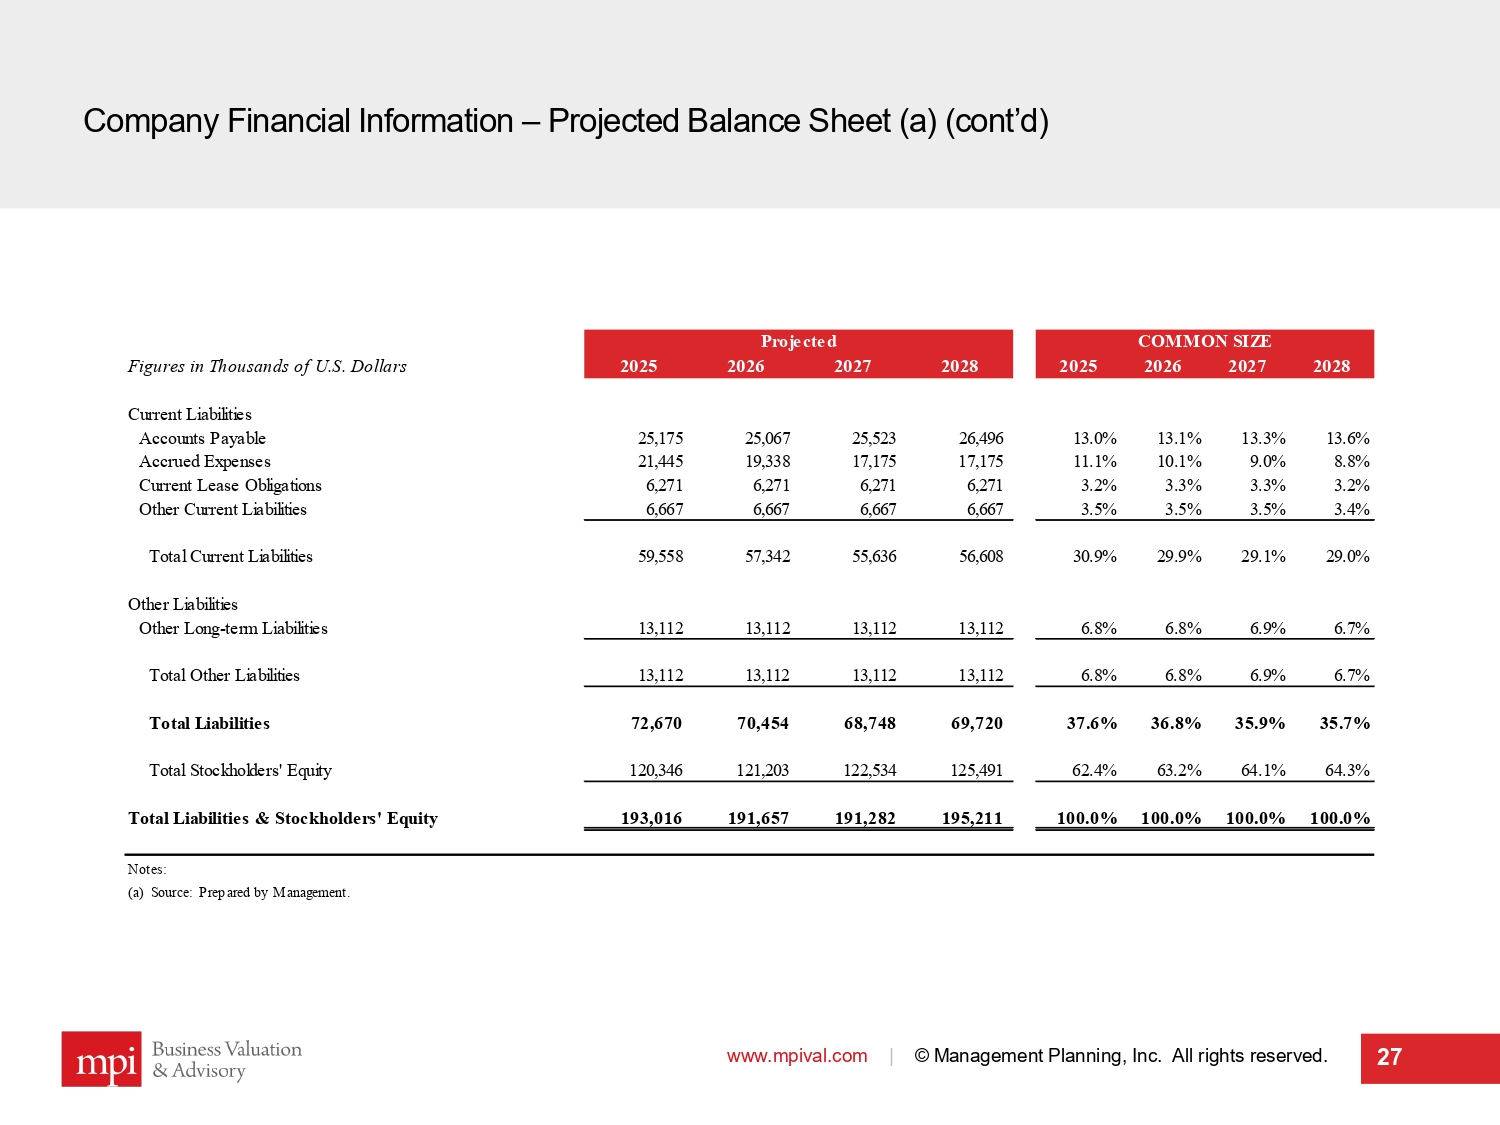
Company Financial Information – Projected Balance Sheet (a) (cont’d) www.mpival.com | © Management Planning, Inc. All rights reserved. 27 Projected COMMON SIZE Figures in Thousands of U.S. Dollars 2025 2026 2027 2028 2025 2026 2027 2028 Current Liabilities Accounts Payable 25,175 25,067 25,523 26,496 13.0% 13.1% 13.3% 13.6% Accrued Expenses 21,445 19,338 17,175 17,175 11.1% 10.1% 9.0% 8.8% Current Lease Obligations 6,271 6,271 6,271 6,271 3.2% 3.3% 3.3% 3.2% Other Current Liabilities 6,667 6,667 6,667 6,667 3.5% 3.5% 3.5% 3.4% Total Current Liabilities 59,558 57,342 55,636 56,608 30.9% 29.9% 29.1% 29.0% Other Liabilities Other Long-term Liabilities 13,112 13,112 13,112 13,112 6.8% 6.8% 6.9% 6.7% Total Other Liabilities 13,112 13,112 13,112 13,112 6.8% 6.8% 6.9% 6.7% Total Liabilities 72,670 70,454 68,748 69,720 37.6% 36.8% 35.9% 35.7% Total Stockholders' Equity 120,346 121,203 122,534 125,491 62.4% 63.2% 64.1% 64.3% Total Liabilities & Stockholders' Equity 193,016 191,657 191,282 195,211 100.0% 100.0% 100.0% 100.0% Notes: (a) Source: Prepared by Management.

Analysis of Steel Connect Components 28
Sub - section I ModusLink Discounted Cash Flow Analysis www.mpival.com | © Management Planning, Inc. All rights reserved. 29
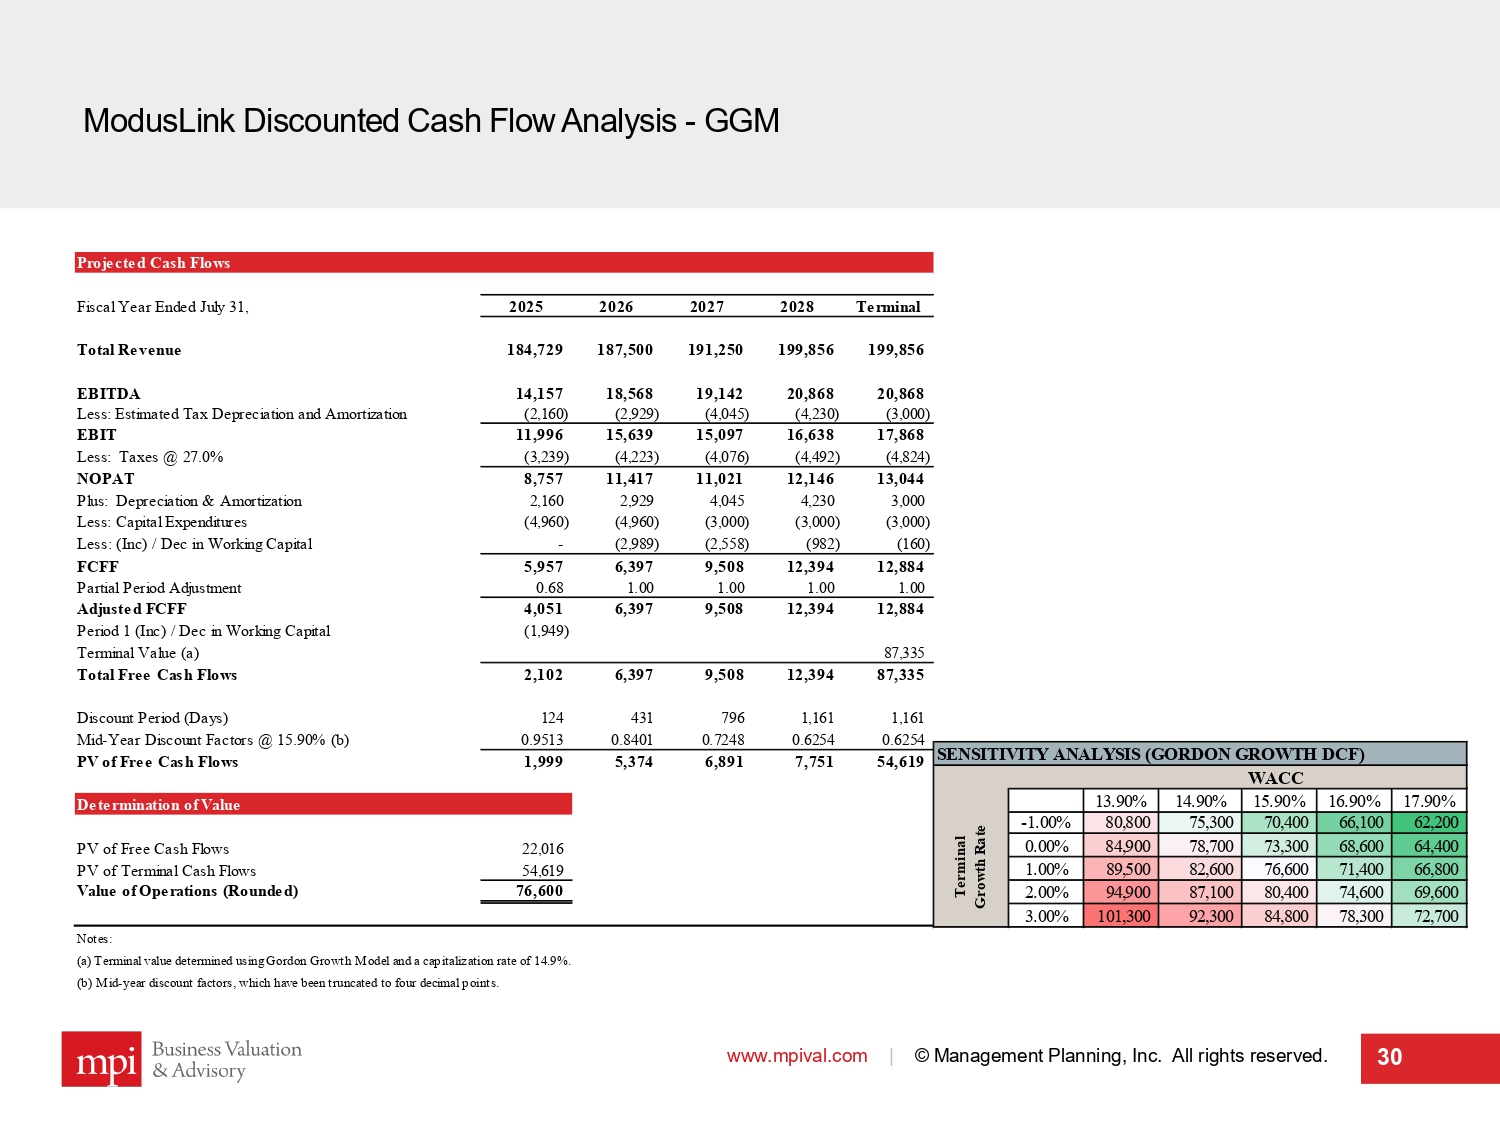
ModusLink Discounted Cash Flow Analysis - GGM www.mpival.com | © Management Planning, Inc. All rights reserved. 30 Projected Cash Flows Fiscal Year Ended July 31, 2025 2026 2027 2028 Terminal Total Revenue 184,729 187,500 191,250 199,856 199,856 EBITDA 14,157 18,568 19,142 20,868 20,868 Less: Estimated Tax Depreciation and Amortization (2,160) (2,929) (4,045) (4,230) (3,000) EBIT 11,996 15,639 15,097 16,638 17,868 Less: Taxes @ 27.0% (3,239) (4,223) (4,076) (4,492) (4,824) NOPAT 8,757 11,417 11,021 12,146 13,044 Plus: Depreciation & Amortization 2,160 2,929 4,045 4,230 3,000 Less:Capital Expenditures (4,960) (4,960) (3,000) (3,000) (3,000) Less:(Inc) / Dec in Working Capital - (2,989) (2,558) (982) (160) FCFF 5,957 6,397 9,508 12,394 12,884 Partial Period Adjustment 0.68 1.00 1.00 1.00 1.00 Adjusted FCFF 4,051 6,397 9,508 12,394 12,884 Period 1 (Inc) / Dec in Working Capital (1,949) Terminal Value (a) 87,335 Total Free Cash Flows 2,102 6,397 9,508 12,394 87,335 Discount Period (Days) 124 431 796 1,161 1,161 Mid-Year Discount Factors @ 15.90% (b) 0.9513 0.8401 0.7248 0.6254 0.6254 PV of Free Cash Flows 1,999 5,374 6,891 7,751 54,619 Determination of Value PV of Free Cash Flows 22,016 PV of Terminal Cash Flows 54,619 Value of Operations (Rounded) 76,600 Notes: (a) Terminal value determined using Gordon Growth Model and a capitalization rate of 14.9%. (b) Mid-year discount factors, which have been truncated to four decimal points. SENSITIVITY ANALYSIS (GORDON GROWTH DCF) WACC 54,619 13.90% 14.90% 15.90% 16.90% 17.90% -1.00% 80,800 75,300 70,400 66,100 62,200 0.00% 84,900 78,700 73,300 68,600 64,400 1.00% 89,500 82,600 76,600 71,400 66,800 2.00% 94,900 87,100 80,400 74,600 69,600 3.00% 101,300 92,300 84,800 78,300 72,700 Terminal Growth Rate
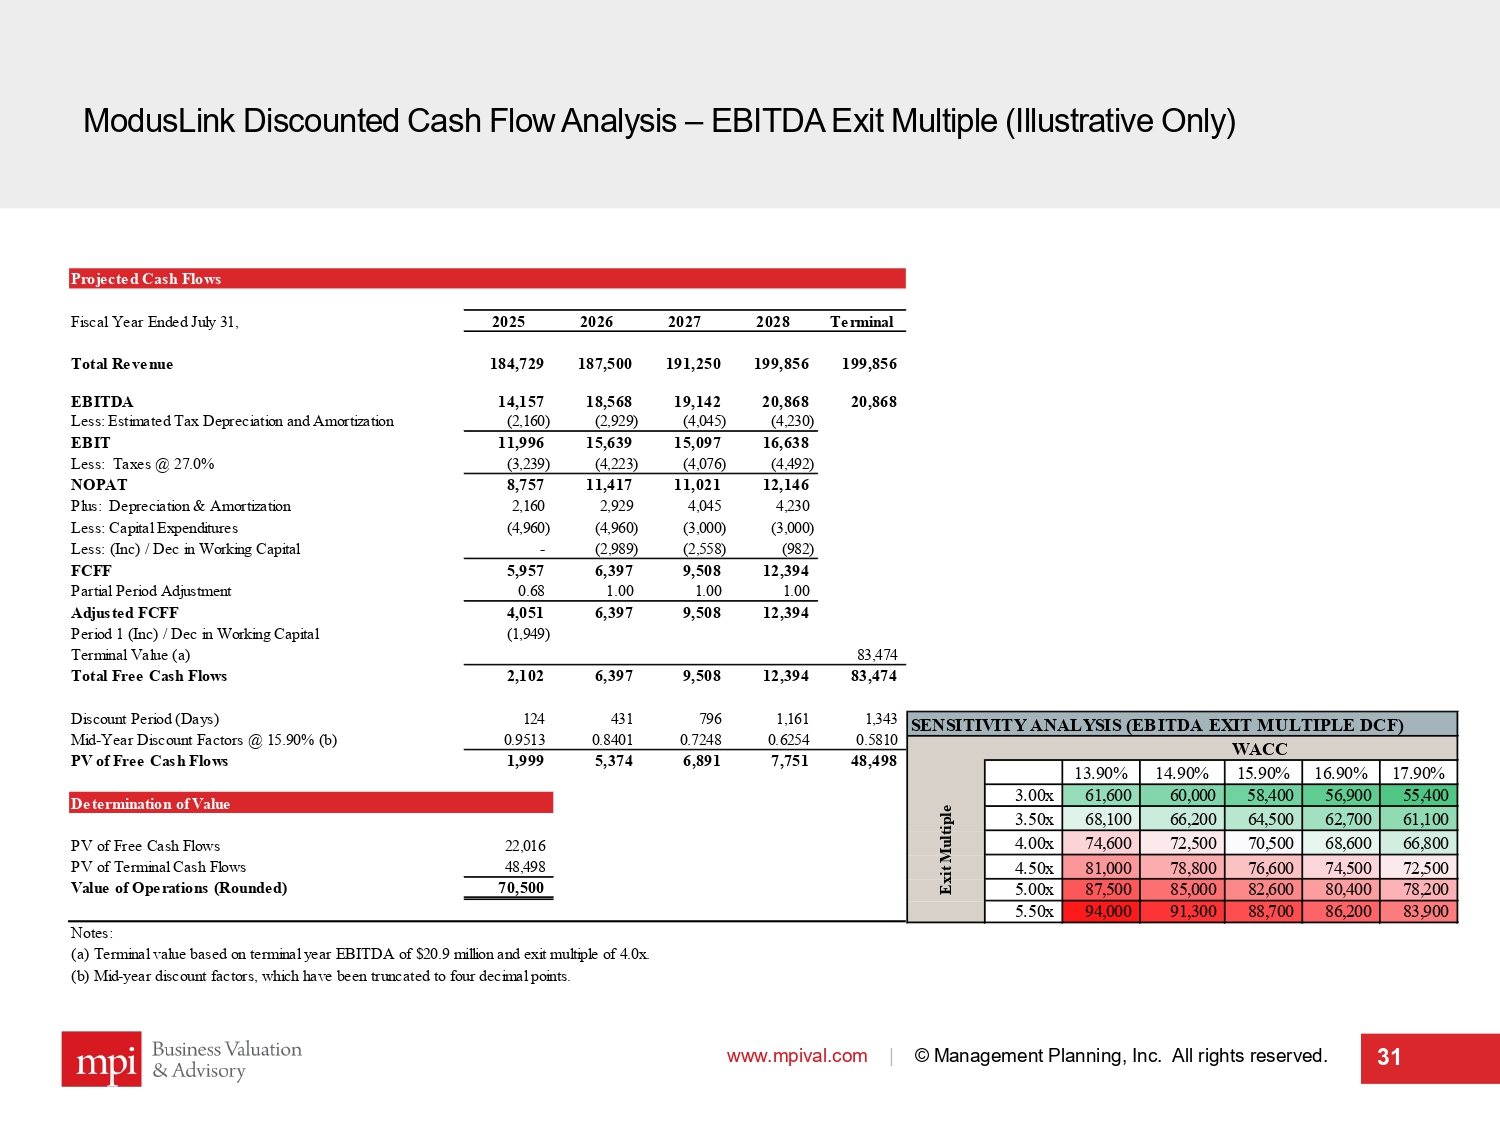
ModusLink Discounted Cash Flow Analysis – EBITDA Exit Multiple (Illustrative Only) www.mpival.com | © Management Planning, Inc. All rights reserved. 31 Projected Cash Flows Fiscal Year Ended July 31, 2025 2026 2027 2028 Terminal Total Revenue 184,729 187,500 191,250 199,856 199,856 EBITDA 14,157 18,568 19,142 20,868 20,868 Less: Estimated Tax Depreciation and Amortization (2,160) (2,929) (4,045) (4,230) EBIT 11,996 15,639 15,097 16,638 Less: Taxes @ 27.0% (3,239) (4,223) (4,076) (4,492) NOPAT 8,757 11,417 11,021 12,146 Plus: Depreciation & Amortization 2,160 2,929 4,045 4,230 Less:Capital Expenditures (4,960) (4,960) (3,000) (3,000) Less:(Inc) / Dec in Working Capital - (2,989) (2,558) (982) FCFF 5,957 6,397 9,508 12,394 Partial Period Adjustment 0.68 1.00 1.00 1.00 Adjusted FCFF 4,051 6,397 9,508 12,394 Period 1 (Inc) / Dec in Working Capital (1,949) Terminal Value (a) 83,474 Total Free Cash Flows 2,102 6,397 9,508 12,394 83,474 Discount Period (Days) 124 431 796 1,161 1,343 Mid-Year Discount Factors @ 15.90% (b) 0.9513 0.8401 0.7248 0.6254 0.5810 PV of Free Cash Flows 1,999 5,374 6,891 7,751 48,498 Determination of Value PV of Free Cash Flows 22,016 PV of Terminal Cash Flows 48,498 Value of Operations (Rounded) 70,500 Notes: (a) Terminal value based on terminal year EBITDA of $20.9 million and exit multiple of 4.0x. (b) Mid-year discount factors, which have been truncated to four decimal points. SENSITIVITY ANALYSIS (EBITDA EXIT MULTIPLE DCF) Step WACC 48,498 13.90% 14.90% 15.90% 16.90% 17.90% 3.00x 61,600 60,000 58,400 56,900 55,400 3.50x 68,100 66,200 64,500 62,700 61,100 4.00x 74,600 72,500 70,500 68,600 66,800 4.50x 81,000 78,800 76,600 74,500 72,500 5.00x 87,500 85,000 82,600 80,400 78,200 5.50x 94,000 91,300 88,700 86,200 83,900 Exit Multiple
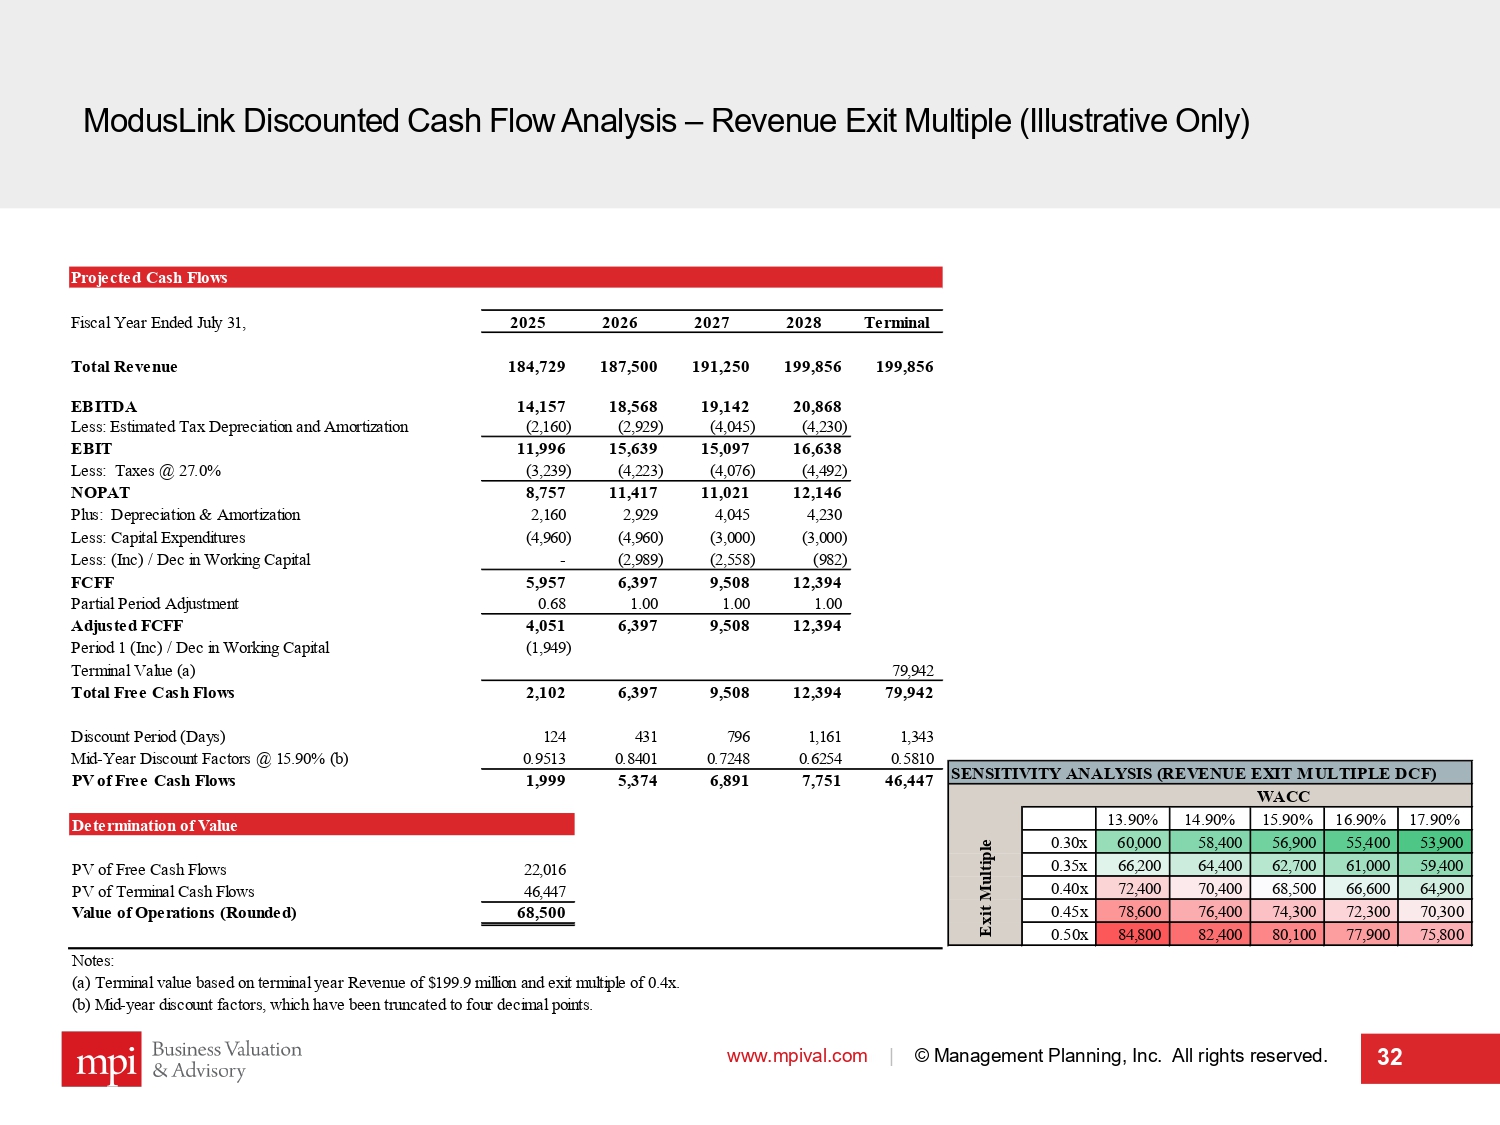
ModusLink Discounted Cash Flow Analysis – Revenue Exit Multiple (Illustrative Only) www.mpival.com | © Management Planning, Inc. All rights reserved. 32 SENSITIVITY ANALYSIS (REVENUE EXIT MULTIPLE DCF) Step WACC 46,447 13.90% 14.90% 15.90% 16.90% 17.90% 0.30x 60,000 58,400 56,900 55,400 53,900 0.35x 66,200 64,400 62,700 61,000 59,400 0.40x 72,400 70,400 68,500 66,600 64,900 0.45x 78,600 76,400 74,300 72,300 70,300 0.50x 84,800 82,400 80,100 77,900 75,800 Exit Multiple Projected Cash Flows Fiscal Year Ended July 31, 2025 2026 2027 2028 Terminal Total Revenue 184,729 187,500 191,250 199,856 199,856 EBITDA 14,157 18,568 19,142 20,868 Less: Estimated Tax Depreciation and Amortization (2,160) (2,929) (4,045) (4,230) EBIT 11,996 15,639 15,097 16,638 Less: Taxes @ 27.0% (3,239) (4,223) (4,076) (4,492) NOPAT 8,757 11,417 11,021 12,146 Plus: Depreciation & Amortization 2,160 2,929 4,045 4,230 Less:Capital Expenditures (4,960) (4,960) (3,000) (3,000) Less:(Inc) / Dec in Working Capital - (2,989) (2,558) (982) FCFF 5,957 6,397 9,508 12,394 Partial Period Adjustment 0.68 1.00 1.00 1.00 Adjusted FCFF 4,051 6,397 9,508 12,394 Period 1 (Inc) / Dec in Working Capital (1,949) Terminal Value (a) 79,942 Total Free Cash Flows 2,102 6,397 9,508 12,394 79,942 Discount Period (Days) 124 431 796 1,161 1,343 Mid-Year Discount Factors @ 15.90% (b) 0.9513 0.8401 0.7248 0.6254 0.5810 PV of Free Cash Flows 1,999 5,374 6,891 7,751 46,447 Determination of Value PV of Free Cash Flows 22,016 PV of Terminal Cash Flows 46,447 Value of Operations (Rounded) 68,500 Notes: (a) Terminal value based on terminal year Revenue of $199.9 million and exit multiple of 0.4x. (b) Mid-year discount factors, which have been truncated to four decimal points.
Sub - section II ModusLink Guideline Company Analysis www.mpival.com | © Management Planning, Inc. All rights reserved. 33
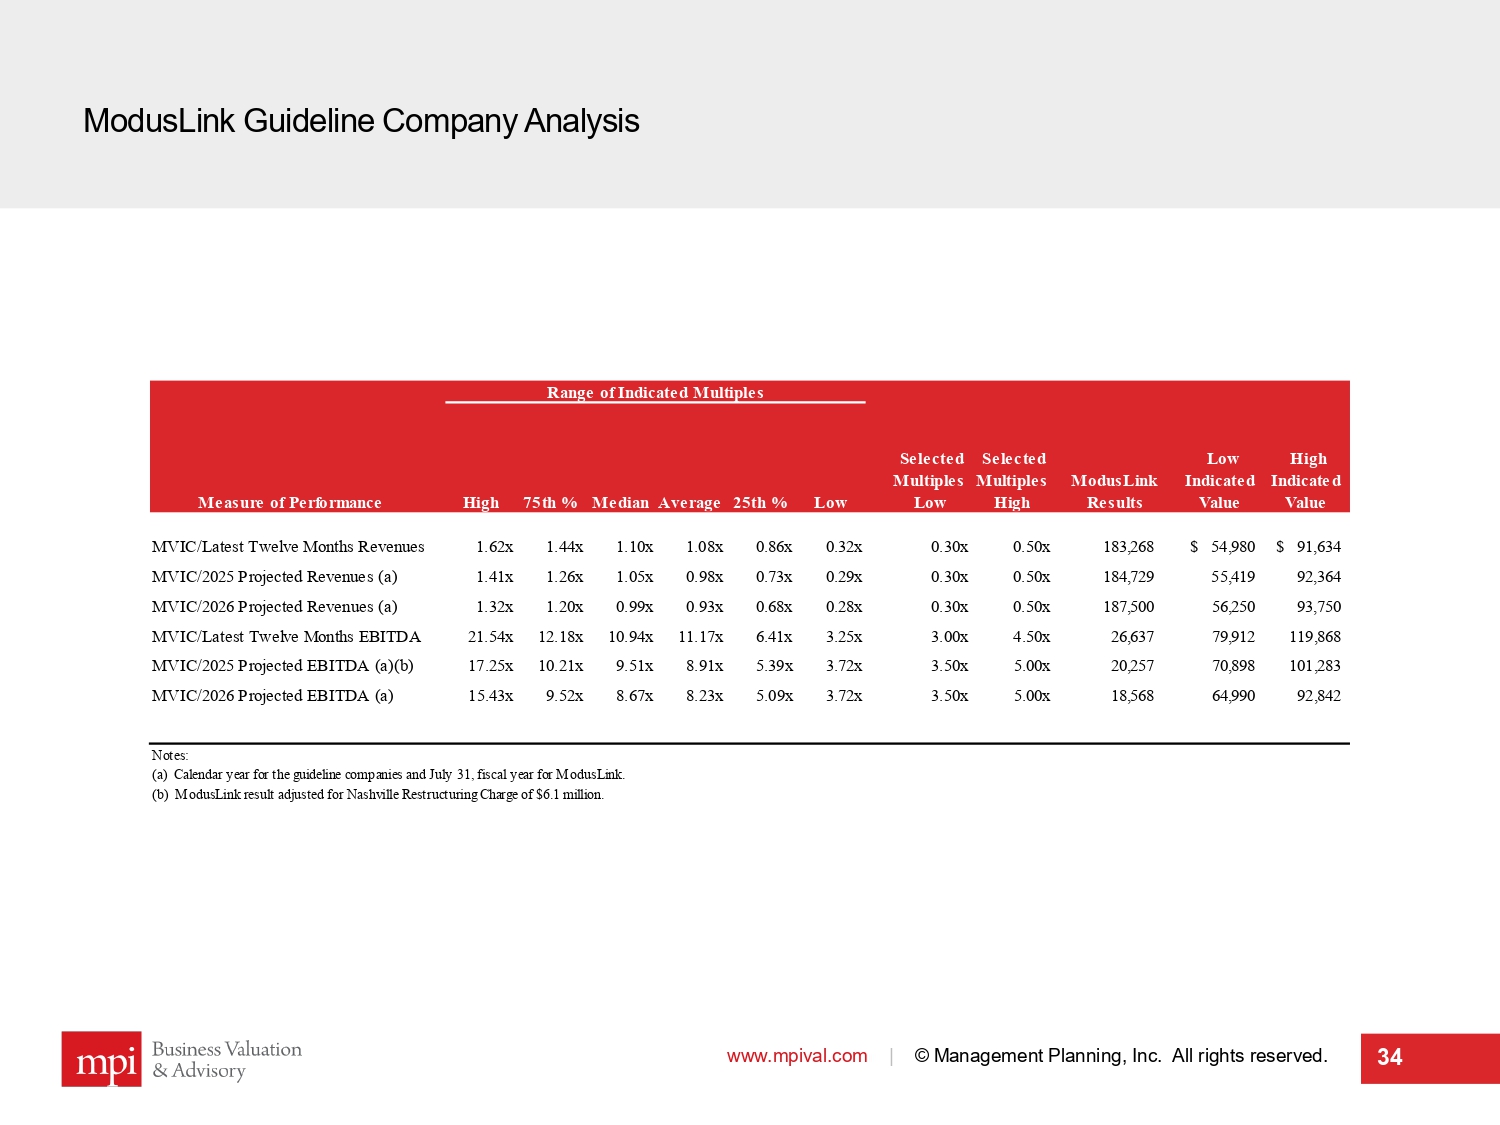
ModusLink Guideline Company Analysis www.mpival.com | © Management Planning, Inc. All rights reserved. 34 Range of Indicated Multiples Measure of Performance High 75th % Median Average 25th % Low Selected Multiples Low Selected Multiples High ModusLink Results Low Indicated Value High Indicated Value MVIC/Latest Twelve Months Revenues 1.62x 1.44x 1.10x 1.08x 0.86x 0.32x 0.30x 0.50x 183,268 54,980$ 91,634$ MVIC/2025 Projected Revenues (a) 1.41x 1.26x 1.05x 0.98x 0.73x 0.29x 0.30x 0.50x 184,729 55,419 92,364 MVIC/2026 Projected Revenues (a) 1.32x 1.20x 0.99x 0.93x 0.68x 0.28x 0.30x 0.50x 187,500 56,250 93,750 MVIC/Latest Twelve Months EBITDA 21.54x 12.18x 10.94x 11.17x 6.41x 3.25x 3.00x 4.50x 26,637 79,912 119,868 MVIC/2025 Projected EBITDA (a)(b) 17.25x 10.21x 9.51x 8.91x 5.39x 3.72x 3.50x 5.00x 20,257 70,898 101,283 MVIC/2026 Projected EBITDA (a) 15.43x 9.52x 8.67x 8.23x 5.09x 3.72x 3.50x 5.00x 18,568 64,990 92,842 Notes: (a) Calendar year for the guideline companies and July 31, fiscal year for ModusLink. (b) ModusLink result adjusted for Nashville Restructuring Charge of $6.1 million.
ModusLink Guideline Company Analysis – Relative Comparison Considerations www.mpival.com | © Management Planning, Inc. All rights reserved. 35 Summary of certain conditions relative to the guideline companies (not all - inclusive) ▪ The Company is substantially smaller than all the publicly traded guideline companies. ▪ The Company is less diversified than all of the publicly traded guideline companies. For example, STCN does not offer warehousing or transportation, whereas many of the guidelines offer these services. ▪ The Company has a major customer concentration with AMD accounting for approximately 38% of latest year sales, and INTC accounting for approximately 14% of latest year sales. Further, the Company is highly concentrated in the PC market and specifically the desktop PC market. ▪ Management indicated that the loss of AMD would put the Company into an immediate loss position, and would require a major, rapid restructuring. ▪ The loss of INTC would also have a material adverse impact on the Company. ▪ The Company has had difficulty attracting meaningful new customers having not brought on a new (larger) customer in at least seven years. ▪ The Company has been in a long - term state of decline. ▪ The Company's short - term (LTM) performance in revenue has been similar to that of the guideline companies; further, the Company has returned to sales growth.
ModusLink Guideline Company Analysis – Relative Comparison Considerations (cont’d) www.mpival.com | © Management Planning, Inc. All rights reserved. 36 ▪ In recent years, the Company has shed unprofitable customers and locations which, when combined with a strong PC market, has resulted in outperformance in earnings trends vs. the guidelines. ▪ Profitability has been trending upward in recent years, during which time the Company has become more profitable as compared to the median guideline company. ▪ The Company is less levered than the typical guideline company with zero (net) debt in recent years. ▪ The Company is similar to slightly superior to the typical guideline company with respect to common liquidity ratios.
ModusLink Guideline Company Analysis - Additional Considerations www.mpival.com | © Management Planning, Inc. All rights reserved. 37 ▪ Notwithstanding the myriad of factors presented above, the most important relative considerations are as follows: (a) size; (b) customer concentration; (c) lack of diversification; and (d) long - term declining business. ▪ Mounting research (e.g., IBISWorld) indicates that the bull market in technology and specifically PCs and peripherals will be declining in coming years. It should be noted that this point was also highlighted by ModusLink management as a significant concern. ▪ A combination of factors including expected decline in the sector/PC market, the Company’s inability to onboard new clients, the Company’s long - term history of a declining business, and threat related to certain service lines, pose a serious threat to the Company’s ability to achieve its financial forecast. The forecast risk is very high. ▪ In prior years (mostly 2019 to 2022), STCN tried to sell ModusLink several times. All such efforts were unsuccessful. ▪ Out of all efforts to sell the Company in earlier years, they received a single offer. The offer was for $80.0 million including cash, reflecting a net value of approximately $60.0 million. This offer fell through with the Buyer pulling out. The estimated multiples associated with this offer were as follows: (a) Likely range of EBITDA multiples from 3.5x to 5.25x, and (b) Likely range of revenue multiples from 0.265x to 0.295x. (a) Notes : (a) The offer was received partially through FY 2022 . ModusLink’s actual revenues and EBITDA for FY 2021 and FY 2022 were used to estimate ranges . .
Sub - section III ModusLink Guideline Transaction Analysis www.mpival.com | © Management Planning, Inc. All rights reserved. 38
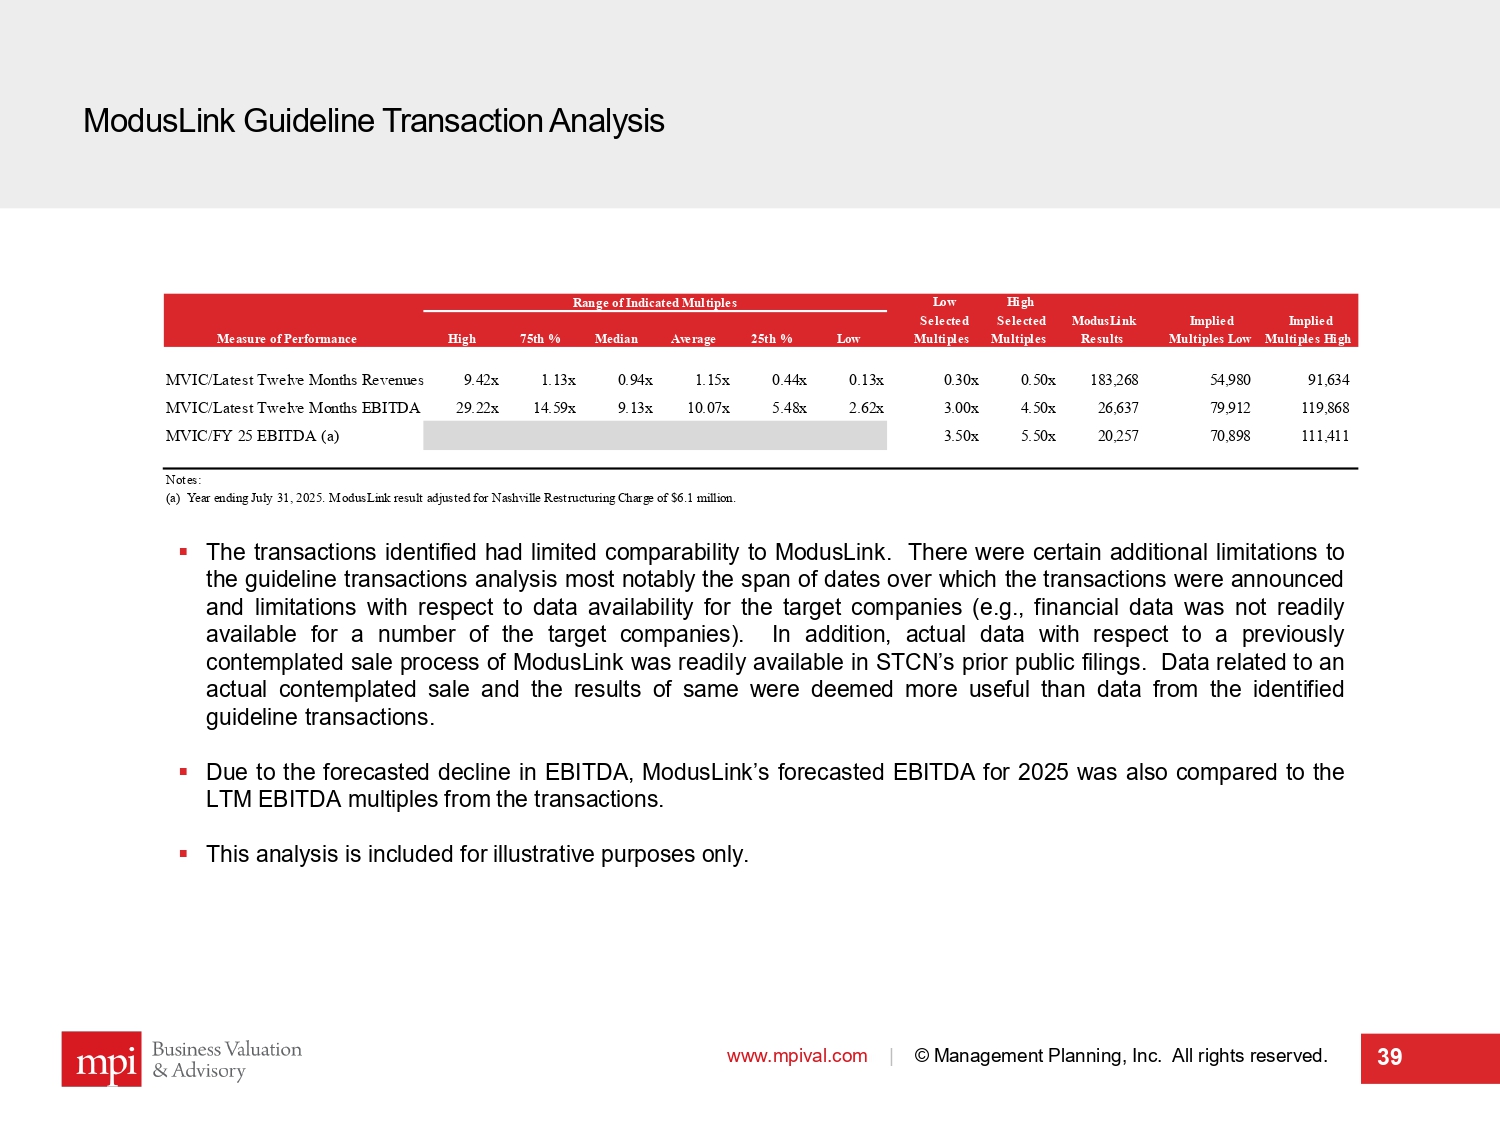
ModusLink Guideline Transaction Analysis www.mpival.com | © Management Planning, Inc. All rights reserved. 39 ▪ The transactions identified had limited comparability to ModusLink . There were certain additional limitations to the guideline transactions analysis most notably the span of dates over which the transactions were announced and limitations with respect to data availability for the target companies (e . g . , financial data was not readily available for a number of the target companies) . In addition, actual data with respect to a previously contemplated sale process of ModusLink was readily available in STCN’s prior public filings . Data related to an actual contemplated sale and the results of same were deemed more useful than data from the identified guideline transactions . ▪ Due to the forecasted decline in EBITDA, ModusLink’s forecasted EBITDA for 2025 was also compared to the LTM EBITDA multiples from the transactions . ▪ This analysis is included for illustrative purposes only . Range of Indicated Multiples Low High Measure of Performance High 75th % Median Average 25th % Low Selected Multiples Selected Multiples ModusLink Results Implied Multiples Low Implied Multiples High MVIC/Latest Twelve Months Revenues 9.42x 1.13x 0.94x 1.15x 0.44x 0.13x 0.30x 0.50x 183,268 54,980 91,634 MVIC/Latest Twelve Months EBITDA 29.22x 14.59x 9.13x 10.07x 5.48x 2.62x 3.00x 4.50x 26,637 79,912 119,868 MVIC/FY 25 EBITDA (a) 3.50x 5.50x 20,257 70,898 111,411 Notes: (a) Year ending July 31, 2025. ModusLink result adjusted for Nashville Restructuring Charge of $6.1 million.
Sub - section IV Corporate Costs Discounted Cash Flow Analysis www.mpival.com | © Management Planning, Inc. All rights reserved. 40
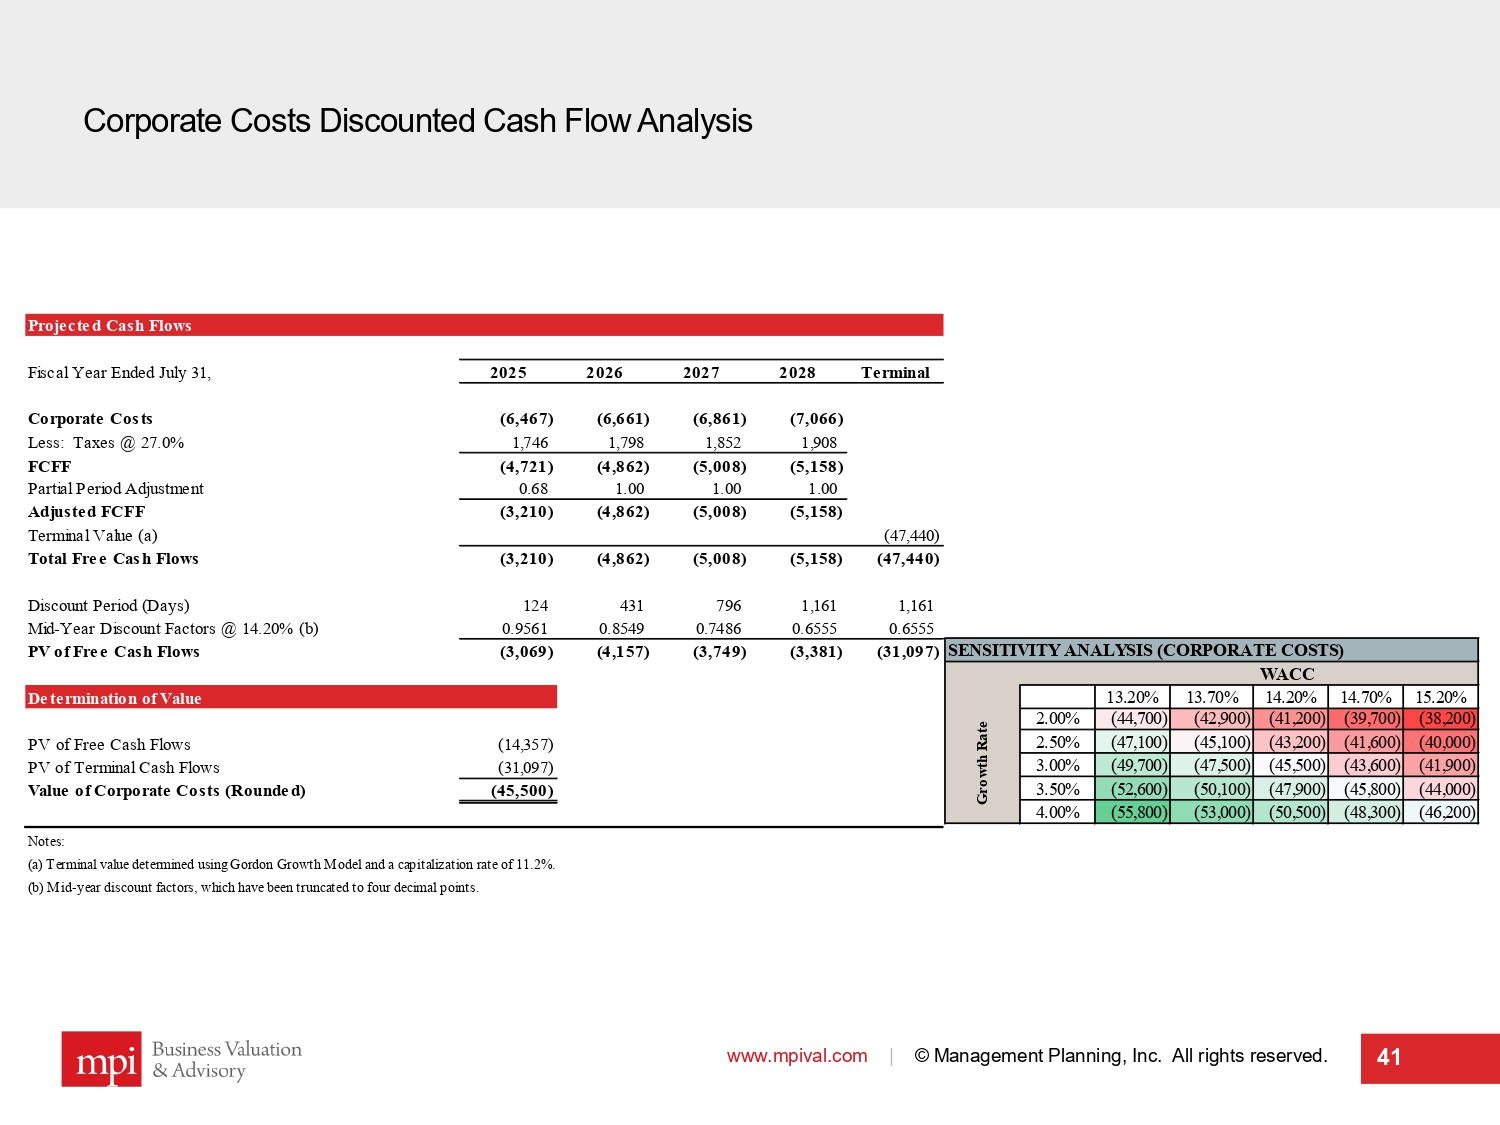
Corporate Costs Discounted Cash Flow Analysis www.mpival.com | © Management Planning, Inc. All rights reserved. 41 Projected Cash Flows Fiscal Year Ended July 31, 2025 2026 2027 2028 Terminal Corporate Costs (6,467) (6,661) (6,861) (7,066) Less: Taxes @ 27.0% 1,746 1,798 1,852 1,908 FCFF (4,721) (4,862) (5,008) (5,158) Partial Period Adjustment 0.68 1.00 1.00 1.00 Adjusted FCFF (3,210) (4,862) (5,008) (5,158) Terminal Value (a) (47,440) Total Free Cash Flows (3,210) (4,862) (5,008) (5,158) (47,440) Discount Period (Days) 124 431 796 1,161 1,161 Mid-Year Discount Factors @ 14.20% (b) 0.9561 0.8549 0.7486 0.6555 0.6555 PV of Free Cash Flows (3,069) (4,157) (3,749) (3,381) (31,097) Determination of Value PV of Free Cash Flows (14,357) PV of Terminal Cash Flows (31,097) Value of Corporate Costs (Rounded) (45,500) Notes: (a) Terminal value determined using Gordon Growth Model and a capitalization rate of 11.2%. (b) Mid-year discount factors, which have been truncated to four decimal points. SENSITIVITY ANALYSIS (CORPORATE COSTS) WACC (45,500) 13.20% 13.70% 14.20% 14.70% 15.20% 2.00% (44,700) (42,900) (41,200) (39,700) (38,200) 2.50% (47,100) (45,100) (43,200) (41,600) (40,000) 3.00% (49,700) (47,500) (45,500) (43,600) (41,900) 3.50% (52,600) (50,100) (47,900) (45,800) (44,000) 4.00% (55,800) (53,000) (50,500) (48,300) (46,200) Growth Rate
Sub - section V Net Operating Loss Analysis www.mpival.com | © Management Planning, Inc. All rights reserved. 42
Net Operating Loss Analysis www.mpival.com | © Management Planning, Inc. All rights reserved. 43 ▪ Management provided a detailed table of Federal, State, and International net operating losses including expiration dates and current utilization . ▪ Following discussions with management, future utilization was estimated based on projected ModusLink pre - tax income as well as a range of potential income from investment of the Cash . According to management, no utilization of the foreign NOLs was expected . ▪ Income growth rates were sensitized from a decline of 1 . 0 % per year to a growth of 3 . 0 % per year . ▪ The tax savings from the NOLs were discounted using a cost of capital ranging from a premium of 300 to 500 basis points over the cost of capital range for the Corporate Costs to account for the additional risk and uncertainty related to the forecasted pre - tax earnings, the timing of the utilization, and regulatory risk . ▪ The resulting value range for the NOL’s was $ 18 . 6 million to $ 39 . 0 Million .
Sub - section VI Cash and Investments www.mpival.com | © Management Planning, Inc. All rights reserved. 44
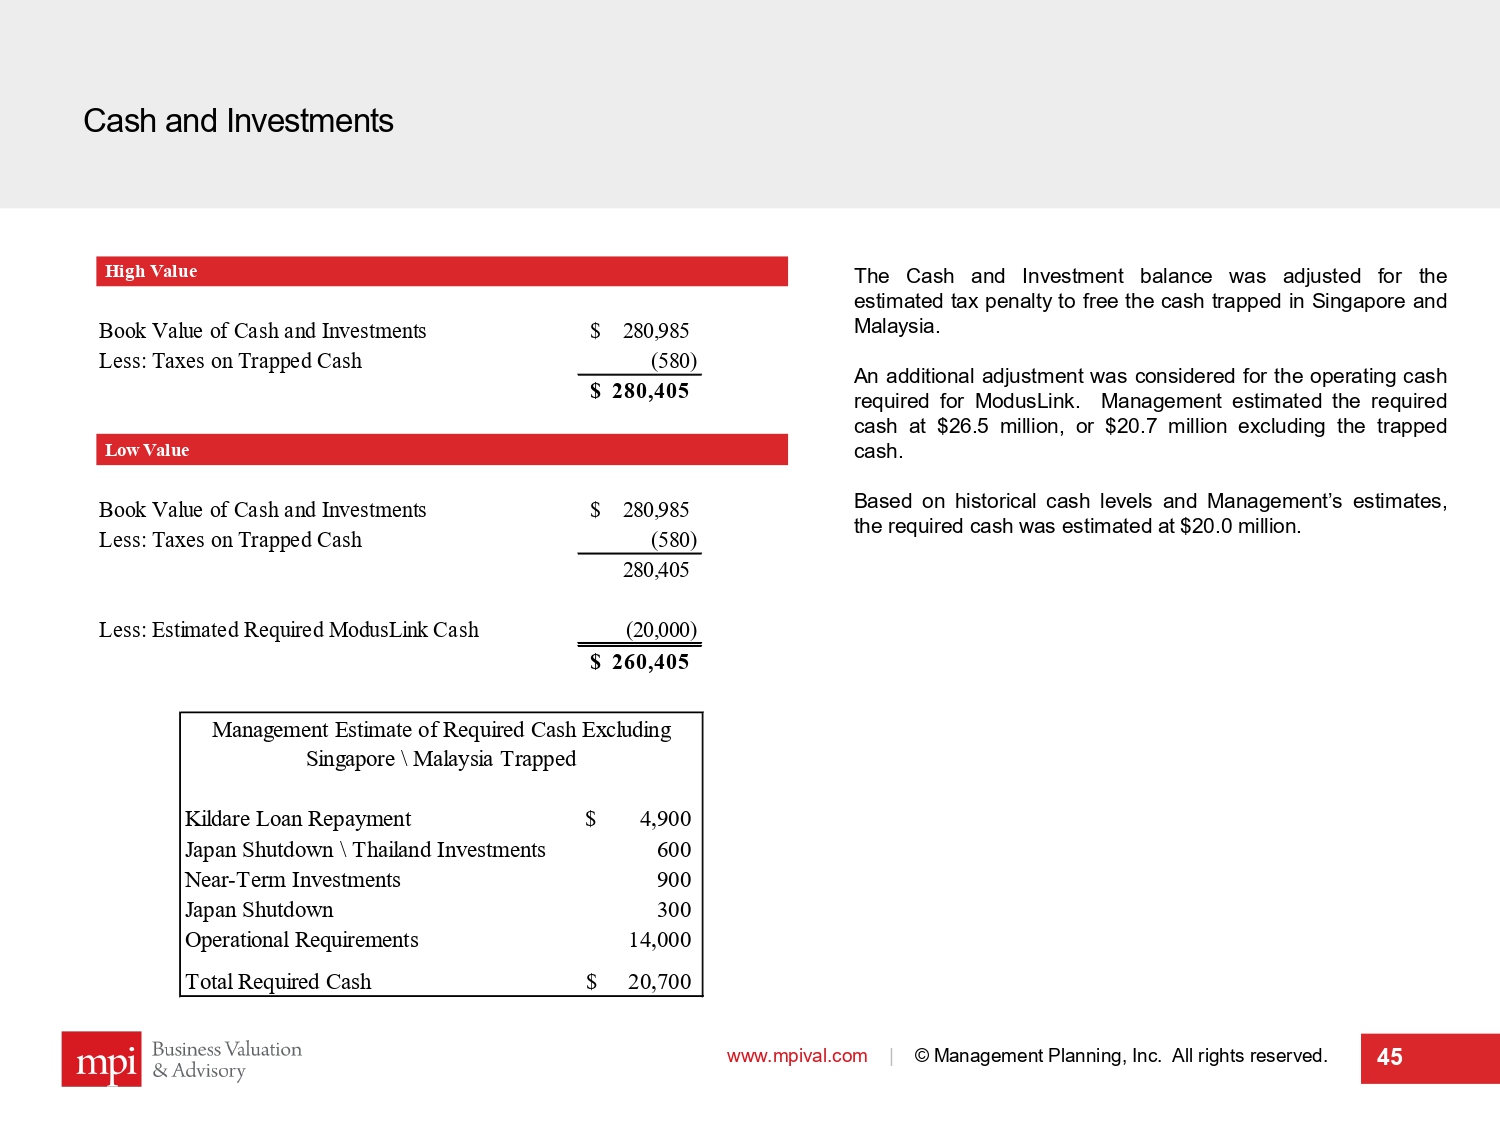
Cash and Investments www.mpival.com | © Management Planning, Inc. All rights reserved. 45 The Cash and Investment balance was adjusted for the estimated tax penalty to free the cash trapped in Singapore and Malaysia . An additional adjustment was considered for the operating cash required for ModusLink . Management estimated the required cash at $ 26 . 5 million, or $ 20 . 7 million excluding the trapped cash . Based on historical cash levels and Management’s estimates, the required cash was estimated at $ 20 . 0 million . High Value Book Value of Cash and Investments 280,985$ Less: Taxes on Trapped Cash (580) 280,405$ Low Value Book Value of Cash and Investments 280,985$ Less: Taxes on Trapped Cash (580) 280,405 Less: Estimated Required ModusLink Cash (20,000) 260,405$ Kildare Loan Repayment 4,900$ Japan Shutdown \ Thailand Investments 600 Near-Term Investments 900 Japan Shutdown 300 Operational Requirements 14,000 Total Required Cash 20,700$ Management Estimate of Required Cash Excluding Singapore \ Malaysia Trapped

Ranges of Value of Steel Connect, Inc. 46
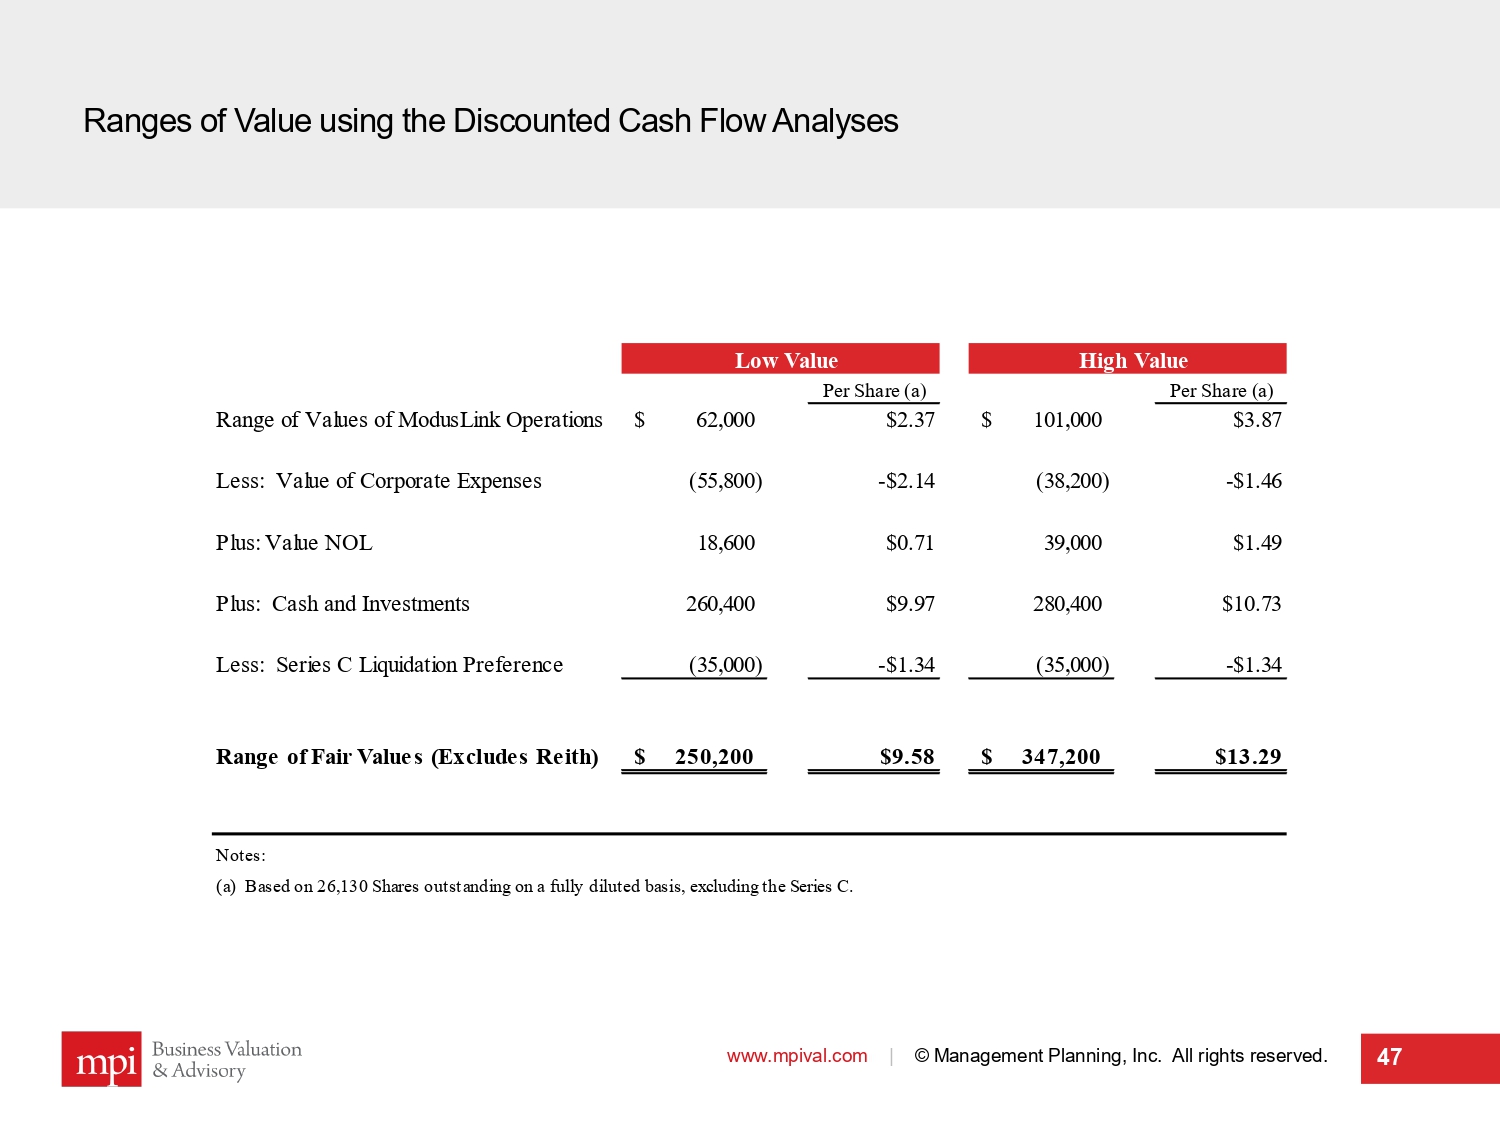
Ranges of Value using the Discounted Cash Flow Analyses www.mpival.com | © Management Planning, Inc. All rights reserved. 47 Low Value High Value Per Share (a) Per Share (a) Range of Values of ModusLink Operations 62,000$ $2.37 101,000$ $3.87 Less: Value of Corporate Expenses (55,800) -$2.14 (38,200) -$1.46 Plus: Value NOL 18,600 $0.71 39,000 $1.49 Plus: Cash and Investments 260,400 $9.97 280,400 $10.73 Less: Series C Liquidation Preference (35,000) -$1.34 (35,000) -$1.34 Range of Fair Values (Excludes Reith) 250,200$ $9.58 347,200$ $13.29 Notes: (a) Based on 26,130 Shares outstanding on a fully diluted basis, excluding the Series C.
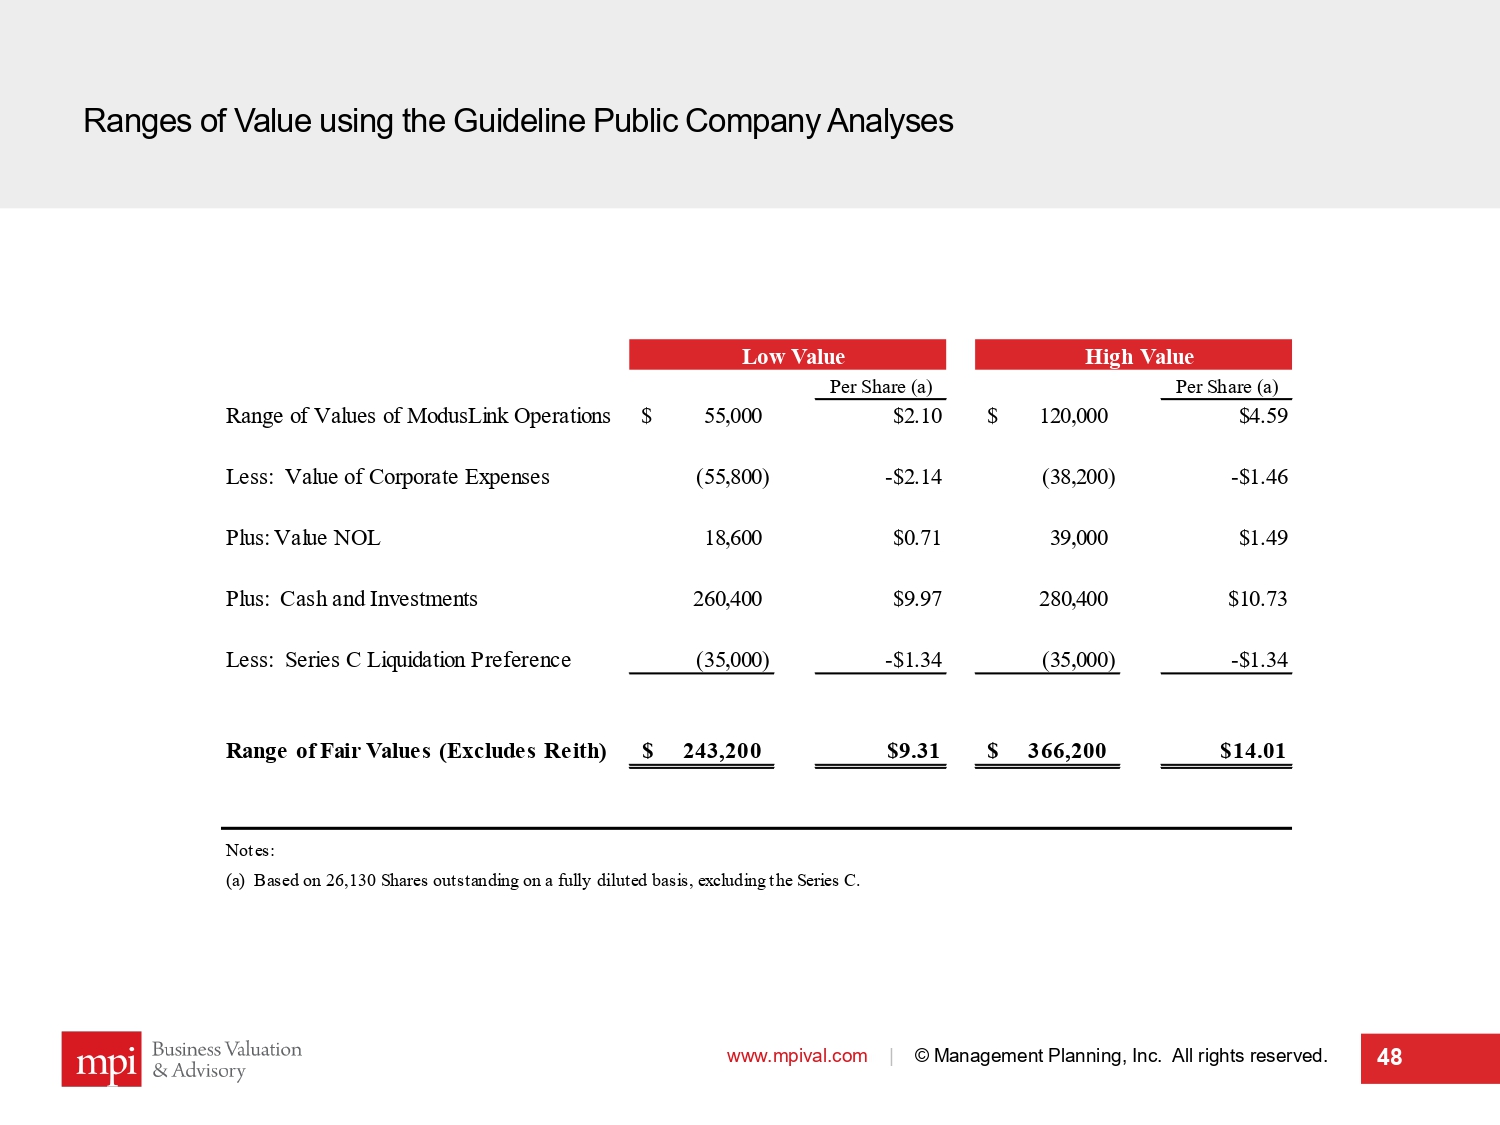
Ranges of Value using the Guideline Public Company Analyses www.mpival.com | © Management Planning, Inc. All rights reserved. 48 Low Value High Value Per Share (a) Per Share (a) Range of Values of ModusLink Operations 55,000$ $2.10 120,000$ $4.59 Less: Value of Corporate Expenses (55,800) -$2.14 (38,200) -$1.46 Plus: Value NOL 18,600 $0.71 39,000 $1.49 Plus: Cash and Investments 260,400 $9.97 280,400 $10.73 Less: Series C Liquidation Preference (35,000) -$1.34 (35,000) -$1.34 Range of Fair Values (Excludes Reith) 243,200$ $9.31 366,200$ $14.01 Notes: (a) Based on 26,130 Shares outstanding on a fully diluted basis, excluding the Series C.
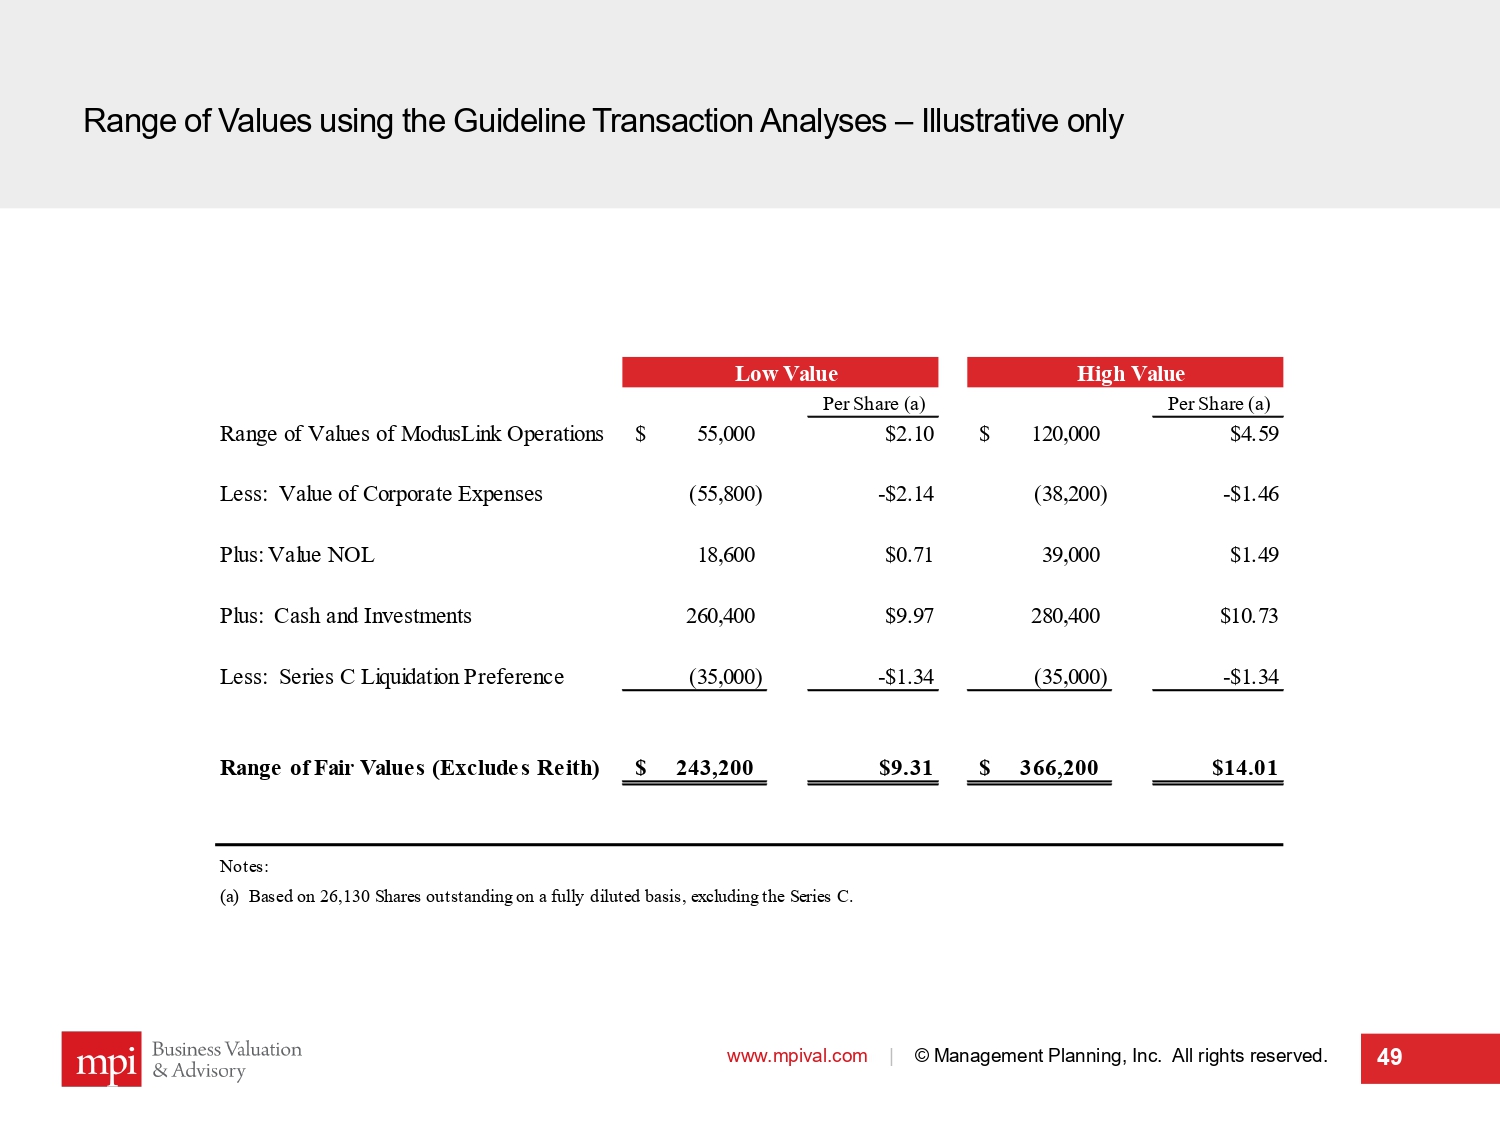
Range of Values using the Guideline Transaction Analyses – Illustrative only www.mpival.com | © Management Planning, Inc. All rights reserved. 49 Low Value High Value Per Share (a) Per Share (a) Range of Values of ModusLink Operations 55,000$ $2.10 120,000$ $4.59 Less: Value of Corporate Expenses (55,800) -$2.14 (38,200) -$1.46 Plus: Value NOL 18,600 $0.71 39,000 $1.49 Plus: Cash and Investments 260,400 $9.97 280,400 $10.73 Less: Series C Liquidation Preference (35,000) -$1.34 (35,000) -$1.34 Range of Fair Values (Excludes Reith) 243,200$ $9.31 366,200$ $14.01 Notes: (a) Based on 26,130 Shares outstanding on a fully diluted basis, excluding the Series C.
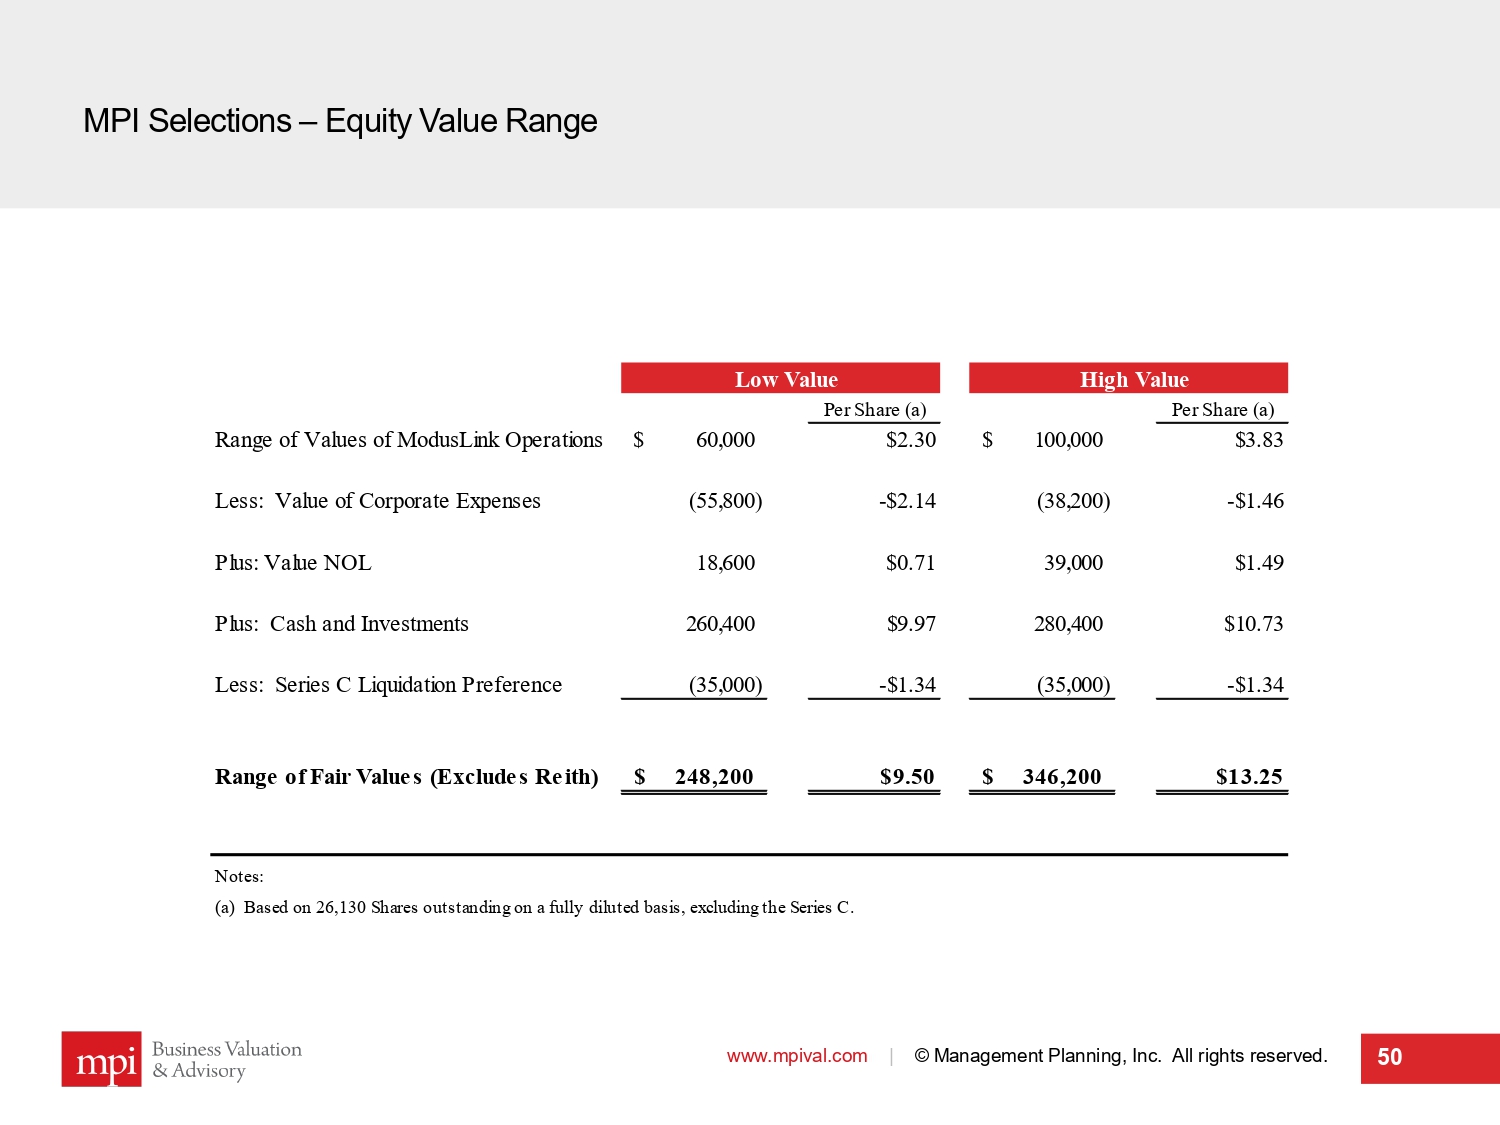
MPI Selections – Equity Value Range www.mpival.com | © Management Planning, Inc. All rights reserved. 50 Low Value High Value Per Share (a) Per Share (a) Range of Values of ModusLink Operations 60,000$ $2.30 100,000$ $3.83 Less: Value of Corporate Expenses (55,800) -$2.14 (38,200) -$1.46 Plus: Value NOL 18,600 $0.71 39,000 $1.49 Plus: Cash and Investments 260,400 $9.97 280,400 $10.73 Less: Series C Liquidation Preference (35,000) -$1.34 (35,000) -$1.34 Range of Fair Values (Excludes Reith) 248,200$ $9.50 346,200$ $13.25 Notes: (a) Based on 26,130 Shares outstanding on a fully diluted basis, excluding the Series C.

51
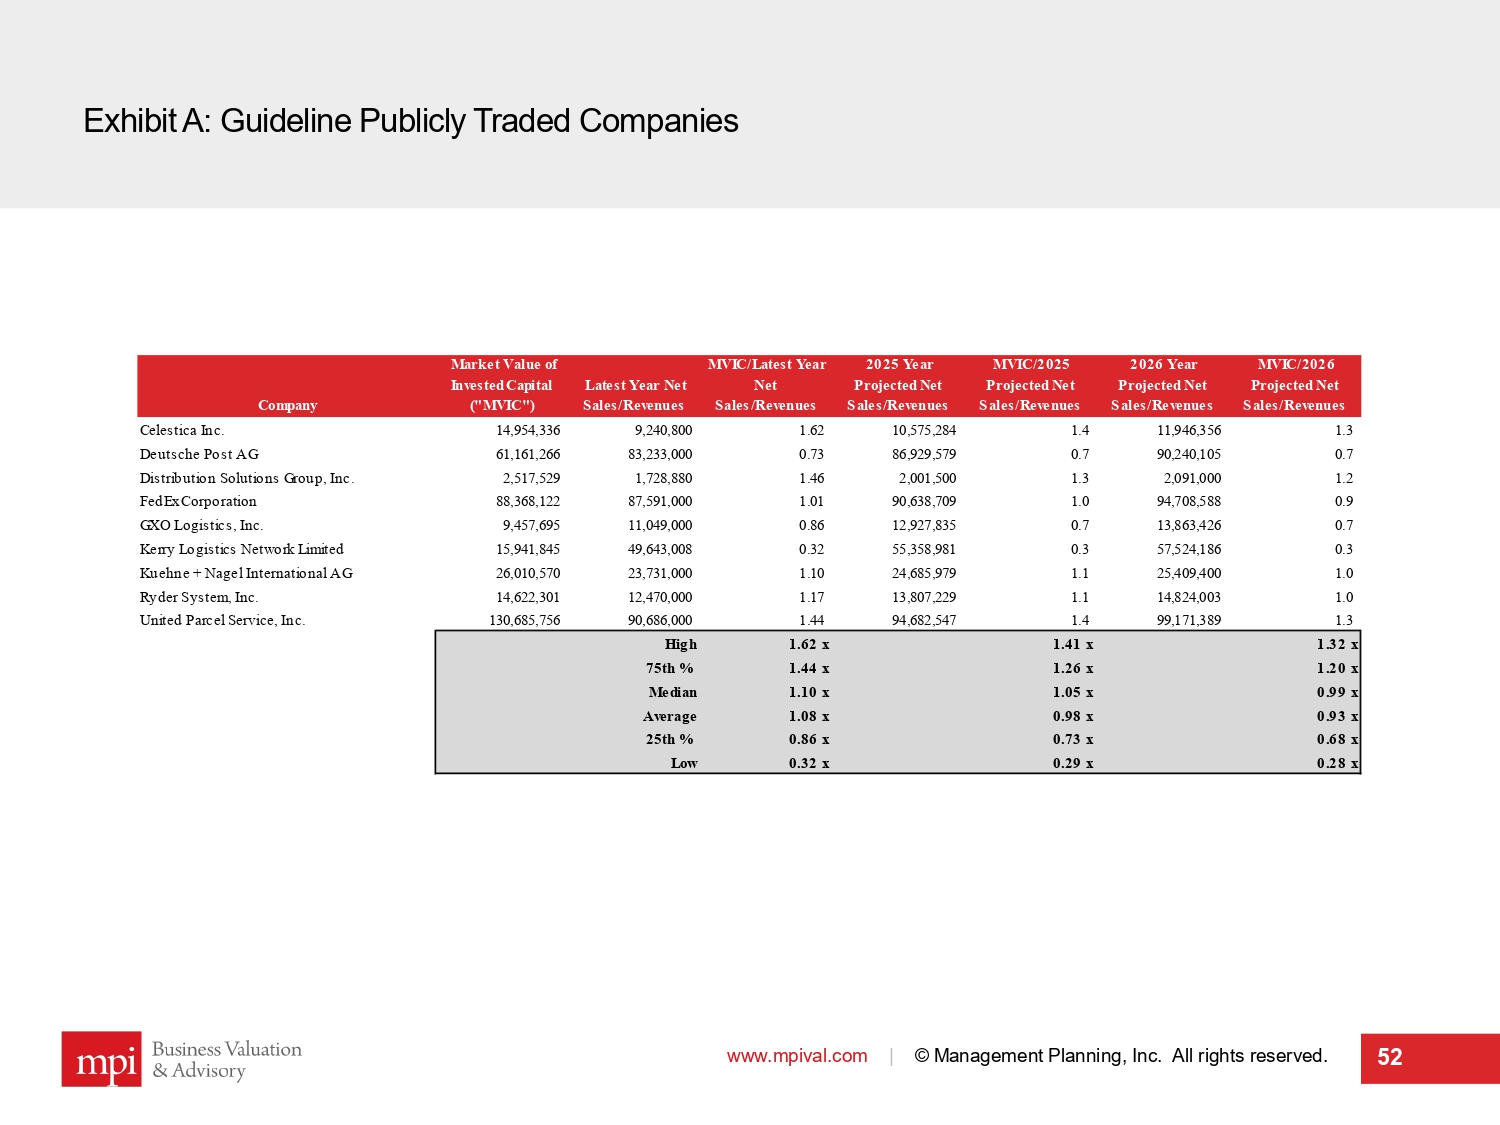
Exhibit A: Guideline Publicly Traded Companies www.mpival.com | © Management Planning, Inc. All rights reserved. 52 Company Market Value of Invested Capital ("MVIC") Latest Year Net Sales/Revenues MVIC/Latest Year Net Sales/Revenues 2025 Year Projected Net Sales/Revenues MVIC/2025 Projected Net Sales/Revenues 2026 Year Projected Net Sales/Revenues MVIC/2026 Projected Net Sales/Revenues Celestica Inc. 14,954,336 9,240,800 1.62 10,575,284 1.4 11,946,356 1.3 Deutsche Post AG 61,161,266 83,233,000 0.73 86,929,579 0.7 90,240,105 0.7 Distribution Solutions Group, Inc. 2,517,529 1,728,880 1.46 2,001,500 1.3 2,091,000 1.2 FedEx Corporation 88,368,122 87,591,000 1.01 90,638,709 1.0 94,708,588 0.9 GXO Logistics, Inc. 9,457,695 11,049,000 0.86 12,927,835 0.7 13,863,426 0.7 Kerry Logistics Network Limited 15,941,845 49,643,008 0.32 55,358,981 0.3 57,524,186 0.3 Kuehne + Nagel International AG 26,010,570 23,731,000 1.10 24,685,979 1.1 25,409,400 1.0 Ryder System, Inc. 14,622,301 12,470,000 1.17 13,807,229 1.1 14,824,003 1.0 United Parcel Service, Inc. 130,685,756 90,686,000 1.44 94,682,547 1.4 99,171,389 1.3 High 1.62x 1.41x 1.32x 75th % 1.44x 1.26x 1.20x Median 1.10x 1.05x 0.99x Average 1.08x 0.98x 0.93x 25th % 0.86x 0.73x 0.68x Low 0.32x 0.29x 0.28x
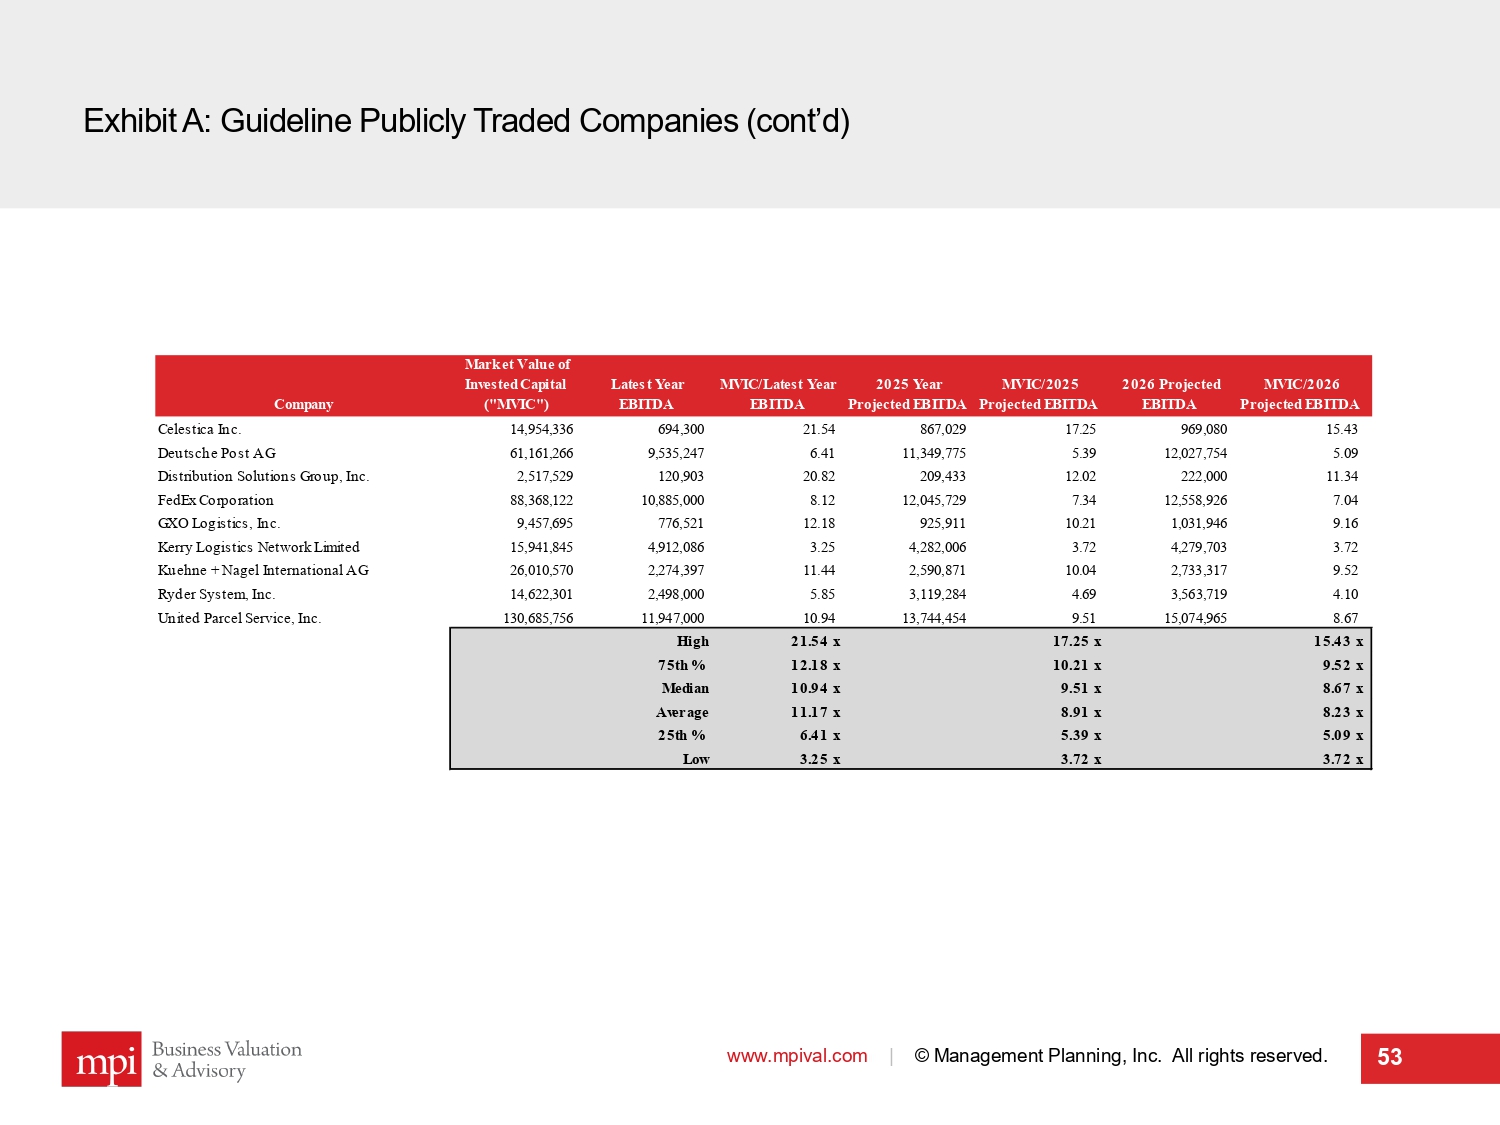
Exhibit A: Guideline Publicly Traded Companies (cont’d) www.mpival.com | © Management Planning, Inc. All rights reserved. 53 Company Market Value of Invested Capital ("MVIC") Latest Year EBITDA MVIC/Latest Year EBITDA 2025 Year Projected EBITDA MVIC/2025 Projected EBITDA 2026 Projected EBITDA MVIC/2026 Projected EBITDA Celestica Inc. 14,954,336 694,300 21.54 867,029 17.25 969,080 15.43 Deutsche Post AG 61,161,266 9,535,247 6.41 11,349,775 5.39 12,027,754 5.09 Distribution Solutions Group, Inc. 2,517,529 120,903 20.82 209,433 12.02 222,000 11.34 FedEx Corporation 88,368,122 10,885,000 8.12 12,045,729 7.34 12,558,926 7.04 GXO Logistics, Inc. 9,457,695 776,521 12.18 925,911 10.21 1,031,946 9.16 Kerry Logistics Network Limited 15,941,845 4,912,086 3.25 4,282,006 3.72 4,279,703 3.72 Kuehne + Nagel International AG 26,010,570 2,274,397 11.44 2,590,871 10.04 2,733,317 9.52 Ryder System, Inc. 14,622,301 2,498,000 5.85 3,119,284 4.69 3,563,719 4.10 United Parcel Service, Inc. 130,685,756 11,947,000 10.94 13,744,454 9.51 15,074,965 8.67 High 21.54x 17.25x 15.43x 75th % 12.18x 10.21x 9.52x Median 10.94x 9.51x 8.67x Average 11.17x 8.91x 8.23x 25th % 6.41x 5.39x 5.09x Low 3.25x 3.72x 3.72x
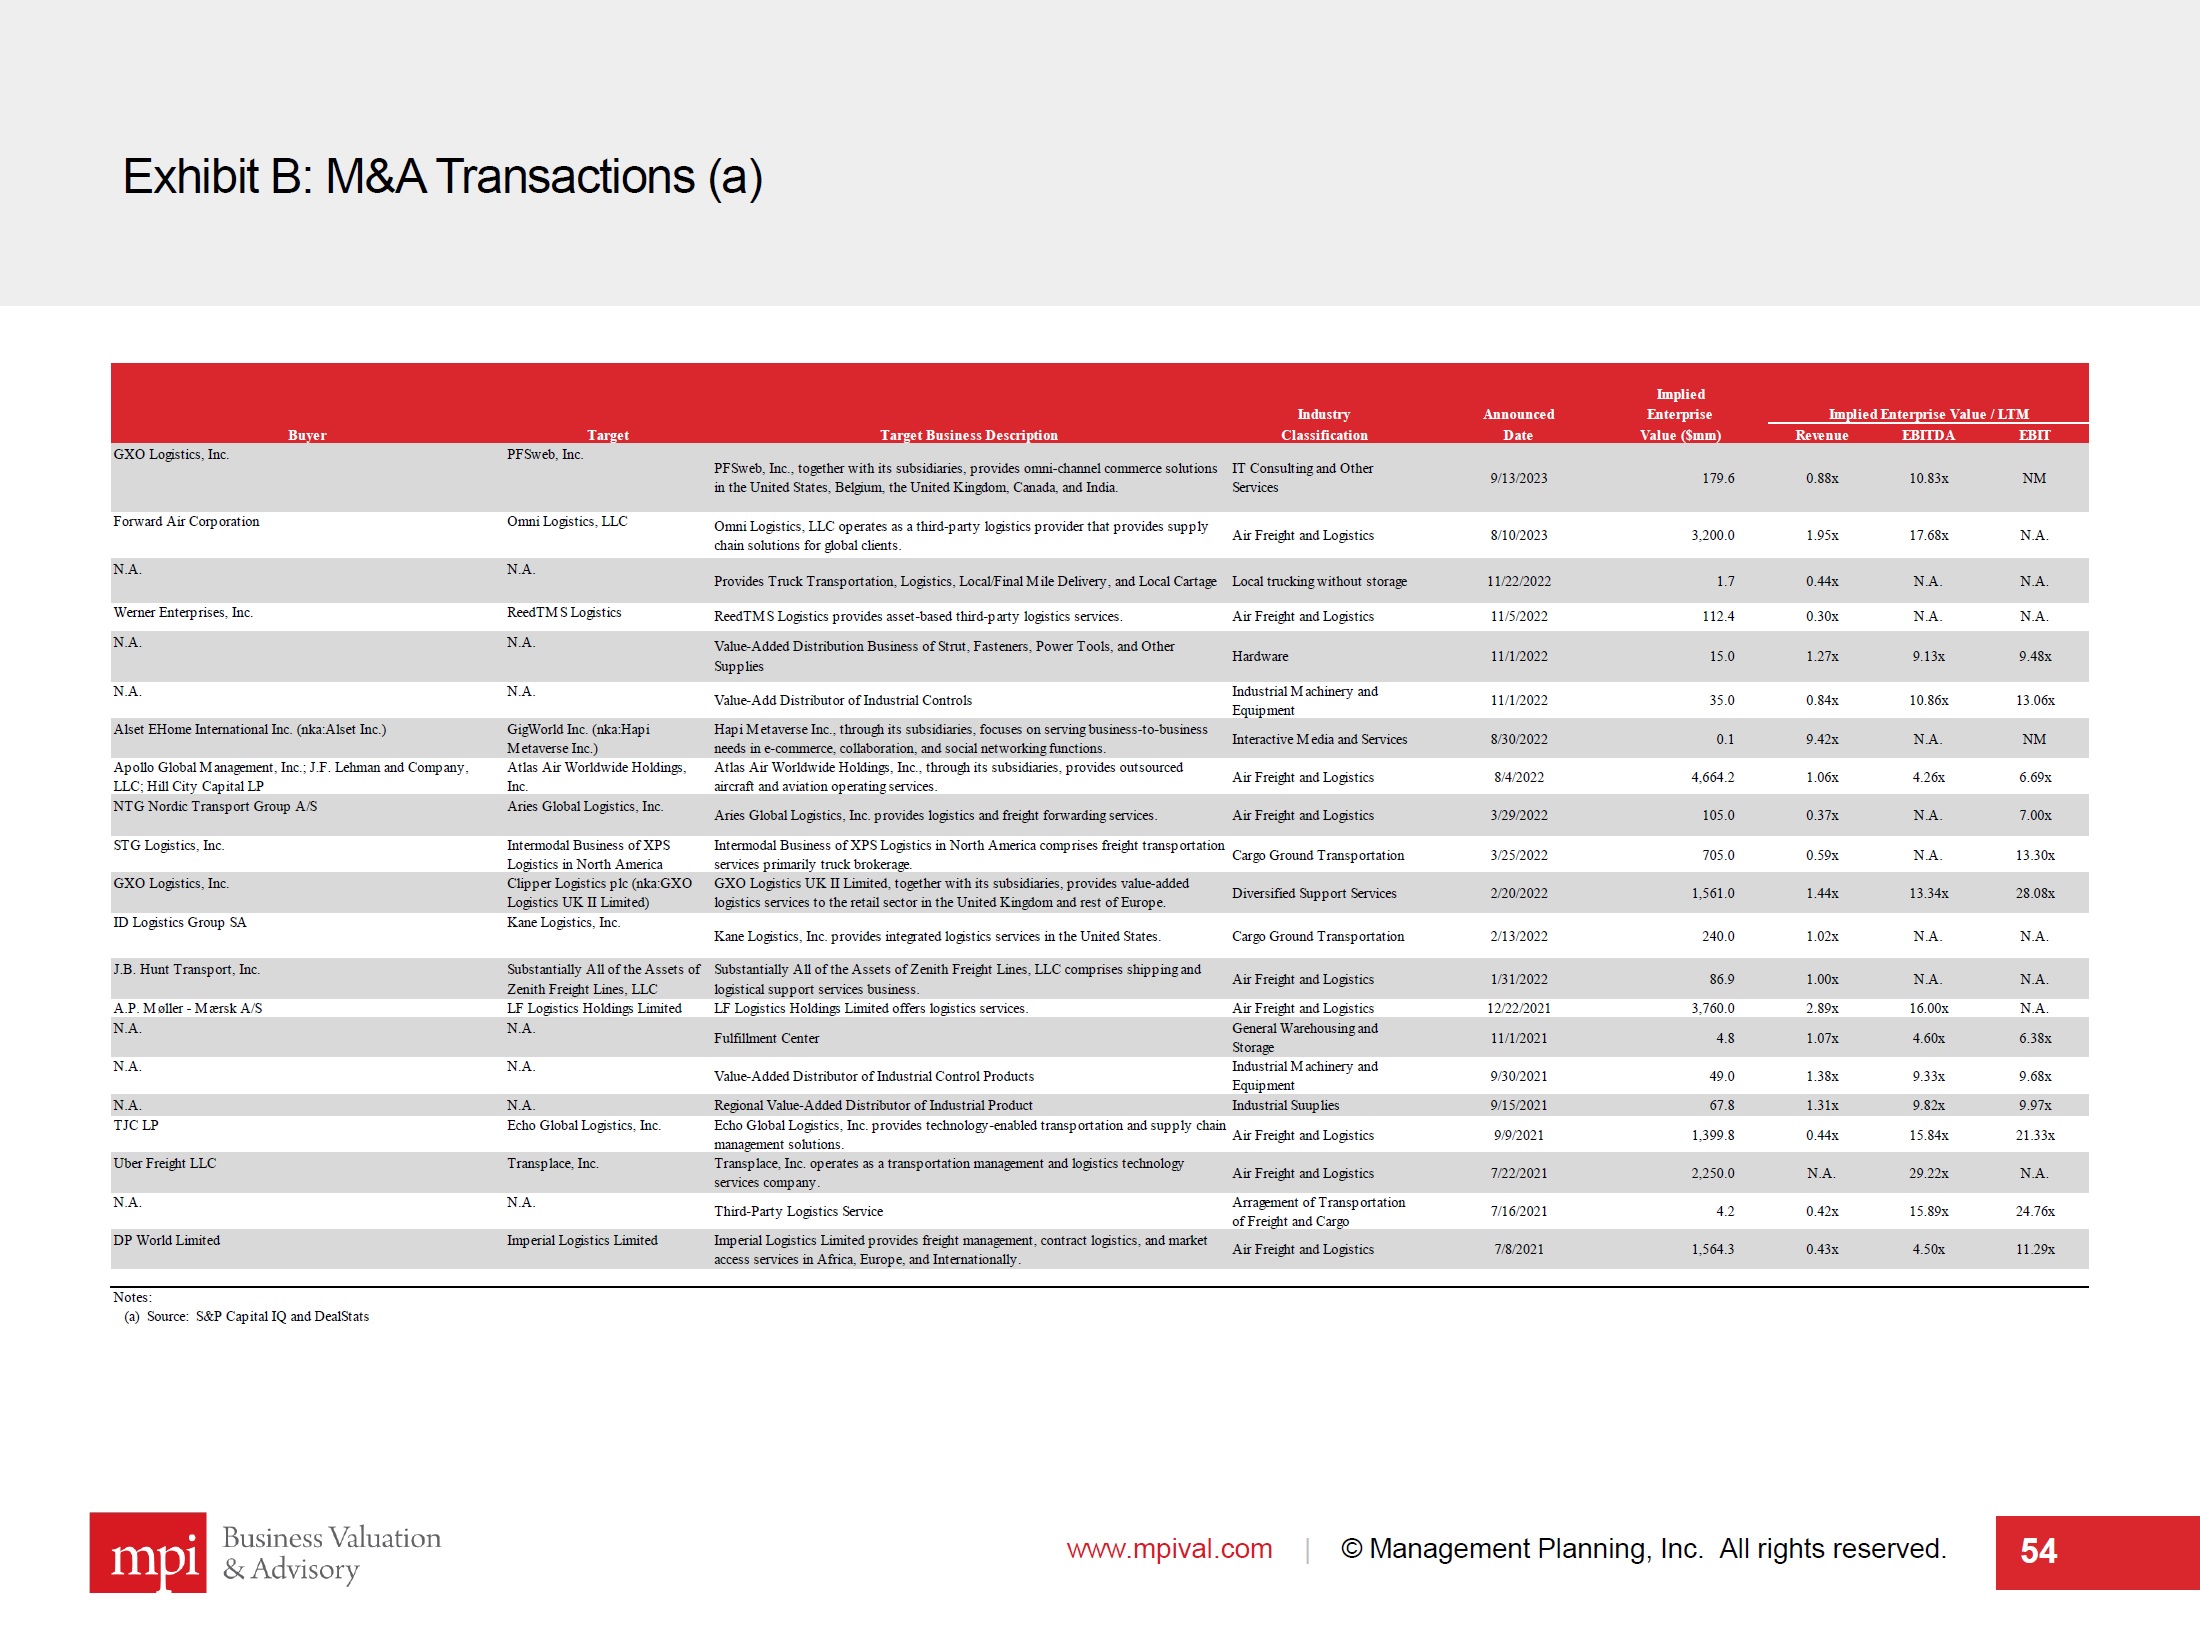
Exhibit B: M&A Transactions (a) www.mpival.com | © Management Planning, Inc. All rights reserved. 54 Implied Industry Announced Enterprise Buyer Target Target Business Description Classification Date Value ($mm) Revenue EBITDA EBIT GXO Logistics, Inc. PFSweb, Inc. PFSweb, Inc., together with its subsidiaries, provides omni-channel commerce solutions in the United States, Belgium, the United Kingdom, Canada, and India. IT Consulting and Other Services 9/13/2023 179.6 0.88x 10.83x NM Forward Air Corporation Omni Logistics, LLC Omni Logistics, LLC operates as a third-party logistics provider that provides supply chain solutions for global clients. Air Freight and Logistics 8/10/2023 3,200.0 1.95x 17.68x N.A. N.A. N.A. Provides Truck Transportation, Logistics, Local/Final Mile Delivery, and Local Cartage Local trucking without storage 11/22/2022 1.7 0.44x N.A. N.A. Werner Enterprises, Inc. ReedTMS Logistics ReedTMS Logistics provides asset-based third-party logistics services. Air Freight and Logistics 11/5/2022 112.4 0.30x N.A. N.A. N.A. N.A. Value-Added Distribution Business of Strut, Fasteners, Power Tools, and Other Supplies Hardware 11/1/2022 15.0 1.27x 9.13x 9.48x N.A. N.A. Value-Add Distributor of Industrial Controls Industrial Machinery and Equipment 11/1/2022 35.0 0.84x 10.86x 13.06x Alset EHome International Inc. (nka:Alset Inc.) GigWorld Inc. (nka:Hapi Metaverse Inc.) Hapi Metaverse Inc., through its subsidiaries, focuses on serving business-to-business needs in e-commerce, collaboration, and social networking functions. Interactive Media and Services 8/30/2022 0.1 9.42x N.A. NM Apollo Global Management, Inc.; J.F. Lehman and Company, LLC; Hill City Capital LP Atlas Air Worldwide Holdings, Inc. Atlas Air Worldwide Holdings, Inc., through its subsidiaries, provides outsourced aircraft and aviation operating services. Air Freight and Logistics 8/4/2022 4,664.2 1.06x 4.26x 6.69x NTG Nordic Transport Group A/S Aries Global Logistics, Inc. Aries Global Logistics, Inc. provides logistics and freight forwarding services. Air Freight and Logistics 3/29/2022 105.0 0.37x N.A. 7.00x STG Logistics, Inc. Intermodal Business of XPS Logistics in North America Intermodal Business of XPS Logistics in North America comprises freight transportation services primarily truck brokerage. Cargo Ground Transportation 3/25/2022 705.0 0.59x N.A. 13.30x GXO Logistics, Inc. Clipper Logistics plc (nka:GXO Logistics UK II Limited) GXO Logistics UK II Limited, together with its subsidiaries, provides value-added logistics services to the retail sector in the United Kingdom and rest of Europe. Diversified Support Services 2/20/2022 1,561.0 1.44x 13.34x 28.08x ID Logistics Group SA Kane Logistics, Inc. Kane Logistics, Inc. provides integrated logistics services in the United States. Cargo Ground Transportation 2/13/2022 240.0 1.02x N.A. N.A. J.B. Hunt Transport, Inc. Substantially All of the Assets of Zenith Freight Lines, LLC Substantially All of the Assets of Zenith Freight Lines, LLC comprises shipping and logistical support services business. Air Freight and Logistics 1/31/2022 86.9 1.00x N.A. N.A. A.P. Møller - Mærsk A/S LF Logistics Holdings Limited LF Logistics Holdings Limited offers logistics services. Air Freight and Logistics 12/22/2021 3,760.0 2.89x 16.00x N.A. N.A. N.A. Fulfillment Center General Warehousing and Storage 11/1/2021 4.8 1.07x 4.60x 6.38x N.A. N.A. Value-Added Distributor of Industrial Control Products Industrial Machinery and Equipment 9/30/2021 49.0 1.38x 9.33x 9.68x N.A. N.A. Regional Value-Added Distributor of Industrial Product Industrial Suuplies 9/15/2021 67.8 1.31x 9.82x 9.97x TJC LP Echo Global Logistics, Inc. Echo Global Logistics, Inc. provides technology-enabled transportation and supply chain management solutions. Air Freight and Logistics 9/9/2021 1,399.8 0.44x 15.84x 21.33x Uber Freight LLC Transplace, Inc. Transplace, Inc. operates as a transportation management and logistics technology services company. Air Freight and Logistics 7/22/2021 2,250.0 N.A. 29.22x N.A. N.A. N.A. Third-Party Logistics Service Arragement of Transportation of Freight and Cargo 7/16/2021 4.2 0.42x 15.89x 24.76x DP World Limited Imperial Logistics Limited Imperial Logistics Limited provides freight management, contract logistics, and market access services in Africa, Europe, and Internationally. Air Freight and Logistics 7/8/2021 1,564.3 0.43x 4.50x 11.29x Notes: (a) Source: S&P Capital IQ and DealStats Implied Enterprise Value / LTM
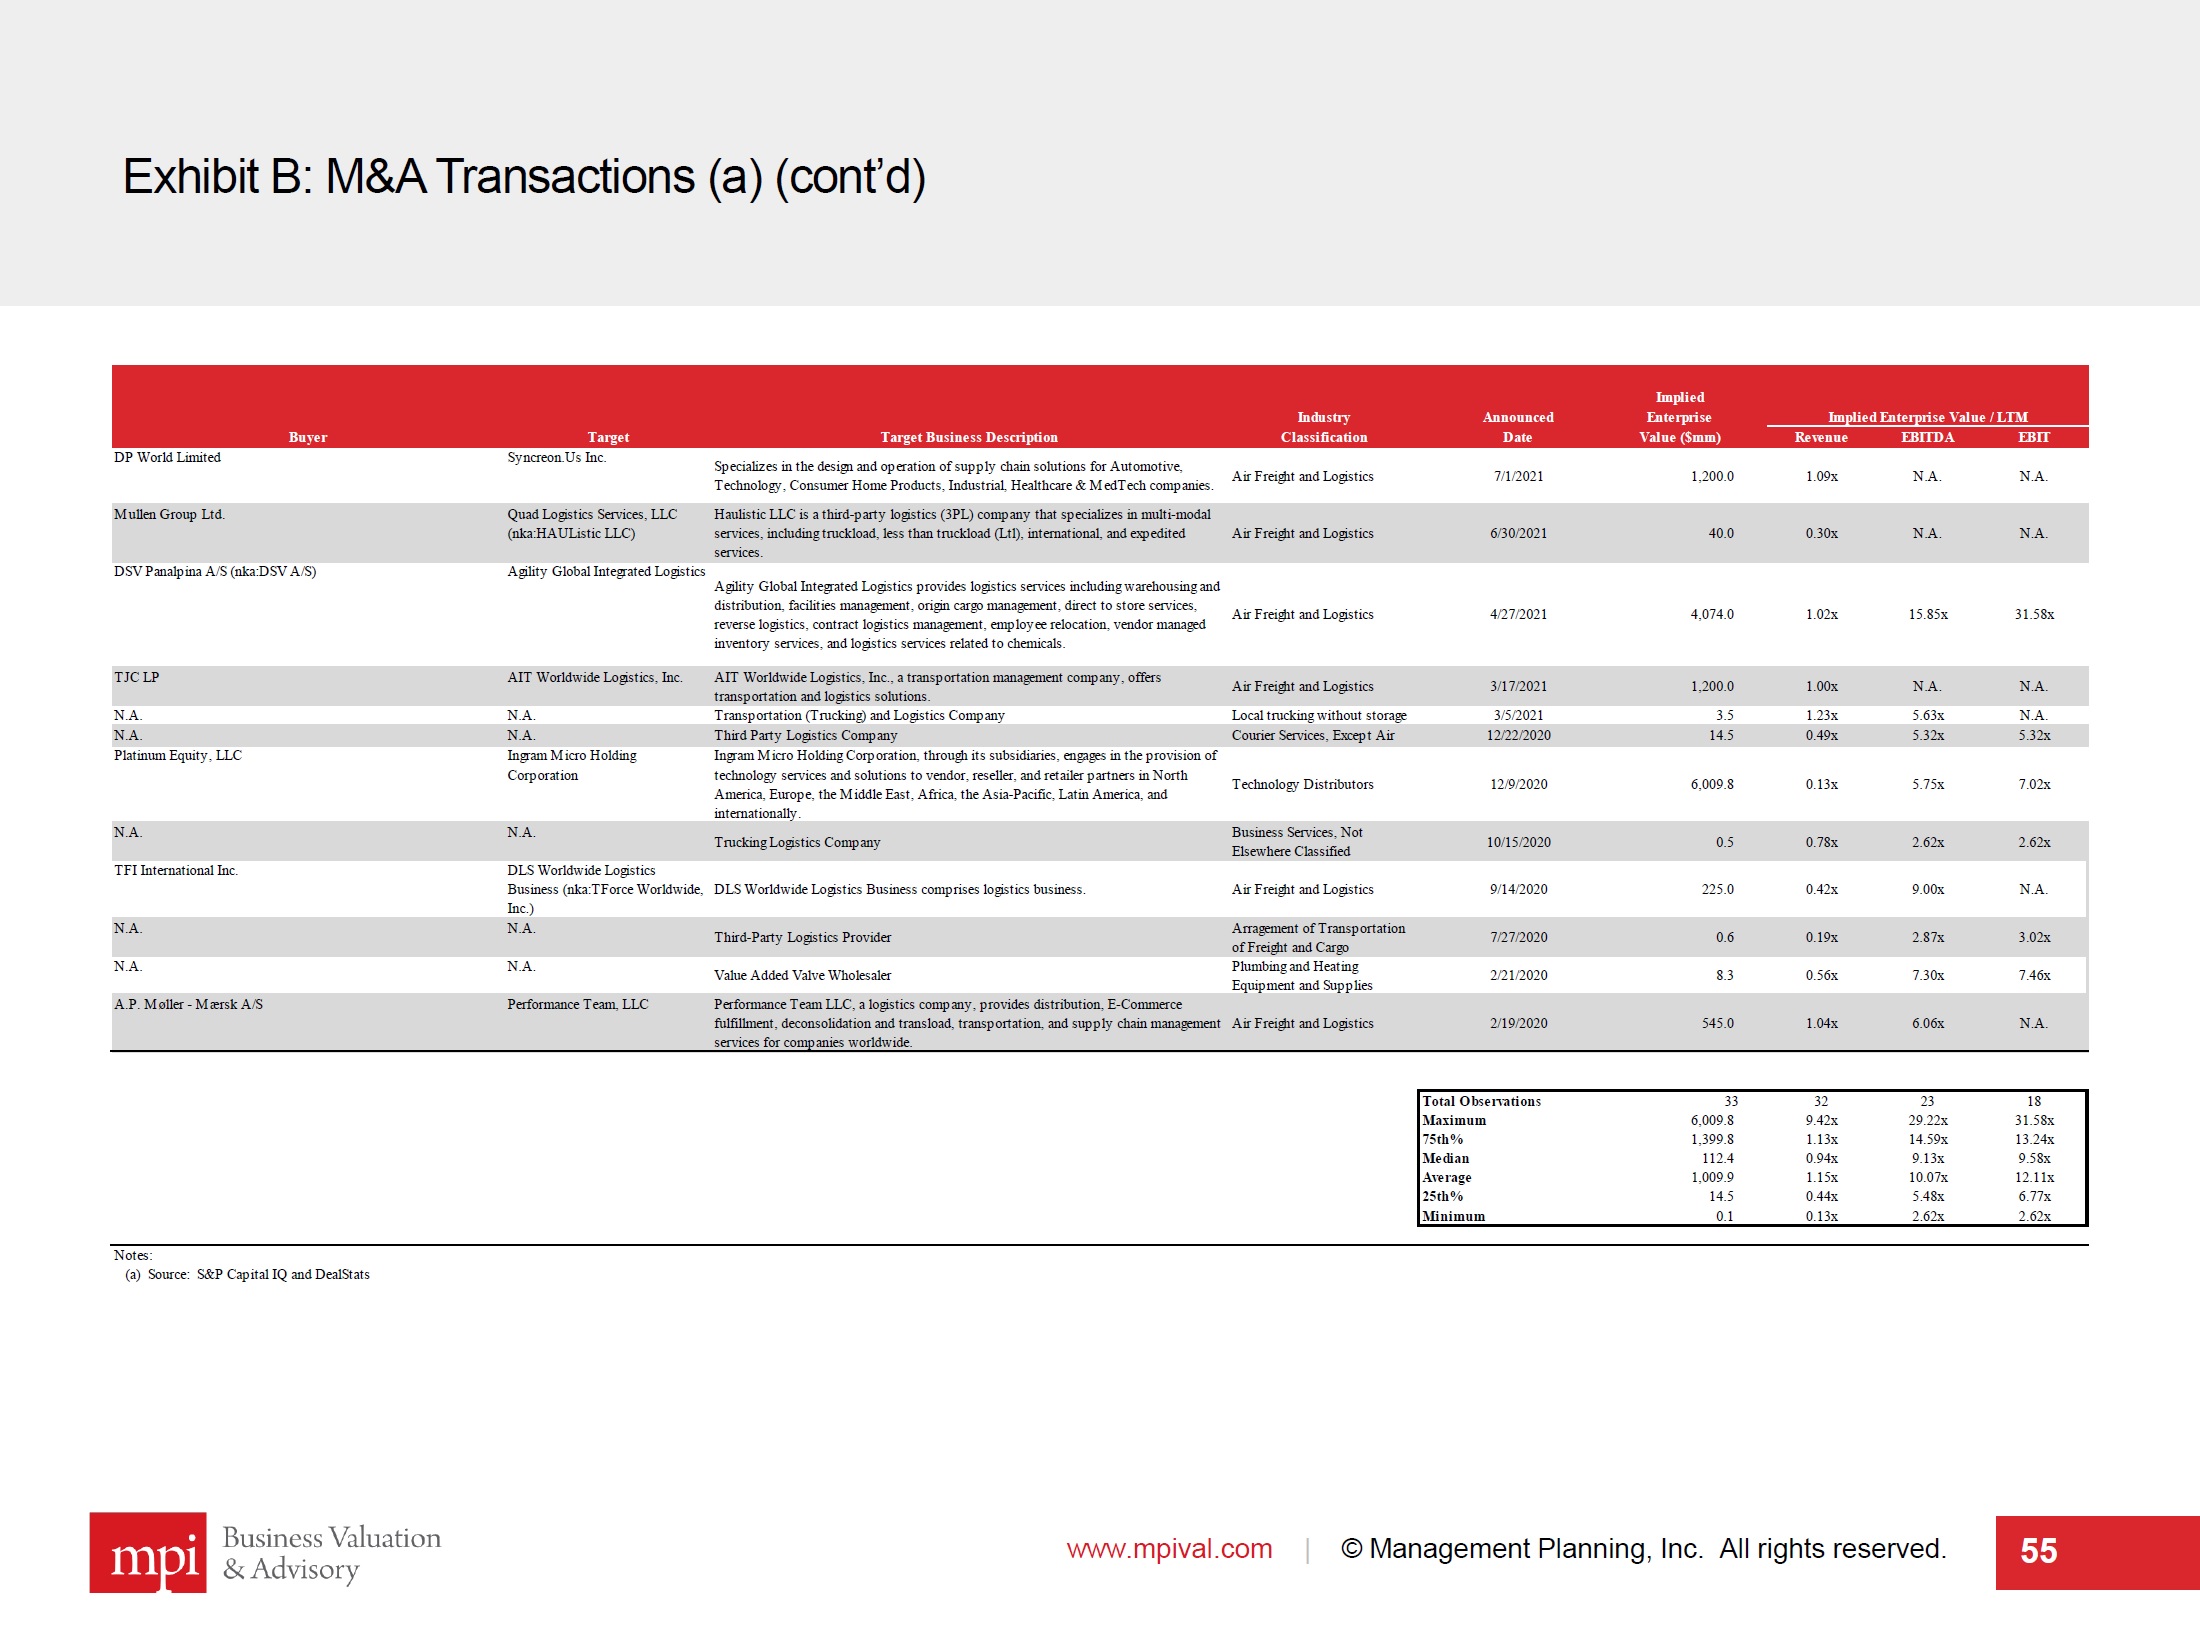
Exhibit B: M&A Transactions (a) (cont’d) www.mpival.com | © Management Planning, Inc. All rights reserved. 55 Implied Industry Announced Enterprise Buyer Target Target Business Description Classification Date Value ($mm) Revenue EBITDA EBIT DP World Limited Syncreon.Us Inc. Specializes in the design and operation of supply chain solutions for Automotive, Technology, Consumer Home Products, Industrial, Healthcare & MedTech companies. Air Freight and Logistics 7/1/2021 1,200.0 1.09x N.A. N.A. Mullen Group Ltd. Quad Logistics Services, LLC (nka:HAUListic LLC) Haulistic LLC is a third-party logistics (3PL) company that specializes in multi-modal services, including truckload, less than truckload (Ltl), international, and expedited services. Air Freight and Logistics 6/30/2021 40.0 0.30x N.A. N.A. DSV Panalpina A/S (nka:DSV A/S) Agility Global Integrated Logistics Agility Global Integrated Logistics provides logistics services including warehousing and distribution, facilities management, origin cargo management, direct to store services, reverse logistics, contract logistics management, employee relocation, vendor managed inventory services, and logistics services related to chemicals. Air Freight and Logistics 4/27/2021 4,074.0 1.02x 15.85x 31.58x TJC LP AIT Worldwide Logistics, Inc. AIT Worldwide Logistics, Inc., a transportation management company, offers transportation and logistics solutions. Air Freight and Logistics 3/17/2021 1,200.0 1.00x N.A. N.A. N.A. N.A. Transportation (Trucking) and Logistics Company Local trucking without storage 3/5/2021 3.5 1.23x 5.63x N.A. N.A. N.A. Third Party Logistics Company Courier Services, Except Air 12/22/2020 14.5 0.49x 5.32x 5.32x Platinum Equity, LLC Ingram Micro Holding Corporation Ingram Micro Holding Corporation, through its subsidiaries, engages in the provision of technology services and solutions to vendor, reseller, and retailer partners in North America, Europe, the Middle East, Africa, the Asia-Pacific, Latin America, and internationally. Technology Distributors 12/9/2020 6,009.8 0.13x 5.75x 7.02x N.A. N.A. Trucking Logistics Company Business Services, Not Elsewhere Classified 10/15/2020 0.5 0.78x 2.62x 2.62x TFI International Inc. DLS Worldwide Logistics Business (nka:TForce Worldwide, Inc.) DLS Worldwide Logistics Business comprises logistics business. Air Freight and Logistics 9/14/2020 225.0 0.42x 9.00x N.A. N.A. N.A. Third-Party Logistics Provider Arragement of Transportation of Freight and Cargo 7/27/2020 0.6 0.19x 2.87x 3.02x N.A. N.A. Value Added Valve Wholesaler Plumbing and Heating Equipment and Supplies 2/21/2020 8.3 0.56x 7.30x 7.46x A.P. Møller - Mærsk A/S Performance Team, LLC Performance Team LLC, a logistics company, provides distribution, E-Commerce fulfillment, deconsolidation and transload, transportation, and supply chain management services for companies worldwide. Air Freight and Logistics 2/19/2020 545.0 1.04x 6.06x N.A. Total Observations 33 32 23 18 Maximum 6,009.8 9.42x 29.22x 31.58x 75th% 1,399.8 1.13x 14.59x 13.24x Median 112.4 0.94x 9.13x 9.58x Average 1,009.9 1.15x 10.07x 12.11x 25th% 14.5 0.44x 5.48x 6.77x Minimum 0.1 0.13x 2.62x 2.62x Notes: (a) Source: S&P Capital IQ and DealStats Implied Enterprise Value / LTM
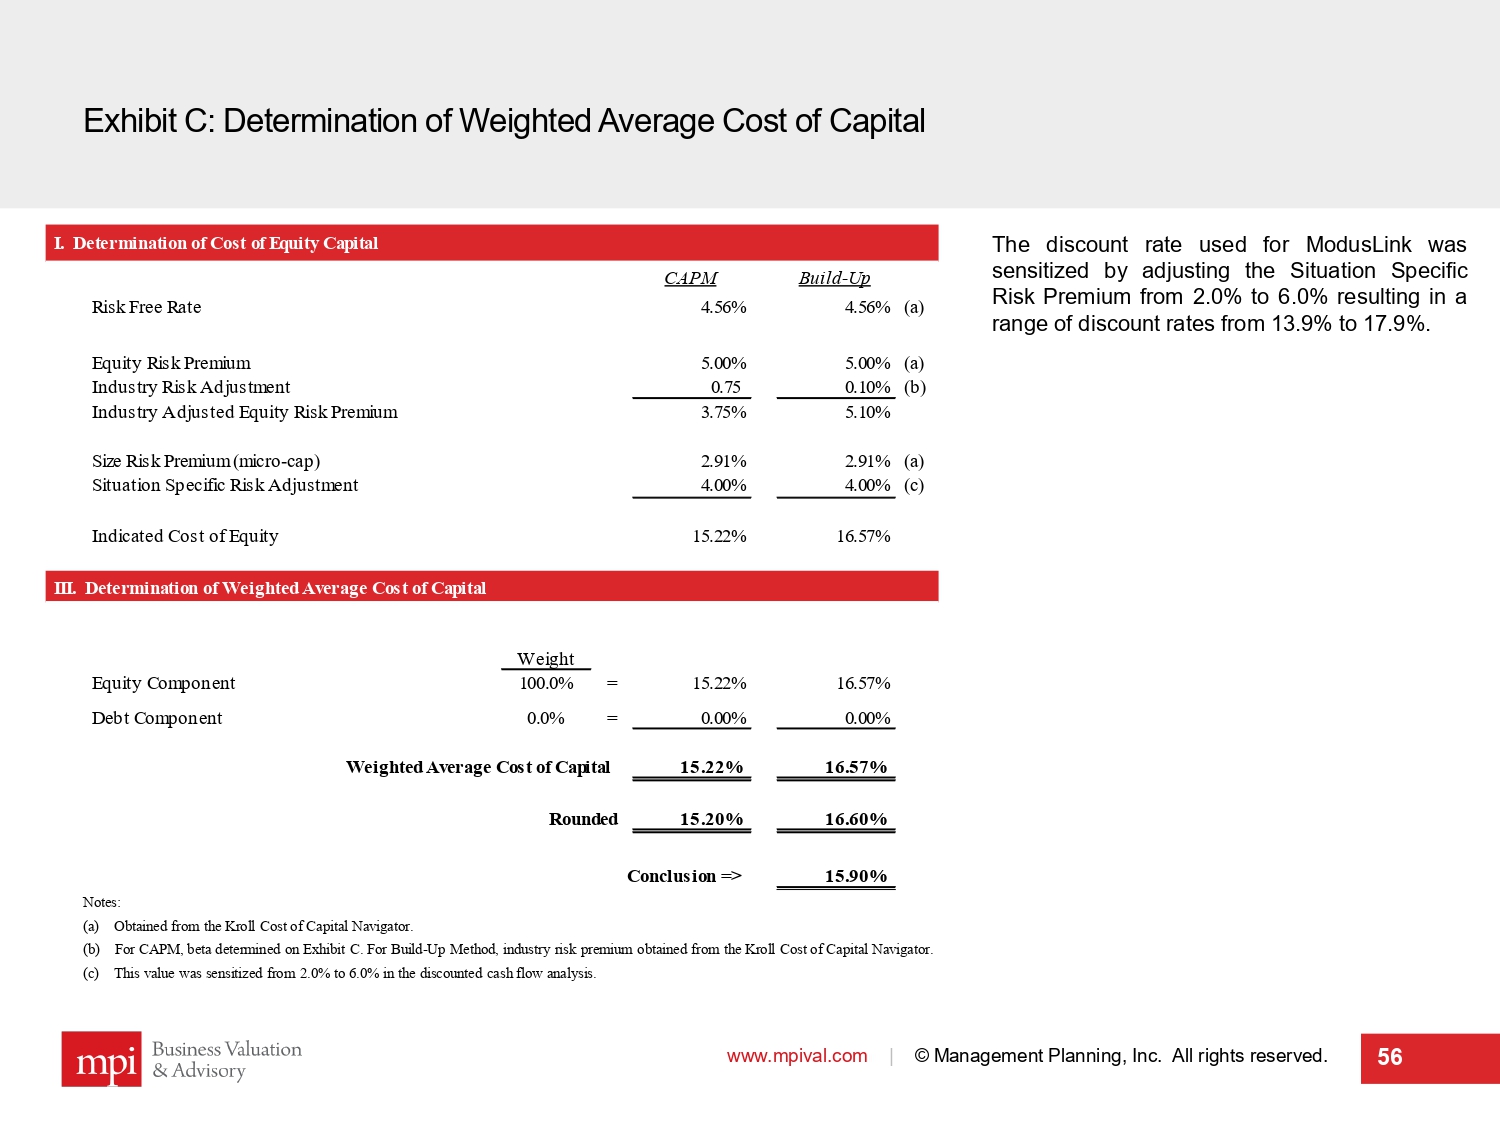
Exhibit C: Determination of Weighted Average Cost of Capital www.mpival.com | © Management Planning, Inc. All rights reserved. 56 Notes : (a) Obtained from the Kroll Cost of Capital Navigator . (b) For CAPM, beta determined on Exhibit C . For Build - Up Method, industry risk premium obtained from the Kroll Cost of Capital Navigator . (c) This value was sensitized from 2 . 0 % to 6 . 0 % in the discounted cash flow analysis . I. Determination of Cost of Equity Capital CAPM Build-Up Risk Free Rate 4.56% 4.56% (a) Equity Risk Premium 5.00% 5.00% (a) Industry Risk Adjustment 0.75 0.10% (b) Industry Adjusted Equity Risk Premium 3.75% 5.10% Size Risk Premium (micro-cap) 2.91% 2.91% (a) Situation Specific Risk Adjustment 4.00% 4.00% (c) Indicated Cost of Equity 15.22% 16.57% III. Determination of Weighted Average Cost of Capital Weight Equity Component 100.0% = 15.22% 16.57% Debt Component 0.0% = 0.00% 0.00% Weighted Average Cost of Capital 15.22% 16.57% Rounded 15.20% 16.60% Conclusion => 15.90% The discount rate used for ModusLink was sensitized by adjusting the Situation Specific Risk Premium from 2 . 0 % to 6 . 0 % resulting in a range of discount rates from 13 . 9 % to 17 . 9 % .
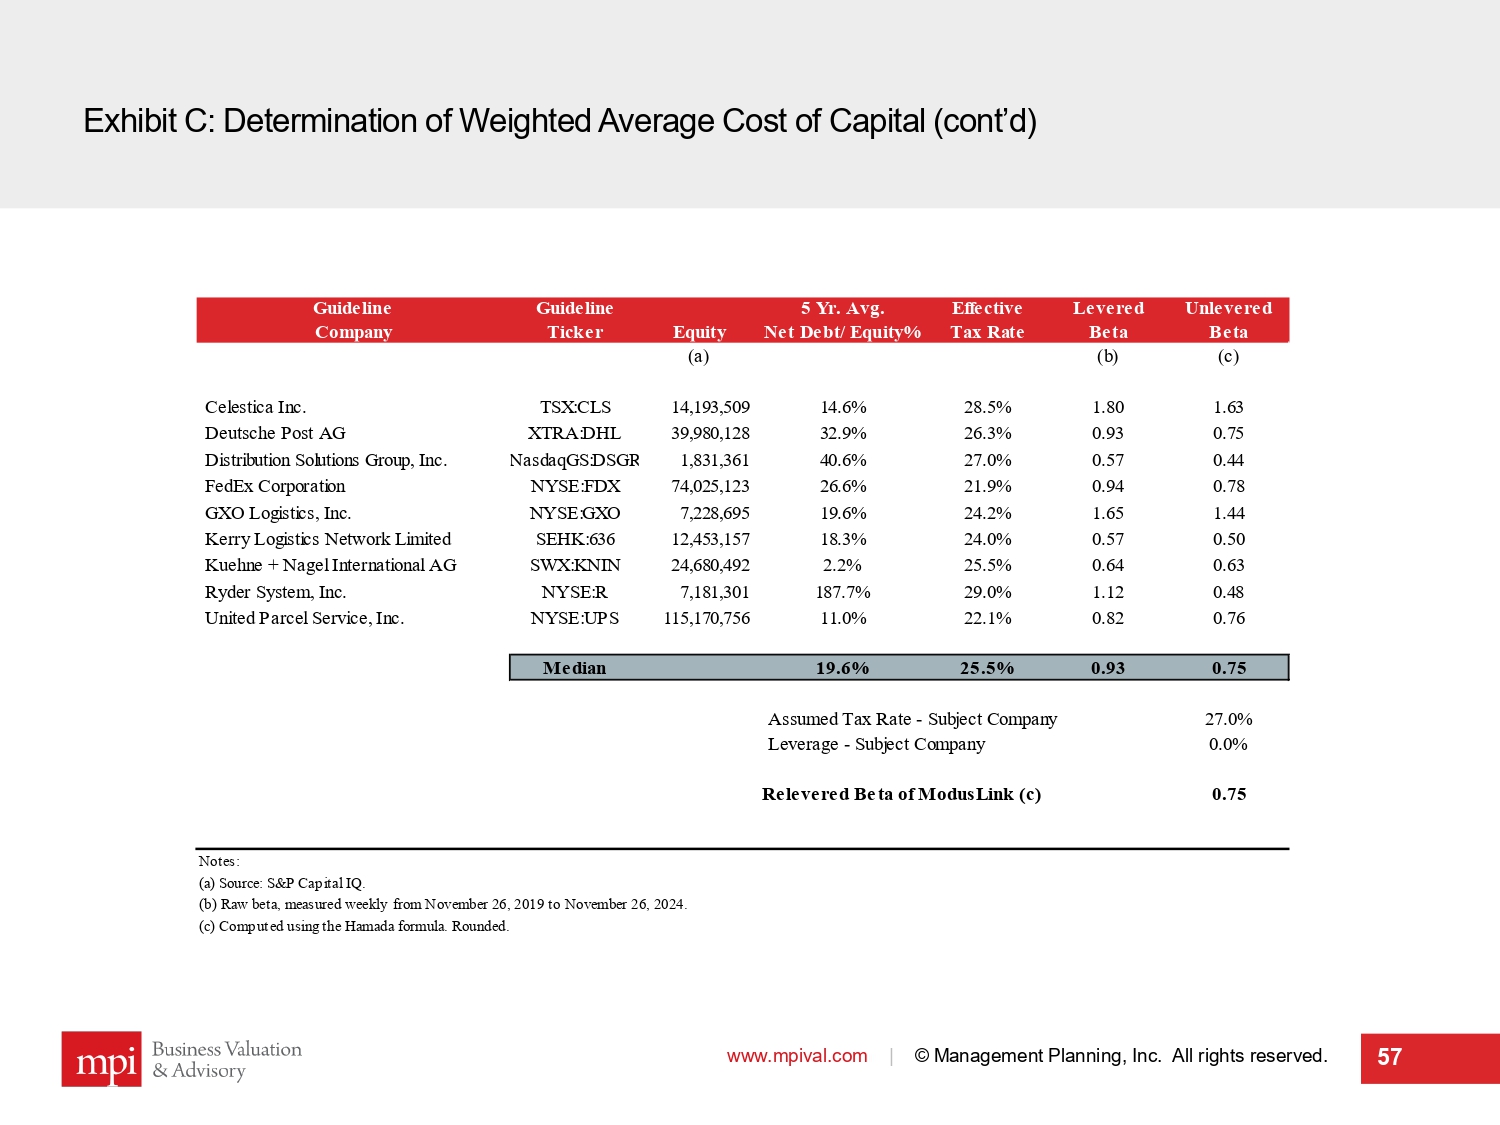
Exhibit C: Determination of Weighted Average Cost of Capital (cont’d) www.mpival.com | © Management Planning, Inc. All rights reserved. 57 Guideline Guideline 5 Yr. Avg. Effective Levered Unlevered Company Ticker Equity Net Debt/ Equity% Tax Rate Beta Beta (a) (b) (c) Celestica Inc. TSX:CLS 14,193,509 14.6% 28.5% 1.80 1.63 Deutsche Post AG XTRA:DHL 39,980,128 32.9% 26.3% 0.93 0.75 Distribution Solutions Group, Inc. NasdaqGS:DSGR 1,831,361 40.6% 27.0% 0.57 0.44 FedEx Corporation NYSE:FDX 74,025,123 26.6% 21.9% 0.94 0.78 GXO Logistics, Inc. NYSE:GXO 7,228,695 19.6% 24.2% 1.65 1.44 Kerry Logistics Network Limited SEHK:636 12,453,157 18.3% 24.0% 0.57 0.50 Kuehne + Nagel International AG SWX:KNIN 24,680,492 2.2% 25.5% 0.64 0.63 Ryder System, Inc. NYSE:R 7,181,301 187.7% 29.0% 1.12 0.48 United Parcel Service, Inc. NYSE:UPS 115,170,756 11.0% 22.1% 0.82 0.76 Median 19.6% 25.5% 0.93 0.75 Assumed Tax Rate - Subject Company 27.0% Leverage - Subject Company 0.0% Relevered Beta of ModusLink (c) 0.75 Notes: (a) Source: S&P Capital IQ. (b) Raw beta, measured weekly from November 26, 2019 to November 26, 2024. (c) Computed using the Hamada formula. Rounded.
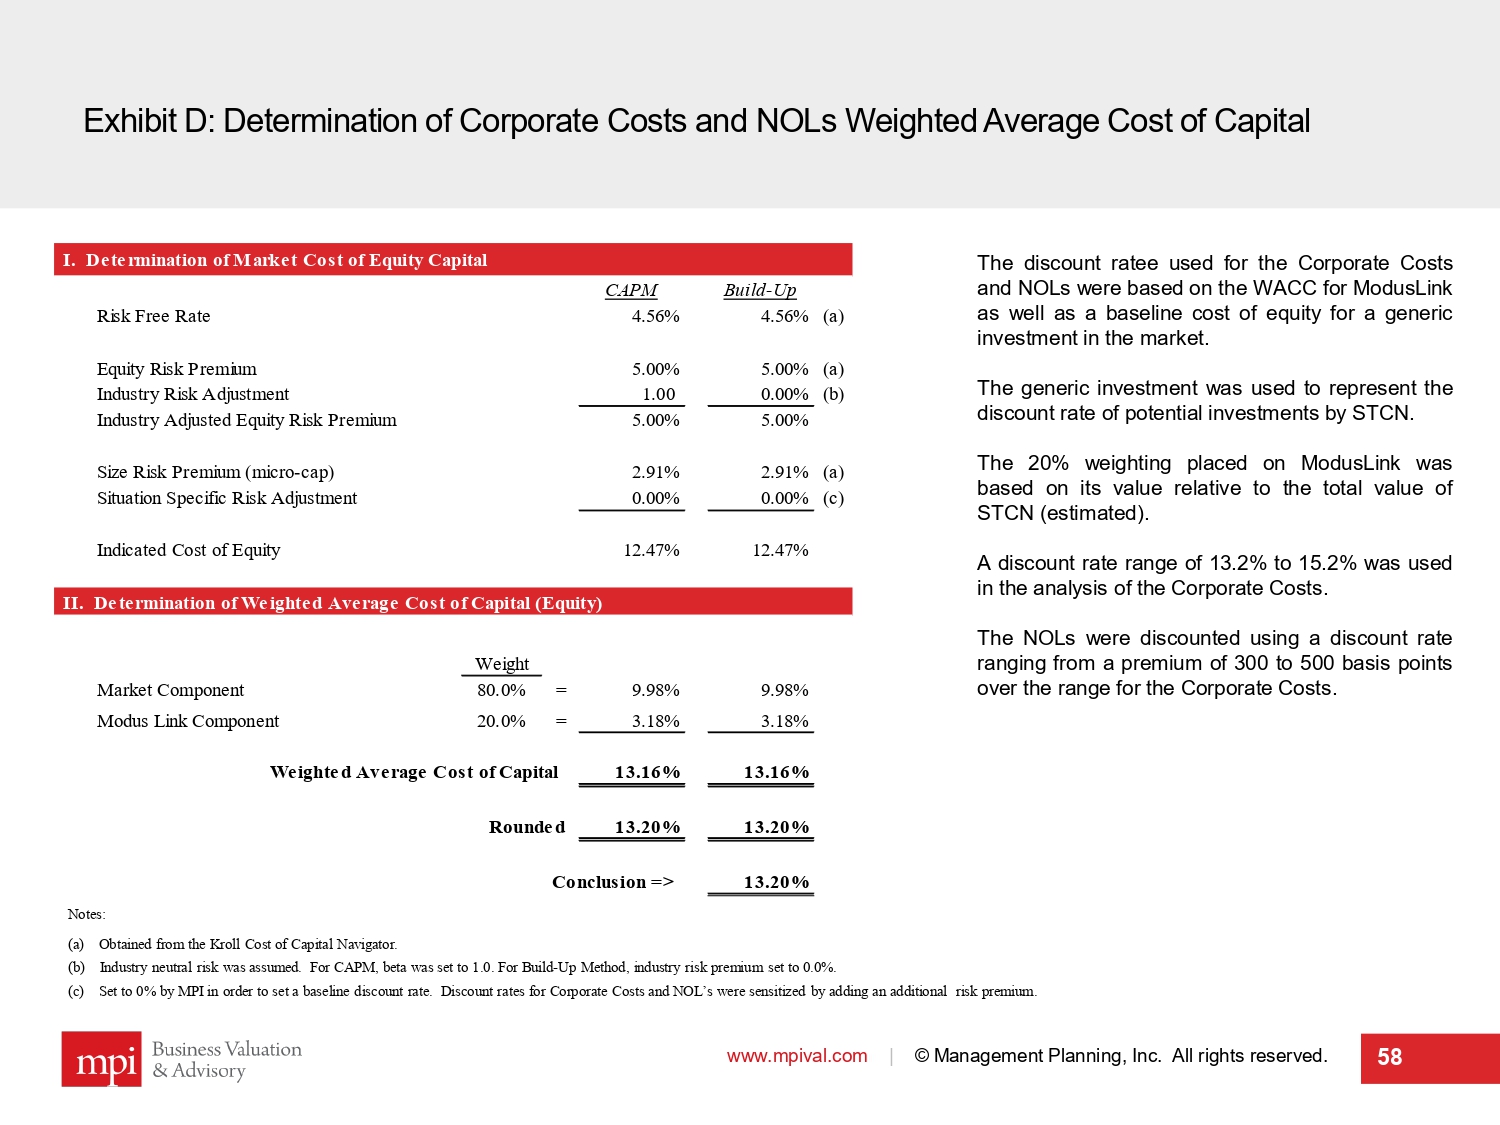
Exhibit D: Determination of Corporate Costs and NOLs Weighted Average Cost of Capital www.mpival.com | © Management Planning, Inc. All rights reserved. 58 Notes : (a) Obtained from the Kroll Cost of Capital Navigator . (b) Industry neutral risk was assumed . For CAPM, beta was set to 1 . 0 . For Build - Up Method, industry risk premium set to 0 . 0 % . (c) Set to 0 % by MPI in order to set a baseline discount rate . Discount rates for Corporate Costs and NOL’s were sensitized by adding an additional risk premium . The discount ratee used for the Corporate Costs and NOLs were based on the WACC for ModusLink as well as a baseline cost of equity for a generic investment in the market . The generic investment was used to represent the discount rate of potential investments by STCN . The 20 % weighting placed on ModusLink was based on its value relative to the total value of STCN (estimated) . A discount rate range of 13 . 2 % to 15 . 2 % was used in the analysis of the Corporate Costs . The NOLs were discounted using a discount rate ranging from a premium of 300 to 500 basis points over the range for the Corporate Costs . I. Determination of Market Cost of Equity Capital CAPM Build-Up Risk Free Rate 4.56% 4.56% (a) Equity Risk Premium 5.00% 5.00% (a) Industry Risk Adjustment 1.00 0.00% (b) Industry Adjusted Equity Risk Premium 5.00% 5.00% Size Risk Premium (micro-cap) 2.91% 2.91% (a) Situation Specific Risk Adjustment 0.00% 0.00% (c) Indicated Cost of Equity 12.47% 12.47% II. Determination of Weighted Average Cost of Capital (Equity) Weight Market Component 80.0% = 9.98% 9.98% Modus Link Component 20.0% = 3.18% 3.18% Weighted Average Cost of Capital 13.16% 13.16% Rounded 13.20% 13.20% Conclusion => 13.20%
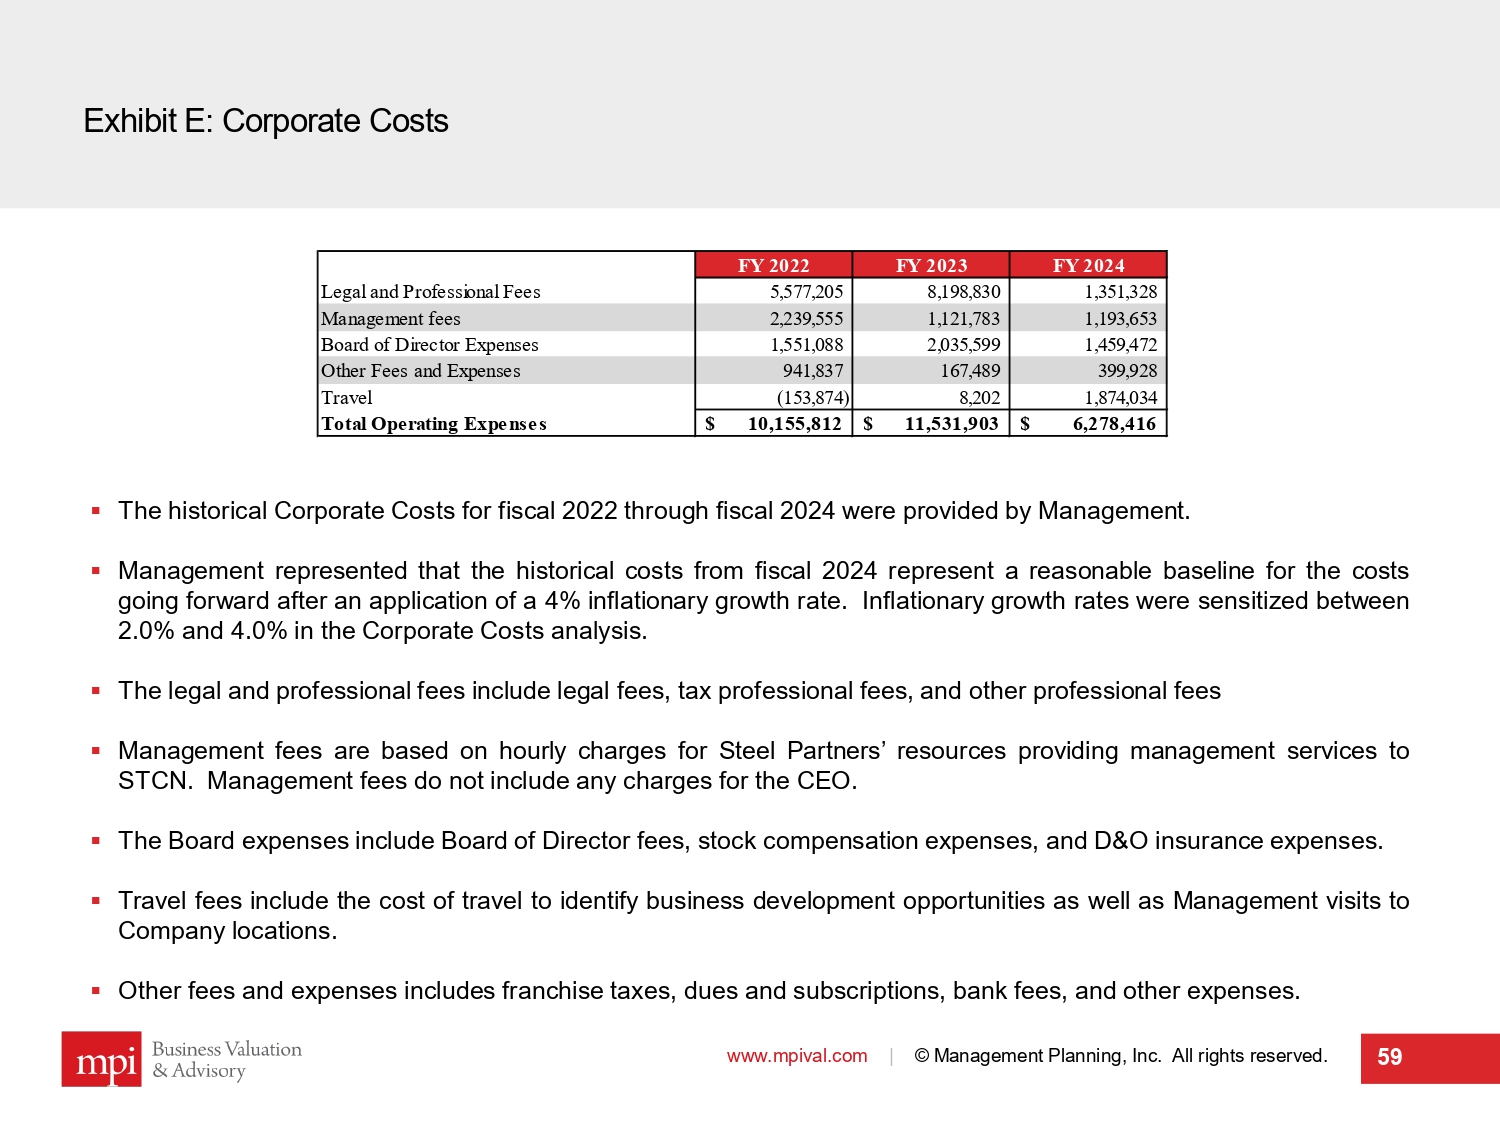
Exhibit E: Corporate Costs www.mpival.com | © Management Planning, Inc. All rights reserved. 59 ▪ The historical Corporate Costs for fiscal 2022 through fiscal 2024 were provided by Management . ▪ Management represented that the historical costs from fiscal 2024 represent a reasonable baseline for the costs going forward after an application of a 4 % inflationary growth rate . Inflationary growth rates were sensitized between 2 . 0 % and 4 . 0 % in the Corporate Costs analysis . ▪ The legal and professional fees include legal fees, tax professional fees, and other professional fees ▪ Management fees are based on hourly charges for Steel Partners’ resources providing management services to STCN . Management fees do not include any charges for the CEO . ▪ The Board expenses include Board of Director fees, stock compensation expenses, and D&O insurance expenses . ▪ Travel fees include the cost of travel to identify business development opportunities as well as Management visits to Company locations . ▪ Other fees and expenses includes franchise taxes, dues and subscriptions, bank fees, and other expenses . FY 2022 FY 2023 FY 2024 Legal and Professional Fees 5,577,205 8,198,830 1,351,328 Management fees 2,239,555 1,121,783 1,193,653 Board of Director Expenses 1,551,088 2,035,599 1,459,472 Other Fees and Expenses 941,837 167,489 399,928 Travel (153,874) 8,202 1,874,034 Total Operating Expenses 10,155,812$ 11,531,903$ 6,278,416$
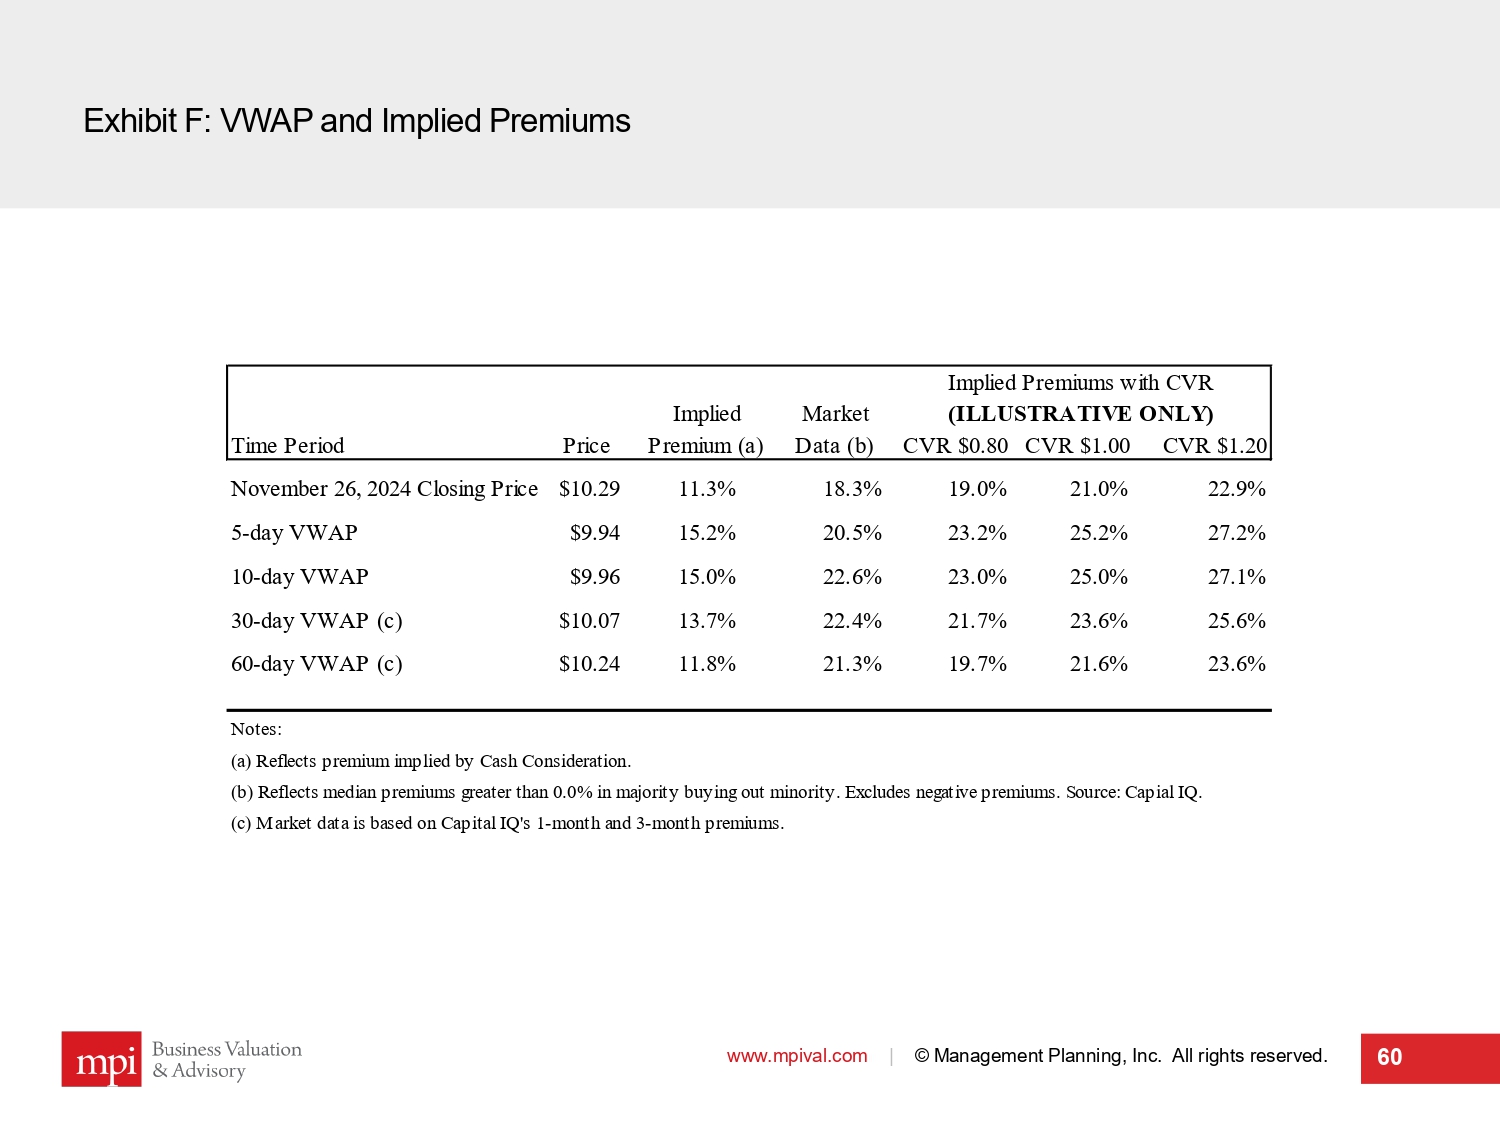
Exhibit F: VWAP and Implied Premiums www.mpival.com | © Management Planning, Inc. All rights reserved. 60 Implied Market Time Period Price Premium (a) Data (b) CVR $0.80 CVR $1.00 CVR $1.20 November 26, 2024 Closing Price $10.29 11.3% 18.3% 19.0% 21.0% 22.9% 5-day VWAP $9.94 15.2% 20.5% 23.2% 25.2% 27.2% 10-day VWAP $9.96 15.0% 22.6% 23.0% 25.0% 27.1% 30-day VWAP (c) $10.07 13.7% 22.4% 21.7% 23.6% 25.6% 60-day VWAP (c) $10.24 11.8% 21.3% 19.7% 21.6% 23.6% Notes: (a) Reflects premium implied by Cash Consideration. (b) Reflects median premiums greater than 0.0% in majority buying out minority. Excludes negative premiums. Source: Capial IQ. (c) Market data is based on Capital IQ's 1-month and 3-month premiums. Implied Premiums with CVR (ILLUSTRATIVE ONLY)