Daktronics Announces Fourth Quarter and Full Fiscal Year 2026 Results
•Record net sales for fiscal 2026 of $838.7 million
•Record orders for fiscal 2026 of $860.8 million
•Q4 EPS of $0.17, adjusted EPS(1) of $0.27, up 50% from adjusted EPS(1) YoY
•Product backlog rose to $356.2 million at year end with solid pipeline entering fiscal 2027
BROOKINGS, S.D., June 24, 2026 -- Daktronics, Inc. (NASDAQ: DAKT) (the “Company”, “Daktronics”, “we”, “our”, or “us”), a recognized industry leader in the design and manufacturing of best-in-class dynamic video communication displays and control systems for customers worldwide, today reported results for its fiscal year and fourth quarter ended May 2, 2026. Fiscal 2026 was a 53-week year, with an extra week in the first quarter, whereas fiscal 2025 was a 52-week year.
Fiscal Q4 and full year 2026 financial highlights:
•Q4 sales of $208.6 million, up 20.9% from the fourth quarter fiscal 2025, and record full year sales of $838.7 million, up 10.9% from full year fiscal 2025
•Q4 operating margin of 6.8% compared to negative operating margin of 1.0% in the year-earlier period, full year operating margin of 7.3%, compared to 4.4% in fiscal 2025
•Q4 earnings per share (“EPS”) of $0.17 compared to loss per share of $0.19 in the year-earlier period, adjusted EPS(1) of $0.27 compared to $0.18 in the year-earlier period; full-year EPS of $0.92 compared to loss per share of $0.21 in the year-earlier period, full year adjusted EPS of $1.05(1) compared to $0.84(1) for fiscal 2025
•Q4 new orders for products and services of $222.0 million(2), down 7.7% from the exceptionally strong Q4 of fiscal 2025; record full year new orders of $860.8 million(2), up 10.2% compared to full year 2025
•Product backlog of $356.2 million(2), up 4.3% from prior year end
“During fiscal 2026, Daktronics successfully completed numerous profitable business initiatives, laying the foundation for gaining momentum in executing our three-year strategic plan that started in fiscal 2025, advancing key initiatives that delivered accelerated sales growth, increased profitability, and a multi-quarter backlog of orders for a strong finish to the year,” said Ramesh Jayaraman, Daktronics’ President and Chief Executive Officer. “In fiscal 2026, we delivered record net sales and orders, reflecting efficient backlog conversion, steady customer demand and effective sales practices supporting our broad product and services portfolio. Margin expansion for the year was driven by stronger operational efficiency, improved supply chain execution, and disciplined inventory and working capital management, along with pricing actions aligned with our strategic initiatives. We ended the year on a strong note, delivering adjusted EPS(1) of $0.27 in the fourth quarter.”
Tracking to Three-Year Plan
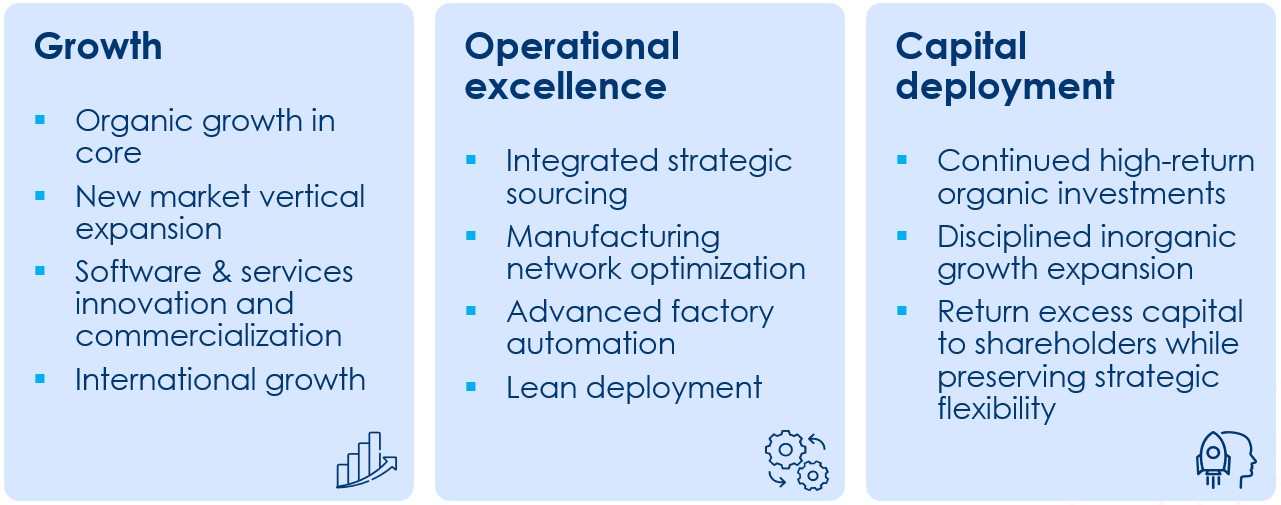
As outlined at Daktronics’ April 9, 2026, Investor Day, management is focused on executing strategic priorities to support growth, operational excellence and cash deployment along the following strategic pillars:
(1) Adjusted Operating Income, Adjusted Net Income, and Adjusted EPS are measures not defined by accounting principles generally accepted in the United States of America ("GAAP"). These non-GAAP measures are used to report our results exclusive of items that are non-recurring or not core to our operating business. We believe presenting this non-GAAP financial measurement provides investors with a consistent way to analyze our performance. For more information, see the supplemental calculation contained later in this release.
(2) Orders and backlog metrics are non-GAAP measures, and our methodology for determining orders and backlog may vary from the methodology used by other companies in determining their orders and backlog amounts. For more information related to backlog, see Part I, Item 1. Business of our Annual Report on Form 10-K for the fiscal year ended May 2, 2026.
“We enter fiscal 2027 with concrete execution plans in place, balancing our strategic priorities between growth and operational excellence,” said Jayaraman. “Our focus is to enhance our core organic growth capability, optimize our operating model to better serve customers while improving ROIC, and deploying capital in a disciplined manner to support organic growth, pursue targeted M&A, and return capital to shareholders through our share repurchase program. We are well positioned with a $356.2 million multi-quarter product backlog and a strong pipeline across all business segments backed by secular demand drivers. I’d like to thank our customers for their continued trust in Daktronics and our approximately 2,700 employees for what they have accomplished. Because of our team’s dedication, we are tracking well toward our fiscal 2028 targets of 7-10% revenue CAGR, 10-12% operating margin and 17-20% ROIC.”
Fourth Quarter and Year-to-Date Results
“Our team delivered an exceptional fiscal 2026, with record net sales, record orders, and a 290 basis point increase in operating margin,” said Daktronics’ Acting Chief Financial Officer Howard Atkins.
Full year 2026 orders increased 10.2 percent to a record $860.8 million, led by the Live Events business unit which won five of five Major League Baseball stadium installations since the third quarter of fiscal 2025. The Transportation and International business units had their own record orders quarters during the year. Fourth quarter fiscal 2026 orders declined 7.7 percent compared to an exceptionally strong fourth quarter of fiscal 2025 in which orders accelerated in advance of pricing increases. Product backlog rose to $356.2 million, with new orders exceeding revenue throughout the year.
Net sales for the fourth quarter of fiscal 2026 were up 20.9 percent from the year-earlier period, driven by the Live Events, High School Park and Recreation, and Transportation business units. The Commercial and International business unit net sales were relatively flat year-over-year. For the full year fiscal 2026, net sales were up 10.9 percent to a record $838.7 million due to strong order growth, the introduction of value-based pricing, and efficient revenue conversion.
Fourth quarter gross profit increased 3.0 percent from a year ago on higher revenue and wider gross profit margin, which increased to 28.0 percent for the fourth quarter of fiscal 2026 compared to 25.0 percent for the fourth quarter of fiscal 2025. A recapture of a prior period warranty provision accounted for 62 basis points of the 28.0 percent gross profit margin. For the full year, gross profit as a percentage of net sales increased to 27.3 percent, including warranty recapture, for fiscal 2026 from 25.8 percent in the prior year. Factors contributing to the margin increase included value-based price increases and operational efficiencies in working capital. The Company is monitoring developments related to tariff refunds, and no amounts have been recognized in the financial statements as of May 2, 2026, due to ongoing uncertainty regarding eligibility, timing and amount.
Operating expenses for the fourth quarter of fiscal 2026 were $44.4 million and relatively flat compared to $44.9 million for the fourth quarter of fiscal 2025. Operating expenses were $168.2 million for the full fiscal 2026 year compared to $162.4 million for the full fiscal 2025 year, an increase of 3.6 percent. The year‑over‑year increase primarily reflects higher
product design and development expenses, including costs associated with the acquisition of certain assets of X Display Company Technology Limited (“XDC”).
Operating expenses during fiscal 2026 also included expenses related to management transition costs, advisory services, and legal expenses associated with the XDC acquisition. By comparison, expenses incurred during fiscal 2025 were primarily related to consultant and advisory costs supporting strategic and digital transformation initiatives and corporate governance matters.
Operating margin was 6.8 percent for the fourth quarter of fiscal 2026 compared to an operating loss of 1.0 percent for the fourth quarter of fiscal 2025. Operating margin was 7.3 percent for fiscal 2026 compared to 4.4 percent for fiscal 2025.
The increase in net interest income for the fourth quarter of fiscal 2026 compared to the same period a year ago is primarily due to a higher average cash level invested in interest-bearing accounts. During the third and fourth quarters of fiscal 2025, interest expense included interest on the convertible note payable, which was settled during fiscal 2025.
The change in fair value of the convertible note was caused by the conversion of the entire convertible note in the third and fourth quarters of fiscal 2025.
The Company’s effective tax rate for fiscal 2026 was 22.2 percent compared to negative 73.0 percent for fiscal 2025. During fiscal 2025, the Company’s effective income tax rate was primarily impacted due to the convertible note fair value adjustment to expense that is not deductible for tax purposes. In fiscal 2026, there were no further impacts of fair value adjustments on the convertible note and our effective tax rate has normalized closer to the U.S. statutory rate.
Fourth quarter fiscal 2026 earnings per diluted share were $0.17, compared to a loss per diluted share of $0.19 in the fourth quarter fiscal 2025. For fiscal 2026, earnings per diluted share were $0.92, compared to a loss per diluted share of $0.21 in fiscal 2025. Fourth quarter fiscal 2026 adjusted EPS(1) of $0.27 excludes a $3.8 million provision for possible credit losses related to the exit of an investment in an affiliate and was up 50.0 percent from adjusted EPS(1) in the year-earlier period. Fourth quarter fiscal 2025 adjusted EPS(1) of $0.18 excludes a $15.5 million provision for possible credit losses booked related to the exit of an investment in a different affiliate.
Balance Sheet and Cash Flow
Cash and cash equivalents totaled $131.6 million as of May 2, 2026, and $10.8 million of total current and long-term debt was outstanding as of that date. Accounts receivable as of May 2, 2026, was $118.6 million compared to $92.8 million at the end of fiscal 2025.
The Company has a $71.5 million senior credit facility that consists of a cash flow‑backed revolving line of credit. As of May 2, 2026, there were no advances under the loan portion of the line of credit, and the balance of letters of credit outstanding was $1.9 million.
In fiscal 2026, Daktronics generated $49.2 million of cash from operations, of which $14.9 million was used for purchases of property and equipment. During fiscal 2026, the Company repurchased 1.4 million shares of common stock at the volume-weighted average price of $17.80, equaling $25.4 million of share repurchases. In the fourth quarter of fiscal 2026, the Company repurchased 0.1 million shares of common stock at the volume-weighted average price of $19.56, equaling $2.6 million of share repurchases.
At the end of fiscal 2026, the Company’s working capital ratio was 2.3 to 1.
Webcast Information
The Company will host a conference call and webcast to discuss its financial results today at 10:00 a.m. (Central Time). This call will be broadcast live at http://investor.daktronics.com, where related presentation materials will also be posted prior to the conference call. A webcast will be available for replay shortly after the event.
About Daktronics
Daktronics has strong leadership positions in, and is the world’s largest supplier of, large-screen video displays, electronic scoreboards, LED text and graphics displays, and related control systems. The Company excels in the control of display
(1) Adjusted Operating Income, Adjusted Net Income, and Adjusted EPS are measures not defined by accounting principles generally accepted in the United States of America ("GAAP"). These non-GAAP measures are used to report our results exclusive of items that are non-recurring or not core to our operating business. We believe presenting this non-GAAP financial measurement provides investors with a consistent way to analyze our performance. For more information, see the supplemental calculation contained later in this release.
(2) Orders and backlog metrics are non-GAAP measures, and our methodology for determining orders and backlog may vary from the methodology used by other companies in determining their orders and backlog amounts. For more information related to backlog, see Part I, Item 1. Business of our Annual Report on Form 10-K for the fiscal year ended May 2, 2026.
systems, including those that require integration of multiple complex displays showing real-time information, graphics, animation, and video. Daktronics designs, manufactures, markets and services display systems for customers around the world in four domestic business units: Live Events, Commercial, High School Park and Recreation, and Transportation; and one International business unit. For more information, visit the Company’s website at: www.daktronics.com.
Safe Harbor Statement
Cautionary Notice: This press release contains certain statements that by be considered forward-looking statements within the meaning of Section 27A of the Securities Act of 1933, as amended, and Section 21E of the Securities Exchange Act of 1934, as amended, and such statements are subject to the safe harbor created by those sections and the Private Securities Litigation Reform Act of 1995, as amended.
All statements, other than historical facts, included or incorporated in this release could be deemed forward-looking statements, particularly statements that reflect our expectations or beliefs of Daktronics, Inc. (the “Company,” “Daktronics,” “we,” or “us”) concerning future events or our future financial performance. You are cautioned not to place undue reliance on forward-looking statements, which are often characterized by discussions of strategy, plans, or intentions or by the use of words such as “may,” “would,” “could,” “should,” “will,” “expect,” “estimate,” “anticipate,” “believe,” “plan,” “forecast,” “project,” “outlook,” “focus,” “goal,” “target,” “transform,” “expand,” “grow,” “predict,” “potential,” “continue,” or “intend,” the negative or other variants of such terms, or other comparable terminology. The Company cautions that these forward-looking statements are subject to risks and uncertainties that could cause actual results to differ materially from our expectations as a result of various factors, including, but not limited to, changes in economic and market conditions, management of growth, timing and magnitude of future contracts, orders, and capital investment projects, fluctuations in margins, the introduction of new products and technology, the impact of adverse weather conditions, increased regulation, the imposition of tariffs or other trade restrictions, the availability and costs of raw materials, components, and shipping services, geopolitical and governmental actions, expansion into new geographical markets, the Company’s recent leadership transition, transformation initiatives, future strategy, and other risks, trends, and uncertainties described more fully in the Company’s Annual Report on Form 10-K for its 2026 fiscal year (the “Form 10-K”) and in other reports filed with or furnished to the U.S. Securities and Exchange Commission (the "SEC") by the Company. You should carefully consider the trends, risks, and uncertainties described in this press release, the Form 10-K, other reports filed with or furnished to the SEC by the Company, and other press releases and stockholders reports of the Company before making any investment decision with respect to our securities. If any of these trends, risks, or uncertainties continues or occurs, our business, financial condition, or operating results could be materially and adversely affected, the trading prices of our securities could decline, and you could lose part or all of your investment.
Forward-looking statements are made in the context of information available as of the date of this press release and are based on our current expectations, forecasts, estimates, and assumptions. The Company disclaims any obligation to update or revise any forward-looking statements to reflect actual results or circumstances or events occurring after this release affecting the forward-looking statements except as may be required by applicable law. All forward-looking statements attributable to us or persons acting on our behalf are expressly qualified in their entirety by this cautionary statement.
For more information contact:
INVESTOR RELATIONS:
Howard Atkins, Acting Chief Financial Officer
Tel (605) 692-0200
Investor@daktronics.com
Alliance Advisors IR
Carolyn Capaccio / Jody Burfening
DAKTIRTeam@allianceadvisors.com
MEDIA RELATIONS
media@daktronics.com
Daktronics, Inc. and Subsidiaries
Consolidated Statements of Operations
(in thousands, except per share amounts)
(unaudited)
Three Months Ended
Year Ended
May 2, 2026
April 26, 2025
May 2, 2026
April 26, 2025
Net sales
$
208,610
$
172,551
$
838,706
$
756,477
Cost of sales
150,130
129,406
609,700
560,990
Gross profit
58,480
43,145
229,006
195,487
Operating expenses:
Selling
16,590
15,200
64,815
60,011
General and administrative
15,984
19,727
59,885
63,498
Product design and development
11,815
9,958
43,458
38,860
44,389
44,885
168,158
162,369
Operating income (loss)
14,091
(1,740)
60,848
33,118
Nonoperating income (expense):
Interest income (expense), net
1,107
637
3,630
1,347
Change in fair value of convertible note
—
2,848
—
(22,521)
Other expense, net
(4,461)
(15,183)
(6,144)
(17,795)
Income (loss) before income taxes
10,737
(13,438)
58,334
(5,851)
Income tax expense (benefit)
2,322
(4,013)
12,958
4,270
Net income (loss)
$
8,415
$
(9,425)
$
45,376
$
(10,121)
Weighted average shares outstanding:
Basic
48,258
49,516
48,564
47,587
Diluted
49,032
49,516
49,382
47,587
Earnings (loss) per share:
Basic
$
0.17
$
(0.19)
$
0.93
$
(0.21)
Diluted
$
0.17
$
(0.19)
$
0.92
$
(0.21)
Daktronics, Inc. and Subsidiaries
Consolidated Balance Sheets
(in thousands)
(unaudited)
May 2, 2026
April 26, 2025
ASSETS
CURRENT ASSETS:
Cash and cash equivalents
$
131,639
$
127,507
Accounts receivable, net
118,590
92,762
Inventories
110,471
105,839
Contract assets
66,552
41,169
Current maturities of long-term receivables
3,405
2,437
Prepaid expenses and other current assets
11,278
8,520
Income tax receivables
6,047
3,217
Total current assets
447,982
381,451
Property and equipment, net
64,263
73,884
Long-term receivables, less current maturities
1,125
1,030
Goodwill
3,685
3,188
Intangibles, net
3,263
568
Debt issuance costs, net
—
1,289
Right of use, investment in affiliates, and other assets
11,828
9,378
Deferred income taxes
22,266
32,104
TOTAL ASSETS
$
554,412
$
502,892
Daktronics, Inc. and Subsidiaries
Consolidated Balance Sheets (continued)
(in thousands)
(unaudited)
May 2, 2026
April 26, 2025
LIABILITIES AND STOCKHOLDERS’ EQUITY
CURRENT LIABILITIES:
Current portion of long-term debt
$
1,150
$
1,500
Accounts payable
68,617
46,669
Contract liabilities
65,310
69,050
Accrued expenses
44,858
41,705
Warranty obligations
12,398
12,706
Income taxes payable
1,375
375
Total current liabilities
193,708
172,005
Long-term warranty obligations
24,362
23,124
Long-term contract liabilities
20,655
18,421
Other long-term obligations
5,289
6,839
Long-term debt, net
9,629
10,487
Deferred income taxes
22
85
Total long-term liabilities
59,957
58,956
STOCKHOLDERS’ EQUITY:
Preferred Shares, $0.00001 par value, authorized 5,000 shares; no shares issued and outstanding
—
—
Common stock, $0.00001 par value, authorized 115,000 shares; 53,650 and 53,030 shares issued as of May 2, 2026 and April 26, 2025, respectively
—
—
Additional paid-in capital
196,837
189,940
Retained earnings
173,286
127,910
Treasury stock, at cost, 5,406 and 3,979 shares as of May 2, 2026 and April 26, 2025, respectively
(65,324)
(39,759)
Accumulated other comprehensive loss
(4,052)
(6,160)
TOTAL STOCKHOLDERS’ EQUITY
300,747
271,931
TOTAL LIABILITIES AND STOCKHOLDERS’ EQUITY
$
554,412
$
502,892
Daktronics, Inc. and Subsidiaries
Consolidated Statements of Cash Flows
(in thousands)
(unaudited)
Year Ended
May 2, 2026
April 26, 2025
CASH FLOWS FROM OPERATING ACTIVITIES:
Net income (loss)
$
45,376
$
(10,121)
Adjustments to reconcile net income to net cash provided by operating activities:
Depreciation and amortization
19,339
19,547
Gain on sale of property, equipment and other assets
(209)
(156)
Share-based compensation
4,905
2,944
Equity in loss of affiliates
2,008
3,053
Allowance for credit losses on affiliate loan
3,205
15,480
Provision (recovery) for doubtful accounts, net
627
(644)
Deferred income taxes, net
9,938
(6,300)
Change in fair value of convertible note
—
22,521
Change in operating assets and liabilities
(35,972)
51,389
Net cash provided by operating activities
49,217
97,713
CASH FLOWS FROM INVESTING ACTIVITIES:
Purchases of property and equipment
(14,917)
(19,494)
Proceeds from sales of property, equipment and other assets
615
277
Acquisition, net of cash acquired
44
—
Loans to equity investees
(5,383)
(4,565)
Net cash used in investing activities
(19,641)
(23,782)
CASH FLOWS FROM FINANCING ACTIVITIES:
Borrowings on notes payable
1,400
—
Payments on notes payable
(2,883)
(2,108)
Principal payments on long-term obligations
(104)
(414)
Payments for common shares repurchased
(25,565)
(29,474)
Proceeds from exercise of stock options
1,796
5,153
Tax payments related to RSU issuances
(882)
(606)
Net cash used in financing activities
(26,238)
(27,449)
EFFECT OF EXCHANGE RATE CHANGES ON CASH
794
(653)
NET INCREASE IN CASH, CASH EQUIVALENTS AND RESTRICTED CASH
4,132
45,829
CASH, CASH EQUIVALENTS AND RESTRICTED CASH:
Beginning of period
127,507
81,678
End of period
$
131,639
$
127,507
Daktronics, Inc. and Subsidiaries
Net Sales and Orders by Business Unit
(in thousands)
(unaudited)
Three Months Ended
Twelve Months Ended
May 2, 2026
April 26, 2025
Dollar
Change
Percent
Change
May 2, 2026
April 26, 2025
Dollar
Change
Percent
Change
Net Sales:
Commercial
$
40,347
$
40,589
$
(242)
(0.6)
%
$
180,772
$
156,203
$
24,569
15.7
%
Live Events
84,861
59,597
25,264
42.4
321,053
291,484
29,569
10.1
High School Park and Recreation
46,287
40,477
5,810
14.4
183,250
165,921
17,329
10.4
Transportation
23,578
18,304
5,274
28.8
76,700
81,061
(4,361)
(5.4)
International
13,537
13,584
(47)
(0.3)
76,931
61,808
15,123
24.5
$
208,610
$
172,551
$
36,059
20.9
%
$
838,706
$
756,477
$
82,229
10.9
%
Orders:
Commercial
$
44,131
$
48,930
$
(4,799)
(9.8)
%
$
172,089
$
176,583
$
(4,494)
(2.5)
%
Live Events
81,195
84,225
(3,030)
(3.6)
336,012
283,780
52,232
18.4
High School Park and Recreation
50,136
59,263
(9,127)
(15.4)
188,245
176,097
12,148
6.9
Transportation
21,692
23,496
(1,804)
(7.7)
89,467
72,315
17,152
23.7
International
24,892
24,769
123
0.5
75,022
72,572
2,450
3.4
$
222,046
$
240,683
$
(18,637)
(7.7)
%
$
860,835
$
781,347
$
79,488
10.2
%
Reconciliation of Free Cash Flow*
(in thousands)
(unaudited)
Twelve Months Ended
May 2, 2026
April 26, 2025
Net cash provided by operating activities
$
49,217
$
97,713
Purchases of property and equipment
(14,917)
(19,494)
Proceeds from sales of property and equipment
615
277
Free cash flow
$
34,915
$
78,496
*The table above reconciles free cash flow to the most directly comparable GAAP financial measure. In evaluating its business, Daktronics considers and uses free cash flow as a key measure of its operating performance. The term free cash flow is not defined under accounting principles generally accepted in the United States of America ("GAAP"). It is not a measure of operating income, cash flows from operating activities or other GAAP figures and should not be considered alternatives to those computations. We define free cash flow as net cash provided by operating activities less payments for property, plant and equipment, plus proceeds from the sale of, insurance recovery for and grants for property, plant and equipment, if applicable. Our definition of free cash flow may not be comparable to similarly titled definitions used by other companies. Free cash flow is intended to provide information that may be useful for investors when assessing period to period results because it provides them with additional information in assessing our liquidity, capital resources and financial operating results.
Reconciliation of Adjusted Operating Income*
(in thousands)
(unaudited)
Three Months Ended
Twelve Months Ended
May 2, 2026
April 26, 2025
May 2, 2026
April 26, 2025
Operating income (loss) (GAAP measure)
$
14,091
$
(1,740)
$
60,848
$
33,118
Management transition expenses
100
2,614
2,145
2,614
XDC acquisition, advisory, and legal costs
126
—
575
—
Consultant related expenses associated with business transformation initiatives
1,062
1,031
1,062
7,085
Corporate governance expenses
—
3,881
—
6,825
Adjusted operating income (non-GAAP measure)
$
15,379
$
5,786
$
64,630
$
49,642
*In evaluating its business, Daktronics considers and uses adjusted operating income as a key measure of its operating performance. The term adjusted operating income is not defined under GAAP and is not a measure of operating income, cash flows from operating activities, or other GAAP figures and should not be considered alternatives to those computations. We define adjusted operating income as operating income (loss) plus management transition expenses, acquisition related expenses, consulting related expenses related to our business transformation initiatives, and corporate governance expenses related to legal and advisory costs of reincorporation and shareholder relations. Management transition and acquisition related expenses incurred during the first and second quarters of fiscal 2026 were immaterial and, accordingly, were not previously disclosed as adjustments. These expenses became more significant during the third quarter of fiscal 2026 and are therefore reflected in the twelve‑month adjusted operating income calculation. Management believes adjusted operating income is a useful indicator of our financial performance and our ability to generate cash flows from operations. Our definition of adjusted operating income may not be comparable to similarly titled definitions used by other companies. The table above reconciles adjusted operating income to comparable GAAP financial measures.
Reconciliation of Adjusted Net Income and Adjusted Earnings per Share*
(in thousands, except per share data)
(unaudited)
Three Months Ended
Twelve Months Ended
May 2, 2026
April 26, 2025
May 2, 2026
April 26, 2025
Net income (loss) (GAAP measure)
$
8,415
$
(9,425)
$
45,376
$
(10,121)
Management transition, net of taxes
74
1,934
1,587
1,934
XDC acquisition, advisory, and legal costs
93
—
426
—
Consultant related expenses associated with business transformation initiatives, net of taxes
786
763
786
5,243
Allowance for credit losses on affiliate loan
3,750
15,480
3,750
15,480
Corporate governance expenses, net of taxes
—
2,872
—
5,050
Change in fair value of convertible note
—
(2,848)
—
22,521
Adjusted net income (non-GAAP measure)
$
13,118
$
8,776
$
51,925
$
40,107
Diluted weighted-average number of common shares outstanding
49,032
49,516
49,382
47,587
Diluted earnings (loss) per share (GAAP measure)
$
0.17
$
(0.19)
$
0.92
$
(0.21)
Adjusted diluted earnings per share (non-GAAP measure)
$
0.27
$
0.18
$
1.05
$
0.84
*Adjusted net income using 26% tax rate. The table above reconciles adjusted net income and adjusted EPS to the most directly comparable GAAP financial measure. In evaluating its business, Daktronics considers and uses adjusted net income and adjusted EPS as key measures of its operating performance. The terms adjusted net income and adjusted EPS are not defined under GAAP. They are not measures of net income or other GAAP figures and should not be considered alternatives to those computations. We disclose adjusted net income and adjusted EPS as non-GAAP financial measures in order to report our results exclusive of items that are non-recurring, unique, or not core to our operating business. Our definition of adjusted net income and adjusted EPS may not be comparable to similarly titled definitions used by other companies. Management believes presenting this non-GAAP financial measurement provides investors with a consistent way to analyze our performance.