
President & CEO
November 16, 2017
Thad Hill
Calpine Corporation
Forward-Looking Statements
The information contained in this presentation includes certain estimates, projections and other forward-looking
information that reflect Calpine’s current views with respect to future events and financial performance. These
estimates, projections and other forward-looking information are based on assumptions that Calpine believes, as of the
date hereof, are reasonable. Inevitably, there will be differences between such estimates and actual results, and those
differences may be material.
There can be no assurance that any estimates, projections or forward-looking information will be realized.
All such estimates, projections and forward-looking information speak only as of the date hereof. Calpine undertakes no
duty to update or revise the information contained herein other than as required by law.
You are cautioned not to place undue reliance on the estimates, projections and other forward-looking information in this
presentation as they are based on current expectations and general assumptions and are subject to various risks,
uncertainties and other factors, including those set forth in Calpine’s Quarterly Reports on Form 10-Q for the three
months ended March 31, June 30 and September 30, 2017, its Annual Report on Form 10-K for the year ended December
31, 2016 and in other documents that Calpine files with the SEC. Many of these risks, uncertainties and other factors are
beyond Calpine’s control and may cause actual results to differ materially from the views, beliefs and estimates
expressed herein. Calpine’s reports and other information filed with the SEC, including the risk factors identified in its
Annual Report on Form 10-K for the year ended December 31, 2016, and its Quarterly Report on Form 10-Q for the three
months ended September 30, 2017, can be found on the SEC’s website at www.sec.gov and on Calpine’s website at
www.calpine.com.
Reconciliation to U.S. GAAP Financial Information
The following presentation includes certain “non-GAAP financial measures” as defined in Regulation G under the
Securities Exchange Act of 1934, as amended. Schedules are included herein that reconcile the non-GAAP financial
measures included in the following presentation to the most directly comparable financial measures calculated and
presented in accordance with U.S. GAAP.
Calpine Corporation 1
Safe Harbor Statement
Additional Information and Where to Find It
This communication may be deemed solicitation material in respect of the proposed acquisition of Calpine by Energy
Capital Partners III, LLC (“ECP”). This communication does not constitute a solicitation of any vote or approval. In
connection with the proposed transaction, Calpine has filed with the SEC preliminary and definitive proxy statements and
other relevant documents. The definitive proxy statement has been mailed or otherwise provided to Calpine’s
stockholders. INVESTORS AND SECURITYHOLDERS ARE ADVISED TO READ THE PROXY STATEMENT AND ANY OTHER
DOCUMENTS TO BE FILED WITH THE SEC IN CONNECTION WITH THE PROPOSED TRANSACTION BEFORE MAKING ANY VOTING
OR INVESTMENT DECISION WITH RESPECT TO THE PROPOSED TRANSACTION BECAUSE THEY WILL CONTAIN IMPORTANT
INFORMATION. Investors and security holders may obtain a free copy of the proxy statement (when available) and other
documents filed by Calpine with the SEC from the SEC’s website at www.sec.gov. In addition, investors and security
holders may obtain free copies of the documents filed with the SEC at Calpine’s website at www.calpine.com/investor-
relations.
Participants in the Solicitation
Calpine and its directors and executive officers may be deemed to be participants in the solicitation of proxies from
Calpine’s stockholders in connection with the proposed transaction. Investors and security holders may obtain more
detailed information regarding the names, affiliations and interests of Calpine’s directors and executive officers by
reading Calpine’s Annual Report on Form 10-K, which was filed with the SEC on February 10, 2017, and proxy statement
for its 2017 annual meeting of stockholders, which was filed with the SEC on March 29, 2017. Additional information
regarding potential participants in such proxy solicitation and a description of their direct and indirect interests, by
security holdings or otherwise, are included in the proxy statement and other relevant documents filed by Calpine with
the SEC in connection with the proposed transaction.
Additional Information
Calpine Corporation 2
0
5
10
15
20
25
30
35
40
CPN DYN NRG VST
Ca
pa
ci
ty
Wt
d
A
vg
Age
(Y
ea
rs
)
0
2,000
4,000
6,000
8,000
10,000
12,000
CPN DYN NRG VST
He
at
R
at
e
(b
tu/
kw
h)
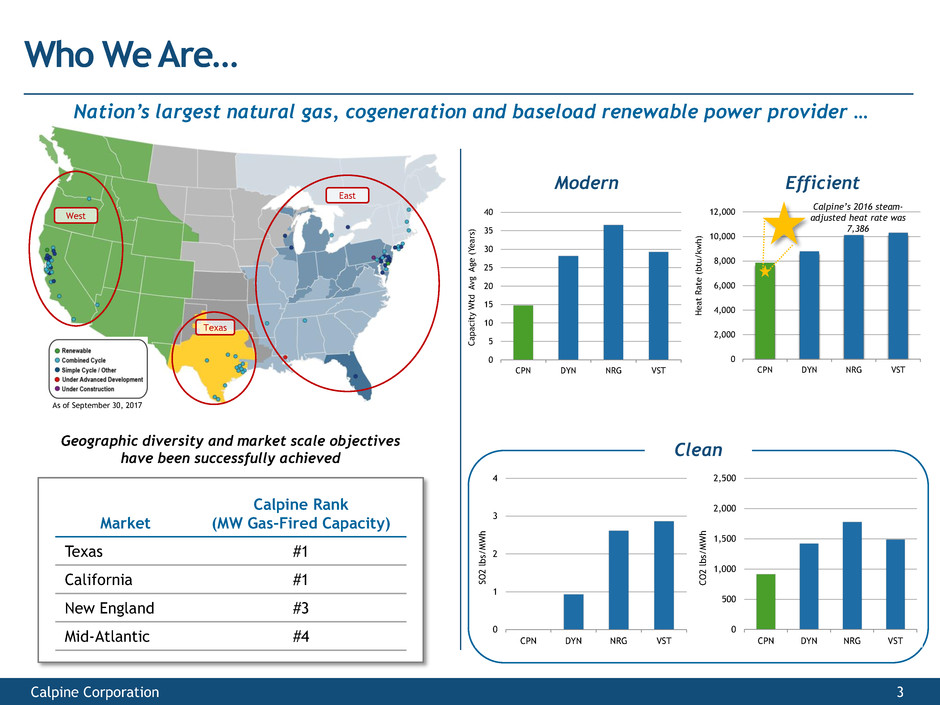
As of September 30, 2017
West
Texas
East
Who We Are…
3
Market
Calpine Rank
(MW Gas-Fired Capacity)
Texas #1
California #1
New England #3
Mid-Atlantic #4
Geographic diversity and market scale objectives
have been successfully achieved
Nation’s largest natural gas, cogeneration and baseload renewable power provider …
Modern Efficient
Clean
Calpine’s 2016 steam-
adjusted heat rate was
7,386
Calpine Corporation
0
1
2
3
4
CPN DYN NRG VST
SO
2
lb
s/
MW
h
0
500
1,000
1,500
2,000
2,500
CPN DYN NRG VST
CO
2
lbs
/MW
h
4
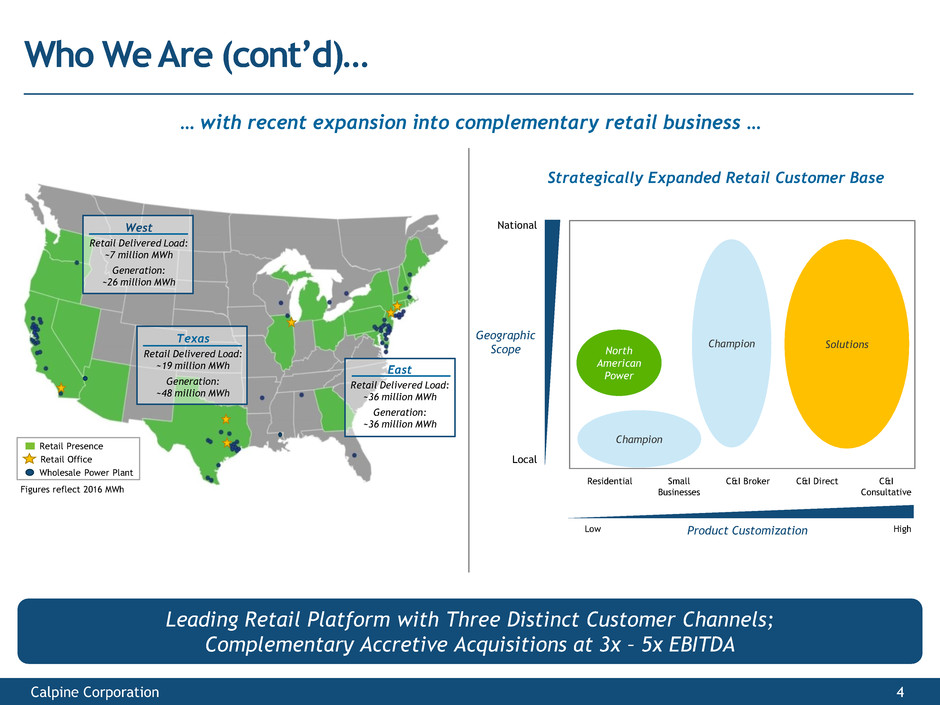
… with recent expansion into complementary retail business …
Strategically Expanded Retail Customer Base
Leading Retail Platform with Three Distinct Customer Channels;
Complementary Accretive Acquisitions at 3x – 5x EBITDA
Who We Are (cont’d)…
Retail Presence
Retail Office
Wholesale Power Plant
West
Retail Delivered Load:
~7 million MWh
Generation:
~26 million MWh
Texas
Retail Delivered Load:
~19 million MWh
Generation:
~48 million MWh
East
Retail Delivered Load:
~36 million MWh
Generation:
~36 million MWh
Figures reflect 2016 MWh
Residential Small
Businesses
C&I Broker C&I Direct C&I
Consultative
Low Product Customization High
National
Geographic
Scope
Local
SolutionsChampion
Champion
North
American
Power
Calpine Corporation
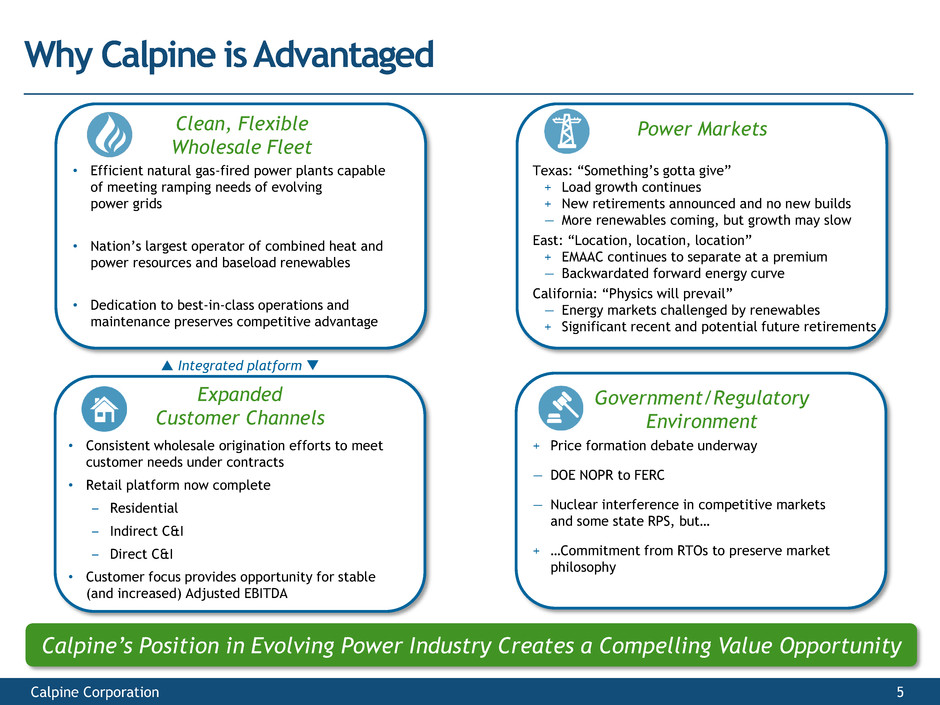
Why Calpine is Advantaged
Calpine Corporation 5
Power Markets
Texas: “Something’s gotta give”
+ Load growth continues
+ New retirements announced and no new builds
— More renewables coming, but growth may slow
East: “Location, location, location”
+ EMAAC continues to separate at a premium
— Backwardated forward energy curve
California: “Physics will prevail”
— Energy markets challenged by renewables
+ Significant recent and potential future retirements
+ Price formation debate underway
— DOE NOPR to FERC
— Nuclear interference in competitive markets
and some state RPS, but…
+ …Commitment from RTOs to preserve market
philosophy
Clean, Flexible
Wholesale Fleet
• Efficient natural gas-fired power plants capable
of meeting ramping needs of evolving
power grids
• Nation’s largest operator of combined heat and
power resources and baseload renewables
• Dedication to best-in-class operations and
maintenance preserves competitive advantage
Expanded
Customer Channels
• Consistent wholesale origination efforts to meet
customer needs under contracts
• Retail platform now complete
‒ Residential
‒ Indirect C&I
‒ Direct C&I
• Customer focus provides opportunity for stable
(and increased) Adjusted EBITDA
Government/Regulatory
Environment
Calpine’s Position in Evolving Power Industry Creates a Compelling Value Opportunity
Integrated platform
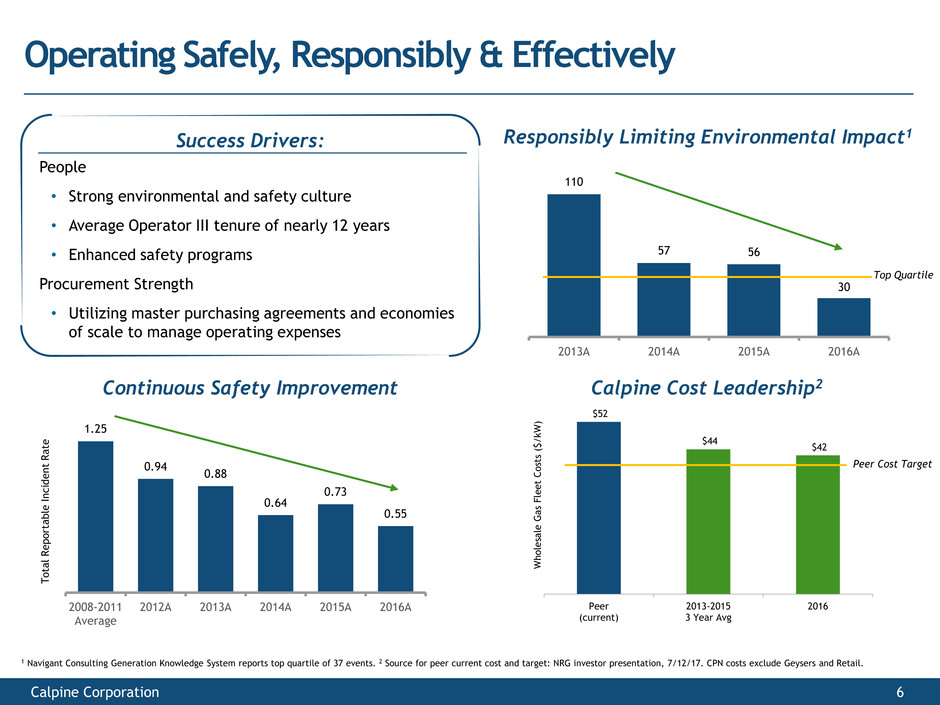
$52
$44
$42
Peer
(current)
2013-2015
3 Year Avg
2016
Who
le
sal
e
Ga
s Fl
ee
t C
os
ts
($
/kW
)
110
57 56
30
2013A 2014A 2015A 2016A
1.25
0.94
0.88
0.64
0.73
0.55
2008-2011
Average
2012A 2013A 2014A 2015A 2016A
Operating Safely, Responsibly & Effectively
Calpine Corporation 6
Continuous Safety Improvement
Responsibly Limiting Environmental Impact1 Success Drivers:
People
• Strong environmental and safety culture
• Average Operator III tenure of nearly 12 years
• Enhanced safety programs
Procurement Strength
• Utilizing master purchasing agreements and economies
of scale to manage operating expenses
Calpine Cost Leadership2
To
tal
R
e
p
or
ta
b
le
I
n
c
id
e
n
t
Ra
te
Top Quartile
1 Navigant Consulting Generation Knowledge System reports top quartile of 37 events. 2 Source for peer current cost and target: NRG investor presentation, 7/12/17. CPN costs exclude Geysers and Retail.
Peer Cost Target
$12
$13
$14
$15
$16
$17
$18
$19
2018 2019 2020
Ho
us
to
n Spar
k Spr
ead
($/
M
W
h)
04/13/17 07/14/17 10/13/17
0
2,000
4,000
6,000
8,000
10,000
12,000
14,000
16,000
18,000
10 12 14 16 18 20 22 24N
or
Ca
l N
on
-Re
newa
ble
S
up
ply
/ L
oa
d
(MW
)
Hour Ending
Load Available Resources Outages
$-
$50
$100
$150
$200
$250
2018/19 2019/20 2020/21
Au
cti
on
Cleeari
ng
Price
($
/M
W
-d
)
RTO CPN MW-weighted price EMAAC
East:
Location, location, location
Texas:
Something’s gotta give
California:
Physics will prevail
7 Calpine Corporation
3
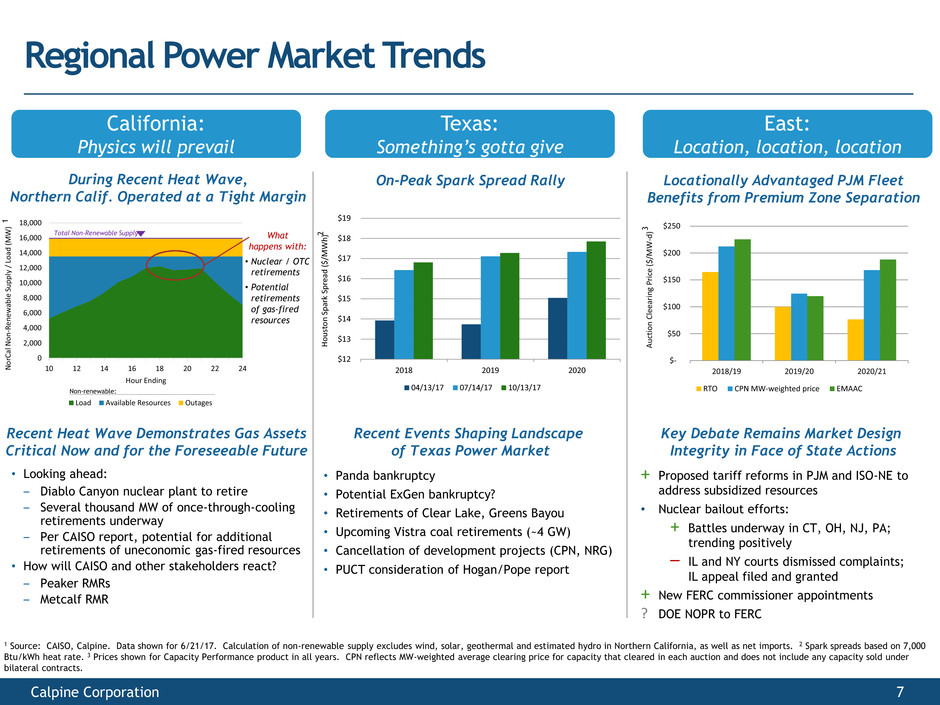
1 Source: CAISO, Calpine. Data shown for 6/21/17. Calculation of non-renewable supply excludes wind, solar, geothermal and estimated hydro in Northern California, as well as net imports. 2 Spark spreads based on 7,000
Btu/kWh heat rate. 3 Prices shown for Capacity Performance product in all years. CPN reflects MW-weighted average clearing price for capacity that cleared in each auction and does not include any capacity sold under
bilateral contracts.
2
During Recent Heat Wave,
Northern Calif. Operated at a Tight Margin
On-Peak Spark Spread Rally
Recent Events Shaping Landscape
of Texas Power Market
Locationally Advantaged PJM Fleet
Benefits from Premium Zone Separation
Key Debate Remains Market Design
Integrity in Face of State Actions
• Looking ahead:
‒ Diablo Canyon nuclear plant to retire
‒ Several thousand MW of once-through-cooling
retirements underway
‒ Per CAISO report, potential for additional
retirements of uneconomic gas-fired resources
• How will CAISO and other stakeholders react?
‒ Peaker RMRs
‒ Metcalf RMR
• Panda bankruptcy
• Potential ExGen bankruptcy?
• Retirements of Clear Lake, Greens Bayou
• Upcoming Vistra coal retirements (~4 GW)
• Cancellation of development projects (CPN, NRG)
• PUCT consideration of Hogan/Pope report
+ Proposed tariff reforms in PJM and ISO-NE to
address subsidized resources
• Nuclear bailout efforts:
+ Battles underway in CT, OH, NJ, PA;
trending positively
– IL and NY courts dismissed complaints;
IL appeal filed and granted
+ New FERC commissioner appointments
? DOE NOPR to FERC
What
happens with:
• Nuclear / OTC
retirements
• Potential
retirements
of gas-fired
resources
1
Total Non-Renewable Supply
Regional Power Market Trends
Non-renewable:
Recent Heat Wave Demonstrates Gas Assets
Critical Now and for the Foreseeable Future
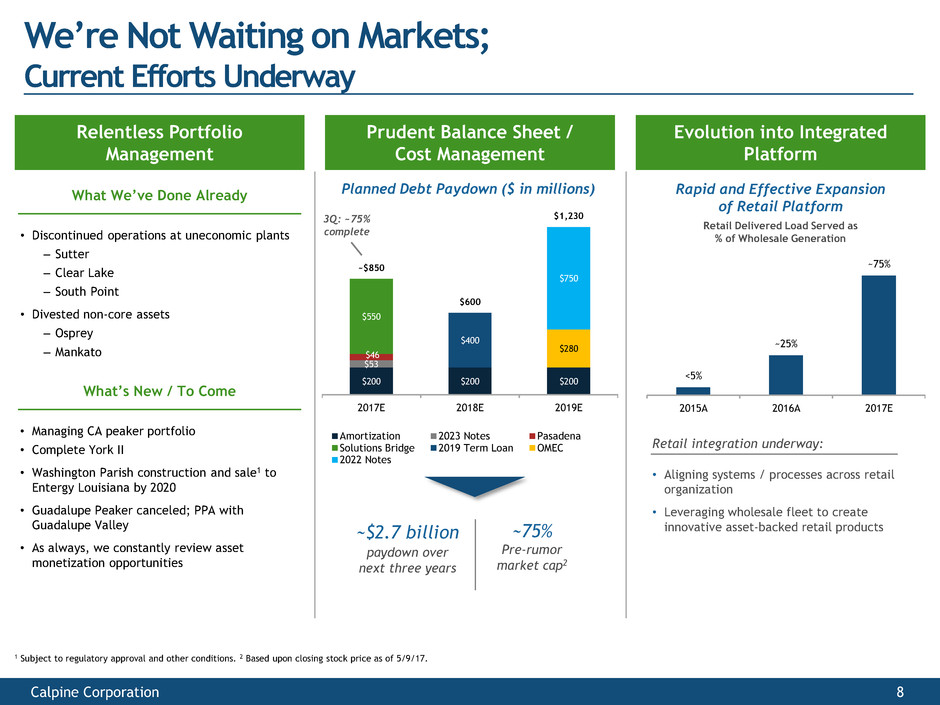
<5%
~25%
~75%
2015A 2016A 2017E
$200 $200 $200
$53
$46
$550
$400
$280
$750
~$850
$600
$1,230
2017E 2018E 2019E
Amortization 2023 Notes Pasadena
Solutions Bridge 2019 Term Loan OMEC
2022 Notes
We’re Not Waiting on Markets;
Current Efforts Underway
Calpine Corporation 8
Relentless Portfolio
Management
Prudent Balance Sheet /
Cost Management
Evolution into Integrated
Platform
Retail integration underway:
• Aligning systems / processes across retail
organization
• Leveraging wholesale fleet to create
innovative asset-backed retail products
Rapid and Effective Expansion
of Retail Platform
Retail Delivered Load Served as
% of Wholesale Generation
3Q: ~75%
complete
~$2.7 billion
paydown over
next three years
Planned Debt Paydown ($ in millions)
1 Subject to regulatory approval and other conditions. 2 Based upon closing stock price as of 5/9/17.
~75%
Pre-rumor
market cap2
What We’ve Done Already
• Discontinued operations at uneconomic plants
‒ Sutter
‒ Clear Lake
‒ South Point
• Divested non-core assets
‒ Osprey
‒ Mankato
What’s New / To Come
• Managing CA peaker portfolio
• Complete York II
• Washington Parish construction and sale1 to
Entergy Louisiana by 2020
• Guadalupe Peaker canceled; PPA with
Guadalupe Valley
• As always, we constantly review asset
monetization opportunities
Calpine Corporation 9
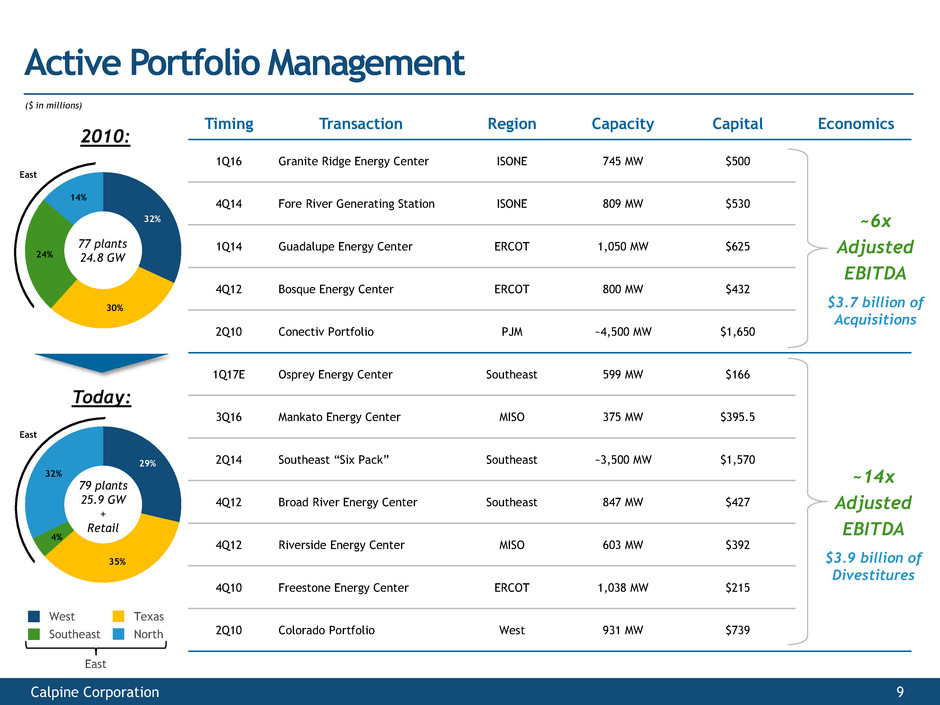
Active Portfolio Management
Timing Transaction Region Capacity Capital Economics
1Q16 Granite Ridge Energy Center ISONE 745 MW $500
4Q14 Fore River Generating Station ISONE 809 MW $530
1Q14 Guadalupe Energy Center ERCOT 1,050 MW $625
4Q12 Bosque Energy Center ERCOT 800 MW $432
2Q10 Conectiv Portfolio PJM ~4,500 MW $1,650
1Q17E Osprey Energy Center Southeast 599 MW $166
3Q16 Mankato Energy Center MISO 375 MW $395.5
2Q14 Southeast “Six Pack” Southeast ~3,500 MW $1,570
4Q12 Broad River Energy Center Southeast 847 MW $427
4Q12 Riverside Energy Center MISO 603 MW $392
4Q10 Freestone Energy Center ERCOT 1,038 MW $215
2Q10 Colorado Portfolio West 931 MW $739
$3.7 billion of
Acquisitions
$3.9 billion of
Divestitures
~6x
Adjusted
EBITDA
~14x
Adjusted
EBITDA
29%
35%
4%
32%
32%
30%
24%
14%
2010:
Today:
77 plants
24.8 GW
Southeast
West
79 plants
25.9 GW
+
Retail
East
East
North
Texas
East
($ in millions)
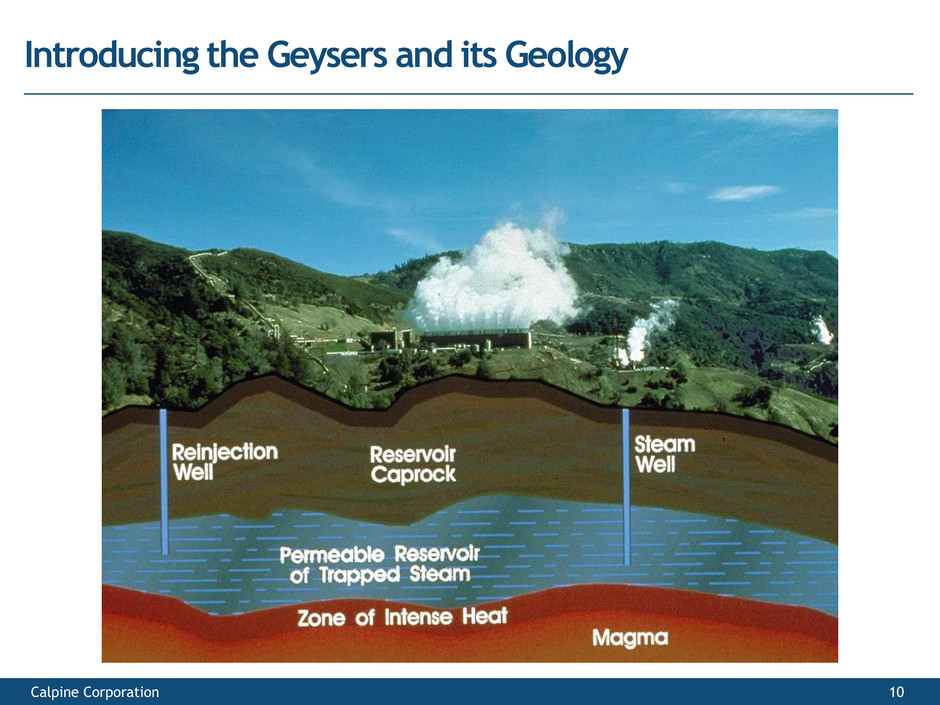
Introducing the Geysers and its Geology
Calpine Corporation 10


