United States
Securities and Exchange Commission
Washington, D.C. 20549
FORM 6-K/A
Report of Foreign Private Issuer
Pursuant to Rule 13a-16 or 15d-16
of the
Securities Exchange Act of 1934
For the month of
February 2026
Vale S.A.
Praia de Botafogo nº 186, 18º andar,
Botafogo
22250-145 Rio de Janeiro, RJ, Brazil
(Address of principal executive office)
(Indicate by check mark whether the registrant files or will file annual reports under cover of Form 20-F or Form 40-F.)
(Check One) Form 20-F x Form 40-F ¨
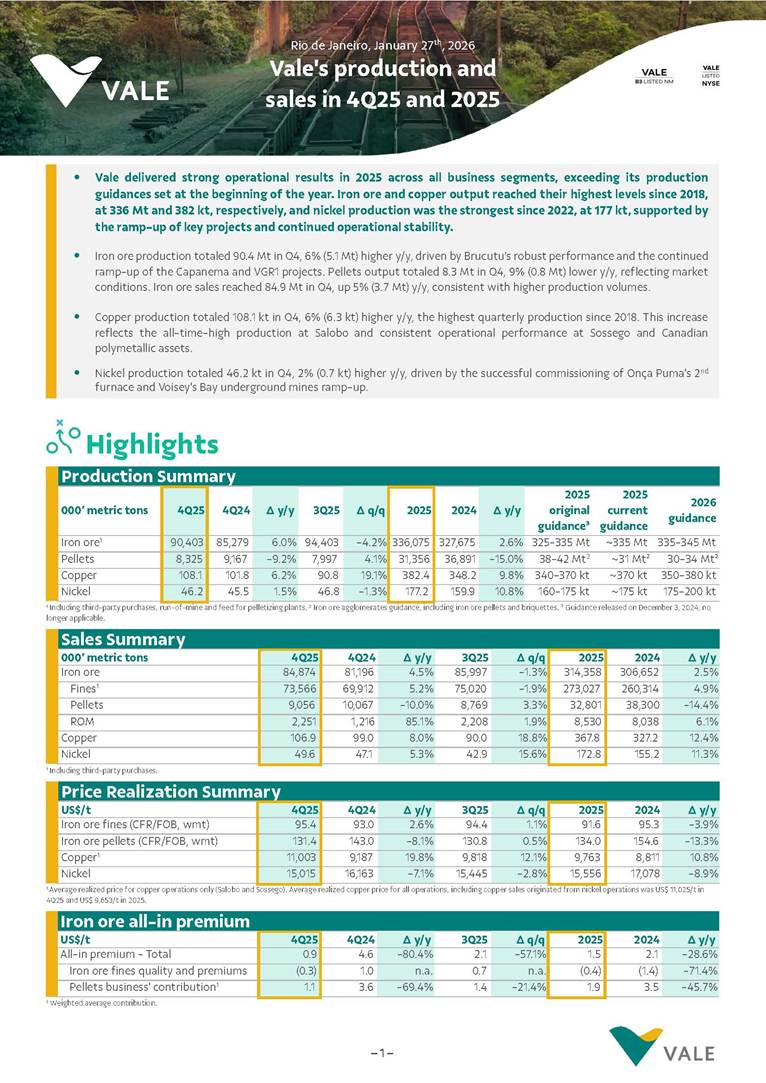
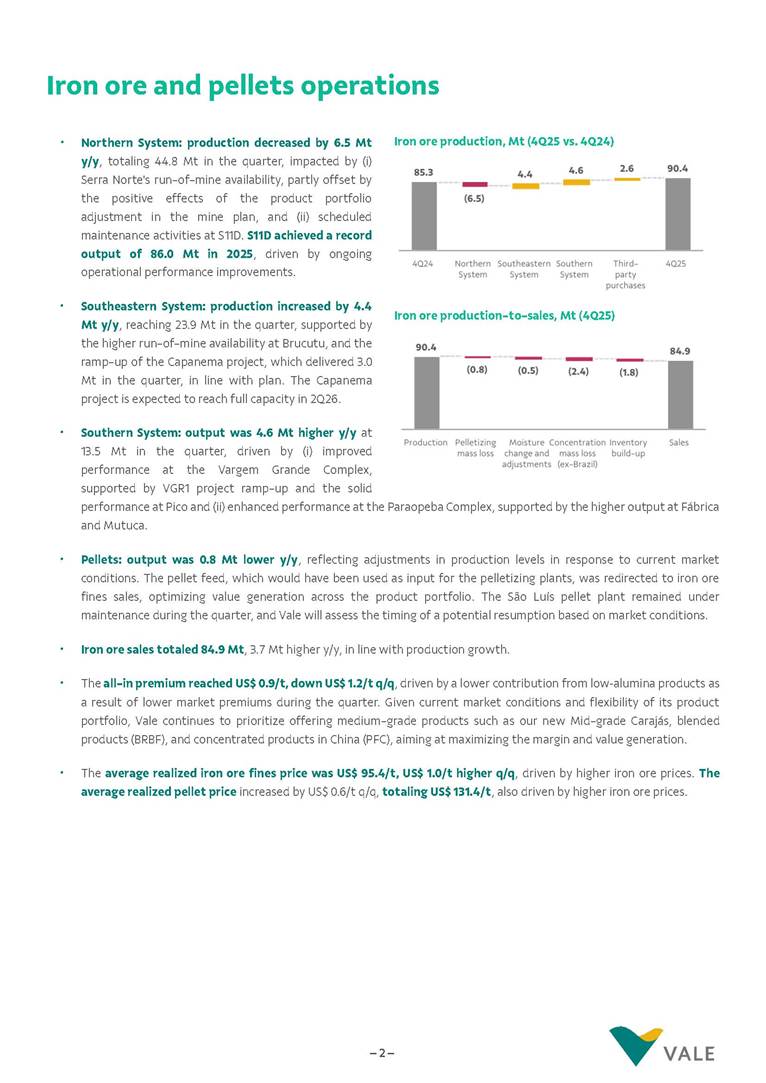
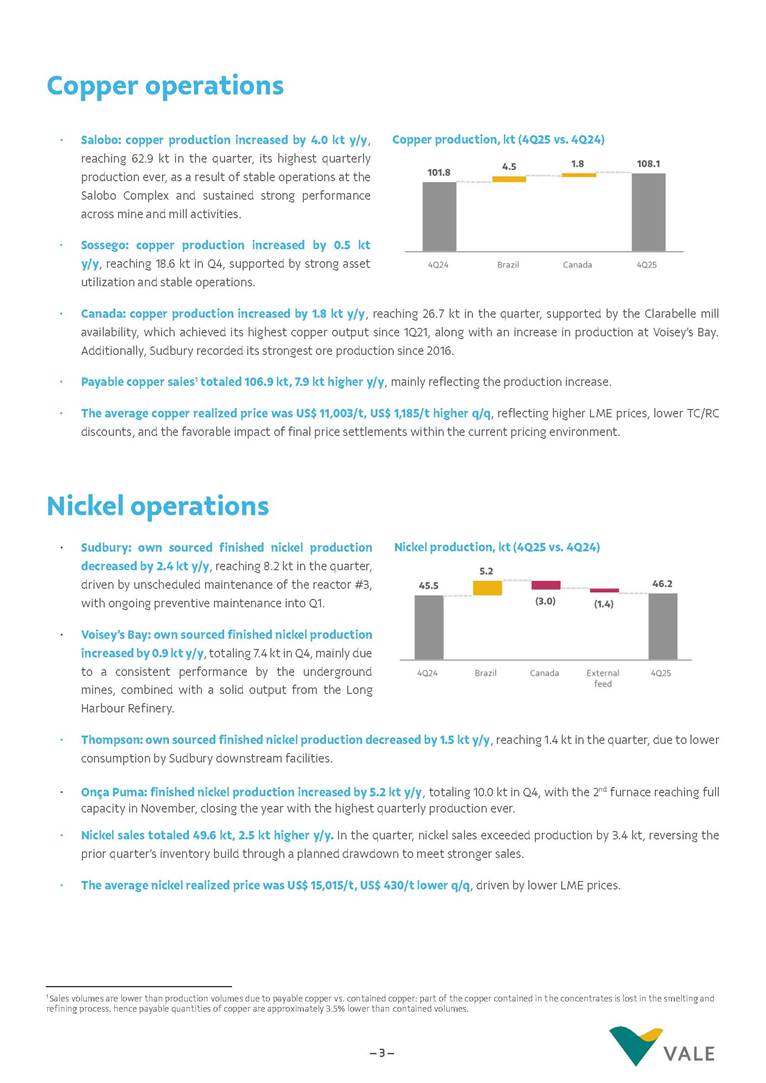
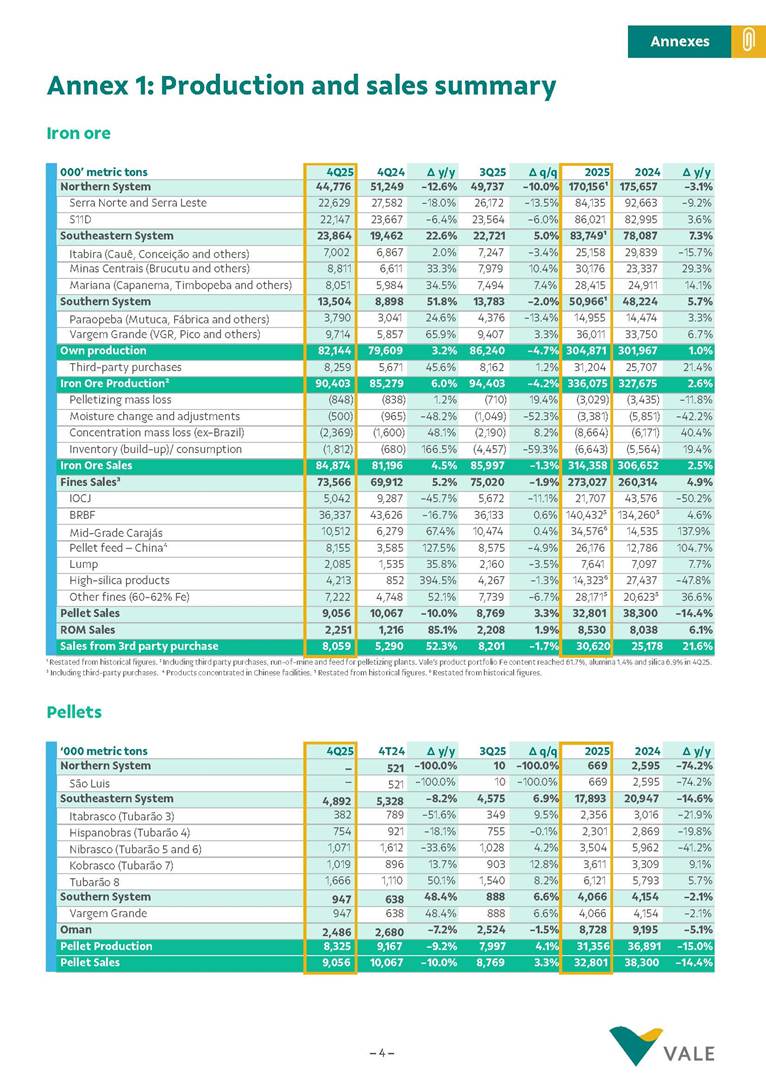
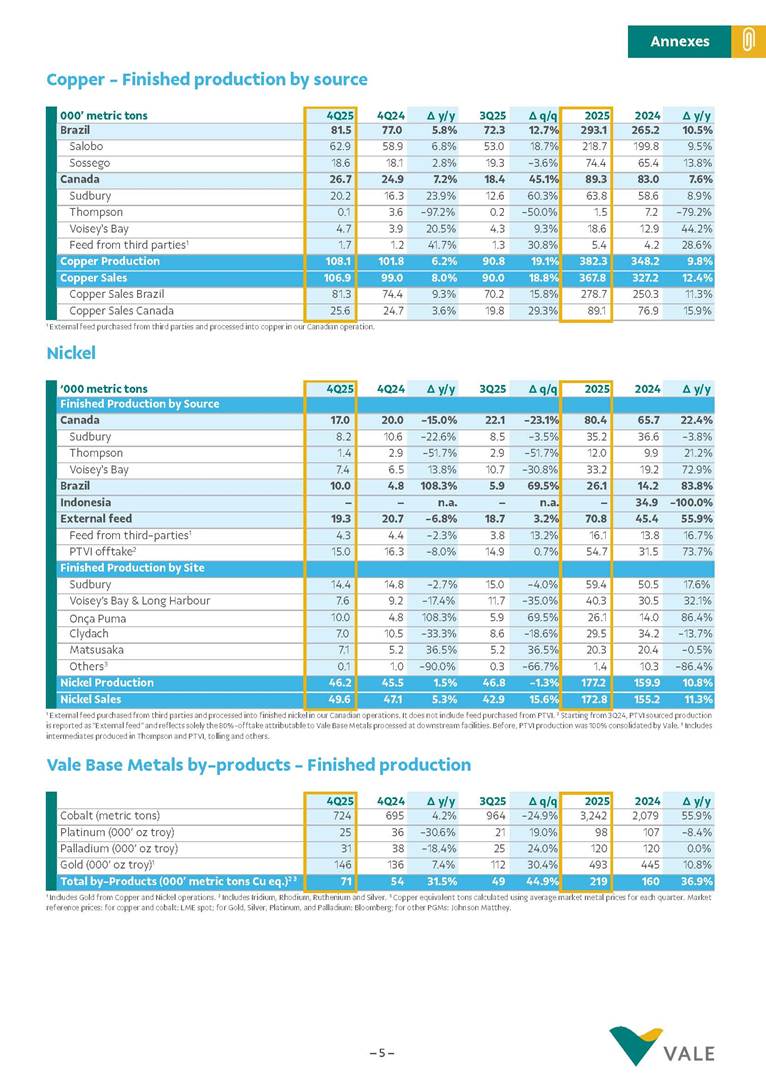
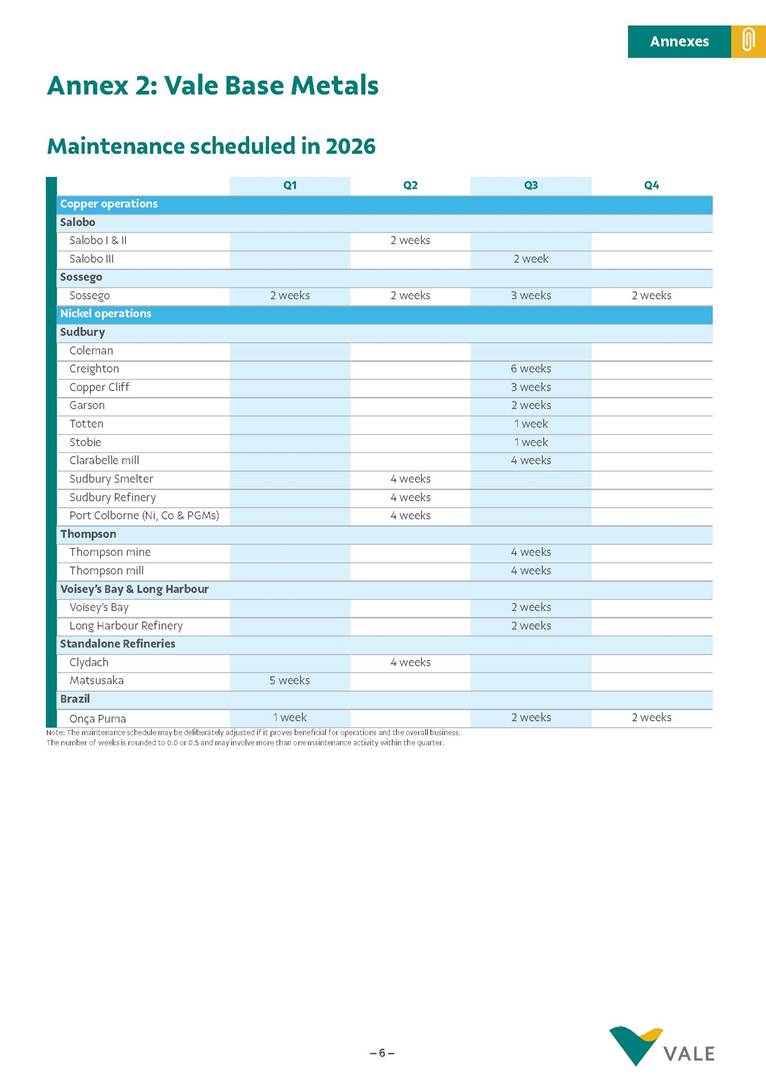
– 1 – • Vale delivered strong operational results in 2025 across all business segments, exceeding its production guidances set at the beginning of the year. Iron ore and copper output reached their highest levels since 2018, at 336 Mt and 382 kt, respectively, and nickel production was the strongest since 2022, at 177 kt, supported by the ramp-up of key projects and continued operational stability. • Iron ore production totaled 90.4 Mt in Q4, 6% (5.1 Mt) higher y/y, driven by Brucutu’s robust performance and the continued ramp-up of the Capanema and VGR1 projects. Pellets output totaled 8.3 Mt in Q4, 9% (0.8 Mt) lower y/y, reflecting market conditions. Iron ore sales reached 84.9 Mt in Q4, up 5% (3.7 Mt) y/y, consistent with higher production volumes. • Copper production totaled 108.1 kt in Q4, 6% (6.3 kt) higher y/y, the highest quarterly production since 2018. This increase reflects the all-time-high production at Salobo and consistent operational performance at Sossego and Canadian polymetallic assets. • Nickel production totaled 46.2 kt in Q4, 2% (0.7 kt) higher y/y, driven by the successful commissioning of Onça Puma's 2nd furnace and Voisey's Bay underground mines ramp-up. Highlights Production Summary 000’ metric tons 4Q25 4Q24 Δ y/y 3Q25 Δ q/q 2025 2024 Δ y/y 2025 original guidance³ 2025 current guidance 2026 guidance Iron ore1 90,403 85,279 6.0% 94,403 -4.2% 336,075 327,675 2.6% 325-335 Mt ~335 Mt 335-345 Mt Pellets 8,325 9,167 -9.2% 7,997 4.1% 31,356 36,891 -15.0% 38-42 Mt2 ~31 Mt² 30-34 Mt² Copper 108.1 101.8 6.2% 90.8 19.1% 382.4 348.2 9.8% 340-370 kt ~370 kt 350-380 kt Nickel 46.2 45.5 1.5% 46.8 -1.3% 177.2 159.9 10.8% 160-175 kt ~175 kt 175-200 kt 1 Including third-party purchases, run-of-mine and feed for pelletizing plants. 2 Iron ore agglomerates guidance, including iron ore pellets and briquettes. ³ Guidance released on December 3, 2024, no longer applicable. Sales Summary 000’ metric tons 4Q25 4Q24 Δ y/y 3Q25 Δ q/q 2025 2024 Δ y/y Iron ore 84,874 81,196 4.5% 85,997 -1.3% 314,358 306,652 2.5% Fines1 73,566 69,912 5.2% 75,020 -1.9% 273,027 260,314 4.9% Pellets 9,056 10,067 -10.0% 8,769 3.3% 32,801 38,300 -14.4% ROM 2,251 1,216 85.1% 2,208 1.9% 8,530 8,038 6.1% Copper 106.9 99.0 8.0% 90.0 18.8% 367.8 327.2 12.4% Nickel 49.6 47.1 5.3% 42.9 15.6% 172.8 155.2 11.3% 1 Including third-party purchases. Price Realization Summary US$/t 4Q25 4Q24 Δ y/y 3Q25 Δ q/q 2025 2024 Δ y/y Iron ore fines (CFR/FOB, wmt) 95.4 93.0 2.6% 94.4 1.1% 91.6 95.3 -3.9% Iron ore pellets (CFR/FOB, wmt) 131.4 143.0 -8.1% 130.8 0.5% 134.0 154.6 -13.3% Copper1 11,003 9,187 19.8% 9,818 12.1% 9,763 8,811 10.8% Nickel 15,015 16,163 -7.1% 15,445 -2.8% 15,556 17,078 -8.9% 1 Average realized price for copper operations only (Salobo and Sossego). Average realized copper price for all operations, including copper sales originated from nickel operations was US$ 11,025/t in 4Q25 and US$ 9,653/t in 2025. Iron ore all-in premium US$/t 4Q25 4Q24 Δ y/y 3Q25 Δ q/q 2025 2024 Δ y/y All-in premium - Total 0.9 4.6 -80.4% 2.1 -57.1% 1.5 2.1 -28.6% Iron ore fines quality and premiums (0.3) 1.0 n.a. 0.7 n.a. (0.4) (1.4) -71.4% Pellets business' contribution1 1.1 3.6 -69.4% 1.4 -21.4% 1.9 3.5 -45.7% 1 Weighted average contribution. Rio de Janeiro, January 27th, 2026 Vale's production and sales in 4Q25 and 2025 – 2 – Iron ore and pellets operations • Northern System: production decreased by 6.5 Mt y/y, totaling 44.8 Mt in the quarter, impacted by (i) Serra Norte's run-of-mine availability, partly offset by the positive effects of the product portfolio adjustment in the mine plan, and (ii) scheduled maintenance activities at S11D. S11D achieved a record output of 86.0 Mt in 2025, driven by ongoing operational performance improvements. • Southeastern System: production increased by 4.4 Mt y/y, reaching 23.9 Mt in the quarter, supported by the higher run-of-mine availability at Brucutu, and the ramp-up of the Capanema project, which delivered 3.0 Mt in the quarter, in line with plan. The Capanema project is expected to reach full capacity in 2Q26. • Southern System: output was 4.6 Mt higher y/y at 13.5 Mt in the quarter, driven by (i) improved performance at the Vargem Grande Complex, supported by VGR1 project ramp-up and the solid performance at Pico and (ii) enhanced performance at the Paraopeba Complex, supported by the higher output at Fábrica and Mutuca. • Pellets: output was 0.8 Mt lower y/y, reflecting adjustments in production levels in response to current market conditions. The pellet feed, which would have been used as input for the pelletizing plants, was redirected to iron ore fines sales, optimizing value generation across the product portfolio. The São Luís pellet plant remained under maintenance during the quarter, and Vale will assess the timing of a potential resumption based on market conditions. • Iron ore sales totaled 84.9 Mt, 3.7 Mt higher y/y, in line with production growth. • The all-in premium reached US$ 0.9/t, down US$ 1.2/t q/q, driven by a lower contribution from low‑alumina products as a result of lower market premiums during the quarter. Given current market conditions and flexibility of its product portfolio, Vale continues to prioritize offering medium-grade products such as our new Mid-grade Carajás, blended products (BRBF), and concentrated products in China (PFC), aiming at maximizing the margin and value generation. • The average realized iron ore fines price was US$ 95.4/t, US$ 1.0/t higher q/q, driven by higher iron ore prices. The average realized pellet price increased by US$ 0.6/t q/q, totaling US$ 131.4/t, also driven by higher iron ore prices. Iron ore production, Mt (4Q25 vs. 4Q24) Iron ore production-to-sales, Mt (4Q25) – 3 – Copper operations • Salobo: copper production increased by 4.0 kt y/y, reaching 62.9 kt in the quarter, its highest quarterly production ever, as a result of stable operations at the Salobo Complex and sustained strong performance across mine and mill activities. • Sossego: copper production increased by 0.5 kt y/y, reaching 18.6 kt in Q4, supported by strong asset utilization and stable operations. • Canada: copper production increased by 1.8 kt y/y, reaching 26.7 kt in the quarter, supported by the Clarabelle mill availability, which achieved its highest copper output since 1Q21, along with an increase in production at Voisey’s Bay. Additionally, Sudbury recorded its strongest ore production since 2016. • Payable copper sales1 totaled 106.9 kt, 7.9 kt higher y/y, mainly reflecting the production increase. • The average copper realized price was US$ 11,003/t, US$ 1,185/t higher q/q, reflecting higher LME prices, lower TC/RC discounts, and the favorable impact of final price settlements within the current pricing environment. Nickel operations • Sudbury: own sourced finished nickel production decreased by 2.4 kt y/y, reaching 8.2 kt in the quarter, driven by unscheduled maintenance of the reactor #3, with ongoing preventive maintenance into Q1. • Voisey’s Bay: own sourced finished nickel production increased by 0.9 kt y/y, totaling 7.4 kt in Q4, mainly due to a consistent performance by the underground mines, combined with a solid output from the Long Harbour Refinery. • Thompson: own sourced finished nickel production decreased by 1.5 kt y/y, reaching 1.4 kt in the quarter, due to lower consumption by Sudbury downstream facilities. • Onça Puma: finished nickel production increased by 5.2 kt y/y, totaling 10.0 kt in Q4, with the 2nd furnace reaching full capacity in November, closing the year with the highest quarterly production ever. • Nickel sales totaled 49.6 kt, 2.5 kt higher y/y. In the quarter, nickel sales exceeded production by 3.4 kt, reversing the prior quarter’s inventory build through a planned drawdown to meet stronger sales. • The average nickel realized price was US$ 15,015/t, US$ 430/t lower q/q, driven by lower LME prices. 1 Sales volumes are lower than production volumes due to payable copper vs. contained copper: part of the copper contained in the concentrates is lost in the smelting and refining process, hence payable quantities of copper are approximately 3.5% lower than contained volumes. Nickel production, kt (4Q25 vs. 4Q24) Copper production, kt (4Q25 vs. 4Q24) Annexes – 4 – Annex 1: Production and sales summary Iron ore 000’ metric tons 4Q25 4Q24 Δ y/y 3Q25 Δ q/q 2025 2024 Δ y/y Northern System 44,776 51,249 -12.6% 49,737 -10.0% 170,156¹ 175,657 -3.1% Serra Norte and Serra Leste 22,629 27,582 -18.0% 26,172 -13.5% 84,135 92,663 -9.2% S11D 22,147 23,667 -6.4% 23,564 -6.0% 86,021 82,995 3.6% Southeastern System 23,864 19,462 22.6% 22,721 5.0% 83,749¹ 78,087 7.3% Itabira (Cauê, Conceição and others) 7,002 6,867 2.0% 7,247 -3.4% 25,158 29,839 -15.7% Minas Centrais (Brucutu and others) 8,811 6,611 33.3% 7,979 10.4% 30,176 23,337 29.3% Mariana (Capanema, Timbopeba and others) 8,051 5,984 34.5% 7,494 7.4% 28,415 24,911 14.1% Southern System 13,504 8,898 51.8% 13,783 -2.0% 50,966¹ 48,224 5.7% Paraopeba (Mutuca, Fábrica and others) 3,790 3,041 24.6% 4,376 -13.4% 14,955 14,474 3.3% Vargem Grande (VGR, Pico and others) 9,714 5,857 65.9% 9,407 3.3% 36,011 33,750 6.7% Own production 82,144 79,609 3.2% 86,240 -4.7% 304,871 301,967 1.0% Third-party purchases 8,259 5,671 45.6% 8,162 1.2% 31,204 25,707 21.4% Iron Ore Production² 90,403 85,279 6.0% 94,403 -4.2% 336,075 327,675 2.6% Pelletizing mass loss (848) (838) 1.2% (710) 19.4% (3,029) (3,435) -11.8% Moisture change and adjustments (500) (965) -48.2% (1,049) -52.3% (3,381) (5,851) -42.2% Concentration mass loss (ex-Brazil) (2,369) (1,600) 48.1% (2,190) 8.2% (8,664) (6,171) 40.4% Inventory (build-up)/ consumption (1,812) (680) 166.5% (4,457) -59.3% (6,643) (5,564) 19.4% Iron Ore Sales 84,874 81,196 4.5% 85,997 -1.3% 314,358 306,652 2.5% Fines Sales³ 73,566 69,912 5.2% 75,020 -1.9% 273,027 260,314 4.9% IOCJ 5,042 9,287 -45.7% 5,672 -11.1% 21,707 43,576 -50.2% BRBF 36,337 43,626 -16.7% 36,133 0.6% 140,432⁵ 134,260⁵ 4.6% Mid-Grade Carajás 10,512 6,279 67.4% 10,474 0.4% 34,576⁶ 14,535 137.9% Pellet feed – China⁴ 8,155 3,585 127.5% 8,575 -4.9% 26,176 12,786 104.7% Lump 2,085 1,535 35.8% 2,160 -3.5% 7,641 7,097 7.7% High-silica products 4,213 852 394.5% 4,267 -1.3% 14,323⁶ 27,437 -47.8% Other fines (60-62% Fe) 7,222 4,748 52.1% 7,739 -6.7% 28,171⁵ 20,623⁵ 36.6% Pellet Sales 9,056 10,067 -10.0% 8,769 3.3% 32,801 38,300 -14.4% ROM Sales 2,251 1,216 85.1% 2,208 1.9% 8,530 8,038 6.1% Sales from 3rd party purchase 8,059 5,290 52.3% 8,201 -1.7% 30,620 25,178 21.6% 1 Restated from historical figures. 2 Including third party purchases, run-of-mine and feed for pelletizing plants. Vale’s product portfolio Fe content reached 61.7%, alumina 1.4% and silica 6.9% in 4Q25. 3 Including third-party purchases. 4 Products concentrated in Chinese facilities. 5 Restated from historical figures. 6 Restated from historical figures. Pellets ‘000 metric tons 4Q25 4T24 Δ y/y 3Q25 Δ q/q 2025 2024 Δ y/y Northern System – 521 -100.0% 10 -100.0% 669 2,595 -74.2% São Luis – 521 -100.0% 10 -100.0% 669 2,595 -74.2% Southeastern System 4,892 5,328 -8.2% 4,575 6.9% 17,893 20,947 -14.6% Itabrasco (Tubarão 3) 382 789 -51.6% 349 9.5% 2,356 3,016 -21.9% Hispanobras (Tubarão 4) 754 921 -18.1% 755 -0.1% 2,301 2,869 -19.8% Nibrasco (Tubarão 5 and 6) 1,071 1,612 -33.6% 1,028 4.2% 3,504 5,962 -41.2% Kobrasco (Tubarão 7) 1,019 896 13.7% 903 12.8% 3,611 3,309 9.1% Tubarão 8 1,666 1,110 50.1% 1,540 8.2% 6,121 5,793 5.7% Southern System 947 638 48.4% 888 6.6% 4,066 4,154 -2.1% Vargem Grande 947 638 48.4% 888 6.6% 4,066 4,154 -2.1% Oman 2,486 2,680 -7.2% 2,524 -1.5% 8,728 9,195 -5.1% Pellet Production 8,325 9,167 -9.2% 7,997 4.1% 31,356 36,891 -15.0% Pellet Sales 9,056 10,067 -10.0% 8,769 3.3% 32,801 38,300 -14.4% Annexes – 5 – Copper - Finished production by source 000’ metric tons 4Q25 4Q24 Δ y/y 3Q25 Δ q/q 2025 2024 Δ y/y Brazil 81.5 77.0 5.8% 72.3 12.7% 293.1 265.2 10.5% Salobo 62.9 58.9 6.8% 53.0 18.7% 218.7 199.8 9.5% Sossego 18.6 18.1 2.8% 19.3 -3.6% 74.4 65.4 13.8% Canada 26.7 24.9 7.2% 18.4 45.1% 89.3 83.0 7.6% Sudbury 20.2 16.3 23.9% 12.6 60.3% 63.8 58.6 8.9% Thompson 0.1 3.6 -97.2% 0.2 -50.0% 1.5 7.2 -79.2% Voisey's Bay 4.7 3.9 20.5% 4.3 9.3% 18.6 12.9 44.2% Feed from third parties1 1.7 1.2 41.7% 1.3 30.8% 5.4 4.2 28.6% Copper Production 108.1 101.8 6.2% 90.8 19.1% 382.3 348.2 9.8% Copper Sales 106.9 99.0 8.0% 90.0 18.8% 367.8 327.2 12.4% Copper Sales Brazil 81.3 74.4 9.3% 70.2 15.8% 278.7 250.3 11.3% Copper Sales Canada 25.6 24.7 3.6% 19.8 29.3% 89.1 76.9 15.9% 1 External feed purchased from third parties and processed into copper in our Canadian operation. Nickel ‘000 metric tons 4Q25 4Q24 Δ y/y 3Q25 Δ q/q 2025 2024 Δ y/y Finished Production by Source Canada 17.0 20.0 -15.0% 22.1 -23.1% 80.4 65.7 22.4% Sudbury 8.2 10.6 -22.6% 8.5 -3.5% 35.2 36.6 -3.8% Thompson 1.4 2.9 -51.7% 2.9 -51.7% 12.0 9.9 21.2% Voisey's Bay 7.4 6.5 13.8% 10.7 -30.8% 33.2 19.2 72.9% Brazil 10.0 4.8 108.3% 5.9 69.5% 26.1 14.2 83.8% Indonesia – – n.a. – n.a. – 34.9 -100.0% External feed 19.3 20.7 -6.8% 18.7 3.2% 70.8 45.4 55.9% Feed from third-parties1 4.3 4.4 -2.3% 3.8 13.2% 16.1 13.8 16.7% PTVI offtake2 15.0 16.3 -8.0% 14.9 0.7% 54.7 31.5 73.7% Finished Production by Site Sudbury 14.4 14.8 -2.7% 15.0 -4.0% 59.4 50.5 17.6% Voisey’s Bay & Long Harbour 7.6 9.2 -17.4% 11.7 -35.0% 40.3 30.5 32.1% Onça Puma 10.0 4.8 108.3% 5.9 69.5% 26.1 14.0 86.4% Clydach 7.0 10.5 -33.3% 8.6 -18.6% 29.5 34.2 -13.7% Matsusaka 7.1 5.2 36.5% 5.2 36.5% 20.3 20.4 -0.5% Others3 0.1 1.0 -90.0% 0.3 -66.7% 1.4 10.3 -86.4% Nickel Production 46.2 45.5 1.5% 46.8 -1.3% 177.2 159.9 10.8% Nickel Sales 49.6 47.1 5.3% 42.9 15.6% 172.8 155.2 11.3% 1 External feed purchased from third parties and processed into finished nickel in our Canadian operations. It does not include feed purchased from PTVI. 2 Starting from 3Q24, PTVI sourced production is reported as “External feed” and reflects solely the 80%-offtake attributable to Vale Base Metals processed at downstream facilities. Before, PTVI production was 100% consolidated by Vale. 3 Includes intermediates produced in Thompson and PTVI, tolling and others. Vale Base Metals by-products - Finished production 4Q25 4Q24 Δ y/y 3Q25 Δ q/q 2025 2024 Δ y/y Cobalt (metric tons) 724 695 4.2% 964 -24.9% 3,242 2,079 55.9% Platinum (000’ oz troy) 25 36 -30.6% 21 19.0% 98 107 -8.4% Palladium (000’ oz troy) 31 38 -18.4% 25 24.0% 120 120 0.0% Gold (000’ oz troy)1 146 136 7.4% 112 30.4% 493 445 10.8% Total by-Products (000’ metric tons Cu eq.)2 3 71 54 31.5% 49 44.9% 219 160 36.9% 1 Includes Gold from Copper and Nickel operations. 2 Includes Iridium, Rhodium, Ruthenium and Silver. 3 Copper equivalent tons calculated using average market metal prices for each quarter. Market reference prices: for copper and cobalt: LME spot; for Gold, Silver, Platinum, and Palladium: Bloomberg; for other PGMs: Johnson Matthey. Annexes – 6 – Annex 2: Vale Base Metals Maintenance scheduled in 2026 Q1 Q2 Q3 Q4 Copper operations Salobo Salobo I & II 2 weeks Salobo III 2 week Sossego Sossego 2 weeks 2 weeks 3 weeks 2 weeks Nickel operations Sudbury Coleman Creighton 6 weeks Copper Cliff 3 weeks Garson 2 weeks Totten 1 week Stobie 1 week Clarabelle mill 4 weeks Sudbury Smelter 4 weeks Sudbury Refinery 4 weeks Port Colborne (Ni, Co & PGMs) 4 weeks Thompson Thompson mine 4 weeks Thompson mill 4 weeks Voisey’s Bay & Long Harbour Voisey’s Bay 2 weeks Long Harbour Refinery 2 weeks Standalone Refineries Clydach 4 weeks Matsusaka 5 weeks Brazil Onça Puma 1 week 2 weeks 2 weeks Note: The maintenance schedule may be deliberately adjusted if it proves beneficial for operations and the overall business. The number of weeks is rounded to 0.0 or 0.5 and may involve more than one maintenance activity within the quarter. Investor Relations – 7 – Investor Relations This press release may include statements about Vale's current expectations about future events or results (forward-looking statements), including in particular expectations for production and sales of iron ore, nickel and copper on pages 1, 2, 3 and 4. Many of those forward-looking statements can be identified by the use of forward-looking words such as "anticipate," "believe," "could," "expect," "should," "plan," "intend," "estimate" “will” and "potential," among others. All forward-looking statements involve various risks and uncertainties. Vale cannot guarantee that these statements will prove correct. These risks and uncertainties include, among others, factors related to: (a) the countries where Vale operates, especially Brazil and Canada; (b) the global economy; (c) the capital markets; (d) the mining and metals prices and their dependence on global industrial production, which is cyclical by nature; and (e) global competition in the markets in which Vale operates. Vale cautions you that actual results may differ materially from the plans, objectives, expectations, estimates and intentions expressed in this presentation. Vale undertakes no obligation to publicly update or revise any forward-looking statement, whether as a result of new information or future events or for any other reason. To obtain further information on factors that may lead to results different from those forecast by Vale, please consult the reports that Vale files with the U.S. Securities and Exchange Commission (SEC), the Brazilian Comissão de Valores Mobiliários (CVM) and, in particular, the factors discussed under “Forward-Looking Statements” and “Risk Factors” in Vale’s annual report on Form 20-F. Vale.RI@vale.com Thiago Lofiego thiago.lofiego@vale.com Mariana Rocha mariana.rocha@vale.com Luciana Oliveti luciana.oliveti@vale.com Pedro Terra pedro.terra@vale.com Patricia Tinoco patricia.tinoco@vale.com
Signatures
Pursuant to the requirements of the Securities Exchange Act of 1934, the registrant has duly caused this report to be signed on its behalf by the undersigned, thereunto duly authorized.
| Vale S.A. (Registrant) | ||
| By: | /s/ Thiago Lofiego | |
| Date: February 5, 2026 | Director of Investor Relations | |